UNITED STATES
SECURITIES AND EXCHANGE COMMISSION
Washington, D.C. 20549
FORM N-CSR
CERTIFIED SHAREHOLDER REPORT OF REGISTERED
MANAGEMENT INVESTMENT COMPANIES
Investment Company Act file number | 811-21265 | |||||||
| ||||||||
PowerShares Exchange-Traded Fund Trust | ||||||||
(Exact name of registrant as specified in charter) | ||||||||
| ||||||||
301 W. Roosevelt Road |
| 60187 | ||||||
(Address of principal executive offices) |
| (Zip code) | ||||||
| ||||||||
H. Bruce Bond | ||||||||
(Name and address of agent for service) | ||||||||
| ||||||||
Registrant’s telephone number, including area code: | 800-983-0903 |
| ||||||
| ||||||||
Date of fiscal year end: | April 30 |
| ||||||
| ||||||||
Date of reporting period: | April 30, 2009 |
| ||||||
Item 1. Reports to Stockholders.
The Registrant’s annual report transmitted to shareholders pursuant to Rule 30e-1 under the Investment Company Act of 1940 is as follows:


2009 Annual Report to Shareholders
April 30, 2009
PowerShares Dynamic MagniQuant Portfolio
PowerShares Dynamic Market Portfolio
PowerShares Dynamic OTC Portfolio
PowerShares FTSE RAFI US 1000 Portfolio
PowerShares NXQ Portfolio

Table of Contents
| The Market Environment | 2 | ||||||
| Manager's Analysis | 4 | ||||||
| Frequency Distribution of Discounts & Premiums | 14 | ||||||
| Fees and Expenses | 16 | ||||||
| Broad Market Portfolios | |||||||
| Schedules of Investments | |||||||
| PowerShares Dynamic MagniQuant Portfolio | 17 | ||||||
| PowerShares Dynamic Market Portfolio | 20 | ||||||
| PowerShares Dynamic OTC Portfolio | 22 | ||||||
| PowerShares FTSE RAFI US 1000 Portfolio | 24 | ||||||
| PowerShares NXQ Portfolio | 35 | ||||||
| Statements of Assets and Liabilities | 36 | ||||||
| Statements of Operations | 37 | ||||||
| Statements of Changes in Net Assets | 38 | ||||||
| Financial Highlights | 40 | ||||||
| Notes to Financial Statements | 43 | ||||||
| Report of Independent Registered Public Accounting Firm | 53 | ||||||
| Supplemental Information | 54 | ||||||
| Board Considerations Regarding Approval of Investment Advisory Agreements | 59 | ||||||
The Market Environment
For the year ended April 30, 2009, stock market losses were larger than most market participants have ever seen in their professional careers. The S&P 500® Index was down 35.29%, the NASDAQ-100® Index declined 26.83% and the Dow Jones Industrial Index dropped 34.12%. Corporate debt markets also declined as the credit crunch continued to limit access to capital. Municipal securities held up a little better but still struggled. The Merrill U.S. Corporate Master Index returned -5.78% while the Merrill Muni Master Index returned 2.26% for the period. Meanwhile, treasury securities rallied as investors fled to quality. Huge companies required capital infusions and/or other forms of financial support through government intervention and the credit crisis evolved into an overall crisis of consumer, investor and business confidence.
The markets fell nearly universally from August through October. As more job losses and layoffs were announced, banks continued to restrict borrowing and consumers, who drive two-thirds of the U.S. economy historically, were unable to sustain their spending. The government spent hundreds of billions of dollars to bail out firms and stimulate the economy while the Federal Open Market Committee moved from a discount rate of 2.50% to 0.50% during the period. Not until March did confidence begin to return to the equity markets with the S&P 500® Index, NASDAQ-100® Index and the Dow Jones Industrial Index moving off the lows and returning 29.99%, 29.97% and 21.24% respectively from March 1 through April 30, 2009. Corporate and municipal debt also showed some appreciation over the period, however the amount of appreciation was less as credit spreads tightened. The Merrill Muni Master Index was up 2.33% while the Merrill U.S. Corporate Master Index rose by 2.55% from March 1 through April 30, 2009.
2
This page intentionally left blank
Manager's Analysis
PowerShares Dynamic MagniQuant Portfolio (ticker: PIQ)
The PowerShares Dynamic MagniQuant Portfolio (the "Fund") seeks investment results that correspond generally to the price and yield (before the Fund's fees and expenses) of an equity index called the Top 200 Dynamic IntellidexSM Index ("Index"). The Fund utilized a direct Index replication method during the reporting period.
Stocks included in the Index are selected using a proprietary methodology which evaluates the investment merit of the 2,000 largest U.S. companies by analyzing numerous unique financial characteristics from four broad financial perspectives: fundamental, valuation, timeliness and risk. Securities that possess the greatest capital appreciation potential, as determined by the Index Provider, are selected for the Index and included in the Fund's portfolio.
The Fund returned -32.40% over the reporting period, while the S&P 500® Equal Weight Index returned -32.82% and the Russell 3000® Index returned -34.95%. Financials and consumer discretionary stocks contributed the most to performance, while health care and materials stocks contributed negatively. The Fund benefited from the Index's effective stock selection among banks and retailing; the Index's stock selection was less effective among pharmaceuticals biotechnology and materials companies.
Sector Breakdown (% of the Fund's
Net Assets) as of April 30, 2009
| Information Technology | 21.4 | ||||||
| Industrials | 19.9 | ||||||
| Consumer Discretionary | 18.7 | ||||||
| Financials | 16.1 | ||||||
| Health Care | 10.0 | ||||||
| Consumer Staples | 7.4 | ||||||
| Materials | 3.1 | ||||||
| Energy | 2.5 | ||||||
| Telecommunication Services | 0.5 | ||||||
| Utilities | 0.4 | ||||||
| Money Market Fund | 0.2 | ||||||
| Other | (0.2 | ) | |||||
Top Ten Fund Holdings (% of the Fund's
Net Assets) as of April 30, 2009
| Security | |||||||
| TNS, Inc. | 1.1 | ||||||
| Deluxe Corp. | 0.8 | ||||||
| 3Com Corp. | 0.8 | ||||||
| Phillips-Van Heusen Corp. | 0.7 | ||||||
| optionsXpress Holdings, Inc. | 0.7 | ||||||
| hhgregg, Inc. | 0.7 | ||||||
| Basic Energy Services, Inc. | 0.7 | ||||||
| Unum Group | 0.7 | ||||||
| Websense, Inc. | 0.7 | ||||||
| Fossil, Inc. | 0.7 | ||||||
| Total | 7.6 | ||||||
Style Allocation (% of the Fund's
Total Investments) as of April 30, 2009
| Small-Cap Growth | 35.6 | ||||||
| Small-Cap Value | 25.3 | ||||||
| Mid-Cap Growth | 17.7 | ||||||
| Mid-Cap Value | 11.2 | ||||||
| Large-Cap Growth | 5.1 | ||||||
| Large-Cap Value | 5.1 | ||||||
4
Manager's Analysis (Continued)
PowerShares Dynamic MagniQuant Portfolio (ticker: PIQ)
Growth of a $10,000 Investment Since Inception†
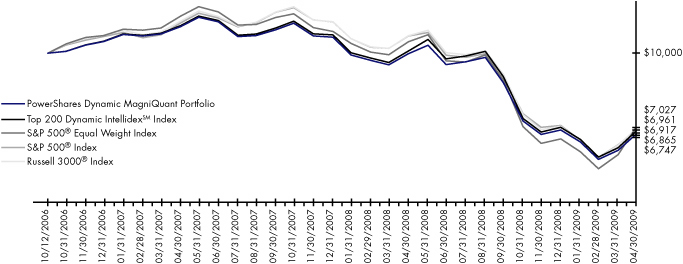
| Fund Performance History (%) | As of April 30, 2009 | ||||||||||||||
| Avg. Ann.†† | Fund Inception† | ||||||||||||||
| 1 Year | Avg. Ann.†† | Cumulative | |||||||||||||
| Index | |||||||||||||||
| Top 200 Dynamic IntellidexSM Index | -31.94 | -13.72 | -31.35 | ||||||||||||
| S&P 500® Equal Weight Index | -32.82 | -12.77 | -29.73 | ||||||||||||
| S&P 500® Index | -35.29 | -13.30 | -30.83 | ||||||||||||
| Russell 3000® Index | -34.95 | -13.08 | -30.39 | ||||||||||||
| Fund | |||||||||||||||
| NAV Return | -32.40 | -14.31 | -32.53 | ||||||||||||
| Share Price Return | -32.41 | -14.29 | -32.49 | ||||||||||||
Fund Inception: October 12, 2006
Performance quoted represents past performance. Past performance is not a guarantee of future results and current performance may be higher or lower than performance quoted. Investment returns and principal value will fluctuate and shares, when redeemed, may be worth more or less than their original cost. The Adviser has waived fees and reimbursed other expenses, absent which, performance would have been lower. The Adviser has contractually agreed to waive fees and/or pay certain Fund expenses through August 31, 2010. According to the Fund's current prospectus, the total gross annual operating expense ratio was indicated as 0.72%. In the Financial Highlights section of this Shareholder Report, the Fund's net (subsidized) total operating expense ratio was determined to be 0.65% while the Fund's gross total operating expense ratio was 0.87%. NAV and Share Price returns assume that dividends and capital gain distributions have been reinvested in the Fund at NAV and Share Price, respectively. The returns shown in the table above do not reflect the deduction of taxes that a shareholder would pay on Fund distributions or the redemption or sale of Fund Shares. See invescopowershares.com to find the most recent month-end performance numbers.
Index performance results are based upon a hypothetical investment in its constituent securities. Index returns do not represent Fund returns. An investor cannot invest directly in an index. The Index does not charge management fees or brokerage expenses, and no such fees or expenses were deducted from the hypothetical performance shown. In addition, the results actual investors might have achieved would have differed from those shown because of differences in the timing, amounts of their investments, and fees and expenses associated with an investment in the Fund.
The S&P 500® Equal Weight Index, S&P 500® Index and Russell 3000® Index (the "Benchmark Indices") are unmanaged indices used as a measurement of change in stock market conditions based on the average performance of approximately 500, 500 and 2,918 common stocks, respectively. The S&P 500® Equal Weight Index and the Russell 3000® Index will be used for comparative purposes going forward as these represent the most appropriate market indices for this fund.
† Fund and underlying Index returns are based on the inception date of the Fund. Returns for the Benchmark Indices are based on the closest month-end to the Fund's inception date.
†† Average annualized.
5
Manager's Analysis
PowerShares Dynamic Market Portfolio (ticker: PWC)
The PowerShares Dynamic Market Portfolio (the "Fund") seeks investment results that correspond generally to the price and yield (before the Fund's fees and expenses) of an equity index called the Dynamic Market IntellidexSM Index ("Index"). The Fund utilized a direct index replication method during the reporting period. Stocks included in the Index are selected using a proprietary methodology which evaluates domestic companies for inclusion in the Index across numerous investment criteria, including fundamentals, valuation, timeliness and risk perspectives. Securities that possess the greatest capital appreciation potential are selected for the Index and included in the Fund's portfolio.
The Fund returned -33.86% over the reporting period, while the S&P 500® Index returned -35.29% and the Russell 3000® Index returned -34.95%. Financials and consumer discretionary stocks contributed the most to performance, while materials and information technology stocks contributed the least. The Fund benefited from the Index's effective stock selection among diversified financials and energy; the Index's stock selection was less effective among materials, technology hardware & equipment and pharmaceuticals biotechnology & life sciences stocks. The Fund was negatively impacted as the Index methodology was poor in stock selection among mid-cap growth stocks.
Sector Breakdown (% of the Fund's
Net Assets) as of April 30, 2009
| Information Technology | 16.1 | ||||||
| Health Care | 14.6 | ||||||
| Energy | 13.7 | ||||||
| Industrials | 11.6 | ||||||
| Financials | 11.5 | ||||||
| Consumer Staples | 10.9 | ||||||
| Consumer Discretionary | 10.7 | ||||||
| Utilities | 4.3 | ||||||
| Telecommunication Services | 3.3 | ||||||
| Materials | 3.2 | ||||||
| Money Market Fund | 0.1 | ||||||
Top Ten Fund Holdings (% of the Fund's
Net Assets) as of April 30, 2009
| Security | |||||||
| Anadarko Petroleum Corp. | 4.9 | ||||||
| National-Oilwell Varco, Inc. | 4.5 | ||||||
| Altria Group, Inc. | 3.8 | ||||||
| Wal-Mart Stores, Inc. | 3.7 | ||||||
| Public Service Enterprise Group, Inc. | 3.1 | ||||||
| Equifax, Inc. | 3.0 | ||||||
| Express Scripts, Inc. | 3.0 | ||||||
| Lockheed Martin Corp. | 2.7 | ||||||
| Quest Diagnostics, Inc. | 2.6 | ||||||
| Red Hat, Inc. | 2.5 | ||||||
| Total | 33.8 | ||||||
Style Allocation (% of the Fund's
Total Investments) as of April 30, 2009
| Large-Cap Value | 25.1 | ||||||
| Large-Cap Growth | 23.6 | ||||||
| Mid-Cap Growth | 15.3 | ||||||
| Small-Cap Growth | 13.6 | ||||||
| Mid-Cap Value | 11.9 | ||||||
| Small-Cap Value | 10.5 | ||||||
6
Manager's Analysis (Continued)
PowerShares Dynamic Market Portfolio (ticker: PWC)
Growth of a $10,000 Investment Since Inception†
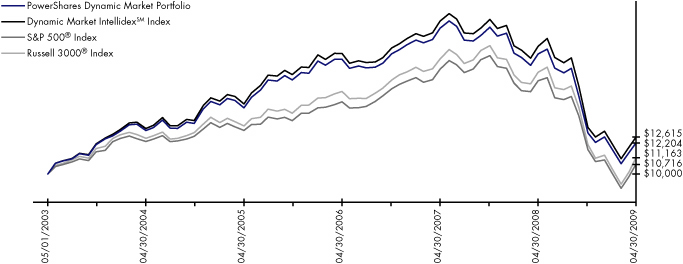
| Fund Performance History (%) | As of April 30, 2009 | ||||||||||||||||||||||
| Avg. Ann.†† | Fund Inception† | ||||||||||||||||||||||
| 1 Year | 3 Year | 5 Year | Avg. Ann.†† | Cumulative | |||||||||||||||||||
| Index | |||||||||||||||||||||||
| Dynamic Market IntellidexSM Index | -33.55 | -11.94 | -0.90 | 3.95 | 26.15 | ||||||||||||||||||
| S&P 500® Index | -35.29 | -10.76 | -2.70 | 1.16 | 7.16 | ||||||||||||||||||
| Russell 3000® Index | -34.95 | -10.94 | -2.26 | 1.85 | 11.63 | ||||||||||||||||||
| Fund | |||||||||||||||||||||||
| NAV Return | -33.86 | -12.26 | -1.35 | 3.38 | 22.04 | ||||||||||||||||||
| Share Price Return | -33.84 | -12.28 | -1.37 | 3.37 | 21.98 | ||||||||||||||||||
Fund Inception: May 1, 2003
Performance quoted represents past performance. Past performance is not a guarantee of future results and current performance may be higher or lower than performance quoted. Investment returns and principal value will fluctuate and shares, when redeemed, may be worth more or less than their original cost. The Adviser has waived fees and reimbursed other expenses, absent which, performance would have been lower. The Adviser has contractually agreed to waive fees and/or pay certain Fund expenses through August 31, 2010. According to the Fund's current prospectus, the total gross annual operating expense ratio was indicated as 0.59%. In the Financial Highlights section of this Shareholder Report, the Fund's net (subsidized) total operating expense ratio was determined to be 0.60% while the Fund's gross total operating expense ratio was 0.60%. NAV and Share Price returns assume that dividends and capital gain distributions have been reinvested in the Fund at NAV and Share Price, respectively. The returns shown in the table above do not reflect the deduction of taxes that a shareholder would pay on Fund distributions or the redemption or sale of Fund Shares. See invescopowershares.com to find the most recent month-end performance numbers.
Index performance results are based upon a hypothetical investment in its constituent securities. Index returns do not represent Fund returns. An investor cannot invest directly in an index. The Index does not charge management fees or brokerage expenses, and no such fees or expenses were deducted from the hypothetical performance shown. In addition, the results actual investors might have achieved would have differed from those shown because of differences in the timing, amounts of their investments, and fees and expenses associated with an investment in the Fund.
The S&P 500® Index and Russell 3000® Index (the "Benchmark Indices") are unmanaged indices used as a measurement of change in stock market conditions based on the average performance of approximately 500 and 2918 common stocks, respectively.
† Fund and underlying Index returns are based on the inception date of the Fund. Returns for the Benchmark Indices are based on the closest month-end to the Fund's inception date.
†† Average annualized.
7
Manager's Analysis
PowerShares Dynamic OTC Portfolio (ticker: PWO)
The PowerShares Dynamic OTC Portfolio (the "Fund") seeks investment results that correspond generally to the price and yield (before the Fund's fees and expenses) of an equity index called the Dynamic OTC IntellidexSM Index ("Index"). The Fund utilized a direct index replication method during the reporting period. Stocks included in the Index are selected using a proprietary methodology which evaluates domestic NASDAQ companies for inclusion in the Index across numerous investment criteria including fundamentals, valuation, timeliness and risk perspectives. Securities that possess the greatest capital appreciation potential are selected for the Index and included in the Fund's portfolio.
The Fund returned -30.03% over the reporting period, while the NASDAQ Composite Index returned -28.83%. Consumer Discretionary stocks contributed the most to performance, while information technology and health care stocks contributed negatively. The Fund benefited from stock selection among consumer services, media and insurance companies; the Fund's stock selection was less effective among technology hardware and pharmaceuticals biotechnology companies.
Sector Breakdown (% of the Fund's
Net Assets) as of April 30, 2009
| Information Technology | 52.4 | ||||||
| Health Care | 15.2 | ||||||
| Consumer Discretionary | 13.2 | ||||||
| Financials | 8.7 | ||||||
| Industrials | 6.0 | ||||||
| Consumer Staples | 2.1 | ||||||
| Energy | 1.0 | ||||||
| Telecommunication Services | 0.8 | ||||||
| Materials | 0.5 | ||||||
| Money Market Fund | 0.2 | ||||||
| Other | (0.1 | ) | |||||
Style Allocation (% of the Fund's
Total Investments) as of April 30, 2009
| Small-Cap Growth | 35.3 | ||||||
| Mid-Cap Growth | 24.0 | ||||||
| Large-Cap Growth | 21.1 | ||||||
| Small-Cap Value | 10.7 | ||||||
| Large-Cap Value | 4.6 | ||||||
| Mid-Cap Value | 4.3 | ||||||
Top Ten Fund Holdings (% of the Fund's
Net Assets) as of April 30, 2009
| Security | |||||||
| Apple, Inc. | 3.6 | ||||||
| Tellabs, Inc. | 3.5 | ||||||
| Cisco Systems, Inc. | 3.4 | ||||||
| Express Scripts, Inc. | 3.2 | ||||||
| Compuware Corp. | 3.2 | ||||||
| Microsoft Corp. | 3.2 | ||||||
| Paychex, Inc. | 3.1 | ||||||
| Synopsys, Inc. | 3.0 | ||||||
| Xilinx, Inc. | 3.0 | ||||||
| Jack Henry & Associates, Inc. | 2.9 | ||||||
| Total | 32.1 | ||||||
8
Manager's Analysis (Continued)
PowerShares Dynamic OTC Portfolio (ticker: PWO)
Growth of a $10,000 Investment Since Inception†

| Fund Performance History (%) | As of April 30, 2009 | ||||||||||||||||||||||
| Avg. Ann.†† | Fund Inception† | ||||||||||||||||||||||
| 1 Year | 3 Year | 5 Year | Avg. Ann.†† | Cumulative | |||||||||||||||||||
| Index | |||||||||||||||||||||||
| Dynamic OTC IntellidexSM Index | -29.61 | -14.65 | -1.59 | 2.99 | 19.30 | ||||||||||||||||||
| NASDAQ Composite Index | -28.83 | -9.57 | -2.21 | 2.69 | 17.28 | ||||||||||||||||||
| NASDAQ -100® Index | -26.83 | -5.91 | 0.37 | 4.38 | 29.32 | ||||||||||||||||||
| Fund | |||||||||||||||||||||||
| NAV Return | -30.03 | -15.04 | -2.10 | 2.38 | 15.19 | ||||||||||||||||||
| Share Price Return | -30.06 | -15.05 | -2.13 | 2.36 | 15.05 | ||||||||||||||||||
Fund Inception: May 1, 2003
Performance quoted represents past performance. Past performance is not a guarantee of future results and current performance may be higher or lower than performance quoted. Investment returns and principal value will fluctuate and shares, when redeemed, may be worth more or less than their original cost. The Adviser has waived fees and reimbursed other expenses, absent which, performance would have been lower. The Adviser has contractually agreed to waive fees and/or pay certain Fund expenses through August 31, 2010. According to the Fund's current prospectus, the total gross annual operating expense ratio was indicated as 0.64%. In the Financial Highlights section of this Shareholder Report, the Fund's net (subsidized) total operating expense ratio was determined to be 0.59% while the Fund's gross total operating expense ratio was 0.74%. NAV and Share Price returns assume that dividends and capital gain distributions have been reinvested in the Fund at NAV and Share Price, respectively. The returns shown in the table above do not reflect the deduction of taxes that a shareholder would pay on Fund distributions or the redemption or sale of Fund Shares. See invescopowershares.com to find the most recent month-end performance numbers.
Index performance results are based upon a hypothetical investment in its constituent securities. Index returns do not represent Fund returns. An investor cannot invest directly in an index. The Index does not charge management fees or brokerage expenses, and no such fees or expenses were deducted from the hypothetical performance shown. In addition, the results actual investors might have achieved would have differed from those shown because of differences in the timing, amounts of their investments, and fees and expenses associated with an investment in the Fund.
The NASDAQ Composite Index and NASDAQ-100® Index (the "Benchmark Indices") are unmanaged indices used as a measurement of change in stock market conditions based on the average performance of approximately 3,087 and 100 common stocks, respectively.
† Fund and underlying Index returns are based on the inception date of the Fund. Returns for the Benchmark Indices are based on the closest month-end to the Fund's inception date.
†† Average annualized.
9
Manager's Analysis
PowerShares FTSE RAFI US 1000 Portfolio (ticker: PRF)
The PowerShares FTSE RAFI US 1000 Portfolio (the "Fund") seeks investment results that correspond generally to the price and yield (before the Fund's fees and expenses) of an equity index called the FTSE Research Affiliates Fundamentals US 1000 Index ("Index"). The Index is designed to track the performance of the largest U.S. equities, selected based on the following four fundamental measures of firm size: book value, cash flow, sales and dividends. U.S. equities are then weighted by each of these four fundamental measures. An overall weight is calculated for each firm by equally-weighting each fundamental measure. Each of the 1000 equities with the highest fundamental weight is then selected and assigned a weight equal to its fundamental weight.
Over the reporting period, the Fund slightly outperformed the S&P 500® Index, returning -35.26% compared to the S&P 500® Index's -35.29%.
The Fund's performance was positively affected by stock selection in the energy sector and allocation in the consumer discretionary sector. This was offset somewhat by poor stock selection in the financials sector and underweighting in the technology sector.
The Fund's performance was helped by an overweight to Ford Motor Co., Verizon Communications, Inc., and Wal-Mart Stores, Inc., and an underweight to General Electric Co.
The Fund's performance suffered from overweighting Citigroup, Inc., General Motors Corp., and Washington Mutual Inc. Washington Mutual Inc. was no longer held at the end of the fiscal year.
Sector Breakdown (% of the Fund's
Net Assets) as of April 30, 2009
| Financials | 25.9 | ||||||
| Consumer Discretionary | 15.2 | ||||||
| Industrials | 12.1 | ||||||
| Information Technology | 10.3 | ||||||
| Energy | 8.8 | ||||||
| Consumer Staples | 8.1 | ||||||
| Health Care | 7.6 | ||||||
| Materials | 4.7 | ||||||
| Utilities | 3.9 | ||||||
| Telecommunication Services | 3.4 | ||||||
Top Ten Fund Holdings (% of the Fund's
Net Assets) as of April 30, 2009
| Security | |||||||
| Bank of America Corp. | 3.7 | ||||||
| Citigroup, Inc. | 2.9 | ||||||
| General Electric Co. | 2.6 | ||||||
| Exxon Mobil Corp. | 2.1 | ||||||
| Ford Motor Co. | 2.0 | ||||||
| JPMorgan Chase & Co. | 1.8 | ||||||
| Microsoft Corp. | 1.4 | ||||||
| AT&T, Inc. | 1.4 | ||||||
| Chevron Corp. | 1.3 | ||||||
| Wells Fargo & Co. | 1.3 | ||||||
| Total | 20.5 | ||||||
Style Allocation (% of the Fund's
Total Investments) as of April 30, 2009
| Large-Cap Value | 36.6 | ||||||
| Large-Cap Growth | 19.3 | ||||||
| Mid-Cap Value | 15.5 | ||||||
| Mid-Cap Growth | 14.6 | ||||||
| Small-Cap Value | 8.3 | ||||||
| Small-Cap Growth | 5.7 | ||||||
10
Manager's Analysis (Continued)
PowerShares FTSE RAFI US 1000 Portfolio (ticker: PRF)
Growth of a $10,000 Investment Since Inception†
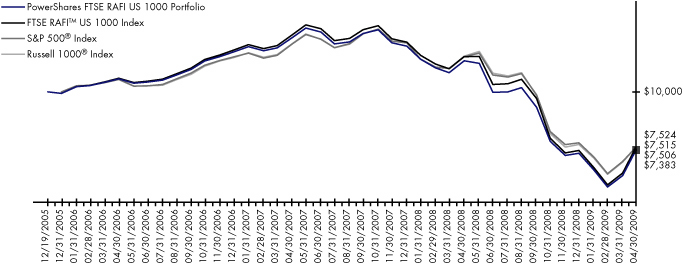
| Fund Performance History (%) | As of April 30, 2009 | ||||||||||||||||||
| Avg. Ann.†† | Fund Inception† | ||||||||||||||||||
| 1 Year | 3 Year | Avg. Ann.†† | Cumulative | ||||||||||||||||
| Index | |||||||||||||||||||
| FTSETM RAFI US 1000 Index | -35.10 | -10.84 | -8.12 | -24.76 | |||||||||||||||
| S&P 500® Index | -35.29 | -10.76 | -8.25 | -24.94 | |||||||||||||||
| Russell 1000® Index | -35.30 | -10.76 | -8.21 | -24.85 | |||||||||||||||
| Fund | |||||||||||||||||||
| NAV Return | -35.26 | -11.33 | -8.63 | -26.17 | |||||||||||||||
| Share Price Return | -35.20 | -11.33 | -8.56 | -25.98 | |||||||||||||||
Fund Inception: December 19, 2005
Performance quoted represents past performance. Past performance is not a guarantee of future results and current performance may be higher or lower than performance quoted. Investment returns and principal value will fluctuate and shares, when redeemed, may be worth more or less than their original cost. The Adviser has waived fees and reimbursed other expenses, absent which, performance would have been lower. The Adviser has contractually agreed to waive fees and/or pay certain Fund expenses through August 31, 2010. According to the Fund's current prospectus, the total gross annual operating expense ratio was indicated as 0.45%. In the Financial Highlights section of this Shareholder Report, the Fund's net (subsidized) total operating expense ratio was determined to be 0.58% while the Fund's gross total operating expense ratio was 0.60%. NAV and Share Price returns assume that dividends and capital gain distributions have been reinvested in the Fund at NAV and Share Price, respectively. The returns shown in the table above do not reflect the deduction of taxes that a shareholder would pay on Fund distributions or the redemption or sale of Fund Shares. See invescopowershares.com to find the most recent month-end performance numbers.
Index performance results are based upon a hypothetical investment in its constituent securities. Index returns do not represent Fund returns. An investor cannot invest directly in an index. The Index does not charge management fees or brokerage expenses, and no such fees or expenses were deducted from the hypothetical performance shown. In addition, the results actual investors might have achieved would have differed from those shown because of differences in the timing, amounts of their investments, and fees and expenses associated with an investment in the Fund.
The S&P 500® Index and Russell 1000® Index (the "Benchmark Indices") are unmanaged indices used as a measurement of change in stock market conditions based on the average performance of approximately 500 and 1000 common stocks, respectively.
† Fund and underlying Index returns are based on the inception date of the Fund. Returns for the Benchmark Indices are based on the closest month-end to the Fund's inception date.
†† Average annualized.
11
Manager's Analysis
PowerShares NXQ Portfolio (ticker: PNXQ)
The PowerShares NXQ Portfolio (the "Fund") seeks investment results that correspond generally to the price and yield (before the Fund's fees and expenses) of an equity index called the NASDAQ Q-50 IndexSM ("Index"), which is designed to track the performance of the 50 securities that are next in line to replace the securities currently included in the NASDAQ-100® Index. The Index reflects companies across major, non-financial industry groups and is rebalanced quarterly.
The Fund returned -36.21% over the reporting period, while the NASDAQ-100® Index returned -26.83%.
For the year ended April 30, 2009, two of the ten sectors represented in the Fund generated positive returns. Suboptimal stock selection in the information technology, health care and industrials sectors made the largest negative contribution to the performance of the Fund. However, stock selection in the telecommunications sector and overexposure to the consumer discretionary sector made positive contributions to the performance of the Fund.
Sector Breakdown (% of the Fund's
Net Assets) as of April 30, 2009
| Health Care | 35.8 | ||||||
| Information Technology | 30.6 | ||||||
| Consumer Discretionary | 18.7 | ||||||
| Telecommunication Services | 6.0 | ||||||
| Industrials | 5.2 | ||||||
| Materials | 3.8 | ||||||
| Other | (0.1 | ) | |||||
Style Allocation (% of the Fund's
Total Investments) as of April 30, 2009
| Mid-Cap Growth | 84.1 | ||||||
| Small-Cap Growth | 6.8 | ||||||
| Large-Cap Growth | 4.0 | ||||||
| Mid-Cap Value | 2.7 | ||||||
| Large-Cap Value | 2.4 | ||||||
Top Ten Fund Holdings (% of the Fund's
Net Assets) as of April 30, 2009
| Security | |||||||
| Cerner Corp. | 3.5 | ||||||
| Mylan, Inc. | 3.3 | ||||||
| Priceline.com, Inc. | 3.2 | ||||||
| Dollar Tree, Inc. | 3.1 | ||||||
| Myriad Genetics, Inc. | 3.0 | ||||||
| SanDisk Corp. | 2.9 | ||||||
| Nuance Communications, Inc. | 2.9 | ||||||
| Qiagen N.V. (Netherlands) | 2.7 | ||||||
| Synopsys, Inc. | 2.5 | ||||||
| SBA Communications Corp., Class A | 2.4 | ||||||
| Total | 29.5 | ||||||
12
Manager's Analysis (Continued)
PowerShares NXQ Portfolio (ticker: PNXQ)
Growth of a $10,000 Investment Since Inception†
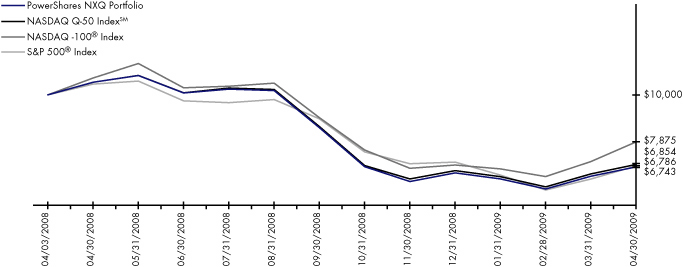
| Fund Performance History (%) | As of April 30, 2009 | ||||||||||||||
| Avg. Ann.†† | Fund Inception† | ||||||||||||||
| 1 Year | Avg. Ann.†† | Cumulative | |||||||||||||
| Index | |||||||||||||||
| NASDAQ Q-50 IndexSM | -35.15 | -29.65 | -31.46 | ||||||||||||
| NASDAQ -100® Index | -26.83 | -19.79 | -21.25 | ||||||||||||
| S&P 500® Index | -35.29 | -30.08 | -32.14 | ||||||||||||
| Fund | |||||||||||||||
| NAV Return | -36.21 | -30.71 | -32.57 | ||||||||||||
| Share Price Return | -36.32 | -30.32 | -32.16 | ||||||||||||
Fund Inception: April 3, 2008
Performance quoted represents past performance. Past performance is not a guarantee of future results and current performance may be higher or lower than performance quoted. Investment returns and principal value will fluctuate and shares, when redeemed, may be worth more or less than their original cost. According to the Fund's current prospectus, the expense ratio of 0.70% is expressed as a unitary fee to cover operating expenses and expenses incurred in connection with managing the portfolio. NAV and Share Price returns assume that dividends and capital gain distributions have been reinvested in the Fund at NAV and Share Price, respectively. The returns shown in the table above do not reflect the deduction of taxes that a shareholder would pay on Fund distributions or the redemption or sale of Fund Shares. See invescopowershares.com to find the most recent month-end performance numbers.
Index performance results are based upon a hypothetical investment in its constituent securities. Index returns do not represent Fund returns. An investor cannot invest directly in an index. The Index does not charge management fees or brokerage expenses, and no such fees or expenses were deducted from the hypothetical performance shown. In addition, the results actual investors might have achieved would have differed from those shown because of differences in the timing, amounts of their investments, and fees and expenses associated with an investment in the Fund.
The NASDAQ-100® Index and S&P 500® Index (the "Benchmark Indices") are unmanaged indices used as a measurement of change in stock market conditions based on the average performance of approximately 100 and 500 common stocks, respectively. The NASDAQ-100® Index will be used for comparative purposes going forward as this represents a more appropriate market index for this fund.
† Fund and underlying Index returns are based on the inception date of the Fund. Returns for the Benchmark Indices are based on the closest month-end to the Fund's inception date.
†† Average annualized.
13
Frequency Distribution of Discounts & Premiums
Since Inception through April 30, 2009
| Closing Price Above NAV (bps) | |||||||||||||||||||||||||||||||||||||||
| Ticker | Fund Name | Inception | Days | 0-24 | 25-49 | 50-99 | 100-149 | 150-199 | 200+ | ||||||||||||||||||||||||||||||
| PIQ | PowerShares Dynamic MagniQuant Portfolio | 10/12/06 | 641 | 265 | 19 | 1 | 1 | 0 | 0 | ||||||||||||||||||||||||||||||
| PWC | PowerShares Dynamic Market Portfolio | 5/1/03 | 1397 | 737 | 71 | 12 | 2 | 0 | 0 | ||||||||||||||||||||||||||||||
| PWO | PowerShares Dynamic OTC Portfolio | 5/1/03 | 1397 | 678 | 38 | 16 | 1 | 1 | 0 | ||||||||||||||||||||||||||||||
| PRF | PowerShares FTSE RAFI US 1000 Portfolio | 12/19/05 | 837 | 382 | 12 | 5 | 0 | 0 | 1 | ||||||||||||||||||||||||||||||
| PNXQ | PowerShares NXQ Portfolio | 4/3/08 | 272 | 91 | 4 | 0 | 0 | 0 | 0 | ||||||||||||||||||||||||||||||
14
| Closing Price Below NAV (bps) | |||||||||||||||||||||||||||
| Ticker | -0-24 | -25-49 | -50-99 | -100-149 | -150-199 | -200+ | |||||||||||||||||||||
| PIQ | 342 | 10 | 3 | 0 | 0 | 0 | |||||||||||||||||||||
| PWC | 561 | 10 | 4 | 0 | 0 | 0 | |||||||||||||||||||||
| PWO | 641 | 18 | 4 | 0 | 0 | 0 | |||||||||||||||||||||
| PRF | 405 | 22 | 8 | 2 | 0 | 0 | |||||||||||||||||||||
| PNXQ | 171 | 5 | 1 | 0 | 0 | 0 | |||||||||||||||||||||
15
Fees and Expenses
As a shareholder of a Fund of the PowerShares Exchange-Traded Fund Trust, you incur advisory fees and other Fund expenses. The expense examples below are intended to help you understand your ongoing costs (in dollars) of investing in the Funds and to compare these costs with the ongoing costs of investing in other funds.
The example is based on an investment of $1,000 invested at the beginning of the period and held through the six-month period ended April 30, 2009.
Actual Expenses
The first line in the following table provides information about actual account values and actual expenses. You may use the information in this line, together with the amount you invested, to estimate the expenses that you paid over the period. Simply divide your account value by $1,000 (for example, an $8,600 account value divided by $1,000 = 8.6), then multiply the result by the number in the first line under the heading "Expenses Paid During the Six-Month Period" to estimate the expenses you paid on your account during this period.
Hypothetical Example for Comparison Purposes
The second line in the following table provides information about hypothetical account values and hypothetical expenses based on each Fund's actual expense ratio and an assumed annualized rate of return of 5% per year before expenses, which is not the Fund's actual return. The hypothetical account values and expenses may not be used to estimate the actual ending account balance or expenses you paid for the period. You may use this information to compare the ongoing costs of investing in the Funds and other funds. To do so, compare this 5% hypothetical example with the 5% hypothetical examples that appear in the shareholder reports of the other funds.
Please note that the expenses shown in the table are meant to highlight your ongoing costs only, and do not reflect any transactional costs such as sales charges (loads). Therefore the second line in the table is useful in comparing ongoing costs only, and will not help you determine the relative total costs of owning different funds. In addition, if these transactional costs were included, your costs would have been higher.
| Beginning Account Value November 1, 2008 | Ending Account Value April 30, 2009 | Annualized Expense Ratio Based on the Six-Month Period | Expenses Paid During the Six-Month Period (1) | ||||||||||||||||
| PowerShares Dynamic MagniQuant Portfolio Actual | $ | 1,000.00 | $ | 927.86 | 0.65 | % | $ | 3.11 | |||||||||||
| Hypothetical (5% return before expenses) | $ | 1,000.00 | $ | 1,021.57 | 0.65 | % | $ | 3.26 | |||||||||||
| PowerShares Dynamic Market Portfolio Actual | $ | 1,000.00 | $ | 946.81 | 0.60 | % | $ | 2.90 | |||||||||||
| Hypothetical (5% return before expenses) | $ | 1,000.00 | $ | 1,021.82 | 0.60 | % | $ | 3.01 | |||||||||||
| PowerShares Dynamic OTC Portfolio Actual | $ | 1,000.00 | $ | 921.14 | 0.58 | % | $ | 2.76 | |||||||||||
| Hypothetical (5% return before expenses) | $ | 1,000.00 | $ | 1,021.92 | 0.58 | % | $ | 2.91 | |||||||||||
| PowerShares FTSE RAFI US 1000 Portfolio Actual | $ | 1,000.00 | $ | 951.06 | 0.39 | % | $ | 1.89 | |||||||||||
| Hypothetical (5% return before expenses) | $ | 1,000.00 | $ | 1,022.86 | 0.39 | % | $ | 1.96 | |||||||||||
| PowerShares NXQ Portfolio Actual | $ | 1,000.00 | $ | 998.70 | 0.70 | % | $ | 3.47 | |||||||||||
| Hypothetical (5% return before expenses) | $ | 1,000.00 | $ | 1,021.32 | 0.70 | % | $ | 3.51 | |||||||||||
(1) Expenses are calculated using the annualized expense ratio, which represents the ongoing expenses as a percentage of net assets for the six months ended April 30, 2009. Expenses are calculated by multiplying the Fund's annualized expense ratio by the average account value for the period; then multiplying the result by 181 and then dividing the result by 365. Expense ratios for the most recent half-year may differ from expense ratios based on the annualized data in the Financial Highlights.
16
Schedule of Investments
PowerShares Dynamic MagniQuant Portfolio
April 30, 2009
| Number of Shares | Value | ||||||||||
| Common Stocks—100.0% | |||||||||||
| Consumer Discretionary—18.7% | |||||||||||
| 5,192 | Aeropostale, Inc.* | $ | 176,372 | ||||||||
| 6,474 | Bally Technologies, Inc.* | 169,489 | |||||||||
| 7,383 | Carter's, Inc.* | 157,849 | |||||||||
| 8,231 | Cato (The) Corp., Class A | 158,200 | |||||||||
| 6,587 | Children's Place Retail Stores (The), Inc.* | 187,334 | |||||||||
| 12,139 | Dress Barn (The), Inc.* | 183,784 | |||||||||
| 4,389 | Family Dollar Stores, Inc. | 145,671 | |||||||||
| 14,200 | FGX International Holdings Ltd.* | 163,584 | |||||||||
| 14,491 | Foot Locker, Inc. | 172,298 | |||||||||
| 9,541 | Fossil, Inc.* | 192,347 | |||||||||
| 11,160 | Gap (The), Inc. | 173,426 | |||||||||
| 4,681 | Gymboree (The) Corp.* | 161,026 | |||||||||
| 11,737 | hhgregg, Inc.* | 194,834 | |||||||||
| 13,561 | Hot Topic, Inc.* | 165,987 | |||||||||
| 5,324 | Interactive Data Corp. | 119,684 | |||||||||
| 3,836 | John Wiley & Sons, Inc., Class A | 130,040 | |||||||||
| 8,398 | Lincoln Educational Services Corp.* | 139,323 | |||||||||
| 13,793 | Maidenform Brands, Inc.* | 175,861 | |||||||||
| 4,657 | Marvel Entertainment, Inc.* | 138,965 | |||||||||
| 2,304 | McDonald's Corp. | 122,780 | |||||||||
| 1,990 | National Presto Industries, Inc. | 141,807 | |||||||||
| 3,332 | Netflix, Inc.* | 150,973 | |||||||||
| 2,734 | Panera Bread Co., Class A* | 153,131 | |||||||||
| 8,739 | PetMed Express, Inc.* | 142,096 | |||||||||
| 7,267 | Phillips-Van Heusen Corp. | 210,962 | |||||||||
| 6,873 | Rent-A-Center, Inc.* | 132,305 | |||||||||
| 4,079 | Ross Stores, Inc. | 154,757 | |||||||||
| 10,704 | Timberland (The) Co., Class A* | 173,833 | |||||||||
| 5,407 | TJX (The) Cos., Inc. | 151,234 | |||||||||
| 5,026 | UniFirst Corp. | 187,420 | |||||||||
| 5,563 | Warnaco Group (The), Inc.* | 160,437 | |||||||||
| 48,167 | Wet Seal (The), Inc., Class A* | 183,516 | |||||||||
| 15,262 | Zumiez, Inc.* | 184,060 | |||||||||
| 5,355,385 | |||||||||||
| Consumer Staples—7.4% | |||||||||||
| 5,439 | Alberto-Culver Co. | 121,235 | |||||||||
| 7,799 | Altria Group, Inc. | 127,358 | |||||||||
| 3,924 | American Italian Pasta Co., Class A* | 123,371 | |||||||||
| 4,030 | BJ's Wholesale Club, Inc.* | 134,360 | |||||||||
| 2,802 | Brown-Forman Corp., Class B | 130,293 | |||||||||
| 1,898 | Chattem, Inc.* | 104,219 | |||||||||
| 16,842 | Del Monte Foods Co. | 127,157 | |||||||||
| 2,295 | General Mills, Inc. | 116,334 | |||||||||
| 3,618 | Hansen Natural Corp.* | 147,470 | |||||||||
| 3,575 | Hershey (The) Co. | 129,201 | |||||||||
| 3,815 | J & J Snack Foods Corp. | 147,869 | |||||||||
| 3,098 | Lancaster Colony Corp. | 135,692 | |||||||||
| 12,810 | Nu Skin Enterprises, Inc., Class A | 164,224 | |||||||||
| 22,014 | Prestige Brands Holdings, Inc.* | 142,210 | |||||||||
| 2,446 | Wal-Mart Stores, Inc. | 123,278 | |||||||||
| 4,893 | WD-40 Co. | 132,405 | |||||||||
| 2,106,676 | |||||||||||
| Number of Shares | Value | ||||||||||
| Common Stocks (Continued) | |||||||||||
| Energy—2.5% | |||||||||||
| 19,084 | Basic Energy Services, Inc.* | $ | 194,657 | ||||||||
| 1,597 | Core Laboratories N.V. (Netherlands) | 132,918 | |||||||||
| 2,010 | SEACOR Holdings, Inc.* | 132,097 | |||||||||
| 21,126 | VAALCO Energy, Inc.* | 100,771 | |||||||||
| 4,151 | World Fuel Services Corp. | 158,278 | |||||||||
| 718,721 | |||||||||||
| Financials—16.1% | |||||||||||
| 7,739 | American Financial Group, Inc. | 136,052 | |||||||||
| 2,842 | American Physicians Capital, Inc. | 118,398 | |||||||||
| 14,370 | AmTrust Financial Services, Inc. | 131,198 | |||||||||
| 3,149 | Aon Corp. | 132,888 | |||||||||
| 4,251 | Argo Group International Holdings Ltd. (Bermuda)* | 118,985 | |||||||||
| 5,527 | Aspen Insurance Holdings Ltd. (Bermuda) | 130,327 | |||||||||
| 3,759 | Bank of Hawaii Corp. | 132,091 | |||||||||
| 3,084 | Chubb (The) Corp. | 120,122 | |||||||||
| 5,863 | Cincinnati Financial Corp. | 140,419 | |||||||||
| 8,276 | CNA Surety Corp.* | 159,313 | |||||||||
| 12,544 | Employers Holdings, Inc. | 104,617 | |||||||||
| 10,087 | First Mercury Financial Corp.* | 133,350 | |||||||||
| 3,246 | FPIC Insurance Group, Inc.* | 99,133 | |||||||||
| 4,046 | Harleysville Group, Inc. | 117,010 | |||||||||
| 5,486 | HCC Insurance Holdings, Inc. | 131,225 | |||||||||
| 15,659 | Horace Mann Educators Corp. | 137,486 | |||||||||
| 6,185 | Investment Technology Group, Inc.* | 140,894 | |||||||||
| 20,834 | LaBranche & Co., Inc.* | 87,086 | |||||||||
| 20,906 | Meadowbrook Insurance Group, Inc. | 124,391 | |||||||||
| 2,305 | Navigators Group (The), Inc.* | 104,601 | |||||||||
| 23,611 | Nelnet, Inc., Class A* | 142,374 | |||||||||
| 2,167 | Northern Trust Corp. | 117,798 | |||||||||
| 2,591 | Odyssey Re Holdings Corp. | 99,209 | |||||||||
| 12,200 | optionsXpress Holdings, Inc. | 200,811 | |||||||||
| 2,520 | ProAssurance Corp.* | 110,729 | |||||||||
| 14,100 | Provident New York Bancorp | 119,427 | |||||||||
| 8,626 | Raymond James Financial, Inc. | 135,342 | |||||||||
| 2,458 | RLI Corp. | 118,058 | |||||||||
| 3,851 | Safety Insurance Group, Inc. | 127,276 | |||||||||
| 12,389 | SeaBright Insurance Holdings, Inc.* | 114,970 | |||||||||
| 10,145 | TD Ameritrade Holding Corp.* | 161,407 | |||||||||
| 5,905 | Tower Group, Inc. | 160,557 | |||||||||
| 22,550 | TradeStation Group, Inc.* | 182,881 | |||||||||
| 3,331 | Travelers (The) Cos., Inc. | 137,037 | |||||||||
| 11,829 | Unum Group | 193,286 | |||||||||
| 4,620,748 | |||||||||||
| Health Care—10.0% | |||||||||||
| 14,685 | Alliance HealthCare Services, Inc.* | 115,571 | |||||||||
| 4,860 | AMERIGROUP Corp.* | 145,168 | |||||||||
| 3,792 | AmerisourceBergen Corp. | 127,563 | |||||||||
| 2,461 | Amgen, Inc.* | 119,285 | |||||||||
| 18,497 | AMN Healthcare Services, Inc.* | 127,444 | |||||||||
See Notes to Financial Statements.
17
Schedule of Investments (Continued)
PowerShares Dynamic MagniQuant Portfolio
April 30, 2009
| Number of Shares | Value | ||||||||||
| Common Stocks (Continued) | |||||||||||
| 1,945 | Becton Dickinson & Co. | $ | 117,634 | ||||||||
| 6,541 | Bristol-Myers Squibb Co. | 125,587 | |||||||||
| 1,501 | C.R. Bard, Inc. | 107,517 | |||||||||
| 7,092 | Centene Corp.* | 130,280 | |||||||||
| 3,025 | Chemed Corp. | 128,048 | |||||||||
| 4,502 | Computer Programs and Systems, Inc. | 157,526 | |||||||||
| 8,953 | Cyberonics, Inc.* | 118,538 | |||||||||
| 3,933 | Emergency Medical Services Corp., Class A* | 137,026 | |||||||||
| 6,345 | Endo Pharmaceuticals Holdings, Inc.* | 104,946 | |||||||||
| 9,102 | Ensign Group (The), Inc. | 141,081 | |||||||||
| 2,394 | Express Scripts, Inc.* | 153,144 | |||||||||
| 16,405 | King Pharmaceuticals, Inc.* | 129,271 | |||||||||
| 3,631 | Magellan Health Services, Inc.* | 107,332 | |||||||||
| 26,465 | NPS Pharmaceuticals, Inc.* | 91,569 | |||||||||
| 2,627 | Quest Diagnostics, Inc. | 134,844 | |||||||||
| 24,778 | Questcor Pharmaceuticals, Inc.* | 111,501 | |||||||||
| 8,039 | Sepracor, Inc.* | 114,234 | |||||||||
| 4,259 | Watson Pharmaceuticals, Inc.* | 131,773 | |||||||||
| 2,876,882 | |||||||||||
| Industrials—19.9% | |||||||||||
| 1,705 | Alliant Techsystems, Inc.* | 135,803 | |||||||||
| 12,716 | Apogee Enterprises, Inc. | 170,394 | |||||||||
| 16,428 | Blount International, Inc.* | 105,139 | |||||||||
| 5,417 | CIRCOR International, Inc. | 139,379 | |||||||||
| 12,650 | Comfort Systems USA, Inc. | 136,494 | |||||||||
| 7,907 | Covanta Holding Corp.* | 111,568 | |||||||||
| 4,621 | Cubic Corp. | 132,669 | |||||||||
| 15,598 | Deluxe Corp. | 226,172 | |||||||||
| 4,829 | Dover Corp. | 148,637 | |||||||||
| 9,879 | DynCorp International, Inc., Class A* | 150,655 | |||||||||
| 7,814 | EMCOR Group, Inc.* | 162,453 | |||||||||
| 5,601 | Equifax, Inc. | 163,325 | |||||||||
| 4,752 | Esterline Technologies Corp.* | 125,215 | |||||||||
| 5,359 | Exponent, Inc.* | 149,516 | |||||||||
| 19,054 | Federal Signal Corp. | 148,050 | |||||||||
| 18,357 | Gibraltar Industries, Inc. | 122,992 | |||||||||
| 3,633 | Goodrich Corp. | 160,869 | |||||||||
| 3,385 | Granite Construction, Inc. | 133,538 | |||||||||
| 23,428 | H&E Equipment Services, Inc.* | 176,413 | |||||||||
| 9,735 | Heartland Express, Inc. | 145,538 | |||||||||
| 11,946 | Herman Miller, Inc. | 177,637 | |||||||||
| 4,488 | Honeywell International, Inc. | 140,070 | |||||||||
| 3,224 | ITT Corp. | 132,216 | |||||||||
| 18,245 | Knoll, Inc. | 129,175 | |||||||||
| 13,032 | Korn/Ferry International* | 138,009 | |||||||||
| 1,780 | L-3 Communications Holdings, Inc. | 135,547 | |||||||||
| 1,908 | Lockheed Martin Corp. | 149,835 | |||||||||
| 7,272 | Marten Transport Ltd.* | 150,821 | |||||||||
| 7,709 | McGrath Rentcorp | 162,968 | |||||||||
| 3,762 | Michael Baker Corp.* | 126,403 | |||||||||
| 3,936 | MSC Industrial Direct Co., Class A | 160,786 | |||||||||
| 5,066 | Pall Corp. | 133,793 | |||||||||
| Number of Shares | Value | ||||||||||
| Common Stocks (Continued) | |||||||||||
| 5,769 | Pentair, Inc. | $ | 153,686 | ||||||||
| 3,013 | Raytheon Co. | 136,278 | |||||||||
| 7,401 | Standard Parking Corp.* | 112,791 | |||||||||
| 5,257 | Thomas & Betts Corp.* | 163,598 | |||||||||
| 7,211 | Tredegar Corp. | 126,769 | |||||||||
| 2,452 | Watson Wyatt Worldwide, Inc., Class A | 130,079 | |||||||||
| 7,254 | WESCO International, Inc.* | 188,604 | |||||||||
| 5,693,884 | |||||||||||
| Information Technology—21.4% | |||||||||||
| 54,488 | 3Com Corp.* | 220,676 | |||||||||
| 4,125 | Accenture Ltd., Class A (Bermuda) | 121,399 | |||||||||
| 2,582 | Affiliated Computer Services, Inc., Class A* | 124,917 | |||||||||
| 1,349 | Apple, Inc.* | 169,745 | |||||||||
| 22,136 | BigBand Networks, Inc.* | 129,717 | |||||||||
| 4,064 | BMC Software, Inc.* | 140,899 | |||||||||
| 7,105 | CA, Inc. | 122,561 | |||||||||
| 3,186 | Comtech Telecommunications Corp.* | 106,635 | |||||||||
| 8,907 | CSG Systems International, Inc.* | 129,152 | |||||||||
| 19,114 | EarthLink, Inc.* | 144,884 | |||||||||
| 3,925 | Global Payments, Inc. | 125,836 | |||||||||
| 4,366 | Hittite Microwave Corp.* | 162,241 | |||||||||
| 4,099 | InterDigital, Inc.* | 107,886 | |||||||||
| 1,308 | �� | International Business Machines Corp. | 134,999 | ||||||||
| 6,430 | j2 Global Communications, Inc.* | 154,256 | |||||||||
| 7,559 | Jack Henry & Associates, Inc. | 136,213 | |||||||||
| 12,414 | JDA Software Group, Inc.* | 175,162 | |||||||||
| 4,308 | McAfee, Inc.* | 161,722 | |||||||||
| 7,163 | Metavante Technologies, Inc.* | 168,975 | |||||||||
| 7,489 | MICROS Systems, Inc.* | 157,119 | |||||||||
| 7,456 | Microsoft Corp. | 151,059 | |||||||||
| 15,204 | NCR Corp.* | 154,321 | |||||||||
| 38,107 | Novell, Inc.* | 143,282 | |||||||||
| 10,581 | Perot Systems Corp., Class A* | 148,769 | |||||||||
| 8,796 | Red Hat, Inc.* | 151,907 | |||||||||
| 21,126 | S1 Corp.* | 130,981 | |||||||||
| 6,368 | SAIC, Inc.* | 115,261 | |||||||||
| 18,526 | Skyworks Solutions, Inc.* | 163,770 | |||||||||
| 5,803 | Synaptics, Inc.* | 188,481 | |||||||||
| 6,464 | Synopsys, Inc.* | 140,786 | |||||||||
| 9,822 | Tekelec* | 152,241 | |||||||||
| 14,596 | TeleCommunication Systems, Inc., Class A* | 143,187 | |||||||||
| 31,689 | Tellabs, Inc.* | 166,050 | |||||||||
| 7,789 | Teradata Corp.* | 130,232 | |||||||||
| 24,932 | TIBCO Software, Inc.* | 157,570 | |||||||||
| 16,984 | TiVo, Inc.* | 127,380 | |||||||||
| 18,000 | TNS, Inc.* | 303,300 | |||||||||
| 9,573 | Total System Services, Inc. | 119,375 | |||||||||
| 10,790 | Websense, Inc.* | 192,386 | |||||||||
| 15,949 | Wind River Systems, Inc.* | 116,906 | |||||||||
| 6,811 | Xilinx, Inc. | 139,217 | |||||||||
| 6,131,455 | |||||||||||
See Notes to Financial Statements.
18
Schedule of Investments (Continued)
PowerShares Dynamic MagniQuant Portfolio
April 30, 2009
| Number of Shares | Value | ||||||||||
| Common Stocks (Continued) | |||||||||||
| Materials—3.1% | |||||||||||
| 6,484 | Bemis Co., Inc. | $ | 155,875 | ||||||||
| 7,607 | Pactiv Corp.* | 166,289 | |||||||||
| 4,361 | Rock-Tenn Co., Class A | 164,671 | |||||||||
| 2,455 | Silgan Holdings, Inc. | 114,133 | |||||||||
| 6,249 | Sonoco Products Co. | 152,538 | |||||||||
| 4,669 | Terra Industries, Inc. | 123,729 | |||||||||
| 877,235 | |||||||||||
| Telecommunication Services—0.5% | |||||||||||
| 5,775 | Atlantic Tele-Network, Inc. | 127,512 | |||||||||
| Utilities—0.4% | |||||||||||
| 9,847 | Mirant Corp.* | 125,352 | |||||||||
| Total Common Stocks (Cost $25,981,267) | 28,633,850 | ||||||||||
| Money Market Fund—0.2% | |||||||||||
| 67,582 | Goldman Sachs Financial Square Prime Obligations Institutional Share Class (Cost $67,582) | 67,582 | |||||||||
| Total Investments (Cost $26,048,849)—100.2% | 28,701,432 | ||||||||||
| Liabilities in excess of other assets—(0.2%) | (50,219 | ) | |||||||||
| Net Assets—100.0% | $ | 28,651,213 | |||||||||
* Non-income producing security.
See Notes to Financial Statements.
19
Schedule of Investments
PowerShares Dynamic Market Portfolio
April 30, 2009
| Number of Shares | Value | ||||||||||
| Common Stocks—99.9% | |||||||||||
| Consumer Discretionary—10.7% | |||||||||||
| 39,215 | Carter's, Inc.* | $ | 838,417 | ||||||||
| 135,973 | Family Dollar Stores, Inc. | 4,512,944 | |||||||||
| 75,425 | FGX International Holdings Ltd.* | 868,896 | |||||||||
| 50,681 | Fossil, Inc.* | 1,021,729 | |||||||||
| 345,788 | Gap (The), Inc. | 5,373,546 | |||||||||
| 72,030 | HOT Topic, Inc.* | 881,647 | |||||||||
| 44,607 | Lincoln Educational Services Corp.* | 740,030 | |||||||||
| 73,263 | Maidenform Brands, Inc.* | 934,103 | |||||||||
| 14,525 | Panera Bread Co., Class A* | 813,545 | |||||||||
| 46,417 | PetMed Express, Inc.* | 754,740 | |||||||||
| 36,504 | Rent-A-Center, Inc.* | 702,702 | |||||||||
| 126,386 | Ross Stores, Inc. | 4,795,085 | |||||||||
| 56,855 | Timberland (The) Co., Class A* | 923,325 | |||||||||
| 167,539 | TJX (The) Cos., Inc. | 4,686,066 | |||||||||
| 27,846,775 | |||||||||||
| Consumer Staples—10.9% | |||||||||||
| 60,560 | Alberto-Culver Co. | 1,349,882 | |||||||||
| 607,842 | Altria Group, Inc. | 9,926,060 | |||||||||
| 187,516 | Del Monte Foods Co. | 1,415,746 | |||||||||
| 40,289 | Hansen Natural Corp.* | 1,642,180 | |||||||||
| 39,800 | Hershey (The) Co. | 1,438,372 | |||||||||
| 34,482 | Lancaster Colony Corp. | 1,510,312 | |||||||||
| 190,596 | Wal-Mart Stores, Inc. | 9,606,038 | |||||||||
| 54,476 | WD-40 Co. | 1,474,121 | |||||||||
| 28,362,711 | |||||||||||
| Energy—13.7% | |||||||||||
| 299,103 | Anadarko Petroleum Corp. | 12,879,374 | |||||||||
| 355,007 | Basic Energy Services, Inc.* | 3,621,071 | |||||||||
| 391,089 | National-Oilwell Varco, Inc.* | 11,842,174 | |||||||||
| 37,390 | SEACOR Holdings, Inc.* | 2,457,271 | |||||||||
| 392,996 | VAALCO Energy, Inc.* | 1,874,591 | |||||||||
| 77,214 | World Fuel Services Corp. | 2,944,170 | |||||||||
| 35,618,651 | |||||||||||
| Financials—11.5% | |||||||||||
| 16,034 | American Physicians Capital, Inc. | 667,976 | |||||||||
| 82,887 | Aon Corp. | 3,497,831 | |||||||||
| 81,188 | Chubb (The) Corp. | 3,162,273 | |||||||||
| 154,314 | Cincinnati Financial Corp. | 3,695,820 | |||||||||
| 46,681 | CNA Surety Corp.* | 898,609 | |||||||||
| 70,750 | Employers Holdings, Inc. | 590,055 | |||||||||
| 18,308 | FPIC Insurance Group, Inc.* | 559,126 | |||||||||
| 30,944 | HCC Insurance Holdings, Inc. | 740,180 | |||||||||
| 34,884 | Investment Technology Group, Inc.* | 794,658 | |||||||||
| 57,062 | Northern Trust Corp. | 3,101,890 | |||||||||
| 14,619 | Odyssey Re Holdings Corp. | 559,762 | |||||||||
| 14,208 | ProAssurance Corp.* | 624,300 | |||||||||
| 13,871 | RLI Corp. | 666,224 | |||||||||
| 21,717 | Safety Insurance Group, Inc. | 717,747 | |||||||||
| 267,031 | TD Ameritrade Holding Corp.* | 4,248,463 | |||||||||
| 33,315 | Tower Group, Inc. | 905,835 | |||||||||
| Number of Shares | Value | ||||||||||
| Common Stocks (Continued) | |||||||||||
| 127,197 | TradeStation Group, Inc.* | $ | 1,031,568 | ||||||||
| 87,677 | Travelers (The) Cos., Inc. | 3,607,032 | |||||||||
| 30,069,349 | |||||||||||
| Health Care—14.6% | |||||||||||
| 116,019 | Alliance HealthCare Services, Inc.* | 913,070 | |||||||||
| 38,392 | AMERIGROUP Corp.* | 1,146,769 | |||||||||
| 124,756 | Amgen, Inc.* | 6,046,923 | |||||||||
| 331,588 | Bristol-Myers Squibb Co. | 6,366,490 | |||||||||
| 56,029 | Centene Corp.* | 1,029,253 | |||||||||
| 35,564 | Computer Programs and Systems, Inc. | 1,244,384 | |||||||||
| 70,729 | Cyberonics, Inc.* | 936,452 | |||||||||
| 31,068 | Emergency Medical Services Corp., Class A* | 1,082,409 | |||||||||
| 50,121 | Endo Pharmaceuticals Holdings, Inc.* | 829,001 | |||||||||
| 71,905 | Ensign Group (The), Inc. | 1,114,528 | |||||||||
| 121,364 | Express Scripts, Inc.* | 7,763,655 | |||||||||
| 28,686 | Magellan Health Services, Inc.* | 847,958 | |||||||||
| 133,197 | Quest Diagnostics, Inc. | 6,837,002 | |||||||||
| 63,509 | Sepracor, Inc.* | 902,463 | |||||||||
| 33,653 | Watson Pharmaceuticals, Inc.* | 1,041,224 | |||||||||
| 38,101,581 | |||||||||||
| Industrials—11.6% | |||||||||||
| 35,370 | Cubic Corp. | 1,015,473 | |||||||||
| 119,403 | Deluxe Corp. | 1,731,344 | |||||||||
| 266,763 | Equifax, Inc. | 7,778,809 | |||||||||
| 41,020 | Exponent, Inc.* | 1,144,458 | |||||||||
| 145,845 | Federal Signal Corp. | 1,133,216 | |||||||||
| 153,559 | ITT Corp. | 6,297,455 | |||||||||
| 139,664 | Knoll, Inc. | 988,821 | |||||||||
| 90,879 | Lockheed Martin Corp. | 7,136,728 | |||||||||
| 55,662 | Marten Transport Ltd.* | 1,154,430 | |||||||||
| 28,799 | Michael Baker Corp.* | 967,646 | |||||||||
| 18,768 | Watson Wyatt Worldwide, Inc., Class A | 995,642 | |||||||||
| 30,344,022 | |||||||||||
| Information Technology—16.1% | |||||||||||
| 459,431 | 3Com Corp.* | 1,860,696 | |||||||||
| 178,561 | Accenture Ltd., Class A (Bermuda) | 5,255,050 | |||||||||
| 111,773 | Affiliated Computer Services, Inc., Class A* | 5,407,578 | |||||||||
| 307,500 | CA, Inc. | 5,304,375 | |||||||||
| 75,099 | CSG Systems International, Inc.* | 1,088,936 | |||||||||
| 34,558 | InterDigital, Inc.* | 909,567 | |||||||||
| 56,633 | International Business Machines Corp. | 5,845,092 | |||||||||
| 54,211 | j2 Global Communications, Inc.* | 1,300,522 | |||||||||
| 128,202 | NCR Corp.* | 1,301,250 | |||||||||
| 89,221 | Perot Systems Corp., Class A* | 1,254,447 | |||||||||
| 380,723 | Red Hat, Inc.* | 6,575,086 | |||||||||
| 178,130 | S1 Corp.* | 1,104,406 | |||||||||
| 48,936 | Synaptics, Inc.* | 1,589,441 | |||||||||
| 123,067 | TeleCommunication Systems, Inc., Class A* | 1,207,287 | |||||||||
| 65,677 | Teradata Corp.* | 1,098,119 | |||||||||
| 80,709 | Total System Services, Inc. | 1,006,441 | |||||||||
| 42,108,293 | |||||||||||
See Notes to Financial Statements.
20
Schedule of Investments (Continued)
PowerShares Dynamic Market Portfolio
April 30, 2009
| Number of Shares | Value | ||||||||||
| Common Stocks (Continued) | |||||||||||
| Materials—3.2% | |||||||||||
| 138,803 | Ball Corp. | $ | 5,235,649 | ||||||||
| 43,019 | Bemis Co., Inc. | 1,034,177 | |||||||||
| 50,464 | Pactiv Corp.* | 1,103,143 | |||||||||
| 41,461 | Sonoco Products Co. | 1,012,063 | |||||||||
| 8,385,032 | |||||||||||
| Telecommunication Services—3.3% | |||||||||||
| 35,338 | Atlantic Tele-Network, Inc. | 780,263 | |||||||||
| 783,885 | Sprint Nextel Corp.* | 3,417,739 | |||||||||
| 48,702 | Syniverse Holdings, Inc.* | 613,645 | |||||||||
| 88,813 | USA Mobility, Inc. | 987,601 | |||||||||
| 90,393 | Verizon Communications, Inc. | 2,742,524 | |||||||||
| 8,541,772 | |||||||||||
| Utilities—4.3% | |||||||||||
| 127,715 | Mirant Corp.* | 1,625,812 | |||||||||
| 95,131 | Portland General Electric Co. | 1,738,043 | |||||||||
| 267,112 | Public Service Enterprise Group, Inc. | 7,970,622 | |||||||||
| 11,334,477 | |||||||||||
| Total Common Stocks (Cost $244,639,651) | 260,712,663 | ||||||||||
| Money Market Fund—0.1% | |||||||||||
| 156,761 | Goldman Sachs Financial Square Prime Obligations Institutional Share Class (Cost $156,761) | 156,761 | |||||||||
| Total Investments (Cost $244,796,412)—100.0% | 260,869,424 | ||||||||||
| Liabilities in excess of other assets—0.0% | (89,996 | ) | |||||||||
| Net Assets—100.0% | $ | 260,779,428 | |||||||||
* Non-income producing security.
See Notes to Financial Statements.
21
Schedule of Investments
PowerShares Dynamic OTC Portfolio
April 30, 2009
| Number of Shares | Value | ||||||||||
| Common Stocks—99.9% | |||||||||||
| Consumer Discretionary—13.2% | |||||||||||
| 10,670 | Apollo Group, Inc., Class A* | $ | 671,677 | ||||||||
| 19,546 | FGX International Holdings Ltd.* | 225,170 | |||||||||
| 13,134 | Fossil, Inc.* | 264,781 | |||||||||
| 18,666 | Hot Topic, Inc.* | 228,472 | |||||||||
| 11,560 | Lincoln Educational Services Corp.* | 191,780 | |||||||||
| 21,404 | Netflix, Inc.* | 969,815 | |||||||||
| 3,763 | Panera Bread Co., Class A* | 210,766 | |||||||||
| 12,028 | PetMed Express, Inc.* | 195,575 | |||||||||
| 38,597 | PetSmart, Inc. | 883,099 | |||||||||
| 9,460 | Rent-A-Center, Inc.* | 182,105 | |||||||||
| 26,203 | Ross Stores, Inc. | 994,142 | |||||||||
| 6,574 | Steiner Leisure Ltd.* | 208,001 | |||||||||
| 5,225,383 | |||||||||||
| Consumer Staples—2.1% | |||||||||||
| 13,139 | Lancaster Colony Corp. | 575,488 | |||||||||
| 8,895 | WD-40 Co. | 240,699 | |||||||||
| 816,187 | |||||||||||
| Energy—1.0% | |||||||||||
| 21,773 | Patterson-UTI Energy, Inc. | 276,735 | |||||||||
| 6,624 | Petroleum Development Corp.* | 107,375 | |||||||||
| 384,110 | |||||||||||
| Financials—8.7% | |||||||||||
| 2,130 | American Physicians Capital, Inc. | 88,736 | |||||||||
| 10,773 | AmTrust Financial Services, Inc. | 98,357 | |||||||||
| 9,754 | Arch Capital Group Ltd.* | 563,586 | |||||||||
| 25,641 | Cincinnati Financial Corp. | 614,102 | |||||||||
| 2,435 | FPIC Insurance Group, Inc.* | 74,365 | |||||||||
| 3,035 | Harleysville Group, Inc. | 87,772 | |||||||||
| 5,175 | Lakeland Financial Corp. | 97,135 | |||||||||
| 9,480 | Northern Trust Corp. | 515,333 | |||||||||
| 9,147 | optionsXpress Holdings, Inc. | 150,560 | |||||||||
| 10,573 | Provident New York Bancorp | 89,553 | |||||||||
| 2,888 | Safety Insurance Group, Inc. | 95,448 | |||||||||
| 44,369 | TD Ameritrade Holding Corp.* | 705,911 | |||||||||
| 4,429 | Tower Group, Inc. | 120,425 | |||||||||
| 16,908 | TradeStation Group, Inc.* | 137,124 | |||||||||
| 3,438,407 | |||||||||||
| Health Care—15.2% | |||||||||||
| 20,543 | Amgen, Inc.* | 995,719 | |||||||||
| 7,158 | Computer Programs and Systems, Inc. | 250,458 | |||||||||
| 14,235 | Cyberonics, Inc.* | 188,471 | |||||||||
| 14,471 | Ensign Group (The), Inc. | 224,301 | |||||||||
| 19,985 | Express Scripts, Inc.* | 1,278,440 | |||||||||
| 6,072 | ICU Medical, Inc.* | 228,307 | |||||||||
| 9,608 | LHC Group, Inc.* | 219,255 | |||||||||
| 30,313 | Magellan Health Services, Inc.* | 896,052 | |||||||||
| 10,861 | Matrixx Initiatives, Inc.* | 185,940 | |||||||||
| 42,079 | NPS Pharmaceuticals, Inc.* | 145,593 | |||||||||
| 32,618 | PDL BioPharma, Inc. | 233,219 | |||||||||
| Number of Shares | Value | ||||||||||
| Common Stocks (Continued) | |||||||||||
| 39,396 | Questcor Pharmaceuticals, Inc.* | $ | 177,282 | ||||||||
| 67,101 | Sepracor, Inc.* | 953,505 | |||||||||
| 5,976,542 | |||||||||||
| Industrials—6.0% | |||||||||||
| 12,516 | Apogee Enterprises, Inc. | 167,714 | |||||||||
| 5,274 | Exponent, Inc.* | 147,145 | |||||||||
| 18,067 | Gibraltar Industries, Inc. | 121,049 | |||||||||
| 23,060 | H&E Equipment Services, Inc.* | 173,642 | |||||||||
| 55,891 | Heartland Express, Inc. | 835,570 | |||||||||
| 7,157 | Marten Transport Ltd.* | 148,436 | |||||||||
| 30,865 | Tetra Tech Inc.* | 758,044 | |||||||||
| 2,351,600 | |||||||||||
| Information Technology—52.4% | |||||||||||
| 69,103 | 3Com Corp.* | 279,867 | |||||||||
| 34,787 | Acme Packet, Inc.* | 268,208 | |||||||||
| 13,635 | Anaren, Inc.* | 177,391 | |||||||||
| 11,304 | Apple, Inc.* | 1,422,383 | |||||||||
| 70,052 | Art Technology Group, Inc.* | 219,963 | |||||||||
| 29,565 | Automatic Data Processing, Inc. | 1,040,688 | |||||||||
| 28,074 | BigBand Networks, Inc.* | 164,514 | |||||||||
| 59,564 | CA, Inc. | 1,027,479 | |||||||||
| 69,295 | Cisco Systems, Inc.* | 1,338,779 | |||||||||
| 14,683 | Cogent, Inc.* | 166,505 | |||||||||
| 170,833 | Compuware Corp.* | 1,277,831 | |||||||||
| 4,042 | Comtech Telecommunications Corp.* | 135,286 | |||||||||
| 11,297 | CSG Systems International, Inc.* | 163,807 | |||||||||
| 22,069 | Double-Take Software, Inc.* | 179,200 | |||||||||
| 24,239 | EarthLink, Inc.* | 183,732 | |||||||||
| 7,605 | EMS Technologies, Inc.* | 144,875 | |||||||||
| 5,536 | Hittite Microwave Corp.* | 205,718 | |||||||||
| 5,199 | InterDigital, Inc.* | 136,838 | |||||||||
| 8,152 | j2 Global Communications, Inc.* | 195,566 | |||||||||
| 63,377 | Jack Henry & Associates, Inc. | 1,142,054 | |||||||||
| 15,743 | JDA Software Group, Inc.* | 222,134 | |||||||||
| 19,353 | ManTech International Corp., Class A* | 700,385 | |||||||||
| 9,496 | MICROS Systems, Inc.* | 199,226 | |||||||||
| 62,514 | Microsoft Corp. | 1,266,534 | |||||||||
| 5,614 | NCI, Inc., Class A* | 136,757 | |||||||||
| 48,327 | Novell, Inc.* | 181,710 | |||||||||
| 5,634 | NVE Corp.* | 214,317 | |||||||||
| 45,768 | Paychex, Inc. | 1,236,194 | |||||||||
| 13,514 | Quest Software, Inc.* | 196,358 | |||||||||
| 19,210 | RightNow Technologies, Inc.* | 145,036 | |||||||||
| 26,792 | S1 Corp.* | 166,110 | |||||||||
| 39,873 | Sapient Corp.* | 204,548 | |||||||||
| 23,492 | Skyworks Solutions, Inc.* | 207,669 | |||||||||
| 45,182 | Symmetricom, Inc.* | 225,006 | |||||||||
| 7,358 | Synaptics, Inc.* | 238,988 | |||||||||
| 54,194 | Synopsys, Inc.* | 1,180,345 | |||||||||
| 7,507 | Syntel, Inc. | 208,094 | |||||||||
| 12,456 | Tekelec* | 193,068 | |||||||||
See Notes to Financial Statements.
22
Schedule of Investments (Continued)
PowerShares Dynamic OTC Portfolio
April 30, 2009
| Number of Shares | Value | ||||||||||
| Common Stocks (Continued) | |||||||||||
| 18,511 | TeleCommunication Systems, Inc., Class A* | $ | 181,593 | ||||||||
| 265,691 | Tellabs, Inc.* | 1,392,221 | |||||||||
| 31,618 | TIBCO Software, Inc.* | 199,826 | |||||||||
| 21,540 | TiVo, Inc.* | 161,550 | |||||||||
| 24,911 | Virtusa Corp.* | 159,181 | |||||||||
| 13,684 | Websense, Inc.* | 243,986 | |||||||||
| 20,229 | Wind River Systems, Inc.* | 148,279 | |||||||||
| 57,107 | Xilinx, Inc. | 1,167,267 | |||||||||
| 20,647,066 | |||||||||||
| Materials—0.5% | |||||||||||
| 4,192 | GenTek, Inc.* | 80,025 | |||||||||
| 2,789 | Silgan Holdings, Inc. | 129,661 | |||||||||
| 209,686 | |||||||||||
| Telecommunication Services—0.8% | |||||||||||
| 3,727 | Atlantic Tele-Network, Inc. | 82,292 | |||||||||
| 14,154 | NII Holdings, Inc.* | 228,729 | |||||||||
| 311,021 | |||||||||||
| Total Common Stocks (Cost $37,325,570) | 39,360,002 | ||||||||||
| Money Market Fund—0.2% | |||||||||||
| 72,998 | Goldman Sachs Financial Square Prime Obligations Institutional Share Class (Cost $72,998) | 72,998 | |||||||||
| Total Investments (Cost $37,398,568)—100.1% | 39,433,000 | ||||||||||
| Liabilities in excess of other assets—(0.1%) | (39,530 | ) | |||||||||
| Net Assets—100.0% | $ | 39,393,470 | |||||||||
* Non-income producing security.
See Notes to Financial Statements.
23
Schedule of Investments
PowerShares FTSE RAFI US 1000 Portfolio
April 30, 2009
| Number of Shares | Value | ||||||||||
| Common Stocks and Other Equity Interests—100.0% | |||||||||||
| Consumer Discretionary—15.2% | |||||||||||
| 4,210 | Abercrombie & Fitch Co., Class A | $ | 113,923 | ||||||||
| 1,064 | Advance Auto Parts, Inc. | 46,550 | |||||||||
| 2,743 | Amazon.com, Inc.* | 220,866 | |||||||||
| 51,370 | American Axle & Manufacturing Holdings, Inc. | 51,370 | |||||||||
| 5,847 | American Eagle Outfitters, Inc. | 86,653 | |||||||||
| 8,573 | AnnTaylor Stores Corp.* | 63,354 | |||||||||
| 1,244 | Apollo Group, Inc., Class A* | 78,310 | |||||||||
| 152,267 | ArvinMeritor, Inc. | 188,811 | |||||||||
| 24,203 | Asbury Automotive Group, Inc. | 234,043 | |||||||||
| 9,502 | Autoliv, Inc. | 234,414 | |||||||||
| 19,328 | AutoNation, Inc.* | 342,299 | |||||||||
| 798 | AutoZone, Inc.* | 132,779 | |||||||||
| 3,640 | Barnes & Noble, Inc. | 95,077 | |||||||||
| 124,573 | Beazer Homes USA, Inc.* | 313,924 | |||||||||
| 8,248 | Bed Bath & Beyond, Inc.* | 250,904 | |||||||||
| 77,191 | Belo Corp., Class A | 131,225 | |||||||||
| 16,875 | Best Buy Co., Inc. | 647,663 | |||||||||
| 5,010 | Big Lots, Inc.* | 138,476 | |||||||||
| 5,619 | Black & Decker (The) Corp. | 226,446 | |||||||||
| 123,443 | Blockbuster, Inc., Class A* | 98,754 | |||||||||
| 105,762 | Borders Group, Inc.* | 288,730 | |||||||||
| 5,981 | BorgWarner, Inc. | 173,150 | |||||||||
| 12,020 | Boyd Gaming Corp. | 110,464 | |||||||||
| 7,029 | Brinker International, Inc. | 124,554 | |||||||||
| 30,508 | Brunswick Corp. | 182,438 | |||||||||
| 2,784 | Burger King Holdings, Inc. | 45,491 | |||||||||
| 4,176 | Cabela's, Inc.* | 53,495 | |||||||||
| 5,506 | Cablevision Systems Corp., Class A | 94,483 | |||||||||
| 2,280 | Career Education Corp.* | 50,251 | |||||||||
| 12,482 | CarMax, Inc.* | 159,270 | |||||||||
| 29,274 | Carnival Corp. | 786,885 | |||||||||
| 176,987 | CBS Corp., Class B | 1,245,988 | |||||||||
| 24,387 | Centex Corp. | 266,794 | |||||||||
| 5,301 | Central European Media Enterprises, Ltd., Class A (Bermuda)* | 86,989 | |||||||||
| 82,623 | Charming Shoppes, Inc.* | 288,354 | |||||||||
| 10,991 | Chico's FAS, Inc.* | 83,971 | |||||||||
| 1,833 | Cinemark Holdings, Inc. | 16,314 | |||||||||
| 35,729 | Clear Channel Outdoor Holdings, Inc., Class A* | 137,199 | |||||||||
| 7,649 | Coach, Inc.* | 187,401 | |||||||||
| 5,583 | Collective Brands, Inc.* | 81,065 | |||||||||
| 89,795 | Comcast Corp., Class A | 1,388,231 | |||||||||
| 35,336 | Comcast Corp., Special Class A | 518,732 | |||||||||
| 10,393 | Cooper Tire & Rubber Co. | 85,950 | |||||||||
| 2,891 | Core-Mark Holding Co., Inc.* | 55,420 | |||||||||
| 28,792 | D.R. Horton, Inc. | 375,736 | |||||||||
| 4,261 | Darden Restaurants, Inc. | 157,529 | |||||||||
| 3,692 | Dick's Sporting Goods, Inc.* | 70,148 | |||||||||
| Number of Shares | Value | ||||||||||
| Common Stocks and Other Equity Interests (Continued) | |||||||||||
| 35,305 | Dillard's, Inc., Class A | $ | 272,202 | ||||||||
| 15,357 | DIRECTV Group (The), Inc.* | 379,779 | |||||||||
| 3,079 | Discovery Communications, Inc., Class A* | 58,470 | |||||||||
| 3,232 | Discovery Communications, Inc., Class C* | 56,625 | |||||||||
| 20,930 | DISH Network Corp., Class A* | 277,323 | |||||||||
| 2,265 | Dollar Tree, Inc.* | 95,900 | |||||||||
| 8,754 | Domino's Pizza, Inc.* | 82,638 | |||||||||
| 67,794 | E.W. Scripps Co., Class A | 133,554 | |||||||||
| 69,012 | Eastman Kodak Co. | 210,487 | |||||||||
| 166,592 | Emmis Communications Corp., Class A* | 58,307 | |||||||||
| 16,505 | Exide Technologies* | 89,622 | |||||||||
| 20,321 | Expedia, Inc.* | 276,569 | |||||||||
| 4,106 | Family Dollar Stores, Inc. | 136,278 | |||||||||
| 7,185 | Federal-Mogul Corp.* | 79,754 | |||||||||
| 13,833 | Foot Locker, Inc. | 164,474 | |||||||||
| 1,344,863 | Ford Motor Co.* | 8,042,280 | |||||||||
| 10,836 | Fortune Brands, Inc. | 425,963 | |||||||||
| 33,265 | Furniture Brands International, Inc. | 105,117 | |||||||||
| 3,699 | GameStop Corp., Class A* | 111,562 | |||||||||
| 115,283 | Gannett Co., Inc. | 450,757 | |||||||||
| 24,474 | Gap (The), Inc. | 380,326 | |||||||||
| 3,996 | Garmin Ltd. | 100,659 | |||||||||
| 817,504 | General Motors Corp. | 1,569,607 | |||||||||
| 7,742 | Genuine Parts Co. | 262,918 | |||||||||
| 79,558 | Goodyear Tire & Rubber (The) Co.* | 874,342 | |||||||||
| 6,674 | Group 1 Automotive, Inc. | 142,156 | |||||||||
| 7,157 | H&R Block, Inc. | 108,357 | |||||||||
| 12,999 | Hanesbrands, Inc.* | 213,964 | |||||||||
| 21,165 | Harley-Davidson, Inc. | 469,016 | |||||||||
| 6,562 | Harman International Industries, Inc. | 119,363 | |||||||||
| 3,829 | Hasbro, Inc. | 102,081 | |||||||||
| 9,597 | Hearst-Argyle Television, Inc. | 43,187 | |||||||||
| 78,636 | Home Depot (The), Inc. | 2,069,699 | |||||||||
| 78,964 | Hovnanian Enterprises, Inc., Class A* | 218,730 | |||||||||
| 24,449 | HSN, Inc.* | 168,943 | |||||||||
| 870 | Interactive Data Corp. | 19,558 | |||||||||
| 14,102 | International Game Technology | 174,160 | |||||||||
| 36,081 | Interpublic Group of Cos., Inc.* | 225,867 | |||||||||
| 24,066 | J. C. Penney Co., Inc. | 738,586 | |||||||||
| 2,741 | Jack in the Box, Inc.* | 67,401 | |||||||||
| 7,614 | Jarden Corp.* | 153,041 | |||||||||
| 50,205 | Johnson Controls, Inc. | 954,397 | |||||||||
| 39,400 | Jones Apparel Group, Inc. | 364,056 | |||||||||
| 12,180 | KB Home | 220,093 | |||||||||
| 11,010 | Kohl's Corp.* | 499,304 | |||||||||
| 17,942 | Lamar Advertising Co., Class A* | 303,220 | |||||||||
| 24,528 | Las Vegas Sands Corp.* | 191,809 | |||||||||
| 312,336 | Lear Corp.* | 249,869 | |||||||||
| 11,271 | Leggett & Platt, Inc. | 161,852 | |||||||||
| 25,493 | Lennar Corp., Class A | 248,302 | |||||||||
| 13,151 | Liberty Global, Inc., Series A* | 216,860 | |||||||||
See Notes to Financial Statements.
24
Schedule of Investments (Continued)
PowerShares FTSE RAFI US 1000 Portfolio
April 30, 2009
| Number of Shares | Value | ||||||||||
| Common Stocks and Other Equity Interests (Continued) | |||||||||||
| 12,733 | Liberty Global, Inc., Series C* | $ | 208,312 | ||||||||
| 47,020 | Liberty Media Corp.-Capital, Series A* | 550,134 | |||||||||
| 109,107 | Liberty Media Corp.-Interactive, Class A* | 578,267 | |||||||||
| 18,636 | Live Nation, Inc.* | 72,867 | |||||||||
| 33,063 | Liz Claiborne, Inc. | 156,719 | |||||||||
| 56,861 | Lowe's Cos., Inc. | 1,222,512 | |||||||||
| 32,568 | Ltd Brands, Inc. | 371,927 | |||||||||
| 63,979 | Macy's, Inc. | 875,233 | |||||||||
| 12,987 | Marriott International, Inc., Class A | 305,974 | |||||||||
| 15,113 | Mattel, Inc. | 226,090 | |||||||||
| 91,534 | McClatchy Co., Class A | 48,513 | |||||||||
| 15,551 | McDonald's Corp. | 828,713 | |||||||||
| 11,118 | McGraw-Hill (The) Cos., Inc. | 335,208 | |||||||||
| 2,542 | MDC Holdings, Inc. | 86,886 | |||||||||
| 2,713 | Meredith Corp. | 68,042 | |||||||||
| 41,361 | MGM MIRAGE* | 346,605 | |||||||||
| 9,795 | Mohawk Industries, Inc.* | 463,401 | |||||||||
| 18,733 | New York Times (The) Co., Class A | 100,784 | |||||||||
| 25,935 | Newell Rubbermaid, Inc. | 271,021 | |||||||||
| 122,609 | News Corp., Class A | 1,012,750 | |||||||||
| 30,319 | News Corp., Class B | 276,509 | |||||||||
| 7,827 | NIKE, Inc., Class B | 410,683 | |||||||||
| 11,396 | Nordstrom, Inc. | 257,891 | |||||||||
| 416 | NVR, Inc.* | 210,234 | |||||||||
| 262,973 | Office Depot, Inc.* | 681,100 | |||||||||
| 38,867 | OfficeMax, Inc. | 289,559 | |||||||||
| 11,658 | Omnicom Group, Inc. | 366,877 | |||||||||
| 2,391 | O'Reilly Automotive, Inc.* | 92,890 | |||||||||
| 3,534 | Penn National Gaming, Inc.* | 120,227 | |||||||||
| 11,569 | Penske Automotive Group, Inc. | 153,289 | |||||||||
| 3,604 | PetSmart, Inc. | 82,460 | |||||||||
| 2,955 | Polo Ralph Lauren Corp. | 159,097 | |||||||||
| 20,921 | Pulte Homes, Inc. | 240,801 | |||||||||
| 38,542 | Quiksilver, Inc.* | 63,594 | |||||||||
| 11,743 | RadioShack Corp. | 165,341 | |||||||||
| 23,324 | RCN Corp.* | 95,628 | |||||||||
| 16,904 | Regal Entertainment Group, Class A | 220,766 | |||||||||
| 3,953 | Regis Corp. | 75,660 | |||||||||
| 5,856 | Rent-A-Center, Inc.* | 112,728 | |||||||||
| 2,904 | Ross Stores, Inc. | 110,178 | |||||||||
| 16,858 | Royal Caribbean Cruises Ltd. | 248,318 | |||||||||
| 4,176 | Ryland Group, Inc. | 86,485 | |||||||||
| 63,494 | Saks, Inc.* | 330,804 | |||||||||
| 3,787 | Scholastic Corp. | 74,718 | |||||||||
| 3,245 | Scripps Networks Interactive, Inc., Class A | 89,043 | |||||||||
| 15,411 | Sears Holdings Corp.* | 962,725 | |||||||||
| 19,201 | Service Corp. International | 86,981 | |||||||||
| 3,180 | Sherwin-Williams (The) Co. | 180,115 | |||||||||
| 2,822 | Snap-On, Inc. | 95,722 | |||||||||
| 68,174 | Sonic Automotive, Inc., Class A | 351,778 | |||||||||
| 59,288 | Standard-Pacific Corp.* | 110,869 | |||||||||
| Number of Shares | Value | ||||||||||
| Common Stocks and Other Equity Interests (Continued) | |||||||||||
| 4,227 | Stanley Works (The) | $ | 160,753 | ||||||||
| 20,950 | Staples, Inc. | 431,989 | |||||||||
| 23,389 | Starbucks Corp.* | 338,205 | |||||||||
| 14,374 | Starwood Hotels & Resorts Worldwide, Inc. | 299,842 | |||||||||
| 36,670 | Target Corp. | 1,513,003 | |||||||||
| 63,768 | Tenneco, Inc.* | 195,130 | |||||||||
| 3,772 | Thor Industries, Inc. | 86,718 | |||||||||
| 13,362 | Ticketmaster Entertainment, Inc.* | 70,284 | |||||||||
| 4,223 | Tiffany & Co. | 122,214 | |||||||||
| 2,091 | Tim Hortons, Inc. (Canada) | 50,790 | |||||||||
| 18,604 | Time Warner Cable, Inc. | 599,607 | |||||||||
| 88,260 | Time Warner, Inc. | 1,926,715 | |||||||||
| 12,195 | TJX (The) Cos., Inc. | 341,094 | |||||||||
| 7,396 | Toll Brothers, Inc.* | 149,843 | |||||||||
| 1,620 | Tractor Supply Co.* | 65,416 | |||||||||
| 29,983 | Travelcenters of America LLC* | 73,458 | |||||||||
| 81,687 | TRW Automotive Holdings Corp.* | 704,142 | |||||||||
| 3,752 | VF Corp. | 222,381 | |||||||||
| 27,538 | Viacom, Inc., Class B* | 529,831 | |||||||||
| 43,238 | Virgin Media, Inc. | 333,797 | |||||||||
| 4,418 | WABCO Holdings, Inc. | 70,644 | |||||||||
| 72,374 | Walt Disney (The) Co. | 1,584,990 | |||||||||
| 18,620 | Warner Music Group Corp.* | 100,176 | |||||||||
| 109 | Washington Post (The) Co., Class B | 45,626 | |||||||||
| 12,901 | Whirlpool Corp. | 582,609 | |||||||||
| 9,098 | Williams-Sonoma, Inc. | 127,372 | |||||||||
| 33,523 | Wyndham Worldwide Corp. | 391,549 | |||||||||
| 851 | Wynn Resorts Ltd.* | 33,385 | |||||||||
| 8,604 | Yum! Brands, Inc. | 286,943 | |||||||||
| 38,629 | Zale Corp.* | 143,700 | |||||||||
| 60,465,491 | |||||||||||
| Consumer Staples—8.1% | |||||||||||
| 2,069 | Alberto-Culver Co. | 46,118 | |||||||||
| 169,518 | Altria Group, Inc. | 2,768,229 | |||||||||
| 28,347 | Archer-Daniels-Midland Co. | 697,903 | |||||||||
| 12,013 | Avon Products, Inc. | 273,416 | |||||||||
| 15,570 | Bare Escentuals, Inc.* | 144,178 | |||||||||
| 4,210 | BJ's Wholesale Club, Inc.* | 140,361 | |||||||||
| 2,425 | Brown-Forman Corp., Class B | 112,763 | |||||||||
| 8,379 | Bunge Ltd. | 402,276 | |||||||||
| 6,438 | Campbell Soup Co. | 165,585 | |||||||||
| 2,491 | Casey's General Stores, Inc. | 66,286 | |||||||||
| 11,161 | Chiquita Brands International, Inc.* | 84,489 | |||||||||
| 945 | Church & Dwight Co., Inc. | 51,417 | |||||||||
| 3,087 | Clorox (The) Co. | 173,026 | |||||||||
| 37,953 | Coca-Cola (The) Co. | 1,633,877 | |||||||||
| 25,566 | Coca-Cola Enterprises, Inc. | 436,156 | |||||||||
| 6,674 | Colgate-Palmolive Co. | 393,766 | |||||||||
| 24,142 | ConAgra Foods, Inc. | 427,313 | |||||||||
| 11,405 | Constellation Brands, Inc., Class A* | 132,184 | |||||||||
| 3,292 | Corn Products International, Inc. | 78,679 | |||||||||
See Notes to Financial Statements.
25
Schedule of Investments (Continued)
PowerShares FTSE RAFI US 1000 Portfolio
April 30, 2009
| Number of Shares | Value | ||||||||||
| Common Stocks and Other Equity Interests (Continued) | |||||||||||
| 13,023 | Cosan Ltd., Class A (Brazil)* | $ | 45,841 | ||||||||
| 18,967 | Costco Wholesale Corp. | 921,796 | |||||||||
| 38,588 | CVS Caremark Corp. | 1,226,327 | |||||||||
| 30,841 | Dean Foods Co.* | 638,409 | |||||||||
| 10,797 | Del Monte Foods Co. | 81,517 | |||||||||
| 16,405 | Dr. Pepper Snapple Group, Inc.* | 339,748 | |||||||||
| 2,305 | Energizer Holdings, Inc.* | 132,077 | |||||||||
| 6,656 | Estee Lauder (The) Cos., Inc., Class A | 199,014 | |||||||||
| 2,518 | Fresh Del Monte Produce, Inc.* | 36,561 | |||||||||
| 8,119 | General Mills, Inc. | 411,552 | |||||||||
| 20,316 | Great Atlantic & Pacific Tea Co., Inc.* | 149,119 | |||||||||
| 8,941 | H.J. Heinz Co. | 307,749 | |||||||||
| 4,429 | Hershey (The) Co. | 160,064 | |||||||||
| 2,961 | Hormel Foods Corp. | 92,650 | |||||||||
| 1,982 | J.M. Smucker (The) Co. | 78,091 | |||||||||
| 6,593 | Kellogg Co. | 277,631 | |||||||||
| 11,476 | Kimberly-Clark Corp. | 563,931 | |||||||||
| 58,809 | Kraft Foods, Inc., Class A | 1,376,131 | |||||||||
| 39,637 | Kroger (The) Co. | 856,952 | |||||||||
| 6,192 | Lorillard, Inc. | 390,901 | |||||||||
| 2,722 | McCormick & Co., Inc. | 80,163 | |||||||||
| 5,877 | Molson Coors Brewing Co., Class B | 224,795 | |||||||||
| 1,422 | Nash Finch Co. | 41,650 | |||||||||
| 2,939 | NBTY, Inc.* | 76,149 | |||||||||
| 4,453 | Pantry (The), Inc.* | 105,180 | |||||||||
| 9,622 | Pepsi Bottling Group (The), Inc. | 300,880 | |||||||||
| 4,398 | PepsiAmericas, Inc. | 108,059 | |||||||||
| 27,341 | PepsiCo, Inc. | 1,360,488 | |||||||||
| 34,329 | Philip Morris International, Inc. | 1,242,710 | |||||||||
| 65,317 | Procter & Gamble (The) Co. | 3,229,272 | |||||||||
| 1,137 | Ralcorp Holdings, Inc.* | 64,991 | |||||||||
| 9,268 | Reynolds American, Inc. | 351,999 | |||||||||
| 1,996 | Ruddick Corp. | 51,217 | |||||||||
| 30,673 | Safeway, Inc. | 605,792 | |||||||||
| 47,493 | Sara Lee Corp. | 395,142 | |||||||||
| 28,322 | Smithfield Foods, Inc.* | 244,702 | |||||||||
| 27,374 | SUPERVALU, Inc. | 447,565 | |||||||||
| 24,336 | Sysco Corp. | 567,759 | |||||||||
| 42,827 | Tyson Foods, Inc., Class A | 451,397 | |||||||||
| 1,909 | Universal Corp. | 57,575 | |||||||||
| 34,523 | Walgreen Co. | 1,085,058 | |||||||||
| 82,267 | Wal-Mart Stores, Inc. | 4,146,257 | |||||||||
| 10,467 | Whole Foods Market, Inc. | 216,981 | |||||||||
| 11,033 | Winn-Dixie Stores, Inc.* | 126,438 | |||||||||
| 32,096,302 | |||||||||||
| Energy—8.8% | |||||||||||
| 1,496 | Alon USA Energy, Inc. | 18,999 | |||||||||
| 16,458 | Anadarko Petroleum Corp. | 708,681 | |||||||||
| 9,547 | Apache Corp. | 695,594 | |||||||||
| 4,414 | Arch Coal, Inc. | 61,664 | |||||||||
| Number of Shares | Value | ||||||||||
| Common Stocks and Other Equity Interests (Continued) | |||||||||||
| 10,734 | Baker Hughes, Inc. | $ | 381,916 | ||||||||
| 15,282 | BJ Services Co. | 212,267 | |||||||||
| 5,243 | Cameron International Corp.* | 134,116 | |||||||||
| 24,052 | Chesapeake Energy Corp. | 474,065 | |||||||||
| 79,764 | Chevron Corp. | 5,272,400 | |||||||||
| 4,591 | Cimarex Energy Co. | 123,498 | |||||||||
| 457 | CNX Gas Corp.* | 11,768 | |||||||||
| 11,144 | Complete Production Services, Inc.* | 74,442 | |||||||||
| 91,249 | ConocoPhillips | 3,741,209 | |||||||||
| 3,418 | CONSOL Energy, Inc. | 106,915 | |||||||||
| 827 | Continental Resources, Inc.* | 19,310 | |||||||||
| 4,084 | CVR Energy, Inc.* | 30,058 | |||||||||
| 2,047 | Delek US Holdings, Inc. | 21,023 | |||||||||
| 4,649 | Denbury Resources, Inc.* | 75,686 | |||||||||
| 17,169 | Devon Energy Corp. | 890,213 | |||||||||
| 1,178 | Diamond Offshore Drilling, Inc. | 85,299 | |||||||||
| 35,945 | El Paso Corp. | 248,021 | |||||||||
| 4,255 | ENSCO International, Inc. | 120,331 | |||||||||
| 4,829 | EOG Resources, Inc. | 306,545 | |||||||||
| 6,882 | Exterran Holdings, Inc.* | 142,113 | |||||||||
| 126,458 | Exxon Mobil Corp. | 8,430,954 | |||||||||
| 2,887 | FMC Technologies, Inc.* | 98,822 | |||||||||
| 6,865 | Forest Oil Corp.* | 109,840 | |||||||||
| 3,467 | Foundation Coal Holdings, Inc. | 56,304 | |||||||||
| 4,084 | Frontier Oil Corp. | 51,908 | |||||||||
| 9,461 | General Maritime Corp. | 93,948 | |||||||||
| 30,426 | Halliburton Co. | 615,214 | |||||||||
| 22,959 | Helix Energy Solutions Group, Inc.* | 208,697 | |||||||||
| 3,040 | Helmerich & Payne, Inc. | 93,693 | |||||||||
| 38,363 | Hercules Offshore, Inc.* | 122,762 | |||||||||
| 9,147 | Hess Corp. | 501,164 | |||||||||
| 1,717 | Holly Corp. | 35,988 | |||||||||
| 21,022 | Key Energy Services, Inc.* | 92,287 | |||||||||
| 3,719 | Linn Energy LLC | 61,512 | |||||||||
| 46,436 | Marathon Oil Corp. | 1,379,149 | |||||||||
| 6,618 | Mariner Energy, Inc.* | 75,313 | |||||||||
| 4,076 | Massey Energy Co. | 64,849 | |||||||||
| 6,266 | Murphy Oil Corp. | 298,951 | |||||||||
| 20,630 | Nabors Industries Ltd. (Bermuda)* | 313,782 | |||||||||
| 9,088 | National Oilwell Varco, Inc.* | 275,185 | |||||||||
| 8,250 | Newfield Exploration Co.* | 257,235 | |||||||||
| 7,027 | Noble Corp. (Switzerland) | 192,048 | |||||||||
| 3,568 | Noble Energy, Inc. | 202,484 | |||||||||
| 12,870 | Occidental Petroleum Corp. | 724,452 | |||||||||
| 1,574 | Oil States International, Inc.* | 29,749 | |||||||||
| 2,487 | Overseas Shipholding Group, Inc. | 71,402 | |||||||||
| 9,687 | Patterson-UTI Energy, Inc. | 123,122 | |||||||||
| 5,783 | Peabody Energy Corp. | 152,613 | |||||||||
| 3,715 | PetroHawk Energy Corp.* | 87,674 | |||||||||
| 21,794 | Pioneer Drilling Co.* | 108,970 | |||||||||
| 7,329 | Pioneer Natural Resources Co. | 169,446 | |||||||||
See Notes to Financial Statements.
26
Schedule of Investments (Continued)
PowerShares FTSE RAFI US 1000 Portfolio
April 30, 2009
| Number of Shares | Value | ||||||||||
| Common Stocks and Other Equity Interests (Continued) | |||||||||||
| 5,738 | Plains Exploration & Production Co.* | $ | 108,276 | ||||||||
| 7,264 | Pride International, Inc.* | 164,893 | |||||||||
| 1,325 | Range Resources Corp. | 52,960 | |||||||||
| 6,093 | Rowan Cos., Inc. | 95,112 | |||||||||
| 5,402 | SandRidge Energy, Inc.* | 44,080 | |||||||||
| 21,510 | Schlumberger Ltd. | 1,053,775 | |||||||||
| 950 | SEACOR Holdings, Inc.* | 62,434 | |||||||||
| 5,680 | Ship Finance International Ltd. (Bermuda) | 49,018 | |||||||||
| 9,223 | Smith International, Inc. | 238,415 | |||||||||
| 5,516 | Southern Union Co. | 87,760 | |||||||||
| 2,171 | Southwestern Energy Co.* | 77,852 | |||||||||
| 29,967 | Spectra Energy Corp. | 434,522 | |||||||||
| 13,642 | Stone Energy Corp.* | 58,797 | |||||||||
| 11,981 | Sunoco, Inc. | 317,616 | |||||||||
| 2,785 | Superior Energy Services, Inc.* | 53,500 | |||||||||
| 4,952 | Teekay Corp. (Bahamas) | 71,507 | |||||||||
| 16,237 | Tesoro Corp. | 247,614 | |||||||||
| 1,708 | Tidewater, Inc. | 73,871 | |||||||||
| 2,962 | Unit Corp.* | 80,833 | |||||||||
| 9,141 | USEC, Inc.* | 56,583 | |||||||||
| 57,128 | Valero Energy Corp. | 1,133,420 | |||||||||
| 2,589 | W&T Offshore, Inc. | 24,026 | |||||||||
| 16,871 | Weatherford International Ltd. (Switzerland)* | 280,565 | |||||||||
| 1,976 | Western Refining, Inc.* | 24,878 | |||||||||
| 2,336 | Whiting Petroleum Corp.* | 76,527 | |||||||||
| 29,684 | Williams (The) Cos., Inc. | 418,544 | |||||||||
| 2,849 | World Fuel Services Corp. | 108,632 | |||||||||
| 9,034 | XTO Energy, Inc. | 313,118 | |||||||||
| 34,864,778 | |||||||||||
| Financials—25.9% | |||||||||||
| 1,602 | Affiliated Managers Group, Inc.* | 91,074 | |||||||||
| 24,420 | Aflac, Inc. | 705,494 | |||||||||
| 1,339 | Alexandria Real Estate Equities, Inc. REIT | 48,847 | |||||||||
| 227 | Alleghany Corp.* | 57,581 | |||||||||
| 135,336 | Allied Capital Corp. | 332,927 | |||||||||
| 2,688 | Allied World Assurance Holdings Ltd. (Bermuda) | 99,832 | |||||||||
| 52,306 | Allstate (The) Corp. | 1,220,299 | |||||||||
| 10,024 | AMB Property Corp. REIT | 191,358 | |||||||||
| 156,457 | American Capital Ltd. | 483,452 | |||||||||
| 82,676 | American Express Co. | 2,085,088 | |||||||||
| 4,045 | American Financial Group, Inc. | 71,111 | |||||||||
| 1,947,098 | American International Group, Inc. | 2,686,994 | |||||||||
| 928 | American National Insurance | 62,983 | |||||||||
| 16,687 | AmeriCredit Corp.* | 169,707 | |||||||||
| 5,083 | Ameriprise Financial, Inc. | 133,937 | |||||||||
| 10,281 | Annaly Capital Management, Inc. REIT | 144,654 | |||||||||
| 6,881 | Aon Corp. | 290,378 | |||||||||
| Number of Shares | Value | ||||||||||
| Common Stocks and Other Equity Interests (Continued) | |||||||||||
| 23,073 | Apartment Investment & Management Co., Class A REIT | $ | 168,433 | ||||||||
| 16,324 | Apollo Investment Corp. | 78,355 | |||||||||
| 1,947 | Arch Capital Group Ltd.* | 112,498 | |||||||||
| 3,626 | Arthur J. Gallagher & Co. | 81,512 | |||||||||
| 3,357 | Aspen Insurance Holdings Ltd. (Bermuda) | 79,158 | |||||||||
| 4,452 | Associated Banc-Corp. | 68,872 | |||||||||
| 8,738 | Assurant, Inc. | 213,557 | |||||||||
| 8,800 | Astoria Financial Corp. | 72,688 | |||||||||
| 2,777 | AvalonBay Communities, Inc. REIT | 157,761 | |||||||||
| 6,302 | Axis Capital Holdings Ltd. (Bermuda) | 155,281 | |||||||||
| 9,826 | Baldwin & Lyons, Inc., Class B | 197,011 | |||||||||
| 2,813 | BancorpSouth, Inc. | 65,402 | |||||||||
| 1,644,613 | Bank of America Corp. | 14,686,393 | |||||||||
| 1,617 | Bank of Hawaii Corp. | 56,821 | |||||||||
| 35,984 | Bank of New York Mellon (The) Corp. | 916,872 | |||||||||
| 42,510 | BB&T Corp. | 992,183 | |||||||||
| 1,255 | Berkshire Hathaway, Inc., Class B* | 3,846,574 | |||||||||
| 650 | BOK Financial Corp. | 24,479 | |||||||||
| 6,841 | Boston Properties, Inc. REIT | 338,082 | |||||||||
| 13,667 | Brandywine Realty Trust REIT | 84,599 | |||||||||
| 2,352 | BRE Properties, Inc. REIT | 57,789 | |||||||||
| 3,608 | Camden Property Trust REIT | 97,885 | |||||||||
| 61,823 | Capital One Financial Corp. | 1,034,917 | |||||||||
| 63,029 | CapitalSource, Inc. | 194,760 | |||||||||
| 39,393 | CB Richard Ellis Group, Inc., Class A* | 295,448 | |||||||||
| 22,679 | CBL & Associates Properties, Inc. REIT | 180,071 | |||||||||
| 18,363 | Charles Schwab (The) Corp. | 339,348 | |||||||||
| 9,108 | Chubb (The) Corp. | 354,757 | |||||||||
| 10,610 | Cincinnati Financial Corp. | 254,110 | |||||||||
| 91,470 | CIT Group, Inc. | 203,063 | |||||||||
| 3,705,764 | Citigroup, Inc. | 11,302,579 | |||||||||
| 2,187 | City National Corp. | 80,044 | |||||||||
| 1,264 | CME Group, Inc. | 279,786 | |||||||||
| 3,116 | CNA Financial Corp. | 37,299 | |||||||||
| 114,976 | Colonial BancGroup (The), Inc. | 87,382 | |||||||||
| 19,767 | Colonial Properties Trust REIT | 143,113 | |||||||||
| 16,752 | Comerica, Inc. | 351,457 | |||||||||
| 1,956 | Commerce Bancshares, Inc. | 64,744 | |||||||||
| 14,248 | CompuCredit Corp.* | 45,594 | |||||||||
| 145,266 | Conseco, Inc.* | 232,426 | |||||||||
| 6,296 | Cousins Properties, Inc. REIT | 53,201 | |||||||||
| 14,994 | DCT Industrial Trust, Inc. REIT | 66,273 | |||||||||
| 43,371 | Developers Diversified Realty Corp. REIT | 179,122 | |||||||||
| 47,879 | Discover Financial Services | 389,256 | |||||||||
| 4,962 | Douglas Emmett, Inc. REIT | 47,486 | |||||||||
| 17,968 | Duke Realty Corp. REIT | 175,547 | |||||||||
| 133,404 | E*TRADE Financial Corp.* | 190,768 | |||||||||
| 3,547 | Endurance Specialty Holdings Ltd. (Bermuda) | 92,790 | |||||||||
| 2,214 | Equity One, Inc. REIT | 32,944 | |||||||||
See Notes to Financial Statements.
27
Schedule of Investments (Continued)
PowerShares FTSE RAFI US 1000 Portfolio
April 30, 2009
| Number of Shares | Value | ||||||||||
| Common Stocks and Other Equity Interests (Continued) | |||||||||||
| 14,026 | Equity Residential REIT | $ | 321,055 | ||||||||
| 740 | Erie Indemnity Co., Class A | 26,137 | |||||||||
| 2,477 | Everest Re Group Ltd. | 184,883 | |||||||||
| 1,402 | �� | Federal Realty Investment Trust REIT | 77,390 | ||||||||
| 2,667 | Federated Investors, Inc., Class B | 61,021 | |||||||||
| 19,308 | Fidelity National Title Group, Inc., Class A | 350,054 | |||||||||
| 248,496 | Fifth Third Bancorp | 1,018,834 | |||||||||
| 7,125 | First American (The) Corp. | 200,070 | |||||||||
| 11,172 | First Horizon National Corp. | 128,590 | |||||||||
| 22,524 | First Industrial Realty Trust, Inc. REIT | 84,915 | |||||||||
| 3,719 | FirstMerit Corp. | 72,186 | |||||||||
| 4,949 | Franklin Resources, Inc. | 299,316 | |||||||||
| 11,312 | Fulton Financial Corp. | 74,772 | |||||||||
| 374,221 | Genworth Financial, Inc., Class A | 883,162 | |||||||||
| 23,258 | Goldman Sachs Group (The), Inc. | 2,988,652 | |||||||||
| 83,503 | Guaranty Financial Group, Inc.* | 49,267 | |||||||||
| 2,082 | Hanover Insurance Group (The), Inc. | 62,418 | |||||||||
| 154,336 | Hartford Financial Services Group (The), Inc. | 1,770,234 | |||||||||
| 3,425 | HCC Insurance Holdings, Inc. | 81,926 | |||||||||
| 7,538 | HCP, Inc. REIT | 165,459 | |||||||||
| 2,693 | Health Care REIT, Inc. | 91,751 | |||||||||
| 3,870 | Healthcare Realty Trust, Inc. REIT | 64,977 | |||||||||
| 2,465 | Highwoods Properties, Inc. REIT | 59,135 | |||||||||
| 8,845 | Hospitality Properties Trust REIT | 108,263 | |||||||||
| 55,330 | Host Hotels & Resorts, Inc. REIT | 425,488 | |||||||||
| 26,508 | HRPT Properties Trust REIT | 114,249 | |||||||||
| 13,913 | Hudson City Bancorp, Inc. | 174,747 | |||||||||
| 135,605 | Huntington Bancshares, Inc. | 378,338 | |||||||||
| 6,375 | Interactive Brokers Group, Inc., Class A* | 94,031 | |||||||||
| 294,216 | Invesco Ltd.(-) | 4,330,859 | |||||||||
| 2,198 | IPC Holdings Ltd. | 57,236 | |||||||||
| 83,933 | iStar Financial, Inc. REIT | 282,854 | |||||||||
| 11,106 | Janus Capital Group, Inc. | 111,393 | |||||||||
| 2,272 | Jones Lang LaSalle, Inc. | 73,317 | |||||||||
| 218,470 | JPMorgan Chase & Co. | 7,209,509 | |||||||||
| 55,159 | Keycorp | 339,228 | |||||||||
| 23,290 | Kimco Realty Corp. REIT | 279,946 | |||||||||
| 62,343 | KKR Financial Holdings LLC | 84,163 | |||||||||
| 14,591 | Legg Mason, Inc. | 292,841 | |||||||||
| 5,170 | Leucadia National Corp.* | 109,759 | |||||||||
| 5,464 | Liberty Property Trust REIT | 132,994 | |||||||||
| 44,301 | Lincoln National Corp. | 497,943 | |||||||||
| 28,566 | Loews Corp. | 711,008 | |||||||||
| 7,010 | M&T Bank Corp. | 367,675 | |||||||||
| 6,817 | Macerich (The) Co. REIT | 119,502 | |||||||||
| 4,810 | Mack-Cali Realty Corp. REIT | 129,197 | |||||||||
| 392 | Markel Corp.* | 112,504 | |||||||||
| 22,818 | Marsh & McLennan Cos., Inc. | 481,232 | |||||||||
| 31,131 | Marshall & Ilsley Corp. | 179,937 | |||||||||
| 45,157 | MBIA, Inc.* | 213,593 | |||||||||
| 1,697 | Mercury General Corp. | 57,325 | |||||||||
| Number of Shares | Value | ||||||||||
| Common Stocks and Other Equity Interests (Continued) | |||||||||||
| 65,478 | MetLife, Inc. | $ | 1,947,971 | ||||||||
| 21,728 | MF Global Ltd.* | 132,541 | |||||||||
| 21,346 | MGIC Investment Corp. | 54,646 | |||||||||
| 5,526 | Montpelier Re Holdings Ltd. (Bermuda) | 68,854 | |||||||||
| 3,733 | Moody's Corp. | 110,198 | |||||||||
| 84,324 | Morgan Stanley | 1,993,419 | |||||||||
| 5,907 | MSCI, Inc., Class A* | 123,988 | |||||||||
| 3,308 | NASDAQ OMX (The) Group, Inc.* | 63,613 | |||||||||
| 2,850 | Nationwide Health Properties, Inc. REIT | 70,367 | |||||||||
| 17,339 | New York Community Bancorp, Inc. | 196,104 | |||||||||
| 4,289 | Northern Trust Corp. | 233,150 | |||||||||
| 13,028 | NYSE Euronext | 301,859 | |||||||||
| 19,343 | Och-Ziff Capital Management Group LLC, Class A | 143,912 | |||||||||
| 689 | Odyssey Re Holdings Corp. | 26,382 | |||||||||
| 15,805 | Old Republic International Corp. | 148,093 | |||||||||
| 7,888 | OneBeacon Insurance Group Ltd. | 91,659 | |||||||||
| 2,289 | PartnerRe Ltd. | 156,087 | |||||||||
| 6,630 | People's United Financial, Inc. | 103,561 | |||||||||
| 15,432 | PHH Corp.* | 258,949 | |||||||||
| 146,937 | Phoenix (The) Cos., Inc. | 229,222 | |||||||||
| 1,878 | Platinum Underwriters Holdings Ltd. (Bermuda) | 54,030 | |||||||||
| 5,210 | Plum Creek Timber Co., Inc. REIT | 179,849 | |||||||||
| 132,424 | PMI Group (The), Inc. | 83,427 | |||||||||
| 20,365 | PNC Financial Services Group, Inc. | 808,491 | |||||||||
| 48,250 | Popular, Inc. | 137,995 | |||||||||
| 2,048 | Potlatch Corp. REIT | 60,232 | |||||||||
| 38,156 | Principal Financial Group, Inc. | 623,469 | |||||||||
| 30,745 | Progressive (The) Corp.* | 469,784 | |||||||||
| 64,564 | ProLogis REIT | 588,178 | |||||||||
| 26,312 | Protective Life Corp. | 225,494 | |||||||||
| 57,939 | Prudential Financial, Inc. | 1,673,278 | |||||||||
| 2,525 | Public Storage | 168,822 | |||||||||
| 28,474 | Radian Group, Inc. | 49,260 | |||||||||
| 5,554 | Raymond James Financial, Inc. | 87,142 | |||||||||
| 2,577 | Rayonier, Inc. REIT | 99,524 | |||||||||
| 3,132 | Realty Income Corp. REIT | 69,938 | |||||||||
| 3,354 | Redwood Trust, Inc. REIT | 54,570 | |||||||||
| 2,679 | Regency Centers Corp. REIT | 100,329 | |||||||||
| 157,003 | Regions Financial Corp. | 704,943 | |||||||||
| 1,889 | Reinsurance Group of America, Inc. | 60,051 | |||||||||
| 2,000 | RenaissanceRe Holdings Ltd. (Bermuda) | 97,320 | |||||||||
| 2,896 | SEI Investments Co. | 40,631 | |||||||||
| 3,900 | Senior Housing Properties Trust REIT | 63,921 | |||||||||
| 8,812 | Simon Property Group, Inc. REIT | 454,699 | |||||||||
| 8,247 | SL Green Realty Corp. REIT | 145,642 | |||||||||
| 54,616 | SLM Corp.* | 263,795 | |||||||||
| 3,721 | StanCorp Financial Group, Inc. | 102,067 | |||||||||
| 16,704 | State Street Corp. | 570,108 | |||||||||
| 422 | Student Loan Corp. | 20,324 | |||||||||
See Notes to Financial Statements.
28
Schedule of Investments (Continued)
PowerShares FTSE RAFI US 1000 Portfolio
April 30, 2009
| Number of Shares | Value | ||||||||||
| Common Stocks and Other Equity Interests (Continued) | |||||||||||
| 59,602 | SunTrust Banks, Inc. | $ | 860,653 | ||||||||
| 5,577 | Susquehanna Bancshares, Inc. | 44,951 | |||||||||
| 45,787 | Synovus Financial Corp. | 147,892 | |||||||||
| 5,820 | T. Rowe Price Group, Inc. | 224,186 | |||||||||
| 6,176 | TCF Financial Corp. | 85,908 | |||||||||
| 30,550 | TD Ameritrade Holding Corp.* | 486,051 | |||||||||
| 6,809 | Torchmark Corp. | 199,708 | |||||||||
| 1,374 | Transatlantic Holdings, Inc. | 52,116 | |||||||||
| 31,891 | Travelers (The) Cos., Inc. | 1,311,996 | |||||||||
| 98,827 | U.S. Bancorp | 1,800,628 | |||||||||
| 8,411 | UDR, Inc. REIT | 84,699 | |||||||||
| 8,531 | Unitrin, Inc. | 145,027 | |||||||||
| 26,688 | Unum Group | 436,082 | |||||||||
| 1,725 | Validus Holdings Ltd. (Bermuda) | 38,640 | |||||||||
| 5,119 | Valley National Bancorp | 74,072 | |||||||||
| 3,555 | Ventas, Inc. REIT | 101,815 | |||||||||
| 7,757 | Vornado Realty Trust REIT | 379,240 | |||||||||
| 6,925 | W.R. Berkley Corp. | 165,577 | |||||||||
| 4,648 | Washington Federal, Inc. | 60,331 | |||||||||
| 16,556 | Webster Financial Corp. | 86,588 | |||||||||
| 7,912 | Weingarten Realty Investors REIT | 122,952 | |||||||||
| 253,791 | Wells Fargo & Co. | 5,078,357 | |||||||||
| 45 | Wesco Financial Corp. | 13,451 | |||||||||
| 621 | White Mountains Insurance Group Ltd. | 118,810 | |||||||||
| 4,468 | Willis Group Holdings Ltd. | 122,915 | |||||||||
| 6,464 | Wilmington Trust Corp. | 93,793 | |||||||||
| 100,342 | XL Capital Ltd., Class A | 954,252 | |||||||||
| 20,458 | Zions Bancorp | 223,606 | |||||||||
| 102,747,725 | |||||||||||
| Health Care—7.6% | |||||||||||
| 21,091 | Abbott Laboratories | 882,658 | |||||||||
| 17,799 | Aetna, Inc. | 391,756 | |||||||||
| 4,542 | Alcon, Inc. (Switzerland) | 417,909 | |||||||||
| 2,907 | Allergan, Inc. | 135,641 | |||||||||
| 2,255 | AMERIGROUP Corp.* | 67,357 | |||||||||
| 18,610 | AmerisourceBergen Corp. | 626,040 | |||||||||
| 18,835 | Amgen, Inc.* | 912,932 | |||||||||
| 8,096 | Baxter International, Inc. | 392,656 | |||||||||
| 1,627 | Beckman Coulter, Inc. | 85,515 | |||||||||
| 4,028 | Becton Dickinson & Co. | 243,613 | |||||||||
| 3,875 | Biogen Idec, Inc.* | 187,318 | |||||||||
| 599 | Bio-Rad Laboratories, Inc., Class A* | 41,744 | |||||||||
| 66,635 | Boston Scientific Corp.* | 560,400 | |||||||||
| 53,072 | Bristol-Myers Squibb Co. | 1,018,982 | |||||||||
| 9,398 | Brookdale Senior Living, Inc. | 96,893 | |||||||||
| 679 | C.R. Bard, Inc. | 48,637 | |||||||||
| 29,515 | Cardinal Health, Inc. | 997,312 | |||||||||
| 924 | Cephalon, Inc.* | 60,624 | |||||||||
| 1,394 | Cerner Corp.* | 74,997 | |||||||||
| 2,437 | Charles River Laboratories International, Inc.* | 67,383 | |||||||||
| Number of Shares | Value | ||||||||||
| Common Stocks and Other Equity Interests (Continued) | |||||||||||
| 20,927 | CIGNA Corp. | $ | 412,471 | ||||||||
| 7,278 | Community Health Systems, Inc.* | 166,230 | |||||||||
| 1,466 | Covance, Inc.* | 57,584 | |||||||||
| 16,685 | Coventry Health Care, Inc.* | 265,458 | |||||||||
| 11,403 | Covidien Ltd. | 376,071 | |||||||||
| 2,523 | DaVita, Inc.* | 116,992 | |||||||||
| 2,564 | DENTSPLY International, Inc. | 73,382 | |||||||||
| 29,721 | Eli Lilly & Co. | 978,415 | |||||||||
| 2,579 | Endo Pharmaceuticals Holdings, Inc.* | 42,657 | |||||||||
| 4,980 | Express Scripts, Inc.* | 318,571 | |||||||||
| 7,861 | Forest Laboratories, Inc.* | 170,505 | |||||||||
| 3,446 | Genzyme Corp.* | 183,775 | |||||||||
| 5,027 | Gilead Sciences, Inc.* | 230,237 | |||||||||
| 90,562 | Health Management Associates, Inc., Class A* | 422,925 | |||||||||
| 15,206 | Health Net, Inc.* | 219,575 | |||||||||
| 2,946 | Henry Schein, Inc.* | 120,904 | |||||||||
| 6,730 | Hill-Rom Holdings, Inc. | 87,355 | |||||||||
| 9,271 | Hologic, Inc.* | 137,767 | |||||||||
| 4,291 | Hospira, Inc.* | 141,045 | |||||||||
| 13,725 | Humana, Inc.* | 395,006 | |||||||||
| 3,763 | IMS Health, Inc. | 47,263 | |||||||||
| 2,512 | Inverness Medical Innovations, Inc.* | 81,112 | |||||||||
| 47,473 | Johnson & Johnson | 2,485,687 | |||||||||
| 3,938 | Kindred Healthcare, Inc.* | 51,273 | |||||||||
| 1,962 | Kinetic Concepts, Inc.* | 48,579 | |||||||||
| 15,023 | King Pharmaceuticals, Inc.* | 118,381 | |||||||||
| 2,264 | Laboratory Corp. of America Holdings* | 145,236 | |||||||||
| 2,301 | Life Technologies Corp.* | 85,827 | |||||||||
| 3,265 | LifePoint Hospitals, Inc.* | 84,400 | |||||||||
| 2,889 | Lincare Holdings, Inc.* | 69,712 | |||||||||
| 1,555 | Magellan Health Services, Inc.* | 45,966 | |||||||||
| 22,195 | McKesson Corp. | 821,215 | |||||||||
| 16,322 | Medco Health Solutions, Inc.* | 710,823 | |||||||||
| 19,647 | Medtronic, Inc. | 628,704 | |||||||||
| 70,957 | Merck & Co., Inc. | 1,719,999 | |||||||||
| 884 | Millipore Corp.* | 52,244 | |||||||||
| 5,017 | Mylan, Inc.* | 66,475 | |||||||||
| 4,654 | Omnicare, Inc. | 119,654 | |||||||||
| 1,942 | Owens & Minor, Inc. | 67,349 | |||||||||
| 3,896 | Patterson Cos., Inc.* | 79,712 | |||||||||
| 286,062 | Pfizer, Inc. | 3,821,789 | |||||||||
| 1,852 | Pharmaceutical Product Development, Inc. | 36,318 | |||||||||
| 2,965 | Quest Diagnostics, Inc. | 152,193 | |||||||||
| 19,340 | Schering-Plough Corp. | 445,207 | |||||||||
| 4,889 | St. Jude Medical, Inc.* | 163,879 | |||||||||
| 4,799 | Stryker Corp. | 185,769 | |||||||||
| 85,102 | Sunrise Senior Living, Inc.* | 217,010 | |||||||||
| 1,312 | Teleflex, Inc. | 56,390 | |||||||||
| 137,931 | Tenet Healthcare Corp.* | 310,345 | |||||||||
| 9,864 | Thermo Fisher Scientific, Inc.* | 346,029 | |||||||||
See Notes to Financial Statements.
29
Schedule of Investments (Continued)
PowerShares FTSE RAFI US 1000 Portfolio
April 30, 2009
| Number of Shares | Value | ||||||||||
| Common Stocks and Other Equity Interests (Continued) | |||||||||||
| 58,570 | UnitedHealth Group, Inc. | $ | 1,377,566 | ||||||||
| 5,120 | Universal American Financial Corp.* | 52,890 | |||||||||
| 2,287 | Universal Health Services, Inc., Class B | 115,265 | |||||||||
| 1,978 | Varian Medical Systems, Inc.* | 66,006 | |||||||||
| 2,012 | Warner Chilcott Ltd., Class A* | 19,697 | |||||||||
| 1,473 | Waters Corp.* | 65,062 | |||||||||
| 2,979 | Watson Pharmaceuticals, Inc.* | 92,170 | |||||||||
| 36,013 | WellPoint, Inc.* | 1,539,916 | |||||||||
| 20,353 | Wyeth | 862,967 | |||||||||
| 6,723 | Zimmer Holdings, Inc.* | 295,745 | |||||||||
| 29,979,116 | |||||||||||
| Industrials—12.1% | |||||||||||
| 21,249 | 3M Co. | 1,223,942 | |||||||||
| 1,935 | Acuity Brands, Inc. | 55,612 | |||||||||
| 3,556 | Aecom Technology Corp.* | 91,496 | |||||||||
| 7,150 | AGCO Corp.* | 173,745 | |||||||||
| 12,517 | Aircastle Ltd. (Bermuda) | 82,612 | |||||||||
| 2,514 | Alaska Air Group, Inc.* | 42,185 | |||||||||
| 2,722 | Alexander & Baldwin, Inc. | 72,514 | |||||||||
| 1,105 | Alliant Techsystems, Inc.* | 88,013 | |||||||||
| 1,676 | AMERCO, Inc.* | 54,386 | |||||||||
| 1,883 | AMETEK, Inc. | 60,651 | |||||||||
| 84,474 | AMR Corp.* | 402,096 | |||||||||
| 3,389 | Armstrong World Industries, Inc.* | 61,612 | |||||||||
| 7,612 | Avery Dennison Corp. | 218,769 | |||||||||
| 669,883 | Avis Budget Group, Inc.* | 1,400,055 | |||||||||
| 5,943 | BE Aerospace, Inc.* | 64,125 | |||||||||
| 31,150 | BlueLinx Holdings, Inc.* | 97,500 | |||||||||
| 31,524 | Boeing (The) Co. | 1,262,536 | |||||||||
| 4,277 | Briggs & Stratton Corp. | 63,642 | |||||||||
| 2,462 | Brink's (The) Co. | 69,798 | |||||||||
| 9,772 | Burlington Northern Santa Fe Corp. | 659,415 | |||||||||
| 2,851 | C.H. Robinson Worldwide, Inc. | 151,559 | |||||||||
| 2,813 | Carlisle Cos., Inc. | 63,996 | |||||||||
| 37,446 | Caterpillar, Inc. | 1,332,329 | |||||||||
| 36,603 | China BAK Battery, Inc.* | 77,964 | |||||||||
| 46,827 | China Yuchai International Ltd. (Bermuda) | 368,997 | |||||||||
| 2,847 | Cintas Corp. | 73,054 | |||||||||
| 20,951 | Continental Airlines, Inc., Class B* | 220,405 | |||||||||
| 4,748 | Con-way, Inc. | 117,655 | |||||||||
| 6,771 | Cooper Industries Ltd., Class A | 222,021 | |||||||||
| 5,392 | Corrections Corp. of America* | 76,189 | |||||||||
| 2,669 | Covanta Holding Corp.* | 37,660 | |||||||||
| 3,265 | Crane Co. | 75,389 | |||||||||
| 15,400 | CSX Corp. | 455,686 | |||||||||
| 9,313 | Cummins, Inc. | 316,642 | |||||||||
| 4,571 | Danaher Corp. | 267,129 | |||||||||
| 19,170 | Deere & Co. | 790,954 | |||||||||
| 71,995 | Delta Air Lines, Inc.* | 444,209 | |||||||||
| 6,466 | Deluxe Corp. | 93,757 | |||||||||
| Number of Shares | Value | ||||||||||
| Common Stocks and Other Equity Interests (Continued) | |||||||||||
| 1,768 | Donaldson Co., Inc. | $ | 58,326 | ||||||||
| 7,860 | Dover Corp. | 241,931 | |||||||||
| 682 | Dun & Bradstreet (The) Corp. | 55,515 | |||||||||
| 9,042 | Eaton Corp. | 396,040 | |||||||||
| 5,300 | EMCOR Group, Inc.* | 110,187 | |||||||||
| 24,810 | Emerson Electric Co. | 844,532 | |||||||||
| 2,876 | Equifax, Inc. | 83,864 | |||||||||
| 2,797 | Expeditors International of Washington, Inc. | 97,084 | |||||||||
| 2,175 | Fastenal Co. | 83,433 | |||||||||
| 16,635 | FedEx Corp. | 930,895 | |||||||||
| 1,317 | Flowserve Corp. | 89,424 | |||||||||
| 5,352 | Fluor Corp. | 202,680 | |||||||||
| 4,207 | Foster Wheeler AG (Switzerland)* | 90,577 | |||||||||
| 2,502 | Gardner Denver, Inc.* | 66,603 | |||||||||
| 2,909 | GATX Corp. | 87,590 | |||||||||
| 115,961 | GenCorp, Inc.* | 278,306 | |||||||||
| 3,783 | General Cable Corp.* | 102,671 | |||||||||
| 13,131 | General Dynamics Corp. | 678,479 | |||||||||
| 829,548 | General Electric Co. | 10,493,783 | |||||||||
| 4,393 | Goodrich Corp. | 194,522 | |||||||||
| 1,241 | Granite Construction, Inc. | 48,957 | |||||||||
| 4,058 | Harsco Corp. | 111,798 | |||||||||
| 108,075 | Hertz Global Holdings, Inc.* | 734,910 | |||||||||
| 4,891 | HNI Corp. | 75,811 | |||||||||
| 27,108 | Honeywell International, Inc. | 846,041 | |||||||||
| 2,688 | Hubbell, Inc., Class B | 89,242 | |||||||||
| 16,058 | Illinois Tool Works, Inc. | 526,702 | |||||||||
| 20,761 | Ingersoll-Rand Co. Ltd., Class A | 451,967 | |||||||||
| 5,111 | Iron Mountain, Inc.* | 145,612 | |||||||||
| 4,915 | ITT Corp. | 201,564 | |||||||||
| 2,287 | J.B. Hunt Transport Services, Inc. | 64,310 | |||||||||
| 4,592 | Jacobs Engineering Group, Inc.* | 174,680 | |||||||||
| 11,067 | JetBlue Airways Corp.* | 54,560 | |||||||||
| 3,273 | Joy Global, Inc. | 83,462 | |||||||||
| 3,653 | Kansas City Southern* | 55,708 | |||||||||
| 13,379 | KBR, Inc. | 208,980 | |||||||||
| 8,513 | Kelly Services, Inc., Class A | 96,708 | |||||||||
| 4,031 | Kennametal, Inc. | 82,434 | |||||||||
| 3,945 | L-3 Communications Holdings, Inc. | 300,412 | |||||||||
| 2,302 | Lennox International, Inc. | 73,411 | |||||||||
| 1,539 | Lincoln Electric Holdings, Inc. | 68,532 | |||||||||
| 11,432 | Lockheed Martin Corp. | 897,755 | |||||||||
| 16,629 | Manitowoc (The) Co., Inc. | 98,943 | |||||||||
| 7,729 | Manpower, Inc. | 333,043 | |||||||||
| 63,722 | Masco Corp. | 564,577 | |||||||||
| 6,564 | McDermott International, Inc.* | 105,943 | |||||||||
| 2,007 | Moog, Inc., Class A* | 53,747 | |||||||||
| 8,804 | MPS Group, Inc.* | 70,784 | |||||||||
| 1,570 | MSC Industrial Direct Co., Class A | 64,135 | |||||||||
| 3,229 | Mueller Industries, Inc. | 70,941 | |||||||||
| 21,496 | Mueller Water Products, Inc., Class B | 90,068 | |||||||||
See Notes to Financial Statements.
30
Schedule of Investments (Continued)
PowerShares FTSE RAFI US 1000 Portfolio
April 30, 2009
| Number of Shares | Value | ||||||||||
| Common Stocks and Other Equity Interests (Continued) | |||||||||||
| 4,653 | Navistar International Corp.* | $ | 175,883 | ||||||||
| 13,796 | Norfolk Southern Corp. | 492,241 | |||||||||
| 21,156 | Northrop Grumman Corp. | 1,022,893 | |||||||||
| 13,759 | Oshkosh Corp. | 132,086 | |||||||||
| 15,950 | Owens Corning, Inc.* | 285,505 | |||||||||
| 17,205 | PACCAR, Inc. | 609,745 | |||||||||
| 2,755 | Pall Corp. | 72,760 | |||||||||
| 7,399 | Parker Hannifin Corp. | 335,545 | |||||||||
| 3,978 | Pentair, Inc. | 105,974 | |||||||||
| 10,286 | Pitney Bowes, Inc. | 252,418 | |||||||||
| 2,469 | Precision Castparts Corp. | 184,829 | |||||||||
| 4,127 | Quanta Services, Inc.* | 93,807 | |||||||||
| 30,327 | R.R. Donnelley & Sons Co. | 353,310 | |||||||||
| 12,279 | Raytheon Co. | 555,379 | |||||||||
| 4,848 | Republic Services, Inc. | 101,808 | |||||||||
| 5,262 | Robert Half International, Inc. | 126,393 | |||||||||
| 7,478 | Rockwell Automation, Inc. | 236,230 | |||||||||
| 3,711 | Rockwell Collins, Inc. | 142,317 | |||||||||
| 1,387 | Roper Industries, Inc. | 63,233 | |||||||||
| 4,195 | RSC Holdings, Inc.* | 29,994 | |||||||||
| 6,264 | Ryder System, Inc. | 173,450 | |||||||||
| 20 | Seaboard Corp. | 18,700 | |||||||||
| 3,983 | Shaw Group (The), Inc.* | 133,550 | |||||||||
| 5,399 | SkyWest, Inc. | 65,004 | |||||||||
| 35,348 | Southwest Airlines Co. | 246,729 | |||||||||
| 8,245 | Spirit Aerosystems Holdings, Inc., Class A* | 105,124 | |||||||||
| 2,404 | SPX Corp. | 110,993 | |||||||||
| 13,885 | Steelcase, Inc., Class A | 62,899 | |||||||||
| 17,135 | Terex Corp.* | 236,463 | |||||||||
| 43,102 | Textron, Inc. | 462,484 | |||||||||
| 2,434 | Thomas & Betts Corp.* | 75,746 | |||||||||
| 8,687 | Timken (The) Co. | 139,687 | |||||||||
| 8,999 | Trinity Industries, Inc. | 131,475 | |||||||||
| 40,949 | Tyco International Ltd. (Switzerland) | 972,948 | |||||||||
| 55,206 | UAL Corp.* | 271,614 | |||||||||
| 16,710 | Union Pacific Corp. | 821,129 | |||||||||
| 29,339 | United Parcel Service, Inc., Class B | 1,535,603 | |||||||||
| 34,464 | United Rentals, Inc.* | 208,852 | |||||||||
| 3,407 | United Stationers, Inc.* | 111,511 | |||||||||
| 28,961 | United Technologies Corp. | 1,414,455 | |||||||||
| 4,072 | URS Corp.* | 179,412 | |||||||||
| 12,825 | US Airways Group, Inc.* | 48,607 | |||||||||
| 16,888 | USG Corp.* | 250,956 | |||||||||
| 3,593 | UTi Worldwide, Inc. (British Virgin Islands) | 48,362 | |||||||||
| 20,427 | Volt Information Sciences, Inc.* | 146,666 | |||||||||
| 2,116 | W.W. Grainger, Inc. | 177,490 | |||||||||
| 16,423 | Waste Management, Inc. | 438,001 | |||||||||
| 2,539 | Werner Enterprises, Inc. | 41,513 | |||||||||
| 5,643 | WESCO International, Inc.* | 146,718 | |||||||||
| 66,113 | YRC Worldwide, Inc.* | 200,322 | |||||||||
| 47,811,291 | |||||||||||
| Number of Shares | Value | ||||||||||
| Common Stocks and Other Equity Interests (Continued) | |||||||||||
| Information Technology—10.3% | |||||||||||
| 13,500 | Accenture Ltd., Class A (Bermuda) | $ | 397,305 | ||||||||
| 6,176 | ACI Worldwide, Inc.* | 106,660 | |||||||||
| 3,537 | Activision Blizzard, Inc.* | 38,093 | |||||||||
| 7,798 | Adobe Systems, Inc.* | 213,275 | |||||||||
| 62,953 | Advanced Micro Devices, Inc.* | 227,260 | |||||||||
| 3,464 | Affiliated Computer Services, Inc., Class A* | 167,588 | |||||||||
| 11,165 | Agilent Technologies, Inc.* | 203,873 | |||||||||
| 1,660 | Alliance Data Systems Corp.* | 69,504 | |||||||||
| 3,304 | Altera Corp. | 53,888 | |||||||||
| 30,214 | Amkor Technology, Inc.* | 130,222 | |||||||||
| 2,600 | Amphenol Corp., Class A | 87,984 | |||||||||
| 7,300 | Analog Devices, Inc. | 155,344 | |||||||||
| 2,604 | Anixter International, Inc.* | 103,587 | |||||||||
| 9,414 | Apple, Inc.* | 1,184,564 | |||||||||
| 37,732 | Applied Materials, Inc. | 460,708 | |||||||||
| 14,524 | Arrow Electronics, Inc.* | 330,276 | |||||||||
| 13,679 | Atmel Corp.* | 52,527 | |||||||||
| 3,960 | Autodesk, Inc.* | 78,962 | |||||||||
| 10,544 | Automatic Data Processing, Inc. | 371,149 | |||||||||
| 15,820 | Avnet, Inc.* | 346,300 | |||||||||
| 2,438 | AVX Corp. | 24,404 | |||||||||
| 6,147 | Benchmark Electronics, Inc.* | 74,563 | |||||||||
| 2,004 | BMC Software, Inc.* | 69,479 | |||||||||
| 8,406 | Brightpoint, Inc.* | 43,795 | |||||||||
| 7,650 | Broadcom Corp., Class A* | 177,404 | |||||||||
| 3,934 | Broadridge Financial Solutions, Inc. | 76,123 | |||||||||
| 17,404 | Brocade Communications Systems, Inc.* | 100,595 | |||||||||
| 6,672 | CA, Inc. | 115,092 | |||||||||
| 1,147 | CACI International, Inc., Class A* | 45,364 | |||||||||
| 18,452 | Cadence Design Systems, Inc.* | 102,962 | |||||||||
| 108,941 | Cisco Systems, Inc.* | 2,104,740 | |||||||||
| 3,223 | Citrix Systems, Inc.* | 91,952 | |||||||||
| 2,974 | Cognizant Technology Solutions Corp., Class A* | 73,725 | |||||||||
| 5,669 | CommScope, Inc.* | 142,292 | |||||||||
| 11,884 | Computer Sciences Corp.* | 439,233 | |||||||||
| 11,773 | Convergys Corp.* | 119,025 | |||||||||
| 34,468 | Corning, Inc. | 503,922 | |||||||||
| 112,171 | Dell, Inc.* | 1,303,427 | |||||||||
| 2,981 | Diebold, Inc. | 78,788 | |||||||||
| 2,030 | DST Systems, Inc.* | 73,425 | |||||||||
| 28,565 | eBay, Inc.* | 470,466 | |||||||||
| 8,925 | Electronic Arts, Inc.* | 181,624 | |||||||||
| 50,482 | EMC Corp.* | 632,539 | |||||||||
| 11,633 | Fairchild Semiconductor International, Inc.* | 71,659 | |||||||||
| 8,629 | Fidelity National Information Services, Inc. | 154,028 | |||||||||
| 4,396 | Fiserv, Inc.* | 164,059 | |||||||||
| 1,982 | Google, Inc., Class A* | 784,813 | |||||||||
| 2,754 | Harris Corp. | 84,217 | |||||||||
| 2,397 | Hewitt Associates, Inc., Class A* | 75,170 | |||||||||
See Notes to Financial Statements.
31
Schedule of Investments (Continued)
PowerShares FTSE RAFI US 1000 Portfolio
April 30, 2009
| Number of Shares | Value | ||||||||||
| Common Stocks and Other Equity Interests (Continued) | |||||||||||
| 70,519 | Hewlett-Packard Co. | $ | 2,537,274 | ||||||||
| 19,396 | IAC/InterActiveCorp* | 310,724 | |||||||||
| 11,196 | InfoSpace, Inc.* | 74,229 | |||||||||
| 28,960 | Ingram Micro, Inc., Class A* | 420,499 | |||||||||
| 23,953 | Insight Enterprises, Inc.* | 137,011 | |||||||||
| 167,211 | Intel Corp. | 2,638,591 | |||||||||
| 25,253 | International Business Machines Corp. | 2,606,362 | |||||||||
| 4,118 | International Rectifier Corp.* | 69,512 | |||||||||
| 5,000 | Intuit, Inc.* | 115,650 | |||||||||
| 39,496 | Jabil Circuit, Inc. | 319,918 | |||||||||
| 16,550 | JDS Uniphase Corp.* | 76,296 | |||||||||
| 12,373 | Juniper Networks, Inc.* | 267,875 | |||||||||
| 6,236 | KLA-Tencor Corp. | 172,987 | |||||||||
| 4,405 | Lam Research Corp.* | 122,811 | |||||||||
| 3,099 | Lender Processing Services, Inc. | 88,817 | |||||||||
| 6,805 | Lexmark International, Inc., Class A* | 133,514 | |||||||||
| 3,162 | Linear Technology Corp. | 68,868 | |||||||||
| 23,323 | LSI Corp.* | 89,560 | |||||||||
| 10,049 | Marvell Technology Group Ltd. (Bermuda)* | 110,338 | |||||||||
| 722 | Mastercard, Inc., Class A | 132,451 | |||||||||
| 2,160 | McAfee, Inc.* | 81,086 | |||||||||
| 4,877 | MEMC Electronic Materials, Inc.* | 79,007 | |||||||||
| 2,204 | Metavante Technologies, Inc.* | 51,992 | |||||||||
| 824 | Mettler Toledo International, Inc.* | 50,783 | |||||||||
| 4,004 | Microchip Technology, Inc. | 92,092 | |||||||||
| 82,791 | Micron Technology, Inc.* | 404,020 | |||||||||
| 273,601 | Microsoft Corp. | 5,543,157 | |||||||||
| 3,694 | Molex, Inc. | 61,579 | |||||||||
| 2,999 | Molex, Inc., Class A | 45,855 | |||||||||
| 224,090 | Motorola, Inc. | 1,239,218 | |||||||||
| 5,767 | National Semiconductor Corp. | 71,338 | |||||||||
| 15,683 | NCR Corp.* | 159,182 | |||||||||
| 5,970 | NetApp, Inc.* | 109,251 | |||||||||
| 4,900 | Novellus Systems, Inc.* | 88,494 | |||||||||
| 12,909 | NVIDIA Corp.* | 148,195 | |||||||||
| 64,422 | Oracle Corp. | 1,245,921 | |||||||||
| 6,097 | Paychex, Inc. | 164,680 | |||||||||
| 3,944 | Perot Systems Corp., Class A* | 55,453 | |||||||||
| 19,184 | QUALCOMM, Inc. | 811,867 | |||||||||
| 9,397 | SAIC, Inc.* | 170,086 | |||||||||
| 16,994 | SanDisk Corp.* | 267,146 | |||||||||
| 569,497 | Sanmina-SCI Corp.* | 318,918 | |||||||||
| 61,105 | Seagate Technology (Cayman Islands) | 498,617 | |||||||||
| 64,092 | Sun Microsystems, Inc.* | 587,083 | |||||||||
| 23,130 | Symantec Corp.* | 398,993 | |||||||||
| 1,949 | SYNNEX Corp.* | 41,962 | |||||||||
| 2,987 | Synopsys, Inc.* | 65,057 | |||||||||
| 16,677 | Tech Data Corp.* | 480,131 | |||||||||
| 18,543 | Tellabs, Inc.* | 97,165 | |||||||||
| 3,312 | Teradata Corp.* | 55,377 | |||||||||
| 10,788 | Teradyne, Inc.* | 64,081 | |||||||||
| Number of Shares | Value | ||||||||||
| Common Stocks and Other Equity Interests (Continued) | |||||||||||
| 35,930 | Texas Instruments, Inc. | $ | 648,896 | ||||||||
| 7,448 | Total System Services, Inc. | 92,877 | |||||||||
| 43,598 | Tyco Electronics Ltd. | 760,349 | |||||||||
| 3,616 | VeriSign, Inc.* | 74,417 | |||||||||
| 8,291 | Visa, Inc., FST | 538,583 | |||||||||
| 45,154 | Vishay Intertechnology, Inc.* | 265,054 | |||||||||
| 2,506 | VMware, Inc., Class A* | 65,356 | |||||||||
| 10,849 | Western Digital Corp.* | 255,168 | |||||||||
| 9,791 | Western Union (The) Co. | 163,999 | |||||||||
| 6,058 | Wright Express Corp.* | 138,607 | |||||||||
| 67,216 | Xerox Corp. | 410,690 | |||||||||
| 4,952 | Xilinx, Inc. | 101,219 | |||||||||
| 20,663 | Yahoo!, Inc.* | 295,274 | |||||||||
| 41,009,516 | |||||||||||
| Materials—4.7% | |||||||||||
| 6,851 | Air Products & Chemicals, Inc. | 451,481 | |||||||||
| 1,717 | Airgas, Inc. | 74,037 | |||||||||
| 20,899 | AK Steel Holding Corp. | 271,896 | |||||||||
| 2,203 | Albemarle Corp. | 59,084 | |||||||||
| 140,672 | Alcoa, Inc. | 1,275,895 | |||||||||
| 5,863 | Allegheny Technologies, Inc. | 191,896 | |||||||||
| 31,549 | Ashland, Inc. | 692,816 | |||||||||
| 3,047 | Ball Corp. | 114,933 | |||||||||
| 4,960 | Bemis Co., Inc. | 119,238 | |||||||||
| 112,198 | Boise, Inc.* | 96,490 | |||||||||
| 6,179 | Cabot Corp. | 90,213 | |||||||||
| 12,383 | Celanese Corp., Series A | 258,062 | |||||||||
| 755 | CF Industries Holdings, Inc. | 54,398 | |||||||||
| 3,132 | Cliffs Natural Resources, Inc. | 72,224 | |||||||||
| 11,719 | Commercial Metals Co. | 174,379 | |||||||||
| 6,357 | Crown Holdings, Inc.* | 140,172 | |||||||||
| 3,111 | Cytec Industries, Inc. | 61,784 | |||||||||
| 232,894 | Domtar Corp.* | 423,867 | |||||||||
| 180,773 | Dow Chemical (The) Co. | 2,892,369 | |||||||||
| 48,720 | E.I. du Pont de Nemours & Co. | 1,359,288 | |||||||||
| 6,582 | Eastman Chemical Co. | 261,174 | |||||||||
| 4,140 | Ecolab, Inc. | 159,597 | |||||||||
| 1,504 | FMC Corp. | 73,290 | |||||||||
| 16,175 | Freeport-McMoRan Copper & Gold, Inc. | 689,864 | |||||||||
| 18,431 | Graphic Packaging Holding Co.* | 31,701 | |||||||||
| 2,040 | Greif, Inc., Class A | 92,351 | |||||||||
| 50,330 | Huntsman Corp. | 269,769 | |||||||||
| 2,452 | International Flavors & Fragrances, Inc. | 76,502 | |||||||||
| 92,682 | International Paper Co. | 1,173,354 | |||||||||
| 50,461 | Louisiana-Pacific Corp. | 205,376 | |||||||||
| 3,571 | Lubrizol (The) Corp. | 154,339 | |||||||||
| 826 | Martin Marietta Materials, Inc. | 69,409 | |||||||||
| 19,306 | MeadWestvaco Corp. | 302,332 | |||||||||
| 4,756 | Monsanto Co. | 403,737 | |||||||||
| 2,667 | Mosaic (The) Co. | 107,880 | |||||||||
See Notes to Financial Statements.
32
Schedule of Investments (Continued)
PowerShares FTSE RAFI US 1000 Portfolio
April 30, 2009
| Number of Shares | Value | ||||||||||
| Common Stocks and Other Equity Interests (Continued) | |||||||||||
| 8,678 | Nalco Holding Co. | $ | 141,625 | ||||||||
| 6,868 | Newmont Mining Corp. | 276,368 | |||||||||
| 14,342 | Nucor Corp. | 583,576 | |||||||||
| 4,766 | Olin Corp. | 60,052 | |||||||||
| 9,104 | Owens-Illinois, Inc.* | 222,047 | |||||||||
| 4,401 | Packaging Corp. of America | 69,844 | |||||||||
| 5,311 | Pactiv Corp.* | 116,098 | |||||||||
| 28,749 | PolyOne Corp.* | 78,772 | |||||||||
| 7,845 | PPG Industries, Inc. | 345,572 | |||||||||
| 5,702 | Praxair, Inc. | 425,426 | |||||||||
| 3,911 | Reliance Steel & Aluminum Co. | 137,785 | |||||||||
| 10,412 | Rockwood Holdings, Inc.* | 128,068 | |||||||||
| 7,253 | RPM International, Inc. | 100,236 | |||||||||
| 2,334 | Scotts Miracle-Gro (The) Co., Class A | 78,819 | |||||||||
| 9,740 | Sealed Air Corp. | 185,644 | |||||||||
| 2,007 | Sigma-Aldrich Corp. | 87,987 | |||||||||
| 763 | Silgan Holdings, Inc. | 35,472 | |||||||||
| 4,962 | Sonoco Products Co. | 121,122 | |||||||||
| 9,551 | Southern Copper Corp. | 177,362 | |||||||||
| 9,439 | Steel Dynamics, Inc. | 117,516 | |||||||||
| 32,291 | Temple-Inland, Inc. | 385,555 | |||||||||
| 1,904 | Terra Industries, Inc. | 50,456 | |||||||||
| 17,278 | United States Steel Corp. | 458,731 | |||||||||
| 4,523 | Valspar (The) Corp. | 108,552 | |||||||||
| 3,566 | Vulcan Materials Co. | 169,563 | |||||||||
| 1,332 | Westlake Chemical Corp. | 24,908 | |||||||||
| 22,229 | Weyerhaeuser Co. | 783,795 | |||||||||
| 7,739 | Worthington Industries, Inc. | 115,311 | |||||||||
| 18,531,459 | |||||||||||
| Telecommunication Services—3.4% | |||||||||||
| 3,741 | American Tower Corp., Class A* | 118,814 | |||||||||
| 211,227 | AT&T, Inc. | 5,411,636 | |||||||||
| 5,260 | CenturyTel, Inc. | 142,809 | |||||||||
| 3,986 | Crown Castle International Corp.* | 97,737 | |||||||||
| 7,205 | Embarq Corp. | 263,415 | |||||||||
| 29,526 | Frontier Communications Corp. | 209,930 | |||||||||
| 41,971 | Ibasis, Inc.* | 44,070 | |||||||||
| 6,379 | iPCS, Inc.* | 92,623 | |||||||||
| 1,662 | Leap Wireless International, Inc.* | 59,948 | |||||||||
| 123,092 | Level 3 Communications, Inc.* | 137,863 | |||||||||
| 4,222 | MetroPCS Communications, Inc.* | 72,154 | |||||||||
| 1,970 | Millicom International Cellular S.A. (Luxembourg) | 95,466 | |||||||||
| 7,615 | NII Holdings, Inc.* | 123,058 | |||||||||
| 103,372 | Qwest Communications International, Inc. | 402,117 | |||||||||
| 353,355 | Sprint Nextel Corp.* | 1,540,628 | |||||||||
| 5,218 | Telephone & Data Systems, Inc. | 149,600 | |||||||||
| 3,217 | US Cellular Corp.* | 109,378 | |||||||||
| 137,103 | Verizon Communications, Inc. | 4,159,705 | |||||||||
| 18,006 | Windstream Corp. | 149,450 | |||||||||
| 13,380,401 | |||||||||||
| Number of Shares | Value | ||||||||||
| Common Stocks and Other Equity Interests (Continued) | |||||||||||
| Utilities—3.9% | |||||||||||
| 67,669 | AES (The) Corp.* | $ | 478,420 | ||||||||
| 3,308 | AGL Resources, Inc. | 103,110 | |||||||||
| 4,446 | Allegheny Energy, Inc. | 115,240 | |||||||||
| 5,770 | Alliant Energy Corp. | 129,017 | |||||||||
| 15,479 | Ameren Corp. | 356,327 | |||||||||
| 16,721 | American Electric Power Co., Inc. | 441,100 | |||||||||
| 3,424 | American Water Works CO. | 61,632 | |||||||||
| 2,379 | Aqua America, Inc. | 43,655 | |||||||||
| 5,819 | Atmos Energy Corp. | 143,787 | |||||||||
| 2,506 | Black Hills Corp. | 49,819 | |||||||||
| 5,844 | Calpine Corporation* | 47,395 | |||||||||
| 21,889 | Centerpoint Energy, Inc. | 232,899 | |||||||||
| 12,745 | CMS Energy Corp. | 153,195 | |||||||||
| 9,986 | Consolidated Edison, Inc. | 370,780 | |||||||||
| 18,069 | Constellation Energy Group, Inc. | 435,102 | |||||||||
| 17,726 | Dominion Resources, Inc. | 534,616 | |||||||||
| 2,834 | DPL, Inc. | 63,567 | |||||||||
| 12,002 | DTE Energy Co. | 354,899 | |||||||||
| 72,197 | Duke Energy Corp. | 997,040 | |||||||||
| 108,587 | Dynegy, Inc., Class A* | 193,285 | |||||||||
| 16,783 | Edison International | 478,483 | |||||||||
| 1,762 | Energen Corp. | 63,643 | |||||||||
| 6,678 | Entergy Corp. | 432,534 | |||||||||
| 1,968 | EQT Corp. | 66,184 | |||||||||
| 15,758 | Exelon Corp. | 726,916 | |||||||||
| 13,396 | FirstEnergy Corp. | 547,896 | |||||||||
| 12,647 | FPL Group, Inc. | 680,281 | |||||||||
| 7,403 | Great Plains Energy, Inc. | 107,121 | |||||||||
| 5,865 | Hawaiian Electric Industries, Inc. | 91,142 | |||||||||
| 2,072 | IDACORP, Inc. | 49,666 | |||||||||
| 6,125 | Integrys Energy Group, Inc. | 161,761 | |||||||||
| 8,189 | MDU Resources Group, Inc. | 143,881 | |||||||||
| 13,919 | Mirant Corp.* | 177,189 | |||||||||
| 3,071 | National Fuel Gas Co. | 100,452 | |||||||||
| 1,689 | New Jersey Resources Corp. | 55,602 | |||||||||
| 2,481 | Nicor, Inc. | 79,739 | |||||||||
| 31,346 | NiSource, Inc. | 344,493 | |||||||||
| 8,006 | Northeast Utilities | 168,286 | |||||||||
| 11,461 | NRG Energy, Inc.* | 206,069 | |||||||||
| 2,960 | NSTAR | 92,974 | |||||||||
| 11,532 | NV Energy, Inc. | 118,203 | |||||||||
| 5,612 | OGE Energy Corp. | 144,285 | |||||||||
| 8,022 | ONEOK, Inc. | 209,936 | |||||||||
| 15,299 | Pepco Holdings, Inc. | 182,823 | |||||||||
| 13,708 | PG&E Corp. | 508,841 | |||||||||
| 2,483 | Piedmont Natural Gas Co., Inc. | 60,635 | |||||||||
| 6,552 | Pinnacle West Capital Corp. | 179,394 | |||||||||
| 8,919 | PNM Resources, Inc. | 75,990 | |||||||||
| 5,279 | Portland General Electric Co. | 96,447 | |||||||||
| 11,876 | PPL Corp. | 355,211 | |||||||||
See Notes to Financial Statements.
33
Schedule of Investments (Continued)
PowerShares FTSE RAFI US 1000 Portfolio
April 30, 2009
| Number of Shares | Value | ||||||||||
| Common Stocks and Other Equity Interests (Continued) | |||||||||||
| 13,941 | Progress Energy, Inc. | $ | 475,667 | ||||||||
| 17,955 | Public Service Enterprise Group, Inc. | 535,777 | |||||||||
| 4,096 | Questar Corp. | 121,733 | |||||||||
| 69,097 | Reliant Energy, Inc.* | 342,721 | |||||||||
| 5,750 | SCANA Corp. | 173,765 | |||||||||
| 9,137 | Sempra Energy | 420,485 | |||||||||
| 19,129 | Southern Co. | 552,446 | |||||||||
| 2,736 | Southwest Gas Corp. | 55,295 | |||||||||
| 13,308 | TECO Energy, Inc. | 140,932 | |||||||||
| 4,708 | UGI Corp. | 108,002 | |||||||||
| 1,871 | Unisource Energy Corp. | 49,245 | |||||||||
| 3,608 | Vectren Corp. | 79,989 | |||||||||
| 4,968 | Westar Energy, Inc. | 87,089 | |||||||||
| 2,247 | WGL Holdings, Inc. | 69,972 | |||||||||
| 3,725 | Wisconsin Energy Corp. | 148,851 | |||||||||
| 15,831 | Xcel Energy, Inc. | 291,924 | |||||||||
| 15,664,855 | |||||||||||
| Total Investments (Cost $638,866,980)—100.0% | 396,550,934 | ||||||||||
| Liabilities in excess of other assets—(0.0%) | (108,401 | ) | |||||||||
| Net Assets—100.0% | $ | 396,442,533 | |||||||||
REIT Real Estate Investment Trust
* Non-income producing security.
(-) Affiliated company. The Fund's Adviser is a subsidiary of Invesco Ltd. and therefore, Invesco Ltd. is considered to be affiliated with the Fund. See Note 4.
See Notes to Financial Statements.
34
Schedule of Investments
PowerShares NXQ Portfolio
April 30, 2009
| Number of Shares | Value | ||||||||||
| Common Stocks and Other Equity Interests—100.1% | |||||||||||
| Consumer Discretionary—18.7% | |||||||||||
| 1,286 | Career Education Corp.* | $ | 28,343 | ||||||||
| 2,015 | Discovery Communications, Inc., Class C* | 35,303 | |||||||||
| 1,299 | Dollar Tree, Inc.* | 55,000 | |||||||||
| 2,005 | LKQ Corp.* | 34,045 | |||||||||
| 841 | Netflix, Inc.* | 38,106 | |||||||||
| 1,822 | PetSmart, Inc. | 41,687 | |||||||||
| 587 | priceline.com, Inc.* | 56,992 | |||||||||
| 202 | Strayer Education, Inc. | 38,261 | |||||||||
| 327,737 | |||||||||||
| Health Care—35.8% | |||||||||||
| 1,171 | Alexion Pharmaceuticals, Inc.* | 39,135 | |||||||||
| 1,432 | BioMarin Pharmaceutical, Inc.* | 18,416 | |||||||||
| 1,151 | Cerner Corp.* | 61,923 | |||||||||
| 1,672 | Endo Pharmaceuticals Holdings, Inc.* | 27,655 | |||||||||
| 750 | Gen-Probe, Inc.* | 36,120 | |||||||||
| 847 | IDEXX Laboratories, Inc.* | 33,287 | |||||||||
| 1,008 | Immucor, Inc.* | 16,420 | |||||||||
| 1,066 | Lincare Holdings, Inc.* | 25,723 | |||||||||
| 4,367 | Mylan, Inc.* | 57,863 | |||||||||
| 1,342 | Myriad Genetics, Inc.* | 52,056 | |||||||||
| 813 | Onyx Pharmaceuticals, Inc.* | 21,057 | |||||||||
| 830 | OSI Pharmaceuticals, Inc.* | 27,863 | |||||||||
| 1,321 | Perrigo Co. | 34,240 | |||||||||
| 2,827 | Qiagen N.V. (Netherlands)* | 46,589 | |||||||||
| 1,565 | Sepracor, Inc.* | 22,239 | |||||||||
| 790 | Shire PLC ADR | 29,443 | |||||||||
| 537 | Techne Corp. | 30,727 | |||||||||
| 808 | Thoratec Corp.* | 23,480 | |||||||||
| 379 | United Therapeutics Corp.* | 23,805 | |||||||||
| 628,041 | |||||||||||
| Industrials—5.2% | |||||||||||
| 1,199 | Copart, Inc.* | 37,636 | |||||||||
| 741 | Landstar System, Inc. | 26,387 | |||||||||
| 609 | Lincoln Electric Holdings, Inc. | 27,119 | |||||||||
| 91,142 | |||||||||||
| Information Technology—30.6% | |||||||||||
| 1,282 | Ansys, Inc.* | 35,409 | |||||||||
| 1,961 | ASML Holding N.V. (Netherlands) | 41,475 | |||||||||
| 1,268 | Cree, Inc.* | 34,731 | |||||||||
| 541 | Equinix, Inc.* | 37,994 | |||||||||
| 1,138 | F5 Networks, Inc.* | 31,033 | |||||||||
| 527 | Itron, Inc.* | 24,242 | |||||||||
| 1,111 | National Instruments Corp. | 24,486 | |||||||||
| 3,772 | Nuance Communications, Inc.* | 50,356 | |||||||||
| 5,902 | ON Semiconductor Corp.* | 31,989 | |||||||||
| 744 | Open Text Corp. (Canada)* | 24,426 | |||||||||
| 3,241 | SanDisk Corp.* | 50,949 | |||||||||
| 2,035 | Synopsys, Inc.* | 44,322 | |||||||||
| Number of Shares | Value | ||||||||||
| Common Stocks and Other Equity Interests (Continued) | |||||||||||
| 4,726 | Telefonaktiebolaget LM Ericsson ADR (Sweden) | $ | 40,313 | ||||||||
| 5,670 | Tellabs, Inc.* | 29,711 | |||||||||
| 1,707 | Trimble Navigation Ltd.* | 36,598 | |||||||||
| 538,034 | |||||||||||
| Materials—3.8% | |||||||||||
| 867 | Randgold Resources Ltd. ADR (Channel Islands) | 41,963 | |||||||||
| 545 | Silgan Holdings, Inc. | 25,337 | |||||||||
| 67,300 | |||||||||||
| Telecommunication Services—6.0% | |||||||||||
| 1,000 | Leap Wireless International, Inc.* | 36,070 | |||||||||
| 23,234 | Level 3 Communications, Inc.* | 26,022 | |||||||||
| 1,695 | SBA Communications Corp., Class A* | 42,714 | |||||||||
| 104,806 | |||||||||||
| Total Investments (Cost $1,890,904)—100.1% | 1,757,060 | ||||||||||
| Liabilities in excess of other assets—(0.1%) | (2,197 | ) | |||||||||
| Net Assets—100.0% | $ | 1,754,863 | |||||||||
ADR American Depositary Receipt
* Non-income producing security.
See Notes to Financial Statements.
35
Statements of Assets and Liabilities
April 30, 2009
| PowerShares Dynamic MagniQuant Portfolio | PowerShares Dynamic Market Portfolio | PowerShares Dynamic OTC Portfolio | PowerShares FTSE RAFI US 1000 Portfolio | PowerShares NXQ Portfolio | |||||||||||||||||||
| ASSETS: | |||||||||||||||||||||||
| Unaffiliated investments at value | $ | 28,701,432 | $ | 260,869,424 | $ | 39,433,000 | $ | 392,220,075 | $ | 1,757,060 | |||||||||||||
| Affiliated investments at value (Note 4) | — | — | — | 4,330,859 | — | ||||||||||||||||||
| Receivables: | |||||||||||||||||||||||
| Dividends | 10,355 | 169,043 | 16,145 | 451,376 | 1,099 | ||||||||||||||||||
| Expense waivers | 6,334 | — | 8,491 | — | — | ||||||||||||||||||
| Investments sold | — | 4,706,563 | — | 3,458,722 | — | ||||||||||||||||||
| Total Assets | 28,718,121 | 265,745,030 | 39,457,636 | 400,461,032 | 1,758,159 | ||||||||||||||||||
| LIABILITIES: | |||||||||||||||||||||||
| Due to custodian | 8,787 | 52 | 2 | 254,635 | 2,318 | ||||||||||||||||||
| Payables: | |||||||||||||||||||||||
| Shares repurchased | — | 4,713,608 | — | 3,477,566 | — | ||||||||||||||||||
| Expense recapture | — | — | — | 53,114 | — | ||||||||||||||||||
| Accrued advisory fees | 11,355 | 148,087 | 15,956 | 88,866 | 978 | ||||||||||||||||||
| Accrued expenses | 46,766 | 103,855 | 48,208 | 144,318 | — | ||||||||||||||||||
| Total Liabilities | 66,908 | 4,965,602 | 64,166 | 4,018,499 | 3,296 | ||||||||||||||||||
| NET ASSETS | $ | 28,651,213 | $ | 260,779,428 | $ | 39,393,470 | $ | 396,442,533 | $ | 1,754,863 | |||||||||||||
| NET ASSETS CONSIST OF: | |||||||||||||||||||||||
| Shares of beneficial interest | $ | 49,093,822 | $ | 568,970,704 | $ | 111,596,692 | $ | 717,033,743 | $ | 2,810,255 | |||||||||||||
| Undistributed net investment income | 22,335 | 357,733 | 52,820 | 1,625,836 | — | ||||||||||||||||||
| Accumulated net realized loss on investments | (23,117,527 | ) | (324,622,021 | ) | (74,290,474 | ) | (79,901,000 | ) | (921,548 | ) | |||||||||||||
| Net unrealized appreciation (depreciation) on investments | 2,652,583 | 16,073,012 | 2,034,432 | (242,316,046 | ) | (133,844 | ) | ||||||||||||||||
| Net Assets | $ | 28,651,213 | $ | 260,779,428 | $ | 39,393,470 | $ | 396,442,533 | $ | 1,754,863 | |||||||||||||
| Shares outstanding (unlimited amount authorized, $0.01 par value) | 1,700,000 | 8,300,000 | 1,200,000 | 11,400,000 | 100,000 | ||||||||||||||||||
| Net asset value | $ | 16.85 | $ | 31.42 | $ | 32.83 | $ | 34.78 | $ | 17.55 | |||||||||||||
| Share price | $ | 16.84 | $ | 31.41 | $ | 32.83 | $ | 34.78 | $ | 17.52 | |||||||||||||
| Unaffiliated investments at cost | $ | 26,048,849 | $ | 244,796,412 | $ | 37,398,568 | $ | 635,205,464 | $ | 1,890,904 | |||||||||||||
| Affiliated investments at cost | $ | — | $ | — | $ | — | $ | 3,661,516 | $ | — | |||||||||||||
See Notes to Financial Statements.
36
Statements of Operations
Year Ended April 30, 2009
| PowerShares Dynamic MagniQuant Portfolio | PowerShares Dynamic Market Portfolio | PowerShares Dynamic OTC Portfolio | PowerShares FTSE RAFI US 1000 Portfolio | PowerShares NXQ Portfolio | |||||||||||||||||||
| INVESTMENT INCOME: | |||||||||||||||||||||||
| Dividend income | $ | 581,582 | $ | 7,762,427 | $ | 436,521 | $ | 15,994,133 | $ | 9,861 | |||||||||||||
| Foreign withholding taxes | — | — | — | (2,284 | ) | (715 | ) | ||||||||||||||||
| Total Income | 581,582 | 7,762,427 | 436,521 | 15,991,849 | 9,146 | ||||||||||||||||||
| EXPENSES: | |||||||||||||||||||||||
| Advisory fees | 215,277 | 2,059,695 | 323,262 | 2,344,410 | 15,955 | ||||||||||||||||||
| Accounting & Administration fees | 74,983 | 119,396 | 74,983 | 158,102 | — | ||||||||||||||||||
| Professional fees | 26,185 | 48,242 | 27,412 | 48,125 | — | ||||||||||||||||||
| Custodian & transfer agent fees | 21,964 | 30,745 | 12,248 | 84,029 | — | ||||||||||||||||||
| Sub-licensing | 21,528 | 123,581 | 19,396 | 528,707 | — | ||||||||||||||||||
| Trustees | 5,427 | 20,348 | 6,499 | 25,651 | — | ||||||||||||||||||
| Other expenses | 10,471 | 77,442 | 17,468 | 81,525 | — | ||||||||||||||||||
| Total Expenses | 375,835 | 2,479,449 | 481,268 | 3,270,549 | 15,955 | ||||||||||||||||||
| (Waivers) and/or Recapture | (95,976 | ) | (7,816 | ) | (97,567 | ) | (98,922 | ) | — | ||||||||||||||
| Net Expenses | 279,859 | 2,471,633 | 383,701 | 3,171,627 | 15,955 | ||||||||||||||||||
| Net Investment Income (Loss) | 301,723 | 5,290,794 | 52,820 | 12,820,222 | (6,809 | ) | |||||||||||||||||
| REALIZED AND UNREALIZED GAIN (LOSS) ON INVESTMENTS: | |||||||||||||||||||||||
| Net realized gain (loss) from: | |||||||||||||||||||||||
| Investments | (11,729,490 | ) | (141,399,882 | ) | (19,090,781 | ) | (87,086,443 | ) | (907,460 | ) | |||||||||||||
| In-kind redemptions | (9,868,346 | ) | (75,780,611 | ) | (10,454,724 | ) | (45,261,321 | ) | 224,470 | ||||||||||||||
| Net realized loss | (21,597,836 | ) | (217,180,493 | ) | (29,545,505 | ) | (132,347,764 | ) | (682,990 | ) | |||||||||||||
| Net change in unrealized appreciation (depreciation) on investments | 3,017,483 | 15,906,229 | 2,948,627 | (160,948,517 | ) | (262,500 | ) | ||||||||||||||||
| Net realized and unrealized loss on investments | (18,580,353 | ) | (201,274,264 | ) | (26,596,878 | ) | (293,296,281 | ) | (945,490 | ) | |||||||||||||
| Net decrease in net assets resulting from operations | $ | (18,278,630 | ) | $ | (195,983,470 | ) | $ | (26,544,058 | ) | $ | (280,476,059 | ) | $ | (952,299 | ) | ||||||||
See Notes to Financial Statements.
37
Statements of Changes in Net Assets
| PowerShares Dynamic MagniQuant Portfolio | PowerShares Dynamic Market Portfolio | PowerShares Dynamic OTC Portfolio | |||||||||||||||||||||||||
| Year Ended April 30, 2009 | Year Ended April 30, 2008 | Year Ended April 30, 2009 | Year Ended April 30, 2008 | Year Ended April 30, 2009 | Year Ended April 30, 2008 | ||||||||||||||||||||||
| OPERATIONS: | |||||||||||||||||||||||||||
| Net investment income (loss) | $ | 301,723 | $ | 443,928 | $ | 5,290,794 | $ | 5,856,571 | $ | 52,820 | $ | (287,512 | ) | ||||||||||||||
| Net realized gain (loss) on investments | (21,597,836 | ) | (5,766,254 | ) | (217,180,493 | ) | (12,424,307 | ) | (29,545,505 | ) | (8,886,691 | ) | |||||||||||||||
| Net change in unrealized appreciation (depreciation) on investments | 3,017,483 | (3,680,252 | ) | 15,906,229 | (71,794,455 | ) | 2,948,627 | (11,624,860 | ) | ||||||||||||||||||
| Net increase (decrease) in net assets resulting from operations | (18,278,630 | ) | (9,002,578 | ) | (195,983,470 | ) | (78,362,191 | ) | (26,544,058 | ) | (20,799,063 | ) | |||||||||||||||
| Undistributed net investment income (loss) included in the price of units issued and redeemed | (14,018 | ) | 7,967 | (90,167 | ) | (101,862 | ) | (30,940 | ) | (18,011 | ) | ||||||||||||||||
| DISTRIBUTIONS TO SHAREHOLDERS FROM: | |||||||||||||||||||||||||||
| Net investment income | (279,388 | ) | (640,462 | ) | (5,193,546 | ) | (7,990,684 | ) | — | — | |||||||||||||||||
| Return of capital | — | (18,785 | ) | — | — | — | (137,064 | ) | |||||||||||||||||||
| Total distributions | (279,388 | ) | (659,247 | ) | (5,193,546 | ) | (7,990,684 | ) | — | (137,064 | ) | ||||||||||||||||
| SHAREHOLDER TRANSACTIONS: | |||||||||||||||||||||||||||
| Proceeds from shares sold | 58,065,641 | 132,508,418 | 419,971,271 | 1,125,461,970 | 117,636,471 | 238,637,254 | |||||||||||||||||||||
| Value of shares repurchased | (73,556,808 | ) | (141,415,198 | ) | (578,717,396 | ) | (1,391,511,138 | ) | (147,885,491 | ) | (281,113,524 | ) | |||||||||||||||
| Net income equalization | 14,018 | (7,967 | ) | 90,167 | 101,862 | 30,940 | 18,011 | ||||||||||||||||||||
| Net increase (decrease) in net assets resulting from shares transactions | (15,477,149 | ) | (8,914,747 | ) | (158,655,958 | ) | (265,947,306 | ) | (30,218,080 | ) | (42,458,259 | ) | |||||||||||||||
| Increase (Decrease) in Net Assets | (34,049,185 | ) | (18,568,605 | ) | (359,923,141 | ) | (352,402,043 | ) | (56,793,078 | ) | (63,412,397 | ) | |||||||||||||||
| NET ASSETS: | |||||||||||||||||||||||||||
| Beginning of period | 62,700,398 | 81,269,003 | 620,702,569 | 973,104,612 | 96,186,548 | 159,598,945 | |||||||||||||||||||||
| End of period | $ | 28,651,213 | $ | 62,700,398 | $ | 260,779,428 | $ | 620,702,569 | $ | 39,393,470 | $ | 96,186,548 | |||||||||||||||
| Undistributed net investment income at end of period | $ | 22,335 | $ | — | $ | 357,733 | $ | 260,485 | $ | 52,820 | $ | — | |||||||||||||||
| CHANGES IN SHARES OUTSTANDING: | |||||||||||||||||||||||||||
| Shares sold | 2,700,000 | 4,900,000 | 11,050,000 | 21,800,000 | 2,800,000 | 4,550,000 | |||||||||||||||||||||
| Shares repurchased | (3,500,000 | ) | (5,300,000 | ) | (15,650,000 | ) | (27,150,000 | ) | (3,650,000 | ) | (5,400,000 | ) | |||||||||||||||
| Shares outstanding, beginning of period | 2,500,000 | 2,900,000 | 12,900,000 | 18,250,000 | 2,050,000 | 2,900,000 | |||||||||||||||||||||
| Shares outstanding, end of period | 1,700,000 | 2,500,000 | 8,300,000 | 12,900,000 | 1,200,000 | 2,050,000 | |||||||||||||||||||||
* Commencement of Investment Operations.
See Notes to Financial Statements.
38
| PowerShares FTSE RAFI US 1000 Portfolio | PowerShares NXQ Portfolio | ||||||||||||||||||
| Year Ended April 30, 2009 | Year Ended April 30, 2008 | Year Ended April 30, 2009 | For the Period April 3, 2008* Through April 30, 2008 | ||||||||||||||||
| OPERATIONS: | |||||||||||||||||||
| Net investment income (loss) | $ | 12,820,222 | $ | 15,941,352 | $ | (6,809 | ) | $ | 2,563 | ||||||||||
| Net realized gain (loss) on investments | (132,347,764 | ) | 36,188,060 | (682,990 | ) | 72,103 | |||||||||||||
| Net change in unrealized appreciation (depreciation) on investments | (160,948,517 | ) | (145,734,972 | ) | (262,500 | ) | 128,656 | ||||||||||||
| Net increase (decrease) in net assets resulting from operations | (280,476,059 | ) | (93,605,560 | ) | (952,299 | ) | 203,322 | ||||||||||||
| Undistributed net investment income (loss) included in the price of units issued and redeemed | (915,463 | ) | (721,388 | ) | 16 | (1,245 | ) | ||||||||||||
| DISTRIBUTIONS TO SHAREHOLDERS FROM: | |||||||||||||||||||
| Net investment income | (15,035,089 | ) | (13,733,870 | ) | (2,563 | ) | — | ||||||||||||
| Return of capital | — | — | (2,563 | ) | — | ||||||||||||||
| Total distributions | (15,035,089 | ) | (13,733,870 | ) | (5,126 | ) | — | ||||||||||||
| SHAREHOLDER TRANSACTIONS: | |||||||||||||||||||
| Proceeds from shares sold | 115,318,454 | 359,656,795 | 16,268,388 | 5,205,900 | |||||||||||||||
| Value of shares repurchased | (300,328,510 | ) | (430,542,238 | ) | (16,314,218 | ) | (2,651,104 | ) | |||||||||||
| Net income equalization | 915,463 | 721,388 | (16 | ) | 1,245 | ||||||||||||||
| Net increase (decrease) in net assets resulting from shares transactions | (184,094,593 | ) | (70,164,055 | ) | (45,846 | ) | 2,556,041 | ||||||||||||
| Increase (Decrease) in Net Assets | (480,521,204 | ) | (178,224,873 | ) | (1,003,255 | ) | 2,758,118 | ||||||||||||
| NET ASSETS: | |||||||||||||||||||
| Beginning of period | 876,963,737 | 1,055,188,610 | 2,758,118 | — | |||||||||||||||
| End of period | $ | 396,442,533 | $ | 876,963,737 | $ | 1,754,863 | $ | 2,758,118 | |||||||||||
| Undistributed net investment income at end of period | $ | 1,625,836 | $ | 3,869,539 | $ | — | $ | 2,563 | |||||||||||
| CHANGES IN SHARES OUTSTANDING: | |||||||||||||||||||
| Shares sold | 3,500,000 | 6,000,000 | 600,000 | 200,000 | |||||||||||||||
| Shares repurchased | (8,000,000 | ) | (7,400,000 | ) | (600,000 | ) | (100,000 | ) | |||||||||||
| Shares outstanding, beginning of period | 15,900,000 | 17,300,000 | 100,000 | — | |||||||||||||||
| Shares outstanding, end of period | 11,400,000 | 15,900,000 | 100,000 | 100,000 | |||||||||||||||
39
Financial Highlights
PowerShares Dynamic MagniQuant Portfolio
| Year Ended April 30, | For the Period October 12, 2006* Through | ||||||||||||||
| 2009 | 2008 | April 30, 2007 | |||||||||||||
| PER SHARE OPERATING PERFORMANCE: | |||||||||||||||
| Net asset value at beginning of period | $ | 25.08 | $ | 28.02 | $ | 25.37 | |||||||||
| Net investment income** | 0.14 | 0.14 | 0.15 | ||||||||||||
| Net realized and unrealized gain (loss) on investments | (8.24 | ) | (2.87 | ) | 2.55 | ||||||||||
| Total from investment operations | (8.10 | ) | (2.73 | ) | 2.70 | ||||||||||
| Distributions to shareholders from: | |||||||||||||||
| Net investment income | (0.13 | ) | (0.20 | ) | (0.05 | ) | |||||||||
| Return of capital | — | (0.01 | ) | — | |||||||||||
| Total distributions | (0.13 | ) | (0.21 | ) | (0.05 | ) | |||||||||
| Net asset value at end of period | $ | 16.85 | $ | 25.08 | $ | 28.02 | |||||||||
| Share price at end of period*** | $ | 16.84 | |||||||||||||
| NET ASSET VALUE TOTAL RETURN**** | (32.40 | )% | (9.81 | )% | 10.67 | % | |||||||||
| SHARE PRICE TOTAL RETURN**** | (32.41 | )% | |||||||||||||
| RATIOS/SUPPLEMENTAL DATA: | |||||||||||||||
| Net assets at end of period (000's omitted) | $ | 28,651 | $ | 62,700 | $ | 81,269 | |||||||||
| Ratio to average net assets of: | |||||||||||||||
| Expenses, after (Waivers) and/or Recapture | 0.65 | % | 0.67 | % | 0.67 | %† | |||||||||
| Expenses, prior to (Waivers) and/or Recapture | 0.87 | % | 0.72 | % | 0.84 | %† | |||||||||
| Net investment income, after (Waivers) and/or Recapture | 0.70 | % | 0.53 | % | 1.04 | %† | |||||||||
| Portfolio turnover rate †† | 102 | % | 76 | % | 23 | % | |||||||||
| Undistributed net investment income (loss) included in price of units issued and redeemed**# | $ | (0.01 | ) | $ | 0.00 | (a) | $ | 0.02 | |||||||
PowerShares Dynamic Market Portfolio
| Year Ended April 30, | |||||||||||||||||||||||
| 2009 | 2008 | 2007 | 2006 | 2005 | |||||||||||||||||||
| PER SHARE OPERATING PERFORMANCE: | �� | ||||||||||||||||||||||
| Net asset value at beginning of period | $ | 48.12 | $ | 53.32 | $ | 47.87 | $ | 39.11 | $ | 35.05 | |||||||||||||
| Net investment income** | 0.50 | 0.37 | 0.42 | 0.34 | 0.26 | ||||||||||||||||||
| Net realized and unrealized gain (loss) on investments | (16.72 | ) | (5.09 | ) | 5.35 | 8.75 | 4.02 | ||||||||||||||||
| Total from investment operations | (16.22 | ) | (4.72 | ) | 5.77 | 9.09 | 4.28 | ||||||||||||||||
| Distributions to shareholders from: | |||||||||||||||||||||||
| Net investment income | (0.48 | ) | (0.48 | ) | (0.32 | ) | (0.33 | ) | (0.22 | ) | |||||||||||||
| Net asset value at end of period | $ | 31.42 | $ | 48.12 | $ | 53.32 | $ | 47.87 | $ | 39.11 | |||||||||||||
| Share price at end of period*** | $ | 31.41 | |||||||||||||||||||||
| NET ASSET VALUE TOTAL RETURN**** | (33.86 | )% | (8.93 | )% | 12.12 | % | 23.30 | % | 12.23 | % | |||||||||||||
| SHARE PRICE TOTAL RETURN**** | (33.84 | )% | |||||||||||||||||||||
| RATIOS/SUPPLEMENTAL DATA: | |||||||||||||||||||||||
| Net assets at end of period (000's omitted) | $ | 260,779 | $ | 620,703 | $ | 973,105 | $ | 919,156 | $ | 283,620 | |||||||||||||
| Ratio to average net assets of: | |||||||||||||||||||||||
| Expenses, after (Waivers) and/or Recapture | 0.60 | % | 0.58 | % | 0.60 | % | 0.60 | % | 0.60 | % | |||||||||||||
| Expenses, prior to (Waivers) and/or Recapture | 0.60 | % | 0.59 | % | 0.62 | % | 0.63 | % | 0.70 | % | |||||||||||||
| Net investment income, after (Waivers) and/or Recapture | 1.28 | % | 0.72 | % | 0.87 | % | 0.76 | % | 0.68 | % | |||||||||||||
| Portfolio turnover rate †† | 113 | % | 121 | % | 114 | % | 103 | % | 94 | % | |||||||||||||
| Undistributed net investment income (loss) included in price of units issued and redeemed**# | $ | (0.01 | ) | $ | (0.01 | ) | $ | 0.00 | (a) | — | — | ||||||||||||
* Commencement of Investment Operations.
** Based on average shares outstanding.
*** The mean between the last bid and ask prices.
**** Net asset value total return is calculated assuming an initial investment made at the net asset value at the beginning of the period, reinvestment of all dividends and distributions at net asset value during the period, and redemption on the last day of the period. Share price total return is calculated assuming an initial investment made at the share price at the beginning of the period, reinvestment of all dividends and distributions at share price during the period, and sale at the share price on the last day of the period. Total investment returns calculated for a period of less than one year are not annualized.
† Annualized.
†† Portfolio turnover rate is not annualized and does not include securities received or delivered from processing creations or redemptions.
# The per share amount of equalization is presented to show the impact of equalization on distributable earnings per share.
(a) Amount represents less than $0.005.
See Notes to Financial Statements.
40
Financial Highlights (Continued)
PowerShares Dynamic OTC Portfolio
| Year Ended April 30, | |||||||||||||||||||||||
| 2009 | 2008 | 2007 | 2006 | 2005 | |||||||||||||||||||
| PER SHARE OPERATING PERFORMANCE: | |||||||||||||||||||||||
| Net asset value at beginning of period | $ | 46.92 | $ | 55.03 | $ | 53.60 | $ | 42.38 | $ | 36.59 | |||||||||||||
| Net investment income (loss)** | 0.03 | (0.11 | ) | (0.07 | ) | (0.02 | ) | (0.03 | ) | ||||||||||||||
| Net realized and unrealized gain (loss) on investments | (14.12 | ) | (7.94 | ) | 1.50 | 11.30 | 5.82 | ||||||||||||||||
| Total from investment operations | (14.09 | ) | (8.05 | ) | 1.43 | 11.28 | 5.79 | ||||||||||||||||
| Distributions to shareholders from: | |||||||||||||||||||||||
| Net investment income | — | — | — | (0.02 | ) | — | |||||||||||||||||
| Return of capital | — | (0.06 | ) | — | (0.04 | ) | — | ||||||||||||||||
| Total distributions | — | (0.06 | ) | — | (0.06 | ) | — | ||||||||||||||||
| Net asset value at end of period | $ | 32.83 | $ | 46.92 | $ | 55.03 | $ | 53.60 | $ | 42.38 | |||||||||||||
| Share price at end of period*** | $ | 32.83 | |||||||||||||||||||||
| NET ASSET VALUE TOTAL RETURN**** | (30.03 | )% | (14.65 | )% | 2.67 | % | 26.63 | % | 15.81 | % | |||||||||||||
| SHARE PRICE TOTAL RETURN**** | (30.06 | )% | |||||||||||||||||||||
| RATIOS/SUPPLEMENTAL DATA: | |||||||||||||||||||||||
| Net assets at end of period (000's omitted) | $ | 39,393 | $ | 96,187 | $ | 159,599 | $ | 222,440 | $ | 65,747 | |||||||||||||
| Ratio to average net assets of: | |||||||||||||||||||||||
| Expenses, after (Waivers) and/or Recapture | 0.59 | % | 0.59 | % | 0.60 | % | 0.60 | % | 0.60 | % | |||||||||||||
| Expenses, prior to (Waivers) and/or Recapture | 0.74 | % | 0.64 | % | 0.69 | % | 0.69 | % | 1.06 | % | |||||||||||||
| Net investment income (loss), after (Waivers) and/or Recapture | 0.08 | % | (0.21 | )% | (0.15 | )% | (0.04 | )% | (0.06 | )% | |||||||||||||
| Portfolio turnover rate †† | 77 | % | 60 | % | 107 | % | 77 | % | 112 | % | |||||||||||||
| Undistributed net investment income (loss) included in price of units issued and redeemed**# | $ | (0.02 | ) | $ | (0.01 | ) | $ | 0.03 | — | — | |||||||||||||
PowerShares FTSE RAFI US 1000 Portfolio
| Year Ended April 30, | For the Period December 19, 2005* Through | ||||||||||||||||||
| 2009 | 2008 | 2007 | April 30, 2006 | ||||||||||||||||
| PER SHARE OPERATING PERFORMANCE: | |||||||||||||||||||
| Net asset value at beginning of period | $ | 55.15 | $ | 60.99 | $ | 52.44 | $ | 49.64 | |||||||||||
| Net investment income** | 0.97 | 0.89 | 0.78 | 0.24 | |||||||||||||||
| Net realized and unrealized gain (loss) on investments | (20.26 | ) | (5.96 | ) | 8.38 | 2.68 | |||||||||||||
| Total from investment operations | (19.29 | ) | (5.07 | ) | 9.16 | 2.92 | |||||||||||||
| Distributions to shareholders from: | |||||||||||||||||||
| Net investment income | (1.08 | ) | (0.77 | ) | (0.61 | ) | (0.12 | ) | |||||||||||
| Net asset value at end of period | $ | 34.78 | $ | 55.15 | $ | 60.99 | $ | 52.44 | |||||||||||
| Share price at end of period*** | $ | 34.78 | |||||||||||||||||
| NET ASSET VALUE TOTAL RETURN**** | (35.26 | )% | (8.42 | )% | 17.60 | % | 5.89 | % | |||||||||||
| SHARE PRICE TOTAL RETURN**** | (35.20 | )% | |||||||||||||||||
| RATIOS/SUPPLEMENTAL DATA: | |||||||||||||||||||
| Net assets at end of period (000's omitted) | $ | 396,443 | $ | 876,964 | $ | 1,055,189 | $ | 104,883 | |||||||||||
| Ratio to average net assets of: | |||||||||||||||||||
| Expenses, after (Waivers) and/or Recapture | 0.58 | % | 0.67 | % | 0.70 | % | 0.76 | %† | |||||||||||
| Expenses, prior to (Waivers) and/or Recapture | 0.60 | % | 0.66 | % | 0.71 | % | 1.00 | %† | |||||||||||
| Net investment income, after (Waivers) and/or Recapture | 2.34 | % | 1.50 | % | 1.40 | % | 1.38 | %† | |||||||||||
| Portfolio turnover rate †† | 15 | % | 12 | % | 8 | % | 2 | % | |||||||||||
| Undistributed net investment income (loss) included in price of units issued and redeemed**# | $ | (0.07 | ) | $ | (0.04 | ) | $ | 0.33 | — | ||||||||||
* Commencement of Investment Operations.
** Based on average shares outstanding.
*** The mean between the last bid and ask prices.
**** Net asset value total return is calculated assuming an initial investment made at the net asset value at the beginning of the period, reinvestment of all dividends and distributions at net asset value during the period, and redemption on the last day of the period. Share price total return is calculated assuming an initial investment made at the share price at the beginning of the period, reinvestment of all dividends and distributions at share price during the period, and sale at the share price on the last day of the period. Total investment returns calculated for a period of less than one year are not annualized.
† Annualized.
†† Portfolio turnover rate is not annualized and does not include securities received or delivered from processing creations or redemptions.
# The per share amount of equalization is presented to show the impact of equalization on distributable earnings per share.
See Notes to Financial Statements.
41
Financial Highlights (Continued)
PowerShares NXQ Portfolio
| Year Ended April 30, 2009 | For the Period April 1, 2008* Through April 30, 2008 | ||||||||||
| PER SHARE OPERATING PERFORMANCE: | |||||||||||
| Net asset value at beginning of period | $ | 27.58 | $ | 25.77 | |||||||
| Net investment income (loss)** | (0.07 | ) | 0.03 | ||||||||
| Net realized and unrealized gain (loss) on investments | (9.91 | ) | 1.78 | ||||||||
| Total from investment operations | (9.98 | ) | 1.81 | ||||||||
| Distributions to shareholders from: | |||||||||||
| Net investment income | (0.03 | ) | — | ||||||||
| Return of capital | (0.02 | ) | — | ||||||||
| Total distributions | (0.05 | ) | — | ||||||||
| Net asset value at end of period | $ | 17.55 | $ | 27.58 | |||||||
| Share price at end of period*** | $ | 17.52 | |||||||||
| NET ASSET VALUE TOTAL RETURN**** | (36.21 | )% | 7.02 | %(a) | |||||||
| SHARE PRICE TOTAL RETURN**** | (36.32 | )% | |||||||||
| RATIOS/SUPPLEMENTAL DATA: | |||||||||||
| Net assets at end of period (000's omitted) | $ | 1,755 | $ | 2,758 | |||||||
| Ratio to average net assets of: | |||||||||||
| Expenses | 0.70 | % | 0.70 | %† | |||||||
| Net investment income (loss) | (0.30 | )% | 0.93 | %† | |||||||
| Portfolio turnover rate †† | 118 | % | 15 | % | |||||||
| Undistributed net investment income (loss) included in price of units issued and redeemed**# | $ | 0.00 | (b) | $ | (0.01 | ) | |||||
* Commencement of Investment Operations.
** Based on average shares outstanding.
*** The mean between the last bid and ask prices.
**** Net asset value total return is calculated assuming an initial investment made at the net asset value at the beginning of the period, reinvestment of all dividends and distributions at net asset value during the period, and redemption on the last day of the period. Share price total return is calculated assuming an initial investment made at the share price at the beginning of the period, reinvestment of all dividends and distributions at share price during the period, and sale at the share price on the last day of the period. Total investment returns calculated for a period of less than one year are not annualized.
† Annualized.
†† Portfolio turnover rate is not annualized and does not include securities received or delivered from processing creations or redemptions.
# The per share amount of equalization is presented to show the impact of equalization on distributable earnings per share.
(a) The total return from Fund Inception (first day of trading on the Exchange) to April 30, 2008 was 5.71%.
(b) Amount represents less than $0.005.
See Notes to Financial Statements.
42
Notes to Financial Statements
PowerShares Exchange-Traded Fund Trust
April 30, 2009
Note 1. Organization
PowerShares Exchange-Traded Fund Trust (the "Trust") was organized as a Massachusetts business trust on June 9, 2000 and is authorized to have multiple series of portfolios. The Trust is an open-end management investment company, registered under the Investment Company Act of 1940, as amended (the "1940 Act"). As of the year end, the Trust offered seventy-five portfolios. This report includes the following portfolios:
| Full Name | Short Name | ||||||
| PowerShares Dynamic MagniQuant Portfolio | "Dynamic MagniQuant Portfolio" | ||||||
| PowerShares Dynamic Market Portfolio | "Dynamic Market Portfolio" | ||||||
| PowerShares Dynamic OTC Portfolio | "Dynamic OTC Portfolio" | ||||||
| PowerShares FTSE RAFI US 1000 Portfolio | "FTSE RAFI US 1000 Portfolio" | ||||||
| PowerShares NXQ Portfolio | "NXQ Portfolio" | ||||||
Each portfolio (the "Fund" or collectively the "Funds") represents a separate series of the Trust. The shares of the Funds are referred to herein as "Shares" or "Fund Shares." Each Fund's Shares are listed and traded on the NYSE Arca, Inc., except for Shares of the NXQ Portfolio which are listed and traded on The NASDAQ Stock Market LLC.
The Funds' market prices may differ to some degree from the net asset value of the Shares of each Fund. Unlike conventional mutual funds, each Fund issues and redeems Shares on a continuous basis, at net asset value, only in a large specified number of Shares, each called a "Creation Unit." Creation Units are issued and redeemed generally in-kind for securities included in the relevant index. Except when aggregated in Creation Units, Shares are not individually redeemable securities of the Funds.
The investment objective of each Fund is to seek investment results that correspond generally to the price and yield (before the Fund's fees and expenses) of the following indices:
| Fund | Index | ||||||
| Dynamic MagniQuant Portfolio | Top 200 Dynamic IntellidexSM Index | ||||||
| Dynamic Market Portfolio | Dynamic Market IntellidexSM Index | ||||||
| Dynamic OTC Portfolio | Dynamic OTC IntellidexSM Index | ||||||
| FTSE RAFI US 1000 Portfolio | FTSE RAFITM US 1000 Index | ||||||
| NXQ Portfolio | NASDAQ Q-50 IndexSM | ||||||
Note 2. Significant Accounting Policies
The preparation of the financial statements in accordance with accounting principles generally accepted in the United States of America requires management to make estimates and assumptions that affect the reported amounts and disclosures in the financial statements, including estimates and assumptions related to taxation. Actual results could differ from these estimates.
A. Security Valuation
Securities, including restricted securities, are valued according to the following policies.
A security listed or traded on an exchange (except convertible bonds) is valued at its last sales price or official closing price as of the close of the customary trading session on the exchange where the security is principally traded, or lacking any sales or official closing price on a particular day, the security may be valued at the closing bid price on that day. Securities traded in the over-the-counter market are valued
43
Notes to Financial Statements (Continued)
PowerShares Exchange-Traded Fund Trust
April 30, 2009
based on prices furnished by independent pricing services or market makers. Listed options, if no closing price is available, are valued at the mean between the last bid and ask prices from the exchange on which they are principally traded. Options not listed on an exchange are valued by an independent source at the mean between the last bid and ask prices.
Investments in open-end registered investment companies not traded on an exchange are valued at the end of day net asset value per share.
Debt obligations (including convertible bonds) and unlisted equities are fair valued using an evaluated quote provided by an independent pricing service. Evaluated quotes provided by the pricing service may be determined without exclusive reliance on quoted prices, and may reflect appropriate factors such as institution-size trading in similar groups of securities, developments related to specific securities, dividend rate, yield, quality, type of issue, coupon rate, maturity, individual trading characteristics and other market data. Short-term obligations, including commercial paper, having 60 days or less to maturity are recorded at amortized cost which approximates value. Debt securities are subject to interest rate and credit risks. In addition, all debt securities involve some risk of default with respect to interest and/or principal payments.
Foreign securities (including foreign exchange contracts) are converted into U.S. dollar amounts using the applicable exchange rates as of the close of the London world markets. If market quotations are available and reliable for foreign exchange traded equity securities, the securities will be valued at the market quotations. Because trading hours for certain foreign securities end before the close of the New York Stock Exchange ("NYSE"), closing market quotations may become unreliable. If between the time trading ends on a particular security and the close of the customary trading session on the NYSE, events occur that are significant and make the closing price unreliable, the Fund may fair value the security. If the event is likely to have affected the closing price of the security, the security will be valued at fair value in good faith using procedures approved by the Board of Trustees. Adjustments to closing prices to refl ect fair value may also be based on a screening process of an independent pricing service to indicate the degree of certainty, based on historical data, that the closing price in the principal market where a foreign security trades is not the current value as of the close of the NYSE. Foreign securities meeting the approved degree of certainty that the price is not reflective of current value will be priced at the indication of fair value from the independent pricing service. Multiple factors may be considered by the independent pricing service in determining adjustments to reflect fair value and may include information relating to sector indices, ADRs and domestic and foreign index futures. Foreign securities may have additional risks including exchange rate changes, potential for sharply devalued currencies and high inflation, political and economic upheaval, the relative lack of issuer information, relatively low market liquidity and the potential lack of strict financial and accounting controls and stand ards.
Securities for which market prices are not provided by any of the above methods may be valued based upon quotes furnished by independent sources.
Securities for which market quotations are not readily available or are unreliable are valued at fair value as determined in good faith by or under the supervision of the Trust's officers following procedures approved by the Board of Trustees. Issuer specific events, market trends, bid/ask quotes of brokers and information providers and other market data may be reviewed in the course of making a good faith determination of a security's fair value.
44
Notes to Financial Statements (Continued)
PowerShares Exchange-Traded Fund Trust
April 30, 2009
Valuations change in response to many factors including the historical and prospective earnings of the issuer, the value of the issuer's assets, general economic conditions, interest rates, investor perceptions and market liquidity. Because of the inherent uncertainties of valuation, the values reflected in the financial statements may materially differ from the value received upon actual sale of those investments.
B. Other Risks
A Fund may concentrate investments in a comparatively narrow segment of the economy. Consequently, such Fund may tend to be more volatile than other funds, and the value of investments may tend to rise and fall more rapidly.
A Fund may invest a large percentage of its assets in securities of a limited number of companies, such that each investment may have a greater effect on the Fund's overall performance, and any change in the value of those securities could significantly affect the value of your investment in the Fund.
C. Federal Income Taxes
Each Fund intends to comply with the provisions of the Internal Revenue Code applicable to regulated investment companies and to distribute substantially all of the Fund's taxable earnings to its shareholders. As such, the Funds will not be subject to Federal income taxes on otherwise taxable income (including net realized gains) that is distributed to the shareholders. Therefore, no provision for Federal income taxes is recorded in the financial statements.
Income and capital gain distributions are determined in accordance with Federal income tax regulations, which may differ from accounting principles generally accepted in the United States of America. These differences are primarily due to differing book and tax treatments for in-kind transactions, losses deferred due to wash sales, and Passive Foreign Investment Company adjustments, if any.
The Funds file tax returns in the United States Federal jurisdiction and certain other jurisdictions. Generally a Fund is subject to examinations by such taxing authorities for up to three years after the filing of the return for the tax period.
D. Investment Income and Investment Transactions
Dividend income is recorded on the ex-dividend date net of foreign taxes withheld, if any. Interest income is recorded on the accrual basis. Investment transactions are recorded on the trade date. Realized gains and losses from the sale or disposition of securities are calculated on the specific identified cost basis. Dividends and interest received by a Fund may give rise to withholding and other taxes imposed by foreign countries. Corporate actions (including cash dividends) are recorded net of non-reclaimable foreign tax withholdings on the ex-dividend date. Tax conventions between certain countries and the United States may reduce or eliminate such taxes.
E. Expenses
Expenses of the Trust, which are directly identifiable to a specific Fund, are applied to that Fund. Expenses which are not readily identifiable to a specific Fund are allocated in such a manner as deemed equitable, taking into consideration the nature and type of expense and the relative net assets of each Fund.
Each Fund (except for NXQ Portfolio) is responsible for all of its expenses, including the investment advisory fees, costs of transfer agency, custody, fund administration, legal, audit and other services, interest, taxes, brokerage commissions and other expenses connected with executions of portfolio transactions, any distribution fees or expenses and extraordinary expenses.
45
Notes to Financial Statements (Continued)
PowerShares Exchange-Traded Fund Trust
April 30, 2009
The NXQ Portfolio has agreed to pay an annual unitary management fee to Invesco PowerShares Capital Management LLC (the "Adviser"). The Adviser has agreed to pay for substantially all expenses of the NXQ Portfolio, including the cost of transfer agency, custody, fund administration, legal, audit and other services, except for advisory fees, distribution fees, if any, brokerage expenses, taxes, interest and other extraordinary expenses.
F. Dividends and Distributions to Shareholders
Each Fund declares and pays dividends from net investment income, if any, to its shareholders quarterly and records on ex-dividend date. Each Fund distributes net realized taxable capital gains, if any, generally annually in cash and records on ex-dividend date. Such distributions on a tax basis are determined in conformity with income tax regulations which may differ from accounting principles generally accepted in the United States of America. Distributions in excess of tax basis earnings and profits, if any, are reported in such Fund's financial statements as a tax return of capital at fiscal period end.
G. Equalization
All Funds use the accounting practice of equalization. This accounting method is used to keep the continuing shareholder's per share equity in undistributed net investment income from being affected by the continuous sales and redemptions of capital shares. Equalization is calculated on a per share basis whereby a portion of the proceeds from the sales and cost of repurchases of capital shares is applied to undistributed net investment income. The amount of equalization is disclosed in the Statements of Changes in Net Assets as undistributed net investment income included in the price of capital shares issued or redeemed. The distributions to shareholders of amounts so applied may be deemed to be a return of capital for tax purposes to the extent that such distributions exceed taxable income.
Note 3. Investment Advisory Agreement and Other Agreements
The Trust has entered into an Investment Advisory Agreement with the Adviser under which the Adviser has overall responsibility as the Funds' investment adviser for the selection and ongoing monitoring of the Funds' investments, managing the Funds' business affairs and providing certain clerical, bookkeeping and other administrative services. Each Fund (except for the FTSE RAFI US 1000 Portfolio and the NXQ Portfolio) has agreed to pay the Adviser an annual fee of 0.50% of the Fund's average daily net assets. Prior to November 1, 2008, the FTSE RAFI US 1000 Portfolio agreed to pay the Adviser an annual fee of 0.50% of the Fund's average daily net assets. Effective November 1, 2008, the FTSE RAFI US 1000 Portfolio agreed to pay the Adviser an annual fee of 0.29% of the Fund's average daily net assets. The NXQ Portfolio has agreed to pay the Adviser an annual unitary management fee of 0.70% of the Fund's average daily net assets a nd the Adviser has agreed to pay for substantially all expenses of the NXQ Portfolio, including the cost of transfer agency, custody, fund administration, legal, audit and other services, except for advisory fees, distribution fees, if any, brokerage expenses, taxes, interest and other extraordinary expenses.
The Adviser has entered into an Amended and Restated Excess Expense Agreement (the "Excess Expense Agreement") with the Trust. For the Dynamic MagniQuant Portfolio, the Adviser has agreed to waive fees and/or pay Fund expenses to the extent necessary to prevent the operating expenses of the Fund (excluding interest expense, brokerage commissions and other trading expenses, sub-licensing fees, offering costs, taxes and extraordinary expenses) from exceeding 0.60% of the Fund's average daily net assets per year (the "Expense Cap"), at least until August 31, 2010. The FTSE RAFI US 1000 Portfolio's Expense Cap is 0.39%, at least until August 31, 2010, and sub-licensing fees are included in the expenses subject to the Expense Cap. Prior to November 1, 2008, the FTSE RAFI US 1000 Portfolio's E xpense Cap, at least until August 30, 2009, was 0.60% and excluded sub-licensing fees. Offering costs excluded from the Expense Cap are: (a) legal fees pertaining to the Funds' shares offered for sale; (b) Securities and Exchange Commission and state registration fees; and (c) initial fees paid to be listed on an exchange. For the Dynamic Market Portfolio and the Dynamic OTC Portfolio, the Adviser has agreed to waive fees and/or
46
Notes to Financial Statements (Continued)
PowerShares Exchange-Traded Fund Trust
April 30, 2009
pay Fund expenses to the extent necessary to prevent the operating expenses of each Fund (excluding interest expense, brokerage commissions and other trading expenses, taxes and extraordinary expenses) from exceeding 0.60% of the Fund's average daily net assets per year at least until August 31, 2010.
For the Dynamic MagniQuant Portfolio and the FTSE RAFI US 1000 Portfolio, the Excess Expense Agreement provides that the expenses borne by the Adviser are subject to recapture by the Adviser for up to three years from the date the fee or expense was borne by the Adviser, but no recapture payment will be made by a Fund if it would result in the Fund exceeding its Expense Cap as specified above. For the Dynamic Market Portfolio and the Dynamic OTC Portfolio, the expenses borne by the Adviser are not subject to recapture. The Excess Expense Agreement does not apply to the NXQ Portfolio.
The net amount of fees waived and other expenses assumed by the Adviser and the amount of recapture paid to the Adviser pursuant to the Excess Expense Agreement are collectively referred to as "(Waivers) and/or Recapture." The net amounts of (Waivers) and/or Recapture for the year ended April 30, 2009 are shown on the Statements of Operations.
The amounts available for potential future recapture by the Adviser under the Excess Expense Agreement and the expiration schedule at April 30, 2009 are as follows:
| Total Potential | Potential Recapture Amounts Expiring | ||||||||||||||||||
| Recapture Amount | 04/30/10 | 04/30/11 | 04/30/12 | ||||||||||||||||
| Dynamic MagniQuant Portfolio | $ | 185,323 | $ | 35,869 | $ | 52,795 | $ | 96,659 | |||||||||||
| FTSE RAFI US 1000 Portfolio | 98,922 | — | — | 98,922 | |||||||||||||||
The Trust has entered into a Distribution Agreement with Invesco Aim Distributors, Inc. (the "Distributor"), which serves as the Distributor of Creation Units for each Fund. The Distributor does not maintain a secondary market in Shares.
The Adviser has entered into a licensing agreement for each Fund with the following Licensors:
| Fund | Licensor | ||||||
| Dynamic MagniQuant Portfolio | NYSE AMEX | ||||||
| Dynamic Market Portfolio | NYSE AMEX | ||||||
| Dynamic OTC Portfolio | NYSE AMEX | ||||||
| FTSE RAFI US 1000 Portfolio | FTSE International Ltd. | ||||||
| NXQ Portfolio | The NASDAQ OMX Group, Inc. | ||||||
The index name trademarks are owned by the respective Licensors. These trademarks have been licensed to the Adviser for use with the Funds. The Funds are not sponsored, endorsed, sold or promoted by the Licensors and the Licensors make no representation regarding the advisability of investing in any of these Funds. The Trust has entered into a sub-licensing agreement under which the Funds (other than the NXQ Portfolio) are required to pay the sub-licensing fees which are shown on the Statements of Operations.
The Trust has entered into service agreements whereby The Bank of New York Mellon, a wholly-owned subsidiary of The Bank of New York Mellon Corporation, serves as the administrator, custodian, fund accounting and transfer agent for each Fund.
The custodian has agreed to provide overdraft protection to the Funds according to the terms of the service agreement.
47
Notes to Financial Statements (Continued)
PowerShares Exchange-Traded Fund Trust
April 30, 2009
Note 4. Investments in Affiliates
The Fund's Adviser is a subsidiary of Invesco Ltd. and therefore, Invesco Ltd. is considered to be affiliated with the Fund. The table below shows the transactions in and earnings from the investment in Invesco Ltd. for the year ended April 30, 2009.
FTSE RAFI US 1000 Portfolio
| Value 04/30/08 | Purchase at Cost | Proceeds from Sales | Change in Unrealized Appreciation | Realized Gain | Value 04/30/09 | Dividend Income | |||||||||||||||||||||||||
| Invesco Ltd. | $ | — | $ | 3,756,796 | $ | (119,534 | ) | $ | 669,343 | $ | 24,254 | $ | 4,330,859 | $ | — | ||||||||||||||||
Note 5. Additional Valuation Information
The Funds adopted the provisions of Statement of Financial Accounting Standards No. 157, "Fair Value Measurements" ("SFAS 157"), effective with the beginning of the Fund's fiscal year. SFAS 157 defines fair value as the price that would be received to sell an asset or paid to transfer a liability in an orderly transaction between market participants at the measurement date. SFAS 157 establishes a hierarchy that prioritizes the inputs to valuation methods giving the highest priority to readily available unadjusted quoted prices in an active market for identical assets (Level 1) and the lowest priority to significant unobservable inputs (Level 3) generally when market prices are not readily available or are unreliable. Based on the valuation inputs the securities or other investments are tiered into one of three levels. Changes in valuation methods may result in transfers in or out of an investment's assigned level:
Level 1 – Prices are determined using quoted prices in an active market for identical assets.
Level 2 – Prices are determined using other significant observable inputs. Observable inputs are inputs that other market participants may use in pricing a security. These may include quoted prices for similar securities, interest rates, prepayment speeds, credit risk and others.
Level 3 – Prices are determined using significant unobservable inputs. In situations where quoted prices or observable inputs are unavailable (for example, when there is little or no market activity for an investment at the end of the period), unobservable inputs may be used. Unobservable inputs reflect the Fund's own assumptions about the factors market participants would use in determining fair value of the securities or instruments and would be based on the best available information.
The following is a summary of the tiered valuation input levels, as of the end of the reporting period, April 30, 2009. The level assigned to the securities valuations may not be an indication of the risk or liquidity associated with investing in those securities. Because of the inherent uncertainties of valuation, the values reflected in the financial statements may materially differ from the value received upon actual sale of those investments.
| Investment in Securities | |||||||||||||||||||
| Level 1 | Level 2 | Level 3 | Total | ||||||||||||||||
| Dynamic MagniQuant Portfolio | $ | 28,701,432 | $ | — | $ | — | $ | 28,701,432 | |||||||||||
| Dynamic Market Portfolio | 260,869,424 | — | — | 260,869,424 | |||||||||||||||
| Dynamic OTC Portfolio | 39,433,000 | — | — | 39,433,000 | |||||||||||||||
| FTSE RAFI US 1000 Portfolio | 396,550,934 | — | — | 396,550,934 | |||||||||||||||
| NXQ Portfolio | 1,757,060 | — | — | 1,757,060 | |||||||||||||||
48
Notes to Financial Statements (Continued)
PowerShares Exchange-Traded Fund Trust
April 30, 2009
Note 6. Federal Income Tax
At April 30, 2009, costs of investments on a tax basis including the adjustments for financial reporting purposes as of the most recently completed Federal income tax reporting year were as follows:
| Dynamic MagniQuant Portfolio | $ | 26,051,847 | |||||
| Dynamic Market Portfolio | 244,812,100 | ||||||
| Dynamic OTC Portfolio | 37,415,563 | ||||||
| FTSE RAFI US 1000 Portfolio | 648,091,022 | ||||||
| NXQ Portfolio | 1,906,185 | ||||||
At April 30, 2009, the components of accumulated earnings (loss) on a tax-basis were as follows:
| Accumulated Earnings | Other Temporary Differences | Net Accumulated Capital and other Losses | Net Unrealized Appreciation (Depreciation) | Gross Unrealized Appreciation | Gross Unrealized Depreciation | Total Accumulated Earnings(Loss) | |||||||||||||||||||||||||
| Dynamic MagniQuant Portfolio | $ | 25,981 | $ | (3,646 | ) | $ | (23,114,529 | ) | $ | 2,649,585 | $ | 4,570,467 | $ | (1,920,882 | ) | $ | (20,442,609 | ) | |||||||||||||
| Dynamic Market Portfolio | 371,572 | (13,839 | ) | (324,606,333 | ) | 16,057,324 | 31,885,285 | (15,827,961 | ) | (308,191,276 | ) | ||||||||||||||||||||
| Dynamic OTC Portfolio | 57,144 | (4,324 | ) | (74,273,479 | ) | 2,017,437 | 5,106,678 | (3,089,241 | ) | (72,203,222 | ) | ||||||||||||||||||||
| FTSE RAFI US 1000 Portfolio | 1,643,526 | (17,690 | ) | (70,676,958 | ) | (251,540,088 | ) | 4,192,242 | (255,732,330 | ) | (320,591,210 | ) | |||||||||||||||||||
| NXQ Portfolio | — | — | (906,267 | ) | (149,125 | ) | 125,678 | (274,803 | ) | (1,055,392 | ) | ||||||||||||||||||||
Distributions to Shareholders:
The tax character of distributions paid was as follows:
| Year ended April 30, 2009 | Year ended April 30, 2008 | ||||||||||
| Distributions paid from Ordinary Income | Distributions paid from Ordinary Income | ||||||||||
| Dynamic MagniQuant Portfolio | $ | 279,388 | $ | 640,462 | |||||||
| Dynamic Market Portfolio | 5,193,546 | 7,990,684 | |||||||||
| FTSE RAFI US 1000 Portfolio | 15,035,089 | 13,733,870 | |||||||||
| NXQ Portfolio | 2,563 | — | |||||||||
| Year ended April 30, 2009 | Year ended April 30, 2008 | ||||||||||
| Distributions paid from Return of Capital | Distributions paid from Return of Capital | ||||||||||
| Dynamic MagniQuant Portfolio | $ | — | $ | 18,785 | |||||||
| Dynamic OTC Portfolio | — | 137,064 | |||||||||
| NXQ Portfolio | 2,563 | — | |||||||||
At April 30, 2009, for Federal income tax purposes, the Funds have capital loss carryforwards available as shown in the table below, to the extent provided by the regulations, to offset future capital gains through the years indicated. To the extent that these loss carryforwards are used to offset future capital gains, it is probable that the capital gains so offset will not be distributed to shareholders. The use of some portion of the capital loss carryforward by any one Fund may be limited by Federal tax rules. Among others, certain
49
Notes to Financial Statements (Continued)
PowerShares Exchange-Traded Fund Trust
April 30, 2009
rules limit the use of the carryforward when there has been a greater than fifty percent change in ownership of a Fund.
| Year of Expiration | Total | ||||||||||||||||||||||||||||||||||
| 2011 | 2012 | 2013 | 2014 | 2015 | 2016 | 2017 | Amount | ||||||||||||||||||||||||||||
| Dynamic MagniQuant Portfolio | $ | — | $ | — | $ | — | $ | — | $ | — | $ | 5,211,608 | $ | 10,595,808 | $ | 15,807,416 | |||||||||||||||||||
| Dynamic Market Portfolio | 225,469 | 8,920,879 | 5,021,729 | 13,686,812 | 65,552,628 | 39,899,556 | 96,635,542 | 229,942,615 | |||||||||||||||||||||||||||
| Dynamic OTC Portfolio | 252,044 | 651,452 | 5,297,385 | 5,449,844 | 21,767,708 | 11,353,752 | 15,759,003 | 60,531,188 | |||||||||||||||||||||||||||
| FTSE RAFI US 1000 Portfolio | — | — | — | — | 44,432 | 1,148,192 | 44,806,806 | 45,999,430 | |||||||||||||||||||||||||||
| NXQ Portfolio | — | — | — | — | — | 14,131 | 126,742 | 140,873 | |||||||||||||||||||||||||||
Capital losses incurred after October 31 ("post-October losses") within the taxable year are deemed to arise on the first business day of each Fund's next taxable year.
During the year ended April 30, 2009, the Funds incurred and will elect to defer net capital losses as follows:
| Post-October Losses | |||||||
| Dynamic MagniQuant Portfolio | $ | 7,307,113 | |||||
| Dynamic Market Portfolio | 94,663,718 | ||||||
| Dynamic OTC Portfolio | 13,742,291 | ||||||
| FTSE RAFI US 1000 Portfolio | 24,677,528 | ||||||
| NXQ Portfolio | 765,394 | ||||||
In order to present shares of beneficial interest and accumulated net realized gains or losses on the Statements of Assets and Liabilities that more closely represent their tax character, certain adjustments have been made to shares of beneficial interest, undistributed net investment income or loss and accumulated net realized gain or loss on investments. These differences are primarily due to redemptions-in-kind, investments in partnerships, wash sales, book equalization, and net operating losses, if any. These adjustments have no effect on net assets. For the year ended April 30, 2009, the adjustments were as follows:
| Undistributed Net Investment Income | Undistributed Capital Gains (Accumulated Losses) | Shares of Beneficial Interest | |||||||||||||
| Dynamic MagniQuant Portfolio | $ | 14,018 | $ | 10,033,431 | $ | (10,047,449 | ) | ||||||||
| Dynamic Market Portfolio | 90,167 | 77,724,409 | (77,814,576 | ) | |||||||||||
| Dynamic OTC Portfolio | 30,940 | 11,012,556 | (11,043,496 | ) | |||||||||||
| FTSE RAFI US 1000 Portfolio | 886,627 | 71,992,195 | (72,878,822 | ) | |||||||||||
| NXQ Portfolio | 9,356 | (224,427 | ) | 215,071 | |||||||||||
50
Notes to Financial Statements (Continued)
PowerShares Exchange-Traded Fund Trust
April 30, 2009
Note 7. Investment Transactions
For the year ended April 30, 2009, the cost of securities purchased and proceeds from sales of securities, excluding short-term securities, money market funds and in-kind transactions, were as follows:
| Purchases | Sales | ||||||||||
| Dynamic MagniQuant Portfolio | $ | 44,370,701 | $ | 45,171,872 | |||||||
| Dynamic Market Portfolio | 471,003,111 | 477,263,032 | |||||||||
| Dynamic OTC Portfolio | 50,203,267 | 52,906,467 | |||||||||
| FTSE RAFI US 1000 Portfolio | 82,001,126 | 81,681,979 | |||||||||
| NXQ Portfolio | 2,465,040 | 2,468,783 | |||||||||
For the year ended April 30, 2009, in-kind transactions associated with creations and redemptions were as follows:
| Securities Received | Securities Delivered | ||||||||||
| Dynamic MagniQuant Portfolio | $ | 60,288,215 | $ | 74,982,093 | |||||||
| Dynamic Market Portfolio | 536,541,729 | 689,025,424 | |||||||||
| Dynamic OTC Portfolio | 145,763,941 | 173,163,180 | |||||||||
| FTSE RAFI US 1000 Portfolio | 114,866,776 | 302,094,685 | |||||||||
| NXQ Portfolio | 16,262,900 | 16,312,852 | |||||||||
Gains on in-kind transactions are generally not considered taxable gains for Federal income tax purposes.
Note 8. Trustees' Fees
The Funds compensate each Trustee who is not an employee of the Adviser or its affiliates. With respect to NXQ Portfolio, the Adviser, as a result of the unitary management fee, pays for such compensation. The "Interested" Trustee of the Trust does not receive any Trustees' fees.
The Trust has adopted a deferred compensation plan (the "Plan"). Under the Plan, a Trustee who is not an "interested person" (as defined in the 1940 Act) (an "Independent Trustee") and has executed a Deferred Fee Agreement (a "Participating Trustee") may defer receipt of all or a portion of his compensation ("Deferral Fees"). Such Deferral Fees are deemed to be invested in selected PowerShares Funds. The Deferral Fees payable to the Participating Trustee are valued as of the date such Fees would have been paid to the Participating Trustee. The value increases with contributions or with increases in the value of the shares selected, and the value decreases with distributions or with declines in the value of the shares selected.
Note 9. Capital
Shares are created and redeemed by the Trust only in Creation Unit size aggregations of 100,000 (50,000 for Dynamic Market and Dynamic OTC Portfolios). Only Authorized Participants are permitted to purchase or redeem Creation Units from the Funds. Such transactions are generally permitted on an in-kind basis, with a balancing cash component to equate the transaction to the net asset value per unit of each Fund of the Trust on the transaction date. Cash may be substituted equivalent to the value of certain securities generally when they are not available in sufficient quantity for delivery, not eligible for trading by the Authorized Participant or as a result of other market circumstances.
51
Notes to Financial Statements (Continued)
PowerShares Exchange-Traded Fund Trust
April 30, 2009
Note 10. Indemnifications
Under the Trust's organizational documents, its officers and Trustees are indemnified against certain liabilities arising out of the performance of their duties to the Trust. Each Independent Trustee is also indemnified against certain liabilities arising out of the performance of his duties to the Trust pursuant to an Indemnification Agreement between the Independent Trustee and the Trust. Additionally, in the normal course of business, the Trust enters into contracts with service providers that contain general indemnification clauses. The Trust's maximum exposure under these arrangements is unknown, as this would involve future claims that may be made against the Trust that have not yet occurred. However, based on experience, the Trust believes the risk of loss to be remote.
52
Report of Independent Registered Public Accounting Firm
To the Board of Trustees and Shareholders of PowerShares Exchange-Traded Fund Trust:
In our opinion, the accompanying statements of assets and liabilities, including the schedules of investments, and the related statements of operations and of changes in net assets and the financial highlights present fairly, in all material respects, the financial position of each of the portfolios indicated in Note 1 of the financial statements (each a portfolio of PowerShares Exchange-Traded Fund Trust, hereafter referred to as the "Trust") at April 30, 2009, and the results of each of their operations, the changes in each of their net assets, and the financial highlights for each of the periods presented, in conformity with accounting principles generally accepted in the United States of America. These financial statements and financial highlights (hereafter referred to as "financial statements") are the responsibility of the Trust's management; our responsibility is to express an opinion on these financial statements based on our audits. We conducted our audits of these financial statements in accordance with the standards of the Public Company Accounting Oversight Board (United States). Those standards require that we plan and perform the audits to obtain reasonable assurance about whether the financial statements are free of material misstatement. An audit includes examining, on a test basis, evidence supporting the amounts and disclosures in the financial statements, assessing the accounting principles used and significant estimates made by management, and evaluating the overall financial statement presentation. We believe that our audits, which included confirmation of securities at April 30, 2009 by correspondence with the custodian, provide a reasonable basis for our opinion.
PricewaterhouseCoopers LLP
New York, New York
June 25, 2009
53
Supplemental Information (Unaudited)
Tax Information
Form 1099-DIV, Form 1042-S and other year-end tax information provide shareholders with actual calendar year amounts that should be included in their tax returns. Shareholders should consult their tax advisors.
The following distribution information is being provided as required by the Internal Revenue Code or to meet a specific state's requirement.
Each Fund designates the following amounts or, if subsequently determined to be different the maximum amount allowable for its fiscal year ended April 30, 2009:
Federal Income Tax Information
| Qualified Dividend Income* | Corporate Dividend Received Deduction* | ||||||||||
| Dynamic MagniQuant Portfolio | 100 | % | 100 | % | |||||||
| Dynamic Market Portfolio | 100 | % | 100 | % | |||||||
| Dynamic OTC Portfolio | 0 | % | 0 | % | |||||||
| FTSE RAFI US 1000 Portfolio | 100 | % | 100 | % | |||||||
| NXQ Portfolio | 0 | % | 0 | % | |||||||
* The above percentages are based on ordinary income dividends paid to shareholders during the Fund's fiscal year.
54
Supplemental Information (Continued)
Trustees and Officers
The Independent Trustees, the Trustee who is affiliated with the Adviser (the "Management Trustee") and the executive officers of the Trust, their term of office and length of time served, their principal business occupations during at least the past five years, the number of portfolios in the Fund Complex (as defined below) overseen by each Trustee and the other directorships, if any, held by a Trustee, are shown below.
| Name, Address, and Age Independent Trustee | Position(s) with Trust | Length Time Served* | Principal Occupation(s) During Past 5 Years | Number of Portfolios in Fund Complex** Overseen by Trustee | Other Directorships Held by Trustee | ||||||||||||||||||
| Ronn R. Bagge 51 YQA Capital Management, LLC 1755 S. Naperville Road Suite 100 Wheaton, IL 60187 | Trustee | Since 2003 | YQA Capital Management LLC (July 1998-Present); formerly Owner/CEO of Electronic Dynamic Balancing Co., Inc. (high-speed rotating equipment service provider) | 119 | None | ||||||||||||||||||
| Marc M. Kole 48 c/o Invesco PowerShares Capital Management LLC 301 W. Roosevelt Road Wheaton, IL 60187 | Trustee | Since 2006 | Vice President of Finance and Accounting, Hope Network (social services) (November 2008-Present); formerly Assistant Vice President and Controller, Priority Health (health insurance) (September 2005-April 2008); Senior Vice President of Finance, United Healthcare (health insurance) (July 2004-July 2005); Senior Vice President of Finance, Oxford Health Plans (June 2000-July 2004) | 119 | None | ||||||||||||||||||
* This is the date the Trustee began serving the Trust. Each Trustee serves an indefinite term, until his successor is elected.
** Fund Complex includes all open-end funds (including all of their portfolios) advised by the Adviser. At April 30, 2009, the Fund Complex consists of the Trust's 75 portfolios and three other exchange-traded fund trusts with 44 portfolios advised by the Adviser.
55
Supplemental Information (Continued)
Trustees and Officers (Continued)
| Name, Address, and Age Independent Trustee | Position(s) with Trust | Length Time Served* | Principal Occupation(s) During Past 5 Years | Number of Portfolios in Fund Complex** Overseen by Trustee | Other Directorships Held by Trustee | ||||||||||||||||||
| Philip M. Nussbaum 47 c/o Invesco PowerShares Capital Management LLC 301 W. Roosevelt Road Wheaton, IL 60187 | Trustee | Since 2003 | Chairman, Performance Trust Capital Partners (formerly Betzold, Berg, Nussbaum & Heitman, Inc.) (November 2004-Present); formerly Managing Director, Communication Institute (May 2002-August 2003); Executive Vice President of Finance, Betzold, Berg, Nussbaum & Heitman, Inc. (March 1994-1999) | 119 | None | ||||||||||||||||||
| Donald H. Wilson 49 c/o Invesco PowerShares Capital Management LLC 301 W. Roosevelt Road Wheaton, IL 60187 | Trustee | Since 2006 | President and Chief Operating Officer, AMCORE Financial, Inc. (bank holding company) (August 2007-April 2009), formerly Executive Vice President and Chief Financial Officer, AMCORE Financial, Inc. (February 2006-August 2007); Senior Vice President and Treasurer, Marshall & Ilsley Corp. (bank holding company) (May 1995-February 2006) | 119 | None | ||||||||||||||||||
* This is the date the Trustee began serving the Trust. Each Trustee serves an indefinite term, until his successor is elected.
** Fund Complex includes all open-end funds (including all of their portfolios) advised by the Adviser. At April 30, 2009, the Fund Complex consists of the Trust's 75 portfolios and three other exchange-traded fund trusts with 44 portfolios advised by the Adviser.
56
Supplemental Information (Continued)
Trustees and Officers (Continued)
| Name, Address, and Age of Management Trustee | Position(s) with Trust | Length Time Served* | Principal Occupation(s) During Past 5 Years | Number of Portfolios in Fund Complex*** Overseen by Trustee | Other Directorships Held by Trustee | ||||||||||||||||||
| H. Bruce Bond** 45 Invesco PowerShares Capital Management LLC 301 W. Roosevelt Road Wheaton, IL 60187 | Chairman of the Board, Trustee and President | Since 2003 | Managing Director, Invesco PowerShares Capital Management LLC (August 2002-Present); formerly Manager, Nuveen Investments (April 1998-August 2002) | 119 | None | ||||||||||||||||||
Availability of Additional Information About the Trustees
The Statement of Additional Information includes additional information about the Trustees and is available, without charge, upon request at 800.337.4246.
* This is the date the Management Trustee began serving the Trust. Each Trustee serves an indefinite term, until his successor is elected. Each officer serves a one year term, until his successor is elected.
** "Interested person" as defined in Section 2(a)(19) of the 1940 Act.
*** Fund Complex includes all open-end funds (including all of their portfolios) advised by the Adviser. At April 30, 2009, the Fund Complex consists of the Trust's 75 portfolios and three other exchange-traded fund trusts with 44 portfolios advised by the Adviser.
57
Supplemental Information (Continued)
Trustees and Officers (Continued)
| Name, Address, and Age of Officers | Position(s) with Trust | Length Time Served* | Principal Occupation(s) During Past 5 Years | ||||||||||||
| Bruce T. Duncan 54 Invesco PowerShares Capital Management LLC 301 W. Roosevelt Road Wheaton, IL 60187 | Chief Financial Officer, Treasurer and Secretary | Chief Financial Officer and Treasurer Since 2006 Secretary Since 2008 | Senior Vice President of Finance, Invesco PowerShares Capital Management LLC (September 2005-Present); formerly Private Practice Attorney (2000-2005); Vice President of Investor Relations, The ServiceMaster Company (1994-2000); Vice President of Taxes, The ServiceMaster Company (1990-2000) | ||||||||||||
| Kevin R. Gustafson 43 Invesco PowerShares Capital Management LLC 301 W. Roosevelt Road Wheaton, IL 60187 | Chief Compliance Officer | Since 2004 | General Counsel, Invesco PowerShares Capital Management LLC (September 2004-Present); formerly Chief Compliance Officer, Invesco PowerShares Capital Management LLC (September 2004-April 2008) | ||||||||||||
| John W. Southard, Jr., CFA, MBA 39 Invesco PowerShares Capital Management LLC 301 West Roosevelt Road Wheaton, IL 60187 | Vice President | Since 2003 | Managing Director, Invesco PowerShares Capital Management LLC (August 2002-Present); formerly, Treasurer of the Trust (April 2003-April 2006); Senior Equity Analyst, Charles Schwab & Company (May 2001-August 2002) | ||||||||||||
* This is the period for which the Officers began serving the Trust. Each Officer serves one year term, until his successor is elected.
58
Board Considerations Regarding Continuation of Investment Advisory Agreement
At a meeting held on April 16, 2009, the Board of Trustees of the PowerShares Exchange-Traded Fund Trust (the "Trust"), including the Independent Trustees, unanimously approved the continuation of the Investment Advisory Agreement between Invesco PowerShares Capital Management LLC (the "Adviser") and the Trust for the following 70 series (each, a "Fund" and collectively, the "Funds"):
PowerShares Dynamic Market Portfolio
PowerShares Dynamic OTC Portfolio
PowerShares Golden Dragon Halter USX China Portfolio
PowerShares High Yield Equity Dividend AchieversTM Portfolio
PowerShares WilderHill Clean Energy Portfolio
PowerShares Dynamic Large Cap Growth Portfolio
PowerShares Dynamic Large Cap Value Portfolio
PowerShares Dynamic Mid Cap Growth Portfolio
PowerShares Dynamic Mid Cap Value Portfolio
PowerShares Dynamic Small Cap Growth Portfolio
PowerShares Dynamic Small Cap Value Portfolio
PowerShares Dynamic Biotechnology & Genome Portfolio
PowerShares Dynamic Food & Beverage Portfolio
PowerShares Dynamic Leisure and Entertainment Portfolio
PowerShares Dynamic Media Portfolio
PowerShares Dynamic Networking Portfolio
PowerShares Dynamic Pharmaceuticals Portfolio
PowerShares Dynamic Semiconductors Portfolio
PowerShares Dynamic Software Portfolio
PowerShares Zacks Micro Cap Portfolio
PowerShares Aerospace & Defense Portfolio
PowerShares Dynamic Hardware & Consumer Electronics Portfolio
PowerShares Dynamic Telecommunications & Wireless Portfolio
PowerShares Value Line Timeliness Select Portfolio
PowerShares Dividend AchieversTM Portfolio
PowerShares International Dividend AchieversTM Portfolio
PowerShares High Growth Rate Dividend AchieversTM Portfolio
PowerShares Zacks Small Cap Portfolio
PowerShares Dynamic Building and Construction Portfolio
PowerShares Dynamic Energy Exploration and Production Portfolio
PowerShares Dynamic Insurance Portfolio
PowerShares Dynamic Oil and Gas Services Portfolio
PowerShares Dynamic Retail Portfolio
PowerShares Dynamic Utilities Portfolio
PowerShares Lux Nanotech Portfolio
PowerShares FTSE RAFI US 1000 Portfolio
PowerShares FTSE RAFI US 1500 Small-Mid Portfolio
PowerShares Water Resources Portfolio
PowerShares Dynamic Energy Sector Portfolio
PowerShares Dynamic Financials Sector Portfolio
PowerShares Dynamic Healthcare Sector Portfolio
PowerShares Dynamic Industrials Sector Portfolio
PowerShares Dynamic Large Cap Portfolio
PowerShares Dynamic MagniQuant Portfolio
PowerShares Dynamic Mid Cap Portfolio
PowerShares Dynamic Small Cap Portfolio
PowerShares Dynamic Technology Sector Portfolio
PowerShares Buyback Achievers(TM) Portfolio
PowerShares FTSE RAFI Basic Materials Sector Portfolio
PowerShares FTSE RAFI Consumer Goods Sector Portfolio
PowerShares FTSE RAFI Consumer Services Sector Portfolio
PowerShares FTSE RAFI Energy Sector Portfolio
PowerShares FTSE RAFI Financials Sector Portfolio
PowerShares FTSE RAFI Health Care Sector Portfolio
PowerShares FTSE RAFI Industrials Sector Portfolio
PowerShares FTSE RAFI Telecommunications & Technology Sector Portfolio
59
Board Considerations Regarding Continuation of Investment Advisory Agreement (Continued)
PowerShares FTSE RAFI Utilities Sector Portfolio
PowerShares Cleantech Portfolio
PowerShares Dynamic Aggressive Growth Portfolio
PowerShares Dynamic Banking Portfolio
PowerShares Dynamic Basic Materials Sector Portfolio
PowerShares Dynamic Consumer Discretionary Sector Portfolio
PowerShares Dynamic Consumer Staples Sector Portfolio
PowerShares Dynamic Healthcare Services Portfolio
PowerShares Dynamic Deep Value Portfolio
PowerShares Financial Preferred Portfolio
PowerShares Listed Private Equity Portfolio
PowerShares DWA Technical Leaders Portfolio
PowerShares Value Line Industry Rotation Portfolio
PowerShares WilderHill Progressive Energy Portfolio
The Trustees reviewed information from the Adviser describing: (i) the nature, extent and quality of services provided, (ii) the investment performance of the Funds and the Adviser, (iii) the costs of services provided and estimated profits realized by the Adviser, (iv) the extent to which economies of scale are realized as the Funds grow, (v) whether fee levels reflect any possible economies of scale for the benefit of Fund shareholders, (vi) comparisons of services rendered and amounts paid to other registered investment companies and (vii) any benefits realized by the Adviser from its relationship with each Fund. Based on all of the information considered and the conclusions reached, the Board, including the Independent Trustees, determined to approve the continuation of the Investment Advisory Agreement for each Fund. No single factor was determinative in the Board's analysis.
Nature, Extent and Quality of Services. In evaluating the nature, extent and quality of the Adviser's services, the Trustees reviewed information concerning the functions performed by the Adviser for the Funds, information describing the Adviser's current organization and projected staffing, including operations assistance provided by the Adviser's parent organization, Invesco Ltd., and the background and experience of the persons responsible for the day-to-day management of the Funds. The Trustees reviewed matters related to the Adviser's execution of portfolio transactions on behalf of the Funds. The Trustees also reviewed information on the performance of the Funds and the performance of their underlying indices through December 31, 2008. The Trustees also reviewed reports on the correlation and tracking error between the underlying index and each Fund's performance, and the Adviser's analysis of the tracking error between each Fund and its underlying index. The Trustees noted that each Fund's correlation was within the targeted range set forth in the Trust's registration statement and that, for each Fund other than PowerShares Financial Preferred Portfolio, the tracking error was within the targeted range set forth in the Trust's registration statement. The Trustees reviewed the reasons for PowerShares Financial Preferred Portfolio's tracking error. The Trustees concluded that each Fund was correlated to its underlying index and that the tracking error for each Fund was within an acceptable range given that Fund's particular circumstances.
The Trustees also considered the services provided by the Adviser in its oversight of the Funds' administrator, custodian and transfer agent. They noted the significant amount of time and effort that had been devoted to this oversight function.
Based on their review, the Trustees concluded that the nature, extent and quality of services provided by the Adviser to the Funds under the Investment Advisory Agreement were appropriate and reasonable.
60
Board Considerations Regarding Continuation of Investment Advisory Agreement (Continued)
Fees, Expenses and Profitability. The Trustees reviewed and discussed the information provided by the Adviser on each Fund's expense ratio and advisory fee, as compared to information compiled by the Adviser from Lipper Inc. databases on the expense ratios of comparable exchange-traded funds ("ETFs"), open-end (non-ETF) index funds and open-end actively-managed funds. The Trustees noted that the annual advisory fee charged to each Fund is:
• 0.50% of the Fund's average net assets, for each Fund other than PowerShares High Yield Equity Dividend Achievers(TM) Portfolio, PowerShares Dividend Achievers(TM) Portfolio, PowerShares High Growth Rate Dividend Achievers(TM) Portfolio, PowerShares International Dividend Achievers(TM) Portfolio, PowerShares FTSE RAFI Basic Materials Sector Portfolio, PowerShares FTSE RAFI Consumer Goods Sector Portfolio, PowerShares FTSE RAFI Consumer Services Sector Portfolio, PowerShares FTSE RAFI Energy Sector Portfolio, PowerShares FTSE RAFI Financials Sector Portfolio, PowerShares FTSE RAFI Health Care Sector Portfolio, PowerShares FTSE RAFI Industrials Sector Portfolio, PowerShares FTSE RAFI Telecommunications & Technology Sector Portfolio, PowerShares FTSE RAFI Utilities Sector Portfolio, PowerShares FTSE RAFI US 1000 Portfolio and PowerShares FTSE RAFI US 1500 Small-Mid Portfolio;
• 0.40% of the Fund's average net assets, for each of PowerShares High Yield Equity Dividend Achievers(TM) Portfolio, PowerShares Dividend Achievers(TM) Portfolio, PowerShares High Growth Rate Dividend Achievers(TM) Portfolio and PowerShares International Dividend Achievers(TM) Portfolio; and
• 0.29% of the Fund's average net assets, for each of PowerShares FTSE RAFI Basic Materials Sector Portfolio, PowerShares FTSE RAFI Consumer Goods Sector Portfolio, PowerShares FTSE RAFI Consumer Services Sector Portfolio, PowerShares FTSE RAFI Energy Sector Portfolio, PowerShares FTSE RAFI Financials Sector Portfolio, PowerShares FTSE RAFI Health Care Sector Portfolio, PowerShares FTSE RAFI Industrials Sector Portfolio, PowerShares FTSE RAFI Telecommunications & Technology Sector Portfolio, PowerShares FTSE RAFI Utilities Sector Portfolio, PowerShares FTSE RAFI US 1000 Portfolio and PowerShares FTSE RAFI US 1500 Small-Mid Portfolio (the Trustees noted that the advisory fee for each of these Funds was reduced to 0.29% effective November 1, 2008).
The Trustees also noted that the Adviser has agreed to waive a portion of its advisory fee and/or pay expenses (an "Expense Cap") to the extent necessary to prevent the annual operating expenses of each Fund from exceeding the percentage of that Fund's average daily net assets, at least until August 31, 2010, as set forth below:
• 0.60%, excluding interest expenses, brokerage commissions and other trading expenses, taxes and extraordinary expenses, for each of PowerShares Dynamic OTC Portfolio and PowerShares Dynamic Market Portfolio;
• 0.50%, excluding interest expenses, licensing fees, offering costs, brokerage commissions and other trading expenses, taxes and extraordinary expenses, for each of PowerShares High Yield Equity Dividend Achievers(TM) Portfolio, PowerShares Dividend Achievers(TM) Portfolio, PowerShares High Growth Rate Dividend Achievers(TM) Portfolio and PowerShares International Dividend Achievers(TM) Portfolio;
61
Board Considerations Regarding Continuation of Investment Advisory Agreement (Continued)
• 0.39%, excluding interest expenses, offering costs, brokerage commissions and other trading expenses, taxes and extraordinary expenses, for each of PowerShares FTSE RAFI Basic Materials Sector Portfolio, PowerShares FTSE RAFI Consumer Goods Sector Portfolio, PowerShares FTSE RAFI Consumer Services Sector Portfolio, PowerShares FTSE RAFI Energy Sector Portfolio, PowerShares FTSE RAFI Financials Sector Portfolio, PowerShares FTSE RAFI Health Care Sector Portfolio, PowerShares FTSE RAFI Industrials Sector Portfolio, PowerShares FTSE RAFI Telecommunications & Technology Sector Portfolio, PowerShares FTSE RAFI Utilities Sector Portfolio, PowerShares FTSE RAFI US 1000 Portfolio and PowerShares FTSE RAFI US 1500 Small-Mid Portfolio (the Trustees noted that, effective November 1, 2008, the Expense Cap for each of these Funds changed from 0.60% to 0.39%); and
• 0.60%, excluding interest expenses, licensing fees, offering costs, brokerage commissions and other trading expenses, taxes and extraordinary expenses, for each other Fund.
The Trustees noted that the Adviser represented that it does not manage any funds other than the Funds and other ETFs overseen by the Board. The Trustees noted that each Fund's advisory fee was:
• higher than the median advisory fee of its ETF peer funds (except for the advisory fee of each of PowerShares Financial Preferred Portfolio, PowerShares Golden Dragon Halter USX China Portfolio and PowerShares International Dividend Achievers(TM) Portfolio, which was lower than the median advisory fee of its ETF peer funds); and
• higher than the median advisory fee of its open-end index peer funds (except for the advisory fee of each of PowerShares DWA Technical Leaders Portfolio, PowerShares Dynamic Aggressive Growth Portfolio, PowerShares Dynamic Mid Cap Growth Portfolio, PowerShares Dynamic Mid Cap Value Portfolio, PowerShares Dynamic OTC Portfolio, PowerShares Dynamic Telecommunications & Wireless Portfolio, PowerShares Dynamic Utilities Portfolio, PowerShares Financial Preferred Portfolio, PowerShares FTSE RAFI Utilities Sector Portfolio and PowerShares Value Line Timeliness Select Portfolio, which was lower than the median advisory fee of its open-end index peer funds, and there was no comparable data for PowerShares Dynamic Basic Materials Sector Portfolio, PowerShares FTSE RAFI Basic Materials Sector Portfolio or PowerShares Golden Dragon Halter USX China Portfolio); but
• lower than the median advisory fee of its open-end actively-managed peer funds.
The Trustees determined that the advisory fees were reasonable, noting the complexity of the indices, which generally require more frequent rebalancing of the portfolios, the distinguishing factors of the Funds, and the higher administrative, operational and management oversight costs for the Adviser. With respect to the Funds' expense ratios, the Trustees noted that the net expense ratio for each Fund was:
• higher than the median expense ratio of its ETF peer funds (except for the net expense ratio of each of PowerShares Dynamic OTC Portfolio, PowerShares Financial Preferred Portfolio and PowerShares International Dividend AchieversTM Portfolio, which was less than the median expense ratio of its ETF peer funds, and the net expense ratio of each of PowerShares Dynamic Aggressive Growth Portfolio and PowerShares Dynamic Market Portfolio, which was equal to the median expense ratio of its ETF peer funds); and
62
Board Considerations Regarding Continuation of Investment Advisory Agreement (Continued)
• higher than the median expense ratio of its open-end index peer funds (except for the net expense ratio of each of PowerShares DWA Technical Leaders Portfolio, PowerShares Dynamic Aggressive Growth Portfolio, PowerShares Dynamic Banking Portfolio, PowerShares Dynamic Biotechnology & Genome Portfolio, PowerShares Dynamic Financials Sector Portfolio, PowerShares Dynamic Healthcare Sector Portfolio, PowerShares Dynamic Healthcare Services Portfolio, PowerShares Dynamic Insurance Portfolio, PowerShares Dynamic OTC Portfolio, PowerShares Dynamic Pharmaceuticals Portfolio, PowerShares Dynamic Telecommunications & Wireless Portfolio, PowerShares Dynamic Utilities Portfolio, PowerShares Financial Preferred Portfolio, PowerShares FTSE RAFI Financials Sector Portfolio, PowerShares FTSE RAFI Utilities Sector Portfolio, PowerShares Listed Private Equity Portfolio and PowerShares Value Line Timeliness Select Portfol io, which was lower than the median expense ratio of its open-end index peer funds, and there was no comparable data for PowerShares Dynamic Basic Materials Sector Portfolio, PowerShares FTSE RAFI Basic Materials Sector Portfolio or PowerShares Golden Dragon Halter USX China Portfolio); but
• lower than the median expense ratio of its open-end actively-managed peer funds.
The Trustees noted that a significant component of the non-advisory fee expenses was the license fees paid by the Funds.
The Board concluded that the advisory fee and expense ratio of each Fund (giving effect to the Fund's Expense Cap) were reasonable and appropriate in light of the services provided.
In conjunction with their review of fees, the Trustees also considered information provided by the Adviser on the revenues received by the Adviser under the Investment Advisory Agreement for each Fund, as well as the fees waived and expenses reimbursed by the Adviser for the Funds. The Trustees reviewed information provided by the Adviser on its profitability as well as any profits or losses realized by the Adviser from its relationship to each Fund. The Trustees concluded that the profitability to the Adviser of the advisory services provided to any of the Funds was not unreasonable.
Economies of Scale and Whether Fee Levels Reflect These Economies of Scale. The Trustees reviewed the information provided by the Adviser as to the extent to which economies of scale are realized as each Fund grows and whether fee levels reflect economies of scale for the benefit of shareholders. The Trustees reviewed each Fund's asset size, expense ratio and expense limitation agreed to by the Adviser. The Trustees noted that, for Funds whose expenses are higher than their respective Expense Caps, any reduction in that Fund's expenses would be enjoyed by the Adviser, but that Fund shareholders benefit from the lower expense ratio as a result of the Fund's Expense Cap. The Trustees also noted that the Excess Expense Agreement with the Trust provides that the Adviser is entitled to be reimbursed by each Fund, other than PowerShares Dynamic Market Portf olio and PowerShares Dynamic OTC Portfolio, for fees waived or expenses absorbed pursuant to the Expense Cap for a period of three years from the date the fee or expense was incurred, provided that no reimbursement would be made that would result in a Fund exceeding its Expense Cap. The Trustees considered whether the advisory fee rate for each Fund was reasonable in relation to the asset size of that Fund, and concluded that the flat advisory fee was reasonable and appropriate, noting the Fund expenses the Adviser has borne as a result of the Expense Cap.
63
Board Considerations Regarding Continuation of Investment Advisory Agreement (Continued)
The Trustees noted that the Adviser had not identified any further benefits that it derived from its relationship with the Funds and had noted that it does not have any soft-dollar arrangements.
Based on all of the information considered and the conclusions reached, the Board, including the Independent Trustees, determined to approve the continuation of the Investment Advisory Agreement for each Fund. No single factor was determinative in the Board's analysis.
64
Board Considerations Regarding Continuation of Investment Advisory Agreement
At a meeting held on April 16, 2009, the Board of Trustees of the PowerShares Exchange-Traded Fund Trust (the "Trust"), including the Independent Trustees, unanimously approved the continuation of the Investment Advisory Agreement between Invesco PowerShares Capital Management LLC (the "Adviser") and the Trust for the following five series (each, a "Fund" and collectively, the "Funds"):
PowerShares FTSE NASDAQ Small Cap Portfolio
PowerShares NASDAQ Internet Portfolio
PowerShares NASDAQ-100 BuyWrite Portfolio
PowerShares NXQ Portfolio
PowerShares S&P 500 BuyWrite Portfolio
The Trustees reviewed information from the Adviser describing: (i) the nature, extent and quality of services provided, (ii) the investment performance of the Funds and the Adviser, (iii) the costs of services provided and estimated profits realized by the Adviser, (iv) the extent to which economies of scale are realized as the Funds grow, (v) whether fee levels reflect any possible economies of scale for the benefit of Fund shareholders, (vi) comparisons of services rendered and amounts paid to other registered investment companies and (vii) any benefits realized by the Adviser from its relationship with each Fund. Based on all of the information considered and the conclusions reached, the Board, including the Independent Trustees, determined to approve the continuation of the Investment Advisory Agreement for each Fund. No single factor was determinative in the Board's analysis.
Nature, Extent and Quality of Services. In evaluating the nature, extent and quality of the Adviser's services, the Trustees reviewed information concerning the functions performed by the Adviser for the Funds, information describing the Adviser's current organization and projected staffing, including operations assistance provided by the Adviser's parent organization, Invesco Ltd., and the background and experience of the persons responsible for the day-to-day management of the Funds. The Trustees reviewed matters related to the Adviser's execution of portfolio transactions on behalf of the Funds. The Trustees also reviewed information on the performance of the Funds and the performance of their underlying indices through December 31, 2008. The Trustees also reviewed reports on the correlation and tracking error between the underlying index and each Fund's performance, and the Adviser's analysis of the tracking error between each Fund and its underlying index. The Trustees noted that, in each case, the correlation and tracking error for each Fund was within the targeted range set forth in the Trust's registration statement. The Trustees concluded that each Fund was correlated to its underlying index and that the tracking error for each Fund was within an acceptable range given that Fund's particular circumstances.
The Trustees also considered the services provided by the Adviser in its oversight of the Funds' administrator, custodian and transfer agent. They noted the significant amount of time and effort that had been devoted to this oversight function.
Based on their review, the Trustees concluded that the nature, extent and quality of services provided by the Adviser to the Funds under the Investment Advisory Agreement were appropriate and reasonable.
Fees, Expenses and Profitability. The Trustees reviewed and discussed the information provided by the Adviser on each Fund's total expense ratio and unitary advisory fee, as compared to information compiled by the Adviser from Lipper Inc. databases on the expense ratios of comparable exchange-traded funds ("ETFs"), open-end (non-ETF) index funds and open-end actively-managed funds. The Trustees noted that
65
Board Considerations Regarding Continuation of Investment Advisory Agreement (Continued)
the annual unitary advisory fee is 0.70% for each of PowerShares FTSE NASDAQ Small Cap Portfolio and PowerShares NXQ Portfolio, 0.60% for PowerShares NASDAQ Internet Portfolio and 0.75% for each of PowerShares NASDAQ-100 BuyWrite Portfolio and PowerShares S&P 500 BuyWrite Portfolio, and that the Adviser pays all other expenses of each Fund, except that each Fund pays its brokerage expenses, taxes, interest and extraordinary expenses.
The Trustees noted that the Adviser represented that it does not manage any funds other than the Funds and other ETFs overseen by the Board. The Trustees noted that: the advisory fee for PowerShares FTSE NASDAQ Small Cap Portfolio was higher than the median expense ratios of its ETF peer funds and open-end index peer funds, but lower than the median expense ratio of its open-end actively-managed peer funds; the advisory fee for PowerShares NASDAQ Internet Portfolio was equal to or lower than the median expense ratio for each peer group; no comparable ETF peer fund information was available for PowerShares NASDAQ-100 BuyWrite Portfolio or PowerShares S&P 500 BuyWrite Portfolio, but the advisory fee for each of these Funds was lower than the median expense ratios of their open-end index peer funds and open-end actively-managed peer funds; and the advisory fee for PowerShares NXQ Portfolio was higher than the median expense rat io of its ETF peer funds, but lower than the median expense ratios of its open-end index peer funds and open-end actively-managed peer funds. The Trustees noted that each Fund's advisory fee was reasonable because of the complexity of the indices, which generally require more frequent rebalancing of the portfolios, the distinguishing factors of the Funds and the higher administrative, operational and management oversight costs for the Adviser. The Trustees also noted that a portion of each Fund's advisory fee was attributable to a license fee payable out of the unitary fee charged to that Fund. The Board concluded that the unitary advisory fee charged to each Fund was reasonable and appropriate in light of the services provided.
In conjunction with their review of the unitary advisory fee, the Trustees also considered information provided by the Adviser on the revenues received by the Adviser under the Investment Advisory Agreement. The Trustees reviewed information provided by the Adviser on its profitability as well as any profits or losses realized by the Adviser from its relationship to each Fund. The Trustees reviewed the overall profitability of the Adviser and noted that the Adviser, to date, had incurred a loss from its relationship with the Funds.
Economies of Scale and Whether Fee Levels Reflect These Economies of Scale. The Trustees reviewed the information provided by the Adviser as to the extent to which economies of scale are realized as each Fund grows and whether fee levels reflect economies of scale for the benefit of shareholders. The Trustees reviewed each Fund's asset size and expense ratio. The Trustees noted that any reduction in fixed costs associated with the management of the Funds would be enjoyed by the Adviser, but a unitary fee provides certainty in expenses for the Funds. The Trustees considered whether the advisory fee rate for each Fund was reasonable in relation to the asset size of that Fund, and concluded that the flat advisory fee was reasonable and appropriate.
The Trustees noted that the Adviser had not identified any further benefits that it derived from its relationship with the Funds and had noted that it does not have any soft-dollar arrangements.
Based on all of the information considered and the conclusions reached, the Board, including the Independent Trustees, determined to approve the continuation of the Investment Advisory Agreement for each Fund. No single factor was determinative in the Board's analysis.
66
This page intentionally left blank
This page intentionally left blank
PROXY VOTING POLICIES AND PROCEDURES
A description of the Funds' proxy voting policies and procedures that the Funds use to determine how to vote proxies relating to portfolio securities is available, without charge and upon request, by calling (800) 337-4246. This information is also available on the Securities and Exchange Commission's ("Commission") website at www.sec.gov.
Information regarding how the Funds voted proxies for portfolio securities, if applicable, during the most recent 12-month period ended June 30, is also available, without charge and upon request, by (i) calling (800) 337-4246; or (ii) accessing the Trust's Form N-PX on the Commission's website at www.sec.gov.
QUARTERLY PORTFOLIOS
The Funds file their complete schedules of portfolio holdings with the Commission for the first and third quarters of each fiscal year on Form N-Q. The Trust's Forms N-Q are available on the Commission's website at www.sec.gov. The Trust's Forms N-Q may also be reviewed and copied at the Commission's Public Reference Room in Washington, D.C.; information on the operation of the Public Reference Room may be obtained by calling (800) SEC-0330.
There are risks involved in investing in exchange-traded funds ("ETFs"), including possible loss of money. Investing in securities of small and medium sized companies involves greater risk than is customarily associated with investing in more established companies, and investments in concentrated industry sectors involve greater risks than investments that are more diversified. Index-based ETFs are not actively managed. Actively-managed ETFs do not necessarily seek to replicate the performance of a specific index. Both index-based and actively-managed ETFs are subject to risks similar to stocks, including those related to short selling and margin maintenance. PowerShares ETFs are not FDIC insured, may lose value and have no bank guarantee. PowerShares is a registered trademark of Invesco PowerShares Capital Management LLC. Past performance is not a guarantee of future results.
Invesco Aim Distributors, Inc. is the distributor of the PowerShares Exchange-Traded Fund Trust.
An investor should consider each PowerShares ETF's investment objective, risks, charges and expenses carefully before investing. For more complete information about PowerShares ETFs call Invesco Aim Distributors, Inc. at (800) 337-4246 or visit invescopowershares.com for a prospectus. Please read the prospectus carefully before investing.


301 West Roosevelt Road
Wheaton, IL 60187
800.983.0903
www.invescopowershares.com
© 2009 Invesco PowerShares Capital Management LLC P-PS-AR-2


2009 Annual Report to Shareholders
April 30, 2009
PowerShares Dynamic Aggressive Growth Portfolio
PowerShares Dynamic Deep Value Portfolio
PowerShares Dynamic Large Cap Growth Portfolio
PowerShares Dynamic Large Cap Portfolio
PowerShares Dynamic Large Cap Value Portfolio
PowerShares Dynamic Mid Cap Growth Portfolio
PowerShares Dynamic Mid Cap Portfolio
PowerShares Dynamic Mid Cap Value Portfolio
PowerShares Dynamic Small Cap Growth Portfolio
PowerShares Dynamic Small Cap Portfolio
PowerShares Dynamic Small Cap Value Portfolio
PowerShares FTSE NASDAQ Small Cap Portfolio
PowerShares Zacks Micro Cap Portfolio
PowerShares Zacks Small Cap Portfolio

Table of Contents
| The Market Environment | 2 | ||||||
| Manager's Analysis | 4 | ||||||
| Frequency Distribution of Discounts & Premiums | 32 | ||||||
| Fees and Expenses | 34 | ||||||
| Style Portfolios | |||||||
| Schedules of Investments | |||||||
| PowerShares Dynamic Aggressive Growth Portfolio | 36 | ||||||
| PowerShares Dynamic Deep Value Portfolio | 38 | ||||||
| PowerShares Dynamic Large Cap Growth Portfolio | 40 | ||||||
| PowerShares Dynamic Large Cap Portfolio | 41 | ||||||
| PowerShares Dynamic Large Cap Value Portfolio | 43 | ||||||
| PowerShares Dynamic Mid Cap Growth Portfolio | 44 | ||||||
| PowerShares Dynamic Mid Cap Portfolio | 45 | ||||||
| PowerShares Dynamic Mid Cap Value Portfolio | 47 | ||||||
| PowerShares Dynamic Small Cap Growth Portfolio | 49 | ||||||
| PowerShares Dynamic Small Cap Portfolio | 51 | ||||||
| PowerShares Dynamic Small Cap Value Portfolio | 54 | ||||||
| PowerShares FTSE NASDAQ Small Cap Portfolio | 56 | ||||||
| PowerShares Zacks Micro Cap Portfolio | 66 | ||||||
| PowerShares Zacks Small Cap Portfolio | 71 | ||||||
| Statements of Assets and Liabilities | 74 | ||||||
| Statements of Operations | 76 | ||||||
| Statements of Changes in Net Assets | 78 | ||||||
| Financial Highlights | 83 | ||||||
| Notes to Financial Statements | 90 | ||||||
| Report of Independent Registered Public Accounting Firm | 103 | ||||||
| Supplemental Information | 104 | ||||||
| Board Consideration Regarding Continuation of Investment Advisory Agreements | 109 | ||||||
The Market Environment
For the year ended April 30, 2009, stock market losses were larger than most market participants have ever seen in their professional careers. The S&P 500® Index was down 35.29%, the NASDAQ-100® Index declined 26.83% and the Dow Jones Industrial Index dropped 34.12%. Corporate debt markets also declined as the credit crunch continued to limit access to capital. Municipal securities held up a little better but still struggled. The Merrill U.S. Corporate Master Index returned -5.78% while the Merrill Muni Master Index returned 2.26% for the period. Meanwhile, treasury securities rallied as investors fled to quality. Huge companies required capital infusions and/or other forms of financial support through government intervention and the credit crisis evolved into an overall crisis of consumer, investor and business confidence.
The markets fell nearly universally from August through October. As more job losses and layoffs were announced, banks continued to restrict borrowing and consumers, who drive two-thirds of the U.S. economy historically, were unable to sustain their spending. The government spent hundreds of billions of dollars to bail out firms and stimulate the economy while the Federal Open Market Committee moved from a discount rate of 2.50% to 0.50% during the period. Not until March did confidence begin to return to the equity markets with the S&P 500® Index, NASDAQ-100® Index and the Dow Jones Industrial Index moving off the lows and returning 29.99%, 29.97% and 21.24% respectively from March 1 through April 30, of 2009. Corporate and municipal debt also showed some appreciation over the period, however the amount of appreciation was less as credit spreads tightened. The Merrill Muni Master Index was up 2. 33% while the Merrill U.S. Corporate Master Index rose by 2.55% from March 1 through April 30, 2009.
2
This page intentionally left blank
Manager's Analysis
PowerShares Dynamic Aggressive Growth Portfolio (ticker: PGZ)
The PowerShares Dynamic Aggressive Growth Portfolio (the "Fund"), based on the Dynamic Aggressive Growth IntellidexSM Index ("Index"), seeks investment results that correspond generally to the price and yield (before the Fund's fees and expenses) of that equity index.
The Fund posted a -38.23% return over the reporting period, underperforming the S&P 1500® Growth Index which returned -30.71%. During the last year, value stocks outperformed growth stocks.
Overallocation to small cap companies had the greatest negative impact on performance. On the sector level, overallocation to the industrials had a negative impact on performance. Stock selection within health care, information technology and consumer staples also contributed to the underperformance.
Sector Breakdown (% of the Fund's
Net Assets) as of April 30, 2009
| Information Technology | 34.0 | ||||||
| Health Care | 27.0 | ||||||
| Consumer Discretionary | 18.6 | ||||||
| Industrials | 13.0 | ||||||
| Financials | 3.7 | ||||||
| Consumer Staples | 2.9 | ||||||
| Telecommunication Services | 0.9 | ||||||
| Money Market Fund | 0.4 | ||||||
| Other | (0.5 | ) | |||||
Style Allocation (% of the Fund's
Total Investments) as of April 30, 2009
| Small-Cap Growth | 60.7 | ||||||
| Mid-Cap Growth | 30.9 | ||||||
| Large-Cap Growth | 6.2 | ||||||
| Small-Cap Value | 2.2 | ||||||
Top Ten Fund Holdings (% of the Fund's
Net Assets) as of April 30, 2009
| Security | |||||||
| GT Solar International, Inc. | 1.5 | ||||||
| Synaptics, Inc. | 1.4 | ||||||
| Allegiant Travel Co. | 1.3 | ||||||
| Cerner Corp. | 1.3 | ||||||
| LoopNet, Inc. | 1.3 | ||||||
| Art Technology Group, Inc. | 1.3 | ||||||
| Dolby Laboratories, Inc., Class A | 1.3 | ||||||
| Resources Connection, Inc. | 1.3 | ||||||
| Apple, Inc. | 1.2 | ||||||
| Bally Technologies, Inc. | 1.2 | ||||||
| Total | 13.1 | ||||||
4
Manager's Analysis (Continued)
PowerShares Dynamic Aggressive Growth Portfolio (ticker: PGZ)
Growth of a $10,000 Investment Since Inception†
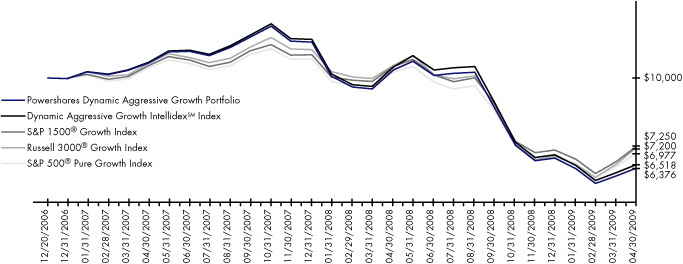
| Fund Performance History (%) | As of April 30, 2009 | ||||||||||||||
| Avg Ann†† | Fund Inception† | ||||||||||||||
| 1 Year | Avg Ann†† | Cumulative | |||||||||||||
| Index | |||||||||||||||
| Dynamic Aggressive Growth IntellidexSM Index | -37.55 | -16.59 | -34.82 | ||||||||||||
| S&P 500® Pure Growth Index | -31.85 | -14.32 | -30.23 | ||||||||||||
| S&P 1500® Growth Index | -30.71 | -12.87 | -27.50 | ||||||||||||
| Russell 3000® Growth Index | -31.46 | -13.13 | -28.00 | ||||||||||||
| Fund | |||||||||||||||
| NAV Return | -38.23 | -17.37 | -36.24 | ||||||||||||
| Share Price Return | -38.35 | -17.45 | -36.39 | ||||||||||||
Fund Inception: December 20, 2006
Performance quoted represents past performance. Past performance is not a guarantee of future results and current performance may be higher or lower than performance quoted. Investment returns and principal value will fluctuate and shares, when redeemed, may be worth more or less than their original cost. The Adviser has waived fees and reimbursed other expenses, absent which, performance would have been lower. The Adviser has contractually agreed to waive fees and/or pay certain Fund expenses through August 31, 2010. According to the Fund's current prospectus, the total gross annual operating expense ratio was indicated as 1.94%. In the Financial Highlights section of this Shareholder Report, the Fund's net (subsidized) total operating expense ratio was determined to be 0.64% while the Fund's gross total operating expense ratio was 1.71%. NAV and Share Price returns assume that dividends and capital gain distributions have been reinvested in the Fund at NAV and Share Price, respectively. The returns shown in the table above do not reflect the deduction of taxes that a shareholder would pay on Fund distributions or the redemption or sale of Fund Shares. See invescopowershares.com to find the most recent month-end performance numbers.
Index performance results are based upon a hypothetical investment in its constituent securities. Index returns do not represent Fund returns. An investor cannot invest directly in an index. The Index does not charge management fees or brokerage expenses, and no such fees or expenses were deducted from the hypothetical performance shown. In addition, the results actual investors might have achieved would have differed from those shown because of differences in the timing, amounts of their investments, and fees and expenses associated with an investment in the Fund.
The S&P 1500® Growth Index, Russell 3000® Growth Index and S&P 500® Pure Growth Index (the "Benchmark Indices") are unmanaged indices used as a measurement of change in stock market conditions based on the average performance of approximately 900, 1,936, and 127 common stocks, respectively. The S&P 1500® Growth Index and the Russell 3000® Growth Index will be used for comparative purposes going forward as these represent the most appropriate market indices for this fund.
† Fund and underlying Index returns are based on the inception date of the Fund. Returns for the Benchmark Indices are based on the closest month-end to the Fund's inception date.
†† Average annualized.
5
Manager's Analysis
PowerShares Dynamic Deep Value Portfolio (ticker: PVM)
The PowerShares Dynamic Deep Value Portfolio (the "Fund"), based on the Dynamic Deep Value IntellidexSM Index ("Index"), seeks investment results that correspond generally to the price and yield (before the Fund's fees and expenses) of that equity index.
The Fund posted a -29.63% return over the reporting period, outperforming the S&P 1500® Value Index which returned -39.08%. During the last year, value stocks outperformed growth stocks.
Stock selection within the financial sector had the greatest positive affect on performance. More specifically, the Fund completely avoided badly beaten financial names like Citigroup, Bank of America, AIG, Merrill Lynch, Wachovia and Lehman Brothers. Overallocation to small cap companies also gave the Fund a significant boost.
Sector Breakdown (% of the Fund's
Net Assets) as of April 30, 2009
| Industrials | 26.2 | ||||||
| Financials | 20.0 | ||||||
| Consumer Discretionary | 14.1 | ||||||
| Information Technology | 10.1 | ||||||
| Materials | 8.4 | ||||||
| Consumer Staples | 8.3 | ||||||
| Health Care | 5.7 | ||||||
| Energy | 3.6 | ||||||
| Telecommunication Services | 1.9 | ||||||
| Utilities | 1.7 | ||||||
| Money Market Fund | 1.3 | ||||||
| Other | (1.3 | ) | |||||
Style Allocation (% of the Fund's
Total Investments) as of April 30, 2009
| Small-Cap Value | 59.6 | ||||||
| Mid-Cap Value | 27.3 | ||||||
| Large-Cap Value | 11.9 | ||||||
| Small-Cap Growth | 1.2 | ||||||
Top Ten Fund Holdings (% of the Fund's
Net Assets) as of April 30, 2009
| Security | |||||||
| Interface, Inc., Class A | 2.0 | ||||||
| Deluxe Corp. | 1.5 | ||||||
| Men's Wearhouse (The), Inc. | 1.4 | ||||||
| Dollar Financial Corp. | 1.3 | ||||||
| Basic Energy Services, Inc. | 1.3 | ||||||
| MetLife, Inc. | 1.3 | ||||||
| Unum Group | 1.3 | ||||||
| Genesco, Inc. | 1.3 | ||||||
| EnerSys | 1.2 | ||||||
| Helen of Troy Ltd. | 1.2 | ||||||
| Total | 13.8 | ||||||
6
Manager's Analysis (Continued)
PowerShares Dynamic Deep Value Portfolio (ticker: PVM)
Growth of a $10,000 Investment Since Inception†
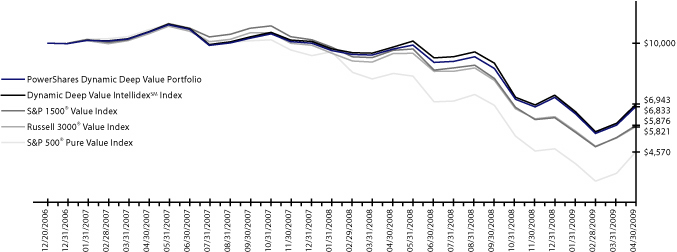
| Fund Performance History (%) | As of April 30, 2009 | ||||||||||||||
| Avg Ann†† | Fund Inception† | ||||||||||||||
| 1 Year | Avg Ann†† | Cumulative | |||||||||||||
| Index | |||||||||||||||
| Dynamic Deep Value IntellidexSM Index | -29.21 | -14.33 | -30.57 | ||||||||||||
| S&P 500® Pure Value Index | -46.10 | -28.54 | -54.30 | ||||||||||||
| S&P 1500® Value Index | -39.08 | -20.38 | -41.24 | ||||||||||||
| Russell 3000® Value Index | -38.61 | -20.70 | -41.79 | ||||||||||||
| Fund | |||||||||||||||
| NAV Return | -29.63 | -14.91 | -31.67 | ||||||||||||
| Share Price Return | -29.66 | -14.94 | -31.73 | ||||||||||||
Fund Inception: December 20, 2006
Performance quoted represents past performance. Past performance is not a guarantee of future results and current performance may be higher or lower than performance quoted. Investment returns and principal value will fluctuate and shares, when redeemed, may be worth more or less than their original cost. The Adviser has waived fees and reimbursed other expenses, absent which, performance would have been lower. The Adviser has contractually agreed to waive fees and/or pay certain Fund expenses through August 31, 2010. According to the Fund's current prospectus, the total gross annual operating expense ratio was indicated as 1.65%. In the Financial Highlights section of this Shareholder Report, the Fund's net (subsidized) total operating expense ratio was determined to be 0.64% while the Fund's gross total operating expense ratio was 1.79%. NAV and Share Price returns assume that dividends and capital gain distributions have been reinvested in the Fund at NAV and Share Price, respectively. The returns shown in the table above do not reflect the deduction of taxes that a shareholder would pay on Fund distributions or the redemption or sale of Fund Shares. See invescopowershares.com to find the most recent month-end performance numbers.
Index performance results are based upon a hypothetical investment in its constituent securities. Index returns do not represent Fund returns. An investor cannot invest directly in an index. The Index does not charge management fees or brokerage expenses, and no such fees or expenses were deducted from the hypothetical performance shown. In addition, the results actual investors might have achieved would have differed from those shown because of differences in the timing, amounts of their investments, and fees and expenses associated with an investment in the Fund.
The S&P 1500® Value Index, Russell 3000® Value Index and S&P 500® Pure Value Index (the "Benchmark Indices") are unmanaged indices used as a measurement of change in stock market conditions based on the average performance of approximately 373, 1,896, and 122 common stocks, respectively. The S&P 1500® Value Index and the Russell 3000® Value Index will be used for comparative purposes going forward as these represent the most appropriate market indices for this fund.
† Fund and underlying Index returns are based on the inception date of the Fund. Returns for the Benchmark Indices are based on the closest month-end to the Fund's inception date.
†† Average annualized.
7
Manager's Analysis
PowerShares Dynamic Large Cap Growth Portfolio (ticker: PWB)
The PowerShares Dynamic Large Cap Growth Portfolio (the "Fund"), based on the Dynamic Large Cap Growth IntellidexSM Index ("Index"), seeks investment results that correspond generally to the price and yield (before the Fund's fees and expenses) of that equity index.
The Fund posted a return of -35.93% over the reporting period, underperforming the S&P Citigroup Large Cap Growth Index which returned -30.70%. During this time, value stocks outperformed growth stocks. The Fund reacted given these conditions, underperforming the market. Health care, industrials, materials and energy were the leading sectors contributing to the Fund's underperformance. Information technology and financial sectors helped offset negative returns.
Sector Breakdown (% of the Fund's
Net Assets) as of April 30, 2009
| Information Technology | 34.1 | ||||||
| Health Care | 27.8 | ||||||
| Consumer Discretionary | 15.4 | ||||||
| Consumer Staples | 9.1 | ||||||
| Industrials | 5.9 | ||||||
| Materials | 3.2 | ||||||
| Financials | 2.9 | ||||||
| Energy | 1.6 | ||||||
| Other | 0.0 | ||||||
Style Allocation (% of the Fund's
Total Investments) as of April 30, 2009
| Large-Cap Growth | 80.5 | ||||||
| Mid-Cap Growth | 14.6 | ||||||
| Large-Cap Value | 3.0 | ||||||
| Mid-Cap Value | 1.9 | ||||||
Top Ten Fund Holdings (% of the Fund's
Net Assets) as of April 30, 2009
| Security | |||||||
| Apple, Inc. | 4.1 | ||||||
| QUALCOMM, Inc. | 3.7 | ||||||
| Oracle Corp. | 3.6 | ||||||
| Intel Corp. | 3.6 | ||||||
| CVS Caremark Corp. | 3.6 | ||||||
| Comcast Corp., Class A | 3.5 | ||||||
| Google, Inc., Class A | 3.4 | ||||||
| Monsanto Co. | 3.2 | ||||||
| Medtronic, Inc. | 3.2 | ||||||
| Bristol-Myers Squibb Co. | 3.0 | ||||||
| Total | 34.9 | ||||||
8
Manager's Analysis (Continued)
PowerShares Dynamic Large Cap Growth Portfolio (ticker: PWB)
Growth of a $10,000 Investment Since Inception†
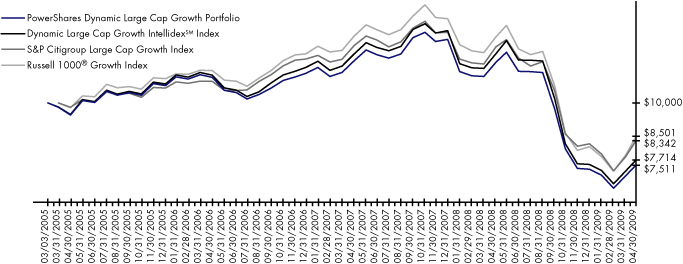
| Fund Performance History (%) | As of April 30, 2009 | ||||||||||||||||||
| Avg Ann†† | Fund Inception† | ||||||||||||||||||
| 1 Year | 3 Year | Avg Ann†† | Cumulative | ||||||||||||||||
| Index | |||||||||||||||||||
| Dynamic Large Cap Growth IntellidexSM Index | -35.59 | -11.46 | -6.05 | -22.86 | |||||||||||||||
| S&P Citigroup Large Cap Growth Index | -30.70 | -7.89 | -4.26 | -16.58 | |||||||||||||||
| Russell 1000® Growth Index | -31.57 | -8.49 | -3.82 | -14.99 | |||||||||||||||
| Fund | |||||||||||||||||||
| NAV Return | -35.93 | -12.01 | -6.65 | -24.89 | |||||||||||||||
| Share Price Return | -35.93 | -11.99 | -6.69 | -25.04 | |||||||||||||||
Fund Inception: March 3, 2005
Performance quoted represents past performance. Past performance is not a guarantee of future results and current performance may be higher or lower than performance quoted. Investment returns and principal value will fluctuate and shares, when redeemed, may be worth more or less than their original cost. The Adviser has waived fees and reimbursed other expenses during previous fiscal periods, absent which, performance during those fiscal periods would have been lower. While the Adviser has contractually agreed to waive and/or pay certain Fund expenses through August 31, 2010, the Fund is currently subject to recapture, which may result in an increased expense ratio. According to the Fund's current prospectus, the total gross annual operating expense ratio was indicated as 0.60%. In the Financial Highlights section of this Shareholder Report, the Fund's net total operating expense ratio was determined to be 0.61% while the Fund' s gross total operating expense ratio was 0.60%. NAV and Share Price returns assume that dividends and capital gain distributions have been reinvested in the Fund at NAV and Share Price, respectively. The returns shown in the table above do not reflect the deduction of taxes that a shareholder would pay on Fund distributions or the redemption or sale of Fund Shares. See invescopowershares.com to find the most recent month-end performance numbers.
Index performance results are based upon a hypothetical investment in its constituent securities. Index returns do not represent Fund returns. An investor cannot invest directly in an index. The Index does not charge management fees or brokerage expenses, and no such fees or expenses were deducted from the hypothetical performance shown. In addition, the results actual investors might have achieved would have differed from those shown because of differences in the timing, amounts of their investments, and fees and expenses associated with an investment in the Fund.
The S&P Citigroup Large Cap Growth Index and Russell 1000® Growth Index (the "Benchmark Indices") are unmanaged indices used as a measurement of change in stock market conditions based on the average performance of approximately 384 and 691 common stocks, respectively.
† Fund and underlying Index returns are based on the inception date of the Fund. Returns for the Benchmark Indices are based on the closest month-end to the Fund's inception date.
†† Average annualized.
9
Manager's Analysis
PowerShares Dynamic Large Cap Portfolio (ticker: PJF)
The PowerShares Dynamic Large Cap Portfolio (the "Fund"), based on the Dynamic Large Cap IntellidexSM Index ("Index"), seeks investment results that correspond generally to the price and yield (before the Fund's fees and expenses) of that equity index.
The Fund posted a -31.47% return during the reporting period, outperforming the S&P 500® Index, which returned -35.29%. While the Fund dropped along with the entire market, positive stock selection within the financials sectors boosted the Fund's performance. Within financials, avoiding beaten down names like Citigroup, Bank of America, AIG, Merrill Lynch, Wachovia, Fannie Mae, Freddie Mac and Lehman Brothers contributed positively to overall performance.
Sector Breakdown (% of the Fund's
Net Assets) as of April 30, 2009
| Health Care | 20.9 | ||||||
| Information Technology | 20.5 | ||||||
| Industrials | 14.8 | ||||||
| Consumer Staples | 14.0 | ||||||
| Consumer Discretionary | 12.2 | ||||||
| Financials | 6.4 | ||||||
| Energy | 4.6 | ||||||
| Telecommunication Services | 3.1 | ||||||
| Utilities | 1.9 | ||||||
| Materials | 1.6 | ||||||
| Money Market Fund | 0.0 | ||||||
| Other | 0.0 | ||||||
Style Allocation (% of the Fund's
Total Investments) as of April 30, 2009
| Large-Cap Growth | 47.4 | ||||||
| Large-Cap Value | 39.7 | ||||||
| Mid-Cap Value | 7.3 | ||||||
| Mid-Cap Growth | 5.6 | ||||||
Top Ten Fund Holdings (% of the Fund's
Net Assets) as of April 30, 2009
| Security | |||||||
| Apple, Inc. | 2.1 | ||||||
| Cisco Systems, Inc. | 2.0 | ||||||
| 3M Co. | 1.9 | ||||||
| Home Depot, Inc. | 1.8 | ||||||
| Microsoft Corp. | 1.8 | ||||||
| Oracle Corp. | 1.8 | ||||||
| Hewlett-Packard Co. | 1.8 | ||||||
| Intel Corp. | 1.8 | ||||||
| United Technologies Corp. | 1.8 | ||||||
| Comcast Corp., Class A | 1.7 | ||||||
| Total | 18.5 | ||||||
10
Manager's Analysis (Continued)
PowerShares Dynamic Large Cap Portfolio (ticker: PJF)
Growth of a $10,000 Investment Since Inception†
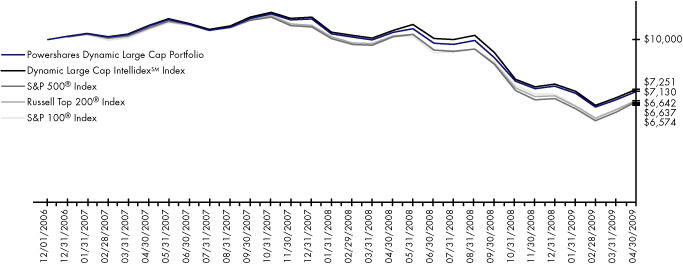
| Fund Performance History (%) | As of April 30, 2009 | ||||||||||||||
| Avg Ann†† | Fund Inception† | ||||||||||||||
| 1 Year | Avg Ann†† | Cumulative | |||||||||||||
| Index | |||||||||||||||
| Dynamic Large Cap IntellidexSM Index | -31.00 | -12.48 | -27.49 | ||||||||||||
| S&P 100® Index | -34.73 | -15.59 | -33.58 | ||||||||||||
| S&P 500® Index | -35.29 | -15.94 | -34.26 | ||||||||||||
| Russell Top 200® Index | -35.00 | -15.60 | -33.63 | ||||||||||||
| Fund | |||||||||||||||
| NAV Return | -31.47 | -13.09 | -28.69 | ||||||||||||
| Share Price Return | -31.48 | -13.14 | -28.79 | ||||||||||||
Fund Inception: December 1, 2006
Performance quoted represents past performance. Past performance is not a guarantee of future results and current performance may be higher or lower than performance quoted. Investment returns and principal value will fluctuate and shares, when redeemed, may be worth more or less than their original cost. The Adviser has waived fees and reimbursed other expenses, absent which, performance would have been lower. The Adviser has contractually agreed to waive fees and/or pay certain Fund expenses through August 31, 2010. According to the Fund's current prospectus, the total gross annual operating expense ratio was indicated as 1.38%. In the Financial Highlights section of this Shareholder Report, the Fund's net (subsidized) total operating expense ratio was determined to be 0.65% while the Fund's gross total operating expense ratio was 0.93%. NAV and Share Price returns assume that dividends and capital gain distributions have been reinvested in the Fund at NAV and Share Price, respectively. The returns shown in the table above do not reflect the deduction of taxes that a shareholder would pay on Fund distributions or the redemption or sale of Fund Shares. See invescopowershares.com to find the most recent month-end performance numbers.
Index performance results are based upon a hypothetical investment in its constituent securities. Index returns do not represent Fund returns. An investor cannot invest directly in an index. The Index does not charge management fees or brokerage expenses, and no such fees or expenses were deducted from the hypothetical performance shown. In addition, the results actual investors might have achieved would have differed from those shown because of differences in the timing, amounts of their investments, and fees and expenses associated with an investment in the Fund.
The S&P 100® Index, S&P 500® Index and Russell Top 200® Index (the "Benchmark Indices") are unmanaged indices used as a measurement of change in stock market conditions based on the average performance of approximately 100, 500 and 205 common stocks, respectively. The S&P 500® Index and the Russell Top 200® Index will be used for comparative purposes going forward as these represent the most appropriate market indices for this fund.
† Fund and underlying Index returns are based on the inception date of the Fund. Returns for the Benchmark Indices are based on the closest month-end to the Fund's inception date.
†† Average annualized.
11
Manager's Analysis
PowerShares Dynamic Large Cap Value Portfolio (ticker: PWV)
The PowerShares Dynamic Large Cap Value Portfolio (the "Fund"), based on the Dynamic Large Cap Value IntellidexSM Index ("Index"), seeks investment results that correspond generally to the price and yield (before the Fund's fees and expenses) of that equity index.
The Fund posted a -28.30% return for the reporting period, outperforming the PowerShares Dynamic Large Cap Growth Portfolio for the year. The Fund did well against the S&P Citigroup Large Cap Value Index, which was down -40.06%. The financials category was the largest sector by weight and was the leading contributor to the Fund's performance, avoiding badly beaten companies held in the benchmark like Citigroup, Merrill Lynch, Wachovia, Lehman Brothers, Fannie Mae, Freddie Mac and Washington Mutual. Overallocation to health care and stock selection within the industrials and energy sectors also boosted the Fund's performance.
Sector Breakdown (% of the Fund's
Net Assets) as of April 30, 2009
| Health Care | 17.2 | ||||||
| Financials | 16.8 | ||||||
| Consumer Discretionary | 16.1 | ||||||
| Industrials | 12.0 | ||||||
| Consumer Staples | 9.8 | ||||||
| Energy | 9.2 | ||||||
| Information Technology | 6.4 | ||||||
| Utilities | 6.4 | ||||||
| Telecommunication Services | 6.1 | ||||||
| Other | 0.0 | ||||||
Style Allocation (% of the Fund's
Total Investments) as of April 30, 2009
| Large-Cap Value | 78.7 | ||||||
| Mid-Cap Value | 14.3 | ||||||
| Large-Cap Growth | 7.0 | ||||||
Top Ten Fund Holdings (% of the Fund's
Net Assets) as of April 30, 2009
| Security | |||||||
| Goldman Sachs Group (The), Inc. | 4.1 | ||||||
| Walt Disney (The) Co. | 3.7 | ||||||
| Time Warner, Inc. | 3.7 | ||||||
| Home Depot, Inc. | 3.6 | ||||||
| United Technologies Corp. | 3.4 | ||||||
| International Business Machines Corp. | 3.2 | ||||||
| Eli Lilly & Co. | 3.2 | ||||||
| ConocoPhillips | 3.2 | ||||||
| Chevron Corp. | 3.1 | ||||||
| Pfizer, Inc. | 3.1 | ||||||
| Total | 34.3 | ||||||
12
Manager's Analysis (Continued)
PowerShares Dynamic Large Cap Value Portfolio (ticker: PWV)
Growth of a $10,000 Investment Since Inception†

| Fund Performance History (%) | As of April 30, 2009 | ||||||||||||||||||
| Avg Ann†† | Fund Inception† | ||||||||||||||||||
| 1 Year | 3 Year | Avg Ann†† | Cumulative | ||||||||||||||||
| Index | |||||||||||||||||||
| Dynamic Large Cap Value IntellidexSM Index | -27.79 | -5.59 | 0.02 | 0.06 | |||||||||||||||
| S&P Citigroup Large Cap Value Index | -40.06 | -13.78 | -6.88 | -25.69 | |||||||||||||||
| Russell 1000® Value Index | -39.21 | -13.21 | -6.70 | -25.08 | |||||||||||||||
| Fund | |||||||||||||||||||
| NAV Return | -28.30 | -6.21 | -0.66 | -2.72 | |||||||||||||||
| Share Price Return | -28.21 | -6.19 | -0.68 | -2.79 | |||||||||||||||
Fund Inception: March 3, 2005
Performance quoted represents past performance. Past performance is not a guarantee of future results and current performance may be higher or lower than performance quoted. Investment returns and principal value will fluctuate and shares, when redeemed, may be worth more or less than their original cost. The Adviser has waived fees and reimbursed other expenses during previous fiscal periods, absent which, performance during those fiscal periods would have been lower. While the Adviser has contractually agreed to waive and/or pay certain Fund expenses through August 31, 2010, the Fund is currently subject to recapture, which may result in an increased expense ratio. According to the Fund's current prospectus, the total gross annual operating expense ratio was indicated as 0.59%. In the Financial Highlights section of this Shareholder Report, the Fund's net total operating expense ratio was determined to be 0.63% while the Fund' s gross total operating expense ratio was 0.61%. NAV and Share Price returns assume that dividends and capital gain distributions have been reinvested in the Fund at NAV and Share Price, respectively. The returns shown in the table above do not reflect the deduction of taxes that a shareholder would pay on Fund distributions or the redemption or sale of Fund Shares. See invescopowershares.com to find the most recent month-end performance numbers.
Index performance results are based upon a hypothetical investment in its constituent securities. Index returns do not represent Fund returns. An investor cannot invest directly in an index. The Index does not charge management fees or brokerage expenses, and no such fees or expenses were deducted from the hypothetical performance shown. In addition, the results actual investors might have achieved would have differed from those shown because of differences in the timing, amounts of their investments, and fees and expenses associated with an investment in the Fund.
The S&P Citigroup Large Cap Value Index and Russell 1000® Value Index (the "Benchmark Indices") are unmanaged indices used as a measurement of change in stock market conditions based on the average performance of approximately 346 and 617 common stocks, respectively.
† Fund and underlying Index returns are based on the inception date of the Fund. Returns for the Benchmark Indices are based on the closest month-end to the Fund's inception date.
†† Average annualized.
13
Manager's Analysis
PowerShares Dynamic Mid Cap Growth Portfolio (ticker: PWJ)
The PowerShares Dynamic Mid Cap Growth Portfolio (the "Fund"), based on the Dynamic Mid Cap Growth IntellidexSM Index ("Index"), seeks investment results that correspond generally to the price and yield (before the Fund's fees and expenses) of that equity index.
The Fund performed the worst of the three PowerShares growth funds (Dynamic Large Cap Growth Portfolio, Dynamic Mid Cap Growth Portfolio and Dynamic Small Cap Portfolio), posting a -37.78% return for the reporting period, underperforming the S&P Citigroup Mid Cap Growth Index which returned -31.32%. The worst contributing sector was industrials with McDermott International and Stericycle making negative contributions. Overweighting and poor stock selection in the information technology sector also contributed to the Funds' negative returns. The health care sector made a positive contribution to the Funds' returns.
Sector Breakdown (% of the Fund's
Net Assets) as of April 30, 2009
| Information Technology | 31.7 | ||||||
| Consumer Discretionary | 22.4 | ||||||
| Industrials | 19.8 | ||||||
| Health Care | 19.3 | ||||||
| Energy | 3.6 | ||||||
| Consumer Staples | 2.1 | ||||||
| Financials | 1.0 | ||||||
| Money Market Fund | 0.2 | ||||||
| Other | (0.1 | ) | |||||
Style Allocation (% of the Fund's
Total Investments) as of April 30, 2009
| Mid-Cap Growth | 88.7 | ||||||
| Small-Cap Growth | 10.6 | ||||||
| Mid-Cap Value | 0.7 | ||||||
Top Ten Fund Holdings (% of the Fund's
Net Assets) as of April 30, 2009
| Security | |||||||
| Bed Bath & Beyond, Inc. | 4.0 | ||||||
| Cognizant Technology Solutions Corp., Class A | 3.7 | ||||||
| McAfee, Inc. | 3.7 | ||||||
| Amphenol Corp., Class A | 3.7 | ||||||
| FMC Technologies, Inc. | 3.6 | ||||||
| Ross Stores, Inc. | 3.6 | ||||||
| Expeditors International of Washington, Inc. | 3.5 | ||||||
| DENTSPLY International, Inc. | 3.4 | ||||||
| Family Dollar Stores, Inc. | 3.4 | ||||||
| BMC Software, Inc. | 3.2 | ||||||
| Total | 35.8 | ||||||
14
Manager's Analysis (Continued)
PowerShares Dynamic Mid Cap Growth Portfolio (ticker: PWJ)
Growth of a $10,000 Investment Since Inception†
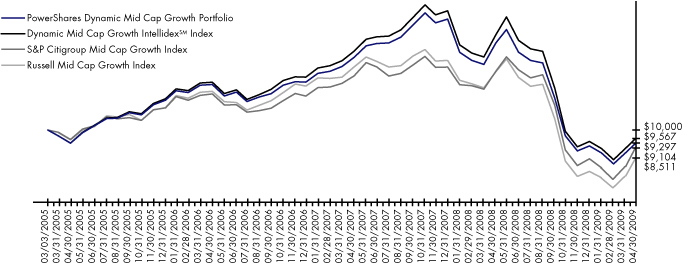
| Fund Performance History (%) | As of April 30, 2009 | ||||||||||||||||||
| Avg Ann†† | Fund Inception† | ||||||||||||||||||
| 1 Year | 3 Year | Avg Ann†† | Cumulative | ||||||||||||||||
| Index | |||||||||||||||||||
| Dynamic Mid Cap Growth IntellidexSM Index | -37.36 | -8.88 | -1.06 | -4.33 | |||||||||||||||
| S&P Citigroup Mid Cap Growth Index | -31.32 | -8.79 | -2.23 | -8.96 | |||||||||||||||
| Russell Mid Cap Growth Index | -35.66 | -11.16 | -3.79 | -14.89 | |||||||||||||||
| Fund | |||||||||||||||||||
| NAV Return | -37.78 | -9.44 | -1.74 | -7.03 | |||||||||||||||
| Share Price Return | -37.86 | -9.49 | -1.80 | -7.29 | |||||||||||||||
Fund Inception: March 3, 2005
Performance quoted represents past performance. Past performance is not a guarantee of future results and current performance may be higher or lower than performance quoted. Investment returns and principal value will fluctuate and shares, when redeemed, may be worth more or less than their original cost. The Adviser has waived fees and reimbursed other expenses during previous fiscal periods, absent which, performance during those fiscal periods would have been lower. While the Adviser has contractually agreed to waive and/or pay certain Fund expenses through August 31, 2010, the Fund is currently subject to recapture, which may result in an increased expense ratio. According to the Fund's current prospectus, the total gross annual operating expense ratio was indicated as 0.60%. In the Financial Highlights section of this Shareholder Report, the Fund's net total operating expense ratio was determined to be 0.63% while the Fund' s gross total operating expense ratio was 0.61%. NAV and Share Price returns assume that dividends and capital gain distributions have been reinvested in the Fund at NAV and Share Price, respectively. The returns shown in the table above do not reflect the deduction of taxes that a shareholder would pay on Fund distributions or the redemption or sale of Fund Shares. See invescopowershares.com to find the most recent month-end performance numbers.
Index performance results are based upon a hypothetical investment in its constituent securities. Index returns do not represent Fund returns. An investor cannot invest directly in an index. The Index does not charge management fees or brokerage expenses, and no such fees or expenses were deducted from the hypothetical performance shown. In addition, the results actual investors might have achieved would have differed from those shown because of differences in the timing, amounts of their investments, and fees and expenses associated with an investment in the Fund.
The S&P Citigroup Mid Cap Growth Index and Russell Mid Cap Growth Index (the "Benchmark Indices") are unmanaged indices used as a measurement of change in stock market conditions based on the average performance of approximately 258 and 548 common stocks, respectively.
† Fund and underlying Index returns are based on the inception date of the Fund. Returns for the Benchmark Indices are based on the closest month-end to the Fund's inception date.
†† Average annualized.
15
Manager's Analysis
PowerShares Dynamic Mid Cap Portfolio (ticker: PJG)
The PowerShares Dynamic Mid Cap Portfolio (the "Fund"), based on the Dynamic Mid Cap IntellidexSM Index ("Index"), seeks investment results that correspond generally to the price and yield (before the Fund's fees and expenses) of that equity index.
The Fund posted a -35.57% return for the reporting period, underperforming the S&P Mid Cap 400® Index which returned -31.84%. Materials, financials, industrials and utilities were the laggards for the reporting period as poor stock selection within these sectors contributed to the Fund's underperformance. Positive stock selection within consumer discretionary and consumer staples contributed positively to the Fund's performance.
Sector Breakdown (% of the Fund's
Net Assets) as of April 30, 2009
| Information Technology | 22.0 | ||||||
| Consumer Discretionary | 21.7 | ||||||
| Industrials | 18.5 | ||||||
| Financials | 10.1 | ||||||
| Health Care | 9.7 | ||||||
| Consumer Staples | 8.6 | ||||||
| Energy | 4.9 | ||||||
| Materials | 3.0 | ||||||
| Utilities | 1.5 | ||||||
| Money Market Fund | 0.6 | ||||||
| Other | (0.6 | ) | |||||
Style Allocation (% of the Fund's
Total Investments) as of April 30, 2009
| Mid-Cap Growth | 52.7 | ||||||
| Mid-Cap Value | 32.6 | ||||||
| Small-Cap Growth | 7.5 | ||||||
| Small-Cap Value | 4.4 | ||||||
| Large-Cap Value | 2.8 | ||||||
Top Ten Fund Holdings (% of the Fund's
Net Assets) as of April 30, 2009
| Security | |||||||
| Coach, Inc. | 2.3 | ||||||
| Pepsi Bottling Group (The), Inc. | 2.2 | ||||||
| Unum Group | 2.1 | ||||||
| Autodesk, Inc. | 2.0 | ||||||
| Polo Ralph Lauren Corp. | 2.0 | ||||||
| Cooper Industries Ltd., Class A | 2.0 | ||||||
| Coca-Cola Enterprises, Inc. | 1.9 | ||||||
| Bed Bath & Beyond, Inc. | 1.9 | ||||||
| Hospira, Inc. | 1.8 | ||||||
| Darden Restaurants, Inc. | 1.8 | ||||||
| Total | 20.0 | ||||||
16
Manager's Analysis (Continued)
PowerShares Dynamic Mid Cap Portfolio (ticker: PJG)
Growth of a $10,000 Investment Since Inception†
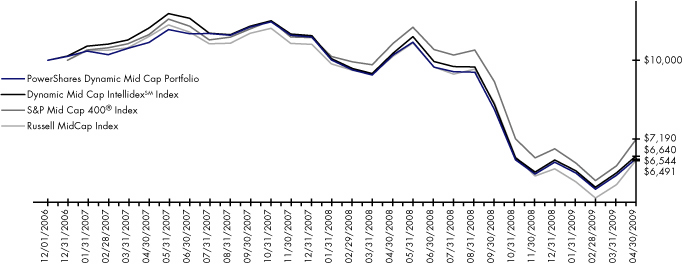
| Fund Performance History (%) | As of April 30, 2009 | ||||||||||||||
| Avg Ann†† | Fund Inception† | ||||||||||||||
| 1 Year | Avg Ann†† | Cumulative | |||||||||||||
| Index | |||||||||||||||
| Dynamic Mid Cap IntellidexSM Index | -35.26 | -15.62 | -33.60 | ||||||||||||
| S&P Mid Cap 400® Index | -31.84 | -12.76 | -28.10 | ||||||||||||
| Russell MidCap Index | -36.03 | -16.38 | -35.09 | ||||||||||||
| Fund | |||||||||||||||
| NAV Return | -35.57 | -16.13 | -34.56 | ||||||||||||
| Share Price Return | -35.63 | -16.14 | -34.58 | ||||||||||||
Fund Inception: December 1, 2006
Performance quoted represents past performance. Past performance is not a guarantee of future results and current performance may be higher or lower than performance quoted. Investment returns and principal value will fluctuate and shares, when redeemed, may be worth more or less than their original cost. The Adviser has waived fees and reimbursed other expenses, absent which, performance would have been lower. The Adviser has contractually agreed to waive fees and/or pay certain Fund expenses through August 31, 2010. According to the Fund's current prospectus, the total gross annual operating expense ratio was indicated as 1.34%. In the Financial Highlights section of this Shareholder Report, the Fund's net (subsidized) total operating expense ratio was determined to be 0.65% while the Fund's gross total operating expense ratio was 1.17%. NAV and Share Price returns assume that dividends and capital gain distributions have been reinvested in the Fund at NAV and Share Price, respectively. The returns shown in the table above do not reflect the deduction of taxes that a shareholder would pay on Fund distributions or the redemption or sale of Fund Shares. See invescopowershares.com to find the most recent month-end performance numbers.
Index performance results are based upon a hypothetical investment in its constituent securities. Index returns do not represent Fund returns. An investor cannot invest directly in an index. The Index does not charge management fees or brokerage expenses, and no such fees or expenses were deducted from the hypothetical performance shown. In addition, the results actual investors might have achieved would have differed from those shown because of differences in the timing, amounts of their investments, and fees and expenses associated with an investment in the Fund.
The S&P Mid Cap 400® Index and Russell MidCap Index (the "Benchmark Indices") are unmanaged indices used as a measurement of change in stock market conditions based on the average performance of approximately 400 and 796 common stocks, respectively.
† Fund and underlying Index returns are based on the inception date of the Fund. Returns for the Benchmark Indices are based on the closest month-end to the Fund's inception date.
†† Average annualized.
17
Manager's Analysis
PowerShares Dynamic Mid Cap Value Portfolio (ticker: PWP)
The PowerShares Dynamic Mid Cap Value Portfolio (the "Fund"), based on the Dynamic Mid Cap Value IntellidexSM Index ("Index"), seeks investment results that correspond generally to the price and yield (before the Fund's fees and expenses) of that equity index.
The Fund slightly underperformed even though value outperformed for the year. The Fund returned -32.71% while the S&P Citigroup Mid Cap Value Index returned -32.44%. Consumer staples, industrials, telecommunication services and information technology sectors provided the greatest positive performance. Stock selection within materials and consumer discretionary sectors contributed negatively to the Fund's performance.
Sector Breakdown (% of the Fund's
Net Assets) as of April 30, 2009
| Financials | 23.6 | ||||||
| Industrials | 23.5 | ||||||
| Consumer Discretionary | 11.6 | ||||||
| Consumer Staples | 9.4 | ||||||
| Health Care | 7.6 | ||||||
| Materials | 6.6 | ||||||
| Information Technology | 5.4 | ||||||
| Telecommunication Services | 5.2 | ||||||
| Energy | 3.6 | ||||||
| Utilities | 3.4 | ||||||
| Money Market Fund | 0.2 | ||||||
| Other | (0.1 | ) | |||||
Style Allocation (% of the Fund's
Total Investments) as of April 30, 2009
| Mid-Cap Value | 81.2 | ||||||
| Small-Cap Value | 12.9 | ||||||
| Large-Cap Value | 5.4 | ||||||
| Mid-Cap Growth | 0.5 | ||||||
Top Ten Fund Holdings (% of the Fund's
Net Assets) as of April 30, 2009
| Security | |||||||
| Pepsi Bottling Group (The), Inc. | 4.2 | ||||||
| Ameriprise Financial, Inc. | 4.1 | ||||||
| Unum Group | 4.0 | ||||||
| Rockwell Automation, Inc. | 3.9 | ||||||
| Cooper Industries Ltd., Class A | 3.9 | ||||||
| Coca-Cola Enterprises, Inc. | 3.7 | ||||||
| Garmin Ltd. | 3.7 | ||||||
| Hospira, Inc. | 3.5 | ||||||
| Parker Hannifin Corp. | 3.4 | ||||||
| Goodrich Corp. | 3.3 | ||||||
| Total | 37.7 | ||||||
18
Manager's Analysis (Continued)
PowerShares Dynamic Mid Cap Value Portfolio (ticker: PWP)
Growth of a $10,000 Investment Since Inception†
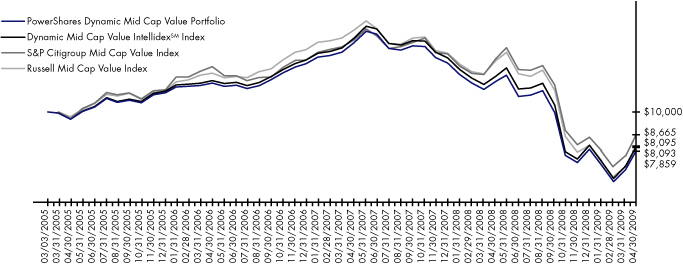
| Fund Performance History (%) | As of April 30, 2009 | ||||||||||||||||||
| Avg Ann†† | Fund Inception† | ||||||||||||||||||
| 1 Year | 3 Year | Avg Ann†† | Cumulative | ||||||||||||||||
| Index | |||||||||||||||||||
| Dynamic Mid Cap Value IntellidexSM Index | -32.43 | -11.64 | -4.96 | -19.07 | |||||||||||||||
| S&P Citigroup Mid Cap Value Index | -32.44 | -11.22 | -3.38 | -13.35 | |||||||||||||||
| Russell Mid Cap Value Index | -36.76 | -12.56 | -4.95 | -19.05 | |||||||||||||||
| Fund | |||||||||||||||||||
| NAV Return | -32.71 | -12.16 | -5.63 | -21.41 | |||||||||||||||
| Share Price Return | -32.89 | -12.24 | -5.72 | -21.73 | |||||||||||||||
Fund Inception: March 3, 2005
Performance quoted represents past performance. Past performance is not a guarantee of future results and current performance may be higher or lower than performance quoted. Investment returns and principal value will fluctuate and shares, when redeemed, may be worth more or less than their original cost. The Adviser has waived fees and reimbursed other expenses, absent which, performance would have been lower. The Adviser has contractually agreed to waive fees and/or pay certain Fund expenses through August 31, 2010. According to the Fund's current prospectus, the total gross annual operating expense ratio was indicated as 0.68%. In the Financial Highlights section of this Shareholder Report, the Fund's net (subsidized) total operating expense ratio was determined to be 0.63% while the Fund's gross total operating expense ratio was 0.78%. NAV and Share Price returns assume that dividends and capital gain distributions have been reinvested in the Fund at NAV and Share Price, respectively. The returns shown in the table above do not reflect the deduction of taxes that a shareholder would pay on Fund distributions or the redemption or sale of Fund Shares. See invescopowershares.com to find the most recent month-end performance numbers.
Index performance results are based upon a hypothetical investment in its constituent securities. Index returns do not represent Fund returns. An investor cannot invest directly in an index. The Index does not charge management fees or brokerage expenses, and no such fees or expenses were deducted from the hypothetical performance shown. In addition, the results actual investors might have achieved would have differed from those shown because of differences in the timing, amounts of their investments, and fees and expenses associated with an investment in the Fund.
The S&P Citigroup Mid Cap Value Index and Russell Mid Cap Value Index (the "Benchmark Indices") are unmanaged indices used as a measurement of change in stock market conditions based on the average performance of approximately 285 and 483 common stocks, respectively.
† Fund and underlying Index returns are based on the inception date of the Fund. Returns for the Benchmark Indices are based on the closest month-end to the Fund's inception date.
†† Average annualized.
19
Manager's Analysis
PowerShares Dynamic Small Cap Growth Portfolio (ticker: PWT)
The PowerShares Dynamic Small Cap Growth Portfolio (the "Fund"), based on the Dynamic Small Cap Growth IntellidexSM Index ("Index"), seeks investment results that correspond generally to the price and yield (before the Fund's fees and expenses) of that equity index.
The Fund posted a -33.23% return during the reporting period, underperforming the S&P Citigroup Small Cap Growth Index which returned -30.97%. Poor stock selection in the consumer discretionary and financials sectors had the greatest adverse effect on the Fund's performance. Stock selection in telecommunication services, consumer staples and industrials sectors also hurt performance. Overallocation and poor stock selection within information technology contributed negatively to the Fund.
Sector Breakdown (% of the Fund's
Net Assets) as of April 30, 2009
| Information Technology | 27.7 | ||||||
| Health Care | 24.4 | ||||||
| Industrials | 22.0 | ||||||
| Energy | 8.1 | ||||||
| Consumer Discretionary | 7.8 | ||||||
| Financials | 5.2 | ||||||
| Consumer Staples | 2.8 | ||||||
| Telecommunication Services | 2.0 | ||||||
| Money Market Fund | 0.1 | ||||||
| Other | (0.1 | ) | |||||
Style Allocation (% of the Fund's
Total Investments) as of April 30, 2009
| Small-Cap Growth | 96.1 | ||||||
| Small-Cap Value | 3.9 | ||||||
Top Ten Fund Holdings (% of the Fund's
Net Assets) as of April 30, 2009
| Security | |||||||
| RPC, Inc. | 3.7 | ||||||
| Synaptics, Inc. | 3.1 | ||||||
| Allegiant Travel Co. | 3.1 | ||||||
| Syntel, Inc. | 2.7 | ||||||
| Hittite Microwave Corp. | 2.7 | ||||||
| Dionex Corp. | 2.7 | ||||||
| Arena Resources, Inc. | 2.7 | ||||||
| DynCorp International, Inc. | 2.5 | ||||||
| Blackboard, Inc. | 2.5 | ||||||
| SYKES Enterprises, Inc. | 2.5 | ||||||
| Total | 28.2 | ||||||
20
Manager's Analysis (Continued)
PowerShares Dynamic Small Cap Growth Portfolio (ticker: PWT)
Growth of a $10,000 Investment Since Inception†

| Fund Performance History (%) | As of April 30, 2009 | ||||||||||||||||||
| Avg Ann†† | Fund Inception† | ||||||||||||||||||
| 1 Year | 3 Year | Avg Ann†† | Cumulative | ||||||||||||||||
| Index | |||||||||||||||||||
| Dynamic Small Cap Growth IntellidexSM Index | -32.60 | -16.77 | -7.90 | -28.99 | |||||||||||||||
| S&P Citigroup Small Cap Growth Index | -30.97 | -11.26 | -4.23 | -16.49 | |||||||||||||||
| Russell 2000® Growth Index | -30.36 | -12.10 | -4.29 | -16.69 | |||||||||||||||
| Fund | |||||||||||||||||||
| NAV Return | -33.23 | -17.25 | -8.40 | -30.58 | |||||||||||||||
| Share Price Return | -33.25 | -17.29 | -8.47 | -30.78 | |||||||||||||||
Fund Inception: March 3, 2005
Performance quoted represents past performance. Past performance is not a guarantee of future results and current performance may be higher or lower than performance quoted. Investment returns and principal value will fluctuate and shares, when redeemed, may be worth more or less than their original cost. The Adviser has waived fees and reimbursed other expenses, absent which, performance would have been lower. The Adviser has contractually agreed to waive fees and/or pay certain Fund expenses through August 31, 2010. According to the Fund's current prospectus, the total gross annual operating expense ratio was indicated as 0.77%. In the Financial Highlights section of this Shareholder Report, the Fund's net (subsidized) total operating expense ratio was determined to be 0.63% while the Fund's gross total operating expense ratio was 0.86%. NAV and Share Price returns assume that dividends and capital gain distributions have been reinvested in the Fund at NAV and Share Price, respectively. The returns shown in the table above do not reflect the deduction of taxes that a shareholder would pay on Fund distributions or the redemption or sale of Fund Shares. See invescopowershares.com to find the most recent month-end performance numbers.
Index performance results are based upon a hypothetical investment in its constituent securities. Index returns do not represent Fund returns. An investor cannot invest directly in an index. The Index does not charge management fees or brokerage expenses, and no such fees or expenses were deducted from the hypothetical performance shown. In addition, the results actual investors might have achieved would have differed from those shown because of differences in the timing, amounts of their investments, and fees and expenses associated with an investment in the Fund.
The S&P Citigroup Small Cap Growth Index and Russell 2000® Growth Index (the "Benchmark Indices") are unmanaged indices used as a measurement of change in stock market conditions based on the average performance of approximately 362 and 1,245 common stocks, respectively.
† Fund and underlying Index returns are based on the inception date of the Fund. Returns for the Benchmark Indices are based on the closest month-end to the Fund's inception date.
†† Average annualized.
21
Manager's Analysis
PowerShares Dynamic Small Cap Portfolio (ticker: PJM)
The PowerShares Dynamic Small Cap Portfolio (the "Fund"), based on the Dynamic Small Cap IntellidexSM Index ("Index"), seeks investment results that correspond generally to the price and yield (before the Fund's fees and expenses) of that equity index.
The Fund posted a -35.34% return during the reporting period. The S&P Small Cap Index returned -30.05%. Positive stock selection within the financial and information technology sectors contributed positively to the Fund's performance. Poor stock selection within the health care, industrials and energy sectors contributed to the Fund's underperformance.
Sector Breakdown (% of the Fund's
Net Assets) as of April 30, 2009
| Information Technology | 25.3 | ||||||
| Industrials | 24.8 | ||||||
| Financials | 12.6 | ||||||
| Health Care | 12.6 | ||||||
| Consumer Discretionary | 12.1 | ||||||
| Energy | 4.9 | ||||||
| Consumer Staples | 2.9 | ||||||
| Telecommunication Services | 2.0 | ||||||
| Materials | 1.9 | ||||||
| Utilities | 0.9 | ||||||
| Money Market Fund | 0.6 | ||||||
| Other | (0.6 | ) | |||||
Style Allocation (% of the Fund's
Total Investments) as of April 30, 2009
| Small-Cap Growth | 62.1 | ||||||
| Small-Cap Value | 37.9 | ||||||
Top Ten Fund Holdings (% of the Fund's
Net Assets) as of April 30, 2009
| Security | |||||||
| RPC, Inc. | 1.7 | ||||||
| 3Com Corp. | 1.7 | ||||||
| Polaris Industries, Inc. | 1.7 | ||||||
| Arris Group, Inc. | 1.7 | ||||||
| Digital River, Inc. | 1.5 | ||||||
| Fossil, Inc. | 1.5 | ||||||
| WESCO International, Inc. | 1.5 | ||||||
| Synaptics, Inc. | 1.5 | ||||||
| RSC Holdings, Inc. | 1.5 | ||||||
| Allegiant Travel Co. | 1.4 | ||||||
| Total | 15.7 | ||||||
22
Manager's Analysis (Continued)
PowerShares Dynamic Small Cap Portfolio (ticker: PJM)
Growth of a $10,000 Investment Since Inception†
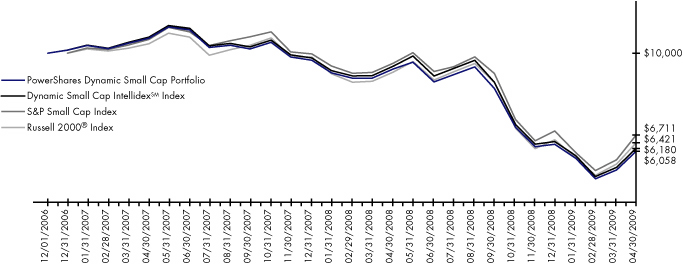
| Fund Performance History (%) | As of April 30, 2009 | ||||||||||||||
| Avg Ann†† | Fund Inception† | ||||||||||||||
| 1 Year | Avg Ann†† | Cumulative | |||||||||||||
| Index | |||||||||||||||
| Dynamic Small Cap IntellidexSM Index | -34.79 | -18.09 | -38.20 | ||||||||||||
| S&P Small Cap Index | -30.05 | -15.21 | -32.89 | ||||||||||||
| Russell 2000® Index | -30.74 | -16.75 | -35.79 | ||||||||||||
| Fund | |||||||||||||||
| NAV Return | -35.34 | -18.77 | -39.42 | ||||||||||||
| Share Price Return | -35.41 | -18.83 | -39.54 | ||||||||||||
Fund Inception: December 1, 2006
Performance quoted represents past performance. Past performance is not a guarantee of future results and current performance may be higher or lower than performance quoted. Investment returns and principal value will fluctuate and shares, when redeemed, may be worth more or less than their original cost. The Adviser has waived fees and reimbursed other expenses, absent which, performance would have been lower. The Adviser has contractually agreed to waive fees and/or pay certain Fund expenses through August 31, 2010. According to the Fund's current prospectus, the total gross annual operating expense ratio was indicated as 1.96%. In the Financial Highlights section of this Shareholder Report, the Fund's net (subsidized) total operating expense ratio was determined to be 0.65% while the Fund's gross total operating expense ratio was 1.35%. NAV and Share Price returns assume that dividends and capital gain distributions have been reinvested in the Fund at NAV and Share Price, respectively. The returns shown in the table above do not reflect the deduction of taxes that a shareholder would pay on Fund distributions or the redemption or sale of Fund Shares. See invescopowershares.com to find the most recent month-end performance numbers.
Index performance results are based upon a hypothetical investment in its constituent securities. Index returns do not represent Fund returns. An investor cannot invest directly in an index. The Index does not charge management fees or brokerage expenses, and no such fees or expenses were deducted from the hypothetical performance shown. In addition, the results actual investors might have achieved would have differed from those shown because of differences in the timing, amounts of their investments, and fees and expenses associated with an investment in the Fund.
The S&P Small Cap Index and Russell 2000® Index (the "Benchmark Indices") are unmanaged indices used as a measurement of change in stock market conditions based on the average performance of approximately 600 and 2,000 common stocks, respectively.
† Fund and underlying Index returns are based on the inception date of the Fund. Returns for the Benchmark Indices are based on the closest month-end to the Fund's inception date.
†† Average annualized.
23
Manager's Analysis
PowerShares Dynamic Small Cap Value Portfolio (ticker: PWY)
The PowerShares Dynamic Small Cap Value Portfolio (the "Fund"), based on the Dynamic Small Cap Value IntellidexSM Index ("Index"), seeks investment results that correspond generally to the price and yield (before the Fund's fees and expenses) of that equity index.
The Fund posted a -33.69% return over the reporting period. The S&P Citigroup Small Cap Value Index returned -29.46% for the same period. Stock selection within financials provided a positive contribution to the Fund's performance. Conversely, stock selection within industrials and an overallocation combined with poor stock selection in the energy sector contributed to the Fund's underperformance.
Sector Breakdown (% of the Fund's
Net Assets) as of April 30, 2009
| Information Technology | 26.8 | ||||||
| Financials | 25.2 | ||||||
| Industrials | 20.6 | ||||||
| Consumer Discretionary | 15.5 | ||||||
| Materials | 4.1 | ||||||
| Utilities | 3.6 | ||||||
| Energy | 2.0 | ||||||
| Telecommunication Services | 0.8 | ||||||
| Consumer Staples | 0.7 | ||||||
| Health Care | 0.7 | ||||||
| Money Market Fund | 0.1 | ||||||
| Other | (0.1 | ) | |||||
Style Allocation (% of the Fund's
Total Investments) as of April 30, 2009
| Small-Cap Value | 74.8 | ||||||
| Small-Cap Growth | 25.2 | ||||||
Top Ten Fund Holdings (% of the Fund's
Net Assets) as of April 30, 2009
| Security | |||||||
| Meredith Corp. | 3.5 | ||||||
| 3Com Corp. | 3.3 | ||||||
| Arris Group, Inc. | 3.2 | ||||||
| Digital River, Inc. | 2.9 | ||||||
| Fossil, Inc. | 2.9 | ||||||
| WESCO International, Inc. | 2.8 | ||||||
| Carpenter Technology Corp. | 2.7 | ||||||
| Skyworks Solutions, Inc. | 2.5 | ||||||
| Hancock Holding Co. | 2.4 | ||||||
| CNA Surety Corp. | 2.4 | ||||||
| Total | 28.6 | ||||||
24
Manager's Analysis (Continued)
PowerShares Dynamic Small Cap Value Portfolio (ticker: PWY)
Growth of a $10,000 Investment Since Inception†
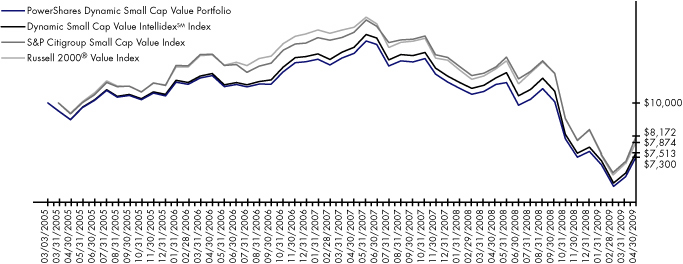
| Fund Performance History (%) | As of April 30, 2009 | ||||||||||||||||||
| Avg Ann†† | Fund Inception† | ||||||||||||||||||
| 1 Year | 3 Year | Avg Ann†† | Cumulative | ||||||||||||||||
| Index | |||||||||||||||||||
| Dynamic Small Cap Value IntellidexSM Index | -33.26 | -13.17 | -6.64 | -24.87 | |||||||||||||||
| S&P Citigroup Small Cap Value Index | -29.46 | -12.54 | -4.73 | -18.28 | |||||||||||||||
| Russell 2000® Value Index | -31.37 | -13.47 | -5.57 | -21.26 | |||||||||||||||
| Fund | |||||||||||||||||||
| NAV Return | -33.69 | -13.74 | -7.29 | -27.00 | |||||||||||||||
| Share Price Return | -33.78 | -13.78 | -7.36 | -27.24 | |||||||||||||||
Fund Inception: March 3, 2005
Performance quoted represents past performance. Past performance is not a guarantee of future results and current performance may be higher or lower than performance quoted. Investment returns and principal value will fluctuate and shares, when redeemed, may be worth more or less than their original cost. The Adviser has waived fees and reimbursed other expenses, absent which, performance would have been lower. The Adviser has contractually agreed to waive fees and/or pay certain Fund expenses through August 31, 2010. According to the Fund's current prospectus, the total gross annual operating expense ratio was indicated as 0.67%. In the Financial Highlights section of this Shareholder Report, the Fund's net (subsidized) total operating expense ratio was determined to be 0.63% while the Fund's gross total operating expense ratio was 0.73%. NAV and Share Price returns assume that dividends and capital gain distributions have been reinvested in the Fund at NAV and Share Price, respectively. The returns shown in the table above do not reflect the deduction of taxes that a shareholder would pay on Fund distributions or the redemption or sale of Fund Shares. See invescopowershares.com to find the most recent month-end performance numbers.
Index performance results are based upon a hypothetical investment in its constituent securities. Index returns do not represent Fund returns. An investor cannot invest directly in an index. The Index does not charge management fees or brokerage expenses, and no such fees or expenses were deducted from the hypothetical performance shown. In addition, the results actual investors might have achieved would have differed from those shown because of differences in the timing, amounts of their investments, and fees and expenses associated with an investment in the Fund.
The S&P Citigroup Small Cap Value Index and Russell 2000® Value Index (the "Benchmark Indices") are unmanaged indices used as a measurement of change in stock market conditions based on the average performance of approximately 467 and 1,279 common stocks, respectively.
† Fund and underlying Index returns are based on the inception date of the Fund. Returns for the Benchmark Indices are based on the closest month-end to the Fund's inception date.
†† Average annualized.
25
Manager's Analysis
PowerShares FTSE NASDAQ Small Cap Portfolio (ticker: PQSC)
The PowerShares FTSE NASDAQ Small Cap Portfolio (the "Fund"), based on the FTSE NASDAQ Small Cap Index ("Index"), seeks investment results that correspond generally to the price and yield (before the Fund's fees and expenses) of this Index. The Index is designed to track the performance of the smallest 10% of companies in the FTSE NASDAQ Index. Eligible securities include common stock, american depositary receipts and real estate investment trusts. The Index is a free float-adjusted market capitalization weighted index, adjusted on an annual basis.
For the year ended April 30, 2009, the Fund returned -33.53%. For the same period, the S&P Small Cap Index returned -30.05%.
For the year ended April 30, 2009, none of the ten sectors represented in the Fund generated positive returns. Slight overexposure in the telecommunication services sector made the largest negative contribution to the performance of the Fund. However, stock selection in health care and materials and an overexposure to the information technology sector all made a positive contribution to the performance of the Fund.
Sector Breakdown (% of the Fund's
Net Assets) as of April 30, 2009
| Information Technology | 26.2 | ||||||
| Health Care | 19.4 | ||||||
| Financials | 16.0 | ||||||
| Industrials | 14.8 | ||||||
| Consumer Discretionary | 12.2 | ||||||
| Consumer Staples | 3.4 | ||||||
| Energy | 3.0 | ||||||
| Materials | 2.1 | ||||||
| Telecommunication Services | 2.1 | ||||||
| Utilities | 0.3 | ||||||
| Other | 0.5 | ||||||
Style Allocation (% of the Fund's
Total Investments) as of April 30, 2009
| Small-Cap Growth | 68.6 | ||||||
| Small-Cap Value | 27.7 | ||||||
| Mid-Cap Growth | 2.3 | ||||||
| Mid-Cap Value | 0.7 | ||||||
| Large-Cap Growth | 0.4 | ||||||
| Large-Cap Value | 0.3 | ||||||
Top Ten Fund Holdings (% of the Fund's
Net Assets) as of April 30, 2009
| Security | |||||||
| Dendreon Corp. | 1.0 | ||||||
| Palm, Inc. | 0.7 | ||||||
| DryShips, Inc. (Greece) | 0.6 | ||||||
| American Superconductor Corp. | 0.5 | ||||||
| Tower Group, Inc. | 0.5 | ||||||
| Cybersource Corp. | 0.5 | ||||||
| Seattle Genetics, Inc. | 0.4 | ||||||
| AsiaInfo Holdings, Inc. | 0.4 | ||||||
| TiVo, Inc. | 0.4 | ||||||
| Healthcare Services Group, Inc. | 0.4 | ||||||
| Total | 5.4 | ||||||
26
Manager's Analysis (Continued)
PowerShares FTSE NASDAQ Small Cap Portfolio (ticker: PQSC)
Growth of a $10,000 Investment Since Inception†

| Fund Performance History (%) | As of April 30, 2009 | ||||||||||||||
| Avg Ann†† | Fund Inception† | ||||||||||||||
| 1 Year | Avg Ann†† | Cumulative | |||||||||||||
| Index | |||||||||||||||
| FTSE NASDAQ Small Cap Index | -34.31 | -32.75 | -34.69 | ||||||||||||
| Russell 2000® Index | -30.74 | -26.01 | -27.84 | ||||||||||||
| S&P Small Cap Index | -30.05 | -25.44 | -27.25 | ||||||||||||
| Fund | |||||||||||||||
| NAV Return | -33.53 | -31.95 | -33.86 | ||||||||||||
| Share Price Return | -33.58 | -32.10 | -34.02 | ||||||||||||
Fund Inception: April 3, 2008
Performance quoted represents past performance. Past performance is not a guarantee of future results and current performance may be higher or lower than performance quoted. Investment returns and principal value will fluctuate and shares, when redeemed, may be worth more or less than their original cost. According to the Fund's current prospectus, the expense ratio of 0.70% is expressed as a unitary fee to cover operating expenses and expenses incurred in connection with managing the portfolio. NAV and Share Price returns assume that dividends and capital gain distributions have been reinvested in the Fund at NAV and Share Price, respectively. The returns shown in the table above do not reflect the deduction of taxes that a shareholder would pay on Fund distributions or the redemption or sale of Fund Shares. See invescopowershares.com to find the most recent month-end performance numbers.
Index performance results are based upon a hypothetical investment in its constituent securities. Index returns do not represent Fund returns. An investor cannot invest directly in an index. The Index does not charge management fees or brokerage expenses, and no such fees or expenses were deducted from the hypothetical performance shown. In addition, the results actual investors might have achieved would have differed from those shown because of differences in the timing, amounts of their investments, and fees and expenses associated with an investment in the Fund.
The Russell 2000® Index and S&P Small Cap Index (the "Benchmark Indices") are unmanaged indices used as a measurement of change in stock market conditions based on the average performance of approximately 2,000 and 600 common stocks, respectively.
† Fund and underlying Index returns are based on the inception date of the Fund. Returns for the Benchmark Indices are based on the closest month-end to the Fund's inception date.
†† Average annualized.
27
Manager's Analysis
PowerShares Zacks Micro Cap Portfolio (ticker: PZI)
The PowerShares Zacks Micro Cap Portfolio (the "Fund"), based on the Zacks Micro Cap Index ("Index"), seeks investment results that correspond generally to the price and yield (before the Fund's fees and expenses) of that equity index. The Index is designed to identify a group of micro cap stocks with the greatest potential to outperform passive benchmark micro cap indices and other actively managed U.S. micro cap strategies.
The Fund returned -39.70% for the reporting period, underperforming the S&P 500® Index which was down -35.29%.
For the year ended April 30, 2009, none of the ten sectors represented in the Fund generated positive returns. While micro cap stocks were generally more negatively affected by the current economic environment, an increased exposure to the financial sector also contributed to the negative Fund performance. Conversely, stock selection did contribute in a positive way to Fund performance.
Sector Breakdown (% of the Fund's
Net Assets) as of April 30, 2009
| Financials | 26.4 | ||||||
| Information Technology | 18.8 | ||||||
| Industrials | 15.7 | ||||||
| Consumer Discretionary | 14.8 | ||||||
| Health Care | 10.4 | ||||||
| Energy | 4.8 | ||||||
| Consumer Staples | 4.3 | ||||||
| Materials | 3.2 | ||||||
| Utilities | 1.1 | ||||||
| Telecommunication Services | 0.9 | ||||||
| Money Market Fund | 0.0 | ||||||
| Other | (0.4 | ) | |||||
Style Allocation (% of the Fund's
Total Investments) as of April 30, 2009
| Small-Cap Value | 51.0 | ||||||
| Small-Cap Growth | 49.0 | ||||||
Top Ten Fund Holdings (% of the Fund's
Net Assets) as of April 30, 2009
| Security | |||||||
| Jones Apparel Group, Inc. | 0.5 | ||||||
| Encore Capital Group, Inc. | 0.4 | ||||||
| Meritage Homes Corp. | 0.4 | ||||||
| Exide Technologies | 0.4 | ||||||
| Navios Maritime Holdings, Inc. (Greece) | 0.4 | ||||||
| Pinnacle Entertainment, Inc. | 0.4 | ||||||
| Skechers U.S.A., Inc., Class A | 0.4 | ||||||
| Spherion Corp. | 0.4 | ||||||
| Medifast, Inc. | 0.3 | ||||||
| Methode Electronics, Inc. | 0.3 | ||||||
| Total | 3.9 | ||||||
28
Manager's Analysis (Continued)
PowerShares Zacks Micro Cap Portfolio (ticker: PZI)
Growth of a $10,000 Investment Since Inception†
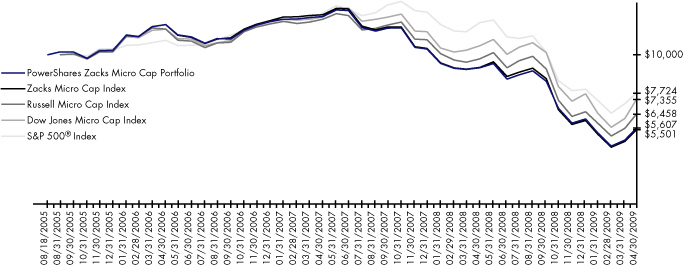
| Fund Performance History (%) | As of April 30, 2009 | ||||||||||||||||||
| Avg Ann†† | Fund Inception† | ||||||||||||||||||
| 1 Year | 3 Year | Avg Ann†† | Cumulative | ||||||||||||||||
| Index | |||||||||||||||||||
| Zacks Micro Cap Index | -40.42 | -22.49 | -14.92 | -44.99 | |||||||||||||||
| S&P 500® Index | -35.29 | -10.76 | -6.80 | -22.76 | |||||||||||||||
| Russell Micro Cap Index | -33.79 | -17.60 | -11.24 | -35.42 | |||||||||||||||
| Dow Jones Micro Cap Index | -30.23 | -13.95 | -8.04 | -26.45 | |||||||||||||||
| Fund | |||||||||||||||||||
| NAV Return | -39.70 | -22.01 | -14.48 | -43.93 | |||||||||||||||
| Share Price Return | -39.66 | -22.01 | -14.51 | -44.01 | |||||||||||||||
Fund Inception: August 18, 2005
Performance quoted represents past performance. Past performance is not a guarantee of future results and current performance may be higher or lower than performance quoted. Investment returns and principal value will fluctuate and shares, when redeemed, may be worth more or less than their original cost. The Adviser has waived fees and reimbursed other expenses, absent which, performance would have been lower. The Adviser has contractually agreed to waive fees and/or pay certain Fund expenses through August 31, 2010. According to the Fund's current prospectus, the total gross annual operating expense ratio was indicated as 0.71%. In the Financial Highlights section of this Shareholder Report, the Fund's net (subsidized) total operating expense ratio was determined to be 0.70% while the Fund's gross total operating expense ratio was 0.86%. NAV and Share Price returns assume that dividends and capital gain distributions have been reinvested in the Fund at NAV and Share Price, respectively. The returns shown in the table above do not reflect the deduction of taxes that a shareholder would pay on Fund distributions or the redemption or sale of Fund Shares. See invescopowershares.com to find the most recent month-end performance numbers.
Index performance results are based upon a hypothetical investment in its constituent securities. Index returns do not represent Fund returns. An investor cannot invest directly in an index. The Index does not charge management fees or brokerage expenses, and no such fees or expenses were deducted from the hypothetical performance shown. In addition, the results actual investors might have achieved would have differed from those shown because of differences in the timing, amounts of their investments, and fees and expenses associated with an investment in the Fund.
The S&P 500® Index, Russell Micro Cap Index and Dow Jones Micro Cap Index (the "Benchmark Indices") are unmanaged indices used as a measurement of change in stock market conditions based on the average performance of approximately 500, 1,000 and 250 common stocks, respectively. The Russell Micro Cap Index and the Dow Jones Micro Cap Index will be used for comparative purposes going forward as these represent the most appropriate market indices for this fund.
† Fund and underlying Index returns are based on the inception date of the Fund. Returns for the Benchmark Indices are based on the closest month-end to the Fund's inception date.
†† Average annualized.
29
Manager's Analysis
PowerShares Zacks Small Cap Portfolio (ticker: PZJ)
The PowerShares Zacks Small Cap Portfolio (the "Fund"), based on the Zacks Small Cap Index ("Index"), seeks investment results that correspond generally to the price and yield (before the Fund's fees and expenses) of that equity index. The Index is designed to identify a group of small cap stocks with the greatest potential to outperform passive benchmark small cap indices and other actively managed U.S. small cap strategies. The Fund is rebalanced and reconstituted quarterly.
The Fund returned -37.56%, underperforming the S&P Small Cap 600 Index which was down -30.05%. The Fund's underperformance was due to its focus in small cap whereas the S&P Small Cap 600 Index had some mid cap exposure. Sector allocation had little impact on the Fund's performance. Stock selection within the small cap value allocation and in particular the consumer discretionary, industrials and energy sectors negatively impacted Fund performance. However, an underweight position and superior stock selection in the financial sector positively impacted the performance of the Fund.
Sector Breakdown (% of the Fund's
Net Assets) as of April 30, 2009
| Industrials | 24.4 | ||||||
| Financials | 17.1 | ||||||
| Information Technology | 16.6 | ||||||
| Consumer Discretionary | 13.1 | ||||||
| Health Care | 9.9 | ||||||
| Energy | 8.3 | ||||||
| Materials | 4.6 | ||||||
| Consumer Staples | 2.9 | ||||||
| Utilities | 2.0 | ||||||
| Telecommunication Services | 0.6 | ||||||
| Money Market Fund | 0.7 | ||||||
| Other | (0.2 | ) | |||||
Style Allocation (% of the Fund's
Total Investments) as of April 30, 2009
| Small-Cap Growth | 54.2 | ||||||
| Small-Cap Value | 45.6 | ||||||
| Mid-Cap Value | 0.2 | ||||||
Top Ten Fund Holdings (% of the Fund's
Net Assets) as of April 30, 2009
| Security | |||||||
| Citi Trends, Inc. | 0.9 | ||||||
| Shutterfly, Inc. | 0.7 | ||||||
| Green Mountain Coffee Roasters, Inc. | 0.7 | ||||||
| Oriental Financial Group, Inc. | 0.7 | ||||||
| Matrix Service Co. | 0.7 | ||||||
| America's Car-Mart, Inc. | 0.7 | ||||||
| Buckle (The), Inc. | 0.7 | ||||||
| Dress Barn, Inc. | 0.6 | ||||||
| Fossil, Inc. | 0.6 | ||||||
| Penson Worldwide, Inc. | 0.6 | ||||||
| Total | 6.9 | ||||||
30
Manager's Analysis (Continued)
PowerShares Zacks Small Cap Portfolio (ticker: PZJ)
Growth of a $10,000 Investment Since Inception†

| Fund Performance History (%) | As of April 30, 2009 | ||||||||||||||||||
| Avg Ann†† | Fund Inception† | ||||||||||||||||||
| 1 Year | 3 Year | Avg Ann†† | Cumulative | ||||||||||||||||
| Index | |||||||||||||||||||
| Zacks Small Cap Index | -37.75 | -18.30 | -15.91 | -42.57 | |||||||||||||||
| S&P Small Cap 600® Index | -30.05 | -11.85 | -9.92 | -28.16 | |||||||||||||||
| Russell 2000® Index | -30.74 | -12.72 | -10.77 | -30.29 | |||||||||||||||
| Fund | |||||||||||||||||||
| NAV Return | -37.56 | -18.12 | -15.74 | -42.19 | |||||||||||||||
| Share Price Return | -37.84 | -18.26 | -15.90 | -42.53 | |||||||||||||||
Fund Inception: February 16, 2006
Performance quoted represents past performance. Past performance is not a guarantee of future results and current performance may be higher or lower than performance quoted. Investment returns and principal value will fluctuate and shares, when redeemed, may be worth more or less than their original cost. The Adviser has waived fees and reimbursed other expenses, absent which, performance would have been lower. The Adviser has contractually agreed to waive fees and/or pay certain Fund expenses through August 31, 2010. According to the Fund's current prospectus, the total gross annual operating expense ratio was indicated as 0.83%. In the Financial Highlights section of this Shareholder Report, the Fund's net (subsidized) total operating expense ratio was determined to be 0.70% while the Fund's gross total operating expense ratio was 1.09%. NAV and Share Price returns assume that dividends and capital gain distributions have been reinvested in the Fund at NAV and Share Price, respectively. The returns shown in the table above do not reflect the deduction of taxes that a shareholder would pay on Fund distributions or the redemption or sale of Fund Shares. See invescopowershares.com to find the most recent month-end performance numbers.
Index performance results are based upon a hypothetical investment in its constituent securities. Index returns do not represent Fund returns. An investor cannot invest directly in an index. The Index does not charge management fees or brokerage expenses, and no such fees or expenses were deducted from the hypothetical performance shown. In addition, the results actual investors might have achieved would have differed from those shown because of differences in the timing, amounts of their investments, and fees and expenses associated with an investment in the Fund.
The S&P Small Cap 600® Index and Russell 2000® Index (the "Benchmark Indices") are unmanaged indices used as a measurement of change in stock market conditions based on the average performance of approximately 600 and 2,000 common stocks, respectively.
† Fund and underlying Index returns are based on the inception date of the Fund. Returns for the Benchmark Indices are based on the closest month-end to the Fund's inception date.
†† Average annualized.
31
Frequency Distribution of Discounts & Premiums
Since Inception through April 30, 2009
| Closing Price Above NAV (bps) | |||||||||||||||||||||||||||||||||||||||
| Ticker | Fund Name | Inception | Days | 0-24 | 25-49 | 50-99 | 100-149 | 150-199 | 200+ | ||||||||||||||||||||||||||||||
| PGZ | PowerShares Dynamic Aggressive Growth Portfolio | 12/20/06 | 593 | 205 | 24 | 6 | 0 | 0 | 0 | ||||||||||||||||||||||||||||||
| PVM | PowerShares Dynamic Deep Value Portfolio | 12/20/06 | 593 | 248 | 19 | 12 | 2 | 0 | 0 | ||||||||||||||||||||||||||||||
| PWB | PowerShares Dynamic Large Cap Growth Portfolio | 03/03/05 | 1048 | 565 | 34 | 3 | 1 | 0 | 0 | ||||||||||||||||||||||||||||||
| PJF | PowerShares Dynamic Large Cap Portfolio | 12/01/06 | 606 | 224 | 14 | 4 | 1 | 1 | 0 | ||||||||||||||||||||||||||||||
| PWV | PowerShares Dynamic Large Cap Value Portfolio | 03/03/05 | 1048 | 598 | 32 | 11 | 1 | 0 | 1 | ||||||||||||||||||||||||||||||
| PWJ | PowerShares Dynamic Mid Cap Growth Portfolio | 03/03/05 | 1048 | 496 | 19 | 6 | 0 | 0 | 0 | ||||||||||||||||||||||||||||||
| PJG | PowerShares Dynamic Mid Cap Portfolio | 12/01/06 | 606 | 251 | 24 | 1 | 1 | 1 | 0 | ||||||||||||||||||||||||||||||
| PWP | PowerShares Dynamic Mid Cap Value Portfolio | 03/03/05 | 1048 | 460 | 21 | 5 | 1 | 0 | 2 | ||||||||||||||||||||||||||||||
| PWT | PowerShares Dynamic Small Cap Growth Portfolio | 03/03/05 | 1048 | 482 | 47 | 6 | 4 | 0 | 2 | ||||||||||||||||||||||||||||||
| PJM | PowerShares Dynamic Small Cap Portfolio | 12/01/06 | 606 | 232 | 25 | 5 | 1 | 0 | 0 | ||||||||||||||||||||||||||||||
| PWY | PowerShares Dynamic Small Cap Value Portfolio | 03/03/05 | 1048 | 507 | 43 | 10 | 1 | 1 | 0 | ||||||||||||||||||||||||||||||
| PQSC | PowerShares FTSE NASDAQ Small Cap Portfolio | 04/03/08 | 272 | 114 | 12 | 4 | 0 | 0 | 1 | ||||||||||||||||||||||||||||||
| PZI | PowerShares Zacks Micro Cap Portfolio | 08/18/05 | 931 | 330 | 49 | 13 | 0 | 1 | 0 | ||||||||||||||||||||||||||||||
| PZJ | PowerShares Zacks Small Cap Portfolio | 02/16/06 | 805 | 370 | 21 | 5 | 1 | 0 | 0 | ||||||||||||||||||||||||||||||
32
| Closing Prices Below NAV (bps) | |||||||||||||||||||||||||||
| Ticker | -0-24 | -25-49 | -50-99 | -100-149 | -150-199 | -200+ | |||||||||||||||||||||
| PGZ | 335 | 23 | 0 | 0 | 0 | 0 | |||||||||||||||||||||
| PVM | 296 | 10 | 3 | 3 | 0 | 0 | |||||||||||||||||||||
| PWB | 424 | 18 | 3 | 0 | 0 | 0 | |||||||||||||||||||||
| PJF | 354 | 6 | 2 | 0 | 0 | 0 | |||||||||||||||||||||
| PWV | 386 | 13 | 6 | 0 | 0 | 0 | |||||||||||||||||||||
| PWJ | 512 | 13 | 2 | 0 | 0 | 0 | |||||||||||||||||||||
| PJG | 319 | 8 | 1 | 0 | 0 | 0 | |||||||||||||||||||||
| PWP | 541 | 14 | 4 | 0 | 0 | 0 | |||||||||||||||||||||
| PWT | 460 | 42 | 4 | 1 | 0 | 0 | |||||||||||||||||||||
| PJM | 314 | 24 | 3 | 2 | 0 | 0 | |||||||||||||||||||||
| PWY | 438 | 39 | 7 | 1 | 1 | 0 | |||||||||||||||||||||
| PQSC | 126 | 15 | 0 | 0 | 0 | 0 | |||||||||||||||||||||
| PZI | 489 | 42 | 7 | 0 | 0 | 0 | |||||||||||||||||||||
| PZJ | 384 | 20 | 3 | 1 | 0 | 0 | |||||||||||||||||||||
33
Fees and Expenses
As a shareholder of a Fund of the PowerShares Exchange-Traded Fund Trust, you incur advisory fees and other Fund expenses. The expense examples below are intended to help you understand your ongoing costs (in dollars) of investing in the Funds and to compare these costs with the ongoing costs of investing in other funds.
The example is based on an investment of $1,000 invested at the beginning of the period and held through the six-month period ended April 30, 2009.
Actual Expenses
The first line in the following table provides information about actual account values and actual expenses. You may use the information in this line, together with the amount you invested, to estimate the expenses that you paid over the period. Simply divide your account value by $1,000 (for example, an $8,600 account value divided by $1,000 = 8.6), then multiply the result by the number in the first line under the heading "Expenses Paid During the Six-Month Period" to estimate the expenses you paid on your account during this period.
Hypothetical Example for Comparison Purposes
The second line in the following table provides information about hypothetical account values and hypothetical expenses based on each Fund's actual expense ratio and an assumed annualized rate of return of 5% per year before expenses, which is not the Fund's actual return. The hypothetical account values and expenses may not be used to estimate the actual ending account balance or expenses you paid for the period. You may use this information to compare the ongoing costs of investing in the Funds and other funds. To do so, compare this 5% hypothetical example with the 5% hypothetical examples that appear in the shareholder reports of the other funds.
Please note that the expenses shown in the table are meant to highlight your ongoing costs only, and do not reflect any transactional costs such as sales charges (loads). Therefore the second line in the table is useful in comparing ongoing costs only, and will not help you determine the relative total costs of owning different funds. In addition, if these transactional costs were included, your costs would have been higher.
| Beginning Account Value November 1, 2008 | Ending Account Value April 30, 2009 | Annualized Expense Ratio Based on the Six-Month Period | Expenses Paid During the Six-Month Period (1) | ||||||||||||||||
| PowerShares Dynamic Aggressive Growth Portfolio Actual | $ | 1,000.00 | $ | 873.76 | 0.63 | % | $ | 2.93 | |||||||||||
| Hypothetical (5% return before expenses) | $ | 1,000.00 | $ | 1,021.67 | 0.63 | % | $ | 3.16 | |||||||||||
| PowerShares Dynamic Deep Value Portfolio Actual | $ | 1,000.00 | $ | 951.57 | 0.64 | % | $ | 3.10 | |||||||||||
| Hypothetical (5% return before expenses) | $ | 1,000.00 | $ | 1,021.62 | 0.64 | % | $ | 3.21 | |||||||||||
| PowerShares Dynamic Large Cap Growth Portfolio Actual | $ | 1,000.00 | $ | 920.66 | 0.60 | % | $ | 2.86 | |||||||||||
| Hypothetical (5% return before expenses) | $ | 1,000.00 | $ | 1,021.82 | 0.60 | % | $ | 3.01 | |||||||||||
| PowerShares Dynamic Large Cap Portfolio Actual | $ | 1,000.00 | $ | 926.17 | 0.65 | % | $ | 3.10 | |||||||||||
| Hypothetical (5% return before expenses) | $ | 1,000.00 | $ | 1,021.57 | 0.65 | % | $ | 3.26 | |||||||||||
| PowerShares Dynamic Large Cap Value Portfolio Actual | $ | 1,000.00 | $ | 940.34 | 0.63 | % | $ | 3.03 | |||||||||||
| Hypothetical (5% return before expenses) | $ | 1,000.00 | $ | 1,021.67 | 0.63 | % | $ | 3.16 | |||||||||||
34
Fees and Expenses (Continued)
| Beginning Account Value November 1, 2008 | Ending Account Value April 30, 2009 | Annualized Expense Ratio Based on the Six-Month Period | Expenses Paid During the Six-Month Period (1) | ||||||||||||||||
| PowerShares Dynamic Mid Cap Growth Portfolio Actual | $ | 1,000.00 | $ | 959.86 | 0.63 | % | $ | 3.06 | |||||||||||
| Hypothetical (5% return before expenses) | $ | 1,000.00 | $ | 1,021.67 | 0.63 | % | $ | 3.16 | |||||||||||
| PowerShares Dynamic Mid Cap Portfolio Actual | $ | 1,000.00 | $ | 1,007.08 | 0.65 | % | $ | 3.23 | |||||||||||
| Hypothetical (5% return before expenses) | $ | 1,000.00 | $ | 1,021.57 | 0.65 | % | $ | 3.26 | |||||||||||
| PowerShares Dynamic Mid Cap Value Portfolio Actual | $ | 1,000.00 | $ | 1,033.92 | 0.63 | % | $ | 3.18 | |||||||||||
| Hypothetical (5% return before expenses) | $ | 1,000.00 | $ | 1,021.67 | 0.63 | % | $ | 3.16 | |||||||||||
| PowerShares Dynamic Small Cap Growth Portfolio Actual | $ | 1,000.00 | $ | 885.97 | 0.63 | % | $ | 2.95 | |||||||||||
| Hypothetical (5% return before expenses) | $ | 1,000.00 | $ | 1,021.67 | 0.63 | % | $ | 3.16 | |||||||||||
| PowerShares Dynamic Small Cap Portfolio Actual | $ | 1,000.00 | $ | 862.51 | 0.65 | % | $ | 3.00 | |||||||||||
| Hypothetical (5% return before expenses) | $ | 1,000.00 | $ | 1,021.57 | 0.65 | % | $ | 3.26 | |||||||||||
| PowerShares Dynamic Small Cap Value Portfolio Actual | $ | 1,000.00 | $ | 889.83 | 0.63 | % | $ | 2.95 | |||||||||||
| Hypothetical (5% return before expenses) | $ | 1,000.00 | $ | 1,021.67 | 0.63 | % | $ | 3.16 | |||||||||||
| PowerShares FTSE NASDAQ Small Cap Portfolio Actual | $ | 1,000.00 | $ | 935.59 | 0.70 | % | $ | 3.36 | |||||||||||
| Hypothetical (5% return before expenses) | $ | 1,000.00 | $ | 1,021.32 | 0.70 | % | $ | 3.51 | |||||||||||
| PowerShares Zacks Micro Cap Portfolio Actual | $ | 1,000.00 | $ | 827.37 | 0.70 | % | $ | 3.17 | |||||||||||
| Hypothetical (5% return before expenses) | $ | 1,000.00 | $ | 1,021.32 | 0.70 | % | $ | 3.51 | |||||||||||
| PowerShares Zacks Small Cap Portfolio Actual | $ | 1,000.00 | $ | 892.98 | 0.70 | % | $ | 3.29 | |||||||||||
| Hypothetical (5% return before expenses) | $ | 1,000.00 | $ | 1,021.32 | 0.70 | % | $ | 3.51 | |||||||||||
(1) Expenses are calculated using the annualized expense ratio, which represents the ongoing expenses as a percentage of net assets for the six months ended April 30, 2009. Expenses are calculated by multiplying the Fund's annualized expense ratio by the average account value for the period; then multiplying the result by 181 and then dividing the result by 365. Expense ratios for the most recent half-year differ from expenses ratios based on annualized data in the Financial Highlights.
35
Schedule of Investments
PowerShares Dynamic Aggressive Growth Portfolio
April 30, 2009
| Number of Shares | Value | ||||||||||
| Common Stocks—100.1% | |||||||||||
| Consumer Discretionary—18.6% | |||||||||||
| 869 | Amazon.com, Inc.* | $ | 69,972 | ||||||||
| 776 | Apollo Group, Inc., Class A* | 48,849 | |||||||||
| 3,026 | Bally Technologies, Inc.* | 79,221 | |||||||||
| 1,823 | Buffalo Wild Wings, Inc.* | 71,170 | |||||||||
| 1,014 | Capella Education Co.* | 52,099 | |||||||||
| 2,281 | Career Education Corp.* | 50,273 | |||||||||
| 2,856 | Corinthian Colleges, Inc.* | 43,982 | |||||||||
| 1,450 | Dollar Tree, Inc.* | 61,393 | |||||||||
| 6,635 | FGX International Holdings Ltd.* | 76,435 | |||||||||
| 2,841 | Fuel Systems Solutions, Inc.* | 43,382 | |||||||||
| 6,337 | Hot Topic, Inc.* | 77,565 | |||||||||
| 2,488 | Interactive Data Corp. | 55,930 | |||||||||
| 496 | ITT Educational Services, Inc.* | 49,982 | |||||||||
| 3,924 | Lincoln Educational Services Corp.* | 65,099 | |||||||||
| 2,176 | Marvel Entertainment, Inc.* | 64,932 | |||||||||
| 1,557 | NetFlix, Inc.* | 70,548 | |||||||||
| 1,278 | Panera Bread Co., Class A* | 71,581 | |||||||||
| 4,083 | PetMed Express, Inc.* | 66,390 | |||||||||
| 331 | Strayer Education, Inc. | 62,695 | |||||||||
| 1,181,498 | |||||||||||
| Consumer Staples—2.9% | |||||||||||
| 887 | Chattem, Inc.* | 48,705 | |||||||||
| 1,150 | Church & Dwight Co., Inc. | 62,572 | |||||||||
| 1,691 | Hansen Natural Corp.* | 68,925 | |||||||||
| 180,202 | |||||||||||
| Financials—3.7% | |||||||||||
| 3,335 | Brown & Brown, Inc. | 64,899 | |||||||||
| 7,079 | Crawford & Co., Class B* | 42,120 | |||||||||
| 3,289 | Life Partners Holdings, Inc. | 61,570 | |||||||||
| 11,034 | Nelnet, Inc., Class A* | 66,535 | |||||||||
| 235,124 | |||||||||||
| Health Care—27.0% | |||||||||||
| 6,863 | Alliance Healthcare Services, Inc.* | 54,012 | |||||||||
| 5,437 | American Medical Systems Holdings, Inc.* | 67,256 | |||||||||
| 701 | C.R. Bard, Inc. | 50,213 | |||||||||
| 858 | Cephalon, Inc.* | 56,293 | |||||||||
| 1,538 | Cerner Corp.* | 82,743 | |||||||||
| 2,103 | Computer Programs & Systems, Inc. | 73,584 | |||||||||
| 3,960 | Cubist Pharmaceuticals, Inc.* | 65,736 | |||||||||
| 4,184 | Cyberonics, Inc.* | 55,396 | |||||||||
| 1,202 | Dionex Corp.* | 75,725 | |||||||||
| 1,012 | Edwards Lifesciences Corp.* | 64,141 | |||||||||
| 1,838 | Emergency Medical Services Corp., Class A* | 64,036 | |||||||||
| 10,637 | Enzon Pharmaceuticals, Inc.* | 61,163 | |||||||||
| 1,118 | Express Scripts, Inc.* | 71,518 | |||||||||
| 1,856 | Genoptix, Inc.* | 53,972 | |||||||||
| 1,387 | Gen-Probe, Inc.* | 66,798 | |||||||||
| 3,247 | Gentiva Health Services, Inc.* | 51,725 | |||||||||
| 1,256 | Gilead Sciences, Inc.* | 57,525 | |||||||||
| Number of Shares | Value | ||||||||||
| Common Stocks (Continued) | |||||||||||
| 1,055 | Haemonetics Corp.* | $ | 54,470 | ||||||||
| 1,785 | ICU Medical, Inc.* | 67,116 | |||||||||
| 2,507 | Immucor, Inc.* | 40,839 | |||||||||
| 5,917 | IRIS International, Inc.* | 66,093 | |||||||||
| 2,823 | LHC Group, Inc.* | 64,421 | |||||||||
| 12,368 | NPS Pharmaceuticals, Inc.* | 42,793 | |||||||||
| 1,651 | OSI Pharmaceuticals, Inc.* | 55,424 | |||||||||
| 9,587 | PDL BioPharma, Inc. | 68,547 | |||||||||
| 11,579 | Questcor Pharmaceuticals, Inc.* | 52,106 | |||||||||
| 1,526 | ResMed, Inc.* | 58,675 | |||||||||
| 4,509 | Synovis Life Technologies, Inc.* | 68,447 | |||||||||
| 1,710,767 | |||||||||||
| Industrials—13.0% | |||||||||||
| 3,626 | AAON, Inc. | 70,634 | |||||||||
| 1,639 | Allegiant Travel Co.* | 85,294 | |||||||||
| 927 | American Science & Engineering, Inc. | 55,861 | |||||||||
| 13,179 | GT Solar International, Inc.* | 93,438 | |||||||||
| 2,308 | HEICO Corp. | 66,263 | |||||||||
| 3,398 | Marten Transport Ltd.* | 70,475 | |||||||||
| 1,839 | MSC Industrial Direct Co., Class A | 75,123 | |||||||||
| 4,092 | Resources Connection, Inc.* | 79,999 | |||||||||
| 3,562 | Rollins, Inc. | 64,116 | |||||||||
| 1,814 | Stanley, Inc.* | 46,765 | |||||||||
| 1,173 | Stericycle, Inc.* | 55,225 | |||||||||
| 2,512 | Tetra Tech, Inc.* | 61,695 | |||||||||
| 824,888 | |||||||||||
| Information Technology—34.0% | |||||||||||
| 631 | Apple, Inc.* | 79,399 | |||||||||
| 25,812 | Art Technology Group, Inc.* | 81,050 | |||||||||
| 10,344 | BigBand Networks, Inc.* | 60,616 | |||||||||
| 5,410 | Cogent, Inc.* | 61,349 | |||||||||
| 1,489 | Comtech Telecommunications Corp.* | 49,837 | |||||||||
| 2,007 | Dolby Laboratories, Inc., Class A* | 80,541 | |||||||||
| 2,803 | EMS Technologies, Inc.* | 53,397 | |||||||||
| 1,460 | Factset Research Systems, Inc. | 78,241 | |||||||||
| 2,757 | FLIR Systems, Inc.* | 61,150 | |||||||||
| 7,105 | Genpact Ltd.* | 63,661 | |||||||||
| 1,835 | Global Payments, Inc. | 58,830 | |||||||||
| 10,344 | Harmonic, Inc.* | 75,822 | |||||||||
| 2,040 | Hittite Microwave Corp.* | 75,806 | |||||||||
| 3,769 | IAC/InterActive Corp.* | 60,379 | |||||||||
| 1,915 | InterDigital, Inc.* | 50,403 | |||||||||
| 9,603 | LoopNet, Inc.* | 82,489 | |||||||||
| 1,078 | Mantech International Corp., Class A* | 39,013 | |||||||||
| 356 | Mastercard, Inc., Class A | 65,308 | |||||||||
| 2,069 | NCI, Inc., Class A* | 50,401 | |||||||||
| 2,550 | Paychex, Inc. | 68,876 | |||||||||
| 4,111 | Red Hat, Inc.* | 70,997 | |||||||||
| 7,079 | RightNow Technologies, Inc.* | 53,446 | |||||||||
| 9,872 | S1 Corp.* | 61,206 | |||||||||
| 2,976 | SAIC, Inc.* | 53,866 | |||||||||
See Notes to Financial Statements.
36
Schedule of Investments (Continued)
PowerShares Dynamic Aggressive Growth Portfolio
April 30, 2009
| Number of Shares | Value | ||||||||||
| Common Stocks (Continued) | |||||||||||
| 14,693 | Sapient Corp.* | $ | 75,375 | ||||||||
| 2,706 | Solera Holdings, Inc.* | 61,751 | |||||||||
| 2,698 | Supertex, Inc.* | 69,393 | |||||||||
| 2,712 | Synaptics, Inc.* | 88,085 | |||||||||
| 2,766 | Syntel, Inc. | 76,674 | |||||||||
| 6,821 | TeleCommunication Systems, Inc., Class A* | 66,914 | |||||||||
| 7,937 | TiVo, Inc.* | 59,528 | |||||||||
| 5,125 | Ultratech, Inc.* | 69,290 | |||||||||
| 7,453 | Wind River Systems, Inc.* | 54,630 | |||||||||
| 2,157,723 | |||||||||||
| Telecommunication Services—0.9% | |||||||||||
| 7,688 | Global Crossing Ltd.* | 55,815 | |||||||||
| Total Common Stocks (Cost $6,302,170) | 6,346,017 | ||||||||||
| Money Market Fund—0.4% | |||||||||||
| 28,027 | Goldman Sachs Financial Square Prime Obligations Institutional Share Class (Cost $28,027) | 28,027 | |||||||||
| Total Investments (Cost $6,330,197)—100.5% | 6,374,044 | ||||||||||
| Liabilities in excess of other assets—(0.5%) | (33,001 | ) | |||||||||
| Net Assets—100.0% | $ | 6,341,043 | |||||||||
* Non-income producing security.
See Notes to Financial Statements.
37
Schedule of Investments
PowerShares Dynamic Deep Value Portfolio
April 30, 2009
| Number of Shares | Value | ||||||||||
| Common Stocks—100.0% | |||||||||||
| Consumer Discretionary—14.1% | |||||||||||
| 9,287 | Cabela's, Inc.* | $ | 118,966 | ||||||||
| 2,883 | Columbia Sportswear Co. | 88,566 | |||||||||
| 7,247 | Gap (The), Inc. | 112,618 | |||||||||
| 5,468 | Genesco, Inc.* | 124,561 | |||||||||
| 3,416 | Hasbro, Inc. | 91,071 | |||||||||
| 7,788 | Helen of Troy Ltd.* | 124,219 | |||||||||
| 4,045 | International Speedway Corp., Class A | 95,786 | |||||||||
| 10,168 | Ltd Brands, Inc. | 116,119 | |||||||||
| 7,321 | Men's Wearhouse (The), Inc. | 136,463 | |||||||||
| 3,254 | Omnicom Group, Inc. | 102,403 | |||||||||
| 6,206 | Regis Corp. | 118,783 | |||||||||
| 4,463 | Rent-A-Center, Inc.* | 85,913 | |||||||||
| 15,990 | Ticketmaster Entertainment, Inc.* | 84,107 | |||||||||
| 1,399,575 | |||||||||||
| Consumer Staples—8.3% | |||||||||||
| 5,064 | Altria Group, Inc. | 82,695 | |||||||||
| 6,811 | Coca-Cola Enterprises, Inc. | 116,195 | |||||||||
| 5,185 | ConAgra Foods, Inc. | 91,775 | |||||||||
| 5,992 | Constellation Brands, Inc., Class A* | 69,447 | |||||||||
| 10,936 | Del Monte Foods Co. | 82,567 | |||||||||
| 4,708 | PepsiAmericas, Inc. | 115,676 | |||||||||
| 14,295 | Prestige Brands Holdings, Inc.* | 92,346 | |||||||||
| 2,329 | Reynolds American, Inc. | 88,455 | |||||||||
| 4,227 | Safeway, Inc. | 83,483 | |||||||||
| 822,639 | |||||||||||
| Energy—3.6% | |||||||||||
| 12,392 | Basic Energy Services, Inc.* | 126,398 | |||||||||
| 8,086 | BJ Services Co. | 112,315 | |||||||||
| 5,928 | Superior Energy Services, Inc.* | 113,877 | |||||||||
| 352,590 | |||||||||||
| Financials—20.0% | |||||||||||
| 2,142 | ACE Ltd. | 99,217 | |||||||||
| 5,025 | American Financial Group, Inc. | 88,340 | |||||||||
| 1,845 | American Physicians Capital, Inc. | 76,863 | |||||||||
| 5,393 | Amerisafe, Inc.* | 82,836 | |||||||||
| 1,448 | Arch Capital Group Ltd.* | 83,665 | |||||||||
| 2,760 | Argo Group International Holdings Ltd. (Bermuda)* | 77,252 | |||||||||
| 3,588 | Aspen Insurance Holdings Ltd. (Bermuda) | 84,605 | |||||||||
| 2,440 | Bank of Hawaii Corp. | 85,742 | |||||||||
| 2,003 | Chubb (The) Corp. | 78,017 | |||||||||
| 3,807 | Cincinnati Financial Corp. | 91,178 | |||||||||
| 12,861 | Dollar Financial Corp.* | 129,896 | |||||||||
| 8,145 | Employers Holdings, Inc. | 67,929 | |||||||||
| 2,108 | FPIC Insurance Group, Inc.* | 64,378 | |||||||||
| 2,627 | Harleysville Group, Inc. | 75,973 | |||||||||
| 3,562 | HCC Insurance Holdings, Inc. | 85,203 | |||||||||
| 10,168 | Horace Mann Educators Corp. | 89,275 | |||||||||
| 2,201 | Infinity Property & Casualty Corp. | 77,563 | |||||||||
| Number of Shares | Value | ||||||||||
| Common Stocks (Continued) | |||||||||||
| 3,077 | IPC Holdings Ltd. | $ | 80,125 | ||||||||
| 4,236 | MetLife, Inc. | 126,021 | |||||||||
| 14,643 | TradeStation Group, Inc.* | 118,755 | |||||||||
| 2,163 | Travelers (The) Cos., Inc. | 88,986 | |||||||||
| 7,681 | Unum Group | 125,508 | |||||||||
| 1,977,327 | |||||||||||
| Health Care—5.7% | |||||||||||
| 12,011 | AMN Healthcare Services, Inc.* | 82,756 | |||||||||
| 3,370 | Hospira, Inc.* | 110,772 | |||||||||
| 3,720 | LifePoint Hospitals, Inc.* | 96,162 | |||||||||
| 3,231 | Merck & Co., Inc. | 78,319 | |||||||||
| 4,175 | Molina Healthcare, Inc.* | 90,389 | |||||||||
| 6,394 | Res-Care, Inc.* | 102,432 | |||||||||
| 560,830 | |||||||||||
| Industrials—26.2% | |||||||||||
| 3,063 | A.O. Smith Corp. | 95,229 | |||||||||
| 3,412 | Acuity Brands, Inc. | 98,061 | |||||||||
| 23,411 | American Commercial Lines, Inc.* | 116,587 | |||||||||
| 3,517 | CIRCOR International, Inc. | 90,492 | |||||||||
| 3,708 | Cooper Industries Ltd., Class A | 121,585 | |||||||||
| 10,129 | Deluxe Corp. | 146,871 | |||||||||
| 7,294 | EnerSys* | 124,363 | |||||||||
| 12,372 | Federal Signal Corp. | 96,130 | |||||||||
| 1,549 | Flowserve Corp. | 105,177 | |||||||||
| 1,784 | General Dynamics Corp. | 92,179 | |||||||||
| 11,920 | Gibraltar Industries, Inc. | 79,864 | |||||||||
| 15,213 | H&E Equipment Services, Inc.* | 114,554 | |||||||||
| 7,757 | Herman Miller, Inc. | 115,347 | |||||||||
| 2,914 | Honeywell International, Inc. | 90,946 | |||||||||
| 35,064 | Interface, Inc., Class A | 203,020 | |||||||||
| 8,069 | John Bean Technologies Corp. | 88,920 | |||||||||
| 11,847 | Knoll, Inc. | 83,877 | |||||||||
| 3,659 | LB Foster Co., Class A* | 119,832 | |||||||||
| 7,636 | SkyWest, Inc. | 91,937 | |||||||||
| 19,403 | Steelcase, Inc., Class A | 87,896 | |||||||||
| 3,413 | Teledyne Technologies, Inc.* | 108,977 | |||||||||
| 3,413 | Thomas & Betts Corp.* | 106,213 | |||||||||
| 1,915 | United Technologies Corp. | 93,529 | |||||||||
| 4,710 | WESCO International, Inc.* | 122,460 | |||||||||
| 2,594,046 | |||||||||||
| Information Technology—10.1% | |||||||||||
| 3,941 | Black Box Corp. | 107,865 | |||||||||
| 12,673 | Cogo Group, Inc.* | 103,665 | |||||||||
| 2,251 | Computer Sciences Corp.* | 83,197 | |||||||||
| 13,231 | Compuware Corp.* | 98,968 | |||||||||
| 2,658 | DST Systems, Inc.* | 96,140 | |||||||||
| 12,412 | EarthLink, Inc.* | 94,083 | |||||||||
| 7,141 | Fair Isaac Corp. | 120,111 | |||||||||
| 850 | International Business Machines Corp. | 87,729 | |||||||||
See Notes to Financial Statements.
38
Schedule of Investments (Continued)
PowerShares Dynamic Deep Value Portfolio
April 30, 2009
| Number of Shares | Value | ||||||||||
| Common Stocks (Continued) | |||||||||||
| 8,061 | JDA Software Group, Inc.* | $ | 113,741 | ||||||||
| 4,562 | Lexmark International, Inc., Class A* | 89,506 | |||||||||
| 995,005 | |||||||||||
| Materials—8.4% | |||||||||||
| 1,941 | Ball Corp. | 73,215 | |||||||||
| 4,211 | Bemis Co., Inc. | 101,232 | |||||||||
| 12,491 | Bway Holding Co.* | 116,416 | |||||||||
| 3,709 | Crown Holdings, Inc.* | 81,783 | |||||||||
| 7,490 | Olin Corp. | 94,374 | |||||||||
| 4,939 | Pactiv Corp.* | 107,967 | |||||||||
| 5,472 | A. Schulman, Inc. | 85,856 | |||||||||
| 1,594 | Silgan Holdings, Inc. | 74,105 | |||||||||
| 4,058 | Sonoco Products Co. | 99,056 | |||||||||
| 834,004 | |||||||||||
| Telecommunication Services—1.9% | |||||||||||
| 3,750 | Atlantic Tele-Network, Inc. | 82,800 | |||||||||
| 9,424 | USA Mobility, Inc. | 104,795 | |||||||||
| 187,595 | |||||||||||
| Utilities—1.7% | |||||||||||
| 4,762 | Portland General Electric Co. | 87,001 | |||||||||
| 2,865 | Public Service Enterprise Group, Inc. | 85,492 | |||||||||
| 172,493 | |||||||||||
| Total Common Stocks (Cost $8,451,459) | 9,896,104 | ||||||||||
| Money Market Fund—1.3% | |||||||||||
| 133,683 | Goldman Sachs Financial Square Prime Obligations Institutional Share Class (Cost $133,683) | 133,683 | |||||||||
| Total Investments (Cost $8,585,142)—101.3% | 10,029,787 | ||||||||||
| Liabilities in excess of other assets—(1.3%) | (130,525 | ) | |||||||||
| Net Assets—100.0% | $ | 9,899,262 | |||||||||
* Non-income producing security.
See Notes to Financial Statements.
39
Schedule of Investments
PowerShares Dynamic Large Cap Growth Portfolio
April 30, 2009
| Number of Shares | Value | ||||||||||
| Common Stocks—100.0% | |||||||||||
| Consumer Discretionary—15.4% | |||||||||||
| 54,156 | Amazon.com, Inc.* | $ | 4,360,641 | ||||||||
| 48,398 | Apollo Group, Inc., Class A* | 3,046,654 | |||||||||
| 626,888 | Comcast Corp., Class A | 9,691,688 | |||||||||
| 99,853 | Kohl's Corp.* | 4,528,334 | |||||||||
| 156,693 | McDonald's Corp. | 8,350,170 | |||||||||
| 84,487 | NIKE, Inc., Class B | 4,433,033 | |||||||||
| 157,556 | TJX Cos., Inc. | 4,406,841 | |||||||||
| 133,514 | Yum! Brands, Inc. | 4,452,692 | |||||||||
| 43,270,053 | |||||||||||
| Consumer Staples—9.1% | |||||||||||
| 199,474 | Avon Products, Inc. | 4,540,028 | |||||||||
| 81,639 | Brown-Forman Corp., Class B | 3,796,214 | |||||||||
| 58,303 | Colgate-Palmolive Co. | 3,439,877 | |||||||||
| 318,073 | CVS Caremark Corp. | 10,108,360 | |||||||||
| 104,148 | Hershey (The) Co. | 3,763,909 | |||||||||
| 25,648,388 | |||||||||||
| Energy—1.6% | |||||||||||
| 100,396 | Anadarko Petroleum Corp. | 4,323,052 | |||||||||
| Financials—2.9% | |||||||||||
| 63,165 | Northern Trust Corp. | 3,433,649 | |||||||||
| 295,601 | TD Ameritrade Holding Corp.* | 4,703,012 | |||||||||
| 8,136,661 | |||||||||||
| Health Care—27.8% | |||||||||||
| 172,945 | Abbott Laboratories | 7,237,748 | |||||||||
| 167,324 | Amgen, Inc.* | 8,110,194 | |||||||||
| 160,817 | Baxter International, Inc. | 7,799,625 | |||||||||
| 56,695 | Becton Dickinson & Co. | 3,428,914 | |||||||||
| 76,212 | Biogen Idec, Inc.* | 3,684,088 | |||||||||
| 444,711 | Bristol-Myers Squibb Co. | 8,538,451 | |||||||||
| 43,719 | C.R. Bard, Inc. | 3,131,592 | |||||||||
| 69,757 | Express Scripts, Inc.* | 4,462,355 | |||||||||
| 182,750 | Gilead Sciences, Inc.* | 8,369,950 | |||||||||
| 86,467 | Medco Health Solutions, Inc.* | 3,765,638 | |||||||||
| 276,688 | Medtronic, Inc. | 8,854,016 | |||||||||
| 76,562 | Quest Diagnostics, Inc. | 3,929,927 | |||||||||
| 105,812 | St. Jude Medical, Inc.* | 3,546,818 | |||||||||
| 96,767 | Thermo Fisher Scientific, Inc.* | 3,394,586 | |||||||||
| 78,253,902 | |||||||||||
| Industrials—5.9% | |||||||||||
| 69,125 | Danaher Corp. | 4,039,665 | |||||||||
| 81,204 | FedEx Corp. | 4,544,176 | |||||||||
| 105,526 | Fluor Corp. | 3,996,270 | |||||||||
| 93,942 | ITT Corp. | 3,852,561 | |||||||||
| 16,432,672 | |||||||||||
| Information Technology—34.1% | |||||||||||
| 210,105 | Adobe Systems, Inc.* | 5,746,372 | |||||||||
| 91,671 | Apple, Inc.* | 11,534,961 | |||||||||
| Number of Shares | Value | ||||||||||
| Common Stocks (Continued) | |||||||||||
| 102,744 | Automatic Data Processing, Inc. | $ | 3,616,589 | ||||||||
| 207,008 | CA, Inc. | 3,570,888 | |||||||||
| 334,168 | EMC Corp.* | 4,187,125 | |||||||||
| 24,221 | Google, Inc., Class A* | 9,590,789 | |||||||||
| 642,633 | Intel Corp. | 10,140,749 | |||||||||
| 153,961 | Intuit, Inc.* | 3,561,118 | |||||||||
| 246,923 | Juniper Networks, Inc.* | 5,345,883 | |||||||||
| 22,204 | Mastercard, Inc., Class A | 4,073,324 | |||||||||
| 526,842 | Oracle Corp.* | 10,189,124 | |||||||||
| 159,056 | Paychex, Inc. | 4,296,103 | |||||||||
| 244,906 | QUALCOMM, Inc. | 10,364,422 | |||||||||
| 244,514 | Texas Instruments, Inc. | 4,415,923 | |||||||||
| 314,406 | Western Union (The) Co. | 5,266,301 | |||||||||
| 95,899,671 | |||||||||||
| Materials—3.2% | |||||||||||
| 107,345 | Monsanto Co. | 9,112,517 | |||||||||
| Total Investments (Cost $293,147,614)—100.0% | 281,076,916 | ||||||||||
| Other assets less liabilities—0.0% | 95,525 | ||||||||||
| Net Assets—100.0% | $ | 281,172,441 | |||||||||
* Non-income producing security.
See Notes to Financial Statements.
40
Schedule of Investments
PowerShares Dynamic Large Cap Portfolio
April 30, 2009
| Number of Shares | Value | ||||||||||
| Common Stocks—100.0% | |||||||||||
| Consumer Discretionary—12.2% | |||||||||||
| 3,231 | Amazon.com, Inc.* | $ | 260,160 | ||||||||
| 2,894 | Apollo Group, Inc., Class A* | 182,177 | |||||||||
| 10,700 | Carnival Corp. | 287,616 | |||||||||
| 37,484 | Comcast Corp., Class A | 579,503 | |||||||||
| 19,444 | Gap (The), Inc. | 302,160 | |||||||||
| 23,434 | Home Depot, Inc. | 616,782 | |||||||||
| 5,956 | Kohl's Corp.* | 270,105 | |||||||||
| 9,369 | McDonald's Corp. | 499,274 | |||||||||
| 5,040 | NIKE, Inc., Class B | 264,449 | |||||||||
| 8,731 | Omnicom Group, Inc. | 274,765 | |||||||||
| 9,421 | TJX Cos., Inc. | 263,505 | |||||||||
| 7,983 | Yum! Brands, Inc. | 266,233 | |||||||||
| 4,066,729 | |||||||||||
| Consumer Staples—14.0% | |||||||||||
| 13,588 | Altria Group, Inc. | 221,892 | |||||||||
| 7,852 | Archer-Daniels-Midland Co. | 193,316 | |||||||||
| 4,882 | Brown-Forman Corp., Class B | 227,013 | |||||||||
| 7,837 | Campbell Soup Co. | 201,568 | |||||||||
| 11,984 | Coca-Cola (The) Co. | 515,911 | |||||||||
| 3,486 | Colgate-Palmolive Co. | 205,674 | |||||||||
| 13,880 | ConAgra Foods, Inc. | 245,676 | |||||||||
| 3,988 | General Mills, Inc. | 202,152 | |||||||||
| 6,212 | Hershey (The) Co. | 224,502 | |||||||||
| 5,390 | Kellogg Co. | 226,973 | |||||||||
| 21,490 | Kraft Foods, Inc., Class A | 502,866 | |||||||||
| 10,163 | Procter & Gamble (The) Co. | 502,459 | |||||||||
| 6,232 | Reynolds American, Inc. | 236,691 | |||||||||
| 11,314 | Safeway, Inc. | 223,452 | |||||||||
| 9,758 | Sysco Corp. | 227,654 | |||||||||
| 9,941 | Wal-Mart Stores, Inc. | 501,026 | |||||||||
| 4,658,825 | |||||||||||
| Energy—4.6% | |||||||||||
| 6,003 | Anadarko Petroleum Corp. | 258,489 | |||||||||
| 8,063 | Chevron Corp. | 532,964 | |||||||||
| 12,834 | Halliburton Co. | 259,503 | |||||||||
| 7,831 | National Oilwell Varco, Inc.* | 237,123 | |||||||||
| 8,532 | Noble Corp. | 233,180 | |||||||||
| 1,521,259 | |||||||||||
| Financials—6.4% | |||||||||||
| 5,734 | ACE Ltd. | 265,599 | |||||||||
| 12,518 | Aflac, Inc. | 361,644 | |||||||||
| 5,473 | AON Corp. | 230,961 | |||||||||
| 5,374 | Chubb (The) Corp. | 209,317 | |||||||||
| 11,365 | MetLife, Inc. | 338,109 | |||||||||
| 3,769 | Northern Trust Corp | 204,883 | |||||||||
| 17,674 | TD Ameritrade Holding Corp.* | 281,194 | |||||||||
| 5,791 | Travelers (The) Cos., Inc. | 238,242 | |||||||||
| 2,129,949 | |||||||||||
| Number of Shares | Value | ||||||||||
| Common Stocks (Continued) | |||||||||||
| Health Care—20.9% | |||||||||||
| 10,340 | Abbott Laboratories | $ | 432,729 | ||||||||
| 10,005 | Amgen, Inc.* | 484,942 | |||||||||
| 9,615 | Baxter International, Inc. | 466,328 | |||||||||
| 3,382 | Becton Dickinson & Co. | 204,543 | |||||||||
| 26,590 | Bristol-Myers Squibb Co. | 510,528 | |||||||||
| 2,613 | C.R. Bard, Inc. | 187,169 | |||||||||
| 6,465 | Cardinal Health, Inc. | 218,452 | |||||||||
| 6,625 | Covidien Ltd. | 218,493 | |||||||||
| 4,171 | Express Scripts, Inc.* | 266,819 | |||||||||
| 9,785 | Forest Laboratories, Inc.* | 212,237 | |||||||||
| 10,927 | Gilead Sciences, Inc.* | 500,457 | |||||||||
| 8,864 | Humana, Inc.* | 255,106 | |||||||||
| 9,790 | Johnson & Johnson | 512,604 | |||||||||
| 5,122 | McKesson Corp. | 189,514 | |||||||||
| 16,544 | Medtronic, Inc. | 529,408 | |||||||||
| 20,229 | Merck & Co., Inc. | 490,351 | |||||||||
| 39,766 | Pfizer, Inc. | 531,273 | |||||||||
| 4,578 | Quest Diagnostics, Inc. | 234,989 | |||||||||
| 11,992 | Wyeth | 508,461 | |||||||||
| 6,954,403 | |||||||||||
| Industrials—14.8% | |||||||||||
| 10,768 | 3M Co. | 620,237 | |||||||||
| 8,482 | CSX Corp. | 250,982 | |||||||||
| 4,124 | Danaher Corp. | 241,007 | |||||||||
| 7,825 | Emerson Electric Co. | 266,363 | |||||||||
| 4,844 | FedEx Corp. | 271,070 | |||||||||
| 6,295 | Fluor Corp. | 238,392 | |||||||||
| 4,788 | General Dynamics Corp. | 247,396 | |||||||||
| 7,819 | Honeywell International, Inc. | 244,031 | |||||||||
| 7,530 | Illinois Tool Works, Inc. | 246,984 | |||||||||
| 5,617 | ITT Corp. | 230,353 | |||||||||
| 3,101 | L-3 Communications Holdings, Inc. | 236,141 | |||||||||
| 3,316 | Lockheed Martin Corp. | 260,405 | |||||||||
| 6,598 | Norfolk Southern Corp. | 235,417 | |||||||||
| 5,249 | Raytheon Co. | 237,412 | |||||||||
| 10,464 | Tyco International, Ltd. | 248,625 | |||||||||
| 5,579 | Union Pacific Corp. | 274,152 | |||||||||
| 11,989 | United Technologies Corp. | 585,543 | |||||||||
| 4,934,510 | |||||||||||
| Information Technology—20.5% | |||||||||||
| 7,187 | Accenture Ltd., Class A (Bermuda) | 211,513 | |||||||||
| 12,562 | Adobe Systems, Inc.* | 343,571 | |||||||||
| 5,481 | Apple, Inc.* | 689,673 | |||||||||
| 6,130 | Automatic Data Processing, Inc. | 215,776 | |||||||||
| 12,378 | CA, Inc. | 213,521 | |||||||||
| 33,599 | Cisco Systems, Inc.* | 649,133 | |||||||||
| 19,935 | EMC Corp.* | 249,786 | |||||||||
| 16,863 | Hewlett-Packard Co. | 606,731 | |||||||||
| 38,424 | Intel Corp. | 606,331 | |||||||||
| 5,319 | International Business Machines Corp. | 548,974 | |||||||||
See Notes to Financial Statements.
41
Schedule of Investments (Continued)
PowerShares Dynamic Large Cap Portfolio
April 30, 2009
| Number of Shares | Value | ||||||||||
| Common Stocks (Continued) | |||||||||||
| 9,185 | Intuit, Inc.* | $ | 212,449 | ||||||||
| 1,325 | Mastercard, Inc., Class A | 243,071 | |||||||||
| 30,312 | Microsoft Corp. | 614,121 | |||||||||
| 31,501 | Oracle Corp.* | 609,229 | |||||||||
| 9,510 | Paychex, Inc. | 256,865 | |||||||||
| 15,170 | Symantec Corp.* | 261,683 | |||||||||
| 18,755 | Western Union (The) Co. | 314,146 | |||||||||
| 6,846,573 | |||||||||||
| Materials—1.6% | |||||||||||
| 6,419 | Monsanto Co. | 544,909 | |||||||||
| Telecommunication Services—3.1% | |||||||||||
| 20,594 | AT&T, Inc. | 527,618 | |||||||||
| 17,158 | Verizon Communications, Inc. | 520,574 | |||||||||
| 1,048,192 | |||||||||||
| Utilities—1.9% | |||||||||||
| 4,433 | Exelon Corp. | 204,494 | |||||||||
| 4,929 | FirstEnergy Corp. | 201,596 | |||||||||
| 7,687 | Public Service Enterprise Group, Inc. | 229,380 | |||||||||
| 635,470 | |||||||||||
| Total Common Stocks (Cost $35,607,669) | 33,340,819 | ||||||||||
| Money Market Fund—0.0% | |||||||||||
| 8,610 | Goldman Sachs Financial Square Prime Obligations Institutional Share Class (Cost $8,610) | 8,610 | |||||||||
| Total Investments (Cost $35,616,279)—100.0% | 33,349,429 | ||||||||||
| Other assets less liabilities—0.0% | 5,489 | ||||||||||
| Net Assets—100.0% | $ | 33,354,918 | |||||||||
* Non-income producing security.
See Notes to Financial Statements.
42
Schedule of Investments
PowerShares Dynamic Large Cap Value Portfolio
April 30, 2009
| Number of Shares | Value | ||||||||||
| Common Stocks—100.0% | |||||||||||
| Consumer Discretionary—16.1% | |||||||||||
| 164,953 | Carnival Corp. | $ | 4,433,937 | ||||||||
| 299,027 | Gap (The), Inc. | 4,646,880 | |||||||||
| 360,389 | Home Depot, Inc. | 9,485,438 | |||||||||
| 134,270 | Omnicom Group, Inc. | 4,225,477 | |||||||||
| 445,081 | Time Warner, Inc. | 9,716,118 | |||||||||
| 448,928 | Walt Disney (The) Co. | 9,831,523 | |||||||||
| 42,339,373 | |||||||||||
| Consumer Staples—9.8% | |||||||||||
| 487,598 | Altria Group, Inc. | 7,962,475 | |||||||||
| 213,960 | ConAgra Foods, Inc. | 3,787,092 | |||||||||
| 98,759 | H.J. Heinz Co. | 3,399,285 | |||||||||
| 68,490 | Kimberly-Clark Corp. | 3,365,599 | |||||||||
| 96,085 | Reynolds American, Inc. | 3,649,308 | |||||||||
| 174,405 | Safeway, Inc. | 3,444,499 | |||||||||
| 25,608,258 | |||||||||||
| Energy—9.2% | |||||||||||
| 124,007 | Chevron Corp. | 8,196,863 | |||||||||
| 201,566 | ConocoPhillips | 8,264,206 | |||||||||
| 197,825 | Halliburton Co. | 4,000,022 | |||||||||
| 53,982 | Transocean Ltd.* | 3,642,705 | |||||||||
| 24,103,796 | |||||||||||
| Financials—16.8% | |||||||||||
| 88,374 | ACE Ltd. | 4,093,484 | |||||||||
| 192,513 | Aflac, Inc. | 5,561,701 | |||||||||
| 84,376 | AON Corp. | 3,560,667 | |||||||||
| 82,645 | Chubb (The) Corp. | 3,219,023 | |||||||||
| 82,658 | Goldman Sachs Group (The), Inc. | 10,621,553 | |||||||||
| 162,543 | Loews Corp. | 4,045,695 | |||||||||
| 174,783 | MetLife, Inc. | 5,199,794 | |||||||||
| 278,868 | Progressive Corp. (The) | 4,261,103 | |||||||||
| 89,253 | Travelers (The) Cos., Inc. | 3,671,868 | |||||||||
| 44,234,888 | |||||||||||
| Health Care—17.2% | |||||||||||
| 135,169 | Aetna, Inc. | 2,975,070 | |||||||||
| 256,246 | Eli Lilly & Co. | 8,435,617 | |||||||||
| 150,490 | Forest Laboratories, Inc.* | 3,264,128 | |||||||||
| 78,657 | McKesson Corp. | 2,910,309 | |||||||||
| 311,094 | Merck & Co., Inc. | 7,540,919 | |||||||||
| 611,577 | Pfizer, Inc. | 8,170,669 | |||||||||
| 95,121 | WellPoint, Inc.* | 4,067,374 | |||||||||
| 184,431 | Wyeth | 7,819,874 | |||||||||
| 45,183,960 | |||||||||||
| Industrials—12.0% | |||||||||||
| 130,734 | CSX Corp. | 3,868,419 | |||||||||
| 73,630 | General Dynamics Corp. | 3,804,462 | |||||||||
| 120,258 | Honeywell International, Inc. | 3,753,252 | |||||||||
| 116,062 | Illinois Tool Works, Inc. | 3,806,834 | |||||||||
| 47,693 | L-3 Communications Holdings, Inc. | 3,631,822 | |||||||||
| Number of Shares | Value | ||||||||||
| Common Stocks (Continued) | |||||||||||
| 101,719 | Norfolk Southern Corp. | $ | 3,629,334 | ||||||||
| 184,387 | United Technologies Corp. | 9,005,461 | |||||||||
| 31,499,584 | |||||||||||
| Information Technology—6.4% | |||||||||||
| 378,255 | Dell, Inc.* | 4,395,323 | |||||||||
| 81,804 | International Business Machines Corp. | 8,442,991 | |||||||||
| 233,296 | Symantec Corp.* | 4,024,356 | |||||||||
| 16,862,670 | |||||||||||
| Telecommunication Services—6.1% | |||||||||||
| 316,723 | AT&T, Inc. | 8,114,443 | |||||||||
| 263,880 | Verizon Communications, Inc. | 8,006,119 | |||||||||
| 16,120,562 | |||||||||||
| Utilities—6.4% | |||||||||||
| 75,811 | FirstEnergy Corp. | 3,100,670 | |||||||||
| 84,419 | PG&E Corp. | 3,133,633 | |||||||||
| 118,230 | Public Service Enterprise Group, Inc. | 3,527,983 | |||||||||
| 77,615 | Sempra Energy | 3,571,843 | |||||||||
| 181,877 | Xcel Energy, Inc. | 3,353,812 | |||||||||
| 16,687,941 | |||||||||||
| Total Investments (Cost $274,543,344)—100.0% | 262,641,032 | ||||||||||
| Other assets less liabilities—0.0% | 58,015 | ||||||||||
| Net Assets—100.0% | $ | 262,699,047 | |||||||||
* Non-income producing security.
See Notes to Financial Statements.
43
Schedule of Investments
PowerShares Dynamic Mid Cap Growth Portfolio
April 30, 2009
| Number of Shares | Value | ||||||||||
| Common Stocks—99.9% | |||||||||||
| Consumer Discretionary—22.4% | |||||||||||
| 29,796 | Aeropostale, Inc.* | $ | 1,012,170 | ||||||||
| 37,149 | Bally Technologies, Inc.* | 972,561 | |||||||||
| 182,344 | Bed Bath & Beyond, Inc.* | 5,546,903 | |||||||||
| 42,362 | Carter's, Inc.* | 905,700 | |||||||||
| 100,050 | Dollar Tree, Inc.* | 4,236,117 | |||||||||
| 141,542 | Family Dollar Stores, Inc. | 4,697,779 | |||||||||
| 30,545 | Interactive Data Corp. | 686,652 | |||||||||
| 34,219 | ITT Educational Services, Inc.* | 3,448,249 | |||||||||
| 22,012 | John Wiley & Sons, Inc., Class A | 746,207 | |||||||||
| 26,719 | Marvel Entertainment, Inc.* | 797,295 | |||||||||
| 19,117 | NetFlix, Inc.* | 866,191 | |||||||||
| 15,689 | Panera Bread Co., Class A* | 878,741 | |||||||||
| 34,479 | PetSmart, Inc. | 788,880 | |||||||||
| 131,570 | Ross Stores, Inc. | 4,991,765 | |||||||||
| 4,070 | Strayer Education, Inc. | 770,899 | |||||||||
| 31,346,109 | |||||||||||
| Consumer Staples—2.1% | |||||||||||
| 31,208 | Alberto-Culver Co. | 695,626 | |||||||||
| 10,891 | Chattem, Inc.* | 598,025 | |||||||||
| 20,762 | Hansen Natural Corp.* | 846,259 | |||||||||
| 17,771 | Lancaster Colony Corp. | 778,370 | |||||||||
| 2,918,280 | |||||||||||
| Energy—3.6% | |||||||||||
| 146,618 | FMC Technologies, Inc.* | 5,018,734 | |||||||||
| Financials—1.0% | |||||||||||
| 40,956 | Brown & Brown, Inc. | 797,003 | |||||||||
| 39,281 | Knight Capital Group, Inc., Class A* | 608,463 | |||||||||
| 1,405,466 | |||||||||||
| Health Care—19.3% | |||||||||||
| 59,215 | Cephalon, Inc.* | 3,885,096 | |||||||||
| 18,878 | Cerner Corp.* | 1,015,636 | |||||||||
| 82,777 | DaVita, Inc.* | 3,838,369 | |||||||||
| 167,990 | DENTSPLY International, Inc. | 4,807,874 | |||||||||
| 12,424 | Edwards Lifesciences Corp.* | 787,433 | |||||||||
| 22,564 | Emergency Medical Services Corp., Class A* | 786,130 | |||||||||
| 36,404 | Endo Pharmaceuticals Holdings, Inc.* | 602,122 | |||||||||
| 30,789 | Immucor, Inc.* | 501,553 | |||||||||
| 20,837 | Magellan Health Services, Inc.* | 615,942 | |||||||||
| 12,548 | Millipore Corp.* | 741,587 | |||||||||
| 26,646 | Omnicare, Inc. | 685,069 | |||||||||
| 20,263 | OSI Pharmaceuticals, Inc.* | 680,229 | |||||||||
| 18,735 | ResMed, Inc.* | 720,361 | |||||||||
| 29,963 | STERIS Corp. | 722,108 | |||||||||
| 14,144 | Techne Corp. | 809,320 | |||||||||
| 127,301 | Varian Medical Systems, Inc.* | 4,248,034 | |||||||||
| 19,618 | Waters Corp.* | 866,527 | |||||||||
| 24,440 | Watson Pharmaceuticals, Inc.* | 756,174 | |||||||||
| 27,069,564 | |||||||||||
| Number of Shares | Value | ||||||||||
| Common Stocks (Continued) | |||||||||||
| Industrials—19.8% | |||||||||||
| 9,777 | Alliant Techsystems, Inc.* | $ | 778,738 | ||||||||
| 45,367 | Covanta Holding Corp.* | 640,128 | |||||||||
| 52,506 | Dun & Bradstreet (The) Corp. | 4,273,988 | |||||||||
| 44,837 | EMCOR Group, Inc.* | 932,161 | |||||||||
| 27,267 | Esterline Technologies Corp.* | 718,485 | |||||||||
| 140,977 | Expeditors International of Washington, Inc. | 4,893,313 | |||||||||
| 55,855 | Heartland Express, Inc. | 835,032 | |||||||||
| 115,113 | Jacobs Engineering Group, Inc.* | 4,378,899 | |||||||||
| 22,587 | MSC Industrial Direct Co., Class A | 922,679 | |||||||||
| 29,067 | Pall Corp. | 767,659 | |||||||||
| 195,173 | Republic Services, Inc. | 4,098,633 | |||||||||
| 80,949 | Stericycle, Inc.* | 3,811,079 | |||||||||
| 30,846 | Tetra Tech, Inc.* | 757,578 | |||||||||
| 27,808,372 | |||||||||||
| Information Technology—31.7% | |||||||||||
| 23,342 | Alliance Data Systems Corp.* | 977,330 | |||||||||
| 253,355 | Altera Corp. | 4,132,220 | |||||||||
| 152,790 | Amphenol Corp., Class A | 5,170,414 | |||||||||
| 131,081 | BMC Software, Inc.* | 4,544,578 | |||||||||
| 66,436 | Cogent, Inc.* | 753,384 | |||||||||
| 211,083 | Cognizant Technology Solutions Corp., Class A* | 5,232,749 | |||||||||
| 18,284 | Comtech Telecommunications Corp.* | 611,965 | |||||||||
| 24,633 | Dolby Laboratories, Inc., Class A* | 988,522 | |||||||||
| 87,239 | Genpact Ltd.* | 781,661 | |||||||||
| 22,521 | Global Payments, Inc. | 722,023 | |||||||||
| 23,519 | InterDigital, Inc.* | 619,020 | |||||||||
| 43,374 | Jack Henry & Associates, Inc. | 781,599 | |||||||||
| 13,244 | ManTech International Corp., Class A* | 479,300 | |||||||||
| 138,960 | McAfee, Inc.* | 5,216,558 | |||||||||
| 42,970 | Micros Systems, Inc.* | 901,511 | |||||||||
| 87,239 | NCR Corp.* | 885,476 | |||||||||
| 218,652 | Novell, Inc.* | 822,132 | |||||||||
| 50,470 | Red Hat, Inc.* | 871,617 | |||||||||
| 205,390 | SAIC, Inc.* | 3,717,559 | |||||||||
| 25,420 | Sybase, Inc.* | 863,263 | |||||||||
| 37,089 | Synopsys, Inc.* | 807,798 | |||||||||
| 219,679 | Xilinx, Inc. | 4,490,239 | |||||||||
| 44,370,918 | |||||||||||
| Total Common Stocks (Cost $138,640,059) | 139,937,443 | ||||||||||
| Money Market Fund—0.2% | |||||||||||
| 254,131 | Goldman Sachs Financial Square Prime Obligations Institutional Share Class (Cost $254,131) | 254,131 | |||||||||
| Total Investments (Cost $138,894,190)—100.1% | 140,191,574 | ||||||||||
| Liabilities in excess of other assets—(0.1%) | (153,804 | ) | |||||||||
| Net Assets—100.0% | $ | 140,037,770 | |||||||||
* Non-income producing security.
See Notes to Financial Statements.
44
Schedule of Investments
PowerShares Dynamic Mid Cap Portfolio
April 30, 2009
| Number of Shares | Value | ||||||||||
| Common Stocks—100.0% | |||||||||||
| Consumer Discretionary—21.7% | |||||||||||
| 1,837 | Aeropostale, Inc.* | $ | 62,403 | ||||||||
| 2,291 | Bally Technologies, Inc.* | 59,978 | |||||||||
| 10,891 | Bed Bath & Beyond, Inc.* | 331,304 | |||||||||
| 2,612 | Carter's, Inc.* | 55,845 | |||||||||
| 16,594 | Coach, Inc.* | 406,554 | |||||||||
| 8,548 | Darden Restaurants, Inc. | 316,020 | |||||||||
| 5,976 | Dollar Tree, Inc.* | 253,024 | |||||||||
| 8,454 | Family Dollar Stores, Inc. | 280,588 | |||||||||
| 5,128 | Foot Locker, Inc. | 60,972 | |||||||||
| 1,862 | Hasbro, Inc. | 49,641 | |||||||||
| 1,884 | Interactive Data Corp. | 42,352 | |||||||||
| 2,204 | International Speedway Corp., Class A | 52,191 | |||||||||
| 2,044 | ITT Educational Services, Inc.* | 205,974 | |||||||||
| 1,357 | John Wiley & Sons, Inc., Class A | 46,002 | |||||||||
| 5,541 | Ltd Brands, Inc. | 63,278 | |||||||||
| 1,648 | Marvel Entertainment, Inc.* | 49,176 | |||||||||
| 1,179 | Netflix, Inc.* | 53,420 | |||||||||
| 967 | Panera Bread Co., Class A* | 54,162 | |||||||||
| 2,126 | PetSmart, Inc. | 48,643 | |||||||||
| 2,571 | Phillips-Van Heusen Corp. | 74,636 | |||||||||
| 6,730 | Polo Ralph Lauren Corp. | 362,343 | |||||||||
| 2,432 | Rent-A-Center, Inc.* | 46,816 | |||||||||
| 7,859 | Ross Stores, Inc. | 298,170 | |||||||||
| 5,049 | Sherwin-Williams (The) Co. | 285,975 | |||||||||
| 4,470 | VF Corp. | 264,937 | |||||||||
| 1,968 | Warnaco Group (The), Inc.* | 56,757 | |||||||||
| 3,881,161 | |||||||||||
| Consumer Staples—8.6% | |||||||||||
| 1,925 | Alberto-Culver Co. | 42,908 | |||||||||
| 1,426 | BJ's Wholesale Club, Inc.* | 47,543 | |||||||||
| 2,140 | Casey's General Stores, Inc. | 56,945 | |||||||||
| 672 | Chattem, Inc.* | 36,900 | |||||||||
| 4,742 | Church & Dwight Co., Inc. | 258,012 | |||||||||
| 20,208 | Coca-Cola Enterprises, Inc. | 344,748 | |||||||||
| 5,959 | Del Monte Foods Co. | 44,990 | |||||||||
| 1,280 | Hansen Natural Corp.* | 52,173 | |||||||||
| 1,096 | Lancaster Colony Corp. | 48,005 | |||||||||
| 7,400 | McCormick & Co., Inc. | 217,930 | |||||||||
| 12,540 | Pepsi Bottling Group (The), Inc. | 392,127 | |||||||||
| 1,542,281 | |||||||||||
| Energy—4.9% | |||||||||||
| 12,033 | Cameron International Corp.* | 307,804 | |||||||||
| 565 | Core Laboratories N.V. (Netherlands) | 47,025 | |||||||||
| 8,757 | FMC Technologies, Inc.* | 299,752 | |||||||||
| 711 | SEACOR Holdings, Inc.* | 46,727 | |||||||||
| 3,230 | Superior Energy Services, Inc.* | 62,048 | |||||||||
| 1,206 | Tidewater, Inc. | 52,160 | |||||||||
| 1,469 | World Fuel Services Corp. | 56,013 | |||||||||
| 871,529 | |||||||||||
| Number of Shares | Value | ||||||||||
| Common Stocks (Continued) | |||||||||||
| Financials—10.1% | |||||||||||
| 2,738 | American Financial Group, Inc. | $ | 48,134 | ||||||||
| 4,296 | Arch Capital Group Ltd.* | 248,223 | |||||||||
| 1,504 | Argo Group International Holdings Ltd. (Bermuda)* | 42,097 | |||||||||
| 1,955 | Aspen Insurance Holdings Ltd. (Bermuda) | 46,099 | |||||||||
| 1,330 | Bank of Hawaii Corp. | 46,736 | |||||||||
| 2,526 | Brown & Brown, Inc. | 49,156 | |||||||||
| 2,075 | Cincinnati Financial Corp. | 49,696 | |||||||||
| 7,436 | Discover Financial Services | 60,455 | |||||||||
| 398 | First Citizens BancShares, Inc., Class A | 47,629 | |||||||||
| 1,212 | Hanover Insurance Group (The), Inc. | 36,336 | |||||||||
| 1,941 | HCC Insurance Holdings, Inc. | 46,429 | |||||||||
| 2,422 | Knight Capital Group, Inc., Class A* | 37,517 | |||||||||
| 917 | Odyssey Re Holdings Corp. | 35,112 | |||||||||
| 3,748 | PartnerRe Ltd. | 255,576 | |||||||||
| 892 | ProAssurance Corp.* | 39,194 | |||||||||
| 3,052 | Raymond James Financial, Inc. | 47,886 | |||||||||
| 870 | RLI Corp. | 41,786 | |||||||||
| 22,789 | Unum Group | 372,371 | |||||||||
| 11,148 | W.R. Berkley Corp. | 266,549 | |||||||||
| 1,816,981 | |||||||||||
| Health Care—9.7% | |||||||||||
| 1,720 | AMERIGROUP Corp.* | 51,376 | |||||||||
| 7,304 | AmerisourceBergen Corp. | 245,707 | |||||||||
| 3,537 | Cephalon, Inc.* | 232,063 | |||||||||
| 4,944 | DaVita, Inc.* | 229,253 | |||||||||
| 1,392 | Emergency Medical Services Corp., Class A* | 48,497 | |||||||||
| 2,245 | Endo Pharmaceuticals Holdings, Inc.* | 37,132 | |||||||||
| 5,261 | Healthspring, Inc.* | 48,559 | |||||||||
| 9,999 | Hospira, Inc.* | 328,666 | |||||||||
| 1,899 | Immucor, Inc.* | 30,935 | |||||||||
| 5,805 | King Pharmaceuticals, Inc.* | 45,743 | |||||||||
| 1,285 | Magellan Health Services, Inc.* | 37,985 | |||||||||
| 774 | Millipore Corp.* | 45,743 | |||||||||
| 1,643 | Omnicare, Inc. | 42,242 | |||||||||
| 1,250 | OSI Pharmaceuticals, Inc.* | 41,963 | |||||||||
| 1,155 | ResMed, Inc.* | 44,410 | |||||||||
| 2,844 | Sepracor, Inc.* | 40,413 | |||||||||
| 1,848 | STERIS Corp. | 44,537 | |||||||||
| 872 | Techne Corp. | 49,896 | |||||||||
| 1,210 | Waters Corp.* | 53,446 | |||||||||
| 1,507 | Watson Pharmaceuticals, Inc.* | 46,627 | |||||||||
| 1,745,193 | |||||||||||
| Industrials—18.5% | |||||||||||
| 603 | Alliant Techsystems, Inc.* | 48,029 | |||||||||
| 11,000 | Cooper Industries Ltd., Class A | 360,691 | |||||||||
| 2,798 | Covanta Holding Corp.* | 39,480 | |||||||||
| 9,302 | Dover Corp. | 286,316 | |||||||||
| 3,136 | Dun & Bradstreet (The) Corp. | 255,270 | |||||||||
| 2,765 | EMCOR Group, Inc.* | 57,484 | |||||||||
See Notes to Financial Statements.
45
Schedule of Investments (Continued)
PowerShares Dynamic Mid Cap Portfolio
April 30, 2009
| Number of Shares | Value | ||||||||||
| Common Stocks (Continued) | |||||||||||
| 1,982 | Equifax, Inc. | $ | 57,795 | ||||||||
| 1,681 | Esterline Technologies Corp.* | 44,294 | |||||||||
| 844 | Flowserve Corp. | 57,308 | |||||||||
| 7,000 | Goodrich Corp. | 309,960 | |||||||||
| 1,198 | Granite Construction, Inc. | 47,261 | |||||||||
| 3,445 | Heartland Express, Inc. | 51,503 | |||||||||
| 6,876 | Jacobs Engineering Group, Inc.* | 261,563 | |||||||||
| 3,382 | KBR, Inc. | 52,827 | |||||||||
| 1,393 | MSC Industrial Direct Co., Class A | 56,904 | |||||||||
| 1,793 | Pall Corp. | 47,353 | |||||||||
| 6,952 | Parker Hannifin Corp. | 315,273 | |||||||||
| 2,042 | Pentair, Inc. | 54,399 | |||||||||
| 11,658 | Republic Services, Inc. | 244,818 | |||||||||
| 4,835 | Stericycle, Inc.* | 227,632 | |||||||||
| 1,902 | Tetra Tech, Inc.* | 46,713 | |||||||||
| 1,860 | Thomas & Betts Corp.* | 57,883 | |||||||||
| 3,506 | W.W. Grainger, Inc. | 294,083 | |||||||||
| 868 | Watson Wyatt Worldwide, Inc, Class A | 46,047 | |||||||||
| 3,320,886 | |||||||||||
| Information Technology—22.0% | |||||||||||
| 4,975 | Affiliated Computer Services, Inc., Class A* | 240,691 | |||||||||
| 15,133 | Altera Corp. | 246,819 | |||||||||
| 18,281 | Autodesk, Inc.* | 364,522 | |||||||||
| 4,978 | AVX Corp. | 49,830 | |||||||||
| 7,829 | BMC Software, Inc.* | 271,431 | |||||||||
| 2,667 | Broadridge Financial Solutions, Inc. | 51,606 | |||||||||
| 996 | CACI International, Inc., Class A* | 39,392 | |||||||||
| 4,097 | Cogent, Inc.* | 46,460 | |||||||||
| 12,608 | Cognizant Technology Solutions Corp., Class A* | 312,552 | |||||||||
| 6,678 | Computer Sciences Corp.* | 246,819 | |||||||||
| 7,210 | Compuware Corp.* | 53,931 | |||||||||
| 1,128 | Comtech Telecommunications Corp.* | 37,754 | |||||||||
| 1,519 | Dolby Laboratories, Inc., Class A* | 60,957 | |||||||||
| 7,112 | Fiserv, Inc.* | 265,420 | |||||||||
| 5,380 | Genpact Ltd.* | 48,205 | |||||||||
| 1,389 | Global Payments, Inc. | 44,531 | |||||||||
| 1,450 | InterDigital, Inc.* | 38,164 | |||||||||
| 2,675 | Jack Henry & Associates, Inc. | 48,204 | |||||||||
| 2,486 | Lexmark International, Inc., Class A* | 48,775 | |||||||||
| 8,300 | McAfee, Inc.* | 311,582 | |||||||||
| 2,535 | Metavante Technologies, Inc.* | 59,801 | |||||||||
| 2,650 | Micros Systems, Inc.* | 55,597 | |||||||||
| 5,380 | NCR Corp.* | 54,607 | |||||||||
| 13,484 | Novell, Inc.* | 50,700 | |||||||||
| 3,744 | Perot Systems Corp., Class A* | 52,641 | |||||||||
| 3,771 | Quest Software, Inc.* | 54,793 | |||||||||
| 3,112 | Red Hat, Inc.* | 53,744 | |||||||||
| 12,268 | SAIC, Inc.* | 222,051 | |||||||||
| 1,568 | Sybase, Inc.* | 53,249 | |||||||||
| 2,287 | Synopsys, Inc.* | 49,811 | |||||||||
| Number of Shares | Value | ||||||||||
| Common Stocks (Continued) | |||||||||||
| 11,213 | Tellabs, Inc.* | $ | 58,756 | ||||||||
| 2,756 | Teradata Corp.* | 46,080 | |||||||||
| 3,387 | Total System Services, Inc. | 42,236 | |||||||||
| 13,121 | Xilinx, Inc. | 268,193 | |||||||||
| 3,949,904 | |||||||||||
| Materials—3.0% | |||||||||||
| 5,758 | Ball Corp. | 217,191 | |||||||||
| 2,295 | Bemis Co., Inc. | 55,172 | |||||||||
| 2,692 | Pactiv Corp.* | 58,847 | |||||||||
| 1,543 | Rock-Tenn Co., Class A | 58,264 | |||||||||
| 869 | Silgan Holdings, Inc. | 40,400 | |||||||||
| 2,211 | Sonoco Products Co. | 53,971 | |||||||||
| 1,652 | Terra Industries, Inc. | 43,778 | |||||||||
| 527,623 | |||||||||||
| Utilities—1.5% | |||||||||||
| 3,484 | Mirant Corp.* | 44,351 | |||||||||
| 7,211 | NSTAR | 226,498 | |||||||||
| 270,849 | |||||||||||
| Total Common Stocks (Cost $16,195,665) | 17,926,407 | ||||||||||
| Money Market Fund—0.6% | |||||||||||
| 110,411 | Goldman Sachs Financial Square Prime Obligations Institutional Share Class (Cost $110,411) | 110,411 | |||||||||
| Total Investments (Cost $16,306,076)—100.6% | 18,036,818 | ||||||||||
| Liabilities in excess of other assets—(0.6%) | (108,225 | ) | |||||||||
| Net Assets—100.0% | $ | 17,928,593 | |||||||||
* Non-income producing security.
See Notes to Financial Statements.
46
Schedule of Investments
PowerShares Dynamic Mid Cap Value Portfolio
April 30, 2009
| Number of Shares | Value | ||||||||||
| Common Stocks—99.9% | |||||||||||
| Consumer Discretionary—11.6% | |||||||||||
| 7,287 | Black & Decker (The) Corp. | $ | 293,666 | ||||||||
| 6,359 | Columbia Sportswear Co. | 195,348 | |||||||||
| 56,632 | Garmin Ltd. | 1,426,560 | |||||||||
| 7,535 | Hasbro, Inc. | 200,883 | |||||||||
| 8,922 | International Speedway Corp., Class A | 211,273 | |||||||||
| 22,428 | Ltd Brands, Inc. | 256,128 | |||||||||
| 10,408 | Phillips-Van Heusen Corp. | 302,144 | |||||||||
| 23,530 | RadioShack Corp. | 331,302 | |||||||||
| 9,844 | Rent-A-Center, Inc.* | 189,497 | |||||||||
| 18,680 | VF Corp. | 1,107,164 | |||||||||
| 4,513,965 | |||||||||||
| Consumer Staples—9.4% | |||||||||||
| 84,454 | Coca-Cola Enterprises, Inc. | 1,440,785 | |||||||||
| 13,216 | Constellation Brands, Inc., Class A* | 153,173 | |||||||||
| 24,122 | Del Monte Foods Co. | 182,121 | |||||||||
| 52,408 | Pepsi Bottling Group (The), Inc. | 1,638,799 | |||||||||
| 10,384 | PepsiAmericas, Inc. | 255,135 | |||||||||
| 3,670,013 | |||||||||||
| Energy—3.6% | |||||||||||
| 17,836 | BJ Services Co. | 247,742 | |||||||||
| 17,763 | Nabors Industries Ltd. (Bermuda)* | 270,175 | |||||||||
| 10,004 | Pride International, Inc.* | �� | 227,091 | ||||||||
| 2,878 | SEACOR Holdings, Inc.* | 189,142 | |||||||||
| 13,075 | Superior Energy Services, Inc.* | 251,171 | |||||||||
| 4,883 | Tidewater, Inc. | 211,190 | |||||||||
| 1,396,511 | |||||||||||
| Financials—23.6% | |||||||||||
| 11,085 | American Financial Group, Inc. | 194,874 | |||||||||
| 60,824 | Ameriprise Financial, Inc. | 1,602,713 | |||||||||
| 17,954 | Arch Capital Group Ltd.* | 1,037,382 | |||||||||
| 6,087 | Argo Group International Holdings Ltd. (Bermuda)* | 170,375 | |||||||||
| 7,915 | Aspen Insurance Holdings Ltd. (Bermuda) | 186,636 | |||||||||
| 5,383 | Bank of Hawaii Corp. | 189,159 | |||||||||
| 47,202 | Cincinnati Financial Corp. | 1,130,488 | |||||||||
| 4,904 | Hanover Insurance Group (The), Inc. | 147,022 | |||||||||
| 7,858 | HCC Insurance Holdings, Inc. | 187,963 | |||||||||
| 6,787 | IPC Holdings Ltd. | 176,733 | |||||||||
| 15,662 | PartnerRe Ltd. | 1,067,992 | |||||||||
| 12,355 | Raymond James Financial, Inc. | 193,850 | |||||||||
| 9,587 | StanCorp Financial Group, Inc. | 262,971 | |||||||||
| 95,240 | Unum Group | 1,556,223 | |||||||||
| 46,590 | W.R. Berkley Corp. | 1,113,967 | |||||||||
| 9,218,348 | |||||||||||
| Health Care—7.6% | |||||||||||
| 61,518 | Cigna Corp. | 1,212,520 | |||||||||
| 41,789 | Hospira, Inc.* | 1,373,604 | |||||||||
| 23,498 | King Pharmaceuticals, Inc.* | 185,164 | |||||||||
| 8,206 | LifePoint Hospitals, Inc.* | 212,125 | |||||||||
| 2,983,413 | |||||||||||
| Number of Shares | Value | ||||||||||
| Common Stocks (Continued) | |||||||||||
| Industrials—23.5% | |||||||||||
| 7,525 | Acuity Brands, Inc. | $ | 216,269 | ||||||||
| 13,495 | Armstrong World Industries, Inc.* | 245,339 | |||||||||
| 8,500 | Cintas Corp. | 218,110 | |||||||||
| 45,971 | Cooper Industries Ltd., Class A | 1,507,389 | |||||||||
| 8,021 | Equifax, Inc. | 233,892 | |||||||||
| 3,417 | Flowserve Corp. | 232,014 | |||||||||
| 29,255 | Goodrich Corp. | 1,295,411 | |||||||||
| 30,527 | GrafTech International Ltd.* | 268,332 | |||||||||
| 6,553 | Hubbell, Inc., Class B | 217,560 | |||||||||
| 13,689 | KBR, Inc. | 213,822 | |||||||||
| 29,055 | Parker Hannifin Corp. | 1,317,644 | |||||||||
| 50,261 | Pitney Bowes, Inc. | 1,233,405 | |||||||||
| 48,236 | Rockwell Automation, Inc. | 1,523,775 | |||||||||
| 7,528 | Teledyne Technologies, Inc.* | 240,369 | |||||||||
| 7,528 | Thomas & Betts Corp.* | 234,271 | |||||||||
| 9,197,602 | |||||||||||
| Information Technology—5.4% | |||||||||||
| 10,793 | Broadridge Financial Solutions, Inc. | 208,845 | |||||||||
| 27,908 | Computer Sciences Corp.* | 1,031,480 | |||||||||
| 29,184 | Compuware Corp.* | 218,296 | |||||||||
| 5,862 | DST Systems, Inc.* | 212,029 | |||||||||
| 10,062 | Lexmark International, Inc., Class A* | 197,416 | |||||||||
| 21,189 | Parametric Technology Corp.* | 236,257 | |||||||||
| 2,104,323 | |||||||||||
| Materials—6.6% | |||||||||||
| 24,063 | Ball Corp. | 907,656 | |||||||||
| 9,288 | Bemis Co., Inc. | 223,284 | |||||||||
| 2,681 | CF Industries Holdings, Inc. | 193,166 | |||||||||
| 8,182 | Crown Holdings, Inc.* | 180,413 | |||||||||
| 16,521 | Olin Corp. | 208,165 | |||||||||
| 10,895 | Pactiv Corp.* | 238,165 | |||||||||
| 3,515 | Silgan Holdings, Inc. | 163,412 | |||||||||
| 8,950 | Sonoco Products Co. | 218,470 | |||||||||
| 10,327 | Valspar (The) Corp. | 247,848 | |||||||||
| 2,580,579 | |||||||||||
| Telecommunication Services—5.2% | |||||||||||
| 32,865 | Telephone & Data Systems, Inc. | 942,240 | |||||||||
| 129,965 | Windstream Corp. | 1,078,710 | |||||||||
| 2,020,950 | |||||||||||
| Utilities—3.4% | |||||||||||
| 14,102 | Mirant Corp.* | 179,518 | |||||||||
| 30,137 | NSTAR | 946,603 | |||||||||
| 10,504 | Portland General Electric Co. | 191,908 | |||||||||
| 1,318,029 | |||||||||||
| Total Common Stocks (Cost $38,732,263) | 39,003,733 | ||||||||||
See Notes to Financial Statements.
47
Schedule of Investments (Continued)
PowerShares Dynamic Mid Cap Value Portfolio
April 30, 2009
| Number of Shares | Value | ||||||||||
| Money Market Fund—0.2% | |||||||||||
| 77,986 | Goldman Sachs Financial Square Prime Obligations Institutional Share Class (Cost $77,986) | $ | 77,986 | ||||||||
| Total Investments (Cost $38,810,249)—100.1% | 39,081,719 | ||||||||||
| Liabilities in excess of other assets—(0.1%) | (26,007 | ) | |||||||||
| Net Assets—100.0% | $ | 39,055,712 | |||||||||
* Non-income producing security.
See Notes to Financial Statements.
48
Schedule of Investments
PowerShares Dynamic Small Cap Growth Portfolio
April 30, 2009
| Number of Shares | Value | ||||||||||
| Common Stocks—100.0% | |||||||||||
| Consumer Discretionary—7.8% | |||||||||||
| 3,768 | Buffalo Wild Wings, Inc.* | $ | 147,103 | ||||||||
| 11,418 | Capella Education Co.* | 586,658 | |||||||||
| 13,715 | FGX International Holdings Ltd.* | 157,997 | |||||||||
| 5,871 | Fuel Systems Solutions, Inc.* | 89,650 | |||||||||
| 11,336 | hhgregg, Inc.* | 188,178 | |||||||||
| 13,097 | Hot Topic, Inc.* | 160,307 | |||||||||
| 8,111 | Lincoln Educational Services Corp.* | 134,561 | |||||||||
| 14,271 | Overstock.com, Inc.* | 192,373 | |||||||||
| 5,904 | PF Chang's China Bistro, Inc.* | 178,183 | |||||||||
| 8,440 | PetMed Express, Inc.* | 137,234 | |||||||||
| 3,645 | Pre-Paid Legal Services, Inc.* | 134,245 | |||||||||
| 11,380 | True Religion Apparel, Inc.* | 179,349 | |||||||||
| 14,741 | Zumiez, Inc.* | 177,776 | |||||||||
| 2,463,614 | |||||||||||
| Consumer Staples—2.8% | |||||||||||
| 3,684 | J & J Snack Foods Corp. | 142,792 | |||||||||
| 65,483 | Winn-Dixie Stores, Inc.* | 750,435 | |||||||||
| 893,227 | |||||||||||
| Energy—8.1% | |||||||||||
| 29,562 | Arena Resources, Inc.* | 847,543 | |||||||||
| 18,217 | CARBO Ceramics, Inc. | 559,444 | |||||||||
| 108,614 | RPC, Inc. | 1,162,169 | |||||||||
| 2,569,156 | |||||||||||
| Financials—5.2% | |||||||||||
| 13,764 | Bank Mutual Corp. | 141,356 | |||||||||
| 14,630 | Crawford & Co., Class B* | 87,049 | |||||||||
| 3,590 | First Financial Corp. | 133,189 | |||||||||
| 6,797 | Life Partners Holdings, Inc. | 127,240 | |||||||||
| 124,161 | Nelnet, Inc., Class A* | 748,690 | |||||||||
| 13,619 | Provident New York Bancorp | 115,353 | |||||||||
| 5,704 | Tower Group, Inc. | 155,092 | |||||||||
| 19,224 | Trustco Bank Corp. NY | 115,344 | |||||||||
| 1,623,313 | |||||||||||
| Health Care—24.4% | |||||||||||
| 13,415 | Albany Molecular Research, Inc.* | 130,930 | |||||||||
| 14,184 | Alliance Healthcare Services, Inc.* | 111,628 | |||||||||
| 61,181 | American Medical Systems Holdings, Inc.* | 756,809 | |||||||||
| 9,319 | Cantel Medical Corp.* | 131,677 | |||||||||
| 15,906 | Chemed Corp. | 673,301 | |||||||||
| 4,348 | Computer Programs & Systems, Inc. | 152,137 | |||||||||
| 8,647 | Cyberonics, Inc.* | 114,486 | |||||||||
| 13,533 | Dionex Corp.* | 852,578 | |||||||||
| 8,791 | Ensign Group (The), Inc. | 136,261 | |||||||||
| 21,986 | Enzon Pharmaceuticals, Inc.* | 126,420 | |||||||||
| 23,981 | eResearchTechnology, Inc.* | 121,584 | |||||||||
| 3,836 | Genoptix, Inc.* | 111,551 | |||||||||
| 36,539 | Gentiva Health Services, Inc.* | 582,066 | |||||||||
| 80,665 | Healthsouth Corp.* | 755,831 | |||||||||
| 20,843 | HMS Holdings Corp.* | 624,873 | |||||||||
| Number of Shares | Value | ||||||||||
| Common Stocks (Continued) | |||||||||||
| 3,689 | ICU Medical, Inc.* | $ | 138,706 | ||||||||
| 7,728 | InterMune, Inc.* | 104,637 | |||||||||
| 12,230 | IRIS International, Inc.* | 136,609 | |||||||||
| 5,836 | LHC Group, Inc.* | 133,178 | |||||||||
| 33,808 | Martek Biosciences Corp.* | 615,982 | |||||||||
| 25,562 | NPS Pharmaceuticals, Inc.* | 88,445 | |||||||||
| 107,874 | PDL BioPharma, Inc. | 771,299 | |||||||||
| 23,931 | Questcor Pharmaceuticals, Inc.* | 107,690 | |||||||||
| 12,880 | WellCare Health Plans, Inc.* | 193,329 | |||||||||
| 7,672,007 | |||||||||||
| Industrials—22.0% | |||||||||||
| 7,494 | AAON, Inc. | 145,983 | |||||||||
| 18,450 | Allegiant Travel Co.* | 960,139 | |||||||||
| 7,408 | American Ecology Corp. | 122,380 | |||||||||
| 10,434 | American Science & Engineering, Inc. | 628,753 | |||||||||
| 10,602 | Beacon Roofing Supply, Inc.* | 168,572 | |||||||||
| 24,299 | Cubic Corp. | 697,624 | |||||||||
| 51,946 | DynCorp International, Inc., Class A* | 792,177 | |||||||||
| 5,176 | Exponent, Inc.* | 144,410 | |||||||||
| 22,540 | Force Protection, Inc.* | 171,755 | |||||||||
| 27,238 | GT Solar International, Inc.* | 193,117 | |||||||||
| 9,549 | Insituform Technologies, Inc., Class A* | 146,386 | |||||||||
| 7,023 | Marten Transport Ltd.* | 145,657 | |||||||||
| 48,822 | Navigant Consulting, Inc.* | 718,172 | |||||||||
| 6,397 | Raven Industries, Inc. | 152,888 | |||||||||
| 8,459 | Resources Connection, Inc.* | 165,373 | |||||||||
| 7,148 | Standard Parking Corp.* | 108,936 | |||||||||
| 20,420 | Stanley, Inc.* | 526,428 | |||||||||
| 7,785 | Sterling Construction Co., Inc.* | 146,124 | |||||||||
| 39,676 | SYKES Enterprises, Inc.* | 780,030 | |||||||||
| 6,914,904 | |||||||||||
| Information Technology—27.7% | |||||||||||
| 26,493 | Acme Packet, Inc.* | 204,261 | |||||||||
| 49,703 | Adaptec, Inc.* | 142,151 | |||||||||
| 53,351 | Art Technology Group, Inc.* | 167,522 | |||||||||
| 21,380 | BigBand Networks, Inc.* | 125,287 | |||||||||
| 23,076 | Blackboard, Inc.* | 785,275 | |||||||||
| 10,573 | Cognex Corp. | 148,762 | |||||||||
| 5,792 | EMS Technologies, Inc.* | 110,338 | |||||||||
| 44,250 | FEI Co.* | 760,215 | |||||||||
| 21,380 | Harmonic, Inc.* | 156,715 | |||||||||
| 22,960 | Hittite Microwave Corp.* | 853,193 | |||||||||
| 19,847 | LoopNet, Inc.* | 170,486 | |||||||||
| 8,150 | Multi-Fineline Electronix, Inc.* | 163,571 | |||||||||
| 4,276 | NCI, Inc., Class A* | 104,163 | |||||||||
| 7,361 | OSI Systems, Inc.* | 138,019 | |||||||||
| 8,116 | Pegasystems, Inc. | 141,787 | |||||||||
| 14,630 | RightNow Technologies, Inc.* | 110,457 | |||||||||
| 6,373 | Rogers Corp* | 162,193 | |||||||||
| 20,404 | S1 Corp.* | 126,505 | |||||||||
| 30,367 | Sapient Corp.* | 155,783 | |||||||||
See Notes to Financial Statements.
49
Schedule of Investments (Continued)
PowerShares Dynamic Small Cap Growth Portfolio
April 30, 2009
| Number of Shares | Value | ||||||||||
| Common Stocks (Continued) | |||||||||||
| 53,891 | Semtech Corp.* | $ | 777,108 | ||||||||
| 4,632 | SPSS, Inc.* | 143,129 | |||||||||
| 5,575 | Supertex, Inc.* | 143,389 | |||||||||
| 30,517 | Synaptics, Inc.* | 991,191 | |||||||||
| 31,132 | Syntel, Inc. | 862,978 | |||||||||
| 14,098 | TeleCommunication Systems, Inc., Class A* | 138,301 | |||||||||
| 89,312 | TiVo, Inc.* | 669,840 | |||||||||
| 10,592 | Ultratech, Inc.* | 143,204 | |||||||||
| 15,405 | Wind River Systems, Inc.* | 112,919 | |||||||||
| 8,708,742 | |||||||||||
| Telecommunication Services—2.0% | |||||||||||
| 15,889 | Global Crossing Ltd.* | 115,354 | |||||||||
| 33,032 | NTELOS Holdings Corp. | 527,852 | |||||||||
| 643,206 | |||||||||||
| Total Common Stocks (Cost $29,068,738) | 31,488,169 | ||||||||||
| Money Market Fund—0.1% | |||||||||||
| 42,353 | Goldman Sachs Financial Square Prime Obligations Institutional Share Class (Cost $42,353) | 42,353 | |||||||||
| Total Investments (Cost $29,111,091)—100.1% | 31,530,522 | ||||||||||
| Liabilities in excess of other assets—(0.1%) | (46,580 | ) | |||||||||
| Net Assets—100.0% | $ | 31,483,942 | |||||||||
* Non-income producing security.
See Notes to Financial Statements.
50
Schedule of Investments
PowerShares Dynamic Small Cap Portfolio
April 30, 2009
| Number of Shares | Value | ||||||||||
| Common Stocks—100.0% | |||||||||||
| Consumer Discretionary—12.1% | |||||||||||
| 760 | Buffalo Wild Wings, Inc.* | $ | 29,670 | ||||||||
| 2,788 | Cabela's, Inc.* | 35,714 | |||||||||
| 2,304 | Capella Education Co.* | 118,380 | |||||||||
| 1,604 | Cato (The) Corp., Class A | 30,829 | |||||||||
| 1,284 | Children's Place Retail Stores (The), Inc.* | 36,517 | |||||||||
| 2,366 | Dress Barn, Inc.* | 35,821 | |||||||||
| 2,768 | FGX International Holdings Ltd.* | 31,887 | |||||||||
| 10,126 | Fossil, Inc.* | 204,140 | |||||||||
| 1,641 | Genesco, Inc.* | 37,382 | |||||||||
| 4,968 | Gymboree (The) Corp.* | 170,899 | |||||||||
| 2,288 | hhgregg, Inc.* | 37,981 | |||||||||
| 2,643 | Hot Topic, Inc.* | 32,350 | |||||||||
| 1,637 | Lincoln Educational Services Corp.* | 27,158 | |||||||||
| 2,689 | Maidenform Brands, Inc.* | 34,285 | |||||||||
| 2,198 | Men's Wearhouse (The), Inc. | 40,971 | |||||||||
| 388 | National Presto Industries, Inc. | 27,649 | |||||||||
| 1,191 | P.F. Chang's China Bistro, Inc.* | 35,944 | |||||||||
| 1,703 | PetMed Express, Inc.* | 27,691 | |||||||||
| 6,941 | Polaris Industries, Inc. | 232,176 | |||||||||
| 736 | Pre-Paid Legal Services, Inc.* | 27,107 | |||||||||
| 1,863 | Regis Corp. | 35,658 | |||||||||
| 4,800 | Ticketmaster Entertainment, Inc.* | 25,248 | |||||||||
| 2,086 | Timberland (The) Co., Class A* | 33,877 | |||||||||
| 980 | UniFirst Corp. | 36,544 | |||||||||
| 9,388 | Wet Seal (The), Inc., Class A* | 35,768 | |||||||||
| 8,429 | Wolverine World Wide, Inc. | 175,576 | |||||||||
| 2,975 | Zumiez, Inc.* | 35,879 | |||||||||
| 1,633,101 | |||||||||||
| Consumer Staples—2.9% | |||||||||||
| 765 | American Italian Pasta Co., Class A* | 24,052 | |||||||||
| 3,142 | Central Garden & Pet Co., Class A* | 28,498 | |||||||||
| 2,134 | China Sky One Medical, Inc.* | 30,111 | |||||||||
| 743 | J & J Snack Foods Corp. | 28,799 | |||||||||
| 2,497 | Nu Skin Enterprises, Inc., Class A | 32,012 | |||||||||
| 4,291 | Prestige Brands Holdings, Inc.* | 27,720 | |||||||||
| 1,534 | Spartan Stores, Inc. | 24,958 | |||||||||
| 954 | WD-40 Co. | 25,815 | |||||||||
| 4,605 | Weis Markets, Inc. | 170,338 | |||||||||
| 392,303 | |||||||||||
| Energy—4.9% | |||||||||||
| 3,720 | Basic Energy Services, Inc.* | 37,944 | |||||||||
| 4,648 | Cal Dive International, Inc.* | 36,812 | |||||||||
| 3,676 | CARBO Ceramics, Inc. | 112,890 | |||||||||
| 3,452 | Delek US Holdings, Inc. | 35,452 | |||||||||
| 6,743 | NuStar GP Holdings LLC | 152,459 | |||||||||
| 1,940 | Petroleum Development Corp.* | 31,447 | |||||||||
| 21,919 | RPC, Inc. | 234,534 | |||||||||
| 4,118 | VAALCO Energy, Inc.* | 19,643 | |||||||||
| 661,181 | |||||||||||
| Number of Shares | Value | ||||||||||
| Common Stocks (Continued) | |||||||||||
| Financials—12.6% | |||||||||||
| 554 | American Physicians Capital, Inc. | $ | 23,080 | ||||||||
| 1,619 | Amerisafe, Inc.* | 24,868 | |||||||||
| 2,801 | Amtrust Financial Services, Inc. | 25,573 | |||||||||
| 673 | BancFirst Corp. | 28,737 | |||||||||
| 2,778 | Bank Mutual Corp. | 28,530 | |||||||||
| 8,783 | CNA Surety Corp.* | 169,073 | |||||||||
| 1,372 | Community Bank System, Inc. | 22,569 | |||||||||
| 2,952 | Crawford & Co., Class B* | 17,564 | |||||||||
| 3,860 | Dollar Financial Corp.* | 38,986 | |||||||||
| 2,445 | Employers Holdings, Inc. | 20,391 | |||||||||
| 1,235 | Financial Federal Corp. | 30,393 | |||||||||
| 1,971 | First Mercury Financial Corp.* | 26,057 | |||||||||
| 633 | FPIC Insurance Group, Inc.* | 19,332 | |||||||||
| 4,506 | Hancock Holding Co. | 170,641 | |||||||||
| 4,294 | Harleysville Group, Inc. | 124,182 | |||||||||
| 3,052 | Horace Mann Educators Corp. | 26,797 | |||||||||
| 661 | Infinity Property & Casualty Corp. | 23,294 | |||||||||
| 1,671 | Interactive Brokers Group, Inc., Class A* | 24,647 | |||||||||
| 6,563 | Investment Technology Group, Inc.* | 149,505 | |||||||||
| 4,061 | LaBranche & Co., Inc.* | 16,975 | |||||||||
| 1,372 | Life Partners Holdings, Inc. | 25,684 | |||||||||
| 4,075 | Meadowbrook Insurance Group, Inc. | 24,246 | |||||||||
| 2,447 | Navigators Group, Inc.* | 111,045 | |||||||||
| 6,503 | NBT Bancorp, Inc. | 153,991 | |||||||||
| 25,056 | Nelnet, Inc., Class A* | 151,088 | |||||||||
| 2,571 | Ocwen Financial Corp.* | 28,590 | |||||||||
| 2,378 | optionsXpress Holdings, Inc. | 39,142 | |||||||||
| 2,748 | Provident New York Bancorp | 23,276 | |||||||||
| 751 | Safety Insurance Group, Inc. | 24,821 | |||||||||
| 2,415 | SeaBright Insurance Holdings, Inc.* | 22,411 | |||||||||
| 1,730 | SWS Group, Inc. | 22,127 | |||||||||
| 1,151 | Tower Group, Inc. | 31,296 | |||||||||
| 4,395 | TradeStation Group, Inc.* | 35,643 | |||||||||
| 1,704,554 | |||||||||||
| Health Care—12.6% | |||||||||||
| 2,862 | Alliance Healthcare Services, Inc.* | 22,524 | |||||||||
| 12,346 | American Medical Systems Holdings, Inc.* | 152,720 | |||||||||
| 3,605 | AMN Healthcare Services, Inc.* | 24,838 | |||||||||
| 7,526 | Centene Corp.* | 138,253 | |||||||||
| 3,210 | Chemed Corp. | 135,879 | |||||||||
| 877 | Computer Programs & Systems, Inc. | 30,686 | |||||||||
| 1,745 | Cyberonics, Inc.* | 23,104 | |||||||||
| 2,731 | Dionex Corp.* | 172,052 | |||||||||
| 1,774 | Ensign Group (The), Inc. | 27,497 | |||||||||
| 774 | Genoptix, Inc.* | 22,508 | |||||||||
| 7,374 | Gentiva Health Services, Inc.* | 117,468 | |||||||||
| 16,278 | Healthsouth Corp.* | 152,525 | |||||||||
| 4,206 | HMS Holdings Corp.* | 126,096 | |||||||||
| 744 | ICU Medical, Inc.* | 27,974 | |||||||||
| 1,463 | Invacare Corp. | 22,516 | |||||||||
See Notes to Financial Statements.
51
Schedule of Investments (Continued)
PowerShares Dynamic Small Cap Portfolio
April 30, 2009
| Number of Shares | Value | ||||||||||
| Common Stocks (Continued) | |||||||||||
| 2,468 | IRIS International, Inc.* | $ | 27,568 | ||||||||
| 1,631 | Kindred Healthcare, Inc.* | 21,236 | |||||||||
| 469 | Landauer, Inc. | 24,848 | |||||||||
| 1,178 | LHC Group, Inc.* | 26,882 | |||||||||
| 6,823 | Martek Biosciences Corp. | 124,315 | |||||||||
| 1,253 | Molina Healthcare, Inc.* | 27,127 | |||||||||
| 5,158 | NPS Pharmaceuticals, Inc.* | 17,847 | |||||||||
| 21,769 | PDL BioPharma, Inc. | 155,647 | |||||||||
| 4,829 | Questcor Pharmaceuticals, Inc.* | 21,731 | |||||||||
| 1,604 | RehabCare Group, Inc.* | 26,787 | |||||||||
| 2,599 | WellCare Health Plans, Inc.* | 39,011 | |||||||||
| 1,709,639 | |||||||||||
| Industrials—24.8% | |||||||||||
| 5,005 | A.O. Smith Corp. | 155,605 | |||||||||
| 1,512 | AAON, Inc. | 29,454 | |||||||||
| 3,723 | Allegiant Travel Co.* | 193,745 | |||||||||
| 7,027 | American Commercial Lines, Inc.* | 34,994 | |||||||||
| 1,495 | American Ecology Corp. | 24,697 | |||||||||
| 2,106 | American Science & Engineering, Inc. | 126,908 | |||||||||
| 1,622 | American Woodmark Corp. | 33,575 | |||||||||
| 2,479 | Apogee Enterprises, Inc. | 33,219 | |||||||||
| 3,202 | Blount International, Inc.* | 20,493 | |||||||||
| 3,656 | Chart Industries, Inc.* | 50,562 | |||||||||
| 1,056 | CIRCOR International, Inc. | 27,171 | |||||||||
| 2,465 | Comfort Systems USA, Inc. | 26,597 | |||||||||
| 4,904 | Cubic Corp. | 140,794 | |||||||||
| 3,040 | Deluxe Corp. | 44,080 | |||||||||
| 5,080 | Dycom Industries, Inc.* | 42,774 | |||||||||
| 10,483 | DynCorp International, Inc., Class A* | 159,866 | |||||||||
| 2,189 | EnerSys* | 37,322 | |||||||||
| 1,045 | Exponent, Inc.* | 29,156 | |||||||||
| 3,714 | Federal Signal Corp. | 28,858 | |||||||||
| 3,578 | Gibraltar Industries, Inc. | 23,973 | |||||||||
| 5,497 | GT Solar International, Inc.* | 38,974 | |||||||||
| 4,566 | H&E Equipment Services, Inc.* | 34,382 | |||||||||
| 2,328 | Herman Miller, Inc. | 34,617 | |||||||||
| 2,422 | John Bean Technologies Corp. | 26,690 | |||||||||
| 3,556 | Knoll, Inc. | 25,176 | |||||||||
| 2,540 | Korn/Ferry International* | 26,899 | |||||||||
| 1,098 | LB Foster Co., Class A* | 35,960 | |||||||||
| 1,417 | Marten Transport Ltd.* | 29,389 | |||||||||
| 13,508 | MasTec, Inc.* | 168,985 | |||||||||
| 1,503 | McGrath Rentcorp | 31,773 | |||||||||
| 733 | Michael Baker Corp.* | 24,629 | |||||||||
| 7,072 | Mueller Industries, Inc. | 155,372 | |||||||||
| 9,852 | Navigant Consulting, Inc.* | 144,923 | |||||||||
| 784 | Powell Industries, Inc.* | 28,216 | |||||||||
| 1,707 | Resources Connection, Inc.* | 33,372 | |||||||||
| 1,455 | Robbins & Myers, Inc. | 27,572 | |||||||||
| 27,780 | RSC Holdings, Inc.* | 198,627 | |||||||||
| 12,479 | Skywest, Inc. | 150,247 | |||||||||
| 1,443 | Standard Parking Corp.* | 21,991 | |||||||||
| Number of Shares | Value | ||||||||||
| Common Stocks (Continued) | |||||||||||
| 4,121 | Stanley, Inc.* | $ | 106,239 | ||||||||
| 5,824 | Steelcase, Inc., Class A | 26,383 | |||||||||
| 1,571 | Sterling Construction Co., Inc.* | 29,488 | |||||||||
| 8,007 | Sykes Enterprises, Inc.* | 157,418 | |||||||||
| 1,405 | Tredegar Corp. | 24,700 | |||||||||
| 3,538 | Triumph Group, Inc. | 146,226 | |||||||||
| 7,530 | Watts Water Technologies, Inc., Class A | 167,618 | |||||||||
| 7,698 | WESCO International, Inc.* | 200,147 | |||||||||
| 3,359,856 | |||||||||||
| Information Technology—25.3% | |||||||||||
| 57,822 | 3Com Corp.* | 234,178 | |||||||||
| 5,346 | Acme Packet, Inc.* | 41,218 | |||||||||
| 15,433 | Acxiom Corp. | 148,928 | |||||||||
| 10,030 | Adaptec, Inc.* | 28,686 | |||||||||
| 20,880 | Arris Group, Inc.* | 222,789 | |||||||||
| 10,766 | Art Technology Group, Inc.* | 33,805 | |||||||||
| 4,314 | BigBand Networks, Inc.* | 25,280 | |||||||||
| 1,183 | Black Box Corp. | 32,379 | |||||||||
| 3,804 | Cogo Group, Inc.* | 31,117 | |||||||||
| 1,736 | CSG Systems International, Inc.* | 25,172 | |||||||||
| 5,342 | Digital River, Inc.* | 205,239 | |||||||||
| 20,283 | Earthlink, Inc.* | 153,745 | |||||||||
| 1,169 | EMS Technologies, Inc.* | 22,269 | |||||||||
| 2,143 | Fair Isaac Corp. | 36,045 | |||||||||
| 4,314 | Harmonic, Inc.* | 31,622 | |||||||||
| 4,633 | Hittite Microwave Corp.* | 172,162 | |||||||||
| 28,524 | Integrated Device Technology, Inc.* | 154,885 | |||||||||
| 6,823 | j2 Global Communications, Inc.* | 163,684 | |||||||||
| 2,420 | JDA Software Group, Inc.* | 34,146 | |||||||||
| 33,278 | Lawson Software, Inc.* | 179,368 | |||||||||
| 4,005 | LoopNet, Inc.* | 34,403 | |||||||||
| 637 | MAXIMUS, Inc. | 25,690 | |||||||||
| 863 | NCI, Inc., Class A* | 21,023 | |||||||||
| 1,485 | OSI Systems, Inc.* | 27,844 | |||||||||
| 1,472 | Progress Software Corp.* | 31,192 | |||||||||
| 2,952 | RightNow Technologies, Inc.* | 22,288 | |||||||||
| 4,118 | S1 Corp.* | 25,532 | |||||||||
| 6,128 | Sapient Corp.* | 31,437 | |||||||||
| 19,659 | Skyworks Solutions, Inc.* | 173,786 | |||||||||
| 6,158 | Synaptics, Inc.* | 200,012 | |||||||||
| 6,283 | Syntel, Inc. | 174,165 | |||||||||
| 10,423 | Tekelec* | 161,557 | |||||||||
| 2,845 | TeleCommunication Systems, Inc., Class A* | 27,909 | |||||||||
| 2,710 | TeleTech Holdings, Inc.* | 35,962 | |||||||||
| 26,457 | TIBCO Software, Inc.* | 167,208 | |||||||||
| 18,023 | TiVo, Inc.* | 135,173 | |||||||||
| 3,508 | TNS, Inc.* | 59,110 | |||||||||
| 2,103 | Websense, Inc.* | 37,496 | |||||||||
| 3,109 | Wind River Systems, Inc.* | 22,789 | |||||||||
| 1,603 | Wright Express Corp.* | 36,677 | |||||||||
| 3,427,970 | |||||||||||
See Notes to Financial Statements.
52
Schedule of Investments (Continued)
PowerShares Dynamic Small Cap Portfolio
April 30, 2009
| Number of Shares | Value | ||||||||||
| Common Stocks (Continued) | |||||||||||
| Materials—1.9% | |||||||||||
| 3,749 | Bway Holding Co.* | $ | 34,941 | ||||||||
| 2,210 | Innophos Holdings, Inc. | 32,774 | |||||||||
| 4,271 | Minerals Technologies, Inc. | 158,838 | |||||||||
| 1,643 | A. Schulman, Inc. | 25,779 | |||||||||
| 252,332 | |||||||||||
| Telecommunication Services—2.0% | |||||||||||
| 1,126 | Atlantic Tele-Network, Inc. | 24,862 | |||||||||
| 6,666 | NTELOS Holdings Corp. | 106,523 | |||||||||
| 8,446 | Syniverse Holdings, Inc.* | 106,420 | |||||||||
| 2,829 | USA Mobility, Inc. | 31,458 | |||||||||
| 269,263 | |||||||||||
| Utilities—0.9% | |||||||||||
| 9,044 | El Paso Electric Co.* | 124,807 | |||||||||
| Total Common Stocks (Cost $12,234,414) | 13,535,006 | ||||||||||
| Money Market Fund—0.6% | |||||||||||
| 80,677 | Goldman Sachs Financial Square Prime Obligations Institutional Share Class (Cost $80,677) | 80,677 | |||||||||
| Total Investments (Cost $12,315,091)—100.6% | 13,615,683 | ||||||||||
| Liabilities in excess of other assets—(0.6%) | (85,733 | ) | |||||||||
| Net Assets—100.0% | $ | 13,529,950 | |||||||||
* Non-income producing security.
See Notes to Financial Statements.
53
Schedule of Investments
PowerShares Dynamic Small Cap Value Portfolio
April 30, 2009
| Number of Shares | Value | ||||||||||
| Common Stocks—100.0% | |||||||||||
| Consumer Discretionary—15.5% | |||||||||||
| 24,516 | Cabela's, Inc.* | $ | 314,050 | ||||||||
| 14,110 | Cato (The) Corp., Class A | 271,194 | |||||||||
| 11,293 | Children's Place Retail Stores (The), Inc.* | 321,173 | |||||||||
| 146,358 | Cinemark Holdings, Inc. | 1,302,586 | |||||||||
| 20,809 | Dress Barn, Inc.* | 315,048 | |||||||||
| 89,184 | Fossil, Inc.* | 1,797,949 | |||||||||
| 14,435 | Genesco, Inc.* | 328,829 | |||||||||
| 8,026 | Gymboree (The) Corp.* | 276,094 | |||||||||
| 20,560 | Helen of Troy Ltd.* | 327,932 | |||||||||
| 23,646 | Maidenform Brands, Inc.* | 301,487 | |||||||||
| 19,329 | Men's Wearhouse (The), Inc. | 360,293 | |||||||||
| 87,587 | Meredith Corp. | 2,196,682 | |||||||||
| 11,213 | Polaris Industries, Inc. | 375,075 | |||||||||
| 16,383 | Regis Corp. | 313,571 | |||||||||
| 42,214 | Ticketmaster Entertainment, Inc.* | 222,046 | |||||||||
| 8,615 | UniFirst Corp. | 321,253 | |||||||||
| 82,572 | Wet Seal (The), Inc., Class A* | 314,599 | |||||||||
| 9,659,861 | |||||||||||
| Consumer Staples—0.7% | |||||||||||
| 37,738 | Prestige Brands Holdings, Inc.* | 243,787 | |||||||||
| 13,492 | Spartan Stores, Inc. | 219,515 | |||||||||
| 463,302 | |||||||||||
| Energy—2.0% | |||||||||||
| 32,715 | Basic Energy Services, Inc.* | 333,693 | |||||||||
| 40,878 | Cal Dive International, Inc.* | 323,754 | |||||||||
| 30,357 | Delek US Holdings, Inc. | 311,766 | |||||||||
| 53,757 | Pioneer Drilling Co.* | 268,785 | |||||||||
| 1,237,998 | |||||||||||
| Financials—25.2% | |||||||||||
| 4,872 | American Physicians Capital, Inc. | 202,968 | |||||||||
| 14,237 | Amerisafe, Inc.* | 218,680 | |||||||||
| 24,632 | Amtrust Financial Services, Inc. | 224,890 | |||||||||
| 77,354 | CNA Surety Corp.* | 1,489,065 | |||||||||
| 12,065 | Community Bank System, Inc. | 198,469 | |||||||||
| 160,327 | CVB Financial Corp. | 963,565 | |||||||||
| 21,504 | Employers Holdings, Inc. | 179,343 | |||||||||
| 17,332 | First Mercury Financial Corp.* | 229,129 | |||||||||
| 5,564 | FPIC Insurance Group, Inc.* | 169,925 | |||||||||
| 39,687 | Hancock Holding Co. | 1,502,948 | |||||||||
| 37,820 | Harleysville Group, Inc. | 1,093,754 | |||||||||
| 26,845 | Horace Mann Educators Corp. | 235,699 | |||||||||
| 5,810 | Infinity Property & Casualty Corp. | 204,744 | |||||||||
| 15,182 | Interactive Brokers Group, Inc., Class A* | 223,935 | |||||||||
| 57,807 | Investment Technology Group, Inc.* | 1,316,843 | |||||||||
| 35,715 | LaBranche & Co., Inc.* | 149,289 | |||||||||
| 35,839 | Meadowbrook Insurance Group, Inc. | 213,242 | |||||||||
| 21,548 | Navigators Group, Inc.* | 977,848 | |||||||||
| 57,278 | NBT Bancorp, Inc. | 1,356,343 | |||||||||
| 74,143 | Northwest Bancorp, Inc. | 1,303,434 | |||||||||
| Number of Shares | Value | ||||||||||
| Common Stocks (Continued) | |||||||||||
| 6,602 | Safety Insurance Group, Inc. | $ | 218,196 | ||||||||
| 21,238 | SeaBright Insurance Holdings, Inc.* | 197,089 | |||||||||
| 93,558 | Selective Insurance Group, Inc. | 1,380,916 | |||||||||
| 67,315 | State Auto Financial Corp. | 1,092,522 | |||||||||
| 38,658 | TradeStation Group, Inc.* | 313,516 | |||||||||
| 15,656,352 | |||||||||||
| Health Care—0.7% | |||||||||||
| 31,710 | AMN Healthcare Services, Inc.* | 218,482 | |||||||||
| 11,020 | Molina Healthcare, Inc.* | 238,583 | |||||||||
| 457,065 | |||||||||||
| Industrials—20.6% | |||||||||||
| 44,084 | A.O. Smith Corp. | 1,370,572 | |||||||||
| 59,269 | American Commercial Lines, Inc.* | 295,160 | |||||||||
| 52,931 | American Reprographics Co.* | 341,405 | |||||||||
| 14,266 | American Woodmark Corp. | 295,306 | |||||||||
| 21,799 | Apogee Enterprises, Inc. | 292,107 | |||||||||
| 9,286 | CIRCOR International, Inc. | 238,929 | |||||||||
| 21,685 | Comfort Systems USA, Inc. | 233,981 | |||||||||
| 26,739 | Deluxe Corp. | 387,716 | |||||||||
| 19,256 | EnerSys* | 328,315 | |||||||||
| 32,664 | Federal Signal Corp. | 253,799 | |||||||||
| 31,468 | Gibraltar Industries, Inc. | 210,836 | |||||||||
| 40,162 | H&E Equipment Services, Inc.* | 302,420 | |||||||||
| 20,480 | Herman Miller, Inc. | 304,538 | |||||||||
| 21,303 | John Bean Technologies Corp. | 234,759 | |||||||||
| 31,278 | Knoll, Inc. | 221,448 | |||||||||
| 22,341 | Korn/Ferry International* | 236,591 | |||||||||
| 9,660 | LB Foster Co., Class A* | 316,365 | |||||||||
| 13,216 | McGrath Rentcorp | 279,386 | |||||||||
| 62,284 | Mueller Industries, Inc. | 1,368,379 | |||||||||
| 6,895 | Powell Industries, Inc.* | 248,151 | |||||||||
| 12,798 | Robbins & Myers, Inc. | 242,522 | |||||||||
| 109,912 | SkyWest, Inc. | 1,323,340 | |||||||||
| 51,222 | Steelcase, Inc., Class A | 232,036 | |||||||||
| 66,323 | Watts Water Technologies, Inc., Class A | 1,476,350 | |||||||||
| 67,802 | WESCO International, Inc.* | 1,762,851 | |||||||||
| 12,797,262 | |||||||||||
| Information Technology—26.8% | |||||||||||
| 506,028 | 3Com Corp.* | 2,049,412 | |||||||||
| 135,930 | Acxiom Corp. | 1,311,725 | |||||||||
| 183,904 | Arris Group, Inc.* | 1,962,256 | |||||||||
| 115,199 | Benchmark Electronics, Inc.* | 1,397,364 | |||||||||
| 10,405 | Black Box Corp. | 284,785 | |||||||||
| 79,703 | Ciber, Inc.* | 257,441 | |||||||||
| 33,456 | Cogo Group, Inc.* | 273,670 | |||||||||
| 15,269 | CSG Systems International, Inc.* | 221,401 | |||||||||
| 47,053 | Digital River, Inc.* | 1,807,776 | |||||||||
| 178,650 | Earthlink, Inc.* | 1,354,167 | |||||||||
| 18,852 | Fair Isaac Corp. | 317,091 | |||||||||
| 251,227 | Integrated Device Technology, Inc.* | 1,364,163 | |||||||||
See Notes to Financial Statements.
54
Schedule of Investments (Continued)
PowerShares Dynamic Small Cap Value Portfolio
April 30, 2009
| Number of Shares | Value | ||||||||||
| Common Stocks (Continued) | |||||||||||
| 21,281 | JDA Software Group, Inc.* | $ | 300,275 | ||||||||
| 12,950 | Progress Software Corp.* | 274,411 | |||||||||
| 173,153 | Skyworks Solutions, Inc.* | 1,530,673 | |||||||||
| 233,022 | TIBCO Software, Inc.* | 1,472,699 | |||||||||
| 30,857 | TNS, Inc.* | 519,940 | |||||||||
| 16,699,249 | |||||||||||
| Materials—4.1% | |||||||||||
| 33,022 | Bway Holding Co.* | 307,765 | |||||||||
| 82,154 | Carpenter Technology Corp. | 1,698,123 | |||||||||
| 19,438 | Innophos Holdings, Inc. | 288,266 | |||||||||
| 14,445 | Schulman A., Inc. | 226,642 | |||||||||
| 2,520,796 | |||||||||||
| Telecommunication Services—0.8% | |||||||||||
| 9,901 | Atlantic Tele-Network, Inc. | 218,614 | |||||||||
| 24,826 | USA Mobility, Inc. | 276,065 | |||||||||
| 494,679 | |||||||||||
| Utilities—3.6% | |||||||||||
| 79,652 | El Paso Electric Co. | 1,099,198 | |||||||||
| 54,929 | NorthWestern Corp. | 1,149,114 | |||||||||
| 2,248,312 | |||||||||||
| Total Common Stocks (Cost $54,315,659) | 62,234,876 | ||||||||||
| Money Market Fund—0.1% | |||||||||||
| 54,903 | Goldman Sachs Financial Square Prime Obligations Institutional Share Class (Cost $54,903) | 54,903 | |||||||||
| Total Investments (Cost $54,370,562)—100.1% | 62,289,779 | ||||||||||
| Liabilities in excess of other assets—(0.1%) | (37,203 | ) | |||||||||
| Net Assets—100.0% | $ | 62,252,576 | |||||||||
* Non Income Producing Security.
See Notes to Financial Statements.
55
Schedule of Investments
PowerShares FTSE NASDAQ Small Cap Portfolio
April 30, 2009
| Number of Shares | Value | ||||||||||
| Common Stocks and Other Equity Interests—99.5% | |||||||||||
| Consumer Discretionary—12.2% | |||||||||||
| 231 | 1-800-FLOWERS.COM, Inc., Class A* | $ | 675 | ||||||||
| 160 | AFC Enterprises, Inc.* | 994 | |||||||||
| 162 | Airmedia Group, Inc. ADR (China)* | 910 | |||||||||
| 160 | Ambassadors Group, Inc. | 1,952 | |||||||||
| 99 | America's Car-Mart, Inc.* | 1,606 | |||||||||
| 112 | Ascent Media Corp., Class A* | 2,885 | |||||||||
| 181 | Audiovox Corp., Class A* | 1,006 | |||||||||
| 689 | Ballard Power Systems, Inc. (Canada)* | 1,412 | |||||||||
| 104 | Bidz.com, Inc.* | 428 | |||||||||
| 223 | BJ's Restaurants, Inc.* | 3,677 | |||||||||
| 91 | Blue Nile, Inc.* | 3,873 | |||||||||
| 112 | Buffalo Wild Wings, Inc.* | 4,372 | |||||||||
| 202 | California Pizza Kitchen, Inc.* | 3,173 | |||||||||
| 54 | Cavco Industries, Inc.* | 1,266 | |||||||||
| 131 | Charlotte Russe Holding, Inc.* | 1,644 | |||||||||
| 949 | Charming Shoppes, Inc.* | 3,312 | |||||||||
| 78 | Cherokee, Inc. | 1,425 | |||||||||
| 92 | Citi Trends, Inc.* | 2,260 | |||||||||
| 571 | Coldwater Creek, Inc.* | 1,970 | |||||||||
| 140 | Conn's, Inc.* | 2,302 | |||||||||
| 68 | Core-Mark Holding Co., Inc.* | 1,304 | |||||||||
| 207 | CROCS, Inc.* | 466 | |||||||||
| 129 | Crown Media Holdings, Inc., Class A* | 399 | |||||||||
| 797 | Denny's Corp.* | 2,136 | |||||||||
| 632 | drugstore.com, Inc.* | 980 | |||||||||
| 631 | Exide Technologies* | 3,426 | |||||||||
| 249 | Federal Mogul Corp.* | 2,764 | |||||||||
| 140 | FGX International Holdings Ltd.* | 1,613 | |||||||||
| 424 | Finish Line (The), Inc., Class A | 3,604 | |||||||||
| 57 | Fisher Communications, Inc. | 687 | |||||||||
| 337 | Fred's, Inc., Class A | 4,603 | |||||||||
| 98 | Fuel Systems Solutions, Inc.* | 1,496 | |||||||||
| 92 | Fuqi International, Inc.* | 578 | |||||||||
| 126 | Gaiam, Inc., Class A* | 733 | |||||||||
| 107 | G-III Apparel Group Ltd.* | 858 | |||||||||
| 171 | Global Sources Ltd. (Bermuda)* | 761 | |||||||||
| 114 | Global Traffic Network, Inc.* | 547 | |||||||||
| 190 | Helen of Troy Ltd.* | 3,031 | |||||||||
| 237 | Hibbett Sports, Inc.* | 4,941 | |||||||||
| 198 | Home Inns & Hotels Management, Inc. ADR (China)* | 2,728 | |||||||||
| 364 | Hot Topic, Inc.* | 4,455 | |||||||||
| 471 | HSN, Inc.* | 3,255 | |||||||||
| 364 | Imax Corp. (Canada)* | 2,359 | |||||||||
| 471 | Interval Leisure Group, Inc.* | 3,773 | |||||||||
| 43 | iRobot Corp.* | 493 | |||||||||
| 128 | Isle of Capri Casinos, Inc.* | 1,375 | |||||||||
| 152 | Jos. A. Bank Clothiers, Inc.* | 6,146 | |||||||||
| 297 | Knology, Inc.* | 2,109 | |||||||||
| 224 | K-Swiss, Inc., Class A | 2,249 | |||||||||
| Number of Shares | Value | ||||||||||
| Common Stocks and Other Equity Interests (Continued) | |||||||||||
| 160 | Lakes Entertainment, Inc.* | $ | 502 | ||||||||
| 108 | Learning Tree International, Inc.* | 888 | |||||||||
| 64 | Lincoln Educational Services Corp.* | 1,062 | |||||||||
| 334 | Mediacom Communications Corp., Class A* | 1,900 | |||||||||
| 896 | Melco Crown Entertainment Ltd. ADR (Macau)* | 4,077 | |||||||||
| 102 | Monarch Casino & Resort, Inc.* | 1,042 | |||||||||
| 164 | Monro Muffler, Inc. | 4,095 | |||||||||
| 250 | Morgans Hotel Group Co.* | 1,073 | |||||||||
| 351 | National CineMedia, Inc. | 5,099 | |||||||||
| 302 | NET Servicos de Comunicacao S.A. ADR (Brazil) | 2,458 | |||||||||
| 322 | Nissan Motor Co. Ltd. ADR (Japan) | 3,349 | |||||||||
| 106 | Outdoor Channel Holdings, Inc.* | 793 | |||||||||
| 142 | Overstock.com, Inc.* | 1,914 | |||||||||
| 550 | Pacific Sunwear of California, Inc.* | 2,228 | |||||||||
| 200 | Palm Harbor Homes, Inc.* | 608 | |||||||||
| 118 | Peet's Coffee & Tea, Inc.* | 3,219 | |||||||||
| 148 | PetMed Express, Inc.* | 2,406 | |||||||||
| 212 | Princeton Review, Inc.* | 920 | |||||||||
| 144 | RC2 Corp.* | 1,629 | |||||||||
| 316 | RCN Corp.* | 1,296 | |||||||||
| 98 | Red Robin Gourmet Burgers, Inc.* | 2,406 | |||||||||
| 45 | RRSat Global Communications Network Ltd. (Israel) | 654 | |||||||||
| 83 | Shoe Carnival, Inc.* | 968 | |||||||||
| 469 | Shuffle Master, Inc.* | 1,787 | |||||||||
| 105 | Shutterfly, Inc.* | 1,345 | |||||||||
| 394 | Smith & Wesson Holding Corp.* | 2,825 | |||||||||
| 274 | Spartan Stores, Inc. | 2,211 | |||||||||
| 115 | Stamps.com, Inc.* | 1,076 | |||||||||
| 131 | Steiner Leisure Ltd.* | 4,145 | |||||||||
| 149 | Steven Madden Ltd.* | 4,384 | |||||||||
| 747 | Stewart Enterprises, Inc., Class A | 2,607 | |||||||||
| 65 | Syms Corp.* | 368 | |||||||||
| 408 | Texas Roadhouse, Inc., Class A* | 4,643 | |||||||||
| 21 | Thomson Reuters PLC ADR (United Kingdom) | 3,248 | |||||||||
| 471 | Ticketmaster Entertainment, Inc.* | 2,477 | |||||||||
| 152 | True Religion Apparel, Inc.* | 2,396 | |||||||||
| 116 | Universal Electronics, Inc.* | 2,174 | |||||||||
| 230 | Velcro Industries N.V. (Netherlands) | 4,727 | |||||||||
| 201 | Visionchina Media, Inc. ADR (China)* | 1,079 | |||||||||
| 152 | Volcom, Inc.* | 2,050 | |||||||||
| 37 | Wacoal Holdings Corp. ADR (Japan) | 2,252 | |||||||||
| 143 | West Marine, Inc.* | 822 | |||||||||
| 267 | Westport Innovations, Inc. (Canada)* | 1,346 | |||||||||
| 817 | Wet Seal (The), Inc., Class A* | 3,113 | |||||||||
| 95 | Weyco Group, Inc. | 2,608 | |||||||||
| 182 | Wonder Auto Technology, Inc.* | 1,225 | |||||||||
| 185 | Zumiez, Inc.* | 2,231 | |||||||||
| 206,736 | |||||||||||
See Notes to Financial Statements.
56
Schedule of Investments (Continued)
PowerShares FTSE NASDAQ Small Cap Portfolio
April 30, 2009
| Number of Shares | Value | ||||||||||
| Common Stocks and Other Equity Interests (Continued) | |||||||||||
| Consumer Staples—3.4% | |||||||||||
| 45 | Alico, Inc. | $ | 1,194 | ||||||||
| 151 | Andersons (The), Inc. | 2,427 | |||||||||
| 20 | Arden Group, Inc., Class A | 2,340 | |||||||||
| 120 | Calavo Growers, Inc. | 1,705 | |||||||||
| 133 | Cal-Maine Foods, Inc. | 3,521 | |||||||||
| 177 | Central Garden & Pet Co.* | 1,703 | |||||||||
| 407 | Central Garden & Pet Co., Class A* | 3,691 | |||||||||
| 42 | Coca-Cola Bottling Co. Consolidated | 2,189 | |||||||||
| 385 | Cresud S.A. ADR (Argentina) | 3,138 | |||||||||
| 135 | Diamond Foods, Inc. | 3,536 | |||||||||
| 70 | Farmer Bros. Co. | 1,383 | |||||||||
| 17 | Griffin Land & Nurseries, Inc. | 529 | |||||||||
| 100 | Imperial Sugar Co. | 655 | |||||||||
| 108 | Inter Parfums, Inc. | 838 | |||||||||
| 116 | J & J Snack Foods Corp. | 4,495 | |||||||||
| 42 | Lifeway Foods, Inc.* | 379 | |||||||||
| 106 | Nash Finch Co. | 3,105 | |||||||||
| 120 | National Beverage Corp.* | 1,264 | |||||||||
| 246 | PriceSmart, Inc. | 4,390 | |||||||||
| 524 | Smart Balance, Inc.* | 3,684 | |||||||||
| 185 | Spartan Stores, Inc. | 3,010 | |||||||||
| 579 | Star Scientific, Inc.* | 2,849 | |||||||||
| 558 | SunOpta, Inc. (Canada)* | 1,004 | |||||||||
| 74 | Susser Holdings Corp.* | 1,069 | |||||||||
| 44 | Village Super Market, Inc., Class A | 1,363 | |||||||||
| 171 | Zhongpin, Inc.* | 1,496 | |||||||||
| 56,957 | |||||||||||
| Energy—3.0% | |||||||||||
| 280 | Acergy S.A. ADR (Luxembourg) | 2,159 | |||||||||
| 69 | Approach Resources, Inc.* | 490 | |||||||||
| 223 | ATP Oil & Gas Corp.* | 1,597 | |||||||||
| 400 | Brigham Exploration Co.* | 936 | |||||||||
| 121 | Bronco Drilling Co., Inc.* | 664 | |||||||||
| 51 | Clayton Williams Energy, Inc.* | 1,532 | |||||||||
| 211 | Clean Energy Fuels Corp.* | 1,785 | |||||||||
| 288 | Crosstex Energy, Inc. | 567 | |||||||||
| 75 | Dampskibsselskabet Torm A/S ADR (Denmark) | 702 | |||||||||
| 67 | Dawson Geophysical Co.* | 1,317 | |||||||||
| 367 | FX Energy, Inc.* | 1,380 | |||||||||
| 102 | Georesources, Inc.* | 724 | |||||||||
| 704 | Global Industries Ltd.* | 4,554 | |||||||||
| 157 | GMX Resources, Inc.* | 1,718 | |||||||||
| 118 | Gulf Island Fabrication, Inc. | 1,527 | |||||||||
| 278 | Gulfport Energy Corp.* | 826 | |||||||||
| 1,775 | Ivanhoe Energy, Inc. (Canada)* | 2,627 | |||||||||
| 230 | James River Coal Co.* | 3,274 | |||||||||
| 142 | Knightsbridge Tankers Ltd. (Bermuda) | 1,879 | |||||||||
| 219 | Matrix Service Co.* | 2,098 | |||||||||
| Number of Shares | Value | ||||||||||
| Common Stocks and Other Equity Interests (Continued) | |||||||||||
| 39 | OYO Geospace Corp.* | $ | 620 | ||||||||
| 371 | Parallel Petroleum Corp.* | 493 | |||||||||
| 123 | Petroleum Development Corp.* | 1,994 | |||||||||
| 104 | PHI, Inc.* | 1,177 | |||||||||
| 348 | RAM Energy Resources, Inc.* | 261 | |||||||||
| 243 | Rex Energy Corp.* | 926 | |||||||||
| 432 | Rosetta Resources, Inc.* | 3,046 | |||||||||
| 146 | StealthGas, Inc. (Greece) | 736 | |||||||||
| 148 | Superior Well Services, Inc.* | 1,584 | |||||||||
| 105 | T-3 Energy Services, Inc.* | 1,410 | |||||||||
| 313 | Tesco Corp. (Canada)* | 3,146 | |||||||||
| 127 | Toreador Resources Corp. | 470 | |||||||||
| 501 | Transglobe Energy Corp. (Canada)* | 1,283 | |||||||||
| 319 | TXCO Resources, Inc.* | 150 | |||||||||
| 96 | Union Drilling, Inc.* | 575 | |||||||||
| 494 | Warren Resources, Inc.* | 790 | |||||||||
| 51,017 | |||||||||||
| Financials—16.0% | |||||||||||
| 151 | 1st Source Corp. | 2,966 | |||||||||
| 201 | Abington Bancorp, Inc. | 1,767 | |||||||||
| 95 | Advanta Corp., Class A | 74 | |||||||||
| 277 | Advanta Corp., Class B | 324 | |||||||||
| 95 | American Capital Agency Corp. REIT | 1,781 | |||||||||
| 78 | American Physicians Capital, Inc. | 3,249 | |||||||||
| 59 | American Physicians Service Group, Inc. | 1,185 | |||||||||
| 118 | Ameris Bancorp | 773 | |||||||||
| 156 | Amerisafe, Inc.* | 2,396 | |||||||||
| 87 | Arrow Financial Corp. | 2,304 | |||||||||
| 134 | Asset Acceptance Capital Corp.* | 1,111 | |||||||||
| 54 | Avatar Holdings, Inc.* | 1,003 | |||||||||
| 79 | Baldwin & Lyons, Inc., Class B | 1,584 | |||||||||
| 38 | Bancorp Rhode Island, Inc. | 703 | |||||||||
| 148 | BancTrust Financial Group, Inc. | 974 | |||||||||
| 105 | Bank of the Ozarks, Inc. | 2,607 | |||||||||
| 185 | BankFinancial Corp. | 1,980 | |||||||||
| 143 | Banner Corp. | 664 | |||||||||
| 102 | Berkshire Hills Bancorp, Inc. | 2,301 | |||||||||
| 308 | BGC Partners, Inc., Class A | 798 | |||||||||
| 540 | Boston Private Financial Holdings, Inc. | 2,489 | |||||||||
| 108 | Capital City Bank Group, Inc. | 1,624 | |||||||||
| 24 | Capital Southwest Corp. | 1,866 | |||||||||
| 213 | Cardinal Financial Corp. | 1,672 | |||||||||
| 235 | Cascade Bancorp | 390 | |||||||||
| 107 | Center Financial Corp. | 272 | |||||||||
| 1,055 | Citizens Republic Bancorp, Inc. | 1,772 | |||||||||
| 137 | City Bank | 429 | |||||||||
| 113 | Clifton Savings Bancorp, Inc. | 1,241 | |||||||||
| 114 | CNinsure, Inc. ADR (Cayman Islands)* | 869 | |||||||||
| 151 | CoBiz Financial, Inc. | 886 | |||||||||
| 152 | Columbia Banking System, Inc. | 1,505 | |||||||||
See Notes to Financial Statements.
57
Schedule of Investments (Continued)
PowerShares FTSE NASDAQ Small Cap Portfolio
April 30, 2009
| Number of Shares | Value | ||||||||||
| Common Stocks and Other Equity Interests (Continued) | |||||||||||
| 126 | Community Trust Bancorp, Inc. | $ | 3,813 | ||||||||
| 201 | CompuCredit Corp.* | 643 | |||||||||
| 76 | Credit Acceptance Corp.* | 1,747 | |||||||||
| 149 | Danvers Bancorp, Inc. | 2,162 | |||||||||
| 20 | Diamond Hill Investment Group, Inc.* | 801 | |||||||||
| 284 | Dime Community Bancshares, Inc. | 2,369 | |||||||||
| 203 | Dollar Financial Corp.* | 2,050 | |||||||||
| 124 | Donegal Group, Inc., Class A | 1,815 | |||||||||
| 64 | eHealth, Inc.* | 1,228 | |||||||||
| 106 | Elbit Imaging Ltd. (Israel) | 1,903 | |||||||||
| 24 | EMC Insurance Group, Inc. | 544 | |||||||||
| 193 | Encore Capital Group, Inc.* | 1,687 | |||||||||
| 107 | Enterprise Financial Services Corp. | 1,054 | |||||||||
| 89 | Epoch Holding Corp. | 656 | |||||||||
| 372 | EZCORP, Inc., Class A* | 4,608 | |||||||||
| 256 | FBR Capital Markets Corp.* | 1,062 | |||||||||
| 234 | FCStone Group, Inc.* | 723 | |||||||||
| 139 | First Bancorp | 1,692 | |||||||||
| 300 | First Busey Corp. | 2,349 | |||||||||
| 244 | First Cash Financial Services, Inc.* | 4,011 | |||||||||
| 92 | First Community Bancshares, Inc. | 1,329 | |||||||||
| 234 | First Financial Bancorp | 2,525 | |||||||||
| 82 | First Financial Corp. | 3,042 | |||||||||
| 97 | First Financial Holdings, Inc. | 873 | |||||||||
| 174 | First Financial Northwest, Inc. | 1,404 | |||||||||
| 185 | First Merchants Corp. | 2,250 | |||||||||
| 86 | First State Bancorp | 994 | |||||||||
| 234 | FirstService Corp. (Canada)* | 2,333 | |||||||||
| 179 | Flushing Financial Corp. | 1,649 | |||||||||
| 63 | Fox Chase Bancorp, Inc.* | 597 | |||||||||
| 67 | FPIC Insurance Group, Inc.* | 2,046 | |||||||||
| 394 | Frontier Financial Corp. | 559 | |||||||||
| 88 | Great Southern Bancorp, Inc. | 1,451 | |||||||||
| 110 | Greene Bankshares, Inc. | 935 | |||||||||
| 249 | Greenlight Capital Re Ltd., Class A (Cayman Islands)* | 3,855 | |||||||||
| 460 | Guaranty Bancorp* | 1,021 | |||||||||
| 175 | Hallmark Financial Services, Inc.* | 1,176 | |||||||||
| 301 | Hanmi Financial Corp. | 467 | |||||||||
| 356 | Harleysville National Corp. | 3,122 | |||||||||
| 217 | Harris & Harris Group, Inc.* | 1,050 | |||||||||
| 136 | Heartland Financial USA, Inc. | 2,010 | |||||||||
| 100 | Heritage Commerce Corp. | 808 | |||||||||
| 75 | Home Bancorp, Inc.* | 830 | |||||||||
| 125 | Home BancShares, Inc. | 2,756 | |||||||||
| 75 | Home Federal Bancorp, Inc. | 757 | |||||||||
| 131 | IBERIABANK Corp. | 5,983 | |||||||||
| 177 | Independent Bank Corp. | 3,533 | |||||||||
| 29 | Kansas City Life Insurance Co. | 639 | |||||||||
| 49 | K-Fed Bancorp | 380 | |||||||||
| 196 | Lakeland Bancorp, Inc. | 1,668 | |||||||||
| Number of Shares | Value | ||||||||||
| Common Stocks and Other Equity Interests (Continued) | |||||||||||
| 102 | Lakeland Financial Corp | $ | 1,915 | ||||||||
| 74 | Legacy Bancorp, Inc. | 784 | |||||||||
| 62 | Life Partners Holdings, Inc. | 1,161 | |||||||||
| 501 | Maiden Holdings Ltd. (Bermuda) | 2,260 | |||||||||
| 168 | MainSource Financial Group, Inc. | 1,455 | |||||||||
| 259 | MarketAxess Holdings, Inc.* | 2,484 | |||||||||
| 153 | Medallion Financial Corp. | 1,128 | |||||||||
| 101 | Meridian Interstate Bancorp, Inc.* | 806 | |||||||||
| 165 | Mission West Properties, Inc. REIT | 1,124 | |||||||||
| 219 | Nara Bancorp, Inc. | 812 | |||||||||
| 26 | NASB Financial, Inc. | 574 | |||||||||
| 50 | National Interstate Corp. | 808 | |||||||||
| 408 | NewStar Financial, Inc.* | 926 | |||||||||
| 374 | Northfield Bancorp, Inc. | 4,226 | |||||||||
| 81 | OceanFirst Financial Corp. | 984 | |||||||||
| 116 | Old Second Bancorp, Inc. | 626 | |||||||||
| 135 | Oritani Financial Corp.* | 1,916 | |||||||||
| 104 | Pacific Continental Corp. | 1,194 | |||||||||
| 157 | Penson Worldwide, Inc.* | 1,592 | |||||||||
| 87 | Peoples Bancorp, Inc. | 1,442 | |||||||||
| 117 | Pico Holdings, Inc.* | 3,510 | |||||||||
| 203 | Pinnacle Financial Partners, Inc.* | 3,622 | |||||||||
| 200 | PMA Capital Corp., Class A* | 750 | |||||||||
| 197 | Premierwest Bancorp | 751 | |||||||||
| 185 | Presidential Life Corp. | 1,978 | |||||||||
| 246 | Prospect Capital Corp. | 2,231 | |||||||||
| 281 | Provident Bankshares Corp. | 2,470 | |||||||||
| 337 | Provident New York Bancorp | 2,854 | |||||||||
| 174 | Renasant Corp. | 2,453 | |||||||||
| 153 | Republic Bancorp, Inc., Class A | 3,403 | |||||||||
| 85 | Rockville Financial, Inc. | 800 | |||||||||
| 259 | Roma Financial Corp. | 3,370 | |||||||||
| 112 | S.Y. Bancorp, Inc. | 2,825 | |||||||||
| 176 | Sanders Morris Harris Group, Inc. | 796 | |||||||||
| 137 | Sandy Spring Bancorp, Inc. | 2,226 | |||||||||
| 95 | SCBT Financial Corp. | 2,192 | |||||||||
| 167 | Seacoast Banking Corp. of Florida | 705 | |||||||||
| 70 | Shore Bancshares, Inc. | 1,357 | |||||||||
| 60 | Sierra Bancorp | 721 | |||||||||
| 117 | Simmons First National Corp., Class A | 3,034 | |||||||||
| 717 | South Financial Group (The), Inc. | 1,190 | |||||||||
| 122 | Southside Bancshares, Inc. | 2,599 | |||||||||
| 122 | Southwest Bancorp, Inc. | 836 | |||||||||
| 188 | StellarOne Corp. | 2,420 | |||||||||
| 437 | Sterling Financial Corp. | 1,394 | |||||||||
| 66 | Stratus Properties, Inc.* | 596 | |||||||||
| 79 | Suffolk Bancorp | 2,022 | |||||||||
| 148 | Sun Bancorp, Inc.* | 974 | |||||||||
| 47 | Taylor Capital Group, Inc.* | 200 | |||||||||
| 257 | Texas Capital Bancshares, Inc.* | 3,598 | |||||||||
| 555 | Thinkorswim Group, Inc.* | 5,272 | |||||||||
See Notes to Financial Statements.
58
Schedule of Investments (Continued)
PowerShares FTSE NASDAQ Small Cap Portfolio
April 30, 2009
| Number of Shares | Value | ||||||||||
| Common Stocks and Other Equity Interests (Continued) | |||||||||||
| 216 | Thomas Weisel Partners Group, Inc.* | $ | 976 | ||||||||
| 336 | Tower Group, Inc. | 9,135 | |||||||||
| 206 | Towne Bank | 3,549 | |||||||||
| 181 | TradeStation Group, Inc.* | 1,468 | |||||||||
| 131 | TriCo Bancshares | 2,096 | |||||||||
| 113 | Union Bankshares Corp. | 1,931 | |||||||||
| 306 | United America Indemnity Ltd., Class A* | 1,551 | |||||||||
| 148 | United Financial Bancorp, Inc. | 1,964 | |||||||||
| 78 | United Security Bancshares | 565 | |||||||||
| 108 | Univest Corp. of Pennsylvania | 2,254 | |||||||||
| 104 | ViewPoint Financial Group | 1,618 | |||||||||
| 229 | Virginia Commerce Bancorp* | 733 | |||||||||
| 133 | Washington Trust Bancorp, Inc. | 2,427 | |||||||||
| 110 | Waterstone Financial, Inc.* | 314 | |||||||||
| 222 | WesBanco, Inc. | 4,415 | |||||||||
| 262 | Westfield Financial, Inc. | 2,447 | |||||||||
| 184 | Wilshire Bancorp, Inc. | 743 | |||||||||
| 135 | World Acceptance Corp.* | 4,007 | |||||||||
| 52 | WSFS Financial Corp. | 1,410 | |||||||||
| 269,487 | |||||||||||
| Health Care—19.4% | |||||||||||
| 133 | 3SBio, Inc. ADR (Cayman Isalnds)* | 942 | |||||||||
| 181 | Abaxis, Inc.* | 2,737 | |||||||||
| 306 | Abiomed, Inc.* | 2,041 | |||||||||
| 232 | Accelrys, Inc.* | 1,044 | |||||||||
| 456 | Accuray, Inc.* | 2,759 | |||||||||
| 320 | Acorda Therapeutics, Inc.* | 6,345 | |||||||||
| 402 | Adolor Corp.* | 905 | |||||||||
| 159 | Affymax, Inc.* | 2,821 | |||||||||
| 589 | Affymetrix, Inc.* | 2,762 | |||||||||
| 102 | Air Methods Corp.* | 2,708 | |||||||||
| 569 | Akorn, Inc.* | 478 | |||||||||
| 200 | Albany Molecular Research, Inc.* | 1,952 | |||||||||
| 508 | Allos Therapeutics, Inc.* | 3,114 | |||||||||
| 67 | Almost Family, Inc.* | 1,655 | |||||||||
| 310 | Alphatec Holdings, Inc.* | 636 | |||||||||
| 142 | AMAG Pharmaceuticals, Inc.* | 6,368 | |||||||||
| 56 | American Dental Partners, Inc.* | 389 | |||||||||
| 58 | Amicus Therapeutics, Inc.* | 519 | |||||||||
| 204 | Angiodynamics, Inc.* | 2,585 | |||||||||
| 618 | Arena Pharmaceuticals, Inc.* | 1,737 | |||||||||
| 600 | Ariad Pharmaceuticals, Inc.* | 900 | |||||||||
| 382 | Arqule, Inc.* | 1,700 | |||||||||
| 400 | Array Biopharma, Inc.* | 1,172 | |||||||||
| 196 | AspenBio Pharma, Inc.* | 331 | |||||||||
| 16 | Atrion Corp. | 1,433 | |||||||||
| 452 | ATS Medical, Inc.* | 1,207 | |||||||||
| 120 | BioMimetic Therapeutics, Inc.* | 1,033 | |||||||||
| 115 | Bio-Reference Labs, Inc.* | 2,952 | |||||||||
| 38 | Biospecifics Technologies Corp.* | 760 | |||||||||
| Number of Shares | Value | ||||||||||
| Common Stocks and Other Equity Interests (Continued) | |||||||||||
| 258 | BMP Sunstone Corp. (China)* | $ | 1,006 | ||||||||
| 320 | Cadence Pharmaceuticals, Inc.* | 3,238 | |||||||||
| 191 | Cardiac Science Corp.* | 563 | |||||||||
| 531 | Cardiome Pharma Corp. (Canada)* | 2,172 | |||||||||
| 196 | CardioNet, Inc.* | 4,067 | |||||||||
| 132 | Celldex Therapeutics, Inc.* | 1,143 | |||||||||
| 212 | China Medical Technologies, Inc. ADR (Cayman Islands) | 4,142 | |||||||||
| 191 | Clinical Data, Inc.* | 2,447 | |||||||||
| 449 | Columbia Laboratories, Inc.* | 624 | |||||||||
| 47 | Computer Programs & Systems, Inc. | 1,645 | |||||||||
| 252 | Conceptus, Inc.* | 3,412 | |||||||||
| 84 | Corvel Corp.* | 1,890 | |||||||||
| 131 | Cougar Biotechnology, Inc.* | 4,574 | |||||||||
| 256 | Cross Country Healthcare, Inc.* | 2,255 | |||||||||
| 95 | Crucell N.V. ADR (Netherlands)* | 1,994 | |||||||||
| 56 | Cutera, Inc.* | 352 | |||||||||
| 171 | Cyberonics, Inc.* | 2,264 | |||||||||
| 85 | Cynosure, Inc., Class A* | 520 | |||||||||
| 317 | Cypress Bioscience, Inc.* | 2,282 | |||||||||
| 323 | Cytokinetics, Inc.* | 601 | |||||||||
| 820 | Dendreon Corp.* | 17,383 | |||||||||
| 844 | Discovery Laboratories, Inc.* | 734 | |||||||||
| 687 | Durect Corp.* | 1,676 | |||||||||
| 527 | Dyax Corp.* | 1,033 | |||||||||
| 68 | Ensign Group (The), Inc. | 1,054 | |||||||||
| 373 | Enzon Pharmaceuticals, Inc.* | 2,145 | |||||||||
| 424 | eResearchTechnology, Inc.* | 2,150 | |||||||||
| 76 | Eurand N.V. (Netherlands)* | 836 | |||||||||
| 79 | Exactech, Inc.* | 1,047 | |||||||||
| 884 | Exelixis, Inc.* | 4,358 | |||||||||
| 208 | Flamel Technologies S.A. ADR (France)* | 1,227 | |||||||||
| 176 | Genomic Health, Inc.* | 3,960 | |||||||||
| 103 | Genoptix, Inc.* | 2,995 | |||||||||
| 242 | Gentiva Health Services, Inc.* | 3,855 | |||||||||
| 666 | Geron Corp.* | 3,423 | |||||||||
| 120 | Given Imaging Ltd. (Israel) | 943 | |||||||||
| 120 | GTx, Inc.* | 1,180 | |||||||||
| 682 | Halozyme Therapeutics, Inc.* | 4,310 | |||||||||
| 111 | Hansen Medical, Inc.* | 596 | |||||||||
| 281 | Healthways, Inc.* | 2,931 | |||||||||
| 63 | Home Diagnostics, Inc.* | 374 | |||||||||
| 1,125 | Human Genome Sciences, Inc.* | 2,464 | |||||||||
| 94 | ICU Medical, Inc.* | 3,534 | |||||||||
| 188 | Idenix Pharmaceuticals, Inc.* | 696 | |||||||||
| 192 | Idera Pharmaceuticals, Inc.* | 1,154 | |||||||||
| 217 | I-Flow Corp.* | 1,085 | |||||||||
| 426 | Immunogen, Inc.* | 2,961 | |||||||||
| 630 | Immunomedics, Inc.* | 731 | |||||||||
| 816 | Incyte Corp.* | 1,926 | |||||||||
| 474 | Inspire Pharmaceuticals, Inc.* | 2,128 | |||||||||
See Notes to Financial Statements.
59
Schedule of Investments (Continued)
PowerShares FTSE NASDAQ Small Cap Portfolio
April 30, 2009
| Number of Shares | Value | ||||||||||
| Common Stocks and Other Equity Interests (Continued) | |||||||||||
| 231 | Insulet Corp.* | $ | 1,328 | ||||||||
| 363 | InterMune, Inc.* | 4,914 | |||||||||
| 276 | inVentiv Health, Inc.* | 3,061 | |||||||||
| 135 | IPC The Hospitalist Co., Inc.* | 2,475 | |||||||||
| 155 | IRIS International, Inc.* | 1,731 | |||||||||
| 123 | Kendle International, Inc.* | 1,095 | |||||||||
| 98 | Kensey Nash Corp.* | 2,052 | |||||||||
| 897 | Lexicon Pharmaceuticals, Inc.* | 987 | |||||||||
| 115 | LHC Group, Inc.* | 2,624 | |||||||||
| 950 | Ligand Pharmaceuticals, Inc., Class B* | 2,841 | |||||||||
| 424 | MannKind Corp.* | 1,734 | |||||||||
| 68 | MAP Pharmaceuticals, Inc.* | 192 | |||||||||
| 80 | Matrixx Initiatives, Inc.* | 1,370 | |||||||||
| 234 | Maxygen, Inc.* | 1,369 | |||||||||
| 122 | MedCath Corp.* | 1,235 | |||||||||
| 135 | Medical Action Industries, Inc.* | 1,310 | |||||||||
| 188 | Medivation, Inc.* | 3,634 | |||||||||
| 233 | Merit Medical Systems, Inc.* | 3,614 | |||||||||
| 98 | Metabolix, Inc.* | 774 | |||||||||
| 132 | Micrus Endovascular Corp.* | 913 | |||||||||
| 252 | Momenta Pharmaceuticals, Inc.* | 2,822 | |||||||||
| 192 | Monogram Biosciences, Inc.* | 513 | |||||||||
| 100 | MWI Veterinary Supply, Inc.* | 3,108 | |||||||||
| 436 | Nabi Biopharmaceuticals* | 1,500 | |||||||||
| 75 | Nanosphere, Inc.* | 263 | |||||||||
| 232 | Natus Medical, Inc.* | 2,037 | |||||||||
| 121 | Neogen Corp.* | 2,743 | |||||||||
| 330 | Neurocrine Biosciences, Inc.* | 1,089 | |||||||||
| 160 | NovaMed, Inc.* | 504 | |||||||||
| 577 | Novavax, Inc.* | 1,408 | |||||||||
| 208 | Noven Pharmaceuticals, Inc.* | 2,147 | |||||||||
| 394 | NPS Pharmaceuticals, Inc.* | 1,363 | |||||||||
| 293 | NxStage Medical, Inc.* | 656 | |||||||||
| 76 | Obagi Medical Products, Inc.* | 457 | |||||||||
| 206 | Odyssey HealthCare, Inc.* | 2,134 | |||||||||
| 259 | Omnicell, Inc.* | 2,279 | |||||||||
| 279 | Optimer Pharmaceuticals, Inc.* | 3,898 | |||||||||
| 386 | OraSure Technologies, Inc.* | 1,397 | |||||||||
| 223 | Orexigen Therapeutics, Inc.* | 633 | |||||||||
| 141 | Orthofix International N.V. (Netherlands)* | 2,404 | |||||||||
| 636 | Orthovita, Inc.* | 1,870 | |||||||||
| 53 | Osiris Therapeutics, Inc.* | 672 | |||||||||
| 351 | Pain Therapeutics, Inc.* | 1,664 | |||||||||
| 114 | Palomar Medical Technologies, Inc.* | 982 | |||||||||
| 236 | Pharmasset, Inc.* | 2,124 | |||||||||
| 218 | Poniard Pharmaceuticals, Inc.* | 695 | |||||||||
| 250 | Pozen, Inc.* | 1,915 | |||||||||
| 254 | Progenics Pharmaceuticals, Inc.* | 1,392 | |||||||||
| 463 | QLT, Inc. (Canada)* | 935 | |||||||||
| 544 | Questcor Pharmaceuticals, Inc.* | 2,448 | |||||||||
| 271 | Quidel Corp.* | 3,154 | |||||||||
| Number of Shares | Value | ||||||||||
| Common Stocks and Other Equity Interests (Continued) | |||||||||||
| 300 | RadNet, Inc.* | $ | 462 | ||||||||
| 260 | Repligen Corp.* | 1,105 | |||||||||
| 96 | Repros Therapeutics, Inc.* | 661 | |||||||||
| 183 | Res-Care, Inc.* | 2,932 | |||||||||
| 305 | Rigel Pharmaceuticals, Inc.* | 2,025 | |||||||||
| 99 | Rochester Medical Corp.* | 1,045 | |||||||||
| 468 | RTI Biologics, Inc.* | 1,657 | |||||||||
| 93 | RXi Pharmaceuticals Corp.* | 423 | |||||||||
| 403 | Salix Pharmaceuticals Ltd.* | 4,433 | |||||||||
| 350 | Sangamo Biosciences, Inc.* | 1,488 | |||||||||
| 449 | Santarus, Inc.* | 790 | |||||||||
| 454 | Savient Pharmaceuticals, Inc.* | 2,397 | |||||||||
| 725 | Seattle Genetics, Inc.* | 6,691 | |||||||||
| 199 | Senomyx, Inc.* | 464 | |||||||||
| 102 | Somanetics Corp.* | 1,653 | |||||||||
| 142 | SonoSite, Inc.* | 2,562 | |||||||||
| 274 | Spectranetics Corp.* | 1,069 | |||||||||
| 264 | Stereotaxis, Inc.* | 882 | |||||||||
| 362 | Sun Healthcare Group, Inc.* | 3,066 | |||||||||
| 502 | SuperGen, Inc.* | 1,009 | |||||||||
| 200 | SXC Health Solutions Corp. (Canada)* | 4,006 | |||||||||
| 243 | Syneron Medical Ltd. (Israel)* | 1,645 | |||||||||
| 104 | Synovis Life Technologies, Inc.* | 1,579 | |||||||||
| 222 | Synta Pharmaceuticals Corp.* | 722 | |||||||||
| 330 | Theravance, Inc.* | 4,728 | |||||||||
| 421 | TomoTherapy, Inc.* | 1,086 | |||||||||
| 129 | TranS1, Inc.* | 939 | |||||||||
| 104 | U.S. Physical Therapy, Inc.* | 1,215 | |||||||||
| 132 | Vascular Solutions, Inc.* | 891 | |||||||||
| 57 | Virtual Radiologic Corp.* | 522 | |||||||||
| 126 | Vital Images, Inc.* | 1,276 | |||||||||
| 578 | Vivus, Inc.* | 2,318 | |||||||||
| 133 | Vnus Medical Technologies, Inc.* | 2,946 | |||||||||
| 1,151 | XOMA Ltd.* | 622 | |||||||||
| 49 | Young Innovations, Inc. | 760 | |||||||||
| 176 | Zoll Medical Corp.* | 2,830 | |||||||||
| 287 | Zymogenetics, Inc.* | 1,005 | |||||||||
| 328,428 | |||||||||||
| Industrials—14.8% | |||||||||||
| 188 | 3D Systems Corp.* | 1,318 | |||||||||
| 108 | AAON, Inc. | 2,104 | |||||||||
| 262 | Acacia Research - Acacia Technologies* | 1,134 | |||||||||
| 474 | Advanced Battery Technologies, Inc.* | 1,304 | |||||||||
| 131 | Aerovironment, Inc.* | 3,099 | |||||||||
| 223 | Altra Holdings, Inc.* | 1,220 | |||||||||
| 106 | American Commercial Lines, Inc.* | 528 | |||||||||
| 115 | American Ecology Corp. | 1,900 | |||||||||
| 93 | American Railcar Industries, Inc. | 848 | |||||||||
| 77 | American Science & Engineering, Inc. | 4,640 | |||||||||
| 365 | American Superconductor Corp.* | 9,380 | |||||||||
See Notes to Financial Statements.
60
Schedule of Investments (Continued)
PowerShares FTSE NASDAQ Small Cap Portfolio
April 30, 2009
| Number of Shares | Value | ||||||||||
| Common Stocks and Other Equity Interests (Continued) | |||||||||||
| 88 | American Woodmark Corp. | $ | 1,822 | ||||||||
| 242 | Apogee Enterprises, Inc. | 3,243 | |||||||||
| 131 | A-Power Energy Generation Systems Ltd.* | 1,081 | |||||||||
| 107 | Applied Signal Technology, Inc. | 2,114 | |||||||||
| 134 | Argon ST, Inc.* | 2,732 | |||||||||
| 187 | Astec Industries, Inc.* | 5,763 | |||||||||
| 170 | ATC Technology Corp.* | 2,701 | |||||||||
| 135 | Atlas Air Worldwide Holdings, Inc.* | 3,584 | |||||||||
| 68 | Barrett Business Services, Inc. | 680 | |||||||||
| 380 | Beacon Roofing Supply, Inc.* | 6,042 | |||||||||
| 225 | Canadian Solar, Inc. (China)* | 1,474 | |||||||||
| 1,460 | Capstone Turbine Corp.* | 1,168 | |||||||||
| 160 | Casella Waste Systems, Inc., Class A* | 330 | |||||||||
| 191 | Celadon Group, Inc.* | 1,306 | |||||||||
| 236 | Chart Industries, Inc.* | 3,264 | |||||||||
| 185 | China Architectural Engineering, Inc.* | 287 | |||||||||
| 363 | China BAK Battery, Inc.* | 773 | |||||||||
| 69 | China Fire & Security Group, Inc.* | 760 | |||||||||
| 239 | China Sunergy Co. Ltd. ADR (China)* | 727 | |||||||||
| 110 | Coleman Cable, Inc.* | 274 | |||||||||
| 158 | Columbus McKinnon Corp.* | 2,048 | |||||||||
| 101 | Courier Corp. | 1,584 | |||||||||
| 92 | CRA International, Inc.* | 2,147 | |||||||||
| 213 | Diamond Management & Technology Consultants, Inc. | 596 | |||||||||
| 1,301 | DryShips, Inc. (Greece) | 9,652 | |||||||||
| 81 | DXP Enterprises, Inc.* | 1,076 | |||||||||
| 83 | Dynamex, Inc.* | 1,221 | |||||||||
| 105 | Dynamic Materials Corp. | 1,684 | |||||||||
| 392 | Eagle Bulk Shipping, Inc. | 2,556 | |||||||||
| 194 | Encore Wire Corp. | 4,237 | |||||||||
| 383 | Ener1, Inc.* | 2,256 | |||||||||
| 317 | Energy Recovery, Inc.* | 2,498 | |||||||||
| 83 | EnerNOC, Inc.* | 1,450 | |||||||||
| 198 | Euroseas Ltd. | 950 | |||||||||
| 1,383 | Evergreen Solar, Inc.* | 3,361 | |||||||||
| 114 | Exponent, Inc.* | 3,181 | |||||||||
| 74 | First Advantage Corp., Class A* | 1,061 | |||||||||
| 170 | Flanders Corp.* | 903 | |||||||||
| 568 | Force Protection, Inc.* | 4,328 | |||||||||
| 99 | FreightCar America, Inc. | 1,904 | |||||||||
| 111 | Frozen Food Express Industries, Inc. | 481 | |||||||||
| 151 | Fuel Tech, Inc.* | 1,980 | |||||||||
| 576 | FuelCell Energy, Inc.* | 1,832 | |||||||||
| 180 | Fushi Copperweld, Inc.* | 914 | |||||||||
| 153 | GeoEye, Inc.* | 3,808 | |||||||||
| 187 | Gibraltar Industries, Inc. | 1,253 | |||||||||
| 368 | Great Lakes Dredge & Dock Corp. | 1,457 | |||||||||
| 116 | H&E Equipment Services, Inc.* | 873 | |||||||||
| 79 | Harbin Electric, Inc.* | 630 | |||||||||
| 433 | Hawaiian Holdings, Inc.* | 2,161 | |||||||||
| Number of Shares | Value | ||||||||||
| Common Stocks and Other Equity Interests (Continued) | |||||||||||
| 358 | Healthcare Services Group, Inc. | $ | 6,401 | ||||||||
| 137 | Heidrick & Struggles International, Inc. | 2,315 | |||||||||
| 67 | Heritage-Crystal Clean, Inc.* | 633 | |||||||||
| 114 | Herley Industries, Inc.* | 1,179 | |||||||||
| 150 | Houston Wire & Cable Co. | 1,446 | |||||||||
| 55 | Hurco Cos, Inc.* | 843 | |||||||||
| 50 | ICF International, Inc.* | 1,376 | |||||||||
| 304 | Innerworkings, Inc.* | 1,535 | |||||||||
| 313 | Insituform Technologies, Inc., Class A* | 4,798 | |||||||||
| 147 | Insteel Industries, Inc. | 1,095 | |||||||||
| 125 | Integrated Electrical Services, Inc.* | 1,201 | |||||||||
| 468 | Interface, Inc., Class A | 2,710 | |||||||||
| 50 | Jinpan International Ltd. (China) | 983 | |||||||||
| 213 | Kaman Corp. | 3,602 | |||||||||
| 262 | Kelly Services, Inc., Class A | 2,976 | |||||||||
| 46 | Key Technology, Inc.* | 485 | |||||||||
| 325 | Kforce, Inc.* | 3,546 | |||||||||
| 212 | Kimball International, Inc., Class B | 1,164 | |||||||||
| 23 | K-Tron International, Inc.* | 1,850 | |||||||||
| 131 | Ladish Co., Inc.* | 992 | |||||||||
| 56 | Lawson Products, Inc. | 643 | |||||||||
| 85 | LB Foster Co., Class A* | 2,784 | |||||||||
| 221 | LECG Corp.* | 643 | |||||||||
| 75 | LMI Aerospace, Inc.* | 494 | |||||||||
| 180 | LSI Industries, Inc. | 1,010 | |||||||||
| 136 | Marten Transport Ltd.* | 2,821 | |||||||||
| 8 | Mitsui & Co. Ltd. ADR (Japan) | 1,704 | |||||||||
| 104 | Multi-Color Corp. | 1,234 | |||||||||
| 76 | Northwest Pipe Co.* | 2,883 | |||||||||
| 444 | Odyssey Marine Exploration, Inc.* | 1,545 | |||||||||
| 27 | Omega Flex, Inc.* | 417 | |||||||||
| 298 | On Assignment, Inc.* | 1,049 | |||||||||
| 192 | Orion Energy Systems, Inc.* | 816 | |||||||||
| 181 | Orion Marine Group, Inc.* | 2,711 | |||||||||
| 219 | Pacer International, Inc. | 929 | |||||||||
| 174 | Paragon Shipping, Inc., Class A | 564 | |||||||||
| 13 | Patriot Transportation Holding, Inc.* | 898 | |||||||||
| 765 | Plug Power, Inc.* | 757 | |||||||||
| 114 | PMFG, Inc.* | 686 | |||||||||
| 71 | Powell Industries, Inc.* | 2,555 | |||||||||
| 763 | Power-One, Inc.* | 923 | |||||||||
| 23 | Preformed Line Products Co. | 853 | |||||||||
| 186 | PRG-Schultz International, Inc.* | 551 | |||||||||
| 66 | Protection One, Inc.* | 203 | |||||||||
| 150 | Raven Industries, Inc. | 3,585 | |||||||||
| 182 | RBC Bearings, Inc.* | 3,367 | |||||||||
| 215 | Republic Airways Holdings, Inc.* | 1,539 | |||||||||
| 170 | Rush Enterprises, Inc., Class A* | 2,237 | |||||||||
| 73 | Rush Enterprises, Inc., Class B* | 812 | |||||||||
| 117 | Saia, Inc.* | 1,528 | |||||||||
| 157 | School Specialty, Inc.* | 2,947 | |||||||||
See Notes to Financial Statements.
61
Schedule of Investments (Continued)
PowerShares FTSE NASDAQ Small Cap Portfolio
April 30, 2009
| Number of Shares | Value | ||||||||||
| Common Stocks and Other Equity Interests (Continued) | |||||||||||
| 102 | SmartHeat, Inc.* | $ | 576 | ||||||||
| 275 | Solarfun Power Holdings Co. Ltd. ADR (China)* | 1,180 | |||||||||
| 72 | Standard Parking Corp.* | 1,097 | |||||||||
| 342 | Star Bulk Carriers Corp. | 1,050 | |||||||||
| 109 | Sterling Construction Co., Inc.* | 2,046 | |||||||||
| 104 | Sun Hydraulics Corp. | 1,882 | |||||||||
| 516 | Taser International, Inc.* | 2,477 | |||||||||
| 157 | Team, Inc.* | 2,256 | |||||||||
| 117 | Tecumseh Products Co., Class A* | 1,195 | |||||||||
| 33 | Tecumseh Products Co., Class B* | 357 | |||||||||
| 113 | Thermadyne Holdings Corp.* | 362 | |||||||||
| 111 | Titan Machinery, Inc.* | 1,124 | |||||||||
| 146 | Ultralife Corp.* | 1,044 | |||||||||
| 220 | Ultrapetrol Bahamas Ltd.* | 818 | |||||||||
| 121 | Universal Forest Products, Inc. | 4,061 | |||||||||
| 134 | Universal Truckload Services, Inc. | 1,651 | |||||||||
| 68 | USA Truck, Inc.* | 956 | |||||||||
| 736 | Valence Technology, Inc.* | 1,649 | |||||||||
| 195 | Vicor Corp. | 1,047 | |||||||||
| 118 | Vitran Corp, Inc. (Canada)* | 802 | |||||||||
| 33 | VSE Corp. | 986 | |||||||||
| 288 | Waste Services, Inc.* | 1,555 | |||||||||
| 496 | YRC Worldwide, Inc.* | 1,503 | |||||||||
| 250,174 | |||||||||||
| Information Technology—26.2% | |||||||||||
| 231 | Acme Packet, Inc.* | 1,781 | |||||||||
| 216 | Actel Corp.* | 2,672 | |||||||||
| 378 | Actuate Corp.* | 1,399 | |||||||||
| 1,015 | Adaptec, Inc.* | 2,903 | |||||||||
| 390 | Advanced Analogic Technologies, Inc.* | 1,872 | |||||||||
| 261 | Advanced Energy Industries, Inc.* | 2,200 | |||||||||
| 215 | Airvana, Inc.* | 1,223 | |||||||||
| 498 | Alvarion Ltd. (Israel)* | 1,559 | |||||||||
| 189 | American Software, Inc., Class A | 1,049 | |||||||||
| 1,142 | Amkor Technology, Inc.* | 4,922 | |||||||||
| 531 | Anadigics, Inc.* | 1,604 | |||||||||
| 122 | Anaren, Inc.* | 1,587 | |||||||||
| 544 | Applied Micro Circuits Corp.* | 2,965 | |||||||||
| 195 | ArcSight, Inc.* | 2,945 | |||||||||
| 602 | ARM Holdings PLC ADR (United Kingdom) | 3,197 | |||||||||
| 1,082 | Art Technology Group, Inc.* | 3,397 | |||||||||
| 524 | Aruba Networks, Inc.* | 2,458 | |||||||||
| 387 | AsiaInfo Holdings, Inc.* | 6,481 | |||||||||
| 70 | ASM International N.V. (Netherlands)* | 833 | |||||||||
| 269 | ATMI, Inc.* | 4,248 | |||||||||
| 118 | Bankrate, Inc.* | 2,950 | |||||||||
| 18 | Bel Fuse, Inc., Class A | 261 | |||||||||
| 79 | Bel Fuse, Inc., Class B | 1,278 | |||||||||
| 403 | BigBand Networks, Inc.* | 2,362 | |||||||||
| Number of Shares | Value | ||||||||||
| Common Stocks and Other Equity Interests (Continued) | |||||||||||
| 324 | Blue Coat Systems, Inc.* | $ | 4,296 | ||||||||
| 637 | Borland Software Corp.* | 484 | |||||||||
| 162 | Bottomline Technologies, Inc.* | 1,272 | |||||||||
| 508 | Brightpoint, Inc.* | 2,647 | |||||||||
| 531 | Brooks Automation, Inc.* | 3,303 | |||||||||
| 58 | Cass Information Systems, Inc. | 1,956 | |||||||||
| 669 | CDC Corp., Class A (Hong Kong)* | 789 | |||||||||
| 309 | Ceragon Networks Ltd. (Israel)* | 1,576 | |||||||||
| 164 | CEVA, Inc.* | 1,353 | |||||||||
| 135 | China Finance Online Co. Ltd. ADR (China)* | 1,582 | |||||||||
| 297 | China Information Security Technology, Inc.* | 903 | |||||||||
| 545 | Cirrus Logic, Inc.* | 2,534 | |||||||||
| 222 | Cogo Group, Inc.* | 1,816 | |||||||||
| 195 | Cohu, Inc. | 1,903 | |||||||||
| 183 | comScore, Inc.* | 2,335 | |||||||||
| 184 | Comverge, Inc.* | 1,411 | |||||||||
| 176 | Constant Contact, Inc.* | 2,804 | |||||||||
| 72 | CPI International, Inc.* | 788 | |||||||||
| 578 | Cybersource Corp.* | 8,444 | |||||||||
| 338 | Daktronics, Inc. | 3,056 | |||||||||
| 159 | Deltek, Inc.* | 655 | |||||||||
| 174 | DemandTec, Inc.* | 1,256 | |||||||||
| 179 | DG FastChannel, Inc.* | 4,176 | |||||||||
| 213 | Digi International, Inc.* | 1,549 | |||||||||
| 257 | Diodes, Inc.* | 3,824 | |||||||||
| 81 | DivX, Inc.* | 416 | |||||||||
| 184 | Double-Take Software, Inc.* | 1,494 | |||||||||
| 224 | DSP Group, Inc.* | 1,409 | |||||||||
| 147 | DTS, Inc.* | 3,918 | |||||||||
| 63 | Ebix, Inc.* | 1,751 | |||||||||
| 257 | Echelon Corp.* | 2,046 | |||||||||
| 162 | Electro Rent Corp. | 1,550 | |||||||||
| 227 | Electro Scientific Industries, Inc.* | 1,952 | |||||||||
| 685 | Emcore Corp.* | 849 | |||||||||
| 128 | EMS Technologies, Inc.* | 2,438 | |||||||||
| 946 | Entegris, Inc.* | 1,400 | |||||||||
| 400 | Entrust, Inc.* | 780 | |||||||||
| 502 | Epicor Software Corp.* | 2,771 | |||||||||
| 295 | EPIQ Systems, Inc.* | 4,564 | |||||||||
| 405 | Exar Corp.* | 2,491 | |||||||||
| 73 | ExlService Holdings, Inc.* | 680 | |||||||||
| 741 | Extreme Networks, Inc.* | 1,304 | |||||||||
| 195 | Ezchip Semiconductor Ltd. (Israel)* | 2,987 | |||||||||
| 304 | FalconStor Software, Inc.* | 1,125 | |||||||||
| 138 | FARO Technologies, Inc.* | 2,092 | |||||||||
| 3,966 | Finisar Corp.* | 2,618 | |||||||||
| 145 | Forrester Research, Inc.* | 3,684 | |||||||||
| 55 | Fundtech Ltd. (Israel)* | 458 | |||||||||
| 317 | GigaMedia Ltd. (Taiwan, Republic of China)* | 2,108 | |||||||||
See Notes to Financial Statements.
62
Schedule of Investments (Continued)
PowerShares FTSE NASDAQ Small Cap Portfolio
April 30, 2009
| Number of Shares | Value | ||||||||||
| Common Stocks and Other Equity Interests (Continued) | |||||||||||
| 345 | Gilat Satellite Networks Ltd. (Israel)* | $ | 1,270 | ||||||||
| 175 | Globecomm Systems, Inc.* | 1,190 | |||||||||
| 208 | Gmarket, Inc. ADR (South Korea)* | 4,975 | |||||||||
| 297 | GSI Commerce, Inc.* | 4,220 | |||||||||
| 331 | Hackett Group (The), Inc.* | 745 | |||||||||
| 794 | Harmonic, Inc.* | 5,820 | |||||||||
| 221 | Harris Stratex Networks, Inc., Class A* | 888 | |||||||||
| 805 | Himax Technologies, Inc. ADR (Taiwan, Republic of China) | 2,182 | |||||||||
| 71 | Hughes Communications, Inc.* | 1,361 | |||||||||
| 140 | i2 Technologies, Inc.* | 1,249 | |||||||||
| 114 | ICx Technologies, Inc.* | 426 | |||||||||
| 225 | iGate Corp. | 853 | |||||||||
| 247 | Immersion Corp.* | 1,030 | |||||||||
| 355 | infoGROUP, Inc. | 1,438 | |||||||||
| 273 | Information Services Group, Inc.* | 808 | |||||||||
| 288 | InfoSpace, Inc.* | 1,909 | |||||||||
| 382 | Insight Enterprises, Inc.* | 2,185 | |||||||||
| 144 | Integral Systems, Inc.* | 955 | |||||||||
| 115 | Interactive Intelligence, Inc.* | 1,265 | |||||||||
| 424 | Internap Network Services Corp.* | 1,179 | |||||||||
| 257 | Internet Brands, Inc., Class A* | 1,575 | |||||||||
| 321 | Internet Capital Group, Inc.* | 1,743 | |||||||||
| 82 | Internet Gold-Golden Lines Ltd. (Israel)* | 390 | |||||||||
| 187 | Intevac, Inc.* | 1,288 | |||||||||
| 544 | Ipass, Inc.* | 620 | |||||||||
| 162 | Isilon Systems, Inc.* | 416 | |||||||||
| 141 | Ituran Location & Control Ltd. (Israel) | 1,105 | |||||||||
| 213 | Ixia* | 1,227 | |||||||||
| 195 | IXYS Corp. | 1,860 | |||||||||
| 258 | JDA Software Group, Inc.* | 3,640 | |||||||||
| 189 | Kenexa Corp.* | 1,240 | |||||||||
| 122 | Keynote Systems, Inc.* | 941 | |||||||||
| 272 | Knot (The), Inc.* | 2,467 | |||||||||
| 568 | Kopin Corp.* | 1,562 | |||||||||
| 969 | Lattice Semiconductor Corp.* | 1,686 | |||||||||
| 277 | Limelight Networks, Inc.* | 1,357 | |||||||||
| 175 | Liquidity Services, Inc.* | 1,318 | |||||||||
| 181 | Littelfuse, Inc.* | 2,967 | |||||||||
| 58 | LoopNet, Inc.* | 498 | |||||||||
| 169 | Loral Space & Communications, Inc.* | 3,946 | |||||||||
| 150 | Manhattan Associates, Inc.* | 2,493 | |||||||||
| 230 | Marchex, Inc., Class B | 1,040 | |||||||||
| 447 | Mattson Technology, Inc.* | 514 | |||||||||
| 191 | Maxwell Technologies, Inc.* | 1,956 | |||||||||
| 268 | Mellanox Technologies Ltd. (Israel)* | 2,734 | |||||||||
| 76 | MicroStrategy, Inc., Class A* | 2,957 | |||||||||
| 445 | Microtune, Inc.* | 930 | |||||||||
| 387 | ModusLink Global Solutions, Inc.* | 1,432 | |||||||||
| 212 | Monolithic Power Systems, Inc.* | 3,922 | |||||||||
| Number of Shares | Value | ||||||||||
| Common Stocks and Other Equity Interests (Continued) | |||||||||||
| 217 | Monotype Imaging Holdings, Inc.* | $ | 805 | ||||||||
| 1,273 | Move, Inc.* | 2,610 | |||||||||
| 1,384 | MRV Communications, Inc.* | 637 | |||||||||
| 379 | MSC.Software Corp.* | 2,327 | |||||||||
| 86 | Multi-Fineline Electronix, Inc.* | 1,726 | |||||||||
| 69 | NCI, Inc., Class A* | 1,681 | |||||||||
| 256 | Ness Technologies, Inc.* | 945 | |||||||||
| 136 | Netlogic Microsystems, Inc.* | 4,432 | |||||||||
| 340 | Netscout Systems, Inc.* | 3,057 | |||||||||
| 301 | Newport Corp.* | 1,502 | |||||||||
| 393 | NIC, Inc. | 2,122 | |||||||||
| 85 | Novatel Wireless, Inc.* | 582 | |||||||||
| 38 | NVE Corp* | 1,446 | |||||||||
| 335 | O2Micro International Ltd. ADR (Cayman Islands)* | 1,464 | |||||||||
| 430 | OmniVision Technologies, Inc.* | 4,089 | |||||||||
| 252 | Online Resources Corp.* | 1,081 | |||||||||
| 958 | OpenTV Corp., Class A* | 1,408 | |||||||||
| 173 | Oplink Communications, Inc.* | 1,910 | |||||||||
| 135 | Opnet Technologies, Inc.* | 1,161 | |||||||||
| 575 | Opnext, Inc.* | 1,455 | |||||||||
| 272 | Orbcomm, Inc.* | 348 | |||||||||
| 290 | Orbotech Ltd. (Israel)* | 1,479 | |||||||||
| 148 | OSI Systems, Inc.* | 2,775 | |||||||||
| 1,135 | Palm, Inc.* | 11,905 | |||||||||
| 163 | Parkervision, Inc.* | 456 | |||||||||
| 70 | PC Connection, Inc.* | 347 | |||||||||
| 152 | PC-Tel, Inc. | 740 | |||||||||
| 122 | Pegasystems, Inc. | 2,131 | |||||||||
| 114 | Perfect World Co. Ltd. ADR (Cayman Islands)* | 2,070 | |||||||||
| 272 | Perficient, Inc.* | 1,896 | |||||||||
| 213 | Pericom Semiconductor Corp.* | 1,898 | |||||||||
| 240 | Phoenix Technologies Ltd.* | 684 | |||||||||
| 233 | Power Integrations, Inc. | 4,963 | |||||||||
| 320 | Presstek, Inc.* | 618 | |||||||||
| 109 | QAD, Inc. | 290 | |||||||||
| 257 | Rackable Systems, Inc.* | 1,172 | |||||||||
| 271 | Radiant Systems, Inc.* | 1,997 | |||||||||
| 195 | Radisys Corp.* | 1,398 | |||||||||
| 179 | RADVision Ltd. (Israel)* | 1,235 | |||||||||
| 153 | RADWARE Ltd. (Israel)* | 985 | |||||||||
| 102 | Renaissance Learning, Inc. | 979 | |||||||||
| 2,194 | RF Micro Devices, Inc.* | 4,629 | |||||||||
| 117 | RightNow Technologies, Inc.* | 883 | |||||||||
| 79 | Rimage Corp.* | 1,163 | |||||||||
| 132 | Rubicon Technology, Inc.* | 1,119 | |||||||||
| 200 | Rudolph Technologies, Inc.* | 1,046 | |||||||||
| 454 | S1 Corp.* | 2,815 | |||||||||
| 4,470 | Sanmina-SCI Corp.* | 2,503 | |||||||||
| 254 | Seachange International, Inc.* | 1,593 | |||||||||
See Notes to Financial Statements.
63
Schedule of Investments (Continued)
PowerShares FTSE NASDAQ Small Cap Portfolio
April 30, 2009
| Number of Shares | Value | ||||||||||
| Common Stocks and Other Equity Interests (Continued) | |||||||||||
| 213 | Semitool, Inc.* | $ | 1,012 | ||||||||
| 145 | ShoreTel, Inc.* | 724 | |||||||||
| 259 | Sierra Wireless, Inc. (Canada)* | 1,461 | |||||||||
| 222 | Sigma Designs, Inc.* | 2,868 | |||||||||
| 622 | Silicon Image, Inc.* | 1,692 | |||||||||
| 279 | Silicon Motion Technology Corp. ADR (Taiwan, Republic of China)* | 896 | |||||||||
| 800 | Silicon Storage Technology, Inc.* | 1,480 | |||||||||
| 522 | SiRF Technology Holdings, Inc.* | 1,451 | |||||||||
| 263 | Smith Micro Software, Inc.* | 2,262 | |||||||||
| 447 | SonicWALL, Inc.* | 2,427 | |||||||||
| 161 | Sourcefire, Inc.* | 1,744 | |||||||||
| 114 | SPSS, Inc.* | 3,523 | |||||||||
| 186 | Standard Microsystems Corp.* | 2,950 | |||||||||
| 218 | STEC, Inc.* | 2,093 | |||||||||
| 169 | Stratasys, Inc.* | 1,582 | |||||||||
| 350 | SuccessFactors, Inc.* | 3,049 | |||||||||
| 266 | SumTotal Systems, Inc.* | 1,024 | |||||||||
| 218 | Super Micro Computer, Inc.* | 1,138 | |||||||||
| 108 | Supertex, Inc.* | 2,778 | |||||||||
| 404 | SupportSoft, Inc.* | 909 | |||||||||
| 216 | Switch & Data Facilities Co., Inc.* | 2,499 | |||||||||
| 373 | Symmetricom, Inc.* | 1,858 | |||||||||
| 291 | Symyx Technologies, Inc.* | 1,408 | |||||||||
| 82 | Synchronoss Technologies, Inc.* | 1,089 | |||||||||
| 255 | Taleo Corp., Class A* | 3,063 | |||||||||
| 106 | TechTarget, Inc.* | 425 | |||||||||
| 54 | Techwell, Inc.* | 398 | |||||||||
| 313 | TeleCommunication Systems, Inc., Class A* | 3,071 | |||||||||
| 98 | Telvent GIT S.A. (Spain) | 1,594 | |||||||||
| 494 | Terremark Worldwide, Inc.* | 1,922 | |||||||||
| 127 | The9 Ltd. ADR (China) | 1,189 | |||||||||
| 258 | TheStreet.com, Inc. | 550 | |||||||||
| 560 | THQ, Inc.* | 1,915 | |||||||||
| 855 | TiVo, Inc.* | 6,412 | |||||||||
| 25 | Travelzoo, Inc.* | 216 | |||||||||
| 528 | Trident Microsystems, Inc.* | 723 | |||||||||
| 1,223 | TriQuint Semiconductor, Inc.* | 4,684 | |||||||||
| 355 | TTM Technologies, Inc.* | 2,634 | |||||||||
| 207 | Ultimate Software Group, Inc.* | 3,877 | |||||||||
| 197 | Ultratech, Inc.* | 2,663 | |||||||||
| 300 | Universal Display Corp.* | 3,387 | |||||||||
| 1,050 | UTStarcom, Inc.* | 1,229 | |||||||||
| 232 | VASCO Data Security International, Inc.* | 1,605 | |||||||||
| 208 | Veeco Instruments, Inc.* | 1,506 | |||||||||
| 199 | Vignette Corp.* | 1,644 | |||||||||
| 147 | Virtusa Corp* | 939 | |||||||||
| 118 | Vocus, Inc.* | 2,006 | |||||||||
| 213 | Volterra Semiconductor Corp.* | 2,447 | |||||||||
| 81 | WebMD Health Corp., Class A* | 2,091 | |||||||||
| 110 | Yucheng Technologies Ltd. (China)* | 784 | |||||||||
| Number of Shares | Value | ||||||||||
| Common Stocks and Other Equity Interests (Continued) | |||||||||||
| 565 | Zix Corp.* | $ | 684 | ||||||||
| 429 | Zoran Corp.* | 3,835 | |||||||||
| 141 | Zygo Corp.* | 708 | |||||||||
| 442,190 | |||||||||||
| Materials—2.1% | |||||||||||
| 42 | AEP Industries, Inc.* | 854 | |||||||||
| 748 | Altair Nanotechnologies, Inc.* | 868 | |||||||||
| 151 | Balchem Corp. | 3,758 | |||||||||
| 465 | Century Aluminum Co.* | 1,879 | |||||||||
| 65 | China Natural Resources, Inc. (Hong Kong)* | 610 | |||||||||
| 197 | DRDGOLD Ltd. ADR (South Africa) | 1,546 | |||||||||
| 87 | GenTek, Inc.* | 1,661 | |||||||||
| 99 | Haynes International, Inc.* | 2,235 | |||||||||
| 304 | Horsehead Holding Corp.* | 2,171 | |||||||||
| 238 | ICO, Inc.* | 588 | |||||||||
| 133 | Innophos Holdings, Inc. | 1,972 | |||||||||
| 197 | Innospec, Inc. | 1,548 | |||||||||
| 161 | KapStone Paper and Packaging Corp.* | 459 | |||||||||
| 220 | Landec Corp.* | 1,487 | |||||||||
| 152 | Lihir Gold Ltd. ADR (Australia)* | 3,253 | |||||||||
| 90 | Olympic Steel, Inc. | 1,651 | |||||||||
| 98 | Penford Corp. | 438 | |||||||||
| 219 | A. Schulman, Inc. | 3,436 | |||||||||
| 354 | ShengdaTech, Inc.* | 1,281 | |||||||||
| 307 | U.S. Concrete, Inc.* | 608 | |||||||||
| 16 | United States Lime & Minerals, Inc.* | 620 | |||||||||
| 287 | Zoltek Cos., Inc.* | 2,259 | |||||||||
| 35,182 | |||||||||||
| Telecommunication Services—2.1% | |||||||||||
| 361 | Alaska Communications Systems Group, Inc. | 2,177 | |||||||||
| 66 | America Movil SAB de CV ADR, Class A (Mexico) | 2,198 | |||||||||
| 95 | Atlantic Tele-Network, Inc. | 2,098 | |||||||||
| 280 | Cogent Communications Group, Inc.* | 2,363 | |||||||||
| 186 | Consolidated Communications Holdings, Inc. | 2,093 | |||||||||
| 126 | D&E Communications, Inc. | 706 | |||||||||
| 316 | General Communication, Inc., Class A* | 2,421 | |||||||||
| 324 | Ibasis, Inc.* | 340 | |||||||||
| 1,290 | ICO Global Communications Holdings Ltd.* | 710 | |||||||||
| 143 | iPCS, Inc.* | 2,076 | |||||||||
| 203 | Neutral Tandem, Inc.* | 5,806 | |||||||||
| 905 | PAETEC Holding Corp.* | 2,778 | |||||||||
| 113 | Partner Communications ADR (Israel) | 1,836 | |||||||||
| 197 | Shenandoah Telecommunications Co. | 3,866 | |||||||||
| 117 | SureWest Communications | 753 | |||||||||
| 46 | Telefonos de Mexico SAB de CV ADR, Series A (Mexico) | 736 | |||||||||
| 193 | USA Mobility, Inc. | 2,146 | |||||||||
| 35,103 | |||||||||||
See Notes to Financial Statements.
64
Schedule of Investments (Continued)
PowerShares FTSE NASDAQ Small Cap Portfolio
April 30, 2009
| Number of Shares | Value | ||||||||||
| Common Stocks and Other Equity Interests (Continued) | |||||||||||
| Utilities—0.3% | |||||||||||
| 104 | Cadiz, Inc.* | $ | 629 | ||||||||
| 122 | Consolidated Water Co., Inc. (Cayman Islands) | 1,637 | |||||||||
| 113 | Middlesex Water Co. | 1,593 | |||||||||
| 211 | Southwest Water Co. | 1,211 | |||||||||
| 5,070 | |||||||||||
| Total Common Stocks and Other Equity Interests (Cost $2,271,386) | 1,680,344 | ||||||||||
| Rights—0.0% | |||||||||||
| Healthcare—0.0% | |||||||||||
| 120 | Biometric Therapeutic, Inc., expiring 06/15/09 | 1 | |||||||||
| Information Technology—0.0% | |||||||||||
| 109 | Deltek, Inc., expiring 05/27/09 | 56 | |||||||||
| Total Rights (Cost $0) | 57 | ||||||||||
| Total Investments (Cost $2,271,386)—99.5% | 1,680,401 | ||||||||||
| Other assets less liabilities—0.5% | 7,929 | ||||||||||
| Net Assets—100.0% | $ | 1,688,330 | |||||||||
ADR American Depositary Receipt.
REIT Real Estate Investment Trust.
* Non-income producing security.
See Notes to Financial Statements.
65
Schedule of Investments
PowerShares Zacks Micro Cap Portfolio
April 30, 2009
| Number of Shares | Value | ||||||||||
| Common Stocks and Other Equity Interests—100.4% | |||||||||||
| Consumer Discretionary—14.8% | |||||||||||
| 20,070 | American Greetings Corp., Class A | $ | 157,550 | ||||||||
| 7,491 | America's Car-Mart, Inc.* | 121,504 | |||||||||
| 7,309 | BJ's Restaurants, Inc.* | 120,525 | |||||||||
| 11,167 | Cabela's, Inc.* | 143,049 | |||||||||
| 7,777 | California Pizza Kitchen, Inc.* | 122,177 | |||||||||
| 14,163 | Callaway Golf Co. | 106,931 | |||||||||
| 5,575 | Cato (The) Corp., Class A | 107,152 | |||||||||
| 3,389 | Churchill Downs, Inc. | 117,971 | |||||||||
| 4,447 | Citi Trends, Inc.* | 109,218 | |||||||||
| 7,245 | Conn's, Inc.* | 119,108 | |||||||||
| 5,574 | Core-Mark Holding Co., Inc.* | 106,854 | |||||||||
| 10,942 | DSW, Inc., Class A* | 118,940 | |||||||||
| 33,871 | Exide Technologies* | 183,920 | |||||||||
| 15,368 | Finish Line (The), Inc., Class A | 130,628 | |||||||||
| 9,005 | Fred's, Inc., Class A | 123,008 | |||||||||
| 7,541 | Fuel Systems Solutions, Inc.* | 115,151 | |||||||||
| 12,195 | Gaylord Entertainment Co.* | 169,998 | |||||||||
| 5,395 | Genesco, Inc.* | 122,898 | |||||||||
| 7,270 | Group 1 Automotive, Inc. | 154,851 | |||||||||
| 9,639 | Haverty Furniture Cos., Inc. | 104,583 | |||||||||
| 7,364 | Helen of Troy Ltd.* | 117,456 | |||||||||
| 9,078 | Hot Topic, Inc.* | 111,115 | |||||||||
| 8,219 | JAKKS Pacific, Inc.* | 103,970 | |||||||||
| 6,204 | Jo-Ann Stores, Inc.* | 113,657 | |||||||||
| 24,073 | Jones Apparel Group, Inc. | 222,434 | |||||||||
| 3,650 | Jos. A. Bank Clothiers, Inc.* | 147,606 | |||||||||
| 11,907 | K-Swiss, Inc., Class A | 119,546 | |||||||||
| 5,547 | Lincoln Educational Services Corp.* | 92,025 | |||||||||
| 38,057 | Live Nation, Inc.* | 148,803 | |||||||||
| 7,973 | Lumber Liquidators, Inc.* | 119,276 | |||||||||
| 11,947 | Marcus Corp. | 151,727 | |||||||||
| 8,908 | Meritage Homes Corp.* | 185,375 | |||||||||
| 3,732 | Monro Muffler, Inc. | 93,188 | |||||||||
| 13,475 | Movado Group, Inc. | 123,566 | |||||||||
| 1,659 | National Presto Industries, Inc. | 118,220 | |||||||||
| 4,442 | P.F. Chang's China Bistro, Inc.* | 134,060 | |||||||||
| 6,166 | PetMed Express, Inc.* | 100,259 | |||||||||
| 14,424 | Pinnacle Entertainment, Inc.* | 180,012 | |||||||||
| 9,466 | Rex Stores Corp.* | 112,645 | |||||||||
| 10,483 | Ruby Tuesday, Inc.* | 80,509 | |||||||||
| 6,744 | Scholastic Corp. | 133,059 | |||||||||
| 9,818 | Shoe Carnival, Inc.* | 114,478 | |||||||||
| 15,247 | Skechers U.S.A., Inc., Class A* | 178,390 | |||||||||
| 5,356 | Skyline Corp. | 111,030 | |||||||||
| 8,589 | Speedway Motorsports, Inc. | 128,835 | |||||||||
| 10,084 | Stage Stores, Inc. | 123,529 | |||||||||
| 13,424 | Steak n Shake (The) Co.* | 155,181 | |||||||||
| 5,403 | Steven Madden Ltd.* | 158,956 | |||||||||
| 31,368 | Stewart Enterprises, Inc., Class A | 109,474 | |||||||||
| 8,245 | Sturm Ruger & Co., Inc. | 101,496 | |||||||||
| Number of Shares | Value | ||||||||||
| Common Stocks and Other Equity Interests (Continued) | |||||||||||
| 8,559 | Superior Industries International, Inc. | $ | 129,070 | ||||||||
| 7,873 | Systemax, Inc.* | 132,739 | |||||||||
| 3,653 | UniFirst Corp. | 136,220 | |||||||||
| 30,239 | Wet Seal (The), Inc., Class A* | 115,211 | |||||||||
| 6,959,133 | |||||||||||
| Consumer Staples—4.3% | |||||||||||
| 26,456 | Alliance One International, Inc.* | 99,210 | |||||||||
| 2,917 | American Italian Pasta Co., Class A* | 91,710 | |||||||||
| 13,356 | Central Garden & Pet Co.* | 128,485 | |||||||||
| 13,527 | Central Garden & Pet Co., Class A* | 122,690 | |||||||||
| 15,338 | Chiquita Brands International, Inc.* | 116,109 | |||||||||
| 3,628 | Diamond Foods, Inc. | 95,017 | |||||||||
| 17,425 | Elizabeth Arden, Inc.* | 150,900 | |||||||||
| 5,717 | Farmer Bros. Co. | 112,911 | |||||||||
| 21,076 | Heckmann Corp.* | 111,071 | |||||||||
| 2,943 | J & J Snack Foods Corp. | 114,071 | |||||||||
| 24,487 | Medifast, Inc.* | 171,163 | |||||||||
| 3,607 | Nash Finch Co. | 105,649 | |||||||||
| 5,764 | Pantry (The), Inc.* | 136,146 | |||||||||
| 19,610 | Prestige Brands Holdings, Inc.* | 126,681 | |||||||||
| 4,883 | Seneca Foods Corp., Class A* | 119,267 | |||||||||
| 18,175 | Smart Balance, Inc.* | 127,770 | |||||||||
| 11,438 | Zhongpin, Inc.* | 100,083 | |||||||||
| 2,028,933 | |||||||||||
| Energy—4.8% | |||||||||||
| 41,819 | Advantage Energy Income Fund (Canada) | 111,657 | |||||||||
| 15,711 | Basic Energy Services, Inc.* | 160,251 | |||||||||
| 81,308 | Boots & Coots International Control, Inc.* | 139,850 | |||||||||
| 15,553 | BreitBurn Energy Partners LP | 98,606 | |||||||||
| 3,489 | Clayton Williams Energy, Inc.* | 104,775 | |||||||||
| 6,798 | Duncan Energy Partners LP | 123,588 | |||||||||
| 19,853 | Eagle Rock Energy Partners LP | 75,243 | |||||||||
| 3,510 | Enbridge Energy Management LLC* | 121,376 | |||||||||
| 7,019 | EV Energy Partner LP | 126,693 | |||||||||
| 9,937 | Genesis Energy LP | 119,940 | |||||||||
| 5,742 | K-Sea Transportation Partners LP | 113,290 | |||||||||
| 8,180 | Legacy Reserves L.P. | 100,532 | |||||||||
| 40,178 | Newpark Resources, Inc.* | 112,498 | |||||||||
| 12,395 | OSG America LP | 110,068 | |||||||||
| 20,541 | Rosetta Resources, Inc.* | 144,814 | |||||||||
| 11,339 | Targa Resources Partners LP | 130,625 | |||||||||
| 8,884 | Teekay Offshore Partners LP (Marshall Islands) | 121,533 | |||||||||
| 6,056 | TransMontaigne Partners LP | 122,331 | |||||||||
| 19,211 | Vaalco Energy, Inc.* | 91,636 | |||||||||
| 2,229,306 | |||||||||||
| Financials—26.4% | |||||||||||
| 5,615 | 1st Source Corp. | 110,279 | |||||||||
| 12,268 | Abington Bancorp, Inc. | 107,836 | |||||||||
See Notes to Financial Statements.
66
Schedule of Investments (Continued)
PowerShares Zacks Micro Cap Portfolio
April 30, 2009
| Number of Shares | Value | ||||||||||
| Common Stocks and Other Equity Interests (Continued) | |||||||||||
| 10,557 | Alternative Asset Management Acquisition Corp.* | $ | 102,192 | ||||||||
| 24,421 | American Equity Investment Life Holding Co. | 137,490 | |||||||||
| 2,482 | American Physicians Capital, Inc. | 103,400 | |||||||||
| 5,299 | American Physicians Service Group, Inc. | 106,457 | |||||||||
| 8,834 | American Safety Insurance Holdings, Ltd. (Bermuda)* | 100,531 | |||||||||
| 6,629 | Amerisafe, Inc.* | 101,821 | |||||||||
| 16,588 | Anworth Mortgage Asset Corp. REIT | 106,661 | |||||||||
| 5,376 | Baldwin & Lyons, Inc., Class B | 107,789 | |||||||||
| 16,051 | BancTrust Financial Group, Inc. | 105,616 | |||||||||
| 11,219 | Bank Mutual Corp. | 115,219 | |||||||||
| 4,391 | Bank of the Ozarks, Inc. | 109,029 | |||||||||
| 10,177 | BankFinancial Corp. | 108,894 | |||||||||
| 4,445 | Berkshire Hills Bancorp, Inc. | 100,279 | |||||||||
| 10,696 | Brookline Bancorp, Inc. | 106,104 | |||||||||
| 1,317 | Capital Southwest Corp. | 102,410 | |||||||||
| 17,694 | Cardinal Financial Corp. | 138,898 | |||||||||
| 6,483 | Cash America International, Inc. | 144,960 | |||||||||
| 18,134 | Central Pacific Financial Corp. | 106,265 | |||||||||
| 25,913 | CFS Bancorp, Inc. | 94,842 | |||||||||
| 4,886 | Chemical Financial Corp. | 104,316 | |||||||||
| 13,995 | Citizens, Inc.* | 100,904 | |||||||||
| 6,059 | Community Bank System, Inc. | 99,671 | |||||||||
| 3,804 | Community Trust Bancorp, Inc. | 115,109 | |||||||||
| 11,351 | Compass Diversified Holdings | 101,478 | |||||||||
| 20,860 | Cowen Group, Inc.* | 120,362 | |||||||||
| 15,113 | Crawford & Co., Class B* | 89,922 | |||||||||
| 25,353 | DiamondRock Hospitality Co. REIT | 164,542 | |||||||||
| 6,599 | Donegal Group, Inc., Class A | 96,609 | |||||||||
| 14,769 | DuPont Fabros Technology, Inc. REIT | 125,389 | |||||||||
| 22,229 | East West Bancorp, Inc. | 151,825 | |||||||||
| 13,081 | Eastern Insurance Holdings, Inc. | 105,564 | |||||||||
| 4,837 | EMC Insurance Group, Inc. | 109,606 | |||||||||
| 22,433 | Encore Capital Group, Inc.* | 196,065 | |||||||||
| 7,638 | ESSA Bancorp, Inc. | 104,182 | |||||||||
| 6,573 | Evercore Partners, Inc., Class A | 124,098 | |||||||||
| 18,457 | Extra Space Storage, Inc. REIT | 131,229 | |||||||||
| 4,804 | Financial Federal Corp. | 118,226 | |||||||||
| 8,494 | First Bancorp | 103,372 | |||||||||
| 13,108 | First Busey Corp. | 102,636 | |||||||||
| 6,827 | First Cash Financial Services, Inc.* | 112,236 | |||||||||
| 10,682 | First Financial Bancorp | 115,259 | |||||||||
| 2,744 | First Financial Corp. | 101,802 | |||||||||
| 12,199 | First Financial Northwest, Inc. | 98,446 | |||||||||
| 9,424 | First Merchants Corp. | 114,596 | |||||||||
| 7,047 | First Mercury Financial Corp.* | 93,161 | |||||||||
| 13,733 | First Potomac Realty Trust REIT | 134,446 | |||||||||
| 2,745 | FPIC Insurance Group, Inc.* | 83,832 | |||||||||
| 11,371 | Gladstone Commercial Corp. REIT | 133,268 | |||||||||
| 11,557 | Greene Bankshares, Inc. | 98,235 | |||||||||
| Number of Shares | Value | ||||||||||
| Common Stocks and Other Equity Interests (Continued) | |||||||||||
| 6,360 | Greenlight Capital Re Ltd., Class A (Cayman Islands)* | $ | 98,453 | ||||||||
| 16,759 | Harleysville National Corp. | 146,976 | |||||||||
| 7,515 | Heartland Financial USA, Inc. | 111,072 | |||||||||
| 20,203 | Hercules Technology Growth Capital, Inc. | 121,420 | |||||||||
| 5,086 | Home BancShares, Inc. | 112,146 | |||||||||
| 12,146 | Horace Mann Educators Corp. | 106,642 | |||||||||
| 6,899 | Independent Bank Corp. | 137,704 | |||||||||
| 2,989 | Infinity Property & Casualty Corp. | 105,332 | |||||||||
| 10,307 | Investors Real Estate Trust REIT | 95,340 | |||||||||
| 2,852 | Kansas City Life Insurance Co. | 62,830 | |||||||||
| 27,169 | LaBranche & Co., Inc.* | 113,566 | |||||||||
| 12,659 | Lakeland Bancorp, Inc. | 107,728 | |||||||||
| 5,301 | Lakeland Financial Corp | 99,500 | |||||||||
| 12,633 | MainSource Financial Group, Inc. | 109,402 | |||||||||
| 16,662 | Meadowbrook Insurance Group, Inc. | 99,139 | |||||||||
| 13,719 | Medallion Financial Corp. | 101,109 | |||||||||
| 27,830 | Medical Properties Trust, Inc. REIT | 148,612 | |||||||||
| 7,117 | Mercer Insurance Group, Inc. | 104,051 | |||||||||
| 15,882 | Mission West Properties, Inc. REIT | 108,156 | |||||||||
| 902 | National Western Life Insurance Co., Class A | 102,729 | |||||||||
| 11,479 | Nelnet, Inc., Class A* | 69,218 | |||||||||
| 9,304 | Northfield Bancorp, Inc. | 105,135 | |||||||||
| 43,805 | NorthStar Realty Finance Corp. REIT | 138,862 | |||||||||
| 8,318 | NYMAGIC, Inc. | 98,069 | |||||||||
| 15,016 | Pacific Capital Bancorp | 104,211 | |||||||||
| 9,869 | Parkway Properties, Inc. REIT | 136,883 | |||||||||
| 15,808 | Penson Worldwide, Inc.* | 160,294 | |||||||||
| 7,826 | Peoples Bancorp, Inc. | 129,677 | |||||||||
| 6,198 | Peoples Financial Corp. | 103,011 | |||||||||
| 3,385 | Pico Holdings, Inc.* | 101,550 | |||||||||
| 4,288 | Pinnacle Financial Partners, Inc.* | 76,498 | |||||||||
| 3,958 | Piper Jaffray Cos.* | 137,224 | |||||||||
| 24,367 | PMA Capital Corp., Class A* | 91,376 | |||||||||
| 11,878 | Provident New York Bancorp | 100,607 | |||||||||
| 83,288 | RAIT Financial Trust REIT | 123,266 | |||||||||
| 8,094 | Renasant Corp. | 114,125 | |||||||||
| 5,451 | Republic Bancorp, Inc., Class A | 121,230 | |||||||||
| 3,270 | Safety Insurance Group, Inc. | 108,074 | |||||||||
| 12,880 | Santander BanCorp | 86,296 | |||||||||
| 4,864 | SCBT Financial Corp. | 112,212 | |||||||||
| 9,714 | SeaBright Insurance Holdings, Inc.* | 90,146 | |||||||||
| 4,021 | Simmons First National Corp., Class A | 104,265 | |||||||||
| 10,818 | Southwest Bancorp, Inc. | 74,103 | |||||||||
| 5,051 | Sovran Self Storage, Inc. REIT | 113,850 | |||||||||
| 15,540 | Sterling Bancshares, Inc. | 103,341 | |||||||||
| 5,199 | Stewart Information Services Corp. | 117,549 | |||||||||
| 20,560 | Sun Bancorp, Inc.* | 135,285 | |||||||||
| 6,546 | SWS Group, Inc. | 83,723 | |||||||||
| 9,037 | Texas Capital Bancshares, Inc.* | 126,518 | |||||||||
| 2,363 | Tompkins Financial Corp. | 99,600 | |||||||||
See Notes to Financial Statements.
67
Schedule of Investments (Continued)
PowerShares Zacks Micro Cap Portfolio
April 30, 2009
| Number of Shares | Value | ||||||||||
| Common Stocks and Other Equity Interests (Continued) | |||||||||||
| 1,921 | Transcontinental Realty Investors, Inc.* | $ | 21,678 | ||||||||
| 6,062 | TriCo Bancshares | 96,992 | |||||||||
| 7,336 | Union Bankshares Corp. | 125,372 | |||||||||
| 8,990 | United America Indemnity Ltd., Class A* | 45,579 | |||||||||
| 7,753 | United Financial Bancorp, Inc. | 102,882 | |||||||||
| 5,810 | Univest Corp. of Pennsylvania | 121,255 | |||||||||
| 7,584 | Urstadt Biddle Properties, Inc., Class A REIT | 116,490 | |||||||||
| 10,258 | Victory Acquisition Corp.* | 102,580 | |||||||||
| 11,559 | Westfield Financial, Inc. | 107,961 | |||||||||
| 19,710 | Wilshire Bancorp, Inc. | 79,628 | |||||||||
| 8,272 | Wintrust Financial Corp. | 140,624 | |||||||||
| 4,547 | WSFS Financial Corp. | 123,269 | |||||||||
| 12,409,773 | |||||||||||
| Health Care—10.4% | |||||||||||
| 10,766 | Albany Molecular Research, Inc.* | 105,076 | |||||||||
| 80,029 | Allied Healthcare International, Inc.* | 124,845 | |||||||||
| 21,960 | Allion Healthcare, Inc.* | 122,317 | |||||||||
| 5,327 | Almost Family, Inc.* | 131,577 | |||||||||
| 14,975 | Anadys Pharmaceuticals, Inc.* | 37,288 | |||||||||
| 9,034 | Angiodynamics, Inc.* | 114,461 | |||||||||
| 40,406 | ATS Medical, Inc.* | 107,884 | |||||||||
| 7,900 | Cantel Medical Corp.* | 111,627 | |||||||||
| 7,047 | CONMED Corp.* | 93,866 | |||||||||
| 14,287 | Cypress Bioscience, Inc.* | 102,866 | |||||||||
| 7,532 | Emergent Biosolutions, Inc.* | 80,668 | |||||||||
| 6,579 | Ensign Group (The), Inc. | 101,975 | |||||||||
| 6,676 | Gentiva Health Services, Inc.* | 106,349 | |||||||||
| 22,724 | Geron Corp.* | 116,801 | |||||||||
| 5,258 | Greatbatch, Inc.* | 110,628 | |||||||||
| 7,681 | Hanger Orthopedic Group, Inc.* | 106,843 | |||||||||
| 12,154 | Healthspring, Inc.* | 112,181 | |||||||||
| 3,166 | ICU Medical, Inc.* | 119,042 | |||||||||
| 14,315 | Immunogen, Inc.* | 99,489 | |||||||||
| 6,331 | Invacare Corp. | 97,434 | |||||||||
| 5,354 | IPC The Hospitalist Co., Inc.* | 98,139 | |||||||||
| 4,570 | LHC Group, Inc.* | 104,287 | |||||||||
| 6,184 | Matrixx Initiatives, Inc.* | 105,870 | |||||||||
| 14,944 | Maxygen, Inc.* | 87,422 | |||||||||
| 13,984 | MedCath Corp.* | 141,519 | |||||||||
| 8,322 | Merit Medical Systems, Inc.* | 129,074 | |||||||||
| 3,565 | MWI Veterinary Supply, Inc.* | 110,800 | |||||||||
| 27,466 | Nabi Biopharmaceuticals* | 94,483 | |||||||||
| 11,947 | Natus Medical, Inc.* | 104,895 | |||||||||
| 10,477 | Odyssey HealthCare, Inc.* | 108,542 | |||||||||
| 7,708 | Optimer Pharmaceuticals, Inc.* | 107,681 | |||||||||
| 10,731 | Par Pharmaceutical Cos., Inc.* | 115,144 | |||||||||
| 6,106 | PharMerica Corp.* | 111,435 | |||||||||
| 57,404 | QLT, Inc. (Canada)* | 115,956 | |||||||||
| 5,812 | RehabCare Group, Inc.* | 97,060 | |||||||||
| 6,973 | Res-Care, Inc.* | 111,707 | |||||||||
| Number of Shares | Value | ||||||||||
| Common Stocks and Other Equity Interests (Continued) | |||||||||||
| 10,694 | Salix Pharmaceuticals Ltd.* | $ | 117,634 | ||||||||
| 12,369 | Skilled Healthcare Group, Inc., Class A* | 107,981 | |||||||||
| 12,043 | Sun Healthcare Group, Inc.* | 102,004 | |||||||||
| 4,708 | SXC Health Solutions Corp. (Canada)* | 94,301 | |||||||||
| 82,813 | Theragenics Corp.* | 102,688 | |||||||||
| 8,245 | Triple-S Management Corp., Class B* | 105,701 | |||||||||
| 19,366 | ViroPharma, Inc.* | 109,031 | |||||||||
| 9,011 | Vital Images, Inc.* | 91,281 | |||||||||
| 4,790 | Vnus Medical Technologies* | 106,099 | |||||||||
| 7,074 | Zoll Medical Corp.* | 113,750 | |||||||||
| 4,897,701 | |||||||||||
| Industrials—15.7% | |||||||||||
| 8,093 | AAR Corp.* | 121,962 | |||||||||
| 17,060 | Aceto Corp. | 121,979 | |||||||||
| 4,859 | Aerovironment, Inc.* | 114,964 | |||||||||
| 21,871 | Aircastle Ltd. (Bermuda) | 144,349 | |||||||||
| 9,528 | Alamo Group, Inc. | 107,285 | |||||||||
| 5,791 | American Woodmark Corp. | 119,874 | |||||||||
| 9,249 | Apogee Enterprises, Inc. | 123,937 | |||||||||
| 5,033 | Applied Signal Technology, Inc. | 99,452 | |||||||||
| 5,350 | Argon ST, Inc.* | 109,087 | |||||||||
| 5,351 | Arkansas Best Corp. | 123,501 | |||||||||
| 5,863 | Atlas Air Worldwide Holdings, Inc.* | 155,663 | |||||||||
| 7,584 | Beacon Roofing Supply, Inc.* | 120,586 | |||||||||
| 10,461 | CDI Corp. | 125,009 | |||||||||
| 5,602 | Ceradyne, Inc.* | 96,578 | |||||||||
| 21,473 | China Yuchai International Ltd. (Bermuda) | 169,206 | |||||||||
| 9,788 | Comfort Systems USA, Inc. | 105,613 | |||||||||
| 6,205 | Cornell Cos., Inc.* | 112,807 | |||||||||
| 6,994 | Ducommun, Inc. | 121,136 | |||||||||
| 17,549 | Dycom Industries, Inc.* | 147,763 | |||||||||
| 4,737 | Encore Wire Corp. | 103,456 | |||||||||
| 8,387 | EnerSys* | 142,998 | |||||||||
| 11,462 | Ennis, Inc. | 103,158 | |||||||||
| 5,921 | EnPro Industries, Inc.* | 94,499 | |||||||||
| 21,183 | Force Protection, Inc.* | 161,414 | |||||||||
| 5,382 | G&K Services, Inc., Class A | 134,389 | |||||||||
| 21,520 | Gibraltar Industries, Inc. | 144,184 | |||||||||
| 13,548 | Griffon Corp.* | 117,461 | |||||||||
| 8,493 | Herley Industries, Inc.* | 87,818 | |||||||||
| 4,411 | ICF International, Inc.* | 121,347 | |||||||||
| 6,485 | Insituform Technologies, Inc., Class A* | 99,415 | |||||||||
| 14,609 | Insteel Industries, Inc. | 108,837 | |||||||||
| 12,609 | Kelly Services, Inc., Class A | 143,238 | |||||||||
| 11,179 | Korn/Ferry International* | 118,386 | |||||||||
| 6,331 | Layne Christensen Co.* | 137,129 | |||||||||
| 5,453 | Marten Transport Ltd.* | 113,095 | |||||||||
| 6,455 | McGrath Rentcorp | 136,459 | |||||||||
| 3,904 | Michael Baker Corp.* | 131,174 | |||||||||
| 8,760 | Mobile Mini, Inc.* | 120,012 | |||||||||
See Notes to Financial Statements.
68
Schedule of Investments (Continued)
PowerShares Zacks Micro Cap Portfolio
April 30, 2009
| Number of Shares | Value | ||||||||||
| Common Stocks and Other Equity Interests (Continued) | |||||||||||
| 30,804 | Mueller Water Products, Inc., Class A | $ | 129,069 | ||||||||
| 44,168 | Navios Maritime Holdings, Inc. (Greece) | 182,413 | |||||||||
| 3,563 | Northwest Pipe Co.* | 135,145 | |||||||||
| 37,506 | On Assignment, Inc.* | 132,021 | |||||||||
| 29,124 | Paragon Shipping, Inc., Class A | 94,362 | |||||||||
| 10,997 | Pike Electric Corp.* | 114,149 | |||||||||
| 2,877 | Powell Industries, Inc.* | 103,543 | |||||||||
| 15,681 | Republic Airways Holdings, Inc.* | 112,276 | |||||||||
| 11,391 | Rush Enterprises, Inc., Class A* | 149,906 | |||||||||
| 8,521 | Saia, Inc.* | 111,284 | |||||||||
| 5,760 | School Specialty, Inc.* | 108,115 | |||||||||
| 48,862 | Spherion Corp.* | 175,414 | |||||||||
| 11,040 | Standex International Corp. | 153,125 | |||||||||
| 5,696 | Sterling Construction Co., Inc.* | 106,914 | |||||||||
| 6,229 | Tredegar Corp. | 109,506 | |||||||||
| 13,324 | Trex Co., Inc.* | 145,898 | |||||||||
| 3,833 | Universal Forest Products, Inc. | 128,635 | |||||||||
| 7,198 | Viad Corp. | 137,338 | |||||||||
| 15,283 | Volt Information Sciences, Inc.* | 109,732 | |||||||||
| 23,761 | Waste Services, Inc.* | 128,309 | |||||||||
| 61,243 | WCA Waste Corp.* | 125,548 | |||||||||
| 7,351,922 | |||||||||||
| Information Technology—18.8% | |||||||||||
| 10,042 | Actel Corp.* | 124,220 | |||||||||
| 42,330 | Adaptec, Inc.* | 121,064 | |||||||||
| 13,498 | Advanced Energy Industries, Inc.* | 113,788 | |||||||||
| 9,297 | Anaren, Inc.* | 120,954 | |||||||||
| 20,904 | Applied Micro Circuits Corp.* | 113,927 | |||||||||
| 11,121 | Avid Technology, Inc.* | 123,109 | |||||||||
| 7,561 | Bel Fuse, Inc., Class B | 122,337 | |||||||||
| 4,296 | Black Box Corp. | 117,582 | |||||||||
| 21,990 | Brooks Automation, Inc.* | 136,778 | |||||||||
| 4,215 | Cabot Microelectronics Corp.* | 121,434 | |||||||||
| 37,227 | Ciber, Inc.* | 120,243 | |||||||||
| 27,019 | Cirrus Logic, Inc.* | 125,638 | |||||||||
| 7,606 | Cognex Corp. | 107,016 | |||||||||
| 5,894 | Coherent, Inc.* | 111,986 | |||||||||
| 9,373 | Compellent Technologies, Inc.* | 104,603 | |||||||||
| 7,116 | CSG Systems International, Inc.* | 103,182 | |||||||||
| 5,429 | DG FastChannel, Inc.* | 126,659 | |||||||||
| 13,258 | Digi International, Inc.* | 96,386 | |||||||||
| 14,043 | Dynamics Research Corp.* | 115,855 | |||||||||
| 10,557 | Electro Rent Corp. | 101,030 | |||||||||
| 10,378 | Electronics for Imaging, Inc.* | 101,912 | |||||||||
| 5,820 | EMS Technologies, Inc.* | 110,871 | |||||||||
| 5,645 | EPIQ Systems, Inc.* | 87,328 | |||||||||
| 16,301 | Exar Corp.* | 100,251 | |||||||||
| 30,234 | Exfo Electro-Optical Engineering, Inc. (Canada)* | 116,099 | |||||||||
| 8,203 | Ezchip Semiconductor Ltd. (Israel)* | 125,670 | |||||||||
| Number of Shares | Value | ||||||||||
| Common Stocks and Other Equity Interests (Continued) | |||||||||||
| 27,239 | Fairchild Semiconductor International, Inc.* | $ | 167,791 | ||||||||
| 4,933 | Forrester Research, Inc.* | 125,348 | |||||||||
| 17,547 | Globecomm Systems, Inc.* | 119,320 | |||||||||
| 13,279 | Imation Corp. | 132,790 | |||||||||
| 19,531 | InfoSpace, Inc.* | 129,491 | |||||||||
| 11,829 | Integral Systems, Inc.* | 78,426 | |||||||||
| 17,304 | Internet Brands, Inc., Class A* | 106,074 | |||||||||
| 12,611 | IXYS Corp. | 120,309 | |||||||||
| 8,808 | JDA Software Group, Inc.* | 124,281 | |||||||||
| 12,810 | Keynote Systems, Inc.* | 98,765 | |||||||||
| 19,880 | L-1 Identity Solutions, Inc.* | 145,522 | |||||||||
| 4,762 | Loral Space & Communications, Inc.* | 111,193 | |||||||||
| 22,903 | Mentor Graphics Corp.* | 153,908 | |||||||||
| 18,389 | Mercury Computer Systems, Inc.* | 149,319 | |||||||||
| 28,400 | Methode Electronics, Inc. | 170,967 | |||||||||
| 6,034 | Multi-Fineline Electronix, Inc.* | 121,102 | |||||||||
| 14,191 | Netscout Systems, Inc.* | 127,577 | |||||||||
| 15,113 | OmniVision Technologies, Inc.* | 143,725 | |||||||||
| 13,204 | Oplink Communications, Inc.* | 145,772 | |||||||||
| 11,737 | Opnet Technologies, Inc.* | 100,938 | |||||||||
| 6,654 | OSI Systems, Inc.* | 124,763 | |||||||||
| 5,891 | Park Electrochemical Corp. | 121,355 | |||||||||
| 23,635 | PC-Tel, Inc. | 115,102 | |||||||||
| 28,450 | Perceptron, Inc.* | 102,705 | |||||||||
| 8,424 | Plantronics, Inc. | 107,322 | |||||||||
| 25,029 | Rackable Systems, Inc.* | 114,132 | |||||||||
| 20,370 | RADVision Ltd. (Israel)* | 140,553 | |||||||||
| 43,610 | RealNetworks, Inc.* | 107,281 | |||||||||
| 5,382 | Rogers Corp.* | 136,972 | |||||||||
| 19,729 | S1 Corp.* | 122,320 | |||||||||
| 17,714 | Seachange International, Inc.* | 111,067 | |||||||||
| 42,338 | Silicon Image, Inc.* | 115,159 | |||||||||
| 61,596 | Silicon Storage Technology, Inc.* | 113,953 | |||||||||
| 19,436 | Smith Micro Software, Inc.* | 167,149 | |||||||||
| 22,779 | SonicWALL, Inc.* | 123,690 | |||||||||
| 5,478 | Standard Microsystems Corp.* | 86,881 | |||||||||
| 13,791 | STEC, Inc.* | 132,394 | |||||||||
| 4,391 | Supertex, Inc.* | 112,937 | |||||||||
| 29,032 | Symmetricom, Inc.* | 144,579 | |||||||||
| 5,182 | SYNNEX Corp.* | 111,568 | |||||||||
| 11,094 | TeleCommunication Systems, Inc., Class A* | 108,832 | |||||||||
| 41,126 | TriQuint Semiconductor, Inc.* | 157,512 | |||||||||
| 17,515 | TTM Technologies, Inc.* | 129,961 | |||||||||
| 8,141 | Ultratech, Inc.* | 110,066 | |||||||||
| 15,211 | Vignette Corp.* | 125,643 | |||||||||
| 15,884 | Wind River Systems, Inc.* | 116,430 | |||||||||
| 11,562 | Zoran Corp.* | 103,364 | |||||||||
| 8,806,230 | |||||||||||
| Materials—3.2% | |||||||||||
| 11,380 | AM Castle & Co. | 110,272 | |||||||||
| 7,336 | Brush Engineered Materials, Inc.* | 124,125 | |||||||||
See Notes to Financial Statements.
69
Schedule of Investments (Continued)
PowerShares Zacks Micro Cap Portfolio
April 30, 2009
| Number of Shares | Value | ||||||||||
| Common Stocks and Other Equity Interests (Continued) | |||||||||||
| 12,883 | Bway Holding Co.* | $ | 120,070 | ||||||||
| 16,296 | Glatfelter | 144,708 | |||||||||
| 32,369 | Headwaters, Inc.* | 81,570 | |||||||||
| 9,012 | Innophos Holdings, Inc. | 133,648 | |||||||||
| 6,707 | Olympic Steel, Inc. | 123,006 | |||||||||
| 7,518 | A. Schulman, Inc. | 117,957 | |||||||||
| 5,494 | Schweitzer-Mauduit International, Inc. | 126,197 | |||||||||
| 3,732 | Stepan Co. | 147,675 | |||||||||
| 49,825 | US Gold Corp.* | 99,152 | |||||||||
| 19,318 | Wausau Paper Corp. | 168,647 | |||||||||
| 1,497,027 | |||||||||||
| Telecommunication Services—0.9% | |||||||||||
| 18,812 | D&E Communications, Inc. | 105,347 | |||||||||
| 15,220 | General Communication, Inc., Class A* | 116,585 | |||||||||
| 12,956 | SureWest Communications | 83,437 | |||||||||
| 11,043 | USA Mobility, Inc. | 122,798 | |||||||||
| 428,167 | |||||||||||
| Utilities—1.1% | |||||||||||
| 7,680 | Brookfield Infrastructure Partners LP (Bermuda) | 104,832 | |||||||||
| 5,865 | Central Vermont Public Service Corp. | 100,643 | |||||||||
| 3,345 | Chesapeake Utilities Corp. | 97,975 | |||||||||
| 7,042 | Empire District Electric (The) Co. | 105,419 | |||||||||
| 39,094 | Star Gas Partners LP | 123,146 | |||||||||
| 532,015 | |||||||||||
| Total Common Stocks and Other Equity Interests (Cost $53,748,220) | 47,140,207 | ||||||||||
| Money Market Fund—0.0% | |||||||||||
| 11,657 | Goldman Sachs Financial Square Prime Obligations Institutional Share Class (Cost $11,657) | 11,657 | |||||||||
| Total Investments (Cost $53,759,877)—100.4% | 47,151,864 | ||||||||||
| Liabilities in excess of other assets—(0.4%) | (191,466 | ) | |||||||||
| Net Assets—100.0% | $ | 46,960,398 | |||||||||
REIT Real Estate Investment Trust.
* Non-income producing security.
See Notes to Financial Statements.
70
Schedule of Investments
PowerShares Zacks Small Cap Portfolio
April 30, 2009
| Number of Shares | Value | ||||||||||
| Common Stocks and Other Equity Interests—99.5% | |||||||||||
| Consumer Discretionary—13.1% | |||||||||||
| 7,555 | America's Car-Mart, Inc.* | $ | 122,542 | ||||||||
| 14,644 | Brown Shoe Co., Inc. | 94,161 | |||||||||
| 3,247 | Buckle (The), Inc. | 121,340 | |||||||||
| 4,042 | Carter's, Inc.* | 86,418 | |||||||||
| 5,191 | Cato (The) Corp., Class A | 99,771 | |||||||||
| 7,207 | Citi Trends, Inc.* | 177,005 | |||||||||
| 1,314 | Deckers Outdoor Corp.* | 74,267 | |||||||||
| 7,967 | Dress Barn, Inc.* | 120,620 | |||||||||
| 9,925 | Einstein Noah Restaurant Group, Inc.* | 107,091 | |||||||||
| 5,951 | Fossil, Inc.* | 119,972 | |||||||||
| 2,627 | Fuel Systems Solutions, Inc.* | 40,114 | |||||||||
| 4,269 | Harman International Industries, Inc. | 77,653 | |||||||||
| 4,066 | Hawk Corp., Class A* | 58,347 | |||||||||
| 13,708 | Interval Leisure Group, Inc.* | 109,801 | |||||||||
| 9,037 | iRobot Corp.* | 103,654 | |||||||||
| 5,378 | Jo-Ann Stores, Inc.* | 98,525 | |||||||||
| 6,406 | K-Swiss, Inc., Class A | 64,316 | |||||||||
| 13,132 | Live Nation, Inc.* | 51,346 | |||||||||
| 7,673 | Maidenform Brands, Inc.* | 97,831 | |||||||||
| 5,895 | Men's Wearhouse (The), Inc. | 109,883 | |||||||||
| 13,818 | New York Times (The) Co., Class A | 74,341 | |||||||||
| 6,255 | Overstock.com, Inc.* | 84,317 | |||||||||
| 10,390 | Shutterfly, Inc.* | 133,096 | |||||||||
| 6,895 | Skechers U.S.A., Inc., Class A* | 80,672 | |||||||||
| 8,396 | Stamps.com, Inc.* | 78,587 | |||||||||
| 5,941 | Steinway Musical Instruments* | 79,788 | |||||||||
| 2,465,458 | |||||||||||
| Consumer Staples—2.9% | |||||||||||
| 2,908 | American Italian Pasta Co., Class A* | 91,428 | |||||||||
| 4,913 | Chiquita Brands International, Inc.* | 37,191 | |||||||||
| 1,795 | Green Mountain Coffee Roasters, Inc.* | 129,796 | |||||||||
| 4,129 | Pantry (The), Inc.* | 97,527 | |||||||||
| 11,621 | Revlon, Inc., Class A* | 55,084 | |||||||||
| 5,254 | Susser Holdings Corp.* | 75,920 | |||||||||
| 4,998 | Winn-Dixie Stores, Inc.* | 57,277 | |||||||||
| 544,223 | |||||||||||
| Energy—8.3% | |||||||||||
| 5,821 | Alon USA Energy, Inc. | 73,927 | |||||||||
| 9,157 | Atlas Pipeline Partners LP | 38,002 | |||||||||
| 6,127 | Calumet Specialty Products Partners LP | 74,014 | |||||||||
| 4,311 | Dawson Geophysical Co.* | 84,754 | |||||||||
| 3,884 | EV Energy Partner LP | 70,106 | |||||||||
| 6,336 | Genesis Energy LP | 76,476 | |||||||||
| 3,030 | GMX Resources, Inc.* | 33,148 | |||||||||
| 2,869 | Gulfmark Offshore, Inc.* | 77,119 | |||||||||
| 12,983 | Matrix Service Co.* | 124,376 | |||||||||
| 8,032 | Natural Gas Services Group, Inc.* | 80,159 | |||||||||
| 1,924 | Overseas Shipholding Group, Inc. | 55,238 | |||||||||
| 13,388 | Patriot Coal Corp.* | 84,344 | |||||||||
| Number of Shares | Value | ||||||||||
| Common Stocks and Other Equity Interests (Continued) | |||||||||||
| 3,334 | Penn Virginia Corp. | $ | 46,909 | ||||||||
| 6,516 | Regency Energy Partners LP | 85,360 | |||||||||
| 11,314 | Rosetta Resources, Inc.* | 79,764 | |||||||||
| 9,231 | RPC, Inc. | 98,772 | |||||||||
| 7,474 | Superior Well Services, Inc.* | 79,972 | |||||||||
| 3,566 | Tsakos Energy Navigation Ltd. (Bermuda) | 55,844 | |||||||||
| 13,493 | USEC, Inc.* | 83,522 | |||||||||
| 5,890 | Western Refining, Inc.* | 74,155 | |||||||||
| 2,034 | World Fuel Services Corp. | 77,556 | |||||||||
| 1,553,517 | |||||||||||
| Financials—17.1% | |||||||||||
| 1,615 | American Physicians Capital, Inc. | 67,281 | |||||||||
| 3,271 | American Physicians Service Group, Inc. | 65,714 | |||||||||
| 3,667 | Amerisafe, Inc.* | 56,325 | |||||||||
| 8,366 | Amtrust Financial Services, Inc. | 76,382 | |||||||||
| 7,778 | Bank Mutual Corp. | 79,880 | |||||||||
| 2,920 | Berkshire Hills Bancorp, Inc. | 65,875 | |||||||||
| 4,150 | CNA Surety Corp.* | 79,888 | |||||||||
| 13,440 | Doral Financial Corp.* | 63,840 | |||||||||
| 4,969 | eHealth, Inc.* | 95,355 | |||||||||
| 3,536 | EMC Insurance Group, Inc. | 80,126 | |||||||||
| 5,072 | Employers Holdings, Inc. | 42,300 | |||||||||
| 5,061 | EZCORP, Inc., Class A* | 62,706 | |||||||||
| 9,659 | First BanCorp | 53,221 | |||||||||
| 7,849 | First Busey Corp. | 61,458 | |||||||||
| 2,199 | GAMCO Investors, Inc., Class A | 110,280 | |||||||||
| 11,151 | Hercules Technology Growth Capital, Inc. | 67,018 | |||||||||
| 9,525 | Heritage Commerce Corp. | 76,962 | |||||||||
| 7,345 | Horace Mann Educators Corp. | 64,489 | |||||||||
| 1,789 | Infinity Property & Casualty Corp. | 63,044 | |||||||||
| 4,846 | Interactive Brokers Group, Inc., Class A* | 71,479 | |||||||||
| 2,258 | Life Partners Holdings, Inc. | 42,270 | |||||||||
| 8,895 | MarketAxess Holdings, Inc.* | 85,303 | |||||||||
| 11,314 | Meadowbrook Insurance Group, Inc. | 67,318 | |||||||||
| 10,160 | Medallion Financial Corp. | 74,879 | |||||||||
| 11,523 | MI Developments, Inc., Class A (Canada) | 82,620 | |||||||||
| 1,337 | Navigators Group, Inc.* | 60,673 | |||||||||
| 4,969 | Nelnet, Inc., Class A* | 29,963 | |||||||||
| 13,599 | Oriental Financial Group, Inc. | 126,335 | |||||||||
| 4,606 | Oritani Financial Corp.* | 65,359 | |||||||||
| 1,266 | Park National Corp. | 84,759 | |||||||||
| 11,485 | Penson Worldwide, Inc.* | 116,458 | |||||||||
| 12,464 | PMA Capital Corp., Class A* | 46,740 | |||||||||
| 6,284 | Provident Financial Services, Inc. | 67,050 | |||||||||
| 6,623 | SeaBright Insurance Holdings, Inc.* | 61,461 | |||||||||
| 5,606 | Sierra Bancorp | 67,328 | |||||||||
| 3,791 | Southside Bancshares, Inc. | 80,748 | |||||||||
| 1,960 | Stifel Financial Corp.* | 96,491 | |||||||||
| 4,688 | SWS Group, Inc. | 59,960 | |||||||||
| 35 | Teton Advisors, Inc.* | — | |||||||||
See Notes to Financial Statements.
71
Schedule of Investments (Continued)
PowerShares Zacks Small Cap Portfolio
April 30, 2009
| Number of Shares | Value | ||||||||||
| Common Stocks and Other Equity Interests (Continued) | |||||||||||
| 9,133 | Thinkorswim Group, Inc.* | $ | 86,764 | ||||||||
| 3,410 | TriCo Bancshares | 54,560 | |||||||||
| 7,009 | Umpqua Holdings Corp. | 67,216 | |||||||||
| 5,009 | United Financial Bancorp, Inc. | 66,469 | |||||||||
| 4,813 | ViewPoint Financial Group | 74,890 | |||||||||
| 3,196 | W.P. Carey & Co. LLC | 67,947 | |||||||||
| 7,132 | Westfield Financial, Inc. | 66,613 | |||||||||
| 3,203,797 | |||||||||||
| Health Care—9.9% | |||||||||||
| 8,014 | Albany Molecular Research, Inc.* | 78,217 | |||||||||
| 8,715 | Align Technology, Inc.* | 108,152 | |||||||||
| 5,988 | Alkermes, Inc.* | 45,808 | |||||||||
| 2,227 | Almost Family, Inc.* | 55,007 | |||||||||
| 3,256 | Alnylam Pharmaceuticals, Inc.* | 59,813 | |||||||||
| 9,882 | American Caresource Holdings, Inc.* | 85,282 | |||||||||
| 4,581 | Cantel Medical Corp.* | 64,730 | |||||||||
| 8,137 | Celera Corp.* | 65,828 | |||||||||
| 8,335 | CryoLife, Inc.* | 45,259 | |||||||||
| 4,463 | Cyberonics, Inc.* | 59,090 | |||||||||
| 3,132 | Emergent Biosolutions, Inc.* | 33,544 | |||||||||
| 10,549 | Enzon Pharmaceuticals, Inc.* | 60,657 | |||||||||
| 2,026 | Genoptix, Inc.* | 58,916 | |||||||||
| 6,844 | Given Imaging Ltd. (Israel) | 53,794 | |||||||||
| 9,812 | Idera Pharmaceuticals, Inc.* | 58,970 | |||||||||
| 3,372 | Luminex Corp.* | 55,335 | |||||||||
| 2,597 | Martek Biosciences Corp.* | 47,317 | |||||||||
| 1,509 | National Healthcare Corp. | 59,907 | |||||||||
| 6,917 | Noven Pharmaceuticals, Inc.* | 71,383 | |||||||||
| 11,006 | NPS Pharmaceuticals, Inc.* | 38,081 | |||||||||
| 4,178 | PharMerica Corp.* | 76,249 | |||||||||
| 5,584 | Quidel Corp.* | 64,998 | |||||||||
| 8,585 | Salix Pharmaceuticals Ltd.* | 94,435 | |||||||||
| 4,691 | Somanetics Corp.* | 76,041 | |||||||||
| 7,465 | Vascular Solutions, Inc.* | 50,389 | |||||||||
| 6,072 | Vital Images, Inc.* | 61,509 | |||||||||
| 4,290 | Vnus Medical Technologies* | 95,024 | |||||||||
| 5,254 | Volcano Corp.* | 69,300 | |||||||||
| 4,290 | Zoll Medical Corp.* | 68,983 | |||||||||
| 1,862,018 | |||||||||||
| Industrials—24.4% | |||||||||||
| 2,500 | A.O. Smith Corp. | 77,725 | |||||||||
| 3,790 | AAON, Inc. | 73,829 | |||||||||
| 4,625 | ABM Industries, Inc. | 81,030 | |||||||||
| 7,682 | Aceto Corp. | 54,926 | |||||||||
| 6,861 | Albany International Corp., Class A | 63,670 | |||||||||
| 1,920 | Allegiant Travel Co.* | 99,917 | |||||||||
| 4,564 | American Woodmark Corp. | 94,475 | |||||||||
| 1,377 | Ameron International Corp. | 81,477 | |||||||||
| 6,700 | Apogee Enterprises, Inc. | 89,780 | |||||||||
| 4,142 | Armstrong World Industries, Inc.* | 75,302 | |||||||||
| Number of Shares | Value | ||||||||||
| Common Stocks and Other Equity Interests (Continued) | |||||||||||
| 5,395 | Beacon Roofing Supply, Inc.* | $ | 85,781 | ||||||||
| 8,196 | Blount International, Inc.* | 52,454 | |||||||||
| 4,644 | Briggs & Stratton Corp. | 69,103 | |||||||||
| 8,447 | CBIZ, Inc.* | 66,393 | |||||||||
| 10,374 | China Fire & Security Group, Inc.* | 114,217 | |||||||||
| 6,713 | Comfort Systems USA, Inc. | 72,433 | |||||||||
| 4,501 | Cornell Cos., Inc.* | 81,828 | |||||||||
| 2,319 | CoStar Group, Inc.* | 85,919 | |||||||||
| 4,372 | Courier Corp. | 68,553 | |||||||||
| 3,269 | CRA International, Inc.* | 76,298 | |||||||||
| 10,084 | Dycom Industries, Inc.* | 84,907 | |||||||||
| 5,657 | Dynamic Materials Corp. | 90,738 | |||||||||
| 4,567 | DynCorp International, Inc., Class A* | 69,647 | |||||||||
| 4,160 | Encore Wire Corp. | 90,854 | |||||||||
| 10,406 | Excel Maritime Carriers Ltd. (Liberia) | 73,987 | |||||||||
| 2,801 | Exponent, Inc.* | 78,148 | |||||||||
| 11,428 | Force Protection, Inc.* | 87,081 | |||||||||
| 3,586 | FreightCar America, Inc. | 68,959 | |||||||||
| 2,527 | Genesee & Wyoming, Inc., Class A* | 75,810 | |||||||||
| 6,713 | Gibraltar Industries, Inc.* | 44,977 | |||||||||
| 6,903 | Griffon Corp.* | 59,849 | |||||||||
| 2,894 | ICF International, Inc.* | 79,614 | |||||||||
| 3,661 | Insituform Technologies, Inc., Class A* | 56,123 | |||||||||
| 6,841 | Kadant, Inc.* | 84,418 | |||||||||
| 6,917 | KHD Humboldt Wedag International Ltd. (Canada)* | 59,970 | |||||||||
| 9,967 | Kimball International, Inc., Class B | 54,719 | |||||||||
| 10,071 | Knoll, Inc. | 71,303 | |||||||||
| 4,352 | Layne Christensen Co.* | 94,264 | |||||||||
| 2,603 | LB Foster Co., Class A* | 85,248 | |||||||||
| 2,642 | Lindsay Corp. | 102,800 | |||||||||
| 3,889 | Marten Transport Ltd.* | 80,658 | |||||||||
| 10,145 | Mueller Water Products, Inc., Class A | 42,508 | |||||||||
| 5,925 | NCI Building Systems, Inc.* | 23,404 | |||||||||
| 1,947 | Northwest Pipe Co.* | 73,850 | |||||||||
| 6,937 | Orion Marine Group, Inc.* | 103,915 | |||||||||
| 3,294 | Perini Corp.* | 56,986 | |||||||||
| 6,105 | Pike Electric Corp.* | 63,370 | |||||||||
| 9,812 | PMFG, Inc.* | 59,068 | |||||||||
| 9,925 | Polypore International, Inc.* | 74,835 | |||||||||
| 2,875 | Powell Industries, Inc.* | 103,471 | |||||||||
| 3,149 | Raven Industries, Inc. | 75,261 | |||||||||
| 6,492 | Seaspan Corp. (Hong Kong) | 42,588 | |||||||||
| 3,588 | Standard Parking Corp.* | 54,681 | |||||||||
| 3,832 | Sterling Construction Co., Inc.* | 71,927 | |||||||||
| 4,110 | SYKES Enterprises, Inc.* | 80,803 | |||||||||
| 6,980 | TBS International Ltd., Class A (Bermuda)* | 55,351 | |||||||||
| 8,850 | Titan International, Inc. | 53,543 | |||||||||
| 6,766 | Titan Machinery, Inc.* | 68,540 | |||||||||
| 4,644 | Trex Co., Inc.* | 50,852 | |||||||||
| 1,517 | Triumph Group, Inc. | 62,698 | |||||||||
See Notes to Financial Statements.
72
Schedule of Investments (Continued)
PowerShares Zacks Small Cap Portfolio
April 30, 2009
| Number of Shares | Value | ||||||||||
| Common Stocks and Other Equity Interests (Continued) | |||||||||||
| 2,452 | United Stationers, Inc.* | $ | 80,254 | ||||||||
| 4,762 | USA Truck, Inc.* | 66,954 | |||||||||
| 3,089 | Viad Corp. | 58,938 | |||||||||
| 4,582,981 | |||||||||||
| Information Technology—16.6% | |||||||||||
| 7,222 | Acxiom Corp. | 69,692 | |||||||||
| 4,786 | Avocent Corp.* | 69,110 | |||||||||
| 10,056 | CEVA, Inc.* | 82,962 | |||||||||
| 5,259 | Cognex Corp. | 73,994 | |||||||||
| 4,498 | Constant Contact, Inc.* | 71,653 | |||||||||
| 7,958 | Daktronics, Inc. | 71,940 | |||||||||
| 4,740 | DG FastChannel, Inc.* | 110,583 | |||||||||
| 9,037 | Digi International, Inc.* | 65,699 | |||||||||
| 10,549 | DSP Group, Inc.* | 66,353 | |||||||||
| 9,281 | Echelon Corp.* | 73,877 | |||||||||
| 10,145 | Exar Corp.* | 62,392 | |||||||||
| 5,407 | Fair Isaac Corp. | 90,946 | |||||||||
| 5,691 | Hughes Communications, Inc.* | 109,096 | |||||||||
| 10,011 | Infinera Corp.* | 84,493 | |||||||||
| 8,574 | InfoSpace, Inc.* | 56,846 | |||||||||
| 6,284 | Integral Systems, Inc.* | 41,663 | |||||||||
| 9,996 | Interactive Intelligence, Inc.* | 109,955 | |||||||||
| 10,026 | IXYS Corp. | 95,648 | |||||||||
| 13,708 | Marchex, Inc., Class B | 61,960 | |||||||||
| 5,652 | Monolithic Power Systems, Inc.* | 104,562 | |||||||||
| 11,801 | MSC.Software Corp.* | 72,458 | |||||||||
| 3,706 | Multi-Fineline Electronix, Inc.* | 74,379 | |||||||||
| 4,829 | Netscout Systems, Inc.* | 43,413 | |||||||||
| 8,376 | Opnet Technologies, Inc.* | 72,034 | |||||||||
| 10,631 | PC-Tel, Inc. | 51,773 | |||||||||
| 5,061 | Pegasystems, Inc. | 88,416 | |||||||||
| 4,025 | Progress Software Corp.* | 85,290 | |||||||||
| 5,239 | Rimage Corp.* | 77,118 | |||||||||
| 11,601 | Seachange International, Inc.* | 72,738 | |||||||||
| 2,982 | Silicon Laboratories, Inc.* | 99,181 | |||||||||
| 4,959 | Standard Microsystems Corp.* | 78,650 | |||||||||
| 4,671 | Starent Networks Corp.* | 92,159 | |||||||||
| 5,530 | Tekelec* | 85,715 | |||||||||
| 9,592 | TeleCommunication Systems, Inc., Class A* | 94,098 | |||||||||
| 9,552 | TiVo, Inc.* | 71,640 | |||||||||
| 5,455 | Tyler Technologies, Inc.* | 90,008 | |||||||||
| 10,129 | VASCO Data Security International, Inc.* | 70,093 | |||||||||
| 2,999 | VistaPrint Ltd. (Bermuda)* | 103,016 | |||||||||
| 8,617 | Wind River Systems, Inc.* | 63,163 | |||||||||
| 12,007 | Zygo Corp.* | 60,275 | |||||||||
| 3,119,041 | |||||||||||
| Materials—4.6% | |||||||||||
| 3,065 | Arch Chemicals, Inc. | 74,112 | |||||||||
| 5,886 | Calgon Carbon Corp.* | 99,944 | |||||||||
| 7,885 | Glatfelter | 70,019 | |||||||||
| Number of Shares | Value | ||||||||||
| Common Stocks and Other Equity Interests (Continued) | |||||||||||
| 4,539 | Innophos Holdings, Inc. | $ | 67,313 | ||||||||
| 2,765 | Kaiser Aluminum Corp. | 81,678 | |||||||||
| 4,240 | Koppers Holdings, Inc. | 80,390 | |||||||||
| 9,306 | LSB Industries, Inc.* | 111,486 | |||||||||
| 3,544 | OM Group, Inc.* | 98,736 | |||||||||
| 7,930 | Penford Corp. | 35,447 | |||||||||
| 4,533 | A. Schulman, Inc. | 71,123 | |||||||||
| 3,210 | Schweitzer-Mauduit International, Inc. | 73,734 | |||||||||
| 863,982 | |||||||||||
| Telecommunication Services—0.6% | |||||||||||
| 3,195 | Atlantic Tele-Network, Inc. | 70,545 | |||||||||
| 3,173 | NTELOS Holdings Corp. | 50,705 | |||||||||
| 121,250 | |||||||||||
| Utilities—2.0% | |||||||||||
| 5,203 | Brookfield Infrastructure Partners LP (Bermuda) | 71,021 | |||||||||
| 2,371 | Chesapeake Utilities Corp. | 69,447 | |||||||||
| 4,153 | El Paso Electric Co.* | 57,311 | |||||||||
| 2,836 | NorthWestern Corp. | 59,329 | |||||||||
| 6,841 | PNM Resources, Inc. | 58,285 | |||||||||
| 2,599 | UIL Holdings Corp. | 60,011 | |||||||||
| 375,404 | |||||||||||
| Total Common Stocks and Other Equity Interests (Cost $23,299,296) | 18,691,671 | ||||||||||
| Money Market Fund—0.7% | |||||||||||
| 133,226 | Goldman Sachs Financial Square Prime Obligations Institutional Share Class (Cost $133,226) | 133,226 | |||||||||
| Total Investments (Cost $23,432,522)—100.2% | 18,824,897 | ||||||||||
| Liabilities in excess of other assets—(0.2%) | (36,507 | ) | |||||||||
| Net Assets—100.0% | $ | 18,788,390 | |||||||||
* Non-income producing security.
See Notes to Financial Statements.
73
Statements of Assets and Liabilities
April 30, 2009
| PowerShares Dynamic Aggressive Growth Portfolio | PowerShares Dynamic Deep Value Portfolio | PowerShares Dynamic Large Cap Growth Portfolio | PowerShares Dynamic Large Cap Portfolio | PowerShares Dynamic Large Cap Value Portfolio | PowerShares Dynamic Mid Cap Growth Portfolio | PowerShares Dynamic Mid Cap Portfolio | |||||||||||||||||||||||||
| ASSETS: | |||||||||||||||||||||||||||||||
| Investments at value | $ | 6,374,044 | $ | 10,029,787 | $ | 281,076,916 | $ | 33,349,429 | $ | 262,641,032 | $ | 140,191,574 | $ | 18,036,818 | |||||||||||||||||
| Receivables: | |||||||||||||||||||||||||||||||
| Expense waivers | 7,398 | 7,256 | — | 10,034 | — | — | 7,818 | ||||||||||||||||||||||||
| Dividends | 939 | 5,258 | 396,620 | 58,597 | 360,625 | 5,349 | 8,455 | ||||||||||||||||||||||||
| Shares sold | — | — | — | — | 1,393,202 | — | — | ||||||||||||||||||||||||
| Investments sold | — | — | 1,097,022 | — | — | — | — | ||||||||||||||||||||||||
| Total Assets | 6,382,381 | 10,042,301 | 282,570,558 | 33,418,060 | 264,394,859 | 140,196,923 | 18,053,091 | ||||||||||||||||||||||||
| LIABILITIES: | |||||||||||||||||||||||||||||||
| Due to custodian | 1 | 100,585 | 63,320 | 3,187 | 149,891 | 9 | 74,676 | ||||||||||||||||||||||||
| Payables: | |||||||||||||||||||||||||||||||
| Investments purchased | — | — | — | — | 1,343,282 | — | — | ||||||||||||||||||||||||
| Shares repurchased | — | — | 1,101,004 | — | — | — | — | ||||||||||||||||||||||||
| Expense recapture | — | — | 15,816 | — | 6,933 | 36,753 | — | ||||||||||||||||||||||||
| Accrued advisory fees | 2,461 | 3,806 | 113,189 | 13,743 | 104,155 | 56,455 | 7,112 | ||||||||||||||||||||||||
| Accrued expenses | 38,876 | 38,648 | 104,788 | 46,212 | 91,551 | 65,936 | 42,710 | ||||||||||||||||||||||||
| Total Liabilities | 41,338 | 143,039 | 1,398,117 | 63,142 | 1,695,812 | 159,153 | 124,498 | ||||||||||||||||||||||||
| NET ASSETS | $ | 6,341,043 | $ | 9,899,262 | $ | 281,172,441 | $ | 33,354,918 | $ | 262,699,047 | $ | 140,037,770 | $ | 17,928,593 | |||||||||||||||||
| NET ASSETS CONSIST OF: | |||||||||||||||||||||||||||||||
| Shares of beneficial interest | $ | 10,696,428 | $ | 11,946,617 | $ | 500,659,688 | $ | 41,980,020 | $ | 353,681,915 | $ | 279,735,146 | $ | 23,994,529 | |||||||||||||||||
| Undistributed net investment income (loss) | (2,648 | ) | 38,036 | 1,012,443 | 227,668 | 2,103,695 | (8,637 | ) | 11,690 | ||||||||||||||||||||||
| Accumulated net realized loss on investments | (4,396,584 | ) | (3,530,036 | ) | (208,428,992 | ) | (6,585,920 | ) | (81,184,251 | ) | (140,986,123 | ) | (7,808,368 | ) | |||||||||||||||||
| Net unrealized appreciation (depreciation) on investments | 43,847 | 1,444,645 | (12,070,698 | ) | (2,266,850 | ) | (11,902,312 | ) | 1,297,384 | 1,730,742 | |||||||||||||||||||||
| Net Assets | $ | 6,341,043 | $ | 9,899,262 | $ | 281,172,441 | $ | 33,354,918 | $ | 262,699,047 | $ | 140,037,770 | $ | 17,928,593 | |||||||||||||||||
| Shares outstanding (unlimited amount authorized, $0.01 par value) | 400,000 | 600,000 | 25,500,000 | 1,900,000 | 19,400,000 | 10,100,000 | 1,100,000 | ||||||||||||||||||||||||
| Net asset value | $ | 15.85 | $ | 16.50 | $ | 11.03 | $ | 17.56 | $ | 13.54 | $ | 13.87 | $ | 16.30 | |||||||||||||||||
| Share price | $ | 15.82 | $ | 16.50 | $ | 11.03 | $ | 17.55 | $ | 13.55 | $ | 13.85 | $ | 16.29 | |||||||||||||||||
| Investments at cost | $ | 6,330,197 | $ | 8,585,142 | $ | 293,147,614 | $ | 35,616,279 | $ | 274,543,344 | $ | 138,894,190 | $ | 16,306,076 | |||||||||||||||||
See Notes to Financial Statements.
74
| PowerShares Dynamic Mid Cap Value Portfolio | PowerShares Dynamic Small Cap Growth Portfolio | PowerShares Dynamic Small Cap Portfolio | PowerShares Dynamic Small Cap Value Portfolio | PowerShares FTSE NASDAQ Small Cap Portfolio | PowerShares Zacks Micro Cap Portfolio | PowerShares Zacks Small Cap Portfolio | |||||||||||||||||||||||||
| ASSETS: | |||||||||||||||||||||||||||||||
| Investments at value | $ | 39,081,719 | $ | 31,530,522 | $ | 13,615,683 | $ | 62,289,779 | $ | 1,680,401 | $ | 47,151,864 | $ | 18,824,897 | |||||||||||||||||
| Receivables: | |||||||||||||||||||||||||||||||
| Expense waivers | 2,790 | 8,066 | 8,346 | 6,175 | — | 13,842 | 8,902 | ||||||||||||||||||||||||
| Dividends | 32,256 | 3,110 | 5,546 | 31,760 | 637 | 23,236 | 6,923 | ||||||||||||||||||||||||
| Shares sold | — | — | — | — | — | — | — | ||||||||||||||||||||||||
| Investments sold | — | — | — | — | 11,892 | 9,850 | 2,138 | ||||||||||||||||||||||||
| Total Assets | 39,116,765 | 31,541,698 | 13,629,575 | 62,327,714 | 1,692,930 | 47,198,792 | 18,842,860 | ||||||||||||||||||||||||
| LIABILITIES: | |||||||||||||||||||||||||||||||
| Due to custodian | 11 | 2 | 51,389 | 341 | 3,687 | 62,263 | 335 | ||||||||||||||||||||||||
| Payables: | |||||||||||||||||||||||||||||||
| Investments purchased | — | — | — | — | — | 100,690 | — | ||||||||||||||||||||||||
| Shares repurchased | — | — | — | — | — | — | — | ||||||||||||||||||||||||
| Expense recapture | — | — | — | — | — | — | — | ||||||||||||||||||||||||
| Accrued advisory fees | 15,127 | 12,401 | 5,258 | 24,118 | 913 | 18,478 | 7,212 | ||||||||||||||||||||||||
| Accrued expenses | 45,915 | 45,353 | 42,978 | 50,679 | — | 56,963 | 46,923 | ||||||||||||||||||||||||
| Total Liabilities | 61,053 | 57,756 | 99,625 | 75,138 | 4,600 | 238,394 | 54,470 | ||||||||||||||||||||||||
| NET ASSETS | $ | 39,055,712 | $ | 31,483,942 | $ | 13,529,950 | $ | 62,252,576 | $ | 1,688,330 | $ | 46,960,398 | $ | 18,788,390 | |||||||||||||||||
| NET ASSETS CONSIST OF: | |||||||||||||||||||||||||||||||
| Shares of beneficial interest | $ | 75,968,206 | $ | 68,865,447 | $ | 17,586,896 | $ | 95,624,845 | $ | 2,614,255 | $ | 123,972,264 | $ | 50,149,156 | |||||||||||||||||
| Undistributed net investment income (loss) | 155,305 | 44,573 | 24,889 | 64,539 | 1,474 | 117,342 | (3,195 | ) | |||||||||||||||||||||||
| Accumulated net realized loss on investments | (37,339,269 | ) | (39,845,509 | ) | (5,382,427 | ) | (41,356,025 | ) | (336,414 | ) | (70,521,195 | ) | (26,749,946 | ) | |||||||||||||||||
| Net unrealized appreciation (depreciation) on investments | 271,470 | 2,419,431 | 1,300,592 | 7,919,217 | (590,985 | ) | (6,608,013 | ) | (4,607,625 | ) | |||||||||||||||||||||
| Net Assets | $ | 39,055,712 | $ | 31,483,942 | $ | 13,529,950 | $ | 62,252,576 | $ | 1,688,330 | $ | 46,960,398 | $ | 18,788,390 | |||||||||||||||||
| Shares outstanding (unlimited amount authorized, $0.01 par value) | 3,500,000 | 3,000,000 | 900,000 | 6,000,000 | 100,000 | 5,800,000 | 1,300,000 | ||||||||||||||||||||||||
| Net asset value | $ | 11.16 | $ | 10.49 | $ | 15.03 | $ | 10.38 | $ | 16.88 | $ | 8.10 | $ | 14.45 | |||||||||||||||||
| Share price | $ | 11.13 | $ | 10.48 | $ | 15.00 | $ | 10.36 | $ | 16.86 | $ | 8.10 | $ | 14.38 | |||||||||||||||||
| Investments at cost | $ | 38,810,249 | $ | 29,111,091 | $ | 12,315,091 | $ | 54,370,562 | $ | 2,271,386 | $ | 53,759,877 | $ | 23,432,522 | |||||||||||||||||
75
Statements of Operations
Year Ended April 30, 2009
| PowerShares Dynamic Aggressive Growth Portfolio | PowerShares Dynamic Deep Value Portfolio | PowerShares Dynamic Large Cap Growth Portfolio | PowerShares Dynamic Large Cap Portfolio | PowerShares Dynamic Large Cap Value Portfolio | PowerShares Dynamic Mid Cap Growth Portfolio | PowerShares Dynamic Mid Cap Portfolio | |||||||||||||||||||||||||
| INVESTMENT INCOME: | |||||||||||||||||||||||||||||||
| Dividend income | $ | 38,149 | $ | 204,773 | $ | 5,270,511 | $ | 726,270 | $ | 7,946,323 | $ | 1,419,776 | $ | 251,191 | |||||||||||||||||
| Foreign withholding taxes | — | — | — | — | — | — | — | ||||||||||||||||||||||||
| Total Income | 38,149 | 204,773 | 5,270,511 | 726,270 | 7,946,323 | 1,419,776 | 251,191 | ||||||||||||||||||||||||
| EXPENSES: | |||||||||||||||||||||||||||||||
| Accounting & Administration fees | 74,983 | 74,983 | 125,952 | 74,983 | 75,264 | 83,071 | 74,983 | ||||||||||||||||||||||||
| Advisory fees | 47,284 | 43,915 | 2,169,170 | 153,981 | 1,188,000 | 1,269,358 | 95,334 | ||||||||||||||||||||||||
| Professional fee | 20,648 | 20,648 | 53,487 | 21,571 | 39,610 | 41,196 | 20,956 | ||||||||||||||||||||||||
| Custodian & transfer agent fees | 10,076 | 8,238 | 27,747 | 9,982 | 19,743 | 19,431 | 13,180 | ||||||||||||||||||||||||
| Sub-licensing | 4,728 | 4,391 | 130,150 | 15,398 | 71,279 | 76,161 | 9,533 | ||||||||||||||||||||||||
| Trustees | 4,036 | 4,000 | 20,315 | 4,810 | 12,564 | 13,160 | 4,390 | ||||||||||||||||||||||||
| Other expenses | 166 | 673 | 80,370 | 6,425 | 39,607 | 48,169 | 4,285 | ||||||||||||||||||||||||
| Total Expenses | 161,921 | 156,848 | 2,607,191 | 287,150 | 1,446,067 | 1,550,546 | 222,661 | ||||||||||||||||||||||||
| (Waivers) and/or Recapture | (100,987 | ) | (100,293 | ) | 46,729 | (86,975 | ) | 50,808 | 48,844 | (98,727 | ) | ||||||||||||||||||||
| Net Expenses | 60,934 | 56,555 | 2,653,920 | 200,175 | 1,496,875 | 1,599,390 | 123,934 | ||||||||||||||||||||||||
| Net Investment Income (Loss) | (22,785 | ) | 148,218 | 2,616,591 | 526,095 | 6,449,448 | (179,614 | ) | 127,257 | ||||||||||||||||||||||
| REALIZED AND UNREALIZED GAIN (LOSS) ON INVESTMENTS: | |||||||||||||||||||||||||||||||
| Net realized loss from: | |||||||||||||||||||||||||||||||
| Investments | (2,356,319 | ) | (1,595,530 | ) | (154,194,518 | ) | (5,754,381 | ) | (74,840,133 | ) | (90,124,794 | ) | (5,232,992 | ) | |||||||||||||||||
| In-kind redemptions | (2,411,989 | ) | (3,195,927 | ) | (55,326,975 | ) | (4,699,419 | ) | (11,445,497 | ) | (51,521,164 | ) | (3,806,864 | ) | |||||||||||||||||
| Net realized loss | (4,768,308 | ) | (4,791,457 | ) | (209,521,493 | ) | (10,453,800 | ) | (86,285,630 | ) | (141,645,958 | ) | (9,039,856 | ) | |||||||||||||||||
| Net change in unrealized appreciation (depreciation) on investments | (477,930 | ) | 1,552,702 | (5,830,350 | ) | (2,016,677 | ) | (3,795,554 | ) | (5,415,786 | ) | 1,438,191 | |||||||||||||||||||
| Net realized and unrealized loss on investments | (5,246,238 | ) | (3,238,755 | ) | (215,351,843 | ) | (12,470,477 | ) | (90,081,184 | ) | (147,061,744 | ) | (7,601,665 | ) | |||||||||||||||||
| Net decrease in net assets resulting from operations | $ | (5,269,023 | ) | $ | (3,090,537 | ) | $ | (212,735,252 | ) | $ | (11,944,382 | ) | $ | (83,631,736 | ) | $ | (147,241,358 | ) | $ | (7,474,408 | ) | ||||||||||
See Notes to Financial Statements.
76
| PowerShares Dynamic Mid Cap Value Portfolio | PowerShares Dynamic Small Cap Growth Portfolio | PowerShares Dynamic Small Cap Portfolio | PowerShares Dynamic Small Cap Value Portfolio | PowerShares FTSE NASDAQ Small Cap Portfolio | PowerShares Zacks Micro Cap Portfolio | PowerShares Zacks Small Cap Portfolio | |||||||||||||||||||||||||
| INVESTMENT INCOME: | |||||||||||||||||||||||||||||||
| Dividend income | $ | 1,409,953 | $ | 304,006 | $ | 168,221 | $ | 1,238,474 | $ | 20,801 | $ | 1,191,714 | $ | 358,768 | |||||||||||||||||
| Foreign withholding taxes | — | — | — | — | (119 | ) | (1,786 | ) | (2,050 | ) | |||||||||||||||||||||
| Total Income | 1,409,953 | 304,006 | 168,221 | 1,238,474 | 20,682 | 1,189,928 | 356,718 | ||||||||||||||||||||||||
| EXPENSES: | |||||||||||||||||||||||||||||||
| Accounting & Administration fees | 74,983 | 74,983 | 74,983 | 74,983 | — | 74,983 | 74,983 | ||||||||||||||||||||||||
| Advisory fees | 273,120 | 205,899 | 75,181 | 379,806 | 14,964 | 328,393 | 139,042 | ||||||||||||||||||||||||
| Professional fee | 27,042 | 26,319 | 20,648 | 28,374 | — | 27,450 | 25,164 | ||||||||||||||||||||||||
| Custodian & transfer agent fees | 9,727 | 11,042 | 17,162 | 10,643 | — | 20,579 | 14,749 | ||||||||||||||||||||||||
| Sub-licensing | 16,387 | 12,354 | 7,518 | 22,788 | — | 65,678 | 27,809 | ||||||||||||||||||||||||
| Trustees | 5,826 | 5,285 | 4,238 | 6,640 | — | 6,345 | 4,816 | ||||||||||||||||||||||||
| Other expenses | 20,206 | 19,312 | 3,236 | 28,017 | — | 41,088 | 17,586 | ||||||||||||||||||||||||
| Total Expenses | 427,291 | 355,194 | 202,966 | 551,251 | 14,964 | 564,516 | 304,149 | ||||||||||||||||||||||||
| (Waivers) and/or Recapture | (82,973 | ) | (95,761 | ) | (105,230 | ) | (72,695 | ) | — | (105,004 | ) | (109,488 | ) | ||||||||||||||||||
| Net Expenses | 344,318 | 259,433 | 97,736 | 478,556 | 14,964 | 459,512 | 194,661 | ||||||||||||||||||||||||
| Net Investment Income (Loss) | 1,065,635 | 44,573 | 70,485 | 759,918 | 5,718 | 730,416 | 162,057 | ||||||||||||||||||||||||
| REALIZED AND UNREALIZED GAIN (LOSS) ON INVESTMENTS: | |||||||||||||||||||||||||||||||
| Net realized loss from: | |||||||||||||||||||||||||||||||
| Investments | (22,904,062 | ) | (13,001,086 | ) | (2,952,609 | ) | (17,316,549 | ) | (378,593 | ) | (24,436,630 | ) | (11,968,001 | ) | |||||||||||||||||
| In-kind redemptions | (9,109,944 | ) | (7,516,473 | ) | (4,361,532 | ) | (25,332,043 | ) | (95,464 | ) | (10,397,687 | ) | (4,452,389 | ) | |||||||||||||||||
| Net realized loss | (32,014,006 | ) | (20,517,559 | ) | (7,314,141 | ) | (42,648,592 | ) | (474,057 | ) | (34,834,317 | ) | (16,420,390 | ) | |||||||||||||||||
| Net change in unrealized appreciation (depreciation) on investments | 5,502,827 | 1,656,821 | 996,503 | 7,267,334 | (581,586 | ) | 928,684 | 984,972 | |||||||||||||||||||||||
| Net realized and unrealized loss on investments | (26,511,179 | ) | (18,860,738 | ) | (6,317,638 | ) | (35,381,258 | ) | (1,055,643 | ) | (33,905,633 | ) | (15,435,418 | ) | |||||||||||||||||
| Net decrease in net assets resulting from operations | $ | (25,445,544 | ) | $ | (18,816,165 | ) | $ | (6,247,153 | ) | $ | (34,621,340 | ) | $ | (1,049,925 | ) | $ | (33,175,217 | ) | $ | (15,273,361 | ) | ||||||||||
77
Statements of Changes in Net Assets
| PowerShares Dynamic Aggressive Growth Portfolio | PowerShares Dynamic Deep Value Portfolio | PowerShares Dynamic Large Cap Growth Portfolio | |||||||||||||||||||||||||
| Year Ended April 30, 2009 | Year Ended April 30, 2008 | Year Ended April 30, 2009 | Year Ended April 30, 2008 | Year Ended April 30, 2009 | Year Ended April 30, 2008 | ||||||||||||||||||||||
| OPERATIONS: | |||||||||||||||||||||||||||
| Net investment income (loss) | $ | (22,785 | ) | $ | (57,714 | ) | $ | 148,218 | $ | 164,067 | $ | 2,616,591 | $ | 1,932,602 | |||||||||||||
| Net realized gain (loss) on investments | (4,768,308 | ) | 68,308 | (4,791,457 | ) | (826,250 | ) | (209,521,493 | ) | (4,534,937 | ) | ||||||||||||||||
| Net change in unrealized appreciation (depreciation) on investments | (477,930 | ) | (109,999 | ) | 1,552,702 | (622,871 | ) | (5,830,350 | ) | (26,766,279 | ) | ||||||||||||||||
| Net decrease in net assets resulting from operations | (5,269,023 | ) | (99,405 | ) | (3,090,537 | ) | (1,285,054 | ) | (212,735,252 | ) | (29,368,614 | ) | |||||||||||||||
| Undistributed net investment income (loss) included in the price of units issued and redeemed | (659 | ) | (24,237 | ) | (1,946 | ) | (10,696 | ) | (483,455 | ) | 458,077 | ||||||||||||||||
| DISTRIBUTIONS TO SHAREHOLDERS FROM: | |||||||||||||||||||||||||||
| Net investment income | — | — | (126,793 | ) | (236,479 | ) | (2,172,246 | ) | (1,364,504 | ) | |||||||||||||||||
| Return of capital | — | — | — | — | — | — | |||||||||||||||||||||
| Total distributions to shareholders | — | — | (126,793 | ) | (236,479 | ) | (2,172,246 | ) | (1,364,504 | ) | |||||||||||||||||
| SHAREHOLDER TRANSACTIONS: | |||||||||||||||||||||||||||
| Proceeds from shares sold | 29,377,057 | 26,499,474 | 22,385,815 | 12,669,700 | 373,056,998 | 939,470,060 | |||||||||||||||||||||
| Value of shares repurchased | (30,597,775 | ) | (24,120,991 | ) | (16,402,614 | ) | (19,800,394 | ) | (542,585,810 | ) | (520,725,740 | ) | |||||||||||||||
| Net income equalization | 659 | 24,237 | 1,946 | 10,696 | 483,455 | (458,077 | ) | ||||||||||||||||||||
| Net increase (decrease) in net assets resulting from shares transactions | (1,220,059 | ) | 2,402,720 | 5,985,147 | (7,119,998 | ) | (169,045,357 | ) | 418,286,243 | ||||||||||||||||||
| Increase (Decrease) in Net Assets | (6,489,741 | ) | 2,279,078 | 2,765,871 | (8,652,227 | ) | (384,436,310 | ) | 388,011,202 | ||||||||||||||||||
| NET ASSETS: | |||||||||||||||||||||||||||
| Beginning of period | 12,830,784 | 10,551,706 | 7,133,391 | 15,785,618 | 665,608,751 | 277,597,549 | |||||||||||||||||||||
| End of period | $ | 6,341,043 | $ | 12,830,784 | $ | 9,899,262 | $ | 7,133,391 | $ | 281,172,441 | $ | 665,608,751 | |||||||||||||||
| Undistributed net investment income (loss) at end of period | $ | (2,648 | ) | $ | — | $ | 38,036 | $ | 16,611 | $ | 1,012,443 | $ | 568,098 | ||||||||||||||
| CHANGES IN SHARES OUTSTANDING: | |||||||||||||||||||||||||||
| Shares sold | 1,500,000 | 1,000,000 | 1,200,000 | 500,000 | 24,800,000 | 51,900,000 | |||||||||||||||||||||
| Shares repurchased | (1,600,000 | ) | (900,000 | ) | (900,000 | ) | (800,000 | ) | (37,700,000 | ) | (29,400,000 | ) | |||||||||||||||
| Shares outstanding, beginning of period | 500,000 | 400,000 | 300,000 | 600,000 | 38,400,000 | 15,900,000 | |||||||||||||||||||||
| Shares outstanding, end of period | 400,000 | 500,000 | 600,000 | 300,000 | 25,500,000 | 38,400,000 | |||||||||||||||||||||
* Commencement of Investment Operations.
See Notes to Financial Statements.
78
| PowerShares Dynamic Large Cap Portfolio | PowerShares Dynamic Large Cap Value Portfolio | PowerShares Dynamic Mid Cap Growth Portfolio | |||||||||||||||||||||||||
| Year Ended April 30, 2009 | Year Ended April 30, 2008 | Year Ended April 30, 2009 | Year Ended April 30, 2008 | Year Ended April 30, 2009 | Year Ended April 30, 2008 | ||||||||||||||||||||||
| OPERATIONS: | |||||||||||||||||||||||||||
| Net investment income (loss) | $ | 526,095 | $ | 163,941 | $ | 6,449,448 | $ | 5,693,041 | $ | (179,614 | ) | $ | (26,776 | ) | |||||||||||||
| Net realized gain (loss) on investments | (10,453,800 | ) | (152,575 | ) | (86,285,630 | ) | 10,364,983 | (141,645,958 | ) | 7,539,136 | |||||||||||||||||
| Net change in unrealized appreciation (depreciation) on investments | (2,016,677 | ) | (886,410 | ) | (3,795,554 | ) | (29,643,000 | ) | (5,415,786 | ) | (11,401,604 | ) | |||||||||||||||
| Net decrease in net assets resulting from operations | (11,944,382 | ) | (875,044 | ) | (83,631,736 | ) | (13,584,976 | ) | (147,241,358 | ) | (3,889,244 | ) | |||||||||||||||
| Undistributed net investment income (loss) included in the price of units issued and redeemed | 60,111 | 36,730 | 385,582 | (32,015 | ) | 126,522 | (171,856 | ) | |||||||||||||||||||
| DISTRIBUTIONS TO SHAREHOLDERS FROM: | |||||||||||||||||||||||||||
| Net investment income | (365,160 | ) | (115,860 | ) | (4,825,414 | ) | (6,461,590 | ) | — | — | |||||||||||||||||
| Return of capital | — | — | — | — | — | (35,820 | ) | ||||||||||||||||||||
| Total distributions to shareholders | (365,160 | ) | (115,860 | ) | (4,825,414 | ) | (6,461,590 | ) | — | (35,820 | ) | ||||||||||||||||
| SHAREHOLDER TRANSACTIONS: | |||||||||||||||||||||||||||
| Proceeds from shares sold | 44,327,546 | 29,568,161 | 275,942,116 | 182,775,903 | 376,214,214 | 637,177,664 | |||||||||||||||||||||
| Value of shares repurchased | (24,585,380 | ) | (13,453,440 | ) | (177,275,109 | ) | (202,370,045 | ) | (479,081,004 | ) | (432,900,741 | ) | |||||||||||||||
| Net income equalization | (60,111 | ) | (36,730 | ) | (385,582 | ) | 32,015 | (126,522 | ) | 171,856 | |||||||||||||||||
| Net increase (decrease) in net assets resulting from shares transactions | 19,682,055 | 16,077,991 | 98,281,425 | (19,562,127 | ) | (102,993,312 | ) | 204,448,779 | |||||||||||||||||||
| Increase (Decrease) in Net Assets | 7,432,624 | 15,123,817 | 10,209,857 | (39,640,708 | ) | (250,108,148 | ) | 200,351,859 | |||||||||||||||||||
| NET ASSETS: | |||||||||||||||||||||||||||
| Beginning of period | 25,922,294 | 10,798,477 | 252,489,190 | 292,129,898 | 390,145,918 | 189,794,059 | |||||||||||||||||||||
| End of period | $ | 33,354,918 | $ | 25,922,294 | $ | 262,699,047 | $ | 252,489,190 | $ | 140,037,770 | $ | 390,145,918 | |||||||||||||||
| Undistributed net investment income (loss) at end of period | $ | 227,668 | $ | 66,667 | $ | 2,103,695 | $ | 479,661 | $ | (8,637 | ) | $ | — | ||||||||||||||
| CHANGES IN SHARES OUTSTANDING: | |||||||||||||||||||||||||||
| Shares sold | 2,200,000 | 1,100,000 | 18,100,000 | 9,100,000 | 19,500,000 | 27,800,000 | |||||||||||||||||||||
| Shares repurchased | (1,300,000 | ) | (500,000 | ) | (11,800,000 | ) | (10,100,000 | ) | (26,900,000 | ) | (19,300,000 | ) | |||||||||||||||
| Shares outstanding, beginning of period | 1,000,000 | 400,000 | 13,100,000 | 14,100,000 | 17,500,000 | 9,000,000 | |||||||||||||||||||||
| Shares outstanding, end of period | 1,900,000 | 1,000,000 | 19,400,000 | 13,100,000 | 10,100,000 | 17,500,000 | |||||||||||||||||||||
79
Statements of Changes in Net Assets (Continued)
| PowerShares Dynamic Mid Cap Portfolio | PowerShares Dynamic Mid Cap Value Portfolio | PowerShares Dynamic Small Cap Growth Portfolio | |||||||||||||||||||||||||
| Year Ended April 30, 2009 | Year Ended April 30, 2008 | Year Ended April 30, 2009 | Year Ended April 30, 2008 | Year Ended April 30, 2009 | Year Ended April 30, 2008 | ||||||||||||||||||||||
| OPERATIONS: | |||||||||||||||||||||||||||
| Net investment income (loss) | $ | 127,257 | $ | 72,256 | $ | 1,065,635 | $ | 1,173,172 | $ | 44,573 | $ | (162,661 | ) | ||||||||||||||
| Net realized gain (loss) on investments | (9,039,856 | ) | (963,513 | ) | (32,014,006 | ) | (4,037,237 | ) | (20,517,559 | ) | (6,461,328 | ) | |||||||||||||||
| Net change in unrealized appreciation (depreciation) on investments | 1,438,191 | (474,721 | ) | 5,502,827 | (15,255,358 | ) | 1,656,821 | (3,893,759 | ) | ||||||||||||||||||
| Net decrease in net assets resulting from operations | (7,474,408 | ) | (1,365,978 | ) | (25,445,544 | ) | (18,119,423 | ) | (18,816,165 | ) | (10,517,748 | ) | |||||||||||||||
| Undistributed net investment income (loss) included in the price of units issued and redeemed | 5,421 | (4,238 | ) | (58,260 | ) | 260 | (11,854 | ) | (6,069 | ) | |||||||||||||||||
| DISTRIBUTIONS TO SHAREHOLDERS FROM: | |||||||||||||||||||||||||||
| Net investment income | (132,595 | ) | (71,701 | ) | (992,947 | ) | (1,388,612 | ) | — | — | |||||||||||||||||
| Net realized gains | — | — | — | — | — | — | |||||||||||||||||||||
| Return of capital | — | — | — | — | — | — | |||||||||||||||||||||
| Total distributions to shareholders | (132,595 | ) | (71,701 | ) | (992,947 | ) | (1,388,612 | ) | — | — | |||||||||||||||||
| SHAREHOLDER TRANSACTIONS: | |||||||||||||||||||||||||||
| Proceeds from shares sold | 25,177,425 | 34,432,643 | 67,494,471 | 137,259,549 | 56,905,093 | 125,298,871 | |||||||||||||||||||||
| Value of shares repurchased | (25,110,529 | ) | (18,716,682 | ) | (81,380,622 | ) | (147,727,489 | ) | (58,451,236 | ) | (124,281,604 | ) | |||||||||||||||
| Net income equalization | (5,421 | ) | 4,238 | 58,260 | (260 | ) | 11,854 | 6,069 | |||||||||||||||||||
| Net increase (decrease) in net assets resulting from shares transactions | 61,475 | 15,720,199 | (13,827,891 | ) | (10,468,200 | ) | (1,534,289 | ) | 1,023,336 | ||||||||||||||||||
| Increase (Decrease) in Net Assets | (7,540,107 | ) | 14,278,282 | (40,324,642 | ) | (29,975,975 | ) | (20,362,308 | ) | (9,500,481 | ) | ||||||||||||||||
| NET ASSETS: | |||||||||||||||||||||||||||
| Beginning of period | 25,468,700 | 11,190,418 | 79,380,354 | 109,356,329 | 51,846,250 | 61,346,731 | |||||||||||||||||||||
| End of period | $ | 17,928,593 | $ | 25,468,700 | $ | 39,055,712 | $ | 79,380,354 | $ | 31,483,942 | $ | 51,846,250 | |||||||||||||||
| Undistributed net investment income (loss) at end of period | $ | 11,690 | $ | 17,028 | $ | 155,305 | $ | 82,617 | $ | 44,573 | $ | — | |||||||||||||||
| CHANGES IN SHARES OUTSTANDING: | |||||||||||||||||||||||||||
| Shares sold | 1,300,000 | 1,300,000 | 4,700,000 | 7,100,000 | 4,200,000 | 7,300,000 | |||||||||||||||||||||
| Shares repurchased | (1,200,000 | ) | (700,000 | ) | (5,900,000 | ) | (7,800,000 | ) | (4,500,000 | ) | (7,300,000 | ) | |||||||||||||||
| Shares outstanding, beginning of period | 1,000,000 | 400,000 | 4,700,000 | 5,400,000 | 3,300,000 | 3,300,000 | |||||||||||||||||||||
| Shares outstanding, end of period | 1,100,000 | 1,000,000 | 3,500,000 | 4,700,000 | 3,000,000 | 3,300,000 | |||||||||||||||||||||
* Commencement of Investment Operations.
See Notes to Financial Statements.
80
| PowerShares Dynamic Small Cap Portfolio | PowerShares Dynamic Small Cap Value Portfolio | PowerShares FTSE NASDAQ Small Cap Portfolio | |||||||||||||||||||||||||
| Year Ended April 30, 2009 | Year Ended April 30, 2008 | Year Ended April 30, 2009 | Year Ended April 30, 2008 | Year Ended April 30, 2009 | For the Period April 1, 2008* Through April 30, 2008 | ||||||||||||||||||||||
| OPERATIONS: | |||||||||||||||||||||||||||
| Net investment income (loss) | $ | 70,485 | $ | 24,860 | $ | 759,918 | $ | 978,923 | $ | 5,718 | $ | (174 | ) | ||||||||||||||
| Net realized gain (loss) on investments | (7,314,141 | ) | (890,101 | ) | (42,648,592 | ) | (11,685,838 | ) | (474,057 | ) | (90 | ) | |||||||||||||||
| Net change in unrealized appreciation (depreciation) on investments | 996,503 | 15,596 | 7,267,334 | (4,447,006 | ) | (581,586 | ) | (9,399 | ) | ||||||||||||||||||
| Net decrease in net assets resulting from operations | (6,247,153 | ) | (849,645 | ) | (34,621,340 | ) | (15,153,921 | ) | (1,049,925 | ) | (9,663 | ) | |||||||||||||||
| Undistributed net investment income (loss) included in the price of units issued and redeemed | 9,361 | 21,115 | 16,498 | (190,409 | ) | (243 | ) | — | |||||||||||||||||||
| DISTRIBUTIONS TO SHAREHOLDERS FROM: | |||||||||||||||||||||||||||
| Net investment income | (45,596 | ) | (24,996 | ) | (695,379 | ) | (1,007,247 | ) | (15,180 | ) | — | ||||||||||||||||
| Net realized gains | — | — | — | — | (9 | ) | — | ||||||||||||||||||||
| Return of capital | — | (66,108 | ) | — | (2,478,948 | ) | — | — | |||||||||||||||||||
| Total distributions to shareholders | (45,596 | ) | (91,104 | ) | (695,379 | ) | (3,486,195 | ) | (15,189 | ) | — | ||||||||||||||||
| SHAREHOLDER TRANSACTIONS: | |||||||||||||||||||||||||||
| Proceeds from shares sold | 28,838,189 | 19,213,060 | 116,494,999 | 158,114,517 | 3,240,574 | 2,572,555 | |||||||||||||||||||||
| Value of shares repurchased | (25,329,007 | ) | (9,963,930 | ) | (110,592,430 | ) | (165,487,537 | ) | (3,050,022 | ) | — | ||||||||||||||||
| Net income equalization | (9,361 | ) | (21,115 | ) | (16,498 | ) | 190,409 | 243 | — | ||||||||||||||||||
| Net increase (decrease) in net assets resulting from shares transactions | 3,499,821 | 9,228,015 | 5,886,071 | (7,182,611 | ) | 190,795 | 2,572,555 | ||||||||||||||||||||
| Increase (Decrease) in Net Assets | (2,783,567 | ) | 8,308,381 | (29,414,150 | ) | (26,013,136 | ) | (874,562 | ) | 2,562,892 | |||||||||||||||||
| NET ASSETS: | |||||||||||||||||||||||||||
| Beginning of period | 16,313,517 | 8,005,136 | 91,666,726 | 117,679,862 | 2,562,892 | — | |||||||||||||||||||||
| End of period | $ | 13,529,950 | $ | 16,313,517 | $ | 62,252,576 | $ | 91,666,726 | $ | 1,688,330 | $ | 2,562,892 | |||||||||||||||
| Undistributed net investment income (loss) at end of period | $ | 24,889 | $ | — | $ | 64,539 | $ | — | $ | 1,474 | $ | — | |||||||||||||||
| CHANGES IN SHARES OUTSTANDING: | |||||||||||||||||||||||||||
| Shares sold | 1,600,000 | 800,000 | 9,200,000 | 9,200,000 | 200,000 | 100,000 | |||||||||||||||||||||
| Shares repurchased | (1,400,000 | ) | (400,000 | ) | (9,000,000 | ) | (9,700,000 | ) | (200,000 | ) | — | ||||||||||||||||
| Shares outstanding, beginning of period | 700,000 | 300,000 | 5,800,000 | 6,300,000 | 100,000 | — | |||||||||||||||||||||
| Shares outstanding, end of period | 900,000 | 700,000 | 6,000,000 | 5,800,000 | 100,000 | 100,000 | |||||||||||||||||||||
81
Statements of Changes in Net Assets (Continued)
| PowerShares Zacks Micro Cap Portfolio | PowerShares Zacks Small Cap Portfolio | ||||||||||||||||||
| Year Ended April 30, 2009 | Year Ended April 30, 2008 | Year Ended April 30, 2009 | Year Ended April 30, 2008 | ||||||||||||||||
| OPERATIONS: | |||||||||||||||||||
| Net investment income (loss) | $ | 730,416 | $ | 1,455,636 | $ | 162,057 | $ | 455,405 | |||||||||||
| Net realized gain (loss) on investments | (34,834,317 | ) | (21,909,812 | ) | (16,420,390 | ) | (833,386 | ) | |||||||||||
| Net change in unrealized appreciation (depreciation) on investments | 928,684 | (20,949,782 | ) | 984,972 | (7,926,121 | ) | |||||||||||||
| Net decrease in net assets resulting from operations | (33,175,217 | ) | (41,403,958 | ) | (15,273,361 | ) | (8,304,102 | ) | |||||||||||
| Undistributed net investment income (loss) included in the price of units issued and redeemed | 24,697 | (221,325 | ) | 26,245 | (96,877 | ) | |||||||||||||
| DISTRIBUTIONS TO SHAREHOLDERS FROM: | |||||||||||||||||||
| Net investment income | (1,156,194 | ) | (1,084,217 | ) | (210,193 | ) | (359,366 | ) | |||||||||||
| Return of capital | — | — | (20,801 | ) | — | ||||||||||||||
| Total distributions to shareholders | (1,156,194 | ) | (1,084,217 | ) | (230,994 | ) | (359,366 | ) | |||||||||||
| SHAREHOLDER TRANSACTIONS: | |||||||||||||||||||
| Proceeds from shares sold | 62,276,992 | 135,042,430 | 26,838,752 | 69,573,912 | |||||||||||||||
| Value of shares repurchased | (75,052,710 | ) | (190,796,918 | ) | (32,175,789 | ) | (92,810,601 | ) | |||||||||||
| Net income equalization | (24,697 | ) | 221,325 | (26,245 | ) | 96,877 | |||||||||||||
| Net increase (decrease) in net assets resulting from shares transactions | (12,800,415 | ) | (55,533,163 | ) | (5,363,282 | ) | (23,139,812 | ) | |||||||||||
| Increase (Decrease) in Net Assets | (47,107,129 | ) | (98,242,663 | ) | (20,841,392 | ) | (31,900,157 | ) | |||||||||||
| NET ASSETS: | |||||||||||||||||||
| Beginning of period | 94,067,527 | 192,310,190 | 39,629,782 | 71,529,939 | |||||||||||||||
| End of period | $ | 46,960,398 | $ | 94,067,527 | $ | 18,788,390 | $ | 39,629,782 | |||||||||||
| Undistributed net investment income (loss) at end of period | $ | 117,342 | $ | 571,023 | $ | (3,195 | ) | $ | 60,388 | ||||||||||
| CHANGES IN SHARES OUTSTANDING: | |||||||||||||||||||
| Shares sold | 6,200,000 | 8,300,000 | 1,400,000 | 2,600,000 | |||||||||||||||
| Shares repurchased | (7,300,000 | ) | (11,900,000 | ) | (1,800,000 | ) | (3,500,000 | ) | |||||||||||
| Shares outstanding, beginning of period | 6,900,000 | 10,500,000 | 1,700,000 | 2,600,000 | |||||||||||||||
| Shares outstanding, end of period | 5,800,000 | 6,900,000 | 1,300,000 | 1,700,000 | |||||||||||||||
* Commencement of Investment Operations.
See Notes to Financial Statements.
82
Financial Highlights
PowerShares Dynamic Aggressive Growth Portfolio
| Year Ended April 30, | For the Period December 20, 2006* Through | ||||||||||||||
| 2009 | 2008 | April 30, 2007 | |||||||||||||
| PER SHARE OPERATING PERFORMANCE: | |||||||||||||||
| Net asset value at beginning of period | $ | 25.66 | $ | 26.38 | $ | 24.86 | |||||||||
| Net investment loss** | (0.05 | ) | (0.15 | ) | (0.05 | ) | |||||||||
| Net realized and unrealized gain (loss) on investments | (9.76 | ) | (0.57 | ) | 1.57 | ||||||||||
| Total from investment operations | (9.81 | ) | (0.72 | ) | 1.52 | ||||||||||
| Net asset value at end of period | $ | 15.85 | $ | 25.66 | $ | 26.38 | |||||||||
| Share price at end of period*** | $ | 15.82 | |||||||||||||
| NET ASSET VALUE, TOTAL RETURN**** | (38.23 | )% | (2.73 | )% | 6.11 | % | |||||||||
| SHARE PRICE TOTAL RETURN**** | (38.35 | )% | |||||||||||||
| RATIOS/SUPPLEMENTAL DATA: | |||||||||||||||
| Net assets at end of period (000's omitted) | $ | 6,341 | $ | 12,831 | $ | 10,552 | |||||||||
| Ratio to average net assets of: | |||||||||||||||
| Expenses, after (Waivers) and/or Recapture | 0.64 | % | 0.86 | % | 0.75 | %† | |||||||||
| Expenses, prior to (Waivers) and/or Recapture | 1.71 | % | 1.94 | % | 1.76 | %† | |||||||||
| Net investment loss, after (Waivers) and/or Recapture | (0.24 | )% | (0.57 | )% | (0.50 | )%† | |||||||||
| Portfolio turnover rate †† | 65 | % | 94 | % | 11 | % | |||||||||
| Undistributed net investment income (loss) included in price of units issued and redeemed**# | $ | (0.00 | )(a) | $ | (0.06 | ) | $ | 0.01 | |||||||
PowerShares Dynamic Deep Value Portfolio
| Year Ended April 30, | For the Period December 20, 2006* Through | ||||||||||||||
| 2009 | 2008 | April 30, 2007 | |||||||||||||
| PER SHARE OPERATING PERFORMANCE: | |||||||||||||||
| Net asset value at beginning of period | $ | 23.78 | $ | 26.31 | $ | 24.99 | |||||||||
| Net investment income** | 0.32 | 0.32 | 0.22 | ||||||||||||
| Net realized and unrealized gain (loss) on investments | (7.31 | ) | (2.41 | ) | 1.17 | ||||||||||
| Total from investment operations | (6.99 | ) | (2.09 | ) | 1.39 | ||||||||||
| Distributions to shareholders from: | |||||||||||||||
| Net investment income | (0.29 | ) | (0.44 | ) | (0.07 | ) | |||||||||
| Net asset value at end of period | $ | 16.50 | $ | 23.78 | $ | 26.31 | |||||||||
| Share price at end of period*** | $ | 16.50 | |||||||||||||
| NET ASSET VALUE, TOTAL RETURN**** | (29.63 | )% | (8.05 | )% | 5.59 | % | |||||||||
| SHARE PRICE TOTAL RETURN**** | (29.66 | )% | |||||||||||||
| RATIOS/SUPPLEMENTAL DATA: | |||||||||||||||
| Net assets at end of period (000's omitted) | $ | 9,899 | $ | 7,133 | $ | 15,786 | |||||||||
| Ratio to average net assets of: | |||||||||||||||
| Expenses, after (Waivers) and/or Recapture | 0.64 | % | 0.82 | % | 0.74 | %† | |||||||||
| Expenses, prior to (Waivers) and/or Recapture | 1.79 | % | 1.65 | % | 1.55 | %† | |||||||||
| Net investment income, after (Waivers) and/or Recapture | 1.69 | % | 1.28 | % | 2.40 | %† | |||||||||
| Portfolio turnover rate †† | 81 | % | 100 | % | 7 | % | |||||||||
| Undistributed net investment income (loss) included in price of units issued and redeemed**# | $ | 0.00 | (a) | $ | (0.02 | ) | $ | 0.00 | (a) | ||||||
* Commencement of Investment Operations.
** Based on average shares outstanding.
*** The mean between the last bid and ask prices.
**** Net asset value total return is calculated assuming an initial investment made at the net asset value at the beginning of the period, reinvestment of all dividends and distributions at net asset value during the period, and redemption on the last day of the period. Share price total return is calculated assuming an initial investment made at the share price at the beginning of the period, reinvestment of all dividends and distributions at share price during the period, and sale at the share price on the last day of the period. Total investment returns calculated for a period of less than one year are not annualized.
† Annualized.
†† Portfolio turnover rate is not annualized and does not include securities received or delivered from processing creations or redemptions.
# The per share amount of equalization is presented to show the impact of equalization on distributable earnings per share.
(a) Amount represents less than $0.005.
See Notes to Financial Statements.
83
Financial Highlights (Continued)
PowerShares Dynamic Large Cap Growth Portfolio
| Year Ended April 30, | For the Period March 3, 2005* Through | ||||||||||||||||||||||
| 2009 | 2008 | 2007 | 2006 | April 30, 2005 | |||||||||||||||||||
| PER SHARE OPERATING PERFORMANCE: | |||||||||||||||||||||||
| Net asset value at beginning of period | $ | 17.33 | $ | 17.46 | $ | 16.35 | $ | 14.11 | $ | 14.83 | |||||||||||||
| Net investment income (loss)** | 0.08 | 0.07 | 0.02 | (0.01 | ) | — | (a) | ||||||||||||||||
| Net realized and unrealized gain (loss) on investments | (6.30 | ) | (0.16 | ) | 1.11 | 2.25 | (0.72 | ) | |||||||||||||||
| Total from investment operations | (6.22 | ) | (0.09 | ) | 1.13 | 2.24 | (0.72 | ) | |||||||||||||||
| Distributions to shareholders from: | |||||||||||||||||||||||
| Net investment income | (0.08 | ) | (0.04 | ) | (0.02 | ) | — | (a) | — | ||||||||||||||
| Return of capital | — | — | — | (a) | — | — | |||||||||||||||||
| Total distributions | (0.08 | ) | (0.04 | ) | (0.02 | ) | — | — | |||||||||||||||
| Net asset value at end of period | $ | 11.03 | $ | 17.33 | $ | 17.46 | $ | 16.35 | $ | 14.11 | |||||||||||||
| Share price at end of period*** | $ | 11.03 | |||||||||||||||||||||
| NET ASSET VALUE, TOTAL RETURN**** | (35.93 | )% | (0.56 | )% | 6.92 | % | 15.89 | % | (4.87 | )% | |||||||||||||
| SHARE PRICE TOTAL RETURN**** | (35.93 | )% | |||||||||||||||||||||
| RATIOS/SUPPLEMENTAL DATA: | |||||||||||||||||||||||
| Net assets at end of period (000's omitted) | $ | 281,172 | $ | 665,609 | $ | 277,598 | $ | 148,750 | $ | 8,467 | |||||||||||||
| Ratio to average net assets of: | |||||||||||||||||||||||
| Expenses, after (Waivers) and/or Recapture | 0.61 | % | 0.63 | % | 0.63 | % | 0.64 | % | 0.63 | %† | |||||||||||||
| Expenses, prior to (Waivers) and/or Recapture | 0.60 | % | 0.60 | % | 0.68 | % | 0.80 | % | 2.45 | %† | |||||||||||||
| Net investment income (loss), after (Waivers) and/or Recapture | 0.60 | % | 0.37 | % | 0.13 | % | (0.04 | )% | 0.13 | %† | |||||||||||||
| Portfolio turnover rate †† | 88 | % | 46 | % | 57 | % | 73 | % | 2 | % | |||||||||||||
| Undistributed net investment income included in price of units issued and redeemed**# | $ | (0.02 | ) | $ | 0.02 | $ | 0.00 | (a) | — | — | |||||||||||||
PowerShares Dynamic Large Cap Portfolio
| Year Ended April 30, | For the Period December 1, 2006* Through | ||||||||||||||
| 2009 | 2008 | April 30, 2007 | |||||||||||||
| PER SHARE OPERATING PERFORMANCE: | |||||||||||||||
| Net asset value at beginning of period | $ | 25.92 | $ | 27.00 | $ | 25.18 | |||||||||
| Net investment income** | 0.34 | 0.27 | 0.12 | ||||||||||||
| Net realized and unrealized gain (loss) on investments | (8.44 | ) | (1.14 | ) | 1.78 | ||||||||||
| Total from investment operations | (8.10 | ) | (0.87 | ) | 1.90 | ||||||||||
| Distributions to shareholders from: | |||||||||||||||
| Net investment income | (0.26 | ) | (0.21 | ) | (0.08 | ) | |||||||||
| Net asset value at end of period | $ | 17.56 | $ | 25.92 | $ | 27.00 | |||||||||
| Share price at end of period*** | $ | 17.55 | |||||||||||||
| NET ASSET VALUE, TOTAL RETURN**** | (31.47 | )% | (3.26 | )% | 7.55 | % | |||||||||
| SHARE PRICE TOTAL RETURN**** | (31.48 | )% | |||||||||||||
| RATIOS/SUPPLEMENTAL DATA: | |||||||||||||||
| Net assets at end of period (000's omitted) | $ | 33,355 | $ | 25,922 | $ | 10,798 | |||||||||
| Ratio to average net assets of: | |||||||||||||||
| Expenses, after (Waivers) and/or Recapture | 0.65 | % | 0.73 | % | 0.74 | %† | |||||||||
| Expenses, prior to (Waivers) and/or Recapture | 0.93 | % | 1.38 | % | 1.45 | %† | |||||||||
| Net investment income, after (Waivers) and/or Recapture | 1.71 | % | 1.03 | % | 1.05 | %† | |||||||||
| Portfolio turnover rate †† | 57 | % | 49 | % | 3 | % | |||||||||
| Undistributed net investment income (loss) included in price of units issued and redeemed**# | $ | 0.04 | $ | 0.06 | $ | (0.01 | ) | ||||||||
* Commencement of Investment Operations.
** Based on average shares outstanding.
*** The mean between the last bid and ask prices.
**** Net asset value total return is calculated assuming an initial investment made at the net asset value at the beginning of the period, reinvestment of all dividends and distributions at net asset value during the period, and redemption on the last day of the period. Share price total return is calculated assuming an initial investment made at the share price at the beginning of the period, reinvestment of all dividends and distributions at share price during the period, and sale at the share price on the last day of the period. Total investment returns calculated for a period of less than one year are not annualized.
† Annualized.
†† Portfolio turnover rate is not annualized and does not include securities received or delivered from processing creations or redemptions.
# The per share amount of equalization is presented to show the impact of equalization on distributable earnings per share.
(a) Amount represents less than $0.005.
See Notes to Financial Statements.
84
Financial Highlights (Continued)
PowerShares Dynamic Large Cap Value Portfolio
| Year Ended April 30, | For the Period March 3, 2005* Through | ||||||||||||||||||||||
| 2009 | 2008 | 2007 | 2006 | April 30, 2005 | |||||||||||||||||||
| PER SHARE OPERATING PERFORMANCE: | |||||||||||||||||||||||
| Net asset value at beginning of period | $ | 19.27 | $ | 20.72 | $ | 17.41 | $ | 14.52 | $ | 15.00 | |||||||||||||
| Net investment income** | 0.41 | 0.43 | 0.39 | 0.28 | 0.05 | ||||||||||||||||||
| Net realized and unrealized gain (loss) on investments | (5.81 | ) | (1.40 | ) | 3.21 | 2.85 | (0.52 | ) | |||||||||||||||
| Total from investment operations | (5.40 | ) | (0.97 | ) | 3.60 | 3.13 | (0.47 | ) | |||||||||||||||
| Distributions to shareholders from: | |||||||||||||||||||||||
| Net investment income | (0.33 | ) | (0.48 | ) | (0.29 | ) | (0.24 | ) | (0.01 | ) | |||||||||||||
| Net asset value at end of period | $ | 13.54 | $ | 19.27 | $ | 20.72 | $ | 17.41 | $ | 14.52 | |||||||||||||
| Share price at end of period*** | $ | 13.55 | |||||||||||||||||||||
| NET ASSET VALUE, TOTAL RETURN**** | (28.30 | )% | (4.78 | )% | 20.85 | % | 21.71 | % | (3.11 | )% | |||||||||||||
| SHARE PRICE TOTAL RETURN**** | (28.21 | )% | |||||||||||||||||||||
| RATIOS/SUPPLEMENTAL DATA: | |||||||||||||||||||||||
| Net assets at end of period (000's omitted) | $ | 262,699 | $ | 252,489 | $ | 292,130 | $ | 90,532 | $ | 10,166 | |||||||||||||
| Ratio to average net assets of: | |||||||||||||||||||||||
| Expenses, after (Waivers) and/or Recapture | 0.63 | % | 0.63 | % | 0.63 | % | 0.65 | % | 0.63 | %† | |||||||||||||
| Expenses, prior to (Waivers) and/or Recapture | 0.61 | % | 0.59 | % | 0.67 | % | 0.94 | % | 2.16 | %† | |||||||||||||
| Net investment income, after (Waivers) and/or Recapture | 2.71 | % | 2.14 | % | 2.00 | % | 1.75 | % | 1.99 | %† | |||||||||||||
| Portfolio turnover rate †† | 77 | % | 22 | % | 16 | % | 29 | % | 0 | % | |||||||||||||
| Undistributed net investment income included in price of units issued and redeemed**# | $ | 0.02 | $ | 0.00 | (a) | $ | 0.03 | — | — | ||||||||||||||
PowerShares Dynamic Mid Cap Growth Portfolio
| Year Ended April 30, | For the Period March 3, 2005* Through | ||||||||||||||||||||||
| 2009 | 2008 | 2007 | 2006 | April 30, 2005 | |||||||||||||||||||
| PER SHARE OPERATING PERFORMANCE: | |||||||||||||||||||||||
| Net asset value at beginning of period | $ | 22.29 | $ | 21.09 | $ | 18.79 | $ | 13.92 | $ | 15.01 | |||||||||||||
| Net investment income (loss)** | (0.01 | ) | — | (a) | (0.03 | ) | 0.28 | (0.01 | ) | ||||||||||||||
| Net realized and unrealized gain (loss) on investments | (8.41 | ) | 1.20 | 2.44 | 4.59 | (1.08 | ) | ||||||||||||||||
| Total from investment operations | (8.42 | ) | 1.20 | 2.41 | 4.87 | (1.09 | ) | ||||||||||||||||
| Distributions to shareholders from: | |||||||||||||||||||||||
| Net investment income | — | — | (0.11 | ) | — | — | |||||||||||||||||
| Return of capital | — | — | (a) | — | (a) | — | — | ||||||||||||||||
| Total distributions | — | — | (0.11 | ) | — | — | |||||||||||||||||
| Net asset value at end of period | $ | 13.87 | $ | 22.29 | $ | 21.09 | $ | 18.79 | $ | 13.92 | |||||||||||||
| Share price at end of period*** | $ | 13.85 | |||||||||||||||||||||
| NET ASSET VALUE, TOTAL RETURN**** | (37.78 | )% | 5.70 | % | 12.91 | % | 34.99 | % | (7.30 | )% | |||||||||||||
| SHARE PRICE TOTAL RETURN**** | (37.86 | )% | |||||||||||||||||||||
| RATIOS/SUPPLEMENTAL DATA: | |||||||||||||||||||||||
| Net assets at end of period (000's omitted) | $ | 140,038 | $ | 390,146 | $ | 189,794 | $ | 103,325 | $ | 8,349 | |||||||||||||
| Ratio to average net assets of: | |||||||||||||||||||||||
| Expenses, after (Waivers) and/or Recapture | 0.63 | % | 0.63 | % | 0.63 | % | 0.65 | % | 0.63 | %† | |||||||||||||
| Expenses, prior to (Waivers) and/or Recapture | 0.61 | % | 0.60 | % | 0.73 | % | 0.90 | % | 2.45 | %† | |||||||||||||
| Net investment income (loss), after (Waivers) and/or Recapture | (0.07 | )% | (0.01 | )% | (0.15 | )% | 1.56 | % | (0.20 | )%† | |||||||||||||
| Portfolio turnover rate †† | 81 | % | 80 | % | 69 | % | 86 | % | 1 | % | |||||||||||||
| Undistributed net investment income (loss) included in price of units issued and redeemed**# | $ | 0.01 | $ | (0.01 | ) | $ | 0.02 | — | — | ||||||||||||||
* Commencement of Investment Operations.
** Based on average shares outstanding.
*** The mean between the last bid and ask prices.
**** Net asset value total return is calculated assuming an initial investment made at the net asset value at the beginning of the period, reinvestment of all dividends and distributions at net asset value during the period, and redemption on the last day of the period. Share price total return is calculated assuming an initial investment made at the share price at the beginning of the period, reinvestment of all dividends and distributions at share price during the period, and sale at the share price on the last day of the period. Total investment returns calculated for a period of less than one year are not annualized.
† Annualized.
†† Portfolio turnover rate is not annualized and does not include securities received or delivered from processing creations or redemptions.
# The per share amount of equalization is presented to show the impact of equalization on distributable earnings per share.
(a) Amount represents less than $0.005.
See Notes to Financial Statements.
85
Financial Highlights (Continued)
PowerShares Dynamic Mid Cap Portfolio
| Year Ended April 30, | For the Period December 1, 2006* Through | ||||||||||||||
| 2009 | 2008 | April 30, 2007 | |||||||||||||
| PER SHARE OPERATING PERFORMANCE: | |||||||||||||||
| Net asset value at beginning of period | $ | 25.47 | $ | 27.98 | $ | 25.26 | |||||||||
| Net investment income** | 0.13 | 0.11 | 0.10 | ||||||||||||
| Net realized and unrealized gain (loss) on investments | (9.17 | ) | (2.49 | ) | 2.68 | ||||||||||
| Total from investment operations | (9.04 | ) | (2.38 | ) | 2.78 | ||||||||||
| Distributions to shareholders from: | |||||||||||||||
| Net investment income | (0.13 | ) | (0.13 | ) | (0.06 | ) | |||||||||
| Net asset value at end of period | $ | 16.30 | $ | 25.47 | $ | 27.98 | |||||||||
| Share price at end of period*** | $ | 16.29 | |||||||||||||
| NET ASSET VALUE, TOTAL RETURN**** | (35.57 | )% | (8.54 | )% | 11.04 | % | |||||||||
| SHARE PRICE TOTAL RETURN**** | (35.63 | )% | |||||||||||||
| RATIOS/SUPPLEMENTAL DATA: | |||||||||||||||
| Net assets at end of period (000's omitted) | $ | 17,929 | $ | 25,469 | $ | 11,190 | |||||||||
| Ratio to average net assets of: | |||||||||||||||
| Expenses, after (Waivers) and/or Recapture | 0.65 | % | 0.73 | % | 0.74 | %† | |||||||||
| Expenses, prior to (Waivers) and/or Recapture | 1.17 | % | 1.34 | % | 1.55 | %† | |||||||||
| Net investment income, after (Waivers) and/or Recapture | 0.67 | % | 0.42 | % | 0.91 | %† | |||||||||
| Portfolio turnover rate †† | 79 | % | 99 | % | 7 | % | |||||||||
| Undistributed net investment loss included in price of units issued and redeemed**# | $ | 0.01 | $ | (0.01 | ) | $ | 0.00 | (a) | |||||||
PowerShares Dynamic Mid Cap Value Portfolio
| Year Ended April 30, | For the Period March 3, 2005* Through | ||||||||||||||||||||||
| 2009 | 2008 | 2007 | 2006 | April 30, 2005 | |||||||||||||||||||
| PER SHARE OPERATING PERFORMANCE: | |||||||||||||||||||||||
| Net asset value at beginning of period | $ | 16.89 | $ | 20.25 | $ | 17.22 | $ | 14.47 | $ | 15.10 | |||||||||||||
| Net investment income** | 0.26 | 0.22 | 0.29 | 0.22 | 0.15 | ||||||||||||||||||
| Net realized and unrealized gain (loss) on investments | (5.75 | ) | (3.32 | ) | 2.97 | 2.78 | (0.76 | ) | |||||||||||||||
| Total from investment operations | (5.49 | ) | (3.10 | ) | 3.26 | 3.00 | (0.61 | ) | |||||||||||||||
| Distributions to shareholders from: | |||||||||||||||||||||||
| Net investment income | (0.24 | ) | (0.26 | ) | (0.23 | ) | (0.25 | ) | (0.02 | ) | |||||||||||||
| Net asset value at end of period | $ | 11.16 | $ | 16.89 | $ | 20.25 | $ | 17.22 | $ | 14.47 | |||||||||||||
| Share price at end of period*** | $ | 11.13 | |||||||||||||||||||||
| NET ASSET VALUE, TOTAL RETURN**** | (32.71 | )% | (15.47 | )% | 19.14 | % | 20.85 | % | (4.07 | )% | |||||||||||||
| SHARE PRICE TOTAL RETURN**** | (32.89 | )% | |||||||||||||||||||||
| RATIOS/SUPPLEMENTAL DATA: | |||||||||||||||||||||||
| Net assets at end of period (000's omitted) | $ | 39,056 | $ | 79,380 | $ | 109,356 | $ | 56,815 | $ | 10,126 | |||||||||||||
| Ratio to average net assets of: | |||||||||||||||||||||||
| Expenses, after (Waivers) and/or Recapture | 0.63 | % | 0.63 | % | 0.63 | % | 0.67 | % | 0.63 | %† | |||||||||||||
| Expenses, prior to (Waivers) and/or Recapture | 0.78 | % | 0.68 | % | 0.82 | % | 1.13 | % | 2.14 | %† | |||||||||||||
| Net investment income, after (Waivers) and/or Recapture | 1.95 | % | 1.14 | % | 1.64 | % | 1.33 | % | 6.34 | %† | |||||||||||||
| Portfolio turnover rate †† | 94 | % | 53 | % | 43 | % | 117 | % | 1 | % | |||||||||||||
| Undistributed net investment income included in price of units issued and redeemed**# | $ | (0.01 | ) | $ | 0.00 | (a) | $ | 0.01 | — | — | |||||||||||||
* Commencement of Investment Operations.
** Based on average shares outstanding.
*** The mean between the last bid and ask prices.
**** Net asset value total return is calculated assuming an initial investment made at the net asset value at the beginning of the period, reinvestment of all dividends and distributions at net asset value during the period, and redemption on the last day of the period. Share price total return is calculated assuming an initial investment made at the share price at the beginning of the period, reinvestment of all dividends and distributions at share price during the period, and sale at the share price on the last day of the period. Total investment returns calculated for a period of less than one year are not annualized.
† Annualized.
†† Portfolio turnover rate is not annualized and does not include securities received or delivered from processing creations or redemptions.
# The per share amount of equalization is presented to show the impact of equalization on distributable earnings per share.
(a) Amount represents less than $0.005.
See Notes to Financial Statements.
86
Financial Highlights (Continued)
PowerShares Dynamic Small Cap Growth Portfolio
| Year Ended April 30, | For the Period March 3, 2005* Through | ||||||||||||||||||||||
| 2009 | 2008 | 2007 | 2006 | April 30, 2005 | |||||||||||||||||||
| PER SHARE OPERATING PERFORMANCE: | |||||||||||||||||||||||
| Net asset value at beginning of period | $ | 15.71 | $ | 18.59 | $ | 18.51 | $ | 13.90 | $ | 15.11 | |||||||||||||
| Net investment income (loss)** | 0.01 | (0.05 | ) | (0.05 | ) | 0.11 | (0.01 | ) | |||||||||||||||
| Net realized and unrealized gain (loss) on investments | (5.23 | ) | (2.83 | ) | 0.13 | 4.50 | (1.20 | ) | |||||||||||||||
| Total from investment operations | (5.22 | ) | (2.88 | ) | 0.08 | 4.61 | (1.21 | ) | |||||||||||||||
| Net asset value at end of period | $ | 10.49 | $ | 15.71 | $ | 18.59 | $ | 18.51 | $ | 13.90 | |||||||||||||
| Share price at end of period*** | $ | 10.48 | |||||||||||||||||||||
| NET ASSET VALUE, TOTAL RETURN**** | (33.23 | )% | (15.49 | )% | 0.43 | % | 33.17 | % | (8.02 | )% | |||||||||||||
| SHARE PRICE TOTAL RETURN**** | (33.25 | )% | |||||||||||||||||||||
| RATIOS/SUPPLEMENTAL DATA: | |||||||||||||||||||||||
| Net assets at end of period (000's omitted) | $ | 31,484 | $ | 51,846 | $ | 61,347 | $ | 118,465 | $ | 9,727 | |||||||||||||
| Ratio to average net assets of: | |||||||||||||||||||||||
| Expenses, after (Waivers) and/or Recapture | 0.63 | % | 0.63 | % | 0.63 | % | 0.65 | % | 0.63 | %† | |||||||||||||
| Expenses, prior to (Waivers) and/or Recapture | 0.86 | % | 0.77 | % | 0.84 | % | 0.90 | % | 2.34 | %† | |||||||||||||
| Net investment income (loss), after (Waivers) and/or Recapture | 0.11 | % | (0.27 | )% | (0.32 | )% | 0.65 | % | (0.48 | )%† | |||||||||||||
| Portfolio turnover rate †† | 109 | % | 78 | % | 114 | % | 120 | % | 0 | % | |||||||||||||
| Undistributed net investment income (loss) included in price of units issued and redeemed**# | $ | 0.00 | (a) | $ | (0.00 | )(a) | $ | (0.02 | ) | — | — | ||||||||||||
PowerShares Dynamic Small Cap Portfolio
| Year Ended April 30, | For the Period December 1, 2006* Through | ||||||||||||||
| 2009 | 2008 | April 30, 2007 | |||||||||||||
| PER SHARE OPERATING PERFORMANCE: | |||||||||||||||
| Net asset value at beginning of period | $ | 23.31 | $ | 26.68 | $ | 25.17 | |||||||||
| Net investment income** | 0.08 | 0.06 | — | (a) | |||||||||||
| Net realized and unrealized gain (loss) on investments | (8.31 | ) | (3.13 | ) | 1.51 | ||||||||||
| Total from investment operations | (8.23 | ) | (3.07 | ) | 1.51 | ||||||||||
| Distributions to shareholders from: | |||||||||||||||
| Net investment income | (0.05 | ) | (0.08 | ) | — | (a) | |||||||||
| Return of capital | — | (0.22 | ) | — | |||||||||||
| Total distribution | (0.05 | ) | (0.30 | ) | — | ||||||||||
| Net asset value at end of period | $ | 15.03 | $ | 23.31 | $ | 26.68 | |||||||||
| Share price at end of period*** | $ | 15.00 | |||||||||||||
| NET ASSET VALUE, TOTAL RETURN**** | (35.34 | )% | (11.61 | )% | 6.01 | % | |||||||||
| SHARE PRICE TOTAL RETURN**** | (35.41 | )% | |||||||||||||
| RATIOS/SUPPLEMENTAL DATA: | |||||||||||||||
| Net assets at end of period (000's omitted) | $ | 13,530 | $ | 16,314 | $ | 8,005 | |||||||||
| Ratio to average net assets of: | |||||||||||||||
| Expenses, after (Waivers) and/or Recapture | 0.65 | % | 0.79 | % | 0.74 | %† | |||||||||
| Expenses, prior to (Waivers) and/or Recapture | 1.35 | % | 1.96 | % | 1.55 | %† | |||||||||
| Net investment income, after (Waivers) and/or Recapture | 0.47 | % | 0.26 | % | 0.04 | %† | |||||||||
| Portfolio turnover rate †† | 81 | % | 103 | % | 52 | % | |||||||||
| Undistributed net investment income included in price of units issued and redeemed**# | $ | 0.01 | $ | 0.05 | $ | 0.00 | (a) | ||||||||
* Commencement of Investment Operations.
** Based on average shares outstanding.
*** The mean between the last bid and ask prices.
**** Net assets value total return is calculated assuming an initial investment made at the net asset value at the beginning of the period, reinvestment of all dividends and distributions at net asset value during the period, and redemption on the last day of the period. Share price total return is calculated assuming an initial investment made at the share price at the beginning at the period, reinvestment of all dividends and distributions at share price during the period, and sale at the share price on the last day of the period. Total investment returns calculated for a period of less than one year are not annualized.
† Annualized.
†† Portfolio turnover rate is not annualized and does not include securities received or delivered from processing creations or redemptions.
# The per share amount of equalization is presented to show the impact of equalization on distributable earnings per share.
(a) Amount represents less than $0.005.
See Notes to Financial Statements.
87
Financial Highlights (Continued)
PowerShares Dynamic Small Cap Value Portfolio
| Year Ended April 30, | For the Period March 3, 2005* Through | ||||||||||||||||||||||
| 2009 | 2008 | 2007 | 2006 | April 30, 2005 | |||||||||||||||||||
| PER SHARE OPERATING PERFORMANCE: | |||||||||||||||||||||||
| Net asset value at beginning of period | $ | 15.80 | $ | 18.68 | $ | 17.01 | $ | 13.79 | $ | 15.06 | |||||||||||||
| Net investment income** | 0.12 | 0.16 | 0.13 | 0.11 | 0.01 | ||||||||||||||||||
| Net realized and unrealized gain (loss) on investments | (5.43 | ) | (2.47 | ) | 1.67 | 3.22 | (1.28 | ) | |||||||||||||||
| Total from investment operations | (5.31 | ) | (2.31 | ) | 1.80 | 3.33 | (1.27 | ) | |||||||||||||||
| Distributions to shareholders from: | |||||||||||||||||||||||
| Net investment income | (0.11 | ) | (0.16 | ) | (0.13 | ) | (0.11 | ) | — | ||||||||||||||
| Return of capital | — | (0.41 | ) | — | — | — | |||||||||||||||||
| Total distribution | (0.11 | ) | (0.57 | ) | (0.13 | ) | (0.11 | ) | — | ||||||||||||||
| Net asset value at end of period | $ | 10.38 | $ | 15.80 | $ | 18.68 | $ | 17.01 | $ | 13.79 | |||||||||||||
| Share price at end of period*** | $ | 10.36 | |||||||||||||||||||||
| NET ASSET VALUE, TOTAL RETURN**** | (33.69 | )% | (12.51 | )% | 10.64 | % | 24.20 | % | (8.46 | )% | |||||||||||||
| SHARE PRICE TOTAL RETURN**** | (33.78 | )% | |||||||||||||||||||||
| RATIOS/SUPPLEMENTAL DATA: | |||||||||||||||||||||||
| Net assets at end of period (000's omitted) | $ | 62,253 | $ | 91,667 | $ | 117,680 | $ | 66,339 | $ | 9,651 | |||||||||||||
| Ratio to average net assets of: | |||||||||||||||||||||||
| Expenses, after (Waivers) and/or Recapture | 0.63 | % | 0.63 | % | 0.63 | % | 0.66 | % | 0.63 | %† | |||||||||||||
| Expenses, prior to (Waivers) and/or Recapture | 0.73 | % | 0.67 | % | 0.80 | % | 1.06 | % | 2.36 | %† | |||||||||||||
| Net investment income, after (Waivers) and/or Recapture | 1.00 | % | 0.91 | % | 0.73 | % | 0.73 | % | 0.45 | %† | |||||||||||||
| Portfolio turnover rate †† | 98 | % | 86 | % | 76 | % | 118 | % | 0 | % | |||||||||||||
| Undistributed net investment income (loss) included in price of units issued and redeemed**# | $ | 0.00 | (a) | $ | (0.03 | ) | $ | 0.01 | — | — | |||||||||||||
PowerShares FTSE NASDAQ Small Cap Portfolio
| Year Ended April 30, 2009 | For the Period April 1, 2008* Through April 30, 2008 | ||||||||||
| PER SHARE OPERATING PERFORMANCE: | |||||||||||
| Net asset value at beginning of period | $ | 25.63 | $ | 25.73 | |||||||
| Net investment income** | 0.05 | — | (a) | ||||||||
| Net realized and unrealized loss on investments | (8.65 | ) | (0.10 | ) | |||||||
| Total from investment operations | (8.60 | ) | (0.10 | ) | |||||||
| Distributions to shareholder from: | |||||||||||
| Net investment income | (0.15 | ) | — | ||||||||
| Net realized gains | — | (a) | — | ||||||||
| Total distribution | (0.15 | ) | — | ||||||||
| Net asset value at end of period | $ | 16.88 | $ | 25.63 | |||||||
| Share price at end of period*** | $ | 16.86 | |||||||||
| NET ASSET VALUE, TOTAL RETURN**** | (33.53 | )% | (0.39 | )%(b) | |||||||
| SHARE PRICE TOTAL RETURN**** | (33.58 | )% | |||||||||
| RATIOS/SUPPLEMENTAL DATA: | |||||||||||
| Net assets at end of period (000's omitted) | $ | 1,688 | $ | 2,563 | |||||||
| Ratio to average net assets of: | |||||||||||
| Expenses | 0.70 | % | 0.70 | %† | |||||||
| Net investment (income) loss | 0.27 | % | (0.09 | )%† | |||||||
| Portfolio turnover rate †† | 19 | % | 0 | % | |||||||
| Undistributed net investment income included in price of units issued and redeemed**# | 0.00 | (a) | — | ||||||||
* Commencement of Investment Operations.
** Based on average shares outstanding.
*** The mean between the last bid and ask prices.
**** Net asset value total return is calculated assuming an initial investment made at the net asset value at the beginning of the period, reinvestment of all dividends and distributions at net asset value during the period, and redemption on the last day of the period. Share price total return is calculated assuming an initial investment made at the share price at the beginning of the period, reinvestment of all dividends and distributions at share price during the period, and sale at the share price on the last day of the period. Total investment returns calculated for a period of less than one year are not annualized.
† Annualized.
†† Portfolio turnover rate is not annualized and does not include securities received or delivered from processing creations or redemptions.
# The per share amount of equalization is presented to show the impact of equalization on distributable earnings per share.
(a) Amount represents less than $0.005.
(b) The total return from Fund Inception (first day of trading on the Exchange) to April 30, 2008 was (0.50)%.
See Notes to Financial Statements.
88
Financial Highlights (Continued)
PowerShares Zacks Micro Cap Portfolio
| Year Ended April 30, | For the Period August 18, 2005* Through | ||||||||||||||||||
| 2009 | 2008 | 2007 | April 30, 2006 | ||||||||||||||||
| PER SHARE OPERATING PERFORMANCE: | |||||||||||||||||||
| Net asset value at beginning of period | $ | 13.63 | $ | 18.32 | $ | 17.47 | $ | 14.79 | |||||||||||
| Net investment income** | 0.12 | 0.16 | 0.06 | — | (a) | ||||||||||||||
| Net realized and unrealized gain (loss) on investments | (5.48 | ) | (4.73 | ) | 0.81 | 2.69 | |||||||||||||
| Total from investment operations | (5.36 | ) | (4.57 | ) | 0.87 | 2.69 | |||||||||||||
| Distributions to shareholders from: | |||||||||||||||||||
| Net investment income | (0.17 | ) | (0.12 | ) | (0.02 | ) | (0.01 | ) | |||||||||||
| Return of capital | — | — | — | — | (a) | ||||||||||||||
| Total distributions | (0.17 | ) | (0.12 | ) | (0.02 | ) | (0.01 | ) | |||||||||||
| Net asset value at end of period | $ | 8.10 | $ | 13.63 | $ | 18.32 | $ | 17.47 | |||||||||||
| Share price at end of period*** | $ | 8.10 | |||||||||||||||||
| NET ASSET VALUE, TOTAL RETURN**** | (39.70 | )% | (25.07 | )% | 4.99 | % | 18.20 | % | |||||||||||
| SHARE PRICE TOTAL RETURN**** | (39.66 | )% | |||||||||||||||||
| RATIOS/SUPPLEMENTAL DATA: | |||||||||||||||||||
| Net assets at end of period (000's omitted) | $ | 46,960 | $ | 94,068 | $ | 192,310 | $ | 158,976 | |||||||||||
| Ratio to average net assets of: | |||||||||||||||||||
| Expenses, after (Waivers) and/or Recapture | 0.70 | % | 0.70 | % | 0.71 | % | 0.72 | %† | |||||||||||
| Expenses, prior to (Waivers) and/or Recapture | 0.86 | % | 0.71 | % | 0.78 | % | 0.82 | %† | |||||||||||
| Net investment income, after (Waivers) and/or Recapture | 1.11 | % | 0.99 | % | 0.36 | % | 0.01 | %† | |||||||||||
| Portfolio turnover rate †† | 51 | % | 54 | % | 72 | % | 78 | % | |||||||||||
| Undistributed net investment income (loss) included in price of units issued and redeemed**# | $ | 0.00 | (a) | $ | (0.03 | ) | $ | 0.01 | — | ||||||||||
PowerShares Zacks Small Cap Portfolio
| Year Ended April 30, | For the Period February 16, 2006* Through | ||||||||||||||||||
| 2009 | 2008 | 2007 | April 30, 2006 | ||||||||||||||||
| PER SHARE OPERATING PERFORMANCE: | |||||||||||||||||||
| Net asset value at beginning of period | $ | 23.31 | $ | 27.51 | $ | 26.76 | $ | 25.41 | |||||||||||
| Net investment income** | 0.11 | 0.22 | ††† | 0.05 | 0.02 | ||||||||||||||
| Net realized and unrealized gain (loss) on investments | (8.83 | ) | (4.23 | ) | 0.76 | 1.33 | |||||||||||||
| Total from investment operations | (8.72 | ) | (4.01 | ) | 0.81 | 1.35 | |||||||||||||
| Distributions to shareholders from: | |||||||||||||||||||
| Net investment income | (0.13 | ) | (0.19 | ) | (0.06 | ) | — | ||||||||||||
| Return of capital | (0.01 | ) | — | — | (a) | — | |||||||||||||
| Total distributions | (0.14 | ) | (0.19 | ) | (0.06 | ) | — | ||||||||||||
| Net asset value at end of period | $ | 14.45 | $ | 23.31 | $ | 27.51 | $ | 26.76 | |||||||||||
| Share price at end of period*** | $ | 14.38 | |||||||||||||||||
| NET ASSET VALUE, TOTAL RETURN**** | (37.56 | )% | (14.66 | )% | 3.03 | % | 5.31 | % | |||||||||||
| SHARE PRICE TOTAL RETURN**** | (37.84 | )% | |||||||||||||||||
| RATIOS/SUPPLEMENTAL DATA: | |||||||||||||||||||
| Net assets at end of period (000's omitted) | $ | 18,788 | $ | 39,630 | $ | 71,530 | $ | 58,866 | |||||||||||
| Ratio to average net assets of: | |||||||||||||||||||
| Expenses, after (Waivers) and/or Recapture | 0.70 | % | 0.70 | % | 0.71 | % | 0.75 | %† | |||||||||||
| Expenses, prior to (Waivers) and/or Recapture | 1.09 | % | 0.83 | % | 0.89 | % | 1.17 | %† | |||||||||||
| Net investment income, after (Waivers) and/or Recapture | 0.58 | % | 0.81 | %††† | 0.19 | % | 0.30 | %† | |||||||||||
| Portfolio turnover rate †† | 63 | % | 58 | % | 87 | % | 1 | % | |||||||||||
| Undistributed net investment income (loss) included in price of units issued and redeemed**# | $ | 0.02 | $ | (0.05 | ) | $ | 0.00 | (a) | — | ||||||||||
* Commencement of Investment Operations.
** Based on average shares outstanding.
*** The mean between the last bid and ask prices.
**** Net asset value total return is calculated assuming an initial investment made at the net asset value at the beginning of the period, reinvestment of all dividends and distributions at net asset value during the period, and redemption on the last day of the period. Share price total return is calculated assuming an initial investment made at the share price at the beginning of the period, reinvestment of all dividends and distributions at share price during the period, and sale at the share price on the last day of the period. Total investment returns calculated for a period of less than one year are not annualized.
† Annualized.
†† Portfolio turnover rate is not annualized and does not include securities received or delivered from processing creations or redemptions.
††† Net investment income per share and the ratio of net investment income to average net assets include a special cash dividend received of $3.00 per share owned of Books-A-Million, Inc. on July 5, 2007. Net investment income per share and the ratio of net investment income to average net assets excluding the special dividend are $0.19 and 0.72%, respectively.
# The per share amount of equalization is presented to show the impact of equalization on distributable earnings per share.
(a) Amount represents less than $0.005.
See Notes to Financial Statements.
89
Notes to Financial Statements
PowerShares Exchange-Traded Fund Trust
April 30, 2009
Note 1. Organization
PowerShares Exchange-Traded Fund Trust (the "Trust") was organized as a Massachusetts business trust on June 9, 2000 and is authorized to have multiple series of portfolios. The Trust is an open-end management investment company, registered under the Investment Company Act of 1940, as amended (the "1940 Act"). As of the year end, the Trust offered seventy-five portfolios. This report includes the following portfolios:
| Full Name | Short Name | ||||||
| PowerShares Dynamic Aggressive Growth Portfolio | "Dynamic Aggressive Growth Portfolio" | ||||||
| PowerShares Dynamic Deep Value Portfolio | "Dynamic Deep Value Portfolio" | ||||||
| PowerShares Dynamic Large Cap Growth Portfolio | "Dynamic Large Cap Growth Portfolio" | ||||||
| PowerShares Dynamic Large Cap Portfolio | "Dynamic Large Cap Portfolio" | ||||||
| PowerShares Dynamic Large Cap Value Portfolio | "Dynamic Large Cap Value Portfolio" | ||||||
| PowerShares Dynamic Mid Cap Growth Portfolio | "Dynamic Mid Cap Growth Portfolio" | ||||||
| PowerShares Dynamic Mid Cap Portfolio | "Dynamic Mid Cap Portfolio" | ||||||
| PowerShares Dynamic Mid Cap Value Portfolio | "Dynamic Mid Cap Value Portfolio" | ||||||
| PowerShares Dynamic Small Cap Growth Portfolio | "Dynamic Small Cap Growth Portfolio" | ||||||
| PowerShares Dynamic Small Cap Portfolio | "Dynamic Small Cap Portfolio" | ||||||
| PowerShares Dynamic Small Cap Value Portfolio | "Dynamic Small Cap Value Portfolio" | ||||||
| PowerShares FTSE NASDAQ Small Cap Portfolio | "FTSE NASDAQ Small Cap Portfolio" | ||||||
| PowerShares Zacks Micro Cap Portfolio | "Zacks Micro Cap Portfolio" | ||||||
| PowerShares Zacks Small Cap Portfolio | "Zacks Small Cap Portfolio" | ||||||
Each portfolio (the "Fund" or collectively the "Funds") represents a separate series of the Trust. The shares of the Funds are referred to herein as "Shares" or "Fund Shares." Each Fund's Shares are listed and traded on the NYSE Arca, Inc., except for Shares of the FTSE NASDAQ Small Cap Portfolio which are listed and traded on the NASDAQ Stock Market LLC.
The Funds' market prices may differ to some degree from the net asset value of the Shares of each Fund. Unlike conventional mutual funds, each Fund issues and redeems Shares on a continuous basis, at net asset value, only in a large specified number of Shares, each called a "Creation Unit." Creation Units are issued and redeemed generally in-kind for securities included in the relevant index. Except when aggregated in Creation Units, Shares are not individually redeemable securities of the Funds.
The investment objective of each Fund is to seek investment results that correspond generally to the price and yield (before the Fund's fees and expenses) of the following indices:
| Fund | Index | ||||||
| Dynamic Aggressive Growth Portfolio | Dynamic Aggressive Growth IntellidexSM Index | ||||||
| Dynamic Deep Value Portfolio | Dynamic Deep Value IntellidexSM Index | ||||||
| Dynamic Large Cap Growth Portfolio | Dynamic Large Cap Growth IntellidexSM Index | ||||||
| Dynamic Large Cap Portfolio | Dynamic Large Cap IntellidexSM Index | ||||||
| Dynamic Large Cap Value Portfolio | Dynamic Large Cap Value IntellidexSM Index | ||||||
| Dynamic Mid Cap Growth Portfolio | Dynamic Mid Cap Growth IntellidexSM Index | ||||||
| Dynamic Mid Cap Portfolio | Dynamic Mid Cap IntellidexSM Index | ||||||
| Dynamic Mid Cap Value Portfolio | Dynamic Mid Cap Value IntellidexSM Index | ||||||
90
Notes to Financial Statements (Continued)
PowerShares Exchange-Traded Fund Trust
April 30, 2009
| Fund | Index | ||||||
| Dynamic Small Cap Growth Portfolio | Dynamic Small Cap Growth IntellidexSM Index | ||||||
| Dynamic Small Cap Portfolio | Dynamic Small Cap IntellidexSM Index | ||||||
| Dynamic Small Cap Value Portfolio | Dynamic Small Cap Value IntellidexSM Index | ||||||
| FTSE NASDAQ Small Cap Portfolio | FTSE NASDAQ Small Cap Index | ||||||
| Zacks Micro Cap Portfolio | Zacks Micro Cap Index | ||||||
| Zacks Small Cap Portfolio | Zacks Small Cap Index | ||||||
Note 2. Significant Accounting Policies
The preparation of the financial statements in accordance with accounting principles generally accepted in the United States of America requires management to make estimates and assumptions that affect the reported amounts and disclosures in the financial statements, including estimates and assumptions related to taxation. Actual results could differ from these estimates.
A. Security Valuation
Securities, including restricted securities, are valued according to the following policies.
A security listed or traded on an exchange (except convertible bonds) is valued at its last sales price or official closing price as of the close of the customary trading session on the exchange where the security is principally traded, or lacking any sales or official closing price on a particular day, the security may be valued at the closing bid price on that day. Securities traded in the over-the-counter market are valued based on prices furnished by independent pricing services or market makers. Listed options, if no closing price is available, are valued at the mean between the last bid and ask prices from the exchange on which they are principally traded. Options not listed on an exchange are valued by an independent source at the mean between the last bid and ask prices.
Investments in open-end registered investment companies not traded on an exchange are valued at the end of day net asset value per share.
Debt obligations (including convertible bonds) and unlisted equities are fair valued using an evaluated quote provided by an independent pricing service. Evaluated quotes provided by the pricing service may be determined without exclusive reliance on quoted prices, and may reflect appropriate factors such as institution-size trading in similar groups of securities, developments related to specific securities, dividend rate, yield, quality, type of issue, coupon rate, maturity, individual trading characteristics and other market data. Short-term obligations, including commercial paper, having 60 days or less to maturity are recorded at amortized cost which approximates value. Debt securities are subject to interest rate and credit risks. In addition, all debt securities involve some risk of default with respect to interest and/or principal payments.
Foreign securities (including foreign exchange contracts) are converted into U.S. dollar amounts using the applicable exchange rates as of the close of the London world markets. If market quotations are available and reliable for foreign exchange traded equity securities, the securities will be valued at the market quotations. Because trading hours for certain foreign securities end before the close of the New York Stock Exchange ("NYSE"), closing market quotations may become unreliable. If between the time trading ends on a particular security and the close of the customary trading session on the NYSE, events occur that are significant and make the closing price unreliable, the Fund may fair value the security. If the event is likely to have affected the closing price of the security, the security will be valued at fair value in good faith using
91
Notes to Financial Statements (Continued)
PowerShares Exchange-Traded Fund Trust
April 30, 2009
procedures approved by the Board of Trustees. Adjustments to closing prices to reflect fair value may also be based on a screening process of an independent pricing service to indicate the degree of certainty, based on historical data, that the closing price in the principal market where a foreign security trades is not the current value as of the close of the NYSE. Foreign securities meeting the approved degree of certainty that the price is not reflective of current value will be priced at the indication of fair value from the independent pricing service. Multiple factors may be considered by the independent pricing service in determining adjustments to reflect fair value and may include information relating to sector indices, ADRs and domestic and foreign index futures. Foreign securities may have additional risks including exchange rate changes, potential for sharply devalued currencies and high inflation, political and econ omic upheaval, the relative lack of issuer information, relatively low market liquidity and the potential lack of strict financial and accounting controls and standards.
Securities for which market prices are not provided by any of the above methods may be valued based upon quotes furnished by independent sources.
Securities for which market quotations are not readily available or are unreliable are valued at fair value as determined in good faith by or under the supervision of the Trust's officers following procedures approved by the Board of Trustees. Issuer specific events, market trends, bid/ask quotes of brokers and information providers and other market data may be reviewed in the course of making a good faith determination of a security's fair value.
Valuations change in response to many factors including the historical and prospective earnings of the issuer, the value of the issuer's assets, general economic conditions, interest rates, investor perceptions and market liquidity. Because of the inherent uncertainties of valuation, the values reflected in the financial statements may materially differ from the value received upon actual sale of those investments.
B. Other Risks
A Fund may concentrate investments in a comparatively narrow segment of the economy. Consequently, such Fund may tend to be more volatile than other funds, and the value of the investments may tend to rise and fall more rapidly.
A Fund may invest a large percentage of its assets in securities of a limited number of companies, such that each investment may have a greater effect on the Fund's overall performance, and any change in the value of those securities could significantly affect the value of your investment in the Fund.
C. Federal Income Taxes
Each Fund intends to comply with the provisions of the Internal Revenue Code applicable to regulated investment companies and to distribute substantially all of the Fund's taxable earnings to its shareholders. As such, the Funds will not be subject to Federal income taxes on otherwise taxable income (including net realized gains) that is distributed to the shareholders. Therefore, no provision for Federal income taxes is recorded in the financial statements.
Income and capital gain distributions are determined in accordance with Federal income tax regulations, which may differ from accounting principles generally accepted in the United States of America. These differences are primarily due to differing book and tax treatments for in-kind transactions, losses deferred due to wash sales, and Passive Foreign Investment Company adjustments, if any.
92
Notes to Financial Statements (Continued)
PowerShares Exchange-Traded Fund Trust
April 30, 2009
The Funds file tax returns in the United States Federal jurisdiction and certain other jurisdictions. Generally a Fund is subject to examinations by such taxing authorities for up to three years after the filing of the return for the tax period.
D. Investment Income and Investment Transactions
Dividend income is recorded on the ex-dividend date net of foreign taxes withheld, if any. Interest income is recorded on the accrual basis. Investment transactions are recorded on the trade date. Realized gains and losses from the sale or disposition of securities are calculated on the specific identified cost basis. Dividends and interest received by a Fund may give rise to withholding and other taxes imposed by foreign countries. Corporate actions (including cash dividends) are recorded net of non-reclaimable foreign tax withholdings on the ex-dividend date. Tax conventions between certain countries and the United States may reduce or eliminate such taxes.
E. Expenses
Expenses of the Trust, which are directly identifiable to a specific Fund, are applied to that Fund. Expenses which are not readily identifiable to a specific Fund are allocated in such a manner as deemed equitable, taking into consideration the nature and type of expense and the relative net assets of each Fund.
Each Fund (except for FTSE NASDAQ Small Cap Portfolio) is responsible for all of its expenses, including the investment advisory fees, costs of transfer agency, custody, fund administration, legal, audit and other services, interest, taxes, brokerage commissions and other expenses connected with executions of portfolio transactions, any distribution fees or expenses and extraordinary expenses.
The FTSE NASDAQ Small Cap Portfolio has agreed to pay an annual unitary management fee to Invesco PowerShares Capital Management LLC (the "Adviser"). The Adviser has agreed to pay for substantially all expenses of the FTSE NASDAQ Small Cap Portfolio, including the cost of transfer agency, custody, fund administration, legal, audit and other services, except for advisory fees, distribution fees, if any, brokerage expenses, taxes, interest, litigation expenses and other extraordinary expenses.
F. Dividends and Distributions to Shareholders
Each Fund declares and pays dividends from net investment income, if any, to its shareholders quarterly and records on ex-dividend date. Each Fund distributes net realized taxable capital gains, if any, generally annually in cash and records on ex-dividend date. Such distributions on a tax basis are determined in conformity with income tax regulations which may differ from accounting principles generally accepted in the United States of America. Distributions in excess of tax basis earnings and profits, if any, are reported in such Fund's financial statements as a tax return of capital at fiscal period end.
G. Equalization
All Funds use the accounting practice of equalization. This accounting method is used to keep the continuing shareholder's per share equity in undistributed net investment income from being affected by the continuous sales and redemptions of capital shares. Equalization is calculated on a per share basis whereby a portion of the proceeds from the sales and cost of repurchases of capital shares is applied to undistributed net investment income. The amount of equalization is disclosed in the Statements of Changes in Net Assets as undistributed net investment income included in the price of capital shares issued or redeemed. The distributions to shareholders of amounts so applied may be deemed to be a return of capital for tax purposes to the extent that such distributions exceed taxable income.
93
Notes to Financial Statements (Continued)
PowerShares Exchange-Traded Fund Trust
April 30, 2009
Note 3. Investment Advisory Agreement and Other Agreements
The Trust has entered into an Investment Advisory Agreement with the Adviser under which the Adviser has overall responsibility as the Funds' investment adviser for the selection and ongoing monitoring of the Funds' investments, managing the Funds' business affairs and providing certain clerical, bookkeeping and other administrative services. Each Fund (except for FTSE NASDAQ Small Cap Portfolio) agreed to pay the Adviser an annual fee of 0.50% of the Fund's average daily net assets. The FTSE NASDAQ Small Cap Portfolio has agreed to pay the Adviser an annual unitary management fee of 0.70% of its average daily net assets and the Adviser has agreed to pay for substantially all expenses of the FTSE NASDAQ Small Cap Portfolio, including the cost of transfer agency, custody, fund administration, legal, audit and other services, except for the management fee, distribution fees, if any, brokerage expenses, taxes, interest, litigation expenses and other extraordinary expenses.
The Adviser has entered into an Amended and Restated Excess Expense Agreement (the "Excess Expense Agreement") with the Trust, under which the Adviser has agreed to waive fees and/or pay Fund expenses to the extent necessary to prevent the operating expenses of each Fund (except for the FTSE NASDAQ Small Cap Portfolio) (excluding interest expense, brokerage commissions and other trading expenses, sub-licensing fees, offering costs, taxes and extraordinary expenses) from exceeding 0.60% of the Fund's average daily net assets per year (the "Expense Cap"), at least until August 31, 2010. Offering costs excluded from the Expense Cap are: (a) legal fees pertaining to the Funds' shares offered for sale; (b) Securities and Exchange Commission and state registration fees; and (c) initial fees paid to be listed on an exchange.
The Excess Expense Agreement provides that the expenses borne by the Adviser are subject to recapture by the Adviser for up to three years from the date the fee or expense was borne by the Adviser, but no recapture payment will be made by a Fund if it would result in the Fund exceeding its Expense Cap as specified above. The Excess Expense Agreement does not apply to the FTSE NASDAQ Small Cap Portfolio.
The net amount of fees waived and other expenses assumed by the Adviser and the amount of recapture paid to the Adviser pursuant to the Excess Expense Agreement are collectively referred to as "(Waivers) and/or Recapture". The net amounts of (Waivers) and/or Recapture for the year ended April 30, 2009 are shown on the Statements of Operations.
The amounts available for potential future recapture by the Adviser under the Excess Expense Agreement and the expiration schedule at April 30, 2009 are as follows:
| Total Potential | Potential Recapture Amounts Expiring | ||||||||||||||||||
| Recapture Amounts | 04/30/10 | 04/30/11 | 04/30/12 | ||||||||||||||||
| Dynamic Aggressive Growth Portfolio | $ | 255,169 | $ | 28,715 | $ | 120,691 | $ | 105,763 | |||||||||||
| Dynamic Deep Value Portfolio | 251,162 | 34,870 | 112,304 | 103,988 | |||||||||||||||
| Dynamic Large Cap Portfolio | 234,923 | 36,731 | 109,396 | 88,796 | |||||||||||||||
| Dynamic Large Cap Value Portfolio | 92,477 | 85,278 | 1,614 | 5,585 | |||||||||||||||
| Dynamic Mid Cap Growth Portfolio | 125,760 | 64,852 | 26,181 | 34,727 | |||||||||||||||
| Dynamic Mid Cap Portfolio | 246,302 | 37,815 | 108,356 | 100,131 | |||||||||||||||
| Dynamic Mid Cap Value Portfolio | 266,621 | 128,796 | 51,113 | 86,712 | |||||||||||||||
| Dynamic Small Cap Growth Portfolio | 322,347 | 142,404 | 84,184 | 95,759 | |||||||||||||||
| Dynamic Small Cap Portfolio | 262,078 | 39,907 | 115,956 | 106,215 | |||||||||||||||
| Dynamic Small Cap Value Portfolio | 252,778 | 133,968 | 45,829 | 72,981 | |||||||||||||||
| Zacks Micro Cap Portfolio | 259,295 | 120,671 | 33,517 | 105,107 | |||||||||||||||
| Zacks Small Cap Portfolio | 310,591 | 114,172 | 86,368 | 110,051 | |||||||||||||||
94
Notes to Financial Statements (Continued)
PowerShares Exchange-Traded Fund Trust
April 30, 2009
The Trust has entered into a Distribution Agreement with Invesco Aim Distributors, Inc. (the "Distributor"), which serves as the Distributor of Creation Units for each Fund. The Distributor does not maintain a secondary market in Shares.
The Adviser has entered into a licensing agreement for each Fund with the following Licensors:
| Fund | Licensors | ||||||
| Dynamic Aggressive Growth Portfolio | NYSE AMEX | ||||||
| Dynamic Deep Value Portfolio | NYSE AMEX | ||||||
| Dynamic Large Cap Growth Portfolio | NYSE AMEX | ||||||
| Dynamic Large Cap Portfolio | NYSE AMEX | ||||||
| Dynamic Large Cap Value Portfolio | NYSE AMEX | ||||||
| Dynamic Mid Cap Growth Portfolio | NYSE AMEX | ||||||
| Dynamic Mid Cap Portfolio | NYSE AMEX | ||||||
| Dynamic Mid Cap Value Portfolio | NYSE AMEX | ||||||
| Dynamic Small Cap Growth Portfolio | NYSE AMEX | ||||||
| Dynamic Small Cap Portfolio | NYSE AMEX | ||||||
| Dynamic Small Cap Value Portfolio | NYSE AMEX | ||||||
| FTSE NASDAQ Small Cap Portfolio | NASDAQ OMX Group, Inc. | ||||||
| Zacks Micro Cap Portfolio | Zacks Investment Research, Inc. | ||||||
| Zacks Small Cap Portfolio | Zacks Investment Research, Inc. | ||||||
The index name trademarks are owned by the respective Licensors. These trademarks have been licensed to the Adviser for use with the Funds. The Funds are not sponsored, endorsed, sold or promoted by the Licensors and the Licensors make no representation regarding the advisability of investing in any of these Funds. The Trust has entered into a sub-licensing agreement under which the Funds (other than FTSE NASDAQ Small Cap Portfolio) are required to pay the sub-licensing fees which are shown on the Statements of Operations.
The Trust has entered into service agreements whereby The Bank of New York Mellon, a wholly-owned subsidiary of The Bank of New York Mellon Corporation, serves as the administrator, custodian, fund accounting and transfer agent for each Fund.
The custodian has agreed to provide overdraft protection to the Funds according to the terms of the service agreement.
Note 4. Additional Valuation Information
The Funds adopted the provisions of Statement of Financial Accounting Standards No. 157, "Fair Value Measurements" ("SFAS 157"), effective with the beginning of the Fund's fiscal year. SFAS 157 defines fair value as the price that would be received to sell an asset or paid to transfer a liability in an orderly transaction between market participants at the measurement date. SFAS 157 establishes a hierarchy that prioritizes the inputs to valuation methods giving the highest priority to readily available unadjusted quoted prices in an active market for identical assets (Level 1) and the lowest priority to significant unobservable inputs (Level 3) generally when market prices are not readily available or are unreliable.
Based on the valuation inputs, the securities or other investments are tiered into one of three levels.
95
Notes to Financial Statements (Continued)
PowerShares Exchange-Traded Fund Trust
April 30, 2009
Changes in valuation methods may result in transfers in or out of an investment's assigned level:
Level 1 – Prices are determined using quoted prices in an active market for identical assets.
Level 2 – Prices are determined using other significant observable inputs. Observable inputs are inputs that other market participants may use in pricing a security. These may include quoted prices for similar securities, interest rates, prepayment speeds, credit risk and others.
Level 3 – Prices are determined using significant unobservable inputs. In situations where quoted prices or observable inputs are unavailable (for example, when there is little or no market activity for an investment at the end of the period), unobservable inputs may be used. Unobservable inputs reflect the Fund's own assumptions about the factors market participants would use in determining fair value of the securities or instruments and would be based on the best available information.
The following is a summary of the tiered valuation input levels, as of the end of the reporting period, April 30, 2009. The level assigned to the securities valuations may not be an indication of the risk or liquidity associated with investing in those securities. Because of the inherent uncertainties of valuation, the values reflected in the financial statements may materially differ from the value received upon actual sale of those investments.
| Investments in Securities | |||||||||||||||||||
| Level 1 | Level 2 | Level 3 | Total | ||||||||||||||||
| Dynamic Aggressive Growth Portfolio | $ | 6,374,044 | $ | — | $ | — | $ | 6,374,044 | |||||||||||
| Dynamic Deep Value Portfolio | 10,029,787 | — | — | 10,029,787 | |||||||||||||||
| Dynamic Large Cap Growth Portfolio | 281,076,916 | — | — | 281,076,916 | |||||||||||||||
| Dynamic Large Cap Portfolio | 33,349,429 | — | — | 33,349,429 | |||||||||||||||
| Dynamic Large Cap Value Portfolio | 262,641,032 | — | — | 262,641,032 | |||||||||||||||
| Dynamic Mid Cap Growth Portfolio | 140,191,574 | — | — | 140,191,574 | |||||||||||||||
| Dynamic Mid Cap Portfolio | 18,036,818 | — | — | 18,036,818 | |||||||||||||||
| Dynamic Mid Cap Value Portfolio | 39,081,719 | — | — | 39,081,719 | |||||||||||||||
| Dynamic Small Cap Growth Portfolio | 31,530,522 | — | — | 31,530,522 | |||||||||||||||
| Dynamic Small Cap Portfolio | 13,615,683 | — | — | 13,615,683 | |||||||||||||||
| Dynamic Small Cap Value Portfolio | 62,289,779 | — | — | 62,289,779 | |||||||||||||||
| FTSE NASDAQ Small Cap Portfolio | 1,680,344 | 57 | — | 1,680,401 | |||||||||||||||
| Zacks Micro Cap Portfolio | 47,049,284 | 102,580 | — | 47,151,864 | |||||||||||||||
| Zacks Small Cap Portfolio | 18,824,897 | — | 0 | 18,824,897 | |||||||||||||||
Note 5. Federal Income Taxes
At April 30, 2009, the costs of investments on a tax basis including the adjustments for financial reporting purposes as of the most recently completed Federal income tax reporting period were as follows:
At April 30, 2009, the cost of investments for Federal income tax purposes was as follows:
| Cost | |||||||
| Dynamic Aggressive Growth Portfolio | $ | 6,341,647 | |||||
| Dynamic Deep Value Portfolio | 8,609,292 | ||||||
| Dynamic Large Cap Growth Portfolio | 294,482,408 | ||||||
| Dynamic Large Cap Portfolio | 35,868,513 | ||||||
96
Notes to Financial Statements (Continued)
PowerShares Exchange-Traded Fund Trust
April 30, 2009
| Cost | |||||||
| Dynamic Large Cap Value Portfolio | $ | 281,035,934 | |||||
| Dynamic Mid Cap Growth Portfolio | 138,925,695 | ||||||
| Dynamic Mid Cap Portfolio | 16,340,622 | ||||||
| Dynamic Mid Cap Value Portfolio | 38,855,201 | ||||||
| Dynamic Small Cap Growth Portfolio | 29,147,988 | ||||||
| Dynamic Small Cap Portfolio | 12,342,935 | ||||||
| Dynamic Small Cap Value Portfolio | 54,479,918 | ||||||
| FTSE NASDAQ Small Cap Portfolio | 2,284,127 | ||||||
| Zacks Micro Cap Portfolio | 53,919,230 | ||||||
| Zacks Small Cap Portfolio | 23,482,664 | ||||||
At April 30, 2009, the components of accumulated earning/(loss) on a tax basis were as follows:
| Accumulated Earnings | Other Temporary Difference | Net Accumulated Capital and other Gains/(Losses) | Net Unrealized Appreciation/ (Depreciation) | Gross Unrealized Appreciation | Gross Unrealized (Depreciation) | Total Accumulated Earnings/(Loss) | |||||||||||||||||||||||||
| Dynamic Aggressive Growth Portfolio | $ | — | $ | (2,648 | ) | $ | (4,385,134 | ) | $ | 32,397 | $ | 603,035 | $ | (570,638 | ) | $ | (4,355,385 | ) | |||||||||||||
| Dynamic Deep Value Portfolio | 40,664 | (2,628 | ) | (3,505,886 | ) | 1,420,495 | 2,014,201 | (593,706 | ) | (2,047,355 | ) | ||||||||||||||||||||
| Dynamic Large Cap Growth Portfolio | 1,025,362 | (12,919 | ) | (207,094,198 | ) | (13,405,492 | ) | 22,153,233 | (35,558,725 | ) | (219,487,247 | ) | |||||||||||||||||||
| Dynamic Large Cap Portfolio | 230,656 | (2,988 | ) | (6,333,686 | ) | (2,519,084 | ) | 2,049,956 | (4,569,040 | ) | (8,625,102 | ) | |||||||||||||||||||
| Dynamic Large Cap Value Portfolio | 2,111,234 | (7,539 | ) | (74,691,661 | ) | (18,394,902 | ) | 19,424,342 | (37,819,244 | ) | (90,982,868 | ) | |||||||||||||||||||
| Dynamic Mid Cap Growth Portfolio | — | (8,637 | ) | (140,954,618 | ) | 1,265,879 | 16,938,472 | (15,672,593 | ) | (139,697,376 | ) | ||||||||||||||||||||
| Dynamic Mid Cap Portfolio | 14,512 | (2,822 | ) | (7,773,822 | ) | 1,696,196 | 2,639,211 | (943,015 | ) | (6,065,936 | ) | ||||||||||||||||||||
| Dynamic Mid Cap Value Portfolio | 159,217 | (3,912 | ) | (37,294,317 | ) | 226,518 | 5,708,848 | (5,482,330 | ) | (36,912,494 | ) | ||||||||||||||||||||
| Dynamic Small Cap Growth Portfolio | 48,019 | (3,446 | ) | (39,808,612 | ) | 2,382,534 | 5,113,258 | (2,730,724 | ) | (37,381,505 | ) | ||||||||||||||||||||
| Dynamic Small Cap Portfolio | 27,590 | (2,701 | ) | (5,354,583 | ) | 1,272,748 | 2,234,231 | (961,483 | ) | (4,056,946 | ) | ||||||||||||||||||||
| Dynamic Small Cap Value Portfolio | 68,771 | (4,232 | ) | (41,246,669 | ) | 7,809,861 | 12,450,145 | (4,640,284 | ) | (33,372,269 | ) | ||||||||||||||||||||
| FTSE NASDAQ Small Cap Portfolio | 1,474 | — | (323,673 | ) | (603,726 | ) | 111,618 | (715,344 | ) | (925,925 | ) | ||||||||||||||||||||
| Zacks Micro Cap Portfolio | 121,683 | (4,341 | ) | (70,361,842 | ) | (6,767,366 | ) | 3,196,100 | (9,963,466 | ) | (77,011,866 | ) | |||||||||||||||||||
| Zacks Small Cap Portfolio | — | (3,195 | ) | (26,699,804 | ) | (4,657,767 | ) | 1,385,526 | (6,043,293 | ) | (31,360,766 | ) | |||||||||||||||||||
97
Notes to Financial Statements (Continued)
PowerShares Exchange-Traded Fund Trust
April 30, 2009
Distributions to Shareholders:
The tax character of distributions paid was as follows:
| Year Ended April 30, 2009 | Year Ended April 30, 2008 | ||||||||||
| Distributions paid from Ordinary Income | Distributions paid from Ordinary Income | ||||||||||
| Dynamic Deep Value Portfolio | $ | 126,793 | $ | 236,479 | |||||||
| Dynamic Large Cap Growth Portfolio | 2,172,246 | 1,364,504 | |||||||||
| Dynamic Large Cap Portfolio | 365,160 | 115,860 | |||||||||
| Dynamic Large Cap Value Portfolio | 4,825,414 | 6,461,590 | |||||||||
| Dynamic Mid Cap Portfolio | 132,595 | 71,701 | |||||||||
| Dynamic Mid Cap Value Portfolio | 992,947 | 1,388,612 | |||||||||
| Dynamic Small Cap Portfolio | 45,596 | 24,996 | |||||||||
| Dynamic Small Cap Value Portfolio | 695,379 | 1,007,247 | |||||||||
| FTSE NASDAQ Small Cap Portfolio | 15,180 | — | |||||||||
| Zacks Micro Cap Portfolio | 1,156,194 | 1,084,217 | |||||||||
| Zacks Small Cap Portfolio | 210,193 | 359,366 | |||||||||
| Year Ended April 30, 2009 | Year Ended April 30, 2008 | ||||||||||
| Distributions paid from Long-term Capital Gains | Distributions paid from Long-term Capital Gains | ||||||||||
| FTSE NASDAQ Small Cap Portfolio | 9 | — | |||||||||
| Year Ended April 30, 2009 | Year Ended April 30, 2008 | ||||||||||
| Distributions paid from Return of Capital | Distributions paid from Return of Capital | ||||||||||
| Dynamic Mid Cap Growth Portfolio | $ | — | $ | 35,820 | |||||||
| Dynamic Small Cap Portfolio | — | 66,108 | |||||||||
| Dynamic Small Cap Value Portfolio | — | 2,478,948 | |||||||||
| Zacks Small Cap Portfolio | 20,801 | — | |||||||||
At April 30, 2009, for Federal income tax purposes, the Funds had capital loss carryforwards available as shown in the table below, to the extent provided by the regulations, to offset future capital gains through the years indicated. To the extent that these loss carryforwards are used to offset future capital gains, it is probable that the capital gains so offset will not be distributed to shareholders. The use of some portion of the capital loss carryforward by any one Fund may be limited by Federal tax rules. Among others, certain rules limit the use of the carryforward when there has been a greater than fifty percent change in ownership of a Fund.
98
Notes to Financial Statements (Continued)
PowerShares Exchange-Traded Fund Trust
April 30, 2009
| Capital Loss Available Through | Total | ||||||||||||||||||||||
| 2014 | 2015 | 2016 | 2017 | Amount | |||||||||||||||||||
| Dynamic Aggressive Growth Portfolio | $ | — | $ | — | $ | 497,988 | $ | 2,497,135 | $ | 2,995,123 | |||||||||||||
| Dynamic Deep Value Portfolio | — | — | 1,131,687 | 1,533,921 | 2,665,608 | ||||||||||||||||||
| Dynamic Large Cap Growth Portfolio | 191,864 | 10,916,066 | 14,024,455 | 68,715,641 | 93,848,026 | ||||||||||||||||||
| Dynamic Large Cap Portfolio | — | — | 87,112 | 2,328,337 | 2,415,449 | ||||||||||||||||||
| Dynamic Large Cap Value Portfolio | 70,814 | 1,378,743 | 2,783,761 | 22,558,581 | 26,791,899 | ||||||||||||||||||
| Dynamic Mid Cap Growth Portfolio | 422,220 | 8,055,857 | 5,112,579 | 54,769,394 | 68,360,050 | ||||||||||||||||||
| Dynamic Mid Cap Portfolio | — | — | 628,828 | 3,815,763 | 4,444,591 | ||||||||||||||||||
| Dynamic Mid Cap Value Portfolio | 237,806 | 2,384,765 | 5,347,255 | 12,697,113 | 20,666,939 | ||||||||||||||||||
| Dynamic Small Cap Growth Portfolio | 823,782 | 13,094,039 | 6,666,558 | 9,873,821 | 30,458,200 | ||||||||||||||||||
| Dynamic Small Cap Portfolio | — | — | 1,028,299 | 2,730,989 | 3,759,288 | ||||||||||||||||||
| Dynamic Small Cap Value Portfolio | 703,862 | 3,929,009 | 8,615,687 | 16,547,947 | 29,796,505 | ||||||||||||||||||
| Zacks Micro Cap Portfolio | 1,951,245 | 15,172,527 | 14,330,930 | 28,781,451 | 60,236,153 | ||||||||||||||||||
| Zacks Small Cap Portfolio | — | 3,417,527 | 7,222,482 | 10,219,592 | 20,859,601 | ||||||||||||||||||
Capital losses incurred after October 31 ("post-October losses") within the taxable year are deemed to arise on the first business day of each Fund's next taxable year.
During the year ended April 30, 2009, the Funds incurred and will elect to defer net capital losses as follows:
| Post-October Losses | |||||||
| Dynamic Aggressive Growth Portfolio | $ | 1,390,011 | |||||
| Dynamic Deep Value Portfolio | 840,278 | ||||||
| Dynamic Large Cap Growth Portfolio | 113,246,172 | ||||||
| Dynamic Large Cap Portfolio | 3,918,237 | ||||||
| Dynamic Large Cap Value Portfolio | 47,899,762 | ||||||
| Dynamic Mid Cap Growth Portfolio | 72,594,568 | ||||||
| Dynamic Mid Cap Portfolio | 3,329,231 | ||||||
| Dynamic Mid Cap Value Portfolio | 16,627,378 | ||||||
| Dynamic Small Cap Growth Portfolio | 9,350,412 | ||||||
| Dynamic Small Cap Portfolio | 1,595,295 | ||||||
| Dynamic Small Cap Value Portfolio | 11,450,164 | ||||||
| FTSE NASDAQ Small Cap Portfolio | 323,673 | ||||||
| Zacks Micro Cap Portfolio | 10,125,689 | ||||||
| Zacks Small Cap Portfolio | 5,840,203 | ||||||
99
Notes to Financial Statements (Continued)
PowerShares Exchange-Traded Fund Trust
April 30, 2009
In order to present shares of beneficial interest and accumulated net realized gains or losses on the Statements of Assets and Liabilities that more closely represent their tax character, certain adjustments have been made to shares of beneficial interest, undistributed net investment income or loss and accumulated net realized gain or loss on investments. These differences are primarily due to redemptions-in-kind, investments in partnerships, wash sales, book equalization, return of capital and net operating losses, if any. These adjustments have no effect on net assets. For the year ended April 30, 2009, the adjustments were as follows:
| Undistributed Net Investment Income (Loss) | Undistributed Capital Gains | Shares of Beneficial Interest | |||||||||||||
| Dynamic Aggressive Growth Portfolio | $ | 20,796 | $ | 2,584,695 | $ | (2,605,491 | ) | ||||||||
| Dynamic Deep Value Portfolio | 1,946 | 3,236,111 | (3,238,057 | ) | |||||||||||
| Dynamic Large Cap Growth Portfolio | 483,455 | 60,386,171 | (60,869,626 | ) | |||||||||||
| Dynamic Large Cap Portfolio | (60,045 | ) | 4,822,824 | (4,762,779 | ) | ||||||||||
| Dynamic Large Cap Value Portfolio | (385,582 | ) | 16,163,838 | (15,778,256 | ) | ||||||||||
| Dynamic Mid Cap Growth Portfolio | 44,455 | 52,300,711 | (52,345,166 | ) | |||||||||||
| Dynamic Mid Cap Portfolio | (5,421 | ) | 3,866,237 | (3,860,816 | ) | ||||||||||
| Dynamic Mid Cap Value Portfolio | 58,260 | 9,730,535 | (9,788,795 | ) | |||||||||||
| Dynamic Small Cap Growth Portfolio | 11,854 | 7,706,965 | (7,718,819 | ) | |||||||||||
| Dynamic Small Cap Portfolio | (9,361 | ) | 4,496,422 | (4,487,061 | ) | ||||||||||
| Dynamic Small Cap Value Portfolio | (16,498 | ) | 25,838,654 | (25,822,156 | ) | ||||||||||
| FTSE NASDAQ Small Cap Portfolio | 11,188 | 137,733 | (148,921 | ) | |||||||||||
| Zacks Micro Cap Portfolio | (52,600 | ) | 11,077,629 | (11,025,029 | ) | ||||||||||
| Zacks Small Cap Portfolio | (20,891 | ) | 4,595,870 | (4,574,979 | ) | ||||||||||
Note 6. Investment Transactions
For the year ended April 30, 2009, the cost of securities purchased and proceeds from sales of securities, excluding short-term securities and in-kind transactions, were as follows:
| Purchases | Sales | ||||||||||
| Dynamic Aggressive Growth Portfolio | $ | 6,197,038 | $ | 6,602,362 | |||||||
| Dynamic Deep Value Portfolio | 7,096,352 | 7,084,203 | |||||||||
| Dynamic Large Cap Growth Portfolio | 384,015,385 | 387,985,462 | |||||||||
| Dynamic Large Cap Portfolio | 17,719,790 | 18,187,707 | |||||||||
| Dynamic Large Cap Value Portfolio | 185,634,686 | 187,438,044 | |||||||||
| Dynamic Mid Cap Growth Portfolio | 211,130,833 | 208,258,851 | |||||||||
| Dynamic Mid Cap Portfolio | 15,354,761 | 15,617,602 | |||||||||
| Dynamic Mid Cap Value Portfolio | 52,181,603 | 51,654,288 | |||||||||
| Dynamic Small Cap Growth Portfolio | 45,616,521 | 46,389,083 | |||||||||
| Dynamic Small Cap Portfolio | 12,250,611 | 12,445,395 | |||||||||
| Dynamic Small Cap Value Portfolio | 75,541,242 | 76,687,190 | |||||||||
| FTSE NASDAQ Small Cap Portfolio | 388,985 | 424,335 | |||||||||
| Zacks Micro Cap Portfolio | 33,718,630 | 36,112,369 | |||||||||
| Zacks Small Cap Portfolio | 17,625,399 | 18,087,470 | |||||||||
100
Notes to Financial Statements (Continued)
PowerShares Exchange-Traded Fund Trust
April 30, 2009
For the year ended April 30, 2009, in-kind transactions associated with creations and redemptions, were as follows:
| Securities Received | Securities Delivered | ||||||||||
| Dynamic Aggressive Growth Portfolio | $ | 31,002,638 | $ | 31,838,733 | |||||||
| Dynamic Deep Value Portfolio | 23,257,504 | 17,267,477 | |||||||||
| Dynamic Large Cap Growth Portfolio | 381,291,685 | 545,886,199 | |||||||||
| Dynamic Large Cap Portfolio | 48,483,968 | 28,079,406 | |||||||||
| Dynamic Large Cap Value Portfolio | 282,011,176 | 179,642,858 | |||||||||
| Dynamic Mid Cap Growth Portfolio | 380,310,581 | 486,065,213 | |||||||||
| Dynamic Mid Cap Portfolio | 28,608,616 | 28,279,272 | |||||||||
| Dynamic Mid Cap Value Portfolio | 70,186,499 | 84,592,826 | |||||||||
| Dynamic Small Cap Growth Portfolio | 62,049,014 | 62,788,941 | |||||||||
| Dynamic Small Cap Portfolio | 31,102,866 | 27,340,365 | |||||||||
| Dynamic Small Cap Value Portfolio | 121,843,545 | 114,633,393 | |||||||||
| FTSE NASDAQ Small Cap Portfolio | 1,722,431 | 1,504,808 | |||||||||
| Zacks Micro Cap Portfolio | 65,111,233 | 75,900,313 | |||||||||
| Zacks Small Cap Portfolio | 27,408,524 | 32,580,023 | |||||||||
Gains on in-kind transactions are generally not considered taxable gains for Federal income tax purposes.
Note 7. Trustees' Fees
The Funds compensate each Trustee who is not an employee of the Adviser or its affiliates. With respect to the FTSE NASDAQ Small Cap Portfolio, the Adviser, as result of the unitary management fee, pays for such compensation. The "Interested" Trustee of the Trust does not receive any Trustees' fees.
The Trust has adopted a deferred compensation plan (the "Plan"). Under the Plan, a Trustee who is not an "interested person" (as defined in the 1940 Act) (an "Independent Trustee") and has executed a Deferred Fee Agreement (a "Participating Trustee") may defer receipt of all or a portion of his compensation ("Deferral Fees"). Such Deferral Fees are deemed to be invested in selected PowerShares Funds. The Deferral Fees payable to the Participating Trustee are valued as of the date such Fees would have been paid to the Participating Trustee. The value increases with contributions or with increases in the value of the shares selected, and the value decreases with distributions or with declines in the value of the shares selected.
Note 8. Capital
Shares are created and redeemed by the Trust only in Creation Unit size aggregations of 100,000. Only Authorized Participants are permitted to purchase or redeem Creation Units from the Funds. Such transactions are generally permitted on an in-kind basis, with a balancing cash component to equate the transaction to the net asset value per unit of each Fund of the Trust on the transaction date. Cash may be substituted equivalent to the value of certain securities generally when they are not available in sufficient quantity for delivery, not eligible for trading by the Authorized Participant or as a result of other market circumstances.
101
Notes to Financial Statements (Continued)
PowerShares Exchange-Traded Fund Trust
April 30, 2009
Note 9. Indemnifications
Under the Trust's organizational documents, its officers and Trustees are indemnified against certain liabilities arising out of the performance of their duties to the Trust. Each Independent Trustee is also indemnified against certain liabilities arising out of the performance of his duties to the Trust pursuant to an Indemnification Agreement between the Independent Trustee and the Trust. Additionally, in the normal course of business, the Trust enters into contracts with service providers that contain general indemnification clauses. The Trust's maximum exposure under these arrangements is unknown, as this would involve future claims that may be made against the Trust that have not yet occurred. However, based on experience, the Trust believes the risk of loss to be remote.
Note 10. Subsequent Event
On May 1, 2009, the Board of Trustees of the Trust approved the liquidation of the PowerShares Dynamic Aggressive Growth Portfolio and PowerShares Dynamic Deep Value Portfolio. The portfolios were liqudated at fair value on May 22, 2009.
102
Report of Independent Registered Public Accounting Firm
To the Board of Trustees and Shareholders of PowerShares Exchange-Traded Fund Trust:
In our opinion, the accompanying statements of assets and liabilities, including the schedules of investments, and the related statements of operations and of changes in net assets and the financial highlights present fairly, in all material respects, the financial position of each of the portfolios indicated in Note 1 of the financial statements (each a portfolio of PowerShares Exchange-Traded Fund Trust, hereafter referred to as the "Trust") at April 30, 2009, and the results of each of their operations, the changes in each of their net assets, and the financial highlights for each of the periods presented, in conformity with accounting principles generally accepted in the United States of America. These financial statements and financial highlights (hereafter referred to as "financial statements") are the responsibility of the Trust's management; our responsibility is to express an opinion on these financial statements based on our audits. We conducted our audits of these financial statements in accordance with the standards of the Public Company Accounting Oversight Board (United States). Those standards require that we plan and perform the audits to obtain reasonable assurance about whether the financial statements are free of material misstatement. An audit includes examining, on a test basis, evidence supporting the amounts and disclosures in the financial statements, assessing the accounting principles used and significant estimates made by management, and evaluating the overall financial statement presentation. We believe that our audits, which included confirmation of securities at April 30, 2009 by correspondence with the custodian and brokers, and the application of alternative auditing procedures where securities purchased had not been received, provide a reasonable basis for our opinion.
As discussed in Note 10 to the financial statements, on May 1, 2009, the Board of Trustees approved the liquidation of the PowerShares Dynamic Aggressive Growth Portfolio and PowerShares Dynamic Deep Value Portfolio, effected on May 22, 2009.
PricewaterhouseCoopers LLP
New York, New York
June 25, 2009
103
Supplemental Information (Unaudited)
Tax Information
Form 1099-DIV, Form 1042-S and other year-end tax information provide shareholders with actual calendar year amounts that should be included in their tax returns. Shareholders should consult their tax advisors.
The following distribution information is being provided as required by the Internal Revenue Code or to meet a specific state's requirement.
Each Fund designates the following amounts or, if subsequently determined to be different the maximum amount allowable for its fiscal year ended April 30, 2009 and if applicable its final fiscal year ended May 22, 2009:
Federal Income Tax Information
| April 30, 2009 | |||||||||||||||
| Long-Term Capital Gains Dividends | Qualified Dividend Income* | Corporate Dividends Received Deduction* | |||||||||||||
| Dynamic Aggressive Growth Portfolio | $ | — | 0 | % | 0 | % | |||||||||
| Dynamic Deep Value Portfolio | — | 100 | % | 100 | % | ||||||||||
| Dynamic Large Cap Growth Portfolio | — | 100 | % | 100 | % | ||||||||||
| Dynamic Large Cap Portfolio | — | 100 | % | 100 | % | ||||||||||
| Dynamic Large Cap Value Portfolio | — | 100 | % | 100 | % | ||||||||||
| Dynamic Mid Cap Growth Portfolio | — | 0 | % | 0 | % | ||||||||||
| Dynamic Mid Cap Portfolio | — | 100 | % | 100 | % | ||||||||||
| Dynamic Mid Cap Value Portfolio | — | 100 | % | 100 | % | ||||||||||
| Dynamic Small Cap Growth Portfolio | — | 0 | % | 0 | % | ||||||||||
| Dynamic Small Cap Portfolio | — | 100 | % | 100 | % | ||||||||||
| Dynamic Small Cap Value Portfolio | — | 100 | % | 100 | % | ||||||||||
| FTSE NASDAQ Small Cap Portfolio | 9 | 100 | % | 100 | % | ||||||||||
| Zacks Micro Cap Portfolio | — | 100 | % | 100 | % | ||||||||||
| Zacks Small Cap Portfolio | — | 100 | % | 100 | % | ||||||||||
Federal Income Tax Information for liquidating funds
| May 22, 2009 | |||||||||||
| Qualified Dividend Income* | Corporate Dividends Received Deduction* | ||||||||||
| Dynamic Aggressive Growth Portfolio | 0 | % | 0 | % | |||||||
| Dynamic Deep Value Portfolio | 100 | % | 100 | % | |||||||
* The above percentages are based on ordinary income dividends paid to shareholders during the Fund's fiscal year.
104
Supplemental Information (Continued)
Trustees and Officers
The Independent Trustees, the Trustee who is affiliated with the Adviser (the "Management Trustee") and the executive officers of the Trust, their term of office and length of time served, their principal business occupations during at least the past five years, the number of portfolios in the Fund Complex (as defined below) overseen by each Trustee and the other directorships, if any, held by a Trustee, are shown below.
| Name, Address, and Age Independent Trustee | Position(s) with Trust | Length Time Served* | Principal Occupation(s) During Past 5 Years | Number of Portfolios in Fund Complex** Overseen by Trustee | Other Directorships Held by Trustee | ||||||||||||||||||
| Ronn R. Bagge 51 YQA Capital Management, LLC 1755 S. Naperville Road Suite 100 Wheaton, IL 60187 | Trustee | Since 2003 | YQA Capital Management LLC (July 1998-Present); formerly Owner/CEO of Electronic Dynamic Balancing Co., Inc. (high-speed rotating equipment service provider) | 119 | None | ||||||||||||||||||
| Marc M. Kole 48 c/o Invesco PowerShares Capital Management LLC 301 W. Roosevelt Road Wheaton, IL 60187 | Trustee | Since 2006 | Vice President of Finance and Accounting, Hope Network (social services) (November 2008-Present); formerly Assistant Vice President and Controller, Priority Health (health insurance) (September 2005-April 2008); Senior Vice President of Finance, United Healthcare (health insurance) (July 2004-July 2005); Senior Vice President of Finance, Oxford Health Plans (June 2000-July 2004) | 119 | None | ||||||||||||||||||
* This is the date the Trustee began serving the Trust. Each Trustee serves an indefinite term, until his successor is elected.
** Fund Complex includes all open-end funds (including all of their portfolios) advised by the Adviser. At April 30, 2009, the Fund Complex consists of the Trust's 75 portfolios and three other exchange-traded fund trusts with 44 portfolios advised by the Adviser.
105
Supplemental Information (Continued)
Trustees and Officers (Continued)
| Name, Address, and Age Independent Trustee | Position(s) with Trust | Length Time Served* | Principal Occupation(s) During Past 5 Years | Number of Portfolios in Fund Complex** Overseen by Trustee | Other Directorships Held by Trustee | ||||||||||||||||||
| Philip M. Nussbaum 47 c/o Invesco PowerShares Capital Management LLC 301 W. Roosevelt Road Wheaton, IL 60187 | Trustee | Since 2003 | Chairman, Performance Trust Capital Partners (formerly Betzold, Berg, Nussbaum & Heitman, Inc.) (November 2004-Present); formerly Managing Director, Communication Institute (May 2002-August 2003); Executive Vice President of Finance, Betzold, Berg, Nussbaum & Heitman, Inc. (March 1994-1999) | 119 | None | ||||||||||||||||||
| Donald H. Wilson 49 c/o Invesco PowerShares Capital Management LLC 301 W. Roosevelt Road Wheaton, IL 60187 | Trustee | Since 2006 | President and Chief Operating Officer, AMCORE Financial, Inc. (bank holding company) (August 2007-April 2009), formerly Executive Vice President and Chief Financial Officer, AMCORE Financial, Inc. (February 2006-August 2007); Senior Vice President and Treasurer, Marshall & Ilsley Corp. (bank holding company) (May 1995-February 2006) | 119 | None | ||||||||||||||||||
* This is the date the Trustee began serving the Trust. Each Trustee serves an indefinite term, until his successor is elected.
** Fund Complex includes all open-end funds (including all of their portfolios) advised by the Adviser. At April 30, 2009, the Fund Complex consists of the Trust's 75 portfolios and three other exchange-traded fund trusts with 44 portfolios advised by the Adviser.
106
Supplemental Information (Continued)
Trustees and Officers (Continued)
| Name, Address, and Age of Management Trustee | Position(s) with Trust | Length Time Served* | Principal Occupation(s) During Past 5 Years | Number of Portfolios in Fund Complex*** Overseen by Trustee | Other Directorships Held by Trustee | ||||||||||||||||||
| H. Bruce Bond** 45 Invesco PowerShares Capital Management LLC 301 W. Roosevelt Road Wheaton, IL 60187 | Chairman of the Board, Trustee and President | Since 2003 | Managing Director, Invesco PowerShares Capital Management LLC (August 2002-Present); formerly Manager, Nuveen Investments (April 1998-August 2002) | 119 | None | ||||||||||||||||||
Availability of Additional Information About the Trustees
The Statement of Additional Information includes additional information about the Trustees and is available, without charge, upon request at 800.337.4246.
* This is the date the Management Trustee began serving the Trust. Each Trustee serves an indefinite term, until his successor is elected. Each officer serves a one year term, until his successor is elected.
** "Interested person" as defined in Section 2(a)(19) of the 1940 Act.
*** Fund Complex includes all open-end funds (including all of their portfolios) advised by the Adviser. At April 30, 2009, the Fund Complex consists of the Trust's 75 portfolios and three other exchange-traded fund trusts with 44 portfolios advised by the Adviser.
107
Supplemental Information (Continued)
Trustees and Officers (Continued)
| Name, Address, and Age of Officers | Position(s) with Trust | Length Time Served* | Principal Occupation(s) During Past 5 Years | ||||||||||||
| Bruce T. Duncan 54 Invesco PowerShares Capital Management LLC 301 W. Roosevelt Road Wheaton, IL 60187 | Chief Financial Officer, Treasurer and Secretary | Chief Financial Officer and Treasurer Since 2006 Secretary Since 2008 | Senior Vice President of Finance, Invesco PowerShares Capital Management LLC (September 2005-Present); formerly Private Practice Attorney (2000-2005); Vice President of Investor Relations, The ServiceMaster Company (1994-2000); Vice President of Taxes, The ServiceMaster Company (1990-2000) | ||||||||||||
| Kevin R. Gustafson 43 Invesco PowerShares Capital Management LLC 301 W. Roosevelt Road Wheaton, IL 60187 | Chief Compliance Officer | Since 2004 | General Counsel, Invesco PowerShares Capital Management LLC (September 2004-Present); formerly Chief Compliance Officer, Invesco PowerShares Capital Management LLC (September 2004-April 2008) | ||||||||||||
| John W. Southard, Jr., CFA, MBA 39 Invesco PowerShares Capital Management LLC 301 West Roosevelt Road Wheaton, IL 60187 | Vice President | Since 2003 | Managing Director, Invesco PowerShares Capital Management LLC (August 2002-Present); formerly, Treasurer of the Trust (April 2003-April 2006); Senior Equity Analyst, Charles Schwab & Company (May 2001-August 2002) | ||||||||||||
* This is the period for which the Officers began serving the Trust. Each Officer serves one year term, until his successor is elected.
108
Board Considerations Regarding Continuation of Investment Advisory Agreement
At a meeting held on April 16, 2009, the Board of Trustees of the PowerShares Exchange-Traded Fund Trust (the "Trust"), including the Independent Trustees, unanimously approved the continuation of the Investment Advisory Agreement between Invesco PowerShares Capital Management LLC (the "Adviser") and the Trust for the following 70 series (each, a "Fund" and collectively, the "Funds"):
PowerShares Dynamic Market Portfolio
PowerShares Dynamic OTC Portfolio
PowerShares Golden Dragon Halter USX China Portfolio
PowerShares High Yield Equity Dividend AchieversTM Portfolio
PowerShares WilderHill Clean Energy Portfolio
PowerShares Dynamic Large Cap Growth Portfolio
PowerShares Dynamic Large Cap Value Portfolio
PowerShares Dynamic Mid Cap Growth Portfolio
PowerShares Dynamic Mid Cap Value Portfolio
PowerShares Dynamic Small Cap Growth Portfolio
PowerShares Dynamic Small Cap Value Portfolio
PowerShares Dynamic Biotechnology & Genome Portfolio
PowerShares Dynamic Food & Beverage Portfolio
PowerShares Dynamic Leisure and Entertainment Portfolio
PowerShares Dynamic Media Portfolio
PowerShares Dynamic Networking Portfolio
PowerShares Dynamic Pharmaceuticals Portfolio
PowerShares Dynamic Semiconductors Portfolio
PowerShares Dynamic Software Portfolio
PowerShares Zacks Micro Cap Portfolio
PowerShares Aerospace & Defense Portfolio
PowerShares Dynamic Hardware & Consumer Electronics Portfolio
PowerShares Dynamic Telecommunications & Wireless Portfolio
PowerShares Value Line Timeliness Select Portfolio
PowerShares Dividend AchieversTM Portfolio
PowerShares International Dividend AchieversTM Portfolio
PowerShares High Growth Rate Dividend AchieversTM Portfolio
PowerShares Zacks Small Cap Portfolio
PowerShares Dynamic Building and Construction Portfolio
PowerShares Dynamic Energy Exploration and Production Portfolio
PowerShares Dynamic Insurance Portfolio
PowerShares Dynamic Oil and Gas Services Portfolio
PowerShares Dynamic Retail Portfolio
PowerShares Dynamic Utilities Portfolio
PowerShares Lux Nanotech Portfolio
PowerShares FTSE RAFI US 1000 Portfolio
PowerShares FTSE RAFI US 1500 Small-Mid Portfolio
PowerShares Water Resources Portfolio
PowerShares Dynamic Energy Sector Portfolio
PowerShares Dynamic Financials Sector Portfolio
PowerShares Dynamic Healthcare Sector Portfolio
PowerShares Dynamic Industrials Sector Portfolio
PowerShares Dynamic Large Cap Portfolio
PowerShares Dynamic MagniQuant Portfolio
PowerShares Dynamic Mid Cap Portfolio
PowerShares Dynamic Small Cap Portfolio
PowerShares Dynamic Technology Sector Portfolio
PowerShares Buyback AchieversTM Portfolio
PowerShares FTSE RAFI Basic Materials Sector Portfolio
PowerShares FTSE RAFI Consumer Goods Sector Portfolio
PowerShares FTSE RAFI Consumer Services Sector Portfolio
PowerShares FTSE RAFI Energy Sector Portfolio
PowerShares FTSE RAFI Financials Sector Portfolio
PowerShares FTSE RAFI Health Care Sector Portfolio
PowerShares FTSE RAFI Industrials Sector Portfolio
PowerShares FTSE RAFI Telecommunications & Technology Sector Portfolio
109
Board Considerations Regarding Continuation of Investment Advisory Agreement (Continued)
PowerShares FTSE RAFI Utilities Sector Portfolio
PowerShares Cleantech Portfolio
PowerShares Dynamic Aggressive Growth Portfolio
PowerShares Dynamic Banking Portfolio
PowerShares Dynamic Basic Materials Sector Portfolio
PowerShares Dynamic Consumer Discretionary Sector Portfolio
PowerShares Dynamic Consumer Staples Sector Portfolio
PowerShares Dynamic Healthcare Services Portfolio
PowerShares Dynamic Deep Value Portfolio
PowerShares Financial Preferred Portfolio
PowerShares Listed Private Equity Portfolio
PowerShares DWA Technical Leaders Portfolio
PowerShares Value Line Industry Rotation Portfolio
PowerShares WilderHill Progressive Energy Portfolio
The Trustees reviewed information from the Adviser describing: (i) the nature, extent and quality of services provided, (ii) the investment performance of the Funds and the Adviser, (iii) the costs of services provided and estimated profits realized by the Adviser, (iv) the extent to which economies of scale are realized as the Funds grow, (v) whether fee levels reflect any possible economies of scale for the benefit of Fund shareholders, (vi) comparisons of services rendered and amounts paid to other registered investment companies and (vii) any benefits realized by the Adviser from its relationship with each Fund. Based on all of the information considered and the conclusions reached, the Board, including the Independent Trustees, determined to approve the continuation of the Investment Advisory Agreement for each Fund. No single factor was determinative in the Board's analysis.
Nature, Extent and Quality of Services. In evaluating the nature, extent and quality of the Adviser's services, the Trustees reviewed information concerning the functions performed by the Adviser for the Funds, information describing the Adviser's current organization and projected staffing, including operations assistance provided by the Adviser's parent organization, Invesco Ltd., and the background and experience of the persons responsible for the day-to-day management of the Funds. The Trustees reviewed matters related to the Adviser's execution of portfolio transactions on behalf of the Funds. The Trustees also reviewed information on the performance of the Funds and the performance of their underlying indices through December 31, 2008. The Trustees also reviewed reports on the correlation and tracking error between the underlying index and each Fund's performance, and the Adviser's analysis of the tracking error between each Fund and its underlying index. The Trustees noted that each Fund's correlation was within the targeted range set forth in the Trust's registration statement and that, for each Fund other than PowerShares Financial Preferred Portfolio, the tracking error was within the targeted range set forth in the Trust's registration statement. The Trustees reviewed the reasons for PowerShares Financial Preferred Portfolio's tracking error. The Trustees concluded that each Fund was correlated to its underlying index and that the tracking error for each Fund was within an acceptable range given that Fund's particular circumstances.
The Trustees also considered the services provided by the Adviser in its oversight of the Funds' administrator, custodian and transfer agent. They noted the significant amount of time and effort that had been devoted to this oversight function.
Based on their review, the Trustees concluded that the nature, extent and quality of services provided by the Adviser to the Funds under the Investment Advisory Agreement were appropriate and reasonable.
110
Board Considerations Regarding Continuation of Investment Advisory Agreement (Continued)
Fees, Expenses and Profitability. The Trustees reviewed and discussed the information provided by the Adviser on each Fund's expense ratio and advisory fee, as compared to information compiled by the Adviser from Lipper Inc. databases on the expense ratios of comparable exchange-traded funds ("ETFs"), open-end (non-ETF) index funds and open-end actively-managed funds. The Trustees noted that the annual advisory fee charged to each Fund is:
• 0.50% of the Fund's average net assets, for each Fund other than PowerShares High Yield Equity Dividend AchieversTM Portfolio, PowerShares Dividend AchieversTM Portfolio, PowerShares High Growth Rate Dividend AchieversTM Portfolio, PowerShares International Dividend AchieversTM Portfolio, PowerShares FTSE RAFI Basic Materials Sector Portfolio, PowerShares FTSE RAFI Consumer Goods Sector Portfolio, PowerShares FTSE RAFI Consumer Services Sector Portfolio, PowerShares FTSE RAFI Energy Sector Portfolio, PowerShares FTSE RAFI Financials Sector Portfolio, PowerShares FTSE RAFI Health Care Sector Portfolio, PowerShares FTSE RAFI Industrials Sector Portfolio, PowerShares FTSE RAFI Telecommunications & Technology Sector Portfolio, PowerShares FTSE RAFI Utilities Sector Portfolio, PowerShares FTSE RAFI US 1000 Portfolio and PowerShares FTSE RAFI US 1500 Small-Mid Portfolio ;
• 0.40% of the Fund's average net assets, for each of PowerShares High Yield Equity Dividend AchieversTM Portfolio, PowerShares Dividend AchieversTM Portfolio, PowerShares High Growth Rate Dividend AchieversTM Portfolio and PowerShares International Dividend AchieversTM Portfolio; and
• 0.29% of the Fund's average net assets, for each of PowerShares FTSE RAFI Basic Materials Sector Portfolio, PowerShares FTSE RAFI Consumer Goods Sector Portfolio, PowerShares FTSE RAFI Consumer Services Sector Portfolio, PowerShares FTSE RAFI Energy Sector Portfolio, PowerShares FTSE RAFI Financials Sector Portfolio, PowerShares FTSE RAFI Health Care Sector Portfolio, PowerShares FTSE RAFI Industrials Sector Portfolio, PowerShares FTSE RAFI Telecommunications & Technology Sector Portfolio, PowerShares FTSE RAFI Utilities Sector Portfolio, PowerShares FTSE RAFI US 1000 Portfolio and PowerShares FTSE RAFI US 1500 Small-Mid Portfolio (the Trustees noted that the advisory fee for each of these Funds was reduced to 0.29% effective November 1, 2008).
The Trustees also noted that the Adviser has agreed to waive a portion of its advisory fee and/or pay expenses (an "Expense Cap") to the extent necessary to prevent the annual operating expenses of each Fund from exceeding the percentage of that Fund's average daily net assets, at least until August 31, 2010, as set forth below:
• 0.60%, excluding interest expenses, brokerage commissions and other trading expenses, taxes and extraordinary expenses, for each of PowerShares Dynamic OTC Portfolio and PowerShares Dynamic Market Portfolio;
• 0.50%, excluding interest expenses, licensing fees, offering costs, brokerage commissions and other trading expenses, taxes and extraordinary expenses, for each of PowerShares High Yield Equity Dividend AchieversTM Portfolio, PowerShares Dividend AchieversTM Portfolio, PowerShares High Growth Rate Dividend AchieversTM Portfolio and PowerShares International Dividend AchieversTM Portfolio;
• 0.39%, excluding interest expenses, offering costs, brokerage commissions and other trading expenses, taxes and extraordinary expenses, for each of PowerShares FTSE RAFI Basic Materials
111
Board Considerations Regarding Continuation of Investment Advisory Agreement (Continued)
Sector Portfolio, PowerShares FTSE RAFI Consumer Goods Sector Portfolio, PowerShares FTSE RAFI Consumer Services Sector Portfolio, PowerShares FTSE RAFI Energy Sector Portfolio, PowerShares FTSE RAFI Financials Sector Portfolio, PowerShares FTSE RAFI Health Care Sector Portfolio, PowerShares FTSE RAFI Industrials Sector Portfolio, PowerShares FTSE RAFI Telecommunications & Technology Sector Portfolio, PowerShares FTSE RAFI Utilities Sector Portfolio, PowerShares FTSE RAFI US 1000 Portfolio and PowerShares FTSE RAFI US 1500 Small-Mid Portfolio (the Trustees noted that, effective November 1, 2008, the Expense Cap for each of these Funds changed from 0.60% to 0.39%); and
• 0.60%, excluding interest expenses, licensing fees, offering costs, brokerage commissions and other trading expenses, taxes and extraordinary expenses, for each other Fund.
The Trustees noted that the Adviser represented that it does not manage any funds other than the Funds and other ETFs overseen by the Board. The Trustees noted that each Fund's advisory fee was:
• higher than the median advisory fee of its ETF peer funds (except for the advisory fee of each of PowerShares Financial Preferred Portfolio, PowerShares Golden Dragon Halter USX China Portfolio and PowerShares International Dividend AchieversTM Portfolio, which was lower than the median advisory fee of its ETF peer funds); and
• higher than the median advisory fee of its open-end index peer funds (except for the advisory fee of each of PowerShares DWA Technical Leaders Portfolio, PowerShares Dynamic Aggressive Growth Portfolio, PowerShares Dynamic Mid Cap Growth Portfolio, PowerShares Dynamic Mid Cap Value Portfolio, PowerShares Dynamic OTC Portfolio, PowerShares Dynamic Telecommunications & Wireless Portfolio, PowerShares Dynamic Utilities Portfolio, PowerShares Financial Preferred Portfolio, PowerShares FTSE RAFI Utilities Sector Portfolio and PowerShares Value Line Timeliness Select Portfolio, which was lower than the median advisory fee of its open-end index peer funds, and there was no comparable data for PowerShares Dynamic Basic Materials Sector Portfolio, PowerShares FTSE RAFI Basic Materials Sector Portfolio or PowerShares Golden Dragon Halter USX China Portfolio); but
• lower than the median advisory fee of its open-end actively-managed peer funds.
The Trustees determined that the advisory fees were reasonable, noting the complexity of the indices, which generally require more frequent rebalancing of the portfolios, the distinguishing factors of the Funds, and the higher administrative, operational and management oversight costs for the Adviser. With respect to the Funds' expense ratios, the Trustees noted that the net expense ratio for each Fund was:
• higher than the median expense ratio of its ETF peer funds (except for the net expense ratio of each of PowerShares Dynamic OTC Portfolio, PowerShares Financial Preferred Portfolio and PowerShares International Dividend AchieversTM Portfolio, which was less than the median expense ratio of its ETF peer funds, and the net expense ratio of each of PowerShares Dynamic Aggressive Growth Portfolio and PowerShares Dynamic Market Portfolio, which was equal to the median expense ratio of its ETF peer funds); and
• higher than the median expense ratio of its open-end index peer funds (except for the net expense ratio of each of PowerShares DWA Technical Leaders Portfolio, PowerShares Dynamic Aggressive
112
Board Considerations Regarding Continuation of Investment Advisory Agreement (Continued)
Growth Portfolio, PowerShares Dynamic Banking Portfolio, PowerShares Dynamic Biotechnology & Genome Portfolio, PowerShares Dynamic Financials Sector Portfolio, PowerShares Dynamic Healthcare Sector Portfolio, PowerShares Dynamic Healthcare Services Portfolio, PowerShares Dynamic Insurance Portfolio, PowerShares Dynamic OTC Portfolio, PowerShares Dynamic Pharmaceuticals Portfolio, PowerShares Dynamic Telecommunications & Wireless Portfolio, PowerShares Dynamic Utilities Portfolio, PowerShares Financial Preferred Portfolio, PowerShares FTSE RAFI Financials Sector Portfolio, PowerShares FTSE RAFI Utilities Sector Portfolio, PowerShares Listed Private Equity Portfolio and PowerShares Value Line Timeliness Select Portfolio, which was lower than the median expense ratio of its open-end index peer funds, and there was no comparable data for PowerShares Dynamic Basic Materials Sector Portfolio, PowerShares FTSE RAFI Basic Materi als Sector Portfolio or PowerShares Golden Dragon Halter USX China Portfolio); but
• lower than the median expense ratio of its open-end actively-managed peer funds.
The Trustees noted that a significant component of the non-advisory fee expenses was the license fees paid by the Funds.
The Board concluded that the advisory fee and expense ratio of each Fund (giving effect to the Fund's Expense Cap) were reasonable and appropriate in light of the services provided.
In conjunction with their review of fees, the Trustees also considered information provided by the Adviser on the revenues received by the Adviser under the Investment Advisory Agreement for each Fund, as well as the fees waived and expenses reimbursed by the Adviser for the Funds. The Trustees reviewed information provided by the Adviser on its profitability as well as any profits or losses realized by the Adviser from its relationship to each Fund. The Trustees concluded that the profitability to the Adviser of the advisory services provided to any of the Funds was not unreasonable.
Economies of Scale and Whether Fee Levels Reflect These Economies of Scale. The Trustees reviewed the information provided by the Adviser as to the extent to which economies of scale are realized as each Fund grows and whether fee levels reflect economies of scale for the benefit of shareholders. The Trustees reviewed each Fund's asset size, expense ratio and expense limitation agreed to by the Adviser. The Trustees noted that, for Funds whose expenses are higher than their respective Expense Caps, any reduction in that Fund's expenses would be enjoyed by the Adviser, but that Fund shareholders benefit from the lower expense ratio as a result of the Fund's Expense Cap. The Trustees also noted that the Excess Expense Agreement with the Trust provides that the Adviser is entitled to be reimbursed by each Fund, other than PowerShares Dynamic Market Portf olio and PowerShares Dynamic OTC Portfolio, for fees waived or expenses absorbed pursuant to the Expense Cap for a period of three years from the date the fee or expense was incurred, provided that no reimbursement would be made that would result in a Fund exceeding its Expense Cap. The Trustees considered whether the advisory fee rate for each Fund was reasonable in relation to the asset size of that Fund, and concluded that the flat advisory fee was reasonable and appropriate, noting the Fund expenses the Adviser has borne as a result of the Expense Cap.
The Trustees noted that the Adviser had not identified any further benefits that it derived from its relationship with the Funds and had noted that it does not have any soft-dollar arrangements.
Based on all of the information considered and the conclusions reached, the Board, including the Independent Trustees, determined to approve the continuation of the Investment Advisory Agreement for each Fund. No single factor was determinative in the Board's analysis.
113
Board Considerations Regarding Continuation of Investment Advisory Agreement (Continued)
At a meeting held on April 16, 2009, the Board of Trustees of the PowerShares Exchange-Traded Fund Trust (the "Trust"), including the Independent Trustees, unanimously approved the continuation of the Investment Advisory Agreement between Invesco PowerShares Capital Management LLC (the "Adviser") and the Trust for the following five series (each, a "Fund" and collectively, the "Funds"):
PowerShares FTSE NASDAQ Small Cap Portfolio
PowerShares NASDAQ Internet Portfolio
PowerShares NASDAQ-100 BuyWrite Portfolio
PowerShares NXQ Portfolio
PowerShares S&P 500 BuyWrite Portfolio
The Trustees reviewed information from the Adviser describing: (i) the nature, extent and quality of services provided, (ii) the investment performance of the Funds and the Adviser, (iii) the costs of services provided and estimated profits realized by the Adviser, (iv) the extent to which economies of scale are realized as the Funds grow, (v) whether fee levels reflect any possible economies of scale for the benefit of Fund shareholders, (vi) comparisons of services rendered and amounts paid to other registered investment companies and (vii) any benefits realized by the Adviser from its relationship with each Fund. Based on all of the information considered and the conclusions reached, the Board, including the Independent Trustees, determined to approve the continuation of the Investment Advisory Agreement for each Fund. No single factor was determinative in the Board's analysis.
Nature, Extent and Quality of Services. In evaluating the nature, extent and quality of the Adviser's services, the Trustees reviewed information concerning the functions performed by the Adviser for the Funds, information describing the Adviser's current organization and projected staffing, including operations assistance provided by the Adviser's parent organization, Invesco Ltd., and the background and experience of the persons responsible for the day-to-day management of the Funds. The Trustees reviewed matters related to the Adviser's execution of portfolio transactions on behalf of the Funds. The Trustees also reviewed information on the performance of the Funds and the performance of their underlying indices through December 31, 2008. The Trustees also reviewed reports on the correlation and tracking error between the underlying index and each Fund's performance, and the Adviser's analysis of the tracking error between each Fund and its underlying index. The Trustees noted that, in each case, the correlation and tracking error for each Fund was within the targeted range set forth in the Trust's registration statement. The Trustees concluded that each Fund was correlated to its underlying index and that the tracking error for each Fund was within an acceptable range given that Fund's particular circumstances.
The Trustees also considered the services provided by the Adviser in its oversight of the Funds' administrator, custodian and transfer agent. They noted the significant amount of time and effort that had been devoted to this oversight function.
Based on their review, the Trustees concluded that the nature, extent and quality of services provided by the Adviser to the Funds under the Investment Advisory Agreement were appropriate and reasonable.
Fees, Expenses and Profitability. The Trustees reviewed and discussed the information provided by the Adviser on each Fund's total expense ratio and unitary advisory fee, as compared to information compiled by the Adviser from Lipper Inc. databases on the expense ratios of comparable exchange-traded funds ("ETFs"), open-end (non-ETF) index funds and open-end actively-managed funds. The Trustees noted that the annual unitary advisory fee is 0.70% for each of PowerShares FTSE NASDAQ Small Cap Portfolio and PowerShares NXQ Portfolio, 0.60% for PowerShares NASDAQ Internet Portfolio and 0.75% for
114
Board Considerations Regarding Continuation of Investment Advisory Agreement (Continued)
each of PowerShares NASDAQ-100 BuyWrite Portfolio and PowerShares S&P 500 BuyWrite Portfolio, and that the Adviser pays all other expenses of each Fund, except that each Fund pays its brokerage expenses, taxes, interest and extraordinary expenses.
The Trustees noted that the Adviser represented that it does not manage any funds other than the Funds and other ETFs overseen by the Board. The Trustees noted that: the advisory fee for PowerShares FTSE NASDAQ Small Cap Portfolio was higher than the median expense ratios of its ETF peer funds and open-end index peer funds, but lower than the median expense ratio of its open-end actively-managed peer funds; the advisory fee for PowerShares NASDAQ Internet Portfolio was equal to or lower than the median expense ratio for each peer group; no comparable ETF peer fund information was available for PowerShares NASDAQ-100 BuyWrite Portfolio or PowerShares S&P 500 BuyWrite Portfolio, but the advisory fee for each of these Funds was lower than the median expense ratios of their open-end index peer funds and open-end actively-managed peer funds; and the advisory fee for PowerShares NXQ Portfolio was higher than the median expense rat io of its ETF peer funds, but lower than the median expense ratios of its open-end index peer funds and open-end actively-managed peer funds. The Trustees noted that each Fund's advisory fee was reasonable because of the complexity of the indices, which generally require more frequent rebalancing of the portfolios, the distinguishing factors of the Funds and the higher administrative, operational and management oversight costs for the Adviser. The Trustees also noted that a portion of each Fund's advisory fee was attributable to a license fee payable out of the unitary fee charged to that Fund. The Board concluded that the unitary advisory fee charged to each Fund was reasonable and appropriate in light of the services provided.
In conjunction with their review of the unitary advisory fee, the Trustees also considered information provided by the Adviser on the revenues received by the Adviser under the Investment Advisory Agreement. The Trustees reviewed information provided by the Adviser on its profitability as well as any profits or losses realized by the Adviser from its relationship to each Fund. The Trustees reviewed the overall profitability of the Adviser and noted that the Adviser, to date, had incurred a loss from its relationship with the Funds.
Economies of Scale and Whether Fee Levels Reflect These Economies of Scale. The Trustees reviewed the information provided by the Adviser as to the extent to which economies of scale are realized as each Fund grows and whether fee levels reflect economies of scale for the benefit of shareholders. The Trustees reviewed each Fund's asset size and expense ratio. The Trustees noted that any reduction in fixed costs associated with the management of the Funds would be enjoyed by the Adviser, but a unitary fee provides certainty in expenses for the Funds. The Trustees considered whether the advisory fee rate for each Fund was reasonable in relation to the asset size of that Fund, and concluded that the flat advisory fee was reasonable and appropriate.
The Trustees noted that the Adviser had not identified any further benefits that it derived from its relationship with the Funds and had noted that it does not have any soft-dollar arrangements.
Based on all of the information considered and the conclusions reached, the Board, including the Independent Trustees, determined to approve the continuation of the Investment Advisory Agreement for each Fund. No single factor was determinative in the Board's analysis.
115
This page intentionally left blank
PROXY VOTING POLICIES AND PROCEDURES
A description of the Funds' proxy voting policies and procedures that the Funds use to determine how to vote proxies relating to portfolio securities is available, without charge and upon request, by calling (800) 337-4246. This information is also available on the Securities and Exchange Commission's ("Commission") website at www.sec.gov.
Information regarding how the Funds voted proxies for portfolio securities, if applicable, during the most recent 12-month period ended June 30, is also available, without charge and upon request, by (i) calling (800) 337-4246; or (ii) accessing the Funds' Form N-PX on the Commission's website at www.sec.gov.
QUARTERLY PORTFOLIOS
The Funds file their complete schedules of portfolio holdings with the Commission for the first and third quarters of each fiscal year on Form N-Q. The Funds' Forms N-Q are available on the Commission's website at www.sec.go v. The Funds' Forms N-Q may also be reviewed and copied at the Commission's Public Reference Room in Washington, D.C.; information on the operation of the Public Reference Room may be obtained by calling (800) SEC-0330.
There are risks involved in investing in exchange-traded funds ("ETFs"), including possible loss of money. Investing in securities of small and medium sized companies involves greater risk than is customarily associated with investing in more established companies, and investments in concentrated industry sectors involve greater risks than investments that are more diversified. Indexed-based ETFs are not actively managed. Actively-managed ETFs do not necessarily seek to replicate the performance of a specific index. Both index-based and actively-managed ETFs are subject to risks similar to stocks, including those related to short selling and margin maintenance. PowerShares ETFs are not FDIC insured, may lose value and have no bank guarantee. PowerShares is a registered trademark of Invesco PowerShares Capital Management LLC. Past performance is not a guarantee of future results.
Invesco Aim Distributors, Inc. is the distributor of the PowerShares Exchange-Traded Fund Trust.
An investor should consider each PowerShares ETF's investment objective, risks, charges and expenses carefully before investing. For more complete information about PowerShares ETFs call Invesco Aim Distributors, Inc. at (800) 337-4246 or visit our website invescopowershares.com for a prospectus. Please read the prospectus carefully before investing.


301 West Roosevelt Road
Wheaton, IL 60187
800.983.0903
www.invescopowershares.com
© 2009 Invesco PowerShares Capital Management LLC P-PS-AR-5


2009 Annual Report to Shareholders
April 30, 2009
PowerShares Buyback AchieversTM Portfolio
PowerShares Dividend AchieversTM Portfolio
PowerShares Financial Preferred Portfolio
PowerShares High Growth Rate Dividend
AchieversTM Portfolio
PowerShares High Yield Equity Dividend
AchieversTM Portfolio
PowerShares International Dividend
AchieversTM Portfolio

Table of Contents
| The Market Environment | 2 | ||||||
| Managers' Analysis | 4 | ||||||
| Frequency Distribution of Discounts & Premiums | 18 | ||||||
| Fees and Expenses | 20 | ||||||
| Dividend Income Portfolios | |||||||
| Schedules of Investments | |||||||
| PowerShares Buyback AchieversTM Portfolio | 22 | ||||||
| PowerShares Dividend AchieversTM Portfolio | 26 | ||||||
| PowerShares Financial Preferred Portfolio | 30 | ||||||
| PowerShares High Growth Rate Dividend AchieversTM Portfolio | 31 | ||||||
| PowerShares High Yield Equity Dividend AchieversTM Portfolio | 33 | ||||||
| PowerShares International Dividend AchieversTM Portfolio | 35 | ||||||
| Statements of Assets and Liabilities | 38 | ||||||
| Statements of Operations | 40 | ||||||
| Statements of Changes in Net Assets | 42 | ||||||
| Financial Highlights | 44 | ||||||
| Notes to Financial Statements | 47 | ||||||
| Report of Independent Registered Public Accounting Firm | 57 | ||||||
| Supplemental Information | 58 | ||||||
| Board Considerations Regarding Continuation of Investment Advisory Agreement | 63 | ||||||
The Market Environment
For the year ended April 30, 2009, stock market losses were larger than most market participants have ever seen in their professional careers. The S&P 500® Index was down 35.29%, the NASDAQ-100® Index declined 26.83% and the Dow Jones Industrial Index dropped 34.12%. Corporate debt markets also declined as the credit crunch continued to limit access to capital. Municipal securities held up a little better but still struggled. The Merrill U.S. Corporate Master Index returned -5.78% while the Merrill Muni Master Index returned 2.26% for the period. Meanwhile, treasury securities rallied as investors fled to quality. Huge companies required capital infusions and/or other forms of financial support through government intervention and the credit crisis evolved into an overall crisis of consumer, investor and business confidence.
The markets fell nearly universally from August through October. As more job losses and layoffs were announced, banks continued to restrict borrowing and consumers, who drive two-thirds of the U.S. economy historically, were unable to sustain their spending. The government spent hundreds of billions of dollars to bail out firms and stimulate the economy while the Federal Open Market Committee moved from a discount rate of 2.50% to 0.50% during the period. Not until March did confidence begin to return to the equity markets with the S&P 500® Index, NASDAQ-100® Index and the Dow Jones Industrial Index moving off the lows and returning 29.99%, 29.97% and 21.24% respectively from March 1 through April 30, 2009. Corporate and municipal debt also showed some appreciation over the period, however the amount of appreciation was less as credit spreads tightened. The Merrill Muni Master Index was up 2.33% while the Merrill U.S. Corporate Master Index rose by 2.55% from March 1 through April 30, 2009.
2
This page intentionally left blank
Manager's Analysis
PowerShares Buyback AchieversTM Portfolio (ticker: PKW)
The PowerShares Buyback Achievers Portfolio, (the "Fund") seeks investment results that correspond generally to the price and yield (before the Fund's fees and expenses) of the Share BuyBack AchieversTM Index ("Index"). To become eligible for inclusion in the index, a company must be incorporated in the U.S., trade on a U.S. exchange and must have repurchased at least 5% or more of its outstanding shares for the trailing 12 months.
For the year ended April 30, 2009, the Fund returned -27.87%, while the Index returned -27.45%.
For the year ended April 30, 2009, none of the ten sectors represented in the Fund generated positive returns. Underexposure in the consumer discretionary and healthcare sectors made the largest negative contribution to the performance of the Fund relative to the broader U.S. equity market. However, overexposure to financials, information technology and industrials sectors made the largest positive contribution to the performance of the Fund relative to the broader U.S. equity market.
Sector Breakdown (% of the Fund's
Net Assets) as of April 30, 2009
| Consumer Discretionary | 27.2 | ||||||
| Information Technology | 16.7 | ||||||
| Industrials | 14.3 | ||||||
| Energy | 11.0 | ||||||
| Financials | 10.6 | ||||||
| Health Care | 9.9 | ||||||
| Consumer Staples | 5.1 | ||||||
| Materials | 2.4 | ||||||
| Telecommunication Services | 1.7 | ||||||
| Utilities | 1.1 | ||||||
| Money Market Fund | 0.7 | ||||||
| Other | (0.7 | ) | |||||
Style Allocation (% of the Fund's
Total Investments) as of April 30, 2009
| Large-Cap Value | 33.8 | ||||||
| Large-Cap Growth | 28.7 | ||||||
| Mid-Cap Value | 13.6 | ||||||
| Mid-Cap Growth | 12.1 | ||||||
| Small-Cap Growth | 6.0 | ||||||
| Small-Cap Value | 5.8 | ||||||
Top Ten Fund Holdings (% of the Fund's
Net Assets) as of April 30, 2009
| Security | |||||||
| ConocoPhillips | 4.9 | ||||||
| Exxon Mobil Corp. | 4.8 | ||||||
| McDonald's Corp. | 4.7 | ||||||
| United Parcel Service, Inc., Class B | 4.2 | ||||||
| Comcast Corp., Class A | 3.6 | ||||||
| Kraft Foods, Inc., Class A | 2.7 | ||||||
| Target Corp. | 2.5 | ||||||
| Boeing (The) Co. | 2.3 | ||||||
| UnitedHealth Group, Inc. | 2.2 | ||||||
| DIRECTV Group (The), Inc. | 2.0 | ||||||
| Total | 33.9 | ||||||
4
Manager's Analysis (Continued)
PowerShares Buyback AchieversTM Portfolio (ticker: PKW)
Growth of a $10,000 Investment Since Inception†
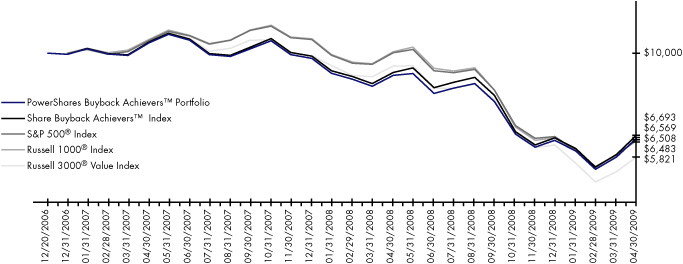
| Fund Performance History (%) | As of April 30, 2009 | ||||||||||||||
| Avg Ann†† | Fund Inception† | ||||||||||||||
| 1 Year | Avg Ann†† | Cumulative | |||||||||||||
| Index | |||||||||||||||
| Share Buyback AchieversTM Index | -27.45 | -15.65 | -33.08 | ||||||||||||
| S&P 500® Index | -35.29 | -16.95 | -35.17 | ||||||||||||
| Russell 1000® Index | -35.30 | -16.81 | -34.91 | ||||||||||||
| Russell 3000® Value Index | -38.61 | -20.70 | -41.79 | ||||||||||||
| Fund | |||||||||||||||
| NAV Return | -27.87 | -16.32 | -34.31 | ||||||||||||
| Share Price Return | -27.80 | -16.35 | -34.37 | ||||||||||||
Fund Inception: December 20, 2006
Performance quoted represents past performance. Past performance is not a guarantee of future results and current performance may be higher or lower than performance quoted. Investment returns and principal value will fluctuate and shares, when redeemed, may be worth more or less than their original cost. The Adviser has waived fees and reimbursed other expenses, absent which, performance would have been lower. The Adviser has contractually agreed to waive fees and/or pay certain Fund expenses through August 31, 2010. According to the Fund's current prospectus, the total gross annual operating expense ratio was indicated as 0.79%. In the Financial Highlights section of this Shareholder Report, the Fund's net (subsidized) total operating expense ratio was determined to be 0.70% while the Fund's gross total operating expense ratio was 0.92%. NAV and Share Price returns assume that dividends and capital gain distributions have been reinvested in the Fund at NAV and Share Price, respectively. The returns shown in the table above do not reflect the deduction of taxes that a shareholder would pay on Fund distributions or the redemption or sale of Fund Shares. See invescopowershares.com to find the most recent month-end performance numbers.
Index performance results are based upon a hypothetical investment in its constituent securities. Index returns do not represent Fund returns. An investor cannot invest directly in an index. The Index does not charge management fees or brokerage expenses, and no such fees or expenses were deducted from the hypothetical performance shown. In addition, the results actual investors might have achieved would have differed from those shown because of differences in the timing, amounts of their investments, and fees and expenses associated with an investment in the Fund.
The S&P 500® Index, Russell 1000® Index and Russell 3000® Value Index "(the "Benchmark Indices") are unmanaged indices used as a measurement of change in stock market conditions based on the average performance of approximately 500, 1,000 and 1,896 common stocks, respectively. The S&P 500 Index and the Russell 3000 Index will be used for comparative purposes going forward as these represent the most appropriate market indices for this fund.
† Fund and underlying Index returns are based on the inception date of the Fund. Returns for the Benchmark Indices are based on the closest month-end to the Fund's inception date.
†† Average annualized.
5
Manager's Analysis
PowerShares Dividend AchieversTM Portfolio (ticker: PFM)
The PowerShares Dividend Achievers Portfolio ( the "Fund") seeks investment results that correspond generally to the price and yield (before the Fund's fees and expenses) of the Broad Dividend AchieversTM Index ("Index").
The Broad Dividend AchieversTM Index is designed to track the performance of companies that meet the requirements to be classified as "Dividend AchieversTM." To become eligible for inclusion in the Broad Dividend AchieversTM Index, a company must be incorporated in the U.S. or U.S. territory, trade on a U.S. exchange, and must have raised its annual regular cash dividend payments for at least each of the last ten consecutive fiscal years.
For the year ended April 30, 2009, the Fund returned -34.84%, while the Index returned -34.90%.
For the year ended April 30, 2009, none of the ten sectors represented in the Fund generated positive returns. Overexposure in the financial sector made the largest negative contribution to the performance of the Fund relative to the broader U.S. equity market. However, overexposure in consumer staples and stock selection in energy and information technology made the largest positive contribution to the performance of the Fund relative to the broader U.S. equity market.
Sector Breakdown (% of the Fund's
Net Assets) as of April 30, 2009
| Consumer Staples | 22.0 | ||||||
| Health Care | 14.8 | ||||||
| Industrials | 14.1 | ||||||
| Financials | 13.1 | ||||||
| Energy | 10.8 | ||||||
| Consumer Discretionary | 7.6 | ||||||
| Information Technology | 5.4 | ||||||
| Telecommunication Services | 5.0 | ||||||
| Materials | 3.3 | ||||||
| Utilities | 2.7 | ||||||
| Money Market Fund | 0.1 | ||||||
| Other | 1.1 | ||||||
Style Allocation (% of the Fund's
Total Investments) as of April 30, 2009
| Large-Cap Growth | 41.4 | ||||||
| Large-Cap Value | 39.6 | ||||||
| Mid-Cap Value | 8.7 | ||||||
| Mid-Cap Growth | 6.8 | ||||||
| Small-Cap Value | 2.5 | ||||||
| Small-Cap Growth | 1.0 | ||||||
Top Ten Fund Holdings (% of the Fund's
Net Assets) as of April 30, 2009
| Security | |||||||
| Wal-Mart Stores, Inc. | 5.1 | ||||||
| AT&T, Inc. | 4.9 | ||||||
| Procter & Gamble (The) Co. | 4.9 | ||||||
| Exxon Mobil Corp. | 4.9 | ||||||
| Johnson & Johnson | 4.7 | ||||||
| General Electric Co. | 4.7 | ||||||
| Chevron Corp. | 4.5 | ||||||
| International Business Machines Corp. | 4.1 | ||||||
| Coca-Cola (The) Co. | 3.5 | ||||||
| Pfizer, Inc. | 3.1 | ||||||
| Total | 44.4 | ||||||
6
Manager's Analysis (Continued)
PowerShares Dividend AchieversTM Portfolio (ticker: PFM)
Growth of a $10,000 Investment Since Inception†
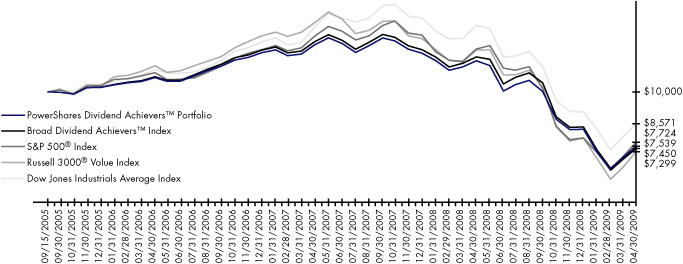
| Fund Performance History (%) | As of April 30, 2009 | ||||||||||||||||||
| Avg Ann†† | Fund Inception† | ||||||||||||||||||
| 1 Year | 3 Year | Avg Ann†† | Cumulative | ||||||||||||||||
| Index | |||||||||||||||||||
| Broad Dividend AchieversTM Index | -34.90 | -10.98 | -7.50 | -24.61 | |||||||||||||||
| S&P 500® Index | -35.29 | -10.76 | -6.80 | -22.76 | |||||||||||||||
| Russell 3000® Value Index | -38.61 | -13.25 | -8.23 | -27.01 | |||||||||||||||
| Dow Jones Industrial Average Index | -34.12 | -8.03 | -4.12 | -14.29 | |||||||||||||||
| Fund | |||||||||||||||||||
| NAV Return | -34.84 | -11.21 | -7.81 | -25.50 | |||||||||||||||
| Share Price Return | -34.84 | -11.24 | -7.81 | -25.51 | |||||||||||||||
Fund Inception: September 15, 2005
Performance quoted represents past performance. Past performance is not a guarantee of future results and current performance may be higher or lower than performance quoted. Investment returns and principal value will fluctuate and shares, when redeemed, may be worth more or less than their original cost. The Adviser has waived fees and reimbursed other expenses, absent which, performance would have been lower. The Adviser has contractually agreed to waive fees and/or pay certain Fund expenses through August 31, 2010. According to the Fund's current prospectus, the total gross annual operating expense ratio was indicated as 0.72%. In the Financial Highlights section of this Shareholder Report, the Fund's net (subsidized) total operating expense ratio was determined to be 0.60% while the Fund's gross total operating expense ratio was 0.74%. NAV and Share Price returns assume that dividends and capital gain distributions have been reinvested in the Fund at NAV and Share Price, respectively. The returns shown in the table above do not reflect the deduction of taxes that a shareholder would pay on Fund distributions or the redemption or sale of Fund Shares. See invescopowershares.com to find the most recent month-end performance numbers.
Index performance results are based upon a hypothetical investment in its constituent securities. Index returns do not represent Fund returns. An investor cannot invest directly in an index. The Index does not charge management fees or brokerage expenses, and no such fees or expenses were deducted from the hypothetical performance shown. In addition, the results actual investors might have achieved would have differed from those shown because of differences in the timing, amounts of their investments, and fees and expenses associated with an investment in the Fund.
The S&P 500® Index, Russell 3000® Value Index, and Dow Jones Industrial Average Index (the "Benchmark Indices") are unmanaged indices used as a measurement of change in stock market conditions based on the average performance of approximately 500, 1,896, and 30 common stocks, respectively. The S&P 500 Index and the Russell 3000 Index will be used for comparative purposes going forward as these represent the most appropriate market indices for this fund.
† Fund and underlying Index returns are based on the inception date of the Fund. Returns for the Benchmark Indices are based on the closest month-end to the Fund's inception date.
†† Average annualized.
7
Manager's Analysis
PowerShares Financial Preferred Portfolio (ticker: PGF)
The PowerShares Financial Preferred Portfolio (the "Fund") seeks investment results that correspond generally to the price and yield (before the Fund's fees and expenses) of the Wachovia Hybrid & Preferred Securities Financial Index ("WHPSSM Financial Index"). The Index tracks the performance of U.S. preferred stocks issued in the U.S. market by financial institutions and currently includes approximately 46 securities selected by Wachovia pursuant to a proprietary selection methodology. The market-capitalization weighted Index is rebalanced monthly.
For the year ending April 30, 2009, the Fund returned -39.56% on a total return basis. Over this same period the WHPSSM Financial Index returned -40.45% and the S&P 500® Preferred Stock Index was -35.85%. Because the WHPSSM Financial Index does not comply with the tax diversification requirements to which the Fund must adhere, a sampling methodology was utilized to help the Fund achieve its investment objective of tracking the Index before fees and expenses. Most of the difference between the Fund and the WHPSSM Financial Index performance, beyond regular fund expenses, can be attributed to the Fund's representative sampling.
Preferred securities, most of which are financial service-related, plunged to their lowest levels since the early '90s (using Merrill Lynch's Fixed Rate Preferred Index) based on the ongoing turmoil in the banking and insurance sectors. Despite a strong rebound in March and April of 2009, the financial sector remained the weakest overall S&P500 sector over the reporting period. Since 100% of the Fund and WHPSSM Financial Index holdings are financial preferred securities, significant losses were sustained over the past year. Government takeovers of mortgage giants Fannie Mae and Freddie Mac, the bankruptcies of Lehman Bros. and Washington Mutual, and deteriorating conditions at companies such as AIG, Bank of America, and Citigroup were all major factors contributing to the collapse in financial preferred stocks. Ironically, Citigroup's suspension of its perpetual preferred dividends and simultaneous conversion opti on (to common stock) offered to those same shareholders was a major catalyst for the overall preferred market rebound. Going forward, preferred market volatility is expected to remain high until the balance sheets of banks and insurance companies improve significantly. The direction of the overall preferred market will likewise closely follow the ebbs and flows of the financial sector recovery.
Industry Breakdown (% of the Fund's
Net Assets) as of April 30, 2009
| Banks | 59.3 | ||||||
| Insurance | 32.1 | ||||||
| Diversified Financial Services | 7.8 | ||||||
| Money Market Fund | 0.9 | ||||||
| Other | (0.1 | ) | |||||
Style Allocation (% of the Fund's
Total Investments) as of April 30, 2009
| Small-Cap Value | 91.9 | ||||||
| Large-Cap Value | 8.1 | ||||||
Top Ten Fund Holdings (% of the Fund's
Net Assets) as of April 30, 2009
| Security | |||||||
| Bank of America Corp., 8.20% | 6.8 | ||||||
| JPMorgan Chase & Co., 8.63% | 6.1 | ||||||
| Barclays Bank PLC, 8.13% (United Kingdom) | 6.1 | ||||||
| HSBC Holdings PLC, 8.13% (United Kingdom) | 4.8 | ||||||
| Allianz SE, 8.38% (Germany) | 4.8 | ||||||
| Wells Fargo & Co., 8.00% | 4.8 | ||||||
| MetLife, Inc., 6.50%, Series B | 4.7 | ||||||
| Credit Suisse Guernsey, 7.90% (Switzerland) | 4.4 | ||||||
| ING Groep N.V., 8.50% (Netherlands) | 4.1 | ||||||
| Bank of America Corp., 8.63%, Series MER | 3.9 | ||||||
| Total | 50.5 | ||||||
8
Manager's Analysis (Continued)
PowerShares Financial Preferred Portfolio (ticker: PGF)
Growth of a $10,000 Investment Since Inception†
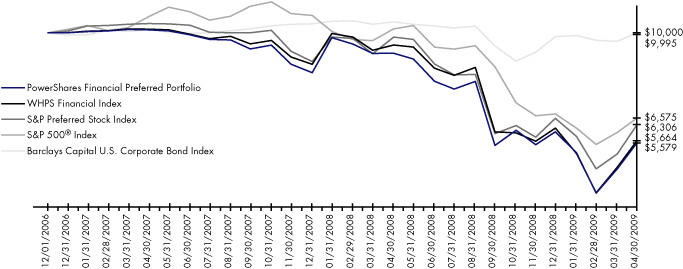
| Fund Performance History (%) | As of April 30, 2009 | ||||||||||||||
| Avg Ann†† | Fund Inception† | ||||||||||||||
| 1 Year | Avg Ann†† | Cumulative | |||||||||||||
| Index | |||||||||||||||
| WHPSSM Financial Index | -40.45 | -21.00 | -43.36 | ||||||||||||
| S&P Preferred Stock Index | -35.85 | -17.37 | -36.94 | ||||||||||||
| S&P 500® Index | -35.29 | -15.94 | -34.26 | ||||||||||||
| Barclays Capital U.S. Corporate Bond Index* | -4.26 | -0.02 | -0.05 | ||||||||||||
| Fund | |||||||||||||||
| NAV Return | -39.56 | -21.50 | -44.21 | ||||||||||||
| Share Price Return | -39.82 | -21.74 | -44.62 | ||||||||||||
Fund Inception: December 1, 2006
Performance quoted represents past performance. Past performance is not a guarantee of future results and current performance may be higher or lower than performance quoted. Investment returns and principal value will fluctuate and shares, when redeemed, may be worth more or less than their original cost. The Adviser has waived fees and reimbursed other expenses during previous fiscal periods, absent which, performance during those fiscal periods would have been lower. While the Adviser has contractually agreed to waive and/or pay certain Fund expenses through August 31, 2010, the Fund is currently subject to recapture, which may result in an increased expense ratio. According to the Fund's current prospectus, the total gross annual operating expense ratio was indicated as 0.74%. In the Financial Highlights section of this Shareholder Report, the Fund's net total operating expense ratio was determined to be 0.69% while the Fund' s gross total operating expense ratio was 0.68%. NAV and Share Price returns assume that dividends and capital gain distributions have been reinvested in the Fund at NAV and Share Price, respectively. The returns shown in the table above do not reflect the deduction of taxes that a shareholder would pay on Fund distributions or the redemption or sale of Fund Shares. See invescopowershares.com to find the most recent month-end performance numbers.
Index performance results are based upon a hypothetical investment in its constituent securities. Index returns do not represent Fund returns. An investor cannot invest directly in an index. The Index does not charge management fees or brokerage expenses, and no such fees or expenses were deducted from the hypothetical performance shown. In addition, the results actual investors might have achieved would have differed from those shown because of differences in the timing, amounts of their investments, and fees and expenses associated with an investment in the Fund.
The S&P Preferred Index and S&P 500® Index and the Barclays Capital U.S. Corporate Bond Index (the "Benchmark Indices") are unmanaged indices used as a measurement of change in stock market conditions based on the average performance of approximately 44 and 500 common stocks and 1,500 Bonds, respectively. The S&P Preferred Index will be used for comparative purposes going forward it represent a more appropriate market index for this fund.
† Fund and underlying Index returns are based on the inception date of the Fund. Returns for the Benchmark Indices are based on the closest month-end to the Fund's inception date.
†† Average annualized.
* Effective 11/3/08, Lehman Brothers Indexes were rebranded as Barclays Capital Indexes
9
Manager's Analysis
PowerShares High Growth Rate Dividend Achievers Portfolio (ticker: PHJ)
The PowerShares High Growth Rate Dividend Achievers Portfolio (the "Fund") seeks investment results that correspond generally to the price and yield (before the Fund's fees and expenses) of the High Growth Rate Dividend AchieversTM Index ("Index").
The High Growth Rate Dividend AchieversTM Index is designed to track the performance of the 100 companies with the highest annual dividend growth rate over the last 10 years that meet the requirements to be classified as "High Growth Rate Dividend AchieversTM." To become eligible for inclusion in the High Growth Rate Dividend AchieversTM Index, a company must be incorporated in the U.S. or a U.S. territory, trade on a U.S. exchange and its aggregate annual regular dividend payments must have increased consistently over the course of the last 10 or more fiscal years.
For the year ended April 30, 2009, the Fund returned -39.72%, while the Index returned -39.32%.
For the year ended April 30, 2009, three of the ten sectors represented in the Fund generated positive returns. Overexposure in the financial sector made the largest negative contribution to the performance of the Fund relative to the broader U.S. equity market. However, stock selection in energy, industrials, and telecom all made the largest positive contribution to the performance of the Fund relative to the broader U.S. equity market.
10
Manager's Analysis (Continued)
PowerShares High Growth Rate Dividend AchieversTM Portfolio (ticker: PHJ)
Industry Breakdown (% of the Fund's
Net Assets) as of April 30, 2009
| Retail | 21.0 | ||||||
| Healthcare-Products | 11.6 | ||||||
| Miscellaneous Manufacturing | 8.9 | ||||||
| Banks | 7.3 | ||||||
| Aerospace/Defense | 6.2 | ||||||
| Phamaceuticals | 5.3 | ||||||
| Insurance | 5.0 | ||||||
| Computers | 4.1 | ||||||
| Chemicals | 4.0 | ||||||
| Beverages | 3.9 | ||||||
| Diversified Financial Services | 3.6 | ||||||
| Commerical Services | 3.5 | ||||||
| Pipelines | 3.4 | ||||||
| Agriculture | 1.9 | ||||||
| Transportation | 1.9 | ||||||
| Food | 1.6 | ||||||
| Iron/Steel | 1.4 | ||||||
| Auto Parts & Equipment | 1.3 | ||||||
| Distribution/Wholesale | 0.8 | ||||||
| Leisure Time | 0.7 | ||||||
| Semiconductors | 0.5 | ||||||
| Textiles | 0.4 | ||||||
| Media | 0.4 | ||||||
| Telecommunications | 0.4 | ||||||
| Savings & Loans | 0.3 | ||||||
| Apparel | 0.1 | ||||||
| Advertising | 0.1 | ||||||
| Enivronmental Control | 0.1 | ||||||
| Oil & Gas | 0.1 | ||||||
| Real Estate | 0.1 | ||||||
| REIT | 0.1 | ||||||
| Money Market Fund | 0.7 | ||||||
| Other | (0.7 | ) | |||||
Top Ten Fund Holdings (% of the Fund's
Net Assets) as of April 30, 2009
| Security | |||||||
| General Electric Co. | 4.1 | ||||||
| Medtronic, Inc. | 4.1 | ||||||
| Wal-Mart Stores, Inc. | 4.1 | ||||||
| Johnson & Johnson | 4.0 | ||||||
| Wells Fargo & Co. | 4.0 | ||||||
| United Technologies Corp. | 4.0 | ||||||
| International Business Machines Corp. | 4.0 | ||||||
| Pfizer, Inc. | 3.9 | ||||||
| PepsiCo, Inc. | 3.9 | ||||||
| McDonald's Corp. | 3.8 | ||||||
| Total | 39.9 | ||||||
Style Allocation (% of the Fund's
Total Investments) as of April 30, 2009
| Large-Cap Growth | 42.7 | ||||||
| Large-Cap Value | 36.8 | ||||||
| Mid-Cap Growth | 10.2 | ||||||
| Mid-Cap Value | 7.4 | ||||||
| Small-Cap Value | 1.7 | ||||||
| Small-Cap Growth | 1.2 | ||||||
11
Manager's Analysis (Continued)
PowerShares High Growth Rate Dividend AchieversTM Portfolio (ticker: PHJ)
Growth of a $10,000 Investment Since Inception†
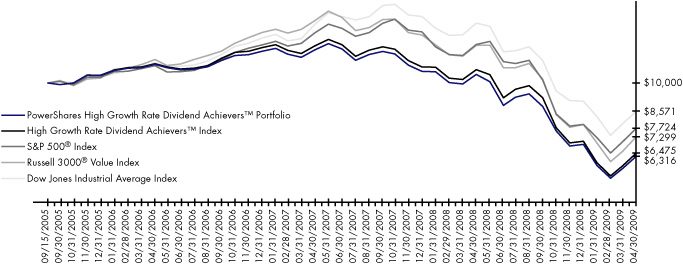
| Fund Performance History (%) | As of April 30, 2009 | ||||||||||||||||||
| Avg Ann†† | Fund Inception† | ||||||||||||||||||
| 1 Year | 3 Year | Avg Ann†† | Cumulative | ||||||||||||||||
| Index | |||||||||||||||||||
| High Growth Rate Dividend AchieversTM Index | -39.32 | -16.11 | -11.31 | -35.25 | |||||||||||||||
| S&P 500® Index | -35.29 | -10.76 | -6.80 | -22.76 | |||||||||||||||
| Russell 3000® Value Index | -38.61 | -13.25 | -8.23 | -27.01 | |||||||||||||||
| Dow Jones Industrial Average Index | -34.12 | -8.03 | -4.12 | -14.29 | |||||||||||||||
| Fund | |||||||||||||||||||
| NAV Return | -39.72 | -16.73 | -11.91 | -36.84 | |||||||||||||||
| Share Price Return | -39.68 | -16.71 | -11.91 | -36.84 | |||||||||||||||
Fund Inception: September 15, 2005
Performance quoted represents past performance. Past performance is not a guarantee of future results and current performance may be higher or lower than performance quoted. Investment returns and principal value will fluctuate and shares, when redeemed, may be worth more or less than their original cost. The Adviser has waived fees and reimbursed other expenses, absent which, performance would have been lower. The Adviser has contractually agreed to waive fees and/or pay certain Fund expenses through August 31, 2010. According to the Fund's current prospectus, the total gross annual operating expense ratio was indicated as 0.89%. In the Financial Highlights section of this Shareholder Report, the Fund's net (subsidized) total operating expense ratio was determined to be 0.60% while the Fund's gross total operating expense ratio was 1.21%. NAV and Share Price returns assume that dividends and capital gain distributions have been reinvested in the Fund at NAV and Share Price, respectively. The returns shown in the table above do not reflect the deduction of taxes that a shareholder would pay on Fund distributions or the redemption or sale of Fund Shares. See invescopowershares.com to find the most recent month-end performance numbers.
Index performance results are based upon a hypothetical investment in its constituent securities. Index returns do not represent Fund returns. An investor cannot invest directly in an index. The Index does not charge management fees or brokerage expenses, and no such fees or expenses were deducted from the hypothetical performance shown. In addition, the results actual investors might have achieved would have differed from those shown because of differences in the timing, amounts of their investments, and fees and expenses associated with an investment in the Fund.
The S&P 500® Index, Russell 3000® Value Index, and Dow Jones Industrial Average Index (the "Benchmark Indices") are unmanaged indices used as a measurement of change in stock market conditions based on the average performance of approximately 500, 1,896, and 30 common stocks, respectively. The S&P 500 Index and the Russell 3000 Index will be used for comparative purposes going forward as these represent the most appropriate market indices for this fund.
† Fund and underlying Index returns are based on the inception date of the Fund. Returns for the Benchmark Indices are based on the closest month-end to the Fund's inception date.
†† Average annualized.
12
This page intentionally left blank
Manager's Analysis
PowerShares High Yield Equity Dividend AchieversTM Portfolio (ticker: PEY)
The PowerShares High Yield Equity Dividend AchieversTM (the "Fund") seeks investment results that correspond generally to the price and yield (before the Fund's fees and expenses) the Dividend AchieversTM 50 Index ("Index"). The Index is designed to track the performance of the 50 companies with highest dividend yield, chosen from the universe of companies which meet the requirements to be classified as Dividend Achievers TM . To qualify, a company must have, among other things, experienced growth in dividends consistently over the last ten or more fiscal years. The yield weighted portfolio is rebalanced quarterly and reconstituted annually.
For the year ended April 30, 2009, the Fund returned -42.88%, while the Index returned -43.71%.
For the year ended April 30, 2009, three of the eight sectors represented in the Fund generated positive returns. Overexposure to the financial sector made the largest negative contribution to the performance of the Fund relative to the broader U.S. equity market.
Industry Breakdown (% of the Fund's
Net Assets) as of April 30, 2009
| Banks | 22.0 | ||||||
| Insurance | 12.0 | ||||||
| Electric | 11.9 | ||||||
| Miscellaneous Manufacturing | 6.7 | ||||||
| Agriculture | 5.9 | ||||||
| Telecommunications | 5.3 | ||||||
| Media | 4.8 | ||||||
| Gas | 4.0 | ||||||
| Chemicals | 3.9 | ||||||
| Leisure Time | 3.6 | ||||||
| REIT | 3.3 | ||||||
| Pharmaceuticals | 3.0 | ||||||
| Office Furnishings | 2.7 | ||||||
| Machinery-Diversified | 2.5 | ||||||
| Household Products/Wares | 2.4 | ||||||
| Office/Business Equipment | 2.0 | ||||||
| Building Materials | 1.5 | ||||||
| Diversified Financial Services | 1.4 | ||||||
| Savings & Loans | 0.9 | ||||||
| Money Market Fund | 0.6 | ||||||
| Other | (0.4 | ) | |||||
Top Ten Fund Holdings (% of the Fund's
Net Assets) as of April 30, 2009
| Security | |||||||
| General Electric Co. | 4.2 | ||||||
| Vector Group Ltd. | 3.9 | ||||||
| BB&T Corp. | 3.7 | ||||||
| Integrys Energy Group, Inc. | 3.5 | ||||||
| Getty Realty Corp. REIT | 3.3 | ||||||
| CenturyTel, Inc. | 3.3 | ||||||
| Pfizer, Inc. | 3.0 | ||||||
| Arthur J. Gallagher & Co. | 2.9 | ||||||
| TCF Financial Corp. | 2.7 | ||||||
| HNI Corp. | 2.7 | ||||||
| Total | 33.2 | ||||||
Style Allocation (% of the Fund's
Total Investments) as of April 30, 2009
| Mid-Cap Value | 36.5 | ||||||
| Small-Cap Value | 34.5 | ||||||
| Large-Cap Value | 18.7 | ||||||
| Small-Cap Growth | 6.4 | ||||||
| Mid-Cap Growth | 3.9 | ||||||
14
Manager's Analysis (Continued)
PowerShares High Yield Equity Dividend AchieversTM Portfolio (ticker: PEY)
Growth of a $10,000 Investment Since Inception���
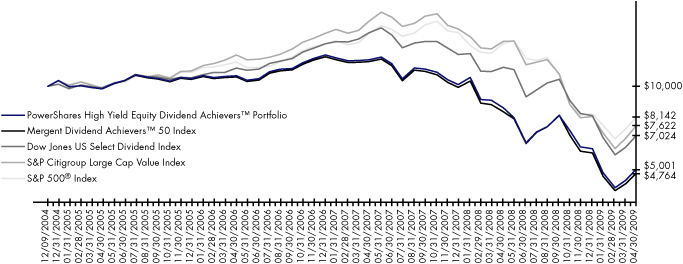
| Fund Performance History (%) | As of April 30, 2009 | ||||||||||||||||||
| Avg Ann†† | Fund Inception† | ||||||||||||||||||
| 1 Year | 3 Year | Avg Ann†† | Cumulative | ||||||||||||||||
| Index | |||||||||||||||||||
| Mergent Dividend AchieversTM 50 Index | -43.71 | -23.32 | -15.55 | -52.36 | |||||||||||||||
| Dow Jones US Select Dividend Index | -37.01 | -14.15 | -7.69 | -29.76 | |||||||||||||||
| S&P Citigroup Large Cap Value Index | -40.06 | -13.78 | -5.96 | -23.78 | |||||||||||||||
| S&P® 500 Index | -35.29 | -10.76 | -4.55 | -18.58 | |||||||||||||||
| Fund | |||||||||||||||||||
| NAV Return | -42.88 | -22.24 | -14.60 | -49.99 | |||||||||||||||
| Share Price Return | -42.88 | -22.20 | -14.59 | -49.95 | |||||||||||||||
Fund Inception: December 9, 2004
Performance quoted represents past performance. Past performance is not a guarantee of future results and current performance may be higher or lower than performance quoted. Investment returns and principal value will fluctuate and shares, when redeemed, may be worth more or less than their original cost. The Adviser has waived fees and reimbursed other expenses, absent which, performance would have been lower. The Adviser has contractually agreed to waive fees and/or pay certain Fund expenses through August 31, 2010. According to the Fund's current prospectus, the total gross annual operating expense ratio was indicated as 0.56%. In the Financial Highlights section of this Shareholder Report, the Fund's net (subsidized) total operating expense ratio was determined to be 0.60% while the Fund's gross total operating expense ratio was 0.62%. NAV and Share Price returns assume that dividends and capital gain distributions have been reinvested in the Fund at NAV and Share Price, respectively. The returns shown in the table above do not reflect the deduction of taxes that a shareholder would pay on Fund distributions or the redemption or sale of Fund Shares. See invescopowershares.com to find the most recent month-end performance numbers.
Index performance results are based upon a hypothetical investment in its constituent securities. Index returns do not represent Fund returns. An investor cannot invest directly in an index. The Index does not charge management fees or brokerage expenses, and no such fees or expenses were deducted from the hypothetical performance shown. In addition, the results actual investors might have achieved would have differed from those shown because of differences in the timing, amounts of their investments, and fees and expenses associated with an investment in the Fund.
The Dow Jones U.S. Select Dividend Index, S&P Citigroup Large Cap Value Index, and S&P 500® Index (the "Benchmark Indices") are unmanaged indices used as a measurement of change in stock market conditions based on the average performance of approximately 100, 346, and 500 common stocks, respectively.
The Dow Jones U.S. Select Dividend Index and the S&P Citigroup Large Cap Value Index will be used for comparative purposes going forward as these represent the most appropriate market indices for this fund.
† Fund and underlying Index returns are based on the inception date of the Fund. Returns for the Benchmark Indices are based on the closest month-end to the Fund's inception date.
†† Average annualized.
15
Manager's Analysis
PowerShares International Dividend AchieversTM Portfolio (ticker: PID)
The PowerShares International Dividend AchieversTM (the "Fund") seeks investment results that correspond generally to the price and yield (before the Fund's fees and expenses) International Dividend AchieversTM Index (the "Index").
The International Dividend AchieversTM Index is designed to track the performance of dividend paying American Depositary Receipts and non-U.S. common or ordinary stocks trading on the New York Stock Exchange or NASDAQ. To become eligible for inclusion in the International Dividend AchieversTM Index, a company's aggregate annual regular dividend payments must have increased consistently over the course of the last five calendar or fiscal years.
For the year ended April 30, 2009, the Fund returned -46.44%, while the Index returned -46.60%.
The United Kingdom, Ireland and the United States were the largest negative contributors while Russia, Peru, Chile and Bermuda were the largest positive contributors to the Fund's performance. Seven of the ten industry sectors represented in the Fund generated positive returns. Overexposure in the financial sector made the largest negative contribution to the performance of the Fund relative to the broader US equity market. However, overexposure to the consumer discretionary sector and stock selection made the largest positive contributions to the performance of the Fund relative to the Index.
Sector Breakdown (% of the Fund's
Net Assets) as of April 30, 2009
| Financials | 34.5 | ||||||
| Energy | 13.4 | ||||||
| Consumer Discretionary | 11.3 | ||||||
| Telecommunication Services | 10.2 | ||||||
| Industrials | 6.8 | ||||||
| Materials | 5.8 | ||||||
| Utilities | 5.4 | ||||||
| Consumer Staples | 4.8 | ||||||
| Health Care | 4.4 | ||||||
| Information Technology | 3.0 | ||||||
| Other | 0.4 | ||||||
Style Allocation (% of the Fund's
Total Investments) as of April 30, 2009
| Large-Cap Value | 53.4 | ||||||
| Large-Cap Growth | 24.9 | ||||||
| Mid-Cap Value | 7.8 | ||||||
| Mid-Cap Growth | 7.7 | ||||||
| Small-Cap Value | 5.6 | ||||||
| Small-Cap Growth | 0.6 | ||||||
Top Ten Fund Holdings (% of the Fund's
Net Assets) as of April 30, 2009
| Security | |||||||
| Banco Bilbao Vizcaya Argentaria S.A. ADR | 3.4 | ||||||
| Tsakos Energy Navigation Ltd. | 2.9 | ||||||
| HSBC Holdings PLC ADR | 2.8 | ||||||
| Banco Santander S.A. ADR | 2.5 | ||||||
| Brookfield Properties Corp. | 2.3 | ||||||
| Teekay Corp. | 2.2 | ||||||
| Methanex Corp. | 2.1 | ||||||
| Westpac Banking Corp. ADR | 2.0 | ||||||
| Bank of Montreal | 2.0 | ||||||
| BP PLC ADR | 1.9 | ||||||
| Total | 24.1 | ||||||
16
Manager's Analysis (Continued)
PowerShares International Dividend AchieversTM Portfolio (ticker: PID)
Growth of a $10,000 Investment Since Inception†
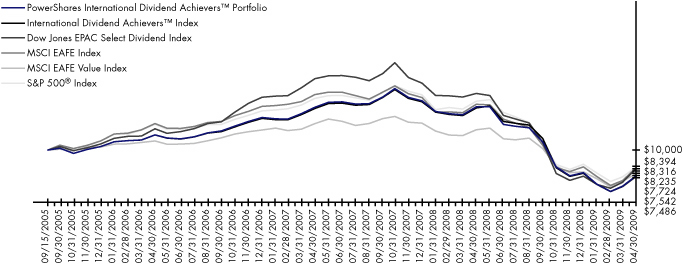
| Fund Performance History (%) | As of April 30, 2009 | ||||||||||||||||||
| Avg Ann†† | Fund Inception† | ||||||||||||||||||
| 1 Year | 3 Year | Avg Ann†† | Cumulative | ||||||||||||||||
| Index | |||||||||||||||||||
| International Dividend AchieversTM Index | -46.60 | -13.19 | -7.68 | -25.14 | |||||||||||||||
| Dow Jones EPAC Select Dividend Index | -46.54 | -11.86 | -5.16 | -17.65 | |||||||||||||||
| MSCI EAFE Value Index | -42.13 | -12.77 | -4.90 | -16.84 | |||||||||||||||
| MSCI EAFE Index | -42.76 | -12.34 | -4.66 | -16.06 | |||||||||||||||
| S&P 500® Index | -35.29 | -10.76 | -6.80 | -22.76 | |||||||||||||||
| Fund | |||||||||||||||||||
| NAV Return | -46.44 | -12.99 | -7.49 | -24.58 | |||||||||||||||
| Share Price Return | -46.30 | -12.96 | -7.47 | -24.51 | |||||||||||||||
Fund Inception: September 15, 2005
Performance quoted represents past performance. Past performance is not a guarantee of future results and current performance may be higher or lower than performance quoted. Investment returns and principal value will fluctuate and shares, when redeemed, may be worth more or less than their original cost. While the Adviser has waived fees and reimbursed other expenses, absent which, performance would have been lower. The Adviser has contractually agreed to waive fees and/or pay certain Fund expenses through August 31, 2010. The Fund is currently subject to recapture which may result in an increased expense ratio. According to the Fund's current prospectus, the total gross annual operating expense ratio was indicated as 0.56%. In the Financial Highlights section of this Shareholder Report, the Fund's net total operating expense ratio was determined to be 0.57% while the Fund's gross total operating expense ratio was 0.57%. NAV an d Share Price returns assume that dividends and capital gain distributions have been reinvested in the Fund at NAV and Share Price, respectively. The returns shown in the table above do not reflect the deduction of taxes that a shareholder would pay on Fund distributions or the redemption or sale of Fund Shares. See invescopowershares.com to find the most recent month-end performance numbers.
Index performance results are based upon a hypothetical investment in its constituent securities. Index returns do not represent Fund returns. An investor cannot invest directly in an index. The Index does not charge management fees or brokerage expenses, and no such fees or expenses were deducted from the hypothetical performance shown. In addition, the results actual investors might have achieved would have differed from those shown because of differences in the timing, amounts of their investments, and fees and expenses associated with an investment in the Fund.
The Dow Jones EPAC Select Dividend Index, MSCI EAFE Index, MSCI EAFE Value Index, and S&P 500® Index (the "Benchmark Indices") are unmanaged indices used as a measurement of change in stock market conditions based on the average performance of approximately 100, 1,137, 607, and 500 common stocks, respectively.
The Dow Jones EPAC Select Dividend Index and the MSCI EAFE Value Index will be used for comparative purposes going forward as these represent the most appropriate market indices for this fund.
† Fund and underlying Index returns are based on the inception date of the Fund. Returns for the Benchmark Indices are based on the closest month-end to the Fund's inception date.
†† Average annualized.
17
Frequency Distribution of Discounts & Premiums
Since Inception through April 30, 2009
| Closing Price Above NAV (bps) | |||||||||||||||||||||||||||||||||||||||
| Ticker | Fund Name | Inception | Days | 0-24 | 25-49 | 50-99 | 100-149 | 150-199 | 200+ | ||||||||||||||||||||||||||||||
| PKW | PowerShares Buyback AchieversTM Portfolio | 12/20/06 | 593 | 249 | 33 | 8 | 1 | 1 | 1 | ||||||||||||||||||||||||||||||
| PFM | PowerShares Dividend AchieversTM Portfolio | 9/15/05 | 912 | 452 | 63 | 15 | 3 | 0 | 3 | ||||||||||||||||||||||||||||||
| PGF | PowerShares Financial Preferred Portfolio | 12/1/06 | 606 | 209 | 132 | 71 | 27 | 24 | 68 | ||||||||||||||||||||||||||||||
| PHJ | PowerShares High Growth Rate Dividend AchieversTM Portfolio | 9/15/05 | 912 | 434 | 38 | 10 | 2 | 1 | 3 | ||||||||||||||||||||||||||||||
| PEY | PowerShares High Yield Equity Dividend AchieversTM Portfolio | 12/9/04 | 1105 | 411 | 39 | 5 | 4 | 0 | 1 | ||||||||||||||||||||||||||||||
| PID | PowerShares International Dividend AchieversTM Portfolio | 9/15/05 | 912 | 415 | 35 | 9 | 4 | 2 | 1 | ||||||||||||||||||||||||||||||
18
| Closing Price Below NAV (bps) | |||||||||||||||||||||||||||
| Ticker | -0-24 | -25-49 | -50-99 | -100-149 | -150-199 | -200+ | |||||||||||||||||||||
| PKW | 287 | 11 | 2 | 0 | 0 | 0 | |||||||||||||||||||||
| PFM | 364 | 9 | 2 | 1 | 0 | 0 | |||||||||||||||||||||
| PGF | 57 | 4 | 8 | 2 | 2 | 2 | |||||||||||||||||||||
| PHJ | 402 | 12 | 5 | 1 | 1 | 3 | |||||||||||||||||||||
| PEY | 548 | 85 | 9 | 1 | 1 | 1 | |||||||||||||||||||||
| PID | 331 | 67 | 36 | 7 | 4 | 1 | |||||||||||||||||||||
19
Fees and Expenses
As a shareholder of a Fund of the PowerShares Exchange-Traded Fund Trust, you incur advisory fees and other Fund expenses. The expense examples below are intended to help you understand your ongoing costs (in dollars) of investing in the Funds and to compare these costs with the ongoing costs of investing in other funds.
The example is based on an investment of $1,000 invested at the beginning of the period and held through the six-month period ended April 30, 2009.
Actual Expenses
The first line in the following table provides information about actual account values and actual expenses. You may use the information in this line, together with the amount you invested, to estimate the expenses that you paid over the period. Simply divide your account value by $1,000 (for example, an $8,600 account value divided by $1,000 = 8.6), then multiply the result by the number in the first line under the heading "Expenses Paid During the Six-Month Period" to estimate the expenses you paid on your account during this period.
Hypothetical Example for Comparison Purposes
The second line in the following table provides information about hypothetical account values and hypothetical expenses based on each Fund's actual expense ratio and an assumed annualized rate of return of 5% per year before expenses, which is not the Fund's actual return. The hypothetical account values and expenses may not be used to estimate the actual ending account balance or expenses you paid for the period. You may use this information to compare the ongoing costs of investing in the Funds and other funds. To do so, compare this 5% hypothetical example with the 5% hypothetical examples that appear in the shareholder reports of the other funds.
Please note that the expenses shown in the table are meant to highlight your ongoing costs only, and do not reflect any transactional costs such as sales charges (loads). Therefore the second line in the table is useful in comparing ongoing costs only, and will not help you determine the relative total costs of owning different funds. In addition, if these transactional costs were included, your costs would have been higher.
| Beginning Account Value November 1, 2008 | Ending Account Value April 30, 2009 | Annualized Expense Ratio Based on the Six-Month Period | Expenses Paid During the Six-Month Period (1) | ||||||||||||||||
| PowerShares Buyback AchieversTM Portfolio Actual | $ | 1,000.00 | $ | 973.12 | 0.70 | % | $ | 3.42 | |||||||||||
| Hypothetical (5% return before expenses) | $ | 1,000.00 | $ | 1,021.32 | 0.70 | % | $ | 3.51 | |||||||||||
| PowerShares Dividend AchieversTM Portfolio Actual | $ | 1,000.00 | $ | 850.65 | 0.60 | % | $ | 2.75 | |||||||||||
| Hypothetical (5% return before expenses) | $ | 1,000.00 | $ | 1,021.82 | 0.60 | % | $ | 3.01 | |||||||||||
| PowerShares Financial Preferred Portfolio Actual | $ | 1,000.00 | $ | 916.41 | 0.69 | % | $ | 3.23 | |||||||||||
| Hypothetical (5% return before expenses) | $ | 1,000.00 | $ | 1,021.42 | 0.69 | % | $ | 3.41 | |||||||||||
| PowerShares High Growth Rate Dividend AchieversTM Portfolio Actual | $ | 1,000.00 | $ | 832.43 | 0.60 | % | $ | 2.73 | |||||||||||
| Hypothetical (5% return before expenses) | $ | 1,000.00 | $ | 1,021.82 | 0.60 | % | $ | 3.01 | |||||||||||
20
Fees and Expenses (Continued)
| Beginning Account Value November 1, 2008 | Ending Account Value April 30, 2009 | Annualized Expense Ratio Based on the Six-Month Period | Expenses Paid During the Six-Month Period (1) | ||||||||||||||||
| PowerShares High Yield Equity Dividend AcheiversTM Portfolio Actual | $ | 1,000.00 | $ | 681.88 | 0.60 | % | $ | 2.50 | |||||||||||
| Hypothetical (5% return before expenses) | $ | 1,000.00 | $ | 1,021.82 | 0.60 | % | $ | 3.01 | |||||||||||
| PowerShares International Dividend AchieversTM Portfolio Actual | $ | 1,000.00 | $ | 900.67 | 0.54 | % | $ | 2.54 | |||||||||||
| Hypothetical (5% return before expenses) | $ | 1,000.00 | $ | 1,022.12 | 0.54 | % | $ | 2.71 | |||||||||||
(1) Expenses are calculated using the annualized expense ratio, which represents the ongoing expenses as a percentage of net assets for the six months ended April 30, 2009. Expenses are calculated by multiplying the Fund's annualized expense ratio by the average account value for the period; then multiplying the result by 181 and then dividing the result by 365. Expense ratios for the most recent half-year may differ from expense ratios based on the one year data in the Financial Highlights.
21
Schedule of Investments
PowerShares Buyback AchieversTM Portfolio
April 30, 2009
| Number of Shares | Value | ||||||||||
| Common Stocks and Other Equity Interests—100.0% | |||||||||||
| Consumer Discretionary—27.2% | |||||||||||
| 2,085 | Advance Auto Parts, Inc. | $ | 91,219 | ||||||||
| 555 | AFC Enterprises, Inc.* | 3,447 | |||||||||
| 997 | American Greetings Corp., Class A | 7,826 | |||||||||
| 1,258 | AnnTaylor Stores Corp.* | 9,297 | |||||||||
| 580 | Arbitron, Inc. | 12,076 | |||||||||
| 1,868 | Autoliv, Inc. | 46,084 | |||||||||
| 1,200 | AutoZone, Inc.* | 199,668 | |||||||||
| 1,246 | Barnes & Noble, Inc. | 32,546 | |||||||||
| 1,812 | Big Lots, Inc.* | 50,084 | |||||||||
| 318 | Blue Nile, Inc.* | 13,534 | |||||||||
| 674 | Bob Evans Farms, Inc. | 16,345 | |||||||||
| 474 | Build-A-Bear Workshop, Inc.* | 2,588 | |||||||||
| 527 | California Pizza Kitchen, Inc.* | 8,279 | |||||||||
| 645 | Cato (The) Corp., Class A | 12,397 | |||||||||
| 499 | CEC Entertainment, Inc.* | 15,200 | |||||||||
| 461 | Charlotte Russe Holding, Inc.* | 5,786 | |||||||||
| 1,312 | Cheesecake Factory (The), Inc.* | 22,789 | |||||||||
| 7,047 | Coach, Inc.* | 172,652 | |||||||||
| 744 | Columbia Sportswear Co. | 22,856 | |||||||||
| 63,231 | Comcast Corp., Class A | 977,550 | |||||||||
| 493 | Conn's, Inc.* | 8,105 | |||||||||
| 1,294 | Cooper Tire & Rubber Co. | 10,701 | |||||||||
| 1,760 | Cox Radio, Inc., Class A* | 8,448 | |||||||||
| 491 | Cracker Barrel Old Country Store, Inc. | 16,012 | |||||||||
| 211 | CSS Industries, Inc. | 4,190 | |||||||||
| 22,180 | DIRECTV Group (The), Inc.* | 548,511 | |||||||||
| 1,255 | Domino's Pizza, Inc.* | 11,847 | |||||||||
| 1,961 | DreamWorks Animation SKG, Inc., Class A* | 47,084 | |||||||||
| 5,887 | Eastman Kodak Co. | 17,955 | |||||||||
| 15,271 | Gap (The), Inc. | 237,311 | |||||||||
| 422 | Genesco, Inc.* | 9,613 | |||||||||
| 3,500 | Genuine Parts Co. | 118,860 | |||||||||
| 1,399 | Harte-Hanks, Inc. | 11,556 | |||||||||
| 3,057 | Hasbro, Inc. | 81,500 | |||||||||
| 627 | Hibbett Sports, Inc.* | 13,073 | |||||||||
| 237 | Hooker Furniture Corp. | 2,778 | |||||||||
| 6,500 | International Game Technology | 80,275 | |||||||||
| 1,069 | International Speedway Corp., Class A | 25,314 | |||||||||
| 722 | Isle of Capri Casinos, Inc.* | 7,754 | |||||||||
| 1,248 | Jack in the Box, Inc.* | 30,688 | |||||||||
| 393 | Kenneth Cole Productions, Inc., Class A | 2,720 | |||||||||
| 3,437 | Leggett & Platt, Inc. | 49,355 | |||||||||
| 6,048 | Liberty Global, Inc., Series A* | 99,732 | |||||||||
| 7,728 | Marriott International, Inc., Class A | 182,072 | |||||||||
| 24,444 | McDonald's Corp. | 1,302,620 | |||||||||
| 1,459 | Mediacom Communications Corp., Class A* | 8,302 | |||||||||
| 354 | Monarch Casino & Resort, Inc.* | 3,618 | |||||||||
| 424 | Monro Muffler, Inc. | 10,587 | |||||||||
| 645 | Morgans Hotel Group Co.* | 2,767 | |||||||||
| 536 | Movado Group, Inc. | 4,915 | |||||||||
| Number of Shares | Value | ||||||||||
| Common Stocks and Other Equity Interests (Continued) | |||||||||||
| 1,284 | Netflix, Inc.* | $ | 58,178 | ||||||||
| 57,374 | News Corp., Class A | 473,909 | |||||||||
| 4,730 | Nordstrom, Inc. | 107,040 | |||||||||
| 677 | NutriSystem, Inc. | 9,302 | |||||||||
| 520 | P.F. Chang's China Bistro, Inc.* | 15,694 | |||||||||
| 1,442 | Pacific Sunwear of California, Inc.* | 5,840 | |||||||||
| 1,719 | Penn National Gaming, Inc.* | 58,480 | |||||||||
| 1,130 | Phillips-Van Heusen Corp. | 32,804 | |||||||||
| 715 | Polaris Industries, Inc. | 23,917 | |||||||||
| 241 | Pre-Paid Legal Services, Inc.* | 8,876 | |||||||||
| 379 | RC2 Corp.* | 4,286 | |||||||||
| 340 | Red Robin Gourmet Burgers, Inc.* | 8,347 | |||||||||
| 2,671 | Sears Holdings Corp.* | 166,857 | |||||||||
| 5,508 | Service Corp. International | 24,951 | |||||||||
| 2,570 | Sherwin-Williams (The) Co. | 145,565 | |||||||||
| 1,774 | Sinclair Broadcast Group, Inc., Class A | 1,969 | |||||||||
| 880 | Sonic Automotive, Inc., Class A | 4,541 | |||||||||
| 836 | Stage Stores, Inc. | 10,241 | |||||||||
| 366 | Stamps.com, Inc.* | 3,426 | |||||||||
| 4,005 | Starwood Hotels & Resorts Worldwide, Inc. | 83,544 | |||||||||
| 393 | Steven Madden Ltd.* | 11,562 | |||||||||
| 2,035 | Stewart Enterprises, Inc., Class A | 7,102 | |||||||||
| 418 | Sturm Ruger & Co., Inc.* | 5,146 | |||||||||
| 16,521 | Target Corp. | 681,655 | |||||||||
| 2,720 | Tiffany & Co. | 78,717 | |||||||||
| 1,263 | Timberland (The) Co., Class A* | 20,511 | |||||||||
| 790 | Tractor Supply Co.* | 31,900 | |||||||||
| 535 | Universal Technical Institute, Inc.* | 7,618 | |||||||||
| 13,311 | Viacom, Inc., Class B* | 256,104 | |||||||||
| 2,701 | Wynn Resorts Ltd.* | 105,960 | |||||||||
| 10,096 | Yum! Brands, Inc. | 336,702 | |||||||||
| 702 | Zale Corp.* | 2,611 | |||||||||
| 7,473,841 | |||||||||||
| Consumer Staples—5.1% | |||||||||||
| 1,953 | Alliance One International, Inc.* | 7,324 | |||||||||
| 1,201 | BJ's Wholesale Club, Inc.* | 40,041 | |||||||||
| 7,757 | Campbell Soup Co. | 199,510 | |||||||||
| 9,817 | ConAgra Foods, Inc. | 173,761 | |||||||||
| 32,254 | Kraft Foods, Inc., Class A | 754,745 | |||||||||
| 614 | Lancaster Colony Corp. | 26,893 | |||||||||
| 281 | Nash Finch Co. | 8,230 | |||||||||
| 1,352 | NBTY, Inc.* | 35,030 | |||||||||
| 4,687 | Pepsi Bottling Group (The), Inc. | 146,562 | |||||||||
| 549 | Universal Corp. | 16,558 | |||||||||
| 1,408,654 | |||||||||||
| Energy—11.0% | |||||||||||
| 32,855 | ConocoPhillips | 1,347,054 | |||||||||
| 19,934 | Exxon Mobil Corp. | 1,329,000 | |||||||||
| 772 | Harvest Natural Resources, Inc.* | 3,937 | |||||||||
| 1,099 | Holly Corp. | 23,035 | |||||||||
See Notes to Financial Statements.
22
Schedule of Investments (Continued)
PowerShares Buyback AchieversTM Portfolio
April 30, 2009
| Number of Shares | Value | ||||||||||
| Common Stocks and Other Equity Interests (Continued) | |||||||||||
| 590 | Overseas Shipholding Group, Inc. | $ | 16,939 | ||||||||
| 439 | SEACOR Holdings, Inc.* | 28,851 | |||||||||
| 1,131 | Tidewater, Inc. | 48,916 | |||||||||
| 11,333 | Valero Energy Corp. | 224,847 | |||||||||
| 3,022,579 | |||||||||||
| Financials—10.6% | |||||||||||
| 11,766 | Allstate (The) Corp. | 274,501 | |||||||||
| 1,172 | American Equity Investment Life Holding Co. | 6,598 | |||||||||
| 191 | American Physicians Capital, Inc. | 7,957 | |||||||||
| 4,809 | Ameriprise Financial, Inc. | 126,717 | |||||||||
| 6,004 | AON Corp. | 253,369 | |||||||||
| 2,575 | Apartment Investment & Management Co., Class A REIT | 18,798 | |||||||||
| 1,739 | Ashford Hospitality Trust, Inc. REIT | 5,252 | |||||||||
| 1,029 | Bank Mutual Corp. | 10,568 | |||||||||
| 2,131 | Calamos Asset Management, Inc., Class A | 24,315 | |||||||||
| 8,620 | Capital One Financial Corp. | 144,299 | |||||||||
| 5,815 | CB Richard Ellis Group, Inc., Class A* | 43,613 | |||||||||
| 7,734 | Chubb (The) Corp. | 301,240 | |||||||||
| 1,097 | Delphi Financial Group, Inc., Class A | 18,945 | |||||||||
| 168 | FPIC Insurance Group, Inc.* | 5,131 | |||||||||
| 619 | Harleysville Group, Inc. | 17,901 | |||||||||
| 860 | Horace Mann Educators Corp. | 7,551 | |||||||||
| 305 | Infinity Property & Casualty Corp. | 10,748 | |||||||||
| 3,471 | Janus Capital Group, Inc. | 34,814 | |||||||||
| 760 | Jones Lang LaSalle, Inc. | 24,525 | |||||||||
| 1,960 | Knight Capital Group, Inc., Class A* | 30,360 | |||||||||
| 9,551 | Loews Corp. | 237,724 | |||||||||
| 5,163 | Moody's Corp. | 152,412 | |||||||||
| 1,322 | Odyssey Re Holdings Corp. | 50,619 | |||||||||
| 9,307 | Prudential Financial, Inc. | 268,786 | |||||||||
| 475 | RLI Corp. | 22,814 | |||||||||
| 1,201 | Sunstone Hotel Investors, Inc. REIT | 6,353 | |||||||||
| 1,855 | Torchmark Corp. | 54,407 | |||||||||
| 12,838 | Travelers (The) Cos., Inc. | 528,156 | |||||||||
| 7,269 | Unum Group | 118,775 | |||||||||
| 3,511 | W.R. Berkley Corp. | 83,948 | |||||||||
| 1,479 | Whitney Holding Corp. | 17,689 | |||||||||
| 2,908,885 | |||||||||||
| Health Care—9.9% | |||||||||||
| 9,955 | Aetna, Inc. | 219,110 | |||||||||
| 2,083 | Alkermes, Inc.* | 15,935 | |||||||||
| 3,342 | AmerisourceBergen Corp. | 112,425 | |||||||||
| 230 | Assisted Living Concepts, Inc.* | 4,561 | |||||||||
| 494 | Chemed Corp. | 20,911 | |||||||||
| 2,280 | Health Net, Inc.* | 32,923 | |||||||||
| 739 | Healthways, Inc.* | 7,708 | |||||||||
| 3,986 | IMS Health, Inc. | 50,064 | |||||||||
| 2,378 | Laboratory Corp. of America Holdings* | 152,549 | |||||||||
| 1,144 | LifePoint Hospitals, Inc.* | 29,572 | |||||||||
| Number of Shares | Value | ||||||||||
| Common Stocks and Other Equity Interests (Continued) | |||||||||||
| 1,562 | Lincare Holdings, Inc.* | $ | 37,691 | ||||||||
| 210 | Matrixx Initiatives, Inc.* | 3,595 | |||||||||
| 6,011 | McKesson Corp. | 222,407 | |||||||||
| 431 | MedCath Corp.* | 4,362 | |||||||||
| 10,749 | Medco Health Solutions, Inc.* | 468,119 | |||||||||
| 965 | MEDNAX, Inc.* | 34,644 | |||||||||
| 587 | Molina Healthcare, Inc.* | 12,709 | |||||||||
| 1,130 | Nabi Biopharmaceuticals* | 3,887 | |||||||||
| 641 | Nighthawk Radiology Holdings, Inc.* | 2,288 | |||||||||
| 693 | Omnicell, Inc.* | 6,098 | |||||||||
| 2,680 | Patterson Cos., Inc.* | 54,833 | |||||||||
| 1,329 | PSS World Medical, Inc.* | 19,297 | |||||||||
| 1,418 | Questcor Pharmaceuticals, Inc.* | 6,381 | |||||||||
| 268 | Somanetics Corp.* | 4,344 | |||||||||
| 1,283 | STERIS Corp. | 30,920 | |||||||||
| 25,930 | UnitedHealth Group, Inc. | 609,874 | |||||||||
| 1,718 | Universal American Financial Corp.* | 17,747 | |||||||||
| 1,077 | Universal Health Services, Inc., Class B | 54,281 | |||||||||
| 1,804 | Valeant Pharmaceuticals International* | 30,235 | |||||||||
| 319 | Vital Images, Inc.* | 3,231 | |||||||||
| 10,638 | WellPoint, Inc.* | 454,881 | |||||||||
| 2,727,582 | |||||||||||
| Industrials—14.3% | |||||||||||
| 377 | AAON, Inc. | 7,344 | |||||||||
| 552 | Administaff, Inc. | 14,716 | |||||||||
| 340 | Advisory Board (The) Co.* | 6,338 | |||||||||
| 797 | Alaska Air Group, Inc.* | 13,374 | |||||||||
| 200 | American Science & Engineering, Inc. | 12,052 | |||||||||
| 434 | ATC Technology Corp.* | 6,896 | |||||||||
| 15,940 | Boeing (The) Co. | 638,396 | |||||||||
| 990 | Brink's (The) Co. | 28,067 | |||||||||
| 238 | Cascade Corp. | 5,752 | |||||||||
| 13,204 | Caterpillar, Inc. | 469,798 | |||||||||
| 415 | CDI Corp. | 4,959 | |||||||||
| 511 | Celadon Group, Inc.* | 3,495 | |||||||||
| 245 | Consolidated Graphics, Inc.* | 4,758 | |||||||||
| 1,828 | Copart, Inc.* | 57,381 | |||||||||
| 8,593 | CSX Corp. | 254,267 | |||||||||
| 4,083 | Dover Corp. | 125,675 | |||||||||
| 1,172 | Dun & Bradstreet (The) Corp. | 95,401 | |||||||||
| 435 | EnPro Industries, Inc.* | 6,943 | |||||||||
| 298 | Exponent, Inc.* | 8,314 | |||||||||
| 406 | G&K Services, Inc., Class A | 10,138 | |||||||||
| 1,315 | Graco, Inc. | 31,021 | |||||||||
| 839 | Granite Construction, Inc. | 33,099 | |||||||||
| 762 | H&E Equipment Services, Inc.* | 5,738 | |||||||||
| 372 | Heidrick & Struggles International, Inc. | 6,287 | |||||||||
| 1,181 | Herman Miller, Inc. | 17,561 | |||||||||
| 662 | Horizon Lines, Inc., Class A | 3,522 | |||||||||
| 387 | Houston Wire & Cable Co. | 3,731 | |||||||||
See Notes to Financial Statements.
23
Schedule of Investments (Continued)
PowerShares Buyback AchieversTM Portfolio
April 30, 2009
| Number of Shares | Value | ||||||||||
| Common Stocks and Other Equity Interests (Continued) | |||||||||||
| 10,957 | Illinois Tool Works, Inc. | $ | 359,390 | ||||||||
| 269 | Kadant, Inc.* | 3,319 | |||||||||
| 1,605 | Kennametal, Inc. | 32,822 | |||||||||
| 839 | Kforce, Inc.* | 9,153 | |||||||||
| 1,032 | Knoll, Inc. | 7,307 | |||||||||
| 2,603 | L-3 Communications Holdings, Inc. | 198,218 | |||||||||
| 1,210 | Lennox International, Inc. | 38,587 | |||||||||
| 424 | M&F Worldwide Corp.* | 6,763 | |||||||||
| 521 | McGrath Rentcorp | 11,014 | |||||||||
| 2,031 | MPS Group, Inc.* | 16,329 | |||||||||
| 1,367 | MSC Industrial Direct Co., Class A | 55,842 | |||||||||
| 756 | Republic Airways Holdings, Inc.* | 5,413 | |||||||||
| 412 | School Specialty, Inc.* | 7,733 | |||||||||
| 1,250 | SkyWest, Inc. | 15,050 | |||||||||
| 1,133 | Spherion Corp.* | 4,067 | |||||||||
| 366 | Standard Parking Corp.* | 5,578 | |||||||||
| 2,930 | Steelcase, Inc., Class A | 13,273 | |||||||||
| 2,072 | Terex Corp.* | 28,594 | |||||||||
| 783 | Toro (The) Co. | 23,788 | |||||||||
| 744 | Tredegar Corp. | 13,080 | |||||||||
| 22,095 | United Parcel Service, Inc., Class B | 1,156,451 | |||||||||
| 1,317 | United Rentals, Inc.* | 7,981 | |||||||||
| 520 | United Stationers, Inc.* | 17,020 | |||||||||
| 806 | Watts Water Technologies, Inc., Class A | 17,942 | |||||||||
| 3,929,737 | |||||||||||
| Information Technology—16.7% | |||||||||||
| 1,269 | Acme Packet Inc.* | 9,784 | |||||||||
| 2,120 | ADC Telecommunications, Inc.* | 15,603 | |||||||||
| 11,496 | Adobe Systems, Inc.* | 314,416 | |||||||||
| 1,363 | ADTRAN, Inc. | 28,827 | |||||||||
| 919 | Advanced Energy Industries, Inc.* | 7,747 | |||||||||
| 1,293 | Alliance Data Systems Corp.* | 54,138 | |||||||||
| 6,441 | Altera Corp. | 105,053 | |||||||||
| 771 | Anixter International, Inc.* | 30,670 | |||||||||
| 816 | Avid Technology, Inc.* | 9,033 | |||||||||
| 1,005 | Avocent Corp.* | 14,512 | |||||||||
| 1,432 | Benchmark Electronics, Inc.* | 17,370 | |||||||||
| 10,784 | Broadcom Corp., Class A* | 250,081 | |||||||||
| 1,398 | Brooks Automation, Inc.* | 8,696 | |||||||||
| 1,449 | Cirrus Logic, Inc.* | 6,738 | |||||||||
| 1,966 | Cogent, Inc.* | 22,294 | |||||||||
| 870 | Cognex Corp. | 12,241 | |||||||||
| 773 | Cogo Group, Inc.* | 6,323 | |||||||||
| 535 | Coherent, Inc.* | 10,165 | |||||||||
| 3,325 | Computer Sciences Corp.* | 122,892 | |||||||||
| 5,413 | Compuware Corp.* | 40,489 | |||||||||
| 2,682 | Convergys Corp.* | 27,115 | |||||||||
| 3,029 | Cypress Semiconductor Corp.* | 24,020 | |||||||||
| 885 | DealerTrack Holdings, Inc.* | 13,434 | |||||||||
| 42,826 | Dell, Inc.* | 497,638 | |||||||||
| Number of Shares | Value | ||||||||||
| Common Stocks and Other Equity Interests (Continued) | |||||||||||
| 838 | Digital River, Inc.* | $ | 32,196 | ||||||||
| 668 | DivX, Inc.* | 3,427 | |||||||||
| 499 | DSP Group, Inc.* | 3,139 | |||||||||
| 1,092 | DST Systems, Inc.* | 39,498 | |||||||||
| 2,390 | EarthLink, Inc.* | 18,116 | |||||||||
| 28,162 | eBay, Inc.* | 463,828 | |||||||||
| 1,137 | Electronics for Imaging, Inc.* | 11,165 | |||||||||
| 1,057 | Exar Corp.* | 6,501 | |||||||||
| 1,946 | Extreme Networks, Inc.* | 3,425 | |||||||||
| 1,714 | F5 Networks, Inc.* | 46,741 | |||||||||
| 979 | FalconStor Software, Inc.* | 3,622 | |||||||||
| 2,071 | Gartner, Inc.* | 27,979 | |||||||||
| 883 | Hackett Group (The), Inc.* | 1,987 | |||||||||
| 2,061 | Hewitt Associates, Inc., Class A* | 64,633 | |||||||||
| 540 | Hutchinson Technology, Inc.* | 1,037 | |||||||||
| 613 | Immersion Corp.* | 2,556 | |||||||||
| 1,001 | Insight Enterprises, Inc.* | 5,726 | |||||||||
| 386 | Integral Systems, Inc.* | 2,559 | |||||||||
| 3,632 | Integrated Device Technology, Inc.* | 19,722 | |||||||||
| 956 | InterDigital, Inc.* | 25,162 | |||||||||
| 2,671 | Intersil Corp., Class A | 30,984 | |||||||||
| 1,395 | Ixia* | 8,035 | |||||||||
| 965 | j2 Global Communications, Inc.* | 23,150 | |||||||||
| 1,843 | Jack Henry & Associates, Inc. | 33,211 | |||||||||
| 494 | Kenexa Corp.* | 3,241 | |||||||||
| 3,729 | KLA-Tencor Corp. | 103,442 | |||||||||
| 3,585 | Lawson Software, Inc.* | 19,323 | |||||||||
| 1,707 | Lexmark International, Inc., Class A* | 33,491 | |||||||||
| 758 | LoopNet, Inc.* | 6,511 | |||||||||
| 14,227 | LSI Corp.* | 54,632 | |||||||||
| 506 | Manhattan Associates, Inc.* | 8,410 | |||||||||
| 791 | Marchex, Inc., Class B | 3,575 | |||||||||
| 738 | Mettler-Toledo International, Inc.* | 45,483 | |||||||||
| 1,435 | Micrel, Inc. | 10,763 | |||||||||
| 3,998 | Microchip Technology, Inc. | 91,954 | |||||||||
| 261 | MicroStrategy, Inc., Class A* | 10,156 | |||||||||
| 1,087 | MKS Instruments, Inc.* | 17,012 | |||||||||
| 1,003 | ModusLink Global Solutions, Inc.* | 3,711 | |||||||||
| 5,040 | National Semiconductor Corp. | 62,345 | |||||||||
| 3,481 | NCR Corp.* | 35,332 | |||||||||
| 667 | Novatel Wireless, Inc.* | 4,569 | |||||||||
| 2,137 | Novellus Systems, Inc.* | 38,594 | |||||||||
| 1,098 | OmniVision Technologies, Inc.* | 10,442 | |||||||||
| 403 | PC-Tel, Inc. | 1,963 | |||||||||
| 864 | Plexus Corp.* | 19,138 | |||||||||
| 1,834 | Polycom, Inc.* | 34,186 | |||||||||
| 876 | Progress Software Corp.* | 18,562 | |||||||||
| 2,661 | QLogic Corp.* | 37,733 | |||||||||
| 2,949 | RealNetworks, Inc.* | 7,255 | |||||||||
| 635 | Rofin-Sinar Technologies, Inc.* | 13,532 | |||||||||
| 1,160 | S1 Corp.* | 7,192 | |||||||||
See Notes to Financial Statements.
24
Schedule of Investments (Continued)
PowerShares Buyback AchieversTM Portfolio
April 30, 2009
| Number of Shares | Value | ||||||||||
| Common Stocks and Other Equity Interests (Continued) | |||||||||||
| 584 | Sigma Designs, Inc.* | $ | 7,545 | ||||||||
| 1,729 | Silicon Image, Inc.* | 4,703 | |||||||||
| 982 | Silicon Laboratories, Inc.* | 32,661 | |||||||||
| 2,159 | Silicon Storage Technology Inc.* | 3,994 | |||||||||
| 1,180 | SonicWALL, Inc.* | 6,407 | |||||||||
| 16,346 | Sun Microsystems, Inc.* | 149,729 | |||||||||
| 291 | Supertex, Inc.* | 7,485 | |||||||||
| 1,809 | Sybase, Inc.* | 61,434 | |||||||||
| 749 | Synaptics, Inc.* | 24,328 | |||||||||
| 680 | Synchronoss Technologies, Inc.* | 9,030 | |||||||||
| 1,100 | Tech Data Corp.* | 31,669 | |||||||||
| 1,405 | TeleTech Holdings, Inc.* | 18,644 | |||||||||
| 8,729 | Tellabs, Inc.* | 45,740 | |||||||||
| 28,021 | Texas Instruments, Inc. | 506,059 | |||||||||
| 3,853 | TIBCO Software, Inc.* | 24,351 | |||||||||
| 775 | Tyler Technologies, Inc.* | 12,788 | |||||||||
| 1,904 | ValueClick, Inc.* | 20,182 | |||||||||
| 4,222 | VeriSign, Inc.* | 86,889 | |||||||||
| 524 | Vignette Corp.* | 4,328 | |||||||||
| 1,681 | Wind River Systems, Inc.* | 12,322 | |||||||||
| 18,982 | Xerox Corp. | 115,980 | |||||||||
| 6,017 | Xilinx, Inc. | 122,987 | |||||||||
| 1,303 | Zebra Technologies Corp., Class A* | 27,689 | |||||||||
| 370 | Zygo Corp.* | 1,857 | |||||||||
| 4,569,026 | |||||||||||
| Materials—2.4% | |||||||||||
| 572 | A. Schulman, Inc. | 8,975 | |||||||||
| 651 | AbitibiBowater, Inc.* | 99 | |||||||||
| 21,385 | Alcoa, Inc. | 193,961 | |||||||||
| 2,151 | Allegheny Technologies, Inc. | 70,402 | |||||||||
| 2,058 | Ball Corp. | 77,628 | |||||||||
| 967 | Carpenter Technology Corp. | 19,988 | |||||||||
| 3,150 | Celanese Corp., Series A | 65,646 | |||||||||
| 1,593 | Eastman Chemical Co. | 63,210 | |||||||||
| 1,066 | H.B. Fuller Co. | 18,826 | |||||||||
| 3,750 | MeadWestvaco Corp. | 58,725 | |||||||||
| 334 | NewMarket Corp. | 21,042 | |||||||||
| 3,995 | Steel Dynamics, Inc. | 49,738 | |||||||||
| 868 | U.S. Concrete, Inc.* | 1,719 | |||||||||
| 649,959 | |||||||||||
| Telecommunication Services—1.7% | |||||||||||
| 2,202 | CenturyTel, Inc. | 59,784 | |||||||||
| 5,002 | Cincinnati Bell, Inc.* | 13,956 | |||||||||
| 973 | Cogent Communications Group, Inc.* | 8,212 | |||||||||
| 3,130 | Embarq Corp. | 114,433 | |||||||||
| 6,833 | Frontier Communications Corp. | 48,583 | |||||||||
| 37,509 | Qwest Communications International, Inc. | 145,909 | |||||||||
| 9,682 | Windstream Corp. | 80,361 | |||||||||
| 471,238 | |||||||||||
| Number of Shares | Value | ||||||||||
| Common Stocks and Other Equity Interests (Continued) | |||||||||||
| Utilities—1.1% | |||||||||||
| 3,146 | Mirant Corp.* | $ | 40,049 | ||||||||
| 5,343 | Sempra Energy | 245,884 | |||||||||
| 285,933 | |||||||||||
| Total Common Stocks and Other Equity Interests (Cost $30,379,571) | 27,447,434 | ||||||||||
| Money Market Fund—0.7% | |||||||||||
| 203,097 | Goldman Sachs Financial Square Prime Obligations Institutional Share Class (Cost $203,097) | 203,097 | |||||||||
| Total Investments (Cost $30,582,668)—100.7% | 27,650,531 | ||||||||||
| Liabilities in excess of other assets—(0.7%) | (194,747 | ) | |||||||||
| Net Assets—100.0% | $ | 27,455,784 | |||||||||
REIT Real Estate Investment Trust
* Non-income producing security.
See Notes to Financial Statements.
25
Schedule of Investments
PowerShares Dividend AchieversTM Portfolio
April 30, 2009
| Number of Shares | Value | ||||||||||
| Common Stocks and Other Equity Interests—98.8% | |||||||||||
| Consumer Discretionary—7.6% | |||||||||||
| 877 | Cato (The) Corp., Class A | $ | 16,856 | ||||||||
| 1,654 | Cedar Fair LP | 18,839 | |||||||||
| 4,186 | Family Dollar Stores, Inc. | 138,933 | |||||||||
| 4,473 | Fortune Brands, Inc. | 175,834 | |||||||||
| 6,804 | Gannett Co., Inc. | 26,604 | |||||||||
| 4,748 | Genuine Parts Co. | 161,242 | |||||||||
| 10,123 | H&R Block, Inc. | 153,262 | |||||||||
| 6,940 | Harley-Davidson, Inc. | 153,790 | |||||||||
| 1,905 | Harte-Hanks, Inc. | 15,735 | |||||||||
| 1,740 | John Wiley & Sons, Inc., Class A | 58,986 | |||||||||
| 17,656 | Johnson Controls, Inc. | 335,641 | |||||||||
| 4,665 | Leggett & Platt, Inc. | 66,989 | |||||||||
| 43,927 | Lowe's Cos., Inc. | 944,430 | |||||||||
| 921 | Matthews International Corp., Class A | 28,846 | |||||||||
| 33,191 | McDonald's Corp. | 1,768,747 | |||||||||
| 9,374 | McGraw-Hill (The) Cos., Inc. | 282,626 | |||||||||
| 1,346 | Meredith Corp. | 33,758 | |||||||||
| 6,431 | Nordstrom, Inc. | 145,534 | |||||||||
| 969 | Polaris Industries, Inc. | 32,413 | |||||||||
| 3,782 | Ross Stores, Inc. | 143,489 | |||||||||
| 3,484 | Sherwin-Williams (The) Co. | 197,334 | |||||||||
| 2,353 | Stanley Works (The) | 89,485 | |||||||||
| 22,449 | Target Corp. | 926,246 | |||||||||
| 12,313 | TJX Cos., Inc. | 344,395 | |||||||||
| 3,288 | VF Corp. | 194,880 | |||||||||
| 338 | Weyco Group, Inc. | 9,278 | |||||||||
| 1,475 | Wolverine World Wide, Inc. | 30,724 | |||||||||
| 6,494,896 | |||||||||||
| Consumer Staples—22.0% | |||||||||||
| 19,138 | Archer-Daniels-Midland Co. | 471,178 | |||||||||
| 12,903 | Avon Products, Inc. | 293,672 | |||||||||
| 4,496 | Brown-Forman Corp., Class B | 209,064 | |||||||||
| 2,091 | Church & Dwight Co., Inc. | 113,771 | |||||||||
| 4,141 | Clorox (The) Co. | 232,103 | |||||||||
| 69,003 | Coca-Cola (The) Co. | 2,970,579 | |||||||||
| 14,937 | Colgate-Palmolive Co. | 881,283 | |||||||||
| 6,794 | Hershey (The) Co. | 245,535 | |||||||||
| 4,005 | Hormel Foods Corp. | 125,316 | |||||||||
| 3,533 | J.M. Smucker (The) Co. | 139,200 | |||||||||
| 12,340 | Kimberly-Clark Corp. | 606,388 | |||||||||
| 834 | Lancaster Colony Corp. | 36,529 | |||||||||
| 3,890 | McCormick & Co., Inc. | 114,561 | |||||||||
| 46,400 | PepsiCo, Inc. | 2,308,864 | |||||||||
| 84,681 | Procter & Gamble (The) Co. | 4,186,629 | |||||||||
| 6,329 | SUPERVALU, Inc. | 103,479 | |||||||||
| 17,576 | Sysco Corp. | 410,048 | |||||||||
| 1,662 | Tootsie Roll Industries, Inc. | 40,470 | |||||||||
| 746 | Universal Corp. | 22,499 | |||||||||
| 1,984 | Vector Group Ltd. | 26,744 | |||||||||
| Number of Shares | Value | ||||||||||
| Common Stocks and Other Equity Interests (Continued) | |||||||||||
| 29,616 | Walgreen Co. | $ | 930,831 | ||||||||
| 86,657 | Wal-Mart Stores, Inc. | 4,367,514 | |||||||||
| 18,836,257 | |||||||||||
| Energy—10.8% | |||||||||||
| 1,525 | Buckeye Partners LP | 58,652 | |||||||||
| 58,319 | Chevron Corp. | 3,854,886 | |||||||||
| 4,746 | Energy Transfer Partners LP | 187,704 | |||||||||
| 13,434 | Enterprise Products Partners LP | 316,908 | |||||||||
| 62,734 | Exxon Mobil Corp. | 4,182,476 | |||||||||
| 3,144 | Helmerich & Payne, Inc. | 96,898 | |||||||||
| 1,497 | Holly Corp. | 31,377 | |||||||||
| 7,963 | Kinder Morgan Energy Partners LP | 380,313 | |||||||||
| 3,130 | TEPPCO Partners LP | 85,230 | |||||||||
| 9,194,444 | |||||||||||
| Financials—13.1% | |||||||||||
| 720 | 1st Source Corp. | 14,141 | |||||||||
| 13,810 | Aflac, Inc. | 398,971 | |||||||||
| 1,178 | Alexandria Real Estate Equities, Inc. REIT | 42,973 | |||||||||
| 15,967 | Allstate (The) Corp. | 372,510 | |||||||||
| 315 | Arrow Financial Corp. | 8,341 | |||||||||
| 2,976 | Arthur J. Gallagher & Co. | 66,900 | |||||||||
| 3,805 | Associated Banc-Corp. | 58,863 | |||||||||
| 453 | BancFirst Corp. | 19,343 | |||||||||
| 2,475 | BancorpSouth, Inc. | 57,544 | |||||||||
| 1,423 | Bank of Hawaii Corp. | 50,004 | |||||||||
| 502 | Bank of the Ozarks, Inc. | 12,465 | |||||||||
| 16,656 | BB&T Corp. | 388,751 | |||||||||
| 4,219 | Brown & Brown, Inc. | 82,102 | |||||||||
| 508 | Capital City Bank Group, Inc. | 7,640 | |||||||||
| 1,972 | CBL & Associates Properties, Inc. REIT | 15,658 | |||||||||
| 711 | Chemical Financial Corp. | 15,180 | |||||||||
| 10,489 | Chubb (The) Corp. | 408,547 | |||||||||
| 4,835 | Cincinnati Financial Corp. | 115,798 | |||||||||
| 1,434 | City National Corp. | 52,484 | |||||||||
| 4,508 | Comerica, Inc. | 94,578 | |||||||||
| 2,259 | Commerce Bancshares, Inc. | 74,773 | |||||||||
| 974 | Community Bank System, Inc. | 16,022 | |||||||||
| 449 | Community Trust Bancorp, Inc. | 13,587 | |||||||||
| 1,623 | Corporate Office Properties Trust REIT | 49,599 | |||||||||
| 1,771 | Cullen/Frost Bankers, Inc. | 83,396 | |||||||||
| 6,705 | Duke Realty Corp. REIT | 65,508 | |||||||||
| 747 | EastGroup Properties, Inc. REIT | 25,107 | |||||||||
| 3,486 | Eaton Vance Corp. | 95,412 | |||||||||
| 1,035 | Entertainment Properties Trust REIT | 23,919 | |||||||||
| 1,715 | Erie Indemnity Co., Class A | 60,574 | |||||||||
| 799 | Essex Property Trust, Inc. REIT | 50,729 | |||||||||
| 2,663 | F.N.B. Corp. | 20,026 | |||||||||
| 1,760 | Federal Realty Investment Trust REIT | 97,152 | |||||||||
| 3,058 | Federated Investors, Inc., Class B | 69,967 | |||||||||
| 1,059 | First Busey Corp. | 8,292 | |||||||||
See Notes to Financial Statements.
26
Schedule of Investments (Continued)
PowerShares Dividend AchieversTM Portfolio
April 30, 2009
| Number of Shares | Value | ||||||||||
| Common Stocks and Other Equity Interests (Continued) | |||||||||||
| 343 | First Community Bancshares, Inc. | $ | 4,956 | ||||||||
| 620 | First Financial Bankshares, Inc. | 30,554 | |||||||||
| 391 | First Financial Corp. | 14,506 | |||||||||
| 347 | First Financial Holdings, Inc. | 3,123 | |||||||||
| 1,436 | First Midwest Bancorp, Inc. | 12,723 | |||||||||
| 4,470 | First Niagara Financial Group, Inc. | 60,524 | |||||||||
| 644 | Flushing Financial Corp. | 5,931 | |||||||||
| 3,101 | Forest City Enterprises, Inc., Class A | 26,141 | |||||||||
| 6,631 | Franklin Resources, Inc. | 401,043 | |||||||||
| 5,221 | Fulton Financial Corp. | 34,511 | |||||||||
| 738 | Getty Realty Corp. REIT | 14,480 | |||||||||
| 1,829 | Glacier Bancorp, Inc. | 28,020 | |||||||||
| 839 | Harleysville Group, Inc. | 24,264 | |||||||||
| 9,711 | Hartford Financial Services Group (The), Inc. | 111,385 | |||||||||
| 3,385 | HCC Insurance Holdings, Inc. | 80,969 | |||||||||
| 7,569 | HCP, Inc. REIT | 166,140 | |||||||||
| 483 | Heartland Financial USA, Inc. | 7,139 | |||||||||
| 980 | Home Properties, Inc. REIT | 35,711 | |||||||||
| 477 | IBERIABANK Corp. | 21,789 | |||||||||
| 1,764 | Investors Real Estate Trust REIT | 16,317 | |||||||||
| 10,839 | Kimco Realty Corp. REIT | 130,285 | |||||||||
| 367 | Lakeland Financial Corp. | 6,889 | |||||||||
| 4,249 | Legg Mason, Inc. | 85,277 | |||||||||
| 3,071 | Liberty Property Trust REIT | 74,748 | |||||||||
| 7,643 | Lincoln National Corp. | 85,907 | |||||||||
| 3,300 | M&T Bank Corp. | 173,085 | |||||||||
| 2,297 | Macerich (The) Co. REIT | 40,266 | |||||||||
| 598 | MainSource Financial Group, Inc. | 5,179 | |||||||||
| 7,826 | Marshall & Ilsley Corp. | 45,234 | |||||||||
| 1,632 | Mercury General Corp. | 55,129 | |||||||||
| 2,441 | National Penn Bancshares, Inc. | 19,748 | |||||||||
| 2,361 | National Retail Properties, Inc. REIT | 41,884 | |||||||||
| 7,136 | Northern Trust Corp. | 387,913 | |||||||||
| 1,972 | Old National Bancorp | 26,878 | |||||||||
| 7,010 | Old Republic International Corp. | 65,684 | |||||||||
| 410 | Old Second Bancorp, Inc. | 2,214 | |||||||||
| 415 | Park National Corp. | 27,784 | |||||||||
| 11,439 | ProLogis REIT | 104,209 | |||||||||
| 3,108 | Realty Income Corp. REIT | 69,402 | |||||||||
| 2,347 | Regency Centers Corp. REIT | 87,895 | |||||||||
| 626 | Renasant Corp. | 8,827 | |||||||||
| 618 | Republic Bancorp, Inc., Class A | 13,744 | |||||||||
| 644 | RLI Corp. | 30,931 | |||||||||
| 822 | S&T Bancorp, Inc. | 14,689 | |||||||||
| 403 | S.Y. Bancorp, Inc. | 10,164 | |||||||||
| 487 | Sandy Spring Bancorp, Inc. | 7,914 | |||||||||
| 5,682 | SEI Investments Co. | 79,718 | |||||||||
| 418 | Simmons First National Corp., Class A | 10,839 | |||||||||
| 438 | Southside Bancshares, Inc. | 9,329 | |||||||||
| 435 | Southwest Bancorp, Inc. | 2,980 | |||||||||
| 656 | Sovran Self Storage, Inc. REIT | 14,786 | |||||||||
| Number of Shares | Value | ||||||||||
| Common Stocks and Other Equity Interests (Continued) | |||||||||||
| 1,179 | State Auto Financial Corp. | $ | 19,135 | ||||||||
| 12,877 | State Street Corp. | 439,492 | |||||||||
| 2,183 | Sterling Bancshares, Inc. | 14,517 | |||||||||
| 2,563 | Susquehanna Bancshares, Inc. | 20,658 | |||||||||
| 7,612 | T. Rowe Price Group, Inc. | 293,214 | |||||||||
| 950 | Tanger Factory Outlet Centers, Inc. REIT | 31,654 | |||||||||
| 1,580 | Taubman Centers, Inc. REIT | 37,636 | |||||||||
| 3,811 | TCF Financial Corp. | 53,011 | |||||||||
| 289 | Tompkins Financial Corp. | 12,181 | |||||||||
| 1,977 | Transatlantic Holdings, Inc. | 74,988 | |||||||||
| 1,709 | Trustmark Corp. | 37,154 | |||||||||
| 51,961 | U.S. Bancorp | 946,728 | |||||||||
| 4,446 | UDR, Inc. REIT | 44,771 | |||||||||
| 1,212 | UMB Financial Corp. | 55,473 | |||||||||
| 1,287 | United Bankshares, Inc. | 33,385 | |||||||||
| 354 | Universal Health Realty Income Trust REIT | 11,335 | |||||||||
| 790 | Urstadt Biddle Properties, Inc., Class A REIT | 12,134 | |||||||||
| 4,211 | Valley National Bancorp | 60,933 | |||||||||
| 5,266 | Vornado Realty Trust REIT | 257,455 | |||||||||
| 1,175 | W.P. Carey & Co. LLC | 24,981 | |||||||||
| 2,622 | Washington Federal, Inc. | 34,034 | |||||||||
| 1,580 | Washington REIT | 33,701 | |||||||||
| 475 | Washington Trust Bancorp, Inc. | 8,669 | |||||||||
| 1,547 | Webster Financial Corp. | 8,091 | |||||||||
| 3,568 | Weingarten Realty Investors REIT | 55,447 | |||||||||
| 126,769 | Wells Fargo & Co. | 2,536,647 | |||||||||
| 790 | WesBanco, Inc. | 15,713 | |||||||||
| 213 | Wesco Financial Corp. | 63,666 | |||||||||
| 860 | Westamerica Bancorp. | 46,122 | |||||||||
| 2,007 | Whitney Holding Corp. | 24,004 | |||||||||
| 2,054 | Wilmington Trust Corp. | 29,804 | |||||||||
| 183 | WSFS Financial Corp. | 4,961 | |||||||||
| 11,218,307 | |||||||||||
| Health Care—14.8% | |||||||||||
| 46,100 | Abbott Laboratories | 1,929,285 | |||||||||
| 1,888 | Beckman Coulter, Inc. | 99,233 | |||||||||
| 7,150 | Becton Dickinson & Co. | 432,432 | |||||||||
| 2,962 | C.R. Bard, Inc. | 212,168 | |||||||||
| 10,763 | Cardinal Health, Inc. | 363,682 | |||||||||
| 4,432 | DENTSPLY International, Inc. | 126,844 | |||||||||
| 34,259 | Eli Lilly & Co. | 1,127,806 | |||||||||
| 76,189 | Johnson & Johnson | 3,989,257 | |||||||||
| 33,415 | Medtronic, Inc. | 1,069,280 | |||||||||
| 1,203 | Meridian Bioscience, Inc. | 20,908 | |||||||||
| 1,236 | Owens & Minor, Inc. | 42,864 | |||||||||
| 200,823 | Pfizer, Inc. | 2,682,996 | |||||||||
| 11,833 | Stryker Corp. | 458,055 | |||||||||
| 1,180 | Teleflex, Inc. | 50,716 | |||||||||
| 975 | West Pharmaceutical Services, Inc. | 31,834 | |||||||||
| 12,637,360 | |||||||||||
See Notes to Financial Statements.
27
Schedule of Investments (Continued)
PowerShares Dividend AchieversTM Portfolio
April 30, 2009
| Number of Shares | Value | ||||||||||
| Common Stocks and Other Equity Interests (Continued) | |||||||||||
| Industrials—14.1% | |||||||||||
| 20,682 | 3M Co. | $ | 1,191,284 | ||||||||
| 903 | A.O. Smith Corp. | 28,074 | |||||||||
| 1,524 | ABM Industries, Inc. | 26,700 | |||||||||
| 3,160 | Avery Dennison Corp. | 90,818 | |||||||||
| 441 | Badger Meter, Inc. | 17,181 | |||||||||
| 1,529 | Brady Corp., Class A | 32,216 | |||||||||
| 5,050 | C.H. Robinson Worldwide, Inc. | 268,458 | |||||||||
| 1,818 | Carlisle Cos., Inc. | 41,360 | |||||||||
| 17,865 | Caterpillar, Inc. | 635,637 | |||||||||
| 4,558 | Cintas Corp. | 116,958 | |||||||||
| 1,518 | CLARCOR, Inc. | 47,179 | |||||||||
| 354 | Courier Corp. | 5,551 | |||||||||
| 9,508 | Danaher Corp. | 555,648 | |||||||||
| 2,298 | Donaldson Co., Inc. | 75,811 | |||||||||
| 5,546 | Dover Corp. | 170,706 | |||||||||
| 22,503 | Emerson Electric Co. | 766,002 | |||||||||
| 6,331 | Expeditors International of Washington, Inc. | 219,749 | |||||||||
| 4,430 | Fastenal Co. | 169,935 | |||||||||
| 686 | Franklin Electric Co., Inc. | 16,251 | |||||||||
| 11,518 | General Dynamics Corp. | 595,135 | |||||||||
| 314,861 | General Electric Co. | 3,982,993 | |||||||||
| 498 | Gorman-Rupp (The) Co. | 10,607 | |||||||||
| 2,395 | Harsco Corp. | 65,982 | |||||||||
| 1,321 | HNI Corp. | 20,476 | |||||||||
| 14,881 | Illinois Tool Works, Inc. | 488,097 | |||||||||
| 10,697 | Masco Corp. | 94,775 | |||||||||
| 708 | McGrath Rentcorp | 14,967 | |||||||||
| 1,065 | Mine Safety Appliances Co. | 26,252 | |||||||||
| 247 | NACCO Industries, Inc., Class A | 9,448 | |||||||||
| 1,002 | Nordson Corp. | 36,353 | |||||||||
| 1,054 | Otter Tail Corp. | 23,378 | |||||||||
| 4,791 | Parker Hannifin Corp. | 217,272 | |||||||||
| 2,932 | Pentair, Inc. | 78,108 | |||||||||
| 6,147 | Pitney Bowes, Inc. | 150,847 | |||||||||
| 537 | Raven Industries, Inc. | 12,834 | |||||||||
| 2,677 | Roper Industries, Inc. | 122,044 | |||||||||
| 546 | Tennant Co. | 8,119 | |||||||||
| 28,072 | United Technologies Corp. | 1,371,037 | |||||||||
| 571 | Universal Forest Products, Inc. | 19,163 | |||||||||
| 2,231 | W.W. Grainger, Inc. | 187,136 | |||||||||
| 12,010,541 | |||||||||||
| Information Technology—5.4% | |||||||||||
| 15,047 | Automatic Data Processing, Inc. | 529,654 | |||||||||
| 1,972 | Diebold, Inc. | 52,120 | |||||||||
| 34,145 | International Business Machines Corp. | 3,524,105 | |||||||||
| 2,503 | Jack Henry & Associates, Inc. | 45,104 | |||||||||
| 6,624 | Linear Technology Corp. | 144,271 | |||||||||
| 10,756 | Paychex, Inc. | 290,520 | |||||||||
| 4,585,774 | |||||||||||
| Number of Shares | Value | ||||||||||
| Common Stocks and Other Equity Interests (Continued) | |||||||||||
| Materials—3.3% | |||||||||||
| 6,265 | Air Products & Chemicals, Inc. | $ | 412,863 | ||||||||
| 2,726 | Albemarle Corp. | 73,111 | |||||||||
| 2,019 | AptarGroup, Inc. | 62,650 | |||||||||
| 2,978 | Bemis Co., Inc. | 71,591 | |||||||||
| 7,044 | Ecolab, Inc. | 271,546 | |||||||||
| 1,449 | H.B. Fuller Co. | 25,589 | |||||||||
| 1,232 | Martin Marietta Materials, Inc. | 103,525 | |||||||||
| 1,050 | Myers Industries, Inc. | 10,532 | |||||||||
| 9,368 | Nucor Corp. | 381,184 | |||||||||
| 4,904 | PPG Industries, Inc. | 216,021 | |||||||||
| 9,165 | Praxair, Inc. | 683,800 | |||||||||
| 3,829 | RPM International, Inc. | 52,917 | |||||||||
| 3,636 | Sigma-Aldrich Corp. | 159,402 | |||||||||
| 2,977 | Sonoco Products Co. | 72,669 | |||||||||
| 287 | Stepan Co. | 11,357 | |||||||||
| 2,991 | Valspar (The) Corp. | 71,784 | |||||||||
| 3,280 | Vulcan Materials Co. | 155,964 | |||||||||
| 2,836,505 | |||||||||||
| Telecommunication Services—5.0% | |||||||||||
| 163,764 | AT&T, Inc. | 4,195,633 | |||||||||
| 2,993 | CenturyTel, Inc. | 81,260 | |||||||||
| 704 | Shenandoah Telecommunications Co. | 13,820 | |||||||||
| 4,290,713 | |||||||||||
| Utilities—2.7% | |||||||||||
| 516 | American States Water Co. | 17,817 | |||||||||
| 4,046 | Aqua America, Inc. | 74,244 | |||||||||
| 2,734 | Atmos Energy Corp. | 67,557 | |||||||||
| 1,157 | Black Hills Corp. | 23,001 | |||||||||
| 617 | California Water Service Group | 24,082 | |||||||||
| 251 | Connecticut Water Service, Inc. | 5,206 | |||||||||
| 8,184 | Consolidated Edison, Inc. | 303,872 | |||||||||
| 2,139 | Energen Corp. | 77,261 | |||||||||
| 12,254 | FPL Group, Inc. | 659,143 | |||||||||
| 2,278 | Integrys Energy Group, Inc. | 60,162 | |||||||||
| 5,476 | MDU Resources Group, Inc. | 96,213 | |||||||||
| 684 | MGE Energy, Inc. | 20,985 | |||||||||
| 400 | Middlesex Water Co. | 5,640 | |||||||||
| 2,371 | National Fuel Gas Co. | 77,555 | |||||||||
| 1,263 | New Jersey Resources Corp. | 41,578 | |||||||||
| 790 | Northwest Natural Gas Co. | 32,311 | |||||||||
| 2,186 | Piedmont Natural Gas Co., Inc. | 53,382 | |||||||||
| 8,310 | Progress Energy, Inc. | 283,537 | |||||||||
| 5,191 | Questar Corp. | 154,277 | |||||||||
| 550 | SJW Corp. | 13,860 | |||||||||
| 784 | Southwest Water Co. | 4,500 | |||||||||
| 979 | Suburban Propane Partners LP | 39,160 | |||||||||
| 3,222 | UGI Corp. | 73,913 | |||||||||
See Notes to Financial Statements.
28
Schedule of Investments (Continued)
PowerShares Dividend AchieversTM Portfolio
April 30, 2009
| Number of Shares | Value | ||||||||||
| Common Stocks and Other Equity Interests (Continued) | |||||||||||
| 2,417 | Vectren Corp. | $ | 53,585 | ||||||||
| 1,495 | WGL Holdings, Inc. | 46,554 | |||||||||
| 2,309,395 | |||||||||||
| Total Common Stocks and Other Equity Interests (Cost $98,897,773) | 84,414,192 | ||||||||||
| Money Market Fund—0.1% | |||||||||||
| 65,504 | Goldman Sachs Financial Square Prime Obligations Institutional Share Class (Cost $65,504) | 65,504 | |||||||||
| Total Investments (Cost $98,963,277)—98.9% | 84,479,696 | ||||||||||
| Other assets less liabilities—1.1% | 971,366 | ||||||||||
| Net Assets—100.0% | $ | 85,451,062 | |||||||||
REIT Real Estate Investment Trust
See Notes to Financial Statements.
29
Schedule of Investments
PowerShares Financial Preferred Portfolio
April 30, 2009
| Number of Shares | Value | ||||||||||
| Preferred Stocks—99.2% | |||||||||||
| Banks—59.3% | |||||||||||
| 1,307,042 | Bank of America Corp., 6.20%, Series D | $ | 16,416,448 | ||||||||
| 1,436,638 | Bank of America Corp., 7.25%, Series J | 19,567,010 | |||||||||
| 3,482,730 | Bank of America Corp., 8.20% | 52,589,223 | |||||||||
| 2,180,951 | Bank of America Corp., 8.63%, Series MER | 30,555,124 | |||||||||
| 2,951,057 | Barclays Bank PLC, 8.13% (United Kingdom) | 46,892,296 | |||||||||
| 1,271,135 | Goldman Sachs Group, Inc., 6.20%, Series B | 26,401,474 | |||||||||
| 1,714,038 | HSBC Holdings PLC, 8.13% (United Kingdom) | 37,246,046 | |||||||||
| 632,974 | HSBC USA, Inc., 6.50%, Series H | 10,760,558 | |||||||||
| 1,971,506 | JPMorgan Chase & Co., 8.63% | 47,473,864 | |||||||||
| 1,058,520 | National Bank of Greece S.A., 9.00% (Greece) | 19,699,057 | |||||||||
| 423,407 | Royal Bank of Scotland Group PLC, 6.25%, Series P (United Kingdom) | 3,281,404 | |||||||||
| 1,629,531 | Royal Bank of Scotland Group PLC, 6.35%, Series N (United Kingdom) | 12,710,342 | |||||||||
| 1,427,432 | Royal Bank of Scotland Group PLC, 6.40%, Series M (United Kingdom) | 11,505,102 | |||||||||
| 1,428,506 | Royal Bank of Scotland Group PLC, 6.60%, Series S (United Kingdom) | 11,642,324 | |||||||||
| 1,059,088 | Royal Bank of Scotland Group PLC, 6.75%, Series Q (United Kingdom) | 9,055,202 | |||||||||
| 2,650,620 | Royal Bank of Scotland Group PLC, 7.25%, Series T (United Kingdom) | 23,086,900 | |||||||||
| 843,479 | Santander Finance Preferred SA Unipersonal, 6.50% (Spain) | 12,643,750 | |||||||||
| 781,727 | Santander Finance Preferred SA Unipersonal, 6.80% (Spain) | 11,530,473 | |||||||||
| 846,798 | U.S. Bancorp, 7.88%, Series D | 19,137,635 | |||||||||
| 1,997,994 | Wells Fargo & Co., 8.00% | 36,962,889 | |||||||||
| 459,157,121 | |||||||||||
| Diversified Financial Services—7.8% | |||||||||||
| 342,439 | CIT Group, Inc., 6.35%, Series A | 1,969,024 | |||||||||
| 1,702,595 | Credit Suisse Guernsey, 7.90% (Switzerland) | 34,051,900 | |||||||||
| 846,840 | HSBC Finance Corp., 6.36% | 11,008,920 | |||||||||
| 594,871 | Repsol International Capital Ltd., 7.45%, Series A | 13,027,675 | |||||||||
| 60,057,519 | |||||||||||
| Insurance—32.1% | |||||||||||
| 905,490 | Aegon N.V., 6.38% (Netherlands) | 8,647,430 | |||||||||
| 554,539 | Aegon N.V., 6.50% (Netherlands) | 5,617,480 | |||||||||
| 1,455,274 | Aegon N.V., 6.88% (Netherlands) | 16,328,174 | |||||||||
| 635,247 | Aegon N.V., 6.88% (Netherlands) | 6,638,331 | |||||||||
| 1,995,222 | Allianz SE, 8.38% (Germany) | 37,210,891 | |||||||||
| 423,407 | Axis Capital Holdings Ltd., 7.25%, Series A | 7,409,623 | |||||||||
| 1,832,829 | ING Groep N.V., 6.37% (Netherlands) | 19,867,866 | |||||||||
| 2,243,006 | ING Groep N.V., 7.37% (Netherlands) | 26,781,492 | |||||||||
| Number of Shares | Value | ||||||||||
| Preferred Stocks (Continued) | |||||||||||
| 1,248,550 | ING Groep N.V., 7.38% (Netherlands) | $ | 13,072,319 | ||||||||
| 2,217,702 | ING Groep N.V., 8.50% (Netherlands) | 31,336,129 | |||||||||
| 1,987,001 | MetLife, Inc., 6.50%, Series B | 36,362,118 | |||||||||
| 491,181 | PartnerRe Ltd., 6.75%, Series C | 9,494,529 | |||||||||
| 508,101 | Prudential PLC, 6.50% (United Kingdom) | 7,362,383 | |||||||||
| 423,407 | Prudential PLC, 6.75% (United Kingdom) | 6,245,253 | |||||||||
| 423,407 | RenaissanceRe Holdings Ltd., 6.08%, Series C | 6,791,448 | |||||||||
| 508,101 | RenaissanceRe Holdings Ltd., 6.60%, Series D | 9,145,818 | |||||||||
| 248,311,284 | |||||||||||
| Total Preferred Stocks (Cost $840,454,641) | 767,525,924 | ||||||||||
| Money Market Fund—0.9% | |||||||||||
| 6,818,377 | Goldman Sachs Financial Square Prime Obligations Institutional Share Class (Cost $6,818,377) | 6,818,377 | |||||||||
| Total Investments (Cost $847,273,018)—100.1% | 774,344,301 | ||||||||||
| Liabilities in excess of other assets—(0.1%) | (700,102 | ) | |||||||||
| Net Assets—100.0% | $ | 773,644,199 | |||||||||
The Fund has holdings greater than 10% of net assets in the following countries:
| United Kingdom | 21.8 | % | |||||
| Netherlands | 16.6 | ||||||
See Notes to Financial Statements.
30
Schedule of Investments
PowerShares High Growth Rate Dividend AchieversTM Portfolio
April 30, 2009
| Number of Shares | Value | ||||||||||
| Common Stocks and Other Equity Interests—100.0% | |||||||||||
| Advertising—0.1% | |||||||||||
| 942 | Harte-Hanks, Inc. | $ | 7,781 | ||||||||
| Aerospace/Defense—6.2% | |||||||||||
| 5,710 | General Dynamics Corp. | 295,036 | |||||||||
| 10,611 | United Technologies Corp. | 518,241 | |||||||||
| 813,277 | |||||||||||
| Agriculture—1.9% | |||||||||||
| 9,494 | Archer-Daniels-Midland Co. | 233,742 | |||||||||
| 984 | Vector Group Ltd. | 13,264 | |||||||||
| 247,006 | |||||||||||
| Apparel—0.1% | |||||||||||
| 168 | Weyco Group, Inc. | 4,612 | |||||||||
| 732 | Wolverine World Wide, Inc. | 15,248 | |||||||||
| 19,860 | |||||||||||
| Auto Parts & Equipment—1.3% | |||||||||||
| 8,789 | Johnson Controls, Inc. | 167,079 | |||||||||
| Banks—7.3% | |||||||||||
| 226 | BancFirst Corp. | 9,650 | |||||||||
| 249 | Bank of the Ozarks, Inc. | 6,183 | |||||||||
| 713 | City National Corp. | 26,096 | |||||||||
| 530 | First Busey Corp. | 4,150 | |||||||||
| 910 | Glacier Bancorp, Inc. | 13,941 | |||||||||
| 237 | IBERIABANK Corp. | 10,826 | |||||||||
| 182 | Lakeland Financial Corp. | 3,416 | |||||||||
| 1,644 | M&T Bank Corp. | 86,228 | |||||||||
| 204 | Old Second Bancorp, Inc. | 1,102 | |||||||||
| 307 | Republic Bancorp, Inc., Class A | 6,828 | |||||||||
| 200 | S.Y. Bancorp, Inc. | 5,044 | |||||||||
| 218 | Southside Bancshares, Inc. | 4,643 | |||||||||
| 216 | Southwest Bancorp, Inc. | 1,480 | |||||||||
| 6,425 | State Street Corp. | 219,285 | |||||||||
| 1,084 | Sterling Bancshares, Inc. | 7,209 | |||||||||
| 1,891 | TCF Financial Corp. | 26,304 | |||||||||
| 26,131 | Wells Fargo & Co. | 522,880 | |||||||||
| 955,265 | |||||||||||
| Beverages—3.9% | |||||||||||
| 10,172 | PepsiCo, Inc. | 506,159 | |||||||||
| Chemicals—4.0% | |||||||||||
| 4,542 | Praxair, Inc. | 338,879 | |||||||||
| 1,732 | Sherwin-Williams (The) Co. | 98,100 | |||||||||
| 1,806 | Sigma-Aldrich Corp. | 79,175 | |||||||||
| 516,154 | |||||||||||
| Commercial Services—3.5% | |||||||||||
| 7,468 | Automatic Data Processing, Inc. | 262,874 | |||||||||
| 351 | McGrath Rentcorp | 7,420 | |||||||||
| Number of Shares | Value | ||||||||||
| Common Stocks and Other Equity Interests (Continued) | |||||||||||
| 5,337 | Paychex, Inc. | $ | 144,152 | ||||||||
| 2,822 | SEI Investments Co. | 39,593 | |||||||||
| 454,039 | |||||||||||
| Computers—4.1% | |||||||||||
| 4,993 | International Business Machines Corp. | 515,328 | |||||||||
| 1,242 | Jack Henry & Associates, Inc. | 22,381 | |||||||||
| 537,709 | |||||||||||
| Distribution/Wholesale—0.8% | |||||||||||
| 2,197 | Fastenal Co. | 84,277 | |||||||||
| 613 | Owens & Minor, Inc. | 21,259 | |||||||||
| 105,536 | |||||||||||
| Diversified Financial Services—3.6% | |||||||||||
| 1,729 | Eaton Vance Corp. | 47,323 | |||||||||
| 1,513 | Federated Investors, Inc., Class B | 34,617 | |||||||||
| 3,297 | Franklin Resources, Inc. | 199,403 | |||||||||
| 2,112 | Legg Mason, Inc. | 42,388 | |||||||||
| 3,779 | T. Rowe Price Group, Inc. | 145,567 | |||||||||
| 469,298 | |||||||||||
| Environmental Control—0.1% | |||||||||||
| 529 | Mine Safety Appliances Co. | 13,040 | |||||||||
| Food—1.6% | |||||||||||
| 8,715 | Sysco Corp. | 203,321 | |||||||||
| Healthcare-Products—11.6% | |||||||||||
| 3,545 | Becton Dickinson & Co. | 214,402 | |||||||||
| 10,050 | Johnson & Johnson | 526,217 | |||||||||
| 16,555 | Medtronic, Inc. | 529,759 | |||||||||
| 598 | Meridian Bioscience, Inc. | 10,393 | |||||||||
| 5,865 | Stryker Corp. | 227,034 | |||||||||
| 1,507,805 | |||||||||||
| Insurance—5.0% | |||||||||||
| 6,915 | Aflac, Inc. | 199,774 | |||||||||
| 7,928 | Allstate (The) Corp. | 184,960 | |||||||||
| 1,476 | Arthur J. Gallagher & Co. | 33,180 | |||||||||
| 2,094 | Brown & Brown, Inc. | 40,749 | |||||||||
| 849 | Erie Indemnity Co., Class A | 29,987 | |||||||||
| 1,680 | HCC Insurance Holdings, Inc. | 40,186 | |||||||||
| 810 | Mercury General Corp. | 27,362 | |||||||||
| 3,476 | Old Republic International Corp. | 32,570 | |||||||||
| 320 | RLI Corp. | 15,370 | |||||||||
| 586 | State Auto Financial Corp. | 9,511 | |||||||||
| 982 | Transatlantic Holdings, Inc. | 37,247 | |||||||||
| 650,896 | |||||||||||
| Iron/Steel—1.4% | |||||||||||
| 4,648 | Nucor Corp. | 189,127 | |||||||||
See Notes to Financial Statements.
31
Schedule of Investments (Continued)
PowerShares High Growth Rate Dividend AchieversTM Portfolio
April 30, 2009
| Number of Shares | Value | ||||||||||
| Common Stocks and Other Equity Interests (Continued) | |||||||||||
| Leisure Time—0.7% | |||||||||||
| 3,455 | Harley-Davidson, Inc. | $ | 76,563 | ||||||||
| 482 | Polaris Industries, Inc. | 16,123 | |||||||||
| 92,686 | |||||||||||
| Media—0.4% | |||||||||||
| 176 | Courier Corp. | 2,760 | |||||||||
| 861 | John Wiley & Sons, Inc., Class A | 29,188 | |||||||||
| 666 | Meredith Corp. | 16,703 | |||||||||
| 48,651 | |||||||||||
| Miscellaneous Manufacturing—8.9% | |||||||||||
| 1,003 | AptarGroup, Inc. | 31,123 | |||||||||
| 4,714 | Danaher Corp. | 275,486 | |||||||||
| 1,140 | Donaldson Co., Inc. | 37,609 | |||||||||
| 42,419 | General Electric Co. | 536,599 | |||||||||
| 7,383 | Illinois Tool Works, Inc. | 242,162 | |||||||||
| 2,316 | Leggett & Platt, Inc. | 33,258 | |||||||||
| 266 | Raven Industries, Inc. | 6,357 | |||||||||
| 1,162,594 | |||||||||||
| Oil & Gas—0.1% | |||||||||||
| 741 | Holly Corp. | 15,531 | |||||||||
| Pharmaceuticals—5.3% | |||||||||||
| 5,330 | Cardinal Health, Inc. | 180,101 | |||||||||
| 38,016 | Pfizer, Inc. | 507,894 | |||||||||
| 687,995 | |||||||||||
| Pipelines—3.4% | |||||||||||
| 2,352 | Energy Transfer Partners LP | 93,022 | |||||||||
| 6,655 | Enterprise Products Partners LP | 156,991 | |||||||||
| 3,933 | Kinder Morgan Energy Partners LP | 187,840 | |||||||||
| 437,853 | |||||||||||
| Real Estate—0.1% | |||||||||||
| 1,531 | Forest City Enterprises, Inc., Class A | 12,906 | |||||||||
| REIT—0.1% | |||||||||||
| 366 | Getty Realty Corp. | 7,181 | |||||||||
| 391 | Urstadt Biddle Properties, Inc., Class A | 6,006 | |||||||||
| 13,187 | |||||||||||
| Retail—21.0% | |||||||||||
| 435 | Cato (The) Corp., Class A | 8,361 | |||||||||
| 21,805 | Lowe's Cos., Inc. | 468,808 | |||||||||
| 9,335 | McDonald's Corp. | 497,462 | |||||||||
| 3,187 | Nordstrom, Inc. | 72,122 | |||||||||
| 1,875 | Ross Stores, Inc. | 71,138 | |||||||||
| 11,132 | Target Corp. | 459,306 | |||||||||
| 6,106 | TJX Cos., Inc. | 170,785 | |||||||||
| 14,668 | Walgreen Co. | 461,015 | |||||||||
| 10,502 | Wal-Mart Stores, Inc. | 529,300 | |||||||||
| 2,738,297 | |||||||||||
| Number of Shares | Value | ||||||||||
| Common Stocks and Other Equity Interests (Continued) | |||||||||||
| Savings & Loans—0.3% | |||||||||||
| 2,215 | First Niagara Financial Group, Inc. | $ | 29,991 | ||||||||
| 321 | Flushing Financial Corp. | 2,956 | |||||||||
| 92 | WSFS Financial Corp. | 2,494 | |||||||||
| 35,441 | |||||||||||
| Semiconductors—0.5% | |||||||||||
| 3,281 | Linear Technology Corp. | 71,460 | |||||||||
| Telecommunications—0.4% | |||||||||||
| 1,484 | CenturyTel, Inc. | 40,291 | |||||||||
| 349 | Shenandoah Telecom Co. | 6,851 | |||||||||
| 47,142 | |||||||||||
| Textiles—0.4% | |||||||||||
| 2,260 | Cintas Corp. | 57,992 | |||||||||
| Transportation—1.9% | |||||||||||
| 2,510 | C.H. Robinson Worldwide, Inc. | 133,432 | |||||||||
| 3,143 | Expeditors International of Washington, Inc. | 109,094 | |||||||||
| 242,526 | |||||||||||
| Total Common Stocks and Other Equity Interests (Cost $16,256,137) | 13,027,613 | ||||||||||
| Money Market Fund—0.7% | |||||||||||
| 87,046 | Goldman Sachs Financial Square Prime Obligations Institutional Share Class (Cost $87,046) | 87,046 | |||||||||
| Total Investments (Cost $16,343,183)—100.7% | 13,114,659 | ||||||||||
| Liabilities in excess of other assets—(0.7%) | (88,102 | ) | |||||||||
| Net Assets—100.0% | $ | 13,026,557 | |||||||||
REIT Real Estate Investment Trust
See Notes to Financial Statements.
32
Schedule of Investments
PowerShares High Yield Equity Dividend AchieversTM Portfolio
April 30, 2009
| Number of Shares | Value | ||||||||||
| Common Stocks and Other Equity Interests—99.8% | |||||||||||
| Agriculture—5.9% | |||||||||||
| 56,031 | Universal Corp. | $ | 1,689,895 | ||||||||
| 252,792 | Vector Group Ltd. | 3,407,636 | |||||||||
| 5,097,531 | |||||||||||
| Banks—22.0% | |||||||||||
| 24,506 | Associated Banc-Corp. | 379,108 | |||||||||
| 138,595 | BB&T Corp. | 3,234,806 | |||||||||
| 15,073 | Comerica, Inc. | 316,232 | |||||||||
| 246,046 | F.N.B. Corp. | 1,850,266 | |||||||||
| 73,954 | Fulton Financial Corp. | 488,836 | |||||||||
| 34,861 | M&T Bank Corp. | 1,828,459 | |||||||||
| 33,582 | Marshall & Ilsley Corp. | 194,104 | |||||||||
| 167,967 | Old National Bancorp | 2,289,390 | |||||||||
| 116,430 | Old Second Bancorp, Inc. | 628,722 | |||||||||
| 30,410 | Park National Corp. | 2,035,950 | |||||||||
| 75,978 | Susquehanna Bancshares, Inc. | 612,383 | |||||||||
| 171,513 | TCF Financial Corp. | 2,385,746 | |||||||||
| 21,624 | U.S. Bancorp | 393,989 | |||||||||
| 52,051 | Webster Financial Corp. | 272,227 | |||||||||
| 7,902 | Whitney Holding Corp. | 94,508 | |||||||||
| 147,507 | Wilmington Trust Corp. | 2,140,327 | |||||||||
| 19,145,053 | |||||||||||
| Building Materials—1.5% | |||||||||||
| 142,853 | Masco Corp. | 1,265,678 | |||||||||
| Chemicals—3.9% | |||||||||||
| 37,110 | PPG Industries, Inc. | 1,634,696 | |||||||||
| 126,268 | RPM International, Inc. | 1,745,023 | |||||||||
| 3,379,719 | |||||||||||
| Diversified Financial Services—1.4% | |||||||||||
| 52,503 | Federated Investors, Inc., Class B | 1,201,269 | |||||||||
| Electric—11.9% | |||||||||||
| 114,450 | Black Hills Corp. | 2,275,266 | |||||||||
| 44,140 | Consolidated Edison, Inc. | 1,638,918 | |||||||||
| 113,515 | Integrys Energy Group, Inc. | 2,997,931 | |||||||||
| 69,094 | Otter Tail Corp. | 1,532,505 | |||||||||
| 55,488 | Progress Energy, Inc. | 1,893,251 | |||||||||
| 10,337,871 | |||||||||||
| Gas—4.0% | |||||||||||
| 65,791 | Atmos Energy Corp. | 1,625,696 | |||||||||
| 82,922 | Vectren Corp. | 1,838,380 | |||||||||
| 3,464,076 | |||||||||||
| Household Products/Wares—2.4% | |||||||||||
| 73,076 | Avery Dennison Corp. | 2,100,204 | |||||||||
| Number of Shares | Value | ||||||||||
| Common Stocks and Other Equity Interests (Continued) | |||||||||||
| Insurance—12.0% | |||||||||||
| 52,449 | Allstate (The) Corp. | $ | 1,223,635 | ||||||||
| 110,307 | Arthur J. Gallagher & Co. | 2,479,701 | |||||||||
| 78,580 | Cincinnati Financial Corp. | 1,881,991 | |||||||||
| 72,985 | Hartford Financial Services Group (The), Inc. | 837,138 | |||||||||
| 66,302 | Mercury General Corp. | 2,239,682 | |||||||||
| 192,372 | Old Republic International Corp. | 1,802,526 | |||||||||
| 10,464,673 | |||||||||||
| Leisure Time—3.6% | |||||||||||
| 42,598 | Harley-Davidson, Inc. | 943,972 | |||||||||
| 64,638 | Polaris Industries, Inc. | 2,162,141 | |||||||||
| 3,106,113 | |||||||||||
| Machinery-Diversified—2.5% | |||||||||||
| 56,508 | NACCO Industries, Inc., Class A | 2,161,431 | |||||||||
| Media—4.8% | |||||||||||
| 596,699 | Gannett Co., Inc. | 2,333,093 | |||||||||
| 71,552 | Meredith Corp. | 1,794,524 | |||||||||
| 4,127,617 | |||||||||||
| Miscellaneous Manufacturing—6.7% | |||||||||||
| 285,340 | General Electric Co. | 3,609,551 | |||||||||
| 151,215 | Leggett & Platt, Inc. | 2,171,447 | |||||||||
| 5,780,998 | |||||||||||
| Office Furnishings—2.7% | |||||||||||
| 153,542 | HNI Corp. | 2,379,901 | |||||||||
| Office/Business Equipment—2.0% | |||||||||||
| 72,285 | Pitney Bowes, Inc. | 1,773,874 | |||||||||
| Pharmaceuticals—3.0% | |||||||||||
| 195,906 | Pfizer, Inc. | 2,617,304 | |||||||||
| REIT—3.3% | |||||||||||
| 146,305 | Getty Realty Corp. REIT | 2,870,504 | |||||||||
| Savings & Loans—0.9% | |||||||||||
| 88,178 | First Financial Holdings, Inc. | 793,602 | |||||||||
| Telecommunications—5.3% | |||||||||||
| 70,826 | AT&T, Inc. | 1,814,562 | |||||||||
| 104,295 | CenturyTel, Inc. | 2,831,609 | |||||||||
| 4,646,171 | |||||||||||
| Total Common Stocks and Other Equity Interests (Cost $99,132,398) | 86,713,589 | ||||||||||
See Notes to Financial Statements.
33
Schedule of Investments (Continued)
PowerShares High Yield Equity Dividend AchieversTM Portfolio
April 30, 2009
| Number of Shares | Value | ||||||||||
| Money Market Fund—0.6% | |||||||||||
| 510,074 | Goldman Sachs Financial Square Prime Obligations Institutional Share Class (Cost $510,074) | $ | 510,074 | ||||||||
| Total Investments (Cost $99,642,472)—100.4% | 87,223,663 | ||||||||||
| Liabilities in excess of other assets—(0.4%) | (377,319 | ) | |||||||||
| Net Assets—100.0% | $ | 86,846,344 | |||||||||
REIT Real Estate Investment Trust
See Notes to Financial Statements.
34
Schedule of Investments
PowerShares International Dividend AchieversTM Portfolio
April 30, 2009
| Number of Shares | Value | ||||||||||
| Common Stocks and Other Equity Interests—99.6% | |||||||||||
| Australia—3.5% | |||||||||||
| 47,547 | BHP Billiton Ltd. ADR | $ | 2,288,913 | ||||||||
| 31,739 | Santos Ltd. ADR | 1,522,202 | |||||||||
| 73,741 | Westpac Banking Corp. ADR | 5,084,442 | |||||||||
| 8,895,557 | |||||||||||
| Bahamas—2.2% | |||||||||||
| 386,947 | Teekay Corp. | 5,587,515 | |||||||||
| Bermuda—4.6% | |||||||||||
| 80,994 | Axis Capital Holdings Ltd. | 1,995,692 | |||||||||
| 76,514 | Max Capital Group Ltd. | 1,266,307 | |||||||||
| 23,145 | RenaissanceRe Holdings Ltd. | 1,126,236 | |||||||||
| 477,301 | Tsakos Energy Navigation Ltd. | 7,474,534 | |||||||||
| 11,862,769 | |||||||||||
| Canada—26.2% | |||||||||||
| 152,385 | Bank of Montreal | 5,030,229 | |||||||||
| 132,583 | Bank of Nova Scotia | 3,773,312 | |||||||||
| 152,922 | Brookfield Asset Management, Inc., Class A | 2,374,879 | |||||||||
| 774,838 | Brookfield Properties Corp. | 5,788,040 | |||||||||
| 30,844 | Cameco Corp. | 702,935 | |||||||||
| 101,268 | Canadian Imperial Bank of Commerce | 4,537,819 | |||||||||
| 33,518 | Canadian National Railway Co. | 1,354,798 | |||||||||
| 11,046 | Canadian Natural Resources Ltd. | 509,331 | |||||||||
| 45,176 | Canadian Pacific Railway Ltd. | 1,620,011 | |||||||||
| 79,216 | Enbridge, Inc. | 2,443,814 | |||||||||
| 52,106 | EnCana Corp. | 2,382,807 | |||||||||
| 14,777 | Imperial Oil Ltd. | 526,357 | |||||||||
| 269,370 | Manulife Financial Corp. | 4,606,227 | |||||||||
| 472,130 | Methanex Corp. | 5,415,331 | |||||||||
| 45,683 | Petro-Canada | 1,440,385 | |||||||||
| 53,285 | Ritchie Bros. Auctioneers, Inc. | 1,193,584 | |||||||||
| 94,486 | Royal Bank of Canada | 3,339,135 | |||||||||
| 168,646 | Shaw Communications, Inc., Class B | 2,600,521 | |||||||||
| 165,843 | Sun Life Financial, Inc. | 3,850,874 | |||||||||
| 16,876 | Suncor Energy, Inc. | 427,975 | |||||||||
| 75,315 | Talisman Energy, Inc. | 944,450 | |||||||||
| 144,015 | Telus Corp. | 3,348,349 | |||||||||
| 95,956 | Thomson Reuters Corp. | 2,728,029 | |||||||||
| 84,865 | Toronto-Dominion (The) Bank | 3,345,378 | |||||||||
| 121,948 | TransCanada Corp. | 3,045,041 | |||||||||
| 67,329,611 | |||||||||||
| Cayman Islands—0.6% | |||||||||||
| 112,619 | Consolidated Water Co., Inc. | 1,510,221 | |||||||||
| Chile—0.8% | |||||||||||
| 62,394 | Sociedad Quimica y Minera de Chile S.A. ADR | 1,966,035 | |||||||||
| Number of Shares | Value | ||||||||||
| Common Stocks and Other Equity Interests (Continued) | |||||||||||
| China—2.0% | |||||||||||
| 30,719 | China Telecom Corp. Ltd. ADR | $ | 1,516,597 | ||||||||
| 136,552 | Huaneng Power International, Inc. ADR | 3,718,311 | |||||||||
| 5,234,908 | |||||||||||
| Denmark—0.4% | |||||||||||
| 20,429 | Novo-Nordisk A/S ADR | 970,582 | |||||||||
| Finland—1.1% | |||||||||||
| 197,725 | Nokia Oyj Corp. ADR | 2,795,832 | |||||||||
| France—3.7% | |||||||||||
| 142,787 | Axa S.A. ADR | 2,453,081 | |||||||||
| 109,709 | Sanofi-Aventis ADR | 3,150,842 | |||||||||
| 140,012 | Veolia Environnement ADR | 3,823,728 | |||||||||
| 9,427,651 | |||||||||||
| Germany—2.3% | |||||||||||
| 267,716 | Allianz SE ADR | 2,425,507 | |||||||||
| 25,679 | Fresenius Medical Care AG & Co. KGaA ADR | 988,898 | |||||||||
| 20,469 | SAP AG ADR | 779,664 | |||||||||
| 25,369 | Siemens AG ADR | 1,697,947 | |||||||||
| 5,892,016 | |||||||||||
| India—0.2% | |||||||||||
| 7,466 | HDFC Bank Ltd. ADR | 552,633 | |||||||||
| Ireland—1.0% | |||||||||||
| 100,994 | CRH PLC ADR | 2,597,566 | |||||||||
| Israel—0.2% | |||||||||||
| 12,211 | Teva Pharmaceutical Industries Ltd. ADR | 535,941 | |||||||||
| Italy—0.9% | |||||||||||
| 119,569 | Luxottica Group SpA ADR | 2,189,308 | |||||||||
| Japan—10.1% | |||||||||||
| 73,435 | Canon, Inc. ADR | 2,218,471 | |||||||||
| 66,514 | Honda Motor Co. Ltd. ADR | 1,932,897 | |||||||||
| 52,554 | Kubota Corp. ADR | 1,576,094 | |||||||||
| 14,114 | Kyocera Corp. ADR | 1,094,964 | |||||||||
| 316,089 | Mitsubishi UFJ Financial Group, Inc. ADR | 1,713,202 | |||||||||
| 12,988 | Mitsui & Co. Ltd. ADR | 2,765,925 | |||||||||
| 59,305 | Nidec Corp. ADR | 824,340 | |||||||||
| 81,859 | Nippon Telegraph & Telephone Corp. ADR | 1,538,949 | |||||||||
| 142,194 | NTT DoCoMo, Inc. ADR | 1,980,763 | |||||||||
| 185,729 | ORIX Corp. ADR | 4,340,487 | |||||||||
| 149,579 | Panasonic Corp. ADR | 2,180,862 | |||||||||
| 32,993 | Toyota Motor Corp. ADR | 2,611,725 | |||||||||
| 19,646 | Wacoal Holdings Corp. ADR | 1,195,656 | |||||||||
| 25,974,335 | |||||||||||
See Notes to Financial Statements.
35
Schedule of Investments (Continued)
PowerShares International Dividend AchieversTM Portfolio
April 30, 2009
| Number of Shares | Value | ||||||||||
| Common Stocks and Other Equity Interests (Continued) | |||||||||||
| Mexico—2.1% | |||||||||||
| 36,868 | America Movil SAB de CV ADR | $ | 1,211,114 | ||||||||
| 14,044 | Fomento Economico Mexicano SAB de CV ADR | 397,586 | |||||||||
| 125,218 | Grupo Aeroportuario del Sureste SAB de CV ADR | 3,881,758 | |||||||||
| 5,490,458 | |||||||||||
| Netherlands—3.4% | |||||||||||
| 182,716 | Koninklijke Philips Electronics N.V. | 3,285,234 | |||||||||
| 114,463 | Reed Elsevier N.V. ADR | 2,503,306 | |||||||||
| 150,558 | Unilever N.V. | 2,979,543 | |||||||||
| 8,768,083 | |||||||||||
| Peru—0.8% | |||||||||||
| 39,253 | Credicorp Ltd. | 1,963,435 | |||||||||
| Portugal—1.9% | |||||||||||
| 637,480 | Portugal Telecom SGPS S.A. ADR | 4,812,974 | |||||||||
| Russia—1.6% | |||||||||||
| 126,909 | Mobile Telesystems OJSC ADR | 4,205,764 | |||||||||
| South Africa—1.0% | |||||||||||
| 88,131 | Sasol Ltd. ADR | 2,653,624 | |||||||||
| Spain—7.1% | |||||||||||
| 808,654 | Banco Bilbao Vizcaya Argentaria S.A. ADR | 8,749,635 | |||||||||
| 714,505 | Banco Santander S.A. ADR | 6,537,721 | |||||||||
| 51,227 | Telefonica S.A. ADR | 2,883,568 | |||||||||
| 18,170,924 | |||||||||||
| Switzerland—0.4% | |||||||||||
| 11,082 | Alcon, Inc. | 1,019,655 | |||||||||
| United Kingdom—18.6% | |||||||||||
| 95,726 | AstraZeneca PLC ADR | 3,347,538 | |||||||||
| 61,146 | BHP Billiton PLC ADR | 2,558,349 | |||||||||
| 114,406 | BP PLC ADR | 4,857,679 | |||||||||
| 67,825 | British American Tobacco PLC ADR | 3,297,652 | |||||||||
| 68,857 | Cadbury PLC ADR | 2,071,907 | |||||||||
| 198,270 | HSBC Holdings PLC ADR | 7,058,412 | |||||||||
| 346,559 | InterContinental Hotels Group PLC ADR | 3,281,914 | |||||||||
| 113,574 | National Grid PLC ADR | 4,730,357 | |||||||||
| 306,636 | Pearson PLC ADR | 3,176,749 | |||||||||
| 36,002 | Smith & Nephew PLC ADR | 1,261,870 | |||||||||
| 13,853 | Thomson Reuters PLC ADR | 2,142,366 | |||||||||
| 146,205 | Unilever PLC ADR | 2,845,149 | |||||||||
| 252,347 | Vodafone Group PLC ADR | 4,630,567 | |||||||||
| 75,241 | WPP PLC ADR | 2,567,223 | |||||||||
| 47,827,732 | |||||||||||
| Number of Shares | Value | ||||||||||
| Common Stocks and Other Equity Interests (Continued) | |||||||||||
| United States—2.9% | |||||||||||
| 33,412 | ACE Ltd. | $ | 1,547,644 | ||||||||
| 16,862 | Bunge Ltd. | 809,545 | |||||||||
| 26,884 | PartnerRe Ltd. | 1,833,220 | |||||||||
| 115,019 | Willis Group Holdings Ltd. | 3,164,172 | |||||||||
| 7,354,581 | |||||||||||
| Total Investments (Cost $345,361,476)—99.6% | 255,589,710 | ||||||||||
| Other assets less liabilities—0.4% | 993,873 | ||||||||||
| Net Assets—100.0% | $ | 256,583,583 | |||||||||
ADR American Depositary Receipt
See Notes to Financial Statements.
36
This page intentionally left blank
Statements of Assets and Liabilities
April 30, 2009
| PowerShares Buyback AchieversTM Portfolio | PowerShares Dividend AchieversTM Portfolio | PowerShares Financial Preferred Portfolio | |||||||||||||
| ASSETS: | |||||||||||||||
| Investments at value | $ | 27,650,531 | $ | 84,479,696 | $ | 774,344,301 | |||||||||
| Receivables: | |||||||||||||||
| Investments sold | 1,483,796 | 5,894,735 | 4,109,042 | ||||||||||||
| Dividends | 22,833 | 197,490 | 3,868,156 | ||||||||||||
| Expense waivers | 874 | �� | 26,049 | 826 | |||||||||||
| Shares sold | — | — | 6,829,928 | ||||||||||||
| Total Assets | 29,158,034 | 90,597,970 | 789,152,253 | ||||||||||||
| LIABILITIES: | |||||||||||||||
| Due to custodian | 53 | 124 | 7,802,848 | ||||||||||||
| Payables: | |||||||||||||||
| Investments purchased | 1,641,589 | 3,010,411 | 7,231,587 | ||||||||||||
| Shares repurchased | — | 2,041,772 | — | ||||||||||||
| Expense recapture | — | — | — | ||||||||||||
| Accrued advisory fees | 11,158 | 29,534 | 284,653 | ||||||||||||
| Accrued expenses | 49,450 | 65,067 | 188,966 | ||||||||||||
| Total Liabilities | 1,702,250 | 5,146,908 | 15,508,054 | ||||||||||||
| NET ASSETS | $ | 27,455,784 | $ | 85,451,062 | $ | 773,644,199 | |||||||||
| NET ASSETS CONSIST OF: | |||||||||||||||
| Shares of beneficial interest | $ | 52,608,846 | $ | 117,453,097 | $ | 940,791,464 | |||||||||
| Undistributed net investment income (loss) | 133,836 | 838,109 | (3,293,978 | ) | |||||||||||
| Accumulated net realized gain (loss) on investments | (22,354,761 | ) | (18,356,563 | ) | (90,924,570 | ) | |||||||||
| Net unrealized appreciation (depreciation) on investments | (2,932,137 | ) | (14,483,581 | ) | (72,928,717 | ) | |||||||||
| Net Assets | $ | 27,455,784 | $ | 85,451,062 | $ | 773,644,199 | |||||||||
| Shares outstanding (unlimited amount authorized, $0.01 par value) | 1,700,000 | 8,300,000 | 67,800,000 | ||||||||||||
| Net asset value | $ | 16.15 | $ | 10.30 | $ | 11.41 | |||||||||
| Share price | $ | 16.16 | $ | 10.30 | $ | 11.41 | |||||||||
| Investments at cost | $ | 30,582,668 | $ | 98,963,277 | $ | 847,273,018 | |||||||||
See Notes to Financial Statements.
38
| PowerShares High Growth Rate Dividend AchieversTM Portfolio | PowerShares High Yield Equity Dividend AchieversTM Portfolio | PowerShares International Dividend AchieversTM Portfolio | |||||||||||||
| ASSETS: | |||||||||||||||
| Investments at value | $ | 13,114,659 | $ | 87,223,663 | $ | 255,589,710 | |||||||||
| Receivables: | |||||||||||||||
| Investments sold | 651,721 | 17,461,009 | 35,646,366 | ||||||||||||
| Dividends | 8,610 | 196,564 | 1,915,027 | ||||||||||||
| Expense waivers | 8,270 | — | — | ||||||||||||
| Shares sold | — | 4,892,752 | — | ||||||||||||
| Total Assets | 13,783,260 | 109,773,988 | 293,151,103 | ||||||||||||
| LIABILITIES: | |||||||||||||||
| Due to custodian | 13 | 298,035 | 356,095 | ||||||||||||
| Payables: | |||||||||||||||
| Investments purchased | 708,763 | 17,620,518 | 34,989,381 | ||||||||||||
| Shares repurchased | — | 4,892,752 | 1,009,278 | ||||||||||||
| Expense recapture | — | 22,663 | 22,809 | ||||||||||||
| Accrued advisory fees | 4,120 | 27,242 | 80,837 | ||||||||||||
| Accrued expenses | 43,807 | 66,434 | 109,120 | ||||||||||||
| Total Liabilities | 756,703 | 22,927,644 | 36,567,520 | ||||||||||||
| NET ASSETS | $ | 13,026,557 | $ | 86,846,344 | $ | 256,583,583 | |||||||||
| NET ASSETS CONSIST OF: | |||||||||||||||
| Shares of beneficial interest | $ | 26,999,016 | $ | 238,016,062 | $ | 532,155,262 | |||||||||
| Undistributed net investment income (loss) | 18,545 | (6,249 | ) | 3,220,322 | |||||||||||
| Accumulated net realized gain (loss) on investments | (10,762,480 | ) | (138,744,660 | ) | (189,020,235 | ) | |||||||||
| Net unrealized appreciation (depreciation) on investments | (3,228,524 | ) | (12,418,809 | ) | (89,771,766 | ) | |||||||||
| Net Assets | $ | 13,026,557 | $ | 86,846,344 | $ | 256,583,583 | |||||||||
| Shares outstanding (unlimited amount authorized, $0.01 par value) | 1,500,000 | 14,200,000 | 25,300,000 | ||||||||||||
| Net asset value | $ | 8.68 | $ | 6.12 | $ | 10.14 | |||||||||
| Share price | $ | 8.68 | $ | 6.12 | $ | 10.15 | |||||||||
| Investments at cost | $ | 16,343,183 | $ | 99,642,472 | $ | 345,361,476 | |||||||||
39
Statements of Operations
Year Ended April 30, 2009
| PowerShares Buyback AchieversTM Portfolio | PowerShares Dividend AchieversTM Portfolio | PowerShares Financial Preferred Portfolio | |||||||||||||
| INVESTMENT INCOME: | |||||||||||||||
| Dividend income | $ | 875,166 | $ | 2,629,235 | $ | 46,626,889 | |||||||||
| Foreign withholding tax | — | — | — | ||||||||||||
| Total Income | 875,166 | 2,629,235 | 46,626,889 | ||||||||||||
| EXPENSES: | |||||||||||||||
| Advisory fees | 209,192 | 283,809 | 1,913,359 | ||||||||||||
| Accounting & administration fees | 74,983 | 74,983 | 111,866 | ||||||||||||
| Sub-licensing | 41,838 | 70,950 | 382,672 | ||||||||||||
| Professional fees | 24,858 | 28,401 | 51,891 | ||||||||||||
| Custodian & transfer agent fees | 19,025 | 15,988 | 25,411 | ||||||||||||
| Trustees | 5,328 | 6,289 | 16,773 | ||||||||||||
| Listing fees and expenses | 2,338 | 7,782 | 4,420 | ||||||||||||
| Printing | 4,316 | 27,072 | 68,870 | ||||||||||||
| Other expenses | 2,596 | 9,424 | 21,075 | ||||||||||||
| Total Expenses | 384,474 | 524,698 | 2,596,337 | ||||||||||||
| (Waivers) and/or Recapture | (91,605 | ) | (98,989 | ) | 60,049 | ||||||||||
| Net Expenses | 292,869 | 425,709 | 2,656,386 | ||||||||||||
| Net Investment Income | 582,297 | 2,203,526 | 43,970,503 | ||||||||||||
| REALIZED AND UNREALIZED GAIN (LOSS) ON INVESTMENTS: | |||||||||||||||
| Net realized gain (loss) from: | |||||||||||||||
| Investments | (12,972,903 | ) | (17,995,562 | ) | (85,875,626 | ) | |||||||||
| In-kind redemptions | (3,522,871 | ) | 134,419 | 6,073,161 | |||||||||||
| Net realized gain (loss) | (16,495,774 | ) | (17,861,143 | ) | (79,802,465 | ) | |||||||||
| Net change in unrealized appreciation (depreciation) on investments | (88,168 | ) | (12,388,077 | ) | (65,037,561 | ) | |||||||||
| Net realized and unrealized gain (loss) on investments | (16,583,942 | ) | (30,249,220 | ) | (144,840,026 | ) | |||||||||
| Net increase (decrease) in net assets resulting from operations | $ | (16,001,645 | ) | $ | (28,045,694 | ) | $ | (100,869,523 | ) | ||||||
See Notes to Financial Statements.
40
| PowerShares High Growth Rate Dividend AchieversTM Portfolio | PowerShares High Yield Equity Dividend AchieversTM Portfolio | PowerShares International Dividend AchieversTM Portfolio | |||||||||||||
| INVESTMENT INCOME: | |||||||||||||||
| Dividend income | $ | 587,618 | $ | 7,473,596 | $ | 17,677,691 | |||||||||
| Foreign withholding tax | — | — | (1,105,796 | ) | |||||||||||
| Total Income | 587,618 | 7,473,596 | 16,571,895 | ||||||||||||
| EXPENSES: | |||||||||||||||
| Advisory fees | 73,209 | 512,151 | 1,491,518 | ||||||||||||
| Accounting & administration fees | 74,983 | 74,983 | 108,918 | ||||||||||||
| Sub-licensing | 18,302 | 128,038 | 372,879 | ||||||||||||
| Professional fees | 24,855 | 30,063 | 47,030 | ||||||||||||
| Custodian & transfer agent fees | 11,557 | 12,734 | 30,403 | ||||||||||||
| Trustees | 4,442 | 9,234 | 18,135 | ||||||||||||
| Listing fees and expenses | 7,608 | 7,603 | 8,718 | ||||||||||||
| Printing | 2,290 | 6,426 | 23,293 | ||||||||||||
| Other expenses | 4,031 | 7,708 | 17,204 | ||||||||||||
| Total Expenses | 221,277 | 788,940 | 2,118,098 | ||||||||||||
| (Waivers) and/or Recapture | (111,465 | ) | (20,713 | ) | 18,082 | ||||||||||
| Net Expenses | 109,812 | 768,227 | 2,136,180 | ||||||||||||
| Net Investment Income | 477,806 | 6,705,369 | 14,435,715 | ||||||||||||
| REALIZED AND UNREALIZED GAIN (LOSS) ON INVESTMENTS: | |||||||||||||||
| Net realized gain (loss) from: | |||||||||||||||
| Investments | (9,364,210 | ) | (97,064,248 | ) | (169,561,826 | ) | |||||||||
| In-kind redemptions | (160,277 | ) | (33,870,735 | ) | (50,971,307 | ) | |||||||||
| Net realized gain (loss) | (9,524,487 | ) | (130,934,983 | ) | (220,533,133 | ) | |||||||||
| Net change in unrealized appreciation (depreciation) on investments | (1,040,495 | ) | 46,776,383 | (62,969,469 | ) | ||||||||||
| Net realized and unrealized gain (loss) on investments | (10,564,982 | ) | (84,158,600 | ) | (283,502,602 | ) | |||||||||
| Net increase (decrease) in net assets resulting from operations | $ | (10,087,176 | ) | $ | (77,453,231 | ) | $ | (269,066,887 | ) | ||||||
41
Statements of Changes in Net Assets
| PowerShares Buyback AchieversTM Portfolio | PowerShares Dividend AchieversTM Portfolio | PowerShares Financial Preferred Portfolio | |||||||||||||||||||||||||
| Year Ended April 30, 2009 | Year Ended April 30, 2008 | Year Ended April 30, 2009 | Year Ended April 30, 2008 | Year Ended April 30, 2009 | Year Ended April 30, 2008 | ||||||||||||||||||||||
| OPERATIONS: | |||||||||||||||||||||||||||
| Net investment income | $ | 582,297 | $ | 325,508 | $ | 2,203,526 | $ | 1,495,676 | $ | 43,970,503 | $ | 8,663,565 | |||||||||||||||
| Net realized gain (loss) on investments | (16,495,774 | ) | (7,476,392 | ) | (17,861,143 | ) | 1,200,791 | (79,802,465 | ) | (11,691,771 | ) | ||||||||||||||||
| Net change in unrealized appreciation (depreciation) of investments | (88,168 | ) | (4,232,518 | ) | (12,388,077 | ) | (8,075,983 | ) | (65,037,561 | ) | (7,396,935 | ) | |||||||||||||||
| Net increase (decrease) in net assets resulting from operations | (16,001,645 | ) | (11,383,402 | ) | (28,045,694 | ) | (5,379,516 | ) | (100,869,523 | ) | (10,425,141 | ) | |||||||||||||||
| Undistributed net investment income (loss) included in the price of units issued and redeemed | (41,505 | ) | (19,113 | ) | 182,813 | (22,948 | ) | 502,058 | 213,903 | ||||||||||||||||||
| DISTRIBUTIONS TO SHAREHOLDERS FROM: | |||||||||||||||||||||||||||
| Net investment income | (456,573 | ) | (298,099 | ) | (1,482,708 | ) | (1,373,568 | ) | (46,382,363 | ) | (9,274,921 | ) | |||||||||||||||
| Return of capital | — | — | — | — | (744,661 | ) | — | ||||||||||||||||||||
| Total distributions to shareholders | (456,573 | ) | (298,099 | ) | (1,482,708 | ) | (1,373,568 | ) | (47,127,024 | ) | (9,274,921 | ) | |||||||||||||||
| SHAREHOLDER TRANSACTIONS: | |||||||||||||||||||||||||||
| Proceeds from shares sold | — | 52,711,783 | 77,327,973 | 19,181,334 | 710,379,663 | 183,234,804 | |||||||||||||||||||||
| Value of shares repurchased | (17,217,725 | ) | (42,281,695 | ) | (22,099,826 | ) | (22,755,868 | ) | (25,864,980 | ) | (25,526,919 | ) | |||||||||||||||
| Net income (loss) equalization | 41,505 | 19,113 | (182,813 | ) | 22,948 | (502,058 | ) | (213,903 | ) | ||||||||||||||||||
| Net increase (decrease) in net assets resulting from shares transactions | (17,176,220 | ) | 10,449,201 | 55,045,334 | (3,551,586 | ) | 684,012,625 | 157,493,982 | |||||||||||||||||||
| Increase (Decrease) in Net Assets | (33,675,943 | ) | (1,251,413 | ) | 25,699,745 | (10,327,618 | ) | 536,518,136 | 138,007,823 | ||||||||||||||||||
| NET ASSETS: | |||||||||||||||||||||||||||
| Beginning of year | 61,131,727 | 62,383,140 | 59,751,317 | 70,078,935 | 237,126,063 | 99,118,240 | |||||||||||||||||||||
| End of year | $ | 27,455,784 | $ | 61,131,727 | $ | 85,451,062 | $ | 59,751,317 | $ | 773,644,199 | $ | 237,126,063 | |||||||||||||||
| Undistributed net investment income (loss) at end of year | $ | 133,836 | $ | 8,111 | $ | 838,109 | $ | 126,779 | $ | (3,293,978 | ) | $ | (596,894 | ) | |||||||||||||
| CHANGES IN SHARES OUTSTANDING: | |||||||||||||||||||||||||||
| Shares sold | — | 2,100,000 | 6,800,000 | 1,100,000 | 59,400,000 | 8,400,000 | |||||||||||||||||||||
| Shares repurchased | (1,000,000 | ) | (1,800,000 | ) | (2,200,000 | ) | (1,400,000 | ) | (2,800,000 | ) | (1,200,000 | ) | |||||||||||||||
| Shares outstanding, beginning of year | 2,700,000 | 2,400,000 | 3,700,000 | 4,000,000 | 11,200,000 | 4,000,000 | |||||||||||||||||||||
| Shares outstanding, end of year | 1,700,000 | 2,700,000 | 8,300,000 | 3,700,000 | 67,800,000 | 11,200,000 | |||||||||||||||||||||
See Notes to Financial Statements.
42
| PowerShares High Growth Rate Dividend AchieversTM Portfolio | PowerShares High Yield Equity Dividend AchieversTM Portfolio | PowerShares International Dividend AchieversTM Portfolio | |||||||||||||||||||||||||
| Year Ended April 30, 2009 | Year Ended April 30, 2008 | Year Ended April 30, 2009 | Year Ended April 30, 2008 | Year Ended April 30, 2009 | Year Ended April 30, 2008 | ||||||||||||||||||||||
| OPERATIONS: | |||||||||||||||||||||||||||
| Net investment income | $ | 477,806 | $ | 673,414 | $ | 6,705,369 | $ | 13,201,105 | $ | 14,435,715 | $ | 21,539,145 | |||||||||||||||
| Net realized gain (loss) on investments | (9,524,487 | ) | (476,688 | ) | (130,934,983 | ) | (36,395,920 | ) | (220,533,133 | ) | 42,958,389 | ||||||||||||||||
| Net change in unrealized appreciation (depreciation) of investments | (1,040,495 | ) | (4,296,368 | ) | 46,776,383 | (52,406,008 | ) | (62,969,469 | ) | (69,656,191 | ) | ||||||||||||||||
| Net increase (decrease) in net assets resulting from operations | (10,087,176 | ) | (4,099,642 | ) | (77,453,231 | ) | (75,600,823 | ) | (269,066,887 | ) | (5,158,657 | ) | |||||||||||||||
| Undistributed net investment income (loss) included in the price of units issued and redeemed | (5,758 | ) | (28,800 | ) | (12,060 | ) | 442,069 | (238,634 | ) | (572,269 | ) | ||||||||||||||||
| DISTRIBUTIONS TO SHAREHOLDERS FROM: | |||||||||||||||||||||||||||
| Net investment income | (506,385 | ) | (624,614 | ) | (6,711,618 | ) | (13,201,105 | ) | (15,651,696 | ) | (17,781,400 | ) | |||||||||||||||
| Return of capital | — | — | (423,105 | ) | (533,357 | ) | — | — | |||||||||||||||||||
| Total distributions to shareholders | (506,385 | ) | (624,614 | ) | (7,134,723 | ) | (13,734,462 | ) | (15,651,696 | ) | (17,781,400 | ) | |||||||||||||||
| SHAREHOLDER TRANSACTIONS: | |||||||||||||||||||||||||||
| Proceeds from shares sold | 1,057,603 | 6,189,314 | 55,194,101 | 74,348,539 | 169,724,730 | 511,488,063 | |||||||||||||||||||||
| Value of shares repurchased | (4,053,627 | ) | (16,976,446 | ) | (67,836,421 | ) | (240,757,005 | ) | (180,052,073 | ) | (490,118,492 | ) | |||||||||||||||
| Net income (loss) equalization | 5,758 | 28,800 | 12,060 | (442,069 | ) | 238,634 | 572,269 | ||||||||||||||||||||
| Net increase (decrease) in net assets resulting from shares transactions | (2,990,266 | ) | (10,758,332 | ) | (12,630,260 | ) | (166,850,535 | ) | (10,088,709 | ) | 21,941,840 | ||||||||||||||||
| Increase (Decrease) in Net Assets | (13,589,585 | ) | (15,511,388 | ) | (97,230,274 | ) | (255,743,751 | ) | (295,045,926 | ) | (1,570,486 | ) | |||||||||||||||
| NET ASSETS: | |||||||||||||||||||||||||||
| Beginning of year | 26,616,142 | 42,127,530 | 184,076,618 | 439,820,369 | 551,629,509 | 553,199,995 | |||||||||||||||||||||
| End of year | $ | 13,026,557 | $ | 26,616,142 | $ | 86,846,344 | $ | 184,076,618 | $ | 256,583,583 | $ | 551,629,509 | |||||||||||||||
| Undistributed net investment income (loss) at end of year | $ | 18,545 | $ | 49,895 | $ | (6,249 | ) | $ | — | $ | 3,220,322 | $ | 4,436,318 | ||||||||||||||
| CHANGES IN SHARES OUTSTANDING: | |||||||||||||||||||||||||||
| Shares sold | 100,000 | 400,000 | 8,300,000 | 5,300,000 | 12,000,000 | 24,900,000 | |||||||||||||||||||||
| Shares repurchased | (400,000 | ) | (1,100,000 | ) | (10,300,000 | ) | (16,900,000 | ) | (14,800,000 | ) | (24,300,000 | ) | |||||||||||||||
| Shares outstanding, beginning of year | 1,800,000 | 2,500,000 | 16,200,000 | 27,800,000 | 28,100,000 | 27,500,000 | |||||||||||||||||||||
| Shares outstanding, end of year | 1,500,000 | 1,800,000 | 14,200,000 | 16,200,000 | 25,300,000 | 28,100,000 | |||||||||||||||||||||
43
Financial Highlights
PowerShares Buyback AchieversTM Portfolio
| Year Ended April 30, | For the Period December 20, 2006* Through | ||||||||||||||
| 2009 | 2008 | April 30, 2007 | |||||||||||||
| PER SHARE OPERATING PERFORMANCE: | |||||||||||||||
| Net asset value at beginning of period | $ | 22.64 | $ | 25.99 | $ | 24.98 | |||||||||
| Net investment income** | 0.26 | 0.10 | 0.01 | ||||||||||||
| Net realized and unrealized gain (loss) on investments | (6.55 | ) | (3.35 | ) | 1.02 | ||||||||||
| Total from investment operations | (6.29 | ) | (3.25 | ) | 1.03 | ||||||||||
| Distributions to shareholders from: | |||||||||||||||
| Net investment income | (0.20 | ) | (0.10 | ) | (0.02 | ) | |||||||||
| Net asset value at end of period | $ | 16.15 | $ | 22.64 | $ | 25.99 | |||||||||
| Share price at end of period*** | $ | 16.16 | |||||||||||||
| NET ASSET VALUE, TOTAL RETURN**** | (27.87 | )% | (12.53 | )% | 4.13 | % | |||||||||
| SHARE PRICE TOTAL RETURN**** | (27.80 | )% | |||||||||||||
| RATIOS/SUPPLEMENTAL DATA: | |||||||||||||||
| Net assets at end of period (000's omitted) | $ | 27,456 | $ | 61,132 | $ | 62,383 | |||||||||
| Ratio to average net assets of: | |||||||||||||||
| Expenses, after (Waivers) and/or Recapture | 0.70 | % | 0.73 | % | 0.73 | %† | |||||||||
| Expenses, prior to (Waivers) and/or Recapture | 0.92 | % | 0.79 | % | 1.04 | %† | |||||||||
| Net investment income, after (Waivers) and/or Recapture | 1.39 | % | 0.41 | % | 0.15 | %† | |||||||||
| Portfolio turnover rate †† | 56 | % | 46 | % | 38 | % | |||||||||
| Undistributed net investment income (loss) included in price of units issued and redeemed**# | $ | (0.02 | ) | $ | (0.01 | ) | $ | 0.01 | |||||||
PowerShares Dividend AchieversTM Portfolio
| Year Ended April 30, | For the Period September 15, 2005* Through | ||||||||||||||||||
| 2009 | 2008 | 2007 | April 30, 2006 | ||||||||||||||||
| PER SHARE OPERATING PERFORMANCE: | |||||||||||||||||||
| Net asset value at beginning of period | $ | 16.15 | $ | 17.52 | $ | 15.63 | $ | 14.84 | |||||||||||
| Net investment income** | 0.36 | 0.37 | 0.32 | 0.17 | |||||||||||||||
| Net realized and unrealized gain (loss) on investments | (5.92 | ) | (1.41 | ) | 1.88 | 0.78 | |||||||||||||
| Total from investment operations | (5.56 | ) | (1.04 | ) | 2.20 | 0.95 | |||||||||||||
| Distributions to shareholders from: | |||||||||||||||||||
| Net investment income | (0.29 | ) | (0.33 | ) | (0.31 | ) | (0.16 | ) | |||||||||||
| Net asset value at end of period | $ | 10.30 | $ | 16.15 | $ | 17.52 | $ | 15.63 | |||||||||||
| Share price at end of period*** | $ | 10.30 | — | — | — | ||||||||||||||
| NET ASSET VALUE, TOTAL RETURN**** | (34.84 | )% | (6.00 | )% | 14.26 | % | 6.45 | % | |||||||||||
| SHARE PRICE TOTAL RETURN**** | (34.84 | )% | |||||||||||||||||
| RATIOS/SUPPLEMENTAL DATA: | |||||||||||||||||||
| Net assets at end of period (000's omitted) | $ | 85,451 | $ | 59,751 | $ | 70,079 | $ | 23,449 | |||||||||||
| Ratio to average net assets of: | |||||||||||||||||||
| Expenses, after (Waivers) and/or Recapture | 0.60 | % | 0.60 | % | 0.60 | % | 0.67 | %† | |||||||||||
| Expenses, prior to (Waivers) and/or Recapture | 0.74 | % | 0.72 | % | 0.92 | % | 1.02 | %† | |||||||||||
| Net investment income, after (Waivers) and/or Recapture | 3.11 | % | 2.15 | % | 1.94 | % | 1.81 | %† | |||||||||||
| Portfolio turnover rate †† | 31 | % | 8 | % | 9 | % | 8 | % | |||||||||||
| Undistributed net investment income (loss) included in price of units issued and redeemed**# | $ | 0.03 | $ | (0.01 | ) | $ | 0.03 | $ | 0.00 | (a) | |||||||||
* Commencement of Investment Operations.
** Based on average shares outstanding.
*** The mean between the last bid and ask prices.
**** Net asset value total return is calculated assuming an initial investment made at the net asset value at the beginning of the period, reinvestment of all dividends and distributions at net asset value during the period, and redemption on the last day of the period. Share price total return is calculated assuming an initial investment made at the share price at the beginning of the period, reinvestment of all dividends and distributions at share price during the period, and sale at the share price on the last day of the period. Total investment return calculated for a period of less than one year is not annualized.
† Annualized.
†† Portfolio turnover rate is not annualized and does not include securities received or delivered from processing creations or redemptions.
# The per share amount of equalization is presented to show the impact of equalization on distributable earnings per share.
(a) Amount represents less than $0.005.
See Notes to Financial Statements.
44
Financial Highlights (Continued)
PowerShares Financial Preferred Portfolio
| Year Ended April 30, | For the Period December 1, 2006* Through | ||||||||||||||
| 2009 | 2008 | April 30, 2007 | |||||||||||||
| PER SHARE OPERATING PERFORMANCE: | |||||||||||||||
| Net asset value at beginning of period | $ | 21.17 | $ | 24.78 | $ | 25.12 | |||||||||
| Net investment income** | 1.35 | 1.35 | 0.41 | ||||||||||||
| Net realized and unrealized gain (loss) on investments | (9.63 | ) | (3.50 | ) | (0.12 | ) | |||||||||
| Total from investment operations | (8.28 | ) | (2.15 | ) | 0.29 | ||||||||||
| Distributions to shareholders from: | |||||||||||||||
| Net investment income | (1.46 | ) | (1.46 | ) | (0.63 | ) | |||||||||
| Return of capital | (0.02 | ) | — | — | |||||||||||
| Total distributions | (1.48 | ) | (1.46 | ) | (0.63 | ) | |||||||||
| Net asset value at end of period | $ | 11.41 | $ | 21.17 | $ | 24.78 | |||||||||
| Share price at end of period*** | $ | 11.41 | |||||||||||||
| NET ASSET VALUE, TOTAL RETURN**** | (39.56 | )% | (8.77 | )% | 1.18 | % | |||||||||
| SHARE PRICE TOTAL RETURN**** | (39.82 | )% | |||||||||||||
| RATIOS/SUPPLEMENTAL DATA: | |||||||||||||||
| Net assets at end of period (000's omitted) | $ | 773,644 | $ | 237,126 | $ | 99,118 | |||||||||
| Ratio to average net assets of: | |||||||||||||||
| Expenses, after (Waivers) and/or Recapture | 0.69 | % | 0.72 | % | 0.72 | %† | |||||||||
| Expenses, prior to (Waivers) and/or Recapture | 0.68 | % | 0.74 | % | 0.89 | %† | |||||||||
| Net investment income, after (Waivers) and/or Recapture | 11.49 | % | 6.20 | % | 4.63 | %† | |||||||||
| Portfolio turnover rate †† | 45 | % | 80 | % | 0 | % | |||||||||
| Undistributed net investment income (loss) included in price of units issued and redeemed**# | $ | 0.02 | $ | 0.03 | $ | 0.07 | |||||||||
PowerShares High Growth Rate Dividend AchieversTM Portfolio
| Year Ended April 30, | For the Period September 15, 2005* Through | ||||||||||||||||||
| 2009 | 2008 | 2007 | April 30, 2006 | ||||||||||||||||
| PER SHARE OPERATING PERFORMANCE: | |||||||||||||||||||
| Net asset value at beginning of period | $ | 14.79 | $ | 16.85 | $ | 16.02 | $ | 14.78 | |||||||||||
| Net investment income** | 0.29 | 0.31 | 0.30 | 0.15 | |||||||||||||||
| Net realized and unrealized gain (loss) on investments | (6.10 | ) | (2.08 | ) | 0.83 | 1.24 | |||||||||||||
| Total from investment operations | (5.81 | ) | (1.77 | ) | 1.13 | 1.39 | |||||||||||||
| Distributions to shareholders from: | |||||||||||||||||||
| Net investment income | (0.30 | ) | (0.29 | ) | (0.30 | ) | (0.15 | ) | |||||||||||
| Net asset value at end of period | $ | 8.68 | $ | 14.79 | $ | 16.85 | $ | 16.02 | |||||||||||
| Share price at end of period*** | $ | 8.68 | |||||||||||||||||
| NET ASSET VALUE, TOTAL RETURN**** | (39.72 | )% | (10.58 | )% | 7.11 | % | 9.39 | % | |||||||||||
| SHARE PRICE TOTAL RETURN**** | (39.68 | )% | |||||||||||||||||
| RATIOS/SUPPLEMENTAL DATA: | |||||||||||||||||||
| Net assets at end of period (000's omitted) | $ | 13,027 | $ | 26,616 | $ | 42,128 | $ | 27,227 | |||||||||||
| Ratio to average net assets of: | |||||||||||||||||||
| Expenses, after (Waivers) and/or Recapture | 0.60 | % | 0.60 | % | 0.61 | % | 0.66 | %† | |||||||||||
| Expenses, prior to (Waivers) and/or Recapture | 1.21 | % | 0.89 | % | 1.04 | % | 1.00 | %† | |||||||||||
| Net investment income, after (Waivers) and/or Recapture | 2.61 | % | 1.94 | % | 1.86 | % | 1.59 | %† | |||||||||||
| Portfolio turnover rate †† | 34 | % | 16 | % | 12 | % | 20 | % | |||||||||||
| Undistributed net investment income (loss) included in price of units issued and redeemed**# | $ | 0.00 | (a) | $ | (0.01 | ) | $ | 0.01 | $ | 0.00 | (a) | ||||||||
* Commencement of Investment Operations.
** Based on average shares outstanding.
*** The mean between the last bid and ask prices.
**** Net asset value total return is calculated assuming an initial investment made at the net asset value at the beginning of the period, reinvestment of all dividends and distributions at net asset value during the period, and redemption on the last day of the period. Share price total return is calculated assuming an initial investment made at the share price at the beginning of the period, reinvestment of all dividends and distributions at share price during the period, and sale at the share price on the last day of the period. Total investment return calculated for a period of less than one year is not annualized.
† Annualized.
†† Portfolio turnover rate is not annualized and does not include securities received or delivered from processing creations or redemptions.
# The per share amount of equalization is presented to show the impact of equalization on distributable earnings per share.
(a) Amount represents less than $0.005.
See Notes to Financial Statements.
45
Financial Highlights (Continued)
PowerShares High Yield Equity Dividend AchieversTM Portfolio
| Year Ended April 30, | For the Period December 9, 2004* Through | ||||||||||||||||||||||
| 2009 | 2008 | 2007 | 2006 | April 30, 2005 | |||||||||||||||||||
| PER SHARE OPERATING PERFORMANCE: | |||||||||||||||||||||||
| Net asset value at beginning of period | $ | 11.36 | $ | 15.82 | $ | 15.07 | $ | 14.41 | $ | 14.79 | |||||||||||||
| Net investment income** | 0.43 | 0.62 | 0.54 | 0.53 | 0.18 | ||||||||||||||||||
| Net realized and unrealized gain (loss) on investments | (5.21 | ) | (4.42 | ) | 0.84 | 0.61 | (0.39 | ) | |||||||||||||||
| Total from investment operations | (4.78 | ) | (3.80 | ) | 1.38 | 1.14 | (0.21 | ) | |||||||||||||||
| Distributions to shareholders from: | |||||||||||||||||||||||
| Net investment income | (0.43 | ) | (0.63 | ) | (0.60 | ) | (0.48 | ) | (0.17 | ) | |||||||||||||
| Return of capital | (0.03 | ) | (0.03 | ) | (0.03 | ) | — | — | |||||||||||||||
| Total distributions | (0.46 | ) | (0.66 | ) | (0.63 | ) | (0.48 | ) | (0.17 | ) | |||||||||||||
| Net asset value at end of period | $ | 6.12 | $ | 11.36 | $ | 15.82 | $ | 15.07 | $ | 14.41 | |||||||||||||
| Share price at end of period*** | $ | 6.12 | |||||||||||||||||||||
| NET ASSET VALUE, TOTAL RETURN**** | (42.88 | )% | (24.67 | )% | 9.28 | % | 7.92 | % | (1.44 | )% | |||||||||||||
| SHARE PRICE TOTAL RETURN**** | (42.88 | )% | |||||||||||||||||||||
| RATIOS/SUPPLEMENTAL DATA: | |||||||||||||||||||||||
| Net assets at end of period (000's omitted) | $ | 86,846 | $ | 184,077 | $ | 439,820 | $ | 459,690 | $ | 314,245 | |||||||||||||
| Ratio to average net assets of: | |||||||||||||||||||||||
| Expenses, after (Waivers) and/or Recapture | 0.60 | % | 0.60 | % | 0.60 | % | 0.61 | % | 0.60 | %† | |||||||||||||
| Expenses, prior to (Waivers) and/or Recapture | 0.62 | % | 0.56 | % | 0.60 | % | 0.65 | % | 0.66 | %† | |||||||||||||
| Net investment income, after (Waivers) and/or Recapture | 5.24 | % | 4.35 | % | 3.47 | % | 3.49 | % | 3.57 | %† | |||||||||||||
| Portfolio turnover rate †† | 77 | % | 42 | % | 20 | % | 9 | % | 21 | % | |||||||||||||
| Undistributed net investment income (loss) included in price of units issued and redeemed**# | $ | 0.00 | (a) | $ | 0.02 | $ | 0.00 | (a) | $ | 0.02 | — | ||||||||||||
PowerShares International Dividend AchieversTM Portfolio
| Year Ended April 30, | For the Period September 15, 2005* Through | ||||||||||||||||||
| 2009 | 2008 | 2007 | April 30, 2006 | ||||||||||||||||
| PER SHARE OPERATING PERFORMANCE: | |||||||||||||||||||
| Net asset value at beginning of period | $ | 19.63 | $ | 20.12 | $ | 16.92 | $ | 14.96 | |||||||||||
| Net investment income** | 0.52 | 0.68 | 0.53 | 0.28 | |||||||||||||||
| Net realized and unrealized gain (loss) on investments | (9.46 | ) | (0.61 | ) | 3.20 | 1.88 | |||||||||||||
| Total from investment operations | (8.94 | ) | 0.07 | 3.73 | 2.16 | ||||||||||||||
| Distributions to shareholders from: | |||||||||||||||||||
| Net investment income | (0.55 | ) | (0.56 | ) | (0.53 | ) | (0.20 | ) | |||||||||||
| Net asset value at end of period | $ | 10.14 | $ | 19.63 | $ | 20.12 | $ | 16.92 | |||||||||||
| Share price at end of period*** | $ | 10.15 | |||||||||||||||||
| NET ASSET VALUE, TOTAL RETURN**** | (46.44 | )% | 0.34 | % | 22.56 | % | 14.50 | % | |||||||||||
| SHARE PRICE TOTAL RETURN**** | (46.30 | )% | |||||||||||||||||
| RATIOS/SUPPLEMENTAL DATA: | |||||||||||||||||||
| Net assets at end of period (000's omitted) | $ | 256,584 | $ | 551,630 | $ | 553,200 | $ | 170,843 | |||||||||||
| Ratio to average net assets of: | |||||||||||||||||||
| Expenses, after (Waivers) and/or Recapture | 0.57 | % | 0.58 | % | 0.60 | % | 0.62 | %† | |||||||||||
| Expenses, prior to (Waivers) and/or Recapture | 0.57 | % | 0.56 | % | 0.62 | % | 0.69 | %† | |||||||||||
| Net investment income, after (Waivers) and/or Recapture | 3.87 | % | 3.28 | % | 2.98 | % | 3.06 | %† | |||||||||||
| Portfolio turnover rate †† | 50 | % | 43 | % | 22 | % | 8 | % | |||||||||||
| Undistributed net investment income (loss) included in price of units issued and redeemed**# | $ | (0.01 | ) | $ | (0.02 | ) | $ | 0.11 | $ | 0.04 | |||||||||
* Commencement of Investment Operations.
** Based on average shares outstanding.
*** The mean between the last bid and ask prices.
**** Net asset value total return is calculated assuming an initial investment made at the net asset value at the beginning of the period, reinvestment of all dividends and distributions at net asset value during the period, and redemption on the last day of the period. Share price total return is calculated assuming an initial investment made at the share price at the beginning of the period, reinvestment of all dividends and distributions at share price during the period, and sale at the share price on the last day of the period. Total investment return calculated for a period of less than one year is not annualized.
† Annualized.
†† Portfolio turnover rate is not annualized and does not include securities received or delivered from processing creations or redemptions.
# The per share amount of equalization is presented to show the impact of equalization on distributable earnings per share.
(a) Amount represents less than $0.005.
See Notes to Financial Statements.
46
Notes to Financial Statements
PowerShares Exchange-Traded Fund Trust
April 30, 2009
Note 1. Organization
PowerShares Exchange-Traded Fund Trust (the "Trust") was organized as a Massachusetts business trust on June 9, 2000 and is authorized to have multiple series of portfolios. The Trust is an open-end management investment company, registered under the Investment Company Act of 1940, as amended (the "1940 Act"). As of the period end, the Trust offered seventy-five portfolios. This report includes the following portfolios:
| Full Name | Short Name | ||||||
| PowerShares Buyback AchieversTM Portfolio | "Buyback AchieversTM Portfolio" | ||||||
| PowerShares Dividend AchieversTM Portfolio | "Dividend AchieversTM Portfolio" | ||||||
| PowerShares Financial Preferred Portfolio | "Financial Preferred Portfolio" | ||||||
| PowerShares High Growth Rate Dividend AchieversTM Portfolio | "High Growth Rate Dividend AchieversTM Portfolio" | ||||||
| PowerShares High Yield Equity Dividend AchieversTM Portfolio | "High Yield Equity Dividend AchieversTM Portfolio" | ||||||
| PowerShares International Dividend AchieversTM Portfolio | "International Dividend AchieversTM Portfolio" | ||||||
Each portfolio (the "Fund" or collectively the "Funds") represents a separate series of the Trust. The shares of the Funds are referred to herein as "Shares" or "Fund Shares." Each Fund's Shares are listed and traded on the NYSE Arca, Inc. The Funds' market prices may differ to some degree from the net asset value of the Shares of each Fund. Unlike conventional mutual funds, each Fund issues and redeems Shares on a continuous basis, at net asset value, only in a large specified number of Shares, each called a "Creation Unit." Creation Units are issued and redeemed generally in-kind for securities included in the relevant index. Except when aggregated in Creation Units, Shares are not individually redeemable securities of the Funds.
The investment objective of each Fund is to seek investment results that correspond generally to the price and yield (before the Fund's fees and expenses) of the following indices:
| Fund | Index | ||||||
| Buyback AchieversTM Portfolio | Share BuyBack AchieversTM Index | ||||||
| Dividend AchieversTM Portfolio | Broad Dividend AchieversTM Index | ||||||
| Financial Preferred Portfolio | Wachovia Hybrid & Preferred Securities Financial Index | ||||||
| High Growth Rate Dividend AchieversTM Portfolio | High Growth Rate Dividend AchieversTM Index | ||||||
| High Yield Equity Dividend AchieversTM Portfolio | Dividend AchieversTM 50 Index | ||||||
| International Dividend AchieversTM Portfolio | International Dividend AchieversTM Index | ||||||
Note 2. Significant Accounting Policies
The preparation of the financial statements in accordance with accounting principles generally accepted in the United States of America requires management to make estimates and assumptions that affect the reported amounts and disclosures in the financial statements, including estimates and assumptions related to taxation. Actual results could differ from these estimates.
47
Notes to Financial Statements (Continued)
PowerShares Exchange-Traded Fund Trust
April 30, 2009
A. Security Valuation
Securities, including restricted securities, are valued according to the following policies.
A security listed or traded on an exchange (except convertible bonds) is valued at its last sales price or official closing price as of the close of the customary trading session on the exchange where the security is principally traded, or lacking any sales or official closing price on a particular day, the security may be valued at the closing bid price on that day. Securities traded in the over-the-counter market are valued based on prices furnished by independent pricing services or market makers. Listed options, if no closing price is available, are valued at the mean between the last bid and ask prices from the exchange on which they are principally traded. Options not listed on an exchange are valued by an independent source at the mean between the last bid and ask prices.
Investments in open-end registered investment companies not traded on an exchange are valued at the end of day net asset value per share.
Debt obligations (including convertible bonds) and unlisted equities are fair valued using an evaluated quote provided by an independent pricing service. Evaluated quotes provided by the pricing service may be determined without exclusive reliance on quoted prices, and may reflect appropriate factors such as institution-size trading in similar groups of securities, developments related to specific securities, dividend rate, yield, quality, type of issue, coupon rate, maturity, individual trading characteristics and other market data. Short-term obligations, including commercial paper, having 60 days or less to maturity are recorded at amortized cost which approximates value. Debt securities are subject to interest rate and credit risks. In addition, all debt securities involve some risk of default with respect to interest and/or principal payments.
Foreign securities (including foreign exchange contracts) are converted into U.S. dollar amounts using the applicable exchange rates as of the close of the London world markets. If market quotations are available and reliable for foreign exchange traded equity securities, the securities will be valued at the market quotations. Because trading hours for certain foreign securities end before the close of the New York Stock Exchange ("NYSE"), closing market quotations may become unreliable. If between the time trading ends on a particular security and the close of the customary trading session on the NYSE, events occur that are significant and make the closing price unreliable, the Fund may fair value the security. If the event is likely to have affected the closing price of the security, the security will be valued at fair value in good faith using procedures approved by the Board of Trustees. Adjustments to closing prices to refl ect fair value may also be based on a screening process of an independent pricing service to indicate the degree of certainty, based on historical data, that the closing price in the principal market where a foreign security trades is not the current value as of the close of the NYSE. Foreign securities meeting the approved degree of certainty that the price is not reflective of current value will be priced at the indication of fair value from the independent pricing service. Multiple factors may be considered by the independent pricing service in determining adjustments to reflect fair value and may include information relating to sector indices, ADRs and domestic and foreign index futures. Foreign securities may have additional risks including exchange rate changes, potential for sharply devalued currencies and high inflation, political and economic upheaval, the relative lack of issuer information, relatively low market liquidity and the potential lack of strict financial and accounting controls and stand ards.
Securities for which market prices are not provided by any of the above methods may be valued based upon quotes furnished by independent sources.
48
Notes to Financial Statements (Continued)
PowerShares Exchange-Traded Fund Trust
April 30, 2009
Securities for which market quotations are not readily available or are unreliable are valued at fair value as determined in good faith by or under the supervision of the Trust's officers following procedures approved by the Board of Trustees. Issuer specific events, market trends, bid/ask quotes of brokers and information providers and other market data may be reviewed in the course of making a good faith determination of a security's fair value.
Valuations change in response to many factors including the historical and prospective earnings of the issuer, the value of the issuer's assets, general economic conditions, interest rates, investor perceptions and market liquidity. Because of the inherent uncertainties of valuation, the values reflected in the financial statements may materially differ from the value received upon actual sale of those investments.
B. Other Risks
A Fund may concentrate in a comparatively narrow segment of the economy. Consequently, such Fund may tend to be more volatile than other funds, and the value of the investments may tend to rise and fall more rapidly.
Investments in the securities of non-U.S. issuers may have greater risk than investments in U.S. securities. Investments in securities denominated in foreign currencies are subject to risk of adverse changes in currency exchange rates, which may negatively impact returns. The risk can also be associated with the level of development of the economies of the countries in a specific region.
A Fund may invest a large percentage of its assets in securities of a limited number of companies, such that each investment may have a greater effect on the Fund's overall performance, and any change in the value of those securities could significantly affect the value of your investment in the Fund.
C. Federal Income Taxes
Each Fund intends to comply with the provisions of the Internal Revenue Code applicable to regulated investment companies and to distribute substantially all of the Fund's taxable earnings to its shareholders. As such, the Funds will not be subject to Federal income taxes on otherwise taxable income (including net realized gains) that is distributed to the shareholders. Therefore, no provision for Federal income taxes is recorded in the Financial Statements.
Income and capital gain distributions are determined in accordance with Federal income tax regulations, which may differ from accounting principles generally accepted in the United States of America. These differences are primarily due to differing book and tax treatments for in-kind transactions, losses deferred due to wash sales, and Passive Foreign Investment Company adjustments, if any.
The Funds file tax returns in the United States Federal jurisdiction and certain other jurisdictions. Generally a Fund is subject to examinations by such taxing authorities for up to three years after the filing of the return for the tax period.
D. Investment Income and Investment Transactions
Dividend income is recorded on the ex-dividend date net of foreign taxes withheld, if any. Interest income is recorded on the accrual basis. Investment transactions are recorded on the trade date. Realized gains and losses from the sale or disposition of securities are calculated on the specific identified cost basis. Dividends and interest received by a Fund may give rise to withholding and other taxes imposed by foreign countries. Corporate actions (including cash dividends) are recorded net of non-reclaimable foreign tax withholdings on the ex-dividend date. Tax conventions between certain countries and the United States may reduce or eliminate such taxes.
49
Notes to Financial Statements (Continued)
PowerShares Exchange-Traded Fund Trust
April 30, 2009
E. Expenses
Expenses of the Trust, which are directly identifiable to a specific Fund, are applied to that Fund. Expenses which are not readily identifiable to a specific Fund are allocated in such a manner as deemed equitable, taking into consideration the nature and type of expense and the relative net assets of each Fund.
Each Fund is responsible for all of its expenses, including the investment advisory fees, costs of transfer agency, custody, fund administration, legal, audit and other services, interest, taxes, brokerage commissions and other expenses connected with executions of portfolio transactions, any distribution fees or expenses and extraordinary expenses.
F. Dividends and Distributions to Shareholders
Each Fund (except for the High Yield Equity Dividend AchieversTM Portfolio and Financial Preferred Portfolio, which declare and pay dividends, if any, monthly) declares and pays dividends from net investment income, if any, to its shareholders quarterly and records on ex-dividend date. Each Fund distributes net realized taxable capital gains, if any, generally annually in cash and records on ex-dividend date. Such distributions on a tax basis are determined in conformity with income tax regulations which may differ from accounting principles generally accepted in the United States of America. Distributions in excess of tax basis earnings and profits, if any, are reported in such Fund's financial statements as a tax return of capital at fiscal period end.
G. Equalization
All Funds use the accounting practice of equalization. This accounting method is used to keep the continuing shareholder's per share equity in undistributed net investment income from being affected by the continuous sales and redemptions of capital shares. Equalization is calculated on a per share basis whereby a portion of the proceeds from the sales and cost of repurchases of capital shares is applied to undistributed net investment income. The amount of equalization is disclosed in the Statements of Changes in Net Assets as undistributed net investment income included in the price of capital shares issued or redeemed. The distributions to shareholders of amounts so applied may be deemed to be a return of capital for tax purposes to the extent that such distributions exceed taxable income.
Note 3. Investment Advisory Agreement and Other Agreements
The Trust has entered into an Investment Advisory Agreement with Invesco PowerShares Capital Management LLC (the "Adviser") under which the Adviser has overall responsibility as the Funds' investment adviser for the selection and ongoing monitoring of the Funds' investments, managing the Funds' business affairs and providing certain clerical, bookkeeping and other administrative services. Each Fund agreed to pay the Adviser an annual fee of 0.40% of the Fund's average daily net assets except for the Buyback AchieversTM Portfolio and Financial Preferred Portfolio, which pay the Adviser an annual fee of 0.50% of that Fund's average daily net assets.
The Adviser has entered into an Amended and Restated Excess Expense Agreement ("Excess Expense Agreement") with the Trust, under which the Adviser has agreed to waive fees and/or pay Fund expenses to the extent necessary to prevent the operating expenses of each Fund (excluding interest expense, brokerage commissions and other trading expenses, sub-licensing fees, offering costs, taxes and extraordinary expenses) from exceeding 0.50% of the Fund's average daily net assets per year (0.60% of the Fund's average daily net assets per year for the Buyback AchieversTM Portfolio and Financial Preferred Portfolio) (the "Expense Cap"), at least until August 31, 2010. Offering costs excluded from the Expense
50
Notes to Financial Statements (Continued)
PowerShares Exchange-Traded Fund Trust
April 30, 2009
Cap are: (a) legal fees pertaining to the Funds' shares offered for sale; (b) Securities and Exchange Commission and state registration fees; and (c) initial fees paid to be listed on an exchange.
The Excess Expense Agreement provides that the expenses borne by the Adviser are subject to recapture by the Adviser for up to three years from the date the fee or expense was borne by the Adviser, but no recapture payment will be made by a Fund if it would result in the Fund exceeding its Expense Cap as specified above.
The net amount of fees waived and other expenses assumed by the Adviser and the amount of recapture paid to the Adviser pursuant to the Excess Expense Agreement are collectively referred to as "(Waivers) and/or Recapture". The net amounts of (Waivers) and/or Recapture for the year ended April 30, 2009 are shown on the Statements of Operations.
The amounts available for potential future recapture by the Adviser under the Excess Expense Agreement and the expiration schedule at April 30, 2009 are as follows:
| Total Potential | Potential Recapture Amounts Expiring | ||||||||||||||||||
| Recapture Amounts | 04/30/10 | 04/30/11 | 04/30/12 | ||||||||||||||||
| Buyback AchieversTM Portfolio | $ | 187,371 | $ | 24,961 | $ | 64,191 | $ | 98,219 | |||||||||||
| Dividend AchieversTM Portfolio | 337,886 | 150,733 | 88,163 | 98,990 | |||||||||||||||
| High Growth Rate Dividend AchieversTM Portfolio | 357,619 | 142,646 | 101,891 | 113,082 | |||||||||||||||
| High Yield Equity Dividend AchieversTM Portfolio | 90,165 | 40,197 | 1,765 | 48,203 | |||||||||||||||
The Trust has entered into a Distribution Agreement with Invesco Aim Distributors, Inc. (the "Distributor"), which serves as the Distributor of Creation Units for each Fund. The Distributor does not maintain a secondary market in Shares.
Licensing Fee Agreements
The Adviser has entered into a licensing agreement for each Fund with the following Licensors:
| Fund | Licensor | ||||||
| Buyback AchieversTM Portfolio | Mergent, Inc. | ||||||
| Dividend AchieversTM Portfolio | Mergent, Inc. | ||||||
| Financial Preferred Portfolio | Wachovia Capital Markets, LLC | ||||||
| High Growth Rate Dividend AchieversTM Portfolio | Mergent, Inc. | ||||||
| High Yield Equity Dividend AchieversTM Portfolio | Mergent, Inc. | ||||||
| International Dividend AchieversTM Portfolio | Mergent, Inc. | ||||||
The index name trademarks are owned by the respective Licensors. These trademarks have been licensed to the Adviser for use with the Funds. The Funds are not sponsored, endorsed, sold or promoted by the Licensors and the Licensors make no representation regarding the advisability of investing in any of these Funds. The Trust has entered into a sub-licensing agreement under which the Funds are required to pay the sub-licensing fees which are shown on the Statements of Operations.
The Trust has entered into service agreements whereby The Bank of New York Mellon, a wholly-owned subsidiary of The Bank of New York Mellon Corporation, serves as the administrator, custodian and fund accounting and transfer agent for each Fund.
51
Notes to Financial Statements (Continued)
PowerShares Exchange-Traded Fund Trust
April 30, 2009
The custodian has agreed to provide overdraft protection to the Funds according to the terms of the service agreement.
Note 4. Additional Valuation Information
The Funds adopted the provisions of Statement of Financial Accounting Standards No. 157, "Fair Value Measurements" ("SFAS 157"), effective with the beginning of the Fund's fiscal year. SFAS 157 defines fair value as the price that would be received to sell an asset or paid to transfer a liability in an orderly transaction between market participants at the measurement date. SFAS 157 establishes a hierarchy that prioritizes the inputs to valuation methods giving the highest priority to readily available unadjusted quoted prices in an active market for identical assets (Level 1) and the lowest priority to significant unobservable inputs (Level 3) generally when market prices are not readily available or are unreliable. Based on the valuation inputs, the securities or other investments are tiered into one of three levels. Changes in valuation methods may result in transfers in or out of an investment's assigned level:
Level 1 – Prices are determined using quoted prices in an active market for identical assets.
Level 2 – Prices are determined using other significant observable inputs. Observable inputs are inputs that other market participants may use in pricing a security. These may include quoted prices for similar securities, interest rates, prepayment speeds, credit risk and others.
Level 3 – Prices are determined using significant unobservable inputs. In situations where quoted prices or observable inputs are unavailable (for example, when there is little or no market activity for an investment at the end of the period), unobservable inputs may be used. Unobservable inputs reflect the Fund's own assumptions about the factors market participants would use in determining fair value of the securities or instruments and would be based on the best available information.
The following is a summary of the tiered valuation input levels, as of the end of the reporting period, April 30, 2009. The level assigned to the securities valuations may not be an indication of the risk or liquidity associated with investing in those securities. Because of the inherent uncertainties of valuation, the values reflected in the financial statements may materially differ from the value received upon actual sale of those investments.
| Investments in Securities | |||||||||||||||||||
| Level 1 | Level 2 | Level 3 | Total | ||||||||||||||||
| Buyback AchieversTM Portfolio | $ | 27,650,531 | $ | — | $ | — | $ | 27,650,531 | |||||||||||
| Dividend AchieversTM Portfolio | 84,479,696 | — | — | 84,479,696 | |||||||||||||||
| Financial Preferred Portfolio | 774,344,301 | — | — | 774,344,301 | |||||||||||||||
| High Growth Rate Dividend AchieversTM Portfolio | 13,114,659 | — | — | 13,114,659 | |||||||||||||||
| High Yield Equity Dividend AchieversTM Portfolio | 87,223,663 | — | — | 87,223,663 | |||||||||||||||
| International Dividend AchieversTM Portfolio | 255,589,710 | — | — | 255,589,710 | |||||||||||||||
52
Notes to Financial Statements (Continued)
PowerShares Exchange-Traded Fund Trust
April 30, 2009
Note 5. Federal Income Tax
At April 30, 2009, the costs of investments on a tax basis including the adjustments for financial reporting purposes as of the most recently completed Federal income tax reporting period were as follows:
| Buyback AchieversTM Portfolio | $ | 30,586,676 | |||||
| Dividend AchieversTM Portfolio | 100,687,424 | ||||||
| Financial Preferred Portfolio(1) | 495,867,751 | ||||||
| High Growth Rate Dividend AchieversTM Portfolio | 16,376,742 | ||||||
| High Yield Equity Dividend AchieversTM Portfolio | 100,144,783 | ||||||
| International Dividend AchieversTM Portfolio | 348,987,787 | ||||||
At April 30, 2009, the components of accumulated earning (loss) on a tax basis were as follows:
| Accumulated Earnings | Other Temporary Differences | Net Accumulated Capital and other Gains (Losses) | Net Unrealized Appreciation (Depreciation) | Gross Unrealized Appreciation | Gross Unrealized (Depreciation) | Total Accumulated Earnings (Loss) | |||||||||||||||||||||||||
| Buyback AchieversTM Portfolio | $ | 137,465 | $ | (3,629 | ) | $ | (22,350,753 | ) | $ | (2,936,145 | ) | $ | 1,972,837 | $ | (4,908,982 | ) | $ | (25,153,062 | ) | ||||||||||||
| Dividend AchieversTM Portfolio | 842,021 | (3,912 | ) | (16,632,416 | ) | (16,207,728 | ) | 811,646 | (17,019,374 | ) | (32,002,035 | ) | |||||||||||||||||||
| Financial Preferred Portfolio(1) | — | (4,132 | ) | (32,341,119 | ) | (104,169,387 | ) | 1,441,466 | (105,610,853 | ) | (136,514,638 | ) | |||||||||||||||||||
| High Growth Rate Dividend AchieversTM Portfolio | 21,472 | (2,927 | ) | (10,728,921 | ) | (3,262,083 | ) | 533,341 | (3,795,424 | ) | (13,972,459 | ) | |||||||||||||||||||
| High Yield Equity Dividend AchieversTM Portfolio | — | (6,249 | ) | (138,242,349 | ) | (12,921,120 | ) | 4,489,387 | (17,410,507 | ) | (151,169,718 | ) | |||||||||||||||||||
| International Dividend AchieversTM Portfolio | 3,233,224 | (12,902 | ) | (185,383,924 | ) | (93,398,077 | ) | 4,342,658 | (97,740,735 | ) | (275,561,679 | ) | |||||||||||||||||||
Distribution to Shareholders:
The tax character of distributions paid was as follows:
| Year Ended April 30, 2009 | Year Ended April 30, 2008 | ||||||||||
| Distributions paid from Ordinary Income | Distributions paid from Ordinary Income | ||||||||||
| Buyback AchieversTM Portfolio | $ | 456,573 | $ | 298,099 | |||||||
| Dividend AchieversTM Portfolio | 1,482,708 | 1,373,568 | |||||||||
| Financial Preferred Portfolio(1) | 16,849,393 | 4,465,491 | |||||||||
| High Growth Rate Dividend AchieversTM Portfolio | 506,385 | 624,614 | |||||||||
| High Yield Equity Dividend AchieversTM Portfolio | 6,711,618 | 13,201,105 | |||||||||
| International Dividend AchieversTM Portfolio | 15,651,696 | 17,781,400 | |||||||||
| Distributions paid from Return of Capital | Distributions paid from Return of Capital | ||||||||||
| Financial Preferred Portfolio(1) | $ | 744,661 | $ | — | |||||||
| High Yield Equity Dividend AchieversTM Portfolio | 423,105 | 533,357 | |||||||||
53
Notes to Financial Statements (Continued)
PowerShares Exchange-Traded Fund Trust
April 30, 2009
At April 30, 2009, for Federal income tax purposes, the Funds had capital loss carryforwards available as shown in the table below, to the extent provided by the regulations, to offset future capital gains through the years indicated. To the extent that these loss carryforwards are used to offset future capital gains, it is probable that the capital gains so offset will not be distributed to shareholders. The use of some portion of the capital loss carryforward by any one Fund may be limited by Federal tax rules. Among others, certain rules limit the use of the carryforward when there has been a greater than fifty percent change in ownership of a Fund.
| Year of Expiration | Total | ||||||||||||||||||||||
| 2014 | 2015 | 2016 | 2017 | Amount | |||||||||||||||||||
| Buyback AchieversTM Portfolio | $ | — | $ | 178,870 | $ | 9,098,882 | $ | 800,254 | $ | 10,078,006 | |||||||||||||
| Dividend AchieversTM Portfolio | 7,896 | — | 50,943 | 1,709,416 | 1,768,255 | ||||||||||||||||||
| Financial Preferred Portfolio(1) | — | 2,445,445 | 29,895,674 | — | 32,341,119 | ||||||||||||||||||
| High Growth Rate Dividend AchieversTM Portfolio | 1,847 | 15,651 | 385,977 | 2,855,315 | 3,258,790 | ||||||||||||||||||
| High Yield Equity Dividend AchieversTM Portfolio | 2,613,033 | 7,009,598 | 5,162,362 | 81,487,358 | 96,272,351 | ||||||||||||||||||
| International Dividend AchieversTM Portfolio | 183,478 | 221,461 | 1,975,339 | 59,472,841 | 61,853,119 | ||||||||||||||||||
Capital losses incurred after October 31 ("post-October losses") within the taxable year are deemed to arise on the first business day of each Fund's next taxable year.
During the year ended April 30, 2009, the Funds incurred and will elect to defer net capital losses as follows:
| Post-October Losses | |||||||
| Buyback AchieversTM Portfolio | $ | 12,272,747 | |||||
| Dividend AchieversTM Portfolio | 14,864,161 | ||||||
| High Growth Rate Dividend AchieversTM Portfolio | 7,470,131 | ||||||
| High Yield Equity Dividend AchieversTM Portfolio | 41,969,998 | ||||||
| International Dividend AchieversTM Portfolio | 123,540,805 | ||||||
In order to present shares of beneficial interest and accumulated net realized gains or losses on the Statements of Assets and Liabilities that more closely represent their tax character, certain adjustments have been made to shares of beneficial interest, undistributed net investment income or loss and accumulated net realized gain or loss on investments. These differences are primarily due to redemptions-in-kind, investments in partnerships, wash sales, book equalization, and net operating losses, if any. These adjustments have no effect on net assets. For the year ended April 30, 2009, the adjustments were as follows:
| Undistributed Net Investment Income (Loss) | Undistributed Capital Gain | Shares of Beneficial Interest | |||||||||||||
| Buyback AchieversTM Portfolio | $ | 41,506 | $ | 3,532,758 | $ | (3,574,264 | ) | ||||||||
| Dividend AchieversTM Portfolio | (192,301 | ) | 684,575 | (492,274 | ) | ||||||||||
| Financial Preferred Portfolio(1) | (42,621 | ) | 596,638 | (554,017 | ) | ||||||||||
| High Growth Rate Dividend AchieversTM Portfolio | 2,987 | 420,076 | (423,063 | ) | |||||||||||
| High Yield Equity Dividend AchieversTM Portfolio | 435,165 | 38,051,346 | (38,486,511 | ) | |||||||||||
| International Dividend AchieversTM Portfolio | 238,619 | 64,195,815 | (64,434,434 | ) | |||||||||||
(1) Tax year-end is October 31
54
Notes to Financial Statements (Continued)
PowerShares Exchange-Traded Fund Trust
April 30, 2009
Note 6. Investment Transactions
For the period ended April 30, 2009, the cost of securities purchased and proceeds from sales of securities, excluding short-term securities, money market funds and in-kind transactions, were as follows:
| Purchases | Sales | ||||||||||
| Buyback AchieversTM Portfolio | $ | 23,586,919 | $ | 23,569,359 | |||||||
| Dividend AchieversTM Portfolio | 22,230,251 | 22,111,872 | |||||||||
| Financial Preferred Portfolio | 180,164,017 | 189,861,419 | |||||||||
| High Growth Rate Dividend AchieversTM Portfolio | 6,363,575 | 6,413,045 | |||||||||
| High Yield Equity Dividend AchieversTM Portfolio | 100,689,025 | 102,409,129 | |||||||||
| International Dividend AchieversTM Portfolio | 193,412,966 | 189,013,347 | |||||||||
For the period ended April 30, 2009, in-kind transactions were as follows:
| Securities Received | Securities Delivered | ||||||||||
| Buyback AchieversTM Portfolio | $ | — | $ | 17,160,469 | |||||||
| Dividend AchieversTM Portfolio | 77,024,322 | 21,939,916 | |||||||||
| Financial Preferred Portfolio | 709,997,965 | 25,791,611 | |||||||||
| High Growth Rate Dividend AchieversTM Portfolio | 663,459 | 3,633,990 | |||||||||
| High Yield Equity Dividend AchieversTM Portfolio | 52,801,899 | 69,257,480 | |||||||||
| International Dividend AchieversTM Portfolio | 163,539,370 | 180,587,063 | |||||||||
Gains on in-kind transactions are generally not considered taxable gains for Federal income tax purposes.
Note 7. Trustees' Fees
The Funds compensate each Trustee who is not an employee of the Adviser or its affiliates. The "Interested" Trustee of the Trust does not receive any Trustees' fees.
The Trust has adopted a deferred compensation plan (the "Plan"). Under the Plan, a Trustee who is not an "interested person" (as defined in the 1940 Act) (an "Independent Trustee") and has executed a Deferred Fee Agreement (a "Participating Trustee") may defer receipt of all or a portion of his compensation ("Deferral Fees"). Such Deferral Fees are deemed to be invested in selected PowerShares Funds. The Deferral Fees payable to the Participating Trustee are valued as of the date such Fees would have been paid to the Participating Trustee. The value increases with contributions or with increases in the value of the shares selected, and the value decreases with distributions or with declines in the value of the shares selected.
Note 8. Capital
Shares are created and redeemed by the Trust only in Creation Unit size aggregations of 100,000. Only Authorized Participants are permitted to purchase or redeem Creation Units from the Funds. Such transactions are generally permitted on an in-kind basis, with a balancing cash component to equate the transaction to the net asset value per unit of each Fund of the Trust on the transaction date. Cash may be substituted equivalent to the value of certain securities generally when they are not available in sufficient quantity for delivery, not eligible for trading by the Authorized Participant or as a result of other market circumstances.
55
Notes to Financial Statements (Continued)
PowerShares Exchange-Traded Fund Trust
April 30, 2009
Note 9. Indemnifications
Under the Trust's organizational documents, its officers and Trustees are indemnified against certain liabilities arising out of the performance of their duties to the Trust. Each Independent Trustee is also indemnified against certain liabilities arising out of the performance of his duties to the Trust pursuant to an Indemnification Agreement between the Independent Trustee and the Trust. Additionally, in the normal course of business, the Trust enters into contracts with service providers that contain general indemnification clauses. The Trust's maximum exposure under these arrangements is unknown, as this would involve future claims that may be made against the Trust that have not yet occurred. However, based on experience, the Trust believes the risk of loss to be remote.
Note 10. Subsequent Event
On May 1, 2009, the Board of Trustees of the Trust approved the liquidation of the PowerShares High Growth Rate Dividend AchieversTM Portfolio. The portfolio was liquidated at fair value on May 22, 2009.
56
Report of Independent Registered Public Accounting Firm
To the Board of Trustees and Shareholders of PowerShares Exchange-Traded Fund Trust:
In our opinion, the accompanying statements of assets and liabilities, including the schedules of investments, and the related statements of operations and of changes in net assets and the financial highlights present fairly, in all material respects, the financial position of each of the portfolios indicated in Note 1 of the financial statements (each a portfolio of PowerShares Exchange-Traded Fund Trust, hereafter referred to as the "Trust") at April 30, 2009, and the results of each of their operations, the changes in each of their net assets, and the financial highlights for each of the periods presented, in conformity with accounting principles generally accepted in the United States of America. These financial statements and financial highlights (hereafter referred to as "financial statements") are the responsibility of the Trust's management; our responsibility is to express an opinion on these financial statements based on our audits. We conducted our audits of these financial statements in accordance with the standards of the Public Company Accounting Oversight Board (United States). Those standards require that we plan and perform the audits to obtain reasonable assurance about whether the financial statements are free of material misstatement. An audit includes examining, on a test basis, evidence supporting the amounts and disclosures in the financial statements, assessing the accounting principles used and significant estimates made by management, and evaluating the overall financial statement presentation. We believe that our audits, which included confirmation of securities at April 30, 2009 by correspondence with the custodian and brokers, and the application of alternative auditing procedures where securities purchased had not been received, provide a reasonable basis for our opinion.
As discussed in Note 10 to the financial statements, on May 1, 2009, the Board of Trustees approved the liquidation of the PowerShares High Growth Rate Dividend Achievers Portfolio, effected on May 22, 2009.
PricewaterhouseCoopers LLP
New York, New York
June 25, 2009
57
Supplemental Information
Tax Information
Form 1099-DIV, Form 1042-S and other year-end tax information provide shareholders with actual calendar year amounts that should be included in their tax returns. Shareholders should consult their tax advisors.
The following distribution information is being provided as required by the Internal Revenue Code or to meet a specific state's requirement.
Each Fund designates the following amounts or, if subsequently determined to be different the maximum amount allowable for its fiscal year ended April 30, 2009 and for High Growth Rate Dividend Achievers Portfolio final fiscal year ended May 22, 2009:
Federal Income Tax Information
| April 30, 2009 | |||||||||||
| Qualified Dividend Income* | Dividends Received Deduction* | ||||||||||
| Buyback AchieversTM Portfolio | 100 | % | 100 | % | |||||||
| Dividend AchieversTM Portfolio | 100 | % | 100 | % | |||||||
| Financial Preferred Portfolio | 100 | % | 60 | % | |||||||
| High Growth Rate Dividend AchieversTM Portfolio | 100 | % | 100 | % | |||||||
| High Yield Equity Dividend AchieversTM Portfolio | 100 | % | 100 | % | |||||||
| International Dividend AchieversTM Portfolio | 100 | % | 0 | % | |||||||
The Fund intends to elect to pass through to shareholders the credit for taxes paid to foreign countries. The gross foreign source income and foreign taxes paid are as follows:
| April 30, 2009 | |||||||||||
| Foreign Source Income | Foreign Taxes | ||||||||||
| International Dividend AchieversTM Portfolio | $ | 16,567,124 | $ | 1,105,796 | |||||||
Federal Income Tax Information for Liquidating Funds
| May 22, 2009 | |||||||||||
| Qualified Dividend Income* | Dividends Received Deduction* | ||||||||||
| High Growth Rate Dividend AchieversTM Portfolio | 100 | % | 100 | % | |||||||
* The above percentages are based on ordinary income dividends paid to shareholders during the Fund's fiscal year.
58
Supplemental Information (Continued)
Trustees and Officers
The Independent Trustees, the Trustee who is affiliated with the Adviser (the "Management Trustee") and the executive officers of the Trust, their term of office and length of time served, their principal business occupations during at least the past five years, the number of portfolios in the Fund Complex (as defined below) overseen by each Trustee and the other directorships, if any, held by a Trustee, are shown below.
| Name, Address, and Age Independent Trustee | Position(s) with Trust | Length Time Served* | Principal Occupation(s) During Past 5 Years | Number of Portfolios in Fund Complex** Overseen by Trustee | Other Directorships Held by Trustee | ||||||||||||||||||
| Ronn R. Bagge 51 YQA Capital Management, LLC 1755 S. Naperville Road Suite 100 Wheaton, IL 60187 | Trustee | Since 2003 | YQA Capital Management LLC (July 1998-Present); formerly Owner/CEO of Electronic Dynamic Balancing Co., Inc. (high-speed rotating equipment service provider) | 119 | None | ||||||||||||||||||
| Marc M. Kole 48 c/o Invesco PowerShares Capital Management LLC 301 W. Roosevelt Road Wheaton, IL 60187 | Trustee | Since 2006 | Vice President of Finance and Accounting, Hope Network (social services) (November 2008-Present); formerly Assistant Vice President and Controller, Priority Health (health insurance) (September 2005-April 2008); Senior Vice President of Finance, United Healthcare (health insurance) (July 2004-July 2005); Senior Vice President of Finance, Oxford Health Plans (June 2000-July 2004) | 119 | None | ||||||||||||||||||
* This is the date the Trustee began serving the Trust. Each Trustee serves an indefinite term, until his successor is elected.
** Fund Complex includes all open-end funds (including all of their portfolios) advised by the Adviser. At April 30, 2009, the Fund Complex consists of the Trust's 75 portfolios and three other exchange-traded fund trusts with 44 portfolios advised by the Adviser.
59
Supplemental Information (Continued)
Trustees and Officers (Continued)
| Name, Address, and Age Independent Trustee | Position(s) with Trust | Length Time Served* | Principal Occupation(s) During Past 5 Years | Number of Portfolios in Fund Complex** Overseen by Trustee | Other Directorships Held by Trustee | ||||||||||||||||||
| Philip M. Nussbaum 47 c/o Invesco PowerShares Capital Management LLC 301 W. Roosevelt Road Wheaton, IL 60187 | Trustee | Since 2003 | Chairman, Performance Trust Capital Partners (formerly Betzold, Berg, Nussbaum & Heitman, Inc.) (November 2004-Present); formerly Managing Director, Communication Institute (May 2002-August 2003); Executive Vice President of Finance, Betzold, Berg, Nussbaum & Heitman, Inc. (March 1994-1999) | 119 | None | ||||||||||||||||||
| Donald H. Wilson 49 c/o Invesco PowerShares Capital Management LLC 301 W. Roosevelt Road Wheaton, IL 60187 | Trustee | Since 2006 | President and Chief Operating Officer, AMCORE Financial, Inc. (bank holding company) (August 2007-April 2009), formerly Executive Vice President and Chief Financial Officer, AMCORE Financial, Inc. (February 2006-August 2007); Senior Vice President and Treasurer, Marshall & Ilsley Corp. (bank holding company) (May 1995-February 2006) | 119 | None | ||||||||||||||||||
* This is the date the Trustee began serving the Trust. Each Trustee serves an indefinite term, until his successor is elected.
** Fund Complex includes all open-end funds (including all of their portfolios) advised by the Adviser. At April 30, 2009, the Fund Complex consists of the Trust's 75 portfolios and three other exchange-traded fund trusts with 44 portfolios advised by the Adviser.
60
Supplemental Information (Continued)
Trustees and Officers (Continued)
| Name, Address, and Age of Management Trustee | Position(s) with Trust | Length Time Served* | Principal Occupation(s) During Past 5 Years | Number of Portfolios in Fund Complex*** Overseen by Trustee | Other Directorships Held by Trustee | ||||||||||||||||||
| H. Bruce Bond** 45 Invesco PowerShares Capital Management LLC 301 W. Roosevelt Road Wheaton, IL 60187 | Chairman of the Board, Trustee and President | Since 2003 | Managing Director, Invesco PowerShares Capital Management LLC (August 2002-Present); formerly Manager, Nuveen Investments (April 1998-August 2002) | 119 | None | ||||||||||||||||||
Availability of Additional Information About the Trustees
The Statement of Additional Information includes additional information about the Trustees and is available, without charge, upon request at 800.337.4246.
* This is the date the Management Trustee began serving the Trust. Each Trustee serves an indefinite term, until his successor is elected. Each officer serves a one year term, until his successor is elected.
** "Interested person" as defined in Section 2(a)(19) of the 1940 Act.
*** Fund Complex includes all open-end funds (including all of their portfolios) advised by the Adviser. At April 30, 2009, the Fund Complex consists of the Trust's 75 portfolios and three other exchange-traded fund trusts with 44 portfolios advised by the Adviser.
61
Supplemental Information (Continued)
Trustees and Officers (Continued)
| Name, Address, and Age of Officers | Position(s) with Trust | Length Time Served* | Principal Occupation(s) During Past 5 Years | ||||||||||||
| Bruce T. Duncan 54 Invesco PowerShares Capital Management LLC 301 W. Roosevelt Road Wheaton, IL 60187 | Chief Financial Officer, Treasurer and Secretary | Chief Financial Officer and Treasurer Since 2006 Secretary Since 2008 | Senior Vice President of Finance, Invesco PowerShares Capital Management LLC (September 2005-Present); formerly Private Practice Attorney (2000-2005); Vice President of Investor Relations, The ServiceMaster Company (1994-2000); Vice President of Taxes, The ServiceMaster Company (1990-2000) | ||||||||||||
| Kevin R. Gustafson 43 Invesco PowerShares Capital Management LLC 301 W. Roosevelt Road Wheaton, IL 60187 | Chief Compliance Officer | Since 2004 | General Counsel, Invesco PowerShares Capital Management LLC (September 2004-Present); formerly Chief Compliance Officer, Invesco PowerShares Capital Management LLC (September 2004-April 2008) | ||||||||||||
| John W. Southard, Jr., CFA, MBA 39 Invesco PowerShares Capital Management LLC 301 West Roosevelt Road Wheaton, IL 60187 | Vice President | Since 2003 | Managing Director, Invesco PowerShares Capital Management LLC (August 2002-Present); formerly, Treasurer of the Trust (April 2003-April 2006); Senior Equity Analyst, Charles Schwab & Company (May 2001-August 2002) | ||||||||||||
* This is the period for which the Officers began serving the Trust. Each Officer serves one year term, until his successor is elected.
62
Board Considerations Regarding Continuation of Investment Advisory Agreement
At a meeting held on April 16, 2009, the Board of Trustees of the PowerShares Exchange-Traded Fund Trust (the "Trust"), including the Independent Trustees, unanimously approved the continuation of the Investment Advisory Agreement between Invesco PowerShares Capital Management LLC (the "Adviser") and the Trust for the following 70 series (each, a "Fund" and collectively, the "Funds"):
PowerShares Dynamic Market Portfolio
PowerShares Dynamic OTC Portfolio
PowerShares Golden Dragon Halter USX China Portfolio
PowerShares High Yield Equity Dividend AchieversTM Portfolio
PowerShares WilderHill Clean Energy Portfolio
PowerShares Dynamic Large Cap Growth Portfolio
PowerShares Dynamic Large Cap Value Portfolio
PowerShares Dynamic Mid Cap Growth Portfolio
PowerShares Dynamic Mid Cap Value Portfolio
PowerShares Dynamic Small Cap Growth Portfolio
PowerShares Dynamic Small Cap Value Portfolio
PowerShares Dynamic Biotechnology & Genome Portfolio
PowerShares Dynamic Food & Beverage Portfolio
PowerShares Dynamic Leisure and Entertainment Portfolio
PowerShares Dynamic Media Portfolio
PowerShares Dynamic Networking Portfolio
PowerShares Dynamic Pharmaceuticals Portfolio
PowerShares Dynamic Semiconductors Portfolio
PowerShares Dynamic Software Portfolio
PowerShares Zacks Micro Cap Portfolio
PowerShares Aerospace & Defense Portfolio
PowerShares Dynamic Hardware & Consumer Electronics Portfolio
PowerShares Dynamic Telecommunications & Wireless Portfolio
PowerShares Value Line Timeliness Select Portfolio
PowerShares Dividend AchieversTM Portfolio
PowerShares International Dividend AchieversTM Portfolio
PowerShares High Growth Rate Dividend AchieversTM Portfolio
PowerShares Zacks Small Cap Portfolio
PowerShares Dynamic Building and Construction Portfolio
PowerShares Dynamic Energy Exploration and Production Portfolio
PowerShares Dynamic Insurance Portfolio
PowerShares Dynamic Oil and Gas Services Portfolio
PowerShares Dynamic Retail Portfolio
PowerShares Dynamic Utilities Portfolio
PowerShares Lux Nanotech Portfolio
PowerShares FTSE RAFI US 1000 Portfolio
PowerShares FTSE RAFI US 1500 Small-Mid Portfolio
PowerShares Water Resources Portfolio
PowerShares Dynamic Energy Sector Portfolio
PowerShares Dynamic Financials Sector Portfolio
PowerShares Dynamic Healthcare Sector Portfolio
PowerShares Dynamic Industrials Sector Portfolio
PowerShares Dynamic Large Cap Portfolio
PowerShares Dynamic MagniQuant Portfolio
PowerShares Dynamic Mid Cap Portfolio
PowerShares Dynamic Small Cap Portfolio
PowerShares Dynamic Technology Sector Portfolio
PowerShares Buyback AchieversTM Portfolio
PowerShares FTSE RAFI Basic Materials Sector Portfolio
PowerShares FTSE RAFI Consumer Goods Sector Portfolio
PowerShares FTSE RAFI Consumer Services Sector Portfolio
PowerShares FTSE RAFI Energy Sector Portfolio
PowerShares FTSE RAFI Financials Sector Portfolio
PowerShares FTSE RAFI Health Care Sector Portfolio
PowerShares FTSE RAFI Industrials Sector Portfolio
PowerShares FTSE RAFI Telecommunications & Technology Sector Portfolio
63
Board Considerations Regarding Continuation of Investment Advisory Agreement (Continued)
PowerShares FTSE RAFI Utilities Sector Portfolio
PowerShares Cleantech Portfolio
PowerShares Dynamic Aggressive Growth Portfolio
PowerShares Dynamic Banking Portfolio
PowerShares Dynamic Basic Materials Sector Portfolio
PowerShares Dynamic Consumer Discretionary Sector Portfolio
PowerShares Dynamic Consumer Staples Sector Portfolio
PowerShares Dynamic Healthcare Services Portfolio
PowerShares Dynamic Deep Value Portfolio
PowerShares Financial Preferred Portfolio
PowerShares Listed Private Equity Portfolio
PowerShares DWA Technical Leaders Portfolio
PowerShares Value Line Industry Rotation Portfolio
PowerShares WilderHill Progressive Energy Portfolio
The Trustees reviewed information from the Adviser describing: (i) the nature, extent and quality of services provided, (ii) the investment performance of the Funds and the Adviser, (iii) the costs of services provided and estimated profits realized by the Adviser, (iv) the extent to which economies of scale are realized as the Funds grow, (v) whether fee levels reflect any possible economies of scale for the benefit of Fund shareholders, (vi) comparisons of services rendered and amounts paid to other registered investment companies and (vii) any benefits realized by the Adviser from its relationship with each Fund. Based on all of the information considered and the conclusions reached, the Board, including the Independent Trustees, determined to approve the continuation of the Investment Advisory Agreement for each Fund. No single factor was determinative in the Board's analysis.
Nature, Extent and Quality of Services. In evaluating the nature, extent and quality of the Adviser's services, the Trustees reviewed information concerning the functions performed by the Adviser for the Funds, information describing the Adviser's current organization and projected staffing, including operations assistance provided by the Adviser's parent organization, Invesco Ltd., and the background and experience of the persons responsible for the day-to-day management of the Funds. The Trustees reviewed matters related to the Adviser's execution of portfolio transactions on behalf of the Funds. The Trustees also reviewed information on the performance of the Funds and the performance of their underlying indices through December 31, 2008. The Trustees also reviewed reports on the correlation and tracking error between the underlying index and each Fund's performance, and the Adviser's analysis of the tracking error between each Fund and its underlying index. The Trustees noted that each Fund's correlation was within the targeted range set forth in the Trust's registration statement and that, for each Fund other than PowerShares Financial Preferred Portfolio, the tracking error was within the targeted range set forth in the Trust's registration statement. The Trustees reviewed the reasons for PowerShares Financial Preferred Portfolio's tracking error. The Trustees concluded that each Fund was correlated to its underlying index and that the tracking error for each Fund was within an acceptable range given that Fund's particular circumstances.
The Trustees also considered the services provided by the Adviser in its oversight of the Funds' administrator, custodian and transfer agent. They noted the significant amount of time and effort that had been devoted to this oversight function.
Based on their review, the Trustees concluded that the nature, extent and quality of services provided by the Adviser to the Funds under the Investment Advisory Agreement were appropriate and reasonable.
64
Board Considerations Regarding Continuation of Investment Advisory Agreement (Continued)
Fees, Expenses and Profitability. The Trustees reviewed and discussed the information provided by the Adviser on each Fund's expense ratio and advisory fee, as compared to information compiled by the Adviser from Lipper Inc. databases on the expense ratios of comparable exchange-traded funds ("ETFs"), open-end (non-ETF) index funds and open-end actively-managed funds. The Trustees noted that the annual advisory fee charged to each Fund is:
• 0.50% of the Fund's average net assets, for each Fund other than PowerShares High Yield Equity Dividend AchieversTM Portfolio, PowerShares Dividend AchieversTM Portfolio, PowerShares High Growth Rate Dividend AchieversTM Portfolio, PowerShares International Dividend AchieversTM Portfolio, PowerShares FTSE RAFI Basic Materials Sector Portfolio, PowerShares FTSE RAFI Consumer Goods Sector Portfolio, PowerShares FTSE RAFI Consumer Services Sector Portfolio, PowerShares FTSE RAFI Energy Sector Portfolio, PowerShares FTSE RAFI Financials Sector Portfolio, PowerShares FTSE RAFI Health Care Sector Portfolio, PowerShares FTSE RAFI Industrials Sector Portfolio, PowerShares FTSE RAFI Telecommunications & Technology Sector Portfolio, PowerShares FTSE RAFI Utilities Sector Portfolio, PowerShares FTSE RAFI US 1000 Portfolio and PowerShares FTSE RAFI US 1500 Small-Mid Portfolio ;
• 0.40% of the Fund's average net assets, for each of PowerShares High Yield Equity Dividend AchieversTM Portfolio, PowerShares Dividend AchieversTM Portfolio, PowerShares High Growth Rate Dividend AchieversTM Portfolio and PowerShares International Dividend AchieversTM Portfolio; and
• 0.29% of the Fund's average net assets, for each of PowerShares FTSE RAFI Basic Materials Sector Portfolio, PowerShares FTSE RAFI Consumer Goods Sector Portfolio, PowerShares FTSE RAFI Consumer Services Sector Portfolio, PowerShares FTSE RAFI Energy Sector Portfolio, PowerShares FTSE RAFI Financials Sector Portfolio, PowerShares FTSE RAFI Health Care Sector Portfolio, PowerShares FTSE RAFI Industrials Sector Portfolio, PowerShares FTSE RAFI Telecommunications & Technology Sector Portfolio, PowerShares FTSE RAFI Utilities Sector Portfolio, PowerShares FTSE RAFI US 1000 Portfolio and PowerShares FTSE RAFI US 1500 Small-Mid Portfolio (the Trustees noted that the advisory fee for each of these Funds was reduced to 0.29% effective November 1, 2008).
The Trustees also noted that the Adviser has agreed to waive a portion of its advisory fee and/or pay expenses (an "Expense Cap") to the extent necessary to prevent the annual operating expenses of each Fund from exceeding the percentage of that Fund's average daily net assets, at least until August 31, 2010, as set forth below:
• 0.60%, excluding interest expenses, brokerage commissions and other trading expenses, taxes and extraordinary expenses, for each of PowerShares Dynamic OTC Portfolio and PowerShares Dynamic Market Portfolio;
• 0.50%, excluding interest expenses, licensing fees, offering costs, brokerage commissions and other trading expenses, taxes and extraordinary expenses, for each of PowerShares High Yield Equity Dividend AchieversTM Portfolio, PowerShares Dividend AchieversTM Portfolio, PowerShares High Growth Rate Dividend AchieversTM Portfolio and PowerShares International Dividend AchieversTM Portfolio;
• 0.39%, excluding interest expenses, offering costs, brokerage commissions and other trading expenses, taxes and extraordinary expenses, for each of PowerShares FTSE RAFI Basic Materials
65
Board Considerations Regarding Continuation of Investment Advisory Agreement (Continued)
Sector Portfolio, PowerShares FTSE RAFI Consumer Goods Sector Portfolio, PowerShares FTSE RAFI Consumer Services Sector Portfolio, PowerShares FTSE RAFI Energy Sector Portfolio, PowerShares FTSE RAFI Financials Sector Portfolio, PowerShares FTSE RAFI Health Care Sector Portfolio, PowerShares FTSE RAFI Industrials Sector Portfolio, PowerShares FTSE RAFI Telecommunications & Technology Sector Portfolio, PowerShares FTSE RAFI Utilities Sector Portfolio, PowerShares FTSE RAFI US 1000 Portfolio and PowerShares FTSE RAFI US 1500 Small-Mid Portfolio (the Trustees noted that, effective November 1, 2008, the Expense Cap for each of these Funds changed from 0.60% to 0.39%); and
• 0.60%, excluding interest expenses, licensing fees, offering costs, brokerage commissions and other trading expenses, taxes and extraordinary expenses, for each other Fund.
The Trustees noted that the Adviser represented that it does not manage any funds other than the Funds and other ETFs overseen by the Board. The Trustees noted that each Fund's advisory fee was:
• higher than the median advisory fee of its ETF peer funds (except for the advisory fee of each of PowerShares Financial Preferred Portfolio, PowerShares Golden Dragon Halter USX China Portfolio and PowerShares International Dividend AchieversTM Portfolio, which was lower than the median advisory fee of its ETF peer funds); and
• higher than the median advisory fee of its open-end index peer funds (except for the advisory fee of each of PowerShares DWA Technical Leaders Portfolio, PowerShares Dynamic Aggressive Growth Portfolio, PowerShares Dynamic Mid Cap Growth Portfolio, PowerShares Dynamic Mid Cap Value Portfolio, PowerShares Dynamic OTC Portfolio, PowerShares Dynamic Telecommunications & Wireless Portfolio, PowerShares Dynamic Utilities Portfolio, PowerShares Financial Preferred Portfolio, PowerShares FTSE RAFI Utilities Sector Portfolio and PowerShares Value Line Timeliness Select Portfolio, which was lower than the median advisory fee of its open-end index peer funds, and there was no comparable data for PowerShares Dynamic Basic Materials Sector Portfolio, PowerShares FTSE RAFI Basic Materials Sector Portfolio or PowerShares Golden Dragon Halter USX China Portfolio); but
• lower than the median advisory fee of its open-end actively-managed peer funds.
The Trustees determined that the advisory fees were reasonable, noting the complexity of the indices, which generally require more frequent rebalancing of the portfolios, the distinguishing factors of the Funds, and the higher administrative, operational and management oversight costs for the Adviser. With respect to the Funds' expense ratios, the Trustees noted that the net expense ratio for each Fund was:
• higher than the median expense ratio of its ETF peer funds (except for the net expense ratio of each of PowerShares Dynamic OTC Portfolio, PowerShares Financial Preferred Portfolio and PowerShares International Dividend AchieversTM Portfolio, which was less than the median expense ratio of its ETF peer funds, and the net expense ratio of each of PowerShares Dynamic Aggressive Growth Portfolio and PowerShares Dynamic Market Portfolio, which was equal to the median expense ratio of its ETF peer funds); and
• higher than the median expense ratio of its open-end index peer funds (except for the net expense ratio of each of PowerShares DWA Technical Leaders Portfolio, PowerShares Dynamic Aggressive
66
Board Considerations Regarding Continuation of Investment Advisory Agreement (Continued)
Growth Portfolio, PowerShares Dynamic Banking Portfolio, PowerShares Dynamic Biotechnology & Genome Portfolio, PowerShares Dynamic Financials Sector Portfolio, PowerShares Dynamic Healthcare Sector Portfolio, PowerShares Dynamic Healthcare Services Portfolio, PowerShares Dynamic Insurance Portfolio, PowerShares Dynamic OTC Portfolio, PowerShares Dynamic Pharmaceuticals Portfolio, PowerShares Dynamic Telecommunications & Wireless Portfolio, PowerShares Dynamic Utilities Portfolio, PowerShares Financial Preferred Portfolio, PowerShares FTSE RAFI Financials Sector Portfolio, PowerShares FTSE RAFI Utilities Sector Portfolio, PowerShares Listed Private Equity Portfolio and PowerShares Value Line Timeliness Select Portfolio, which was lower than the median expense ratio of its open-end index peer funds, and there was no comparable data for PowerShares Dynamic Basic Materials Sector Portfolio, PowerShares FTSE RAFI Basic Materi als Sector Portfolio or PowerShares Golden Dragon Halter USX China Portfolio); but
• lower than the median expense ratio of its open-end actively-managed peer funds.
The Trustees noted that a significant component of the non-advisory fee expenses was the license fees paid by the Funds.
The Board concluded that the advisory fee and expense ratio of each Fund (giving effect to the Fund's Expense Cap) were reasonable and appropriate in light of the services provided.
In conjunction with their review of fees, the Trustees also considered information provided by the Adviser on the revenues received by the Adviser under the Investment Advisory Agreement for each Fund, as well as the fees waived and expenses reimbursed by the Adviser for the Funds. The Trustees reviewed information provided by the Adviser on its profitability as well as any profits or losses realized by the Adviser from its relationship to each Fund. The Trustees concluded that the profitability to the Adviser of the advisory services provided to any of the Funds was not unreasonable.
Economies of Scale and Whether Fee Levels Reflect These Economies of Scale. The Trustees reviewed the information provided by the Adviser as to the extent to which economies of scale are realized as each Fund grows and whether fee levels reflect economies of scale for the benefit of shareholders. The Trustees reviewed each Fund's asset size, expense ratio and expense limitation agreed to by the Adviser. The Trustees noted that, for Funds whose expenses are higher than their respective Expense Caps, any reduction in that Fund's expenses would be enjoyed by the Adviser, but that Fund shareholders benefit from the lower expense ratio as a result of the Fund's Expense Cap. The Trustees also noted that the Excess Expense Agreement with the Trust provides that the Adviser is entitled to be reimbursed by each Fund, other than PowerShares Dynamic Market Portf olio and PowerShares Dynamic OTC Portfolio, for fees waived or expenses absorbed pursuant to the Expense Cap for a period of three years from the date the fee or expense was incurred, provided that no reimbursement would be made that would result in a Fund exceeding its Expense Cap. The Trustees considered whether the advisory fee rate for each Fund was reasonable in relation to the asset size of that Fund, and concluded that the flat advisory fee was reasonable and appropriate, noting the Fund expenses the Adviser has borne as a result of the Expense Cap.
The Trustees noted that the Adviser had not identified any further benefits that it derived from its relationship with the Funds and had noted that it does not have any soft-dollar arrangements.
Based on all of the information considered and the conclusions reached, the Board, including the Independent Trustees, determined to approve the continuation of the Investment Advisory Agreement for each Fund. No single factor was determinative in the Board's analysis.
67
This page intentionally left blank
PROXY VOTING POLICIES AND PROCEDURES
A description of the Funds' proxy voting policies and procedures that the Funds use to determine how to vote proxies relating to portfolio securities is available, without charge and upon request, by calling (800) 337-4246. This information is also available on the Securities and Exchange Commission's ("Commission") website at www.sec.gov.
Information regarding how the Funds voted proxies for portfolio securities, if applicable, during the most recent 12-month period ended June 30, is also available, without charge and upon request, by (i) calling (800) 337-4246; or (ii) accessing the Trust's Form N-PX on the Commission's website at www.sec.gov.
QUARTERLY PORTFOLIOS
The Funds file their complete schedules of portfolio holdings with the Commission for the first and third quarters of each fiscal year on Form N-Q. The Trust's Forms N-Q are available on the Commission's website at www.sec.gov. The Trust's Forms N-Q may also be reviewed and copied at the Commission's Public Reference Room in Washington, D.C.; information on the operation of the Public Reference Room may be obtained by calling (800) SEC-0330.
There are risks involved in investing in exchange-traded funds ("ETFs"), including possible loss of money. Investing in securities of small and medium sized companies involves greater risk than is customarily associated with investing in more established companies, and investments in concentrated industry sectors involve greater risks than investments that are more diversified. Index-based ETFs are not actively managed. Actively-managed ETFs do not necessarily seek to replicate the performance of a specific index. Both index-based and actively-managed ETFs are subject to risks similar to stocks, including those related to short selling and margin maintenance. PowerShares ETFs are not FDIC insured, may lose value and have no bank guarantee. PowerShares is a registered trademark of Invesco PowerShares Capital Management LLC. Past performance is not a guarantee of future results.
Invesco Aim Distributors, Inc. is the distributor of the PowerShares Exchange-Traded Fund Trust.
An investor should consider each PowerShares ETF's investment objective, risks, charges and expenses carefully before investing. For more complete information about PowerShares ETFs call Invesco Aim Distributors, Inc. at (800) 337-4246 or visit invescopowershares.com for a prospectus. Please read the prospectus carefully before investing.


301 West Roosevelt Road
Wheaton, IL 60187
800.983.0903
www.invescopowershares.com
© 2009 Invesco PowerShares Capital Management LLC P-PS-AR-1


2009 Annual Report to Shareholders
April 30, 2009
PowerShares Aerospace & Defense Portfolio
PowerShares CleantechTM Portfolio
PowerShares DWA Technical LeadersTM Portfolio
PowerShares Golden Dragon Halter USX China Portfolio
PowerShares Listed Private Equity Portfolio
PowerShares Lux Nanotech Portfolio
PowerShares NASDAQ-100 BuyWrite Portfolio
PowerShares S&P 500 BuyWrite Portfolio
PowerShares Value Line Industry Rotation Portfolio
PowerShares Value Line TimelinessTM Select Portfolio
PowerShares Water Resources Portfolio
PowerShares WilderHill Clean Energy Portfolio
PowerShares WilderHill Progressive Energy Portfolio

Table of Contents
| The Market Environment | 2 | ||||||
| Manager's Analysis | 4 | ||||||
| Frequency Distribution of Discounts & Premiums | 34 | ||||||
| Fees and Expenses | 36 | ||||||
| Specialty Portfolios | |||||||
| Schedules of Investments | |||||||
| PowerShares Aerospace & Defense Portfolio | 38 | ||||||
| PowerShares CleantechTM Portfolio | 39 | ||||||
| PowerShares DWA Technical LeadersTM Portfolio | 41 | ||||||
| PowerShares Golden Dragon Halter USX China Portfolio | 43 | ||||||
| PowerShares Listed Private Equity Portfolio | 45 | ||||||
| PowerShares Lux Nanotech Portfolio | 46 | ||||||
| PowerShares NASDAQ-100 BuyWrite Portfolio | 47 | ||||||
| PowerShares S&P 500 BuyWrite Portfolio | 49 | ||||||
| PowerShares Value Line Industry Rotation Portfolio | 55 | ||||||
| PowerShares Value Line TimelinessTM Select Portfolio | 57 | ||||||
| PowerShares Water Resources Portfolio | 58 | ||||||
| PowerShares WilderHill Clean Energy Portfolio | 59 | ||||||
| PowerShares WilderHill Progressive Energy Portfolio | 60 | ||||||
| Statements of Assets and Liabilities | 62 | ||||||
| Statements of Operations | 64 | ||||||
| Statements of Changes in Net Assets | 66 | ||||||
| Financial Highlights | 70 | ||||||
| Notes to Financial Statements | 77 | ||||||
| Report of Independent Registered Public Accounting Firm | 93 | ||||||
| Supplemental Information | 94 | ||||||
| Board Considerations Regarding Continuation of Investment Advisory Agreements | 99 | ||||||
The Market Environment
For the year ended April 30, 2009, stock market losses were larger than most market participants have ever seen in their professional careers. The S&P 500® Index was down 35.29%, the NASDAQ-100® Index declined 26.83% and the Dow Jones Industrial Index dropped 34.12%. Corporate debt markets also declined as the credit crunch continued to limit access to capital. Municipal securities held up a little better but still struggled. The Merrill U.S. Corporate Master Index returned -5.78% while the Merrill Muni Master Index returned 2.26% for the period. Meanwhile, treasury securities rallied as investors fled to quality. Huge companies required capital infusions and/or other forms of financial support through government intervention and the credit crisis evolved into an overall crisis of consumer, investor and business confidence.
The markets fell nearly universally from August through October. As more job losses and layoffs were announced, banks continued to restrict borrowing and consumers, who drive two-thirds of the U.S. economy historically, were unable to sustain their spending. The government spent hundreds of billions of dollars to bail out firms and stimulate the economy while the Federal Open Market Committee moved from a discount rate of 2.50% to 0.50% during the period. Not until March did confidence begin to return to the equity markets with the S&P 500® Index, NASDAQ-100® Index and the Dow Jones Industrial Index moving off the lows and returning 29.99%, 29.97% and 21.24% respectively from March 1 through April 30, of 2009. Corporate and municipal debt also showed some appreciation over the period, however the amount of appreciation was less as credit spreads tightened. The Merrill Muni Master Index was up 2. 33% while the Merrill U.S. Corporate Master Index rose by 2.55% from March 1 through April 30, 2009.
2
This page intentionally left blank
Manager's Analysis
PowerShares Aerospace & Defense Portfolio (ticker: PPA)
The PowerShares Aerospace & Defense Portfolio (the "Fund") seeks investment results that correspond generally to the price and yield, before the Fund's fees and expenses, of the SPADE(TM) Defense Index ("Index"). The Index includes companies involved in the development, manufacturing, operations and support of U.S. defense, military, homeland security and aerospace operations.
For the year ended April 30, 2009, the Fund returned -35.46%. This compares to a return of -35.29% for the S&P 500® Index. The Fund benefited versus the broader market by having more exposure to small-cap companies. However, an overweight position within the industrials sector detracted from the Fund's relative performance bringing overall returns in line with the broad market.
Industry Breakdown (% of the Fund's
Net Assets) as of April 30, 2009
| Aerospace/Defense | 56.4 | ||||||
| Miscellaneous Manufacturing | 12.5 | ||||||
| Electonics | 8.2 | ||||||
| Computers | 4.9 | ||||||
| Metal Fabricate/Hardware | 4.4 | ||||||
| Commercial Services | 4.2 | ||||||
| Telecommunications | 3.2 | ||||||
| Engineering & Construction | 2.6 | ||||||
| Packaging & Containers | 2.1 | ||||||
| Software | 0.8 | ||||||
| Auto Manufacturers | 0.7 | ||||||
| Money Market Fund | 0.1 | ||||||
| Other | (0.1 | ) | |||||
Style Allocation (% of the Fund's
Total Investments) as of April 30, 2009
| Large-Cap Value | 45.4 | ||||||
| Mid-Cap Growth | 23.2 | ||||||
| Mid-Cap Value | 19.1 | ||||||
| Small-Cap Growth | 8.5 | ||||||
| Small-Cap Value | 3.8 | ||||||
Top Ten Fund Holdings (% of the Fund's
Net Assets) as of April 30, 2009
| Security | |||||||
| Lockheed Martin Corp. | 7.6 | ||||||
| United Technologies Corp. | 7.6 | ||||||
| Boeing (The) Co. | 7.3 | ||||||
| Honeywell International, Inc. | 6.9 | ||||||
| General Dynamics Corp. | 6.0 | ||||||
| Raytheon Co. | 5.4 | ||||||
| Northrop Grumman Corp. | 4.7 | ||||||
| Precision Castparts Corp. | 4.4 | ||||||
| L-3 Communications Holdings, Inc. | 4.0 | ||||||
| ITT Corp. | 3.7 | ||||||
| Total | 57.6 | ||||||
4
Manager's Analysis (Continued)
PowerShares Aerospace & Defense Portfolio (ticker: PPA)
Growth of a $10,000 Investment Since Inception†
| Fund Performance History (%) | As of April 30, 2009 | ||||||||||||||||||
| Avg Ann†† | Fund Inception† | ||||||||||||||||||
| 1 Year | 3 Year | Avg Ann†† | Cumulative | ||||||||||||||||
| Index | |||||||||||||||||||
| SPADETM Defense Index | -36.21 | -8.39 | -3.10 | -10.46 | |||||||||||||||
| Russell 3000® Index | -34.95 | -10.94 | -6.79 | -21.81 | |||||||||||||||
| S&P 500® Index | -35.29 | -10.76 | -6.88 | -22.08 | |||||||||||||||
| S&P SuperComposite Aerospace & Defense Index | -37.51 | -7.31 | -0.38 | -1.32 | |||||||||||||||
| DJ US Aerospace and Defense Index | -39.71 | -9.23 | -2.36 | -8.01 | |||||||||||||||
| Fund | |||||||||||||||||||
| NAV Return | -35.46 | -7.87 | -2.58 | -8.77 | |||||||||||||||
| Share Price Return | -35.48 | -7.89 | -2.58 | -8.78 | |||||||||||||||
Fund Inception: October 26, 2005
Performance quoted represents past performance. Past performance is not a guarantee of future results and current performance may be higher or lower than performance quoted. Investment returns and principal value will fluctuate and shares, when redeemed, may be worth more or less than their original cost. The Adviser has waived fees and reimbursed other expenses, absent which, performance would have been lower. The Adviser has contractually agreed to waive fees and/or pay certain Fund expenses through August 31, 2010. According to the Fund's current prospectus, the total gross annual operating expense ratio was indicated as 0.64%. In the Financial Highlights section of this Shareholder Report, the Fund's net (subsidized) total operating expense ratio was determined to be 0.66% while the Fund's gross total operating expense ratio was 0.67%. NAV and Share Price returns assume that dividends and capital gain distributions have been reinvested in the Fund at NAV and Share Price, respectively. The returns shown in the table above do not reflect the deduction of taxes that a shareholder would pay on Fund distributions or the redemption or sale of Fund Shares. See invescopowershares.com to find the most recent month-end performance numbers.
Index performance results are based upon a hypothetical investment in its constituent securities. Index returns do not represent Fund returns. An investor cannot invest directly in an index. The Index does not charge management fees or brokerage expenses, and no such fees or expenses were deducted from the hypothetical performance shown. In addition, the results actual investors might have achieved would have differed from those shown because of differences in the timing, amounts of their investments, and fees and expenses associated with an investment in the Fund.
The S&P SuperComposite Aerospace & Defense Index, DJ US Aerospace and Defense Index, S&P 500 Index and Russell 3000® Index (the "Benchmark Indices") are unmanaged indices used as a measurement of change in stock market conditions based on the average performance of approximately 34, 50, 500, and 2,918 common stocks, respectively. The S&P SuperComposite Aerospace & Defense Index and the DJ US Aerospace and Defense Index will be used for comparative purposes going forward as these represent the most appropriate market indices for this fund.
† Fund and underlying Index returns are based on the inception date of the Fund. Returns for the Benchmark Indices are based on the closest month-end to the Fund's inception date.
†† Average annualized.
5
Manager's Analysis
PowerShares CleantechTM Portfolio (ticker: PZD)
The PowerShares CleantechTM Portfolio (the "Fund") is based on The Cleantech IndexTM ("Index") and seeks investment results that correspond generally to the price and yield (before the Fund's fees and expenses) of the Index.
The Index is designed to track cleantech companies across a broad range of industries, including alternative energy, energy efficiency and transmission, air and water purification, advanced materials, eco-friendly agriculture, transportation, manufacturing efficiency, recycling and pollution prevention.
Index companies must meet 18 stringent criteria for inclusion including quality, profitability, growth, strategy, sector leadership, and have strong technology/knowledge-based businesses.
For the year ended April 30, 2009, the Fund returned -42.76% compared to -35.29% for S&P 500® Index and -28.83% for the NASDAQ Composite Index. Contributing to this fall was the overweight in the producer manufacturing sector which was 43.37% of the Fund. Its constituents were down -49.14% on average and contributed -24.23% of the -42.76% total return.
Industry Breakdown (% of the Fund's
Net Assets) as of April 30, 2009
| Electrical Components & Equipment | 19.1 | ||||||
| Miscellaneous Manufacturing | 15.1 | ||||||
| Environmental Control | 10.8 | ||||||
| Electronics | 9.4 | ||||||
| Energy-Alternate Sources | 9.2 | ||||||
| Semiconductors | 6.0 | ||||||
| Engineering & Construction | 5.1 | ||||||
| Telecommunications | 4.9 | ||||||
| Software | 4.9 | ||||||
| Machinery-Diversified | 3.5 | ||||||
| Biotechnology | 2.8 | ||||||
| Hand/Machine Tools | 2.0 | ||||||
| Building Materials | 1.6 | ||||||
| Chemicals | 1.5 | ||||||
| Electric | 1.1 | ||||||
| Healthcare-Services | 0.8 | ||||||
| Office Furnishings | 0.8 | ||||||
| Auto Parts & Equipment | 0.8 | ||||||
| Computers | 0.6 | ||||||
| Money Market Fund | 0.0 | ||||||
| Other | 0.0 | ||||||
Top Ten Fund Holdings (% of the Fund's
Net Assets) as of April 30, 2009
| Security | |||||||
| Vestas Wind Systems A/S (Denmark) | 3.8 | ||||||
| Gamesa Corporacion Tecnologica S.A. (Spain) | 3.2 | ||||||
| First Solar, Inc. | 3.2 | ||||||
| Siemens AG (Germany) | 3.1 | ||||||
| Corning, Inc. | 2.9 | ||||||
| Autodesk, Inc. | 2.8 | ||||||
| Schneider Electric S.A. (France) | 2.8 | ||||||
| Kurita Water Industries Ltd. (Japan) | 2.8 | ||||||
| ABB Ltd. (Switzerland) | 2.7 | ||||||
| Iberdrola Renovables S.A. (Spain) | 2.4 | ||||||
| Total | 29.7 | ||||||
Style Allocation (% of the Fund's Net
Total Investments) as of April 30, 2009
| Mid-Cap Growth | 36.5 | ||||||
| Small-Cap Growth | 27.7 | ||||||
| Large-Cap Growth | 17.3 | ||||||
| Small-Cap Value | 7.8 | ||||||
| Large-Cap Value | 6.0 | ||||||
| Mid-Cap Value | 4.7 | ||||||
6
Manager's Analysis (Continued)
PowerShares CleantechTM Portfolio (ticker: PZD)
Growth of a $10,000 Investment Since Inception†
| Fund Performance History (%) | As of April 30, 2009 | ||||||||||||||
| Avg Ann†† | Fund Inception† | ||||||||||||||
| 1 Year | Avg Ann†† | Cumulative | |||||||||||||
| Index | |||||||||||||||
| The Cleantech IndexTM | -43.01 | -9.42 | -22.02 | ||||||||||||
| NASDAQ Composite Index | -28.83 | -12.04 | -27.44 | ||||||||||||
| S&P 500® Index | -35.29 | -14.81 | -33.01 | ||||||||||||
| Fund | |||||||||||||||
| NAV Return | -42.76 | -9.44 | -22.06 | ||||||||||||
| Share Price Return | -42.45 | -9.25 | -21.66 | ||||||||||||
Fund Inception: October 24, 2006
Performance quoted represents past performance. Past performance is not a guarantee of future results and current performance may be higher or lower than performance quoted. Investment returns and principal value will fluctuate and shares, when redeemed, may be worth more or less than their original cost. The Adviser has waived fees and reimbursed other expenses, absent which, performance would have been lower. The Adviser has contractually agreed to waive fees and/or pay certain Fund expenses through August 31, 2010. According to the Fund's current prospectus, the total gross annual operating expense ratio was indicated as 0.77%. In the Financial Highlights section of this Shareholder Report, the Fund's net (subsidized) total operating expense ratio was determined to be 0.67% while the Fund's gross total operating expense ratio was 0.73%. NAV and Share Price returns assume that dividends and capital gain distributions have been reinvested in the Fund at NAV and Share Price, respectively. The returns shown in the table above do not reflect the deduction of taxes that a shareholder would pay on Fund distributions or the redemption or sale of Fund Shares. See invescopowershares.com to find the most recent month-end performance numbers.
Index performance results are based upon a hypothetical investment in its constituent securities. Index returns do not represent Fund returns. An investor cannot invest directly in an index. The Index does not charge management fees or brokerage expenses, and no such fees or expenses were deducted from the hypothetical performance shown. In addition, the results actual investors might have achieved would have differed from those shown because of differences in the timing, amounts of their investments, and fees and expenses associated with an investment in the Fund.
The NASDAQ Composite Index and S&P 500® Index (the "Benchmark Indices") are unmanaged indices used as a measurement of change in stock market conditions based on the average performance of approximately 3,087 and 500 common stocks, respectively.
† Fund and underlying Index returns are based on the inception date of the Fund. Returns for the Benchmark Indices are based on the closest month-end to the Fund's inception date.
†† Average annualized.
7
Manager's Analysis
PowerShares DWA Technical LeadersTM Portfolio (ticker: PDP)
The PowerShares DWA Technical LeadersTM Portfolio (the "Fund") is based on the Dorsey Wright Technical LeadersTM Index ("Index") and seeks investment results that generally correspond to the price and yield (before the Fund's fees and expenses) of the Index, which includes approximately 100 U.S.-listed companies that demonstrate strong relative strength characteristics. The Index is constructed pursuant to Dorsey Wright & Associates, Inc.'s proprietary methodology, which takes into account, among other factors, the performance of each of the 3,000 largest U.S.-listed companies as compared to a benchmark index, and the relative performance of industry sectors and sub-sectors.
For the year ended April 30, 2009, the Fund returned -45.40% underperforming the S&P 500® Index which returned -35.29 over the same period.
For the year ended April 30, 2009, none of the ten sectors represented in the Fund generated positive returns. An increased allocation to industrials relative to the S&P 500® Index combined with poor stock selection in the consumer staples sector were the largest negative contributors to Fund performance while superior stock selection in larger cap securities contributed positively to Fund performance.
Sector Breakdown (% of the Fund's
Net Assets) as of April 30, 2009
| Industrials | 23.2 | ||||||
| Consumer Discretionary | 13.4 | ||||||
| Health Care | 12.3 | ||||||
| Information Technology | 12.2 | ||||||
| Materials | 11.2 | ||||||
| Utilities | 9.1 | ||||||
| Financials | 6.2 | ||||||
| Energy | 4.8 | ||||||
| Consumer Staples | 4.1 | ||||||
| Telecommunication Services | 3.6 | ||||||
| Money Market Fund | 0.0 | ||||||
| Other | (0.1 | ) | |||||
Style Allocation (% of the Fund's
Total Investments) as of April 30, 2009
| Mid-Cap Growth | 44.1 | ||||||
| Large-Cap Growth | 24.6 | ||||||
| Mid-Cap Value | 19.3 | ||||||
| Large-Cap Value | 7.1 | ||||||
| Small-Cap Growth | 2.7 | ||||||
| Small-Cap Value | 2.2 | ||||||
Top Ten Fund Holdings (% of the Fund's
Net Assets) as of April 30, 2009
| Security | |||||||
| Apple, Inc. | 3.8 | ||||||
| American Tower Corp., Class A | 3.6 | ||||||
| Stericycle, Inc. | 3.2 | ||||||
| Gilead Sciences, Inc. | 3.1 | ||||||
| C.H. Robinson Worldwide, Inc. | 2.6 | ||||||
| Airgas, Inc. | 2.6 | ||||||
| O'Reilly Automotive, Inc. | 2.1 | ||||||
| Cypress Semiconductor Corp. | 1.8 | ||||||
| Henry Schein, Inc. | 1.7 | ||||||
| Noble Energy, Inc. | 1.6 | ||||||
| Total | 26.1 | ||||||
8
Manager's Analysis (Continued)
PowerShares DWA Technical LeadersTM Portfolio (ticker: PDP)
Growth of a $10,000 Investment Since Inception†
| Fund Performance History (%) | As of April 30, 2009 | ||||||||||||||
| Avg Ann†† | Fund Inception† | ||||||||||||||
| 1 Year | Avg Ann†† | Cumulative | |||||||||||||
| Index | |||||||||||||||
| Dorsey Wright Technical LeadersTM Index | -46.36 | -21.90 | -41.43 | ||||||||||||
| S&P 500® Index | -35.29 | -17.95 | -34.87 | ||||||||||||
| (S&P Citigroup Large Cap Growth) | -30.70 | -13.57 | -27.09 | ||||||||||||
| Russell 3000 Growth Index | -31.46 | -14.35 | -28.51 | ||||||||||||
| Fund | |||||||||||||||
| NAV Return | -45.40 | -21.48 | -40.74 | ||||||||||||
| Share Price Return | -45.49 | -21.58 | -40.91 | ||||||||||||
Fund Inception: March 1, 2007
Performance quoted represents past performance. Past performance is not a guarantee of future results and current performance may be higher or lower than performance quoted. Investment returns and principal value will fluctuate and shares, when redeemed, may be worth more or less than their original cost. The Adviser has waived fees and reimbursed other expenses during previous fiscal periods, absent which, performance during those fiscal periods would have been lower. While the Adviser has contractually agreed to waive and/or pay certain Fund expenses through August 31, 2010, the Fund is currently subject to recapture, which may result in an increased expense ratio. According to the Fund's current prospectus, the total gross annual operating expense ratio was indicated as 0.68%. In the Financial Highlights section of this Shareholder Report, the Fund's net total operating expense ratio was determined to be 0.69% while the Fund' s gross total operating expense ratio was 0.68%. NAV and Share Price returns assume that dividends and capital gain distributions have been reinvested in the Fund at NAV and Share Price, respectively. The returns shown in the table above do not reflect the deduction of taxes that a shareholder would pay on Fund distributions or the redemption or sale of Fund Shares. See invescopowershares.com to find the most recent month-end performance numbers.
Index performance results are based upon a hypothetical investment in its constituent securities. Index returns do not represent Fund returns. An investor cannot invest directly in an index. The Index does not charge management fees or brokerage expenses, and no such fees or expenses were deducted from the hypothetical performance shown. In addition, the results actual investors might have achieved would have differed from those shown because of differences in the timing, amounts of their investments, and fees and expenses associated with an investment in the Fund.
The S&P Citigroup Large Cap Growth, Russell 3000 Growth Index and S&P 500® Index (the "Benchmark Indices") are unmanaged indices used as a measurement of change in stock market conditions based on the average performance of approximately 384, 1,936 and 500 common stocks, respectively. The S&P Citigroup Large Cap Growth Index and the Russell 3000 Growth Index will be used for comparative purposes going forward as these represent the most appropriate market indices for this fund.
† Fund and underlying Index returns are based on the inception date of the Fund. Returns for the Benchmark Indices are based on the closest month-end to the Fund's inception date.
†† Average annualized.
9
Manager's Analysis
PowerShares Golden Dragon Halter USX China Portfolio (ticker: PGJ)
The PowerShares Golden Dragon Halter USX China Portfolio (the "Fund") seeks investment results that correspond generally to the price and yield, before the Fund's fees and expenses, of the Halter USX China IndexSM ("Index"). The Index is comprised of U.S.-listed securities of companies that derive a majority of their revenue from the People's Republic of China.
For the year ended April 30, 2009, the Fund returned -39.06% versus a return of -37.26% for the MSCI China Index. Chinese stocks dropped relatively in line with the broader global markets. In particular, several solar energy companies held within the Fund were severely hit. These include Suntech Power, LDK Solar, and JA Solar. Focus Media and China Unicom were also heavy detractors to Fund performance.
Sector Breakdown (% of the Fund's
Net Assets) as of April 30, 2009
| Information Technology | 24.9 | ||||||
| Energy | 18.2 | ||||||
| Telecommunication Services | 12.7 | ||||||
| Industrials | 12.6 | ||||||
| Materials | 7.7 | ||||||
| Consumer Discretionary | 7.6 | ||||||
| Financials | 5.8 | ||||||
| Health Care | 4.7 | ||||||
| Utilities | 4.0 | ||||||
| Consumer Staples | 1.7 | ||||||
| Money Market Fund | 0.0 | ||||||
| Other | 0.1 | ||||||
Style Allocation (% of the Fund's Net
Total Investments) as of April 30, 2009
| Mid-Cap Growth | 28.0 | ||||||
| Large-Cap Growth | 24.2 | ||||||
| Large-Cap Value | 21.5 | ||||||
| Mid-Cap Value | 12.0 | ||||||
| Small-Cap Growth | 11.7 | ||||||
| Small-Cap Value | 2.6 | ||||||
Top Ten Fund Holdings (% of the Fund's
Net Assets) as of April 30, 2009
| Security | |||||||
| Baidu, Inc. ADR | 5.0 | ||||||
| Yanzhou Coal Mining Co. Ltd. ADR | 4.8 | ||||||
| China Petroleum and Chemical Corp. ADR | 4.7 | ||||||
| China Telecom Corp. Ltd. ADR | 4.7 | ||||||
| Aluminum Corp. of China Ltd. ADR | 4.4 | ||||||
| China Unicom Ltd. ADR | 4.2 | ||||||
| CNOOC Ltd. ADR | 4.1 | ||||||
| China Life Insurance Co. Ltd. ADR | 4.1 | ||||||
| PetroChina Co. Ltd. ADR | 4.0 | ||||||
| Huaneng Power International, Inc. ADR | 4.0 | ||||||
| Total | 44.0 | ||||||
10
Manager's Analysis (Continued)
PowerShares Golden Dragon Halter USX China Portfolio (ticker: PGJ)
Growth of a $10,000 Investment Since Inception†
| Fund Performance History (%) | As of April 30, 2009 | ||||||||||||||||||
| Avg Ann†† | Fund Inception† | ||||||||||||||||||
| 1 Year | 3 Year | Avg Ann†† | Cumulative | ||||||||||||||||
| Index | |||||||||||||||||||
| Halter USX China IndexSM | -39.31 | 2.51 | 5.76 | 27.86 | |||||||||||||||
| S&P 500® Index | -35.29 | -10.76 | -4.55 | -18.58 | |||||||||||||||
| MSCI EAFE Index | -42.76 | -12.34 | -1.99 | -8.50 | |||||||||||||||
| MSCI China Index | -37.26 | 9.61 | 16.72 | 97.93 | |||||||||||||||
| FTSE/Xinhua China Index | -39.50 | 6.53 | 12.34 | 67.17 | |||||||||||||||
| Fund | |||||||||||||||||||
| NAV Return | -39.06 | 2.10 | 5.23 | 25.06 | |||||||||||||||
| Share Price Return | -38.92 | 2.06 | 5.18 | 24.79 | |||||||||||||||
Fund Inception: December 9, 2004
Performance quoted represents past performance. Past performance is not a guarantee of future results and current performance may be higher or lower than performance quoted. Investment returns and principal value will fluctuate and shares, when redeemed, may be worth more or less than their original cost. The Adviser has waived fees and reimbursed other expenses, absent which, performance would have been lower. The Adviser has contractually agreed to waive fees and/or pay certain Fund expenses through August 31, 2010. According to the Fund's current prospectus, the total gross annual operating expense ratio was indicated as 0.66%. In the Financial Highlights section of this Shareholder Report, the Fund's net (subsidized) total operating expense ratio was determined to be 0.69% while the Fund's gross total operating expense ratio was 0.71%. NAV and Share Price returns assume that dividends and capital gain distributions have been reinvested in the Fund at NAV and Share Price, respectively. The returns shown in the table above do not reflect the deduction of taxes that a shareholder would pay on Fund distributions or the redemption or sale of Fund Shares. See invescopowershares.com to find the most recent month-end performance numbers.
Index performance results are based upon a hypothetical investment in its constituent securities. Index returns do not represent Fund returns. An investor cannot invest directly in an index. The Index does not charge management fees or brokerage expenses, and no such fees or expenses were deducted from the hypothetical performance shown. In addition, the results actual investors might have achieved would have differed from those shown because of differences in the timing, amounts of their investments, and fees and expenses associated with an investment in the Fund.
The MSCI China Index, FTSE/Xinhua China Index, S&P 500® Index and MSCI EAFE Index (the "Benchmark Indices") are unmanaged indices used as a measurement of change in stock market conditions based on the average performance of approximately 101, 20, 500 and 1,137 common stocks, respectively. The MSCI China Index and the FTSE/Xinhua China Index will be used for comparative purposes going forward as these represent the most appropriate market indices for this fund.
† Fund and underlying Index returns are based on the inception date of the Fund. Returns for the Benchmark Indices are based on the closest month-end to the Fund's inception date.
†† Average annualized.
11
Manager's Analysis
PowerShares Listed Private Equity Portfolio (ticker: PSP)
The PowerShares Listed Private Equity Portfolio (the "Fund") seeks investment results that generally correspond to the price and yield (before the Fund's fees and expenses) of the Red Rocks Capital Listed Private Equity IndexSM ("Index"). The Index provides investors with a means of exposure to private equity firms and their underlying portfolio investments. The private equity asset class has historically provided non-correlated performance to other traditional asset classes.
For the year ended April 30, 2009, the Fund returned -64.23% while the S&P 500® Index returned -35.29%. The Fund is heavily invested in financials relative to the broader U.S. equity market which attributed to the negative performance. In particular, American Capital, CapitalSource, Macquarie Infrastructure, and KKR Financial were all down 90% or more for the year and were heavy drags on Fund performance. CapitalSource and KKR Financial are no longer held at the end of the fiscal year.
Industry Breakdown (% of the Fund's
Net Assets) as of April 30, 2009
| Investment Companies | 54.3 | ||||||
| Holding Companies-Diversifed | 15.8 | ||||||
| Diversified Financial Services | 11.5 | ||||||
| Electric | 4.6 | ||||||
| Water | 4.4 | ||||||
| Banks | 3.9 | ||||||
| Internet | 3.9 | ||||||
| Commercial Services | 1.6 | ||||||
| Money Market Fund | 2.2 | ||||||
| Other | (2.2 | ) | |||||
Style Allocation (% of the Fund's
Total Investments) as of April 30, 2009
| Mid-Cap Growth | 17.6 | ||||||
| Small-Cap Growth | 15.4 | ||||||
| Small-Cap Value | 67.0 | ||||||
Top Ten Fund Holdings (% of the Fund's
Net Assets) as of April 30, 2009
| Security | |||||||
| Leucadia National Corp. | 12.1 | ||||||
| Allied Capital Corp. | 5.8 | ||||||
| American Capital Ltd. | 5.4 | ||||||
| Otter Tail Corp. | 4.6 | ||||||
| Ares Capital Corp. | 4.4 | ||||||
| Affiliated Managers Group, Inc. | 4.4 | ||||||
| Pico Holdings, Inc. | 4.3 | ||||||
| Apollo Investment Corp. | 4.2 | ||||||
| SVB Financial Group | 3.9 | ||||||
| Greenhill & Co., Inc. | 3.9 | ||||||
| Total | 53.0 | ||||||
12
Manager's Analysis (Continued)
PowerShares Listed Private Equity Portfolio (ticker: PSP)
Growth of a $10,000 Investment Since Inception†

| Fund Performance History (%) | As of April 30, 2009 | ||||||||||||||
| Avg Ann†† | Fund Inception† | ||||||||||||||
| 1 Year | Avg Ann†† | Cumulative | |||||||||||||
| Index | |||||||||||||||
| Red Rocks Capital Listed Private Equity IndexSM | -61.02 | -35.33 | -66.59 | ||||||||||||
| Russell 2000® Index | -30.74 | -15.36 | -34.10 | ||||||||||||
| S&P 500 Pure Growth Index | -31.81 | -12.52 | -29.22 | ||||||||||||
| S&P Financials Index | -57.55 | -35.75 | -66.91 | ||||||||||||
| S&P 500® Index | -35.29 | -14.81 | -33.01 | ||||||||||||
| Fund | |||||||||||||||
| NAV Return | -64.23 | -37.47 | -69.30 | ||||||||||||
| Share Price Return | -64.29 | -37.52 | -69.36 | ||||||||||||
Fund Inception: October 24, 2006
Performance quoted represents past performance. Past performance is not a guarantee of future results and current performance may be higher or lower than performance quoted. Investment returns and principal value will fluctuate and shares, when redeemed, may be worth more or less than their original cost. The Adviser has waived fees and reimbursed other expenses, absent which, performance would have been lower. The Adviser has contractually agreed to waive fees and/or pay certain Fund expenses through August 31, 2010. According to the Fund's current prospectus, the total gross annual operating expense ratio was indicated as 0.72%. In the Financial Highlights section of this Shareholder Report, the Fund's net (subsidized) total operating expense ratio was determined to be 0.70% while the Fund's gross total operating expense ratio was 0.78%. NAV and Share Price returns assume that dividends and capital gain distributions have been reinvested in the Fund at NAV and Share Price, respectively. The returns shown in the table above do not reflect the deduction of taxes that a shareholder would pay on Fund distributions or the redemption or sale of Fund Shares. See invescopowershares.com to find the most recent month-end performance numbers.
Index performance results are based upon a hypothetical investment in its constituent securities. Index returns do not represent Fund returns. An investor cannot invest directly in an index. The Index does not charge management fees or brokerage expenses, and no such fees or expenses were deducted from the hypothetical performance shown. In addition, the results actual investors might have achieved would have differed from those shown because of differences in the timing, amounts of their investments, and fees and expenses associated with an investment in the Fund.
The Russell 2000® Index, S&P Financials Index, S&P 500® Index and S&P 500 Pure Growth Index (the "Benchmark Indices") are unmanaged indices used as a measurement of change in stock market conditions based on the average performance of approximately 2,000, 93, 500 and 127 common stocks, respectively. The S&P Financials Index and the S&P 500® Index will be used for comparative purposes going forward as these represent the most appropriate market indices for this fund.
† Fund and underlying Index returns are based on the inception date of the Fund. Returns for the Benchmark Indices are based on the closest month-end to the Fund's inception date.
†† Average annualized.
13
Manager's Analysis
PowerShares Lux Nanotech Portfolio (ticker: PXN)
The PowerShares Lux Nanotech Portfolio (the "Fund") seeks investment results that correspond generally to the price and yield (before the Fund's fees and expenses) of the Lux Nanotech IndexTM ("Index"). The Index is designed to measure the performance of companies involved with funding nanotechnology development, developing nanotechnology applications, manufacturing goods that incorporate those applications and/or supplying tools and instrumentation to nanotechnology researchers. Companies may be involved in one or more stages of Lux Research Inc.'s nanotechnolgy value chain framework: nanomaterials, nanointermediates, nano-enabled products and nanotools.
For the year ended April 30, 2009, the Fund returned -46.06%, underperforming S&P 500® Index which returned -35.29%. The Fund's holdings are primarily allocated amongst technology, materials and healthcare stocks. The stocks held within the materials and healthcare sectors were the worst performing in the Fund. In particular, Headwaters, Inc., ShengdaTech, Inc., BioSante Pharmaceuticals, and Elan Corp. were heavy drags on Fund performance. BioSante Pharmaceuticals is no longer held at the end of the fiscal year.
Industry Breakdown (% of the Fund's
Net Assets) as of April 30, 2009
| Chemicals | 18.6 | ||||||
| Electronics | 13.0 | ||||||
| Pharmaceuticals | 10.2 | ||||||
| Semiconductors | 9.2 | ||||||
| Miscellaneous Manufacturing | 7.6 | ||||||
| Computers | 7.0 | ||||||
| Commercial Services | 7.0 | ||||||
| Software | 6.3 | ||||||
| Electrical Components and Equipment | 4.7 | ||||||
| Investment Companies | 4.5 | ||||||
| Biotechnology | 4.2 | ||||||
| Energy-Alternative Sources | 4.0 | ||||||
| Auto Manufacturers | 3.9 | ||||||
| Other | (0.2 | ) | |||||
Style Allocation (% of the Fund's
Total Investments) as of April 30, 2009
| Small-Cap Growth | 62.2 | ||||||
| Large-Cap Value | 18.5 | ||||||
| Large-Cap Growth | 10.7 | ||||||
| Mid-Cap Growth | 4.6 | ||||||
| Small-Cap Value | 4.0 | ||||||
Top Ten Fund Holdings (% of the Fund's
Net Assets) as of April 30, 2009
| Security | |||||||
| Altair Nanotechnologies, Inc. | 7.0 | ||||||
| FEI Co. | 6.5 | ||||||
| NVE Corp. | 6.5 | ||||||
| Accelrys, Inc. | 6.3 | ||||||
| ShengdaTech, Inc. | 6.2 | ||||||
| Veeco Instruments, Inc. | 5.9 | ||||||
| Flamel Technologies S.A. ADR (France) | 5.6 | ||||||
| Symyx Technologies, Inc. | 4.9 | ||||||
| Ener1, Inc. | 4.7 | ||||||
| Elan Corp. PLC ADR (Ireland) | 4.6 | ||||||
| Total | 58.2 | ||||||
14
Manager's Analysis (Continued)
PowerShares Lux Nanotech Portfolio (ticker: PXN)
Growth of a $10,000 Investment Since Inception†
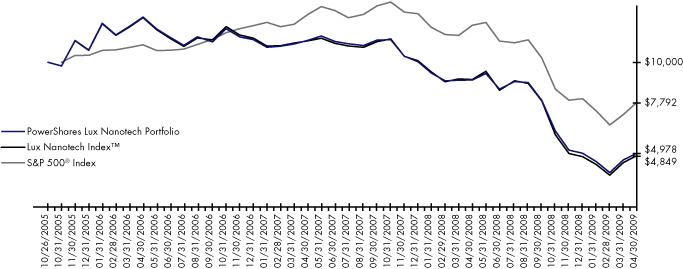
| Fund Performance History (%) | As of April 30, 2009 | ||||||||||||||||||
| Avg Ann†† | Fund Inception† | ||||||||||||||||||
| 1 Year | 3 Year | Avg Ann†† | Cumulative | ||||||||||||||||
| Index | |||||||||||||||||||
| Lux Nanotech IndexTM | -46.41 | -27.00 | -18.64 | -51.51 | |||||||||||||||
| S&P 500® Index | -35.29 | -10.76 | -6.88 | -22.08 | |||||||||||||||
| Fund | |||||||||||||||||||
| NAV Return | -46.06 | -26.42 | -18.03 | -50.22 | |||||||||||||||
| Share Price Return | -45.79 | -26.42 | -18.01 | -50.19 | |||||||||||||||
Fund Inception: October 26, 2005
Performance quoted represents past performance. Past performance is not a guarantee of future results and current performance may be higher or lower than performance quoted. Investment returns and principal value will fluctuate and shares, when redeemed, may be worth more or less than their original cost. The Adviser has waived fees and reimbursed other expenses, absent which, performance would have been lower. The Adviser has contractually agreed to waive fees and/or pay certain Fund expenses through August 31, 2010. According to the Fund's current prospectus, the total gross annual operating expense ratio was indicated as 0.73%. In the Financial Highlights section of this Shareholder Report, the Fund's net (subsidized) total operating expense ratio was determined to be 0.70% while the Fund's gross total operating expense ratio was 0.89%. NAV and Share Price returns assume that dividends and capital gain distributions have been reinvested in the Fund at NAV and Share Price, respectively. The returns shown in the table above do not reflect the deduction of taxes that a shareholder would pay on Fund distributions or the redemption or sale of Fund Shares. See invescopowershares.com to find the most recent month-end performance numbers.
Index performance results are based upon a hypothetical investment in its constituent securities. Index returns do not represent Fund returns. An investor cannot invest directly in an index. The Index does not charge management fees or brokerage expenses, and no such fees or expenses were deducted from the hypothetical performance shown. In addition, the results actual investors might have achieved would have differed from those shown because of differences in the timing, amounts of their investments, and fees and expenses associated with an investment in the Fund.
The S&P 500® Index ("Benchmark Index") is an unmanaged index used as a measurement of change in stock market conditions based on the average performance of approximately 500 common stocks.
† Fund and underlying Index returns are based on the inception date of the Fund. Returns for the Benchmark Index are based on the closest month-end to the Fund's inception date.
†† Average annualized.
15
Manager's Analysis
PowerShares NASDAQ-100 BuyWrite Portfolio (ticker: PQBW)
The PowerShares NASDAQ-100 BuyWrite Portfolio (the "Fund") is based on the CBOE NASDAQ-100 BuyWrite Index ("Index") and seeks investment results that correspond generally to the price and yield (before the Fund's fees and expenses) of the Index. The Index measures the total returns of a theoretical portfolio of NASDAQ-100® Index stocks combined with NASDAQ-100® Index call options which are systematically written (sold) against the portfolio through a "buy-write" strategy. The Index also reinvests the dividends and options premium received by the portfolio back into the component stocks.
For the period June 12, 2008 through April, 30 2009 (the Fund's inception date), the Fund returned -23.83%. The Index returned -22.71% while the NASDAQ-100® Index returned -31.02% and the Fund faired better than the broader market as measured by the Russell 3000® Index.
One factor contributing to the NASDAQ-100® Index's outperformance of the overall U.S. equity market over the reporting period was that it contained no financial holdings (financials was the hardest hit sector). The NASDAQ-100® Index also benefited on a relative basis from its large information technology sector weight (over 60% weighting on average), with Apple (11.6%) and QUALCOMM (6.2%) specifically contributing the most to the index's performance. In addition, equity market volatility, as measured by the CBOE S&P 500 VIX Index, rose to historic high levels. Last year's unusually high volatility resulted in greater options premium generated for the Fund, which helped mitigate the Fund's overall negative return.
16
Manager's Analysis (Continued)
PowerShares NASDAQ-100 BuyWrite Portfolio (ticker: PQBW)
Industry Breakdown (% of the Fund's
Net Assets) as of April 30, 2009
| Computers | 19.2 | ||||||
| Software | 14.8 | ||||||
| Internet | 12.0 | ||||||
| Telecommunications | 11.7 | ||||||
| Biotechnology | 11.2 | ||||||
| Semiconductors | 8.2 | ||||||
| Retail | 5.7 | ||||||
| Media | 4.8 | ||||||
| Pharmaceuticals | 4.4 | ||||||
| Commercial Services | 2.9 | ||||||
| Healthcare-Products | 1.7 | ||||||
| Transportation | 1.6 | ||||||
| Auto Manufacturers | 1.2 | ||||||
| Energy-Alternative Sources | 1.1 | ||||||
| Electronics | 1.0 | ||||||
| Distribution/Wholesale | 0.5 | ||||||
| Lodging | 0.4 | ||||||
| Chemicals | 0.4 | ||||||
| Textiles | 0.4 | ||||||
| Environmental Control | 0.4 | ||||||
| Beverages | 0.3 | ||||||
| Airlines | 0.3 | ||||||
| Engineering & Construction | 0.2 | ||||||
| Machinery-Construction & Mining | 0.2 | ||||||
| Iron/Steel | 0.2 | ||||||
| Money Market Fund | 0.0 | ||||||
| Other | (4.8 | ) | |||||
Top Ten Fund Holdings (% of the Fund's
Net Assets) as of April 30, 2009
| Security | |||||||
| Apple, Inc. | 13.1 | ||||||
| QUALCOMM, Inc. | 7.0 | ||||||
| Microsoft Corp. | 5.2 | ||||||
| Google, Inc., Class A | 4.8 | ||||||
| Gilead Sciences, Inc. | 3.4 | ||||||
| Oracle Corp. | 3.4 | ||||||
| Cisco Systems, Inc. | 3.4 | ||||||
| Research In Motion Ltd. (Canada) | 3.3 | ||||||
| Teva Pharmaceutical Industries Ltd. ADR (Israel) | 2.6 | ||||||
| Intel Corp. | 2.6 | ||||||
| Total | 48.8 | ||||||
Style Allocation (% of the Fund's Net
Total Investments) as of April 30, 2009
| Large-Cap Growth | 66.1 | ||||||
| Mid-Cap Growth | 20.9 | ||||||
| Large-Cap Value | 9.0 | ||||||
| Mid-Cap Value | 4.0 | ||||||
17
Manager's Analysis (Continued)
PowerShares NASDAQ-100 BuyWrite Portfolio (ticker: PQBW)
Growth of a $10,000 Investment Since Inception†
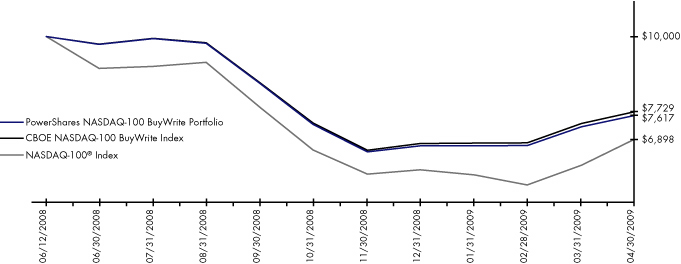
| Fund Performance History (%) | As of April 30, 2009 | ||||||
| Fund Inception† Cumulative | |||||||
| Index | |||||||
| CBOE NASDAQ-100 BuyWrite Index | -22.71 | ||||||
| NASDAQ-100® Index | -31.02 | ||||||
| Fund | |||||||
| NAV Return | -23.83 | ||||||
| Share Price Return | -23.97 | ||||||
Fund Inception: June 12, 2008
Performance quoted represents past performance. Past performance is not a guarantee of future results and current performance may be higher or lower than performance quoted. Investment returns and principal value will fluctuate and shares, when redeemed, may be worth more or less than their original cost. According to the Fund's current prospectus, the expense ratio of 0.75% is expressed as a unitary fee to cover operating expenses and expenses incurred in connection with managing the portfolio. NAV and Share Price returns assume that dividends and capital gain distributions have been reinvested in the Fund at NAV and Share Price, respectively. The returns shown in the table above do not reflect the deduction of taxes that a shareholder would pay on Fund distributions or the redemption or sale of Fund Shares. See invescopowershares.com to find the most recent month-end performance numbers.
Index performance results are based upon a hypothetical investment in its constituent securities. Index returns do not represent Fund returns. An investor cannot invest directly in an index. The Index does not charge management fees or brokerage expenses, and no such fees or expenses were deducted from the hypothetical performance shown. In addition, the results actual investors might have achieved would have differed from those shown because of differences in the timing, amounts of their investments, and fees and expenses associated with an investment in the Fund.
The NASDAQ-100® Index ("Benchmark Index") is an unmanaged index used as a measurement of change in stock market conditions based on the average performance of approximately 100 common stocks.
† Fund and underlying Index returns are based on the inception date of the Fund. Returns for the Benchmark Index are based on the closest month-end to the Fund's inception date.
18
This page intentionally left blank
Manager's Analysis
PowerShares S&P 500 BuyWrite Portfolio (ticker: PBP)
The PowerShares S&P 500 BuyWrite Portfolio (the "Fund") is based on the CBOE S&P 500 BuyWrite Index ("Index") and seeks investment results that correspond generally to the price and yield (before the Fund's fees and expenses) of the Index. The Index measures the total returns of a theoretical portfolio of S&P 500® Index stocks combined with S&P 500® Index call options which are systematically written (sold) against the portfolio through a "buy-write" strategy. The Index also reinvests the dividends and options premium received by the portfolio back into the component stocks.
For the year ended April, 30 2009, the Fund returned -28.26%. The Index returned -27.05% while the S&P 500® Index returned -35.29% over this same timeframe.
The global banking and economic crises which occurred during the past year created the perfect storm for a major equity market sell off. Over the year, large-cap U.S. stocks experienced their worst performance since the Great Depression of the 1930s. As a result, equity market volatility, as measured by the CBOE S&P 500 VIX Index, rose to historic high levels. Last year's higher-than-average S&P 500® Index's volatility resulted in greater options premium generated for the Fund, which helped mitigate the Fund's overall negative return.
Sector Breakdown (% of the Fund's
Net Assets) as of April 30, 2009
| Information Technology | 19.0 | ||||||
| Health Care | 14.2 | ||||||
| Energy | 12.9 | ||||||
| Financials | 12.6 | ||||||
| Consumer Staples | 12.4 | ||||||
| Industrials | 10.8 | ||||||
| Consumer Discretionary | 9.8 | ||||||
| Utilities | 4.1 | ||||||
| Telecommunication Services | 3.8 | ||||||
| Materials | 3.5 | ||||||
| Other | (3.1 | ) | |||||
Style Allocation (% of the Fund's Net
Total Investments) as of April 30, 2009
| Large-Cap Growth | 41.7 | ||||||
| Large-Cap Value | 39.2 | ||||||
| Mid-Cap Growth | 9.7 | ||||||
| Mid-Cap Value | 8.4 | ||||||
| Small-Cap Value | 0.6 | ||||||
| Small-Cap Growth | 0.4 | ||||||
Top Ten Fund Holdings (% of the Fund's
Net Assets) as of April 30, 2009
| Security | |||||||
| Exxon Mobil Corp. | 4.5 | ||||||
| Microsoft Corp. | 2.1 | ||||||
| AT&T, Inc. | 2.0 | ||||||
| Procter & Gamble (The) Co. | 2.0 | ||||||
| Johnson & Johnson | 2.0 | ||||||
| International Business Machines Corp. | 1.9 | ||||||
| General Electric Co. | 1.8 | ||||||
| Chevron Corp. | 1.8 | ||||||
| JPMorgan Chase & Co. | 1.7 | ||||||
| Cisco Systems, Inc. | 1.5 | ||||||
| Total | 21.3 | ||||||
20
Manager's Analysis (Continued)
PowerShares S&P 500 BuyWrite Portfolio (ticker: PBP)
Growth of a $10,000 Investment Since Inception†
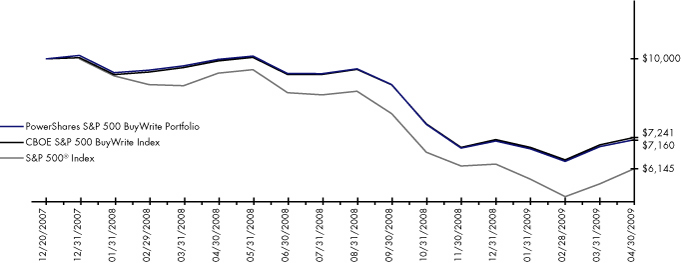
| Fund Performance History (%) | As of April 30, 2009 | ||||||||||||||
| Avg Ann†† | Fund Inception† | ||||||||||||||
| 1 Year | Avg Ann†† | Cumulative | |||||||||||||
| Index | |||||||||||||||
| CBOE S&P 500 BuyWrite Index | -27.05 | -21.10 | -27.59 | ||||||||||||
| S&P 500® Index | -35.29 | -30.59 | -38.55 | ||||||||||||
| Fund | |||||||||||||||
| NAV Return | -28.26 | -21.76 | -28.40 | ||||||||||||
| Share Price Return | -28.16 | -21.58 | -28.17 | ||||||||||||
Fund Inception: December 20, 2007
Performance quoted represents past performance. Past performance is not a guarantee of future results and current performance may be higher or lower than performance quoted. Investment returns and principal value will fluctuate and shares, when redeemed, may be worth more or less than their original cost. According to the Fund's current prospectus, the expense ratio of 0.75% is expressed as a unitary fee to cover operating expenses incurred in connection with managing the portfolio. NAV and Share Price returns assume that dividends and capital gain distributions have been reinvested in the Fund at NAV and Share Price, respectively. The returns shown in the table above do not reflect the deduction of taxes that a shareholder would pay on Fund distributions or the redemption or sale of Fund Shares. See invescopowershares.com to find the most recent month-end performance numbers.
Index performance results are based upon a hypothetical investment in its constituent securities. Index returns do not represent Fund returns. An investor cannot invest directly in an index. The Index does not charge management fees or brokerage expenses, and no such fees or expenses were deducted from the hypothetical performance shown. In addition, the results actual investors might have achieved would have differed from those shown because of differences in the timing, amounts of their investments, and fees and expenses associated with an investment in the Fund.
The S&P 500® Index ("Benchmark Index") is an unmanaged index used as a measurement of change in stock market conditions based on the average performance of approximately 500 common stocks.
† Fund and underlying Index returns are based on the inception date of the Fund. Returns for the Benchmark Index are based on the closest month-end to the Fund's inception date.
†† Average annualized.
21
Manager's Analysis
PowerShares Value Line Industry Rotation Portfolio (ticker: PYH)
The PowerShares Value Line Industry Rotation Portfolio (the "Fund") is based on the Value Line Industry Rotation Index ("Index") and seeks investment results that correspond generally to the price and yield (before the Fund's fees and expenses) of the Index. The Index is comprised of 75 stocks chosen based on both their TimelinessTM rank and their industry TimelinessTM rank by the Index provider pursuant to a proprietary selection methodology. The Index is reconstituted and rebalanced quarterly.
For the year ended April 30, 2009, the Fund returned -43.93%, underperforming the S&P 500® Index which returned -35.29%.
For the year ended April 30, 2009, none of the Global Industry Classification Standard's ten sectors represented in the Fund generated positive returns. Poor stock selection and an overallocation to the industrial sector had the largest negative effect on overall Fund performance. However overallocation and stock selection in smaller cap securities contributed positively to Fund performance. Also contributing in a positive way was an underallocation to the financial sector.
22
Manager's Analysis (Continued)
PowerShares Value Line Industry Rotation Portfolio (ticker: PYH)
Industry Breakdown (% of the Fund's
Net Assets) as of April 30, 2009
| Software | 10.1 | ||||||
| Commercial Services | 6.0 | ||||||
| Beverages | 5.3 | ||||||
| Food | 4.9 | ||||||
| Retail | 4.7 | ||||||
| Transportation | 4.7 | ||||||
| Oil & Gas | 4.4 | ||||||
| Electric | 4.1 | ||||||
| Closed-end Funds | 4.0 | ||||||
| Pharmaceuticals | 3.8 | ||||||
| Biotechnology | 3.4 | ||||||
| Engineering & Construction | 3.3 | ||||||
| Internet | 3.3 | ||||||
| Packaging & Containers | 2.9 | ||||||
| Media | 2.9 | ||||||
| Healthcare-Products | 2.7 | ||||||
| Agriculture | 2.7 | ||||||
| Environmental Control | 2.6 | ||||||
| Telecommunications | 2.5 | ||||||
| Water | 2.4 | ||||||
| Aerospace/Defense | 2.4 | ||||||
| Gas | 2.3 | ||||||
| Healthcare-Services | 2.1 | ||||||
| Insurance | 1.5 | ||||||
| Pipelines | 1.5 | ||||||
| Coal | 1.5 | ||||||
| Savings & Loans | 1.4 | ||||||
| Household Products/Wares | 1.4 | ||||||
| Chemicals | 1.2 | ||||||
| Miscellaneous Manufacturing | 1.1 | ||||||
| Mining | 1.1 | ||||||
| Diversified Financial Services | 1.1 | ||||||
| Airlines | 0.9 | ||||||
| Money Market Fund | 0.2 | ||||||
| Other | (0.4 | ) | |||||
Top Ten Fund Holdings (% of the Fund's
Net Assets) as of April 30, 2009
| Security | |||||||
| Green Mountain Coffee Roasters, Inc. | 2.4 | ||||||
| Cerner Corp. | 1.8 | ||||||
| URS Corp. | 1.7 | ||||||
| Genesee & Wyoming, Inc., Class A | 1.7 | ||||||
| Petrohawk Energy Corp. | 1.7 | ||||||
| F5 Networks, Inc. | 1.7 | ||||||
| Southwestern Energy Co. | 1.7 | ||||||
| Rock-Tenn Co., Class A | 1.7 | ||||||
| Computer Programs & Systems, Inc. | 1.7 | ||||||
| Tractor Supply Co. | 1.6 | ||||||
| Total | 17.7 | ||||||
Style Allocation (% of the Fund's
Total Investments) as of April 30, 2009
| Mid-Cap Growth | 34.7 | ||||||
| Small-Cap Growth | 25.8 | ||||||
| Large-Cap Growth | 11.9 | ||||||
| Small-Cap Value | 10.4 | ||||||
| Mid-Cap Value | 8.9 | ||||||
| Large-Cap Value | 8.3 | ||||||
23
Manager's Analysis (Continued)
PowerShares Value Line Industry Rotation Portfolio (ticker: PYH)
Growth of a $10,000 Investment Since Inception†
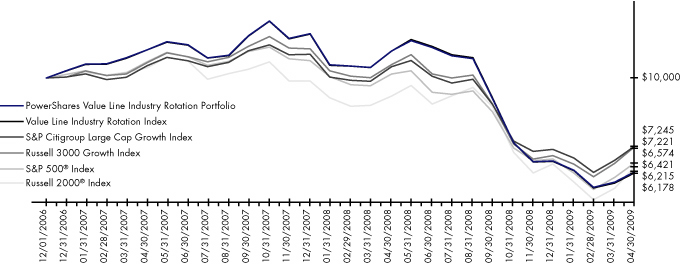
| Fund Performance History (%) | As of April 30, 2009 | ||||||||||||||
| Avg Ann†† | Fund Inception† | ||||||||||||||
| 1 Year | Avg Ann†† | Cumulative | |||||||||||||
| Index | |||||||||||||||
| Value Line Industry Rotation Index | -44.25 | -18.11 | -38.22 | ||||||||||||
| S&P 500® Index | -35.29 | -15.94 | -34.26 | ||||||||||||
| Russell 2000® Index | -30.74 | -16.75 | -35.79 | ||||||||||||
| S&P Citigroup Large Cap Growth Index | -30.70 | -12.49 | -27.55 | ||||||||||||
| Russell 3000 Growth Index | -31.46 | -12.61 | -27.79 | ||||||||||||
| Fund | |||||||||||||||
| NAV Return | -43.93 | -17.90 | -37.84 | ||||||||||||
| Share Price Return | -43.93 | -17.92 | -37.88 | ||||||||||||
Fund Inception: December 1, 2006
Performance quoted represents past performance. Past performance is not a guarantee of future results and current performance may be higher or lower than performance quoted. Investment returns and principal value will fluctuate and shares, when redeemed, may be worth more or less than their original cost. The Adviser has waived fees and reimbursed other expenses, absent which, performance would have been lower. The Adviser has contractually agreed to waive fees and/or pay certain Fund expenses through August 31, 2010. According to the Fund's current prospectus, the total gross annual operating expense ratio was indicated as 0.98%. In the Financial Highlights section of this Shareholder Report, the Fund's net (subsidized) total operating expense ratio was determined to be 0.70% while the Fund's gross total operating expense ratio was 0.94%. NAV and Share Price returns assume that dividends and capital gain distributions have been reinvested in the Fund at NAV and Share Price, respectively. The returns shown in the table above do not reflect the deduction of taxes that a shareholder would pay on Fund distributions or the redemption or sale of Fund Shares. See invescopowershares.com to find the most recent month-end performance numbers.
Index performance results are based upon a hypothetical investment in its constituent securities. Index returns do not represent Fund returns. An investor cannot invest directly in an index. The Index does not charge management fees or brokerage expenses, and no such fees or expenses were deducted from the hypothetical performance shown. In addition, the results actual investors might have achieved would have differed from those shown because of differences in the timing, amounts of their investments, and fees and expenses associated with an investment in the Fund.
The Russell 2000® Index, S&P Citigroup Large Cap Growth Index, Russell 3000 Growth Index and S&P 500® Index (the "Benchmark Indices") are unmanaged indices used as a measurement of change in stock market conditions based on the average performance of approximately 2,000, 384, 1,936 and 500 common stocks, respectively. The S&P Citigroup Large Cap Growth Index and the Russell 3000 Growth Index will be used for comparative purposes going forward as these represent the most appropriate market indices for this fund.
† Fund and underlying Index returns are based on the inception date of the Fund. Returns for the Benchmark Indices are based on the closest month-end to the Fund's inception date.
†† Average annualized.
24
This page intentionally left blank
Manager's Analysis
PowerShares Value Line TimelinessTM Select Portfolio (ticker: PIV)
The PowerShares Value Line TimelinessTM Select Portfolio (the "Fund") seeks investment results that correspond generally to the price and yield (before the Fund's fees and expenses) of an equity index called the Value Line TimelinessTM Select Index ("Index"). The Index is comprised of the 50 domestic stocks with the greatest capital appreciation potential as identified by the Index provider pursuant to a proprietary selection methodology.
For the year ended April 30, 2009, the Fund returned -42.66%, underperforming the S&P 500® Index which returned -35.29%.
For the year ended April 30, 2009, none of the Global Industry Classification Standard's ten sectors represented in the Fund generated positive returns. Stock selection and an overallocation to healthcare made the largest negative contribution to the performance of the Fund relative to the broader U.S. equity market. Conversely, stock selection and underallocation to financials contributed the most positive effects for the Fund.
Sector Breakdown (% of the Fund's
Net Assets) as of April 30, 2009
| Health Care | 43.3 | ||||||
| Industrials | 14.1 | ||||||
| Consumer Discretionary | 13.5 | ||||||
| Information Technology | 12.2 | ||||||
| Consumer Staples | 9.2 | ||||||
| Materials | 2.8 | ||||||
| Utilities | 1.9 | ||||||
| Telecommunication Services | 1.6 | ||||||
| Financials | 1.3 | ||||||
| Money Market Fund | 0.1 | ||||||
| Other | 0.0 | ||||||
Style Allocation (% of the Fund's
Total Investments) as of April 30, 2009
| Small-Cap Growth | 28.5 | ||||||
| Mid-Cap Growth | 26.9 | ||||||
| Large-Cap Growth | 20.3 | ||||||
| Small-Cap Value | 11.1 | ||||||
| Large-Cap Value | 9.4 | ||||||
| Mid-Cap Value | 3.8 | ||||||
Top Ten Fund Holdings (% of the Fund's
Net Assets) as of April 30, 2009
| Security | |||||||
| Green Mountain Coffee Roasters, Inc. | 3.8 | ||||||
| Jos. A. Bank Clothiers, Inc. | 3.2 | ||||||
| Rock-Tenn Co., Class A | 2.8 | ||||||
| Computer Programs & Systems, Inc. | 2.7 | ||||||
| NetFlix, Inc. | 2.5 | ||||||
| W.W. Grainger, Inc. | 2.5 | ||||||
| C.H. Robinson Worldwide, Inc. | 2.4 | ||||||
| Peet's Coffee & Tea, Inc. | 2.4 | ||||||
| Oracle Corp. | 2.4 | ||||||
| Thoratec Corp. | 2.3 | ||||||
| Total | 27.0 | ||||||
26
Manager's Analysis (Continued)
PowerShares Value Line TimelinessTM Select Portfolio (ticker: PIV)
Growth of a $10,000 Investment Since Inception†
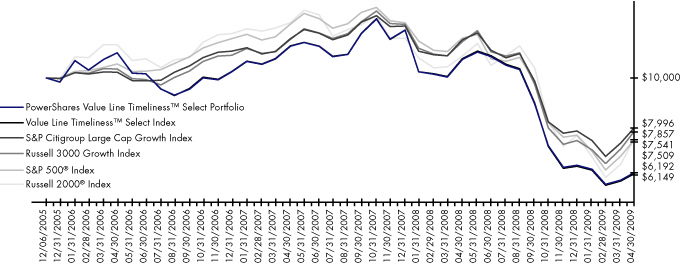
| Fund Performance History (%) | As of April 30, 2009 | ||||||||||||||||||
| Avg Ann†† | Fund Inception† | ||||||||||||||||||
| 1 Year | 3 Year | Avg Ann†† | Cumulative | ||||||||||||||||
| Index | |||||||||||||||||||
| Value Line TimelinessTM Select Index | -42.94 | -17.66 | -13.34 | -38.51 | |||||||||||||||
| S&P 500® Index | -35.29 | -10.76 | -8.04 | -24.91 | |||||||||||||||
| Russell 2000® Index | -30.74 | -12.72 | -7.93 | -24.59 | |||||||||||||||
| S&P Citigroup Large Cap Growth Index | -30.70 | -7.89 | -6.34 | -20.04 | |||||||||||||||
| Russell 3000 Growth Index | -31.46 | -8.81 | -6.81 | -21.43 | |||||||||||||||
| Fund | |||||||||||||||||||
| NAV Return | -42.66 | -17.46 | -13.16 | -38.08 | |||||||||||||||
| Share Price Return | -42.62 | -17.49 | -13.27 | -38.35 | |||||||||||||||
Fund Inception: December 6, 2005
Performance quoted represents past performance. Past performance is not a guarantee of future results and current performance may be higher or lower than performance quoted. Investment returns and principal value will fluctuate and shares, when redeemed, may be worth more or less than their original cost. The Adviser has waived fees and reimbursed other expenses, absent which, performance would have been lower. The Adviser has contractually agreed to waive fees and/or pay certain Fund expenses through August 31, 2010. According to the Fund's current prospectus, the total gross annual operating expense ratio was indicated as 0.70%. In the Financial Highlights section of this Shareholder Report, the Fund's net (subsidized) total operating expense ratio was determined to be 0.70% while the Fund's gross total operating expense ratio was 0.72%. NAV and Share Price returns assume that dividends and capital gain distributions have been reinvested in the Fund at NAV and Share Price, respectively. The returns shown in the table above do not reflect the deduction of taxes that a shareholder would pay on Fund distributions or the redemption or sale of Fund Shares. See invescopowershares.com to find the most recent month-end performance numbers.
Index performance results are based upon a hypothetical investment in its constituent securities. Index returns do not represent Fund returns. An investor cannot invest directly in an index. The Index does not charge management fees or brokerage expenses, and no such fees or expenses were deducted from the hypothetical performance shown. In addition, the results actual investors might have achieved would have differed from those shown because of differences in the timing, amounts of their investments, and fees and expenses associated with an investment in the Fund.
The Russell 2000® Index, S&P Citigroup Large Cap Growth Index, Russell 3000 Growth Index and S&P 500® Index (the "Benchmark Indices") are unmanaged indices used as a measurement of change in stock market conditions based on the average performance of approximately 2,000, 384, 1,936 and 500 common stocks, respectively. The S&P Citigroup Large Cap Growth Index and the Russell 3000 Growth Index will be used for comparative purposes going forward as these represent the most appropriate market indices for this fund.
† Fund and underlying Index returns are based on the inception date of the Fund. Returns for the Benchmark Indices are based on the closest month-end to the Fund's inception date.
†† Average annualized.
27
Manager's Analysis
PowerShares Water Resources Portfolio (ticker: PHO)
The PowerShares Water Resources Portfolio (the "Fund") seeks investment results that correspond generally to the price and yield (before the Fund's fees and expenses) of the Palisades Water Index ("Index"). The Index includes companies that focus on the provision of potable water, the treatment of water, and the technology and services that are directly related to water consumption.
The Fund returned -31.76% while the S&P 500® Index returned -35.29%. The Fund outperformed the S&P 500® Index by having no exposure to the financial sector. Additionally, the Fund is heavily invested in the industrial sector, which was an average performing sector for the year. URS Corp. and Tetra Tech, Inc., two of the Fund's top holdings, were up on an absolute basis in a period when few companies achieved positive returns.
Industry Breakdown (% of the Fund's
Net Assets) as of April 30, 2009
| Miscellaneous Manufacturing | 20.8 | ||||||
| Machinery-Diversified | 16.1 | ||||||
| Engineering & Construction | 14.8 | ||||||
| Electronics | 11.6 | ||||||
| Metal Fabricate/Hardware | 11.5 | ||||||
| Envrionmental Control | 11.4 | ||||||
| Water | 10.9 | ||||||
| Hand/Machine Tools | 2.9 | ||||||
| Other | 0.0 | ||||||
Style Allocation (% of the Fund's
Total Investments) as of April 30, 2009
| Small-Cap Growth | 29.3 | ||||||
| Mid-Cap Growth | 26.4 | ||||||
| Small-Cap Value | 18.8 | ||||||
| Mid-Cap Value | 11.9 | ||||||
| Large-Cap Value | 9.0 | ||||||
| Large-Cap Growth | 4.6 | ||||||
Top Ten Fund Holdings (% of the Fund's
Net Assets) as of April 30, 2009
| Security | |||||||
| Veolia Environnement ADR (France) | 5.6 | ||||||
| Valmont Industries, Inc. | 5.3 | ||||||
| Tetra Tech, Inc. | 5.0 | ||||||
| URS Corp. | 4.6 | ||||||
| Danaher Corp. | 4.6 | ||||||
| Aecom Technology Corp. | 4.3 | ||||||
| Badger Meter, Inc. | 4.2 | ||||||
| Itron, Inc. | 4.2 | ||||||
| Ameron International Corp. | 3.8 | ||||||
| Mueller Water Products, Inc., Class A | 3.6 | ||||||
| Total | 45.2 | ||||||
28
Manager's Analysis (Continued)
PowerShares Water Resources Portfolio (ticker: PHO)
Growth of a $10,000 Investment Since Inception†
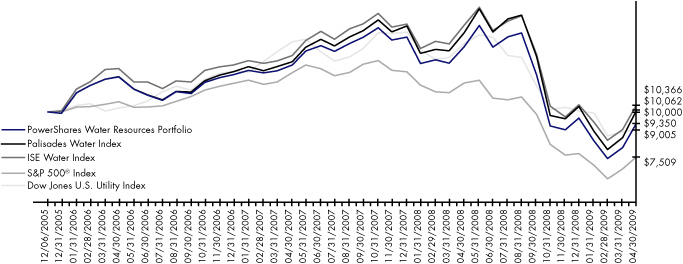
| Fund Performance History (%) | As of April 30, 2009 | ||||||||||||||||||
| Avg Ann†† | Fund Inception† | ||||||||||||||||||
| 1 Year | 3 Year | Avg Ann†† | Cumulative | ||||||||||||||||
| Index | |||||||||||||||||||
| Palisades Water Index | -30.03 | -5.57 | 0.18 | 0.62 | |||||||||||||||
| S&P 500® Index | -35.29 | -10.76 | -8.04 | -24.91 | |||||||||||||||
| Dow Jones U.S. Utility Index | -34.66 | -4.12 | -3.02 | -9.95 | |||||||||||||||
| ISE Water Index | -29.95 | -5.79 | 1.06 | 3.66 | |||||||||||||||
| Fund | |||||||||||||||||||
| NAV Return | -31.76 | -7.82 | -1.96 | -6.50 | |||||||||||||||
| Share Price Return | -31.63 | -7.97 | -2.32 | -7.66 | |||||||||||||||
Fund Inception: December 6, 2005
Performance quoted represents past performance. Past performance is not a guarantee of future results and current performance may be higher or lower than performance quoted. Investment returns and principal value will fluctuate and shares, when redeemed, may be worth more or less than their original cost. The Adviser has waived fees and reimbursed other expenses, absent which, performance would have been lower. The Adviser has contractually agreed to waive fees and/or pay certain Fund expenses through August 31, 2010. According to the Fund's current prospectus, the total gross annual operating expense ratio was indicated as 0.63%. In the Financial Highlights section of this Shareholder Report, the Fund's net (subsidized) total operating expense ratio was determined to be 0.64% while the Fund's gross total operating expense ratio was 0.64%. NAV and Share Price returns assume that dividends and capital gain distributions have been reinvested in the Fund at NAV and Share Price, respectively. The returns shown in the table above do not reflect the deduction of taxes that a shareholder would pay on Fund distributions or the redemption or sale of Fund Shares. See invescopowershares.com to find the most recent month-end performance numbers.
Index performance results are based upon a hypothetical investment in its constituent securities. Index returns do not represent Fund returns. An investor cannot invest directly in an index. The Index does not charge management fees or brokerage expenses, and no such fees or expenses were deducted from the hypothetical performance shown. In addition, the results actual investors might have achieved would have differed from those shown because of differences in the timing, amounts of their investments, and fees and expenses associated with an investment in the Fund.
The Dow Jones U.S. Utility Index, ISE Water Index and S&P 500® Index (the "Benchmark Indices") are unmanaged indices used as a measurement of change in stock market conditions based on the average performance of approximately 15, 36 and 500 common stocks, respectively. The ISE Water Index will be used for comparative purposes going forward as it represents a more appropriate market index for this fund.
† Fund and underlying Index returns are based on the inception date of the Fund. Returns for the Benchmark Indices are based on the closest month-end to the Fund's inception date.
†† Average annualized.
29
Manager's Analysis
PowerShares WilderHill Clean Energy Portfolio (ticker: PBW)
The PowerShares WilderHill Clean Energy Portfolio (the "Fund") seeks investment results that correspond generally to the price and yield (before the Fund's fees and expenses) of the WilderHill Clean Energy Index ("Index"), which includes companies that focus on "greener" and generally renewable sources of energy and technologies that facilitate cleaner energy.
For the year ended April 30, 2009, the Fund returned -56.88% versus the S&P 500® Index which returned -35.29%. The clean energy industry experienced greater volatility over the reporting period. Solar and ethanol companies were the largest detractors from Fund performance. In particular, VeraSun, JA Solar, and SunPower Corp. were heavy drags on Fund performance. VeraSun is no longer held at the end of the fiscal year.
Industry Breakdown (% of the Fund's
Net Assets) as of April 30, 2009
| Electrical Components & Equipment | 32.1 | ||||||
| Semiconductors | 14.2 | ||||||
| Energy-Alternate Sources | 13.2 | ||||||
| Electric | 11.3 | ||||||
| Chemicals | 11.2 | ||||||
| Auto Parts & Equipment | 4.2 | ||||||
| Computers | 3.2 | ||||||
| Food | 2.8 | ||||||
| Commercial Services | 2.4 | ||||||
| Electronics | 2.3 | ||||||
| Machinery-Diversified | 2.3 | ||||||
| Miscellaneous Manufacturing | 0.8 | ||||||
| Other | 0.0 | ||||||
Style Allocation (% of the Fund's
Total Investments) as of April 30, 2009
| Small-Cap Growth | 56.4 | ||||||
| Mid-Cap Growth | 22.9 | ||||||
| Large-Cap Growth | 8.8 | ||||||
| Small-Cap Value | 7.8 | ||||||
| Large-Cap Value | 4.1 | ||||||
Top Ten Fund Holdings (% of the Fund's
Net Assets) as of April 30, 2009
| Security | |||||||
| OM Group, Inc. | 3.6 | ||||||
| Fuel Systems Solutions, Inc. | 3.5 | ||||||
| American Superconductor Corp. | 3.4 | ||||||
| Suntech Power Holdings Co. Ltd. ADR (China) | 3.4 | ||||||
| Universal Display Corp. | 3.3 | ||||||
| Ormat Technologies, Inc. | 3.2 | ||||||
| First Solar, Inc. | 3.2 | ||||||
| Evergreen Solar, Inc. | 3.1 | ||||||
| GT Solar International, Inc. | 3.0 | ||||||
| Sociedad Quimica y Minera de Chile S.A. ADR (Chile) | 3.0 | ||||||
| Total | 32.7 | ||||||
30
Manager's Analysis (Continued)
PowerShares WilderHill Clean Energy Portfolio (ticker: PBW)
Growth of a $10,000 Investment Since Inception†

| Fund Performance History (%) | As of April 30, 2009 | ||||||||||||||||||
| Avg Ann†† | Fund Inception† | ||||||||||||||||||
| 1 Year | 3 Year | Avg Ann†† | Cumulative | ||||||||||||||||
| Index | |||||||||||||||||||
| WilderHill Clean Energy Index | -58.06 | -27.54 | -13.49 | -45.26 | |||||||||||||||
| S&P 500® Index | -35.29 | -10.76 | -5.49 | -20.95 | |||||||||||||||
| NASDAQ Composite Index | -28.83 | -9.57 | -4.18 | -16.30 | |||||||||||||||
| Fund | |||||||||||||||||||
| NAV Return | -56.88 | -26.04 | -12.28 | -42.00 | |||||||||||||||
| Share Price Return | -57.07 | -26.16 | -12.36 | -42.22 | |||||||||||||||
Fund Inception: March 3, 2005
Performance quoted represents past performance. Past performance is not a guarantee of future results and current performance may be higher or lower than performance quoted. Investment returns and principal value will fluctuate and shares, when redeemed, may be worth more or less than their original cost. The Adviser has waived fees and reimbursed other expenses, absent which, performance would have been lower. The Adviser has contractually agreed to waive fees and/or pay certain Fund expenses through August 31, 2010. According to the Fund's current prospectus, the total gross annual operating expense ratio was indicated as 0.67%. In the Financial Highlights section of this Shareholder Report, the Fund's net (subsidized) total operating expense ratio was determined to be 0.69% while the Fund's gross total operating expense ratio was 0.69%. NAV and Share Price returns assume that dividends and capital gain distributions have been reinvested in the Fund at NAV and Share Price, respectively. The returns shown in the table above do not reflect the deduction of taxes that a shareholder would pay on Fund distributions or the redemption or sale of Fund Shares. See invescopowershares.com to find the most recent month-end performance numbers.
Index performance results are based upon a hypothetical investment in its constituent securities. Index returns do not represent Fund returns. An investor cannot invest directly in an index. The Index does not charge management fees or brokerage expenses, and no such fees or expenses were deducted from the hypothetical performance shown. In addition, the results actual investors might have achieved would have differed from those shown because of differences in the timing, amounts of their investments, and fees and expenses associated with an investment in the Fund.
The NASDAQ Composite Index and S&P 500® Index (the "Benchmark Indices") are unmanaged indices used as a measurement of change in stock market conditions based on the average performance of approximately 3,087 and 500 common stocks, respectively.
† Fund and underlying Index returns are based on the inception date of the Fund. Returns for the Benchmark Indices are based on the closest month-end to the Fund's inception date.
†† Average annualized.
31
Manager's Analysis
PowerShares WilderHill Progressive Energy Portfolio (ticker: PUW)
The PowerShares WilderHill Progressive Energy Portfolio (the "Fund") seeks investment results that correspond generally to the price and yield (before the Fund's fees and expenses) of the WilderHill Progressive Energy Index ("Index"). The Index is comprised of U.S.-listed companies that are significantly involved in transitional energy bridge technologies, with an emphasis on improving the use of fossil fuels. The modified equal-weighted portfolio is rebalanced and reconstituted quarterly.
For the year ended April 30, 2009, the Fund returned -38.23% versus a return for the S&P 500® Index of -35.29%. The Fund invests heavily in industrial companies which was an average performing sector during the year. This resulted in performance that was mostly in line with the broader U.S. equity market. Overweight positions in Tenneco, Inc., Andersons, Inc., and Chesapeake Energy resulted in the Fund's underperformance. Andersons, Inc. is no longer held at the end of the fiscal year.
Industry Breakdown (% of the Fund's
Net Assets) as of April 30, 2009
| Electrical Components & Equipment | 13.1 | ||||||
| Oil & Gas | 12.9 | ||||||
| Miscellaneous Manufacturing | 11.2 | ||||||
| Electric | 10.7 | ||||||
| Electronics | 9.0 | ||||||
| Chemicals | 6.8 | ||||||
| Mining | 6.7 | ||||||
| Auto Parts & Equipment | 4.9 | ||||||
| Engineering & Construction | 4.9 | ||||||
| Building Materials | 3.9 | ||||||
| Environmental Control | 3.8 | ||||||
| Energy-Alternate Sources | 3.5 | ||||||
| Hand/Machine Tools | 3.4 | ||||||
| Telecommunications | 2.4 | ||||||
| Aerospace/Defense | 2.4 | ||||||
| Money Market Fund | 0.4 | ||||||
| Other | (0.0 | ) | |||||
Top Ten Fund Holdings (% of the Fund's
Net Assets) as of April 30, 2009
| Security | |||||||
| Methanex Corp. (Canada) | 3.9 | ||||||
| Owens Corning, Inc. | 3.9 | ||||||
| Woodward Governor Co. | 3.8 | ||||||
| EnerSys | 3.4 | ||||||
| Cameco Corp. (Canada) | 3.4 | ||||||
| Baldor Electric Co. | 3.4 | ||||||
| USEC, Inc. | 3.3 | ||||||
| Johnson Controls, Inc. | 3.3 | ||||||
| EnergySolutions, Inc. | 3.0 | ||||||
| Energizer Holdings, Inc. | 2.9 | ||||||
| Total | 34.3 | ||||||
Style Allocation (% of the Fund's Net
Total Investments) as of April 30, 2009
| Small-Cap Growth | 22.7 | ||||||
| Large-Cap Value | 20.6 | ||||||
| Large-Cap Growth | 16.4 | ||||||
| Small-Cap Value | 15.1 | ||||||
| Mid-Cap Value | 14.3 | ||||||
| Mid-Cap Growth | 10.9 | ||||||
32
Manager's Analysis (Continued)
PowerShares WilderHill Progressive Energy Portfolio (ticker: PUW)
Growth of a $10,000 Investment Since Inception†
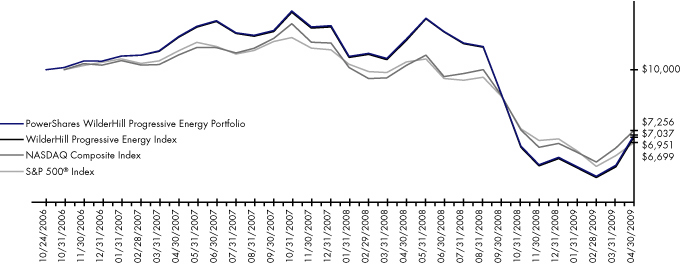
| Fund Performance History (%) | As of April 30, 2009 | ||||||||||||||
| Avg Ann†† | Fund Inception† | ||||||||||||||
| 1 Year | Avg Ann†† | Cumulative | |||||||||||||
| Index | |||||||||||||||
| WilderHill Progressive Energy Index | -38.62 | -13.46 | -30.49 | ||||||||||||
| S&P 500® Index | -35.29 | -14.81 | -33.01 | ||||||||||||
| NASDAQ Composite Index | -28.83 | -12.04 | -27.44 | ||||||||||||
| Fund | |||||||||||||||
| NAV Return | -38.23 | -13.04 | -29.63 | ||||||||||||
| Share Price Return | -38.16 | -13.03 | -29.60 | ||||||||||||
Fund Inception: October 24, 2006
Performance quoted represents past performance. Past performance is not a guarantee of future results and current performance may be higher or lower than performance quoted. Investment returns and principal value will fluctuate and shares, when redeemed, may be worth more or less than their original cost. The Adviser has waived fees and reimbursed other expenses, absent which, performance would have been lower. The Adviser has contractually agreed to waive fees and/or pay certain Fund expenses through August 31, 2010. According to the Fund's current prospectus, the total gross annual operating expense ratio was indicated as 0.88%. In the Financial Highlights section of this Shareholder Report, the Fund's net (subsidized) total operating expense ratio was determined to be 0.70% while the Fund's gross total operating expense ratio was 0.86%. NAV and Share Price returns assume that dividends and capital gain distributions have been reinvested in the Fund at NAV and Share Price, respectively. The returns shown in the table above do not reflect the deduction of taxes that a shareholder would pay on Fund distributions or the redemption or sale of Fund Shares. See invescopowershares.com to find the most recent month-end performance numbers.
Index performance results are based upon a hypothetical investment in its constituent securities. Index returns do not represent Fund returns. An investor cannot invest directly in an index. The Index does not charge management fees or brokerage expenses, and no such fees or expenses were deducted from the hypothetical performance shown. In addition, the results actual investors might have achieved would have differed from those shown because of differences in the timing, amounts of their investments, and fees and expenses associated with an investment in the Fund.
The NASDAQ Composite Index and S&P 500® Index (the "Benchmark Indices") are unmanaged indices used as a measurement of change in stock market conditions based on the average performance of approximately 3,087 and 500 common stocks, respectively.
† Fund and underlying Index returns are based on the inception date of the Fund. Returns for the Benchmark Indices are based on the closest month-end to the Fund's inception date.
†† Average annualized.
33
Frequency Distribution of Discounts & Premiums
Since Inception through April 30, 2009
| Closing Price Above NAV (bps) | |||||||||||||||||||||||||||||||||||||||
| Ticker | Fund Name | Inception | Days | 0-24 | 25-49 | 50-99 | 100-149 | 150-199 | 200+ | ||||||||||||||||||||||||||||||
| PPA | PowerShares Aerospace & Defense Portfolio | 10/26/05 | 883 | 349 | 15 | 2 | 1 | 0 | 2 | ||||||||||||||||||||||||||||||
| PZD | PowerShares CleantechTM Portfolio | 10/24/06 | 633 | 179 | 44 | 70 | 24 | 4 | 3 | ||||||||||||||||||||||||||||||
| PDP | PowerShares DWA Technical LeadersTM Portfolio | 3/1/07 | 547 | 225 | 13 | 8 | 0 | 0 | 0 | ||||||||||||||||||||||||||||||
| PGJ | PowerShares Golden Dragon Halter USX China Portfolio | 12/9/04 | 1105 | 466 | 122 | 21 | 1 | 0 | 0 | ||||||||||||||||||||||||||||||
| PSP | PowerShares Listed Private Equity Portfolio | 10/24/06 | 633 | 247 | 28 | 29 | 7 | 2 | 4 | ||||||||||||||||||||||||||||||
| PXN | PowerShares Lux Nanotech Portfolio | 10/26/05 | 883 | 299 | 61 | 20 | 5 | 1 | 1 | ||||||||||||||||||||||||||||||
| PQBW | PowerShares NASDAQ-100 BuyWrite Portfolio | 6/12/08 | 189 | 39 | 24 | 35 | 6 | 3 | 27 | ||||||||||||||||||||||||||||||
| PBP | PowerShares S&P 500 BuyWrite Portfolio | 12/20/07 | 341 | 84 | 91 | 74 | 16 | 7 | 12 | ||||||||||||||||||||||||||||||
| PYH | PowerShares Value Line Industry Rotation Portfolio | 12/1/06 | 606 | 229 | 10 | 5 | 3 | 0 | 1 | ||||||||||||||||||||||||||||||
| PIV | PowerShares Value Line TimelinessTM Select Portfolio | 12/6/05 | 855 | 339 | 30 | 5 | 2 | 2 | 1 | ||||||||||||||||||||||||||||||
| PHO | PowerShares Water Resources Portfolio | 12/6/05 | 855 | 378 | 95 | 19 | 1 | 0 | 0 | ||||||||||||||||||||||||||||||
| PBW | PowerShares WilderHill Clean Energy Portfolio | 3/3/05 | 1048 | 458 | 112 | 23 | 5 | 0 | 0 | ||||||||||||||||||||||||||||||
| PUW | PowerShares WilderHill Progressive Energy Portfolio | 10/24/06 | 633 | 212 | 20 | 5 | 0 | 0 | 0 | ||||||||||||||||||||||||||||||
34
| Closing Price Below NAV (bps) | |||||||||||||||||||||||||||
| Ticker | -0-24 | -25-49 | -50-99 | -100-149 | -150-199 | -200+ | |||||||||||||||||||||
| PPA | 490 | 14 | 9 | 0 | 0 | 1 | |||||||||||||||||||||
| PZD | 272 | 16 | 14 | 3 | 1 | 3 | |||||||||||||||||||||
| PDP | 269 | 24 | 8 | 0 | 0 | 0 | |||||||||||||||||||||
| PGJ | 408 | 70 | 13 | 3 | 0 | 1 | |||||||||||||||||||||
| PSP | 263 | 32 | 18 | 3 | 0 | 0 | |||||||||||||||||||||
| PXN | 407 | 70 | 14 | 3 | 1 | 1 | |||||||||||||||||||||
| PQBW | 35 | 5 | 6 | 1 | 4 | 4 | |||||||||||||||||||||
| PBP | 43 | 7 | 5 | 0 | 1 | 1 | |||||||||||||||||||||
| PYH | 342 | 13 | 3 | 0 | 0 | 0 | |||||||||||||||||||||
| PIV | 459 | 12 | 3 | 0 | 1 | 1 | |||||||||||||||||||||
| PHO | 318 | 30 | 13 | 1 | 0 | 0 | |||||||||||||||||||||
| PBW | 374 | 63 | 10 | 1 | 1 | 1 | |||||||||||||||||||||
| PUW | 373 | 20 | 3 | 0 | 0 | 0 | |||||||||||||||||||||
35
Fees and Expenses
As a shareholder of a Fund of the PowerShares Exchange-Traded Fund Trust, you incur advisory fees and other Fund expenses. The expense examples below are intended to help you understand your ongoing costs (in dollars) of investing in the Funds and to compare these costs with the ongoing costs of investing in other funds.
The example is based on an investment of $1,000 invested at the beginning of the period and held through the six-month period ended April 30, 2009.
Actual Expenses
The first line in the following table provides information about actual account values and actual expenses. You may use the information in this line, together with the amount you invested, to estimate the expenses that you paid over the period. Simply divide your account value by $1,000 (for example, an $8,600 account value divided by $1,000 = 8.6), then multiply the result by the number in the first line under the heading "Expenses Paid During the Six-Month Period" to estimate the expenses you paid on your account during this period.
Hypothetical Example for Comparison Purposes
The second line in the following table provides information about hypothetical account values and hypothetical expenses based on each Fund's actual expense ratio and an assumed annualized rate of return of 5% per year before expenses, which is not the Fund's actual return. The hypothetical account values and expenses may not be used to estimate the actual ending account balance or expenses you paid for the period. You may use this information to compare the ongoing costs of investing in the Funds and other funds. To do so, compare this 5% hypothetical example with the 5% hypothetical examples that appear in the shareholder reports of the other funds.
Please note that the expenses shown in the table are meant to highlight your ongoing costs only, and do not reflect any transactional costs such as sales charges (loads). Therefore the second line in the table is useful in comparing ongoing costs only, and will not help you determine the relative total costs of owning different funds. In addition, if these transactional costs were included, your costs would have been higher.
| Beginning Account Value November 1, 2008 | Ending Account Value April 30, 2009 | Annualized Expense Ratio Based on the Six-Month Period | Expenses Paid During the Six-Month Period (1) | ||||||||||||||||
| PowerShares Aerospace & Defense Portfolio Actual | $ | 1,000.00 | $ | 949.19 | 0.66 | % | $ | 3.19 | |||||||||||
| Hypothetical (5% return before expenses) | $ | 1,000.00 | $ | 1,021.52 | 0.66 | % | $ | 3.31 | |||||||||||
| PowerShares CleantechTM Portfolio Actual | $ | 1,000.00 | $ | 1,069.45 | 0.67 | % | $ | 3.44 | |||||||||||
| Hypothetical (5% return before expenses) | $ | 1,000.00 | $ | 1,021.47 | 0.67 | % | $ | 3.36 | |||||||||||
| PowerShares DWA Technical LeadersTM Portfolio Actual | $ | 1,000.00 | $ | 917.12 | 0.70 | % | $ | 3.33 | |||||||||||
| Hypothetical (5% return before expenses) | $ | 1,000.00 | $ | 1,021.32 | 0.70 | % | $ | 3.51 | |||||||||||
| PowerShares Golden Dragon Halter USX China Portfolio Actual | $ | 1,000.00 | $ | 1,174.84 | 0.66 | % | $ | 3.56 | |||||||||||
| Hypothetical (5% return before expenses) | $ | 1,000.00 | $ | 1,021.52 | 0.66 | % | $ | 3.31 | |||||||||||
| PowerShares Listed Private Equity Portfolio Actual | $ | 1,000.00 | $ | 653.00 | 0.70 | % | $ | 2.87 | |||||||||||
| Hypothetical (5% return before expenses) | $ | 1,000.00 | $ | 1,021.32 | 0.70 | % | $ | 3.51 | |||||||||||
36
Fees and Expenses (Continued)
| Beginning Account Value November 1, 2008 | Ending Account Value April 30, 2009 | Annualized Expense Ratio Based on the Six-Month Period | Expenses Paid During the Six-Month Period (1) | ||||||||||||||||
| PowerShares Lux Nanotech Portfolio Actual | $ | 1,000.00 | $ | 802.32 | 0.70 | % | $ | 3.13 | |||||||||||
| Hypothetical (5% return before expenses) | $ | 1,000.00 | $ | 1,021.32 | 0.70 | % | $ | 3.51 | |||||||||||
| PowerShares NASDAQ-100 BuyWrite Portfolio Actual | $ | 1,000.00 | $ | 1,036.59 | 0.75 | % | $ | 3.79 | |||||||||||
| Hypothetical (5% return before expenses) | $ | 1,000.00 | $ | 1,021.08 | 0.75 | % | $ | 3.76 | |||||||||||
| PowerShares S&P 500 BuyWrite Portfolio Actual | $ | 1,000.00 | $ | 930.32 | 0.75 | % | $ | 3.59 | |||||||||||
| Hypothetical (5% return before expenses) | $ | 1,000.00 | $ | 1,021.08 | 0.75 | % | $ | 3.76 | |||||||||||
| PowerShares Value Line Industry Rotation Portfolio Actual | $ | 1,000.00 | $ | 840.08 | 0.70 | % | $ | 3.19 | |||||||||||
| Hypothetical (5% return before expenses) | $ | 1,000.00 | $ | 1,021.32 | 0.70 | % | $ | 3.51 | |||||||||||
| PowerShares Value Line TimelinessTM Select Portfolio Actual | $ | 1,000.00 | $ | 851.24 | 0.70 | % | $ | 3.21 | |||||||||||
| Hypothetical (5% return before expenses) | $ | 1,000.00 | $ | 1,021.32 | 0.70 | % | $ | 3.51 | |||||||||||
| PowerShares Water Resources Portfolio Actual | $ | 1,000.00 | $ | 1,013.31 | 0.63 | % | $ | 3.14 | |||||||||||
| Hypothetical (5% return before expenses) | $ | 1,000.00 | $ | 1,021.67 | 0.63 | % | $ | 3.16 | |||||||||||
| PowerShares WilderHill Clean Energy Portfolio Actual | $ | 1,000.00 | $ | 903.00 | 0.69 | % | $ | 3.26 | |||||||||||
| Hypothetical (5% return before expenses) | $ | 1,000.00 | $ | 1,021.37 | 0.69 | % | $ | 3.46 | |||||||||||
| PowerShares WilderHill Progressive Energy Portfolio Actual | $ | 1,000.00 | $ | 1,075.60 | 0.70 | % | $ | 3.60 | |||||||||||
| Hypothetical (5% return before expenses) | $ | 1,000.00 | $ | 1,021.32 | 0.70 | % | $ | 3.51 | |||||||||||
(1) Expenses are calculated using the annualized expense ratio, which represents the ongoing expenses as a percentage of net assets for the six months ended April 30, 2009. Expenses are calculated by multiplying the Fund's annualized expense ratio by the average account value for the period; then multiplying the result by 181 and then dividing the result by 365. Expense ratios for the most recent half-year may differ from expense ratios based on the annualized data in the Financial Highlights.
37
Schedule of Investments
PowerShares Aerospace & Defense Portfolio
April 30, 2009
| Number of Shares | Value | ||||||||||
| Common Stocks—100.0% | |||||||||||
| Aerospace/Defense—56.4% | |||||||||||
| 26,439 | AAR Corp.* | $ | 398,436 | ||||||||
| 14,572 | Aerovironment, Inc.* | 344,774 | |||||||||
| 22,344 | Alliant Techsystems, Inc.* | 1,779,700 | |||||||||
| 14,841 | Argon ST, Inc.* | 302,608 | |||||||||
| 211,713 | Boeing (The) Co. | 8,479,105 | |||||||||
| 18,263 | Cubic Corp. | 524,331 | |||||||||
| 7,181 | Ducommun, Inc. | 124,375 | |||||||||
| 28,748 | Elbit Systems Ltd. (Israel) | 1,414,114 | |||||||||
| 20,283 | Esterline Technologies Corp.* | 534,457 | |||||||||
| 134,550 | General Dynamics Corp. | 6,952,199 | |||||||||
| 84,492 | Goodrich Corp. | 3,741,306 | |||||||||
| 9,264 | Herley Industries, Inc.* | 95,790 | |||||||||
| 61,517 | L-3 Communications Holdings, Inc. | 4,684,520 | |||||||||
| 112,630 | Lockheed Martin Corp. | 8,844,833 | |||||||||
| 29,068 | Moog, Inc., Class A* | 778,441 | |||||||||
| 114,027 | Northrop Grumman Corp. | 5,513,205 | |||||||||
| 39,054 | Orbital Sciences Corp.* | 603,775 | |||||||||
| 139,447 | Raytheon Co. | 6,307,188 | |||||||||
| 107,935 | Rockwell Collins, Inc. | 4,139,307 | |||||||||
| 24,609 | Teledyne Technologies, Inc.* | 785,765 | |||||||||
| 11,326 | Triumph Group, Inc. | 468,104 | |||||||||
| 180,005 | United Technologies Corp. | 8,791,443 | |||||||||
| 65,607,776 | |||||||||||
| Auto Manufacturers—0.7% | |||||||||||
| 46,677 | Force Protection, Inc.* | 355,679 | |||||||||
| 50,854 | Oshkosh Corp. | 488,198 | |||||||||
| 843,877 | |||||||||||
| Commercial Services—4.2% | |||||||||||
| 38,943 | DynCorp International, Inc., Class A* | 593,881 | |||||||||
| 236,473 | SAIC, Inc.* | 4,280,161 | |||||||||
| 4,874,042 | |||||||||||
| Computers—4.9% | |||||||||||
| 20,447 | CACI International, Inc., Class A* | 808,679 | |||||||||
| 103,424 | Computer Sciences Corp.* | 3,822,551 | |||||||||
| 11,798 | Integral Systems, Inc.* | 78,221 | |||||||||
| 15,504 | Mercury Computer Systems, Inc.* | 125,892 | |||||||||
| 9,159 | NCI, Inc., Class A* | 223,113 | |||||||||
| 38,402 | SRA International, Inc., Class A* | 591,007 | |||||||||
| 5,649,463 | |||||||||||
| Electronics—8.2% | |||||||||||
| 6,221 | American Science & Engineering, Inc. | 374,877 | |||||||||
| 7,707 | Axsys Technologies, Inc.* | 323,000 | |||||||||
| 61,201 | Cogent, Inc.* | 694,019 | |||||||||
| 96,803 | FLIR Systems, Inc.* | 2,147,091 | |||||||||
| 136,802 | Garmin Ltd. | 3,446,043 | |||||||||
| 59,080 | L-1 Identity Solutions, Inc.* | 432,466 | |||||||||
| 11,803 | OSI Systems, Inc.* | 221,306 | |||||||||
| 42,252 | Taser International, Inc.* | 202,810 | |||||||||
| 81,301 | Trimble Navigation Ltd.* | 1,743,093 | |||||||||
| 9,584,705 | |||||||||||
| Number of Shares | Value | ||||||||||
| Common Stocks (Continued) | |||||||||||
| Engineering & Construction—2.6% | |||||||||||
| 16,079 | Stanley, Inc.* | $ | 414,517 | ||||||||
| 57,999 | URS Corp.* | 2,555,435 | |||||||||
| 3,503 | VSE Corp. | 104,705 | |||||||||
| 3,074,657 | |||||||||||
| Metal Fabricate/Hardware—4.4% | |||||||||||
| 10,863 | Ladish Co., Inc.* | 82,233 | |||||||||
| 67,933 | Precision Castparts Corp. | 5,085,464 | |||||||||
| 5,167,697 | |||||||||||
| Miscellaneous Manufacturing—12.5% | |||||||||||
| 17,651 | Ceradyne, Inc.* | 304,303 | |||||||||
| 256,220 | Honeywell International, Inc. | 7,996,627 | |||||||||
| 106,125 | ITT Corp. | 4,352,186 | |||||||||
| 179,985 | Textron, Inc. | 1,931,239 | |||||||||
| 14,584,355 | |||||||||||
| Packaging & Containers—2.1% | |||||||||||
| 64,019 | Ball Corp. | 2,414,797 | |||||||||
| Software—0.8% | |||||||||||
| 24,254 | ManTech International Corp., Class A* | 877,752 | |||||||||
| Telecommunications—3.2% | |||||||||||
| 8,878 | Applied Signal Technology, Inc. | 175,429 | |||||||||
| 12,496 | GeoEye, Inc.* | 311,025 | |||||||||
| 91,220 | Harris Corp. | 2,789,509 | |||||||||
| 21,175 | ViaSat, Inc.* | 486,813 | |||||||||
| 3,762,776 | |||||||||||
| Total Common Stocks (Cost $199,215,244) | 116,441,897 | ||||||||||
| Money Market Fund—0.1% | |||||||||||
| 101,128 | Goldman Sachs Financial Square Prime Obligations Institutional Share Class (Cost $101,128) | 101,128 | |||||||||
| Total Investments (Cost $199,316,372)—100.1% | 116,543,025 | ||||||||||
| Liabilities in excess of other assets—(0.1%) | (113,551 | ) | |||||||||
| Net Assets—100.0% | $ | 116,429,474 | |||||||||
* Non-income producing security.
See Notes to Financial Statements.
38
Schedule of Investments
PowerShares CleantechTM Portfolio
April 30, 2009
| Number of Shares | Value | ||||||||||
| Common Stocks and Other Equity Interests—100.0% | |||||||||||
| Auto Parts & Equipment—0.8% | |||||||||||
| 36,315 | Fuel Systems Solutions, Inc.* | $ | 554,530 | ||||||||
| 54,017 | Westport Innovations, Inc. (Canada)* | 272,790 | |||||||||
| 827,320 | |||||||||||
| Biotechnology—2.8% | |||||||||||
| 44,110 | Martek Biosciences Corp. | 803,684 | |||||||||
| 34,952 | Novozymes A/S, Class B (Denmark) | 2,360,248 | |||||||||
| 3,163,932 | |||||||||||
| Building Materials—1.6% | |||||||||||
| 231,083 | Kingspan Group PLC (Ireland) | 1,196,895 | |||||||||
| 28,064 | WaterFurnace Renewable Energy, Inc. (Canada) | 531,470 | |||||||||
| 1,728,365 | |||||||||||
| Chemicals—1.5% | |||||||||||
| 817 | Gurit Holding AG (Switzerland) | 331,856 | |||||||||
| 79,543 | Landec Corp.* | 537,710 | |||||||||
| 71,365 | Plant Health Care PLC (United Kingdom)* | 213,153 | |||||||||
| 66,756 | Zoltek Cos., Inc.* | 525,370 | |||||||||
| 1,608,089 | |||||||||||
| Computers—0.6% | |||||||||||
| 38,348 | Telvent GIT S.A. (Spain) | 623,922 | |||||||||
| Electric—1.1% | |||||||||||
| 35,857 | Ormat Technologies, Inc. | 1,262,166 | |||||||||
| Electrical Components & Equipment—19.1% | |||||||||||
| 37,871 | American Superconductor Corp.* | 973,285 | |||||||||
| 737,350 | China High Speed Transmission Equipment Group Co., Ltd. (China) | 1,317,327 | |||||||||
| 460,755 | Chloride Group PLC (United Kingdom) | 1,111,182 | |||||||||
| 61,339 | Energy Conversion Devices, Inc.* | 1,127,411 | |||||||||
| 64,512 | EnerSys* | 1,099,930 | |||||||||
| 189,907 | Gamesa Corporacion Tecnologica S.A. (Spain) | 3,589,808 | |||||||||
| 31,945 | Saft Groupe S.A. (France)* | 979,214 | |||||||||
| 41,132 | Schneider Electric S.A. (France) | 3,134,812 | |||||||||
| 81,619 | SunPower Corp., Class A* | 2,234,728 | |||||||||
| 105,719 | Suntech Power Holdings Co. Ltd. ADR (China)* | 1,578,385 | |||||||||
| 64,626 | Vestas Wind Systems A/S (Denmark)* | 4,201,463 | |||||||||
| 21,347,545 | |||||||||||
| Electronics—9.4% | |||||||||||
| 25,894 | Badger Meter, Inc. | 1,008,830 | |||||||||
| 25,336 | Dionex Corp.* | 1,596,168 | |||||||||
| 58,200 | Horiba Ltd. (Japan) | 1,064,676 | |||||||||
| 37,166 | Itron, Inc.* | 1,709,636 | |||||||||
| 27,618 | Roth & Rau AG (Germany)* | 659,014 | |||||||||
| 112,600 | Trimble Navigation Ltd.* | 2,414,144 | |||||||||
| 14,306 | Vaisala Oyj, Class A (Finland) | 453,442 | |||||||||
| 81,636 | Woodward Governor Co. | 1,629,455 | |||||||||
| 10,535,365 | |||||||||||
| Number of Shares | Value | ||||||||||
| Common Stocks and Other Equity Interests (Continued) | |||||||||||
| Energy - Alternate Sources—9.2% | |||||||||||
| 13,101,000 | Energy Development Corp. (Philippines) | $ | 973,409 | ||||||||
| 18,883 | First Solar, Inc.* | 3,536,596 | |||||||||
| 172,777 | GT Solar International, Inc.* | 1,224,989 | |||||||||
| 668,590 | Iberdrola Renovables S.A. (Spain)* | 2,719,121 | |||||||||
| 132,850 | Renewable Energy Corp. A/S (Norway)* | 1,198,055 | |||||||||
| 31,749 | Solar Millennium AG (Germany)* | 645,303 | |||||||||
| 10,297,473 | |||||||||||
| Engineering & Construction—5.1% | |||||||||||
| 216,111 | ABB Ltd. (Switzerland) | 3,065,788 | |||||||||
| 72,752 | Arcadis N.V. (Netherlands) | 1,073,592 | |||||||||
| 34,688 | Grontmij CVA (Netherlands) | 764,323 | |||||||||
| 54,174 | Insituform Technologies, Inc., Class A* | 830,487 | |||||||||
| 5,734,190 | |||||||||||
| Environmental Control—10.8% | |||||||||||
| 319,616 | Accsys Technologies PLC (United Kingdom) | 498,699 | |||||||||
| 57,579 | Asahi Holdings, Inc. (Japan)* | 798,855 | |||||||||
| 32,123 | BWT AG (Austria) | 635,946 | |||||||||
| 77,669 | Energy Recovery, Inc.* | 612,032 | |||||||||
| 42,479 | Fuel Tech, Inc.* | 556,900 | |||||||||
| 632,000 | Hyflux Ltd. (Singapore) | 773,805 | |||||||||
| 125,900 | Kurita Water Industries Ltd. (Japan) | 3,074,155 | |||||||||
| 140,102 | Nalco Holding Co. | 2,286,465 | |||||||||
| 80,678 | Tetra Tech, Inc.* | 1,981,452 | |||||||||
| 221,600 | Tomra Systems ASA (Norway) | 818,144 | |||||||||
| 12,036,453 | |||||||||||
| Hand/Machine Tools—2.0% | |||||||||||
| 62,632 | Baldor Electric Co. | 1,453,062 | |||||||||
| 5,819 | Meyer Burger Technology AG (Switzerland)* | 799,148 | |||||||||
| 2,252,210 | |||||||||||
| Healthcare - Services—0.8% | |||||||||||
| 16,754 | Eurofins Scientific (France) | 927,865 | |||||||||
| Machinery - Diversified—3.5% | |||||||||||
| 34,476 | Kadant, Inc.* | 425,434 | |||||||||
| 22,689 | Lindsay Corp. | 882,829 | |||||||||
| 58,013 | Roper Industries, Inc. | 2,644,813 | |||||||||
| 3,953,076 | |||||||||||
| Miscellaneous Manufacturing—15.1% | |||||||||||
| 67,736 | CLARCOR, Inc. | 2,105,235 | |||||||||
| 76,380 | Donaldson Co., Inc. | 2,519,776 | |||||||||
| 31,335 | ESCO Technologies, Inc.* | 1,302,909 | |||||||||
| 443,100 | Hansen Transmissions International N.V. (Belgium)* | 966,532 | |||||||||
| 118,226 | Hexcel Corp.* | 1,133,787 | |||||||||
| 100,351 | Pall Corp. | 2,650,270 | |||||||||
| 55,627 | Polypore International, Inc.* | 419,428 | |||||||||
| 51,904 | Siemens AG (Germany) | 3,495,030 | |||||||||
| 48,674 | SPX Corp. | 2,247,279 | |||||||||
| 16,840,246 | |||||||||||
See Notes to Financial Statements.
39
Schedule of Investments (Continued)
PowerShares CleantechTM Portfolio
April 30, 2009
| Number of Shares | Value | ||||||||||
| Common Stocks and Other Equity Interests (Continued) | |||||||||||
| Office Furnishings—0.8% | |||||||||||
| 144,623 | Interface, Inc., Class A | $ | 837,367 | ||||||||
| Semiconductors—6.0% | |||||||||||
| 27,683 | Centrotherm Photovoltaics AG (Germany)* | 1,073,869 | |||||||||
| 88,773 | Cree, Inc.* | 2,431,492 | |||||||||
| 134,715 | MEMC Electronic Materials, Inc.* | 2,182,383 | |||||||||
| 46,295 | Power Integrations, Inc. | 986,084 | |||||||||
| 6,673,828 | |||||||||||
| Software—4.9% | |||||||||||
| 82,925 | ANSYS, Inc.* | 2,290,389 | |||||||||
| 158,640 | Autodesk, Inc.* | 3,163,281 | |||||||||
| 5,453,670 | |||||||||||
| Telecommunications—4.9% | |||||||||||
| 218,960 | Corning, Inc. | 3,201,195 | |||||||||
| 27,631 | RuggedCom, Inc. (Canada)* | 605,133 | |||||||||
| 121,100 | Tandberg ASA (Norway) | 1,700,947 | |||||||||
| 5,507,275 | |||||||||||
| | Total Common Stocks and Other Equity Interests (Cost $152,126,708) | 111,610,357 | |||||||||
| Money Market Fund—0.0% | |||||||||||
| 22,463 | Goldman Sachs Financial Square Prime Obligations Institutional Share Class (Cost $22,463) | 22,463 | |||||||||
| Total Investments (Cost $152,149,171)—100.0% | 111,632,820 | ||||||||||
| Other assets less liabilities—0.0% | 40,698 | ||||||||||
| Net Assets—100.0% | $ | 111,673,518 | |||||||||
ADR American Depositary Receipt.
CVA Dutch Certificate.
* Non-income producing security.
See Notes to Financial Statements.
40
Schedule of Investments
PowerShares DWA Technical LeadersTM Portfolio
April 30, 2009
| Number of Shares | Value | ||||||||||
| Common Stocks and Other Equity Interests—100.1% | |||||||||||
| Consumer Discretionary—13.4% | |||||||||||
| 10,128 | Apollo Group, Inc., Class A* | $ | 637,558 | ||||||||
| 52,771 | AutoNation, Inc.* | 934,574 | |||||||||
| 3,992 | AutoZone, Inc.* | 664,229 | |||||||||
| 49,138 | Brinker International, Inc. | 870,725 | |||||||||
| 16,264 | Dollar Tree, Inc.* | 688,618 | |||||||||
| 21,119 | Family Dollar Stores, Inc. | 700,940 | |||||||||
| 7,469 | ITT Educational Services, Inc.* | 752,651 | |||||||||
| 27,919 | John Wiley & Sons, Inc., Class A | 946,454 | |||||||||
| 17,256 | McDonald's Corp. | 919,572 | |||||||||
| 26,366 | NIKE, Inc., Class B | 1,383,424 | |||||||||
| 75,762 | O'Reilly Automotive, Inc.* | 2,943,354 | |||||||||
| 17,419 | Priceline.com, Inc.* | 1,691,211 | |||||||||
| 20,538 | Sherwin-Williams (The) Co. | 1,163,272 | |||||||||
| 50,435 | Staples, Inc. | 1,039,970 | |||||||||
| 17,522 | VF Corp. | 1,038,529 | |||||||||
| 66,621 | Yum! Brands, Inc. | 2,221,810 | |||||||||
| 18,596,891 | |||||||||||
| Consumer Staples—4.1% | |||||||||||
| 95,106 | Altria Group, Inc. | 1,553,080 | |||||||||
| 23,324 | BJ's Wholesale Club, Inc.* | 777,622 | |||||||||
| 21,437 | Brown-Forman Corp., Class B | 996,821 | |||||||||
| 26,610 | CVS Caremark Corp. | 845,666 | |||||||||
| 26,482 | Hormel Foods Corp. | 828,622 | |||||||||
| 12,759 | PepsiCo, Inc. | 634,888 | |||||||||
| 5,636,699 | |||||||||||
| Energy—4.8% | |||||||||||
| 53,066 | Atwood Oceanics, Inc.* | 1,184,433 | |||||||||
| 10,089 | Chevron Corp. | 666,883 | |||||||||
| 10,679 | Exxon Mobil Corp. | 711,969 | |||||||||
| 39,344 | Noble Energy, Inc. | 2,232,772 | |||||||||
| 13,054 | SEACOR Holdings, Inc.* | 857,909 | |||||||||
| 28,587 | Southwestern Energy Co.* | 1,025,130 | |||||||||
| 6,679,096 | |||||||||||
| Financials—6.2% | |||||||||||
| 2,863 | Alleghany Corp.* | 726,229 | |||||||||
| 20,461 | Commerce Bancshares, Inc. | 677,259 | |||||||||
| 24,728 | Digital Realty Trust, Inc. REIT | 890,455 | |||||||||
| 67,479 | First Horizon National Corp. | 776,683 | |||||||||
| 58,535 | HCC Insurance Holdings, Inc. | 1,400,157 | |||||||||
| 13,183 | PartnerRe Ltd. | 898,949 | |||||||||
| 95,491 | People's United Financial, Inc. | 1,491,569 | |||||||||
| 33,991 | RenaissanceRe Holdings Ltd. (Bermuda) | 1,654,003 | |||||||||
| 8,515,304 | |||||||||||
| Health Care—12.3% | |||||||||||
| 15,917 | Becton Dickinson & Co. | 962,660 | |||||||||
| 20,348 | C.R. Bard, Inc. | 1,457,527 | |||||||||
| 46,597 | DENTSPLY International, Inc. | 1,333,606 | |||||||||
| 28,818 | Edwards Lifesciences Corp.* | 1,826,485 | |||||||||
| Number of Shares | Value | ||||||||||
| Common Stocks and Other Equity Interests (Continued) | |||||||||||
| 31,488 | Gen-Probe, Inc.* | $ | 1,516,462 | ||||||||
| 94,798 | Gilead Sciences, Inc.* | 4,341,749 | |||||||||
| 56,095 | Henry Schein, Inc.* | 2,302,139 | |||||||||
| 11,797 | Laboratory Corp. of America Holdings* | 756,778 | |||||||||
| 20,166 | Medco Health Solutions, Inc.* | 878,229 | |||||||||
| 26,225 | Thermo Fisher Scientific, Inc.* | 919,973 | |||||||||
| 23,864 | Vertex Pharmaceuticals, Inc.* | 735,488 | |||||||||
| 17,031,096 | |||||||||||
| Industrials—23.2% | |||||||||||
| 68,714 | AMETEK, Inc. | 2,213,278 | |||||||||
| 66,891 | C.H. Robinson Worldwide, Inc. | 3,555,925 | |||||||||
| 31,527 | Copart, Inc.* | 989,633 | |||||||||
| 19,948 | Danaher Corp. | 1,165,761 | |||||||||
| 39,446 | Donaldson Co., Inc. | 1,301,324 | |||||||||
| 20,448 | Dun & Bradstreet (The) Corp. | 1,664,467 | |||||||||
| 27,316 | Flowserve Corp. | 1,854,756 | |||||||||
| 21,527 | FTI Consulting, Inc.* | 1,181,402 | |||||||||
| 17,753 | Goodrich Corp. | 786,103 | |||||||||
| 34,838 | IDEX Corp. | 879,659 | |||||||||
| 41,855 | Iron Mountain, Inc.* | 1,192,449 | |||||||||
| 30,770 | ITT Corp. | 1,261,878 | |||||||||
| 43,747 | Kirby Corp.* | 1,350,032 | |||||||||
| 16,046 | Northrop Grumman Corp. | 775,824 | |||||||||
| 50,794 | PACCAR, Inc. | 1,800,139 | |||||||||
| 27,342 | Precision Castparts Corp. | 2,046,822 | |||||||||
| 36,674 | Roper Industries, Inc. | 1,671,968 | |||||||||
| 95,428 | Stericycle, Inc.* | 4,492,749 | |||||||||
| 15,378 | United Technologies Corp. | 751,062 | |||||||||
| 14,351 | W.W. Grainger, Inc. | 1,203,762 | |||||||||
| 32,138,993 | |||||||||||
| Information Technology—12.2% | |||||||||||
| 40,114 | Amphenol Corp., Class A | 1,357,458 | |||||||||
| 42,322 | Apple, Inc* | 5,325,376 | |||||||||
| 21,014 | BMC Software, Inc.* | 728,555 | |||||||||
| 315,420 | Cypress Semiconductor Corp.* | 2,501,281 | |||||||||
| 21,636 | Dolby Laboratories, Inc., Class A* | 868,253 | |||||||||
| 20,757 | Factset Research Systems, Inc. | 1,112,368 | |||||||||
| 20,551 | Fiserv, Inc.* | 766,963 | |||||||||
| 6,954 | Mastercard, Inc., Class A | 1,275,711 | |||||||||
| 36,834 | Oracle Corp. | 712,370 | |||||||||
| 29,601 | Salesforce.com, Inc.* | 1,267,219 | |||||||||
| 40,565 | Western Digital Corp.* | 954,089 | |||||||||
| 16,869,643 | |||||||||||
| Materials—11.2% | |||||||||||
| 14,556 | Air Products & Chemicals, Inc. | 959,240 | |||||||||
| 81,730 | Airgas, Inc. | 3,524,197 | |||||||||
| 36,264 | AptarGroup, Inc. | 1,125,272 | |||||||||
| 53,772 | Ball Corp. | 2,028,280 | |||||||||
| 24,762 | Ecolab, Inc. | 954,575 | |||||||||
| 30,782 | FMC Corp. | 1,500,007 | |||||||||
See Notes to Financial Statements.
41
Schedule of Investments (Continued)
PowerShares DWA Technical LeadersTM Portfolio
April 30, 2009
| Number of Shares | Value | ||||||||||
| Common Stocks and Other Equity Interests (Continued) | |||||||||||
| 23,927 | International Flavors & Fragrances, Inc. | $ | 746,522 | ||||||||
| 22,272 | Praxair, Inc. | 1,661,714 | |||||||||
| 19,576 | Scotts Miracle-Gro (The) Co., Class A | 661,082 | |||||||||
| 35,301 | Sigma-Aldrich Corp. | 1,547,596 | |||||||||
| 35,980 | Valspar (The) Corp. | 863,520 | |||||||||
| 15,572,005 | |||||||||||
| Telecommunication Services—3.6% | |||||||||||
| 156,902 | American Tower Corp., Class A* | 4,983,208 | |||||||||
| Utilities—9.1% | |||||||||||
| 60,785 | CMS Energy Corp. | 730,636 | |||||||||
| 41,209 | Edison International | 1,174,869 | |||||||||
| 51,398 | Energen Corp. | 1,856,496 | |||||||||
| 65,607 | EQT Corp. | 2,206,363 | |||||||||
| 19,845 | FPL Group, Inc. | 1,067,463 | |||||||||
| 43,708 | PG&E Corp. | 1,622,441 | |||||||||
| 21,822 | Sempra Energy | 1,004,248 | |||||||||
| 60,434 | UGI Corp. | 1,386,356 | |||||||||
| 20,218 | Wisconsin Energy Corp. | 807,911 | |||||||||
| 40,307 | Xcel Energy, Inc. | 743,261 | |||||||||
| 12,600,044 | |||||||||||
| Total Common Stocks and Other Equity Interests (Cost $139,871,136) | 138,622,979 | ||||||||||
| Money Market Fund—0.0% | |||||||||||
| 36,585 | Goldman Sachs Financial Square Prime Obligations Institutional Share Class (Cost $36,585) | 36,585 | |||||||||
| Total Investments (Cost $139,907,721)—100.1% | 138,659,564 | ||||||||||
| Liabilities in excess of other assets—(0.1%) | (110,667 | ) | |||||||||
| Net Assets—100.0% | $ | 138,548,897 | |||||||||
REIT Real Estate Investment Trust.
* Non-income producing security.
See Notes to Financial Statements.
42
Schedule of Investments
PowerShares Golden Dragon Halter USX China Portfolio
April 30, 2009
| Number of Shares | Value | ||||||||||
| Common Stocks—99.9% | |||||||||||
| Bermuda—0.5% | |||||||||||
| 106,969 | China Yuchai International Ltd. | $ | 842,916 | ||||||||
| 127,500 | Global Sources Ltd.* | 567,375 | |||||||||
| 1,410,291 | |||||||||||
| Cayman Islands—8.7% | |||||||||||
| 61,740 | 3SBio, Inc. ADR* | 437,119 | |||||||||
| 242,886 | Actions Semiconductor Co. Ltd. ADR* | 422,622 | |||||||||
| 159,670 | China Digital TV Holding Co. Ltd. ADR | 1,334,841 | |||||||||
| 91,995 | China Medical Technologies, Inc. ADR | 1,797,582 | |||||||||
| 298,406 | China Nepstar Chain Drugstore Ltd. ADR | 1,503,966 | |||||||||
| 124,142 | China Techfaith Wireless Communication Technology Ltd. ADR* | 194,903 | |||||||||
| 130,958 | CNinsure, Inc. ADR* | 997,900 | |||||||||
| 228,557 | E-House China Holdings Ltd. ADR* | 2,831,821 | |||||||||
| 145,184 | Longtop Financial Technologies Ltd. ADR* | 3,435,054 | |||||||||
| 106,505 | New Oriental Education & Technology Group ADR* | 5,642,635 | |||||||||
| 109,618 | Noah Education Holdings Ltd. ADR | 344,201 | |||||||||
| 32,439 | Perfect World Co. Ltd. ADR* | 589,092 | |||||||||
| 1,280,641 | Semiconductor Manufacturing International Corp. ADR* | 2,510,056 | |||||||||
| 84,101 | Trina Solar Ltd. ADR* | 1,189,188 | |||||||||
| 188,036 | WuXi PharmaTech Cayman, Inc. ADR* | 1,084,968 | |||||||||
| 24,315,948 | |||||||||||
| China—71.4% | |||||||||||
| 80,972 | 51job, Inc. ADR* | 648,586 | |||||||||
| 86,836 | Acorn International, Inc. ADR* | 281,349 | |||||||||
| 109,935 | AgFeed Industries, Inc.* | 402,362 | |||||||||
| 181,403 | Agria Corp. ADR* | 321,083 | |||||||||
| 191,513 | Airmedia Group, Inc. ADR* | 1,075,346 | |||||||||
| 645,891 | Aluminum Corp. of China Ltd. ADR | 12,420,484 | |||||||||
| 62,255 | ATA, Inc. ADR* | 305,050 | |||||||||
| 59,374 | Baidu, Inc. ADR* | 13,828,205 | |||||||||
| 115,520 | BMP Sunstone Corp.* | 450,528 | |||||||||
| 102,088 | Canadian Solar, Inc.* | 668,676 | |||||||||
| 150,573 | China Architectural Engineering, Inc.* | 233,388 | |||||||||
| 139,450 | China Eastern Airlines Corp. Ltd. ADR* | 2,355,311 | |||||||||
| 62,895 | China Finance Online Co. Ltd. ADR* | 737,129 | |||||||||
| 214,586 | China Life Insurance Co. Ltd. ADR | 11,362,329 | |||||||||
| 169,877 | China Petroleum and Chemical Corp. ADR | 13,182,455 | |||||||||
| 143,211 | China Security & Surveillance Technology, Inc.* | 970,971 | |||||||||
| 375,990 | China Southern Airlines Co. Ltd. ADR* | 4,391,563 | |||||||||
| 128,099 | China Sunergy Co. Ltd. ADR* | 389,421 | |||||||||
| 265,644 | China Telecom Corp. Ltd. ADR | 13,114,844 | |||||||||
| 55,913 | ChinaEdu Corp. ADR* | 318,145 | |||||||||
| 190,372 | Ctrip.com International Ltd. ADR | 5,886,301 | |||||||||
| 36,304 | eLong, Inc. ADR* | 229,441 | |||||||||
| 371,047 | Focus Media Holding Ltd. ADR* | 2,337,596 | |||||||||
| 103,707 | General Steel Holdings, Inc.* | 603,575 | |||||||||
| 650,460 | Giant Interactive Group, Inc. ADR | 5,385,809 | |||||||||
| Number of Shares | Value | ||||||||||
| Common Stocks (Continued) | |||||||||||
| 405,918 | Guangshen Railway Co. Ltd. ADR | $ | 9,072,266 | ||||||||
| 239,007 | Gushan Enviromental Energy Ltd. ADR | 576,007 | |||||||||
| 102,020 | Home Inns & Hotels Management, Inc. ADR* | 1,405,836 | |||||||||
| 410,847 | Huaneng Power International, Inc. ADR | 11,187,364 | |||||||||
| 481,036 | JA Solar Holdings Co. Ltd. ADR* | 1,688,436 | |||||||||
| 23,523 | Jinpan International Ltd. | 462,227 | |||||||||
| 101,943 | KongZhong Corp. ADR* | 642,241 | |||||||||
| 324,084 | LDK Solar Co. Ltd. ADR* | 2,592,672 | |||||||||
| 68,971 | Linktone Ltd. ADR* | 100,698 | |||||||||
| 309,160 | Mindray Medical International Ltd. ADR | 7,055,032 | |||||||||
| 347,983 | Netease.com, Inc. ADR* | 10,502,127 | |||||||||
| 128,936 | PetroChina Co. Ltd. ADR | 11,205,828 | |||||||||
| 136,654 | Qiao Xing Mobile Communication Co. Ltd.* | 379,898 | |||||||||
| 198,800 | Shanda Interactive Entertainment Ltd. ADR* | 9,508,604 | |||||||||
| 178,361 | Simcere Pharmaceutical Group ADR* | 1,252,094 | |||||||||
| 159,082 | SINA Corp.* | 4,455,887 | |||||||||
| 206,294 | Sinopec Shanghai Petrochemical Co. Ltd. ADR | 7,011,933 | |||||||||
| 123,082 | Sinovac Biotech Ltd.* | 328,629 | |||||||||
| 154,184 | Solarfun Power Holdings Co. Ltd. ADR* | 661,449 | |||||||||
| 441,064 | Suntech Power Holdings Co. Ltd. ADR* | 6,585,086 | |||||||||
| 76,839 | The9 Ltd. ADR | 719,213 | |||||||||
| 97,130 | Tongjitang Chinese Medicines Co. ADR* | 362,295 | |||||||||
| 101,288 | Vimicro International Corp. ADR* | 184,344 | |||||||||
| 205,458 | VisionChina Media, Inc. ADR* | 1,103,309 | |||||||||
| 294,327 | WSP Holdings Ltd. ADR | 1,030,145 | |||||||||
| 206,225 | Xinyuan Real Estate Co. Ltd. ADR* | 973,382 | |||||||||
| 1,409,235 | Yanzhou Coal Mining Co. Ltd. ADR | 13,486,378 | |||||||||
| 363,664 | Yingli Green Energy Holding Co. Ltd. ADR* | 2,538,375 | |||||||||
| 50,414 | Yucheng Technologies Ltd.* | 359,452 | |||||||||
| 199,331,154 | |||||||||||
| Hong Kong—12.5% | |||||||||||
| 306,738 | CDC Corp., Class A* | 361,951 | |||||||||
| 244,186 | China Mobile Ltd. ADR | 10,539,068 | |||||||||
| 49,723 | China Natural Resources, Inc.* | 466,402 | |||||||||
| 1,022,560 | China Unicom Ltd. ADR | 11,831,019 | |||||||||
| 102,654 | CNOOC Ltd. ADR | 11,430,523 | |||||||||
| 128,603 | Nam Tai Electronics, Inc. | 532,416 | |||||||||
| 35,161,379 | |||||||||||
| United States—6.8% | |||||||||||
| 157,240 | Advanced Battery Technologies, Inc.* | 432,410 | |||||||||
| 48,571 | American Dairy, Inc.* | 767,908 | |||||||||
| 93,712 | A-Power Energy Generation Systems Ltd.* | 773,124 | |||||||||
| 124,599 | AsiaInfo Holdings, Inc.* | 2,087,033 | |||||||||
| 77,450 | China Automotive Systems, Inc.* | 375,633 | |||||||||
| 165,560 | China BAK Battery, Inc.* | 352,643 | |||||||||
| 79,044 | China Fire & Security Group, Inc.* | 870,274 | |||||||||
See Notes to Financial Statements.
43
Schedule of Investments (Continued)
PowerShares Golden Dragon Halter USX China Portfolio
April 30, 2009
| Number of Shares | Value | ||||||||||
| Common Stocks (Continued) | |||||||||||
| 135,660 | China Information Security Technology, Inc.* | $ | 412,406 | ||||||||
| 133,650 | China Precision Steel, Inc.* | 208,494 | |||||||||
| 46,788 | China Sky One Medical, Inc.* | 660,179 | |||||||||
| 102,321 | ChinaCast Education Corp.* | 454,817 | |||||||||
| 41,955 | Chindex International, Inc.* | 343,611 | |||||||||
| 100,945 | Cogo Group, Inc.* | 825,730 | |||||||||
| 78,945 | Fushi Copperweld, Inc.* | 401,041 | |||||||||
| 63,162 | Fuqi International, Inc.* | 396,657 | |||||||||
| 63,446 | Harbin Electric, Inc.* | 506,299 | |||||||||
| 126,129 | HLS Systems International Ltd.* | 542,355 | |||||||||
| 155,576 | Shengda Tech, Inc.* | 563,185 | |||||||||
| 109,209 | Sohu.com, Inc.* | 5,695,249 | |||||||||
| 108,945 | Sutor Technology Group Ltd.* | 245,126 | |||||||||
| 204,754 | Tiens Biotech Group USA, Inc.* | 429,983 | |||||||||
| 363,292 | UTStarcom, Inc.* | 425,052 | |||||||||
| 77,384 | Wonder Auto Technology, Inc.* | 520,794 | |||||||||
| 79,005 | Zhongpin, Inc.* | 691,294 | |||||||||
| 18,981,297 | |||||||||||
| Total Common Stocks (Cost $462,626,621) | 279,200,069 | ||||||||||
| Money Market Fund—0.0% | |||||||||||
| 47,639 | Goldman Sachs Financial Square Prime Obligations Institutional Share Class (Cost $47,639) | 47,639 | |||||||||
| Total Investments (Cost $462,674,260)—99.9% | 279,247,708 | ||||||||||
| Other assets less liabilities—0.1% | 242,584 | ||||||||||
| Net Assets—100.0% | $ | 279,490,292 | |||||||||
ADR American Depositary Receipt.
* Non-income producing security.
See Notes to Financial Statements.
44
Schedule of Investments
PowerShares Listed Private Equity Portfolio
April 30, 2009
| Number of Shares | Value | ||||||||||
| Common Stocks and Other Equity Interests—100.0% | |||||||||||
| Banks—3.9% | |||||||||||
| 114,655 | SVB Financial Group* | $ | 2,380,238 | ||||||||
| Commercial Services—1.6% | |||||||||||
| 394,832 | Macquarie Infrastructure Co. LLC | 979,183 | |||||||||
| Diversified Financial Services—11.5% | |||||||||||
| 46,266 | Affiliated Managers Group, Inc.* | 2,630,222 | |||||||||
| 104,093 | Evercore Partners, Inc., Class A | 1,965,276 | |||||||||
| 30,654 | Greenhill & Co., Inc. | 2,376,605 | |||||||||
| 6,972,103 | |||||||||||
| Electric—4.6% | |||||||||||
| 125,370 | Otter Tail Corp. | 2,780,707 | |||||||||
| Holding Companies - Diversified—15.8% | |||||||||||
| 247,224 | Compass Diversified Holdings | 2,210,183 | |||||||||
| 345,921 | Leucadia National Corp.* | 7,343,902 | |||||||||
| 9,554,085 | |||||||||||
| Internet—3.9% | |||||||||||
| 313,168 | Internet Capital Group, Inc.* | 1,700,502 | |||||||||
| 746,238 | Safeguard Scientifics, Inc.* | 679,077 | |||||||||
| 2,379,579 | |||||||||||
| Investment Companies—54.3% | |||||||||||
| 1,419,470 | Allied Capital Corp. | 3,491,895 | |||||||||
| 1,047,678 | American Capital Ltd. | 3,237,324 | |||||||||
| 530,841 | Apollo Investment Corp. | 2,548,037 | |||||||||
| 450,348 | Ares Capital Corp. | 2,643,543 | |||||||||
| 342,120 | BlackRock Kelso Capital Corp. | 1,994,560 | |||||||||
| 29,639 | Capital Southwest Corp. | 2,304,729 | |||||||||
| 176,623 | Fifth Street Finance Corp. | 1,324,673 | |||||||||
| 186,292 | Gladstone Capital Corp. | 1,250,019 | |||||||||
| 164,007 | Gladstone Investment Corp. | 596,985 | |||||||||
| 184,253 | Harris & Harris Group, Inc.* | 891,785 | |||||||||
| 292,229 | Hercules Technology Growth Capital, Inc. | 1,756,296 | |||||||||
| 88,250 | Kayne Anderson Energy Development Co. | 962,808 | |||||||||
| 170,113 | Kohlberg Capital Corp. | 605,602 | |||||||||
| 586,663 | MCG Capital Corp. | 1,032,527 | |||||||||
| 203,886 | MVC Capital, Inc. | 1,745,264 | |||||||||
| 215,498 | NGP Capital Resources Co. | 1,512,796 | |||||||||
| 155,034 | PennantPark Investment Corp. | 851,137 | |||||||||
| 249,001 | Prospect Capital Corp. | 2,258,439 | |||||||||
| 224,771 | TICC Capital Corp. | 892,341 | |||||||||
| 58,117 | Tortoise Capital Resources Corp. | 348,121 | |||||||||
| 87,448 | UTEK Corp.* | 568,412 | |||||||||
| 32,817,293 | |||||||||||
| Number of Shares | Value | ||||||||||
| Common Stocks and Other Equity Interests (Continued) | |||||||||||
| Water—4.4% | |||||||||||
| 87,439 | Pico Holdings, Inc.* | $ | 2,623,170 | ||||||||
| Total Common Stocks and Other Equity Interests (Cost $76,355,334) | 60,486,358 | ||||||||||
| Money Market Fund—2.2% | |||||||||||
| 1,333,551 | Goldman Sachs Financial Square Prime Obligations Institutional Share Class (Cost $1,333,551) | 1,333,551 | |||||||||
| Total Investments (Cost $77,688,885)—102.2% | 61,819,909 | ||||||||||
| Liabilities in excess of other assets—(2.2%) | (1,343,978 | ) | |||||||||
| Net Assets—100.0% | $ | 60,475,931 | |||||||||
* Non-income producing security.
See Notes to Financial Statements.
45
Schedule of Investments
PowerShares Lux Nanotech Portfolio
April 30, 2009
| Number of Shares | Value | ||||||||||
| Common Stocks and Other Equity Interests—100.2% | |||||||||||
| Auto Manufacturers—3.9% | |||||||||||
| 19,411 | Toyota Motor Corp. ADR (Japan) | $ | 1,536,575 | ||||||||
| Biotechnology—4.2% | |||||||||||
| 470,375 | Nanosphere, Inc.* | 1,646,313 | |||||||||
| Chemicals—18.6% | |||||||||||
| 21,742 | Air Products & Chemicals, Inc. | 1,432,798 | |||||||||
| 55,452 | E.I. du Pont de Nemours & Co. | 1,547,111 | |||||||||
| 678,650 | ShengdaTech, Inc.* | 2,456,712 | |||||||||
| 396,351 | Symyx Technologies, Inc.* | 1,918,338 | |||||||||
| 7,354,959 | |||||||||||
| Commercial Services—7.0% | |||||||||||
| 2,368,055 | Altair Nanotechnologies, Inc.* | 2,746,944 | |||||||||
| Computers—7.0% | |||||||||||
| 39,216 | Hewlett-Packard Co. | 1,410,991 | |||||||||
| 13,180 | International Business Machines Corp. | 1,360,308 | |||||||||
| 2,771,299 | |||||||||||
| Electrical Components & Equipment—4.7% | |||||||||||
| 311,469 | Ener1, Inc.* | 1,834,552 | |||||||||
| Electronics—13.0% | |||||||||||
| 149,796 | FEI Co.* | 2,573,495 | |||||||||
| 67,108 | NVE Corp.* | 2,552,788 | |||||||||
| 5,126,283 | |||||||||||
| Energy - Alternate Sources—4.0% | |||||||||||
| 627,611 | Headwaters, Inc.* | 1,581,580 | |||||||||
| Investment Companies—4.5% | |||||||||||
| 370,484 | Harris & Harris Group, Inc.* | 1,793,143 | |||||||||
| Miscellaneous Manufacturing—7.6% | |||||||||||
| 25,512 | 3M Co. | 1,469,491 | |||||||||
| 119,450 | General Electric Co. | 1,511,043 | |||||||||
| 2,980,534 | |||||||||||
| Pharmaceuticals—10.2% | |||||||||||
| 309,162 | Elan Corp. PLC ADR (Ireland)* | 1,827,147 | |||||||||
| 375,374 | Flamel Technologies S.A. ADR (France)* | 2,214,707 | |||||||||
| 4,041,854 | |||||||||||
| Semiconductors—9.2% | |||||||||||
| 82,302 | Intel Corp. | 1,298,726 | |||||||||
| 324,013 | Veeco Instruments, Inc.* | 2,345,854 | |||||||||
| 3,644,580 | |||||||||||
| Number of Shares | Value | ||||||||||
| Common Stocks and Other Equity Interests (Continued) | |||||||||||
| Software—6.3% | |||||||||||
| 556,493 | Accelrys, Inc.* | $ | 2,504,219 | ||||||||
| Total Investments (Cost $62,715,780)—100.2% | 39,562,835 | ||||||||||
| Liabilities in excess of other assets—(0.2%) | (78,884 | ) | |||||||||
| Net Assets—100.0% | $ | 39,483,951 | |||||||||
ADR American Depositary Receipt.
* Non-income producing security.
See Notes to Financial Statements.
46
Schedule of Investments
PowerShares NASDAQ-100 BuyWrite Portfolio
April 30, 2009
| Number of Shares | Value | ||||||||||
| Common Stocks and Other Equity Interests(<)—104.8% | |||||||||||
| Airlines—0.3% | |||||||||||
| 537 | Ryanair Holdings PLC ADR (Ireland)* | $ | 14,687 | ||||||||
| Auto Manufacturers—1.2% | |||||||||||
| 1,880 | PACCAR, Inc. | 66,627 | |||||||||
| Beverages—0.3% | |||||||||||
| 414 | Hansen Natural Corp.* | 16,875 | |||||||||
| Biotechnology—11.2% | |||||||||||
| 2,228 | Amgen, Inc.* | 107,991 | |||||||||
| 1,493 | Biogen Idec, Inc.* | 72,172 | |||||||||
| 2,105 | Celgene Corp.* | 89,926 | |||||||||
| 1,572 | Genzyme Corp.* | 83,835 | |||||||||
| 4,147 | Gilead Sciences, Inc.* | 189,932 | |||||||||
| 549 | Illumina, Inc.* | 20,505 | |||||||||
| 813 | Life Technologies Corp.* | 30,325 | |||||||||
| 833 | Vertex Pharmaceuticals, Inc.* | 25,673 | |||||||||
| 620,359 | |||||||||||
| Chemicals—0.4% | |||||||||||
| 542 | Sigma-Aldrich Corp. | 23,761 | |||||||||
| Commercial Services—2.9% | |||||||||||
| 746 | Apollo Group, Inc., Class A* | 46,961 | |||||||||
| 1,649 | Automatic Data Processing, Inc. | 58,045 | |||||||||
| 1,582 | Paychex, Inc. | 42,730 | |||||||||
| 530 | Pharmaceutical Product Development, Inc. | 10,393 | |||||||||
| 158,129 | |||||||||||
| Computers—19.2% | |||||||||||
| 5,741 | Apple, Inc.* | 722,389 | |||||||||
| 1,314 | Cognizant Technology Solutions Corp., Class A* | 32,574 | |||||||||
| 3,307 | Dell, Inc.* | 38,427 | |||||||||
| 518 | Infosys Technologies Ltd. ADR (India) | 15,960 | |||||||||
| 806 | Logitech International S.A. (Switzerland)* | 10,736 | |||||||||
| 1,598 | NetApp, Inc.* | 29,243 | |||||||||
| 2,617 | Research In Motion Ltd. (Canada)* | 181,882 | |||||||||
| 2,264 | Seagate Technology (Cayman Islands) | 18,474 | |||||||||
| 1,497 | Sun Microsystems, Inc.* | 13,713 | |||||||||
| 1,063,398 | |||||||||||
| Distribution/Wholesale—0.5% | |||||||||||
| 656 | Fastenal Co. | 25,164 | |||||||||
| Electronics—1.0% | |||||||||||
| 4,060 | Flextronics International Ltd. (Singapore)* | 15,753 | |||||||||
| 686 | FLIR Systems, Inc.* | 15,215 | |||||||||
| 860 | Garmin Ltd. | 21,664 | |||||||||
| 52,632 | |||||||||||
| Energy - Alternate Sources—1.1% | |||||||||||
| 330 | First Solar, Inc.* | 61,806 | |||||||||
| Number of Shares | Value | ||||||||||
| Common Stocks and Other Equity Interests(<) (Continued) | |||||||||||
| Engineering & Construction—0.2% | |||||||||||
| 611 | Foster Wheeler AG (Switzerland)*(>) | $ | 13,155 | ||||||||
| Environmental Control—0.4% | |||||||||||
| 414 | Stericycle, Inc.* | 19,491 | |||||||||
| Healthcare - Products—1.7% | |||||||||||
| 659 | DENTSPLY International, Inc. | 18,861 | |||||||||
| 411 | Henry Schein, Inc.* | 16,867 | |||||||||
| 1,245 | Hologic, Inc.* | 18,501 | |||||||||
| 181 | Intuitive Surgical, Inc.* | 26,015 | |||||||||
| 540 | Patterson Cos., Inc.* | 11,048 | |||||||||
| 91,292 | |||||||||||
| Internet—12.0% | |||||||||||
| 755 | Akamai Technologies, Inc.* | 16,625 | |||||||||
| 1,316 | Amazon.com, Inc.* | 105,964 | |||||||||
| 122 | Baidu, Inc. ADR (China)* | 28,414 | |||||||||
| 4,423 | eBay, Inc.* | 72,847 | |||||||||
| 1,307 | Expedia, Inc.* | 17,788 | |||||||||
| 675 | Google, Inc., Class A* | 267,279 | |||||||||
| 677 | IAC/InterActiveCorp* | 10,846 | |||||||||
| 2,515 | Liberty Media Corp. - Interactive, Class A* | 13,330 | |||||||||
| 3,967 | Symantec Corp.* | 68,431 | |||||||||
| 839 | VeriSign, Inc.* | 17,267 | |||||||||
| 3,098 | Yahoo!, Inc.* | 44,270 | |||||||||
| 663,061 | |||||||||||
| Iron/Steel—0.2% | |||||||||||
| 867 | Steel Dynamics, Inc. | 10,794 | |||||||||
| Lodging—0.4% | |||||||||||
| 620 | Wynn Resorts Ltd.* | 24,323 | |||||||||
| Machinery - Construction & Mining—0.2% | |||||||||||
| 464 | Joy Global, Inc. | 11,832 | |||||||||
| Media—4.8% | |||||||||||
| 6,671 | Comcast Corp., Class A | 103,133 | |||||||||
| 3,424 | DIRECTV Group (The), Inc.* | 84,676 | |||||||||
| 998 | DISH Network Corp., Class A* | 13,224 | |||||||||
| 662 | Liberty Global, Inc., Series A* | 10,916 | |||||||||
| 6,559 | News Corp., Class A | 54,177 | |||||||||
| 266,126 | |||||||||||
| Pharmaceuticals—4.4% | |||||||||||
| 309 | Cephalon, Inc.* | 20,273 | |||||||||
| 1,022 | Express Scripts, Inc.* | 65,377 | |||||||||
| 3,310 | Teva Pharmaceutical Industries Ltd. ADR (Israel) | 145,277 | |||||||||
| 1,157 | Warner Chilcott Ltd., Class A* | 11,327 | |||||||||
| 242,254 | |||||||||||
See Notes to Financial Statements.
47
Schedule of Investments (Continued)
PowerShares NASDAQ-100 BuyWrite Portfolio
April 30, 2009
| Number of Shares | Value | ||||||||||
| Common Stocks and Other Equity Interests(<) (Continued) | |||||||||||
| Retail—5.7% | |||||||||||
| 1,614 | Bed Bath & Beyond, Inc.* | $ | 49,098 | ||||||||
| 1,055 | Costco Wholesale Corp. | 51,273 | |||||||||
| 621 | O'Reilly Automotive, Inc.* | 24,126 | |||||||||
| 605 | Ross Stores, Inc. | 22,954 | |||||||||
| 590 | Sears Holdings Corp.* | 36,857 | |||||||||
| 2,215 | Staples, Inc. | 45,673 | |||||||||
| 4,720 | Starbucks Corp.* | 68,251 | |||||||||
| 767 | Urban Outfitters, Inc.* | 14,949 | |||||||||
| 313,181 | |||||||||||
| Semiconductors—8.2% | |||||||||||
| 1,907 | Altera Corp. | 31,103 | |||||||||
| 3,178 | Applied Materials, Inc. | 38,803 | |||||||||
| 1,797 | Broadcom Corp., Class A* | 41,672 | |||||||||
| 9,002 | Intel Corp. | 142,051 | |||||||||
| 951 | KLA-Tencor Corp. | 26,381 | |||||||||
| 599 | Lam Research Corp.* | 16,700 | |||||||||
| 1,370 | Linear Technology Corp. | 29,839 | |||||||||
| 2,705 | Marvell Technology Group Ltd. (Bermuda)* | 29,701 | |||||||||
| 1,383 | Maxim Integrated Products, Inc. | 18,740 | |||||||||
| 699 | Microchip Technology, Inc. | 16,077 | |||||||||
| 2,438 | NVIDIA Corp.* | 27,988 | |||||||||
| 1,681 | Xilinx, Inc. | 34,360 | |||||||||
| 453,415 | |||||||||||
| Software—14.8% | |||||||||||
| 5,395 | Activision Blizzard, Inc.* | 58,104 | |||||||||
| 2,375 | Adobe Systems, Inc.* | 64,956 | |||||||||
| 1,089 | Autodesk, Inc.* | 21,715 | |||||||||
| 2,303 | CA, Inc. | 39,727 | |||||||||
| 959 | Check Point Software Technologies (Israel)* | 22,220 | |||||||||
| 989 | Citrix Systems, Inc.* | 28,216 | |||||||||
| 1,499 | Electronic Arts, Inc.* | 30,505 | |||||||||
| 902 | Fiserv, Inc.* | 33,663 | |||||||||
| 1,871 | Intuit, Inc.* | 43,276 | |||||||||
| 14,143 | Microsoft Corp. | 286,536 | |||||||||
| 9,725 | Oracle Corp. | 188,082 | |||||||||
| 817,000 | |||||||||||
| Telecommunications—11.7% | |||||||||||
| 9,639 | Cisco Systems, Inc.* | 186,225 | |||||||||
| 1,586 | Juniper Networks, Inc.* | 34,337 | |||||||||
| 483 | Millicom International Cellular S.A. (Luxembourg) | 23,406 | |||||||||
| 744 | NII Holdings, Inc.* | 12,023 | |||||||||
| 9,195 | QUALCOMM, Inc. | 389,133 | |||||||||
| 645,124 | |||||||||||
| Textiles—0.4% | |||||||||||
| 848 | Cintas Corp. | 21,760 | |||||||||
| Number of Shares | Value | ||||||||||
| Common Stocks and Other Equity Interests(<) (Continued) | |||||||||||
| Transportation—1.6% | |||||||||||
| 777 | C.H. Robinson Worldwide, Inc. | $ | 41,305 | ||||||||
| 963 | Expeditors International of Washington, Inc. | 33,426 | |||||||||
| 582 | J.B. Hunt Transport Services, Inc. | 16,366 | |||||||||
| 91,097 | |||||||||||
| Total Common Stocks and Other Equity Interests (Cost $5,681,373) | 5,787,343 | ||||||||||
| Money Market Fund—0.0% | |||||||||||
| 2,849 | Goldman Sachs Financial Square Prime Obligations Institutional Share Class (Cost $2,849) | 2,849 | |||||||||
| Total Investments (Cost $5,684,222)—104.8% | 5,790,192 | ||||||||||
| Liabilities in excess of other assets—(4.8%) | (265,711 | ) | |||||||||
| Net Assets—100.0% | $ | 5,524,481 | |||||||||
ADR American Depositary Receipt.
* Non-income producing security.
(<) Except as otherwise noted, a portion of all securities in the portfolio are subject to call options written. See Note 2H.
(>) Security not subject to call options written.
See Notes to Financial Statements.
48
Schedule of Investments
PowerShares S&P 500 BuyWrite Portfolio
April 30, 2009
| Number of Shares | Value | ||||||||||
| Common Stocks and Other Equity Interests(<)—103.1% | |||||||||||
| Consumer Discretionary—9.8% | |||||||||||
| 994 | Abercrombie & Fitch Co., Class A | $ | 26,898 | ||||||||
| 3,675 | Amazon.com, Inc.* | 295,911 | |||||||||
| 1,228 | Apollo Group, Inc., Class A* | 77,303 | |||||||||
| 1,232 | AutoNation, Inc.* | 21,819 | |||||||||
| 434 | AutoZone, Inc.* | 72,213 | |||||||||
| 2,972 | Bed Bath & Beyond, Inc.* | 90,408 | |||||||||
| 3,878 | Best Buy Co., Inc. | 148,838 | |||||||||
| 936 | Big Lots, Inc.* | 25,871 | |||||||||
| 691 | Black & Decker (The) Corp. | 27,847 | |||||||||
| 5,013 | Carnival Corp. | 134,749 | |||||||||
| 7,771 | CBS Corp., Class B | 54,708 | |||||||||
| 1,420 | Centex Corp. | 15,535 | |||||||||
| 3,670 | Coach, Inc.* | 89,915 | |||||||||
| 32,965 | Comcast Corp., Class A | 509,639 | |||||||||
| 3,151 | D.R. Horton, Inc. | 41,121 | |||||||||
| 1,565 | Darden Restaurants, Inc. | 57,858 | |||||||||
| 6,055 | DIRECTV Group (The), Inc.* | 149,740 | |||||||||
| 3,069 | Eastman Kodak Co. | 9,360 | |||||||||
| 2,401 | Expedia, Inc.* | 32,678 | |||||||||
| 1,604 | Family Dollar Stores, Inc. | 53,237 | |||||||||
| 32,773 | Ford Motor Co.* | 195,983 | |||||||||
| 1,717 | Fortune Brands, Inc. | 67,495 | |||||||||
| 1,875 | GameStop Corp., Class A* | 56,550 | |||||||||
| 2,618 | Gannett Co., Inc. | 10,236 | |||||||||
| 5,338 | Gap (The), Inc. | 82,953 | |||||||||
| 6,983 | General Motors Corp. | 13,407 | |||||||||
| 1,825 | Genuine Parts Co. | 61,977 | |||||||||
| 2,758 | Goodyear Tire & Rubber (The) Co.* | 30,310 | |||||||||
| 3,887 | H&R Block, Inc. | 58,849 | |||||||||
| 2,671 | Harley-Davidson, Inc. | 59,189 | |||||||||
| 670 | Harman International Industries, Inc. | 12,187 | |||||||||
| 1,414 | Hasbro, Inc. | 37,697 | |||||||||
| 19,405 | Home Depot (The), Inc. | 510,740 | |||||||||
| 3,385 | International Game Technology | 41,805 | |||||||||
| 5,449 | Interpublic Group of Cos., Inc.* | 34,111 | |||||||||
| 2,543 | J. C. Penney Co., Inc. | 78,045 | |||||||||
| 6,797 | Johnson Controls, Inc. | 129,211 | |||||||||
| 861 | KB Home | 15,558 | |||||||||
| 3,484 | Kohl's Corp.* | 157,999 | |||||||||
| 1,799 | Leggett & Platt, Inc. | 25,834 | |||||||||
| 1,614 | Lennar Corp., Class A | 15,720 | |||||||||
| 16,770 | Lowe's Cos., Inc. | 360,555 | |||||||||
| 3,092 | Limited Brands, Inc. | 35,311 | |||||||||
| 4,816 | Macy's, Inc. | 65,883 | |||||||||
| 3,364 | Marriott International, Inc., Class A | 79,256 | |||||||||
| 4,107 | Mattel, Inc. | 61,441 | |||||||||
| 12,740 | McDonald's Corp. | 678,914 | |||||||||
| 3,598 | McGraw-Hill (The) Cos., Inc. | 108,480 | |||||||||
| 408 | Meredith Corp. | 10,233 | |||||||||
| 1,333 | New York Times (The) Co., Class A | 7,172 | |||||||||
| Number of Shares | Value | ||||||||||
| Common Stocks and Other Equity Interests(<) (Continued) | |||||||||||
| 3,173 | Newell Rubbermaid, Inc. | $ | 33,158 | ||||||||
| 26,319 | News Corp., Class A | 217,395 | |||||||||
| 4,435 | NIKE, Inc., Class B | 232,704 | |||||||||
| 1,824 | Nordstrom, Inc. | 41,277 | |||||||||
| 3,352 | Office Depot, Inc.* | 8,682 | |||||||||
| 3,560 | Omnicom Group, Inc. | 112,033 | |||||||||
| 1,546 | O'Reilly Automotive, Inc.* | 60,062 | |||||||||
| 651 | Polo Ralph Lauren Corp. | 35,050 | |||||||||
| 2,458 | Pulte Homes, Inc. | 28,292 | |||||||||
| 1,430 | RadioShack Corp. | 20,134 | |||||||||
| 1,036 | Scripps Networks Interactive, Inc., Class A | 28,428 | |||||||||
| 629 | Sears Holdings Corp.* | 39,294 | |||||||||
| 1,131 | Sherwin-Williams (The) Co. | 64,060 | |||||||||
| 655 | Snap-On, Inc. | 22,218 | |||||||||
| 901 | Stanley Works (The) | 34,265 | |||||||||
| 8,165 | Staples, Inc. | 168,362 | |||||||||
| 8,408 | Starbucks Corp.* | 121,580 | |||||||||
| 2,083 | Starwood Hotels & Resorts Worldwide, Inc. | 43,451 | |||||||||
| 8,611 | Target Corp. | 355,290 | |||||||||
| 1,412 | Tiffany & Co. | 40,863 | |||||||||
| 4,032 | Time Warner Cable, Inc. | 129,951 | |||||||||
| 13,688 | Time Warner, Inc. | 298,809 | |||||||||
| 4,767 | TJX Cos., Inc. | 133,333 | |||||||||
| 1,009 | VF Corp. | 59,803 | |||||||||
| 6,935 | Viacom, Inc., Class B* | 133,429 | |||||||||
| 21,241 | Walt Disney (The) Co. | 465,178 | |||||||||
| 73 | Washington Post (The) Co., Class B | 30,557 | |||||||||
| 838 | Whirlpool Corp. | 37,844 | |||||||||
| 2,034 | Wyndham Worldwide Corp. | 23,757 | |||||||||
| 765 | Wynn Resorts Ltd.* | 30,011 | |||||||||
| 5,261 | Yum! Brands, Inc. | 175,454 | |||||||||
| 8,263,473 | |||||||||||
| Consumer Staples—12.4% | |||||||||||
| 23,643 | Altria Group, Inc. | 386,090 | |||||||||
| 7,346 | Archer-Daniels-Midland Co. | 180,859 | |||||||||
| 4,876 | Avon Products, Inc. | 110,978 | |||||||||
| 1,126 | Brown-Forman Corp., Class B | 52,359 | |||||||||
| 2,343 | Campbell Soup Co. | 60,262 | |||||||||
| 1,592 | Clorox (The) Co. | 89,232 | |||||||||
| 22,778 | Coca-Cola (The) Co. | 980,593 | |||||||||
| 3,626 | Coca-Cola Enterprises, Inc. | 61,860 | |||||||||
| 5,733 | Colgate-Palmolive Co. | 338,247 | |||||||||
| 5,113 | ConAgra Foods, Inc. | 90,500 | |||||||||
| 2,232 | Constellation Brands, Inc., Class A* | 25,869 | |||||||||
| 4,961 | Costco Wholesale Corp. | 241,105 | |||||||||
| 16,658 | CVS Caremark Corp. | 529,391 | |||||||||
| 1,765 | Dean Foods Co.* | 36,536 | |||||||||
| 2,908 | DR Pepper Snapple Group, Inc.* | 60,225 | |||||||||
| 1,325 | Estee Lauder (The) Cos., Inc., Class A | 39,618 | |||||||||
| 3,754 | General Mills, Inc. | 190,290 | |||||||||
See Notes to Financial Statements.
49
Schedule of Investments (Continued)
PowerShares S&P 500 BuyWrite Portfolio
April 30, 2009
| Number of Shares | Value | ||||||||||
| Common Stocks and Other Equity Interests(<) (Continued) | |||||||||||
| 3,601 | H.J. Heinz Co. | $ | 123,946 | ||||||||
| 1,892 | Hershey (The) Co. | 68,377 | |||||||||
| 796 | Hormel Foods Corp. (>) | 24,907 | |||||||||
| 1,357 | J.M. Smucker (The) Co. | 53,466 | |||||||||
| 2,886 | Kellogg Co. | 121,529 | |||||||||
| 4,733 | Kimberly-Clark Corp. | 232,580 | |||||||||
| 16,819 | Kraft Foods, Inc., Class A | 393,565 | |||||||||
| 7,463 | Kroger (The) Co. | 161,350 | |||||||||
| 1,924 | Lorillard, Inc. | 121,462 | |||||||||
| 1,489 | McCormick & Co., Inc. | 43,851 | |||||||||
| 1,713 | Molson Coors Brewing Co., Class B | 65,522 | |||||||||
| 1,552 | Pepsi Bottling Group (The), Inc. | 48,531 | |||||||||
| 17,811 | PepsiCo, Inc. | 886,275 | |||||||||
| 22,932 | Philip Morris International, Inc. | 830,138 | |||||||||
| 33,539 | Procter & Gamble (The) Co. | 1,658,167 | |||||||||
| 1,937 | Reynolds American, Inc. | 73,567 | |||||||||
| 4,911 | Safeway, Inc. | 96,992 | |||||||||
| 7,959 | Sara Lee Corp. | 66,219 | |||||||||
| 2,428 | SUPERVALU, Inc. | 39,698 | |||||||||
| 6,740 | Sysco Corp. | 157,244 | |||||||||
| 3,461 | Tyson Foods, Inc., Class A | 36,479 | |||||||||
| 11,295 | Walgreen Co. | 355,002 | |||||||||
| 25,589 | Wal-Mart Stores, Inc. | 1,289,685 | |||||||||
| 1,611 | Whole Foods Market, Inc. | 33,396 | |||||||||
| 10,455,962 | |||||||||||
| Energy—12.9% | |||||||||||
| 5,260 | Anadarko Petroleum Corp. | 226,496 | |||||||||
| 3,829 | Apache Corp. | 278,981 | |||||||||
| 3,532 | Baker Hughes, Inc. | 125,669 | |||||||||
| 3,339 | BJ Services Co. | 46,379 | |||||||||
| 1,181 | Cabot Oil & Gas Corp. | 35,654 | |||||||||
| 2,480 | Cameron International Corp.* | 63,438 | |||||||||
| 6,432 | Chesapeake Energy Corp. | 126,775 | |||||||||
| 22,940 | Chevron Corp. | 1,516,333 | |||||||||
| 16,940 | ConocoPhillips | 694,540 | |||||||||
| 2,067 | CONSOL Energy, Inc. | 64,656 | |||||||||
| 2,845 | Denbury Resources, Inc.* | 46,317 | |||||||||
| 5,077 | Devon Energy Corp. | 263,242 | |||||||||
| 792 | Diamond Offshore Drilling, Inc. | 57,349 | |||||||||
| 7,991 | El Paso Corp. | 55,138 | |||||||||
| 1,621 | ENSCO International, Inc. | 45,842 | |||||||||
| 2,853 | EOG Resources, Inc. | 181,108 | |||||||||
| 56,555 | Exxon Mobil Corp. | 3,770,521 | |||||||||
| 10,267 | Halliburton Co. | 207,599 | |||||||||
| 3,244 | Hess Corp. | 177,739 | |||||||||
| 8,094 | Marathon Oil Corp. | 240,392 | |||||||||
| 982 | Massey Energy Co. | 15,624 | |||||||||
| 2,187 | Murphy Oil Corp. | 104,342 | |||||||||
| 3,242 | Nabors Industries Ltd. (Bermuda)* | 49,311 | |||||||||
| 4,772 | National Oilwell Varco, Inc.* | 144,496 | |||||||||
| Number of Shares | Value | ||||||||||
| Common Stocks and Other Equity Interests(<) (Continued) | |||||||||||
| 1,981 | Noble Energy, Inc. | $ | 112,422 | ||||||||
| 9,275 | Occidental Petroleum Corp. | 522,090 | |||||||||
| 3,057 | Peabody Energy Corp. | 80,674 | |||||||||
| 1,319 | Pioneer Natural Resources Co. | 30,495 | |||||||||
| 1,790 | Range Resources Corp. | 71,546 | |||||||||
| 1,293 | Rowan Cos., Inc. | 20,184 | |||||||||
| 13,689 | Schlumberger Ltd. | 670,624 | |||||||||
| 2,512 | Smith International, Inc. | 64,935 | |||||||||
| 3,932 | Southwestern Energy Co.* | 141,002 | |||||||||
| 7,366 | Spectra Energy Corp. | 106,807 | |||||||||
| 1,336 | Sunoco, Inc. | 35,417 | |||||||||
| 1,584 | Tesoro Corp. | 24,156 | |||||||||
| 5,910 | Valero Energy Corp. | 117,254 | |||||||||
| 6,630 | Williams (The) Cos., Inc. | 93,483 | |||||||||
| 6,636 | XTO Energy, Inc. | 230,004 | |||||||||
| 10,859,034 | |||||||||||
| Financials—12.6% | |||||||||||
| 5,354 | Aflac, Inc. | 154,677 | |||||||||
| 6,133 | Allstate (The) Corp. | 143,083 | |||||||||
| 13,404 | American Express Co. | 338,049 | |||||||||
| 30,790 | American International Group, Inc. | 42,490 | |||||||||
| 2,506 | Ameriprise Financial, Inc. | 66,033 | |||||||||
| 3,132 | Aon Corp. | 132,170 | |||||||||
| 1,342 | Apartment Investment & Management Co., Class A REIT | 9,797 | |||||||||
| 1,349 | Assurant, Inc. | 32,970 | |||||||||
| 913 | AvalonBay Communities, Inc. REIT | 51,868 | |||||||||
| 73,254 | Bank of America Corp. | 654,158 | |||||||||
| 13,149 | Bank of New York Mellon (The) Corp. | 335,037 | |||||||||
| 6,404 | BB&T Corp. | 149,469 | |||||||||
| 1,387 | Boston Properties, Inc. REIT | 68,546 | |||||||||
| 4,488 | Capital One Financial Corp. | 75,129 | |||||||||
| 2,571 | CB Richard Ellis Group, Inc., Class A* | 19,283 | |||||||||
| 10,724 | Charles Schwab (The) Corp. | 198,180 | |||||||||
| 4,032 | Chubb (The) Corp. | 157,046 | |||||||||
| 1,857 | Cincinnati Financial Corp. | 44,475 | |||||||||
| 4,446 | CIT Group, Inc. | 9,870 | |||||||||
| 62,668 | Citigroup, Inc. | 191,137 | |||||||||
| 758 | CME Group, Inc. | 167,783 | |||||||||
| 1,731 | Comerica, Inc. | 36,316 | |||||||||
| 5,508 | Discover Financial Services | 44,780 | |||||||||
| 6,550 | E*TRADE Financial Corp.* | 9,367 | |||||||||
| 3,122 | Equity Residential REIT | 71,463 | |||||||||
| 1,020 | Federated Investors, Inc., Class B | 23,338 | |||||||||
| 6,605 | Fifth Third Bancorp | 27,081 | |||||||||
| 2,418 | First Horizon National Corp. | 27,831 | |||||||||
| 1,734 | Franklin Resources, Inc. | 104,872 | |||||||||
| 4,960 | Genworth Financial, Inc., Class A | 11,706 | |||||||||
| 5,748 | Goldman Sachs Group, (The) Inc. | 738,618 | |||||||||
| 3,718 | Hartford Financial Services Group (The), Inc. | 42,645 | |||||||||
See Notes to Financial Statements.
50
Schedule of Investments (Continued)
PowerShares S&P 500 BuyWrite Portfolio
April 30, 2009
| Number of Shares | Value | ||||||||||
| Common Stocks and Other Equity Interests(<) (Continued) | |||||||||||
| 2,902 | HCP, Inc. REIT | $ | 63,699 | ||||||||
| 1,271 | Health Care, Inc. REIT | 43,303 | |||||||||
| 6,831 | Host Hotels & Resorts, Inc. REIT | 52,530 | |||||||||
| 5,974 | Hudson City Bancorp, Inc. | 75,033 | |||||||||
| 4,193 | Huntington Bancshares, Inc. | 11,698 | |||||||||
| 834 | IntercontinentalExchange, Inc.* | 73,058 | |||||||||
| 4,333 | Invesco Ltd.(~) | 63,782 | |||||||||
| 1,807 | Janus Capital Group, Inc. | 18,124 | |||||||||
| 43,007 | JPMorgan Chase & Co. | 1,419,232 | |||||||||
| 5,661 | Keycorp | 34,815 | |||||||||
| 3,572 | Kimco Realty Corp. REIT | 42,935 | |||||||||
| 1,635 | Legg Mason, Inc. | 32,814 | |||||||||
| 2,076 | Leucadia National Corp.* | 44,073 | |||||||||
| 2,931 | Lincoln National Corp. | 32,944 | |||||||||
| 4,134 | Loews Corp. | 102,895 | |||||||||
| 886 | M&T Bank Corp. | 46,471 | |||||||||
| 5,892 | Marsh & McLennan Cos., Inc. | 124,262 | |||||||||
| 3,039 | Marshall & Ilsley Corp. | 17,565 | |||||||||
| 1,957 | MBIA, Inc.* | 9,257 | |||||||||
| 9,363 | MetLife, Inc. | 278,549 | |||||||||
| 2,184 | Moody's Corp. | 64,472 | |||||||||
| 12,299 | Morgan Stanley | 290,748 | |||||||||
| 1,569 | NASDAQ OMX (The) Group, Inc.* | 30,172 | |||||||||
| 2,729 | Northern Trust Corp. | 148,348 | |||||||||
| 2,962 | NYSE Euronext | 68,630 | |||||||||
| 3,985 | People's United Financial, Inc. | 62,246 | |||||||||
| 1,889 | Plum Creek Timber Co., Inc. REIT | 65,208 | |||||||||
| 4,898 | PNC Financial Services Group, Inc. | 194,451 | |||||||||
| 2,969 | Principal Financial Group, Inc. | 48,513 | |||||||||
| 7,748 | Progressive (The) Corp.* | 118,389 | |||||||||
| 4,802 | ProLogis REIT | 43,746 | |||||||||
| 4,853 | Prudential Financial, Inc. | 140,155 | |||||||||
| 1,434 | Public Storage REIT | 95,877 | |||||||||
| 7,946 | Regions Financial Corp. | 35,678 | |||||||||
| 2,882 | Simon Property Group, Inc. REIT | 148,711 | |||||||||
| 5,353 | SLM Corp.* | 25,855 | |||||||||
| 4,943 | State Street Corp. | 168,705 | |||||||||
| 4,082 | SunTrust Banks, Inc. | 58,944 | |||||||||
| 2,931 | T. Rowe Price Group, Inc. | 112,902 | |||||||||
| 969 | Torchmark Corp. | 28,421 | |||||||||
| 6,698 | Travelers (The) Cos., Inc. | 275,556 | |||||||||
| 20,082 | U.S. Bancorp | 365,894 | |||||||||
| 3,790 | Unum Group | 61,929 | |||||||||
| 1,789 | Ventas, Inc. REIT(>) | 51,237 | |||||||||
| 1,787 | Vornado Realty Trust REIT | 87,366 | |||||||||
| 48,494 | Wells Fargo & Co. | 970,366 | |||||||||
| 3,913 | XL Capital Ltd., Class A | 37,213 | |||||||||
| 1,315 | Zions Bancorp | 14,373 | |||||||||
| 10,580,411 | |||||||||||
| Number of Shares | Value | ||||||||||
| Common Stocks and Other Equity Interests(<) (Continued) | |||||||||||
| Health Care—14.2% | |||||||||||
| 17,682 | Abbott Laboratories | $ | 739,991 | ||||||||
| 5,191 | Aetna, Inc. | 114,254 | |||||||||
| 3,522 | Allergan, Inc. | 164,337 | |||||||||
| 1,745 | AmerisourceBergen Corp. | 58,702 | |||||||||
| 11,829 | Amgen, Inc.* | 573,352 | |||||||||
| 7,028 | Baxter International, Inc. | 340,858 | |||||||||
| 2,745 | Becton Dickinson & Co. | 166,018 | |||||||||
| 3,401 | Biogen Idec, Inc.* | 164,404 | |||||||||
| 17,194 | Boston Scientific Corp.* | 144,602 | |||||||||
| 22,654 | Bristol-Myers Squibb Co. | 434,957 | |||||||||
| 1,135 | C.R. Bard, Inc. | 81,300 | |||||||||
| 4,124 | Cardinal Health, Inc. | 139,350 | |||||||||
| 5,254 | Celgene Corp.* | 224,451 | |||||||||
| 791 | Cephalon, Inc.* | 51,898 | |||||||||
| 3,098 | CIGNA Corp. | 61,062 | |||||||||
| 1,700 | Coventry Health Care, Inc.* | 27,047 | |||||||||
| 5,768 | Covidien Ltd. | 190,229 | |||||||||
| 1,187 | DaVita, Inc.* | 55,041 | |||||||||
| 1,705 | DENTSPLY International, Inc. | 48,797 | |||||||||
| 11,572 | Eli Lilly & Co. | 380,950 | |||||||||
| 2,835 | Express Scripts, Inc.* | 181,355 | |||||||||
| 3,451 | Forest Laboratories, Inc.* | 74,852 | |||||||||
| 3,103 | Genzyme Corp.* | 165,483 | |||||||||
| 10,427 | Gilead Sciences, Inc.* | 477,557 | |||||||||
| 1,827 | Hospira, Inc.* | 60,053 | |||||||||
| 1,935 | Humana, Inc.* | 55,689 | |||||||||
| 2,081 | IMS Health, Inc. | 26,137 | |||||||||
| 452 | Intuitive Surgical, Inc.* | 64,966 | |||||||||
| 31,649 | Johnson & Johnson | 1,657,141 | |||||||||
| 2,819 | King Pharmaceuticals, Inc.* | 22,214 | |||||||||
| 1,238 | Laboratory Corp. of America Holdings* | 79,418 | |||||||||
| 1,993 | Life Technologies Corp.* | 74,339 | |||||||||
| 3,136 | McKesson Corp. | 116,032 | |||||||||
| 5,620 | Medco Health Solutions, Inc.* | 244,751 | |||||||||
| 12,794 | Medtronic, Inc. | 409,408 | |||||||||
| 24,117 | Merck & Co., Inc. | 584,596 | |||||||||
| 636 | Millipore Corp.* | 37,588 | |||||||||
| 3,484 | Mylan, Inc.* | 46,163 | |||||||||
| 1,045 | Patterson Cos., Inc.* | 21,381 | |||||||||
| 1,327 | PerkinElmer, Inc. | 19,334 | |||||||||
| 77,189 | Pfizer, Inc. | 1,031,244 | |||||||||
| 1,765 | Quest Diagnostics, Inc. | 90,597 | |||||||||
| 18,611 | Schering-Plough Corp. | 428,425 | |||||||||
| 3,957 | St. Jude Medical, Inc.* | 132,639 | |||||||||
| 2,720 | Stryker Corp. | 105,291 | |||||||||
| 5,071 | Tenet Healthcare Corp.* | 11,410 | |||||||||
| 4,783 | Thermo Fisher Scientific, Inc.* | 167,788 | |||||||||
| 13,910 | UnitedHealth Group, Inc. | 327,163 | |||||||||
| 1,420 | Varian Medical Systems, Inc.* | 47,385 | |||||||||
| 1,112 | Waters Corp.* | 49,117 | |||||||||
See Notes to Financial Statements.
51
Schedule of Investments (Continued)
PowerShares S&P 500 BuyWrite Portfolio
April 30, 2009
| Number of Shares | Value | ||||||||||
| Common Stocks and Other Equity Interests(<) (Continued) | |||||||||||
| 1,197 | Watson Pharmaceuticals, Inc.* | $ | 37,035 | ||||||||
| 5,702 | WellPoint, Inc.* | 243,818 | |||||||||
| 15,233 | Wyeth | 645,879 | |||||||||
| 2,551 | Zimmer Holdings, Inc.* | 112,218 | |||||||||
| 12,010,066 | |||||||||||
| Industrials—10.8% | |||||||||||
| 7,944 | 3M Co. | 457,575 | |||||||||
| 1,289 | Avery Dennison Corp. | 37,046 | |||||||||
| 8,311 | Boeing (The) Co. | 332,856 | |||||||||
| 3,188 | Burlington Northern Santa Fe Corp. | 215,126 | |||||||||
| 1,944 | C.H. Robinson Worldwide, Inc. | 103,343 | |||||||||
| 6,888 | Caterpillar, Inc. | 245,075 | |||||||||
| 1,507 | Cintas Corp. | 38,670 | |||||||||
| 1,911 | Cooper Industries Ltd., Class A | 62,662 | |||||||||
| 4,571 | CSX Corp. | 135,256 | |||||||||
| 2,304 | Cummins, Inc. | 78,336 | |||||||||
| 2,916 | Danaher Corp. | 170,411 | |||||||||
| 4,835 | Deere & Co. | 199,492 | |||||||||
| 2,132 | Dover Corp. | 65,623 | |||||||||
| 608 | Dun & Bradstreet (The) Corp. | 49,491 | |||||||||
| 1,894 | Eaton Corp. | 82,957 | |||||||||
| 8,641 | Emerson Electric Co. | 294,140 | |||||||||
| 1,449 | Equifax, Inc. | 42,253 | |||||||||
| 2,424 | Expeditors International of Washington, Inc. | 84,137 | |||||||||
| 1,477 | Fastenal Co. | 56,658 | |||||||||
| 3,564 | FedEx Corp. | 199,441 | |||||||||
| 643 | Flowserve Corp. | 43,660 | |||||||||
| 2,080 | Fluor Corp. | 78,770 | |||||||||
| 4,419 | General Dynamics Corp. | 228,330 | |||||||||
| 120,856 | General Electric Co. | 1,528,829 | |||||||||
| 1,412 | Goodrich Corp. | 62,523 | |||||||||
| 8,416 | Honeywell International, Inc. | 262,663 | |||||||||
| 4,395 | Illinois Tool Works, Inc. | 144,156 | |||||||||
| 3,649 | Ingersoll-Rand Co. Ltd., Class A | 79,439 | |||||||||
| 2,054 | Iron Mountain, Inc.* | 58,518 | |||||||||
| 2,084 | ITT Corp. | 85,465 | |||||||||
| 1,412 | Jacobs Engineering Group, Inc.* | 53,712 | |||||||||
| 1,360 | L-3 Communications Holdings, Inc. | 103,564 | |||||||||
| 3,801 | Lockheed Martin Corp. | 298,493 | |||||||||
| 1,591 | Manitowoc (The) Co., Inc. | 9,466 | |||||||||
| 4,112 | Masco Corp. | 36,432 | |||||||||
| 1,460 | Monster Worldwide, Inc.* | 20,148 | |||||||||
| 4,197 | Norfolk Southern Corp. | 149,749 | |||||||||
| 3,744 | Northrop Grumman Corp. | 181,022 | |||||||||
| 4,148 | PACCAR, Inc. | 147,005 | |||||||||
| 1,353 | Pall Corp. | 35,733 | |||||||||
| 1,841 | Parker Hannifin Corp. | 83,489 | |||||||||
| 2,363 | Pitney Bowes, Inc. | 57,988 | |||||||||
| 1,605 | Precision Castparts Corp. | 120,150 | |||||||||
| 2,348 | R.R. Donnelley & Sons Co. | 27,354 | |||||||||
| Number of Shares | Value | ||||||||||
| Common Stocks and Other Equity Interests(<) (Continued) | |||||||||||
| 4,583 | Raytheon Co. | $ | 207,289 | ||||||||
| 3,683 | Republic Services, Inc. | 77,343 | |||||||||
| 1,733 | Robert Half International, Inc. | 41,627 | |||||||||
| 1,621 | Rockwell Automation, Inc. | 51,207 | |||||||||
| 1,807 | Rockwell Collins, Inc. | 69,298 | |||||||||
| 639 | Ryder System, Inc. | 17,694 | |||||||||
| 8,467 | Southwest Airlines Co. | 59,100 | |||||||||
| 979 | Stericycle, Inc.* | 46,091 | |||||||||
| 3,017 | Textron, Inc. | 32,372 | |||||||||
| 5,758 | Union Pacific Corp. | 282,948 | |||||||||
| 11,395 | United Parcel Service, Inc., Class B | 596,415 | |||||||||
| 10,781 | United Technologies Corp. | 526,545 | |||||||||
| 730 | W.W. Grainger, Inc. | 61,232 | |||||||||
| 5,626 | Waste Management, Inc. | 150,045 | |||||||||
| 9,066,412 | |||||||||||
| Information Technology—19.0% | |||||||||||
| 5,997 | Adobe Systems, Inc.* | 164,018 | |||||||||
| 6,403 | Advanced Micro Devices, Inc.* | 23,115 | |||||||||
| 1,119 | Affiliated Computer Services, Inc., Class A* | 54,137 | |||||||||
| 4,027 | Agilent Technologies, Inc.* | 73,533 | |||||||||
| 1,948 | Akamai Technologies, Inc.* | 42,895 | |||||||||
| 3,356 | Altera Corp. | 54,736 | |||||||||
| 1,957 | Amphenol Corp., Class A | 66,225 | |||||||||
| 3,337 | Analog Devices, Inc. | 71,011 | |||||||||
| 10,195 | Apple, Inc.* | 1,282,836 | |||||||||
| 15,213 | Applied Materials, Inc. | 185,751 | |||||||||
| 2,589 | Autodesk, Inc.* | 51,625 | |||||||||
| 5,782 | Automatic Data Processing, Inc. | 203,526 | |||||||||
| 2,113 | BMC Software, Inc.* | 73,258 | |||||||||
| 4,873 | Broadcom Corp., Class A* | 113,005 | |||||||||
| 4,513 | CA, Inc. | 77,849 | |||||||||
| 1,034 | Ciena Corp.* | 12,356 | |||||||||
| 66,798 | Cisco Systems, Inc.* | 1,290,536 | |||||||||
| 2,061 | Citrix Systems, Inc.* | 58,800 | |||||||||
| 3,335 | Cognizant Technology Solutions Corp., Class A* | 82,675 | |||||||||
| 1,735 | Computer Sciences Corp.* | 64,126 | |||||||||
| 2,820 | Compuware Corp.* | 21,094 | |||||||||
| 1,400 | Convergys Corp.* | 14,154 | |||||||||
| 17,794 | Corning, Inc. | 260,148 | |||||||||
| 19,801 | Dell, Inc.* | 230,088 | |||||||||
| 12,333 | eBay, Inc.* | 203,125 | |||||||||
| 3,681 | Electronic Arts, Inc.* | 74,908 | |||||||||
| 23,022 | EMC Corp.* | 288,466 | |||||||||
| 2,181 | Fidelity National Information Services, Inc. | 38,931 | |||||||||
| 1,787 | Fiserv, Inc.* | 66,691 | |||||||||
| 1,725 | FLIR Systems, Inc.* | 38,261 | |||||||||
| 2,744 | Google, Inc., Class A* | 1,086,541 | |||||||||
| 1,528 | Harris Corp. | 46,726 | |||||||||
| 27,423 | Hewlett-Packard Co. | 986,680 | |||||||||
See Notes to Financial Statements.
52
Schedule of Investments (Continued)
PowerShares S&P 500 BuyWrite Portfolio
April 30, 2009
| Number of Shares | Value | ||||||||||
| Common Stocks and Other Equity Interests(<) (Continued) | |||||||||||
| 63,654 | Intel Corp. | $ | 1,004,460 | ||||||||
| 15,354 | International Business Machines Corp. | 1,584,685 | |||||||||
| 3,672 | Intuit, Inc.* | 84,933 | |||||||||
| 2,447 | Jabil Circuit, Inc. | 19,821 | |||||||||
| 2,465 | JDS Uniphase Corp.* | 11,364 | |||||||||
| 5,972 | Juniper Networks, Inc.* | 129,294 | |||||||||
| 1,939 | KLA-Tencor Corp. | 53,788 | |||||||||
| 886 | Lexmark International, Inc., Class A* | 17,383 | |||||||||
| 2,538 | Linear Technology Corp. | 55,278 | |||||||||
| 7,413 | LSI Corp.* | 28,466 | |||||||||
| 832 | Mastercard, Inc., Class A | 152,630 | |||||||||
| 1,761 | McAfee, Inc.* | 66,108 | |||||||||
| 2,560 | MEMC Electronic Materials, Inc.* | 41,472 | |||||||||
| 2,088 | Microchip Technology, Inc. | 48,024 | |||||||||
| 9,427 | Micron Technology, Inc.* | 46,004 | |||||||||
| 87,502 | Microsoft Corp. | 1,772,790 | |||||||||
| 1,586 | Molex, Inc. | 26,439 | |||||||||
| 26,052 | Motorola, Inc. | 144,068 | |||||||||
| 2,236 | National Semiconductor Corp. | 27,659 | |||||||||
| 3,784 | NetApp, Inc.* | 69,247 | |||||||||
| 3,942 | Novell, Inc.* | 14,822 | |||||||||
| 1,112 | Novellus Systems, Inc.* | 20,083 | |||||||||
| 6,147 | NVIDIA Corp.* | 70,568 | |||||||||
| 43,885 | Oracle Corp. | 848,736 | |||||||||
| 3,671 | Paychex, Inc. | 99,154 | |||||||||
| 1,387 | QLogic Corp.* | 19,668 | |||||||||
| 18,879 | QUALCOMM, Inc. | 798,959 | |||||||||
| 1,211 | Salesforce.com, Inc.* | 51,843 | |||||||||
| 2,587 | SanDisk Corp.* | 40,668 | |||||||||
| 8,519 | Sun Microsystems, Inc.* | 78,034 | |||||||||
| 9,393 | Symantec Corp.* | 162,029 | |||||||||
| 4,531 | Tellabs, Inc.* | 23,742 | |||||||||
| 1,983 | Teradata Corp.* | 33,156 | |||||||||
| 1,978 | Teradyne, Inc.* | 11,749 | |||||||||
| 14,613 | Texas Instruments, Inc. | 263,911 | |||||||||
| 2,258 | Total System Services, Inc. | 28,157 | |||||||||
| 5,243 | Tyco Electronics Ltd. (Bermuda) | 91,438 | |||||||||
| 2,200 | VeriSign, Inc.* | 45,276 | |||||||||
| 8,128 | Western Union (The) Co. | 136,144 | |||||||||
| 9,899 | Xerox Corp. | 60,483 | |||||||||
| 3,140 | Xilinx, Inc. | 64,182 | |||||||||
| 15,959 | Yahoo!, Inc.* | 228,054 | |||||||||
| 15,976,595 | |||||||||||
| Materials—3.5% | |||||||||||
| 2,399 | Air Products & Chemicals, Inc. | 158,094 | |||||||||
| 1,273 | AK Steel Holding Corp. | 16,562 | |||||||||
| 10,872 | Alcoa, Inc. | 98,609 | |||||||||
| 1,117 | Allegheny Technologies, Inc. | 36,559 | |||||||||
| 1,076 | Ball Corp. | 40,587 | |||||||||
| 1,141 | Bemis Co., Inc. | 27,430 | |||||||||
| Number of Shares | Value | ||||||||||
| Common Stocks and Other Equity Interests(<) (Continued) | |||||||||||
| 550 | CF Industries Holdings, Inc. | $ | 39,628 | ||||||||
| 10,582 | Dow Chemical (The) Co. | 169,312 | |||||||||
| 10,331 | E.I. du Pont de Nemours & Co. | 288,235 | |||||||||
| 833 | Eastman Chemical Co. | 33,053 | |||||||||
| 1,919 | Ecolab, Inc. | 73,977 | |||||||||
| 4,713 | Freeport-McMoRan Copper & Gold, Inc. | 201,009 | |||||||||
| 898 | International Flavors & Fragrances, Inc. | 28,018 | |||||||||
| 4,895 | International Paper Co. | 61,971 | |||||||||
| 1,952 | MeadWestvaco Corp. | 30,568 | |||||||||
| 6,268 | Monsanto Co. | 532,091 | |||||||||
| 5,595 | Newmont Mining Corp. | 225,143 | |||||||||
| 3,593 | Nucor Corp. | 146,199 | |||||||||
| 1,912 | Owens-Illinois, Inc.* | 46,634 | |||||||||
| 1,508 | Pactiv Corp.* | 32,965 | |||||||||
| 1,881 | PPG Industries, Inc. | 82,858 | |||||||||
| 3,516 | Praxair, Inc. | 262,329 | |||||||||
| 1,804 | Sealed Air Corp. | 34,384 | |||||||||
| 1,399 | Sigma-Aldrich Corp. | 61,332 | |||||||||
| 977 | Titanium Metals Corp. | 6,634 | |||||||||
| 1,600 | United States Steel Corp. | 42,480 | |||||||||
| 1,266 | Vulcan Materials Co. | 60,198 | |||||||||
| 2,421 | Weyerhaeuser Co. | 85,364 | |||||||||
| 2,922,223 | |||||||||||
| Telecommunication Services—3.8% | |||||||||||
| 4,542 | American Tower Corp., Class A* | 144,254 | |||||||||
| 67,446 | AT&T, Inc. | 1,727,966 | |||||||||
| 1,147 | CenturyTel, Inc. | 31,141 | |||||||||
| 1,632 | Embarq Corp. | 59,666 | |||||||||
| 3,565 | Frontier Communications Corp. | 25,347 | |||||||||
| 16,822 | Qwest Communications International, Inc. | 65,438 | |||||||||
| 32,788 | Sprint Nextel Corp.* | 142,956 | |||||||||
| 32,511 | Verizon Communications, Inc. | 986,384 | |||||||||
| 5,050 | Windstream Corp. | 41,915 | |||||||||
| 3,225,067 | |||||||||||
| Utilities—4.1% | |||||||||||
| 7,623 | AES (The) Corp.* | 53,895 | |||||||||
| 1,942 | Allegheny Energy, Inc. | 50,337 | |||||||||
| 2,429 | Ameren Corp. | 55,916 | |||||||||
| 5,335 | American Electric Power Co., Inc. | 140,737 | |||||||||
| 3,974 | Centerpoint Energy, Inc. | 42,283 | |||||||||
| 2,594 | CMS Energy Corp. | 31,180 | |||||||||
| 3,137 | Consolidated Edison, Inc. | 116,477 | |||||||||
| 2,283 | Constellation Energy Group, Inc. | 54,975 | |||||||||
| 6,679 | Dominion Resources, Inc. | 201,439 | |||||||||
| 1,868 | DTE Energy Co. | 55,237 | |||||||||
| 14,658 | Duke Energy Corp. | 202,427 | |||||||||
| 5,790 | Dynegy, Inc., Class A* | 10,306 | |||||||||
| 3,726 | Edison International | 106,228 | |||||||||
| 2,170 | Entergy Corp. | 140,551 | |||||||||
| 1,499 | EQT Corp.(>) | 50,411 | |||||||||
See Notes to Financial Statements.
53
Schedule of Investments (Continued)
PowerShares S&P 500 BuyWrite Portfolio
April 30, 2009
| Number of Shares | Value | ||||||||||
| Common Stocks and Other Equity Interests(<) (Continued) | |||||||||||
| 7,533 | Exelon Corp. | $ | 347,496 | ||||||||
| 3,486 | FirstEnergy Corp. | 142,577 | |||||||||
| 4,676 | FPL Group, Inc. | 251,521 | |||||||||
| 877 | Integrys Energy Group, Inc. | 23,162 | |||||||||
| 515 | Nicor, Inc. | 16,552 | |||||||||
| 3,143 | NiSource, Inc. | 34,542 | |||||||||
| 1,971 | Northeast Utilities | 41,430 | |||||||||
| 2,510 | Pepco Holdings, Inc. | 29,995 | |||||||||
| 4,188 | PG&E Corp. | 155,459 | |||||||||
| 1,156 | Pinnacle West Capital Corp. | 31,651 | |||||||||
| 4,292 | PPL Corp. | 128,374 | |||||||||
| 3,151 | Progress Energy, Inc. | 107,512 | |||||||||
| 5,788 | Public Service Enterprise Group, Inc. | 172,714 | |||||||||
| 1,990 | Questar Corp. | 59,143 | |||||||||
| 1,386 | SCANA Corp. | 41,885 | |||||||||
| 2,786 | Sempra Energy | 128,212 | |||||||||
| 8,903 | Southern (The) Co. | 257,118 | |||||||||
| 2,435 | TECO Energy, Inc. | 25,787 | |||||||||
| 1,337 | Wisconsin Energy Corp. | 53,427 | |||||||||
| 5,201 | Xcel Energy, Inc. | 95,906 | |||||||||
| 3,456,862 | |||||||||||
| Total Investments (Cost $95,403,192)—103.1% | 86,816,105 | ||||||||||
| Liabilities in excess of other assets—(3.1%) | (2,604,934 | ) | |||||||||
| Net Assets—100.0% | $ | 84,211,171 | |||||||||
REIT Real Estate Investment Trust.
* Non-income producing security.
(<) Except as otherwise noted, a portion of all securities in the portfolio are subject to call options when written. See Note 2H.
(>) Security not subject to call options written.
(~) Affiliated company. The Fund's Adviser is a subsidiary of Invesco Ltd. and therefore, Invesco Ltd. is considered to be affiliated with the Fund. See Note 5.
See Notes to Financial Statements.
54
Schedule of Investments
PowerShares Value Line Industry Rotation Portfolio
April 30, 2009
| Number of Shares | Value | ||||||||||
| Common Stocks and Other Equity Interests—100.2% | |||||||||||
| Aerospace/Defense—2.4% | |||||||||||
| 22,486 | AAR Corp.* | $ | 338,864 | ||||||||
| 10,141 | HEICO Corp. | 291,148 | |||||||||
| 630,012 | |||||||||||
| Agriculture—2.7% | |||||||||||
| 6,793 | British American Tobacco PLC ADR (United Kingdom) | 330,276 | |||||||||
| 9,821 | Reynolds American, Inc. | 373,001 | |||||||||
| 703,277 | |||||||||||
| Airlines—0.9% | |||||||||||
| 14,057 | Alaska Air Group, Inc.* | 235,876 | |||||||||
| Beverages—5.3% | |||||||||||
| 7,752 | Brown-Forman Corp., Class B | 360,468 | |||||||||
| 8,835 | Green Mountain Coffee Roasters, Inc.* | 638,859 | |||||||||
| 10,073 | Hansen Natural Corp.* | 410,575 | |||||||||
| 1,409,902 | |||||||||||
| Biotechnology—3.4% | |||||||||||
| 5,931 | Amgen, Inc.* | 287,476 | |||||||||
| 6,691 | Gilead Sciences, Inc.* | 306,448 | |||||||||
| 8,192 | Myriad Genetics, Inc.* | 317,767 | |||||||||
| 911,691 | |||||||||||
| Chemicals—1.2% | |||||||||||
| 24,091 | American Vanguard Corp. | 308,124 | |||||||||
| Closed-end Funds—4.0% | |||||||||||
| 56,897 | Japan Smaller Capitalization Fund Inc. (Japan) | 350,486 | |||||||||
| 66,698 | MFS Multimarket Income Trust (Canada) | 361,503 | |||||||||
| 38,146 | Nuveen Municipal Value Fund | 349,799 | |||||||||
| 1,061,788 | |||||||||||
| Coal—1.5% | |||||||||||
| 12,363 | Consol Energy, Inc. | 386,715 | |||||||||
| Commercial Services—6.0% | |||||||||||
| 4,374 | Apollo Group, Inc., Class A* | 275,343 | |||||||||
| 7,583 | Chemed Corp. | 320,988 | |||||||||
| 14,494 | Interactive Data Corp. | 325,825 | |||||||||
| 2,973 | ITT Educational Services, Inc.* | 299,589 | |||||||||
| 20,315 | Rollins, Inc. | 365,671 | |||||||||
| 1,587,416 | |||||||||||
| Diversified Financial Services—1.1% | |||||||||||
| 18,416 | Knight Cap Group, Inc., Class A* | 285,264 | |||||||||
| Electric—4.1% | |||||||||||
| 6,860 | FPL Group, Inc. | 368,999 | |||||||||
| 8,980 | ITC Holdings, Corp. | 390,900 | |||||||||
| 9,166 | PG&E Corp. | 340,242 | |||||||||
| 1,100,141 | |||||||||||
| Number of Shares | Value | ||||||||||
| Common Stocks and Other Equity Interests (Continued) | |||||||||||
| Engineering & Construction—3.3% | |||||||||||
| 10,639 | Granite Construction, Inc. | $ | 419,709 | ||||||||
| 10,384 | URS Corp.* | 457,519 | |||||||||
| 877,228 | |||||||||||
| Environmental Control—2.6% | |||||||||||
| 7,115 | Stericycle, Inc.* | 334,974 | |||||||||
| 14,862 | Tetra Tech, Inc.* | 365,011 | |||||||||
| 699,985 | |||||||||||
| Food—4.9% | |||||||||||
| 14,641 | Diamond Foods, Inc. | 383,448 | |||||||||
| 15,798 | Kroger (The) Co. | 341,553 | |||||||||
| 8,774 | Nash Finch Co. | 256,990 | |||||||||
| 12,130 | TreeHouse Foods, Inc.* | 322,537 | |||||||||
| 1,304,528 | |||||||||||
| Gas—2.3% | |||||||||||
| 8,199 | Laclede Group (The), Inc. | 284,341 | |||||||||
| 13,984 | UGI Corp. | 320,793 | |||||||||
| 605,134 | |||||||||||
| Healthcare - Products—2.7% | |||||||||||
| 8,235 | ResMed, Inc.* | 316,636 | |||||||||
| 13,430 | Thoratec Corp.* | 390,276 | |||||||||
| 706,912 | |||||||||||
| Healthcare - Services—2.1% | |||||||||||
| 7,457 | Amedisys, Inc.* | 250,108 | |||||||||
| 6,495 | DaVita, Inc.* | 301,173 | |||||||||
| 551,281 | |||||||||||
| Household Products/Wares—1.4% | |||||||||||
| 6,719 | Church & Dwight Co., Inc. | 365,581 | |||||||||
| Insurance—1.5% | |||||||||||
| 8,679 | ACE Ltd. | 402,011 | |||||||||
| Internet—3.3% | |||||||||||
| 16,586 | F5 Networks, Inc.* | 452,300 | |||||||||
| 9,341 | Netflix, Inc.* | 423,241 | |||||||||
| 875,541 | |||||||||||
| Media—2.9% | |||||||||||
| 25,893 | Comcast Corp., Class A | 380,109 | |||||||||
| 15,404 | DIRECTV Group (The), Inc.* | 380,941 | |||||||||
| 761,050 | |||||||||||
| Mining—1.1% | |||||||||||
| 6,119 | Compass Minerals International, Inc. | 295,058 | |||||||||
| Miscellaneous Manufacturing—1.1% | |||||||||||
| 9,547 | Matthews International Corp., Class A | 299,012 | |||||||||
See Notes to Financial Statements.
55
Schedule of Investments (Continued)
PowerShares Value Line Industry Rotation Portfolio
April 30, 2009
| Number of Shares | Value | ||||||||||
| Common Stocks and Other Equity Interests (Continued) | |||||||||||
| Oil & Gas—4.4% | |||||||||||
| 19,250 | Petrohawk Energy Corp.* | $ | 454,300 | ||||||||
| 12,506 | Southwestern Energy Co.* | 448,465 | |||||||||
| 9,767 | Sunoco, Inc. | 258,923 | |||||||||
| 1,161,688 | |||||||||||
| Packaging & Containers—2.9% | |||||||||||
| 11,870 | Rock-Tenn Co., Class A | 448,212 | |||||||||
| 6,809 | Silgan Holdings, Inc. | 316,550 | |||||||||
| 764,762 | |||||||||||
| Pharmaceuticals—3.8% | |||||||||||
| 4,671 | Cephalon, Inc.* | 306,464 | |||||||||
| 5,870 | Express Scripts, Inc.* | 375,504 | |||||||||
| 7,393 | Medco Health Solutions, Inc.* | 321,965 | |||||||||
| 1,003,933 | |||||||||||
| Pipelines—1.5% | |||||||||||
| 10,135 | Energy Transfer Partners LP | 400,839 | |||||||||
| Retail—4.7% | |||||||||||
| 10,747 | Buffalo Wild Wings, Inc.* | 419,563 | |||||||||
| 10,044 | Suburban Propane Partners LP | 401,760 | |||||||||
| 10,690 | Tractor Supply Co.* | 431,662 | |||||||||
| 1,252,985 | |||||||||||
| Savings & Loans—1.4% | |||||||||||
| 9,625 | Capitol Federal Financial | 374,990 | |||||||||
| Software—10.1% | |||||||||||
| 8,796 | Cerner Corp.* | 473,225 | |||||||||
| 12,803 | Computer Programs & Systems, Inc. | 447,977 | |||||||||
| 15,633 | Concur Technologies, Inc.* | 423,185 | |||||||||
| 4,552 | Dun & Bradstreet (The) Corp. | 370,533 | |||||||||
| 5,926 | ManTech International Corp., Class A* | 214,462 | |||||||||
| 10,486 | Open Text Corp. (Canada)* | 344,255 | |||||||||
| 12,221 | Sybase, Inc.* | 415,025 | |||||||||
| 2,688,662 | |||||||||||
| Telecommunications—2.5% | |||||||||||
| 17,073 | NTELOS Holdings Corp. | 272,827 | |||||||||
| 17,360 | ViaSat, Inc.* | 399,106 | |||||||||
| 671,933 | |||||||||||
| Transportation—4.7% | |||||||||||
| 5,386 | Burlington Northern Santa Fe Corp. | 363,447 | |||||||||
| 7,806 | C.H. Robinson Worldwide, Inc. | 414,967 | |||||||||
| 15,221 | Genesee & Wyoming, Inc., Class A* | 456,630 | |||||||||
| 1,235,044 | |||||||||||
| Number of Shares | Value | ||||||||||
| Common Stocks and Other Equity Interests (Continued) | |||||||||||
| Water—2.4% | |||||||||||
| 17,608 | Aqua America, Inc. | $ | 323,107 | ||||||||
| 8,267 | California Water Service Group | 322,661 | |||||||||
| 645,768 | |||||||||||
| Total Common Stocks and Other Equity Interests (Cost $26,019,180) | 26,564,131 | ||||||||||
| Money Market Fund—0.2% | |||||||||||
| 56,289 | Goldman Sachs Financial Square Prime Obligations Institutional Share Class (Cost $56,289) | 56,289 | |||||||||
| Total Investments (Cost $26,075,469)—100.4% | 26,620,420 | ||||||||||
| Liabilities in excess of other assets—(0.4%) | (112,871 | ) | |||||||||
| Net Assets—100.0% | $ | 26,507,549 | |||||||||
ADR American Depositary Receipt.
* Non-income producing security.
See Notes to Financial Statements.
56
Schedule of Investments
PowerShares Value Line TimelinessTM Select Portfolio
April 30, 2009
| Number of Shares | Value | ||||||||||
| Common Stocks and Other Equity Interests—99.9% | |||||||||||
| Consumer Discretionary—13.5% | |||||||||||
| 17,545 | Apollo Group, Inc., Class A* | $ | 1,104,458 | ||||||||
| 60,178 | Interactive Data Corp. | 1,352,801 | |||||||||
| 57,064 | Jos. A. Bank Clothiers, Inc.* | 2,307,667 | |||||||||
| 25,595 | McDonald's Corp. | 1,363,958 | |||||||||
| 38,747 | NetFlix, Inc.* | 1,755,627 | |||||||||
| 62,217 | Peet's Coffee & Tea, Inc.* | 1,697,280 | |||||||||
| 9,581,791 | |||||||||||
| Consumer Staples—9.2% | |||||||||||
| 22,237 | Chattem, Inc.* | 1,221,034 | |||||||||
| 28,178 | Church & Dwight Co., Inc. | 1,533,165 | |||||||||
| 37,843 | Green Mountain Coffee Roasters, Inc.* | 2,736,427 | |||||||||
| 36,598 | Nash Finch Co. | 1,071,955 | |||||||||
| 6,562,581 | |||||||||||
| Financials—1.3% | |||||||||||
| 160,311 | Crawford & Co., Class B* | 953,850 | |||||||||
| Health Care—43.3% | |||||||||||
| 39,837 | AmerisourceBergen Corp. | 1,340,117 | |||||||||
| 24,565 | Amgen, Inc.* | 1,190,666 | |||||||||
| 24,046 | Baxter International, Inc. | 1,166,231 | |||||||||
| 20,083 | Becton Dickinson & Co. | 1,214,620 | |||||||||
| 69,349 | Bristol-Myers Squibb Co. | 1,331,501 | |||||||||
| 16,329 | C.R. Bard, Inc. | 1,169,646 | |||||||||
| 19,257 | Cephalon, Inc.* | 1,263,452 | |||||||||
| 31,853 | Chemed Corp. | 1,348,337 | |||||||||
| 54,218 | Computer Programs & Systems, Inc. | 1,897,088 | |||||||||
| 23,709 | Edwards Lifesciences Corp.* | 1,502,676 | |||||||||
| 28,165 | Gilead Sciences, Inc.* | 1,289,957 | |||||||||
| 62,782 | Greatbatch, Inc.* | 1,320,933 | |||||||||
| 24,573 | Haemonetics Corp.* | 1,268,704 | |||||||||
| 25,696 | Johnson & Johnson | 1,345,443 | |||||||||
| 22,766 | Laboratory Corp. of America Holdings* | 1,460,439 | |||||||||
| 31,619 | McKesson Corp. | 1,169,903 | |||||||||
| 30,875 | Medco Health Solutions, Inc.* | 1,344,606 | |||||||||
| 64,366 | Meridian Bioscience, Inc. | 1,118,681 | |||||||||
| 26,805 | Novo Nordisk A/S ADR (Denmark) | 1,273,506 | |||||||||
| 34,100 | ResMed, Inc.* | 1,311,145 | |||||||||
| 49,151 | Sanofi-Synthelabo S.A. ADR (France) | 1,411,617 | |||||||||
| 30,461 | Teva Pharmaceutical Industries Ltd. ADR (Israel) | 1,336,933 | |||||||||
| 56,088 | Thoratec Corp.* | 1,629,917 | |||||||||
| 30,706,118 | |||||||||||
| Industrials—14.1% | |||||||||||
| 92,034 | AAR Corp.* | 1,386,952 | |||||||||
| 57,733 | Alaska Air Group, Inc.* | 968,760 | |||||||||
| 32,334 | C.H. Robinson Worldwide, Inc. | 1,718,875 | |||||||||
| 42,437 | HEICO Corp. | 1,218,366 | |||||||||
| 31,450 | Raytheon Co. | 1,422,484 | |||||||||
| Number of Shares | Value | ||||||||||
| Common Stocks and Other Equity Interests (Continued) | |||||||||||
| 85,952 | Rollins, Inc. | $ | 1,547,136 | ||||||||
| 20,916 | W.W. Grainger, Inc. | 1,754,434 | |||||||||
| 10,017,007 | |||||||||||
| Information Technology—12.2% | |||||||||||
| 47,721 | Accenture Ltd., Class A (Bermuda) | 1,404,429 | |||||||||
| 32,957 | CACI International, Inc., Class A* | 1,303,449 | |||||||||
| 59,763 | Intuit, Inc.* | 1,382,318 | |||||||||
| 38,730 | MAXIMUS, Inc. | 1,561,981 | |||||||||
| 86,927 | Oracle Corp. | 1,681,169 | |||||||||
| 73,963 | SAIC, Inc.* | 1,338,730 | |||||||||
| 8,672,076 | |||||||||||
| Materials—2.8% | |||||||||||
| 52,183 | Rock-Tenn Co., Class A | 1,970,430 | |||||||||
| Telecommunication Services—1.6% | |||||||||||
| 72,222 | NTELOS Holdings Corp. | 1,154,108 | |||||||||
| Utilities—1.9% | |||||||||||
| 57,806 | UGI Corp. | 1,326,070 | |||||||||
| Total Common Stocks and Other Equity Interests (Cost $69,050,136) | 70,944,031 | ||||||||||
| Money Market Fund—0.1% | |||||||||||
| 92,842 | Goldman Sachs Financial Square Prime Obligations Institutional Share Class (Cost $92,842) | 92,842 | |||||||||
| Total Investments (Cost $69,142,978)—100.0% | 71,036,873 | ||||||||||
| Other assets less liabilities—0.0% | 11,374 | ||||||||||
| Net Assets—100.0% | $ | 71,048,247 | |||||||||
ADR American Depositary Receipt.
* Non-income producing security.
See Notes to Financial Statements.
57
Schedule of Investments
PowerShares Water Resources Portfolio
April 30, 2009
| Number of Shares | Value | ||||||||||
| Common Stocks and Other Equity Interests—100.0% | |||||||||||
| Electronics—11.6% | |||||||||||
| 1,330,934 | Badger Meter, Inc.(~) | $ | 51,853,188 | ||||||||
| 1,101,384 | Itron, Inc.* | 50,663,664 | |||||||||
| 1,762,325 | Watts Water Technologies, Inc., Class A(~) | 39,229,355 | |||||||||
| 141,746,207 | |||||||||||
| Engineering & Construction—14.8% | |||||||||||
| 2,058,330 | Aecom Technology Corp.* | 52,960,831 | |||||||||
| 2,256,748 | Insituform Technologies, Inc., Class A*(~) | 34,595,947 | |||||||||
| 1,671,972 | Layne Christensen Co.*(~) | 36,214,914 | |||||||||
| 1,282,625 | URS Corp.* | 56,512,458 | |||||||||
| 180,284,150 | |||||||||||
| Environmental Control—11.4% | |||||||||||
| 2,182,604 | Calgon Carbon Corp.* | 37,060,616 | |||||||||
| 2,491,055 | Nalco Holding Co. | 40,654,018 | |||||||||
| 2,476,181 | Tetra Tech, Inc.* | 60,815,005 | |||||||||
| 138,529,639 | |||||||||||
| Hand/Machine Tools—2.9% | |||||||||||
| 1,519,654 | Franklin Electric Co., Inc.(~) | 36,000,603 | |||||||||
| Machinery - Diversified—16.1% | |||||||||||
| 636,882 | Flowserve Corp. | 43,244,289 | |||||||||
| 1,501,999 | Gorman-Rupp (The) Co.(~) | 31,992,579 | |||||||||
| 1,539,693 | IDEX Corp. | 38,877,248 | |||||||||
| 1,106,274 | Lindsay Corp.(~) | 43,045,121 | |||||||||
| 851,914 | Roper Industries, Inc. | 38,838,759 | |||||||||
| 195,997,996 | |||||||||||
| Metal Fabricate/Hardware—11.5% | |||||||||||
| 10,393,085 | Mueller Water Products, Inc., Class A(~) | 43,547,026 | |||||||||
| 830,288 | Northwest Pipe Co.*(~) | 31,492,824 | |||||||||
| 1,023,516 | Valmont Industries, Inc. | 65,279,850 | |||||||||
| 140,319,700 | |||||||||||
| Miscellaneous Manufacturing—20.8% | |||||||||||
| 785,931 | Ameron International Corp.(~) | 46,503,537 | |||||||||
| 957,925 | Danaher Corp. | 55,981,136 | |||||||||
| 791,064 | ITT Corp. | 32,441,535 | |||||||||
| 1,494,637 | Pall Corp. | 39,473,363 | |||||||||
| 1,444,701 | Pentair, Inc. | 38,486,835 | |||||||||
| 620,815 | Siemens AG ADR (Germany) | 41,551,148 | |||||||||
| 254,437,554 | |||||||||||
| Water—10.9% | |||||||||||
| 324,834 | American States Water Co. | 11,216,518 | |||||||||
| 625,790 | American Water Works Co., Inc. | 11,264,220 | |||||||||
| 583,839 | Aqua America, Inc. | 10,713,446 | |||||||||
| 498,001 | Companhia de Saneamento Basico do Estado de Sao Paulo ADR (Brazil) | 14,053,588 | |||||||||
| Number of Shares | Value | ||||||||||
| Common Stocks and Other Equity Interests (Continued) | |||||||||||
| 1,306,113 | Consolidated Water Co., Inc. (Cayman Islands)(~) | $ | 17,514,975 | ||||||||
| 2,483,875 | Veolia Environnement ADR (France) | 67,834,626 | |||||||||
| 132,597,373 | |||||||||||
| Total Investments (Cost $1,574,372,045)—100.0% | 1,219,913,222 | ||||||||||
| Other assets less liabilities—0.0% | 114,119 | ||||||||||
| Net Assets—100.0% | $ | 1,220,027,341 | |||||||||
ADR American Depositary Receipt.
* Non-income producing security.
(~) Affiliated Investment. See Note 5.
See Notes to Financial Statements.
58
Schedule of Investments
PowerShares WilderHill Clean Energy Portfolio
April 30, 2009
| Number of Shares | Value | ||||||||||
| Common Stocks and Other Equity Interests—100.0% | |||||||||||
| Auto Parts & Equipment—4.2% | |||||||||||
| 837,657 | Amerigon, Inc.* | $ | 4,732,762 | ||||||||
| 1,511,152 | Fuel Systems Solutions, Inc.*(~) | 23,075,291 | |||||||||
| 27,808,053 | |||||||||||
| Chemicals—11.2% | |||||||||||
| 220,268 | Air Products & Chemicals, Inc. | 14,515,661 | |||||||||
| 843,054 | OM Group, Inc.* | 23,487,485 | |||||||||
| 629,748 | Sociedad Quimica y Minera de Chile S.A. ADR (Chile) | 19,843,359 | |||||||||
| 1,990,662 | Zoltek Cos., Inc.*(~) | 15,666,510 | |||||||||
| 73,513,015 | |||||||||||
| Commercial Services—2.4% | |||||||||||
| 696,378 | Quanta Services Inc.* | 15,828,672 | |||||||||
| Computers—3.2% | |||||||||||
| 2,182,046 | Echelon Corp.*(~) | 17,369,086 | |||||||||
| 390,902 | Maxwell Technologies, Inc.* | 4,002,836 | |||||||||
| 21,371,922 | |||||||||||
| Electric—11.3% | |||||||||||
| 1,646,667 | Calpine Corp.* | 13,354,469 | |||||||||
| 277,761 | CPFL Energia S.A. ADR (Brazil) | 12,640,903 | |||||||||
| 483,086 | IDACORP, Inc. | 11,579,571 | |||||||||
| 604,139 | Ormat Technologies, Inc. | 21,265,693 | |||||||||
| 669,959 | Portland General Electric Co. | 12,240,151 | |||||||||
| 3,488,609 | US Geothermal, Inc.*(~) | 3,035,090 | |||||||||
| 74,115,877 | |||||||||||
| Electrical Components & Equipment—32.1% | |||||||||||
| 1,291,551 | Advanced Battery Technologies, Inc.* | 3,551,765 | |||||||||
| 877,497 | American Superconductor Corp.* | 22,551,673 | |||||||||
| 5,529,173 | Beacon Power Corp.* | 4,699,797 | |||||||||
| 1,610,143 | China BAK Battery, Inc.* | 3,429,605 | |||||||||
| 3,214,508 | Ener1 Inc.* | 18,933,452 | |||||||||
| 1,033,458 | Energy Conversion Devices, Inc.* | 18,994,958 | |||||||||
| 8,333,508 | Evergreen Solar, Inc.*(~) | 20,250,424 | |||||||||
| 4,509,375 | JA Solar Holdings Co. Ltd. ADR (China)* | 15,827,906 | |||||||||
| 637,190 | SunPower Corp., Class A* | 17,446,262 | |||||||||
| 1,505,791 | Suntech Power Holdings Co. Ltd. ADR (China)* | 22,481,460 | |||||||||
| 380,570 | Ultralife Corp.* | 2,721,076 | |||||||||
| 1,900,735 | Universal Display Corp.*(~) | 21,459,298 | |||||||||
| 8,765,225 | Valence Technology, Inc.*(~) | 19,634,104 | |||||||||
| 2,828,671 | Yingli Green Energy Holding Co. Ltd. ADR (China)* | 19,744,124 | |||||||||
| 211,725,904 | |||||||||||
| Electronics—2.3% | |||||||||||
| 333,422 | Itron, Inc.* | 15,337,412 | |||||||||
| Number of Shares | Value | ||||||||||
| Common Stocks and Other Equity Interests (Continued) | |||||||||||
| Energy - Alternate Sources—13.2% | |||||||||||
| 667,525 | Ascent Solar Technologies, Inc.* | $ | 3,017,213 | ||||||||
| 2,124,480 | Ballard Power Systems Inc. (Canada)* | 4,355,184 | |||||||||
| 407,565 | Comverge, Inc.* | 3,126,024 | |||||||||
| 113,040 | First Solar, Inc.* | 21,171,262 | |||||||||
| 1,039,641 | FuelCell Energy, Inc.* | 3,306,058 | |||||||||
| 2,802,282 | GT Solar International, Inc.* | 19,868,179 | |||||||||
| 1,584,026 | Gushan Environmental Energy Ltd. ADR (China) | 3,817,503 | |||||||||
| 424,787 | Ocean Power Technologies, Inc.* | 2,786,603 | |||||||||
| 2,960,031 | Plug Power, Inc.* | 2,930,431 | |||||||||
| 3,617,821 | Quantum Fuel Systems Technologies Worldwide, Inc.* | 2,604,831 | |||||||||
| 1,394,932 | Trina Solar Ltd. ADR (Cayman Islands)* | 19,724,338 | |||||||||
| 86,707,626 | |||||||||||
| Food—2.8% | |||||||||||
| 5,213,407 | Cosan Ltd., Class A (Brazil)* | 18,351,193 | |||||||||
| Machinery - Diversified—2.3% | |||||||||||
| 3,915,149 | Raser Technologies, Inc.*(~) | 15,308,233 | |||||||||
| Miscellaneous Manufacturing—0.8% | |||||||||||
| 709,884 | Spire Corp.*(~) | 4,962,089 | |||||||||
| Semiconductors—14.2% | |||||||||||
| 1,408,358 | Applied Materials, Inc. | 17,196,051 | |||||||||
| 667,148 | Cree, Inc.* | 18,273,184 | |||||||||
| 3,907,248 | Emcore Corp.* | 4,844,988 | |||||||||
| 1,152,481 | International Rectifier Corp.* | 19,453,879 | |||||||||
| 859,976 | MEMC Electronic Materials, Inc.* | 13,931,611 | |||||||||
| 4,423,041 | Renesola Ltd. ADR (British Virgin Islands)* | 15,347,952 | |||||||||
| 515,022 | Rubicon Technology, Inc.* | 4,367,387 | |||||||||
| 93,415,052 | |||||||||||
| Total Investments (Cost $1,045,891,428)—100.0% | 658,445,048 | ||||||||||
| Liabilities in excess of other assets—(0.0%) | (45,400 | ) | |||||||||
| Net Assets—100.0% | $ | 658,399,648 | |||||||||
ADR American Depositary Receipt.
* Non-income producing security.
(~) Affiliated Investment. See Note 5.
See Notes to Financial Statements.
59
Schedule of Investments
PowerShares WilderHill Progressive Energy Portfolio
April 30, 2009
| Number of Shares | Value | ||||||||||
| Common Stocks and Other Equity Interests—99.6% | |||||||||||
| Aerospace/Defense—2.4% | |||||||||||
| 19,462 | United Technologies Corp. | $ | 950,524 | ||||||||
| Auto Parts & Equipment—4.9% | |||||||||||
| 49,896 | Exide Technologies* | 270,935 | |||||||||
| 68,600 | Johnson Controls, Inc. | 1,304,087 | |||||||||
| 75,607 | Tenneco, Inc.* | 231,357 | |||||||||
| 31,480 | Westport Innovations, Inc. (Canada)* | 158,659 | |||||||||
| 1,965,038 | |||||||||||
| Building Materials—3.9% | |||||||||||
| 86,504 | Owens Corning, Inc.* | 1,548,422 | |||||||||
| Chemicals—6.8% | |||||||||||
| 135,946 | Methanex Corp. (Canada) | 1,559,301 | |||||||||
| 15,490 | Praxair, Inc. | 1,155,709 | |||||||||
| 2,715,010 | |||||||||||
| Electric—10.7% | |||||||||||
| 66,295 | Cia Energetica de Minas Gerais ADR (Brazil) | 997,740 | |||||||||
| 11,185 | EnerNOC, Inc.* | 195,402 | |||||||||
| 66,380 | Enersis S.A. ADR (Chile) | 995,036 | |||||||||
| 20,066 | FPL Group, Inc. | 1,079,350 | |||||||||
| 23,807 | National Grid PLC ADR (United Kingdom) | 991,562 | |||||||||
| 4,259,090 | |||||||||||
| Electrical Components & Equipment—13.1% | |||||||||||
| 38,137 | A-Power Energy Generation Systems Ltd.* | 314,630 | |||||||||
| 196,750 | Capstone Turbine Corp.* | 157,400 | |||||||||
| 31,786 | Emerson Electric Co. | 1,081,995 | |||||||||
| 20,456 | Energizer Holdings, Inc.* | 1,172,129 | |||||||||
| 80,336 | EnerSys* | 1,369,728 | |||||||||
| 131,102 | GrafTech International Ltd.* | 1,152,387 | |||||||||
| 5,248,269 | |||||||||||
| Electronics—9.0% | |||||||||||
| 28,006 | Badger Meter, Inc. | 1,091,114 | |||||||||
| 54,869 | Koninklijke Philips Electronics NV (Netherlands) | 986,545 | |||||||||
| 76,044 | Woodward Governor Co. | 1,517,838 | |||||||||
| 3,595,497 | |||||||||||
| Energy - Alternate Sources—3.5% | |||||||||||
| 25,958 | Clean Energy Fuels Corp.* | 219,605 | |||||||||
| 75,462 | Covanta Holding Corp.* | 1,064,769 | |||||||||
| 45,206 | Headwaters, Inc.* | 113,919 | |||||||||
| 1,398,293 | |||||||||||
| Engineering & Construction—4.9% | |||||||||||
| 45,899 | Foster Wheeler Ltd.* | 988,205 | |||||||||
| 59,392 | McDermott International, Inc.* | 958,587 | |||||||||
| 1,946,792 | |||||||||||
| Number of Shares | Value | ||||||||||
| Common Stocks and Other Equity Interests (Continued) | |||||||||||
| Environmental Control—3.8% | |||||||||||
| 122,274 | EnergySolutions, Inc. | $ | 1,186,058 | ||||||||
| 14,913 | Fuel Tech, Inc.* | 195,509 | |||||||||
| 262,334 | Rentech, Inc.* | 154,777 | |||||||||
| 1,536,344 | |||||||||||
| Hand/Machine Tools—3.4% | |||||||||||
| 58,343 | Baldor Electric Co. | 1,353,558 | |||||||||
| Mining—6.7% | |||||||||||
| 59,490 | Cameco Corp. (Canada) | 1,355,777 | |||||||||
| 216,425 | USEC, Inc.* | 1,339,671 | |||||||||
| 2,695,448 | |||||||||||
| Miscellaneous Manufacturing—11.2% | |||||||||||
| 22,466 | Eaton Corp. | 984,011 | |||||||||
| 24,676 | ESCO Technologies, Inc.* | 1,026,028 | |||||||||
| 120,400 | Hexcel Corp.* | 1,154,637 | |||||||||
| 16,648 | LSB Industries, Inc.* | 199,443 | |||||||||
| 21,670 | PMFG, Inc.* | 130,453 | |||||||||
| 14,593 | Siemens AG ADR (Germany) | 976,709 | |||||||||
| 4,471,281 | |||||||||||
| Oil & Gas—12.9% | |||||||||||
| 56,954 | Chesapeake Energy Corp. | 1,122,563 | |||||||||
| 33,648 | Questar Corp. | 1,000,019 | |||||||||
| 24,106 | Range Resources Corp. | 963,517 | |||||||||
| 30,088 | Sasol Ltd. ADR (South Africa) | 905,950 | |||||||||
| 31,940 | Southwestern Energy Co.* | 1,145,367 | |||||||||
| 5,137,416 | |||||||||||
| Telecommunications—2.4% | |||||||||||
| 66,920 | Corning, Inc. | 978,370 | |||||||||
| Total Common Stocks and Other Equity Interests (Cost $53,332,207) | 39,799,352 | ||||||||||
| Money Market Fund—0.4% | |||||||||||
| 174,558 | Goldman Sachs Financial Square Prime Obligations Institutional Share Class (Cost $174,558) | 174,558 | |||||||||
| Total Investments (Cost $53,506,765)—100.0% | 39,973,910 | ||||||||||
| Liabilities in excess of other assets—(0.0%) | (3,720 | ) | |||||||||
| Net Assets—100.0% | $ | 39,970,190 | |||||||||
ADR American Depositary Receipt.
* Non-income producing security.
See Notes to Financial Statements.
60
This page intentionally left blank
Statements of Assets and Liabilities
April 30, 2009
| PowerShares Aerospace & Defense Portfolio | PowerShares CleantechTM Portfolio | PowerShares DWA Technical LeadersTM Portfolio | PowerShares Golden Dragon Halter USX China Portfolio | PowerShares Listed Private Equity Portfolio | PowerShares Lux Nanotech Portfolio | PowerShares NASDAQ-100 BuyWrite Portfolio | |||||||||||||||||||||||||
| ASSETS: | |||||||||||||||||||||||||||||||
| Unaffiliated investments at value | $ | 116,543,025 | $ | 111,632,820 | $ | 138,659,564 | $ | 279,247,708 | $ | 61,819,909 | $ | 39,562,835 | $ | 5,790,192 | |||||||||||||||||
| Affiliated investments at value (Note 5) | — | — | — | — | — | — | — | ||||||||||||||||||||||||
| Cash | — | — | — | 13,881 | — | — | — | ||||||||||||||||||||||||
| Receivables: | |||||||||||||||||||||||||||||||
| Dividends | 92,349 | 136,704 | 52,960 | 462,791 | 15,033 | 11,549 | 864 | ||||||||||||||||||||||||
| Investments sold | 80,665 | — | — | — | 6,405,022 | — | — | ||||||||||||||||||||||||
| Foreign tax reclaims | — | — | — | — | — | — | — | ||||||||||||||||||||||||
| Shares sold | — | — | — | 1,735,885 | 660,227 | — | — | ||||||||||||||||||||||||
| Expense waivers | — | 14,065 | — | 36,590 | — | 23,866 | — | ||||||||||||||||||||||||
| Total Assets | 116,716,039 | 111,783,589 | 138,712,524 | 281,496,855 | 68,900,191 | 39,598,250 | 5,791,056 | ||||||||||||||||||||||||
| LIABILITIES: | |||||||||||||||||||||||||||||||
| Due to custodian | 50 | 527 | 641 | — | 830 | 46,817 | — | ||||||||||||||||||||||||
| Due to foreign custodian | — | 31 | — | — | — | — | — | ||||||||||||||||||||||||
| Payables: | |||||||||||||||||||||||||||||||
| Investments purchased | 150,339 | — | — | 1,732,580 | 8,340,024 | — | — | ||||||||||||||||||||||||
| Expense recapture | 21,107 | — | 28,785 | — | 4,761 | — | — | ||||||||||||||||||||||||
| Open written options, at value | — | — | — | — | — | — | 264,056 | ||||||||||||||||||||||||
| Shares repurchased | — | — | — | — | — | — | — | ||||||||||||||||||||||||
| Accrued advisory fees | 44,780 | 41,139 | 55,993 | 106,657 | 21,882 | 15,753 | 2,519 | ||||||||||||||||||||||||
| Accrued expenses | 70,289 | 68,374 | 78,208 | 167,326 | 56,763 | 51,729 | — | ||||||||||||||||||||||||
| Total Liabilities | 286,565 | 110,071 | 163,627 | 2,006,563 | 8,424,260 | 114,299 | 266,575 | ||||||||||||||||||||||||
| NET ASSETS | $ | 116,429,474 | $ | 111,673,518 | $ | 138,548,897 | $ | 279,490,292 | $ | 60,475,931 | $ | 39,483,951 | $ | 5,524,481 | |||||||||||||||||
| NET ASSETS CONSIST OF: | |||||||||||||||||||||||||||||||
| Shares of beneficial interest | $ | 212,254,405 | $ | 195,073,153 | $ | 292,268,627 | $ | 550,066,920 | $ | 180,388,283 | $ | 115,765,644 | $ | 5,930,888 | |||||||||||||||||
| Undistributed net investment income (loss) | 395,750 | 90,754 | 503,999 | 505,793 | 226,162 | 97,124 | — | ||||||||||||||||||||||||
| Accumulated net realized loss on investments and foreign currency related transactions | (13,447,334 | ) | (42,973,884 | ) | (152,975,572 | ) | (87,655,869 | ) | (104,269,538 | ) | (53,225,872 | ) | (423,372 | ) | |||||||||||||||||
| Net unrealized appreciation (depreciation) on investments and translation of assets and liabilities denominated in foreign currencies | (82,773,347 | ) | (40,516,505 | ) | (1,248,157 | ) | (183,426,552 | ) | (15,868,976 | ) | (23,152,945 | ) | 16,965 | ||||||||||||||||||
| Net Assets | $ | 116,429,474 | $ | 111,673,518 | $ | 138,548,897 | $ | 279,490,292 | $ | 60,475,931 | $ | 39,483,951 | $ | 5,524,481 | |||||||||||||||||
| Shares outstanding (unlimited amount authorized, $0.01 par value) | 8,700,000 | 5,800,000 | 9,800,000 | 16,000,000 | 9,000,000 | 5,200,000 | 300,000 | ||||||||||||||||||||||||
| Net asset value | $ | 13.38 | $ | 19.25 | $ | 14.14 | $ | 17.47 | $ | 6.72 | $ | 7.59 | $ | 18.41 | |||||||||||||||||
| Share price | $ | 13.37 | $ | 19.35 | $ | 14.13 | $ | 17.48 | $ | 6.71 | $ | 7.60 | $ | 18.43 | |||||||||||||||||
| Unaffiliated investments at cost | $ | 199,316,372 | $ | 152,149,171 | $ | 139,907,721 | $ | 462,674,260 | $ | 77,688,885 | $ | 62,715,780 | $ | 5,684,222 | |||||||||||||||||
| Affiliated investments at cost | $ | — | $ | — | $ | — | $ | — | $ | — | $ | — | $ | — | |||||||||||||||||
| Foreign currency, at cost | $ | — | $ | (32 | ) | $ | — | $ | — | $ | — | $ | — | $ | — | ||||||||||||||||
| Premium received | $ | — | $ | — | $ | — | $ | — | $ | — | $ | — | $ | 175,051 | |||||||||||||||||
See Notes to Financial Statements.
62
| PowerShares S&P 500 Buy Write Portfolio | PowerShares Value Line Industry Rotation Portfolio | PowerShares Value Line TimelinessTM Select Portfolio | PowerShares Water Resources Portfolio | PowerShares WilderHill Clean Energy Portfolio | PowerShares WilderHill Progressive Energy Portfolio | ||||||||||||||||||||||
| ASSETS: | |||||||||||||||||||||||||||
| Unaffiliated investments at value | $ | 86,752,323 | $ | 26,620,420 | $ | 71,036,873 | $ | 807,923,153 | $ | 517,684,923 | $ | 39,973,910 | |||||||||||||||
| Affiliated investments at value (Note 5) | 63,782 | — | — | 411,990,069 | 140,760,125 | — | |||||||||||||||||||||
| Cash | — | — | — | — | — | — | |||||||||||||||||||||
| Receivables: | |||||||||||||||||||||||||||
| Dividends | 180,554 | 19,352 | 124,211 | 1,383,034 | 809,376 | 55,224 | |||||||||||||||||||||
| Investments sold | — | — | 955,373 | — | — | — | |||||||||||||||||||||
| Foreign tax reclaims | — | — | — | 367,004 | — | — | |||||||||||||||||||||
| Shares sold | — | — | — | 1,412,026 | 16,807,311 | — | |||||||||||||||||||||
| Expense waivers | — | 6,926 | — | — | — | 8,049 | |||||||||||||||||||||
| Total Assets | 86,996,659 | 26,646,698 | 72,116,457 | 1,223,075,286 | 676,061,735 | 40,037,183 | |||||||||||||||||||||
| LIABILITIES: | |||||||||||||||||||||||||||
| Due to custodian | 64,534 | 82,968 | 156 | 971,686 | 144,185 | 435 | |||||||||||||||||||||
| Due to foreign custodian | — | — | — | — | — | — | |||||||||||||||||||||
| Payables: | |||||||||||||||||||||||||||
| Investments purchased | 18,497 | — | — | 1,158,449 | 16,806,436 | — | |||||||||||||||||||||
| Expense recapture | — | — | 16,377 | 49,386 | — | — | |||||||||||||||||||||
| Open written options, at value | 2,646,345 | — | — | — | — | — | |||||||||||||||||||||
| Shares repurchased | — | — | 958,407 | — | — | — | |||||||||||||||||||||
| Accrued advisory fees | 56,112 | 10,516 | 29,419 | 467,529 | 241,382 | 14,982 | |||||||||||||||||||||
| Accrued expenses | — | 45,665 | 63,851 | 400,895 | 470,084 | 51,576 | |||||||||||||||||||||
| Total Liabilities | 2,785,488 | 139,149 | 1,068,210 | 3,047,945 | 17,662,087 | 66,993 | |||||||||||||||||||||
| NET ASSETS | $ | 84,211,171 | $ | 26,507,549 | $ | 71,048,247 | $ | 1,220,027,341 | $ | 658,399,648 | $ | 39,970,190 | |||||||||||||||
| NET ASSETS CONSIST OF: | |||||||||||||||||||||||||||
| Shares of beneficial interest | $ | 97,245,177 | $ | 51,126,346 | $ | 194,664,643 | $ | 1,898,092,013 | $ | 1,899,212,277 | $ | 72,756,939 | |||||||||||||||
| Undistributed net investment income (loss) | 190,870 | 74,653 | 232,181 | 2,265,526 | (25,802 | ) | 132,709 | ||||||||||||||||||||
| Accumulated net realized loss on investments and foreign currency related transactions | (4,949,397 | ) | (25,238,401 | ) | (125,742,472 | ) | (325,871,375 | ) | (853,340,447 | ) | (19,386,603 | ) | |||||||||||||||
| Net unrealized appreciation (depreciation) on investments and translation of assets and liabilities denominated in foreign currencies | (8,275,479 | ) | 544,951 | 1,893,895 | (354,458,823 | ) | (387,446,380 | ) | (13,532,855 | ) | |||||||||||||||||
| Net Assets | $ | 84,211,171 | $ | 26,507,549 | $ | 71,048,247 | $ | 1,220,027,341 | $ | 658,399,648 | $ | 39,970,190 | |||||||||||||||
| Shares outstanding (unlimited amount authorized, $0.01 par value) | 4,800,000 | 1,700,000 | 7,400,000 | 86,900,000 | 72,900,000 | 2,300,000 | |||||||||||||||||||||
| Net asset value | $ | 17.54 | $ | 15.59 | $ | 9.60 | $ | 14.04 | $ | 9.03 | $ | 17.38 | |||||||||||||||
| Share price | $ | 17.59 | $ | 15.58 | $ | 9.60 | $ | 14.02 | $ | 8.99 | $ | 17.38 | |||||||||||||||
| Unaffiliated investments at cost | $ | 95,329,181 | $ | 26,075,469 | $ | 69,142,978 | $ | 1,048,163,201 | $ | 813,190,473 | $ | 53,506,765 | |||||||||||||||
| Affiliated investments at cost | $ | 74,011 | $ | — | $ | — | $ | 526,208,844 | $ | 232,700,955 | $ | — | |||||||||||||||
| Foreign currency, at cost | $ | — | $ | — | $ | — | $ | — | $ | — | $ | — | |||||||||||||||
| Premium received | $ | 2,957,953 | $ | — | $ | — | $ | — | $ | — | $ | — | |||||||||||||||
63
Statements of Operations
| PowerShares Aerospace & Defense Portfolio | PowerShares CleantechTM Portfolio | PowerShares DWA Technical LeadersTM Portfolio | PowerShares Golden Dragon Halter USX China Portfolio | PowerShares Listed Private Equity Portfolio | PowerShares Lux Nanotech Portfolio | PowerShares NASDAQ-100 BuyWrite Portfolio | |||||||||||||||||||||||||
| Year Ended April 30, 2009 | Year Ended April 30, 2009 | Year Ended April 30, 2009 | Year Ended April 30, 2009 | Year Ended April 30, 2009 | Year Ended April 30, 2009 | For the Period June 9, 2008* Through April 30, 2009 | |||||||||||||||||||||||||
| INVESTMENT INCOME: | |||||||||||||||||||||||||||||||
| Unaffiliated dividend income | $ | 2,697,677 | $ | 840,191 | $ | 2,803,054 | $ | 5,657,404 | $ | 6,843,521 | $ | 509,334 | $ | 18,065 | |||||||||||||||||
| Affiliated dividend income | — | — | — | — | — | — | — | ||||||||||||||||||||||||
| Foreign withholding taxes | (7,320 | ) | (77,328 | ) | — | (92,272 | ) | — | (5,459 | ) | (129 | ) | |||||||||||||||||||
| Total Income | 2,690,357 | 762,863 | 2,803,054 | 5,565,132 | 6,843,521 | 503,875 | 17,936 | ||||||||||||||||||||||||
| EXPENSES: | |||||||||||||||||||||||||||||||
| Advisory fees | 805,647 | 571,846 | 1,315,339 | 1,597,741 | 405,010 | 290,537 | 19,806 | ||||||||||||||||||||||||
| Sub-licensing | 96,676 | 85,777 | 263,059 | 275,775 | 81,001 | 58,107 | — | ||||||||||||||||||||||||
| Accounting & Administration fees | 74,778 | 74,983 | 84,147 | 96,051 | 74,983 | 74,983 | — | ||||||||||||||||||||||||
| Professional fees | 33,548 | 36,373 | 37,730 | 45,534 | 32,494 | 34,902 | — | ||||||||||||||||||||||||
| Printing | 25,168 | 36,926 | 34,825 | 54,220 | 11,876 | 34,244 | — | ||||||||||||||||||||||||
| Custodian & transfer agent fees | 11,883 | 13,312 | 23,543 | 25,403 | 10,859 | 8,161 | — | ||||||||||||||||||||||||
| Trustees | 9,868 | 7,935 | 13,390 | 15,343 | 6,945 | 5,983 | — | ||||||||||||||||||||||||
| Other expenses | 17,539 | 11,545 | 19,470 | 156,690 | 7,427 | 12,496 | — | ||||||||||||||||||||||||
| Total Expenses | 1,075,107 | 838,697 | 1,791,503 | 2,266,757 | 630,595 | 519,413 | 19,806 | ||||||||||||||||||||||||
| (Waivers) and/or Recapture | (11,656 | ) | (66,705 | ) | 21,472 | (74,560 | ) | (63,581 | ) | (112,662 | ) | — | |||||||||||||||||||
| Net Expenses | 1,063,451 | 771,992 | 1,812,975 | 2,192,197 | 567,014 | 406,751 | 19,806 | ||||||||||||||||||||||||
| Net Investment Income (Loss) | 1,626,906 | (9,129 | ) | 990,079 | 3,372,935 | 6,276,507 | 97,124 | (1,870 | ) | ||||||||||||||||||||||
| REALIZED AND UNREALIZED GAIN (LOSS): | |||||||||||||||||||||||||||||||
| Net realized loss from: | |||||||||||||||||||||||||||||||
| Investments | (5,828,217 | ) | (37,547,529 | ) | (122,677,295 | ) | (73,675,688 | ) | (115,906,149 | ) | (38,971,937 | ) | (538,715 | ) | |||||||||||||||||
| Written options | — | — | — | — | — | — | 115,343 | ||||||||||||||||||||||||
| In-kind redemptions | (11,226,510 | ) | 7,441,442 | (51,022,668 | ) | (6,729,176 | ) | 2,289,109 | 1,477,312 | — | |||||||||||||||||||||
| Foreign currency related transactions | — | 99,883 | — | — | — | — | — | ||||||||||||||||||||||||
| Net realized loss | (17,054,727 | ) | (30,006,204 | ) | (173,699,963 | ) | (80,404,864 | ) | (113,617,040 | ) | (37,494,625 | ) | (423,372 | ) | |||||||||||||||||
| Net change in unrealized appreciation (depreciation) on: | |||||||||||||||||||||||||||||||
| Investments | (66,015,919 | ) | (41,945,826 | ) | (17,193,055 | ) | (115,281,921 | ) | 19,810,362 | 1,642,166 | 105,970 | ||||||||||||||||||||
| Written options | — | — | — | — | — | — | (89,005 | ) | |||||||||||||||||||||||
| Translation of assets and liabilities denominated in foreign currencies | — | (154 | ) | — | — | — | — | — | |||||||||||||||||||||||
| Net realized and unrealized loss | (83,070,646 | ) | (71,952,184 | ) | (190,893,018 | ) | (195,686,785 | ) | (93,806,678 | ) | (35,852,459 | ) | (406,407 | ) | |||||||||||||||||
| Net decrease in net assets resulting from operations | $ | (81,443,740 | ) | $ | (71,961,313 | ) | $ | (189,902,939 | ) | $ | (192,313,850 | ) | $ | (87,530,171 | ) | $ | (35,755,335 | ) | $ | (408,277 | ) | ||||||||||
* Commencement of Investment Operations.
See Notes to Financial Statements.
64
| PowerShares S&P 500 Buy Write Portfolio | PowerShares Value Line Industry Rotation Portfolio | Value Line TimelinessTM Select Portfolio | PowerShares Water Resources Portfolio | PowerShares WilderHill Clean Energy Portfolio | PowerShares WilderHill Progressive Energy Portfolio | ||||||||||||||||||||||
| Year Ended April 30, 2009 | Year Ended April 30, 2009 | Year Ended April 30, 2009 | Year Ended April 30, 2009 | Year Ended April 30, 2009 | Year Ended April 30, 2009 | ||||||||||||||||||||||
| INVESTMENT INCOME: | |||||||||||||||||||||||||||
| Unaffiliated dividend income | $ | 1,291,347 | $ | 441,974 | $ | 1,203,516 | $ | 15,332,163 | $ | 5,486,811 | $ | 708,456 | |||||||||||||||
| Affiliated dividend income | 688 | — | — | 4,410,191 | — | — | |||||||||||||||||||||
| Foreign withholding taxes | (113 | ) | (6,103 | ) | (36,940 | ) | (634,528 | ) | (70,651 | ) | (50,835 | ) | |||||||||||||||
| Total Income | 1,291,922 | 435,871 | 1,166,576 | 19,107,826 | 5,416,160 | 657,621 | |||||||||||||||||||||
| EXPENSES: | |||||||||||||||||||||||||||
| Advisory fees | 341,560 | 185,971 | 599,540 | 8,422,923 | 4,760,677 | 249,269 | |||||||||||||||||||||
| Sub-licensing | — | 37,195 | 119,908 | 1,263,440 | 827,742 | 49,854 | |||||||||||||||||||||
| Accounting & Administration fees | — | 74,983 | 74,983 | 490,335 | 275,134 | 74,983 | |||||||||||||||||||||
| Professional fees | — | 24,135 | 31,152 | 134,422 | 89,334 | 26,699 | |||||||||||||||||||||
| Printing | — | 5,483 | 14,558 | 225,991 | 132,039 | 10,741 | |||||||||||||||||||||
| Custodian & transfer agent fees | — | 9,972 | 5,152 | 94,412 | 56,199 | 6,293 | |||||||||||||||||||||
| Trustees | — | 5,096 | 8,368 | 67,813 | 39,546 | 5,564 | |||||||||||||||||||||
| Other expenses | — | 7,690 | 12,214 | 65,066 | 359,713 | 3,480 | |||||||||||||||||||||
| Total Expenses | 341,560 | 350,525 | 865,875 | 10,764,402 | 6,540,384 | 426,883 | |||||||||||||||||||||
| (Waivers) and/or Recapture | — | (90,165 | ) | (26,520 | ) | 75,183 | 170 | (77,906 | ) | ||||||||||||||||||
| Net Expenses | 341,560 | 260,360 | 839,355 | 10,839,585 | 6,540,554 | 348,977 | |||||||||||||||||||||
| Net Investment Income (Loss) | 950,362 | 175,511 | 327,221 | 8,268,241 | (1,124,394 | ) | 308,644 | ||||||||||||||||||||
| REALIZED AND UNREALIZED GAIN (LOSS): | |||||||||||||||||||||||||||
| Net realized loss from: | |||||||||||||||||||||||||||
| Investments | (9,917,086 | ) | (18,180,139 | ) | (56,041,610 | ) | (266,684,115 | ) | (720,886,301 | ) | (15,172,400 | ) | |||||||||||||||
| Written options | 2,333,704 | — | — | — | — | — | |||||||||||||||||||||
| In-kind redemptions | 2,738,093 | (5,625,724 | ) | (11,446,886 | ) | 4,145,540 | 56,173,041 | (2,908,176 | ) | ||||||||||||||||||
| Foreign currency related transactions | — | 4 | — | — | — | — | |||||||||||||||||||||
| Net realized loss | (4,845,289 | ) | (23,805,859 | ) | (67,488,496 | ) | (262,538,575 | ) | (664,713,260 | ) | (18,080,576 | ) | |||||||||||||||
| Net change in unrealized appreciation (depreciation) on: | |||||||||||||||||||||||||||
| Investments | (8,601,910 | ) | (1,182,836 | ) | (1,367,281 | ) | (478,207,181 | ) | (202,143,081 | ) | (15,514,733 | ) | |||||||||||||||
| Written options | 269,029 | — | — | — | — | — | |||||||||||||||||||||
| Translation of assets and liabilities denominated in foreign currencies | — | — | — | — | — | — | |||||||||||||||||||||
| Net realized and unrealized loss | (13,178,170 | ) | (24,988,695 | ) | (68,855,777 | ) | (740,745,756 | ) | (866,856,341 | ) | (33,595,309 | ) | |||||||||||||||
| Net decrease in net assets resulting from operations | $ | (12,227,808 | ) | $ | (24,813,184 | ) | $ | (68,528,556 | ) | $ | (732,477,515 | ) | $ | (867,980,735 | ) | $ | (33,286,665 | ) | |||||||||
65
Statements of Changes in Net Assets
| PowerShares Aerospace & Defense Portfolio | PowerShares CleantechTM Portfolio | PowerShares DWA Technical LeadersTM Portfolio | |||||||||||||||||||||||||
| Year Ended April 30, 2009 | Year Ended April 30, 2008 | Year Ended April 30, 2009 | Year Ended April 30, 2008 | Year Ended April 30, 2009 | Year Ended April 30, 2008 | ||||||||||||||||||||||
| OPERATIONS: | |||||||||||||||||||||||||||
| Net investment income (loss) | $ | 1,626,906 | $ | 813,416 | $ | (9,129 | ) | $ | (225,960 | ) | $ | 990,079 | $ | (153,701 | ) | ||||||||||||
| Net realized gain (loss) on investments and foreign currency related transactions | (17,054,727 | ) | 31,289,401 | (30,006,204 | ) | 7,205,438 | (173,699,963 | ) | (19,707,076 | ) | |||||||||||||||||
| Net change in unrealized appreciation (depreciation) on investments and translation of assets and liabilities denominated in foreign currencies | (66,015,919 | ) | (37,436,934 | ) | (41,945,980 | ) | 423,812 | (17,193,055 | ) | 13,955,713 | |||||||||||||||||
| Net increase (decrease) in net assets resulting from operations | (81,443,740 | ) | (5,334,117 | ) | (71,961,313 | ) | 7,403,290 | (189,902,939 | ) | (5,905,064 | ) | ||||||||||||||||
| Undistributed net investment income (loss) included in the price of units issued and redeemed | (109,833 | ) | 15,071 | (244,900 | ) | (192,676 | ) | (380,236 | ) | 610,622 | |||||||||||||||||
| DISTRIBUTIONS TO SHAREHOLDERS FROM: | |||||||||||||||||||||||||||
| Net investment income | (1,446,628 | ) | (597,944 | ) | — | — | (486,080 | ) | (105,514 | ) | |||||||||||||||||
| Return of capital | — | — | — | — | — | (57,242 | ) | ||||||||||||||||||||
| Total distributions to shareholders | (1,446,628 | ) | (597,944 | ) | — | — | (486,080 | ) | (162,756 | ) | |||||||||||||||||
| SHAREHOLDER TRANSACTIONS: | |||||||||||||||||||||||||||
| Proceeds from shares sold | 29,268,610 | 306,615,261 | 76,687,579 | 121,607,209 | 263,642,733 | 469,242,076 | |||||||||||||||||||||
| Value of shares repurchased | (87,444,233 | ) | (245,073,856 | ) | (7,389,055 | ) | (36,337,012 | ) | (298,218,621 | ) | (191,750,748 | ) | |||||||||||||||
| Net income equalization | 109,833 | (15,071 | ) | 244,900 | 192,676 | 380,236 | (610,622 | ) | |||||||||||||||||||
| Net increase (decrease) in net assets resulting from shares transactions | (58,065,790 | ) | 61,526,334 | 69,543,424 | 85,462,873 | (34,195,652 | ) | 276,880,706 | |||||||||||||||||||
| Increase (Decrease) in Net Assets | (141,065,991 | ) | 55,609,344 | (2,662,789 | ) | 92,673,487 | (224,964,907 | ) | 271,423,508 | ||||||||||||||||||
| NET ASSETS: | |||||||||||||||||||||||||||
| Beginning of period | 257,495,465 | 201,886,121 | 114,336,307 | 21,662,820 | 363,513,804 | 92,090,296 | |||||||||||||||||||||
| End of period | $ | 116,429,474 | $ | 257,495,465 | $ | 111,673,518 | $ | 114,336,307 | $ | 138,548,897 | $ | 363,513,804 | |||||||||||||||
| Undistributed net investment income (loss) at end of period | $ | 395,750 | $ | 215,472 | $ | 90,754 | $ | — | $ | 503,999 | $ | — | |||||||||||||||
| CHANGES IN SHARES OUTSTANDING: | |||||||||||||||||||||||||||
| Shares sold | 1,800,000 | 13,600,000 | 2,700,000 | 3,700,000 | 12,600,000 | 17,900,000 | |||||||||||||||||||||
| Shares repurchased | (5,400,000 | ) | (11,300,000 | ) | (300,000 | ) | (1,100,000 | ) | (16,800,000 | ) | (7,500,000 | ) | |||||||||||||||
| Shares outstanding, beginning of period | 12,300,000 | 10,000,000 | 3,400,000 | 800,000 | 14,000,000 | 3,600,000 | |||||||||||||||||||||
| Shares outstanding, end of period | 8,700,000 | 12,300,000 | 5,800,000 | 3,400,000 | 9,800,000 | 14,000,000 | |||||||||||||||||||||
See Notes to Financial Statements.
66
| PowerShares Golden Dragon Halter USX China Portfolio | PowerShares Listed Private Equity Portfolio | PowerShares Lux Nanotech Portfolio | |||||||||||||||||||||||||
| Year Ended April 30, 2009 | Year Ended April 30, 2008 | Year Ended April 30, 2009 | Year Ended April 30, 2008 | Year Ended April 30, 2009 | Year Ended April 30, 2008 | ||||||||||||||||||||||
| OPERATIONS: | |||||||||||||||||||||||||||
| Net investment income (loss) | $ | 3,372,935 | $ | 2,542,230 | $ | 6,276,507 | $ | 6,816,457 | $ | 97,124 | $ | (211,067 | ) | ||||||||||||||
| Net realized gain (loss) on investments and foreign currency related transactions | (80,404,864 | ) | 225,313,096 | (113,617,040 | ) | (5,793,748 | ) | (37,494,625 | ) | (5,038,081 | ) | ||||||||||||||||
| Net change in unrealized appreciation (depreciation) on investments and translation of assets and liabilities denominated in foreign currencies | (115,281,921 | ) | (101,212,578 | ) | 19,810,362 | (40,433,048 | ) | 1,642,166 | (20,211,100 | ) | |||||||||||||||||
| Net increase (decrease) in net assets resulting from operations | (192,313,850 | ) | 126,642,748 | (87,530,171 | ) | (39,410,339 | ) | (35,755,335 | ) | (25,460,248 | ) | ||||||||||||||||
| Undistributed net investment income (loss) included in the price of units issued and redeemed | (415,792 | ) | 619,099 | 1,520,354 | (182,741 | ) | 4,781 | 73,183 | |||||||||||||||||||
| DISTRIBUTIONS TO SHAREHOLDERS FROM: | |||||||||||||||||||||||||||
| Net investment income | (2,867,142 | ) | (3,881,852 | ) | (6,364,696 | ) | (6,147,694 | ) | — | — | |||||||||||||||||
| Return of capital | — | (198,502 | ) | — | — | — | — | ||||||||||||||||||||
| Total distributions to shareholders | (2,867,142 | ) | (4,080,354 | ) | (6,364,696 | ) | (6,147,694 | ) | — | — | |||||||||||||||||
| SHAREHOLDER TRANSACTIONS: | |||||||||||||||||||||||||||
| Proceeds from shares sold | 124,754,282 | 831,380,876 | 78,938,052 | 76,913,561 | 17,226,459 | 24,034,571 | |||||||||||||||||||||
| Value of shares repurchased | (178,565,999 | ) | (819,780,640 | ) | (27,946,437 | ) | (78,054,703 | ) | (26,415,388 | ) | (73,198,428 | ) | |||||||||||||||
| Net income equalization | 415,792 | (619,099 | ) | (1,520,354 | ) | 182,741 | (4,781 | ) | (73,183 | ) | |||||||||||||||||
| Net increase (decrease) in net assets resulting from shares transactions | (53,395,925 | ) | 10,981,137 | 49,471,261 | (958,401 | ) | (9,193,710 | ) | (49,237,040 | ) | |||||||||||||||||
| Increase (Decrease) in Net Assets | (248,992,709 | ) | 134,162,630 | (42,903,252 | ) | (46,699,175 | ) | (44,944,264 | ) | (74,624,105 | ) | ||||||||||||||||
| NET ASSETS: | |||||||||||||||||||||||||||
| Beginning of period | 528,483,001 | 394,320,371 | 103,379,183 | 150,078,358 | 84,428,215 | 159,052,320 | |||||||||||||||||||||
| End of period | $ | 279,490,292 | $ | 528,483,001 | $ | 60,475,931 | $ | 103,379,183 | $ | 39,483,951 | $ | 84,428,215 | |||||||||||||||
| Undistributed net investment income (loss) at end of period | $ | 505,793 | $ | — | $ | 226,162 | $ | 1,142,260 | $ | 97,124 | $ | — | |||||||||||||||
| CHANGES IN SHARES OUTSTANDING: | |||||||||||||||||||||||||||
| Shares sold | 5,800,000 | 27,200,000 | 6,700,000 | 2,900,000 | 1,600,000 | 1,400,000 | |||||||||||||||||||||
| Shares repurchased | (8,100,000 | ) | (27,300,000 | ) | (2,800,000 | ) | (3,200,000 | ) | (2,400,000 | ) | (4,500,000 | ) | |||||||||||||||
| Shares outstanding, beginning of period | 18,300,000 | 18,400,000 | 5,100,000 | 5,400,000 | 6,000,000 | 9,100,000 | |||||||||||||||||||||
| Shares outstanding, end of period | 16,000,000 | 18,300,000 | 9,000,000 | 5,100,000 | 5,200,000 | 6,000,000 | |||||||||||||||||||||
67
Statements of Changes in Net Assets (Continued)
| PowerShares NASDAQ-100 BuyWrite Portfolio | PowerShares S&P 500 Buy Write Portfolio | PowerShares Value Line Industry Rotation Portfolio | PowerShares Value Line TimelinessTM Select Portfolio | ||||||||||||||||||||||||||||
| For the Period June 9, 2008* Through April 30, 2009 | Year Ended April 30, 2009 | For The Period December 19, 2007* Through April 30, 2008 | Year Ended April 30, 2009 | Year Ended April 30, 2008 | Year Ended April 30, 2009 | Year Ended April 30, 2008 | |||||||||||||||||||||||||
| OPERATIONS: | |||||||||||||||||||||||||||||||
| Net investment income (loss) | $ | (1,870 | ) | $ | 950,362 | $ | 13,626 | $ | 175,511 | $ | 11,257 | $ | 327,221 | $ | (240,523 | ) | |||||||||||||||
| Net realized gain (loss) on investments and foreign currency related transactions | (423,372 | ) | (4,845,289 | ) | 20,654 | (23,805,859 | ) | (556,166 | ) | (67,488,496 | ) | 9,749,852 | |||||||||||||||||||
| Net change in unrealized appreciation (depreciation) on investments and translation of assets and liabilities denominated in foreign currencies | 16,965 | (8,332,881 | ) | 57,402 | (1,182,836 | ) | (11,149 | ) | (1,367,281 | ) | (20,623,471 | ) | |||||||||||||||||||
| Net increase (decrease) in net assets resulting from operations | (408,277 | ) | (12,227,808 | ) | 91,682 | (24,813,184 | ) | (556,058 | ) | (68,528,556 | ) | (11,114,142 | ) | ||||||||||||||||||
| Undistributed net investment income (loss) included in the price of units issued and redeemed | (5,030 | ) | (113,226 | ) | 14,403 | (7,380 | ) | 1,411 | (31,377 | ) | 56,801 | ||||||||||||||||||||
| DISTRIBUTIONS TO SHAREHOLDERS FROM: | |||||||||||||||||||||||||||||||
| Net investment income | — | (887,380 | ) | (10,500 | ) | (100,862 | ) | (19,266 | ) | (95,040 | ) | — | |||||||||||||||||||
| Return of capital | — | — | — | — | (1,384 | ) | — | — | |||||||||||||||||||||||
| Total distributions to shareholders | — | (887,380 | ) | (10,500 | ) | (100,862 | ) | (20,650 | ) | (95,040 | ) | — | |||||||||||||||||||
| SHAREHOLDER TRANSACTIONS: | |||||||||||||||||||||||||||||||
| Proceeds from shares sold | 5,932,758 | 110,330,594 | 7,419,561 | 72,452,696 | 90,728,154 | 221,405,325 | 410,338,472 | ||||||||||||||||||||||||
| Value of shares repurchased | — | (20,504,978 | ) | — | (62,881,279 | ) | (81,951,087 | ) | (259,402,068 | ) | (494,163,323 | ) | |||||||||||||||||||
| Net income equalization | 5,030 | 113,226 | (14,403 | ) | 7,380 | (1,411 | ) | 31,377 | (56,801 | ) | |||||||||||||||||||||
| Net increase (decrease) in net assets resulting from shares transactions | 5,937,788 | 89,938,842 | 7,405,158 | 9,578,797 | 8,775,656 | (37,965,366 | ) | (83,881,652 | ) | ||||||||||||||||||||||
| Increase (Decrease) in Net Assets | 5,524,481 | 76,710,428 | 7,500,743 | (15,342,629 | ) | 8,200,359 | (106,620,339 | ) | (94,938,993 | ) | |||||||||||||||||||||
| NET ASSETS: | |||||||||||||||||||||||||||||||
| Beginning of period | — | 7,500,743 | — | 41,850,178 | 33,649,819 | 177,668,586 | 272,607,579 | ||||||||||||||||||||||||
| End of period | $ | 5,524,481 | $ | 84,211,171 | $ | 7,500,743 | $ | 26,507,549 | $ | 41,850,178 | $ | 71,048,247 | $ | 177,668,586 | |||||||||||||||||
| Undistributed net investment income (loss) at end of period | $ | — | $ | 190,870 | $ | 3,126 | $ | 74,653 | $ | — | $ | 232,181 | $ | — | |||||||||||||||||
| CHANGES IN SHARES OUTSTANDING: | |||||||||||||||||||||||||||||||
| Shares sold | 300,000 | 5,700,000 | 300,000 | 3,100,000 | 3,200,000 | 15,600,000 | 23,600,000 | ||||||||||||||||||||||||
| Shares repurchased | — | (1,200,000 | ) | — | (2,900,000 | ) | (2,900,000 | ) | (18,800,000 | ) | (28,500,000 | ) | |||||||||||||||||||
| Shares outstanding, beginning of period | — | 300,000 | — | 1,500,000 | 1,200,000 | 10,600,000 | 15,500,000 | ||||||||||||||||||||||||
| Shares outstanding, end of period | 300,000 | 4,800,000 | 300,000 | 1,700,000 | 1,500,000 | 7,400,000 | 10,600,000 | ||||||||||||||||||||||||
* Commencement of Investment Operations.
See Notes to Financial Statements.
68
| PowerShares Water Resources Portfolio | PowerShares WilderHill Clean Energy Portfolio | PowerShares WilderHill Progressive Energy Portfolio | |||||||||||||||||||||||||
| Year Ended April 30, 2009 | Year Ended April 30, 2008 | Year Ended April 30, 2009 | Year Ended April 30, 2008 | Year Ended April 30, 2009 | Year Ended April 30, 2008 | ||||||||||||||||||||||
| OPERATIONS: | |||||||||||||||||||||||||||
| Net investment income (loss) | $ | 8,268,241 | $ | 7,576,287 | $ | (1,124,394 | ) | $ | (3,941,540 | ) | $ | 308,644 | $ | 147,013 | |||||||||||||
| Net realized gain (loss) on investments and foreign currency related transactions | (262,538,575 | ) | 112,706,721 | (664,713,260 | ) | 220,990,947 | (18,080,576 | ) | (2,065,989 | ) | |||||||||||||||||
| Net change in unrealized appreciation (depreciation) on investments and translation of assets and liabilities denominated in foreign currencies | (478,207,181 | ) | (5,048 | ) | (202,143,081 | ) | (213,773,816 | ) | (15,514,733 | ) | 144,615 | ||||||||||||||||
| Net increase (decrease) in net assets resulting from operations | (732,477,515 | ) | 120,277,960 | (867,980,735 | ) | 3,275,591 | (33,286,665 | ) | (1,774,361 | ) | |||||||||||||||||
| Undistributed net investment income (loss) included in the price of units issued and redeemed | (692,733 | ) | 434,907 | (82,390 | ) | (912,742 | ) | 6,067 | 22,365 | ||||||||||||||||||
| DISTRIBUTIONS TO SHAREHOLDERS FROM: | |||||||||||||||||||||||||||
| Net investment income | (6,232,539 | ) | (7,498,823 | ) | — | — | (175,935 | ) | (193,423 | ) | |||||||||||||||||
| Return of capital | — | — | — | — | — | (9,290 | ) | ||||||||||||||||||||
| Total distributions to shareholders | (6,232,539 | ) | (7,498,823 | ) | — | — | (175,935 | ) | (202,713 | ) | |||||||||||||||||
| SHAREHOLDER TRANSACTIONS: | |||||||||||||||||||||||||||
| Proceeds from shares sold | 340,520,394 | 1,059,031,268 | 490,135,966 | 1,424,637,475 | 38,554,939 | 66,870,104 | |||||||||||||||||||||
| Value of shares repurchased | (578,435,173 | ) | (581,939,914 | ) | (437,648,405 | ) | (868,365,037 | ) | (27,219,587 | ) | (25,700,249 | ) | |||||||||||||||
| Net income equalization | 692,733 | (434,907 | ) | 82,390 | 912,742 | (6,067 | ) | (22,365 | ) | ||||||||||||||||||
| Net increase (decrease) in net assets resulting from shares transactions | (237,222,046 | ) | 476,656,447 | 52,569,951 | 557,185,180 | 11,329,285 | 41,147,490 | ||||||||||||||||||||
| Increase (Decrease) in Net Assets | (976,624,833 | ) | 589,870,491 | (815,493,174 | ) | 559,548,029 | (22,127,248 | ) | 39,192,781 | ||||||||||||||||||
| NET ASSETS: | |||||||||||||||||||||||||||
| Beginning of period | 2,196,652,174 | 1,606,781,683 | 1,473,892,822 | 914,344,793 | 62,097,438 | 22,904,657 | |||||||||||||||||||||
| End of period | $ | 1,220,027,341 | $ | 2,196,652,174 | $ | 658,399,648 | $ | 1,473,892,822 | $ | 39,970,190 | $ | 62,097,438 | |||||||||||||||
| Undistributed net investment income (loss) at end of period | $ | 2,265,526 | $ | 229,824 | $ | (25,802 | ) | $ | — | $ | 132,709 | $ | — | ||||||||||||||
| CHANGES IN SHARES OUTSTANDING: | |||||||||||||||||||||||||||
| Shares sold | 17,600,000 | 50,300,000 | 38,900,000 | 61,200,000 | 1,500,000 | 2,300,000 | |||||||||||||||||||||
| Shares repurchased | (37,000,000 | ) | (27,700,000 | ) | (36,400,000 | ) | (38,200,000 | ) | (1,400,000 | ) | (900,000 | ) | |||||||||||||||
| Shares outstanding, beginning of period | 106,300,000 | 83,700,000 | 70,400,000 | 47,400,000 | 2,200,000 | 800,000 | |||||||||||||||||||||
| Shares outstanding, end of period | 86,900,000 | 106,300,000 | 72,900,000 | 70,400,000 | 2,300,000 | 2,200,000 | |||||||||||||||||||||
69
Financial Highlights
PowerShares Aerospace & Defense Portfolio
| Year Ended April 30, | For the Period October 26, 2005* Through | ||||||||||||||||||
| 2009 | 2008 | 2007 | April 30, 2006 | ||||||||||||||||
| PER SHARE OPERATING PERFORMANCE: | |||||||||||||||||||
| Net asset value at beginning of period | $ | 20.93 | $ | 20.19 | $ | 17.37 | $ | 14.91 | |||||||||||
| Net investment income** | 0.16 | 0.06 | 0.05 | 0.03 | |||||||||||||||
| Net realized and unrealized gain (loss) on investments | (7.56 | ) | 0.72 | 2.83 | 2.45 | ||||||||||||||
| Total from investment operations | (7.40 | ) | 0.78 | 2.88 | 2.48 | ||||||||||||||
| Distributions to shareholders from: | |||||||||||||||||||
| Net investment income | (0.15 | ) | (0.04 | ) | (0.06 | ) | (0.02 | ) | |||||||||||
| Return of capital | — | — | — | (a) | — | ||||||||||||||
| Total distributions | (0.15 | ) | (0.04 | ) | (0.06 | ) | (0.02 | ) | |||||||||||
| Net asset value at end of period | $ | 13.38 | $ | 20.93 | $ | 20.19 | $ | 17.37 | |||||||||||
| Share price at end of period*** | $ | 13.37 | |||||||||||||||||
| NET ASSET VALUE, TOTAL RETURN**** | (35.46 | )% | 3.86 | % | 16.66 | % | 16.66 | % | |||||||||||
| SHARE PRICE TOTAL RETURN**** | (35.48 | )% | |||||||||||||||||
| RATIOS/SUPPLEMENTAL DATA: | |||||||||||||||||||
| Net assets at end of period (000's omitted) | $ | 116,429 | $ | 257,495 | $ | 201,886 | $ | 85,136 | |||||||||||
| Ratio to average net assets of: | |||||||||||||||||||
| Expenses, after (Waivers) and/or Recapture | 0.66 | % | 0.66 | % | 0.66 | % | 0.68 | %† | |||||||||||
| Expenses, prior to (Waivers) and/or Recapture | 0.67 | % | 0.64 | % | 0.77 | % | 0.80 | %† | |||||||||||
| Net investment income, after (Waivers) and/or Recapture | 1.01 | % | 0.27 | % | 0.28 | % | 0.31 | %† | |||||||||||
| Portfolio turnover rate †† | 9 | % | 13 | % | 16 | % | 1 | % | |||||||||||
| Undistributed net investment income (loss) included in price of units issued and redeemed**# | $ | (0.01 | ) | $ | 0.00 | (a) | $ | 0.00 | (a) | — | |||||||||
PowerShares CleantechTM Portfolio
| Year Ended April 30, | For the Period October 24, 2006* Through | ||||||||||||||
| 2009 | 2008 | April 30, 2007 | |||||||||||||
| PER SHARE OPERATING PERFORMANCE: | |||||||||||||||
| Net asset value at beginning of period | $ | 33.63 | $ | 27.08 | $ | 24.70 | |||||||||
| Net investment income (loss)** | (0.00 | )(a) | (0.10 | ) | (0.04 | ) | |||||||||
| Net realized and unrealized gain (loss) on investments | (14.38 | ) | 6.65 | 2.42 | |||||||||||
| Total from investment operations | (14.38 | ) | 6.55 | 2.38 | |||||||||||
| Net asset value at end of period | $ | 19.25 | $ | 33.63 | $ | 27.08 | |||||||||
| Share price at end of period*** | $ | 19.35 | |||||||||||||
| NET ASSET VALUE, TOTAL RETURN**** | (42.76 | )% | 24.19 | % | 9.64 | % | |||||||||
| SHARE PRICE TOTAL RETURN**** | (42.45 | )% | |||||||||||||
| RATIOS/SUPPLEMENTAL DATA: | |||||||||||||||
| Net assets at end of period (000's omitted) | $ | 111,674 | $ | 114,336 | $ | 21,663 | |||||||||
| Ratio to average net assets of: | |||||||||||||||
| Expenses, after (Waivers) and/or Recapture | 0.67 | % | 0.69 | % | 0.71 | %† | |||||||||
| Expenses, prior to (Waivers) and/or Recapture | 0.73 | % | 0.77 | % | 1.06 | %† | |||||||||
| Net investment loss, after (Waivers) and/or Recapture | (0.01 | )% | (0.31 | )% | (0.29 | )%† | |||||||||
| Portfolio turnover rate †† | 72 | % | 23 | % | 22 | % | |||||||||
| Undistributed net investment income (loss) included in price of units issued and redeemed**# | $ | (0.05 | ) | $ | (0.09 | ) | $ | 0.01 | |||||||
* Commencement of Investment Operations.
** Based on average shares outstanding.
*** The mean between the last bid and ask prices.
**** Net asset value total return is calculated assuming an initial investment made at the net asset value at the beginning of the period, reinvestment of all dividends and distributions at net asset value during the period, and redemption on the last day of the period. Share price total return is calculated assuming an initial investment made at the share price at the beginning of the period, reinvestment of all dividends and distributions at share price during the period, and sale at the share price on the last day of the period. Total investment returns calculated for a period of less than one year are not annualized.
† Annualized.
†† Portfolio turnover rate is not annualized and does not include securities received or delivered from processing creations or redemptions.
# The per share amount of equalization is presented to show the impact of equalization on distributable earnings per share.
(a) Amount represents less than $0.005.
See Notes to Financial Statements.
70
Financial Highlights (Continued)
PowerShares DWA Technical LeadersTM Portfolio
| Year Ended April 30, | For the Period March 1, 2007* Through | ||||||||||||||
| 2009 | 2008 | April 30, 2007 | |||||||||||||
| PER SHARE OPERATING PERFORMANCE: | |||||||||||||||
| Net asset value at beginning of period | $ | 25.97 | $ | 25.58 | $ | 23.95 | |||||||||
| Net investment income (loss)** | 0.07 | (0.02 | ) | 0.04 | |||||||||||
| Net realized and unrealized gain (loss) on investments | (11.86 | ) | 0.43 | 1.59 | |||||||||||
| Total from investment operations | (11.79 | ) | 0.41 | 1.63 | |||||||||||
| Distributions to shareholders from: | |||||||||||||||
| Net investment income | (0.04 | ) | (0.01 | ) | — | ||||||||||
| Return of capital | — | (0.01 | ) | — | |||||||||||
| Total distributions | (0.04 | ) | (0.02 | ) | — | ||||||||||
| Net asset value at end of period | $ | 14.14 | $ | 25.97 | $ | 25.58 | |||||||||
| Share price at end of period*** | $ | 14.13 | |||||||||||||
| NET ASSET VALUE, TOTAL RETURN**** | (45.40 | )% | 1.62 | % | 6.81 | % | |||||||||
| SHARE PRICE TOTAL RETURN**** | (45.49 | )% | |||||||||||||
| RATIOS/SUPPLEMENTAL DATA: | |||||||||||||||
| Net assets at end of period (000's omitted) | $ | 138,549 | $ | 363,514 | $ | 92,090 | |||||||||
| Ratio to average net assets of: | |||||||||||||||
| Expenses, after (Waivers) and/or Recapture | 0.69 | % | 0.71 | % | 0.72 | %† | |||||||||
| Expenses, prior to (Waivers) and/or Recapture | 0.68 | % | 0.68 | % | 1.78 | %† | |||||||||
| Net investment income (loss), after (Waivers) and/or Recapture | 0.38 | % | (0.07 | )% | 1.50 | %†(a) | |||||||||
| Portfolio turnover rate †† | 87 | % | 83 | % | 9 | % | |||||||||
| Undistributed net investment income (loss) included in price of units issued and redeemed**# | $ | (0.03 | ) | $ | 0.07 | $ | 0.07 | ||||||||
PowerShares Golden Dragon Halter USX China Portfolio
| Year Ended April 30, | For the Period December 9, 2004* Through | ||||||||||||||||||||||
| 2009 | 2008 | 2007 | 2006 | April 30, 2005 | |||||||||||||||||||
| PER SHARE OPERATING PERFORMANCE: | |||||||||||||||||||||||
| Net asset value at beginning of period | $ | 28.88 | $ | 21.43 | $ | 16.90 | $ | 13.00 | $ | 14.55 | |||||||||||||
| Net investment income** | 0.20 | 0.12 | 0.20 | 0.17 | 0.06 | ||||||||||||||||||
| Net realized and unrealized gain (loss) on investments | (11.44 | ) | 7.54 | 4.54 | 3.89 | (1.61 | ) | ||||||||||||||||
| Total from investment operations | (11.24 | ) | 7.66 | 4.74 | 4.06 | (1.55 | ) | ||||||||||||||||
| Distributions to shareholders from: | |||||||||||||||||||||||
| Net investment income | (0.17 | ) | (0.20 | ) | (0.21 | ) | (0.16 | ) | — | ||||||||||||||
| Return of capital | — | (0.01 | ) | — | — | — | |||||||||||||||||
| Total distributions | (0.17 | ) | (0.21 | ) | (0.21 | ) | (0.16 | ) | — | ||||||||||||||
| Net asset value at end of period | $ | 17.47 | $ | 28.88 | $ | 21.43 | $ | 16.90 | $ | 13.00 | |||||||||||||
| Share price at end of period*** | $ | 17.48 | |||||||||||||||||||||
| NET ASSET VALUE, TOTAL RETURN**** | (39.06 | )% | 35.87 | % | 28.53 | % | 31.52 | % | (10.68 | )% | |||||||||||||
| SHARE PRICE TOTAL RETURN**** | (38.92 | )% | |||||||||||||||||||||
| RATIOS/SUPPLEMENTAL DATA: | |||||||||||||||||||||||
| Net assets at end of period (000's omitted) | $ | 279,490 | $ | 528,483 | $ | 394,320 | $ | 238,330 | $ | 49,384 | |||||||||||||
| Ratio to average net assets of: | |||||||||||||||||||||||
| Expenses, after (Waivers) and/or Recapture | 0.69 | % | 0.69 | % | 0.70 | % | 0.71 | % | 0.70 | %† | |||||||||||||
| Expenses, prior to (Waivers) and/or Recapture | 0.71 | % | 0.66 | % | 0.72 | % | 0.88 | % | 0.97 | %† | |||||||||||||
| Net investment income, after (Waivers) and/or Recapture | 1.06 | % | 0.42 | % | 1.06 | % | 1.18 | % | 1.24 | %† | |||||||||||||
| Portfolio turnover rate †† | 20 | % | 15 | % | 17 | % | 21 | % | 9 | % | |||||||||||||
| Undistributed net investment income (loss) included in price of units issued and redeemed**# | $ | (0.03 | ) | $ | 0.03 | $ | 0.01 | — | — | ||||||||||||||
* Commencement of Investment Operations.
** Based on average shares outstanding.
*** The mean between the last bid and ask prices.
**** Net asset value total return is calculated assuming an initial investment made at the net asset value at the beginning of the period, reinvestment of all dividends and distributions at net asset value during the period, and redemption on the last day of the period. Share price total return is calculated assuming an initial investment made at the share price at the beginning of the period, reinvestment of all dividends and distributions at share price during the period, and sale at the share price on the last day of the period. Total investment returns calculated for a period of less than one year are not annualized.
† Annualized.
†† Portfolio turnover rate is not annualized and does not include securities received or delivered from processing creations or redemptions.
# The per share amount of equalization is presented to show the impact of equalization on distributable earnings per share.
(a) Net investment income per share and the ratio of net investment income to average net assets include a special cash dividend received of $15.00 per share owned of Dean Foods Co. on April 2, 2007. Net investment loss per share and the ratio of net investment loss to average net assets excluding the special dividend were less than $0.005 and (0.11)%, respectively, for the year ended April 30, 2007.
See Notes to Financial Statements.
71
Financial Highlights (Continued)
PowerShares Listed Private Equity Portfolio
Year Ended April 30, | For the Period October 24, 2006* Through | ||||||||||||||
| 2009 | 2008 | April 30, 2007 | |||||||||||||
| PER SHARE OPERATING PERFORMANCE: | |||||||||||||||
| Net asset value at beginning of period | $ | 20.27 | $ | 27.79 | $ | 25.09 | |||||||||
| Net investment income** | 0.87 | 1.22 | 0.44 | ||||||||||||
| Net realized and unrealized gain (loss) on investments | (13.55 | ) | (7.63 | ) | 2.60 | ||||||||||
| Total from investment operations | (12.68 | ) | (6.41 | ) | 3.04 | ||||||||||
| Distributions to shareholders from: | |||||||||||||||
| Net investment income | (0.87 | ) | (1.11 | ) | (0.34 | ) | |||||||||
| Net asset value at end of period | $ | 6.72 | $ | 20.27 | $ | 27.79 | |||||||||
| Share price at end of period*** | $ | 6.71 | |||||||||||||
| NET ASSET VALUE, TOTAL RETURN**** | (64.23 | )% | (23.50 | )% | 12.18 | % | |||||||||
| SHARE PRICE TOTAL RETURN**** | (64.29 | )% | |||||||||||||
| RATIOS/SUPPLEMENTAL DATA: | |||||||||||||||
| Net assets at end of period (000's omitted) | $ | 60,476 | $ | 103,379 | $ | 150,078 | |||||||||
| Ratio to average net assets of: | |||||||||||||||
| Expenses, after (Waivers) and/or Recapture | 0.70 | % | 0.71 | % | 0.71 | %† | |||||||||
| Expenses, prior to (Waivers) and/or Recapture | 0.78 | % | 0.72 | % | 0.82 | %† | |||||||||
| Net investment income, after (Waivers) and/or Recapture | 7.75 | % | 5.04 | % | 3.38 | %† | |||||||||
| Portfolio turnover rate †† | 74 | % | 30 | % | 19 | % | |||||||||
| Undistributed net investment income (loss) included in price of units issued and redeemed**# | $ | 0.21 | $ | (0.03 | ) | $ | 0.08 | ||||||||
PowerShares Lux Nanotech Portfolio
| Year Ended April 30, | For the Period October 26, 2005* Through | ||||||||||||||||||
| 2009 | 2008 | 2007 | April 30, 2006 | ||||||||||||||||
| PER SHARE OPERATING PERFORMANCE: | |||||||||||||||||||
| Net asset value at beginning of period | $ | 14.07 | $ | 17.48 | $ | 19.05 | $ | 15.32 | |||||||||||
| Net investment income (loss)** | 0.02 | (0.03 | ) | (0.02 | ) | 0.02 | |||||||||||||
| Net realized and unrealized gain (loss) on investments | (6.50 | ) | (3.38 | ) | (1.55 | ) | 3.79 | ||||||||||||
| Total from investment operations | (6.48 | ) | (3.41 | ) | (1.57 | ) | 3.81 | ||||||||||||
| Distributions to shareholders from: | |||||||||||||||||||
| Net investment income | — | — | — | (0.01 | ) | ||||||||||||||
| Return of capital | — | — | — | (0.07 | ) | ||||||||||||||
| Total distributions | — | — | — | (0.08 | ) | ||||||||||||||
| Net asset value at end of period | $ | 7.59 | $ | 14.07 | $ | 17.48 | $ | 19.05 | |||||||||||
| Share price at end of period*** | $ | 7.60 | |||||||||||||||||
| NET ASSET VALUE, TOTAL RETURN**** | (46.06 | )% | (19.51 | )% | (8.24 | )% | 24.94 | % | |||||||||||
| SHARE PRICE TOTAL RETURN**** | (45.79 | )% | |||||||||||||||||
| RATIOS/SUPPLEMENTAL DATA: | |||||||||||||||||||
| Net assets at end of period (000's omitted) | $ | 39,484 | $ | 84,428 | $ | 159,052 | $ | 112,416 | |||||||||||
| Ratio to average net assets of: | |||||||||||||||||||
| Expenses, after (Waivers) and/or Recapture | 0.70 | % | 0.70 | % | 0.71 | % | 0.73 | %† | |||||||||||
| Expenses, prior to (Waivers) and/or Recapture | 0.89 | % | 0.73 | % | 0.79 | % | 0.83 | %† | |||||||||||
| Net investment income (loss), after (Waivers) and/or Recapture | 0.17 | % | (0.17 | )% | (0.09 | )% | 0.17 | %† | |||||||||||
| Portfolio turnover rate †† | 50 | % | 42 | % | 16 | % | 6 | % | |||||||||||
| Undistributed net investment income (loss) included in price of units issued and redeemed**# | $ | 0.00 | (a) | $ | 0.01 | $ | (0.01 | ) | — | ||||||||||
* Commencement of Investment Operations.
** Based on average shares outstanding.
*** The mean between the last bid and ask prices.
**** Net asset value total return is calculated assuming an initial investment made at the net asset value at the beginning of the period, reinvestment of all dividends and distributions at net asset value during the period, and redemption on the last day of the period. Share price total return is calculated assuming an initial investment made at the share price at the beginning of the period, reinvestment of all dividends and distributions at share price during the period, and sale at the share price on the last day of the period. Total investment returns calculated for a period of less than one year are not annualized.
† Annualized.
†† Portfolio turnover rate is not annualized and does not include securities received or delivered from processing creations or redemptions.
# The per share amount of equalization is presented to show the impact of equalization on distributable earnings per share.
(a) Amount represents less than $0.005.
See Notes to Financial Statements.
72
Financial Highlights (Continued)
PowerShares NASDAQ-100 BuyWrite Portfolio
| For the Period June 9, 2008* Through April 30, 2009 | |||||||
| PER SHARE OPERATING PERFORMANCE: | |||||||
| Net asset value at beginning of period | $ | 24.86 | |||||
| Net investment loss** | (0.01 | ) | |||||
| Net realized and unrealized loss on investments | (6.44 | ) | |||||
| Total from investment operations | (6.45 | ) | |||||
| Net asset value at end of period | $ | 18.41 | |||||
| Share price at end of period*** | $ | 18.43 | |||||
| NET ASSET VALUE, TOTAL RETURN**** | (25.95 | )%(a) | |||||
| SHARE PRICE TOTAL RETURN**** | (25.87 | )%(a) | |||||
| RATIOS/SUPPLEMENTAL DATA: | |||||||
| Net assets at end of period (000's omitted) | $ | 5,524 | |||||
| Ratio to average net assets of: | |||||||
| Expenses | 0.75 | %† | |||||
| Net investment loss | (0.07 | )%† | |||||
| Portfolio turnover rate †† | 65 | % | |||||
| Undistributed net investment loss included in price of units issued and redeemed**# | $ | (0.03 | ) | ||||
PowerShares S&P 500 BuyWrite Portfolio
| Year Ended April 30, 2009 | For the Period December 19, 2007* Through April 30, 2008 | ||||||||||
| PER SHARE OPERATING PERFORMANCE: | |||||||||||
| Net asset value at beginning of period | $ | 25.00 | $ | 24.97 | |||||||
| Net investment income** | 0.38 | 0.09 | |||||||||
| Net realized and unrealized loss on investments | (7.38 | ) | (0.01 | ) | |||||||
| Total from investment operations | (7.00 | ) | 0.08 | ||||||||
| Distributions to shareholders from: | |||||||||||
| Net investment income | (0.46 | ) | (0.05 | ) | |||||||
| Net asset value at end of period | $ | 17.54 | $ | 25.00 | |||||||
| Share price at end of period*** | $ | 17.59 | |||||||||
| NET ASSET VALUE, TOTAL RETURN**** | (28.26 | )% | 0.33 | %(b) | |||||||
| SHARE PRICE TOTAL RETURN**** | (28.16 | )% | |||||||||
| RATIOS/SUPPLEMENTAL DATA: | |||||||||||
| Net assets at end of period (000's omitted) | $ | 84,211 | $ | 7,500 | |||||||
| Ratio to average net assets of: | |||||||||||
| Expenses | 0.75 | % | 0.75 | %† | |||||||
| Net investment income | 2.09 | % | 1.12 | %† | |||||||
| Portfolio turnover rate †† | 83 | % | 10 | % | |||||||
| Undistributed net investment income (loss) included in price of units issued and redeemed**# | $ | (0.05 | ) | $ | 0.09 | ||||||
* Commencement of Investment Operations.
** Based on average shares outstanding.
*** The mean between the last bid and ask prices.
**** Net asset value total return is calculated assuming an initial investment made at the net asset value at the beginning of the period, reinvestment of all dividends and distributions at net asset value during the period, and redemption on the last day of the period. Share price total return is calculated assuming an initial investment made at the share price at the beginning of the period, reinvestment of all dividends and distributions at share price during the period, and sale at the share price on the last day of the period. Total investment returns calculated for a period of less than one year are not annualized.
† Annualized.
†† Portfolio turnover rate is not annualized and does not include securities received or delivered from processing creations or redemptions.
# The per share amount of equalization is presented to show the impact of equalization on distributable earnings per share.
(a) The net asset value, total return from Fund Inception (June 12, 2008, first day of trading on the Exchange) to April 30, 2009 was (23.83)%. The share price total return from Fund Inception to April 30, 2009 was (23.97)%.
(b) The total return from Fund Inception (first day of trading on the Exchange) to April 30, 2008 was (0.19)%.
See Notes to Financial Statements.
73
Financial Highlights (Continued)
PowerShares Value Line Industry Rotation Portfolio
Year Ended April 30, | For the Period December 1, 2006* Through | ||||||||||||||
| 2009 | 2008 | April 30, 2007 | |||||||||||||
| PER SHARE OPERATING PERFORMANCE: | |||||||||||||||
| Net asset value at beginning of period | $ | 27.90 | $ | 28.04 | $ | 25.19 | |||||||||
| Net investment income** | 0.10 | 0.01 | 0.00 | (a) | |||||||||||
| Net realized and unrealized gain (loss) on investments | (12.35 | ) | (0.14 | ) | 2.86 | ||||||||||
| Total from investment operations | (12.25 | ) | (0.13 | ) | 2.86 | ||||||||||
| Distributions to shareholders from: | |||||||||||||||
| Net investment income | (0.06 | ) | (0.01 | ) | 0.00 | (a) | |||||||||
| Return of capital | — | 0.00 | (a) | (0.01 | ) | ||||||||||
| Total distributions | (0.06 | ) | (0.01 | ) | (0.01 | ) | |||||||||
| Net asset value at end of period | $ | 15.59 | $ | 27.90 | $ | 28.04 | |||||||||
| Share price at end of period*** | $ | 15.58 | |||||||||||||
| NET ASSET VALUE, TOTAL RETURN**** | (43.93 | )% | (0.45 | )% | 11.36 | % | |||||||||
| SHARE PRICE TOTAL RETURN**** | (43.93 | )% | |||||||||||||
| RATIOS/SUPPLEMENTAL DATA: | |||||||||||||||
| Net assets at end of period (000's omitted) | $ | 26,508 | $ | 41,850 | $ | 33,650 | |||||||||
| Ratio to average net assets of: | |||||||||||||||
| Expenses, after (Waivers) and/or Recapture | 0.70 | % | 0.73 | % | 0.75 | %† | |||||||||
| Expenses, prior to (Waivers) and/or Recapture | 0.94 | % | 0.95 | % | 1.21 | %† | |||||||||
| Net investment income, after (Waivers) and/or Recapture | 0.47 | % | 0.03 | % | 0.03 | %† | |||||||||
| Portfolio turnover rate †† | 113 | % | 77 | % | 13 | % | |||||||||
| Undistributed net investment income included in price of units issued and redeemed**# | $ | 0.00 | (a) | $ | 0.00 | (a) | $ | 0.00 | (a) | ||||||
PowerShares Value Line TimelinessTM Select Portfolio
| Year Ended April 30, | For the Period December 6, 2005* Through | ||||||||||||||||||
| 2009 | 2008 | 2007 | April 30, 2006 | ||||||||||||||||
| PER SHARE OPERATING PERFORMANCE: | |||||||||||||||||||
| Net asset value at beginning of period | $ | 16.76 | $ | 17.59 | $ | 17.09 | $ | 15.52 | |||||||||||
| Net investment income (loss)** | 0.04 | (0.02 | ) | (0.01 | ) | (0.02 | ) | ||||||||||||
| Net realized and unrealized gain (loss) on investments | (7.19 | ) | (0.81 | ) | 0.51 | 1.59 | |||||||||||||
| Total from investment operations | (7.15 | ) | (0.83 | ) | 0.50 | 1.57 | |||||||||||||
| Distributions to shareholders from: | |||||||||||||||||||
| Net investment income | (0.01 | ) | — | — | — | ||||||||||||||
| Net asset value at end of period | $ | 9.60 | $ | 16.76 | $ | 17.59 | $ | 17.09 | |||||||||||
| Share price at end of period*** | $ | 9.60 | |||||||||||||||||
| NET ASSET VALUE, TOTAL RETURN**** | (42.66 | )% | (4.72 | )% | 2.93 | % | 10.12 | % | |||||||||||
| SHARE PRICE TOTAL RETURN**** | (42.62 | )% | |||||||||||||||||
| RATIOS/SUPPLEMENTAL DATA: | |||||||||||||||||||
| Net assets at end of period (000's omitted) | $ | 71,048 | $ | 177,669 | $ | 272,608 | $ | 182,810 | |||||||||||
| Ratio to average net assets of: | |||||||||||||||||||
| Expenses, after (Waivers) and/or Recapture | 0.70 | % | 0.70 | % | 0.70 | % | 0.71 | %† | |||||||||||
| Expenses, prior to (Waivers) and/or Recapture | 0.72 | % | 0.70 | % | 0.75 | % | 0.78 | %† | |||||||||||
| Net investment gain (loss), after (Waivers) and/or Recapture | 0.27 | % | (0.12 | )% | (0.06 | )% | (0.30 | )%† | |||||||||||
| Portfolio turnover rate †† | 143 | % | 101 | % | 113 | % | 39 | % | |||||||||||
| Undistributed net investment income included in price of units issued and redeemed**# | $ | 0.00 | (a) | $ | 0.01 | $ | 0.00 | (a) | — | ||||||||||
* Commencement of Investment Operations.
** Based on average shares outstanding.
*** The mean between the last bid and ask prices.
**** Net asset value total return is calculated assuming an initial investment made at the net asset value at the beginning of the period, reinvestment of all dividends and distributions at net asset value during the period, and redemption on the last day of the period. Share price total return is calculated assuming an initial investment made at the share price at the beginning of the period, reinvestment of all dividends and distributions at share price during the period, and sale at the share price on the last day of the period. Total investment returns calculated for a period of less than one year are not annualized.
† Annualized.
†† Portfolio turnover rate is not annualized and does not include securities received or delivered from processing creations or redemptions.
# The per share amount of equalization is presented to show the impact of equalization on distributable earnings per share.
(a) Amount represents less than $0.005.
See Notes to Financial Statements.
74
Financial Highlights (Continued)
PowerShares Water Resources Portfolio
| Year Ended April 30, | For the Period December 6, 2005* Through | ||||||||||||||||||
| 2009 | 2008 | 2007 | April 30, 2006 | ||||||||||||||||
| PER SHARE OPERATING PERFORMANCE: | |||||||||||||||||||
| Net asset value at beginning of period | $ | 20.66 | $ | 19.20 | $ | 18.25 | $ | 15.32 | |||||||||||
| Net investment income** | 0.08 | 0.08 | 0.17 | 0.02 | |||||||||||||||
| Net realized and unrealized gain (loss) on investments | (6.64 | ) | 1.46 | 0.95 | 2.94 | ||||||||||||||
| Total from investment operations | (6.56 | ) | 1.54 | 1.12 | 2.96 | ||||||||||||||
| Distributions to shareholders from: | |||||||||||||||||||
| Net investment income | (0.06 | ) | (0.08 | ) | (0.17 | ) | (0.03 | ) | |||||||||||
| Net asset value at end of period | $ | 14.04 | $ | 20.66 | $ | 19.20 | $ | 18.25 | |||||||||||
| Share price at end of period*** | $ | 14.02 | |||||||||||||||||
| NET ASSET VALUE, TOTAL RETURN**** | (31.76 | )% | 8.02 | % | 6.26 | % | 19.38 | % | |||||||||||
| SHARE PRICE TOTAL RETURN**** | (31.63 | )% | |||||||||||||||||
| RATIOS/SUPPLEMENTAL DATA: | |||||||||||||||||||
| Net assets at end of period (000's omitted) | $ | 1,220,027 | $ | 2,196,652 | $ | 1,606,782 | $ | 991,208 | |||||||||||
| Ratio to average net assets of: | |||||||||||||||||||
| Expenses, after (Waivers) and/or Recapture | 0.64 | % | 0.64 | % | 0.66 | % | 0.67 | %† | |||||||||||
| Expenses, prior to (Waivers) and/or Recapture | 0.64 | % | 0.63 | % | 0.67 | % | 0.70 | %† | |||||||||||
| Net investment income, after (Waivers) and/or Recapture | 0.49 | % | 0.39 | % | 0.96 | % | 0.40 | %† | |||||||||||
| Portfolio turnover rate †† | 33 | % | 23 | % | 27 | % | 2 | % | |||||||||||
| Undistributed net investment income (loss) included in price of units issued and redeemed**# | $ | (0.01 | ) | $ | 0.01 | $ | 0.02 | — | |||||||||||
PowerShares WilderHill Clean Energy Portfolio
| Year Ended April 30, | For the Period March 3, 2005* Through | ||||||||||||||||||||||
| 2009 | 2008 | 2007 | 2006 | April 30, 2005 | |||||||||||||||||||
| PER SHARE OPERATING PERFORMANCE: | |||||||||||||||||||||||
| Net asset value at beginning of period | $ | 20.94 | $ | 19.29 | $ | 22.38 | $ | 12.86 | $ | 15.61 | |||||||||||||
| Net investment income (loss)** | (0.02 | ) | (0.07 | ) | 0.04 | (0.07 | ) | (0.01 | ) | ||||||||||||||
| Net realized and unrealized gain (loss) on investments | (11.89 | ) | 1.72 | (3.08 | ) | 9.59 | (2.74 | ) | |||||||||||||||
| Total from investment operations | (11.91 | ) | 1.65 | (3.04 | ) | 9.52 | (2.75 | ) | |||||||||||||||
| Distributions to shareholders from: | |||||||||||||||||||||||
| Net investment income | — | — | (0.05 | ) | — | — | |||||||||||||||||
| Return of capital | — | — | 0.00 | (a) | — | — | |||||||||||||||||
| Total distributions | — | — | (0.05 | ) | — | — | |||||||||||||||||
| Net asset value at end of period | $ | 9.03 | $ | 20.94 | $ | 19.29 | $ | 22.38 | $ | 12.86 | |||||||||||||
| Share price at end of period*** | $ | 8.99 | |||||||||||||||||||||
| NET ASSET VALUE, TOTAL RETURN**** | (56.88 | )% | 8.55 | % | (13.58 | )% | 74.03 | % | (17.59 | )% | |||||||||||||
| SHARE PRICE TOTAL RETURN**** | (57.07 | )% | |||||||||||||||||||||
| RATIOS/SUPPLEMENTAL DATA: | |||||||||||||||||||||||
| Net assets at end of period (000's omitted) | $ | 658,400 | $ | 1,473,893 | $ | 914,345 | $ | 722,940 | $ | 27,012 | |||||||||||||
| Ratio to average net assets of: | |||||||||||||||||||||||
| Expenses, after (Waivers) and/or Recapture | 0.69 | % | 0.67 | % | 0.70 | % | 0.71 | % | 0.70 | %† | |||||||||||||
| Expenses, prior to (Waivers) and/or Recapture | 0.69 | % | 0.67 | % | 0.69 | % | 0.75 | % | 1.35 | %† | |||||||||||||
| Net investment income (loss), after (Waivers) and/or Recapture | (0.12 | )% | (0.32 | )% | 0.24 | %††† | (0.39 | )% | (0.31 | )%† | |||||||||||||
| Portfolio turnover rate †† | 41 | % | 20 | % | 41 | % | 6 | % | 9 | % | |||||||||||||
| Undistributed net investment income (loss) included in price of units issued and redeemed**# | $ | 0.00 | (a) | $ | (0.02 | ) | $ | 0.01 | — | — | |||||||||||||
* Commencement of Investment Operations.
** Based on average shares outstanding.
*** The mean between the last bid and ask prices.
**** Net asset value total return is calculated assuming an initial investment made at the net asset value at the beginning of the period, reinvestment of all dividends and distributions at net asset value during the period, and redemption on the last day of the period. Share price total return is calculated assuming an initial investment made at the share price at the beginning of the period, reinvestment of all dividends and distributions at share price during the period, and sale at the share price on the last day of the period. Total investment returns calculated for a period of less than one year are not annualized.
† Annualized.
†† Portfolio turnover rate is not annualized and does not include securities received or delivered from processing creations or redemptions.
††† Net investment income per share and the ratio of net investment income to average net assets include a special cash dividend received of $6.72 per share owned of Scottish Power PLC ADR on May 18, 2006. Net investment loss per share and the ratio of net investment loss to average net assets excluding the special dividend were $(0.04) and (0.23)%, respectively, for the year ended April 30, 2007.
# The per share amount of equalization is presented to show the impact of equalization on distributable earnings per share.
(a) Amount represents less than $0.005.
See Notes to Financial Statements.
75
Financial Highlights (Continued)
PowerShares WilderHill Progressive Energy Portfolio
Year Ended April 30, | For the Period October 24, 2006* Through | ||||||||||||||
| 2009 | 2008 | April 30, 2007 | |||||||||||||
| PER SHARE OPERATING PERFORMANCE: | |||||||||||||||
| Net asset value at beginning of period | $ | 28.23 | $ | 28.63 | $ | 24.91 | |||||||||
| Net investment income** | 0.13 | 0.09 | 0.06 | ||||||||||||
| Net realized and unrealized gain (loss) on investments | (10.91 | ) | (0.36 | ) | 3.68 | ||||||||||
| Total from investment operations | (10.78 | ) | (0.27 | ) | 3.74 | ||||||||||
| Distributions to shareholders from: | |||||||||||||||
| Net investment income | (0.07 | ) | (0.12 | ) | (0.02 | ) | |||||||||
| Return of capital | — | (0.01 | ) | — | |||||||||||
| Total distributions | (0.07 | ) | (0.13 | ) | (0.02 | ) | |||||||||
| Net asset value at end of period | $ | 17.38 | $ | 28.23 | $ | 28.63 | |||||||||
| Share price at end of period*** | $ | 17.38 | |||||||||||||
| NET ASSET VALUE, TOTAL RETURN**** | (38.23 | )% | (0.96 | )% | 15.01 | % | |||||||||
| SHARE PRICE TOTAL RETURN**** | (38.16 | )% | |||||||||||||
| RATIOS/SUPPLEMENTAL DATA: | |||||||||||||||
| Net assets at end of period (000's omitted) | $ | 39,970 | $ | 62,097 | $ | 22,905 | |||||||||
| Ratio to average net assets of: | |||||||||||||||
| Expenses, after (Waivers) and/or Recapture | 0.70 | % | 0.73 | % | 0.74 | %† | |||||||||
| Expenses, prior to (Waivers) and/or Recapture | 0.86 | % | 0.88 | % | 1.09 | %† | |||||||||
| Net investment income, after (Waivers) and/or Recapture | 0.62 | % | 0.30 | % | 0.45 | %† | |||||||||
| Portfolio turnover rate †† | 32 | % | 31 | % | 12 | % | |||||||||
| Undistributed net investment income included in price of units issued and redeemed**# | $ | 0.00 | (a) | $ | 0.01 | $ | 0.00 | (a) | |||||||
* Commencement of Investment Operations.
** Based on average shares outstanding.
*** The mean between the last bid and ask prices.
**** Net asset value total return is calculated assuming an initial investment made at the net asset value at the beginning of the period, reinvestment of all dividends and distributions at net asset value during the period, and redemption on the last day of the period. Share price total return is calculated assuming an initial investment made at the share price at the beginning of the period, reinvestment of all dividends and distributions at share price during the period, and sale at the share price on the last day of the period. Total investment returns calculated for a period of less than one year are not annualized.
† Annualized.
†† Portfolio turnover rate is not annualized and does not include securities received or delivered from processing creations or redemptions.
# The per share amount of equalization is presented to show the impact of equalization on distributable earnings per share.
(a) Amount represents less than $0.005.
See Notes to Financial Statements.
76
Notes to Financial Statements
PowerShares Exchange-Traded Fund Trust
April 30, 2009
Note 1. Organization
PowerShares Exchange-Traded Fund Trust (the "Trust") was organized as a Massachusetts business trust on June 9, 2000 and is authorized to have multiple series of portfolios. The Trust is an open-end management investment company, registered under the Investment Company Act of 1940, as amended (the "1940 Act"). As of the year end, the Trust offered seventy-five portfolios. This report includes the following portfolios:
| Fund Name | Short Name | ||||||
| PowerShares Aerospace & Defense Portfolio | "Aerospace & Defense Portfolio" | ||||||
| PowerShares CleantechTM Portfolio | "CleantechTM Portfolio" | ||||||
| PowerShares DWA Technical LeadersTM Portfolio | "DWA Technical LeadersTM Portfolio" | ||||||
| PowerShares Golden Dragon Halter USX | "Golden Dragon Halter USX China Porfolio" China Portfolio | ||||||
| PowerShares Listed Private Equity Portfolio | "Listed Private Equity Portfolio" | ||||||
| PowerShares Lux Nanotech Portfolio | "Lux Nanotech Portfolio" | ||||||
| PowerShares NASDAQ-100 BuyWrite Portfolio | "NASDAQ-100 BuyWrite Portfolio" | ||||||
| PowerShares S&P 500 BuyWrite Portfolio | "S&P 500 BuyWrite Portfolio" | ||||||
| PowerShares Value Line Industry | "Value Line Industry Rotation Portfolio" Rotation Portfolio | ||||||
| PowerShares Value Line TimelinessTM | "Value Line TimelinessTM Select Portfolio" Select Portfolio | ||||||
| PowerShares Water Resources Portfolio | "Water Resources Portfolio" | ||||||
| PowerShares WilderHill Clean Energy Portfolio | "WilderHill Clean Energy Portfolio" | ||||||
| PowerShares WilderHill Progressive | "WilderHill Progressive Energy Portfolio" Energy Portfolio | ||||||
Each portfolio (the "Fund" or collectively the "Funds") represents a separate series of the Trust. The shares of the Funds are referred to herein as "Shares" or "Fund Shares". Each Fund's Shares are listed and traded on the NYSE Arca, Inc., except for Shares of the NASDAQ-100 BuyWrite Portfolio which are listed and traded on the NASDAQ Stock Market LLC.
The Funds' market prices may differ to some degree from the net asset value of the Shares of each Fund. Unlike conventional mutual funds, each Fund issues and redeems Shares on a continuous basis, at net asset value, only in a large specified number of Shares, each called a "Creation Unit." Creation Units are issued and redeemed generally in-kind for securities included in the relevant index. Except when aggregated in Creation Units, Shares are not individually redeemable securities of the Funds.
The investment objective of each Fund is to seek investment results that correspond generally to the price and yield (before the Fund's fees and expenses) of the following indices:
| Fund | Index | ||||||
| Aerospace & Defense Portfolio | SPADETM Defense Index | ||||||
| CleantechTM Portfolio | The Cleantech IndexTM | ||||||
| DWA Technical LeadersTM Portfolio | Dorsey Wright Technical LeadersTM Index | ||||||
| Golden Dragon Halter USX China Portfolio | Halter USX China IndexSM | ||||||
| Listed Private Equity Portfolio | Red Rocks Capital Listed Private Equity IndexSM | ||||||
77
Notes to Financial Statements (Continued)
PowerShares Exchange-Traded Fund Trust
April 30, 2009
| Fund | Index | ||||||
| Lux Nanotech Portfolio | Lux Nanotech IndexTM | ||||||
| NASDAQ-100 BuyWrite Portfolio | CBOE NASDAQ-100 BuyWrite IndexTM | ||||||
| S&P 500 BuyWrite Portfolio | CBOE S&P 500 BuyWrite Index | ||||||
| Value Line Industry Rotation Portfolio | Value Line Industry Rotation Index | ||||||
| Value Line TimelinessTM Select Portfolio | Value Line TimelinessTM Select Index | ||||||
| Water Resources Portfolio | Palisades Water Index | ||||||
| WilderHill Clean Energy Portfolio | WilderHill Clean Energy Index | ||||||
| WilderHill Progressive Energy Portfolio | WilderHill Progressive Energy Index | ||||||
Note 2. Significant Accounting Policies
The preparation of the financial statements in accordance with accounting principles generally accepted in the United States of America requires management to make estimates and assumptions that affect the reported amounts and disclosures in the financial statements, including estimates and assumptions related to taxation. Actual results could differ from these estimates.
A. Security Valuation
Securities, including restricted securities, are valued according to the following policies.
A security listed or traded on an exchange (except convertible bonds) is valued at its last sales price or official closing price as of the close of the customary trading session on the exchange where the security is principally traded, or lacking any sales or official closing price on a particular day, the security may be valued at the closing bid price on that day. Securities traded in the over-the-counter market are valued based on prices furnished by independent pricing services or market makers. Listed options, if no closing price is available, are valued at the mean between the last bid and ask prices from the exchange on which they are principally traded. Options not listed on an exchange are valued by an independent source at the mean between the last bid and ask prices.
Investments in open-end registered investment companies not traded on an exchange are valued at the end of day net asset value per share.
Debt obligations (including convertible bonds) and unlisted equities are fair valued using an evaluated quote provided by an independent pricing service. Evaluated quotes provided by the pricing service may be determined without exclusive reliance on quoted prices, and may reflect appropriate factors such as institution-size trading in similar groups of securities, developments related to specific securities, dividend rate, yield, quality, type of issue, coupon rate, maturity, individual trading characteristics and other market data. Short-term obligations, including commercial paper, having 60 days or less to maturity are recorded at amortized cost which approximates value. Debt securities are subject to interest rate and credit risks. In addition, all debt securities involve some risk of default with respect to interest and/or principal payments.
Foreign securities (including foreign exchange contracts) are converted into U.S. dollar amounts using the applicable exchange rates as of the close of the London world markets. If market quotations are available and reliable for foreign exchange traded equity securities, the securities will be valued at the market quotations. Because trading hours for certain foreign securities end before the close of the New York Stock Exchange ("NYSE"), closing market quotations may become unreliable. If between the time trading ends on a particular security and the close of the customary trading session on the NYSE, events occur that are
78
Notes to Financial Statements (Continued)
PowerShares Exchange-Traded Fund Trust
April 30, 2009
significant and make the closing price unreliable, the Fund may fair value the security. If the event is likely to have affected the closing price of the security, the security will be valued at fair value in good faith using procedures approved by the Board of Trustees. Adjustments to closing prices to reflect fair value may also be based on a screening process of an independent pricing service to indicate the degree of certainty, based on historical data, that the closing price in the principal market where a foreign security trades is not the current value as of the close of the NYSE. Foreign securities meeting the approved degree of certainty that the price is not reflective of current value will be priced at the indication of fair value from the independent pricing service. Multiple factors may be considered by the independent pricing service in determining adjustments to reflect fair value and may include information relat ing to sector indices, ADRs and domestic and foreign index futures. Foreign securities may have additional risks including exchange rate changes, potential for sharply devalued currencies and high inflation, political and economic upheaval, the relative lack of issuer information, relatively low market liquidity and the potential lack of strict financial and accounting controls and standards.
Securities for which market prices are not provided by any of the above methods may be valued based upon quotes furnished by independent sources.
Securities for which market quotations are not readily available or are unreliable are valued at fair value as determined in good faith by or under the supervision of the Trust's officers following procedures approved by the Board of Trustees. Issuer specific events, market trends, bid/ask quotes of brokers and information providers and other market data may be reviewed in the course of making a good faith determination of a security's fair value.
Valuations change in response to many factors including the historical and prospective earnings of the issuer, the value of the issuer's assets, general economic conditions, interest rates, investor perceptions and market liquidity. Because of the inherent uncertainties of valuation, the values reflected in the financial statements may materially differ from the value received upon actual sale of those investments.
B. Other Risks
A Fund may concentrate investments in a comparatively narrow segment of the economy. Consequently, such Fund may tend to be more volatile than other funds, and the value of the investments may tend to rise and fall more rapidly.
A Fund may invest a large percentage of its assets in securities of a limited number of companies, such that each investment may have a greater effect on the Fund's overall performance, and any change in the value of those securities could significantly affect the value of your investment in the Fund.
C. Federal Income Taxes
Each Fund intends to comply with the provisions of the Internal Revenue Code applicable to regulated investment companies and to distribute substantially all of the Fund's taxable earnings to its shareholders. As such, the Funds will not be subject to Federal income taxes on otherwise taxable income (including net realized gains) that is distributed to the shareholders. Therefore, no provision for Federal income taxes is recorded in the financial statements.
Income and capital gain distributions are determined in accordance with Federal income tax regulations, which may differ from accounting principles generally accepted in the United States of America. These differences are primarily due to differing book and tax treatments for in-kind transactions, losses deferred due to wash sales, and Passive Foreign Investment Company adjustments, if any.
79
Notes to Financial Statements (Continued)
PowerShares Exchange-Traded Fund Trust
April 30, 2009
The Funds file tax returns in the United States Federal jurisdiction and certain other jurisdictions. Generally a Fund is subject to examinations by such taxing authorities for up to three years after the filing of the return for the tax period.
D. Investment Income and Investment Transactions
Dividend income is recorded on the ex-dividend date net of foreign taxes withheld, if any. Interest income is recorded on the accrual basis. Investment transactions are recorded on the trade date. Realized gains and losses from the sale or disposition of securities are calculated on the specific identified cost basis. Dividends and interest received by a Fund may give rise to withholding and other taxes imposed by foreign countries. Corporate actions (including cash dividends) are recorded net of non-reclaimable foreign tax withholdings on the ex-dividend date. Tax conventions between certain countries and the United States may reduce or eliminate such taxes.
E. Expenses
Expenses of the Trust, which are directly identifiable to a specific Fund, are applied to that Fund. Expenses which are not readily identifiable to a specific Fund are allocated in such a manner as deemed equitable, taking into consideration the nature and type of expense and the relative net assets of each Fund.
Each Fund (except for S&P 500 BuyWrite Portfolio and NASDAQ-100 BuyWrite Portfolio) is responsible for all of its expenses, including the investment advisory fees, costs of transfer agency, custody, fund administration, legal, audit and other services, interest, taxes, brokerage commissions and other expenses connected with executions of portfolio transactions, any distribution fees or expenses and extraordinary expenses.
The S&P 500 BuyWrite Portfolio and NASDAQ-100 BuyWrite Portfolio have agreed to pay an annual unitary management fee to Invesco PowerShares Capital Management LLC (the "Adviser"). The Adviser has agreed to pay for substantially all expenses of the S&P 500 BuyWrite Portfolio and NASDAQ-100 BuyWrite Portfolio, including the cost of transfer agency, custody, fund administration, legal, audit and other services, except for advisory fees, distribution fees, if any, brokerage expenses, taxes, interest, litigation expenses and other extraordinary expenses.
F. Dividends and Distributions to Shareholders
Each Fund declares and pays dividends from net investment income, if any, to its shareholders quarterly and records on ex-dividend date. Each Fund distributes net realized taxable capital gains, if any, generally annually in cash and records on ex-dividend date. Such distributions on a tax basis are determined in conformity with income tax regulations which may differ from accounting principles generally accepted in the United States of America. Distributions in excess of tax basis earnings and profits, if any, are reported in such Fund's financial statements as a tax return of capital at fiscal period end.
G. Equalization
All Funds use the accounting practice of equalization. This accounting method is used to keep the continuing shareholder's per share equity in undistributed net investment income from being affected by the continuous sales and redemptions of capital shares. Equalization is calculated on a per share basis whereby a portion of the proceeds from the sales and cost of repurchases of capital shares is applied to undistributed net investment income. The amount of equalization is disclosed in the Statements of Changes in Net Assets as undistributed net investment income included in the price of capital shares issued
80
Notes to Financial Statements (Continued)
PowerShares Exchange-Traded Fund Trust
April 30, 2009
or redeemed. The distributions to shareholders of amounts so applied may be deemed to be a return of capital for tax purposes to the extent that such distributions exceed taxable income.
H. Option Contracts Written
The S&P 500 BuyWrite Portfolio and NASDAQ-100 BuyWrite Portfolio may write (sell) call options against the portfolio through a "buy-write" strategy. A "buy-write," also called a covered call, generally is considered to be an investment strategy in which an investor buys a stock or basket of stocks, and also sells call options that correspond to the stock or basket of stocks. When a Fund writes (sells) call options, the amount of the premium received is recorded as a liability and is subsequently adjusted to the current fair value of the option written, the Fund gives the right to the purchaser of the option written by the Fund to receive a cash payment equal to the difference between the value of the index and the exercise price, if the value on the expiration date is above the exercise price. By writing written options, in return for the receipt of premiums, the Fund gives up the opportunity during the term of the option to profit from any price increase in the index above the option exercise price. In addition, covered call options partially hedge against a decline in the price of the securities on which they are written to the extent of the premium received by the Fund. Therefore, the Fund, by writing covered call options, will give up the opportunity to benefit from potential increases in the value of the index above the exercise prices of the written options, but will continue to bear the risk of declines in the value of the index. The premiums received from the options may not be sufficient to offset any losses sustained from the volatility of the underlying stocks over time. In addition, the Fund's ability to sell the underlying securities will be limited while the option is in effect unless the Fund extinguishes the option position, through the purchase of an offsetting identical option prior to the expiration of the written option.
NASDAQ-100 BuyWrite Portfolio
| Transactions During the Period | |||||||||||
| Call Option Contracts | |||||||||||
| Number of Contracts | Premiums Received | ||||||||||
| Beginning of period | — | $ | — | ||||||||
| Written | 320 | 1,487,301 | |||||||||
| Closed | (118 | ) | (586,141 | ) | |||||||
| Exercised | — | — | |||||||||
| Expired | (150 | ) | (726,109 | ) | |||||||
| End of period | 52 | $ | 175,051 | ||||||||
| Open Options Written at Period End | |||||||||||||||||||||||||||
| Contract Month | Strike Price | Number of Contracts | Premiums Received | Value | Unrealized Depreciation | ||||||||||||||||||||||
| Call Option Mini-NASDAQ-100 Index | May-09 | $ | 135 | 40 | $ | 4,801 | $ | (7,656 | ) | $ | (2,855 | ) | |||||||||||||||
| Call Option NASDAQ-100 Index | May-09 | 1,350 | 12 | 170,250 | (256,400 | ) | (86,150 | ) | |||||||||||||||||||
| 52 | $ | 175,051 | $ | (264,056 | ) | $ | (89,005 | ) | |||||||||||||||||||
81
Notes to Financial Statements (Continued)
PowerShares Exchange-Traded Fund Trust
April 30, 2009
S&P 500 BuyWrite Portfolio
| Transactions During the Year | |||||||||||
| Call Option Contracts | |||||||||||
| Number of Contracts | Premiums Received | ||||||||||
| Beginning of year | 63 | $ | 144,450 | ||||||||
| Written | 7,665 | 27,883,340 | |||||||||
| Closed | (3,367 | ) | (12,064,034 | ) | |||||||
| Exercised | — | — | |||||||||
| Expired | (3,368 | ) | (13,005,803 | ) | |||||||
| End of year | 993 | $ | 2,957,953 | ||||||||
| Open Options Written at Year End | |||||||||||||||||||||||||||
| Contract Month | Strike Price | Number of Contracts | Premiums Received | Value | Unrealized Appreciation | ||||||||||||||||||||||
| Call Option S&P 500 Index | May-09 | $ | 865 | 993 | $ | 2,957,953 | $ | (2,646,345 | ) | $ | 311,608 | ||||||||||||||||
Note 3. Investment Advisory Agreement and Other Agreements
The Trust has entered into an Investment Advisory Agreement with the Adviser under which the Adviser has overall responsibility as the Funds' investment adviser for the selection and ongoing monitoring of the Funds' investments, managing the Funds' business affairs and providing certain clerical, bookkeeping and other administrative services. Each Fund (except for S&P 500 BuyWrite Portfolio and NASDAQ-100 BuyWrite Portfolio) agreed to pay the Adviser an annual fee of 0.50% of the Fund's average daily net assets. The S&P 500 BuyWrite Portfolio and NASDAQ-100 BuyWrite Portfolio each have agreed to pay the Adviser an annual unitary management fee of 0.75% of its average daily net assets and the Adviser has agreed to pay for substantially all expenses of S&P 500 BuyWrite Portfolio and NASDAQ-100 BuyWrite Portfolio, including the cost of transfer agency, custody, fund administration, legal, audit and other services, excep t for advisory fees and distribution fees, if any, brokerage expenses, taxes, interest, litigation expenses and other extraordinary expenses.
The Adviser has entered into an Amended and Restated Excess Expense Agreement (the "Excess Expense Agreement") with the Trust, under which the Adviser has agreed to waive fees and/or pay Fund expenses to the extent necessary to prevent the operating expenses of each Fund (except for S&P 500 BuyWrite Portfolio and NASDAQ-100 BuyWrite Portfolio) (excluding interest expense, brokerage commissions and other trading expenses, sub-licensing fees, offering costs, taxes and extraordinary expenses) from exceeding 0.60% of the Fund's average daily net assets per year (the "Expense Cap"), at least until August 31, 2010. Offering costs excluded from the Expense Cap are: (a) legal fees pertaining to the Funds' shares offered for sale; (b) Securities and Exchange Commission and state registration fees; and (c) initial fees paid to be listed on an exchange.
The Excess Expense Agreement provides that the expenses borne by the Adviser are subject to recapture by the Adviser for up to three years from the date the fee or expense was borne by the Adviser, but no recapture payment will be made by a Fund if it would result in the Fund exceeding its Expense Cap as specified above.
82
Notes to Financial Statements (Continued)
PowerShares Exchange-Traded Fund Trust
April 30, 2009
The Excess Expense Agreement does not apply to the S&P 500 BuyWrite Portfolio and NASDAQ-100 BuyWrite Portfolio.
The net amount of fees waived and other expenses assumed by the Adviser and the amount of recapture paid to the Adviser pursuant to the Excess Expense Agreement are collectively referred to as "(Waivers) and/or Recapture". The net amounts of (Waivers) and/or Recapture for the year ended April 30, 2009 are shown on the Statements of Operations.
The amounts available for potential future recapture by the Adviser under the Excess Expense Agreement and the expiration schedule at April 30, 2009 are as follows:
| Total Potential | Potential Recapture Amounts Expiring | ||||||||||||||||||
| Recapture Amounts | 04/30/10 | 04/30/11 | 04/30/12 | ||||||||||||||||
| Aerospace & Defense Portfolio | $ | 96,383 | $ | 44,793 | $ | 11,853 | $ | 39,737 | |||||||||||
| CleantechTM Portfolio | 171,946 | 42,717 | 57,688 | 71,541 | |||||||||||||||
| DWA Technical LeadersTM Portfolio | 179 | — | — | 179 | |||||||||||||||
| Golden Dragon Halter USX China Portfolio | 115,877 | — | — | 115,877 | |||||||||||||||
| Listed Private Equity Portfolio | 114,305 | 21,562 | 24,401 | 68,342 | |||||||||||||||
| Lux Nanotech Portfolio | 260,088 | 103,506 | 41,389 | 115,193 | |||||||||||||||
| Value Line Industry Rotation Portfolio | 216,761 | 33,149 | 92,038 | 91,574 | |||||||||||||||
| Value Line TimelinessTM Select Portfolio | 137,035 | 69,680 | 24,331 | 43,024 | |||||||||||||||
| WilderHill Clean Energy Portfolio | 90,586 | — | — | 90,586 | |||||||||||||||
| WilderHill Progressive Energy Portfolio | 196,494 | 38,721 | 79,132 | 78,641 | |||||||||||||||
The Trust has entered into a Distribution Agreement with Invesco Aim Distributors, Inc. (the "Distributor"), which serves as the Distributor of Creation Units for each Fund. The Distributor does not maintain a secondary market in Shares.
The Adviser has entered into a licensing agreement for each Fund with the following Licensors:
| Fund | Licensor | ||||||
| Aerospace & Defense Portfolio | International Space Business Council | ||||||
| CleantechTM Portfolio | Cleantech Capital Indices LLC | ||||||
| DWA Technical LeadersTM Portfolio | Dorsey Wright & Associates, Inc. | ||||||
| Golden Dragon Halter USX China Portfolio | Halter Financial Group, Inc. | ||||||
| Listed Private Equity Portfolio | Red Rocks Capital Partners LLC | ||||||
| Lux Nanotech Portfolio | Lux Research, Inc. | ||||||
| NASDAQ-100 BuyWrite Portfolio | NASDAQ OMX Group, Inc. | ||||||
| S&P 500 BuyWrite Portfolio | Standard & Poor's ("S&P"), a division of The McGraw-Hill Companies, Inc. | ||||||
| Value Line Industry Rotation Portfolio | Value Line Publishing, Inc. | ||||||
| Value Line TimelinessTM Select Portfolio | Value Line Publishing, Inc. | ||||||
| Water Resources Portfolio | Hydrogen Ventures | ||||||
| WilderHill Clean Energy Portfolio | WilderShares, LLC | ||||||
| WilderHill Progressive Energy Portfolio | WilderShares, LLC | ||||||
83
Notes to Financial Statements (Continued)
PowerShares Exchange-Traded Fund Trust
April 30, 2009
The index name trademarks are owned by the respective Licensors. These trademarks have been licensed to the Adviser for use with the Funds. The Funds are not sponsored, endorsed, sold or promoted by the Licensors and the Licensors make no representation regarding the advisability of investing in any of these Funds. The Trust has entered into a sub-licensing agreement under which the Funds (other than the NASDAQ-100 BuyWrite Portfolio and S&P 500 BuyWrite Portfolio) are required to pay the sub-licensing fees which are shown on the Statements of Operations.
The Trust has entered into service agreements whereby The Bank of New York Mellon, a wholly-owned subsidiary of The Bank of New York Mellon Corporation, serves as the administrator, custodian, fund accounting and transfer agent for each Fund.
The custodian has agreed to provide overdraft protection to the Funds according to the terms of the service agreement.
Note 4. Additional Valuation Information
The Funds adopted the provisions of Statement of Financial Accounting Standards No. 157, "Fair Value Measurements" ("SFAS 157"), effective with the beginning of the Fund's fiscal year. SFAS 157 defines fair value as the price that would be received to sell an asset or paid to transfer a liability in an orderly transaction between market participants at the measurement date. SFAS 157 establishes a hierarchy that prioritizes the inputs to valuation methods giving the highest priority to readily available unadjusted quoted prices in an active market for identical assets (Level 1) and the lowest priority to significant unobservable inputs (Level 3) generally when market prices are not readily available or are unreliable. Based on the valuation inputs, the securities or other investments are tiered into one of three levels. Changes in valuation methods may result in transfers in or out of an investment's assigned level:
Level 1 – Prices are determined using quoted prices in an active market for identical assets.
Level 2 – Prices are determined using other significant observable inputs. Observable inputs are inputs that other market participants may use in pricing a security. These may include quoted prices for similar securities, interest rates, prepayment speeds, credit risk and others.
Level 3 – Prices are determined using significant unobservable inputs. In situations where quoted prices or observable inputs are unavailable (for example, when there is little or no market activity for an investment at the end of the period), unobservable inputs may be used. Unobservable inputs reflect the Fund's own assumptions about the factors market participants would use in determining fair value of the securities or instruments and would be based on the best available information.
The following is a summary of the tiered valuation input levels, as of the end of the reporting period, April 30, 2009. The level assigned to the securities valuations may not be an indication of the risk or liquidity associated with investing in those securities. Because of the inherent uncertainties of valuation, the values reflected in the financial statements may materially differ from the value received upon actual sale of those investments.
84
Notes to Financial Statements (Continued)
PowerShares Exchange-Traded Fund Trust
April 30, 2009
| Investments in Securities | |||||||||||||||||||
| Level 1 | Level 2 | Level 3 | Total | ||||||||||||||||
| Aerospace & Defense Portfolio | $ | 116,543,025 | $ | — | $ | — | $ | 116,543,025 | |||||||||||
| CleantechTM Portfolio | 66,314,698 | 45,318,122 | — | 111,632,820 | |||||||||||||||
| DWA Technical LeadersTM Portfolio | 138,659,564 | — | — | 138,659,564 | |||||||||||||||
| Golden Dragon Halter USX China Portfolio | 279,247,708 | — | — | 279,247,708 | |||||||||||||||
| Listed Private Equity Portfolio | 61,819,909 | — | — | 61,819,909 | |||||||||||||||
| Lux Nanotech Portfolio | 39,562,835 | — | — | 39,562,835 | |||||||||||||||
| NASDAQ-100 BuyWrite Portfolio | 5,790,192 | — | — | 5,790,192 | |||||||||||||||
| S&P 500 BuyWrite Portfolio | 86,816,105 | — | — | 86,816,105 | |||||||||||||||
| Value Line Industry Rotation Portfolio | 26,620,420 | — | — | 26,620,420 | |||||||||||||||
| Value Line TimelinessTM Select Portfolio | 71,036,873 | — | — | 71,036,873 | |||||||||||||||
| Water Resources Portfolio | 1,219,913,222 | — | — | 1,219,913,222 | |||||||||||||||
| WilderHill Clean Energy Portfolio | 658,445,048 | — | — | 658,445,048 | |||||||||||||||
| WilderHill Progressive Energy Portfolio | 39,973,910 | — | — | 39,973,910 | |||||||||||||||
| Other Investments* | |||||||||||||||||||
| Level 1 | Level 2 | Level 3 | Total | ||||||||||||||||
| Aerospace & Defense Portfolio | $ | — | $ | — | $ | — | $ | — | |||||||||||
| CleantechTM Portfolio | — | — | — | — | |||||||||||||||
| DWA Technical LeadersTM Portfolio | — | — | — | — | |||||||||||||||
| Golden Dragon Halter USX China Portfolio | — | — | — | — | |||||||||||||||
| Listed Private Equity Portfolio | — | — | — | — | |||||||||||||||
| Lux Nanotech Portfolio | — | — | — | — | |||||||||||||||
| NASDAQ-100 BuyWrite Portfolio | (89,005 | ) | — | — | (89,005 | ) | |||||||||||||
| S&P 500 BuyWrite Portfolio | (311,608 | ) | — | — | (311,608 | ) | |||||||||||||
| Value Line Industry Rotation Portfolio | — | — | — | — | |||||||||||||||
| Value Line TimelinessTM Select Portfolio | — | — | — | — | |||||||||||||||
| Water Resources Portfolio | — | — | — | — | |||||||||||||||
| WilderHill Clean Energy Portfolio | — | — | — | — | |||||||||||||||
| WilderHill Progressive Energy Portfolio | — | — | — | — | |||||||||||||||
* Other investments include written options which are included at unrealized appreciation (depreciation).
Note 5. Investments in Affiliates
The 1940 Act defines "affiliate" to include issuers of which a fund holds 5% or more of the outstanding voting securities. The following is a summary of the transactions with affiliates for the year ended April 30, 2009.
85
Notes to Financial Statements (Continued)
PowerShares Exchange-Traded Fund Trust
April 30, 2009
Water Resources Portfolio
| Value April 30, 2008 | Purchase at Cost | Proceeds from Sales | Change in Unrealized Appreciation (Depreciation) | Realized Loss | Value April 30, 2009 | Dividend Income | |||||||||||||||||||||||||
| Ameron International Corp. | $ | 69,579,307 | $ | 27,269,038 | $ | (22,247,141 | ) | $ | (27,816,180 | ) | $ | (281,487 | ) | $ | 46,503,537 | $ | 910,625 | ||||||||||||||
| Badger Meter, Inc. | 67,874,182 | 1,932,412 | (826,130 | ) | (16,727,024 | ) | (400,252 | ) | 51,853,188 | 553,890 | |||||||||||||||||||||
| Consolidated Water Co., Inc. | 21,593,994 | 14,731,985 | (7,776,369 | ) | (5,361,804 | ) | (5,672,831 | ) | 17,514,975 | 262,496 | |||||||||||||||||||||
| Franklin Electric Co., Inc. | 62,894,638 | 19,647,728 | (27,238,167 | ) | (15,042,563 | ) | (4,261,033 | ) | 36,000,603 | 768,534 | |||||||||||||||||||||
| Gorman-Rupp (The) Co. | 54,129,757 | 9,738,775 | (11,145,345 | ) | (20,261,200 | ) | (469,408 | ) | 31,992,579 | 607,851 | |||||||||||||||||||||
| Insituform Technologies, Inc., Class A | 41,786,918 | 4,059,795 | (8,445,910 | ) | 776,355 | (3,581,211 | ) | 34,595,947 | — | ||||||||||||||||||||||
| Layne Christensen Co. | 70,509,913 | 24,088,801 | (24,815,355 | ) | (32,169,274 | ) | (1,399,171 | ) | 36,214,914 | — | |||||||||||||||||||||
| Lindsay Corp. | 90,551,603 | 18,822,806 | (2,210,425 | ) | (61,303,371 | ) | (2,815,492 | ) | 43,045,121 | 292,180 | |||||||||||||||||||||
| Mueller Water Products, Inc., Class A* | 54,985,675 | 41,184,926 | (26,258,279 | ) | 3,715,049 | (30,080,345 | ) | 43,547,026 | 109,073 | ||||||||||||||||||||||
| Northwest Pipe Co. | — | 36,968,691 | (1,329,011 | ) | (3,634,179 | ) | (512,677 | ) | 31,492,824 | — | |||||||||||||||||||||
| Watts Water Technologies, Inc., Class A | 54,232,903 | 23,050,998 | (30,533,920 | ) | 130,996 | (7,651,622 | ) | 39,229,355 | 905,542 | ||||||||||||||||||||||
| Total Investments in Affiliates | $ | 588,138,890 | $ | 221,495,955 | $ | (162,826,052 | ) | $ | (177,693,195 | ) | $ | (57,125,529 | ) | $ | 411,990,069 | $ | 4,410,191 | ||||||||||||||
* formerly Mueller Water Products, Inc., Class B
WilderHill Clean Energy Portfolio
| Value April 30, 2008 | Purchase at Cost | Proceeds from Sales | Change in Unrealized Appreciation (Depreciation) | Realized Gain (Loss) | Value April 30, 2009 | Dividend Income | |||||||||||||||||||||||||
| Echelon Corp. | $ | 35,615,065 | $ | 8,808,660 | $ | (19,255,539 | ) | $ | 8,624,753 | $ | (16,423,853 | ) | $ | 17,369,086 | $ | — | |||||||||||||||
| Evergreen Solar, Inc. | 43,649,149 | 25,942,094 | (23,523,250 | ) | (11,685,251 | ) | (14,132,318 | ) | 20,250,424 | — | |||||||||||||||||||||
| Fuel Systems Solutions, Inc. | 24,240,568 | 18,175,750 | (34,209,514 | ) | (83,517 | ) | 14,952,004 | 23,075,291 | — | ||||||||||||||||||||||
| Raser Technologies, Inc. | 17,252,858 | 36,144,574 | (10,286,164 | ) | (14,725,194 | ) | (13,077,841 | ) | 15,308,233 | — | |||||||||||||||||||||
| Spire Corp. | 3,180,344 | 5,553,367 | (990,818 | ) | (1,660,904 | ) | (1,119,900 | ) | 4,962,089 | — | |||||||||||||||||||||
| Universal Display Corp. | 38,916,173 | 14,472,163 | (21,902,743 | ) | (303,064 | ) | (9,723,231 | ) | 21,459,298 | — | |||||||||||||||||||||
| US Geothermal, Inc. | — | 11,849,704 | (2,399,580 | ) | (1,295,243 | ) | (5,119,791 | ) | 3,035,090 | — | |||||||||||||||||||||
| Valence Technology, Inc. | — | 44,089,974 | (6,932,629 | ) | (12,590,796 | ) | (4,932,445 | ) | 19,634,104 | — | |||||||||||||||||||||
| Zoltek Cos., Inc. | 43,639,827 | 17,087,551 | (14,035,873 | ) | (10,093,547 | ) | (20,931,448 | ) | 15,666,510 | — | |||||||||||||||||||||
| Total Investments in Affiliates | $ | 206,493,984 | $ | 182,123,837 | $ | (133,536,110 | ) | $ | (43,812,763 | ) | $ | (70,508,823 | ) | $ | 140,760,125 | $ | — | ||||||||||||||
86
Notes to Financial Statements (Continued)
PowerShares Exchange-Traded Fund Trust
April 30, 2009
The Fund's Adviser is a subsidiary of Invesco Ltd. and therefore, Invesco Ltd. is considered to be affiliated with the Fund. The table below shows the transactions in and earnings from the investment in Invesco Ltd. for the year ended April 30, 2009.
S&P 500 BuyWrite Portfolio
| Value April 30, 2008 | Purchase at Cost | Proceeds from Sales | Change in Unrealized Depreciation | Realized Loss | Value April 30, 2009 | Dividend Income | |||||||||||||||||||||||||
| Invesco Ltd. | $ | — | $ | 104,280 | $ | (26,737 | ) | $ | (10,229 | ) | $ | (3,532 | ) | $ | 63,782 | $ | 688 | ||||||||||||||
Note 6. Federal Income Tax
At April 30, 2009, the costs of investments on a tax basis including the adjustments for financial reporting purposes as of the most recently completed Federal income tax reporting period were as follows:
| Cost | |||||||
| Aerospace & Defense Portfolio | $ | 200,141,168 | |||||
| CleantechTM Portfolio | 161,868,177 | ||||||
| DWA Technical LeadersTM Portfolio | 140,722,795 | ||||||
| Golden Dragon Halter USX China Portfolio | 476,429,138 | ||||||
| Listed Private Equity Portfolio | 151,303,981 | ||||||
| Lux Nanotech Portfolio | 73,077,021 | ||||||
| NASDAQ-100 BuyWrite Portfolio | 5,701,187 | ||||||
| S&P 500 BuyWrite Portfolio | 87,127,713 | ||||||
| Value Line Industry Rotation Portfolio | 26,078,838 | ||||||
| Value Line TimelinessTM Select Portfolio | 69,149,149 | ||||||
| Water Resources Portfolio | 1,608,998,610 | ||||||
| WilderHill Clean Energy Portfolio | 1,106,052,185 | ||||||
| WilderHill Progressive Energy Portfolio | 54,163,905 | ||||||
At April 30, 2009, the components of accumulated earnings/loss on tax-basis were as follows:
| Accumulated Earnings | Other Temporary Differences | Net Accumulated Capital and other Gains (Losses) | Net Unrealized Appreciation (Depreciation) | Gross Unrealized Appreciation | Gross Unrealized Depreciation | Total Accumulated Earnings (Loss) | |||||||||||||||||||||||||
| Aerospace & Defense Portfolio | $ | 403,011 | $ | (7,261 | ) | $ | (12,622,538 | ) | $ | (83,598,143 | ) | $ | 134,686 | $ | (83,732,829 | ) | $ | (95,824,931 | ) | ||||||||||||
| CleantechTM Portfolio | 95,439 | (4,685 | ) | (33,254,878 | ) | (50,235,511 | ) | 947,060 | (51,182,571 | ) | (83,399,635 | ) | |||||||||||||||||||
| DWA Technical LeadersTM Portfolio | 511,998 | (7,999 | ) | (152,160,498 | ) | (2,063,231 | ) | 10,376,967 | (12,440,198 | ) | (153,719,730 | ) | |||||||||||||||||||
| Golden Dragon Halter USX China Portfolio | 524,082 | (11,883 | ) | (73,907,397 | ) | (197,181,430 | ) | 7,767,278 | (204,948,708 | ) | (270,576,628 | ) | |||||||||||||||||||
| Listed Private Equity Portfolio | 230,687 | (4,525 | ) | (30,654,442 | ) | (89,484,072 | ) | 362,163 | (89,846,235 | ) | (119,912,352 | ) | |||||||||||||||||||
| Lux Nanotech Portfolio | 101,214 | (4,090 | ) | (42,864,631 | ) | (33,514,186 | ) | 892,011 | (34,406,197 | ) | (76,281,693 | ) | |||||||||||||||||||
| NASDAQ-100 BuyWrite Portfolio | — | — | (406,407 | ) | — | 363,956 | (363,956 | ) | (406,407 | ) | |||||||||||||||||||||
| S&P 500 BuyWrite Portfolio | 190,870 | — | (13,224,876 | ) | — | 10,484,664 | (10,484,664 | ) | (13,034,006 | ) | |||||||||||||||||||||
87
Notes to Financial Statements (Continued)
PowerShares Exchange-Traded Fund Trust
April 30, 2009
| Accumulated Earnings | Other Temporary Differences | Net Accumulated Capital and other Gains (Losses) | Net Unrealized Appreciation (Depreciation) | Gross Unrealized Appreciation | Gross Unrealized Depreciation | Total Accumulated Earnings (Loss) | |||||||||||||||||||||||||
| Value Line Industry Rotation Portfolio | $ | 77,897 | $ | (3,244 | ) | $ | (25,235,032 | ) | $ | 541,582 | $ | 2,367,546 | $ | (1,825,964 | ) | $ | (24,618,797 | ) | |||||||||||||
| Value Line TimelinessTM Select Portfolio | 237,807 | (5,626 | ) | (125,736,301 | ) | 1,887,724 | 6,684,054 | (4,796,330 | ) | (123,616,396 | ) | ||||||||||||||||||||
| Water Resources Portfolio | 2,306,444 | (40,918 | ) | (291,244,810 | ) | (389,085,388 | ) | 52,457,447 | (441,542,835 | ) | (678,064,672 | ) | |||||||||||||||||||
| WilderHill Clean Energy Portfolio | — | (25,802 | ) | (793,179,690 | ) | (447,607,137 | ) | 6,362,142 | (453,969,279 | ) | (1,240,812,629 | ) | |||||||||||||||||||
| WilderHill Progressive Energy Portfolio | 136,222 | (3,513 | ) | (18,729,463 | ) | (14,189,995 | ) | 797,566 | (14,987,561 | ) | (32,786,749 | ) | |||||||||||||||||||
Distributions to Shareholders
The tax character of distributions paid during the year ended April 30, 2009 was as follows:
| Year Ended April 30, 2009 | Year Ended April 30, 2008 | ||||||||||
| Distributions paid from Ordinary Income | Distributions paid from Ordinary Income | ||||||||||
| Aerospace & Defense Portfolio | $ | 1,446,628 | $ | 597,944 | |||||||
| DWA Technical LeadersTM Portfolio | 486,080 | 105,514 | |||||||||
| Golden Dragon Halter USX China Portfolio | 2,867,142 | 3,881,852 | |||||||||
| Listed Private Equity Portfolio | 6,364,696 | 6,147,694 | |||||||||
| S&P 500 BuyWrite Portfolio | 887,380 | 10,500 | |||||||||
| Value Line Industry Rotation Portfolio | 100,862 | 19,266 | |||||||||
| Value Line TimelinessTM Select Portfolio | 95,040 | — | |||||||||
| Water Resources Portfolio | 6,232,539 | 7,498,823 | |||||||||
| WilderHill Progressive Energy Portfolio | 175,935 | 193,423 | |||||||||
| Year Ended April 30, 2009 | Year Ended April 30, 2008 | ||||||||||
| Distributions paid from Return of Capital | Distributions paid from Return of Capital | ||||||||||
| DWA Technical LeadersTM Portfolio | $ | — | $ | 57,242 | |||||||
| Golden Dragon Halter USX China Portfolio | — | 198,502 | |||||||||
| Value Line Industry Rotation Portfolio | — | 1,384 | |||||||||
| WilderHill Progressive Energy Portfolio | — | 9,290 | |||||||||
At April 30, 2009, for Federal income tax purposes, the Funds had capital loss carryforwards available as shown in the table below, to the extent provided by the regulations, to offset future capital gains through the years indicated. To the extent that these loss carryforwards are used to offset future capital gains, it is probable that the capital gains so offset will not be distributed to shareholders. The use of some portion of the capital loss carryforward by any one Fund may be limited by Federal tax rules. Among others, certain rules limit the use of the carryforward when there has been a greater than fifty percent change in ownership of a Fund.
88
Notes to Financial Statements (Continued)
PowerShares Exchange-Traded Fund Trust
April 30, 2009
| Year of Expiration | Total | ||||||||||||||||||||||
| 2014 | 2015 | 2016 | 2017 | Amounts | |||||||||||||||||||
| Aerospace & Defense Portfolio | $ | — | $ | 104,662 | $ | 2,374,303 | $ | 7,470,897 | $ | 9,949,862 | |||||||||||||
| CleantechTM Portfolio | — | — | 1,171,839 | 14,341,075 | 15,512,914 | ||||||||||||||||||
| DWA Technical LeadersTM Portfolio | — | — | 5,046,566 | 92,771,702 | 97,818,268 | ||||||||||||||||||
| Golden Dragon Halter USX China Portfolio | 1,018,146 | 3,128,677 | 1,235,904 | 22,836,421 | 28,219,148 | ||||||||||||||||||
| Listed Private Equity Portfolio | — | — | 4,388,498 | 8,910,720 | 13,299,218 | ||||||||||||||||||
| Lux Nanotech Portfolio | — | 3,986,980 | 793,005 | 27,406,131 | 32,186,116 | ||||||||||||||||||
| NASDAQ-100 BuyWrite Portfolio | — | — | — | 406,407 | 406,407 | ||||||||||||||||||
| S&P 500 BuyWrite Portfolio | — | — | — | 10,526,359 | 10,526,359 | ||||||||||||||||||
| Value Line Industry Rotation Portfolio | — | — | 3,798,072 | 6,546,039 | 10,344,111 | ||||||||||||||||||
| Value Line TimelinessTM Select Portfolio | — | 28,753,751 | 21,013,690 | 37,241,965 | 87,009,406 | ||||||||||||||||||
| Water Resources Portfolio | — | 11,876,489 | 3,553,481 | 93,208,162 | 108,638,132 | ||||||||||||||||||
| WilderHill Clean Energy Portfolio | 2,098,368 | 89,533,576 | 44,707,703 | 261,712,498 | 398,052,145 | ||||||||||||||||||
| WilderHill Progressive Energy Portfolio | — | — | 179,432 | 8,319,827 | 8,499,259 | ||||||||||||||||||
Capital losses incurred after October 31 ("post-October losses") within the taxable year are deemed to arise on the first business day of each Fund's next taxable year.
During the year ended April 30, 2009, the Funds incurred and will elect to defer net capital losses as follows:
| Post-October Losses | |||||||
| Aerospace & Defense Portfolio | $ | 2,672,676 | |||||
| CleantechTM Portfolio | 17,741,964 | ||||||
| DWA Technical LeadersTM Portfolio | 54,342,230 | ||||||
| Golden Dragon Halter USX China Portfolio | 45,688,249 | ||||||
| Listed Private Equity Portfolio | 17,355,224 | ||||||
| Lux Nanotech Portfolio | 10,678,515 | ||||||
| S&P 500 BuyWrite Portfolio | 2,698,517 | ||||||
| Value Line Industry Rotation Portfolio | 14,890,921 | ||||||
| Value Line TimelinessTM Select Portfolio | 38,726,895 | ||||||
| Water Resources Portfolio | 182,606,678 | ||||||
| WilderHill Clean Energy Portfolio | 395,127,545 | ||||||
| WilderHill Progressive Energy Portfolio | 10,230,204 | ||||||
In order to present shares of beneficial interest and accumulated net realized gains or losses on the Statements of Assets and Liabilities that more closely represent their tax character, certain adjustments have been made to shares of beneficial interest, undistributed net investment income or loss and accumulated net realized gain or loss on investments. These differences are primarily due to redemptions-in-kind, investments in partnerships, wash sales, book equalization, and net operating losses, if any. These adjustments have no effect on net assets. For the year ended April 30, 2009, the adjustments were as follows:
| Undistributed Net Investment Income (Loss) | Accumulated Net Realized Gain (Loss) | Shares of Beneficial Interest | |||||||||||||
| Aerospace & Defense Portfolio | $ | 109,833 | $ | 13,314,423 | $ | (13,424,256 | ) | ||||||||
| CleantechTM Portfolio | 344,783 | (7,106,889 | ) | 6,762,106 | |||||||||||
| DWA Technical LeadersTM Portfolio | 380,236 | 52,092,024 | (52,472,260 | ) | |||||||||||
89
Notes to Financial Statements (Continued)
PowerShares Exchange-Traded Fund Trust
April 30, 2009
| Undistributed Net Investment Income (Loss) | Accumulated Net Realized Gain (Loss) | Shares of Beneficial Interest | |||||||||||||
| Golden Dragon Halter USX China Portfolio | $ | 415,792 | $ | 20,146,616 | $ | (20,562,408 | ) | ||||||||
| Listed Private Equity Portfolio | (2,348,263 | ) | 19,910,520 | (17,562,257 | ) | ||||||||||
| Lux Nanotech Portfolio | (4,781 | ) | 2,493,535 | (2,488,754 | ) | ||||||||||
| NASDAQ-100 BuyWrite Portfolio | 6,900 | — | (6,900 | ) | |||||||||||
| S&P 500 BuyWrite Portfolio | 237,988 | (124,762 | ) | (113,226 | ) | ||||||||||
| Value Line Industry Rotation Portfolio | 7,384 | 5,648,847 | (5,656,231 | ) | |||||||||||
| Value Line TimelinessTM Select Portfolio | 31,377 | 11,735,654 | (11,767,031 | ) | |||||||||||
| Water Resources Portfolio | 692,733 | 18,841,548 | (19,534,281 | ) | |||||||||||
| WilderHill Clean Energy Portfolio | 1,180,982 | 12,782,089 | (13,963,071 | ) | |||||||||||
| WilderHill Progressive Energy Portfolio | (6,067 | ) | 3,664,211 | (3,658,144 | ) | ||||||||||
Note 7. Investment Transactions
For the year ended April 30, 2009, the cost of securities purchased and proceeds from sales of securities, excluding short-term securities, money market funds and in-kind transactions, were as follows:
| Purchases | Sales | ||||||||||
| Aerospace & Defense Portfolio | $ | 14,718,723 | $ | 14,003,414 | |||||||
| CleantechTM Portfolio | 84,906,914 | 84,191,002 | |||||||||
| DWA Technical LeadersTM Portfolio | 230,450,413 | 230,296,190 | |||||||||
| Golden Dragon Halter USX China Portfolio | 67,778,315 | 66,493,719 | |||||||||
| Listed Private Equity Portfolio | 66,142,242 | 61,038,572 | |||||||||
| Lux Nanotech Portfolio | 30,352,596 | 29,222,048 | |||||||||
| NASDAQ-100 BuyWrite Portfolio | 4,198,958 | 2,125,693 | |||||||||
| S&P 500 BuyWrite Portfolio | 51,708,689 | 39,571,465 | |||||||||
| Value Line Industry Rotation Portfolio | 42,675,703 | 42,154,854 | |||||||||
| Value Line TimelinessTM Select Portfolio | 173,899,579 | 182,307,311 | |||||||||
| Water Resources Portfolio | 559,775,452 | 582,410,049 | |||||||||
| WilderHill Clean Energy Portfolio | 416,270,066 | 399,527,879 | |||||||||
| WilderHill Progressive Energy Portfolio | 16,414,237 | 16,698,319 | |||||||||
For the year ended April 30, 2009, in-kind transactions associated with creations and redemptions were as follows:
| Securities Received | Securities Delivered | ||||||||||
| Aerospace & Defense Portfolio | $ | 28,029,465 | $ | 86,269,299 | |||||||
| CleantechTM Portfolio | 107,941,478 | 39,364,336 | |||||||||
| DWA Technical LeadersTM Portfolio | 256,996,353 | 291,221,200 | |||||||||
| Golden Dragon Halter USX China Portfolio | 125,744,013 | 178,932,925 | |||||||||
| Listed Private Equity Portfolio | 74,094,483 | 27,317,108 | |||||||||
| Lux Nanotech Portfolio | 17,582,776 | 27,330,941 | |||||||||
| NASDAQ-100 BuyWrite Portfolio | 4,146,823 | — | |||||||||
| S&P 500 BuyWrite Portfolio | 104,537,839 | 21,668,499 | |||||||||
| Value Line Industry Rotation Portfolio | 73,444,395 | 64,324,677 | |||||||||
90
Notes to Financial Statements (Continued)
PowerShares Exchange-Traded Fund Trust
April 30, 2009
| Securities Received | Securities Delivered | ||||||||||
| Value Line TimelinessTM Select Portfolio | $ | 228,742,937 | $ | 258,340,915 | |||||||
| Water Resources Portfolio | 307,412,134 | 512,794,505 | |||||||||
| WilderHill Clean Energy Portfolio | 451,150,301 | 413,840,105 | |||||||||
| WilderHill Progressive Energy Portfolio | 38,709,631 | 27,109,704 | |||||||||
Gains on in-kind transactions are generally not considered taxable gains for Federal income tax purposes.
Note 8. Trustees' Fees
The Funds compensate each Trustee who is not an employee of the Adviser or its affiliates. With respect to S&P 500 BuyWrite Portfolio and NASDAQ-100 BuyWrite Portfolio, the Adviser, as result of the unitary management fee, pays for such compensation. The "Interested" Trustee of the Trust does not receive any Trustees' fees.
The Trust has adopted a deferred compensation plan (the "Plan"). Under the Plan, a Trustee who is not an "interested person" (as defined in the 1940 Act) (an "Independent Trustee") and has executed a Deferred Fee Agreement (a "Participating Trustee") may defer receipt of all or a portion of his compensation ("Deferral Fees"). Such Deferral Fees are deemed to be invested in selected PowerShares Funds. The Deferral Fees payable to the Participating Trustee are valued as of the date such Fees would have been paid to the Participating Trustee. The value increases with contributions or with increases in the value of the shares selected, and the value decreases with distributions or with declines in the value of the shares selected.
Note 9. Capital
Shares are created and redeemed by the Trust only in Creation Unit size aggregations of 100,000. Only Authorized Participants are permitted to purchase or redeem Creation Units from the Funds. Such transactions are generally permitted on an in-kind basis, with a balancing cash component to equate the transaction to the net asset value per unit of each Fund of the Trust on the transaction date. Cash may be substituted equivalent to the value of certain securities generally when they are not available in sufficient quantity for delivery, not eligible for trading by the Authorized Participant or as a result of other market circumstances.
Note 10. Indemnifications
Under the Trust's organizational documents, its officers and Trustees are indemnified against certain liabilities arising out of the performance of their duties to the Trust. Each Independent Trustee is also indemnified against certain liabilities arising out of the performance of his duties to the Trust pursuant to an Indemnification Agreement between the Independent Trustee and the Trust. Additionally, in the normal course of business, the Trust enters into contracts with service providers that contain general indemnification clauses. The Trust's maximum exposure under these arrangements is unknown, as this would involve future claims that may be made against the Trust that have not yet occurred. However, based on experience, the Trust believes the risk of loss to be remote.
91
Notes to Financial Statements (Continued)
PowerShares Exchange-Traded Fund Trust
April 30, 2009
Note 11. New Accounting Pronouncement
In March 2008, the Financial Accounting Standards Board ("FASB") issued FASB Statement No. 161, Disclosures about Derivative Instruments and Hedging Activities. The standard is intended to improve financial reporting about derivative instruments and hedging activities by requiring enhanced disclosures to enable investors to better understand their effects on an entity's financial position and financial performance. It is effective for financial statements issued for fiscal years and interim periods beginning after November 15, 2008. Management is currently in the process of determining the impact of the standard on the S&P 500 BuyWrite Portfolio and NASDAQ-100 BuyWrite Portfolio financial statements and currently intends for the Funds to adopt FAS 161 provisions during the year ended April 30, 2010.
92
Report of Independent Registered Public Accounting Firm
To the Board of Trustees and Shareholders of PowerShares Exchange-Traded Fund Trust:
In our opinion, the accompanying statements of assets and liabilities, including the schedules of investments, and the related statements of operations and of changes in net assets and the financial highlights present fairly, in all material respects, the financial position of each of the portfolios indicated in Note 1 of the financial statements (each a portfolio of PowerShares Exchange-Traded Fund Trust, hereafter referred to as the "Trust") at April 30, 2009, and the results of each of their operations, the changes in each of their net assets, and the financial highlights for each of the periods presented, in conformity with accounting principles generally accepted in the United States of America. These financial statements and financial highlights (hereafter referred to as "financial statements") are the responsibility of the Trust's management; our responsibility is to express an opinion on these financial statements based on our audits. We conducted our audits of these financial statements in accordance with the standards of the Public Company Accounting Oversight Board (United States). Those standards require that we plan and perform the audits to obtain reasonable assurance about whether the financial statements are free of material misstatement. An audit includes examining, on a test basis, evidence supporting the amounts and disclosures in the financial statements, assessing the accounting principles used and significant estimates made by management, and evaluating the overall financial statement presentation. We believe that our audits, which included confirmation of securities at April 30, 2009 by correspondence with the custodian and brokers, and the application of alternative auditing procedures where securities purchased had not been received, provide a reasonable basis for our opinion.
PricewaterhouseCoopers LLP
New York, New York
June 25, 2009
93
Supplemental Information
Tax Information
Form 1099-DIV, Form 1042-S and other year-end tax information provide shareholders with actual calendar year amounts that should be included in their tax returns. Shareholders should consult their tax advisors.
The following distribution information is being provided as required by the Internal Revenue Code or to meet a specific state's requirement.
Each Fund designates the following amounts or, if subsequently determined to be different, the maximum amount allowable for its fiscal year ended April 30, 2009:
Federal and State Income Tax
| Qualified Dividend Income* | Corporate Dividends Received Deduction* | ||||||||||
| Aerospace & Defense Portfolio | 100 | % | 100 | % | |||||||
| CleantechTM Portfolio | 0 | % | 0 | % | |||||||
| DWA Technical LeadersTM Portfolio | 100 | % | 100 | % | |||||||
| Golden Dragon Halter USX China Portfolio | 100 | % | 0 | % | |||||||
| Listed Private Equity Portfolio | 100 | % | 100 | % | |||||||
| Lux Nanotech Portfolio | 0 | % | 0 | % | |||||||
| NASDAQ-100 BuyWrite Portfolio | 0 | % | 0 | % | |||||||
| S&P 500 BuyWrite Portfolio | 0 | % | 0 | % | |||||||
| Value Line Industry Rotation Portfolio | 100 | % | 100 | % | |||||||
| Value Line TimelinessTM Select Portfolio | 100 | % | 100 | % | |||||||
| Water Resources Portfolio | 100 | % | 100 | % | |||||||
| WilderHill Clean Energy Portfolio | 0 | % | 0 | % | |||||||
| WilderHill Progressive Energy Portfolio | 100 | % | 88 | % | |||||||
* The above percentage is based on ordinary income dividends paid to shareholders during the Fund's fiscal year.
94
Supplemental Information (Continued)
Trustees and Officers
The Independent Trustees, the Trustee who is affiliated with the Adviser (the "Management Trustee") and the executive officers of the Trust, their term of office and length of time served, their principal business occupations during at least the past five years, the number of portfolios in the Fund Complex (as defined below) overseen by each Trustee and the other directorships, if any, held by a Trustee, are shown below.
| Name, Address, and Age Independent Trustee | Position(s) with Trust | Length Time Served* | Principal Occupation(s) During Past 5 Years | Number of Portfolios in Fund Complex** Overseen by Trustee | Other Directorships Held by Trustee | ||||||||||||||||||
| Ronn R. Bagge 51 YQA Capital Management, LLC 1755 S. Naperville Road Suite 100 Wheaton, IL 60187 | Trustee | Since 2003 | YQA Capital Management LLC (July 1998-Present); formerly Owner/CEO of Electronic Dynamic Balancing Co., Inc. (high-speed rotating equipment service provider) | 119 | None | ||||||||||||||||||
| Marc M. Kole 48 c/o Invesco PowerShares Capital Management LLC 301 W. Roosevelt Road Wheaton, IL 60187 | Trustee | Since 2006 | Vice President of Finance and Accounting, Hope Network (social services) (November 2008-Present); formerly Assistant Vice President and Controller, Priority Health (health insurance) (September 2005-April 2008); Senior Vice President of Finance, United Healthcare (health insurance) (July 2004-July 2005); Senior Vice President of Finance, Oxford Health Plans (June 2000-July 2004) | 119 | None | ||||||||||||||||||
* This is the date the Trustee began serving the Trust. Each Trustee serves an indefinite term, until his successor is elected.
** Fund Complex includes all open-end funds (including all of their portfolios) advised by the Adviser. At April 30, 2009, the Fund Complex consists of the Trust's 75 portfolios and three other exchange-traded fund trusts with 44 portfolios advised by the Adviser.
95
Supplemental Information (Continued)
Trustees and Officers (Continued)
| Name, Address, and Age Independent Trustee | Position(s) with Trust | Length Time Served* | Principal Occupation(s) During Past 5 Years | Number of Portfolios in Fund Complex** Overseen by Trustee | Other Directorships Held by Trustee | ||||||||||||||||||
| Philip M. Nussbaum 47 c/o Invesco PowerShares Capital Management LLC 301 W. Roosevelt Road Wheaton, IL 60187 | Trustee | Since 2003 | Chairman, Performance Trust Capital Partners (formerly Betzold, Berg, Nussbaum & Heitman, Inc.) (November 2004-Present); formerly Managing Director, Communication Institute (May 2002-August 2003); Executive Vice President of Finance, Betzold, Berg, Nussbaum & Heitman, Inc. (March 1994-1999) | 119 | None | ||||||||||||||||||
| Donald H. Wilson 49 c/o Invesco PowerShares Capital Management LLC 301 W. Roosevelt Road Wheaton, IL 60187 | Trustee | Since 2006 | President and Chief Operating Officer, AMCORE Financial, Inc. (bank holding company) (August 2007-April 2009), formerly Executive Vice President and Chief Financial Officer, AMCORE Financial, Inc. (February 2006-August 2007); Senior Vice President and Treasurer, Marshall & Ilsley Corp. (bank holding company) (May 1995-February 2006) | 119 | None | ||||||||||||||||||
* This is the date the Trustee began serving the Trust. Each Trustee serves an indefinite term, until his successor is elected.
** Fund Complex includes all open-end funds (including all of their portfolios) advised by the Adviser. At April 30, 2009, the Fund Complex consists of the Trust's 75 portfolios and three other exchange-traded fund trusts with 44 portfolios advised by the Adviser.
96
Supplemental Information (Continued)
Trustees and Officers (Continued)
| Name, Address, and Age of Management Trustee | Position(s) with Trust | Length Time Served* | Principal Occupation(s) During Past 5 Years | Number of Portfolios in Fund Complex*** Overseen by Trustee | Other Directorships Held by Trustee | ||||||||||||||||||
| H. Bruce Bond** 45 Invesco PowerShares Capital Management LLC 301 W. Roosevelt Road Wheaton, IL 60187 | Chairman of the Board, Trustee and President | Since 2003 | Managing Director, Invesco PowerShares Capital Management LLC (August 2002-Present); formerly Manager, Nuveen Investments (April 1998-August 2002) | 119 | None | ||||||||||||||||||
Availability of Additional Information About the Trustees
The Statement of Additional Information includes additional information about the Trustees and is available, without charge, upon request at 800.337.4246.
* This is the date the Management Trustee began serving the Trust. Each Trustee serves an indefinite term, until his successor is elected. Each officer serves a one year term, until his successor is elected.
** "Interested person" as defined in Section 2(a)(19) of the 1940 Act.
*** Fund Complex includes all open-end funds (including all of their portfolios) advised by the Adviser. At April 30, 2009, the Fund Complex consists of the Trust's 75 portfolios and three other exchange-traded fund trusts with 44 portfolios advised by the Adviser.
97
Supplemental Information (Continued)
Trustees and Officers (Continued)
| Name, Address, and Age of Officers | Position(s) with Trust | Length Time Served* | Principal Occupation(s) During Past 5 Years | ||||||||||||
| Bruce T. Duncan 54 Invesco PowerShares Capital Management LLC 301 W. Roosevelt Road Wheaton, IL 60187 | Chief Financial Officer, Treasurer and Secretary | Chief Financial Officer and Treasurer Since 2006 Secretary Since 2008 | Senior Vice President of Finance, Invesco PowerShares Capital Management LLC (September 2005-Present); formerly Private Practice Attorney (2000-2005); Vice President of Investor Relations, The ServiceMaster Company (1994-2000); Vice President of Taxes, The ServiceMaster Company (1990-2000) | ||||||||||||
| Kevin R. Gustafson 43 Invesco PowerShares Capital Management LLC 301 W. Roosevelt Road Wheaton, IL 60187 | Chief Compliance Officer | Since 2004 | General Counsel, Invesco PowerShares Capital Management LLC (September 2004-Present); formerly Chief Compliance Officer, Invesco PowerShares Capital Management LLC (September 2004-April 2008) | ||||||||||||
| John W. Southard, Jr., CFA, MBA 39 Invesco PowerShares Capital Management LLC 301 West Roosevelt Road Wheaton, IL 60187 | Vice President | Since 2003 | Managing Director, Invesco PowerShares Capital Management LLC (August 2002-Present); formerly, Treasurer of the Trust (April 2003-April 2006); Senior Equity Analyst, Charles Schwab & Company (May 2001-August 2002) | ||||||||||||
* This is the period for which the Officers began serving the Trust. Each Officer serves one year term, until his successor is elected.
98
Board Considerations Regarding Continuation of Investment
Advisory Agreement
At a meeting held on April 16, 2009, the Board of Trustees of the PowerShares Exchange-Traded Fund Trust (the "Trust"), including the Independent Trustees, unanimously approved the continuation of the Investment Advisory Agreement between Invesco PowerShares Capital Management LLC (the "Adviser") and the Trust for the following 70 series (each, a "Fund" and collectively, the "Funds"):
PowerShares Dynamic Market Portfolio
PowerShares Dynamic OTC Portfolio
PowerShares Golden Dragon Halter USX China Portfolio
PowerShares High Yield Equity Dividend AchieversTM Portfolio
PowerShares WilderHill Clean Energy Portfolio
PowerShares Dynamic Large Cap Growth Portfolio
PowerShares Dynamic Large Cap Value Portfolio
PowerShares Dynamic Mid Cap Growth Portfolio
PowerShares Dynamic Mid Cap Value Portfolio
PowerShares Dynamic Small Cap Growth Portfolio
PowerShares Dynamic Small Cap Value Portfolio
PowerShares Dynamic Biotechnology & Genome Portfolio
PowerShares Dynamic Food & Beverage Portfolio
PowerShares Dynamic Leisure and Entertainment Portfolio
PowerShares Dynamic Media Portfolio
PowerShares Dynamic Networking Portfolio
PowerShares Dynamic Pharmaceuticals Portfolio
PowerShares Dynamic Semiconductors Portfolio
PowerShares Dynamic Software Portfolio
PowerShares Zacks Micro Cap Portfolio
PowerShares Aerospace & Defense Portfolio
PowerShares Dynamic Hardware & Consumer Electronics Portfolio
PowerShares Dynamic Telecommunications & Wireless Portfolio
PowerShares Value Line Timeliness Select Portfolio
PowerShares Dividend AchieversTM Portfolio
PowerShares International Dividend AchieversTM Portfolio
PowerShares High Growth Rate Dividend AchieversTM Portfolio
PowerShares Zacks Small Cap Portfolio
PowerShares Dynamic Building and Construction Portfolio
PowerShares Dynamic Energy Exploration and Production Portfolio
PowerShares Dynamic Insurance Portfolio
PowerShares Dynamic Oil and Gas Services Portfolio
PowerShares Dynamic Retail Portfolio
PowerShares Dynamic Utilities Portfolio
PowerShares Lux Nanotech Portfolio
PowerShares FTSE RAFI US 1000 Portfolio
PowerShares FTSE RAFI US 1500 Small-Mid Portfolio
PowerShares Water Resources Portfolio
PowerShares Dynamic Energy Sector Portfolio
PowerShares Dynamic Financials Sector Portfolio
PowerShares Dynamic Healthcare Sector Portfolio
PowerShares Dynamic Industrials Sector Portfolio
PowerShares Dynamic Large Cap Portfolio
PowerShares Dynamic MagniQuant Portfolio
PowerShares Dynamic Mid Cap Portfolio
PowerShares Dynamic Small Cap Portfolio
PowerShares Dynamic Technology Sector Portfolio
PowerShares Buyback AchieversTM Portfolio
PowerShares FTSE RAFI Basic Materials Sector Portfolio
PowerShares FTSE RAFI Consumer Goods Sector Portfolio
PowerShares FTSE RAFI Consumer Services Sector Portfolio
PowerShares FTSE RAFI Energy Sector Portfolio
PowerShares FTSE RAFI Financials Sector Portfolio
PowerShares FTSE RAFI Health Care Sector Portfolio
PowerShares FTSE RAFI Industrials Sector Portfolio
PowerShares FTSE RAFI Telecommunications & Technology Sector Portfolio
99
Board Considerations Regarding Continuation of Investment
Advisory Agreement (Continued)
PowerShares FTSE RAFI Utilities Sector Portfolio
PowerShares Cleantech Portfolio
PowerShares Dynamic Aggressive Growth Portfolio
PowerShares Dynamic Banking Portfolio
PowerShares Dynamic Basic Materials Sector Portfolio
PowerShares Dynamic Consumer Discretionary Sector Portfolio
PowerShares Dynamic Consumer Staples Sector Portfolio
PowerShares Dynamic Healthcare Services Portfolio
PowerShares Dynamic Deep Value Portfolio
PowerShares Financial Preferred Portfolio
PowerShares Listed Private Equity Portfolio
PowerShares DWA Technical Leaders Portfolio
PowerShares Value Line Industry Rotation Portfolio
PowerShares WilderHill Progressive Energy Portfolio
The Trustees reviewed information from the Adviser describing: (i) the nature, extent and quality of services provided, (ii) the investment performance of the Funds and the Adviser, (iii) the costs of services provided and estimated profits realized by the Adviser, (iv) the extent to which economies of scale are realized as the Funds grow, (v) whether fee levels reflect any possible economies of scale for the benefit of Fund shareholders, (vi) comparisons of services rendered and amounts paid to other registered investment companies and (vii) any benefits realized by the Adviser from its relationship with each Fund. Based on all of the information considered and the conclusions reached, the Board, including the Independent Trustees, determined to approve the continuation of the Investment Advisory Agreement for each Fund. No single factor was determinative in the Board's analysis.
Nature, Extent and Quality of Services. In evaluating the nature, extent and quality of the Adviser's services, the Trustees reviewed information concerning the functions performed by the Adviser for the Funds, information describing the Adviser's current organization and projected staffing, including operations assistance provided by the Adviser's parent organization, Invesco Ltd., and the background and experience of the persons responsible for the day-to-day management of the Funds. The Trustees reviewed matters related to the Adviser's execution of portfolio transactions on behalf of the Funds. The Trustees also reviewed information on the performance of the Funds and the performance of their underlying indices through December 31, 2008. The Trustees also reviewed reports on the correlation and tracking error between the underlying index and each Fund's performance, and the Adviser's analysis of the tracking error between each Fund and its underlying index. The Trustees noted that each Fund's correlation was within the targeted range set forth in the Trust's registration statement and that, for each Fund other than PowerShares Financial Preferred Portfolio, the tracking error was within the targeted range set forth in the Trust's registration statement. The Trustees reviewed the reasons for PowerShares Financial Preferred Portfolio's tracking error. The Trustees concluded that each Fund was correlated to its underlying index and that the tracking error for each Fund was within an acceptable range given that Fund's particular circumstances.
The Trustees also considered the services provided by the Adviser in its oversight of the Funds' administrator, custodian and transfer agent. They noted the significant amount of time and effort that had been devoted to this oversight function.
Based on their review, the Trustees concluded that the nature, extent and quality of services provided by the Adviser to the Funds under the Investment Advisory Agreement were appropriate and reasonable.
100
Board Considerations Regarding Continuation of Investment
Advisory Agreement (Continued)
Fees, Expenses and Profitability. The Trustees reviewed and discussed the information provided by the Adviser on each Fund's expense ratio and advisory fee, as compared to information compiled by the Adviser from Lipper Inc. databases on the expense ratios of comparable exchange-traded funds ("ETFs"), open-end (non-ETF) index funds and open-end actively-managed funds. The Trustees noted that the annual advisory fee charged to each Fund is:
• 0.50% of the Fund's average net assets, for each Fund other than PowerShares High Yield Equity Dividend AchieversTM Portfolio, PowerShares Dividend AchieversTM Portfolio, PowerShares High Growth Rate Dividend AchieversTM Portfolio, PowerShares International Dividend AchieversTM Portfolio, PowerShares FTSE RAFI Basic Materials Sector Portfolio, PowerShares FTSE RAFI Consumer Goods Sector Portfolio, PowerShares FTSE RAFI Consumer Services Sector Portfolio, PowerShares FTSE RAFI Energy Sector Portfolio, PowerShares FTSE RAFI Financials Sector Portfolio, PowerShares FTSE RAFI Health Care Sector Portfolio, PowerShares FTSE RAFI Industrials Sector Portfolio, PowerShares FTSE RAFI Telecommunications & Technology Sector Portfolio, PowerShares FTSE RAFI Utilities Sector Portfolio, PowerShares FTSE RAFI US 1000 Portfolio and PowerShares FTSE RAFI US 1500 Small-Mid Portfolio ;
• 0.40% of the Fund's average net assets, for each of PowerShares High Yield Equity Dividend AchieversTM Portfolio, PowerShares Dividend AchieversTM Portfolio, PowerShares High Growth Rate Dividend AchieversTM Portfolio and PowerShares International Dividend AchieversTM Portfolio; and
• 0.29% of the Fund's average net assets, for each of PowerShares FTSE RAFI Basic Materials Sector Portfolio, PowerShares FTSE RAFI Consumer Goods Sector Portfolio, PowerShares FTSE RAFI Consumer Services Sector Portfolio, PowerShares FTSE RAFI Energy Sector Portfolio, PowerShares FTSE RAFI Financials Sector Portfolio, PowerShares FTSE RAFI Health Care Sector Portfolio, PowerShares FTSE RAFI Industrials Sector Portfolio, PowerShares FTSE RAFI Telecommunications & Technology Sector Portfolio, PowerShares FTSE RAFI Utilities Sector Portfolio, PowerShares FTSE RAFI US 1000 Portfolio and PowerShares FTSE RAFI US 1500 Small-Mid Portfolio (the Trustees noted that the advisory fee for each of these Funds was reduced to 0.29% effective November 1, 2008).
The Trustees also noted that the Adviser has agreed to waive a portion of its advisory fee and/or pay expenses (an "Expense Cap") to the extent necessary to prevent the annual operating expenses of each Fund from exceeding the percentage of that Fund's average daily net assets, at least until August 31, 2010, as set forth below:
• 0.60%, excluding interest expenses, brokerage commissions and other trading expenses, taxes and extraordinary expenses, for each of PowerShares Dynamic OTC Portfolio and PowerShares Dynamic Market Portfolio;
• 0.50%, excluding interest expenses, licensing fees, offering costs, brokerage commissions and other trading expenses, taxes and extraordinary expenses, for each of PowerShares High Yield Equity Dividend AchieversTM Portfolio, PowerShares Dividend AchieversTM Portfolio, PowerShares High Growth Rate Dividend AchieversTM Portfolio and PowerShares International Dividend AchieversTM Portfolio;
• 0.39%, excluding interest expenses, offering costs, brokerage commissions and other trading expenses, taxes and extraordinary expenses, for each of PowerShares FTSE RAFI Basic Materials
101
Board Considerations Regarding Continuation of Investment
Advisory Agreement (Continued)
Sector Portfolio, PowerShares FTSE RAFI Consumer Goods Sector Portfolio, PowerShares FTSE RAFI Consumer Services Sector Portfolio, PowerShares FTSE RAFI Energy Sector Portfolio, PowerShares FTSE RAFI Financials Sector Portfolio, PowerShares FTSE RAFI Health Care Sector Portfolio, PowerShares FTSE RAFI Industrials Sector Portfolio, PowerShares FTSE RAFI Telecommunications & Technology Sector Portfolio, PowerShares FTSE RAFI Utilities Sector Portfolio, PowerShares FTSE RAFI US 1000 Portfolio and PowerShares FTSE RAFI US 1500 Small-Mid Portfolio (the Trustees noted that, effective November 1, 2008, the Expense Cap for each of these Funds changed from 0.60% to 0.39%); and
• 0.60%, excluding interest expenses, licensing fees, offering costs, brokerage commissions and other trading expenses, taxes and extraordinary expenses, for each other Fund.
The Trustees noted that the Adviser represented that it does not manage any funds other than the Funds and other ETFs overseen by the Board. The Trustees noted that each Fund's advisory fee was:
• higher than the median advisory fee of its ETF peer funds (except for the advisory fee of each of PowerShares Financial Preferred Portfolio, PowerShares Golden Dragon Halter USX China Portfolio and PowerShares International Dividend AchieversTM Portfolio, which was lower than the median advisory fee of its ETF peer funds); and
• higher than the median advisory fee of its open-end index peer funds (except for the advisory fee of each of PowerShares DWA Technical Leaders Portfolio, PowerShares Dynamic Aggressive Growth Portfolio, PowerShares Dynamic Mid Cap Growth Portfolio, PowerShares Dynamic Mid Cap Value Portfolio, PowerShares Dynamic OTC Portfolio, PowerShares Dynamic Telecommunications & Wireless Portfolio, PowerShares Dynamic Utilities Portfolio, PowerShares Financial Preferred Portfolio, PowerShares FTSE RAFI Utilities Sector Portfolio and PowerShares Value Line Timeliness Select Portfolio, which was lower than the median advisory fee of its open-end index peer funds, and there was no comparable data for PowerShares Dynamic Basic Materials Sector Portfolio, PowerShares FTSE RAFI Basic Materials Sector Portfolio or PowerShares Golden Dragon Halter USX China Portfolio); but
• lower than the median advisory fee of its open-end actively-managed peer funds.
The Trustees determined that the advisory fees were reasonable, noting the complexity of the indices, which generally require more frequent rebalancing of the portfolios, the distinguishing factors of the Funds, and the higher administrative, operational and management oversight costs for the Adviser. With respect to the Funds' expense ratios, the Trustees noted that the net expense ratio for each Fund was:
• higher than the median expense ratio of its ETF peer funds (except for the net expense ratio of each of PowerShares Dynamic OTC Portfolio, PowerShares Financial Preferred Portfolio and PowerShares International Dividend AchieversTM Portfolio, which was less than the median expense ratio of its ETF peer funds, and the net expense ratio of each of PowerShares Dynamic Aggressive Growth Portfolio and PowerShares Dynamic Market Portfolio, which was equal to the median expense ratio of its ETF peer funds); and
• higher than the median expense ratio of its open-end index peer funds (except for the net expense ratio of each of PowerShares DWA Technical Leaders Portfolio, PowerShares Dynamic Aggressive
102
Board Considerations Regarding Continuation of Investment
Advisory Agreement (Continued)
Growth Portfolio, PowerShares Dynamic Banking Portfolio, PowerShares Dynamic Biotechnology & Genome Portfolio, PowerShares Dynamic Financials Sector Portfolio, PowerShares Dynamic Healthcare Sector Portfolio, PowerShares Dynamic Healthcare Services Portfolio, PowerShares Dynamic Insurance Portfolio, PowerShares Dynamic OTC Portfolio, PowerShares Dynamic Pharmaceuticals Portfolio, PowerShares Dynamic Telecommunications & Wireless Portfolio, PowerShares Dynamic Utilities Portfolio, PowerShares Financial Preferred Portfolio, PowerShares FTSE RAFI Financials Sector Portfolio, PowerShares FTSE RAFI Utilities Sector Portfolio, PowerShares Listed Private Equity Portfolio and PowerShares Value Line Timeliness Select Portfolio, which was lower than the median expense ratio of its open-end index peer funds, and there was no comparable data for PowerShares Dynamic Basic Materials Sector Portfolio, PowerShares FTSE RAFI Basic Materi als Sector Portfolio or PowerShares Golden Dragon Halter USX China Portfolio); but
• lower than the median expense ratio of its open-end actively-managed peer funds.
The Trustees noted that a significant component of the non-advisory fee expenses was the license fees paid by the Funds.
The Board concluded that the advisory fee and expense ratio of each Fund (giving effect to the Fund's Expense Cap) were reasonable and appropriate in light of the services provided.
In conjunction with their review of fees, the Trustees also considered information provided by the Adviser on the revenues received by the Adviser under the Investment Advisory Agreement for each Fund, as well as the fees waived and expenses reimbursed by the Adviser for the Funds. The Trustees reviewed information provided by the Adviser on its profitability as well as any profits or losses realized by the Adviser from its relationship to each Fund. The Trustees concluded that the profitability to the Adviser of the advisory services provided to any of the Funds was not unreasonable.
Economies of Scale and Whether Fee Levels Reflect These Economies of Scale. The Trustees reviewed the information provided by the Adviser as to the extent to which economies of scale are realized as each Fund grows and whether fee levels reflect economies of scale for the benefit of shareholders. The Trustees reviewed each Fund's asset size, expense ratio and expense limitation agreed to by the Adviser. The Trustees noted that, for Funds whose expenses are higher than their respective Expense Caps, any reduction in that Fund's expenses would be enjoyed by the Adviser, but that Fund shareholders benefit from the lower expense ratio as a result of the Fund's Expense Cap. The Trustees also noted that the Excess Expense Agreement with the Trust provides that the Adviser is entitled to be reimbursed by each Fund, other than PowerShares Dynamic Market Portf olio and PowerShares Dynamic OTC Portfolio, for fees waived or expenses absorbed pursuant to the Expense Cap for a period of three years from the date the fee or expense was incurred, provided that no reimbursement would be made that would result in a Fund exceeding its Expense Cap. The Trustees considered whether the advisory fee rate for each Fund was reasonable in relation to the asset size of that Fund, and concluded that the flat advisory fee was reasonable and appropriate, noting the Fund expenses the Adviser has borne as a result of the Expense Cap.
The Trustees noted that the Adviser had not identified any further benefits that it derived from its relationship with the Funds and had noted that it does not have any soft-dollar arrangements.
Based on all of the information considered and the conclusions reached, the Board, including the Independent Trustees, determined to approve the continuation of the Investment Advisory Agreement for each Fund. No single factor was determinative in the Board's analysis.
103
Board Considerations Regarding Continuation of Investment
Advisory Agreement (Continued)
At a meeting held on April 16, 2009, the Board of Trustees of the PowerShares Exchange-Traded Fund Trust (the "Trust"), including the Independent Trustees, unanimously approved the continuation of the Investment Advisory Agreement between Invesco PowerShares Capital Management LLC (the "Adviser") and the Trust for the following five series (each, a "Fund" and collectively, the "Funds"):
PowerShares FTSE NASDAQ Small Cap Portfolio
PowerShares NASDAQ Internet Portfolio
PowerShares NASDAQ-100 BuyWrite Portfolio
PowerShares NXQ Portfolio
PowerShares S&P 500 BuyWrite Portfolio
The Trustees reviewed information from the Adviser describing: (i) the nature, extent and quality of services provided, (ii) the investment performance of the Funds and the Adviser, (iii) the costs of services provided and estimated profits realized by the Adviser, (iv) the extent to which economies of scale are realized as the Funds grow, (v) whether fee levels reflect any possible economies of scale for the benefit of Fund shareholders, (vi) comparisons of services rendered and amounts paid to other registered investment companies and (vii) any benefits realized by the Adviser from its relationship with each Fund. Based on all of the information considered and the conclusions reached, the Board, including the Independent Trustees, determined to approve the continuation of the Investment Advisory Agreement for each Fund. No single factor was determinative in the Board's analysis.
Nature, Extent and Quality of Services. In evaluating the nature, extent and quality of the Adviser's services, the Trustees reviewed information concerning the functions performed by the Adviser for the Funds, information describing the Adviser's current organization and projected staffing, including operations assistance provided by the Adviser's parent organization, Invesco Ltd., and the background and experience of the persons responsible for the day-to-day management of the Funds. The Trustees reviewed matters related to the Adviser's execution of portfolio transactions on behalf of the Funds. The Trustees also reviewed information on the performance of the Funds and the performance of their underlying indices through December 31, 2008. The Trustees also reviewed reports on the correlation and tracking error between the underlying index and each Fund's performance, and the Adviser's analysis of the tracking error between each Fund and its underlying index. The Trustees noted that, in each case, the correlation and tracking error for each Fund was within the targeted range set forth in the Trust's registration statement. The Trustees concluded that each Fund was correlated to its underlying index and that the tracking error for each Fund was within an acceptable range given that Fund's particular circumstances.
The Trustees also considered the services provided by the Adviser in its oversight of the Funds' administrator, custodian and transfer agent. They noted the significant amount of time and effort that had been devoted to this oversight function.
Based on their review, the Trustees concluded that the nature, extent and quality of services provided by the Adviser to the Funds under the Investment Advisory Agreement were appropriate and reasonable.
Fees, Expenses and Profitability. The Trustees reviewed and discussed the information provided by the Adviser on each Fund's total expense ratio and unitary advisory fee, as compared to information compiled by the Adviser from Lipper Inc. databases on the expense ratios of comparable exchange-traded funds ("ETFs"), open-end (non-ETF) index funds and open-end actively-managed funds. The Trustees noted that
104
Board Considerations Regarding Continuation of Investment
Advisory Agreement (Continued)
the annual unitary advisory fee is 0.70% for each of PowerShares FTSE NASDAQ Small Cap Portfolio and PowerShares NXQ Portfolio, 0.60% for PowerShares NASDAQ Internet Portfolio and 0.75% for each of PowerShares NASDAQ-100 BuyWrite Portfolio and PowerShares S&P 500 BuyWrite Portfolio, and that the Adviser pays all other expenses of each Fund, except that each Fund pays its brokerage expenses, taxes, interest and extraordinary expenses.
The Trustees noted that the Adviser represented that it does not manage any funds other than the Funds and other ETFs overseen by the Board. The Trustees noted that: the advisory fee for PowerShares FTSE NASDAQ Small Cap Portfolio was higher than the median expense ratios of its ETF peer funds and open-end index peer funds, but lower than the median expense ratio of its open-end actively-managed peer funds; the advisory fee for PowerShares NASDAQ Internet Portfolio was equal to or lower than the median expense ratio for each peer group; no comparable ETF peer fund information was available for PowerShares NASDAQ-100 BuyWrite Portfolio or PowerShares S&P 500 BuyWrite Portfolio, but the advisory fee for each of these Funds was lower than the median expense ratios of their open-end index peer funds and open-end actively-managed peer funds; and the advisory fee for PowerShares NXQ Portfolio was higher than the median expense rat io of its ETF peer funds, but lower than the median expense ratios of its open-end index peer funds and open-end actively-managed peer funds. The Trustees noted that each Fund's advisory fee was reasonable because of the complexity of the indices, which generally require more frequent rebalancing of the portfolios, the distinguishing factors of the Funds and the higher administrative, operational and management oversight costs for the Adviser. The Trustees also noted that a portion of each Fund's advisory fee was attributable to a license fee payable out of the unitary fee charged to that Fund. The Board concluded that the unitary advisory fee charged to each Fund was reasonable and appropriate in light of the services provided.
In conjunction with their review of the unitary advisory fee, the Trustees also considered information provided by the Adviser on the revenues received by the Adviser under the Investment Advisory Agreement. The Trustees reviewed information provided by the Adviser on its profitability as well as any profits or losses realized by the Adviser from its relationship to each Fund. The Trustees reviewed the overall profitability of the Adviser and noted that the Adviser, to date, had incurred a loss from its relationship with the Funds.
Economies of Scale and Whether Fee Levels Reflect These Economies of Scale. The Trustees reviewed the information provided by the Adviser as to the extent to which economies of scale are realized as each Fund grows and whether fee levels reflect economies of scale for the benefit of shareholders. The Trustees reviewed each Fund's asset size and expense ratio. The Trustees noted that any reduction in fixed costs associated with the management of the Funds would be enjoyed by the Adviser, but a unitary fee provides certainty in expenses for the Funds. The Trustees considered whether the advisory fee rate for each Fund was reasonable in relation to the asset size of that Fund, and concluded that the flat advisory fee was reasonable and appropriate.
The Trustees noted that the Adviser had not identified any further benefits that it derived from its relationship with the Funds and had noted that it does not have any soft-dollar arrangements.
Based on all of the information considered and the conclusions reached, the Board, including the Independent Trustees, determined to approve the continuation of the Investment Advisory Agreement for each Fund. No single factor was determinative in the Board's analysis.
105
This page intentionally left blank
This page intentionally left blank
This page intentionally left blank
PROXY VOTING POLICIES AND PROCEDURES
A description of the Funds' proxy voting policies and procedures that the Funds use to determine how to vote proxies relating to portfolio securities is available, without charge and upon request, by calling (800) 337-4246. This information is also available on the Securities and Exchange Commission's ("Commission") website at www.sec.gov.
Information regarding how the Funds voted proxies for portfolio securities, if applicable, during the most recent 12-month period ended June 30, is also available, without charge and upon request, by (i) calling (800) 337-4246; or (ii) accessing the Funds' Form N-PX on the Commission's website at www.sec.gov.
QUARTERLY PORTFOLIOS
The Funds file their complete schedules of portfolio holdings with the Commission for the first and third quarters of each fiscal year on Form N-Q. The Funds' Forms N-Q are available on the Commission's website at www.sec.gov. The Funds' Forms N-Q may also be reviewed and copied at the Commission's Public Reference Room in Washington, D.C.; information on the operation of the Public Reference Room may be obtained by calling (800) SEC-0330.
There are risks involved in investing in exchange-traded funds ("ETFs"), including possible loss of money. Investing in securities of small and medium sized companies involves greater risk than is customarily associated with investing in more established companies, and investments in concentrated industry sectors involve greater risks than investments that are more diversified. Index-based ETFs are not actively managed. Actively-managed ETFs do not necessarily seek to replicate the performance of a specific index. Both index-based and actively-managed ETFs are subject to risks similar to stocks, including those related to short selling and margin maintenance. PowerShares ETFs are not FDIC insured, may lose value and have no bank guarantee. PowerShares is a registered trademark of Invesco PowerShares Capital Management LLC. Past performance is not a guarantee of future results.
Invesco Aim Distributors, Inc. is the distributor of the PowerShares Exchange-Traded Fund Trust.
An investor should consider each PowerShares ETF's investment objective, risks, charges and expenses carefully before investing. For more complete information about PowerShares ETFs call Invesco Aim Distributors, Inc. at (800) 337-4246 or visit our website invescopowershares.com for a prospectus. Please read the prospectus carefully before investing.


301 West Roosevelt Road
Wheaton, IL 60187
800.983.0903
www.invescopowershares.com
© 2009 Invesco PowerShares Capital Management LLC P-PS-AR-4


2009 Annual Report to Shareholders
April 30, 2009
PowerShares Dynamic Banking Portfolio
PowerShares Dynamic Biotechnology & Genome Portfolio
PowerShares Dynamic Building & Construction Portfolio
PowerShares Dynamic Energy Exploration & Production Portfolio
PowerShares Dynamic Food & Beverage Portfolio
PowerShares Dynamic Hardware & Consumer Electronics Portfolio
PowerShares Dynamic Healthcare Services Portfolio
PowerShares Dynamic Insurance Portfolio
PowerShares Dynamic Leisure and Entertainment Portfolio
PowerShares Dynamic Media Portfolio
PowerShares Dynamic Networking Portfolio
PowerShares Dynamic Oil & Gas Services Portfolio
PowerShares Dynamic Pharmaceuticals Portfolio
PowerShares Dynamic Retail Portfolio
PowerShares Dynamic Semiconductors Portfolio
PowerShares Dynamic Software Portfolio

Table of Contents
| The Market Environment | 2 | ||||||
| Manager's Analysis | 4 | ||||||
| Frequency Distribution of Discounts & Premiums | 36 | ||||||
| Fees and Expenses | 38 | ||||||
| Industry Portfolios | |||||||
| Schedules of Investments | |||||||
| PowerShares Dynamic Banking Portfolio | 40 | ||||||
| PowerShares Dynamic Biotechnology & Genome Portfolio | 41 | ||||||
| PowerShares Dynamic Building & Construction Portfolio | 42 | ||||||
| PowerShares Dynamic Energy Exploration & Production Portfolio | 43 | ||||||
| PowerShares Dynamic Food & Beverage Portfolio | 44 | ||||||
| PowerShares Dynamic Hardware & Consumer Electronics Portfolio | 45 | ||||||
| PowerShares Dynamic Healthcare Services Portfolio | 46 | ||||||
| PowerShares Dynamic Insurance Portfolio | 47 | ||||||
| PowerShares Dynamic Leisure and Entertainment Portfolio | 48 | ||||||
| PowerShares Dynamic Media Portfolio | 49 | ||||||
| PowerShares Dynamic Networking Portfolio | 50 | ||||||
| PowerShares Dynamic Oil & Gas Services Portfolio | 51 | ||||||
| PowerShares Dynamic Pharmaceuticals Portfolio | 52 | ||||||
| PowerShares Dynamic Retail Portfolio | 53 | ||||||
| PowerShares Dynamic Semiconductors Portfolio | 54 | ||||||
| PowerShares Dynamic Software Portfolio | 55 | ||||||
| Statements of Assets and Liabilities | 56 | ||||||
| Statements of Operations | 58 | ||||||
| Statements of Changes in Net Assets | 60 | ||||||
| Financial Highlights | 66 | ||||||
| Notes to Financial Statements | 74 | ||||||
| Report of Independent Registered Public Accounting Firm | 88 | ||||||
| Supplemental Information | 89 | ||||||
| Board Considerations Regarding Continuation of Investment Advisory Agreement | 94 | ||||||
The Market Environment
For the year ended April 30, 2009, stock market losses were larger than most market participants have ever seen in their professional careers. The S&P 500® Index was down 35.29%, the NASDAQ-100® Index declined 26.83% and the Dow Jones Industrial Index dropped 34.12%. Corporate debt markets also declined as the credit crunch continued to limit access to capital. Municipal securities held up a little better but still struggled. The Merrill U.S. Corporate Master Index returned -5.78% while the Merrill Muni Master Index returned 2.26% for the period. Meanwhile, treasury securities rallied as investors fled to quality. Huge companies required capital infusions and/or other forms of financial support through government intervention and the credit crisis evolved into an overall crisis of consumer, investor and business confidence.
The markets fell nearly universally from August through October. As more job losses and layoffs were announced, banks continued to restrict borrowing and consumers, who drive two-thirds of the U.S. economy historically, were unable to sustain their spending. The government spent hundreds of billions of dollars to bail out firms and stimulate the economy while the Federal Open Market Committee moved from a discount rate of 2.50% to 0.50% during the period. Not until March did confidence begin to return to the equity markets with the S&P 500® Index, NASDAQ-100® Index and the Dow Jones Industrial Index moving off the lows and returning 29.99%, 29.97% and 21.24% respectively from March 1 through April 30, 2009. Corporate and municipal debt also showed some appreciation over the period, however the amount of appreciation was less as credit spreads tightened. The Merrill Muni Master Index was up 2.33% while the Merrill U.S. Corporate Master Index rose by 2.55% from March 1 through April 30, 2009.
2
This page intentionally left blank
Manager's Analysis
PowerShares Dynamic Banking Portfolio (ticker: PJB)
The PowerShares Dynamic Banking Portfolio (the "Fund"), based on the Dynamic Banking Intellidex Index ("Index"), seeks investment results that correspond generally to the price and yield (before the Fund's fees and expenses) of that equity index. The Index thoroughly evaluates companies based on a variety of investment merit criteria, including fundamental growth, stock valuation, investment timeliness and risk factors. Securities shown to possess the greatest capital appreciation potential are selected by the Index.
The Fund returned -34.34% compared to the Dow Jones Regional Banks Index which returned -48.37%. The portfolio was heavily weighed in the commercial banks industry. Within commercial banks, avoiding companies like Regions Financial, Fifth Third Bancorp and National City boosted the Fund's performance. PNC Financial Services, BB&T and First Horizon National contributed negatively to the Fund's return. PNC Financial Services and BB&T are no longer held at the end of the fiscal year.
Industry Breakdown (% of the Fund's
Net Assets) as of April 30, 2009
| Commercial Banks-Central U.S. | 30.1 | ||||||
| Commercial Banks-Southern U.S. | 28.5 | ||||||
| S&L/Thrifts-Eastern U.S. | 11.9 | ||||||
| Commercial Banks-Eastern U.S. | 10.1 | ||||||
| S&L/Thrifts-Central U.S. | 9.2 | ||||||
| Commercial Banks-Western U.S. | 5.7 | ||||||
| Fiduciary Banks | 4.4 | ||||||
| Money Market Fund | 0.1 | ||||||
| Other | (0.0 | ) | |||||
Style Allocation (% of the Fund's
Total Investments) as of April 30, 2009
| Small-Cap Value | 42.7 | ||||||
| Mid-Cap Growth | 24.5 | ||||||
| Mid-Cap Value | 14.8 | ||||||
| Small-Cap Growth | 13.6 | ||||||
| Large-Cap Growth | 4.4 | ||||||
Top Ten Fund Holdings (% of the Fund's
Net Assets) as of April 30, 2009
| Security | |||||||
| First Horizon National Corp. | 5.8 | ||||||
| Hudson City Bancorp, Inc. | 5.4 | ||||||
| Cullen/Frost Bankers, Inc. | 4.9 | ||||||
| Capitol Federal Financial | 4.7 | ||||||
| TFS Financial Corp. | 4.5 | ||||||
| Northern Trust Corp. | 4.4 | ||||||
| Commerce Bancshares, Inc. | 4.3 | ||||||
| People's United Financial | 4.0 | ||||||
| International Bancshares Corp. | 3.3 | ||||||
| Hancock Holding Co. | 3.3 | ||||||
| Total | 44.6 | ||||||
4
Manager's Analysis (Continued)
PowerShares Dynamic Banking Portfolio (ticker: PJB)
Growth of a $10,000 Investment Since Inception†
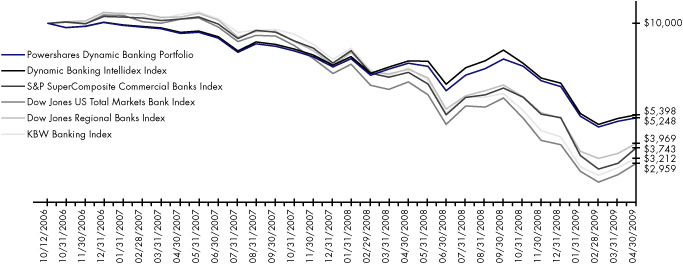
| Fund Performance History (%) | As of April 30, 2009 | ||||||||||||||
| Avg Ann†† | Fund Inception† | ||||||||||||||
| 1 Year | Avg Ann†† | Cumulative | |||||||||||||
| Index | |||||||||||||||
| Dynamic Banking IntellidexSM Index | -33.41 | -21.49 | -46.02 | ||||||||||||
| S&P SuperComposite Commercial Banks Index | -50.32 | -31.64 | -62.57 | ||||||||||||
| Dow Jones US Total Markets Bank Index | -58.06 | -37.58 | -70.41 | ||||||||||||
| Dow Jones Regional Banks Index | -48.37 | -30.93 | -60.31 | ||||||||||||
| KBW Banking Index | -58.60 | -36.54 | -67.88 | ||||||||||||
| Fund | |||||||||||||||
| NAV Return | -34.34 | -22.36 | -47.52 | ||||||||||||
| Share Price Return | -34.49 | -22.43 | -47.64 | ||||||||||||
Fund Inception: October 12, 2006
Performance quoted represents past performance. Past performance is not a guarantee of future results and current performance may be higher or lower than performance quoted. Investment returns and principal value will fluctuate and shares, when redeemed, may be worth more or less than their original cost. The Adviser has waived fees and reimbursed other expenses, absent which, performance would have been lower. The Adviser has contractually agreed to waive fees and/or pay certain Fund expenses through August 31, 2010. According to the Fund's current prospectus, the total gross annual operating expense ratio was indicated as 0.78%. In the Financial Highlights section of this Shareholder Report, the Fund's net (subsidized) total operating expense ratio was determined to be 0.65% while the Fund's gross total operating expense ratio was 0.72%. NAV and Share Price returns assume that dividends and capital gain distributions have been reinvested in the Fund at NAV and Share Price, respectively. The returns shown in the table above do not reflect the deduction of taxes that a shareholder would pay on Fund distributions or the redemption or sale of Fund Shares. See invescopowershares.com to find the most recent month-end performance numbers.
Index performance results are based upon a hypothetical investment in its constituent securities. Index returns do not represent Fund returns. An investor cannot invest directly in an index. The Index does not charge management fees or brokerage expenses, and no such fees or expenses were deducted from the hypothetical performance shown. In addition, the results actual investors might have achieved would have differed from those shown because of differences in the timing, amounts of their investments, and fees and expenses associated with an investment in the Fund.
The S&P SuperComposite Commercial Banks Index, Dow Jones US Total Markets Bank Index, Dow Jones Regional Banks Index and KBW Banking Index (the "Benchmark Indices") are unmanaged indices used as a measurement of change in stock market conditions based on the average performance of approximately 77, 50, 50 and 24 common stocks, respectively. The S&P SuperComposite Commercial Banks Index and the Dow Jones US Total Markets Bank Index will be used for comparative purposes going forward as these represent the most appropriate market indices for this Fund.
† Fund and underlying Index returns are based on the inception date of the Fund. Returns for the Benchmark Indices are based on the closest month-end to the Fund's inception date.
†† Average annualized.
5
Manager's Analysis
PowerShares Dynamic Biotechnology & Genome Portfolio (ticker: PBE)
The PowerShares Dynamic Biotechnology & Genome Portfolio (the "Fund"), based on the Dynamic Biotechnology & Genome Intellidex Index ("Index"), seeks investment results that correspond generally to the price and yield (before the Fund's fees and expenses) of that equity index. The Index thoroughly evaluates companies based on a variety of investment criteria, including fundamental growth, stock valuation, investment timeliness and risk factors. Securities shown to possess the greatest capital appreciation potential are selected by the Index.
The Fund returned -27.41% which underperformed the performance of the S&P SuperComposite Biotech Index which returned -10.08% during the same period. Stock selection specific to biotechnology and allocation to life sciences tools & services sub-industries were the leading contributors to the Fund's underperformance. Within biotechnology, Amgen, Incyte and Human Genome Sciences had the greatest negative effect on performance. Incyte and Human Genome Sciences are no longer held at the end of the fiscal year.
Industry Breakdown (% of the Fund's
Net Assets) as of April 30, 2009
| Biotechnology | 51.3 | ||||||
| Pharmaceuticals | 21.6 | ||||||
| Electronics | 12.9 | ||||||
| Healthcare-Products | 8.5 | ||||||
| Chemicals | 5.7 | ||||||
| Other | (0.0 | ) | |||||
Style Allocation (% of the Fund's
Total Investments) as of April 30, 2009
| Small-Cap Growth | 51.9 | ||||||
| Mid-Cap Growth | 30.3 | ||||||
| Large-Cap Growth | 14.1 | ||||||
| Small-Cap Value | 3.7 | ||||||
Top Ten Fund Holdings (% of the Fund's
Net Assets) as of April 30, 2009
| Security | |||||||
| Synta Pharmaceuticals Corp. | 6.0 | ||||||
| Waters Corp. | 5.8 | ||||||
| Sigma-Aldrich Corp. | 5.7 | ||||||
| Techne Corp. | 5.4 | ||||||
| Millipore Corp. | 5.0 | ||||||
| Biogen Idec, Inc. | 4.8 | ||||||
| Gilead Sciences, Inc. | 4.7 | ||||||
| Amgen, Inc. | 4.6 | ||||||
| Immunogen, Inc. | 4.3 | ||||||
| Abraxis Bioscience, Inc. | 3.8 | ||||||
| Total | 50.1 | ||||||
6
Manager's Analysis (Continued)
PowerShares Dynamic Biotechnology & Genome Portfolio (ticker: PBE)
Growth of a $10,000 Investment Since Inception†
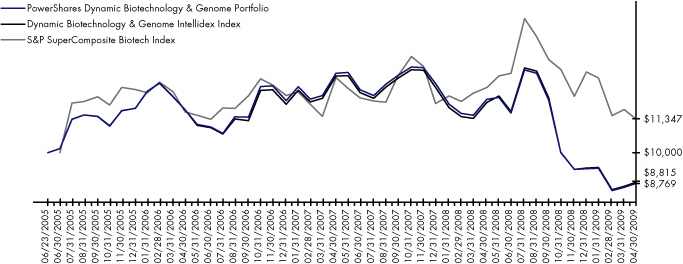
| Fund Performance History (%) | As of April 30, 2009 | ||||||||||||||||||
| Avg Ann†† | Fund Inception† | ||||||||||||||||||
| 1 Year | 3 Year | Avg Ann†† | Cumulative | ||||||||||||||||
| Index | |||||||||||||||||||
| Dynamic Biotechnology & Genome IntellidexSM Index | -26.65 | -9.07 | -3.22 | -11.85 | |||||||||||||||
| S&P SuperComposite Biotech Index | -10.08 | -0.84 | 3.35 | 13.47 | |||||||||||||||
| Fund | |||||||||||||||||||
| NAV Return | -27.41 | -9.21 | -3.35 | -12.30 | |||||||||||||||
| Share Price Return | -27.62 | -9.32 | -3.43 | -12.57 | |||||||||||||||
Fund Inception: June 23, 2005
Performance quoted represents past performance. Past performance is not a guarantee of future results and current performance may be higher or lower than performance quoted. Investment returns and principal value will fluctuate and shares, when redeemed, may be worth more or less than their original cost. The Adviser has waived fees and reimbursed other expenses during previous fiscal periods, absent which, performance during those fiscal periods would have been lower. While the Adviser has contractually agreed to waive and/or pay certain Fund expenses through August 31, 2010, the Fund is currently subject to recapture, which may result in an increased expense ratio. According to the Fund's current prospectus, the total gross annual operating expense ratio was indicated as 0.62%. In the Financial Highlights section of this Shareholder Report, the Fund's net total operating expense ratio was determined to be 0.63% while the Fund' s gross total operating expense ratio was 0.62%. NAV and Share Price returns assume that dividends and capital gain distributions have been reinvested in the Fund at NAV and Share Price, respectively. The returns shown in the table above do not reflect the deduction of taxes that a shareholder would pay on Fund distributions or the redemption or sale of Fund Shares. See invescopowershares.com to find the most recent month-end performance numbers.
Index performance results are based upon a hypothetical investment in its constituent securities. Index returns do not represent Fund returns. An investor cannot invest directly in an index. The Index does not charge management fees or brokerage expenses, and no such fees or expenses were deducted from the hypothetical performance shown. In addition, the results actual investors might have achieved would have differed from those shown because of differences in the timing, amounts of their investments, and fees and expenses associated with an investment in the Fund.
The S&P SuperComposite Biotech Index is an unmanaged index used as a measurement of change in stock market conditions based on the average performance of approximately 14 common stocks.
† Fund and underlying Index returns are based on the inception date of the Fund. Returns for the Benchmark Indices are based on the closest month-end to the Fund's inception date.
†† Average annualized.
7
Manager's Analysis
PowerShares Dynamic Building & Construction Portfolio (ticker: PKB)
The PowerShares Dynamic Building & Construction Portfolio (the "Fund"), based on the Dynamic Building & Construction Intellidex Index ("Index"), seeks investment results that correspond generally to the price and yield (before the Fund's fees and expenses) of that equity index. The Index thoroughly evaluates companies based on a variety of investment criteria, including fundamental growth, stock valuation, investment timeliness and risk factors. Securities shown to possess the greatest capital appreciation potential are selected by the Index.
The Fund returned -36.61% for the reporting period. The S&P SuperComposite Construction & Engineering Index had a return for the reporting period of -37.70%. The industries which contributed the most to the Fund's outperformance were commercial services & supplies, construction & engineering and specialty retail. Allocation to machinery and building products had a negative impact on the Fund's performance. Names like Terex Corp, Tecumseh Products and Caterpillar suffered significant losses and are no longer held at the end of the fiscal year.
Industry Breakdown (% of the Fund's
Net Assets) as of April 30, 2009
| Engineering & Construction | 36.8 | ||||||
| Building Materials | 15.3 | ||||||
| Home Builders | 10.5 | ||||||
| Retail | 9.9 | ||||||
| Metal Fabricate/Hardware | 6.0 | ||||||
| Office Furnishings | 5.3 | ||||||
| Distribution/Wholesale | 3.0 | ||||||
| Home Furnishings | 2.9 | ||||||
| Commercial Services | 2.8 | ||||||
| Telecommunications | 2.7 | ||||||
| Miscellaneous Manufacturing | 2.5 | ||||||
| Environmental Control | 2.3 | ||||||
| Money Market Fund | 0.1 | ||||||
| Other | (0.1 | ) | |||||
Style Allocation (% of the Fund's
Total Investments) as of April 30, 2009
| Small-Cap Value | 41.3 | ||||||
| Mid-Cap Growth | 22.6 | ||||||
| Small-Cap Growth | 20.5 | ||||||
| Large-Cap Growth | 9.9 | ||||||
| Mid-Cap Value | 5.7 | ||||||
Top Ten Fund Holdings (% of the Fund's
Net Assets) as of April 30, 2009
| Security | |||||||
| NVR, Inc. | 5.7 | ||||||
| URS Corp. | 5.4 | ||||||
| Interface, Inc., Class A | 5.3 | ||||||
| Lowe's Cos., Inc. | 5.1 | ||||||
| Home Depot, Inc. | 4.8 | ||||||
| Pulte Homes, Inc. | 4.7 | ||||||
| Fluor Corp. | 4.3 | ||||||
| Jacobs Engineering Group, Inc. | 4.2 | ||||||
| Aecom Technology Corp. | 4.0 | ||||||
| Dycom Industries, Inc. | 3.8 | ||||||
| Total | 47.3 | ||||||
8
Manager's Analysis (Continued)
PowerShares Dynamic Building & Construction Portfolio (ticker: PKB)
Growth of a $10,000 Investment Since Inception†

| Fund Performance History (%) | As of April 30, 2009 | ||||||||||||||||||
| Avg Ann†† | Fund Inception† | ||||||||||||||||||
| 1 Year | 3 Year | Avg Ann†† | Cumulative | ||||||||||||||||
| Index | |||||||||||||||||||
| Dynamic Building & Construction IntellidexSM Index | -36.15 | -14.71 | -8.14 | -25.78 | |||||||||||||||
| S&P SuperComposite Construction & Engineering Index | -37.70 | -1.91 | 7.07 | 27.01 | |||||||||||||||
| S&P SuperComposite Homebuilders Index | -26.32 | -30.48 | -27.79 | -68.00 | |||||||||||||||
| Russell 3000® Index | -34.95 | -10.94 | -6.79 | -21.81 | |||||||||||||||
| Fund | |||||||||||||||||||
| NAV Return | -36.61 | -15.51 | -9.02 | -28.23 | |||||||||||||||
| Share Price Return | -36.46 | -15.44 | -8.99 | -28.14 | |||||||||||||||
Fund Inception: October 26, 2005
Performance quoted represents past performance. Past performance is not a guarantee of future results and current performance may be higher or lower than performance quoted. Investment returns and principal value will fluctuate and shares, when redeemed, may be worth more or less than their original cost. The Adviser has waived fees and reimbursed other expenses, absent which, performance would have been lower. The Adviser has contractually agreed to waive fees and/or pay certain Fund expenses through August 31, 2010. According to the Fund's current prospectus, the total gross annual operating expense ratio was indicated as 1.18%. In the Financial Highlights section of this Shareholder Report, the Fund's net (subsidized) total operating expense ratio was determined to be 0.63% while the Fund's gross total operating expense ratio was 1.06%. NAV and Share Price returns assume that dividends and capital gain distributions have been reinvested in the Fund at NAV and Share Price, respectively. The returns shown in the table above do not reflect the deduction of taxes that a shareholder would pay on Fund distributions or the redemption or sale of Fund Shares. See invescopowershares.com to find the most recent month-end performance numbers.
Index performance results are based upon a hypothetical investment in its constituent securities. Index returns do not represent Fund returns. An investor cannot invest directly in an index. The Index does not charge management fees or brokerage expenses, and no such fees or expenses were deducted from the hypothetical performance shown. In addition, the results actual investors might have achieved would have differed from those shown because of differences in the timing, amounts of their investments, and fees and expenses associated with an investment in the Fund.
The S&P SuperComposite Construction & Engineering Index, S&P SuperComposite Homebuilders Index and Russell 3000® Index (the "Benchmark Indices") are unmanaged indices used as a measurement of change in stock market conditions based on the average performance of approximately 9, 13, and 2918 common stocks, respectively. The S&P SuperComposite Construction & Engineering Index and the S&P SuperComposite Homebuilders Index will be used for comparative purposes going forward as these represent the most appropriate market indices for this Fund.
† Fund and underlying Index returns are based on the inception date of the Fund. Returns for the Benchmark Indices are based on the closest month-end to the Fund's inception date.
†† Average annualized.
9
Manager's Analysis
PowerShares Dynamic Energy Exploration & Production Portfolio (ticker: PXE)
The PowerShares Dynamic Energy Exploration & Production Portfolio (the "Fund"), based on the Dynamic Energy Exploration & Production Intellidex Index ("Index"), seeks investment results that correspond generally to the price and yield (before the Fund's fees and expenses) of that equity index. The Index thoroughly evaluates companies based on a variety of investment criteria, including fundamental growth, stock valuation, investment timeliness and risk factors. Securities shown to possess the greatest capital appreciation potential are selected by the Index and incorporated by the portfolio manager.
The Fund returned -50.42% for the year versus -48.42% for the S&P SuperComposite Oil & Gas Exploration & Production Index. Energy prices pulled back significantly from the 2008 highs as demand waned and the reality of the global recession made its impact felt. The Fund was hurt relative to the benchmark by underweighting Exxon Mobil Corp. and overweighting Swift Energy Co. The Fund was also negatively affected by its holdings of McMoRan Exploration Co., Callon Petroleum Co., and W&T Offshore Inc., which the benchmark did not hold. The Fund benefitted from strong performers such as Delek US Holdings Inc. and CVR Energy Inc., which were not in the benchmark and helped limit the relative underperformance. Swift Energy Co., McMoRan Exploration Co., Callon Petroleum Co. and W&T Offshore Inc. are no longer held at the end of the fiscal year.
Industry Breakdown (% of the Fund's
Net Assets) as of April 30, 2009
| Oil Companies-Exploration & Production | 67.0 | ||||||
| Oil Companies-Integrated | 20.0 | ||||||
| Oil Refining & Marketing | 7.5 | ||||||
| Gas-Distribution | 5.5 | ||||||
| Money Market Fund | 0.2 | ||||||
| Other | (0.2 | ) | |||||
Style Allocation (% of the Fund's
Total Investments) as of April 30, 2009
| Large-Cap Growth | 28.9 | ||||||
| Small-Cap Value | 26.4 | ||||||
| Small-Cap Growth | 13.2 | ||||||
| Mid-Cap Growth | 11.3 | ||||||
| Large-Cap Value | 10.3 | ||||||
| Mid-Cap Value | 9.9 | ||||||
Top Ten Fund Holdings (% of the Fund's
Net Assets) as of April 30, 2009
| Security | |||||||
| Marathon Oil Corp. | 5.3 | ||||||
| EOG Resources, Inc. | 5.3 | ||||||
| Southwestern Energy Co. | 5.2 | ||||||
| Anadarko Petroleum Corp. | 5.1 | ||||||
| Devon Energy Corp. | 5.0 | ||||||
| Chevron Corp. | 4.6 | ||||||
| Occidental Petroleum Corp. | 4.5 | ||||||
| Exxon Mobil Corp. | 4.1 | ||||||
| CVR Energy, Inc. | 3.6 | ||||||
| Delek US Holdings, Inc. | 3.5 | ||||||
| Total | 46.2 | ||||||
10
Manager's Analysis (Continued)
PowerShares Dynamic Energy Exploration & Production Portfolio (ticker: PXE)
Growth of a $10,000 Investment Since Inception†
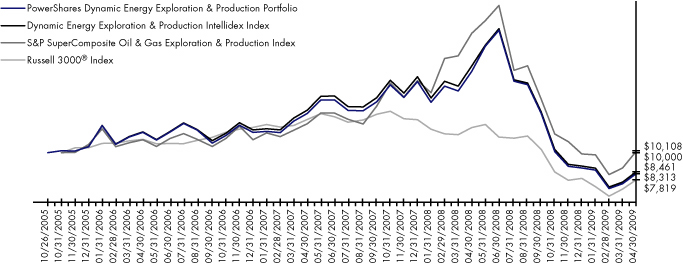
| Fund Performance History (%) | As of April 30, 2009 | ||||||||||||||||||
| Avg Ann†† | Fund Inception† | ||||||||||||||||||
| 1 Year | 3 Year | Avg Ann†† | Cumulative | ||||||||||||||||
| Index | |||||||||||||||||||
| Dynamic Energy Exploration & Production IntellidexSM Index | -50.16 | -10.17 | -4.65 | -15.39 | |||||||||||||||
| S&P SuperComposite Oil & Gas Exploration & Production Index | -48.42 | -2.89 | 0.31 | 1.08 | |||||||||||||||
| Russell 3000® Index | -34.95 | -10.94 | -6.79 | -21.81 | |||||||||||||||
| Fund | |||||||||||||||||||
| NAV Return | -50.42 | -10.60 | -5.13 | -16.87 | |||||||||||||||
| Share Price Return | -50.44 | -10.69 | -5.20 | -17.10 | |||||||||||||||
Fund Inception: October 26, 2005
Performance quoted represents past performance. Past performance is not a guarantee of future results and current performance may be higher or lower than performance quoted. Investment returns and principal value will fluctuate and shares, when redeemed, may be worth more or less than their original cost. The Adviser has waived fees and reimbursed other expenses, absent which, performance would have been lower. The Adviser has contractually agreed to waive fees and/or pay certain Fund expenses through August 31, 2010. According to the Fund's current prospectus, the total gross annual operating expense ratio was indicated as 0.65%. In the Financial Highlights section of this Shareholder Report, the Fund's net (subsidized) total operating expense ratio was determined to be 0.63% while the Fund's gross total operating expense ratio was 0.69%. NAV and Share Price returns assume that dividends and capital gain distributions have been reinvested in the Fund at NAV and Share Price, respectively. The returns shown in the table above do not reflect the deduction of taxes that a shareholder would pay on Fund distributions or the redemption or sale of Fund Shares. See invescopowershares.com to find the most recent month-end performance numbers.
Index performance results are based upon a hypothetical investment in its constituent securities. Index returns do not represent Fund returns. An investor cannot invest directly in an index. The Index does not charge management fees or brokerage expenses, and no such fees or expenses were deducted from the hypothetical performance shown. In addition, the results actual investors might have achieved would have differed from those shown because of differences in the timing, amounts of their investments, and fees and expenses associated with an investment in the Fund.
The S&P SuperComposite Oil & Gas Exploration & Production Index and Russell 3000® Index (the "Benchmark Indices") are unmanaged indices used as a measurement of change in stock market conditions based on the average performance of approximately 24 and 2918 common stocks, respectively. The S&P SuperComposite Oil & Gas Exploration & Production Index will be used for comparative purposes going forward as this represents a more appropriate market index for this Fund.
† Fund and underlying Index returns are based on the inception date of the Fund. Returns for the Benchmark Indices are based on the closest month-end to the Fund's inception date.
†† Average annualized.
11
Manager's Analysis
PowerShares Dynamic Food & Beverage Portfolio (ticker: PBJ)
The PowerShares Dynamic Food & Beverage Portfolio (the "Fund"), based on the Dynamic Food & Beverage Intellidex Index ("Index"), seeks investment results that correspond generally to the price and yield (before the Fund's fees and expenses) of that equity index.
The Fund returned -22.99%, underperforming the S&P SuperComposite Food Beverage & Tobacco Index which returned -19.35% during the same period. Poor stock selection within brewers and agricultural products sub-industries had the greatest negative impact on the Fund's performance. An overallocation to the food distributors sub industry also affected the Fund negatively.
Industry Breakdown (% of the Fund's
Net Assets) as of April 30, 2009
| Food-Miscellaneous/Diversified | 26.6 | ||||||
| Retail-Restaurants | 19.2 | ||||||
| Beverages-Non-alcoholic | 14.2 | ||||||
| Food-Retail | 10.8 | ||||||
| Food-Wholesale/Distribution | 9.4 | ||||||
| Beverages-Wines/Spirits | 4.8 | ||||||
| Agricultural Operations | 4.1 | ||||||
| Alternative Waste Technology | 3.2 | ||||||
| Food-Confectionery | 2.6 | ||||||
| Food-Canned | 2.5 | ||||||
| Food-Dairy Products | 2.4 | ||||||
| Money Market Fund | 0.2 | ||||||
| Other | 0.0 | ||||||
Style Allocation (% of the Fund's
Total Investments) as of April 30, 2009
| Small-Cap Growth | 26.5 | ||||||
| Mid-Cap Value | 21.0 | ||||||
| Large-Cap Growth | 19.1 | ||||||
| Large-Cap Value | 13.3 | ||||||
| Mid-Cap Growth | 12.9 | ||||||
| Small-Cap Value | 7.2 | ||||||
Top Ten Fund Holdings (% of the Fund's
Net Assets) as of April 30, 2009
| Security | |||||||
| Yum! Brands, Inc. | 5.6 | ||||||
| Sysco Corp. | 4.8 | ||||||
| Kellogg Co. | 4.8 | ||||||
| Safeway, Inc. | 4.7 | ||||||
| McDonald's Corp. | 4.5 | ||||||
| General Mills, Inc. | 4.3 | ||||||
| Campbell Soup Co. | 4.3 | ||||||
| Archer-Daniels-Midland Co. | 4.1 | ||||||
| Pepsi Bottling Group (The), Inc. | 4.1 | ||||||
| Coca-Cola Enterprises, Inc. | 3.6 | ||||||
| Total | 44.8 | ||||||
12
Manager's Analysis (Continued)
PowerShares Dynamic Food & Beverage Portfolio (ticker: PBJ)
Growth of a $10,000 Investment Since Inception†
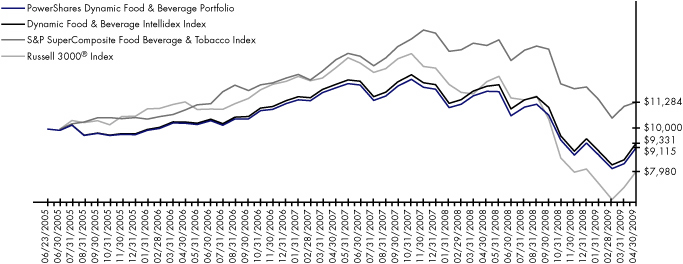
| Fund Performance History (%) | As of April 30, 2009 | ||||||||||||||||||
| Avg Ann†† | Fund Inception† | ||||||||||||||||||
| 1 Year | 3 Year | Avg Ann†† | Cumulative | ||||||||||||||||
| Index | |||||||||||||||||||
| Dynamic Food & Beverage IntellidexSM Index | -22.54 | -3.36 | -1.78 | -6.69 | |||||||||||||||
| S&P SuperComposite Food Beverage & Tobacco Index | -19.35 | 1.12 | 3.20 | 12.84 | |||||||||||||||
| Russell 3000® Index | -34.95 | -10.94 | -5.72 | -20.20 | |||||||||||||||
| Fund | |||||||||||||||||||
| NAV Return | -22.99 | -3.93 | -2.38 | -8.85 | |||||||||||||||
| Share Price Return | -22.89 | -3.90 | -2.36 | -8.78 | |||||||||||||||
Fund Inception: June 23, 2005
Performance quoted represents past performance. Past performance is not a guarantee of future results and current performance may be higher or lower than performance quoted. Investment returns and principal value will fluctuate and shares, when redeemed, may be worth more or less than their original cost. The Adviser has waived fees and reimbursed other expenses, absent which, performance would have been lower. The Adviser has contractually agreed to waive fees and/or pay certain Fund expenses through August 31, 2010. According to the Fund's current prospectus, the total gross annual operating expense ratio was indicated as 0.88%. In the Financial Highlights section of this Shareholder Report, the Fund's net (subsidized) total operating expense ratio was determined to be 0.63% while the Fund's gross total operating expense ratio was 0.71%. NAV and Share Price returns assume that dividends and capital gain distributions have been reinvested in the Fund at NAV and Share Price, respectively. The returns shown in the table above do not reflect the deduction of taxes that a shareholder would pay on Fund distributions or the redemption or sale of Fund Shares. See invescopowershares.com to find the most recent month-end performance numbers.
Index performance results are based upon a hypothetical investment in its constituent securities. Index returns do not represent Fund returns. An investor cannot invest directly in an index. The Index does not charge management fees or brokerage expenses, and no such fees or expenses were deducted from the hypothetical performance shown. In addition, the results actual investors might have achieved would have differed from those shown because of differences in the timing, amounts of their investments, and fees and expenses associated with an investment in the Fund.
The S&P SuperComposite Food Beverage & Tobacco Index and Russell 3000® Index (the "Benchmark Indices") are unmanaged indices used as a measurement of change in stock market conditions based on the average performance of approximately 42 and 2918 common stocks, respectively. The S&P SuperComposite Food Beverage & Tobacco Index will be used for comparative purposes going forward as this represents a more appropriate market index for this Fund.
† Fund and underlying Index returns are based on the inception date of the Fund. Returns for the Benchmark Indices are based on the closest month-end to the Fund's inception date.
†† Average annualized.
13
Manager's Analysis
PowerShares Dynamic Hardware & Consumer Electronics (ticker: PHW)
The PowerShares Dynamic Hardware & Consumer Electronics Portfolio (the "Fund"), based on the Dynamic Hardware & Consumer Electronics Intellidex Index ("Index"), seeks investment results that correspond generally to the price and yield (before the Fund's fees and expenses) of that equity index.
The Fund returned -37.71% while the S&P SuperComposite Technology Hardware & Equipment Index returned -24.52% during the period.
Overallocation to small- and mid-capitalization stocks and a smaller allocation to the large- and mega-capitalization sectors contributed to the Fund's underperformance relative to the broader market index. Stock selection in computers and peripherals, and communications equipment industry groups contributed to the Fund's underperformance. Overallocation relative to the benchmark to Xerox, Qualcomm and Kodak were the largest contributors to underperformance while Western Digital, Garmin and Multi-Fineline Electonix Inc. were the largest positive contributors to Fund performance. Qualcomm and Kodak are no longer held at the end of the fiscal year.
Industry Breakdown (% of the Fund's
Net Assets) as of April 30, 2009
| Computers | 39.3 | ||||||
| Electronics | 24.4 | ||||||
| Office/Business Equipment | 9.4 | ||||||
| Semiconductors | 7.4 | ||||||
| Telecommunications | 5.5 | ||||||
| Miscellaneous Manufacturing | 4.6 | ||||||
| Internet | 2.5 | ||||||
| Machinery-Diversified | 2.5 | ||||||
| Home Furnishings | 2.2 | ||||||
| Software | 2.2 | ||||||
| Money Market Fund | 1.1 | ||||||
| Other | (1.1 | ) | |||||
Style Allocation (% of the Fund's
Total Investments) as of April 30, 2009
| Small-Cap Growth | 38.8 | ||||||
| Large-Cap Growth | 19.4 | ||||||
| Small-Cap Value | 15.3 | ||||||
| Mid-Cap Value | 12.5 | ||||||
| Mid-Cap Growth | 8.7 | ||||||
| Large-Cap Value | 5.3 | ||||||
Top Ten Fund Holdings (% of the Fund's
Net Assets) as of April 30, 2009
| Security | |||||||
| Apple, Inc. | 5.4 | ||||||
| Dell, Inc. | 5.3 | ||||||
| Agilent Technologies, Inc. | 5.1 | ||||||
| Pitney Bowes, Inc. | 4.9 | ||||||
| Hewlett-Packard Co. | 4.8 | ||||||
| EMC Corp. | 4.6 | ||||||
| Tyco International Ltd. (Switzerland) | 4.6 | ||||||
| Xerox Corp. | 4.6 | ||||||
| Emulex Corp. | 4.2 | ||||||
| Western Digital Corp. | 3.6 | ||||||
| Total | 47.1 | ||||||
14
Manager's Analysis (Continued)
PowerShares Dynamic Hardware & Consumer Electronics Portfolio (ticker: PHW)
Growth of a $10,000 Investment Since Inception†
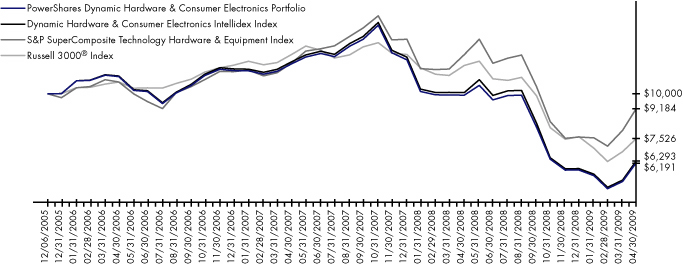
| Fund Performance History (%) | As of April 30, 2009 | ||||||||||||||||||
| Avg Ann†† | Fund Inception† | ||||||||||||||||||
| 1 Year | 3 Year | Avg Ann†† | Cumulative | ||||||||||||||||
| Index | |||||||||||||||||||
| Dynamic Hardware & Consumer Electronics IntellidexSM Index | -37.51 | -16.96 | -12.74 | -37.07 | |||||||||||||||
| S&P SuperComposite Technology Hardware & Equipment Index | -24.52 | -4.84 | -2.46 | -8.17 | |||||||||||||||
| Russell 3000® Index | -34.95 | -10.94 | -7.98 | -24.74 | |||||||||||||||
| Fund | |||||||||||||||||||
| NAV Return | -37.71 | -17.32 | -13.16 | -38.09 | |||||||||||||||
| Share Price Return | -37.71 | -17.35 | -13.18 | -38.13 | |||||||||||||||
Fund Inception: December 6, 2005
Performance quoted represents past performance. Past performance is not a guarantee of future results and current performance may be higher or lower than performance quoted. Investment returns and principal value will fluctuate and shares, when redeemed, may be worth more or less than their original cost. The Adviser has waived fees and reimbursed other expenses, absent which, performance would have been lower. The Adviser has contractually agreed to waive fees and/or pay certain Fund expenses through August 31, 2010. According to the Fund's current prospectus, the total gross annual operating expense ratio was indicated as 1.47%. In the Financial Highlights section of this Shareholder Report, the Fund's net (subsidized) total operating expense ratio was determined to be 0.62% while the Fund's gross total operating expense ratio was 3.23%. NAV and Share Price returns assume that dividends and capital gain distributions have been reinvested in the Fund at NAV and Share Price, respectively. The returns shown in the table above do not reflect the deduction of taxes that a shareholder would pay on Fund distributions or the redemption or sale of Fund Shares. See invescopowershares.com to find the most recent month-end performance numbers.
Index performance results are based upon a hypothetical investment in its constituent securities. Index returns do not represent Fund returns. An investor cannot invest directly in an index. The Index does not charge management fees or brokerage expenses, and no such fees or expenses were deducted from the hypothetical performance shown. In addition, the results actual investors might have achieved would have differed from those shown because of differences in the timing, amounts of their investments, and fees and expenses associated with an investment in the Fund.
The S&P SuperComposite Technology Hardware & Equipment Index and Russell 3000® Index (the "Benchmark Indices") are unmanaged indices used as a measurement of change in stock market conditions based on the average performance of approximately 107 and 2918 common stocks, respectively. The S&P SuperComposite Technology Hardware & Equipment Index will be used for comparative purposes going forward as this represents a more appropriate market index for this Fund.
† Fund and underlying Index returns are based on the inception date of the Fund. Returns for the Benchmark Indices are based on the closest month-end to the Fund's inception date.
†† Average annualized.
15
Manager's Analysis
PowerShares Dynamic Healthcare Services Portfolio (ticker: PTJ)
The PowerShares Dynamic Healthcare Services Portfolio (the "Fund"), based on the Dynamic Healthcare Services Intellidex Index ("Index"), seeks investment results that correspond generally to the price and yield (before the Fund's fees and expenses) of that equity index. The Index thoroughly evaluates companies based on a variety of investment criteria, including fundamental growth, stock valuation, investment timeliness and risk factors. Securities shown to possess the greatest capital appreciation potential are selected by the Index.
The Fund returned -33.92%. The Fund underperformed the Dow Jones Healthcare Providers Index which returned -29.26% over the same period. The stocks which contributed negatively to the Fund's performance were Gentiva Health Services, Health Management Associates, WellPoint Inc., United Health Group and Kindred Healthcare. An overweight position in Quest Diagnostics contributed positively to the Fund's performance as the security's return was 3.79% for the reporting period. Health Management Associates, Wellpoint Inc. and United Health Group are no longer held at the end of the fiscal year.
Industry Breakdown (% of the Fund's
Net Assets) as of April 30, 2009
| Medical-HMO | 23.4 | ||||||
| Medical-Wholesale Drug Distribution | 13.8 | ||||||
| Pharmacy Services | 13.2 | ||||||
| Medical-Outpatient/Home Medical Care | 8.4 | ||||||
| Medical Labs & Testing Services | 7.5 | ||||||
| Human Resources | 5.5 | ||||||
| Medical-Nursing Homes | 5.2 | ||||||
| Dialysis Centers | 4.5 | ||||||
| Medical-Hospitals | 3.1 | ||||||
| Physical Therapy/Rehabilitation Centers | 2.9 | ||||||
| Diversified Operations/ Commercial Services | 2.7 | ||||||
| Internet Application Software | 2.6 | ||||||
| Commercial Services | 2.5 | ||||||
| Hazardous Waste Disposal | 2.4 | ||||||
| MRI/Medical Diagnostic Imaging | 2.4 | ||||||
| Money Market Fund | 0.3 | ||||||
| Other | (0.4 | ) | |||||
Style Allocation (% of the Fund's
Total Investments) as of April 30, 2009
| Small-Cap Growth | 31.2 | ||||||
| Small-Cap Value | 24.1 | ||||||
| Large-Cap Growth | 15.9 | ||||||
| Mid-Cap Value | 10.4 | ||||||
| Mid-Cap Growth | 9.5 | ||||||
| Large-Cap Value | 8.9 | ||||||
Top Ten Fund Holdings (% of the Fund's
Net Assets) as of April 30, 2009
| Security | |||||||
| Express Scripts, Inc. | 5.8 | ||||||
| Humana, Inc. | 5.6 | ||||||
| Quest Diagnostics, Inc. | 5.1 | ||||||
| Medco Health Solutions, Inc. | 4.9 | ||||||
| AmerisourceBergen Corp. | 4.8 | ||||||
| Cardinal Health, Inc. | 4.8 | ||||||
| DaVita, Inc. | 4.5 | ||||||
| WellCare Health Plans, Inc. | 4.2 | ||||||
| McKesson Corp. | 4.1 | ||||||
| Res-Care, Inc. | 3.3 | ||||||
| Total | 47.1 | ||||||
16
Manager's Analysis (Continued)
PowerShares Dynamic Healthcare Services Portfolio (ticker: PTJ)
Growth of a $10,000 Investment Since Inception†
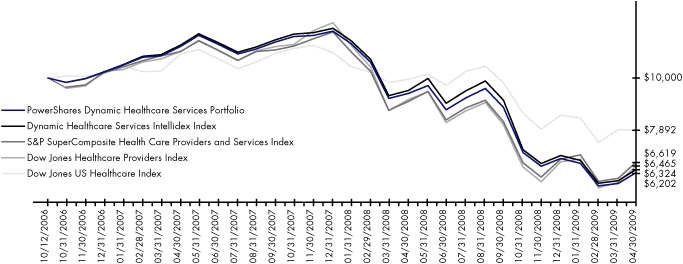
| Fund Performance History (%) | As of April 30, 2009 | ||||||||||||||
| Avg Ann†† | Fund Inception† | ||||||||||||||
| 1 Year | Avg Ann†† | Cumulative | |||||||||||||
| Index | |||||||||||||||
| Dynamic Healthcare Services IntellidexSM Index | -33.43 | -16.46 | -36.76 | ||||||||||||
| S&P SuperComposite Health Care Providers and Services Index | -26.96 | -14.76 | -33.81 | ||||||||||||
| Dow Jones Healthcare Providers Index | -29.26 | -15.54 | -35.35 | ||||||||||||
| Dow Jones US Healthcare Index | -20.74 | -8.76 | -21.08 | ||||||||||||
| Fund | |||||||||||||||
| NAV Return | -33.92 | -17.10 | -37.98 | ||||||||||||
| Share Price Return | -33.89 | -17.10 | -37.98 | ||||||||||||
Fund Inception: October 12, 2006
Performance quoted represents past performance. Past performance is not a guarantee of future results and current performance may be higher or lower than performance quoted. Investment returns and principal value will fluctuate and shares, when redeemed, may be worth more or less than their original cost. The Adviser has waived fees and reimbursed other expenses, absent which, performance would have been lower. The Adviser has contractually agreed to waive fees and/or pay certain Fund expenses through August 31, 2010. According to the Fund's current prospectus, the total gross annual operating expense ratio was indicated as 0.80%. In the Financial Highlights section of this Shareholder Report, the Fund's net (subsidized) total operating expense ratio was determined to be 0.65% while the Fund's gross total operating expense ratio was 1.10%. NAV and Share Price returns assume that dividends and capital gain distributions have been reinvested in the Fund at NAV and Share Price, respectively. The returns shown in the table above do not reflect the deduction of taxes that a shareholder would pay on Fund distributions or the redemption or sale of Fund Shares. See invescopowershares.com to find the most recent month-end performance numbers.
Index performance results are based upon a hypothetical investment in its constituent securities. Index returns do not represent Fund returns. An investor cannot invest directly in an index. The Index does not charge management fees or brokerage expenses, and no such fees or expenses were deducted from the hypothetical performance shown. In addition, the results actual investors might have achieved would have differed from those shown because of differences in the timing, amounts of their investments, and fees and expenses associated with an investment in the Fund.
The S&P SuperComposite Health Care Providers and Services Index, Dow Jones Healthcare Providers Index and Dow Jones US Healthcare Index (the "Benchmark Indices") are unmanaged indices used as a measurement of change in stock market conditions based on the average performance of approximately 26, 35 and 50 common stocks, respectively. The S&P SuperComposite Health Care Providers and Services Index and the Dow Jones Healthcare Providers Index will be used for comparative purposes going forward as these represent the most appropriate market indices for this Fund.
† Fund and underlying Index returns are based on the inception date of the Fund. Returns for the Benchmark Indices are based on the closest month-end to the Fund's inception date.
†† Average annualized.
17
Manager's Analysis
PowerShares Dynamic Insurance Portfolio (ticker: PIC)
The PowerShares Dynamic Insurance Portfolio (the "Fund"), based on the Dynamic Insurance Intellidex Index ("Index"), seeks investment results that correspond generally to the price and yield (before the Fund's fees and expenses) of that equity index. The Index thoroughly evaluates companies based on a variety of investment criteria, including fundamental growth, stock valuation, investment timeliness and risk factors. Securities shown to possess the greatest capital appreciation potential are selected by the Index.
Over the past year, the Fund has returned -27.26%, outperforming the S&P SuperComposite Insurance Index, which returned -55.88% during the same period. The Fund completely avoided the mega-capitalization name AIG, which made up 7.33% of the S&P SuperComposite Insurance Index and had a total return for the reporting period of -96.97%.
Stock selection within the large-capitalization space was also positive. The Fund avoided badly beaten names like Hartford Financial Services, Lincoln National, Genworth Financial and Principal Financial.
Industry Breakdown (% of the Fund's
Net Assets) as of April 30, 2009
| Property/Casualty Insurance | 50.6 | ||||||
| Multi-Line Insurance | 23.2 | ||||||
| Life/Health Insurance | 14.4 | ||||||
| Reinsurance | 6.9 | ||||||
| Insurance Brokers | 4.8 | ||||||
| Money Market Fund | 0.2 | ||||||
| Other | (0.1 | ) | |||||
Style Allocation (% of the Fund's
Total Investments) as of April 30, 2009
| Mid-Cap Value | 34.5 | ||||||
| Large-Cap Value | 29.1 | ||||||
| Small-Cap Value | 28.1 | ||||||
| Small-Cap Growth | 6.3 | ||||||
| Mid-Cap Growth | 2.0 | ||||||
Top Ten Fund Holdings (% of the Fund's
Net Assets) as of April 30, 2009
| Security | |||||||
| Aflac, Inc. | 7.5 | ||||||
| MetLife, Inc. | 7.0 | ||||||
| Unum Group | 7.0 | ||||||
| ACE Ltd. | 5.5 | ||||||
| W.R. Berkley Corp. | 5.0 | ||||||
| Travelers (The) Cos., Inc. | 4.9 | ||||||
| Aon Corp. | 4.8 | ||||||
| Chubb (The) Corp. | 4.3 | ||||||
| Tower Group, Inc. | 3.2 | ||||||
| CNA Surety Corp. | 3.1 | ||||||
| Total | 52.3 | ||||||
18
Manager's Analysis (Continued)
PowerShares Dynamic Insurance Portfolio (ticker: PIC)
Growth of a $10,000 Investment Since Inception†
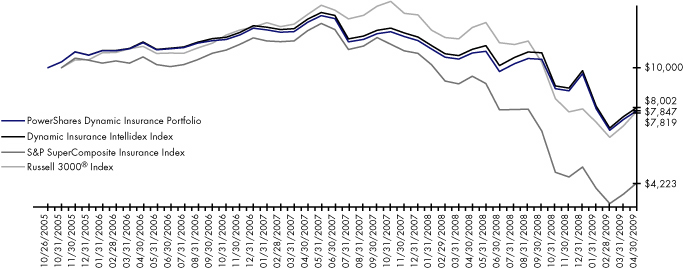
| Fund Performance History (%) | As of April 30, 2009 | ||||||||||||||||||
| Avg Ann†† | Fund Inception† | ||||||||||||||||||
| 1 Year | 3 Year | Avg Ann†† | Cumulative | ||||||||||||||||
| Index | |||||||||||||||||||
| Dynamic Insurance IntellidexSM Index | -26.73 | -10.84 | -6.15 | -19.98 | |||||||||||||||
| S&P SuperComposite Insurance Index | -55.88 | -26.28 | -21.83 | -57.77 | |||||||||||||||
| Russell 3000® Index | -34.95 | -10.94 | -6.79 | -21.81 | |||||||||||||||
| Fund | |||||||||||||||||||
| NAV Return | -27.26 | -11.33 | -6.68 | -21.53 | |||||||||||||||
| Share Price Return | -27.53 | -11.47 | -6.79 | -21.87 | |||||||||||||||
Fund Inception: October 26, 2005
Performance quoted represents past performance. Past performance is not a guarantee of future results and current performance may be higher or lower than performance quoted. Investment returns and principal value will fluctuate and shares, when redeemed, may be worth more or less than their original cost. The Adviser has waived fees and reimbursed other expenses, absent which, performance would have been lower. The Adviser has contractually agreed to waive fees and/or pay certain Fund expenses through August 31, 2010. According to the Fund's current prospectus, the total gross annual operating expense ratio was indicated as 0.82%. In the Financial Highlights section of this Shareholder Report, the Fund's net (subsidized) total operating expense ratio was determined to be 0.63% while the Fund's gross total operating expense ratio was 0.98%. NAV and Share Price returns assume that dividends and capital gain distributions have been reinvested in the Fund at NAV and Share Price, respectively. The returns shown in the table above do not reflect the deduction of taxes that a shareholder would pay on Fund distributions or the redemption or sale of Fund Shares. See invescopowershares.com to find the most recent month-end performance numbers.
Index performance results are based upon a hypothetical investment in its constituent securities. Index returns do not represent Fund returns. An investor cannot invest directly in an index. The Index does not charge management fees or brokerage expenses, and no such fees or expenses were deducted from the hypothetical performance shown. In addition, the results actual investors might have achieved would have differed from those shown because of differences in the timing, amounts of their investments, and fees and expenses associated with an investment in the Fund.
The S&P SuperComposite Insurance Index and Russell 3000® Index (the "Benchmark Indices") are unmanaged indices used as a measurement of change in stock market conditions based on the average performance of approximately 55 and 2918 common stocks, respectively. The S&P SuperComposite Insurance Index will be used for comparative purposes going forward as this represents a more appropriate market index for this Fund.
† Fund and underlying Index returns are based on the inception date of the Fund. Returns for the Benchmark Indices are based on the closest month-end to the Fund's inception date.
†† Average annualized.
19
Manager's Analysis
PowerShares Dynamic Leisure and Entertainment Portfolio (ticker: PEJ)
The PowerShares Dynamic Leisure & Entertainment Portfolio (the "Fund"), based on the Dynamic Leisure & Entertainment Intellidex Index ("Index"), seeks investment results that correspond generally to the price and yield (before the Fund's fees and expenses) of that equity index.
The Fund returned -28.91% during the reporting period, underperforming the S&P SuperComposite Hotels, Restaurants and Leisure Index which returned -21.16% for the same period. The Fund is comprised mainly of consumer discretionary stocks with the majority of its weight in the hotels, restaurants and leisure industry with a small weighting in the media and internet and catalog retail industry. Liberty Media, CBS and MGM Mirage were responsible for the greatest drag on performance. An underallocation to outperforming McDonald's also hurt the Fund. CBS and MGM Mirage are no longer held at the end of the fiscal year.
Industry Breakdown (% of the Fund's
Net Assets) as of April 30, 2009
| Retail | 43.3 | ||||||
| Entertainment | 18.5 | ||||||
| Media | 14.7 | ||||||
| Leisure Time | 8.7 | ||||||
| Commercial Services | 4.4 | ||||||
| Lodging | 3.1 | ||||||
| Beverages | 2.6 | ||||||
| Toys/Games/Hobbies | 2.3 | ||||||
| Internet | 2.3 | ||||||
| Money Market Fund | 0.3 | ||||||
| Other | (0.2 | ) | |||||
Style Allocation (% of the Fund's
Total Investments) as of April 30, 2009
| Small-Cap Growth | 33.3 | ||||||
| Mid-Cap Growth | 22.7 | ||||||
| Small-Cap Value | 20.3 | ||||||
| Large-Cap Value | 15.2 | ||||||
| Large-Cap Growth | 8.5 | ||||||
Top Ten Fund Holdings (% of the Fund's
Net Assets) as of April 30, 2009
| Security | |||||||
| Starbucks Corp. | 5.9 | ||||||
| Liberty Media Corp.-Entertainment, Class A | 5.2 | ||||||
| Carnival Corp. | 5.1 | ||||||
| Darden Restaurants, Inc. | 5.1 | ||||||
| Walt Disney (The) Co. | 4.9 | ||||||
| Yum! Brands, Inc. | 4.7 | ||||||
| Discovery Communications, Inc., Class A | 4.6 | ||||||
| Cheesecake Factory (The), Inc. | 4.3 | ||||||
| McDonald's Corp. | 3.8 | ||||||
| WMS Industries, Inc. | 3.6 | ||||||
| Total | 47.2 | ||||||
20
Manager's Analysis (Continued)
PowerShares Dynamic Leisure and Entertainment Portfolio (ticker: PEJ)
Growth of a $10,000 Investment Since Inception†
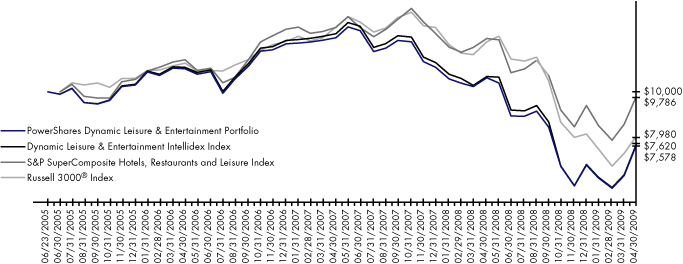
| Fund Performance History (%) | As of April 30, 2009 | ||||||||||||||||||
| Avg Ann†† | Fund Inception† | ||||||||||||||||||
| 1 Year | 3 Year | Avg Ann†† | Cumulative | ||||||||||||||||
| Index | |||||||||||||||||||
| Dynamic Leisure & Entertainment IntellidexSM Index | -28.75 | -11.80 | -6.81 | -23.80 | |||||||||||||||
| S&P SuperComposite Hotels, Restaurants and Leisure Index | -21.16 | -5.11 | -0.56 | -2.14 | |||||||||||||||
| Russell 3000® Index | -34.95 | -10.94 | -5.72 | -20.20 | |||||||||||||||
| Fund | |||||||||||||||||||
| NAV Return | -28.91 | -11.79 | -6.95 | -24.22 | |||||||||||||||
| Share Price Return | -29.09 | -11.86 | -6.99 | -24.34 | |||||||||||||||
Fund Inception: June 23, 2005
Performance quoted represents past performance. Past performance is not a guarantee of future results and current performance may be higher or lower than performance quoted. Investment returns and principal value will fluctuate and shares, when redeemed, may be worth more or less than their original cost. The Adviser has waived fees and reimbursed other expenses, absent which, performance would have been lower. The Adviser has contractually agreed to waive fees and/or pay certain Fund expenses through August 31, 2010. According to the Fund's current prospectus, the total gross annual operating expense ratio was indicated as 0.95%. In the Financial Highlights section of this Shareholder Report, the Fund's net (subsidized) total operating expense ratio was determined to be 0.63% while the Fund's gross total operating expense ratio was 1.65%. NAV and Share Price returns assume that dividends and capital gain distributions have been reinvested in the Fund at NAV and Share Price, respectively. The returns shown in the table above do not reflect the deduction of taxes that a shareholder would pay on Fund distributions or the redemption or sale of Fund Shares. See invescopowershares.com to find the most recent month-end performance numbers.
Index performance results are based upon a hypothetical investment in its constituent securities. Index returns do not represent Fund returns. An investor cannot invest directly in an index. The Index does not charge management fees or brokerage expenses, and no such fees or expenses were deducted from the hypothetical performance shown. In addition, the results actual investors might have achieved would have differed from those shown because of differences in the timing, amounts of their investments, and fees and expenses associated with an investment in the Fund.
The S&P SuperComposite Hotels, Restaurants and Leisure Index and Russell 3000® Index (the "Benchmark Indices") are unmanaged indices used as a measurement of change in stock market conditions based on the average performance of approximately 46 and 2918 common stocks, respectively. The S&P SuperComposite Hotels, Restaurants and Leisure Index will be used for comparative purposes going forward as this represents a more appropriate market index for this Fund.
† Fund and underlying Index returns are based on the inception date of the Fund. Returns for the Benchmark Indices are based on the closest month-end to the Fund's inception date.
†† Average annualized.
21
Manager's Analysis
PowerShares Dynamic Media Portfolio (ticker: PBS)
The PowerShares Dynamic Media Portfolio (the "Fund"), based on the Dynamic Media Intellidex Index ("Index"), seeks investment results that correspond generally to the price and yield (before the Fund's fees and expenses) of that equity index.
The Fund returned -38.30% during the reporting period underperforming the S&P SuperComposite Media Index which returned -35.17%. The Fund is comprised of around 70% media stocks with internet software and services being weighed just under 20%. Sirius XM Radio, Valassis Communications and Comcast were the biggest detractors for the Fund. Liberty Media and Mediacom Communications contributed positively to the Fund's performance for the reporting period. Sirius XM Radio and Valassis Communications are no longer held at the end of the fiscal year.
Industry Breakdown (% of the Fund's
Net Assets) as of April 30, 2009
| Multimedia | 27.1 | ||||||
| Cable/Satellite TV | 14.6 | ||||||
| Web Portals/ISP | 8.5 | ||||||
| Advertising Agencies | 6.1 | ||||||
| Publishing-Books | 5.9 | ||||||
| Internet Content-Information/Network | 5.3 | ||||||
| E-Commerce/Services | 4.8 | ||||||
| Human Resources | 4.3 | ||||||
| E-Marketing/Information | 3.5 | ||||||
| Retail-Discount | 3.3 | ||||||
| Theaters | 2.7 | ||||||
| Motion Pictures & Services | 2.6 | ||||||
| Advertising Sales | 2.5 | ||||||
| Schools | 2.4 | ||||||
| Toys | 2.4 | ||||||
| Computer Services | 2.1 | ||||||
| Radio | 1.9 | ||||||
| Money Market Fund | 1.9 | ||||||
| Other | (1.9 | ) | |||||
Style Allocation (% of the Fund's
Total Investments) as of April 30, 2009
| Small-Cap Growth | 26.1 | ||||||
| Large-Cap Growth | 18.6 | ||||||
| Large-Cap Value | 15.8 | ||||||
| Mid-Cap Growth | 15.7 | ||||||
| Small-Cap Value | 12.6 | ||||||
| Mid-Cap Value | 11.2 | ||||||
Top Ten Fund Holdings (% of the Fund's
Net Assets) as of April 30, 2009
| Security | |||||||
| Liberty Media Corp.-Entertainment, Class A | 5.3 | ||||||
| Walt Disney (The) Co. | 4.9 | ||||||
| Time Warner, Inc. | 4.9 | ||||||
| Viacom, Inc., Class B | 4.7 | ||||||
| DIRECTV Group (The), Inc. | 4.7 | ||||||
| Comcast Corp., Class A | 4.5 | ||||||
| Google ,Inc., Class A | 4.4 | ||||||
| Monster Worldwide ,Inc. | 4.3 | ||||||
| Yahoo!, Inc. | 4.1 | ||||||
| Meredith Corp. | 4.0 | ||||||
| Total | 45.8 | ||||||
22
Manager's Analysis (Continued)
PowerShares Dynamic Media Portfolio (ticker: PBS)
Growth of a $10,000 Investment Since Inception†

| Fund Performance History (%) | As of April 30, 2009 | ||||||||||||||||||
| Avg Ann†† | Fund Inception† | ||||||||||||||||||
| 1 Year | 3 Year | Avg Ann†† | Cumulative | ||||||||||||||||
| Index | |||||||||||||||||||
| Dynamic Media IntellidexSM Index | -37.96 | -16.37 | -13.54 | -42.91 | |||||||||||||||
| S&P SuperComposite Media Index | -35.17 | -13.96 | -10.55 | -34.79 | |||||||||||||||
| Russell 3000® Index | -34.95 | -10.94 | -5.72 | -20.20 | |||||||||||||||
| Fund | |||||||||||||||||||
| NAV Return | -38.30 | -16.29 | -13.65 | -43.18 | |||||||||||||||
| Share Price Return | -38.31 | -16.25 | -13.62 | -43.11 | |||||||||||||||
Fund Inception: June 23, 2005
Performance quoted represents past performance. Past performance is not a guarantee of future results and current performance may be higher or lower than performance quoted. Investment returns and principal value will fluctuate and shares, when redeemed, may be worth more or less than their original cost. The Adviser has waived fees and reimbursed other expenses, absent which, performance would have been lower. The Adviser has contractually agreed to waive fees and/or pay certain Fund expenses through August 31, 2010. According to the Fund's current prospectus, the total gross annual operating expense ratio was indicated as 0.85%. In the Financial Highlights section of this Shareholder Report, the Fund's net (subsidized) total operating expense ratio was determined to be 0.63% while the Fund's gross total operating expense ratio was 1.22%. NAV and Share Price returns assume that dividends and capital gain distributions have been reinvested in the Fund at NAV and Share Price, respectively. The returns shown in the table above do not reflect the deduction of taxes that a shareholder would pay on Fund distributions or the redemption or sale of Fund Shares. See invescopowershares.com to find the most recent month-end performance numbers.
Index performance results are based upon a hypothetical investment in its constituent securities. Index returns do not represent Fund returns. An investor cannot invest directly in an index. The Index does not charge management fees or brokerage expenses, and no such fees or expenses were deducted from the hypothetical performance shown. In addition, the results actual investors might have achieved would have differed from those shown because of differences in the timing, amounts of their investments, and fees and expenses associated with an investment in the Fund.
The S&P SuperComposite Media Index and Russell 3000® Index (the "Benchmark Indices") are unmanaged indices used as a measurement of change in stock market conditions based on the average performance of approximately 32 and 2918 common stocks, respectively. The S&P SuperComposite Media Index will be used for comparative purposes going forward as this represents a more appropriate market index for this Fund.
† Fund and underlying Index returns are based on the inception date of the Fund. Returns for the Benchmark Indices are based on the closest month-end to the Fund's inception date.
†† Average annualized.
23
Manager's Analysis
PowerShares Dynamic Networking Portfolio (ticker: PXQ)
The PowerShares Dynamic Networking Portfolio (the "Fund"), based on the Dynamic Networking Intellidex Index ("Index"), seeks investment results that correspond generally to the price and yield (before the Fund's fees and expenses) of that equity index.
The Fund returned -15.46% during the reporting period. The S&P SuperComposite Communications Equipment Index returned -23.10 for the same period. Significant weightings in 3Com Corp, McAfee and Citrix Systems made the greatest contribution to the Fund's return. Avoiding underperforming names with significant benchmark weightings like Corning and Motorola also boosted the Fund's performance.
Industry Breakdown (% of the Fund's
Net Assets) as of April 30, 2009
| Telecommunications | 49.3 | ||||||
| Internet | 18.1 | ||||||
| Semiconductors | 15.1 | ||||||
| Software | 12.7 | ||||||
| Computers | 4.8 | ||||||
| Money Market Fund | 0.2 | ||||||
| Other | (0.2 | ) | |||||
Style Allocation (% of the Fund's
Total Investments) as of April 30, 2009
| Small-Cap Growth | 47.5 | ||||||
| Mid-Cap Growth | 29.8 | ||||||
| Small-Cap Value | 13.3 | ||||||
| Large-Cap Growth | 9.4 | ||||||
Top Ten Fund Holdings (% of the Fund's
Net Assets) as of April 30, 2009
| Security | |||||||
| Juniper Networks, Inc. | 5.5 | ||||||
| Citrix Systems, Inc. | 5.0 | ||||||
| Tellabs, Inc. | 5.0 | ||||||
| F5 Networks, Inc. | 4.9 | ||||||
| McAfee, Inc. | 4.9 | ||||||
| Cisco Systems, Inc. | 4.8 | ||||||
| QUALCOMM, Inc. | 4.6 | ||||||
| VMware, Inc., Class A | 4.6 | ||||||
| Emulex Corp. | 3.9 | ||||||
| 3Com Corp. | 3.6 | ||||||
| Total | 46.8 | ||||||
24
Manager's Analysis (Continued)
PowerShares Dynamic Networking Portfolio (ticker: PXQ)
Growth of a $10,000 Investment Since Inception†

| Fund Performance History (%) | As of April 30, 2009 | ||||||||||||||||||
| Avg Ann†† | Fund Inception† | ||||||||||||||||||
| 1 Year | 3 Year | Avg Ann†† | Cumulative | ||||||||||||||||
| Index | |||||||||||||||||||
| Dynamic Networking IntellidexSM Index | -14.73 | -7.28 | -1.95 | -7.29 | |||||||||||||||
| S&P SuperComposite Communications Equipment Index | -23.10 | -9.79 | -1.87 | -6.98 | |||||||||||||||
| Russell 3000® Index | -34.95 | -10.94 | -5.72 | -20.20 | |||||||||||||||
| Fund | |||||||||||||||||||
| NAV Return | -15.46 | -7.94 | -2.52 | -9.36 | |||||||||||||||
| Share Price Return | -15.28 | -7.84 | -2.48 | -9.22 | |||||||||||||||
Fund Inception: June 23, 2005
Performance quoted represents past performance. Past performance is not a guarantee of future results and current performance may be higher or lower than performance quoted. Investment returns and principal value will fluctuate and shares, when redeemed, may be worth more or less than their original cost. The Adviser has waived fees and reimbursed other expenses, absent which, performance would have been lower. The Adviser has contractually agreed to waive fees and/or pay certain Fund expenses through August 31, 2010. According to the Fund's current prospectus, the total gross annual operating expense ratio was indicated as 1.25%. In the Financial Highlights section of this Shareholder Report, the Fund's net (subsidized) total operating expense ratio was determined to be 0.63% while the Fund's gross total operating expense ratio was 1.92%. NAV and Share Price returns assume that dividends and capital gain distributions have been reinvested in the Fund at NAV and Share Price, respectively. The returns shown in the table above do not reflect the deduction of taxes that a shareholder would pay on Fund distributions or the redemption or sale of Fund Shares. See invescopowershares.com to find the most recent month-end performance numbers.
Index performance results are based upon a hypothetical investment in its constituent securities. Index returns do not represent Fund returns. An investor cannot invest directly in an index. The Index does not charge management fees or brokerage expenses, and no such fees or expenses were deducted from the hypothetical performance shown. In addition, the results actual investors might have achieved would have differed from those shown because of differences in the timing, amounts of their investments, and fees and expenses associated with an investment in the Fund.
The S&P SuperComposite Communications Equipment Index and Russell 3000® Index (the "Benchmark Indices") are unmanaged indices used as a measurement of change in stock market conditions based on the average performance of approximately 35 and 2918 common stocks, respectively. The S&P SuperComposite Communications Equipment Index will be used for comparative purposes going forward as this represents a more appropriate market index for this Fund.
† Fund and underlying Index returns are based on the inception date of the Fund. Returns for the Benchmark Indices are based on the closest month-end to the Fund's inception date.
†† Average annualized.
25
Manager's Analysis
PowerShares Dynamic Oil & Gas Services Portfolio (ticker: PXJ)
The PowerShares Dynamic Oil & Gas Services Portfolio (the "Fund"), based on the Dynamic Oil Services Intellidex Index ("Index"), seeks investment results that correspond generally to the price and yield (before the Fund's fees and expenses) of that equity index.
The Fund posted negative returns of -55.04%. The S&P SuperComposite Energy & Services Index returned -54.83% during the reporting period. The Fund was hurt by declining energy prices, notably oil, as they pulled back in the global recession due largely to lower demand. The Fund's performance was helped relative to the benchmark by the timing of holding Helix Energy Solutions Group, Inc. as well as overweighting good performers such as Dresser-Rand Group Inc. and Dril-Quip Inc. The Fund was hurt by detractors Complete Production Services Inc., Pioneer Drilling Co., and Willbros Group Inc. Complete Production Services Inc. and Willbros Group Inc. are no longer held at the end of the fiscal year.
Industry Breakdown (% of the Fund's
Net Assets) as of April 30, 2009
| Oil-Field Services | 51.6 | ||||||
| Oil & Gas Drilling | 23.7 | ||||||
| Oil Field Machinery & Equipment | 19.8 | ||||||
| Transport-Marine | 4.8 | ||||||
| Money Market Fund | 0.1 | ||||||
| Other | 0.0 | ||||||
Style Allocation (% of the Fund's
Total Investments) as of April 30, 2009
| Small-Cap Value | 33.5 | ||||||
| Large-Cap Value | 23.6 | ||||||
| Mid-Cap Value | 14.3 | ||||||
| Mid-Cap Growth | 12.8 | ||||||
| Small-Cap Growth | 11.3 | ||||||
| Large-Cap Growth | 4.5 | ||||||
Top Ten Fund Holdings (% of the Fund's
Net Assets) as of April 30, 2009
| Security | |||||||
| Helix Energy Solutions Group, Inc. | 6.0 | ||||||
| Cameron International Corp. | 5.0 | ||||||
| Schlumberger Ltd. | 4.8 | ||||||
| Halliburton Co. | 4.7 | ||||||
| Baker Hughes, Inc. | 4.6 | ||||||
| Diamond Offshore Drilling, Inc. | 4.3 | ||||||
| National Oilwell Varco, Inc. | 4.3 | ||||||
| Transocean Ltd. | 4.2 | ||||||
| Noble Corp. [Switzerland] | 4.2 | ||||||
| Superior Well Services, Inc. | 3.8 | ||||||
| Total | 45.9 | ||||||
26
Manager's Analysis (Continued)
PowerShares Dynamic Oil & Gas Services Portfolio (ticker: PXJ)
Growth of a $10,000 Investment Since Inception†

| Fund Performance History (%) | As of April 30, 2009 | ||||||||||||||||||
| Avg Ann†† | Fund Inception† | ||||||||||||||||||
| 1 Year | 3 Year | Avg Ann†† | Cumulative | ||||||||||||||||
| Index | |||||||||||||||||||
| Dynamic Oil & Gas Services IntellidexSM Index | -54.78 | -14.73 | -5.79 | -18.88 | |||||||||||||||
| S&P SuperComposite Energy Equipment & Services Index | -54.83 | -14.64 | -4.70 | -15.51 | |||||||||||||||
| Russell 3000® Index | -34.95 | -10.94 | -6.79 | -21.81 | |||||||||||||||
| S&P SuperComposite Oil & Gas Equipment & Services Index | 2.23 | -14.10 | -3.29 | -11.06 | |||||||||||||||
| Fund | |||||||||||||||||||
| NAV Return | -55.04 | -15.01 | -6.16 | -20.01 | |||||||||||||||
| Share Price Return | -54.93 | -15.02 | -6.12 | -19.89 | |||||||||||||||
Fund Inception: October 26, 2005
Performance quoted represents past performance. Past performance is not a guarantee of future results and current performance may be higher or lower than performance quoted. Investment returns and principal value will fluctuate and shares, when redeemed, may be worth more or less than their original cost. The Adviser has waived fees and reimbursed other expenses during previous fiscal periods, absent which, performance during those fiscal periods would have been lower. While the Adviser has contractually agreed to waive and/or pay certain Fund expenses through August 31, 2010, the Fund is currently subject to recapture, which may result in an increased expense ratio. According to the Fund's current prospectus, the total gross annual operating expense ratio was indicated as 0.60%. In the Financial Highlights section of this Shareholder Report, the Fund's net total operating expense ratio was determined to be 0.62% while the Fund' s gross total operating expense ratio was 0.61%. NAV and Share Price returns assume that dividends and capital gain distributions have been reinvested in the Fund at NAV and Share Price, respectively. The returns shown in the table above do not reflect the deduction of taxes that a shareholder would pay on Fund distributions or the redemption or sale of Fund Shares. See invescopowershares.com to find the most recent month-end performance numbers.
Index performance results are based upon a hypothetical investment in its constituent securities. Index returns do not represent Fund returns. An investor cannot invest directly in an index. The Index does not charge management fees or brokerage expenses, and no such fees or expenses were deducted from the hypothetical performance shown. In addition, the results actual investors might have achieved would have differed from those shown because of differences in the timing, amounts of their investments, and fees and expenses associated with an investment in the Fund.
The S&P SuperComposite Energy Equipment & Services Index and Russell 3000® Index (the "Benchmark Indices") are unmanaged indices used as a measurement of change in stock market conditions based on the average performance of approximately 25 and 2918 common stocks, respectively. The S&P SuperComposite Energy Equipment & Services Index will be used for comparative purposes going forward as this represents a more appropriate market index for this Fund.
† Fund and underlying Index returns are based on the inception date of the Fund. Returns for the Benchmark Indices are based on the closest month-end to the Fund's inception date.
†† Average annualized.
27
Manager's Analysis
PowerShares Dynamic Pharmaceuticals Portfolio (ticker: PJP)
The PowerShares Dynamic Pharmaceuticals Portfolio (the "Fund"), based on the Dynamic Pharmaceuticals Intellidex Index ("Index"), seeks investment results that correspond generally to the price and yield (before the Fund's fees and expenses) of that equity index.
The Fund returned -18.52%, outperforming the S&P SuperComposite Pharmaceuticals Index which returned -18.67% for the reporting period. Biotechnology stocks gave the Fund the greatest boost with Genentech and Amgen having the greatest positive impact. The detractors for the period were Questcor Pharmaceuticals, Eurand N.V., VIVUS and Schering-Plough. Genentech, Eurand N.V. and VIVUS are no longer held at the end of the fiscal year.
Industry Breakdown (% of the Fund's
Net Assets) as of April 30, 2009
| Medical-Drugs | 53.3 | ||||||
| Medical-Biomedical/Genetics | 20.2 | ||||||
| Medical-Generic Drugs | 11.2 | ||||||
| Medical Products | 5.1 | ||||||
| Therapeutics | 4.8 | ||||||
| Consumer Products-Miscellaneous | 3.1 | ||||||
| Cosmetics & Toiletries | 2.3 | ||||||
| Other | 0.0 | ||||||
Style Allocation (% of the Fund's
Total Investments) as of April 30, 2009
| Large-Cap Growth | 28.3 | ||||||
| Large-Cap Value | 28.2 | ||||||
| Mid-Cap Growth | 19.4 | ||||||
| Small-Cap Growth | 13.5 | ||||||
| Mid-Cap Value | 7.5 | ||||||
| Small-Cap Value | 3.1 | ||||||
Top Ten Fund Holdings (% of the Fund's
Net Assets) as of April 30, 2009
| Security | |||||||
| Pfizer, Inc. | 5.2 | ||||||
| Johnson & Johnson | 5.1 | ||||||
| Bristol-Myers Squibb Co. | 5.0 | ||||||
| Wyeth | 5.0 | ||||||
| Gilead Sciences, Inc. | 4.9 | ||||||
| Merck & Co., Inc. | 4.8 | ||||||
| Amgen, Inc. | 4.8 | ||||||
| Abbott Laboratories | 4.3 | ||||||
| Medicis Pharmaceutical Corp., Class A | 3.8 | ||||||
| Schering-Plough Corp. | 3.5 | ||||||
| Total | 46.4 | ||||||
28
Manager's Analysis (Continued)
PowerShares Dynamic Pharmaceuticals Portfolio (ticker: PJP)
Growth of a $10,000 Investment Since Inception†

| Fund Performance History (%) | As of April 30, 2009 | ||||||||||||||||||
| Avg Ann†† | Fund Inception† | ||||||||||||||||||
| 1 Year | 3 Year | Avg Ann†† | Cumulative | ||||||||||||||||
| Index | |||||||||||||||||||
| Dynamic Pharmaceuticals IntellidexSM Index | -17.90 | -4.47 | -0.62 | -2.35 | |||||||||||||||
| S&P SuperComposite Pharmaceuticals Index | -18.67 | -5.53 | -4.73 | -16.95 | |||||||||||||||
| Russell 3000® Index | -34.95 | -10.94 | -5.72 | -20.20 | |||||||||||||||
| Fund | |||||||||||||||||||
| NAV Return | -18.52 | -5.10 | -1.18 | -4.48 | |||||||||||||||
| Share Price Return | -18.41 | -5.09 | -1.15 | -4.35 | |||||||||||||||
Fund Inception: June 23, 2005
Performance quoted represents past performance. Past performance is not a guarantee of future results and current performance may be higher or lower than performance quoted. Investment returns and principal value will fluctuate and shares, when redeemed, may be worth more or less than their original cost. The Adviser has waived fees and reimbursed other expenses, absent which, performance would have been lower. The Adviser has contractually agreed to waive fees and/or pay certain Fund expenses through August 31, 2010. According to the Fund's current prospectus, the total gross annual operating expense ratio was indicated as 0.69%. In the Financial Highlights section of this Shareholder Report, the Fund's net (subsidized) total operating expense ratio was determined to be 0.63% while the Fund's gross total operating expense ratio was 0.66%. NAV and Share Price returns assume that dividends and capital gain distributions have been reinvested in the Fund at NAV and Share Price, respectively. The returns shown in the table above do not reflect the deduction of taxes that a shareholder would pay on Fund distributions or the redemption or sale of Fund Shares. See invescopowershares.com to find the most recent month-end performance numbers.
Index performance results are based upon a hypothetical investment in its constituent securities. Index returns do not represent Fund returns. An investor cannot invest directly in an index. The Index does not charge management fees or brokerage expenses, and no such fees or expenses were deducted from the hypothetical performance shown. In addition, the results actual investors might have achieved would have differed from those shown because of differences in the timing, amounts of their investments, and fees and expenses associated with an investment in the Fund.
The S&P SuperComposite Pharmaceuticals Index and Russell 3000® Index (the "Benchmark Indices") are unmanaged indices used as a measurement of change in stock market conditions based on the average performance of approximately 26 and 2918 common stocks, respectively. The S&P SuperComposite Pharmaceuticals Index will be used for comparative purposes going forward as this represents a more appropriate market index for this Fund.
† Fund and underlying Index returns are based on the inception date of the Fund. Returns for the Benchmark Indices are based on the closest month-end to the Fund's inception date.
†† Average annualized.
29
Manager's Analysis
PowerShares Dynamic Retail Portfolio (ticker: PMR)
The PowerShares Dynamic Retail Portfolio (the "Fund"), based on the Dynamic Retail Intellidex Index ("Index"), seeks investment results that correspond generally to the price and yield (before the Fund's fees and expenses) of that equity index.
The Fund returned -8.11% outperforming the S&P SuperComposite Retailing Index which returned -14.81% during the reporting period. Retail companies outperformed the broader market during the year as the industry was not hit as hard by the global recession as the broader market. The Fund's performance was driven by the stock selection of good performers such as AutoZone Inc., Netflix Inc., Aaron's Inc. and Lowe's Cos. Also benefiting the Fund relative to the benchmark was the omission of poor performing Macy's Inc. and Sears Holding Corp. AutoZone Inc. and Aaron's Inc. are no longer held at the end of the fiscal year.
Industry Breakdown (% of the Fund's
Net Assets) as of April 30, 2009
| Retail-Apparel/Shoe | 41.3 | ||||||
| Retail-Discount | 10.8 | ||||||
| Food-Retail | 6.7 | ||||||
| Retail-Sporting Goods | 6.2 | ||||||
| Retail-Bedding | 5.3 | ||||||
| Retail-Building Products | 5.1 | ||||||
| Retail-Regional Department Stores | 4.8 | ||||||
| Retail-Major Department Stores | 4.7 | ||||||
| E-Commerce/Products | 4.6 | ||||||
| Retail-Appliances | 3.3 | ||||||
| E-Commerce/Services | 2.5 | ||||||
| Retail-Pet Food & Supplies | 2.4 | ||||||
| Rental/Auto Equipment | 2.2 | ||||||
| Money Market Fund | 0.2 | ||||||
| Other | (0.1 | ) | |||||
Style Allocation (% of the Fund's
Total Investments) as of April 30, 2009
| Small-Cap Growth | 26.6 | ||||||
| Large-Cap Growth | 23.0 | ||||||
| Mid-Cap Growth | 20.4 | ||||||
| Small-Cap Value | 17.6 | ||||||
| Mid-Cap Value | 12.4 | ||||||
Top Ten Fund Holdings (% of the Fund's
Net Assets) as of April 30, 2009
| Security | |||||||
| Gap (The), Inc. | 5.4 | ||||||
| Bed Bath & Beyond, Inc. | 5.3 | ||||||
| Lowe's Cos., Inc. | 5.1 | ||||||
| Kohl's Corp. | 4.8 | ||||||
| TJX Cos., Inc. | 4.7 | ||||||
| Amazon.com, Inc. | 4.6 | ||||||
| Safeway, Inc. | 4.0 | ||||||
| Wal-Mart Stores, Inc. | 3.8 | ||||||
| Men's Wearhouse (The), Inc. | 3.6 | ||||||
| hhgregg, Inc. | 3.3 | ||||||
| Total | 44.6 | ||||||
30
Manager's Analysis (Continued)
PowerShares Dynamic Retail Portfolio (ticker: PMR)
Growth of a $10,000 Investment Since Inception†
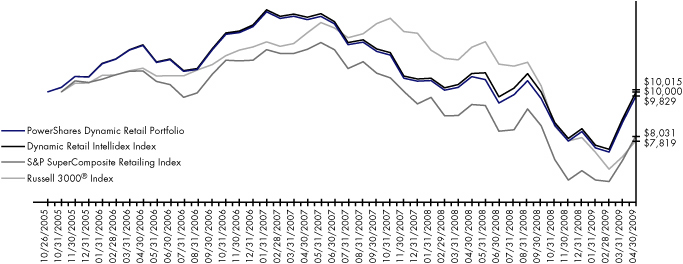
| Fund Performance History (%) | As of April 30, 2009 | ||||||||||||||||||
| Avg Ann†† | Fund Inception† | ||||||||||||||||||
| 1 Year | 3 Year | Avg Ann†† | Cumulative | ||||||||||||||||
| Index | |||||||||||||||||||
| Dynamic Retail IntellidexSM Index | -7.53 | -6.18 | 0.04 | 0.15 | |||||||||||||||
| S&P SuperComposite Retailing Index | -14.81 | -9.81 | -6.07 | -19.70 | |||||||||||||||
| Russell 3000® Index | -34.95 | -10.94 | -6.79 | -21.81 | |||||||||||||||
| Fund | |||||||||||||||||||
| NAV Return | -8.11 | -6.69 | -0.49 | -1.71 | |||||||||||||||
| Share Price Return | -8.11 | -6.67 | -0.51 | -1.77 | |||||||||||||||
Fund Inception: October 26, 2005
Performance quoted represents past performance. Past performance is not a guarantee of future results and current performance may be higher or lower than performance quoted. Investment returns and principal value will fluctuate and shares, when redeemed, may be worth more or less than their original cost. The Adviser has waived fees and reimbursed other expenses, absent which, performance would have been lower. The Adviser has contractually agreed to waive fees and/or pay certain Fund expenses through August 31, 2010. According to the Fund's current prospectus, the total gross annual operating expense ratio was indicated as 1.46%. In the Financial Highlights section of this Shareholder Report, the Fund's net (subsidized) total operating expense ratio was determined to be 0.63% while the Fund's gross total operating expense ratio was 1.08%. NAV and Share Price returns assume that dividends and capital gain distributions have been reinvested in the Fund at NAV and Share Price, respectively. The returns shown in the table above do not reflect the deduction of taxes that a shareholder would pay on Fund distributions or the redemption or sale of Fund Shares. See invescopowershares.com to find the most recent month-end performance numbers.
Index performance results are based upon a hypothetical investment in its constituent securities. Index returns do not represent Fund returns. An investor cannot invest directly in an index. The Index does not charge management fees or brokerage expenses, and no such fees or expenses were deducted from the hypothetical performance shown. In addition, the results actual investors might have achieved would have differed from those shown because of differences in the timing, amounts of their investments, and fees and expenses associated with an investment in the Fund.
The S&P SuperComposite Retailing Index and Russell 3000® Index (the "Benchmark Indices") are unmanaged indices used as a measurement of change in stock market conditions based on the average performance of approximately 94 and 2918 common stocks, respectively. The S&P SuperComposite Retailing Index will be used for comparative purposes going forward as this represents a more appropriate market index for this Fund.
† Fund and underlying Index returns are based on the inception date of the Fund. Returns for the Benchmark Indices are based on the closest month-end to the Fund's inception date.
†† Average annualized.
31
Manager's Analysis
PowerShares Dynamic Semiconductors Portfolio (ticker: PSI)
The PowerShares Dynamic Semiconductors Portfolio (the "Fund"), based on the Dynamic Semiconductors Intellidex Index ("Index"), seeks investment results that correspond generally to the price and yield (before the Fund's fees and expenses) of that equity index.
The Fund returned -36.01% during the reporting period. The S&P SuperComposite Semiconductor Index had a return for the reporting period of -29.32%. Poor holdings within small- and mid-capitalization categories hurt the Fund's performance. Amkor Technology, Intel, Silicon Storage, Veeco Instruments and Fairchild Semiconductor International helped offset the Fund's underperformance. Amkor Technology, Silicon Storage, Veeco Instruments and Fairchild Semiconductor International are no longer held at the end of the fiscal year.
Industry Breakdown (% of the Fund's
Net Assets) as of April 30, 2009
| Electronic Components & Semiconductors | 56.8 | ||||||
| Semiconductor Components-Integrated Circuits | 24.5 | ||||||
| Wireless Equipment | 7.1 | ||||||
| Semiconductor Equipment | 5.5 | ||||||
| Lasers-System/Components | 3.4 | ||||||
| Instruments-Scientific | 2.7 | ||||||
| Money Market Fund | 0.1 | ||||||
| Other | (0.1 | ) | |||||
Style Allocation (% of the Fund's
Total Investments) as of April 30, 2009
| Small-Cap Growth | 48.4 | ||||||
| Mid-Cap Growth | 33.7 | ||||||
| Large-Cap Growth | 15.4 | ||||||
| Small-Cap Value | 2.5 | ||||||
Top Ten Fund Holdings (% of the Fund's
Net Assets) as of April 30, 2009
| Security | |||||||
| QUALCOMM, Inc. | 5.2 | ||||||
| Texas Instruments, Inc. | 5.1 | ||||||
| Intel Corp. | 5.1 | ||||||
| Microchip Technology, Inc. | 5.0 | ||||||
| Xilinx, Inc. | 4.7 | ||||||
| Analog Devices, Inc. | 4.6 | ||||||
| Altera Corp. | 4.3 | ||||||
| Linear Technology Corp. | 4.1 | ||||||
| PMC-Sierra, Inc. | 3.5 | ||||||
| Cymer, Inc. | 3.4 | ||||||
| Total | 45.0 | ||||||
32
Manager's Analysis (Continued)
PowerShares Dynamic Semiconductors Portfolio (ticker: PSI)
Growth of a $10,000 Investment Since Inception†
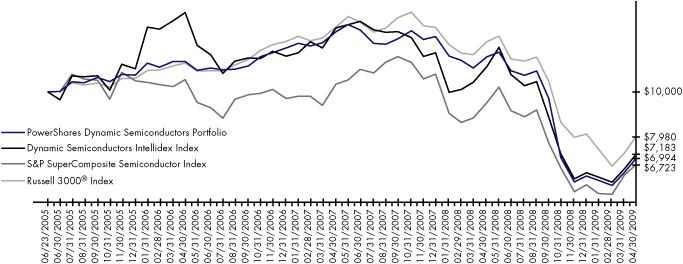
| Fund Performance History (%) | As of April 30, 2009 | ||||||||||||||||||
| Avg Ann†† | Fund Inception† | ||||||||||||||||||
| 1 Year | 3 Year | Avg Ann†† | Cumulative | ||||||||||||||||
| Index | |||||||||||||||||||
| Dynamic Semiconductors IntellidexSM Index | -35.52 | -19.14 | -8.23 | -28.17 | |||||||||||||||
| S&P SuperComposite Semiconductor Index | -29.32 | -13.96 | -9.84 | -32.77 | |||||||||||||||
| Russell 3000® Index | -34.95 | -10.94 | -5.72 | -20.20 | |||||||||||||||
| Fund | |||||||||||||||||||
| NAV Return | -36.01 | -19.72 | -8.86 | -30.06 | |||||||||||||||
| Share Price Return | -36.01 | -19.72 | -8.88 | -30.10 | |||||||||||||||
Fund Inception: June 23, 2005
Performance quoted represents past performance. Past performance is not a guarantee of future results and current performance may be higher or lower than performance quoted. Investment returns and principal value will fluctuate and shares, when redeemed, may be worth more or less than their original cost. The Adviser has waived fees and reimbursed other expenses, absent which, performance would have been lower. The Adviser has contractually agreed to waive fees and/or pay certain Fund expenses through August 31, 2010. According to the Fund's current prospectus, the total gross annual operating expense ratio was indicated as 0.67%. In the Financial Highlights section of this Shareholder Report, the Fund's net (subsidized) total operating expense ratio was determined to be 0.63% while the Fund's gross total operating expense ratio was 0.82%. NAV and Share Price returns assume that dividends and capital gain distributions have been reinvested in the Fund at NAV and Share Price, respectively. The returns shown in the table above do not reflect the deduction of taxes that a shareholder would pay on Fund distributions or the redemption or sale of Fund Shares. See invescopowershares.com to find the most recent month-end performance numbers.
Index performance results are based upon a hypothetical investment in its constituent securities. Index returns do not represent Fund returns. An investor cannot invest directly in an index. The Index does not charge management fees or brokerage expenses, and no such fees or expenses were deducted from the hypothetical performance shown. In addition, the results actual investors might have achieved would have differed from those shown because of differences in the timing, amounts of their investments, and fees and expenses associated with an investment in the Fund.
The S&P SuperComposite Semiconductor Index and Russell 3000® Index (the "Benchmark Indices") are unmanaged indices used as a measurement of change in stock market conditions based on the average performance of approximately 37 and 2918 common stocks, respectively. The S&P SuperComposite Semiconductor Index will be used for comparative purposes going forward as this represents a more appropriate market index for this Fund.
† Fund and underlying Index returns are based on the inception date of the Fund. Returns for the Benchmark Indices are based on the closest month-end to the Fund's inception date.
†† Average annualized.
33
Manager's Analysis
PowerShares Dynamic Software Portfolio (ticker: PSJ)
The PowerShares Dynamic Software Portfolio (the "Fund"), based on the Dynamic Software Intellidex Index ("Index"), seeks investment results that correspond generally to the price and yield (before the Fund's fees and expenses) of that equity index.
The Fund returned -12.32% during the reporting period outperforming the S&P SuperComposite Software & Services Index which returned -26.32%. Positive holdings in the software and internet software and services industries contributed positively to the Fund's performance. In the software category, Autodesk, BMC Software and Red Hat had the greatest positive affect on performance. In the internet software and services category, avoiding Yahoo! and eBay had significant impact on performance. Across the entire Fund, Adobe Systems, Oracle, MicroStrategy and Take-Two Interactive Software had the greatest negative affect on the Fund's performance. Adobe Systems, MicroStrategy and Take-Two Interactive Software are no longer held at the end of the fiscal year.
Industry Breakdown (% of the Fund's
Net Assets) as of April 30, 2009
| Enterprise Software/Services | 21.6 | ||||||
| Applications Software | 18.0 | ||||||
| Computers-Integrated Systems | 7.5 | ||||||
| Computer Aided Design | 6.1 | ||||||
| Industry Audio & Video Production | 5.5 | ||||||
| Data Processing/Management | 5.5 | ||||||
| Internet Application Software | 5.4 | ||||||
| Internet Security | 5.2 | ||||||
| Networking Products | 3.7 | ||||||
| E-Services/Consulting | 3.4 | ||||||
| Medical Information System | 3.1 | ||||||
| Computer Software | 3.0 | ||||||
| Internet Infrastructure Software | 2.8 | ||||||
| Electronic Design Automation | 2.5 | ||||||
| Transactional Software | 2.3 | ||||||
| Identification System/Development | 2.3 | ||||||
| Decision Support Software | 2.1 | ||||||
| Money Market Fund | 0.1 | ||||||
| Other | (0.1 | ) | |||||
Style Allocation (% of the Fund's)
Total Investments) as of April 30, 2009
| Mid-Cap Growth | 33.7 | ||||||
| Small-Cap Growth | 32.4 | ||||||
| Small-Cap Value | 14.1 | ||||||
| Large-Cap Growth | 8.8 | ||||||
| Mid-Cap Value | 6.1 | ||||||
| Large-Cap Value | 4.9 | ||||||
Top Ten Fund Holdings (% of the Fund's
Net Assets) as of April 30, 2009
| Security | |||||||
| Autodesk, Inc. | 6.1 | ||||||
| Dolby Laboratories, Inc., Class A | 5.5 | ||||||
| McAfee, Inc. | 5.2 | ||||||
| Red Hat, Inc. | 4.9 | ||||||
| Microsoft Corp. | 4.9 | ||||||
| Oracle Corp. | 4.8 | ||||||
| BMC Software, Inc. | 4.6 | ||||||
| CA, Inc. | 4.0 | ||||||
| Acme Packet, Inc. | 3.7 | ||||||
| Websense, Inc. | 3.4 | ||||||
| Total | 47.1 | ||||||
34
Manager's Analysis (Continued)
PowerShares Dynamic Software Portfolio (ticker: PSJ)
Growth of a $10,000 Investment Since Inception†
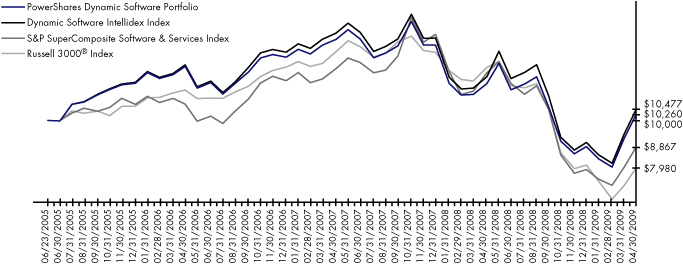
| Fund Performance History (%) | As of April 30, 2009 | ||||||||||||||||||
| Avg Ann†† | Fund Inception† | ||||||||||||||||||
| 1 Year | 3 Year | Avg Ann†† | Cumulative | ||||||||||||||||
| Index | |||||||||||||||||||
| Dynamic Software IntellidexSM Index | -11.69 | -5.39 | 1.22 | 4.77 | |||||||||||||||
| S&P SuperComposite Software & Services Index | -26.32 | -6.07 | -3.09 | -11.33 | |||||||||||||||
| Russell 3000® Index | -34.95 | -10.94 | -5.72 | -20.20 | |||||||||||||||
| Fund | |||||||||||||||||||
| NAV Return | -12.32 | -5.89 | 0.67 | 2.60 | |||||||||||||||
| Share Price Return | -12.37 | -5.92 | 0.65 | 2.53 | |||||||||||||||
Fund Inception: June 23, 2005
Performance quoted represents past performance. Past performance is not a guarantee of future results and current performance may be higher or lower than performance quoted. Investment returns and principal value will fluctuate and shares, when redeemed, may be worth more or less than their original cost. The Adviser has waived fees and reimbursed other expenses, absent which, performance would have been lower. The Adviser has contractually agreed to waive fees and/or pay certain Fund expenses through August 31, 2010. According to the Fund's current prospectus, the total gross annual operating expense ratio was indicated as 0.78%. In the Financial Highlights section of this Shareholder Report, the Fund's net (subsidized) total operating expense ratio was determined to be 0.63% while the Fund's gross total operating expense ratio was 0.97%. NAV and Share Price returns assume that dividends and capital gain distributions have been reinvested in the Fund at NAV and Share Price, respectively. The returns shown in the table above do not reflect the deduction of taxes that a shareholder would pay on Fund distributions or the redemption or sale of Fund Shares. See invescopowershares.com to find the most recent month-end performance numbers.
Index performance results are based upon a hypothetical investment in its constituent securities. Index returns do not represent Fund returns. An investor cannot invest directly in an index. The Index does not charge management fees or brokerage expenses, and no such fees or expenses were deducted from the hypothetical performance shown. In addition, the results actual investors might have achieved would have differed from those shown because of differences in the timing, amounts of their investments, and fees and expenses associated with an investment in the Fund.
The S&P SuperComposite Software & Services Index and Russell 3000® Index (the "Benchmark Indices") are unmanaged indices used as a measurement of change in stock market conditions based on the average performance of approximately 99 and 2918 common stocks, respectively. The S&P SuperComposite Software & Services Index will be used for comparative purposes going forward as this represents a more appropriate market index for this Fund.
† Fund and underlying Index returns are based on the inception date of the Fund. Returns for the Benchmark Indices are based on the closest month-end to the Fund's inception date.
†† Average annualized.
35
Frequency Distribution of Discounts & Premiums
Since Inception through April 30, 2009
| Closing Price Above NAV (bps) | |||||||||||||||||||||||||||||||||||||||
| Ticker | Fund Name | Inception | Days | 0-24 | 25-49 | 50-99 | 100-149 | 150-199 | 200+ | ||||||||||||||||||||||||||||||
| PJB | PowerShares Dynamic Banking Portfolio | 10/12/06 | 641 | 247 | 33 | 9 | 7 | 1 | 3 | ||||||||||||||||||||||||||||||
| PBE | PowerShares Dynamic Biotechnology & Genome Portfolio | 6/23/05 | 970 | 410 | 36 | 3 | 1 | 0 | 0 | ||||||||||||||||||||||||||||||
| PKB | PowerShares Dynamic Building & Construction Portfolio | 10/26/05 | 883 | 309 | 38 | 14 | 1 | 1 | 1 | ||||||||||||||||||||||||||||||
| PXE | PowerShares Dynamic Energy Exploration & Production Portfolio | 10/26/05 | 883 | 386 | 22 | 6 | 1 | 0 | 1 | ||||||||||||||||||||||||||||||
| PBJ | PowerShares Dynamic Food & Beverage Portfolio | 6/23/05 | 970 | 416 | 31 | 8 | 3 | 0 | 0 | ||||||||||||||||||||||||||||||
| PHW | PowerShares Dynamic Hardware & Consumer Electronics Portfolio | 12/6/05 | 855 | 326 | 20 | 6 | 3 | 1 | 4 | ||||||||||||||||||||||||||||||
| PTJ | PowerShares Dynamic Healthcare Services Portfolio | 10/12/06 | 641 | 218 | 11 | 4 | 1 | 0 | 0 | ||||||||||||||||||||||||||||||
| PIC | PowerShares Dynamic Insurance Portfolio | 10/26/05 | 883 | 369 | 24 | 16 | 1 | 3 | 1 | ||||||||||||||||||||||||||||||
| PEJ | PowerShares Dynamic Leisure and Entertainment Portfolio | 6/23/05 | 970 | 358 | 28 | 13 | 0 | 0 | 0 | ||||||||||||||||||||||||||||||
| PBS | PowerShares Dynamic Media Portfolio | 6/23/05 | 970 | 342 | 27 | 4 | 1 | 0 | 1 | ||||||||||||||||||||||||||||||
| PXQ | PowerShares Dynamic Networking Portfolio | 6/23/05 | 970 | 393 | 31 | 9 | 0 | 0 | 0 | ||||||||||||||||||||||||||||||
| PXJ | PowerShares Dynamic Oil & Gas Services Portfolio | 10/26/05 | 883 | 342 | 51 | 16 | 0 | 0 | 1 | ||||||||||||||||||||||||||||||
| PJP | PowerShares Dynamic Pharmaceuticals Portfolio | 6/23/05 | 970 | 478 | 18 | 9 | 2 | 0 | 0 | ||||||||||||||||||||||||||||||
| PMR | PowerShares Dynamic Retail Portfolio | 10/26/05 | 883 | 339 | 28 | 8 | 1 | 0 | 0 | ||||||||||||||||||||||||||||||
| PSI | PowerShares Dynamic Semiconductors Portfolio | 6/23/05 | 970 | 432 | 32 | 7 | 1 | 2 | 2 | ||||||||||||||||||||||||||||||
| PSJ | PowerShares Dynamic Software Portfolio | 6/23/05 | 970 | 487 | 22 | 12 | 5 | 2 | 0 | ||||||||||||||||||||||||||||||
36
| Closing Price Below NAV (bps) | |||||||||||||||||||||||||||
| Ticker | -0-24 | -25-49 | -50-99 | -100-149 | -150-199 | -200+ | |||||||||||||||||||||
| PJB | 305 | 31 | 4 | 0 | 1 | 0 | |||||||||||||||||||||
| PBE | 465 | 45 | 9 | 1 | 0 | 0 | |||||||||||||||||||||
| PKB | 492 | 23 | 3 | 0 | 1 | 0 | |||||||||||||||||||||
| PXE | 435 | 24 | 7 | 0 | 1 | 0 | |||||||||||||||||||||
| PBJ | 489 | 23 | 0 | 0 | 0 | 0 | |||||||||||||||||||||
| PHW | 470 | 17 | 3 | 3 | 1 | 1 | |||||||||||||||||||||
| PTJ | 398 | 9 | 0 | 0 | 0 | 0 | |||||||||||||||||||||
| PIC | 441 | 21 | 3 | 3 | 1 | 0 | |||||||||||||||||||||
| PEJ | 556 | 14 | 1 | 0 | 0 | 0 | |||||||||||||||||||||
| PBS | 561 | 32 | 2 | 0 | 0 | 0 | |||||||||||||||||||||
| PXQ | 514 | 22 | 1 | 0 | 0 | 0 | |||||||||||||||||||||
| PXJ | 448 | 20 | 5 | 0 | 0 | 0 | |||||||||||||||||||||
| PJP | 444 | 17 | 2 | 0 | 0 | 0 | |||||||||||||||||||||
| PMR | 478 | 27 | 2 | 0 | 0 | 0 | |||||||||||||||||||||
| PSI | 474 | 15 | 2 | 2 | 0 | 1 | |||||||||||||||||||||
| PSJ | 431 | 7 | 3 | 0 | 1 | 0 | |||||||||||||||||||||
37
Fees and Expenses
As a shareholder of a Fund of the PowerShares Exchange-Traded Fund Trust, you incur Fund expenses. The expense examples below are intended to help you understand your ongoing costs (in dollars) of investing in the Funds and to compare these costs with the ongoing costs of investing in other funds.
The example is based on an investment of $1,000 invested at the beginning of the period and held through the six-month period ended April 30, 2009.
Actual Expenses
The first line in the following tables provides information about actual account values and actual expenses. You may use the information in this line, together with the amount you invested, to estimate the expenses that you paid over the period. Simply divide your account value by $1,000 (for example, an $8,600 account value divided by $1,000 = 8.6), then multiply the result by the number in the first line under the heading "Expenses Paid During the Six-Month Period" to estimate the expenses you paid on your account during this period.
Hypothetical Example for Comparison Purposes
The second line in the following tables provides information about hypothetical account values and hypothetical expenses based on the Funds' actual expense ratio and an assumed annualized rate of return of 5% per year before expenses, which is not the Funds' actual return. The hypothetical account values and expenses may not be used to estimate the actual ending account balance or expenses you paid for the period. You may use this information to compare the ongoing costs of investing in the Funds and other funds. To do so, compare this 5% hypothetical example with the 5% hypothetical examples that appear in the shareholder reports of the other funds.
Please note that the expenses shown in the tables are meant to highlight your ongoing costs only, and do not reflect any transactional costs such as sales charges (loads). Therefore the second line in the table is useful in comparing ongoing costs only, and will not help you determine the relative total costs of owning different funds. In addition, if these transactional costs were included, your costs would have been higher.
| Beginning Account Value November 1, 2008 | Ending Account Value April 30, 2009 | Annualized Expense Ratio Based on the Six-Month Period | Expenses Paid During the Six-Month Period (1) | ||||||||||||||||
| PowerShares Dynamic Banking Portfolio Actual | $ | 1,000.00 | $ | 668.82 | 0.65 | % | $ | 2.69 | |||||||||||
| Hypothetical (5% return before expenses) | $ | 1,000.00 | $ | 1,021.57 | 0.65 | % | $ | 3.26 | |||||||||||
| PowerShares Dynamic Biotechnology & Genome Portfolio Actual | $ | 1,000.00 | $ | 875.77 | 0.63 | % | $ | 2.93 | |||||||||||
| Hypothetical (5% return before expenses) | $ | 1,000.00 | $ | 1,021.67 | 0.63 | % | $ | 3.16 | |||||||||||
| PowerShares Dynamic Building & Construction Portfolio Actual | $ | 1,000.00 | $ | 1,027.28 | 0.63 | % | $ | 3.17 | |||||||||||
| Hypothetical (5% return before expenses) | $ | 1,000.00 | $ | 1,021.67 | 0.63 | % | $ | 3.16 | |||||||||||
| PowerShares Dynamic Energy Exploration & Production Portfolio Actual | $ | 1,000.00 | $ | 824.32 | 0.63 | % | $ | 2.85 | |||||||||||
| Hypothetical (5% return before expenses) | $ | 1,000.00 | $ | 1,021.67 | 0.63 | % | $ | 3.16 | |||||||||||
38
Fees and Expenses (Continued)
| Beginning Account Value November 1, 2008 | Ending Account Value April 30, 2009 | Annualized Expense Ratio Based on the Six-Month Period | Expenses Paid During the Six-Month Period (1) | ||||||||||||||||
| PowerShares Dynamic Food & Beverage Portfolio Actual | $ | 1,000.00 | $ | 961.57 | 0.63 | % | $ | 3.06 | |||||||||||
| Hypothetical (5% return before expenses) | $ | 1,000.00 | $ | 1,021.67 | 0.63 | % | $ | 3.16 | |||||||||||
| PowerShares Dynamic Hardware & Consumer Electronics Portfolio Actual | $ | 1,000.00 | $ | 968.75 | 0.58 | % | $ | 2.83 | |||||||||||
| Hypothetical (5% return before expenses) | $ | 1,000.00 | $ | 1,021.92 | 0.58 | % | $ | 2.91 | |||||||||||
| PowerShares Dynamic Healthcare Services Portfolio Actual | $ | 1,000.00 | $ | 885.25 | 0.65 | % | $ | 3.04 | |||||||||||
| Hypothetical (5% return before expenses) | $ | 1,000.00 | $ | 1,021.57 | 0.65 | % | $ | 3.26 | |||||||||||
| PowerShares Dynamic Insurance Portfolio Actual | $ | 1,000.00 | $ | 877.05 | 0.63 | % | $ | 2.93 | |||||||||||
| Hypothetical (5% return before expenses) | $ | 1,000.00 | $ | 1,021.67 | 0.63 | % | $ | 3.16 | |||||||||||
| PowerShares Dynamic Leisure and Entertainment Portfolio Actual | $ | 1,000.00 | $ | 1,142.73 | 0.63 | % | $ | 3.35 | |||||||||||
| Hypothetical (5% return before expenses) | $ | 1,000.00 | $ | 1,021.67 | 0.63 | % | $ | 3.16 | |||||||||||
| PowerShares Dynamic Media Portfolio Actual | $ | 1,000.00 | $ | 1,065.89 | 0.63 | % | $ | 3.23 | |||||||||||
| Hypothetical (5% return before expenses) | $ | 1,000.00 | $ | 1,021.67 | 0.63 | % | $ | 3.16 | |||||||||||
| PowerShares Dynamic Networking Portfolio Actual | $ | 1,000.00 | $ | 1,148.18 | 0.63 | % | $ | 3.36 | |||||||||||
| Hypothetical (5% return before expenses) | $ | 1,000.00 | $ | 1,021.67 | 0.63 | % | $ | 3.16 | |||||||||||
| PowerShares Dynamic Oil & Gas Services Portfolio Actual | $ | 1,000.00 | $ | 887.87 | 0.60 | % | $ | 2.81 | |||||||||||
| Hypothetical (5% return before expenses) | $ | 1,000.00 | $ | 1,021.82 | 0.60 | % | $ | 3.01 | |||||||||||
| PowerShares Dynamic Pharmaceuticals Portfolio Actual | $ | 1,000.00 | $ | 900.99 | 0.63 | % | $ | 2.97 | |||||||||||
| Hypothetical (5% return before expenses) | $ | 1,000.00 | $ | 1,021.67 | 0.63 | % | $ | 3.16 | |||||||||||
| PowerShares Dynamic Retail Portfolio Actual | $ | 1,000.00 | $ | 1,157.82 | 0.63 | % | $ | 3.37 | |||||||||||
| Hypothetical (5% return before expenses) | $ | 1,000.00 | $ | 1,021.67 | 0.63 | % | $ | 3.16 | |||||||||||
| PowerShares Dynamic Semiconductors Portfolio Actual | $ | 1,000.00 | $ | 994.55 | 0.63 | % | $ | 3.12 | |||||||||||
| Hypothetical (5% return before expenses) | $ | 1,000.00 | $ | 1,021.67 | 0.63 | % | $ | 3.16 | |||||||||||
| PowerShares Dynamic Software Portfolio Actual | $ | 1,000.00 | $ | 1,125.18 | 0.63 | % | $ | 3.32 | |||||||||||
| Hypothetical (5% return before expenses) | $ | 1,000.00 | $ | 1,021.67 | 0.63 | % | $ | 3.16 | |||||||||||
(1) Expenses are calculated using the annualized expense ratio, which represents the ongoing expenses as a percentage of net assets for the six months ended April 30, 2009. Expenses are calculated by multiplying the Fund's annualized expense ratio by the average account value for the period; then multiplying the result by 181 and then dividing the result by 365. Expense ratios for the most recent half-year differ from expenses ratios based on the annualized data in the Financial Highlights.
39
Schedule of Investments
PowerShares Dynamic Banking Portfolio
April 30, 2009
| Number of Shares | Value | ||||||||||
| Common Stocks—99.9% | |||||||||||
| Commercial Banks - Central U.S.—30.1% | |||||||||||
| 52,427 | BancFirst Corp. | $ | 2,238,633 | ||||||||
| 216,485 | Bank Mutual Corp | 2,223,301 | |||||||||
| 96,569 | Commerce Bancshares, Inc. | 3,196,434 | |||||||||
| 77,916 | Cullen/Frost Bankers, Inc. | 3,669,065 | |||||||||
| 56,464 | First Financial Corp. | 2,094,814 | |||||||||
| 124,361 | FirstMerit Corp. | 2,413,847 | |||||||||
| 182,744 | International Bancshares Corp. | 2,468,871 | |||||||||
| 71,685 | Prosperity Bancshares, Inc. | 1,990,692 | |||||||||
| 48,230 | Umb Financial Corporation | 2,207,487 | |||||||||
| 22,503,144 | |||||||||||
| Commercial Banks - Eastern U.S.—10.1% | |||||||||||
| 106,919 | Community Bank System, Inc. | 1,758,818 | |||||||||
| 93,091 | NBT Bancorp, Inc. | 2,204,395 | |||||||||
| 70,332 | Suffolk Bancorp | 1,800,499 | |||||||||
| 302,368 | TrustCo Bank Corp. NY | 1,814,208 | |||||||||
| 7,577,920 | |||||||||||
| Commercial Banks - Southern U.S.—28.5% | |||||||||||
| 88,161 | Bank of the Ozarks, Inc. | 2,189,038 | |||||||||
| 70,606 | Community Trust Bancorp, Inc. | 2,136,538 | |||||||||
| 17,095 | First Citizens BancShares, Inc., Class A | 2,045,759 | |||||||||
| 375,488 | First Horizon National Corp. | 4,321,867 | |||||||||
| 64,498 | Hancock Holding Co. | 2,442,539 | |||||||||
| 42,344 | IBERIABANK Corp. | 1,934,274 | |||||||||
| 77,484 | S.Y. Bancorp, Inc. | 1,954,146 | |||||||||
| 102,825 | Trustmark Corp. | 2,235,416 | |||||||||
| 103,172 | WesBanco, Inc. | 2,052,091 | |||||||||
| 21,311,668 | |||||||||||
| Commercial Banks - Western U.S.—5.7% | |||||||||||
| 57,095 | Bank of Hawaii Corp. | 2,006,318 | |||||||||
| 138,693 | Trico Bancshares | 2,219,088 | |||||||||
| 4,225,406 | |||||||||||
| Fiduciary Banks—4.4% | |||||||||||
| 60,375 | Northern Trust Corp. | 3,281,985 | |||||||||
| S&L/Thrifts - Central U.S.—9.2% | |||||||||||
| 90,566 | Capitol Federal Financial | 3,528,451 | |||||||||
| 287,137 | TFS Financial Corp. | 3,368,117 | |||||||||
| 6,896,568 | |||||||||||
| S&L/Thrifts - Eastern U.S.—11.9% | |||||||||||
| 323,411 | Hudson City Bancorp, Inc. | 4,062,042 | |||||||||
| 192,634 | People's United Financial | 3,008,943 | |||||||||
| 214,206 | Provident New York Bancorp | 1,814,325 | |||||||||
| 8,885,310 | |||||||||||
| Total Common Stocks (Cost $87,465,252) | 74,682,001 | ||||||||||
| Number of Shares | Value | ||||||||||
| Money Market Fund—0.1% | |||||||||||
| 115,580 | Goldman Sachs Financial Square Prime Obligations Institutional Share Class (Cost $115,580) | $ | 115,580 | ||||||||
| Total Investments (Cost $87,580,832)—100.0% | 74,797,581 | ||||||||||
| Liabilities in excess of other assets—(0.0%) | (23,726 | ) | |||||||||
| Net Assets—100.0% | $ | 74,773,855 | |||||||||
See Notes to Financial Statements.
40
Schedule of Investments
PowerShares Dynamic Biotechnology & Genome Portfolio
April 30, 2009
| Number of Shares | Value | ||||||||||
| Common Stocks—100.0% | |||||||||||
| Biotechnology—51.3% | |||||||||||
| 109,779 | Abraxis Bioscience, Inc.* | $ | 5,324,282 | ||||||||
| 131,340 | Amgen, Inc.* | 6,366,050 | |||||||||
| 139,584 | Biogen Idec, Inc.* | 6,747,491 | |||||||||
| 246,680 | Cubist Pharmaceuticals, Inc.* | 4,094,888 | |||||||||
| 662,793 | Enzon Pharmaceuticals, Inc.* | 3,811,060 | |||||||||
| 181,573 | Emergent Biosolutions, Inc.* | 1,944,647 | |||||||||
| 811,419 | Exelixis, Inc.* | 4,000,296 | |||||||||
| 143,448 | Gilead Sciences, Inc.* | 6,569,918 | |||||||||
| 863,382 | Immunogen, Inc.* | 6,000,505 | |||||||||
| 232,968 | InterMune, Inc.* | 3,154,387 | |||||||||
| 504,486 | Maxygen, Inc.* | 2,951,243 | |||||||||
| 116,717 | Millipore Corp.* | 6,897,974 | |||||||||
| 770,589 | NPS Pharmaceuticals, Inc.* | 2,666,238 | |||||||||
| 102,820 | OSI Pharmaceuticals, Inc.* | 3,451,667 | |||||||||
| 597,160 | PDL BioPharma, Inc. | 4,269,694 | |||||||||
| 246,047 | Regeneron Pharmaceuticals, Inc.* | 3,262,583 | |||||||||
| 71,512,923 | |||||||||||
| Chemicals—5.7% | |||||||||||
| 180,013 | Sigma-Aldrich Corp. | 7,891,770 | |||||||||
| Electronics—12.9% | |||||||||||
| 74,934 | Dionex Corp.* | 4,720,842 | |||||||||
| 154,898 | Varian, Inc.* | 5,114,732 | |||||||||
| 182,466 | Waters Corp.* | 8,059,523 | |||||||||
| 17,895,097 | |||||||||||
| Healthcare - Products—8.5% | |||||||||||
| 200,697 | SurModics, Inc.* | 4,355,125 | |||||||||
| 131,554 | Techne Corp. | 7,527,520 | |||||||||
| 11,882,645 | |||||||||||
| Pharmaceuticals—21.6% | |||||||||||
| 347,834 | Alkermes, Inc.* | 2,660,930 | |||||||||
| 1,864,987 | Dyax Corp.* | 3,655,375 | |||||||||
| 780,697 | Nektar Therapeutics* | 4,371,903 | |||||||||
| 431,160 | Noven Pharmaceuticals, Inc.* | 4,449,571 | |||||||||
| 116,911 | Onyx Pharmaceuticals, Inc.* | 3,027,995 | |||||||||
| 2,577,449 | Synta Pharmaceuticals Corp.*(~) | 8,376,709 | |||||||||
| 251,519 | Theravance, Inc.* | 3,604,267 | |||||||||
| 30,146,750 | |||||||||||
| Total Common Stocks (Cost $161,862,935)—100.0% | 139,329,185 | ||||||||||
| Liabilities in excess of other assets—(0.0%) | (32,589 | ) | |||||||||
| Net Assets—100.0% | $ | 139,296,596 | |||||||||
* Non-income producing security.
(~) Affiliated Investment. See Note 5.
See Notes to Financial Statements.
41
Schedule of Investments
PowerShares Dynamic Building & Construction Portfolio
April 30, 2009
| Number of Shares | Value | ||||||||||
| Common Stocks—100.0% | |||||||||||
| Building Materials—15.3% | |||||||||||
| 65,140 | AAON, Inc. | $ | 1,268,927 | ||||||||
| 106,754 | Apogee Enterprises, Inc. | 1,430,504 | |||||||||
| 79,106 | Armstrong World Industries, Inc.* | 1,438,147 | |||||||||
| 106,191 | Comfort Systems USA, Inc. | 1,145,801 | |||||||||
| 154,109 | Gibraltar Industries, Inc. | 1,032,530 | |||||||||
| 112,205 | Trex Co., Inc.* | 1,228,645 | |||||||||
| 7,544,554 | |||||||||||
| Commercial Services—2.8% | |||||||||||
| 64,720 | McGrath Rentcorp | 1,368,181 | |||||||||
| Distribution/Wholesale—3.0% | |||||||||||
| 92,157 | Beacon Roofing Supply, Inc.* | 1,465,296 | |||||||||
| Engineering & Construction—36.8% | |||||||||||
| 75,558 | Aecom Technology Corp.* | 1,944,107 | |||||||||
| 218,821 | Dycom Industries, Inc.* | 1,842,473 | |||||||||
| 65,605 | EMCOR Group, Inc.* | 1,363,928 | |||||||||
| 55,743 | Fluor Corp. | 2,110,987 | |||||||||
| 28,414 | Granite Construction, Inc. | 1,120,932 | |||||||||
| 83,000 | Insituform Technologies, Inc., Class A* | 1,272,390 | |||||||||
| 54,933 | Jacobs Engineering Group, Inc.* | 2,089,651 | |||||||||
| 62,137 | Layne Christensen Co.* | 1,345,887 | |||||||||
| 31,580 | Michael Baker Corp.* | 1,061,088 | |||||||||
| 67,669 | Sterling Construction Co., Inc.* | 1,270,147 | |||||||||
| 59,941 | URS Corp.* | 2,641,001 | |||||||||
| 18,062,591 | |||||||||||
| Environmental Control—2.3% | |||||||||||
| 45,130 | Tetra Tech, Inc.* | 1,108,393 | |||||||||
| Home Builders—10.5% | |||||||||||
| 5,572 | NVR, Inc.* | 2,815,922 | |||||||||
| 201,898 | Pulte Homes, Inc. | 2,323,846 | |||||||||
| 5,139,768 | |||||||||||
| Home Furnishings—2.9% | |||||||||||
| 69,867 | American Woodmark Corp. | 1,446,247 | |||||||||
| Metal Fabricate/Hardware—6.0% | |||||||||||
| 47,309 | LB Foster Co., Class A* | 1,549,370 | |||||||||
| 37,100 | Northwest Pipe Co.* | 1,407,203 | |||||||||
| 2,956,573 | |||||||||||
| Miscellaneous Manufacturing—2.5% | |||||||||||
| 20,684 | Ameron International Corp. | 1,223,872 | |||||||||
| Office Furnishings—5.3% | |||||||||||
| 453,345 | Interface, Inc., Class A | 2,624,868 | |||||||||
| Retail—9.9% | |||||||||||
| 88,721 | Home Depot, Inc. | 2,335,137 | |||||||||
| 117,008 | Lowe's Cos., Inc. | 2,515,672 | |||||||||
| 4,850,809 | |||||||||||
| Number of Shares | Value | ||||||||||
| Common Stocks (Continued) | |||||||||||
| Telecommunications—2.7% | |||||||||||
| 106,865 | MasTec, Inc.* | $ | 1,336,881 | ||||||||
| Total Common Stocks (Cost $45,731,867) | 49,128,033 | ||||||||||
| Money Market Fund—0.1% | |||||||||||
| 56,143 | Goldman Sachs Financial Square Prime Obligations Institutional Share Class (Cost $56,143) | 56,143 | |||||||||
| Total Investments (Cost $45,788,010)—100.1% | 49,184,176 | ||||||||||
| Liabilities in excess of other assets—(0.1%) | (42,189 | ) | |||||||||
| Net Assets—100.0% | $ | 49,141,987 | |||||||||
* Non-income producing security.
See Notes to Financial Statements.
42
Schedule of Investments
PowerShares Dynamic Energy Exploration & Production Portfolio
April 30, 2009
| Number of Shares | Value | ||||||||||
| Common Stocks and Other Equity Interests—100.0% | |||||||||||
| Gas - Distribution—5.5% | |||||||||||
| 43,713 | Energen Corp. | $ | 1,578,914 | ||||||||
| 38,651 | National Fuel Gas Co. | 1,264,274 | |||||||||
| 2,843,188 | |||||||||||
| Oil Companies - Exploration & Production—67.0% | |||||||||||
| 61,452 | Anadarko Petroleum Corp. | 2,646,123 | |||||||||
| 54,692 | Arena Resources, Inc.* | 1,568,020 | |||||||||
| 60,574 | Bill Barrett Corp.* | 1,573,713 | |||||||||
| 187,440 | BreitBurn Energy Partners LP | 1,188,370 | |||||||||
| 46,748 | Clayton Williams Energy, Inc.* | 1,403,842 | |||||||||
| 53,714 | CNX Gas Corp.* | 1,383,136 | |||||||||
| 58,722 | Concho Resources, Inc.* | 1,610,157 | |||||||||
| 32,166 | Contango Oil & Gas Co.* | 1,218,770 | |||||||||
| 90,955 | Denbury Resources, Inc.* | 1,480,747 | |||||||||
| 49,181 | Devon Energy Corp. | 2,550,035 | |||||||||
| 58,342 | Encore Acquisition Co.* | 1,703,003 | |||||||||
| 89,770 | Encore Energy Partners LP | 1,499,159 | |||||||||
| 42,921 | EOG Resources, Inc. | 2,724,624 | |||||||||
| 59,047 | Goodrich Petroleum Corp.* | 1,353,948 | |||||||||
| 78,048 | Linn Energy LLC | 1,290,914 | |||||||||
| 41,407 | Occidental Petroleum Corp. | 2,330,800 | |||||||||
| 96,818 | Petroleum Development Corp.* | 1,569,420 | |||||||||
| 230,157 | Rosetta Resources, Inc.* | 1,622,607 | |||||||||
| 74,652 | Southwestern Energy Co.* | 2,677,020 | |||||||||
| 205,526 | VAALCO Energy, Inc.* | 980,359 | |||||||||
| 34,374,767 | |||||||||||
| Oil Companies - Integrated—20.0% | |||||||||||
| 35,377 | Chevron Corp. | 2,338,420 | |||||||||
| 172,279 | Delek US Holdings, Inc. | 1,769,305 | |||||||||
| 31,631 | Exxon Mobil Corp. | 2,108,839 | |||||||||
| 92,297 | Marathon Oil Corp. | 2,741,221 | |||||||||
| 28,019 | Murphy Oil Corp. | 1,336,786 | |||||||||
| 10,294,571 | |||||||||||
| Oil Refining & Marketing—7.5% | |||||||||||
| 248,199 | CVR Energy, Inc.* | 1,826,745 | |||||||||
| 85,824 | Frontier Oil Corp. | 1,090,823 | |||||||||
| 35,040 | Sunoco, Inc. | 928,910 | |||||||||
| 3,846,478 | |||||||||||
| Total Common Stocks and Other Equity Interests (Cost $55,346,727) | 51,359,004 | ||||||||||
| Number of Shares | Value | ||||||||||
| Money Market Fund—0.2% | |||||||||||
| 75,483 | Goldman Sachs Financial Square Prime Obligations Institutional Share Class (Cost $75,483) | $ | 75,483 | ||||||||
| Total Investments (Cost $55,422,210)—100.2% | 51,434,487 | ||||||||||
| Liabilities in excess of other assets—(0.2%) | (90,531 | ) | |||||||||
| Net Assets—100.0% | $ | 51,343,956 | |||||||||
* Non-income producing security.
See Notes to Financial Statements.
43
Schedule of Investments
PowerShares Dynamic Food & Beverage Portfolio
April 30, 2009
| Number of Shares | Value | ||||||||||
| Common Stocks—99.8% | |||||||||||
| Agricultural Operations—4.1% | |||||||||||
| 143,811 | Archer-Daniels-Midland Co. | $ | 3,540,627 | ||||||||
| Alternative Waste Technology—3.2% | |||||||||||
| 482,975 | Darling International, Inc.* | 2,762,617 | |||||||||
| Beverages - Non-alcoholic—14.2% | |||||||||||
| 182,166 | Coca-Cola Enterprises, Inc. | 3,107,752 | |||||||||
| 62,838 | Hansen Natural Corp.* | 2,561,277 | |||||||||
| 113,043 | Pepsi Bottling Group (The), Inc. | 3,534,855 | |||||||||
| 125,904 | PepsiAmericas, Inc. | 3,093,461 | |||||||||
| 12,297,345 | |||||||||||
| Beverages - Wine/Spirits—4.8% | |||||||||||
| 48,657 | Brown-Forman Corp., Class B | 2,262,551 | |||||||||
| 160,250 | Constellation Brands, Inc., Class A* | 1,857,298 | |||||||||
| 4,119,849 | |||||||||||
| Food - Canned—2.5% | |||||||||||
| 292,486 | Del Monte Foods Co. | 2,208,269 | |||||||||
| Food - Confectionery—2.6% | |||||||||||
| 62,074 | Hershey (The) Co. | 2,243,354 | |||||||||
| Food - Dairy Products—2.4% | |||||||||||
| 102,265 | Dean Foods Co.* | 2,116,886 | |||||||||
| Food - Miscellaneous/Diversified—26.6% | |||||||||||
| 68,142 | American Italian Pasta Co., Class A* | 2,142,384 | |||||||||
| 143,220 | Campbell Soup Co. | 3,683,618 | |||||||||
| 138,678 | ConAgra Foods, Inc. | 2,454,601 | |||||||||
| 73,058 | General Mills, Inc. | 3,703,310 | |||||||||
| 66,242 | J & J Snack Foods Corp. | 2,567,540 | |||||||||
| 98,509 | Kellogg Co. | 4,148,214 | |||||||||
| 53,788 | Lancaster Colony Corp. | 2,355,914 | |||||||||
| 66,707 | McCormick & Co., Inc. | 1,964,521 | |||||||||
| 23,020,102 | |||||||||||
| Food - Retail—10.8% | |||||||||||
| 207,242 | Safeway, Inc. | 4,093,030 | |||||||||
| 75,361 | Weis Markets, Inc. | 2,787,603 | |||||||||
| 216,264 | Winn-Dixie Stores, Inc.* | 2,478,385 | |||||||||
| 9,359,018 | |||||||||||
| Food - Wholesale/Distribution—9.4% | |||||||||||
| 60,025 | Nash Finch Co. | 1,758,132 | |||||||||
| 136,684 | Spartan Stores, Inc. | 2,223,849 | |||||||||
| 178,324 | Sysco Corp. | 4,160,299 | |||||||||
| 8,142,280 | |||||||||||
| Number of Shares | Value | ||||||||||
| Common Stocks (Continued) | |||||||||||
| Retail - Restaurants—19.2% | |||||||||||
| 107,575 | Jack in the Box, Inc.* | $ | 2,645,269 | ||||||||
| 73,378 | McDonald's Corp. | 3,910,314 | |||||||||
| 47,485 | Panera Bread Co., Class A* | 2,659,635 | |||||||||
| 94,413 | Papa John's International, Inc.* | 2,505,721 | |||||||||
| 145,890 | Yum! Brands, Inc. | 4,865,431 | |||||||||
| 16,586,370 | |||||||||||
| Total Common Stocks (Cost $83,886,048) | 86,396,717 | ||||||||||
| Money Market Fund—0.2% | |||||||||||
| 155,831 | Goldman Sachs Financial Square Prime Obligations Institutional Share Class (Cost $155,831) | 155,831 | |||||||||
| Total Investments (Cost $84,041,879)—100.0% | 86,552,548 | ||||||||||
| Other assets less liabilities—0.0% | 39,890 | ||||||||||
| Net Assets—100.0% | $ | 86,592,438 | |||||||||
* Non-income producing security.
See Notes to Financial Statements.
44
Schedule of Investments
PowerShares Dynamic Hardware & Consumer Electronics Portfolio
April 30, 2009
| Number of Shares | Value | ||||||||||
| Common Stocks—100.0% | |||||||||||
| Computers—39.3% | |||||||||||
| 8,676 | 3PAR, Inc.* | $ | 66,458 | ||||||||
| 1,204 | Apple, Inc.* | 151,500 | |||||||||
| 12,605 | Dell, Inc.* | 146,471 | |||||||||
| 2,651 | Diebold, Inc. | 70,066 | |||||||||
| 6,590 | Electronics for Imaging, Inc.* | 64,714 | |||||||||
| 10,240 | EMC Corp.* | 128,307 | |||||||||
| 3,704 | Hewlett-Packard Co. | 133,270 | |||||||||
| 3,422 | Lexmark International, Inc., Class A* | 67,140 | |||||||||
| 7,405 | NCR Corp.* | 75,161 | |||||||||
| 2,826 | Synaptics, Inc.* | 91,788 | |||||||||
| 4,293 | Western Digital Corp.* | 100,971 | |||||||||
| 1,095,846 | |||||||||||
| Electronics—24.4% | |||||||||||
| 7,752 | Agilent Technologies, Inc.* | 141,551 | |||||||||
| 966 | American Science & Engineering, Inc. | 58,211 | |||||||||
| 6,003 | Benchmark Electronics, Inc.* | 72,816 | |||||||||
| 7,538 | Checkpoint Systems, Inc.* | 91,587 | |||||||||
| 8,549 | Daktronics, Inc. | 77,283 | |||||||||
| 3,426 | Garmin Ltd. | 86,301 | |||||||||
| 4,110 | Multi-Fineline Electronix, Inc.* | 82,488 | |||||||||
| 3,712 | OSI Systems, Inc.* | 69,600 | |||||||||
| 679,837 | |||||||||||
| Home Furnishings—2.2% | |||||||||||
| 8,272 | TiVo, Inc.* | 62,040 | |||||||||
| Internet—2.5% | |||||||||||
| 4,896 | Avocent Corp.* | 70,698 | |||||||||
| Machinery - Diversified—2.5% | |||||||||||
| 5,813 | Intermec, Inc.* | 70,221 | |||||||||
| Miscellaneous Manufacturing—4.6% | |||||||||||
| 5,363 | Tyco International Ltd. (Switzerland) | 127,425 | |||||||||
| Office/Business Equipment—9.4% | |||||||||||
| 5,574 | Pitney Bowes, Inc. | 136,786 | |||||||||
| 20,757 | Xerox Corp. | 126,825 | |||||||||
| 263,611 | |||||||||||
| Semiconductors—7.4% | |||||||||||
| 11,150 | Emulex Corp.* | 116,740 | |||||||||
| 6,361 | QLogic Corp.* | 90,199 | |||||||||
| 206,939 | |||||||||||
| Software—2.2% | |||||||||||
| 8,191 | Digi International, Inc.* | 59,549 | |||||||||
| Number of Shares | Value | ||||||||||
| Common Stocks (Continued) | |||||||||||
| Telecommunications—5.5% | |||||||||||
| 25,064 | Adaptec, Inc.* | $ | 71,683 | ||||||||
| 4,410 | Polycom, Inc.* | 82,202 | |||||||||
| 153,885 | |||||||||||
| Total Common Stocks (Cost $3,564,465) | 2,790,051 | ||||||||||
| Money Market Fund—1.1% | |||||||||||
| 31,783 | Goldman Sachs Financial Square Prime Obligations Institutional Share Class (Cost $31,783) | 31,783 | |||||||||
| Total Investments (Cost $3,596,248)—101.1% | 2,821,834 | ||||||||||
| Liabilities in excess of other assets—(1.1%) | (30,553 | ) | |||||||||
| Net Assets—100.0% | $ | 2,791,281 | |||||||||
* Non-income producing security.
See Notes to Financial Statements.
45
Schedule of Investments
PowerShares Dynamic Healthcare Services Portfolio
April 30, 2009
| Number of Shares | Value | ||||||||||
| Common Stocks—100.1% | |||||||||||
| Commercial Services—2.5% | |||||||||||
| 8,886 | HMS Holdings Corp.* | $ | 266,402 | ||||||||
| Dialysis Centers—4.5% | |||||||||||
| 10,548 | DaVita, Inc.* | 489,111 | |||||||||
| Diversified Operations/Commercial Services—2.7% | |||||||||||
| 6,781 | Chemed Corp. | 287,040 | |||||||||
| Hazardous Waste Disposal—2.4% | |||||||||||
| 5,627 | Stericycle, Inc.* | 264,919 | |||||||||
| Human Resources—5.5% | |||||||||||
| 41,468 | AMN Healthcare Services, Inc.* | 285,714 | |||||||||
| 8,816 | Emergency Medical Services Corp., Class A* | 307,149 | |||||||||
| 592,863 | |||||||||||
| Internet Application Software—2.6% | |||||||||||
| 55,662 | eResearchTechnology, Inc.* | 282,206 | |||||||||
| Medical Labs & Testing Services—7.5% | |||||||||||
| 8,904 | Genoptix, Inc.* | 258,928 | |||||||||
| 10,799 | Quest Diagnostics, Inc. | 554,313 | |||||||||
| 813,241 | |||||||||||
| Medical - HMO—23.4% | |||||||||||
| 10,895 | AMERIGROUP Corp.* | 325,434 | |||||||||
| 15,899 | Centene Corp.* | 292,065 | |||||||||
| 33,328 | Healthspring, Inc.* | 307,617 | |||||||||
| 20,910 | Humana, Inc.* | 601,791 | |||||||||
| 8,141 | Magellan Health Services, Inc.* | 240,648 | |||||||||
| 14,413 | Molina Healthcare, Inc.* | 312,041 | |||||||||
| 29,896 | WellCare Health Plans, Inc.* | 448,739 | |||||||||
| 2,528,335 | |||||||||||
| Medical - Hospitals—3.1% | |||||||||||
| 12,843 | LifePoint Hospitals, Inc.* | 331,992 | |||||||||
| Medical - Nursing Homes—5.2% | |||||||||||
| 20,406 | Ensign Group, Inc. (The) | 316,293 | |||||||||
| 18,760 | Kindred Healthcare, Inc.* | 244,255 | |||||||||
| 560,548 | |||||||||||
| Medical - Outpatient/Home Medical Care—8.4% | |||||||||||
| 15,578 | Gentiva Health Services, Inc.* | 248,158 | |||||||||
| 13,545 | LHC Group, Inc.* | 309,097 | |||||||||
| 22,073 | Res-Care, Inc.* | 353,609 | |||||||||
| 910,864 | |||||||||||
| Medical - Wholesale Drug Distribution—13.8% | |||||||||||
| 15,583 | AmerisourceBergen Corp. | 524,212 | |||||||||
| 15,252 | Cardinal Health, Inc. | 515,365 | |||||||||
| 12,065 | McKesson Corp. | 446,405 | |||||||||
| 1,485,982 | |||||||||||
| Number of Shares | Value | ||||||||||
| Common Stocks (Continued) | |||||||||||
| MRI/Medical Diagnostic Imaging—2.4% | |||||||||||
| 32,922 | Alliance Healthcare Services, Inc.* | $ | 259,096 | ||||||||
| Pharmacy Services—13.2% | |||||||||||
| 9,839 | Express Scripts, Inc.* | 629,401 | |||||||||
| 12,197 | Medco Health Solutions, Inc.* | 531,179 | |||||||||
| 10,412 | Omnicare, Inc. | 267,693 | |||||||||
| 1,428,273 | |||||||||||
| Physical Therapy/Rehabilitation Centers—2.9% | |||||||||||
| 18,452 | RehabCare Group, Inc.* | 308,148 | |||||||||
| Total Common Stocks (Cost $13,132,396) | 10,809,020 | ||||||||||
| Money Market Fund—0.3% | |||||||||||
| 38,009 | Goldman Sachs Financial Square Prime Obligations Institutional Share Class (Cost $38,009) | 38,009 | |||||||||
| Total Investments (Cost $13,170,405)—100.4% | 10,847,029 | ||||||||||
| Liabilities in excess of other assets—(0.4%) | (46,682 | ) | |||||||||
| Net Assets—100.0% | $ | 10,800,347 | |||||||||
* Non-income producing security.
See Notes to Financial Statements.
46
Schedule of Investments
PowerShares Dynamic Insurance Portfolio
April 30, 2009
| Number of Shares | Value | ||||||||||
| Common Stocks—99.9% | |||||||||||
| Insurance Brokers—4.8% | |||||||||||
| 30,401 | Aon Corp. | $ | 1,282,922 | ||||||||
| Life/Health Insurance—14.4% | |||||||||||
| 69,364 | Aflac, Inc. | 2,003,925 | |||||||||
| 114,197 | Unum Group | 1,865,979 | |||||||||
| 3,869,904 | |||||||||||
| Multi-line Insurance—23.2% | |||||||||||
| 31,841 | ACE Ltd. | 1,474,875 | |||||||||
| 40,752 | American Financial Group, Inc. | 716,420 | |||||||||
| 30,872 | Cincinnati Financial Corp. | 739,384 | |||||||||
| 28,889 | HCC Insurance Holdings, Inc. | 691,025 | |||||||||
| 82,460 | Horace Mann Educators Corp. | 723,999 | |||||||||
| 62,976 | MetLife, Inc. | 1,873,536 | |||||||||
| 6,219,239 | |||||||||||
| Property/Casualty Insurance—50.6% | |||||||||||
| 14,966 | American Physicians Capital, Inc. | 623,484 | |||||||||
| 11,743 | Arch Capital Group Ltd.* | 678,511 | |||||||||
| 75,670 | Amtrust Financial Services, Inc. | 690,867 | |||||||||
| 29,778 | Chubb (The) Corp. | 1,159,853 | |||||||||
| 43,582 | CNA Surety Corp.* | 838,954 | |||||||||
| 66,054 | Employers Holdings, Inc. | 550,890 | |||||||||
| 53,060 | First Mercury Financial Corp.* | 701,453 | |||||||||
| 17,092 | FPIC Insurance Group, Inc.* | 521,990 | |||||||||
| 21,308 | Harleysville Group, Inc. | 616,227 | |||||||||
| 110,090 | Meadowbrook Insurance Group, Inc. | 655,036 | |||||||||
| 12,141 | Navigators Group, Inc.* | 550,959 | |||||||||
| 13,269 | ProAssurance Corp.* | 583,040 | |||||||||
| 12,946 | RLI Corp. | 621,796 | |||||||||
| 20,277 | Safety Insurance Group, Inc. | 670,155 | |||||||||
| 65,238 | Seabright Insurance Holdings, Inc.* | 605,409 | |||||||||
| 31,100 | Tower Group, Inc. | 845,609 | |||||||||
| 32,159 | Travelers (The) Cos., Inc. | 1,323,021 | |||||||||
| 55,864 | W.R. Berkley Corp. | 1,335,708 | |||||||||
| 13,572,962 | |||||||||||
| Reinsurance—6.9% | |||||||||||
| 22,383 | Argo Group International Holdings Ltd. (Bermuda)* | 626,500 | |||||||||
| 29,101 | Aspen Insurance Holdings Ltd. (Bermuda) | 686,202 | |||||||||
| 13,648 | Odyssey Re Holdings Corp. | 522,582 | |||||||||
| 1,835,284 | |||||||||||
| Total Common Stocks (Cost $30,587,737) | 26,780,311 | ||||||||||
| Number of Shares | Value | ||||||||||
| Money Market Fund—0.2% | |||||||||||
| 59,416 | Goldman Sachs Financial Square Prime Obligations Institutional Share Class (Cost $59,416) | $ | 59,416 | ||||||||
| Total Investments (Cost $30,647,153)—100.1% | 26,839,727 | ||||||||||
| Liabilities in excess of other assets—(0.1%) | (30,847 | ) | |||||||||
| Net Assets—100.0% | $ | 26,808,880 | |||||||||
* Non-income producing security.
See Notes to Financial Statements.
47
Schedule of Investments
PowerShares Dynamic Leisure and Entertainment Portfolio
April 30, 2009
| Number of Shares | Value | ||||||||||
| Common Stocks—99.9% | |||||||||||
| Beverages—2.6% | |||||||||||
| 12,030 | Peet's Coffee & Tea, Inc.* | $ | 328,178 | ||||||||
| Commercial Services—4.4% | |||||||||||
| 73,859 | Live Nation, Inc.* | 288,789 | |||||||||
| 53,017 | Ticketmaster Entertainment, Inc.* | 278,869 | |||||||||
| 567,658 | |||||||||||
| Entertainment—18.5% | |||||||||||
| 13,937 | Bally Technologies, Inc.* | 364,871 | |||||||||
| 8,636 | Churchill Downs, Inc. | 300,619 | |||||||||
| 33,712 | Cinemark Holdings, Inc. | 300,037 | |||||||||
| 13,440 | DreamWorks Animation SKG, Inc., Class A* | 322,694 | |||||||||
| 13,411 | International Speedway Corp., Class A | 317,572 | |||||||||
| 24,502 | Scientific Games Corp., Class A* | 428,540 | |||||||||
| 21,840 | Speedway Motorsports, Inc. | 327,600 | |||||||||
| 2,361,933 | |||||||||||
| Internet—2.3% | |||||||||||
| 3,056 | Priceline.com, Inc.* | 296,707 | �� | ||||||||
| Leisure Time—8.7% | |||||||||||
| 24,298 | Carnival Corp. | 653,130 | |||||||||
| 14,297 | WMS Industries, Inc.* | 459,077 | |||||||||
| 1,112,207 | |||||||||||
| Lodging—3.1% | |||||||||||
| 31,311 | Marcus Corp. | 397,650 | |||||||||
| Media—14.7% | |||||||||||
| 30,642 | Discovery Communications, Inc., Class A* | 581,892 | |||||||||
| 27,440 | Liberty Media Corp. - Entertainment, Class A* | 668,164 | |||||||||
| 28,340 | Walt Disney (The) Co. | 620,646 | |||||||||
| 1,870,702 | |||||||||||
| Retail—43.3% | |||||||||||
| 8,397 | Buffalo Wild Wings, Inc.* | 327,819 | |||||||||
| 31,849 | Cheesecake Factory (The), Inc.* | 553,217 | |||||||||
| 11,584 | Cracker Barrel Old Country Store, Inc. | 377,754 | |||||||||
| 17,512 | Darden Restaurants, Inc. | 647,419 | |||||||||
| 60,715 | HSN, Inc.* | 419,541 | |||||||||
| 13,336 | Jack in the Box, Inc.* | 327,932 | |||||||||
| 9,098 | McDonald's Corp. | 484,832 | |||||||||
| 5,887 | Panera Bread Co., Class A* | 329,731 | |||||||||
| 13,159 | P.F. Chang's China Bistro, Inc.* | 397,139 | |||||||||
| 11,704 | Papa John's International, Inc.* | 310,624 | |||||||||
| 51,947 | Starbucks Corp.* | 751,153 | |||||||||
| 18,085 | Yum! Brands, Inc. | 603,135 | |||||||||
| 5,530,296 | |||||||||||
| Number of Shares | Value | ||||||||||
| Common Stocks (Continued) | |||||||||||
| Toys/Games/Hobbies—2.3% | |||||||||||
| 10,025 | Marvel Entertainment, Inc.* | $ | 299,146 | ||||||||
| Total Common Stocks (Cost $12,581,012) | 12,764,477 | ||||||||||
| Money Market Fund—0.3% | |||||||||||
| 38,048 | Goldman Sachs Financial Square Prime Obligations Institutional Share Class (Cost $38,048) | 38,048 | |||||||||
| Total Investments (Cost $12,619,060)—100.2% | 12,802,525 | ||||||||||
| Liabilities in excess of other assets—(0.2%) | (26,815 | ) | |||||||||
| Net Assets—100.0% | $ | 12,775,710 | |||||||||
* Non-income producing security.
See Notes to Financial Statements.
48
Schedule of Investments
PowerShares Dynamic Media Portfolio
April 30, 2009
| Number of Shares | Value | ||||||||||
| Common Stocks—100.0% | |||||||||||
| Advertising Agencies—6.1% | |||||||||||
| 44,722 | Interpublic Group of Cos., Inc.* | $ | 279,959 | ||||||||
| 7,091 | Omnicom Group, Inc. | 223,154 | |||||||||
| 503,113 | |||||||||||
| Advertising Sales—2.5% | |||||||||||
| 52,427 | Clear Channel Outdoor Holdings, Inc., Class A* | 201,320 | |||||||||
| Cable/Satellite TV—14.6% | |||||||||||
| 23,919 | Comcast Corp., Class A | 369,788 | |||||||||
| 15,667 | DIRECTV Group (The), Inc.* | 387,444 | |||||||||
| 15,146 | DISH Network Corp., Class A* | 200,685 | |||||||||
| 43,691 | Mediacom Communications Corp., Class A* | 248,602 | |||||||||
| 1,206,519 | |||||||||||
| Computer Services—2.1% | |||||||||||
| 4,182 | IHS, Inc., Class A* | 172,968 | |||||||||
| E-Commerce/Services—4.8% | |||||||||||
| 11,413 | IAC/InterActiveCorp* | 182,836 | |||||||||
| 105,182 | Move, Inc.* | 215,623 | |||||||||
| 398,459 | |||||||||||
| E-Marketing/Information—3.5% | |||||||||||
| 27,176 | ValueClick, Inc.* | 288,066 | |||||||||
| Human Resources—4.3% | |||||||||||
| 25,857 | Monster Worldwide, Inc.* | 356,827 | |||||||||
| Internet Content - Information/Network—5.3% | |||||||||||
| 29,078 | LoopNet, Inc.* | 249,780 | |||||||||
| 7,351 | WebMD Health Corp., Class A* | 189,729 | |||||||||
| 439,509 | |||||||||||
| Motion Pictures & Services—2.6% | |||||||||||
| 8,833 | DreamWorks Animation SKG, Inc., Class A* | 212,080 | |||||||||
| Multimedia—27.1% | |||||||||||
| 18,035 | Liberty Media Corp. - Entertainment, Class A* | 439,151 | |||||||||
| 8,637 | McGraw-Hill (The) Cos., Inc. | 260,406 | |||||||||
| 13,260 | Meredith Corp. | 332,561 | |||||||||
| 18,470 | Time Warner, Inc. | 403,200 | |||||||||
| 20,298 | Viacom, Inc., Class B* | 390,534 | |||||||||
| 18,627 | Walt Disney (The) Co. | 407,931 | |||||||||
| 2,233,783 | |||||||||||
| Publishing - Books—5.9% | |||||||||||
| 5,429 | John Wiley & Sons, Inc., Class A | 184,043 | |||||||||
| 15,477 | Scholastic Corp. | 305,361 | |||||||||
| 489,404 | |||||||||||
| Radio—1.9% | |||||||||||
| 31,672 | Cox Radio, Inc., Class A* | 152,026 | |||||||||
| Number of Shares | Value | ||||||||||
| Common Stocks (Continued) | |||||||||||
| Retail-Discount—3.3% | |||||||||||
| 39,904 | HSN, Inc.* | $ | 275,737 | ||||||||
| Schools—2.4% | |||||||||||
| 474 | Washington Post (The) Co., Class B | 198,412 | |||||||||
| Theaters—2.7% | |||||||||||
| 15,490 | National CineMedia, Inc. | 225,070 | |||||||||
| Toys—2.4% | |||||||||||
| 6,590 | Marvel Entertainment, Inc.* | 196,646 | |||||||||
| Web Portals/ISP—8.5% | |||||||||||
| 926 | Google, Inc., Class A* | 366,667 | |||||||||
| 23,613 | Yahoo!, Inc.* | 337,430 | |||||||||
| 704,097 | |||||||||||
| Total Common Stocks (Cost $9,545,500) | 8,254,036 | ||||||||||
| Money Market Fund—1.9% | |||||||||||
| 157,096 | Goldman Sachs Financial Square Prime Obligations Institutional Share Class (Cost $157,096) | 157,096 | |||||||||
| Total Investments (Cost $9,702,596)—101.9% | 8,411,132 | ||||||||||
| Liabilities in excess of other assets—(1.9%) | (156,927 | ) | |||||||||
| Net Assets—100.0% | $ | 8,254,205 | |||||||||
* Non-income producing security.
See Notes to Financial Statements.
49
Schedule of Investments
PowerShares Dynamic Networking Portfolio
April 30, 2009
| Number of Shares | Value | ||||||||||
| Common Stocks—100.0% | |||||||||||
| Computers—4.8% | |||||||||||
| 24,320 | Netscout Systems, Inc.* | $ | 218,637 | ||||||||
| 30,684 | Riverbed Technology, Inc.* | 562,131 | |||||||||
| 780,768 | |||||||||||
| Internet—18.1% | |||||||||||
| 29,448 | F5 Networks, Inc.* | 803,047 | |||||||||
| 21,071 | McAfee, Inc.* | 791,005 | |||||||||
| 72,680 | SonicWALL, Inc.* | 394,652 | |||||||||
| 65,031 | VASCO Data Security International, Inc.* | 450,015 | |||||||||
| 28,787 | Websense, Inc.* | 513,272 | |||||||||
| 2,951,991 | |||||||||||
| Semiconductors—15.1% | |||||||||||
| 61,075 | Emulex Corp.* | 639,454 | |||||||||
| 54,913 | Exar Corp.* | 337,715 | |||||||||
| 62,865 | PMC - Sierra, Inc.* | 497,891 | |||||||||
| 34,842 | QLogic Corp.* | 494,060 | |||||||||
| 14,668 | Silicon Laboratories, Inc.* | 487,858 | |||||||||
| 2,456,978 | |||||||||||
| Software—12.7% | |||||||||||
| 34,394 | ArcSight, Inc.* | 519,349 | |||||||||
| 28,619 | Citrix Systems, Inc.* | 816,500 | |||||||||
| 28,369 | VMware, Inc., Class A* | 739,864 | |||||||||
| 2,075,713 | |||||||||||
| Telecommunications—49.3% | |||||||||||
| 145,361 | 3Com Corp.* | 588,712 | |||||||||
| 73,175 | Acme Packet, Inc.* | 564,179 | |||||||||
| 22,247 | ADTRAN, Inc. | 470,524 | |||||||||
| 52,492 | Arris Group, Inc.* | 560,090 | |||||||||
| 59,051 | BigBand Networks, Inc.* | 346,039 | |||||||||
| 40,422 | Cisco Systems, Inc.* | 780,953 | |||||||||
| 8,499 | Comtech Telecommunications Corp.* | 284,462 | |||||||||
| 15,999 | Ems Technologies, Inc* | 304,781 | |||||||||
| 59,051 | Harmonic, Inc.* | 432,844 | |||||||||
| 41,445 | Juniper Networks, Inc.* | 897,284 | |||||||||
| 17,617 | QUALCOMM, Inc. | 745,551 | |||||||||
| 259,071 | Sonus Networks, Inc.* | 448,193 | |||||||||
| 127,478 | Sycamore Networks, Inc.* | 376,060 | |||||||||
| 26,204 | Tekelec* | 406,162 | |||||||||
| 154,989 | Tellabs, Inc.* | 812,142 | |||||||||
| 8,017,976 | |||||||||||
| Total Common Stocks (Cost $15,350,889) | 16,283,426 | ||||||||||
| Number of Shares | Value | ||||||||||
| Money Market Fund—0.2% | |||||||||||
| 27,558 | Goldman Sachs Financial Square Prime Obligations Institutional Share Class (Cost $27,558) | $ | 27,558 | ||||||||
| Total Investments (Cost $15,378,447)—100.2% | 16,310,984 | ||||||||||
| Liabilities in excess of other assets—(0.2%) | (34,812 | ) | |||||||||
| Net Assets—100.0% | $ | 16,276,172 | |||||||||
* Non-income producing security.
See Notes to Financial Statements.
50
Schedule of Investments
PowerShares Dynamic Oil & Gas Services Portfolio
April 30, 2009
| Number of Shares | Value | ||||||||||
| Common Stocks—99.9% | |||||||||||
| Oil Field Machinery & Equipment—19.8% | |||||||||||
| 302,967 | Cameron International Corp.* | $ | 7,749,896 | ||||||||
| 151,648 | Dresser-Rand Group, Inc.* | 3,735,090 | |||||||||
| 151,575 | Dril-Quip, Inc.* | 5,211,149 | |||||||||
| 120,276 | FMC Technologies, Inc.* | 4,117,047 | |||||||||
| 96,990 | Lufkin Industries, Inc. | 3,384,951 | |||||||||
| 218,527 | National Oilwell Varco, Inc.* | 6,616,998 | |||||||||
| 30,815,131 | |||||||||||
| Oil & Gas Drilling—23.7% | |||||||||||
| 93,250 | Diamond Offshore Drilling, Inc. | 6,752,233 | |||||||||
| 129,623 | ENSCO International, Inc. | 3,665,738 | |||||||||
| 328,128 | Nabors Industries Ltd. (Bermuda)* | 4,990,827 | |||||||||
| 237,545 | Noble Corp. (Switzerland) | 6,492,105 | |||||||||
| 829,720 | Pioneer Drilling Co.* | 4,148,600 | |||||||||
| 184,810 | Pride International, Inc.* | 4,195,187 | |||||||||
| 97,728 | Transocean Ltd.* | 6,594,685 | |||||||||
| 36,839,375 | |||||||||||
| Oil - Field Services—51.6% | |||||||||||
| 199,290 | Baker Hughes, Inc. | 7,090,738 | |||||||||
| 504,932 | Basic Energy Services, Inc.* | 5,150,306 | |||||||||
| 329,484 | BJ Services Co. | 4,576,533 | |||||||||
| 630,917 | Cal Dive International, Inc.* | 4,996,863 | |||||||||
| 91,661 | CARBO Ceramics, Inc. | 2,814,909 | |||||||||
| 42,257 | Core Laboratories N.V. (Netherlands) | 3,517,050 | |||||||||
| 358,138 | Halliburton Co. | 7,241,550 | |||||||||
| 1,024,478 | Helix Energy Solutions Group, Inc.* | 9,312,506 | |||||||||
| 1,193,305 | Key Energy Services, Inc.* | 5,238,609 | |||||||||
| 1,072,769 | Newpark Resources, Inc.* | 3,003,753 | |||||||||
| 546,505 | RPC, Inc. | 5,847,604 | |||||||||
| 153,473 | Schlumberger Ltd. | 7,518,642 | |||||||||
| 53,182 | SEACOR Holdings, Inc.* | 3,495,121 | |||||||||
| 241,555 | Superior Energy Services, Inc.* | 4,640,272 | |||||||||
| 554,109 | Superior Well Services, Inc.* | 5,928,966 | |||||||||
| 80,373,422 | |||||||||||
| Transport - Marine—4.8% | |||||||||||
| 123,877 | Overseas Shipholding Group, Inc. | 3,556,509 | |||||||||
| 90,207 | Tidewater, Inc. | 3,901,452 | |||||||||
| 7,457,961 | |||||||||||
| Total Common Stocks (Cost $201,953,068) | 155,485,889 | ||||||||||
| Number of Shares | Value | ||||||||||
| Money Market Fund—0.1% | |||||||||||
| 175,847 | Goldman Sachs Financial Square Prime Obligations Institutional Share Class (Cost $175,847) | $ | 175,847 | ||||||||
| Total Investments (Cost $202,128,915)—100.0% | 155,661,736 | ||||||||||
| Other assets less liabilities—0.0% | 54,001 | ||||||||||
| Net Assets—100.0% | $ | 155,715,737 | |||||||||
* Non-income producing security.
See Notes to Financial Statements.
51
Schedule of Investments
PowerShares Dynamic Pharmaceuticals Portfolio
April 30, 2009
| Number of Shares | Value | ||||||||||
| Common Stocks—100.0% | |||||||||||
| Consumer Products - Miscellaneous—3.1% | |||||||||||
| 502,812 | Prestige Brands Holdings, Inc.* | $ | 3,248,166 | ||||||||
| Cosmetics & Toiletries—2.3% | |||||||||||
| 43,360 | Chattem, Inc.* | 2,380,898 | |||||||||
| Medical Products—5.1% | |||||||||||
| 100,848 | Johnson & Johnson | 5,280,401 | |||||||||
| Medical - Biomedical/Genetics—20.2% | |||||||||||
| 103,052 | Amgen, Inc.* | 4,994,931 | |||||||||
| 59,739 | Biogen Idec, Inc.* | 2,887,783 | |||||||||
| 61,488 | Celgene Corp.* | 2,626,767 | |||||||||
| 45,140 | Genzyme Corp.* | 2,407,316 | |||||||||
| 112,553 | Gilead Sciences, Inc.* | 5,154,928 | |||||||||
| 1,014,900 | Ligand Pharmaceuticals, Inc., Class B* | 3,034,551 | |||||||||
| 21,106,276 | |||||||||||
| Medical - Drugs—53.3% | |||||||||||
| 106,513 | Abbott Laboratories | 4,457,569 | |||||||||
| 70,995 | Allergan, Inc. | 3,312,627 | |||||||||
| 273,893 | Bristol-Myers Squibb Co. | 5,258,745 | |||||||||
| 41,933 | Cephalon, Inc.* | 2,751,224 | |||||||||
| 93,615 | Eli Lilly & Co. | 3,081,806 | |||||||||
| 144,909 | Endo Pharmaceuticals Holdings, Inc.* | 2,396,795 | |||||||||
| 128,283 | Forest Laboratories, Inc.* | 2,782,458 | |||||||||
| 374,712 | King Pharmaceuticals, Inc.* | 2,952,731 | |||||||||
| 243,828 | Medicis Pharmaceutical Corp., Class A | 3,918,316 | |||||||||
| 208,362 | Merck & Co., Inc. | 5,050,695 | |||||||||
| 409,616 | Pfizer, Inc. | 5,472,469 | |||||||||
| 158,159 | Schering-Plough Corp. | 3,640,820 | |||||||||
| 183,603 | Sepracor, Inc.* | 2,608,999 | |||||||||
| 158,068 | Valeant Pharmaceuticals International* | 2,649,220 | |||||||||
| 123,526 | Wyeth | 5,237,502 | |||||||||
| 55,571,976 | |||||||||||
| Medical - Generic Drugs—11.2% | |||||||||||
| 206,486 | Par Pharmaceutical Cos., Inc.* | 2,215,595 | |||||||||
| 136,902 | Perrigo Co. | 3,548,499 | |||||||||
| 221,269 | Mylan Laboratories, Inc.* | 2,931,814 | |||||||||
| 97,290 | Watson Pharmaceuticals, Inc.* | 3,010,153 | |||||||||
| 11,706,061 | |||||||||||
| Therapeutics—4.8% | |||||||||||
| 565,920 | Questcor Pharmaceuticals, Inc.* | 2,546,640 | |||||||||
| 253,491 | Warner Chilcott Ltd., Class A* | 2,481,677 | |||||||||
| 5,028,317 | |||||||||||
| Total Investments (Cost $140,344,505)—100.0% | 104,322,095 | ||||||||||
| Other assets less liabilities—0.0% | 26,637 | ||||||||||
| Net Assets—100.0% | $ | 104,348,732 | |||||||||
* Non-income producing security.
See Notes to Financial Statements.
52
Schedule of Investments
PowerShares Dynamic Retail Portfolio
April 30, 2009
| Number of Shares | Value | ||||||||||
| Common Stocks—99.9% | |||||||||||
| E-Commerce/Products—4.6% | |||||||||||
| 44,675 | Amazon.com, Inc.* | $ | 3,597,231 | ||||||||
| E-Commerce/Services—2.5% | |||||||||||
| 43,679 | Netflix, Inc.* | 1,979,095 | |||||||||
| Food - Retail—6.7% | |||||||||||
| 156,443 | Safeway, Inc. | 3,089,750 | |||||||||
| 56,881 | Weis Markets, Inc. | 2,104,028 | |||||||||
| 5,193,778 | |||||||||||
| Rental/Auto Equipment—2.2% | |||||||||||
| 90,105 | Rent-A-Center, Inc.* | 1,734,521 | |||||||||
| Retail - Apparel/Shoe—41.3% | |||||||||||
| 68,073 | Aeropostale, Inc.* | 2,312,440 | |||||||||
| 107,904 | Cato (The) Corp., Class A | 2,073,915 | |||||||||
| 86,358 | Children's Place Retail Stores (The), Inc.* | 2,456,022 | |||||||||
| 159,141 | Dress Barn, Inc.* | 2,409,395 | |||||||||
| 189,968 | Foot Locker, Inc. | 2,258,720 | |||||||||
| 268,224 | Gap (The), Inc. | 4,168,201 | |||||||||
| 110,394 | Genesco, Inc.* | 2,514,775 | |||||||||
| 61,378 | Gymboree (The) Corp.* | 2,111,403 | |||||||||
| 177,772 | Hot Topic, Inc.* | 2,175,929 | |||||||||
| 205,285 | Limited Brands, Inc. | 2,344,355 | |||||||||
| 147,814 | Men's Wearhouse (The), Inc. | 2,755,253 | |||||||||
| 53,479 | Ross Stores, Inc. | 2,028,993 | |||||||||
| 631,460 | Wet Seal (The), Inc., Class A* | 2,405,863 | |||||||||
| 32,015,264 | |||||||||||
| Retail - Appliances—3.3% | |||||||||||
| 153,861 | hhgregg, Inc.* | 2,554,093 | |||||||||
| Retail - Bedding—5.3% | |||||||||||
| 135,877 | Bed Bath & Beyond, Inc.* | 4,133,378 | |||||||||
| Retail - Building Products—5.1% | |||||||||||
| 182,710 | Lowe's Cos., Inc. | 3,928,265 | |||||||||
| Retail - Discount—10.8% | |||||||||||
| 52,838 | BJ's Wholesale Club, Inc.* | 1,761,619 | |||||||||
| 40,660 | Dollar Tree, Inc.* | 1,721,544 | |||||||||
| 57,532 | Family Dollar Stores, Inc. | 1,909,487 | |||||||||
| 58,779 | Wal-Mart Stores, Inc. | 2,962,463 | |||||||||
| 8,355,113 | |||||||||||
| Retail - Major Department Stores—4.7% | |||||||||||
| 129,956 | TJX Cos., Inc. | 3,634,869 | |||||||||
| Retail - Pet Food & Supplies—2.4% | |||||||||||
| 114,563 | PetMed Express, Inc.* | 1,862,794 | |||||||||
| Retail - Regional Department Stores—4.8% | |||||||||||
| 82,364 | Kohl's Corp.* | 3,735,207 | |||||||||
| Number of Shares | Value | ||||||||||
| Common Stocks (Continued) | |||||||||||
| Retail - Sporting Goods—6.2% | |||||||||||
| 187,487 | Cabela's, Inc.* | $ | 2,401,708 | ||||||||
| 200,081 | Zumiez, Inc.* | 2,412,977 | |||||||||
| 4,814,685 | |||||||||||
| Total Common Stocks (Cost $60,633,519) | 77,538,293 | ||||||||||
| Money Market Fund—0.2% | |||||||||||
| 130,620 | Goldman Sachs Financial Square Prime Obligations Institutional Share Class (Cost $130,620) | 130,620 | |||||||||
| Total Investments (Cost $60,764,139)—100.1% | 77,668,913 | ||||||||||
| Liabilities in excess of other assets—(0.1%) | (61,991 | ) | |||||||||
| Net Assets—100.0% | $ | 77,606,922 | |||||||||
* Non-income producing security.
See Notes to Financial Statements.
53
Schedule of Investments
PowerShares Dynamic Semiconductors Portfolio
April 30, 2009
| Number of Shares | Value | ||||||||||
| Common Stocks—100.0% | |||||||||||
| Electronic Components & Semiconductors—56.8% | |||||||||||
| 96,700 | Altera Corp. | $ | 1,577,177 | ||||||||
| 41,170 | Cree, Inc.* | 1,127,646 | |||||||||
| 116,358 | Intel Corp. | 1,836,129 | |||||||||
| 278,823 | LSI Corp.* | 1,070,680 | |||||||||
| 78,977 | Microchip Technology, Inc. | 1,816,471 | |||||||||
| 79,979 | Microsemi Corp.* | 1,073,318 | |||||||||
| 74,182 | National Semiconductor Corp. | 917,631 | |||||||||
| 158,236 | PMC - Sierra, Inc.* | 1,253,229 | |||||||||
| 94,461 | Rambus, Inc.* | 1,131,643 | |||||||||
| 68,816 | Semtech Corp.* | 992,327 | |||||||||
| 348,528 | Silicon Image, Inc.* | 947,996 | |||||||||
| 36,921 | Silicon Laboratories, Inc.* | 1,227,992 | |||||||||
| 124,398 | Skyworks Solutions, Inc.* | 1,099,678 | |||||||||
| 38,762 | Supertex, Inc.* | 996,959 | |||||||||
| 103,304 | Texas Instruments, Inc. | 1,865,671 | |||||||||
| 83,847 | Xilinx, Inc. | 1,713,833 | |||||||||
| 20,648,380 | |||||||||||
| Instruments - Scientific—2.7% | |||||||||||
| 56,505 | FEI Co.* | 970,756 | |||||||||
| Lasers - System/Components—3.4% | |||||||||||
| 43,778 | Cymer, Inc.* | 1,243,733 | |||||||||
| Semiconductor Components - Integrated Circuits—24.5% | |||||||||||
| 79,528 | Analog Devices, Inc. | 1,692,355 | |||||||||
| 226,494 | Atmel Corp.* | 869,737 | |||||||||
| 227,770 | Cirrus Logic, Inc.* | 1,059,131 | |||||||||
| 29,318 | Hittite Microwave Corp.* | 1,089,457 | |||||||||
| 180,487 | Integrated Device Technology, Inc.* | 980,044 | |||||||||
| 68,000 | Linear Technology Corp. | 1,481,040 | |||||||||
| 121,592 | Micrel, Inc. | 911,940 | |||||||||
| 51,932 | Standard Microsystems Corp.* | 823,642 | |||||||||
| 8,907,346 | |||||||||||
| Semiconductor Equipment—5.5% | |||||||||||
| 64,225 | MKS Instruments, Inc.* | 1,005,121 | |||||||||
| 73,642 | Ultratech, Inc.* | 995,640 | |||||||||
| 2,000,761 | |||||||||||
| Wireless Equipment—7.1% | |||||||||||
| 27,522 | InterDigital, Inc.* | 724,379 | |||||||||
| 44,344 | QUALCOMM, Inc. | 1,876,638 | |||||||||
| 2,601,017 | |||||||||||
| Total Common Stocks (Cost $41,716,647) | 36,371,993 | ||||||||||
| Number of Shares | Value | ||||||||||
| Money Market Fund—0.1% | |||||||||||
| 53,069 | Goldman Sachs Financial Square Prime Obligations Institutional Share Class (Cost $53,069) | $ | 53,069 | ||||||||
| Total Investments (Cost $41,769,716)—100.1% | 36,425,062 | ||||||||||
| Liabilities in excess of assets—(0.1%) | (51,569 | ) | |||||||||
| Net Assets—100.0% | $ | 36,373,493 | |||||||||
* Non-income producing security.
See Notes to Financial Statements.
54
Schedule of Investments
PowerShares Dynamic Software Portfolio
April 30, 2009
| Number of Shares | Value | ||||||||||
| Common Stocks—100.0% | |||||||||||
| Applications Software—18.0% | |||||||||||
| 132,418 | Compuware Corp.* | $ | 990,487 | ||||||||
| 88,838 | Microsoft Corp. | 1,799,858 | |||||||||
| 49,097 | Progress Software Corp.* | 1,040,365 | |||||||||
| 69,255 | Quest Software, Inc.* | 1,006,275 | |||||||||
| 104,801 | Red Hat, Inc.* | 1,809,914 | |||||||||
| 6,646,899 | |||||||||||
| Computer Aided Design—6.1% | |||||||||||
| 113,059 | Autodesk, Inc.* | 2,254,396 | |||||||||
| Computer Software—3.0% | |||||||||||
| 46,556 | Metavante Technologies, Inc.* | 1,098,256 | |||||||||
| Computers - Integrated Systems—7.5% | |||||||||||
| 49,128 | Jack Henry & Associates, Inc. | 885,287 | |||||||||
| 48,670 | Micros Systems, Inc.* | 1,021,097 | |||||||||
| 50,617 | Teradata Corp.* | 846,316 | |||||||||
| 2,752,700 | |||||||||||
| Data Processing/Management—5.5% | |||||||||||
| 57,885 | CSG Systems International, Inc.* | 839,333 | |||||||||
| 71,469 | Fair Isaac Corp. | 1,202,108 | |||||||||
| 2,041,441 | |||||||||||
| Decision Support Software—2.1% | |||||||||||
| 103,653 | Wind River Systems, Inc.* | 759,776 | |||||||||
| Electronic Design Automation—2.5% | |||||||||||
| 42,004 | Synopsys, Inc.* | 914,847 | |||||||||
| Enterprise Software/Services—21.6% | |||||||||||
| 48,423 | BMC Software, Inc.* | 1,678,825 | |||||||||
| 84,645 | CA, Inc. | 1,460,126 | |||||||||
| 80,678 | JDA Software Group, Inc.* | 1,138,367 | |||||||||
| 247,648 | Novell, Inc.* | 931,156 | |||||||||
| 92,325 | Oracle Corp. | 1,785,567 | |||||||||
| 28,795 | Sybase, Inc.* | 977,878 | |||||||||
| 7,971,919 | |||||||||||
| E-Services/Consulting—3.4% | |||||||||||
| 70,124 | Websense, Inc.* | 1,250,311 | |||||||||
| Identification System/Development—2.3% | |||||||||||
| 75,244 | Cogent, Inc.* | 853,267 | |||||||||
| Industry Audio & Video Production—5.5% | |||||||||||
| 51,146 | Dolby Laboratories, Inc., Class A* | 2,052,489 | |||||||||
| Internet Application Software—5.4% | |||||||||||
| 358,980 | Art Technology Group, Inc.* | 1,127,197 | |||||||||
| 137,296 | S1 Corp.* | 851,235 | |||||||||
| 1,978,432 | |||||||||||
| Internet Infrastructure Software—2.8% | |||||||||||
| 162,022 | TIBCO Software, Inc.* | 1,023,979 | |||||||||
| Number of Shares | Value | ||||||||||
| Common Stocks (Continued) | |||||||||||
| Internet Security—5.2% | |||||||||||
| 51,334 | McAfee, Inc.* | $ | 1,927,078 | ||||||||
| Medical Information System—3.1% | |||||||||||
| 21,381 | Cerner Corp.* | 1,150,298 | |||||||||
| Networking Products—3.7% | |||||||||||
| 178,263 | Acme Packet, Inc.* | 1,374,408 | |||||||||
| Transactional Software—2.3% | |||||||||||
| 37,643 | Solera Holdings, Inc.* | 859,013 | |||||||||
| Total Common Stocks (Cost $34,997,109) | 36,909,509 | ||||||||||
| Money Market Fund—0.1% | |||||||||||
| 36,542 | Goldman Sachs Financial Square Prime Obligations Institutional Share Class (Cost $36,542) | 36,542 | |||||||||
| Total Investments (Cost $35,033,651)—100.1% | 36,946,051 | ||||||||||
| Liabilities in excess of other assets—(0.1%) | (49,562 | ) | |||||||||
| Net Assets—100.0% | $ | 36,896,489 | |||||||||
* Non-income producing security.
See Notes to Financial Statements.
55
Statements of Assets and Liabilities
April 30, 2009
| PowerShares Dynamic Banking Portfolio | PowerShares Dynamic Biotechnology & Genome Portfolio | PowerShares Dynamic Building & Construction Portfolio | PowerShares Dynamic Energy Exploration & Production Portfolio | PowerShares Dynamic Food & Beverage Portfolio | PowerShares Dynamic Hardware & Consumer Electronics Portfolio | PowerShares Dynamic Healthcare Services Portfolio | PowerShares Dynamic Insurance Portfolio | ||||||||||||||||||||||||||||
| ASSETS: | |||||||||||||||||||||||||||||||||||
| Unaffiliated investments at value | $ | 74,797,581 | $ | 130,952,476 | $ | 49,184,176 | $ | 51,434,487 | $ | 86,552,548 | $ | 2,821,834 | $ | 10,847,029 | $ | 26,839,727 | |||||||||||||||||||
| Affiliated investments at value (Note 5) | — | 8,376,709 | — | — | — | — | — | — | |||||||||||||||||||||||||||
| Receivables: | |||||||||||||||||||||||||||||||||||
| Investments sold | 11,392,342 | 4,322,200 | — | — | — | — | — | — | |||||||||||||||||||||||||||
| Dividends | 134,682 | 38 | 15,815 | 27 | 128,681 | 1,084 | 15 | 13,514 | |||||||||||||||||||||||||||
| Expense waivers | 33,203 | — | 11,991 | — | 1,270 | 7,315 | 1,282 | 11,311 | |||||||||||||||||||||||||||
| Shares sold | — | — | — | — | — | — | — | — | |||||||||||||||||||||||||||
| Total Assets | 86,357,808 | 143,651,423 | 49,211,982 | 51,434,514 | 86,682,499 | 2,830,233 | 10,848,326 | 26,864,552 | |||||||||||||||||||||||||||
| LIABILITIES: | |||||||||||||||||||||||||||||||||||
| Due to custodian | 175 | 4,191,957 | 3,057 | 238 | 15 | 1 | 1 | 2 | |||||||||||||||||||||||||||
| Payables: | |||||||||||||||||||||||||||||||||||
| Shares repurchased | 11,486,639 | — | — | — | — | — | — | — | |||||||||||||||||||||||||||
| Investments purchased | — | — | — | — | — | — | — | — | |||||||||||||||||||||||||||
| Expense recapture | — | 15,113 | — | 17,627 | — | — | — | — | |||||||||||||||||||||||||||
| Accrued advisory fees | 35,088 | 56,651 | 17,837 | 20,518 | 33,690 | 1,054 | 4,317 | 11,047 | |||||||||||||||||||||||||||
| Accrued expenses | 62,051 | 91,106 | 49,101 | 52,175 | 56,356 | 37,897 | 43,661 | 44,623 | |||||||||||||||||||||||||||
| Total Liabilities | 11,583,953 | 4,354,827 | 69,995 | 90,558 | 90,061 | 38,952 | 47,979 | 55,672 | |||||||||||||||||||||||||||
| NET ASSETS | $ | 74,773,855 | $ | 139,296,596 | $ | 49,141,987 | $ | 51,343,956 | $ | 86,592,438 | $ | 2,791,281 | $ | 10,800,347 | $ | 26,808,880 | |||||||||||||||||||
| NET ASSETS CONSIST OF: | |||||||||||||||||||||||||||||||||||
| Shares of beneficial interest | $ | 128,497,865 | $ | 273,404,801 | $ | 56,783,719 | $ | 84,067,740 | $ | 103,509,203 | $ | 7,738,975 | $ | 23,628,982 | $ | 41,039,382 | |||||||||||||||||||
| Undistributed net investment income (loss) | 701,295 | (6,720 | ) | 41,806 | 20,273 | 413,492 | (668 | ) | (3,309 | ) | 63,320 | ||||||||||||||||||||||||
| Accumulated net realized loss on investments | (41,642,054 | ) | (111,567,735 | ) | (11,079,704 | ) | (28,756,334 | ) | (19,840,926 | ) | (4,172,612 | ) | (10,501,950 | ) | (10,486,396 | ) | |||||||||||||||||||
| Net unrealized appreciation (depreciation) of investments | (12,783,251 | ) | (22,533,750 | ) | 3,396,166 | (3,987,723 | ) | 2,510,669 | (774,414 | ) | (2,323,376 | ) | (3,807,426 | ) | |||||||||||||||||||||
| Net Assets | $ | 74,773,855 | $ | 139,296,596 | $ | 49,141,987 | $ | 51,343,956 | $ | 86,592,438 | $ | 2,791,281 | $ | 10,800,347 | $ | 26,808,880 | |||||||||||||||||||
| Shares outstanding (unlimited amount authorized, $0.01 par value) | 6,000,000 | 10,800,000 | 4,500,000 | 3,900,000 | 6,800,000 | 300,000 | 700,000 | 2,300,000 | |||||||||||||||||||||||||||
| Net asset value | $ | 12.46 | $ | 12.90 | $ | 10.92 | $ | 13.17 | $ | 12.73 | $ | 9.30 | $ | 15.43 | $ | 11.66 | |||||||||||||||||||
| Share price | $ | 12.43 | $ | 12.87 | $ | 10.94 | $ | 13.15 | $ | 12.74 | $ | 9.30 | $ | 15.43 | $ | 11.61 | |||||||||||||||||||
| Unaffiliated investments at cost | $ | 87,580,832 | $ | 154,375,748 | $ | 45,788,010 | $ | 55,422,210 | $ | 84,041,879 | $ | 3,596,248 | $ | 13,170,405 | $ | 30,647,153 | |||||||||||||||||||
| Affiliated investments at cost | $ | — | $ | 7,487,187 | $ | — | $ | — | $ | — | $ | — | $ | — | $ | — | |||||||||||||||||||
See Notes to Financial Statements.
56
| PowerShares Dynamic Leisure and Entertainment Portfolio | PowerShares Dynamic Media Portfolio | PowerShares Dynamic Networking Portfolio | PowerShares Dynamic Oil & Gas Services Portfolio | PowerShares Dynamic Pharmaceuticals Portfolio | PowerShares Dynamic Retail Portfolio | PowerShares Dynamic Semiconductors Portfolio | PowerShares Dynamic Software Portfolio | ||||||||||||||||||||||||||||
| ASSETS: | |||||||||||||||||||||||||||||||||||
| Unaffiliated investments at value | $ | 12,802,525 | $ | 8,411,132 | $ | 16,310,984 | $ | 155,661,736 | $ | 104,322,095 | $ | 77,668,913 | $ | 36,425,062 | $ | 36,946,051 | |||||||||||||||||||
| Affiliated investments at value (Note 5) | — | — | — | — | — | — | — | — | |||||||||||||||||||||||||||
| Receivables: | |||||||||||||||||||||||||||||||||||
| Investments sold | — | — | — | 3,912,539 | — | — | — | — | |||||||||||||||||||||||||||
| Dividends | 9,424 | 2,242 | 2,013 | 236,328 | 138,927 | 42,415 | 11,383 | 4,055 | |||||||||||||||||||||||||||
| Expense waivers | 8,527 | 5,838 | 8,185 | — | 8,063 | 13,490 | — | 6,549 | |||||||||||||||||||||||||||
| Shares sold | — | — | — | 1,349,680 | — | 1,445,632 | — | — | |||||||||||||||||||||||||||
| Total Assets | 12,820,476 | 8,419,212 | 16,321,182 | 161,160,283 | 104,469,085 | 79,170,450 | 36,436,445 | 36,956,655 | |||||||||||||||||||||||||||
| LIABILITIES: | |||||||||||||||||||||||||||||||||||
| Due to custodian | 7 | 122,133 | 1 | 11 | 10,949 | 40,644 | 1 | 1 | |||||||||||||||||||||||||||
| Payables: | |||||||||||||||||||||||||||||||||||
| Shares repurchased | — | — | — | 3,913,962 | — | — | — | — | |||||||||||||||||||||||||||
| Investments purchased | — | — | — | 1,348,088 | — | 1,444,429 | — | — | |||||||||||||||||||||||||||
| Expense recapture | — | — | — | 48,557 | — | — | 2,356 | — | |||||||||||||||||||||||||||
| Accrued advisory fees | 4,052 | 3,111 | 4,967 | 58,847 | 43,180 | 28,739 | 13,970 | 15,014 | |||||||||||||||||||||||||||
| Accrued expenses | 40,707 | 39,763 | 40,042 | 75,081 | 66,224 | 49,716 | 46,625 | 45,151 | |||||||||||||||||||||||||||
| Total Liabilities | 44,766 | 165,007 | 45,010 | 5,444,546 | 120,353 | 1,563,528 | 62,952 | 60,166 | |||||||||||||||||||||||||||
| NET ASSETS | $ | 12,775,710 | $ | 8,254,205 | $ | 16,276,172 | $ | 155,715,737 | $ | 104,348,732 | $ | 77,606,922 | $ | 36,373,493 | $ | 36,896,489 | |||||||||||||||||||
| NET ASSETS CONSIST OF: | |||||||||||||||||||||||||||||||||||
| Shares of beneficial interest | $ | 21,734,403 | $ | 26,106,736 | $ | 21,262,259 | $ | 339,077,821 | $ | 154,757,729 | $ | 67,176,231 | $ | 83,116,999 | $ | 49,739,838 | |||||||||||||||||||
| Undistributed net investment income (loss) | 3,029 | (2,967 | ) | (2,677 | ) | 196,719 | 449,678 | 58,278 | 5,834 | (3,232 | ) | ||||||||||||||||||||||||
| Accumulated net realized loss on investments | (9,145,187 | ) | (16,558,100 | ) | (5,915,947 | ) | (137,091,624 | ) | (14,836,265 | ) | (6,532,361 | ) | (41,404,686 | ) | (14,752,517 | ) | |||||||||||||||||||
| Net unrealized appreciation (depreciation) of investments | 183,465 | (1,291,464 | ) | 932,537 | (46,467,179 | ) | (36,022,410 | ) | 16,904,774 | (5,344,654 | ) | 1,912,400 | |||||||||||||||||||||||
| Net Assets | $ | 12,775,710 | $ | 8,254,205 | $ | 16,276,172 | $ | 155,715,737 | $ | 104,348,732 | $ | 77,606,922 | $ | 36,373,493 | $ | 36,896,489 | |||||||||||||||||||
| Shares outstanding (unlimited amount authorized, $0.01 par value) | 1,200,000 | 1,000,000 | 1,200,000 | 11,900,000 | 7,500,000 | 5,300,000 | 3,500,000 | 2,400,000 | |||||||||||||||||||||||||||
| Net asset value | $ | 10.65 | $ | 8.25 | $ | 13.56 | $ | 13.09 | $ | 13.91 | $ | 14.64 | $ | 10.39 | $ | 15.37 | |||||||||||||||||||
| Share price | $ | 10.63 | $ | 8.26 | $ | 13.58 | $ | 13.11 | $ | 13.92 | $ | 14.64 | $ | 10.39 | $ | 15.37 | |||||||||||||||||||
| Unaffiliated investments at cost | $ | 12,619,060 | $ | 9,702,596 | $ | 15,378,447 | $ | 202,128,915 | $ | 140,344,505 | $ | 60,764,139 | $ | 41,769,716 | $ | 35,033,651 | |||||||||||||||||||
| Affiliated investments at cost | $ | — | $ | — | $ | — | $ | — | $ | — | $ | — | $ | — | $ | — | |||||||||||||||||||
57
Statements of Operations
Year Ended April 30, 2009
| PowerShares Dynamic Banking Portfolio | PowerShares Dynamic Biotechnology & Genome Portfolio | PowerShares Dynamic Building & Construction Portfolio | PowerShares Dynamic Energy Exploration & Production Portfolio | PowerShares Dynamic Food & Beverage Portfolio | PowerShares Dynamic Hardware Consumer Electronics Portfolio | PowerShares Dynamic Healthcare Services Portfolio | PowerShares Dynamic Insurance Portfolio | ||||||||||||||||||||||||||||
| INVESTMENT INCOME: | |||||||||||||||||||||||||||||||||||
| Unaffiliated dividend income | $ | 3,772,315 | $ | 465,375 | $ | 198,194 | $ | 839,954 | $ | 1,915,047 | $ | 25,138 | $ | 78,153 | $ | 508,930 | |||||||||||||||||||
| Total Income | 3,772,315 | 465,375 | 198,194 | 839,954 | 1,915,047 | 25,138 | 78,153 | 508,930 | |||||||||||||||||||||||||||
| EXPENSES: | |||||||||||||||||||||||||||||||||||
| Advisory fees | 544,048 | 936,718 | 121,410 | 452,351 | 394,573 | 20,965 | 103,521 | 144,737 | |||||||||||||||||||||||||||
| Accounting & Administration fees | 74,983 | 74,983 | 74,983 | 74,983 | 74,983 | 74,983 | 74,983 | 74,983 | |||||||||||||||||||||||||||
| Printing | 58,299 | 29,112 | 5,917 | 6,974 | 11,497 | 199 | 664 | 8,533 | |||||||||||||||||||||||||||
| Sub-licensing | 54,405 | 56,203 | 7,284 | 27,141 | 23,674 | 1,258 | 10,352 | 8,684 | |||||||||||||||||||||||||||
| Professional fees | 29,267 | 35,580 | 25,560 | 29,259 | 29,089 | 23,966 | 24,057 | 25,361 | |||||||||||||||||||||||||||
| Custodian & transfer agent fees | 10,117 | 13,122 | 6,067 | 8,056 | 7,126 | 3,482 | 6,341 | 6,506 | |||||||||||||||||||||||||||
| Trustees | 8,180 | 10,815 | 4,467 | 7,357 | 6,552 | 3,856 | 5,021 | 4,814 | |||||||||||||||||||||||||||
| Listing fee and expenses | 2,260 | 8,038 | 7,559 | 7,915 | 7,616 | 6,869 | 2,188 | 7,660 | |||||||||||||||||||||||||||
| Other expenses | 3,005 | 6,305 | 4,212 | 6,289 | 4,322 | — | 555 | 2,868 | |||||||||||||||||||||||||||
| Total Expenses | 784,564 | 1,170,876 | 257,459 | 620,325 | 559,432 | 135,578 | 227,682 | 284,146 | |||||||||||||||||||||||||||
| Less fees waived: | |||||||||||||||||||||||||||||||||||
| (Waivers) and/or Recapture | (77,300 | ) | 9,388 | (104,483 | ) | (50,362 | ) | (62,271 | ) | (109,772 | ) | (93,104 | ) | (101,778 | ) | ||||||||||||||||||||
| Net Expenses | 707,264 | 1,180,264 | 152,976 | 569,963 | 497,161 | 25,806 | 134,578 | 182,368 | |||||||||||||||||||||||||||
| Net Investment Income (Loss) | 3,065,051 | (714,889 | ) | 45,218 | 269,991 | 1,417,886 | (668 | ) | (56,425 | ) | 326,562 | ||||||||||||||||||||||||
| REALIZED AND UNREALIZED GAIN (LOSS) ON INVESTMENTS: | |||||||||||||||||||||||||||||||||||
| Net realized gain (loss) from: | |||||||||||||||||||||||||||||||||||
| Investments | (29,513,539 | ) | (47,770,364 | ) | (5,711,612 | ) | (23,126,103 | ) | (14,332,389 | ) | (1,649,262 | ) | (7,243,425 | ) | (4,425,832 | ) | |||||||||||||||||||
| In-kind redemptions | (14,536,511 | ) | 2,517,366 | (7,803,569 | ) | (16,924,297 | ) | (7,201,652 | ) | (1,343,645 | ) | (7,970,825 | ) | (4,247,237 | ) | ||||||||||||||||||||
| Net realized loss | (44,050,050 | ) | (45,252,998 | ) | (13,515,181 | ) | (40,050,400 | ) | (21,534,041 | ) | (2,992,907 | ) | (15,214,250 | ) | (8,673,069 | ) | |||||||||||||||||||
| Net change in unrealized appreciation (depreciation) on investments | (14,785,699 | ) | (23,412,046 | ) | 3,991,876 | (26,868,276 | ) | 672,398 | 678,034 | 5,594,158 | (2,704,707 | ) | |||||||||||||||||||||||
| Net realized and unrealized gain (loss) on investments | (58,835,749 | ) | (68,665,044 | ) | (9,523,305 | ) | (66,918,676 | ) | (20,861,643 | ) | (2,314,873 | ) | (9,620,092 | ) | (11,377,776 | ) | |||||||||||||||||||
| Net increase (decrease) in net assets resulting from operations | $ | (55,770,698 | ) | $ | (69,379,933 | ) | $ | (9,478,087 | ) | $ | (66,648,685 | ) | $ | (19,443,757 | ) | $ | (2,315,541 | ) | $ | (9,676,517 | ) | $ | (11,051,214 | ) | |||||||||||
See Notes to Financial Statements.
58
| PowerShares Dynamic Leisure and Entertainment Portfolio | PowerShares Dynamic Media Portfolio | PowerShares Dynamic Networking Portfolio | PowerShares Dynamic Oil & Gas Services Portfolio | PowerShares Dynamic Pharmaceuticals Portfolio | PowerShares Dynamic Retail Portfolio | PowerShares Dynamic Semiconductors Portfolio | PowerShares Dynamic Software Portfolio | ||||||||||||||||||||||||||||
| INVESTMENT INCOME: | |||||||||||||||||||||||||||||||||||
| Unaffiliated dividend income | $ | 172,636 | $ | 206,094 | $ | 11,813 | $ | 2,163,979 | $ | 1,979,620 | $ | 256,568 | $ | 435,959 | $ | 60,294 | |||||||||||||||||||
| Total Income | 172,636 | 206,094 | 11,813 | 2,163,979 | 1,979,620 | 256,568 | 435,959 | 60,294 | |||||||||||||||||||||||||||
| EXPENSES: | |||||||||||||||||||||||||||||||||||
| Advisory fees | 54,412 | 89,850 | 42,744 | 1,184,457 | 624,605 | 119,065 | 229,464 | 146,805 | |||||||||||||||||||||||||||
| Accounting & Administration fees | 74,983 | 74,983 | 74,983 | 85,597 | 74,983 | 74,983 | 74,983 | 74,983 | |||||||||||||||||||||||||||
| Printing | 1,435 | 2,131 | 1,036 | 17,793 | 26,059 | 8,561 | 6,115 | 5,412 | |||||||||||||||||||||||||||
| Sub-licensing | 3,265 | 5,391 | 2,565 | 71,067 | 37,476 | 7,144 | 13,768 | 8,808 | |||||||||||||||||||||||||||
| Professional fees | 24,266 | 24,856 | 24,431 | 39,050 | 31,423 | 26,215 | 26,276 | 25,589 | |||||||||||||||||||||||||||
| Custodian & transfer agent fees | 5,878 | 5,824 | 4,700 | 16,168 | 10,405 | 7,242 | 6,217 | 6,214 | |||||||||||||||||||||||||||
| Trustees | 4,171 | 4,433 | 4,003 | 12,916 | 8,453 | 4,447 | 5,500 | 4,833 | |||||||||||||||||||||||||||
| Listing fee and expenses | 7,580 | 7,640 | 7,566 | 8,352 | 7,786 | 7,554 | 7,680 | 7,678 | |||||||||||||||||||||||||||
| Other expenses | 3,904 | 3,979 | 1,872 | 9,283 | 8,082 | 2,620 | 4,211 | 3,123 | |||||||||||||||||||||||||||
| Total Expenses | 179,894 | 219,087 | 163,900 | 1,444,683 | 829,272 | 257,831 | 374,214 | 283,445 | |||||||||||||||||||||||||||
| Less fees waived: | |||||||||||||||||||||||||||||||||||
| (Waivers) and/or Recapture | (111,335 | ) | (105,876 | ) | (110,045 | ) | 24,216 | (42,273 | ) | (107,809 | ) | (85,089 | ) | (98,470 | ) | ||||||||||||||||||||
| Net Expenses | 68,559 | 113,211 | 53,855 | 1,468,899 | 786,999 | 150,022 | 289,125 | 184,975 | |||||||||||||||||||||||||||
| Net Investment Income (Loss) | 104,077 | 92,883 | (42,042 | ) | 695,080 | 1,192,621 | 106,546 | 146,834 | (124,681 | ) | |||||||||||||||||||||||||
| REALIZED AND UNREALIZED GAIN (LOSS) ON INVESTMENTS: | |||||||||||||||||||||||||||||||||||
| Net realized gain (loss) from: | |||||||||||||||||||||||||||||||||||
| Investments | (2,824,936 | ) | (8,531,174 | ) | (1,099,451 | ) | (102,462,995 | ) | (10,150,704 | ) | (1,883,843 | ) | (15,014,807 | ) | (5,372,321 | ) | |||||||||||||||||||
| In-kind redemptions | (3,204,055 | ) | (6,045,229 | ) | (1,632,311 | ) | 8,481,056 | 2,748,842 | (4,668,134 | ) | (12,276,678 | ) | 281,874 | ||||||||||||||||||||||
| Net realized loss | (6,028,991 | ) | (14,576,403 | ) | (2,731,762 | ) | (93,981,939 | ) | (7,401,862 | ) | (6,551,977 | ) | (27,291,485 | ) | (5,090,447 | ) | |||||||||||||||||||
| Net change in unrealized appreciation (depreciation) on investments | 1,748,598 | 2,190,171 | 2,466,022 | (103,881,339 | ) | (25,038,354 | ) | 16,783,713 | 3,722,475 | 2,850,819 | |||||||||||||||||||||||||
| Net realized and unrealized gain (loss) on investments | (4,280,393 | ) | (12,386,232 | ) | (265,740 | ) | (197,863,278 | ) | (32,440,216 | ) | 10,231,736 | (23,569,010 | ) | (2,239,628 | ) | ||||||||||||||||||||
| Net increase (decrease) in net assets resulting from operations | $ | (4,176,316 | ) | $ | (12,293,349 | ) | $ | (307,782 | ) | $ | (197,168,198 | ) | $ | (31,247,595 | ) | $ | 10,338,282 | $ | (23,422,176 | ) | $ | (2,364,309 | ) | ||||||||||||
59
Statements of Changes in Net Assets
| PowerShares Dynamic Banking Portfolio | Dynamic Biotechnology & Genome Portfolio | Dynamic Building & Construction Portfolio | |||||||||||||||||||||||||
| Year Ended April 30, 2009 | Year Ended April 30, 2008 | Year Ended April 30, 2009 | Year Ended April 30, 2008 | Year Ended April 30, 2009 | Year Ended April 30, 2008 | ||||||||||||||||||||||
| OPERATIONS: | |||||||||||||||||||||||||||
| Net investment income (loss) | $ | 3,065,051 | $ | 1,669,867 | $ | (714,889 | ) | $ | (1,336,496 | ) | $ | 45,218 | $ | 19,576 | |||||||||||||
| Net realized gain (loss) on investments | (44,050,050 | ) | (12,135,346 | ) | (45,252,998 | ) | (59,309 | ) | (13,515,181 | ) | (83,155 | ) | |||||||||||||||
| Net change in unrealized appreciation (depreciation) of investments | (14,785,699 | ) | 2,176,920 | (23,412,046 | ) | (21,265,610 | ) | 3,991,876 | (2,997,274 | ) | |||||||||||||||||
| Net increase (decrease) in net assets resulting from operations | (55,770,698 | ) | (8,288,559 | ) | (69,379,933 | ) | (22,661,415 | ) | (9,478,087 | ) | (3,060,853 | ) | |||||||||||||||
| Undistributed net investment income (loss) included in the price of units issued and redeemed | (39,384 | ) | (165,457 | ) | (155,505 | ) | 177,867 | 108,043 | (22,619 | ) | |||||||||||||||||
| DISTRIBUTIONS TO SHAREHOLDERS FROM: | |||||||||||||||||||||||||||
| Net investment income | (3,373,727 | ) | (684,636 | ) | — | — | (22,670 | ) | (18,567 | ) | |||||||||||||||||
| Return of capital | — | — | — | — | — | — | |||||||||||||||||||||
| Total distributions to shareholders | (3,373,727 | ) | (684,636 | ) | — | — | (22,670 | ) | (18,567 | ) | |||||||||||||||||
| SHAREHOLDER TRANSACTIONS: | |||||||||||||||||||||||||||
| Proceeds from shares sold | 149,390,286 | 227,990,630 | 173,345,740 | 229,940,570 | 63,471,504 | 56,345,601 | |||||||||||||||||||||
| Value of shares repurchased | (123,120,186 | ) | (116,105,241 | ) | (163,668,814 | ) | (266,895,466 | ) | (20,351,949 | ) | (56,441,780 | ) | |||||||||||||||
| Net income equalization | 39,384 | 165,457 | 155,505 | (177,867 | ) | (108,043 | ) | 22,619 | |||||||||||||||||||
| Net increase (decrease) in net assets resulting from shares transactions | 26,309,484 | 112,050,846 | 9,832,431 | (37,132,763 | ) | 43,011,512 | (73,560 | ) | |||||||||||||||||||
| Increase (Decrease) in Net Assets | (32,874,325 | ) | 102,912,194 | (59,703,007 | ) | (59,616,311 | ) | 33,618,798 | (3,175,599 | ) | |||||||||||||||||
| NET ASSETS: | |||||||||||||||||||||||||||
| Beginning of period | 107,648,180 | 4,735,986 | 198,999,603 | 258,615,914 | 15,523,189 | 18,698,788 | |||||||||||||||||||||
| End of period | $ | 74,773,855 | $ | 107,648,180 | $ | 139,296,596 | $ | 198,999,603 | $ | 49,141,987 | $ | 15,523,189 | |||||||||||||||
| Undistributed net investment income (loss) at end of period | $ | 701,295 | $ | 1,009,971 | $ | (6,720 | ) | $ | — | $ | 41,806 | $ | 19,258 | ||||||||||||||
| CHANGES IN SHARES OUTSTANDING: | |||||||||||||||||||||||||||
| Shares sold | 8,500,000 | 11,000,000 | 9,800,000 | 12,300,000 | 5,400,000 | 3,000,000 | |||||||||||||||||||||
| Shares repurchased | (8,000,000 | ) | (5,700,000 | ) | (10,200,000 | ) | (14,500,000 | ) | (1,800,000 | ) | (3,100,000 | ) | |||||||||||||||
| Shares outstanding, beginning of period | 5,500,000 | 200,000 | 11,200,000 | 13,400,000 | 900,000 | 1,000,000 | |||||||||||||||||||||
| Shares outstanding, end of period | 6,000,000 | 5,500,000 | 10,800,000 | 11,200,000 | 4,500,000 | 900,000 | |||||||||||||||||||||
See Notes to Financial Statements.
60
| Dynamic Energy Exploration & Production Portfolio | PowerShares Dynamic Food & Beverage Portfolio | Dynamic Hardware & Consumer Electronics Portfolio | |||||||||||||||||||||||||
| Year Ended April 30, 2009 | Year Ended April 30, 2008 | Year Ended April 30, 2009 | Year Ended April 30, 2008 | Year Ended April 30, 2009 | Year Ended April 30, 2008 | ||||||||||||||||||||||
| OPERATIONS: | |||||||||||||||||||||||||||
| Net investment income (loss) | $ | 269,991 | $ | 337,738 | $ | 1,417,886 | $ | 466,518 | $ | (668 | ) | $ | (43,393 | ) | |||||||||||||
| Net realized gain (loss) on investments | (40,050,400 | ) | 22,766,144 | (21,534,041 | ) | 2,709,318 | (2,992,907 | ) | (503,401 | ) | |||||||||||||||||
| Net change in unrealized appreciation (depreciation) of investments | (26,868,276 | ) | 6,700,824 | 672,398 | (1,717,175 | ) | 678,034 | (2,563,775 | ) | ||||||||||||||||||
| Net increase (decrease) in net assets resulting from operations | (66,648,685 | ) | 29,804,706 | (19,443,757 | ) | 1,458,661 | (2,315,541 | ) | (3,110,569 | ) | |||||||||||||||||
| Undistributed net investment income (loss) included in the price of units issued and redeemed | 11,918 | 26,395 | 207,792 | 170,513 | 7,717 | (46,779 | ) | ||||||||||||||||||||
| DISTRIBUTIONS TO SHAREHOLDERS FROM: | |||||||||||||||||||||||||||
| Net investment income | (345,726 | ) | (387,353 | ) | (1,004,394 | ) | (889,330 | ) | — | — | |||||||||||||||||
| Return of capital | — | (12,322 | ) | — | (369,392 | ) | — | (303,093 | ) | ||||||||||||||||||
| Total distributions to shareholders | (345,726 | ) | (399,675 | ) | (1,004,394 | ) | (1,258,722 | ) | — | (303,093 | ) | ||||||||||||||||
| SHAREHOLDER TRANSACTIONS: | |||||||||||||||||||||||||||
| Proceeds from shares sold | 98,734,331 | 148,755,294 | 85,048,720 | 114,332,928 | 4,600,205 | 20,684,926 | |||||||||||||||||||||
| Value of shares repurchased | (119,198,333 | ) | (162,846,293 | ) | (65,021,064 | ) | (60,833,736 | ) | (5,464,358 | ) | (23,820,679 | ) | |||||||||||||||
| Net income equalization | (11,918 | ) | (26,395 | ) | (207,792 | ) | (170,513 | ) | (7,717 | ) | 46,779 | ||||||||||||||||
| Net increase (decrease) in net assets resulting from shares transactions | (20,475,920 | ) | (14,117,394 | ) | 19,819,864 | 53,328,679 | (871,870 | ) | (3,088,974 | ) | |||||||||||||||||
| Increase (Decrease) in Net Assets | (87,458,413 | ) | 15,314,032 | (420,495 | ) | 53,699,131 | (3,179,694 | ) | (6,549,415 | ) | |||||||||||||||||
| NET ASSETS: | |||||||||||||||||||||||||||
| Beginning of period | 138,802,369 | 123,488,337 | 87,012,933 | 33,313,802 | 5,970,975 | 12,520,390 | |||||||||||||||||||||
| End of period | $ | 51,343,956 | $ | 138,802,369 | $ | 86,592,438 | $ | 87,012,933 | $ | 2,791,281 | $ | 5,970,975 | |||||||||||||||
| Undistributed net investment income (loss) at end of period | $ | 20,273 | $ | — | $ | 413,492 | $ | — | $ | (668 | ) | $ | — | ||||||||||||||
| CHANGES IN SHARES OUTSTANDING: | |||||||||||||||||||||||||||
| Shares sold | 4,700,000 | 6,400,000 | 6,400,000 | 6,900,000 | 400,000 | 1,100,000 | |||||||||||||||||||||
| Shares repurchased | (6,000,000 | ) | (7,000,000 | ) | (4,800,000 | ) | (3,600,000 | ) | (500,000 | ) | (1,400,000 | ) | |||||||||||||||
| Shares outstanding, beginning of period | 5,200,000 | 5,800,000 | 5,200,000 | 1,900,000 | 400,000 | 700,000 | |||||||||||||||||||||
| Shares outstanding, end of period | 3,900,000 | 5,200,000 | 6,800,000 | 5,200,000 | 300,000 | 400,000 | |||||||||||||||||||||
61
Statements of Changes in Net Assets (Continued)
| PowerShares Healthcare Services Portfolio | PowerShares Dynamic Insurance Portfolio | PowerShares Dynamic Leisure and Entertainment Portfolio | |||||||||||||||||||||||||
| Year Ended April 30, 2009 | Year Ended April 30, 2008 | Year Ended April 30, 2009 | Year Ended April 30, 2008 | Year Ended April 30, 2009 | Year Ended April 30, 2008 | ||||||||||||||||||||||
| OPERATIONS: | |||||||||||||||||||||||||||
| Net investment income (loss) | $ | (56,425 | ) | $ | (282,696 | ) | $ | 326,562 | $ | 763,085 | $ | 104,077 | $ | 237,929 | |||||||||||||
| Net realized gain (loss) on investments | (15,214,250 | ) | (13,585,038 | ) | (8,673,069 | ) | (2,383,354 | ) | (6,028,991 | ) | (567,404 | ) | |||||||||||||||
| Net change in unrealized appreciation (depreciation) of investments | 5,594,158 | (9,150,564 | ) | (2,704,707 | ) | (5,113,803 | ) | 1,748,598 | (5,546,327 | ) | |||||||||||||||||
| Net increase (decrease) in net assets resulting from operations | (9,676,517 | ) | (23,018,298 | ) | (11,051,214 | ) | (6,734,072 | ) | (4,176,316 | ) | (5,875,802 | ) | |||||||||||||||
| Undistributed net investment income (loss) included in the price of units issued and redeemed | (5,281 | ) | 63,340 | (22,747 | ) | (97,621 | ) | (45,282 | ) | (309,164 | ) | ||||||||||||||||
| DISTRIBUTIONS TO SHAREHOLDERS FROM: | |||||||||||||||||||||||||||
| Net investment income | — | — | (304,900 | ) | (785,432 | ) | (101,048 | ) | (237,929 | ) | |||||||||||||||||
| Return of capital | — | — | — | — | — | (485,571 | ) | ||||||||||||||||||||
| Total distributions to shareholders | — | — | (304,900 | ) | (785,432 | ) | (101,048 | ) | (723,500 | ) | |||||||||||||||||
| SHAREHOLDER TRANSACTIONS: | |||||||||||||||||||||||||||
| Proceeds from shares sold | 26,116,175 | 153,002,599 | 40,493,250 | 43,758,738 | 33,503,371 | 61,308,076 | |||||||||||||||||||||
| Value of shares repurchased | (33,664,830 | ) | (130,000,271 | ) | (36,340,003 | ) | (60,628,701 | ) | (31,564,852 | ) | (89,066,554 | ) | |||||||||||||||
| Net income equalization | 5,281 | (63,340 | ) | 22,747 | 97,621 | 45,282 | 309,164 | ||||||||||||||||||||
| Net increase (decrease) in net assets resulting from shares transactions | (7,543,374 | ) | 22,938,988 | 4,175,994 | (16,772,342 | ) | 1,983,801 | (27,449,314 | ) | ||||||||||||||||||
| Increase (Decrease) in Net Assets | (17,225,172 | ) | (15,970 | ) | (7,202,867 | ) | (24,389,467 | ) | (2,338,845 | ) | (34,357,780 | ) | |||||||||||||||
| NET ASSETS: | |||||||||||||||||||||||||||
| Beginning of period | 28,025,519 | 28,041,489 | 34,011,747 | 58,401,214 | 15,114,555 | 49,472,335 | |||||||||||||||||||||
| End of period | $ | 10,800,347 | $ | 28,025,519 | $ | 26,808,880 | $ | 34,011,747 | $ | 12,775,710 | $ | 15,114,555 | |||||||||||||||
| Undistributed net investment income (loss) at end of period | $ | (3,309 | ) | $ | — | $ | 63,320 | $ | 41,414 | $ | 3,029 | $ | — | ||||||||||||||
| CHANGES IN SHARES OUTSTANDING: | |||||||||||||||||||||||||||
| Shares sold | 1,200,000 | 5,400,000 | 2,900,000 | 2,400,000 | 2,900,000 | 3,600,000 | |||||||||||||||||||||
| Shares repurchased | (1,700,000 | ) | (5,200,000 | ) | (2,700,000 | ) | (3,400,000 | ) | (2,700,000 | ) | (5,300,000 | ) | |||||||||||||||
| Shares outstanding, beginning of period | 1,200,000 | 1,000,000 | 2,100,000 | 3,100,000 | 1,000,000 | 2,700,000 | |||||||||||||||||||||
| Shares outstanding, end of period | 700,000 | 1,200,000 | 2,300,000 | 2,100,000 | 1,200,000 | 1,000,000 | |||||||||||||||||||||
See Notes to Financial Statements.
62
| PowerShares Dynamic Media Portfolio | PowerShares Dynamic Networking Portfolio | PowerShares Dynamic Oil & Gas Services Portfolio | |||||||||||||||||||||||||
| Year Ended April 30, 2009 | Year Ended April 30, 2008 | Year Ended April 30, 2009 | Year Ended April 30, 2008 | Year Ended April 30, 2009 | Year Ended April 30, 2008 | ||||||||||||||||||||||
| OPERATIONS: | |||||||||||||||||||||||||||
| Net investment income (loss) | $ | 92,883 | $ | 161,012 | $ | (42,042 | ) | $ | (97,127 | ) | $ | 695,080 | $ | (227,494 | ) | ||||||||||||
| Net realized gain (loss) on investments | (14,576,403 | ) | (6,536,041 | ) | (2,731,762 | ) | (945,353 | ) | (93,981,939 | ) | 49,457,976 | ||||||||||||||||
| Net change in unrealized appreciation (depreciation) of investments | 2,190,171 | (4,371,386 | ) | 2,466,022 | (1,976,065 | ) | (103,881,339 | ) | 27,334,628 | ||||||||||||||||||
| Net increase (decrease) in net assets resulting from operations | (12,293,349 | ) | (10,746,415 | ) | (307,782 | ) | (3,018,545 | ) | (197,168,198 | ) | 76,565,110 | ||||||||||||||||
| Undistributed net investment income (loss) included in the price of units issued and redeemed | 83,755 | (100,942 | ) | 74,424 | 6,671 | 19,943 | 47,462 | ||||||||||||||||||||
| DISTRIBUTIONS TO SHAREHOLDERS FROM: | |||||||||||||||||||||||||||
| Net investment income | (95,850 | ) | (173,173 | ) | — | — | (543,711 | ) | — | ||||||||||||||||||
| Return of capital | (48,916 | ) | (655,987 | ) | — | — | — | — | |||||||||||||||||||
| Total distributions to shareholders | (144,766 | ) | (829,160 | ) | — | — | (543,711 | ) | — | ||||||||||||||||||
| SHAREHOLDER TRANSACTIONS: | |||||||||||||||||||||||||||
| Proceeds from shares sold | 33,989,362 | 107,963,303 | 16,238,074 | 18,413,457 | 224,020,307 | 351,285,457 | |||||||||||||||||||||
| Value of shares repurchased | (44,220,220 | ) | (96,769,925 | ) | (12,485,502 | ) | (21,240,566 | ) | (250,531,653 | ) | (320,367,537 | ) | |||||||||||||||
| Net income equalization | (83,755 | ) | 100,942 | (74,424 | ) | (6,671 | ) | (19,943 | ) | (47,462 | ) | ||||||||||||||||
| Net increase (decrease) in net assets resulting from shares transactions | (10,314,613 | ) | 11,294,320 | 3,678,148 | (2,833,780 | ) | (26,531,289 | ) | 30,870,458 | ||||||||||||||||||
| Increase (Decrease) in Net Assets | (22,668,973 | ) | (382,197 | ) | 3,444,790 | (5,845,654 | ) | (224,223,255 | ) | 107,483,030 | |||||||||||||||||
| NET ASSETS: | |||||||||||||||||||||||||||
| Beginning of period | 30,923,178 | 31,305,375 | 12,831,382 | 18,677,036 | 379,938,992 | 272,455,962 | |||||||||||||||||||||
| End of period | $ | 8,254,205 | $ | 30,923,178 | $ | 16,276,172 | $ | 12,831,382 | $ | 155,715,737 | $ | 379,938,992 | |||||||||||||||
| Undistributed net investment income (loss) at end of period | $ | (2,967 | ) | $ | — | $ | (2,677 | ) | $ | — | $ | 196,719 | $ | 45,350 | |||||||||||||
| CHANGES IN SHARES OUTSTANDING: | |||||||||||||||||||||||||||
| Shares sold | 3,100,000 | 6,900,000 | 1,300,000 | 1,000,000 | 10,100,000 | 13,500,000 | |||||||||||||||||||||
| Shares repurchased | (4,400,000 | ) | (6,500,000 | ) | (900,000 | ) | (1,200,000 | ) | (11,200,000 | ) | (12,500,000 | ) | |||||||||||||||
| Shares outstanding, beginning of period | 2,300,000 | 1,900,000 | 800,000 | 1,000,000 | 13,000,000 | 12,000,000 | |||||||||||||||||||||
| Shares outstanding, end of period | 1,000,000 | 2,300,000 | 1,200,000 | 800,000 | 11,900,000 | 13,000,000 | |||||||||||||||||||||
63
Statements of Changes in Net Assets (Continued)
| PowerShares Dynamic Pharmaceuticals Portfolio | PowerShares Dynamic Retail Portfolio | ||||||||||||||||||
| Year Ended April 30, 2009 | Year Ended April 30, 2008 | Year Ended April 30, 2009 | Year Ended April 30, 2008 | ||||||||||||||||
| OPERATIONS: | |||||||||||||||||||
| Net investment income (loss) | $ | 1,192,621 | $ | 542,778 | $ | 106,546 | $ | 31,361 | |||||||||||
| Net realized gain (loss) on investments | (7,401,862 | ) | 2,377,913 | (6,551,977 | ) | (2,691,592 | ) | ||||||||||||
| Net change in unrealized appreciation (depreciation) of investments | (25,038,354 | ) | (17,014,573 | ) | 16,783,713 | (644,652 | ) | ||||||||||||
| Net increase (decrease) in net assets resulting from operations | (31,247,595 | ) | (14,093,882 | ) | 10,338,282 | (3,304,883 | ) | ||||||||||||
| Undistributed net investment income (loss) included in the price of units issued and redeemed | (32,948 | ) | (52,293 | ) | (334,997 | ) | (60,052 | ) | |||||||||||
| DISTRIBUTIONS TO SHAREHOLDERS FROM: | |||||||||||||||||||
| Net investment income | (949,059 | ) | (339,784 | ) | (48,268 | ) | (53,516 | ) | |||||||||||
| Return of capital | — | — | — | (28,135 | ) | ||||||||||||||
| Total distributions to shareholders | (949,059 | ) | (339,784 | ) | (48,268 | ) | (81,651 | ) | |||||||||||
| SHAREHOLDER TRANSACTIONS: | |||||||||||||||||||
| Proceeds from shares sold | 97,609,610 | 114,128,748 | 109,311,011 | 41,315,136 | |||||||||||||||
| Value of shares repurchased | (67,679,197 | ) | (75,425,400 | ) | (56,384,978 | ) | (47,566,973 | ) | |||||||||||
| Net income equalization | 32,948 | 52,293 | 334,997 | 60,052 | |||||||||||||||
| Net increase (decrease) in net assets resulting from shares transactions | 29,963,361 | 38,755,641 | 53,261,030 | (6,191,785 | ) | ||||||||||||||
| Increase (Decrease) in Net Assets | (2,266,241 | ) | 24,269,682 | 63,216,047 | (9,638,371 | ) | |||||||||||||
| NET ASSETS: | |||||||||||||||||||
| Beginning of period | 106,614,973 | 82,345,291 | 14,390,875 | 24,029,246 | |||||||||||||||
| End of period | $ | 104,348,732 | $ | 106,614,973 | $ | 77,606,922 | $ | 14,390,875 | |||||||||||
| Undistributed net investment income (loss) at end of period | $ | 449,678 | $ | 202,994 | $ | 58,278 | $ | — | |||||||||||
| CHANGES IN SHARES OUTSTANDING: | |||||||||||||||||||
| Shares sold | 5,800,000 | 6,100,000 | 8,500,000 | 2,400,000 | |||||||||||||||
| Shares repurchased | (4,500,000 | ) | (4,100,000 | ) | (4,100,000 | ) | (2,700,000 | ) | |||||||||||
| Shares outstanding, beginning of period | 6,200,000 | 4,200,000 | 900,000 | 1,200,000 | |||||||||||||||
| Shares outstanding, end of period | 7,500,000 | 6,200,000 | 5,300,000 | 900,000 | |||||||||||||||
See Notes to Financial Statements.
64
| PowerShares Dynamic Semiconductors Portfolio | PowerShares Dynamic Software Portfolio | ||||||||||||||||||
| Year Ended April 30, 2009 | Year Ended April 30, 2008 | Year Ended April 30, 2009 | Year Ended April 30, 2008 | ||||||||||||||||
| OPERATIONS: | |||||||||||||||||||
| Net investment income (loss) | $ | 146,834 | $ | (50,780 | ) | $ | (124,681 | ) | $ | (281,115 | ) | ||||||||
| Net realized gain (loss) on investments | (27,291,485 | ) | (5,221,652 | ) | (5,090,447 | ) | (348,591 | ) | |||||||||||
| Net change in unrealized appreciation (depreciation) of investments | 3,722,475 | (17,046,491 | ) | 2,850,819 | (7,898,477 | ) | |||||||||||||
| Net increase (decrease) in net assets resulting from operations | (23,422,176 | ) | (22,318,923 | ) | (2,364,309 | ) | (8,528,183 | ) | |||||||||||
| Undistributed net investment income (loss) included in the price of units issued and redeemed | (23,617 | ) | 124,852 | 36,904 | 139,588 | ||||||||||||||
| DISTRIBUTIONS TO SHAREHOLDERS FROM: | |||||||||||||||||||
| Net investment income | (141,000 | ) | — | — | — | ||||||||||||||
| Return of capital | — | — | — | — | |||||||||||||||
| Total distributions to shareholders | (141,000 | ) | — | — | — | ||||||||||||||
| SHAREHOLDER TRANSACTIONS: | |||||||||||||||||||
| Proceeds from shares sold | 37,774,948 | 199,521,339 | 29,449,067 | 59,042,633 | |||||||||||||||
| Value of shares repurchased | (52,894,493 | ) | (264,032,209 | ) | (25,243,698 | ) | (86,828,275 | ) | |||||||||||
| Net income equalization | 23,617 | (124,852 | ) | (36,904 | ) | (139,588 | ) | ||||||||||||
| Net increase (decrease) in net assets resulting from shares transactions | (15,095,928 | ) | (64,635,722 | ) | 4,168,465 | (27,925,230 | ) | ||||||||||||
| Increase (Decrease) in Net Assets | (38,682,721 | ) | (86,829,793 | ) | 1,841,060 | (36,313,825 | ) | ||||||||||||
| NET ASSETS: | |||||||||||||||||||
| Beginning of period | 75,056,214 | 161,886,007 | 35,055,429 | 71,369,254 | |||||||||||||||
| End of period | $ | 36,373,493 | $ | 75,056,214 | $ | 36,896,489 | $ | 35,055,429 | |||||||||||
| Undistributed net investment income (loss) at end of period | $ | 5,834 | $ | — | $ | (3,232 | ) | $ | — | ||||||||||
| CHANGES IN SHARES OUTSTANDING: | |||||||||||||||||||
| Shares sold | 3,000,000 | 11,100,000 | 2,000,000 | 3,000,000 | |||||||||||||||
| Shares repurchased | (4,100,000 | ) | (15,000,000 | ) | (1,600,000 | ) | (4,500,000 | ) | |||||||||||
| Shares outstanding, beginning of period | 4,600,000 | 8,500,000 | 2,000,000 | 3,500,000 | |||||||||||||||
| Shares outstanding, end of period | 3,500,000 | 4,600,000 | 2,400,000 | 2,000,000 | |||||||||||||||
65
Financial Highlights
PowerShares Dynamic Banking Portfolio
| Year Ended April 30, | For the Period October 12, 2006* Through | ||||||||||||||
| 2009 | 2008 | April 30, 2007 | |||||||||||||
| PER SHARE OPERATING PERFORMANCE: | |||||||||||||||
| Net asset value at beginning of period | $ | 19.57 | $ | 23.68 | $ | 25.17 | |||||||||
| Net investment income** | 0.46 | 0.52 | 0.22 | ||||||||||||
| Net realized and unrealized loss on investments | (7.04 | ) | (4.22 | ) | (1.49 | ) | |||||||||
| Total from investment operations | (6.58 | ) | (3.70 | ) | (1.27 | ) | |||||||||
| Distributions to shareholders from: | |||||||||||||||
| Net investment income | (0.53 | ) | (0.41 | ) | (0.22 | ) | |||||||||
| Net asset value at end of period | $ | 12.46 | $ | 19.57 | $ | 23.68 | |||||||||
| Share price at end of period*** | $ | 12.43 | |||||||||||||
| NET ASSET VALUE, TOTAL RETURN:**** | (34.34 | )% | (15.80 | )% | (5.08 | )% | |||||||||
| SHARE PRICE TOTAL RETURN**** | (34.49 | )% | |||||||||||||
| RATIOS/SUPPLEMENTAL DATA: | |||||||||||||||
| Net assets at end of period (000's omitted) | $ | 74,774 | $ | 107,648 | $ | 4,736 | |||||||||
| Ratio to average net assets of: | |||||||||||||||
| Expenses, after (Waivers) and/or Recapture | 0.65 | % | 0.66 | % | 0.76 | %† | |||||||||
| Expenses, prior to (Waivers) and/or Recapture | 0.72 | % | 0.78 | % | 1.88 | %† | |||||||||
| Net investment income, after (Waivers) and/or Recapture | 2.82 | % | 2.71 | % | 1.58 | %† | |||||||||
| Portfolio turnover rate †† | 93 | % | 111 | % | 57 | % | |||||||||
| Undistributed net investment loss included in price of units issued and redeemed**# | $ | (0.01 | ) | $ | (0.05 | ) | $ | (0.06 | ) | ||||||
PowerShares Dynamic Biotechnology & Genome Portfolio
| Year Ended April 30, | For the Period June 23, 2005* Through | ||||||||||||||||||
| 2009 | 2008 | 2007 | April 30, 2006 | ||||||||||||||||
| PER SHARE OPERATING PERFORMANCE: | |||||||||||||||||||
| Net asset value at beginning of period | $ | 17.77 | $ | 19.30 | $ | 17.24 | $ | 14.71 | |||||||||||
| Net investment loss** | (0.06 | ) | (0.11 | ) | (0.10 | ) | (0.08 | ) | |||||||||||
| Net realized and unrealized gain (loss) on investments | (4.81 | ) | (1.42 | ) | 2.16 | 2.61 | |||||||||||||
| Total from investment operations | (4.87 | ) | (1.53 | ) | 2.06 | 2.53 | |||||||||||||
| Net asset value at end of period | $ | 12.90 | $ | 17.77 | $ | 19.30 | $ | 17.24 | |||||||||||
| Share price at end of period*** | $ | 12.87 | |||||||||||||||||
| NET ASSET VALUE, TOTAL RETURN:**** | (27.41 | )% | (7.93 | )% | 11.95 | % | 17.20 | % | |||||||||||
| SHARE PRICE TOTAL RETURN**** | (27.62 | )% | |||||||||||||||||
| RATIOS/SUPPLEMENTAL DATA: | |||||||||||||||||||
| Net assets at end of period (000's omitted) | $ | 139,297 | $ | 199,000 | $ | 258,616 | $ | 250,021 | |||||||||||
| Ratio to average net assets of: | |||||||||||||||||||
| Expenses, after (Waivers) and/or Recapture | 0.63 | % | 0.63 | % | 0.63 | % | 0.64 | %† | |||||||||||
| Expenses, prior to (Waivers) and/or Recapture | 0.62 | % | 0.62 | % | 0.66 | % | 0.67 | %† | |||||||||||
| Net investment loss, after (Waivers) and/or Recapture | (0.38 | )% | (0.57 | )% | (0.56 | )% | (0.55 | )%† | |||||||||||
| Portfolio turnover rate †† | 93 | % | 91 | % | 82 | % | 49 | % | |||||||||||
| Undistributed net investment income (loss) included in price of units issued and redeemed**# | $ | (0.01 | ) | $ | 0.01 | $ | 0.01 | — | |||||||||||
* Commencement of Investment Operations.
** Based on average shares outstanding.
*** The mean between the last bid and ask prices.
**** Net asset value total return is calculated assuming an initial investment made at the net asset value at the beginning of the period, reinvestment of all dividends and distributions at net asset value during the period, and redemption on the last day of the period. Share price total return is calculated assuming an initial investment made at the share price at the beginning of the period, reinvestment of all dividends and distributions at share price during the period, and sale at the share price on the last day of the period. Total investment returns calculated for a period of less than one year are not annualized.
† Annualized.
†† Portfolio turnover rate is not annualized and does not include securities received or delivered from processing creations or redemptions.
# The per share amount of equalization is presented to show the impact of equalization on distributable earnings per share.
See Notes to Financial Statements.
66
Financial Highlights (Continued)
PowerShares Dynamic Building & Construction Portfolio
| Year Ended April 30, | For the Period October 26, 2005* Through | ||||||||||||||||||
| 2009 | 2008 | 2007 | April 30, 2006 | ||||||||||||||||
| PER SHARE OPERATING PERFORMANCE: | |||||||||||||||||||
| Net asset value at beginning of period | $ | 17.25 | $ | 18.70 | $ | 18.15 | $ | 15.26 | |||||||||||
| Net investment income (loss)** | 0.02 | 0.02 | 0.02 | — | (a) | ||||||||||||||
| Net realized and unrealized gain (loss) on investments | (6.33 | ) | (1.45 | ) | 0.53 | 2.90 | |||||||||||||
| Total from investment operations | (6.31 | ) | (1.43 | ) | 0.55 | 2.90 | |||||||||||||
| Distributions to shareholders from: | |||||||||||||||||||
| Net investment income | (0.02 | ) | (0.02 | ) | 0.00 | (a) | (0.01 | ) | |||||||||||
| Net asset value at end of period | $ | 10.92 | $ | 17.25 | $ | 18.70 | $ | 18.15 | |||||||||||
| Share price at end of period*** | $ | 10.94 | |||||||||||||||||
| NET ASSET VALUE, TOTAL RETURN:**** | (36.61 | )% | (7.66 | )% | 3.06 | % | 18.99 | % | |||||||||||
| SHARE PRICE TOTAL RETURN**** | (36.46 | )% | |||||||||||||||||
| RATIOS/SUPPLEMENTAL DATA: | |||||||||||||||||||
| Net assets at end of period (000's omitted) | $ | 49,142 | $ | 15,523 | $ | 18,699 | $ | 25,406 | |||||||||||
| Ratio to average net assets of: | |||||||||||||||||||
| Expenses, after (Waivers) and/or Recapture | 0.63 | % | 0.63 | % | 0.63 | % | 0.67 | %† | |||||||||||
| Expenses, prior to (Waivers) and/or Recapture | 1.06 | % | 1.18 | % | 1.65 | % | 0.80 | %† | |||||||||||
| Net investment income (loss), after (Waivers) and/or Recapture | 0.19 | % | 0.09 | % | 0.15 | % | 0.00 | †(a) | |||||||||||
| Portfolio turnover rate †† | 50 | % | 75 | % | 59 | % | 29 | % | |||||||||||
| Undistributed net investment income (loss) included in price of units issued and redeemed**# | $ | 0.05 | $ | (0.02 | ) | $ | 0.01 | — | |||||||||||
PowerShares Dynamic Energy Exploration & Production Portfolio
| Year Ended April 30, | For the Period October 26, 2005* Through | ||||||||||||||||||
| 2009 | 2008 | 2007 | April 30, 2006 | ||||||||||||||||
| PER SHARE OPERATING PERFORMANCE: | |||||||||||||||||||
| Net asset value at beginning of period | $ | 26.69 | $ | 21.29 | $ | 18.63 | $ | 16.03 | |||||||||||
| Net investment income** | 0.06 | 0.05 | 0.09 | 0.00 | (a) | ||||||||||||||
| Net realized and unrealized gain (loss) on investments | (13.50 | ) | 5.41 | 2.63 | 2.62 | ||||||||||||||
| Total from investment operations | (13.44 | ) | 5.46 | 2.72 | 2.62 | ||||||||||||||
| Distributions to shareholders from: | |||||||||||||||||||
| Net investment income | (0.08 | ) | (0.06 | ) | (0.06 | ) | (0.02 | ) | |||||||||||
| Tax return of capital | — | 0.00 | (a) | — | — | ||||||||||||||
| Total distributions | (0.08 | ) | (0.06 | ) | (0.06 | ) | (0.02 | ) | |||||||||||
| Net asset value at end of period | $ | 13.17 | $ | 26.69 | $ | 21.29 | $ | 18.63 | |||||||||||
| Share price at end of period*** | $ | 13.15 | |||||||||||||||||
| NET ASSET VALUE, TOTAL RETURN:**** | (50.42 | )% | 25.69 | % | 14.66 | % | 16.33 | % | |||||||||||
| SHARE PRICE TOTAL RETURN**** | (50.44 | )% | |||||||||||||||||
| RATIOS/SUPPLEMENTAL DATA: | |||||||||||||||||||
| Net assets at end of period (000's omitted) | $ | 51,344 | $ | 138,802 | $ | 123,488 | $ | 111,795 | |||||||||||
| Ratio to average net assets of: | |||||||||||||||||||
| Expenses, after (Waivers) and/or Recapture | 0.63 | % | 0.63 | % | 0.63 | % | 0.66 | %† | |||||||||||
| Expenses, prior to (Waivers) and/or Recapture | 0.69 | % | 0.65 | % | 0.74 | % | 0.75 | %† | |||||||||||
| Net investment income (loss), after (Waivers) and/or Recapture | 0.30 | % | 0.23 | % | 0.47 | % | (0.01 | )%† | |||||||||||
| Portfolio turnover rate †† | 68 | % | 39 | % | 59 | % | 19 | % | |||||||||||
| Undistributed net investment income (loss) included in price of units issued and redeemed**# | $ | 0.00 | (a) | $ | 0.00 | (a) | $ | (0.01 | ) | — | |||||||||
* Commencement of Investment Operations.
** Based on average shares outstanding.
*** The mean between the last bid and ask prices.
**** Net asset value total return is calculated assuming an initial investment made at the net asset value at the beginning of the period, reinvestment of all dividends and distributions at net asset value during the period, and redemption on the last day of the period. Share price total return is calculated assuming an initial investment made at the share price at the beginning of the period, reinvestment of all dividends and distributions at share price during the period, and sale at the share price on the last day of the period. Total investment returns calculated for a period of less than one year are not annualized.
† Annualized.
†† Portfolio turnover rate is not annualized and does not include securities received or delivered from processing creations or redemptions.
# The per share amount of equalization is presented to show the impact of equalization on distributable earnings per share.
(a) Amount represents less than $0.005 or 0.005%.
See Notes to Financial Statements.
67
Financial Highlights (Continued)
PowerShares Dynamic Food & Beverage Portfolio
| Year Ended April 30, | For the Period June 23, 2005* Through | ||||||||||||||||||
| 2009 | 2008 | 2007 | April 30, 2006 | ||||||||||||||||
| PER SHARE OPERATING PERFORMANCE: | |||||||||||||||||||
| Net asset value at beginning of period | $ | 16.73 | $ | 17.53 | $ | 15.17 | $ | 14.85 | |||||||||||
| Net investment income** | 0.25 | 0.18 | 0.39 | 0.11 | |||||||||||||||
| Net realized and unrealized gain (loss) on investments | (4.08 | ) | (0.42 | ) | 2.14 | 0.30 | |||||||||||||
| Total from investment operations | (3.83 | ) | (0.24 | ) | 2.53 | 0.41 | |||||||||||||
| Distributions to shareholders from: | |||||||||||||||||||
| Net investment income | (0.17 | ) | (0.40 | ) | (0.17 | ) | (0.09 | ) | |||||||||||
| Return of capital | — | (0.16 | ) | — | — | ||||||||||||||
| Total distributions | (0.17 | ) | (0.56 | ) | (0.17 | ) | (0.09 | ) | |||||||||||
| Net asset value at end of period | $ | 12.73 | $ | 16.73 | $ | 17.53 | $ | 15.17 | |||||||||||
| Share price at end of period*** | $ | 12.74 | |||||||||||||||||
| NET ASSET VALUE, TOTAL RETURN:**** | (22.99 | )% | (1.40 | )% | 16.79 | % | 2.78 | % | |||||||||||
| SHARE PRICE TOTAL RETURN**** | (22.89 | )% | |||||||||||||||||
| RATIOS/SUPPLEMENTAL DATA: | |||||||||||||||||||
| Net assets at end of period (000's omitted) | $ | 86,592 | $ | 87,013 | $ | 33,314 | $ | 24,270 | |||||||||||
| Ratio to average net assets of: | |||||||||||||||||||
| Expenses, after (Waivers) and/or Recapture | 0.63 | % | 0.63 | % | 0.64 | % | 0.69 | %† | |||||||||||
| Expenses, prior to (Waivers) and/or Recapture | 0.71 | % | 0.88 | % | 1.15 | % | 1.07 | %† | |||||||||||
| Net investment income, after (Waivers) and/or Recapture | 1.80 | % | 1.11 | % | 2.42 | % | 0.91 | %† | |||||||||||
| Portfolio turnover rate †† | 65 | % | 64 | % | 50 | % | 72 | % | |||||||||||
| Undistributed net investment income included in price of units issued and redeemed**# | $ | 0.04 | $ | 0.07 | $ | 0.02 | — | ||||||||||||
PowerShares Dynamic Hardware & Consumer Electronics Portfolio
| Year Ended April 30, | For the Period December 6, 2005* Through | ||||||||||||||||||
| 2009 | 2008 | 2007 | April 30, 2006 | ||||||||||||||||
| PER SHARE OPERATING PERFORMANCE: | |||||||||||||||||||
| Net asset value at beginning of period | $ | 14.93 | $ | 17.89 | $ | 16.76 | $ | 15.30 | |||||||||||
| Net investment loss** | 0.00 | (a) | (0.06 | ) | (0.08 | ) | (0.03 | ) | |||||||||||
| Net realized and unrealized gain (loss) on investments | (5.63 | ) | (2.56 | ) | 1.21 | 1.49 | |||||||||||||
| Total from investment operations | (5.63 | ) | (2.62 | ) | 1.13 | 1.46 | |||||||||||||
| Distributions to shareholders from: | |||||||||||||||||||
| Return of capital | — | (0.34 | ) | — | — | ||||||||||||||
| Net asset value at end of period | $ | 9.30 | $ | 14.93 | $ | 17.89 | $ | 16.76 | |||||||||||
| Share price at end of period*** | $ | 9.30 | |||||||||||||||||
| NET ASSET VALUE, TOTAL RETURN:**** | (37.71 | )% | (15.00 | )% | 6.74 | % | 9.54 | % | |||||||||||
| SHARE PRICE TOTAL RETURN**** | (37.71 | )% | |||||||||||||||||
| RATIOS/SUPPLEMENTAL DATA: | |||||||||||||||||||
| Net assets at end of period (000's omitted) | $ | 2,791 | $ | 5,971 | $ | 12,520 | $ | 16,764 | |||||||||||
| Ratio to average net assets of: | |||||||||||||||||||
| Expenses, after (Waivers) and/or Recapture | 0.62 | % | 0.63 | % | 0.72 | % | 0.68 | %† | |||||||||||
| Expenses, prior to (Waivers) and/or Recapture | 3.23 | % | 1.47 | % | 1.96 | % | 1.03 | %† | |||||||||||
| Net investment loss, after (Waivers) and/or Recapture | (0.02 | )% | (0.32 | )% | (0.48 | )% | (0.48 | )%† | |||||||||||
| Portfolio turnover rate †† | 87 | % | 43 | % | 52 | % | 14 | % | |||||||||||
| Undistributed net investment income (loss) included in price of units issued and redeemed**# | $ | 0.02 | $ | (0.07 | ) | $ | 0.02 | — | |||||||||||
* Commencement of Investment Operations.
** Based on average shares outstanding.
*** The mean between the last bid and ask prices.
**** Net asset value total return is calculated assuming an initial investment made at the net asset value at the beginning of the period, reinvestment of all dividends and distributions at net asset value during the period, and redemption on the last day of the period. Share price total return is calculated assuming an initial investment made at the share price at the beginning of the period, reinvestment of all dividends and distributions at share price during the period, and sale at the share price on the last day of the period. Total investment returns calculated for a period of less than one year are not annualized.
† Annualized.
†† Portfolio turnover rate is not annualized and does not include securities received or delivered from processing creations or redemptions.
# The per share amount of equalization is presented to show the impact of equalization on distributable earnings per share.
(a) Amount represents less than $0.005.
See Notes to Financial Statements.
68
Financial Highlights (Continued)
PowerShares Dynamic Healthcare Services Portfolio
| Year Ended April 30, | For the Period October 12, 2006* Through | ||||||||||||||
| 2009 | 2008 | April 30, 2007 | |||||||||||||
| PER SHARE OPERATING PERFORMANCE: | |||||||||||||||
| Net asset value at beginning of period | $ | 23.35 | $ | 28.04 | $ | 24.88 | |||||||||
| Net investment loss** | (0.05 | ) | (0.16 | ) | (0.08 | ) | |||||||||
| Net realized and unrealized gain (loss) on investments | (7.87 | ) | (4.53 | ) | 3.24 | ||||||||||
| Total from investment operations | (7.92 | ) | (4.69 | ) | 3.16 | ||||||||||
| Net asset value at end of period | $ | 15.43 | $ | 23.35 | $ | 28.04 | |||||||||
| Share price at end of period*** | $ | 15.43 | |||||||||||||
| NET ASSET VALUE, TOTAL RETURN:**** | (33.92 | )% | (16.73 | )% | 12.70 | % | |||||||||
| SHARE PRICE TOTAL RETURN**** | (33.89 | )% | |||||||||||||
| RATIOS/SUPPLEMENTAL DATA: | |||||||||||||||
| Net assets at end of period (000's omitted) | $ | 10,800 | $ | 28,026 | $ | 28,041 | |||||||||
| Ratio to average net assets of: | |||||||||||||||
| Expenses, after (Waivers) and/or Recapture | 0.65 | % | 0.67 | % | 0.70 | %† | |||||||||
| Expenses, prior to (Waivers) and/or Recapture | 1.10 | % | 0.80 | % | 1.20 | %† | |||||||||
| Net investment loss, after (Waivers) and/or Recapture | (0.27 | )% | (0.54 | )% | (0.56 | )%† | |||||||||
| Portfolio turnover rate †† | 91 | % | 63 | % | 13 | % | |||||||||
| Undistributed net investment income (loss) included in price of units issued and redeemed**# | $ | (0.01 | ) | $ | 0.04 | $ | (0.04 | ) | |||||||
PowerShares Dynamic Insurance Portfolio
| Year Ended April 30, | For the Period October 26, 2005* Through | ||||||||||||||||||
| 2009 | 2008 | 2007 | April 30, 2006 | ||||||||||||||||
| PER SHARE OPERATING PERFORMANCE: | |||||||||||||||||||
| Net asset value at beginning of period | $ | 16.20 | $ | 18.84 | $ | 17.31 | $ | 15.44 | |||||||||||
| Net investment income** | 0.15 | 0.27 | ††† | 0.15 | 0.07 | ||||||||||||||
| Net realized and unrealized gain (loss) on investments | (4.54 | ) | (2.61 | ) | 1.51 | 1.86 | |||||||||||||
| Total from investment operations | (4.39 | ) | (2.34 | ) | 1.66 | 1.93 | |||||||||||||
| Distributions to shareholders from: | |||||||||||||||||||
| Net investment income | (0.15 | ) | (0.30 | ) | (0.13 | ) | (0.06 | ) | |||||||||||
| Net asset value at end of period | $ | 11.66 | $ | 16.20 | $ | 18.84 | $ | 17.31 | |||||||||||
| Share price at end of period*** | $ | 11.61 | |||||||||||||||||
| NET ASSET VALUE, TOTAL RETURN:**** | (27.26 | )% | (12.56 | )% | 9.62 | % | 12.54 | % | |||||||||||
| SHARE PRICE TOTAL RETURN**** | (27.53 | )% | |||||||||||||||||
| RATIOS/SUPPLEMENTAL DATA: | |||||||||||||||||||
| Net assets at end of period (000's omitted) | $ | 26,809 | $ | 34,012 | $ | 58,401 | $ | 31,164 | |||||||||||
| Ratio to average net assets of: | |||||||||||||||||||
| Expenses, after (Waivers) and/or Recapture | 0.63 | % | 0.63 | % | 0.63 | % | 0.68 | %† | |||||||||||
| Expenses, prior to (Waivers) and/or Recapture | 0.98 | % | 0.82 | % | 0.96 | % | 0.87 | %† | |||||||||||
| Net investment income, after (Waivers) and/or Recapture | 1.13 | % | 1.54 | %††† | 0.87 | % | 0.81 | %† | |||||||||||
| Portfolio turnover rate †† | 52 | % | 82 | % | 40 | % | 30 | % | |||||||||||
| Undistributed net investment income (loss) included in price of units issued and redeemed**# | $ | (0.01 | ) | $ | (0.03 | ) | $ | 0.01 | — | ||||||||||
* Commencement of Investment Operations.
** Based on average shares outstanding.
*** The mean between the last bid and ask prices.
**** Net asset value total return is calculated assuming an initial investment made at the net asset value at the beginning of the period, reinvestment of all dividends and distributions at net asset value during the period, and redemption on the last day of the period. Share price total return is calculated assuming an initial investment made at the share price at the beginning of the period, reinvestment of all dividends and distributions at share price during the period, and sale at the share price on the last day of the period. Total investment returns calculated for a period of less than one year are not annualized.
† Annualized.
†† Portfolio turnover rate is not annualized and does not include securities received or delivered from processing creations or redemptions.
††† Net investment income per share and the ratio of net investment income to average net assets include a special cash dividend received of $2.00 per share owned of Progressive Corp. (The) on September 14, 2007. Net investment income per share and the ratio of net investment income to average net assets excluding the special dividend are $0.17 and 0.96%, respectively.
# The per share amount of equalization is presented to show the impact of equalization on distributable earnings per share.
See Notes to Financial Statements.
69
Financial Highlights (Continued)
PowerShares Dynamic Leisure and Entertainment Portfolio
| Year Ended April 30, | For the Period June 23, 2005* Through | ||||||||||||||||||
| 2009 | 2008 | 2007 | April 30, 2006 | ||||||||||||||||
| PER SHARE OPERATING PERFORMANCE: | |||||||||||||||||||
| Net asset value at beginning of period | $ | 15.11 | $ | 18.32 | $ | 16.29 | $ | 14.77 | |||||||||||
| Net investment income** | 0.10 | 0.12 | 0.07 | 0.03 | |||||||||||||||
| Net realized and unrealized gain (loss) on investments | (4.46 | ) | (2.75 | ) | 2.05 | 1.51 | |||||||||||||
| Total from investment operations | (4.36 | ) | (2.63 | ) | 2.12 | 1.54 | |||||||||||||
| Distributions to shareholders from: | |||||||||||||||||||
| Net investment income | (0.10 | ) | (0.19 | ) | (0.08 | ) | (0.02 | ) | |||||||||||
| Return of capital | — | (0.39 | ) | (0.01 | ) | — | |||||||||||||
| Total distributions | (0.10 | ) | (0.58 | ) | (0.09 | ) | (0.02 | ) | |||||||||||
| Net asset value at end of period | $ | 10.65 | $ | 15.11 | $ | 18.32 | $ | 16.29 | |||||||||||
| Share price at end of period*** | $ | 10.63 | |||||||||||||||||
| NET ASSET VALUE, TOTAL RETURN:**** | (28.91 | )% | (14.58 | )% | 13.02 | % | 10.41 | % | |||||||||||
| SHARE PRICE TOTAL RETURN**** | (29.09 | )% | |||||||||||||||||
| RATIOS/SUPPLEMENTAL DATA: | |||||||||||||||||||
| Net assets at end of period (000's omitted) | $ | 12,776 | $ | 15,115 | $ | 49,472 | $ | 27,701 | |||||||||||
| Ratio to average net assets of: | |||||||||||||||||||
| Expenses, after (Waivers) and/or Recapture | 0.63 | % | 0.63 | % | 0.64 | % | 0.68 | %† | |||||||||||
| Expenses, prior to (Waivers) and/or Recapture | 1.65 | % | 0.95 | % | 1.07 | % | 1.03 | %† | |||||||||||
| Net investment income, after (Waivers) and/or Recapture | 0.96 | % | 0.70 | % | 0.42 | % | 0.22 | %† | |||||||||||
| Portfolio turnover rate †† | 50 | % | 58 | % | 35 | % | 48 | % | |||||||||||
| Undistributed net investment income (loss) included in price of units issued and redeemed**# | $ | (0.04 | ) | $ | (0.16 | ) | $ | 0.01 | — | ||||||||||
PowerShares Dynamic Media Portfolio
| Year Ended April 30, | For the Period June 23, 2005* Through | ||||||||||||||||||
| 2009 | 2008 | 2007 | April 30, 2006 | ||||||||||||||||
| PER SHARE OPERATING PERFORMANCE: | |||||||||||||||||||
| Net asset value at beginning of period | $ | 13.44 | $ | 16.48 | $ | 14.44 | $ | 14.93 | |||||||||||
| Net investment income** | 0.05 | 0.06 | 0.04 | 0.02 | |||||||||||||||
| Net realized and unrealized gain (loss) on investments | (5.18 | ) | (2.82 | ) | 2.04 | (0.49 | ) | ||||||||||||
| Total from investment operations | (5.13 | ) | (2.76 | ) | 2.08 | (0.47 | ) | ||||||||||||
| Distributions to shareholders from: | |||||||||||||||||||
| Net investment income | (0.04 | ) | (0.06 | ) | (0.04 | ) | (0.02 | ) | |||||||||||
| Return of capital | (0.02 | ) | (0.22 | ) | — | — | |||||||||||||
| Total distributions | (0.06 | ) | (0.28 | ) | (0.04 | ) | (0.02 | ) | |||||||||||
| Net asset value at end of period | $ | 8.25 | $ | 13.44 | $ | 16.48 | $ | 14.44 | |||||||||||
| Share price at end of period*** | $ | 8.26 | |||||||||||||||||
| NET ASSET VALUE, TOTAL RETURN:**** | (38.30 | )% | (16.91 | )% | 14.42 | % | (3.15 | )% | |||||||||||
| SHARE PRICE TOTAL RETURN**** | (38.31 | )% | |||||||||||||||||
| RATIOS/SUPPLEMENTAL DATA: | |||||||||||||||||||
| Net assets at end of period (000's omitted) | $ | 8,254 | $ | 30,923 | $ | 31,305 | $ | 24,543 | |||||||||||
| Ratio to average net assets of: | |||||||||||||||||||
| Expenses, after (Waivers) and/or Recapture | 0.63 | % | 0.63 | % | 0.64 | % | 0.68 | %† | |||||||||||
| Expenses, prior to (Waivers) and/or Recapture | 1.22 | % | 0.85 | % | 1.24 | % | 1.04 | %† | |||||||||||
| Net investment income, after (Waivers) and/or Recapture | 0.52 | % | 0.36 | % | 0.25 | % | 0.19 | %† | |||||||||||
| Portfolio turnover rate †† | 69 | % | 62 | % | 43 | % | 68 | % | |||||||||||
| Undistributed net investment income (loss) included in price of units issued and redeemed**# | $ | 0.05 | $ | (0.04 | ) | $ | (0.01 | ) | — | ||||||||||
* Commencement of Investment Operations.
** Based on average shares outstanding.
*** The mean between the last bid and ask prices.
**** Net asset value total return is calculated assuming an initial investment made at the net asset value at the beginning of the period, reinvestment of all dividends and distributions at net asset value during the period, and redemption on the last day of the period. Share price total return is calculated assuming an initial investment made at the share price at the beginning of the period, reinvestment of all dividends and distributions at share price during the period, and sale at the share price on the last day of the period. Total investment returns calculated for a period of less than one year are not annualized.
† Annualized.
†† Portfolio turnover rate is not annualized and does not include securities received or delivered from processing creations or redemptions.
# The per share amount of equalization is presented to show the impact of equalization on distributable earnings per share.
(a) Amount represents less than $0.005.
See Notes to Financial Statements.
70
Financial Highlights (Continued)
PowerShares Dynamic Networking Portfolio
| Year Ended April 30, | For the Period June 23, 2005* Through | ||||||||||||||||||
| 2009 | 2008 | 2007 | April 30, 2006 | ||||||||||||||||
| PER SHARE OPERATING PERFORMANCE: | |||||||||||||||||||
| Net asset value at beginning of period | $ | 16.04 | $ | 18.68 | $ | 17.38 | $ | 14.96 | |||||||||||
| Net investment loss** | (0.06 | ) | (0.09 | ) | (0.09 | ) | (0.08 | ) | |||||||||||
| Net realized and unrealized gain (loss) on investments | (2.42 | ) | (2.55 | ) | 1.39 | 2.50 | |||||||||||||
| Total from investment operations | (2.48 | ) | (2.64 | ) | 1.30 | 2.42 | |||||||||||||
| Net asset value at end of period | $ | 13.56 | $ | 16.04 | $ | 18.68 | $ | 17.38 | |||||||||||
| Share price at end of period*** | $ | 13.58 | |||||||||||||||||
| NET ASSET VALUE, TOTAL RETURN:**** | (15.46 | )% | (14.13 | )% | 7.48 | % | 16.18 | % | |||||||||||
| SHARE PRICE TOTAL RETURN**** | (15.28 | )% | |||||||||||||||||
| RATIOS/SUPPLEMENTAL DATA: | |||||||||||||||||||
| Net assets at end of period (000's omitted) | $ | 16,276 | $ | 12,831 | $ | 18,677 | $ | 27,806 | |||||||||||
| Ratio to average net assets of: | |||||||||||||||||||
| Expenses, after (Waivers) and/or Recapture | 0.63 | % | 0.63 | % | 0.64 | % | 0.68 | %† | |||||||||||
| Expenses, prior to (Waivers) and/or Recapture | 1.92 | % | 1.25 | % | 1.24 | % | 1.03 | %† | |||||||||||
| Net investment loss, after (Waivers) and/or Recapture | (0.49 | )% | (0.51 | )% | (0.54 | )% | (0.59 | )%† | |||||||||||
| Portfolio turnover rate †† | 23 | % | 17 | % | 62 | % | 42 | % | |||||||||||
| Undistributed net investment income (loss) included in price of units issued and redeemed**# | $ | 0.11 | $ | 0.01 | $ | 0.03 | — | ||||||||||||
PowerShares Dynamic Oil & Gas Services Portfolio
| Year Ended April 30, | For the Period October 26, 2005* Through | ||||||||||||||||||
| 2009 | 2008 | 2007 | April 30, 2006 | ||||||||||||||||
| PER SHARE OPERATING PERFORMANCE: | |||||||||||||||||||
| Net asset value at beginning of period | $ | 29.23 | $ | 22.70 | $ | 21.41 | $ | 16.43 | |||||||||||
| Net investment income (loss)** | 0.06 | (0.02 | ) | 0.00 | (a) | (0.01 | ) | ||||||||||||
| Net realized and unrealized gain (loss) on investments | (16.16 | ) | 6.55 | 1.29 | 4.99 | ||||||||||||||
| Total from investment operations | (16.10 | ) | 6.53 | 1.29 | 4.98 | ||||||||||||||
| Distributions to shareholders from: | |||||||||||||||||||
| Net investment income | (0.04 | ) | — | — | — | ||||||||||||||
| Net asset value at end of period | $ | 13.09 | $ | 29.23 | $ | 22.70 | $ | 21.41 | |||||||||||
| Share price at end of period*** | $ | 13.11 | |||||||||||||||||
| NET ASSET VALUE, TOTAL RETURN:**** | (55.04 | )% | 28.77 | % | 6.03 | % | 30.31 | % | |||||||||||
| SHARE PRICE TOTAL RETURN**** | (54.93 | )% | |||||||||||||||||
| RATIOS/SUPPLEMENTAL DATA: | |||||||||||||||||||
| Net assets at end of period (000's omitted) | $ | 155,716 | $ | 379,939 | $ | 272,456 | $ | 336,132 | |||||||||||
| Ratio to average net assets of: | |||||||||||||||||||
| Expenses, after (Waivers) and/or Recapture | 0.62 | % | 0.62 | % | 0.63 | % | 0.64 | %† | |||||||||||
| Expenses, prior to (Waivers) and/or Recapture | 0.61 | % | 0.60 | % | 0.65 | % | 0.67 | %† | |||||||||||
| Net investment income (loss), after (Waivers) and/or Recapture | 0.29 | % | (0.06 | )% | 0.02 | % | (0.10 | )%† | |||||||||||
| Portfolio turnover rate †† | 48 | % | 67 | % | 76 | % | 10 | % | |||||||||||
| Undistributed net investment income included in price of units issued and redeemed**# | $ | 0.00 | (a) | $ | 0.00 | (a) | $ | 0.00 | (a) | — | |||||||||
* Commencement of Investment Operations.
** Based on average shares outstanding.
*** The mean between the last bid and ask prices.
**** Net asset value total return is calculated assuming an initial investment made at the net asset value at the beginning of the period, reinvestment of all dividends and distributions at net asset value during the period, and redemption on the last day of the period. Share price total return is calculated assuming an initial investment made at the share price at the beginning of the period, reinvestment of all dividends and distributions at share price during the period, and sale at the share price on the last day of the period. Total investment returns calculated for a period of less than one year are not annualized.
† Annualized.
†† Portfolio turnover rate is not annualized and does not include securities received or delivered from processing creations or redemptions.
# The per share amount of equalization is presented to show the impact of equalization on distributable earnings per share.
(a) Amount represents less than $0.005.
See Notes to Financial Statements.
71
Financial Highlights (Continued)
PowerShares Dynamic Pharmaceuticals Portfolio
| Year Ended April 30, | For the Period June 23, 2005* Through | ||||||||||||||||||
| 2009 | 2008 | 2007 | April 30, 2006 | ||||||||||||||||
| PER SHARE OPERATING PERFORMANCE: | |||||||||||||||||||
| Net asset value at beginning of period | $ | 17.20 | $ | 19.61 | $ | 16.54 | $ | 14.84 | |||||||||||
| Net investment income** | 0.15 | 0.10 | 0.08 | 0.06 | |||||||||||||||
| Net realized and unrealized gain (loss) on investments | (3.32 | ) | (2.45 | ) | 3.08 | 1.68 | |||||||||||||
| Total from investment operations | (3.17 | ) | (2.35 | ) | 3.16 | 1.74 | |||||||||||||
| Distributions to shareholders from: | |||||||||||||||||||
| Net investment income | (0.12 | ) | (0.06 | ) | (0.08 | ) | (0.04 | ) | |||||||||||
| Return of capital | — | — | (0.01 | ) | — | ||||||||||||||
| Total distributions | (0.12 | ) | (0.06 | ) | (0.09 | ) | (0.04 | ) | |||||||||||
| Net asset value at end of period | $ | 13.91 | $ | 17.20 | $ | 19.61 | $ | 16.54 | |||||||||||
| Share price at end of period*** | $ | 13.92 | |||||||||||||||||
| NET ASSET VALUE, TOTAL RETURN:**** | (18.52 | )% | (11.99 | )% | 19.20 | % | 11.74 | % | |||||||||||
| SHARE PRICE TOTAL RETURN**** | (18.41 | )% | |||||||||||||||||
| RATIOS/SUPPLEMENTAL DATA: | |||||||||||||||||||
| Net assets at end of period (000's omitted) | $ | 104,349 | $ | 106,615 | $ | 82,345 | $ | 66,157 | |||||||||||
| Ratio to average net assets of: | |||||||||||||||||||
| Expenses, after (Waivers) and/or Recapture | 0.63 | % | 0.63 | % | 0.63 | % | 0.66 | %† | |||||||||||
| Expenses, prior to (Waivers) and/or Recapture | 0.66 | % | 0.69 | % | 0.80 | % | 0.88 | %† | |||||||||||
| Net investment income, after (Waivers) and/or Recapture | 0.95 | % | 0.52 | % | 0.43 | % | 0.42 | %† | |||||||||||
| Portfolio turnover rate †† | 31 | % | 45 | % | 29 | % | 29 | % | |||||||||||
| Undistributed net investment loss included in price of units issued and redeemed**# | $ | 0.00 | (a) | $ | (0.01 | ) | $ | (0.01 | ) | — | |||||||||
PowerShares Dynamic Retail Portfolio
| Year Ended April 30, | For the Period October 26, 2005* Through | ||||||||||||||||||
| 2009 | 2008 | 2007 | April 30, 2006 | ||||||||||||||||
| PER SHARE OPERATING PERFORMANCE: | |||||||||||||||||||
| Net asset value at beginning of period | $ | 15.99 | $ | 20.02 | $ | 18.29 | $ | 15.13 | |||||||||||
| Net investment income** | 0.05 | 0.04 | 0.07 | 0.01 | |||||||||||||||
| Net realized and unrealized gain (loss) on investments | (1.36 | ) | (3.92 | ) | 1.71 | 3.16 | |||||||||||||
| Total from investment operations | (1.31 | ) | (3.88 | ) | 1.78 | 3.17 | |||||||||||||
| Distributions to shareholders from: | |||||||||||||||||||
| Net investment income | (0.04 | ) | (0.10 | ) | (0.05 | ) | (0.01 | ) | |||||||||||
| Return of capital | — | (0.05 | ) | — | — | ||||||||||||||
| Total distributions | (0.04 | ) | (0.15 | ) | (0.05 | ) | (0.01 | ) | |||||||||||
| Net asset value at end of period | $ | 14.64 | $ | 15.99 | $ | 20.02 | $ | 18.29 | |||||||||||
| Share price at end of period*** | $ | 14.64 | |||||||||||||||||
| NET ASSET VALUE, TOTAL RETURN:**** | (8.11 | )% | (19.41 | )% | 9.72 | % | 20.98 | % | |||||||||||
| SHARE PRICE TOTAL RETURN**** | (8.11 | )% | |||||||||||||||||
| RATIOS/SUPPLEMENTAL DATA: | |||||||||||||||||||
| Net assets at end of period (000's omitted) | $ | 77,607 | $ | 14,391 | $ | 24,029 | $ | 23,783 | |||||||||||
| Ratio to average net assets of: | |||||||||||||||||||
| Expenses, after (Waivers) and/or Recapture | 0.63 | % | 0.63 | % | 0.64 | % | 0.70 | %† | |||||||||||
| Expenses, prior to (Waivers) and/or Recapture | 1.08 | % | 1.46 | % | 1.41 | % | 0.97 | %† | |||||||||||
| Net investment income, after (Waivers) and/or Recapture | 0.45 | % | 0.22 | % | 0.35 | % | 0.17 | %† | |||||||||||
| Portfolio turnover rate †† | 53 | % | 198 | % | 73 | % | 11 | % | |||||||||||
| Undistributed net investment income (loss) included in price of units issued and redeemed**# | $ | (0.17 | ) | $ | (0.07 | ) | $ | 0.00 | (a) | — | |||||||||
* Commencement of Investment Operations.
** Based on average shares outstanding.
*** The mean between the last bid and ask prices.
**** Net asset value total return is calculated assuming an initial investment made at the net asset value at the beginning of the period, reinvestment of all dividends and distributions at net asset value during the period, and redemption on the last day of the period. Share price total return is calculated assuming an initial investment made at the share price at the beginning of the period, reinvestment of all dividends and distributions at share price during the period, and sale at the share price on the last day of the period. Total investment returns calculated for a period of less than one year are not annualized.
† Annualized.
†† Portfolio turnover rate is not annualized and does not include securities received or delivered from processing creations or redemptions.
# The per share amount of equalization is presented to show the impact of equalization on distributable earnings per share.
(a) Amount represents less than $0.005.
See Notes to Financial Statements.
72
Financial Highlights (Continued)
PowerShares Dynamic Semiconductors Portfolio
| Year Ended April 30, | For the Period June 23, 2005* Through | ||||||||||||||||||
| 2009 | 2008 | 2007 | April 30, 2006 | ||||||||||||||||
| PER SHARE OPERATING PERFORMANCE: | |||||||||||||||||||
| Net asset value at beginning of period | $ | 16.32 | $ | 19.05 | $ | 20.18 | $ | 14.93 | |||||||||||
| Net investment income (loss)** | 0.04 | (0.01 | ) | (0.04 | ) | (0.05 | ) | ||||||||||||
| Net realized and unrealized gain (loss) on investments | (5.92 | ) | (2.72 | ) | (1.09 | ) | 5.30 | ||||||||||||
| Total from investment operations | (5.88 | ) | (2.73 | ) | (1.13 | ) | 5.25 | ||||||||||||
| Distribution to shareholder from: | |||||||||||||||||||
| Net investment income | (0.05 | ) | — | — | — | ||||||||||||||
| Net asset value at end of period | $ | 10.39 | $ | 16.32 | $ | 19.05 | $ | 20.18 | |||||||||||
| Share price at end of period*** | $ | 10.39 | |||||||||||||||||
| NET ASSET VALUE, TOTAL RETURN:**** | (36.01 | )% | (14.33 | )% | (5.60 | )% | 35.16 | % | |||||||||||
| SHARE PRICE TOTAL RETURN**** | (36.01 | )% | |||||||||||||||||
| RATIOS/SUPPLEMENTAL DATA: | |||||||||||||||||||
| Net assets at end of period (000's omitted) | $ | 36,373 | $ | 75,056 | $ | 161,886 | $ | 106,929 | |||||||||||
| Ratio to average net assets of: | |||||||||||||||||||
| Expenses, after (Waivers) and/or Recapture | 0.63 | % | 0.63 | % | 0.63 | % | 0.65 | %† | |||||||||||
| Expenses, prior to (Waivers) and/or Recapture | 0.82 | % | 0.67 | % | 0.78 | % | 0.75 | %† | |||||||||||
| Net investment income (loss), after (Waivers) and/or Recapture | 0.32 | % | (0.04 | )% | (0.23 | )% | (0.33 | )%† | |||||||||||
| Portfolio turnover rate †† | 65 | % | 56 | % | 51 | % | 42 | % | |||||||||||
| Undistributed net investment income (loss) included in price of units issued and redeemed**# | $ | (0.01 | ) | $ | 0.02 | $ | (0.01 | ) | — | ||||||||||
PowerShares Dynamic Software Portfolio
| Year Ended April 30, | For the Period June 23, 2005* Through | ||||||||||||||||||
| 2009 | 2008 | 2007 | April 30, 2006 | ||||||||||||||||
| PER SHARE OPERATING PERFORMANCE: | |||||||||||||||||||
| Net asset value at beginning of period | $ | 17.53 | $ | 20.39 | $ | 18.44 | $ | 14.98 | |||||||||||
| Net investment loss** | (0.06 | ) | (0.10 | ) | (0.10 | ) | (0.08 | ) | |||||||||||
| Net realized and unrealized gain (loss) on investments | (2.10 | ) | (2.76 | ) | 2.05 | 3.54 | |||||||||||||
| Total from investment operations | (2.16 | ) | (2.86 | ) | 1.95 | 3.46 | |||||||||||||
| Net asset value at end of period | $ | 15.37 | $ | 17.53 | $ | 20.39 | $ | 18.44 | |||||||||||
| Share price at end of period*** | $ | 15.37 | |||||||||||||||||
| NET ASSET VALUE, TOTAL RETURN:**** | (12.32 | )% | (14.03 | )% | 10.57 | % | 23.10 | % | |||||||||||
| SHARE PRICE TOTAL RETURN**** | (12.37 | )% | |||||||||||||||||
| RATIOS/SUPPLEMENTAL DATA: | |||||||||||||||||||
| Net assets at end of period (000's omitted) | $ | 36,896 | $ | 35,055 | $ | 71,369 | $ | 49,799 | |||||||||||
| Ratio to average net assets of: | |||||||||||||||||||
| Expenses, after (Waivers) and/or Recapture | 0.63 | % | 0.63 | % | 0.63 | % | 0.67 | %† | |||||||||||
| Expenses, prior to (Waivers) and/or Recapture | 0.97 | % | 0.78 | % | 0.83 | % | 0.91 | %† | |||||||||||
| Net investment loss, after (Waivers) and/or Recapture | (0.42 | )% | (0.49 | )% | (0.51 | )% | (0.53 | )%† | |||||||||||
| Portfolio turnover rate †† | 53 | % | 64 | % | 59 | % | 75 | % | |||||||||||
| Undistributed net investment income included in price of units issued and redeemed**# | $ | 0.02 | $ | 0.05 | $ | 0.00 | (a) | — | |||||||||||
* Commencement of Investment Operations.
** Based on average shares outstanding.
*** The mean between the last bid and ask prices.
**** Net asset value total return is calculated assuming an initial investment made at the net asset value at the beginning of the period, reinvestment of all dividends and distributions at net asset value during the period, and redemption on the last day of the period. Share price total return is calculated assuming an initial investment made at the share price at the beginning of the period, reinvestment of all dividends and distributions at share price during the period, and sale at the share price on the last day of the period. Total investment returns calculated for a period of less than one year are not annualized.
† Annualized.
†† Portfolio turnover rate is not annualized and does not include securities received or delivered from processing creations or redemptions.
# The per share amount of equalization is presented to show the impact of equalization on distributable earnings per share.
(a) Amount represents less than $0.005.
See Notes to Financial Statements.
73
Notes to Financial Statements
PowerShares Exchange-Traded Fund Trust
April 30, 2009
Note 1. Organization
PowerShares Exchange-Traded Fund Trust (the "Trust") was organized as a Massachusetts business trust on June 9, 2000 and is authorized to have multiple series of portfolios. The Trust is an open-end management investment company, registered under the Investment Company Act of 1940, as amended (the "1940 Act"). As of the year end, the Trust offered seventy-five portfolios. This report includes the following portfolios:
| Full Name | Short Name | ||||||
| PowerShares Dynamic Banking Portfolio | "Dynamic Banking Portfolio" | ||||||
| PowerShares Dynamic Biotechnology & Genome Portfolio | "Dynamic Biotechnology & Genome Portfolio" | ||||||
| PowerShares Dynamic Building & Construction Portfolio | "Dynamic Building & Construction Portfolio" | ||||||
| PowerShares Dynamic Energy Exploration & Production Portfolio | "Dynamic Energy Exploration & Production Portfolio" | ||||||
| PowerShares Dynamic Food & Beverage Portfolio | "Dynamic Food & Beverage Portfolio" | ||||||
| PowerShares Dynamic Hardware & Consumer Electronics Portfolio | "Dynamic Hardware & Consumer Electronics Portfolio" | ||||||
| PowerShares Dynamic Healthcare Services Portfolio | "Dynamic Healthcare Services Portfolio" | ||||||
| PowerShares Dynamic Insurance Portfolio | "Dynamic Insurance Portfolio" | ||||||
| PowerShares Dynamic Leisure and Entertainment Portfolio | "Dynamic Leisure and Entertainment Portfolio" | ||||||
| PowerShares Dynamic Media Portfolio | "Dynamic Media Portfolio" | ||||||
| PowerShares Dynamic Networking Portfolio | "Dynamic Networking Portfolio" | ||||||
| PowerShares Dynamic Oil & Gas Services Portfolio | "Dynamic Oil & Gas Services Portfolio" | ||||||
| PowerShares Dynamic Pharmaceuticals Portfolio | "Dynamic Pharmaceuticals Portfolio" | ||||||
| PowerShares Dynamic Retail Portfolio | "Dynamic Retail Portfolio" | ||||||
| PowerShares Dynamic Semiconductors Portfolio | "Dynamic Semiconductors Portfolio" | ||||||
| PowerShares Dynamic Software Portfolio | "Dynamic Software Portfolio" | ||||||
Each portfolio (the "Fund" or collectively the "Funds") represents a separate series of the Trust. The shares of the Funds are referred to herein as "Shares" or "Fund Shares." Each Fund's Shares are listed and traded on the NYSE Arca, Inc.
The Funds' market prices may differ to some degree from the net asset value of the Shares of each Fund. Unlike conventional mutual funds, each Fund issues and redeems Shares on a continuous basis, at net asset value, only in a large specified number of Shares, each called a "Creation Unit." Creation Units are issued and redeemed generally in-kind for securities included in the relevant index. Except when aggregated in Creation Units Shares are not individually redeemable securities of the Funds.
74
Notes to Financial Statements (Continued)
PowerShares Exchange-Traded Fund Trust
April 30, 2009
The investment objective of each Fund is to seek investment results that correspond generally to the price and yield (before the Fund's fees and expenses) of the following indices:
| Fund | Index | ||||||
| Dynamic Banking Portfolio | Dynamic Banking IntellidexSM Index | ||||||
| Dynamic Biotechnology & Genome Portfolio | Dynamic Biotechnology & Genome IntellidexSM Index | ||||||
| Dynamic Building & Construction Portfolio | Dynamic Building & Construction IntellidexSM Index | ||||||
| Dynamic Energy Exploration & Production Portfolio | Dynamic Energy Exploration & Production IntellidexSM Index | ||||||
| Dynamic Food & Beverage Portfolio | Dynamic Food & Beverage IntellidexSM Index | ||||||
| Dynamic Hardware & Consumer Electronics Portfolio | Dynamic Hardware & Consumer Electronics IntellidexSM Index | ||||||
| Dynamic Healthcare Services Portfolio | Dynamic Healthcare Services IntellidexSM Index | ||||||
| Dynamic Insurance Portfolio | Dynamic Insurance IntellidexSM Index | ||||||
| Dynamic Leisure and Entertainment Portfolio | Dynamic Leisure and Entertainment IntellidexSM Index | ||||||
| Dynamic Media Portfolio | Dynamic Media IntellidexSM Index | ||||||
| Dynamic Networking Portfolio | Dynamic Networking IntellidexSM Index | ||||||
| Dynamic Oil & Gas Services Portfolio | Dynamic Oil Services IntellidexSM Index | ||||||
| Dynamic Pharmaceuticals Portfolio | Dynamic Pharmaceuticals IntellidexSM Index | ||||||
| Dynamic Retail Portfolio | Dynamic Retail IntellidexSM Index | ||||||
| Dynamic Semiconductors Portfolio | Dynamic Semiconductors IntellidexSM Index | ||||||
| Dynamic Software Portfolio | Dynamic Software IntellidexSM Index | ||||||
Note 2. Significant Accounting Policies
The preparation of the financial statements in accordance with accounting principles generally accepted in the United States of America requires management to make estimates and assumptions that affect the reported amounts and disclosures in the financial statements, including estimates and assumptions related to taxation. Actual results could differ from these estimates.
A. Security Valuation
Securities, including restricted securities, are valued according to the following policies.
A security listed or traded on an exchange (except convertible bonds) is valued at its last sales price or official closing price as of the close of the customary trading session on the exchange where the security is principally traded, or lacking any sales or official closing price on a particular day, the security may be valued at the closing bid price on that day. Securities traded in the over-the-counter market are valued based on prices furnished by independent pricing services or market makers. Listed options, if no closing price is available, are valued at the mean between the last bid and ask prices from the exchange on which they are principally traded. Options not listed on an exchange are valued by an independent source at the mean between the last bid and ask prices.
Investments in open-end registered investment companies not traded on an exchange are valued at the end of day net asset value per share.
75
Notes to Financial Statements (Continued)
PowerShares Exchange-Traded Fund Trust
April 30, 2009
Debt obligations (including convertible bonds) and unlisted equities are fair valued using an evaluated quote provided by an independent pricing service. Evaluated quotes provided by the pricing service may be determined without exclusive reliance on quoted prices, and may reflect appropriate factors such as institution-size trading in similar groups of securities, developments related to specific securities, dividend rate, yield, quality, type of issue, coupon rate, maturity, individual trading characteristics and other market data. Short-term obligations, including commercial paper, having 60 days or less to maturity are recorded at amortized cost which approximates value. Debt securities are subject to interest rate and credit risks. In addition, all debt securities involve some risk of default with respect to interest and/or principal payments.
Foreign securities (including foreign exchange contracts) are converted into U.S. dollar amounts using the applicable exchange rates as of the close of the London world markets. If market quotations are available and reliable for foreign exchange traded equity securities, the securities will be valued at the market quotations. Because trading hours for certain foreign securities end before the close of the New York Stock Exchange ("NYSE"), closing market quotations may become unreliable. If between the time trading ends on a particular security and the close of the customary trading session on the NYSE, events occur that are significant and make the closing price unreliable, the Fund may fair value the security. If the event is likely to have affected the closing price of the security, the security will be valued at fair value in good faith using procedures approved by the Board of Trustees. Adjustments to closing prices to refl ect fair value may also be based on a screening process of an independent pricing service to indicate the degree of certainty, based on historical data, that the closing price in the principal market where a foreign security trades is not the current value as of the close of the NYSE. Foreign securities meeting the approved degree of certainty that the price is not reflective of current value will be priced at the indication of fair value from the independent pricing service. Multiple factors may be considered by the independent pricing service in determining adjustments to reflect fair value and may include information relating to sector indices, ADRs and domestic and foreign index futures. Foreign securities may have additional risks including exchange rate changes, potential for sharply devalued currencies and high inflation, political and economic upheaval, the relative lack of issuer information, relatively low market liquidity and the potential lack of strict financial and accounting controls and stand ards.
Securities for which market prices are not provided by any of the above methods may be valued based upon quotes furnished by independent sources.
Securities for which market quotations are not readily available or are unreliable are valued at fair value as determined in good faith by or under the supervision of the Trust's officers following procedures approved by the Board of Trustees. Issuer specific events, market trends, bid/ask quotes of brokers and information providers and other market data may be reviewed in the course of making a good faith determination of a security's fair value.
Valuations change in response to many factors including the historical and prospective earnings of the issuer, the value of the issuer's assets, general economic conditions, interest rates, investor perceptions and market liquidity. Because of the inherent uncertainties of valuation, the values reflected in the financial statements may materially differ from the value received upon actual sale of those investments.
B. Other Risks
A Fund may concentrate investments in a comparatively narrow segment of the economy. Consequently, such Fund may tend to be more volatile than other funds, and the value of the investments may tend to rise and fall more rapidly.
76
Notes to Financial Statements (Continued)
PowerShares Exchange-Traded Fund Trust
April 30, 2009
A Fund may invest a large percentage of its assets in securities of a limited number of companies, such that each investment may have a greater effect on the Fund's overall performance, and any change in the value of those securities could significantly affect the value of your investment in the Fund.
C. Federal Income Taxes
Each Fund intends to comply with the provisions of the Internal Revenue Code applicable to regulated investment companies and to distribute substantially all of the Fund's taxable earnings to its shareholders. As such, the Funds will not be subject to Federal income taxes on otherwise taxable income (including net realized gains) that is distributed to the shareholders. Therefore, no provision for Federal income taxes is recorded in the financial statements.
Income and capital gain distributions are determined in accordance with Federal income tax regulations, which may differ from accounting principles generally accepted in the United States of America. These differences are primarily due to differing book and tax treatments for in-kind transactions, losses deferred due to wash sales, and Passive Foreign Investment Company adjustments, if any.
The Funds file tax returns in the United States Federal jurisdiction and certain other jurisdictions. Generally a Fund is subject to examinations by such taxing authorities for up to three years after the filing of the return for the tax period.
D. Investment Income and Investment Transactions
Dividend income is recorded on the ex-dividend date net of foreign taxes withheld, if any. Interest income is recorded on the accrual basis. Investment transactions are recorded on the trade date. Realized gains and losses from the sale or disposition of securities are calculated on the specific identified cost basis. Dividends and interest received by a Fund may give rise to withholding and other taxes imposed by foreign countries. Corporate actions (including cash dividends) are recorded net of non-reclaimable foreign tax withholdings on the ex-dividend date. Tax conventions between certain countries and the United States may reduce or eliminate such taxes.
E. Expenses
Expenses of the Trust, which are directly identifiable to a specific Fund, are applied to that Fund. Expenses which are not readily identifiable to a specific Fund are allocated in such a manner as deemed equitable, taking into consideration the nature and type of expense and the relative net assets of each Fund.
Each Fund is responsible for all of its expenses, including the investment advisory fees, costs of transfer agency, custody, fund administration, legal, audit and other services, interest, taxes, brokerage commissions and other expenses connected with executions of portfolio transactions, any distribution fees or expenses and extraordinary expenses.
F. Dividends and Distributions to Shareholders
Each Fund declares and pays dividends from net investment income, if any, to its shareholders quarterly and recorded on ex-dividend date. Each Fund distributes net realized taxable capital gains, if any, generally annually in cash and recorded on ex-dividend date. Such distributions on a tax basis are determined in conformity with income tax regulations which may differ from accounting principles generally accepted in the United States of America. Distributions in excess of tax basis earnings and profits, if any, are reported in such Fund's financial statements as a tax return of capital at fiscal period end.
77
Notes to Financial Statements (Continued)
PowerShares Exchange-Traded Fund Trust
April 30, 2009
G. Equalization
All Funds use the accounting practice of equalization. This accounting method is used to keep the continuing shareholder's per share equity in undistributed net investment income from being affected by the continuous sales and redemptions of capital shares. Equalization is calculated on a per share basis whereby a portion of the proceeds from the sales and cost of repurchases of capital shares is applied to undistributed net investment income. The amount of equalization is disclosed in the Statements of Changes in Net Assets as undistributed net investment income (loss) included in the price of capital shares issued or redeemed. The distributions to shareholders of amounts so applied may be deemed to be a return of capital for tax purposes to the extent that such distributions exceed taxable income.
Note 3. Investment Advisory Agreement and Other Agreements
The Trust has entered into an Investment Advisory Agreement with Invesco PowerShares Capital Management LLC (the "Adviser") under which the Adviser has overall responsibility as the Funds' investment adviser for the selection and ongoing monitoring of the Funds' investments, managing the Funds' business affairs and providing certain clerical, bookkeeping and other administrative services. Each Fund agreed to pay the Adviser an annual fee of 0.50% of the Fund's average daily net assets.
The Adviser has entered into an Amended and Restated Excess Expense Agreement (the "Excess Expense Agreement") with the Trust under which the Adviser has agreed to waive fees and/or pay Fund expenses to the extent necessary to prevent the operating expenses of each Fund (excluding interest expense, brokerage commissions and other trading expenses, sub-licensing fees, offering costs, taxes and extraordinary expenses) from exceeding 0.60% of the Fund's average daily net assets per year (the "Expense Cap"), at least until August 31, 2010. Offering costs excluded from the Expense Cap are: (a) legal fees pertaining to the Funds' shares offered for sale; (b) Securities and Exchange Commission and state registration fees; and (c) initial fees paid to be listed on an exchange.
The Excess Expense Agreement provides that the expenses borne by the Adviser are subject to recapture by the Adviser for up to three years from the date the fee or expense was borne by the Adviser, but no recapture payment will be made by a Fund if it would result in the Fund exceeding its Expense Cap as specified above.
The net amount of fees waived and other expenses assumed by the Adviser and the amount of recapture paid to the Adviser pursuant to the Excess Expense Agreement are collectively referred to as "(Waivers) and/or Recapture". The net amount of (Waivers) and /or Recapture for the year ended April 30, 2009 is shown on the Statement of Operations.
78
Notes to Financial Statements (Continued)
PowerShares Exchange-Traded Fund Trust
April 30, 2009
The amounts available for potential future recapture by the Adviser under the Excess Expense Agreement and the expiration schedule at April 30, 2009 are as follows:
| Total Potential | Potential Recapture Amounts Expiring | ||||||||||||||||||
| Recapture Amounts | 04/30/10 | 04/30/11 | 04/30/12 | ||||||||||||||||
| Dynamic Banking Portfolio | $ | 201,084 | $ | 44,551 | $ | 74,803 | $ | 81,730 | |||||||||||
| Dynamic Biotechnology & Genome Portfolio | 98,184 | 56,254 | 23,890 | 18,040 | |||||||||||||||
| Dynamic Building & Construction Portfolio | 376,079 | 153,869 | 117,728 | 104,482 | |||||||||||||||
| Dynamic Energy Exploration & Production Portfolio | 201,199 | 95,619 | 33,825 | 71,755 | |||||||||||||||
| Dynamic Food & Beverage Portfolio | 315,752 | 145,175 | 106,057 | 64,520 | |||||||||||||||
| Dynamic Hardware & Consumer Electronics Portfolio | 377,397 | 150,772 | 115,846 | 110,779 | |||||||||||||||
| Dynamic Healthcare Services Portfolio | 208,719 | 36,928 | 73,787 | 98,004 | |||||||||||||||
| Dynamic Insurance Portfolio | 337,134 | 140,805 | 94,552 | 101,777 | |||||||||||||||
| Dynamic Leisure and Entertainment Portfolio | 366,896 | 146,252 | 109,307 | 111,337 | |||||||||||||||
| Dynamic Media Portfolio | 354,880 | 147,426 | 99,363 | 108,091 | |||||||||||||||
| Dynamic Networking Portfolio | 377,589 | 148,592 | 118,952 | 110,045 | |||||||||||||||
| Dynamic Pharmaceuticals Portfolio | 236,238 | 130,710 | 62,631 | 42,897 | |||||||||||||||
| Dynamic Retail Portfolio | 379,438 | 152,165 | 119,462 | 107,811 | |||||||||||||||
| Dynamic Semiconductors Portfolio | 266,697 | 119,497 | 55,112 | 92,088 | |||||||||||||||
| Dynamic Software Portfolio | 323,368 | 132,710 | 92,188 | 98,470 | |||||||||||||||
The Trust has entered into a Distribution Agreement with Invesco Aim Distributors, Inc. (the "Distributor"), which serves as the Distributor of Creation Units for each Fund. The Distributor does not maintain a secondary market in Shares.
The Adviser has entered into a licensing agreement for each Fund with the NYSE AMEX ("Licensor"). The index name trademarks are owned by the respective Licensor. These trademarks have been licensed to the Adviser for use with the Funds. The Funds are not sponsored, endorsed, sold or promoted by the Licensor and the Licensor makes no representation regarding the advisability of investing in any of these Funds.
The Trust has entered into a sub-licensing agreement under which the Funds are required to pay the sub-licensing fees, which are shown on the Statements of Operations.
The Trust has entered into service agreements whereby The Bank of New York Mellon, a wholly-owned subsidiary of The Bank of New York Mellon Corporation, serves as the administrator, custodian, fund accounting and transfer agent for each Fund.
The custodian has agreed to provide overdraft protection to the Funds according to the terms of the service agreement.
79
Notes to Financial Statements (Continued)
PowerShares Exchange-Traded Fund Trust
April 30, 2009
Note 4. Additional Valuation Information
The Funds adopted the provisions of Statement of Financial Accounting Standards No. 157, "Fair Value Measurements" ("SFAS 157"), effective with the beginning of the Fund's fiscal year. SFAS 157 defines fair value as the price that would be received to sell an asset or paid to transfer a liability in an orderly transaction between market participants at the measurement date. SFAS 157 establishes a hierarchy that prioritizes the inputs to valuation methods giving the highest priority to readily available unadjusted quoted prices in an active market for identical assets (Level 1) and the lowest priority to significant unobservable inputs (Level 3) generally when market prices are not readily available or are unreliable. Based on the valuation inputs, the securities or other investments are tiered into one of three levels. Changes in valuation methods may result in transfers in or out of an investment's assigned level:
Level 1 – Prices are determined using quoted prices in an active market for identical assets.
Level 2 – Prices are determined using other significant observable inputs. Observable inputs are inputs that other market participants may use in pricing a security. These may include quoted prices for similar securities, interest rates, prepayment speeds, credit risk and others.
Level 3 – Prices are determined using significant unobservable inputs. In situations where quoted prices or observable inputs are unavailable (for example, when there is little or no market activity for an investment at the end of the period), unobservable inputs may be used. Unobservable inputs reflect the Fund's own assumptions about the factors market participants would use in determining fair value of the securities or instruments and would be based on the best available information.
The following is a summary of the tiered valuation input levels, as of the end of the reporting period, April 30, 2009. The level assigned to the securities valuations may not be an indication of the risk or liquidity associated with investing in those securities. Because of the inherent uncertainties of valuation, the value reflected in the financial statements may materially differ from the value received upon actual sale of those investments.
| Investments in Securities | |||||||||||||||||||
| Level 1 | Level 2 | Level 3 | Total | ||||||||||||||||
| Dynamic Banking Portfolio | $ | 74,797,581 | $ | — | $ | — | $ | 74,797,581 | |||||||||||
| Dynamic Biotechnology & Genome Portfolio | 139,329,185 | — | — | 139,329,185 | |||||||||||||||
| Dynamic Building & Construction Portfolio | 49,184,176 | — | — | 49,184,176 | |||||||||||||||
| Dynamic Energy Exploration & Production Portfolio | 51,434,487 | — | — | 51,434,487 | |||||||||||||||
| Dynamic Food & Beverage Portfolio | 86,552,548 | — | — | 86,552,548 | |||||||||||||||
| Dynamic Hardware & Consumer Electronics Portfolio | 2,821,834 | — | — | 2,821,834 | |||||||||||||||
| Dynamic Healthcare Services Portfolio | 10,847,029 | — | — | 10,847,029 | |||||||||||||||
| Dynamic Insurance Portfolio | 26,839,727 | — | — | 26,839,727 | |||||||||||||||
| Dynamic Leisure and Entertainment Portfolio | 12,802,525 | — | — | 12,802,525 | |||||||||||||||
| Dynamic Media Portfolio | 8,411,132 | — | — | 8,411,132 | |||||||||||||||
| Dynamic Networking Portfolio | 16,310,984 | — | — | 16,310,984 | |||||||||||||||
| Dynamic Oil & Gas Services Portfolio | 155,661,736 | — | — | 155,661,736 | |||||||||||||||
| Dynamic Pharmaceuticals Portfolio | 104,322,095 | — | — | 104,322,095 | |||||||||||||||
| Dynamic Retail Portfolio | 77,668,913 | — | — | 77,668,913 | |||||||||||||||
| Dynamic Semiconductors Portfolio | 36,425,062 | — | — | 36,425,062 | |||||||||||||||
| Dynamic Software Portfolio | 36,946,051 | — | — | 36,946,051 | |||||||||||||||
80
Notes to Financial Statements (Continued)
PowerShares Exchange-Traded Fund Trust
April 30, 2009
Note 5. Investments in Affiliates
The 1940 Act defines "affiliate" to include issuers of which a fund holds 5% or more of the outstanding voting securities. The following is a summary of the transactions with affiliates for the year ended April 30, 2009.
Dynamic Biotechnology & Genome Portfolio
| Value April 30, 2008 | Purchase at Cost | Proceeds from Sales | Change in Unrealized Appreciation | Realized Loss | Value April 30, 2009 | Dividend Income | |||||||||||||||||||||||||
| Synta Pharmaceuticals Corp. | $ | — | $ | 8,145,925 | $ | (551,281 | ) | $ | 889,522 | $ | (107,457 | ) | $ | 8,376,709 | $ | — | |||||||||||||||
Note 6. Federal Income Taxes
At April 30, 2009, the costs of investments on a tax basis including the adjustments for financial reporting purposes as of the most recently completed Federal income tax reporting period were as follows:
| Cost | |||||||
| Dynamic Banking Portfolio | $ | 87,911,100 | |||||
| Dynamic Biotechnology & Genome Portfolio | 162,886,571 | ||||||
| Dynamic Building & Construction Portfolio | 46,051,070 | ||||||
| Dynamic Energy Exploration & Production Portfolio | 55,530,444 | ||||||
| Dynamic Food & Beverage Portfolio | 84,453,570 | ||||||
| Dynamic Hardware & Consumer Electronics Portfolio | 3,682,002 | ||||||
| Dynamic Healthcare Services Portfolio | 13,175,370 | ||||||
| Dynamic Insurance Portfolio | 30,659,985 | ||||||
| Dynamic Leisure and Entertainment Portfolio | 12,628,867 | ||||||
| Dynamic Media Portfolio | 9,714,865 | ||||||
| Dynamic Networking Portfolio | 15,396,547 | ||||||
| Dynamic Oil & Gas Services Portfolio | 202,708,154 | ||||||
| Dynamic Pharmaceuticals Portfolio | 141,431,865 | ||||||
| Dynamic Retail Portfolio | 60,910,454 | ||||||
| Dynamic Semiconductors Portfolio | 41,856,824 | ||||||
| Dynamic Software Portfolio | 35,102,370 | ||||||
81
Notes to Financial Statements (Continued)
PowerShares Exchange-Traded Fund Trust
April 30, 2009
At April 30, 2009, the components of accumulated earning/(loss) on a tax basis were as follows:
| Accumulated Earnings | Other Temporary Differences | Net Accumulated Capital and other Gains/(Losses) | Net Unrealized Appreciation/ (Depreciation) | Gross Unrealized Appreciation | Gross Unrealized Depreciation | Total Accumulated Earnings/(Loss) | |||||||||||||||||||||||||
| Dynamic Banking Portfolio | $ | 706,031 | $ | (4,736 | ) | $ | (41,311,786 | ) | $ | (13,113,519 | ) | $ | 3,810,699 | $ | (16,924,218 | ) | $ | (53,724,010 | ) | ||||||||||||
| Dynamic Biotechnology & Genome Portfolio | — | (6,720 | ) | (110,544,099 | ) | (23,557,386 | ) | 5,136,115 | (28,693,501 | ) | (134,108,205 | ) | |||||||||||||||||||
| Dynamic Building & Construction Portfolio | 44,712 | (2,906 | ) | (10,816,644 | ) | 3,133,106 | 6,531,466 | (3,398,360 | ) | (7,641,732 | ) | ||||||||||||||||||||
| Dynamic Energy Exploration & Production Portfolio | 25,136 | (4,863 | ) | (28,648,100 | ) | (4,095,957 | ) | 7,152,600 | (11,248,557 | ) | (32,723,784 | ) | |||||||||||||||||||
| Dynamic Food & Beverage Portfolio | 417,298 | (3,806 | ) | (19,429,235 | ) | 2,098,978 | 8,173,409 | (6,074,431 | ) | (16,916,765 | ) | ||||||||||||||||||||
| Dynamic Hardware & Consumer Electronics Portfolio | 1,933 | (2,601 | ) | (4,086,858 | ) | (860,168 | ) | 243,576 | (1,103,744 | ) | (4,947,694 | ) | |||||||||||||||||||
| Dynamic Healthcare Services Portfolio | — | (3,309 | ) | (10,496,985 | ) | (2,328,341 | ) | 585,328 | (2,913,669 | ) | (12,828,635 | ) | |||||||||||||||||||
| Dynamic Insurance Portfolio | 66,491 | (3,171 | ) | (10,473,564 | ) | (3,820,258 | ) | 982,100 | (4,802,358 | ) | (14,230,502 | ) | |||||||||||||||||||
| Dynamic Leisure and Entertainment Portfolio | 5,791 | (2,762 | ) | (9,135,380 | ) | 173,658 | 1,216,451 | (1,042,793 | ) | (8,958,693 | ) | ||||||||||||||||||||
| Dynamic Media Portfolio | — | (2,967 | ) | (16,545,831 | ) | (1,303,733 | ) | 1,168,455 | (2,472,188 | ) | (17,852,531 | ) | |||||||||||||||||||
| Dynamic Networking Portfolio | — | (2,677 | ) | (5,897,847 | ) | 914,437 | 1,294,342 | (379,905 | ) | (4,986,087 | ) | ||||||||||||||||||||
| Dynamic Oil & Gas Services Portfolio | 205,497 | (8,778 | ) | (136,512,385 | ) | (47,046,418 | ) | 21,300,983 | (68,347,401 | ) | (183,362,084 | ) | |||||||||||||||||||
| Dynamic Pharmaceuticals Portfolio | 454,545 | (4,867 | ) | (13,748,905 | ) | (37,109,770 | ) | 947,042 | (38,056,812 | ) | (50,408,997 | ) | |||||||||||||||||||
| Dynamic Retail Portfolio | 61,057 | (2,779 | ) | (6,386,046 | ) | 16,758,459 | 16,811,233 | (52,774 | ) | 10,430,691 | |||||||||||||||||||||
| Dynamic Semiconductors Portfolio | 9,771 | (3,937 | ) | (41,317,578 | ) | (5,431,762 | ) | 3,131,497 | (8,563,259 | ) | (46,743,506 | ) | |||||||||||||||||||
| Dynamic Software Portfolio | — | (3,232 | ) | (14,683,798 | ) | 1,843,681 | 4,655,510 | (2,811,829 | ) | (12,843,349 | ) | ||||||||||||||||||||
82
Notes to Financial Statements (Continued)
PowerShares Exchange-Traded Fund Trust
April 30, 2009
Distributions to Shareholders:
The tax character of distributions paid was as follows:
| Year Ended April 30, 2009 | Year Ended April 30, 2008 | ||||||||||
| Distributions paid from Ordinary Income | Distributions paid from Ordinary Income | ||||||||||
| Dynamic Banking Portfolio | $ | 3,373,727 | $ | 684,636 | |||||||
| Dynamic Building & Construction Portfolio | 22,670 | 18,567 | |||||||||
| Dynamic Energy Exploration & Production Portfolio | 345,726 | 387,353 | |||||||||
| Dynamic Food & Beverage Portfolio | 1,004,394 | 889,330 | |||||||||
| Dynamic Insurance Portfolio | 304,900 | 785,432 | |||||||||
| Dynamic Leisure and Entertainment Portfolio | 101,048 | 237,929 | |||||||||
| Dynamic Media Portfolio | 95,850 | 173,173 | |||||||||
| Dynamic Oil & Gas Services Portfolio | 543,711 | — | |||||||||
| Dynamic Pharmaceuticals Portfolio | 949,059 | 339,784 | |||||||||
| Dynamic Retail Portfolio | 48,268 | 53,516 | |||||||||
| Dynamic Semiconductors Portfolio | 141,000 | — | |||||||||
| Year Ended April 30, 2009 | Year Ended April 30, 2008 | ||||||||||
| Distributions paid from Return of Capital | Distributions paid from Return of Capital | ||||||||||
| Dynamic Energy Exploration & Production Portfolio | $ | — | $ | 12,322 | |||||||
| Dynamic Food & Beverage Portfolio | — | 369,392 | |||||||||
| Dynamic Hardware & Consumer Electronics Portfolio | — | 303,093 | |||||||||
| Dynamic Leisure and Entertainment Portfolio | — | 485,571 | |||||||||
| Dynamic Media Portfolio | 48,916 | 655,987 | |||||||||
| Dynamic Retail Portfolio | — | 28,135 | |||||||||
At April 30, 2009, for Federal income tax purposes, the Funds had capital loss carryforwards available as shown in the table below, to the extent provided by the regulations, to offset future capital gains through the years indicated. To the extent that these loss carryforwards are used to offset future capital gains, it is probable that the capital gains so offset will not be distributed to shareholders. The use of some portion of the capital loss carryforward by any one Fund may be limited by Federal tax rules. Among others, certain rules limit the use of the carryforward when there has been a greater than fifty percent change in ownership of a Fund.
83
Notes to Financial Statements (Continued)
PowerShares Exchange-Traded Fund Trust
April 30, 2009
| Capital Loss Available Through | Total | ||||||||||||||||||||||||||
| 2013 | 2014 | 2015 | 2016 | 2017 | Amounts | ||||||||||||||||||||||
| Dynamic Banking Portfolio | $ | — | $ | — | $ | — | $ | 1,146,630 | $ | 16,399,927 | $ | 17,546,557 | |||||||||||||||
| Dynamic Biotechnology & Genome Portfolio | — | 321,497 | 19,612,223 | 15,818,255 | 34,286,844 | 70,038,819 | |||||||||||||||||||||
| Dynamic Building & Construction Portfolio | — | — | 2,263,182 | 742,893 | 2,843,349 | 5,849,424 | |||||||||||||||||||||
| Dynamic Energy Exploration & Production Portfolio | — | — | 285,311 | 3,232,521 | 7,646,917 | 11,164,749 | |||||||||||||||||||||
| Dynamic Food & Beverage Portfolio | — | 433,620 | 1,965,652 | 1,260,041 | 7,585,250 | 11,244,563 | |||||||||||||||||||||
| Dynamic Hardware & Consumer Electronics Portfolio | — | — | 1,413,579 | 361,881 | 1,800,424 | 3,575,884 | |||||||||||||||||||||
| Dynamic Healthcare Services Portfolio | — | — | — | 1,525,186 | 5,942,546 | 7,467,732 | |||||||||||||||||||||
| Dynamic Insurance Portfolio | — | — | 774,301 | 2,181,744 | 4,422,035 | 7,378,080 | |||||||||||||||||||||
| Dynamic Leisure and Entertainment Portfolio | — | 751,908 | 1,611,839 | 2,111,801 | 2,895,936 | 7,371,484 | |||||||||||||||||||||
| Dynamic Media Portfolio | — | 545,973 | 3,187,134 | 2,505,039 | 4,930,761 | 11,168,907 | |||||||||||||||||||||
| Dynamic Networking Portfolio | — | 383,187 | 1,939,441 | 1,064,275 | 1,975,581 | 5,362,484 | |||||||||||||||||||||
| Dynamic Oil & Gas Services Portfolio | — | — | 15,026,862 | 7,909,602 | 24,680,663 | 47,617,127 | |||||||||||||||||||||
| Dynamic Pharmaceuticals Portfolio | 164,751 | 66,659 | 644,797 | 1,727,610 | 2,128,715 | 4,732,532 | |||||||||||||||||||||
| Dynamic Retail Portfolio | — | — | 937,070 | 1,908,967 | 2,427,604 | 5,273,641 | |||||||||||||||||||||
| Dynamic Semiconductors Portfolio | — | 271,588 | 9,158,832 | 10,196,415 | 14,001,359 | 33,628,194 | |||||||||||||||||||||
| Dynamic Software Portfolio | — | 108,427 | 3,017,278 | 1,542,190 | 7,095,351 | 11,763,246 | |||||||||||||||||||||
Capital losses incurred after October 31 ("post-October losses") within the taxable year are deemed to arise on the first business day of each Fund's next taxable year.
84
Notes to Financial Statements (Continued)
PowerShares Exchange-Traded Fund Trust
April 30, 2009
During the year ended April 30, 2009, the Funds incurred and will elect to defer net capital losses as follows:
| Post-October Losses | |||||||
| Dynamic Banking Portfolio | $ | 23,765,229 | |||||
| Dynamic Biotechnology & Genome Portfolio | 40,505,280 | ||||||
| Dynamic Building & Construction Portfolio | 4,967,220 | ||||||
| Dynamic Energy Exploration & Production Portfolio | 17,483,351 | ||||||
| Dynamic Food & Beverage Portfolio | 8,184,672 | ||||||
| Dynamic Hardware & Consumer Electronics Portfolio | 510,974 | ||||||
| Dynamic Healthcare Services Portfolio | 3,029,253 | ||||||
| Dynamic Insurance Portfolio | 3,095,484 | ||||||
| Dynamic Leisure and Entertainment Portfolio | 1,763,896 | ||||||
| Dynamic Media Portfolio | 5,376,924 | ||||||
| Dynamic Networking Portfolio | 535,363 | ||||||
| Dynamic Oil & Gas Services Portfolio | 88,895,258 | ||||||
| Dynamic Pharmaceuticals Portfolio | 9,016,373 | ||||||
| Dynamic Retail Portfolio | 1,112,405 | ||||||
| Dynamic Semiconductors Portfolio | 7,689,384 | ||||||
| Dynamic Software Portfolio | 2,920,552 | ||||||
In order to present shares of beneficial interest and accumulated net realized gains or losses on the Statements of Assets and Liabilities that more closely represent their tax character, certain adjustments have been made to shares of beneficial interest, undistributed net investment income or loss and accumulated net realized gain or loss on investments. These differences are primarily due to redemptions-in-kind, investments in partnerships, wash sales, book equalization, and net operating losses, if any. These adjustments have no effect on net assets. For the year ended April 30, 2009, the adjustments were as follows:
| Undistributed Net Investment Income (Loss) | Undistributed Capital Gains/ (Accumulated Losses) | Shares of Beneficial Interest | |||||||||||||
| Dynamic Banking Portfolio | $ | 39,384 | $ | 15,578,595 | $ | (15,617,979 | ) | ||||||||
| Dynamic Biotechnology & Genome Portfolio | 863,674 | (1,303,262 | ) | 439,588 | |||||||||||
| Dynamic Building & Construction Portfolio | (108,043 | ) | 7,909,401 | (7,801,358 | ) | ||||||||||
| Dynamic Energy Exploration & Production Portfolio | 84,090 | 17,977,519 | (18,061,609 | ) | |||||||||||
| Dynamic Food & Beverage Portfolio | (207,792 | ) | 7,680,749 | (7,472,957 | ) | ||||||||||
| Dynamic Hardware & Consumer Electronics Portfolio | (7,717 | ) | 1,486,842 | (1,479,125 | ) | ||||||||||
| Dynamic Healthcare Services Portfolio | 58,397 | 8,119,089 | (8,177,486 | ) | |||||||||||
| Dynamic Insurance Portfolio | 22,991 | 4,314,541 | (4,337,532 | ) | |||||||||||
| Dynamic Leisure and Entertainment Portfolio | 45,282 | 3,350,292 | (3,395,574 | ) | |||||||||||
| Dynamic Media Portfolio | (34,839 | ) | 7,021,033 | (6,986,194 | ) | ||||||||||
| Dynamic Networking Portfolio | (35,059 | ) | 1,652,463 | (1,617,404 | ) | ||||||||||
| Dynamic Oil & Gas Services Portfolio | (19,943 | ) | (5,379,563 | ) | 5,399,506 | ||||||||||
| Dynamic Pharmaceuticals Portfolio | 36,070 | (916,575 | ) | 880,505 | |||||||||||
| Dynamic Retail Portfolio | 334,997 | 4,895,188 | (5,230,185 | ) | |||||||||||
| Dynamic Semiconductors Portfolio | 23,617 | 12,771,844 | (12,795,461 | ) | |||||||||||
| Dynamic Software Portfolio | 84,545 | (67,110 | ) | (17,435 | ) | ||||||||||
85
Notes to Financial Statements (Continued)
PowerShares Exchange-Traded Fund Trust
April 30, 2009
Note 7. Investment Transactions
For the year ended April 30, 2009, the cost of securities purchased and proceeds from sales of securities, excluding short-term securities, money market funds and in-kind transactions, were as follows:
| Purchases | Sales | ||||||||||
| Dynamic Banking Portfolio | $ | 101,449,662 | $ | 102,080,683 | |||||||
| Dynamic Biotechnology & Genome Portfolio | 176,096,011 | 182,181,297 | |||||||||
| Dynamic Building & Construction Portfolio | 12,728,321 | 12,443,304 | |||||||||
| Dynamic Energy Exploration & Production Portfolio | 62,616,574 | 62,119,469 | |||||||||
| Dynamic Food & Beverage Portfolio | 51,556,946 | 52,469,444 | |||||||||
| Dynamic Hardware & Consumer Electronics Portfolio | 3,678,375 | 4,188,453 | |||||||||
| Dynamic Healthcare Services Portfolio | 18,807,068 | 18,534,104 | |||||||||
| Dynamic Insurance Portfolio | 15,364,965 | 15,291,729 | |||||||||
| Dynamic Leisure and Entertainment Portfolio | 5,671,164 | 5,957,610 | |||||||||
| Dynamic Media Portfolio | 13,159,547 | 12,622,128 | |||||||||
| Dynamic Networking Portfolio | 2,184,921 | 2,065,709 | |||||||||
| Dynamic Oil & Gas Services Portfolio | 123,784,151 | 116,317,215 | |||||||||
| Dynamic Pharmaceuticals Portfolio | 40,193,893 | 39,259,984 | |||||||||
| Dynamic Retail Portfolio | 14,061,407 | 14,372,016 | |||||||||
| Dynamic Semiconductors Portfolio | 30,162,679 | 32,049,643 | |||||||||
| Dynamic Software Portfolio | 15,752,324 | 16,135,831 | |||||||||
For the year ended April 30, 2009, in-kind transactions associated with creations and redemptions were as follows:
| Securities Received | Securities Delivered | ||||||||||
| Dynamic Banking Portfolio | $ | 160,319,991 | $ | 133,982,414 | |||||||
| Dynamic Biotechnology & Genome Portfolio | 183,042,270 | 168,276,877 | |||||||||
| Dynamic Building & Construction Portfolio | 67,217,813 | 24,313,276 | |||||||||
| Dynamic Energy Exploration & Production Portfolio | 101,849,993 | 122,911,509 | |||||||||
| Dynamic Food & Beverage Portfolio | 87,530,837 | 66,532,403 | |||||||||
| Dynamic Hardware & Consumer Electronics Portfolio | 3,436,721 | 3,781,638 | |||||||||
| Dynamic Healthcare Services Portfolio | 28,372,731 | 36,249,684 | |||||||||
| Dynamic Insurance Portfolio | 42,858,430 | 38,740,765 | |||||||||
| Dynamic Leisure and Entertainment Portfolio | 34,967,907 | 32,749,628 | |||||||||
| Dynamic Media Portfolio | 34,617,581 | 45,408,628 | |||||||||
| Dynamic Networking Portfolio | 13,704,456 | 10,117,279 | |||||||||
| Dynamic Oil & Gas Services Portfolio | 224,613,740 | 258,238,957 | |||||||||
| Dynamic Pharmaceuticals Portfolio | 98,453,234 | 69,254,866 | |||||||||
| Dynamic Retail Portfolio | 107,116,302 | 53,880,544 | |||||||||
| Dynamic Semiconductors Portfolio | 41,232,726 | 54,432,874 | |||||||||
| Dynamic Software Portfolio | 33,343,618 | 28,805,776 | |||||||||
Gains on in-kind transactions are generally not considered taxable gains for Federal income tax purposes.
86
Notes to Financial Statements (Continued)
PowerShares Exchange-Traded Fund Trust
April 30, 2009
Note 8. Trustees' Fees
The Funds compensate each Trustee who is not an employee of the Adviser or its affiliates. The "Interested" Trustee of the Trust does not receive any Trustees' fees.
The Trust has adopted a deferred compensation plan (the "Plan"). Under the Plan, a Trustee who is not an "interested person" (as defined in the 1940 Act) (an "Independent Trustee") and has executed a Deferred Fee Agreement (a "Participating Trustee") may defer receipt of all or a portion of his compensation ("Deferral Fees"). Such Deferral Fees are deemed to be invested in selected PowerShares Funds. The Deferral Fees payable to the Participating Trustee are valued as of the date such Fees would have been paid to the Participating Trustee. The value increases with contributions or with increases in the value of the shares selected, and the value decreases with distributions or with declines in the value of the shares selected.
Note 9. Capital
Shares are created and redeemed by the Trust only in Creation Unit size aggregations of 100,000. Only Authorized Participants are permitted to purchase or redeem Creation Units from the Funds. Such transactions are generally permitted on an in-kind basis, with a balancing cash component to equate the transaction to the net asset value per unit of each Fund of the Trust on the transaction date. Cash may be substituted equivalent to the value of certain securities generally when they are not available in sufficient quantity for delivery, not eligible for trading by the Authorized Participant or as a result of other market circumstances.
Note 10. Indemnifications
Under the Trust's organizational documents, its officers and Trustees are indemnified against certain liabilities arising out of the performance of their duties to the Trust. Each Independent Trustee is also indemnified against certain liabilities arising out of the performance of his duties to the Trust pursuant to an Indemnification Agreement between the Independent Trustee and the Trust. Additionally, in the normal course of business, the Trust enters into contracts with service providers that contain general indemnification clauses. The Trust's maximum exposure under these arrangements is unknown, as this would involve future claims that may be made against the Trust that have not yet occurred. However, based on experience, the Trust believes the risk of loss to be remote.
Note 11. Subsequent Event
On May 1, 2009, the Board of Trustees of the Trust approved the liquidation of the PowerShares Dynamic Hardware & Consumer Electronics Portfolio. The portfolio was liquidated at fair value on May 22, 2009.
87
Report of Independent Registered Public Accounting Firm
To the Board of Trustees and Shareholders of PowerShares Exchange-Traded Fund Trust:
In our opinion, the accompanying statements of assets and liabilities, including the schedules of investments, and the related statements of operations and of changes in net assets and the financial highlights present fairly, in all material respects, the financial position of each of the portfolios indicated in Note 1 of the financial statements (each a portfolio of PowerShares Exchange-Traded Fund Trust, hereafter referred to as the "Trust") at April 30, 2009, and the results of each of their operations, the changes in each of their net assets, and the financial highlights for each of the periods presented, in conformity with accounting principles generally accepted in the United States of America. These financial statements and financial highlights (hereafter referred to as "financial statements") are the responsibility of the Trust's management; our responsibility is to express an opinion on these financial statements based on our audits. We conducted our audits of these financial statements in accordance with the standards of the Public Company Accounting Oversight Board (United States). Those standards require that we plan and perform the audits to obtain reasonable assurance about whether the financial statements are free of material misstatement. An audit includes examining, on a test basis, evidence supporting the amounts and disclosures in the financial statements, assessing the accounting principles used and significant estimates made by management, and evaluating the overall financial statement presentation. We believe that our audits, which included confirmation of securities at April 30, 2009 by correspondence with the custodian and brokers, and the application of alternative auditing procedures where securities purchased had not been received, provide a reasonable basis for our opinion.
As discussed in Note 11 to the financial statements, on May 1, 2009, the Board of Trustees approved the liquidation of the PowerShares Dynamic Hardware & Consumer Electronics Portfolio, effected on May 22, 2009.
PricewaterhouseCoopers LLP
New York, New York
June 25, 2009
88
Supplemental Information
Tax Information
Form 1099-DIV, Form 1042-S and other year-end tax information provide shareholders with actual calendar year amounts that should be included in their tax returns. Shareholders should consult their tax advisors
The following distribution information is being provided as required by the Internal Revenue Code or to meet a specific state's requirement.
Each Fund designates the following amounts or, if subsequently determined to be different the maximum amount allowable for its fiscal year ended April 30, 2009 and if applicable its final fiscal year ended May 22, 2009:
Federal Income Tax Information
| April 30, 2009 | |||||||||||
| Qualified Dividend Income* | Corporate Dividends Received Deduction* | ||||||||||
| Dynamic Banking Portfolio | 100 | % | 100 | % | |||||||
| Dynamic Biotechnology & Genome Portfolio | 0 | % | 0 | % | |||||||
| Dynamic Building & Construction Portfolio | 100 | % | 100 | % | |||||||
| Dynamic Energy Exploration & Production Portfolio | 100 | % | 100 | % | |||||||
| Dynamic Food & Beverage Portfolio | 100 | % | 100 | % | |||||||
| Dynamic Hardware & Consumer Electronics Portfolio | 0 | % | 0 | % | |||||||
| Dynamic Healthcare Services Portfolio | 0 | % | 0 | % | |||||||
| Dynamic Insurance Portfolio | 100 | % | 100 | % | |||||||
| Dynamic Leisure and Entertainment Portfolio | 100 | % | 100 | % | |||||||
| Dynamic Media Portfolio | 100 | % | 100 | % | |||||||
| Dynamic Networking Portfolio | 0 | % | 0 | % | |||||||
| Dynamic Oil & Gas Services Portfolio | 100 | % | 100 | % | |||||||
| Dynamic Pharmaceuticals Portfolio | 100 | % | 100 | % | |||||||
| Dynamic Retail Portfolio | 100 | % | 100 | % | |||||||
| Dynamic Semiconductors Portfolio | 100 | % | 100 | % | |||||||
| Dynamic Software Portfolio | 0 | % | 0 | % | |||||||
Federal Income Tax Information for Liquidating Fund
| May 22, 2009 | |||||||||||
| Qualified Dividend Income* | Corporate Dividends Received Deduction* | ||||||||||
| Dynamic Hardware & Consumer Electronics Portfolio | 100 | % | 100 | % | |||||||
* The above percentages are based on ordinary income dividends paid to shareholders during the Fund's fiscal year.
89
Supplemental Information (Continued)
Trustees and Officers
The Independent Trustees, the Trustee who is affiliated with the Adviser (the "Management Trustee") and the executive officers of the Trust, their term of office and length of time served, their principal business occupations during at least the past five years, the number of portfolios in the Fund Complex (as defined below) overseen by each Trustee and the other directorships, if any, held by a Trustee, are shown below.
| Name, Address, and Age Independent Trustee | Position(s) with Trust | Length Time Served* | Principal Occupation(s) During Past 5 Years | Number of Portfolios in Fund Complex** Overseen by Trustee | Other Directorships Held by Trustee | ||||||||||||||||||
| Ronn R. Bagge 51 YQA Capital Management, LLC 1755 S. Naperville Road Suite 100 Wheaton, IL 60187 | Trustee | Since 2003 | YQA Capital Management LLC (July 1998-Present); formerly Owner/CEO of Electronic Dynamic Balancing Co., Inc. (high-speed rotating equipment service provider) | 119 | None | ||||||||||||||||||
| Marc M. Kole 48 c/o Invesco PowerShares Capital Management LLC 301 W. Roosevelt Road Wheaton, IL 60187 | Trustee | Since 2006 | Vice President of Finance and Accounting, Hope Network (social services) (November 2008-Present); formerly Assistant Vice President and Controller, Priority Health (health insurance) (September 2005-April 2008); Senior Vice President of Finance, United Healthcare (health insurance) (July 2004-July 2005); Senior Vice President of Finance, Oxford Health Plans (June 2000-July 2004) | 119 | None | ||||||||||||||||||
* This is the date the Trustee began serving the Trust. Each Trustee serves an indefinite term, until his successor is elected.
** Fund Complex includes all open-end funds (including all of their portfolios) advised by the Adviser. At April 30, 2009, the Fund Complex consists of the Trust's 75 portfolios and three other exchange-traded fund trusts with 44 portfolios advised by the Adviser.
90
Supplemental Information (Continued)
Trustees and Officers (Continued)
| Name, Address, and Age Independent Trustee | Position(s) with Trust | Length Time Served* | Principal Occupation(s) During Past 5 Years | Number of Portfolios in Fund Complex** Overseen by Trustee | Other Directorships Held by Trustee | ||||||||||||||||||
| Philip M. Nussbaum 47 c/o Invesco PowerShares Capital Management LLC 301 W. Roosevelt Road Wheaton, IL 60187 | Trustee | Since 2003 | Chairman, Performance Trust Capital Partners (formerly Betzold, Berg, Nussbaum & Heitman, Inc.) (November 2004-Present); formerly Managing Director, Communication Institute (May 2002-August 2003); Executive Vice President of Finance, Betzold, Berg, Nussbaum & Heitman, Inc. (March 1994-1999) | 119 | None | ||||||||||||||||||
| Donald H. Wilson 49 c/o Invesco PowerShares Capital Management LLC 301 W. Roosevelt Road Wheaton, IL 60187 | Trustee | Since 2006 | President and Chief Operating Officer, AMCORE Financial, Inc. (bank holding company) (August 2007-April 2009), formerly Executive Vice President and Chief Financial Officer, AMCORE Financial, Inc. (February 2006-August 2007); Senior Vice President and Treasurer, Marshall & Ilsley Corp. (bank holding company) (May 1995-February 2006) | 119 | None | ||||||||||||||||||
* This is the date the Trustee began serving the Trust. Each Trustee serves an indefinite term, until his successor is elected.
** Fund Complex includes all open-end funds (including all of their portfolios) advised by the Adviser. At April 30, 2009, the Fund Complex consists of the Trust's 75 portfolios and three other exchange-traded fund trusts with 44 portfolios advised by the Adviser.
91
Supplemental Information (Continued)
Trustees and Officers (Continued)
| Name, Address, and Age of Management Trustee | Position(s) with Trust | Length Time Served* | Principal Occupation(s) During Past 5 Years | Number of Portfolios in Fund Complex*** Overseen by Trustee | Other Directorships Held by Trustee | ||||||||||||||||||
| H. Bruce Bond** 45 Invesco PowerShares Capital Management LLC 301 W. Roosevelt Road Wheaton, IL 60187 | Chairman of the Board, Trustee and President | Since 2003 | Managing Director, Invesco PowerShares Capital Management LLC (August 2002-Present); formerly Manager, Nuveen Investments (April 1998-August 2002) | 119 | None | ||||||||||||||||||
Availability of Additional Information About the Trustees
The Statement of Additional Information includes additional information about the Trustees and is available, without charge, upon request at 800.337.4246.
* This is the date the Management Trustee began serving the Trust. Each Trustee serves an indefinite term, until his successor is elected. Each officer serves a one year term, until his successor is elected.
** "Interested person" as defined in Section 2(a)(19) of the 1940 Act.
*** Fund Complex includes all open-end funds (including all of their portfolios) advised by the Adviser. At April 30, 2009, the Fund Complex consists of the Trust's 75 portfolios and three other exchange-traded fund trusts with 44 portfolios advised by the Adviser.
92
Supplemental Information (Continued)
Trustees and Officers (Continued)
| Name, Address, and Age of Officers | Position(s) with Trust | Length Time Served* | Principal Occupation(s) During Past 5 Years | ||||||||||||
| Bruce T. Duncan 54 Invesco PowerShares Capital Management LLC 301 W. Roosevelt Road Wheaton, IL 60187 | Chief Financial Officer, Treasurer and Secretary | Chief Financial Officer and Treasurer Since 2006 Secretary Since 2008 | Senior Vice President of Finance, Invesco PowerShares Capital Management LLC (September 2005-Present); formerly Private Practice Attorney (2000-2005); Vice President of Investor Relations, The ServiceMaster Company (1994-2000); Vice President of Taxes, The ServiceMaster Company (1990-2000) | ||||||||||||
| Kevin R. Gustafson 43 Invesco PowerShares Capital Management LLC 301 W. Roosevelt Road Wheaton, IL 60187 | Chief Compliance Officer | Since 2004 | General Counsel, Invesco PowerShares Capital Management LLC (September 2004-Present); formerly Chief Compliance Officer, Invesco PowerShares Capital Management LLC (September 2004-April 2008) | ||||||||||||
| John W. Southard, Jr., CFA, MBA 39 Invesco PowerShares Capital Management LLC 301 West Roosevelt Road Wheaton, IL 60187 | Vice President | Since 2003 | Managing Director, Invesco PowerShares Capital Management LLC (August 2002-Present); formerly, Treasurer of the Trust (April 2003-April 2006); Senior Equity Analyst, Charles Schwab & Company (May 2001-August 2002) | ||||||||||||
* This is the period for which the Officers began serving the Trust. Each Officer serves one year term, until his successor is elected.
93
Board Considerations Regarding Continuation of Investment Advisory Agreement
At a meeting held on April 16, 2009, the Board of Trustees of the PowerShares Exchange-Traded Fund Trust (the "Trust"), including the Independent Trustees, unanimously approved the continuation of the Investment Advisory Agreement between Invesco PowerShares Capital Management LLC (the "Adviser") and the Trust for the following 70 series (each, a "Fund" and collectively, the "Funds"):
PowerShares Dynamic Market Portfolio
PowerShares Dynamic OTC Portfolio
PowerShares Golden Dragon Halter USX China Portfolio
PowerShares High Yield Equity Dividend AchieversTM Portfolio
PowerShares WilderHill Clean Energy Portfolio
PowerShares Dynamic Large Cap Growth Portfolio
PowerShares Dynamic Large Cap Value Portfolio
PowerShares Dynamic Mid Cap Growth Portfolio
PowerShares Dynamic Mid Cap Value Portfolio
PowerShares Dynamic Small Cap Growth Portfolio
PowerShares Dynamic Small Cap Value Portfolio
PowerShares Dynamic Biotechnology & Genome Portfolio
PowerShares Dynamic Food & Beverage Portfolio
PowerShares Dynamic Leisure and Entertainment Portfolio
PowerShares Dynamic Media Portfolio
PowerShares Dynamic Networking Portfolio
PowerShares Dynamic Pharmaceuticals Portfolio
PowerShares Dynamic Semiconductors Portfolio
PowerShares Dynamic Software Portfolio
PowerShares Zacks Micro Cap Portfolio
PowerShares Aerospace & Defense Portfolio
PowerShares Dynamic Hardware & Consumer Electronics Portfolio
PowerShares Dynamic Telecommunications & Wireless Portfolio
PowerShares Value Line Timeliness Select Portfolio
PowerShares Dividend AchieversTM Portfolio
PowerShares International Dividend AchieversTM Portfolio
PowerShares High Growth Rate Dividend AchieversTM Portfolio
PowerShares Zacks Small Cap Portfolio
PowerShares Dynamic Building and Construction Portfolio
PowerShares Dynamic Energy Exploration and Production Portfolio
PowerShares Dynamic Insurance Portfolio
PowerShares Dynamic Oil and Gas Services Portfolio
PowerShares Dynamic Retail Portfolio
PowerShares Dynamic Utilities Portfolio
PowerShares Lux Nanotech Portfolio
PowerShares FTSE RAFI US 1000 Portfolio
PowerShares FTSE RAFI US 1500 Small-Mid Portfolio
PowerShares Water Resources Portfolio
PowerShares Dynamic Energy Sector Portfolio
PowerShares Dynamic Financials Sector Portfolio
PowerShares Dynamic Healthcare Sector Portfolio
PowerShares Dynamic Industrials Sector Portfolio
PowerShares Dynamic Large Cap Portfolio
PowerShares Dynamic MagniQuant Portfolio
PowerShares Dynamic Mid Cap Portfolio
PowerShares Dynamic Small Cap Portfolio
PowerShares Dynamic Technology Sector Portfolio
PowerShares Buyback AchieversTM Portfolio
PowerShares FTSE RAFI Basic Materials Sector Portfolio
PowerShares FTSE RAFI Consumer Goods Sector Portfolio
PowerShares FTSE RAFI Consumer Services Sector Portfolio
PowerShares FTSE RAFI Energy Sector Portfolio
PowerShares FTSE RAFI Financials Sector Portfolio
PowerShares FTSE RAFI Health Care Sector Portfolio
PowerShares FTSE RAFI Industrials Sector Portfolio
PowerShares FTSE RAFI Telecommunications & Technology Sector Portfolio
94
Board Considerations Regarding Continuation of Investment Advisory Agreement (Continued)
PowerShares FTSE RAFI Utilities Sector Portfolio
PowerShares Cleantech Portfolio
PowerShares Dynamic Aggressive Growth Portfolio
PowerShares Dynamic Banking Portfolio
PowerShares Dynamic Basic Materials Sector Portfolio
PowerShares Dynamic Consumer Discretionary Sector Portfolio
PowerShares Dynamic Consumer Staples Sector Portfolio
PowerShares Dynamic Healthcare Services Portfolio
PowerShares Dynamic Deep Value Portfolio
PowerShares Financial Preferred Portfolio
PowerShares Listed Private Equity Portfolio
PowerShares DWA Technical Leaders Portfolio
PowerShares Value Line Industry Rotation Portfolio
PowerShares WilderHill Progressive Energy Portfolio
The Trustees reviewed information from the Adviser describing: (i) the nature, extent and quality of services provided, (ii) the investment performance of the Funds and the Adviser, (iii) the costs of services provided and estimated profits realized by the Adviser, (iv) the extent to which economies of scale are realized as the Funds grow, (v) whether fee levels reflect any possible economies of scale for the benefit of Fund shareholders, (vi) comparisons of services rendered and amounts paid to other registered investment companies and (vii) any benefits realized by the Adviser from its relationship with each Fund. Based on all of the information considered and the conclusions reached, the Board, including the Independent Trustees, determined to approve the continuation of the Investment Advisory Agreement for each Fund. No single factor was determinative in the Board's analysis.
Nature, Extent and Quality of Services. In evaluating the nature, extent and quality of the Adviser's services, the Trustees reviewed information concerning the functions performed by the Adviser for the Funds, information describing the Adviser's current organization and projected staffing, including operations assistance provided by the Adviser's parent organization, Invesco Ltd., and the background and experience of the persons responsible for the day-to-day management of the Funds. The Trustees reviewed matters related to the Adviser's execution of portfolio transactions on behalf of the Funds. The Trustees also reviewed information on the performance of the Funds and the performance of their underlying indices through December 31, 2008. The Trustees also reviewed reports on the correlation and tracking error between the underlying index and each Fund's performance, and the Adviser's analysis of the tracking error between each Fund and its underlying index. The Trustees noted that each Fund's correlation was within the targeted range set forth in the Trust's registration statement and that, for each Fund other than PowerShares Financial Preferred Portfolio, the tracking error was within the targeted range set forth in the Trust's registration statement. The Trustees reviewed the reasons for PowerShares Financial Preferred Portfolio's tracking error. The Trustees concluded that each Fund was correlated to its underlying index and that the tracking error for each Fund was within an acceptable range given that Fund's particular circumstances.
The Trustees also considered the services provided by the Adviser in its oversight of the Funds' administrator, custodian and transfer agent. They noted the significant amount of time and effort that had been devoted to this oversight function.
Based on their review, the Trustees concluded that the nature, extent and quality of services provided by the Adviser to the Funds under the Investment Advisory Agreement were appropriate and reasonable.
95
Board Considerations Regarding Continuation of Investment Advisory Agreement (Continued)
Fees, Expenses and Profitability. The Trustees reviewed and discussed the information provided by the Adviser on each Fund's expense ratio and advisory fee, as compared to information compiled by the Adviser from Lipper Inc. databases on the expense ratios of comparable exchange-traded funds ("ETFs"), open-end (non-ETF) index funds and open-end actively-managed funds. The Trustees noted that the annual advisory fee charged to each Fund is:
• 0.50% of the Fund's average net assets, for each Fund other than PowerShares High Yield Equity Dividend AchieversTM Portfolio, PowerShares Dividend AchieversTM Portfolio, PowerShares High Growth Rate Dividend AchieversTM Portfolio, PowerShares International Dividend AchieversTM Portfolio, PowerShares FTSE RAFI Basic Materials Sector Portfolio, PowerShares FTSE RAFI Consumer Goods Sector Portfolio, PowerShares FTSE RAFI Consumer Services Sector Portfolio, PowerShares FTSE RAFI Energy Sector Portfolio, PowerShares FTSE RAFI Financials Sector Portfolio, PowerShares FTSE RAFI Health Care Sector Portfolio, PowerShares FTSE RAFI Industrials Sector Portfolio, PowerShares FTSE RAFI Telecommunications & Technology Sector Portfolio, PowerShares FTSE RAFI Utilities Sector Portfolio, PowerShares FTSE RAFI US 1000 Portfolio and PowerShares FTSE RAFI US 1500 Small-Mid Portfolio ;
• 0.40% of the Fund's average net assets, for each of PowerShares High Yield Equity Dividend AchieversTM Portfolio, PowerShares Dividend AchieversTM Portfolio, PowerShares High Growth Rate Dividend AchieversTM Portfolio and PowerShares International Dividend AchieversTM Portfolio; and
• 0.29% of the Fund's average net assets, for each of PowerShares FTSE RAFI Basic Materials Sector Portfolio, PowerShares FTSE RAFI Consumer Goods Sector Portfolio, PowerShares FTSE RAFI Consumer Services Sector Portfolio, PowerShares FTSE RAFI Energy Sector Portfolio, PowerShares FTSE RAFI Financials Sector Portfolio, PowerShares FTSE RAFI Health Care Sector Portfolio, PowerShares FTSE RAFI Industrials Sector Portfolio, PowerShares FTSE RAFI Telecommunications & Technology Sector Portfolio, PowerShares FTSE RAFI Utilities Sector Portfolio, PowerShares FTSE RAFI US 1000 Portfolio and PowerShares FTSE RAFI US 1500 Small-Mid Portfolio (the Trustees noted that the advisory fee for each of these Funds was reduced to 0.29% effective November 1, 2008).
The Trustees also noted that the Adviser has agreed to waive a portion of its advisory fee and/or pay expenses (an "Expense Cap") to the extent necessary to prevent the annual operating expenses of each Fund from exceeding the percentage of that Fund's average daily net assets, at least until August 31, 2010, as set forth below:
• 0.60%, excluding interest expenses, brokerage commissions and other trading expenses, taxes and extraordinary expenses, for each of PowerShares Dynamic OTC Portfolio and PowerShares Dynamic Market Portfolio;
• 0.50%, excluding interest expenses, licensing fees, offering costs, brokerage commissions and other trading expenses, taxes and extraordinary expenses, for each of PowerShares High Yield Equity Dividend AchieversTM Portfolio, PowerShares Dividend AchieversTM Portfolio, PowerShares High Growth Rate Dividend AchieversTM Portfolio and PowerShares International Dividend AchieversTM Portfolio;
• 0.39%, excluding interest expenses, offering costs, brokerage commissions and other trading expenses, taxes and extraordinary expenses, for each of PowerShares FTSE RAFI Basic Materials
96
Board Considerations Regarding Continuation of Investment Advisory Agreement (Continued)
Sector Portfolio, PowerShares FTSE RAFI Consumer Goods Sector Portfolio, PowerShares FTSE RAFI Consumer Services Sector Portfolio, PowerShares FTSE RAFI Energy Sector Portfolio, PowerShares FTSE RAFI Financials Sector Portfolio, PowerShares FTSE RAFI Health Care Sector Portfolio, PowerShares FTSE RAFI Industrials Sector Portfolio, PowerShares FTSE RAFI Telecommunications & Technology Sector Portfolio, PowerShares FTSE RAFI Utilities Sector Portfolio, PowerShares FTSE RAFI US 1000 Portfolio and PowerShares FTSE RAFI US 1500 Small-Mid Portfolio (the Trustees noted that, effective November 1, 2008, the Expense Cap for each of these Funds changed from 0.60% to 0.39%); and
• 0.60%, excluding interest expenses, licensing fees, offering costs, brokerage commissions and other trading expenses, taxes and extraordinary expenses, for each other Fund.
The Trustees noted that the Adviser represented that it does not manage any funds other than the Funds and other ETFs overseen by the Board. The Trustees noted that each Fund's advisory fee was:
• higher than the median advisory fee of its ETF peer funds (except for the advisory fee of each of PowerShares Financial Preferred Portfolio, PowerShares Golden Dragon Halter USX China Portfolio and PowerShares International Dividend AchieversTM Portfolio, which was lower than the median advisory fee of its ETF peer funds); and
• higher than the median advisory fee of its open-end index peer funds (except for the advisory fee of each of PowerShares DWA Technical Leaders Portfolio, PowerShares Dynamic Aggressive Growth Portfolio, PowerShares Dynamic Mid Cap Growth Portfolio, PowerShares Dynamic Mid Cap Value Portfolio, PowerShares Dynamic OTC Portfolio, PowerShares Dynamic Telecommunications & Wireless Portfolio, PowerShares Dynamic Utilities Portfolio, PowerShares Financial Preferred Portfolio, PowerShares FTSE RAFI Utilities Sector Portfolio and PowerShares Value Line Timeliness Select Portfolio, which was lower than the median advisory fee of its open-end index peer funds, and there was no comparable data for PowerShares Dynamic Basic Materials Sector Portfolio, PowerShares FTSE RAFI Basic Materials Sector Portfolio or PowerShares Golden Dragon Halter USX China Portfolio); but
• lower than the median advisory fee of its open-end actively-managed peer funds.
The Trustees determined that the advisory fees were reasonable, noting the complexity of the indices, which generally require more frequent rebalancing of the portfolios, the distinguishing factors of the Funds, and the higher administrative, operational and management oversight costs for the Adviser. With respect to the Funds' expense ratios, the Trustees noted that the net expense ratio for each Fund was:
• higher than the median expense ratio of its ETF peer funds (except for the net expense ratio of each of PowerShares Dynamic OTC Portfolio, PowerShares Financial Preferred Portfolio and PowerShares International Dividend AchieversTM Portfolio, which was less than the median expense ratio of its ETF peer funds, and the net expense ratio of each of PowerShares Dynamic Aggressive Growth Portfolio and PowerShares Dynamic Market Portfolio, which was equal to the median expense ratio of its ETF peer funds); and
• higher than the median expense ratio of its open-end index peer funds (except for the net expense ratio of each of PowerShares DWA Technical Leaders Portfolio, PowerShares Dynamic Aggressive
97
Board Considerations Regarding Continuation of Investment Advisory Agreement (Continued)
Growth Portfolio, PowerShares Dynamic Banking Portfolio, PowerShares Dynamic Biotechnology & Genome Portfolio, PowerShares Dynamic Financials Sector Portfolio, PowerShares Dynamic Healthcare Sector Portfolio, PowerShares Dynamic Healthcare Services Portfolio, PowerShares Dynamic Insurance Portfolio, PowerShares Dynamic OTC Portfolio, PowerShares Dynamic Pharmaceuticals Portfolio, PowerShares Dynamic Telecommunications & Wireless Portfolio, PowerShares Dynamic Utilities Portfolio, PowerShares Financial Preferred Portfolio, PowerShares FTSE RAFI Financials Sector Portfolio, PowerShares FTSE RAFI Utilities Sector Portfolio, PowerShares Listed Private Equity Portfolio and PowerShares Value Line Timeliness Select Portfolio, which was lower than the median expense ratio of its open-end index peer funds, and there was no comparable data for PowerShares Dynamic Basic Materials Sector Portfolio, PowerShares FTSE RAFI Basic Materi als Sector Portfolio or PowerShares Golden Dragon Halter USX China Portfolio); but
• lower than the median expense ratio of its open-end actively-managed peer funds.
The Trustees noted that a significant component of the non-advisory fee expenses was the license fees paid by the Funds.
The Board concluded that the advisory fee and expense ratio of each Fund (giving effect to the Fund's Expense Cap) were reasonable and appropriate in light of the services provided.
In conjunction with their review of fees, the Trustees also considered information provided by the Adviser on the revenues received by the Adviser under the Investment Advisory Agreement for each Fund, as well as the fees waived and expenses reimbursed by the Adviser for the Funds. The Trustees reviewed information provided by the Adviser on its profitability as well as any profits or losses realized by the Adviser from its relationship to each Fund. The Trustees concluded that the profitability to the Adviser of the advisory services provided to any of the Funds was not unreasonable.
Economies of Scale and Whether Fee Levels Reflect These Economies of Scale. The Trustees reviewed the information provided by the Adviser as to the extent to which economies of scale are realized as each Fund grows and whether fee levels reflect economies of scale for the benefit of shareholders. The Trustees reviewed each Fund's asset size, expense ratio and expense limitation agreed to by the Adviser. The Trustees noted that, for Funds whose expenses are higher than their respective Expense Caps, any reduction in that Fund's expenses would be enjoyed by the Adviser, but that Fund shareholders benefit from the lower expense ratio as a result of the Fund's Expense Cap. The Trustees also noted that the Excess Expense Agreement with the Trust provides that the Adviser is entitled to be reimbursed by each Fund, other than PowerShares Dynamic Market Portf olio and PowerShares Dynamic OTC Portfolio, for fees waived or expenses absorbed pursuant to the Expense Cap for a period of three years from the date the fee or expense was incurred, provided that no reimbursement would be made that would result in a Fund exceeding its Expense Cap. The Trustees considered whether the advisory fee rate for each Fund was reasonable in relation to the asset size of that Fund, and concluded that the flat advisory fee was reasonable and appropriate, noting the Fund expenses the Adviser has borne as a result of the Expense Cap.
The Trustees noted that the Adviser had not identified any further benefits that it derived from its relationship with the Funds and had noted that it does not have any soft-dollar arrangements.
Based on all of the information considered and the conclusions reached, the Board, including the Independent Trustees, determined to approve the continuation of the Investment Advisory Agreement for each Fund. No single factor was determinative in the Board's analysis.
98
This page intentionally left blank
This page intentionally left blank
PROXY VOTING POLICIES AND PROCEDURES
A description of the Funds' proxy voting policies and procedures that the Funds use to determine how to vote proxies relating to portfolio securities is available, without charge and upon request, by calling (800) 337-4246. This information is also available on the Securities and Exchange Commission's ("Commission") website at www.sec.gov.
Information regarding how the Funds voted proxies for portfolio securities, if applicable, during the most recent 12-month period ended June 30, is also available, without charge and upon request, by (i) calling (800) 337-4246; or (ii) accessing the Trust's Form N-PX on the Commission's website at www.sec.gov.
QUARTERLY PORTFOLIOS
The Funds file their complete schedules of portfolio holdings with the Commission for the first and third quarters of each fiscal year on Form N-Q. The Trust's Forms N-Q are available on the Commission's website at www.sec.gov. The Trust's Forms N-Q may also be reviewed and copied at the Commission's Public Reference Room in Washington, D.C.; information on the operation of the Public Reference Room may be obtained by calling (800) SEC-0330.
There are risks involved in investing in exchange-traded funds ("ETFs"), including possible loss of money. Investing in securities of small and medium sized companies involves greater risk than is customarily associated with investing in more established companies, and investments in concentrated industry sectors involve greater risks than investments that are more diversified. Indexed-based ETFs are not actively managed. Actively-managed ETFs do not necessarily seek to replicate the performance of a specific index. Both index-based and actively-managed ETFs are subject to risks similar to stocks, including those related to short selling and margin maintenance. PowerShares ETFs are not FDIC insured, may lose value and have no bank guarantee. PowerShares is a registered trademark of Invesco PowerShares Capital Management LLC. Past performance is not a guarantee of future results.
Invesco Aim Distributors, Inc. is the distributor of the PowerShares Exchange-Traded Fund Trust.
An investor should consider each PowerShares ETF's investment objective, risks, charges and expenses carefully before investing. For more complete information about PowerShares ETFs call Invesco Aim Distributors, Inc. at (800) 337-4246 or visit invescopowershares.com for a prospectus. Please read the prospectus carefully before investing.


301 West Roosevelt Road
Wheaton, IL 60187
800.983.0903
www.invescopowershares.com
© 2009 Invesco PowerShares Capital Management LLC P-PS-AR-7


2009 Annual Report to Shareholders
April 30, 2009
PowerShares FTSE RAFI Basic Materials Sector Portfolio
PowerShares FTSE RAFI Consumer Goods Sector Portfolio
PowerShares FTSE RAFI Consumer Services Sector Portfolio
PowerShares FTSE RAFI Energy Sector Portfolio
PowerShares FTSE RAFI Financials Sector Portfolio
PowerShares FTSE RAFI Health Care Sector Portfolio
PowerShares FTSE RAFI Industrials Sector Portfolio
PowerShares FTSE RAFI Telecommunications & Technology Sector Portfolio
PowerShares FTSE RAFI US 1500 Small-Mid Portfolio
PowerShares FTSE RAFI Utilities Sector Portfolio

Table of Contents
| The Market Environment | 2 | ||||||
| Manager's Analysis | 4 | ||||||
| Frequency Distribution of Discounts & Premiums | 30 | ||||||
| Fees and Expenses | 32 | ||||||
| Fundamental Indices Portfolios | |||||||
| Schedules of Investments | |||||||
| PowerShares FTSE RAFI Basic Materials Sector Portfolio | 34 | ||||||
| PowerShares FTSE RAFI Consumer Goods Sector Portfolio | 35 | ||||||
| PowerShares FTSE RAFI Consumer Services Sector Portfolio | 37 | ||||||
| PowerShares FTSE RAFI Energy Sector Portfolio | 39 | ||||||
| PowerShares FTSE RAFI Financials Sector Portfolio | 41 | ||||||
| PowerShares FTSE RAFI Health Care Sector Portfolio | 45 | ||||||
| PowerShares FTSE RAFI Industrials Sector Portfolio | 46 | ||||||
| PowerShares FTSE RAFI Telecommunications & Technology Sector Portfolio | 49 | ||||||
| PowerShares FTSE RAFI US 1500 Small-Mid Portfolio | 51 | ||||||
| PowerShares FTSE RAFI Utilities Sector Portfolio | 67 | ||||||
| Statements of Assets and Liabilities | 68 | ||||||
| Statements of Operations | 70 | ||||||
| Statements of Changes in Net Assets | 72 | ||||||
| Financial Highlights | 76 | ||||||
| Notes to Financial Statements | 81 | ||||||
| Report of Independent Registered Public Accounting Firm | 92 | ||||||
| Supplemental Information | 93 | ||||||
| Board Considerations Regarding Approval of Investment Advisory Agreement | 98 | ||||||
The Market Environment
For the year ended April 30, 2009, stock market losses were larger than most market participants have ever seen in their professional careers. The S&P 500® Index was down 35.29%, the NASDAQ-100® Index declined 26.83% and the Dow Jones Industrial Index dropped 34.12%. Corporate debt markets also declined as the credit crunch continued to limit access to capital. Municipal securities held up a little better but still struggled. The Merrill U.S. Corporate Master Index returned -5.78% while the Merrill Muni Master Index returned 2.26% for the period. Meanwhile, treasury securities rallied as investors fled to quality. Huge companies required capital infusions and/or other forms of financial support through government intervention and the credit crisis evolved into an overall crisis of consumer, investor and business confidence.
The markets fell nearly universally from August through October. As more job losses and layoffs were announced, banks continued to restrict borrowing and consumers, who drive two-thirds of the U.S. economy historically, were unable to sustain their spending. The government spent hundreds of billions of dollars to bail out firms and stimulate the economy while the Federal Open Market Committee moved from a discount rate of 2.50% to 0.50% during the period. Not until March did confidence begin to return to the equity markets with the S&P 500® Index, NASDAQ-100® Index and the Dow Jones Industrial Index moving off the lows and returning 29.99%, 29.97% and 21.24% respectively during from March 1 through April 30, 2009. Corporate and municipal debt also showed some appreciation over the period, however the amount of appreciation was less as credit spreads tightened. The Merrill Muni Master Index was u p 2.33% while the Merrill U.S. Corporate Master Index rose by 2.55% from March 1 through April 30, 2009.
2
This page intentionally left blank
Manager's Analysis
PowerShares FTSE RAFI Basic Materials Sector Portfolio (ticker: PRFM)
The PowerShares FTSE RAFI Basic Materials Sector Portfolio (the "Fund") seeks investment results that correspond generally to the price and yield (before the Fund's fees and expenses) of an equity index called the FTSE RAFI Basic Materials Sector Index. The FTSE RAFI Basic Materials Sector Index is designed to track the performance of the largest U.S. equities in the basic materials sector which are selected based on the following four fundamental measures of firm size: book value, cash flow, sales and dividends. The equities are then weighted by each of these four fundamental measures. An overall weight is calculated for each firm by equally-weighting each fundamental measure. Each of the equities with the highest fundamental weight are then selected and assigned a weight equal to its fundamental weight.
For the year ended April 30, 2009, the Fund returned -41.72%, underperforming the S&P Materials Index which returned -40.05%.
The Fund was underweight in Monsanto Co. and Praxair Inc. which contributed to its underperformance relative to the S&P Materials Index. The Fund was also hurt by holding poor performers AbitibiBowater Inc. and Chemtura Corp. which the benchmark did not hold.
Top performers in the Fund were Boise Inc., Cliffs Natural Resources Inc., and Rohm & Haas. Top contributors to performance were Rohm & Haas, Newmont Mining Corp., and Ashland Inc. Bottom contributors included Dow Chemical Co. and E.I. DuPont de Nemours & Co.
Industry Breakdown (% of the Fund's
Net Assets) as of April 30, 2009
| Chemicals-Diversified | 35.0 | ||||||
| Paper & Related Products | 10.9 | ||||||
| Chemicals-Specialty | 10.6 | ||||||
| Steel-Producers | 10.1 | ||||||
| Metal-Aluminum | 8.3 | ||||||
| Industrial Gases | 6.1 | ||||||
| Metal-Copper | 5.6 | ||||||
| Coal | 2.8 | ||||||
| Metal Processors & Fabricate | 1.8 | ||||||
| Gold Mining | 1.8 | ||||||
| Office Supplies & Forms | 1.4 | ||||||
| Agricultural Chemicals | 1.4 | ||||||
| Coatings/Paint | 1.3 | ||||||
| Steel-Specialty | 1.2 | ||||||
| Metal-Iron | 0.5 | ||||||
| Chemicals-Plastics | 0.5 | ||||||
| Non-Ferrous Metals | 0.4 | ||||||
| Money Market Fund | 1.1 | ||||||
| Other | (0.8 | ) | |||||
Top Ten Fund Holdings (% of the Fund's
Net Assets) as of April 30, 2009
| Security | |||||||
| Dow Chemical (The) Co. | 18.7 | ||||||
| E.I. du Pont de Nemours & Co. | 8.8 | ||||||
| Alcoa, Inc. | 8.3 | ||||||
| International Paper Co. | 7.6 | ||||||
| Ashland, Inc. | 4.5 | ||||||
| Freeport-McMoRan Copper & Gold, Inc. | 4.5 | ||||||
| Nucor Corp. | 3.8 | ||||||
| United States Steel Corp. | 3.0 | ||||||
| Air Products & Chemicals, Inc. | 2.9 | ||||||
| Praxair, Inc. | 2.7 | ||||||
| Total | 64.8 | ||||||
Style Allocation (% of the Fund's
Total Investments) as of April 30, 2009
| Mid-Cap Value | 35.3 | ||||||
| Large-Cap Value | 20.0 | ||||||
| Mid-Cap Growth | 18.8 | ||||||
| Small-Cap Value | 12.7 | ||||||
| Small-Cap Growth | 6.8 | ||||||
| Large-Cap Growth | 6.4 | ||||||
4
Manager's Analysis (Continued)
PowerShares FTSE RAFI Basic Materials Sector Portfolio (ticker: PRFM)
Growth of a $10,000 Investment Since Inception†
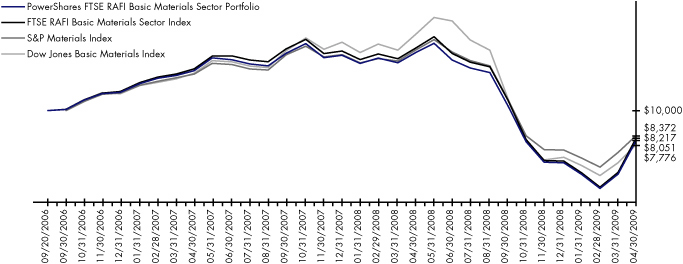
| Fund Performance History (%) | As of April 30, 2009 | ||||||||||||||
| Avg. Ann.†† | Fund Inception† | ||||||||||||||
| 1 Year | Avg. Ann.†† | Cumulative | |||||||||||||
| Index | |||||||||||||||
| FTSE RAFI Basic Materials Sector Index | -41.69 | -7.25 | -17.83 | ||||||||||||
| S&P Materials Index | -40.05 | -6.65 | -16.28 | ||||||||||||
| Dow Jones Basic Materials Index | -48.15 | -9.28 | -22.24 | ||||||||||||
| Fund | |||||||||||||||
| NAV Return | -41.72 | -7.97 | -19.49 | ||||||||||||
| Share Price Return | -41.75 | -8.01 | -19.58 | ||||||||||||
Fund Inception: September 20, 2006
Performance quoted represents past performance. Past performance is not a guarantee of future results and current performance may be higher or lower than performance quoted. Investment returns and principal value will fluctuate and shares, when redeemed, may be worth more or less than their original cost. The Adviser has waived fees and reimbursed other expenses, absent which, performance would have been lower. The Adviser has contractually agreed to waive fees and/or pay certain Fund expenses through August 31, 2010. According to the Fund's current prospectus, the total gross annual operating expense ratio was indicated as 1.29%. In the Financial Highlights section of this Shareholder Report, the Fund's net (subsidized) total operating expense ratio was determined to be 0.65% while the Fund's gross total operating expense ratio was 1.80%. NAV and Share Price returns assume that dividends and capital gain distributions have been reinvested in the Fund at NAV and Share Price, respectively. The returns shown in the table above do not reflect the deduction of taxes that a shareholder would pay on Fund distributions or the redemption or sale of Fund Shares. See invescopowershares.com to find the most recent month-end performance numbers.
Index performance results are based upon a hypothetical investment in its constituent securities. Index returns do not represent Fund returns. An investor cannot invest directly in an index. The Index does not charge management fees or brokerage expenses, and no such fees or expenses were deducted from the hypothetical performance shown. In addition, the results actual investors might have achieved would have differed from those shown because of differences in the timing, amounts of their investments, and fees and expenses associated with an investment in the Fund.
The S&P Materials Index and Dow Jones Basic Materials Index (the "Benchmark Indices") are unmanaged indices used as a measurement of change in stock market conditions based on the average performance of approximately 29 and 71 common stocks, respectively.
† Fund and underlying Index returns are based on the inception date of the Fund. Returns for the Benchmark Indices are based on the closest month-end to the Fund's inception date.
†† Average annualized.
5
Manager's Analysis
PowerShares FTSE RAFI Consumer Goods Sector Portfolio (ticker: PRFG)
The PowerShares FTSE RAFI Consumer Goods Sector Portfolio (the "Fund") seeks investment results that correspond generally to the price and yield (before the Fund's fees and expenses) of an equity index called the FTSE RAFI Consumer Goods Sector Index. The FTSE RAFI Consumer Goods Sector Index is designed to track the performance of the largest U.S. equities in the consumer goods sector which are selected based on the following four fundamental measures of firm size: book value, cash flow, sales and dividends. The equities are then weighted by each of these four fundamental measures. An overall weight is calculated for each firm by equally-weighting each fundamental measure. Each of the equities with the highest fundamental weight are then selected and assigned a weight equal to its fundamental weight.
For the year ended April 30, 2009, the Fund returned -27.43%, behind the S&P 500 Consumer Staples Index which returned -19.93%.
The Fund was negatively affected by the selection of General Motors Corp., Lear Corp., and Eastman Kodak Co., which the S&P 500 Consumer Staples Index did not hold. The Fund did not hold Wal-Mart Stores, Inc., which also contributed to its underperformance relative to the S&P 500 Consumer Staples Index.
Top performers in the Fund included Bare Escentuals Inc., Federal-Mogul Corp. and Anheuser-Busch. Top contributors to return included Anheuser-Busch and Dr Pepper Snapple Group Inc. Bottom contributors included General Motors Corp., Procter & Gamble Co., and Philip Morris International Inc.
Industry Breakdown (% of the Fund's
Net Assets) as of April 30, 2009
| Auto Manufacturers | 21.9 | ||||||
| Agriculture | 13.5 | ||||||
| Food | 12.6 | ||||||
| Beverages | 10.6 | ||||||
| Cosmetics/Personal Care | 9.8 | ||||||
| Auto Parts & Equipment | 9.0 | ||||||
| Home Builders | 6.0 | ||||||
| Apparel | 3.3 | ||||||
| Household Products/Wares | 2.3 | ||||||
| Home Furnishings | 1.8 | ||||||
| Leisure Time | 1.5 | ||||||
| Hand/Machine Tools | 1.1 | ||||||
| Textiles | 1.1 | ||||||
| Chemicals | 0.9 | ||||||
| Miscellaneous Manufacturing | 0.9 | ||||||
| Toys/Games/Hobbies | 0.7 | ||||||
| Housewares | 0.6 | ||||||
| Distribution/Wholesale | 0.6 | ||||||
| Software | 0.5 | ||||||
| Retail | 0.4 | ||||||
| Office Furnishings | 0.3 | ||||||
| Electrical Components & Equipment | 0.3 | ||||||
| Electronics | 0.2 | ||||||
| Pharmaceuticals | 0.2 | ||||||
| Machinery-Diversified | 0.2 | ||||||
| Money Market Fund | 2.3 | ||||||
| Other | (2.6 | ) | |||||
Top Ten Fund Holdings (% of the Fund's
Net Assets) as of April 30, 2009
| Security | |||||||
| Ford Motor Co. | 18.4 | ||||||
| Procter & Gamble (The) Co. | 7.4 | ||||||
| Altria Group, Inc. | 6.3 | ||||||
| Coca-Cola (The) Co. | 3.7 | ||||||
| General Motors Corp. | 3.6 | ||||||
| Kraft Foods, Inc., Class A | 3.1 | ||||||
| PepsiCo, Inc. | 3.1 | ||||||
| Philip Morris International, Inc. | 2.8 | ||||||
| Johnson Controls, Inc. | 2.2 | ||||||
| Goodyear Tire & Rubber (The) Co. | 2.0 | ||||||
| Total | 52.6 | ||||||
Style Allocation (% of the Fund's
Total Investments) as of April 30, 2009
| Mid-Cap Growth | 27.6 | ||||||
| Large-Cap Growth | 21.4 | ||||||
| Mid-Cap Value | 16.3 | ||||||
| Large-Cap Value | 15.0 | ||||||
| Small-Cap Growth | 11.7 | ||||||
| Small-Cap Value | 8.0 | ||||||
6
Manager's Analysis (Continued)
PowerShares FTSE RAFI Consumer Goods Sector Portfolio (ticker: PRFG)
Growth of a $10,000 Investment Since Inception†
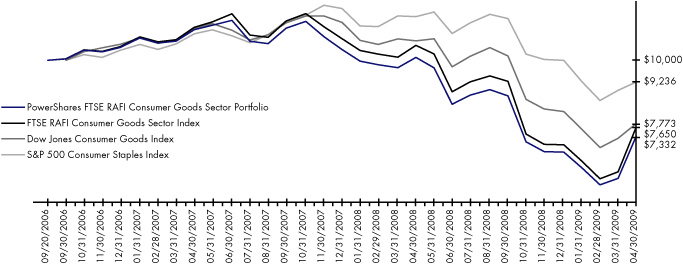
| Fund Performance History (%) | As of April 30, 2009 | ||||||||||||||
| Avg. Ann.†† | Fund Inception† | ||||||||||||||
| 1 Year | Avg. Ann.†† | Cumulative | |||||||||||||
| Index | |||||||||||||||
| FTSE RAFI Consumer Goods Sector Index | -27.31 | -9.76 | -23.50 | ||||||||||||
| Dow Jones Consumer Goods Index | -27.24 | -9.29 | -22.27 | ||||||||||||
| S&P 500 Consumer Staples Index | -19.93 | -3.03 | -7.64 | ||||||||||||
| Fund | |||||||||||||||
| NAV Return | -27.43 | -11.22 | -26.68 | ||||||||||||
| Share Price Return | -27.68 | -11.33 | -26.93 | ||||||||||||
Fund Inception: September 20, 2006
Performance quoted represents past performance. Past performance is not a guarantee of future results and current performance may be higher or lower than performance quoted. Investment returns and principal value will fluctuate and shares, when redeemed, may be worth more or less than their original cost. The Adviser has waived fees and reimbursed other expenses, absent which, performance would have been lower. The Adviser has contractually agreed to waive fees and/or pay certain Fund expenses through August 31, 2010. According to the Fund's current prospectus, the total gross annual operating expense ratio was indicated as 2.72%. In the Financial Highlights section of this Shareholder Report, the Fund's net (subsidized) total operating expense ratio was determined to be 0.56% while the Fund's gross total operating expense ratio was 3.83%. NAV and Share Price returns assume that dividends and capital gain distributions have been reinvested in the Fund at NAV and Share Price, respectively. The returns shown in the table above do not reflect the deduction of taxes that a shareholder would pay on Fund distributions or the redemption or sale of Fund Shares. See invescopowershares.com to find the most recent month-end performance numbers.
Index performance results are based upon a hypothetical investment in its constituent securities. Index returns do not represent Fund returns. An investor cannot invest directly in an index. The Index does not charge management fees or brokerage expenses, and no such fees or expenses were deducted from the hypothetical performance shown. In addition, the results actual investors might have achieved would have differed from those shown because of differences in the timing, amounts of their investments, and fees and expenses associated with an investment in the Fund.
The Dow Jones Consumer Goods Index and S&P Consumer Staples Index (the "Benchmark Indices") are unmanaged indices used as a measurement of change in stock market conditions based on the average performance of approximately 160 and 41 common stocks, respectively.
† Fund and underlying Index returns are based on the inception date of the Fund. Returns for the Benchmark Indices are based on the closest month-end to the Fund's inception date. The Dow Jones Consumer Goods Index will be used for comparative purposes going forward as it represents a more appropriate market index for this fund.
†† Average annualized.
7
Manager's Analysis
PowerShares FTSE RAFI Consumer Services Sector Portfolio (ticker: PRFS)
The PowerShares FTSE RAFI Consumer Services Sector Portfolio (the "Fund") seeks investment results that correspond generally to the price and yield (before the Fund's fees and expenses) of an equity index called the FTSE RAFI Consumer Services Sector Index. The FTSE RAFI Consumer Services Sector Index is designed to track the performance of the largest U.S. equities in the consumer services sector which are selected based on the following four fundamental measures of firm size: book value, cash flow, sales and dividends. The equities are then weighted by each of these four fundamental measures. An overall weight is calculated for each firm by equally-weighting each fundamental measure. Each of the equities with the highest fundamental weight are then selected and assigned a weight equal to its fundamental weight.
For the year ended April 30, 2009, the Fund returned -20.62%, ahead of the S&P 500 Consumer Discretionary Index which returned -26.10%.
The Fund benefited from stock selection in the consumer staples sector, including holding Wal-Mart Stores Inc., which was not in the S&P 500 Consumer Discretionary Index. The Fund also was helped by a larger allocation to General Motors Corp.
Top performers in the Fund included Pantry Inc., Wynn Resorts Ltd., and Long Drug Stores. Top contributors to return included Avis Budget Group Inc., Liberty Media Corp, and General Motors Corp. Bottom contributors to return included Time Warner Inc., News Corp., and Walt Disney Co.
Industry Breakdown (% of the Fund's
Net Assets) as of April 30, 2009
| Retail | 47.7 | ||||||
| Media | 22.6 | ||||||
| Food | 5.5 | ||||||
| Commercial Services | 5.1 | ||||||
| Pharmaceuticals | 4.6 | ||||||
| Airlines | 3.2 | ||||||
| Lodging | 3.0 | ||||||
| Internet | 2.8 | ||||||
| Leisure Time | 1.9 | ||||||
| Advertising | 1.9 | ||||||
| Entertainment | 1.1 | ||||||
| Apparel | 0.3 | ||||||
| Software | 0.1 | ||||||
| Distribution/Wholesale | 0.1 | ||||||
| Trucking & Leasing | 0.1 | ||||||
| Money Market Fund | 1.5 | ||||||
| Other | (1.5 | ) | |||||
Top Ten Fund Holdings (% of the Fund's
Net Assets) as of April 30, 2009
| Security | |||||||
| Wal-Mart Stores, Inc. | 7.5 | ||||||
| Home Depot, Inc. | 3.7 | ||||||
| Time Warner, Inc. | 3.5 | ||||||
| Walt Disney (The) Co. | 2.9 | ||||||
| Target Corp. | 2.7 | ||||||
| Avis Budget Group, Inc. | 2.5 | ||||||
| Comcast Corp., Class A | 2.5 | ||||||
| CBS Corp., Class B | 2.2 | ||||||
| CVS Caremark Corp. | 2.2 | ||||||
| Lowe's Cos., Inc. | 2.2 | ||||||
| Total | 31.9 | ||||||
Style Allocation (% of the Fund's
Total Investments) as of April 30, 2009
| Large-Cap Growth | 34.3 | ||||||
| Mid-Cap Value | 18.7 | ||||||
| Small-Cap Value | 14.5 | ||||||
| Large-Cap Value | 14.3 | ||||||
| Small-Cap Growth | 9.2 | ||||||
| Mid-Cap Growth | 9.0 | ||||||
8
Manager's Analysis (Continued)
PowerShares FTSE RAFI Consumer Services Sector Portfolio (ticker: PRFS)
Growth of a $10,000 Investment Since Inception†

| Fund Performance History (%) | As of April 30, 2009 | ||||||||||||||
| Avg. Ann.†† | Fund Inception† | ||||||||||||||
| 1 Year | Avg. Ann.†† | Cumulative | |||||||||||||
| Index | |||||||||||||||
| FTSE RAFI Consumer Services Sector Index | -20.49 | -9.74 | -23.46 | ||||||||||||
| Dow Jones Consumer Services Index | -25.82 | -12.23 | -28.61 | ||||||||||||
| S&P 500 Consumer Discretionary Index | -26.10 | -13.18 | -30.59 | ||||||||||||
| Fund | |||||||||||||||
| NAV Return | -20.62 | -10.08 | -24.20 | ||||||||||||
| Share Price Return | -20.52 | -10.05 | -24.14 | ||||||||||||
Fund Inception: September 20, 2006
Performance quoted represents past performance. Past performance is not a guarantee of future results and current performance may be higher or lower than performance quoted. Investment returns and principal value will fluctuate and shares, when redeemed, may be worth more or less than their original cost. The Adviser has waived fees and reimbursed other expenses, absent which, performance would have been lower. The Adviser has contractually agreed to waive fees and/or pay certain Fund expenses through August 31, 2010. According to the Fund's current prospectus, the total gross annual operating expense ratio was indicated as 2.15%. In the Financial Highlights section of this Shareholder Report, the Fund's net (subsidized) total operating expense ratio was determined to be 0.56% while the Fund's gross total operating expense ratio was 3.76%. NAV and Share Price returns assume that dividends and capital gain distributions have been reinvested in the Fund at NAV and Share Price, respectively. The returns shown in the table above do not reflect the deduction of taxes that a shareholder would pay on Fund distributions or the redemption or sale of Fund Shares. See invescopowershares.com to find the most recent month-end performance numbers.
Index performance results are based upon a hypothetical investment in its constituent securities. Index returns do not represent Fund returns. An investor cannot invest directly in an index. The Index does not charge management fees or brokerage expenses, and no such fees or expenses were deducted from the hypothetical performance shown. In addition, the results actual investors might have achieved would have differed from those shown because of differences in the timing, amounts of their investments, and fees and expenses associated with an investment in the Fund.
The Dow Jones Consumer Services Index and S&P 500 Consumer Discretionary Index (the "Benchmark Indices") are unmanaged indices used as a measurement of change in stock market conditions based on the average performance of approximately 250 and 81 common stocks, respectively.
† Fund and underlying Index returns are based on the inception date of the Fund. Returns for the Benchmark Indices are based on the closest month-end to the Fund's inception date. The Dow Jones Consumer Services Index will be used for comparative purposes going forward as it represents a more appropriate market index for this fund.
†† Average annualized.
9
Manager's Analysis
PowerShares FTSE RAFI Energy Sector Portfolio (ticker: PRFE)
The PowerShares FTSE RAFI Energy Sector Portfolio (the "Fund") seeks investment results that correspond generally to the price and yield (before the Fund's fees and expenses) of an equity index called the FTSE RAFI Oil & Gas Sector Index. The FTSE RAFI Oil & Gas Sector Index is designed to track the performance of the largest U.S. equities in the energy sector which are selected based on the following four fundamental measures of firm size: book value, cash flow, sales and dividends. The equities are then weighted by each of these four fundamental measures. An overall weight is calculated for each firm by equally-weighting each fundamental measure. Each of the equities with the highest fundamental weight are then selected and assigned a weight equal to its fundamental weight.
For the year ended April 30, 2009, the Fund returned -39.03%, outperforming the S&P Energy Index, which returned -41.32%.
The Fund was underweight the energy equipment and services industry which contributed to its outperformance relative to the S&P Energy Index.
The Fund was underweight in Schlumberger Ltd. and Transocean Ltd. and overweight Chevron Corp., which helped the return relative to the S&P Energy Index.
Top performers in the Fund included Complete Production Services Inc., Hercules Offshore Inc., and W&T Offshore Inc. Top contributors to the Fund included Pioneer Drilling Co. and Key Energy Services Inc. Bottom contributors included ConocoPhillips, Chevron Corp., and Exxon Mobil Corp.
Industry Breakdown (% of the Fund's
Net Assets) as of April 30, 2009
| Oil Companies-Integrated | 49.8 | ||||||
| Oil Companies-Exploration & Production | 20.3 | ||||||
| Oil-Field Services | 11.9 | ||||||
| Oil Refining & Marketing | 6.7 | ||||||
| Oil & Gas Drilling | 5.3 | ||||||
| Pipelines | 2.4 | ||||||
| Oil Field Machinery & Equipment | 2.1 | ||||||
| Gas-Distribution | 0.5 | ||||||
| Electric-Integrated | 0.5 | ||||||
| Transport-Marine | 0.3 | ||||||
| Money Market Fund | 1.3 | ||||||
| Other | (1.1 | ) | |||||
Style Allocation (% of the Fund's
Total Investments) as of April 30, 2009
| Large-Cap Growth | 45.6 | ||||||
| Large-Cap Value | 32.3 | ||||||
| Mid-Cap Value | 9.0 | ||||||
| Mid-Cap Growth | 6.8 | ||||||
| Small-Cap Value | 4.8 | ||||||
| Small-Cap Growth | 1.5 | ||||||
Top Ten Fund Holdings (% of the Fund's
Net Assets) as of April 30, 2009
| Security | |||||||
| Exxon Mobil Corp. | 18.0 | ||||||
| Chevron Corp. | 14.1 | ||||||
| ConocoPhillips | 10.0 | ||||||
| Marathon Oil Corp. | 4.9 | ||||||
| Valero Energy Corp. | 4.0 | ||||||
| Schlumberger Ltd. | 3.7 | ||||||
| Devon Energy Corp. | 3.2 | ||||||
| Occidental Petroleum Corp. | 2.6 | ||||||
| Anadarko Petroleum Corp. | 2.5 | ||||||
| Apache Corp. | 2.5 | ||||||
| Total | 65.5 | ||||||
10
Manager's Analysis (Continued)
PowerShares FTSE RAFI Energy Sector Portfolio (ticker: PRFE)
Growth of a $10,000 Investment Since Inception†
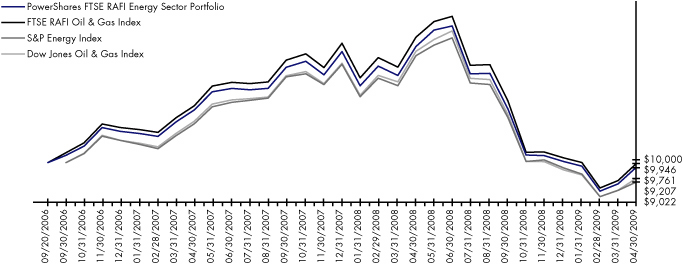
| Fund Performance History (%) | As of April 30, 2009 | ||||||||||||||
| Avg. Ann.†† | Fund Inception† | ||||||||||||||
| 1 Year | Avg. Ann.†† | Cumulative | |||||||||||||
| Index | |||||||||||||||
| FTSE RAFI Oil & Gas Index | -38.99 | -0.21 | -0.54 | ||||||||||||
| S&P Energy Index | -41.32 | -3.90 | -9.78 | ||||||||||||
| Dow Jones Oil & Gas Index | -40.95 | -3.15 | -7.93 | ||||||||||||
| Fund | |||||||||||||||
| NAV Return | -39.03 | -0.92 | -2.38 | ||||||||||||
| Share Price Return | -38.99 | -0.94 | -2.42 | ||||||||||||
Fund Inception: September 20, 2006
Performance quoted represents past performance. Past performance is not a guarantee of future results and current performance may be higher or lower than performance quoted. Investment returns and principal value will fluctuate and shares, when redeemed, may be worth more or less than their original cost. The Adviser has waived fees and reimbursed other expenses, absent which, performance would have been lower. The Adviser has contractually agreed to waive fees and/or pay certain Fund expenses through August 31, 2010. According to the Fund's current prospectus, the total gross annual operating expense ratio was indicated as 1.06%. In the Financial Highlights section of this Shareholder Report, the Fund's net (subsidized) total operating expense ratio was determined to be 0.60% while the Fund's gross total operating expense ratio was 1.38%. NAV and Share Price returns assume that dividends and capital gain distributions have been reinvested in the Fund at NAV and Share Price, respectively. The returns shown in the table above do not reflect the deduction of taxes that a shareholder would pay on Fund distributions or the redemption or sale of Fund Shares. See invescopowershares.com to find the most recent month-end performance numbers.
Index performance results are based upon a hypothetical investment in its constituent securities. Index returns do not represent Fund returns. An investor cannot invest directly in an index. The Index does not charge management fees or brokerage expenses, and no such fees or expenses were deducted from the hypothetical performance shown. In addition, the results actual investors might have achieved would have differed from those shown because of differences in the timing, amounts of their investments, and fees and expenses associated with an investment in the Fund.
The S&P Energy Index and Dow Jones Oil & Gas Index (the "Benchmark Indices") are unmanaged indices used as a measurement of change in stock market conditions based on the average performance of approximately 34 and 70 common stocks, respectively.
† Fund and underlying Index returns are based on the inception date of the Fund. Returns for the Benchmark Indices are based on the closest month-end to the Fund's inception date.
†† Average annualized.
11
Manager's Analysis
PowerShares FTSE RAFI Financials Sector Portfolio (ticker: PRFF)
The PowerShares FTSE RAFI Financials Sector Portfolio (the "Fund") seeks investment results that correspond generally to the price and yield (before the Fund's fees and expenses) of an equity index called the FTSE RAFI Financials Sector Index. The FTSE RAFI Financials Sector Index is designed to track the performance of the largest U.S. equities in the financials sector which are selected based on the following four fundamental measures of firm size: book value, cash flow, sales and dividends. The equities are then weighted by each of these four fundamental measures. An overall weight is calculated for each firm by equally-weighting each fundamental measure. Each of the equities with the highest fundamental weight are then selected and assigned a weight equal to its fundamental weight.
For the year ended April 30, 2009, the Fund slightly underperformed the S&P Financials Index, returning -57.81% compared to the S&P Financials return of -57.55%.
The Fund's underperformance was largely driven by holding almost double the weight of Citigroup Inc. relative to the S&P Financials Index. Also negatively affecting the Fund was an underweight in Goldman Sachs Group Inc. and JP Morgan Chase & Co. which were relatively good performers.
Top performers in the Fund included KKR Financial Holdings LLC, Philadelphia Consolidated Holding Co., and Jones Lang LaSalle Inc. Bottom contributors included Citigroup, Bank of America, and American International Group.
12
Manager's Analysis (Continued)
PowerShares FTSE RAFI Financials Sector Portfolio (ticker: PRFF)
Industry Breakdown (% of the Fund's
Net Assets) as of April 30, 2009
| Diversified Banking Institutions | 36.9 | ||||||
| Super-Regional Banks-U.S. | 11.3 | ||||||
| Multi-line Insurance | 10.8 | ||||||
| Investment Management/Advisory Service | 5.5 | ||||||
| Reinsurance | 5.0 | ||||||
| Life/Health Insurance | 4.8 | ||||||
| Property/Casualty Insurance | 3.6 | ||||||
| Finance-Credit Card | 2.4 | ||||||
| Commercial Banks-Southern U.S. | 2.2 | ||||||
| Fiduciary Banks | 1.8 | ||||||
| Finance-Investment Banker | 1.3 | ||||||
| Commercial Service-Finance | 1.0 | ||||||
| Insurance Broker | 1.0 | ||||||
| Investment Companies | 1.0 | ||||||
| REITS-Office Property | 0.9 | ||||||
| REITS-Warehouse/Industry | 0.9 | ||||||
| REITS-Apartments | 0.9 | ||||||
| REITS-Diversified | 0.9 | ||||||
| Commercial Banks-Eastern U.S. | 0.8 | ||||||
| REITS-Shopping Centers | 0.8 | ||||||
| REITS-Regional Malls | 0.7 | ||||||
| Finance-Other Services | 0.6 | ||||||
| REITS-Health Care | 0.5 | ||||||
| S&L/Thrifts-Eastern U.S. | 0.5 | ||||||
| REITS-Hotels | 0.5 | ||||||
| Commercial Banks-Central U.S. | 0.5 | ||||||
| REITS-Mortgage | 0.5 | ||||||
| Financial Guarantee Insurance | 0.4 | ||||||
| Commercial Banks-Western U.S. | 0.3 | ||||||
| Real Estate Management/Service | 0.3 | ||||||
| Finance-Consumer Loans | 0.3 | ||||||
| Finance-Commercial | 0.2 | ||||||
| Forestry | 0.2 | ||||||
| Finance-Auto Loans | 0.2 | ||||||
| REITS-Storage | 0.2 | ||||||
| Paper & Related Products | 0.2 | ||||||
| Decision Support Software | 0.1 | ||||||
| REITS-Single Tenant | 0.1 | ||||||
| S&L/Thrifts-Western U.S. | 0.1 | ||||||
| S&L/Thrifts-Southern U.S. | 0.0 | ||||||
| Money Market Fund | 0.2 | ||||||
| Other | (0.4 | ) | |||||
Top Ten Fund Holdings (% of the Fund's
Net Assets) as of April 30, 2009
| Security | |||||||
| Bank of America Corp. | 14.2 | ||||||
| Citigroup, Inc. | 11.0 | ||||||
| JPMorgan Chase & Co. | 7.0 | ||||||
| Wells Fargo & Co. | 4.9 | ||||||
| Invesco Ltd. | 4.2 | ||||||
| Berkshire Hathaway, Inc., Class B | 3.8 | ||||||
| Goldman Sachs Group, (The) Inc. | 2.9 | ||||||
| American International Group, Inc. | 2.6 | ||||||
| American Express Co. | 2.0 | ||||||
| Morgan Stanley | 1.9 | ||||||
| Total | 54.5 | ||||||
Style Allocation (% of the Fund's
Total Investments) as of April 30, 2009
| Large-Cap Value | 48.3 | ||||||
| Mid-Cap Growth | 19.1 | ||||||
| Mid-Cap Value | 16.7 | ||||||
| Small-Cap Value | 9.5 | ||||||
| Small-Cap Growth | 4.8 | ||||||
| Large-Cap Growth | 1.6 | ||||||
13
Manager's Analysis (Continued)
PowerShares FTSE RAFI Financials Sector Portfolio (ticker: PRFF)
Growth of a $10,000 Investment Since Inception†

| Fund Performance History (%) | As of April 30, 2009 | ||||||||||||||
| Avg. Ann.†† | Fund Inception† | ||||||||||||||
| 1 Year | Avg. Ann.†† | Cumulative | |||||||||||||
| Index | |||||||||||||||
| FTSE RAFI Financials Sector Index | -58.49 | -33.89 | -66.02 | ||||||||||||
| S&P Financials Index | -57.55 | -34.22 | -66.10 | ||||||||||||
| Dow Jones Financials Index | -54.47 | -33.08 | -64.57 | ||||||||||||
| Fund | |||||||||||||||
| NAV Return | -57.81 | -33.67 | -65.72 | ||||||||||||
| Share Price Return | -57.84 | -33.68 | -65.74 | ||||||||||||
Fund Inception: September 20, 2006
Performance quoted represents past performance. Past performance is not a guarantee of future results and current performance may be higher or lower than performance quoted. Investment returns and principal value will fluctuate and shares, when redeemed, may be worth more or less than their original cost. The Adviser has waived fees and reimbursed other expenses, absent which, performance would have been lower. The Adviser has contractually agreed to waive fees and/or pay certain Fund expenses through August 31, 2010. According to the Fund's current prospectus, the total gross annual operating expense ratio was indicated as 1.28%. In the Financial Highlights section of this Shareholder Report, the Fund's net (subsidized) total operating expense ratio was determined to be 0.59% while the Fund's gross total operating expense ratio was 1.31%. NAV and Share Price returns assume that dividends and capital gain distributions have been reinvested in the Fund at NAV and Share Price, respectively. The returns shown in the table above do not reflect the deduction of taxes that a shareholder would pay on Fund distributions or the redemption or sale of Fund Shares. See invescopowershares.com to find the most recent month-end performance numbers.
Index performance results are based upon a hypothetical investment in its constituent securities. Index returns do not represent Fund returns. An investor cannot invest directly in an index. The Index does not charge management fees or brokerage expenses, and no such fees or expenses were deducted from the hypothetical performance shown. In addition, the results actual investors might have achieved would have differed from those shown because of differences in the timing, amounts of their investments, and fees and expenses associated with an investment in the Fund.
The S&P Financials Index and Dow Jones Financials Index (the "Benchmark Indices") are unmanaged indices used as a measurement of change in stock market conditions based on the average performance of approximately 93 and 300 common stocks, respectively.
† Fund and underlying Index returns are based on the inception date of the Fund. Returns for the Benchmark Indices are based on the closest month-end to the Fund's inception date.
†† Average annualized.
14
This page intentionally left blank
Manager's Analysis
PowerShares FTSE RAFI Health Care Sector Portfolio (ticker: PRFH)
The PowerShares FTSE RAFI Health Care Sector Portfolio (the "Fund") seeks investment results that correspond generally to the price and yield (before the Fund's fees and expenses) of an equity index called the FTSE RAFI Health Care Sector Index. The FTSE RAFI Health Care Sector Index is designed to track the performance of the largest U.S. equities in the health care sector which are selected based on the following four fundamental measures of firm size: book value, cash flow, sales and dividends. The equities are then weighted by each of these four fundamental measures. An overall weight is calculated for each firm by equally-weighting each fundamental measure. Each of the equities with the highest fundamental weight are then selected and assigned a weight equal to its fundamental weight.
For the year ended April 30, 2009, the Fund returned -19.34%, ahead of the S&P Health Care Index, which returned -21.53%.
The Fund received a boost from overweighting Bristol-Myers Squibb Co. and holding Sunrise Senior Living Inc. and Genentech, which the S&P Health Care Index did not hold.
Top performers in the Fund were Sunrise Senior Living Inc., Genentech, and Waters Corp. Top contributors to performance were Schering-Plough Corp., Sunrise Senior Living Inc., and Amgen Inc. Bottom contributors to performance included Pfizer, Johnson & Johnson, and Merck & Co., Inc.
Industry Breakdown (% of the Fund's
Net Assets) as of April 30, 2009
| Pharmaceuticals | 42.1 | ||||||
| Healthcare-Services | 24.7 | ||||||
| Healthcare-Products | 24.6 | ||||||
| Biotechnology | 6.5 | ||||||
| Electronics | 1.5 | ||||||
| Distribution/Wholesale | 0.2 | ||||||
| Insurance | 0.2 | ||||||
| Commercial Services | 0.1 | ||||||
| Money Market Fund | 0.7 | ||||||
| Other | (0.6 | ) | |||||
Style Allocation (% of the Fund's
Total Investments) as of April 30, 2009
| Large-Cap Value | 53.5 | ||||||
| Large-Cap Growth | 26.1 | ||||||
| Mid-Cap Value | 8.0 | ||||||
| Mid-Cap Growth | 6.1 | ||||||
| Small-Cap Value | 4.4 | ||||||
| Small-Cap Growth | 1.9 | ||||||
Top Ten Fund Holdings (% of the Fund's
Net Assets) as of April 30, 2009
| Security | |||||||
| Pfizer, Inc. | 14.0 | ||||||
| Johnson & Johnson | 9.1 | ||||||
| Merck & Co., Inc. | 6.3 | ||||||
| WellPoint, Inc. | 5.7 | ||||||
| UnitedHealth Group, Inc. | 5.1 | ||||||
| Bristol-Myers Squibb Co. | 3.7 | ||||||
| Eli Lilly & Co. | 3.6 | ||||||
| Amgen, Inc. | 3.3 | ||||||
| Abbott Laboratories | 3.2 | ||||||
| Wyeth | 3.2 | ||||||
| Total | 57.2 | ||||||
16
Manager's Analysis (Continued)
PowerShares FTSE RAFI Health Care Sector Portfolio (ticker: PRFH)
Growth of a $10,000 Investment Since Inception
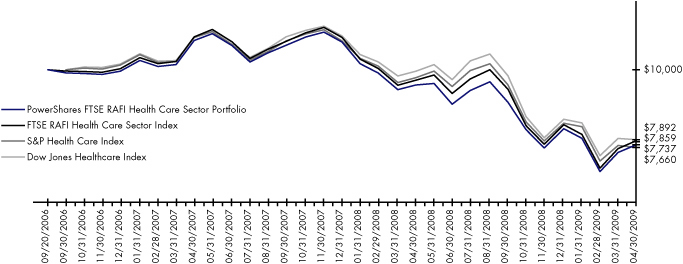
| Fund Performance History (%) | As of April 30, 2009 | ||||||||||||||
| Avg. Ann.†† | Fund Inception† | ||||||||||||||
| 1 Year | Avg. Ann.†† | Cumulative | |||||||||||||
| Index | |||||||||||||||
| FTSE RAFI Health Care Sector Index | -18.86 | -8.82 | -21.41 | ||||||||||||
| S&P Health Care Index | -21.53 | -9.80 | -23.40 | ||||||||||||
| Dow Jones Healthcare Index | -20.74 | -8.76 | -21.08 | ||||||||||||
| Fund | |||||||||||||||
| NAV Return | -19.34 | -9.37 | -22.63 | ||||||||||||
| Share Price Return | -19.22 | -9.37 | -22.63 | ||||||||||||
Fund Inception: September 20, 2006
Performance data quoted represents past performance. Past performance is not a guarantee of future results and current performance may be higher or lower than performance quoted. Investment returns and principal value will fluctuate and shares, when redeemed, may be worth more or less than their original cost. The Adviser has waived fees and reimbursed other expenses, absent which, performance would have been lower. The Adviser has contractually agreed to waive fees and/or pay certain Fund expenses through August 31, 2010. According to the Fund's current prospectus, the total gross annual operating expense ratio was indicated as 1.34%. In the Financial Highlights section of this Shareholder Report, the Fund's net (subsidized) total operating expense ratio was determined to be 0.56% while the Fund's gross total operating expense ratio was 1.47%. NAV and Share Price returns assume that dividends and capital gain distributions have been reinvested in the Fund at NAV and Share Price, respectively. The returns shown in the table above do not reflect the deduction of taxes that a shareholder would pay on Fund distributions or the redemption or sale of Fund Shares. See invescopowershares.com to find the most recent month-end performance numbers.
Index performance results are based upon a hypothetical investment in its constituent securities. Index returns do not represent Fund returns. An investor cannot invest directly in an index. The Index does not charge management fees or brokerage expenses, and no such fees or expenses were deducted from the hypothetical performance shown. In addition, the results actual investors might have achieved would have differed from those shown because of differences in the timing, amounts of their investments, and fees and expenses associated with an investment in the Fund.
The S&P Health Care Index and Dow Jones Healthcare Index (the "Benchmark Indices") are unmanaged indices used as a measurement of change in stock market conditions based on the average performance of approximately 51 and 180 common stocks, respectively.
† Fund and underlying Index returns are based on the inception date of the Fund. Returns for the Benchmark Indices are based on the closest month-end to the Fund's inception date.
†† Average annualized.
17
Manager's Analysis
PowerShares FTSE RAFI Industrials Sector Portfolio (ticker: PRFN)
The PowerShares FTSE RAFI Industrials Sector Portfolio (the "Fund") seeks investment results that correspond generally to the price and yield (before the Fund's fees and expenses) of an equity index called the FTSE RAFI Industrials Sector Index. The FTSE RAFI Industrials Sector Index is designed to track the performance of the largest U.S. equities in the industrials sector which are selected based on the following four fundamental measures of firm size: book value, cash flow, sales and dividends. The equities are then weighted by each of these four fundamental measures. An overall weight is calculated for each firm by equally-weighting each fundamental measure. Each of the equities with the highest fundamental weight are then selected and assigned a weight equal to its fundamental weight.
For the year ended April 30, 2009, the Fund returned -38.81%, ahead of the S&P Industrials Index which returned -42.48%.
Outperformance of the index resulted from a higher weight and stock selection among mid value stocks. The Fund held several stocks in this style that outperformed and were not included in the S&P Industrials Index. Outperformance also resulted from stock selection in the information technology and containers & packaging industry groups. The Fund was also helped by an underweight in General Electric Co.
Top performers in the Fund included CommScope Inc. and China Yuchai International Ltd. Top contributors to performance included PHH Corp. and Temple-Inland Inc. Bottom contributors included General Electric, Tyco International, and Boeing.
18
Manager's Analysis (Continued)
PowerShares FTSE RAFI Industrials Sector Portfolio (ticker: PRFN)
Industry Breakdown (% of the Fund's
Net Assets) as of April 30, 2009
| Miscellaneous Manufacturing | 33.0 | ||||||
| Aerospace/Defense | 13.3 | ||||||
| Transportation | 11.6 | ||||||
| Commercial Services | 5.9 | ||||||
| Electronics | 5.4 | ||||||
| Machinery-Diversified | 3.4 | ||||||
| Machinery-Construction & Mining | 3.1 | ||||||
| Packaging & Containers | 3.1 | ||||||
| Building Materials | 2.8 | ||||||
| Engineering & Construction | 2.5 | ||||||
| Electrical Components & Equipment | 2.4 | ||||||
| Forest Products & Paper | 2.0 | ||||||
| Auto Manufacturers | 1.7 | ||||||
| Environmental Control | 1.3 | ||||||
| Distribution/Wholesale | 1.2 | ||||||
| Computers | 1.1 | ||||||
| Software | 0.9 | ||||||
| Metal Fabricate/Hardware | 0.9 | ||||||
| Household Products/Wares | 0.8 | ||||||
| Auto Parts & Equipment | 0.7 | ||||||
| Telecommunications | 0.5 | ||||||
| Chemicals | 0.4 | ||||||
| Retail | 0.3 | ||||||
| Trucking & Leasing | 0.3 | ||||||
| Mining | 0.3 | ||||||
| Hand/Machine Tools | 0.3 | ||||||
| Electric | 0.3 | ||||||
| Textiles | 0.1 | ||||||
| Energy-Alternative Sources | 0.1 | ||||||
| Money Market Fund | 0.7 | ||||||
| Other | (0.4 | ) | |||||
Top Ten Fund Holdings (% of the Fund's
Net Assets) as of April 30, 2009
| Security | |||||||
| General Electric Co. | 19.8 | ||||||
| United Parcel Service, Inc., Class B | 2.9 | ||||||
| United Technologies Corp. | 2.6 | ||||||
| Caterpillar, Inc. | 2.5 | ||||||
| Boeing (The) Co. | 2.4 | ||||||
| 3M Co. | 2.3 | ||||||
| Northrop Grumman Corp. | 1.9 | ||||||
| Tyco International Ltd. (Switzerland) | 1.8 | ||||||
| FedEx Corp. | 1.7 | ||||||
| Lockheed Martin Corp. | 1.7 | ||||||
| Total | 39.6 | ||||||
Style Allocation (% of the Fund's
Total Investments) as of April 30, 2009
| Large-Cap Value | 44.3 | ||||||
| Mid-Cap Value | 14.6 | ||||||
| Mid-Cap Growth | 12.8 | ||||||
| Large-Cap Growth | 11.9 | ||||||
| Small-Cap Value | 10.1 | ||||||
| Small-Cap Growth | 6.3 | ||||||
19
Manager's Analysis (Continued)
PowerShares FTSE RAFI Industrials Sector Portfolio (ticker: PRFN)
Growth of a $10,000 Investment Since Inception†

| Fund Performance History (%) | As of April 30, 2009 | ||||||||||||||
| Avg. Ann.†† | Fund Inception† | ||||||||||||||
| 1 Year | Avg. Ann.†† | Cumulative | |||||||||||||
| Index | |||||||||||||||
| FTSE RAFI Industrials Sector Index | -38.44 | -11.44 | -27.15 | ||||||||||||
| S&P Industrials Index | -42.48 | -14.62 | -33.52 | ||||||||||||
| Dow Jones Industrials Index | -34.12 | -10.53 | -24.98 | ||||||||||||
| Fund | |||||||||||||||
| NAV Return | -38.81 | -12.02 | -28.39 | ||||||||||||
| Share Price Return | -38.74 | -12.03 | -28.41 | ||||||||||||
Fund Inception: September 20, 2006
Performance quoted represents past performance. Past performance is not a guarantee of future results and current performance may be higher or lower than performance quoted. Investment returns and principal value will fluctuate and shares, when redeemed, may be worth more or less than their original cost. The Adviser has waived fees and reimbursed other expenses, absent which, performance would have been lower. The Adviser has contractually agreed to waive fees and/or pay certain Fund expenses through August 31, 2010. According to the Fund's current prospectus, the total gross annual operating expense ratio was indicated as 0.78%. In the Financial Highlights section of this Shareholder Report, the Fund's net (subsidized) total operating expense ratio was determined to be 0.58% while the Fund's gross total operating expense ratio was 2.02%. NAV and Share Price returns assume that dividends and capital gain distributions have been reinvested in the Fund at NAV and Share Price, respectively. The returns shown in the table above do not reflect the deduction of taxes that a shareholder would pay on Fund distributions or the redemption or sale of Fund Shares. See invescopowershares.com to find the most recent month-end performance numbers.
Index performance results are based upon a hypothetical investment in its constituent securities. Index returns do not represent Fund returns. An investor cannot invest directly in an index. The Index does not charge management fees or brokerage expenses, and no such fees or expenses were deducted from the hypothetical performance shown. In addition, the results actual investors might have achieved would have differed from those shown because of differences in the timing, amounts of their investments, and fees and expenses associated with an investment in the Fund.
The S&P Industrials Index and Dow Jones Industrials Index (the "Benchmark Indices") are unmanaged indices used as a measurement of change in stock market conditions based on the average performance of approximately 56 and 270 common stocks, respectively.
† Fund and underlying Index returns are based on the inception date of the Fund. Returns for the Benchmark Indices are based on the closest month-end to the Fund's inception date.
†† Average annualized.
20
This page intentionally left blank
Manager's Analysis
PowerShares FTSE RAFI Telecommunications & Technology Sector Portfolio (ticker: PRFQ)
The PowerShares FTSE RAFI Telecommunications & Technology Sector Portfolio (the "Fund") seeks investment results that correspond generally to the price and yield (before the Fund's fees and expenses) of an equity index called the FTSE RAFI Telecommunications & Technology Sector Index. The FTSE RAFI Telecommunications & Technology Sector Index is designed to track the performance of the largest U.S. equities in the telecommunications & technology sector which are selected based on the following four fundamental measures of firm size: book value, cash flow, sales and dividends. The equities are then weighted by each of these four fundamental measures. An overall weight is calculated for each firm by equally-weighting each fundamental measure. Each of the equities with the highest fundamental weight are then selected and assigned a weight equal to its fundamental weight.
For the year ended April 30, 2009, the Fund returned -24.92%, ahead of the S&P Information Technology Index, which returned -26.69%.
The Fund was positively affected by holding Verizon Communications Inc. and not holding eBay Inc. or Electronic Arts Inc. The Fund was overweight in Microsoft Corp., which helped contribute to its outperformance of the index.
Top performers in the Fund were Brocade Communication Systems, IKON Office Solutions, and iPCS Inc. Top contributors to performance were Electronic Data Systems Corp. and IKON Office Solutions. Bottom contributors to performance included Microsoft Corp. and AT&T Inc.
22
Manager's Analysis (Continued)
PowerShares FTSE RAFI Telecommunications & Technology Sector Portfolio (ticker: PRFQ)
Industry Breakdown (% of the Fund's
Net Assets) as of April 30, 2009
| Telephone-Integrated | 25.3 | ||||||
| Computers | 16.9 | ||||||
| Applications Software | 11.8 | ||||||
| Electronic Component-Semiconductors | 10.3 | ||||||
| Networking Products | 4.9 | ||||||
| Wireless Equipment | 4.7 | ||||||
| Computers-Memory Devices | 3.6 | ||||||
| Enterprise Software/Services | 3.0 | ||||||
| Web Portals/ISP | 2.2 | ||||||
| Distribution/Wholesale | 1.9 | ||||||
| Semiconductor Equipment | 1.9 | ||||||
| Computer Services | 1.7 | ||||||
| Telecommunication Services | 1.4 | ||||||
| Office Automation & Equipment | 1.4 | ||||||
| Telecommunication Equipment Fiber Optics | 1.2 | ||||||
| Internet Security | 1.1 | ||||||
| Cellular Telecommunications | 1.1 | ||||||
| Semiconductor Components-Integrated Circuit | 0.8 | ||||||
| Computers-Integrated Systems | 0.8 | ||||||
| E-Commerce/Services | 0.6 | ||||||
| Electronic Forms | 0.4 | ||||||
| Telecommunication Equipment | 0.4 | ||||||
| Consulting Services | 0.4 | ||||||
| Electronic Design Automation | 0.4 | ||||||
| Computers-Peripheral Equipment | 0.3 | ||||||
| Diversified Operations | 0.2 | ||||||
| Transactional Software | 0.2 | ||||||
| Computer Aide Design | 0.2 | ||||||
| Medical Information Systems | 0.2 | ||||||
| Internet Content-Info/Network | 0.2 | ||||||
| Software Tools | 0.1 | ||||||
| Internet Telephony | 0.1 | ||||||
| Money Market Fund | 0.7 | ||||||
| Other | (0.4 | ) | |||||
Top Ten Fund Holdings (% of the Fund's
Net Assets) as of April 30, 2009
| Security | |||||||
| Microsoft Corp. | 11.4 | ||||||
| AT&T, Inc. | 11.1 | ||||||
| Verizon Communications, Inc. | 8.6 | ||||||
| Intel Corp. | 5.4 | ||||||
| International Business Machines Corp. | 5.4 | ||||||
| Hewlett-Packard Co. | 5.2 | ||||||
| Cisco Systems, Inc. | 4.3 | ||||||
| Sprint Nextel Corp. | 3.2 | ||||||
| Dell, Inc. | 2.7 | ||||||
| Oracle Corp. | 2.6 | ||||||
| Total | 59.9 | ||||||
Style Allocation (% of the Fund's
Total Investments) as of April 30, 2009
| Large-Cap Value | 43.2 | ||||||
| Large-Cap Growth | 29.9 | ||||||
| Mid-Cap Growth | 13.0 | ||||||
| Mid-Cap Value | 8.4 | ||||||
| Small-Cap Growth | 3.3 | ||||||
| Small-Cap Value | 2.2 | ||||||
23
Manager's Analysis (Continued)
PowerShares FTSE RAFI Telecommunications & Technology Sector Portfolio (ticker: PRFQ)
Growth of a $10,000 Investment Since Inception†
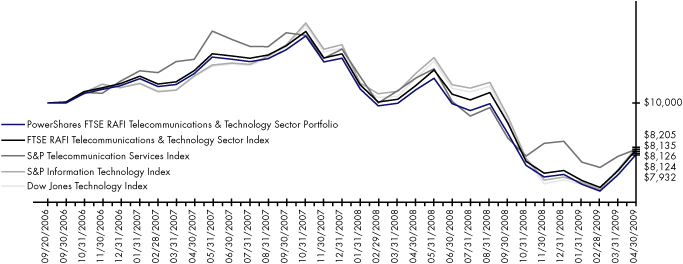
| Fund Performance History (%) | As of April 30, 2009 | ||||||||||||||
| Avg. Ann.†† | Fund Inception† | ||||||||||||||
| 1 Year | Avg. Ann.†† | Cumulative | |||||||||||||
| Index | |||||||||||||||
| FTSE RAFI Telecommunications & Technology Sector Index | -24.08 | -7.65 | -18.74 | ||||||||||||
| S&P Telecommunication Services Index | -26.05 | -7.68 | -18.65 | ||||||||||||
| S&P Information Technology Index | -26.69 | -7.37 | -17.95 | ||||||||||||
| Dow Jones Technology Index | -26.20 | -7.73 | -18.76 | ||||||||||||
| Fund | |||||||||||||||
| NAV Return | -24.92 | -8.50 | -20.68 | ||||||||||||
| Share Price Return | -24.86 | -8.48 | -20.64 | ||||||||||||
Fund Inception: September 20, 2006
Performance quoted represents past performance. Past performance is not a guarantee of future results and current performance may be higher or lower than performance quoted. Investment returns and principal value will fluctuate and shares, when redeemed, may be worth more or less than their original cost. The Adviser has waived fees and reimbursed other expenses, absent which, performance would have been lower. The Adviser has contractually agreed to waive fees and/or pay certain Fund expenses through August 31, 2010. According to the Fund's current prospectus, the total gross annual operating expense ratio was indicated as 1.29%. In the Financial Highlights section of this Shareholder Report, the Fund's net (subsidized) total operating expense ratio was determined to be 0.57% while the Fund's gross total operating expense ratio was 1.84%. NAV and Share Price returns assume that dividends and capital gain distributions have been reinvested in the Fund at NAV and Share Price, respectively. The returns shown in the table above do not reflect the deduction of taxes that a shareholder would pay on Fund distributions or the redemption or sale of Fund Shares. See invescopowershares.com to find the most recent month-end performance numbers.
Index performance results are based upon a hypothetical investment in its constituent securities. Index returns do not represent Fund returns. An investor cannot invest directly in an index. The Index does not charge management fees or brokerage expenses, and no such fees or expenses were deducted from the hypothetical performance shown. In addition, the results actual investors might have achieved would have differed from those shown because of differences in the timing, amounts of their investments, and fees and expenses associated with an investment in the Fund.
The S&P Telecommunication Services Index and S&P Information Technology Index (the "Benchmark Indices") are unmanaged indices used as a measurement of change in stock market conditions based on the average performance of approximately 9 and 70 common stocks, respectively.
† Fund and underlying Index returns are based on the inception date of the Fund. Returns for the Benchmark Indices are based on the closest month-end to the Fund's inception date. The S&P Telecommunication Services Index and the S&P Information Technology Index will be used for comparative purposes going forward as these represent the most appropriate market indices for this fund.
†† Average annualized.
24
This page intentionally left blank
Manager's Analysis
PowerShares FTSE RAFI US 1500 Small-Mid Portfolio (ticker: PRFZ)
The PowerShares FTSE RAFI US 1500 Small-Mid Portfolio (the "Fund") seeks investment results that correspond generally to the price and yield (before the Fund's fees and expenses) of an equity index called the FTSE RAFI US 1500 Small-Mid Index. The FTSE RAFI US 1500 Small-Mid Index is designed to track the performance of small and medium-sized U.S. companies which are selected based on the following four fundamental measures of firm size: book value, cash flow, sales and dividends. Each of the equities with a fundamental weight ranking of 1,001 to 2,500 is then selected and assigned a weight equal to its fundamental weight.
For the year ended April 30, 2009, the Fund returned -29.79%, slightly ahead of the S&P Small Cap 600 Index, which returned -30.05%
The Fund outperformed relative to the S&P Small Cap 600 Index due to overallocation and stock selection within the consumer discretionary and health care sectors. The Fund was also helped by having a larger weighting in small cap stocks.
The Fund's performance was helped by a larger weighting in Ruby Tuesday Inc., and Corinthian Colleges, Inc. The Fund also benefited from not holding poor performers Arch Coal Inc. and Forest Oil Corp.
Sector Breakdown (% of the Fund's
Net Assets) as of April 30, 2009
| Financials | 22.8 | ||||||
| Consumer Discretionary | 21.9 | ||||||
| Industrials | 17.0 | ||||||
| Information Technology | 15.7 | ||||||
| Health Care | 6.1 | ||||||
| Energy | 5.6 | ||||||
| Materials | 5.5 | ||||||
| Consumer Staples | 2.7 | ||||||
| Utilities | 1.5 | ||||||
| Telecommunication Services | 1.0 | ||||||
| Money Market Fund | 0.2 | ||||||
Style Allocation (% of the Fund's
Total Investments) as of April 30, 2009
| Small-Cap Value | 53.3 | ||||||
| Small-Cap Growth | 38.2 | ||||||
| Mid-Cap Growth | 7.1 | ||||||
| Mid-Cap Value | 1.3 | ||||||
| Large-Cap Growth | 0.1 | ||||||
Top Ten Fund Holdings (% of the Fund's
Net Assets) as of April 30, 2009
| Security | |||||||
| Pier 1 Imports, Inc. | 0.7 | ||||||
| Ruby Tuesday, Inc. | 0.6 | ||||||
| Hayes Lemmerz International, Inc. | 0.3 | ||||||
| Valassis Communications, Inc. | 0.3 | ||||||
| Ashford Hospitality Trust, Inc. REIT | 0.3 | ||||||
| Modine Manufacturing Co. | 0.3 | ||||||
| Caraustar Industries, Inc. | 0.3 | ||||||
| ADC Telecommunications, Inc. | 0.3 | ||||||
| Spherion Corp. | 0.3 | ||||||
| Pacific Sunwear of California, Inc. | 0.3 | ||||||
| Total | 3.7 | ||||||
26
Manager's Analysis (Continued)
PowerShares FTSE RAFI US 1500 Small-Mid Portfolio (ticker: PRFZ)
Growth of a $10,000 Investment Since Inception†

| Fund Performance History (%) | As of April 30, 2009 | ||||||||||||||
| Avg. Ann.†† | Fund Inception† | ||||||||||||||
| 1 Year | Avg. Ann.†† | Cumulative | |||||||||||||
| Index | |||||||||||||||
| FTSE RAFI US 1500 Small-Mid Index | -29.81 | -12.02 | -28.39 | ||||||||||||
| S&P Small Cap 600 Index | -30.05 | -11.76 | -27.61 | ||||||||||||
| Russell 2000® Index | -30.74 | -13.04 | -30.30 | ||||||||||||
| Fund | |||||||||||||||
| NAV Return | -29.79 | -12.41 | -29.21 | ||||||||||||
| Share Price Return | -29.84 | -12.46 | -29.33 | ||||||||||||
Fund Inception: September 20, 2006
Performance quoted represents past performance. Past performance is not a guarantee of future results and current performance may be higher or lower than performance quoted. Investment returns and principal value will fluctuate and shares, when redeemed, may be worth more or less than their original cost. The Adviser has waived fees and reimbursed other expenses, absent which, performance would have been lower. The Adviser has contractually agreed to waive fees and/or pay certain Fund expenses through August 31, 2010. According to the Fund's current prospectus, the total gross annual operating expense ratio was indicated as 0.55%. In the Financial Highlights section of this Shareholder Report, the Fund's net (subsidized) total operating expense ratio was determined to be 0.58% while the Fund's gross total operating expense ratio was 0.79%. NAV and Share Price returns assume that dividends and capital gain distributions have been reinvested in the Fund at NAV and Share Price, respectively. The returns shown in the table above do not reflect the deduction of taxes that a shareholder would pay on Fund distributions or the redemption or sale of Fund Shares. See invescopowershares.com to find the most recent month-end performance numbers.
Index performance results are based upon a hypothetical investment in its constituent securities. Index returns do not represent Fund returns. An investor cannot invest directly in an index. The Index does not charge management fees or brokerage expenses, and no such fees or expenses were deducted from the hypothetical performance shown. In addition, the results actual investors might have achieved would have differed from those shown because of differences in the timing, amounts of their investments, and fees and expenses associated with an investment in the Fund.
The S&P Small Cap 600 Index and Russell 2000 Index (the "Benchmark Indices") are unmanaged indices used as a measurement of change in stock market conditions based on the average performance of approximately 600 and 2000 common stocks, respectively.
† Fund and underlying Index returns are based on the inception date of the Fund. Returns for the Benchmark Indices are based on the closest month-end to the Fund's inception date.
†† Average annualized.
27
Manager's Analysis
PowerShares FTSE RAFI Utilities Sector Portfolio (ticker: PRFU)
The PowerShares FTSE RAFI Utilities Sector Portfolio (the "Fund") seeks investment results that correspond generally to the price and yield (before the Fund's fees and expenses) of an equity index called the FTSE RAFI Utilities Sector Index. The FTSE RAFI Utilities Sector Index is designed to track the performance of the largest U.S. equities in the utilities sector which are selected based on the following four fundamental measures of firm size: book value, cash flow, sales and dividends. The equities are then weighted by each of these four fundamental measures. An overall weight is calculated for each firm by equally-weighting each fundamental measure. Each of the equities with the highest fundamental weight are then selected and assigned a weight equal to its fundamental weight.
For the year ended April 30, 2009, the Fund returned -28.79%, ahead of the S&P Utilities Index which returned -32.76%.
The Fund outperformed primarily due to underweighting in Constellation Energy Group Inc., Exelon Corp., and Dynegy Inc.
Top performers were Calpine Corp., Energy East Corp., and Puget Energy Inc. Top contributors to return were Exelon and FirstEnergy Corp. Bottom contributors to return included Energy East Corp. and PG&E Corp.
Industry Breakdown (% of the Fund's
Net Assets) as of April 30, 2009
| Electric-Integrated | 73.1 | ||||||
| Gas-Distribution | 11.8 | ||||||
| Independent Power Producer | 6.1 | ||||||
| Pipelines | 4.1 | ||||||
| Electric-Generation | 3.0 | ||||||
| Oil Companies-Exploration & Production | 1.2 | ||||||
| Water | 0.7 | ||||||
| Money Market Fund | 1.4 | ||||||
| Other | (1.4 | ) | |||||
Style Allocation (% of the Fund's
Total Investments) as of April 30, 2009
| Large-Cap Value | 51.6 | ||||||
| Mid-Cap Value | 31.7 | ||||||
| Mid-Cap Growth | 7.6 | ||||||
| Small-Cap Value | 3.5 | ||||||
| Small-Cap Growth | 3.4 | ||||||
| Large-Cap Growth | 2.2 | ||||||
Top Ten Fund Holdings (% of the Fund's
Net Assets) as of April 30, 2009
| Security | |||||||
| Duke Energy Corp. | 6.3 | ||||||
| Exelon Corp. | 4.6 | ||||||
| FPL Group, Inc. | 4.3 | ||||||
| Southern Co. | 3.5 | ||||||
| FirstEnergy Corp. | 3.5 | ||||||
| Public Service Enterprise Group, Inc. | 3.4 | ||||||
| Dominion Resources, Inc. | 3.4 | ||||||
| PG&E Corp. | 3.2 | ||||||
| AES (The) Corp. | 3.1 | ||||||
| Edison International | 3.0 | ||||||
| Total | 38.3 | ||||||
28
Manager's Analysis (Continued)
PowerShares FTSE RAFI Utilities Sector Portfolio (ticker: PRFU)
Growth of a $10,000 Investment Since Inception†
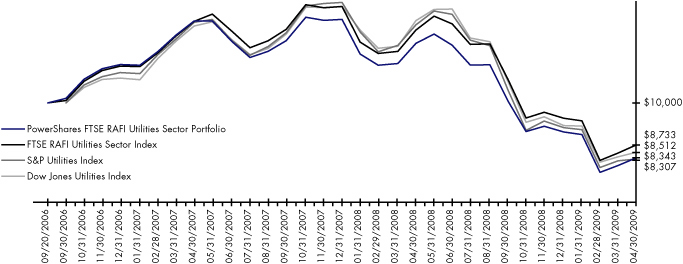
| Fund Performance History (%) | As of April 30, 2009 | ||||||||||||||
| Avg. Ann.†† | Fund Inception† | ||||||||||||||
| 1 Year | Avg. Ann.†† | Cumulative | |||||||||||||
| Index | |||||||||||||||
| FTSE RAFI Utilities Sector Index | -28.40 | -5.06 | -12.67 | ||||||||||||
| S&P Utilities Index | -32.76 | -6.93 | -16.93 | ||||||||||||
| Dow Jones Utilities Index | -31.80 | -6.05 | -14.88 | ||||||||||||
| Fund | |||||||||||||||
| NAV Return | -28.79 | -6.71 | -16.56 | ||||||||||||
| Share Price Return | -28.76 | -6.72 | -16.59 | ||||||||||||
Fund Inception: September 20, 2006
Performance quoted represents past performance. Past performance is not a guarantee of future results and current performance may be higher or lower than performance quoted. Investment returns and principal value will fluctuate and shares, when redeemed, may be worth more or less than their original cost. The Adviser has waived fees and reimbursed other expenses, absent which, performance would have been lower. The Adviser has contractually agreed to waive fees and/or pay certain Fund expenses through August 31, 2010. According to the Fund's current prospectus, the total gross annual operating expense ratio was indicated as 1.71%. In the Financial Highlights section of this Shareholder Report, the Fund's net (subsidized) total operating expense ratio was determined to be 0.56% while the Fund's gross total operating expense ratio was 1.76%. NAV and Share Price returns assume that dividends and capital gain distributions have been reinvested in the Fund at NAV and Share Price, respectively. The returns shown in the table above do not reflect the deduction of taxes that a shareholder would pay on Fund distributions or the redemption or sale of Fund Shares. See invescopowershares.com to find the most recent month-end performance numbers.
Index performance results are based upon a hypothetical investment in its constituent securities. Index returns do not represent Fund returns. An investor cannot invest directly in an index. The Index does not charge management fees or brokerage expenses, and no such fees or expenses were deducted from the hypothetical performance shown. In addition, the results actual investors might have achieved would have differed from those shown because of differences in the timing, amounts of their investments, and fees and expenses associated with an investment in the Fund.
The S&P Utilities Index and Dow Jones Utilities Index (the "Benchmark Indices") are unmanaged indices used as a measurement of change in stock market conditions based on the average performance of approximately 35 and 90 common stocks, respectively.
† Fund and underlying Index returns are based on the inception date of the Fund. Returns for the Benchmark Indices are based on the closest month-end to the Fund's inception date.
†† Average annualized.
29
Frequency Distribution of Discounts & Premiums
Since Inception through April 30, 2009
| Closing Price Above NAV (bps) | |||||||||||||||||||||||||||||||||||||||
| Ticker | Fund Name | Inception | Days | 0-24 | 25-49 | 50-99 | 100-149 | 150-199 | 200+ | ||||||||||||||||||||||||||||||
| PRFM | PowerShares FTSE RAFI Basic Materials Sector Portfolio | 9/20/06 | 657 | 254 | 9 | 3 | 1 | 1 | 1 | ||||||||||||||||||||||||||||||
| PRFG | PowerShares FTSE RAFI Consumer Goods Sector Portfolio | 9/20/06 | 657 | 262 | 11 | 2 | 3 | 0 | 0 | ||||||||||||||||||||||||||||||
| PRFS | PowerShares FTSE RAFI Consumer Services Sector Portfolio | 9/20/06 | 657 | 260 | 8 | 3 | 0 | 0 | 0 | ||||||||||||||||||||||||||||||
| PRFE | PowerShares FTSE RAFI Energy Sector Portfolio | 9/20/06 | 657 | 267 | 15 | 2 | 1 | 0 | 0 | ||||||||||||||||||||||||||||||
| PRFF | PowerShares FTSE RAFI Financials Sector Portfolio | 9/20/06 | 657 | 273 | 29 | 12 | 2 | 1 | 3 | ||||||||||||||||||||||||||||||
| PRFH | PowerShares FTSE RAFI Health Care Sector Portfolio | 9/20/06 | 657 | 287 | 11 | 2 | 2 | 1 | 0 | ||||||||||||||||||||||||||||||
| PRFN | PowerShares FTSE RAFI Industrials Sector Portfolio | 9/20/06 | 657 | 270 | 12 | 3 | 1 | 0 | 0 | ||||||||||||||||||||||||||||||
| PRFQ | PowerShares FTSE RAFI Telecommunications & Technology Sector Portfolio | 9/20/06 | 657 | 264 | 10 | 7 | 2 | 0 | 0 | ||||||||||||||||||||||||||||||
| PRFZ | PowerShares FTSE RAFI US 1500 Small-Mid Portfolio | 9/20/06 | 657 | 275 | 18 | 1 | 0 | 2 | 1 | ||||||||||||||||||||||||||||||
| PRFU | PowerShares FTSE RAFI Utilities Sector Portfolio | 9/20/06 | 657 | 249 | 10 | 4 | 1 | 0 | 1 | ||||||||||||||||||||||||||||||
30
| Closing Price Below NAV (bps) | |||||||||||||||||||||||||||
| Ticker | -0-24 | -25-49 | -50-99 | -100-149 | -150-199 | -200+ | |||||||||||||||||||||
| PRFM | 376 | 9 | 2 | 1 | 0 | 0 | |||||||||||||||||||||
| PRFG | 363 | 12 | 4 | 0 | 0 | 0 | |||||||||||||||||||||
| PRFS | 383 | 3 | 0 | 0 | 0 | 0 | |||||||||||||||||||||
| PRFE | 350 | 18 | 4 | 0 | 0 | 0 | |||||||||||||||||||||
| PRFF | 302 | 29 | 1 | 1 | 2 | 2 | |||||||||||||||||||||
| PRFH | 346 | 6 | 2 | 0 | 0 | 0 | |||||||||||||||||||||
| PRFN | 366 | 4 | 0 | 1 | 0 | 0 | |||||||||||||||||||||
| PRFQ | 363 | 9 | 1 | 1 | 0 | 0 | |||||||||||||||||||||
| PRFZ | 329 | 29 | 2 | 0 | 0 | 0 | |||||||||||||||||||||
| PRFU | 387 | 3 | 1 | 0 | 0 | 1 | |||||||||||||||||||||
31
Fees and Expenses
As a shareholder of a Fund of the PowerShares Exchange-Traded Fund Trust, you incur advisory fees and other Fund expenses. The expense examples below are intended to help you understand your ongoing costs (in dollars) of investing in the Funds and to compare these costs with the ongoing costs of investing in other funds.
The example is based on an investment of $1,000 invested at the beginning of the period and held through the six-month period ended April 30, 2009.
Actual Expenses
The first line in the following table provides information about actual account values and actual expenses. You may use the information in this line, together with the amount you invested, to estimate the expenses that you paid over the period. Simply divide your account value by $1,000 (for example, an $8,600 account value divided by $1,000 = 8.6), then multiply the result by the number in the first line under the heading "Expenses Paid During the Six-Month Period" to estimate the expenses you paid on your account during this period.
Hypothetical Example for Comparison Purposes
The second line in the following table provides information about hypothetical account values and hypothetical expenses based on each Fund's actual expense ratio and an assumed annualized rate of return of 5% per year before expenses, which is not the Fund's actual return. The hypothetical account values and expenses may not be used to estimate the actual ending account balance or expenses you paid for the period. You may use this information to compare the ongoing costs of investing in the Funds and other funds. To do so, compare this 5% hypothetical example with the 5% hypothetical examples that appear in the shareholder reports of the other funds.
Please note that the expenses shown in the table are meant to highlight your ongoing costs only, and do not reflect any transactional costs such as sales charges (loads). Therefore the second line in the table is useful in comparing ongoing costs only, and will not help you determine the relative total costs of owning different funds. In addition, if these transactional costs were included, your costs would have been higher.
| Beginning Account Value November 1, 2008 | Ending Account Value April 30, 2009 | Annualized Expense Ratio Based on the Six-Month Period | Expenses Paid During the Six-Month Period (1) | ||||||||||||||||
| PowerShares FTSE RAFI Basic Materials Sector Portfolio Actual | $ | 1,000.00 | $ | 1,010.82 | 0.35 | % | $ | 1.75 | |||||||||||
| Hypothetical (5% return before expenses) | $ | 1,000.00 | $ | 1,023.06 | 0.35 | % | $ | 1.76 | |||||||||||
| PowerShares FTSE RAFI Consumer Goods Sector Portfolio Actual | $ | 1,000.00 | $ | 1,028.26 | 0.35 | % | $ | 1.76 | |||||||||||
| Hypothetical (5% return before expenses) | $ | 1,000.00 | $ | 1,023.06 | 0.35 | % | $ | 1.76 | |||||||||||
| PowerShares FTSE RAFI Consumer Services Sector Portfolio Actual | $ | 1,000.00 | $ | 1,094.47 | 0.36 | % | $ | 1.87 | |||||||||||
| Hypothetical (5% return before expenses) | $ | 1,000.00 | $ | 1,023.01 | 0.36 | % | $ | 1.81 | |||||||||||
| PowerShares FTSE RAFI Energy Sector Portfolio Actual | $ | 1,000.00 | $ | 940.33 | 0.38 | % | $ | 1.83 | |||||||||||
| Hypothetical (5% return before expenses) | $ | 1,000.00 | $ | 1,022.91 | 0.38 | % | $ | 1.91 | |||||||||||
32
Fees and Expenses (Continued)
| Beginning Account Value November 1, 2008 | Ending Account Value April 30, 2009 | Annualized Expense Ratio Based on the Six-Month Period | Expenses Paid During the Six-Month Period (1) | ||||||||||||||||
| PowerShares FTSE RAFI Financials Sector Portfolio Actual | $ | 1,000.00 | $ | 708.07 | 0.39 | % | $ | 1.65 | |||||||||||
| Hypothetical (5% return before expenses) | $ | 1,000.00 | $ | 1,022.86 | 0.39 | % | $ | 1.96 | |||||||||||
| PowerShares FTSE RAFI Health Care Sector Portfolio Actual | $ | 1,000.00 | $ | 944.24 | 0.38 | % | $ | 1.83 | |||||||||||
| Hypothetical (5% return before expenses) | $ | 1,000.00 | $ | 1,022.91 | 0.38 | % | $ | 1.91 | |||||||||||
| PowerShares FTSE RAFI Industrials Sector Portfolio Actual | $ | 1,000.00 | $ | 939.67 | 0.37 | % | $ | 1.78 | |||||||||||
| Hypothetical (5% return before expenses) | $ | 1,000.00 | $ | 1,022.96 | 0.37 | % | $ | 1.86 | |||||||||||
| PowerShares FTSE RAFI Telecommunications & Technology Sector Portfolio Actual | $ | 1,000.00 | $ | 1,059.22 | 0.38 | % | $ | 1.94 | |||||||||||
| Hypothetical (5% return before expenses) | $ | 1,000.00 | $ | 1,022.91 | 0.38 | % | $ | 1.91 | |||||||||||
| PowerShares FTSE RAFI US 1500 Small-Mid Portfolio Actual | $ | 1,000.00 | $ | 991.05 | 0.39 | % | $ | 1.93 | |||||||||||
| Hypothetical (5% return before expenses) | $ | 1,000.00 | $ | 1,022.86 | 0.39 | % | $ | 1.96 | |||||||||||
| PowerShares FTSE RAFI Utilities Sector Portfolio Actual | $ | 1,000.00 | $ | 913.16 | 0.38 | % | $ | 1.80 | |||||||||||
| Hypothetical (5% return before expenses) | $ | 1,000.00 | $ | 1,022.91 | 0.38 | % | $ | 1.91 | |||||||||||
(1) Expenses are calculated using the annualized expense ratio, which represents the ongoing expenses as a percentage of net assets for the six months ended April 30, 2009. Expenses are calculated by multiplying the Fund's annualized expense ratio by the average account value for the period; then multiplying the result by 181 and then dividing the result by 365. Expense ratios for the most recent half-year may differ from expense ratios based on the annualized data in the Financial Highlights.
33
Schedule of Investments
PowerShares FTSE RAFI Basic Materials Sector Portfolio
April 30, 2009
| Number of Shares | Value | ||||||||||
| Common Stocks—99.7% | |||||||||||
| Agricultural Chemicals—1.4% | |||||||||||
| 183 | CF Industries Holdings, Inc. | $ | 13,185 | ||||||||
| 636 | Mosaic (The) Co. | 25,726 | |||||||||
| 462 | Terra Industries, Inc. | 12,243 | |||||||||
| 51,154 | |||||||||||
| Chemicals - Diversified—35.0% | |||||||||||
| 3,030 | Celanese Corp., Series A | 63,145 | |||||||||
| 44,228 | Dow Chemical (The) Co. | 707,649 | |||||||||
| 11,920 | E.I. du Pont de Nemours & Co. | 332,569 | |||||||||
| 365 | FMC Corp. | 17,786 | |||||||||
| 12,314 | Huntsman Corp. | 66,003 | |||||||||
| 1,157 | Olin Corp. | 14,578 | |||||||||
| 1,919 | PPG Industries, Inc. | 84,532 | |||||||||
| 2,527 | Rockwood Holdings, Inc.* | 31,082 | |||||||||
| 323 | Westlake Chemical Corp. | 6,040 | |||||||||
| 1,323,384 | |||||||||||
| Chemicals - Plastics—0.5% | |||||||||||
| 6,978 | PolyOne Corp.* | 19,120 | |||||||||
| Chemicals - Specialty—10.6% | |||||||||||
| 535 | Albemarle Corp. | 14,349 | |||||||||
| 7,719 | Ashland, Inc. | 169,510 | |||||||||
| 1,500 | Cabot Corp. | 21,900 | |||||||||
| 755 | Cytec Industries, Inc. | 14,994 | |||||||||
| 1,610 | Eastman Chemical Co. | 63,885 | |||||||||
| 988 | Ecolab, Inc. | 38,087 | |||||||||
| 595 | International Flavors & Fragrances, Inc. | 18,564 | |||||||||
| 852 | Lubrizol (The) Corp. | 36,823 | |||||||||
| 487 | Sigma-Aldrich Corp. | 21,350 | |||||||||
| 399,462 | |||||||||||
| Coal—2.8% | |||||||||||
| 1,072 | Arch Coal, Inc. | 14,976 | |||||||||
| 830 | Consol Energy, Inc. | 25,962 | |||||||||
| 842 | Foundation Coal Holdings, Inc. | 13,674 | |||||||||
| 990 | Massey Energy Co. | 15,751 | |||||||||
| 1,380 | Peabody Energy Corp. | 36,418 | |||||||||
| 106,781 | |||||||||||
| Coatings/Paint—1.3% | |||||||||||
| 1,760 | RPM International, Inc. | 24,323 | |||||||||
| 1,098 | Valspar (The) Corp. | 26,352 | |||||||||
| 50,675 | |||||||||||
| Gold Mining—1.8% | |||||||||||
| 1,680 | Newmont Mining Corp. | 67,603 | |||||||||
| Industrial Gases—6.1% | |||||||||||
| 1,676 | Air Products & Chemicals, Inc. | 110,448 | |||||||||
| 417 | Airgas, Inc. | 17,981 | |||||||||
| 1,395 | Praxair, Inc. | 104,081 | |||||||||
| 232,510 | |||||||||||
| Number of Shares | Value | ||||||||||
| Common Stocks (Continued) | |||||||||||
| Metal - Aluminum—8.3% | |||||||||||
| 34,417 | Alcoa, Inc. | $ | 312,162 | ||||||||
| Metal - Copper—5.6% | |||||||||||
| 2,337 | Southern Copper Corp. | 43,398 | |||||||||
| 3,957 | Freeport-McMoRan Copper & Gold, Inc. | 168,766 | |||||||||
| 212,164 | |||||||||||
| Metal - Iron—0.5% | |||||||||||
| 760 | Cliffs Natural Resources, Inc. | 17,526 | |||||||||
| Metal Processors & Fabricate—1.8% | |||||||||||
| 2,796 | Commercial Metals Co. | 41,605 | |||||||||
| 1,879 | Worthington Industries, Inc. | 27,997 | |||||||||
| 69,602 | |||||||||||
| Non-Ferrous Metals—0.4% | |||||||||||
| 2,219 | USEC, Inc.* | 13,736 | |||||||||
| Office Supplies & Forms—1.4% | |||||||||||
| 1,862 | Avery Dennison Corp. | 53,514 | |||||||||
| Paper & Related Products—10.9% | |||||||||||
| 27,192 | Boise, Inc.* | 23,385 | |||||||||
| 56,980 | Domtar Corp.* | 103,704 | |||||||||
| 22,675 | International Paper Co. | 287,065 | |||||||||
| 414,154 | |||||||||||
| Steel - Producers—10.1% | |||||||||||
| 5,113 | AK Steel Holding Corp. | 66,520 | |||||||||
| 3,509 | Nucor Corp. | 142,781 | |||||||||
| 949 | Reliance Steel & Aluminum Co. | 33,433 | |||||||||
| 2,291 | Steel Dynamics, Inc. | 28,523 | |||||||||
| 4,227 | United States Steel Corp. | 112,227 | |||||||||
| 383,484 | |||||||||||
| Steel - Specialty—1.2% | |||||||||||
| 1,399 | Allegheny Technologies, Inc. | 45,789 | |||||||||
| Total Common Stocks (Cost $6,706,633) | 3,772,820 | ||||||||||
| Money Market Fund—1.1% | |||||||||||
| 40,929 | Goldman Sachs Financial Square Prime Obligations Institutional Share Class (Cost $40,929) | 40,929 | |||||||||
| Total Investments (Cost $6,747,562)—100.8% | 3,813,749 | ||||||||||
| Liabilities in excess of other assets—(0.8%) | (29,205 | ) | |||||||||
| Net Assets—100.0% | $ | 3,784,544 | |||||||||
* Non-income producing security.
See Notes to Financial Statements.
34
Schedule of Investments
PowerShares FTSE RAFI Consumer Goods Sector Portfolio
April 30, 2009
| Number of Shares | Value | ||||||||||
| Common Stocks—100.3% | |||||||||||
| Agriculture—13.5% | |||||||||||
| 13,098 | Altria Group, Inc. | $ | 213,889 | ||||||||
| 2,190 | Archer-Daniels-Midland Co. | 53,918 | |||||||||
| 647 | Bunge Ltd. | 31,062 | |||||||||
| 478 | Lorillard, Inc. | 30,176 | |||||||||
| 2,653 | Philip Morris International, Inc., | 96,039 | |||||||||
| 716 | Reynolds American, Inc. | 27,194 | |||||||||
| 148 | Universal Corp. | 4,464 | |||||||||
| 456,742 | |||||||||||
| Apparel—3.3% | |||||||||||
| 591 | Coach, Inc.* | 14,480 | |||||||||
| 1,004 | Hanesbrands, Inc.* | 16,526 | |||||||||
| 3,044 | Jones Apparel Group, Inc. | 28,127 | |||||||||
| 605 | NIKE, Inc., Class B | 31,743 | |||||||||
| 2,978 | Quiksilver, Inc.* | 4,914 | |||||||||
| 290 | VF Corp. | 17,188 | |||||||||
| 112,978 | |||||||||||
| Auto Manufacturers—21.9% | |||||||||||
| 103,914 | Ford Motor Co.* | 621,405 | |||||||||
| 63,166 | General Motors Corp. | 121,278 | |||||||||
| 742,683 | |||||||||||
| Auto Parts & Equipment—9.0% | |||||||||||
| 3,969 | American Axle & Manufacturing Holdings, Inc. | 3,969 | |||||||||
| 11,765 | ArvinMeritor, Inc. | 14,589 | |||||||||
| 734 | Autoliv, Inc. | 18,108 | |||||||||
| 462 | BorgWarner, Inc. | 13,375 | |||||||||
| 803 | Cooper Tire & Rubber Co. | 6,641 | |||||||||
| 1,275 | Exide Technologies* | 6,923 | |||||||||
| 555 | Federal Mogul Corp., Class A* | 6,161 | |||||||||
| 6,147 | Goodyear Tire & Rubber (The) Co.* | 67,555 | |||||||||
| 3,879 | Johnson Controls, Inc. | 73,739 | |||||||||
| 24,133 | Lear Corp* | 19,306 | |||||||||
| 4,927 | Tenneco, Inc.* | 15,077 | |||||||||
| 6,312 | TRW Automotive Holdings Corp.* | 54,409 | |||||||||
| 341 | WABCO Holdings, Inc. | 5,453 | |||||||||
| 305,305 | |||||||||||
| Beverages—10.6% | |||||||||||
| 187 | Brown-Forman Corp., Class B | 8,696 | |||||||||
| 2,933 | Coca-Cola (The) Co. | 126,265 | |||||||||
| 1,975 | Coca-Cola Enterprises, Inc. | 33,694 | |||||||||
| 881 | Constellation Brands, Inc., Class A* | 10,211 | |||||||||
| 1,268 | DR Pepper Snapple Group, Inc.* | 26,260 | |||||||||
| 454 | Molson Coors Brewing Co., Class B | 17,366 | |||||||||
| 743 | Pepsi Bottling Group (The), Inc. | 23,234 | |||||||||
| 340 | PepsiAmericas, Inc. | 8,354 | |||||||||
| 2,113 | PepsiCo, Inc. | 105,142 | |||||||||
| 359,222 | |||||||||||
| Number of Shares | Value | ||||||||||
| Common Stocks (Continued) | |||||||||||
| Chemicals—0.9% | |||||||||||
| 368 | Monsanto Co. | $ | 31,240 | ||||||||
| Cosmetics/Personal Care—9.8% | |||||||||||
| 160 | Alberto-Culver Co. | 3,566 | |||||||||
| 928 | Avon Products, Inc. | 21,121 | |||||||||
| 1,203 | Bare Escentuals, Inc.* | 11,140 | |||||||||
| 516 | Colgate-Palmolive Co. | 30,444 | |||||||||
| 514 | Estee Lauder (The) Cos., Inc., Class A | 15,369 | |||||||||
| 5,047 | Procter & Gamble (The) Co. | 249,524 | |||||||||
| 331,164 | |||||||||||
| Distribution/Wholesale—0.6% | |||||||||||
| 598 | Genuine Parts Co. | 20,308 | |||||||||
| Electrical Components & Equipment—0.3% | |||||||||||
| 178 | Energizer Holdings, Inc.* | 10,199 | |||||||||
| Electronics—0.2% | |||||||||||
| 309 | Garmin Ltd. | 7,784 | |||||||||
| Food—12.6% | |||||||||||
| 497 | Campbell Soup Co. | 12,783 | |||||||||
| 862 | Chiquita Brands International, Inc.* | 6,525 | |||||||||
| 1,865 | ConAgra Foods, Inc. | 33,011 | |||||||||
| 254 | Corn Products International, Inc. | 6,071 | |||||||||
| 1,006 | Cosan Ltd., Class A (Brazil)* | 3,541 | |||||||||
| 2,383 | Dean Foods Co.* | 49,328 | |||||||||
| 834 | Del Monte Foods Co. | 6,297 | |||||||||
| 195 | Fresh Del Monte Produce, Inc.* | 2,831 | |||||||||
| 627 | General Mills, Inc. | 31,783 | |||||||||
| 691 | H.J. Heinz Co. | 23,784 | |||||||||
| 342 | Hershey (The) Co. | 12,360 | |||||||||
| 229 | Hormel Foods Corp. | 7,165 | |||||||||
| 153 | J.M. Smucker (The) Co. | 6,028 | |||||||||
| 509 | Kellogg Co. | 21,434 | |||||||||
| 4,544 | Kraft Foods, Inc., Class A | 106,330 | |||||||||
| 210 | McCormick & Co., Inc. | 6,185 | |||||||||
| 88 | Ralcorp Holdings, Inc.* | 5,030 | |||||||||
| 3,670 | Sara Lee Corp. | 30,534 | |||||||||
| 2 | Seaboard Corp. | 1,870 | |||||||||
| 2,188 | Smithfield Foods, Inc.* | 18,904 | |||||||||
| 3,309 | Tyson Foods, Inc., Class A | 34,877 | |||||||||
| 426,671 | |||||||||||
| Hand/Machine Tools—1.1% | |||||||||||
| 434 | Black & Decker (The) Corp. | 17,490 | |||||||||
| 218 | Snap-On, Inc. | 7,395 | |||||||||
| 327 | Stanley Works (The) | 12,436 | |||||||||
| 37,321 | |||||||||||
| Home Builders—6.0% | |||||||||||
| 9,625 | Beazer Homes USA, Inc.* | 24,255 | |||||||||
| 1,884 | Centex Corp. | 20,611 | |||||||||
See Notes to Financial Statements.
35
Schedule of Investments (Continued)
PowerShares FTSE RAFI Consumer Goods Sector Portfolio
April 30, 2009
| Number of Shares | Value | ||||||||||
| Common Stocks (Continued) | |||||||||||
| 2,225 | D.R. Horton, Inc. | $ | 29,037 | ||||||||
| 6,101 | Hovnanian Enterprises, Inc., Class A* | 16,900 | |||||||||
| 941 | KB Home | 17,004 | |||||||||
| 1,970 | Lennar Corp., Class A | 19,188 | |||||||||
| 196 | M.D.C. Holdings, Inc. | 6,699 | |||||||||
| 32 | NVR, Inc.* | 16,172 | |||||||||
| 1,617 | Pulte Homes, Inc. | 18,612 | |||||||||
| 323 | Ryland Group, Inc. | 6,689 | |||||||||
| 4,581 | Standard-Pacific Corp.* | 8,566 | |||||||||
| 291 | Thor Industries, Inc. | 6,690 | |||||||||
| 571 | Toll Brothers, Inc.* | 11,568 | |||||||||
| 201,991 | |||||||||||
| Home Furnishings—1.8% | |||||||||||
| 2,570 | Furniture Brands International, Inc. | 8,121 | |||||||||
| 507 | Harman International Industries, Inc. | 9,222 | |||||||||
| 997 | Whirlpool Corp. | 45,025 | |||||||||
| 62,368 | |||||||||||
| Household Products/Wares—2.3% | |||||||||||
| 73 | Church & Dwight Co., Inc. | 3,972 | |||||||||
| 238 | Clorox (The) Co. | 13,340 | |||||||||
| 588 | Jarden Corp.* | 11,819 | |||||||||
| 887 | Kimberly-Clark Corp. | 43,586 | |||||||||
| 180 | Scotts Miracle-Gro (The) Co., Class A | 6,079 | |||||||||
| 78,796 | |||||||||||
| Housewares—0.6% | |||||||||||
| 2,004 | Newell Rubbermaid, Inc. | 20,942 | |||||||||
| Leisure Time—1.5% | |||||||||||
| 2,357 | Brunswick Corp. | 14,095 | |||||||||
| 1,635 | Harley-Davidson, Inc. | 36,231 | |||||||||
| 50,326 | |||||||||||
| Machinery - Diversified—0.2% | |||||||||||
| 330 | Briggs & Stratton Corp. | 4,910 | |||||||||
| Miscellaneous Manufacturing—0.9% | |||||||||||
| 5,332 | Eastman Kodak Co. | 16,262 | |||||||||
| 871 | Leggett & Platt, Inc. | 12,508 | |||||||||
| 28,770 | |||||||||||
| Office Furnishings—0.3% | |||||||||||
| 378 | HNI Corp. | 5,859 | |||||||||
| 1,073 | Steelcase, Inc., Class A | 4,861 | |||||||||
| 10,720 | |||||||||||
| Pharmaceuticals—0.2% | |||||||||||
| 227 | NBTY, Inc.* | 5,882 | |||||||||
| Retail—0.4% | |||||||||||
| 2,555 | Liz Claiborne, Inc. | 12,111 | |||||||||
| Number of Shares | Value | ||||||||||
| Common Stocks (Continued) | |||||||||||
| Software—0.5% | |||||||||||
| 273 | Activision Blizzard, Inc.* | $ | 2,940 | ||||||||
| 690 | Electronic Arts, Inc.* | 14,042 | |||||||||
| 16,982 | |||||||||||
| Textiles—1.1% | |||||||||||
| 757 | Mohawk Industries, Inc.* | 35,814 | |||||||||
| Toys/Games/Hobbies—0.7% | |||||||||||
| 296 | Hasbro, Inc. | 7,891 | |||||||||
| 1,168 | Mattel, Inc. | 17,474 | |||||||||
| 25,365 | |||||||||||
| Total Common Stocks (Cost $4,520,619) | 3,396,594 | ||||||||||
| Money Market Fund—2.3% | |||||||||||
| 76,035 | Goldman Sachs Financial Square Prime Obligations Institutional Share Class (Cost $76,035) | 76,035 | |||||||||
| Total Investments (Cost $4,596,654)—102.6% | 3,472,629 | ||||||||||
| Liabilities in excess of other assets—(2.6%) | (87,306 | ) | |||||||||
| Net Assets—100.0% | $ | 3,385,323 | |||||||||
* Non-income producing security.
See Notes to Financial Statements.
36
Schedule of Investments
PowerShares FTSE RAFI Consumer Services Sector Portfolio
April 30, 2009
| Number of Shares | Value | ||||||||||
| Common Stocks—100.0% | |||||||||||
| Advertising—1.9% | |||||||||||
| 2,416 | Clear Channel Outdoor Holdings, Inc., Class A* | $ | 9,277 | ||||||||
| 2,439 | Interpublic Group of Cos., Inc.* | 15,268 | |||||||||
| 1,213 | Lamar Advertising Co., Class A* | 20,500 | |||||||||
| 788 | Omnicom Group, Inc. | 24,799 | |||||||||
| 69,844 | |||||||||||
| Airlines—3.2% | |||||||||||
| 170 | Alaska Air Group, Inc.* | 2,853 | |||||||||
| 5,711 | AMR Corp.* | 27,184 | |||||||||
| 1,415 | Continental Airlines, Inc., Class B* | 14,886 | |||||||||
| 4,868 | Delta Air Lines, Inc.* | 30,035 | |||||||||
| 748 | JetBlue Airways Corp.* | 3,688 | |||||||||
| 365 | SkyWest, Inc. | 4,395 | |||||||||
| 2,390 | Southwest Airlines Co. | 16,682 | |||||||||
| 3,732 | UAL Corp.* | 18,361 | |||||||||
| 867 | US Airways Group, Inc.* | 3,286 | |||||||||
| 121,370 | |||||||||||
| Apparel—0.3% | |||||||||||
| 200 | Polo Ralph Lauren Corp. | 10,768 | |||||||||
| Commercial Services—5.1% | |||||||||||
| 84 | Apollo Group, Inc., Class A* | 5,288 | |||||||||
| 45,290 | Avis Budget Group, Inc.* | 94,655 | |||||||||
| 154 | Career Education Corp.* | 3,394 | |||||||||
| 484 | H&R Block, Inc. | 7,328 | |||||||||
| 7,307 | Hertz Global Holdings, Inc.* | 49,688 | |||||||||
| 59 | Interactive Data Corp. | 1,326 | |||||||||
| 1,260 | Live Nation, Inc.* | 4,927 | |||||||||
| 396 | Rent-A-Center, Inc.* | 7,623 | |||||||||
| 1,298 | Service Corp International | 5,880 | |||||||||
| 903 | Ticketmaster Entertainment, Inc.* | 4,750 | |||||||||
| 2,027 | TravelCenters of America LLC* | 4,966 | |||||||||
| 7 | Washington Post (The) Co., Class B | 2,930 | |||||||||
| 192,755 | |||||||||||
| Distribution/Wholesale—0.1% | |||||||||||
| 195 | Core-Mark Holding Co., Inc.* | 3,738 | |||||||||
| Entertainment—1.1% | |||||||||||
| 124 | Cinemark Holdings, Inc. | 1,104 | |||||||||
| 953 | International Game Technology | 11,770 | |||||||||
| 239 | Penn National Gaming, Inc.* | 8,131 | |||||||||
| 1,143 | Regal Entertainment Group, Class A | 14,927 | |||||||||
| 1,259 | Warner Music Group Corp.* | 6,773 | |||||||||
| 42,705 | |||||||||||
| Food—5.5% | |||||||||||
| 1,373 | Great Atlantic & Pacific Tea Co., Inc.* | 10,078 | |||||||||
| 2,680 | Kroger (The) Co. | 57,941 | |||||||||
| 96 | Nash Finch Co. | 2,812 | |||||||||
| 135 | Ruddick Corp. | 3,464 | |||||||||
| Number of Shares | Value | ||||||||||
| Common Stocks (Continued) | |||||||||||
| 2,074 | Safeway, Inc. | $ | 40,962 | ||||||||
| 1,851 | SUPERVALU, Inc. | 30,264 | |||||||||
| 1,645 | Sysco Corp. | 38,378 | |||||||||
| 702 | Whole Foods Market, Inc. | 14,552 | |||||||||
| 746 | Winn-Dixie Stores, Inc.* | 8,549 | |||||||||
| 207,000 | |||||||||||
| Internet—2.8% | |||||||||||
| 185 | Amazon.com, Inc.* | 14,896 | |||||||||
| 1,931 | eBay, Inc.* | 31,804 | |||||||||
| 1,374 | Expedia, Inc.* | 18,700 | |||||||||
| 7,377 | Liberty Media Corp. - Interactive, Series A* | 39,098 | |||||||||
| 104,498 | |||||||||||
| Leisure Time—1.9% | |||||||||||
| 1,979 | Carnival Corp. | 53,196 | |||||||||
| 1,140 | Royal Caribbean Cruises Ltd. | 16,792 | |||||||||
| 69,988 | |||||||||||
| Lodging—3.0% | |||||||||||
| 813 | Boyd Gaming Corp. | 7,471 | |||||||||
| 1,658 | Las Vegas Sands Corp.* | 12,966 | |||||||||
| 878 | Marriott International, Inc., Class A | 20,686 | |||||||||
| 2,796 | MGM MIRAGE* | 23,430 | |||||||||
| 972 | Starwood Hotels & Resorts Worldwide, Inc. | 20,276 | |||||||||
| 2,267 | Wyndham Worldwide Corp. | 26,479 | |||||||||
| 57 | Wynn Resorts Ltd.* | 2,236 | |||||||||
| 113,544 | |||||||||||
| Media—22.6% | |||||||||||
| 5,219 | Belo Corp., Class A | 8,872 | |||||||||
| 372 | Cablevision Systems Corp., Class A | 6,384 | |||||||||
| 11,966 | CBS Corp., Class B | 84,241 | |||||||||
| 358 | Central European Media Enterprises Ltd., Class A (Bermuda)* | 5,875 | |||||||||
| 6,071 | Comcast Corp., Class A | 93,857 | |||||||||
| 2,389 | Comcast Corp., Special Class A | 35,071 | |||||||||
| 1,038 | DIRECTV Group (The), Inc.* | 25,670 | |||||||||
| 208 | Discovery Communications, Inc., Class A* | 3,950 | |||||||||
| 218 | Discovery Communications, Inc., Class C* | 3,819 | |||||||||
| 1,415 | DISH Network Corp., Class A* | 18,749 | |||||||||
| 4,584 | E.W. Scripps Co., Class A | 9,030 | |||||||||
| 11,263 | Emmis Communications Corp., Class A* | 3,942 | |||||||||
| 7,794 | Gannett Co., Inc. | 30,475 | |||||||||
| 649 | Hearst-Argyle Television, Inc. | 2,921 | |||||||||
| 889 | Liberty Global, Inc., Series A* | 14,660 | |||||||||
| 861 | Liberty Global, Inc., Series C* | 14,086 | |||||||||
| 3,179 | Liberty Media Corp. Capital, Series A* | 37,194 | |||||||||
| 6,188 | McClatchy Co., Class A | 3,280 | |||||||||
| 752 | McGraw-Hill (The) Cos., Inc. | 22,673 | |||||||||
| 183 | Meredith Corp. | 4,590 | |||||||||
| 1,267 | New York Times (The) Co., Class A | 6,816 | |||||||||
| 8,290 | News Corp., Class A | 68,475 | |||||||||
| 2,050 | News Corp., Class B | 18,696 | |||||||||
See Notes to Financial Statements.
37
Schedule of Investments (Continued)
PowerShares FTSE RAFI Consumer Services Sector Portfolio
April 30, 2009
| Number of Shares | Value | ||||||||||
| Common Stocks (Continued) | |||||||||||
| 256 | Scholastic Corp. | $ | 5,051 | ||||||||
| 219 | Scripps Networks Interactive, Inc., Class A | 6,009 | |||||||||
| 1,257 | Time Warner Cable, Inc. | 40,513 | |||||||||
| 5,967 | Time Warner, Inc. | 130,259 | |||||||||
| 1,862 | Viacom, Inc., Class B* | 35,825 | |||||||||
| 4,893 | Walt Disney (The) Co. | 107,156 | |||||||||
| 848,139 | |||||||||||
| Pharmaceuticals—4.6% | |||||||||||
| 1,258 | AmerisourceBergen Corp. | 42,319 | |||||||||
| 1,996 | Cardinal Health, Inc. | 67,445 | |||||||||
| 1,501 | McKesson Corp. | 55,537 | |||||||||
| 315 | Omnicare, Inc. | 8,099 | |||||||||
| 173,400 | |||||||||||
| Retail—47.7% | |||||||||||
| 285 | Abercrombie & Fitch Co., Class A | 7,712 | |||||||||
| 72 | Advance Auto Parts, Inc. | 3,150 | |||||||||
| 395 | American Eagle Outfitters, Inc. | 5,854 | |||||||||
| 580 | AnnTaylor Stores Corp.* | 4,286 | |||||||||
| 1,636 | Asbury Automotive Group, Inc. | 15,820 | |||||||||
| 1,307 | AutoNation, Inc.* | 23,147 | |||||||||
| 54 | AutoZone, Inc.* | 8,985 | |||||||||
| 246 | Barnes & Noble, Inc. | 6,426 | |||||||||
| 558 | Bed Bath & Beyond, Inc.* | 16,974 | |||||||||
| 1,141 | Best Buy Co., Inc. | 43,792 | |||||||||
| 339 | Big Lots, Inc.* | 9,370 | |||||||||
| 285 | BJ's Wholesale Club, Inc.* | 9,502 | |||||||||
| 8,346 | Blockbuster, Inc., Class A* | 6,677 | |||||||||
| 7,151 | Borders Group, Inc.* | 19,522 | |||||||||
| 475 | Brinker International, Inc. | 8,417 | |||||||||
| 188 | Burger King Holdings, Inc. | 3,072 | |||||||||
| 282 | Cabela's, Inc.* | 3,612 | |||||||||
| 837 | CarMax, Inc.* | 10,680 | |||||||||
| 168 | Casey's General Stores, Inc. | 4,470 | |||||||||
| 5,586 | Charming Shoppes, Inc.* | 19,495 | |||||||||
| 743 | Chico's FAS, Inc.* | 5,677 | |||||||||
| 377 | Collective Brands, Inc.* | 5,474 | |||||||||
| 1,282 | Costco Wholesale Corp. | 62,305 | |||||||||
| 2,609 | CVS Caremark Corp. | 82,914 | |||||||||
| 288 | Darden Restaurants, Inc. | 10,647 | |||||||||
| 250 | Dick's Sporting Goods, Inc.* | 4,750 | |||||||||
| 2,387 | Dillard's, Inc., Class A | 18,404 | |||||||||
| 153 | Dollar Tree, Inc.* | 6,478 | |||||||||
| 592 | Domino's Pizza, Inc.* | 5,588 | |||||||||
| 278 | Family Dollar Stores, Inc. | 9,227 | |||||||||
| 935 | Foot Locker, Inc. | 11,117 | |||||||||
| 250 | GameStop Corp., Class A* | 7,540 | |||||||||
| 1,655 | Gap (The), Inc. | 25,719 | |||||||||
| 451 | Group 1 Automotive, Inc. | 9,606 | |||||||||
| 5,317 | Home Depot, Inc. | 139,942 | |||||||||
| 1,653 | HSN, Inc.* | 11,422 | |||||||||
| 1,627 | J. C. Penney Co., Inc. | 49,933 | |||||||||
| Number of Shares | Value | ||||||||||
| Common Stocks (Continued) | |||||||||||
| 185 | Jack in the Box, Inc.* | $ | 4,549 | ||||||||
| 744 | Kohl's Corp.* | 33,740 | |||||||||
| 2,202 | Limited Brands, Inc. | 25,147 | |||||||||
| 3,844 | Lowe's Cos., Inc. | 82,646 | |||||||||
| 4,326 | Macy's, Inc. | 59,180 | |||||||||
| 1,051 | McDonald's Corp. | 56,008 | |||||||||
| 771 | Nordstrom, Inc. | 17,448 | |||||||||
| 17,779 | Office Depot, Inc.* | 46,048 | |||||||||
| 2,628 | OfficeMax, Inc. | 19,579 | |||||||||
| 162 | O'Reilly Automotive, Inc.* | 6,294 | |||||||||
| 301 | Pantry (The), Inc.* | 7,110 | |||||||||
| 782 | Penske Automotive Group, Inc. | 10,362 | |||||||||
| 244 | PetSmart, Inc. | 5,583 | |||||||||
| 794 | RadioShack Corp. | 11,180 | |||||||||
| 267 | Regis Corp. | 5,110 | |||||||||
| 196 | Ross Stores, Inc. | 7,436 | |||||||||
| 4,293 | Saks, Inc.* | 22,367 | |||||||||
| 1,042 | Sears Holdings Corp.* | 65,094 | |||||||||
| 4,609 | Sonic Automotive, Inc., Class A | 23,782 | |||||||||
| 1,416 | Staples, Inc. | 29,198 | |||||||||
| 1,581 | Starbucks Corp.* | 22,861 | |||||||||
| 2,479 | Target Corp. | 102,283 | |||||||||
| 286 | Tiffany & Co. | 8,277 | |||||||||
| 141 | Tim Hortons, Inc. (Canada) | 3,425 | |||||||||
| 825 | TJX Cos., Inc. | 23,075 | |||||||||
| 110 | Tractor Supply Co.* | 4,442 | |||||||||
| 2,334 | Walgreen Co. | 73,358 | |||||||||
| 5,562 | Wal-Mart Stores, Inc. | 280,324 | |||||||||
| 615 | Williams-Sonoma, Inc. | 8,610 | |||||||||
| 582 | Yum! Brands, Inc. | 19,410 | |||||||||
| 2,612 | Zale Corp.* | 9,717 | |||||||||
| 1,791,349 | |||||||||||
| Software—0.1% | |||||||||||
| 46 | Dun & Bradstreet (The) Corp. | 3,744 | |||||||||
| Trucking & Leasing—0.1% | |||||||||||
| 113 | AMERCO, Inc.* | 3,667 | |||||||||
| Total Common Stocks (Cost $4,295,709) | 3,756,509 | ||||||||||
| Money Market Fund—1.5% | |||||||||||
| 56,664 | Goldman Sachs Financial Square Prime Obligations Institutional Share Class (Cost $56,664) | 56,664 | |||||||||
| Total Investments (Cost $4,352,373)—101.5% | 3,813,173 | ||||||||||
| Liabilities in excess of other assets—(1.5%) | (58,165 | ) | |||||||||
| Net Assets—100.0% | $ | 3,755,008 | |||||||||
* Non-income producing security.
See Notes to Financial Statements.
38
Schedule of Investments
PowerShares FTSE RAFI Energy Sector Portfolio
April 30, 2009
| Number of Shares | Value | ||||||||||
| Common Stocks—99.8% | |||||||||||
| Electric - Integrated—0.5% | |||||||||||
| 1,857 | OGE Energy Corp. | $ | 47,743 | ||||||||
| Gas - Distribution—0.5% | |||||||||||
| 583 | Energen Corp. | 21,058 | |||||||||
| 1,825 | Southern Union Co. | 29,036 | |||||||||
| 50,094 | |||||||||||
| Oil - Field Services—11.9% | |||||||||||
| 3,552 | Baker Hughes, Inc. | 126,380 | |||||||||
| 5,056 | BJ Services Co. | 70,228 | |||||||||
| 2,277 | Exterran Holdings, Inc.* | 47,020 | |||||||||
| 10,121 | Halliburton Co. | 204,647 | |||||||||
| 7,596 | Helix Energy Solutions Group, Inc.* | 69,048 | |||||||||
| 6,956 | Key Energy Services, Inc.* | 30,537 | |||||||||
| 521 | Oil States International, Inc.* | 9,847 | |||||||||
| 7,155 | Schlumberger Ltd. | 350,523 | |||||||||
| 314 | SEACOR Holdings, Inc.* | 20,636 | |||||||||
| 3,052 | Smith International, Inc. | 78,894 | |||||||||
| 921 | Superior Energy Services, Inc.* | 17,692 | |||||||||
| 5,582 | Weatherford International, Ltd. (Switzerland)* | 92,829 | |||||||||
| 1,118,281 | |||||||||||
| Oil & Gas Drilling—5.3% | |||||||||||
| 390 | Diamond Offshore Drilling, Inc. | 28,240 | |||||||||
| 1,408 | ENSCO International, Inc. | 39,818 | |||||||||
| 1,006 | Helmerich & Payne, Inc. | 31,005 | |||||||||
| 12,693 | Hercules Offshore, Inc.* | 40,618 | |||||||||
| 6,826 | Nabors Industries, Ltd. (Bermuda)* | 103,823 | |||||||||
| 2,325 | Noble Corp. (Switzerland) | 63,542 | |||||||||
| 3,205 | Patterson-UTI Energy, Inc. | 40,736 | |||||||||
| 7,210 | Pioneer Drilling Co.* | 36,050 | |||||||||
| 2,403 | Pride International, Inc.* | 54,548 | |||||||||
| 2,016 | Rowan Cos., Inc. | 31,470 | |||||||||
| 980 | Unit Corp.* | 26,744 | |||||||||
| 496,594 | |||||||||||
| Oil Companies - Exploration & Production—20.3% | |||||||||||
| 5,475 | Anadarko Petroleum Corp. | 235,754 | |||||||||
| 3,176 | Apache Corp. | 231,403 | |||||||||
| 7,958 | Chesapeake Energy Corp. | 156,852 | |||||||||
| 1,519 | Cimarex Energy Co. | 40,861 | |||||||||
| 151 | CNX Gas Corp.* | 3,888 | |||||||||
| 273 | Continental Resources, Inc.* | 6,375 | |||||||||
| 1,538 | Denbury Resources, Inc.* | 25,039 | |||||||||
| 5,711 | Devon Energy Corp. | 296,116 | |||||||||
| 1,598 | EOG Resources, Inc. | 101,441 | |||||||||
| 2,271 | Forest Oil Corp.* | 36,336 | |||||||||
| 1,230 | Linn Energy LLC - C Units | 20,344 | |||||||||
| 2,190 | Mariner Energy, Inc.* | 24,922 | |||||||||
| 2,729 | Newfield Exploration Co.* | 85,090 | |||||||||
| 1,181 | Noble Energy, Inc. | 67,022 | |||||||||
| 4,281 | Occidental Petroleum Corp. | 240,978 | |||||||||
| Number of Shares | Value | ||||||||||
| Common Stocks (Continued) | |||||||||||
| 1,229 | PetroHawk Energy Corp.* | $ | 29,004 | ||||||||
| 2,425 | Pioneer Natural Resources Co. | 56,066 | |||||||||
| 1,898 | Plains Exploration & Production Co.* | 35,815 | |||||||||
| 438 | Range Resources Corp. | 17,507 | |||||||||
| 1,787 | Sandridge Energy, Inc.* | 14,582 | |||||||||
| 718 | Southwestern Energy Co.* | 25,747 | |||||||||
| 4,514 | Stone Energy Corp.* | 19,455 | |||||||||
| 857 | W&T Offshore, Inc. | 7,953 | |||||||||
| 773 | Whiting Petroleum Corp.* | 25,323 | |||||||||
| 2,989 | XTO Energy, Inc. | 103,599 | |||||||||
| 1,907,472 | |||||||||||
| Oil Companies - Integrated—49.8% | |||||||||||
| 19,993 | Chevron Corp. | 1,321,537 | |||||||||
| 22,812 | ConocoPhillips | 935,292 | |||||||||
| 25,356 | Exxon Mobil Corp. | 1,690,485 | |||||||||
| 3,026 | Hess Corp. | 165,795 | |||||||||
| 15,446 | Marathon Oil Corp. | 458,746 | |||||||||
| 2,073 | Murphy Oil Corp. | 98,903 | |||||||||
| 4,670,758 | |||||||||||
| Oil Field Machinery & Equipment—2.1% | |||||||||||
| 1,735 | Cameron International Corp.* | 44,381 | |||||||||
| 3,687 | Complete Production Services, Inc.* | 24,629 | |||||||||
| 955 | FMC Technologies, Inc.* | 32,690 | |||||||||
| 3,007 | National Oilwell Varco, Inc.* | 91,052 | |||||||||
| 192,752 | |||||||||||
| Oil Refining & Marketing—6.7% | |||||||||||
| 495 | Alon USA Energy, Inc. | 6,287 | |||||||||
| 1,351 | CVR Energy, Inc.* | 9,943 | |||||||||
| 677 | Delek US Holdings, Inc. | 6,953 | |||||||||
| 1,351 | Frontier Oil Corp. | 17,171 | |||||||||
| 568 | Holly Corp. | 11,905 | |||||||||
| 3,964 | Sunoco, Inc. | 105,086 | |||||||||
| 5,372 | Tesoro Corp. | 81,923 | |||||||||
| 19,003 | Valero Energy Corp. | 377,019 | |||||||||
| 654 | Western Refining, Inc.* | 8,234 | |||||||||
| 624,521 | |||||||||||
| Pipelines—2.4% | |||||||||||
| 11,893 | El Paso Corp. | 82,062 | |||||||||
| 9,821 | Williams (The) Cos., Inc. | 138,476 | |||||||||
| 220,538 | |||||||||||
| Transport - Marine—0.3% | |||||||||||
| 565 | Tidewater, Inc. | 24,436 | |||||||||
| Total Common Stocks (Cost $11,243,416) | 9,353,189 | ||||||||||
See Notes to Financial Statements.
39
Schedule of Investments (Continued)
PowerShares FTSE RAFI Energy Sector Portfolio
April 30, 2009
| Number of Shares | Value | ||||||||||
| Money Market Fund—1.3% | |||||||||||
| 120,326 | Goldman Sachs Financial Square Prime Obligations Institutional Share Class (Cost $120,326) | $ | 120,326 | ||||||||
| Total Investments (Cost $11,363,742)—101.1% | 9,473,515 | ||||||||||
| Liabilities in excess of other assets—(1.1%) | (103,038 | ) | |||||||||
| Net Assets—100.0% | $ | 9,370,477 | |||||||||
* Non-income producing security.
See Notes to Financial Statements.
40
Schedule of Investments
PowerShares FTSE RAFI Financials Sector Portfolio
April 30, 2009
| Number of Shares | Value | ||||||||||
| Common Stocks and Other Equity Interests—100.2% | |||||||||||
| Commercial Banks - Central U.S.—0.5% | |||||||||||
| 494 | Associated Banc-Corp | $ | 7,642 | ||||||||
| 72 | BOK Financial Corp. | 2,712 | |||||||||
| 217 | Commerce Bancshares, Inc. | 7,183 | �� | ||||||||
| 413 | FirstMerit Corp. | 8,016 | |||||||||
| 3,456 | Marshall & Ilsley Corp. | 19,976 | |||||||||
| 686 | TCF Financial Corp. | 9,542 | |||||||||
| 55,071 | |||||||||||
| Commercial Banks - Eastern U.S.—0.8% | |||||||||||
| 6,998 | CapitalSource, Inc. | 21,624 | |||||||||
| 1,256 | Fulton Financial Corp. | 8,302 | |||||||||
| 772 | M&T Bank Corp. | 40,492 | |||||||||
| 619 | Susquehanna Bancshares, Inc. | 4,989 | |||||||||
| 569 | Valley National Bancorp | 8,233 | |||||||||
| 1,838 | Webster Financial Corp. | 9,613 | |||||||||
| 93,253 | |||||||||||
| Commercial Banks - Southern U.S.—2.2% | |||||||||||
| 313 | BancorpSouth, Inc. | 7,277 | |||||||||
| 4,687 | BB&T Corp. | 109,396 | |||||||||
| 12,765 | Colonial BancGroup (The), Inc. | 9,701 | |||||||||
| 1,240 | First Horizon National Corp. | 14,272 | |||||||||
| 5,357 | Popular, Inc. | 15,321 | |||||||||
| 17,309 | Regions Financial Corp. | 77,717 | |||||||||
| 5,084 | Synovus Financial Corp. | 16,421 | |||||||||
| 250,105 | |||||||||||
| Commercial Banks - Western U.S.—0.3% | |||||||||||
| 180 | Bank of Hawaii Corp. | 6,325 | |||||||||
| 243 | City National Corp. | 8,894 | |||||||||
| 2,272 | Zions Bancorp | 24,833 | |||||||||
| 40,052 | |||||||||||
| Commercial Services - Finance—1.0% | |||||||||||
| 319 | Equifax, Inc. | 9,302 | |||||||||
| 81 | MasterCard, Inc., Class A | 14,859 | |||||||||
| 414 | Moody's Corp. | 12,221 | |||||||||
| 322 | SEI Investments Co. | 4,518 | |||||||||
| 914 | Visa, Inc., Class A Shares | 59,374 | |||||||||
| 1,087 | Western Union (The) Co. | 18,207 | |||||||||
| 118,481 | |||||||||||
| Decision Support Software—0.1% | |||||||||||
| 656 | MSCI, Inc., Class A* | 13,769 | |||||||||
| Diversified Banking Institutions—36.9% | |||||||||||
| 181,265 | Bank of America Corp. | 1,618,696 | |||||||||
| 408,439 | Citigroup, Inc. | 1,245,739 | |||||||||
| 2,538 | Goldman Sachs Group, (The) Inc. | 326,133 | |||||||||
| 24,079 | JPMorgan Chase & Co. | 794,607 | |||||||||
| 9,296 | Morgan Stanley | 219,757 | |||||||||
| 4,204,932 | |||||||||||
| Number of Shares | Value | ||||||||||
| Common Stocks and Other Equity Interests (Continued) | |||||||||||
| Fiduciary Banks—1.8% | |||||||||||
| 3,967 | Bank of New York Mellon (The) Corp. | $ | 101,080 | ||||||||
| 473 | Northern Trust Corp. | 25,712 | |||||||||
| 1,842 | State Street Corp. | 62,867 | |||||||||
| 717 | Wilmington Trust Corp. | 10,404 | |||||||||
| 200,063 | |||||||||||
| Finance - Auto Loans—0.2% | |||||||||||
| 1,853 | AmeriCredit Corp.* | 18,845 | |||||||||
| Finance - Commercial—0.2% | |||||||||||
| 10,156 | CIT Group, Inc. | 22,546 | |||||||||
| Finance - Consumer Loans—0.3% | |||||||||||
| 6,064 | SLM Corp.* | 29,289 | |||||||||
| 47 | Student Loan (The) Corp. | 2,264 | |||||||||
| 31,553 | |||||||||||
| Finance - Credit Card—2.4% | |||||||||||
| 9,114 | American Express Co. | 229,856 | |||||||||
| 1,582 | CompuCredit Corp.* | 5,062 | |||||||||
| 5,278 | Discover Financial Services | 42,910 | |||||||||
| 277,828 | |||||||||||
| Finance - Investment Banker—1.3% | |||||||||||
| 2,024 | Charles Schwab (The) Corp. | 37,404 | |||||||||
| 14,707 | E*TRADE Financial Corp.* | 21,031 | |||||||||
| 696 | Interactive Brokers Group, Inc., Class A* | 10,266 | |||||||||
| 2,413 | MF Global Ltd.* | 14,719 | |||||||||
| 617 | Raymond James Financial, Inc. | 9,681 | |||||||||
| 3,367 | TD Ameritrade Holding Corp.* | 53,568 | |||||||||
| 146,669 | |||||||||||
| Finance - Other Services—0.6% | |||||||||||
| 140 | CME Group, Inc. | 30,989 | |||||||||
| 367 | NASDAQ OMX (The) Group, Inc.* | 7,057 | |||||||||
| 1,436 | NYSE Euronext | 33,273 | |||||||||
| 71,319 | |||||||||||
| Financial Guarantee Insurance—0.4% | |||||||||||
| 5,014 | MBIA, Inc.* | 23,717 | |||||||||
| 2,370 | MGIC Investment Corp. | 6,067 | |||||||||
| 14,703 | PMI Group (The), Inc. | 9,263 | |||||||||
| 3,162 | Radian Group, Inc. | 5,470 | |||||||||
| 44,517 | |||||||||||
| Forestry—0.2% | |||||||||||
| 578 | Plum Creek Timber Co., Inc. REIT | 19,953 | |||||||||
| Insurance Brokers—1.0% | |||||||||||
| 764 | Aon Corp. | 32,241 | |||||||||
| 403 | Arthur J. Gallagher & Co. | 9,059 | |||||||||
| 82 | Erie Indemnity Co., Class A | 2,896 | |||||||||
See Notes to Financial Statements.
41
Schedule of Investments (Continued)
PowerShares FTSE RAFI Financials Sector Portfolio
April 30, 2009
| Number of Shares | Value | ||||||||||
| Common Stocks and Other Equity Interests (Continued) | |||||||||||
| 2,516 | Marsh & McLennan Cos., Inc. | $ | 53,063 | ||||||||
| 496 | Willis Group Holdings Ltd. | 13,645 | |||||||||
| 110,904 | |||||||||||
| Investment Companies—1.0% | |||||||||||
| 15,026 | Allied Capital Corp. | 36,964 | |||||||||
| 17,343 | American Capital Ltd. | 53,590 | |||||||||
| 1,813 | Apollo Investment Corp. | 8,702 | |||||||||
| 6,922 | KKR Financial Holdings, LLC | 9,345 | |||||||||
| 108,601 | |||||||||||
| Investment Management/ Advisory Services—5.5% | |||||||||||
| 178 | Affiliated Managers Group, Inc.* | 10,119 | |||||||||
| 564 | Ameriprise Financial, Inc. | 14,861 | |||||||||
| 296 | Federated Investors, Inc., Class B | 6,772 | |||||||||
| 549 | Franklin Resources, Inc. | 33,204 | |||||||||
| 32,581 | Invesco Ltd.(-) | 479,592 | |||||||||
| 1,233 | Janus Capital Group, Inc. | 12,367 | |||||||||
| 1,609 | Legg Mason, Inc. | 32,293 | |||||||||
| 2,147 | Och-Ziff Capital Management Group LLC, Class A | 15,974 | |||||||||
| 647 | T. Rowe Price Group, Inc. | 24,922 | |||||||||
| 630,104 | |||||||||||
| Life/Health Insurance—4.8% | |||||||||||
| 2,692 | Aflac, Inc. | 77,772 | |||||||||
| 16,129 | Conseco, Inc.* | 25,806 | |||||||||
| 4,884 | Lincoln National Corp. | 54,896 | |||||||||
| 16,314 | Phoenix (The) Cos., Inc. | 25,450 | |||||||||
| 4,206 | Principal Financial Group, Inc. | 68,726 | |||||||||
| 2,922 | Protective Life Corp. | 25,042 | |||||||||
| 6,388 | Prudential Financial, Inc. | 184,485 | |||||||||
| 413 | StanCorp Financial Group, Inc. | 11,329 | |||||||||
| 756 | Torchmark Corp. | 22,173 | |||||||||
| 2,942 | Unum Group | 48,072 | |||||||||
| 543,751 | |||||||||||
| Multi-line Insurance—10.8% | |||||||||||
| 5,767 | Allstate (The) Corp. | 134,544 | |||||||||
| 449 | American Financial Group, Inc. | 7,893 | |||||||||
| 214,650 | American International Group, Inc. | 296,216 | |||||||||
| 103 | American National Insurance Co. | 6,991 | |||||||||
| 970 | Assurant, Inc. | 23,707 | |||||||||
| 1,178 | Cincinnati Financial Corp. | 28,213 | |||||||||
| 346 | CNA Financial Corp. | 4,142 | |||||||||
| 41,254 | Genworth Financial, Inc., Class A | 97,359 | |||||||||
| 17,014 | Hartford Financial Services Group (The), Inc. | 195,151 | |||||||||
| 3,149 | Loews Corp. | 78,379 | |||||||||
| 7,219 | MetLife, Inc. | 214,764 | |||||||||
| 1,755 | Old Republic International Corp. | 16,444 | |||||||||
| Number of Shares | Value | ||||||||||
| Common Stocks and Other Equity Interests (Continued) | |||||||||||
| 947 | Unitrin, Inc. | $ | 16,099 | ||||||||
| 11,062 | XL Capital Ltd., Class A | 105,200 | |||||||||
| 1,225,102 | |||||||||||
| Paper & Related Products—0.2% | |||||||||||
| 228 | Potlatch Corp. REIT | 6,705 | |||||||||
| 286 | Rayonier, Inc. REIT | 11,046 | |||||||||
| 17,751 | |||||||||||
| Property/Casualty Insurance—3.6% | |||||||||||
| 25 | Alleghany Corp.* | 6,342 | |||||||||
| 216 | Arch Capital Group Ltd.* | 12,480 | |||||||||
| 1,091 | Baldwin & Lyons, Inc., Class B | 21,875 | |||||||||
| 1,004 | Chubb (The) Corp. | 39,106 | |||||||||
| 2,128 | Fidelity National Financial, Inc., Class A | 38,581 | |||||||||
| 791 | First American (The) Corp. | 22,211 | |||||||||
| 231 | Hanover Insurance Group (The), Inc. | 6,925 | |||||||||
| 380 | HCC Insurance Holdings, Inc. | 9,090 | |||||||||
| 43 | Markel Corp.* | 12,341 | |||||||||
| 188 | Mercury General Corp. | 6,351 | |||||||||
| 876 | OneBeacon Insurance Group Ltd., Class A | 10,179 | |||||||||
| 3,389 | Progressive (The) Corp.* | 51,784 | |||||||||
| 3,515 | Travelers (The) Cos., Inc. | 144,606 | |||||||||
| 769 | W.R. Berkley Corp. | 18,387 | |||||||||
| 5 | Wesco Financial Corp. | 1,495 | |||||||||
| 69 | White Mountains Insurance Group Ltd. | 13,201 | |||||||||
| 414,954 | |||||||||||
| Real Estate Management/Services—0.3% | |||||||||||
| 4,111 | C.B. Richard Ellis Group, Inc., Class A* | 30,833 | |||||||||
| 252 | Jones Lang LaSalle, Inc. | 8,132 | |||||||||
| 38,965 | |||||||||||
| Reinsurance—5.0% | |||||||||||
| 299 | Allied World Assurance Holdings Ltd. (Bermuda) | 11,105 | |||||||||
| 423 | Aspen Insurance Holdings Ltd. (Bermuda) | 9,974 | |||||||||
| 700 | Axis Capital Holdings Ltd. (Bermuda) | 17,248 | |||||||||
| 141 | Berkshire Hathaway, Inc., Class B* | 432,165 | |||||||||
| 394 | Endurance Specialty Holdings Ltd. (Bermuda) | 10,307 | |||||||||
| 275 | Everest Re Group Ltd. | 20,526 | |||||||||
| 237 | IPC Holdings Ltd. | 6,171 | |||||||||
| 613 | Montpelier Re Holdings Ltd. (Bermuda) | 7,638 | |||||||||
| 76 | Odyssey Re Holdings Corp. | 2,910 | |||||||||
| 254 | PartnerRe Ltd. | 17,320 | |||||||||
| 209 | Platinum Underwriters Holdings Ltd. (Bermuda) | 6,013 | |||||||||
| 209 | Reinsurance Group of America, Inc. | 6,644 | |||||||||
| 222 | RenaissanceRe Holdings Ltd. (Bermuda) | 10,803 | |||||||||
| 152 | Transatlantic Holdings, Inc. | 5,765 | |||||||||
| 192 | Validus Holdings Ltd. | 4,301 | |||||||||
| 568,890 | |||||||||||
See Notes to Financial Statements.
42
Schedule of Investments (Continued)
PowerShares FTSE RAFI Financials Sector Portfolio
April 30, 2009
| Number of Shares | Value | ||||||||||
| Common Stocks and Other Equity Interests (Continued) | |||||||||||
| REITS - Apartments—0.9% | |||||||||||
| 2,562 | Apartment Investment & Management Co., Class A | $ | 18,703 | ||||||||
| 308 | AvalonBay Communities, Inc. | 17,497 | |||||||||
| 261 | BRE Properties, Inc. | 6,413 | |||||||||
| 400 | Camden Property Trust | 10,852 | |||||||||
| 1,547 | Equity Residential | 35,411 | |||||||||
| 934 | UDR, Inc. | 9,405 | |||||||||
| 98,281 | |||||||||||
| REITS - Diversified—0.9% | |||||||||||
| 2,195 | Colonial Properties Trust | 15,892 | |||||||||
| 699 | Cousins Properties, Inc. | 5,907 | |||||||||
| 1,904 | Duke Realty Corp. | 18,602 | |||||||||
| 607 | Liberty Property Trust | 14,774 | |||||||||
| 855 | Vornado Realty Trust | 41,801 | |||||||||
| 96,976 | |||||||||||
| REITS - Health Care—0.5% | |||||||||||
| 837 | HCP, Inc. | 18,372 | |||||||||
| 299 | Health Care REIT, Inc. | 10,187 | |||||||||
| 429 | Healthcare Realty Trust, Inc. | 7,203 | |||||||||
| 316 | Nationwide Health Properties, Inc. | 7,802 | |||||||||
| 433 | Senior Housing Properties Trust | 7,097 | |||||||||
| 394 | Ventas, Inc. | 11,284 | |||||||||
| 61,945 | |||||||||||
| REITS - Hotels—0.5% | |||||||||||
| 982 | Hospitality Properties Trust | 12,020 | |||||||||
| 6,100 | Host Hotels & Resorts, Inc. | 46,909 | |||||||||
| 58,929 | |||||||||||
| REITS - Mortgage—0.5% | |||||||||||
| 1,142 | Annaly Capital Management, Inc. | 16,068 | |||||||||
| 9,253 | iStar Financial, Inc. | 31,183 | |||||||||
| 372 | Redwood Trust, Inc. | 6,052 | |||||||||
| 53,303 | |||||||||||
| REITS - Office Property—0.9% | |||||||||||
| 144 | Alexandria Real Estate Equities, Inc. | 5,253 | |||||||||
| 754 | Boston Properties, Inc. | 37,263 | |||||||||
| 1,517 | Brandywine Realty Trust | 9,390 | |||||||||
| 551 | Douglas Emmett, Inc. | 5,273 | |||||||||
| 273 | Highwoods Properties, Inc. | 6,549 | |||||||||
| 2,944 | HRPT Properties Trust | 12,689 | |||||||||
| 534 | Mack-Cali Realty Corp. | 14,343 | |||||||||
| 915 | SL Green Realty Corp. | 16,159 | |||||||||
| 106,919 | |||||||||||
| REITS - Regional Malls—0.7% | |||||||||||
| 2,511 | CBL & Associates Properties, Inc. | 19,937 | |||||||||
| 757 | Macerich (The) Co. | 13,270 | |||||||||
| 972 | Simon Property Group, Inc. | 50,156 | |||||||||
| 83,363 | |||||||||||
| Number of Shares | Value | ||||||||||
| Common Stocks and Other Equity Interests (Continued) | |||||||||||
| REITS - Shopping Centers—0.8% | |||||||||||
| 4,789 | Developers Diversified Realty Corp. | $ | 19,779 | ||||||||
| 241 | Equity One, Inc. | 3,586 | |||||||||
| 156 | Federal Realty Investment Trust | 8,611 | |||||||||
| 2,486 | Kimco Realty Corp. | 29,882 | |||||||||
| 297 | Regency Centers Corp. | 11,123 | |||||||||
| 845 | Weingarten Realty Investors | 13,131 | |||||||||
| 86,112 | |||||||||||
| REITS - Single Tenant—0.1% | |||||||||||
| 348 | Realty Income Corp. | 7,771 | |||||||||
| REITS - Storage—0.2% | |||||||||||
| 280 | Public Storage | 18,721 | |||||||||
| REITS - Warehouse/Industry—0.9% | |||||||||||
| 1,063 | AMB Property Corp. | 20,293 | |||||||||
| 1,665 | DCT Industrial Trust, Inc. | 7,359 | |||||||||
| 2,501 | First Industrial Realty Trust, Inc. | 9,429 | |||||||||
| 6,791 | ProLogis | 61,866 | |||||||||
| 98,947 | |||||||||||
| S&L/Thrifts-Eastern US—0.5% | |||||||||||
| 977 | Astoria Financial Corp. | 8,070 | |||||||||
| 1,544 | Hudson City Bancorp, Inc. | 19,393 | |||||||||
| 1,925 | New York Community Bancorp, Inc. | 21,772 | |||||||||
| 736 | People's United Financial, Inc. | 11,496 | |||||||||
| 60,731 | |||||||||||
| S&L/Thrifts-Southern US—0.0% | |||||||||||
| 9,271 | Guaranty Financial Group, Inc.* | 5,470 | |||||||||
| S&L/Thrifts-Western US—0.1% | |||||||||||
| 516 | Washington Federal, Inc. | 6,698 | |||||||||
| Super - Regional Banks - U.S.—11.3% | |||||||||||
| 6,816 | Capital One Financial Corp. | 114,100 | |||||||||
| 1,847 | Comerica, Inc. | 38,750 | |||||||||
| 27,394 | Fifth Third Bancorp | 112,315 | |||||||||
| 14,949 | Huntington Bancshares, Inc. | 41,708 | |||||||||
| 6,081 | KeyCorp | 37,398 | |||||||||
| 2,245 | PNC Financial Services Group, Inc. | 89,127 | |||||||||
| 6,571 | SunTrust Banks, Inc. | 94,885 | |||||||||
| 10,895 | U.S. Bancorp | 198,507 | |||||||||
| 27,978 | Wells Fargo & Co. | 559,839 | |||||||||
| 1,286,629 | |||||||||||
| Total Common Stocks and Other Equity Interests (Cost $22,599,375) | 11,398,773 | ||||||||||
See Notes to Financial Statements.
43
Schedule of Investments (Continued)
PowerShares FTSE RAFI Financials Sector Portfolio
April 30, 2009
| Number of Shares | Value | ||||||||||
| Money Market Fund—0.2% | |||||||||||
| 22,621 | Goldman Sachs Financial Square Prime Obligations Institutional Share Class (Cost $22,621) | $ | 22,621 | ||||||||
| Total Investments (Cost $22,621,996)—100.4% | 11,421,394 | ||||||||||
| Liabilities in excess of other assets—(0.4%) | (39,464 | ) | |||||||||
| Net Assets—100.0% | $ | 11,381,930 | |||||||||
REIT Real Estate Investment Trust
* Non-income producing security.
(-) Affiliated company. The Fund's Adviser is a subsidiary of Invesco Ltd. and therefore, Invesco Ltd. is considered to be affiliated with the Fund. See Note 4.
See Notes to Financial Statements.
44
Schedule of Investments
PowerShares FTSE RAFI Health Care Sector Portfolio
April 30, 2009
| Number of Shares | Value | ||||||||||
| Common Stocks—99.9% | |||||||||||
| Biotechnology—6.5% | |||||||||||
| 7,753 | Amgen, Inc.* | $ | 375,789 | ||||||||
| 1,595 | Biogen Idec, Inc.* | 77,102 | |||||||||
| 247 | Bio-Rad Laboratories, Inc., Class A* | 17,213 | |||||||||
| 1,003 | Charles River Laboratories International, Inc.* | 27,733 | |||||||||
| 1,418 | Genzyme Corp.* | 75,622 | |||||||||
| 2,069 | Gilead Sciences, Inc.* | 94,760 | |||||||||
| 947 | Life Technologies Corp.* | 35,323 | |||||||||
| 364 | Millipore Corp.* | 21,512 | |||||||||
| 725,054 | |||||||||||
| Commercial Services—0.1% | |||||||||||
| 762 | Pharmaceutical Product Development, Inc. | 14,943 | |||||||||
| Distribution/Wholesale—0.2% | |||||||||||
| 799 | Owens & Minor, Inc. | 27,709 | |||||||||
| Electronics—1.5% | |||||||||||
| 4,060 | Thermo Fisher Scientific, Inc.* | 142,425 | |||||||||
| 606 | Waters Corp.* | 26,767 | |||||||||
| 169,192 | |||||||||||
| Healthcare - Products—24.6% | |||||||||||
| 1,870 | Alcon, Inc. (Switzerland) | 172,059 | |||||||||
| 3,333 | Baxter International, Inc. | 161,651 | |||||||||
| 670 | Beckman Coulter, Inc. | 35,215 | |||||||||
| 1,658 | Becton Dickinson & Co. | 100,276 | |||||||||
| 27,430 | Boston Scientific Corp.* | 230,686 | |||||||||
| 280 | C.R. Bard, Inc. | 20,056 | |||||||||
| 4,694 | Covidien Ltd. | 154,808 | |||||||||
| 1,055 | DENTSPLY International, Inc. | 30,194 | |||||||||
| 1,213 | Henry Schein, Inc.* | 49,782 | |||||||||
| 2,771 | Hill-Rom Holdings, Inc. | 35,968 | |||||||||
| 3,816 | Hologic, Inc.* | 56,706 | |||||||||
| 1,766 | Hospira, Inc.* | 58,048 | |||||||||
| 1,034 | Inverness Medical Innovations* | 33,388 | |||||||||
| 19,542 | Johnson & Johnson | 1,023,218 | |||||||||
| 807 | Kinetic Concepts, Inc.* | 19,981 | |||||||||
| 8,088 | Medtronic, Inc. | 258,816 | |||||||||
| 1,604 | Patterson Cos., Inc.* | 32,818 | |||||||||
| 2,013 | St. Jude Medical, Inc.* | 67,476 | |||||||||
| 1,976 | Stryker Corp. | 76,491 | |||||||||
| 814 | Varian Medical Systems, Inc.* | 27,163 | |||||||||
| 2,768 | Zimmer Holdings, Inc.* | 121,764 | |||||||||
| 2,766,564 | |||||||||||
| Healthcare - Services—24.7% | |||||||||||
| 7,327 | Aetna, Inc. | 161,267 | |||||||||
| 928 | AMERIGROUP Corp.* | 27,719 | |||||||||
| 3,868 | Brookdale Senior Living, Inc. | 39,879 | |||||||||
| 8,615 | CIGNA Corp. | 169,802 | |||||||||
| 2,996 | Community Health Systems, Inc.* | 68,429 | |||||||||
| 604 | Covance, Inc.* | 23,725 | |||||||||
| 6,868 | Coventry Health Care, Inc.* | 109,270 | |||||||||
| Number of Shares | Value | ||||||||||
| Common Stocks (Continued) | |||||||||||
| 1,038 | DaVita, Inc.* | $ | 48,132 | ||||||||
| 37,279 | Health Management Associates, Inc., Class A* | 174,093 | |||||||||
| 6,259 | Health Net, Inc.* | 90,380 | |||||||||
| 5,650 | Humana, Inc.* | 162,607 | |||||||||
| 1,621 | Kindred Healthcare, Inc.* | 21,105 | |||||||||
| 932 | Laboratory Corp. of America Holdings* | 59,788 | |||||||||
| 1,344 | LifePoint Hospitals, Inc.* | 34,742 | |||||||||
| 1,189 | Lincare Holdings, Inc.* | 28,691 | |||||||||
| 640 | Magellan Health Services, Inc.* | 18,918 | |||||||||
| 1,221 | Quest Diagnostics, Inc. | 62,674 | |||||||||
| 35,031 | Sunrise Senior Living, Inc.* | 89,329 | |||||||||
| 56,779 | Tenet Healthcare Corp.* | 127,753 | |||||||||
| 24,110 | UnitedHealth Group, Inc. | 567,067 | |||||||||
| 941 | Universal Health Services, Inc., Class B | 47,426 | |||||||||
| 14,824 | WellPoint, Inc.* | 633,875 | |||||||||
| 2,766,671 | |||||||||||
| Insurance—0.2% | |||||||||||
| 2,108 | Universal American Corp.* | 21,776 | |||||||||
| Pharmaceuticals—42.1% | |||||||||||
| 8,682 | Abbott Laboratories | 363,342 | |||||||||
| 1,197 | Allergan, Inc. | 55,852 | |||||||||
| 21,846 | Bristol-Myers Squibb Co. | 419,443 | |||||||||
| 380 | Cephalon, Inc.* | 24,932 | |||||||||
| 12,235 | Eli Lilly & Co. | 402,776 | |||||||||
| 1,062 | Endo Pharmaceuticals Holdings, Inc.* | 17,565 | |||||||||
| 2,050 | Express Scripts, Inc.* | 131,139 | |||||||||
| 3,236 | Forest Laboratories, Inc.* | 70,189 | |||||||||
| 6,184 | King Pharmaceuticals, Inc.* | 48,730 | |||||||||
| 6,719 | Medco Health Solutions, Inc.* | 292,612 | |||||||||
| 29,209 | Merck & Co., Inc. | 708,027 | |||||||||
| 2,065 | Mylan, Inc.* | 27,361 | |||||||||
| 117,755 | Pfizer, Inc. | 1,573,208 | |||||||||
| 7,961 | Schering-Plough Corp. | 183,262 | |||||||||
| 828 | Warner Chilcott Ltd., Class A* | 8,106 | |||||||||
| 1,226 | Watson Pharmaceuticals, Inc.* | 37,932 | |||||||||
| 8,378 | Wyeth | 355,227 | |||||||||
| 4,719,703 | |||||||||||
| Total Common Stocks (Cost $14,255,665) | 11,211,612 | ||||||||||
| Money Market Fund—0.7% | |||||||||||
| 71,752 | Goldman Sachs Financial Square Prime Obligations Institutional Share Class (Cost $71,752) | 71,752 | |||||||||
| Total Investments (Cost $14,327,417)—100.6% | 11,283,364 | ||||||||||
| Liabilities in excess of other assets—(0.6%) | (63,758 | ) | |||||||||
| Net Assets—100.0% | $ | 11,219,606 | |||||||||
* Non-income producing security.
See Notes to Financial Statements.
45
Schedule of Investments
PowerShares FTSE RAFI Industrials Sector Portfolio
April 30, 2009
| Number of Shares | Value | ||||||||||
| Common Stocks—99.7% | |||||||||||
| Aerospace/Defense—13.3% | |||||||||||
| 142 | Alliant Techsystems, Inc.* | $ | 11,310 | ||||||||
| 762 | BE Aerospace, Inc.* | 8,222 | |||||||||
| 4,041 | Boeing (The) Co. | 161,842 | |||||||||
| 14,865 | GenCorp, Inc.* | 35,676 | |||||||||
| 1,683 | General Dynamics Corp. | 86,961 | |||||||||
| 563 | Goodrich Corp. | 24,930 | |||||||||
| 506 | L-3 Communications Holdings, Inc. | 38,532 | |||||||||
| 1,465 | Lockheed Martin Corp. | 115,046 | |||||||||
| 257 | Moog Inc., Class A* | 6,882 | |||||||||
| 2,712 | Northrop Grumman Corp. | 131,125 | |||||||||
| 1,574 | Raytheon Co. | 71,192 | |||||||||
| 476 | Rockwell Collins, Inc. | 18,255 | |||||||||
| 1,057 | Spirit Aerosystems Holdings, Inc., Class A* | 13,477 | |||||||||
| 3,712 | United Technologies Corp. | 181,293 | |||||||||
| 904,743 | |||||||||||
| Auto Manufacturers—1.7% | |||||||||||
| 597 | Navistar International Corp.* | 22,567 | |||||||||
| 1,764 | Oshkosh Truck Corp. | 16,934 | |||||||||
| 2,205 | PACCAR, Inc. | 78,145 | |||||||||
| 117,646 | |||||||||||
| Auto Parts & Equipment—0.7% | |||||||||||
| 6,003 | China Yuchai International Ltd. (Bermuda) | 47,304 | |||||||||
| Building Materials—2.8% | |||||||||||
| 435 | Armstrong World Industries, Inc.* | 7,908 | |||||||||
| 295 | Lennox International, Inc. | 9,408 | |||||||||
| 6,469 | Louisiana-Pacific Corp. | 26,329 | |||||||||
| 106 | Martin Marietta Materials, Inc. | 8,907 | |||||||||
| 8,168 | Masco Corp. | 72,368 | |||||||||
| 2,045 | Owens Corning, Inc.* | 36,606 | |||||||||
| 2,165 | USG Corp.* | 32,172 | |||||||||
| 193,698 | |||||||||||
| Chemicals—0.4% | |||||||||||
| 408 | Sherwin-Williams (The) Co. | 23,109 | |||||||||
| Commercial Services—5.9% | |||||||||||
| 213 | Alliance Data Systems Corp.* | 8,918 | |||||||||
| 1,352 | Automatic Data Processing, Inc. | 47,589 | |||||||||
| 1,509 | Convergys Corp.* | 15,256 | |||||||||
| 691 | Corrections Corp. of America* | 9,764 | |||||||||
| 829 | Deluxe Corp. | 12,021 | |||||||||
| 307 | Hewitt Associates, Inc., Class A* | 9,628 | |||||||||
| 655 | Iron Mountain, Inc.* | 18,661 | |||||||||
| 1,091 | Kelly Services, Inc., Class A | 12,394 | |||||||||
| 397 | Lender Processing Services, Inc. | 11,378 | |||||||||
| 991 | Manpower, Inc. | 42,702 | |||||||||
| 1,129 | MPS Group, Inc.* | 9,077 | |||||||||
| 782 | Paychex, Inc. | 21,122 | |||||||||
| 1,978 | PHH Corp.* | 33,191 | |||||||||
| 529 | Quanta Services Inc.* | 12,024 | |||||||||
| Number of Shares | Value | ||||||||||
| Common Stocks (Continued) | |||||||||||
| 3,888 | R.R. Donnelley & Sons Co. | $ | 45,295 | ||||||||
| 675 | Robert Half International, Inc. | 16,214 | |||||||||
| 538 | RSC Holdings, Inc.* | 3,847 | |||||||||
| 955 | Total System Services, Inc. | 11,909 | |||||||||
| 4,418 | United Rentals, Inc.* | 26,773 | |||||||||
| 2,618 | Volt Information Sciences, Inc.* | 18,797 | |||||||||
| 777 | Wright Express Corp.* | 17,778 | |||||||||
| 404,338 | |||||||||||
| Computers—1.1% | |||||||||||
| 1,730 | Accenture Ltd. | 50,914 | |||||||||
| 444 | Affiliated Computer Services, Inc.* | 21,481 | |||||||||
| 72,395 | |||||||||||
| Distribution/Wholesale—1.2% | |||||||||||
| 3,993 | BlueLinx Holdings, Inc.* | 12,498 | |||||||||
| 279 | Fastenal Co. | 10,702 | |||||||||
| 437 | United Stationers, Inc.* | 14,303 | |||||||||
| 271 | W.W. Grainger, Inc. | 22,732 | |||||||||
| 723 | WESCO International, Inc.* | 18,798 | |||||||||
| 79,033 | |||||||||||
| Electric—0.3% | |||||||||||
| 1,050 | MDU Resources Group, Inc. | 18,449 | |||||||||
| Electrical Components & Equipment—2.4% | |||||||||||
| 241 | AMETEK, Inc. | 7,763 | |||||||||
| 4,692 | China BAK Battery, Inc.* | 9,994 | |||||||||
| 3,180 | Emerson Electric Co. | 108,247 | |||||||||
| 485 | General Cable Corp.* | 13,163 | |||||||||
| 344 | Hubbell, Inc., Class B | 11,421 | |||||||||
| 473 | Molex, Inc. | 7,885 | |||||||||
| 384 | Molex, Inc., Class A | 5,871 | |||||||||
| 164,344 | |||||||||||
| Electronics—5.4% | |||||||||||
| 1,431 | Agilent Technologies, Inc.* | 26,130 | |||||||||
| 333 | Amphenol Corp., Class A | 11,269 | |||||||||
| 1,862 | Arrow Electronics, Inc.* | 42,342 | |||||||||
| 2,028 | Avnet, Inc.* | 44,393 | |||||||||
| 313 | AVX Corp. | 3,133 | |||||||||
| 788 | Benchmark Electronics, Inc.* | 9,558 | |||||||||
| 5,063 | Jabil Circuit, Inc. | 41,010 | |||||||||
| 106 | Mettler Toledo International, Inc.* | 6,533 | |||||||||
| 73,002 | Sanmina-SCI Corp.* | 40,881 | |||||||||
| 312 | Thomas & Betts Corp.* | 9,709 | |||||||||
| 5,589 | Tyco Electronics Ltd. | 97,473 | |||||||||
| 5,788 | Vishay Intertechnology, Inc.* | 33,976 | |||||||||
| 366,407 | |||||||||||
| Energy - Alternate Sources—0.1% | |||||||||||
| 342 | Covanta Holding Corp.* | 4,826 | |||||||||
See Notes to Financial Statements.
46
Schedule of Investments (Continued)
PowerShares FTSE RAFI Industrials Sector Portfolio
April 30, 2009
| Number of Shares | Value | ||||||||||
| Common Stocks (Continued) | |||||||||||
| Engineering & Construction—2.5% | |||||||||||
| 456 | Aecom Technology Corp.* | $ | 11,733 | ||||||||
| 679 | EMCOR Group, Inc.* | 14,116 | |||||||||
| 686 | Fluor Corp. | 25,979 | |||||||||
| 539 | Foster Wheeler AG* | 11,605 | |||||||||
| 159 | Granite Construction, Inc. | 6,273 | |||||||||
| 589 | Jacobs Engineering Group, Inc.* | 22,406 | |||||||||
| 1,715 | KBR, Inc. | 26,787 | |||||||||
| 841 | McDermott International, Inc.* | 13,574 | |||||||||
| 511 | Shaw Group (The), Inc.* | 17,134 | |||||||||
| 522 | URS Corp.* | 22,999 | |||||||||
| 172,606 | |||||||||||
| Environmental Control—1.3% | |||||||||||
| 1,112 | Nalco Holding Co. | 18,148 | |||||||||
| 621 | Republic Services, Inc. | 13,041 | |||||||||
| 2,105 | Waste Management, Inc. | 56,140 | |||||||||
| 87,329 | |||||||||||
| Forest Products & Paper—2.0% | |||||||||||
| 2,475 | MeadWestvaco Corp. | 38,759 | |||||||||
| 2,849 | Weyerhaeuser Co. | 100,455 | |||||||||
| 139,214 | |||||||||||
| Hand/Machine Tools—0.3% | |||||||||||
| 517 | Kennametal, Inc. | 10,573 | |||||||||
| 197 | Lincoln Electric Holdings, Inc. | 8,772 | |||||||||
| 19,345 | |||||||||||
| Household Products/Wares—0.8% | |||||||||||
| 1,389 | Fortune Brands, Inc. | 54,602 | |||||||||
| Machinery - Construction & Mining—3.1% | |||||||||||
| 4,800 | Caterpillar, Inc. | 170,784 | |||||||||
| 420 | Joy Global, Inc. | 10,710 | |||||||||
| 2,197 | Terex Corp.* | 30,319 | |||||||||
| 211,813 | |||||||||||
| Machinery - Diversified—3.4% | |||||||||||
| 916 | AGCO Corp.* | 22,259 | |||||||||
| 1,194 | Cummins, Inc. | 40,596 | |||||||||
| 2,457 | Deere & Co. | 101,376 | |||||||||
| 169 | Flowserve Corp. | 11,475 | |||||||||
| 321 | Gardner Denver, Inc.* | 8,545 | |||||||||
| 2,132 | Manitowoc (The) Co., Inc. | 12,685 | |||||||||
| 959 | Rockwell Automation, Inc. | 30,295 | |||||||||
| 178 | Roper Industries, Inc. | 8,115 | |||||||||
| 235,346 | |||||||||||
| Metal Fabricate/Hardware—0.9% | |||||||||||
| 414 | Mueller Industries, Inc. | 9,096 | |||||||||
| 2,755 | Mueller Water Products, Inc., Class A | 11,543 | |||||||||
| 317 | Precision Castparts Corp. | 23,731 | |||||||||
| 1,114 | Timken (The) Co. | 17,913 | |||||||||
| 62,283 | |||||||||||
| Number of Shares | Value | ||||||||||
| Common Stocks (Continued) | |||||||||||
| Mining—0.3% | |||||||||||
| 457 | Vulcan Materials Co. | $ | 21,730 | ||||||||
| Miscellaneous Manufacturing—33.0% | |||||||||||
| 2,724 | 3M Co. | 156,902 | |||||||||
| 248 | Acuity Brands, Inc. | 7,128 | |||||||||
| 316 | Brink's (The) Co. | 8,959 | |||||||||
| 361 | Carlisle Cos., Inc. | 8,213 | |||||||||
| 868 | Cooper Industries Ltd., Class A | 28,462 | |||||||||
| 419 | Crane Co. | 9,675 | |||||||||
| 586 | Danaher Corp. | 34,246 | |||||||||
| 227 | Donaldson Co., Inc. | 7,489 | |||||||||
| 1,008 | Dover Corp. | 31,026 | |||||||||
| 1,159 | Eaton Corp. | 50,764 | |||||||||
| 106,697 | General Electric Co. | 1,349,716 | |||||||||
| 520 | Harsco Corp. | 14,326 | |||||||||
| 3,475 | Honeywell International, Inc. | 108,455 | |||||||||
| 2,058 | Illinois Tool Works, Inc. | 67,502 | |||||||||
| 2,661 | Ingersoll-Rand Co. Ltd., Class A | 57,930 | |||||||||
| 630 | ITT Corp. | 25,836 | |||||||||
| 353 | Pall Corp. | 9,323 | |||||||||
| 948 | Parker Hannifin Corp. | 42,992 | |||||||||
| 510 | Pentair, Inc. | 13,586 | |||||||||
| 308 | SPX Corp. | 14,220 | |||||||||
| 168 | Teleflex, Inc. | 7,221 | |||||||||
| 5,525 | Textron, Inc. | 59,283 | |||||||||
| 1,154 | Trinity Industries, Inc. | 16,860 | |||||||||
| 5,249 | Tyco International, Ltd. (Switzerland) | 124,716 | |||||||||
| 2,254,830 | |||||||||||
| Packaging & Containers—3.1% | |||||||||||
| 391 | Ball Corp. | 14,749 | |||||||||
| 636 | Bemis Co., Inc. | 15,289 | |||||||||
| 815 | Crown Holdings, Inc.* | 17,971 | |||||||||
| 2,363 | Graphic Packaging Holding Co.* | 4,064 | |||||||||
| 262 | Greif, Inc., Class A | 11,861 | |||||||||
| 1,167 | Owens-Illinois, Inc.* | 28,463 | |||||||||
| 564 | Packaging Corp. of America | 8,951 | |||||||||
| 681 | Pactiv Corp.* | 14,887 | |||||||||
| 1,249 | Sealed Air Corp. | 23,806 | |||||||||
| 98 | Silgan Holdings, Inc. | 4,556 | |||||||||
| 636 | Sonoco Products Co. | 15,525 | |||||||||
| 4,139 | Temple-Inland, Inc. | 49,419 | |||||||||
| 209,541 | |||||||||||
| Retail—0.3% | |||||||||||
| 201 | MSC Industrial Direct Co., Class A | 8,211 | |||||||||
| 365 | World Fuel Services Corp. | 13,917 | |||||||||
| 22,128 | |||||||||||
| Software—0.9% | |||||||||||
| 504 | Broadridge Financial Solutions, Inc. | 9,752 | |||||||||
| 1,106 | Fidelity National Information Services, Inc. | 19,742 | |||||||||
| 563 | Fiserv, Inc.* | 21,012 | |||||||||
See Notes to Financial Statements.
47
Schedule of Investments (Continued)
PowerShares FTSE RAFI Industrials Sector Portfolio
April 30, 2009
| Number of Shares | Value | ||||||||||
| Common Stocks (Continued) | |||||||||||
| 482 | IMS Health, Inc. | $ | 6,054 | ||||||||
| 282 | Metavante Technologies, Inc.* | 6,652 | |||||||||
| 63,212 | |||||||||||
| Telecommunications—0.5% | |||||||||||
| 334 | Anixter International, Inc.* | 13,287 | |||||||||
| 727 | CommScope, Inc.* | 18,247 | |||||||||
| 31,534 | |||||||||||
| Textiles—0.1% | |||||||||||
| 365 | Cintas Corp. | 9,366 | |||||||||
| Transportation—11.6% | |||||||||||
| 349 | Alexander & Baldwin, Inc. | 9,297 | |||||||||
| 1,253 | Burlington Northern Santa Fe Corp. | 84,552 | |||||||||
| 366 | C.H. Robinson Worldwide, Inc. | 19,457 | |||||||||
| 609 | Con-way, Inc. | 15,091 | |||||||||
| 1,974 | CSX Corp. | 58,411 | |||||||||
| 358 | Expeditors International of Washington, Inc. | 12,426 | |||||||||
| 2,132 | FedEx Corp. | 119,307 | |||||||||
| 1,213 | General Maritime Corp. | 12,045 | |||||||||
| 293 | J.B. Hunt Transport Services, Inc. | 8,239 | |||||||||
| 468 | Kansas City Southern* | 7,137 | |||||||||
| 1,768 | Norfolk Southern Corp. | 63,082 | |||||||||
| 319 | Overseas Shipholding Group, Inc. | 9,158 | |||||||||
| 803 | Ryder System, Inc. | 22,235 | |||||||||
| 728 | Ship Finance International Ltd. (Bermuda) | 6,283 | |||||||||
| 635 | Teekay Corp. (Bahamas) | 9,169 | |||||||||
| 2,142 | Union Pacific Corp. | 105,258 | |||||||||
| 3,761 | United Parcel Service, Inc., Class B | 196,851 | |||||||||
| 460 | Uti Worldwide, Inc. | 6,192 | |||||||||
| 325 | Werner Enterprises, Inc. | 5,314 | |||||||||
| 8,475 | YRC Worldwide, Inc.* | 25,679 | |||||||||
| 795,183 | |||||||||||
| Trucking & Leasing—0.3% | |||||||||||
| 1,604 | Aircastle Ltd. | 10,586 | |||||||||
| 373 | GATX Corp. | 11,231 | |||||||||
| 21,817 | |||||||||||
| Total Common Stocks (Cost $9,074,565) | 6,808,171 | ||||||||||
| Money Market Fund—0.7% | |||||||||||
| 50,790 | Goldman Sachs Financial Square Prime Obligations Institutional Share Class (Cost $50,790) | 50,790 | |||||||||
| Total Investments (Cost $9,125,355)—100.4% | 6,858,961 | ||||||||||
| Liabilities in excess of other assets—(0.4%) | (26,299 | ) | |||||||||
| Net Assets—100.0% | $ | 6,832,662 | |||||||||
* Non-income producing security.
See Notes to Financial Statements.
48
Schedule of Investments
PowerShares FTSE RAFI Telecommunications & Technology Sector Portfolio
April 30, 2009
| Number of Shares | Value | ||||||||||
| Common Stocks—99.7% | |||||||||||
| Applications Software—11.8% | |||||||||||
| 770 | Citrix Systems, Inc.* | $ | 21,968 | ||||||||
| 1,195 | Intuit, Inc.* | 27,640 | |||||||||
| 65,383 | Microsoft Corp. | 1,324,660 | |||||||||
| 1,374,268 | |||||||||||
| Cellular Telecommunications—1.1% | |||||||||||
| 1,524 | iPCS, Inc.* | 22,128 | |||||||||
| 398 | Leap Wireless International, Inc.* | 14,356 | |||||||||
| 1,008 | MetroPCS Communications* | 17,227 | |||||||||
| 471 | Millicom International Cellular S.A. (Luxembourg) | 22,825 | |||||||||
| 1,820 | NII Holdings, Inc.* | 29,411 | |||||||||
| 768 | United States Cellular Corp.* | 26,112 | |||||||||
| 132,059 | |||||||||||
| Computer Aided Design—0.2% | |||||||||||
| 947 | Autodesk, Inc.* | 18,883 | |||||||||
| Computer Services—1.7% | |||||||||||
| 274 | CACI International, Inc., Class A* | 10,837 | |||||||||
| 711 | Cognizant Technology Solutions Corp., Class A* | 17,626 | |||||||||
| 2,840 | Computer Sciences Corp.* | 104,966 | |||||||||
| 485 | DST Systems, Inc.* | 17,542 | |||||||||
| 5,724 | Insight Enterprises, Inc.* | 32,741 | |||||||||
| 942 | Perot Systems Corp., Class A* | 13,245 | |||||||||
| 196,957 | |||||||||||
| Computers—16.9% | |||||||||||
| 2,249 | Apple, Inc.* | 282,992 | |||||||||
| 26,806 | Dell, Inc.* | 311,486 | |||||||||
| 16,852 | Hewlett-Packard Co. | 606,335 | |||||||||
| 6,034 | International Business Machines Corp. | 622,768 | |||||||||
| 15,316 | Sun Microsystems, Inc.* | 140,295 | |||||||||
| 1,963,876 | |||||||||||
| Computers - Integrated Systems—0.8% | |||||||||||
| 4,159 | Brocade Communications Systems, Inc.* | 24,039 | |||||||||
| 713 | Diebold, Inc. | 18,845 | |||||||||
| 3,748 | NCR Corp.* | 38,042 | |||||||||
| 528 | Teradata Corp.* | 8,828 | |||||||||
| 89,754 | |||||||||||
| Computers - Memory Devices—3.6% | |||||||||||
| 12,064 | EMC Corp.* | 151,163 | |||||||||
| 1,427 | NetApp, Inc.* | 26,114 | |||||||||
| 4,061 | SanDisk Corp.* | 63,839 | |||||||||
| 14,602 | Seagate Technology (Cayman Islands) | 119,152 | |||||||||
| 2,593 | Western Digital Corp.* | 60,987 | |||||||||
| 421,255 | |||||||||||
| Computers - Peripheral Equipment—0.3% | |||||||||||
| 1,626 | Lexmark International, Inc., Class A* | 31,902 | |||||||||
| Number of Shares | Value | ||||||||||
| Common Stocks (Continued) | |||||||||||
| Consulting Services—0.4% | |||||||||||
| 2,246 | SAIC, Inc.* | $ | 40,653 | ||||||||
| Distribution/Wholesale—1.9% | |||||||||||
| 2,009 | Brightpoint, Inc.* | 10,467 | |||||||||
| 6,921 | Ingram Micro, Inc., Class A* | 100,493 | |||||||||
| 3,985 | Tech Data Corp.* | 114,728 | |||||||||
| 225,688 | |||||||||||
| Diversified Operations—0.2% | |||||||||||
| 1,236 | Leucadia National Corp. | 26,240 | |||||||||
| E-Commerce/Services—0.6% | |||||||||||
| 4,635 | IAC/InterActiveCorp* | 74,253 | |||||||||
| Electronic Component - Semiconductors—10.3% | |||||||||||
| 15,045 | Advanced Micro Devices, Inc.* | 54,312 | |||||||||
| 789 | Altera Corp. | 12,869 | |||||||||
| 7,221 | Amkor Technology, Inc.* | 31,123 | |||||||||
| 1,829 | Broadcom Corp., Class A* | 42,415 | |||||||||
| 2,780 | Fairchild Semiconductor International, Inc.* | 17,125 | |||||||||
| 39,959 | Intel Corp. | 630,552 | |||||||||
| 984 | International Rectifier Corp.* | 16,610 | |||||||||
| 5,574 | LSI Corp.* | 21,404 | |||||||||
| 1,166 | MEMC Electronic Materials, Inc.* | 18,889 | |||||||||
| 957 | Microchip Technology, Inc. | 22,011 | |||||||||
| 19,784 | Micron Technology, Inc.* | 96,546 | |||||||||
| 1,379 | National Semiconductor Corp. | 17,058 | |||||||||
| 3,085 | NVIDIA Corp.* | 35,416 | |||||||||
| 8,586 | Texas Instruments, Inc. | 155,063 | |||||||||
| 1,184 | Xilinx, Inc. | 24,201 | |||||||||
| 1,195,594 | |||||||||||
| Electronic Design Automation—0.4% | |||||||||||
| 4,409 | Cadence Design Systems, Inc.* | 24,602 | |||||||||
| 714 | Synopsys, Inc.* | 15,551 | |||||||||
| 40,153 | |||||||||||
| Electronic Forms—0.4% | |||||||||||
| 1,863 | Adobe Systems, Inc.* | 50,953 | |||||||||
| Enterprise Software/Services—3.0% | |||||||||||
| 479 | BMC Software, Inc.* | 16,607 | |||||||||
| 1,595 | CA, Inc. | 27,514 | |||||||||
| 15,395 | Oracle Corp. | 297,739 | |||||||||
| 465 | SYNNEX Corp.* | 10,011 | |||||||||
| 351,871 | |||||||||||
| Internet Content - Info/Network—0.2% | |||||||||||
| 2,675 | Infospace, Inc.* | 17,735 | |||||||||
| Internet Security—1.1% | |||||||||||
| 516 | McAfee, Inc.* | 19,371 | |||||||||
| 5,527 | Symantec Corp.* | 95,341 | |||||||||
See Notes to Financial Statements.
49
Schedule of Investments (Continued)
PowerShares FTSE RAFI Telecommunications & Technology Sector Portfolio
April 30, 2009
| Number of Shares | Value | ||||||||||
| Common Stocks (Continued) | |||||||||||
| 864 | VeriSign, Inc.* | $ | 17,781 | ||||||||
| 132,493 | |||||||||||
| Internet Telephony—0.1% | |||||||||||
| 10,030 | iBasis, Inc.* | 10,532 | |||||||||
| Medical Information Systems—0.2% | |||||||||||
| 333 | Cerner Corp.* | 17,915 | |||||||||
| Networking Products—4.9% | |||||||||||
| 26,034 | Cisco Systems, Inc.* | 502,977 | |||||||||
| 2,957 | Juniper Networks, Inc.* | 64,019 | |||||||||
| 566,996 | |||||||||||
| Office Automation & Equipment—1.4% | |||||||||||
| 2,458 | Pitney Bowes, Inc. | 60,319 | |||||||||
| 16,062 | Xerox Corp. | 98,139 | |||||||||
| 158,458 | |||||||||||
| Semiconductor Components - Integrated Circuits—0.8% | |||||||||||
| 1,745 | Analog Devices, Inc. | 37,133 | |||||||||
| 3,269 | Atmel Corp.* | 12,553 | |||||||||
| 756 | Linear Technology Corp. | 16,466 | |||||||||
| 2,402 | Marvell Technology Group Ltd. (Bermuda)* | 26,374 | |||||||||
| 92,526 | |||||||||||
| Semiconductor Equipment—1.9% | |||||||||||
| 9,017 | Applied Materials, Inc. | 110,097 | |||||||||
| 1,490 | KLA-Tencor Corp. | 41,333 | |||||||||
| 1,053 | Lam Research Corp.* | 29,358 | |||||||||
| 1,170 | Novellus Systems, Inc.* | 21,130 | |||||||||
| 2,578 | Teradyne, Inc.* | 15,313 | |||||||||
| 217,231 | |||||||||||
| Software Tools—0.1% | |||||||||||
| 599 | VMware, Inc., Class A* | 15,622 | |||||||||
| Telecommunication Equipment—0.4% | |||||||||||
| 658 | Harris Corp. | 20,122 | |||||||||
| 4,432 | Tellabs, Inc.* | 23,223 | |||||||||
| 43,345 | |||||||||||
| Telecommunication Equipment Fiber Optics—1.2% | |||||||||||
| 8,237 | Corning, Inc. | 120,424 | |||||||||
| 3,955 | JDS Uniphase Corp* | 18,233 | |||||||||
| 138,657 | |||||||||||
| Telecommunication Services—1.4% | |||||||||||
| 1,722 | Embarq Corp. | 62,956 | |||||||||
| 5,574 | RCN Corp.* | 22,853 | |||||||||
| 10,333 | Virgin Media, Inc. | 79,771 | |||||||||
| 165,580 | |||||||||||
| Number of Shares | Value | ||||||||||
| Common Stocks (Continued) | |||||||||||
| Telephone - Integrated—25.3% | |||||||||||
| 50,477 | AT&T, Inc. | $ | 1,293,222 | ||||||||
| 1,257 | CenturyTel, Inc. | 34,128 | |||||||||
| 7,056 | Frontier Communications Corp. | 50,168 | |||||||||
| 29,416 | Level 3 Communications, Inc.* | 32,946 | |||||||||
| 24,703 | Qwest Communications International, Inc. | 96,095 | |||||||||
| 84,442 | Sprint Nextel Corp.* | 368,167 | |||||||||
| 1,247 | Telephone & Data Systems, Inc. | 35,751 | |||||||||
| 32,763 | Verizon Communications, Inc. | 994,029 | |||||||||
| 4,303 | Windstream Corp. | 35,715 | |||||||||
| 2,940,221 | |||||||||||
| Transactional Software—0.2% | |||||||||||
| 1,476 | ACI Worldwide, Inc* | 25,491 | |||||||||
| Web Portals/ISP—2.2% | |||||||||||
| 474 | Google, Inc., Class A* | 187,690 | |||||||||
| 4,938 | Yahoo!, Inc.* | 70,564 | |||||||||
| 258,254 | |||||||||||
| Wireless Equipment—4.7% | |||||||||||
| 894 | American Tower Corp., Class A* | 28,393 | |||||||||
| 953 | Crown Castle International Corp.* | 23,368 | |||||||||
| 53,551 | Motorola, Inc. | 296,137 | |||||||||
| 4,585 | QUALCOMM, Inc. | 194,037 | |||||||||
| 541,935 | |||||||||||
| Total Common Stocks (Cost $13,321,544) | 11,577,350 | ||||||||||
| Money Market Fund—0.7% | |||||||||||
| 79,251 | Goldman Sachs Financial Square Prime Obligations Institutional Share Class (Cost $79,251) | 79,251 | |||||||||
| Total Investments (Cost $13,400,795)—100.4% | 11,656,601 | ||||||||||
| Liabilities in excess of other assets—(0.4%) | (46,714 | ) | |||||||||
| Net Assets—100.0% | $ | 11,609,887 | |||||||||
* Non-income producing security.
See Notes to Financial Statements.
50
Schedule of Investments
PowerShares FTSE RAFI US 1500 Small-Mid Portfolio
April 30, 2009
| Number of Shares | Value | ||||||||||
| Common Stocks and Other Equity Interests—99.8% | |||||||||||
| Consumer Discretionary—21.9% | |||||||||||
| 32,186 | 1-800-FLOWERS.COM, Inc., Class A* | $ | 93,983 | ||||||||
| 12,756 | 4Kids Entertainment, Inc.* | 16,328 | |||||||||
| 6,063 | 99 Cents Only Stores* | 65,117 | |||||||||
| 17,010 | A.C. Moore Arts & Crafts, Inc.* | 50,180 | |||||||||
| 4,598 | Aaron's, Inc. | 154,309 | |||||||||
| 3,275 | Aeropostale, Inc.* | 111,252 | |||||||||
| 38,257 | AH Belo Corp., Class A | 72,688 | |||||||||
| 30,590 | American Greetings Corp., Class A | 240,131 | |||||||||
| 1,449 | America's Car-Mart, Inc.* | 23,503 | |||||||||
| 3,487 | Ameristar Casinos, Inc. | 71,553 | |||||||||
| 2,227 | Arbitron, Inc. | 46,366 | |||||||||
| 9,576 | Arctic Cat, Inc. | 38,304 | |||||||||
| 13,096 | Audiovox Corp., Class A* | 72,814 | |||||||||
| 3,010 | Bally Technologies, Inc.* | 78,802 | |||||||||
| 57,611 | Bassett Furniture Industries, Inc. | 130,201 | |||||||||
| 4,289 | Bebe Stores, Inc. | 39,459 | |||||||||
| 2,373 | Benihana, Inc.* | 12,814 | |||||||||
| 7,016 | Benihana, Inc., Class A* | 36,694 | |||||||||
| 6,906 | Big 5 Sporting Goods Corp. | 56,836 | |||||||||
| 1,607 | BJ's Restaurants, Inc.* | 26,499 | |||||||||
| 34,737 | Bluegreen Corp.* | 66,348 | |||||||||
| 2,725 | Blyth, Inc. | 120,118 | |||||||||
| 4,949 | Bob Evans Farms, Inc. | 120,013 | |||||||||
| 51,503 | Bon-Ton Stores (The), Inc. | 151,934 | |||||||||
| 9,341 | Books-A-Million, Inc. | 53,617 | |||||||||
| 2,534 | Brink's Home Security Holdings, Inc.* | 67,354 | |||||||||
| 18,790 | Brookfield Homes Corp. | 98,648 | |||||||||
| 26,060 | Brown Shoe Co., Inc. | 167,566 | |||||||||
| 1,126 | Buckle (The), Inc. | 42,079 | |||||||||
| 458 | Buffalo Wild Wings, Inc.* | 17,880 | |||||||||
| 8,200 | Build-A-Bear Workshop, Inc.* | 44,772 | |||||||||
| 10,285 | Cache, Inc.* | 46,797 | |||||||||
| 3,397 | California Pizza Kitchen, Inc.* | 53,367 | |||||||||
| 10,121 | Callaway Golf Co. | 76,414 | |||||||||
| 235 | Capella Education Co.* | 12,074 | |||||||||
| 13,127 | Carmike Cinemas, Inc. | 53,558 | |||||||||
| 6,847 | Carriage Services, Inc.* | 18,008 | |||||||||
| 6,693 | Carrols Restaurant Group, Inc.* | 39,623 | |||||||||
| 2,322 | Carter's, Inc.* | 49,644 | |||||||||
| 88,546 | Casual Male Retail Group, Inc.* | 112,453 | |||||||||
| 3,366 | Cato (The) Corp., Class A | 64,695 | |||||||||
| 2,797 | CEC Entertainment, Inc.* | 85,197 | |||||||||
| 212,923 | Champion Enterprises, Inc.* | 123,495 | |||||||||
| 6,086 | Charlotte Russe Holding, Inc.* | 76,379 | |||||||||
| 11,002 | Cheesecake Factory (The), Inc.* | 191,105 | |||||||||
| 1,567 | Cherokee, Inc. | 28,629 | |||||||||
| 2,566 | Children's Place Retail Stores (The), Inc.* | 72,977 | |||||||||
| 512 | Chipotle Mexican Grill, Inc., Class A* | 41,518 | |||||||||
| 616 | Chipotle Mexican Grill, Inc., Class B* | 40,354 | |||||||||
| 1,850 | Choice Hotels International, Inc. | 55,371 | |||||||||
| Number of Shares | Value | ||||||||||
| Common Stocks and Other Equity Interests (Continued) | |||||||||||
| 8,255 | Christopher & Banks Corp. | $ | 45,898 | ||||||||
| 349 | Churchill Downs, Inc. | 12,149 | |||||||||
| 1,251 | Citi Trends, Inc.* | 30,725 | |||||||||
| 10,007 | CKE Restaurants, Inc. | 95,767 | |||||||||
| 4,559 | CKX, Inc.* | 24,573 | |||||||||
| 1,674 | Coinstar, Inc.* | 59,578 | |||||||||
| 23,389 | Coldwater Creek, Inc.* | 80,692 | |||||||||
| 934 | Columbia Sportswear Co. | 28,692 | |||||||||
| 2,868 | Conn's, Inc.* | 47,150 | |||||||||
| 3,552 | Corinthian Colleges, Inc.* | 54,701 | |||||||||
| 68,572 | Cost Plus, Inc.* | 128,915 | |||||||||
| 18,190 | Cox Radio, Inc., Class A* | 87,312 | |||||||||
| 2,400 | CPI Corp. | 24,480 | |||||||||
| 4,590 | Cracker Barrel Old Country Store, Inc. | 149,680 | |||||||||
| 10,744 | CROCS, Inc.* | 24,174 | |||||||||
| 1,716 | CSS Industries, Inc. | 34,080 | |||||||||
| 7,221 | CTC Media, Inc.* | 56,613 | |||||||||
| 13,963 | Cumulus Media, Inc., Class A* | 17,174 | |||||||||
| 812 | Deckers Outdoor Corp.* | 45,894 | |||||||||
| 24,884 | Denny's Corp.* | 66,689 | |||||||||
| 3,856 | Destination Maternity Corp.* | 51,748 | |||||||||
| 1,406 | DeVry, Inc. | 59,839 | |||||||||
| 5,734 | DineEquity, Inc. | 183,717 | |||||||||
| 6,845 | Dover Downs Gaming & Entertainment, Inc. | 29,228 | |||||||||
| 3,637 | DreamWorks Animation SKG, Inc., Class A* | 87,324 | |||||||||
| 8,897 | Dress Barn, Inc.* | 134,701 | |||||||||
| 5,032 | Drew Industries, Inc.* | 71,857 | |||||||||
| 12,970 | drugstore.com, Inc.* | 20,104 | |||||||||
| 8,140 | DSW, Inc., Class A* | 88,482 | |||||||||
| 90,483 | Eddie Bauer Holdings, Inc.* | 29,706 | |||||||||
| 1,459 | Einstein Noah Restaurant Group, Inc.* | 15,743 | |||||||||
| 136,257 | Entravision Communications Corp., Class A* | 69,491 | |||||||||
| 9,093 | Ethan Allen Interiors, Inc. | 122,301 | |||||||||
| 14,443 | Finish Line (The), Inc., Class A | 122,766 | |||||||||
| 1,571 | Fisher Communications, Inc. | 18,946 | |||||||||
| 3,946 | Fossil, Inc.* | 79,551 | |||||||||
| 6,599 | Fred's, Inc., Class A | 90,142 | |||||||||
| 4,072 | Gaiam, Inc., Class A* | 23,699 | |||||||||
| 5,965 | Gander Mountain Co.* | 23,264 | |||||||||
| 12,756 | Gaylord Entertainment Co.* | 177,819 | |||||||||
| 5,601 | Genesco, Inc.* | 127,591 | |||||||||
| 12,211 | Gentex Corp. | 163,261 | |||||||||
| 5,113 | G-III Apparel Group Ltd.* | 41,006 | |||||||||
| 1,490 | Global Sources Ltd. (Bermuda)* | 6,631 | |||||||||
| 8,593 | Golfsmith International Holdings, Inc.* | 9,109 | |||||||||
| 119,196 | Gray Television, Inc. | 81,053 | |||||||||
| 14,828 | Great Wolf Resorts, Inc.* | 54,715 | |||||||||
| 2,376 | Guess?, Inc. | 61,871 | |||||||||
| 1,919 | Gymboree (The) Corp.* | 66,014 | |||||||||
| 10,074 | Harte-Hanks, Inc. | 83,211 | |||||||||
| 9,065 | Hastings Entertainment, Inc.* | 32,634 | |||||||||
See Notes to Financial Statements.
51
Schedule of Investments (Continued)
PowerShares FTSE RAFI US 1500 Small-Mid Portfolio
April 30, 2009
| Number of Shares | Value | ||||||||||
| Common Stocks and Other Equity Interests (Continued) | |||||||||||
| 4,339 | Haverty Furniture Cos., Inc. | $ | 47,078 | ||||||||
| 1,927,285 | Hayes Lemmerz International, Inc.* | 325,710 | |||||||||
| 4,642 | Helen of Troy Ltd.* | 74,040 | |||||||||
| 1,879 | hhgregg, Inc.* | 31,191 | |||||||||
| 2,085 | Hibbett Sports, Inc.* | 43,472 | |||||||||
| 3,820 | Hillenbrand, Inc. | 69,448 | |||||||||
| 2,847 | Hooker Furniture Corp. | 33,367 | |||||||||
| 5,163 | Hot Topic, Inc.* | 63,195 | |||||||||
| 4,458 | Iconix Brand Group, Inc.* | 63,571 | |||||||||
| 5,489 | International Speedway Corp., Class A | 129,980 | |||||||||
| 14,543 | Interval Leisure Group, Inc.* | 116,489 | |||||||||
| 13,886 | Isle of Capri Casinos, Inc.* | 149,136 | |||||||||
| 658 | ITT Educational Services, Inc.* | 66,307 | |||||||||
| 3,807 | J.Crew Group, Inc.* | 65,518 | |||||||||
| 3,530 | Jackson Hewitt Tax Service, Inc. | 17,262 | |||||||||
| 5,495 | JAKKS Pacific, Inc.* | 69,512 | |||||||||
| 5,906 | Jo-Ann Stores, Inc.* | 108,198 | |||||||||
| 3,061 | John Wiley & Sons, Inc., Class A | 103,768 | |||||||||
| 1,743 | Jos. A. Bank Clothiers, Inc.* | 70,487 | |||||||||
| 65,826 | Journal Communications, Inc., Class A | 102,030 | |||||||||
| 4,995 | Kenneth Cole Productions, Inc., Class A | 34,565 | |||||||||
| 4,446 | Kirkland's, Inc.* | 30,455 | |||||||||
| 3,861 | Knology, Inc.* | 27,413 | |||||||||
| 21,241 | Krispy Kreme Doughnuts, Inc.* | 83,690 | |||||||||
| 3,990 | K-Swiss, Inc., Class A | 40,060 | |||||||||
| 8,488 | Landry's Restaurants, Inc.* | 77,580 | |||||||||
| 92,450 | La-Z-Boy, Inc. | 245,916 | |||||||||
| 20,390 | Leapfrog Enterprises, Inc.* | 36,498 | |||||||||
| 278,882 | Lee Enterprises, Inc. | 105,975 | |||||||||
| 3,664 | Life Time Fitness, Inc.* | 68,737 | |||||||||
| 9,780 | Lifetime Brands, Inc. | 27,482 | |||||||||
| 115,984 | Lin TV Corp., Class A* | 185,574 | |||||||||
| 510 | Lincoln Educational Services Corp.* | 8,461 | |||||||||
| 39,718 | Lithia Motors, Inc., Class A | 115,977 | |||||||||
| 5,508 | LKQ Corp.* | 93,526 | |||||||||
| 37,959 | LodgeNet Interactive Corp.* | 154,114 | |||||||||
| 16,284 | Lodgian, Inc.* | 41,850 | |||||||||
| 4,396 | Luby's, Inc.* | 23,563 | |||||||||
| 2,848 | Lululemon Athletica, Inc.* | 39,730 | |||||||||
| 773 | Lumber Liquidators, Inc.* | 11,564 | |||||||||
| 7,307 | M/I Homes, Inc. | 111,578 | |||||||||
| 1,385 | Maidenform Brands, Inc.* | 17,659 | |||||||||
| 4,172 | Marcus Corp. | 52,984 | |||||||||
| 1,860 | Marine Products Corp. | 8,649 | |||||||||
| 36,948 | MarineMax, Inc.* | 168,113 | |||||||||
| 6,274 | Martha Stewart Living Omnimedia, Inc., Class A* | 22,712 | |||||||||
| 1,615 | Marvel Entertainment, Inc.* | 48,192 | |||||||||
| 1,542 | Matthews International Corp., Class A | 48,295 | |||||||||
| 9,342 | McCormick & Schmick's Seafood Restaurants, Inc.* | 66,141 | |||||||||
| Number of Shares | Value | ||||||||||
| Common Stocks and Other Equity Interests (Continued) | |||||||||||
| 41,924 | Media General, Inc., Class A | $ | 109,002 | ||||||||
| 14,471 | Mediacom Communications Corp., Class A* | 82,340 | |||||||||
| 10,047 | Men's Wearhouse (The), Inc. | 187,276 | |||||||||
| 11,665 | Meritage Homes Corp.* | 242,748 | |||||||||
| 76,193 | Modine Manufacturing Co. | 291,056 | |||||||||
| 1,790 | Monarch Casino & Resort, Inc.* | 18,294 | |||||||||
| 1,081 | Monro Muffler, Inc. | 26,993 | |||||||||
| 11,419 | Morgans Hotel Group Co.* | 48,988 | |||||||||
| 417 | Morningstar, Inc.* | 16,542 | |||||||||
| 7,902 | Morton's Restaurant Group, Inc.* | 36,665 | |||||||||
| 6,828 | Movado Group, Inc. | 62,613 | |||||||||
| 23,916 | MTR Gaming Group, Inc.* | 49,267 | |||||||||
| 12,746 | Multimedia Games, Inc.* | 27,022 | |||||||||
| 374 | National Presto Industries, Inc. | 26,651 | |||||||||
| 49,817 | Nautilus, Inc.* | 49,817 | |||||||||
| 2,342 | Netflix, Inc.* | 106,116 | |||||||||
| 10,881 | New Frontier Media, Inc.* | 21,327 | |||||||||
| 11,796 | New York & Co., Inc.* | 68,417 | |||||||||
| 20,537 | Nexstar Broadcasting Group, Inc., Class A* | 16,019 | |||||||||
| 2,232 | NutriSystem, Inc. | 30,668 | |||||||||
| 21,320 | O'Charleys, Inc. | 148,600 | |||||||||
| 14,835 | Orbitz Worldwide, Inc.* | 28,187 | |||||||||
| 14,115 | Orient-Express Hotels Ltd., Class A | 91,324 | |||||||||
| 5,583 | Orleans Homebuilders, Inc. | 11,724 | |||||||||
| 1,625 | Overstock.com, Inc.* | 21,905 | |||||||||
| 12,525 | Oxford Industries, Inc. | 121,994 | |||||||||
| 2,844 | P.F. Chang's China Bistro, Inc.* | 85,832 | |||||||||
| 66,361 | Pacific Sunwear of California, Inc.* | 268,761 | |||||||||
| 10,722 | Palm Harbor Homes, Inc.* | 32,595 | |||||||||
| 1,410 | Panera Bread Co., Class A* | 78,974 | |||||||||
| 1,835 | Papa John's International, Inc.* | 48,701 | |||||||||
| 782 | Peet's Coffee & Tea, Inc.* | 21,333 | |||||||||
| 29,008 | PEP Boys-Manny, Moe & Jack | 214,658 | |||||||||
| 7,191 | Perry Ellis International, Inc.* | 52,710 | |||||||||
| 6,849 | Phillips-Van Heusen Corp. | 198,826 | |||||||||
| 346,174 | Pier 1 Imports, Inc.* | 647,344 | |||||||||
| 12,471 | Pinnacle Entertainment, Inc.* | 155,638 | |||||||||
| 13,972 | Playboy Enterprises, Inc., Class B* | 42,056 | |||||||||
| 5,965 | Polaris Industries, Inc. | 199,529 | |||||||||
| 5,616 | Pool Corp. | 100,302 | |||||||||
| 573 | Pre-Paid Legal Services, Inc.* | 21,104 | |||||||||
| 886 | Priceline.com, Inc.* | 86,022 | |||||||||
| 141,730 | Radio One, Inc., Class D* | 63,779 | |||||||||
| 10,212 | RC2 Corp.* | 115,498 | |||||||||
| 6,510 | Red Lion Hotels Corp.* | 29,751 | |||||||||
| 2,059 | Red Robin Gourmet Burgers, Inc.* | 50,548 | |||||||||
| 44,170 | Retail Ventures, Inc.* | 114,842 | |||||||||
| 3,568 | Rex Stores Corp.* | 42,459 | |||||||||
| 14,414 | RHI Entertainment, Inc.* | 46,557 | |||||||||
| 69,973 | Ruby Tuesday, Inc.* | 537,392 | |||||||||
| 27,057 | Russ Berrie & Co., Inc.* | 51,679 | |||||||||
See Notes to Financial Statements.
52
Schedule of Investments (Continued)
PowerShares FTSE RAFI US 1500 Small-Mid Portfolio
April 30, 2009
| Number of Shares | Value | ||||||||||
| Common Stocks and Other Equity Interests (Continued) | |||||||||||
| 13,214 | Ruth's Hospitality Group, Inc.* | $ | 47,835 | ||||||||
| 8,491 | Saga Communications, Inc. Class A* | 79,051 | |||||||||
| 41,050 | Salem Communications Corp., Class A* | 25,862 | |||||||||
| 11,273 | Sally Beauty Holdings, Inc.* | 83,420 | |||||||||
| 6,701 | Scientific Games Corp., Class A* | 117,200 | |||||||||
| 41,719 | Sealy Corp.* | 147,685 | |||||||||
| 123,312 | Select Comfort Corp.* | 124,545 | |||||||||
| 3,950 | Shoe Carnival, Inc.* | 46,057 | |||||||||
| 5,975 | Shuffle Master, Inc.* | 22,765 | |||||||||
| 953 | Shutterfly, Inc.* | 12,208 | |||||||||
| 36,671 | Sinclair Broadcast Group, Inc., Class A | 40,705 | |||||||||
| 12,390 | Skechers U.S.A., Inc., Class A* | 144,963 | |||||||||
| 1,505 | Skyline Corp. | 31,199 | |||||||||
| 5,827 | Sonic Corp.* | 63,631 | |||||||||
| 11,003 | Sotheby's | �� | 127,745 | ||||||||
| 617,286 | Source Interlink Cos., Inc.* | 62,346 | |||||||||
| 254,890 | Spanish Broadcasting System, Inc., Class A* | 45,880 | |||||||||
| 8,356 | Spartan Stores, Inc. | 67,433 | |||||||||
| 2,598 | Speedway Motorsports, Inc. | 38,970 | |||||||||
| 9,552 | Stage Stores, Inc. | 117,012 | |||||||||
| 16,798 | Standard Motor Products, Inc. | 67,192 | |||||||||
| 2,096 | Stanley Furniture Co., Inc. | 21,505 | |||||||||
| 5,422 | Steak n Shake (The) Co.* | 62,678 | |||||||||
| 45,076 | Stein Mart, Inc.* | 196,982 | |||||||||
| 1,202 | Steiner Leisure Ltd.* | 38,031 | |||||||||
| 4,040 | Steinway Musical Instruments* | 54,257 | |||||||||
| 1,902 | Steven Madden Ltd.* | 55,957 | |||||||||
| 19,793 | Stewart Enterprises, Inc., Class A | 69,078 | |||||||||
| 11,912 | Stoneridge, Inc.* | 27,517 | |||||||||
| 198 | Strayer Education, Inc. | 37,503 | |||||||||
| 5,975 | Superior Industries International, Inc. | 90,103 | |||||||||
| 1,870 | Syms Corp.* | 10,584 | |||||||||
| 3,062 | Systemax, Inc.* | 51,625 | |||||||||
| 16,600 | Talbots (The), Inc. | 39,176 | |||||||||
| 8,403 | Tempur-Pedic International, Inc. | 108,063 | |||||||||
| 4,069 | Texas Roadhouse, Inc., Class A* | 46,305 | |||||||||
| 7,405 | Timberland (The) Co., Class A* | 120,257 | |||||||||
| 5,841 | Town Sports International Holdings, Inc.* | 20,151 | |||||||||
| 101,168 | Trans World Entertainment Corp.* | 68,794 | |||||||||
| 43,979 | Tuesday Morning Corp.* | 149,968 | |||||||||
| 8,088 | Tupperware Brands Corp. | 202,443 | |||||||||
| 43,389 | Tween Brands, Inc.* | 126,696 | |||||||||
| 3,012 | Ulta Salon Cosmetics & Fragrance, Inc.* | 26,355 | |||||||||
| 2,163 | Under Armour, Inc., Class A* | 50,917 | |||||||||
| 80,526 | Unifi, Inc.* | 72,473 | |||||||||
| 2,458 | UniFirst Corp. | 91,659 | |||||||||
| 1,134 | Universal Electronics, Inc.* | 21,251 | |||||||||
| 1,633 | Universal Technical Institute, Inc.* | 23,254 | |||||||||
| 4,992 | Urban Outfitters, Inc.* | 97,294 | |||||||||
| 2,118 | Vail Resorts, Inc.* | 61,846 | |||||||||
| 60,366 | Valassis Communications, Inc.* | 312,091 | |||||||||
| Number of Shares | Value | ||||||||||
| Common Stocks and Other Equity Interests (Continued) | |||||||||||
| 91,829 | ValueVision Media, Inc., Class A* | $ | 65,199 | ||||||||
| 1,862 | Volcom, Inc.* | 25,118 | |||||||||
| 5,233 | Warnaco Group, Inc.(The)* | 150,920 | |||||||||
| 2,300 | Weight Watchers International, Inc. | 57,224 | |||||||||
| 14,115 | Wendy's/Arby's Group, Inc., Class A | 70,575 | |||||||||
| 5,990 | West Marine, Inc.* | 34,443 | |||||||||
| 10,536 | Wet Seal (The), Inc., Class A* | 40,142 | |||||||||
| 809 | Weyco Group, Inc. | 22,207 | |||||||||
| 11,014 | Winnebago Industries, Inc. | 97,033 | |||||||||
| 2,361 | WMS Industries, Inc.* | 75,812 | |||||||||
| 4,538 | Wolverine World Wide, Inc. | 94,527 | |||||||||
| 6,123 | World Wrestling Entertainment, Inc., Class A | 65,516 | |||||||||
| 1,912 | Zumiez, Inc.* | 23,059 | |||||||||
| 20,657,829 | |||||||||||
| Consumer Staples—2.7% | |||||||||||
| 18,954 | Alliance One International, Inc.* | 71,078 | |||||||||
| 4,736 | Andersons (The), Inc. | 76,108 | |||||||||
| 231 | Arden Group, Inc., Class A | 27,027 | |||||||||
| 10,186 | B&G Foods, Inc., Class A | 62,338 | |||||||||
| 832 | Boston Beer Co., Inc., Class A* | 22,131 | |||||||||
| 1,390 | Cal-Maine Foods, Inc. | 36,793 | |||||||||
| 11,381 | Central European Distribution Corp.* | 254,935 | |||||||||
| 3,791 | Central Garden & Pet Co.* | 36,469 | |||||||||
| 8,902 | Central Garden & Pet Co., Class A* | 80,741 | |||||||||
| 215 | Chattem, Inc.* | 11,806 | |||||||||
| 1,069 | Coca-Cola Bottling Co. Consolidated | 55,716 | |||||||||
| 7,274 | Darling International, Inc.* | 41,607 | |||||||||
| 1,372 | Diamond Foods, Inc. | 35,933 | |||||||||
| 11,605 | Elizabeth Arden, Inc.* | 100,499 | |||||||||
| 565 | Farmer Bros. Co. | 11,159 | |||||||||
| 4,654 | Flowers Foods, Inc. | 107,507 | |||||||||
| 437 | Green Mountain Coffee Roasters, Inc.* | 31,599 | |||||||||
| 5,225 | Hain Celestial Group, Inc.* | 87,205 | |||||||||
| 1,197 | Hansen Natural Corp.* | 48,790 | |||||||||
| 2,970 | Herbalife Ltd. (Cayman Islands) | 58,865 | |||||||||
| 6,383 | Imperial Sugar Co. | 41,809 | |||||||||
| 4,054 | Ingles Markets, Inc., Class A | 63,283 | |||||||||
| 1,523 | Inter Parfums, Inc. | 11,818 | |||||||||
| 858 | J & J Snack Foods Corp. | 33,256 | |||||||||
| 1,682 | Lancaster Colony Corp. | 73,672 | |||||||||
| 2,138 | Lance, Inc. | 49,516 | |||||||||
| 4,350 | Mannatech, Inc. | 19,010 | |||||||||
| 22,183 | MGP Ingredients, Inc.* | 37,267 | |||||||||
| 1,231 | National Beverage Corp.* | 12,962 | |||||||||
| 126,369 | New Dragon Asia Corp.* | 20,219 | |||||||||
| 5,656 | Nu Skin Enterprises, Inc., Class A | 72,510 | |||||||||
| 4,671 | Prestige Brands Holdings, Inc.* | 30,175 | |||||||||
| 2,298 | PriceSmart, Inc. | 41,019 | |||||||||
| 43,403 | Reddy Ice Holdings, Inc. | 97,657 | |||||||||
| 1,382 | Sanderson Farms, Inc. | 55,142 | |||||||||
See Notes to Financial Statements.
53
Schedule of Investments (Continued)
PowerShares FTSE RAFI US 1500 Small-Mid Portfolio
April 30, 2009
| Number of Shares | Value | ||||||||||
| Common Stocks and Other Equity Interests (Continued) | |||||||||||
| 4,496 | Spartan Stores, Inc. | $ | 73,150 | ||||||||
| 4,042 | Susser Holdings Corp.* | 58,407 | |||||||||
| 558 | Synutra International, Inc.* | 4,710 | |||||||||
| 2,096 | Tootsie Roll Industries, Inc. | 51,038 | |||||||||
| 2,755 | TreeHouse Foods, Inc.* | 73,255 | |||||||||
| 7,791 | United Natural Foods, Inc.* | 177,479 | |||||||||
| 825 | USANA Health Sciences, Inc.* | 19,726 | |||||||||
| 2,957 | Vector Group Ltd. | 39,860 | |||||||||
| 1,118 | Village Super Market, Inc., Class A | 34,636 | |||||||||
| 1,195 | WD-40 Co. | 32,337 | |||||||||
| 1,661 | Weis Markets, Inc. | 61,440 | |||||||||
| 2,543,659 | |||||||||||
| Energy—5.6% | |||||||||||
| 2,114 | Adams Resources & Energy, Inc. | 31,182 | |||||||||
| 14,327 | Allis-Chalmers Energy, Inc.* | 27,651 | |||||||||
| 5,104 | Alpha Natural Resources, Inc.* | 104,530 | |||||||||
| 984 | Approach Resources, Inc.* | 6,986 | |||||||||
| 888 | Arena Resources, Inc.* | 25,459 | |||||||||
| 8,170 | Atlas America, Inc. | 127,125 | |||||||||
| 4,195 | Atlas Energy Resources LLC | 74,419 | |||||||||
| 12,405 | ATP Oil & Gas Corp.* | 88,820 | |||||||||
| 4,909 | Atwood Oceanics, Inc.* | 109,569 | |||||||||
| 10,547 | Basic Energy Services, Inc.* | 107,579 | |||||||||
| 8,712 | Berry Petroleum Co., Class A | 143,574 | |||||||||
| 1,850 | Bill Barrett Corp.* | 48,063 | |||||||||
| 21,766 | Brigham Exploration Co.* | 50,932 | |||||||||
| 4,151 | Bristow Group, Inc.* | 94,477 | |||||||||
| 4,077 | Bronco Drilling Co., Inc.* | 22,383 | |||||||||
| 5,187 | Cabot Oil & Gas Corp. | 156,596 | |||||||||
| 5,027 | Cal Dive International, Inc.* | 39,814 | |||||||||
| 30,497 | Callon Petroleum Co.* | 53,675 | |||||||||
| 814 | CARBO Ceramics, Inc. | 24,998 | |||||||||
| 2,483 | Carrizo Oil & Gas, Inc.* | 30,615 | |||||||||
| 689 | Clayton Williams Energy, Inc.* | 20,691 | |||||||||
| 3,272 | Comstock Resources, Inc.* | 112,753 | |||||||||
| 2,393 | Concho Resources, Inc.* | 65,616 | |||||||||
| 538 | Contango Oil & Gas Co.* | 20,385 | |||||||||
| 6,286 | Copano Energy LLC | 98,313 | |||||||||
| 522 | Core Laboratories N.V. (Netherlands) | 43,446 | |||||||||
| 33,550 | Crosstex Energy, Inc. | 66,094 | |||||||||
| 1,865 | Dawson Geophysical Co.* | 36,666 | |||||||||
| 11,052 | Delta Petroleum Corp.* | 32,493 | |||||||||
| 2,744 | DHT Maritime, Inc. | 11,552 | |||||||||
| 5,198 | Dresser-Rand Group, Inc.* | 128,027 | |||||||||
| 1,929 | Dril-Quip, Inc.* | 66,319 | |||||||||
| 290,606 | Edge Petroleum Corp.* | 58,121 | |||||||||
| 4,137 | Encore Acquisition Co.* | 120,759 | |||||||||
| 8,331 | EXCO Resources, Inc.* | 98,139 | |||||||||
| 7,560 | GeoMet, Inc.* | 7,106 | |||||||||
| 21,954 | Global Industries Ltd.* | 142,042 | |||||||||
| Number of Shares | Value | ||||||||||
| Common Stocks and Other Equity Interests (Continued) | |||||||||||
| 841 | Goodrich Petroleum Corp.* | $ | 19,284 | ||||||||
| 2,496 | Gulf Island Fabrication, Inc. | 32,298 | |||||||||
| 2,657 | Gulfmark Offshore, Inc.* | 71,420 | |||||||||
| 7,155 | Gulfport Energy Corp.* | 21,250 | |||||||||
| 9,940 | Harvest Natural Resources, Inc.* | 50,694 | |||||||||
| 4,037 | Hornbeck Offshore Services, Inc.* | 93,780 | |||||||||
| 37,265 | International Coal Group, Inc.* | 74,157 | |||||||||
| 42,555 | ION Geophysical Corp.* | 106,388 | |||||||||
| 1,870 | James River Coal Co.* | 26,629 | |||||||||
| 4,592 | Knightsbridge Tankers Ltd. (Bermuda) | 60,752 | |||||||||
| 1,215 | Lufkin Industries, Inc. | 42,404 | |||||||||
| 4,195 | Matrix Service Co.* | 40,188 | |||||||||
| 13,784 | McMoRan Exploration Co.* | 75,674 | |||||||||
| 222,021 | Meridian Resource Corp.* | 59,946 | |||||||||
| 1,835 | NATCO Group, Inc., Class A* | 44,150 | |||||||||
| 15,010 | Newpark Resources, Inc.* | 42,028 | |||||||||
| 3,417 | Nordic American Tanker Shipping Ltd. (Bermuda) | 110,950 | |||||||||
| 1,237 | NuStar GP Holdings LLC | 27,969 | |||||||||
| 3,655 | Oceaneering International, Inc.* | 166,559 | |||||||||
| 20,120 | Oilsands Quest, Inc.* | 15,090 | |||||||||
| 56,048 | Pacific Ethanol, Inc.* | 20,738 | |||||||||
| 18,062 | Parallel Petroleum Corp.* | 24,022 | |||||||||
| 44,225 | Parker Drilling Co.* | 122,061 | |||||||||
| 6,212 | Patriot Coal Corp.* | 39,136 | |||||||||
| 5,535 | Penn Virginia Corp. | 77,877 | |||||||||
| 3,398 | Petroleum Development Corp* | 55,082 | |||||||||
| 11,616 | PetroQuest Energy, Inc.* | 34,964 | |||||||||
| 4,816 | PHI, Inc.* | 54,517 | |||||||||
| 5,053 | Quicksilver Resources, Inc.* | 41,081 | |||||||||
| 17,386 | Rosetta Resources, Inc.* | 122,571 | |||||||||
| 4,300 | RPC, Inc. | 46,010 | |||||||||
| 7,403 | St. Mary Land & Exploration Co. | 132,292 | |||||||||
| 7,725 | StealthGas, Inc. (Greece) | 38,934 | |||||||||
| 3,292 | Superior Well Services, Inc.* | 35,224 | |||||||||
| 15,135 | Swift Energy Co.* | 163,761 | |||||||||
| 1,587 | T-3 Energy Services, Inc.* | 21,313 | |||||||||
| 2,052 | Teekay Tankers, Ltd. Class A (Marshall Islands) | 24,747 | |||||||||
| 22,462 | TETRA Technologies, Inc.* | 128,483 | |||||||||
| 16,235 | TOP Ships, Inc. (Greece)* | 25,164 | |||||||||
| 3,224 | TriCo Marine Services, Inc.* | 12,509 | |||||||||
| 3,990 | Tsakos Energy Navigation Ltd. (Bermuda) | 62,483 | |||||||||
| 3,165 | Ultra Petroleum Corp.* | 135,462 | |||||||||
| 3,291 | Union Drilling, Inc.* | 19,713 | |||||||||
| 3,539 | VAALCO Energy, Inc.* | 16,881 | |||||||||
| 5,879 | Venoco, Inc.* | 25,691 | |||||||||
| 2,822 | Walter Energy. Inc. | 64,342 | |||||||||
| 29,099 | Warren Resources, Inc.* | 46,558 | |||||||||
| 5,370 | Willbros Group, Inc.* | 61,540 | |||||||||
| 5,331,735 | |||||||||||
See Notes to Financial Statements.
54
Schedule of Investments (Continued)
PowerShares FTSE RAFI US 1500 Small-Mid Portfolio
April 30, 2009
| Number of Shares | Value | ||||||||||
| Common Stocks and Other Equity Interests (Continued) | |||||||||||
| Financials—22.8% | |||||||||||
| 1,681 | 1st Source Corp. | $ | 33,015 | ||||||||
| 3,073 | Acadia Realty Trust REIT | 44,559 | |||||||||
| 63,714 | Advance America Cash Advance Centers, Inc. | 254,855 | |||||||||
| 32,122 | Advanta Corp., Class A | 25,055 | |||||||||
| 102,977 | Advanta Corp., Class B | 120,483 | |||||||||
| 11,170 | Affirmative Insurance Holdings, Inc. | 36,973 | |||||||||
| 1,503 | Agree Realty Corp. REIT | 23,988 | |||||||||
| 44 | Alexander's, Inc. REIT | 9,596 | |||||||||
| 193,835 | AMBAC Financial Group, Inc. | 176,390 | |||||||||
| 21,751 | AMCORE Financial, Inc. | 31,974 | |||||||||
| 2,046 | American Campus Communities, Inc. REIT | 44,357 | |||||||||
| 16,328 | American Equity Investment Life Holding Co. | 91,927 | |||||||||
| 511 | American Physicians Capital, Inc. | 21,288 | |||||||||
| 2,020 | American Safety Insurance Holdings, Ltd. (Bermuda)* | 22,988 | |||||||||
| 45,307 | AmericanWest Bancorp* | 36,246 | |||||||||
| 1,721 | Amerisafe, Inc.* | 26,435 | |||||||||
| 2,012 | Amtrust Financial Services Inc. | 18,370 | |||||||||
| 64,271 | Anchor Bancorp Wisconsin, Inc. | 104,762 | |||||||||
| 81,612 | Anthracite Capital, Inc. REIT | 32,645 | |||||||||
| 6,994 | Anworth Mortgage Asset Corp. REIT | 44,971 | |||||||||
| 75,546 | Arbor Realty Trust, Inc. REIT | 212,284 | |||||||||
| 24,362 | Ares Capital Corp. | 143,005 | |||||||||
| 2,247 | Argo Group International Holdings Ltd.* | 62,894 | |||||||||
| 742 | Arrow Financial Corp. | 19,648 | |||||||||
| 97,089 | Ashford Hospitality Trust, Inc. REIT | 293,208 | |||||||||
| 11,287 | Asset Acceptance Capital Corp.* | 93,569 | |||||||||
| 2,893 | Associated Estates Realty Corp. REIT | 16,056 | |||||||||
| 15,206 | Assured Guaranty Ltd. (Bermuda) | 146,890 | |||||||||
| 12,254 | Asta Funding, Inc. | 35,292 | |||||||||
| 2,500 | Avatar Holdings, Inc.* | 46,450 | |||||||||
| 253 | BancFirst Corp. | 10,803 | |||||||||
| 8,373 | Banco Latinoamericano de Exportaciones, S.A., Class E (Panama) | 102,988 | |||||||||
| 2,952 | BancTrust Financial Group, Inc. | 19,424 | |||||||||
| 2,113 | Bank Mutual Corp. | 21,701 | |||||||||
| 7,461 | Bank of Granite Corp. | 15,668 | |||||||||
| 40,135 | BankAtlantic Bancorp, Inc., Class A | 93,113 | |||||||||
| 2,135 | BankFinancial Corp. | 22,845 | |||||||||
| 10,211 | Banner Corp. | 47,379 | |||||||||
| 1,285 | Beneficial Mutual Bancorp, Inc.* | 12,927 | |||||||||
| 1,211 | Berkshire Hills Bancorp, Inc. | 27,320 | |||||||||
| 22,667 | BGC Partners, Inc., Class A | 58,708 | |||||||||
| 10,265 | BioMed Realty Trust, Inc. REIT | 117,124 | |||||||||
| 19,373 | BlackRock Kelso Capital Corp. | 112,945 | |||||||||
| 8,522 | Boston Private Financial Holdings, Inc. | 39,286 | |||||||||
| 6,369 | Brookline Bancorp, Inc. | 63,180 | |||||||||
| 6,655 | Brown & Brown, Inc. | 129,506 | |||||||||
| 4,109 | BRT Realty Trust REIT | 20,627 | |||||||||
| 12,239 | Calamos Asset Management, Inc., Class A | 139,647 | |||||||||
| Number of Shares | Value | ||||||||||
| Common Stocks and Other Equity Interests (Continued) | |||||||||||
| 1,846 | Capital City Bank Group, Inc. | $ | 27,764 | ||||||||
| 343 | Capital Southwest Corp. | 26,672 | |||||||||
| 31,472 | Capital Trust, Inc., Class A REIT | 53,502 | |||||||||
| 5,584 | Capitol Bancorp Ltd. | 20,437 | |||||||||
| 677 | Capitol Federal Financial | 26,376 | |||||||||
| 16,402 | CapLease, Inc. REIT | 48,714 | |||||||||
| 5,322 | Capstead Mortgage Corp. REIT | 60,618 | |||||||||
| 6,738 | Cardtronics, Inc.* | 16,508 | |||||||||
| 2,486 | Cash America International, Inc. | 55,587 | |||||||||
| 9,710 | Cathay General Bancorp | 108,946 | |||||||||
| 8,625 | Cedar Shopping Centers, Inc. REIT | 30,964 | |||||||||
| 13,423 | Central Pacific Financial Corp. | 78,659 | |||||||||
| 2,753 | Chemical Financial Corp. | 58,777 | |||||||||
| 149,515 | Citizens Republic Bancorp, Inc.* | 251,184 | |||||||||
| 2,629 | Citizens, Inc.* | 18,955 | |||||||||
| 18,857 | City Bank | 59,022 | |||||||||
| 1,446 | City Holding Co. | 42,643 | |||||||||
| 1,582 | CNA Surety Corp.* | 30,454 | |||||||||
| 2,851 | CoBiz Financial, Inc. | 16,735 | |||||||||
| 890 | Cohen & Steers, Inc. | 13,101 | |||||||||
| 3,606 | Columbia Banking System, Inc. | 35,699 | |||||||||
| 19,245 | Community Bancorp* | 43,301 | |||||||||
| 3,121 | Community Bank System, Inc. | 51,340 | |||||||||
| 1,331 | Community Trust Bancorp, Inc. | 40,276 | |||||||||
| 4,159 | Compass Diversified Holdings | 37,181 | |||||||||
| 3,017 | Corporate Office Properties Trust REIT | 92,200 | |||||||||
| 511,017 | Corus Bankshares, Inc.* | 107,314 | |||||||||
| 5,096 | Cowen Group, Inc.* | 29,404 | |||||||||
| 5,286 | Crawford & Co., Class B* | 31,452 | |||||||||
| 584 | Credit Acceptance Corp.* | 13,426 | |||||||||
| 2,248 | Cullen/Frost Bankers, Inc. | 105,858 | |||||||||
| 8,930 | CVB Financial Corp. | 53,669 | |||||||||
| 10,538 | Delphi Financial Group, Inc., Class A | 181,991 | |||||||||
| 29,863 | DiamondRock Hospitality Co. REIT | 193,811 | |||||||||
| 2,146 | Digital Realty Trust, Inc. REIT | 77,277 | |||||||||
| 3,545 | Dime Community Bancshares, Inc. | 29,565 | |||||||||
| 6,182 | Dollar Financial Corp.* | 62,438 | |||||||||
| 1,657 | Donegal Group, Inc., Class A | 24,258 | |||||||||
| 14,782 | East West Bancorp, Inc. | 100,961 | |||||||||
| 2,142 | EastGroup Properties, Inc. REIT | 71,993 | |||||||||
| 6,328 | Eaton Vance Corp. | 173,197 | |||||||||
| 8,351 | Education Realty Trust, Inc. REIT | 39,166 | |||||||||
| 351 | EMC Insurance Group, Inc. | 7,954 | |||||||||
| 5,646 | Employers Holdings, Inc. | 47,088 | |||||||||
| 5,539 | Encore Capital Group, Inc.* | 48,411 | |||||||||
| 747 | Enstar Group Ltd. (Bermuda)* | 53,291 | |||||||||
| 6,653 | Entertainment Properties Trust REIT | 153,751 | |||||||||
| 893 | Equity Lifestyle Properties, Inc. REIT | 35,425 | |||||||||
| 1,949 | Essex Property Trust, Inc. REIT | 123,742 | |||||||||
| 1,607 | Evercore Partners, Inc., Class A | 30,340 | |||||||||
| 8,913 | Extra Space Storage, Inc. REIT | 63,371 | |||||||||
See Notes to Financial Statements.
55
Schedule of Investments (Continued)
PowerShares FTSE RAFI US 1500 Small-Mid Portfolio
April 30, 2009
| Number of Shares | Value | ||||||||||
| Common Stocks and Other Equity Interests (Continued) | |||||||||||
| 3,154 | EZCORP, Inc., Class A* | $ | 39,078 | ||||||||
| 15,496 | F.N.B. Corp. | 116,530 | |||||||||
| 1,400 | Farmers Capital Bank Corp. | 29,708 | |||||||||
| 13,906 | FBL Financial Group, Inc., Class A | 79,960 | |||||||||
| 11,369 | FBR Capital Markets Corp.* | 47,181 | |||||||||
| 31,960 | FCStone Group, Inc.* | 98,756 | |||||||||
| 5,607 | Federal Agricultural Mortgage Corp., Class C | 17,718 | |||||||||
| 127,975 | FelCor Lodging Trust, Inc. REIT | 253,390 | |||||||||
| 1,984 | Financial Federal Corp. | 48,826 | |||||||||
| 4,057 | Financial Institutions, Inc. | 60,246 | |||||||||
| 3,196 | First Acceptance Corp.* | 8,150 | |||||||||
| 24,375 | First BanCorp. | 134,306 | |||||||||
| 5,454 | First Busey Corp. | 42,705 | |||||||||
| 1,866 | First Cash Financial Services, Inc.* | 30,677 | |||||||||
| 815 | First Citizens BancShares, Inc., Class A | 97,531 | |||||||||
| 9,319 | First Commonwealth Financial Corp. | 80,796 | |||||||||
| 2,087 | First Community Bancshares, Inc. | 30,157 | |||||||||
| 2,803 | First Financial Bancorp | 30,244 | |||||||||
| 1,025 | First Financial Bankshares, Inc. | 50,512 | |||||||||
| 359 | First Financial Corp. | 13,319 | |||||||||
| 4,655 | First Financial Holdings, Inc. | 41,895 | |||||||||
| 2,602 | First Financial Northwest, Inc. | 20,998 | |||||||||
| 49,252 | First Marblehead (The) Corp.* | 94,564 | |||||||||
| 3,617 | First Merchants Corp. | 43,983 | |||||||||
| 1,539 | First Mercury Financial Corp.* | 20,346 | |||||||||
| 12,160 | First Midwest Bancorp, Inc. | 107,738 | |||||||||
| 4,625 | First Niagara Financial Group, Inc. | 62,623 | |||||||||
| 12,188 | First Place Financial Corp. | 69,228 | |||||||||
| 4,408 | First Potomac Realty Trust REIT | 43,154 | |||||||||
| 21,157 | First Regional Bancorp* | 26,446 | |||||||||
| 24,154 | First State Bancorp | 52,173 | |||||||||
| 110,863 | Flagstar Bancorp, Inc.* | 160,751 | |||||||||
| 4,322 | Flushing Financial Corp. | 39,806 | |||||||||
| 21,610 | Forest City Enterprises, Inc., Class A | 182,172 | |||||||||
| 5,131 | Forestar Group, Inc.* | 65,985 | |||||||||
| 905 | FPIC Insurance Group, Inc.* | 27,639 | |||||||||
| 8,480 | Franklin Street Properties Corp. REIT | 113,208 | |||||||||
| 19,650 | Frontier Financial Corp. | 27,903 | |||||||||
| 1,340 | GAMCO Investors, Inc., Class A | 67,201 | |||||||||
| 2,023 | Getty Realty Corp. REIT | 39,691 | |||||||||
| 12,796 | GFI Group, Inc. | 52,208 | |||||||||
| 2,059 | Glacier Bancorp, Inc. | 31,544 | |||||||||
| 3,782 | Gladstone Capital Corp. | 25,377 | |||||||||
| 4,099 | Gladstone Investment Corp. | 14,920 | |||||||||
| 48,052 | Glimcher Realty Trust REIT | 117,727 | |||||||||
| 3,270 | Greene Bankshares, Inc. | 27,795 | |||||||||
| 438 | Greenhill & Co., Inc. | 33,958 | |||||||||
| 2,839 | Greenlight Capital Re Ltd., Class A (Cayman Islands)* | 43,948 | |||||||||
| 91,267 | Grubb & Ellis Co. | 84,878 | |||||||||
| Number of Shares | Value | ||||||||||
| Common Stocks and Other Equity Interests (Continued) | |||||||||||
| 11,901 | Guaranty Bancorp* | $ | 26,420 | ||||||||
| 2,520 | Hallmark Financial Services, Inc.* | 16,934 | |||||||||
| 2,346 | Hancock Holding Co. | 88,843 | |||||||||
| 21,190 | Hanmi Financial Corp. | 32,845 | |||||||||
| 2,547 | Harleysville Group, Inc. | 73,659 | |||||||||
| 5,557 | Harleysville National Corp. | 48,735 | |||||||||
| 2,987 | Hatteras Financial Corp. REIT | 71,897 | |||||||||
| 2,344 | Heartland Financial USA, Inc. | 34,644 | |||||||||
| 6,853 | Hercules Technology Growth Capital, Inc. | 41,187 | |||||||||
| 15,640 | Hersha Hospitality Trust REIT | 57,086 | |||||||||
| 11,035 | HFF, Inc. Class A* | 29,795 | |||||||||
| 2,979 | Hilltop Holdings, Inc.* | 33,752 | |||||||||
| 738 | Home BancShares, Inc. | 16,273 | |||||||||
| 4,088 | Home Properties, Inc. REIT | 148,967 | |||||||||
| 9,424 | Horace Mann Educators Corp. | 82,743 | |||||||||
| 1,133 | IBERIABANK Corp. | 51,755 | |||||||||
| 2,708 | Independence Holding Co. | 14,000 | |||||||||
| 19,934 | Independent Bank Corp. | 35,881 | |||||||||
| 1,974 | Independent Bank Corp. | 39,401 | |||||||||
| 1,899 | Infinity Property & Casualty Corp. | 66,921 | |||||||||
| 9,084 | Inland Real Estate Corp. REIT | 79,758 | |||||||||
| 31,228 | Integra Bank Corp. | 67,452 | |||||||||
| 1,429 | IntercontinentalExchange, Inc.* | 125,180 | |||||||||
| 7,947 | International Bancshares Corp. | 107,364 | |||||||||
| 4,884 | Intervest Bancshares Corp. Class A | 19,194 | |||||||||
| 4,414 | Investment Technology Group, Inc. | 100,551 | |||||||||
| 3,805 | Investors Bancorp, Inc.* | 34,854 | |||||||||
| 4,700 | Investors Real Estate Trust REIT | 43,475 | |||||||||
| 7,934 | Irwin Financial Corp.* | 9,997 | |||||||||
| 5,861 | Jefferies Group, Inc. | 114,700 | |||||||||
| 738 | Kansas City Life Insurance Co. | 16,258 | |||||||||
| 1,547 | KBW, Inc.* | 37,422 | |||||||||
| 727 | Kearny Financial Corp. | 8,106 | |||||||||
| 4,559 | Kilroy Realty Corp. REIT | 98,201 | |||||||||
| 8,008 | Kite Realty Group Trust REIT | 28,028 | |||||||||
| 6,421 | Knight Capital Group, Inc., Class A* | 99,461 | |||||||||
| 14,083 | Kohlberg Capital Corp. | 50,135 | |||||||||
| 7,566 | LaBranche & Co., Inc.* | 31,626 | |||||||||
| 3,268 | Lakeland Bancorp, Inc. | 27,811 | |||||||||
| 933 | Lakeland Financial Corp | 17,512 | |||||||||
| 14,854 | LaSalle Hotel Properties REIT | 177,654 | |||||||||
| 3,976 | Lazard Ltd., Class A (Bermuda) | 108,545 | |||||||||
| 36,537 | Lexington Realty Trust REIT | 140,667 | |||||||||
| 2,197 | LTC Properties, Inc. REIT | 39,568 | |||||||||
| 8,876 | Macatawa Bank Corp. | 28,137 | |||||||||
| 45,975 | Maguire Properties, Inc. REIT* | 50,113 | |||||||||
| 5,929 | Maiden Holdings Ltd. (Bermuda) | 26,740 | |||||||||
| 4,346 | MainSource Financial Group, Inc. | 37,636 | |||||||||
| 4,482 | Marlin Business Services Corp.* | 14,298 | |||||||||
| 938 | Maui Land & Pineapple Co., Inc.* | 5,956 | |||||||||
| 6,967 | Max Capital Group Ltd. (Bermuda) | 115,304 | |||||||||
See Notes to Financial Statements.
56
Schedule of Investments (Continued)
PowerShares FTSE RAFI US 1500 Small-Mid Portfolio
April 30, 2009
| Number of Shares | Value | ||||||||||
| Common Stocks and Other Equity Interests (Continued) | |||||||||||
| 5,465 | MB Financial, Inc. | $ | 74,488 | ||||||||
| 129,152 | MCG Capital Corp. | 227,308 | |||||||||
| 5,129 | Meadowbrook Insurance Group, Inc. | 30,518 | |||||||||
| 2,921 | Medallion Financial Corp. | 21,528 | |||||||||
| 16,768 | Medical Properties Trust, Inc. REIT | 89,541 | |||||||||
| 14,385 | MFA Financial, Inc. REIT | 84,728 | |||||||||
| 2,526 | Mid-America Apartment Communities, Inc. REIT | 93,437 | |||||||||
| 13,844 | Midwest Banc Holdings, Inc. | 22,427 | |||||||||
| 4,348 | Mission West Properties, Inc. REIT | 29,610 | |||||||||
| 2,986 | Monmouth Real Estate Investment Corp. Class A | 18,274 | |||||||||
| 3,501 | MVC Capital, Inc. | 29,969 | |||||||||
| 7,492 | Nara Bancorp, Inc. | 27,795 | |||||||||
| 531 | NASB Financial, Inc. | 11,714 | |||||||||
| 31,104 | National Financial Partners Corp. | 219,594 | |||||||||
| 2,754 | National Health Investors, Inc. REIT | 73,862 | |||||||||
| 378 | National Interstate Corp. | 6,105 | |||||||||
| 4,783 | National Penn Bancshares, Inc. | 38,694 | |||||||||
| 7,630 | National Retail Properties, Inc. REIT | 135,356 | |||||||||
| 847 | Navigators Group, Inc.* | 38,437 | |||||||||
| 2,731 | NBT Bancorp, Inc. | 64,670 | |||||||||
| 10,206 | Nelnet, Inc., Class A* | 61,542 | |||||||||
| 7,528 | NewAlliance Bancshares, Inc. | 97,186 | |||||||||
| 359,012 | Newcastle Investment Corp. REIT | 222,587 | |||||||||
| 18,710 | NewStar Financial, Inc.* | 42,472 | |||||||||
| 3,397 | NGP Capital Resources Co. | 23,847 | |||||||||
| 2,012 | Northfield Bancorp, Inc. | 22,736 | |||||||||
| 26,518 | NorthStar Realty Finance Corp. REIT | 84,062 | |||||||||
| 1,151 | Northwest Bancorp, Inc. | 20,235 | |||||||||
| 1,244 | NYMAGIC, Inc. | 14,667 | |||||||||
| 1,347 | OceanFirst Financial Corp. | 16,366 | |||||||||
| 6,198 | Ocwen Financial Corp.* | 68,922 | |||||||||
| 5,242 | Old National Bancorp | 71,448 | |||||||||
| 3,109 | Old Second Bancorp, Inc. | 16,789 | |||||||||
| 4,411 | Omega Healthcare Investors, Inc. REIT | 69,341 | |||||||||
| 6,477 | One Liberty Properties, Inc. REIT | 26,426 | |||||||||
| 2,847 | optionsXpress Holdings, Inc. | 46,862 | |||||||||
| 18,369 | Oriental Financial Group, Inc. | 170,648 | |||||||||
| 692 | Oritani Financial Corp.* | 9,819 | |||||||||
| 13,110 | Pacific Capital Bancorp | 90,983 | |||||||||
| 3,915 | PacWest Bancorp | 57,042 | |||||||||
| 1,717 | Park National Corp. | 114,953 | |||||||||
| 4,323 | Parkway Properties, Inc. REIT | 59,960 | |||||||||
| 11,048 | Patriot Capital Funding, Inc. | 24,968 | |||||||||
| 33,888 | Pennsylvania REIT | 262,631 | |||||||||
| 3,922 | Penson Worldwide, Inc.* | 39,769 | |||||||||
| 2,203 | Peoples Bancorp, Inc. | 36,504 | |||||||||
| 1,036 | Pico Holdings, Inc.* | 31,080 | |||||||||
| 1,831 | Pinnacle Financial Partners, Inc.* | 32,665 | |||||||||
| 3,632 | Piper Jaffray Cos.* | 125,921 | |||||||||
| Number of Shares | Value | ||||||||||
| Common Stocks and Other Equity Interests (Continued) | |||||||||||
| 5,441 | PMA Capital Corp., Class A* | $ | 20,404 | ||||||||
| 1,387 | Portfolio Recovery Associates, Inc.* | 48,503 | |||||||||
| 11,049 | Post Properties, Inc. REIT | 140,985 | |||||||||
| 6,297 | Presidential Life Corp. | 67,315 | |||||||||
| 2,607 | PrivateBancorp, Inc. | 52,792 | |||||||||
| 2,297 | ProAssurance Corp.* | 100,930 | |||||||||
| 3,956 | Prospect Capital Corp. | 35,881 | |||||||||
| 2,262 | Prosperity Bancshares, Inc. | 62,816 | |||||||||
| 11,015 | Provident Bankshares Corp. | 96,822 | |||||||||
| 7,609 | Provident Financial Services, Inc. | 81,188 | |||||||||
| 3,313 | Provident New York Bancorp | 28,061 | |||||||||
| 1,317 | PS Business Parks, Inc. REIT | 57,619 | |||||||||
| 112,658 | RAIT Financial Trust REIT | 166,734 | |||||||||
| 7,461 | Ramco-Gershenson Properties Trust REIT | 82,071 | |||||||||
| 3,034 | Renasant Corp. | 42,779 | |||||||||
| 1,446 | Republic Bancorp, Inc., Class A | 32,159 | |||||||||
| 14,939 | Resource Capital Corp. REIT | 47,058 | |||||||||
| 4,295 | Rewards Network, Inc.* | 16,020 | |||||||||
| 717 | Riskmetrics Group, Inc.* | 12,469 | |||||||||
| 1,493 | RLI Corp. | 71,709 | |||||||||
| 2,828 | Royal Bancshares of Pennsylvania, Class A* | 6,618 | |||||||||
| 2,145 | S&T Bancorp, Inc. | 38,331 | |||||||||
| 757 | S.Y. Bancorp, Inc. | 19,092 | |||||||||
| 1,882 | Safety Insurance Group, Inc. | 62,200 | |||||||||
| 2,840 | Sanders Morris Harris Group, Inc. | 12,837 | |||||||||
| 1,701 | Sandy Spring Bancorp, Inc. | 27,641 | |||||||||
| 1,601 | Santander BanCorp | 10,727 | |||||||||
| 803 | Saul Centers, Inc. REIT | 25,568 | |||||||||
| 1,063 | SCBT Financial Corp. | 24,523 | |||||||||
| 2,844 | SeaBright Insurance Holdings, Inc.* | 26,392 | |||||||||
| 4,726 | Seacoast Banking Corp. of Florida | 19,944 | |||||||||
| 6,945 | Selective Insurance Group, Inc. | 102,508 | |||||||||
| 1,918 | Signature Bank* | 52,150 | |||||||||
| 1,093 | Simmons First National Corp., Class A | 28,341 | |||||||||
| 63,442 | South Financial Group (The), Inc. | 105,314 | |||||||||
| 2,250 | Southwest Bancorp, Inc. | 15,413 | |||||||||
| 2,855 | Sovran Self Storage, Inc. REIT | 64,352 | |||||||||
| 4,345 | St. Joe (The) Co.* | 108,104 | |||||||||
| 5,246 | State Auto Financial Corp. | 85,143 | |||||||||
| 2,027 | StellarOne Corp. | 26,087 | |||||||||
| 2,686 | Sterling Bancorp | 30,728 | |||||||||
| 8,119 | Sterling Bancshares, Inc. | 53,991 | |||||||||
| 47,354 | Sterling Financial Corp. | 151,059 | |||||||||
| 5,530 | Stewart Information Services Corp. | 125,033 | |||||||||
| 1,254 | Stifel Financial Corp.* | 61,734 | |||||||||
| 107,049 | Strategic Hotels & Resorts, Inc. REIT | 89,921 | |||||||||
| 660 | Suffolk Bancorp | 16,896 | |||||||||
| 5,278 | Sun Bancorp, Inc.* | 34,729 | |||||||||
| 4,158 | Sun Communities, Inc. REIT | 60,915 | |||||||||
| 45,151 | Sunstone Hotel Investors, Inc. REIT | 238,848 | |||||||||
| 9,469 | Superior Bancorp* | 40,054 | |||||||||
See Notes to Financial Statements.
57
Schedule of Investments (Continued)
PowerShares FTSE RAFI US 1500 Small-Mid Portfolio
April 30, 2009
| Number of Shares | Value | ||||||||||
| Common Stocks and Other Equity Interests (Continued) | |||||||||||
| 5,283 | SVB Financial Group* | $ | 109,675 | ||||||||
| 2,875 | SWS Group, Inc. | 36,771 | |||||||||
| 1,660 | Tanger Factory Outlet Centers, Inc. REIT | 55,311 | |||||||||
| 3,221 | Taubman Centers, Inc. REIT | 76,724 | |||||||||
| 1,897 | Taylor Capital Group, Inc.* | 8,062 | |||||||||
| 27 | Teton Advisors, Inc.* | 0 | |||||||||
| 3,562 | Texas Capital Bancshares, Inc.* | 49,868 | |||||||||
| 3,378 | TFS Financial Corp. | 39,624 | |||||||||
| 8,792 | Thomas Weisel Partners Group, Inc.* | 39,740 | |||||||||
| 6,881 | TICC Capital Corp. | 27,318 | |||||||||
| 15,311 | TierOne Corp. | 32,459 | |||||||||
| 452 | Tompkins Financial Corp. | 19,052 | |||||||||
| 1,159 | Tower Group, Inc. | 31,513 | |||||||||
| 1,538 | TradeStation Group, Inc.* | 12,473 | |||||||||
| 5,310 | Tree.com, Inc.* | 34,090 | |||||||||
| 79,960 | Triad Guaranty, Inc.* | 26,387 | |||||||||
| 1,557 | TriCo Bancshares | 24,912 | |||||||||
| 8,996 | Trustco Bank Corp. NY | 53,976 | |||||||||
| 6,139 | Trustmark Corp. | 133,462 | |||||||||
| 60,814 | UCBH Holdings, Inc. | 77,842 | |||||||||
| 1,614 | UMB Financial Corp. | 73,873 | |||||||||
| 4,691 | Umpqua Holdings Corp. | 44,987 | |||||||||
| 1,890 | Union Bankshares Corp. | 32,300 | |||||||||
| 19,743 | United America Indemnity Ltd., Class A* | 100,097 | |||||||||
| 5,805 | United Bankshares, Inc. | 150,582 | |||||||||
| 17,722 | United Community Banks, Inc. | 114,307 | |||||||||
| 47,572 | United Community Financial Corp. | 98,474 | |||||||||
| 2,754 | United Fire & Casualty Co. | 51,417 | |||||||||
| 14,408 | United PanAm Financial Corp.* | 26,367 | |||||||||
| 850 | Universal Health Realty Income Trust REIT | 27,217 | |||||||||
| 1,091 | Univest Corp. of Pennsylvania | 22,769 | |||||||||
| 150 | Urstadt Biddle Properties, Inc. REIT | 2,171 | |||||||||
| 2,107 | Urstadt Biddle Properties, Inc., Class A REIT | 32,364 | |||||||||
| 27,703 | U-Store-It Trust REIT | 95,021 | |||||||||
| 4,835 | Virginia Commerce Bancorp* | 15,472 | |||||||||
| 3,701 | W.P. Carey & Co. LLC | 78,683 | |||||||||
| 5,251 | Waddell & Reed Financial, Inc., Class A | 117,675 | |||||||||
| 4,681 | Washington REIT | 99,846 | |||||||||
| 1,736 | Washington Trust Bancorp, Inc. | 31,682 | |||||||||
| 2,736 | Waterstone Financial, Inc.* | 7,798 | |||||||||
| 3,135 | WesBanco, Inc. | 62,355 | |||||||||
| 3,053 | West Bancorporation, Inc. | 26,866 | |||||||||
| 15,833 | West Coast Bancorp | 44,649 | |||||||||
| 1,677 | Westamerica Bancorp | 89,938 | |||||||||
| 2,568 | Western Alliance Bancorp* | 16,718 | |||||||||
| 1,628 | Westfield Financial, Inc. | 15,206 | |||||||||
| 7,582 | Whitney Holding Corp. | 90,681 | |||||||||
| 3,356 | Wilshire Bancorp, Inc. | 13,558 | |||||||||
| 2,328 | Winthrop Realty Trust REIT | 20,486 | |||||||||
| 4,843 | Wintrust Financial Corp. | 82,331 | |||||||||
| 2,739 | World Acceptance Corp.* | 81,294 | |||||||||
| Number of Shares | Value | ||||||||||
| Common Stocks and Other Equity Interests (Continued) | |||||||||||
| 892 | WSFS Financial Corp. | $ | 24,182 | ||||||||
| 3,082 | Zenith National Insurance Corp. | 70,239 | |||||||||
| 21,534,080 | |||||||||||
| Health Care—6.1% | |||||||||||
| 232 | Abraxis Bioscience, Inc.* | 11,252 | |||||||||
| 17,870 | Affymetrix, Inc.* | 83,810 | |||||||||
| 1,394 | Air Methods Corp.* | 37,011 | |||||||||
| 2,478 | Albany Molecular Research, Inc.* | 24,185 | |||||||||
| 3,152 | Align Technology, Inc.* | 39,116 | |||||||||
| 1,735 | Alkermes, Inc.* | 13,273 | |||||||||
| 2,564 | Alliance Healthcare Services, Inc.* | 20,179 | |||||||||
| 1,539 | Allscripts-Misys Healthcare Solutions, Inc. | 19,114 | |||||||||
| 1,388 | Amedisys, Inc.* | 46,554 | |||||||||
| 1,804 | America Service Group, Inc.* | 25,671 | |||||||||
| 1,333 | American Dental Partners, Inc.* | 9,258 | |||||||||
| 2,884 | American Medical Systems Holdings, Inc.* | 35,675 | |||||||||
| 7,932 | AMN Healthcare Services, Inc.* | 54,651 | |||||||||
| 3,876 | AmSurg Corp. Class A* | 79,613 | |||||||||
| 819 | Analogic Corp. | 29,812 | |||||||||
| 1,851 | Angiodynamics, Inc.* | 23,452 | |||||||||
| 16,959 | Animal Health International, Inc.* | 30,187 | |||||||||
| 1,064 | Assisted Living Concepts, Inc. Class A* | 21,099 | |||||||||
| 680 | Bio-Reference Labs, Inc.* | 17,456 | |||||||||
| 26,081 | BioScrip, Inc.* | 82,938 | |||||||||
| 2,878 | Bruker Corp.* | 18,937 | |||||||||
| 35,495 | Cambrex Corp.* | 82,703 | |||||||||
| 1,131 | Cantel Medical Corp.* | 15,981 | |||||||||
| 2,580 | Capital Senior Living Corp.* | 10,191 | |||||||||
| 4,719 | Cardiac Science Corp.* | 13,921 | |||||||||
| 2,417 | Catalyst Health Solutions, Inc.* | 54,503 | |||||||||
| 3,234 | Celera Corp.* | 26,163 | |||||||||
| 1,722 | Celgene Corp.* | 73,564 | |||||||||
| 5,121 | Centene Corp.* | 94,073 | |||||||||
| 1,224 | Chemed Corp. | 51,812 | |||||||||
| 4,494 | CONMED Corp.* | 59,860 | |||||||||
| 4,408 | Cooper (The) Cos., Inc. | 126,729 | |||||||||
| 765 | Corvel Corp.* | 17,213 | |||||||||
| 6,458 | Cross Country Healthcare, Inc.* | 56,895 | |||||||||
| 1,332 | Cubist Pharmaceuticals, Inc.* | 22,111 | |||||||||
| 670 | Dionex Corp.* | 42,210 | |||||||||
| 3,529 | Eclipsys Corp.* | 46,583 | |||||||||
| 1,968 | Edwards Lifesciences Corp.* | 124,732 | |||||||||
| 3,496 | Emergency Medical Services Corp., Class A* | 121,801 | |||||||||
| 194 | Emergent Biosolutions, Inc.* | 2,078 | |||||||||
| 4,862 | Emeritus Corp.* | 43,952 | |||||||||
| 740 | Ensign Group (The), Inc. | 11,470 | |||||||||
| 2,814 | Enzon Pharmaceuticals, Inc.* | 16,181 | |||||||||
| 5,030 | ev3, Inc.* | 42,051 | |||||||||
| 19,727 | Five Star Quality Care, Inc.* | 33,339 | |||||||||
| 1,581 | Gen-Probe, Inc.* | 76,141 | |||||||||
See Notes to Financial Statements.
58
Schedule of Investments (Continued)
PowerShares FTSE RAFI US 1500 Small-Mid Portfolio
April 30, 2009
| Number of Shares | Value | ||||||||||
| Common Stocks and Other Equity Interests (Continued) | |||||||||||
| 3,214 | Gentiva Health Services, Inc.* | $ | 51,199 | ||||||||
| 1,628 | Greatbatch, Inc.* | 34,253 | |||||||||
| 1,001 | Haemonetics Corp.* | 51,682 | |||||||||
| 2,346 | Hanger Orthopedic Group, Inc.* | 32,633 | |||||||||
| 10,226 | Healthsouth Corp.* | 95,818 | |||||||||
| 8,059 | Healthspring, Inc.* | 74,385 | |||||||||
| 19,177 | HealthTronics, Inc.* | 27,998 | |||||||||
| 5,504 | Healthways, Inc.* | 57,407 | |||||||||
| 7,135 | Hlth Corp.* | 78,485 | |||||||||
| 514 | ICU Medical Inc* | 19,326 | |||||||||
| 2,214 | IDEXX Laboratories, Inc.* | 87,010 | |||||||||
| 898 | Illumina, Inc.* | 33,540 | |||||||||
| 1,494 | Immucor, Inc.* | 24,337 | |||||||||
| 983 | Integra LifeSciences Holdings Corp.* | 25,381 | |||||||||
| 1,158 | Intuitive Surgical, Inc.* | 166,438 | |||||||||
| 4,452 | Invacare Corp. | 68,516 | |||||||||
| 5,345 | inVentiv Health, Inc.* | 59,276 | |||||||||
| 1,187 | Kendle International, Inc.* | 10,564 | |||||||||
| 78,517 | KV Pharmaceutical Co., Class A* | 109,924 | |||||||||
| 409 | Landauer, Inc. | 21,669 | |||||||||
| 6,981 | LCA-Vision, Inc. | 40,141 | |||||||||
| 645 | LHC Group Inc* | 14,719 | |||||||||
| 2,482 | Martek Biosciences Corp. | 45,222 | |||||||||
| 866 | Masimo Corp.* | 25,027 | |||||||||
| 1,081 | MedAssets, Inc.* | 18,636 | |||||||||
| 5,080 | MedCath Corp.* | 51,410 | |||||||||
| 2,337 | Medical Action Industries, Inc.* | 22,669 | |||||||||
| 1,094 | Medicines (The) Co.* | 10,918 | |||||||||
| 4,057 | Medicis Pharmaceutical Corp., Class A | 65,196 | |||||||||
| 3,408 | Mednax, Inc.* | 122,347 | |||||||||
| 743 | Meridian Bioscience, Inc. | 12,913 | |||||||||
| 1,672 | Merit Medical Systems, Inc.* | 25,933 | |||||||||
| 1,873 | Molina Healthcare, Inc.* | 40,550 | |||||||||
| 1,261 | MWI Veterinary Supply, Inc.* | 39,192 | |||||||||
| 551 | Myriad Genetics, Inc.* | 21,373 | |||||||||
| 661 | National Healthcare Corp. | 26,242 | |||||||||
| 2,026 | Odyssey HealthCare, Inc.* | 20,989 | |||||||||
| 2,688 | Orthofix International N.V. (Netherlands)* | 45,830 | |||||||||
| 4,383 | Par Pharmaceutical Cos., Inc.* | 47,030 | |||||||||
| 6,850 | Parexel International Corp.* | 67,884 | |||||||||
| 2,443 | PDI, Inc.* | 7,842 | |||||||||
| 5,566 | PDL BioPharma Inc | 39,797 | |||||||||
| 6,825 | PerkinElmer, Inc. | 99,440 | |||||||||
| 4,807 | Perrigo Co. | 124,597 | |||||||||
| 3,634 | PharMerica Corp.* | 66,321 | |||||||||
| 1,116 | Phase Forward, Inc.* | 15,914 | |||||||||
| 5,326 | Providence Service (The) Corp.* | 52,301 | |||||||||
| 5,682 | PSS World Medical, Inc.* | 82,503 | |||||||||
| 3,679 | Psychiatric Solutions, Inc.* | 71,336 | |||||||||
| 2,496 | RehabCare Group, Inc.* | 41,683 | |||||||||
| 4,142 | Res-Care, Inc.* | 66,355 | |||||||||
| Number of Shares | Value | ||||||||||
| Common Stocks and Other Equity Interests (Continued) | |||||||||||
| 2,032 | ResMed, Inc.* | $ | 78,130 | ||||||||
| 2,858 | Salix Pharmaceuticals Ltd.* | 31,438 | |||||||||
| 4,952 | Sepracor, Inc.* | 70,368 | |||||||||
| 1,658 | Sirona Dental Systems, Inc.* | 27,125 | |||||||||
| 6,231 | Skilled Healthcare Group, Inc., Class A* | 54,397 | |||||||||
| 814 | SonoSite, Inc.* | 14,685 | |||||||||
| 3,730 | STERIS Corp. | 89,893 | |||||||||
| 5,742 | Sun Healthcare Group, Inc.* | 48,635 | |||||||||
| 840 | SurModics, Inc.* | 18,228 | |||||||||
| 3,678 | Symmetry Medical, Inc.* | 26,702 | |||||||||
| 1,030 | Techne Corp. | 58,937 | |||||||||
| 1,320 | Thoratec Corp.* | 38,359 | |||||||||
| 7,539 | TomoTherapy, Inc.* | 19,451 | |||||||||
| 6,447 | Triple-S Management Corp., Class B* | 82,651 | |||||||||
| 319 | United Therapeutics Corp.* | 20,036 | |||||||||
| 4,047 | Valeant Pharmaceuticals International* | 67,828 | |||||||||
| 3,289 | Varian, Inc.* | 108,603 | |||||||||
| 4,161 | VCA Antech, Inc.* | 104,108 | |||||||||
| 9,020 | ViroPharma, Inc.* | 50,783 | |||||||||
| 5,772 | WellCare Health Plans, Inc.* | 86,638 | |||||||||
| 2,008 | West Pharmaceutical Services, Inc. | 65,561 | |||||||||
| 1,295 | Wright Medical Group, Inc.* | 17,806 | |||||||||
| 1,955 | Zoll Medical Corp.* | 31,436 | |||||||||
| 5,763,449 | |||||||||||
| Industrials—17.0% | |||||||||||
| 3,160 | A.O. Smith Corp. | 98,244 | |||||||||
| 723 | AAON, Inc. | 14,084 | |||||||||
| 5,667 | AAR Corp.* | 85,402 | |||||||||
| 7,091 | ABM Industries, Inc. | 124,234 | |||||||||
| 101,398 | ACCO Brands Corp.* | 211,921 | |||||||||
| 2,933 | Aceto Corp. | 20,971 | |||||||||
| 7,568 | Actuant Corp., Class A | 92,784 | |||||||||
| 2,540 | Administaff, Inc. | 67,716 | |||||||||
| 1,210 | Advisory Board (The) Co.* | 22,554 | |||||||||
| 428 | Aerovironment, Inc.* | 10,126 | |||||||||
| 344,484 | Air Transport Services Group, Inc.* | 223,810 | |||||||||
| 23,329 | AirTran Holdings, Inc.* | 162,137 | |||||||||
| 1,395 | Alamo Group, Inc. | 15,708 | |||||||||
| 8,359 | Albany International Corp., Class A | 77,572 | |||||||||
| 329 | Allegiant Travel Co.* | 17,121 | |||||||||
| 5,383 | Altra Holdings, Inc.* | 29,445 | |||||||||
| 4,556 | American Commercial Lines, Inc.* | 22,689 | |||||||||
| 1,931 | American Railcar Industries, Inc. | 17,611 | |||||||||
| 9,582 | American Reprographics Co.* | 61,804 | |||||||||
| 276 | American Science & Engineering, Inc. | 16,632 | |||||||||
| 1,906 | American Woodmark Corp. | 39,454 | |||||||||
| 496 | Ameron International Corp. | 29,348 | |||||||||
| 1,339 | Ampco-Pittsburgh Corp. | 32,618 | |||||||||
| 320 | Amrep Corp.* | 5,949 | |||||||||
| 3,960 | Apogee Enterprises, Inc. | 53,064 | |||||||||
See Notes to Financial Statements.
59
Schedule of Investments (Continued)
PowerShares FTSE RAFI US 1500 Small-Mid Portfolio
April 30, 2009
| Number of Shares | Value | ||||||||||
| Common Stocks and Other Equity Interests (Continued) | |||||||||||
| 5,539 | Applied Industrial Technologies, Inc. | $ | 124,628 | ||||||||
| 1,242 | Argon ST, Inc.* | 25,324 | |||||||||
| 23,343 | Aries Maritime Transport Ltd. (Bermuda) | 14,473 | |||||||||
| 5,611 | Arkansas Best Corp. | 129,502 | |||||||||
| 2,107 | Astec Industries, Inc.* | 64,938 | |||||||||
| 3,703 | ATC Technology Corp.* | 58,841 | |||||||||
| 5,665 | Atlas Air Worldwide Holdings, Inc.* | 150,406 | |||||||||
| 601 | Badger Meter, Inc. | 23,415 | |||||||||
| 6,817 | Baldor Electric Co. | 158,154 | |||||||||
| 6,400 | Barnes Group, Inc. | 90,624 | |||||||||
| 6,828 | Beacon Roofing Supply, Inc.* | 108,565 | |||||||||
| 9,278 | Belden CDT, Inc. | 149,561 | |||||||||
| 4,874 | Blount International, Inc.* | 31,194 | |||||||||
| 25,350 | Bowne & Co., Inc. | 129,539 | |||||||||
| 5,921 | Brady Corp., Class A | 124,755 | |||||||||
| 5,144 | Bucyrus International, Inc. | 111,676 | |||||||||
| 19,331 | Builders FirstSource, Inc.* | 63,986 | |||||||||
| 4,288 | CAI International, Inc.* | 15,694 | |||||||||
| 2,072 | Cascade Corp. | 50,080 | |||||||||
| 14,633 | Casella Waste Systems, Inc., Class A* | 30,144 | |||||||||
| 5,455 | CBIZ, Inc.* | 42,876 | |||||||||
| 5,804 | CDI Corp. | 69,358 | |||||||||
| 5,131 | Celadon Group, Inc.* | 35,096 | |||||||||
| 22,186 | Cenveo, Inc.* | 104,718 | |||||||||
| 3,695 | Ceradyne, Inc.* | 63,702 | |||||||||
| 6,759 | Chart Industries, Inc.* | 93,477 | |||||||||
| 16,982 | China Technology Development Group Corp. (British Virgin Islands)* | 39,568 | |||||||||
| 1,182 | CIRCOR International, Inc. | 30,413 | |||||||||
| 2,821 | CLARCOR, Inc. | 87,677 | |||||||||
| 1,010 | Clean Harbors, Inc.* | 50,601 | |||||||||
| 9,108 | Coleman Cable, Inc.* | 22,679 | |||||||||
| 3,086 | Colfax Corp.* | 26,632 | |||||||||
| 4,858 | Columbus McKinnon Corp.* | 62,960 | |||||||||
| 4,079 | Comfort Systems USA, Inc. | 44,012 | |||||||||
| 87,264 | Commercial Vehicle Group, Inc.* | 83,773 | |||||||||
| 1,159 | Compx International, Inc. | 6,931 | |||||||||
| 4,919 | COMSYS IT Partners, Inc.* | 25,972 | |||||||||
| 4,582 | Consolidated Graphics, Inc.* | 88,982 | |||||||||
| 2,345 | Copa Holdings S.A., Class A (Panama) | 71,874 | |||||||||
| 2,596 | Copart, Inc.* | 81,488 | |||||||||
| 1,842 | Cornell Cos., Inc.* | 33,488 | |||||||||
| 3,114 | Corporate Executive Board (The) Co. | 53,810 | |||||||||
| 856 | CoStar Group, Inc.* | 31,715 | |||||||||
| 1,682 | Courier Corp. | 26,374 | |||||||||
| 14,975 | Covenant Transport, Inc., Class A* | 30,849 | |||||||||
| 1,373 | CRA International, Inc.* | 32,046 | |||||||||
| 1,254 | Cubic Corp. | 36,002 | |||||||||
| 3,378 | Curtiss-Wright Corp. | 107,995 | |||||||||
| 7,647 | Deswell Industries, Inc. (Hong Kong) | 18,659 | |||||||||
| Number of Shares | Value | ||||||||||
| Common Stocks and Other Equity Interests (Continued) | |||||||||||
| 7,527 | Diamond Management & Technology Consultants, Inc. | $ | 21,076 | ||||||||
| 4,799 | Diana Shipping, Inc. (Greece) | 75,344 | |||||||||
| 16,719 | DryShips, Inc. (Greece) | 124,055 | |||||||||
| 1,913 | Ducommun, Inc. | 33,133 | |||||||||
| 1,009 | DXP Enterprises, Inc.* | 13,400 | |||||||||
| 16,274 | Dycom Industries, Inc.* | 137,027 | |||||||||
| 1,699 | Dynamex, Inc.* | 24,992 | |||||||||
| 4,145 | DynCorp International, Inc. Class A* | 63,211 | |||||||||
| 21,591 | Eagle Bulk Shipping, Inc. | 140,773 | |||||||||
| 2,479 | Encore Wire Corp. | 54,141 | |||||||||
| 1,618 | Energy Conversion Devices, Inc.* | 29,739 | |||||||||
| 16,828 | EnergySolutions, Inc. | 163,231 | |||||||||
| 9,278 | EnerSys* | 158,190 | |||||||||
| 5,222 | Ennis, Inc. | 46,998 | |||||||||
| 4,259 | EnPro Industries, Inc.* | 67,974 | |||||||||
| 1,583 | ESCO Technologies, Inc.* | 65,821 | |||||||||
| 4,242 | Esterline Technologies Corp.* | 111,777 | |||||||||
| 14,737 | Evergreen Solar, Inc.* | 35,811 | |||||||||
| 20,078 | Excel Maritime Carriers Ltd. (Liberia) | 142,755 | |||||||||
| 710 | Exponent, Inc.* | 19,809 | |||||||||
| 10,368 | Federal Signal Corp. | 80,559 | |||||||||
| 5,832 | First Advantage Corp., Class A* | 83,631 | |||||||||
| 313 | First Solar, Inc.* | 58,622 | |||||||||
| 3,533 | Force Protection, Inc.* | 26,921 | |||||||||
| 1,712 | Forward Air Corp. | 28,539 | |||||||||
| 3,944 | Franklin Covey Co.* | 16,525 | |||||||||
| 1,408 | Franklin Electric Co., Inc. | 33,356 | |||||||||
| 29,828 | FreeSeas, Inc. (Marshall Islands) | 40,566 | |||||||||
| 2,221 | FreightCar America, Inc. | 42,710 | |||||||||
| 2,521 | FTI Consulting, Inc.* | 138,352 | |||||||||
| 3,187 | G&K Services, Inc., Class A | 79,579 | |||||||||
| 6,020 | Genco Shipping & Trading Ltd. | 114,982 | |||||||||
| 2,313 | Genesee & Wyoming, Inc., Class A* | 69,390 | |||||||||
| 5,109 | Geo Group (The), Inc.* | 84,963 | |||||||||
| 985 | GeoEye, Inc.* | 24,517 | |||||||||
| 7,413 | Gibraltar Industries, Inc.* | 49,667 | |||||||||
| 1,066 | Gorman-Rupp (The) Co. | 22,706 | |||||||||
| 4,591 | Graco, Inc. | 108,302 | |||||||||
| 10,849 | GrafTech International Ltd.* | 95,363 | |||||||||
| 9,395 | Great Lakes Dredge & Dock Corp. | 37,204 | |||||||||
| 13,244 | Greenbrier Cos., Inc. | 112,706 | |||||||||
| 9,759 | Griffon Corp.* | 84,611 | |||||||||
| 4,672 | H&E Equipment Services, Inc.* | 35,180 | |||||||||
| 6,050 | Hardinge, Inc. | 29,040 | |||||||||
| 8,034 | Hawaiian Holdings, Inc.* | 40,090 | |||||||||
| 1,843 | Healthcare Services Group, Inc. | 32,953 | |||||||||
| 4,380 | Heartland Express, Inc. | 65,481 | |||||||||
| 422 | Heico Corp. | 12,116 | |||||||||
| 1,129 | Heico Corp., Class A | 28,169 | |||||||||
| 1,922 | Heidrick & Struggles International, Inc. | 32,482 | |||||||||
See Notes to Financial Statements.
60
Schedule of Investments (Continued)
PowerShares FTSE RAFI US 1500 Small-Mid Portfolio
April 30, 2009
| Number of Shares | Value | ||||||||||
| Common Stocks and Other Equity Interests (Continued) | |||||||||||
| 1,803 | Herley Industries, Inc.* | $ | 18,643 | ||||||||
| 7,992 | Herman Miller, Inc. | 118,841 | |||||||||
| 14,416 | Hexcel Corp.* | 138,249 | |||||||||
| 12,469 | Horizon Lines, Inc., Class A | 66,335 | |||||||||
| 2,597 | Houston Wire & Cable Co. | 25,035 | |||||||||
| 3,502 | Hub Group, Inc., Class A* | 80,546 | |||||||||
| 41,354 | Hudson Highland Group, Inc.* | 67,821 | |||||||||
| 1,314 | Hurco Cos, Inc.* | 20,144 | |||||||||
| 500 | Huron Consulting Group, Inc.* | 23,975 | |||||||||
| 402 | ICF International, Inc.* | 11,059 | |||||||||
| 5,299 | ICT Group, Inc.* | 37,517 | |||||||||
| 4,429 | IDEX Corp. | 111,832 | |||||||||
| 1,431 | IHS, Inc., Class A* | 59,186 | |||||||||
| 1,707 | II-VI, Inc.* | 40,917 | |||||||||
| 3,302 | Insituform Technologies, Inc., Class A* | 50,620 | |||||||||
| 3,820 | Insteel Industries, Inc. | 28,459 | |||||||||
| 5,345 | Integrated Electrical Services, Inc.* | 51,365 | |||||||||
| 22,470 | Interface, Inc., Class A | 130,101 | |||||||||
| 6,039 | Interline Brands, Inc.* | 78,265 | |||||||||
| 1,636 | Intersections, Inc.* | 5,382 | |||||||||
| 5,457 | John Bean Technologies Corp. | 60,136 | |||||||||
| 2,817 | Kadant, Inc.* | 34,762 | |||||||||
| 4,314 | Kaman Corp. | 72,950 | |||||||||
| 1,933 | Kaydon Corp. | 61,779 | |||||||||
| 7,478 | Kforce, Inc.* | 81,585 | |||||||||
| 3,437 | KHD Humboldt Wedag International Ltd. (Canada)* | 29,799 | |||||||||
| 11,622 | Kimball International, Inc., Class B | 63,805 | |||||||||
| 3,337 | Kirby Corp.* | 102,980 | |||||||||
| 3,342 | Knight Transportation, Inc. | 59,087 | |||||||||
| 9,123 | Knoll, Inc. | 64,591 | |||||||||
| 6,043 | Korn/Ferry International* | 63,995 | |||||||||
| 3,710 | Ladish Co., Inc.* | 28,085 | |||||||||
| 2,987 | Landstar System, Inc. | 106,367 | |||||||||
| 1,103 | Lawson Products, Inc. | 12,662 | |||||||||
| 2,966 | Layne Christensen Co.* | 64,244 | |||||||||
| 1,173 | LB Foster Co., Class A* | 38,416 | |||||||||
| 9,968 | LECG Corp.* | 29,007 | |||||||||
| 804 | Lindsay Corp. | 31,284 | |||||||||
| 2,197 | LS Starrett Co. Class A | 22,497 | |||||||||
| 6,386 | LSI Industries, Inc. | 35,825 | |||||||||
| 8,161 | Lydall, Inc.* | 35,011 | |||||||||
| 4,115 | M&F Worldwide Corp.* | 65,634 | |||||||||
| 1,845 | Marten Transport Ltd.* | 38,265 | |||||||||
| 3,880 | MasTec, Inc.* | 48,539 | |||||||||
| 2,392 | McGrath Rentcorp | 50,567 | |||||||||
| 1,093,076 | Mesa Air Group, Inc.* | 188,883 | |||||||||
| 6,337 | Metalico, Inc.* | 14,575 | |||||||||
| 867 | Michael Baker Corp.* | 29,131 | |||||||||
| 1,224 | Middleby (The) Corp.* | 53,574 | |||||||||
| 3,431 | Miller Industries, Inc.* | 27,448 | |||||||||
| Number of Shares | Value | ||||||||||
| Common Stocks and Other Equity Interests (Continued) | |||||||||||
| 3,055 | Mine Safety Appliances Co. | $ | 75,306 | ||||||||
| 4,656 | Mobile Mini, Inc.* | 63,787 | |||||||||
| 11,289 | Monster Worldwide, Inc.* | 155,788 | |||||||||
| 4,942 | NACCO Industries, Inc., Class A | 189,031 | |||||||||
| 3,906 | Navigant Consulting, Inc.* | 57,457 | |||||||||
| 20,156 | NCI Building Systems, Inc.* | 79,616 | |||||||||
| 16,843 | NN, Inc. | 22,064 | |||||||||
| 2,413 | Nordson Corp. | 87,544 | |||||||||
| 1,026 | Northwest Pipe Co.* | 38,916 | |||||||||
| 4,382 | Old Dominion Freight Line, Inc.* | 123,353 | |||||||||
| 8,856 | On Assignment, Inc.* | 31,173 | |||||||||
| 4,107 | Orbital Sciences Corp.* | 63,494 | |||||||||
| 1,763 | Orion Marine Group, Inc.* | 26,410 | |||||||||
| 4,682 | Otter Tail Corp. | 103,847 | |||||||||
| 2,205 | P.A.M. Transportation Services, Inc.* | 11,731 | |||||||||
| 20,378 | Pacer International, Inc. | 86,403 | |||||||||
| 10,127 | Park-Ohio Holdings Corp.* | 47,091 | |||||||||
| 5,260 | Perini Corp.* | 90,998 | |||||||||
| 10,168 | PGT, Inc.* | 21,861 | |||||||||
| 2,704 | Pike Electric Corp.* | 28,068 | |||||||||
| 25,646 | Pinnacle Airlines Corp.* | 53,344 | |||||||||
| 8,465 | Polypore International, Inc.* | 63,826 | |||||||||
| 672 | Powell Industries, Inc.* | 24,185 | |||||||||
| 25,902 | Power-One, Inc.* | 31,341 | |||||||||
| 267 | Preformed Line Products Co. | 9,906 | |||||||||
| 8,050 | Quality Distribution, Inc.* | 16,020 | |||||||||
| 3,806 | Quanex Building Products Corp. | 39,012 | |||||||||
| 1,039 | Raven Industries, Inc. | 24,832 | |||||||||
| 1,893 | RBC Bearings, Inc.* | 35,021 | |||||||||
| 3,148 | Regal-Beloit Corp. | 127,903 | |||||||||
| 9,352 | Republic Airways Holdings, Inc.* | 66,960 | |||||||||
| 5,681 | Resources Connection, Inc.* | 111,064 | |||||||||
| 2,074 | Robbins & Myers, Inc. | 39,302 | |||||||||
| 1,772 | Rollins, Inc. | 31,896 | |||||||||
| 5,538 | Rush Enterprises, Inc., Class A* | 72,880 | |||||||||
| 2,435 | Rush Enterprises, Inc., Class B* | 27,077 | |||||||||
| 5,935 | Saia, Inc.* | 77,511 | |||||||||
| 4,889 | Sauer-Danfoss, Inc. | 20,289 | |||||||||
| 2,059 | Schawk, Inc. | 14,804 | |||||||||
| 5,212 | School Specialty, Inc.* | 97,829 | |||||||||
| 3,561 | Simpson Manufacturing Co., Inc. | 79,268 | |||||||||
| 75,748 | Spherion Corp.* | 271,934 | |||||||||
| 604 | Standard Parking Corp.* | 9,205 | |||||||||
| 7,358 | Standard Register (The) Co. | 38,409 | |||||||||
| 3,319 | Standex International Corp. | 46,035 | |||||||||
| 424 | Stanley, Inc.* | 10,931 | |||||||||
| 1,880 | Stericycle, Inc.* | 88,510 | |||||||||
| 1,146 | Sterling Construction Co., Inc.* | 21,510 | |||||||||
| 387 | SunPower Corp., Class A* | 10,596 | |||||||||
| 371 | SunPower, Corp., Class B* | 9,409 | |||||||||
| 2,056 | SYKES Enterprises, Inc.* | 40,421 | |||||||||
See Notes to Financial Statements.
61
Schedule of Investments (Continued)
PowerShares FTSE RAFI US 1500 Small-Mid Portfolio
April 30, 2009
| Number of Shares | Value | ||||||||||
| Common Stocks and Other Equity Interests (Continued) | |||||||||||
| 11,521 | Sypris Solutions, Inc. | $ | 8,756 | ||||||||
| 4,935 | TAL International Group, Inc. | 47,277 | |||||||||
| 4,185 | TBS International Ltd., Class A (Bermuda)* | 33,187 | |||||||||
| 1,494 | Team, Inc.* | 21,469 | |||||||||
| 15,653 | Tecumseh Products Co., Class A* | 159,817 | |||||||||
| 4,323 | Teledyne Technologies, Inc.* | 138,033 | |||||||||
| 3,445 | Tennant Co. | 51,227 | |||||||||
| 3,921 | Tetra Tech, Inc.* | 96,300 | |||||||||
| 3,800 | Textainer Group Holdings Ltd. | 33,668 | |||||||||
| 13,775 | Thermadyne Holdings Corp.* | 44,080 | |||||||||
| 5,494 | Titan International, Inc. | 33,239 | |||||||||
| 1,304 | Titan Machinery, Inc.* | 13,210 | |||||||||
| 4,407 | Toro (The) Co. | 133,885 | |||||||||
| 1,155 | TransDigm Group, Inc.* | 40,587 | |||||||||
| 3,284 | Tredegar Corp. | 57,733 | |||||||||
| 928 | Trex Co., Inc.* | 10,162 | |||||||||
| 29,349 | Trimas Corp.* | 73,373 | |||||||||
| 1,662 | Triumph Group, Inc. | 68,690 | |||||||||
| 9,351 | TrueBlue, Inc.* | 90,798 | |||||||||
| 3,406 | Twin Disc, Inc. | 23,229 | |||||||||
| 9,570 | Ultrapetrol Bahamas Ltd.* | 35,600 | |||||||||
| 3,259 | Universal Forest Products, Inc. | 109,372 | |||||||||
| 2,307 | Universal Truckload Services, Inc. | 28,422 | |||||||||
| 1,399 | USA Truck, Inc.* | 19,670 | |||||||||
| 1,182 | Valmont Industries, Inc. | 75,388 | |||||||||
| 4,385 | Viad Corp. | 83,666 | |||||||||
| 2,822 | Vicor Corp. | 15,154 | |||||||||
| 23,067 | Wabash National Corp. | 28,834 | |||||||||
| 2,405 | Wabtec Corp. | 91,727 | |||||||||
| 4,295 | Waste Connections, Inc.* | 110,725 | |||||||||
| 6,292 | Waste Services, Inc.* | 33,977 | |||||||||
| 2,421 | Watsco, Inc. | 103,982 | |||||||||
| 1,920 | Watson Wyatt Worldwide, Inc, Class A | 101,856 | |||||||||
| 4,813 | Watts Water Technologies, Inc., Class A | 107,137 | |||||||||
| 5,881 | WCA Waste Corp.* | 12,056 | |||||||||
| 1,828 | Willis Lease Finance Corp.* | 20,839 | |||||||||
| 4,206 | Woodward Governor Co. | 83,952 | |||||||||
| 29,294 | Xerium Technologies, Inc.* | 24,314 | |||||||||
| 16,011,097 | |||||||||||
| Information Technology—15.7% | |||||||||||
| 29,260 | 3Com Corp.* | 118,503 | |||||||||
| 2,325 | Actel Corp.* | 28,760 | |||||||||
| 11,995 | Acxiom Corp. | 115,752 | |||||||||
| 13,118 | Adaptec, Inc.* | 37,517 | |||||||||
| 37,207 | ADC Telecommunications, Inc.* | 273,843 | |||||||||
| 4,065 | ADTRAN, Inc. | 85,975 | |||||||||
| 4,267 | Advanced Energy Industries, Inc.* | 35,971 | |||||||||
| 602 | Advent Software, Inc.* | 20,010 | |||||||||
| 12,367 | Agilysys, Inc. | 74,573 | |||||||||
| 1,599 | Airvana, Inc.* | 9,098 | |||||||||
| Number of Shares | Value | ||||||||||
| Common Stocks and Other Equity Interests (Continued) | |||||||||||
| 5,338 | Akamai Technologies, Inc.* | $ | 117,543 | ||||||||
| 1,593 | Amdocs Ltd. (Guernsey)* | 33,341 | |||||||||
| 2,607 | Ansys, Inc.* | 72,005 | |||||||||
| 9,102 | Applied Micro Circuits Corp.* | 49,606 | |||||||||
| 3,200 | Ariba, Inc.* | 30,752 | |||||||||
| 13,525 | Arris Group, Inc.* | 144,311 | |||||||||
| 1,847 | Atheros Communications, Inc.* | 31,805 | |||||||||
| 2,910 | ATMI, Inc.* | 45,949 | |||||||||
| 3,955 | Avid Technology, Inc.* | 43,782 | |||||||||
| 5,966 | Avocent Corp.* | 86,149 | |||||||||
| 127,640 | Axcelis Technologies, Inc.* | 59,991 | |||||||||
| 517 | Bankrate, Inc.* | 12,925 | |||||||||
| 2,106 | Bel Fuse, Inc., Class B | 34,075 | |||||||||
| 2,764 | Black Box Corp. | 75,651 | |||||||||
| 623 | Blackbaud, Inc. | 9,482 | |||||||||
| 499 | Blackboard, Inc.* | 16,981 | |||||||||
| 1,737 | Blue Coat Systems, Inc.* | 23,033 | |||||||||
| 51,834 | Borland Software Corp.* | 39,394 | |||||||||
| 12,281 | Brooks Automation, Inc.* | 76,388 | |||||||||
| 2,138 | Cabot Microelectronics Corp.* | 61,596 | |||||||||
| 26,687 | CDC Corp., Class A (Hong Kong)* | 31,491 | |||||||||
| 8,364 | Check Point Software Technologies* | 101,623 | |||||||||
| 253,691 | ChipMOS TECHNOLOGIES Bermuda Ltd. (Taiwan, Republic of China)* | 147,140 | |||||||||
| 23,642 | Ciber, Inc.* | 76,364 | |||||||||
| 11,649 | Ciena Corp.* | 139,206 | |||||||||
| 5,237 | Cirrus Logic, Inc.* | 24,352 | |||||||||
| 1,016 | Cogent Inc* | 11,521 | |||||||||
| 3,356 | Cognex Corp. | 47,219 | |||||||||
| 3,878 | Coherent, Inc.* | 73,682 | |||||||||
| 2,480 | Cohu, Inc. | 24,205 | |||||||||
| 13,275 | Commtouch Software, Ltd. (Israel)* | 22,700 | |||||||||
| 19,220 | Compuware Corp.* | 143,765 | |||||||||
| 1,266 | Comtech Telecommunications Corp.* | 42,373 | |||||||||
| 1,558 | Concur Technologies, Inc.* | 42,175 | |||||||||
| 40,802 | Conexant Systems, Inc.* | 55,083 | |||||||||
| 1,832 | CPI International, Inc.* | 20,060 | |||||||||
| 4,811 | Cree, Inc.* | 131,773 | |||||||||
| 3,140 | CSG Systems International, Inc.* | 45,530 | |||||||||
| 11,270 | CTS Corp. | 68,409 | |||||||||
| 2,887 | Cymer, Inc.* | 82,020 | |||||||||
| 15,934 | Cypress Semiconductor Corp.* | 126,357 | |||||||||
| 3,161 | Daktronics, Inc. | 28,575 | |||||||||
| 2,295 | DealerTrack Holdings, Inc.* | 34,838 | |||||||||
| 2,824 | Digi International, Inc.* | 20,530 | |||||||||
| 956 | Digital River, Inc.* | 36,730 | |||||||||
| 3,514 | Diodes, Inc.* | 52,288 | |||||||||
| 3,369 | Dolby Laboratories, Inc., Class A* | 135,198 | |||||||||
| 5,619 | DSP Group, Inc.* | 35,344 | |||||||||
| 2,087 | Dynamics Research Corp.* | 17,218 | |||||||||
| 13,859 | EarthLink, Inc.* | 105,051 | |||||||||
See Notes to Financial Statements.
62
Schedule of Investments (Continued)
PowerShares FTSE RAFI US 1500 Small-Mid Portfolio
April 30, 2009
| Number of Shares | Value | ||||||||||
| Common Stocks and Other Equity Interests (Continued) | |||||||||||
| 5,683 | EchoStar Corp.* | $ | 89,905 | ||||||||
| 2,314 | Electro Rent Corp. | 22,145 | |||||||||
| 5,886 | Electro Scientific Industries, Inc.* | 50,620 | |||||||||
| 3,336 | Electronics for Imaging, Inc.* | 32,760 | |||||||||
| 1,198 | Ems Technologies, Inc* | 22,822 | |||||||||
| 11,947 | Emulex Corp.* | 125,085 | |||||||||
| 110,197 | Entegris, Inc.* | 163,091 | |||||||||
| 10,897 | Epicor Software Corp.* | 60,151 | |||||||||
| 1,562 | EPIQ Systems, Inc.* | 24,164 | |||||||||
| 1,245 | Equinix, Inc.* | 87,436 | |||||||||
| 6,569 | Euronet Worldwide, Inc.* | 106,286 | |||||||||
| 3,477 | Exar Corp.* | 21,384 | |||||||||
| 571 | ExlService Holdings, Inc.* | 5,316 | |||||||||
| 17,452 | Extreme Networks, Inc.* | 30,716 | |||||||||
| 3,162 | F5 Networks, Inc.* | 86,228 | |||||||||
| 1,108 | Factset Research Systems, Inc. | 59,378 | |||||||||
| 6,413 | Fair Isaac Corp. | 107,867 | |||||||||
| 1,357 | FARO Technologies, Inc.* | 20,572 | |||||||||
| 3,255 | FEI Co.* | 55,921 | |||||||||
| 69,577 | Finisar Corp.* | 45,921 | |||||||||
| 3,537 | FLIR Systems, Inc.* | 78,451 | |||||||||
| 3,510 | Formfactor, Inc.* | 61,179 | |||||||||
| 933 | Forrester Research, Inc.* | 23,708 | |||||||||
| 2,669 | Gartner, Inc.* | 36,058 | |||||||||
| 5,212 | Genpact Ltd.* | 46,700 | |||||||||
| 13,235 | Gerber Scientific, Inc.* | 52,278 | |||||||||
| 13,792 | Gevity HR, Inc. | 54,616 | |||||||||
| 9,877 | Global Cash Access Holdings, Inc.* | 59,953 | |||||||||
| 3,197 | Global Payments, Inc. | 102,496 | |||||||||
| 2,052 | GSI Commerce, Inc.* | 29,159 | |||||||||
| 35,118 | GSI Group, Inc.* | 39,683 | |||||||||
| 15,871 | Harris Stratex Networks, Inc., Class A* | 63,801 | |||||||||
| 2,858 | Heartland Payment Systems, Inc. | 22,978 | |||||||||
| 567 | Hittite Microwave Corp.* | 21,070 | |||||||||
| 1,706 | Hughes Communications, Inc.* | 32,704 | |||||||||
| 24,936 | Hutchinson Technology, Inc.* | 47,877 | |||||||||
| 14,276 | Hypercom Corp.* | 15,418 | |||||||||
| 3,222 | iGate Corp. | 12,211 | |||||||||
| 12,687 | Imation Corp. | 126,870 | |||||||||
| 10,624 | infoGROUP, Inc.* | 43,027 | |||||||||
| 1,398 | Informatica Corp.* | 22,228 | |||||||||
| 25,227 | Integrated Device Technology, Inc.* | 136,983 | |||||||||
| 1,019 | InterDigital, Inc.* | 26,820 | |||||||||
| 4,578 | Intermec, Inc.* | 55,302 | |||||||||
| 8,047 | Internap Network Services Corp.* | 22,371 | |||||||||
| 3,455 | Internet Brands, Inc., Class A* | 21,179 | |||||||||
| 9,107 | Intersil Corp., Class A | 105,641 | |||||||||
| 4,242 | Intevac, Inc.* | 29,227 | |||||||||
| 19,166 | Ipass, Inc.* | 21,849 | |||||||||
| 695 | IPG Photonics Corp.* | 7,763 | |||||||||
| 1,691 | Itron, Inc.* | 77,786 | |||||||||
| Number of Shares | Value | ||||||||||
| Common Stocks and Other Equity Interests (Continued) | |||||||||||
| 1,996 | Ixia* | $ | 11,497 | ||||||||
| 1,875 | IXYS Corp. | 17,888 | |||||||||
| 1,580 | j2 Global Communications, Inc.* | 37,904 | |||||||||
| 4,585 | Jack Henry & Associates, Inc. | 82,622 | |||||||||
| 3,541 | JDA Software Group, Inc.* | 49,964 | |||||||||
| 4,287 | Kenexa Corp.* | 28,123 | |||||||||
| 25,191 | Kulicke & Soffa Industries, Inc.* | 100,764 | |||||||||
| 13,174 | L-1 Identity Solutions, Inc.* | 96,434 | |||||||||
| 11,859 | Lawson Software, Inc.* | 63,920 | |||||||||
| 14,956 | Lionbridge Technologies, Inc.* | 20,191 | |||||||||
| 3,799 | Littelfuse, Inc.* | 62,266 | |||||||||
| 4,598 | LoJack Corp.* | 15,725 | |||||||||
| 4,256 | Loral Space & Communications, Inc.* | 99,378 | |||||||||
| 2,739 | Macrovision Solutions Corp.* | 55,383 | |||||||||
| 1,271 | Manhattan Associates, Inc.* | 21,124 | |||||||||
| 1,433 | ManTech International Corp., Class A* | 51,860 | |||||||||
| 5,023 | Marchex, Inc., Class B | 22,704 | |||||||||
| 39,091 | Mattson Technology, Inc.* | 44,955 | |||||||||
| 1,051 | MAXIMUS, Inc. | 42,387 | |||||||||
| 4,511 | Measurement Specialties, Inc.* | 30,630 | |||||||||
| 16,543 | Mentor Graphics Corp.* | 111,169 | |||||||||
| 2,693 | Mercury Computer Systems, Inc.* | 21,867 | |||||||||
| 84,308 | Merix Corp.* | 52,271 | |||||||||
| 10,238 | Methode Electronics, Inc. Class A | 61,633 | |||||||||
| 1,860 | Micrel, Inc. | 13,950 | |||||||||
| 4,650 | Micros Systems, Inc.* | 97,557 | |||||||||
| 5,719 | Microsemi Corp.* | 76,749 | |||||||||
| 770 | MicroStrategy, Inc., Class A* | 29,961 | |||||||||
| 6,445 | MKS Instruments, Inc.* | 100,864 | |||||||||
| 31,718 | ModusLink Global Solutions, Inc.* | 117,357 | |||||||||
| 78,794 | MRV Communications, Inc.* | 36,245 | |||||||||
| 6,219 | MSC.Software Corp.* | 38,185 | |||||||||
| 1,244 | MTS Systems Corp. | 26,286 | |||||||||
| 1,133 | Multi-Fineline Electronix, Inc.* | 22,739 | |||||||||
| 15,148 | NAM TAI Electronics, Inc. (Hong Kong) | 62,713 | |||||||||
| 1,771 | National Instruments Corp. | 39,033 | |||||||||
| 9,041 | Ness Technologies, Inc.* | 33,361 | |||||||||
| 2,115 | Net 1 UEPS Technologies, Inc.* | 34,898 | |||||||||
| 2,866 | NETGEAR, Inc.* | 45,885 | |||||||||
| 2,459 | NeuStar, Inc., Class A* | 46,746 | |||||||||
| 8,893 | Newport Corp.* | 44,376 | |||||||||
| 1,091 | Novatel Wireless, Inc.* | 7,473 | |||||||||
| 30,797 | Novell, Inc.* | 115,797 | |||||||||
| 13,177 | NU Horizons Electronics Corp.* | 36,764 | |||||||||
| 8,386 | Nuance Communications, Inc.* | 111,953 | |||||||||
| 1,089 | Omniture, Inc.* | 13,416 | |||||||||
| 8,006 | OmniVision Technologies, Inc.* | 76,137 | |||||||||
| 26,060 | ON Semiconductor Corp.* | 141,245 | |||||||||
| 97,929 | Openwave Systems, Inc.* | 117,515 | |||||||||
| 9,481 | Opnext, Inc.* | 23,987 | |||||||||
| 1,881 | OSI Systems, Inc.* | 35,269 | |||||||||
See Notes to Financial Statements.
63
Schedule of Investments (Continued)
PowerShares FTSE RAFI US 1500 Small-Mid Portfolio
April 30, 2009
| Number of Shares | Value | ||||||||||
| Common Stocks and Other Equity Interests (Continued) | |||||||||||
| 7,936 | Palm, Inc.* | $ | 83,249 | ||||||||
| 10,423 | Parametric Technology Corp.* | 116,216 | |||||||||
| 2,290 | Park Electrochemical Corp. | 47,174 | |||||||||
| 5,151 | PC Connection, Inc.* | 25,497 | |||||||||
| 8,610 | PC Mall, Inc.* | 55,104 | |||||||||
| 2,786 | Pericom Semiconductor Corp.* | 24,823 | |||||||||
| 59,756 | Photronics, Inc.* | 99,793 | |||||||||
| 6,746 | Plantronics, Inc. | 85,944 | |||||||||
| 6,425 | Plexus Corp.* | 142,314 | |||||||||
| 4,003 | PMC - Sierra, Inc.* | 31,704 | |||||||||
| 7,014 | Polycom, Inc.* | 130,741 | |||||||||
| 1,207 | Power Integrations, Inc. | 25,709 | |||||||||
| 115,837 | Powerwave Technologies, Inc.* | 98,461 | |||||||||
| 3,160 | Progress Software Corp.* | 66,960 | |||||||||
| 8,843 | QLogic Corp.* | 125,394 | |||||||||
| 487 | Quality Systems, Inc. | 26,113 | |||||||||
| 3,236 | Quest Software, Inc.* | 47,019 | |||||||||
| 6,084 | Rackable Systems, Inc.* | 27,743 | |||||||||
| 2,140 | Rackspace Hosting, Inc.* | 19,667 | |||||||||
| 5,561 | Radiant Systems, Inc.* | 40,985 | |||||||||
| 3,550 | Radisys Corp.* | 25,454 | |||||||||
| 17,308 | RealNetworks, Inc.* | 42,578 | |||||||||
| 3,649 | Red Hat, Inc.* | 63,018 | |||||||||
| 1,221 | Renaissance Learning, Inc. | 11,722 | |||||||||
| 111,485 | RF Micro Devices, Inc.* | 235,232 | |||||||||
| 7,228 | Richardson Electronics Ltd. | 25,876 | |||||||||
| 3,266 | Rofin-Sinar Technologies, Inc.* | 69,598 | |||||||||
| 1,564 | Rogers Corp. | 39,804 | |||||||||
| 7,579 | Rudolph Technologies, Inc.* | 39,638 | |||||||||
| 3,228 | S1 Corp.* | 20,014 | |||||||||
| 1,065 | Salesforce.com, Inc.* | 45,593 | |||||||||
| 5,448 | Sapient Corp* | 27,948 | |||||||||
| 3,287 | SAVVIS, Inc.* | 37,406 | |||||||||
| 5,333 | ScanSource, Inc.* | 131,778 | |||||||||
| 5,530 | Semitool, Inc.* | 26,268 | |||||||||
| 1,519 | Semtech Corp.* | 21,904 | |||||||||
| 1,596 | Sigma Designs, Inc.* | 20,620 | |||||||||
| 11,947 | Silicon Image, Inc.* | 32,496 | |||||||||
| 1,938 | Silicon Laboratories, Inc.* | 64,458 | |||||||||
| 21,188 | Silicon Storage Technology Inc.* | 39,198 | |||||||||
| 701 | SINA Corp. (China)* | 19,635 | |||||||||
| 18,953 | SiRF Technology Holdings, Inc.* | 52,689 | |||||||||
| 13,242 | Skyworks Solutions, Inc.* | 117,059 | |||||||||
| 27,425 | Smart Modular Technologies (WWH), Inc.* | 67,466 | |||||||||
| 2,621 | Solera Holdings, Inc.* | 59,811 | |||||||||
| 4,790 | SonicWALL, Inc.* | 26,010 | |||||||||
| 26,116 | Sonus Networks, Inc.* | 45,181 | |||||||||
| 759 | SPSS, Inc.* | 23,453 | |||||||||
| 4,794 | SRA International, Inc., Class A* | 73,780 | |||||||||
| 2,354 | Standard Microsystems Corp.* | 37,334 | |||||||||
| 5,684 | Startek, Inc.* | 23,418 | |||||||||
| Number of Shares | Value | ||||||||||
| Common Stocks and Other Equity Interests (Continued) | |||||||||||
| 1,651 | STEC, Inc.* | $ | 15,850 | ||||||||
| 3,946 | Super Micro Computer, Inc.* | 20,598 | |||||||||
| 1,828 | Switch & Data Facilities Co., Inc.* | 21,150 | |||||||||
| 2,448 | Sybase, Inc.* | 83,134 | |||||||||
| 13,947 | Sycamore Networks, Inc.* | 41,144 | |||||||||
| 5,749 | Symmetricom, Inc.* | 28,630 | |||||||||
| 5,131 | Symyx Technologies, Inc.* | 24,834 | |||||||||
| 930 | Synaptics, Inc.* | 30,206 | |||||||||
| 617 | Syntel Inc | 17,103 | |||||||||
| 14,013 | Take-Two Interactive Software, Inc. | 127,238 | |||||||||
| 44,854 | Technitrol, Inc. | 182,555 | |||||||||
| 3,355 | Tekelec* | 52,003 | |||||||||
| 6,583 | TeleTech Holdings, Inc.* | 87,356 | |||||||||
| 2,097 | Tessco Technologies, Inc.* | 19,188 | |||||||||
| 3,164 | Tessera Technologies, Inc.* | 44,423 | |||||||||
| 39,265 | THQ, Inc.* | 134,286 | |||||||||
| 14,130 | TIBCO Software, Inc.* | 89,302 | |||||||||
| 12,545 | TNS, Inc.* | 211,382 | |||||||||
| 15,554 | Trident Microsystems, Inc.* | 21,309 | |||||||||
| 7,470 | Trimble Navigation Ltd.* | 160,156 | |||||||||
| 18,430 | TriQuint Semiconductor, Inc.* | 70,587 | |||||||||
| 7,844 | TTM Technologies, Inc.* | 58,202 | |||||||||
| 963 | Tyler Technologies, Inc.* | 15,890 | |||||||||
| 13,921 | Ultra Clean Holdings, Inc.* | 25,336 | |||||||||
| 11,589 | United Online, Inc. | 61,422 | |||||||||
| 110,377 | UTStarcom, Inc.* | 129,141 | |||||||||
| 9,649 | ValueClick, Inc.* | 102,279 | |||||||||
| 4,109 | Varian Semiconductor Equipment Associates, Inc.* | 105,149 | |||||||||
| 5,450 | Veeco Instruments, Inc.* | 39,458 | |||||||||
| 7,214 | VeriFone Holdings, Inc.* | 54,177 | |||||||||
| 9,137 | Verigy Ltd. (Singapore)* | 100,507 | |||||||||
| 2,307 | Viasat, Inc.* | 53,038 | |||||||||
| 3,323 | Vignette Corp.* | 27,448 | |||||||||
| 649 | VistaPrint Ltd. (Bermuda)* | 22,293 | |||||||||
| 1,707 | WebMD Health Corp., Class A* | 44,058 | |||||||||
| 16,132 | WebMediaBrands, Inc.* | 8,227 | |||||||||
| 1,712 | Websense, Inc.* | 30,525 | |||||||||
| 53,465 | Westell Technologies, Inc., Class A* | 20,317 | |||||||||
| 3,695 | Wind River Systems, Inc.* | 27,084 | |||||||||
| 4,618 | X-Rite, Inc.* | 7,943 | |||||||||
| 4,977 | Xyratex Ltd. (Bermuda)* | 16,673 | |||||||||
| 5,416 | Zebra Technologies Corp., Class A* | 115,090 | |||||||||
| 8,530 | Zoran Corp.* | 76,258 | |||||||||
| 3,929 | Zygo Corp.* | 19,724 | |||||||||
| 14,781,577 | |||||||||||
| Materials—5.5% | |||||||||||
| 2,017 | AEP Industries, Inc.* | 41,006 | |||||||||
| 4,992 | AM Castle & Co. | 48,372 | |||||||||
| 2,004 | AMCOL International Corp. | 38,838 | |||||||||
See Notes to Financial Statements.
64
Schedule of Investments (Continued)
PowerShares FTSE RAFI US 1500 Small-Mid Portfolio
April 30, 2009
| Number of Shares | Value | ||||||||||
| Common Stocks and Other Equity Interests (Continued) | |||||||||||
| 4,038 | Arch Chemicals, Inc. | $ | 97,639 | ||||||||
| 3,793 | Brush Engineered Materials, Inc.* | 64,178 | |||||||||
| 21,513 | Buckeye Technologies, Inc.* | 110,792 | |||||||||
| 6,497 | Bway Holding Co.* | 60,552 | |||||||||
| 1,263 | Calgon Carbon Corp.* | 21,446 | |||||||||
| 1,212,746 | Caraustar Industries, Inc.* | 278,932 | |||||||||
| 8,461 | Carpenter Technology Corp. | 174,889 | |||||||||
| 37,128 | Century Aluminum, Co.* | 149,997 | |||||||||
| 6,866 | Clearwater Paper Corp.* | 104,501 | |||||||||
| 899 | Compass Minerals International, Inc. | 43,350 | |||||||||
| 586 | Deltic Timber Corp. | 24,694 | |||||||||
| 4,768 | Eagle Materials, Inc. | 132,550 | |||||||||
| 67,607 | Ferro Corp. | 187,271 | |||||||||
| 7,124 | GenTek, Inc.* | 135,997 | |||||||||
| 143,431 | Georgia Gulf Corp. | 157,774 | |||||||||
| 9,270 | Glatfelter | 82,318 | |||||||||
| 5,459 | H.B. Fuller Co. | 96,406 | |||||||||
| 3,503 | Haynes International, Inc.* | 79,098 | |||||||||
| 49,076 | Headwaters, Inc.* | 123,672 | |||||||||
| 23,653 | Hecla Mining Co.* | 58,423 | |||||||||
| 11,089 | Horsehead Holding Corp.* | 79,175 | |||||||||
| 12,722 | ICO, Inc.* | 31,423 | |||||||||
| 2,471 | Innophos Holdings, Inc. | 36,645 | |||||||||
| 9,504 | Innospec, Inc. | 74,701 | |||||||||
| 2,760 | Kaiser Aluminum Corp. | 81,530 | |||||||||
| 9,779 | KapStone Paper and Packaging Corp.* | 27,870 | |||||||||
| 3,492 | Koppers Holdings, Inc. | 66,208 | |||||||||
| 2,066 | LSB Industries, Inc.* | 24,751 | |||||||||
| 94,860 | Mercer International, Inc.* | 54,070 | |||||||||
| 2,481 | Minerals Technologies, Inc. | 92,268 | |||||||||
| 8,823 | Myers Industries, Inc. | 88,495 | |||||||||
| 7,916 | Neenah Paper, Inc. | 39,659 | |||||||||
| 1,653 | NewMarket Corp. | 104,139 | |||||||||
| 1,069 | NL Industries, Inc. | 12,946 | |||||||||
| 3,083 | Olympic Steel, Inc. | 56,542 | |||||||||
| 6,621 | OM Group, Inc.* | 184,461 | |||||||||
| 37,017 | Omnova Solutions, Inc.* | 88,100 | |||||||||
| 3,778 | Penford Corp. | 16,888 | |||||||||
| 4,363 | Quaker Chemical Corp. | 51,047 | |||||||||
| 3,054 | Rock-Tenn Co., Class A | 115,319 | |||||||||
| 678 | Royal Gold, Inc. | 24,516 | |||||||||
| 4,858 | RTI International Metals, Inc.* | 63,203 | |||||||||
| 3,973 | Schnitzer Steel Industries, Inc., Class A | 196,902 | |||||||||
| 5,292 | Schulman (A.), Inc. | 83,031 | |||||||||
| 2,915 | Schweitzer-Mauduit International, Inc. | 66,958 | |||||||||
| 4,822 | Sensient Technologies Corp. | 112,738 | |||||||||
| 22,060 | Solutia, Inc.* | 82,946 | |||||||||
| 26,267 | Spartech Corp. | 103,229 | |||||||||
| 781 | Stepan Co. | 30,904 | |||||||||
| 8,550 | Stillwater Mining Co.* | 38,561 | |||||||||
| 5,044 | Texas Industries, Inc. | 161,307 | |||||||||
| Number of Shares | Value | ||||||||||
| Common Stocks and Other Equity Interests (Continued) | |||||||||||
| 8,376 | Titanium Metals Corp. | $ | 56,873 | ||||||||
| 25,413 | U.S. Concrete, Inc.* | 50,318 | |||||||||
| 1,738 | Universal Stainless & Alloy Products, Inc.* | 23,289 | |||||||||
| 1,332 | Valhi, Inc. | 14,172 | |||||||||
| 92,947 | Verso Paper Corp. | 97,594 | |||||||||
| 19,475 | W.R. Grace & Co.* | 171,964 | |||||||||
| 10,750 | Wausau Paper Corp. | 93,848 | |||||||||
| 3,020 | Zep, Inc. | 40,861 | |||||||||
| 4,054 | Zoltek Cos., Inc.* | 31,905 | |||||||||
| 5,184,051 | |||||||||||
| Telecommunication Services—1.0% | |||||||||||
| 7,835 | Alaska Communications Systems Group, Inc. | 47,245 | |||||||||
| 568 | Atlantic Tele-Network Inc | 12,541 | |||||||||
| 800 | Cbeyond, Inc.* | 16,304 | |||||||||
| 1,915 | Centennial Communications Corp.* | 15,837 | |||||||||
| 52,342 | Cincinnati Bell, Inc.* | 146,035 | |||||||||
| 4,213 | Consolidated Communications Holdings, Inc. | 47,396 | |||||||||
| 30,213 | Fairpoint Communications, Inc. | 31,422 | |||||||||
| 7,170 | General Communication, Inc., Class A* | 54,922 | |||||||||
| 2,483 | Global Crossing Ltd.* | 18,027 | |||||||||
| 53,552 | Globalstar, Inc.* | 34,809 | |||||||||
| 3,627 | Iowa Telecommunications Services, Inc. | 47,804 | |||||||||
| 1,926 | NTELOS Holdings Corp. | 30,777 | |||||||||
| 19,100 | PAETEC Holding Corp.* | 58,637 | |||||||||
| 2,290 | SBA Communications Corp., Class A* | 57,708 | |||||||||
| 753 | Shenandoah Telecommunications Co. | 14,781 | |||||||||
| 3,000 | SureWest Communications | 19,320 | |||||||||
| 2,826 | Syniverse Holdings, Inc.* | 35,608 | |||||||||
| 12,226 | tw telecom, Inc.* | 112,357 | |||||||||
| 12,478 | USA Mobility, Inc. | 138,755 | |||||||||
| 19,796 | Virgin Mobile USA, Inc. Class A* | 40,582 | |||||||||
| 980,867 | |||||||||||
| Utilities—1.5% | |||||||||||
| 4,043 | ALLETE, Inc. | 105,280 | |||||||||
| 1,112 | American States Water Co. | 38,397 | |||||||||
| 7,992 | Avista Corp. | 120,279 | |||||||||
| 1,197 | California Water Service Group | 46,719 | |||||||||
| 1,258 | Central Vermont Public Service Corp. | 21,587 | |||||||||
| 1,903 | CH Energy Group, Inc. | 84,569 | |||||||||
| 693 | Chesapeake Utilities Corp. | 20,298 | |||||||||
| 5,561 | Cleco Corp. | 117,280 | |||||||||
| 6,514 | El Paso Electric Co.* | 89,893 | |||||||||
| 4,875 | Empire District Electric (The) Co. | 72,979 | |||||||||
| 1,754 | ITC Holdings Corp. | 76,352 | |||||||||
| 2,473 | Laclede Group (The), Inc. | 85,764 | |||||||||
| 1,935 | MGE Energy, Inc. | 59,366 | |||||||||
| 1,097 | Middlesex Water Co. | 15,468 | |||||||||
| 2,222 | Northwest Natural Gas Co. | 90,880 | |||||||||
| 5,488 | NorthWestern Corp. | 114,809 | |||||||||
| 663 | Ormat Technologies, Inc. | 23,338 | |||||||||
See Notes to Financial Statements.
65
Schedule of Investments (Continued)
PowerShares FTSE RAFI US 1500 Small-Mid Portfolio
April 30, 2009
| Number of Shares | Value | ||||||||||
| Common Stocks and Other Equity Interests (Continued) | |||||||||||
| 895 | SJW Corp. | $ | 22,554 | ||||||||
| 2,003 | South Jersey Industries, Inc. | 69,524 | |||||||||
| 3,517 | Southwest Water Co. | 20,188 | |||||||||
| 4,188 | UIL Holdings Corp. | 96,701 | |||||||||
| 1,392,225 | |||||||||||
| Total Common Stocks and Other Equity Interests (Cost 123,402,584) | 94,180,569 | ||||||||||
| Money Market Fund—0.2% | |||||||||||
| 231,338 | Goldman Sachs Financial Square Prime Obligations Institutional Share Class (Cost 231,338) | 231,338 | |||||||||
| Total Investments (Cost $123,633,922)—100.0% | 94,411,907 | ||||||||||
| Liabilities in excess of other assets—0.0% | (12,978 | ) | |||||||||
| Net Assets—100.0% | $ | 94,398,929 | |||||||||
REIT Real Estate Investment Trust
* Non-income producing security.
See Notes to Financial Statements.
66
Schedule of Investments
PowerShares FTSE RAFI Utilities Sector Portfolio
April 30, 2009
| Number of Shares | Value | ||||||||||
| Common Stocks—100.0% | |||||||||||
| Electric - Generation—3.0% | |||||||||||
| 33,387 | AES (The) Corp.* | $ | 236,046 | ||||||||
| Electric - Integrated—73.1% | |||||||||||
| 2,193 | Allegheny Energy, Inc. | 56,843 | |||||||||
| 2,846 | Alliant Energy Corp. | 63,637 | |||||||||
| 7,637 | Ameren Corp. | 175,804 | |||||||||
| 8,232 | American Electric Power Co., Inc. | 217,160 | |||||||||
| 1,236 | Black Hills Corp. | 24,572 | |||||||||
| 6,288 | CMS Energy Corp. | 75,582 | |||||||||
| 4,927 | Consolidated Edison, Inc. | 182,940 | |||||||||
| 8,915 | Constellation Energy Group, Inc. | 214,673 | |||||||||
| 8,727 | Dominion Resources, Inc. | 263,206 | |||||||||
| 1,398 | DPL, Inc. | 31,357 | |||||||||
| 5,922 | DTE Energy Co. | 175,114 | |||||||||
| 35,544 | Duke Energy Corp. | 490,862 | |||||||||
| 8,263 | Edison International | 235,578 | |||||||||
| 3,287 | Entergy Corp. | 212,899 | |||||||||
| 7,758 | Exelon Corp. | 357,876 | |||||||||
| 6,595 | FirstEnergy Corp. | 269,735 | |||||||||
| 6,226 | FPL Group, Inc. | 334,896 | |||||||||
| 3,653 | Great Plains Energy, Inc. | 52,859 | |||||||||
| 2,894 | Hawaiian Electric Industries, Inc. | 44,973 | |||||||||
| 1,022 | IDACORP, Inc. | 24,497 | |||||||||
| 3,022 | Integrys Energy Group, Inc. | 79,811 | |||||||||
| 3,953 | Northeast Utilities | 83,092 | |||||||||
| 1,461 | NSTAR | 45,890 | |||||||||
| 5,690 | NV Energy, Inc. | 58,323 | |||||||||
| 7,549 | Pepco Holdings, Inc. | 90,211 | |||||||||
| 6,749 | PG&E Corp. | 250,523 | |||||||||
| 3,233 | Pinnacle West Capital Corp. | 88,520 | |||||||||
| 4,401 | PNM Resources, Inc. | 37,497 | |||||||||
| 2,604 | Portland General Electric Co. | 47,575 | |||||||||
| 5,859 | PPL Corp. | 175,243 | |||||||||
| 6,864 | Progress Energy, Inc. | 234,200 | |||||||||
| 8,839 | Public Service Enterprise Group, Inc. | 263,755 | |||||||||
| 2,837 | SCANA Corp. | 85,734 | |||||||||
| 9,417 | Southern Co. | 271,962 | |||||||||
| 6,566 | TECO Energy, Inc. | 69,534 | |||||||||
| 923 | Unisource Energy Corp. | 24,293 | |||||||||
| 2,451 | Westar Energy, Inc. | 42,966 | |||||||||
| 1,838 | Wisconsin Energy Corp. | 73,446 | |||||||||
| 7,811 | Xcel Energy, Inc. | 144,035 | |||||||||
| 5,671,673 | |||||||||||
| Gas - Distribution—11.8% | |||||||||||
| 1,632 | AGL Resources, Inc. | 50,869 | |||||||||
| 2,871 | Atmos Energy Corp. | 70,942 | |||||||||
| 10,800 | CenterPoint Energy, Inc. | 114,912 | |||||||||
| 1,515 | National Fuel Gas Co. | 49,556 | |||||||||
| 834 | New Jersey Resources Corp. | 27,455 | |||||||||
| 1,224 | Nicor, Inc. | 39,339 | |||||||||
| 15,466 | NiSource, Inc. | 169,971 | |||||||||
| Number of Shares | Value | ||||||||||
| Common Stocks (Continued) | |||||||||||
| 1,225 | Piedmont Natural Gas Co., Inc. | $ | 29,915 | ||||||||
| 4,508 | Sempra Energy | 207,458 | |||||||||
| 1,350 | Southwest Gas Corp. | 27,284 | |||||||||
| 2,323 | UGI Corp. | 53,290 | |||||||||
| 1,780 | Vectren Corp. | 39,463 | |||||||||
| 1,109 | WGL Holdings, Inc. | 34,534 | |||||||||
| 914,988 | |||||||||||
| Independent Power Producer—6.1% | |||||||||||
| 2,883 | Calpine Corp.* | 23,381 | |||||||||
| 53,575 | Dynegy, Inc., Class A* | 95,364 | |||||||||
| 6,868 | Mirant Corp.* | 87,430 | |||||||||
| 5,655 | NRG Energy, Inc.* | 101,677 | |||||||||
| 34,091 | Reliant Energy, Inc.* | 169,091 | |||||||||
| 476,943 | |||||||||||
| Oil Companies - Exploration & Production—1.2% | |||||||||||
| 971 | EQT Corp. | 32,655 | |||||||||
| 2,021 | Questar Corp. | 60,064 | |||||||||
| 92,719 | |||||||||||
| Pipelines—4.1% | |||||||||||
| 3,958 | ONEOK, Inc. | 103,581 | |||||||||
| 14,786 | Spectra Energy Corp. | 214,397 | |||||||||
| 317,978 | |||||||||||
| Water—0.7% | |||||||||||
| 1,689 | American Water Works Co. | 30,402 | |||||||||
| 1,174 | Aqua America, Inc. | 21,543 | |||||||||
| 51,945 | |||||||||||
| Total Common Stocks (Cost $10,875,691) | 7,762,292 | ||||||||||
| Money Market Fund—1.4% | |||||||||||
| 111,710 | Goldman Sachs Financial Square Prime Obligations Institutional Share Class (Cost $111,710) | 111,710 | |||||||||
| Total Investments (Cost $10,987,401)—101.4% | 7,874,002 | ||||||||||
| Liabilities in excess of other assets—(1.4%) | (109,645 | ) | |||||||||
| Net Assets—100.0% | $ | 7,764,357 | |||||||||
* Non-income producing security.
See Notes to Financial Statements.
67
Statements of Assets and Liabilities
PowerShares Exchange-Traded Funds
April 30, 2009
| PowerShares FTSE RAFI Basic Materials Sector Portfolio | PowerShares FTSE RAFI Consumer Goods Sector Portfolio | PowerShares FTSE RAFI Consumer Services Sector Portfolio | PowerShares FTSE RAFI Energy Sector Portfolio | PowerShares FTSE RAFI Financials Sector Portfolio | |||||||||||||||||||
| ASSETS: | |||||||||||||||||||||||
| Unaffiliated investments at value | $ | 3,813,749 | $ | 3,472,629 | $ | 3,813,173 | $ | 9,473,515 | $ | 10,941,802 | |||||||||||||
| Affiliated investments at value (Note 4) | — | — | — | — | 479,592 | ||||||||||||||||||
| Receivables: | |||||||||||||||||||||||
| Dividends | 2,171 | 3,610 | 1,565 | 1,837 | 7,549 | ||||||||||||||||||
| Due from Adviser | — | — | 18,746 | — | — | ||||||||||||||||||
| Expense waivers | 7,015 | 8,930 | 8,560 | 3,709 | 6,868 | ||||||||||||||||||
| Investments sold | — | — | — | — | 1,619,618 | ||||||||||||||||||
| Total Assets | 3,822,935 | 3,485,169 | 3,842,044 | 9,479,061 | 13,055,429 | ||||||||||||||||||
| LIABILITIES: | |||||||||||||||||||||||
| Due to custodian | 9 | 61,789 | 48,776 | 67,449 | 19 | ||||||||||||||||||
| Payables: | |||||||||||||||||||||||
| Shares repurchased | — | — | — | — | 1,629,312 | ||||||||||||||||||
| Accrued advisory fees | 768 | 723 | 814 | 2,181 | 2,604 | ||||||||||||||||||
| Accrued expenses | 37,614 | 37,334 | 37,446 | 38,954 | 41,564 | ||||||||||||||||||
| Total Liabilities | 38,391 | 99,846 | 87,036 | 108,584 | 1,673,499 | ||||||||||||||||||
| NET ASSETS | $ | 3,784,544 | $ | 3,385,323 | $ | 3,755,008 | $ | 9,370,477 | $ | 11,381,930 | |||||||||||||
| NET ASSETS CONSIST OF: | |||||||||||||||||||||||
| Shares of beneficial interest | $ | 7,932,046 | $ | 5,379,479 | $ | 5,670,736 | $ | 14,718,498 | $ | 32,256,762 | |||||||||||||
| Undistributed net investment income (loss) | 40,393 | 19,504 | 13,424 | 45,394 | 63,732 | ||||||||||||||||||
| Accumulated net realized loss on investments | (1,254,082 | ) | (889,635 | ) | (1,389,952 | ) | (3,503,188 | ) | (9,737,962 | ) | |||||||||||||
| Net unrealized depreciation on investments | (2,933,813 | ) | (1,124,025 | ) | (539,200 | ) | (1,890,227 | ) | (11,200,602 | ) | |||||||||||||
| Net Assets | $ | 3,784,544 | $ | 3,385,323 | $ | 3,755,008 | $ | 9,370,477 | $ | 11,381,930 | |||||||||||||
| Shares outstanding (unlimited amount authorized, $0.01 par value) | 100,000 | 100,000 | 100,000 | 200,000 | 700,000 | ||||||||||||||||||
| Net asset value | $ | 37.85 | $ | 33.85 | $ | 37.55 | $ | 46.85 | $ | 16.26 | |||||||||||||
| Share Price | $ | 37.82 | $ | 33.74 | $ | 37.58 | $ | 46.85 | $ | 16.25 | |||||||||||||
| Unaffiliated investments at cost | $ | 6,747,562 | $ | 4,596,654 | $ | 4,352,373 | $ | 11,363,742 | $ | 22,207,830 | |||||||||||||
| Affiliated investments at cost | $ | — | $ | — | $ | — | $ | — | $ | 414,166 | |||||||||||||
See Notes to Financial Statements.
68
| PowerShares FTSE RAFI Health Care Sector Portfolio | PowerShares FTSE RAFI Industrials Sector Portfolio | PowerShares FTSE RAFI Telecommunications & Technology Sector Portfolio | PowerShares FTSE RAFI US 1500 Small-Mid Portfolio | PowerShares FTSE RAFI Utilities Sector Portfolio | |||||||||||||||||||
| ASSETS: | |||||||||||||||||||||||
| Unaffiliated investments at value | $ | 11,283,364 | $ | 6,858,961 | $ | 11,656,601 | $ | 94,411,907 | $ | 7,874,002 | |||||||||||||
| Affiliated investments at value (Note 4) | — | — | — | — | — | ||||||||||||||||||
| Receivables: | |||||||||||||||||||||||
| Dividends | 11,583 | 9,855 | 37,512 | 52,541 | 18,409 | ||||||||||||||||||
| Due from Adviser | — | — | — | — | — | ||||||||||||||||||
| Expense waivers | 7,893 | 4,331 | 8,775 | 32,902 | 8,015 | ||||||||||||||||||
| Investments sold | — | — | — | — | — | ||||||||||||||||||
| Total Assets | 11,302,840 | 6,873,147 | 11,702,888 | 94,497,350 | 7,900,426 | ||||||||||||||||||
| LIABILITIES: | |||||||||||||||||||||||
| Due to custodian | 40,870 | 8 | 50,667 | 49 | 95,249 | ||||||||||||||||||
| Payables: | |||||||||||||||||||||||
| Shares repurchased | — | — | — | — | — | ||||||||||||||||||
| Accrued advisory fees | 2,628 | 1,489 | 2,655 | 20,560 | 1,829 | ||||||||||||||||||
| Accrued expenses | 39,736 | 38,988 | 39,679 | 77,812 | 38,991 | ||||||||||||||||||
| Total Liabilities | 83,234 | 40,485 | 93,001 | 98,421 | 136,069 | ||||||||||||||||||
| NET ASSETS | $ | 11,219,606 | $ | 6,832,662 | $ | 11,609,887 | $ | 94,398,929 | $ | 7,764,357 | |||||||||||||
| NET ASSETS CONSIST OF: | |||||||||||||||||||||||
| Shares of beneficial interest | $ | 15,907,533 | $ | 10,578,181 | $ | 15,361,589 | $ | 136,943,330 | $ | 11,675,380 | |||||||||||||
| Undistributed net investment income (loss) | 74,458 | (2,880 | ) | 16,772 | 203,397 | 108,997 | |||||||||||||||||
| Accumulated net realized loss on investments | (1,718,332 | ) | (1,476,245 | ) | (2,024,280 | ) | (13,525,783 | ) | (906,621 | ) | |||||||||||||
| Net unrealized depreciation on investments | (3,044,053 | ) | (2,266,394 | ) | (1,744,194 | ) | (29,222,015 | ) | (3,113,399 | ) | |||||||||||||
| Net Assets | $ | 11,219,606 | $ | 6,832,662 | $ | 11,609,887 | $ | 94,398,929 | $ | 7,764,357 | |||||||||||||
| Shares outstanding (unlimited amount authorized, $0.01 par value) | 300,000 | 200,000 | 300,000 | 2,700,000 | 200,000 | ||||||||||||||||||
| Net asset value | $ | 37.40 | $ | 34.16 | $ | 38.70 | $ | 34.96 | $ | 38.82 | |||||||||||||
| Share Price | $ | 37.41 | $ | 34.17 | $ | 38.72 | $ | 34.90 | $ | 38.82 | |||||||||||||
| Unaffiliated investments at cost | $ | 14,327,417 | $ | 9,125,355 | $ | 13,400,795 | $ | 123,633,922 | $ | 10,987,401 | |||||||||||||
| Affiliated investments at cost | $ | — | $ | — | $ | — | $ | — | $ | — | |||||||||||||
69
Statements of Operations
Year Ended April 30, 2009
| PowerShares FTSE RAFI Basic Materials Sector Portfolio | PowerShares FTSE RAFI Consumer Goods Sector Portfolio | PowerShares FTSE RAFI Consumer Services Sector Portfolio | PowerShares FTSE RAFI Energy Sector Portfolio | PowerShares FTSE RAFI Financials Sector Portfolio | |||||||||||||||||||
| INVESTMENT INCOME: | |||||||||||||||||||||||
| Dividend income | $ | 289,682 | $ | 102,908 | $ | 75,524 | $ | 284,380 | $ | 668,225 | |||||||||||||
| Foreign withholding taxes | — | — | — | — | (214 | ) | |||||||||||||||||
| Total Income | 289,682 | 102,908 | 75,524 | 284,380 | 668,011 | ||||||||||||||||||
| EXPENSES: | |||||||||||||||||||||||
| Accounting & Administration fees | 74,983 | 74,983 | 74,983 | 74,983 | 74,983 | ||||||||||||||||||
| Advisory fees | 45,449 | 14,837 | 15,480 | 60,987 | 70,527 | ||||||||||||||||||
| Professional fees | 24,806 | 23,894 | 23,997 | 24,923 | 24,859 | ||||||||||||||||||
| Sub-licensing | 9,563 | 3,436 | 3,588 | 13,659 | 16,068 | ||||||||||||||||||
| Custodian & transfer agent fees | 7,439 | 10,145 | 11,892 | 7,193 | 14,566 | ||||||||||||||||||
| Listing fee and expenses | 5,833 | 5,845 | 6,071 | 6,121 | 9,033 | ||||||||||||||||||
| Trustees | 4,093 | 3,829 | 3,830 | 4,242 | 4,347 | ||||||||||||||||||
| Printing | 2,617 | 355 | 893 | 2,540 | 3,871 | ||||||||||||||||||
| Other expenses | — | — | — | — | 710 | ||||||||||||||||||
| Total Expenses | 174,783 | 137,324 | 140,734 | 194,648 | 218,964 | ||||||||||||||||||
| (Waivers) and/or Recapture | (111,928 | ) | (117,322 | ) | (119,844 | ) | (110,532 | ) | (121,204 | ) | |||||||||||||
| Net Expenses | 62,855 | 20,002 | 20,890 | 84,116 | 97,760 | ||||||||||||||||||
| Net Investment Income | 226,827 | 82,906 | 54,634 | 200,264 | 570,251 | ||||||||||||||||||
| REALIZED AND UNREALIZED GAIN (LOSS) ON INVESTMENTS: | |||||||||||||||||||||||
| Net realized gain (loss) from: | |||||||||||||||||||||||
| Investments | (1,304,511 | ) | (621,949 | ) | (1,278,519 | ) | (3,457,044 | ) | (9,671,511 | ) | |||||||||||||
| In-kind redemptions | (3,179,618 | ) | — | — | 790,765 | 211,404 | |||||||||||||||||
| Net increase from payment by affiliate (see Note 3) | — | — | 18,746 | — | — | ||||||||||||||||||
| Net realized loss | (4,484,129 | ) | (621,949 | ) | (1,259,773 | ) | (2,666,279 | ) | (9,460,107 | ) | |||||||||||||
| Net change in unrealized appreciation (depreciation) on investments | (3,560,471 | ) | (757,580 | ) | 217,395 | (4,260,172 | ) | (7,807,728 | ) | ||||||||||||||
| Net realized and unrealized loss on investments | (8,044,600 | ) | (1,379,529 | ) | (1,042,378 | ) | (6,926,451 | ) | (17,267,835 | ) | |||||||||||||
| Net decrease in net assets resulting from operations | $ | (7,817,773 | ) | $ | (1,296,623 | ) | $ | (987,744 | ) | $ | (6,726,187 | ) | $ | (16,697,584 | ) | ||||||||
See Notes to Financial Statements.
70
| PowerShares FTSE RAFI Health Care Sector Portfolio | PowerShares FTSE RAFI Industrials Sector Portfolio | PowerShares FTSE RAFI Telecommunications & Technology Sector Portfolio | PowerShares FTSE RAFI US 1500 Small-Mid Portfolio | PowerShares FTSE RAFI Utilities Sector Portfolio | |||||||||||||||||||
| INVESTMENT INCOME: | |||||||||||||||||||||||
| Dividend income | $ | 370,787 | $ | 239,938 | $ | 219,973 | $ | 1,857,171 | $ | 420,091 | |||||||||||||
| Foreign withholding taxes | (122 | ) | — | — | (1,527 | ) | — | ||||||||||||||||
| Total Income | 370,665 | 239,938 | 219,973 | 1,855,644 | 420,091 | ||||||||||||||||||
| EXPENSES: | |||||||||||||||||||||||
| Accounting & Administration fees | 74,983 | 74,983 | 74,983 | 74,983 | 74,983 | ||||||||||||||||||
| Advisory fees | 50,915 | 34,778 | 38,238 | 429,123 | 38,643 | ||||||||||||||||||
| Professional fees | 24,841 | 24,327 | 24,739 | 30,875 | 24,438 | ||||||||||||||||||
| Sub-licensing | 11,965 | 7,915 | 8,853 | 99,080 | 9,057 | ||||||||||||||||||
| Custodian & transfer agent fees | 8,142 | 10,335 | 9,147 | 58,588 | 8,368 | ||||||||||||||||||
| Listing fee and expenses | 6,245 | 8,751 | 6,460 | 7,501 | 5,602 | ||||||||||||||||||
| Trustees | 4,166 | 4,083 | 4,042 | 7,624 | 4,042 | ||||||||||||||||||
| Printing | 3,331 | 821 | 3,029 | 63,528 | 1,960 | ||||||||||||||||||
| Other expenses | — | — | — | 40,837 | — | ||||||||||||||||||
| Total Expenses | 184,588 | 165,993 | 169,491 | 812,139 | 167,093 | ||||||||||||||||||
| (Waivers) and/or Recapture | (114,558 | ) | (118,318 | ) | (117,095 | ) | (217,994 | ) | (114,192 | ) | |||||||||||||
| Net Expenses | 70,030 | 47,675 | 52,396 | 594,145 | 52,901 | ||||||||||||||||||
| Net Investment Income | 300,635 | 192,263 | 167,577 | 1,261,499 | 367,190 | ||||||||||||||||||
| REALIZED AND UNREALIZED GAIN (LOSS) ON INVESTMENTS: | |||||||||||||||||||||||
| Net realized gain (loss) from: | |||||||||||||||||||||||
| Investments | (1,495,659 | ) | (1,068,835 | ) | (1,990,317 | ) | (16,199,244 | ) | (655,284 | ) | |||||||||||||
| In-kind redemptions | — | (2,676,818 | ) | (18,802 | ) | (8,306,881 | ) | (617,181 | ) | ||||||||||||||
| Net increase from payment by affiliate (see Note 3) | — | — | — | — | — | ||||||||||||||||||
| Net realized loss | (1,495,659 | ) | (3,745,653 | ) | (2,009,119 | ) | (24,506,125 | ) | (1,272,465 | ) | |||||||||||||
| Net change in unrealized appreciation (depreciation) on investments | (1,523,846 | ) | (812,490 | ) | (917,664 | ) | (16,174,382 | ) | (2,931,603 | ) | |||||||||||||
| Net realized and unrealized loss on investments | (3,019,505 | ) | (4,558,143 | ) | (2,926,783 | ) | (40,680,507 | ) | (4,204,068 | ) | |||||||||||||
| Net decrease in net assets resulting from operations | $ | (2,718,870 | ) | $ | (4,365,880 | ) | $ | (2,759,206 | ) | $ | (39,419,008 | ) | $ | (3,836,878 | ) | ||||||||
71
Statements of Changes in Net Assets
| PowerShares FTSE RAFI Basic Materials Sector Portfolio | PowerShares FTSE RAFI Consumer Goods Sector Portfolio | PowerShares FTSE RAFI Consumer Services Sector Portfolio | |||||||||||||||||||||||||
| Year Ended April 30, 2009 | Year Ended April 30, 2008 | Year Ended April 30, 2009 | Year Ended April 30, 2008 | Year Ended April 30, 2009 | Year Ended April 30, 2008 | ||||||||||||||||||||||
| OPERATIONS: | |||||||||||||||||||||||||||
| Net investment income | $ | 226,827 | $ | 283,968 | $ | 82,906 | $ | 96,204 | $ | 54,634 | $ | 48,731 | |||||||||||||||
| Net realized gain (loss) on investments | (4,484,129 | ) | 4,332,382 | (621,949 | ) | 1,369,624 | (1,259,773 | ) | 278,547 | ||||||||||||||||||
| Net change in unrealized appreciation (depreciation) on investments | (3,560,471 | ) | (2,732,556 | ) | (757,580 | ) | (1,588,932 | ) | 217,395 | (1,892,273 | ) | ||||||||||||||||
| Net increase (decrease) in net assets resulting from operations | (7,817,773 | ) | 1,883,794 | (1,296,623 | ) | (123,104 | ) | (987,744 | ) | (1,564,995 | ) | ||||||||||||||||
| Undistributed net investment income (loss) included in the price of units issued and redeemed | 3,010 | 11,302 | — | (53,332 | ) | — | (5,881 | ) | |||||||||||||||||||
| DISTRIBUTIONS TO SHAREHOLDERS FROM: | |||||||||||||||||||||||||||
| Net investment income | (223,156 | ) | (371,654 | ) | (63,402 | ) | (184,859 | ) | (46,582 | ) | (51,137 | ) | |||||||||||||||
| Return of capital | — | — | — | (4,451 | ) | — | — | ||||||||||||||||||||
| Total distributions to shareholders | (223,156 | ) | (371,654 | ) | (63,402 | ) | (189,310 | ) | (46,582 | ) | (51,137 | ) | |||||||||||||||
| SHAREHOLDER TRANSACTIONS: | |||||||||||||||||||||||||||
| Proceeds from shares sold | 7,289,700 | 26,294,459 | — | 15,327,128 | — | 21,159,141 | |||||||||||||||||||||
| Value of shares repurchased | (8,897,958 | ) | (39,454,858 | ) | — | (26,456,277 | ) | — | (26,131,240 | ) | |||||||||||||||||
| Net income equalization | (3,010 | ) | (11,302 | ) | — | 53,332 | — | 5,881 | |||||||||||||||||||
| Net increase (decrease) in net assets resulting from shares transactions | (1,611,268 | ) | (13,171,701 | ) | — | (11,075,817 | ) | — | (4,966,218 | ) | |||||||||||||||||
| Increase (Decrease) in Net Assets | (9,649,187 | ) | (11,648,259 | ) | (1,360,025 | ) | (11,441,563 | ) | (1,034,326 | ) | (6,588,231 | ) | |||||||||||||||
| NET ASSETS: | |||||||||||||||||||||||||||
| Beginning of period | 13,433,731 | 25,081,990 | 4,745,348 | 16,186,911 | 4,789,334 | 11,377,565 | |||||||||||||||||||||
| End of period | $ | 3,784,544 | $ | 13,433,731 | $ | 3,385,323 | $ | 4,745,348 | $ | 3,755,008 | $ | 4,789,334 | |||||||||||||||
| Undistributed net investment income at end of period | $ | 40,393 | $ | 36,722 | $ | 19,504 | $ | — | $ | 13,424 | $ | 5,372 | |||||||||||||||
| CHANGES IN SHARES OUTSTANDING: | |||||||||||||||||||||||||||
| Shares sold | 100,000 | 400,000 | — | 300,000 | — | 400,000 | |||||||||||||||||||||
| Shares repurchased | (200,000 | ) | (600,000 | ) | — | (500,000 | ) | — | (500,000 | ) | |||||||||||||||||
| Shares outstanding, beginning of period | 200,000 | 400,000 | 100,000 | 300,000 | 100,000 | 200,000 | |||||||||||||||||||||
| Shares outstanding, end of period | 100,000 | 200,000 | 100,000 | 100,000 | 100,000 | 100,000 | |||||||||||||||||||||
See Notes to Financial Statements.
72
| PowerShares FTSE RAFI Energy Sector Portfolio | PowerShares FTSE RAFI Financials Sector Portfolio | ||||||||||||||||||
| Year Ended April 30, 2009 | Year Ended April 30, 2008 | Year Ended April 30, 2009 | Year Ended April 30, 2008 | ||||||||||||||||
| OPERATIONS: | |||||||||||||||||||
| Net investment income | $ | 200,264 | $ | 133,939 | $ | 570,251 | $ | 377,372 | |||||||||||
| Net realized gain (loss) on investments | (2,666,279 | ) | 3,515,769 | (9,460,107 | ) | (841,176 | ) | ||||||||||||
| Net change in unrealized appreciation (depreciation) on investments | (4,260,172 | ) | 248,164 | (7,807,728 | ) | (4,094,818 | ) | ||||||||||||
| Net increase (decrease) in net assets resulting from operations | (6,726,187 | ) | 3,897,872 | (16,697,584 | ) | (4,558,622 | ) | ||||||||||||
| Undistributed net investment income (loss) included in the price of units issued and redeemed | (21,211 | ) | 5,134 | 34,479 | 8,951 | ||||||||||||||
| DISTRIBUTIONS TO SHAREHOLDERS FROM: | |||||||||||||||||||
| Net investment income | (162,262 | ) | (140,976 | ) | (555,902 | ) | (387,102 | ) | |||||||||||
| Return of capital | — | — | — | — | |||||||||||||||
| Total distributions to shareholders | (162,262 | ) | (140,976 | ) | (555,902 | ) | (387,102 | ) | |||||||||||
| SHAREHOLDER TRANSACTIONS: | |||||||||||||||||||
| Proceeds from shares sold | — | 42,355,170 | 9,568,020 | 23,447,399 | |||||||||||||||
| Value of shares repurchased | (7,113,557 | ) | (41,527,090 | ) | (4,769,905 | ) | (10,983,334 | ) | |||||||||||
| Net income equalization | 21,211 | (5,134 | ) | (34,479 | ) | (8,951 | ) | ||||||||||||
| Net increase (decrease) in net assets resulting from shares transactions | (7,092,346 | ) | 822,946 | 4,763,636 | 12,455,114 | ||||||||||||||
| Increase (Decrease) in Net Assets | (14,002,006 | ) | 4,584,976 | (12,455,371 | ) | 7,518,341 | |||||||||||||
| NET ASSETS: | |||||||||||||||||||
| Beginning of period | 23,372,483 | 18,787,507 | 23,837,301 | 16,318,960 | |||||||||||||||
| End of period | $ | 9,370,477 | $ | 23,372,483 | $ | 11,381,930 | $ | 23,837,301 | |||||||||||
| Undistributed net investment income at end of period | $ | 45,394 | $ | 7,392 | $ | 63,732 | $ | 49,792 | |||||||||||
| CHANGES IN SHARES OUTSTANDING: | |||||||||||||||||||
| Shares sold | — | 600,000 | 400,000 | 500,000 | |||||||||||||||
| Shares repurchased | (100,000 | ) | (600,000 | ) | (300,000 | ) | (200,000 | ) | |||||||||||
| Shares outstanding, beginning of period | 300,000 | 300,000 | 600,000 | 300,000 | |||||||||||||||
| Shares outstanding, end of period | 200,000 | 300,000 | 700,000 | 600,000 | |||||||||||||||
73
Statements of Changes in Net Assets (Continued)
| PowerShares FTSE RAFI Health Care Sector Portfolio | PowerShares FTSE RAFI Industrials Sector Portfolio | PowerShares FTSE RAFI Telecommunications & Technology Sector Portfolio | |||||||||||||||||||||||||
| Year Ended April 30, 2009 | Year Ended April 30, 2008 | Year Ended April 30, 2009 | Year Ended April 30, 2008 | Year Ended April 30, 2009 | Year Ended April 30, 2008 | ||||||||||||||||||||||
| OPERATIONS: | |||||||||||||||||||||||||||
| Net investment income | $ | 300,635 | $ | 217,513 | $ | 192,263 | $ | 431,920 | $ | 167,577 | $ | 133,343 | |||||||||||||||
| Net realized gain (loss) on investments | (1,495,659 | ) | 1,011,808 | (3,745,653 | ) | 3,344,846 | (2,009,119 | ) | 703,014 | ||||||||||||||||||
| Net change in unrealized appreciation (depreciation) on investments | (1,523,846 | ) | (3,024,831 | ) | (812,490 | ) | (4,359,652 | ) | (917,664 | ) | (2,023,102 | ) | |||||||||||||||
| Net decrease in net assets resulting from operations | (2,718,870 | ) | (1,795,510 | ) | (4,365,880 | ) | (582,886 | ) | (2,759,206 | ) | (1,186,745 | ) | |||||||||||||||
| Undistributed net investment income (loss) included in the price of units issued and redeemed | — | (6,792 | ) | 347 | (60,308 | ) | (8,975 | ) | (16,374 | ) | |||||||||||||||||
| DISTRIBUTIONS TO SHAREHOLDERS FROM: | |||||||||||||||||||||||||||
| Net investment income | (291,957 | ) | (167,854 | ) | (248,303 | ) | (385,729 | ) | (202,651 | ) | (116,397 | ) | |||||||||||||||
| Return of capital | — | — | (24,207 | ) | — | — | — | ||||||||||||||||||||
| Total distributions to shareholders | (291,957 | ) | (167,854 | ) | (272,510 | ) | (385,729 | ) | (202,651 | ) | (116,397 | ) | |||||||||||||||
| SHAREHOLDER TRANSACTIONS: | |||||||||||||||||||||||||||
| Proceeds from shares sold | — | 16,273,363 | 3,408,474 | 49,593,398 | 8,637,397 | 23,577,926 | |||||||||||||||||||||
| Value of shares repurchased | — | (21,982,352 | ) | (3,489,016 | ) | (78,001,088 | ) | (4,621,883 | ) | (28,666,754 | ) | ||||||||||||||||
| Net income equalization | — | 6,792 | (347 | ) | 60,308 | 8,975 | 16,374 | ||||||||||||||||||||
| Net increase (decrease) in net assets resulting from shares transactions | — | (5,702,197 | ) | (80,889 | ) | (28,347,382 | ) | 4,024,489 | (5,072,454 | ) | |||||||||||||||||
| Increase (Decrease) in Net Assets | (3,010,827 | ) | (7,672,353 | ) | (4,718,932 | ) | (29,376,305 | ) | 1,053,657 | (6,391,970 | ) | ||||||||||||||||
| NET ASSETS: | |||||||||||||||||||||||||||
| Beginning of period | 14,230,433 | 21,902,786 | 11,551,594 | 40,927,899 | 10,556,230 | 16,948,200 | |||||||||||||||||||||
| End of period | $ | 11,219,606 | $ | 14,230,433 | $ | 6,832,662 | $ | 11,551,594 | $ | 11,609,887 | $ | 10,556,230 | |||||||||||||||
| Undistributed net investment income (loss) at end of period | $ | 74,458 | $ | 65,606 | $ | (2,880 | ) | $ | 53,160 | $ | 16,772 | $ | 51,846 | ||||||||||||||
| CHANGES IN SHARES OUTSTANDING: | |||||||||||||||||||||||||||
| Shares sold | — | 300,000 | 100,000 | 800,000 | 200,000 | 400,000 | |||||||||||||||||||||
| Shares repurchased | — | (400,000 | ) | (100,000 | ) | (1,300,000 | ) | (100,000 | ) | (500,000 | ) | ||||||||||||||||
| Shares outstanding, beginning of period | 300,000 | 400,000 | 200,000 | 700,000 | 200,000 | 300,000 | |||||||||||||||||||||
| Shares outstanding, end of period | 300,000 | 300,000 | 200,000 | 200,000 | 300,000 | 200,000 | |||||||||||||||||||||
See Notes to Financial Statements.
74
| PowerShares FTSE RAFI US 1500 Small-Mid Portfolio | PowerShares FTSE RAFI Utilities Sector Portfolio | ||||||||||||||||||
| Year Ended April 30, 2009 | Year Ended April 30, 2008 | Year Ended April 30, 2009 | Year Ended April 30, 2008 | ||||||||||||||||
| OPERATIONS: | |||||||||||||||||||
| Net investment income | $ | 1,261,499 | $ | 1,097,874 | $ | 367,190 | $ | 214,606 | |||||||||||
| Net realized gain (loss) on investments | (24,506,125 | ) | (918,876 | ) | (1,272,465 | ) | 1,225,852 | ||||||||||||
| Net change in unrealized appreciation (depreciation) on investments | (16,174,382 | ) | (15,981,090 | ) | (2,931,603 | ) | (2,429,056 | ) | |||||||||||
| Net decrease in net assets resulting from operations | (39,419,008 | ) | (15,802,092 | ) | (3,836,878 | ) | (988,598 | ) | |||||||||||
| Undistributed net investment income (loss) included in the price of units issued and redeemed | 11,433 | 190,881 | (14,841 | ) | (34,736 | ) | |||||||||||||
| DISTRIBUTIONS TO SHAREHOLDERS FROM: | |||||||||||||||||||
| Net investment income | (1,209,035 | ) | (1,013,277 | ) | (309,762 | ) | (255,837 | ) | |||||||||||
| Return of capital | — | — | — | — | |||||||||||||||
| Total distributions to shareholders | (1,209,035 | ) | (1,013,277 | ) | (309,762 | ) | (255,837 | ) | |||||||||||
| SHAREHOLDER TRANSACTIONS: | |||||||||||||||||||
| Proceeds from shares sold | 49,466,935 | 100,097,511 | 4,370,469 | 11,731,584 | |||||||||||||||
| Value of shares repurchased | (45,383,840 | ) | (38,018,141 | ) | (3,718,362 | ) | (17,566,526 | ) | |||||||||||
| Net income equalization | (11,433 | ) | (190,881 | ) | 14,841 | 34,736 | |||||||||||||
| Net increase (decrease) in net assets resulting from shares transactions | 4,071,662 | 61,888,489 | 666,948 | (5,800,206 | ) | ||||||||||||||
| Increase (Decrease) in Net Assets | (36,544,948 | ) | 45,264,001 | (3,494,533 | ) | (7,079,377 | ) | ||||||||||||
| NET ASSETS: | |||||||||||||||||||
| Beginning of period | 130,943,877 | 85,679,876 | 11,258,890 | 18,338,267 | |||||||||||||||
| End of period | $ | 94,398,929 | $ | 130,943,877 | $ | 7,764,357 | $ | 11,258,890 | |||||||||||
| Undistributed net investment income (loss) at end of period | $ | 203,397 | $ | 191,096 | $ | 108,997 | $ | 51,569 | |||||||||||
| CHANGES IN SHARES OUTSTANDING: | |||||||||||||||||||
| Shares sold | 1,700,000 | 1,800,000 | 100,000 | 200,000 | |||||||||||||||
| Shares repurchased | (1,600,000 | ) | (700,000 | ) | (100,000 | ) | (300,000 | ) | |||||||||||
| Shares outstanding, beginning of period | 2,600,000 | 1,500,000 | 200,000 | 300,000 | |||||||||||||||
| Shares outstanding, end of period | 2,700,000 | 2,600,000 | 200,000 | 200,000 | |||||||||||||||
75
Financial Highlights
PowerShares FTSE RAFI Basic Materials Sector Portfolio
| Year Ended April 30, | For the Period September 20, 2006* Through | ||||||||||||||
| 2009 | 2008 | April 30, 2007 | |||||||||||||
| PER SHARE OPERATING PERFORMANCE: | |||||||||||||||
| Net asset value at beginning of period | $ | 67.17 | $ | 62.70 | $ | 50.27 | |||||||||
| Net investment income** | 1.23 | 1.12 | 0.78 | ||||||||||||
| Net realized and unrealized gain (loss) on investments | (29.27 | ) | 4.80 | 12.31 | |||||||||||
| Total from investment operations | (28.04 | ) | 5.92 | 13.09 | |||||||||||
| Distributions to shareholders from: | |||||||||||||||
| Net investment income | (1.28 | ) | (1.45 | ) | (0.66 | ) | |||||||||
| Net asset value at end of period | $ | 37.85 | $ | 67.17 | $ | 62.70 | |||||||||
| Share price at end of period*** | $ | 37.82 | |||||||||||||
| NET ASSET VALUE TOTAL RETURN**** | (41.72 | )% | 9.50 | % | 26.17 | % | |||||||||
| SHARE PRICE TOTAL RETURN**** | (41.75 | )% | |||||||||||||
| RATIOS/SUPPLEMENTAL DATA: | |||||||||||||||
| Net assets at end of period (000's omitted) | $ | 3,785 | $ | 13,434 | $ | 25,082 | |||||||||
| Ratio to average net assets of: | |||||||||||||||
| Expenses, after (Waivers) and/or Recapture | 0.65 | % | 0.75 | % | 0.76 | %† | |||||||||
| Expenses, prior to (Waivers) and/or Recapture | 1.80 | % | 1.50 | % | 1.18 | %† | |||||||||
| Net investment income, after (Waivers) and/or Recapture | 2.34 | % | 1.78 | % | 2.23 | %† | |||||||||
| Portfolio turnover rate †† | 29 | % | 19 | % | 15 | % | |||||||||
| Undistributed net investment income (loss) included in price of units issued and redeemed**# | $ | 0.02 | $ | 0.05 | $ | (0.18 | ) | ||||||||
PowerShares FTSE RAFI Consumer Goods Sector Portfolio
| Year Ended April 30, | For the Period September 20, 2006* Through | ||||||||||||||
| 2009 | 2008 | April 30, 2007 | |||||||||||||
| PER SHARE OPERATING PERFORMANCE: | |||||||||||||||
| Net asset value at beginning of period | $ | 47.45 | $ | 53.96 | $ | 49.03 | |||||||||
| Net investment income** | 0.83 | 0.83 | 0.54 | ||||||||||||
| Net realized and unrealized gain (loss) on investments | (13.80 | ) | (5.45 | ) | 4.72 | ||||||||||
| Total from investment operations | (12.97 | ) | (4.62 | ) | 5.26 | ||||||||||
| Distributions to shareholders from: | |||||||||||||||
| Net investment income | (0.63 | ) | (1.89 | ) | (0.33 | ) | |||||||||
| Return of capital | — | (0.00 | )(a) | — | |||||||||||
| Total distributions | (0.63 | ) | (1.89 | ) | (0.33 | ) | |||||||||
| Net asset value at end of period | $ | 33.85 | $ | 47.45 | $ | 53.96 | |||||||||
| Share price at end of period*** | $ | 33.74 | |||||||||||||
| NET ASSET VALUE TOTAL RETURN**** | (27.43 | )% | (8.80 | )% | 10.78 | % | |||||||||
| SHARE PRICE TOTAL RETURN**** | (27.68 | )% | |||||||||||||
| RATIOS/SUPPLEMENTAL DATA: | |||||||||||||||
| Net assets at end of period (000's omitted) | $ | 3,385 | $ | 4,745 | $ | 16,187 | |||||||||
| Ratio to average net assets of: | |||||||||||||||
| Expenses, after (Waivers) and/or Recapture | 0.56 | % | 0.82 | % | 0.76 | %† | |||||||||
| Expenses, prior to (Waivers) and/or Recapture | 3.83 | % | 2.93 | % | 1.27 | %† | |||||||||
| Net investment income, after (Waivers) and/or Recapture | 2.31 | % | 1.60 | % | 1.67 | %† | |||||||||
| Portfolio turnover rate †† | 39 | % | 20 | % | 1 | % | |||||||||
| Undistributed net investment loss included in price of units issued and redeemed**# | $ | — | $ | (0.46 | ) | $ | (0.07 | ) | |||||||
* Commencement of Investment Operations.
** Based on average shares outstanding.
*** The mean between the last bid and ask prices.
**** Net asset value total return is calculated assuming an initial investment made at the net asset value at the beginning of the period, reinvestment of all dividends and distributions at net asset value during the period, and redemption on the last day of the period. Share price total return is calculated assuming an initial investment made at the share price at the beginning of the period, reinvestment of all dividends and distributions at share price during the period, and sale at the share price on the last day of the period. Total investment returns calculated for a period of less than one year are not annualized.
† Annualized.
†† Portfolio turnover rate is not annualized and does not include securities received or delivered from processing creations or redemptions.
# The per share amount of equalization is presented to show the impact of equalization on distributable earnings per share.
(a) Amount represents less than $0.005.
See Notes to Financial Statements.
76
Financial Highlights (Continued)
PowerShares FTSE RAFI Consumer Services Sector Portfolio
| Year Ended April 30, | For the Period September 20, 2006* Through | ||||||||||||||
| 2009 | 2008 | April 30, 2007 | |||||||||||||
| PER SHARE OPERATING PERFORMANCE: | |||||||||||||||
| Net asset value at beginning of period | $ | 47.89 | $ | 56.89 | $ | 50.53 | |||||||||
| Net investment income** | 0.55 | 0.32 | 0.10 | ||||||||||||
| Net realized and unrealized gain (loss) on investments | (10.42 | )*** | (9.02 | ) | 6.35 | ||||||||||
| Total from investment operations | (9.87 | ) | (8.70 | ) | 6.45 | ||||||||||
| Distributions to shareholders from: | |||||||||||||||
| Net investment income | (0.47 | ) | (0.30 | ) | (0.09 | ) | |||||||||
| Net asset value at end of period | $ | 37.55 | $ | 47.89 | $ | 56.89 | |||||||||
| Share price at end of period**** | $ | 37.58 | |||||||||||||
| NET ASSET VALUE TOTAL RETURN***** | (20.62 | )% | (15.32 | )% | 12.78 | % | |||||||||
| SHARE PRICE TOTAL RETURN***** | (20.52 | )% | |||||||||||||
| RATIOS/SUPPLEMENTAL DATA: | |||||||||||||||
| Net assets at end of period (000's omitted) | $ | 3,755 | $ | 4,789 | $ | 11,378 | |||||||||
| Ratio to average net assets of: | |||||||||||||||
| Expenses, after (Waivers) and/or Recapture | 0.56 | % | 0.79 | % | 0.77 | %† | |||||||||
| Expenses, prior to (Waivers) and/or Recapture | 3.76 | % | 2.36 | % | 1.40 | %† | |||||||||
| Net investment income, after (Waivers) and/or Recapture | 1.46 | % | 0.61 | % | 0.28 | %† | |||||||||
| Portfolio turnover rate †† | 261 | % | 16 | % | 4 | % | |||||||||
| Undistributed net investment income (loss) included in price of units issued and redeemed**# | $ | — | $ | (0.04 | ) | $ | 0.00 | (a) | |||||||
PowerShares FTSE RAFI Energy Sector Portfolio
| Year Ended April 30, | For the Period September 20, 2006* Through | ||||||||||||||
| 2009 | 2008 | April 30, 2007 | |||||||||||||
| PER SHARE OPERATING PERFORMANCE: | |||||||||||||||
| Net asset value at beginning of period | $ | 77.91 | $ | 62.63 | $ | 49.16 | |||||||||
| Net investment income** | 0.87 | 0.45 | 0.23 | ||||||||||||
| Net realized and unrealized gain (loss) on investments | (31.19 | ) | 15.30 | 13.45 | |||||||||||
| Total from investment operations | (30.32 | ) | 15.75 | 13.68 | |||||||||||
| Distributions to shareholders from: | |||||||||||||||
| Net investment income | (0.74 | ) | (0.47 | ) | (0.21 | ) | |||||||||
| Net asset value at end of period | $ | 46.85 | $ | 77.91 | $ | 62.63 | |||||||||
| Share price at end of period**** | $ | 46.85 | |||||||||||||
| NET ASSET VALUE TOTAL RETURN***** | (39.03 | )% | 25.22 | % | 27.86 | % | |||||||||
| SHARE PRICE TOTAL RETURN***** | (38.99 | )% | |||||||||||||
| RATIOS/SUPPLEMENTAL DATA: | |||||||||||||||
| Net assets at end of period (000's omitted) | $ | 9,370 | $ | 23,372 | $ | 18,788 | |||||||||
| Ratio to average net assets of: | |||||||||||||||
| Expenses, after (Waivers) and/or Recapture | 0.60 | % | 0.74 | % | 0.74 | %† | |||||||||
| Expenses, prior to (Waivers) and/or Recapture | 1.38 | % | 1.27 | % | 1.09 | %† | |||||||||
| Net investment income, after (Waivers) and/or Recapture | 1.42 | % | 0.62 | % | 0.66 | %† | |||||||||
| Portfolio turnover rate †† | 52 | % | 2 | % | 1 | % | |||||||||
| Undistributed net investment income (loss) included in price of units issued and redeemed**# | $ | (0.09 | ) | $ | 0.02 | $ | (0.03 | ) | |||||||
* Commencement of Investment Operations.
** Based on average shares outstanding.
*** Amount includes the effect of the Adviser pay-in for an economic loss of $18,746. Had the reimbursement not been made the total return would have been lower.
**** The mean between the last bid and ask prices.
***** Net asset value total return is calculated assuming an initial investment made at the net asset value at the beginning of the period, reinvestment of all dividends and distributions at net asset value during the period, and redemption on the last day of the period. Share price total return is calculated assuming an initial investment made at the share price at the beginning of the period, reinvestment of all dividends and distributions at share price during the period, and sale at the share price on the last day of the period. Total investment returns calculated for a period of less than one year are not annualized.
† Annualized.
†† Portfolio turnover rate is not annualized and does not include securities received or delivered from processing creations or redemptions.
# The per share amount of equalization is presented to show the impact of equalization on distributable earnings per share.
(a) Amount represents less than $0.005.
See Notes to Financial Statements.
77
Financial Highlights (Continued)
PowerShares FTSE RAFI Financials Sector Portfolio
| Year Ended April 30, | For the Period September 20, 2006* Through | ||||||||||||||
| 2009 | 2008 | April 30, 2007 | |||||||||||||
| PER SHARE OPERATING PERFORMANCE: | |||||||||||||||
| Net asset value at beginning of period | $ | 39.73 | $ | 54.40 | $ | 50.47 | |||||||||
| Net investment income** | 0.79 | 1.00 | 0.52 | ||||||||||||
| Net realized and unrealized gain (loss) on investments | (23.52 | ) | (14.55 | ) | 3.83 | ||||||||||
| Total from investment operations | (22.73 | ) | (13.55 | ) | 4.35 | ||||||||||
| Distributions to shareholders from: | |||||||||||||||
| Net investment income | (0.74 | ) | (1.12 | ) | (0.42 | ) | |||||||||
| Net asset value at end of period | $ | 16.26 | $ | 39.73 | $ | 54.40 | |||||||||
| Share price at end of period*** | $ | 16.25 | |||||||||||||
| NET ASSET VALUE TOTAL RETURN**** | (57.81 | )% | (25.22 | )% | 8.62 | % | |||||||||
| SHARE PRICE TOTAL RETURN**** | (57.84 | )% | |||||||||||||
| RATIOS/SUPPLEMENTAL DATA: | |||||||||||||||
| Net assets at end of period (000's omitted) | $ | 11,382 | $ | 23,837 | $ | 16,319 | |||||||||
| Ratio to average net assets of: | |||||||||||||||
| Expenses, after (Waivers) and/or Recapture | 0.59 | % | 0.75 | % | 0.78 | %† | |||||||||
| Expenses, prior to (Waivers) and/or Recapture | 1.31 | % | 1.49 | % | 1.44 | %† | |||||||||
| Net investment income, after (Waivers) and/or Recapture | 3.42 | % | 2.30 | % | 1.65 | %† | |||||||||
| Portfolio turnover rate †† | 36 | % | 46 | % | 10 | % | |||||||||
| Undistributed net investment income (loss) included in price of units issued and redeemed**# | $ | 0.05 | $ | 0.02 | $ | (0.09 | ) | ||||||||
PowerShares FTSE RAFI Health Care Sector Portfolio
| Year Ended April 30, | For the Period September 20, 2006* Through | ||||||||||||||
| 2009 | 2008 | April 30, 2007 | |||||||||||||
| PER SHARE OPERATING PERFORMANCE: | |||||||||||||||
| Net asset value at beginning of period | $ | 47.43 | $ | 54.76 | $ | 50.44 | |||||||||
| Net investment income** | 1.00 | 0.74 | 0.42 | ||||||||||||
| Net realized and unrealized gain (loss) on investments | (10.06 | ) | (7.41 | ) | 4.28 | ||||||||||
| Total from investment operations | (9.06 | ) | (6.67 | ) | 4.70 | ||||||||||
| Distributions to shareholders from: | |||||||||||||||
| Net investment income | (0.97 | ) | (0.66 | ) | (0.38 | ) | |||||||||
| Net asset value at end of period | $ | 37.40 | $ | 47.43 | $ | 54.76 | |||||||||
| Share price at end of period*** | $ | 37.41 | |||||||||||||
| NET ASSET VALUE TOTAL RETURN**** | (19.34 | )% | (12.32 | )% | 9.38 | % | |||||||||
| SHARE PRICE TOTAL RETURN**** | (19.22 | )% | |||||||||||||
| RATIOS/SUPPLEMENTAL DATA: | |||||||||||||||
| Net assets at end of period (000's omitted) | $ | 11,220 | $ | 14,230 | $ | 21,903 | |||||||||
| Ratio to average net assets of: | |||||||||||||||
| Expenses, after (Waivers) and/or Recapture | 0.56 | % | 0.75 | % | 0.75 | %† | |||||||||
| Expenses, prior to (Waivers) and/or Recapture | 1.47 | % | 1.55 | % | 1.11 | %† | |||||||||
| Net investment income, after (Waivers) and/or Recapture | 2.40 | % | 1.46 | % | 1.33 | %† | |||||||||
| Portfolio turnover rate †† | 36 | % | 12 | % | 5 | % | |||||||||
| Undistributed net investment loss included in price of units issued and redeemed**# | $ | — | $ | (0.02 | ) | $ | (0.01 | ) | |||||||
* Commencement of Investment Operations.
** Based on average shares outstanding.
*** The mean between the last bid and ask prices.
**** Net asset value total return is calculated assuming an initial investment made at the net asset value at the beginning of the period, reinvestment of all dividends and distributions at net asset value during the period, and redemption on the last day of the period. Share price total return is calculated assuming an initial investment made at the share price at the beginning of the period, reinvestment of all dividends and distributions at share price during the period, and sale at the share price on the last day of the period. Total investment returns calculated for a period of less than one year are not annualized.
† Annualized.
†† Portfolio turnover rate is not annualized and does not include securities received or delivered from processing creations or redemptions.
# The per share amount of equalization is presented to show the impact of equalization on distributable earnings per share.
See Notes to Financial Statements.
78
Financial Highlights (Continued)
PowerShares FTSE RAFI Industrials Sector Portfolio
| Year Ended April 30, | For the Period September 20, 2006* Through | ||||||||||||||
| 2009 | 2008 | April 30, 2007 | |||||||||||||
| PER SHARE OPERATING PERFORMANCE: | |||||||||||||||
| Net asset value at beginning of period | $ | 57.76 | $ | 58.47 | $ | 50.27 | |||||||||
| Net investment income** | 0.96 | 0.66 | 0.36 | ||||||||||||
| Net realized and unrealized gain (loss) on investments | (23.20 | ) | (0.65 | ) | 8.17 | ||||||||||
| Total from investment operations | (22.24 | ) | 0.01 | 8.53 | |||||||||||
| Distributions to shareholders from: | |||||||||||||||
| Net investment income | (1.24 | ) | (0.72 | ) | (0.33 | ) | |||||||||
| Return of capital | (0.12 | ) | — | — | |||||||||||
| Total distributions | (1.36 | ) | (0.72 | ) | (0.33 | ) | |||||||||
| Net asset value at end of period | $ | 34.16 | $ | 57.76 | $ | 58.47 | |||||||||
| Share price at end of period*** | $ | 34.17 | |||||||||||||
| NET ASSET VALUE TOTAL RETURN**** | (38.81 | )% | 0.00 | %(a) | 17.01 | % | |||||||||
| SHARE PRICE TOTAL RETURN**** | (38.74 | )% | |||||||||||||
| RATIOS/SUPPLEMENTAL DATA: | |||||||||||||||
| Net assets at end of period (000's omitted) | $ | 6,833 | $ | 11,552 | $ | 40,928 | |||||||||
| Ratio to average net assets of: | |||||||||||||||
| Expenses, after (Waivers) and/or Recapture | 0.58 | % | 0.72 | % | 0.73 | %† | |||||||||
| Expenses, prior to (Waivers) and/or Recapture | 2.02 | % | 0.99 | % | 1.00 | %† | |||||||||
| Net investment income, after (Waivers) and/or Recapture | 2.34 | % | 1.12 | % | 1.05 | %† | |||||||||
| Portfolio turnover rate †† | 22 | % | 17 | % | 3 | % | |||||||||
| Undistributed net investment income (loss) included in price of units issued and redeemed**# | $ | 0.00 | (b) | $ | (0.09 | ) | $ | 0.02 | |||||||
PowerShares FTSE RAFI Telecommunications & Technology Sector Portfolio
| Year Ended April 30, | For the Period September 20, 2006* Through | ||||||||||||||
| 2009 | 2008 | April 30, 2007 | |||||||||||||
| PER SHARE OPERATING PERFORMANCE: | |||||||||||||||
| Net asset value at beginning of period | $ | 52.78 | $ | 56.49 | $ | 50.60 | |||||||||
| Net investment income** | 0.75 | 0.51 | 0.32 | ||||||||||||
| Net realized and unrealized gain (loss) on investments | (13.88 | ) | (3.74 | ) | 5.82 | ||||||||||
| Total from investment operations | (13.13 | ) | (3.23 | ) | 6.14 | ||||||||||
| Distributions to shareholders from: | |||||||||||||||
| Net investment income | (0.95 | ) | (0.48 | ) | (0.25 | ) | |||||||||
| Net asset value at end of period | $ | 38.70 | $ | 52.78 | $ | 56.49 | |||||||||
| Share price at end of period*** | $ | 38.72 | |||||||||||||
| NET ASSET VALUE TOTAL RETURN**** | (24.92 | )% | (5.79 | )% | 12.15 | % | |||||||||
| SHARE PRICE TOTAL RETURN**** | (24.86 | )% | |||||||||||||
| RATIOS/SUPPLEMENTAL DATA: | |||||||||||||||
| Net assets at end of period (000's omitted) | $ | 11,610 | $ | 10,556 | $ | 16,948 | |||||||||
| Ratio to average net assets of: | |||||||||||||||
| Expenses, after (Waivers) and/or Recapture | 0.57 | % | 0.75 | % | 0.75 | %† | |||||||||
| Expenses, prior to (Waivers) and/or Recapture | 1.84 | % | 1.50 | % | 1.17 | %† | |||||||||
| Net investment income, after (Waivers) and/or Recapture | 1.82 | % | 0.91 | % | 0.97 | %† | |||||||||
| Portfolio turnover rate †† | 46 | % | 12 | % | 4 | % | |||||||||
| Undistributed net investment income (loss) included in price of units issued and redeemed**# | $ | (0.04 | ) | $ | (0.06 | ) | $ | (0.03 | ) | ||||||
* Commencement of Investment Operations.
** Based on average shares outstanding.
*** The mean between the last bid and ask prices.
**** Net asset value total investment return is calculated assuming an initial investment made at the net asset value at the beginning of the period, reinvestment of all dividends and distributions at net asset value during the period, and redemption on the last day of the period. Share price total return is calculated assuming an initial investment made at the share price at the beginning of the period, reinvestment of all dividends and distributions at share price during the period, and sale at the share price on the last day of the period. Total investment returns calculated for a period of less than one year are not annualized.
† Annualized.
†† Portfolio turnover rate is not annualized and does not include securities received or delivered from processing creations or redemptions.
# The per share amount of equalization is presented to show the impact of equalization on distributable earnings per share.
(a) Amount represents less than 0.005%.
(b) Amount represents less than $0.005.
See Notes to Financial Statements.
79
Financial Highlights (Continued)
PowerShares FTSE RAFI US 1500 Small-Mid Portfolio
| Year Ended April 30, | For the Period September 20, 2006* Through | ||||||||||||||
| 2009 | 2008 | April 30, 2007 | |||||||||||||
| PER SHARE OPERATING PERFORMANCE: | |||||||||||||||
| Net asset value at beginning of period | $ | 50.36 | $ | 57.12 | $ | 50.52 | |||||||||
| Net investment income** | 0.46 | 0.50 | 0.27 | ||||||||||||
| Net realized and unrealized gain (loss) on investments | (15.42 | ) | (6.81 | ) | 6.50 | ||||||||||
| Total from investment operations | (14.96 | ) | (6.31 | ) | 6.77 | ||||||||||
| Distributions to shareholders from: | |||||||||||||||
| Net investment income | (0.44 | ) | (0.45 | ) | (0.17 | ) | |||||||||
| Net asset value at end of period | $ | 34.96 | $ | 50.36 | $ | 57.12 | |||||||||
| Share price at end of period*** | $ | 34.90 | |||||||||||||
| NET ASSET VALUE TOTAL RETURN**** | (29.79 | )% | (11.10 | )% | 13.42 | % | |||||||||
| SHARE PRICE TOTAL RETURN**** | (29.84 | )% | |||||||||||||
| RATIOS/SUPPLEMENTAL DATA: | |||||||||||||||
| Net assets at end of period (000's omitted) | $ | 94,399 | $ | 130,944 | $ | 85,680 | |||||||||
| Ratio to average net assets of: | |||||||||||||||
| Expenses, after (Waivers) and/or Recapture | 0.58 | % | 0.71 | % | 0.73 | %† | |||||||||
| Expenses, prior to (Waivers) and/or Recapture | 0.79 | % | 0.76 | % | 0.92 | %† | |||||||||
| Net investment income, after (Waivers) and/or Recapture | 1.22 | % | 0.92 | % | 0.83 | %† | |||||||||
| Portfolio turnover rate †† | 15 | % | 42 | % | 9 | % | |||||||||
| Undistributed net investment income included in price of units issued and redeemed**# | $ | 0.00 | (a) | $ | 0.09 | $ | 0.05 | ||||||||
PowerShares FTSE RAFI Utilities Sector Portfolio
| Year Ended April 30, | For the Period September 20, 2006* Through | ||||||||||||||
| 2009 | 2008 | April 30, 2007 | |||||||||||||
| PER SHARE OPERATING PERFORMANCE: | |||||||||||||||
| Net asset value at beginning of period | $ | 56.29 | $ | 61.13 | $ | 49.93 | |||||||||
| Net investment income** | 1.84 | 1.21 | 0.78 | ||||||||||||
| Net realized and unrealized gain (loss) on investments | (17.76 | ) | (4.47 | ) | 11.07 | ||||||||||
| Total from investment operations | (15.92 | ) | (3.26 | ) | 11.85 | ||||||||||
| Distributions to shareholders from: | |||||||||||||||
| Net investment income | (1.55 | ) | (1.58 | ) | (0.65 | ) | |||||||||
| Net asset value at end of period | $ | 38.82 | $ | 56.29 | $ | 61.13 | |||||||||
| Share price at end of period*** | $ | 38.82 | |||||||||||||
| NET ASSET VALUE TOTAL RETURN**** | (28.79 | )% | (5.41 | )% | 23.87 | % | |||||||||
| SHARE PRICE TOTAL RETURN**** | (28.76 | )% | |||||||||||||
| RATIOS/SUPPLEMENTAL DATA: | |||||||||||||||
| Net assets at end of period (000's omitted) | $ | 7,764 | $ | 11,259 | $ | 18,338 | |||||||||
| Ratio to average net assets of: | |||||||||||||||
| Expenses, after (Waivers) and/or Recapture | 0.56 | % | 0.78 | % | 0.75 | %† | |||||||||
| Expenses, prior to (Waivers) and/or Recapture | 1.76 | % | 1.92 | % | 1.19 | %† | |||||||||
| Net investment income, after (Waivers) and/or Recapture | 3.88 | % | 2.16 | % | 2.32 | %† | |||||||||
| Portfolio turnover rate †† | 21 | % | 16 | % | 0 | %(b) | |||||||||
| Undistributed net investment loss included in price of units issued and redeemed**# | $ | (0.07 | ) | $ | (0.20 | ) | $ | (0.16 | ) | ||||||
* Commencement of Investment Operations.
** Based on average shares outstanding.
*** The mean between the last bid and ask prices.
**** Net asset value total investment return is calculated assuming an initial investment made at the net asset value at the beginning of the period, reinvestment of all dividends and distributions at net asset value during the period, and redemption on the last day of the period. Share price total return is calculated assuming an initial investment made at the share price at the beginning of the period, reinvestment of all dividends and distributions at share price during the period, and sale at the share price on the last day of the period. Total investment returns calculated for a period of less than one year are not annualized.
† Annualized.
†† Portfolio turnover rate is not annualized and does not include securities received or delivered from processing creations or redemptions.
# The per share amount of equalization is presented to show the impact of equalization on distributable earnings per share.
(a) Amount represents less than $0.005.
(b) Amount represents less than 1%.
See Notes to Financial Statements.
80
Notes to Financial Statements
PowerShares Exchange-Traded Fund Trust
April 30, 2009
Note 1. Organization
PowerShares Exchange-Traded Fund Trust (the "Trust") was organized as a Massachusetts business trust on June 9, 2000 and is authorized to have multiple series of portfolios. The Trust is an open-end management investment company, registered under the Investment Company Act of 1940, as amended (the "1940 Act"). As of the year end, the Trust offered seventy-five portfolios. This report includes the following portfolios:
| Full Name | Short Name | ||||||
| PowerShares FTSE RAFI Basic Materials Sector Portfolio | "FTSE RAFI Basic Materials Sector Portfolio" | ||||||
| PowerShares FTSE RAFI Consumer Goods Sector Portfolio | "FTSE RAFI Consumer Goods Sector Portfolio" | ||||||
| PowerShares FTSE RAFI Consumer Services Sector Portfolio | "FTSE RAFI Consumer Services Sector Portfolio" | ||||||
| PowerShares FTSE RAFI Energy Sector Portfolio | "FTSE RAFI Energy Sector Portfolio" | ||||||
| PowerShares FTSE RAFI Financials Sector Portfolio | "FTSE RAFI Financials Sector Portfolio" | ||||||
| PowerShares FTSE RAFI Health Care Sector Portfolio | "FTSE RAFI Health Care Sector Portfolio" | ||||||
| PowerShares FTSE RAFI Industrials Sector Portfolio | "FTSE RAFI Industrials Sector Portfolio" | ||||||
| PowerShares FTSE RAFI Telecommunications & Technology Sector Portfolio | "FTSE RAFI Telecommunications & Technology Sector Portfolio" | ||||||
| PowerShares FTSE RAFI US 1500 Small-Mid Portfolio | "FTSE RAFI US 1500 Small-Mid Portfolio" | ||||||
| PowerShares FTSE RAFI Utilities Sector Portfolio | "FTSE RAFI Utilities Sector Portfolio" | ||||||
Each portfolio (the "Fund" or collectively the "Funds") represents a separate series of the Trust. The shares of the Funds are referred to herein as "Shares" or "Fund Shares." Each Fund's Shares are listed and traded on The NASDAQ Stock Market LLC.
The Funds' market prices may differ to some degree from the net asset value of the Shares of each Fund. Unlike conventional mutual funds, each Fund issues and redeems Shares on a continuous basis, at net asset value, only in a large specified number of Shares, each called a "Creation Unit." Creation Units are issued and redeemed generally in-kind for securities included in the relevant index. Except when aggregated in Creation Units, Shares are not individually redeemable securities of the Funds.
The investment objective of each Fund is to seek investment results that correspond generally to the price and yield (before the Fund's fees and expenses) of the following indices:
| Fund | Index | ||||||
| FTSE RAFI Basic Materials Sector Portfolio | FTSE RAFI Basic Materials Sector Index | ||||||
| FTSE RAFI Consumer Goods Sector Portfolio | FTSE RAFI Consumer Goods Sector Index | ||||||
| FTSE RAFI Consumer Services Sector Portfolio | FTSE RAFI Consumer Services Sector Index | ||||||
| FTSE RAFI Energy Sector Portfolio | FTSE RAFI Oil & Gas Index | ||||||
| FTSE RAFI Financials Sector Portfolio | FTSE RAFI Financials Sector Index | ||||||
| FTSE RAFI Health Care Sector Portfolio | FTSE RAFI Health Care Sector Index | ||||||
81
Notes to Financial Statements (Continued)
PowerShares Exchange-Traded Fund Trust
April 30, 2009
| Fund | Index | ||||||
| FTSE RAFI Industrials Sector Portfolio | FTSE RAFI Industrials Sector Index | ||||||
| FTSE RAFI Telecommunications & Technology Sector Portfolio | FTSE RAFI Telecommunications & Technology Sector Index | ||||||
| FTSE RAFI US 1500 Small-Mid Portfolio | FTSE RAFI US 1500 Small-Mid Index | ||||||
| FTSE RAFI Utilities Sector Portfolio | FTSE RAFI Utilities Sector Index | ||||||
Note 2. Significant Accounting Policies
The preparation of the financial statements in accordance with accounting principles generally accepted in the United States of America requires management to make estimates and assumptions that affect the reported amounts and disclosures in the financial statements, including estimates and assumptions related to taxation. Actual results could differ from these estimates.
A. Security Valuation
Securities, including restricted securities, are valued according to the following policies.
A security listed or traded on an exchange (except convertible bonds) is valued at its last sales price or official closing price as of the close of the customary trading session on the exchange where the security is principally traded, or lacking any sales or official closing price on a particular day, the security may be valued at the closing bid price on that day. Securities traded in the over-the-counter market are valued based on prices furnished by independent pricing services or market makers. Listed options, if no closing price is available, are valued at the mean between the last bid and the ask prices from the exchange on which they are principally traded. Options not listed on an exchange are valued by an independent source at the mean between the last bid and ask prices.
Investments in open-end registered investment companies not traded on an exchange are valued at the end of day net asset value per share.
Debt obligations (including convertible bonds) and unlisted equities are fair valued using an evaluated quote provided by an independent pricing service. Evaluated quotes provided by the pricing service may be determined without exclusive reliance on quoted prices, and may reflect appropriate factors such as institution-size trading in similar groups of securities, developments related to specific securities, dividend rate, yield, quality, type of issue, coupon rate, maturity, individual trading characteristics and other market data. Short-term obligations, including commercial paper, having 60 days or less to maturity are recorded at amortized cost which approximates value. Debt securities are subject to interest rate and credit risks. In addition, all debt securities involve some risk of default with respect to interest and/or principal payments.
Foreign securities (including foreign exchange contracts) are converted into U.S. dollar amounts using the applicable exchange rates as of the close of the London world markets. If market quotations are available and reliable for foreign exchange traded equity securities, the securities will be valued at the market quotations. Because trading hours for certain foreign securities end before the close of the New York Stock Exchange ("NYSE"), closing market quotations may become unreliable. If between the time trading ends on a particular security and the close of the customary trading session on the NYSE, events occur that are significant and make the closing price unreliable, the Fund may fair value the security. If the event is likely to have affected the closing price of the security, the security will be valued at fair value in good faith using procedures approved by the Board of Trustees. Adjustments to closing prices to refl ect fair value may also
82
Notes to Financial Statements (Continued)
PowerShares Exchange-Traded Fund Trust
April 30, 2009
be based on a screening process of an independent pricing service to indicate the degree of certainty, based on historical data, that the closing price in the principal market where a foreign security trades is not the current value as of the close of the NYSE. Foreign securities meeting the approved degree of certainty that the price is not reflective of current value will be priced at the indication of fair value from the independent pricing service. Multiple factors may be considered by the independent pricing service in determining adjustments to reflect fair value and may include information relating to sector indices, ADRs and domestic and foreign index futures. Foreign securities may have additional risks including exchange rate changes, potential for sharply devalued currencies and high inflation, political and economic upheaval, the relative lack of issuer information, relatively low market liquidity and the potential l ack of strict financial and accounting controls and standards.
Securities for which market prices are not provided by any of the above methods may be valued based upon quotes furnished by independent sources.
Securities for which market quotations are not readily available or are unreliable are valued at fair value as determined in good faith by or under the supervision of the Trust's officers following procedures approved by the Board of Trustees. Issuer specific events, market trends, bid/ask quotes of brokers and information providers and other market data may be reviewed in the course of making a good faith determination of a security's fair value.
Valuations change in response to many factors including the historical and prospective earnings of the issuer, the value of the issuer's assets, general economic conditions, interest rates, investor perceptions and market liquidity. Because of the inherent uncertainties of valuation, the values reflected in the financial statements may materially differ from the value received upon actual sale of those investments.
B. Other Risks
A Fund may concentrate investments in a comparatively narrow segment of the economy. Consequently, such Fund may tend to be more volatile than other funds, and the value of the investments may tend to rise and fall more rapidly.
A Fund may invest a large percentage of its assets in securities of a limited number of companies, such that each investment may have a greater effect on the Fund's overall performance, and any change in the value of those securities could significantly affect the value of your investment in the Fund.
C. Federal Income Taxes
Each Fund intends to comply with the provisions of the Internal Revenue Code applicable to regulated investment companies and to distribute substantially all of the Fund's taxable earnings to its shareholders. As such, the Funds will not be subject to Federal income taxes on otherwise taxable income (including net realized gains) that is distributed to the shareholders. Therefore, no provision for Federal income taxes is recorded in the financial statements.
Income and capital gain distributions are determined in accordance with Federal income tax regulations, which may differ from accounting principles generally accepted in the United States of America. These differences are primarily due to differing book and tax treatments for in-kind transactions, losses deferred due to wash sales, and Passive Foreign Investment Company adjustments, if any.
83
Notes to Financial Statements (Continued)
PowerShares Exchange-Traded Fund Trust
April 30, 2009
The Funds file tax returns in the United States Federal jurisdiction and certain other jurisdictions. Generally a Fund is subject to examinations by such taxing authorities for up to three years after the filing of the return for the tax period.
D. Investment Income and Investment Transactions
Dividend income is recorded on the ex-dividend date net of foreign taxes withheld, if any. Interest income is recorded on the accrual basis. Investment transactions are recorded on the trade date. Realized gains and losses from the sale or disposition of securities are calculated on the specific identified cost basis. Dividends and interest received by a Fund may give rise to withholding and other taxes imposed by foreign countries. Corporate actions (including cash dividends) are recorded net of non-reclaimable foreign tax withholdings on the ex-dividend date. Tax conventions between certain countries and the United States may reduce or eliminate such taxes.
E. Expenses
Expenses of the Trust, which are directly identifiable to a specific Fund, are applied to that Fund. Expenses which are not readily identifiable to a specific Fund are allocated in such a manner as deemed equitable, taking into consideration the nature and type of expense and the relative net assets of each Fund.
Each Fund is responsible for all of its expenses, including the investment advisory fees, costs of transfer agency, custody, fund administration, legal, audit and other services, interest, taxes, brokerage commissions and other expenses connected with executions of portfolio transactions, any distribution fees or expenses and extraordinary expenses.
F. Dividends and Distributions to Shareholders
Each Fund declares and pays dividends from net investment income, if any, to its shareholders quarterly and records on ex-dividend date. Each Fund distributes net realized taxable capital gains, if any, generally annually in cash and records on ex-dividend date. Such distributions on a tax basis are determined in conformity with income tax regulations which may differ from accounting principles generally accepted in the United States of America. Distributions in excess of tax basis earnings and profits, if any, are reported in such Fund's financial statements as a tax return of capital at fiscal period end.
G. Equalization
All Funds use the accounting practice of equalization. This accounting method is used to keep the continuing shareholder's per share equity in undistributed net investment income from being affected by the continuous sales and redemptions of capital shares. Equalization is calculated on a per share basis whereby a portion of the proceeds from the sales and cost of repurchases of capital shares is applied to undistributed net investment income. The amount of equalization is disclosed in the Statements of Changes in Net Assets as undistributed net investment income included in the price of capital shares issued or redeemed. The distributions to shareholders of amounts so applied may be deemed to be a return of capital for tax purposes to the extent that such distributions exceed taxable income.
Note 3. Investment Advisory Agreement and Other Agreements
The Trust has entered into an Investment Advisory Agreement with Invesco PowerShares Capital Management LLC (the "Adviser") under which the Adviser has overall responsibility as the Funds' investment adviser for the selection and ongoing monitoring of the Funds' investments, managing the Funds' business affairs and providing certain clerical, bookkeeping and other administrative services. Prior to November 1, 2008, each Fund agreed to pay the Adviser an annual fee of 0.50% of the Fund's average daily net assets. Effective November 1, 2008, each Fund has agreed to pay the Adviser an annual fee of 0.29% of the Fund's average daily net assets.
84
Notes to Financial Statements (Continued)
PowerShares Exchange-Traded Fund Trust
April 30, 2009
The Adviser has entered into an Amended and Restated Excess Expense Agreement (the "Excess Expense Agreement") with the Trust. The Adviser has agreed to waive fees and/or pay Fund expenses to the extent necessary to prevent the operating expenses of each Fund (excluding interest expense, brokerage commissions and other trading expenses, offering costs, taxes and extraordinary expenses) from exceeding 0.39% of the Funds average daily net assets per year (the "Expense Cap"), at least until August 31, 2010. Prior to November 1, 2008, each Fund's Expense Cap was 0.60%, at least until August 31, 2009, and sub-licensing fees were excluded from the Expense Cap. Offering costs excluded from the Expense Cap are: (a) legal fees pertaining to the Funds' shares offered for sale; (b) Securities and Exchange Commission and state registration fees; and (c) initial fees paid to be listed on an exchange.
The Excess Expense Agreement provides that the expenses borne by the Adviser are subject to recapture by the Adviser for up to three years from the date the fee or expense was borne by the Adviser, but no recapture payment will be made by a Fund if it would result in the Fund exceeding its Expense Cap as specified above.
The net amount of fees waived and other expenses assumed by the Adviser and the amount of recapture paid to the Adviser pursuant to the Excess Expense Agreement are collectively referred to as "(Waivers) and/or Recapture." The net amounts of (Waivers) and/or Recapture for the year ended April 30, 2009 are shown on the Statements of Operations.
For the year ended April 30, 2009, the Adviser agreed to reimburse the FTSE RAFI Consumer Services Sector Portfolio for an economic loss of $18,746.
The amounts available for potential future recapture by the Adviser under the Excess Expense Agreement and the expiration schedule at April 30, 2009 are as follows:
| Total Potential | Potential Recapture Amounts Expiring | ||||||||||||||||||
| Recapture Amounts | 04/30/10 | 04/30/11 | 04/30/12 | ||||||||||||||||
| FTSE RAFI Basic Materials Sector Portfolio | $ | 288,060 | $ | 51,661 | $ | 121,791 | $ | 114,608 | |||||||||||
| FTSE RAFI Consumer Goods Sector Portfolio | 300,985 | 53,258 | 127,844 | 119,883 | |||||||||||||||
| FTSE RAFI Consumer Services Sector Portfolio | 302,727 | 54,286 | 126,290 | 122,151 | |||||||||||||||
| FTSE RAFI Energy Sector Portfolio | 282,607 | 48,170 | 116,454 | 117,983 | |||||||||||||||
| FTSE RAFI Financials Sector Portfolio | 299,744 | 52,586 | 122,879 | 124,279 | |||||||||||||||
| FTSE RAFI Health Care Sector Portfolio | 290,554 | 52,471 | 120,656 | 117,427 | |||||||||||||||
| FTSE RAFI Industrials Sector Portfolio | 278,376 | 48,914 | 107,165 | 122,297 | |||||||||||||||
| FTSE RAFI Telecommunications & Technology Sector Portfolio | 284,274 | 51,543 | 113,203 | 119,528 | |||||||||||||||
| FTSE RAFI US 1500 Small-Mid Portfolio | 336,476 | 37,394 | 70,284 | 228,798 | |||||||||||||||
| FTSE RAFI Utilities Sector Portfolio | 284,978 | 49,472 | 116,739 | 118,767 | |||||||||||||||
The Trust has entered into a Distribution Agreement with Invesco Aim Distributors, Inc. (the "Distributor"), which serves as the Distributor of Creation Units for each Fund. The Distributor does not maintain a secondary market in Shares.
The Adviser has entered into a licensing agreement for each Fund with FTSE International Ltd. (the "Licensor"). The index name trademark is owned by the Licensor. This trademark has been licensed to the Adviser for use with the Funds. The Funds are not sponsored, endorsed, sold or promoted by the Licensor and the Licensor makes no representation regarding the advisability of investing in any of these Funds. The Trust has entered into a sub-licensing agreement under which the Funds are required to pay the sub-licensing fees which are shown on the Statements of Operations.
85
Notes to Financial Statements (Continued)
PowerShares Exchange-Traded Fund Trust
April 30, 2009
The Trust has entered into service agreements whereby The Bank of New York Mellon, a wholly-owned subsidiary of The Bank of New York Mellon Corporation, serves as the administrator, custodian, fund accounting and transfer agent for each Fund.
The custodian has agreed to provide overdraft protection to the Funds according to the terms of the service agreement.
Note 4. Investments in Affiliates
The Fund's Adviser is a subsidiary of Invesco Ltd. and therefore, Invesco Ltd. is considered to be affiliated with the Fund. The table below shows the transactions in and earnings from the investment in Invesco Ltd. for the year ended April 30, 2009.
PowerShares FTSE RAFI Financials Sector Portfolio
| Value 04/30/08 | Purchase at Cost | Proceeds from Sales | Change in Unrealized Appreciation | Realized Gain | Value 04/30/09 | Dividend Income | |||||||||||||||||||||||||
| Invesco Ltd. | $ | — | $ | 528,298 | $ | (131,040 | ) | $ | 65,426 | $ | 16,908 | $ | 479,592 | $ | — | ||||||||||||||||
Note 5. Additional Valuation Information
The Funds adopted the provisions of Statement of Financial Accounting Standards No. 157, "Fair Value Measurements" ("SFAS 157"), effective with the beginning of the Fund's fiscal year. SFAS 157 defines fair value as the price that would be received to sell an asset or paid to transfer a liability in an orderly transaction between market participants at the measurement date. SFAS 157 establishes a hierarchy that prioritizes the inputs to valuation methods giving the highest priority to readily available unadjusted quoted prices in an active market for identical assets (Level 1) and the lowest priority to significant unobservable inputs (Level 3) generally when market prices are not readily available or are unreliable. Based on the valuation inputs, the securities or other investments are tiered into one of three levels. Changes in valuation methods may result in transfers in or out of an investment's assigned level:
Level 1 – Prices are determined using quoted prices in an active market for identical assets.
Level 2 – Prices are determined using other significant observable inputs. Observable inputs are inputs that other market participants may use in pricing a security. These may include quoted prices for similar securities, interest rates, prepayment speeds, credit risk and others.
Level 3 – Prices are determined using significant unobservable inputs. In situations where quoted prices or observable inputs are unavailable (for example, when there is little or no market activity for an investment at the end of the period), unobservable inputs may be used. Unobservable inputs reflect the Fund's own assumptions about the factors market participants would use in determining fair value of the securities or instruments and would be based on the best available information.
The following is a summary of the tiered valuation input levels, as of the end of the reporting period, April 30, 2009. The level assigned to the securities valuations may not be an indication of the risk or liquidity associated with investing in those securities. Because of the inherent uncertainties of valuation, the values reflected in the financial statements may materially differ from the value received upon actual sale of those investments.
86
Notes to Financial Statements (Continued)
PowerShares Exchange-Traded Fund Trust
April 30, 2009
| Investments in Securities | |||||||||||||||||||
| Level 1 | Level 2 | Level 3 | Total | ||||||||||||||||
| FTSE RAFI Basic Materials Sector Portfolio | $ | 3,813,749 | $ | — | $ | — | $ | 3,813,749 | |||||||||||
| FTSE RAFI Consumer Goods Sector Portfolio | 3,472,629 | — | — | 3,472,629 | |||||||||||||||
| FTSE RAFI Consumer Services Sector Portfolio | 3,813,173 | — | — | 3,813,173 | |||||||||||||||
| FTSE RAFI Energy Sector Portfolio | 9,473,515 | — | — | 9,473,515 | |||||||||||||||
| FTSE RAFI Financials Sector Portfolio | 11,421,394 | — | — | 11,421,394 | |||||||||||||||
| FTSE RAFI Health Care Sector Portfolio | 11,283,364 | — | — | 11,283,364 | |||||||||||||||
| FTSE RAFI Industrials Sector Portfolio | 6,858,961 | — | — | 6,858,961 | |||||||||||||||
| FTSE RAFI Telecommunications & Technology Sector Portfolio | 11,656,601 | — | — | 11,656,601 | |||||||||||||||
| FTSE RAFI US 1500 Small-Mid Portfolio | 94,411,907 | — | 0 | 94,411,907 | |||||||||||||||
| FTSE RAFI Utilities Sector Portfolio | 7,874,002 | — | — | 7,874,002 | |||||||||||||||
Note 6. Federal Income Tax
At April 30, 2009, costs of investments on a tax basis including the adjustments for financial reporting purposes as of the most recently completed Federal income tax reporting year were as follows:
| FTSE RAFI Basic Materials Sector Portfolio | $ | 6,954,279 | |||||
| FTSE RAFI Consumer Goods Sector Portfolio | 4,682,027 | ||||||
| FTSE RAFI Consumer Services Sector Portfolio | 5,375,237 | ||||||
| FTSE RAFI Energy Sector Portfolio | 14,064,338 | ||||||
| FTSE RAFI Financials Sector Portfolio | 24,435,617 | ||||||
| FTSE RAFI Health Care Sector Portfolio | 14,913,563 | ||||||
| FTSE RAFI Industrials Sector Portfolio | 9,283,816 | ||||||
| FTSE RAFI Telecommunications & Technology Sector Portfolio | 14,561,395 | ||||||
| FTSE RAFI US 1500 Small Mid-Cap Portfolio | 126,319,501 | ||||||
| FTSE RAFI Utilities Sector Portfolio | 11,044,694 | ||||||
At April 30, 2009, the components of accumulated earnings/loss on a tax-basis were as follows:
| Accumulated Earnings | Other Temporary Differences | Net Accumulated Capital and Other Losses | Net Unrealized Appreciation (Depreciation) | Gross Unrealized Appreciation | Gross Unrealized Depreciation | Total Accumulated Earnings (Loss) | |||||||||||||||||||||||||
| FTSE RAFI Basic Materials Sector Portfolio | $ | 43,082 | $ | (2,689 | ) | $ | (1,047,365 | ) | $ | (3,140,530 | ) | $ | 21,048 | $ | (3,161,578 | ) | $ | (4,147,502 | ) | ||||||||||||
| FTSE RAFI Consumer Goods Sector Portfolio | 22,017 | (2,513 | ) | (804,262 | ) | (1,209,398 | ) | 90,496 | (1,299,894 | ) | (1,994,156 | ) | |||||||||||||||||||
| FTSE RAFI Consumer Services Sector Portfolio | 15,966 | (2,542 | ) | (367,088 | ) | (1,562,064 | ) | 52,723 | (1,614,787 | ) | (1,915,728 | ) | |||||||||||||||||||
| FTSE RAFI Energy Sector Portfolio | 48,182 | (2,788 | ) | (802,592 | ) | (4,590,823 | ) | 132,820 | (4,723,643 | ) | (5,348,021 | ) | |||||||||||||||||||
| FTSE RAFI Financials Sector Portfolio | 66,524 | (2,792 | ) | (7,924,341 | ) | (13,014,223 | ) | 124,366 | (13,138,589 | ) | (20,874,832 | ) | |||||||||||||||||||
| FTSE RAFI Health Care Sector Portfolio | 77,172 | (2,714 | ) | (1,132,186 | ) | (3,630,199 | ) | 309,996 | (3,940,195 | ) | (4,687,927 | ) | |||||||||||||||||||
| FTSE RAFI Industrials Sector Portfolio | — | (2,880 | ) | (1,317,784 | ) | (2,424,855 | ) | 91,077 | (2,515,932 | ) | (3,745,519 | ) | |||||||||||||||||||
87
Notes to Financial Statements (Continued)
PowerShares Exchange-Traded Fund Trust
April 30, 2009
| Accumulated Earnings | Other Temporary Differences | Net Accumulated Capital and Other Losses | Net Unrealized Appreciation (Depreciation) | Gross Unrealized Appreciation | Gross Unrealized Depreciation | Total Accumulated Earnings (Loss) | |||||||||||||||||||||||||
| FTSE RAFI Telecommunications & Technology Sector Portfolio | $ | 19,446 | $ | (2,674 | ) | $ | (863,680 | ) | $ | (2,904,794 | ) | $ | 59,719 | $ | (2,964,513 | ) | $ | (3,751,702 | ) | ||||||||||||
| FTSE RAFI US 1500 Small Mid-Cap Portfolio | 210,238 | (6,841 | ) | (10,840,204 | ) | (31,907,594 | ) | 5,578,278 | (37,485,872 | ) | (42,544,401 | ) | |||||||||||||||||||
| FTSE RAFI Utilities Sector Portfolio | 111,620 | (2,623 | ) | (849,328 | ) | (3,170,692 | ) | 6,026 | (3,176,718 | ) | (3,911,023 | ) | |||||||||||||||||||
Distributions to Shareholders:
The tax character of distributions paid was as follows:
| Year ended April 30, 2009 | Year ended April 30, 2008 | ||||||||||
| Distributions paid from Ordinary Income | Distributions paid from Ordinary Income | ||||||||||
| FTSE RAFI Basic Materials Sector Portfolio | $ | 223,156 | $ | 371,654 | |||||||
| FTSE RAFI Consumer Goods Sector Portfolio | 63,402 | 184,859 | |||||||||
| FTSE RAFI Consumer Services Sector Portfolio | 46,582 | 51,137 | |||||||||
| FTSE RAFI Energy Sector Portfolio | 162,262 | 140,976 | |||||||||
| FTSE RAFI Financials Sector Portfolio | 555,902 | 387,102 | |||||||||
| FTSE RAFI Health Care Sector Portfolio | 291,957 | 167,854 | |||||||||
| FTSE RAFI Industrials Sector Portfolio | 248,303 | 385,729 | |||||||||
| FTSE RAFI Telecommunications & Technology Sector Portfolio | 202,651 | 116,397 | |||||||||
| FTSE RAFI US 1500 Small Mid-Cap Portfolio | 1,209,035 | 1,013,277 | |||||||||
| FTSE RAFI Utilities Sector Portfolio | 309,762 | 255,837 | |||||||||
| Year ended April 30, 2009 | Year ended April 30, 2008 | ||||||||||
| Distributions paid from Return of Capital | Distributions paid from Return of Capital | ||||||||||
| FTSE RAFI Consumer Goods Sector Portfolio | $ | — | $ | 4,451 | |||||||
| FTSE RAFI Industrials Sector Portfolio | 24,207 | — | |||||||||
At April 30, 2009, for Federal income tax purposes, the Funds have capital loss carryforwards available as shown in the table below, to the extent provided by the regulations, to offset future capital gains through the years indicated. To the extent that these loss carryforwards are used to offset future capital gains, it is probable that the capital gains so offset will not be distributed to shareholders. The use of some portion of the capital loss carryforwards by any one Fund may be limited by Federal tax rules. Among others, certain rules limit the use of the carryforwards when there has been a greater than fifty percent change in ownership of a Fund.
88
Notes to Financial Statements (Continued)
PowerShares Exchange-Traded Fund Trust
April 30, 2009
| Year of Expiration | Total | ||||||||||||||||||
| 2015 | 2016 | 2017 | Amounts | ||||||||||||||||
| FTSE RAFI Basic Materials Sector Portfolio | $ | — | $ | 54,564 | $ | 264,727 | $ | 319,291 | |||||||||||
| FTSE RAFI Consumer Goods Sector Portfolio | — | 77,599 | 301,059 | 378,658 | |||||||||||||||
| FTSE RAFI Consumer Services Sector Portfolio | 9,952 | 14,878 | 77,288 | 102,118 | |||||||||||||||
| FTSE RAFI Energy Sector Portfolio | 26,908 | 108,825 | 135,733 | ||||||||||||||||
| FTSE RAFI Financials Sector Portfolio | 4,934 | 164,786 | 3,275,287 | 3,445,007 | |||||||||||||||
| FTSE RAFI Health Care Sector Portfolio | — | 124,698 | 331,722 | 456,420 | |||||||||||||||
| FTSE RAFI Industrials Sector Portfolio | — | 181,254 | 376,679 | 557,933 | |||||||||||||||
| FTSE RAFI Telecommunications & Technology Sector Portfolio | 9 | 37,273 | 470,338 | 507,620 | |||||||||||||||
| FTSE RAFI US 1500 Small Mid-Cap Portfolio | 5,818 | 128,460 | 8,217,980 | 8,352,258 | |||||||||||||||
| FTSE RAFI Utilities Sector Portfolio | — | 64,318 | 256,387 | 320,705 | |||||||||||||||
Capital losses incurred after October 31 ("post-October losses") within the taxable year are deemed to arise on the first business day of each Fund's next taxable year.
During the year ended April 30, 2009, the Funds incurred and will elect to defer net capital losses as follows:
| Post-October Losses | |||||||
| FTSE RAFI Basic Materials Sector Portfolio | $ | (728,074 | ) | ||||
| FTSE RAFI Consumer Goods Sector Portfolio | (425,604 | ) | |||||
| FTSE RAFI Consumer Services Sector Portfolio | (264,970 | ) | |||||
| FTSE RAFI Energy Sector Portfolio | (666,859 | ) | |||||
| FTSE RAFI Financials Sector Portfolio | (4,479,334 | ) | |||||
| FTSE RAFI Health Care Sector Portfolio | (675,766 | ) | |||||
| FTSE RAFI Industrials Sector Portfolio | (759,851 | ) | |||||
| FTSE RAFI Telecommunications & Technology Sector Portfolio | (356,060 | ) | |||||
| FTSE RAFI US 1500 Small Mid-Cap Portfolio | (2,487,946 | ) | |||||
| FTSE RAFI Utilities Sector Portfolio | (528,623 | ) | |||||
In order to present shares of beneficial interest and accumulated net realized gains or losses on the Statements of Assets and Liabilities that more closely represent their tax character, certain adjustments have been made to shares of beneficial interest, undistributed net investment income or loss and net realized gains or losses on investments. These differences are primarily due to redemptions in-kind, investments in partnerships, wash sales, book equalization, and net operating losses, if any. These adjustments have no effect on net assets. For the year ended April 30, 2009, the adjustments were as follows:
| Undistributed Net Investment Income (Loss) | Accumulated Net Realized Gain (Loss) | Shares of Beneficial Interest | |||||||||||||
| FTSE RAFI Basic Materials Sector Portfolio | $ | (3,010 | ) | $ | 3,292,588 | $ | (3,289,578 | ) | |||||||
| FTSE RAFI Consumer Goods Sector Portfolio | — | — | — | ||||||||||||
| FTSE RAFI Consumer Services Sector Portfolio | — | — | — | ||||||||||||
| FTSE RAFI Energy Sector Portfolio | 21,211 | (790,756 | ) | 769,545 | |||||||||||
89
Notes to Financial Statements (Continued)
PowerShares Exchange-Traded Fund Trust
April 30, 2009
| Undistributed Net Investment Income (Loss) | Accumulated Net Realized Gain (Loss) | Shares of Beneficial Interest | |||||||||||||
| FTSE RAFI Financials Sector Portfolio | $ | (34,888 | ) | $ | 1,042,816 | $ | (1,007,928 | ) | |||||||
| FTSE RAFI Health Care Sector Portfolio | 174 | — | (174 | ) | |||||||||||
| FTSE RAFI Industrials Sector Portfolio | 23,860 | 2,711,724 | (2,735,584 | ) | |||||||||||
| FTSE RAFI Telecommunications & Technology Sector Portfolio | 8,975 | 54,326 | (63,301 | ) | |||||||||||
| FTSE RAFI US 1500 Small Mid-Cap Portfolio | (51,596 | ) | 14,926,200 | (14,874,604 | ) | ||||||||||
| FTSE RAFI Utilities Sector Portfolio | 14,841 | 669,043 | (683,884 | ) | |||||||||||
Note 7. Investment Transactions
For the year ended April 30, 2009, the cost of securities purchased and proceeds from sales of securities, excluding short-term securities, money market funds and in-kind transactions, were as follows:
| Purchases | Sales | ||||||||||
| FTSE RAFI Basic Materials Sector Portfolio | $ | 2,910,040 | $ | 2,821,740 | |||||||
| FTSE RAFI Consumer Goods Sector Portfolio | 1,436,020 | 1,413,030 | |||||||||
| FTSE RAFI Consumer Services Sector Portfolio | 9,954,926 | 9,842,541 | |||||||||
| FTSE RAFI Energy Sector Portfolio | 7,464,068 | 7,399,992 | |||||||||
| FTSE RAFI Financials Sector Portfolio | 6,220,869 | 6,122,388 | |||||||||
| FTSE RAFI Health Care Sector Portfolio | 4,559,359 | 4,501,676 | |||||||||
| FTSE RAFI Industrials Sector Portfolio | 1,824,012 | 1,941,136 | |||||||||
| FTSE RAFI Telecommunications & Technology Sector Portfolio | 4,348,237 | 4,414,629 | |||||||||
| FTSE RAFI US 1500 Small-Mid Portfolio | 16,492,049 | 16,039,252 | |||||||||
| FTSE RAFI Utilities Sector Portfolio | 2,125,258 | 1,934,436 | |||||||||
For the year ended April 30, 2009, in-kind transactions associated with creations and redemptions were as follows:
| Securities Received | Securities Delivered | ||||||||||
| FTSE RAFI Basic Materials Sector Portfolio | $ | 7,274,674 | $ | 8,860,353 | |||||||
| FTSE RAFI Consumer Goods Sector Portfolio | — | — | |||||||||
| FTSE RAFI Consumer Services Sector Portfolio | — | — | |||||||||
| FTSE RAFI Energy Sector Portfolio | — | 7,088,830 | |||||||||
| FTSE RAFI Financials Sector Portfolio | 9,490,773 | 4,743,367 | |||||||||
| FTSE RAFI Health Care Sector Portfolio | — | — | |||||||||
| FTSE RAFI Industrials Sector Portfolio | 3,357,479 | 3,463,059 | |||||||||
| FTSE RAFI Telecommunications & Technology Sector Portfolio | 8,622,211 | 4,625,111 | |||||||||
| FTSE RAFI US 1500 Small-Mid Portfolio | 49,143,606 | 44,795,830 | |||||||||
| FTSE RAFI Utilities Sector Portfolio | 4,358,062 | 3,695,689 | |||||||||
Gains on in-kind transactions are generally not considered taxable gains for Federal income tax purposes.
Note 8. Trustees' Fees
The Funds compensate each Trustee who is not an employee of the Adviser or its affiliates. The "Interested" Trustee of the Trust does not receive any Trustees' fees.
90
Notes to Financial Statements (Continued)
PowerShares Exchange-Traded Fund Trust
April 30, 2009
The Trust has adopted a deferred compensation plan (the "Plan"). Under the Plan, a Trustee who is not an "interested person" (as defined in the 1940 Act) (an "Independent Trustee") and has executed a Deferred Fee Agreement (a "Participating Trustee") may defer receipt of all or a portion of his compensation ("Deferral Fees"). Such Deferral Fees are deemed to be invested in selected PowerShares Funds. The Deferral Fees payable to the Participating Trustee are valued as of the date such Fees would have been paid to the Participating Trustee. The value increases with contributions or with increases in the value of the shares selected, and the value decreases with distributions or with declines in the value of the shares selected.
Note 9. Capital
Shares are created and redeemed by the Trust only in Creation Unit size aggregations of 100,000. Only Authorized Participants are permitted to purchase or redeem Creation Units from the Funds. Such transactions are generally permitted on an in-kind basis, with a balancing cash component to equate the transaction to the net asset value per unit of each Fund of the Trust on the transaction date. Cash may be substituted equivalent to the value of certain securities generally when they are not available in sufficient quantity for delivery, not eligible for trading by the Authorized Participant or as a result of other market circumstances.
Note 10. Indemnifications
Under the Trust's organizational documents, its officers and Trustees are indemnified against certain liabilities arising out of the performance of their duties to the Trust. Each Independent Trustee is also indemnified against certain liabilities arising out of the performance of his duties to the Trust pursuant to an Indemnification Agreement between the Independent Trustee and the Trust. Additionally, in the normal course of business, the Trust enters into contracts with service providers that contain general indemnification clauses. The Trust's maximum exposure under these arrangements is unknown, as this would involve future claims that may be made against the Trust that have not yet occurred. However, based on experience, the Trust believes the risk of loss to be remote.
Note 11. Subsequent Event
On May 1, 2009, the Board of Trustees of the Trust approved the liquidation of the PowerShares FTSE RAFI Basic Materials Sector Portfolio, PowerShares FTSE RAFI Consumer Goods Sector Portfolio, PowerShares FTSE RAFI Consumer Services Sector Portfolio, PowerShares FTSE RAFI Energy Sector Portfolio, PowerShares FTSE RAFI Financials Sector Portfolio, PowerShares FTSE RAFI Health Care Sector Portfolio, PowerShares FTSE RAFI Industrials Sector Portfolio, PowerShares FTSE RAFI Telecommunications & Technology Sector Portfolio, and PowerShares FTSE RAFI Utilities Sector Portfolio (collectively, the "Funds"). The portfolios were liquidated at fair value on May 22, 2009.
91
Report of Independent Registered Public Accounting Firm
To the Board of Trustees and Shareholders of PowerShares Exchange-Traded Fund Trust:
In our opinion, the accompanying statements of assets and liabilities, including the schedules of investments, and the related statements of operations and of changes in net assets and the financial highlights present fairly, in all material respects, the financial position of each of the portfolios indicated in Note 1 of the financial statements (each a portfolio of PowerShares Exchange-Traded Fund Trust, hereafter referred to as the "Trust") at April 30, 2009, and the results of each of their operations, the changes in each of their net assets, and the financial highlights for each of the periods presented, in conformity with accounting principles generally accepted in the United States of America. These financial statements and financial highlights (hereafter referred to as "financial statements") are the responsibility of the Trust's management; our responsibility is to express an opinion on these financial statements based on our audits. We conducted our audits of these financial statements in accordance with the standards of the Public Company Accounting Oversight Board (United States). Those standards require that we plan and perform the audits to obtain reasonable assurance about whether the financial statements are free of material misstatement. An audit includes examining, on a test basis, evidence supporting the amounts and disclosures in the financial statements, assessing the accounting principles used and significant estimates made by management, and evaluating the overall financial statement presentation. We believe that our audits, which included confirmation of securities at April 30, 2009 by correspondence with the custodian and brokers, and the application of alternative auditing procedures where securities purchased had not been received, provide a reasonable basis for our opinion.
As discussed in Note 11 to the financial statements, on May 1, 2009, the Board of Trustees approved the liquidation of the PowerShares FTSE RAFI Basic Materials Sector Portfolio, PowerShares FTSE RAFI Consumer Goods Sector Portfolio, PowerShares FTSE RAFI Consumer Services Sector Portfolio, PowerShares FTSE RAFI Energy Sector Portfolio, PowerShares FTSE RAFI Financials Sector Portfolio, PowerShares FTSE RAFI Health Care Sector Portfolio, PowerShares FTSE RAFI Industrials Sector Portfolio, PowerShares FTSE RAFI Telecommunications & Technology Sector Portfolio, and PowerShares FTSE RAFI Utilities Sector Portfolio, effected on May 22, 2009.
PricewaterhouseCoopers LLP
New York, New York
June 25, 2009
92
Supplemental Information
Tax Information
Form 1099-DIV, Form 1042-S and other year-end tax information provide shareholders with actual calendar year amounts that should be included in their tax returns. Shareholders should consult their tax advisors.
The following distribution information is being provided as required by the Internal Revenue Code or to meet a specific state's requirement.
Each Fund designates the following amounts or, if subsequently determined to be different the maximum amount allowable for its fiscal year ended April 30, 2009 and if applicable its final fiscal year ended May 22, 2009:
Federal Income Tax Information
| April 30, 2009 | |||||||||||
| Qualified Dividend Income* | Corporate Dividend Received Deduction* | ||||||||||
| FTSE RAFI Basic Materials Sector Portfolio | 100 | % | 100 | % | |||||||
| FTSE RAFI Consumer Goods Sector Portfolio | 100 | % | 100 | % | |||||||
| FTSE RAFI Consumer Services Sector Portfolio | 100 | % | 100 | % | |||||||
| FTSE RAFI Energy Sector Portfolio | 100 | % | 100 | % | |||||||
| FTSE RAFI Financials Sector Portfolio | 100 | % | 100 | % | |||||||
| FTSE RAFI Health Care Sector Portfolio | 100 | % | 100 | % | |||||||
| FTSE RAFI Industrials Sector Portfolio | 100 | % | 100 | % | |||||||
| FTSE RAFI Telecommunications & Technology Sector Portfolio | 100 | % | 100 | % | |||||||
| FTSE RAFI US 1500 Small Mid-Cap Portfolio | 100 | % | 100 | % | |||||||
| FTSE RAFI Utilities Sector Portfolio | 100 | % | 100 | % | |||||||
Federal Income Tax Information for Liquidating Funds
| May 22, 2009 | |||||||||||
| Qualified Dividend Income* | Corporate Dividend Received Deduction* | ||||||||||
| FTSE RAFI Basic Materials Sector Portfolio | 100 | % | 100 | % | |||||||
| FTSE RAFI Consumer Goods Sector Portfolio | 100 | % | 100 | % | |||||||
| FTSE RAFI Consumer Services Sector Portfolio | 100 | % | 100 | % | |||||||
| FTSE RAFI Energy Sector Portfolio | 100 | % | 87 | % | |||||||
| FTSE RAFI Financials Sector Portfolio | 100 | % | 96 | % | |||||||
| FTSE RAFI Health Care Sector Portfolio | 100 | % | 92 | % | |||||||
| FTSE RAFI Industrials Sector Portfolio | 100 | % | 100 | % | |||||||
| FTSE RAFI Telecommunications & Technology Sector Portfolio | 100 | % | 100 | % | |||||||
| FTSE RAFI Utilities Sector Portfolio | 100 | % | 100 | % | |||||||
* The above percentages are based on ordinary income dividends paid to shareholders during the Fund's fiscal year.
93
Supplemental Information (Continued)
Trustees and Officers
The Independent Trustees, the Trustee who is affiliated with the Adviser (the "Management Trustee") and the executive officers of the Trust, their term of office and length of time served, their principal business occupations during at least the past five years, the number of portfolios in the Fund Complex (as defined below) overseen by each Trustee and the other directorships, if any, held by a Trustee, are shown below.
| Name, Address, and Age Independent Trustee | Position(s) with Trust | Length Time Served* | Principal Occupation(s) During Past 5 Years | Number of Portfolios in Fund Complex** Overseen by Trustee | Other Directorships Held by Trustee | ||||||||||||||||||
| Ronn R. Bagge 51 YQA Capital Management, LLC 1755 S. Naperville Road Suite 100 Wheaton, IL 60187 | Trustee | Since 2003 | YQA Capital Management LLC (July 1998-Present); formerly Owner/CEO of Electronic Dynamic Balancing Co., Inc. (high-speed rotating equipment service provider) | 119 | None | ||||||||||||||||||
| Marc M. Kole 48 c/o Invesco PowerShares Capital Management LLC 301 W. Roosevelt Road Wheaton, IL 60187 | Trustee | Since 2006 | Vice President of Finance and Accounting, Hope Network (social services) (November 2008-Present); formerly Assistant Vice President and Controller, Priority Health (health insurance) (September 2005-April 2008); Senior Vice President of Finance, United Healthcare (health insurance) (July 2004-July 2005); Senior Vice President of Finance, Oxford Health Plans (June 2000-July 2004) | 119 | None | ||||||||||||||||||
* This is the date the Trustee began serving the Trust. Each Trustee serves an indefinite term, until his successor is elected.
** Fund Complex includes all open-end funds (including all of their portfolios) advised by the Adviser. At April 30, 2009, the Fund Complex consists of the Trust's 75 portfolios and three other exchange-traded fund trusts with 44 portfolios advised by the Adviser.
94
Supplemental Information (Continued)
Trustees and Officers (Continued)
| Name, Address, and Age Independent Trustee | Position(s) with Trust | Length Time Served* | Principal Occupation(s) During Past 5 Years | Number of Portfolios in Fund Complex** Overseen by Trustee | Other Directorships Held by Trustee | ||||||||||||||||||
| Philip M. Nussbaum 47 c/o Invesco PowerShares Capital Management LLC 301 W. Roosevelt Road Wheaton, IL 60187 | Trustee | Since 2003 | Chairman, Performance Trust Capital Partners (formerly Betzold, Berg, Nussbaum & Heitman, Inc.) (November 2004-Present); formerly Managing Director, Communication Institute (May 2002-August 2003); Executive Vice President of Finance, Betzold, Berg, Nussbaum & Heitman, Inc. (March 1994-1999) | 119 | None | ||||||||||||||||||
| Donald H. Wilson 49 c/o Invesco PowerShares Capital Management LLC 301 W. Roosevelt Road Wheaton, IL 60187 | Trustee | Since 2006 | President and Chief Operating Officer, AMCORE Financial, Inc. (bank holding company) (August 2007-April 2009), formerly Executive Vice President and Chief Financial Officer, AMCORE Financial, Inc. (February 2006-August 2007); Senior Vice President and Treasurer, Marshall & Ilsley Corp. (bank holding company) (May 1995-February 2006) | 119 | None | ||||||||||||||||||
* This is the date the Trustee began serving the Trust. Each Trustee serves an indefinite term, until his successor is elected.
** Fund Complex includes all open-end funds (including all of their portfolios) advised by the Adviser. At April 30, 2009, the Fund Complex consists of the Trust's 75 portfolios and three other exchange-traded fund trusts with 44 portfolios advised by the Adviser.
95
Supplemental Information (Continued)
Trustees and Officers (Continued)
| Name, Address, and Age of Management Trustee | Position(s) with Trust | Length Time Served* | Principal Occupation(s) During Past 5 Years | Number of Portfolios in Fund Complex*** Overseen by Trustee | Other Directorships Held by Trustee | ||||||||||||||||||
| H. Bruce Bond** 45 Invesco PowerShares Capital Management LLC 301 W. Roosevelt Road Wheaton, IL 60187 | Chairman of the Board, Trustee and President | Since 2003 | Managing Director, Invesco PowerShares Capital Management LLC (August 2002-Present); formerly Manager, Nuveen Investments (April 1998-August 2002) | 119 | None | ||||||||||||||||||
Availability of Additional Information About the Trustees
The Statement of Additional Information includes additional information about the Trustees and is available, without charge, upon request at 800.337.4246.
* This is the date the Management Trustee began serving the Trust. Each Trustee serves an indefinite term, until his successor is elected. Each officer serves a one year term, until his successor is elected.
** "Interested person" as defined in Section 2(a)(19) of the 1940 Act.
*** Fund Complex includes all open-end funds (including all of their portfolios) advised by the Adviser. At April 30, 2009, the Fund Complex consists of the Trust's 75 portfolios and three other exchange-traded fund trusts with 44 portfolios advised by the Adviser.
96
Supplemental Information (Continued)
Trustees and Officers (Continued)
| Name, Address, and Age of Officers | Position(s) with Trust | Length Time Served* | Principal Occupation(s) During Past 5 Years | ||||||||||||
| Bruce T. Duncan 54 Invesco PowerShares Capital Management LLC 301 W. Roosevelt Road Wheaton, IL 60187 | Chief Financial Officer, Treasurer and Secretary | Chief Financial Officer and Treasurer Since 2006 Secretary Since 2008 | Senior Vice President of Finance, Invesco PowerShares Capital Management LLC (September 2005-Present); formerly Private Practice Attorney (2000-2005); Vice President of Investor Relations, The ServiceMaster Company (1994-2000); Vice President of Taxes, The ServiceMaster Company (1990-2000) | ||||||||||||
| Kevin R. Gustafson 43 Invesco PowerShares Capital Management LLC 301 W. Roosevelt Road Wheaton, IL 60187 | Chief Compliance Officer | Since 2004 | General Counsel, Invesco PowerShares Capital Management LLC (September 2004-Present); formerly Chief Compliance Officer, Invesco PowerShares Capital Management LLC (September 2004-April 2008); Attorney, Nyberg & Gustafson (2001-2004) | ||||||||||||
| John W. Southard, Jr., CFA, MBA 39 Invesco PowerShares Capital Management LLC 301 West Roosevelt Road Wheaton, IL 60187 | Vice President | Since 2003 | Managing Director, Invesco PowerShares Capital Management LLC (August 2002-Present); formerly, Treasurer of the Trust (April 2003-April 2006); Senior Equity Analyst, Charles Schwab & Company (May 2001-August 2002) | ||||||||||||
* This is the period for which the Officers began serving the Trust. Each Officer serves one year term, until his successor is elected.
97
Board Considerations Regarding Approval of Investment Advisory Agreement
At a meeting held on April 16, 2009, the Board of Trustees of the PowerShares Exchange-Traded Fund Trust (the "Trust"), including the Independent Trustees, unanimously approved the continuation of the Investment Advisory Agreement between Invesco PowerShares Capital Management LLC (the "Adviser") and the Trust for the following 70 series (each, a "Fund" and collectively, the "Funds"):
PowerShares Dynamic Market Portfolio
PowerShares Dynamic OTC Portfolio
PowerShares Golden Dragon Halter USX China Portfolio
PowerShares High Yield Equity Dividend AchieversTM Portfolio
PowerShares WilderHill Clean Energy Portfolio
PowerShares Dynamic Large Cap Growth Portfolio
PowerShares Dynamic Large Cap Value Portfolio
PowerShares Dynamic Mid Cap Growth Portfolio
PowerShares Dynamic Mid Cap Value Portfolio
PowerShares Dynamic Small Cap Growth Portfolio
PowerShares Dynamic Small Cap Value Portfolio
PowerShares Dynamic Biotechnology & Genome Portfolio
PowerShares Dynamic Food & Beverage Portfolio
PowerShares Dynamic Leisure and Entertainment Portfolio
PowerShares Dynamic Media Portfolio
PowerShares Dynamic Networking Portfolio
PowerShares Dynamic Pharmaceuticals Portfolio
PowerShares Dynamic Semiconductors Portfolio
PowerShares Dynamic Software Portfolio
PowerShares Zacks Micro Cap Portfolio
PowerShares Aerospace & Defense Portfolio
PowerShares Dynamic Hardware & Consumer Electronics Portfolio
PowerShares Dynamic Telecommunications & Wireless Portfolio
PowerShares Value Line Timeliness Select Portfolio
PowerShares Dividend AchieversTM Portfolio
PowerShares International Dividend AchieversTM Portfolio
PowerShares High Growth Rate Dividend AchieversTM Portfolio
PowerShares Zacks Small Cap Portfolio
PowerShares Dynamic Building and Construction Portfolio
PowerShares Dynamic Energy Exploration and Production Portfolio
PowerShares Dynamic Insurance Portfolio
PowerShares Dynamic Oil and Gas Services Portfolio
PowerShares Dynamic Retail Portfolio
PowerShares Dynamic Utilities Portfolio
PowerShares Lux Nanotech Portfolio
PowerShares FTSE RAFI US 1000 Portfolio
PowerShares FTSE RAFI US 1500 Small-Mid Portfolio
PowerShares Water Resources Portfolio
PowerShares Dynamic Energy Sector Portfolio
PowerShares Dynamic Financials Sector Portfolio
PowerShares Dynamic Healthcare Sector Portfolio
PowerShares Dynamic Industrials Sector Portfolio
PowerShares Dynamic Large Cap Portfolio
PowerShares Dynamic MagniQuant Portfolio
PowerShares Dynamic Mid Cap Portfolio
PowerShares Dynamic Small Cap Portfolio
PowerShares Dynamic Technology Sector Portfolio
PowerShares Buyback AchieversTM Portfolio
PowerShares FTSE RAFI Basic Materials Sector Portfolio
PowerShares FTSE RAFI Consumer Goods Sector Portfolio
PowerShares FTSE RAFI Consumer Services Sector Portfolio
PowerShares FTSE RAFI Energy Sector Portfolio
PowerShares FTSE RAFI Financials Sector Portfolio
PowerShares FTSE RAFI Health Care Sector Portfolio
PowerShares FTSE RAFI Industrials Sector Portfolio
PowerShares FTSE RAFI Telecommunications & Technology Sector Portfolio
PowerShares FTSE RAFI Utilities Sector Portfolio
PowerShares Cleantech Portfolio
98
Board Considerations Regarding Approval of Investment Advisory Agreement (Continued)
PowerShares Dynamic Aggressive Growth Portfolio
PowerShares Dynamic Banking Portfolio
PowerShares Dynamic Basic Materials Sector Portfolio
PowerShares Dynamic Consumer Discretionary Sector Portfolio
PowerShares Dynamic Consumer Staples Sector Portfolio
PowerShares Dynamic Healthcare Services Portfolio
PowerShares Dynamic Deep Value Portfolio
PowerShares Financial Preferred Portfolio
PowerShares Listed Private Equity Portfolio
PowerShares DWA Technical Leaders Portfolio
PowerShares Value Line Industry Rotation Portfolio
PowerShares WilderHill Progressive Energy Portfolio
The Trustees reviewed information from the Adviser describing: (i) the nature, extent and quality of services provided, (ii) the investment performance of the Funds and the Adviser, (iii) the costs of services provided and estimated profits realized by the Adviser, (iv) the extent to which economies of scale are realized as the Funds grow, (v) whether fee levels reflect any possible economies of scale for the benefit of Fund shareholders, (vi) comparisons of services rendered and amounts paid to other registered investment companies and (vii) any benefits realized by the Adviser from its relationship with each Fund. Based on all of the information considered and the conclusions reached, the Board, including the Independent Trustees, determined to approve the continuation of the Investment Advisory Agreement for each Fund. No single factor was determinative in the Board's analysis.
Nature, Extent and Quality of Services. In evaluating the nature, extent and quality of the Adviser's services, the Trustees reviewed information concerning the functions performed by the Adviser for the Funds, information describing the Adviser's current organization and projected staffing, including operations assistance provided by the Adviser's parent organization, Invesco Ltd., and the background and experience of the persons responsible for the day-to-day management of the Funds. The Trustees reviewed matters related to the Adviser's execution of portfolio transactions on behalf of the Funds. The Trustees also reviewed information on the performance of the Funds and the performance of their underlying indices through December 31, 2008. The Trustees also reviewed reports on the correlation and tracking error between the underlying index and each Fund's performance, and the Adviser's analysis of the tracking error between each Fund and its underlying index. The Trustees noted that each Fund's correlation was within the targeted range set forth in the Trust's registration statement and that, for each Fund other than PowerShares Financial Preferred Portfolio, the tracking error was within the targeted range set forth in the Trust's registration statement. The Trustees reviewed the reasons for PowerShares Financial Preferred Portfolio's tracking error. The Trustees concluded that each Fund was correlated to its underlying index and that the tracking error for each Fund was within an acceptable range given that Fund's particular circumstances.
The Trustees also considered the services provided by the Adviser in its oversight of the Funds' administrator, custodian and transfer agent. They noted the significant amount of time and effort that had been devoted to this oversight function.
Based on their review, the Trustees concluded that the nature, extent and quality of services provided by the Adviser to the Funds under the Investment Advisory Agreement were appropriate and reasonable.
Fees, Expenses and Profitability. The Trustees reviewed and discussed the information provided by the Adviser on each Fund's expense ratio and advisory fee, as compared to information compiled by the
99
Board Considerations Regarding Approval of Investment Advisory Agreement (Continued)
Adviser from Lipper Inc. databases on the expense ratios of comparable exchange-traded funds ("ETFs"), open-end (non-ETF) index funds and open-end actively-managed funds. The Trustees noted that the annual advisory fee charged to each Fund is:
• 0.50% of the Fund's average net assets, for each Fund other than PowerShares High Yield Equity Dividend AchieversTM Portfolio, PowerShares Dividend AchieversTM Portfolio, PowerShares High Growth Rate Dividend AchieversTM Portfolio, PowerShares International Dividend AchieversTM Portfolio, PowerShares FTSE RAFI Basic Materials Sector Portfolio, PowerShares FTSE RAFI Consumer Goods Sector Portfolio, PowerShares FTSE RAFI Consumer Services Sector Portfolio, PowerShares FTSE RAFI Energy Sector Portfolio, PowerShares FTSE RAFI Financials Sector Portfolio, PowerShares FTSE RAFI Health Care Sector Portfolio, PowerShares FTSE RAFI Industrials Sector Portfolio, PowerShares FTSE RAFI Telecommunications & Technology Sector Portfolio, PowerShares FTSE RAFI Utilities Sector Portfolio, PowerShares FTSE RAFI US 1000 Portfolio and PowerShares FTSE RAFI US 1500 Small-Mid Portfolio ;
• 0.40% of the Fund's average net assets, for each of PowerShares High Yield Equity Dividend AchieversTM Portfolio, PowerShares Dividend AchieversTM Portfolio, PowerShares High Growth Rate Dividend AchieversTM Portfolio and PowerShares International Dividend AchieversTM Portfolio; and
• 0.29% of the Fund's average net assets, for each of PowerShares FTSE RAFI Basic Materials Sector Portfolio, PowerShares FTSE RAFI Consumer Goods Sector Portfolio, PowerShares FTSE RAFI Consumer Services Sector Portfolio, PowerShares FTSE RAFI Energy Sector Portfolio, PowerShares FTSE RAFI Financials Sector Portfolio, PowerShares FTSE RAFI Health Care Sector Portfolio, PowerShares FTSE RAFI Industrials Sector Portfolio, PowerShares FTSE RAFI Telecommunications & Technology Sector Portfolio, PowerShares FTSE RAFI Utilities Sector Portfolio, PowerShares FTSE RAFI US 1000 Portfolio and PowerShares FTSE RAFI US 1500 Small-Mid Portfolio (the Trustees noted that the advisory fee for each of these Funds was reduced to 0.29% effective November 1, 2008).
The Trustees also noted that the Adviser has agreed to waive a portion of its advisory fee and/or pay expenses (an "Expense Cap") to the extent necessary to prevent the annual operating expenses of each Fund from exceeding the percentage of that Fund's average daily net assets, at least until August 31, 2010, as set forth below:
• 0.60%, excluding interest expenses, brokerage commissions and other trading expenses, taxes and extraordinary expenses, for each of PowerShares Dynamic OTC Portfolio and PowerShares Dynamic Market Portfolio;
• 0.50%, excluding interest expenses, licensing fees, offering costs, brokerage commissions and other trading expenses, taxes and extraordinary expenses, for each of PowerShares High Yield Equity Dividend AchieversTM Portfolio, PowerShares Dividend AchieversTM Portfolio, PowerShares High Growth Rate Dividend AchieversTM Portfolio and PowerShares International Dividend AchieversTM Portfolio;
• 0.39%, excluding interest expenses, offering costs, brokerage commissions and other trading expenses, taxes and extraordinary expenses, for each of PowerShares FTSE RAFI Basic Materials Sector Portfolio, PowerShares FTSE RAFI Consumer Goods Sector Portfolio, PowerShares FTSE RAFI Consumer Services Sector Portfolio, PowerShares FTSE RAFI Energy Sector Portfolio,
100
Board Considerations Regarding Approval of Investment Advisory Agreement (Continued)
PowerShares FTSE RAFI Financials Sector Portfolio, PowerShares FTSE RAFI Health Care Sector Portfolio, PowerShares FTSE RAFI Industrials Sector Portfolio, PowerShares FTSE RAFI Telecommunications & Technology Sector Portfolio, PowerShares FTSE RAFI Utilities Sector Portfolio, PowerShares FTSE RAFI US 1000 Portfolio and PowerShares FTSE RAFI US 1500 Small-Mid Portfolio (the Trustees noted that, effective November 1, 2008, the Expense Cap for each of these Funds changed from 0.60% to 0.39%); and
• 0.60%, excluding interest expenses, licensing fees, offering costs, brokerage commissions and other trading expenses, taxes and extraordinary expenses, for each other Fund.
The Trustees noted that the Adviser represented that it does not manage any funds other than the Funds and other ETFs overseen by the Board. The Trustees noted that each Fund's advisory fee was:
• higher than the median advisory fee of its ETF peer funds (except for the advisory fee of each of PowerShares Financial Preferred Portfolio, PowerShares Golden Dragon Halter USX China Portfolio and PowerShares International Dividend AchieversTM Portfolio, which was lower than the median advisory fee of its ETF peer funds); and
• higher than the median advisory fee of its open-end index peer funds (except for the advisory fee of each of PowerShares DWA Technical Leaders Portfolio, PowerShares Dynamic Aggressive Growth Portfolio, PowerShares Dynamic Mid Cap Growth Portfolio, PowerShares Dynamic Mid Cap Value Portfolio, PowerShares Dynamic OTC Portfolio, PowerShares Dynamic Telecommunications & Wireless Portfolio, PowerShares Dynamic Utilities Portfolio, PowerShares Financial Preferred Portfolio, PowerShares FTSE RAFI Utilities Sector Portfolio and PowerShares Value Line Timeliness Select Portfolio, which was lower than the median advisory fee of its open-end index peer funds, and there was no comparable data for PowerShares Dynamic Basic Materials Sector Portfolio, PowerShares FTSE RAFI Basic Materials Sector Portfolio or PowerShares Golden Dragon Halter USX China Portfolio); but
• lower than the median advisory fee of its open-end actively-managed peer funds.
The Trustees determined that the advisory fees were reasonable, noting the complexity of the indices, which generally require more frequent rebalancing of the portfolios, the distinguishing factors of the Funds, and the higher administrative, operational and management oversight costs for the Adviser. With respect to the Funds' expense ratios, the Trustees noted that the net expense ratio for each Fund was:
• higher than the median expense ratio of its ETF peer funds (except for the net expense ratio of each of PowerShares Dynamic OTC Portfolio, PowerShares Financial Preferred Portfolio and PowerShares International Dividend AchieversTM Portfolio, which was less than the median expense ratio of its ETF peer funds, and the net expense ratio of each of PowerShares Dynamic Aggressive Growth Portfolio and PowerShares Dynamic Market Portfolio, which was equal to the median expense ratio of its ETF peer funds); and
• higher than the median expense ratio of its open-end index peer funds (except for the net expense ratio of each of PowerShares DWA Technical Leaders Portfolio, PowerShares Dynamic Aggressive Growth Portfolio, PowerShares Dynamic Banking Portfolio, PowerShares Dynamic Biotechnology & Genome Portfolio, PowerShares Dynamic Financials Sector Portfolio, PowerShares Dynamic Healthcare Sector Portfolio, PowerShares Dynamic Healthcare Services Portfolio, PowerShares Dynamic Insurance
101
Board Considerations Regarding Approval of Investment Advisory Agreement (Continued)
Portfolio, PowerShares Dynamic OTC Portfolio, PowerShares Dynamic Pharmaceuticals Portfolio, PowerShares Dynamic Telecommunications & Wireless Portfolio, PowerShares Dynamic Utilities Portfolio, PowerShares Financial Preferred Portfolio, PowerShares FTSE RAFI Financials Sector Portfolio, PowerShares FTSE RAFI Utilities Sector Portfolio, PowerShares Listed Private Equity Portfolio and PowerShares Value Line Timeliness Select Portfolio, which was lower than the median expense ratio of its open-end index peer funds, and there was no comparable data for PowerShares Dynamic Basic Materials Sector Portfolio, PowerShares FTSE RAFI Basic Materials Sector Portfolio or PowerShares Golden Dragon Halter USX China Portfolio); but
• lower than the median expense ratio of its open-end actively-managed peer funds.
The Trustees noted that a significant component of the non-advisory fee expenses was the license fees paid by the Funds.
The Board concluded that the advisory fee and expense ratio of each Fund (giving effect to the Fund's Expense Cap) were reasonable and appropriate in light of the services provided.
In conjunction with their review of fees, the Trustees also considered information provided by the Adviser on the revenues received by the Adviser under the Investment Advisory Agreement for each Fund, as well as the fees waived and expenses reimbursed by the Adviser for the Funds. The Trustees reviewed information provided by the Adviser on its profitability as well as any profits or losses realized by the Adviser from its relationship to each Fund. The Trustees concluded that the profitability to the Adviser of the advisory services provided to any of the Funds was not unreasonable.
Economies of Scale and Whether Fee Levels Reflect These Economies of Scale. The Trustees reviewed the information provided by the Adviser as to the extent to which economies of scale are realized as each Fund grows and whether fee levels reflect economies of scale for the benefit of shareholders. The Trustees reviewed each Fund's asset size, expense ratio and expense limitation agreed to by the Adviser. The Trustees noted that, for Funds whose expenses are higher than their respective Expense Caps, any reduction in that Fund's expenses would be enjoyed by the Adviser, but that Fund shareholders benefit from the lower expense ratio as a result of the Fund's Expense Cap. The Trustees also noted that the Excess Expense Agreement with the Trust provides that the Adviser is entitled to be reimbursed by each Fund, other than PowerShares Dynamic Market Portf olio and PowerShares Dynamic OTC Portfolio, for fees waived or expenses absorbed pursuant to the Expense Cap for a period of three years from the date the fee or expense was incurred, provided that no reimbursement would be made that would result in a Fund exceeding its Expense Cap. The Trustees considered whether the advisory fee rate for each Fund was reasonable in relation to the asset size of that Fund, and concluded that the flat advisory fee was reasonable and appropriate, noting the Fund expenses the Adviser has borne as a result of the Expense Cap.
The Trustees noted that the Adviser had not identified any further benefits that it derived from its relationship with the Funds and had noted that it does not have any soft-dollar arrangements.
Based on all of the information considered and the conclusions reached, the Board, including the Independent Trustees, determined to approve the continuation of the Investment Advisory Agreement for each Fund. No single factor was determinative in the Board's analysis.
102
This page intentionally left blank
This page intentionally left blank
PROXY VOTING POLICIES AND PROCEDURES
A description of the Funds' proxy voting policies and procedures that the Funds use to determine how to vote proxies relating to portfolio securities is available, without charge and upon request, by calling (800) 337-4246. This information is also available on the Securities and Exchange Commission's ("Commission") website at www.sec.gov.
Information regarding how the Funds voted proxies for portfolio securities, if applicable, during the most recent 12-month period ended June 30, is also available, without charge and upon request, by (i) calling (800) 337-4246; or (ii) accessing the Trust's Form N-PX on the Commission's website at www.sec.gov.
QUARTERLY PORTFOLIOS
The Funds file their complete schedules of portfolio holdings with the Commission for the first and third quarters of each fiscal year on Form N-Q. The Trust's Forms N-Q are available on the Commission's website at www.sec.gov. The Trust's Forms N-Q may also be reviewed and copied at the Commission's Public Reference Room in Washington, D.C.; information on the operation of the Public Reference Room may be obtained by calling (800) SEC-0330.
There are risks involved in investing in exchange-traded funds ("ETFs"), including possible loss of money. Investing in securities of small and medium sized companies involves greater risk than is customarily associated with investing in more established companies, and investments in concentrated industry sectors involve greater risks than investments that are more diversified. Index-based ETFs are not actively managed. Actively-managed ETFs do not necessarily seek to replicate the performance of a specific index. Both index-based and actively-managed ETFs are subject to risks similar to stocks, including those related to short selling and margin maintenance. PowerShares ETFs are not FDIC insured, may lose value and have no bank guarantee. PowerShares is a registered trademark of Invesco PowerShares Capital Management LLC. Past performance is not a guarantee of future results.
Invesco Aim Distributors, Inc. is the distributor of the PowerShares Exchange-Traded Fund Trust.
An investor should consider each PowerShares ETF's investment objective, risks, charges and expenses carefully before investing. For more complete information about PowerShares ETFs call Invesco Aim Distributors, Inc. at (800) 337-4246 or visit invescopowershares.com for a prospectus. Please read the prospectus carefully before investing.


301 West Roosevelt Road
Wheaton, IL 60187
800.983.0903
www.invescopowershares.com
© 2009 Invesco PowerShares Capital Management LLC P-PS-AR-6


2009 Annual Report to Shareholders
April 30, 2009
PowerShares Dynamic Basic Materials Sector Portfolio
PowerShares Dynamic Consumer Discretionary Sector Portfolio
PowerShares Dynamic Consumer Staples Sector Portfolio
PowerShares Dynamic Energy Sector Portfolio
PowerShares Dynamic Financial Sector Portfolio
PowerShares Dynamic Healthcare Sector Portfolio
PowerShares Dynamic Industrials Sector Portfolio
PowerShares Dynamic Technology Sector Portfolio
PowerShares Dynamic Telecommunications & Wireless Portfolio
PowerShares Dynamic Utilities Portfolio
PowerShares NASDAQ Internet Portfolio

Table of Contents
| The Market Environment | 2 | ||||||
| Manager's Analysis | 4 | ||||||
| Frequency Distribution of Discounts & Premiums | 26 | ||||||
| Fees and Expenses | 28 | ||||||
| Sector Portfolios | |||||||
| Schedules of Investments | |||||||
| PowerShares Dynamic Basic Materials Sector Portfolio | 30 | ||||||
| PowerShares Dynamic Consumer Discretionary Sector Portfolio | 32 | ||||||
| PowerShares Dynamic Consumer Staples Sector Portfolio | 33 | ||||||
| PowerShares Dynamic Energy Sector Portfolio | 34 | ||||||
| PowerShares Dynamic Financial Sector Portfolio | 35 | ||||||
| PowerShares Dynamic Healthcare Sector Portfolio | 37 | ||||||
| PowerShares Dynamic Industrials Sector Portfolio | 38 | ||||||
| PowerShares Dynamic Technology Sector Portfolio | 40 | ||||||
| PowerShares Dynamic Telecommunications & Wireless Portfolio | 41 | ||||||
| PowerShares Dynamic Utilities Portfolio | 42 | ||||||
| PowerShares NASDAQ Internet Portfolio | 43 | ||||||
| Statements of Assets and Liabilities | 46 | ||||||
| Statements of Operations | 48 | ||||||
| Statements of Changes in Net Assets | 50 | ||||||
| Financial Highlights | 54 | ||||||
| Notes to Financial Statements | 60 | ||||||
| Report of Independent Registered Public Accounting Firm | 72 | ||||||
| Supplemental Information | 73 | ||||||
| Board Considerations Regarding Continuation of Investment Advisory Agreements | 78 | ||||||
The Market Environment
For the year ended April 30, 2009, stock market losses were larger than most market participants have ever seen in their professional careers. The S&P 500® Index was down 35.29%, the NASDAQ-100® Index declined 26.83% and the Dow Jones Industrial Index dropped 34.12%. Corporate debt markets also declined as the credit crunch continued to limit access to capital. Municipal securities held up a little better but still struggled. The Merrill U.S. Corporate Master Index returned -5.78% while the Merrill Muni Master Index returned 2.26% for the period. Meanwhile, treasury securities rallied as investors fled to quality. Huge companies required capital infusions and/or other forms of financial support through government intervention and the credit crisis evolved into an overall crisis of consumer, investor and business confidence.
The markets fell nearly universally from August through October. As more job losses and layoffs were announced, banks continued to restrict borrowing and consumers, who drive two-thirds of the U.S. economy historically, were unable to sustain their spending. The government spent hundreds of billions of dollars to bail out firms and stimulate the economy while the Federal Open Market Committee moved from a discount rate of 2.50% to 0.50% during the period. Not until March did confidence begin to return to the equity markets with the S&P 500® Index, NASDAQ-100® Index and the Dow Jones Industrial Index moving off the lows and returning 29.99%, 29.97% and 21.24% respectively from March 1 through April 30, 2009. Corporate and municipal debt also showed some appreciation over the period, however the amount of appreciation was less as credit spreads tightened. The Merrill Muni Master Index was up 2.33% while the Merrill U.S. Corporate Master Index rose by 2.55% from March 1 through April 30, 2009.
2
This page intentionally left blank
Manager's Analysis
PowerShares Dynamic Basic Materials Sector Portfolio (ticker: PYZ)
The PowerShares Dynamic Basic Materials Sector Portfolio (the "Fund") is based on the Dynamic Basic Materials SectorSM Intellidex Index ("Index") and seeks investment results that correspond generally to the price and yield (before the Fund's fees and expenses) of that equity index.
For the year ended April 30, 2009, the Fund returned -43.63%, underperforming the S&P Materials Index which returned -40.05%. Overallocation to containers and packaging and metals & mining industries made the largest positive contribution to the Fund. Conversely, poor stock selection within the chemicals industry had a negative impact on the Fund. Stock selection within large-cap value companies, specifically underweighting names like Dow Chemical, Alcoa and Freeport-McMoRan Copper and Gold had a positive impact on performance. Conversely, overallocation to mid- and mega-cap companies contributed to the Fund's underperformance.
Industry Breakdown (% of the Fund's
Net Assets) as of April 30, 2009
| Chemicals-Specialty | 16.0 | ||||||
| Chemicals-Diversified | 14.9 | ||||||
| Containers-Paper/Plastic | 8.9 | ||||||
| Containers-Metal/Glass | 8.6 | ||||||
| Industrial Gases | 6.7 | ||||||
| Steel-Producers | 6.5 | ||||||
| Agricultural Chemicals | 6.2 | ||||||
| Paper & Related Products | 4.8 | ||||||
| Quarrying | 3.2 | ||||||
| Chemicals-Plastics | 2.9 | ||||||
| Gold Mining | 2.9 | ||||||
| Forestry | 2.8 | ||||||
| Metal-Copper | 2.6 | ||||||
| Steel-Specialty | 1.8 | ||||||
| Metal-Iron | 1.6 | ||||||
| Building Products-Cement/Aggregate | 1.5 | ||||||
| Coatings/Paint | 1.5 | ||||||
| Diversified Manufacturing Operations | 1.5 | ||||||
| Consumer Products-Miscellaneous | 1.3 | ||||||
| Alternative Waste Technology | 1.2 | ||||||
| Non-Ferrous Metals | 1.2 | ||||||
| Miscellaneous Manufacturing | 1.2 | ||||||
| Money Market Fund | 0.5 | ||||||
| Other | (0.3 | ) | |||||
Top Ten Fund Holdings (% of the Fund's
Net Assets) as of April 30, 2009
| Security | |||||||
| Dow Chemical (The) Co. | 4.3 | ||||||
| E.I. du Pont de Nemours & Co. | 2.9 | ||||||
| Weyerhaeuser Co. | 2.8 | ||||||
| Air Products & Chemicals, Inc. | 2.7 | ||||||
| PPG Industries, Inc. | 2.7 | ||||||
| Southern Copper Corp. | 2.6 | ||||||
| United States Steel Corp. | 2.6 | ||||||
| Praxair, Inc. | 2.5 | ||||||
| Sigma-Aldrich Corp. | 2.4 | ||||||
| Ecolab, Inc. | 2.3 | ||||||
| Total | 27.8 | ||||||
Style Allocation (% of the Fund's
Total Investments) as of April 30, 2009
| Mid-Cap Value | 42.9 | ||||||
| Small-Cap Value | 23.2 | ||||||
| Large-Cap Growth | 10.9 | ||||||
| Small-Cap Growth | 9.3 | ||||||
| Large-Cap Value | 7.9 | ||||||
| Mid-Cap Growth | 5.8 | ||||||
4
Manager's Analysis (Continued)
PowerShares Dynamic Basic Materials Sector Portfolio (ticker: PYZ)
Growth of a $10,000 Investment Since Inception†

| Fund Performance History (%) | As of April 30, 2009 | ||||||||||||||
| Avg Ann†† | Fund Inception† | ||||||||||||||
| 1 Year | Avg Ann†† | Cumulative | |||||||||||||
| Index | |||||||||||||||
| Dynamic Basic Materials Sector IntellidexSM Index | -42.76 | -6.83 | -16.50 | ||||||||||||
| S&P Materials Index | -40.05 | -6.65 | -16.28 | ||||||||||||
| Dow Jones Basic Materials Index | -48.15 | -9.28 | -22.24 | ||||||||||||
| Fund | |||||||||||||||
| NAV Return | -43.63 | -7.87 | -18.85 | ||||||||||||
| Share Price Return | -43.59 | -7.84 | -18.77 | ||||||||||||
Fund Inception: October 12, 2006
Performance quoted represents past performance. Past performance is not a guarantee of future results and current performance may be higher or lower than performance quoted. Investment returns and principal value will fluctuate and shares, when redeemed, may be worth more or less than their original cost. The Adviser has waived fees and reimbursed other expenses, absent which, performance would have been lower. The Adviser has contractually agreed to waive fees and/or pay certain Fund expenses through August 31, 2010. According to the Fund's current prospectus, the total gross annual operating expense ratio was indicated as 0.96%. In the Financial Highlights section of this Shareholder Report, the Fund's net (subsidized) total operating expense ratio was determined to be 0.65% while the Fund's gross total operating expense ratio was 0.97%. NAV and Share Price returns assume that dividends and capital gain distributions have been reinvested in the Fund at NAV and Share Price, respectively. The returns shown in the table above do not reflect the deduction of taxes that a shareholder would pay on Fund distributions or the redemption or sale of Fund Shares. See invescopowershares.com to find the most recent month-end performance numbers.
Index performance results are based upon a hypothetical investment in its constituent securities. Index returns do not represent Fund returns. An investor cannot invest directly in an index. The Index does not charge management fees or brokerage expenses, and no such fees or expenses were deducted from the hypothetical performance shown. In addition, the results actual investors might have achieved would have differed from those shown because of differences in the timing, amounts of their investments, and fees and expenses associated with an investment in the Fund.
The S&P Materials Index and Dow Jones Basic Materials Index (the "Benchmark Indices") are unmanaged indices used as a measurement of change in stock market conditions based on the average performance of approximately 29 and 71 common stocks, respectively.
† Fund and underlying Index returns are based on the inception date of the Fund. Returns for the Benchmark Indices are based on the closest month-end to the Fund's inception date.
†† Average annualized.
5
Manager's Analysis
PowerShares Dynamic Consumer Discretionary Sector Portfolio (ticker: PEZ)
The PowerShares Dynamic Consumer Discretionary Sector Portfolio (the "Fund") is based on the Dynamic Consumer Discretionary Sector IntellidexSM Index ("Index") and seeks investment results that correspond generally to the price and yield (before the Fund's fees and expenses) of that equity index.
For the year ended April 30, 2009, the Fund returned -23.19%, outperforming the S&P Consumer Discretionary Index which returned -26.10%.
Stock selection within specialty retail made the largest positive contribution to the Fund's performance relative to the index. Overallocating to diversified consumer services and media industries also contributed positively to the Fund. Conversely, stock selection and overallocation within household durables, textiles and apparel and luxury goods industries partially offset the positive performance of the Fund.
On a cap weighted level, overallocation to mid-cap companies made the largest positive contribution to the Fund's performance. Conversely, overallocating to small-cap companies had an adverse effect on performance.
Industry Breakdown (% of the Fund's
Net Assets) as of April 30, 2009
| Retail | 50.2 | ||||||
| Commercial Services | 12.1 | ||||||
| Apparel | 10.3 | ||||||
| Internet | 3.7 | ||||||
| Toys/Games/Hobbies | 3.5 | ||||||
| Distribution/Wholesale | 3.1 | ||||||
| Airlines | 2.8 | ||||||
| Entertainment | 2.8 | ||||||
| Leisure Time | 2.7 | ||||||
| Advertising | 2.5 | ||||||
| Chemicals | 2.4 | ||||||
| Textiles | 1.6 | ||||||
| Aerospace/Defense | 1.2 | ||||||
| Media | 1.1 | ||||||
| Money Market Fund | 0.3 | ||||||
| Other | (0.3 | ) | |||||
Top Ten Fund Holdings (% of the Fund's
Net Assets) as of April 30, 2009
| Security | |||||||
| Polo Ralph Lauren Corp. | 3.0 | ||||||
| Gap (The), Inc. | 2.8 | ||||||
| Bed Bath & Beyond, Inc. | 2.8 | ||||||
| Carnival Corp. | 2.6 | ||||||
| Omnicom Group, Inc. | 2.5 | ||||||
| Ross Stores, Inc. | 2.5 | ||||||
| Yum! Brands, Inc | 2.4 | ||||||
| TJX Cos., Inc. | 2.4 | ||||||
| Amazon.com, Inc. | 2.4 | ||||||
| Sherwin-Williams (The) Co. | 2.4 | ||||||
| Total | 25.8 | ||||||
Style Allocation (% of the Fund's
Total Investments) as of April 30, 2009
| Small-Cap Growth | 31.9 | ||||||
| Mid-Cap Growth | 23.2 | ||||||
| Small-Cap Value | 19.3 | ||||||
| Mid-Cap Value | 12.1 | ||||||
| Large-Cap Growth | 10.9 | ||||||
| Large-Cap Value | 2.6 | ||||||
6
Manager's Analysis (Continued)
PowerShares Dynamic Consumer Discretionary Sector Portfolio (ticker: PEZ)
Growth of a $10,000 Investment Since Inception†
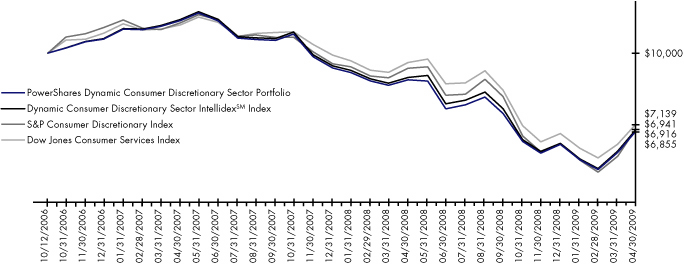
| Fund Performance History (%) | As of April 30, 2009 | ||||||||||||||
| Avg Ann†† | Fund Inception† | ||||||||||||||
| 1 Year | Avg Ann†† | Cumulative | |||||||||||||
| Index | |||||||||||||||
| Dynamic Consumer Discretionary Sector IntellidexSM Index | -23.33 | -13.47 | -30.84 | ||||||||||||
| S&P Consumer Discretionary Index | -26.10 | -13.18 | -30.59 | ||||||||||||
| Dow Jones Consumer Services Index | -25.82 | -12.23 | -28.61 | ||||||||||||
| Fund | |||||||||||||||
| NAV Return | -23.19 | -13.77 | -31.45 | ||||||||||||
| Share Price Return | -23.22 | -13.76 | -31.42 | ||||||||||||
Fund Inception: October 12, 2006
Performance quoted represents past performance. Past performance is not a guarantee of future results and current performance may be higher or lower than performance quoted. Investment returns and principal value will fluctuate and shares, when redeemed, may be worth more or less than their original cost. The Adviser has waived fees and reimbursed other expenses, absent which, performance would have been lower. The Adviser has contractually agreed to waive fees and/or pay certain Fund expenses through August 31, 2010. According to the Fund's current prospectus, the total gross annual operating expense ratio was indicated as 1.31%. In the Financial Highlights section of this Shareholder Report, the Fund's net (subsidized) total operating expense ratio was determined to be 0.64% while the Fund's gross total operating expense ratio was 1.68%. NAV and Share Price returns assume that dividends and capital gain distributions have been reinvested in the Fund at NAV and Share Price, respectively. The returns shown in the table above do not reflect the deduction of taxes that a shareholder would pay on Fund distributions or the redemption or sale of Fund Shares. See invescopowershares.com to find the most recent month-end performance numbers.
Index performance results are based upon a hypothetical investment in its constituent securities. Index returns do not represent Fund returns. An investor cannot invest directly in an index. The Index does not charge management fees or brokerage expenses, and no such fees or expenses were deducted from the hypothetical performance shown. In addition, the results actual investors might have achieved would have differed from those shown because of differences in the timing, amounts of their investments, and fees and expenses associated with an investment in the Fund.
The S&P Consumer Discretionary Index and Dow Jones Consumer Services Index (the "Benchmark Indices") are unmanaged indices used as a measurement of change in stock market conditions based on the average performance of approximately 81 and 201 common stocks, respectively. The S&P Consumer Discretionary Index will be used for comparative purposes going forward as this represents the most appropriate market index for this fund.
† Fund and underlying Index returns are based on the inception date of the Fund. Returns for the Benchmark Indices are based on the closest month-end to the Fund's inception date.
†† Average annualized.
7
Manager's Analysis
PowerShares Dynamic Consumer Staples Sector Portfolio (ticker: PSL)
The PowerShares Dynamic Consumer Staples Sector Portfolio (the "Fund") is based on the Dynamic Consumer Staples Sector IntellidexSM Index ("Index") and seeks investment results that correspond generally to the price and yield (before the Fund's fees and expenses) of that equity index.
For the year ended April 30, 2009, the Fund returned -21.02%, while the S&P Consumer Staples Index had a total return for the period of -19.93%.
Overallocation to the food products industry and stock selection within the tobacco industry contributed to the negative performance of the Fund. Conversely, stock selection within household products and beverages contributed toward the offset of negative returns in the Fund.
Stock selection within large-cap companies and overallocation to small-cap companies made the largest negative contribution to the Fund's performance, while stock selection within mid-cap companies made the greatest positive contribution.
Industry Breakdown (% of the Fund's
Net Assets) as of April 30, 2009
| Food | 37.0 | ||||||
| Retail | 13.9 | ||||||
| Beverages | 13.8 | ||||||
| Cosmetics/Personal Care | 13.4 | ||||||
| Agriculture | 9.3 | ||||||
| Household Products/Wares | 9.1 | ||||||
| Pharmaceuticals | 1.7 | ||||||
| Environmental Control | 1.6 | ||||||
| Money Market Fund | 0.2 | ||||||
| Other | (0.0 | ) | |||||
Style Allocation (% of the Fund's
Total Investments) as of April 30, 2009
| Large-Cap Value | 19.4 | ||||||
| Small-Cap Value | 19.2 | ||||||
| Large-Cap Growth | 18.2 | ||||||
| Small-Cap Growth | 16.6 | ||||||
| Mid-Cap Growth | 13.7 | ||||||
| Mid-Cap Value | 12.9 | ||||||
Top Ten Fund Holdings (% of the Fund's
Net Assets) as of April 30, 2009
| Security | |||||||
| Bare Escentials, Inc. | 3.5 | ||||||
| CVS Caremark Corp. | 2.7 | ||||||
| Reynolds American, Inc. | 2.4 | ||||||
| Sysco Corp. | 2.3 | ||||||
| Kellogg Co. | 2.3 | ||||||
| Altria Group, Inc. | 2.3 | ||||||
| Coca-Cola (The) Co. | 2.3 | ||||||
| H.J. Heinz Co. | 2.3 | ||||||
| Kroger (The) Co. | 2.3 | ||||||
| Kimberly-Clark Corp. | 2.3 | ||||||
| Total | 24.7 | ||||||
8
Manager's Analysis (Continued)
PowerShares Dynamic Consumer Staples Sector Portfolio (ticker: PSL)
Growth of a $10,000 Investment Since Inception†
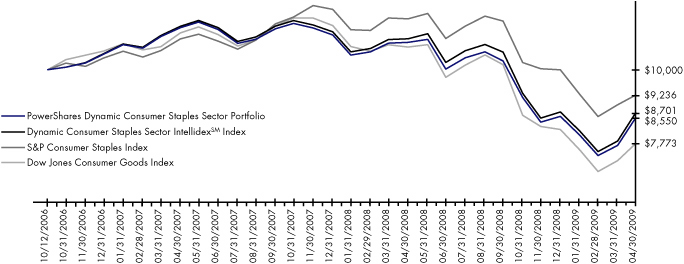
| Fund Performance History (%) | As of April 30, 2009 | ||||||||||||||
| Avg Ann†† | Fund Inception† | ||||||||||||||
| 1 Year | Avg Ann†† | Cumulative | |||||||||||||
| Index | |||||||||||||||
| Dynamic Consumer Staples Sector IntellidexSM Index | -20.42 | -5.32 | -12.99 | ||||||||||||
| S&P Consumer Staples Index | -19.93 | -3.03 | -7.64 | ||||||||||||
| Dow Jones Consumer Goods Index | -27.24 | -9.29 | -22.27 | ||||||||||||
| Fund | |||||||||||||||
| NAV Return | -21.02 | -5.96 | -14.50 | ||||||||||||
| Share Price Return | -21.09 | -6.01 | -14.61 | ||||||||||||
Fund Inception: October 12, 2006
Performance quoted represents past performance. Past performance is not a guarantee of future results and current performance may be higher or lower than performance quoted. Investment returns and principal value will fluctuate and shares, when redeemed, may be worth more or less than their original cost. The Adviser has waived fees and reimbursed other expenses, absent which, performance would have been lower. The Adviser has contractually agreed to waive fees and/or pay certain Fund expenses through August 31, 2010. According to the Fund's current prospectus, the total gross annual operating expense ratio was indicated as 1.18%. In the Financial Highlights section of this Shareholder Report, the Fund's net (subsidized) total operating expense ratio was determined to be 0.65% while the Fund's gross total operating expense ratio was 0.94%. NAV and Share Price returns assume that dividends and capital gain distributions have been reinvested in the Fund at NAV and Share Price, respectively. The returns shown in the table above do not reflect the deduction of taxes that a shareholder would pay on Fund distributions or the redemption or sale of Fund Shares. See invescopowershares.com to find the most recent month-end performance numbers.
Index performance results are based upon a hypothetical investment in its constituent securities. Index returns do not represent Fund returns. An investor cannot invest directly in an index. The Index does not charge management fees or brokerage expenses, and no such fees or expenses were deducted from the hypothetical performance shown. In addition, the results actual investors might have achieved would have differed from those shown because of differences in the timing, amounts of their investments, and fees and expenses associated with an investment in the Fund.
The S&P Consumer Staples Index and Dow Jones Consumer Goods Index (the "Benchmark Indices") are unmanaged indices used as a measurement of change in stock market conditions based on the average performance of approximately 41 and 134 common stocks, respectively. The S&P Consumer Staples Index will be used for comparative purposes going forward as this represents a more appropriate market index for this fund.
† Fund and underlying Index returns are based on the inception date of the Fund. Returns for the Benchmark Indices are based on the closest month-end to the Fund's inception date.
†† Average annualized.
9
Manager's Analysis
PowerShares Dynamic Energy Sector Portfolio (ticker: PXI)
The PowerShares Dynamic Energy Sector Portfolio (the "Fund") is based on the Dynamic Energy Sector IntellidexSM Index ("Index") and seeks investment results that correspond generally to the price and yield (before the Fund's fees and expenses) of that equity index.
For the year ended April 30, 2009, the Fund returned -48.52%, underperforming the S&P Energy Index which returned -41.32%.
Stock selection within the oil, gas & consumable fuels industry had the greatest negative effect on performance in the Fund. Overallocation within gas utilities made the largest positive contribution to the Fund. On a cap weighted level, overallocation to small-cap companies provided the majority of the Fund's negative returns. Stock selection within mega-caps also had a negative impact on performance. Conversely, underallocation to large-cap companies made the largest positive contribution to the Fund's performance.
Industry Breakdown (% of the Fund's
Net Assets) as of April 30, 2009
| Oil-Field Services | 27.8 | ||||||
| Oil Companies-Exploration & Production | 15.0 | ||||||
| Oil & Gas Drilling | 12.3 | ||||||
| Oil Field Machinery & Equipment | 10.7 | ||||||
| Gas-Distribution | 6.6 | ||||||
| Oil Companies-Integrated | 6.5 | ||||||
| Coal | 6.1 | ||||||
| Oil Refining & Marketing | 5.0 | ||||||
| Pipelines | 2.6 | ||||||
| Transport-Marine | 2.6 | ||||||
| Retail-Petroleum Products | 1.5 | ||||||
| Electric-Integrated | 1.1 | ||||||
| Computer Services | 1.1 | ||||||
| Energy-Alternate Sources | 1.0 | ||||||
| Money Market Fund | 0.3 | ||||||
| Other | (0.2 | ) | |||||
Top Ten Fund Holdings (% of the Fund's
Net Assets) as of April 30, 2009
| Security | |||||||
| Helix Energy Solutions Group, Inc. | 3.2 | ||||||
| Cameron International Corp. | 2.7 | ||||||
| Schlumberger Ltd. | 2.6 | ||||||
| EOG Resources, Inc. | 2.6 | ||||||
| Southwestern Energy Co. | 2.5 | ||||||
| Halliburton Co. | 2.5 | ||||||
| Anadarko Petroleum Corp. | 2.5 | ||||||
| Baker Hughes, Inc. | 2.4 | ||||||
| Murphy Oil Corp. | 2.3 | ||||||
| National Oilwell Varco, Inc. | 2.3 | ||||||
| Total | 25.6 | ||||||
Style Allocation (% of the Fund's
Total Investments) as of April 30, 2009
| Small-Cap Value | 33.2 | ||||||
| Large-Cap Value | 14.7 | ||||||
| Small-Cap Growth | 13.8 | ||||||
| Mid-Cap Growth | 13.6 | ||||||
| Mid-Cap Value | 12.7 | ||||||
| Large-Cap Growth | 12.0 | ||||||
10
Manager's Analysis (Continued)
PowerShares Dynamic Energy Sector Portfolio (ticker: PXI)
Growth of a $10,000 Investment Since Inception†
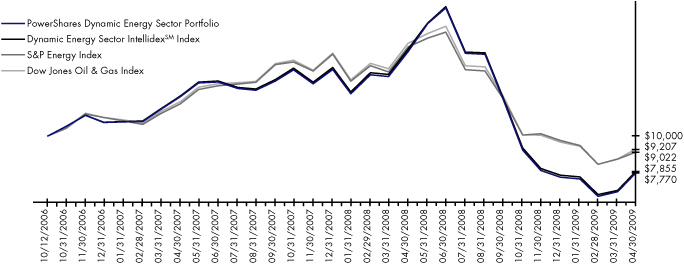
| Fund Performance History (%) | As of April 30, 2009 | ||||||||||||||
| Avg Ann†† | Fund Inception† | ||||||||||||||
| 1 Year | Avg Ann†† | Cumulative | |||||||||||||
| Index | |||||||||||||||
| Dynamic Energy Sector IntellidexSM Index | -48.47 | -9.04 | -21.45 | ||||||||||||
| S&P Energy Index | -41.32 | -3.90 | -9.78 | ||||||||||||
| Dow Jones Oil & Gas Index | -40.95 | -3.15 | -7.93 | ||||||||||||
| Fund | |||||||||||||||
| NAV Return | -48.52 | -9.43 | -22.30 | ||||||||||||
| Share Price Return | -48.44 | -9.38 | -22.20 | ||||||||||||
Fund Inception: October 12, 2006
Performance quoted represents past performance. Past performance is not a guarantee of future results and current performance may be higher or lower than performance quoted. Investment returns and principal value will fluctuate and shares, when redeemed, may be worth more or less than their original cost. The Adviser has waived fees and reimbursed other expenses, absent which, performance would have been lower. The Adviser has contractually agreed to waive fees and/or pay certain Fund expenses through August 31, 2010. According to the Fund's current prospectus, the total gross annual operating expense ratio was indicated as 0.96%. In the Financial Highlights section of this Shareholder Report, the Fund's net (subsidized) total operating expense ratio was determined to be 0.65% while the Fund's gross total operating expense ratio was 0.98%. NAV and Share Price returns assume that dividends and capital gain distributions have been reinvested in the Fund at NAV and Share Price, respectively. The returns shown in the table above do not reflect the deduction of taxes that a shareholder would pay on Fund distributions or the redemption or sale of Fund Shares. See invescopowershares.com to find the most recent month-end performance numbers.
Index performance results are based upon a hypothetical investment in its constituent securities. Index returns do not represent Fund returns. An investor cannot invest directly in an index. The Index does not charge management fees or brokerage expenses, and no such fees or expenses were deducted from the hypothetical performance shown. In addition, the results actual investors might have achieved would have differed from those shown because of differences in the timing, amounts of their investments, and fees and expenses associated with an investment in the Fund.
The S&P Energy Index and Dow Jones Oil & Gas Index (the "Benchmark Indices") are unmanaged indices used as a measurement of change in stock market conditions based on the average performance of approximately 34 and 70 common stocks, respectively.
† Fund and underlying Index returns are based on the inception date of the Fund. Returns for the Benchmark Indices are based on the closest month-end to the Fund's inception date.
†† Average annualized.
11
Manager's Analysis
PowerShares Dynamic Financial Sector Portfolio (ticker: PFI)
The PowerShares Dynamic Financial Sector Portfolio (the "Fund") is based on the Dynamic Financial Sector IntellidexSM Index ("Index") and seeks investment results that correspond generally to the price and yield (before the Fund's fees and expenses) of that equity index.
For the year ended April 30, 2009, the Fund returned -35.53%, outperforming the S&P Financials Index which returned -57.55%.
60% of the Fund was allocated to the insurance industry which significantly outperformed each of the other industry categories. Stock selection was positive across industries, the only exception being consumer finance. Positive stock selection was also most pronounced among large-caps.
Industry Breakdown (% of the Fund's
Net Assets) as of April 30, 2009
| Property/Casuality Insurance | 33.5 | ||||||
| Finance-Investment Banker/Broker | 13.5 | ||||||
| Multi-line Insurance | 11.3 | ||||||
| Life/Health Insurance | 7.1 | ||||||
| Investment Management/ Advisory Service | 6.4 | ||||||
| Reinsurance | 5.7 | ||||||
| Commercial Banks-Central U.S. | 4.2 | ||||||
| Insurance Brokers | 3.7 | ||||||
| Finance-Consumer Loans | 2.8 | ||||||
| Commercial Banks-Eastern U.S. | 2.5 | ||||||
| Fiduciary Banks | 2.1 | ||||||
| Finance-Credit Card | 1.7 | ||||||
| Finance-Leasing Company | 1.5 | ||||||
| Commercial Banks-Southern U.S. | 1.3 | ||||||
| Commercial Banks-Western U.S. | 1.3 | ||||||
| S & L/Thrifts-Eastern U.S. | 1.2 | ||||||
| Money Market Fund | 0.4 | ||||||
| Other | (0.2 | ) | |||||
Top Ten Fund Holdings (% of the Fund's
Net Assets) as of April 30, 2009
| Security | |||||||
| Aflac, Inc. | 3.7 | ||||||
| Ameriprise Financial, Inc. | 3.5 | ||||||
| MetLife, Inc. | 3.5 | ||||||
| Unum Group | 3.4 | ||||||
| TD Ameritrade Holding Corp. | 2.9 | ||||||
| Progressive (The) Corp. | 2.8 | ||||||
| Franklin Resources, Inc. | 2.8 | ||||||
| ACE Ltd. | 2.7 | ||||||
| Cincinnati Financial Corp. | 2.5 | ||||||
| W.R. Berkley Corp. | 2.5 | ||||||
| Total | 30.3 | ||||||
Style Allocation (% of the Fund's
Total Investments) as of April 30, 2009
| Mid-Cap Value | 29.6 | ||||||
| Small-Cap Value | 27.1 | ||||||
| Large-Cap Value | 20.6 | ||||||
| Small-Cap Growth | 12.7 | ||||||
| Mid-Cap Growth | 7.9 | ||||||
| Large-Cap Growth | 2.1 | ||||||
12
Manager's Analysis (Continued)
PowerShares Dynamic Financial Sector Portfolio (ticker: PFI)
Growth of a $10,000 Investment Since Inception†
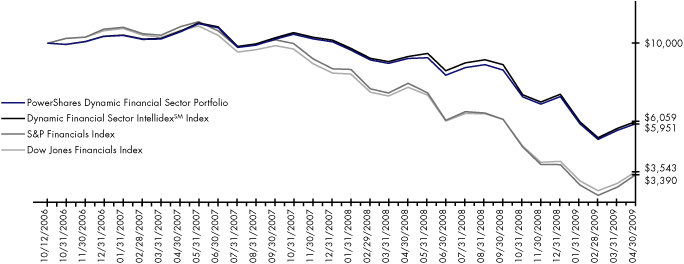
| Fund Performance History (%) | As of April 30, 2009 | ||||||||||||||
| Avg Ann†† | Fund Inception† | ||||||||||||||
| 1 Year | Avg Ann†† | Cumulative | |||||||||||||
| Index | |||||||||||||||
| Dynamic Financial Sector IntellidexSM Index | -35.05 | -17.85 | -39.41 | ||||||||||||
| S&P Financials Index | -57.55 | -34.22 | -66.10 | ||||||||||||
| Dow Jones Financials Index | -54.47 | -33.08 | -64.57 | ||||||||||||
| Fund | |||||||||||||||
| NAV Return | -35.53 | -18.43 | -40.49 | ||||||||||||
| Share Price Return | -35.66 | -18.48 | -40.59 | ||||||||||||
Fund Inception: October 12, 2006
Performance quoted represents past performance. Past performance is not a guarantee of future results and current performance may be higher or lower than performance quoted. Investment returns and principal value will fluctuate and shares, when redeemed, may be worth more or less than their original cost. The Adviser has waived fees and reimbursed other expenses, absent which, performance would have been lower. The Adviser has contractually agreed to waive fees and/or pay certain Fund expenses through August 31, 2010. According to the Fund's current prospectus, the total gross annual operating expense ratio was indicated as 1.42%. In the Financial Highlights section of this Shareholder Report, the Fund's net (subsidized) total operating expense ratio was determined to be 0.65% while the Fund's gross total operating expense ratio was 1.13%. NAV and Share Price returns assume that dividends and capital gain distributions have been reinvested in the Fund at NAV and Share Price, respectively. The returns shown in the table above do not reflect the deduction of taxes that a shareholder would pay on Fund distributions or the redemption or sale of Fund Shares. See invescopowershares.com to find the most recent month-end performance numbers.
Index performance results are based upon a hypothetical investment in its constituent securities. Index returns do not represent Fund returns. An investor cannot invest directly in an index. The Index does not charge management fees or brokerage expenses, and no such fees or expenses were deducted from the hypothetical performance shown. In addition, the results actual investors might have achieved would have differed from those shown because of differences in the timing, amounts of their investments, and fees and expenses associated with an investment in the Fund.
The S&P Financials Index and Dow Jones Financials Index (the "Benchmark Indices") are unmanaged indices used as a measurement of change in stock market conditions based on the average performance of approximately 93 and 300 common stocks, respectively.
† Fund and underlying Index returns are based on the inception date of the Fund. Returns for the Benchmark Indices are based on the closest month-end to the Fund's inception date.
†† Average annualized.
13
Manager's Analysis
PowerShares Dynamic Healthcare Sector Portfolio (ticker: PTH)
The PowerShares Dynamic Healthcare Sector Portfolio (the "Fund") is based on the Dynamic Healthcare Sector IntellidexSM Index ("Index") and seeks investment results that correspond generally to the price and yield (before the Fund's fees and expenses) of that equity index.
For the year ended April 30, 2009, the Fund returned -30.85%, underperforming the S&P Health Care Index which returned -21.53%.
Stock selection within the health care providers and services and pharmaceuticals industries had the greatest negative impact on the Fund. Stock selection within health care equipment and supplies and health care technology had the largest positive effect upon the performance of the Fund. In general, stock selection among large caps and overallocating to small-cap companies had the greatest negative impact on the Fund's performance.
Industry Breakdown (% of the Fund's
Net Assets) as of April 30, 2009
| Healthcare-Services | 27.7 | ||||||
| Pharmaceuticals | 24.0 | ||||||
| Healthcare-Products | 22.1 | ||||||
| Biotechnology | 12.6 | ||||||
| Commercial Services | 5.4 | ||||||
| Electronics | 4.6 | ||||||
| Software | 3.5 | ||||||
| Money Market Fund | 0.2 | ||||||
| Other | (0.1 | ) | |||||
Style Allocation (% of the Fund's
Total Investments) as of April 30, 2009
| Small-Cap Growth | 31.2 | ||||||
| Mid-Cap Growth | 23.0 | ||||||
| Small-Cap Value | 15.1 | ||||||
| Large-Cap Growth | 14.4 | ||||||
| Mid-Cap Value | 11.8 | ||||||
| Large-Cap Value | 4.5 | ||||||
Top Ten Fund Holdings (% of the Fund's
Net Assets) as of April 30, 2009
| Security | |||||||
| Hospira, Inc. | 3.3 | ||||||
| Express Scripts, Inc. | 2.9 | ||||||
| Waters Corp. | 2.9 | ||||||
| Humana, Inc. | 2.8 | ||||||
| Quest Diagnostics, Inc. | 2.6 | ||||||
| AmerisourceBergen Corp. | 2.4 | ||||||
| Bristol-Myers Squibb Co. | 2.4 | ||||||
| Gilead Sciences, Inc. | 2.3 | ||||||
| Omnicare, Inc. | 2.3 | ||||||
| Amgen, Inc. | 2.3 | ||||||
| Total | 26.2 | ||||||
14
Manager's Analysis (Continued)
PowerShares Dynamic Healthcare Sector Portfolio (ticker: PTH)
Growth of a $10,000 Investment Since Inception†
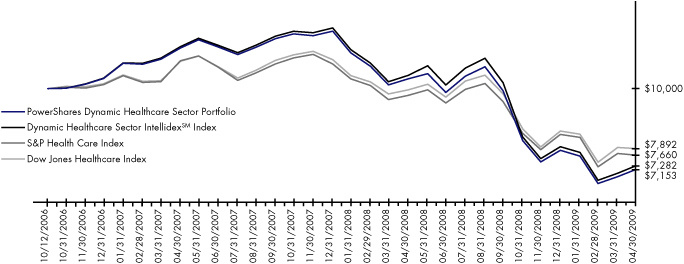
| Fund Performance History (%) | As of April 30, 2009 | ||||||||||||||
| Avg Ann†† | Fund Inception† | ||||||||||||||
| 1 Year | Avg Ann†† | Cumulative | |||||||||||||
| Index | |||||||||||||||
| Dynamic Healthcare Sector IntellidexSM Index | -30.42 | -11.70 | -27.18 | ||||||||||||
| S&P Health Care Index | -21.53 | -9.80 | -23.40 | ||||||||||||
| Dow Jones Healthcare Index | -20.74 | -8.76 | -21.08 | ||||||||||||
| Fund | |||||||||||||||
| NAV Return | -30.85 | -12.32 | -28.47 | ||||||||||||
| Share Price Return | -30.94 | -12.38 | -28.59 | ||||||||||||
Fund Inception: October 12, 2006
Performance quoted represents past performance. Past performance is not a guarantee of future results and current performance may be higher or lower than performance quoted. Investment returns and principal value will fluctuate and shares, when redeemed, may be worth more or less than their original cost. The Adviser has waived fees and reimbursed other expenses, absent which, performance would have been lower. The Adviser has contractually agreed to waive fees and/or pay certain Fund expenses through August 31, 2010. According to the Fund's current prospectus, the total gross annual operating expense ratio was indicated as 0.72%. In the Financial Highlights section of this Shareholder Report, the Fund's net (subsidized) total operating expense ratio was determined to be 0.65% while the Fund's gross total operating expense ratio was 0.71%. NAV and Share Price returns assume that dividends and capital gain distributions have been reinvested in the Fund at NAV and Share Price, respectively. The returns shown in the table above do not reflect the deduction of taxes that a shareholder would pay on Fund distributions or the redemption or sale of Fund Shares. See invescopowershares.com to find the most recent month-end performance numbers.
Index performance results are based upon a hypothetical investment in its constituent securities. Index returns do not represent Fund returns. An investor cannot invest directly in an index. The Index does not charge management fees or brokerage expenses, and no such fees or expenses were deducted from the hypothetical performance shown. In addition, the results actual investors might have achieved would have differed from those shown because of differences in the timing, amounts of their investments, and fees and expenses associated with an investment in the Fund.
The S&P Health Care Index and Dow Jones Healthcare Index (the "Benchmark Indices") are unmanaged indices used as a measurement of change in stock market conditions based on the average performance of approximately 51 and 180 common stocks, respectively.
† Fund and underlying Index returns are based on the inception date of the Fund. Returns for the Benchmark Indices are based on the closest month-end to the Fund's inception date.
†† Average annualized.
15
Manager's Analysis
PowerShares Dynamic Industrials Sector Portfolio (ticker: PRN)
The PowerShares Dynamic Industrials Sector Portfolio (the "Fund") is based on the Dynamic Industrials Sector IntellidexSM Index ("Index") and seeks investment results that correspond generally to the price and yield (before the Fund's fees and expenses) of that equity index.
For the year ended April 30, 2009, the Fund returned -37.41%, outperforming the S&P Industrials Index which returned -42.48%.
Underallocating to industrial conglomerates made the largest positive contribution to the Fund's performance. Overallocation combined with positive stock selection in construction and engineering and electrical equipment industries also contributed positively to performance. Stock selection in the road and rail industry also boosted performance. Conversely, stock selection within aerospace & defense and air freight and logistics industries partially offset the positive returns of the Fund.
From a cap weighted standpoint, overallocating to mid- and small-cap companies made the largest positive contribution to the Fund's performance. Conversely, stock selection within large-cap companies partially offset the positive performance of the Fund.
Industry Breakdown (% of the Fund's
Net Assets) as of April 30, 2009
| Miscellaneous Manufacturing | 19.4 | ||||||
| Aerospace/Defense | 19.3 | ||||||
| Engineering & Construction | 10.7 | ||||||
| Commercial Services | 8.4 | ||||||
| Transportation | 6.9 | ||||||
| Machinery-Diversified | 6.3 | ||||||
| Environmental Control | 4.3 | ||||||
| Office Furnishings | 4.0 | ||||||
| Building Materials | 3.9 | ||||||
| Electrical Components & Equipment | 3.0 | ||||||
| Metal Fabricate/Hardware | 2.9 | ||||||
| Energy-Alternate Sources | 1.8 | ||||||
| Distribution/Wholesale | 1.7 | ||||||
| Home Furnishings | 1.6 | ||||||
| Electronics | 1.5 | ||||||
| Retail | 1.5 | ||||||
| Telecommunications | 1.4 | ||||||
| Computers | 1.3 | ||||||
| Money Market Fund | 0.1 | ||||||
| Other | (0.0 | ) | |||||
Top Ten Fund Holdings (% of the Fund's
Net Assets) as of April 30, 2009
| Security | |||||||
| Cooper Industries Ltd., Class A | 3.1 | ||||||
| Flowserve Corp. | 2.7 | ||||||
| Goodrich Corp. | 2.7 | ||||||
| Union Pacific Corp. | 2.6 | ||||||
| Lockheed Martin Corp. | 2.5 | ||||||
| Dover Corp. | 2.4 | ||||||
| United Technologies Corp. | 2.4 | ||||||
| Illinois Tool Works, Inc. | 2.3 | ||||||
| Chart Industries, Inc. | 2.3 | ||||||
| Honeywell International, Inc. | 2.3 | ||||||
| Total | 25.3 | ||||||
Style Allocation (% of the Fund's
Total Investments) as of April 30, 2009
| Small-Cap Value | 30.7 | ||||||
| Small-Cap Growth | 25.5 | ||||||
| Mid-Cap Growth | 14.8 | ||||||
| Mid-Cap Value | 14.6 | ||||||
| Large-Cap Value | 11.8 | ||||||
| Large-Cap Growth | 2.6 | ||||||
16
Manager's Analysis (Continued)
PowerShares Dynamic Industrials Sector Portfolio (ticker: PRN)
Growth of a $10,000 Investment Since Inception†

| Fund Performance History (%) | As of April 30, 2009 | ||||||||||||||
| Avg Ann†† | Fund Inception† | ||||||||||||||
| 1 Year | Avg Ann†† | Cumulative | |||||||||||||
| Index | |||||||||||||||
| Dynamic Industrial Sector IntellidexSM Index | -36.87 | -10.34 | -24.27 | ||||||||||||
| S&P Industrials Index | -42.48 | -14.62 | -33.52 | ||||||||||||
| Dow Jones Industrials Index | -34.12 | -10.53 | -24.98 | ||||||||||||
| Fund | |||||||||||||||
| NAV Return | -37.41 | -11.00 | -25.68 | ||||||||||||
| Share Price Return | -37.51 | -11.04 | -25.77 | ||||||||||||
Fund Inception: October 12, 2006
Performance quoted represents past performance. Past performance is not a guarantee of future results and current performance may be higher or lower than performance quoted. Investment returns and principal value will fluctuate and shares, when redeemed, may be worth more or less than their original cost. The Adviser has waived fees and reimbursed other expenses, absent which, performance would have been lower. The Adviser has contractually agreed to waive fees and/or pay certain Fund expenses through August 31, 2010. According to the Fund's current prospectus, the total gross annual operating expense ratio was indicated as 0.90%. In the Financial Highlights section of this Shareholder Report, the Fund's net (subsidized) total operating expense ratio was determined to be 0.65% while the Fund's gross total operating expense ratio was 0.81%. NAV and Share Price returns assume that dividends and capital gain distributions have been reinvested in the Fund at NAV and Share Price, respectively. The returns shown in the table above do not reflect the deduction of taxes that a shareholder would pay on Fund distributions or the redemption or sale of Fund Shares. See invescopowershares.com to find the most recent month-end performance numbers.
Index performance results are based upon a hypothetical investment in its constituent securities. Index returns do not represent Fund returns. An investor cannot invest directly in an index. The Index does not charge management fees or brokerage expenses, and no such fees or expenses were deducted from the hypothetical performance shown. In addition, the results actual investors might have achieved would have differed from those shown because of differences in the timing, amounts of their investments, and fees and expenses associated with an investment in the Fund.
The S&P Industrials Index and Dow Jones Industrials Index (the "Benchmark Indices") are unmanaged indices used as a measurement of change in stock market conditions based on the average performance of approximately 56 and 270 common stocks, respectively.
† Fund and underlying Index returns are based on the inception date of the Fund. Returns for the Benchmark Indices are based on the closest month-end to the Fund's inception date.
†† Average annualized.
17
Manager's Analysis
PowerShares Dynamic Technology Sector Portfolio (ticker: PTF)
The PowerShares Dynamic Technology Sector Portfolio (the "Fund") is based on the Dynamic Technology Sector IntellidexSM Index ("Index") and seeks investment results that correspond generally to the price and yield (before the Fund's fees and expenses) of that equity index.
For the year ended April 30, 2009, the Fund returned -30.37%, underperforming the overall S&P Information Technology Index which returned -26.69%.
Overallocation and stock selection within IT services, and stock selection within computers & peripherals industries made the largest negative contribution to the Fund. Positive stock selection in the software industry helped offset the Fund's negative performance.
Overallocation to small cap and underallocation combined with poor stock selection within mega cap companies had the largest negative impact on the Fund's performance.
Industry Breakdown (% of the Fund's
Net Assets) as of April 30, 2009
| Software | 26.5 | ||||||
| Computers | 25.2 | ||||||
| Telecommunications | 13.9 | ||||||
| Internet | 11.3 | ||||||
| Commercial Services | 9.8 | ||||||
| Electronics | 6.7 | ||||||
| Semiconductors | 5.4 | ||||||
| Home Furnishings | 1.2 | ||||||
| Money Market Fund | 0.2 | ||||||
| Other | (0.2 | ) | |||||
Style Allocation (% of the Fund's
Total Investments) as of April 30, 2009
| Small-Cap Growth | 42.0 | ||||||
| Mid-Cap Growth | 24.0 | ||||||
| Large-Cap Growth | 14.3 | ||||||
| Mid-Cap Value | 7.8 | ||||||
| Small-Cap Value | 7.0 | ||||||
| Large-Cap Value | 4.9 | ||||||
Top Ten Fund Holdings (% of the Fund's
Net Assets) as of April 30, 2009
| Security | |||||||
| Autodesk, Inc. | 3.2 | ||||||
| Dolby Laboratroies, Inc., Class A | 2.9 | ||||||
| Apple, Inc. | 2.9 | ||||||
| McAfee, Inc. | 2.7 | ||||||
| Cisco Systems, Inc. | 2.7 | ||||||
| Microsoft Corp. | 2.6 | ||||||
| EMC Corp. | 2.4 | ||||||
| BMC Software, Inc. | 2.4 | ||||||
| Xilinx, Inc. | 2.4 | ||||||
| International Business Machines Corp. | 2.3 | ||||||
| Total | 26.5 | ||||||
18
Manager's Analysis (Continued)
PowerShares Dynamic Technology Sector Portfolio (ticker: PTF)
Growth of a $10,000 Investment Since Inception†
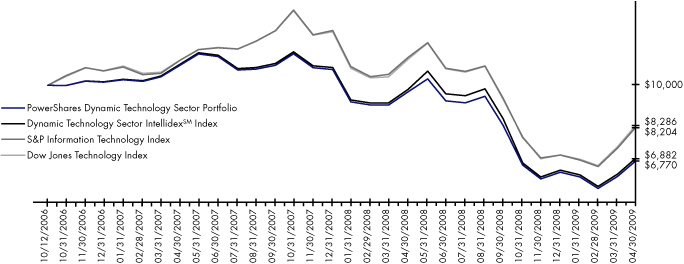
| Fund Performance History (%) | As of April 30, 2009 | ||||||||||||||
| Avg Ann†† | Fund Inception† | ||||||||||||||
| 1 Year | Avg Ann†† | Cumulative | |||||||||||||
| Index | |||||||||||||||
| Dynamic Technology Sector IntellidexSM Index | -29.96 | -13.64 | -31.18 | ||||||||||||
| S&P Information Technology Index | -26.69 | -7.37 | -17.95 | ||||||||||||
| Dow Jones Technology Index | -25.45 | -7.02 | -17.14 | ||||||||||||
| Fund | |||||||||||||||
| NAV Return | -30.37 | -14.20 | -32.30 | ||||||||||||
| Share Price Return | -30.31 | -14.20 | -32.30 | ||||||||||||
Fund Inception: October 12, 2006
Performance quoted represents past performance. Past performance is not a guarantee of future results and current performance may be higher or lower than performance quoted. Investment returns and principal value will fluctuate and shares, when redeemed, may be worth more or less than their original cost. The Adviser has waived fees and reimbursed other expenses, absent which, performance would have been lower. The Adviser has contractually agreed to waive fees and/or pay certain Fund expenses through August 31, 2010. According to the Fund's current prospectus, the total gross annual operating expense ratio was indicated as 0.94%. In the Financial Highlights section of this Shareholder Report, the Fund's net (subsidized) total operating expense ratio was determined to be 0.65% while the Fund's gross total operating expense ratio was 0.89%. NAV and Share Price returns assume that dividends and capital gain distributions have been reinvested in the Fund at NAV and Share Price, respectively. The returns shown in the table above do not reflect the deduction of taxes that a shareholder would pay on Fund distributions or the redemption or sale of Fund Shares. See invescopowershares.com to find the most recent month-end performance numbers.
Index performance results are based upon a hypothetical investment in its constituent securities. Index returns do not represent Fund returns. An investor cannot invest directly in an index. The Index does not charge management fees or brokerage expenses, and no such fees or expenses were deducted from the hypothetical performance shown. In addition, the results actual investors might have achieved would have differed from those shown because of differences in the timing, amounts of their investments, and fees and expenses associated with an investment in the Fund.
The S&P Information Technology Index and Dow Jones Technology Index (the "Benchmark Indices") are unmanaged indices used as a measurement of change in stock market conditions based on the average performance of approximately 70 and 252 common stocks, respectively.
† Fund and underlying Index returns are based on the inception date of the Fund. Returns for the Benchmark Indices are based on the closest month-end to the Fund's inception date.
†† Average annualized.
19
Manager's Analysis
PowerShares Dynamic Telecommunications & Wireless Portfolio (ticker: PTE)
The PowerShares Dynamic Telecommunications & Wireless Portfolio (the "Fund") is based on the Dynamic Telecommunications & Wireless IntellidexSM Index ("Index") and seeks investment results that correspond generally to the price and yield (before the Fund's fees and expenses) of that equity index.
For the year ended April 30, 2009, the Fund returned -26.55%, while the S&P Telecommunication Services Index returned -26.05% for the same period.
Overallocation within the communications equipment industry and poor stock selection in diversified telecommunication services made the largest negative contribution to the Fund's performance. Conversely, overallocation and stock selection within household durables and software industries partially offset the negative returns of the Fund.
Overallocation within small- and mid-cap companies made the largest negative contribution to the Fund's performance. Conversely, overallocation and stock selection within large-cap companies partially offset the negative performance of the Fund.
Industry Breakdown (% of the Fund's
Net Assets) as of April 30, 2009
| Telephone-Integrated | 37.5 | ||||||
| Cable/Satellite TV | 15.6 | ||||||
| Telecommunication Services | 10.4 | ||||||
| Networking Products | 10.0 | ||||||
| Internet Infrastructure Software | 6.0 | ||||||
| Cellular Telecommunications | 4.3 | ||||||
| Electronic Component-Miscellaneous | 3.5 | ||||||
| Internet Connective Services | 3.0 | ||||||
| Web Portals/ISP | 2.8 | ||||||
| Data Processing/Management | 2.5 | ||||||
| Wireless Equipment | 2.2 | ||||||
| Telecommunication Equipment | 2.1 | ||||||
| Money Market Fund | 0.7 | ||||||
| Other | (0.6 | ) | |||||
Style Allocation (% of the Fund's
Total Investments) as of April 30, 2009
| Small-Cap Growth | 29.1 | ||||||
| Mid-Cap Value | 25.5 | ||||||
| Large-Cap Growth | 16.2 | ||||||
| Large-Cap Value | 15.0 | ||||||
| Small-Cap Value | 11.0 | ||||||
| Mid-Cap Growth | 3.2 | ||||||
Top Ten Fund Holdings (% of the Fund's
Net Assets) as of April 30, 2009
| Security | |||||||
| Cisco Systems, Inc. | 5.7 | ||||||
| Sprint Nextel Corp. | 5.7 | ||||||
| DIRECTV Group (The), Inc. | 5.3 | ||||||
| Comcast Corp., Class A | 5.1 | ||||||
| DISH Network Corp., Class A | 5.1 | ||||||
| Qwest Communications International, Inc. | 5.0 | ||||||
| AT&T, Inc. | 4.6 | ||||||
| Verizon Communications, Inc. | 4.6 | ||||||
| 3Com Corp. | 4.3 | ||||||
| Garmin Ltd. | 3.5 | ||||||
| Total | 48.9 | ||||||
20
Manager's Analysis (Continued)
PowerShares Dynamic Telecommunications & Wireless Portfolio (ticker: PTE)
Growth of a $10,000 Investment Since Inception†

| Fund Performance History (%) | As of April 30, 2009 | ||||||||||||||||||
| Avg Ann†† | Fund Inception† | ||||||||||||||||||
| 1 Year | 3 Year | Avg Ann†† | Cumulative | ||||||||||||||||
| Index | |||||||||||||||||||
| Dynamic Telecommunications & Wireless IntellidexSM Index | -25.87 | -10.88 | -6.48 | -20.36 | |||||||||||||||
| S&P Telecommunication Services Index | -26.05 | -2.94 | -0.39 | -1.34 | |||||||||||||||
| S&P Information Technology Index | -26.69 | -6.63 | -5.85 | -18.62 | |||||||||||||||
| Russell 3000 Index | -34.95 | -10.94 | -7.98 | -24.74 | |||||||||||||||
| S&P SuperComposite Telecommunication Services Index | -32.76 | -2.85 | -2.02 | -6.89 | |||||||||||||||
| Fund | |||||||||||||||||||
| NAV Return | -26.55 | -11.37 | -7.13 | -22.21 | |||||||||||||||
| Share Price Return | -26.55 | -11.39 | -7.13 | -22.21 | |||||||||||||||
Fund Inception: December 6, 2005
Performance quoted represents past performance. Past performance is not a guarantee of future results and current performance may be higher or lower than performance quoted. Investment returns and principal value will fluctuate and shares, when redeemed, may be worth more or less than their original cost. The Adviser has waived fees and reimbursed other expenses, absent which, performance would have been lower. The Adviser has contractually agreed to waive fees and/or pay certain Fund expenses through August 31, 2010. According to the Fund's current prospectus, the total gross annual operating expense ratio was indicated as 1.01%. In the Financial Highlights section of this Shareholder Report, the Fund's net (subsidized) total operating expense ratio was determined to be 0.63% while the Fund's gross total operating expense ratio was 1.29%. NAV and Share Price returns assume that dividends and capital gain distributions have been reinvested in the Fund at NAV and Share Price, respectively. The returns shown in the table above do not reflect the deduction of taxes that a shareholder would pay on Fund distributions or the redemption or sale of Fund Shares. See invescopowershares.com to find the most recent month-end performance numbers.
Index performance results are based upon a hypothetical investment in its constituent securities. Index returns do not represent Fund returns. An investor cannot invest directly in an index. The Index does not charge management fees or brokerage expenses, and no such fees or expenses were deducted from the hypothetical performance shown. In addition, the results actual investors might have achieved would have differed from those shown because of differences in the timing, amounts of their investments, and fees and expenses associated with an investment in the Fund.
The S&P Telecommunication Services Index, S&P Information Technology Index, Russell 3000 Index and S&P SuperComposite Telecommunication Services Index (the "Benchmark Indices") are unmanaged indices used as a measurement of change in stock market conditions based on the average performance of approximately 9, 70, 2,918 and 17 common stocks, respectively. The S&P Telecommunication Services Index and the S&P Information Technology Index will be used for comparative purposes going forward as these represent the most appropriate market indices for this fund.
† Fund and underlying Index returns are based on the inception date of the Fund. Returns for the Benchmark Indices are based on the closest month-end to the Fund's inception date.
†† Average annualized.
21
Manager's Analysis
PowerShares Dynamic Utilities Portfolio (ticker: PUI)
The PowerShares Dynamic Utilities Portfolio (the "Fund") is based on the Dynamic Utilities Sector IntellidexSM Index ("Index") and seeks investment results that correspond generally to the price and yield (before the Fund's fees and expenses) of that equity index.
For the year ended April 30, 2009, the Fund returned -29.00%, outperforming the S&P Utilities Index which returned -32.76%.
Stock selection within the gas utility industry made the largest positive contribution to the Fund. Conversely, stock selection within the independent power producers & energy traders and commercial services & supplies industries partially offset the positive performance of the Fund.
Stock selection within mid cap companies and overallocation to small-cap companies made the largest positive contribution to the Fund's performance. Underallocation to mega-cap names also boosted performance. Conversely, stock selection within large-cap companies partially offset the positive performance of the Fund.
Industry Breakdown (% of the Fund's
Net Assets) as of April 30, 2009
| Electric-Integrated | 67.5 | ||||||
| Gas-Distribution | 18.7 | ||||||
| Water | 5.4 | ||||||
| Electric-Generation | 3.0 | ||||||
| Independent Power Producer | 2.8 | ||||||
| Energy-Alternate Sources | 2.5 | ||||||
| Money Market Fund | 0.0 | ||||||
| Other | 0.1 | ||||||
Style Allocation (% of the Fund's
Total Investments) as of April 30, 2009
| Large-Cap Value | 39.9 | ||||||
| Mid-Cap Value | 24.8 | ||||||
| Small-Cap Value | 13.6 | ||||||
| Small-Cap Growth | 13.4 | ||||||
| Mid-Cap Growth | 8.3 | ||||||
Top Ten Fund Holdings (% of the Fund's
Net Assets) as of April 30, 2009
| Security | |||||||
| Sempra Energy | 5.4 | ||||||
| Public Service Enterprise Group, Inc. | 5.4 | ||||||
| Edison International | 5.1 | ||||||
| Duke Energy Corp. | 5.0 | ||||||
| Exelon Corp. | 4.8 | ||||||
| PG&E Corp. | 4.8 | ||||||
| FirstEnergy Corp. | 4.7 | ||||||
| Southern (The) Co. | 4.7 | ||||||
| AES (The) Corp. | 3.0 | ||||||
| DPL, Inc. | 3.0 | ||||||
| Total | 45.9 | ||||||
22
Manager's Analysis (Continued)
PowerShares Dynamic Utilities Portfolio (ticker: PUI)
Growth of a $10,000 Investment Since Inception†

| Fund Performance History (%) | As of April 30, 2009 | ||||||||||||||||||
| Avg Ann†† | Fund Inception† | ||||||||||||||||||
| 1 Year | 3 Year | Avg Ann†† | Cumulative | ||||||||||||||||
| Index | |||||||||||||||||||
| Dynamic Utilities IntellidexSM Index | -28.58 | -4.20 | -1.39 | -4.79 | |||||||||||||||
| S&P Utilities Index (name change from S&P SuperComposite Utilities) | -32.76 | -2.85 | -2.08 | -7.09 | |||||||||||||||
| Dow Jones Utilities Index | -31.80 | -2.31 | -1.75 | -5.99 | |||||||||||||||
| Russell 3000 Index | -34.95 | -10.94 | -6.79 | -21.81 | |||||||||||||||
| Fund | |||||||||||||||||||
| NAV Return | -29.00 | -4.77 | -2.01 | -6.89 | |||||||||||||||
| Share Price Return | -29.11 | -4.80 | -2.02 | -6.92 | |||||||||||||||
Fund Inception: October 26, 2005
Performance quoted represents past performance. Past performance is not a guarantee of future results and current performance may be higher or lower than performance quoted. Investment returns and principal value will fluctuate and shares, when redeemed, may be worth more or less than their original cost. The Adviser has waived fees and reimbursed other expenses, absent which, performance would have been lower. The Adviser has contractually agreed to waive fees and/or pay certain Fund expenses through August 31, 2010. According to the Fund's current prospectus, the total gross annual operating expense ratio was indicated as 0.86%. In the Financial Highlights section of this Shareholder Report, the Fund's net (subsidized) total operating expense ratio was determined to be 0.63% while the Fund's gross total operating expense ratio was 0.82%. NAV and Share Price returns assume that dividends and capital gain distributions have been reinvested in the Fund at NAV and Share Price, respectively. The returns shown in the table above do not reflect the deduction of taxes that a shareholder would pay on Fund distributions or the redemption or sale of Fund Shares. See invescopowershares.com to find the most recent month-end performance numbers.
Index performance results are based upon a hypothetical investment in its constituent securities. Index returns do not represent Fund returns. An investor cannot invest directly in an index. The Index does not charge management fees or brokerage expenses, and no such fees or expenses were deducted from the hypothetical performance shown. In addition, the results actual investors might have achieved would have differed from those shown because of differences in the timing, amounts of their investments, and fees and expenses associated with an investment in the Fund.
The S&P Utilities Index, Dow Jones Utilities Index and Russell 3000 Index (the "Benchmark Indices") are unmanaged indices used as a measurement of change in stock market conditions based on the average performance of approximately 35, 90, and 2,918 common stocks, respectively. The S&P Utilities Index (name change from S&P SuperComposite Utilities Index) and the Dow Jones Utilities Index will be used for comparative purposes going forward as these represent the most appropriate market indices for this fund.
† Fund and underlying Index returns are based on the inception date of the Fund. Returns for the Benchmark Indices are based on the closest month-end to the Fund's inception date.
†† Average annualized.
23
Manager's Analysis
PowerShares NASDAQ Internet Portfolio (ticker: PNQI)
The PowerShares NASDAQ Internet Portfolio (the "Fund") seeks investment results that correspond generally to the price and yield (before the Fund's fees and expenses), of the NASDAQ Internet IndexSM ("Index"), and is designed to track the performance of the largest and most liquid U.S.-listed companies engaged in internet-related businesses and that are listed on one of the major U.S. stock exchanges. The Index employs a modified market capitalization-weighted methodology based on the market capitalization ranking of the Index securities and is rebalanced quarterly.
The Fund outperformed the NASDAQ-100® Index returning -25.33% while the NASAQ-100® Index returned -31.02% from the inception date of the Fund (June 12, 2008) through 4/30/2009. Internet companies in general outperformed the general market during this time. Technology and consumer discretionary sectors were overrepresented in the Fund with Amazon, Netflix and Priceline all contributing positively to the overall performance of the Fund.
Industry Breakdown (% of the Fund's
Net Assets) as of April 30, 2009
| Web Portals/ISP | 22.9 | ||||||
| E-Commerce/Services | 22.7 | ||||||
| E-Commerce/Products | 11.9 | ||||||
| Internet Content-Information/Network | 8.1 | ||||||
| Web Hosting/Design | 5.0 | ||||||
| Internet Infrastructure Software | 4.8 | ||||||
| E-Marketing/Information | 4.1 | ||||||
| Internet Security | 3.4 | ||||||
| Enterprise Software/Services | 3.1 | ||||||
| E-Services/Consulting | 2.0 | ||||||
| Telecommuniction Services | 2.0 | ||||||
| Printing-Commercial | 1.8 | ||||||
| Internet Application Software | 1.7 | ||||||
| Internet Telephony | 1.3 | ||||||
| Computer Software | 1.1 | ||||||
| Educational Software | 1.1 | ||||||
| Internet Connective Services | 0.6 | ||||||
| Commercial Services-Finance | 0.6 | ||||||
| Networking Products | 0.5 | ||||||
| Retail-Pet Food & Supplies | 0.5 | ||||||
| Communications Software | 0.2 | ||||||
| Internet Incubators | 0.2 | ||||||
| Internet Financial Services | 0.2 | ||||||
| Advertising Services | 0.1 | ||||||
| Money Market Fund | 0.1 | ||||||
| Other | (0.0 | ) | |||||
Top Ten Fund Holdings (% of the Fund's
Net Assets) as of April 30, 2009
| Security | |||||||
| eBay, Inc. | 9.2 | ||||||
| Amazon.com, Inc. | 7.6 | ||||||
| Google, Inc., Class A | 7.5 | ||||||
| Baidu, Inc. ADR (China) | 6.8 | ||||||
| Yahoo!, Inc. | 6.4 | ||||||
| Expedia, Inc. | 4.4 | ||||||
| Akamai Technologies, Inc. | 3.9 | ||||||
| priceline.com, Inc. | 3.4 | ||||||
| Netflix, Inc. | 3.3 | ||||||
| Equinix, Inc. | 3.2 | ||||||
| Total | 55.7 | ||||||
Style Allocation (% of the Fund's
Total Investments) as of April 30, 2009
| Large-Cap Growth | 31.0 | ||||||
| Mid-Cap Growth | 27.9 | ||||||
| Small-Cap Growth | 23.5 | ||||||
| Large-Cap Value | 9.2 | ||||||
| Mid-Cap Value | 4.4 | ||||||
| Small-Cap Value | 4.0 | ||||||
24
Manager's Analysis (Continued)
PowerShares NASDAQ Internet Portfolio (ticker: PNQI)
Growth of a $10,000 Investment Since Inception†
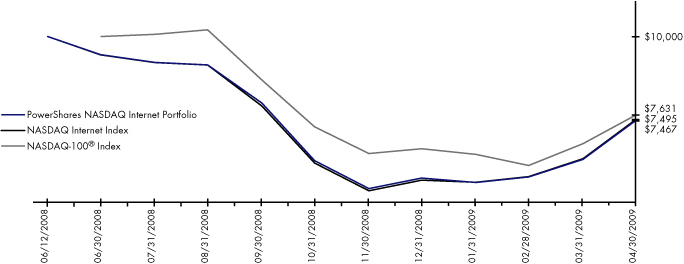
| Fund Performance History (%) | As of April 30, 2009 | ||||||
| Fund Inception† Cumulative | |||||||
| Index | |||||||
| NASDAQ Internet Index | -25.05 | ||||||
| NASDAQ-100® Index | -31.02 | ||||||
| Fund | |||||||
| NAV Return | -25.33 | ||||||
| Share Price Return | -26.53 | ||||||
Fund Inception: June 12, 2008
Performance quoted represents past performance. Past performance is not a guarantee of future results and current performance may be higher or lower than performance quoted. Investment returns and principal value will fluctuate and shares, when redeemed, may be worth more or less than their original cost. According to the Fund's current prospectus, the total gross annual operating expense ratio of 0.60% is expressed as a unitary fee to cover operating expenses incurred in connection with managing the portfolio. NAV and Share Price returns assume that dividends and capital gain distributions have been reinvested in the Fund at NAV and Share Price, respectively. The returns shown in the table above do not reflect the deduction of taxes that a shareholder would pay on Fund distributions or the redemption or sale of Fund Shares. See invescopowershares.com to find the most recent month-end performance numbers.
Index performance results are based upon a hypothetical investment in its constituent securities. Index returns do not represent Fund returns. An investor cannot invest directly in an index. The Index does not charge management fees or brokerage expenses, and no such fees or expenses were deducted from the hypothetical performance shown. In addition, the results actual investors might have achieved would have differed from those shown because of differences in the timing, amounts of their investments, and fees and expenses associated with an investment in the Fund.
The NASDAQ-100® Index ("Benchmark") is an unmanaged index used as a measurement of change in stock market conditions based on the average performance of approximately 100 common stocks.
† Fund and underlying Index returns are based on the inception date of the Fund. Returns for the Benchmark Index are based on the closest month-end to the Fund's inception date.
25
Frequency Distribution of Discounts & Premiums
Since Inception through April 30, 2009
| Closing Price Above NAV (bps) | |||||||||||||||||||||||||||||||||||||||
| Ticker | Fund Name | Inception | Days | 0-24 | 25-49 | 50-99 | 100-149 | 150-199 | 200+ | ||||||||||||||||||||||||||||||
| PYZ | PowerShares Dynamic Basic Materials Sector Portfolio | 10/12/06 | 641 | 261 | 18 | 3 | 0 | 0 | 0 | ||||||||||||||||||||||||||||||
| PEZ | PowerShares Dynamic Consumer Discretionary Sector Portfolio | 10/12/06 | 641 | 249 | 16 | 4 | 0 | 0 | 1 | ||||||||||||||||||||||||||||||
| PSL | PowerShares Dynamic Consumer Staples Sector Portfolio | 10/12/06 | 641 | 258 | 15 | 6 | 0 | 0 | 2 | ||||||||||||||||||||||||||||||
| PXI | PowerShares Dynamic Energy Sector Portfolio | 10/12/06 | 641 | 216 | 15 | 6 | 1 | 0 | 0 | ||||||||||||||||||||||||||||||
| PFI | PowerShares Dynamic Financial Sector Portfolio | 10/12/06 | 641 | 259 | 21 | 8 | 1 | 1 | 1 | ||||||||||||||||||||||||||||||
| PTH | PowerShares Dynamic Healthcare Sector Portfolio | 10/12/06 | 641 | 236 | 12 | 12 | 0 | 0 | 0 | ||||||||||||||||||||||||||||||
| PRN | PowerShares Dynamic Industrials Sector Portfolio | 10/12/06 | 641 | 268 | 11 | 7 | 0 | 0 | 1 | ||||||||||||||||||||||||||||||
| PTF | PowerShares Dynamic Technology Sector Portfolio | 10/12/06 | 641 | 252 | 54 | 9 | 1 | 1 | 1 | ||||||||||||||||||||||||||||||
| PTE | PowerShares Dynamic Telecommunications & Wireless Portfolio | 12/6/05 | 855 | 331 | 41 | 8 | 2 | 0 | 0 | ||||||||||||||||||||||||||||||
| PUI | PowerShares Dynamic Utilities Portfolio | 10/26/05 | 883 | 335 | 25 | 5 | 1 | 1 | 1 | ||||||||||||||||||||||||||||||
| PNQI | PowerShares NASDAQ Internet Portfolio | 6/12/08 | 189 | 56 | 7 | 2 | 0 | 2 | 2 | ||||||||||||||||||||||||||||||
26
| Closing Price Below NAV (bps) | |||||||||||||||||||||||||||
| Ticker | -0-24 | -25-49 | -50-99 | -100-149 | -150-199 | -200+ | |||||||||||||||||||||
| PYZ | 346 | 11 | 2 | 0 | 0 | 0 | |||||||||||||||||||||
| PEZ | 360 | 9 | 1 | 0 | 0 | 1 | |||||||||||||||||||||
| PSL | 353 | 6 | 1 | 0 | 0 | 0 | |||||||||||||||||||||
| PXI | 389 | 9 | 5 | 0 | 0 | 0 | |||||||||||||||||||||
| PFI | 325 | 14 | 5 | 4 | 2 | 0 | |||||||||||||||||||||
| PTH | 372 | 9 | 0 | 0 | 0 | 0 | |||||||||||||||||||||
| PRN | 343 | 11 | 0 | 0 | 0 | 0 | |||||||||||||||||||||
| PTF | 308 | 12 | 1 | 0 | 0 | 2 | |||||||||||||||||||||
| PTE | 445 | 24 | 4 | 0 | 0 | 0 | |||||||||||||||||||||
| PUI | 500 | 14 | 0 | 0 | 1 | 0 | |||||||||||||||||||||
| PNQI | 114 | 4 | 1 | 0 | 0 | 1 | |||||||||||||||||||||
27
Fees and Expenses
As a shareholder of a Fund of the PowerShares Exchange-Traded Fund Trust, you incur advisory fees and other Fund expenses. The expense examples below are intended to help you understand your ongoing costs (in dollars) of investing in the Funds and to compare these costs with the ongoing costs of investing in other funds.
The example is based on an investment of $1,000 invested at the beginning of the period and held through the six-month period ended April 30, 2009.
Actual Expenses
The first line in the following table provides information about actual account values and actual expenses. You may use the information in this line, together with the amount you invested, to estimate the expenses that you paid over the period. Simply divide your account value by $1,000 (for example, an $8,600 account value divided by $1,000 = 8.6), then multiply the result by the number in the first line under the heading "Expenses Paid During the Six-Month Period" to estimate the expenses you paid on your account during this period.
Hypothetical Example for Comparison Purposes
The second line in the following table provides information about hypothetical account values and hypothetical expenses based on each Fund's actual expense ratio and an assumed annualized rate of return of 5% per year before expenses, which is not the Fund's actual return. The hypothetical account values and expenses may not be used to estimate the actual ending account balance or expenses you paid for the period. You may use this information to compare the ongoing costs of investing in the Funds and other funds. To do so, compare this 5% hypothetical example with the 5% hypothetical examples that appear in the shareholder reports of the other funds.
Please note that the expenses shown in the table are meant to highlight your ongoing costs only, and do not reflect any transactional costs such as sales charges (loads). Therefore the second line in the table is useful in comparing ongoing costs only, and will not help you determine the relative total costs of owning different funds. In addition, if these transactional costs were included, your costs would have been higher.
| Beginning Account Value November 1, 2008 | Ending Account Value April 30, 2009 | Annualized Expense Ratio Based on the Six-Month Period | Expenses Paid During the Six-Month Period (1) | ||||||||||||||||
| PowerShares Dynamic Basic Materials Sector Portfolio Actual | $ | 1,000.00 | $ | 968.29 | 0.65 | % | $ | 3.17 | |||||||||||
| Hypothetical (5% return before expenses) | $ | 1,000.00 | $ | 1,021.57 | 0.65 | % | $ | 3.26 | |||||||||||
| PowerShares Dynamic Consumer Discretionary Sector Portfolio Actual | $ | 1,000.00 | $ | 1,063.43 | 0.64 | % | $ | 3.27 | |||||||||||
| Hypothetical (5% return before expenses) | $ | 1,000.00 | $ | 1,021.62 | 0.64 | % | $ | 3.21 | |||||||||||
| PowerShares Dynamic Consumer Staples Sector Portfolio Actual | $ | 1,000.00 | $ | 933.37 | 0.65 | % | $ | 3.12 | |||||||||||
| Hypothetical (5% return before expenses) | $ | 1,000.00 | $ | 1,021.57 | 0.65 | % | $ | 3.26 | |||||||||||
| PowerShares Dynamic Energy Sector Portfolio Actual | $ | 1,000.00 | $ | 849.40 | 0.65 | % | $ | 2.98 | |||||||||||
| Hypothetical (5% return before expenses) | $ | 1,000.00 | $ | 1,021.57 | 0.65 | % | $ | 3.26 | |||||||||||
28
Fees and Expenses (Continued)
| Beginning Account Value November 1, 2008 | Ending Account Value April 30, 2009 | Annualized Expense Ratio Based on the Six-Month Period | Expenses Paid During the Six-Month Period (1) | ||||||||||||||||
| PowerShares Dynamic Financial Sector Portfolio Actual | $ | 1,000.00 | $ | 815.18 | 0.65 | % | $ | 2.93 | |||||||||||
| Hypothetical (5% return before expenses) | $ | 1,000.00 | $ | 1,021.57 | 0.65 | % | $ | 3.26 | |||||||||||
| PowerShares Dynamic Healthcare Sector Portfolio Actual | $ | 1,000.00 | $ | 875.25 | 0.65 | % | $ | 3.02 | |||||||||||
| Hypothetical (5% return before expenses) | $ | 1,000.00 | $ | 1,021.57 | 0.65 | % | $ | 3.26 | |||||||||||
| PowerShares Dynamic Industrials Sector Portfolio Actual | $ | 1,000.00 | $ | 944.42 | 0.65 | % | $ | 3.13 | |||||||||||
| Hypothetical (5% return before expenses) | $ | 1,000.00 | $ | 1,021.57 | 0.65 | % | $ | 3.26 | |||||||||||
| PowerShares Dynamic Technology Sector Portfolio Actual | $ | 1,000.00 | $ | 1,027.34 | 0.65 | % | $ | 3.27 | |||||||||||
| Hypothetical (5% return before expenses) | $ | 1,000.00 | $ | 1,021.57 | 0.65 | % | $ | 3.26 | |||||||||||
| PowerShares Dynamic Telecommunications & Wireless Portfolio Actual | $ | 1,000.00 | $ | 995.99 | 0.63 | % | $ | 3.12 | |||||||||||
| Hypothetical (5% return before expenses) | $ | 1,000.00 | $ | 1,021.67 | 0.63 | % | $ | 3.16 | |||||||||||
| PowerShares Dynamic Utilities Portfolio Actual | $ | 1,000.00 | $ | 866.14 | 0.63 | % | $ | 2.92 | |||||||||||
| Hypothetical (5% return before expenses) | $ | 1,000.00 | $ | 1,021.67 | 0.63 | % | $ | 3.16 | |||||||||||
| PowerShares NASDAQ Internet Portfolio Actual | $ | 1,000.00 | $ | 1,193.76 | 0.60 | % | $ | 3.26 | |||||||||||
| Hypothetical (5% return before expenses) | $ | 1,000.00 | $ | 1,021.82 | 0.60 | % | $ | 3.01 | |||||||||||
(1) Expenses are calculated using the annualized expense ratio, which represents the ongoing expenses as a percentage of net assets for the six months ended April 30, 2009. Expenses are calculated by multiplying the Fund's annualized expense ratio by the average account value for the period; then multiplying the result by 181 and then dividing the result by 365. Expense ratios for the most recent half-year may differ from expense ratios based on the annualized data in the Financial Highlights.
29
Schedule of Investments
PowerShares Dynamic Basic Materials Sector Portfolio
April 30, 2009
| Number of Shares | Value | ||||||||||
| Common Stocks—99.8% | |||||||||||
| Agricultural Chemicals—6.2% | |||||||||||
| 2,951 | CF Industries Holdings, Inc. | $ | 212,620 | ||||||||
| 4,562 | Monsanto Co. | 387,268 | |||||||||
| 8,083 | Mosaic (The) Co. | 326,957 | |||||||||
| 7,359 | Terra Industries, Inc. | 195,014 | |||||||||
| 1,121,859 | |||||||||||
| Alternative Waste Technology—1.2% | |||||||||||
| 12,956 | Calgon Carbon Corp.* | 219,993 | |||||||||
| Building Products - Cement/Aggregate—1.5% | |||||||||||
| 9,952 | Eagle Materials, Inc. | 276,666 | |||||||||
| Chemicals - Diversified—14.9% | |||||||||||
| 48,598 | Dow Chemical (The) Co. | 777,567 | |||||||||
| 18,549 | E.I. du Pont de Nemours & Co. | 517,517 | |||||||||
| 4,695 | FMC Corp. | 228,787 | |||||||||
| 17,872 | Innophos Holdings, Inc. | 265,042 | |||||||||
| 18,180 | Olin Corp. | 229,068 | |||||||||
| 11,203 | PPG Industries, Inc. | 493,492 | |||||||||
| 50,613 | Solutia, Inc.* | 190,305 | |||||||||
| 2,701,778 | |||||||||||
| Chemicals - Plastics—2.9% | |||||||||||
| 117,888 | PolyOne Corp.* | 323,013 | |||||||||
| 13,282 | A. Schulman, Inc. | 208,395 | |||||||||
| 531,408 | |||||||||||
| Chemicals - Specialty—16.0% | |||||||||||
| 9,147 | Balchem Corp. | 227,669 | |||||||||
| 10,949 | Ecolab, Inc. | 422,084 | |||||||||
| 7,214 | International Flavors & Fragrances, Inc. | 225,077 | |||||||||
| 6,904 | Lubrizol (The) Corp. | 298,391 | |||||||||
| 6,344 | Minerals Technologies, Inc. | 235,933 | |||||||||
| 5,491 | NewMarket Corp. | 345,933 | |||||||||
| 12,245 | OM Group, Inc.* | 341,146 | |||||||||
| 9,396 | Sensient Technologies Corp. | 219,678 | |||||||||
| 9,747 | Sigma-Aldrich Corp. | 427,308 | |||||||||
| 15,196 | Valhi, Inc. | 161,685 | |||||||||
| 2,904,904 | |||||||||||
| Coatings/Paint—1.5% | |||||||||||
| 11,365 | Valspar (The) Corp. | 272,760 | |||||||||
| Consumer Products - Miscellaneous—1.3% | |||||||||||
| 6,795 | Scotts Miracle-Gro (The) Co., Class A | 229,467 | |||||||||
| Containers - Metal/Glass—8.6% | |||||||||||
| 8,637 | Ball Corp. | 325,788 | |||||||||
| 30,319 | Bway Holding Co.* | 282,573 | |||||||||
| 9,003 | Crown Holdings, Inc.* | 198,516 | |||||||||
| 6,172 | Greif, Inc., Class A | 279,406 | |||||||||
| 12,308 | Owens-Illinois, Inc.* | 300,192 | |||||||||
| 3,869 | Silgan Holdings, Inc. | 179,870 | |||||||||
| 1,566,345 | |||||||||||
| Number of Shares | Value | ||||||||||
| Common Stocks (Continued) | |||||||||||
| Containers - Paper/Plastic—8.9% | |||||||||||
| 10,221 | Bemis Co., Inc. | $ | 245,713 | ||||||||
| 17,922 | Packaging Corp. of America | 284,422 | |||||||||
| 11,990 | Pactiv Corp.* | 262,101 | |||||||||
| 6,874 | Rock-Tenn Co., Class A | 259,562 | |||||||||
| 17,007 | Sealed Air Corp. | 324,154 | |||||||||
| 9,849 | Sonoco Products Co. | 240,414 | |||||||||
| 1,616,366 | |||||||||||
| Diversified Manufacturing Operations—1.5% | |||||||||||
| 14,206 | Koppers Holdings, Inc. | 269,346 | |||||||||
| Forestry—2.8% | |||||||||||
| 14,403 | Weyerhaeuser Co. | 507,850 | |||||||||
| Gold Mining—2.9% | |||||||||||
| 8,359 | Newmont Mining Corp. | 336,366 | |||||||||
| 106,629 | Western Goldfields, Inc. (Canada)* | 189,800 | |||||||||
| 526,166 | |||||||||||
| Industrial Gases—6.7% | |||||||||||
| 7,524 | Air Products & Chemicals, Inc. | 495,831 | |||||||||
| 6,164 | Airgas, Inc. | 265,792 | |||||||||
| 6,132 | Praxair, Inc. | 457,509 | |||||||||
| 1,219,132 | |||||||||||
| Metal - Copper—2.6% | |||||||||||
| 25,380 | Southern Copper Corp. | 471,307 | |||||||||
| Metal - Iron—1.6% | |||||||||||
| 12,300 | Cliffs Natural Resources, Inc. | 283,638 | |||||||||
| Miscellaneous Manufacturing—1.2% | |||||||||||
| 6,764 | AptarGroup, Inc. | 209,887 | |||||||||
| Non-Ferrous Metals—1.2% | |||||||||||
| 32,500 | Titanium Metals Corp | 220,675 | |||||||||
| Paper & Related Products—4.8% | |||||||||||
| 30,514 | Glatfelter | 270,964 | |||||||||
| 20,321 | MeadWestvaco Corp. | 318,228 | |||||||||
| 12,487 | Schweitzer-Mauduit International, Inc. | 286,826 | |||||||||
| 876,018 | |||||||||||
| Quarrying—3.2% | |||||||||||
| 3,634 | Compass Minerals International, Inc. | 175,231 | |||||||||
| 8,403 | Vulcan Materials Co. | 399,563 | |||||||||
| 574,794 | |||||||||||
| Steel - Producers—6.5% | |||||||||||
| 13,854 | Carpenter Technology Corp. | 286,362 | |||||||||
| 10,340 | Nucor Corp. | 420,735 | |||||||||
| 17,690 | United States Steel Corp. | 469,669 | |||||||||
| 1,176,766 | |||||||||||
See Notes to Financial Statements.
30
Schedule of Investments (Continued)
PowerShares Dynamic Basic Materials Sector Portfolio
April 30, 2009
| Number of Shares | Value | ||||||||||
| Common Stocks (Continued) | |||||||||||
| Steel - Specialty—1.8% | |||||||||||
| 9,649 | Allegheny Technologies, Inc. | $ | 315,812 | ||||||||
| Total Common Stocks (Cost $21,084,130) | 18,092,937 | ||||||||||
| Money Market Fund—0.5% | |||||||||||
| 81,054 | Goldman Sachs Financial Square Prime Obligations Institutional Share Class (Cost $81,054) | 81,054 | |||||||||
| Total Investments (Cost $21,165,184)—100.3% | 18,173,991 | ||||||||||
| Liabilities in excess of other assets—(0.3%) | (45,193 | ) | |||||||||
| Net Assets—100.0% | $ | 18,128,798 | |||||||||
* Non-income producing security.
See Notes to Financial Statements.
31
Schedule of Investments
PowerShares Dynamic Consumer Discretionary Sector Portfolio
April 30, 2009
| Number of Shares | Value | ||||||||||
| Common Stocks—100.0% | |||||||||||
| Advertising—2.5% | |||||||||||
| 10,940 | Omnicom Group, Inc. | $ | 344,282 | ||||||||
| Aerospace/Defense—1.2% | |||||||||||
| 2,370 | National Presto Industries, Inc. | 168,886 | |||||||||
| Airlines—2.8% | |||||||||||
| 4,178 | Allegiant Travel Co.* | 217,423 | |||||||||
| 14,004 | Skywest, Inc. | 168,608 | |||||||||
| 386,031 | |||||||||||
| Apparel—10.3% | |||||||||||
| 8,794 | Carter's, Inc.* | 188,016 | |||||||||
| 16,427 | Maidenform Brands, Inc.* | 209,444 | |||||||||
| 7,627 | Polo Ralph Lauren Corp. | 410,638 | |||||||||
| 12,747 | Timberland (The) Co., Class A* | 207,011 | |||||||||
| 6,625 | Warnaco Group (The), Inc.* | 191,065 | |||||||||
| 9,459 | Wolverine World Wide, Inc. | 197,031 | |||||||||
| 1,403,205 | |||||||||||
| Chemicals—2.4% | |||||||||||
| 5,722 | Sherwin-Williams (The) Co. | 324,094 | |||||||||
| Commercial Services—12.1% | |||||||||||
| 3,626 | Apollo Group, Inc., Class A* | 228,257 | |||||||||
| 2,586 | Capella Education Co.* | 132,869 | |||||||||
| 7,281 | Corinthian Colleges, Inc.* | 112,127 | |||||||||
| 6,338 | Interactive Data Corp. | 142,478 | |||||||||
| 2,317 | ITT Educational Services, Inc.* | 233,484 | |||||||||
| 10,002 | Lincoln Educational Services Corp.* | 165,933 | |||||||||
| 4,495 | Pre-Paid Legal Services, Inc.* | 165,551 | |||||||||
| 8,186 | Rent-A-Center, Inc.* | 157,581 | |||||||||
| 846 | Strayer Education, Inc. | 160,241 | |||||||||
| 29,327 | Ticketmaster Entertainment, Inc.* | 154,260 | |||||||||
| 1,652,781 | |||||||||||
| Distribution/Wholesale—3.1% | |||||||||||
| 16,914 | FGX International Holdings Ltd.* | 194,849 | |||||||||
| 11,363 | Fossil, Inc.* | 229,078 | |||||||||
| 423,927 | |||||||||||
| Entertainment—2.8% | |||||||||||
| 7,712 | Bally Technologies, Inc.* | 201,900 | |||||||||
| 7,419 | International Speedway Corp., Class A | 175,682 | |||||||||
| 377,582 | |||||||||||
| Internet—3.7% | |||||||||||
| 4,058 | Amazon.com, Inc.* | 326,751 | |||||||||
| 3,969 | Netflix, Inc.* | 179,835 | |||||||||
| 506,586 | |||||||||||
| Leisure Time—2.7% | |||||||||||
| 13,443 | Carnival Corp. | 361,348 | |||||||||
| Media—1.1% | |||||||||||
| 4,569 | John Wiley & Sons, Inc., Class A | 154,889 | |||||||||
| Number of Shares | Value | ||||||||||
| Common Stocks (Continued) | |||||||||||
| Retail—50.2% | |||||||||||
| 6,185 | Aeropostale, Inc.* | $ | 210,104 | ||||||||
| 12,345 | Bed Bath & Beyond, Inc.* | 375,535 | |||||||||
| 4,647 | Buffalo Wild Wings, Inc.* | 181,419 | |||||||||
| 17,034 | Cabela's, Inc.* | 218,206 | |||||||||
| 9,803 | Cato (The) Corp., Class A | 188,414 | |||||||||
| 7,844 | Children's Place Retail Stores (The), Inc.* | 223,083 | |||||||||
| 6,771 | Dollar Tree, Inc.* | 286,684 | |||||||||
| 14,458 | Dress Barn, Inc.* | 218,894 | |||||||||
| 9,581 | Family Dollar Stores, Inc. | 317,993 | |||||||||
| 17,259 | Foot Locker, Inc. | 205,210 | |||||||||
| 24,366 | Gap (The), Inc. | 378,647 | |||||||||
| 10,027 | Genesco, Inc.* | 228,415 | |||||||||
| 5,577 | Gymboree (The) Corp.* | 191,849 | |||||||||
| 13,979 | hhgregg, Inc.* | 232,051 | |||||||||
| 16,149 | Hot Topic, Inc.* | 197,664 | |||||||||
| 18,651 | Limited Brands, Inc. | 212,994 | |||||||||
| 5,033 | McDonald's Corp. | 268,209 | |||||||||
| 13,427 | Men's Wearhouse (The), Inc. | 250,279 | |||||||||
| 7,281 | P.F. Chang's China Bistro, Inc.* | 219,741 | |||||||||
| 3,257 | Panera Bread Co., Class A* | 182,425 | |||||||||
| 7,155 | PetSmart, Inc. | 163,706 | |||||||||
| 8,656 | Phillips-Van Heusen Corp. | 251,284 | |||||||||
| 11,381 | Regis Corp. | 217,832 | |||||||||
| 8,907 | Ross Stores, Inc. | 337,932 | |||||||||
| 11,805 | TJX Cos., Inc. | 330,186 | |||||||||
| 57,366 | Wet Seal (The), Inc., Class A* | 218,564 | |||||||||
| 10,003 | Yum! Brands, Inc. | 333,600 | |||||||||
| 18,179 | Zumiez, Inc.* | 219,239 | |||||||||
| 6,860,159 | |||||||||||
| Textiles—1.6% | |||||||||||
| 5,986 | UniFirst Corp. | 223,218 | |||||||||
| Toys/Games/Hobbies—3.5% | |||||||||||
| 11,487 | Hasbro, Inc. | 306,243 | |||||||||
| 5,546 | Marvel Entertainment, Inc.* | 165,493 | |||||||||
| 471,736 | |||||||||||
| Total Common Stocks (Cost $12,042,839) | 13,658,724 | ||||||||||
| Money Market Fund—0.3% | |||||||||||
| 36,181 | Goldman Sachs Financial Square Prime Obligations Institutional Share Class (Cost $36,181) | 36,181 | |||||||||
| Total Investments (Cost $12,079,020)—100.3% | 13,694,905 | ||||||||||
| Liabilities in excess of other assets—(0.3%) | (37,099 | ) | |||||||||
| Net Assets—100.0% | $ | 13,657,806 | |||||||||
* Non-income producing security.
See Notes to Financial Statements.
32
Schedule of Investments
PowerShares Dynamic Consumer Staples Sector Portfolio
April 30, 2009
| Number of Shares | Value | ||||||||||
| Common Stocks—99.8% | |||||||||||
| Agriculture—9.3% | |||||||||||
| 128,147 | Alliance One International, Inc.* | $ | 480,551 | ||||||||
| 52,648 | Altria Group, Inc. | 859,742 | |||||||||
| 30,490 | Archer-Daniels-Midland Co. | 750,664 | |||||||||
| 24,207 | Reynolds American, Inc. | 919,382 | |||||||||
| 35,728 | Vector Group Ltd. | 481,613 | |||||||||
| 3,491,952 | |||||||||||
| Beverages—13.8% | |||||||||||
| 10,316 | Brown-Forman Corp., Class B | 479,694 | |||||||||
| 19,899 | Coca-Cola (The) Co. | 856,653 | |||||||||
| 38,623 | Coca-Cola Enterprises, Inc. | 658,908 | |||||||||
| 33,976 | Constellation Brands, Inc., Class A* | 393,782 | |||||||||
| 13,323 | Hansen Natural Corp.* | 543,045 | |||||||||
| 23,967 | Pepsi Bottling Group (The), Inc. | 749,448 | |||||||||
| 26,695 | PepsiAmericas, Inc. | 655,896 | |||||||||
| 16,886 | PepsiCo, Inc. | 840,247 | |||||||||
| 5,177,673 | |||||||||||
| Cosmetics/Personal Care—13.4% | |||||||||||
| 20,027 | Alberto-Culver Co. | 446,402 | |||||||||
| 25,207 | Avon Products, Inc. | 573,711 | |||||||||
| 140,313 | Bare Escentuals, Inc.* | 1,299,298 | |||||||||
| 6,990 | Chattem, Inc.* | 383,821 | |||||||||
| 13,508 | Colgate-Palmolive Co. | 796,972 | |||||||||
| 16,875 | Procter & Gamble (The) Co. | 834,300 | |||||||||
| 142,569 | Revlon, Inc., Class A* | 675,777 | |||||||||
| 5,010,281 | |||||||||||
| Environmental Control—1.6% | |||||||||||
| 102,399 | Darling International, Inc.* | 585,722 | |||||||||
| Food—37.0% | |||||||||||
| 14,447 | American Italian Pasta Co., Class A* | 454,214 | |||||||||
| 16,563 | Campbell Soup Co. | 426,000 | |||||||||
| 29,403 | ConAgra Foods, Inc. | 520,433 | |||||||||
| 21,682 | Dean Foods Co.* | 448,817 | |||||||||
| 62,013 | Del Monte Foods Co. | 468,198 | |||||||||
| 15,489 | General Mills, Inc. | 785,137 | |||||||||
| 24,881 | H.J. Heinz Co. | 856,404 | |||||||||
| 13,161 | Hershey (The) Co. | 475,639 | |||||||||
| 13,931 | Hormel Foods Corp. | 435,901 | |||||||||
| 14,045 | J & J Snack Foods Corp. | 544,384 | |||||||||
| 20,886 | Kellogg Co. | 879,509 | |||||||||
| 35,684 | Kraft Foods, Inc., Class A | 835,006 | |||||||||
| 39,327 | Kroger (The) Co. | 850,250 | |||||||||
| 11,404 | Lancaster Colony Corp. | 499,495 | |||||||||
| 14,143 | McCormick & Co., Inc. | 416,511 | |||||||||
| 12,726 | Nash Finch Co. | 372,745 | |||||||||
| 7,317 | Ralcorp Holdings, Inc.* | 418,240 | |||||||||
| 23,967 | Safeway, Inc. | 473,348 | |||||||||
| 504 | Seaboard Corp. | 471,240 | |||||||||
| 28,980 | Spartan Stores, Inc. | 471,505 | |||||||||
| 37,808 | Sysco Corp. | 882,062 | |||||||||
| Number of Shares | Value | ||||||||||
| Common Stocks (Continued) | |||||||||||
| 15,978 | Weis Markets, Inc. | $ | 591,026 | ||||||||
| 36,493 | Whole Foods Market, Inc. | 756,500 | |||||||||
| 45,853 | Winn-Dixie Stores, Inc.* | 525,475 | |||||||||
| 13,858,039 | |||||||||||
| Household Products/Wares—9.1% | |||||||||||
| 59,356 | Central Garden & Pet Co., Class A* | 538,359 | |||||||||
| 9,063 | Church & Dwight Co., Inc. | 493,118 | |||||||||
| 9,124 | Clorox (The) Co. | 511,400 | |||||||||
| 17,255 | Kimberly-Clark Corp. | 847,911 | |||||||||
| 81,059 | Prestige Brands Holdings, Inc.* | 523,641 | |||||||||
| 18,016 | WD-40 Co. | 487,513 | |||||||||
| 3,401,942 | |||||||||||
| Pharmaceuticals—1.7% | |||||||||||
| 32,507 | Herbalife Ltd. (Cayman Islands) | 644,289 | |||||||||
| Retail—13.9% | |||||||||||
| 14,839 | BJ's Wholesale Club, Inc.* | 494,732 | |||||||||
| 22,270 | Casey's General Stores, Inc. | 592,605 | |||||||||
| 31,580 | CVS Caremark Corp. | 1,003,612 | |||||||||
| 47,170 | Nu Skin Enterprises, Inc., Class A | 604,719 | |||||||||
| 28,680 | Pantry (The), Inc.* | 677,422 | |||||||||
| 32,176 | PetMed Express, Inc.* | 523,182 | |||||||||
| 26,518 | Pricesmart, Inc. | 473,346 | |||||||||
| 16,509 | Wal-Mart Stores, Inc. | 832,054 | |||||||||
| 5,201,672 | |||||||||||
| Total Common Stocks (Cost $39,114,245) | 37,371,570 | ||||||||||
| Money Market Fund—0.2% | |||||||||||
| 90,927 | Goldman Sachs Financial Square Prime Obligations Institutional Share Class (Cost $90,927) | 90,927 | |||||||||
| Total Investments (Cost $39,205,172)—100.0% | 37,462,497 | ||||||||||
| Liabilities in excess of other assets—(0.0%) | (9,210 | ) | |||||||||
| Net Assets—100.0% | $ | 37,453,287 | |||||||||
* Non-income producing security.
See Notes to Financial Statements.
33
Schedule of Investments
PowerShares Dynamic Energy Sector Portfolio
April 30, 2009
| Number of Shares | Value | ||||||||||
| Common Stocks and Other Equity Interests—99.9% | |||||||||||
| Coal—6.1% | |||||||||||
| 19,239 | Alliance Holdings GP LP | $ | 353,613 | ||||||||
| 17,743 | Foundation Coal Holdings, Inc. | 288,146 | |||||||||
| 22,098 | Peabody Energy Corp. | 583,167 | |||||||||
| 15,703 | Walter Energy, Inc. | 358,028 | |||||||||
| 1,582,954 | |||||||||||
| Computer Services—1.1% | |||||||||||
| 7,004 | IHS, Inc., Class A* | 289,685 | |||||||||
| Electric - Integrated—1.1% | |||||||||||
| 13,924 | NorthWestern Corp. | 291,290 | |||||||||
| Energy - Alternate Sources—1.0% | |||||||||||
| 18,733 | Covanta Holding Corp.* | 264,323 | |||||||||
| Gas - Distribution—6.6% | |||||||||||
| 7,208 | Laclede Group (The), Inc. | 249,973 | |||||||||
| 9,413 | National Fuel Gas Co. | 307,899 | |||||||||
| 12,582 | Sempra Energy | 579,024 | |||||||||
| 11,893 | UGI Corp. | 272,825 | |||||||||
| 9,397 | WGL Holdings, Inc. | 292,623 | |||||||||
| 1,702,344 | |||||||||||
| Oil Companies - Exploration & Production—15.0% | |||||||||||
| 14,966 | Anadarko Petroleum Corp. | 644,436 | |||||||||
| 13,320 | Arena Resources, Inc.* | 381,884 | |||||||||
| 45,650 | BreitBurn Energy Partners LP | 289,421 | |||||||||
| 11,384 | Clayton Williams Energy, Inc.* | 341,862 | |||||||||
| 7,834 | Contango Oil & Gas Co.* | 296,830 | |||||||||
| 10,452 | EOG Resources, Inc. | 663,493 | |||||||||
| 23,580 | Petroleum Development Corp.* | 382,232 | |||||||||
| 18,181 | Southwestern Energy Co.* | 651,971 | |||||||||
| 50,055 | VAALCO Energy, Inc.* | 238,762 | |||||||||
| 3,890,891 | |||||||||||
| Oil Companies - Integrated—6.5% | |||||||||||
| 8,616 | Chevron Corp. | 569,518 | |||||||||
| 7,703 | Exxon Mobil Corp. | 513,559 | |||||||||
| 12,510 | Murphy Oil Corp. | 596,852 | |||||||||
| 1,679,929 | |||||||||||
| Oil Field Machinery & Equipment—10.7% | |||||||||||
| 27,131 | Cameron International Corp.* | 694,011 | |||||||||
| 13,580 | Dresser-Rand Group, Inc.* | 334,475 | |||||||||
| 13,574 | Dril-Quip, Inc.* | 466,674 | |||||||||
| 10,770 | FMC Technologies, Inc.* | 368,657 | |||||||||
| 8,685 | Lufkin Industries, Inc. | 303,107 | |||||||||
| 19,568 | National Oilwell Varco, Inc.* | 592,519 | |||||||||
| 2,759,443 | |||||||||||
| Oil - Field Services—27.8% | |||||||||||
| 17,846 | Baker Hughes, Inc. | 634,961 | |||||||||
| 45,217 | Basic Energy Services, Inc.* | 461,213 | |||||||||
| 29,505 | BJ Services Co. | 409,824 | |||||||||
| 56,498 | Cal Dive International, Inc.* | 447,464 | |||||||||
| 8,207 | CARBO Ceramics, Inc. | 252,037 | |||||||||
| Number of Shares | Value | ||||||||||
| Common Stocks and Other Equity Interests (Continued) | |||||||||||
| 3,783 | Core Laboratories NV (Netherlands) | $ | 314,859 | ||||||||
| 32,071 | Halliburton Co. | 648,476 | |||||||||
| 91,742 | Helix Energy Solutions Group, Inc.* | 833,936 | |||||||||
| 106,860 | Key Energy Services, Inc.* | 469,115 | |||||||||
| 96,066 | Newpark Resources, Inc.* | 268,985 | |||||||||
| 48,939 | RPC, Inc. | 523,647 | |||||||||
| 13,743 | Schlumberger Ltd. | 673,270 | |||||||||
| 4,762 | SEACOR Holdings, Inc.* | 312,959 | |||||||||
| 21,630 | Superior Energy Services, Inc.* | 415,512 | |||||||||
| 49,620 | Superior Well Services, Inc.* | 530,934 | |||||||||
| 7,197,192 | |||||||||||
| Oil Refining & Marketing—5.0% | |||||||||||
| 60,448 | CVR Energy, Inc.* | 444,897 | |||||||||
| 41,958 | Delek US Holdings, Inc. | 430,909 | |||||||||
| 15,638 | Sunoco, Inc. | 414,563 | |||||||||
| 1,290,369 | |||||||||||
| Oil & Gas Drilling—12.3% | |||||||||||
| 11,607 | ENSCO International, Inc. | 328,246 | |||||||||
| 29,384 | Nabors Industries, Ltd. (Bermuda)* | 446,931 | |||||||||
| 21,272 | Noble Corp. (Switzerland) | 581,364 | |||||||||
| 178,324 | Parker Drilling Co.* | 492,174 | |||||||||
| 74,301 | Pioneer Drilling Co.* | 371,505 | |||||||||
| 16,549 | Pride International, Inc.* | 375,662 | |||||||||
| 8,751 | Transocean Ltd. (Switzerland)* | 590,517 | |||||||||
| 3,186,399 | |||||||||||
| Pipelines—2.6% | |||||||||||
| 15,056 | NuStar GP Holdings LLC | 340,416 | |||||||||
| 17,990 | Williams Pipeline Partners LP | 336,413 | |||||||||
| 676,829 | |||||||||||
| Retail - Petroleum Products—1.5% | |||||||||||
| 9,835 | World Fuel Services Corp. | 375,009 | |||||||||
| Transport - Marine—2.6% | |||||||||||
| 11,093 | Overseas Shipholding Group, Inc. | 318,480 | |||||||||
| 8,077 | Tidewater, Inc. | 349,330 | |||||||||
| 667,810 | |||||||||||
| Total Common Stocks and Other Equity Interests (Cost $25,589,658) | 25,854,467 | ||||||||||
| Money Market Fund—0.3% | |||||||||||
| 66,853 | Goldman Sachs Financial Square Prime Obligations Institutional Share Class (Cost $66,853) | 66,853 | |||||||||
| Total Investments (Cost $25,656,511)—100.2% | 25,921,320 | ||||||||||
| Liabilities in excess of other assets—(0.2%) | (43,277 | ) | |||||||||
| Net Assets—100.0% | $ | 25,878,043 | |||||||||
* Non-income producing security.
See Notes to Financial Statements.
34
Schedule of Investments
PowerShares Dynamic Financial Sector Portfolio
April 30, 2009
| Number of Shares | Value | ||||||||||
| Common Stocks—99.8% | |||||||||||
| Commercial Banks - Central U.S.—4.2% | |||||||||||
| 4,893 | BancFirst Corp. | $ | 208,931 | ||||||||
| 20,201 | Bank Mutual Corp. | 207,464 | |||||||||
| 4,500 | UMB Financial Corp. | 205,965 | |||||||||
| 622,360 | |||||||||||
| Commercial Banks - Eastern U.S.—2.5% | |||||||||||
| 9,977 | Community Bank System, Inc. | 164,122 | |||||||||
| 8,687 | NBT Bancorp, Inc. | 205,708 | |||||||||
| 369,830 | |||||||||||
| Commercial Banks - Southern U.S.—1.3% | |||||||||||
| 1,595 | First Citizens BancShares, Inc., Class A | 190,874 | |||||||||
| Commercial Banks - Western U.S.—1.3% | |||||||||||
| 5,328 | Bank of Hawaii Corp. | 187,226 | |||||||||
| Fiduciary Banks—2.1% | |||||||||||
| 5,634 | Northern Trust Corp. | 306,264 | |||||||||
| Finance - Consumer Loans—2.8% | |||||||||||
| 33,471 | Nelnet, Inc., Class A* | 201,830 | |||||||||
| 18,697 | Ocwen Financial Corp.* | 207,911 | |||||||||
| 409,741 | |||||||||||
| Finance - Credit Card—1.7% | |||||||||||
| 29,791 | Discover Financial Services | 242,201 | |||||||||
| Finance - Investment Banker/Broker—13.5% | |||||||||||
| 12,149 | Interactive Brokers Group, Inc., Class A* | 179,198 | |||||||||
| 8,767 | Investment Technology Group, Inc.* | 199,712 | |||||||||
| 9,704 | Knight Capital Group, Inc., Class A* | 150,315 | |||||||||
| 29,533 | LaBranche & Co., Inc.* | 123,448 | |||||||||
| 17,295 | optionsXpress Holdings, Inc. | 284,676 | |||||||||
| 12,228 | Raymond James Financial, Inc. | 191,857 | |||||||||
| 12,579 | SWS Group, Inc. | 160,885 | |||||||||
| 26,365 | TD Ameritrade Holding Corp.* | 419,468 | |||||||||
| 31,966 | TradeStation Group, Inc.* | 259,244 | |||||||||
| 1,968,803 | |||||||||||
| Finance - Leasing Company—1.5% | |||||||||||
| 8,984 | Financial Federal Corp. | 221,096 | |||||||||
| Insurance Brokers—3.7% | |||||||||||
| 8,184 | Aon Corp. | 345,365 | |||||||||
| 10,119 | Brown & Brown, Inc. | 196,916 | |||||||||
| 542,281 | |||||||||||
| Investment Management/Advisory Service—6.4% | |||||||||||
| 19,633 | Ameriprise Financial, Inc. | 517,329 | |||||||||
| 6,833 | Franklin Resources, Inc. | 413,260 | |||||||||
| 930,589 | |||||||||||
| Number of Shares | Value | ||||||||||
| Common Stocks (Continued) | |||||||||||
| Life/Health Insurance—7.1% | |||||||||||
| 18,672 | Aflac, Inc. | $ | 539,434 | ||||||||
| 30,742 | Unum Group | 502,324 | |||||||||
| 1,041,758 | |||||||||||
| Multi-line Insurance—11.3% | |||||||||||
| 8,572 | ACE Ltd. | 397,055 | |||||||||
| 10,970 | American Financial Group, Inc. | 192,853 | |||||||||
| 15,236 | Cincinnati Financial Corp. | 364,902 | |||||||||
| 22,198 | Horace Mann Educators Corp. | 194,898 | |||||||||
| 16,953 | MetLife, Inc. | 504,352 | |||||||||
| 1,654,060 | |||||||||||
| Property/Casualty Insurance—33.5% | |||||||||||
| 4,029 | American Physicians Capital, Inc. | 167,848 | |||||||||
| 11,772 | Amerisafe, Inc.* | 180,818 | |||||||||
| 20,370 | Amtrust Financial Services, Inc. | 185,978 | |||||||||
| 5,795 | Arch Capital Group Ltd.* | 334,835 | |||||||||
| 8,016 | Chubb (The) Corp. | 312,223 | |||||||||
| 11,732 | CNA Surety Corp.* | 225,841 | |||||||||
| 17,781 | Employers Holdings, Inc. | 148,294 | |||||||||
| 14,281 | First Mercury Financial Corp.* | 188,795 | |||||||||
| 4,601 | FPIC Insurance Group, Inc.* | 140,515 | |||||||||
| 4,854 | Hanover Insurance Group (The), Inc. | 145,523 | |||||||||
| 5,736 | Harleysville Group, Inc. | 165,885 | |||||||||
| 7,777 | HCC Insurance Holdings, Inc. | 186,026 | |||||||||
| 4,804 | Infinity Property & Casualty Corp. | 169,293 | |||||||||
| 29,635 | Meadowbrook Insurance Group, Inc. | 176,328 | |||||||||
| 3,268 | Navigators Group (The), Inc.* | 148,302 | |||||||||
| 3,572 | ProAssurance Corp.* | 156,954 | |||||||||
| 27,048 | Progressive (The) Corp. | 413,292 | |||||||||
| 3,485 | RLI Corp. | 167,385 | |||||||||
| 5,459 | Safety Insurance Group, Inc. | 180,420 | |||||||||
| 17,562 | Seabright Insurance Holdings, Inc.* | 162,975 | |||||||||
| 8,372 | Tower Group, Inc. | 227,635 | |||||||||
| 8,657 | Travelers (The) Cos., Inc. | 356,149 | |||||||||
| 15,038 | W.R. Berkley Corp. | 359,558 | |||||||||
| 4,900,872 | |||||||||||
| Reinsurance—5.7% | |||||||||||
| 6,025 | Argo Group International Holdings Ltd. (Bermuda)* | 168,640 | |||||||||
| 7,834 | Aspen Insurance Holdings Ltd. (Bermuda) | 184,726 | |||||||||
| 3,674 | Odyssey Re Holdings Corp. | 140,677 | |||||||||
| 5,056 | PartnerRe Ltd. | 344,769 | |||||||||
| 838,812 | |||||||||||
| S & L/Thrifts - Eastern U.S.—1.2% | |||||||||||
| 19,988 | Provident New York Bancorp | 169,298 | |||||||||
| Total Common Stocks (Cost $16,615,223) | 14,596,065 | ||||||||||
See Notes to Financial Statements.
35
Schedule of Investments (Continued)
PowerShares Dynamic Financial Sector Portfolio
April 30, 2009
| Number of Shares | Value | ||||||||||
| Money Market Fund—0.4% | |||||||||||
| 68,317 | Goldman Sachs Financial Square Prime Obligations Institutional Share Class (Cost $68,317) | $ | 68,317 | ||||||||
| Total Investments (Cost $16,683,540)—100.2% | 14,664,382 | ||||||||||
| Liabilities in excess other assets—(0.2%) | (34,301 | ) | |||||||||
| Net Assets—100.0% | $ | 14,630,081 | |||||||||
* Non-income producing security.
See Notes to Financial Statements.
36
Schedule of Investments
PowerShares Dynamic Healthcare Sector Portfolio
April 30, 2009
| Number of Shares | Value | ||||||||||
| Common Stocks—99.9% | |||||||||||
| Biotechnology—12.6% | |||||||||||
| 33,695 | Amgen, Inc.* | $ | 1,633,197 | ||||||||
| 63,283 | Cubist Pharmaceuticals, Inc.* | 1,050,498 | |||||||||
| 169,995 | Enzon Pharmaceuticals, Inc.* | 977,471 | |||||||||
| 36,801 | Gilead Sciences, Inc.* | 1,685,485 | |||||||||
| 16,333 | Millipore Corp.* | 965,280 | |||||||||
| 197,643 | NPS Pharmaceuticals, Inc.* | 683,845 | |||||||||
| 26,372 | OSI Pharmaceuticals, Inc.* | 885,308 | |||||||||
| 153,197 | PDL BioPharma, Inc. | 1,095,359 | |||||||||
| 8,976,443 | |||||||||||
| Commercial Services—5.4% | |||||||||||
| 138,136 | AMN Healthcare Services, Inc.* | 951,757 | |||||||||
| 22,586 | Chemed Corp. | 956,065 | |||||||||
| 29,369 | Emergency Medical Services Corp., Class A* | 1,023,217 | |||||||||
| 17,981 | Landauer, Inc. | 952,633 | |||||||||
| 3,883,672 | |||||||||||
| Electronics—4.6% | |||||||||||
| 19,219 | Dionex Corp.* | 1,210,797 | |||||||||
| 46,811 | Waters Corp.* | 2,067,642 | |||||||||
| 3,278,439 | |||||||||||
| Healthcare - Products—22.1% | |||||||||||
| 26,639 | Becton Dickinson & Co. | 1,611,127 | |||||||||
| 20,541 | C.R. Bard, Inc. | 1,471,352 | |||||||||
| 72,058 | Cantel Medical Corporation* | 1,018,180 | |||||||||
| 66,861 | Cyberonics, Inc.* | 885,240 | |||||||||
| 22,166 | Gen-Probe, Inc.* | 1,067,515 | |||||||||
| 16,847 | Haemonetics Corp.* | 869,811 | |||||||||
| 71,064 | Hospira, Inc.* | 2,335,873 | |||||||||
| 28,522 | ICU Medical, Inc.* | 1,072,427 | |||||||||
| 40,073 | Immucor, Inc.* | 652,789 | |||||||||
| 56,065 | Invacare Corp. | 862,840 | |||||||||
| 94,561 | IRIS International, Inc.* | 1,056,246 | |||||||||
| 24,383 | ResMed, Inc.* | 937,526 | |||||||||
| 38,994 | STERIS Corp. | 939,755 | |||||||||
| 18,409 | Techne Corp. | 1,053,363 | |||||||||
| 15,834,044 | |||||||||||
| Healthcare - Services—27.7% | |||||||||||
| 109,665 | Alliance HealthCare Services, Inc.* | 863,064 | |||||||||
| 36,290 | AMERIGROUP Corp.* | 1,083,982 | |||||||||
| 52,958 | Centene Corp.* | 972,838 | |||||||||
| 35,138 | DaVita, Inc.* | 1,629,349 | |||||||||
| 67,973 | Ensign Group (The), Inc. | 1,053,582 | |||||||||
| 29,659 | Genoptix, Inc.* | 862,484 | |||||||||
| 111,020 | Healthspring, Inc.* | 1,024,715 | |||||||||
| 69,653 | Humana, Inc.* | 2,004,612 | |||||||||
| 62,494 | Kindred Healthcare, Inc.* | 813,672 | |||||||||
| 45,123 | LHC Group, Inc.* | 1,029,707 | |||||||||
| 42,782 | LifePoint Hospitals, Inc.* | 1,105,915 | |||||||||
| 27,120 | Magellan Health Services, Inc.* | 801,667 | |||||||||
| 48,013 | Molina Healthcare, Inc.* | 1,039,481 | |||||||||
| Number of Shares | Value | ||||||||||
| Common Stocks (Continued) | |||||||||||
| 35,974 | Quest Diagnostics, Inc. | $ | 1,846,545 | ||||||||
| 61,468 | RehabCare Group, Inc.* | 1,026,516 | |||||||||
| 73,527 | Res-Care, Inc.* | 1,177,903 | |||||||||
| 99,588 | WellCare Health Plans, Inc.* | 1,494,816 | |||||||||
| 19,830,848 | |||||||||||
| Pharmaceuticals—24.0% | |||||||||||
| 34,826 | Abbott Laboratories | 1,457,468 | |||||||||
| 51,910 | AmerisourceBergen Corp. | 1,746,252 | |||||||||
| 89,553 | Bristol-Myers Squibb Co. | 1,719,418 | |||||||||
| 81,752 | China Sky One Medical, Inc.* | 1,153,521 | |||||||||
| 47,380 | Endo Pharmaceuticals Holdings, Inc.* | 783,665 | |||||||||
| 32,776 | Express Scripts, Inc.* | 2,096,681 | |||||||||
| 122,518 | King Pharmaceuticals, Inc.* | 965,442 | |||||||||
| 40,190 | McKesson Corp. | 1,487,030 | |||||||||
| 63,582 | Omnicare, Inc. | 1,634,693 | |||||||||
| 185,036 | Questcor Pharmaceuticals, Inc.* | 832,662 | |||||||||
| 60,032 | Sepracor, Inc.* | 853,055 | |||||||||
| 151,951 | Warner Chilcott Ltd., Class A* | 1,487,600 | |||||||||
| 31,811 | Watson Pharmaceuticals, Inc.* | 984,232 | |||||||||
| 17,201,719 | |||||||||||
| Software—3.5% | |||||||||||
| 24,570 | Cerner Corp.* | 1,321,866 | |||||||||
| 33,618 | Computer Programs & Systems, Inc. | 1,176,294 | |||||||||
| 2,498,160 | |||||||||||
| Total Common Stocks (Cost $78,073,659) | 71,503,325 | ||||||||||
| Money Market Fund—0.2% | |||||||||||
| 120,395 | Goldman Sachs Financial Square Prime Obligations Institutional Share Class (Cost $120,395) | 120,395 | |||||||||
| Total Investments (Cost $78,194,054)—100.1% | 71,623,720 | ||||||||||
| Liabilities in excess of other assets—(0.1%) | (47,698 | ) | |||||||||
| Net Assets—100.0% | $ | 71,576,022 | |||||||||
See Notes to Financial Statements.
37
Schedule of Investments
PowerShares Dynamic Industrials Sector Portfolio
April 30, 2009
| Number of Shares | Value | ||||||||||
| Common Stocks—99.9% | |||||||||||
| Aerospace/Defense—19.3% | |||||||||||
| 16,988 | Alliant Techsystems, Inc.* | $ | 1,353,094 | ||||||||
| 25,124 | Cubic Corp. | 721,310 | |||||||||
| 25,839 | Esterline Technologies Corp.* | 680,858 | |||||||||
| 36,222 | Goodrich Corp. | 1,603,910 | |||||||||
| 17,743 | L-3 Communications Holdings, Inc. | 1,351,129 | |||||||||
| 19,019 | Lockheed Martin Corp. | 1,493,562 | |||||||||
| 30,033 | Raytheon Co. | 1,358,393 | |||||||||
| 28,578 | Teledyne Technologies, Inc.* | 912,496 | |||||||||
| 18,126 | Triumph Group, Inc. | 749,148 | |||||||||
| 29,399 | United Technologies Corp. | 1,435,847 | |||||||||
| 11,659,747 | |||||||||||
| Building Materials—3.9% | |||||||||||
| 69,138 | Apogee Enterprises, Inc. | 926,449 | |||||||||
| 68,776 | Comfort Systems USA, Inc. | 742,093 | |||||||||
| 99,807 | Gibraltar Industries, Inc. | 668,707 | |||||||||
| 2,337,249 | |||||||||||
| Commercial Services—8.4% | |||||||||||
| 84,811 | Deluxe Corp. | 1,229,759 | |||||||||
| 53,711 | DynCorp International, Inc., Class A* | 819,093 | |||||||||
| 127,381 | H&E Equipment Services, Inc.* | 959,179 | |||||||||
| 70,860 | Korn/Ferry International* | 750,407 | |||||||||
| 40,242 | Standard Parking Corp.* | 613,288 | |||||||||
| 13,332 | Watson Wyatt Worldwide, Inc., Class A | 707,263 | |||||||||
| 5,078,989 | |||||||||||
| Computers—1.3% | |||||||||||
| 41,024 | SYKES Enterprises, Inc.* | 806,532 | |||||||||
| Distribution/Wholesale—1.7% | |||||||||||
| 39,442 | WESCO International, Inc.* | 1,025,492 | |||||||||
| Electrical Components & Equipment—3.0% | |||||||||||
| 61,077 | EnerSys* | 1,041,363 | |||||||||
| 21,868 | Powell Industries, Inc.* | 787,029 | |||||||||
| 1,828,392 | |||||||||||
| Electronics—1.5% | |||||||||||
| 28,578 | Thomas & Betts Corp.* | 889,347 | |||||||||
| Energy - Alternate Sources—1.8% | |||||||||||
| 153,336 | GT Solar International, Inc.* | 1,087,152 | |||||||||
| Engineering & Construction—10.7% | |||||||||||
| 141,718 | Dycom Industries, Inc.* | 1,193,266 | |||||||||
| 42,488 | EMCOR Group, Inc.* | 883,326 | |||||||||
| 29,140 | Exponent Inc.* | 813,006 | |||||||||
| 36,101 | Fluor Corp. | 1,367,145 | |||||||||
| 18,402 | Granite Construction, Inc. | 725,959 | |||||||||
| 51,963 | KBR, Inc. | 811,662 | |||||||||
| 20,454 | Michael Baker Corp.* | 687,254 | |||||||||
| 6,481,618 | |||||||||||
| Number of Shares | Value | ||||||||||
| Common Stocks (Continued) | |||||||||||
| Environmental Control—4.3% | |||||||||||
| 41,703 | American Ecology Corp. | $ | 688,934 | ||||||||
| 25,017 | Stericycle, Inc.* | 1,177,800 | |||||||||
| 29,231 | Tetra Tech, Inc.* | 717,913 | |||||||||
| 2,584,647 | |||||||||||
| Home Furnishings—1.6% | |||||||||||
| 45,247 | American Woodmark Corp. | 936,613 | |||||||||
| Machinery - Diversified—6.3% | |||||||||||
| 101,984 | Chart Industries, Inc.* | 1,410,439 | |||||||||
| 23,784 | Flowserve Corp. | 1,614,934 | |||||||||
| 40,591 | Robbins & Myers, Inc. | 769,199 | |||||||||
| 3,794,572 | |||||||||||
| Metal Fabricate/Hardware—2.9% | |||||||||||
| 29,453 | CIRCOR International, Inc. | 757,826 | |||||||||
| 30,638 | L.B. Foster Co., Class A* | 1,003,394 | |||||||||
| 1,761,220 | |||||||||||
| Miscellaneous Manufacturing—19.4% | |||||||||||
| 89,322 | Blount International, Inc.* | 571,661 | |||||||||
| 56,916 | Cooper Industries Ltd., Class A | 1,866,277 | |||||||||
| 48,129 | Dover Corp. | 1,481,411 | |||||||||
| 103,599 | Federal Signal Corp. | 804,964 | |||||||||
| 44,738 | Honeywell International, Inc. | 1,396,273 | |||||||||
| 43,178 | Illinois Tool Works, Inc. | 1,416,238 | |||||||||
| 32,137 | ITT Corp. | 1,317,938 | |||||||||
| 50,500 | Pall Corp. | 1,333,705 | |||||||||
| 31,372 | Pentair, Inc. | 835,750 | |||||||||
| 39,207 | Tredegar Corp. | 689,259 | |||||||||
| 11,713,476 | |||||||||||
| Office Furnishings—4.0% | |||||||||||
| 64,955 | Herman Miller, Inc. | 965,881 | |||||||||
| 99,204 | Knoll, Inc. | 702,364 | |||||||||
| 162,466 | Steelcase, Inc., Class A | 735,971 | |||||||||
| 2,404,216 | |||||||||||
| Retail—1.5% | |||||||||||
| 21,404 | MSC Industrial Direct Co., Class A | 874,353 | |||||||||
| Telecommunications—1.4% | |||||||||||
| 69,211 | MasTec, Inc.* | 865,830 | |||||||||
| Transportation—6.9% | |||||||||||
| 194,429 | American Commercial Lines, Inc.* | 968,256 | |||||||||
| 52,931 | Heartland Express, Inc. | 791,318 | |||||||||
| 39,537 | Marten Transport Ltd.* | 819,997 | |||||||||
| 31,994 | Union Pacific Corp. | 1,572,186 | |||||||||
| 4,151,757 | |||||||||||
| Total Common Stocks (Cost $58,970,415) | 60,281,202 | ||||||||||
See Notes to Financial Statements.
38
Schedule of Investments (Continued)
PowerShares Dynamic Industrials Sector Portfolio
April 30, 2009
| Number of Shares | Value | ||||||||||
| Money Market Fund—0.1% | |||||||||||
| 65,780 | Goldman Sachs Financial Square Prime Obligations Institutional Share Class (Cost $65,780) | $ | 65,780 | ||||||||
| Total Investments (Cost $59,036,195)—100.0% | 60,346,982 | ||||||||||
| Liabilities in excess of other assets—(0.0%) | (22,598 | ) | |||||||||
| Net Assets—100.0% | $ | 60,324,384 | |||||||||
* Non-income producing security.
See Notes to Financial Statements.
39
Schedule of Investments
PowerShares Dynamic Technology Sector Portfolio
April 30, 2009
| Number of Shares | Value | ||||||||||
| Common Stocks—100.0% | |||||||||||
| Commercial Services—9.8% | |||||||||||
| 15,505 | Automatic Data Processing, Inc. | $ | 545,776 | ||||||||
| 9,414 | Global Payments, Inc. | 301,813 | |||||||||
| 28,001 | SAIC, Inc.* | 506,818 | |||||||||
| 33,351 | TeleTech Holdings, Inc.* | 442,568 | |||||||||
| 22,958 | Total System Services, Inc. | 286,286 | |||||||||
| 19,728 | Wright Express Corp.* | 451,377 | |||||||||
| 2,534,638 | |||||||||||
| Computers—25.2% | |||||||||||
| 18,140 | Accenture Ltd., Class A | 533,860 | |||||||||
| 11,355 | Affiliated Computer Services, Inc., Class A* | 549,355 | |||||||||
| 5,929 | Apple, Inc.* | 746,047 | |||||||||
| 15,242 | Computer Sciences Corp.* | 563,344 | |||||||||
| 50,429 | EMC Corp.* | 631,875 | |||||||||
| 5,754 | International Business Machines Corp. | 593,870 | |||||||||
| 18,131 | Jack Henry & Associates, Inc. | 326,721 | |||||||||
| 17,962 | Micros Systems, Inc.* | 376,843 | |||||||||
| 36,467 | NCR Corp.* | 370,140 | |||||||||
| 25,380 | Perot Systems Corp., Class A* | 356,843 | |||||||||
| 13,919 | Synaptics, Inc.* | 452,089 | |||||||||
| 15,503 | Synopsys, Inc.* | 337,655 | |||||||||
| 14,200 | Syntel, Inc. | 393,624 | |||||||||
| 18,682 | Teradata Corp.* | 312,363 | |||||||||
| 6,544,629 | |||||||||||
| Electronics—6.7% | |||||||||||
| 33,741 | AVX Corp. | 337,747 | |||||||||
| 27,771 | Cogent, Inc.* | 314,923 | |||||||||
| 18,877 | Dolby Laboratories, Inc., Class A* | 757,535 | |||||||||
| 18,280 | OSI Systems, Inc.* | 342,750 | |||||||||
| 1,752,955 | |||||||||||
| Home Furnishings—1.2% | |||||||||||
| 40,736 | TiVo, Inc.* | 305,520 | |||||||||
| Internet—11.3% | |||||||||||
| 45,844 | Earthlink, Inc.* | 347,498 | |||||||||
| 15,420 | j2 Global Communications, Inc.* | 369,926 | |||||||||
| 18,945 | McAfee, Inc.* | 711,196 | |||||||||
| 50,670 | S1 Corp.* | 314,154 | |||||||||
| 35,008 | TeleCommunication Systems, Inc., Class A* | 343,428 | |||||||||
| 59,797 | TIBCO Software, Inc.* | 377,917 | |||||||||
| 25,880 | Websense, Inc.* | 461,440 | |||||||||
| 2,925,559 | |||||||||||
| Semiconductors—5.4% | |||||||||||
| 10,472 | Hittite Microwave Corp.* | 389,140 | |||||||||
| 44,434 | Skyworks Solutions, Inc.* | 392,797 | |||||||||
| 29,949 | Xilinx, Inc. | 612,157 | |||||||||
| 1,394,094 | |||||||||||
| Software—26.5% | |||||||||||
| 41,726 | Autodesk, Inc.* | 832,015 | |||||||||
| 17,870 | BMC Software, Inc.* | 619,553 | |||||||||
| Number of Shares | Value | ||||||||||
| Common Stocks (Continued) | |||||||||||
| 18,074 | Broadridge Financial Solutions, Inc. | $ | 349,732 | ||||||||
| 31,239 | CA, Inc. | 538,873 | |||||||||
| 48,869 | Compuware Corp.* | 365,540 | |||||||||
| 21,362 | CSG Systems International, Inc.* | 309,749 | |||||||||
| 29,775 | JDA Software Group, Inc.* | 420,125 | |||||||||
| 17,181 | Metavante Technologies, Inc.* | 405,300 | |||||||||
| 32,787 | Microsoft Corp. | 664,265 | |||||||||
| 91,398 | Novell, Inc.* | 343,656 | |||||||||
| 18,119 | Progress Software Corp.* | 383,942 | |||||||||
| 25,559 | Quest Software, Inc.* | 371,372 | |||||||||
| 21,097 | Red Hat, Inc.* | 364,345 | |||||||||
| 36,329 | RightNow Technologies, Inc.* | 274,284 | |||||||||
| 10,626 | Sybase, Inc.* | 360,859 | |||||||||
| 38,254 | Wind River Systems, Inc.* | 280,402 | |||||||||
| 6,884,012 | |||||||||||
| Telecommunications—13.9% | |||||||||||
| 130,687 | 3Com Corp.* | 529,282 | |||||||||
| 65,790 | Acme Packet, Inc.* | 507,241 | |||||||||
| 53,092 | BigBand Networks, Inc.* | 311,119 | |||||||||
| 36,342 | Cisco Systems, Inc.* | 702,128 | |||||||||
| 7,643 | Comtech Telecommunications Corp.* | 255,811 | |||||||||
| 14,383 | EMS Technologies, Inc* | 273,996 | |||||||||
| 9,831 | InterDigital, Inc.* | 258,752 | |||||||||
| 23,558 | Tekelec* | 365,149 | |||||||||
| 76,005 | Tellabs, Inc.* | 398,266 | |||||||||
| 3,601,744 | |||||||||||
| Total Common Stocks (Cost $22,198,254) | 25,943,151 | ||||||||||
| Money Market Fund—0.2% | |||||||||||
| 42,186 | Goldman Sachs Financial Square Prime Obligations Institutional Share Class (Cost $42,186) | 42,186 | |||||||||
| Total Investments (Cost $22,240,440)—100.2% | 25,985,337 | ||||||||||
| Liabilities in excess of other assets—(0.2%) | (53,557 | ) | |||||||||
| Net Assets—100.0% | $ | 25,931,780 | |||||||||
* Non-income producing security.
See Notes to Financial Statements.
40
Schedule of Investments
PowerShares Dynamic Telecommunications & Wireless Portfolio
April 30, 2009
| Number of Shares | Value | ||||||||||
| Common Stocks—99.9% | |||||||||||
| Cable/Satellite TV—15.6% | |||||||||||
| 47,598 | Comcast Corp., Class A | $ | 735,865 | ||||||||
| 31,175 | DIRECTV Group (The), Inc.* | 770,958 | |||||||||
| 55,256 | DISH Network Corp., Class A* | 732,142 | |||||||||
| 2,238,965 | |||||||||||
| Cellular Telecommunications—4.3% | |||||||||||
| 22,410 | Syniverse Holdings, Inc.* | 282,366 | |||||||||
| 9,857 | United States Cellular Corp.* | 335,138 | |||||||||
| 617,504 | |||||||||||
| Data Processing/Management—2.5% | |||||||||||
| 25,079 | CSG Systems International, Inc.* | 363,646 | |||||||||
| Electronic Component - Miscellaneous—3.5% | |||||||||||
| 19,806 | Garmin Ltd. | 498,913 | |||||||||
| Internet Connective Services—3.0% | |||||||||||
| 51,219 | Cogent Communications Group, Inc.* | 432,288 | |||||||||
| Internet Infrastructure Software—6.0% | |||||||||||
| 27,770 | AsiaInfo Holdings, Inc.* | 465,148 | |||||||||
| 41,099 | TeleCommunication Systems, Inc., Class A* | 403,181 | |||||||||
| 868,329 | |||||||||||
| Networking Products—10.0% | |||||||||||
| 153,425 | 3Com Corp.* | 621,371 | |||||||||
| 42,665 | Cisco Systems, Inc.* | 824,288 | |||||||||
| 1,445,659 | |||||||||||
| Telecommunications Services—10.4% | |||||||||||
| 46,321 | Global Crossing Ltd.* | 336,290 | |||||||||
| 21,889 | NeuStar, Inc., Class A* | 416,110 | |||||||||
| 17,687 | NTELOS Holdings Corp. | 282,638 | |||||||||
| 40,867 | USA Mobility, Inc. | 454,442 | |||||||||
| 1,489,480 | |||||||||||
| Telecommunication Equipment—2.1% | |||||||||||
| 8,972 | Comtech Telecommunications Corp.* | 300,293 | |||||||||
| Telephone - Integrated—37.5% | |||||||||||
| 26,152 | AT&T, Inc. | 670,014 | |||||||||
| 16,262 | Atlantic Tele-Network, Inc. | 359,065 | |||||||||
| 12,878 | CenturyTel, Inc. | 349,638 | |||||||||
| 47,093 | Frontier Communications Corp. | 334,831 | |||||||||
| 423,836 | Level 3 Communications, Inc.* | 474,696 | |||||||||
| 183,371 | Qwest Communications International, Inc. | 713,313 | |||||||||
| 16,032 | Shenandoah Telecommunications Co. | 314,708 | |||||||||
| 188,944 | Sprint Nextel Corp.* | 823,795 | |||||||||
| 11,494 | Telephone & Data Systems, Inc. | 329,533 | |||||||||
| 21,788 | Verizon Communications, Inc. | 661,048 | |||||||||
| 45,452 | Windstream Corp. | 377,252 | |||||||||
| 5,407,893 | |||||||||||
| Web Portals/ISP—2.8% | |||||||||||
| 53,820 | Earthlink, Inc.* | 407,956 | |||||||||
| Number of Shares | Value | ||||||||||
| Common Stocks (Continued) | |||||||||||
| Wireless Equipment—2.2% | |||||||||||
| 16,886 | Ems Technologies, Inc* | $ | 321,678 | ||||||||
| Total Common Stocks (Cost $16,045,178) | 14,392,604 | ||||||||||
| Money Market Fund—0.7% | |||||||||||
| 108,165 | Goldman Sachs Financial Square Prime Obligations Institutional Share Class (Cost $108,165) | 108,165 | |||||||||
| Total Investments (Cost $16,153,343)—100.6% | 14,500,769 | ||||||||||
| Liabilities in excess of other assets—(0.6%) | (89,030 | ) | |||||||||
| Net Assets—100.0% | $ | 14,411,739 | |||||||||
* Non-income producing security.
See Notes to Financial Statements.
41
Schedule of Investments
PowerShares Dynamic Utilities Portfolio
April 30, 2009
| Number of Shares | Value | ||||||||||
| Common Stocks—99.9% | |||||||||||
| Electric - Generation—3.0% | |||||||||||
| 178,550 | AES (The) Corp.* | $ | 1,262,349 | ||||||||
| Electric - Integrated—67.5% | |||||||||||
| 27,002 | CH Energy Group, Inc. | 1,199,969 | |||||||||
| 54,819 | Cleco Corp. | 1,156,133 | |||||||||
| 55,964 | DPL, Inc. | 1,255,273 | |||||||||
| 153,099 | Duke Energy Corp. | 2,114,296 | |||||||||
| 75,760 | Edison International | 2,159,917 | |||||||||
| 79,606 | El Paso Electric Co.* | 1,098,563 | |||||||||
| 43,674 | Exelon Corp. | 2,014,681 | |||||||||
| 48,455 | FirstEnergy Corp. | 1,981,810 | |||||||||
| 37,396 | MGE Energy, Inc. | 1,147,309 | |||||||||
| 51,340 | Northeast Utilities | 1,079,167 | |||||||||
| 54,899 | NorthWestern Corp. | 1,148,487 | |||||||||
| 34,964 | NSTAR | 1,098,219 | |||||||||
| 53,957 | PG&E Corp. | 2,002,884 | |||||||||
| 42,836 | Pinnacle West Capital Corp. | 1,172,850 | |||||||||
| 68,507 | Portland General Electric Co. | 1,251,623 | |||||||||
| 75,565 | Public Service Enterprise Group, Inc. | 2,254,859 | |||||||||
| 68,037 | Southern (The) Co. | 1,964,909 | |||||||||
| 28,248 | Wisconsin Energy Corp. | 1,128,790 | |||||||||
| 63,408 | Xcel Energy, Inc. | 1,169,244 | |||||||||
| 28,398,983 | |||||||||||
| Energy - Alternate Sources—2.5% | |||||||||||
| 73,857 | Covanta Holding Corp.* | 1,042,122 | |||||||||
| Gas - Distribution—18.7% | |||||||||||
| 108,999 | CenterPoint Energy, Inc. | 1,159,749 | |||||||||
| 28,421 | Laclede Group (The), Inc. | 985,640 | |||||||||
| 49,608 | Sempra Energy | 2,282,961 | |||||||||
| 31,195 | South Jersey Industries, Inc. | 1,082,778 | |||||||||
| 53,924 | Vectren Corp. | 1,195,496 | |||||||||
| 37,052 | WGL Holdings, Inc. | 1,153,799 | |||||||||
| 7,860,423 | |||||||||||
| Independent Power Producer—2.8% | |||||||||||
| 91,977 | Mirant Corp.* | 1,170,867 | |||||||||
| Water—5.4% | |||||||||||
| 33,529 | American States Water Co. | 1,157,756 | |||||||||
| 28,653 | California Water Service Group | 1,118,327 | |||||||||
| 2,276,083 | |||||||||||
| Total Common Stocks (Cost $46,635,455) | 42,010,827 | ||||||||||
| Number of Shares | Value | ||||||||||
| Money Market Fund—0.0% | |||||||||||
| 10,738 | Goldman Sachs Financial Square Prime Obligations Institutional Share Class (Cost $10,738) | $ | 10,738 | ||||||||
| Total Investments (Cost $46,646,193)—99.9% | 42,021,565 | ||||||||||
| Other assets less liabilities—0.1% | 49,061 | ||||||||||
| Net Assets—100.0% | $ | 42,070,626 | |||||||||
* Non-income producing security.
See Notes to Financial Statements.
42
Schedule of Investments
PowerShares NASDAQ Internet Portfolio
April 30, 2009
| Number of Shares | Value | ||||||||||
| Common Stocks and Other Equity Interests—99.9% | |||||||||||
| Advertising Services—0.1% | |||||||||||
| 536 | Marchex, Inc., Class B | $ | 2,423 | ||||||||
| Commercial Services - Finance—0.6% | |||||||||||
| 411 | Bankrate, Inc.* | 10,275 | |||||||||
| Communications Software—0.2% | |||||||||||
| 629 | DivX, Inc.* | 3,227 | |||||||||
| Computer Software—1.1% | |||||||||||
| 1,660 | Omniture, Inc.* | 20,451 | |||||||||
| E-Commerce/Products—11.9% | |||||||||||
| 1,693 | Amazon.com, Inc.* | 136,321 | |||||||||
| 317 | Blue Nile, Inc.* | 13,492 | |||||||||
| 597 | Gmarket, Inc. ADR (Korea)* | 14,280 | |||||||||
| 962 | MercadoLibre, Inc. (Argentina)* | 26,291 | |||||||||
| 668 | NutriSystem, Inc. | 9,178 | |||||||||
| 498 | Overstock.com, Inc.* | 6,713 | |||||||||
| 549 | Shutterfly, Inc.* | 7,033 | |||||||||
| 213,308 | |||||||||||
| E-Commerce/Services—22.7% | |||||||||||
| 10,015 | eBay, Inc.* | 164,948 | |||||||||
| 5,715 | Expedia, Inc.* | 77,781 | |||||||||
| 2,798 | IAC/InterActiveCorp* | 44,824 | |||||||||
| 1,281 | Netflix, Inc.* | 58,042 | |||||||||
| 625 | priceline.com, Inc.* | 60,681 | |||||||||
| 406,276 | |||||||||||
| Educational Software—1.1% | |||||||||||
| 2,258 | SkillSoft PLC ADR (Ireland)* | 19,012 | |||||||||
| E-Marketing/Information—4.1% | |||||||||||
| 635 | comScore, Inc.* | 8,103 | |||||||||
| 614 | Constant Contact, Inc.* | 9,781 | |||||||||
| 809 | Digital River, Inc.* | 31,082 | |||||||||
| 546 | Liquidity Services, Inc.* | 4,111 | |||||||||
| 1,894 | ValueClick, Inc.* | 20,076 | |||||||||
| 73,153 | |||||||||||
| Enterprise Software/Services—3.1% | |||||||||||
| 1,897 | Ariba, Inc.* | 18,230 | |||||||||
| 1,133 | Open Text Corp. (Canada)* | 37,197 | |||||||||
| 55,427 | |||||||||||
| E-Services/Consulting—2.0% | |||||||||||
| 1,040 | GSI Commerce, Inc.* | 14,778 | |||||||||
| 631 | Perficient, Inc.* | 4,398 | |||||||||
| 980 | Websense, Inc.* | 17,474 | |||||||||
| 36,650 | |||||||||||
| Number of Shares | Value | ||||||||||
| Common Stocks and Other Equity Interests (Continued) | |||||||||||
| Internet Application Software—1.7% | |||||||||||
| 870 | DealerTrack Holdings, Inc.* | $ | 13,207 | ||||||||
| 1,154 | S1 Corp.* | 7,155 | |||||||||
| 463 | Vignette Corp.* | 3,824 | |||||||||
| 415 | Vocus, Inc.* | 7,055 | |||||||||
| 31,241 | |||||||||||
| Internet Connective Services—0.6% | |||||||||||
| 968 | Cogent Communications Group, Inc.* | 8,170 | |||||||||
| 978 | Internap Network Services Corp.* | 2,719 | |||||||||
| 10,889 | |||||||||||
| Internet Content - Information/Network—8.1% | |||||||||||
| 521 | Baidu, Inc. ADR (China)* | 121,341 | |||||||||
| 763 | Infospace, Inc.* | 5,059 | |||||||||
| 705 | Knot (The), Inc.* | 6,394 | |||||||||
| 751 | LoopNet, Inc.* | 6,451 | |||||||||
| 222 | WebMD Health Corp., Class A* | 5,730 | |||||||||
| 144,975 | |||||||||||
| Internet Financial Services—0.2% | |||||||||||
| 329 | China Finance Online Co. Ltd. ADR (China)* | 3,856 | |||||||||
| Internet Incubators—0.2% | |||||||||||
| 745 | Internet Capital Group, Inc.* | 4,045 | |||||||||
| Internet Infrastructure Software—4.8% | |||||||||||
| 3,193 | Akamai Technologies, Inc.* | 70,309 | |||||||||
| 950 | AsiaInfo Holdings, Inc.* | 15,913 | |||||||||
| 86,222 | |||||||||||
| Internet Security—3.4% | |||||||||||
| 1,174 | SonicWALL, Inc.* | 6,375 | |||||||||
| 2,604 | VeriSign, Inc.* | 53,590 | |||||||||
| 59,965 | |||||||||||
| Internet Telephony—1.3% | |||||||||||
| 960 | j2 Global Communications, Inc.* | 23,030 | |||||||||
| Networking Products—0.5% | |||||||||||
| 755 | Switch & Data Facilities Co., Inc.* | 8,735 | |||||||||
| Printing - Commercial—1.8% | |||||||||||
| 920 | VistaPrint Ltd. (Bermuda)* | 31,602 | |||||||||
| Retail - Pet Food & Supplies—0.5% | |||||||||||
| 510 | PetMed Express, Inc.* | 8,293 | |||||||||
| Telecommunication Services—2.0% | |||||||||||
| 4,178 | Clearwire Corp., Class A* | 23,146 | |||||||||
| 1,170 | SAVVIS, Inc.* | 13,315 | |||||||||
| 36,461 | |||||||||||
See Notes to Financial Statements.
43
Schedule of Investments (Continued)
PowerShares NASDAQ Internet Portfolio
April 30, 2009
| Number of Shares | Value | ||||||||||
| Common Stocks and Other Equity Interests (Continued) | |||||||||||
| Web Hosting/Design—5.0% | |||||||||||
| 825 | Equinix, Inc.* | $ | 57,940 | ||||||||
| 1,371 | NIC, Inc. | 7,403 | |||||||||
| 2,567 | Rackspace Hosting, Inc.* | 23,591 | |||||||||
| 88,934 | |||||||||||
| Web Portals/ISP—22.9% | |||||||||||
| 2,377 | Earthlink, Inc.* | 18,018 | |||||||||
| 1,179 | GigaMedia Ltd. (Taiwan, Republic of China)* | 7,840 | |||||||||
| 339 | Google, Inc., Class A* | 134,233 | |||||||||
| 1,570 | Netease.com, Inc. ADR (China)* | 47,383 | |||||||||
| 1,219 | SINA Corp. (China)* | 34,144 | |||||||||
| 832 | Sohu.com, Inc.* | 43,389 | |||||||||
| 1,794 | United Online, Inc. | 9,508 | |||||||||
| 8,005 | Yahoo!, Inc.* | 114,391 | |||||||||
| 408,906 | |||||||||||
| Total Common Stocks and Other Equity Interests (Cost $2,307,988) | 1,787,356 | ||||||||||
| Money Market Fund—0.1% | |||||||||||
| 2,071 | Goldman Sachs Financial Square Prime Obligations Institutional Share Class (Cost $2,071) | 2,071 | |||||||||
| Total Investments (Cost $2,310,059)—100.0% | 1,789,427 | ||||||||||
| Liabilities in excess of other assets—(0.0%) | (803 | ) | |||||||||
| Net Assets—100.0% | $ | 1,788,624 | |||||||||
ADR American Depositary Receipt.
* Non-income producing security.
The Fund has holdings greater than 10% of net assets in the following country:
| China | 12.0 | % | |||||
See Notes to Financial Statements.
44
This page intentionally left blank
Statements of Assets and Liabilities
April 30, 2009
| PowerShares Dynamic Basic Materials Sector Portfolio | PowerShares Dynamic Consumer Discretionary Sector Portfolio | PowerShares Dynamic Consumer Staples Sector Portfolio | PowerShares Dynamic Energy Sector Portfolio | PowerShares Dynamic Financial Sector Portfolio | PowerShares Dynamic Healthcare Sector Portfolio | ||||||||||||||||||||||
| ASSETS: | |||||||||||||||||||||||||||
| Investments at value | $ | 18,173,991 | $ | 13,694,905 | $ | 37,462,497 | $ | 25,921,320 | $ | 14,664,382 | $ | 71,623,720 | |||||||||||||||
| Cash | — | — | — | — | — | — | |||||||||||||||||||||
| Receivables: | |||||||||||||||||||||||||||
| Dividends | 16,391 | 4,664 | 43,786 | 8,988 | 6,895 | 45,030 | |||||||||||||||||||||
| Expense waivers | 2,104 | 6,569 | 10,144 | 1,840 | 8,031 | — | |||||||||||||||||||||
| Shares sold | — | 3,406,054 | — | — | — | — | |||||||||||||||||||||
| Total Assets | 18,192,486 | 17,112,192 | 37,516,427 | 25,932,148 | 14,679,308 | 71,668,750 | |||||||||||||||||||||
| LIABILITIES: | |||||||||||||||||||||||||||
| Due to custodian | 12,760 | 7,442 | 12 | 755 | 406 | 5 | |||||||||||||||||||||
| Payables: | |||||||||||||||||||||||||||
| Investments purchased | — | 3,405,507 | — | — | — | — | |||||||||||||||||||||
| Expense recapture | — | — | — | — | — | 6,511 | |||||||||||||||||||||
| Accrued advisory fees | 6,913 | 2,876 | 14,807 | 9,354 | 5,979 | 28,976 | |||||||||||||||||||||
| Accrued expenses | 44,015 | 38,561 | 48,321 | 43,996 | 42,842 | 57,236 | |||||||||||||||||||||
| Total Liabilities | 63,688 | 3,454,386 | 63,140 | 54,105 | 49,227 | 92,728 | |||||||||||||||||||||
| NET ASSETS | $ | 18,128,798 | $ | 13,657,806 | $ | 37,453,287 | $ | 25,878,043 | $ | 14,630,081 | $ | 71,576,022 | |||||||||||||||
| NET ASSETS CONSIST OF: | |||||||||||||||||||||||||||
| Shares of beneficial interest | $ | 28,833,137 | $ | 15,374,635 | $ | 44,982,741 | $ | 34,604,693 | $ | 22,541,859 | $ | 111,441,046 | |||||||||||||||
| Undistributed net investment income (loss) | 71,878 | (2,660 | ) | 201,350 | 25,996 | 56,709 | 93,371 | ||||||||||||||||||||
| Accumulated net realized loss on investments | (7,785,024 | ) | (3,330,054 | ) | (5,988,129 | ) | (9,017,455 | ) | (5,949,329 | ) | (33,388,061 | ) | |||||||||||||||
| Net unrealized appreciation (depreciation) of investments | (2,991,193 | ) | 1,615,885 | (1,742,675 | ) | 264,809 | (2,019,158 | ) | (6,570,334 | ) | |||||||||||||||||
| Net Assets | $ | 18,128,798 | $ | 13,657,806 | $ | 37,453,287 | $ | 25,878,043 | $ | 14,630,081 | $ | 71,576,022 | |||||||||||||||
| Shares outstanding (unlimited amount authorized, $0.01 par value) | 900,000 | 800,000 | 1,800,000 | 1,300,000 | 1,000,000 | 4,000,000 | |||||||||||||||||||||
| Net asset value | $ | 20.14 | $ | 17.07 | $ | 20.81 | $ | 19.91 | $ | 14.63 | $ | 17.89 | |||||||||||||||
| Share price | $ | 20.15 | $ | 17.07 | $ | 20.79 | $ | 19.92 | $ | 14.60 | $ | 17.86 | |||||||||||||||
| Investments at cost | $ | 21,165,184 | $ | 12,079,020 | $ | 39,205,172 | $ | 25,656,511 | $ | 16,683,540 | $ | 78,194,054 | |||||||||||||||
See Notes to Financial Statements.
46
| PowerShares Dynamic Industrials Sector Portfolio | PowerShares Dynamic Technology Sector Portfolio | PowerShares Dynamic Telecommunications & Wireless Portfolio | PowerShares Dynamic Utilities Portfolio | PowerShares NASDAQ Internet Portfolio | |||||||||||||||||||
| ASSETS: | |||||||||||||||||||||||
| Investments at value | $ | 60,346,982 | $ | 25,985,337 | $ | 14,500,769 | $ | 42,021,565 | $ | 1,789,427 | |||||||||||||
| Cash | 9,806 | — | — | — | — | ||||||||||||||||||
| Receivables: | |||||||||||||||||||||||
| Dividends | 22,040 | 14 | 20,788 | 107,176 | 12 | ||||||||||||||||||
| Expense waivers | 12,884 | 3,052 | 5,287 | 8,757 | — | ||||||||||||||||||
| Shares sold | 1,890,064 | — | — | — | — | ||||||||||||||||||
| Total Assets | 62,281,776 | 25,988,403 | 14,526,844 | 42,137,498 | 1,789,439 | ||||||||||||||||||
| LIABILITIES: | |||||||||||||||||||||||
| Due to custodian | — | 2 | 68,497 | 97 | — | ||||||||||||||||||
| Payables: | |||||||||||||||||||||||
| Investments purchased | 1,885,270 | — | — | — | — | ||||||||||||||||||
| Expense recapture | — | — | — | — | — | ||||||||||||||||||
| Accrued advisory fees | 20,972 | 10,198 | 5,749 | 17,757 | 815 | ||||||||||||||||||
| Accrued expenses | 51,150 | 46,423 | 40,859 | 49,018 | — | ||||||||||||||||||
| Total Liabilities | 1,957,392 | 56,623 | 115,105 | 66,872 | 815 | ||||||||||||||||||
| NET ASSETS | $ | 60,324,384 | $ | 25,931,780 | $ | 14,411,739 | $ | 42,070,626 | $ | 1,788,624 | |||||||||||||
| NET ASSETS CONSIST OF: | |||||||||||||||||||||||
| Shares of beneficial interest | $ | 85,272,203 | $ | 40,100,624 | $ | 25,652,060 | $ | 53,183,066 | $ | 2,463,527 | |||||||||||||
| Undistributed net investment income (loss) | 142,375 | (3,182 | ) | 51,678 | 529,318 | — | |||||||||||||||||
| Accumulated net realized loss on investments | (26,400,981 | ) | (17,910,559 | ) | (9,639,425 | ) | (7,017,130 | ) | (154,271 | ) | |||||||||||||
| Net unrealized appreciation (depreciation) of investments | 1,310,787 | 3,744,897 | (1,652,574 | ) | (4,624,628 | ) | (520,632 | ) | |||||||||||||||
| Net Assets | $ | 60,324,384 | $ | 25,931,780 | $ | 14,411,739 | $ | 42,070,626 | $ | 1,788,624 | |||||||||||||
| Shares outstanding (unlimited amount authorized, $0.01 par value) | 3,200,000 | 1,500,000 | 1,300,000 | 3,200,000 | 100,000 | ||||||||||||||||||
| Net asset value | $ | 18.85 | $ | 17.29 | $ | 11.09 | $ | 13.15 | $ | 17.89 | |||||||||||||
| Share price | $ | 18.82 | $ | 17.29 | $ | 11.09 | $ | 13.13 | $ | 17.88 | |||||||||||||
| Investments at cost | $ | 59,036,195 | $ | 22,240,440 | $ | 16,153,343 | $ | 46,646,193 | $ | 2,310,059 | |||||||||||||
47
Statements of Operations
| PowerShares Dynamic Basic Materials Sector Portfolio | PowerShares Dynamic Consumer Discretionary Sector Portfolio | PowerShares Dynamic Consumer Staples Sector Portfolio | PowerShares Dynamic Energy Sector Portfolio | PowerShares Dynamic Financial Sector Portfolio | PowerShares Dynamic Healthcare Sector Portfolio | ||||||||||||||||||||||
| Year Ended April 30, 2009 | Year Ended April 30, 2009 | Year Ended April 30, 2009 | Year Ended April 30, 2009 | Year Ended April 30, 2009 | Year Ended April 30, 2009 | ||||||||||||||||||||||
| INVESTMENT INCOME: | |||||||||||||||||||||||||||
| Dividend income | $ | 620,636 | $ | 145,005 | $ | 844,394 | $ | 357,763 | $ | 387,244 | $ | 696,918 | |||||||||||||||
| EXPENSES: | |||||||||||||||||||||||||||
| Advisory fees | 140,028 | 49,691 | 155,298 | 137,746 | 100,674 | 464,267 | |||||||||||||||||||||
| Accounting & Administration fees | 74,983 | 74,983 | 74,983 | 74,983 | 74,983 | 74,983 | |||||||||||||||||||||
| Professional fees | 24,693 | 22,776 | 24,343 | 24,830 | 23,315 | 30,357 | |||||||||||||||||||||
| Sub-licensing | 14,003 | 4,969 | 15,530 | 13,775 | 10,067 | 46,427 | |||||||||||||||||||||
| Custodian & transfer agent fees | 9,111 | 9,577 | 7,870 | 9,044 | 8,450 | 11,576 | |||||||||||||||||||||
| Trustees | 4,701 | 4,034 | 4,834 | 4,688 | 4,457 | 7,303 | |||||||||||||||||||||
| Listing fee and expenses | 2,155 | — | 2,073 | 2,141 | 2,079 | 2,352 | |||||||||||||||||||||
| Other expenses | 2,564 | 1,133 | 7,971 | 3,627 | 3,978 | 20,171 | |||||||||||||||||||||
| Total Expenses | 272,238 | 167,163 | 292,902 | 270,834 | 228,003 | 657,436 | |||||||||||||||||||||
| Less fees waived: | |||||||||||||||||||||||||||
| (Waivers) and/or Recapture | (90,201 | ) | (103,099 | ) | (91,015 | ) | (91,764 | ) | (97,127 | ) | (53,889 | ) | |||||||||||||||
| Net Expenses | 182,037 | 64,064 | 201,887 | 179,070 | 130,876 | 603,547 | |||||||||||||||||||||
| Net Investment Income (Loss) | 438,599 | 80,941 | 642,507 | 178,693 | 256,368 | 93,371 | |||||||||||||||||||||
| REALIZED AND UNREALIZED GAIN (LOSS) ON INVESTMENTS: | |||||||||||||||||||||||||||
| Net realized loss from: | |||||||||||||||||||||||||||
| Investments | (5,969,806 | ) | (3,562,168 | ) | (4,543,124 | ) | (7,398,673 | ) | (4,854,376 | ) | (23,992,096 | ) | |||||||||||||||
| In-kind redemptions | (5,489,338 | ) | (1,150,722 | ) | (1,466,665 | ) | (1,586,337 | ) | (4,365,946 | ) | (16,180,975 | ) | |||||||||||||||
| Net realized loss | (11,459,144 | ) | (4,712,890 | ) | (6,009,789 | ) | (8,985,010 | ) | (9,220,322 | ) | (40,173,071 | ) | |||||||||||||||
| Net change in unrealized appreciation (depreciation) on investments | (6,905,563 | ) | 1,977,179 | (1,522,087 | ) | (6,310,019 | ) | (1,126,796 | ) | 3,120,607 | |||||||||||||||||
| Net realized and unrealized loss on investments | (18,364,707 | ) | (2,735,711 | ) | (7,531,876 | ) | (15,295,029 | ) | (10,347,118 | ) | (37,052,464 | ) | |||||||||||||||
| Net decrease in net assets resulting from operations | $ | (17,926,108 | ) | $ | (2,654,770 | ) | $ | (6,889,369 | ) | $ | (15,116,336 | ) | $ | (10,090,750 | ) | $ | (36,959,093 | ) | |||||||||
* Commencement of Investment Operations.
See Notes to Financial Statements.
48
| PowerShares Dynamic Industrials Sector Portfolio | PowerShares Dynamic Technology Sector Portfolio | PowerShares Dynamic Telecommunications & Wireless Portfolio | PowerShares Dynamic Utilities Portfolio | PowerShares NASDAQ Internet Portfolio | |||||||||||||||||||
| Year Ended April 30, 2009 | Year Ended April 30, 2009 | Year Ended April 30, 2009 | Year Ended April 30, 2009 | For the Period June 10, 2008* Through April 30, 2009 | |||||||||||||||||||
| INVESTMENT INCOME: | |||||||||||||||||||||||
| Dividend income | $ | 883,787 | $ | 211,589 | $ | 343,195 | $ | 1,857,954 | $ | 1,326 | |||||||||||||
| EXPENSES: | |||||||||||||||||||||||
| Advisory fees | 260,664 | 173,553 | 77,210 | 228,403 | 9,005 | ||||||||||||||||||
| Accounting & Administration fees | 74,983 | 74,983 | 74,983 | 74,983 | — | ||||||||||||||||||
| Professional fees | 26,738 | 25,074 | 24,542 | 26,236 | — | ||||||||||||||||||
| Sub-licensing | 26,067 | 17,355 | 4,633 | 13,704 | — | ||||||||||||||||||
| Custodian & transfer agent fees | 9,645 | 8,708 | 5,630 | 7,522 | — | ||||||||||||||||||
| Trustees | 5,692 | 4,964 | 4,289 | 5,429 | — | ||||||||||||||||||
| Listing fee and expenses | 2,122 | 2,153 | 7,592 | 7,645 | — | ||||||||||||||||||
| Other expenses | 15,660 | 3,660 | 983 | 11,514 | — | ||||||||||||||||||
| Total Expenses | 421,571 | 310,450 | 199,862 | 375,436 | 9,005 | ||||||||||||||||||
| Less fees waived: | |||||||||||||||||||||||
| (Waivers) and/or Recapture | (82,709 | ) | (84,832 | ) | (102,577 | ) | (87,650 | ) | — | ||||||||||||||
| Net Expenses | 338,862 | 225,618 | 97,285 | 287,786 | 9,005 | ||||||||||||||||||
| Net Investment Income (Loss) | 544,925 | (14,029 | ) | 245,910 | 1,570,168 | (7,679 | ) | ||||||||||||||||
| REALIZED AND UNREALIZED GAIN (LOSS) ON INVESTMENTS: | |||||||||||||||||||||||
| Net realized loss from: | |||||||||||||||||||||||
| Investments | (21,788,022 | ) | (10,730,750 | ) | (3,800,088 | ) | (4,178,019 | ) | (154,271 | ) | |||||||||||||
| In-kind redemptions | (12,543,618 | ) | (9,338,919 | ) | (628,146 | ) | (6,613,501 | ) | — | ||||||||||||||
| Net realized loss | (34,331,640 | ) | (20,069,669 | ) | (4,428,234 | ) | (10,791,520 | ) | (154,271 | ) | |||||||||||||
| Net change in unrealized appreciation (depreciation) on investments | 791,867 | 3,563,803 | (391,588 | ) | (5,703,784 | ) | (520,632 | ) | |||||||||||||||
| Net realized and unrealized loss on investments | (33,539,773 | ) | (16,505,866 | ) | (4,819,822 | ) | (16,495,304 | ) | (674,903 | ) | |||||||||||||
| Net decrease in net assets resulting from operations | $ | (32,994,848 | ) | $ | (16,519,895 | ) | $ | (4,573,912 | ) | $ | (14,925,136 | ) | $ | (682,582 | ) | ||||||||
49
Statements of Changes in Net Assets
| PowerShares Dynamic Basic Materials Sector Portfolio | PowerShares Dynamic Consumer Discretionary Sector Portfolio | PowerShares Dynamic Consumer Staples Sector Portfolio | |||||||||||||||||||||||||
| Year Ended April 30, 2009 | Year Ended April 30, 2008 | Year Ended April 30, 2009 | Year Ended April 30, 2008 | Year Ended April 30, 2009 | Year Ended April 30, 2008 | ||||||||||||||||||||||
| OPERATIONS: | |||||||||||||||||||||||||||
| Net investment income (loss) | $ | 438,599 | $ | 306,739 | $ | 80,941 | $ | 57,372 | $ | 642,507 | $ | 243,785 | |||||||||||||||
| Net realized gain (loss) on investments | (11,459,144 | ) | 1,741,225 | (4,712,890 | ) | (3,278,352 | ) | (6,009,789 | ) | (52,157 | ) | ||||||||||||||||
| Net change in unrealized appreciation (depreciation) on investments | (6,905,563 | ) | 1,959,923 | 1,977,179 | (1,171,467 | ) | (1,522,087 | ) | (985,452 | ) | |||||||||||||||||
| Net increase (decrease) in net assets resulting from operations | (17,926,108 | ) | 4,007,887 | (2,654,770 | ) | (4,392,447 | ) | (6,889,369 | ) | (793,824 | ) | ||||||||||||||||
| Undistributed net investment income (loss) included in the price of units issued and redeemed | (6,851 | ) | 31,241 | (54,188 | ) | 12,537 | 217,757 | 160,815 | |||||||||||||||||||
| DISTRIBUTIONS TO SHAREHOLDERS FROM: | |||||||||||||||||||||||||||
| Net investment income | (463,180 | ) | (220,357 | ) | (83,601 | ) | (70,989 | ) | (473,177 | ) | (286,444 | ) | |||||||||||||||
| Tax return of capital | — | — | (1,843 | ) | (11,300 | ) | — | — | |||||||||||||||||||
| Total distributions to shareholders | (463,180 | ) | (220,357 | ) | (85,444 | ) | (82,289 | ) | (473,177 | ) | (286,444 | ) | |||||||||||||||
| SHAREHOLDER TRANSACTIONS: | |||||||||||||||||||||||||||
| Proceeds from shares sold | 22,737,065 | 40,891,183 | 42,174,838 | 140,023,221 | 33,416,470 | 38,717,136 | |||||||||||||||||||||
| Value of shares repurchased | (29,769,000 | ) | (20,116,550 | ) | (37,003,776 | ) | (141,477,925 | ) | (12,672,345 | ) | (24,829,491 | ) | |||||||||||||||
| Net income equalization | 6,851 | (31,241 | ) | 54,188 | (12,537 | ) | (217,757 | ) | (160,815 | ) | |||||||||||||||||
| Net increase (decrease) in net assets resulting from shares transactions | (7,025,084 | ) | 20,743,392 | 5,225,250 | (1,467,241 | ) | 20,526,368 | 13,726,830 | |||||||||||||||||||
| Increase (Decrease) in Net Assets | (25,421,223 | ) | 24,562,163 | 2,430,848 | (5,929,440 | ) | 13,381,579 | 12,807,377 | |||||||||||||||||||
| NET ASSETS: | |||||||||||||||||||||||||||
| Beginning of period | 43,550,021 | 18,987,858 | 11,226,958 | 17,156,398 | 24,071,708 | 11,264,331 | |||||||||||||||||||||
| End of period | $ | 18,128,798 | $ | 43,550,021 | $ | 13,657,806 | $ | 11,226,958 | $ | 37,453,287 | $ | 24,071,708 | |||||||||||||||
| Undistributed net investment income (loss) at end of period | $ | 71,878 | $ | 96,459 | $ | (2,660 | ) | $ | — | $ | 201,350 | $ | 32,020 | ||||||||||||||
| CHANGES IN SHARES OUTSTANDING: | |||||||||||||||||||||||||||
| Shares sold | 800,000 | 1,200,000 | 2,600,000 | 5,400,000 | 1,500,000 | 1,400,000 | |||||||||||||||||||||
| Shares repurchased | (1,100,000 | ) | (600,000 | ) | (2,300,000 | ) | (5,500,000 | ) | (600,000 | ) | (900,000 | ) | |||||||||||||||
| Shares outstanding, beginning of period | 1,200,000 | 600,000 | 500,000 | 600,000 | 900,000 | 400,000 | |||||||||||||||||||||
| Shares outstanding, end of period | 900,000 | 1,200,000 | 800,000 | 500,000 | 1,800,000 | 900,000 | |||||||||||||||||||||
See Notes to Financial Statements.
50
| PowerShares Dynamic Energy Sector Portfolio | PowerShares Dynamic Financial Sector Portfolio | ||||||||||||||||||
| Year Ended April 30, 2009 | Year Ended April 30, 2008 | Year Ended April 30, 2009 | Year Ended April 30, 2008 | ||||||||||||||||
| OPERATIONS: | |||||||||||||||||||
| Net investment income (loss) | $ | 178,693 | $ | 135,372 | $ | 256,368 | $ | 151,071 | |||||||||||
| Net realized gain (loss) on investments | (8,985,010 | ) | 2,805,702 | (9,220,322 | ) | (659,895 | ) | ||||||||||||
| Net change in unrealized appreciation (depreciation) on investments | (6,310,019 | ) | 3,251,353 | (1,126,796 | ) | (1,332,472 | ) | ||||||||||||
| Net increase (decrease) in net assets resulting from operations | (15,116,336 | ) | 6,192,427 | (10,090,750 | ) | (1,841,296 | ) | ||||||||||||
| Undistributed net investment income (loss) included in the price of units issued and redeemed | 25,855 | 19,097 | 2,117 | 31,709 | |||||||||||||||
| DISTRIBUTIONS TO SHAREHOLDERS FROM: | |||||||||||||||||||
| Net investment income | (135,550 | ) | (75,016 | ) | (254,006 | ) | (115,884 | ) | |||||||||||
| Tax return of capital | — | — | — | — | |||||||||||||||
| Total distributions to shareholders | (135,550 | ) | (75,016 | ) | (254,006 | ) | (115,884 | ) | |||||||||||
| SHAREHOLDER TRANSACTIONS: | |||||||||||||||||||
| Proceeds from shares sold | 39,796,946 | 54,703,703 | 17,493,282 | 29,172,553 | |||||||||||||||
| Value of shares repurchased | (41,341,841 | ) | (37,283,571 | ) | (15,461,800 | ) | (12,226,396 | ) | |||||||||||
| Net income equalization | (25,855 | ) | (19,097 | ) | (2,117 | ) | (31,709 | ) | |||||||||||
| Net increase (decrease) in net assets resulting from shares transactions | (1,570,750 | ) | 17,401,035 | 2,029,365 | 16,914,448 | ||||||||||||||
| Increase (Decrease) in Net Assets | (16,796,781 | ) | 23,537,543 | (8,313,274 | ) | 14,988,977 | |||||||||||||
| NET ASSETS: | |||||||||||||||||||
| Beginning of period | 42,674,824 | 19,137,281 | 22,943,355 | 7,954,378 | |||||||||||||||
| End of period | $ | 25,878,043 | $ | 42,674,824 | $ | 14,630,081 | $ | 22,943,355 | |||||||||||
| Undistributed net investment income (loss) at end of period | $ | 25,996 | $ | 51,637 | $ | 56,709 | $ | 54,347 | |||||||||||
| CHANGES IN SHARES OUTSTANDING: | |||||||||||||||||||
| Shares sold | 1,600,000 | 1,600,000 | 900,000 | 1,200,000 | |||||||||||||||
| Shares repurchased | (1,400,000 | ) | (1,100,000 | ) | (900,000 | ) | (500,000 | ) | |||||||||||
| Shares outstanding, beginning of period | 1,100,000 | 600,000 | 1,000,000 | 300,000 | |||||||||||||||
| Shares outstanding, end of period | 1,300,000 | 1,100,000 | 1,000,000 | 1,000,000 | |||||||||||||||
51
Statements of Changes in Net Assets (Continued)
| PowerShares Dynamic Healthcare Sector Portfolio | PowerShares Dynamic Industrials Sector Portfolio | PowerShares Dynamic Technology Sector Portfolio | |||||||||||||||||||||||||
| Year Ended April 30, 2009 | Year Ended April 30, 2008 | Year Ended April 30, 2009 | Year Ended April 30, 2008 | Year Ended April 30, 2009 | Year Ended April 30, 2008 | ||||||||||||||||||||||
| OPERATIONS: | |||||||||||||||||||||||||||
| Net investment income (loss) | $ | 93,371 | $ | (162,393 | ) | $ | 544,925 | $ | 172,776 | $ | (14,029 | ) | $ | (122,095 | ) | ||||||||||||
| Net realized gain (loss) on investments | (40,173,071 | ) | (4,327,332 | ) | (34,331,640 | ) | 934,358 | (20,069,669 | ) | (2,888,234 | ) | ||||||||||||||||
| Net change in unrealized appreciation/depreciation on investments | 3,120,607 | (10,832,188 | ) | 791,867 | (1,455,235 | ) | 3,563,803 | (1,461,170 | ) | ||||||||||||||||||
| Net increase (decrease) in net assets resulting from operations | (36,959,093 | ) | (15,321,913 | ) | (32,994,848 | ) | (348,101 | ) | (16,519,895 | ) | (4,471,499 | ) | |||||||||||||||
| Undistributed net investment income (loss) included in the price of units issued and redeemed | 23,648 | (127,828 | ) | 83,792 | 2,552 | (33,735 | ) | (66,231 | ) | ||||||||||||||||||
| DISTRIBUTIONS TO SHAREHOLDERS FROM: | |||||||||||||||||||||||||||
| Net investment income | — | — | (413,638 | ) | (164,357 | ) | — | — | |||||||||||||||||||
| Tax return of capital | — | — | — | — | — | — | |||||||||||||||||||||
| Total distributions to shareholders | — | — | (413,638 | ) | (164,357 | ) | — | — | |||||||||||||||||||
| SHAREHOLDER TRANSACTIONS: | |||||||||||||||||||||||||||
| Proceeds from shares sold | 95,864,233 | 144,890,658 | 117,152,678 | 120,525,074 | 57,419,781 | 62,259,099 | |||||||||||||||||||||
| Value of shares repurchased | (106,348,401 | ) | (67,732,497 | ) | (59,816,387 | ) | (110,025,370 | ) | (52,213,652 | ) | (42,752,339 | ) | |||||||||||||||
| Net income equalization | (23,648 | ) | 127,828 | (83,792 | ) | (2,552 | ) | 33,735 | 66,231 | ||||||||||||||||||
| Net increase (decrease) in net assets resulting from shares transactions | (10,507,816 | ) | 77,285,989 | 57,252,499 | 10,497,152 | 5,239,864 | 19,572,991 | ||||||||||||||||||||
| Increase (Decrease) in Net Assets | (47,443,261 | ) | 61,836,248 | 23,927,805 | 9,987,246 | (11,313,766 | ) | 15,035,261 | |||||||||||||||||||
| NET ASSETS: | |||||||||||||||||||||||||||
| Beginning of period | 119,019,283 | 57,183,035 | 36,396,579 | 26,409,333 | 37,245,546 | 22,210,285 | |||||||||||||||||||||
| End of period | $ | 71,576,022 | $ | 119,019,283 | $ | 60,324,384 | $ | 36,396,579 | $ | 25,931,780 | $ | 37,245,546 | |||||||||||||||
| Undistributed net investment income (loss) at end of period | $ | 93,371 | $ | — | $ | 142,375 | $ | 11,088 | $ | (3,182 | ) | $ | — | ||||||||||||||
| CHANGES IN SHARES OUTSTANDING: | |||||||||||||||||||||||||||
| Shares sold | 4,300,000 | 5,000,000 | 4,700,000 | 3,900,000 | 2,700,000 | 2,300,000 | |||||||||||||||||||||
| Shares repurchased | (4,900,000 | ) | (2,400,000 | ) | (2,700,000 | ) | (3,600,000 | ) | (2,700,000 | ) | (1,600,000 | ) | |||||||||||||||
| Shares outstanding, beginning of period | 4,600,000 | 2,000,000 | 1,200,000 | 900,000 | 1,500,000 | 800,000 | |||||||||||||||||||||
| Shares outstanding, end of period | 4,000,000 | 4,600,000 | 3,200,000 | 1,200,000 | 1,500,000 | 1,500,000 | |||||||||||||||||||||
* Commencement of Investment Operations.
See Notes to Financial Statements.
52
| PowerShares Dynamic Telecommunications & Wireless Portfolio | PowerShares Dynamic Utilities Portfolio | PowerShares NASDAQ Internet Portfolio | |||||||||||||||||||||
| Year Ended April 30, 2009 | Year Ended April 30, 2008 | Year Ended April 30, 2009 | Year Ended April 30, 2008 | For the Period June 10, 2008* Through April 30, 2009 | |||||||||||||||||||
| OPERATIONS: | |||||||||||||||||||||||
| Net investment income (loss) | $ | 245,910 | $ | 278,211 | $ | 1,570,168 | $ | 968,208 | $ | (7,679 | ) | ||||||||||||
| Net realized gain (loss) on investments | (4,428,234 | ) | (801,387 | ) | (10,791,520 | ) | 1,251,624 | (154,271 | ) | ||||||||||||||
| Net change in unrealized appreciation/depreciation on investments | (391,588 | ) | (5,689,699 | ) | (5,703,784 | ) | (5,229,214 | ) | (520,632 | ) | |||||||||||||
| Net increase (decrease) in net assets resulting from operations | (4,573,912 | ) | (6,212,875 | ) | (14,925,136 | ) | (3,009,382 | ) | (682,582 | ) | |||||||||||||
| Undistributed net investment income (loss) included in the price of units issued and redeemed | (8,969 | ) | (37,684 | ) | (189 | ) | (107,405 | ) | — | ||||||||||||||
| DISTRIBUTIONS TO SHAREHOLDERS FROM: | |||||||||||||||||||||||
| Net investment income | (194,232 | ) | (353,595 | ) | (1,226,368 | ) | (935,373 | ) | — | ||||||||||||||
| Tax return of capital | — | (339,866 | ) | — | — | (1,258 | ) | ||||||||||||||||
| Total distributions to shareholders | (194,232 | ) | (693,461 | ) | (1,226,368 | ) | (935,373 | ) | (1,258 | ) | |||||||||||||
| SHAREHOLDER TRANSACTIONS: | |||||||||||||||||||||||
| Proceeds from shares sold | 9,693,362 | 21,542,359 | 75,893,770 | 54,291,229 | 2,472,464 | ||||||||||||||||||
| Value of shares repurchased | (8,833,055 | ) | (29,922,409 | ) | (57,600,692 | ) | (69,996,903 | ) | — | ||||||||||||||
| Net income equalization | 8,969 | 37,684 | 189 | 107,405 | — | ||||||||||||||||||
| Net increase (decrease) in net assets resulting from shares transactions | 869,276 | (8,342,366 | ) | 18,293,267 | (15,598,269 | ) | 2,472,464 | ||||||||||||||||
| Increase (Decrease) in Net Assets | (3,907,837 | ) | (15,286,386 | ) | 2,141,574 | (19,650,429 | ) | 1,788,624 | |||||||||||||||
| NET ASSETS: | |||||||||||||||||||||||
| Beginning of period | 18,319,576 | 33,605,962 | 39,929,052 | 59,579,481 | — | ||||||||||||||||||
| End of period | $ | 14,411,739 | $ | 18,319,576 | $ | 42,070,626 | $ | 39,929,052 | $ | 1,788,624 | |||||||||||||
| Undistributed net investment income (loss) at end of period | $ | 51,678 | $ | — | $ | 529,318 | $ | 185,518 | $ | — | |||||||||||||
| CHANGES IN SHARES OUTSTANDING: | |||||||||||||||||||||||
| Shares sold | 800,000 | 1,100,000 | 5,000,000 | 2,800,000 | 100,000 | ||||||||||||||||||
| Shares repurchased | (700,000 | ) | (1,600,000 | ) | (3,900,000 | ) | (3,600,000 | ) | — | ||||||||||||||
| Shares outstanding, beginning of period | 1,200,000 | 1,700,000 | 2,100,000 | 2,900,000 | — | ||||||||||||||||||
| Shares outstanding, end of period | 1,300,000 | 1,200,000 | 3,200,000 | 2,100,000 | 100,000 | ||||||||||||||||||
53
Financial Highlights
PowerShares Dynamic Basic Materials Sector Portfolio
| Year Ended April 30, | For the Period October 12, 2006* Through | ||||||||||||||
| 2009 | 2008 | April 30, 2007 | |||||||||||||
| PER SHARE OPERATING PERFORMANCE: | |||||||||||||||
| Net asset value at beginning of period | $ | 36.29 | $ | 31.65 | $ | 25.56 | |||||||||
| Net investment income** | 0.42 | 0.33 | 0.24 | ||||||||||||
| Net realized and unrealized gain (loss) on investments | (16.15 | ) | 4.55 | 6.05 | |||||||||||
| Total from investment operations | (15.73 | ) | 4.88 | 6.29 | |||||||||||
| Distributions to shareholders from: | |||||||||||||||
| Net investment income | (0.42 | ) | (0.24 | ) | (0.20 | ) | |||||||||
| Net asset value at end of period | $ | 20.14 | $ | 36.29 | $ | 31.65 | |||||||||
| Share price at end of period*** | $ | 20.15 | |||||||||||||
| NET ASSET VALUE, TOTAL RETURN**** | (43.63 | )% | 15.47 | % | 24.69 | % | |||||||||
| SHARE PRICE TOTAL RETURN**** | (43.59 | )% | |||||||||||||
| RATIOS/SUPPLEMENTAL DATA: | |||||||||||||||
| Net assets at end of period (000's omitted) | $ | 18,129 | $ | 43,550 | $ | 18,988 | |||||||||
| Ratio to average net assets of: | |||||||||||||||
| Expenses, after (Waivers) and/or Recapture | 0.65 | % | 0.68 | % | 0.71 | %† | |||||||||
| Expenses, prior to (Waivers) and/or Recapture | 0.97 | % | 0.96 | % | 1.32 | %† | |||||||||
| Net investment income, after (Waivers) and/or Recapture | 1.57 | % | 0.95 | % | 1.52 | %† | |||||||||
| Portfolio turnover rate †† | 47 | % | 28 | % | 9 | % | |||||||||
| Undistributed net investment income (loss) included in price of units issued and redeemed**# | $ | (0.01 | ) | $ | 0.03 | $ | 0.02 | ||||||||
PowerShares Dynamic Consumer Discretionary Sector Portfolio
| Year Ended April 30, | For the Period October 12, 2006* Through | ||||||||||||||
| 2009 | 2008 | April 30, 2007 | |||||||||||||
| PER SHARE OPERATING PERFORMANCE: | |||||||||||||||
| Net asset value at beginning of period | $ | 22.45 | $ | 28.59 | $ | 25.43 | |||||||||
| Net investment income** | 0.13 | 0.10 | 0.09 | ||||||||||||
| Net realized and unrealized gain (loss) on investments | (5.35 | ) | (6.11 | ) | 3.23 | ||||||||||
| Total from investment operations | (5.22 | ) | (6.01 | ) | 3.32 | ||||||||||
| Distributions to shareholders from: | |||||||||||||||
| Net investment income | (0.15 | ) | (0.11 | ) | (0.16 | ) | |||||||||
| Return of capital | (0.01 | ) | (0.02 | ) | — | ||||||||||
| Total distributions | (0.16 | ) | (0.13 | ) | (0.16 | ) | |||||||||
| Net asset value at end of period | $ | 17.07 | $ | 22.45 | $ | 28.59 | |||||||||
| Share price at end of period*** | $ | 17.07 | |||||||||||||
| NET ASSET VALUE, TOTAL RETURN**** | (23.19 | )% | (21.10 | )% | 13.11 | % | |||||||||
| SHARE PRICE TOTAL RETURN**** | (23.22 | )% | |||||||||||||
| RATIOS/SUPPLEMENTAL DATA: | |||||||||||||||
| Net assets at end of period (000's omitted) | $ | 13,658 | $ | 11,227 | $ | 17,156 | |||||||||
| Ratio to average net assets of: | |||||||||||||||
| Expenses, after (Waivers) and/or Recapture | 0.64 | % | 0.70 | % | 0.72 | %† | |||||||||
| Expenses, prior to (Waivers) and/or Recapture | 1.68 | % | 1.31 | % | 1.41 | %† | |||||||||
| Net investment income, after (Waivers) and/or Recapture | 0.81 | % | 0.36 | % | 0.65 | %† | |||||||||
| Portfolio turnover rate †† | 157 | % | 95 | % | 20 | % | |||||||||
| Undistributed net investment income (loss) included in price of units issued and redeemed**# | $ | (0.09 | ) | $ | 0.02 | $ | (0.11 | ) | |||||||
* Commencement of Investment Operations.
** Based on average shares outstanding.
*** The mean between the last bid and ask prices.
**** Net asset value total return is calculated assuming an initial investment made at the net asset value at the beginning of the period, reinvestment of all dividends and distributions at net asset value during the period, and redemption on the last day of the period. Share price total return is calculated assuming an initial investment made at the share price at the beginning of the period, reinvestment of all dividends and distributions at share price during the period, and sale at the share price on the last day of the period. Total investment returns calculated for a period of less than one year are not annualized.
† Annualized.
†† Portfolio turnover rate is not annualized and does not include securities received or delivered from processing creations or redemptions.
# The per share amount of equalization is presented to show the impact of equalization on distributable earnings per share.
See Notes to Financial Statements.
54
Financial Highlights (Continued)
PowerShares Dynamic Consumer Staples Sector Portfolio
| Year Ended April 30, | For the Period October 12, 2006* Through | ||||||||||||||
| 2009 | 2008 | April 30, 2007 | |||||||||||||
| PER SHARE OPERATING PERFORMANCE: | |||||||||||||||
| Net asset value at beginning of period | $ | 26.75 | $ | 28.16 | $ | 25.25 | |||||||||
| Net investment income** | 0.45 | 0.34 | 0.49 | ||||||||||||
| Net realized and unrealized gain (loss) on investments | (6.04 | ) | (1.43 | ) | 2.69 | ||||||||||
| Total from investment operations | (5.59 | ) | (1.09 | ) | 3.18 | ||||||||||
| Distributions to shareholders from: | |||||||||||||||
| Net investment income | (0.35 | ) | (0.32 | ) | (0.27 | ) | |||||||||
| Net asset value at end of period | $ | 20.81 | $ | 26.75 | $ | 28.16 | |||||||||
| Share price at end of period*** | $ | 20.79 | |||||||||||||
| NET ASSET VALUE, TOTAL RETURN**** | (21.02 | )% | (3.94 | )% | 12.69 | % | |||||||||
| SHARE PRICE TOTAL RETURN**** | (21.09 | )% | |||||||||||||
| RATIOS/SUPPLEMENTAL DATA: | |||||||||||||||
| Net assets at end of period (000's omitted) | $ | 37,453 | $ | 24,072 | $ | 11,264 | |||||||||
| Ratio to average net assets of: | |||||||||||||||
| Expenses, after (Waivers) and/or Recapture | 0.65 | % | 0.69 | % | 0.73 | %† | |||||||||
| Expenses, prior to (Waivers) and/or Recapture | 0.94 | % | 1.18 | % | 1.46 | %† | |||||||||
| Net investment income, after (Waivers) and/or Recapture | 2.07 | % | 1.22 | % | 3.42 | %† | |||||||||
| Portfolio turnover rate †† | 48 | % | 44 | % | 18 | % | |||||||||
| Undistributed net investment income included in price of units issued and redeemed**# | $ | 0.15 | $ | 0.22 | $ | 0.04 | |||||||||
PowerShares Dynamic Energy Sector Portfolio
| Year Ended April 30, | For the Period October 12, 2006* Through | ||||||||||||||
| 2009 | 2008 | April 30, 2007 | |||||||||||||
| PER SHARE OPERATING PERFORMANCE: | |||||||||||||||
| Net asset value at beginning of period | $ | 38.80 | $ | 31.90 | $ | 25.80 | |||||||||
| Net investment income** | 0.18 | 0.14 | 0.05 | ||||||||||||
| Net realized and unrealized gain (loss) on investments | (18.93 | ) | 6.84 | 6.08 | |||||||||||
| Total from investment operations | (18.75 | ) | 6.98 | 6.13 | |||||||||||
| Distributions to shareholders from: | |||||||||||||||
| Net investment income | (0.14 | ) | (0.08 | ) | (0.03 | ) | |||||||||
| Net asset value at end of period | $ | 19.91 | $ | 38.80 | $ | 31.90 | |||||||||
| Share price at end of period*** | $ | 19.92 | |||||||||||||
| NET ASSET VALUE, TOTAL RETURN**** | (48.52 | )% | 21.93 | % | 23.78 | % | |||||||||
| SHARE PRICE TOTAL RETURN**** | (48.44 | )% | |||||||||||||
| RATIOS/SUPPLEMENTAL DATA: | |||||||||||||||
| Net assets at end of period (000's omitted) | $ | 25,878 | $ | 42,675 | $ | 19,137 | |||||||||
| Ratio to average net assets of: | |||||||||||||||
| Expenses, after (Waivers) and/or Recapture | 0.65 | % | 0.68 | % | 0.71 | %† | |||||||||
| Expenses, prior to (Waivers) and/or Recapture | 0.98 | % | 0.96 | % | 1.22 | %† | |||||||||
| Net investment income, after (Waivers) and/or Recapture | 0.65 | % | 0.41 | % | 0.28 | %† | |||||||||
| Portfolio turnover rate †† | 67 | % | 50 | % | 12 | % | |||||||||
| Undistributed net investment income included in price of units issued and redeemed**# | $ | 0.03 | $ | 0.02 | $ | — | |||||||||
* Commencement of Investment Operations.
** Based on average shares outstanding.
*** The mean between the last bid and ask prices.
**** Net asset value total return is calculated assuming an initial investment made at the net asset value at the beginning of the period, reinvestment of all dividends and distributions at net asset value during the period, and redemption on the last day of the period. Share price total return is calculated assuming an initial investment made at the share price at the beginning of the period, reinvestment of all dividends and distributions at share price during the period, and sale at the share price on the last day of the period. Total investment returns calculated for a period of less than one year are not annualized.
† Annualized.
†† Portfolio turnover rate is not annualized and does not include securities received or delivered from processing creations or redemptions.
# The per share amount of equalization is presented to show the impact of equalization on distributable earnings per share.
See Notes to Financial Statements.
55
Financial Highlights (Continued)
PowerShares Dynamic Financial Sector Portfolio
| Year Ended April 30, | For the Period October 12, 2006* Through | ||||||||||||||
| 2009 | 2008 | April 30, 2007 | |||||||||||||
| PER SHARE OPERATING PERFORMANCE: | |||||||||||||||
| Net asset value at beginning of period | $ | 22.94 | $ | 26.51 | $ | 25.16 | |||||||||
| Net investment income** | 0.24 | 0.25 | 0.13 | ||||||||||||
| Net realized and unrealized gain (loss) on investments | (8.33 | ) | (3.59 | ) | 1.31 | ||||||||||
| Total from investment operations | (8.09 | ) | (3.34 | ) | 1.44 | ||||||||||
| Distributions to shareholders from: | |||||||||||||||
| Net investment income | (0.22 | ) | (0.23 | ) | (0.09 | ) | |||||||||
| Net asset value at end of period | $ | 14.63 | $ | 22.94 | $ | 26.51 | |||||||||
| Share price at end of period*** | $ | 14.60 | |||||||||||||
| NET ASSET VALUE, TOTAL RETURN**** | (35.53 | )% | (12.69 | )% | 5.72 | % | |||||||||
| SHARE PRICE TOTAL RETURN**** | (35.66 | )% | |||||||||||||
| RATIOS/SUPPLEMENTAL DATA: | |||||||||||||||
| Net assets at end of period (000's omitted) | $ | 14,630 | $ | 22,943 | $ | 7,954 | |||||||||
| Ratio to average net assets of: | |||||||||||||||
| Expenses, after (Waivers) and/or Recapture | 0.65 | % | 0.72 | % | 0.72 | %† | |||||||||
| Expenses, prior to (Waivers) and/or Recapture | 1.13 | % | 1.42 | % | 1.38 | %† | |||||||||
| Net investment income, after (Waivers) and/or Recapture | 1.27 | % | 1.07 | % | 0.87 | %† | |||||||||
| Portfolio turnover rate †† | 66 | % | 50 | % | 33 | % | |||||||||
| Undistributed net investment income (loss) included in price of units issued and redeemed**# | $ | 0.00 | (a) | $ | 0.05 | $ | (0.02 | ) | |||||||
PowerShares Dynamic Healthcare Sector Portfolio
| Year Ended April 30, | For the Period October 12, 2006* Through | ||||||||||||||
| 2009 | 2008 | April 30, 2007 | |||||||||||||
| PER SHARE OPERATING PERFORMANCE: | |||||||||||||||
| Net asset value at beginning of period | $ | 25.87 | $ | 28.59 | $ | 25.01 | |||||||||
| Net investment income (loss)** | 0.02 | (0.05 | ) | (0.04 | ) | ||||||||||
| Net realized and unrealized gain (loss) on investments | (8.00 | ) | (2.67 | ) | 3.62 | ||||||||||
| Total from investment operations | (7.98 | ) | (2.72 | ) | 3.58 | ||||||||||
| Net asset value at end of period | $ | 17.89 | $ | 25.87 | $ | 28.59 | |||||||||
| Share price at end of period*** | $ | 17.86 | |||||||||||||
| NET ASSET VALUE, TOTAL RETURN**** | (30.85 | )% | (9.51 | )% | 14.31 | % | |||||||||
| SHARE PRICE TOTAL RETURN**** | (30.94 | )% | |||||||||||||
| RATIOS/SUPPLEMENTAL DATA: | |||||||||||||||
| Net assets at end of period (000's omitted) | $ | 71,576 | $ | 119,019 | $ | 57,183 | |||||||||
| Ratio to average net assets of: | |||||||||||||||
| Expenses, after (Waivers) and/or Recapture | 0.65 | % | 0.66 | % | 0.71 | %† | |||||||||
| Expenses, prior to (Waivers) and/or Recapture | 0.71 | % | 0.72 | % | 1.20 | %† | |||||||||
| Net investment loss, after (Waivers) and/or Recapture | 0.10 | % | (0.17 | )% | (0.31 | )%† | |||||||||
| Portfolio turnover rate †† | 96 | % | 75 | % | 14 | % | |||||||||
| Undistributed net investment income (loss) included in price of units issued and redeemed**# | $ | 0.01 | $ | (0.04 | ) | $ | (0.05 | ) | |||||||
* Commencement of Investment Operations.
** Based on average shares outstanding.
*** The mean between the last bid and ask prices.
**** Net asset value total return is calculated assuming an initial investment made at the net asset value at the beginning of the period, reinvestment of all dividends and distributions at net asset value during the period, and redemption on the last day of the period. Share price total return is calculated assuming an initial investment made at the share price at the beginning of the period, reinvestment of all dividends and distributions at share price during the period, and sale at the share price on the last day of the period. Total investment returns calculated for a period of less than one year are not annualized.
† Annualized.
†† Portfolio turnover rate is not annualized and does not include securities received or delivered from processing creations or redemptions.
# The per share amount of equalization is presented to show the impact of equalization on distributable earnings per share.
(a) Amount represents less than $0.005.
See Notes to Financial Statements.
56
Financial Highlights (Continued)
PowerShares Dynamic Industrials Sector Portfolio
| Year Ended April 30, | For the Period October 12, 2006* Through | ||||||||||||||
| 2009 | 2008 | April 30, 2007 | |||||||||||||
| PER SHARE OPERATING PERFORMANCE: | |||||||||||||||
| Net asset value at beginning of period | $ | 30.33 | $ | 29.34 | $ | 25.72 | |||||||||
| Net investment income** | 0.22 | 0.14 | 0.04 | ||||||||||||
| Net realized and unrealized gain (loss) on investments | (11.55 | ) | 1.00 | 3.63 | |||||||||||
| Total from investment operations | (11.33 | ) | 1.14 | 3.67 | |||||||||||
| Distributions to shareholders from: | |||||||||||||||
| Net investment income | (0.15 | ) | (0.15 | ) | (0.04 | ) | |||||||||
| Return of capital | — | — | (0.01 | ) | |||||||||||
| Total distributions | (0.15 | ) | (0.15 | ) | (0.05 | ) | |||||||||
| Net asset value at end of period | $ | 18.85 | $ | 30.33 | $ | 29.34 | |||||||||
| Share price at end of period*** | $ | 18.82 | |||||||||||||
| NET ASSET VALUE, TOTAL RETURN**** | (37.41 | )% | 3.90 | % | 14.28 | % | |||||||||
| SHARE PRICE TOTAL RETURN**** | (37.51 | )% | |||||||||||||
| RATIOS/SUPPLEMENTAL DATA: | |||||||||||||||
| Net assets at end of period (000's omitted) | $ | 60,324 | $ | 36,397 | $ | 26,409 | |||||||||
| Ratio to average net assets of: | |||||||||||||||
| Expenses, after (Waivers) and/or Recapture | 0.65 | % | 0.68 | % | 0.71 | %† | |||||||||
| Expenses, prior to (Waivers) and/or Recapture | 0.81 | % | 0.90 | % | 1.19 | %† | |||||||||
| Net investment income, after (Waivers) and/or Recapture | 1.05 | % | 0.45 | % | 0.30 | %† | |||||||||
| Portfolio turnover rate †† | 81 | % | 84 | % | 14 | % | |||||||||
| Undistributed net investment income included in price of units issued and redeemed**# | $ | 0.03 | $ | 0.00 | (a) | $ | 0.01 | ||||||||
PowerShares Dynamic Technology Sector Portfolio
| Year Ended April 30, | For the Period October 12, 2006* Through | ||||||||||||||
| 2009 | 2008 | April 30, 2007 | |||||||||||||
| PER SHARE OPERATING PERFORMANCE: | |||||||||||||||
| Net asset value at beginning of period | $ | 24.83 | $ | 27.76 | $ | 25.54 | |||||||||
| Net investment loss** | (0.01 | ) | (0.09 | ) | (0.07 | ) | |||||||||
| Net realized and unrealized gain (loss) on investments | (7.53 | ) | (2.84 | ) | 2.29 | ||||||||||
| Total from investment operations | (7.54 | ) | (2.93 | ) | 2.22 | ||||||||||
| Net asset value at end of period | $ | 17.29 | $ | 24.83 | $ | 27.76 | |||||||||
| Share price at end of period*** | $ | 17.29 | |||||||||||||
| NET ASSET VALUE, TOTAL RETURN**** | (30.37 | )% | (10.55 | )% | 8.69 | % | |||||||||
| SHARE PRICE TOTAL RETURN**** | (30.31 | )% | |||||||||||||
| RATIOS/SUPPLEMENTAL DATA: | |||||||||||||||
| Net assets at end of period (000's omitted) | $ | 25,932 | $ | 37,246 | $ | 22,210 | |||||||||
| Ratio to average net assets of: | |||||||||||||||
| Expenses, after (Waivers) and/or Recapture | 0.65 | % | 0.68 | % | 0.71 | %† | |||||||||
| Expenses, prior to (Waivers) and/or Recapture | 0.89 | % | 0.94 | % | 1.25 | %† | |||||||||
| Net investment loss, after (Waivers) and/or Recapture | (0.04 | )% | (0.36 | )% | (0.49 | )%† | |||||||||
| Portfolio turnover rate †† | 90 | % | 77 | % | 27 | % | |||||||||
| Undistributed net investment loss included in price of units issued and redeemed**# | $ | (0.02 | ) | $ | (0.05 | ) | $ | (0.02 | ) | ||||||
* Commencement of Investment Operations.
** Based on average shares outstanding.
*** The mean between the last bid and ask prices.
**** Net asset value total return is calculated assuming an initial investment made at the net asset value at the beginning of the period, reinvestment of all dividends and distributions at net asset value during the period, and redemption on the last day of the period. Share price total return is calculated assuming an initial investment made at the share price at the beginning of the period, reinvestment of all dividends and distributions at share price during the period, and sale at the share price on the last day of the period. Total investment return calculated for a period of less than one year are not annualized.
† Annualized.
†† Portfolio turnover rate is not annualized and does not include securities received or delivered from processing creations or redemptions.
# The per share amount of equalization is presented to show the impact of equalization on distributable earnings per share.
(a) Amount represents less than $0.005.
See Notes to Financial Statements.
57
Financial Highlights (Continued)
PowerShares Dynamic Telecommunications & Wireless Portfolio
| Year Ended April 30, | For the Period December 6, 2005* Through | ||||||||||||||||||
| 2009 | 2008 | 2007 | April 30, 2006 | ||||||||||||||||
| PER SHARE OPERATING PERFORMANCE: | |||||||||||||||||||
| Net asset value at beginning of period | $ | 15.27 | $ | 19.77 | $ | 16.67 | $ | 14.95 | |||||||||||
| Net investment income** | 0.20 | 0.18 | 0.22 | 0.05 | |||||||||||||||
| Net realized and unrealized gain (loss) on investments | (4.22 | ) | (4.23 | ) | 3.08 | 1.70 | |||||||||||||
| Total from investment operations | (4.02 | ) | (4.05 | ) | 3.30 | 1.75 | |||||||||||||
| Distributions to shareholders from: | |||||||||||||||||||
| Net investment income | (0.16 | ) | (0.23 | ) | (0.20 | ) | (0.03 | ) | |||||||||||
| Return of capital | — | (0.22 | ) | — | — | ||||||||||||||
| Total distributions | (0.16 | ) | (0.45 | ) | (0.20 | ) | (0.03 | ) | |||||||||||
| Net asset value at end of period | $ | 11.09 | $ | 15.27 | $ | 19.77 | $ | 16.67 | |||||||||||
| Share price at end of period*** | $ | 11.09 | |||||||||||||||||
| NET ASSET VALUE, TOTAL RETURN**** | (26.55 | )% | (20.96 | )% | 19.93 | % | 11.74 | % | |||||||||||
| SHARE PRICE TOTAL RETURN**** | (26.55 | )% | |||||||||||||||||
| RATIOS/SUPPLEMENTAL DATA: | |||||||||||||||||||
| Net assets at end of period (000's omitted) | $ | 14,412 | $ | 18,320 | $ | 33,606 | $ | 31,669 | |||||||||||
| Ratio to average net assets of: | |||||||||||||||||||
| Expenses, after (Waivers) and/or Recapture | 0.63 | % | 0.63 | % | 0.66 | % | 0.67 | %† | |||||||||||
| Expenses, prior to (Waivers) and/or Recapture | 1.29 | % | 1.01 | % | 1.12 | % | 0.97 | %† | |||||||||||
| Net investment income, after (Waivers) and/or Recapture | 1.59 | % | 0.94 | % | 1.24 | % | 0.79 | %† | |||||||||||
| Portfolio turnover rate †† | 46 | % | 49 | % | 43 | % | 3 | % | |||||||||||
| Undistributed net investment income (loss) included in price of units issued and redeemed**# | $ | (0.01 | ) | $ | (0.02 | ) | $ | (0.02 | ) | $ | — | ||||||||
PowerShares Dynamic Utilities Portfolio
| Year Ended April 30, | For the Period October 26, 2005* Through | ||||||||||||||||||
| 2009 | 2008 | 2007 | April 30, 2006 | ||||||||||||||||
| PER SHARE OPERATING PERFORMANCE: | |||||||||||||||||||
| Net asset value at beginning of period | $ | 19.01 | $ | 20.54 | $ | 16.33 | $ | 15.32 | |||||||||||
| Net investment income** | 0.54 | 0.45 | 0.44 | 0.24 | |||||||||||||||
| Net realized and unrealized gain (loss) on investments | (5.95 | ) | (1.53 | ) | 4.16 | 0.96 | |||||||||||||
| Total from investment operations | (5.41 | ) | (1.08 | ) | 4.60 | 1.20 | |||||||||||||
| Distributions to shareholders from: | |||||||||||||||||||
| Net investment income | (0.45 | ) | (0.45 | ) | (0.39 | ) | (0.19 | ) | |||||||||||
| Net asset value at end of period | $ | 13.15 | $ | 19.01 | $ | 20.54 | $ | 16.33 | |||||||||||
| Share price at end of period*** | $ | 13.13 | |||||||||||||||||
| NET ASSET VALUE, TOTAL RETURN**** | (29.00 | )% | (5.34 | )% | 28.48 | % | 7.82 | % | |||||||||||
| SHARE PRICE TOTAL RETURN**** | (29.11 | )% | |||||||||||||||||
| RATIOS/SUPPLEMENTAL DATA: | |||||||||||||||||||
| Net assets at end of period (000's omitted) | $ | 42,071 | $ | 39,929 | $ | 59,579 | $ | 22,861 | |||||||||||
| Ratio to average net assets of: | |||||||||||||||||||
| Expenses, after (Waivers) and/or Recapture | 0.63 | % | 0.63 | % | 0.63 | % | 0.69 | %† | |||||||||||
| Expenses, prior to (Waivers) and/or Recapture | 0.82 | % | 0.86 | % | 0.92 | % | 0.89 | %† | |||||||||||
| Net investment income, after (Waivers) and/or Recapture | 3.44 | % | 2.32 | % | 2.34 | % | 2.62 | %† | |||||||||||
| Portfolio turnover rate †† | 68 | % | 64 | % | 39 | % | 38 | % | |||||||||||
| Undistributed net investment income (loss) included in price of units issued and redeemed**# | $ | 0.00 | (a) | $ | (0.05 | ) | $ | 0.05 | $ | (0.01 | ) | ||||||||
* Commencement of Investment Operations.
** Based on average shares outstanding.
*** The mean between the last bid and ask prices.
**** Net asset value total return is calculated assuming an initial investment made at the net asset value at the beginning of the period, reinvestment of all dividends and distributions at net asset value during the period, and redemption on the last day of the period. Share price total return is calculated assuming an initial investment made at the share price at the beginning of the period, reinvestment of all dividends and distributions at share price during the period, and sale at the share price on the last day of the period. Total investment returns calculated for a period of less than one year are not annualized.
† Annualized.
†† Portfolio turnover rate is not annualized and does not include securities received or delivered from processing creations or redemptions.
# The per share amount of equalization is presented to show the impact of equalization on distributable earnings per share.
(a) Amount represents less than $0.005.
See Notes to Financial Statements.
58
Financial Highlights (Continued)
PowerShares NASDAQ Internet Portfolio
| For the Period June 10, 2008* Through April 30, 2009 | |||||||
| PER SHARE OPERATING PERFORMANCE: | |||||||
| Net asset value at beginning of period | $ | 24.72 | |||||
| Net investment loss** | (0.08 | ) | |||||
| Net realized and unrealized loss on investments | (6.74 | ) | |||||
| Total from investment operations | (6.82 | ) | |||||
| Distributions to shareholders from: | |||||||
| Return of capital | (0.01 | ) | |||||
| Net asset value at end of period | $ | 17.89 | |||||
| Share price at end of period*** | $ | 17.88 | |||||
| NET ASSET VALUE, TOTAL RETURN**** | (27.56 | )%(a) | |||||
| SHARE PRICE TOTAL RETURN**** | (27.60 | )%(a) | |||||
| RATIOS/SUPPLEMENTAL DATA: | |||||||
| Net assets at end of period (000's omitted) | $ | 1,789 | |||||
| Ratio to average net assets of: | |||||||
| Expenses | 0.60 | %† | |||||
| Net investment loss | (0.51 | )%† | |||||
| Portfolio turnover rate †† | 25 | % | |||||
| Undistributed net investment income included in price of units issued and redeemed**# | $ | — | |||||
* Commencement of Investment Operations.
** Based on average shares outstanding.
*** The mean between the last bid and ask prices.
**** Net asset value total return is calculated assuming an initial investment made at the net asset value at the beginning of the period, reinvestment of all dividends and distributions at net asset value during the period, and redemption on the last day of the period. Share price total return is calculated assuming an initial investment made at the share price at the beginning of the period, reinvestment of all dividends and distributions at share price during the period, and sale at the share price on the last day of the period. Total investment returns calculated for a period of less than one year are not annualized.
† Annualized.
†† Portfolio turnover rate is not annualized and does not include securities received or delivered from processing creations or redemptions.
# The per share amount of equalization is presented to show the impact of equalization on distributable earnings per share.
(a) The net asset value, total return from Fund Inception (June 12, 2008, first day of trading on the Exchange) to April 30, 2009 was (25.33)%. The share price total return from Fund Inception to April 30, 2009 was (26.53)%.
See Notes to Financial Statements.
59
Notes to Financial Statements
PowerShares Exchange-Traded Fund Trust
April 30, 2009
Note 1. Organization
PowerShares Exchange-Traded Fund Trust (the "Trust") was organized as a Massachusetts business trust on June 9, 2000 and is authorized to have multiple series of portfolios. The Trust is an open-end management investment company, registered under the Investment Company Act of 1940, as amended (the "1940 Act"). As of the year end, the Trust offered seventy-five portfolios. This report includes the following portfolios:
| Full Name | Short Name | ||||||
| PowerShares Dynamic Basic Materials Sector Portfolio | "Dynamic Basic Materials Sector Portfolio" | ||||||
| PowerShares Dynamic Consumer Discretionary Sector Portfolio | "Dynamic Consumer Discretionary Sector Portfolio" | ||||||
| PowerShares Dynamic Consumer Staples Sector Portfolio | "Dynamic Consumer Staples Sector Portfolio" | ||||||
| PowerShares Dynamic Energy Sector Portfolio | "Dynamic Energy Sector Portfolio" | ||||||
| PowerShares Dynamic Financial Sector Portfolio | "Dynamic Financial Sector Portfolio" | ||||||
| PowerShares Dynamic Healthcare Sector Portfolio | "Dynamic Healthcare Sector Portfolio" | ||||||
| PowerShares Dynamic Industrials Sector Portfolio | "Dynamic Industrials Sector Portfolio" | ||||||
| PowerShares Dynamic Technology Sector Portfolio | "Dynamic Technology Sector Portfolio" | ||||||
| PowerShares Dynamic Telecommunications & Wireless Portfolio | "Dynamic Telecommunications & Wireless Portfolio" | ||||||
| PowerShares Dynamic Utilities Portfolio | "Dynamic Utilities Portfolio" | ||||||
| PowerShares NASDAQ Internet Portfolio | "NASDAQ Internet Portfolio" | ||||||
Each portfolio (the "Fund" or collectively the "Funds") represents a separate series of the Trust. The shares of the Funds are referred to herein as "Shares" or "Fund Shares." Each Fund's Shares are listed and traded on the NYSE Arca, Inc. except for Shares of the NASDAQ Internet Portfolio, which are listed and traded on the NASDAQ Stock Market LLC.
The Funds' market prices may differ to some degree from the net asset value of the Shares of each Fund. Unlike conventional mutual funds, each Fund issues and redeems Shares on a continuous basis, at net asset value, only in a large specified number of Shares, each called a "Creation Unit." Creation Units are issued and redeemed generally in-kind for securities included in the relevant index. Except when aggregated in Creation Units, Shares are not individually redeemable securities of the Funds.
The investment objective of each Fund is to seek investment results that correspond generally to the price and yield (before the Fund's fees and expenses) of the following indices:
| Fund | Index | ||||||
| Dynamic Basic Materials Sector Portfolio | Dynamic Basic Materials Sector IntellidexSM Index | ||||||
| Dynamic Consumer Discretionary Sector Portfolio | Dynamic Consumer Discretionary Sector IntellidexSM Index | ||||||
| Dynamic Consumer Staples Sector Portfolio | Dynamic Consumer Staples Sector IntellidexSM Index | ||||||
| Dynamic Energy Sector Portfolio | Dynamic Energy Sector IntellidexSM Index | ||||||
| Dynamic Financial Sector Portfolio | Dynamic Financial Sector IntellidexSM Index | ||||||
60
Notes to Financial Statements (Continued)
PowerShares Exchange-Traded Fund Trust
April 30, 2009
| Fund | Index | ||||||
| Dynamic Healthcare Sector Portfolio | Dynamic Healthcare Sector IntellidexSM Index | ||||||
| Dynamic Industrials Sector Portfolio | Dynamic Industrials Sector IntellidexSM Index | ||||||
| Dynamic Technology Sector Portfolio | Dynamic Technology Sector IntellidexSM Index | ||||||
| Dynamic Telecommunications & Wireless Portfolio | Dynamic Telecommunications & Wireless IntellidexSM Index | ||||||
| Dynamic Utilities Portfolio | Dynamic Utilities IntellidexSM Index | ||||||
| NASDAQ Internet Portfolio | NASDAQ Internet IndexSM | ||||||
Note 2. Significant Accounting Policies
The preparation of the financial statements in accordance with accounting principles generally accepted in the United States of America requires management to make estimates and assumptions that affect the reported amounts and disclosures in the financial statements, including estimates and assumptions related to taxation. Actual results could differ from these estimates.
A. Security Valuation
Securities, including restricted securities, are valued according to the following policies.
A security listed or traded on an exchange (except convertible bonds) is valued at its last sales price or official closing price as of the close of the customary trading session on the exchange where the security is principally traded, or lacking any sales or official closing price on a particular day, the security may be valued at the closing bid price on that day. Securities traded in the over-the-counter market are valued based on prices furnished by independent pricing services or market makers. Listed options, if no closing price is available, are valued at the mean between the last bid and ask prices from the exchange on which they are principally traded. Options not listed on an exchange are valued by an independent source at the mean between the last bid and ask prices.
Investments in open-end registered investment companies not traded on an exchange are valued at the end of day net asset value per share.
Debt obligations (including convertible bonds) and unlisted equities are fair valued using an evaluated quote provided by an independent pricing service. Evaluated quotes provided by the pricing service may be determined without exclusive reliance on quoted prices, and may reflect appropriate factors such as institution-size trading in similar groups of securities, developments related to specific securities, dividend rate, yield, quality, type of issue, coupon rate, maturity, individual trading characteristics and other market data. Short-term obligations, including commercial paper, having 60 days or less to maturity are recorded at amortized cost which approximates value. Debt securities are subject to interest rate and credit risks. In addition, all debt securities involve some risk of default with respect to interest and/or principal payments.
Foreign securities (including foreign exchange contracts) are converted into U.S. dollar amounts using the applicable exchange rates as of the close of the London world markets. If market quotations are available and reliable for foreign exchange traded equity securities, the securities will be valued at the market quotations. Because trading hours for certain foreign securities end before the close of the New York Stock Exchange ("NYSE"), closing market quotations may become unreliable. If between the time trading ends on a particular security and the close of the customary trading session on the NYSE, events occur that are significant and make the closing price unreliable, the Fund may fair value the security. If the event is likely
61
Notes to Financial Statements (Continued)
PowerShares Exchange-Traded Fund Trust
April 30, 2009
to have affected the closing price of the security, the security will be valued at fair value in good faith using procedures approved by the Board of Trustees. Adjustments to closing prices to reflect fair value may also be based on a screening process of an independent pricing service to indicate the degree of certainty, based on historical data, that the closing price in the principal market where a foreign security trades is not the current value as of the close of the NYSE. Foreign securities meeting the approved degree of certainty that the price is not reflective of current value will be priced at the indication of fair value from the independent pricing service. Multiple factors may be considered by the independent pricing service in determining adjustments to reflect fair value and may include information relating to sector indices, ADRs and domestic and foreign index futures. Foreign securities may have additional risks including exchange rate changes, potential for sharply devalued currencies and high inflation, political and economic upheaval, the relative lack of issuer information, relatively low market liquidity and the potential lack of strict financial and accounting controls and standards.
Securities for which market prices are not provided by any of the above methods may be valued based upon quotes furnished by independent sources.
Securities for which market quotations are not readily available or are unreliable are valued at fair value as determined in good faith by or under the supervision of the Trust's officers following procedures approved by the Board of Trustees. Issuer specific events, market trends, bid/ask quotes of brokers and information providers and other market data may be reviewed in the course of making a good faith determination of a security's fair value.
Valuations change in response to many factors including the historical and prospective earnings of the issuer, the value of the issuer's assets, general economic conditions, interest rates, investor perceptions and market liquidity. Because of the inherent uncertainties of valuation, the values reflected in the financial statements may materially differ from the value received upon actual sale of those investments.
B. Other Risks
A Fund may concentrate investments in a comparatively narrow segment of the economy. Consequently, such Fund may tend to be more volatile than other funds, and the value of the investments may tend to rise and fall more rapidly.
A Fund may invest a large percentage of its assets in securities of a limited number of companies, such that each investment may have a greater effect on the Fund's overall performance, and any change in the value of those securities could significantly affect the value of your investment in the Fund.
C. Federal Income Taxes
Each Fund intends to comply with the provisions of the Internal Revenue Code applicable to regulated investment companies and to distribute substantially all of the Fund's taxable earnings to its shareholders. As such, the Funds will not be subject to Federal income taxes on otherwise taxable income (including net realized gains) that is distributed to the shareholders. Therefore, no provision for Federal income taxes is recorded in the financial statements.
Income and capital gain distributions are determined in accordance with Federal income tax regulations, which may differ from accounting principles generally accepted in the United States of America. These differences are primarily due to differing book and tax treatments for in-kind transactions, losses deferred due to wash sales, and Passive Foreign Investment Company adjustments, if any.
62
Notes to Financial Statements (Continued)
PowerShares Exchange-Traded Fund Trust
April 30, 2009
The Funds file tax returns in the United States Federal jurisdiction and certain other jurisdictions. Generally a Fund is subject to examinations by such taxing authorities for up to three years after the filing of the return for the tax period.
D. Investment Income and Investment Transactions
Dividend income is recorded on the ex-dividend date net of foreign taxes withheld, if any. Interest income is recorded on the accrual basis. Investment transactions are recorded on the trade date. Realized gains and losses from the sale or disposition of securities are calculated on the specific identified cost basis. Dividends and interest received by a Fund may give rise to withholding and other taxes imposed by foreign countries. Corporate actions (including cash dividends) are recorded net of non-reclaimable foreign tax withholdings on the ex-dividend date. Tax conventions between certain countries and the United States may reduce or eliminate such taxes.
E. Expenses
Expenses of the Trust, which are directly identifiable to a specific Fund, are applied to that Fund. Expenses which are not readily identifiable to a specific Fund are allocated in such a manner as deemed equitable, taking into consideration the nature and type of expense and the relative net assets of each Fund.
Each Fund (except for NASDAQ Internet Portfolio) is responsible for all of its expenses, including the investment advisory fees, costs of transfer agency, custody, fund administration, legal, audit and other services, interest, taxes, brokerage commissions and other expenses connected with executions of portfolio transactions, any distribution fees or expenses and extraordinary expenses.
The NASDAQ Internet Portfolio has agreed to pay an annual unitary management fee to Invesco PowerShares Capital Management LLC (the "Adviser"). The Adviser has agreed to pay for substantially all expenses of the NASDAQ Internet Portfolio, including the cost of transfer agency, custody, fund administration, legal, audit and other services, except for advisory fees, distribution fees, if any, brokerage expenses, taxes, interest, litigation expenses and other extraordinary expenses.
F. Dividends and Distributions to Shareholders
Each Fund declares and pays dividends from net investment income, if any, to its shareholders quarterly and records on ex-dividend date. Each Fund distributes net realized taxable capital gains, if any, generally annually in cash and records on ex-dividend date. Such distributions on a tax basis are determined in conformity with income tax regulations which may differ from accounting principles generally accepted in the United States of America. Distributions in excess of tax basis earnings and profits, if any, are reported in such Fund's financial statements as a tax return of capital at fiscal period end.
G. Equalization
All Funds use the accounting practice of equalization. This accounting method is used to keep the continuing shareholder's per share equity in undistributed net investment income from being affected by the continuous sales and redemptions of capital shares. Equalization is calculated on a per share basis whereby a portion of the proceeds from the sales and cost of repurchases of capital shares is applied to undistributed net investment income. The amount of equalization is disclosed in the Statements of Changes in Net Assets as undistributed net investment income (loss) included in the price of capital shares issued or redeemed. The distributions to shareholders of amounts so applied may be deemed to be a return of capital for tax purposes to the extent that such distributions exceed taxable income.
63
Notes to Financial Statements (Continued)
PowerShares Exchange-Traded Fund Trust
April 30, 2009
Note 3. Investment Advisory Agreement and Other Agreements
The Trust has entered into an Investment Advisory Agreement with the Adviser under which the Adviser has overall responsibility as the Funds' investment adviser for the selection and ongoing monitoring of the Funds' investments, managing the Funds' business affairs and providing certain clerical, bookkeeping and other administrative services. Each Fund (except for NASDAQ Internet Portfolio) agreed to pay the Adviser an annual fee of 0.50% of the Fund's average net assets. The NASDAQ Internet Portfolio has agreed to pay the Adviser an annual unitary management fee of 0.60% of the Fund's average daily net assets and the Adviser has agreed to pay for substantially all expenses of the NASDAQ Internet Portfolio, including the cost of transfer agency, custody, fund administration, legal, audit and other services, except for advisory fees and distribution fees, if any, brokerage expenses, taxes, interest, litigation expenses and other extraordinary expenses.
The Adviser has entered into an Amended and Restated Excess Expense Agreement (the "Excess Expense Agreement") with the Trust, under which the Adviser has agreed to waive fees and/or pay Fund expenses to the extent necessary to prevent the operating expenses of each Fund other than the NASDAQ Internet Portfolio (excluding interest expense, brokerage commissions and other trading expenses, sub-licensing fees, offering costs, taxes and extraordinary expenses) from exceeding 0.60% of the Fund's average daily net assets per year (the "Expense Cap"), at least until August 31, 2010. Offering costs excluded from the Expense Cap are: (a) legal fees pertaining to the Funds' shares offered for sale; (b) Securities and Exchange Commission and state registration fees; and (c) initial fees paid to be listed on an exchange.
The Excess Expense Agreement provides that the expenses borne by the Adviser are subject to recapture by the Adviser for up to three years from the date the fee or expense was borne by the Adviser, but no recapture payment will be made by a Fund if it would result in the Fund exceeding its Expense Cap as specified above. The Excess Expense Agreement does not apply to the NASDAQ Internet Portfolio.
The net amount of fees waived and other expenses assumed by the Adviser and the amount of recapture paid to the Adviser pursuant to the Excess Expense Agreement are collectively referred to as "(Waivers) and/or Recapture". The net amounts of (Waivers) and/or Recapture for the year ended April 30, 2009 are shown on the Statements of Operations.
The amounts available for potential future recapture by the Adviser under the Excess Expense Agreement and the expiration schedule at April 30, 2009 are as follows:
| Total Potential | Potential Recapture Amounts Expiring | ||||||||||||||||||
| Recapture Amounts | 04/30/10 | 04/30/11 | 04/30/12 | ||||||||||||||||
| Dynamic Basic Materials Sector Portfolio | $ | 229,839 | $ | 40,662 | $ | 91,354 | $ | 97,823 | |||||||||||
| Dynamic Consumer Discretionary Sector Portfolio | 250,018 | 40,242 | 103,476 | 106,300 | |||||||||||||||
| Dynamic Consumer Staples Sector Portfolio | 236,573 | 45,563 | 98,981 | 92,029 | |||||||||||||||
| Dynamic Energy Sector Portfolio | 229,403 | 40,260 | 90,453 | 98,690 | |||||||||||||||
| Dynamic Financial Sector Portfolio | 246,366 | 42,652 | 104,352 | 99,362 | |||||||||||||||
| Dynamic Healthcare Sector Portfolio | 155,443 | 31,968 | 54,627 | 68,848 | |||||||||||||||
| Dynamic Industrials Sector Portfolio | 216,748 | 45,415 | 88,624 | 82,709 | |||||||||||||||
| Dynamic Technology Sector Portfolio | 222,743 | 42,859 | 89,766 | 90,118 | |||||||||||||||
| Dynamic Telecommunications & Wireless Portfolio | 353,917 | 135,603 | 113,750 | 104,564 | |||||||||||||||
| Dynamic Utilities Portfolio | 324,547 | 139,461 | 97,438 | 87,648 | |||||||||||||||
64
Notes to Financial Statements (Continued)
PowerShares Exchange-Traded Fund Trust
April 30, 2009
The Trust has entered into a Distribution Agreement with Invesco Aim Distributors, Inc. (the "Distributor"), which serves as the Distributor of Creation Units for each Fund. The Distributor does not maintain a secondary market in Shares.
The Adviser has entered into a licensing agreement for each Fund with the following Licensors:
| Fund | Licensor | ||||||
| Dynamic Basic Materials Sector Portfolio | NYSE AMEX | ||||||
| Dynamic Consumer Discretionary Sector Portfolio | NYSE AMEX | ||||||
| Dynamic Consumer Staples Sector Portfolio | NYSE AMEX | ||||||
| Dynamic Energy Sector Portfolio | NYSE AMEX | ||||||
| Dynamic Financial Sector Portfolio | NYSE AMEX | ||||||
| Dynamic Healthcare Sector Portfolio | NYSE AMEX | ||||||
| Dynamic Industrials Sector Portfolio | NYSE AMEX | ||||||
| Dynamic Technology Sector Portfolio | NYSE AMEX | ||||||
| Dynamic Telecommunications & Wireless Portfolio | NYSE AMEX | ||||||
| Dynamic Utilities Portfolio | NYSE AMEX | ||||||
| NASDAQ Internet Portfolio | NASDAQ OMX Group, Inc. | ||||||
The index name trademarks are owned by the respective Licensors. These trademarks have been licensed to the Adviser for use with the Funds. The Funds are not sponsored, endorsed, sold or promoted by the Licensors and the Licensors make no representation regarding the advisability of investing in any of these Funds. The Trust has entered into a sub-licensing agreement under which the Funds (other than the NASDAQ Internet Portfolio) are required to pay the sub-licensing fees which are shown on the Statements of Operations.
The Trust has entered into service agreements whereby The Bank of New York Mellon, a wholly-owned subsidiary of The Bank of New York Mellon Corporation, serves as the administrator, custodian, fund accounting and transfer agent for each Fund.
The custodian has agreed to provide overdraft protection to the Funds according to the terms of the service agreement.
Note 4. Additional Valuation Information
The Funds adopted the provisions of Statement of Financial Accounting Standards No. 157, "Fair Value Measurements" ("SFAS 157"), effective with the beginning of the Fund's fiscal year. SFAS 157 defines fair value as the price that would be received to sell an asset or paid to transfer a liability in an orderly transaction between market participants at the measurement date. SFAS 157 establishes a hierarchy that prioritizes the inputs to valuation methods giving the highest priority to readily available unadjusted quoted prices in an active market for identical assets (Level 1) and the lowest priority to significant unobservable inputs (Level 3) generally when market prices are not readily available or are unreliable. Based on the valuation inputs, the securities or other investments are tiered
65
Notes to Financial Statements (Continued)
PowerShares Exchange-Traded Fund Trust
April 30, 2009
into one of three levels. Changes in valuation methods may result in transfers in or out of an investment's assigned level:
Level 1 – Prices are determined using quoted prices in an active market for identical assets.
Level 2 – Prices are determined using other significant observable inputs. Observable inputs are inputs that other market participants may use in pricing a security. These may include quoted prices for similar securities, interest rates, prepayment speeds, credit risk and others.
Level 3 – Prices are determined using significant unobservable inputs. In situations where quoted prices or observable inputs are unavailable (for example, when there is little or no market activity for an investment at the end of the period), unobservable inputs may be used. Unobservable inputs reflect the Fund's own assumptions about the factors market participants would use in determining fair value of the securities or instruments and would be based on the best available information.
The following is a summary of the tiered valuation input levels, as of the end of the reporting period, April 30, 2009. The level assigned to the securities valuations may not be an indication of the risk or liquidity associated with investing in those securities. Because of the inherent uncertainties of valuation, the values reflected in the financial statements may materially differ from the value received upon actual sale of those investments.
| Investments in Securities | |||||||||||||||||||
| Level 1 | Level 2 | Level 3 | Total | ||||||||||||||||
| Dynamic Basic Materials Sector Portfolio | $ | 18,173,991 | $ | — | $ | — | $ | 18,173,991 | |||||||||||
| Dynamic Consumer Discretionary Sector Portfolio | 13,694,905 | — | — | 13,694,905 | |||||||||||||||
| Dynamic Consumer Staples Sector Portfolio | 37,462,497 | �� | — | 37,462,497 | |||||||||||||||
| Dynamic Energy Sector Portfolio | 25,921,320 | — | — | 25,921,320 | |||||||||||||||
| Dynamic Financial Sector Portfolio | 14,664,382 | — | — | 14,664,382 | |||||||||||||||
| Dynamic Healthcare Sector Portfolio | 71,623,720 | — | — | 71,623,720 | |||||||||||||||
| Dynamic Industrials Sector Portfolio | 60,346,982 | — | — | 60,346,982 | |||||||||||||||
| Dynamic Technology Sector Portfolio | 25,985,337 | — | — | 25,985,337 | |||||||||||||||
| Dynamic Telecommunications & Wireless Portfolio | 14,500,769 | — | — | 14,500,769 | |||||||||||||||
| Dynamic Utilities Portfolio | 42,021,565 | — | — | 42,021,565 | |||||||||||||||
| NASDAQ Internet Portfolio | 1,789,427 | — | — | 1,789,427 | |||||||||||||||
Note 5. Federal Income Taxes
At April 30, 2009, the costs of investments on a tax basis including the adjustments for financial reporting purposes as of the most recently completed Federal income tax reporting period were as follows:
| Cost | |||||||
| Dynamic Basic Materials Sector Portfolio | $ | 21,629,677 | |||||
| Dynamic Consumer Discretionary Sector Portfolio | 12,085,669 | ||||||
| Dynamic Consumer Staples Sector Portfolio | 39,547,789 | ||||||
| Dynamic Energy Sector Portfolio | 26,283,101 | ||||||
| Dynamic Financial Sector Portfolio | 16,717,488 | ||||||
| Dynamic Healthcare Sector Portfolio | 78,683,560 | ||||||
66
Notes to Financial Statements (Continued)
PowerShares Exchange-Traded Fund Trust
April 30, 2009
| Cost | |||||||
| Dynamic Industrials Sector Portfolio | $ | 59,098,581 | |||||
| Dynamic Technology Sector Portfolio | 22,247,564 | ||||||
| Dynamic Telecommunications & Wireless Portfolio | 16,345,429 | ||||||
| Dynamic Utilities Portfolio | 46,702,168 | ||||||
| NASDAQ Internet Portfolio | 2,316,898 | ||||||
At April 30, 2009, the components of accumulated earning/loss on a tax-basis were as follows:
| Accumulated Earnings | Other Temporary Differences | Net Accumulated Capital and other Gains (Losses) | Net Unrealized Appreciation (Depreciation) | Gross Unrealized Appreciation | Gross Unrealized Depreciation | Total Accumulated Earnings (Loss) | |||||||||||||||||||||||||
| Dynamic Basic Materials Sector Portfolio | $ | 74,943 | $ | (3,065 | ) | $ | (7,320,531 | ) | $ | (3,455,686 | ) | $ | 1,614,809 | $ | (5,070,495 | ) | $ | (10,704,339 | ) | ||||||||||||
| Dynamic Consumer Discretionary Sector Portfolio | — | (2,660 | ) | (3,323,405 | ) | 1,609,236 | 1,704,836 | (95,600 | ) | (1,716,829 | ) | ||||||||||||||||||||
| Dynamic Consumer Staples Sector Portfolio | 204,333 | (2,983 | ) | (5,645,512 | ) | (2,085,292 | ) | 3,160,820 | (5,246,112 | ) | (7,529,454 | ) | |||||||||||||||||||
| Dynamic Energy Sector Portfolio | 29,045 | (3,049 | ) | (8,390,865 | ) | (361,781 | ) | 3,049,259 | (3,411,040 | ) | (8,726,650 | ) | |||||||||||||||||||
| Dynamic Financial Sector Portfolio | 59,549 | (2,840 | ) | (5,915,381 | ) | (2,053,106 | ) | 810,213 | (2,863,319 | ) | (7,911,778 | ) | |||||||||||||||||||
| Dynamic Healthcare Sector Portfolio | 97,873 | (4,502 | ) | (32,898,555 | ) | (7,059,840 | ) | 4,100,970 | (11,160,810 | ) | (39,865,024 | ) | |||||||||||||||||||
| Dynamic Industrials Sector Portfolio | 145,813 | (3,438 | ) | (26,338,595 | ) | 1,248,401 | 8,955,523 | (7,707,122 | ) | (24,947,819 | ) | ||||||||||||||||||||
| Dynamic Technology Sector Portfolio | — | (3,182 | ) | (17,903,435 | ) | 3,737,773 | 4,922,305 | (1,184,532 | ) | (14,168,844 | ) | ||||||||||||||||||||
| Dynamic Telecommunications & Wireless Portfolio | 54,531 | (2,853 | ) | (9,447,339 | ) | (1,844,660 | ) | 1,364,433 | (3,209,093 | ) | (11,240,321 | ) | |||||||||||||||||||
| Dynamic Utilities Portfolio | 532,648 | (3,330 | ) | (6,961,155 | ) | (4,680,603 | ) | 1,806,841 | (6,487,444 | ) | (11,112,440 | ) | |||||||||||||||||||
| NASDAQ Internet Portfolio | — | — | (147,432 | ) | (527,471 | ) | 52,307 | (579,778 | ) | (674,903 | ) | ||||||||||||||||||||
Distributions to Shareholders:
The tax character of distributions paid during the year ended April 30, 2009 was as follows:
| Year ended April 30, 2009 | Year ended April 30, 2008 | ||||||||||
| Distributions paid from Ordinary Income | Distributions paid from Ordinary Income | ||||||||||
| Dynamic Basic Materials Sector Portfolio | $ | 463,180 | $ | 220,357 | |||||||
| Dynamic Consumer Discretionary Sector Portfolio | 83,601 | 70,989 | |||||||||
| Dynamic Consumer Staples Sector Portfolio | 473,177 | 286,444 | |||||||||
| Dynamic Energy Sector Portfolio | 135,550 | 75,016 | |||||||||
| Dynamic Financial Sector Portfolio | 254,006 | 115,884 | |||||||||
| Dynamic Industrials Sector Portfolio | 413,638 | 164,357 | |||||||||
| Dynamic Telecommunications & Wireless Portfolio | 194,232 | 353,595 | |||||||||
| Dynamic Utilities Portfolio | 1,226,368 | 935,373 | |||||||||
67
Notes to Financial Statements (Continued)
PowerShares Exchange-Traded Fund Trust
April 30, 2009
| Year ended April 30, 2009 | Year ended April 30, 2008 | ||||||||||
| Distributions paid from Return of Capital | Distributions paid from Return of Capital | ||||||||||
| Dynamic Consumer Discretionary Sector Portfolio | $ | 1,843 | $ | 11,300 | |||||||
| Dynamic Telecommunications & Wireless Portfolio | — | 339,866 | |||||||||
| NASDAQ Internet Portfolio | 1,258 | — | |||||||||
At April 30, 2009, for Federal income tax purposes, the Funds had capital loss carryforwards available as shown in the table below, to the extent provided by the regulations, to offset future capital gains through the years indicated. To the extent that these loss carryforwards are used to offset future capital gains, it is probable that the capital gains so offset will not be distributed to shareholders. The use of some portion of the capital loss carryforward by any one Fund may be limited by Federal tax rules. Among other, certain rules limit the use of the carryforward when there has been a greater than fifty percent change in ownership of a Fund.
| Year of Expiration | Total | ||||||||||||||||||
| 2015 | 2016 | 2017 | Amounts | ||||||||||||||||
| Dynamic Basic Materials Sector Portfolio | $ | — | $ | 205,528 | $ | 3,783,798 | $ | 3,989,326 | |||||||||||
| Dynamic Consumer Discretionary Sector Portfolio | — | 1,249,661 | 1,993,654 | 3,243,315 | |||||||||||||||
| Dynamic Consumer Staples Sector Portfolio | — | 634,544 | 2,156,980 | 2,791,524 | |||||||||||||||
| Dynamic Energy Sector Portfolio | — | 880,885 | 2,836,269 | 3,717,154 | |||||||||||||||
| Dynamic Financial Sector Portfolio | — | 614,940 | 1,821,971 | 2,436,911 | |||||||||||||||
| Dynamic Healthcare Sector Portfolio | — | 2,234,184 | 17,890,879 | 20,125,063 | |||||||||||||||
| Dynamic Industrials Sector Portfolio | — | 1,476,057 | 6,525,387 | 8,001,444 | |||||||||||||||
| Dynamic Technology Sector Portfolio | — | 2,465,875 | 8,220,697 | 10,686,572 | |||||||||||||||
| Dynamic Telecommunications & Wireless Portfolio | 1,394,222 | 1,538,650 | 3,596,484 | 6,529,356 | |||||||||||||||
| Dynamic Utilities Portfolio | 430,964 | 2,124,736 | 1,366,073 | 3,921,773 | |||||||||||||||
| NASDAQ Internet Portfolio | — | — | 2,112 | 2,112 | |||||||||||||||
Capital losses incurred after October 31 ("post-October losses") within the taxable year are deemed to arise on the first business day of each Fund's next taxable year.
During the year ended April 30, 2009, the Funds incurred and will elect to defer net capital losses as follows:
| Post-October Losses | |||||||
| Dynamic Basic Materials Sector Portfolio | $ | 3,331,205 | |||||
| Dynamic Consumer Discretionary Sector Portfolio | 80,090 | ||||||
| Dynamic Consumer Staples Sector Portfolio | 2,853,988 | ||||||
| Dynamic Energy Sector Portfolio | 4,673,711 | ||||||
| Dynamic Financial Sector Portfolio | 3,478,470 | ||||||
| Dynamic Healthcare Sector Portfolio | 12,773,492 | ||||||
68
Notes to Financial Statements (Continued)
PowerShares Exchange-Traded Fund Trust
April 30, 2009
| Post-October Losses | |||||||
| Dynamic Industrials Sector Portfolio | $ | 18,337,151 | |||||
| Dynamic Technology Sector Portfolio | 7,216,863 | ||||||
| Dynamic Telecommunications & Wireless Portfolio | 2,917,983 | ||||||
| Dynamic Utilities Portfolio | 3,039,382 | ||||||
| NASDAQ Internet Portfolio | 145,320 | ||||||
In order to present shares of beneficial interest and accumulated net realized gains or losses on the Statements of Assets and Liabilities that more closely represent their tax character, certain adjustments have been made to shares of beneficial interest, undistributed net investment income or loss and accumulated net realized gain or loss on investments. These differences are primarily due to redemptions-in-kind, investments in partnerships, wash sales, book equalization, and net operating losses, if any. These adjustments have no effect on net assets. For the year ended April 30, 2009, the adjustments were as follows:
| Undistributed Net Investment Income (Loss) | Accumulated Net Realized Gain | Shares of Beneficial Interest | |||||||||||||
| Dynamic Basic Materials Sector Portfolio | $ | 6,851 | $ | 5,774,142 | $ | (5,780,993 | ) | ||||||||
| Dynamic Consumer Discretionary Sector Portfolio | 56,031 | 3,574,788 | (3,630,819 | ) | |||||||||||
| Dynamic Consumer Staples Sector Portfolio | (217,757 | ) | 1,572,846 | (1,355,089 | ) | ||||||||||
| Dynamic Energy Sector Portfolio | (94,639 | ) | 2,268,428 | (2,173,789 | ) | ||||||||||
| Dynamic Financial Sector Portfolio | (2,117 | ) | 4,559,857 | (4,557,740 | ) | ||||||||||
| Dynamic Healthcare Sector Portfolio | (23,648 | ) | 16,476,273 | (16,452,625 | ) | ||||||||||
| Dynamic Industrials Sector Portfolio | (83,792 | ) | 12,809,105 | (12,725,313 | ) | ||||||||||
| Dynamic Technology Sector Portfolio | 44,582 | 9,448,206 | (9,492,788 | ) | |||||||||||
| Dynamic Telecommunications & Wireless Portfolio | 8,969 | 835,633 | (844,602 | ) | |||||||||||
| Dynamic Utilities Portfolio | 189 | 6,731,437 | (6,731,626 | ) | |||||||||||
| NASDAQ Internet Portfolio | 8,937 | — | (8,937 | ) | |||||||||||
Note 6. Investment Transactions
For the year ended April 30, 2009, the cost of securities purchased and proceeds from sales of securities, excluding short-term securities, money market funds and in-kind transactions, were as follows:
| Purchases | Sales | ||||||||||
| Dynamic Basic Materials Sector Portfolio | $ | 13,401,191 | $ | 13,982,169 | |||||||
| Dynamic Consumer Discretionary Sector Portfolio | 17,224,993 | 17,486,748 | |||||||||
| Dynamic Consumer Staples Sector Portfolio | 15,351,107 | 15,208,871 | |||||||||
| Dynamic Energy Sector Portfolio | 19,383,605 | 19,111,853 | |||||||||
| Dynamic Financial Sector Portfolio | 13,388,812 | 14,260,265 | |||||||||
| Dynamic Healthcare Sector Portfolio | 90,517,971 | 89,654,670 | |||||||||
| Dynamic Industrials Sector Portfolio | 42,800,114 | 42,711,819 | |||||||||
| Dynamic Technology Sector Portfolio | 31,360,234 | 31,691,869 | |||||||||
| Dynamic Telecommunications & Wireless Portfolio | 7,254,544 | 7,949,755 | |||||||||
| Dynamic Utilities Portfolio | 31,155,275 | 30,917,780 | |||||||||
| NASDAQ Internet Portfolio | 417,882 | 428,086 | |||||||||
69
Notes to Financial Statements (Continued)
PowerShares Exchange-Traded Fund Trust
April 30, 2009
For the year ended April 30, 2009, in-kind transactions associated with creations and redemptions were as follows:
| Securities Received | Securities Delivered | ||||||||||
| Dynamic Basic Materials Sector Portfolio | $ | 24,033,385 | $ | 30,542,247 | |||||||
| Dynamic Consumer Discretionary Sector Portfolio | 44,348,558 | 38,897,441 | |||||||||
| Dynamic Consumer Staples Sector Portfolio | 36,914,373 | 16,141,673 | |||||||||
| Dynamic Energy Sector Portfolio | 41,721,358 | 43,504,085 | |||||||||
| Dynamic Financial Sector Portfolio | 19,789,879 | 16,863,943 | |||||||||
| Dynamic Healthcare Sector Portfolio | 100,917,378 | 112,294,073 | |||||||||
| Dynamic Industrials Sector Portfolio | 120,931,812 | 63,651,269 | |||||||||
| Dynamic Technology Sector Portfolio | 62,183,207 | 56,637,383 | |||||||||
| Dynamic Telecommunications & Wireless Portfolio | 12,753,696 | 11,100,610 | |||||||||
| Dynamic Utilities Portfolio | 78,709,734 | 60,350,503 | |||||||||
| NASDAQ Internet Portfolio | 2,472,463 | — | |||||||||
Gains on in-kind transactions are generally not considered taxable gains for Federal income tax purposes.
Note 7. Trustees' Fees
The Funds compensate each Trustee who is not an employee of the Adviser or its affiliates. With respect to the NASDAQ Internet Portfolio, the Adviser, as result of the unitary management fee, pays for such compensation. The "Interested" Trustee of the Trust does not receive any Trustees' fees.
The Trust has adopted a deferred compensation plan (the "Plan"). Under the Plan, a Trustee who is not an "interested person" (as defined in the 1940 Act) (an "Independent Trustee") and has executed a Deferred Fee Agreement (a "Participating Trustee") may defer receipt of all or a portion of his compensation ("Deferral Fees"). Such Deferral Fees are deemed to be invested in selected PowerShares Funds. The Deferral Fees payable to the Participating Trustee are valued as of the date such Fees would have been paid to the Participating Trustee. The value increases with contributions or with increases in the value of the shares selected, and the value decreases with distributions or with declines in the value of the shares selected.
Note 8. Capital
Shares are created and redeemed by the Trust only in Creation Unit size aggregations of 100,000. Only Authorized Participants are permitted to purchase or redeem Creation Units from the Funds. Such transactions are generally permitted on an in-kind basis, with a balancing cash component to equate the transaction to the net asset value per unit of each Fund of the Trust on the transaction date. Cash may be substituted equivalent to the value of certain securities generally when they are not available in sufficient quantity for delivery, not eligible for trading by the Authorized Participant or as a result of other market circumstances.
Note 9. Indemnifications
Under the Trust's organizational documents, its officers and Trustees are indemnified against certain liabilities arising out of the performance of their duties to the Trust. Each Independent Trustee is also indemnified against certain liabilities arising out of the performance of his duties to the Trust pursuant to
70
Notes to Financial Statements (Continued)
PowerShares Exchange-Traded Fund Trust
April 30, 2009
an Indemnification Agreement between the Independent Trustee and the Trust. Additionally, in the normal course of business, the Trust enters into contracts with service providers that contain general indemnification clauses. The Trust's maximum exposure under these arrangements is unknown, as this would involve future claims that may be made against the Trust that have not yet occurred. However, based on experience, the Trust believes the risk of loss to be remote.
71
Report of Independent Registered Public Accounting Firm
To the Board of Trustees and Shareholders of PowerShares Exchange-Traded Fund Trust:
In our opinion, the accompanying statements of assets and liabilities, including the schedules of investments, and the related statements of operations and of changes in net assets and the financial highlights present fairly, in all material respects, the financial position of each of the portfolios indicated in Note 1 of the financial statements (each a portfolio of PowerShares Exchange-Traded Fund Trust, hereafter referred to as the "Trust") at April 30, 2009, and the results of each of their operations, the changes in each of their net assets, and the financial highlights for each of the periods presented, in conformity with accounting principles generally accepted in the United States of America. These financial statements and financial highlights (hereafter referred to as "financial statements") are the responsibility of the Trust's management; our responsibility is to express an opinion on these financial statements based on our audits. We conducted our audits of these financial statements in accordance with the standards of the Public Company Accounting Oversight Board (United States). Those standards require that we plan and perform the audits to obtain reasonable assurance about whether the financial statements are free of material misstatement. An audit includes examining, on a test basis, evidence supporting the amounts and disclosures in the financial statements, assessing the accounting principles used and significant estimates made by management, and evaluating the overall financial statement presentation. We believe that our audits, which included confirmation of securities at April 30, 2009 by correspondence with the custodian and brokers, and the application of alternative auditing procedures where securities purchased had not been received, provide a reasonable basis for our opinion.
PricewaterhouseCoopers LLP
New York, New York
June 25, 2009
72
Supplemental Information
Tax Information
Form 1099-DIV, Form 1042-S and other year-end tax information provide shareholders with actual calendar year amounts that should be included in their tax returns. Shareholders should consult their tax advisors.
The following distribution information is being provided as required by the Internal Revenue Code or to meet a specific state's requirement.
Each Fund designates the following amounts or, if subsequently determined to be different, the maximum amount allowable for its fiscal year ended April 30, 2009:
Federal and State Income Tax
| Qualified Dividend Income* | Corporate Dividends Received Deduction* | ||||||||||
| Dynamic Basic Materials Sector Portfolio | 100 | % | 100 | % | |||||||
| Dynamic Consumer Discretionary Sector Portfolio | 100 | % | 100 | % | |||||||
| Dynamic Consumer Staples Sector Portfolio | 100 | % | 100 | % | |||||||
| Dynamic Energy Sector Portfolio | 100 | % | 100 | % | |||||||
| Dynamic Financial Sector Portfolio | 100 | % | 100 | % | |||||||
| Dynamic Healthcare Sector Portfolio | 0 | % | 0 | % | |||||||
| Dynamic Industrials Sector Portfolio | 100 | % | 100 | % | |||||||
| Dynamic Technology Sector Portfolio | 0 | % | 0 | % | |||||||
| Dynamic Telecommunications & Wireless Portfolio | 100 | % | 100 | % | |||||||
| Dynamic Utilities Portfolio | 100 | % | 100 | % | |||||||
| NASDAQ Internet Portfolio | 0 | % | 0 | % | |||||||
* The above percentage is based on ordinary income dividends paid to shareholders during the Fund's fiscal year.
73
Supplemental Information (Continued)
Trustees and Officers
The Independent Trustees, the Trustee who is affiliated with the Adviser (the "Management Trustee") and the executive officers of the Trust, their term of office and length of time served, their principal business occupations during at least the past five years, the number of portfolios in the Fund Complex (as defined below) overseen by each Trustee and the other directorships, if any, held by a Trustee, are shown below.
| Name, Address, and Age Independent Trustee | Position(s) with Trust | Length Time Served* | Principal Occupation(s) During Past 5 Years | Number of Portfolios in Fund Complex** Overseen by Trustee | Other Directorships Held by Trustee | ||||||||||||||||||
| Ronn R. Bagge 51 YQA Capital Management, LLC 1755 S. Naperville Road Suite 100 Wheaton, IL 60187 | Trustee | Since 2003 | YQA Capital Management LLC (July 1998-Present); formerly Owner/CEO of Electronic Dynamic Balancing Co., Inc. (high-speed rotating equipment service provider) | 119 | None | ||||||||||||||||||
| Marc M. Kole 48 c/o Invesco PowerShares Capital Management LLC 301 W. Roosevelt Road Wheaton, IL 60187 | Trustee | Since 2006 | Vice President of Finance and Accounting, Hope Network (social services) (November 2008-Present); formerly Assistant Vice President and Controller, Priority Health (health insurance) (September 2005-April 2008); Senior Vice President of Finance, United Healthcare (health insurance) (July 2004-July 2005); Senior Vice President of Finance, Oxford Health Plans (June 2000-July 2004) | 119 | None | ||||||||||||||||||
* This is the date the Trustee began serving the Trust. Each Trustee serves an indefinite term, until his successor is elected.
** Fund Complex includes all open-end funds (including all of their portfolios) advised by the Adviser. At April 30, 2009, the Fund Complex consists of the Trust's 75 portfolios and three other exchange-traded fund trusts with 44 portfolios advised by the Adviser.
74
Supplemental Information (Continued)
Trustees and Officers (Continued)
| Name, Address, and Age Independent Trustee | Position(s) with Trust | Length Time Served* | Principal Occupation(s) During Past 5 Years | Number of Portfolios in Fund Complex** Overseen by Trustee | Other Directorships Held by Trustee | ||||||||||||||||||
| Philip M. Nussbaum 47 c/o Invesco PowerShares Capital Management LLC 301 W. Roosevelt Road Wheaton, IL 60187 | Trustee | Since 2003 | Chairman, Performance Trust Capital Partners (formerly Betzold, Berg, Nussbaum & Heitman, Inc.) (November 2004-Present); formerly Managing Director, Communication Institute (May 2002-August 2003); Executive Vice President of Finance, Betzold, Berg, Nussbaum & Heitman, Inc. (March 1994-1999) | 119 | None | ||||||||||||||||||
| Donald H. Wilson 49 c/o Invesco PowerShares Capital Management LLC 301 W. Roosevelt Road Wheaton, IL 60187 | Trustee | Since 2006 | President and Chief Operating Officer, AMCORE Financial, Inc. (bank holding company) (August 2007-April 2009), formerly Executive Vice President and Chief Financial Officer, AMCORE Financial, Inc. (February 2006-August 2007); Senior Vice President and Treasurer, Marshall & Ilsley Corp. (bank holding company) (May 1995-February 2006) | 119 | None | ||||||||||||||||||
* This is the date the Trustee began serving the Trust. Each Trustee serves an indefinite term, until his successor is elected.
** Fund Complex includes all open-end funds (including all of their portfolios) advised by the Adviser. At April 30, 2009, the Fund Complex consists of the Trust's 75 portfolios and three other exchange-traded fund trusts with 44 portfolios advised by the Adviser.
75
Supplemental Information (Continued)
Trustees and Officers (Continued)
| Name, Address, and Age of Management Trustee | Position(s) with Trust | Length Time Served* | Principal Occupation(s) During Past 5 Years | Number of Portfolios in Fund Complex*** Overseen by Trustee | Other Directorships Held by Trustee | ||||||||||||||||||
| H. Bruce Bond** 45 Invesco PowerShares Capital Management LLC 301 W. Roosevelt Road Wheaton, IL 60187 | Chairman of the Board, Trustee and President | Since 2003 | Managing Director, Invesco PowerShares Capital Management LLC (August 2002-Present); formerly Manager, Nuveen Investments (April 1998-August 2002) | 119 | None | ||||||||||||||||||
Availability of Additional Information About the Trustees
The Statement of Additional Information includes additional information about the Trustees and is available, without charge, upon request at 800.337.4246.
* This is the date the Management Trustee began serving the Trust. Each Trustee serves an indefinite term, until his successor is elected. Each officer serves a one year term, until his successor is elected.
** "Interested person" as defined in Section 2(a)(19) of the 1940 Act.
*** Fund Complex includes all open-end funds (including all of their portfolios) advised by the Adviser. At April 30, 2009, the Fund Complex consists of the Trust's 75 portfolios and three other exchange-traded fund trusts with 44 portfolios advised by the Adviser.
76
Supplemental Information (Continued)
Trustees and Officers (Continued)
| Name, Address, and Age of Officers | Position(s) with Trust | Length Time Served* | Principal Occupation(s) During Past 5 Years | ||||||||||||
| Bruce T. Duncan 54 Invesco PowerShares Capital Management LLC 301 W. Roosevelt Road Wheaton, IL 60187 | Chief Financial Officer, Treasurer and Secretary | Chief Financial Officer and Treasurer Since 2006 Secretary Since 2008 | Senior Vice President of Finance, Invesco PowerShares Capital Management LLC (September 2005-Present); formerly Private Practice Attorney (2000-2005); Vice President of Investor Relations, The ServiceMaster Company (1994-2000); Vice President of Taxes, The ServiceMaster Company (1990-2000) | ||||||||||||
| Kevin R. Gustafson 43 Invesco PowerShares Capital Management LLC 301 W. Roosevelt Road Wheaton, IL 60187 | Chief Compliance Officer | Since 2004 | General Counsel, Invesco PowerShares Capital Management LLC (September 2004-Present); formerly Chief Compliance Officer, Invesco PowerShares Capital Management LLC (September 2004-April 2008) | ||||||||||||
| John W. Southard, Jr., CFA, MBA 39 Invesco PowerShares Capital Management LLC 301 West Roosevelt Road Wheaton, IL 60187 | Vice President | Since 2003 | Managing Director, Invesco PowerShares Capital Management LLC (August 2002-Present); formerly, Treasurer of the Trust (April 2003-April 2006); Senior Equity Analyst, Charles Schwab & Company (May 2001-August 2002) | ||||||||||||
* This is the period for which the Officers began serving the Trust. Each Officer serves one year term, until his successor is elected.
77
Board Considerations Regarding Continuation of Investment Advisory Agreement
At a meeting held on April 16, 2009, the Board of Trustees of the PowerShares Exchange-Traded Fund Trust (the "Trust"), including the Independent Trustees, unanimously approved the continuation of the Investment Advisory Agreement between Invesco PowerShares Capital Management LLC (the "Adviser") and the Trust for the following 70 series (each, a "Fund" and collectively, the "Funds"):
PowerShares Dynamic Market Portfolio
PowerShares Dynamic OTC Portfolio
PowerShares Golden Dragon Halter USX China Portfolio
PowerShares High Yield Equity Dividend AchieversTM Portfolio
PowerShares WilderHill Clean Energy Portfolio
PowerShares Dynamic Large Cap Growth Portfolio
PowerShares Dynamic Large Cap Value Portfolio
PowerShares Dynamic Mid Cap Growth Portfolio
PowerShares Dynamic Mid Cap Value Portfolio
PowerShares Dynamic Small Cap Growth Portfolio
PowerShares Dynamic Small Cap Value Portfolio
PowerShares Dynamic Biotechnology & Genome Portfolio
PowerShares Dynamic Food & Beverage Portfolio
PowerShares Dynamic Leisure and Entertainment Portfolio
PowerShares Dynamic Media Portfolio
PowerShares Dynamic Networking Portfolio
PowerShares Dynamic Pharmaceuticals Portfolio
PowerShares Dynamic Semiconductors Portfolio
PowerShares Dynamic Software Portfolio
PowerShares Zacks Micro Cap Portfolio
PowerShares Aerospace & Defense Portfolio
PowerShares Dynamic Hardware & Consumer Electronics Portfolio
PowerShares Dynamic Telecommunications & Wireless Portfolio
PowerShares Value Line Timeliness Select Portfolio
PowerShares Dividend AchieversTM Portfolio
PowerShares International Dividend AchieversTM Portfolio
PowerShares High Growth Rate Dividend AchieversTM Portfolio
PowerShares Zacks Small Cap Portfolio
PowerShares Dynamic Building and Construction Portfolio
PowerShares Dynamic Energy Exploration and Production Portfolio
PowerShares Dynamic Insurance Portfolio
PowerShares Dynamic Oil and Gas Services Portfolio
PowerShares Dynamic Retail Portfolio
PowerShares Dynamic Utilities Portfolio
PowerShares Lux Nanotech Portfolio
PowerShares FTSE RAFI US 1000 Portfolio
PowerShares FTSE RAFI US 1500 Small-Mid Portfolio
PowerShares Water Resources Portfolio
PowerShares Dynamic Energy Sector Portfolio
PowerShares Dynamic Financials Sector Portfolio
PowerShares Dynamic Healthcare Sector Portfolio
PowerShares Dynamic Industrials Sector Portfolio
PowerShares Dynamic Large Cap Portfolio
PowerShares Dynamic MagniQuant Portfolio
PowerShares Dynamic Mid Cap Portfolio
PowerShares Dynamic Small Cap Portfolio
PowerShares Dynamic Technology Sector Portfolio
PowerShares Buyback AchieversTM Portfolio
PowerShares FTSE RAFI Basic Materials Sector Portfolio
PowerShares FTSE RAFI Consumer Goods Sector Portfolio
PowerShares FTSE RAFI Consumer Services Sector Portfolio
PowerShares FTSE RAFI Energy Sector Portfolio
PowerShares FTSE RAFI Financials Sector Portfolio
PowerShares FTSE RAFI Health Care Sector Portfolio
PowerShares FTSE RAFI Industrials Sector Portfolio
PowerShares FTSE RAFI Telecommunications & Technology Sector Portfolio
78
Board Considerations Regarding Continuation of Investment Advisory Agreement (Continued)
PowerShares FTSE RAFI Utilities Sector Portfolio
PowerShares Cleantech Portfolio
PowerShares Dynamic Aggressive Growth Portfolio
PowerShares Dynamic Banking Portfolio
PowerShares Dynamic Basic Materials Sector Portfolio
PowerShares Dynamic Consumer Discretionary Sector Portfolio
PowerShares Dynamic Consumer Staples Sector Portfolio
PowerShares Dynamic Healthcare Services Portfolio
PowerShares Dynamic Deep Value Portfolio
PowerShares Financial Preferred Portfolio
PowerShares Listed Private Equity Portfolio
PowerShares DWA Technical Leaders Portfolio
PowerShares Value Line Industry Rotation Portfolio
PowerShares WilderHill Progressive Energy Portfolio
The Trustees reviewed information from the Adviser describing: (i) the nature, extent and quality of services provided, (ii) the investment performance of the Funds and the Adviser, (iii) the costs of services provided and estimated profits realized by the Adviser, (iv) the extent to which economies of scale are realized as the Funds grow, (v) whether fee levels reflect any possible economies of scale for the benefit of Fund shareholders, (vi) comparisons of services rendered and amounts paid to other registered investment companies and (vii) any benefits realized by the Adviser from its relationship with each Fund. Based on all of the information considered and the conclusions reached, the Board, including the Independent Trustees, determined to approve the continuation of the Investment Advisory Agreement for each Fund. No single factor was determinative in the Board's analysis.
Nature, Extent and Quality of Services. In evaluating the nature, extent and quality of the Adviser's services, the Trustees reviewed information concerning the functions performed by the Adviser for the Funds, information describing the Adviser's current organization and projected staffing, including operations assistance provided by the Adviser's parent organization, Invesco Ltd., and the background and experience of the persons responsible for the day-to-day management of the Funds. The Trustees reviewed matters related to the Adviser's execution of portfolio transactions on behalf of the Funds. The Trustees also reviewed information on the performance of the Funds and the performance of their underlying indices through December 31, 2008. The Trustees also reviewed reports on the correlation and tracking error between the underlying index and each Fund's performance, and the Adviser's analysis of the tracking error between each Fund and its underlying index. The Trustees noted that each Fund's correlation was within the targeted range set forth in the Trust's registration statement and that, for each Fund other than PowerShares Financial Preferred Portfolio, the tracking error was within the targeted range set forth in the Trust's registration statement. The Trustees reviewed the reasons for PowerShares Financial Preferred Portfolio's tracking error. The Trustees concluded that each Fund was correlated to its underlying index and that the tracking error for each Fund was within an acceptable range given that Fund's particular circumstances.
The Trustees also considered the services provided by the Adviser in its oversight of the Funds' administrator, custodian and transfer agent. They noted the significant amount of time and effort that had been devoted to this oversight function.
Based on their review, the Trustees concluded that the nature, extent and quality of services provided by the Adviser to the Funds under the Investment Advisory Agreement were appropriate and reasonable.
79
Board Considerations Regarding Continuation of Investment Advisory Agreement (Continued)
Fees, Expenses and Profitability. The Trustees reviewed and discussed the information provided by the Adviser on each Fund's expense ratio and advisory fee, as compared to information compiled by the Adviser from Lipper Inc. databases on the expense ratios of comparable exchange-traded funds ("ETFs"), open-end (non-ETF) index funds and open-end actively-managed funds. The Trustees noted that the annual advisory fee charged to each Fund is:
• 0.50% of the Fund's average net assets, for each Fund other than PowerShares High Yield Equity Dividend AchieversTM Portfolio, PowerShares Dividend AchieversTM Portfolio, PowerShares High Growth Rate Dividend AchieversTM Portfolio, PowerShares International Dividend AchieversTM Portfolio, PowerShares FTSE RAFI Basic Materials Sector Portfolio, PowerShares FTSE RAFI Consumer Goods Sector Portfolio, PowerShares FTSE RAFI Consumer Services Sector Portfolio, PowerShares FTSE RAFI Energy Sector Portfolio, PowerShares FTSE RAFI Financials Sector Portfolio, PowerShares FTSE RAFI Health Care Sector Portfolio, PowerShares FTSE RAFI Industrials Sector Portfolio, PowerShares FTSE RAFI Telecommunications & Technology Sector Portfolio, PowerShares FTSE RAFI Utilities Sector Portfolio, PowerShares FTSE RAFI US 1000 Portfolio and PowerShares FTSE RAFI US 1500 Small-Mid Portfolio ;
• 0.40% of the Fund's average net assets, for each of PowerShares High Yield Equity Dividend AchieversTM Portfolio, PowerShares Dividend AchieversTM Portfolio, PowerShares High Growth Rate Dividend AchieversTM Portfolio and PowerShares International Dividend AchieversTM Portfolio; and
• 0.29% of the Fund's average net assets, for each of PowerShares FTSE RAFI Basic Materials Sector Portfolio, PowerShares FTSE RAFI Consumer Goods Sector Portfolio, PowerShares FTSE RAFI Consumer Services Sector Portfolio, PowerShares FTSE RAFI Energy Sector Portfolio, PowerShares FTSE RAFI Financials Sector Portfolio, PowerShares FTSE RAFI Health Care Sector Portfolio, PowerShares FTSE RAFI Industrials Sector Portfolio, PowerShares FTSE RAFI Telecommunications & Technology Sector Portfolio, PowerShares FTSE RAFI Utilities Sector Portfolio, PowerShares FTSE RAFI US 1000 Portfolio and PowerShares FTSE RAFI US 1500 Small-Mid Portfolio (the Trustees noted that the advisory fee for each of these Funds was reduced to 0.29% effective November 1, 2008).
The Trustees also noted that the Adviser has agreed to waive a portion of its advisory fee and/or pay expenses (an "Expense Cap") to the extent necessary to prevent the annual operating expenses of each Fund from exceeding the percentage of that Fund's average daily net assets, at least until August 31, 2010, as set forth below:
• 0.60%, excluding interest expenses, brokerage commissions and other trading expenses, taxes and extraordinary expenses, for each of PowerShares Dynamic OTC Portfolio and PowerShares Dynamic Market Portfolio;
• 0.50%, excluding interest expenses, licensing fees, offering costs, brokerage commissions and other trading expenses, taxes and extraordinary expenses, for each of PowerShares High Yield Equity Dividend AchieversTM Portfolio, PowerShares Dividend AchieversTM Portfolio, PowerShares High Growth Rate Dividend AchieversTM Portfolio and PowerShares International Dividend AchieversTM Portfolio;
• 0.39%, excluding interest expenses, offering costs, brokerage commissions and other trading expenses, taxes and extraordinary expenses, for each of PowerShares FTSE RAFI Basic Materials
80
Board Considerations Regarding Continuation of Investment Advisory Agreement (Continued)
Sector Portfolio, PowerShares FTSE RAFI Consumer Goods Sector Portfolio, PowerShares FTSE RAFI Consumer Services Sector Portfolio, PowerShares FTSE RAFI Energy Sector Portfolio, PowerShares FTSE RAFI Financials Sector Portfolio, PowerShares FTSE RAFI Health Care Sector Portfolio, PowerShares FTSE RAFI Industrials Sector Portfolio, PowerShares FTSE RAFI Telecommunications & Technology Sector Portfolio, PowerShares FTSE RAFI Utilities Sector Portfolio, PowerShares FTSE RAFI US 1000 Portfolio and PowerShares FTSE RAFI US 1500 Small-Mid Portfolio (the Trustees noted that, effective November 1, 2008, the Expense Cap for each of these Funds changed from 0.60% to 0.39%); and
• 0.60%, excluding interest expenses, licensing fees, offering costs, brokerage commissions and other trading expenses, taxes and extraordinary expenses, for each other Fund.
The Trustees noted that the Adviser represented that it does not manage any funds other than the Funds and other ETFs overseen by the Board. The Trustees noted that each Fund's advisory fee was:
• higher than the median advisory fee of its ETF peer funds (except for the advisory fee of each of PowerShares Financial Preferred Portfolio, PowerShares Golden Dragon Halter USX China Portfolio and PowerShares International Dividend AchieversTM Portfolio, which was lower than the median advisory fee of its ETF peer funds); and
• higher than the median advisory fee of its open-end index peer funds (except for the advisory fee of each of PowerShares DWA Technical Leaders Portfolio, PowerShares Dynamic Aggressive Growth Portfolio, PowerShares Dynamic Mid Cap Growth Portfolio, PowerShares Dynamic Mid Cap Value Portfolio, PowerShares Dynamic OTC Portfolio, PowerShares Dynamic Telecommunications & Wireless Portfolio, PowerShares Dynamic Utilities Portfolio, PowerShares Financial Preferred Portfolio, PowerShares FTSE RAFI Utilities Sector Portfolio and PowerShares Value Line Timeliness Select Portfolio, which was lower than the median advisory fee of its open-end index peer funds, and there was no comparable data for PowerShares Dynamic Basic Materials Sector Portfolio, PowerShares FTSE RAFI Basic Materials Sector Portfolio or PowerShares Golden Dragon Halter USX China Portfolio); but
• lower than the median advisory fee of its open-end actively-managed peer funds.
The Trustees determined that the advisory fees were reasonable, noting the complexity of the indices, which generally require more frequent rebalancing of the portfolios, the distinguishing factors of the Funds, and the higher administrative, operational and management oversight costs for the Adviser. With respect to the Funds' expense ratios, the Trustees noted that the net expense ratio for each Fund was:
• higher than the median expense ratio of its ETF peer funds (except for the net expense ratio of each of PowerShares Dynamic OTC Portfolio, PowerShares Financial Preferred Portfolio and PowerShares International Dividend AchieversTM Portfolio, which was less than the median expense ratio of its ETF peer funds, and the net expense ratio of each of PowerShares Dynamic Aggressive Growth Portfolio and PowerShares Dynamic Market Portfolio, which was equal to the median expense ratio of its ETF peer funds); and
• higher than the median expense ratio of its open-end index peer funds (except for the net expense ratio of each of PowerShares DWA Technical Leaders Portfolio, PowerShares Dynamic Aggressive
81
Board Considerations Regarding Continuation of Investment Advisory Agreement (Continued)
Growth Portfolio, PowerShares Dynamic Banking Portfolio, PowerShares Dynamic Biotechnology & Genome Portfolio, PowerShares Dynamic Financials Sector Portfolio, PowerShares Dynamic Healthcare Sector Portfolio, PowerShares Dynamic Healthcare Services Portfolio, PowerShares Dynamic Insurance Portfolio, PowerShares Dynamic OTC Portfolio, PowerShares Dynamic Pharmaceuticals Portfolio, PowerShares Dynamic Telecommunications & Wireless Portfolio, PowerShares Dynamic Utilities Portfolio, PowerShares Financial Preferred Portfolio, PowerShares FTSE RAFI Financials Sector Portfolio, PowerShares FTSE RAFI Utilities Sector Portfolio, PowerShares Listed Private Equity Portfolio and PowerShares Value Line Timeliness Select Portfolio, which was lower than the median expense ratio of its open-end index peer funds, and there was no comparable data for PowerShares Dynamic Basic Materials Sector Portfolio, PowerShares FTSE RAFI Basic Materi als Sector Portfolio or PowerShares Golden Dragon Halter USX China Portfolio); but
• lower than the median expense ratio of its open-end actively-managed peer funds.
The Trustees noted that a significant component of the non-advisory fee expenses was the license fees paid by the Funds.
The Board concluded that the advisory fee and expense ratio of each Fund (giving effect to the Fund's Expense Cap) were reasonable and appropriate in light of the services provided.
In conjunction with their review of fees, the Trustees also considered information provided by the Adviser on the revenues received by the Adviser under the Investment Advisory Agreement for each Fund, as well as the fees waived and expenses reimbursed by the Adviser for the Funds. The Trustees reviewed information provided by the Adviser on its profitability as well as any profits or losses realized by the Adviser from its relationship to each Fund. The Trustees concluded that the profitability to the Adviser of the advisory services provided to any of the Funds was not unreasonable.
Economies of Scale and Whether Fee Levels Reflect These Economies of Scale. The Trustees reviewed the information provided by the Adviser as to the extent to which economies of scale are realized as each Fund grows and whether fee levels reflect economies of scale for the benefit of shareholders. The Trustees reviewed each Fund's asset size, expense ratio and expense limitation agreed to by the Adviser. The Trustees noted that, for Funds whose expenses are higher than their respective Expense Caps, any reduction in that Fund's expenses would be enjoyed by the Adviser, but that Fund shareholders benefit from the lower expense ratio as a result of the Fund's Expense Cap. The Trustees also noted that the Excess Expense Agreement with the Trust provides that the Adviser is entitled to be reimbursed by each Fund, other than PowerShares Dynamic Market Portf olio and PowerShares Dynamic OTC Portfolio, for fees waived or expenses absorbed pursuant to the Expense Cap for a period of three years from the date the fee or expense was incurred, provided that no reimbursement would be made that would result in a Fund exceeding its Expense Cap. The Trustees considered whether the advisory fee rate for each Fund was reasonable in relation to the asset size of that Fund, and concluded that the flat advisory fee was reasonable and appropriate, noting the Fund expenses the Adviser has borne as a result of the Expense Cap.
The Trustees noted that the Adviser had not identified any further benefits that it derived from its relationship with the Funds and had noted that it does not have any soft-dollar arrangements.
Based on all of the information considered and the conclusions reached, the Board, including the Independent Trustees, determined to approve the continuation of the Investment Advisory Agreement for each Fund. No single factor was determinative in the Board's analysis.
82
Board Considerations Regarding Continuation of Investment Advisory Agreement
At a meeting held on April 16, 2009, the Board of Trustees of the PowerShares Exchange-Traded Fund Trust (the "Trust"), including the Independent Trustees, unanimously approved the continuation of the Investment Advisory Agreement between Invesco PowerShares Capital Management LLC (the "Adviser") and the Trust for the following five series (each, a "Fund" and collectively, the "Funds"):
PowerShares FTSE NASDAQ Small Cap Portfolio
PowerShares NASDAQ Internet Portfolio
PowerShares NASDAQ-100 BuyWrite Portfolio
PowerShares NXQ Portfolio
PowerShares S&P 500 BuyWrite Portfolio
The Trustees reviewed information from the Adviser describing: (i) the nature, extent and quality of services provided, (ii) the investment performance of the Funds and the Adviser, (iii) the costs of services provided and estimated profits realized by the Adviser, (iv) the extent to which economies of scale are realized as the Funds grow, (v) whether fee levels reflect any possible economies of scale for the benefit of Fund shareholders, (vi) comparisons of services rendered and amounts paid to other registered investment companies and (vii) any benefits realized by the Adviser from its relationship with each Fund. Based on all of the information considered and the conclusions reached, the Board, including the Independent Trustees, determined to approve the continuation of the Investment Advisory Agreement for each Fund. No single factor was determinative in the Board's analysis.
Nature, Extent and Quality of Services. In evaluating the nature, extent and quality of the Adviser's services, the Trustees reviewed information concerning the functions performed by the Adviser for the Funds, information describing the Adviser's current organization and projected staffing, including operations assistance provided by the Adviser's parent organization, Invesco Ltd., and the background and experience of the persons responsible for the day-to-day management of the Funds. The Trustees reviewed matters related to the Adviser's execution of portfolio transactions on behalf of the Funds. The Trustees also reviewed information on the performance of the Funds and the performance of their underlying indices through December 31, 2008. The Trustees also reviewed reports on the correlation and tracking error between the underlying index and each Fund's performance, and the Adviser's analysis of the tracking error between each Fund and its underlying index. The Trustees noted that, in each case, the correlation and tracking error for each Fund was within the targeted range set forth in the Trust's registration statement. The Trustees concluded that each Fund was correlated to its underlying index and that the tracking error for each Fund was within an acceptable range given that Fund's particular circumstances.
The Trustees also considered the services provided by the Adviser in its oversight of the Funds' administrator, custodian and transfer agent. They noted the significant amount of time and effort that had been devoted to this oversight function.
Based on their review, the Trustees concluded that the nature, extent and quality of services provided by the Adviser to the Funds under the Investment Advisory Agreement were appropriate and reasonable.
Fees, Expenses and Profitability. The Trustees reviewed and discussed the information provided by the Adviser on each Fund's total expense ratio and unitary advisory fee, as compared to information compiled by the Adviser from Lipper Inc. databases on the expense ratios of comparable exchange-traded funds ("ETFs"), open-end (non-ETF) index funds and open-end actively-managed funds. The Trustees noted that
83
Board Considerations Regarding Continuation of Investment Advisory Agreement (Continued)
the annual unitary advisory fee is 0.70% for each of PowerShares FTSE NASDAQ Small Cap Portfolio and PowerShares NXQ Portfolio, 0.60% for PowerShares NASDAQ Internet Portfolio and 0.75% for each of PowerShares NASDAQ-100 BuyWrite Portfolio and PowerShares S&P 500 BuyWrite Portfolio, and that the Adviser pays all other expenses of each Fund, except that each Fund pays its brokerage expenses, taxes, interest and extraordinary expenses.
The Trustees noted that the Adviser represented that it does not manage any funds other than the Funds and other ETFs overseen by the Board. The Trustees noted that: the advisory fee for PowerShares FTSE NASDAQ Small Cap Portfolio was higher than the median expense ratios of its ETF peer funds and open-end index peer funds, but lower than the median expense ratio of its open-end actively-managed peer funds; the advisory fee for PowerShares NASDAQ Internet Portfolio was equal to or lower than the median expense ratio for each peer group; no comparable ETF peer fund information was available for PowerShares NASDAQ-100 BuyWrite Portfolio or PowerShares S&P 500 BuyWrite Portfolio, but the advisory fee for each of these Funds was lower than the median expense ratios of their open-end index peer funds and open-end actively-managed peer funds; and the advisory fee for PowerShares NXQ Portfolio was higher than the median expense rat io of its ETF peer funds, but lower than the median expense ratios of its open-end index peer funds and open-end actively-managed peer funds. The Trustees noted that each Fund's advisory fee was reasonable because of the complexity of the indices, which generally require more frequent rebalancing of the portfolios, the distinguishing factors of the Funds and the higher administrative, operational and management oversight costs for the Adviser. The Trustees also noted that a portion of each Fund's advisory fee was attributable to a license fee payable out of the unitary fee charged to that Fund. The Board concluded that the unitary advisory fee charged to each Fund was reasonable and appropriate in light of the services provided.
In conjunction with their review of the unitary advisory fee, the Trustees also considered information provided by the Adviser on the revenues received by the Adviser under the Investment Advisory Agreement. The Trustees reviewed information provided by the Adviser on its profitability as well as any profits or losses realized by the Adviser from its relationship to each Fund. The Trustees reviewed the overall profitability of the Adviser and noted that the Adviser, to date, had incurred a loss from its relationship with the Funds.
Economies of Scale and Whether Fee Levels Reflect These Economies of Scale. The Trustees reviewed the information provided by the Adviser as to the extent to which economies of scale are realized as each Fund grows and whether fee levels reflect economies of scale for the benefit of shareholders. The Trustees reviewed each Fund's asset size and expense ratio. The Trustees noted that any reduction in fixed costs associated with the management of the Funds would be enjoyed by the Adviser, but a unitary fee provides certainty in expenses for the Funds. The Trustees considered whether the advisory fee rate for each Fund was reasonable in relation to the asset size of that Fund, and concluded that the flat advisory fee was reasonable and appropriate.
The Trustees noted that the Adviser had not identified any further benefits that it derived from its relationship with the Funds and had noted that it does not have any soft-dollar arrangements.
Based on all of the information considered and the conclusions reached, the Board, including the Independent Trustees, determined to approve the continuation of the Investment Advisory Agreement for each Fund. No single factor was determinative in the Board's analysis.
84
PROXY VOTING POLICIES AND PROCEDURES
A description of the Funds' proxy voting policies and procedures that the Funds use to determine how to vote proxies relating to portfolio securities is available, without charge and upon request, by calling (800) 337-4246. This information is also available on the Securities and Exchange Commission's ("Commission") website at www.sec.gov.
Information regarding how the Funds voted proxies for portfolio securities, if applicable, during the most recent 12-month period ended June 30, is also available, without charge and upon request, by (i) calling (800) 337-4246; or (ii) accessing the Funds' Form N-PX on the Commission's website at www.sec.gov.
QUARTERLY PORTFOLIOS
The Funds file their complete schedules of portfolio holdings with the Commission for the first and third quarters of each fiscal year on Form N-Q. The Funds' Forms N-Q are available on the Commission's website at www.sec.gov. The Funds' Forms N-Q may also be reviewed and copied at the Commission's Public Reference Room in Washington, D.C.; information on the operation of the Public Reference Room may be obtained by calling (800) SEC-0330.
There are risks involved in investing in exchange-traded funds ("ETFs"), including possible loss of money. Investing in securities of small and medium sized companies involves greater risk than is customarily associated with investing in more established companies, and investments in concentrated industry sectors involve greater risks than investments that are more diversified. Indexed-based ETFs are not actively managed. Actively-managed ETFs do not necessarily seek to replicate the performance of a specific index. Both index-based and actively-managed ETFs are subject to risks similar to stocks, including those related to short selling and margin maintenance. PowerShares ETFs are not FDIC insured, may lose value and have no bank guarantee. PowerShares is a registered trademark of InvescoPowerShares Capital Management LLC. Past performance is not a guarantee of future results.
Invesco Aim Distributors, Inc. is the distributor of the PowerShares Exchange-Traded Fund Trust.
An investor should consider each PowerShares Fund's investment objective, risks, charges and expenses carefully before investing. For more complete information about PowerShares ETFs call Invesco Aim Distributors, Inc. at (800) 337-4246 or visit our website invescopowershares.com for a prospectus. Please read the prospectus carefully before investing.


301 West Roosevelt Road
Wheaton, IL 60187
800.983.0903
www.invescopowershares.com
© 2009 Invesco PowerShares Capital Management LLC P-PS-AR-3
Item 2. Code of Ethics.
The Registrant has adopted a Code of Ethics that applies to the Registrant’s principal executive officer and principal financial officer. This Code is filed as an exhibit to this report on Form N-CSR under Item 12(a)(1).
Item 3. Audit Committee Financial Expert.
The Registrant’s Board of Trustees has determined that the Registrant has three “audit committee financial experts” serving on its audit committee: Mr. Marc M. Kole , Mr. Philip M. Nussbaum, and Mr. Donald H. Wilson. Each of these audit committee members is “independent,” meaning that he is not an “interested person” of the Registrant (as that term is defined in Section 2(a)(19) of the Investment Company Act of 1940) and he does not accept any consulting, advisory, or other compensatory fee from the Registrant (except in the capacity as a Board or committee member).
An “audit committee financial expert” is not an “expert” for any purpose, including for purposes of Section 11 of the Securities Act of 1933, as a result of being designated as an “audit committee financial expert.” Further, the designation of a person as an “audit committee financial expert” does not mean that the person has any greater duties, obligations, or liability than those imposed on the person without the “audit committee financial expert” designation. Similarly, the designation of a person as an “audit committee financial expert” does not affect the duties, obligations, or liability of any other member of the audit committee or board of trustees.
Item 4. Principal Accountant Fees and Services.
PricewaterhouseCoopers (“PWC”) billed the Registrant aggregate fees for services rendered to the Registrant for the last two fiscal years as follows:
|
| Fees Billed by |
| Percentage of |
| Fees Billed by |
| Percentage of |
| ||
|
|
|
|
|
|
|
|
|
| ||
Audit Fees |
| $ | 1,268,000 |
| N/A |
| $ | 1,200,500 |
| N/A |
|
Audit-Related Fees(2) |
| $ | 11,250 |
| 0% |
| $ | 0 |
| 0% |
|
Tax Fees(3) |
| $ | 561,550 |
| 0% |
| $ | 514,050 |
| 0% |
|
|
|
|
|
|
|
|
|
|
| ||
All Other Fees |
| $ | 0 |
| 0% |
| $ | 0 |
| 0% |
|
|
|
|
|
|
|
|
|
|
| ||
Total Fees |
| $ | 1,840,800 |
| 0% |
| $ | 1,714,550 |
| 0% |
|
PWC billed the Registrant aggregate fees of $572,800 for the fiscal year ended 2009 and $514,050 for the fiscal year ended 2008, for non-audit services rendered to the Registrant.
(1) For the provision of non-audit services, the pre-approval requirement is waived pursuant to a de minimis exception if (i) such services were not recognized as non-audit services by the Registrant at the time of engagement, (ii) the aggregate amount of all such services provided is no more than 5% of the aggregate audit and non-audit fees paid by the Registrant during the fiscal year in which the services are provided; and (iii) such services are promptly brought to the attention of the Registrant’s Audit Committee and approved by the Registrant’s Audit Committee prior to the completion of the audit.
(2) Audit-Related Fees for the fiscal year ended April 30, 2009 includes fees billed for reviewing certain registration statements, of which $6,000 was ratified by the Audit Committee following the rendering of such services.
(3) Tax fees for the fiscal year ended April 30, 2009 includes fees billed for reviewing tax returns and for providing tax consultation services for the PowerShares Dynamic Oil & Gas Services Portfolio. Tax fees for fiscal year ended April 30, 2008 includes fees billed for reviewing tax returns.
PWC did not bill any fees for non-audit services rendered to the Registrant’s investment adviser (not including any sub adviser whose role is primarily portfolio management and is subcontracted with or overseen by another investment adviser) or any entity controlling, controlled by or under common control with the Registrant’s investment adviser that provides ongoing services to the Registrant for the fiscal years ended April 30, 2009 and April 30, 2008.
Audit Committee Pre Approval Policies and Procedures
In accordance with Rule 2-01(c)(7) the Audit Committee pre-approves the engagement of the auditor, including the fees to be paid to the auditor, to provide any audit or non-audit services to the Registrant and any non-audit services to Registrant’s investment adviser or any entity controlling, controlled by or under common control with the investment adviser that provides on-going services to the Registrant if the engagement relates directly to the operations and financial reporting of the Registrant. The Chairman of the Audit Committee may pre-approve certain services to be provided by the auditor to the Registrant. All such delegated pre-approvals shall be presented to the Audit Committee no later than the next Audit Committee.
PwC advised the Registrant’s Audit Committee that PwC had identified three matters for consideration under the SEC’s auditor independence rules.
First, PwC was engaged to perform services to an affiliate of the Registrant’s investment adviser, including (a) consulting with respect to the acquisition by the affiliate of certain assets from a third party; and (b) providing expert testimony in connection with any arbitration proceeding or litigation arising from or relating to the transaction. Rules of the Securities and Exchange Commission (“SEC”) provide that an accountant is not independent if, at any point during the audit and professional engagement period, the accountant provides expert services unrelated to the audit to an audit client. Specifically, PwC would not be permitted to provide expert testimony nor perform other services in support of the client or its counsel in connection with a proceeding. Within days of being engaged to provide the services, PwC determined that some of the services contemplated in the engagement terms would be inconsistent with the SEC’s auditor independence rules. A review of the services performed pursuant to the original agreement was conducted. Following the review, the initial engagement terms were modified to limit PwC’s services to those permitted under the rules. Although PwC concluded that the services performed were not inconsistent with the SEC’s independence rules, because PwC entered into an agreement that would have
permitted PwC to provide an impermissible service in violation of Rule 2-01(c)(4)(x) of Regulation S-X, PwC reported this independence exception to the Audit Committee.
Second, an employee of PwC served as a nominee shareholder (effectively equivalent to a Trustee) of various companies or trusts since 2001. Some of these companies held shares of Invesco Nippon Warrants Fund (the “Investment”), an affiliate of the Registrant’s investment adviser. The Investment, which consisted of 2,070 shares, was initially entered into during July 1, 2001 - December 31, 2005. PwC informed the Audit Committee that this matter could have constituted an investment in an affiliate of an audit client in violation of Rule 2-01(c)(1) of Regulation S-X.
Third, PwC became aware that certain aspects of investment advisory services provided by a PwC network member firm’s Wealth Advisory Practice to its clients (generally high net worth individuals not associated with the Registrant or its affiliates) were inconsistent with [Rule 2-01(c)(4)(viii) and (c)(5) of Regulation S-X]. The violations occurred as a result of professionals of the Wealth Advisory Practice making a single recommendation of a product of an affiliate of the Registrant’s investment adviser to its clients rather than also identifying one or more suitable alternatives for the Wealth Advisory Practice’s client to consider. The Wealth Advisory Practice also received commissions from the affiliate of the Registrant’s investment adviser. With respect to the affiliates of the Registrant’s investment adviser, there were 33 cases of single product recommendation and 20 cases of commissions received totaling approximately £7,000. These violations occurred over a two year period and ended in November 2007. PwC represented that at no time did the Wealth Advisory Practice recommend products on behalf the affiliates of the Registrant’s investment adviser. Additionally, members of the audit engagement team were not aware of these violations or services; the advice provided was based on an understanding of the investment objectives of the clients of the Wealth Advisory Practice and not to promote the affiliates of the Registrant’s investment adviser, and the volume and nature of the violations were insignificant. PwC derived no economic benefit from the commissions, since any commissions received were deducted from the time-based fees charged to the Wealth Advisory Practice client and created no incentive for PwC to recommend the investment.
PwC advised the Audit Committee that it believes its independence had not been adversely affected as it related to the audits of the Registrant by any of these matters. In reaching this conclusion, PwC noted that during the time of its audits, the engagement team was not aware of the services provided or the Investment and noted the insignificance of the services provided. Based on the foregoing, PwC did not believe any of these matters affected PwC’s ability to act objectively and impartially and to issue a report on financial statements as the Registrant’s independent auditor, and believes that a reasonable investor with knowledge of all the facts would agree with this conclusion.
Item 5. Audit Committee of Listed Registrants.
The Registrant has a separately designated Audit Committee established in accordance with Section 3(a)(58)(A) of the Securities Exchange Act of 1934, as amended, which consists of the independent trustees. The Audit Committee members are Ronn R. Bagge, Marc M. Kole, Philip M. Nussbaum, and Donald H. Wilson.
Item 6. Schedule of Investments.
The Schedules of Investments are included as a part of the report to shareholders filed under Item 1 of this Form N-CSR.
Item 7. Disclosure of Proxy Voting Policies and Procedures for Closed-End Management Investment Companies.
Not applicable.
Item 8. Portfolio Managers of Closed-End Management Investment Companies.
Not applicable.
Item 9. Purchases of Equity Securities by Closed-End Management Investment Company and Affiliated Purchasers.
Not applicable.
Item 10. Submission of Matters to a Vote of Security Holders.
There have been no changes to the procedures by which shareholders may recommend nominees to the Registrant’s Board of Trustees that would require disclosure herein.
Item 11. Controls and Procedures.
a) Based on their evaluation of the Registrant’s disclosure controls and procedures (as defined in Rule 30a-3(c) under the Investment Company Act of 1940) as of a date within 90 days of the filing date of this report, the Registrant’s President (principal executive officer) and Treasurer (principal financial officer) have concluded that such disclosure controls and procedures are effective.
b) There were no significant changes in the Registrant’s internal control over financial reporting (as defined in Rule 30a-3(d) under the Investment Company Act of 1940) that occurred during the fourth fiscal quarter of the period covered by this report that have materially affected, or are reasonably likely to materially affect, the Registrant’s internal control over financial reporting.
Item 12. Exhibits.
(a)(1) Code of Ethics.
(a)(2) Certifications of the Registrant’s Chief Executive Officer and Chief Financial Officer pursuant to Section 302 of the Sarbanes-Oxley Act of 2002 are attached as Exhibit 99.CERT.
(b) Certifications of the Registrant’s Chief Executive Officer and Chief Financial Officer pursuant to Section 906 of the Sarbanes-Oxley Act of 2002 are attached as Exhibit 99.906CERT.
SIGNATURES
Pursuant to the requirements of the Securities Exchange Act of 1934 and the Investment Company Act of 1940, the Registrant has duly caused this report to be signed on its behalf by the undersigned, thereunto duly authorized.
(Registrant) PowerShares Exchange-Traded Fund Trust
By: | /s/ H. Bruce Bond |
| |
|
|
| |
Name: | H. Bruce Bond |
| |
|
|
| |
Title: | President |
| |
|
|
| |
Date: | July 08, 2009 |
| |
Pursuant to the requirements of the Securities Exchange Act of 1934 and the Investment Company Act of 1940, this report has been signed below by the following persons on behalf of the Registrant and in the capacities and on the dates indicated.
By: | /s/ H. Bruce Bond |
| |
|
|
| |
Name: | H. Bruce Bond |
| |
|
|
| |
Title: | President |
| |
|
|
| |
Date: | July 08, 2009 |
| |
|
|
| |
By: | /s/ Bruce T. Duncan |
| |
|
|
| |
Name: | Bruce T. Duncan |
| |
|
|
| |
Title: | Treasurer |
| |
|
|
| |
Date: | July 08, 2009 |
| |