UNITED STATES
SECURITIES AND EXCHANGE COMMISSION
Washington, D.C. 20549
FORM N-CSR
CERTIFIED SHAREHOLDER REPORT OF REGISTERED
MANAGEMENT INVESTMENT COMPANIES
Investment Company Act file number | 811-21265 | |||||||
| ||||||||
PowerShares Exchange-Traded Fund Trust | ||||||||
(Exact name of registrant as specified in charter) | ||||||||
| ||||||||
301 W. Roosevelt Road Wheaton, IL |
| 60187 | ||||||
(Address of principal executive offices) |
| (Zip code) | ||||||
| ||||||||
Andrew Schlossberg President 301 W. Roosevelt Road Wheaton, IL 60187 | ||||||||
(Name and address of agent for service) | ||||||||
| ||||||||
Registrant’s telephone number, including area code: | 800-983-0903 |
| ||||||
| ||||||||
Date of fiscal year end: | April 30 |
| ||||||
| ||||||||
Date of reporting period: | April 30, 2011 |
| ||||||
Item 1. Reports to Stockholders.
The Registrant’s annual report transmitted to shareholders pursuant to Rule 30e-1 under the Investment Company Act of 1940 is as follows:


2011 Annual Report to Shareholders
April 30, 2011
PowerShares Buyback AchieversTM Portfolio (PKW)
PowerShares Dividend AchieversTM Portfolio (PFM)
PowerShares Financial Preferred Portfolio (PGF)
PowerShares High Yield Equity Dividend
AchieversTM Portfolio (PEY)
PowerShares International Dividend
AchieversTM Portfolio (PID)

Table of Contents
| The Market Environment | 2 | ||||||
| Manager's Analysis | 4 | ||||||
| Frequency Distribution of Discounts & Premiums | 14 | ||||||
| Fees and Expenses | 16 | ||||||
| Dividend Income Portfolios | |||||||
| Schedules of Investments | |||||||
| PowerShares Buyback AchieversTM Portfolio (PKW) | 18 | ||||||
| PowerShares Dividend AchieversTM Portfolio (PFM) | 20 | ||||||
| PowerShares Financial Preferred Portfolio (PGF) | 23 | ||||||
| PowerShares High Yield Equity Dividend AchieversTM Portfolio (PEY) | 24 | ||||||
| PowerShares International Dividend AchieversTM Portfolio (PID) | 25 | ||||||
| Statements of Assets and Liabilities | 28 | ||||||
| Statements of Operations | 29 | ||||||
| Statements of Changes in Net Assets | 30 | ||||||
| Financial Highlights | 32 | ||||||
| Notes to Financial Statements | 35 | ||||||
| Report of Independent Registered Public Accounting Firm | 45 | ||||||
| Tax Information | 46 | ||||||
| Trustees and Officers | 47 | ||||||
| Board Considerations Regarding Continuation of Investment Advisory Agreement | 54 | ||||||
The Market Environment
For the fiscal year ended April 30, 2011, the market environment saw continued improvement. Global equities ended up 18.25% after declining the first two months of the period. Emerging markets led equities up during the fiscal year with the MSCI Emerging Markets Index returning 20.67%. Developed International and U.S. Equities followed closely behind emerging markets with the MSCI EAFE Index up 19.18% and the S&P 500® up 17.24%. Volatility continued to decline on a year-over-year basis with the CBOE Volatility Index® (VIX®) dropping 33.11% for the fiscal year. Fixed income markets moved higher for the fiscal year with the Barclays Aggregate Bond Index ending up 5.37%.
2
This page intentionally left blank
Manager's Analysis
PowerShares Buyback AchieversTM Portfolio (ticker: PKW)
The PowerShares Buyback AchieversTM Portfolio (the "Fund") seeks investment results that correspond (before fees and expenses) generally to the price and yield performance of the Share BuyBack AchieversTM Index (the "Index").
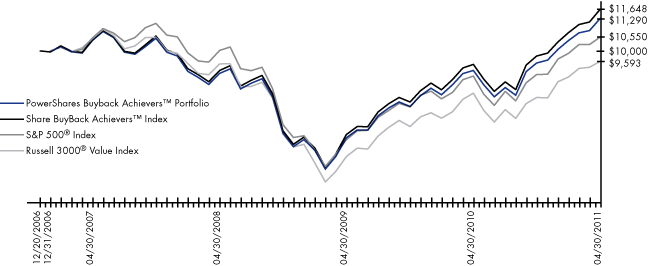
For the fiscal year ended April 30, 2011, the Fund returned 22.34%. Over this same year, the Index returned 23.11%, while the S&P 500® Index returned 17.24% and the Russell 3000® Value Index returned 15.17%. The Fund benefited from positive performance of securities of companies in consumer discretionary and health care.
Sector Breakdown (% of the Fund's
Net Assets) as of April 30, 2011
| Health Care | 26.9 | ||||||
| Consumer Discretionary | 23.3 | ||||||
| Information Technology | 22.9 | ||||||
| Consumer Staples | 11.9 | ||||||
| Financials | 8.0 | ||||||
| Industrials | 6.0 | ||||||
| Materials | 0.9 | ||||||
| Money Market Fund | 0.1 | ||||||
| Utilities | 0.1 | ||||||
| Telecommunication Services | 0.0 | ||||||
| Liabilities in excess of other assets | (0.1 | ) | |||||
Style Allocation (% of the Fund's
Total Investments) as of April 30, 2011
| Large-Cap Value | 43.1 | ||||||
| Large-Cap Growth | 32.9 | ||||||
| Mid-Cap Growth | 9.6 | ||||||
| Mid-Cap Value | 9.4 | ||||||
| Small-Cap Value | 2.7 | ||||||
| Small-Cap Growth | 2.3 | ||||||
Top Ten Fund Holdings (% of the Fund's
Net Assets) as of April 30, 2011
| Security | |||||||
| Wal-Mart Stores, Inc. | 5.0 | ||||||
| International Business Machines Corp. | 5.0 | ||||||
| Hewlett-Packard Co. | 4.9 | ||||||
| UnitedHealth Group, Inc. | 4.3 | ||||||
| Amgen, Inc. | 4.2 | ||||||
| Bristol-Myers Squibb Co. | 3.8 | ||||||
| Texas Instruments, Inc. | 3.3 | ||||||
| Time Warner, Inc. | 3.3 | ||||||
| Walgreen Co. | 3.1 | ||||||
| DIRECTV, Class A | 3.1 | ||||||
| Total | 40.0 | ||||||
4
Manager's Analysis (Continued)
PowerShares Buyback AchieversTM Portfolio (ticker: PKW)
Growth of a $10,000 Investment Since Inception†
| Fund Performance History (%) | As of April 30, 2011 | ||||||||||||||||||||||
| Avg Ann†† | Fund Inception | ||||||||||||||||||||||
| 1 Year | 3 Year | Avg Ann†† | Cumulative | ||||||||||||||||||||
| Index | |||||||||||||||||||||||
| Share BuyBack AchieversTM Index | 23.11 | % | 8.09 | % | 3.56 | % | 16.48 | % | |||||||||||||||
| Russell 3000® Value Index | 15.17 | % | 0.39 | % | -0.95 | % | -4.07 | % | |||||||||||||||
| S&P 500® Index | 17.24 | % | 1.74 | % | 1.24 | % | 5.50 | % | |||||||||||||||
| Fund | |||||||||||||||||||||||
| Net Asset Value ("NAV") Return | 22.34 | % | 7.42 | % | 2.82 | % | 12.90 | % | |||||||||||||||
| Share Price Return | 22.29 | % | 7.43 | % | 2.78 | % | 12.72 | % | |||||||||||||||
Fund Inception: December 20, 2006
Performance quoted represents past performance. Past performance is not a guarantee of future results and current performance may be higher or lower than performance quoted. Investment returns and principal value will fluctuate and shares, when redeemed, may be worth more or less than their original cost. The Adviser has waived fees and reimbursed other expenses, absent which, performance would have been lower. The Adviser has contractually agreed to waive fees and/or pay certain Fund expenses through August 31, 2012. According to the Fund's current prospectus, the total gross annual operating expense ratio was indicated as 0.97%. In the Financial Highlights section of this Shareholder Report, the Fund's net total operating expense ratio was determined to be 0.70%, while the Fund's gross total expense ratio was determined to be 1.00%. NAV and Share Price returns assume that dividends and capital gain distributions have been reinvested in the Fund at NAV and Share Price, respectively. The returns shown in the table above do not reflect the deduction of taxes that a shareholder would pay on Fund distributions or the redemption or sale of Fund Shares. See invescopowershares.com to find the most recent month-end performance numbers.
Index performance results are based upon a hypothetical investment in its constituent securities. Index returns do not represent Fund returns. An investor cannot invest directly in an index. The Index does not charge management fees or brokerage expenses, and no such fees or expenses were deducted from the hypothetical performance shown. In addition, the results actual investors might have achieved would have differed from those shown because of differences in the timing, amounts of their investments, and fees and expenses associated with an investment in the Fund.
The Russell 3000® Value Index and S&P 500® Index (the "Benchmark Indices") are unmanaged indices used as a measurement of change in stock market conditions based on the average performance of approximately 1,957 and 500 common stocks, respectively.
† Fund and underlying Index returns are based on the inception date of the Fund. Returns for the Benchmark Indices are based on the closest month-end to the Fund's inception date.
†† Average annualized.
5
Manager's Analysis
PowerShares Dividend AchieversTM Portfolio (ticker: PFM)
The PowerShares Dividend AchieversTM Portfolio (the "Fund") seeks investment results that correspond (before fees and expenses) generally to the price and yield performance of the Broad Dividend AchieversTM Index (the "Index").
For the fiscal year ended April 30, 2011, the Fund returned 18.39%. Over this same year, the Index returned 18.49%, while the S&P 500® Index returned 17.24% and the Russell 3000® Value Index returned 15.17%. The Fund benefited from positive performance of securities of companies in energy and consumer staples sectors. Fund performance was positive for securities of companies within each sector.
Sector Breakdown (% of the Fund's
Net Assets) as of April 30, 2011
| Consumer Staples | 25.7 | ||||||
| Energy | 16.8 | ||||||
| Industrials | 13.5 | ||||||
| Health Care | 11.1 | ||||||
| Consumer Discretionary | 7.2 | ||||||
| Information Technology | 6.3 | ||||||
| Financials | 6.0 | ||||||
| Telecommunication Services | 5.8 | ||||||
| Materials | 4.1 | ||||||
| Utilities | 3.5 | ||||||
| Other assets less liabilities | 0.0 | ||||||
Style Allocation (% of the Fund's
Total Investments) as of April 30, 2011
| Large-Cap Value | 44.3 | ||||||
| Large-Cap Growth | 40.7 | ||||||
| Mid-Cap Value | 6.4 | ||||||
| Mid-Cap Growth | 5.9 | ||||||
| Small-Cap Value | 2.0 | ||||||
| Small-Cap Growth | 0.7 | ||||||
Top Ten Fund Holdings (% of the Fund's
Net Assets) as of April 30, 2011
| Security | |||||||
| Wal-Mart Stores, Inc. | 5.1 | ||||||
| Johnson & Johnson | 5.1 | ||||||
| AT&T, Inc. | 5.0 | ||||||
| International Business Machines Corp. | 5.0 | ||||||
| Procter & Gamble Co. (The) | 4.8 | ||||||
| Exxon Mobil Corp. | 4.8 | ||||||
| Chevron Corp. | 4.8 | ||||||
| Coca-Cola Co. (The) | 4.6 | ||||||
| ConocoPhillips | 3.4 | ||||||
| PepsiCo, Inc. | 3.3 | ||||||
| Total | 45.9 | ||||||
6
Manager's Analysis (Continued)
PowerShares Dividend AchieversTM Portfolio (ticker: PFM)
Growth of a $10,000 Investment Since Inception†

| Fund Performance History (%) | As of April 30, 2011 | ||||||||||||||||||||||
| Avg Ann†† | Fund Inception | ||||||||||||||||||||||
| 1 Year | 3 Year | 5 Year | Avg Ann†† | Cumulative | |||||||||||||||||||
| Index | |||||||||||||||||||||||
| Broad Dividend AchieversTM Index | 18.49 | % | 0.64 | % | 2.01 | % | 2.99 | % | 18.03 | % | |||||||||||||
| S&P 500® Index | 17.24 | % | 1.74 | % | 2.95 | % | 4.12 | % | 25.71 | % | |||||||||||||
| Russell 3000® Value Index | 15.17 | % | 0.39 | % | 1.47 | % | 3.31 | % | 20.29 | % | |||||||||||||
| Fund | |||||||||||||||||||||||
| Net Asset Value ("NAV") Return | 18.39 | % | 0.55 | % | 1.77 | % | 2.71 | % | 16.21 | % | |||||||||||||
| Share Price Return | 18.39 | % | 0.55 | % | 1.76 | % | 2.71 | % | 16.21 | % | |||||||||||||
Fund Inception: September 15, 2005
Performance quoted represents past performance. Past performance is not a guarantee of future results and current performance may be higher or lower than performance quoted. Investment returns and principal value will fluctuate and shares, when redeemed, may be worth more or less than their original cost. The Adviser has waived fees and reimbursed other expenses, absent which, performance would have been lower. The Adviser has contractually agreed to waive fees and/or pay certain Fund expenses through August 31, 2012. According to the Fund's current prospectus, the total gross annual operating expense ratio was indicated as 0.64%. In the Financial Highlights section of this Shareholder Report, the Fund's net total operating expense ratio was determined to be 0.60%, while the Fund's gross total expense ratio was determined to be 0.61%. NAV and Share Price returns assume that dividends and capital gain distributions have been reinvested in the Fund at NAV and Share Price, respectively. The returns shown in the table above do not reflect the deduction of taxes that a shareholder would pay on Fund distributions or the redemption or sale of Fund Shares. See invescopowershares.com to find the most recent month-end performance numbers.
Index performance results are based upon a hypothetical investment in its constituent securities. Index returns do not represent Fund returns. An investor cannot invest directly in an index. The Index does not charge management fees or brokerage expenses, and no such fees or expenses were deducted from the hypothetical performance shown. In addition, the results actual investors might have achieved would have differed from those shown because of differences in the timing, amounts of their investments, and fees and expenses associated with an investment in the Fund.
The S&P 500® Index and Russell 3000® Value Index (the "Benchmark Indices") are unmanaged indices used as a measurement of change in stock market conditions based on the average performance of approximately 500 and 1,957 common stocks, respectively.
† Fund and underlying Index returns are based on the inception date of the Fund. Returns for the Benchmark Indices are based on the closest month-end to the Fund's inception date.
†† Average annualized.
7
Manager's Analysis
PowerShares Financial Preferred Portfolio (ticker: PGF)
The PowerShares Financial Preferred Portfolio (the "Fund") seeks investment results that correspond (before fees and expenses) generally to the price and yield performance of the Wells Fargo® Hybrid & Preferred Securities Financial Index (the "Index").
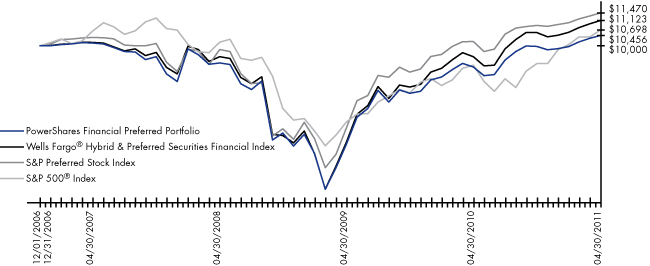
For the fiscal year ended April 30, 2011, the Fund returned 15.57%. Over this same year the Index returned 16.94% while the S&P Preferred Stock Index returned 12.59% and the S&P 500® Index returned 17.24%. Because the Index does not comply with the tax diversification requirements to which the Fund must adhere, the Fund may not be able to invest in all of the stocks comprising the Index in proportion to their weightings in the Index at all times, which contributed to the difference between the Fund and the Index performance, beyond regular Fund expenses, can be attributed to the Fund's sampling methodology.
Industry Breakdown (% of the Fund's
Net Assets) as of April 30, 2011
| Banks | 66.6 | ||||||
| Insurance | 27.0 | ||||||
| Diversified Financial Services | 6.3 | ||||||
| Other assets less liabilities | 0.1 | ||||||
Style Allocation (% of the Fund's
Total Investments) as of April 30, 2011
| Small-Cap Value | 58.0 | ||||||
| Mid-Cap Value | 34.0 | ||||||
| Large-Cap Value | 8.0 | ||||||
Top Ten Fund Holdings (% of the Fund's
Net Assets) as of April 30, 2011
| Security | |||||||
| HSBC Holdings PLC, 8.00% | 9.8 | ||||||
| Bank of America Corp., 8.20% | 7.6 | ||||||
| HSBC Holdings PLC, 8.13% | 5.7 | ||||||
| ING Groep NV, 8.50% | 5.6 | ||||||
| Bank of America Corp., 8.63% | 4.9 | ||||||
| Wells Fargo & Co., 8.00% | 4.7 | ||||||
| JPMorgan Chase & Co., 8.63% | 4.4 | ||||||
| Credit Suisse Guernsey, 7.90% | 4.3 | ||||||
| MetLife, Inc., 6.50% | 4.3 | ||||||
| ING Groep NV, 7.38% | 4.1 | ||||||
| Total | 55.4 | ||||||
8
Manager's Analysis (Continued)
PowerShares Financial Preferred Portfolio (ticker: PGF)
Growth of a $10,000 Investment Since Inception†
| Fund Performance History (%) | As of April 30, 2011 | ||||||||||||||||||||||
| Avg Ann†† | Fund Inception | ||||||||||||||||||||||
| 1 Year | 3 Year | Avg Ann†† | Cumulative | ||||||||||||||||||||
| Index | |||||||||||||||||||||||
| Wells Fargo® Hybrid & Preferred Securities Financial Index | 16.94 | % | 5.36 | % | 2.44 | % | 11.23 | % | |||||||||||||||
| S&P Preferred Stock Index | 12.59 | % | 5.28 | % | 3.15 | % | 14.70 | % | |||||||||||||||
| S&P 500® Index | 17.24 | % | 1.74 | % | 1.54 | % | 6.98 | % | |||||||||||||||
| Fund | |||||||||||||||||||||||
| Net Asset Value ("NAV") Return | 15.57 | % | 4.24 | % | 1.02 | % | 4.56 | % | |||||||||||||||
| Share Price Return | 15.97 | % | 4.12 | % | 0.87 | % | 3.87 | % | |||||||||||||||
Fund Inception: December 1, 2006
Performance quoted represents past performance. Past performance is not a guarantee of future results and current performance may be higher or lower than performance quoted. Investment returns and principal value will fluctuate and shares, when redeemed, may be worth more or less than their original cost. The Adviser has waived fees and reimbursed other expenses, absent which, performance would have been lower. The Adviser has contractually agreed to waive fees and/or pay certain Fund expenses through August 31, 2012. According to the Fund's current prospectus, the total gross annual operating expense ratio was indicated as 0.65%. In the Financial Highlights section of this Shareholder Report, the Fund's net and gross total operating expense ratios were determined to be 0.66%. NAV and Share Price returns assume that dividends and capital gain distributions have been reinvested in the Fund at NAV and Share Price, respectively. The returns shown in the table above do not reflect the deduction of taxes that a shareholder would pay on Fund distributions or the redemption or sale of Fund Shares. See invescopowershares.com to find the most recent month-end performance numbers.
Index performance results are based upon a hypothetical investment in its constituent securities. Index returns do not represent Fund returns. An investor cannot invest directly in an index. The Index does not charge management fees or brokerage expenses, and no such fees or expenses were deducted from the hypothetical performance shown. In addition, the results actual investors might have achieved would have differed from those shown because of differences in the timing, amounts of their investments, and fees and expenses associated with an investment in the Fund.
The S&P Preferred Stock Index and S&P 500® Index (the "Benchmark Indices") are unmanaged indices used as a measurement of change in stock market conditions based on the average performance of approximately 224 preferred stocks and 500 common stocks, respectively.
† Fund and underlying Index returns are based on the inception date of the Fund. Returns for the Benchmark Indices are based on the closest month-end to the Fund's inception date.
†† Average annualized.
9
Manager's Analysis
PowerShares High Yield Equity Dividend AchieversTM Portfolio (ticker: PEY)
The PowerShares High Yield Equity Dividend AchieversTM Portfolio (the "Fund") seeks investment results that correspond (before fees and expenses) generally to the price and yield performance of the Mergent Dividend AchieversTM 50 Index (the "Index").
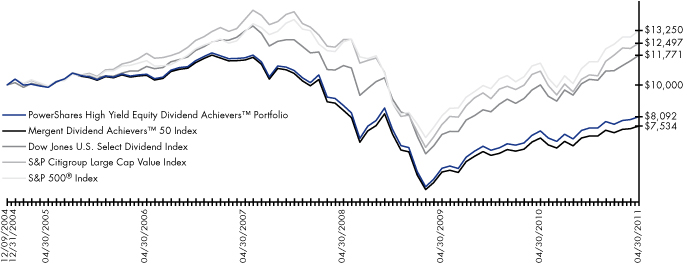
For the fiscal year ended April 30, 2011, the Fund returned 11.91%. Over this same year, the Index returned 10.71%, while the Dow Jones U.S. Select Dividend Index returned 17.71%, the S&P Citigroup Large Cap Value Index returned 15.52% and the S&P 500® Index returned 17.24%. The Fund benefited from positive performance of securities of companies in utilities and telecommunication services sectors. Fund performance was positive for securities of companies within each sector for the reporting period.
Industry Breakdown (% of the Fund's
Net Assets) as of April 30, 2011
| Electric | 20.3 | ||||||
| Gas | 13.5 | ||||||
| Insurance | 9.9 | ||||||
| Banks | 8.0 | ||||||
| Telecommunications | 6.1 | ||||||
| Agriculture | 5.0 | ||||||
| Savings & Loans | 4.0 | ||||||
| Household Products/Wares | 3.6 | ||||||
| Healthcare-Products | 3.3 | ||||||
| Office/Business Equipment | 2.6 | ||||||
| Pipelines | 2.6 | ||||||
| Miscellaneous Manufacturing | 2.3 | ||||||
| Water | 2.0 | ||||||
| Pharmaceuticals | 1.9 | ||||||
| Food | 1.8 | ||||||
| Chemicals | 1.7 | ||||||
| Commerical Services | 1.6 | ||||||
| Distribution/Wholesale | 1.6 | ||||||
| Iron/Steel | 1.5 | ||||||
| Oil & Gas | 1.5 | ||||||
| Packaging & Containers | 1.5 | ||||||
| Environmental Control | 1.4 | ||||||
| Computers | 1.4 | ||||||
| Textiles | 0.8 | ||||||
| Other assets less liabilities | 0.1 | ||||||
Top Ten Fund Holdings (% of the Fund's
Net Assets) as of April 30, 2011
| Security | |||||||
| CenturyLink, Inc. | 3.4 | ||||||
| Mercury General Corp. | 3.0 | ||||||
| Altria Group, Inc. | 2.8 | ||||||
| AT&T, Inc. | 2.7 | ||||||
| PPL Corp. | 2.7 | ||||||
| Pitney Bowes, Inc. | 2.6 | ||||||
| Enterprise Products Partners LP | 2.6 | ||||||
| Old Republic International Corp. | 2.6 | ||||||
| Vectren Corp. | 2.5 | ||||||
| People's United Financial, Inc. | 2.5 | ||||||
| Total | 27.4 | ||||||
Style Allocation (% of the Fund's
Total Investments) as of April 30, 2011
| Small-Cap Value | 35.2 | ||||||
| Mid-Cap Value | 26.5 | ||||||
| Large-Cap Value | 24.7 | ||||||
| Mid-Cap Growth | 8.5 | ||||||
| Large-Cap Growth | 3.4 | ||||||
| Small-Cap Growth | 1.7 | ||||||
10
Manager's Analysis (Continued)
PowerShares High Yield Equity Dividend AchieversTM Portfolio (ticker: PEY)
Growth of a $10,000 Investment Since Inception†
| Fund Performance History (%) | As of April 30, 2011 | ||||||||||||||||||||||
| Avg Ann†† | Fund Inception | ||||||||||||||||||||||
| 1 Year | 3 Year | 5 Year | Avg Ann†† | Cumulative | |||||||||||||||||||
| Index | |||||||||||||||||||||||
| Mergent Dividend AchieversTM 50 Index | 10.71 | % | -3.80 | % | -6.54 | % | -4.34 | % | -24.66 | % | |||||||||||||
| Dow Jones U.S. Select Dividend Index | 17.71 | % | 1.82 | % | 1.18 | % | 2.57 | % | 17.71 | % | |||||||||||||
| S&P Citigroup Large Cap Value Index | 15.52 | % | -0.58 | % | 1.00 | % | 3.53 | % | 24.97 | % | |||||||||||||
| S&P 500® Index | 17.24 | % | 1.74 | % | 2.95 | % | 4.48 | % | 32.50 | % | |||||||||||||
| Fund | |||||||||||||||||||||||
| Net Asset Value ("NAV") Return | 11.91 | % | -2.59 | % | -5.32 | % | -3.26 | % | -19.08 | % | |||||||||||||
| Share Price Return | 11.91 | % | -2.59 | % | -5.30 | % | -3.25 | % | -19.03 | % | |||||||||||||
Fund Inception: December 9, 2004
Performance quoted represents past performance. Past performance is not a guarantee of future results and current performance may be higher or lower than performance quoted. Investment returns and principal value will fluctuate and shares, when redeemed, may be worth more or less than their original cost. The Adviser has waived fees and reimbursed other expenses, absent which, performance would have been lower. The Adviser has contractually agreed to waive fees and/or pay certain Fund expenses through August 31, 2012. According to the Fund's current prospectus, the total gross annual operating expense ratio was indicated as 0.65%. In the Financial Highlights section of this Shareholder Report, the Fund's net total operating expense ratio was determined to be 0.60%, while the Fund's gross total expense ratio was determined to be 0.62%. NAV and Share Price returns assume that dividends and capital gain distributions have been reinvested in the Fund at NAV and Share Price, respectively. The returns shown in the table above do not reflect the deduction of taxes that a shareholder would pay on Fund distributions or the redemption or sale of Fund Shares. See invescopowershares.com to find the most recent month-end performance numbers.
Index performance results are based upon a hypothetical investment in its constituent securities. Index returns do not represent Fund returns. An investor cannot invest directly in an index. The Index does not charge management fees or brokerage expenses, and no such fees or expenses were deducted from the hypothetical performance shown. In addition, the results actual investors might have achieved would have differed from those shown because of differences in the timing, amounts of their investments, and fees and expenses associated with an investment in the Fund.
The Dow Jones U.S. Select Dividend Index, S&P Citigroup Large Cap Value Index and S&P 500® Index (the "Benchmark Indices") are unmanaged indices used as a measurement of change in stock market conditions based on the average performance of approximately 100, 1,086 and 500 common stocks, respectively.
† Fund and underlying Index returns are based on the inception date of the Fund. Returns for the Benchmark Indices are based on the closest month-end to the Fund's inception date.
†† Average annualized.
11
Manager's Analysis
PowerShares International Dividend AchieversTM Portfolio (ticker: PID)
The PowerShares International Dividend AchieversTM Portfolio (the "Fund") seeks investment results that correspond (before fees and expenses) generally to the price and yield performance of the International Dividend AchieversTM Index (the "Index").
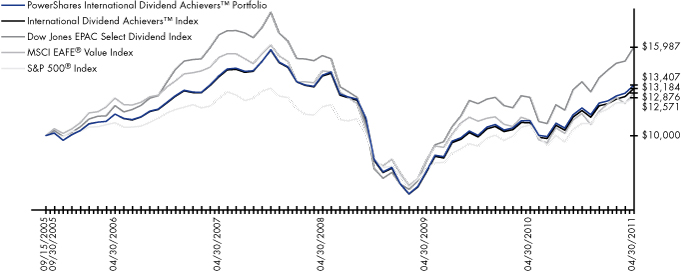
For the fiscal year ended April 30, 2011, the Fund returned 21.95%. Over this same year, the Index returned 21.32%, while the Dow Jones EPAC Select Dividend Index returned 27.01%, the MSCI EAFE® Value Index returned 16.86% and the S&P 500® Index returned 17.24%. The Fund benefited from positive performance of securities of companies in energy, telecommunication services and consumer staples sectors. Fund performance was positive for securities of companies within each sector. The Fund benefited from positive performance of securities of companies in Canada and the United Kingdom.
Sector Breakdown (% of the Fund's
Net Assets) as of April 30, 2011
| Telecommunication Services | 24.7 | ||||||
| Energy | 17.5 | ||||||
| Health Care | 12.1 | ||||||
| Consumer Staples | 12.0 | ||||||
| Financials | 8.4 | ||||||
| Consumer Discretionary | 7.5 | ||||||
| Utilities | 5.9 | ||||||
| Information Technology | 4.7 | ||||||
| Industrials | 3.8 | ||||||
| Materials | 3.6 | ||||||
| Liabilities in excess of other assets | (0.2 | ) | |||||
Style Allocation (% of the Fund's
Total Investments) as of April 30, 2011
| Large-Cap Value | 54.2 | ||||||
| Large-Cap Growth | 27.7 | ||||||
| Mid-Cap Value | 12.9 | ||||||
| Mid-Cap Growth | 2.6 | ||||||
| Small-Cap Growth | 1.5 | ||||||
| Small-Cap Value | 1.1 | ||||||
Top Ten Fund Holdings (% of the Fund's
Net Assets) as of April 30, 2011
| Security | |||||||
| Partner Communications Co. Ltd. ADR | 5.0 | ||||||
| Philippine Long Distance Telephone Co. ADR | 4.0 | ||||||
| Telefonica SA ADR | 3.6 | ||||||
| National Grid PLC ADR | 3.3 | ||||||
| Teekay LNG Partners LP | 3.3 | ||||||
| GlaxoSmithKline PLC ADR | 3.1 | ||||||
| AstraZeneca PLC ADR | 3.0 | ||||||
| Vodafone Group PLC ADR | 2.6 | ||||||
| British American Tobacco PLC ADR | 2.5 | ||||||
| Telefonos de Mexico SAB de CV, Series L ADR | 2.5 | ||||||
| Total | 32.9 | ||||||
12
Manager's Analysis (Continued)
PowerShares International Dividend AchieversTM Portfolio (ticker: PID)
Growth of a $10,000 Investment Since Inception†
| Fund Performance History (%) | As of April 30, 2011 | ||||||||||||||||||||||
| Avg Ann†† | Fund Inception | ||||||||||||||||||||||
| 1 Year | 3 Year | 5 Year | Avg Ann†† | Cumulative | |||||||||||||||||||
| Index | |||||||||||||||||||||||
| International Dividend AchieversTM Index | 21.32 | % | -2.03 | % | 2.87 | % | 5.04 | % | 31.84 | % | |||||||||||||
| Dow Jones EPAC Select Dividend Index | 27.01 | % | 1.24 | % | 5.86 | % | 8.63 | % | 59.87 | % | |||||||||||||
| MSCI EAFE® Value Index | 16.86 | % | -3.60 | % | 0.55 | % | 4.56 | % | 28.76 | % | |||||||||||||
| S&P 500® Index | 17.24 | % | 1.74 | % | 2.95 | % | 4.12 | % | 25.71 | % | |||||||||||||
| Fund | |||||||||||||||||||||||
| Net Asset Value ("NAV") Return | 21.95 | % | -1.62 | % | 3.21 | % | 5.35 | % | 34.07 | % | |||||||||||||
| Share Price Return | 22.23 | % | -1.50 | % | 3.25 | % | 5.40 | % | 34.38 | % | |||||||||||||
Fund Inception: September 15, 2005
Performance quoted represents past performance. Past performance is not a guarantee of future results and current performance may be higher or lower than performance quoted. Investment returns and principal value will fluctuate and shares, when redeemed, may be worth more or less than their original cost. The Adviser has waived fees and reimbursed other expenses, absent which, performance would have been lower. The Adviser has contractually agreed to waive fees and/or pay certain Fund expenses through August 31, 2012. According to the Fund's current prospectus, the total gross annual operating expense ratio was indicated as 0.57%. In the Financial Highlights section of this Shareholder Report, the Fund's net and gross total operating expense ratios were determined to be 0.58%. NAV and Share Price returns assume that dividends and capital gain distributions have been reinvested in the Fund at NAV and Share Price, respectively. The returns shown in the table above do not reflect the deduction of taxes that a shareholder would pay on Fund distributions or the redemption or sale of Fund Shares. See invescopowershares.com to find the most recent month-end performance numbers.
Index performance results are based upon a hypothetical investment in its constituent securities. Index returns do not represent Fund returns. An investor cannot invest directly in an index. The Index does not charge management fees or brokerage expenses, and no such fees or expenses were deducted from the hypothetical performance shown. In addition, the results actual investors might have achieved would have differed from those shown because of differences in the timing, amounts of their investments, and fees and expenses associated with an investment in the Fund.
The Dow Jones EPAC Select Dividend Index, MSCI EAFE® Value Index and S&P 500® Index (the "Benchmark Indices") are unmanaged indices used as a measurement of change in stock market conditions based on the average performance of approximately 100, 300 and 500 common stocks, respectively.
† Fund and underlying Index returns are based on the inception date of the Fund. Returns for the Benchmark Indices are based on the closest month-end to the Fund's inception date.
†† Average annualized.
13
Frequency Distribution of Discounts & Premiums
Since Inception through April 30, 2011
| Closing Price Above NAV (bps) | |||||||||||||||||||||||||||||||||||||||
| Ticker | Fund Name | Inception | Trading Days | 0-24 | 25-49 | 50-99 | 100-149 | 150-199 | 200+ | ||||||||||||||||||||||||||||||
| PKW | PowerShares Buyback Achievers(TM) Portfolio | 12/20/06 | 1097 | 451 | 35 | 8 | 1 | 2 | 1 | ||||||||||||||||||||||||||||||
| PFM | PowerShares Dividend Achievers(TM) Portfolio | 09/15/05 | 1416 | 711 | 66 | 15 | 3 | 0 | 3 | ||||||||||||||||||||||||||||||
| PGF | PowerShares Financial Preferred Portfolio | 12/01/06 | 1110 | 450 | 199 | 88 | 29 | 24 | 68 | ||||||||||||||||||||||||||||||
| PEY | PowerShares High Yield Equity Dividend Achievers(TM) Portfolio | 12/09/04 | 1609 | 610 | 54 | 8 | 6 | 0 | 1 | ||||||||||||||||||||||||||||||
| PID | PowerShares International Dividend Achievers(TM) Portfolio | 09/15/05 | 1416 | 699 | 63 | 17 | 4 | 2 | 1 | ||||||||||||||||||||||||||||||
14
| Closing Price Below NAV (bps) | |||||||||||||||||||||||||||
| Ticker | -0-24 | -25-49 | -50-99 | -100-149 | -150-199 | -200+ | |||||||||||||||||||||
| PKW | 585 | 11 | 3 | 0 | 0 | 0 | |||||||||||||||||||||
| PFM | 604 | 11 | 2 | 1 | 0 | 0 | |||||||||||||||||||||
| PGF | 211 | 21 | 13 | 3 | 2 | 2 | |||||||||||||||||||||
| PEY | 822 | 91 | 14 | 1 | 1 | 1 | |||||||||||||||||||||
| PID | 506 | 74 | 38 | 7 | 4 | 1 | |||||||||||||||||||||
15
Fees and Expenses
As a shareholder of a Fund of the PowerShares Exchange-Traded Fund Trust, you incur advisory fees and other Fund expenses. The expense examples below are intended to help you understand your ongoing costs (in dollars) of investing in the Funds and to compare these costs with the ongoing costs of investing in other funds.
The example is based on an investment of $1,000 invested at the beginning of the period and held through the six-month period ended April 30, 2011.
Actual Expenses
The first line in the following table provides information about actual account values and actual expenses. You may use the information in this line, together with the amount you invested, to estimate the expenses that you paid over the period. Simply divide your account value by $1,000 (for example, an $8,600 account value divided by $1,000 = 8.6), then multiply the result by the number in the first line under the heading "Expenses Paid During the Six-Month Period" to estimate the expenses you paid on your account during this period.
Hypothetical Example for Comparison Purposes
The second line in the following table provides information about hypothetical account values and hypothetical expenses based on each Fund's actual expense ratio and an assumed annualized rate of return of 5% per year before expenses, which is not the Fund's actual return. The hypothetical account values and expenses may not be used to estimate the actual ending account balance or expenses you paid for the period. You may use this information to compare the ongoing costs of investing in the Funds and other funds. To do so, compare this 5% hypothetical example with the 5% hypothetical examples that appear in the shareholder reports of the other funds.
Please note that the expenses shown in the table are meant to highlight your ongoing costs only, and do not reflect any transactional costs such as sales charges and brokerage commissions. Therefore the second line in the table is useful in comparing ongoing costs only, and will not help you determine the relative total costs of owning different funds. In addition, if these transactional costs were included, your costs would have been higher.
| Beginning Account Value November 1, 2010 | Ending Account Value April 30, 2011 | Annualized Expense Ratio Based on the Six-Month Period | Expenses Paid During the Six-Month Period(1) | ||||||||||||||||
| PowerShares Buyback AchieversTM Portfolio Actual | $ | 1,000.00 | $ | 1,185.67 | 0.70 | % | $ | 3.79 | |||||||||||
| Hypothetical (5% return before expenses) | $ | 1,000.00 | $ | 1,021.32 | 0.70 | % | $ | 3.51 | |||||||||||
| PowerShares Dividend AchieversTM Portfolio Actual | $ | 1,000.00 | $ | 1,145.10 | 0.60 | % | $ | 3.19 | |||||||||||
| Hypothetical (5% return before expenses) | $ | 1,000.00 | $ | 1,021.82 | 0.60 | % | $ | 3.01 | |||||||||||
| PowerShares Financial Preferred Portfolio Actual | $ | 1,000.00 | $ | 1,049.06 | 0.67 | % | $ | 3.40 | |||||||||||
| Hypothetical (5% return before expenses) | $ | 1,000.00 | $ | 1,021.47 | 0.67 | % | $ | 3.36 | |||||||||||
| PowerShares High Yield Equity Dividend AchieversTM Portfolio Actual | $ | 1,000.00 | $ | 1,092.81 | 0.60 | % | $ | 3.11 | |||||||||||
| Hypothetical (5% return before expenses) | $ | 1,000.00 | $ | 1,021.82 | 0.60 | % | $ | 3.01 | |||||||||||
16
Fees and Expenses (Continued)
| Beginning Account Value November 1, 2010 | Ending Account Value April 30, 2011 | Annualized Expense Ratio Based on the Six-Month Period | Expenses Paid During the Six-Month Period(1) | ||||||||||||||||
| PowerShares International Dividend AchieversTM Portfolio Actual | $ | 1,000.00 | $ | 1,129.98 | 0.59 | % | $ | 3.12 | |||||||||||
| Hypothetical (5% return before expenses) | $ | 1,000.00 | $ | 1,021.87 | 0.59 | % | $ | 2.96 | |||||||||||
(1) Expenses are calculated using the annualized expense ratio, which represents the ongoing expenses as a percentage of net assets for the six months ended April 30, 2011. Expenses are calculated by multiplying the Fund's annualized expense ratio by the average account value for the period; then multiplying the result by 181 and then dividing the result by 365. Expense ratios for the most recent half-year may differ from expense ratios based on the annualized data in the Financial Highlights.
17
Schedule of Investments
PowerShares Buyback AchieversTM Portfolio
April 30, 2011
| Number of Shares | Value | ||||||||||
| Common Stocks and Other Equity Interests—100.0% | |||||||||||
| Consumer Discretionary—23.3% | |||||||||||
| 2,775 | Advance Auto Parts, Inc. | $ | 181,652 | ||||||||
| 2,925 | Aeropostale, Inc.* | 74,675 | |||||||||
| 6,982 | American Eagle Outfitters, Inc. | 108,640 | |||||||||
| 360 | America's Car-Mart, Inc.* | 8,813 | |||||||||
| 5,484 | AutoNation, Inc.* | 185,962 | |||||||||
| 1,503 | AutoZone, Inc.* | 424,417 | |||||||||
| 2,676 | Big Lots, Inc.* | 110,010 | |||||||||
| 286 | Blyth, Inc. | 13,482 | |||||||||
| 3,263 | Brinker International, Inc. | 78,606 | |||||||||
| 2,703 | Career Education Corp.* | 58,952 | |||||||||
| 717 | CEC Entertainment, Inc. | 27,124 | |||||||||
| 907 | Children's Place Retail Stores, Inc. (The)* | 48,225 | |||||||||
| 10,300 | Coach, Inc. | 616,043 | |||||||||
| 1,750 | Dillard's, Inc., Class A | 84,035 | |||||||||
| 27,610 | DIRECTV, Class A* | 1,341,570 | |||||||||
| 4,236 | Dollar Tree, Inc.* | 243,570 | |||||||||
| 4,265 | Family Dollar Stores, Inc. | 231,206 | |||||||||
| 5,044 | GameStop Corp., Class A* | 129,530 | |||||||||
| 19,992 | Gap, Inc. (The) | 464,614 | |||||||||
| 11,059 | H&R Block, Inc. | 191,210 | |||||||||
| 968 | ITT Educational Services, Inc.* | 69,435 | |||||||||
| 1,792 | Jack in the Box, Inc.* | 37,005 | |||||||||
| 4,165 | Liberty Global, Inc., Class A* | 193,672 | |||||||||
| 773 | Lincoln Educational Services Corp. | 12,909 | |||||||||
| 46,075 | Lowe's Cos., Inc. | 1,209,469 | |||||||||
| 967 | Nutrisystem, Inc. | 14,544 | |||||||||
| 205 | NVR, Inc.* | 151,563 | |||||||||
| 923 | Papa John's International, Inc.* | 27,745 | |||||||||
| 347 | Pre-Paid Legal Services, Inc.* | 22,885 | |||||||||
| 3,726 | RadioShack Corp. | 58,908 | |||||||||
| 24,060 | Target Corp. | 1,181,346 | |||||||||
| 2,401 | Tempur-Pedic International, Inc.* | 150,735 | |||||||||
| 1,427 | Timberland Co. (The), Class A* | 64,486 | |||||||||
| 38,102 | Time Warner, Inc. | 1,442,542 | |||||||||
| 13,654 | TJX Cos., Inc. (The) | 732,127 | |||||||||
| 235 | Washington Post Co. (The), Class B | 102,436 | |||||||||
| 14,650 | Wendy's/Arby's Group, Inc., Class A | 70,613 | |||||||||
| 10,164,756 | |||||||||||
| Consumer Staples—11.9% | |||||||||||
| 322 | Boston Beer Co., Inc., Class A* | 30,352 | |||||||||
| 1,313 | Casey's General Stores, Inc. | 51,246 | |||||||||
| 1,457 | Central Garden & Pet Co., Class A* | 14,599 | |||||||||
| 7,596 | Dr Pepper Snapple Group, Inc. | 297,763 | |||||||||
| 4,872 | Lorillard, Inc. | 518,868 | |||||||||
| 12,820 | Safeway, Inc. | 311,654 | |||||||||
| 21,329 | Sara Lee Corp. | 409,517 | |||||||||
| 32,155 | Walgreen Co. | 1,373,662 | |||||||||
| 39,968 | Wal-Mart Stores, Inc. | 2,197,441 | |||||||||
| 5,205,102 | |||||||||||
| Number of Shares | Value | ||||||||||
| Common Stocks and Other Equity Interests (Continued) | |||||||||||
| Financials—8.0% | |||||||||||
| 701 | Abington Bancorp, Inc. | $ | 8,496 | ||||||||
| 3,624 | American Financial Group, Inc. | 129,630 | |||||||||
| 1,550 | Arch Capital Group Ltd.* | 161,200 | |||||||||
| 2,083 | Ashford Hospitality Trust, Inc. REIT | 25,975 | |||||||||
| 2,480 | Aspen Insurance Holdings Ltd. (Bermuda) | 70,854 | |||||||||
| 3,469 | Assurant, Inc. | 137,719 | |||||||||
| 10,152 | Chubb Corp. (The) | 661,809 | |||||||||
| 1,347 | Employers Holdings, Inc. | 27,155 | |||||||||
| 1,411 | Endurance Specialty Holdings Ltd. (Bermuda) | 62,564 | |||||||||
| 2,230 | Everest Re Group Ltd. | 203,198 | |||||||||
| 293 | FPIC Insurance Group, Inc.* | 10,817 | |||||||||
| 1,602 | Hanover Insurance Group, Inc. (The) | 67,636 | |||||||||
| 443 | Infinity Property & Casualty Corp. | 26,181 | |||||||||
| 3,263 | iStar Financial, Inc. REIT* | 31,390 | |||||||||
| 1,396 | LaBranche & Co., Inc.* | 5,626 | |||||||||
| 5,355 | Legg Mason, Inc. | 198,938 | |||||||||
| 1,815 | Meadowbrook Insurance Group, Inc. | 18,586 | |||||||||
| 2,175 | Montpelier Re Holdings Ltd. (Bermuda) | 39,346 | |||||||||
| 6,200 | NASDAQ OMX Group, Inc. (The)* | 168,020 | |||||||||
| 1,312 | Platinum Underwriters Holdings Ltd. (Bermuda) | 49,607 | |||||||||
| 1,201 | ProAssurance Corp.* | 79,746 | |||||||||
| 1,820 | RenaissanceRe Holdings Ltd. (Bermuda) | 127,910 | |||||||||
| 1,649 | StanCorp Financial Group, Inc. | 71,072 | |||||||||
| 14,750 | Travelers Cos., Inc. (The) | 933,380 | |||||||||
| 5,021 | W.R. Berkley Corp. | 163,735 | |||||||||
| 3,480,590 | |||||||||||
| Health Care—26.9% | |||||||||||
| 13,164 | Aetna, Inc. | 544,726 | |||||||||
| 31,864 | Amgen, Inc.* | 1,811,468 | |||||||||
| 8,641 | Biogen Idec, Inc.* | 841,201 | |||||||||
| 59,328 | Bristol-Myers Squibb Co. | 1,667,117 | |||||||||
| 1,803 | Charles River Laboratories International, Inc.* | 76,069 | |||||||||
| 9,863 | Forest Laboratories, Inc.* | 327,057 | |||||||||
| 27,648 | Gilead Sciences, Inc.* | 1,073,848 | |||||||||
| 3,169 | Health Net, Inc.* | 105,528 | |||||||||
| 485 | ICU Medical, Inc.* | 21,878 | |||||||||
| 291 | Kensey Nash Corp.* | 7,196 | |||||||||
| 1,053 | Maxygen, Inc. | 5,434 | |||||||||
| 8,900 | McKesson Corp. | 738,789 | |||||||||
| 13,950 | Medco Health Solutions, Inc.* | 827,654 | |||||||||
| 1,434 | Nabi Biopharmaceuticals* | 8,289 | |||||||||
| 1,923 | PSS World Medical, Inc.* | 55,306 | |||||||||
| 5,551 | Quest Diagnostics, Inc. | 312,965 | |||||||||
| 1,152 | Quidel Corp.* | 15,287 | |||||||||
| 502 | SonoSite, Inc.* | 17,419 | |||||||||
| 37,821 | UnitedHealth Group, Inc. | 1,861,928 | |||||||||
See Notes to Financial Statements.
18
Schedule of Investments (Continued)
PowerShares Buyback AchieversTM Portfolio
April 30, 2011
| Number of Shares | Value | ||||||||||
| Common Stocks and Other Equity Interests (Continued) | |||||||||||
| 12,573 | WellPoint, Inc. | $ | 965,481 | ||||||||
| 6,665 | Zimmer Holdings, Inc.* | 434,891 | |||||||||
| 11,719,531 | |||||||||||
| Industrials—6.0% | |||||||||||
| 1,704 | CBIZ, Inc.* | 12,490 | |||||||||
| 5,067 | Cintas Corp. | 157,330 | |||||||||
| 1,256 | Dycom Industries, Inc.* | 18,664 | |||||||||
| 1,458 | FTI Consulting, Inc.* | 58,174 | |||||||||
| 5,465 | KBR, Inc. | 209,692 | |||||||||
| 12,132 | Lockheed Martin Corp. | 961,461 | |||||||||
| 10,144 | Northrop Grumman Corp. | 645,260 | |||||||||
| 1,723 | Ryder System, Inc. | 92,181 | |||||||||
| 1,091 | Toro Co. (The) | 74,090 | |||||||||
| 1,114 | Tredegar Corp. | 24,374 | |||||||||
| 2,443 | W.W. Grainger, Inc. | 370,359 | |||||||||
| 2,624,075 | |||||||||||
| Information Technology—22.9% | |||||||||||
| 6,940 | Amdocs Ltd. (Guernsey)* | 213,405 | |||||||||
| 2,115 | Benchmark Electronics, Inc.* | 35,743 | |||||||||
| 2,403 | Brightpoint, Inc.* | 24,318 | |||||||||
| 4,347 | Broadridge Financial Solutions, Inc. | 101,024 | |||||||||
| 7,734 | Compuware Corp.* | 87,626 | |||||||||
| 1,645 | DST Systems, Inc. | 81,115 | |||||||||
| 1,633 | Electronics for Imaging, Inc.* | 29,329 | |||||||||
| 1,403 | Fair Isaac Corp. | 41,922 | |||||||||
| 10,774 | Fidelity National Information Services, Inc. | 356,619 | |||||||||
| 2,203 | Global Cash Access Holdings, Inc.* | 7,270 | |||||||||
| 52,999 | Hewlett-Packard Co. | 2,139,570 | |||||||||
| 2,902 | IAC/InterActiveCorp.* | 104,791 | |||||||||
| 5,098 | Integrated Device Technology, Inc.* | 41,472 | |||||||||
| 12,767 | International Business Machines Corp. | 2,177,795 | |||||||||
| 1,120 | LoopNet, Inc.* | 20,810 | |||||||||
| 21,824 | LSI Corp.* | 159,970 | |||||||||
| 263 | MicroStrategy, Inc., Class A* | 37,162 | |||||||||
| 536 | MTS Systems Corp. | 23,729 | |||||||||
| 833 | Multi-Fineline Electronix, Inc.* | 22,183 | |||||||||
| 3,153 | Novellus Systems, Inc.* | 101,211 | |||||||||
| 699 | Oplink Communications, Inc.* | 13,840 | |||||||||
| 3,794 | QLogic Corp.* | 68,216 | |||||||||
| 12,452 | SAIC, Inc.* | 216,665 | |||||||||
| 16,286 | Seagate Technology PLC (Ireland) | 286,959 | |||||||||
| 501 | Stamps.com, Inc. | 6,774 | |||||||||
| 1,617 | Tech Data Corp.* | 85,911 | |||||||||
| 1,979 | TeleTech Holdings, Inc.* | 39,323 | |||||||||
| 40,922 | Texas Instruments, Inc. | 1,453,959 | |||||||||
| 1,116 | Tyler Technologies, Inc.* | 27,666 | |||||||||
| 2,826 | ValueClick, Inc.* | 47,335 | |||||||||
| 5,969 | VeriSign, Inc. | 220,614 | |||||||||
| 5,665 | Vishay Intertechnology, Inc.* | 108,088 | |||||||||
| 22,599 | Western Union Co. (The) | 480,229 | |||||||||
| Number of Shares | Value | ||||||||||
| Common Stocks and Other Equity Interests (Continued) | |||||||||||
| 8,981 | Xilinx, Inc. | $ | 313,078 | ||||||||
| 46,028 | Yahoo!, Inc.* | 816,997 | |||||||||
| 9,992,718 | |||||||||||
| Materials—0.9% | |||||||||||
| 5,967 | Ball Corp. | 222,629 | |||||||||
| 645 | Kaiser Aluminum Corp. | 32,321 | |||||||||
| 473 | NewMarket Corp. | 87,183 | |||||||||
| 2,626 | Worthington Industries, Inc. | 56,643 | |||||||||
| 398,776 | |||||||||||
| Telecommunication Services—0.0% | |||||||||||
| 1,471 | General Communication, Inc., Class A* | 16,916 | |||||||||
| Utilities—0.1% | |||||||||||
| 4,078 | Dynegy, Inc., Class A* | 25,855 | |||||||||
| Total Common Stocks and Other Equity Interests (Cost $39,805,875) | 43,628,319 | ||||||||||
| Money Market Fund—0.1% | |||||||||||
| 67,464 | Goldman Sachs Financial Square Prime Obligations Institutional Share Class (Cost $67,464) | 67,464 | |||||||||
| Total Investments (Cost $39,873,339)—100.1% | 43,695,783 | ||||||||||
| Liabilities in excess of other assets—(0.1%) | (59,147 | ) | |||||||||
| Net Assets—100.0% | $ | 43,636,636 | |||||||||
Investment Abbreviations:
REIT—Real Estate Investment Trust
Notes to Schedule of Investments:
* Non-income producing security.
See Notes to Financial Statements.
19
Schedule of Investments
PowerShares Dividend AchieversTM Portfolio
April 30, 2011
| Number of Shares | Value | ||||||||||
| Common Stocks and Other Equity Interests—100.0% | |||||||||||
| Consumer Discretionary—7.2% | |||||||||||
| 7,901 | Family Dollar Stores, Inc. | $ | 428,313 | ||||||||
| 10,183 | Genuine Parts Co. | 546,827 | |||||||||
| 3,310 | John Wiley & Sons, Inc., Class A | 168,578 | |||||||||
| 9,421 | Leggett & Platt, Inc. | 247,678 | |||||||||
| 85,150 | Lowe's Cos., Inc. | 2,235,188 | |||||||||
| 1,912 | Matthews International Corp., Class A | 76,748 | |||||||||
| 67,025 | McDonald's Corp. | 5,248,728 | |||||||||
| 19,667 | McGraw-Hill Cos., Inc. (The) | 795,923 | |||||||||
| 2,376 | Meredith Corp. | 79,406 | |||||||||
| 2,199 | Polaris Industries, Inc. | 231,841 | |||||||||
| 7,590 | Ross Stores, Inc. | 559,307 | |||||||||
| 10,800 | Stanley Black & Decker, Inc. | 784,620 | |||||||||
| 44,764 | Target Corp. | 2,197,912 | |||||||||
| 25,167 | TJX Cos., Inc. (The) | 1,349,455 | |||||||||
| 7,021 | VF Corp. | 706,032 | |||||||||
| 15,656,556 | |||||||||||
| Consumer Staples—25.7% | |||||||||||
| 135,203 | Altria Group, Inc. | 3,628,849 | |||||||||
| 41,162 | Archer-Daniels-Midland Co. | 1,523,817 | |||||||||
| 28,195 | Avon Products, Inc. | 828,369 | |||||||||
| 5,725 | Brown-Forman Corp., Class B | 411,398 | |||||||||
| 2,450 | Casey's General Stores, Inc. | 95,623 | |||||||||
| 4,615 | Church & Dwight Co., Inc. | 380,645 | |||||||||
| 8,889 | Clorox Co. (The) | 619,208 | |||||||||
| 148,239 | Coca-Cola Co. (The) | 10,000,203 | |||||||||
| 31,678 | Colgate-Palmolive Co. | 2,672,039 | |||||||||
| 17,247 | Hormel Foods Corp. | 507,234 | |||||||||
| 7,494 | J.M. Smucker Co. (The) | 562,575 | |||||||||
| 26,033 | Kimberly-Clark Corp. | 1,719,740 | |||||||||
| 1,783 | Lancaster Colony Corp. | 108,959 | |||||||||
| 7,752 | McCormick & Co., Inc. | 380,778 | |||||||||
| 103,371 | PepsiCo, Inc. | 7,121,228 | |||||||||
| 162,012 | Procter & Gamble Co. (The) | 10,514,579 | |||||||||
| 37,635 | Sysco Corp. | 1,088,028 | |||||||||
| 2,329 | Tootsie Roll Industries, Inc. | 69,032 | |||||||||
| 1,515 | Universal Corp. | 65,721 | |||||||||
| 4,819 | Vector Group Ltd. | 88,477 | |||||||||
| 59,126 | Walgreen Co. | 2,525,863 | |||||||||
| 201,432 | Wal-Mart Stores, Inc. | 11,074,731 | |||||||||
| 55,987,096 | |||||||||||
| Energy—16.8% | |||||||||||
| 5,500 | Buckeye Partners LP | 357,830 | |||||||||
| 1,496 | CARBO Ceramics, Inc. | 240,766 | |||||||||
| 95,676 | Chevron Corp. | 10,470,782 | |||||||||
| 94,027 | ConocoPhillips | 7,421,551 | |||||||||
| 54,490 | Enterprise Products Partners LP | 2,357,782 | |||||||||
| 17,322 | EOG Resources, Inc. | 1,955,827 | |||||||||
| 119,203 | Exxon Mobil Corp. | 10,489,864 | |||||||||
| 6,867 | Helmerich & Payne, Inc. | 455,557 | |||||||||
| Number of Shares | Value | ||||||||||
| Common Stocks and Other Equity Interests (Continued) | |||||||||||
| 14,146 | Kinder Morgan Energy Partners LP | $ | 1,093,769 | ||||||||
| 12,492 | Murphy Oil Corp. | 967,880 | |||||||||
| 9,564 | Plains All American Pipeline LP | 614,391 | |||||||||
| 2,986 | TC Pipelines LP | 144,463 | |||||||||
| 36,570,462 | |||||||||||
| Financials—6.0% | |||||||||||
| 30,369 | Aflac, Inc. | 1,706,434 | |||||||||
| 992 | BancFirst Corp. | 39,948 | |||||||||
| 1,104 | Bank of the Ozarks, Inc. | 49,161 | |||||||||
| 9,191 | Brown & Brown, Inc. | 237,587 | |||||||||
| 18,963 | Chubb Corp. (The) | 1,236,198 | |||||||||
| 10,528 | Cincinnati Financial Corp. | 333,527 | |||||||||
| 5,622 | Commerce Bancshares, Inc. | 239,272 | |||||||||
| 2,157 | Community Bank System, Inc. | 53,968 | |||||||||
| 994 | Community Trust Bancorp, Inc. | 28,130 | |||||||||
| 4,331 | Corporate Office Properties Trust REIT | 152,495 | |||||||||
| 3,955 | Cullen/Frost Bankers, Inc. | 234,294 | |||||||||
| 7,667 | Eaton Vance Corp. | 258,915 | |||||||||
| 3,215 | Erie Indemnity Co., Class A | 232,862 | |||||||||
| 2,080 | Essex Property Trust, Inc. REIT | 281,798 | |||||||||
| 4,017 | Federal Realty Investment Trust REIT | 351,729 | |||||||||
| 839 | First Financial Corp. | 26,982 | |||||||||
| 14,407 | Franklin Resources, Inc. | 1,860,232 | |||||||||
| 2,169 | Getty Realty Corp. REIT | 55,114 | |||||||||
| 1,735 | Harleysville Group, Inc. | 55,659 | |||||||||
| 7,412 | HCC Insurance Holdings, Inc. | 241,187 | |||||||||
| 25,931 | HCP, Inc. REIT | 1,027,386 | |||||||||
| 34,018 | Hudson City Bancorp, Inc. | 324,192 | |||||||||
| 5,171 | Investors Real Estate Trust REIT | 48,659 | |||||||||
| 3,541 | Mercury General Corp. | 140,719 | |||||||||
| 5,462 | National Retail Properties, Inc. REIT | 143,869 | |||||||||
| 16,743 | Old Republic International Corp. | 212,134 | |||||||||
| 23,226 | People's United Financial, Inc. | 317,964 | |||||||||
| 3,021 | Prosperity Bancshares, Inc. | 138,513 | |||||||||
| 8,119 | Realty Income Corp. REIT | 288,630 | |||||||||
| 1,358 | RLI Corp. | 80,448 | |||||||||
| 11,952 | SEI Investments Co. | 266,888 | |||||||||
| 1,075 | Southside Bancshares, Inc. | 23,381 | |||||||||
| 2,954 | StanCorp Financial Group, Inc. | 127,317 | |||||||||
| 16,775 | T. Rowe Price Group, Inc. | 1,077,794 | |||||||||
| 5,250 | Tanger Factory Outlet Centers, Inc. REIT | 145,058 | |||||||||
| 4,035 | Transatlantic Holdings, Inc. | 198,885 | |||||||||
| 2,616 | UMB Financial Corp. | 110,160 | |||||||||
| 2,816 | United Bankshares, Inc. | 73,667 | |||||||||
| 817 | Universal Health Realty Income Trust REIT | 35,221 | |||||||||
| 1,339 | Urstadt Biddle Properties, Inc., Class A REIT | 26,352 | |||||||||
| 2,552 | W.P. Carey & Co. LLC | 91,540 | |||||||||
| 4,255 | Washington REIT | 137,862 | |||||||||
See Notes to Financial Statements.
20
Schedule of Investments (Continued)
PowerShares Dividend AchieversTM Portfolio
April 30, 2011
| Number of Shares | Value | ||||||||||
| Common Stocks and Other Equity Interests (Continued) | |||||||||||
| 460 | Wesco Financial Corp. | $ | 180,320 | ||||||||
| 1,874 | Westamerica Bancorp | 95,180 | |||||||||
| 12,987,631 | |||||||||||
| Health Care—11.1% | |||||||||||
| 99,956 | Abbott Laboratories | 5,201,710 | |||||||||
| 4,602 | Beckman Coulter, Inc. | 381,276 | |||||||||
| 14,281 | Becton, Dickinson and Co. | 1,227,309 | |||||||||
| 5,584 | C.R. Bard, Inc. | 596,092 | |||||||||
| 22,589 | Cardinal Health, Inc. | 986,914 | |||||||||
| 167,688 | Johnson & Johnson | 11,020,455 | |||||||||
| 69,067 | Medtronic, Inc. | 2,883,547 | |||||||||
| 2,646 | Meridian Bioscience, Inc. | 65,383 | |||||||||
| 4,116 | Owens & Minor, Inc. | 141,796 | |||||||||
| 25,117 | Stryker Corp. | 1,481,903 | |||||||||
| 2,161 | West Pharmaceutical Services, Inc. | 102,086 | |||||||||
| 24,088,471 | |||||||||||
| Industrials—13.5% | |||||||||||
| 45,974 | 3M Co. | 4,469,133 | |||||||||
| 2,968 | A.O. Smith Corp. | 130,503 | |||||||||
| 3,424 | ABM Industries, Inc. | 83,272 | |||||||||
| 972 | Badger Meter, Inc. | 36,848 | |||||||||
| 3,175 | Brady Corp., Class A | 119,729 | |||||||||
| 10,528 | C.H. Robinson Worldwide, Inc. | 844,135 | |||||||||
| 3,988 | Carlisle Cos., Inc. | 197,565 | |||||||||
| 41,640 | Caterpillar, Inc. | 4,805,672 | |||||||||
| 9,384 | Cintas Corp. | 291,373 | |||||||||
| 3,256 | CLARCOR, Inc. | 147,139 | |||||||||
| 4,966 | Donaldson Co., Inc. | 304,068 | |||||||||
| 12,051 | Dover Corp. | 819,950 | |||||||||
| 48,705 | Emerson Electric Co. | 2,959,316 | |||||||||
| 13,695 | Expeditors International of Washington, Inc. | 743,228 | |||||||||
| 9,520 | Fastenal Co. | 638,697 | |||||||||
| 1,507 | Franklin Electric Co., Inc. | 67,981 | |||||||||
| 24,115 | General Dynamics Corp. | 1,756,054 | |||||||||
| 1,089 | Gorman-Rupp Co. (The) | 44,050 | |||||||||
| 3,887 | Graco, Inc. | 194,467 | |||||||||
| 5,207 | Harsco Corp. | 185,369 | |||||||||
| 32,207 | Illinois Tool Works, Inc. | 1,881,211 | |||||||||
| 1,569 | McGrath Rentcorp | 44,544 | |||||||||
| 2,358 | Mine Safety Appliances Co. | 93,565 | |||||||||
| 439 | NACCO Industries, Inc., Class A | 46,196 | |||||||||
| 4,406 | Nordson Corp. | 251,010 | |||||||||
| 10,456 | Parker Hannifin Corp. | 986,210 | |||||||||
| 6,355 | Pentair, Inc. | 255,217 | |||||||||
| 13,166 | Pitney Bowes, Inc. | 323,357 | |||||||||
| 1,167 | Raven Industries, Inc. | 63,438 | |||||||||
| 6,158 | Roper Industries, Inc. | 532,605 | |||||||||
| 1,232 | Tennant Co. | 50,537 | |||||||||
| 59,498 | United Technologies Corp. | 5,329,831 | |||||||||
| Number of Shares | Value | ||||||||||
| Common Stocks and Other Equity Interests (Continued) | |||||||||||
| 1,260 | Universal Forest Products, Inc. | $ | 40,685 | ||||||||
| 4,485 | W.W. Grainger, Inc. | 679,926 | |||||||||
| 29,416,881 | |||||||||||
| Information Technology—6.3% | |||||||||||
| 32,062 | Automatic Data Processing, Inc. | 1,742,570 | |||||||||
| 4,246 | Diebold, Inc. | 143,515 | |||||||||
| 2,982 | FactSet Research Systems, Inc. | 326,260 | |||||||||
| 64,117 | International Business Machines Corp. | 10,937,078 | |||||||||
| 5,565 | Jack Henry & Associates, Inc. | 189,043 | |||||||||
| 14,650 | Linear Technology Corp. | 509,820 | |||||||||
| 13,848,286 | |||||||||||
| Materials—4.1% | |||||||||||
| 13,881 | Air Products & Chemicals, Inc. | 1,325,913 | |||||||||
| 5,919 | Albemarle Corp. | 417,585 | |||||||||
| 4,334 | AptarGroup, Inc. | 227,318 | |||||||||
| 6,899 | Bemis Co., Inc. | 216,215 | |||||||||
| 14,987 | Ecolab, Inc. | 790,714 | |||||||||
| 3,192 | H.B. Fuller Co. | 69,745 | |||||||||
| 20,412 | Nucor Corp. | 958,548 | |||||||||
| 10,402 | PPG Industries, Inc. | 984,757 | |||||||||
| 19,609 | Praxair, Inc. | 2,086,790 | |||||||||
| 8,423 | RPM International, Inc. | 197,941 | |||||||||
| 6,927 | Sherwin-Williams Co. (The) | 570,023 | |||||||||
| 7,867 | Sigma-Aldrich Corp. | 555,253 | |||||||||
| 6,476 | Sonoco Products Co. | 223,811 | |||||||||
| 695 | Stepan Co. | 50,019 | |||||||||
| 6,198 | Valspar Corp. (The) | 243,643 | |||||||||
| 8,918,275 | |||||||||||
| Telecommunication Services—5.8% | |||||||||||
| 351,901 | AT&T, Inc. | 10,951,159 | |||||||||
| 993 | Atlantic Tele-Network, Inc. | 36,473 | |||||||||
| 38,738 | CenturyLink, Inc. | 1,579,736 | |||||||||
| 1,510 | Shenandoah Telecommunications Co. | 28,418 | |||||||||
| 3,642 | Telephone & Data Systems, Inc. | 122,225 | |||||||||
| 12,718,011 | |||||||||||
| Utilities—3.5% | |||||||||||
| 1,203 | American States Water Co. | 41,997 | |||||||||
| 8,926 | Aqua America, Inc. | 201,281 | |||||||||
| 5,841 | Atmos Energy Corp. | 203,792 | |||||||||
| 2,545 | Black Hills Corp. | 88,439 | |||||||||
| 1,338 | California Water Service Group | 50,469 | |||||||||
| 18,876 | Consolidated Edison, Inc. | 983,817 | |||||||||
| 4,653 | Energen Corp. | 302,492 | |||||||||
| 12,194 | MDU Resources Group, Inc. | 291,315 | |||||||||
| 1,491 | MGE Energy, Inc. | 62,637 | |||||||||
| 1,007 | Middlesex Water Co. | 19,012 | |||||||||
| 5,319 | National Fuel Gas Co. | 389,883 | |||||||||
| 2,673 | New Jersey Resources Corp. | 117,024 | |||||||||
| 27,254 | NextEra Energy, Inc. | 1,541,759 | |||||||||
See Notes to Financial Statements.
21
Schedule of Investments (Continued)
PowerShares Dividend AchieversTM Portfolio
April 30, 2011
| Number of Shares | Value | ||||||||||
| Common Stocks and Other Equity Interests (Continued) | |||||||||||
| 11,412 | Northeast Utilities | $ | 406,267 | ||||||||
| 1,721 | Northwest Natural Gas Co. | 79,579 | |||||||||
| 6,690 | NSTAR | 309,747 | |||||||||
| 4,637 | Piedmont Natural Gas Co., Inc. | 147,225 | |||||||||
| 36,499 | PPL Corp. | 1,001,168 | |||||||||
| 11,443 | Questar Corp. | 201,053 | |||||||||
| 8,269 | SCANA Corp. | 343,329 | |||||||||
| 1,181 | SJW Corp. | 27,446 | |||||||||
| 1,929 | South Jersey Industries, Inc. | 110,821 | |||||||||
| 2,284 | Suburban Propane Partners LP | 128,384 | |||||||||
| 7,176 | UGI Corp. | 238,961 | |||||||||
| 2,369 | Unisource Energy Corp. | 87,961 | |||||||||
| 5,278 | Vectren Corp. | 150,845 | |||||||||
| 3,291 | WGL Holdings, Inc. | 130,060 | |||||||||
| 7,656,763 | |||||||||||
| Total Investments (Cost $181,516,465)—100.0% | 217,848,432 | ||||||||||
| Other assets less liabilities—0.0% | 10,822 | ||||||||||
| Net Assets—100.0% | $ | 217,859,254 | |||||||||
Investment Abbreviations:
REIT—Real Estate Investment Trust
See Notes to Financial Statements.
22
Schedule of Investments
PowerShares Financial Preferred Portfolio
April 30, 2011
| Number of Shares | Value | ||||||||||
| Preferred Stocks—99.9% | |||||||||||
| Banks—66.6% | |||||||||||
| 1,414,604 | Bank of America Corp., 6.20%, Series D | $ | 32,649,060 | ||||||||
| 1,920,517 | Bank of America Corp., 7.25%, Series J | 48,665,901 | |||||||||
| 5,333,282 | Bank of America Corp., 8.20%, Series H | 138,665,332 | |||||||||
| 3,301,363 | Bank of America Corp., 8.63%, Series MER | 88,872,692 | |||||||||
| 422,765 | Barclays Bank PLC, 6.63%, Series 2 (United Kingdom) | 10,442,296 | |||||||||
| 578,288 | Barclays Bank PLC, 7.75%, Series 4 (United Kingdom) | 15,035,488 | |||||||||
| 2,429,330 | Barclays Bank PLC, 8.13%, Series 5 (United Kingdom) | 64,620,178 | |||||||||
| 379,102 | Deutsche Bank Capital Funding Trust IX, 6.63% | 9,371,401 | |||||||||
| 1,236,930 | Deutsche Bank Contingent Capital Trust III, 7.60% | 33,050,770 | |||||||||
| 718,635 | Deutsche Bank Contingent Capital Trust V, 8.05% | 19,546,872 | |||||||||
| 1,898,835 | Goldman Sachs Group, Inc. (The), 6.20%, Series B | 47,432,898 | |||||||||
| 6,566,686 | HSBC Holdings PLC, 8.00%, Series 2 (United Kingdom) | 180,124,197 | |||||||||
| 3,826,044 | HSBC Holdings PLC, 8.13% (United Kingdom) | 104,910,127 | |||||||||
| 1,238,176 | HSBC USA, Inc., 6.50%, Series H | 30,954,400 | |||||||||
| 2,934,376 | JPMorgan Chase & Co., 8.63%, Series J | 81,106,153 | |||||||||
| 1,314,446 | National Bank of Greece SA, 9.00%(Greece) | 23,673,172 | |||||||||
| 1,475,675 | Royal Bank of Scotland Group PLC, 5.75%, Series L (United Kingdom) | 28,111,609 | |||||||||
| 381,354 | Royal Bank of Scotland Group PLC, 6.35%, Series N (United Kingdom)* | 6,871,999 | |||||||||
| 522,548 | Royal Bank of Scotland Group PLC, 6.60%, Series S (United Kingdom)* | 9,541,726 | |||||||||
| 327,150 | Royal Bank of Scotland Group PLC, 6.75%, Series Q (United Kingdom)* | 6,071,904 | |||||||||
| 2,030,479 | Royal Bank of Scotland Group PLC, 7.25%, Series T (United Kingdom)* | 40,731,409 | |||||||||
| 2,017,508 | Santander Finance Preferred SA Unipersonal, 10.50%, Series 10 (Spain) | 58,084,055 | |||||||||
| 993,996 | U.S. Bancorp, 7.88%, Series D | 27,583,389 | |||||||||
| 2,998,593 | Wells Fargo & Co., 8.00%, Series J | 86,629,352 | |||||||||
| 1,041,124 | Zions Bancorp, 9.50%, Series C | 27,995,824 | |||||||||
| 1,220,742,204 | |||||||||||
| Diversified Financial Services—6.3% | |||||||||||
| 2,909,858 | Credit Suisse Guernsey, 7.90% (Switzerland) | 79,497,321 | |||||||||
| 1,521,028 | HSBC Finance Corp., 6.36%, Series B | 36,200,466 | |||||||||
| 115,697,787 | |||||||||||
| Number of Shares | Value | ||||||||||
| Preferred Stocks (Continued) | |||||||||||
| Insurance—27.0% | |||||||||||
| 1,060,253 | Aegon NV, 6.38%(Netherlands) | $ | 24,661,485 | ||||||||
| 343,755 | Aegon NV, 6.50%(Netherlands) | 7,940,741 | |||||||||
| 492,134 | Aegon NV, 6.88%(Netherlands) | 11,830,901 | |||||||||
| 1,742,395 | Aegon NV, 7.25%(Netherlands) | 43,612,147 | |||||||||
| 442,567 | Axis Capital Holdings Ltd., 7.25%, Series A | 11,090,729 | |||||||||
| 865,638 | ING Groep NV, 6.13%(Netherlands) | 18,706,437 | |||||||||
| 1,709,530 | ING Groep NV, 6.38%(Netherlands) | 37,370,326 | |||||||||
| 3,094,940 | ING Groep NV, 7.38%(Netherlands) | 75,268,941 | |||||||||
| 3,923,540 | ING Groep NV, 8.50%(Netherlands) | 102,522,100 | |||||||||
| 3,059,586 | MetLife, Inc., 6.50%, Series B | 78,172,422 | |||||||||
| 560,409 | PartnerRe Ltd., 6.75%, Series C | 13,926,164 | |||||||||
| 460,801 | Principal Financial Group, Inc., 6.52%, Series B | 11,510,809 | |||||||||
| 665,894 | Prudential PLC, 6.50%(United Kingdom) | 16,654,009 | |||||||||
| 612,913 | Prudential PLC, 6.75%(United Kingdom) | 15,384,116 | |||||||||
| 486,659 | RenaissanceRe Holdings Ltd., 6.08%, Series C | 11,280,756 | |||||||||
| 594,657 | RenaissanceRe Holdings Ltd., 6.60%, Series D | 14,902,104 | |||||||||
| 494,834,187 | |||||||||||
| Total Investments (Cost $1,497,617,912)—99.9% | 1,831,274,178 | ||||||||||
| Other assets less liabilities—0.1% | 1,241,334 | ||||||||||
| Net Assets—100.0% | $ | 1,832,515,512 | |||||||||
Notes to Schedule of Investments:
This Fund has holdings greater than 10% of net assets in the following countries:
| United Kingdom | 27.2 | % | |||||
| Netherlands | 17.6 | % | |||||
* Non-income producing security.
See Notes to Financial Statements.
23
Schedule of Investments
PowerShares High Yield Equity Dividend AchieversTM Portfolio
April 30, 2011
| Number of Shares | Value | ||||||||||
| Common Stocks and Other Equity Interests—99.9% | |||||||||||
| Agriculture—5.0% | |||||||||||
| 220,766 | Altria Group, Inc. | $ | 5,925,359 | ||||||||
| 103,105 | Universal Corp. | 4,472,695 | |||||||||
| 10,398,054 | |||||||||||
| Banks—8.0% | |||||||||||
| 163,730 | Community Bank System, Inc. | 4,096,524 | |||||||||
| 156,999 | Community Trust Bancorp, Inc. | 4,443,072 | |||||||||
| 158,323 | Southside Bancshares, Inc. | 3,443,525 | |||||||||
| 177,748 | United Bankshares, Inc. | 4,649,888 | |||||||||
| 16,633,009 | |||||||||||
| Chemicals—1.7% | |||||||||||
| 150,960 | RPM International, Inc. | 3,547,560 | |||||||||
| Commercial Services—1.6% | |||||||||||
| 120,932 | McGrath Rentcorp | 3,433,260 | |||||||||
| Computers—1.4% | |||||||||||
| 85,068 | Diebold, Inc. | 2,875,298 | |||||||||
| Distribution/Wholesale—1.6% | |||||||||||
| 63,517 | Genuine Parts Co. | 3,410,863 | |||||||||
| Electric—20.3% | |||||||||||
| 128,903 | Black Hills Corp. | 4,479,379 | |||||||||
| 92,027 | Consolidated Edison, Inc. | 4,796,447 | |||||||||
| 119,354 | MDU Resources Group, Inc. | 2,851,367 | |||||||||
| 89,591 | MGE Energy, Inc. | 3,763,718 | |||||||||
| 70,941 | NextEra Energy, Inc. | 4,013,132 | |||||||||
| 90,607 | Northeast Utilities | 3,225,609 | |||||||||
| 80,798 | NSTAR | 3,740,947 | |||||||||
| 202,436 | PPL Corp. | 5,552,820 | |||||||||
| 122,557 | SCANA Corp. | 5,088,567 | |||||||||
| 127,130 | Unisource Energy Corp. | 4,720,337 | |||||||||
| 42,232,323 | |||||||||||
| Environmental Control—1.4% | |||||||||||
| 74,939 | Mine Safety Appliances Co. | 2,973,580 | |||||||||
| Food—1.8% | |||||||||||
| 127,771 | Sysco Corp. | 3,693,860 | |||||||||
| Gas—13.5% | |||||||||||
| 117,565 | Atmos Energy Corp. | 4,101,843 | |||||||||
| 78,161 | New Jersey Resources Corp. | 3,421,889 | |||||||||
| 82,459 | Northwest Natural Gas Co. | 3,812,904 | |||||||||
| 123,535 | Piedmont Natural Gas Co., Inc. | 3,922,236 | |||||||||
| 201,152 | Questar Corp. | 3,534,241 | |||||||||
| 182,321 | Vectren Corp. | 5,210,734 | |||||||||
| 103,654 | WGL Holdings, Inc. | 4,096,406 | |||||||||
| 28,100,253 | |||||||||||
| Number of Shares | Value | ||||||||||
| Common Stocks and Other Equity Interests (Continued) | |||||||||||
| Healthcare-Products—3.3% | |||||||||||
| 56,049 | Johnson & Johnson | $ | 3,683,540 | ||||||||
| 127,914 | Meridian Bioscience, Inc. | 3,160,755 | |||||||||
| 6,844,295 | |||||||||||
| Household Products/Wares—3.6% | |||||||||||
| 45,173 | Clorox Co. (The) | 3,146,751 | |||||||||
| 65,839 | Kimberly-Clark Corp. | 4,349,325 | |||||||||
| 7,496,076 | |||||||||||
| Insurance—9.9% | |||||||||||
| 149,539 | Cincinnati Financial Corp. | 4,737,396 | |||||||||
| 134,894 | Harleysville Group, Inc. | 4,327,399 | |||||||||
| 156,912 | Mercury General Corp. | 6,235,683 | |||||||||
| 423,573 | Old Republic International Corp. | 5,366,670 | |||||||||
| 20,667,148 | |||||||||||
| Iron/Steel—1.5% | |||||||||||
| 68,788 | Nucor Corp. | 3,230,284 | |||||||||
| Miscellaneous Manufacturing—2.3% | |||||||||||
| 183,562 | Leggett & Platt, Inc. | 4,825,845 | |||||||||
| Office/Business Equipment—2.6% | |||||||||||
| 221,452 | Pitney Bowes, Inc. | 5,438,861 | |||||||||
| Oil & Gas—1.5% | |||||||||||
| 40,515 | ConocoPhillips | 3,197,849 | |||||||||
| Packaging & Containers—1.5% | |||||||||||
| 91,904 | Sonoco Products Co. | 3,176,202 | |||||||||
| Pharmaceuticals—1.9% | |||||||||||
| 75,203 | Abbott Laboratories | 3,913,564 | |||||||||
| Pipelines—2.6% | |||||||||||
| 125,442 | Enterprise Products Partners LP | 5,427,875 | |||||||||
| Savings & Loans—4.0% | |||||||||||
| 343,100 | Hudson City Bancorp, Inc. | 3,269,743 | |||||||||
| 372,432 | People's United Financial, Inc. | 5,098,594 | |||||||||
| 8,368,337 | |||||||||||
| Telecommunications—6.1% | |||||||||||
| 181,364 | AT&T, Inc. | 5,644,048 | |||||||||
| 174,703 | CenturyLink, Inc. | 7,124,388 | |||||||||
| 12,768,436 | |||||||||||
| Textiles—0.8% | |||||||||||
| 52,482 | Cintas Corp. | 1,629,566 | |||||||||
| Water—2.0% | |||||||||||
| 216,045 | Middlesex Water Co. | 4,078,930 | |||||||||
| Total Investments (Cost $190,586,563)—99.9% | 208,361,328 | ||||||||||
| Other assets less liabilities—0.1% | 109,203 | ||||||||||
| Net Assets—100.0% | $ | 208,470,531 | |||||||||
See Notes to Financial Statements.
24
Schedule of Investments
PowerShares International Dividend AchieversTM Portfolio
April 30, 2011
| Number of Shares | Value | ||||||||||
| Common Stocks and Other Equity Interests—100.2% | |||||||||||
| Australia—1.0% | |||||||||||
| 56,660 | BHP Billiton Ltd. ADR | $ | 5,736,258 | ||||||||
| Bahamas—3.3% | |||||||||||
| 478,918 | Teekay LNG Partners LP | 18,160,571 | |||||||||
| Belgium—1.0% | |||||||||||
| 63,157 | Delhaize Group SA ADR | 5,422,660 | |||||||||
| Bermuda—3.5% | |||||||||||
| 300,364 | Alterra Capital Holdings Ltd. | 6,602,001 | |||||||||
| 226,131 | Axis Capital Holdings Ltd. | 7,995,992 | |||||||||
| 65,873 | RenaissanceRe Holdings Ltd. | 4,629,554 | |||||||||
| 19,227,547 | |||||||||||
| Brazil—0.8% | |||||||||||
| 159,769 | Cia de Bebidas DAS Americas ADR | 4,201,925 | |||||||||
| Canada—18.2% | |||||||||||
| 137,879 | Cameco Corp. | 4,064,673 | |||||||||
| 69,900 | Canadian National Railway Co. | 5,412,357 | |||||||||
| 47,245 | Canadian Natural Resources Ltd. | 2,218,625 | |||||||||
| 77,554 | Canadian Pacific Railway Ltd. | 5,137,177 | |||||||||
| 146,506 | Enbridge, Inc. | 9,497,984 | |||||||||
| 49,130 | Imperial Oil Ltd. | 2,597,012 | |||||||||
| 155,289 | Ritchie Bros. Auctioneers, Inc. | 4,855,887 | |||||||||
| 324,043 | Rogers Communications, Inc., Class B | 12,258,547 | |||||||||
| 637,410 | Shaw Communications, Inc., Class B | 13,487,596 | |||||||||
| 58,483 | Suncor Energy, Inc. | 2,692,557 | |||||||||
| 124,089 | Talisman Energy, Inc. | 2,990,545 | |||||||||
| 257,416 | Telus Corp. | 12,914,561 | |||||||||
| 234,350 | Thomson Reuters Corp. | 9,484,144 | |||||||||
| 286,541 | TransCanada Corp. | 12,304,070 | |||||||||
| 99,915,735 | |||||||||||
| Cayman Islands—1.5% | |||||||||||
| 832,697 | Consolidated Water Co. Ltd.(~) | 8,168,758 | |||||||||
| Chile—1.1% | |||||||||||
| 103,607 | Empresa Nacional de Electricidad SA ADR | 5,841,363 | |||||||||
| Denmark—0.6% | |||||||||||
| 25,208 | Novo Nordisk A/S ADR | 3,211,247 | |||||||||
| France—1.8% | |||||||||||
| 247,311 | Sanofi-Aventis SA ADR | 9,773,731 | |||||||||
| Hong Kong—3.2% | |||||||||||
| 245,938 | China Mobile Ltd. ADR | 11,335,282 | |||||||||
| 25,197 | CNOOC Ltd. ADR | 6,285,392 | |||||||||
| 17,620,674 | |||||||||||
| India—1.1% | |||||||||||
| 7,562 | HDFC Bank Ltd. ADR | 1,301,420 | |||||||||
| 77,677 | Infosys Technologies Ltd. ADR | 5,062,987 | |||||||||
| 6,364,407 | |||||||||||
| Number of Shares | Value | ||||||||||
| Common Stocks and Other Equity Interests (Continued) | |||||||||||
| Ireland—1.9% | |||||||||||
| 87,820 | Accenture PLC, Class A | $ | 5,017,157 | ||||||||
| 81,836 | Cooper Industries PLC | 5,397,084 | |||||||||
| 10,414,241 | |||||||||||
| Israel—5.7% | |||||||||||
| 1,405,522 | Partner Communications Co. Ltd. ADR | 27,224,961 | |||||||||
| 95,193 | Teva Pharmaceutical Industries Ltd. ADR | 4,353,176 | |||||||||
| 31,578,137 | |||||||||||
| Japan—2.6% | |||||||||||
| 216,467 | Canon, Inc. ADR | 10,210,749 | |||||||||
| 38,033 | Kyocera Corp. ADR | 4,180,207 | |||||||||
| 14,390,956 | |||||||||||
| Mexico—4.4% | |||||||||||
| 47,193 | America Movil SAB de CV, Series L ADR | 2,699,440 | |||||||||
| 96,425 | Coca-Cola Femsa SAB de CV ADR | 7,691,822 | |||||||||
| 737,445 | Telefonos de Mexico SAB de CV, Series L ADR | 13,804,970 | |||||||||
| 24,196,232 | |||||||||||
| Netherlands—1.7% | |||||||||||
| 280,305 | Unilever NV | 9,250,065 | |||||||||
| Norway—1.9% | |||||||||||
| 367,049 | Statoil ASA ADR | 10,758,206 | |||||||||
| Philippines—4.0% | |||||||||||
| 379,462 | Philippine Long Distance Telephone Co. ADR | 22,005,001 | |||||||||
| Russia—1.1% | |||||||||||
| 84,201 | LUKOIL OAO ADR | 5,826,709 | |||||||||
| Spain—3.6% | |||||||||||
| 740,103 | Telefonica SA ADR | 19,953,177 | |||||||||
| Switzerland—4.6% | |||||||||||
| 154,673 | Noble Corp. | 6,652,486 | |||||||||
| 195,668 | Novartis AG ADR | 11,577,676 | |||||||||
| 103,018 | Syngenta AG ADR* | 7,287,493 | |||||||||
| 25,517,655 | |||||||||||
| United Kingdom—27.9% | |||||||||||
| 42,731 | ARM Holdings PLC ADR | 1,344,317 | |||||||||
| 336,143 | AstraZeneca PLC ADR | 16,750,006 | |||||||||
| 82,621 | BHP Billiton PLC ADR | 6,955,036 | |||||||||
| 158,210 | British American Tobacco PLC ADR | 13,954,122 | |||||||||
| 125,009 | Diageo PLC ADR | 10,171,982 | |||||||||
| 389,899 | GlaxoSmithKline PLC ADR | 17,022,990 | |||||||||
| 355,391 | National Grid PLC ADR | 18,242,220 | |||||||||
| 566,396 | Pearson PLC ADR | 10,789,844 | |||||||||
| 410,736 | Prudential PLC ADR | 10,613,418 | |||||||||
| 158,394 | Royal Dutch Shell PLC, Class A ADR | 12,272,367 | |||||||||
| 45,946 | Smith & Nephew PLC ADR | 2,546,327 | |||||||||
See Notes to Financial Statements.
25
Schedule of Investments (Continued)
PowerShares International Dividend AchieversTM Portfolio
April 30, 2011
| Number of Shares | Value | ||||||||||
| Common Stocks and Other Equity Interests (Continued) | |||||||||||
| 345,112 | Unilever PLC ADR | $ | 11,240,298 | ||||||||
| 482,545 | Vodafone Group PLC ADR | 14,051,711 | |||||||||
| 113,649 | WPP PLC ADR | 7,420,143 | |||||||||
| 153,374,781 | |||||||||||
| United States—3.7% | |||||||||||
| 94,534 | ACE Ltd. | 6,357,411 | |||||||||
| 51,799 | Bunge Ltd. | 3,907,717 | |||||||||
| 106,616 | PartnerRe Ltd. | 8,567,662 | |||||||||
| 14,826 | Shire PLC ADR | 1,381,931 | |||||||||
| 20,214,721 | |||||||||||
| Total Investments (Cost $486,562,283)—100.2% | 551,124,757 | ||||||||||
| Liabilities in excess of other assets—(0.2%) | (842,440 | ) | |||||||||
| Net Assets—100.0% | $ | 550,282,317 | |||||||||
Investment Abbreviations:
ADR—American Depositary Receipt
Notes to Schedule of Investments:
(~) Affiliated Investment. See Note 4.
* Non-income producing security.
See Notes to Financial Statements.
26
This page intentionally left blank
Statements of Assets and Liabilities
April 30, 2011
| PowerShares Buyback AchieversTM Portfolio | PowerShares Dividend AchieversTM Portfolio | PowerShares Financial Preferred Portfolio | PowerShares High Yield Equity Dividend AchieversTM Portfolio | PowerShares International Dividend AchieversTM Portfolio | |||||||||||||||||||
| ASSETS: | |||||||||||||||||||||||
| Unaffiliated investments, at value | $ | 43,695,783 | $ | 217,848,432 | $ | 1,831,274,178 | $ | 208,361,328 | $ | 542,955,999 | |||||||||||||
| Affiliated investments, at value (Note 4) | — | — | — | — | 8,168,758 | ||||||||||||||||||
| Total investments, at value | 43,695,783 | 217,848,432 | 1,831,274,178 | 208,361,328 | 551,124,757 | ||||||||||||||||||
| Receivables: | |||||||||||||||||||||||
| Investments sold | 946,676 | 3,222,479 | 2,288,106 | 11,733,837 | 58,807,175 | ||||||||||||||||||
| Dividends | 32,806 | 384,746 | 5,889,395 | 412,455 | 1,130,259 | ||||||||||||||||||
| Expense waivers | 8,539 | 6,683 | 19,061 | 6,159 | 321 | ||||||||||||||||||
| Shares sold | — | 2,293,218 | — | 8,610,600 | 19,379,510 | ||||||||||||||||||
| Foreign tax reclaims | — | — | — | — | 210,506 | ||||||||||||||||||
| Total Assets | 44,683,804 | 223,755,558 | 1,839,470,740 | 229,124,379 | 630,652,528 | ||||||||||||||||||
| LIABILITIES: | |||||||||||||||||||||||
| Due to custodian | — | 65,030 | 5,010,512 | 91,847 | 820,683 | ||||||||||||||||||
| Payables: | |||||||||||||||||||||||
| Investments purchased | 940,150 | 3,300,916 | 180,550 | 11,707,482 | 60,471,308 | ||||||||||||||||||
| Shares repurchased | — | 2,293,218 | — | 8,610,601 | 18,538,949 | ||||||||||||||||||
| Accrued advisory fees | 17,149 | 69,995 | 747,770 | 65,874 | 174,686 | ||||||||||||||||||
| Accrued expenses | 89,869 | 167,145 | 1,016,396 | 178,044 | 364,585 | ||||||||||||||||||
| Total Liabilities | 1,047,168 | 5,896,304 | 6,955,228 | 20,653,848 | 80,370,211 | ||||||||||||||||||
| NET ASSETS | $ | 43,636,636 | $ | 217,859,254 | $ | 1,832,515,512 | $ | 208,470,531 | $ | 550,282,317 | |||||||||||||
| NET ASSETS CONSIST OF: | |||||||||||||||||||||||
| Shares of beneficial interest | $ | 64,857,245 | $ | 202,261,374 | $ | 1,541,666,553 | $ | 334,682,177 | $ | 705,382,351 | |||||||||||||
| Undistributed net investment income (loss) | 62,686 | 606,451 | (289,320 | ) | (8,300 | ) | 2,252,829 | ||||||||||||||||
| Undistributed net realized gain (loss) | (25,105,739 | ) | (21,340,538 | ) | (42,517,987 | ) | (143,978,111 | ) | (221,915,337 | ) | |||||||||||||
| Net unrealized appreciation | 3,822,444 | 36,331,967 | 333,656,266 | 17,774,765 | 64,562,474 | ||||||||||||||||||
| Net Assets | $ | 43,636,636 | $ | 217,859,254 | $ | 1,832,515,512 | $ | 208,470,531 | $ | 550,282,317 | |||||||||||||
| Shares outstanding (unlimited amount authorized, $0.01 par value) | 1,600,000 | 14,250,000 | 100,350,000 | 23,000,000 | 32,650,000 | ||||||||||||||||||
| Net asset value | $ | 27.27 | $ | 15.29 | $ | 18.26 | $ | 9.06 | $ | 16.85 | |||||||||||||
| Share price | $ | 27.27 | $ | 15.29 | $ | 18.28 | $ | 9.06 | $ | 16.89 | |||||||||||||
| Unaffiliated investments, at cost | $ | 39,873,339 | $ | 181,516,465 | $ | 1,497,617,912 | $ | 190,586,563 | $ | 477,228,802 | |||||||||||||
| Affiliated investments, at cost | $ | — | $ | — | $ | — | $ | — | $ | 9,333,481 | |||||||||||||
| Total investments, at cost | $ | 39,873,339 | $ | 181,516,465 | $ | 1,497,617,912 | $ | 190,586,563 | $ | 486,562,283 | |||||||||||||
See Notes to Financial Statements.
28
Statements of Operations
Year Ended April 30, 2011
| PowerShares Buyback AchieversTM Portfolio | PowerShares Dividend AchieversTM Portfolio | PowerShares Financial Preferred Portfolio | PowerShares High Yield Equity Dividend AchieversTM Portfolio | PowerShares International Dividend AchieversTM Portfolio | |||||||||||||||||||
| INVESTMENT INCOME: | |||||||||||||||||||||||
| Unaffiliated dividend income | $ | 431,621 | $ | 5,163,895 | $ | 129,452,940 | $ | 7,528,878 | $ | 18,148,112 | |||||||||||||
| Affiliated dividend income | — | — | ��� | — | 167,005 | ||||||||||||||||||
| Foreign withholding tax | — | — | — | — | (1,501,617 | ) | |||||||||||||||||
| Total Income | 431,621 | 5,163,895 | 129,452,940 | 7,528,878 | 16,813,500 | ||||||||||||||||||
| EXPENSES: | |||||||||||||||||||||||
| Advisory fees | 181,136 | 712,707 | 8,737,380 | 652,458 | 1,775,241 | ||||||||||||||||||
| Accounting & administration fees | 68,240 | 68,240 | 427,715 | 68,240 | 108,267 | ||||||||||||||||||
| Sub-licensing | 36,227 | 178,172 | 1,747,474 | 163,111 | 443,809 | ||||||||||||||||||
| Professional fees | 32,327 | 40,468 | 143,729 | 39,136 | 56,707 | ||||||||||||||||||
| Custodian & transfer agent fees | 18,370 | 42,311 | 187,368 | 31,116 | 72,713 | ||||||||||||||||||
| Trustees | 6,019 | 10,170 | 60,018 | 9,865 | 18,359 | ||||||||||||||||||
| Recapture (See Note 3) | — | 62 | 31,250 | — | 3,295 | ||||||||||||||||||
| Other expenses | 21,675 | 38,834 | 272,154 | 55,307 | 116,193 | ||||||||||||||||||
| Total Expenses | 363,994 | 1,090,964 | 11,607,088 | 1,019,233 | 2,594,584 | ||||||||||||||||||
| Less: Waivers | (110,403 | ) | (21,912 | ) | (42,557 | ) | (40,549 | ) | (3,588 | ) | |||||||||||||
| Net Expenses | 253,591 | 1,069,052 | 11,564,531 | 978,684 | 2,590,996 | ||||||||||||||||||
| Net Investment Income | 178,030 | 4,094,843 | 117,888,409 | 6,550,194 | 14,222,504 | ||||||||||||||||||
| REALIZED AND UNREALIZED GAIN (LOSS): | |||||||||||||||||||||||
| Net realized gain (loss) from: | |||||||||||||||||||||||
| Investments | (743,177 | ) | (1,486,230 | ) | 18,378,691 | 865,130 | 2,385,105 | ||||||||||||||||
| In-kind redemptions | 7,514,114 | 10,237,679 | 57,774,585 | 11,205,389 | 41,285,821 | ||||||||||||||||||
| Foreign currencies | — | — | — | — | 221 | ||||||||||||||||||
| Net realized gain | 6,770,937 | 8,751,449 | 76,153,276 | 12,070,519 | 43,671,147 | ||||||||||||||||||
| Net change in unrealized appreciation on investments | 448,673 | 22,646,874 | 55,999,303 | 3,341,741 | 31,849,135 | ||||||||||||||||||
| Net realized and unrealized gain | 7,219,610 | 31,398,323 | 132,152,579 | 15,412,260 | 75,520,282 | ||||||||||||||||||
| Net increase in net assets resulting from operations | $ | 7,397,640 | $ | 35,493,166 | $ | 250,040,988 | $ | 21,962,454 | $ | 89,742,786 | |||||||||||||
See Notes to Financial Statements.
29
Statements of Changes in Net Assets
| PowerShares Buyback AchieversTM Portfolio | PowerShares Dividend AchieversTM Portfolio | PowerShares Financial Preferred Portfolio | |||||||||||||||||||||||||
| Year Ended April 30, 2011 | Year Ended April 30, 2010 | Year Ended April 30, 2011 | Year Ended April 30, 2010 | Year Ended April 30, 2011 | Year Ended April 30, 2010 | ||||||||||||||||||||||
| OPERATIONS: | |||||||||||||||||||||||||||
| Net investment income | $ | 178,030 | $ | 330,119 | $ | 4,094,843 | $ | 2,379,666 | $ | 117,888,409 | $ | 113,420,686 | |||||||||||||||
| Net realized gain (loss) | 6,770,937 | 4,628,427 | 8,751,449 | (3,080,940 | ) | 76,153,276 | 66,377,711 | ||||||||||||||||||||
| Net change in unrealized appreciation | 448,673 | 6,305,908 | 22,646,874 | 28,168,674 | 55,999,303 | 350,585,680 | |||||||||||||||||||||
| Net increase in net assets resulting from operations | 7,397,640 | 11,264,454 | 35,493,166 | 27,467,400 | 250,040,988 | 530,384,077 | |||||||||||||||||||||
| Undistributed net investment income (loss) included in the price of units issued and redeemed | 4,185 | 6,239 | 435,134 | 92,598 | 279,389 | (1,698,335 | ) | ||||||||||||||||||||
| DISTRIBUTIONS TO SHAREHOLDERS FROM: | |||||||||||||||||||||||||||
| Net investment income | (111,858 | ) | (467,441 | ) | (4,080,812 | ) | (2,653,314 | ) | (120,705,130 | ) | (112,572,843 | ) | |||||||||||||||
| Return of capital | — | — | — | — | (4,382,771 | ) | (4,876,161 | ) | |||||||||||||||||||
| Total distributions to shareholders | (111,858 | ) | (467,441 | ) | (4,080,812 | ) | (2,653,314 | ) | (125,087,901 | ) | (117,449,004 | ) | |||||||||||||||
| SHAREHOLDER TRANSACTIONS: | |||||||||||||||||||||||||||
| Proceeds from shares sold | 31,415,572 | 26,715,685 | 109,729,654 | 54,083,996 | 144,693,621 | 658,426,601 | |||||||||||||||||||||
| Value of shares repurchased | (33,083,924 | ) | (26,949,276 | ) | (56,663,024 | ) | (30,968,874 | ) | (151,955,562 | ) | (130,181,507 | ) | |||||||||||||||
| Net income (loss) equalization | (4,185 | ) | (6,239 | ) | (435,134 | ) | (92,598 | ) | (279,389 | ) | 1,698,335 | ||||||||||||||||
| Net increase (decrease) in net assets resulting from shares transactions | (1,672,537 | ) | (239,830 | ) | 52,631,496 | 23,022,524 | (7,541,330 | ) | 529,943,429 | ||||||||||||||||||
| Increase in Net Assets | 5,617,430 | 10,563,422 | 84,478,984 | 47,929,208 | 117,691,146 | 941,180,167 | |||||||||||||||||||||
| NET ASSETS: | |||||||||||||||||||||||||||
| Beginning of year | 38,019,206 | 27,455,784 | 133,380,270 | 85,451,062 | 1,714,824,366 | 773,644,199 | |||||||||||||||||||||
| End of year | $ | 43,636,636 | $ | 38,019,206 | $ | 217,859,254 | $ | 133,380,270 | $ | 1,832,515,512 | $ | 1,714,824,366 | |||||||||||||||
| Undistributed net investment income (loss) at end of year | $ | 62,686 | $ | (3,486 | ) | $ | 606,451 | $ | 558,686 | $ | (289,320 | ) | $ | (3,284,219 | ) | ||||||||||||
| CHANGES IN SHARES OUTSTANDING: | |||||||||||||||||||||||||||
| Shares sold | 1,250,000 | 1,350,000 | 8,500,000 | 4,450,000 | 8,300,000 | 41,950,000 | |||||||||||||||||||||
| Shares repurchased | (1,350,000 | ) | (1,350,000 | ) | (4,350,000 | ) | (2,650,000 | ) | (9,000,000 | ) | (8,700,000 | ) | |||||||||||||||
| Shares outstanding, beginning of year | 1,700,000 | 1,700,000 | 10,100,000 | 8,300,000 | 101,050,000 | 67,800,000 | |||||||||||||||||||||
| Shares outstanding, end of year | 1,600,000 | 1,700,000 | 14,250,000 | 10,100,000 | 100,350,000 | 101,050,000 | |||||||||||||||||||||
See Notes to Financial Statements.
30
| PowerShares High Yield Equity Dividend AchieversTM Portfolio | PowerShares International Dividend AchieversTM Portfolio | ||||||||||||||||||
| Year Ended April 30, 2011 | Year Ended April 30, 2010 | Year Ended April 30, 2011 | Year Ended April 30, 2010 | ||||||||||||||||
| OPERATIONS: | |||||||||||||||||||
| Net investment income | $ | 6,550,194 | $ | 4,674,969 | $ | 14,222,504 | $ | 9,615,929 | |||||||||||
| Net realized gain (loss) | 12,070,519 | 7,437,890 | 43,671,147 | (10,160,962 | ) | ||||||||||||||
| Net change in unrealized appreciation | 3,341,741 | 26,851,833 | 31,849,135 | 122,485,105 | |||||||||||||||
| Net increase in net assets resulting from operations | 21,962,454 | 38,964,692 | 89,742,786 | 121,940,072 | |||||||||||||||
| Undistributed net investment income (loss) included in the price of units issued and redeemed | 65,191 | 1,096 | 256,262 | 446,981 | |||||||||||||||
| DISTRIBUTIONS TO SHAREHOLDERS FROM: | |||||||||||||||||||
| Net investment income | (6,552,543 | ) | (4,674,671 | ) | (13,859,836 | ) | (12,740,323 | ) | |||||||||||
| Return of capital | (277,932 | ) | (344,802 | ) | — | — | |||||||||||||
| Total distributions to shareholders | (6,830,475 | ) | (5,019,473 | ) | (13,859,836 | ) | (12,740,323 | ) | |||||||||||
| SHAREHOLDER TRANSACTIONS: | |||||||||||||||||||
| Proceeds from shares sold | 148,651,386 | 64,896,968 | 193,763,089 | 130,274,190 | |||||||||||||||
| Value of shares repurchased | (82,736,906 | ) | (58,264,459 | ) | (147,146,410 | ) | (68,274,834 | ) | |||||||||||
| Net income (loss) equalization | (65,191 | ) | (1,096 | ) | (256,262 | ) | (446,981 | ) | |||||||||||
| Net increase (decrease) in net assets resulting from shares transactions | 65,849,289 | 6,631,413 | 46,360,417 | 61,552,375 | |||||||||||||||
| Increase in Net Assets | 81,046,459 | 40,577,728 | 122,499,629 | 171,199,105 | |||||||||||||||
| NET ASSETS: | |||||||||||||||||||
| Beginning of year | 127,424,072 | 86,846,344 | 427,782,688 | 256,583,583 | |||||||||||||||
| End of year | $ | 208,470,531 | $ | 127,424,072 | $ | 550,282,317 | $ | 427,782,688 | |||||||||||
| Undistributed net investment income (loss) at end of year | $ | (8,300 | ) | $ | (5,951 | ) | $ | 2,252,829 | $ | 1,889,940 | |||||||||
| CHANGES IN SHARES OUTSTANDING: | |||||||||||||||||||
| Shares sold | 17,700,000 | 8,550,000 | 12,650,000 | 9,700,000 | |||||||||||||||
| Shares repurchased | (9,800,000 | ) | (7,650,000 | ) | (10,000,000 | ) | (5,000,000 | ) | |||||||||||
| Shares outstanding, beginning of year | 15,100,000 | 14,200,000 | 30,000,000 | 25,300,000 | |||||||||||||||
| Shares outstanding, end of year | 23,000,000 | 15,100,000 | 32,650,000 | 30,000,000 | |||||||||||||||
31
Financial Highlights
PowerShares Buyback AchieversTM Portfolio
| Year Ended April 30, | For the Period December 20, 2006* Through | ||||||||||||||||||||||
| 2011 | 2010 | 2009 | 2008 | April 30, 2007 | |||||||||||||||||||
| PER SHARE OPERATING PERFORMANCE: | |||||||||||||||||||||||
| Net asset value at beginning of period | $ | 22.36 | $ | 16.15 | $ | 22.64 | $ | 25.99 | $ | 24.98 | |||||||||||||
| Net investment income** | 0.11 | 0.19 | 0.26 | 0.10 | 0.01 | ||||||||||||||||||
| Net realized and unrealized gain (loss) on investments | 4.87 | 6.29 | (6.55 | ) | (3.35 | ) | 1.02 | ||||||||||||||||
| Total from investment operations | 4.98 | 6.48 | (6.29 | ) | (3.25 | ) | 1.03 | ||||||||||||||||
| Distributions to shareholders from: | |||||||||||||||||||||||
| Net investment income | (0.07 | ) | (0.27 | ) | (0.20 | ) | (0.10 | ) | (0.02 | ) | |||||||||||||
| Net asset value at end of period | $ | 27.27 | $ | 22.36 | $ | 16.15 | $ | 22.64 | $ | 25.99 | |||||||||||||
| Share price at end of period*** | $ | 27.27 | $ | 22.37 | $ | 16.16 | |||||||||||||||||
| NET ASSET VALUE, TOTAL RETURN**** | 22.34 | % | 40.46 | % | (27.87 | )% | (12.53 | )% | 4.13 | % | |||||||||||||
| SHARE PRICE TOTAL RETURN**** | 22.29 | % | 40.43 | % | (27.80 | )% | |||||||||||||||||
| RATIOS/SUPPLEMENTAL DATA: | |||||||||||||||||||||||
| Net assets at end of period (000's omitted) | $ | 43,637 | $ | 38,019 | $ | 27,456 | $ | 61,132 | $ | 62,383 | |||||||||||||
| Ratio to average net assets of: | |||||||||||||||||||||||
| Expenses, after (Waivers) and/or Recapture | 0.70 | % | 0.70 | % | 0.70 | % | 0.73 | % | 0.73 | %† | |||||||||||||
| Expenses, prior to (Waivers) and/or Recapture | 1.00 | % | 0.97 | % | 0.92 | % | 0.79 | % | 1.04 | %† | |||||||||||||
| Net investment income, after (Waivers) and/or Recapture | 0.49 | % | 0.98 | % | 1.39 | % | 0.41 | % | 0.15 | %† | |||||||||||||
| Portfolio turnover rate †† | 26 | % | 23 | % | 56 | % | 46 | % | 38 | % | |||||||||||||
| Undistributed net investment income (loss) included in price of units issued and redeemed**# | $ | 0.00 | (a) | $ | 0.00 | (a) | $ | (0.02 | ) | $ | (0.01 | ) | $ | 0.01 | |||||||||
PowerShares Dividend AchieversTM Portfolio
| Year Ended April 30, | |||||||||||||||||||||||
| 2011 | 2010 | 2009 | 2008 | 2007 | |||||||||||||||||||
| PER SHARE OPERATING PERFORMANCE: | |||||||||||||||||||||||
| Net asset value at beginning of year | $ | 13.21 | $ | 10.30 | $ | 16.15 | $ | 17.52 | $ | 15.63 | |||||||||||||
| Net investment income** | 0.31 | 0.27 | 0.36 | 0.37 | 0.32 | ||||||||||||||||||
| Net realized and unrealized gain (loss) on investments | 2.08 | 2.96 | (5.92 | ) | (1.41 | ) | 1.88 | ||||||||||||||||
| Total from investment operations | 2.39 | 3.23 | (5.56 | ) | (1.04 | ) | 2.20 | ||||||||||||||||
| Distributions to shareholders from: | |||||||||||||||||||||||
| Net investment income | (0.31 | ) | (0.32 | ) | (0.29 | ) | (0.33 | ) | (0.31 | ) | |||||||||||||
| Net asset value at end of year | $ | 15.29 | $ | 13.21 | $ | 10.30 | $ | 16.15 | $ | 17.52 | |||||||||||||
| Share price at end of year*** | $ | 15.29 | $ | 13.21 | $ | 10.30 | |||||||||||||||||
| NET ASSET VALUE, TOTAL RETURN**** | 18.39 | % | 31.76 | % | (34.84 | )% | (6.00 | )% | 14.26 | % | |||||||||||||
| SHARE PRICE TOTAL RETURN**** | 18.39 | % | 31.76 | % | (34.84 | )% | |||||||||||||||||
| RATIOS/SUPPLEMENTAL DATA: | |||||||||||||||||||||||
| Net assets at end of year (000's omitted) | $ | 217,859 | $ | 133,380 | $ | 85,451 | $ | 59,751 | $ | 70,079 | |||||||||||||
| Ratio to average net assets of: | |||
| Expenses, after (Waivers) and/or Recapture | 0.60 | % | 0.60 | % | 0.60 | % | 0.60 | % | 0.60 | % | |||||||||||||
| Expenses, prior to (Waivers) and/or Recapture | 0.61 | % | 0.64 | % | 0.74 | % | 0.72 | % | 0.92 | % | |||||||||||||
| Net investment income, after (Waivers) and/or Recapture | 2.30 | % | 2.28 | % | 3.11 | % | 2.15 | % | 1.94 | % | |||||||||||||
| Portfolio turnover rate †† | 11 | % | 18 | % | 31 | % | 8 | % | 9 | % | |||||||||||||
| Undistributed net investment income (loss) included in price of units issued and redeemed**# | $ | 0.03 | $ | 0.01 | $ | 0.03 | $ | (0.01 | ) | $ | 0.03 | ||||||||||||
* Commencement of Investment Operations.
** Based on average shares outstanding.
*** The mean between the last bid and ask prices.
**** Net asset value total return is calculated assuming an initial investment made at the net asset value at the beginning of the period, reinvestment of all dividends and distributions at net asset value during the period, and redemption on the last day of the period. Share price total return is calculated assuming an initial investment made at the share price at the beginning of the period, reinvestment of all dividends and distributions at share price during the period, and sale at the share price on the last day of the period. Total investment return calculated for a period of less than one year is not annualized.
† Annualized.
†† Portfolio turnover rate is not annualized and does not include securities received or delivered from processing creations or redemptions.
# The per share amount of equalization is presented to show the impact of equalization on distributable earnings per share.
(a) Amount represents less than $0.005.
See Notes to Financial Statements.
32
Financial Highlights (Continued)
PowerShares Financial Preferred Portfolio
| Year Ended April 30, | For the Period December 1, 2006* Through | ||||||||||||||||||||||
| 2011 | 2010 | 2009 | 2008 | April 30, 2007 | |||||||||||||||||||
| PER SHARE OPERATING PERFORMANCE: | |||||||||||||||||||||||
| Net asset value at beginning of period | $ | 16.97 | $ | 11.41 | $ | 21.17 | $ | 24.78 | $ | 25.12 | |||||||||||||
| Net investment income** | 1.18 | 1.31 | 1.35 | 1.35 | 0.41 | ||||||||||||||||||
| Net realized and unrealized gain (loss) on investments | 1.36 | 5.61 | (9.63 | ) | (3.50 | ) | (0.12 | ) | |||||||||||||||
| Total from investment operations | 2.54 | 6.92 | (8.28 | ) | (2.15 | ) | 0.29 | ||||||||||||||||
| Distributions to shareholders from: | |||||||||||||||||||||||
| Net investment income | (1.21 | ) | (1.30 | ) | (1.46 | ) | (1.46 | ) | (0.63 | ) | |||||||||||||
| Return of capital | (0.04 | ) | (0.06 | ) | (0.02 | ) | — | — | |||||||||||||||
| Total distributions | (1.25 | ) | (1.36 | ) | (1.48 | ) | (1.46 | ) | (0.63 | ) | |||||||||||||
| Net asset value at end of period | $ | 18.26 | $ | 16.97 | $ | 11.41 | $ | 21.17 | $ | 24.78 | |||||||||||||
| Share price at end of period*** | $ | 18.28 | $ | 16.93 | $ | 11.41 | |||||||||||||||||
| NET ASSET VALUE, TOTAL RETURN**** | 15.57 | % | 62.16 | % | (39.56 | )% | (8.77 | )% | 1.18 | % | |||||||||||||
| SHARE PRICE TOTAL RETURN**** | 15.97 | % | 61.76 | % | (39.82 | )% | |||||||||||||||||
| RATIOS/SUPPLEMENTAL DATA: | |||||||||||||||||||||||
| Net assets at end of period (000's omitted) | $ | 1,832,516 | $ | 1,714,824 | $ | 773,644 | $ | 237,126 | $ | 99,118 | |||||||||||||
| Ratio to average net assets of: | |||||||||||||||||||||||
| Expenses, after (Waivers) and/or Recapture | 0.66 | % | 0.65 | % | 0.69 | % | 0.72 | % | 0.72 | %† | |||||||||||||
| Expenses, prior to (Waivers) and/or Recapture | 0.66 | % | 0.65 | % | 0.68 | % | 0.74 | % | 0.89 | %† | |||||||||||||
| Net investment income, after (Waivers) and/or Recapture | 6.75 | % | 8.30 | % | 11.49 | % | 6.20 | % | 4.63 | %† | |||||||||||||
| Portfolio turnover rate †† | 26 | % | 23 | % | 45 | % | 80 | % | 0 | % | |||||||||||||
| Undistributed net investment income (loss) included in price of units issued and redeemed**# | $ | 0.00 | (a) | $ | (0.02 | ) | $ | 0.02 | $ | 0.03 | $ | 0.07 | |||||||||||
PowerShares High Yield Equity Dividend AchieversTM Portfolio
| Year Ended April 30, | |||||||||||||||||||||||
| 2011 | 2010 | 2009 | 2008 | 2007 | |||||||||||||||||||
| PER SHARE OPERATING PERFORMANCE: | |||||||||||||||||||||||
| Net asset value at beginning of year | $ | 8.44 | $ | 6.12 | $ | 11.36 | $ | 15.82 | $ | 15.07 | |||||||||||||
| Net investment income** | 0.34 | 0.32 | 0.43 | 0.62 | 0.54 | ||||||||||||||||||
| Net realized and unrealized gain (loss) on investments | 0.63 | 2.35 | (5.21 | ) | (4.42 | ) | 0.84 | ||||||||||||||||
| Total from investment operations | 0.97 | 2.67 | (4.78 | ) | (3.80 | ) | 1.38 | ||||||||||||||||
| Distributions to shareholders from: | |||||||||||||||||||||||
| Net investment income | (0.34 | ) | (0.33 | ) | (0.43 | ) | (0.63 | ) | (0.60 | ) | |||||||||||||
| Return of capital | (0.01 | ) | (0.02 | ) | (0.03 | ) | (0.03 | ) | (0.03 | ) | |||||||||||||
| Total distributions | (0.35 | ) | (0.35 | ) | (0.46 | ) | (0.66 | ) | (0.63 | ) | |||||||||||||
| Net asset value at end of year | $ | 9.06 | $ | 8.44 | $ | 6.12 | $ | 11.36 | $ | 15.82 | |||||||||||||
| Share price at end of year*** | $ | 9.06 | $ | 8.44 | $ | 6.12 | |||||||||||||||||
| NET ASSET VALUE, TOTAL RETURN**** | 11.91 | % | 44.59 | % | (42.88 | )% | (24.67 | )% | 9.28 | % | |||||||||||||
| SHARE PRICE TOTAL RETURN**** 11.91% | 44.58 | % | (42.88 | )% | |||||||||||||||||||
| RATIOS/SUPPLEMENTAL DATA: | |||||||||||||||||||||||
| Net assets at end of year (000's omitted) | $ | 208,471 | $ | 127,424 | $ | 86,846 | $ | 184,077 | $ | 439,820 | |||||||||||||
| Ratio to average net assets of: | |||
| Expenses, after (Waivers) and/or Recapture | 0.60 | % | 0.60 | % | 0.60 | % | 0.60 | % | 0.60 | % | |||||||||||||
| Expenses, prior to (Waivers) and/or Recapture | 0.62 | % | 0.65 | % | 0.62 | % | 0.56 | % | 0.60 | % | |||||||||||||
| Net investment income, after (Waivers) and/or Recapture | 4.02 | % | 4.42 | % | 5.24 | % | 4.35 | % | 3.47 | % | |||||||||||||
| Portfolio turnover rate †† | 44 | % | 57 | % | 77 | % | 42 | % | 20 | % | |||||||||||||
| Undistributed net investment income (loss) included in price of units issued and redeemed**# | $ | 0.00 | (a) | $ | 0.00 | (a) | $ | 0.00 | (a) | $ | 0.02 | $ | 0.00 | (a) | |||||||||
* Commencement of Investment Operations.
** Based on average shares outstanding.
*** The mean between the last bid and ask prices.
**** Net asset value total return is calculated assuming an initial investment made at the net asset value at the beginning of the period, reinvestment of all dividends and distributions at net asset value during the period, and redemption on the last day of the period. Share price total return is calculated assuming an initial investment made at the share price at the beginning of the period, reinvestment of all dividends and distributions at share price during the period, and sale at the share price on the last day of the period. Total investment return calculated for a period of less than one year is not annualized.
† Annualized.
†† Portfolio turnover rate is not annualized and does not include securities received or delivered from processing creations or redemptions.
# The per share amount of equalization is presented to show the impact of equalization on distributable earnings per share.
(a) Amount represents less than $0.005.
See Notes to Financial Statements.
33
Financial Highlights (Continued)
PowerShares International Dividend AchieversTM Portfolio
| Year Ended April 30, | |||||||||||||||||||||||
| 2011 | 2010 | 2009 | 2008 | 2007 | |||||||||||||||||||
| PER SHARE OPERATING PERFORMANCE: | |||||||||||||||||||||||
| Net asset value at beginning of year | $ | 14.26 | $ | 10.14 | $ | 19.63 | $ | 20.12 | $ | 16.92 | |||||||||||||
| Net investment income* | 0.47 | 0.35 | 0.52 | 0.68 | 0.53 | ||||||||||||||||||
| Net realized and unrealized gain (loss) on investments | 2.59 | 4.24 | (9.46 | ) | (0.61 | ) | 3.20 | ||||||||||||||||
| Total from investment operations | 3.06 | 4.59 | (8.94 | ) | 0.07 | 3.73 | |||||||||||||||||
| Distributions to shareholders from: | |||||||||||||||||||||||
| Net investment income | (0.47 | ) | (0.47 | ) | (0.55 | ) | (0.56 | ) | (0.53 | ) | |||||||||||||
| Net asset value at end of year | $ | 16.85 | $ | 14.26 | $ | 10.14 | $ | 19.63 | $ | 20.12 | |||||||||||||
| Share price at end of year** | $ | 16.89 | $ | 14.26 | $ | 10.15 | |||||||||||||||||
| NET ASSET VALUE, TOTAL RETURN*** | 21.95 | % | 45.77 | % | (46.44 | )% | 0.34 | % | 22.56 | % | |||||||||||||
| SHARE PRICE TOTAL RETURN*** | 22.23 | % | 45.62 | % | (46.30 | )% | |||||||||||||||||
| RATIOS/SUPPLEMENTAL DATA: | |||||||||||||||||||||||
| Net assets at end of year (000's omitted) | $ | 550,282 | $ | 427,783 | $ | 256,584 | $ | 551,630 | $ | 553,200 | |||||||||||||
| Ratio to average net assets of: | |||
| Expenses, after (Waivers) and/or Recapture | 0.58 | % | 0.57 | % | 0.57 | % | 0.58 | % | 0.60 | % | |||||||||||||
| Expenses, prior to (Waivers) and/or Recapture | 0.58 | % | 0.57 | % | 0.57 | % | 0.56 | % | 0.62 | % | |||||||||||||
| Net investment income, after (Waivers) and/or Recapture | 3.20 | % | 2.65 | % | 3.87 | % | 3.28 | % | 2.98 | % | |||||||||||||
| Portfolio turnover rate † | 42 | % | 63 | % | 50 | % | 43 | % | 22 | % | |||||||||||||
| Undistributed net investment income (loss) included in price of units issued and redeemed*# | $ | 0.01 | $ | 0.02 | $ | (0.01 | ) | $ | (0.02 | ) | $ | 0.11 | |||||||||||
* Based on average shares outstanding.
** The mean between the last bid and ask prices.
*** Net asset value total return is calculated assuming an initial investment made at the net asset value at the beginning of the period, reinvestment of all dividends and distributions at net asset value during the period, and redemption on the last day of the period. Share price total return is calculated assuming an initial investment made at the share price at the beginning of the period, reinvestment of all dividends and distributions at share price during the period, and sale at the share price on the last day of the period. Total investment return calculated for a period of less than one year is not annualized.
† Portfolio turnover rate is not annualized and does not include securities received or delivered from processing creations or redemptions.
# The per share amount of equalization is presented to show the impact of equalization on distributable earnings per share.
See Notes to Financial Statements.
34
Notes to Financial Statements
PowerShares Exchange-Traded Fund Trust
April 30, 2011
Note 1. Organization
PowerShares Exchange-Traded Fund Trust (the "Trust") was organized as a Massachusetts business trust on June 9, 2000 and is authorized to have multiple series of portfolios. The Trust is an open-end management investment company registered under the Investment Company Act of 1940, as amended (the "1940 Act"). As of April 30, 2011, the Trust offered fifty-six portfolios. This report includes the following portfolios:
| Full Name | Short Name | ||||||
| PowerShares Buyback AchieversTM Portfolio | "Buyback AchieversTM Portfolio" | ||||||
| PowerShares Dividend AchieversTM Portfolio | "Dividend AchieversTM Portfolio" | ||||||
| PowerShares Financial Preferred Portfolio | "Financial Preferred Portfolio" | ||||||
| PowerShares High Yield Equity Dividend AchieversTM Portfolio | "High Yield Equity Dividend AchieversTM Portfolio" | ||||||
| PowerShares International Dividend AchieversTM Portfolio | "International Dividend AchieversTM Portfolio" | ||||||
Each portfolio (the "Fund" and collectively the "Funds") represents a separate series of the Trust. The shares of the Funds are referred to herein as "Shares" or "Fund's Shares." Each Fund's Shares are listed and traded on the NYSE Arca, Inc. The Funds' market prices may differ to some degree from the net asset value ("NAV") of the Shares of each Fund. Unlike conventional mutual funds, each Fund issues and redeems Shares on a continuous basis, at NAV, only in a large specified number of Shares, each called a "Creation Unit." Creation Units are issued and redeemed generally in-kind for securities included in the relevant index. Except when aggregated in Creation Units by Authorized Participants, the Shares are not individually redeemable securities of the Funds.
The investment objective of each Fund is to seek investment results that correspond (before fees and expenses) generally to the price and yield performance of the following indices (each, an "Underlying Index"):
| Fund | Index | ||||||
| Buyback AchieversTM Portfolio | Share BuyBack AchieversTM Index | ||||||
| Dividend AchieversTM Portfolio | Broad Dividend AchieversTM Index | ||||||
| Financial Preferred Portfolio | Wells Fargo® Hybrid & Preferred Securities Financial Index | ||||||
| High Yield Equity Dividend AchieversTM Portfolio | Mergent Dividend AchieversTM 50 Index | ||||||
| International Dividend AchieversTM Portfolio | International Dividend AchieversTM Index | ||||||
Note 2. Significant Accounting Policies
The preparation of the financial statements in accordance with Generally Accepted Accounting Principles ("GAAP") in the United States of America requires management to make estimates and assumptions that affect the reported amounts and disclosures in the financial statements, including estimates and assumptions related to taxation. Actual results could differ from these estimates. In addition, the Funds monitor for material events or transactions that may occur or become known after the period-end date and before the date the financial statements are released to print.
35
Notes to Financial Statements (Continued)
PowerShares Exchange-Traded Fund Trust
April 30, 2011
A. Security Valuation
Securities, including restricted securities, are valued according to the following policies.
A security listed or traded on an exchange (except convertible bonds) is valued at its last sales price or official closing price as of the close of the customary trading session on the exchange where the security is principally traded, or lacking any sales or official closing price on a particular day, the security may be valued at the closing bid price on that day. Securities traded in the over-the-counter market are valued based on prices furnished by independent pricing services or market makers. Listed options, if no closing price is available, are valued at the mean between the last bid and ask prices from the exchange on which they are principally traded. Options not listed on an exchange are valued by an independent source at the mean between the last bid and ask prices.
Investments in open-end registered investment companies not traded on an exchange are valued at the end of day NAV per share.
Debt obligations (including convertible bonds) and unlisted equities are fair valued using an evaluated quote provided by an independent pricing service. Evaluated quotes provided by the pricing service may be determined without exclusive reliance on quoted prices, and may reflect appropriate factors such as institution-size trading in similar groups of securities, developments related to specific securities, dividend rate, yield, quality, type of issue, coupon rate, maturity, individual trading characteristics and other market data. Short-term obligations, including commercial paper, having 60 days or less to maturity are recorded at amortized cost which approximates value. Debt securities are subject to interest rate and credit risks. In addition, all debt securities involve some risk of default with respect to interest and/or principal payments.
Foreign securities (including foreign exchange contracts) are converted into U.S. dollar amounts using the applicable exchange rates as of the close of the London world markets. If market quotations are available and reliable for foreign exchange traded equity securities, the securities will be valued at the market quotations. Because trading hours for certain foreign securities end before the close of the New York Stock Exchange ("NYSE"), closing market quotations may become unreliable. If between the time trading ends on a particular security and the close of the customary trading session on the NYSE, events occur that are significant and make the closing price unreliable, the Fund may fair value the security. If the event is likely to have affected the closing price of the security, the security will be valued at fair value in good faith using procedures approved by the Board of Trustees. Adjustments to closing prices to reflect fair value may also be based on a screening process of an independent pricing service to indicate the degree of certainty, based on historical data, that the closing price in the principal market where a foreign security trades is not the current value as of the close of the NYSE. Foreign securities meeting the approved degree of certainty that the price is not reflective of current value will be priced at the indication of fair value from the independent pricing service. Multiple factors may be considered by the independent pricing service in determining adjustments to reflect fair value and may include information relating to sector indices, American depositary receipts and domestic and foreign index futures. Foreign securities may have additional risks including exchange rate changes, potential for sharply devalued currencies and high inflation, political and economic upheaval, the relative lack of issuer information, relatively low market liquidity and the potential lack of strict financial and accounting controls and standards.
Securities for which market prices are not provided by any of the above methods may be valued based upon quotes furnished by independent sources.
36
Notes to Financial Statements (Continued)
PowerShares Exchange-Traded Fund Trust
April 30, 2011
Securities for which market quotations are not readily available or are unreliable are valued at fair value as determined in good faith by or under the supervision of the Trust's officers following procedures approved by the Board of Trustees. Issuer specific events, market trends, bid/ask quotes of brokers and information providers and other market data may be reviewed in the course of making a good faith determination of a security's fair value.
Valuations change in response to many factors, including the historical and prospective earnings of the issuer, the value of the issuer's assets, general economic conditions, interest rates, investor perceptions and market liquidity. Because of the inherent uncertainties of valuation, the values reflected in the financial statements may materially differ from the value received upon actual sale of those investments.
B. Other Risks
Replication Management Risk. Unlike many investment companies, the Funds do not utilize an investing strategy that seeks returns in excess of each Fund's respective Underlying Index. Therefore, a Fund would not necessarily sell a security unless that security is removed from its respective Underlying Index.
Non-Diversified Fund Risk. Buyback AchieversTM Portfolio and Financial Preferred Portfolio are considered non-diversified and can invest a greater portion of assets in securities of individual issuers than a diversified fund. As a result, changes in the market value of a single investment could cause greater fluctuations in Share price than would occur in a diversified fund.
Concentration Risk. To the extent a Fund concentrates its investments in an industry or group of industries, the value of the Fund's Shares may rise and fall more than the value of Shares of a fund that invests in a broader range of securities.
Non-Correlation Risk. Each Fund's return may not match the return of its Underlying Index for a number of reasons. For example, each Fund incurs operating expenses not applicable to the Underlying Index, and incurs costs in buying and selling securities, especially when rebalancing the Fund's securities holdings to reflect changes in the composition of its Underlying Index. In addition, the performance of each Fund and its Underlying Index may vary due to asset valuation differences and differences between each Fund's portfolio and its Underlying Index resulting from legal restrictions, cost or liquidity constraints. For Financial Preferred Portfolio, because the Fund's Underlying Index does not meet the diversification requirements set forth in the Internal Revenue Code, the Fund may not be able to invest in all of the stocks comprising its Underlying Index in proportion to their weightings in the Underlying Index at all times.
Foreign and Emerging Market Securities Risk. With respect to International Dividend AchieversTM Portfolio, investments in the securities of non-U.S. issuers involve risks beyond those associated with investments in U.S. securities. These additional risks include greater market volatility, the availability of less reliable financial information, higher transactional costs, taxation by foreign governments, decreased market liquidity and political instability. As certain Funds will invest in securities denominated in foreign currencies, changes in currency exchange rates may negatively impact the Fund's returns.
Small and Medium Capitalization Company Risk. Investing in securities of small and medium capitalization companies involves greater risk than is customarily associated with investing in larger, more established companies. These companies' securities may be more volatile and less liquid than those of more established companies. These securities may have returns that vary, sometimes significantly, from the
37
Notes to Financial Statements (Continued)
PowerShares Exchange-Traded Fund Trust
April 30, 2011
overall securities market. Often small and medium capitalization companies and the industries in which they are focused are still evolving and may make them be more sensitive to changing market conditions.
Preferred Securities Risk. There are special risks associated with the Financial Preferred Portfolio's investments in preferred securities. Preferred securities may include provisions that permit the issuer, in its discretion, to defer or omit distributions for a certain period of time. If the Fund owns a security that is deferring or omitting its distributions, the Fund may be required to report the distribution on its tax returns, even though it may not have received this income. Further, preferred securities may lose substantial value due to the omission or deferment of dividend payments. Preferred securities may be less liquid than many other securities, such as common stocks, and generally offer no voting rights with respect to the issuer. Preferred securities may also be subordinated to bonds or other debt instruments in an issuer's capital structure, subjecting them to a greater risk of non-payment than more senior securities. In addition, in certain circumstances, an issuer of preferred securities may redeem the securities prior to a specified date, and this may negatively impact the return of the security. Certain of the companies that comprise the Fund's Underlying Index, while traded on U.S. exchanges, may be issued by foreign financial institutions and, therefore, subject the Fund to the risks of investing in securities issued by foreign companies.
High Yield Securities Risk. With respect to Financial Preferred Portfolio investments in high yield securities may involve greater risk and are generally less liquid than higher grade issues. The ability of issuers of high yield securities to make timely payments of interest and principal may be adversely impacted by changes in general economic conditions, changes in the financial condition of the issuers and changes in interest rates.
C. Federal Income Taxes
Each Fund intends to comply with the provisions of the Internal Revenue Code applicable to regulated investment companies and to distribute substantially all of the Fund's taxable earnings to its shareholders. As such, the Funds will not be subject to Federal income taxes on otherwise taxable income (including net realized gains) that is distributed to the shareholders. Therefore, no provision for Federal income taxes is recorded in the Financial Statements.
Income and capital gain distributions are determined in accordance with Federal income tax regulations, which may differ from GAAP. These differences are primarily due to differing book and tax treatments for in-kind transactions, losses deferred due to wash sales, and passive foreign investment company adjustments, if any.
The Funds file tax returns in the United States Federal jurisdiction and certain other jurisdictions. Generally, a Fund is subject to examinations by such taxing authorities for up to three years after the filing of the return for the tax period.
D. Investment Income and Investment Transactions
Dividend income is recorded on the ex-dividend date, net of foreign taxes withheld, if any. Interest income is recorded on the accrual basis. Investment transactions are recorded on the trade date. Realized gains and losses from the sale or disposition of securities are calculated on the specific identified cost basis. Dividends and interest received by a Fund may give rise to withholding and other taxes imposed by foreign countries. Corporate actions (including cash dividends) are recorded net of non-reclaimable foreign tax withholdings on the ex-dividend date. Tax conventions between certain countries and the United States may reduce or eliminate such taxes.
38
Notes to Financial Statements (Continued)
PowerShares Exchange-Traded Fund Trust
April 30, 2011
E. Expenses
Expenses of the Trust that are directly identifiable to a specific Fund are applied to that Fund. Expenses that are not readily identifiable to a specific Fund are allocated in such a manner as deemed equitable, taking into consideration the nature and type of expense and the relative net assets of each Fund.
Each Fund is responsible for all its expenses, including the investment advisory fees, costs of transfer agency, custody, fund administration, legal, audit and other services, interest, taxes, brokerage commissions and other expenses connected with executions of portfolio transactions, sub-licensing fees related to its respective Underlying Intellidex or Underlying Index, any distribution fees or expenses, litigation expenses, fees payable to the Trust's Board members and officers who are not "interested persons" of the Trust or the Adviser, expenses incurred in connection with the Board members' services, including travel expenses and legal fees of counsel for those members of the Board who are not "interested persons" of the Trust and extraordinary expenses.
F. Dividends and Distributions to Shareholders
Each Fund (except for the High Yield Equity Dividend AchieversTM Portfolio and Financial Preferred Portfolio, which declare and pay dividends, if any, monthly) declares and pays dividends from net investment income, if any, to its shareholders quarterly and records on ex-dividend date. Each Fund distributes net realized taxable capital gains, if any, generally annually in cash and records them on ex-dividend date. Such distributions on a tax basis are determined in conformity with income tax regulations which may differ from GAAP. Distributions in excess of tax basis earnings and profits, if any, are reported in such Fund's financial statements as a tax return of capital at fiscal period-end.
G. Equalization
All of the Funds use the accounting practice of equalization. This accounting method is used to keep the continuing shareholder's per Share equity in undistributed net investment income from being affected by the continuous sales and redemptions of capital Shares. Equalization is calculated on a per Share basis whereby a portion of the proceeds from the sales and cost of repurchases of capital Shares is applied to undistributed net investment income. The amount of equalization is disclosed in the Statements of Changes in Net Assets as undistributed net investment income included in the price of capital Shares issued or redeemed. The distributions to shareholders of amounts so applied may be deemed to be a return of capital for tax purposes to the extent that such distributions exceed taxable income.
Note 3. Investment Advisory Agreement and Other Agreements
The Trust has entered into an Investment Advisory Agreement with Invesco PowerShares Capital Management LLC (the "Adviser") pursuant to which the Adviser has overall responsibility as the Funds' investment adviser for the selection and ongoing monitoring of the Funds' investments, managing the Funds' business affairs and providing certain clerical, bookkeeping and other administrative services. Each Fund has agreed to pay the Adviser an annual fee of 0.40% of the Fund's average daily net assets except for the Buyback AchieversTM Portfolio and Financial Preferred Portfolio, which pay the Adviser an annual fee of 0.50% of that Fund's average daily net assets.
The Adviser has entered into an Amended and Restated Excess Expense Agreement ("Excess Expense Agreement") with the Trust, pursuant to which the Adviser has agreed to waive fees and/or pay Fund expenses to the extent necessary to prevent the operating expenses of each Fund (excluding interest expense, brokerage commissions and other trading expenses, sub-licensing fees, offering costs, taxes and
39
Notes to Financial Statements (Continued)
PowerShares Exchange-Traded Fund Trust
April 30, 2011
extraordinary expenses) from exceeding 0.50% of the Fund's average daily net assets per year (0.60% of the Fund's average daily net assets per year for the Buyback AchieversTM Portfolio and Financial Preferred Portfolio) (the "Expense Cap"), at least until August 31, 2012. Offering costs excluded from the Expense Cap are: (a) initial legal fees pertaining to the Funds' Shares offered for sale; (b) initial Securities and Exchange Commission and state registration fees; and (c) initial fees paid to be listed on an exchange.
The Excess Expense Agreement provides that the expenses borne by the Adviser are subject to recapture by the Adviser for up to three years from the date the fee or expense was borne by the Adviser, but no recapture payment will be made by a Fund if it would result in the Fund exceeding its Expense Cap as specified above.
The amounts available for potential future recapture by the Adviser under the Excess Expense Agreement and the expiration schedule at April 30, 2011 are as follows:
| Total Potential | Potential Recapture Amounts Expiring | ||||||||||||||||||
| Recapture Amounts | 04/30/12 | 04/30/13 | 04/30/14 | ||||||||||||||||
| Buyback AchieversTM Portfolio | $ | 300,057 | $ | 98,219 | $ | 91,435 | $ | 110,403 | |||||||||||
| Dividend AchieversTM Portfolio | 176,527 | 98,990 | 55,625 | 21,912 | |||||||||||||||
| Financial Preferred Portfolio | 27,977 | — | — | 27,977 | |||||||||||||||
| High Yield Equity Dividend AchieversTM Portfolio | 140,409 | 48,203 | 51,657 | 40,549 | |||||||||||||||
| International Dividend AchieversTM Portfolio | 2,628 | — | — | 2,628 | |||||||||||||||
The Trust has entered into a Distribution Agreement with Invesco Distributors, Inc. (the "Distributor"), which serves as the distributor of Creation Units for each Fund. The Distributor does not maintain a secondary market in the Shares. The Distributor is an affiliate of the Adviser.
The Adviser has entered into a licensing agreement for each Fund with the following Licensors:
| Fund | Licensor | ||||||
| Buyback AchieversTM Portfolio | Mergent, Inc. | ||||||
| Dividend AchieversTM Portfolio | Mergent, Inc. | ||||||
| Financial Preferred Portfolio | Wells Fargo Securities, LLC | ||||||
| High Yield Equity Dividend AchieversTM Portfolio | Mergent, Inc. | ||||||
| International Dividend AchieversTM Portfolio | Mergent, Inc. | ||||||
Each Underlying Index name trademark is owned by the respective Licensors. These trademarks have been licensed to the Adviser for use with the Funds. The Funds are not sponsored, endorsed, sold or promoted by the Licensors and the Licensors make no representation regarding the advisability of investing in any of these Funds. The Trust has entered into a sub-licensing agreement under which the Funds are required to pay the sub-licensing fees which are shown on the Statements of Operations.
The Trust has entered into service agreements whereby The Bank of New York Mellon, a wholly-owned subsidiary of The Bank of New York Mellon Corporation, serves as the administrator, custodian and fund accountant and transfer agent for each Fund.
40
Notes to Financial Statements (Continued)
PowerShares Exchange-Traded Fund Trust
April 30, 2011
Note 4. Investments in Affiliates
The 1940 Act defines "affiliate" to include issuers of which a fund holds 5% or more of the outstanding voting securities. The following is a summary of the transactions with affiliates for the fiscal year ended April 30, 2011.
International Dividend AchieversTM Portfolio
| Value 04/30/10 | Purchases at Cost | Proceeds from Sales | Change in Unrealized Appreciation (Depreciation) | Realized Gain (Loss) | Value 04/30/11 | Dividend Income | |||||||||||||||||||||||||
| Consolidated Water Co. Ltd. | $ | 3,873,421 | $ | 8,191,247 | $ | (2,102,451 | ) | $ | (754,491 | ) | $ | (1,038,968 | ) | $ | 8,168,758 | $ | 167,005 | ||||||||||||||
Note 5. Additional Valuation Information
GAAP defines fair value as the price that would be received to sell an asset or paid to transfer a liability in an orderly transaction between market participants at the measurement date, under current market conditions. GAAP establishes a hierarchy that prioritizes the inputs to valuation methods giving the highest priority to readily available unadjusted quoted prices in an active market for identical assets (Level 1) and the lowest priority to significant unobservable inputs (Level 3) generally when market prices are not readily available or are unreliable. Based on the valuation inputs, the securities or other investments are tiered into one of three levels. Changes in valuation methods may result in transfers in or out of an investment's assigned level:
Level 1 – Prices are determined using quoted prices in an active market for identical assets.
Level 2 – Prices are determined using other significant observable inputs. Observable inputs are inputs that other market participants may use in pricing a security. These may include quoted prices for similar securities, interest rates, prepayment speeds, credit risk, yield curves, loss severities, default rates, discount rates, volatilities and others.
Level 3 – Prices are determined using significant unobservable inputs. In situations where quoted prices or observable inputs are unavailable (for example, when there is little or no market activity for an investment at the end of the period), unobservable inputs may be used. Unobservable inputs reflect the Fund's own assumptions about the factors market participants would use in determining fair value of the securities or instruments and would be based on the best available information.
As of April 30, 2011, the securities in each Fund were valued based on Level 1 inputs. The level assigned to the securities valuations may not be an indication of the risk or liquidity associated with investing in those securities. Because of the inherent uncertainties of valuation, the values reflected in the financial statements may materially differ from the value received upon actual sale of those investments.
With respect to each Fund, during the fiscal year ended April 30, 2011, there were no significant transfers between investment levels.
41
Notes to Financial Statements (Continued)
PowerShares Exchange-Traded Fund Trust
April 30, 2011
Note 6. Distributions to Shareholders and Tax Components of Net Assets
Tax Character of Distributions to Shareholders Paid During the Fiscal Years Ended April 30, 2011 and 2010:
| 2011 | 2010 | ||||||||||||||||||
| Ordinary Income | Return of Capital | Ordinary Income | Return of Capital | ||||||||||||||||
| Buyback AchieversTM Portfolio | $ | 111,858 | $ | — | $ | 467,441 | $ | — | |||||||||||
| Dividend AchieversTM Portfolio | 4,080,812 | — | 2,653,314 | — | |||||||||||||||
| Financial Preferred Portfolio(1) | 117,851,509 | 4,382,771 | 86,530,325 | 4,876,161 | |||||||||||||||
| High Yield Equity Dividend AchieversTM Portfolio | 6,552,543 | 277,932 | 4,674,671 | 344,802 | |||||||||||||||
| International Dividend AchieversTM Portfolio | 13,859,836 | — | 12,740,323 | — | |||||||||||||||
(1) Tax year-end is October 31
Tax Components of Net Assets at Fiscal Year-End:
| Undistributed Ordinary Income | Temporary Book/Tax Differences | Net Unrealized Appreciation | Capital Loss Carryforward | Post-October Deferrals* | Shares of Beneficial Interest | Total Net Assets | |||||||||||||||||||||||||
| Buyback AchieversTM Portfolio | $ | 67,751 | $ | (5,065 | ) | $ | 3,782,051 | $ | (24,328,400 | ) | $ | (736,946 | ) | $ | 64,857,245 | $ | 43,636,636 | ||||||||||||||
| Dividend AchieversTM Portfolio | 613,171 | (6,720 | ) | 34,172,355 | (18,709,998 | ) | (470,928 | ) | 202,261,374 | 217,859,254 | |||||||||||||||||||||
| Financial Preferred Portfolio(1) | — | (21,955 | ) | 314,497,839 | (48,730,612 | ) | — | 1,562,175,645 | 1,827,920,917 | ||||||||||||||||||||||
| High Yield Equity Dividend AchieversTM Portfolio | — | (8,300 | ) | 17,087,447 | (143,290,793 | ) | — | 334,682,177 | 208,470,531 | ||||||||||||||||||||||
| International Dividend AchieversTM Portfolio | 2,269,425 | (16,596 | ) | 61,975,391 | (219,328,254 | ) | — | 705,382,351 | 550,282,317 | ||||||||||||||||||||||
* Capital losses incurred after October 31 ("post-October losses") within the taxable year are deemed to arise on the first business day of each Fund's next taxable year.
(1) Tax year-end is October 31
Capital loss carryforward is calculated and reported as of a specific date. Results of transactions and other activity after that date may affect the amount of capital loss carryforward actually available for the Funds to utilize. The ability to utilize capital loss carryforward in the future may be limited under Internal Revenue Code rules and related regulations based on the results of future transactions.
The following Funds had capital loss carryforward amounts as of April 30, 2011, which expire on April 30 of each year listed below:
| 2014 | 2015 | 2016 | 2017 | 2018 | 2019 | Total** | |||||||||||||||||||||||||
| Buyback Achievers(TM) Portfolio | $ | — | $ | 178,870 | $ | 9,098,882 | $ | 800,254 | $ | 12,142,749 | $ | 2,107,645 | $ | 24,328,400 | |||||||||||||||||
| Dividend Achievers(TM) Portfolio | 7,896 | — | 50,943 | 1,716,151 | 14,632,363 | 2,302,645 | 18,709,998 | ||||||||||||||||||||||||
| Financial Preferred Portfolio(1) | — | 2,445,445 | 29,895,674 | 9,034,558 | 7,354,935 | — | 48,730,612 | ||||||||||||||||||||||||
| High Yield Equity Dividend Achievers(TM) Portfolio | 2,613,033 | 7,009,598 | 5,162,362 | 81,487,358 | 44,815,128 | 2,203,314 | 143,290,793 | ||||||||||||||||||||||||
| International Dividend Achievers(TM) Portfolio | 183,478 | 221,461 | 1,975,339 | 59,472,841 | 145,514,837 | 11,960,298 | 219,328,254 | ||||||||||||||||||||||||
** Capital loss carryforward as of the date listed above is reduced for limitations, if any, to the extent required by the Internal Revenue Code.
(1) Tax year-end and carryforward expiration is October 31
42
Notes to Financial Statements (Continued)
PowerShares Exchange-Traded Fund Trust
April 30, 2011
Note 7. Investment Transactions
For the fiscal year ended April 30, 2011, the cost of securities purchased and proceeds from sales of securities, excluding short-term securities, money market funds and in-kind transactions, were as follows:
| Purchases | Sales | ||||||||||
| Buyback AchieversTM Portfolio | $ | 9,638,102 | $ | 9,286,948 | |||||||
| Dividend AchieversTM Portfolio | 34,679,008 | 20,039,623 | |||||||||
| Financial Preferred Portfolio | 483,854,104 | 444,759,572 | |||||||||
| High Yield Equity Dividend AchieversTM Portfolio | 72,394,257 | 71,757,735 | |||||||||
| International Dividend AchieversTM Portfolio | 195,208,012 | 189,413,494 | |||||||||
For the fiscal year ended April 30, 2011, in-kind transactions associated with creations and redemptions were as follows:
| Securities Received | Securities Delivered | ||||||||||
| Buyback AchieversTM Portfolio | $ | 31,731,395 | $ | 33,670,838 | |||||||
| Dividend AchieversTM Portfolio | 89,930,454 | 51,483,127 | |||||||||
| Financial Preferred Portfolio | 110,492,539 | 148,292,450 | |||||||||
| High Yield Equity Dividend AchieversTM Portfolio | 148,072,622 | 83,606,086 | |||||||||
| International Dividend AchieversTM Portfolio | 261,969,117 | 219,445,699 | |||||||||
Gains and (losses) on in-kind transactions are generally not considered taxable gains and (losses) for Federal income tax purposes.
At April 30, 2011 the aggregate cost and the net unrealized appreciation of investments for tax purposes were as follows:
| Cost | Net Unrealized Appreciation | Gross Unrealized Appreciation | Gross Unrealized (Depreciation) | ||||||||||||||||
| Buyback AchieversTM Portfolio | $ | 39,913,732 | $ | 3,782,051 | $ | 4,272,607 | $ | (490,556 | ) | ||||||||||
| Dividend AchieversTM Portfolio | 183,676,077 | 34,172,355 | 34,608,473 | (436,118 | ) | ||||||||||||||
| Financial Preferred Portfolio(1) | 1,429,547,096 | 314,497,839 | 314,617,482 | (119,643 | ) | ||||||||||||||
| High Yield Equity Dividend AchieversTM Portfolio | 191,273,881 | 17,087,447 | 18,506,609 | (1,419,162 | ) | ||||||||||||||
| International Dividend AchieversTM Portfolio | 489,149,366 | 61,975,391 | 64,856,312 | (2,880,921 | ) | ||||||||||||||
(1) Tax year-end is October 31
43
Notes to Financial Statements (Continued)
PowerShares Exchange-Traded Fund Trust
April 30, 2011
Note 8. Reclassification of Permanent Differences
Primarily as a result of differing book/tax treatment of investment activity, on April 30, 2011, amounts were reclassified between undistributed net investment income (loss), undistributed net realized gain (loss) and Share of beneficial interest. These reclassifications had no effect on the net assets of each Fund. For the fiscal year ended April 30, 2011, the reclassifications were as follows:
| Undistributed Net Investment Income (Loss) | Undistributed Net Realized Gain (Loss) | Shares of Beneficial Interest | |||||||||||||
| Buyback AchieversTM Portfolio | $ | (4,185 | ) | $ | (7,419,925 | ) | $ | 7,424,110 | |||||||
| Dividend AchieversTM Portfolio | (401,400 | ) | (9,035,842 | ) | 9,437,242 | ||||||||||
| Financial Preferred Portfolio(1) | 5,532,231 | (65,648,817 | ) | 60,116,586 | |||||||||||
| High Yield Equity Dividend AchieversTM Portfolio | (65,191 | ) | (10,871,433 | ) | 10,936,624 | ||||||||||
| International Dividend AchieversTM Portfolio | (256,041 | ) | (38,405,692 | ) | 38,661,733 | ||||||||||
(1) Tax year-end is October 31
Note 9. Trustees' Fees
The Funds compensate each Trustee who is not an "interested person" as defined in the 1940 Act (an "Independent Trustee"). The Non-Independent Trustees of the Trust do not receive any Trustees' fees.
The Trust has adopted a deferred compensation plan (the "Plan"). Under the Plan, a Trustee who has executed a Deferred Fee Agreement (a "Participating Trustee") may defer receipt of all or a portion of his compensation ("Deferral Fees"). Such Deferral Fees are deemed to be invested in select PowerShares Funds. The Deferral Fees payable to the Participating Trustee are valued as of the date such Fees would have been paid to the Participating Trustee. The value increases with contributions or with increases in the value of the Shares selected, and the value decreases with distributions or with declines in the value of the Shares selected.
Note 10. Capital
Shares are created and redeemed by the Trust only in Creation Unit size aggregations of 50,000 Shares. Only Authorized Participants are permitted to purchase or redeem Creation Units from the Funds. Such transactions are generally permitted on an in-kind basis, with a balancing cash component to equate the transaction to the NAV per Share of each Fund of the Trust on the transaction date. Cash may be substituted equivalent to the value of certain securities generally when they are not available in sufficient quantity for delivery, not eligible for trading by the Authorized Participant or as a result of other market circumstances.
Note 11. Indemnifications
Under the Trust's organizational documents, its officers and Trustees are indemnified against certain liabilities arising out of the performance of their duties to the Trust. Each Independent Trustee is also indemnified against certain liabilities arising out of the performance of his duties to the Trust pursuant to an Indemnification Agreement between the Independent Trustee and the Trust. Additionally, in the normal course of business, the Trust enters into contracts with service providers that contain general indemnification clauses. The Trust's maximum exposure under these arrangements is unknown, as this would involve future claims that may be made against the Trust that have not yet occurred. However, based on experience, the Trust believes the risk of loss to be remote.
44
Report of Independent Registered Public Accounting Firm
To the Board of Trustees and Shareholders of PowerShares Exchange-Traded Fund Trust:
In our opinion, the accompanying statements of assets and liabilities, including the schedules of investments, and the related statements of operations and of changes in net assets and the financial highlights present fairly, in all material respects, the financial position of each of the portfolios indicated in Note 1 of the financial statements (each a portfolio of PowerShares Exchange-Traded Fund Trust, hereafter referred to as the "Trust") at April 30, 2011, and the results of each of their operations, the changes in each of their net assets, and the financial highlights for each of the periods presented, in conformity with accounting principles generally accepted in the United States of America. These financial statements and financial highlights (hereafter referred to as "financial statements") are the responsibility of the Trust's management; our responsibility is to express an opinion on these financial statements based on our audits. We conducted our audits of these financial statements in accordance with the standards of the Public Company Accounting Oversight Board (United States). Those standards require that we plan and perform the audit to obtain reasonable assurance about whether the financial statements are free of material misstatement. An audit includes examining, on a test basis, evidence supporting the amounts and disclosures in the financial statements, assessing the accounting principles used and significant estimates made by management, and evaluating the overall financial statement presentation. We believe that our audits, which included confirmation of securities at April 30, 2011 by correspondence with the custodian and brokers, and the application of alternative auditing procedures where securities purchased had not been received, provide a reasonable basis for our opinion.
/s/ PricewaterhouseCoopers LLP
New York, New York
June 24, 2011
45
Tax Information
Form 1099-DIV, Form 1042-S and other year-end tax information provide shareholders with actual calendar year amounts that should be included in their tax returns. Shareholders should consult their tax advisors.
The following distribution information is being provided as required by the Internal Revenue Code or to meet a specific state's requirement.
Each Fund designates the following amounts or, if subsequently determined to be different the maximum amount allowable for its fiscal year ended April 30, 2011:
Federal Income Tax Information
| Qualified Dividend Income* | Corporate Dividends Received Deduction* | ||||||||||
| Buyback AchieversTM Portfolio | 100 | % | 100 | % | |||||||
| Dividend AchieversTM Portfolio | 100 | % | 100 | % | |||||||
| Financial Preferred Portfolio(1) | 100 | % | 44 | % | |||||||
| High Yield Equity Dividend AchieversTM Portfolio | 100 | % | 100 | % | |||||||
| International Dividend AchieversTM Portfolio | 100 | % | 0 | % | |||||||
The Fund intends to elect to pass through to shareholders the credit for taxes paid to foreign countries. The gross foreign source income and foreign taxes paid are as follows:
| Foreign Source Income | Foreign Taxes | ||||||||||
| International Dividend AchieversTM Portfolio | $ | 18,314,430 | $ | 1,475,412 | |||||||
* The above percentages are based on ordinary income dividends paid to shareholders during the Fund's fiscal year.
(1) Tax year-end is October 31.
46
Supplemental Information
Trustees and Officers
The Independent Trustees, the Trustees who are affiliated with the Adviser (the "Non-Independent Trustees") and the executive officers of the Trust, their term of office and length of time served, their principal business occupations during at least the past five years, the number of portfolios in the Fund Complex overseen by each Trustee and the other directorships, if any, held by a Trustee, are shown below.
The Trustees and Officers information is current as of April 30, 2011.
| Name, Address and Age of Independent Trustees | Position(s) Held with Trust | Term of Office and Length of Time Served* | Principal Occupation(s) During Past 5 Years | Number of Portfolios in Fund Complex** Overseen by Independent Trustees | Other Directorships Held by Independent Trustees | ||||||||||||||||||
| Ronn R. Bagge (53) c/o Invesco PowerShares Capital Management LLC 301 West Roosevelt Road Wheaton, IL 60187 | Trustee | Since 2003 | Founder and Principal, YQA Capital Management LLC (1998-Present); formerly Owner/CEO of Electronic Dynamic Balancing Co., Inc. (high-speed rotating equipment service provider) | 107 | None | ||||||||||||||||||
| Todd J. Barre (53) c/o Invesco PowerShares Capital Management LLC 301 West Roosevelt Road Wheaton, IL 60187 | Trustee | Since 2010 | Assistant Professor of Business, Trinity Christian College (2010-Present); formerly Vice President and Senior Investment Strategist (2001-2008), Director of Open Architecture and Trading (2007-2008); Head of Fundamental Research (2004-2007); and Vice President and Senior Fixed Income Strategist (1994-2001). BMO Financial Group/Harris Private Bank | 107 | None | ||||||||||||||||||
* This is the date the Trustee began serving the Trust. Each Trustee serves an indefinite term, until his successor is elected.
** Fund Complex includes all open-end funds (including all of their portfolios) advised by the Adviser. At April 30, 2011, the Fund Complex consisted of the Trust's 56 portfolios and three other exchange-traded fund trusts with 51 portfolios advised by the Adviser.
47
Supplemental Information (Continued)
Trustees and Officers (Continued)
| Name, Address and Age of Independent Trustees | Position(s) Held with Trust | Term of Office and Length of Time Served* | Principal Occupation(s) During Past 5 Years | Number of Portfolios in Fund Complex** Overseen by Independent Trustees | Other Directorships Held by Independent Trustees | ||||||||||||||||||
| Marc M. Kole (50) c/o Invesco PowerShares Capital Management LLC 301 West Roosevelt Road Wheaton, IL 60187 | Trustee | Since 2006 | Chief Financial Officer, Hope Network (social services) (2008-Present); formerly Assistant Vice President and Controller, Priority Health (health insurance) (2005-2008); Senior Vice President of Finance, United Healthcare (2004-2005); Senior Vice President of Finance, Oxford Health Plans (2000-2004) | 107 | None | ||||||||||||||||||
| Philip M. Nussbaum (49) c/o Invesco PowerShares Capital Management LLC 301 West Roosevelt Road Wheaton, IL 60187 | Trustee | Since 2003 | Chairman, Performance Trust Capital Partners (2004-Present) | 107 | None | ||||||||||||||||||
* This is the date the Trustee began serving the Trust. Each Trustee serves an indefinite term, until his successor is elected.
** Fund Complex includes all open-end funds (including all of their portfolios) advised by the Adviser. At April 30, 2011, the Fund Complex consisted of the Trust's 56 portfolios and three other exchange-traded fund trusts with 51 portfolios advised by the Adviser.
48
Supplemental Information (Continued)
Trustees and Officers (Continued)
| Name, Address and Age of Independent Trustees | Position(s) Held with Trust | Term of Office and Length of Time Served* | Principal Occupation(s) During Past 5 Years | Number of Portfolios in Fund Complex** Overseen by Independent Trustees | Other Directorships Held by Independent Trustees | ||||||||||||||||||
| Donald H. Wilson (51) c/o Invesco PowerShares Capital Management LLC 301 West Roosevelt Road Wheaton, IL 60187 | Trustee | Since 2006 | Chairman and Chief Executive Officer, Stone Pillar Advisers, Ltd. (2010-Present); formerly, Chief Operating Officer, AMCORE Financial, Inc. (bank holding company) (2007-2009); Executive Vice President and Chief Financial Officer, AMCORE Financial, Inc. (2006-2007); Senior Vice President and Treasurer, Marshall & Ilsley Corp. (bank holding company) (1995-2006) | 107 | None | ||||||||||||||||||
* This is the date the Trustee began serving the Trust. Each Trustee serves an indefinite term, until his successor is elected.
** Fund Complex includes all open-end funds (including all of their portfolios) advised by the Adviser. At April 30, 2011, the Fund Complex consisted of the Trust's 56 portfolios and three other exchange-traded fund trusts with 51 portfolios advised by the Adviser.
49
Supplemental Information (Continued)
Trustees and Officers (Continued)
| Name, Address and Age of Interested Trustees | Position(s) Held with Trust | Term of Office and Length of Time Served* | Principal Occupation(s) During Past 5 Years | Number of Portfolios in Fund Complex** Overseen by Interested Trustees | Other Directorships Held by Interested Trustees | ||||||||||||||||||
| H. Bruce Bond (47) Invesco PowerShares Capital Management LLC 301 West Roosevelt Road Wheaton, IL 60187 | Chairman of the Board and Trustee | Since 2003 | Chairman, Invesco Power-Shares Capital Management LLC (2009-Present); formerly, Managing Director, Invesco PowerShares Capital Management LLC (2002-2009); Manager, Nuveen Investments (1998-2002) | 107 | None | ||||||||||||||||||
* This is the date the Trustee began serving the Trust. Each Trustee serves an indefinite term, until his successor is elected.
** Fund Complex includes all open-end funds (including all of their portfolios) advised by the Adviser. At April 30, 2011, the Fund Complex consisted of the Trust's 56 portfolios and three other exchange-traded fund trusts with 51 portfolios advised by the Adviser.
50
Supplemental Information (Continued)
Trustees and Officers (Continued)
| Name, Address and Age of Interested Trustees | Position(s) Held with Trust | Term of Office and Length of Time Served* | Principal Occupation(s) During Past 5 Years | Number of Portfolios in Fund Complex** Overseen by Interested Trustees | Other Directorships Held by Interested Trustees | ||||||||||||||||||
| Kevin M. Carome (54) Invesco Ltd. Two Peachtree Pointe 1555 Peachtree St., N.E. Suite 1800 Atlanta, GA 30309 | Trustee | Since 2010 | Senior Managing Director and General Counsel, Invesco Ltd. (2006-Present); formerly Senior Vice President and General Counsel, Invesco Advisors, Inc. (2003-2005); Senior Vice President and General Counsel, Liberty Financial Companies, Inc. (2000-2001); General Counsel of certain investment management subsidiaries of Liberty Financial Companies, Inc. (1998-2000); Associate General Counsel, Liberty Financial Companies, Inc. (1993-1998); Associate, Ropes & Gray LLP | 107 | None | ||||||||||||||||||
* This is the date the Trustee began serving the Trust. Each Trustee serves an indefinite term, until his successor is elected.
** Fund Complex includes all open-end funds (including all of their portfolios) advised by the Adviser. At April 30, 2011, the Fund Complex consisted of the Trust's 56 portfolios and three other exchange-traded fund trusts with 51 portfolios advised by the Adviser.
51
Supplemental Information (Continued)
Trustees and Officers (Continued)
| Name, Address and Age of Executive Officer | Position(s) Held with Trust | Length of Time Served* | Principal Occupation(s) During Past 5 Years | ||||||||||||
| Andrew Schlossberg (36) Invesco Management Group, Inc. 11 Greenway Plaza Suite 100 Houston, TX 77046 | President | Since 2009 | Managing Director, U.S. head of business strategy and chief marketing officer for Invesco Ltd. in the United States (2008-Present); formerly Mr. Schlossberg served in multiple roles within Invesco, including head of corporate development, as well as global leadership roles in strategy and product development in the company's North American Institutional and Retirement divisions (2002-2007) | ||||||||||||
| Bruce T. Duncan (56) Invesco PowerShares Capital Management LLC 301 West Roosevelt Road Wheaton, IL 60187 | Treasurer and Secretary | Treasurer since 2006 and Secretary since 2008 | Senior Vice President of Finance, Invesco PowerShares Capital Management LLC (2005-Present); formerly Private Practice Attorney (2000-2005); Vice President of Investor Relations. The ServiceMaster Company (1994-2000); Vice President of Taxes, The ServiceMaster Company (1990-2000) | ||||||||||||
| Benjamin Fulton (49) Invesco PowerShares Capital Management LLC 301 West Roosevelt Road Wheaton, IL 60187 | Vice President | Since 2009 | Executive Vice President – Global Product Development, Invesco PowerShares Capital Management LLC (2005-Present); formerly principal of Clermont Consulting, a consulting firm focused on the creation and development of retail investment products (2003-2005); President and a founding partner of Claymore Securities, a financial services firm in the Chicagoland area (2001-2003); Managing Director of Structured Investments at Nuveen Investments (1998-2001) | ||||||||||||
| Peter Hubbard (29) Invesco PowerShares Capital Management LLC 301 West Roosevelt Road Wheaton, IL 60187 | Vice President | Since 2009 | Vice President and Director of Portfolio Management – Invesco PowerShares Capital Management LLC (2008-Present); formerly Portfolio Manager, Invesco PowerShares Capital Management LLC (2007-2008); Research Analyst, Invesco PowerShares Capital Management LLC (2005-2007); Research Analyst and Trader, Ritchie Capital, a hedge fund operator (2003-2005) | ||||||||||||
* This is the date the Officer began serving the Trust. Each Officer serves a one-year term, until his successor is elected.
52
Supplemental Information (Continued)
Trustees and Officers (Continued)
| Name, Address and Age of Executive Officer | Position(s) Held with Trust | Length of Time Served* | Principal Occupation(s) During Past 5 Years | ||||||||||||
| David Warren (53) Invesco Trimark Ltd. 5140 Yonge Street Suite 900 Toronto, Ontario M2N 6X7 | Vice President | Since 2009 | Director, Executive Vice President and Chief Financial Officer, Invesco Trimark Ltd. and Chief Administrative Officer, North American Retail, Invesco Ltd. (2007-Present); formerly Director, Executive Vice President and Chief Financial Officer, Invesco Trimark Ltd. (2000-2006) | ||||||||||||
| Todd Spillane (51) Invesco Management Group, Inc. 11 Greenway Plaza Suite 100 Houston, TX 77046 | Chief Compliance Officer | Since 2010 | Senior Vice President, Invesco Management Group, Inc.; Chief Compliance Officer, INVESCO Private Capital Investments, Inc. (holding company), Invesco Private Capital, Inc. (registered investment adviser) and Invesco Senior Secured Management, Inc. (registered investment adviser); Chief Compliance Officer and Senior Vice President, Invesco Advisers, Inc. (formerly Invesco Institutional (N.A.), Inc. – registered investment adviser) and Vice President, Invesco Distributors, Inc. and Invesco Investment Services, Inc.; formerly Chief Compliance Officer, Invesco Global Asset Management (N.A.), Inc. – (registered investment adviser) and Invesco Advisers, Inc. (formerly Invesco Institutional (N.A.), Inc.) (registered investment adviser); Senior Vice President and Chief Compliance Officer, Invesco Advisors, Inc., Invesco Capital Management, Inc. and Invesco Private Asset Management, Inc.; Vice President, Invesco Capital Management, Inc. and Fund Management Company | ||||||||||||
Availability of Additional Information About the Trustees
The Statement of Additional Information includes additional information about the Trustees and is available, without charge, upon request at (800) 983-0903.
* This is the date the Officer began serving the Trust. Each Officer serves a one-year term, until his successor is elected.
53
Board Considerations Regarding Continuation of Investment Advisory Agreement
At a meeting held on April 14, 2011, the Board of Trustees of the PowerShares Exchange-Traded Fund Trust (the "Trust"), including the Independent Trustees, unanimously approved the continuation of the Investment Advisory Agreement between Invesco PowerShares Capital Management LLC (the "Adviser") and the Trust for the following 54 series (each, a "Fund" and collectively, the "Funds"):
PowerShares Dynamic Market Portfolio
PowerShares Dynamic OTC Portfolio
PowerShares Golden Dragon Halter USX China Portfolio
PowerShares High Yield Equity Dividend AchieversTM Portfolio
PowerShares WilderHill Clean Energy Portfolio
PowerShares Dynamic Large Cap Growth Portfolio
PowerShares Dynamic Large Cap Value Portfolio
PowerShares Dynamic Mid Cap Growth Portfolio
PowerShares Dynamic Mid Cap Value Portfolio
PowerShares Dynamic Small Cap Growth Portfolio
PowerShares Dynamic Small Cap Value Portfolio
PowerShares Dynamic Biotechnology & Genome Portfolio
PowerShares Dynamic Food & Beverage Portfolio
PowerShares Dynamic Leisure and Entertainment Portfolio
PowerShares Dynamic Media Portfolio
PowerShares Dynamic Networking Portfolio
PowerShares Dynamic Pharmaceuticals Portfolio
PowerShares Dynamic Semiconductors Portfolio
PowerShares Dynamic Software Portfolio
PowerShares Zacks Micro Cap Portfolio
PowerShares Aerospace & Defense Portfolio
PowerShares Morningstar StockInvestor Core Portfolio
PowerShares Dividend AchieversTM Portfolio
PowerShares International Dividend AchieversTM Portfolio
PowerShares Dynamic Building and Construction Portfolio
PowerShares Dynamic Energy Exploration and Production Portfolio
PowerShares WilderHill Progressive Energy Portfolio
PowerShares Dynamic Insurance Portfolio
PowerShares Dynamic Oil and Gas Services Portfolio
PowerShares Dynamic Retail Portfolio
PowerShares Dynamic Utilities Portfolio
PowerShares Lux Nanotech Portfolio
PowerShares FTSE RAFI US 1000 Portfolio
PowerShares FTSE RAFI US 1500 Small-Mid Portfolio
PowerShares Water Resources Portfolio
PowerShares Dynamic Energy Sector Portfolio
PowerShares Dynamic Financial Sector Portfolio
PowerShares Dynamic Healthcare Sector Portfolio
PowerShares Dynamic Industrials Sector Portfolio
PowerShares Dynamic Large Cap Portfolio
PowerShares Dynamic MagniQuant Portfolio
PowerShares Dynamic Mid Cap Portfolio
PowerShares Dynamic Small Cap Portfolio
PowerShares Dynamic Technology Sector Portfolio
PowerShares Buyback AchieversTM Portfolio
PowerShares CleantechTM Portfolio
PowerShares Dynamic Banking Portfolio
PowerShares Dynamic Basic Materials Sector Portfolio
PowerShares Dynamic Consumer Discretionary Sector Portfolio
PowerShares Dynamic Consumer Staples Sector Portfolio
PowerShares Financial Preferred Portfolio
PowerShares Global Listed Private Equity Portfolio
PowerShares DWA Technical LeadersTM Portfolio
PowerShares S&P 500® High Quality Portfolio
54
Board Considerations Regarding Continuation of Investment Advisory Agreement (Continued)
The Trustees reviewed information from the Adviser describing: (i) the nature, extent and quality of services provided, (ii) the investment performance of the Funds and the Adviser, (iii) the costs of services provided and estimated profits realized by the Adviser, (iv) the extent to which economies of scale are realized as the Funds grow, (v) whether fee levels reflect any possible economies of scale for the benefit of Fund shareholders, (vi) comparisons of services rendered and amounts paid to other registered investment companies and (vii) any benefits realized by the Adviser from its relationship with each Fund. Based on all of the information considered and the conclusions reached, the Board, including the Independent Trustees, determined to approve the continuation of the Investment Advisory Agreement for each Fund. No single factor was determinative in the Board's analysis.
Nature, Extent and Quality of Services. In evaluating the nature, extent and quality of the Adviser's services, the Trustees reviewed information concerning the functions performed by the Adviser for the Funds, information describing the Adviser's current organization and projected staffing, including operations assistance provided by the Adviser's parent organization, Invesco Ltd., and the background and experience of the persons responsible for the day-to-day management of the Funds. The Trustees reviewed matters related to the Adviser's execution of portfolio transactions on behalf of the Funds. The Trustees also reviewed information on the performance of the Funds and the performance of their underlying indices through December 31, 2010, including reports on the correlation and tracking error between the underlying index and each Fund's performance, as well as the Adviser's analysis of the tracking error between each Fund and its underlying index. The Trustees noted that, in each case, the correlation and tracking error for each Fund was within the targeted range set forth in the Trust's registration statement. The Trustees concluded that each Fund was correlated to its underlying index and that the tracking error for each Fund was within an acceptable range given that Fund's particular circumstances.
The Trustees also considered the services provided by the Adviser in its oversight of the Funds' administrator, custodian and transfer agent. They noted the significant amount of time and effort that had been devoted to this oversight function.
Based on their review, the Trustees concluded that the nature, extent and quality of services provided by the Adviser to the Funds under the Investment Advisory Agreement were appropriate and reasonable.
Fees, Expenses and Profitability. The Trustees reviewed and discussed the information provided by the Adviser on each Fund's expense ratio and advisory fee, as compared to information compiled by the Adviser from Lipper Inc. databases on the expense ratios of comparable exchange-traded funds ("ETFs"), open-end (non-ETF) index funds and open-end actively-managed funds. The Trustees noted that the annual advisory fee charged to each Fund is:
• 0.50% of the Fund's average net assets, for each Fund other than PowerShares High Yield Equity Dividend Achievers(TM) Portfolio, PowerShares Dividend Achievers(TM) Portfolio, PowerShares International Dividend Achievers(TM) Portfolio, PowerShares FTSE RAFI US 1000 Portfolio and PowerShares FTSE RAFI US 1500 Small-Mid Portfolio;
• 0.40% of the Fund's average net assets, for each of PowerShares High Yield Equity Dividend Achievers(TM) Portfolio, PowerShares Dividend Achievers(TM) Portfolio and PowerShares International Dividend Achievers(TM) Portfolio; and
• 0.29% of the Fund's average net assets, for each of PowerShares FTSE RAFI US 1000 Portfolio and PowerShares FTSE RAFI US 1500 Small-Mid Portfolio.
55
Board Considerations Regarding Continuation of Investment Advisory Agreement (Continued)
The Trustees also noted that the Adviser has agreed to waive a portion of its advisory fee and/or pay expenses (an "Expense Cap") to the extent necessary to prevent the annual operating expenses of each Fund from exceeding the percentage of that Fund's average daily net assets, at least until August 31, 2012, as set forth below:
• 0.60%, excluding interest expenses, brokerage commissions and other trading expenses, taxes and extraordinary expenses, for each of PowerShares Dynamic OTC Portfolio and PowerShares Dynamic Market Portfolio;
• 0.50%, excluding interest expenses, licensing fees, offering costs, brokerage commissions and other trading expenses, taxes and extraordinary expenses, for each of PowerShares High Yield Equity Dividend Achievers(TM) Portfolio, PowerShares Dividend Achievers(TM) Portfolio and PowerShares International Dividend Achievers(TM) Portfolio;
• 0.50%, excluding interest expenses, offering costs, brokerage commissions and other trading expenses, taxes and extraordinary expenses, for each of PowerShares Morningstar StockInvestor Core Portfolio and PowerShares S&P 500® High Quality Portfolio (the Trustees noted that the Expense Cap for each of these Funds was reduced to 0.50% effective July 1, 2010);
• 0.39%, excluding interest expenses, offering costs, brokerage commissions and other trading expenses, taxes and extraordinary expenses, for each of PowerShares FTSE RAFI US 1000 Portfolio and PowerShares FTSE RAFI US 1500 Small-Mid Portfolio; and
• 0.60%, excluding interest expenses, licensing fees, offering costs, brokerage commissions and other trading expenses, taxes and extraordinary expenses, for each other Fund.
The Trustees noted that the Adviser represented that it does not provide investment advisory services to any clients other than the Funds and other ETFs overseen by the Board. The Trustees noted that each Fund's advisory fee was:
• higher than the median advisory fee of its ETF peer funds (except for the advisory fee of each of PowerShares Financial Preferred Portfolio, PowerShares FTSE RAFI US 1000 Portfolio, PowerShares Global Listed Private Equity Portfolio and PowerShares Golden Dragon Halter USX China Portfolio, which was equal to or lower than the median advisory fee of its ETF peer funds); and
• higher than the median advisory fee of its open-end index peer funds (except for the advisory fee of each of PowerShares DWA Technical Leaders(TM) Portfolio, PowerShares Dynamic Banking Portfolio, PowerShares Dynamic Basic Materials Sector Portfolio, PowerShares Dynamic Biotechnology & Genome Portfolio, PowerShares Dynamic Financial Sector Portfolio, PowerShares Dynamic Healthcare Portfolio, PowerShares Dynamic Insurance Portfolio, PowerShares Dynamic Mid Cap Growth Portfolio, PowerShares Dynamic Networking Portfolio, PowerShares Dynamic OTC Portfolio, PowerShares Dynamic Pharmaceuticals Portfolio, PowerShares Dynamic Semiconductors Portfolio, PowerShares Dynamic Small Cap Growth Portfolio, PowerShares Dynamic Software Portfolio, PowerShares Dynamic Technology Sector Portfolio, PowerShares Golden Dragon Halter USX China Portfolio, PowerShares Lux Nanotech Portfolio, PowerShares Morningstar StockInvestor Core Portfolio and PowerShares S&P 500® High Quality Portfolio, which was equal to or lower than
56
Board Considerations Regarding Continuation of Investment Advisory Agreement (Continued)
the median advisory fee of its open-end index peer funds, and there was no comparable data for PowerShares Financial Preferred Portfolio or PowerShares Global Listed Private Equity Portfolio); but
• lower than the median advisory fee of its open-end actively-managed peer funds.
The Trustees determined that the advisory fees were reasonable, noting the complexity of the indices, which generally require more frequent rebalancing of the portfolios, the distinguishing factors of the Funds, and the higher administrative, operational and management oversight costs for the Adviser. With respect to the Funds' expense ratios, the Trustees noted that the net expense ratio for each Fund was:
• higher than the median expense ratio of its ETF peer funds (except for the net expense ratio of each of PowerShares Dynamic Market Portfolio, PowerShares Dynamic OTC Portfolio, PowerShares FTSE RAFI US 1000 Portfolio, PowerShares Golden Dragon Halter USX China Portfolio and PowerShares S&P 500® High Quality Portfolio, which was equal to or less than the median expense ratio of its ETF peer funds); and
• higher than the median expense ratio of its open-end index peer funds (except for the net expense ratio of each of PowerShares Aerospace & Defense Portfolio, PowerShares Cleantech(TM) Portfolio, PowerShares DWA Technical Leaders(TM) Portfolio, PowerShares Dynamic Banking Portfolio, PowerShares Dynamic Basic Materials Sector Portfolio, PowerShares Dynamic Biotechnology & Genome Portfolio, PowerShares Dynamic Building & Construction Portfolio, PowerShares Dynamic Consumer Discretionary Sector Portfolio, PowerShares Dynamic Consumer Staples Sector Portfolio, PowerShares Dynamic Financial Sector Portfolio, PowerShares Dynamic Food & Beverage Portfolio, PowerShares Dynamic Healthcare Portfolio, PowerShares Dynamic Industrials Sector Portfolio, PowerShares Dynamic Insurance Portfolio, PowerShares Dynamic Large Cap Portfolio, PowerShares Dynamic Large Cap Growth Portfolio, PowerShares Dynamic Leisure and Entertainment Portfolio, PowerShares Dynamic Media Portfolio, PowerShares Dynamic Mid Cap Growth Portfolio, PowerShares Morningstar StockInvestor Core Portfolio, PowerShares Dynamic Networking Portfolio, PowerShares Dynamic OTC Portfolio, PowerShares Dynamic Pharmaceuticals Portfolio, PowerShares Dynamic Retail Portfolio, PowerShares Dynamic Semiconductors Portfolio, PowerShares Dynamic Small Cap Growth Portfolio, PowerShares Dynamic Small Cap Value Portfolio, PowerShares Dynamic Software Portfolio, PowerShares Dynamic Technology Sector Portfolio, PowerShares Dynamic Utilities Sector Portfolio, PowerShares FTSE RAFI US 1000 Portfolio, PowerShares FTSE RAFI US 1500 Small-Mid Portfolio, PowerShares Golden Dragon Halter USX China Portfolio, PowerShares Lux Nanotech Portfolio and PowerShares S&P 500® High Quality Portfolio, which was equal to or lower than the median expense ratio of its open-end index peer funds, and there was no comparable data for PowerShares Financial Preferred Portfolio or PowerShares Global Listed Private Equity Portfolio); but
• lower than the median expense ratio of its open-end actively-managed peer funds.
The Trustees noted that a significant component of the non-advisory fee expenses was the license fees paid by the Funds, and those Funds for which license fees are included in the Funds' Expense Caps.
The Board concluded that the advisory fee and expense ratio of each Fund (giving effect to the Fund's Expense Cap) were reasonable and appropriate in light of the services provided.
57
Board Considerations Regarding Continuation of Investment Advisory Agreement (Continued)
In conjunction with their review of fees, the Trustees also considered information provided by the Adviser on the revenues received by the Adviser under the Investment Advisory Agreement for each Fund, as well as the fees waived and expenses reimbursed by the Adviser for the Funds. The Trustees reviewed information provided by the Adviser on its profitability as well as any profits or losses realized by the Adviser from its relationship to each Fund. The Trustees concluded that the estimated profitability to the Adviser of the advisory services provided to any of the Funds was not unreasonable.
Also at the April 14, 2011 meeting, the Adviser proposed reducing the annual advisory fee for each of PowerShares Dynamic Large Cap Portfolio, PowerShares Dynamic Mid Cap Growth Portfolio, PowerShares Dynamic Mid Cap Portfolio, PowerShares Dynamic Mid Cap Value Portfolio, PowerShares Dynamic Small Cap Growth Portfolio, PowerShares Dynamic Small Cap Portfolio and PowerShares Dynamic Small Cap Value Portfolio (each, a "Style Fund") effective June 16, 2011. The Adviser also proposed revising each Style Fund's Expense Cap that is in place until August 31, 2012 to further reduce each Style Fund's annual operating expenses effective June 16, 2011. The Board considered the Adviser's representation that there would be no diminution in the quantity or quality of services provided to each Style Fund in connection with the amendment to the Investment Advisory Agreement to reflect the advisory fee changes. The Board concluded for each Style Fund that the reduced advisory fee was appropriate, and determined to approve the amended Investment Advisory Agreement and amended Expense Cap, effective June 16, 2011.
Economies of Scale and Whether Fee Levels Reflect These Economies of Scale. The Trustees reviewed the information provided by the Adviser as to the extent to which economies of scale are realized as each Fund grows and whether fee levels reflect economies of scale for the benefit of shareholders. The Trustees reviewed each Fund's asset size, expense ratio and expense limitation agreed to by the Adviser. The Trustees noted that, for Funds whose expenses are higher than their respective Expense Caps, any reduction in that Fund's expenses would be enjoyed by the Adviser, but that Fund shareholders benefit from the lower expense ratio as a result of the Fund's Expense Cap. The Trustees also noted that the Excess Expense Agreement with the Trust provides that the Adviser is entitled to be reimbursed by each Fund, other than PowerShares Dynamic Market Portfolio and PowerShares Dynamic OTC Portfolio, for fees waived or expenses absorbed pursuant to the Expense Cap for a period of three years from the date the fee or expense was incurred, provided that no reimbursement would be made that would result in a Fund exceeding its Expense Cap. The Trustees considered whether the advisory fee rate for each Fund was reasonable in relation to the asset size of that Fund, and concluded that the flat advisory fee was reasonable and appropriate, noting the Fund expenses the Adviser has borne as a result of the Expense Cap.
The Trustees noted that the Adviser had not identified any further benefits that it derived from its relationship with the Funds and had noted that it does not have any soft-dollar arrangements.
Based on all of the information considered and the conclusions reached, the Board, including the Independent Trustees, determined to approve the continuation of the Investment Advisory Agreement for each Fund. No single factor was determinative in the Board's analysis.
58
This page intentionally left blank
This page intentionally left blank
PROXY VOTING POLICIES AND PROCEDURES
A description of the Funds' proxy voting policies and procedures that the Funds use to determine how to vote proxies relating to portfolio securities is available, without charge and upon request, by calling (800) 983-0903. This information is also available on the Securities and Exchange Commission's ("Commission") website at www.sec.gov.
Information regarding how the Funds voted proxies for portfolio securities, if applicable, during the most recent 12-month period ended June 30, is also available, without charge and upon request, by (i) calling (800) 983-0903; or (ii) accessing the Trust's Form N-PX on the Commission's website at www.sec.gov.
QUARTERLY PORTFOLIOS
The Funds file their complete schedules of portfolio holdings with the Commission for the first and third quarters of each fiscal year on Form N-Q. The Trust's Forms N-Q are available on the Commission's website at www.sec.gov. The Trust's Forms N-Q may also be reviewed and copied at the Commission's Public Reference Room in Washington, D.C.; information on the operation of the Public Reference Room may be obtained by calling (800) SEC-0330.


301 West Roosevelt Road
Wheaton, IL 60187
800.983.0903
www.invescopowershares.com
© 2011 Invesco PowerShares Capital Management LLC P-PS-AR-1


2011 Annual Report to Shareholders
April 30, 2011
PowerShares Aerospace & Defense Portfolio (PPA)
PowerShares CleantechTM Portfolio (PZD)
PowerShares DWA Technical LeadersTM Portfolio (PDP)
PowerShares Global Listed Private Equity Portfolio (PSP)
PowerShares Golden Dragon Halter USX China Portfolio (PGJ)
PowerShares Lux Nanotech Portfolio (PXN)
PowerShares Morningstar StockInvestor Core Portfolio (PYH)
PowerShares S&P 500 BuyWrite Portfolio (PBP)
PowerShares S&P 500® High Quality Portfolio (PIV)
PowerShares Water Resources Portfolio (PHO)
PowerShares WilderHill Clean Energy Portfolio (PBW)
PowerShares WilderHill Progressive Energy Portfolio (PUW)

Table of Contents
| The Market Environment | 2 | ||||||
| Manager's Analysis | 4 | ||||||
| Frequency Distribution of Discounts & Premiums | 30 | ||||||
| Fees and Expenses | 32 | ||||||
| Specialty Portfolios | |||||||
| Schedules of Investments | |||||||
| PowerShares Aerospace & Defense Portfolio (PPA) | 34 | ||||||
| PowerShares CleantechTM Portfolio (PZD) | 35 | ||||||
| PowerShares DWA Technical LeadersTM Portfolio (PDP) | 37 | ||||||
| PowerShares Global Listed Private Equity Portfolio (PSP) | 39 | ||||||
| PowerShares Golden Dragon Halter USX China Portfolio (PGJ) | 41 | ||||||
| PowerShares Lux Nanotech Portfolio (PXN) | 44 | ||||||
| PowerShares Morningstar StockInvestor Core Portfolio (PYH) | 45 | ||||||
| PowerShares S&P 500 BuyWrite Portfolio (PBP) | 47 | ||||||
| PowerShares S&P 500® High Quality Portfolio (PIV) | 53 | ||||||
| PowerShares Water Resources Portfolio (PHO) | 55 | ||||||
| PowerShares WilderHill Clean Energy Portfolio (PBW) | 56 | ||||||
| PowerShares WilderHill Progressive Energy Portfolio (PUW) | 58 | ||||||
| Statements of Assets and Liabilities | 60 | ||||||
| Statements of Operations | 62 | ||||||
| Statements of Changes in Net Assets | 64 | ||||||
| Financial Highlights | 68 | ||||||
| Notes to Financial Statements | 74 | ||||||
| Report of Independent Registered Public Accounting Firm | 90 | ||||||
| Tax Information | 91 | ||||||
| Trustees and Officers | 92 | ||||||
| Board Considerations Regarding Continuation of Investment Advisory Agreements | 98 | ||||||
The Market Environment
For the fiscal year ended April 30, 2011, the market environment saw continued improvement. Global equities ended up 18.25% after declining the first two months of the period. Emerging markets led equities up during the fiscal year with the MSCI Emerging Markets Index returning 20.67%. Developed International and U.S. Equities followed closely behind emerging markets with the MSCI EAFE Index up 19.18% and the S&P 500® Index up 17.24%. Volatility continued to decline on a year-over-year basis with the CBOE Volatility Index® (VIX®) dropping 33.11% for the fiscal year. Fixed income markets moved higher for the fiscal year with the Barclays Aggregate Bond Index ending up 5.37%.
2
This page intentionally left blank
Manager's Analysis
PowerShares Aerospace & Defense Portfolio (ticker: PPA)
The PowerShares Aerospace & Defense Portfolio (the "Fund") seeks investment results that correspond (before fees and expenses) generally to the price and yield performance of the SPADE® Defense Index (the "Index").
For the fiscal year ended April 30, 2011, the Fund returned 8.91%. Over this same year, the Index returned 7.79%, while the S&P SuperComposite Aerospace & Defense Index returned 11.60%. The Fund benefited from positive performance of securities of companies in industrials, information technology and materials sectors. Fund performance was positive for securities of companies within each sector in which it was invested.
Industry Breakdown (% of the Fund's
Net Assets) as of April 30, 2011
| Aerospace/Defense | 55.1 | ||||||
| Miscellaneous Manufacturing | 14.6 | ||||||
| Computers | 5.7 | ||||||
| Telecommunications | 5.2 | ||||||
| Metal Fabricate/Hardware | 5.1 | ||||||
| Commercial Services | 4.0 | ||||||
| Electronics | 3.7 | ||||||
| Packaging & Containers | 2.8 | ||||||
| Engineering & Construction | 1.6 | ||||||
| Auto Manufacturers | 1.4 | ||||||
| Software | 0.7 | ||||||
| Money Market Fund | 0.2 | ||||||
| Liabilities in excess of other assets | (0.1 | ) | |||||
Style Allocation (% of the Fund's
Total Investments) as of April 30, 2011
| Large-Cap Value | 45.6 | ||||||
| Mid-Cap Value | 21.5 | ||||||
| Mid-Cap Growth | 12.3 | ||||||
| Small-Cap Growth | 8.7 | ||||||
| Large-Cap Growth | 7.2 | ||||||
| Small-Cap Value | 4.7 | ||||||
Top Ten Fund Holdings (% of the Fund's
Net Assets) as of April 30, 2011
| Security | |||||||
| Boeing Co. (The) | 7.3 | ||||||
| United Technologies Corp. | 7.2 | ||||||
| Honeywell International, Inc. | 7.0 | ||||||
| Lockheed Martin Corp. | 5.3 | ||||||
| General Dynamics Corp. | 5.2 | ||||||
| Precision Castparts Corp. | 4.7 | ||||||
| Raytheon Co. | 4.2 | ||||||
| Northrop Grumman Corp. | 4.1 | ||||||
| Goodrich Corp. | 4.1 | ||||||
| Rockwell Collins, Inc. | 3.9 | ||||||
| Total | 53.0 | ||||||
4
Manager's Analysis (Continued)
PowerShares Aerospace & Defense Portfolio (ticker: PPA)
Growth of a $10,000 Investment Since Inception†
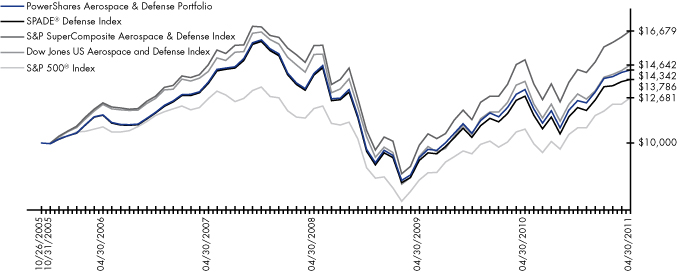
Fund Performance History (%) As of April 30, 2011
| Avg Ann†† | Fund Inception | ||||||||||||||||||||||
| 1 Year | 3 Year | 5 Year | Avg Ann†† | Cumulative | |||||||||||||||||||
| Index | |||||||||||||||||||||||
| SPADE® Defense Index | 7.79 | % | -0.60 | % | 3.43 | % | 6.00 | % | 37.86 | % | |||||||||||||
| S&P SuperComposite Aerospace & Defense Index | 11.60 | % | 1.84 | % | 6.13 | % | 9.75 | % | 66.79 | % | |||||||||||||
| Dow Jones US Aerospace and Defense Index | 7.19 | % | -1.36 | % | 3.55 | % | 7.18 | % | 46.42 | % | |||||||||||||
| S&P 500® Index | 17.24 | % | 1.74 | % | 2.95 | % | 4.41 | % | 26.81 | % | |||||||||||||
| Fund | |||||||||||||||||||||||
| Net Asset Value ("NAV") Return | 8.91 | % | 0.49 | % | 4.22 | % | 6.76 | % | 43.42 | % | |||||||||||||
| Share Price Return | 8.91 | % | 0.50 | % | 4.22 | % | 6.78 | % | 43.52 | % | |||||||||||||
Fund Inception: October 26, 2005
Performance quoted represents past performance. Past performance is not a guarantee of future results and current performance may be higher or lower than performance quoted. Investment returns and principal value will fluctuate and shares, when redeemed, may be worth more or less than their original cost. The Adviser has waived fees and reimbursed other expenses, absent which, performance would have been lower. The Adviser has contractually agreed to waive fees and/or pay certain Fund expenses through August 31, 2012. According to the Fund's current prospectus, the total gross annual operating expense ratio was indicated as 0.69%. In the Financial Highlights section of this Shareholder Report, the Fund's net total operating expense ratio was determined to be 0.66%, while the Fund's gross total expense ratio was determined to be 0.73%. NAV and Share Price returns assume that dividends and capital gain distributions have been reinvested in the Fund at NAV and Share Price, respectively. The returns shown in the table above do not reflect the deduction of taxes that a shareholder would pay on Fund distributions or the redemption or sale of Fund Shares. See invescopowershares.com to find the most recent month-end performance numbers.
Index performance results are based upon a hypothetical investment in its constituent securities. Index returns do not represent Fund returns. An investor cannot invest directly in an index. The Index does not charge management fees or brokerage expenses, and no such fees or expenses were deducted from the hypothetical performance shown. In addition, the results actual investors might have achieved would have differed from those shown because of differences in the timing, amounts of their investments, and fees and expenses associated with an investment in the Fund.
The S&P SuperComposite Aerospace & Defense Index, Dow Jones US Aerospace and Defense Index and S&P 500® Index (the "Benchmark Indices") are unmanaged indices used as a measurement of change in stock market conditions based on the average performance of approximately 54, 32 and 500 common stocks, respectively.
† Fund and underlying Index returns are based on the inception date of the Fund. Returns for the Benchmark Indices are based on the closest month-end to the Fund's inception date.
†† Average annualized.
5
Manager's Analysis
PowerShares CleantechTM Portfolio (ticker: PZD)
The PowerShares CleantechTM Portfolio (the "Fund") seeks investment results that correspond (before fees and expenses) generally to the price and yield performance of the Cleantech IndexTM (the "Index").
For the fiscal year ended April 30, 2011, the Fund returned 20.43%. Over this same year, the Index returned 19.39%, while the NASDAQ Composite Index returned 16.75% and the S&P 500® Index returned 17.24%. The Fund benefited from positive performance of securities of companies in the United States and in the industrials and information technology sectors. The Fund suffered from negative performance of securities of companies in Belgium, Spain and China.
Industry Breakdown (% of the Fund's
Net Assets) as of April 30, 2011
| Miscellaneous Manufacturing | 18.2 | ||||||
| Electrical Components & Equipment | 13.6 | ||||||
| Environmental Control | 8.9 | ||||||
| Electronics | 8.8 | ||||||
| Semiconductors | 7.5 | ||||||
| Engineering & Construction | 6.4 | ||||||
| Telecommunications | 5.5 | ||||||
| Software | 4.6 | ||||||
| Machinery-Diversified | 4.2 | ||||||
| Electric | 3.7 | ||||||
| Energy-Alternate Sources | 3.6 | ||||||
| Auto Parts & Equipment | 3.6 | ||||||
| Biotechnology | 2.6 | ||||||
| Commercial Services | 2.5 | ||||||
| Building Materials | 1.7 | ||||||
| Hand/Machine Tools | 1.5 | ||||||
| Healthcare-Services | 1.2 | ||||||
| Computers | 0.9 | ||||||
| Chemicals | 0.5 | ||||||
| Mining | 0.5 | ||||||
| Money Market Fund | 0.0 | ||||||
| Liabilities in excess of other assets | (0.0 | ) | |||||
Top Ten Fund Holdings (% of the Fund's
Net Assets) as of April 30, 2011
| Security | |||||||
| ABB Ltd. | 3.0 | ||||||
| Siemens AG | 2.8 | ||||||
| Schneider Electric SA | 2.7 | ||||||
| Johnson Controls, Inc. | 2.6 | ||||||
| Novozymes A/S Class B | 2.6 | ||||||
| Corning, Inc. | 2.5 | ||||||
| SGS SA | 2.5 | ||||||
| Polycom, Inc. | 2.5 | ||||||
| Alfa Laval AB | 2.3 | ||||||
| Autodesk, Inc. | 2.3 | ||||||
| Total | 25.8 | ||||||
Style Allocation (% of the Fund's
Total Investments) as of April 30, 2011
| Mid-Cap Growth | 32.4 | ||||||
| Small-Cap Growth | 26.2 | ||||||
| Large-Cap Growth | 16.9 | ||||||
| Small-Cap Value | 9.8 | ||||||
| Mid-Cap Value | 7.4 | ||||||
| Large-Cap Value | 7.3 | ||||||
6
Manager's Analysis (Continued)
PowerShares CleantechTM Portfolio (ticker: PZD)
Growth of a $10,000 Investment Since Inception†
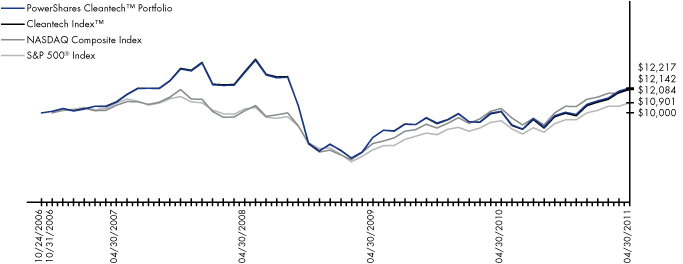
Fund Performance History (%) As of April 30, 2011
| Avg Ann†† | Fund Inception | ||||||||||||||||||
| 1 Year | 3 Year | Avg Ann†† | Cumulative | ||||||||||||||||
| Index | |||||||||||||||||||
| Cleantech Index(TM) | 19.39 | % | -4.06 | % | 4.28 | % | 20.84 | % | |||||||||||
| NASDAQ Composite Index | 16.75 | % | 6.00 | % | 4.41 | % | 21.42 | % | |||||||||||
| S&P 500® Index | 17.24 | % | 1.74 | % | 1.94 | % | 9.01 | % | |||||||||||
| Fund | |||||||||||||||||||
| Net Asset Value ("NAV") Return | 20.43 | % | -3.55 | % | 4.53 | % | 22.17 | % | |||||||||||
| Share Price Return | 21.32 | % | -3.56 | % | 4.52 | % | 22.09 | % | |||||||||||
Fund Inception: October 24, 2006
Performance quoted represents past performance. Past performance is not a guarantee of future results and current performance may be higher or lower than performance quoted. Investment returns and principal value will fluctuate and shares, when redeemed, may be worth more or less than their original cost. The Adviser has waived fees and reimbursed other expenses, absent which, performance would have been lower. The Adviser has contractually agreed to waive fees and/or pay certain Fund expenses through August 31, 2012. According to the Fund's current prospectus, the total gross annual operating expense ratio was indicated as 0.71%. In the Financial Highlights section of this Shareholder Report, the Fund's net total operating expense ratio was determined to be 0.67%, while the Fund's gross total expense ratio was determined to be 0.74%. NAV and Share Price returns assume that dividends and capital gain distributions have been reinvested in the Fund at NAV and Share Price, respectively. The returns shown in the table above do not reflect the deduction of taxes that a shareholder would pay on Fund distributions or the redemption or sale of Fund Shares. See invescopowershares.com to find the most recent month-end performance numbers.
Index performance results are based upon a hypothetical investment in its constituent securities. Index returns do not represent Fund returns. An investor cannot invest directly in an index. The Index does not charge management fees or brokerage expenses, and no such fees or expenses were deducted from the hypothetical performance shown. In addition, the results actual investors might have achieved would have differed from those shown because of differences in the timing, amounts of their investments, and fees and expenses associated with an investment in the Fund.
The NASDAQ Composite Index and S&P 500® Index (the "Benchmark Indices") are unmanaged indices used as a measurement of change in stock market conditions based on the average performance of approximately 100 and 500 common stocks, respectively.
† Fund and underlying Index returns are based on the inception date of the Fund. Returns for the Benchmark Indices are based on the closest month-end to the Fund's inception date.
†† Average annualized.
7
Manager's Analysis
PowerShares DWA Technical LeadersTM Portfolio (ticker: PDP)
The PowerShares DWA Technical LeadersTM Portfolio (the "Fund") seeks investment results that correspond (before fees and expenses) generally to the price and yield performance of the Dorsey Wright Technical LeadersTM Index (the "Index").
For the fiscal year ended April 30, 2011, the Fund returned 25.11%. Over this same year, the Index returned 25.57%, while the S&P Citigroup Large Cap Growth Index returned 18.99%, the Russell 3000® Growth Index returned 21.62% and the S&P 500® Index returned 17.24%. The Fund benefited from positive performance of securities of companies in the consumer discretionary, industrials, and information technology sectors. The Fund suffered from negative performance of securities of companies in the health care sector.
Sector Breakdown (% of the Fund's
Net Assets) as of April 30, 2011
| Consumer Discretionary | 26.7 | ||||||
| Industrials | 25.3 | ||||||
| Health Care | 9.9 | ||||||
| Information Technology | 9.1 | ||||||
| Materials | 7.6 | ||||||
| Financials | 7.3 | ||||||
| Energy | 5.8 | ||||||
| Consumer Staples | 4.6 | ||||||
| Utilities | 3.7 | ||||||
| Money Market Fund | 0.1 | ||||||
| Liabilities in excess of other assets | (0.1 | ) | |||||
Style Allocation (% of the Fund's
Total Investments) as of April 30, 2011
| Mid-Cap Growth | 46.3 | ||||||
| Mid-Cap Value | 27.9 | ||||||
| Large-Cap Growth | 11.4 | ||||||
| Large-Cap Value | 6.5 | ||||||
| Small-Cap Value | 5.7 | ||||||
| Small-Cap Growth | 2.2 | ||||||
Top Ten Fund Holdings (% of the Fund's
Net Assets) as of April 30, 2011
| Security | |||||||
| Priceline.com, Inc. | 3.2 | ||||||
| Apple, Inc. | 3.1 | ||||||
| Liberty Media Corp. — Capital | 3.1 | ||||||
| TRW Automotive Holdings Corp. | 2.7 | ||||||
| J.B. Hunt Transport Services, Inc. | 2.4 | ||||||
| C.H. Robinson Worldwide, Inc. | 2.2 | ||||||
| Edwards Lifesciences Corp. | 2.0 | ||||||
| AMETEK, Inc. | 1.9 | ||||||
| Precision Castparts Corp. | 1.7 | ||||||
| Henry Schein, Inc. | 1.7 | ||||||
| Total | 24.0 | ||||||
8
Manager's Analysis (Continued)
PowerShares DWA Technical LeadersTM Portfolio (ticker: PDP)
Growth of a $10,000 Investment Since Inception†
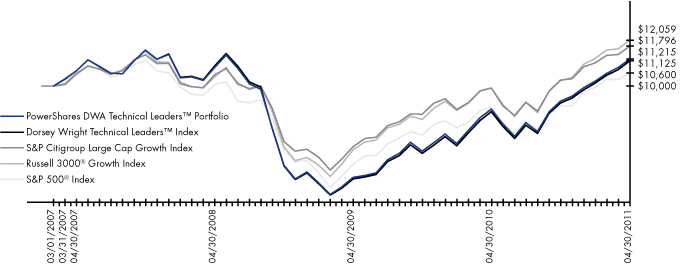
Fund Performance History (%) As of April 30, 2011
| Avg Ann†† | Fund Inception | ||||||||||||||||||
| 1 Year | 3 Year | Avg Ann†† | Cumulative | ||||||||||||||||
| Index | |||||||||||||||||||
| Dorsey Wright Technical Leaders(TM) Index | 25.57 | % | 0.63 | % | 2.59 | % | 11.25 | % | |||||||||||
| S&P Citigroup Large Cap Growth Index | 18.99 | % | 3.89 | % | 4.04 | % | 17.96 | % | |||||||||||
| Russell 3000® Growth Index | 21.62 | % | 4.95 | % | 4.60 | % | 20.59 | % | |||||||||||
| S&P 500® Index | 17.24 | % | 1.74 | % | 1.41 | % | 6.00 | % | |||||||||||
| Fund | |||||||||||||||||||
| Net Asset Value ("NAV") Return | 25.11 | % | 1.10 | % | 2.79 | % | 12.15 | % | |||||||||||
| Share Price Return | 25.26 | % | 1.10 | % | 2.76 | % | 12.00 | % | |||||||||||
Fund Inception: March 1, 2007
Performance quoted represents past performance. Past performance is not a guarantee of future results and current performance may be higher or lower than performance quoted. Investment returns and principal value will fluctuate and shares, when redeemed, may be worth more or less than their original cost. The Adviser has waived fees and reimbursed other expenses, absent which, performance would have been lower. The Adviser has contractually agreed to waive fees and/or pay certain Fund expenses through August 31, 2012. According to the Fund's current prospectus, the total gross annual operating expense ratio was indicated as 0.73%. In the Financial Highlights section of this Shareholder Report, the Fund's net total operating expense ratio was determined to be 0.70%, while the Fund's gross total expense ratio was determined to be 0.71%. NAV and Share Price returns assume that dividends and capital gain distributions have been reinvested in the Fund at NAV and Share Price, respectively. The returns shown in the table above do not reflect the deduction of taxes that a shareholder would pay on Fund distributions or the redemption or sale of Fund Shares. See invescopowershares.com to find the most recent month-end performance numbers.
Index performance results are based upon a hypothetical investment in its constituent securities. Index returns do not represent Fund returns. An investor cannot invest directly in an index. The Index does not charge management fees or brokerage expenses, and no such fees or expenses were deducted from the hypothetical performance shown. In addition, the results actual investors might have achieved would have differed from those shown because of differences in the timing, amounts of their investments, and fees and expenses associated with an investment in the Fund.
The S&P Citigroup Large Cap Growth Index, Russell 3000® Growth Index and S&P 500® Index (the "Benchmark Indices") are unmanaged indices used as a measurement of change in stock market conditions based on the average performance of approximately 1,987, 1,887 and 500 common stocks, respectively.
† Fund and underlying Index returns are based on the inception date of the Fund. Returns for the
Benchmark Indices are based on the closest month-end to the Fund's inception date.
†† Average annualized.
9
Manager's Analysis
PowerShares Global Listed Private Equity Portfolio (ticker: PSP)
The PowerShares Global Listed Private Equity Portfolio (the "Fund") seeks investment results that correspond (before fees and expenses) generally to the price and yield performance of the Global Listed Private Equity IndexSM (the "Index").
For the fiscal year ended April 30, 2011, the Fund returned 27.93%. Over this same year, the Index returned 32.53%, while the S&P Financials Index returned 2.58%. The Fund benefited from positive performance of securities of companies in the United States, France, and the United Kingdom. The Fund suffered from negative performance of securities of companies in Japan, Finland, and Bermuda.
Industry Breakdown (% of the Fund's
Net Assets) as of April 30, 2011
| Investment Companies | 35.2 | ||||||
| Private Equity | 21.7 | ||||||
| Holding Companies-Diversified | 20.8 | ||||||
| Equity Fund | 9.8 | ||||||
| Diversified Financial Services | 6.4 | ||||||
| Food | 2.6 | ||||||
| Electric | 1.2 | ||||||
| Water | 1.0 | ||||||
| Internet | 0.4 | ||||||
| Other assets less liabilities | 0.9 | ||||||
Style Allocation (% of the Fund's
Total Investments) as of April 30, 2011
| Mid-Cap Value | 39.1 | ||||||
| Small-Cap Value | 30.1 | ||||||
| Small-Cap Growth | 15.7 | ||||||
| Mid-Cap Growth | 15.1 | ||||||
Top Ten Fund Holdings (% of the Fund's
Net Assets) as of April 30, 2011
| Security | |||||||
| Leucadia National Corp. | 5.0 | ||||||
| Ratos AB | 5.0 | ||||||
| SPDR S&P 500 ETF Trust | 4.9 | ||||||
| Financial Select Sector SPDR Fund | 4.9 | ||||||
| Hal Trust | 4.6 | ||||||
| Wendel | 4.1 | ||||||
| 3i Group PLC | 4.1 | ||||||
| Ares Capital Corp. | 3.8 | ||||||
| Partners Group Holding AG | 3.7 | ||||||
| Onex Corp. | 3.5 | ||||||
| Total | 43.6 | ||||||
10
Manager's Analysis (Continued)
PowerShares Global Listed Private Equity Portfolio (ticker: PSP)
Growth of a $10,000 Investment Since Inception†
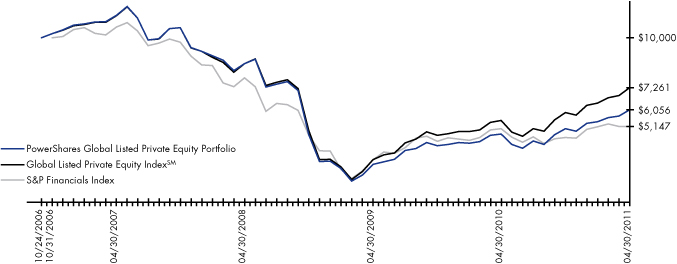
Fund Performance History (%) As of April 30, 2011
| Avg Ann†† | Fund Inception | ||||||||||||||||||
| 1 Year | 3 Year | Avg Ann†† | Cumulative | ||||||||||||||||
| Index | |||||||||||||||||||
| Global Listed Private Equity IndexSM | 32.53 | % | -5.39 | % | -6.84 | % | -27.39 | % | |||||||||||
| S&P Financials Index | 2.58 | % | -12.92 | % | -13.72 | % | -48.53 | % | |||||||||||
| Fund | |||||||||||||||||||
| Net Asset Value ("NAV") Return | 27.93 | % | -10.97 | % | -10.51 | % | -39.44 | % | |||||||||||
| Share Price Return | 28.48 | % | -10.79 | % | -10.40 | % | -39.09 | % | |||||||||||
Fund Inception: October 24, 2006
Performance quoted represents past performance. Past performance is not a guarantee of future results and current performance may be higher or lower than performance quoted. Investment returns and principal value will fluctuate and shares, when redeemed, may be worth more or less than their original cost. The Adviser has waived fees and reimbursed other expenses, absent which, performance would have been lower. The Adviser has contractually agreed to waive fees and/or pay certain Fund expenses through August 31, 2012. According to the Fund's current prospectus, the total gross annual operating expense ratio of 2.97% includes estimated acquired fund fees and expenses of 2.25%. In the Financial Highlights section of this Shareholder Report, the Fund's net total operating expense ratio was determined to be 0.70%, while the Fund's gross total expense ratio was determined to be 0.73%. NAV and Share Price returns assume that dividends and capital gain distributions have been reinvested in the Fund at NAV and Share Price, respectively. The returns shown in the table above do not reflect the deduction of taxes that a shareholder would pay on Fund distributions or the redemption or sale of Fund Shares. See invescopowershares.com to find the most recent month-end performance numbers.
Index performance results are based upon a hypothetical investment in its constituent securities. Index returns do not represent Fund returns. An investor cannot invest directly in an index. The Index does not charge management fees or brokerage expenses, and no such fees or expenses were deducted from the hypothetical performance shown. In addition, the results actual investors might have achieved would have differed from those shown because of differences in the timing, amounts of their investments, and fees and expenses associated with an investment in the Fund.
The S&P Financials Index (the "Benchmark Index") is an unmanaged index used as a measurement of change in stock market conditions based on the average performance of approximately 82 common stocks, respectively.
† Fund and underlying Index returns are based on the inception date of the Fund. Returns for the Benchmark Indices are based on the closest month-end to the Fund's inception date.
†† Average annualized.
11
Manager's Analysis
PowerShares Golden Dragon Halter USX China Portfolio (ticker: PGJ)
The PowerShares Golden Dragon Halter USX China Portfolio (the "Fund") seeks investment results that correspond (before fees and expenses) generally to the price and yield performance of the Halter USX China IndexSM (the "Index").
For the fiscal year ended April 30, 2011, the Fund returned 16.60%. Over this same year, the Index returned 17.84%, while the MSCI China Index returned 11.50%, the FTSE/Xinhua China Index returned 7.79% and the S&P 500® Index returned 17.24%. The Fund benefited from positive performance of securities of companies in the energy, information technology, and telecommunication services sectors. The Fund did not suffer from negative performance of any securities of companies in any of the sectors in which it was invested.
Sector Breakdown (% of the Fund's
Net Assets) as of April 30, 2011
| Information Technology | 27.7 | ||||||
| Energy | 20.0 | ||||||
| Telecommunication Services | 13.8 | ||||||
| Consumer Discretionary | 10.9 | ||||||
| Materials | 7.5 | ||||||
| Industrials | 7.1 | ||||||
| Financials | 5.9 | ||||||
| Health Care | 3.0 | ||||||
| Utilities | 2.8 | ||||||
| Consumer Staples | 1.3 | ||||||
| Other assets less liabilities | 0.0 | ||||||
Style Allocation (% of the Fund's
Total Investments) as of April 30, 2011
| Large-Cap Growth | 34.4 | ||||||
| Large-Cap Value | 23.1 | ||||||
| Mid-Cap Growth | 15.2 | ||||||
| Small-Cap Growth | 15.2 | ||||||
| Mid-Cap Value | 9.6 | ||||||
| Small-Cap Value | 2.5 | ||||||
Top Ten Fund Holdings (% of the Fund's
Net Assets) as of April 30, 2011
| Security | |||||||
| Baidu, Inc. ADR | 6.3 | ||||||
| PetroChina Co. Ltd. ADR | 5.8 | ||||||
| China Unicom Ltd. ADR | 5.2 | ||||||
| Yanzhou Coal Mining Co. Ltd. ADR | 4.9 | ||||||
| CNOOC Ltd. ADR | 4.5 | ||||||
| China Petroleum and Chemical Corp. ADR | 4.3 | ||||||
| China Mobile Ltd. ADR | 4.3 | ||||||
| Aluminum Corp. of China Ltd. ADR | 4.3 | ||||||
| China Life Insurance Co. Ltd. ADR | 4.2 | ||||||
| China Telecom Corp. Ltd. ADR | 4.2 | ||||||
| Total | 48.0 | ||||||
12
Manager's Analysis (Continued)
PowerShares Golden Dragon Halter USX China Portfolio (ticker: PGJ)
Growth of a $10,000 Investment Since Inception†
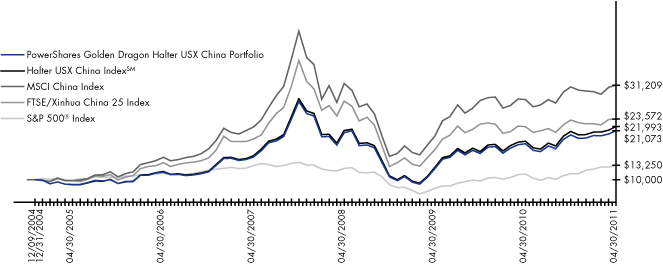
Fund Performance History (%) As of April 30, 2011
| Avg Ann†† | Fund Inception | ||||||||||||||||||||||
| 1 Year | 3 Year | 5 Year | Avg Ann†† | Cumulative | |||||||||||||||||||
| Index | |||||||||||||||||||||||
| Halter USX China IndexSM | 17.84 | % | 1.44 | % | 13.13 | % | 13.13 | % | 119.93 | % | |||||||||||||
| MSCI China Index | 11.50 | % | -0.36 | % | 15.73 | % | 19.41 | % | 212.09 | % | |||||||||||||
| FTSE/Xinhua China 25 Index | 7.79 | % | -5.16 | % | 11.26 | % | 14.30 | % | 135.72 | % | |||||||||||||
| S&P 500® Index | 17.24 | % | 1.74 | % | 2.95 | % | 4.48 | % | 32.50 | % | |||||||||||||
| Fund | |||||||||||||||||||||||
| Net Asset Value ("NAV") Return | 16.60 | % | 0.89 | % | 12.39 | % | 12.37 | % | 110.73 | % | |||||||||||||
| Share Price Return | 16.11 | % | 0.82 | % | 12.26 | % | 12.26 | % | 109.35 | % | |||||||||||||
Fund Inception: December 9, 2004
Performance quoted represents past performance. Past performance is not a guarantee of future results and current performance may be higher or lower than performance quoted. Investment returns and principal value will fluctuate and shares, when redeemed, may be worth more or less than their original cost. The Adviser has waived fees and reimbursed other expenses, absent which, performance would have been lower. The Adviser has contractually agreed to waive fees and/or pay certain Fund expenses through August 31, 2012. According to the Fund's current prospectus, the total gross annual operating expense ratio was indicated as 0.71%. In the Financial Highlights section of this Shareholder Report, the Fund's net total operating expense ratio was determined to be 0.70%, while the Fund's gross total expense ratio was determined to be 0.72%. NAV and Share Price returns assume that dividends and capital gain distributions have been reinvested in the Fund at NAV and Share Price, respectively. The returns shown in the table above do not reflect the deduction of taxes that a shareholder would pay on Fund distributions or the redemption or sale of Fund Shares. See invescopowershares.com to find the most recent month-end performance numbers.
Index performance results are based upon a hypothetical investment in its constituent securities. Index returns do not represent Fund returns. An investor cannot invest directly in an index. The Index does not charge management fees or brokerage expenses, and no such fees or expenses were deducted from the hypothetical performance shown. In addition, the results actual investors might have achieved would have differed from those shown because of differences in the timing, amounts of their investments, and fees and expenses associated with an investment in the Fund.
The MSCI China Index, FTSE/Xinhua China 25 Index and S&P 500® Index (the "Benchmark Indices") are unmanaged indices used as a measurement of change in stock market conditions based on the average performance of approximately 140, 25 and 500 common stocks, respectively.
† Fund and underlying Index returns are based on the inception date of the Fund. Returns for the Benchmark Indices are based on the closest month-end to the Fund's inception date.
†† Average annualized.
13
Manager's Analysis
PowerShares Lux Nanotech Portfolio (ticker: PXN)
The PowerShares Lux Nanotech Portfolio (the "Fund") seeks investment results that correspond (before fees and expenses) generally to the price and yield performance of the Lux Nanotech IndexTM (the "Index").
For the fiscal year ended April 30, 2011, the Fund returned (7.07)%. Over this same year, the Index returned (6.83)%, while the S&P 500® Index returned 17.24%. The Fund benefited from positive performance of securities of companies in semiconductors & semiconductors, software, and IT services industries. The Fund suffered negative performance of securities of companies in the electrical equipment, biotechnology, and life sciences tools & services industries.
Industry Breakdown (% of the Fund's
Net Assets) as of April 30, 2011
| Pharmaceuticals | 19.7 | ||||||
| Electronics | 11.1 | ||||||
| Semiconductors | 10.5 | ||||||
| Chemicals | 10.5 | ||||||
| Electrical Components & Equipment | 9.3 | ||||||
| Miscellaneous Manufacturing | 7.3 | ||||||
| Computers | 7.0 | ||||||
| Investment Companies | 6.4 | ||||||
| Biotechnology | 6.0 | ||||||
| Software | 4.5 | ||||||
| Energy-Alternate Sources | 4.3 | ||||||
| Auto Manufacturers | 3.4 | ||||||
| Money Market Fund | 0.2 | ||||||
| Liabilities in excess of other assets | (0.2 | ) | |||||
Style Allocation (% of the Fund's
Total Investments) as of April 30, 2011
| Small-Cap Growth | 56.1 | ||||||
| Large-Cap Value | 18.0 | ||||||
| Large-Cap Growth | 11.1 | ||||||
| Mid-Cap Growth | 7.6 | ||||||
| Small-Cap Value | 7.2 | ||||||
Top Ten Fund Holdings (% of the Fund's
Net Assets) as of April 30, 2011
| Security | |||||||
| Elan Corp. PLC ADR | 7.7 | ||||||
| BioDelivery Sciences International, Inc. | 7.2 | ||||||
| NVE Corp. | 6.7 | ||||||
| Veeco Instruments, Inc. | 6.6 | ||||||
| Harris & Harris Group, Inc. | 6.4 | ||||||
| Nanosphere, Inc. | 6.0 | ||||||
| Ener1, Inc. | 5.4 | ||||||
| Flamel Technologies SA ADR | 4.8 | ||||||
| Accelrys, Inc. | 4.5 | ||||||
| FEI Co. | 4.4 | ||||||
| Total | 59.7 | ||||||
14
Manager's Analysis (Continued)
PowerShares Lux Nanotech Portfolio (ticker: PXN)
Growth of a $10,000 Investment Since Inception†
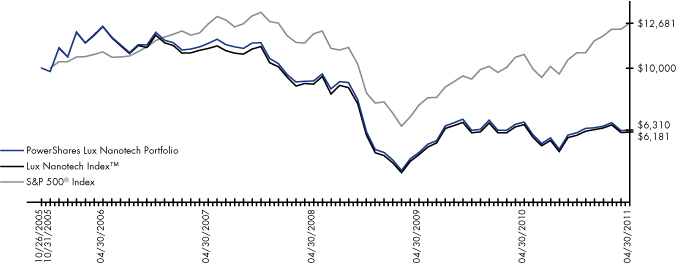
Fund Performance History (%) As of April 30, 2011
| Avg Ann†† | Fund Inception | ||||||||||||||||||||||
| 1 Year | 3 Year | 5 Year | Avg Ann†† | Cumulative | |||||||||||||||||||
| Index | |||||||||||||||||||||||
| Lux Nanotech Index(TM) | -6.83 | % | -11.93 | % | -13.09 | % | -8.36 | % | -38.19 | % | |||||||||||||
| S&P 500® Index | 17.24 | % | 1.74 | % | 2.95 | % | 4.41 | % | 26.81 | % | |||||||||||||
| Fund | |||||||||||||||||||||||
| Net Asset Value ("NAV") Return | -7.07 | % | -11.90 | % | -12.77 | % | -8.02 | % | -36.90 | % | |||||||||||||
| Share Price Return | -6.01 | % | -11.49 | % | -12.62 | % | -7.86 | % | -36.29 | % | |||||||||||||
Fund Inception: October 26, 2005
Performance quoted represents past performance. Past performance is not a guarantee of future results and current performance may be higher or lower than performance quoted. Investment returns and principal value will fluctuate and shares, when redeemed, may be worth more or less than their original cost. The Adviser has waived fees and reimbursed other expenses, absent which, performance would have been lower. The Adviser has contractually agreed to waive fees and/or pay certain Fund expenses through August 31, 2012. According to the Fund's current prospectus, the total gross annual operating expense ratio of 1.20% includes estimated acquired fund fees and expenses of 0.35%. In the Financial Highlights section of this Shareholder Report, the Fund's net total operating expense ratio was determined to be 0.70%, while the Fund's gross total expense ratio was determined to be 0.95%. NAV and Share Price returns assume that dividends and capital gain distributions have been reinvested in the Fund at NAV and Share Price, respectively. The returns shown in the table above do not reflect the deduction of taxes that a shareholder would pay on Fund distributions or the redemption or sale of Fund Shares. See invescopowershares.com to find the most recent month-end performance numbers.
Index performance results are based upon a hypothetical investment in its constituent securities. Index returns do not represent Fund returns. An investor cannot invest directly in an index. The Index does not charge management fees or brokerage expenses, and no such fees or expenses were deducted from the hypothetical performance shown. In addition, the results actual investors might have achieved would have differed from those shown because of differences in the timing, amounts of their investments, and fees and expenses associated with an investment in the Fund.
The S&P 500® Index (the "Benchmark Index") is an unmanaged index used as a measurement of change in stock market conditions based on the average performance of approximately 500 common stocks, respectively.
† Fund and underlying Index returns are based on the inception date of the Fund. Returns for the Benchmark Indices are based on the closest month-end to the Fund's inception date.
†† Average annualized.
15
Manager's Analysis
PowerShares Morningstar StockInvestor Core Portfolio (ticker: PYH)
The PowerShares Morningstar StockInvestor Core Portfolio (the "Fund") seeks investment results that correspond (before fees and expenses) generally to the price and yield performance of the Morningstar® StockInvestor Core Index (the "Index"). The Fund will normally invest at least 90% of its total assets in common stocks that comprise the Index.
Effective June 30, 2010, the name of the PowerShares Value Line Industry Rotation Portfolio changed to PowerShares Morningstar StockInvestor Core Portfolio. Its underlying index also changed to the Morningstar® StockInvestor Core Index. Prior to June 30, 2010, the Fund's underlying index was the Value Line Industry Rotation Index.
For the fiscal year ended April 30, 2011, the Fund returned 9.25%. Over this same year, the Blended-Index returned 12.77%, while the S&P Citigroup Large Cap Growth Index returned 18.99%, the Russell 3000® Growth Index returned 21.62% and the S&P 500® Index returned 17.24%. The Fund benefited from positive performance of securities of companies in the information technology, financials, and consumer staples sectors. The Fund suffered from negative performance of securities of companies in the consumer discretionary sector.
16
Manager's Analysis (Continued)
PowerShares Morningstar StockInvestor Core Portfolio (ticker: PYH)
Industry Breakdown (% of the Fund's
Net Assets) as of April 30, 2011
| Commercial Services | 14.3 | ||||||
| Retail | 9.8 | ||||||
| Pharmaceuticals | 9.2 | ||||||
| Real Estate | 7.0 | ||||||
| Mining | 6.4 | ||||||
| Insurance | 4.9 | ||||||
| Diversified Financial Services | 4.7 | ||||||
| Healthcare-Products | 4.3 | ||||||
| Electric | 4.0 | ||||||
| Software | 3.9 | ||||||
| Pipelines | 3.4 | ||||||
| Oil & Gas | 3.3 | ||||||
| Entertainment | 3.1 | ||||||
| Internet | 2.9 | ||||||
| Beverages | 2.2 | ||||||
| Coal | 2.1 | ||||||
| Aerospace/Defense | 2.1 | ||||||
| Banks | 1.8 | ||||||
| Food | 1.7 | ||||||
| Textiles | 1.6 | ||||||
| Cosmetics/Personal Care | 1.2 | ||||||
| Miscellaneous Manufacturing | 1.2 | ||||||
| Telecommunications | 1.1 | ||||||
| Biotechnology | 1.1 | ||||||
| Building Materials | 0.9 | ||||||
| Distribution/Wholesale | 0.9 | ||||||
| Computers | 0.8 | ||||||
| Money Market Fund | 0.4 | ||||||
| Liabilities in excess of other assets | (0.3 | ) | |||||
Top Ten Fund Holdings (% of the Fund's
Net Assets) as of April 30, 2011
| Security | |||||||
| St. Joe (The) Co. | 7.0 | ||||||
| Compass Minerals International, Inc. | 5.0 | ||||||
| Exelon Corp. | 4.0 | ||||||
| Abbott Laboratories | 3.8 | ||||||
| Berkshire Hathaway, Inc. Class B | 3.7 | ||||||
| MasterCard, Inc. Class A | 3.5 | ||||||
| Lowe's Cos., Inc. | 3.4 | ||||||
| Exxon Mobil Corp. | 3.3 | ||||||
| Discover Financial Services | 3.2 | ||||||
| CarMax, Inc. | 3.1 | ||||||
| Total | 40.0 | ||||||
Style Allocation (% of the Fund's
Total Investments) as of April 30, 2011
| Large-Cap Growth | 33.0 | ||||||
| Large-Cap Value | 29.5 | ||||||
| Mid-Cap Growth | 21.7 | ||||||
| Mid-Cap Value | 10.3 | ||||||
| Small-Cap Value | 4.3 | ||||||
| Small-Cap Growth | 1.2 | ||||||
17
Manager's Analysis (Continued)
PowerShares Morningstar StockInvestor Core Portfolio (ticker: PYH)
Growth of a $10,000 Investment Since Inception†
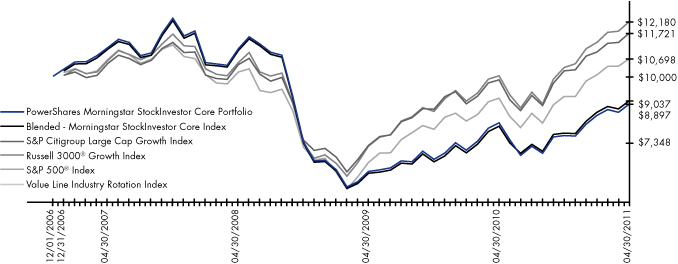
Fund Performance History (%) As of April 30, 2011
| Avg Ann†† | Fund Inception | ||||||||||||||||||
| 1 Year | 3 Year | Avg Ann†† | Cumulative | ||||||||||||||||
| Index | |||||||||||||||||||
| Blended – Morningstar StockInvestor Core Index* | 12.77 | % | -6.38 | % | -2.14 | % | -9.08 | % | |||||||||||
| Morningstar® StockInvestor Core Index | N/A | N/A | N/A | N/A | |||||||||||||||
| Value Line Industry Rotation Index | 16.84 | % | -5.27 | % | -1.34 | % | -5.80 | % | |||||||||||
| S&P Citigroup Large Cap Growth Index | 18.99 | % | 3.89 | % | 3.66 | % | 17.21 | % | |||||||||||
| Russell 3000® Growth Index | 21.62 | % | 4.95 | % | 4.57 | % | 21.80 | % | |||||||||||
| S&P 500® Index | 17.24 | % | 1.74 | % | 1.54 | % | 6.98 | % | |||||||||||
| Fund | |||||||||||||||||||
| Net Asset Value ("NAV") Return | 9.25 | % | -7.07 | % | -2.61 | % | -11.03 | % | |||||||||||
| Share Price Return | 9.20 | % | -7.06 | % | -2.62 | % | -11.07 | % | |||||||||||
Fund Inception: December 1, 2006
Performance quoted represents past performance. Past performance is not a guarantee of future results and current performance may be higher or lower than performance quoted. Investment returns and principal value will fluctuate and shares, when redeemed, may be worth more or less than their original cost. The Adviser has waived fees and reimbursed other expenses, absent which, performance would have been lower. The Adviser has contractually agreed to waive fees and/or pay certain Fund expenses through August 31, 2012. According to the Fund's current prospectus, the total gross annual operating expense ratio of 1.11% includes estimated acquired fund fees and expenses of 0.02%. In the Financial Highlights section of this Shareholder Report, the Fund's net total operating expense ratio was determined to be 0.53%, while the Fund's gross total expense ratio was determined to be 1.81%. NAV and Share Price returns assume that dividends and capital gain distributions have been reinvested in the Fund at NAV and Share Price, respectively. The returns shown in the table above do not reflect the deduction of taxes that a shareholder would pay on Fund distributions or the redemption or sale of Fund Shares. See invescopowershares.com to find the most recent month-end performance numbers.
Index performance results are based upon a hypothetical investment in its constituent securities. Index returns do not represent Fund returns. An investor cannot invest directly in an index. The Index does not charge management fees or brokerage expenses, and no such fees or expenses were deducted from the hypothetical performance shown. In addition, the results actual investors might have achieved would have differed from those shown because of differences in the timing, amounts of their investments, and fees and expenses associated with an investment in the Fund.
The S&P Citigroup Large Cap Growth Index, Russell 3000® Growth Index and S&P 500® Index (the "Benchmark Indices") are unmanaged indices used as a measurement change in stock market conditions based on the average performance of approximately 1,987, 1,887 and 500 common stocks, respectively.
† Fund and underlying Index returns are based on the inception date of the Fund. Returns for the Benchmark Indices are based on the closest month-end to the Fund's inception date.
†† Average annualized.
* The data known as "Blended" is comprised of the original underlying index from Fund inception through the conversion date, June 29, 2010, followed by the performance of the new underlying index starting at the conversion date and through April 30, 2011.
18
This page intentionally left blank
19
Manager's Analysis
PowerShares S&P 500 BuyWrite Portfolio (ticker: PBP)
The PowerShares S&P 500 BuyWrite Portfolio (the "Fund") seeks investment results that correspond (before fees and expenses) generally to the price and yield performance of the CBOE S&P 500 BuyWrite Index (the "Index").
For the fiscal year ended April, 30 2011, the Fund returned 7.87%. Over this same year, the Index returned 8.80%, while the S&P 500® Index returned 17.24%. The Fund slightly underperformed the Index due to the relatively wide option bid-ask spreads which prevailed during monthly rebalance periods. Additionally, the steady upward trend of the S&P 500® Index combined with volatility, contributed to the Fund's underperformance of the S&P 500® Index.
Sector Breakdown (% of the Fund's
Net Assets) as of April 30, 2011
| Information Technology | 18.7 | ||||||
| Financials | 16.0 | ||||||
| Energy | 13.5 | ||||||
| Health Care | 11.7 | ||||||
| Industrials | 11.6 | ||||||
| Consumer Discretionary | 11.0 | ||||||
| Consumer Staples | 10.8 | ||||||
| Materials | 3.8 | ||||||
| Utilities | 3.3 | ||||||
| Telecommunication Services | 3.1 | ||||||
| Liabilities in excess of other assets | (3.5 | ) | |||||
Style Allocation (% of the Fund's
Total Investments) as of April 30, 2011
| Large-Cap Value | 42.6 | ||||||
| Large-Cap Growth | 42.6 | ||||||
| Mid-Cap Growth | 8.6 | ||||||
| Mid-Cap Value | 6.1 | ||||||
| Small-Cap Growth | 0.1 | ||||||
Top Ten Fund Holdings (% of the Fund's
Net Assets) as of April 30, 2011
| Security | |||||||
| Exxon Mobil Corp. | 3.7 | ||||||
| Apple, Inc. | 2.7 | ||||||
| Chevron Corp. | 1.8 | ||||||
| General Electric Co. | 1.8 | ||||||
| International Business Machines Corp. | 1.7 | ||||||
| Microsoft Corp. | 1.6 | ||||||
| AT&T, Inc. | 1.5 | ||||||
| Procter & Gamble (The) Co. | 1.5 | ||||||
| JPMorgan Chase & Co. | 1.5 | ||||||
| Johnson & Johnson | 1.5 | ||||||
| Total | 19.3 | ||||||
20
Manager's Analysis (Continued)
PowerShares S&P 500 BuyWrite Portfolio (ticker: PBP)
Growth of a $10,000 Investment Since Inception†
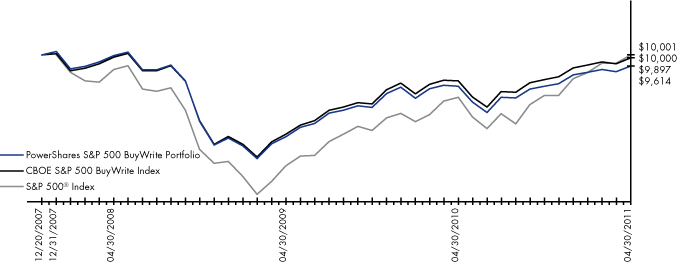
Fund Performance History (%) As of April 30, 2011
| Avg Ann†† | Fund Inception | ||||||||||||||||||
| 1 Year | 3 Year | Avg Ann†† | Cumulative | ||||||||||||||||
| Index | |||||||||||||||||||
| CBOE S&P 500 BuyWrite Index | 8.80 | % | -0.10 | % | -0.31 | % | -1.03 | % | |||||||||||
| S&P 500® Index | 17.24 | % | 1.74 | % | 0.00 | % | 0.01 | % | |||||||||||
| Fund | |||||||||||||||||||
| Net Asset Value ("NAV") Return | 7.87 | % | -1.24 | % | -1.16 | % | -3.86 | % | |||||||||||
| Share Price Return | 7.86 | % | -1.29 | % | -1.16 | % | -3.86 | % | |||||||||||
Fund Inception: December 20, 2007
Performance quoted represents past performance. Past performance is not a guarantee of future results and current performance may be higher or lower than performance quoted. Investment returns and principal value will fluctuate and shares, when redeemed, may be worth more or less than their original cost. According to the Fund's current prospectus, the expense ratio of 0.75% is expressed as a unitary management fee to cover operating expenses and expenses incurred in connection with managing the portfolio. NAV and Share Price returns assume that dividends and capital gain distributions have been reinvested in the Fund at NAV and Share Price, respectively. The returns shown in the table above do not reflect the deduction of taxes that a shareholder would pay on Fund distributions or redemption or sale of Fund Shares. See invescopowershares.com to find the most recent month-end performance numbers.
Index performance results are based upon a hypothetical investment in its constituent securities. Index returns do not represent Fund returns. An investor cannot invest directly in an index. The Index does not charge management fees or brokerage expenses, and no such fees or expenses were deducted from the hypothetical performance shown. In addition, the results actual investors might have achieved would have differed from those shown because of differences in the timing, amounts of their investments, and fees and expenses associated with an investment in the Fund.
The S&P 500® Index (the "Benchmark Index") is an unmanaged index used as a measurement of change in stock market conditions based on the average performance of approximately 500 common stocks, respectively.
† Fund and underlying Index returns are based on the inception date of the Fund. Returns for the Benchmark Indices are based on the closest month-end to the Fund's inception date.
†† Average annualized.
21
Manager's Analysis
PowerShares S&P 500® High Quality Portfolio (ticker: PIV)
The PowerShares S&P 500® High Quality Portfolio (the "Fund") seeks investment results that correspond (before fees and expenses) generally to the price and yield performance of the S&P 500® High Quality Rankings Index (the "Index"). The Fund will normally invest at least 90% of its total assets in common stocks that comprise the Index.
Effective June 30, 2010, the name of the PowerShares Value Line TimelinessTM Select Portfolio changed to PowerShares S&P 500® High Quality Portfolio. Its underlying index also changed to the S&P 500® High Quality Rankings Index. Prior to June 30, 2010, the Fund's underlying index was the Value Line Timeliness Select Index.
For the fiscal year ended April 30, 2011, the Fund returned 20.61%. Over this same year, the Blended-Index returned 20.64%, while the S&P 500 Citigroup Large Cap Growth Index returned 18.99%, the Russell 3000® Growth Index returned 21.62% and the S&P 500® Index returned 17.24%. The Fund benefited from positive performance of securities of companies in the industrials, consumer staples, and financials sectors. The Fund suffered from negative performance of securities of companies in the information technology and telecommunication services sectors.
Sector Breakdown (% of the Fund's
Net Assets) as of April 30, 2011
| Consumer Staples | 23.5 | ||||||
| Industrials | 20.6 | ||||||
| Consumer Discretionary | 18.7 | ||||||
| Health Care | 10.0 | ||||||
| Financials | 8.7 | ||||||
| Materials | 6.8 | ||||||
| Information Technology | 4.7 | ||||||
| Utilities | 4.3 | ||||||
| Energy | 2.6 | ||||||
| Money Market Fund | 0.1 | ||||||
| Liabilities in excess of other assets | (0.0 | ) | |||||
Style Allocation (% of the Fund's
Total Investments) as of April 30, 2011
| Large-Cap Growth | 37.2 | ||||||
| Large-Cap Value | 30.4 | ||||||
| Mid-Cap Growth | 16.8 | ||||||
| Mid-Cap Value | 15.6 | ||||||
Top Ten Fund Holdings (% of the Fund's
Net Assets) as of April 30, 2011
| Security | |||||||
| UnitedHealth Group, Inc. | 1.4 | ||||||
| Johnson & Johnson | 1.4 | ||||||
| Sigma-Aldrich Corp. | 1.4 | ||||||
| C.H. Robinson Worldwide, Inc. | 1.3 | ||||||
| Expeditors International of Washington, Inc. | 1.3 | ||||||
| Danaher Corp. | 1.3 | ||||||
| NIKE, Inc. Class B | 1.3 | ||||||
| Kellogg Co. | 1.3 | ||||||
| Hormel Foods Corp. | 1.3 | ||||||
| W.W. Grainger, Inc. | 1.3 | ||||||
| Total | 13.3 | ||||||
22
Manager's Analysis (Continued)
PowerShares S&P 500® High Quality Portfolio (ticker: PIV)
Growth of a $10,000 Investment Since Inception†
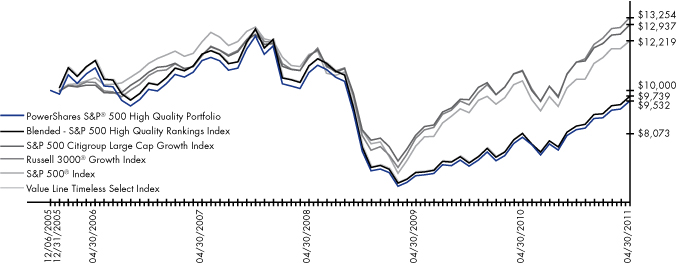
Fund Performance History (%) As of April 30, 2011
| Avg Ann†† | Fund Inception | ||||||||||||||||||||||
| 1 Year | 3 Year | 5 Year | Avg Ann†† | Cumulative | |||||||||||||||||||
| Index | |||||||||||||||||||||||
| Blended – S&P 500 High Quality Rankings Index* | 20.64 | % | -4.26 | % | -3.00 | % | -1.03 | % | -5.44 | % | |||||||||||||
| S&P 500® High Quality Rankings Index | N/A | N/A | N/A | N/A | N/A | ||||||||||||||||||
| Value Line TimelinessTM Select Index | 30.43 | % | -1.74 | % | -1.47 | % | 0.41 | % | 2.24 | % | |||||||||||||
| S&P 500 Citigroup Large Cap Growth Index | 18.99 | % | 3.89 | % | 4.80 | % | 4.87 | % | 29.37 | % | |||||||||||||
| Russell 3000® Growth Index | 21.62 | % | 4.95 | % | 5.05 | % | 5.34 | % | 32.54 | % | |||||||||||||
| S&P 500® Index | 17.24 | % | 1.74 | % | 2.95 | % | 3.77 | % | 22.19 | % | |||||||||||||
| Fund | |||||||||||||||||||||||
| Net Asset Value ("NAV") Return | 20.61 | % | -4.07 | % | -2.84 | % | -0.88 | % | -4.68 | % | |||||||||||||
| Share Price Return | 20.61 | % | -4.05 | % | -2.87 | % | -0.97 | % | -5.10 | % | |||||||||||||
Fund Inception: December 6, 2005
Performance quoted represents past performance. Past performance is not a guarantee of future results and current performance may be higher or lower than performance quoted. Investment returns and principal value will fluctuate and shares, when redeemed, may be worth more or less than their original cost. The Adviser has waived fees and reimbursed other expenses, absent which, performance would have been lower. The Adviser has contractually agreed to waive fees and/or pay certain Fund expenses through August 31, 2012. According to the Fund's current prospectus, the total gross annual operating expense ratio was indicated as 0.80%. In the Financial Highlights section of this Shareholder Report, the Fund's net total operating expense ratio was determined to be 0.52%, while the Fund's gross total expense ratio was determined to be 0.84%. NAV and Share Price returns assume that dividends and capital gain distributions have been reinvested in the Fund at NAV and Share Price, respectively. The returns shown in the table above do not reflect the deduction of taxes that a shareholder would pay on Fund distributions or the redemption or sale of Fund Shares. See invescopowershares.com to find the most recent month-end performance numbers.
Index performance results are based upon a hypothetical investment in its constituent securities. Index returns do not represent Fund returns. An investor cannot invest directly in an index. The Index does not charge management fees or brokerage expenses, and no such fees or expenses were deducted from the hypothetical performance shown. In addition, the results actual investors might have achieved would have differed from those shown because of differences in the timing, amounts of their investments, and fees and expenses associated with an investment in the Fund.
The S&P 500 Citigroup Large Cap Growth Index, Russell 3000® Growth Index and S&P 500® Index (the "Benchmark Indices") are unmanaged indices used as a measurement of change in stock market conditions based on the average performance of approximately 1,987, 1,887 and 500 common stocks, respectively.
† Fund and underlying Index returns are based on the inception date of the Fund. Returns for the Benchmark Indices are based on the closest month-end to the Fund's inception date.
†† Average annualized.
* The data known as "Blended" is comprised of the original underlying index from Fund inception through the conversion date, June 29, 2010, followed by the performance of the new underlying index starting at the conversion date and through April 30, 2011.
23
Manager's Analysis
PowerShares Water Resources Portfolio (ticker: PHO)
The PowerShares Water Resources Portfolio (the "Fund") seeks investment results that correspond (before fees and expenses) generally to the price and yield performance of the Palisades Water Index (the "Index").
For the fiscal year ended April 30, 2011, the Fund returned 12.81%. Over this same year, the Index returned 13.82%, while the ISE Water Index returned 16.27% and the S&P 500® Index returned 17.24%. The Fund benefited from positive performance of securities of companies in the industrials sector.
Industry Breakdown (% of the Fund's
Net Assets) as of April 30, 2011
| Machinery-Diversified | 17.8 | ||||||
| Miscellaneous Manufacturing | 17.3 | ||||||
| Engineering & Construction | 15.0 | ||||||
| Water | 13.5 | ||||||
| Environmental Control | 12.4 | ||||||
| Electronics | 11.1 | ||||||
| Metal Fabricate/Hardware | 9.6 | ||||||
| Hand/Machine Tools | 3.3 | ||||||
| Money Market Fund | 0.0 | ||||||
| Liabilities in excess of other assets | (0.0 | ) | |||||
Style Allocation (% of the Fund's
Total Investments) as of April 30, 2011
| Small-Cap Growth | 38.0 | ||||||
| Mid-Cap Growth | 28.7 | ||||||
| Mid-Cap Value | 10.7 | ||||||
| Small-Cap Value | 10.2 | ||||||
| Large-Cap Value | 8.1 | ||||||
| Large-Cap Growth | 4.3 | ||||||
Top Ten Fund Holdings (% of the Fund's
Net Assets) as of April 30, 2011
| Security | |||||||
| Veolia Environnement SA ADR | 5.0 | ||||||
| Valmont Industries, Inc. | 4.8 | ||||||
| Aecom Technology Corp. | 4.6 | ||||||
| URS Corp. | 4.4 | ||||||
| Lindsay Corp. | 4.3 | ||||||
| Tetra Tech, Inc. | 4.3 | ||||||
| Danaher Corp. | 4.3 | ||||||
| Itron, Inc. | 4.1 | ||||||
| Badger Meter, Inc. | 3.8 | ||||||
| Calgon Carbon Corp. | 3.6 | ||||||
| Total | 43.2 | ||||||
24
Manager's Analysis (Continued)
PowerShares Water Resources Portfolio (ticker: PHO)
Growth of a $10,000 Investment Since Inception†

Fund Performance History (%) As of April 30, 2011
| Avg Ann†† | Fund Inception | ||||||||||||||||||||||
| 1 Year | 3 Year | 5 Year | Avg Ann†† | Cumulative | |||||||||||||||||||
| Index | |||||||||||||||||||||||
| Palisades Water Index | 13.82 | % | 0.98 | % | 4.38 | % | 7.55 | % | 48.09 | % | |||||||||||||
| ISE Water Index | 16.27 | % | 2.12 | % | 4.91 | % | 8.76 | % | 57.58 | % | |||||||||||||
| S&P 500® Index | 17.24 | % | 1.74 | % | 2.95 | % | 3.77 | % | 22.19 | % | |||||||||||||
| Fund | |||||||||||||||||||||||
| Net Asset Value ("NAV") Return | 12.81 | % | -0.11 | % | 2.73 | % | 5.94 | % | 36.56 | % | |||||||||||||
| Share Price Return | 12.75 | % | -0.01 | % | 2.65 | % | 5.72 | % | 35.00 | % | |||||||||||||
Fund Inception: December 6, 2005
Performance quoted represents past performance. Past performance is not a guarantee of future results and current performance may be higher or lower than performance quoted. Investment returns and principal value will fluctuate and shares, when redeemed, may be worth more or less than their original cost. The Adviser has waived fees and reimbursed other expenses, absent which, performance would have been lower. The Adviser has contractually agreed to waive fees and/or pay certain Fund expenses through August 31, 2012. According to the Fund's current prospectus, the total gross annual operating expense ratio was indicated as 0.64%. In the Financial Highlights section of this Shareholder Report, the Fund's net total operating expense ratio and the Fund's gross total expense ratio was determined to be 0.66%. NAV and Share Price returns assume that dividends and capital gain distributions have been reinvested in the Fund at NAV and Share Price, respectively. The returns shown in the table above do not reflect the deduction of taxes that a shareholder would pay on Fund distributions or the redemption or sale of Fund Shares. See invescopowershares.com to find the most recent month-end performance numbers.
Index performance results are based upon a hypothetical investment in its constituent securities. Index returns do not represent Fund returns. An investor cannot invest directly in an index. The Index does not charge management fees or brokerage expenses, and no such fees or expenses were deducted from the hypothetical performance shown. In addition, the results actual investors might have achieved would have differed from those shown because of differences in the timing, amounts of their investments, and fees and expenses associated with an investment in the Fund.
The ISE Water Index and S&P 500® Index (the "Benchmark Indices") are unmanaged indices used as a measurement of change in stock market conditions based on the average performance of approximately 37 and 500 common stocks, respectively.
† Fund and underlying Index returns are based on the inception date of the Fund. Returns for the Benchmark Indices are based on the closest month-end to the Fund's inception date.
†† Average annualized.
25
Manager's Analysis
PowerShares WilderHill Clean Energy Portfolio (ticker: PBW)
The PowerShares WilderHill Clean Energy Portfolio (the "Fund") seeks investment results that correspond (before fees and expenses) generally to the price and yield performance of the WilderHill Clean Energy Index (the "Index").
For the fiscal year ended April 30, 2011, the Fund returned 2.27%. Over this same year, the Index returned 2.67%, while the NASDAQ Composite Index returned 16.75% and the S&P 500® Index returned 17.24%. The Fund benefited from positive performance of securities of companies in China and the information technology and materials sectors. The Fund suffered from negative performance of securities of companies in the U.S. and the industrials sector.
Industry Breakdown (% of the Fund's
Net Assets) as of April 30, 2011
| Electrical Components & Equipment | 24.5 | ||||||
| Semiconductors | 16.4 | ||||||
| Energy-Alternate Sources | 12.8 | ||||||
| Electric | 10.4 | ||||||
| Chemicals | 8.2 | ||||||
| Mining | 5.0 | ||||||
| Auto Parts & Equipment | 4.7 | ||||||
| Computers | 4.2 | ||||||
| Miscellaneous Manufacturing | 4.1 | ||||||
| Electronics | 2.6 | ||||||
| Auto Manufacturers | 2.4 | ||||||
| Commercial Services | 2.0 | ||||||
| Food | 1.7 | ||||||
| Building Materials | 0.6 | ||||||
| Metal Fabricate/Hardware | 0.4 | ||||||
| Money Market Fund | 0.1 | ||||||
| Liabilities in excess of other assets | (0.1 | ) | |||||
Style Allocation (% of the Fund's
Total Investments) as of April 30, 2011
| Small-Cap Growth | 57.8 | ||||||
| Mid-Cap Growth | 21.4 | ||||||
| Mid-Cap Value | 6.7 | ||||||
| Small-Cap Value | 6.4 | ||||||
| Large-Cap Growth | 4.0 | ||||||
| Large-Cap Value | 3.7 | ||||||
Top Ten Fund Holdings (% of the Fund's
Net Assets) as of April 30, 2011
| Security | |||||||
| SunPower Corp. Class A | 2.7 | ||||||
| Molycorp, Inc. | 2.7 | ||||||
| Ameresco, Inc. Class A | 2.5 | ||||||
| Tesla Motors, Inc. | 2.4 | ||||||
| Rare Element Resources Ltd. | 2.4 | ||||||
| Amerigon, Inc. | 2.3 | ||||||
| Fuel Systems Solutions, Inc. | 2.3 | ||||||
| Sociedad Quimica y Minera de Chile SA | 2.3 | ||||||
| Rubicon Technology, Inc. | 2.2 | ||||||
| Polypore International, Inc. | 2.2 | ||||||
| Total | 24.0 | ||||||
26
Manager's Analysis (Continued)
PowerShares WilderHill Clean Energy Portfolio (ticker: PBW)
Growth of a $10,000 Investment Since Inception†
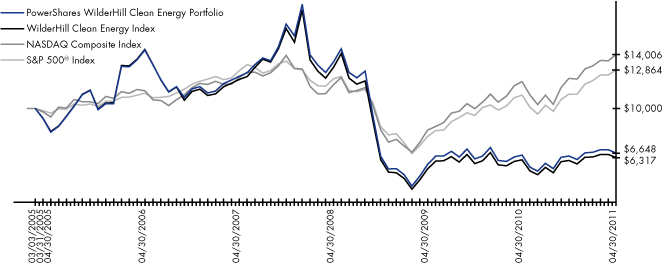
Fund Performance History (%) As of April 30, 2011
| Avg Ann†† | Fund Inception | ||||||||||||||||||||||
| 1 Year | 3 Year | 5 Year | Avg Ann†† | Cumulative | |||||||||||||||||||
| Index | |||||||||||||||||||||||
| WilderHill Clean Energy Index | 2.67 | % | -21.49 | % | -15.18 | % | -7.19 | % | -36.83 | % | |||||||||||||
| NASDAQ Composite Index | 16.75 | % | 6.00 | % | 4.35 | % | 5.61 | % | 40.06 | % | |||||||||||||
| S&P 500® Index | 17.24 | % | 1.74 | % | 2.95 | % | 4.17 | % | 28.64 | % | |||||||||||||
| Fund | |||||||||||||||||||||||
| Net Asset Value ("NAV") Return | 2.27 | % | -20.93 | % | -14.25 | % | -6.41 | % | -33.52 | % | |||||||||||||
| Share Price Return | 2.18 | % | -20.99 | % | -14.29 | % | -6.43 | % | -33.61 | % | |||||||||||||
Fund Inception: March 3, 2005
Performance quoted represents past performance. Past performance is not a guarantee of future results and current performance may be higher or lower than performance quoted. Investment returns and principal value will fluctuate and shares, when redeemed, may be worth more or less than their original cost. The Adviser has waived fees and reimbursed other expenses, absent which, performance would have been lower. The Adviser has contractually agreed to waive fees and/or pay certain Fund expenses through August 31, 2012. According to the Fund's current prospectus, the total gross annual operating expense ratio was indicated as 0.70%. In the Financial Highlights section of this Shareholder Report, the Fund's net total operating expense ratio was determined to be 0.70%, while the Fund's gross total expense ratio was determined to be 0.73%. NAV and Share Price returns assume that dividends and capital gain distributions have been reinvested in the Fund at NAV and Share Price, respectively. The returns shown in the table above do not reflect the deduction of taxes that a shareholder would pay on Fund distributions or the redemption or sale of Fund Shares. See invescopowershares.com to find the most recent month-end performance numbers.
Index performance results are based upon a hypothetical investment in its constituent securities. Index returns do not represent Fund returns. An investor cannot invest directly in an index. The Index does not charge management fees or brokerage expenses, and no such fees or expenses were deducted from the hypothetical performance shown. In addition, the results actual investors might have achieved would have differed from those shown because of differences in the timing, amounts of their investments, and fees and expenses associated with an investment in the Fund.
The NASDAQ Composite Index and S&P 500® Index (the "Benchmark Indices") are unmanaged indices used as a measurement of change in stock market conditions based on the average performance of approximately 100 and 500 common stocks, respectively.
† Fund and underlying Index returns are based on the inception date of the Fund. Returns for the Benchmark Indices are based on the closest month-end to the Fund's inception date.
†† Average annualized.
27
Manager's Analysis
PowerShares WilderHill Progressive Energy Portfolio (ticker: PUW)
The PowerShares WilderHill Progressive Energy Portfolio (the "Fund") seeks investment results that correspond (before fees and expenses) generally to the price and yield performance of the WilderHill Progressive Energy Index (the "Index").
For the fiscal year ended April 30, 2011, the Fund returned 22.47%. Over this same year, the Index returned 22.60%, while the NASDAQ Composite Index returned 16.75% and the S&P 500® Index returned 17.24%. The Fund benefited from positive performance of securities of companies in the United States and the industrials and energy sectors. The Fund suffered from negative performance of securities of companies in China.
Industry Breakdown (% of the Fund's
Net Assets) as of April 30, 2011
| Miscellaneous Manufacturing | 15.0 | ||||||
| Electrical Components & Equipment | 13.6 | ||||||
| Auto Parts & Equipment | 8.6 | ||||||
| Oil & Gas | 8.0 | ||||||
| Electric | 7.9 | ||||||
| Electronics | 7.3 | ||||||
| Engineering & Construction | 5.9 | ||||||
| Mining | 5.6 | ||||||
| Chemicals | 4.4 | ||||||
| Energy-Alternate Sources | 4.4 | ||||||
| Environmental Control | 2.6 | ||||||
| Machinery-Diversified | 2.2 | ||||||
| Building Materials | 2.2 | ||||||
| Agriculture | 2.1 | ||||||
| Semiconductors | 2.1 | ||||||
| Computers | 2.1 | ||||||
| Hand/Machine Tools | 2.1 | ||||||
| Auto Manufacturers | 2.0 | ||||||
| Telecommunications | 1.9 | ||||||
| Money Market Fund | 0.1 | ||||||
| Liabilities in excess of other assets | (0.1 | ) | |||||
Top Ten Fund Holdings (% of the Fund's
Net Assets) as of April 30, 2011
| Security | |||||||
| Westport Innovations, Inc. | 2.6 | ||||||
| Rockwood Holdings, Inc. | 2.4 | ||||||
| Clean Energy Fuels Corp. | 2.3 | ||||||
| GrafTech International Ltd. | 2.3 | ||||||
| Hexcel Corp. | 2.3 | ||||||
| Altra Holdings, Inc. | 2.3 | ||||||
| General Cable Corp. | 2.2 | ||||||
| Siemens AG | 2.2 | ||||||
| Owens Corning | 2.2 | ||||||
| Energizer Holdings, Inc. | 2.2 | ||||||
| Total | 23.0 | ||||||
Style Allocation (% of the Fund's
Total Investments) as of April 30, 2011
| Small-Cap Growth | 35.0 | ||||||
| Small-Cap Value | 16.4 | ||||||
| Large-Cap Growth | 16.0 | ||||||
| Large-Cap Value | 12.1 | ||||||
| Mid-Cap Growth | 10.3 | ||||||
| Mid-Cap Value | 10.2 | ||||||
28
Manager's Analysis (Continued)
PowerShares WilderHill Progressive Energy Portfolio (ticker: PUW)
Growth of a $10,000 Investment Since Inception†

Fund Performance History (%) As of April 30, 2011
| Avg Ann†† | Fund Inception | ||||||||||||||||||
| 1 Year | 3 Year | Avg Ann†† | Cumulative | ||||||||||||||||
| Index | |||||||||||||||||||
| WilderHill Progressive Energy Index | 22.60 | % | 2.99 | % | 4.83 | % | 23.73 | % | |||||||||||
| NASDAQ Composite Index | 16.75 | % | 6.00 | % | 4.41 | % | 21.42 | % | |||||||||||
| S&P 500® Index | 17.24 | % | 1.74 | % | 1.94 | % | 9.01 | % | |||||||||||
| Fund | |||||||||||||||||||
| Net Asset Value ("NAV") Return | 22.47 | % | 3.36 | % | 5.21 | % | 25.79 | % | |||||||||||
| Share Price Return | 22.55 | % | 3.42 | % | 5.24 | % | 25.92 | % | |||||||||||
Fund Inception: October 24, 2006
Performance quoted represents past performance. Past performance is not a guarantee of future results and current performance may be higher or lower than performance quoted. Investment returns and principal value will fluctuate and shares, when redeemed, may be worth more or less than their original cost. The Adviser has waived fees and reimbursed other expenses, absent which, performance would have been lower. The Adviser has contractually agreed to waive fees and/or pay certain Fund expenses through August 31, 2012. According to the Fund's current prospectus, the total gross annual operating expense ratio was indicated as 0.84%. In the Financial Highlights section of this Shareholder Report, the Fund's net total operating expense ratio was determined to be 0.70%, while the Fund's gross total expense ratio was determined to be 0.86%. NAV and Share Price returns assume that dividends and capital gain distributions have been reinvested in the Fund at NAV and Share Price, respectively. The returns shown in the table above do not reflect the deduction of taxes that a shareholder would pay on Fund distributions or the redemption or sale of Fund Shares. See invescopowershares.com to find the most recent month-end performance numbers.
Index performance results are based upon a hypothetical investment in its constituent securities. Index returns do not represent Fund returns. An investor cannot invest directly in an index. The Index does not charge management fees or brokerage expenses, and no such fees or expenses were deducted from the hypothetical performance shown. In addition, the results actual investors might have achieved would have differed from those shown because of differences in the timing, amounts of their investments, and fees and expenses associated with an investment in the Fund.
The NASDAQ Composite Index and S&P 500® Index (the "Benchmark Indices") are unmanaged indices used as a measurement of change in stock market conditions based on the average performance of approximately 100 and 500 common stocks, respectively.
† Fund and underlying Index returns are based on the inception date of the Fund. Returns for the Benchmark Indices are based on the closest month-end to the Fund's inception date.
†† Average annualized.
29
Frequency Distribution of Discounts & Premiums
Since Inception through April 30, 2011
| Closing Price Above NAV (bps) | |||||||||||||||||||||||||||||||||||||||
| Ticker | Fund Name | Inception | Trading Days | 0-24 | 25-49 | 50-99 | 100-149 | 150-199 | 200+ | ||||||||||||||||||||||||||||||
| PPA | PowerShares Aerospace & Defense Portfolio | 10/26/05 | 1387 | 467 | 16 | 2 | 1 | 0 | 3 | ||||||||||||||||||||||||||||||
| PZD | PowerShares CleantechTM Portfolio | 10/24/06 | 1137 | 254 | 95 | 93 | 24 | 4 | 3 | ||||||||||||||||||||||||||||||
| PDP | PowerShares DWA Technical LeadersTM Portfolio | 3/1/07 | 1051 | 434 | 15 | 8 | 0 | 0 | 0 | ||||||||||||||||||||||||||||||
| PSP | PowerShares Global Listed Private Equity Portfolio | 10/24/06 | 1137 | 332 | 139 | 174 | 35 | 11 | 7 | ||||||||||||||||||||||||||||||
| PGJ | PowerShares Golden Dragon Halter USX China Portfolio | 12/9/04 | 1609 | 608 | 140 | 23 | 2 | 0 | 0 | ||||||||||||||||||||||||||||||
| PXN | PowerShares Lux Nanotech Portfolio | 10/26/05 | 1387 | 422 | 77 | 35 | 5 | 1 | 1 | ||||||||||||||||||||||||||||||
| PYH | PowerShares Morningstar StockInvestor Core Portfolio | 12/1/06 | 1110 | 376 | 12 | 6 | 3 | 0 | 1 | ||||||||||||||||||||||||||||||
| PBP | PowerShares S&P 500 BuyWrite Portfolio | 12/20/07 | 845 | 298 | 110 | 85 | 20 | 10 | 14 | ||||||||||||||||||||||||||||||
| PIV | PowerShares S&P 500® High Quality Portfolio | 12/6/05 | 1359 | 483 | 34 | 5 | 2 | 2 | 1 | ||||||||||||||||||||||||||||||
| PHO | PowerShares Water Resources Portfolio | 12/6/05 | 1359 | 494 | 99 | 20 | 1 | 0 | 0 | ||||||||||||||||||||||||||||||
| PBW | PowerShares WilderHill Clean Energy Portfolio | 3/3/05 | 1552 | 589 | 129 | 26 | 7 | 0 | 0 | ||||||||||||||||||||||||||||||
| PUW | PowerShares WilderHill Progressive Energy Portfolio | 10/24/06 | 1137 | 396 | 23 | 6 | 0 | 0 | 0 | ||||||||||||||||||||||||||||||
30
| Closing Price Below NAV (bps) | |||||||||||||||||||||||||||
| Ticker | -0-24 | -25-49 | -50-99 | -100-149 | -150-199 | -200+ | |||||||||||||||||||||
| PPA | 873 | 15 | 9 | 0 | 0 | 1 | |||||||||||||||||||||
| PZD | 436 | 135 | 76 | 13 | 1 | 3 | |||||||||||||||||||||
| PDP | 562 | 24 | 8 | 0 | 0 | 0 | |||||||||||||||||||||
| PSP | 338 | 51 | 38 | 13 | 0 | 0 | |||||||||||||||||||||
| PGJ | 730 | 87 | 14 | 4 | 0 | 1 | |||||||||||||||||||||
| PXN | 727 | 97 | 17 | 3 | 1 | 1 | |||||||||||||||||||||
| PYH | 693 | 16 | 3 | 0 | 0 | 0 | |||||||||||||||||||||
| PBP | 287 | 11 | 8 | 0 | 1 | 1 | |||||||||||||||||||||
| PIV | 814 | 13 | 3 | 0 | 1 | 1 | |||||||||||||||||||||
| PHO | 692 | 39 | 13 | 1 | 0 | 0 | |||||||||||||||||||||
| PBW | 684 | 99 | 14 | 2 | 1 | 1 | |||||||||||||||||||||
| PUW | 687 | 22 | 3 | 0 | 0 | 0 | |||||||||||||||||||||
31
Fees and Expenses
As a shareholder of a Fund of the PowerShares Exchange-Traded Fund Trust, you incur advisory fees and other Fund expenses fee. The expense examples below are intended to help you understand your ongoing costs (in dollars) of investing in the Funds and to compare these costs with the ongoing costs of investing in other funds.
The example is based on an investment of $1,000 invested at the beginning of the period and held through the six-month period ended April 30, 2011.
In pursuing their investment objective, PowerShares Global Listed Private Equity Portfolio, PowerShares Lux Nanotech Portfolio and PowerShares Morningstar StockInvestor Core Portfolio (the "Portfolios") may invest a portion of their assets in investment companies. Each Portfolio indirectly bears a pro rata share of the fees and expenses of the investment companies in which each Portfolio invests. The effect of such expenses are included in each Portfolio's total return.
Actual Expenses
The first line in the following table provides information about actual account values and actual expenses. You may use the information in this line, together with the amount you invested, to estimate the expenses that you paid over the period. Simply divide your account value by $1,000 (for example, an $8,600 account value divided by $1,000 = 8.6), then multiply the result by the number in the first line under the heading "Expenses Paid During the Six-Month Period" to estimate the expenses you paid on your account during this period.
Hypothetical Example for Comparison Purposes
The second line in the following table provides information about hypothetical account values and hypothetical expenses based on each Fund's actual expense ratio and an assumed annualized rate of return of 5% per year before expenses, which is not the Fund's actual return. The hypothetical account values and expenses may not be used to estimate the actual ending account balance or expenses you paid for the period. You may use this information to compare the ongoing costs of investing in the Funds and other funds. To do so, compare this 5% hypothetical example with the 5% hypothetical examples that appear in the shareholder reports of the other funds.
Please note that the expenses shown in the table are meant to highlight your ongoing costs only, and do not reflect any transactional costs such as sales charges and brokerage commissions. Therefore the second line in the table is useful in comparing ongoing costs only, and will not help you determine the relative total costs of owning different funds. In addition, if these transactional costs were included, your costs would have been higher.
| Beginning Account Value November 1, 2010 | Ending Account Value April 30, 2011 | Annualized Expense Ratio Based on the Six-Month Period | Expenses Paid During the Six-Month Period (1) | ||||||||||||||||
| PowerShares Aerospace & Defense Portfolio Actual | $ | 1,000.00 | $ | 1,145.65 | 0.66 | % | $ | 3.51 | |||||||||||
| Hypothetical (5% return before expenses) | $ | 1,000.00 | $ | 1,021.52 | 0.66 | % | $ | 3.31 | |||||||||||
| PowerShares CleantechTM Portfolio Actual | $ | 1,000.00 | $ | 1,213.72 | 0.67 | % | $ | 3.68 | |||||||||||
| Hypothetical (5% return before expenses) | $ | 1,000.00 | $ | 1,021.47 | 0.67 | % | $ | 3.36 | |||||||||||
| PowerShares DWA Technical LeadersTM Portfolio Actual | $ | 1,000.00 | $ | 1,203.56 | 0.70 | % | $ | 3.82 | |||||||||||
| Hypothetical (5% return before expenses) | $ | 1,000.00 | $ | 1,021.32 | 0.70 | % | $ | 3.51 | |||||||||||
32
Fees and Expenses (Continued)
| Beginning Account Value November 1, 2010 | Ending Account Value April 30, 2011 | Annualized Expense Ratio Based on the Six-Month Period | Expenses Paid During the Six-Month Period (1) | ||||||||||||||||
| PowerShares Global Listed Private Equity Portfolio Actual | $ | 1,000.00 | $ | 1,206.14 | 0.70 | % | $ | 3.83 | |||||||||||
| Hypothetical (5% return before expenses) | $ | 1,000.00 | $ | 1,021.32 | 0.70 | % | $ | 3.51 | |||||||||||
| PowerShares Golden Dragon Halter USX China Portfolio Actual | $ | 1,000.00 | $ | 1,050.64 | 0.70 | % | $ | 3.56 | |||||||||||
| Hypothetical (5% return before expenses) | $ | 1,000.00 | $ | 1,021.32 | 0.70 | % | $ | 3.51 | |||||||||||
| PowerShares Lux Nanotech Portfolio Actual | $ | 1,000.00 | $ | 1,026.74 | 0.70 | % | $ | 3.52 | |||||||||||
| Hypothetical (5% return before expenses) | $ | 1,000.00 | $ | 1,021.32 | 0.70 | % | $ | 3.51 | |||||||||||
| PowerShares Morningstar® StockInvestorSM Core Portfolio Actual | $ | 1,000.00 | $ | 1,165.14 | 0.50 | % | $ | 2.68 | |||||||||||
| Hypothetical (5% return before expenses) | $ | 1,000.00 | $ | 1,022.32 | 0.50 | % | $ | 2.51 | |||||||||||
| PowerShares S&P 500 BuyWrite Portfolio Actual | $ | 1,000.00 | $ | 1,078.15 | 0.75 | % | $ | 3.86 | |||||||||||
| Hypothetical (5% return before expenses) | $ | 1,000.00 | $ | 1,021.08 | 0.75 | % | $ | 3.76 | |||||||||||
| PowerShares S&P 500® High Quality Portfolio Actual | $ | 1,000.00 | $ | 1,155.95 | 0.50 | % | $ | 2.67 | |||||||||||
| Hypothetical (5% return before expenses) | $ | 1,000.00 | $ | 1,022.32 | 0.50 | % | $ | 2.51 | |||||||||||
| PowerShares Water Resource Portfolio Actual | $ | 1,000.00 | $ | 1,171.08 | 0.66 | % | $ | 3.55 | |||||||||||
| Hypothetical (5% return before expenses) | $ | 1,000.00 | $ | 1,021.52 | 0.66 | % | $ | 3.31 | |||||||||||
| PowerShares WilderHill Clean Energy Portfolio Actual | $ | 1,000.00 | $ | 1,031.91 | 0.70 | % | $ | 3.53 | |||||||||||
| Hypothetical (5% return before expenses) | $ | 1,000.00 | $ | 1,021.32 | 0.70 | % | $ | 3.51 | |||||||||||
| PowerShares WilderHill Progressive Energy Portfolio Actual | $ | 1,000.00 | $ | 1,214.25 | 0.70 | % | $ | 3.84 | |||||||||||
| Hypothetical (5% return before expenses) | $ | 1,000.00 | $ | 1,021.32 | 0.70 | % | $ | 3.51 | |||||||||||
(1) Expenses are calculated using the annualized expense ratio, which represents the ongoing expenses as a percentage of net assets for the six-month period ended April 30, 2011. Expenses are calculated by multiplying the Fund's annualized expense ratio by the average account value for the period; then multiplying the result by 181 and then dividing the result by 365. Expense ratios for the most recent six-month period may differ from expense ratios based on the one year data in the Financial Highlights.
33
Schedule of Investments
PowerShares Aerospace & Defense Portfolio
April 30, 2011
| Number of Shares | Value | ||||||||||
| Common Stocks—99.9% | |||||||||||
| Aerospace/Defense—55.1% | |||||||||||
| 18,917 | AAR Corp. | $ | 492,599 | ||||||||
| 10,422 | Aerovironment, Inc.* | 298,590 | |||||||||
| 16,047 | Alliant Techsystems, Inc. | 1,133,720 | |||||||||
| 98,229 | Boeing Co. (The) | 7,836,710 | |||||||||
| 12,726 | Cubic Corp. | 688,222 | |||||||||
| 5,001 | Ducommun, Inc. | 113,773 | |||||||||
| 20,460 | Elbit Systems Ltd. (Israel) | 1,146,169 | |||||||||
| 14,605 | Esterline Technologies Corp.* | 1,048,639 | |||||||||
| 27,860 | GenCorp, Inc.* | 181,926 | |||||||||
| 77,821 | General Dynamics Corp. | 5,666,925 | |||||||||
| 50,008 | Goodrich Corp. | 4,419,207 | |||||||||
| 11,273 | Kratos Defense & Security Solutions, Inc.* | 154,102 | |||||||||
| 51,878 | L-3 Communications Holdings, Inc. | 4,160,097 | |||||||||
| 5,616 | LMI Aerospace, Inc.* | 112,601 | |||||||||
| 72,895 | Lockheed Martin Corp. | 5,776,929 | |||||||||
| 21,657 | Moog, Inc., Class A* | 955,507 | |||||||||
| 70,151 | Northrop Grumman Corp. | 4,462,305 | |||||||||
| 27,761 | Orbital Sciences Corp.* | 522,740 | |||||||||
| 94,019 | Raytheon Co. | 4,564,622 | |||||||||
| 66,790 | Rockwell Collins, Inc. | 4,214,449 | |||||||||
| 17,441 | Teledyne Technologies, Inc.* | 880,596 | |||||||||
| 23,768 | TransDigm Group, Inc.* | 1,979,874 | |||||||||
| 11,617 | Triumph Group, Inc. | 1,000,456 | |||||||||
| 86,260 | United Technologies Corp. | 7,727,171 | |||||||||
| 59,537,929 | |||||||||||
| Auto Manufacturers—1.4% | |||||||||||
| 33,600 | Force Protection, Inc.* | 150,864 | |||||||||
| 43,420 | Oshkosh Corp.* | 1,374,677 | |||||||||
| 1,525,541 | |||||||||||
| Commercial Services—4.0% | |||||||||||
| 67,165 | Booz Allen Hamilton Holding Corp.* | 1,298,971 | |||||||||
| 171,136 | SAIC, Inc.* | 2,977,766 | |||||||||
| 4,276,737 | |||||||||||
| Computers—5.7% | |||||||||||
| 14,477 | CACI International, Inc., Class A* | 884,690 | |||||||||
| 74,184 | Computer Sciences Corp. | 3,781,900 | |||||||||
| 8,409 | Integral Systems, Inc.* | 105,028 | |||||||||
| 12,014 | Keyw Holding Corp. (The)* | 134,437 | |||||||||
| 13,366 | Mercury Computer Systems, Inc.* | 258,097 | |||||||||
| 6,509 | NCI, Inc., Class A* | 160,187 | |||||||||
| 27,283 | SRA International, Inc., Class A* | 845,500 | |||||||||
| 6,169,839 | |||||||||||
| Electronics—3.7% | |||||||||||
| 4,325 | American Science & Engineering, Inc. | 381,033 | |||||||||
| 76,327 | FLIR Systems, Inc. | 2,688,237 | |||||||||
| 42,995 | L-1 Identity Solutions, Inc.* | 504,331 | |||||||||
| 9,014 | OSI Systems, Inc.* | 346,048 | |||||||||
| 29,814 | Taser International, Inc.* | 132,970 | |||||||||
| 4,052,619 | |||||||||||
| Number of Shares | Value | ||||||||||
| Common Stocks (Continued) | |||||||||||
| Engineering & Construction—1.6% | |||||||||||
| 38,602 | URS Corp.* | $ | 1,727,440 | ||||||||
| Metal Fabricate/Hardware—5.1% | |||||||||||
| 7,482 | Ladish Co., Inc.* | 424,229 | |||||||||
| 32,645 | Precision Castparts Corp. | 5,044,306 | |||||||||
| 5,468,535 | |||||||||||
| Miscellaneous Manufacturing—14.6% | |||||||||||
| 11,820 | Ceradyne, Inc.* | 553,885 | |||||||||
| 123,416 | Honeywell International, Inc. | 7,556,761 | |||||||||
| 72,915 | ITT Corp. | 4,213,758 | |||||||||
| 132,067 | Textron, Inc. | 3,446,949 | |||||||||
| 15,771,353 | |||||||||||
| Packaging & Containers—2.8% | |||||||||||
| 80,936 | Ball Corp. | 3,019,722 | |||||||||
| Software—0.7% | |||||||||||
| 17,374 | ManTech International Corp., Class A* | 762,545 | |||||||||
| Telecommunications—5.2% | |||||||||||
| 12,708 | Comtech Telecommunications Corp. | 359,636 | |||||||||
| 21,885 | DigitalGlobe, Inc.* | 634,665 | |||||||||
| 7,296 | EMS Technologies, Inc.* | 184,297 | |||||||||
| 10,524 | GeoEye, Inc.* | 390,335 | |||||||||
| 61,231 | Harris Corp. | 3,253,203 | |||||||||
| 19,806 | ViaSat, Inc.* | 790,656 | |||||||||
| 5,612,792 | |||||||||||
| Total Common Stocks (Cost $117,475,986) | 107,925,052 | ||||||||||
| Money Market Fund—0.2% | |||||||||||
| 185,902 | Goldman Sachs Financial Square Prime Obligations Institutional Share Class (Cost $185,902) | 185,902 | |||||||||
| Total Investments (Cost $117,661,888)—100.1% | 108,110,954 | ||||||||||
| Liabilities in excess of other assets—(0.1%) | (139,703 | ) | |||||||||
| Net Assets—100.0% | $ | 107,971,251 | |||||||||
Notes to Schedule of Investments:
* Non-income producing security.
See Notes to Financial Statements.
34
Schedule of Investments
PowerShares CleantechTM Portfolio
April 30, 2011
| Number of Shares | Value | ||||||||||
| Common Stocks and Other Equity Interests—100.0% | |||||||||||
| Auto Parts & Equipment—3.6% | |||||||||||
| 32,002 | Fuel Systems Solutions, Inc.* | $ | 951,260 | ||||||||
| 101,728 | Johnson Controls, Inc. | 4,170,848 | |||||||||
| 26,547 | Westport Innovations, Inc. (Canada)* | 669,515 | |||||||||
| 5,791,623 | |||||||||||
| Biotechnology—2.6% | |||||||||||
| 24,062 | Novozymes A/S, Class B (Denmark) | 4,164,591 | |||||||||
| Building Materials—1.7% | |||||||||||
| 212,804 | Kingspan Group PLC (Ireland)* | 2,083,726 | |||||||||
| 28,039 | WaterFurnace Renewable Energy, Inc. (Canada) | 685,572 | |||||||||
| 2,769,298 | |||||||||||
| Chemicals—0.5% | |||||||||||
| 1,101 | Gurit Holding AG (Switzerland)* | 854,481 | |||||||||
| Commercial Services—2.5% | |||||||||||
| 2,031 | SGS SA (Switzerland) | 4,015,461 | |||||||||
| Computers—0.9% | |||||||||||
| 46,724 | Telvent GIT SA (Spain)* | 1,438,632 | |||||||||
| Electric—3.7% | |||||||||||
| 57,610 | Ameresco, Inc., Class A* | 928,097 | |||||||||
| 18,991,700 | Energy Development Corp. (Philippines) | 2,994,487 | |||||||||
| 38,421 | EnerNOC, Inc.* | 688,120 | |||||||||
| 54,902 | Ormat Technologies, Inc. | 1,367,060 | |||||||||
| 5,977,764 | |||||||||||
| Electrical Components & Equipment—13.6% | |||||||||||
| 68,425 | Advanced Energy Industries, Inc.* | 968,214 | |||||||||
| 1,186,095 | China High Speed Transmission Equipment Group Co. Ltd. (China) | 1,569,733 | |||||||||
| 56,858 | EnerSys* | 2,154,349 | |||||||||
| 254,858 | Gamesa Corp. Tecnologica SA (Spain)* | 2,399,848 | |||||||||
| 33,135 | Saft Groupe SA (France) | 1,523,932 | |||||||||
| 25,125 | Schneider Electric SA (France) | 4,446,962 | |||||||||
| 26,996 | SMA Solar Technology AG (Germany) | 3,223,727 | |||||||||
| 127,714 | SunPower Corp., Class A* | 2,780,334 | |||||||||
| 84,223 | Vestas Wind Systems A/S (Denmark)* | 2,995,846 | |||||||||
| 22,062,945 | |||||||||||
| Electronics—8.8% | |||||||||||
| 27,629 | Badger Meter, Inc. | 1,047,416 | |||||||||
| 53,444 | Elster Group SE ADR (Germany)* | 827,313 | |||||||||
| 57,000 | Horiba Ltd. (Japan) | 1,707,752 | |||||||||
| 49,507 | Itron, Inc.* | 2,694,666 | |||||||||
| 32,037 | Roth & Rau AG (Germany)* | 1,100,797 | |||||||||
| 74,664 | Trimble Navigation Ltd.* | 3,497,262 | |||||||||
| 18,407 | Vaisala Oyj, Class A (Finland) | 621,271 | |||||||||
| 78,286 | Woodward, Inc. | 2,900,496 | |||||||||
| 14,396,973 | |||||||||||
| Number of Shares | Value | ||||||||||
| Common Stocks and Other Equity Interests (Continued) | |||||||||||
| Energy-Alternate Sources—3.6% | |||||||||||
| 2,589,000 | China Longyuan Power Group Corp., H-Shares (China) | $ | 2,659,794 | ||||||||
| 23,323 | First Solar, Inc.* | 3,255,191 | |||||||||
| 5,914,985 | |||||||||||
| Engineering & Construction—6.4% | |||||||||||
| 176,139 | ABB Ltd. (Switzerland) | 4,843,341 | |||||||||
| 86,865 | Arcadis NV (Netherlands) | 2,246,255 | |||||||||
| 42,218 | Grontmij NV CVA (Netherlands) | 950,794 | |||||||||
| 61,947 | Insituform Technologies, Inc., Class A* | 1,567,879 | |||||||||
| 45,320 | Mistras Group, Inc.* | 830,262 | |||||||||
| 10,438,531 | |||||||||||
| Environmental Control—8.9% | |||||||||||
| 55,170 | Asahi Holdings, Inc. (Japan) | 1,132,773 | |||||||||
| 28,598 | BWT AG (Austria) | 864,683 | |||||||||
| 1,167,000 | Hyflux Ltd. (Singapore) | 2,052,813 | |||||||||
| 113,900 | Kurita Water Industries Ltd. (Japan) | 3,312,842 | |||||||||
| 123,184 | Nalco Holding Co. | 3,598,205 | |||||||||
| 78,549 | Tetra Tech, Inc.* | 1,855,327 | |||||||||
| 201,625 | Tomra Systems ASA (Norway) | 1,731,826 | |||||||||
| 14,548,469 | |||||||||||
| Hand/Machine Tools—1.5% | |||||||||||
| 49,512 | Meyer Burger Technology AG (Switzerland)* | 2,465,765 | |||||||||
| Healthcare-Services—1.2% | |||||||||||
| 18,426 | Eurofins Scientific (France) | 1,989,027 | |||||||||
| Machinery-Diversified—4.2% | |||||||||||
| 104,567 | GLV, Inc., Class A (Canada)* | 848,570 | |||||||||
| 32,747 | Kadant, Inc.* | 1,010,245 | |||||||||
| 17,728 | Lindsay Corp. | 1,299,817 | |||||||||
| 41,974 | Roper Industries, Inc. | 3,630,331 | |||||||||
| 6,788,963 | |||||||||||
| Mining—0.5% | |||||||||||
| 83,072 | 5N Plus, Inc. (Canada)* | 812,466 | |||||||||
| Miscellaneous Manufacturing—18.2% | |||||||||||
| 169,621 | Alfa Laval AB (Sweden) | 3,807,566 | |||||||||
| 60,018 | CLARCOR, Inc. | 2,712,213 | |||||||||
| 54,382 | Donaldson Co., Inc. | 3,329,810 | |||||||||
| 43,283 | ESCO Technologies, Inc. | 1,587,620 | |||||||||
| 109,497 | Hexcel Corp.* | 2,357,470 | |||||||||
| 63,724 | Pall Corp. | 3,724,031 | |||||||||
| 45,903 | Polypore International, Inc.* | 2,835,428 | |||||||||
| 31,556 | Siemens AG (Germany) | 4,598,316 | |||||||||
| 41,296 | SPX Corp. | 3,570,039 | |||||||||
| 63,531 | STR Holdings, Inc.* | 1,046,356 | |||||||||
| 29,568,849 | |||||||||||
See Notes to Financial Statements.
35
Schedule of Investments (Continued)
PowerShares CleantechTM Portfolio
April 30, 2011
| Number of Shares | Value | ||||||||||
| Common Stocks and Other Equity Interests (Continued) | |||||||||||
| Semiconductors—7.5% | |||||||||||
| 77,509 | Aixtron SE (Germany) | $ | 3,311,780 | ||||||||
| 22,484 | Centrotherm Photovoltaics AG (Germany)* | 1,363,478 | |||||||||
| 71,853 | Cree, Inc.* | 2,927,291 | |||||||||
| 172,014 | GT Solar International, Inc.* | 1,921,397 | |||||||||
| 41,561 | Power Integrations, Inc. | 1,676,571 | |||||||||
| 35,375 | Rubicon Technology, Inc.* | 1,008,541 | |||||||||
| 12,209,058 | |||||||||||
| Software—4.6% | |||||||||||
| 66,609 | ANSYS, Inc.* | 3,682,812 | |||||||||
| 83,196 | Autodesk, Inc.* | 3,742,156 | |||||||||
| 7,424,968 | |||||||||||
| Telecommunications—5.5% | |||||||||||
| 195,393 | Corning, Inc. | 4,091,530 | |||||||||
| 66,586 | Polycom, Inc.* | 3,983,840 | |||||||||
| 38,079 | RuggedCom, Inc. (Canada)* | 824,707 | |||||||||
| 8,900,077 | |||||||||||
| Total Common Stocks and Other Equity Interests (Cost $131,505,564) | 162,532,926 | ||||||||||
| Money Market Fund—0.0% | |||||||||||
| 49,264 | Goldman Sachs Financial Square Prime | ||||||||||
| Obligations Institutional Share Class | |||||||||||
| (Cost $49,264) | 49,264 | ||||||||||
| Total Investments (Cost $131,554,828)—100.0% | 162,582,190 | ||||||||||
| Liabilities in excess of other assets—(0.0%) | (51,749 | ) | |||||||||
| Net Assets—100.0% | $ | 162,530,441 | |||||||||
Investment Abbreviations:
ADR—American Depositary Receipt
CVA—Dutch Certificate
Notes to Schedule of Investments:
* Non-income producing security.
See Notes to Financial Statements.
36
Schedule of Investments
PowerShares DWA Technical LeadersTM Portfolio
April 30, 2011
| Number of Shares | Value | ||||||||||
| Common Stocks and Other Equity Interests—100.0% | |||||||||||
| Consumer Discretionary—26.7% | |||||||||||
| 97,687 | AutoNation, Inc.* | $ | 3,312,566 | ||||||||
| 57,637 | Big Lots, Inc.* | 2,369,457 | |||||||||
| 98,920 | Brinker International, Inc. | 2,382,983 | |||||||||
| 108,302 | CBS Corp., Class B | 2,731,376 | |||||||||
| 217,750 | Chico's FAS, Inc. | 3,185,683 | |||||||||
| 163,116 | Clear Channel Outdoor Holdings, Inc., Class A* | 2,244,476 | |||||||||
| 139,456 | Federal-Mogul Corp.* | 3,695,584 | |||||||||
| 33,807 | Fossil, Inc.* | 3,238,034 | |||||||||
| 175,385 | Gannett Co., Inc. | 2,641,298 | |||||||||
| 49,575 | John Wiley & Sons, Inc., Class A | 2,524,855 | |||||||||
| 167,756 | Liberty Media Corp. - Capital, Series A* | 13,801,286 | |||||||||
| 186,094 | Liberty Media Corp. - Interactive, Class A* | 3,252,923 | |||||||||
| 32,174 | McDonald's Corp. | 2,519,546 | |||||||||
| 21,333 | Panera Bread Co., Class A* | 2,583,640 | |||||||||
| 52,267 | Polo Ralph Lauren Corp. | 6,834,956 | |||||||||
| 26,236 | priceline.com, Inc.* | 14,351,354 | |||||||||
| 66,359 | Royal Caribbean Cruises Ltd.* | 2,642,415 | |||||||||
| 64,931 | Signet Jewelers Ltd. (United Kingdom)* | 2,840,731 | |||||||||
| 34,454 | Stanley Black & Decker, Inc. | 2,503,083 | |||||||||
| 82,987 | Tempur-Pedic International, Inc.* | 5,209,924 | |||||||||
| 41,821 | Tractor Supply Co. | 2,587,465 | |||||||||
| 211,033 | TRW Automotive Holdings Corp.* | 12,041,543 | |||||||||
| 31,558 | VF Corp. | 3,173,473 | |||||||||
| 118,405 | Virgin Media, Inc. | 3,582,935 | |||||||||
| 128,164 | Wyndham Worldwide Corp. | 4,435,756 | |||||||||
| 21,824 | Wynn Resorts Ltd. | 3,211,402 | |||||||||
| 123,845 | Yum! Brands, Inc. | 6,643,046 | |||||||||
| 120,541,790 | |||||||||||
| Consumer Staples—4.6% | |||||||||||
| 167,324 | Altria Group, Inc. | 4,490,976 | |||||||||
| 38,892 | Brown-Forman Corp., Class B | 2,794,779 | |||||||||
| 111,512 | Green Mountain Coffee Roasters, Inc.* | 7,466,844 | |||||||||
| 100,466 | Hormel Foods Corp. | 2,954,705 | |||||||||
| 45,681 | Whole Foods Market, Inc. | 2,866,940 | |||||||||
| 20,574,244 | |||||||||||
| Energy—5.8% | |||||||||||
| 86,343 | Atwood Oceanics, Inc.* | 3,879,391 | |||||||||
| 29,283 | Cimarex Energy Co. | 3,238,407 | |||||||||
| 24,925 | Concho Resources, Inc.* | 2,663,236 | |||||||||
| 111,805 | EQT Corp. | 5,882,061 | |||||||||
| 39,082 | Massey Energy Co. | 2,666,956 | |||||||||
| 112,696 | McDermott International, Inc.* | 2,602,150 | |||||||||
| 29,899 | Pioneer Natural Resources Co. | 3,056,575 | |||||||||
| 32,678 | Whiting Petroleum Corp.* | 2,271,121 | |||||||||
| 26,259,897 | |||||||||||
| Number of Shares | Value | ||||||||||
| Common Stocks and Other Equity Interests (Continued) | |||||||||||
| Financials—7.3% | |||||||||||
| 58,698 | Arch Capital Group Ltd.* | $ | 6,104,592 | ||||||||
| 379,209 | CapitalSource, Inc. | 2,533,116 | |||||||||
| 164,355 | CB Richard Ellis Group, Inc., Class A* | 4,389,922 | |||||||||
| 257,291 | Developers Diversified Realty Corp. REIT | 3,792,469 | |||||||||
| 94,214 | Hartford Financial Services Group, Inc. (The) | 2,729,380 | |||||||||
| 71,026 | Macerich Co. (The) REIT | 3,751,593 | |||||||||
| 112,043 | Protective Life Corp. | 3,015,077 | |||||||||
| 37,614 | SL Green Realty Corp. REIT | 3,104,284 | |||||||||
| 147,105 | XL Group PLC (Ireland) | 3,592,304 | |||||||||
| 33,012,737 | |||||||||||
| Health Care—9.9% | |||||||||||
| 62,439 | Alexion Pharmaceuticals, Inc.* | 6,049,714 | |||||||||
| 106,025 | Edwards Lifesciences Corp.* | 9,155,259 | |||||||||
| 412,542 | Health Management Associates, Inc., Class A* | 4,653,474 | |||||||||
| 103,618 | Henry Schein, Inc.* | 7,571,367 | |||||||||
| 16,170 | Mettler-Toledo International, Inc.* | 3,030,258 | |||||||||
| 42,169 | Perrigo Co. | 3,810,391 | |||||||||
| 125,155 | SXC Health Solutions Corp. (Canada)* | 6,903,550 | |||||||||
| 62,846 | Valeant Pharmaceuticals International, Inc. (Canada) | 3,307,585 | |||||||||
| 44,481,598 | |||||||||||
| Industrials—25.3% | |||||||||||
| 183,424 | AMETEK, Inc. | 8,444,841 | |||||||||
| 127,053 | C.H. Robinson Worldwide, Inc. | 10,187,110 | |||||||||
| 74,341 | CSX Corp. | 5,849,893 | |||||||||
| 73,575 | Danaher Corp. | 4,064,283 | |||||||||
| 43,093 | Deere & Co. | 4,201,568 | |||||||||
| 72,415 | Donaldson Co., Inc. | 4,433,970 | |||||||||
| 49,384 | Flowserve Corp. | 6,253,002 | |||||||||
| 59,491 | Gardner Denver, Inc. | 5,140,617 | |||||||||
| 32,062 | Goodrich Corp. | 2,833,319 | |||||||||
| 63,390 | IDEX Corp. | 2,974,259 | |||||||||
| 231,649 | J.B. Hunt Transport Services, Inc. | 11,045,024 | |||||||||
| 82,757 | Kirby Corp.* | 4,698,943 | |||||||||
| 135,806 | Manitowoc Co., Inc. (The) | 3,013,535 | |||||||||
| 56,325 | Norfolk Southern Corp. | 4,206,351 | |||||||||
| 50,040 | Precision Castparts Corp. | 7,732,181 | |||||||||
| 68,443 | Roper Industries, Inc. | 5,919,635 | |||||||||
| 89,200 | Textron, Inc. | 2,328,120 | |||||||||
| 38,236 | Union Pacific Corp. | 3,956,279 | |||||||||
| 28,163 | United Technologies Corp. | 2,522,842 | |||||||||
| 26,662 | W.W. Grainger, Inc. | 4,041,959 | |||||||||
| 41,000 | WABCO Holdings, Inc.* | 3,027,850 | |||||||||
| 241,233 | Waste Connections, Inc. | 7,422,739 | |||||||||
| 114,298,320 | |||||||||||
See Notes to Financial Statements.
37
Schedule of Investments (Continued)
PowerShares DWA Technical LeadersTM Portfolio
April 30, 2011
| Number of Shares | Value | ||||||||||
| Common Stocks and Other Equity Interests (Continued) | |||||||||||
| Information Technology—9.1% | |||||||||||
| 73,883 | Amphenol Corp., Class A | $ | 4,130,799 | ||||||||
| 40,060 | Apple, Inc.* | 13,950,094 | |||||||||
| 40,818 | FactSet Research Systems, Inc. | 4,465,897 | |||||||||
| 137,385 | Fairchild Semiconductor International, Inc.* | 2,880,963 | |||||||||
| 66,936 | Gartner, Inc.* | 2,872,224 | |||||||||
| 45,989 | Informatica Corp.* | 2,575,844 | |||||||||
| 67,441 | SanDisk Corp.* | 3,314,051 | |||||||||
| 113,194 | Skyworks Solutions, Inc.* | 3,561,083 | |||||||||
| 167,094 | Vishay Intertechnology, Inc.* | 3,188,153 | |||||||||
| 40,939,108 | |||||||||||
| Materials—7.6% | |||||||||||
| 68,135 | AptarGroup, Inc. | 3,573,681 | |||||||||
| 199,773 | Ball Corp. | 7,453,531 | |||||||||
| 29,526 | Cliffs Natural Resources, Inc. | 2,767,177 | |||||||||
| 44,947 | Domtar Corp. | 4,180,970 | |||||||||
| 56,057 | FMC Corp. | 4,948,712 | |||||||||
| 161,766 | Huntsman Corp. | 3,372,821 | |||||||||
| 39,350 | Sherwin-Williams Co. (The) | 3,238,111 | |||||||||
| 64,970 | Sigma-Aldrich Corp. | 4,585,582 | |||||||||
| 34,120,585 | |||||||||||
| Utilities—3.7% | |||||||||||
| 93,637 | Energen Corp. | 6,087,341 | |||||||||
| 35,995 | National Fuel Gas Co. | 2,638,434 | |||||||||
| 60,068 | ONEOK, Inc. | 4,201,156 | |||||||||
| 112,539 | UGI Corp. | 3,747,549 | |||||||||
| 16,674,480 | |||||||||||
| Total Common Stocks and Other Equity Interests (Cost $380,218,495) | 450,902,759 | ||||||||||
| Money Market Fund—0.1% | |||||||||||
| 355,273 | Goldman Sachs Financial Square Prime Obligations Institutional Share Class (Cost $355,273) | 355,273 | |||||||||
| Total Investments (Cost $380,573,768)—100.1% | 451,258,032 | ||||||||||
| Liabilities in excess of other assets—(0.1%) | (353,893 | ) | |||||||||
| Net Assets—100.0% | $ | 450,904,139 | |||||||||
Investment Abbreviations:
REIT—Real Estate Investment Trust
Notes to Schedule of Investments:
* Non-income producing security.
See Notes to Financial Statements.
38
Schedule of Investments
PowerShares Global Listed Private Equity Portfolio
April 30, 2011
| Number of Shares | Value | ||||||||||
| Common Stocks and Other Equity Interests—89.3% | |||||||||||
| Diversified Financial Services—6.4% | |||||||||||
| 847,602 | Brait SA (South Africa) | $ | 2,406,206 | ||||||||
| 2,002,458 | Intermediate Capital Group PLC (United Kingdom) | 11,022,006 | |||||||||
| 85,217 | Partners Group Holding AG (Switzerland) | 18,025,635 | |||||||||
| 31,453,847 | |||||||||||
| Electric—1.2% | |||||||||||
| 256,318 | Otter Tail Corp. | 5,992,715 | |||||||||
| Food—2.6% | |||||||||||
| 725,707 | Hakon Invest AB (Sweden) | 12,834,782 | |||||||||
| Holding Companies-Diversified—20.8% | |||||||||||
| 146,425 | Ackermans & van Haaren NV (Belgium) | 15,345,563 | |||||||||
| 291,255 | Compass Diversified Holdings | 4,881,434 | |||||||||
| 143,600 | Hal Trust (Netherlands) | 22,550,813 | |||||||||
| 446,799 | Latour Investment AB, Class B (Sweden) | 10,896,813 | |||||||||
| 638,778 | Leucadia National Corp. | 24,695,158 | |||||||||
| 130,415 | Schouw & Co. (Denmark) | 3,878,735 | |||||||||
| 163,279 | Wendel (France) | 20,486,302 | |||||||||
| 102,734,818 | |||||||||||
| Internet—0.4% | |||||||||||
| 116,272 | Safeguard Scientifics, Inc.* | 2,273,118 | |||||||||
| Investment Companies—35.2% | |||||||||||
| 486,156 | AP Alternative Assets LP (United Kingdom)* | 6,290,859 | |||||||||
| 1,044,899 | Apollo Investment Corp. | 12,382,053 | |||||||||
| 3,196,669 | ARC Capital Holdings Ltd. (Cayman Islands)* | 3,532,319 | |||||||||
| 1,070,590 | Ares Capital Corp. | 18,960,149 | |||||||||
| 494,055 | BlackRock Kelso Capital Corp. | 5,197,459 | |||||||||
| 236,247 | Candover Investments PLC (United Kingdom)* | 2,418,472 | |||||||||
| 25,862 | Capital Southwest Corp. | 2,488,959 | |||||||||
| 1,642,000 | China Merchants China Direct Investments Ltd. (Hong Kong) | 3,597,873 | |||||||||
| 1,633,811 | DeA Capital SpA (Italy)* | 3,776,471 | |||||||||
| 173,472 | Electra Private Equity PLC (United Kingdom)* | 5,060,605 | |||||||||
| 486,262 | Fifth Street Finance Corp. | 6,481,873 | |||||||||
| 204,706 | Gladstone Capital Corp. | 2,325,460 | |||||||||
| 137,588 | Golub Capital BDC, Inc. | 2,206,912 | |||||||||
| 234,098 | Hercules Technology Growth Capital, Inc. | 2,516,553 | |||||||||
| 205,603 | HgCapital Trust PLC (United Kingdom) | 3,875,174 | |||||||||
| 619,200 | Hosken Consolidated Investments Ltd. (South Africa) | 7,708,040 | |||||||||
| 550,393 | JZ Capital Partners Ltd. (Guernsey) | 3,901,621 | |||||||||
| 122,115 | Kayne Anderson Energy Development Co.* | 2,393,454 | |||||||||
| Number of Shares | Value | ||||||||||
| Common Stocks and Other Equity Interests (Continued) | |||||||||||
| 2,412,640 | Macquarie Korea Infrastructure Fund (South Korea) | $ | 11,391,740 | ||||||||
| 136,484 | Main Street Capital Corp. | 2,567,264 | |||||||||
| 579,559 | MCG Capital Corp. | 3,825,089 | |||||||||
| 169,219 | MVC Capital, Inc. | 2,340,299 | |||||||||
| 244,357 | NGP Capital Resources Co. | 2,306,730 | |||||||||
| 293,412 | PennantPark Investment Corp. | 3,620,704 | |||||||||
| 505,547 | Prospect Capital Corp. | 6,122,174 | |||||||||
| 594,205 | Ratos AB, Class B (Sweden) | 24,616,416 | |||||||||
| 566,991 | RHJ International (Belgium)* | 4,719,065 | |||||||||
| 266,070 | Solar Capital Ltd. | 6,752,857 | |||||||||
| 1,688,760 | SVG Capital PLC (United Kingdom)* | 7,729,214 | |||||||||
| 217,077 | TICC Capital Corp. | 2,461,653 | |||||||||
| 173,567,511 | |||||||||||
| Private Equity—21.7% | |||||||||||
| 4,342,763 | 3i Group PLC (United Kingdom) | 20,289,088 | |||||||||
| 311,985 | Altamir Amboise (France)* | 3,841,747 | |||||||||
| 1,390,022 | American Capital Ltd.* | 14,275,526 | |||||||||
| 123,219 | Deutsche Beteiligungs AG (Germany) | 3,625,077 | |||||||||
| 198,280 | Dinamia Capital Privado Sociedad de Capital Riesgo SA (Spain) | 2,412,180 | |||||||||
| 208,432 | Eurazeo (France) | 17,391,082 | |||||||||
| 132,304 | Gimv NV (Belgium) | 8,785,773 | |||||||||
| 881,698 | GP Investments Ltd. BDR (Bermuda)* | 3,632,401 | |||||||||
| 369,060 | Jafco Co. Ltd. (Japan) | 9,347,033 | |||||||||
| 18,418,000 | K1 Ventures Ltd. (Singapore) | 2,260,339 | |||||||||
| 455 | KKR & Co. LP | 8,627 | |||||||||
| 466,624 | Onex Corp. (Canada) | 17,458,136 | |||||||||
| 127,292 | Paris Orleans et Cie SA (France) | 3,767,566 | |||||||||
| 107,094,575 | |||||||||||
| Water—1.0% | |||||||||||
| 158,323 | Pico Holdings, Inc.* | 5,085,335 | |||||||||
| Total Common Stocks and Other Equity Interests (Cost $345,375,067) | 441,036,701 | ||||||||||
| Exchange Traded Funds—9.8% | |||||||||||
| Equity Fund—9.8% | |||||||||||
| 1,476,121 | Financial Select Sector SPDR Fund | 24,164,101 | |||||||||
| 177,177 | SPDR S&P 500 ETF Trust | 24,191,747 | |||||||||
| Total Exchange Traded Funds (Cost $48,034,644) | 48,355,848 | ||||||||||
| Total Investments (Cost $393,409,711)—99.1% | 489,392,549 | ||||||||||
| Other assets less liabilities—0.9% | 4,229,378 | ||||||||||
| Net Assets—100.0% | $ | 493,621,927 | |||||||||
See Notes to Financial Statements.
39
Schedule of Investments (Continued)
PowerShares Global Listed Private Equity Portfolio
April 30, 2011
Investment Abbreviations:
ETF—Exchange-Traded Fund
BDR—Brazilian Depositary Receipt
SPDR—Standard & Poors Depositary Receipt
Notes to Schedule of Investments:
* Non-income producing security.
This Fund has holdings greater than 10% of net assets in the following countries:
| United Kingdom | 11.5 | % | |||||
See Notes to Financial Statements.
40
Schedule of Investments
PowerShares Golden Dragon Halter USX China Portfolio
April 30, 2011
| Number of Shares | Value | ||||||||||
| Common Stocks and Other Equity Interests—100.0% | |||||||||||
| Bermuda—0.6% | |||||||||||
| 60,221 | China Yuchai International Ltd.* | $ | 1,994,519 | ||||||||
| 54,253 | Global Sources Ltd.* | 664,057 | |||||||||
| 2,658,576 | |||||||||||
| British Virgin Islands—1.2% | |||||||||||
| 72,559 | Camelot Information Systems, Inc. ADR* | 1,400,389 | |||||||||
| 26,590 | China Ceramics Co. Ltd.* | 146,245 | |||||||||
| 73,401 | China Gerui Advanced Materials Group Ltd.* | 355,995 | |||||||||
| 103,044 | China Metro-Rural Holdings Ltd.* | 360,654 | |||||||||
| 39,772 | Duoyuan Global Water, Inc. ADR* | 154,315 | |||||||||
| 87,986 | Hollysys Automation Technologies Ltd.* | 1,056,712 | |||||||||
| 41,673 | Origin Agritech Ltd.* | 323,382 | |||||||||
| 32,319 | Ossen Innovation Co. Ltd. ADR* | 104,714 | |||||||||
| 139,573 | Renesola Ltd. ADR* | 1,281,280 | |||||||||
| 5,183,686 | |||||||||||
| Canada—0.9% | |||||||||||
| 282,272 | Silvercorp Metals, Inc. | 3,836,076 | |||||||||
| Cayman Islands—15.9% | |||||||||||
| 34,762 | 3SBio, Inc. ADR* | 625,368 | |||||||||
| 80,345 | 7 Days Group Holdings Ltd. ADR* | 1,846,328 | |||||||||
| 114,891 | Actions Semiconductor Co. Ltd. ADR* | 273,441 | |||||||||
| 115,187 | Ambow Education Holding Ltd. ADR* | 840,865 | |||||||||
| 31,808 | AutoChina International Ltd.* | 844,820 | |||||||||
| 75,743 | AutoNavi Holdings Ltd. ADR* | 1,364,131 | |||||||||
| 28,662 | Bcd Semiconductor Manufacturing Ltd. ADR* | 277,448 | |||||||||
| 66,661 | Bitauto Holdings Ltd. ADR* | 675,276 | |||||||||
| 94,851 | Bona FILM Group Ltd. ADR* | 558,672 | |||||||||
| 56,950 | CDC Corp., Class A* | 182,240 | |||||||||
| 42,044 | Changyou.com Ltd. ADR* | 1,905,434 | |||||||||
| 31,566 | Charm Communications, Inc. ADR* | 347,226 | |||||||||
| 58,703 | ChemSpec International Ltd. ADR* | 437,924 | |||||||||
| 119,166 | China Cord Blood Corp.* | 401,589 | |||||||||
| 93,796 | China Digital TV Holding Co. Ltd. ADR | 635,937 | |||||||||
| 55,318 | China Distance Education Holdings Ltd. ADR* | 204,123 | |||||||||
| 37,175 | China GrenTech Corp. Ltd. ADR* | 112,640 | |||||||||
| 82,569 | China Hydroelectric Corp. ADR* | 521,836 | |||||||||
| 36,848 | China Kanghui Holdings, Inc. ADR* | 707,482 | |||||||||
| 97,365 | China Lodging Group Ltd. ADR* | 2,131,320 | |||||||||
| 43,271 | China Mass Media Corp. ADR* | 77,455 | |||||||||
| 52,141 | China Medical Technologies, Inc. ADR* | 615,785 | |||||||||
| 201,990 | China Ming Yang Wind Power Group Ltd. ADR* | 1,739,134 | |||||||||
| 168,294 | China Nepstar Chain Drugstore Ltd. ADR | 597,444 | |||||||||
| 41,571 | China New Borun Corp. ADR* | 387,857 | |||||||||
| 32,414 | China Nuokang Bio-Pharmaceutical, Inc. ADR* | 135,166 | |||||||||
| Number of Shares | Value | ||||||||||
| Common Stocks and Other Equity Interests (Continued) | |||||||||||
| 232,059 | China Real Estate Information Corp. ADR* | $ | 2,028,196 | ||||||||
| 85,536 | China Techfaith Wireless Communication Technology Ltd. ADR* | 398,598 | |||||||||
| 92,763 | China Xiniya Fashion Ltd. ADR* | 374,763 | |||||||||
| 37,499 | ChinaCache International Holdings Ltd. ADR* | 630,358 | |||||||||
| 81,159 | CNinsure, Inc. ADR | 1,191,414 | |||||||||
| 76,678 | Concord Medical Services Holdings Ltd. ADR* | 417,128 | |||||||||
| 41,204 | Country Style Cooking Restaurant Chain Co. Ltd. ADR* | 690,579 | |||||||||
| 56,790 | Daqo New Energy Corp. ADR* | 696,813 | |||||||||
| 25,278 | E-Commerce China Dangdang, Inc. ADR* | 581,647 | |||||||||
| 129,643 | E-House China Holdings Ltd. ADR | 1,549,234 | |||||||||
| 97,325 | Funtalk China Holdings Ltd.* | 622,880 | |||||||||
| 42,151 | Global Education & Technology Group Ltd. ADR* | 264,287 | |||||||||
| 27,715 | Gushan Environmental Energy Ltd. ADR* | 114,186 | |||||||||
| 118,630 | Hanwha SolarOne Co. Ltd. ADR* | 810,243 | |||||||||
| 47,885 | hiSoft Technology International Ltd. ADR* | 893,534 | |||||||||
| 73,920 | IFM Investments Ltd. ADR* | 208,454 | |||||||||
| 84,668 | iSoftStone Holdings Ltd. ADR* | 1,678,120 | |||||||||
| 35,118 | JinkoSolar Holding Co. Ltd. ADR* | 953,454 | |||||||||
| 35,552 | Ku6 Media Co. Ltd. ADR* | 264,507 | |||||||||
| 171,458 | Lentuo International, Inc. ADR* | 524,661 | |||||||||
| 92,227 | Longtop Financial Technologies Ltd. ADR* | 2,080,641 | |||||||||
| 92,615 | Mecox Lane Ltd. ADR* | 509,382 | |||||||||
| 62,965 | New Oriental Education & Technology Group, Inc. ADR* | 7,847,958 | |||||||||
| 64,004 | Noah Education Holdings Ltd. ADR* | 154,250 | |||||||||
| 89,940 | Noah Holdings Ltd. ADR* | 1,618,021 | |||||||||
| 16,337 | Perfect World Co. Ltd. ADR* | 444,530 | |||||||||
| 70,430 | RDA Microelectronics, Inc. ADR* | 926,155 | |||||||||
| 885,362 | Semiconductor Manufacturing International Corp. ADR* | 3,877,886 | |||||||||
| 232,728 | Shanda Games Ltd. ADR* | 1,745,460 | |||||||||
| 30,128 | ShangPharma Corp. ADR* | 361,536 | |||||||||
| 105,330 | SinoTech Energy Ltd. ADR* | 679,378 | |||||||||
| 51,991 | Sky-Mobi Ltd. ADR* | 1,126,645 | |||||||||
| 163,785 | SouFun Holdings Ltd. ADR* | 3,775,244 | |||||||||
| 77,999 | Spreadtrum Communications, Inc. ADR* | 1,669,179 | |||||||||
| 78,079 | Syswin, Inc. ADR* | 469,255 | |||||||||
| 60,192 | TAL Education Group ADR* | 767,448 | |||||||||
| 127,574 | Trina Solar Ltd. ADR* | 3,634,583 | |||||||||
| 13,013 | Tri-Tech Holding, Inc.* | 139,760 | |||||||||
| 71,468 | VanceInfo Technologies, Inc. ADR* | 2,298,411 | |||||||||
| 112,961 | WuXi PharmaTech Cayman, Inc. ADR* | 1,988,114 | |||||||||
| 108,509 | Xueda Education Group ADR* | 1,190,344 | |||||||||
| 9,456 | Youku.Com, Inc. ADR* | 559,039 | |||||||||
| 71,203,216 | |||||||||||
See Notes to Financial Statements.
41
Schedule of Investments (Continued)
PowerShares Golden Dragon Halter USX China Portfolio
April 30, 2011
| Number of Shares | Value | ||||||||||
| Common Stocks and Other Equity Interests (Continued) | |||||||||||
| China—60.6% | |||||||||||
| 45,552 | 51job, Inc. ADR* | $ | 2,550,456 | ||||||||
| 48,090 | Acorn International, Inc. ADR | 244,297 | |||||||||
| 87,085 | AgFeed Industries, Inc.* | 140,207 | |||||||||
| 101,124 | Agria Corp. ADR* | 122,360 | |||||||||
| 105,987 | Airmedia Group, Inc. ADR* | 504,498 | |||||||||
| 806,758 | Aluminum Corp. of China Ltd. ADR | 18,999,151 | |||||||||
| 127,010 | American Oriental Bioengineering, Inc.* | 191,785 | |||||||||
| 36,197 | ATA, Inc. ADR* | 300,797 | |||||||||
| 188,929 | Baidu, Inc. ADR* | 28,059,735 | |||||||||
| 69,021 | Canadian Solar, Inc.* | 744,737 | |||||||||
| 365,529 | China Eastern Airlines Corp. Ltd. ADR* | 8,059,914 | |||||||||
| 35,553 | China Finance Online Co. Ltd. ADR* | 199,452 | |||||||||
| 352,832 | China Life Insurance Co. Ltd. ADR | 18,943,550 | |||||||||
| 192,283 | China Petroleum and Chemical Corp. ADR | 19,376,358 | |||||||||
| 144,982 | China Security & Surveillance Technology, Inc.* | 780,003 | |||||||||
| 318,269 | China Southern Airlines Co. Ltd. ADR* | 8,367,292 | |||||||||
| 71,987 | China Sunergy Co. Ltd. ADR* | 259,873 | |||||||||
| 322,791 | China Telecom Corp. Ltd. ADR | 18,834,855 | |||||||||
| 26,338 | ChinaEdu Corp. ADR* | 189,897 | |||||||||
| 220,802 | Ctrip.com International Ltd. ADR* | 10,757,473 | |||||||||
| 19,161 | eLong, Inc. ADR* | 277,260 | |||||||||
| 232,064 | Focus Media Holding Ltd. ADR* | 8,157,050 | |||||||||
| 21,103 | Fuwei Films Holdings Co. Ltd.* | 52,969 | |||||||||
| 88,618 | General Steel Holdings, Inc.* | 200,277 | |||||||||
| 365,912 | Giant Interactive Group, Inc. ADR | 3,238,321 | |||||||||
| 228,927 | Guangshen Railway Co. Ltd. ADR | 4,548,779 | |||||||||
| 66,022 | Home Inns & Hotels Management, Inc. ADR* | 2,854,131 | |||||||||
| 508,760 | Huaneng Power International, Inc. ADR | 11,289,384 | |||||||||
| 271,445 | JA Solar Holdings Co. Ltd. ADR* | 1,864,827 | |||||||||
| 26,544 | Jinpan International Ltd. | 324,899 | |||||||||
| 56,116 | KongZhong Corp. ADR* | 490,454 | |||||||||
| 234,245 | LDK Solar Co. Ltd. ADR* | 2,705,530 | |||||||||
| 69,315 | Linktone Ltd. ADR* | 83,871 | |||||||||
| 184,376 | Mindray Medical International Ltd. ADR | 4,928,370 | |||||||||
| 209,937 | NetEase.com, Inc. ADR* | 10,345,695 | |||||||||
| 176,975 | PetroChina Co. Ltd. ADR | 25,764,021 | |||||||||
| 85,134 | Qiao Xing Mobile Communication Co. Ltd.* | 234,119 | |||||||||
| 147,494 | Qiao Xing Universal Resources, Inc.* | 314,162 | |||||||||
| 108,965 | Shanda Interactive Entertainment Ltd. ADR* | 5,271,727 | |||||||||
| 87,164 | Simcere Pharmaceutical Group ADR* | 1,106,111 | |||||||||
| 100,129 | SINA Corp.* | 13,492,383 | |||||||||
| 116,347 | Sinopec Shanghai Petrochemical Co. Ltd. ADR | 5,674,243 | |||||||||
| 87,536 | Sinovac Biotech Ltd.* | 348,393 | |||||||||
| 291,104 | Suntech Power Holdings Co. Ltd. ADR* | 2,611,203 | |||||||||
| 40,578 | The9 Ltd. ADR* | 293,785 | |||||||||
| 59,645 | Vimicro International Corp. ADR* | 165,813 | |||||||||
| Number of Shares | Value | ||||||||||
| Common Stocks and Other Equity Interests (Continued) | |||||||||||
| 165,225 | VisionChina Media, Inc. ADR* | $ | 710,468 | ||||||||
| 166,269 | WSP Holdings Ltd. ADR* | 226,126 | |||||||||
| 124,272 | Xinyuan Real Estate Co. Ltd. ADR* | 269,670 | |||||||||
| 565,371 | Yanzhou Coal Mining Co. Ltd. ADR | 22,072,084 | |||||||||
| 239,830 | Yingli Green Energy Holding Co. Ltd. ADR* | 3,005,070 | |||||||||
| 28,942 | Yucheng Technologies Ltd.* | 115,768 | |||||||||
| 270,663,653 | |||||||||||
| Hong Kong—14.2% | |||||||||||
| 418,968 | China Mobile Ltd. ADR | 19,310,235 | |||||||||
| 36,280 | China Natural Resources, Inc.* | 492,683 | |||||||||
| 1,130,794 | China Unicom Ltd. ADR | 23,136,045 | |||||||||
| 79,827 | CNOOC Ltd. ADR | 19,912,845 | |||||||||
| 72,397 | Nam Tai Electronics, Inc. | 444,518 | |||||||||
| 63,296,326 | |||||||||||
| United States—6.6% | |||||||||||
| 123,521 | Advanced Battery Technologies, Inc.* | 212,456 | |||||||||
| 55,928 | American Lorain Corp.* | 124,719 | |||||||||
| 76,605 | Aoxing Pharmaceutical Co., Inc.* | 149,380 | |||||||||
| 74,711 | A-Power Energy Generation Systems Ltd.* | 302,580 | |||||||||
| 121,279 | AsiaInfo-Linkage, Inc.* | 2,292,173 | |||||||||
| 44,267 | Biostar Pharmaceuticals, Inc.* | 73,483 | |||||||||
| 28,045 | China Advanced Construction Materials Group, Inc.* | 79,087 | |||||||||
| 34,224 | China Agritech, Inc.* | 211,915 | |||||||||
| 29,820 | China Auto Logistics, Inc.* | 61,131 | |||||||||
| 43,815 | China Automotive Systems, Inc.* | 422,815 | |||||||||
| 102,800 | China BAK Battery, Inc.* | 161,396 | |||||||||
| 39,132 | China Biologic Products, Inc.* | 548,239 | |||||||||
| 59,126 | China Botanic Pharmaceutical, Inc.* | 84,550 | |||||||||
| 51,489 | China Education Alliance, Inc.* | 65,906 | |||||||||
| 35,828 | China Electric Motor, Inc.* | 94,478 | |||||||||
| 45,015 | China Fire & Security Group, Inc.* | 312,854 | |||||||||
| 39,253 | China GengSheng Minerals, Inc.* | 107,161 | |||||||||
| 43,385 | China Green Agriculture, Inc.* | 305,430 | |||||||||
| 53,792 | China Housing & Land Development, Inc.* | 118,880 | |||||||||
| 84,522 | China Information Technology, Inc.* | 221,448 | |||||||||
| 61,604 | China Integrated Energy, Inc.* | 113,351 | |||||||||
| 22,250 | China Jo-Jo Drugstores, Inc.* | 60,297 | |||||||||
| 47,170 | China Marine Food Group Ltd.* | 163,680 | |||||||||
| 60,579 | China MediaExpress Holdings, Inc.* | 537,487 | |||||||||
| 34,455 | China Natural Gas, Inc.* | 182,956 | |||||||||
| 47,837 | China North East Petroleum Holdings Ltd.* | 204,264 | |||||||||
| 59,459 | China Nutrifruit Group Ltd.* | 127,242 | |||||||||
| 69,957 | China Pharma Holdings, Inc.* | 172,794 | |||||||||
| 75,241 | China Precision Steel, Inc.* | 118,881 | |||||||||
| 62,661 | China Recycling Energy Corp.* | 150,386 | |||||||||
| 45,205 | China Shen Zhou Mining & Resources, Inc.* | 215,628 | |||||||||
| 63,760 | China Shengda Packaging Group, Inc.* | 96,278 | |||||||||
| 27,659 | China Sky One Medical, Inc.* | 78,828 | |||||||||
See Notes to Financial Statements.
42
Schedule of Investments (Continued)
PowerShares Golden Dragon Halter USX China Portfolio
April 30, 2011
| Number of Shares | Value | ||||||||||
| Common Stocks and Other Equity Interests (Continued) | |||||||||||
| 40,813 | China TransInfo Technology Corp.* | $ | 197,535 | ||||||||
| 57,045 | China Valves Technology, Inc.* | 229,321 | |||||||||
| 30,387 | China Wind Systems, Inc.* | 72,929 | |||||||||
| 76,965 | China XD Plastics Co. Ltd.* | 339,416 | |||||||||
| 31,593 | China Yida Holding Co.* | 221,151 | |||||||||
| 35,795 | China-Biotics, Inc.* | 349,359 | |||||||||
| 80,437 | ChinaCast Education Corp.* | 491,470 | |||||||||
| 28,132 | ChinaNet Online Holdings, Inc.* | 90,304 | |||||||||
| 24,353 | Chindex International, Inc.* | 418,628 | |||||||||
| 58,195 | Cogo Group, Inc.* | 477,781 | |||||||||
| 54,281 | Deer Consumer Products, Inc. | 550,409 | |||||||||
| 36,030 | Feihe International, Inc.* | 384,800 | |||||||||
| 61,076 | Fushi Copperweld, Inc.* | 491,662 | |||||||||
| 32,955 | Guanwei Recycling Corp.* | 74,808 | |||||||||
| 56,128 | Gulf Resources, Inc.* | 175,681 | |||||||||
| 50,500 | Harbin Electric, Inc.* | 945,360 | |||||||||
| 29,480 | HQ Sustainable Maritime Industries, Inc.* | 90,209 | |||||||||
| 20,599 | Jiangbo Pharmaceuticals, Inc.* | 97,227 | |||||||||
| 32,861 | Jingwei International Ltd.* | 94,640 | |||||||||
| 39,275 | Kandi Technolgies Corp.* | 113,897 | |||||||||
| 93,039 | Keyuan Petrochemicals, Inc. | 452,169 | |||||||||
| 68,421 | Kingold Jewelry, Inc.* | 135,474 | |||||||||
| 51,263 | L&L Energy, Inc.* | 356,278 | |||||||||
| 48,036 | Lihua International, Inc.* | 386,690 | |||||||||
| 159,560 | Longwei Petroleum Investment Holding Ltd.* | 287,208 | |||||||||
| 20,379 | New Energy Systems Group* | 74,791 | |||||||||
| 79,031 | NIVS IntelliMedia Technology Group, Inc.* | 156,481 | |||||||||
| 29,646 | Orient Paper, Inc.* | 112,062 | |||||||||
| 48,514 | Puda Coal, Inc.* | 291,084 | |||||||||
| 48,053 | QKL Stores, Inc.* | 118,210 | |||||||||
| 88,087 | ShengdaTech, Inc.* | 235,192 | |||||||||
| 43,616 | Shengkai Innovations, Inc.* | 143,933 | |||||||||
| 27,147 | Sino Clean Energy, Inc.* | 78,183 | |||||||||
| 33,969 | SinoCoking Coal And Coke Chemical Industries, Inc.* | 217,402 | |||||||||
| 47,051 | Sinohub, Inc.* | 79,987 | |||||||||
| 41,351 | SkyPeople Fruit Juice, Inc.* | 132,323 | |||||||||
| 11,571 | Skystar Bio-Pharmaceutical Co. Ltd.* | 50,102 | |||||||||
| 61,781 | SmartHeat, Inc.* | 181,636 | |||||||||
| 61,875 | Sohu.com, Inc.* | 6,543,900 | |||||||||
| 31,197 | SORL Auto Parts, Inc.* | 160,665 | |||||||||
| 67,048 | Sutor Technology Group Ltd.* | 109,959 | |||||||||
| 78,252 | Synthesis Energy Systems, Inc.* | 313,790 | |||||||||
| 92,594 | Synutra International, Inc.* | 962,978 | |||||||||
| 19,176 | Telestone Technologies Corp.* | 121,768 | |||||||||
| 45,820 | Tianyin Pharmaceutical Co., Inc.* | 103,553 | |||||||||
| 115,269 | Tiens Biotech Group USA, Inc.* | 152,155 | |||||||||
| 58,934 | Trunkbow International Holdings Ltd.* | 268,739 | |||||||||
| 32,152 | Universal Travel Group* | 114,590 | |||||||||
| 249,103 | UTStarcom, Inc.* | 640,195 | |||||||||
| Number of Shares | Value | ||||||||||
| Common Stocks and Other Equity Interests (Continued) | |||||||||||
| 38,992 | Winner Medical Group, Inc.* | $ | 196,910 | ||||||||
| 54,715 | Wonder Auto Technology, Inc.* | 323,913 | |||||||||
| 79,777 | Yongye International, Inc.* | 418,031 | |||||||||
| 32,083 | Yuhe International, Inc.* | 177,740 | |||||||||
| 65,211 | Zhongpin, Inc.* | 1,089,024 | |||||||||
| 21,540 | Zoom Technologies, Inc.* | 79,052 | |||||||||
| 19,201 | ZST Digital Networks, Inc.* | 56,451 | |||||||||
| 29,401,358 | |||||||||||
| Total Investments (Cost $398,015,244)—100.0% | 446,242,891 | ||||||||||
| Other assets less liabilities—0.0% | 48,899 | ||||||||||
| Net Assets—100.0% | $ | 446,291,790 | |||||||||
Investment Abbreviations:
ADR—American Depositary Receipt
Notes to Schedule of Investments:
* Non-income producing security.
See Notes to Financial Statements.
43
Schedule of Investments
PowerShares Lux Nanotech Portfolio
April 30, 2011
| Number of Shares | Value | ||||||||||
| Common Stocks and Other Equity Interests—100.0% | |||||||||||
| Auto Manufacturers—3.4% | |||||||||||
| 16,540 | Toyota Motor Corp. ADR (Japan) | $ | 1,317,907 | ||||||||
| Biotechnology—6.0% | |||||||||||
| 780,844 | Nanosphere, Inc.* | 2,319,107 | |||||||||
| Chemicals—10.5% | |||||||||||
| 14,822 | Air Products & Chemicals, Inc. | 1,415,798 | |||||||||
| 24,704 | E.I. du Pont de Nemours & Co. | 1,402,940 | |||||||||
| 454,921 | ShengdaTech, Inc.* | 1,214,639 | |||||||||
| 4,033,377 | |||||||||||
| Computers—7.0% | |||||||||||
| 31,616 | Hewlett-Packard Co. | 1,276,338 | |||||||||
| 8,256 | International Business Machines Corp. | 1,408,308 | |||||||||
| 2,684,646 | |||||||||||
| Electrical Components & Equipment—9.3% | |||||||||||
| 245,337 | A123 Systems, Inc.* | 1,481,835 | |||||||||
| 822,628 | Ener1, Inc.* | 2,081,249 | |||||||||
| 3,563,084 | |||||||||||
| Electronics—11.1% | |||||||||||
| 52,080 | FEI Co.* | 1,690,517 | |||||||||
| 43,813 | NVE Corp.* | 2,583,214 | |||||||||
| 4,273,731 | |||||||||||
| Energy-Alternate Sources—4.3% | |||||||||||
| 303,127 | Headwaters, Inc.* | 1,655,073 | |||||||||
| Investment Companies—6.4% | |||||||||||
| 467,613 | Harris & Harris Group, Inc.* | 2,440,940 | |||||||||
| Miscellaneous Manufacturing—7.3% | |||||||||||
| 14,463 | 3M Co. | 1,405,948 | |||||||||
| 67,459 | General Electric Co. | 1,379,537 | |||||||||
| 2,785,485 | |||||||||||
| Pharmaceuticals—19.7% | |||||||||||
| 752,190 | BioDelivery Sciences International, Inc.* | 2,775,581 | |||||||||
| 362,247 | Elan Corp. PLC ADR (Ireland)* | 2,934,201 | |||||||||
| 286,710 | Flamel Technologies SA ADR (France)* | 1,849,279 | |||||||||
| 7,559,061 | |||||||||||
| Semiconductors—10.5% | |||||||||||
| 65,502 | Intel Corp. | 1,518,992 | |||||||||
| 49,470 | Veeco Instruments, Inc.* | 2,529,401 | |||||||||
| 4,048,393 | |||||||||||
| Software—4.5% | |||||||||||
| 226,249 | Accelrys, Inc.* | 1,712,705 | |||||||||
| Total Common Stocks and Other Equity Interests (Cost $37,937,712) | 38,393,509 | ||||||||||
| Number of Shares | Value | ||||||||||
| Money Market Fund—0.2% | |||||||||||
| 90,796 | Goldman Sachs Financial Square Prime Obligations Institutional Share Class (Cost $90,796) | $ | 90,796 | ||||||||
| Total Investments (Cost $38,028,508)—100.2% | 38,484,305 | ||||||||||
| Liabilities in excess of other assets—(0.2%) | (93,829 | ) | |||||||||
| Net Assets—100.0% | $ | 38,390,476 | |||||||||
Investment Abbreviations:
ADR—American Depositary Receipt
Notes to Schedule of Investments:
* Non-income producing security.
See Notes to Financial Statements.
44
Schedule of Investments
PowerShares Morningstar StockInvestor Core Portfolio
April 30, 2011
| Number of Shares | Value | ||||||||||
| Common Stocks and Other Equity Interests—99.9% | |||||||||||
| Aerospace/Defense—2.1% | |||||||||||
| 5,577 | General Dynamics Corp. | $ | 406,117 | ||||||||
| Banks—1.8% | |||||||||||
| 7,605 | JPMorgan Chase & Co. | 347,016 | |||||||||
| Beverages—2.2% | |||||||||||
| 3,549 | Molson Coors Brewing Co., Class B | 173,014 | |||||||||
| 3,802 | PepsiCo, Inc. | 261,920 | |||||||||
| 434,934 | |||||||||||
| Biotechnology—1.1% | |||||||||||
| 3,802 | Amgen, Inc.* | 216,144 | |||||||||
| Building Materials—0.9% | |||||||||||
| 21,670 | Cemex SAB de CV ADR (Mexico)* | 188,096 | |||||||||
| Coal—2.1% | |||||||||||
| 20,280 | Cloud Peak Energy, Inc.* | 422,230 | |||||||||
| Commercial Services—14.3% | |||||||||||
| 9,886 | Apollo Group, Inc., Class A* | 395,737 | |||||||||
| 8,872 | Automatic Data Processing, Inc. | 482,193 | |||||||||
| 15,210 | CoreLogic, Inc.* | 280,016 | |||||||||
| 2,535 | MasterCard, Inc., Class A | 699,381 | |||||||||
| 17,745 | Paychex, Inc. | 580,439 | |||||||||
| 18,505 | Western Union Co. (The) | 393,231 | |||||||||
| 2,830,997 | |||||||||||
| Computers—0.8% | |||||||||||
| 10,140 | Dell, Inc.* | 157,271 | |||||||||
| Cosmetics/Personal Care—1.2% | |||||||||||
| 3,802 | Procter & Gamble Co. (The) | 246,750 | |||||||||
| Distribution/Wholesale—0.9% | |||||||||||
| 2,535 | Fastenal Co. | 170,073 | |||||||||
| Diversified Financial Services—4.7% | |||||||||||
| 6,337 | American Express Co. | 311,020 | |||||||||
| 25,350 | Discover Financial Services | 629,694 | |||||||||
| 940,714 | |||||||||||
| Electric—4.0% | |||||||||||
| 18,759 | Exelon Corp. | 790,692 | |||||||||
| Entertainment—3.1% | |||||||||||
| 10,140 | International Game Technology | 179,377 | |||||||||
| 14,196 | International Speedway Corp., Class A | 434,397 | |||||||||
| 613,774 | |||||||||||
| Food—1.7% | |||||||||||
| 11,914 | Sysco Corp. | 344,434 | |||||||||
| Number of Shares | Value | ||||||||||
| Common Stocks and Other Equity Interests (Continued) | |||||||||||
| Healthcare-Products—4.3% | |||||||||||
| 6,591 | Johnson & Johnson | $ | 433,161 | ||||||||
| 6,337 | Zimmer Holdings, Inc.* | 413,489 | |||||||||
| 846,650 | |||||||||||
| Insurance—4.9% | |||||||||||
| 8,872 | Berkshire Hathaway, Inc., Class B* | 739,038 | |||||||||
| 15,210 | First American Financial Corp. | 237,276 | |||||||||
| 976,314 | |||||||||||
| Internet—2.9% | |||||||||||
| 16,731 | eBay, Inc.* | 575,546 | |||||||||
| Mining—6.4% | |||||||||||
| 10,140 | Compass Minerals International, Inc. | 989,765 | |||||||||
| 6,084 | Vulcan Materials Co. | 274,997 | |||||||||
| 1,264,762 | |||||||||||
| Miscellaneous Manufacturing—1.2% | |||||||||||
| 2,535 | 3M Co. | 246,427 | |||||||||
| Oil & Gas—3.3% | |||||||||||
| 7,402 | Exxon Mobil Corp. | 651,376 | |||||||||
| Pharmaceuticals—9.2% | |||||||||||
| 14,652 | Abbott Laboratories | 762,490 | |||||||||
| 9,379 | Novartis AG ADR (Switzerland) | 554,955 | |||||||||
| 23,829 | Pfizer, Inc. | 499,456 | |||||||||
| 1,816,901 | |||||||||||
| Pipelines—3.4% | |||||||||||
| 5,157 | Kinder Morgan Management LLC* | 351,583 | |||||||||
| 7,605 | TransCanada Corp. (Canada) | 326,559 | |||||||||
| 678,142 | |||||||||||
| Real Estate—7.0% | |||||||||||
| 53,234 | St. Joe Co. (The)* | 1,390,472 | |||||||||
| Retail—9.8% | |||||||||||
| 17,745 | CarMax, Inc.* | 615,752 | |||||||||
| 25,350 | Lowe's Cos., Inc. | 665,437 | |||||||||
| 5,577 | Walgreen Co. | 238,249 | |||||||||
| 7,605 | Wal-Mart Stores, Inc. | 418,123 | |||||||||
| 1,937,561 | |||||||||||
| Software—3.9% | |||||||||||
| 12,675 | Autodesk, Inc.* | 570,122 | |||||||||
| 7,605 | Microsoft Corp. | 197,882 | |||||||||
| 768,004 | |||||||||||
| Telecommunications—1.1% | |||||||||||
| 12,675 | Cisco Systems, Inc. | 222,573 | |||||||||
See Notes to Financial Statements.
45
Schedule of Investments (Continued)
PowerShares Morningstar StockInvestor Core Portfolio
April 30, 2011
| Number of Shares | Value | ||||||||||
| Common Stocks and Other Equity Interests (Continued) | |||||||||||
| Textiles—1.6% | |||||||||||
| 10,140 | Cintas Corp. | $ | 314,847 | ||||||||
| Total Common Stocks and Other Equity Interests (Cost $16,134,762) | 19,798,817 | ||||||||||
| Money Market Fund—0.4% | |||||||||||
| 75,730 | Goldman Sachs Financial Square Prime Obligations Institutional Share Class (Cost $75,730) | 75,730 | |||||||||
| Total Investments (Cost $16,210,492)—100.3% | 19,874,547 | ||||||||||
| Liabilities in excess of other assets—(0.3%) | (58,073 | ) | |||||||||
| Net Assets—100.0% | $ | 19,816,474 | |||||||||
Investment Abbreviations:
ADR—American Depositary Receipt
Notes to Schedule of Investments:
* Non-income producing security.
See Notes to Financial Statements.
46
Schedule of Investments
PowerShares S&P 500 BuyWrite Portfolio
April 30, 2011
| Number of Shares | Value | ||||||||||
| Common Stocks and Other Equity Interests(<)—103.5% | |||||||||||
| Consumer Discretionary—11.0% | |||||||||||
| 876 | Abercrombie & Fitch Co., Class A | $ | 62,021 | ||||||||
| 3,571 | Amazon.com, Inc.* | 701,702 | |||||||||
| 1,236 | Apollo Group, Inc., Class A* | 49,477 | |||||||||
| 644 | AutoNation, Inc.* | 21,838 | |||||||||
| 268 | AutoZone, Inc.* | 75,678 | |||||||||
| 2,557 | Bed Bath & Beyond, Inc.* | 143,499 | |||||||||
| 3,285 | Best Buy Co., Inc. | 102,558 | |||||||||
| 758 | Big Lots, Inc.* | 31,161 | |||||||||
| 2,335 | Cablevision Systems Corp., Class A | 82,262 | |||||||||
| 2,264 | CarMax, Inc.* | 78,561 | |||||||||
| 4,333 | Carnival Corp. | 164,957 | |||||||||
| 6,751 | CBS Corp., Class B | 170,260 | |||||||||
| 311 | Chipotle Mexican Grill, Inc.* | 82,972 | |||||||||
| 2,969 | Coach, Inc. | 177,576 | |||||||||
| 27,829 | Comcast Corp., Class A | 730,233 | |||||||||
| 2,821 | D.R. Horton, Inc. | 35,093 | |||||||||
| 1,386 | Darden Restaurants, Inc. | 65,100 | |||||||||
| 619 | DeVry, Inc. | 32,745 | |||||||||
| 7,967 | DIRECTV, Class A* | 387,117 | |||||||||
| 2,827 | Discovery Communications, Inc., Class A* | 125,123 | |||||||||
| 2,009 | Expedia, Inc. | 50,285 | |||||||||
| 1,269 | Family Dollar Stores, Inc. | 68,792 | |||||||||
| 37,977 | Ford Motor Co.* | 587,504 | |||||||||
| 1,540 | Fortune Brands, Inc. | 100,223 | |||||||||
| 1,413 | GameStop Corp., Class A* | 36,286 | |||||||||
| 2,406 | Gannett Co., Inc. | 36,234 | |||||||||
| 4,147 | Gap, Inc. (The) | 96,376 | |||||||||
| 1,583 | Genuine Parts Co. | 85,007 | |||||||||
| 2,439 | Goodyear Tire & Rubber Co. (The)* | 44,268 | |||||||||
| 3,065 | H&R Block, Inc. | 52,994 | |||||||||
| 2,365 | Harley-Davidson, Inc. | 88,120 | |||||||||
| 699 | Harman International Industries, Inc. | 33,922 | |||||||||
| 1,376 | Hasbro, Inc. | 64,452 | |||||||||
| 16,426 | Home Depot, Inc. (The) | 610,062 | |||||||||
| 3,000 | International Game Technology | 53,070 | |||||||||
| 4,911 | Interpublic Group of Cos., Inc. (The) | 57,704 | |||||||||
| 2,376 | J.C. Penney Co., Inc. | 91,357 | |||||||||
| 6,800 | Johnson Controls, Inc. | 278,800 | |||||||||
| 2,935 | Kohl's Corp. | 154,704 | |||||||||
| 1,470 | Leggett & Platt, Inc. | 38,646 | |||||||||
| 1,613 | Lennar Corp., Class A | 30,631 | |||||||||
| 2,655 | Limited Brands, Inc. | 109,280 | |||||||||
| 13,855 | Lowe's Cos., Inc. | 363,694 | |||||||||
| 4,250 | Macy's, Inc. | 101,618 | |||||||||
| 2,918 | Marriott International, Inc., Class A | 103,005 | |||||||||
| 3,501 | Mattel, Inc. | 93,547 | |||||||||
| 10,457 | McDonald's Corp. | 818,888 | |||||||||
| 3,079 | McGraw-Hill Cos., Inc. (The) | 124,607 | |||||||||
| 441 | Netflix, Inc.* | 102,607 | |||||||||
| 2,917 | Newell Rubbermaid, Inc.* | 55,598 | |||||||||
| Number of Shares | Value | ||||||||||
| Common Stocks and Other Equity Interests(<) (Continued) | |||||||||||
| 22,928 | News Corp., Class A | $ | 408,577 | ||||||||
| 3,843 | NIKE, Inc., Class B | 316,356 | |||||||||
| 1,685 | Nordstrom, Inc. | 80,122 | |||||||||
| 2,852 | Omnicom Group, Inc. | 140,290 | |||||||||
| 1,417 | O'Reilly Automotive, Inc.* | 83,688 | |||||||||
| 657 | Polo Ralph Lauren Corp. | 85,916 | |||||||||
| 493 | priceline.com, Inc.* | 269,676 | |||||||||
| 3,375 | Pulte Group, Inc.* | 27,439 | |||||||||
| 1,062 | RadioShack Corp. | 16,790 | |||||||||
| 1,196 | Ross Stores, Inc. | 88,133 | |||||||||
| 909 | Scripps Networks Interactive, Inc., Class A | 46,741 | |||||||||
| 437 | Sears Holdings Corp.* | 37,569 | |||||||||
| 1,679 | Stanley Black & Decker, Inc. | 121,979 | |||||||||
| 7,223 | Staples, Inc. | 152,694 | |||||||||
| 7,490 | Starbucks Corp. | 271,063 | |||||||||
| 1,929 | Starwood Hotels & Resorts Worldwide, Inc. | 114,911 | |||||||||
| 7,109 | Target Corp. | 349,052 | |||||||||
| 1,269 | Tiffany & Co. | 88,119 | |||||||||
| 3,447 | Time Warner Cable, Inc. | 269,314 | |||||||||
| 10,972 | Time Warner, Inc. | 415,400 | |||||||||
| 3,974 | TJX Cos., Inc. (The) | 213,086 | |||||||||
| 1,285 | Urban Outfitters, Inc.* | 40,426 | |||||||||
| 869 | VF Corp. | 87,387 | |||||||||
| 5,993 | Viacom, Inc., Class B | 306,602 | |||||||||
| 19,035 | Walt Disney Co. (The) | 820,409 | |||||||||
| 53 | Washington Post Co. (The), Class B | 23,103 | |||||||||
| 763 | Whirlpool Corp. | 65,755 | |||||||||
| 1,739 | Wyndham Worldwide Corp. | 60,187 | |||||||||
| 763 | Wynn Resorts Ltd. | 112,275 | |||||||||
| 4,693 | Yum! Brands, Inc. | 251,733 | |||||||||
| 13,217,006 | |||||||||||
| Consumer Staples—10.8% | |||||||||||
| 21,003 | Altria Group, Inc. | 563,721 | |||||||||
| 6,398 | Archer-Daniels-Midland Co. | 236,854 | |||||||||
| 4,315 | Avon Products, Inc. | 126,775 | |||||||||
| 1,035 | Brown-Forman Corp., Class B | 74,375 | |||||||||
| 1,833 | Campbell Soup Co. | 61,570 | |||||||||
| 1,382 | Clorox Co. (The) | 96,270 | |||||||||
| 22,996 | Coca-Cola Co. (The) | 1,551,310 | |||||||||
| 3,315 | Coca-Cola Enterprises, Inc. | 94,179 | |||||||||
| 4,958 | Colgate-Palmolive Co. | 418,207 | |||||||||
| 4,105 | ConAgra Foods, Inc. | 100,367 | |||||||||
| 1,766 | Constellation Brands, Inc., Class A* | 39,541 | |||||||||
| 4,383 | Costco Wholesale Corp. | 354,672 | |||||||||
| 13,736 | CVS Caremark Corp. | 497,793 | |||||||||
| 1,839 | Dean Foods Co.* | 20,578 | |||||||||
| 2,249 | Dr Pepper Snapple Group, Inc. | 88,161 | |||||||||
| 1,150 | Estee Lauder Cos., Inc. (The), Class A | 111,550 | |||||||||
| 6,383 | General Mills, Inc. | 246,256 | |||||||||
| 3,231 | H.J. Heinz Co. | 165,524 | |||||||||
See Notes to Financial Statements.
47
Schedule of Investments (Continued)
PowerShares S&P 500 BuyWrite Portfolio
April 30, 2011
| Number of Shares | Value | ||||||||||
| Common Stocks and Other Equity Interests(<) (Continued) | |||||||||||
| 1,552 | Hershey Co. (The) | $ | 89,566 | ||||||||
| 1,390 | Hormel Foods Corp. | 40,880 | |||||||||
| 1,195 | J.M. Smucker Co. (The) | 89,709 | |||||||||
| 2,529 | Kellogg Co. | 144,836 | |||||||||
| 4,060 | Kimberly-Clark Corp. | 268,204 | |||||||||
| 17,558 | Kraft Foods, Inc., Class A | 589,598 | |||||||||
| 6,385 | Kroger Co. (The) | 155,219 | |||||||||
| 1,461 | Lorillard, Inc. | 155,596 | |||||||||
| 1,335 | McCormick & Co., Inc. | 65,575 | |||||||||
| 2,054 | Mead Johnson Nutrition Co. | 137,371 | |||||||||
| 1,595 | Molson Coors Brewing Co., Class B | 77,756 | |||||||||
| 15,902 | PepsiCo, Inc. | 1,095,489 | |||||||||
| 18,013 | �� | Philip Morris International, Inc. | 1,250,823 | ||||||||
| 28,073 | Procter & Gamble Co. (The) | 1,821,938 | |||||||||
| 3,395 | Reynolds American, Inc. | 125,988 | |||||||||
| 3,697 | Safeway, Inc. | 89,874 | |||||||||
| 6,249 | Sara Lee Corp. | 119,981 | |||||||||
| 2,130 | SUPERVALU, Inc. | 23,984 | |||||||||
| 5,850 | Sysco Corp. | 169,123 | |||||||||
| 2,994 | Tyson Foods, Inc., Class A | 59,581 | |||||||||
| 9,261 | Walgreen Co. | 395,630 | |||||||||
| 19,636 | Wal-Mart Stores, Inc. | 1,079,587 | |||||||||
| 1,481 | Whole Foods Market, Inc. | 92,948 | |||||||||
| 12,986,959 | |||||||||||
| Energy—13.5% | |||||||||||
| 4,982 | Anadarko Petroleum Corp. | 393,279 | |||||||||
| 3,843 | Apache Corp. | 512,541 | |||||||||
| 4,360 | Baker Hughes, Inc. | 337,508 | |||||||||
| 1,047 | Cabot Oil & Gas Corp. | 58,925 | |||||||||
| 2,457 | Cameron International Corp.* | 129,533 | |||||||||
| 6,602 | Chesapeake Energy Corp. | 222,289 | |||||||||
| 20,121 | Chevron Corp. | 2,202,042 | |||||||||
| 14,330 | ConocoPhillips | 1,131,067 | |||||||||
| 2,271 | CONSOL Energy, Inc. | 122,838 | |||||||||
| 4,026 | Denbury Resources, Inc.* | 90,867 | |||||||||
| 4,287 | Devon Energy Corp. | 390,117 | |||||||||
| 698 | Diamond Offshore Drilling, Inc. | 52,957 | |||||||||
| 7,685 | El Paso Corp. | 149,166 | |||||||||
| 2,689 | EOG Resources, Inc. | 303,615 | |||||||||
| 1,498 | EQT Corp. | 78,810 | |||||||||
| 49,701 | Exxon Mobil Corp. | 4,373,688 | |||||||||
| 2,412 | FMC Technologies, Inc.* | 112,110 | |||||||||
| 9,170 | Halliburton Co. | 462,902 | |||||||||
| 1,068 | Helmerich & Payne, Inc. | 70,851 | |||||||||
| 3,017 | Hess Corp. | 259,341 | |||||||||
| 7,131 | Marathon Oil Corp. | 385,359 | |||||||||
| 1,039 | Massey Energy Co. | 70,901 | |||||||||
| 1,936 | Murphy Oil Corp. | 150,001 | |||||||||
| 2,873 | Nabors Industries Ltd. (Bermuda)* | 88,029 | |||||||||
| 4,227 | National Oilwell Varco, Inc. | 324,169 | |||||||||
| Number of Shares | Value | ||||||||||
| Common Stocks and Other Equity Interests(<) (Continued) | |||||||||||
| 1,349 | Newfield Exploration Co.* | $ | 95,509 | ||||||||
| 2,533 | Noble Corp. (Switzerland) | 108,944 | |||||||||
| 1,764 | Noble Energy, Inc. | 169,820 | |||||||||
| 8,147 | Occidental Petroleum Corp. | 931,121 | |||||||||
| 2,716 | Peabody Energy Corp. | 181,483 | |||||||||
| 1,169 | Pioneer Natural Resources Co. | 119,507 | |||||||||
| 1,770 | QEP Resources, Inc. | 75,632 | |||||||||
| 1,611 | Range Resources Corp. | 90,941 | |||||||||
| 1,268 | Rowan Cos., Inc.* | 52,876 | |||||||||
| 13,641 | Schlumberger Ltd. | 1,224,280 | |||||||||
| 3,491 | Southwestern Energy Co.* | 153,115 | |||||||||
| 6,512 | Spectra Energy Corp. | 189,109 | |||||||||
| 1,211 | Sunoco, Inc. | 51,661 | |||||||||
| 1,437 | Tesoro Corp.* | 38,971 | |||||||||
| 5,712 | Valero Energy Corp. | 161,650 | |||||||||
| 5,885 | Williams Cos., Inc. (The) | 195,206 | |||||||||
| 16,312,730 | |||||||||||
| Financials—16.0% | |||||||||||
| 3,369 | ACE Ltd. (Switzerland) | 226,565 | |||||||||
| 4,721 | Aflac, Inc. | 265,273 | |||||||||
| 5,319 | Allstate Corp. (The) | 179,995 | |||||||||
| 10,502 | American Express Co. | 515,438 | |||||||||
| 1,442 | American International Group, Inc.* | 44,918 | |||||||||
| 2,475 | Ameriprise Financial, Inc. | 153,599 | |||||||||
| 3,344 | Aon Corp. | 174,457 | |||||||||
| 1,186 | Apartment Investment & Management Co., Class A REIT | 31,975 | |||||||||
| 1,003 | Assurant, Inc. | 39,819 | |||||||||
| 864 | AvalonBay Communities, Inc. REIT | 109,391 | |||||||||
| 101,446 | Bank of America Corp. | 1,245,757 | |||||||||
| 12,467 | Bank of New York Mellon Corp. (The) | 361,044 | |||||||||
| 6,974 | BB&T Corp. | 187,740 | |||||||||
| 17,350 | Berkshire Hathaway, Inc., Class B* | 1,445,255 | |||||||||
| 960 | BlackRock, Inc. | 188,102 | |||||||||
| 1,432 | Boston Properties, Inc. REIT | 149,687 | |||||||||
| 4,592 | Capital One Financial Corp. | 251,320 | |||||||||
| 2,924 | CB Richard Ellis Group, Inc., Class A* | 78,100 | |||||||||
| 10,027 | Charles Schwab Corp. (The) | 183,594 | |||||||||
| 2,964 | Chubb Corp. (The) | 193,223 | |||||||||
| 1,636 | Cincinnati Financial Corp. | 51,829 | |||||||||
| 291,233 | Citigroup, Inc.* | 1,336,760 | |||||||||
| 673 | CME Group, Inc. | 199,053 | |||||||||
| 1,775 | Comerica, Inc. | 67,326 | |||||||||
| 5,474 | Discover Financial Services | 135,974 | |||||||||
| 2,488 | E*TRADE Financial Corp.* | 40,405 | |||||||||
| 2,951 | Equity Residential REIT | 176,234 | |||||||||
| 930 | Federated Investors, Inc., Class B | 23,975 | |||||||||
| 9,214 | Fifth Third Bancorp | 122,270 | |||||||||
| 2,644 | First Horizon National Corp. | 28,952 | |||||||||
| 1,456 | Franklin Resources, Inc. | 187,999 | |||||||||
See Notes to Financial Statements.
48
Schedule of Investments (Continued)
PowerShares S&P 500 BuyWrite Portfolio
April 30, 2011
| Number of Shares | Value | ||||||||||
| Common Stocks and Other Equity Interests(<) (Continued) | |||||||||||
| 4,918 | Genworth Financial, Inc., Class A* | $ | 59,950 | ||||||||
| 5,217 | Goldman Sachs Group, Inc. (The) | 787,819 | |||||||||
| 4,465 | Hartford Financial Services Group, Inc. (The) | 129,351 | |||||||||
| 4,026 | HCP, Inc. REIT | 159,510 | |||||||||
| 1,768 | Health Care REIT, Inc. REIT | 95,065 | |||||||||
| 6,831 | Host Hotels & Resorts, Inc. REIT | 121,524 | |||||||||
| 5,288 | Hudson City Bancorp, Inc. | 50,395 | |||||||||
| 8,668 | Huntington Bancshares, Inc. | 58,856 | |||||||||
| 737 | IntercontinentalExchange, Inc.* | 88,698 | |||||||||
| 4,622 | Invesco Ltd.(~) | 114,949 | |||||||||
| 1,868 | Janus Capital Group, Inc. | 22,734 | |||||||||
| 39,927 | JPMorgan Chase & Co. | 1,821,869 | |||||||||
| 9,549 | KeyCorp | 82,790 | |||||||||
| 4,080 | Kimco Realty Corp. REIT | 79,723 | |||||||||
| 1,528 | Legg Mason, Inc. | 56,765 | |||||||||
| 1,987 | Leucadia National Corp. | 76,817 | |||||||||
| 3,170 | Lincoln National Corp. | 98,999 | |||||||||
| 3,157 | Loews Corp. | 139,729 | |||||||||
| 1,207 | M&T Bank Corp. | 106,663 | |||||||||
| 5,462 | Marsh & McLennan Cos., Inc. | 165,389 | |||||||||
| 5,322 | Marshall & Ilsley Corp. | 43,481 | |||||||||
| 10,593 | MetLife, Inc. | 495,646 | |||||||||
| 2,004 | Moody's Corp. | 78,437 | |||||||||
| 15,517 | Morgan Stanley | 405,770 | |||||||||
| 1,504 | NASDAQ OMX Group, Inc. (The)* | 40,758 | |||||||||
| 2,431 | Northern Trust Corp. | 121,526 | |||||||||
| 2,622 | NYSE Euronext | 105,011 | |||||||||
| 3,634 | People's United Financial, Inc. | 49,749 | |||||||||
| 1,625 | Plum Creek Timber Co., Inc. REIT | 70,021 | |||||||||
| 5,276 | PNC Financial Services Group, Inc. | 328,906 | |||||||||
| 3,221 | Principal Financial Group, Inc. | 108,709 | |||||||||
| 6,626 | Progressive Corp. (The) | 145,374 | |||||||||
| 5,727 | ProLogis REIT | 93,293 | |||||||||
| 4,879 | Prudential Financial, Inc. | 309,426 | |||||||||
| 1,403 | Public Storage REIT | 164,586 | |||||||||
| 12,627 | Regions Financial Corp. | 92,682 | |||||||||
| 2,981 | Simon Property Group, Inc. REIT | 341,444 | |||||||||
| 5,290 | SLM Corp. | 87,761 | |||||||||
| 5,042 | State Street Corp. | 234,705 | |||||||||
| 5,379 | SunTrust Banks, Inc. | 151,634 | |||||||||
| 2,600 | T. Rowe Price Group, Inc. | 167,050 | |||||||||
| 782 | Torchmark Corp. | 52,331 | |||||||||
| 4,328 | Travelers Cos., Inc. (The) | 273,876 | |||||||||
| 19,295 | U.S. Bancorp | 498,197 | |||||||||
| 3,109 | Unum Group | 82,326 | |||||||||
| 1,636 | Ventas, Inc. REIT | 91,502 | |||||||||
| 1,641 | Vornado Realty Trust REIT | 158,652 | |||||||||
| 52,803 | Wells Fargo & Co. | 1,537,095 | |||||||||
| 5,393 | Weyerhaeuser Co. REIT | 124,093 | |||||||||
| 3,122 | XL Group PLC (Ireland) | 76,239 | |||||||||
| Number of Shares | Value | ||||||||||
| Common Stocks and Other Equity Interests(<) (Continued) | |||||||||||
| 1,837 | Zions Bancorp | $ | 44,915 | ||||||||
| 19,288,819 | |||||||||||
| Health Care—11.7% | |||||||||||
| 15,512 | Abbott Laboratories | 807,244 | |||||||||
| 3,860 | Aetna, Inc. | 159,727 | |||||||||
| 3,465 | Agilent Technologies, Inc.* | 172,938 | |||||||||
| 3,069 | Allergan, Inc. | 244,170 | |||||||||
| 2,752 | AmerisourceBergen Corp. | 111,841 | |||||||||
| 9,361 | Amgen, Inc.* | 532,173 | |||||||||
| 5,817 | Baxter International, Inc. | 330,987 | |||||||||
| 2,220 | Becton, Dickinson and Co. | 190,787 | |||||||||
| 2,419 | Biogen Idec, Inc.* | 235,490 | |||||||||
| 15,294 | Boston Scientific Corp.* | 114,552 | |||||||||
| 17,092 | Bristol-Myers Squibb Co. | 480,285 | |||||||||
| 854 | C.R. Bard, Inc. | 91,164 | |||||||||
| 3,511 | Cardinal Health, Inc. | 153,396 | |||||||||
| 2,240 | CareFusion Corp.* | 65,789 | |||||||||
| 4,667 | Celgene Corp.* | 274,793 | |||||||||
| 760 | Cephalon, Inc.* | 58,368 | |||||||||
| 720 | Cerner Corp.* | 86,530 | |||||||||
| 2,723 | CIGNA Corp. | 127,518 | |||||||||
| 1,504 | Coventry Health Care, Inc.* | 48,534 | |||||||||
| 4,958 | Covidien PLC (Ireland) | 276,111 | |||||||||
| 964 | DaVita, Inc.* | 84,919 | |||||||||
| 1,427 | DENTSPLY International, Inc. | 53,570 | |||||||||
| 1,153 | Edwards Lifesciences Corp.* | 99,562 | |||||||||
| 10,228 | Eli Lilly & Co. | 378,538 | |||||||||
| 5,304 | Express Scripts, Inc.* | 300,949 | |||||||||
| 2,872 | Forest Laboratories, Inc.* | 95,236 | |||||||||
| 7,984 | Gilead Sciences, Inc.* | 310,099 | |||||||||
| 1,673 | Hospira, Inc.* | 94,909 | |||||||||
| 1,692 | Humana, Inc. | 128,795 | |||||||||
| 390 | Intuitive Surgical, Inc.* | 136,383 | |||||||||
| 27,416 | Johnson & Johnson | 1,801,780 | |||||||||
| 1,004 | Laboratory Corp. of America Holdings* | 96,856 | |||||||||
| 1,807 | Life Technologies Corp.* | 99,746 | |||||||||
| 2,553 | McKesson Corp. | 211,925 | |||||||||
| 4,061 | Medco Health Solutions, Inc.* | 240,939 | |||||||||
| 10,736 | Medtronic, Inc. | 448,228 | |||||||||
| 30,902 | Merck & Co., Inc. | 1,110,927 | |||||||||
| 4,388 | Mylan, Inc.* | 109,349 | |||||||||
| 961 | Patterson Cos., Inc. | 33,356 | |||||||||
| 1,138 | PerkinElmer, Inc. | 32,171 | |||||||||
| 80,137 | Pfizer, Inc. | 1,679,671 | |||||||||
| 1,564 | Quest Diagnostics, Inc. | 88,178 | |||||||||
| 3,268 | St. Jude Medical, Inc. | 174,642 | |||||||||
| 3,378 | Stryker Corp. | 199,302 | |||||||||
| 4,879 | Tenet Healthcare Corp.* | 33,811 | |||||||||
| 3,922 | Thermo Fisher Scientific, Inc.* | 235,281 | |||||||||
| 10,980 | UnitedHealth Group, Inc. | 540,545 | |||||||||
See Notes to Financial Statements.
49
Schedule of Investments (Continued)
PowerShares S&P 500 BuyWrite Portfolio
April 30, 2011
| Number of Shares | Value | ||||||||||
| Common Stocks and Other Equity Interests(<) (Continued) | |||||||||||
| 1,205 | Varian Medical Systems, Inc.* | $ | 84,591 | ||||||||
| 917 | Waters Corp.* | 89,866 | |||||||||
| 1,263 | Watson Pharmaceuticals, Inc.* | 78,331 | |||||||||
| 3,770 | WellPoint, Inc. | 289,498 | |||||||||
| 1,929 | Zimmer Holdings, Inc.* | 125,867 | |||||||||
| 14,050,217 | |||||||||||
| Industrials—11.6% | |||||||||||
| 7,135 | 3M Co. | 693,593 | |||||||||
| 1,073 | Avery Dennison Corp. | 44,787 | |||||||||
| 7,392 | Boeing Co. (The) | 589,734 | |||||||||
| 1,667 | C.H. Robinson Worldwide, Inc. | 133,660 | |||||||||
| 6,403 | Caterpillar, Inc. | 738,970 | |||||||||
| 1,269 | Cintas Corp. | 39,402 | |||||||||
| 3,718 | CSX Corp. | 292,569 | |||||||||
| 1,986 | Cummins, Inc. | 238,677 | |||||||||
| 5,427 | Danaher Corp. | 299,787 | |||||||||
| 4,227 | Deere & Co. | 412,132 | |||||||||
| 1,873 | Dover Corp. | 127,439 | |||||||||
| 499 | Dun & Bradstreet Corp. (The) | 41,008 | |||||||||
| 3,417 | Eaton Corp. | 182,912 | |||||||||
| 7,571 | Emerson Electric Co. | 460,014 | |||||||||
| 1,232 | Equifax, Inc. | 46,237 | |||||||||
| 2,130 | Expeditors International of Washington, Inc. | 115,595 | |||||||||
| 1,480 | Fastenal Co. | 99,293 | |||||||||
| 3,163 | FedEx Corp. | 302,604 | |||||||||
| 559 | Flowserve Corp. | 70,781 | |||||||||
| 1,773 | Fluor Corp. | 124,004 | |||||||||
| 3,742 | General Dynamics Corp. | 272,492 | |||||||||
| 106,431 | General Electric Co. | 2,176,514 | |||||||||
| 1,261 | Goodrich Corp. | 111,435 | |||||||||
| 7,872 | Honeywell International, Inc. | 482,003 | |||||||||
| 5,004 | Illinois Tool Works, Inc. | 292,284 | |||||||||
| 3,309 | Ingersoll-Rand PLC (Ireland) | 167,105 | |||||||||
| 2,010 | Iron Mountain, Inc. | 64,018 | |||||||||
| 1,844 | ITT Corp. | 106,565 | |||||||||
| 1,269 | Jacobs Engineering Group, Inc.* | 62,955 | |||||||||
| 1,052 | Joy Global, Inc. | 106,199 | |||||||||
| 1,136 | L-3 Communications Holdings, Inc. | 91,096 | |||||||||
| 2,880 | Lockheed Martin Corp. | 228,240 | |||||||||
| 3,595 | Masco Corp. | 48,245 | |||||||||
| 3,575 | Norfolk Southern Corp. | 266,981 | |||||||||
| 2,925 | Northrop Grumman Corp. | 186,059 | |||||||||
| 3,668 | PACCAR, Inc. | 194,807 | |||||||||
| 1,159 | Pall Corp. | 67,732 | |||||||||
| 1,625 | Parker Hannifin Corp. | 153,270 | |||||||||
| 2,046 | Pitney Bowes, Inc. | 50,250 | |||||||||
| 1,440 | Precision Castparts Corp. | 222,509 | |||||||||
| 2,164 | Quanta Services, Inc.* | 46,916 | |||||||||
| 2,073 | R.R. Donnelley & Sons Co. | 39,097 | |||||||||
| 3,611 | Raytheon Co. | 175,314 | |||||||||
| Number of Shares | Value | ||||||||||
| Common Stocks and Other Equity Interests(<) (Continued) | |||||||||||
| 3,085 | Republic Services, Inc. | $ | 97,548 | ||||||||
| 1,469 | Robert Half International, Inc. | 44,555 | |||||||||
| 1,429 | Rockwell Automation, Inc. | 124,509 | |||||||||
| 1,557 | Rockwell Collins, Inc. | 98,247 | |||||||||
| 957 | Roper Industries, Inc. | 82,771 | |||||||||
| 514 | Ryder System, Inc. | 27,499 | |||||||||
| 585 | Snap-On, Inc. | 36,135 | |||||||||
| 7,505 | Southwest Airlines Co. | 88,184 | |||||||||
| 857 | Stericycle, Inc.* | 78,227 | |||||||||
| 2,771 | Textron, Inc. | 72,323 | |||||||||
| 4,756 | Tyco International Ltd. (Switzerland) | 231,807 | |||||||||
| 4,929 | Union Pacific Corp. | 510,004 | |||||||||
| 9,894 | United Parcel Service, Inc., Class B | 741,753 | |||||||||
| 9,226 | United Technologies Corp. | 826,465 | |||||||||
| 586 | W.W. Grainger, Inc. | 88,838 | |||||||||
| 4,774 | Waste Management, Inc. | 188,382 | |||||||||
| 14,002,531 | |||||||||||
| Information Technology—18.7% | |||||||||||
| 5,081 | Adobe Systems, Inc.* | 170,468 | |||||||||
| 5,779 | Advanced Micro Devices, Inc.* | 52,589 | |||||||||
| 1,879 | Akamai Technologies, Inc.* | 64,713 | |||||||||
| 3,212 | Altera Corp. | 156,424 | |||||||||
| 1,766 | Amphenol Corp., Class A | 98,737 | |||||||||
| 3,008 | Analog Devices, Inc. | 121,252 | |||||||||
| 9,234 | Apple, Inc.* | 3,215,556 | |||||||||
| 13,246 | Applied Materials, Inc. | 207,830 | |||||||||
| 2,298 | Autodesk, Inc.* | 103,364 | |||||||||
| 4,984 | Automatic Data Processing, Inc. | 270,880 | |||||||||
| 1,793 | BMC Software, Inc.* | 90,062 | |||||||||
| 4,774 | Broadcom Corp., Class A | 167,949 | |||||||||
| 3,841 | CA, Inc. | 94,450 | |||||||||
| 55,408 | Cisco Systems, Inc. | 972,964 | |||||||||
| 1,884 | Citrix Systems, Inc.* | 158,897 | |||||||||
| 3,054 | Cognizant Technology Solutions Corp., Class A* | 253,177 | |||||||||
| 1,557 | Computer Sciences Corp. | 79,376 | |||||||||
| 2,196 | Compuware Corp.* | 24,881 | |||||||||
| 15,719 | Corning, Inc. | 329,156 | |||||||||
| 16,860 | Dell, Inc.* | 261,499 | |||||||||
| 11,471 | eBay, Inc.* | 394,602 | |||||||||
| 3,356 | Electronic Arts, Inc.* | 67,724 | |||||||||
| 20,768 | EMC Corp.* | 588,565 | |||||||||
| 811 | F5 Networks, Inc.* | 82,203 | |||||||||
| 2,673 | Fidelity National Information Services, Inc. | 88,476 | |||||||||
| 543 | First Solar, Inc.* | 75,787 | |||||||||
| 1,467 | Fiserv, Inc.* | 89,942 | |||||||||
| 1,601 | FLIR Systems, Inc. | 56,387 | |||||||||
| 2,514 | Google, Inc., Class A* | 1,367,867 | |||||||||
| 1,284 | Harris Corp. | 68,219 | |||||||||
| 21,796 | Hewlett-Packard Co. | 879,905 | |||||||||
See Notes to Financial Statements.
50
Schedule of Investments (Continued)
PowerShares S&P 500 BuyWrite Portfolio
April 30, 2011
| Number of Shares | Value | ||||||||||
| Common Stocks and Other Equity Interests(<) (Continued) | |||||||||||
| 55,007 | Intel Corp. | $ | 1,275,612 | ||||||||
| 12,224 | International Business Machines Corp. | 2,085,170 | |||||||||
| 2,734 | Intuit, Inc.* | 151,901 | |||||||||
| 1,968 | Jabil Circuit, Inc. | 39,045 | |||||||||
| 2,251 | JDS Uniphase Corp.* | 46,911 | |||||||||
| 5,370 | Juniper Networks, Inc.* | 205,832 | |||||||||
| 1,679 | KLA-Tencor Corp. | 73,708 | |||||||||
| 789 | Lexmark International, Inc., Class A* | 25,445 | |||||||||
| 2,278 | Linear Technology Corp. | 79,274 | |||||||||
| 6,185 | LSI Corp.* | 45,336 | |||||||||
| 970 | MasterCard, Inc., Class A | 267,613 | |||||||||
| 2,312 | MEMC Electronic Materials, Inc.* | 27,351 | |||||||||
| 1,892 | Microchip Technology, Inc. | 77,648 | |||||||||
| 8,611 | Micron Technology, Inc.* | 97,218 | |||||||||
| 74,112 | Microsoft Corp. | 1,928,394 | |||||||||
| 1,387 | Molex, Inc. | 37,449 | |||||||||
| 1,307 | Monster Worldwide, Inc.* | 21,448 | |||||||||
| 2,954 | Motorola Mobility Holdings, Inc.* | 76,981 | |||||||||
| 3,380 | Motorola Solutions, Inc.* | 155,074 | |||||||||
| 2,421 | National Semiconductor Corp. | 58,395 | |||||||||
| 3,693 | NetApp, Inc.* | 191,962 | |||||||||
| 905 | Novellus Systems, Inc.* | 29,050 | |||||||||
| 5,833 | NVIDIA Corp.* | 116,660 | |||||||||
| 38,994 | Oracle Corp. | 1,405,734 | |||||||||
| 3,232 | Paychex, Inc. | 105,719 | |||||||||
| 16,476 | QUALCOMM, Inc. | 936,496 | |||||||||
| 1,937 | Red Hat, Inc.* | 91,949 | |||||||||
| 2,949 | SAIC, Inc.* | 51,313 | |||||||||
| 1,187 | Salesforce.com, Inc.* | 164,518 | |||||||||
| 2,376 | SanDisk Corp.* | 116,757 | |||||||||
| 7,663 | Symantec Corp.* | 150,578 | |||||||||
| 3,641 | Tellabs, Inc. | 17,914 | |||||||||
| 1,689 | Teradata Corp.* | 94,449 | |||||||||
| 1,861 | Teradyne, Inc.* | 29,962 | |||||||||
| 11,767 | Texas Instruments, Inc. | 418,082 | |||||||||
| 1,631 | Total System Services, Inc. | 30,744 | |||||||||
| 1,741 | VeriSign, Inc. | 64,347 | |||||||||
| 4,865 | Visa, Inc., Class A | 380,054 | |||||||||
| 2,326 | Western Digital Corp.* | 92,575 | |||||||||
| 6,493 | Western Union Co. (The) | 137,976 | |||||||||
| 14,050 | Xerox Corp. | 141,765 | |||||||||
| 2,621 | Xilinx, Inc. | 91,368 | |||||||||
| 13,146 | Yahoo!, Inc.* | 233,342 | |||||||||
| 22,523,020 | |||||||||||
| Materials—3.8% | |||||||||||
| 2,158 | Air Products & Chemicals, Inc. | 206,132 | |||||||||
| 752 | Airgas, Inc. | 52,226 | |||||||||
| 1,107 | AK Steel Holding Corp. | 17,989 | |||||||||
| 10,669 | Alcoa, Inc. | 181,373 | |||||||||
| 991 | Allegheny Technologies, Inc. | 71,352 | |||||||||
| Number of Shares | Value | ||||||||||
| Common Stocks and Other Equity Interests(<) (Continued) | |||||||||||
| 1,699 | Ball Corp. | $ | 63,390 | ||||||||
| 1,075 | Bemis Co., Inc. | 33,691 | |||||||||
| 716 | CF Industries Holdings, Inc. | 101,350 | |||||||||
| 1,360 | Cliffs Natural Resources, Inc. | 127,459 | |||||||||
| 11,725 | Dow Chemical Co. (The) | 480,608 | |||||||||
| 9,253 | E.I. du Pont de Nemours & Co. | 525,478 | |||||||||
| 710 | Eastman Chemical Co. | 76,148 | |||||||||
| 2,336 | Ecolab, Inc. | 123,247 | |||||||||
| 718 | FMC Corp. | 63,385 | |||||||||
| 9,502 | Freeport-McMoRan Copper & Gold, Inc. | 522,895 | |||||||||
| 806 | International Flavors & Fragrances, Inc. | 51,197 | |||||||||
| 4,415 | International Paper Co. | 136,335 | |||||||||
| 1,690 | MeadWestvaco Corp. | 56,936 | |||||||||
| 5,388 | Monsanto Co. | 366,600 | |||||||||
| 4,952 | Newmont Mining Corp. | 290,237 | |||||||||
| 3,172 | Nucor Corp. | 148,957 | |||||||||
| 1,644 | Owens-Illinois, Inc.* | 48,777 | |||||||||
| 1,612 | PPG Industries, Inc. | 152,608 | |||||||||
| 3,045 | Praxair, Inc. | 324,049 | |||||||||
| 1,599 | Sealed Air Corp. | 41,206 | |||||||||
| 894 | Sherwin-Williams Co. (The) | 73,567 | |||||||||
| 1,224 | Sigma-Aldrich Corp. | 86,390 | |||||||||
| 904 | Titanium Metals Corp.* | 18,107 | |||||||||
| 1,443 | United States Steel Corp. | 68,846 | |||||||||
| 1,296 | Vulcan Materials Co. | 58,579 | |||||||||
| 4,569,114 | |||||||||||
| Telecommunication Services—3.1% | |||||||||||
| 3,992 | American Tower Corp., Class A* | 208,821 | |||||||||
| 59,251 | AT&T, Inc. | 1,843,891 | |||||||||
| 5,980 | CenturyLink, Inc. | 243,864 | |||||||||
| 9,977 | Frontier Communications Corp. | 82,510 | |||||||||
| 2,649 | MetroPCS Communications, Inc.* | 44,583 | |||||||||
| 30,021 | Sprint Nextel Corp.* | 155,509 | |||||||||
| 28,346 | Verizon Communications, Inc. | 1,070,912 | |||||||||
| 5,063 | Windstream Corp. | 64,857 | |||||||||
| 3,714,947 | |||||||||||
| Utilities—3.3% | |||||||||||
| 6,648 | AES Corp. (The)* | 88,019 | |||||||||
| 2,415 | Ameren Corp. | 70,784 | |||||||||
| 4,827 | American Electric Power Co., Inc. | 176,089 | |||||||||
| 4,265 | CenterPoint Energy, Inc. | 79,329 | |||||||||
| 2,531 | CMS Energy Corp. | 50,114 | |||||||||
| 2,931 | Consolidated Edison, Inc. | 152,764 | |||||||||
| 2,006 | Constellation Energy Group, Inc. | 73,058 | |||||||||
| 5,831 | Dominion Resources, Inc. | 270,675 | |||||||||
| 1,701 | DTE Energy Co. | 85,952 | |||||||||
| 13,344 | Duke Energy Corp. | 248,866 | |||||||||
| 3,271 | Edison International | 128,452 | |||||||||
| 1,797 | Entergy Corp. | 125,287 | |||||||||
| 6,645 | Exelon Corp. | 280,087 | |||||||||
See Notes to Financial Statements.
51
Schedule of Investments (Continued)
PowerShares S&P 500 BuyWrite Portfolio
April 30, 2011
| Number of Shares | Value | ||||||||||
| Common Stocks and Other Equity Interests(<) (Continued) | |||||||||||
| 4,199 | FirstEnergy Corp. | $ | 167,792 | ||||||||
| 783 | Integrys Energy Group, Inc. | 40,998 | |||||||||
| 4,226 | NextEra Energy, Inc. | 239,065 | |||||||||
| 457 | Nicor, Inc. | 25,331 | |||||||||
| 2,804 | NiSource, Inc. | 54,538 | |||||||||
| 1,772 | Northeast Utilities | 63,083 | |||||||||
| 2,485 | NRG Energy, Inc.* | 60,137 | |||||||||
| 1,074 | ONEOK, Inc. | 75,116 | |||||||||
| 2,260 | Pepco Holdings, Inc. | 43,550 | |||||||||
| 3,978 | PG&E Corp. | 183,306 | |||||||||
| 1,092 | Pinnacle West Capital Corp. | 47,382 | |||||||||
| 5,666 | PPL Corp. | 155,418 | |||||||||
| 2,947 | Progress Energy, Inc. | 139,835 | |||||||||
| 5,080 | Public Service Enterprise Group, Inc. | 163,424 | |||||||||
| 1,143 | SCANA Corp. | 47,457 | |||||||||
| 2,415 | Sempra Energy | 133,066 | |||||||||
| 8,490 | Southern Co. | 331,450 | |||||||||
| 2,157 | TECO Energy, Inc. | 41,565 | |||||||||
| 2,347 | Wisconsin Energy Corp. | 73,250 | |||||||||
| 4,846 | Xcel Energy, Inc. | 117,903 | |||||||||
| 4,033,142 | |||||||||||
| Total Investments (Cost $92,452,986)—103.5% | 124,698,485 | ||||||||||
| Liabilities in excess of other assets—(3.5%) | (4,187,161 | ) | |||||||||
| Net Assets—100.0% | $ | 120,511,324 | |||||||||
Investment Abbreviations:
REIT—Real Estate Investment Trust
Notes to Schedule of Investments:
* Non-income producing security.
(<) A portion of the securities in the portfolio are subject to call options written. In addition, the unrealized appreciation (depreciation) of the call options written were based on Level 1 inputs. See Note 2H and Note 3.
(~) Affiliated company. The Fund's Adviser is a subsidiary of Invesco Ltd. and therefore, Invesco Ltd. is considered to be affiliated with the Fund. See Note 6.
See Notes to Financial Statements.
52
Schedule of Investments
PowerShares S&P 500 High Quality Portfolio
April 30, 2011
| Number of Shares | Value | ||||||||||
| Common Stocks and Other Equity Interests—99.9% | |||||||||||
| Consumer Discretionary—18.7% | |||||||||||
| 19,821 | Darden Restaurants, Inc. | $ | 930,992 | ||||||||
| 26,943 | Family Dollar Stores, Inc. | 1,460,580 | |||||||||
| 41,779 | Gap, Inc. (The) | 970,944 | |||||||||
| 17,455 | Genuine Parts Co. | 937,334 | |||||||||
| 11,751 | Harley-Davidson, Inc. | 437,842 | |||||||||
| 9,924 | Hasbro, Inc. | 464,840 | |||||||||
| 24,815 | Home Depot, Inc. (The) | 921,629 | |||||||||
| 23,063 | Johnson Controls, Inc. | 945,583 | |||||||||
| 17,330 | Lowe's Cos., Inc. | 454,913 | |||||||||
| 13,444 | Marriott International, Inc., Class A | 474,573 | |||||||||
| 12,222 | McDonald's Corp. | 957,105 | |||||||||
| 27,068 | News Corp., Class A | 482,352 | |||||||||
| 18,016 | NIKE, Inc., Class B | 1,483,077 | |||||||||
| 10,058 | Nordstrom, Inc. | 478,258 | |||||||||
| 28,533 | Omnicom Group, Inc. | 1,403,538 | |||||||||
| 3,760 | Polo Ralph Lauren Corp. | 491,695 | |||||||||
| 19,751 | Ross Stores, Inc. | 1,455,451 | |||||||||
| 28,150 | Target Corp. | 1,382,165 | |||||||||
| 7,566 | Tiffany & Co. | 525,383 | |||||||||
| 27,503 | TJX Cos., Inc. (The) | 1,474,711 | |||||||||
| 9,556 | VF Corp. | 960,951 | |||||||||
| 22,262 | Walt Disney Co. (The) | 959,492 | |||||||||
| 18,748 | Yum! Brands, Inc. | 1,005,643 | |||||||||
| 21,059,051 | |||||||||||
| Consumer Staples—23.5% | |||||||||||
| 35,425 | Altria Group, Inc. | 950,807 | |||||||||
| 26,357 | Archer-Daniels-Midland Co. | 975,736 | |||||||||
| 33,220 | Avon Products, Inc. | 976,004 | |||||||||
| 13,634 | Brown-Forman Corp., Class B | 979,739 | |||||||||
| 13,968 | Campbell Soup Co. | 469,185 | |||||||||
| 13,393 | Clorox Co. (The) | 932,956 | |||||||||
| 20,727 | Coca-Cola Co. (The) | 1,398,243 | |||||||||
| 17,156 | Colgate-Palmolive Co. | 1,447,109 | |||||||||
| 19,650 | ConAgra Foods, Inc. | 480,442 | |||||||||
| 6,086 | Costco Wholesale Corp. | 492,479 | |||||||||
| 38,487 | CVS Caremark Corp. | 1,394,769 | |||||||||
| 25,669 | General Mills, Inc. | 990,310 | |||||||||
| 50,284 | Hormel Foods Corp. | 1,478,852 | |||||||||
| 19,083 | J.M. Smucker Co. (The) | 1,432,561 | |||||||||
| 25,850 | Kellogg Co. | 1,480,430 | |||||||||
| 14,205 | Kimberly-Clark Corp. | 938,382 | |||||||||
| 14,672 | Kraft Foods, Inc., Class A | 492,686 | |||||||||
| 29,690 | McCormick & Co., Inc. | 1,458,373 | |||||||||
| 9,932 | Molson Coors Brewing Co., Class B | 484,185 | |||||||||
| 21,211 | PepsiCo, Inc. | 1,461,226 | |||||||||
| 22,523 | Procter & Gamble Co. (The) | 1,461,743 | |||||||||
| 49,670 | Sysco Corp. | 1,435,960 | |||||||||
| 33,998 | Walgreen Co. | 1,452,395 | |||||||||
| Number of Shares | Value | ||||||||||
| Common Stocks and Other Equity Interests (Continued) | |||||||||||
| 26,535 | Wal-Mart Stores, Inc. | $ | 1,458,894 | ||||||||
| 26,523,466 | |||||||||||
| Energy—2.6% | |||||||||||
| 3,574 | Apache Corp. | 476,664 | |||||||||
| 4,240 | Chevron Corp. | 464,026 | |||||||||
| 16,222 | Exxon Mobil Corp. | 1,427,536 | |||||||||
| 4,482 | Occidental Petroleum Corp. | 512,248 | |||||||||
| 2,880,474 | |||||||||||
| Financials—8.7% | |||||||||||
| 17,323 | Aflac, Inc. | 973,379 | |||||||||
| 10,039 | American Express Co. | 492,714 | |||||||||
| 3,939 | AvalonBay Communities, Inc. REIT | 498,717 | |||||||||
| 9,001 | Capital One Financial Corp. | 492,625 | |||||||||
| 14,966 | Chubb Corp. (The) | 975,634 | |||||||||
| 28,233 | Cincinnati Financial Corp. | 894,421 | |||||||||
| 17,568 | Federated Investors, Inc., Class B | 452,903 | |||||||||
| 2,887 | Goldman Sachs Group, Inc. (The) | 435,966 | |||||||||
| 8,949 | Health Care REIT, Inc. REIT | 481,188 | |||||||||
| 94,174 | Hudson City Bancorp, Inc. | 897,478 | |||||||||
| 26,495 | Kimco Realty Corp. REIT | 517,712 | |||||||||
| 8,914 | Northern Trust Corp. | 445,611 | |||||||||
| 10,087 | State Street Corp. | 469,550 | |||||||||
| 6,848 | T. Rowe Price Group, Inc. | 439,984 | |||||||||
| 13,944 | Torchmark Corp. | 933,133 | |||||||||
| 14,695 | Wells Fargo & Co. | 427,771 | |||||||||
| 9,828,786 | |||||||||||
| Health Care—10.0% | |||||||||||
| 18,412 | Abbott Laboratories | 958,160 | |||||||||
| 11,561 | AmerisourceBergen Corp. | 469,839 | |||||||||
| 17,302 | Baxter International, Inc. | 984,484 | |||||||||
| 11,510 | Becton, Dickinson and Co. | 989,169 | |||||||||
| 9,306 | C.R. Bard, Inc. | 993,415 | |||||||||
| 12,735 | DENTSPLY International, Inc. | 478,072 | |||||||||
| 23,448 | Johnson & Johnson | 1,541,003 | |||||||||
| 5,923 | McKesson Corp. | 491,668 | |||||||||
| 23,435 | Medtronic, Inc. | 978,411 | |||||||||
| 19,830 | Mylan, Inc.* | 494,164 | |||||||||
| 23,353 | Stryker Corp. | 1,377,827 | |||||||||
| 31,420 | UnitedHealth Group, Inc. | 1,546,807 | |||||||||
| 11,303,019 | |||||||||||
| Industrials—20.6% | |||||||||||
| 14,960 | 3M Co. | 1,454,262 | |||||||||
| 18,771 | C.H. Robinson Worldwide, Inc. | 1,505,059 | |||||||||
| 12,699 | Caterpillar, Inc. | 1,465,591 | |||||||||
| 15,397 | Cintas Corp. | 478,077 | |||||||||
| 27,047 | Danaher Corp. | 1,494,076 | |||||||||
| 4,847 | Deere & Co. | 472,582 | |||||||||
| 7,141 | Dover Corp. | 485,874 | |||||||||
| 8,566 | Eaton Corp. | 458,538 | |||||||||
See Notes to Financial Statements.
53
Schedule of Investments (Continued)
PowerShares S&P 500 High Quality Portfolio
April 30, 2011
| Number of Shares | Value | ||||||||||
| Common Stocks and Other Equity Interests (Continued) | |||||||||||
| 24,144 | Emerson Electric Co. | $ | 1,466,989 | ||||||||
| 27,643 | Expeditors International of Washington, Inc. | 1,500,186 | |||||||||
| 13,808 | Fastenal Co. | 926,379 | |||||||||
| 18,713 | General Dynamics Corp. | 1,362,681 | |||||||||
| 23,022 | General Electric Co. | 470,800 | |||||||||
| 17,107 | Illinois Tool Works, Inc. | 999,220 | |||||||||
| 7,902 | ITT Corp. | 456,656 | |||||||||
| 11,689 | L-3 Communications Holdings, Inc. | 937,341 | |||||||||
| 6,867 | Norfolk Southern Corp. | 512,827 | |||||||||
| 9,756 | Parker Hannifin Corp. | 920,186 | |||||||||
| 14,608 | Rockwell Collins, Inc. | 921,765 | |||||||||
| 10,881 | Roper Industries, Inc. | 941,098 | |||||||||
| 9,716 | Union Pacific Corp. | 1,005,314 | |||||||||
| 16,443 | United Technologies Corp. | 1,472,964 | |||||||||
| 9,742 | W.W. Grainger, Inc. | 1,476,887 | |||||||||
| 23,185,352 | |||||||||||
| Information Technology—4.7% | |||||||||||
| 17,725 | Automatic Data Processing, Inc. | 963,354 | |||||||||
| 9,152 | Harris Corp. | 486,246 | |||||||||
| 11,416 | Hewlett-Packard Co. | 460,864 | |||||||||
| 5,669 | International Business Machines Corp. | 967,018 | |||||||||
| 13,923 | Linear Technology Corp. | 484,520 | |||||||||
| 13,858 | Oracle Corp. | 499,581 | |||||||||
| 29,084 | Paychex, Inc. | 951,337 | |||||||||
| 25,274 | Total System Services, Inc. | 476,415 | |||||||||
| 5,289,335 | |||||||||||
| Materials—6.8% | |||||||||||
| 10,103 | Air Products & Chemicals, Inc. | 965,039 | |||||||||
| 6,942 | Airgas, Inc. | 482,122 | |||||||||
| 12,908 | Ball Corp. | 481,597 | |||||||||
| 27,066 | Ecolab, Inc. | 1,428,002 | |||||||||
| 7,334 | International Flavors & Fragrances, Inc. | 465,856 | |||||||||
| 13,632 | Praxair, Inc. | 1,450,717 | |||||||||
| 10,937 | Sherwin-Williams Co. (The) | 900,006 | |||||||||
| 21,510 | Sigma-Aldrich Corp. | 1,518,176 | |||||||||
| 7,691,515 | |||||||||||
| Utilities—4.3% | |||||||||||
| 14,017 | Entergy Corp. | 977,265 | |||||||||
| 12,515 | FirstEnergy Corp. | 500,099 | |||||||||
| 16,600 | NextEra Energy, Inc. | 939,062 | |||||||||
| 7,103 | ONEOK, Inc. | 496,784 | |||||||||
| 17,962 | PPL Corp. | 492,698 | |||||||||
| 8,691 | Sempra Energy | 478,874 | |||||||||
| 12,102 | Southern Co. | 472,462 | |||||||||
| Number of Shares | Value | ||||||||||
| Common Stocks and Other Equity Interests (Continued) | |||||||||||
| 15,450 | Wisconsin Energy Corp. | $ | 482,195 | ||||||||
| 4,839,439 | |||||||||||
| Total Common Stocks and Other Equity Interests (Cost $93,058,529) | 112,600,437 | ||||||||||
| Money Market Fund—0.1% | |||||||||||
| 147,761 | Goldman Sachs Financial Square Prime Obligations Institutional Share Class (Cost $147,761) | 147,761 | |||||||||
| Total Investments (Cost $93,206,290—100.0% | 112,748,198 | ||||||||||
| Liabilities in excess of other assets—(0.0%) | (53,462 | ) | |||||||||
| Net Assets—100.0% | $ | 112,694,736 | |||||||||
Investment Abbreviations:
REIT—Real Estate Investment Trust
Notes to Schedule of Investments:
* Non-income producing security.
See Notes to Financial Statements.
54
Schedule of Investments
PowerShares Water Resources Portfolio
April 30, 2011
| Number of Shares | Value | ||||||||||
| Common Stocks and Other Equity Interests—100.0% | |||||||||||
| Electronics—11.1% | |||||||||||
| 1,274,913 | Badger Meter, Inc.(~) | $ | 48,331,952 | ||||||||
| 951,549 | Itron, Inc.* | 51,792,812 | |||||||||
| 1,043,792 | Watts Water Technologies, Inc., Class A | 40,394,750 | |||||||||
| 140,519,514 | |||||||||||
| Engineering & Construction—15.0% | |||||||||||
| 2,124,553 | Aecom Technology Corp.* | 57,915,315 | |||||||||
| 1,526,256 | Insituform Technologies, Inc., Class A* | 38,629,540 | |||||||||
| 1,205,041 | Layne Christensen Co.(~)* | 35,862,020 | |||||||||
| 1,253,051 | URS Corp.* | 56,074,032 | |||||||||
| 188,480,907 | |||||||||||
| Environmental Control—12.4% | |||||||||||
| 2,615,960 | Calgon Carbon Corp.* | 44,889,874 | |||||||||
| 1,951,342 | Energy Recovery, Inc.* | 6,029,647 | |||||||||
| 536,866 | Met-Pro Corp. | 6,383,337 | |||||||||
| 1,527,960 | Nalco Holding Co. | 44,631,711 | |||||||||
| 2,314,854 | Tetra Tech, Inc.* | 54,676,851 | |||||||||
| 156,611,420 | |||||||||||
| Hand/Machine Tools—3.3% | |||||||||||
| 908,294 | Franklin Electric Co., Inc. | 40,973,142 | |||||||||
| Machinery-Diversified—17.8% | |||||||||||
| 335,210 | Flowserve Corp. | 42,444,290 | |||||||||
| 1,027,457 | Gorman-Rupp Co. (The)(~) | 41,560,636 | |||||||||
| 924,711 | IDEX Corp. | 43,387,440 | |||||||||
| 746,586 | Lindsay Corp.(~) | 54,739,685 | |||||||||
| 493,353 | Roper Industries, Inc. | 42,670,101 | |||||||||
| 224,802,152 | |||||||||||
| Metal Fabricate/Hardware—9.6% | |||||||||||
| 9,182,450 | Mueller Water Products, Inc., Class A(~) | 40,402,780 | |||||||||
| 837,450 | Northwest Pipe Co.(~)* | 20,149,047 | |||||||||
| 573,045 | Valmont Industries, Inc. | 60,341,639 | |||||||||
| 120,893,466 | |||||||||||
| Miscellaneous Manufacturing—17.3% | |||||||||||
| 545,702 | Ameron International Corp.(~) | 38,384,679 | |||||||||
| 978,320 | Danaher Corp. | 54,042,397 | |||||||||
| 694,171 | ITT Corp. | 40,116,142 | |||||||||
| 719,039 | Pall Corp. | 42,020,639 | |||||||||
| 1,081,159 | Pentair, Inc. | 43,419,345 | |||||||||
| 217,983,202 | |||||||||||
| Water—13.5% | |||||||||||
| 669,331 | American States Water Co. | 23,366,345 | |||||||||
| 825,102 | American Water Works Co., Inc. | 24,241,497 | |||||||||
| 1,014,767 | Aqua America, Inc. | 22,882,996 | |||||||||
| 419,333 | Cia de Saneamento Basico do Estado de Sao Paulo ADR (Brazil) | 24,539,367 | |||||||||
| 1,310,310 | Consolidated Water Co. Ltd. (Cayman Islands)(~) | 12,854,141 | |||||||||
| Number of Shares | Value | ||||||||||
| Common Stocks and Other Equity Interests (Continued) | |||||||||||
| 1,860,464 | Veolia Environnement SA ADR (France) | $ | 62,381,358 | ||||||||
| 170,265,704 | |||||||||||
| Total Common Stocks and Other Equity Interests (Cost $1,116,859,688) | 1,260,529,507 | ||||||||||
| Money Market Fund—0.0% | |||||||||||
| 386,714 | Goldman Sachs Financial Square Prime Obligations Institutional Share Class (Cost $386,714) | 386,714 | |||||||||
| Total Investments (Cost $1,117,246,402)—100.0% | 1,260,916,221 | ||||||||||
| Liabilities in excess of other assets—(0.0%) | (268,192 | ) | |||||||||
| Net Assets—100.0% | $ | 1,260,648,029 | |||||||||
Investment Abbreviations:
ADR—American Depositary Receipt
Notes to Schedule of Investments:
(~) Affiliated Investment. See Note 6.
* Non-income producing security.
See Notes to Financial Statements.
55
Schedule of Investments
PowerShares WilderHill Clean Energy Portfolio
April 30, 2011
| Number of Shares | Value | ||||||||||
| Common Stocks and Other Equity Interests—100.0% | |||||||||||
| Auto Manufacturers—2.4% | |||||||||||
| 468,110 | Tesla Motors, Inc.* | $ | 12,919,836 | ||||||||
| Auto Parts & Equipment—4.7% | |||||||||||
| 740,381 | Amerigon, Inc.* | 12,623,496 | |||||||||
| 423,975 | Fuel Systems Solutions, Inc.* | 12,602,657 | |||||||||
| 25,226,153 | |||||||||||
| Building Materials—0.6% | |||||||||||
| 2,093,000 | Broadwind Energy, Inc.* | 3,453,450 | |||||||||
| Chemicals—8.2% | |||||||||||
| 105,937 | Air Products & Chemicals, Inc. | 10,119,102 | |||||||||
| 304,955 | OM Group, Inc.* | 11,051,569 | |||||||||
| 201,992 | Sociedad Quimica y Minera de Chile SA ADR (Chile) | 12,327,572 | |||||||||
| 853,526 | Zoltek Cos., Inc.* | 10,967,809 | |||||||||
| 44,466,052 | |||||||||||
| Commercial Services—2.0% | |||||||||||
| 505,832 | Quanta Services, Inc.* | 10,966,438 | |||||||||
| Computers—4.2% | |||||||||||
| 1,178,833 | Echelon Corp.* | 11,210,702 | |||||||||
| 646,679 | Maxwell Technologies, Inc.* | 11,530,287 | |||||||||
| 22,740,989 | |||||||||||
| Electric—10.4% | |||||||||||
| 824,143 | Ameresco, Inc., Class A* | 13,276,944 | |||||||||
| 582,503 | Calpine Corp.* | 9,756,925 | |||||||||
| 109,767 | CPFL Energia SA ADR (Brazil) | 9,707,793 | |||||||||
| 244,338 | IDACORP, Inc. | 9,580,493 | |||||||||
| 454,042 | Ormat Technologies, Inc. | 11,305,646 | |||||||||
| 2,496,233 | U.S. Geothermal, Inc.* | 2,496,233 | |||||||||
| 56,124,034 | |||||||||||
| Electrical Components & Equipment—24.5% | |||||||||||
| 1,391,757 | A123 Systems, Inc.* | 8,406,212 | |||||||||
| 4,076,247 | Active Power, Inc.(~)* | 9,905,280 | |||||||||
| 3,031,640 | Advanced Battery Technologies, Inc.* | 5,214,421 | |||||||||
| 461,554 | American Superconductor Corp.* | 5,469,415 | |||||||||
| 980,289 | Canadian Solar, Inc. (China)* | 10,577,318 | |||||||||
| 1,520,049 | China BAK Battery, Inc.* | 2,386,477 | |||||||||
| 1,089,416 | China Ming Yang Wind Power Group Ltd. ADR (Cayman Islands)* | 9,379,872 | |||||||||
| 3,639,989 | Ener1, Inc.* | 9,209,172 | |||||||||
| 2,047,628 | Energy Conversion Devices, Inc.* | 4,095,256 | |||||||||
| 1,261,136 | Power-One, Inc.* | 10,416,984 | |||||||||
| 3,031,640 | Satcon Technology Corp.* | 9,701,248 | |||||||||
| 674,877 | SunPower Corp., Class A* | 14,692,072 | |||||||||
| 1,199,541 | Suntech Power Holdings Co. Ltd. ADR ( China)* | 10,759,883 | |||||||||
| 211,861 | Universal Display Corp.* | 11,639,643 | |||||||||
| Number of Shares | Value | ||||||||||
| Common Stocks and Other Equity Interests (Continued) | |||||||||||
| 868,140 | Yingli Green Energy Holding Co. Ltd. ADR (China)* | $ | 10,877,794 | ||||||||
| 132,731,047 | |||||||||||
| Electronics—2.6% | |||||||||||
| 209,336 | Itron, Inc.* | 11,394,159 | |||||||||
| 928,627 | UQM Technologies, Inc.* | 2,590,869 | |||||||||
| 13,985,028 | |||||||||||
| Energy-Alternate Sources—12.8% | |||||||||||
| 349,475 | Amyris, Inc.* | 9,236,624 | |||||||||
| 1,015,255 | Ascent Solar Technologies, Inc.* | 1,634,561 | |||||||||
| 1,214,682 | Ballard Power Systems, Inc. (Canada)* | 2,502,245 | |||||||||
| 605,993 | Comverge, Inc.* | 2,339,133 | |||||||||
| 72,778 | First Solar, Inc.* | 10,157,626 | |||||||||
| 5,335,078 | FuelCell Energy, Inc.* | 9,122,983 | |||||||||
| 507,626 | Gevo, Inc.* | 9,822,563 | |||||||||
| 1,602,829 | JA Solar Holdings Co. Ltd. ADR (China)* | 11,011,435 | |||||||||
| 514,351 | Ocean Power Technologies, Inc.* | 2,504,889 | |||||||||
| 390,059 | Trina Solar Ltd. ADR (Cayman Islands)* | 11,112,781 | |||||||||
| 69,444,840 | |||||||||||
| Food—1.7% | |||||||||||
| 742,253 | Cosan Ltd., Class A (Brazil) | 9,241,050 | |||||||||
| Metal Fabricate/Hardware—0.4% | |||||||||||
| 858,328 | China Wind Systems, Inc.* | 2,059,987 | |||||||||
| Mining—5.0% | |||||||||||
| 196,065 | Molycorp, Inc.* | 14,371,564 | |||||||||
| 892,833 | Rare Element Resources Ltd. (Canada)* | 12,901,437 | |||||||||
| 27,273,001 | |||||||||||
| Miscellaneous Manufacturing—4.1% | |||||||||||
| 190,433 | Polypore International, Inc.* | 11,763,046 | |||||||||
| 644,927 | STR Holdings, Inc.* | 10,621,948 | |||||||||
| 22,384,994 | |||||||||||
| Semiconductors—16.4% | |||||||||||
| 266,977 | Aixtron SE ADR (Germany) | 11,333,174 | |||||||||
| 717,052 | Applied Materials, Inc. | 11,250,546 | |||||||||
| 245,094 | Cree, Inc.* | 9,985,130 | |||||||||
| 991,315 | GT Solar International, Inc.* | 11,072,989 | |||||||||
| 338,213 | International Rectifier Corp.* | 11,688,641 | |||||||||
| 872,087 | MEMC Electronic Materials, Inc.* | 10,316,789 | |||||||||
| 1,182,612 | Renesola Ltd. ADR (British Virgin Islands)* | 10,856,378 | |||||||||
| 421,938 | Rubicon Technology, Inc.* | 12,029,452 | |||||||||
| 88,533,099 | |||||||||||
| Total Common Stocks and Other Equity Interests (Cost $608,918,739) | 541,549,998 | ||||||||||
See Notes to Financial Statements.
56
Schedule of Investments (Continued)
PowerShares WilderHill Clean Energy Portfolio
April 30, 2011
| Number of Shares | Value | ||||||||||
| Money Market Fund—0.1% | |||||||||||
| 467,305 | Goldman Sachs Financial Square Prime Obligations Institutional Share Class (Cost $467,305) | $ | 467,305 | ||||||||
| Total Investments (Cost $609,386,044)—100.1% | 542,017,303 | ||||||||||
| Liabilities in excess of other assets—(0.1%) | (545,213 | ) | |||||||||
| Net Assets—100.0% | $ | 541,472,090 | |||||||||
Investment Abbreviations:
ADR—American Depositary Receipt
Notes to Schedule of Investments:
(~) Affiliated Investment. See Note 6.
* Non-income producing security.
See Notes to Financial Statements.
57
Schedule of Investments
PowerShares WilderHill Progressive Energy Portfolio
April 30, 2011
| Number of Shares | Value | ||||||||||
| Common Stocks and Other Equity Interests—100.0% | |||||||||||
| Agriculture—2.1% | |||||||||||
| 31,749 | Andersons, Inc. (The) | $ | 1,576,338 | ||||||||
| Auto Manufacturers—2.0% | |||||||||||
| 55,169 | Tata Motors Ltd. ADR (India) | 1,513,837 | |||||||||
| Auto Parts & Equipment—8.6% | |||||||||||
| 138,127 | Exide Technologies* | 1,386,795 | |||||||||
| 36,931 | Johnson Controls, Inc. | 1,514,171 | |||||||||
| 34,910 | Tenneco, Inc.* | 1,613,191 | |||||||||
| 78,391 | Westport Innovations, Inc. (Canada)* | 1,983,293 | |||||||||
| 6,497,450 | |||||||||||
| Building Materials—2.2% | |||||||||||
| 43,848 | Owens Corning* | 1,659,208 | |||||||||
| Chemicals—4.4% | |||||||||||
| 47,859 | Methanex Corp. (Canada) | 1,544,888 | |||||||||
| 31,366 | Rockwood Holdings, Inc.* | 1,779,707 | |||||||||
| 3,324,595 | |||||||||||
| Computers—2.1% | |||||||||||
| 50,412 | Telvent GIT SA (Spain)* | 1,552,186 | |||||||||
| Electric—7.9% | |||||||||||
| 97,677 | Centrais Eletricas Brasileiras SA ADR (Brazil) | 1,447,573 | |||||||||
| 78,926 | Companhia Energetica de Minas Gerais ADR (Brazil) | 1,647,186 | |||||||||
| 75,117 | EnerNOC, Inc.* | 1,345,345 | |||||||||
| 69,903 | Enersis SA ADR (Chile) | 1,493,128 | |||||||||
| 5,933,232 | |||||||||||
| Electrical Components & Equipment—13.6% | |||||||||||
| 74,559 | A-Power Energy Generation Systems Ltd.* | 301,964 | |||||||||
| 25,439 | Emerson Electric Co. | 1,545,674 | |||||||||
| 21,902 | Energizer Holdings, Inc.* | 1,654,258 | |||||||||
| 40,177 | EnerSys* | 1,522,307 | |||||||||
| 34,619 | General Cable Corp.* | 1,679,021 | |||||||||
| 75,138 | GrafTech International Ltd.* | 1,743,202 | |||||||||
| 77,414 | Harbin Electric, Inc.* | 1,449,190 | |||||||||
| 107,647 | SmartHeat, Inc.* | 316,482 | |||||||||
| 10,212,098 | |||||||||||
| Electronics—7.3% | |||||||||||
| 92,877 | Elster Group SE ADR (Germany)* | 1,437,736 | |||||||||
| 46,827 | Koninklijke Philips Electronics NV (Netherlands) | 1,380,928 | |||||||||
| 95,939 | SemiLEDs Corp.* | 1,090,826 | |||||||||
| 43,431 | Woodward, Inc. | 1,609,119 | |||||||||
| 5,518,609 | |||||||||||
| Energy-Alternate Sources—4.4% | |||||||||||
| 102,881 | Clean Energy Fuels Corp.* | 1,753,092 | |||||||||
| Number of Shares | Value | ||||||||||
| Common Stocks and Other Equity Interests (Continued) | |||||||||||
| 89,167 | Covanta Holding Corp. | $ | 1,530,998 | ||||||||
| 3,284,090 | |||||||||||
| Engineering & Construction—5.9% | |||||||||||
| 37,776 | Chicago Bridge & Iron Co. NV (Netherlands) | 1,531,439 | |||||||||
| 42,466 | Foster Wheeler AG (Switzerland)* | 1,510,516 | |||||||||
| 61,278 | McDermott International, Inc.* | 1,414,909 | |||||||||
| 4,456,864 | |||||||||||
| Environmental Control—2.6% | |||||||||||
| 223,319 | EnergySolutions, Inc. | 1,261,752 | |||||||||
| 41,299 | Fuel Tech, Inc.* | 334,935 | |||||||||
| 291,078 | Rentech, Inc.* | 323,097 | |||||||||
| 1,919,784 | |||||||||||
| Hand/Machine Tools—2.1% | |||||||||||
| 20,378 | Regal-Beloit Corp. | 1,544,449 | |||||||||
| Machinery-Diversified—2.2% | |||||||||||
| 66,183 | Altra Holdings, Inc.* | 1,680,386 | |||||||||
| Mining—5.6% | |||||||||||
| 48,481 | Cameco Corp. (Canada) | 1,429,220 | |||||||||
| 566,299 | Denison Mines Corp. (Canada)* | 1,325,140 | |||||||||
| 320,570 | USEC, Inc.* | 1,468,210 | |||||||||
| 4,222,570 | |||||||||||
| Miscellaneous Manufacturing—15.0% | |||||||||||
| 33,689 | A.O. Smith Corp. | 1,481,305 | |||||||||
| 23,452 | Cooper Industries PLC (Ireland) | 1,546,659 | |||||||||
| 28,171 | Eaton Corp. | 1,507,994 | |||||||||
| 39,399 | ESCO Technologies, Inc. | 1,445,155 | |||||||||
| 78,918 | Hexcel Corp.* | 1,699,105 | |||||||||
| 36,697 | LSB Industries, Inc.* | 1,480,724 | |||||||||
| 18,736 | PMFG, Inc.* | 429,429 | |||||||||
| 11,499 | Siemens AG ADR (Germany) | 1,678,164 | |||||||||
| 11,268,535 | |||||||||||
| Oil & Gas—8.0% | |||||||||||
| 44,023 | Chesapeake Energy Corp. | 1,482,254 | |||||||||
| 26,423 | Range Resources Corp. | 1,491,578 | |||||||||
| 26,773 | Sasol Ltd. ADR (South Africa) | 1,548,015 | |||||||||
| 34,204 | Southwestern Energy Co.* | 1,500,188 | |||||||||
| 6,022,035 | |||||||||||
| Semiconductors—2.1% | |||||||||||
| 30,602 | Veeco Instruments, Inc.* | 1,564,680 | |||||||||
| Telecommunications—1.9% | |||||||||||
| 67,850 | Corning, Inc. | 1,420,779 | |||||||||
| Total Common Stocks and Other Equity Interests (Cost $59,838,570) | 75,171,725 | ||||||||||
See Notes to Financial Statements.
58
Schedule of Investments (Continued)
PowerShares WilderHill Progressive Energy Portfolio
April 30, 2010
| Number of Shares | Value | ||||||||||
| Money Market Fund—0.1% | |||||||||||
| 79,466 | Goldman Sachs Financial Square Prime Obligations Institutional Share Class (Cost $79,466) | $ | 79,466 | ||||||||
| Total Investments (Cost $59,918,036)—100.1% | 75,251,191 | ||||||||||
| Liabilities in excess of other assets—(0.1%) | (75,934 | ) | |||||||||
| Net Assets—100.0% | $ | 75,175,257 | |||||||||
Investment Abbreviations:
ADR—American Depositary Receipt
Notes to Schedule of Investments:
* Non-income producing security.
See Notes to Financial Statements.
59
Statements of Assets and Liabilities
April 30, 2011
| PowerShares Aerospace & Defense Portfolio | PowerShares CleantechTM Portfolio | PowerShares DWA Technical LeadersTM Portfolio | PowerShares Global Listed Private Equity Portfolio | PowerShares Golden Dragon Halter USX China Portfolio | PowerShares Lux Nanotech Portfolio | ||||||||||||||||||||||
| ASSETS: | |||||||||||||||||||||||||||
| Unaffiliated investments, at value | $ | 108,110,954 | $ | 162,582,190 | $ | 451,258,032 | $ | 489,392,549 | $ | 446,242,891 | $ | 38,484,305 | |||||||||||||||
| Affiliated investments, at value (Note 6) | — | — | — | — | — | — | |||||||||||||||||||||
| Total investments, at value | 108,110,954 | 162,582,190 | 451,258,032 | 489,392,549 | 446,242,891 | 38,484,305 | |||||||||||||||||||||
| Cash | — | 386 | 615 | — | — | 262 | |||||||||||||||||||||
| Foreign currencies, at value | — | 17,476 | — | 27,873 | — | — | |||||||||||||||||||||
| Receivables: | |||||||||||||||||||||||||||
| Dividends | 44,203 | 266,821 | 112,152 | 289,620 | 2,000,171 | 8,381 | |||||||||||||||||||||
| Expense waivers | 7,506 | 7,235 | — | 48,345 | 8,258 | 10,341 | |||||||||||||||||||||
| Investments sold | — | — | 1,318,815 | 54,247,343 | 283,614 | — | |||||||||||||||||||||
| Foreign tax reclaims | — | 72,563 | — | 148,355 | — | — | |||||||||||||||||||||
| Shares sold | — | — | 5,304,654 | 4,823,929 | — | — | |||||||||||||||||||||
| Other assets | — | — | — | 2,500 | — | — | |||||||||||||||||||||
| Total Assets | 108,162,663 | 162,946,671 | 457,994,268 | 548,980,514 | 448,534,934 | 38,503,289 | |||||||||||||||||||||
| LIABILITIES: | |||||||||||||||||||||||||||
| Due to custodian | 7,670 | — | — | 72,374 | 1,029,111 | — | |||||||||||||||||||||
| Payables: | |||||||||||||||||||||||||||
| Shares repurchased | — | — | 1,318,663 | — | — | — | |||||||||||||||||||||
| Investments purchased | — | 199,865 | 5,305,551 | 54,816,809 | 571,318 | — | |||||||||||||||||||||
| Expense recapture | — | — | 18,396 | — | — | — | |||||||||||||||||||||
| Open written options, at value | — | — | — | — | — | — | |||||||||||||||||||||
| Accrued advisory fees | 44,029 | 64,472 | 171,054 | 187,210 | 182,775 | 15,518 | |||||||||||||||||||||
| Accrued expenses | 139,713 | 151,893 | 276,465 | 282,194 | 459,940 | 97,295 | |||||||||||||||||||||
| Total Liabilities | 191,412 | 416,230 | 7,090,129 | 55,358,587 | 2,243,144 | 112,813 | |||||||||||||||||||||
| NET ASSETS | $ | 107,971,251 | $ | 162,530,441 | $ | 450,904,139 | $ | 493,621,927 | $ | 446,291,790 | $ | 38,390,476 | |||||||||||||||
| NET ASSETS CONSIST OF: | |||||||||||||||||||||||||||
| Shares of beneficial interest | $ | 144,215,812 | $ | 196,593,012 | $ | 552,847,954 | $ | 482,155,877 | $ | 588,023,395 | $ | 105,173,223 | |||||||||||||||
| Undistributed net investment income (loss) | 151,517 | 102,024 | (10,205 | ) | (7,350,386 | ) | 293,268 | (5,613 | ) | ||||||||||||||||||
| Undistributed net realized gain (loss) | (26,845,144 | ) | (65,199,837 | ) | (172,617,874 | ) | (77,189,896 | ) | (190,252,520 | ) | (67,232,931 | ) | |||||||||||||||
| Net unrealized appreciation (depreciation) | (9,550,934 | ) | 31,035,242 | 70,684,264 | 96,006,332 | 48,227,647 | 455,797 | ||||||||||||||||||||
| Net Assets | $ | 107,971,251 | $ | 162,530,441 | $ | 450,904,139 | $ | 493,621,927 | $ | 446,291,790 | $ | 38,390,476 | |||||||||||||||
| Shares outstanding (unlimited amount authorized, $0.01 par value) | 5,250,000 | 5,400,000 | 17,000,000 | 40,550,000 | 15,400,000 | 4,000,000 | |||||||||||||||||||||
| Net asset value | $ | 20.57 | $ | 30.10 | $ | 26.52 | $ | 12.17 | $ | 28.98 | $ | 9.60 | |||||||||||||||
| Share price | $ | 20.57 | $ | 30.08 | $ | 26.54 | $ | 12.25 | $ | 28.87 | $ | 9.70 | |||||||||||||||
| Unaffiliated investments, at cost | $ | 117,661,888 | $ | 131,554,828 | $ | 380,573,768 | $ | 393,409,711 | $ | 398,015,244 | $ | 38,028,508 | |||||||||||||||
| Affiliated investments, at cost | $ | — | $ | — | $ | — | $ | — | $ | — | $ | — | |||||||||||||||
| Total investments, at cost | $ | 117,661,888 | $ | 131,554,828 | $ | 380,573,768 | $ | 393,409,711 | $ | 398,015,244 | $ | 38,028,508 | |||||||||||||||
| Foreign currencies, at cost | $ | — | $ | 16,785 | $ | — | $ | 27,319 | $ | — | $ | — | |||||||||||||||
| Premium received | $ | — | $ | — | $ | — | $ | — | $ | — | $ | — | |||||||||||||||
See Notes to Financial Statements.
60
| PowerShares Morningstar StockInvestor Core Portfolio | PowerShares S&P 500 BuyWrite Portfolio | PowerShares S&P 500® High Quality Portfolio | PowerShares Water Resources Portfolio | PowerShares WilderHill Clean Energy Portfolio | PowerShares WilderHill Progressive Energy Portfolio | ||||||||||||||||||||||
| ASSETS: | |||||||||||||||||||||||||||
| Unaffiliated investments, at value | $ | 19,874,547 | $ | 124,583,536 | $ | 112,748,198 | $ | 968,631,281 | $ | 532,112,023 | $ | 75,251,191 | |||||||||||||||
| Affiliated investments, at value (Note 6) | — | 114,949 | — | 292,284,940 | 9,905,280 | — | |||||||||||||||||||||
| Total investments, at value | 19,874,547 | 124,698,485 | 112,748,198 | 1,260,916,221 | 542,017,303 | 75,251,191 | |||||||||||||||||||||
| Cash | 23,844 | — | 329 | — | — | 284 | |||||||||||||||||||||
| Foreign currencies, at value | — | — | — | — | — | — | |||||||||||||||||||||
| Receivables: | |||||||||||||||||||||||||||
| Dividends | 23,367 | 133,486 | 126,260 | 1,159,333 | 257,981 | 44,334 | |||||||||||||||||||||
| Expense waivers | — | — | 2,126 | 11,685 | — | 8,915 | |||||||||||||||||||||
| Investments sold | — | — | — | — | — | — | |||||||||||||||||||||
| Foreign tax reclaims | — | — | — | 34,150 | — | 4,346 | |||||||||||||||||||||
| Shares sold | — | — | — | — | — | — | |||||||||||||||||||||
| Other assets | 340 | — | — | — | — | — | |||||||||||||||||||||
| Total Assets | 19,922,098 | 124,831,971 | 112,876,913 | 1,262,121,389 | 542,275,284 | 75,309,070 | |||||||||||||||||||||
| LIABILITIES: | |||||||||||||||||||||||||||
| Due to custodian | — | 33,595 | — | 53,268 | 27,021 | — | |||||||||||||||||||||
| Payables: | |||||||||||||||||||||||||||
| Shares repurchased | — | — | — | — | — | — | |||||||||||||||||||||
| Investments purchased | — | — | — | — | — | — | |||||||||||||||||||||
| Expense recapture | 14,814 | — | — | — | 4,812 | — | |||||||||||||||||||||
| Open written options, at value | — | 4,213,440 | — | — | — | — | |||||||||||||||||||||
| Accrued advisory fees | 7,930 | 73,612 | 45,039 | 513,693 | 222,654 | 29,920 | |||||||||||||||||||||
| Accrued expenses | 82,880 | — | 137,138 | 906,399 | 548,707 | 103,893 | |||||||||||||||||||||
| Total Liabilities | 105,624 | 4,320,647 | 182,177 | 1,473,360 | 803,194 | 133,813 | |||||||||||||||||||||
| NET ASSETS | $ | 19,816,474 | $ | 120,511,324 | $ | 112,694,736 | $ | 1,260,648,029 | $ | 541,472,090 | $ | 75,175,257 | |||||||||||||||
| NET ASSETS CONSIST OF: | |||||||||||||||||||||||||||
| Shares of beneficial interest | $ | 46,401,287 | $ | 111,488,576 | $ | 231,847,511 | $ | 1,569,642,038 | $ | 1,762,670,557 | $ | 85,843,293 | |||||||||||||||
| Undistributed net investment income (loss) | 80,443 | 270,459 | 664,833 | 1,059,040 | (29,770 | ) | 19,901 | ||||||||||||||||||||
| Undistributed net realized gain (loss) | (30,329,311 | ) | (21,158,969 | ) | (139,359,516 | ) | (453,722,868 | ) | (1,153,799,956 | ) | (26,021,092 | ) | |||||||||||||||
| Net unrealized appreciation (depreciation) | 3,664,055 | 29,911,258 | 19,541,908 | 143,669,819 | (67,368,741 | ) | 15,333,155 | ||||||||||||||||||||
| Net Assets | $ | 19,816,474 | $ | 120,511,324 | $ | 112,694,736 | $ | 1,260,648,029 | $ | 541,472,090 | $ | 75,175,257 | |||||||||||||||
| Shares outstanding (unlimited amount authorized, $0.01 par value) | 900,000 | 5,600,000 | 7,700,000 | 62,250,000 | 52,300,000 | 2,450,000 | |||||||||||||||||||||
| Net asset value | $ | 22.02 | $ | 21.52 | $ | 14.64 | $ | 20.25 | $ | 10.35 | $ | 30.68 | |||||||||||||||
| Share price | $ | 22.01 | $ | 21.52 | $ | 14.64 | $ | 20.24 | $ | 10.33 | $ | 30.70 | |||||||||||||||
| Unaffiliated investments, at cost | $ | 16,210,492 | $ | 92,369,431 | $ | 93,206,290 | $ | 864,607,298 | $ | 599,193,333 | $ | 59,918,036 | |||||||||||||||
| Affiliated investments, at cost | $ | — | $ | 83,555 | $ | — | $ | 252,639,104 | $ | 10,192,711 | $ | — | |||||||||||||||
| Total investments, at cost | $ | 16,210,492 | $ | 92,452,986 | $ | 93,206,290 | $ | 1,117,246,402 | $ | 609,386,044 | $ | 59,918,036 | |||||||||||||||
| Foreign currencies, at cost | $ | — | $ | — | $ | — | $ | — | $ | — | $ | — | |||||||||||||||
| Premium received | $ | — | $ | 1,879,199 | $ | — | $ | — | $ | — | $ | — | |||||||||||||||
61
Statements of Operations
Year Ended April 30, 2011
| PowerShares Aerospace & Defense Portfolio | PowerShares CleantechTM Portfolio | PowerShares DWA Technical LeadersTM Portfolio | PowerShares Global Listed Private Equity Portfolio | PowerShares Golden Dragon Halter USX China Portfolio | PowerShares Lux Nanotech Portfolio | ||||||||||||||||||||||
| INVESTMENT INCOME: | |||||||||||||||||||||||||||
| Unaffiliated dividend income | $ | 1,842,493 | $ | 1,449,048 | $ | 2,287,041 | $ | 9,841,369 | $ | 7,296,049 | $ | 296,709 | |||||||||||||||
| Affiliated dividend income | — | — | — | — | — | — | |||||||||||||||||||||
| Foreign withholding tax | (6,395 | ) | (139,813 | ) | (17,873 | ) | (514,917 | ) | (742,252 | ) | (1,601 | ) | |||||||||||||||
| Total Income | 1,836,098 | 1,309,235 | 2,269,168 | 9,326,452 | 6,553,797 | 295,108 | |||||||||||||||||||||
| EXPENSES: | |||||||||||||||||||||||||||
| Advisory fees | 557,769 | 731,402 | 1,276,503 | 1,457,668 | 2,161,604 | 225,001 | |||||||||||||||||||||
| Accounting & administration fees | 68,240 | 68,240 | 74,979 | 75,639 | 105,520 | 68,241 | |||||||||||||||||||||
| Sub-licensing | 66,931 | 109,710 | 255,300 | 291,533 | 416,872 | 45,000 | |||||||||||||||||||||
| Printing | 41,197 | 39,695 | 48,007 | 53,783 | 107,001 | 22,305 | |||||||||||||||||||||
| Professional fees | 37,381 | 39,178 | 40,654 | 62,303 | 58,248 | 33,068 | |||||||||||||||||||||
| Custodian & transfer agent fees | 23,185 | 55,179 | 32,528 | 105,586 | 215,373 | 14,125 | |||||||||||||||||||||
| Trustees | 8,583 | 9,518 | 11,708 | 12,887 | 18,700 | 6,420 | |||||||||||||||||||||
| Recapture (See Note 4) | — | 2,114 | 41,073 | 14,597 | 11,120 | — | |||||||||||||||||||||
| Other expenses | 14,063 | 25,191 | 25,002 | 43,869 | 22,726 | 12,810 | |||||||||||||||||||||
| Total Expenses | 817,349 | 1,080,227 | 1,805,754 | 2,117,865 | 3,117,164 | 426,970 | |||||||||||||||||||||
| Less: Waivers | (81,095 | ) | (92,835 | ) | (18,650 | ) | (77,130 | ) | (105,598 | ) | (111,968 | ) | |||||||||||||||
| Net Expenses | 736,254 | 987,392 | 1,787,104 | 2,040,735 | 3,011,566 | 315,002 | |||||||||||||||||||||
| Net Investment Income (Loss) | 1,099,844 | 321,843 | 482,064 | 7,285,717 | 3,542,231 | (19,894 | ) | ||||||||||||||||||||
| REALIZED AND UNREALIZED GAIN (LOSS): | |||||||||||||||||||||||||||
| Net realized gain (loss) from: | |||||||||||||||||||||||||||
| Investments | (3,186,072 | ) | (16,374,010 | ) | (12,612,013 | ) | 5,388,756 | (30,202,926 | ) | (11,525,252 | ) | ||||||||||||||||
| Written options | — | — | — | — | — | — | |||||||||||||||||||||
| In-kind redemptions | (3,331,744 | ) | 12,531,485 | 46,624,580 | 2,791,577 | 45,138,364 | 3,527,837 | ||||||||||||||||||||
| Foreign currencies | — | (145,800 | ) | — | (247,061 | ) | — | — | |||||||||||||||||||
| Net realized gain (loss) | (6,517,816 | ) | (3,988,325 | ) | 34,012,567 | 7,933,272 | 14,935,438 | (7,997,415 | ) | ||||||||||||||||||
| Net change in unrealized appreciation (depreciation) on: | |||||||||||||||||||||||||||
| Investments | 12,580,366 | 31,401,658 | 37,481,504 | 71,827,661 | 44,598,566 | 3,460,627 | |||||||||||||||||||||
| Written options | — | — | — | — | — | — | |||||||||||||||||||||
| Foreign currencies | — | 12,050 | — | 25,317 | — | — | |||||||||||||||||||||
| Net change in unrealized appreciation (depreciation) | 12,580,366 | 31,413,708 | 37,481,504 | 71,852,978 | 44,598,566 | 3,460,627 | |||||||||||||||||||||
| Net realized and unrealized gain | 6,062,550 | 27,425,383 | 71,494,071 | 79,786,250 | 59,534,004 | (4,536,788 | ) | ||||||||||||||||||||
| Net increase (decrease) in net assets resulting from operations | 7,162,394 | 27,747,226 | 71,976,135 | 87,071,967 | 63,076,235 | (4,556,682 | ) | ||||||||||||||||||||
See Notes to Financial Statements.
62
| PowerShares Morningstar StockInvestor Core Portfolio | PowerShares S&P 500 BuyWrite Portfolio | PowerShares S&P 500® High Quality Portfolio | PowerShares Water Resources Portfolio | PowerShares WilderHill Clean Energy Portfolio | PowerShares WilderHill Progressive Energy Portfolio | ||||||||||||||||||||||
| INVESTMENT INCOME: | |||||||||||||||||||||||||||
| Unaffiliated dividend income | $ | 297,429 | $ | 3,140,981 | $ | 1,794,187 | $ | 10,289,626 | $ | 2,441,955 | $ | 670,196 | |||||||||||||||
| Affiliated dividend income | — | 2,905 | — | 5,207,313 | — | — | |||||||||||||||||||||
| Foreign withholding tax | (4,978 | ) | (30 | ) | (435 | ) | (721,671 | ) | (58,757 | ) | (29,551 | ) | |||||||||||||||
| Total Income | 292,451 | 3,143,856 | 1,793,752 | 14,775,268 | 2,383,198 | 640,645 | |||||||||||||||||||||
| EXPENSES: | |||||||||||||||||||||||||||
| Advisory fees | 88,853 | 1,110,109 | 444,269 | 5,765,805 | 2,761,318 | 299,969 | |||||||||||||||||||||
| Accounting & administration fees | 68,240 | — | 68,240 | 281,977 | 134,886 | 68,240 | |||||||||||||||||||||
| Sub-licensing | 17,737 | — | 88,854 | 864,872 | 552,272 | 59,994 | |||||||||||||||||||||
| Printing | 20,321 | — | 27,298 | 360,212 | 267,193 | 20,070 | |||||||||||||||||||||
| Professional fees | 54,552 | — | 50,188 | 100,262 | 64,265 | 33,599 | |||||||||||||||||||||
| Custodian & transfer agent fees | 16,534 | — | 20,850 | 96,519 | 51,736 | 15,871 | |||||||||||||||||||||
| Trustees | 5,463 | — | 7,457 | 41,621 | 23,237 | 6,715 | |||||||||||||||||||||
| Recapture (See Note 4) | 35,753 | — | 24,164 | — | 236,006 | — | |||||||||||||||||||||
| Other expenses | 13,397 | — | 15,878 | 64,352 | 30,963 | 13,135 | |||||||||||||||||||||
| Total Expenses | 320,850 | 1,110,109 | 747,198 | 7,575,620 | 4,121,876 | 517,593 | |||||||||||||||||||||
| Less: Waivers | (226,080 | ) | — | (281,303 | ) | (11,685 | ) | (256,014 | ) | (97,636 | ) | ||||||||||||||||
| Net Expenses | 94,770 | 1,110,109 | 465,895 | 7,563,935 | 3,865,862 | 419,957 | |||||||||||||||||||||
| Net Investment Income (Loss) | 197,681 | 2,033,747 | 1,327,857 | 7,211,333 | (1,482,664 | ) | 220,688 | ||||||||||||||||||||
| REALIZED AND UNREALIZED GAIN (LOSS): | |||||||||||||||||||||||||||
| Net realized gain (loss) from: | |||||||||||||||||||||||||||
| Investments | (2,028,179 | ) | 2,273,557 | (5,546,857 | ) | (29,893,638 | ) | (125,796,142 | ) | (3,742,524 | ) | ||||||||||||||||
| Written options | — | (9,038,928 | ) | — | — | — | — | ||||||||||||||||||||
| In-kind redemptions | 1,837,507 | 18,713,626 | 13,098,297 | 51,777,837 | 57,106,333 | 8,190,141 | |||||||||||||||||||||
| Foreign currencies | — | — | — | — | — | — | |||||||||||||||||||||
| Net realized gain (loss) | (190,672 | ) | 11,948,255 | 7,551,440 | 21,884,199 | (68,689,809 | ) | 4,447,617 | |||||||||||||||||||
| Net change in unrealized appreciation (depreciation) on: | |||||||||||||||||||||||||||
| Investments | 1,581,696 | (134,789 | ) | 10,923,267 | 94,753,726 | 74,473,012 | 8,016,614 | ||||||||||||||||||||
| Written options | — | (3,061,141 | ) | — | — | — | — | ||||||||||||||||||||
| Foreign currencies | — | — | — | — | — | — | |||||||||||||||||||||
| Net change in unrealized appreciation (depreciation) | 1,581,696 | (3,195,930 | ) | 10,923,267 | 94,753,726 | 74,473,012 | 8,016,614 | ||||||||||||||||||||
| Net realized and unrealized gain | 1,391,024 | 8,752,325 | 18,474,707 | 116,637,925 | 5,783,203 | 12,464,231 | |||||||||||||||||||||
| Net increase (decrease) in net assets resulting from operations | 1,588,705 | 10,786,072 | 19,802,564 | 123,849,258 | 4,300,539 | 12,684,919 | |||||||||||||||||||||
63
Statements of Changes in Net Assets
| PowerShares Aerospace & Defense Portfolio | PowerShares CleantechTM Portfolio | PowerShares DWA Technical LeadersTM Portfolio | |||||||||||||||||||||||||
| Year Ended April 30, 2011 | Year Ended April 30, 2010 | Year Ended April 30, 2011 | Year Ended April 30, 2010 | Year Ended April 30, 2011 | Year Ended April 30, 2010 | ||||||||||||||||||||||
| OPERATIONS: | |||||||||||||||||||||||||||
| Net investment income (loss) | $ | 1,099,844 | $ | 1,375,666 | $ | 321,843 | $ | 157,312 | $ | 482,064 | $ | 460,102 | |||||||||||||||
| Net realized gain (loss) | (6,517,816 | ) | (15,836,109 | ) | (3,988,325 | ) | (6,097,898 | ) | 34,012,567 | 16,658,427 | |||||||||||||||||
| Net change in unrealized appreciation (depreciation) | 12,580,366 | 60,642,047 | 31,413,708 | 40,138,039 | 37,481,504 | 34,450,917 | |||||||||||||||||||||
| Net increase in net assets resulting from operations | 7,162,394 | 46,181,604 | 27,747,226 | 34,197,453 | 71,976,135 | 51,569,446 | |||||||||||||||||||||
| Undistributed net investment income (loss) included in the price of units issued and redeemed | (9,800 | ) | (44,617 | ) | 70,849 | (48,876 | ) | 543,029 | (137,660 | ) | |||||||||||||||||
| DISTRIBUTIONS TO SHAREHOLDERS FROM: | |||||||||||||||||||||||||||
| Net investment income | (1,074,351 | ) | (1,645,392 | ) | (38,868 | ) | (223,251 | ) | (639,994 | ) | (843,823 | ) | |||||||||||||||
| Return of capital | — | — | — | (75,171 | ) | — | — | ||||||||||||||||||||
| Net realized gains | — | — | — | — | — | — | |||||||||||||||||||||
| Total distributions to shareholders | (1,074,351 | ) | (1,645,392 | ) | (38,868 | ) | (298,422 | ) | (639,994 | ) | (843,823 | ) | |||||||||||||||
| SHAREHOLDER TRANSACTIONS: | |||||||||||||||||||||||||||
| Proceeds from shares sold | 52,743,977 | 13,619,982 | 10,600,376 | 24,079,029 | 476,751,057 | 153,039,448 | |||||||||||||||||||||
| Value of shares repurchased | (88,198,319 | ) | (37,248,118 | ) | (35,799,445 | ) | (9,630,426 | ) | (256,554,369 | ) | (182,942,658 | ) | |||||||||||||||
| Net income equalization | 9,800 | 44,617 | (70,849 | ) | 48,876 | (543,029 | ) | 137,660 | |||||||||||||||||||
| Net increase (decrease) in net assets resulting from shares transactions | (35,444,542 | ) | (23,583,519 | ) | (25,269,918 | ) | 14,497,479 | 219,653,659 | (29,765,550 | ) | |||||||||||||||||
| Increase (Decrease) in Net Assets | (29,366,299 | ) | 20,908,076 | 2,509,289 | 48,347,634 | 291,532,829 | 20,822,413 | ||||||||||||||||||||
| NET ASSETS: | |||||||||||||||||||||||||||
| Beginning of year | 137,337,550 | 116,429,474 | 160,021,152 | 111,673,518 | 159,371,310 | 138,548,897 | |||||||||||||||||||||
| End of year | $ | 107,971,251 | $ | 137,337,550 | $ | 162,530,441 | $ | 160,021,152 | $ | 450,904,139 | $ | 159,371,310 | |||||||||||||||
| Undistributed net investment income (loss) at end of year | $ | 151,517 | $ | 126,024 | $ | 102,024 | $ | (4,993 | ) | $ | (10,205 | ) | $ | 120,278 | |||||||||||||
| CHANGES IN SHARES OUTSTANDING: | |||||||||||||||||||||||||||
| Shares sold | 2,650,000 | 850,000 | 400,000 | 1,000,000 | 20,800,000 | 8,750,000 | |||||||||||||||||||||
| Shares repurchased | (4,600,000 | ) | (2,350,000 | ) | (1,400,000 | ) | (400,000 | ) | (11,300,000 | ) | (11,050,000 | ) | |||||||||||||||
| Shares outstanding, beginning of year | 7,200,000 | 8,700,000 | 6,400,000 | 5,800,000 | 7,500,000 | 9,800,000 | |||||||||||||||||||||
| Shares outstanding, end of year | 5,250,000 | 7,200,000 | 5,400,000 | 6,400,000 | 17,000,000 | 7,500,000 | |||||||||||||||||||||
See Notes to Financial Statements.
64
| PowerShares Global Listed Private Equity Portfolio | PowerShares Golden Dragon Halter USX China Portfolio | PowerShares Lux Nanotech Portfolio | |||||||||||||||||||||||||
| Year Ended April 30, 2011 | Year Ended April 30, 2010 | Year Ended April 30, 2011 | Year Ended April 30, 2010 | Year Ended April 30, 2011 | Year Ended April 30, 2010 | ||||||||||||||||||||||
| OPERATIONS: | |||||||||||||||||||||||||||
| Net investment income (loss) | $ | 7,285,717 | $ | 5,444,893 | $ | 3,542,231 | $ | 2,408,094 | $ | (19,894 | ) | $ | (23,148 | ) | |||||||||||||
| Net realized gain (loss) | 7,933,272 | 7,645,151 | 14,935,438 | (57,442,677 | ) | (7,997,415 | ) | (5,661,907 | ) | ||||||||||||||||||
| Net change in unrealized appreciation (depreciation) | 71,852,978 | 40,022,330 | 44,598,566 | 187,055,633 | 3,460,627 | 20,148,115 | |||||||||||||||||||||
| Net increase in net assets resulting from operations | 87,071,967 | 53,112,374 | 63,076,235 | 132,021,050 | (4,556,682 | ) | 14,463,060 | ||||||||||||||||||||
| Undistributed net investment income (loss) included in the price of units issued and redeemed | 755,924 | 4,003,173 | (55,327 | ) | 455,464 | (9,346 | ) | 5,513 | |||||||||||||||||||
| DISTRIBUTIONS TO SHAREHOLDERS FROM: | |||||||||||||||||||||||||||
| Net investment income | (14,909,521 | ) | (4,710,562 | ) | (3,021,508 | ) | (3,271,139 | ) | — | (101,214 | ) | ||||||||||||||||
| Return of capital | — | — | — | (501,022 | ) | — | (16 | ) | |||||||||||||||||||
| Net realized gains | — | — | — | — | — | — | |||||||||||||||||||||
| Total distributions to shareholders | (14,909,521 | ) | (4,710,562 | ) | (3,021,508 | ) | (3,772,161 | ) | — | (101,230 | ) | ||||||||||||||||
| SHAREHOLDER TRANSACTIONS: | |||||||||||||||||||||||||||
| Proceeds from shares sold | 217,018,377 | 167,432,792 | 47,660,723 | 142,365,948 | 2,350,154 | 8,086,112 | |||||||||||||||||||||
| Value of shares repurchased | (7,438,354 | ) | (64,431,077 | ) | (116,946,947 | ) | (94,581,842 | ) | (14,693,067 | ) | (6,641,822 | ) | |||||||||||||||
| Net income equalization | (755,924 | ) | (4,003,173 | ) | 55,327 | (455,464 | ) | 9,346 | (5,513 | ) | |||||||||||||||||
| Net increase (decrease) in net assets resulting from shares transactions | 208,824,099 | 98,998,542 | (69,230,897 | ) | 47,328,642 | (12,333,567 | ) | 1,438,777 | |||||||||||||||||||
| Increase (Decrease) in Net Assets | 281,742,469 | 151,403,527 | (9,231,497 | ) | 176,032,995 | (16,899,595 | ) | 15,806,120 | |||||||||||||||||||
| NET ASSETS: | |||||||||||||||||||||||||||
| Beginning of year | 211,879,458 | 60,475,931 | 455,523,287 | 279,490,292 | 55,290,071 | 39,483,951 | |||||||||||||||||||||
| End of year | $ | 493,621,927 | $ | 211,879,458 | $ | 446,291,790 | $ | 455,523,287 | $ | 38,390,476 | $ | 55,290,071 | |||||||||||||||
| Undistributed net investment income (loss) at end of year | $ | (7,350,386 | ) | $ | 8,504 | $ | 293,268 | $ | (317,994 | ) | $ | (5,613 | ) | $ | (4,088 | ) | |||||||||||
| CHANGES IN SHARES OUTSTANDING: | |||||||||||||||||||||||||||
| Shares sold | 20,150,000 | 18,900,000 | 1,750,000 | 6,350,000 | 250,000 | 800,000 | |||||||||||||||||||||
| Shares repurchased | (700,000 | ) | (6,800,000 | ) | (4,550,000 | ) | (4,150,000 | ) | (1,600,000 | ) | (650,000 | ) | |||||||||||||||
| Shares outstanding, beginning of year | 21,100,000 | 9,000,000 | 18,200,000 | 16,000,000 | 5,350,000 | 5,200,000 | |||||||||||||||||||||
| Shares outstanding, end of year | 40,550,000 | 21,100,000 | 15,400,000 | 18,200,000 | 4,000,000 | 5,350,000 | |||||||||||||||||||||
65
Statements of Changes in Net Assets (Continued)
| PowerShares Morningstar StockInvestor Core Portfolio | PowerShares S&P 500 BuyWrite Portfolio | PowerShares S&P 500® High Quality Portfolio | |||||||||||||||||||||||||
| Year Ended April 30, 2011 | Year Ended April 30, 2010 | Year Ended April 30, 2011 | Year Ended April 30, 2010 | Year Ended April 30, 2011 | Year Ended April 30, 2010 | ||||||||||||||||||||||
| OPERATIONS: | |||||||||||||||||||||||||||
| Net investment income (loss) | $ | 197,681 | $ | 67,667 | $ | 2,033,747 | $ | 1,730,359 | $ | 1,327,857 | $ | (18,539 | ) | ||||||||||||||
| Net realized gain (loss) | (190,672 | ) | 5,681,406 | 11,948,255 | (18,998,077 | ) | 7,551,440 | 10,216,561 | |||||||||||||||||||
| Net change in unrealized appreciation (depreciation) | 1,581,696 | 1,537,408 | (3,195,930 | ) | 41,382,667 | 10,923,267 | 6,724,746 | ||||||||||||||||||||
| Net increase in net assets resulting from operations | 1,588,705 | 7,286,481 | 10,786,072 | 24,114,949 | 19,802,564 | 16,922,768 | |||||||||||||||||||||
| Undistributed net investment income (loss) included in the price of units issued and redeemed | (482 | ) | (6,004 | ) | (71,222 | ) | (4,975 | ) | 141,061 | (13,912 | ) | ||||||||||||||||
| DISTRIBUTIONS TO SHAREHOLDERS FROM: | |||||||||||||||||||||||||||
| Net investment income | (132,812 | ) | (145,806 | ) | (1,906,422 | ) | (1,778,095 | ) | (663,992 | ) | (237,779 | ) | |||||||||||||||
| Return of capital | — | — | — | — | — | — | |||||||||||||||||||||
| Net realized gains | — | — | (9,159,750 | ) | — | — | — | ||||||||||||||||||||
| Total distributions to shareholders | (132,812 | ) | (145,806 | ) | (11,066,172 | ) | (1,778,095 | ) | (663,992 | ) | (237,779 | ) | |||||||||||||||
| SHAREHOLDER TRANSACTIONS: | |||||||||||||||||||||||||||
| Proceeds from shares sold | 17,682,163 | 43,952,344 | 8,285,348 | 63,425,020 | 103,697,810 | 94,901,543 | |||||||||||||||||||||
| Value of shares repurchased | (18,611,672 | ) | (58,310,478 | ) | (55,333,752 | ) | (2,133,217 | ) | (77,887,161 | ) | (114,889,264 | ) | |||||||||||||||
| Net income equalization | 482 | 6,004 | 71,222 | 4,975 | (141,061 | ) | 13,912 | ||||||||||||||||||||
| Net increase (decrease) in net assets resulting from shares transactions | (929,027 | ) | (14,352,130 | ) | (46,977,182 | ) | 61,296,778 | 25,669,588 | (19,973,809 | ) | |||||||||||||||||
| Increase (Decrease) in Net Assets | 526,384 | (7,217,459 | ) | (47,328,504 | ) | 83,628,657 | 44,949,221 | (3,302,732 | ) | ||||||||||||||||||
| NET ASSETS: | |||||||||||||||||||||||||||
| Beginning of year | 19,290,090 | 26,507,549 | 167,839,828 | 84,211,171 | 67,745,515 | 71,048,247 | |||||||||||||||||||||
| End of year | $ | 19,816,474 | $ | 19,290,090 | $ | 120,511,324 | $ | 167,839,828 | $ | 112,694,736 | $ | 67,745,515 | |||||||||||||||
| Undistributed net investment income (loss) at end of year | $ | 80,443 | $ | 1,416 | $ | 270,459 | $ | 143,134 | $ | 664,833 | $ | (5,321 | ) | ||||||||||||||
| CHANGES IN SHARES OUTSTANDING: | |||||||||||||||||||||||||||
| Shares sold | 950,000 | 2,550,000 | 400,000 | 3,100,000 | 8,650,000 | 9,050,000 | |||||||||||||||||||||
| Shares repurchased | (1,000,000 | ) | (3,300,000 | ) | (2,600,000 | ) | (100,000 | ) | (6,500,000 | ) | (10,900,000 | ) | |||||||||||||||
| Shares outstanding, beginning of year | 950,000 | 1,700,000 | 7,800,000 | 4,800,000 | 5,550,000 | 7,400,000 | |||||||||||||||||||||
| Shares outstanding, end of year | 900,000 | 950,000 | 5,600,000 | 7,800,000 | 7,700,000 | 5,550,000 | |||||||||||||||||||||
See Notes to Financial Statements.
66
| PowerShares Water Resources Portfolio | PowerShares WilderHill Clean Energy Portfolio | PowerShares WilderHill Progressive Energy Portfolio | |||||||||||||||||||||||||
| Year Ended April 30, 2011 | Year Ended April 30, 2010 | Year Ended April 30, 2011 | Year Ended April 30, 2010 | Year Ended April 30, 2011 | Year Ended April 30, 2010 | ||||||||||||||||||||||
| OPERATIONS: | |||||||||||||||||||||||||||
| Net investment income (loss) | $ | 7,211,333 | $ | 7,422,105 | $ | (1,482,664 | ) | $ | (1,344,796 | ) | $ | 220,688 | $ | 333,938 | |||||||||||||
| Net realized gain (loss) | 21,884,199 | (77,663,256 | ) | (68,689,809 | ) | (167,945,273 | ) | 4,447,617 | (2,297,784 | ) | |||||||||||||||||
| Net change in unrealized appreciation (depreciation) | 94,753,726 | 403,374,916 | 74,473,012 | 245,604,627 | 8,016,614 | 20,849,396 | |||||||||||||||||||||
| Net increase in net assets resulting from operations | 123,849,258 | 333,133,765 | 4,300,539 | 76,314,558 | 12,684,919 | 18,885,550 | |||||||||||||||||||||
| Undistributed net investment income (loss) included in the price of units issued and redeemed | (473,043 | ) | (468,057 | ) | 327,754 | 205,468 | (7,103 | ) | 11,802 | ||||||||||||||||||
| DISTRIBUTIONS TO SHAREHOLDERS FROM: | |||||||||||||||||||||||||||
| Net investment income | (6,570,710 | ) | (9,289,108 | ) | — | — | (319,968 | ) | (347,466 | ) | |||||||||||||||||
| Return of capital | — | — | — | — | — | — | |||||||||||||||||||||
| Net realized gains | — | — | — | — | — | — | |||||||||||||||||||||
| Total distributions to shareholders | (6,570,710 | ) | (9,289,108 | ) | — | — | (319,968 | ) | (347,466 | ) | |||||||||||||||||
| SHAREHOLDER TRANSACTIONS: | |||||||||||||||||||||||||||
| Proceeds from shares sold | 114,470,396 | 29,217,910 | 146,699,587 | 184,160,845 | 18,569,744 | 4,334,078 | |||||||||||||||||||||
| Value of shares repurchased | (306,134,214 | ) | (238,056,609 | ) | (267,013,644 | ) | (261,389,443 | ) | (16,210,652 | ) | (2,391,138 | ) | |||||||||||||||
| Net income equalization | 473,043 | 468,057 | (327,754 | ) | (205,468 | ) | 7,103 | (11,802 | ) | ||||||||||||||||||
| Net increase (decrease) in net assets resulting from shares transactions | (191,190,775 | ) | (208,370,642 | ) | (120,641,811 | ) | (77,434,066 | ) | 2,366,195 | 1,931,138 | |||||||||||||||||
| Increase (Decrease) in Net Assets | (74,385,270 | ) | 115,005,958 | (116,013,518 | ) | (914,040 | ) | 14,724,043 | 20,481,024 | ||||||||||||||||||
| NET ASSETS: | |||||||||||||||||||||||||||
| Beginning of year | 1,335,033,299 | 1,220,027,341 | 657,485,608 | 658,399,648 | 60,451,214 | 39,970,190 | |||||||||||||||||||||
| End of year | $ | 1,260,648,029 | $ | 1,335,033,299 | $ | 541,472,090 | $ | 657,485,608 | $ | 75,175,257 | $ | 60,451,214 | |||||||||||||||
| Undistributed net investment income (loss) at end of year | $ | 1,059,040 | $ | 398,523 | $ | (29,770 | ) | $ | (24,281 | ) | $ | 19,901 | $ | 119,181 | |||||||||||||
| CHANGES IN SHARES OUTSTANDING: | |||||||||||||||||||||||||||
| Shares sold | 6,200,000 | 1,750,000 | 15,200,000 | 17,750,000 | 650,000 | 200,000 | |||||||||||||||||||||
| Shares repurchased | (17,900,000 | ) | (14,700,000 | ) | (27,900,000 | ) | (25,650,000 | ) | (600,000 | ) | (100,000 | ) | |||||||||||||||
| Shares outstanding, beginning of year | 73,950,000 | 86,900,000 | 65,000,000 | 72,900,000 | 2,400,000 | 2,300,000 | |||||||||||||||||||||
| Shares outstanding, end of year | 62,250,000 | 73,950,000 | 52,300,000 | 65,000,000 | 2,450,000 | 2,400,000 | |||||||||||||||||||||
67
Financial Highlights
PowerShares Aerospace & Defense Portfolio
| Year Ended April 30, | |||||||||||||||||||||||
| 2011 | 2010 | 2009 | 2008 | 2007 | |||||||||||||||||||
| PER SHARE OPERATING PERFORMANCE: | |||||||||||||||||||||||
| Net asset value at beginning of year | $ | 19.07 | $ | 13.38 | $ | 20.93 | $ | 20.19 | $ | 17.37 | |||||||||||||
| Net investment income** | 0.18 | 0.17 | 0.16 | 0.06 | 0.05 | ||||||||||||||||||
| Net realized and unrealized gain (loss) on investments | 1.49 | 5.73 | (7.56 | ) | 0.72 | 2.83 | |||||||||||||||||
| Total from investment operations | 1.67 | 5.90 | (7.40 | ) | 0.78 | 2.88 | |||||||||||||||||
| Distributions to shareholders from: | |||||||||||||||||||||||
| Net investment income | (0.17 | ) | (0.21 | ) | (0.15 | ) | (0.04 | ) | (0.06 | ) | |||||||||||||
| Return of capital | — | — | — | — | (0.00 | )(a) | |||||||||||||||||
| Total distributions | (0.17 | ) | (0.21 | ) | (0.15 | ) | (0.04 | ) | (0.06 | ) | |||||||||||||
| Net asset value at end of year | $ | 20.57 | $ | 19.07 | $ | 13.38 | $ | 20.93 | $ | 20.19 | |||||||||||||
| Share price at end of year*** | $ | 20.57 | $ | 19.07 | $ | 13.37 | |||||||||||||||||
| NET ASSET VALUE, TOTAL RETURN**** | 8.91 | % | 44.36 | % | (35.46 | )% | 3.86 | % | 16.66 | % | |||||||||||||
| SHARE PRICE TOTAL RETURN**** | 8.91 | % | 44.47 | % | (35.48 | )% | |||||||||||||||||
| RATIOS/SUPPLEMENTAL DATA: | |||||||||||||||||||||||
| Net assets at end of year (000's omitted) | $ | 107,971 | $ | 137,338 | $ | 116,429 | $ | 257,495 | $ | 201,886 | |||||||||||||
| Ratio to average net assets of: | |||||||||||||||||||||||
| Expenses, after (Waivers) and/or Recapture | 0.66 | % | 0.66 | % | 0.66 | % | 0.66 | % | 0.66 | % | |||||||||||||
| Expenses, prior to (Waivers) and/or Recapture | 0.73 | % | 0.69 | % | 0.67 | % | 0.64 | % | 0.77 | % | |||||||||||||
| Net investment income, after (Waivers) and/or Recapture | 0.99 | % | 1.08 | % | 1.01 | % | 0.27 | % | 0.28 | % | |||||||||||||
| Portfolio turnover rate †† | 12 | % | 17 | % | 9 | % | 13 | % | 16 | % | |||||||||||||
| Undistributed net investment income (loss) included in price of units issued and redeemed**# | $ | (0.00 | )(a) | $ | (0.01 | ) | $ | (0.01 | ) | $ | 0.00 | (a) | $ | 0.00 | (a) | ||||||||
PowerShares CleantechTM Portfolio
| Year Ended April 30, | For the Period October 24, 2006* Through | ||||||||||||||||||||||
| 2011 | 2010 | 2009 | 2008 | April 30, 2007 | |||||||||||||||||||
| PER SHARE OPERATING PERFORMANCE: | |||||||||||||||||||||||
| Net asset value at beginning of period | $ | 25.00 | $ | 19.25 | $ | 33.63 | $ | 27.08 | $ | 24.70 | |||||||||||||
| Net investment income (loss)** | 0.06 | 0.03 | (0.00 | )(a) | (0.10 | ) | (0.04 | ) | |||||||||||||||
| Net realized and unrealized gain (loss) on investments | 5.05 | 5.77 | (14.38 | ) | 6.65 | 2.42 | |||||||||||||||||
| Total from investment operations | 5.11 | 5.80 | (14.38 | ) | 6.55 | 2.38 | |||||||||||||||||
| Distributions to shareholders from: | |||||||||||||||||||||||
| Net investment income | (0.01 | ) | (0.04 | ) | — | — | — | ||||||||||||||||
| Return of capital | — | (0.01 | ) | — | — | — | |||||||||||||||||
| Total distributions | (0.01 | ) | (0.05 | ) | — | — | — | ||||||||||||||||
| Net asset value at end of period | $ | 30.10 | $ | 25.00 | $ | 19.25 | $ | 33.63 | $ | 27.08 | |||||||||||||
| Share price at end of period*** | $ | 30.08 | $ | 24.80 | $ | 19.35 | |||||||||||||||||
| NET ASSET VALUE, TOTAL RETURN**** | 20.43 | % | 30.16 | % | (42.76 | )% | 24.19 | % | 9.64 | % | |||||||||||||
| SHARE PRICE TOTAL RETURN**** | 21.32 | % | 28.45 | % | (42.45 | )% | |||||||||||||||||
| RATIOS/SUPPLEMENTAL DATA: | |||||||||||||||||||||||
| Net assets at end of period (000's omitted) | $ | 162,530 | $ | 160,021 | $ | 111,674 | $ | 114,336 | $ | 21,663 | |||||||||||||
| Ratio to average net assets of: | |||||||||||||||||||||||
| Expenses, after (Waivers) and/or Recapture | 0.67 | % | 0.67 | % | 0.67 | % | 0.69 | % | 0.71 | %† | |||||||||||||
| Expenses, prior to (Waivers) and/or Recapture | 0.74 | % | 0.71 | % | 0.73 | % | 0.77 | % | 1.06 | %† | |||||||||||||
| Net investment income (loss), after (Waivers) and/or Recapture | 0.22 | % | 0.11 | % | (0.01 | )% | (0.31 | )% | (0.29 | )%† | |||||||||||||
| Portfolio turnover rate †† | 24 | % | 31 | % | 72 | % | 23 | % | 22 | % | |||||||||||||
| Undistributed net investment income (loss) included in price of units issued and redeemed**# | $ | 0.01 | $ | (0.01 | ) | $ | (0.05 | ) | $ | (0.09 | ) | $ | 0.01 | ||||||||||
* Commencement of Investment Operations.
** Based on average shares outstanding.
*** The mean between the last bid and ask prices.
**** Net asset value total return is calculated assuming an initial investment made at the net asset value at the beginning of the period, reinvestment of all dividends and distributions at net asset value during the period, and redemption on the last day of the period. Share price total return is calculated assuming an initial investment made at the share price at the beginning of the period, reinvestment of all dividends and distributions at share price during the period, and sale at the share price on the last day of the period. Total investment returns calculated for a period of less than one year are not annualized.
† Annualized.
†† Portfolio turnover rate is not annualized and does not include securities received or delivered from processing creations or redemptions.
# The per share amount of equalization is presented to show the impact of equalization on distributable earnings per share.
(a) Amount represents less than $0.005.
See Notes to Financial Statements.
68
Financial Highlights (Continued)
PowerShares DWA Technical LeadersTM Portfolio
| Year Ended April 30, | For the Period March 1, 2007* Through | ||||||||||||||||||||||
| 2011 | 2010 | 2009 | 2008 | April 30, 2007 | |||||||||||||||||||
| PER SHARE OPERATING PERFORMANCE: | |||||||||||||||||||||||
| Net asset value at beginning of period | $ | 21.25 | $ | 14.14 | $ | 25.97 | $ | 25.58 | $ | 23.95 | |||||||||||||
| Net investment income (loss)** | 0.04 | 0.06 | 0.07 | (0.02 | ) | 0.04 | |||||||||||||||||
| Net realized and unrealized gain (loss) on investments | 5.29 | 7.15 | (11.86 | ) | 0.43 | 1.59 | |||||||||||||||||
| Total from investment operations | 5.33 | 7.21 | (11.79 | ) | 0.41 | 1.63 | |||||||||||||||||
| Distributions to shareholders from: | |||||||||||||||||||||||
| Net investment income | (0.06 | ) | (0.10 | ) | (0.04 | ) | (0.01 | ) | — | ||||||||||||||
| Return of capital | — | — | — | (0.01 | ) | — | |||||||||||||||||
| Total distributions | (0.06 | ) | (0.10 | ) | (0.04 | ) | (0.02 | ) | — | ||||||||||||||
| Net asset value at end of period | $ | 26.52 | $ | 21.25 | $ | 14.14 | $ | 25.97 | $ | 25.58 | |||||||||||||
| Share price at end of period*** | $ | 26.54 | $ | 21.24 | $ | 14.13 | |||||||||||||||||
| NET ASSET VALUE, TOTAL RETURN**** | 25.11 | % | 51.28 | % | (45.40 | )% | 1.62 | % | 6.81 | % | |||||||||||||
| SHARE PRICE TOTAL RETURN**** | 25.26 | % | 51.31 | % | (45.49 | )% | |||||||||||||||||
| RATIOS/SUPPLEMENTAL DATA: | |||||||||||||||||||||||
| Net assets at end of period (000's omitted) | $ | 450,904 | $ | 159,371 | $ | 138,549 | $ | 363,514 | $ | 92,090 | |||||||||||||
| Ratio to average net assets of: | |||||||||||||||||||||||
| Expenses, after (Waivers) and/or Recapture | 0.70 | % | 0.70 | % | 0.69 | % | 0.71 | % | 0.72 | %† | |||||||||||||
| Expenses, prior to (Waivers) and/or Recapture | 0.71 | % | 0.73 | % | 0.68 | % | 0.68 | % | 1.78 | %† | |||||||||||||
| Net investment income (loss), after (Waivers) and/or Recapture | 0.19 | % | 0.35 | % | 0.38 | % | (0.07 | )% | 1.50 | %†(a) | |||||||||||||
| Portfolio turnover rate †† | 42 | % | 52 | % | 87 | % | 83 | % | 9 | % | |||||||||||||
| Undistributed net investment income (loss) included in price of units issued and redeemed**# | $ | 0.05 | $ | (0.02 | ) | $ | (0.03 | ) | $ | 0.07 | $ | 0.07 | |||||||||||
PowerShares Global Listed Private Equity Portfolio
Year Ended April 30, | For the Period October 24, 2006* Through | ||||||||||||||||||||||
| 2011 | 2010 | 2009 | 2008 | April 30, 2007 | |||||||||||||||||||
| PER SHARE OPERATING PERFORMANCE: | |||||||||||||||||||||||
| Net asset value at beginning of period | $ | 10.04 | $ | 6.72 | $ | 20.27 | $ | 27.79 | $ | 25.09 | |||||||||||||
| Net investment income** | 0.26 | 0.33 | 0.87 | 1.22 | 0.44 | ||||||||||||||||||
| Net realized and unrealized gain (loss) on investments | 2.41 | 3.27 | (13.55 | ) | (7.63 | ) | 2.60 | ||||||||||||||||
| Total from investment operations | 2.67 | 3.60 | (12.68 | ) | (6.41 | ) | 3.04 | ||||||||||||||||
| Distributions to shareholders from: | |||||||||||||||||||||||
| Net investment income | (0.54 | ) | (0.28 | ) | (0.87 | ) | (1.11 | ) | (0.34 | ) | |||||||||||||
| Net asset value at end of period | $ | 12.17 | $ | 10.04 | $ | 6.72 | $ | 20.27 | $ | 27.79 | |||||||||||||
| Share price at end of period*** | $ | 12.25 | $ | 10.06 | $ | 6.71 | |||||||||||||||||
| NET ASSET VALUE, TOTAL RETURN**** | 27.93 | % | 54.20 | % | (64.23 | )% | (23.50 | )% | 12.18 | % | |||||||||||||
| SHARE PRICE TOTAL RETURN**** | 28.48 | % | 54.70 | % | (64.29 | )% | |||||||||||||||||
| RATIOS/SUPPLEMENTAL DATA: | |||||||||||||||||||||||
| Net assets at end of period (000's omitted) | $ | 493,622 | $ | 211,879 | $ | 60,476 | $ | 103,379 | $ | 150,078 | |||||||||||||
| Ratio to average net assets of: | |||||||||||||||||||||||
| Expenses, after (Waivers) and/or Recapturer | 0.70 | % | 0.70 | % | 0.70 | % | 0.71 | % | 0.71 | %† | |||||||||||||
| Expenses, prior to (Waivers) and/or Recapturer | 0.73 | % | 0.72 | % | 0.78 | % | 0.72 | % | 0.82 | %† | |||||||||||||
| Net investment income, after (Waivers) and/or Recapture | 2.50 | % | 3.66 | %(b) | 7.75 | % | 5.04 | % | 3.38 | %† | |||||||||||||
| Portfolio turnover rate †† | 112 | % | 121 | % | 74 | % | 30 | % | 19 | % | |||||||||||||
| Undistributed net investment income (loss) included in price of units issued and redeemed**# | $ | 0.03 | $ | 0.24 | $ | 0.21 | $ | (0.03 | ) | $ | 0.08 | ||||||||||||
* Commencement of Investment Operations.
** Based on average shares outstanding.
*** The mean between the last bid and ask prices.
**** Net asset value total return is calculated assuming an initial investment made at the net asset value at the beginning of the period, reinvestment of all dividends and distributions at net asset value during the period, and redemption on the last day of the period. Share price total return is calculated assuming an initial investment made at the share price at the beginning of the period, reinvestment of all dividends and distributions at share price during the period, and sale at the share price on the last day of the period. Total investment returns calculated for a period of less than one year are not annualized.
r In addition to the fees and expenses which the Fund bears directly, the Fund indirectly bears a pro rata share of the fees and expenses of the investment companies in which the Fund invests. Estimated investment companies expenses are not expenses that are incurred directly by your Fund. They are expenses that are incurred directly by the investment companies and are deducted from the value of the funds your Fund invests in. The effect of the estimated underlying fund expenses that you bear indirectly is included in your Fund's total return.
† Annualized.
†† Portfolio turnover rate is not annualized and does not include securities received or delivered from processing creations or redemptions.
# The per share amount of equalization is presented to show the impact of equalization on distributable earnings per share.
(a) Net investment income per share and the ratio of net investment income to average net assets include a special cash dividend received of $15.00 per share owned of Dean Foods Co. on April 2, 2007. Net investment loss per share and the ratio of net investment loss to average net assets excluding the special dividend were less than $0.005 and (0.11)%, respectively, for the year ended April 30, 2007.
(b) Net investment income per share and the ratio of net investment income to average net assets include a special stock dividend in which the Fund elected a cash payment of $0.96 per share owned of American Captial Ltd. on August 7, 2009. Net investment income per share and the ratio of net investment income to average net assets excluding the special dividend are $0.27 and 2.94%, respectively.
See Notes to Financial Statements.
69
Financial Highlights (Continued)
PowerShares Golden Dragon Halter USX China Portfolio
| Year Ended April 30, | |||||||||||||||||||||||
| 2011 | 2010 | 2009 | 2008 | 2007 | |||||||||||||||||||
| PER SHARE OPERATING PERFORMANCE: | |||||||||||||||||||||||
| Net asset value at beginning of year | $ | 25.03 | $ | 17.47 | $ | 28.88 | $ | 21.43 | $ | 16.90 | |||||||||||||
| Net investment income* | 0.21 | 0.13 | 0.20 | 0.12 | 0.20 | ||||||||||||||||||
| Net realized and unrealized gain (loss) on investments | 3.92 | 7.63 | (11.44 | ) | 7.54 | 4.54 | |||||||||||||||||
| Total from investment operations | 4.13 | 7.76 | (11.24 | ) | 7.66 | 4.74 | |||||||||||||||||
| Distributions to shareholders from: | |||||||||||||||||||||||
| Net investment income | (0.18 | ) | (0.17 | ) | (0.17 | ) | (0.20 | ) | (0.21 | ) | |||||||||||||
| Return of capital | — | (0.03 | ) | — | (0.01 | ) | — | ||||||||||||||||
| Total distributions | (0.18 | ) | (0.20 | ) | (0.17 | ) | (0.21 | ) | (0.21 | ) | |||||||||||||
| Net asset value at end of year | $ | 28.98 | $ | 25.03 | $ | 17.47 | $ | 28.88 | $ | 21.43 | |||||||||||||
| Share price at end of year** | $ | 28.87 | $ | 25.04 | $ | 17.48 | |||||||||||||||||
| NET ASSET VALUE, TOTAL RETURN*** | 16.60 | % | 44.51 | % | (39.06 | )% | 35.87 | % | 28.53 | % | |||||||||||||
| SHARE PRICE TOTAL RETURN*** | 16.11 | % | 44.49 | % | (38.92 | )% | |||||||||||||||||
| RATIOS/SUPPLEMENTAL DATA: | |||||||||||||||||||||||
| Net assets at end of year (000's omitted) | $ | 446,292 | $ | 455,523 | $ | 279,490 | $ | 528,483 | $ | 394,320 | |||||||||||||
| Ratio to average net assets of: | |||||||||||||||||||||||
| Expenses, after (Waivers) and/or Recapture | 0.70 | % | 0.70 | % | 0.69 | % | 0.69 | % | 0.70 | % | |||||||||||||
| Expenses, prior to (Waivers) and/or Recapture | 0.72 | % | 0.71 | % | 0.71 | % | 0.66 | % | 0.72 | % | |||||||||||||
| Net investment income, after (Waivers) and/or Recapture | 0.82 | % | 0.56 | % | 1.06 | % | 0.42 | % | 1.06 | % | |||||||||||||
| Portfolio turnover rate † | 15 | % | 35 | % | 20 | % | 15 | % | 17 | % | |||||||||||||
| Undistributed net investment income (loss) included in price of units issued and redeemed*# | $ | (0.00 | )(a) | $ | 0.02 | $ | (0.03 | ) | $ | 0.03 | $ | 0.01 | |||||||||||
PowerShares Lux Nanotech Portfolio
| Year Ended April 30, | |||||||||||||||||||||||
| 2011 | 2010 | 2009 | 2008 | 2007 | |||||||||||||||||||
| PER SHARE OPERATING PERFORMANCE: | |||||||||||||||||||||||
| Net asset value at beginning of year | $ | 10.33 | $ | 7.59 | $ | 14.07 | $ | 17.48 | $ | 19.05 | |||||||||||||
| Net investment income (loss)* | (0.00 | )(a) | (0.00 | )(a) | 0.02 | (0.03 | ) | (0.02 | ) | ||||||||||||||
| Net realized and unrealized gain (loss) on investments | (0.73 | ) | 2.76 | (6.50 | ) | (3.38 | ) | (1.55 | ) | ||||||||||||||
| Total from investment operations | (0.73 | ) | 2.76 | (6.48 | ) | (3.41 | ) | (1.57 | ) | ||||||||||||||
| Distributions to shareholders from: | |||||||||||||||||||||||
| Net investment income | — | (0.02 | ) | — | — | — | |||||||||||||||||
| Return of capital | — | 0.00 | (a) | — | — | — | |||||||||||||||||
| Total distributions | — | (0.02 | ) | — | — | — | |||||||||||||||||
| Net asset value at end of year | $ | 9.60 | $ | 10.33 | $ | 7.59 | $ | 14.07 | $ | 17.48 | |||||||||||||
| Share price at end of year** | $ | 9.70 | $ | 10.32 | $ | 7.60 | |||||||||||||||||
| NET ASSET VALUE, TOTAL RETURN*** | (7.07 | )% | 36.39 | % | (46.06 | )% | (19.51 | )% | (8.24 | )% | |||||||||||||
| SHARE PRICE TOTAL RETURN*** | (6.01 | )% | 36.08 | % | (45.79 | )% | |||||||||||||||||
| RATIOS/SUPPLEMENTAL DATA: | |||||||||||||||||||||||
| Net assets at end of year (000's omitted) | $ | 38,390 | $ | 55,290 | $ | 39,484 | $ | 84,428 | $ | 159,052 | |||||||||||||
| Ratio to average net assets of: | |||||||||||||||||||||||
| Expenses, after (Waivers) and/or Recapturer | 0.70 | % | 0.70 | % | 0.70 | % | 0.70 | % | 0.71 | % | |||||||||||||
| Expenses, prior to (Waivers) and/or Recapturer | 0.95 | % | 0.85 | % | 0.89 | % | 0.73 | % | 0.79 | % | |||||||||||||
| Net investment income (loss), after (Waivers) and/or Recapture | (0.04 | )% | (0.04 | )% | 0.17 | % | (0.17 | )% | (0.09 | )% | |||||||||||||
| Portfolio turnover rate † | 58 | % | 57 | % | 50 | % | 42 | % | 16 | % | |||||||||||||
| Undistributed net investment income (loss) included in price of units issued and redeemed*# | $ | (0.00 | )(a) | $ | 0.00 | (a) | $ | 0.00 | (a) | $ | 0.01 | $ | (0.01 | ) | |||||||||
* Based on average shares outstanding.
** The mean between the last bid and ask prices.
*** Net asset value total return is calculated assuming an initial investment made at the net asset value at the beginning of the period, reinvestment of all dividends and distributions at net asset value during the period, and redemption on the last day of the period. Share price total return is calculated assuming an initial investment made at the share price at the beginning of the period, reinvestment of all dividends and distributions at share price during the period, and sale at the share price on the last day of the period. Total investment returns calculated for a period of less than one year are not annualized.
r In addition to the fees and expenses which the Fund bears directly, the Fund indirectly bears a pro rata share of the fees and expenses of the investment companies in which the Fund invests. Estimated investment companies expenses are not expenses that are incurred directly by your Fund. They are expenses that are incurred directly by the investment companies and are deducted from the value of the funds your Fund invests in. The effect of the estimated underlying fund expenses that you bear indirectly is included in your Fund's total return.
† Portfolio turnover rate is not annualized and does not include securities received or delivered from processing creations or redemptions.
# The per share amount of equalization is presented to show the impact of equalization on distributable earnings per share.
(a) Amount represents less than $0.005.
See Notes to Financial Statements.
70
Financial Highlights (Continued)
PowerShares Morningstar StockInvestor Core Portfolio
Year Ended April 30, | For the Period December 1, 2006* Through | ||||||||||||||||||||||
| 2011 | 2010 | 2009 | 2008 | April 30, 2007 | |||||||||||||||||||
| PER SHARE OPERATING PERFORMANCE: | |||||||||||||||||||||||
| Net asset value at beginning of period | $ | 20.31 | $ | 15.59 | $ | 27.90 | $ | 28.04 | $ | 25.19 | |||||||||||||
| Net investment income** | 0.22 | 0.05 | 0.10 | 0.01 | 0.00 | (a) | |||||||||||||||||
| Net realized and unrealized gain (loss) on investments | 1.64 | 4.76 | (12.35 | ) | (0.14 | ) | 2.86 | ||||||||||||||||
| Total from investment operations | 1.86 | 4.81 | (12.25 | ) | (0.13 | ) | 2.86 | ||||||||||||||||
| Distributions to shareholders from: | |||||||||||||||||||||||
| Net investment income | (0.15 | ) | (0.09 | ) | (0.06 | ) | (0.01 | ) | 0.00 | (a) | |||||||||||||
| Return of capital | — | — | — | 0.00 | (a) | (0.01 | ) | ||||||||||||||||
| Total distributions | (0.15 | ) | (0.09 | ) | (0.06 | ) | (0.01 | ) | (0.01 | ) | |||||||||||||
| Net asset value at end of period | $ | 22.02 | $ | 20.31 | $ | 15.59 | $ | 27.90 | $ | 28.04 | |||||||||||||
| Share price at end of period*** | $ | 22.01 | $ | 20.31 | $ | 15.58 | |||||||||||||||||
| NET ASSET VALUE, TOTAL RETURN**** | 9.25 | % | 31.03 | % | (43.93 | )% | (0.45 | )% | 11.36 | % | |||||||||||||
| SHARE PRICE TOTAL RETURN**** | 9.20 | % | 31.11 | % | (43.93 | )% | |||||||||||||||||
| RATIOS/SUPPLEMENTAL DATA: | |||||||||||||||||||||||
| Net assets at end of period (000's omitted) | $ | 19,816 | $ | 19,290 | $ | 26,508 | $ | 41,850 | $ | 33,650 | |||||||||||||
| Ratio to average net assets of: | |||||||||||||||||||||||
| Expenses, after (Waivers) and/or Recapturer | 0.53 | % | 0.70 | % | 0.70 | % | 0.73 | % | 0.75 | %† | |||||||||||||
| Expenses, prior to (Waivers) and/or Recapturer | 1.81 | % | 1.09 | % | 0.94 | % | 0.95 | % | 1.21 | %† | |||||||||||||
| Net investment income, after (Waivers) and/or Recapture | 1.11 | % | 0.27 | % | 0.47 | % | 0.03 | % | 0.03 | %† | |||||||||||||
| Portfolio turnover rate †† | 91 | % | 127 | % | 113 | % | 77 | % | 13 | % | |||||||||||||
| Undistributed net investment income (loss) included in price of units issued and redeemed**# | $ | (0.00 | )(a) | $ | (0.00 | )(a) | $ | (0.00 | )(a) | $ | 0.00 | (a) | $ | 0.00 | (a) | ||||||||
PowerShares S&P 500 BuyWrite Portfolio
| Year Ended April 30, | For the Period December 19, 2007* Through | ||||||||||||||||||
| 2011 | 2010 | 2009 | April 30, 2008 | ||||||||||||||||
| PER SHARE OPERATING PERFORMANCE: | |||||||||||||||||||
| Net asset value at beginning of period | $ | 21.52 | $ | 17.54 | $ | 25.00 | $ | 24.97 | |||||||||||
| Net investment income** | 0.29 | 0.27 | 0.38 | 0.09 | |||||||||||||||
| Net realized and unrealized gain (loss) on investments | 1.34 | 4.00 | (7.38 | ) | (0.01 | ) | |||||||||||||
| Total from investment operations | 1.63 | 4.27 | (7.00 | ) | 0.08 | ||||||||||||||
| Distributions to shareholders from: | |||||||||||||||||||
| Net investment income | (0.27 | ) | (0.29 | ) | (0.46 | ) | (0.05 | ) | |||||||||||
| Net realized gains | (1.36 | ) | — | — | — | ||||||||||||||
| Total distributions | (1.63 | ) | (0.29 | ) | (0.46 | ) | (0.05 | ) | |||||||||||
| Net asset value at end of period | $ | 21.52 | $ | 21.52 | $ | 17.54 | $ | 25.00 | |||||||||||
| Share price at end of period*** | $ | 21.52 | $ | 21.52 | $ | 17.59 | |||||||||||||
| NET ASSET VALUE, TOTAL RETURN**** | 8.11 | % | 24.48 | % | (28.26 | )% | 0.33 | %(b) | |||||||||||
| SHARE PRICE TOTAL RETURN**** | 8.09 | % | 24.11 | % | (28.16 | )% | |||||||||||||
| RATIOS/SUPPLEMENTAL DATA: | |||||||||||||||||||
| Net assets at end of period (000's omitted) | $ | 120,511 | $ | 167,840 | $ | 84,211 | $ | 7,500 | |||||||||||
| Ratio to average net assets of: | |||||||||||||||||||
| Expenses | 0.75 | % | 0.75 | % | 0.75 | % | 0.75 | %† | |||||||||||
| Net investment income | 1.37 | % | 1.35 | % | 2.09 | % | 1.12 | %† | |||||||||||
| Portfolio turnover rate †† | 61 | % | 51 | % | 83 | % | 10 | % | |||||||||||
| Undistributed net investment income (loss) included in price of units issued and redeemed**# | $ | (0.01 | ) | $ | (0.00 | )(a) | $ | (0.05 | ) | $ | 0.09 | ||||||||
* Commencement of Investment Operations.
** Based on average shares outstanding.
*** The mean between the last bid and ask prices.
**** Net asset value total return is calculated assuming an initial investment made at the net asset value at the beginning of the period, reinvestment of all dividends and distributions at net asset value during the period, and redemption on the last day of the period. Share price total return is calculated assuming an initial investment made at the share price at the beginning of the period, reinvestment of all dividends and distributions at share price during the period, and sale at the share price on the last day of the period. Total investment returns calculated for a period of less than one year are not annualized.
r In addition to the fees and expenses which the Fund bears directly, the Fund indirectly bears a pro rata share of the fees and expenses of the investment companies in which the Fund invests. Estimated investment companies expenses are not expenses that are incurred directly by your Fund. They are expenses that are incurred directly by the investment companies and are deducted from the value of the funds your Fund invests in. The effect of the estimated underlying fund expenses that you bear indirectly is included in your Fund's total return.
† Annualized.
†† Portfolio turnover rate is not annualized and does not include securities received or delivered from processing creations or redemptions.
# The per share amount of equalization is presented to show the impact of equalization on distributable earnings per share.
(a) Amount represents less than $0.005.
(b) The total return from Inception (first day of trading on the exchange) to April 30, 2008 was (0.19)%.
See Notes to Financial Statements.
71
Financial Highlights (Continued)
PowerShares S&P 500® High Quality Portfolio
| Year Ended April 30, | |||||||||||||||||||||||
| 2011 | 2010 | 2009 | 2008 | 2007 | |||||||||||||||||||
| PER SHARE OPERATING PERFORMANCE: | |||||||||||||||||||||||
| Net asset value at beginning of year | $ | 12.21 | $ | 9.60 | $ | 16.76 | $ | 17.59 | $ | 17.09 | |||||||||||||
| Net investment income (loss)* | 0.20 | 0.00 | (a) | 0.04 | (0.02 | ) | (0.01 | ) | |||||||||||||||
| Net realized and unrealized gain (loss) on investments | 2.31 | 2.64 | (7.19 | ) | (0.81 | ) | 0.51 | ||||||||||||||||
| Total from investment operations | 2.51 | 2.64 | (7.15 | ) | (0.83 | ) | 0.50 | ||||||||||||||||
| Distributions to shareholders from: | |||||||||||||||||||||||
| Net investment income | (0.08 | ) | (0.03 | ) | (0.01 | ) | — | — | |||||||||||||||
| Net asset value at end of year | $ | 14.64 | $ | 12.21 | $ | 9.60 | $ | 16.76 | $ | 17.59 | |||||||||||||
| Share price at end of year** | $ | 14.64 | $ | 12.21 | $ | 9.60 | |||||||||||||||||
| NET ASSET VALUE, TOTAL RETURN*** | 20.61 | % | 27.63 | % | (42.66 | )% | (4.72 | )% | 2.93 | % | |||||||||||||
| SHARE PRICE TOTAL RETURN*** | 20.61 | % | 27.63 | % | (42.62 | )% | |||||||||||||||||
| RATIOS/SUPPLEMENTAL DATA: | |||||||||||||||||||||||
| Net assets at end of year (000's omitted) | $ | 112,695 | $ | 67,746 | $ | 71,048 | $ | 177,669 | $ | 272,608 | |||||||||||||
| Ratio to average net assets of: | |||||||||||||||||||||||
| Expenses, after (Waivers) and/or Recapture | 0.52 | % | 0.70 | % | 0.70 | % | 0.70 | % | 0.70 | % | |||||||||||||
| Expenses, prior to (Waivers) and/or Recapture | 0.84 | % | 0.80 | % | 0.72 | % | 0.70 | % | 0.75 | % | |||||||||||||
| Net investment income (loss), after (Waivers) and/or Recapture | 1.49 | % | (0.03 | )% | 0.27 | % | (0.12 | )% | (0.06 | )% | |||||||||||||
| Portfolio turnover rate † | 64 | % | 138 | % | 143 | % | 101 | % | 113 | % | |||||||||||||
| Undistributed net investment income (loss) included in price of units issued and redeemed*# | $ | 0.02 | $ | (0.00 | )(a) | $ | (0.00 | )(a) | $ | 0.01 | $ | 0.00 | (a) | ||||||||||
PowerShares Water Resources Portfolio
| Year Ended April 30, | |||||||||||||||||||||||
| 2011 | 2010 | 2009 | 2008 | 2007 | |||||||||||||||||||
| PER SHARE OPERATING PERFORMANCE: | |||||||||||||||||||||||
| Net asset value at beginning of year | $ | 18.05 | $ | 14.04 | $ | 20.66 | $ | 19.20 | $ | 18.25 | |||||||||||||
| Net investment income* | 0.11 | 0.09 | 0.08 | 0.08 | 0.17 | ||||||||||||||||||
| Net realized and unrealized gain (loss) on investments | 2.19 | 4.03 | (6.64 | ) | 1.46 | 0.95 | |||||||||||||||||
| Total from investment operations | 2.30 | 4.12 | (6.56 | ) | 1.54 | 1.12 | |||||||||||||||||
| Distributions to shareholders from: | |||||||||||||||||||||||
| Net investment income | (0.10 | ) | (0.11 | ) | (0.06 | ) | (0.08 | ) | (0.17 | ) | |||||||||||||
| Net asset value at end of year | $ | 20.25 | $ | 18.05 | $ | 14.04 | $ | 20.66 | $ | 19.20 | |||||||||||||
| Share price at end of year** | $ | 20.24 | $ | 18.05 | $ | 14.02 | |||||||||||||||||
| NET ASSET VALUE, TOTAL RETURN*** | 12.81 | % | 29.48 | % | (31.76 | )% | 8.02 | % | 6.26 | % | |||||||||||||
| SHARE PRICE TOTAL RETURN*** | 12.75 | % | 29.67 | % | (31.63 | )% | |||||||||||||||||
| RATIOS/SUPPLEMENTAL DATA: | |||||||||||||||||||||||
| Net assets at end of year (000's omitted) | $ | 1,260,648 | $ | 1,335,033 | $ | 1,220,027 | $ | 2,196,652 | $ | 1,606,782 | |||||||||||||
| Ratio to average net assets of: | |||||||||||||||||||||||
| Expenses, after (Waivers) and/or Recapture | 0.66 | % | 0.64 | % | 0.64 | % | 0.64 | % | 0.66 | % | |||||||||||||
| Expenses, prior to (Waivers) and/or Recapture | 0.66 | % | 0.64 | % | 0.64 | % | 0.63 | % | 0.67 | % | |||||||||||||
| Net investment income, after (Waivers) and/or Recapture | 0.63 | % | 0.57 | % | 0.49 | % | 0.39 | % | 0.96 | % | |||||||||||||
| Portfolio turnover rate † | 13 | % | 20 | % | 33 | % | 23 | % | 27 | % | |||||||||||||
| Undistributed net investment income (loss) included in price of units issued and redeemed*# | $ | (0.01 | ) | $ | (0.01 | ) | $ | (0.01 | ) | $ | 0.01 | $ | 0.02 | ||||||||||
* Based on average shares outstanding.
** The mean between the last bid and ask prices.
*** Net asset value total return is calculated assuming an initial investment made at the net asset value at the beginning of the period, reinvestment of all dividends and distributions at net asset value during the period, and redemption on the last day of the period. Share price total return is calculated assuming an initial investment made at the share price at the beginning of the period, reinvestment of all dividends and distributions at share price during the period, and sale at the share price on the last day of the period. Total investment returns calculated for a period of less than one year are not annualized.
† Portfolio turnover rate is not annualized and does not include securities received or delivered from processing creations or redemptions.
# The per share amount of equalization is presented to show the impact of equalization on distributable earnings per share.
(a) Amount represents less than $0.005.
See Notes to Financial Statements.
72
Financial Highlights (Continued)
PowerShares WilderHill Clean Energy Portfolio
| Year Ended April 30, | |||||||||||||||||||||||
| 2011 | 2010 | 2009 | 2008 | 2007 | |||||||||||||||||||
| PER SHARE OPERATING PERFORMANCE: | |||||||||||||||||||||||
| Net asset value at beginning of year | $ | 10.12 | $ | 9.03 | $ | 20.94 | $ | 19.29 | $ | 22.38 | |||||||||||||
| Net investment income (loss)** | (0.03 | ) | (0.02 | ) | (0.02 | ) | (0.07 | ) | 0.04 | ||||||||||||||
| Net realized and unrealized gain (loss) on investments | 0.26 | 1.11 | (11.89 | ) | 1.72 | (3.08 | ) | ||||||||||||||||
| Total from investment operations | 0.23 | 1.09 | (11.91 | ) | 1.65 | (3.04 | ) | ||||||||||||||||
| Distributions to shareholders from: | |||||||||||||||||||||||
| Net investment income | — | — | — | — | (0.05 | ) | |||||||||||||||||
| Return of capital | — | — | — | — | 0.00 | (a) | |||||||||||||||||
| Total distributions | — | — | — | — | (0.05 | ) | |||||||||||||||||
| Net asset value at end of year | $ | 10.35 | $ | 10.12 | $ | 9.03 | $ | 20.94 | $ | 19.29 | |||||||||||||
| Share price at end of year*** | $ | 10.33 | $ | 10.11 | $ | 8.99 | |||||||||||||||||
| NET ASSET VALUE, TOTAL RETURN**** | 2.27 | % | 12.07 | % | (56.88 | )% | 8.55 | % | (13.58 | )% | |||||||||||||
| SHARE PRICE TOTAL RETURN**** | 2.18 | % | 12.46 | % | (57.07 | )% | |||||||||||||||||
| RATIOS/SUPPLEMENTAL DATA: | |||||||||||||||||||||||
| Net assets at end of year (000's omitted) | $ | 541,472 | $ | 657,486 | $ | 658,400 | $ | 1,473,893 | $ | 914,345 | |||||||||||||
| Ratio to average net assets of: | |||||||||||||||||||||||
| Expenses, after (Waivers) and/or Recapture | 0.70 | % | 0.70 | % | 0.69 | % | 0.67 | % | 0.70 | % | |||||||||||||
| Expenses, prior to (Waivers) and/or Recapture | 0.75 | % | 0.70 | % | 0.69 | % | 0.67 | % | 0.69 | % | |||||||||||||
| Net investment income (loss), after (Waivers) and/or Recapture | (0.27 | )% | (0.18 | )% | (0.12 | )% | (0.32 | )% | 0.24 | %††† | |||||||||||||
| Portfolio turnover rate †† | 32 | % | 42 | % | 41 | % | 20 | % | 41 | % | |||||||||||||
| Undistributed net investment income (loss) included in price of units issued and redeemed**# | $ | 0.01 | $ | 0.00 | (a) | $ | (0.00 | )(a) | $ | (0.02 | ) | $ | 0.01 | ||||||||||
PowerShares WilderHill Progressive Energy Portfolio
| Year Ended April 30, | For the Period October 24, 2006* Through | ||||||||||||||||||||||
| 2011 | 2010 | 2009 | 2008 | April 30, 2007 | |||||||||||||||||||
| PER SHARE OPERATING PERFORMANCE: | |||||||||||||||||||||||
| Net asset value at beginning of period | $ | 25.19 | $ | 17.38 | $ | 28.23 | $ | 28.63 | $ | 24.91 | |||||||||||||
| Net investment income** | 0.10 | 0.14 | 0.13 | 0.09 | 0.06 | ||||||||||||||||||
| Net realized and unrealized gain (loss) on investments | 5.53 | 7.81 | (10.91 | ) | (0.36 | ) | 3.68 | ||||||||||||||||
| Total from investment operations | 5.63 | 7.95 | (10.78 | ) | (0.27 | ) | 3.74 | ||||||||||||||||
| Distributions to shareholders from: | |||||||||||||||||||||||
| Net investment income | (0.14 | ) | (0.14 | ) | (0.07 | ) | (0.12 | ) | (0.02 | ) | |||||||||||||
| Return of capital | — | — | — | (0.01 | ) | — | |||||||||||||||||
| Total distributions | (0.14 | ) | (0.14 | ) | (0.07 | ) | (0.13 | ) | (0.02 | ) | |||||||||||||
| Net asset value at end of period | $ | 30.68 | $ | 25.19 | $ | 17.38 | $ | 28.23 | $ | 28.63 | |||||||||||||
| Share price at end of period*** | $ | 30.70 | $ | 25.19 | $ | 17.38 | |||||||||||||||||
| NET ASSET VALUE, TOTAL RETURN**** | 22.47 | % | 45.96 | % | (38.23 | )% | (0.96 | )% | 15.01 | % | |||||||||||||
| SHARE PRICE TOTAL RETURN**** | 22.55 | % | 45.96 | % | (38.16 | )% | |||||||||||||||||
| RATIOS/SUPPLEMENTAL DATA: | |||||||||||||||||||||||
| Net assets at end of period (000's omitted) | $ | 75,175 | $ | 60,451 | $ | 39,970 | $ | 62,097 | $ | 22,905 | |||||||||||||
| Ratio to average net assets of: | |||||||||||||||||||||||
| Expenses, after (Waivers) and/or Recapture | 0.70 | % | 0.70 | % | 0.70 | % | 0.73 | % | 0.74 | %† | |||||||||||||
| Expenses, prior to (Waivers) and/or Recapture | 0.86 | % | 0.84 | % | 0.86 | % | 0.88 | % | 1.09 | %† | |||||||||||||
| Net investment income, after (Waivers) and/or Recapture | 0.37 | % | 0.63 | % | 0.62 | % | 0.30 | % | 0.45 | %† | |||||||||||||
| Portfolio turnover rate †† | 22 | % | 52 | % | 32 | % | 31 | % | 12 | % | |||||||||||||
| Undistributed net investment income (loss) included in price of units issued and redeemed**# | $ | (0.00 | )(a) | $ | 0.00 | (a) | $ | 0.00 | (a) | $ | 0.01 | $ | 0.00 | (a) | |||||||||
* Commencement of Investment Operations.
** Based on average shares outstanding.
*** The mean between the last bid and ask prices.
**** Net asset value total return is calculated assuming an initial investment made at the net asset value at the beginning of the period, reinvestment of all dividends and distributions at net asset value during the period, and redemption on the last day of the period. Share price total return is calculated assuming an initial investment made at the share price at the beginning of the period, reinvestment of all dividends and distributions at share price during the period, and sale at the share price on the last day of the period. Total investment returns calculated for a period of less than one year are not annualized.
† Annualized.
†† Portfolio turnover rate is not annualized and does not include securities received or delivered from processing creations or redemptions.
††† Net investment income per share and the ratio of net investment income to average net assets include a special cash dividend received of $6.72 per share owned of Scottish Power PLC ADR on May 18, 2006. Net investment loss per share and the ratio of net investment loss to average net assets excluding the special dividend were $(0.04) and (0.23)%, respectively, for the year ended April 30, 2007.
# The per share amount of equalization is presented to show the impact of equalization on distributable earnings per share.
(a) Amount represents less than $0.005.
See Notes to Financial Statements.
73
Notes to Financial Statements
PowerShares Exchange-Traded Fund Trust
April 30, 2011
Note 1. Organization
PowerShares Exchange-Traded Fund Trust (the "Trust") was organized as a Massachusetts business trust on June 9, 2000 and is authorized to have multiple series of portfolios. The Trust is an open-end management investment company registered under the Investment Company Act of 1940, as amended (the "1940 Act"). As of April 30, 2011, the Trust offered fifty-six portfolios. This report includes the following portfolios:
| Fund Name | Short Name | ||||||
| PowerShares Aerospace & Defense Portfolio | "Aerospace & Defense Portfolio" | ||||||
| PowerShares CleantechTM Portfolio | "CleantechTM Portfolio" | ||||||
| PowerShares DWA Technical LeadersTM Portfolio | "DWA Technical LeadersTM Portfolio" | ||||||
| PowerShares Global Listed Private Equity Portfolio | "Global Listed Private Equity Portfolio" | ||||||
| PowerShares Golden Dragon Halter USX China Portfolio | "Golden Dragon Halter USX China Portfolio" | ||||||
| PowerShares Lux Nanotech Portfolio | "Lux Nanotech Portfolio" | ||||||
| PowerShares Morningstar StockInvestor Core Portfolio (formerly PowerShares Value Line | "Morningstar StockInvestor Core Portfolio" | ||||||
| Industry Rotation Portfolio) | |||||||
| PowerShares S&P 500 BuyWrite Portfolio | "S&P 500 BuyWrite Portfolio" | ||||||
| PowerShares S&P 500® High Quality Portfolio | "S&P 500® High Quality Portfolio" | ||||||
| (formerly PowerShares Value Line TimelinessTM | |||||||
| Select Portfolio) | |||||||
| PowerShares Water Resources Portfolio | "Water Resources Portfolio" | ||||||
| PowerShares WilderHill Clean Energy Portfolio | "WilderHill Clean Energy Portfolio" | ||||||
| PowerShares WilderHill Progressive Energy Portfolio | "WilderHill Progressive Energy Portfolio" | ||||||
Each portfolio (the "Fund" and collectively the "Funds") represents a separate series of the Trust. The shares of the Funds are referred to herein as "Shares" or "Fund's Shares." Each Fund's Shares are listed and traded on the NYSE Arca, Inc.
The Funds' market prices may differ to some degree from the net asset value ("NAV") of the Shares of each Fund. Unlike conventional mutual funds, each Fund issues and redeems Shares on a continuous basis, at NAV, only in a large specified number of Shares, each called a "Creation Unit." Creation Units are issued and redeemed generally in-kind for securities included in the relevant index. Except when aggregated in Creation Units by Authorized Participants, the Shares are not individually redeemable securities of the Funds.
The investment objective of each Fund is to seek investment results that correspond (before fees and expenses) generally to the price and yield performance of the following indices (each, an "Underlying Index"):
| Fund | Index | ||||||
| Aerospace & Defense Portfolio | SPADETM Defense Index | ||||||
| CleantechTM Portfolio | The Cleantech IndexTM | ||||||
| DWA Technical LeadersTM Portfolio | Dorsey Wright Technical LeadersTM Index | ||||||
| Global Listed Private Equity Portfolio | Global Listed Private Equity IndexSM | ||||||
| Golden Dragon Halter USX China Portfolio | Halter USX China IndexSM | ||||||
74
Notes to Financial Statements (Continued)
PowerShares Exchange-Traded Fund Trust
April 30, 2011
| Fund | Index | ||||||
| Lux Nanotech Portfolio | Lux Nanotech IndexTM | ||||||
| Morningstar StockInvestor Core Portfolio | Morningstar® StockInvestor Core IndexSM | ||||||
| S&P 500 BuyWrite Portfolio | CBOE S&P 500 BuyWrite Index | ||||||
| S&P 500® High Quality Portfolio | S&P 500® High Quality Rankings Index | ||||||
| Water Resources Portfolio | Palisades Water Index | ||||||
| WilderHill Clean Energy Portfolio | WilderHill Clean Energy Index | ||||||
| WilderHill Progressive Energy Portfolio | WilderHill Progressive Energy Index | ||||||
Note 2. Significant Accounting Policies
The preparation of the financial statements in accordance with General Accepted Accounting Principles ("GAAP") in the United States of America requires management to make estimates and assumptions that affect the reported amounts and disclosures in the financial statements, including estimates and assumptions related to taxation. Actual results could differ from these estimates. In addition, the Funds monitor for material events or transactions that may occur or become known after the period-end date and before the date the financial statements are released to print.
A. Security Valuation
Securities, including restricted securities, are valued according to the following policies.
A security listed or traded on an exchange (except convertible bonds) is valued at its last sales price or official closing price as of the close of the customary trading session on the exchange where the security is principally traded, or lacking any sales or official closing price on a particular day, the security may be valued at the closing bid price on that day. Securities traded in the over-the-counter market are valued based on prices furnished by independent pricing services or market makers. Listed options, if no closing price is available, are valued at the mean between the last bid and ask prices from the exchange on which they are principally traded. Options not listed on an exchange are valued by an independent source at the mean between the last bid and ask prices.
Investments in open-end registered investment companies not traded on an exchange are valued at the end of day NAV per share.
Debt obligations (including convertible bonds) and unlisted equities are fair valued using an evaluated quote provided by an independent pricing service. Evaluated quotes provided by the pricing service may be determined without exclusive reliance on quoted prices, and may reflect appropriate factors such as institution-size trading in similar groups of securities, developments related to specific securities, dividend rate, yield, quality, type of issue, coupon rate, maturity, individual trading characteristics and other market data. Short-term obligations, including commercial paper, having 60 days or less to maturity are recorded at amortized cost which approximates value. Debt securities are subject to interest rate and credit risks. In addition, all debt securities involve some risk of default with respect to interest and/or principal payments.
Foreign securities (including foreign exchange contracts) are converted into U.S. dollar amounts using the applicable exchange rates as of the close of the London world markets. If market quotations are available and reliable for foreign exchange traded equity securities, the securities will be valued at the market quotations. Because trading hours for certain foreign securities end before the close of the New York Stock Exchange ("NYSE"), closing market quotations may become unreliable. If between the time trading ends on a particular security and the close of the customary trading session on the NYSE, events occur that are
75
Notes to Financial Statements (Continued)
PowerShares Exchange-Traded Fund Trust
April 30, 2011
significant and make the closing price unreliable, the Fund may fair value the security. If the event is likely to have affected the closing price of the security, the security will be valued at fair value in good faith using procedures approved by the Board of Trustees. Adjustments to closing prices to reflect fair value may also be based on a screening process of an independent pricing service to indicate the degree of certainty, based on historical data, that the closing price in the principal market where a foreign security trades is not the current value as of the close of the NYSE. Foreign securities meeting the approved degree of certainty that the price is not reflective of current value will be priced at the indication of fair value from the independent pricing service. Multiple factors may be considered by the independent pricing service in determining adjustments to reflect fair value and may include information relating to sector indices, American depositary receipts and domestic and foreign index futures. Foreign securities may have additional risks including exchange rate changes, potential for sharply devalued currencies and high inflation, political and economic upheaval, the relative lack of issuer information, relatively low market liquidity and the potential lack of strict financial and accounting controls and standards.
Securities for which market prices are not provided by any of the above methods may be valued based upon quotes furnished by independent sources.
Securities for which market quotations are not readily available or are unreliable are valued at fair value as determined in good faith by or under the supervision of the Trust's officers following procedures approved by the Board of Trustees. Issuer specific events, market trends, bid/ask quotes of brokers and information providers and other market data may be reviewed in the course of making a good faith determination of a security's fair value.
Valuations change in response to many factors including the historical and prospective earnings of the issuer, the value of the issuer's assets, general economic conditions, interest rates, investor perceptions and market liquidity. Because of the inherent uncertainties of valuation, the values reflected in the financial statements may materially differ from the value received upon actual sale of those investments.
B. Other Risks
Replication Management Risk. Unlike many investment companies, the Funds do not utilize an investing strategy that seeks returns in excess of each Fund's respective Underlying Index. Therefore, a Fund would not necessarily sell a security unless that security is removed from its respective Underlying Index.
With respect to the Water Resources Portfolio, the Fund's use of a representative sampling approach will result in its holding a smaller number of securities than are in its Underlying Index. As a result, an adverse development respecting an issuer of securities held by the Fund could result in a greater decline in NAV than would be the case if the Fund held all of the securities in its Underlying Index. To the extent the assets in the Fund are smaller, these risks will be greater.
Non-Diversified Fund Risk. Except for CleantechTM Portfolio, each Fund is considered non-diversified and can invest a greater portion of its assets in securities of individual issuers than a diversified fund. As a result, changes in the market value of a single investment could cause greater fluctuations in Share price than would occur in a diversified fund.
Concentration Risk. To the extent a Fund concentrates its investments in an industry or group of industries, the value of the Fund's Shares may rise and fall more than the value of Shares of a fund that invests in a broader range of securities.
76
Notes to Financial Statements (Continued)
PowerShares Exchange-Traded Fund Trust
April 30, 2011
Non-Correlation Risk. Each Fund's return may not match the return of its Underlying Index for a number of reasons. For example, each Fund incurs operating expenses not applicable to its Underlying Index, and incurs costs in buying and selling securities, especially when rebalancing the securities holdings to reflect changes in the composition of its Underlying Index. In addition, the performance of each Fund and its Underlying Index may vary due to asset valuation differences and differences between each Fund's portfolio and its Underlying Index resulting from legal restrictions, cost or liquidity constraints.
Small and Medium Capitalization Company Risk. Investing in securities of small and medium capitalization companies involves greater risk than is customarily associated with investing in larger, more established companies. These companies' securities may be more volatile and less liquid than those of more established companies. These securities may have returns that vary, sometimes significantly, from the overall securities market. Often small and medium capitalization companies and the industries in which they are focused are still evolving and may make them be more sensitive to changing market conditions.
Foreign Investment Risk. The CleantechTM Portfolio's, the Global Listed Private Equity Portfolio's and the Golden Dragon Halter USX China Portfolio's investments in the securities of non-U.S. issuers, including depositary receipts, involve risks beyond those associated with investments in U.S. securities. These additional risks include greater market volatility, the availability of less reliable financial information, higher transactional costs, taxation by foreign governments, decreased market liquidity and political instability. As certain Funds will invest in securities denominated in foreign currencies, changes in currency exchange rates may negatively impact the Fund's returns.
Risk of Investing in Listed Private Equity Companies. There are certain risks inherent in the Global Listed Private Equity Portfolio's investments in listed private equity companies, which encompass business development companies ("BDCs") and other financial institutions or vehicles whose principal business is to invest in and lend capital to privately-held companies. The 1940 Act imposes certain restraints upon the operations of a BDC. Generally, little public information exists for private and thinly traded companies and there is a risk that investors may not be able to make a fully informed investment decision. With investments in debt instruments, there is a risk that the issuer may default on its payments or declare bankruptcy. Additionally, a BDC may only incur indebtedness in amounts such that the BDC's asset coverage equals at least 200% after such incurrence. These limitations on asset mix and leverage may prohibit the way that the BDC raises capital. BDCs generally invest in less mature private companies which involve greater risk than well-established publicly-traded companies. To the extent that the Fund invests in BDCs or other investment companies, a shareholder in the Fund will bear not only his or her proportionate share of the expenses of the Fund, but also, indirectly the expenses of the BDCs or other investment companies.
The Fund may not acquire greater than 3% of the total outstanding shares of BDCs or other investment companies. As a result, this limitation could inhibit the Fund's ability to purchase certain of the securities in the Underlying Index in the proportions represented in the Underlying Index. In these circumstances, the Fund would be required to use sampling techniques which could increase the risk of tracking error.
Risks of Investing in MLP Units. The Global Listed Private Equity Portfolio's investments in master limited partnerships ("MLP") units are subject to certain risks inherent in the structure of MLPs, including (i) tax risks, (ii) the limited ability to elect or remove management or the general partner or managing member, (iii) limited voting rights and (iv) conflicts of interest between the general partner or managing member and its affiliates and the limited partners or members.
77
Notes to Financial Statements (Continued)
PowerShares Exchange-Traded Fund Trust
April 30, 2011
China Exposure Risk. The value of the securities of companies which derive the majority of their revenues from China included in the Golden Dragon Halter USX China Portfolio is likely to be more volatile than that of other issuers. The economy of China differs, often unfavorably, from the U.S. economy in such respects as structure, general development, government involvement, wealth distribution, rate of inflation, growth rate, allocation of resources and capital reinvestment, among others.
Nanotechnology Industry Concentration Risk. Small technology companies included in the Lux Nanotech Portfolio are especially risky and may be less experienced, with limited product lines, markets or financial resources. Consequently, these companies are subject to scientific, technological and commercialization risks. These securities have a significantly greater risk of loss than traditional investment securities due to the speculative nature of these investments. Technology companies are generally subject to the risk of rapidly changing technologies, a limited product life span due to the frequent introduction of new or improved products, as well as cyclical market patterns and evolving industry standards. Technology companies also face the risk of losing patent, copyright and trademark protections.
C. Federal Income Taxes
Each Fund intends to comply with the provisions of the Internal Revenue Code applicable to regulated investment companies and to distribute substantially all of the Fund's taxable earnings to its shareholders. As such, the Funds will not be subject to Federal income taxes on otherwise taxable income (including net realized gains) that is distributed to the shareholders. Therefore, no provision for Federal income taxes is recorded in the financial statements.
Income and capital gain distributions are determined in accordance with Federal income tax regulations, which may differ from GAAP. These differences are primarily due to differing book and tax treatments for in-kind transactions, losses deferred due to wash sales, and passive foreign investment company adjustments, if any.
The Funds file tax returns in the United States Federal jurisdiction and certain other jurisdictions. Generally, a Fund is subject to examinations by such taxing authorities for up to three years after the filing of the return for the tax period.
D. Investment Income and Investment Transactions
Dividend income is recorded on the ex-dividend date, net of foreign taxes withheld, if any. Interest income is recorded on the accrual basis. Investment transactions are recorded on the trade date. Realized gains and losses from the sale or disposition of securities are calculated on the specific identified cost basis. Dividends and interest received by a Fund may give rise to withholding and other taxes imposed by foreign countries. Corporate actions (including cash dividends) are recorded net of non-reclaimable foreign tax withholdings on the ex-dividend date. Tax conventions between certain countries and the United States may reduce or eliminate such taxes.
E. Expenses
Expenses of the Trust that are directly identifiable to a specific Fund are applied to that Fund. Expenses that are not readily identifiable to a specific Fund are allocated in such a manner as deemed equitable, taking into consideration the nature and type of expense and the relative net assets of each Fund.
Each Fund (except S&P 500 BuyWrite Portfolio) is responsible for all its expenses, including the investment advisory fees, costs of transfer agency, custody, fund administration, legal, audit and other services, interest, taxes, brokerage commissions and other expenses connected with executions of portfolio
78
Notes to Financial Statements (Continued)
PowerShares Exchange-Traded Fund Trust
April 30, 2011
transactions, sub-licensing fees related to its respective Underlying Intellidex or Underlying Index, any distribution fees or expenses, litigation expenses, fees payable to the Trust's Board members and officers who are not "interested persons" of the Trust or the Adviser, expenses incurred in connection with the Board members' services, including travel expenses and legal fees of counsel for those members of the Board who are not "interested persons" of the Trust and extraordinary expenses.
The S&P 500 BuyWrite Portfolio has agreed to pay an annual unitary management fee to Invesco PowerShares Capital Management LLC (the "Adviser"). The Adviser has agreed to pay for substantially all expenses of the S&P 500 BuyWrite Portfolio including the cost of transfer agency, custody, fund administration, legal, audit and other services, except for distribution fees, if any, brokerage expenses, taxes, interest, litigation expenses and other extraordinary expenses.
F. Dividends and Distributions to Shareholders
Each Fund declares and pays dividends from net investment income, if any, to its shareholders quarterly and records on ex-dividend date. Each Fund distributes net realized taxable capital gains, if any, generally annually in cash and records them on ex-dividend date. Such distributions on a tax basis are determined in conformity with income tax regulations which may differ from GAAP. Distributions in excess of tax basis earnings and profits, if any, are reported in such Fund's financial statements as a tax return of capital at fiscal period-end.
G. Equalization
All of the Funds use the accounting practice of equalization. This accounting method is used to keep the continuing shareholder's per Share equity in undistributed net investment income from being affected by the continuous sales and redemptions of capital Shares. Equalization is calculated on a per Share basis whereby a portion of the proceeds from the sales and cost of repurchases of capital Shares is applied to undistributed net investment income. The amount of equalization is disclosed in the Statements of Changes in Net Assets as undistributed net investment income (loss) included in the price of capital Shares issued or redeemed. The distributions to shareholders of amounts so applied may be deemed to be a return of capital for tax purposes to the extent that such distributions exceed taxable income.
H. Option Contracts Written
The S&P 500 BuyWrite Portfolio may engage in certain strategies involving options to manage or minimize the risk of its investments or for investment purposes. A call option gives the purchaser of such option the right to buy, and the writer (the Fund) the obligation to sell, the underlying security at the stated exercise price during the option period. When a Fund writes (sells) call options, the amount of the premium received is recorded as a liability in the Statement of Assets and Liabilities and is subsequently "marked-to-market" to reflect the current value of the option written. The difference between the premium received and the current value of the option is recorded as unrealized appreciation or depreciation. The net change in unrealized appreciation (depreciation) is reported in the Statement of Operations. If a written call option expires, or if the Fund enters into a closing purchase transaction, the Fund realizes a gain (or a loss if the closing purchase transaction exceeds the premium received when the option was written) without regard to any unrealized gain or loss on the underlying security, and the liability related to such option is extinguished. If a written option is exercised, the Fund realizes a gain or loss from the sale of the underlying security and the proceeds of the sale are increased by the premium originally received. The primary risk in writing a call option is market risk; the Fund gives up the opportunity for profit if the market price of the underlying security increases and the option is exercised but will continue to bear the risk of loss should the
79
Notes to Financial Statements (Continued)
PowerShares Exchange-Traded Fund Trust
April 30, 2011
price of the underlying security decline. There is also a risk the Fund may not be able to enter into a closing transaction because of an illiquid market.
Writing Covered Call Option Risk. By writing covered call options, in return for the receipt of premiums, the S&P 500 BuyWrite Portfolio will give up the opportunity to benefit from potential increases in the value of the S&P 500 Index above the exercise prices of the Written Options, but will continue to bear the risk of declines in the value of the S&P 500 Index. The premiums received from the options may not be sufficient to offset any losses sustained from the volatility of the underlying stocks over time. In addition, the Fund's ability to sell the underlying securities will be limited while the option is in effect unless the Fund extinguishes the option position, through the purchase of an offsetting identical option prior to the expiration of the written option. If trading of options is suspended, the Fund may be unable to write options at times that may be desirable or advantageous to the Fund to do so.
Note 3. Derivative Investments
S&P 500 BuyWrite Portfolio has implemented required disclosures about derivative instruments and hedging activities in accordance with GAAP. This disclosure is intended to improve financial reporting about derivative instruments and hedging activities by requiring enhanced disclosures to enable investors to better understand their effects on an entity's financial position and financial performance. The enhanced disclosure has no impact on the results of operations reported in the financial statements.
Value of Derivative Instruments at Year-End
The table below summarizes the value of the Fund's derivative instruments, detailed by primary risk exposure, held as of April 30, 2011:
| Value | |||||||||||
| Risk Exposure/Derivative Type | Assets | Liabilities | |||||||||
| S&P 500 BuyWrite Portfolio | |||||||||||
| Equity risk | |||||||||||
| Options written contracts | $ | — | $ | (4,213,440 | ) | ||||||
Effect of Derivative Instruments for the year ended April 30, 2011
The table below summarizes the gains (losses) on derivative instruments, detailed by primary risk exposure, recognized in earnings during the year:
| Location of Gain (Loss) on Statements of Operations | |||||||
| Options | |||||||
| S&P 500 BuyWrite Portfolio* | |||||||
| Realized Gain (Loss) | |||||||
| Equity risk | $ | (9,038,928 | ) | ||||
| Change in Unrealized Appreciation (Depreciation) | |||||||
| Equity risk | (3,061,141 | ) | |||||
| Total | $ | (12,100,069 | ) | ||||
* The average value of outstanding options during the year was $2,756,777.
80
Notes to Financial Statements (Continued)
PowerShares Exchange-Traded Fund Trust
April 30, 2011
S&P 500 BuyWrite Portfolio
| Transactions During the Year | |||||||||||
| Call Option Contracts | |||||||||||
| Number of Contracts | Premiums Received | ||||||||||
| Beginning of year | 1,429 | $ | 2,584,600 | ||||||||
| Written | 15,317 | 36,445,008 | |||||||||
| Closed | (5,276 | ) | (11,055,579 | ) | |||||||
| Expired | (10,558 | ) | (26,094,830 | ) | |||||||
| End of year | 912 | $ | 1,879,199 | ||||||||
| Open Options Written at Year End | |||||||||||||||||||||||||||
| Contract Month | Strike Price | Number of Contracts | Premiums Received | Notional Value | Unrealized Appreciation (Depreciation) | ||||||||||||||||||||||
| Call Option S&P 500 Index | May-11 | $ | 1,320 | 912 | $ | 1,879,199 | $ | 4,213,440 | $ | (2,334,241 | ) | ||||||||||||||||
Note 4. Investment Advisory Agreement and Other Agreements
The Trust has entered into an Investment Advisory Agreement with the Adviser pursuant to which the Adviser has overall responsibility as the Funds' investment adviser for the selection and ongoing monitoring of the Funds' investments, managing the Funds' business affairs and providing certain clerical, bookkeeping and other administrative services. Each Fund (except for S&P 500 BuyWrite Portfolio) has agreed to pay the Adviser an annual fee of 0.50% of the Fund's average daily net assets. The S&P 500 BuyWrite Portfolio has agreed to pay the Adviser an annual unitary management fee of 0.75% of its average daily net assets and the Adviser has agreed to pay for substantially all expenses of S&P 500 BuyWrite Portfolio including the cost of transfer agency, custody, fund administration, legal, audit, litigation expenses, and other services, except for distribution fees, if any, brokerage expenses, taxes, interest, litigation expenses and other extraordinary expenses.
The Adviser's parent, Invesco Ltd., has agreed to indemnify and hold harmless the Global Listed Private Equity Portfolio and the Independent Trustees (as defined herein) of the Trust against any and all loss, damages, liability and expenses arising from certain alleged omission or misstatement in the Fund's registration statement.
The Adviser has entered into an Amended and Restated Excess Expense Agreement (the "Excess Expense Agreement") with the Trust, pursuant to which the Adviser has agreed to waive fees and/or pay Fund expenses to the extent necessary to prevent the operating expenses of (i) each Fund (except for Morningstar StockInvestor Core Portfolio, S&P 500® High Quality Portfolio and S&P 500 BuyWrite Portfolio) (excluding interest expense, brokerage commissions and other trading expenses, sub-licensing fees, offering costs, taxes, expenses of the investment companies that are paid indirectly as a result of share ownership of the investment company and extraordinary expenses) from exceeding 0.60% of the Fund's average daily net assets per year and (ii) each of Morningstar StockInvestor Core Portfolio and S&P 500® High Quality Portfolio (excluding interest expense, brokerage commissions and other trading expenses, offering costs, taxes and extraordinary expenses) from exceeding 0.50% of the Funds average daily net assets per year (the "Expense Cap"), at least until August 31, 2012. Offering costs excluded from the
81
Notes to Financial Statements (Continued)
PowerShares Exchange-Traded Fund Trust
April 30, 2011
Expense Cap are: (a) initial legal fees pertaining to the Funds' Shares offered for sale; (b) initial Securities and Exchange Commission and state registration fees; and (c) initial fees paid to be listed on an exchange.
The Excess Expense Agreement provides that the expenses borne by the Adviser are subject to recapture by the Adviser for up to three years from the date the fee or expense was borne by the Adviser, but no recapture payment will be made by a Fund if it would result in the Fund exceeding its Expense Cap as specified above.
The Excess Expense Agreement does not apply to S&P 500 BuyWrite Portfolio.
The amounts available for potential future recapture by the Adviser under the Excess Expense Agreement and the expiration schedule at April 30, 2011 are as follows:
| Total Potential | Potential Recapture Amounts Expiring | ||||||||||||||||||
| Recapture Amounts | 04/30/12 | 04/30/13 | 04/30/14 | ||||||||||||||||
| Aerospace & Defense Portfolio | $ | 157,175 | $ | 39,737 | $ | 36,343 | $ | 81,095 | |||||||||||
| CleantechTM Portfolio | 223,884 | 70,478 | 60,571 | 92,835 | |||||||||||||||
| DWA Technical LeadersTM Portfolio | 20,795 | — | 2,145 | 18,650 | |||||||||||||||
| Global Listed Private Equity Portfolio | 173,023 | 65,227 | 30,666 | 77,130 | |||||||||||||||
| Golden Dragon Halter USX China Portfolio | 263,692 | 85,848 | 72,246 | 105,598 | |||||||||||||||
| Lux Nanotech Portfolio | 308,103 | 115,193 | 80,942 | 111,968 | |||||||||||||||
| Morningstar StockInvestor Core Portfolio | 379,416 | 55,821 | 97,515 | 226,080 | |||||||||||||||
| S&P 500® High Quality Portfolio | 368,053 | 18,860 | 67,890 | 281,303 | |||||||||||||||
| Water Resources Portfolio | 11,685 | — | — | 11,685 | |||||||||||||||
| WilderHill Clean Energy Portfolio | 138,708 | — | — | 138,708 | |||||||||||||||
| WilderHill Progressive Energy Portfolio | 251,347 | 78,641 | 75,070 | 97,636 | |||||||||||||||
The Trust has entered into a Distribution Agreement with Invesco Distributors, Inc. (the "Distributor"), which serves as the distributor of Creation Units for each Fund. The Distributor does not maintain a secondary market in the Shares. The Distributor is an affiliate of the Adviser.
The Adviser has entered into a licensing agreement for each Fund with the following Licensors:
| Fund | Licensor | ||||||
| Aerospace & Defense Portfolio | International Space Business Council | ||||||
| CleantechTM Portfolio | Cleantech Captial Indices LLC | ||||||
| DWA Technical LeadersTM Portfolio | Dorsey Wright & Associates, Inc. | ||||||
| Global Listed Private Equity Portfolio | Red Rocks Capital Partners, LLC | ||||||
| Golden Dragon Halter USX China Portfolio | Halter Financial Group, Inc. | ||||||
| Lux Nanotech Portfolio | Lux Research, Inc. | ||||||
| Morningstar StockInvestor Core Portfolio | Morningstar, Inc. | ||||||
| S&P 500 BuyWrite Portfolio | Standard & Poor's ("S&P"), a division of The McGraw-Hill Companies, Inc. | ||||||
| S&P 500® High Quality Portfolio | Standard & Poor's Financial Services LLC | ||||||
| Water Resources Portfolio | Hydrogen Ventures LLC | ||||||
| WilderHill Clean Energy Portfolio | WilderShares, LLC | ||||||
| WilderHill Progressive Energy Portfolio | WilderShares, LLC | ||||||
82
Notes to Financial Statements (Continued)
PowerShares Exchange-Traded Fund Trust
April 30, 2011
Each Underlying Index name trademark is owned by the respective Licensors. These trademarks have been licensed to the Adviser for use with the Funds. The Funds are not sponsored, endorsed, sold or promoted by the Licensors and the Licensors make no representation regarding the advisability of investing in any of these Funds. The Trust has entered into a sub-licensing agreement under which the Funds (other than the S&P 500 BuyWrite Portfolio) are required to pay the sub-licensing fees which are shown on the Statements of Operations.
The Trust has entered into service agreements whereby The Bank of New York Mellon, a wholly-owned subsidiary of The Bank of New York Mellon Corporation, serves as the administrator, custodian, fund accountant and transfer agent for each Fund.
Note 5. Additional Valuation Information
GAAP defines fair value as the price that would be received to sell an asset or paid to transfer a liability in an orderly transaction between market participants at the measurement date, under current market conditions. GAAP establishes a hierarchy that prioritizes the inputs to valuation methods giving the highest priority to readily available unadjusted quoted prices in an active market for identical assets (Level 1) and the lowest priority to significant unobservable inputs (Level 3) generally when market prices are not readily available or are unreliable. Based on the valuation inputs, the securities or other investments are tiered into one of three levels. Changes in valuation methods may result in transfers in or out of an investment's assigned level:
Level 1 – Prices are determined using quoted prices in an active market for identical assets.
Level 2 – Prices are determined using other significant observable inputs. Observable inputs are inputs that other market participants may use in pricing a security. These may include quoted prices for similar securities, interest rates, prepayment speeds, credit risk yield curves, loss severities, default rates and discount rates, volatilities and others.
Level 3 – Prices are determined using significant unobservable inputs. In situations where quoted prices or observable inputs are unavailable (for example, when there is little or no market activity for an investment at the end of the period), unobservable inputs may be used. Unobservable inputs reflect the Fund's own assumptions about the factors market participants would use in determining fair value of the securities or instruments and would be based on the best available information.
Except for the Fund listed below, as of April 30, 2011, the securities in each Fund were valued based on Level 1 inputs. The appreciation on options held in S&P 500 BuyWrite Portfolio was based on Level 1 inputs. The level assigned to the securities valuations may not be an indication of the risk or liquidity associated with investing in those securities. Because of the inherent uncertainties of valuation, the values reflected in the financial statements may materially differ from the value received upon actual sale of those investments.
83
Notes to Financial Statements (Continued)
PowerShares Exchange-Traded Fund Trust
April 30, 2011
With respect to each Fund (except for Global Listed Private Equity Portfolio), during the fiscal year ended April 30, 2011, there were no significant transfers between investment levels. During the fiscal year ended April 30, 2011, there were transfers between investment levels, due to the application of foreign fair value triggers for the Global Listed Private Equity Portfolio.
| Investments in Securities | |||||||||||||||||||
| Level 1 | Level 2 | Level 3 | Total | ||||||||||||||||
| Golden Dragon Halter USX China Portfolio | |||||||||||||||||||
| Equity Securities | $ | 443,791,620 | $ | 1,101,128 | $ | 1,350,143 | $ | 446,242,891 | |||||||||||
| Lux Nanotech Portfolio | |||||||||||||||||||
| Equity Securities | $ | 37,178,870 | $ | — | $ | 1,214,639 | $ | 38,393,509 | |||||||||||
| Money Market Fund | 90,796 | — | — | 90,796 | |||||||||||||||
| Total Investments | $ | 37,269,666 | $ | — | $ | 1,214,639 | $ | 38,484,305 | |||||||||||
Note 6. Investments in Affiliates
The 1940 Act defines "affiliate" to include issuers of which a fund holds 5% or more of the outstanding voting securities. The following is a summary of the transactions with affiliates for the fiscal year ended April 30, 2011.
Water Resources Portfolio
| Value April 30, 2010 | Purchase at Cost | Proceeds from Sales | Change in Unrealized Appreciation (Depreciation) | Realized Gain (Loss) | Value April 30, 2011 | Dividend Income | |||||||||||||||||||||||||
| Ameron International Corp. | $ | 57,586,206 | $ | 5,781,536 | $ | (23,993,172 | ) | $ | 5,655,691 | $ | (6,645,582 | ) | $ | 38,384,679 | $ | 2,663,238 | |||||||||||||||
| Badger Meter, Inc. | 55,772,802 | 10,138,815 | (12,618,981 | ) | (8,830,694 | ) | 3,870,010 | 48,331,952 | 651,906 | ||||||||||||||||||||||
| Consolidated Water Co. Ltd. (Cayman Islands) | 18,519,265 | 1,236,026 | (1,286,369 | ) | (4,499,106 | ) | (1,115,675 | ) | 12,854,141 | 386,233 | |||||||||||||||||||||
| Gorman-Rupp Co. (The) | 41,609,621 | 2,309,447 | (15,912,067 | ) | 13,251,378 | 302,257 | 41,560,636 | 518,239 | |||||||||||||||||||||||
| Layne Christensen Co. | 39,022,469 | 8,405,306 | (14,107,462 | ) | 1,198,898 | 1,342,809 | 35,862,020 | — | |||||||||||||||||||||||
| Lindsay Corp. | 42,735,908 | 4,330,745 | (31,010,054 | ) | 29,858,911 | 8,824,175 | 54,739,685 | 360,575 | |||||||||||||||||||||||
| Mueller Water Products, Inc., Class A | 46,394,068 | 16,552,244 | (15,415,538 | ) | 489,745 | (7,617,739 | ) | 40,402,780 | 627,122 | ||||||||||||||||||||||
| Northwest Pipe Co. | 20,051,776 | 889,317 | (773,781 | ) | 818,504 | (836,769 | ) | 20,149,047 | — | ||||||||||||||||||||||
| Total Investments in Affiliates | $ | 321,692,115 | $ | 49,643,436 | $ | (115,117,424 | ) | $ | 37,943,327 | $ | (1,876,514 | ) | $ | 292,284,940 | $ | 5,207,313 | |||||||||||||||
WilderHill Clean Energy Portfolio
| Value April 30, 2010 | Purchase at Cost | Proceeds from Sales | Change in Unrealized Appreciation (Depreciation) | Realized Gain | Value April 30, 2011 | Dividend Income | |||||||||||||||||||||||||
| Active Power, Inc. | $ | — | $ | 12,072,036 | $ | (2,943,498 | ) | $ | (287,430 | ) | $ | 1,064,172 | $ | 9,905,280 | $ | — | |||||||||||||||
84
Notes to Financial Statements (Continued)
PowerShares Exchange-Traded Fund Trust
April 30, 2011
The Fund's Adviser is a subsidiary of Invesco Ltd. and therefore, Invesco Ltd. is considered to be affiliated with the Fund. The table below shows the transactions in and earnings from the investment in Invesco Ltd. for the fiscal year ended April 30, 2011.
S&P 500 BuyWrite Portfolio
| Value April 30, 2010 | Purchase at Cost | Proceeds from Sales | Change in Unrealized Appreciation (Depreciation) | Realized Gain | Notional Value April 30, 2011 | Dividend Income | |||||||||||||||||||||||||
| Invesco Ltd | $ | 156,056 | $ | 30,391 | $ | (87,876 | ) | $ | (4,634 | ) | $ | 21,012 | $ | 114,949 | $ | 2,905 | |||||||||||||||
Note 7. Distributions to Shareholders and Tax Components of Net Assets
Tax Character of Distributions to Shareholders Paid During the Fiscal Years Ended April 30, 2011 and 2010:
| 2011 | 2010 | ||||||||||||||||||
| Ordinary Income | Return of Capital | Ordinary Income | Return of Capital | ||||||||||||||||
| Aerospace & Defense Portfolio | $ | 1,074,351 | $ | — | $ | 1,645,392 | $ | — | |||||||||||
| CleantechTM Portfolio | 38,868 | — | 223,251 | 75,171 | |||||||||||||||
| DWA Technical LeadersTM Portfolio | 639,994 | — | 843,823 | — | |||||||||||||||
| Global Listed Private Equity Portfolio | 14,909,521 | — | 4,710,562 | — | |||||||||||||||
| Golden Dragon Halter USX China Portfolio | 3,021,508 | — | 3,271,139 | 501,022 | |||||||||||||||
| Lux Nanotech Portfolio | — | — | 101,214 | 16 | |||||||||||||||
| Morningstar StockInvestor Core Portfolio | 132,812 | — | 145,806 | — | |||||||||||||||
| S&P 500 BuyWrite Portfolio | 11,066,172 | — | 1,778,095 | — | |||||||||||||||
| S&P 500® High Quality Portfolio | 663,992 | — | 237,779 | — | |||||||||||||||
| Water Resources Portfolio | 6,570,710 | — | 9,289,108 | — | |||||||||||||||
| WilderHill Clean Energy Portfolio | — | — | — | — | |||||||||||||||
| WilderHill Progressive Energy Portfolio | 319,968 | — | 347,466 | — | |||||||||||||||
Tax Components of Net Assets at Fiscal Year-End:
| Undistributed Ordinary Income | Undistributed Long-term Capital Gains | Temporary Book/Tax Differences | Net Unrealized Appreciation (Depreciation) | Capital Loss Carryforward | Post-October* Deferrals | Shares of Beneficial Interest | Total Net Assets | ||||||||||||||||||||||||||||
| Aerospace & Defense Portfolio | $ | 160,406 | $ | — | $ | (8,889 | ) | $ | (9,658,853 | ) | $ | (25,843,550 | ) | $ | (893,675 | ) | $ | 144,215,812 | $ | 107,971,251 | |||||||||||||||
| CleantechTM Portfolio | 200,349 | — | (7,352 | ) | 27,126,954 | (52,797,556 | ) | (8,584,966 | ) | 196,593,012 | 162,530,441 | ||||||||||||||||||||||||
| DWA Technical LeadersTM Portfolio | — | — | (10,205 | ) | 70,159,585 | (168,534,642 | ) | (3,558,553 | ) | 552,847,954 | 450,904,139 | ||||||||||||||||||||||||
| Global Listed Private Equity Portfolio | 21,813,808 | — | (7,884 | ) | 45,893,788 | (55,296,478 | ) | (937,184 | ) | 482,155,877 | 493,621,927 | ||||||||||||||||||||||||
| Golden Dragon Halter USX China Portfolio | 488,111 | — | (16,410 | ) | 7,955,837 | (137,775,029 | ) | (12,384,114 | ) | 588,023,395 | 446,291,790 | ||||||||||||||||||||||||
85
Notes to Financial Statements (Continued)
PowerShares Exchange-Traded Fund Trust
April 30, 2011
| Undistributed Ordinary Income | Undistributed Long-term Capital Gains | Temporary Book/Tax Differences | Net Unrealized Appreciation (Depreciation) | Capital Loss Carryforward | Post-October* Deferrals | Shares of Beneficial Interest | Total Net Assets | ||||||||||||||||||||||||||||
| Lux Nanotech Portfolio | $ | — | $ | — | $ | (5,613 | ) | $ | (3,990,754 | ) | $ | (59,228,657 | ) | $ | (3,557,723 | ) | $ | 105,173,223 | $ | 38,390,476 | |||||||||||||||
| Morningstar StockInvestor Core Portfolio | 85,066 | — | (4,623 | ) | 3,663,520 | (30,328,775 | ) | (1 | ) | 46,401,287 | 19,816,474 | ||||||||||||||||||||||||
| S&P 500 BuyWrite Portfolio | 8,523,283 | 499,465 | — | — | — | — | 111,488,576 | 120,511,324 | |||||||||||||||||||||||||||
| S&P 500® High Quality Portfolio | 671,925 | — | (7,092 | ) | 19,528,243 | (139,345,851 | ) | — | 231,847,511 | 112,694,736 | |||||||||||||||||||||||||
| Water Resources Portfolio | 1,107,881 | — | (48,841 | ) | 108,823,303 | (408,564,463 | ) | (10,311,889 | ) | 1,569,642,038 | 1,260,648,029 | ||||||||||||||||||||||||
| WilderHill Clean Energy Portfolio | — | — | (29,770 | ) | (95,357,839 | ) | (1,099,718,852 | ) | (26,214,141 | ) | 1,762,792,692 | 541,472,090 | |||||||||||||||||||||||
| WilderHill Progressive Energy Portfolio | 512,768 | — | (5,273 | ) | 13,564,008 | (23,216,033 | ) | (1,523,506 | ) | 85,843,293 | 75,175,257 | ||||||||||||||||||||||||
* Capital, currency and Passive Foreign Investment Company ("PFIC") losses incurred after October 31 ("Post-October losses") within the taxable year are deemed to arise on the first business day of each Fund's next taxable year.
Capital loss carryforward is calculated and reported as of a specific date. Results of transactions and other activity after that date may affect the amount of capital loss carryforward actually available for the Funds to utilize. The ability to utilize capital loss carryforward in the future may be limited under Internal Revenue Code rules and related regulations based on the results of future transactions.
The following Funds have capital loss carryforward amounts as of April 30, 2011, which expire on April 30 of each year listed below:
| 2014 | 2015 | 2016 | 2017 | 2018 | 2019 | Total* | |||||||||||||||||||||||||
| Aerospace & Defense Portfolio | $ | — | $ | 104,662 | $ | 2,374,303 | $ | 7,470,897 | $ | 6,428,813 | $ | 9,464,875 | $ | 25,843,550 | |||||||||||||||||
| CleantechTM Portfolio | — | — | 1,171,839 | 14,341,075 | 25,186,026 | 12,098,616 | 52,797,556 | ||||||||||||||||||||||||
| DWA Technical LeadersTM Portfolio | — | — | 5,046,566 | 92,771,702 | 60,219,842 | 10,496,532 | 168,534,642 | ||||||||||||||||||||||||
| Global Listed Private Equity Portfolio** | — | — | 460,027 | 7,687,052 | 47,149,399 | — | 55,296,478 | ||||||||||||||||||||||||
| Golden Dragon Halter USX China Portfolio | 1,018,146 | 3,128,677 | 1,235,904 | 22,836,421 | 74,072,167 | 35,483,714 | 137,775,029 | ||||||||||||||||||||||||
86
Notes to Financial Statements (Continued)
PowerShares Exchange-Traded Fund Trust
April 30, 2011
| 2014 | 2015 | 2016 | 2017 | 2018 | 2019 | Total* | |||||||||||||||||||||||||
| Lux Nanotech Portfolio | $ | — | $ | 3,986,980 | $ | 793,005 | $ | 27,406,131 | $ | 14,663,516 | $ | 12,379,025 | $ | 59,228,657 | |||||||||||||||||
| Morningstar StockInvestor Core Portfolio | — | — | 3,798,072 | 6,546,039 | 17,110,347 | 2,874,317 | 30,328,775 | ||||||||||||||||||||||||
| S&P 500® High Quality Portfolio | — | 28,753,751 | 21,013,690 | 37,241,965 | 42,466,537 | 9,869,908 | 139,345,851 | ||||||||||||||||||||||||
| Water Resources Portfolio | — | 11,876,489 | 3,553,481 | 93,208,162 | 265,948,030 | 33,978,301 | 408,564,463 | ||||||||||||||||||||||||
| WilderHill Clean Energy Portfolio | 2,098,368 | 89,533,576 | 44,707,703 | 261,712,498 | 460,657,845 | 241,008,862 | 1,099,718,852 | ||||||||||||||||||||||||
| WilderHill Progressive Energy Portfolio | — | — | 179,432 | 8,319,827 | 12,433,887 | 2,282,887 | 23,216,033 | ||||||||||||||||||||||||
* Capital loss carryforward as of the date listed above is reduced for limitations, if any, to the extent required by the Internal Revenue Code.
** The Fund utilized $3,928,471 of capital loss capital loss carryforward during the fiscal year ended April 30, 2011.
Note 8. Investment Transactions
For the fiscal year ended April 30, 2011, the cost of securities purchased and proceeds from sales of securities, excluding short-term securities, money market funds and in-kind transactions, were as follows:
| Purchases | Sales | ||||||||||
| Aerospace & Defense Portfolio | $ | 14,144,178 | $ | 13,864,632 | |||||||
| CleantechTM Portfolio | 37,334,287 | 35,646,098 | |||||||||
| DWA Technical LeadersTM Portfolio | 111,734,195 | 109,241,933 | |||||||||
| Global Listed Private Equity Portfolio | 328,939,819 | 331,460,574 | |||||||||
| Golden Dragon Halter USX China Portfolio | 72,591,710 | 66,060,952 | |||||||||
| Lux Nanotech Portfolio | 25,884,489 | 26,370,058 | |||||||||
| Morningstar StockInvestor Core Portfolio | 16,274,797 | 16,782,222 | |||||||||
| S&P 500 BuyWrite Portfolio | 90,671,622 | 100,201,639 | |||||||||
| S&P 500® High Quality Portfolio | 57,119,119 | 56,574,081 | |||||||||
| Water Resources Portfolio | 144,639,763 | 175,117,704 | |||||||||
| WilderHill Clean Energy Portfolio | 183,112,107 | 178,272,215 | |||||||||
| WilderHill Progressive Energy Portfolio | 13,280,818 | 14,341,926 | |||||||||
For the fiscal year ended April 30, 2011, in-kind transactions associated with creations and redemptions were as follows:
| Securities Received | Securities Delivered | ||||||||||
| Aerospace & Defense Portfolio | $ | 52,485,882 | $ | 88,297,222 | |||||||
| CleantechTM Portfolio | 10,037,570 | 36,741,081 | |||||||||
| DWA Technical LeadersTM Portfolio | 475,713,588 | 258,166,252 | |||||||||
| Global Listed Private Equity Portfolio | 206,449,974 | 7,305,931 | |||||||||
| Golden Dragon Halter USX China Portfolio | 43,002,416 | 118,278,835 | |||||||||
87
Notes to Financial Statements (Continued)
PowerShares Exchange-Traded Fund Trust
April 30, 2011
| Securities Received | Securities Delivered | ||||||||||
| Lux Nanotech Portfolio | $ | 2,808,032 | $ | 14,722,138 | |||||||
| Morningstar StockInvestor Core Portfolio | 16,173,728 | 16,557,973 | |||||||||
| S&P 500 BuyWrite Portfolio | — | 56,320,439 | |||||||||
| S&P 500® High Quality Portfolio | 105,772,170 | 79,951,026 | |||||||||
| Water Resources Portfolio | 119,825,356 | 280,545,348 | |||||||||
| WilderHill Clean Energy Portfolio | 137,834,725 | 264,515,994 | |||||||||
| WilderHill Progressive Energy Portfolio | 21,203,278 | 17,826,374 | |||||||||
Gains and (losses) on in-kind transactions are generally not considered taxable gains and (losses) for Federal income tax purposes.
At April 30, 2011, the aggregate cost and the net unrealized appreciation (depreciation) of investments for tax purposes were as follows:
| Cost | Net Unrealized Appreciation (Depreciation) | Gross Unrealized Appreciation | Gross Unrealized (Depreciation) | ||||||||||||||||
| Aerospace & Defense Portfolio | $ | 117,769,807 | $ | (9,658,853 | ) | $ | 3,793,718 | $ | (13,452,571 | ) | |||||||||
| CleantechTM Portfolio | 135,463,130 | 27,119,060 | 34,882,837 | (7,763,777 | ) | ||||||||||||||
| DWA Technical LeadersTM Portfolio | 381,098,447 | 70,159,585 | 71,393,324 | (1,233,739 | ) | ||||||||||||||
| Global Listed Private Equity Portfolio | 443,522,279 | 45,870,270 | 51,636,722 | (5,766,452 | ) | ||||||||||||||
| Golden Dragon Halter USX China Portfolio | 438,287,054 | 7,955,837 | 91,211,867 | (83,256,030 | ) | ||||||||||||||
| Lux Nanotech Portfolio | 42,475,059 | (3,990,754 | ) | 5,072,106 | (9,062,860 | ) | |||||||||||||
| Morningstar StockInvestor Core Portfolio | 16,211,027 | 3,663,520 | 3,786,074 | (122,554 | ) | ||||||||||||||
| S&P 500 BuyWrite Portfolio | 122,364,244 | — | — | — | |||||||||||||||
| S&P 500® High Quality Portfolio | 93,219,955 | 19,528,243 | 19,871,066 | (342,823 | ) | ||||||||||||||
| Water Resources Portfolio | 1,152,092,918 | 108,823,303 | 192,639,529 | (83,816,226 | ) | ||||||||||||||
| WilderHill Clean Energy Portfolio | 637,375,142 | (95,357,839 | ) | 72,939,072 | (168,296,911 | ) | |||||||||||||
| WilderHill Progressive Energy Portfolio | 61,687,183 | 13,564,008 | 16,445,328 | (2,881,320 | ) | ||||||||||||||
Note 9. Reclassification of Permanent Differences
Primarily as a result of differing book/tax treatment of investment activity, on April 30, 2011, amounts were reclassified between undistributed net investment income (loss), undistributed net realized gain (loss) and Shares of beneficial interest. These reclassifications had no effect on the net assets of each Fund. For the fiscal year ended April 30, 2011, the reclassifications were as follow:
| Undistributed Net Investment Income (Loss) | Undistributed Net Realized Gain (Loss) | Shares of Beneficial Interest | |||||||||||||
| Aerospace & Defense Portfolio | $ | 9,800 | $ | 5,316,734 | $ | (5,326,534 | ) | ||||||||
| CleantechTM Portfolio | (246,807 | ) | (10,359,364 | ) | 10,606,171 | ||||||||||
88
Notes to Financial Statements (Continued)
PowerShares Exchange-Traded Fund Trust
April 30, 2011
| Undistributed Net Investment Income (Loss) | Undistributed Net Realized Gain (Loss) | Shares of Beneficial Interest | |||||||||||||
| DWA Technical LeadersTM Portfolio | $ | (515,582 | ) | $ | (45,981,900 | ) | $ | 46,497,482 | |||||||
| Global Listed Private Equity Portfolio | (491,010 | ) | (1,196,754 | ) | 1,687,764 | ||||||||||
| Golden Dragon Halter USX China Portfolio | 145,866 | (35,706,913 | ) | 35,561,047 | |||||||||||
| Lux Nanotech Portfolio | 27,715 | (488,063 | ) | 460,348 | |||||||||||
| Morningstar StockInvestor Core Portfolio | 14,640 | (1,840,332 | ) | 1,825,692 | |||||||||||
| S&P 500 BuyWrite Portfolio | 71,222 | — | (71,222 | ) | |||||||||||
| S&P 500® High Quality Portfolio | (134,772 | ) | (13,121,778 | ) | 13,256,550 | ||||||||||
| Water Resources Portfolio | 492,937 | (42,770,821 | ) | 42,277,884 | |||||||||||
| WilderHill Clean Energy Portfolio | 1,149,421 | (46,780,667 | ) | 45,631,246 | |||||||||||
| WilderHill Progressive Energy Portfolio | 7,103 | (7,930,329 | ) | 7,923,226 | |||||||||||
Note 10. Trustees' Fees
The Fund compensates each Trustee who is not an "interested person" as defined in the 1940 Act (an "Independent Trustee"). The Adviser, as a result of the unitary management fee, pays for such compensation for S&P 500 BuyWrite Portfolio. The Non-Independent Trustees of the Trust do not receive any Trustees' fees.
The Trust has adopted a deferred compensation plan (the "Plan"). Under the Plan, an Independent Trustee who has executed a Deferred Fee Agreement (a "Participating Trustee") may defer receipt of all or a portion of his compensation ("Deferral Fees"). Such Deferral Fees are deemed to be invested in select PowerShares Funds. The Deferral Fees payable to the Participating Trustee are valued as of the date such Deferral Fees would have been paid to the Participating Trustee. The value increases with contributions or with increases in the value of the Shares selected, and the value decreases with distributions or with declines in the value of the Shares selected.
Note 11. Capital
Shares are created and redeemed by the Trust only in Creation Unit size aggregations of 50,000 Shares. Only Authorized Participants are permitted to purchase or redeem Creation Units from the Funds. Such transactions are generally permitted on an in-kind basis, with a balancing cash component to equate the transaction to the NAV per Share of each Fund of the Trust on the transaction date. Cash may be substituted equivalent to the value of certain securities generally when they are not available in sufficient quantity for delivery, not eligible for trading by the Authorized Participant or as a result of other market circumstances.
Note 12. Indemnifications
Under the Trust's organizational documents, its officers and Trustees are indemnified against certain liabilities arising out of the performance of their duties to the Trust. Each Independent Trustee is also indemnified against certain liabilities arising out of the performance of his duties to the Trust pursuant to an Indemnification Agreement between the Independent Trustee and the Trust. Additionally, in the normal course of business, the Trust enters into contracts with service providers that contain general indemnification clauses. The Trust's maximum exposure under these arrangements is unknown, as this would involve future claims that may be made against the Trust that have not yet occurred. However, based on experience, the Trust believes the risk of loss to be remote.
89
Report of Independent Registered Public Accounting Firm
To the Board of Trustees and Shareholders of PowerShares Exchange-Traded Fund Trust:
In our opinion, the accompanying statements of assets and liabilities, including the schedules of investments, and the related statements of operations and of changes in net assets and the financial highlights present fairly, in all material respects, the financial position of each of the portfolios indicated in Note 1 of the financial statements (each a portfolio of PowerShares Exchange-Traded Fund Trust, hereafter referred to as the "Trust") at April 30, 2011, and the results of each of their operations, the changes in each of their net assets, and the financial highlights for each of the periods presented, in conformity with accounting principles generally accepted in the United States of America. These financial statements and financial highlights (hereafter referred to as "financial statements") are the responsibility of the Trust's management; our responsibility is to express an opinion on these financial statements based on our audits. We conducted our audits of these financial statements in accordance with the standards of the Public Company Accounting Oversight Board (United States). Those standards require that we plan and perform the audit to obtain reasonable assurance about whether the financial statements are free of material misstatement. An audit includes examining, on a test basis, evidence supporting the amounts and disclosures in the financial statements, assessing the accounting principles used and significant estimates made by management, and evaluating the overall financial statement presentation. We believe that our audits, which included confirmation of securities at April 30, 2011 by correspondence with the custodian and brokers, and the application of alternative auditing procedures where securities purchased had not been received, provide a reasonable basis for our opinion.
/s/ PricewaterhouseCoopers LLP
New York, New York
June 24, 2011
90
Tax Information
Form 1099-DIV, Form 1042-S and other year-end tax information provide shareholders with actual calendar year amounts that should be included in their tax returns. Shareholders should consult their tax advisors.
The following distribution information is being provided as required by the Internal Revenue Code or to meet a specific state's requirement.
Each Fund designates the following amounts or, if subsequently determined to be different, the maximum amount allowable for its fiscal year ended April 30, 2011:
Federal Income Tax Information
| Qualified Dividend Income* | Corporate Dividends-Received Deduction* | ||||||||||
| Aerospace & Defense Portfolio | 100 | % | 100 | % | |||||||
| CleantechTM Portfolio | 100 | % | 100 | % | |||||||
| DWA Technical LeadersTM Portfolio | 100 | % | 100 | % | |||||||
| Global Listed Private Equity Portfolio | 41 | % | 34 | % | |||||||
| Golden Dragon Halter USX China Portfolio | 100 | % | 0 | % | |||||||
| Lux Nanotech Portfolio | 0 | % | 0 | % | |||||||
| S&P 500 BuyWrite Portfolio | 0 | % | 0 | % | |||||||
| Morningstar StockInvestor Core Portfolio | 100 | % | 100 | % | |||||||
| S&P 500® High Quality Portfolio | 100 | % | 100 | % | |||||||
| Water Resources Portfolio | 100 | % | 100 | % | |||||||
| WilderHill Clean Energy Portfolio | 0 | % | 0 | % | |||||||
| WilderHill Progressive Energy Portfolio | 100 | % | 95 | % | |||||||
The Fund intends to elect to pass through to shareholders the credit for taxes paid to foreign countries.
| April 30, 2011 | |||||||||||
| Foreign Source Income | Foreign Taxes | ||||||||||
| Golden Dragon Halter USX China Portfolio | $ | 7,292,686 | $ | 742,117 | |||||||
* The above percentages are based on ordinary income dividends paid to shareholders during the Fund's fiscal year.
91
Trustees and Officers
The Independent Trustees, the Trustees who are affiliated with the Adviser (the "Non-Independent Trustees") and the executive officers of the Trust, their term of office and length of time served, their principal business occupations during at least the past five years, the number of portfolios in the Fund Complex overseen by each Trustee and the other directorships, if any, held by a Trustee, are shown below.
The Trustees and officers information is current as of April 30, 2011.
| Name, Address and Age of Independent Trustees | Position(s) Held with Trust | Term of Office and Length of Time Served* | Principal Occupation(s) During Past 5 Years | Number of Portfolios in Fund Complex Overseen by Independent Trustees | Other Directorships Held by Independent Trustees | ||||||||||||||||||
| Ronn R. Bagge (53) c/o Invesco PowerShares Capital Management LLC 301 West Roosevelt Road Wheaton, IL 60187 | Trustee | Since 2003 | Founder and Principal, YQA Capital Management LLC (1998-Present); formerly Owner/CEO of Electronic Dynamic Balancing Co., Inc. (high-speed rotating equipment service provider) | 107 | None | ||||||||||||||||||
| Todd J. Barre (53) c/o Invesco PowerShares Capital Management LLC 301 West Roosevelt Road Wheaton, IL 60187 | Trustee | Since 2010 | Assistant Professor of Business, Trinity Christian College (2010-Present); formerly Vice President and Senior Investment Strategist (2001-2008); Director of Open Architecture and Trading (2007-2008); Head of Fundamental Research (2004-2007); and Vice President and Senior Fixed Income Strategist (1994-2001), BMO Financial Group/Harris Private Bank | 107 | None | ||||||||||||||||||
* This is the date the Trustee began serving the Trust. Each Trustee serves an indefinite term, until his successor is elected.
** Fund Complex includes all open-end funds (including all of their portfolios) advised by the Adviser. At April 30, 2011, the Fund Complex consisted of the Trust's 56 portfolios and three other exchange-traded fund trusts with 51 portfolios advised by the Adviser.
92
Trustees and Officers (Continued)
| Name, Address and Age of Independent Trustees | Position(s) Held with Trust | Term of Office and Length of Time Served* | Principal Occupation(s) During Past 5 Years | Number of Portfolios in Fund Complex Overseen by Independent Trustees | Other Directorships Held by Independent Trustees | ||||||||||||||||||
| Marc M. Kole (50) c/o Invesco PowerShares Capital Management LLC 301 West Roosevelt Road Wheaton, IL 60187 | Trustee | Since 2006 | Chief Financial Officer, Hope Network (social services) (2008-Present); formerly Assistant Vice President and Controller, Priority Health (health insurance) (2005-2008); Senior Vice President of Finance, United Healthcare (2004-2005); Senior Vice President of Finance, Oxford Health Plans (2000-2004) | 107 | None | ||||||||||||||||||
| Philip M. Nussbaum (49) c/o Invesco PowerShares Capital Management LLC 301 West Roosevelt Road Wheaton, IL 60187 | Trustee | Since 2003 | Chairman, Performance Trust Capital Partners (2004-Present) | 107 | None | ||||||||||||||||||
* This is the date the Trustee began serving the Trust. Each Trustee serves an indefinite term, until his successor is elected.
** Fund Complex includes all open-end funds (including all of their portfolios) advised by the Adviser. At April 30, 2011, the Fund Complex consisted of the Trust's 56 portfolios and three other exchange-traded fund trusts with 51 portfolios advised by the Adviser.
93
Trustees and Officers (Continued)
| Name, Address and Age of Independent Trustees | Position(s) Held with Trust | Term of Office and Length of Time Served* | Principal Occupation(s) During Past 5 Years | Number of Portfolios in Fund Complex Overseen by Independent Trustees | Other Directorships Held by Independent Trustees | ||||||||||||||||||
| Donald H. Wilson (51) c/o Invesco PowerShares Capital Management LLC 301 West Roosevelt Road Wheaton, IL 60187 | Trustee | Since 2006 | Chairman and Chief Executive Officer, Stone Pillar Advisers, Ltd. (2010-Present); formerly, Chief Operating Officer, AMCORE Financial, Inc. (bank holding company) (2007-2009); Executive Vice President and Chief Financial Officer, AMCORE Financial, Inc. (2006-2007); Senior Vice President and Treasurer, Marshall & Ilsley Corp. (bank holding company) (1995-2006) | 107 | None | ||||||||||||||||||
* This is the date the Trustee began serving the Trust. Each Trustee serves an indefinite term, until his successor is elected.
** Fund Complex includes all open-end funds (including all of their portfolios) advised by the Adviser. At April 30, 2011, the Fund Complex consisted of the Trust's 56 portfolios and three other exchange-traded fund trusts with 51 portfolios advised by the Adviser.
94
Trustees and Officers (Continued)
| Name, Address and Age of Interested Trustees | Position(s) Held with Trust | Term of Office and Length of Time Served* | Principal Occupation(s) During Past 5 Years | Number of Portfolios in Fund Complex Overseen by Interested Trustee | Other Directorships Held by Interested Trustee | ||||||||||||||||||
| H. Bruce Bond (47) Invesco PowerShares Capital Management LLC 301 West Roosevelt Road Wheaton, IL 60187 | Chairman of the Board and Trustee | Since 2003 | Chairman, Invesco Power-Shares Capital Management LLC (2009-Present); formerly, Managing Director, Invesco PowerShares Capital Management LLC (2002-2009); Manager, Nuveen Investments (1998-2002) | 107 | None | ||||||||||||||||||
| Kevin M. Carome (54) Invesco Ltd. Two Peachtree Pointe 1555 Peachtree St., N.E., Suite 1800 Atlanta, GA 30309 | Trustee | Since 2010 | Senior Managing Director and General Counsel, Invesco Ltd. (2006-Present); formerly, Senior Vice President and General Counsel, Invesco Advisors, Inc. (2003-2005); Senior Vice President and General Counsel, Liberty Financial Companies, Inc. (2000-2001); General Counsel of certain investment management subsidiaries of Liberty Financial Companies, Inc. (1998-2000); Associate General Counsel, Liberty Financial Companies, Inc. (1993-1998); Associate, Ropes & Gray LLP | 107 | None | ||||||||||||||||||
* This is the date the Interested Trustee began serving the Trust. Each Trustee serves an indefinite term, until his successor is elected.
** Fund Complex includes all open-end funds (including all of their portfolios) advised by the Adviser. At April 30, 2011, the Fund Complex consisted of the Trust's 56 portfolios and three other exchange-traded fund trusts with 51 portfolios advised by the Adviser.
95
Trustees and Officers (Continued)
| Name, Address and Age of Executive Officer | Position(s) Held with Trust | Length of Time Served* | Principal Occupation(s) During Past 5 Years | ||||||||||||
| Andrew Schlossberg (36) Invesco Management Group, Inc. 11 Greenway Plaza Suite 100 Houston, Texas 77046 | President | Since 2009 | Managing Director, U.S. head of business strategy and chief marketing officer for Invesco Ltd. in the United States (2008-Present); formerly, Mr. Schlossberg served in multiple roles within Invesco, including head of corporate development, as well as global leadership roles in strategy and product development in the company's North American Institutional and Retirement divisions (2002-2007) | ||||||||||||
| Bruce T. Duncan (56) Invesco PowerShares Capital Management LLC 301 West Roosevelt Road Wheaton, IL 60187 | Treasurer and Secretary | Treasurer since 2006 and Secretary since 2008 | Senior Vice President of Finance, Invesco PowerShares Capital Management LLC (2005-Present); formerly Private Practice Attorney (2000-2005); Vice President of Investor Relations, The ServiceMaster Company (1994-2000); Vice President of Taxes, The ServiceMaster Company (1990-2000) | ||||||||||||
| Benjamin Fulton (49) Invesco PowerShares Capital Management LLC 301 West Roosevelt Road Wheaton, IL 60187 | Vice President | Since 2009 | Executive Vice President – Global Product Development, Invesco PowerShares Capital Management LLC (2005-Present); formerly principal of Clermont Consulting, a consulting firm focused on the creation and development of retail investment products (2003-2005); President and a founding partner of Claymore Securities, a financial services firm in the Chicago land area (2001-2003); Managing Director of Structured Investments at Nuveen Investments (1998-2001) | ||||||||||||
| Peter Hubbard (29) Invesco PowerShares Capital Management LLC 301 West Roosevelt Road Wheaton, IL 60187 | Vice President | Since 2009 | Vice President and Director of Portfolio Management – Invesco PowerShares Capital Management LLC (2008-Present); formerly Portfolio Manager, Invesco PowerShares Capital Management LLC (2007-2008); Research Analyst, Invesco PowerShares Capital Management LLC (2005-2007); Research Analyst and Trader, Ritchie Capital, a hedge fund operator (2003-2005) | ||||||||||||
* This is the period for which the Officers began serving the Trust. Each Officer serves a one-year term, until his successor is elected.
96
Trustees and Officers (Continued)
| Name, Address and Age of Executive Officer | Position(s) Held with Trust | Length of Time Served* | Principal Occupation(s) During Past 5 Years | ||||||||||||
| David Warren (53) Invesco Trimark Ltd. 5140 Yonge Street Suite 900 Toronto, Ontario M2N 6X7 | Vice President | Since 2009 | Director, Executive Vice President and Chief Financial Officer, Invesco Trimark Ltd. and Chief Administrative Officer, North American Retail, Invesco Ltd (2007-Present); formerly, Director, Executive Vice President and Chief Financial Officer, Invesco Trimark Ltd. (2000-2006) | ||||||||||||
| Todd Spillane (51) Invesco Management Group, Inc. 11 Greenway Plaza Suite 100 Houston, Texas 77046 | Chief Compliance Officer | Since 2010 | Senior Vice President, Invesco Management Group, Inc.; Chief Compliance Officer, INVESCO Private Capital Investments, Inc. (holding company), Invesco Private Capital, Inc. (registered investment adviser) and Invesco Senior Secured Management, Inc. (registered investment adviser); Chief Compliance Officer and Senior Vice President, Invesco Advisers Inc. (formerly Invesco Institutional, (N.A.), Inc. – registered investment adviser) and Vice President, Invesco Distributors, Inc. and Invesco Investment Services, Inc.; formerly Chief Compliance Officer, Invesco Global Asset Management (N.A.), Inc. – registered investment adviser) and Invesco Advisers, Inc. (formerly Invesco Institutional (N.A.), Inc.) (registered investment adviser); Senior Vice President and Chief Compliance Officer, Invesco Advisors, Inc., Invesco Capital Management, Inc. and Invesco Private Asset Management, Inc.; Vice President, Invesco Capital Management, Inc. and Fund Management Company | ||||||||||||
Availability of Additional Information About the Trustees
The Statement of Additional Information includes additional information about the Trustees and is available, without charge, upon request at (800) 983-0903.
* This is the period for which the Officers began serving the Trust. Each Officer serves a one-year term, until his successor is elected.
97
Board Considerations Regarding Continuation of Investment Advisory Agreement
At a meeting held on April 14, 2011, the Board of Trustees of the PowerShares Exchange-Traded Fund Trust (the "Trust"), including the Independent Trustees, unanimously approved the continuation of the Investment Advisory Agreement between Invesco PowerShares Capital Management LLC (the "Adviser") and the Trust for the following 54 series (each, a "Fund" and collectively, the "Funds"):
PowerShares Dynamic Market Portfolio
PowerShares Dynamic OTC Portfolio
PowerShares Golden Dragon Halter USX China Portfolio
PowerShares High Yield Equity Dividend AchieversTM Portfolio
PowerShares WilderHill Clean Energy Portfolio
PowerShares Dynamic Large Cap Growth Portfolio
PowerShares Dynamic Large Cap Value Portfolio
PowerShares Dynamic Mid Cap Growth Portfolio
PowerShares Dynamic Mid Cap Value Portfolio
PowerShares Dynamic Small Cap Growth Portfolio
PowerShares Dynamic Small Cap Value Portfolio
PowerShares Dynamic Biotechnology & Genome Portfolio
PowerShares Dynamic Food & Beverage Portfolio
PowerShares Dynamic Leisure and Entertainment Portfolio
PowerShares Dynamic Media Portfolio
PowerShares Dynamic Networking Portfolio
PowerShares Dynamic Pharmaceuticals Portfolio
PowerShares Dynamic Semiconductors Portfolio
PowerShares Dynamic Software Portfolio
PowerShares Zacks Micro Cap Portfolio
PowerShares Aerospace & Defense Portfolio
PowerShares Morningstar StockInvestor Core Portfolio
PowerShares Dividend AchieversTM Portfolio
PowerShares International Dividend AchieversTM Portfolio
PowerShares Dynamic Building and Construction Portfolio
PowerShares Dynamic Energy Exploration and Production Portfolio
PowerShares WilderHill Progressive Energy Portfolio
PowerShares Dynamic Insurance Portfolio
PowerShares Dynamic Oil and Gas Services Portfolio
PowerShares Dynamic Retail Portfolio
PowerShares Dynamic Utilities Portfolio
PowerShares Lux Nanotech Portfolio
PowerShares FTSE RAFI US 1000 Portfolio
PowerShares FTSE RAFI US 1500 Small-Mid Portfolio
PowerShares Water Resources Portfolio
PowerShares Dynamic Energy Sector Portfolio
PowerShares Dynamic Financial Sector Portfolio
PowerShares Dynamic Healthcare Sector Portfolio
PowerShares Dynamic Industrials Sector Portfolio
PowerShares Dynamic Large Cap Portfolio
PowerShares Dynamic MagniQuant Portfolio
PowerShares Dynamic Mid Cap Portfolio
PowerShares Dynamic Small Cap Portfolio
PowerShares Dynamic Technology Sector Portfolio
PowerShares Buyback AchieversTM Portfolio
PowerShares CleantechTM Portfolio
PowerShares Dynamic Banking Portfolio
PowerShares Dynamic Basic Materials Sector Portfolio
PowerShares Dynamic Consumer Discretionary Sector Portfolio
PowerShares Dynamic Consumer Staples Sector Portfolio
PowerShares Financial Preferred Portfolio
PowerShares Global Listed Private Equity Portfolio
PowerShares DWA Technical LeadersTM Portfolio
PowerShares S&P 500® High Quality Portfolio
The Trustees reviewed information from the Adviser describing: (i) the nature, extent and quality of services provided, (ii) the investment performance of the Funds and the Adviser, (iii) the costs of services
98
Board Considerations Regarding Continuation of Investment Advisory Agreement (Continued)
provided and estimated profits realized by the Adviser, (iv) the extent to which economies of scale are realized as the Funds grow, (v) whether fee levels reflect any possible economies of scale for the benefit of Fund shareholders, (vi) comparisons of services rendered and amounts paid to other registered investment companies and (vii) any benefits realized by the Adviser from its relationship with each Fund. Based on all of the information considered and the conclusions reached, the Board, including the Independent Trustees, determined to approve the continuation of the Investment Advisory Agreement for each Fund. No single factor was determinative in the Board's analysis.
Nature, Extent and Quality of Services. In evaluating the nature, extent and quality of the Adviser's services, the Trustees reviewed information concerning the functions performed by the Adviser for the Funds, information describing the Adviser's current organization and projected staffing, including operations assistance provided by the Adviser's parent organization, Invesco Ltd., and the background and experience of the persons responsible for the day-to-day management of the Funds. The Trustees reviewed matters related to the Adviser's execution of portfolio transactions on behalf of the Funds. The Trustees also reviewed information on the performance of the Funds and the performance of their underlying indices through December 31, 2010, including reports on the correlation and tracking error between the underlying index and each Fund's performance, as well as the Adviser's analysis of the tracking error between each Fund and its underlying index. The Trustees noted that, in each case, the correlation and tracking error for each Fund was within the targeted range set forth in the Trust's registration statement. The Trustees concluded that each Fund was correlated to its underlying index and that the tracking error for each Fund was within an acceptable range given that Fund's particular circumstances.
The Trustees also considered the services provided by the Adviser in its oversight of the Funds' administrator, custodian and transfer agent. They noted the significant amount of time and effort that had been devoted to this oversight function.
Based on their review, the Trustees concluded that the nature, extent and quality of services provided by the Adviser to the Funds under the Investment Advisory Agreement were appropriate and reasonable.
Fees, Expenses and Profitability. The Trustees reviewed and discussed the information provided by the Adviser on each Fund's expense ratio and advisory fee, as compared to information compiled by the Adviser from Lipper Inc. databases on the expense ratios of comparable exchange-traded funds ("ETFs"), open-end (non-ETF) index funds and open-end actively-managed funds. The Trustees noted that the annual advisory fee charged to each Fund is:
• 0.50% of the Fund's average net assets, for each Fund other than PowerShares High Yield Equity Dividend AchieversTM Portfolio, PowerShares Dividend AchieversTM Portfolio, PowerShares International Dividend AchieversTM Portfolio, PowerShares FTSE RAFI US 1000 Portfolio and PowerShares FTSE RAFI US 1500 Small-Mid Portfolio;
• 0.40% of the Fund's average net assets, for each of PowerShares High Yield Equity Dividend AchieversTM Portfolio, PowerShares Dividend AchieversTM Portfolio and PowerShares International Dividend AchieversTM Portfolio; and
• 0.29% of the Fund's average net assets, for each of PowerShares FTSE RAFI US 1000 Portfolio and PowerShares FTSE RAFI US 1500 Small-Mid Portfolio.
99
Board Considerations Regarding Continuation of Investment Advisory Agreement (Continued)
The Trustees also noted that the Adviser has agreed to waive a portion of its advisory fee and/or pay expenses (an "Expense Cap") to the extent necessary to prevent the annual operating expenses of each Fund from exceeding the percentage of that Fund's average daily net assets, at least until August 31, 2012, as set forth below:
• 0.60%, excluding interest expenses, brokerage commissions and other trading expenses, taxes and extraordinary expenses, for each of PowerShares Dynamic OTC Portfolio and PowerShares Dynamic Market Portfolio;
• 0.50%, excluding interest expenses, licensing fees, offering costs, brokerage commissions and other trading expenses, taxes and extraordinary expenses, for each of PowerShares High Yield Equity Dividend AchieversTM Portfolio, PowerShares Dividend AchieversTM Portfolio and PowerShares International Dividend AchieversTM Portfolio;
• 0.50%, excluding interest expenses, offering costs, brokerage commissions and other trading expenses, taxes and extraordinary expenses, for each of PowerShares Morningstar StockInvestor Core Portfolio and PowerShares S&P 500® High Quality Portfolio (the Trustees noted that the Expense Cap for each of these Funds was reduced to 0.50% effective July 1, 2010);
• 0.39%, excluding interest expenses, offering costs, brokerage commissions and other trading expenses, taxes and extraordinary expenses, for each of PowerShares FTSE RAFI US 1000 Portfolio and PowerShares FTSE RAFI US 1500 Small-Mid Portfolio; and
• 0.60%, excluding interest expenses, licensing fees, offering costs, brokerage commissions and other trading expenses, taxes and extraordinary expenses, for each other Fund.
The Trustees noted that the Adviser represented that it does not provide investment advisory services to any clients other than the Funds and other ETFs overseen by the Board. The Trustees noted that each Fund's advisory fee was:
• higher than the median advisory fee of its ETF peer funds (except for the advisory fee of each of PowerShares Financial Preferred Portfolio, PowerShares FTSE RAFI US 1000 Portfolio, PowerShares Global Listed Private Equity Portfolio and PowerShares Golden Dragon Halter USX China Portfolio, which was equal to or lower than the median advisory fee of its ETF peer funds); and
• higher than the median advisory fee of its open-end index peer funds (except for the advisory fee of each of PowerShares DWA Technical LeadersTM Portfolio, PowerShares Dynamic Banking Portfolio, PowerShares Dynamic Basic Materials Sector Portfolio, PowerShares Dynamic Biotechnology & Genome Portfolio, PowerShares Dynamic Financial Sector Portfolio, PowerShares Dynamic Healthcare Portfolio, PowerShares Dynamic Insurance Portfolio, PowerShares Dynamic Mid Cap Growth Portfolio, PowerShares Dynamic Networking Portfolio, PowerShares Dynamic OTC Portfolio, PowerShares Dynamic Pharmaceuticals Portfolio, PowerShares Dynamic Semiconductors Portfolio, PowerShares Dynamic Small Cap Growth Portfolio, PowerShares Dynamic Software Portfolio, PowerShares Dynamic Technology Sector Portfolio, PowerShares Golden Dragon Halter USX China Portfolio, PowerShares Lux Nanotech Portfolio, PowerShares Morningstar StockInvestor Core Portfolio and PowerShares S&P 500® High Quality Portfolio, which was equal to or lower than
100
Board Considerations Regarding Continuation of Investment Advisory Agreement (Continued)
the median advisory fee of its open-end index peer funds, and there was no comparable data for PowerShares Financial Preferred Portfolio or PowerShares Global Listed Private Equity Portfolio); but
• lower than the median advisory fee of its open-end actively-managed peer funds.
The Trustees determined that the advisory fees were reasonable, noting the complexity of the indices, which generally require more frequent rebalancing of the portfolios, the distinguishing factors of the Funds, and the higher administrative, operational and management oversight costs for the Adviser. With respect to the Funds' expense ratios, the Trustees noted that the net expense ratio for each Fund was:
• higher than the median expense ratio of its ETF peer funds (except for the net expense ratio of each of PowerShares Dynamic Market Portfolio, PowerShares Dynamic OTC Portfolio, PowerShares FTSE RAFI US 1000 Portfolio, PowerShares Golden Dragon Halter USX China Portfolio and PowerShares S&P 500® High Quality Portfolio, which was equal to or less than the median expense ratio of its ETF peer funds); and
• higher than the median expense ratio of its open-end index peer funds (except for the net expense ratio of each of PowerShares Aerospace & Defense Portfolio, PowerShares CleantechTM Portfolio, PowerShares DWA Technical LeadersTM Portfolio, PowerShares Dynamic Banking Portfolio, PowerShares Dynamic Basic Materials Sector Portfolio, PowerShares Dynamic Biotechnology & Genome Portfolio, PowerShares Dynamic Building & Construction Portfolio, PowerShares Dynamic Consumer Discretionary Sector Portfolio, PowerShares Dynamic Consumer Staples Sector Portfolio, PowerShares Dynamic Financial Sector Portfolio, PowerShares Dynamic Food & Beverage Portfolio, PowerShares Dynamic Healthcare Portfolio, PowerShares Dynamic Industrials Sector Portfolio, PowerShares Dynamic Insurance Portfolio, PowerShares Dynamic Large Cap Portfolio, PowerShares Dynamic Large Cap Growth Portfolio, PowerShares Dynamic Leisure and Entertainment Portfolio, PowerShares Dynamic Media Portfolio, PowerShares Dynamic Mid Cap Growth Portfolio, PowerShares Morningstar StockInvestor Core Portfolio, PowerShares Dynamic Networking Portfolio, PowerShares Dynamic OTC Portfolio, PowerShares Dynamic Pharmaceuticals Portfolio, PowerShares Dynamic Retail Portfolio, PowerShares Dynamic Semiconductors Portfolio, PowerShares Dynamic Small Cap Growth Portfolio, PowerShares Dynamic Small Cap Value Portfolio, PowerShares Dynamic Software Portfolio, PowerShares Dynamic Technology Sector Portfolio, PowerShares Dynamic Utilities Sector Portfolio, PowerShares FTSE RAFI US 1000 Portfolio, PowerShares FTSE RAFI US 1500 Small-Mid Portfolio, PowerShares Golden Dragon Halter USX China Portfolio, PowerShares Lux Nanotech Portfolio and PowerShares S&P 500® High Quality Portfolio, which was equal to or lower than the median expense ratio of its open-end index peer funds, and there was no comparable data for PowerShares Financial Preferred Portfolio or PowerShares Global Listed Private Equity Portfolio); but
• lower than the median expense ratio of its open-end actively-managed peer funds.
The Trustees noted that a significant component of the non-advisory fee expenses was the license fees paid by the Funds, and those Funds for which license fees are included in the Funds' Expense Caps.
The Board concluded that the advisory fee and expense ratio of each Fund (giving effect to the Fund's Expense Cap) were reasonable and appropriate in light of the services provided.
101
Board Considerations Regarding Continuation of Investment Advisory Agreement (Continued)
In conjunction with their review of fees, the Trustees also considered information provided by the Adviser on the revenues received by the Adviser under the Investment Advisory Agreement for each Fund, as well as the fees waived and expenses reimbursed by the Adviser for the Funds. The Trustees reviewed information provided by the Adviser on its profitability as well as any profits or losses realized by the Adviser from its relationship to each Fund. The Trustees concluded that the estimated profitability to the Adviser of the advisory services provided to any of the Funds was not unreasonable.
Also at the April 14, 2011 meeting, the Adviser proposed reducing the annual advisory fee for each of PowerShares Dynamic Large Cap Portfolio, PowerShares Dynamic Mid Cap Growth Portfolio, PowerShares Dynamic Mid Cap Portfolio, PowerShares Dynamic Mid Cap Value Portfolio, PowerShares Dynamic Small Cap Growth Portfolio, PowerShares Dynamic Small Cap Portfolio and PowerShares Dynamic Small Cap Value Portfolio (each, a "Style Fund") effective June 16, 2011. The Adviser also proposed revising each Style Fund's Expense Cap that is in place until August 31, 2012 to further reduce each Style Fund's annual operating expenses effective June 16, 2011. The Board considered the Adviser's representation that there would be no diminution in the quantity or quality of services provided to each Style Fund in connection with the amendment to the Investment Advisory Agreement to reflect the advisory fee changes. The Board concluded for each Style Fund that the reduced advisory fee was appropriate, and determined to approve the amended Investment Advisory Agreement and amended Expense Cap, effective June 16, 2011.
Economies of Scale and Whether Fee Levels Reflect These Economies of Scale. The Trustees reviewed the information provided by the Adviser as to the extent to which economies of scale are realized as each Fund grows and whether fee levels reflect economies of scale for the benefit of shareholders. The Trustees reviewed each Fund's asset size, expense ratio and expense limitation agreed to by the Adviser. The Trustees noted that, for Funds whose expenses are higher than their respective Expense Caps, any reduction in that Fund's expenses would be enjoyed by the Adviser, but that Fund shareholders benefit from the lower expense ratio as a result of the Fund's Expense Cap. The Trustees also noted that the Excess Expense Agreement with the Trust provides that the Adviser is entitled to be reimbursed by each Fund, other than PowerShares Dynamic Market Portfolio and PowerShares Dynamic OTC Portfolio, for fees waived or expenses absorbed pursuant to the Expense Cap for a period of three years from the date the fee or expense was incurred, provided that no reimbursement would be made that would result in a Fund exceeding its Expense Cap. The Trustees considered whether the advisory fee rate for each Fund was reasonable in relation to the asset size of that Fund, and concluded that the flat advisory fee was reasonable and appropriate, noting the Fund expenses the Adviser has borne as a result of the Expense Cap.
The Trustees noted that the Adviser had not identified any further benefits that it derived from its relationship with the Funds and had noted that it does not have any soft-dollar arrangements.
Based on all of the information considered and the conclusions reached, the Board, including the Independent Trustees, determined to approve the continuation of the Investment Advisory Agreement for each Fund. No single factor was determinative in the Board's analysis.
102
Board Considerations Regarding Continuation of Investment Advisory Agreement (Continued)
At a meeting held on April 14, 2011, the Board of Trustees of the PowerShares Exchange-Traded Fund Trust (the "Trust"), including the Independent Trustees, unanimously approved the continuation of the Investment Advisory Agreement between Invesco PowerShares Capital Management LLC (the "Adviser") and the Trust for PowerShares NASDAQ Internet Portfolio and PowerShares S&P 500 BuyWrite Portfolio (each, a "Fund" and collectively, the "Funds").
The Trustees reviewed information from the Adviser describing: (i) the nature, extent and quality of services provided, (ii) the investment performance of the Funds and the Adviser, (iii) the costs of services provided and estimated profits realized by the Adviser, (iv) the extent to which economies of scale are realized as the Funds grow, (v) whether fee levels reflect any possible economies of scale for the benefit of Fund shareholders, (vi) comparisons of services rendered and amounts paid to other registered investment companies and (vii) any benefits realized by the Adviser from its relationship with each Fund. Based on all of the information considered and the conclusions reached, the Board, including the Independent Trustees, determined to approve the continuation of the Investment Advisory Agreement for each Fund. No single factor was determinative in the Board's analysis.
Nature, Extent and Quality of Services. In evaluating the nature, extent and quality of the Adviser's services, the Trustees reviewed information concerning the functions performed by the Adviser for the Funds, information describing the Adviser's current organization and projected staffing, including operations assistance provided by the Adviser's parent organization, Invesco Ltd., and the background and experience of the persons responsible for the day-to-day management of the Funds. The Trustees reviewed matters related to the Adviser's oversight of the execution of portfolio transactions on behalf of the Funds. The Trustees also reviewed information on the performance of the Funds and the performance of their underlying indices through December 31, 2010, including reports on the correlation and tracking error between the underlying index and each Fund's performance, as well as the Adviser's analysis of the tracking error between each Fund and its underlying index. The Trustees noted that, in each case, the correlation and tracking error for each Fund was within the targeted range set forth in the Trust's registration statement. The Trustees concluded that each Fund was correlated to its underlying index and that the tracking error for each Fund was within an acceptable range given that Fund's particular circumstances.
The Trustees also considered the services provided by the Adviser in its oversight of the Funds' administrator, custodian and transfer agent. They noted the significant amount of time and effort that had been devoted to this oversight function.
Based on their review, the Trustees concluded that the nature, extent and quality of services provided by the Adviser to the Funds under the Investment Advisory Agreement were appropriate and reasonable.
Fees, Expenses and Profitability. The Trustees reviewed and discussed the information provided by the Adviser on each Fund's total expense ratio and unitary advisory fee, as compared to information compiled by the Adviser from Lipper Inc. databases on the expense ratios of comparable exchange-traded funds ("ETFs"), open-end (non-ETF) index funds and open-end actively-managed funds. The Trustees noted that the annual unitary advisory fee is 0.60% for PowerShares NASDAQ Internet Portfolio and 0.75% for PowerShares S&P 500 BuyWrite Portfolio, and that the Adviser pays all other operating expenses of each Fund, except that each Fund pays its brokerage expenses, taxes, interest and extraordinary expenses.
103
Board Considerations Regarding Continuation of Investment Advisory Agreement (Continued)
The Trustees noted that the Adviser represented that it does not provide investment advisory services to any clients other than the Funds and other ETFs overseen by the Board. The Trustees noted that the advisory fee for each Fund was equal to or lower than the median expense ratios of its ETF peer funds, open-end index peer funds and open-end actively-managed peer funds. The Trustees noted that each Fund's advisory fee was reasonable because of the complexity of the indices, which generally require more frequent rebalancing of the portfolios, the distinguishing factors of the Funds and the higher administrative, operational and management oversight costs for the Adviser. The Trustees also noted that a portion of each Fund's advisory fee was attributable to a license fee payable out of the unitary fee charged to that Fund. The Board concluded that the unitary advisory fee charged to each Fund was reasonable and appropriate in light of the services provided.
In conjunction with their review of the unitary advisory fee, the Trustees also considered information provided by the Adviser on the revenues received by the Adviser under the Investment Advisory Agreement. The Trustees reviewed information provided by the Adviser on its profitability as well as any profits or losses realized by the Adviser from its relationship to each Fund. The Trustees concluded that the estimated profitability to the Adviser of the advisory services provided to any of the Funds was not unreasonable.
Economies of Scale and Whether Fee Levels Reflect These Economies of Scale. The Trustees reviewed the information provided by the Adviser as to the extent to which economies of scale are realized as each Fund grows and whether fee levels reflect economies of scale for the benefit of shareholders. The Trustees reviewed each Fund's asset size and expense ratio. The Trustees noted that any reduction in fixed costs associated with the management of the Funds would be enjoyed by the Adviser, but a unitary fee provides certainty in expenses for the Funds. The Trustees considered whether the advisory fee rate for each Fund was reasonable in relation to the asset size of that Fund, and concluded that the flat advisory fee was reasonable and appropriate.
The Trustees noted that the Adviser had not identified any further benefits that it derived from its relationship with the Funds and had noted that it does not have any soft-dollar arrangements.
Based on all of the information considered and the conclusions reached, the Board, including the Independent Trustees, determined to approve the continuation of the Investment Advisory Agreement for each Fund. No single factor was determinative in the Board's analysis.
104
PROXY VOTING POLICIES AND PROCEDURES
A description of the Funds' proxy voting policies and procedures that the Funds use to determine how to vote proxies relating to portfolio securities is available, without charge and upon request, by calling (800) 983-0903. This information is also available on the Securities and Exchange Commission's ("Commission") website at www.sec.gov.
Information regarding how the Funds voted proxies for portfolio securities, if applicable, during the most recent 12-month period ended June 30, is also available, without charge and upon request, by (i) calling (800) 983-0903; or (ii) accessing the Funds' Form N-PX on the Commission's website at www.sec.gov.
QUARTERLY PORTFOLIOS
The Funds file their complete schedules of portfolio holdings with the Commission for the first and third quarters of each fiscal year on Form N-Q. The Funds' Forms N-Q are available on the Commission's website at www.sec.gov. The Funds' Forms N-Q may also be reviewed and copied at the Commission's Public Reference Room in Washington, D.C.; information on the operation of the Public Reference Room may be obtained by calling (800) SEC-0330.


301 West Roosevelt Road
Wheaton, IL 60187
800.983.0903
www.invescopowershares.com
© 2011 Invesco PowerShares Capital Management LLC P-PS-AR-4


2011 Annual Report to Shareholders
April 30, 2011
PowerShares Dynamic Basic Materials Sector Portfolio (PYZ)
PowerShares Dynamic Consumer Discretionary Sector Portfolio (PEZ)
PowerShares Dynamic Consumer Staples Sector Portfolio (PSL)
PowerShares Dynamic Energy Sector Portfolio (PXI)
PowerShares Dynamic Financial Sector Portfolio (PFI)
PowerShares Dynamic Healthcare Sector Portfolio (PTH)
PowerShares Dynamic Industrials Sector Portfolio (PRN)
PowerShares Dynamic Technology Sector Portfolio (PTF)
PowerShares Dynamic Utilities Portfolio (PUI)
PowerShares NASDAQ Internet Portfolio (PNQI)

Table of Contents
| The Market Environment | 2 | ||||||
| Manager's Analysis | 4 | ||||||
| Frequency Distribution of Discounts & Premiums | 24 | ||||||
| Fees and Expenses | 26 | ||||||
| Sector Portfolios | |||||||
| Schedules of Investments | |||||||
| PowerShares Dynamic Basic Materials Sector Portfolio (PYZ) | 28 | ||||||
| PowerShares Dynamic Consumer Discretionary Sector Portfolio (PEZ) | 30 | ||||||
| PowerShares Dynamic Consumer Staples Sector Portfolio (PSL) | 32 | ||||||
| PowerShares Dynamic Energy Sector Portfolio (PXI) | 33 | ||||||
| PowerShares Dynamic Financial Sector Portfolio (PFI) | 34 | ||||||
| PowerShares Dynamic Healthcare Sector Portfolio (PTH) | 36 | ||||||
| PowerShares Dynamic Industrials Sector Portfolio (PRN) | 37 | ||||||
| PowerShares Dynamic Technology Sector Portfolio (PTF) | 39 | ||||||
| PowerShares Dynamic Utilities Portfolio (PUI) | 40 | ||||||
| PowerShares NASDAQ Internet Portfolio (PNQI) | 42 | ||||||
| Statements of Assets and Liabilities | 44 | ||||||
| Statements of Operations | 46 | ||||||
| Statements of Changes in Net Assets | 48 | ||||||
| Financial Highlights | 52 | ||||||
| Notes to Financial Statements | 57 | ||||||
| Report of Independent Registered Public Accounting Firm | 68 | ||||||
| Tax Information | 69 | ||||||
| Trustees and Officers | 70 | ||||||
| Board Considerations Regarding Continuation of Investment Advisory Agreements | 77 | ||||||
The Market Environment
For the fiscal year ended April 30, 2011, the market environment saw continued improvement. Global equities ended up 18.25% after declining the first two months of the period. Emerging markets led equities up during the fiscal year with the MSCI Emerging Markets Index returning 20.67%. Developed International and U.S. Equities followed closely behind emerging markets with the MSCI EAFE Index up 19.18% and the S&P 500® Index up 17.24%. Volatility continued to decline on a year-over-year basis with the CBOE Volatility Index® (VIX®) dropping 33.11% for the fiscal year. Fixed income markets moved higher for the fiscal year with the Barclays Aggregate Bond Index ending up 5.37%.
2
This page intentionally left blank
Manager's Analysis
PowerShares Dynamic Basic Materials Sector Portfolio (ticker: PYZ)
The PowerShares Dynamic Basic Materials Sector Portfolio (the "Fund") seeks investment results that correspond (before fees and expenses) generally to the price and yield performance of the Dynamic Basic Materials Sector IntellidexSM Index (the "Index").
For the fiscal year ended April 30, 2011, the Fund returned 33.12%. Over this same year, the Index returned 34.14%, while the S&P Materials Index returned 26.26%. The Fund benefited from positive performance of securities of companies in chemicals, containers & packaging and metals & mining industries. Fund performance was positive for securities of companies within each industry in which it was invested.
Industry Breakdown (% of the Fund's
Net Assets) as of April 30, 2011
| Chemicals-Specialty | 26.4 | ||||||
| Chemicals-Diversified | 18.4 | ||||||
| Paper & Related Products | 12.7 | ||||||
| Containers-Metal/Glass | 6.3 | ||||||
| Containers-Paper/Plastic | 5.0 | ||||||
| Metal-Copper | 4.4 | ||||||
| Agricultural Chemicals | 4.3 | ||||||
| Coatings/Paint | 3.8 | ||||||
| Diversified Manufacturing Operations | 3.1 | ||||||
| Gold Mining | 2.5 | ||||||
| Industrial Gases | 2.4 | ||||||
| Metal-Aluminum | 2.3 | ||||||
| Petrochemicals | 1.8 | ||||||
| Water Treatment Systems | 1.4 | ||||||
| Miscellaneous Manufacturing | 1.4 | ||||||
| Quarrying | 1.3 | ||||||
| Chemicals-Plastics | 1.3 | ||||||
| Non-Ferrous Metals | 1.2 | ||||||
| Money Market Fund | 0.1 | ||||||
| Liabilities in excess of other assets | (0.1 | ) | |||||
Top Ten Fund Holdings (% of the Fund's
Net Assets) as of April 30, 2011
| Security | |||||||
| Lubrizol Corp. (The) | 2.8 | ||||||
| Celanese Corp. | 2.8 | ||||||
| Sigma-Aldrich Corp. | 2.6 | ||||||
| International Paper Co. | 2.5 | ||||||
| Ecolab, Inc. | 2.5 | ||||||
| PPG Industries, Inc. | 2.5 | ||||||
| Newmont Mining Corp. | 2.5 | ||||||
| E.I. du Pont de Nemours & Co. | 2.4 | ||||||
| Freeport-McMoRan Copper & Gold, Inc. | 2.4 | ||||||
| Air Products & Chemicals, Inc. | 2.4 | ||||||
| Total | 25.4 | ||||||
Style Allocation (% of the Fund's
Total Investments) as of April 30, 2011
| Large-Cap Growth | 7.0 | ||||||
| Large-Cap Value | 16.5 | ||||||
| Mid-Cap Growth | 5.4 | ||||||
| Mid-Cap Value | 27.4 | ||||||
| Small-Cap Value | 29.9 | ||||||
| Small-Cap Growth | 13.8 | ||||||
4
Manager's Analysis (Continued)
PowerShares Dynamic Basic Materials Sector Portfolio (ticker: PYZ)
Growth of a $10,000 Investment Since Inception†
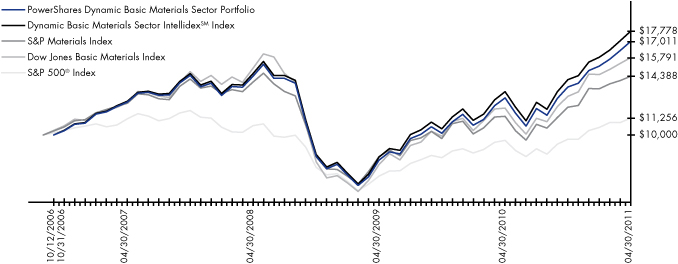
Fund Performance History (%) As of April 30, 2011
| Avg Ann†† | Fund Inception† | ||||||||||||||||||
| 1 Year | 3 Year | Avg Ann†† | Cumulative | ||||||||||||||||
| Index | |||||||||||||||||||
| Dynamic Basic Materials Sector IntellidexSM Index | 34.14 | % | 6.81 | % | 13.49 | % | 77.78 | % | |||||||||||
| S&P Materials Index | 26.26 | % | 1.00 | % | 8.26 | % | 43.88 | % | |||||||||||
| Dow Jones Basic Materials Index | 31.46 | % | 1.74 | % | 10.48 | % | 57.91 | % | |||||||||||
| S&P 500® Index | 17.24 | % | 1.74 | % | 2.62 | % | 12.56 | % | |||||||||||
| Fund | |||||||||||||||||||
| Net Asset Value ("NAV") Return | 33.12 | % | 5.72 | % | 12.39 | % | 70.11 | % | |||||||||||
| Share Price Return | 32.98 | % | 5.74 | % | 12.41 | % | 70.21 | % | |||||||||||
Fund Inception: October 12, 2006
Performance quoted represents past performance. Past performance is not a guarantee of future results and current performance may be higher or lower than performance quoted. Investment returns and principal value will fluctuate and shares, when redeemed, may be worth more or less than their original cost. The Adviser has waived fees and reimbursed other expenses, absent which, performance would have been lower. The Adviser has contractually agreed to waive fees and/or pay certain Fund expenses through August 31, 2012. According to the Fund's current prospectus, the total gross annual operating expense ratio was indicated as 0.91%. In the Financial Highlights section of this Shareholder Report, the Fund's net total operating expense ratio was determined to be 0.65%, while the Fund's gross total expense ratio was determined to be 0.80%. NAV and Share Price returns assume that dividends and capital gain distributions have been reinvested in the Fund at NAV and Share Price, respectively. The returns shown in the table above do not reflect the deduction of taxes that a shareholder would pay on Fund distributions or the redemption or sale of Fund Shares. See invescopowershares.com to find the most recent month-end performance numbers.
Index performance results are based upon a hypothetical investment in its constituent securities. Index returns do not represent Fund returns. An investor cannot invest directly in an index. The Index does not charge management fees or brokerage expenses, and no such fees or expenses were deducted from the hypothetical performance shown. In addition, the results actual investors might have achieved would have differed from those shown because of differences in the timing, amounts of their investments, and fees and expenses associated with an investment in the Fund.
The S&P Materials Index, Dow Jones Basic Materials Index and S&P 500® Index (the "Benchmark Indices") are unmanaged indices used as a measurement of change in stock market conditions based on the average performance of approximately 60, 70 and 500 common stocks, respectively.
† Fund and underlying Index returns are based on the inception date of the Fund. Returns for the Benchmark Indices are based on the closest month-end to the Fund's inception date.
†† Average annualized.
5
Manager's Analysis
PowerShares Dynamic Consumer Discretionary Sector Portfolio (ticker: PEZ)
The PowerShares Dynamic Consumer Discretionary Sector Portfolio (the "Fund") seeks investment results that correspond (before fees and expenses) generally to the price and yield performance of the Dynamic Consumer Discretionary Sector IntellidexSM Index (the "Index").
For the fiscal year ended April 30, 2011, the Fund returned 16.91%. Over this same year, the Index returned 17.85%, while the S&P Consumer Discretionary Index returned 18.60% and the S&P 500® Index returned 17.24%. The Fund benefited from positive performance of securities of companies in specialty retail, auto components, and leisure equipment & products industries. The Fund suffered from negative performance for securities of companies in diversified consumer services, household durables, and airlines industries.
Industry Breakdown (% of the Fund's
Net Assets) as of April 30, 2011
| Retail | 52.7 | ||||||
| Auto Parts & Equipment | 7.1 | ||||||
| Apparel | 6.5 | ||||||
| Media | 6.2 | ||||||
| Commercial Services | 6.1 | ||||||
| Internet | 2.8 | ||||||
| Airlines | 2.7 | ||||||
| Auto Manufacturers | 2.2 | ||||||
| Advertising | 2.1 | ||||||
| Leisure Time | 1.8 | ||||||
| Home Furnishings | 1.7 | ||||||
| Distribution/Wholesale | 1.6 | ||||||
| Household Products/Wares | 1.5 | ||||||
| Entertainment | 1.3 | ||||||
| Machinery-Diversified | 1.3 | ||||||
| Housewares | 1.2 | ||||||
| Textiles | 1.2 | ||||||
| Money Market Fund | 0.3 | ||||||
| Liabilities in excess of other assets | (0.3 | ) | |||||
Top Ten Fund Holdings (% of the Fund's
Net Assets) as of April 30, 2011
| Security | |||||||
| Limited Brands, Inc. | 3.0 | ||||||
| Priceline.com, Inc. | 2.8 | ||||||
| Bed Bath & Beyond, Inc. | 2.7 | ||||||
| Starbucks Corp. | 2.6 | ||||||
| Coach, Inc. | 2.5 | ||||||
| Time Warner Cable, Inc. | 2.5 | ||||||
| Yum! Brands, Inc. | 2.5 | ||||||
| TJX Cos., Inc. (The) | 2.5 | ||||||
| McDonald's Corp. | 2.5 | ||||||
| Nordstrom, Inc. | 2.4 | ||||||
| Total | 26.0 | ||||||
Style Allocation (% of the Fund's
Total Investments) as of April 30, 2011
| Large-Cap Growth | 24.9 | ||||||
| Large-Cap Value | 4.9 | ||||||
| Mid-Cap Growth | 21.1 | ||||||
| Mid-Cap Value | 9.5 | ||||||
| Small-Cap Value | 27.2 | ||||||
| Small-Cap Growth | 12.4 | ||||||
6
Manager's Analysis (Continued)
PowerShares Dynamic Consumer Discretionary Sector Portfolio (ticker: PEZ)
Growth of a $10,000 Investment Since Inception†
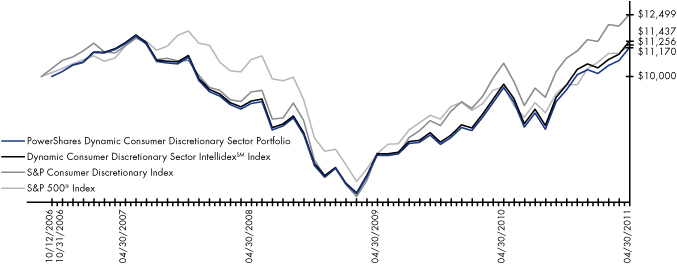
Fund Performance History (%) As of April 30, 2011
| Avg Ann†† | Fund Inception† | ||||||||||||||||||
| 1 Year | 3 Year | Avg Ann†† | Cumulative | ||||||||||||||||
| Index | |||||||||||||||||||
| Dynamic Consumer Discretionary Sector IntellidexSM Index | 17.85 | % | 8.23 | % | 3.00 | % | 14.37 | % | |||||||||||
| S&P Consumer Discretionary Index | 18.60 | % | 10.00 | % | 4.99 | % | 24.99 | % | |||||||||||
| S&P 500® Index | 17.24 | % | 1.74 | % | 2.62 | % | 12.56 | % | |||||||||||
| Fund | |||||||||||||||||||
| Net Asset Value ("NAV") Return | 16.91 | % | 7.77 | % | 2.46 | % | 11.70 | % | |||||||||||
| Share Price Return | 16.77 | % | 7.74 | % | 2.46 | % | 11.69 | % | |||||||||||
Fund Inception: October 12, 2006
Performance quoted represents past performance. Past performance is not a guarantee of future results and current performance may be higher or lower than performance quoted. Investment returns and principal value will fluctuate and shares, when redeemed, may be worth more or less than their original cost. The Adviser has waived fees and reimbursed other expenses, absent which, performance would have been lower. The Adviser has contractually agreed to waive fees and/or pay certain Fund expenses through August 31, 2012. According to the Fund's current prospectus, the total gross annual operating expense ratio was indicated as 1.32%. In the Financial Highlights section of this Shareholder Report, the Fund's net total operating expense ratio was determined to be 0.65%, while the Fund's gross total expense ratio was determined to be 1.24%. NAV and Share Price returns assume that dividends and capital gain distributions have been reinvested in the Fund at NAV and Share Price, respectively. The returns shown in the table above do not reflect the deduction of taxes that a shareholder would pay on Fund distributions or the redemption or sale of Fund Shares. See invescopowershares.com to find the most recent month-end performance numbers.
Index performance results are based upon a hypothetical investment in its constituent securities. Index returns do not represent Fund returns. An investor cannot invest directly in an index. The Index does not charge management fees or brokerage expenses, and no such fees or expenses were deducted from the hypothetical performance shown. In addition, the results actual investors might have achieved would have differed from those shown because of differences in the timing, amounts of their investments, and fees and expenses associated with an investment in the Fund.
The S&P Consumer Discretionary Index and S&P 500® Index (the "Benchmark Indices") are unmanaged indices used as a measurement of change in stock market conditions based on the average performance of approximately 182 and 500 common stocks, respectively.
† Fund and underlying Index returns are based on the inception date of the Fund. Returns for the Benchmark Indices are based on the closest month-end to the Fund's inception date.
†† Average annualized.
7
Manager's Analysis
PowerShares Dynamic Consumer Staples Sector Portfolio (ticker: PSL)
The PowerShares Dynamic Consumer Staples Sector Portfolio (the "Fund") seeks investment results that correspond (before fees and expenses) generally to the price and yield performance of the Dynamic Consumer Staples Sector IntellidexSM Index (the "Index").
For the fiscal year ended April 30, 2011, the Fund returned 19.46%. Over this same year, the Index returned 20.32%, while the S&P Consumer Staples Index returned 17.99% and the S&P 500® Index returned 17.24%. The Fund benefited from positive performance of securities of companies in food products, beverages, and tobacco industries. Fund performance was positive for securities of companies within each industry in which it was invested.
Industry Breakdown (% of the Fund's
Net Assets) as of April 30, 2011
| Food | 33.8 | ||||||
| Retail | 16.6 | ||||||
| Beverages | 14.7 | ||||||
| Cosmetics/Personal Care | 11.4 | ||||||
| Agriculture | 11.3 | ||||||
| Household Products/Wares | 5.1 | ||||||
| Pharmaceuticals | 4.2 | ||||||
| Environmental Control | 1.5 | ||||||
| Electrical Components & Equipment | 1.4 | ||||||
| Money Market Fund | 0.1 | ||||||
| Liabilities in excess of other assets | (0.1 | ) | |||||
Style Allocation (% of the Fund's
Total Investments) as of April 30, 2011
| Large-Cap Growth | 26.3 | ||||||
| Large-Cap Value | 21.5 | ||||||
| Mid-Cap Growth | 8.2 | ||||||
| Mid-Cap Value | 17.8 | ||||||
| Small-Cap Value | 22.4 | ||||||
| Small-Cap Growth | 3.8 | ||||||
Top Ten Fund Holdings (% of the Fund's
Net Assets) as of April 30, 2011
| Security | |||||||
| Philip Morris International, Inc. | 2.6 | ||||||
| CVS Caremark Corp. | 2.6 | ||||||
| Costco Wholesale Corp. | 2.6 | ||||||
| Reynolds American, Inc. | 2.5 | ||||||
| PepsiCo, Inc. | 2.5 | ||||||
| Colgate-Palmolive Co. | 2.5 | ||||||
| Kellogg Co. | 2.5 | ||||||
| Altria Group, Inc. | 2.5 | ||||||
| Wal-Mart Stores, Inc. | 2.5 | ||||||
| Coca-Cola Co. (The) | 2.4 | ||||||
| Total | 25.2 | ||||||
8
Manager's Analysis (Continued)
PowerShares Dynamic Consumer Staples Sector Portfolio (ticker: PSL)
Growth of a $10,000 Investment Since Inception†
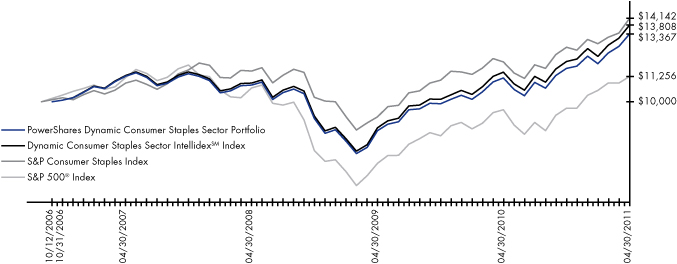
Fund Performance History (%) As of April 30, 2011
| Avg Ann†† | Fund Inception† | ||||||||||||||||||
| 1 Year | 3 Year | Avg Ann†† | Cumulative | ||||||||||||||||
| Index | |||||||||||||||||||
| Dynamic Consumer Staples Sector IntellidexSM Index | 20.32 | % | 8.09 | % | 7.35 | % | 38.08 | % | |||||||||||
| S&P Consumer Staples Index | 17.99 | % | 7.03 | % | 7.85 | % | 41.42 | % | |||||||||||
| S&P 500® Index | 17.24 | % | 1.74 | % | 2.62 | % | 12.56 | % | |||||||||||
| Fund | |||||||||||||||||||
| Net Asset Value ("NAV") Return | 19.46 | % | 7.28 | % | 6.59 | % | 33.67 | % | |||||||||||
| Share Price Return | 19.50 | % | 7.30 | % | 6.59 | % | 33.68 | % | |||||||||||
Fund Inception: October 12, 2006
Performance quoted represents past performance. Past performance is not a guarantee of future results and current performance may be higher or lower than performance quoted. Investment returns and principal value will fluctuate and shares, when redeemed, may be worth more or less than their original cost. The Adviser has waived fees and reimbursed other expenses, absent which, performance would have been lower. The Adviser has contractually agreed to waive fees and/or pay certain Fund expenses through August 31, 2012. According to the Fund's current prospectus, the total gross annual operating expense ratio was indicated as 0.87%. In the Financial Highlights section of this Shareholder Report, the Fund's net total operating expense ratio was determined to be 0.65%, while the Fund's gross total expense ratio was determined to be 0.94%. NAV and Share Price returns assume that dividends and capital gain distributions have been reinvested in the Fund at NAV and Share Price, respectively. The returns shown in the table above do not reflect the deduction of taxes that a shareholder would pay on Fund distributions or the redemption or sale of Fund Shares. See invescopowershares.com to find the most recent month-end performance numbers.
Index performance results are based upon a hypothetical investment in its constituent securities. Index returns do not represent Fund returns. An investor cannot invest directly in an index. The Index does not charge management fees or brokerage expenses, and no such fees or expenses were deducted from the hypothetical performance shown. In addition, the results actual investors might have achieved would have differed from those shown because of differences in the timing, amounts of their investments, and fees and expenses associated with an investment in the Fund.
The S&P Consumer Staples Index and S&P 500® Index (the "Benchmark Indices") are unmanaged indices used as a measurement of change in stock market conditions based on the average performance of approximately 96 and 500 common stocks, respectively.
† Fund and underlying Index returns are based on the inception date of the Fund. Returns for the Benchmark Indices are based on the closest month-end to the Fund's inception date.
†† Average annualized.
9
Manager's Analysis
PowerShares Dynamic Energy Sector Portfolio (ticker: PXI)
The PowerShares Dynamic Energy Sector Portfolio (the "Fund") seeks investment results that correspond(before fees and expenses) generally to the price and yield performance of the Dynamic Energy Sector IntellidexSM Index (the "Index").
For the fiscal year ended April 30, 2010, the Fund returned 51.01%. Over this same year, the Index returned 51.97%, while the S&P Energy Index returned 35.86%, the Dow Jones Oil & Gas Index returned 35.17% and the S&P 500® Index returned 17.24%. The Fund benefited from positive performance of securities of companies in oil gas & consumable fuels, energy equipment & services and gas utilities industries. Fund performance was positive for securities of companies within each industry in which it was invested.
Industry Breakdown (% of the Fund's
Net Assets) as of April 30, 2011
| Oil Companies-Exploration & Production | 16.9 | ||||||
| Oil Companies-Integrated | 14.8 | ||||||
| Gas-Distribution | 14.4 | ||||||
| Pipelines | 14.4 | ||||||
| Coal | 9.1 | ||||||
| Oil-Field Services | 7.7 | ||||||
| Oil Field Machinery & Equipment | 6.2 | ||||||
| Oil Refining & Marketing | 5.2 | ||||||
| Oil & Gas Drilling | 5.0 | ||||||
| Seismic Data Collection | 2.4 | ||||||
| Electric-Integrated | 1.4 | ||||||
| Transportation-Services | 1.2 | ||||||
| Retail-Petroleum Products | 1.2 | ||||||
| Money Market Fund | 0.1 | ||||||
| Liabilities in excess of other assets | (0.0 | ) | |||||
Top Ten Fund Holdings (% of the Fund's
Net Assets) as of April 30, 2011
| Security | |||||||
| Marathon Oil Corp. | 2.6 | ||||||
| Occidental Petroleum Corp. | 2.6 | ||||||
| Spectra Energy Corp. | 2.6 | ||||||
| Halliburton Co. | 2.5 | ||||||
| Chevron Corp. | 2.5 | ||||||
| Murphy Oil Corp. | 2.5 | ||||||
| El Paso Corp. | 2.5 | ||||||
| Sempra Energy | 2.4 | ||||||
| Exxon Mobil Corp. | 2.4 | ||||||
| Peabody Energy Corp. | 2.4 | ||||||
| Total | 25.0 | ||||||
Style Allocation (% of the Fund's
Total Investments) as of April 30, 2011
| Large-Cap Growth | 7.2 | ||||||
| Large-Cap Value | 27.0 | ||||||
| Mid-Cap Growth | 4.9 | ||||||
| Mid-Cap Value | 18.7 | ||||||
| Small-Cap Value | 31.6 | ||||||
| Small-Cap Growth | 10.6 | ||||||
10
Manager's Analysis (Continued)
PowerShares Dynamic Energy Sector Portfolio (ticker: PXI)
Growth of a $10,000 Investment Since Inception†
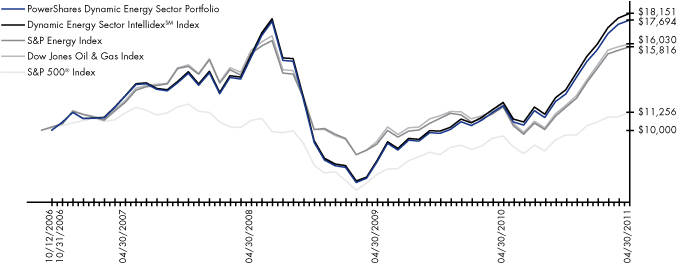
Fund Performance History (%) As of April 30, 2011
| Avg Ann†† | Fund Inception† | ||||||||||||||||||
| 1 Year | 3 Year | Avg Ann†† | Cumulative | ||||||||||||||||
| Index | |||||||||||||||||||
| Dynamic Energy Sector IntellidexSM Index | 51.97 | % | 5.99 | % | 14.01 | % | 81.51 | % | |||||||||||
| S&P Energy Index | 35.86 | % | 0.95 | % | 10.52 | % | 58.16 | % | |||||||||||
| Dow Jones Oil & Gas Index | 35.17 | % | 0.92 | % | 10.84 | % | 60.30 | % | |||||||||||
| S&P 500® Index | 17.24 | % | 1.74 | % | 2.62 | % | 12.56 | % | |||||||||||
| Fund | |||||||||||||||||||
| Net Asset Value ("NAV") Return | 51.01 | % | 5.44 | % | 13.37 | % | 76.94 | % | |||||||||||
| Share Price Return | 51.07 | % | 5.50 | % | 13.40 | % | 77.14 | % | |||||||||||
Fund Inception: October 12, 2006
Performance quoted represents past performance. Past performance is not a guarantee of future results and current performance may be higher or lower than performance quoted. Investment returns and principal value will fluctuate and shares, when redeemed, may be worth more or less than their original cost. The Adviser has waived fees and reimbursed other expenses, absent which, performance would have been lower. The Adviser has contractually agreed to waive fees and/or pay certain Fund expenses through August 31, 2012. According to the Fund's current prospectus, the total gross annual operating expense ratio was indicated as 0.93%. In the Financial Highlights section of this Shareholder Report, the Fund's net total operating expense ratio was determined to be 0.65%, while the Fund's gross total expense ratio was determined to be 0.74%. NAV and Share Price returns assume that dividends and capital gain distributions have been reinvested in the Fund at NAV and Share Price, respectively. The returns shown in the table above do not reflect the deduction of taxes that a shareholder would pay on Fund distributions or the redemption or sale of Fund Shares. See invescopowershares.com to find the most recent month-end performance numbers.
Index performance results are based upon a hypothetical investment in its constituent securities. Index returns do not represent Fund returns. An investor cannot invest directly in an index. The Index does not charge management fees or brokerage expenses, and no such fees or expenses were deducted from the hypothetical performance shown. In addition, the results actual investors might have achieved would have differed from those shown because of differences in the timing, amounts of their investments, and fees and expenses associated with an investment in the Fund.
The S&P Energy Index, Dow Jones Oil & Gas Index and S&P 500® Index (the "Benchmark Indices") are unmanaged indices used as a measurement of change in stock market conditions based on the average performance of approximately 78, 92 and 500 common stocks, respectively.
† Fund and underlying Index returns are based on the inception date of the Fund. Returns for the Benchmark Indices are based on the closest month-end to the Fund's inception date.
†† Average annualized.
11
Manager's Analysis
PowerShares Dynamic Financial Sector Portfolio (ticker: PFI)
The PowerShares Dynamic Financial Sector Portfolio (the "Fund") seeks investment results that correspond (before fees and expenses) generally to the price and yield performance of the Dynamic Financial Sector IntellidexSM Index (the "Index").
For the fiscal year ended April 30, 2011, the Fund returned 12.76%. Over this same year, the Index returned 13.53%, while the S&P Financials Index returned 2.58%, the Dow Jones Financials Index returned 2.16% and the S&P 500® Index returned 17.24%. The Fund benefited from positive performance of securities of companies in insurance, consumer finance and diversified financial services industries. The Fund suffered negative performance for securities of companies in commercial banks, capital markets, and thrifts & mortgage finance industries.
Industry Breakdown (% of the Fund's
Net Assets) as of April 30, 2011
| Property/Casualty Insurance | 21.0 | ||||||
| Investment Management/ Advisor Services | 12.6 | ||||||
| Life/Health Insurance | 11.2 | ||||||
| Multi-line Insurance | 6.6 | ||||||
| Commercial Banks-Eastern U.S. | 6.4 | ||||||
| Commercial Banks-Central U.S. | 4.1 | ||||||
| Reinsurance | 4.0 | ||||||
| Real Estate Management/Services | 4.0 | ||||||
| Insurance Brokers | 4.0 | ||||||
| Diversified Operations | 2.9 | ||||||
| Finance-Other Services | 2.9 | ||||||
| Finance-Credit Card | 2.8 | ||||||
| Commercial Services-Finance | 2.8 | ||||||
| Fiduciary Banks | 2.6 | ||||||
| Super-Regional Banks-U.S. | 2.3 | ||||||
| Finance-Auto Loans | 1.5 | ||||||
| Finance-Consumer Loans | 1.5 | ||||||
| Finance-Commercial | 1.5 | ||||||
| REITS-Diversified | 1.5 | ||||||
| Commercial Banks-Southern U.S. | 1.3 | ||||||
| Finance-Investment Banker/Broker | 1.3 | ||||||
| Private Equity | 1.2 | ||||||
| Money Market Fund | 0.3 | ||||||
| Liabilities in excess of other assets | (0.3 | ) | |||||
Top Ten Fund Holdings (% of the Fund's
Net Assets) as of April 30, 2011
| Security | |||||||
| Leucadia National Corp. | 2.9 | ||||||
| Discover Financial Services | 2.8 | ||||||
| Chubb Corp. (The) | 2.7 | ||||||
| Progressive Corp. (The) | 2.6 | ||||||
| CB Richard Ellis Group, Inc. | 2.6 | ||||||
| Travelers Cos., Inc. (The) | 2.6 | ||||||
| State Street Corp. | 2.6 | ||||||
| Franklin Resources, Inc. | 2.5 | ||||||
| Loews Corp. | 2.5 | ||||||
| M&T Bank Corp. | 2.4 | ||||||
| Total | 26.2 | ||||||
Style Allocation (% of the Fund's
Total Investments) as of April 30, 2011
| Large-Cap Growth | 7.0 | ||||||
| Large-Cap Value | 20.3 | ||||||
| Mid-Cap Growth | 17.7 | ||||||
| Mid-Cap Value | 22.7 | ||||||
| Small-Cap Value | 24.2 | ||||||
| Small-Cap Growth | 8.1 | ||||||
12
Manager's Analysis (Continued)
PowerShares Dynamic Financial Sector Portfolio (ticker: PFI)
Growth of a $10,000 Investment Since Inception†

Fund Performance History (%) As of April 30, 2011
| Avg Ann†† | Fund Inception† | ||||||||||||||||||
| 1 Year | 3 Year | Avg Ann†† | Cumulative | ||||||||||||||||
| Index | |||||||||||||||||||
| Dynamic Financial Sector IntellidexSM Index | 13.53 | % | -1.52 | % | -2.50 | % | -10.89 | % | |||||||||||
| S&P Financials Index | 2.58 | % | -12.92 | % | -13.04 | % | -47.28 | % | |||||||||||
| Dow Jones Financials Index | 2.16 | % | -11.87 | % | -12.84 | % | -46.75 | % | |||||||||||
| S&P 500® Index | 17.24 | % | 1.74 | % | 2.62 | % | 12.56 | % | |||||||||||
| Fund | |||||||||||||||||||
| Net Asset Value ("NAV") Return | 12.76 | % | -2.40 | % | -3.31 | % | -14.18 | % | |||||||||||
| Share Price Return | 12.77 | % | -2.41 | % | -3.31 | % | -14.18 | % | |||||||||||
Fund Inception: October 12, 2006
Performance quoted represents past performance. Past performance is not a guarantee of future results and current performance may be higher or lower than performance quoted. Investment returns and principal value will fluctuate and shares, when redeemed, may be worth more or less than their original cost. The Adviser has waived fees and reimbursed other expenses, absent which, performance would have been lower. The Adviser has contractually agreed to waive fees and/or pay certain Fund expenses through August 31, 2012. According to the Fund's current prospectus, the total gross annual operating expense ratio of 1.26% includes estimated acquired fund fees and expenses of 0.01%. In the Financial Highlights section of this Shareholder Report, the Fund's net total operating expense ratio was determined to be 0.65%, while the Fund's gross total expense ratio was determined to be 1.30%. NAV and Share Price returns assume that dividends and capital gain distributions have been reinvested in the Fund at NAV and Share Price, respectively. The returns shown in the table above do not reflect the deduction of taxes that a shareholder would pay on Fund distributions or the redemption or sale of Fund Shares. See invescopowershares.com to find the most recent month-end performance numbers.
Index performance results are based upon a hypothetical investment in its constituent securities. Index returns do not represent Fund returns. An investor cannot invest directly in an index. The Index does not charge management fees or brokerage expenses, and no such fees or expenses were deducted from the hypothetical performance shown. In addition, the results actual investors might have achieved would have differed from those shown because of differences in the timing, amounts of their investments, and fees and expenses associated with an investment in the Fund.
The S&P Financials Index, Dow Jones Financials Index and S&P 500® Index (the "Benchmark Indices") are unmanaged indices used as a measurement of change in stock market conditions based on the average performance of approximately 82, 262 and 500 common stocks, respectively.
† Fund and underlying Index returns are based on the inception date of the Fund. Returns for the Benchmark Indices are based on the closest month-end to the Fund's inception date.
†† Average annualized.
13
Manager's Analysis
PowerShares Dynamic Healthcare Sector Portfolio (ticker: PTH)
The PowerShares Dynamic Healthcare Sector Portfolio (the "Fund") seeks investment results that correspond (before fees and expenses) generally to the price and yield performance of the Dynamic Healthcare Sector IntellidexSM Index (the "Index").
For the fiscal year ended April 30, 2011, the Fund returned 22.31%. Over this same year, the Index returned 23.15%, while the S&P Health Care Index returned 16.42%, the Dow Jones U.S. Health Care Index returned 17.08% and the S&P 500® Index returned 17.24%. The Fund benefited from positive performance of securities of companies in health care providers & services, pharmaceuticals and biotechnology industries. Fund performance was positive for securities of companies within each industry in which it was invested.
Industry Breakdown (% of the Fund's
Net Assets) as of April 30, 2011
| Healthcare-Services | 35.2 | ||||||
| Pharmaceuticals | 21.6 | ||||||
| Healthcare-Products | 20.7 | ||||||
| Biotechnology | 8.2 | ||||||
| Commercial Services | 5.3 | ||||||
| Electronics | 5.1 | ||||||
| Software | 2.5 | ||||||
| Distribution/Wholesale | 1.4 | ||||||
| Money Market Fund | 0.2 | ||||||
| Liabilities in excess of other assets | (0.2 | ) | |||||
Style Allocation (% of the Fund's
Total Investments) as of April 30, 2011
| Large-Cap Growth | 9.0 | ||||||
| Large-Cap Value | 18.3 | ||||||
| Mid-Cap Growth | 17.7 | ||||||
| Mid-Cap Value | 13.5 | ||||||
| Small-Cap Value | 16.2 | ||||||
| Small-Cap Growth | 25.3 | ||||||
Top Ten Fund Holdings (% of the Fund's
Net Assets) as of April 30, 2011
| Security | |||||||
| Biogen Idec, Inc. | 3.2 | ||||||
| Humana, Inc. | 2.7 | ||||||
| Waters Corp. | 2.7 | ||||||
| UnitedHealth Group, Inc. | 2.6 | ||||||
| WellPoint, Inc. | 2.6 | ||||||
| CIGNA Corp. | 2.5 | ||||||
| Aetna, Inc. | 2.5 | ||||||
| Amgen, Inc. | 2.5 | ||||||
| AmerisourceBergen Corp. | 2.4 | ||||||
| Eli Lilly & Co. | 2.4 | ||||||
| Total | 26.1 | ||||||
14
Manager's Analysis (Continued)
PowerShares Dynamic Healthcare Sector Portfolio (ticker: PTH)
Growth of a $10,000 Investment Since Inception†
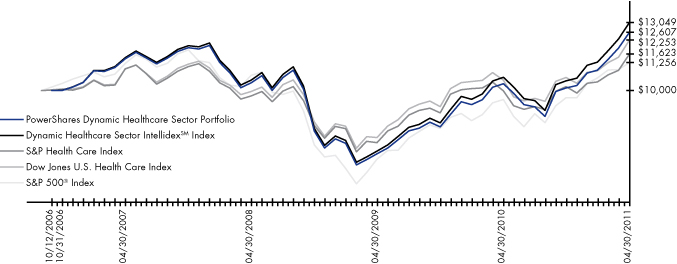
Fund Performance History (%) As of April 30, 2011
| Avg Ann†† | Fund Inception† | ||||||||||||||||||
| 1 Year | 3 Year | Avg Ann†† | Cumulative | ||||||||||||||||
| Index | |||||||||||||||||||
| Dynamic Healthcare Sector IntellidexSM Index | 23.15 | % | 7.63 | % | 6.03 | % | 30.49 | % | |||||||||||
| S&P Health Care Index | 16.42 | % | 5.99 | % | 3.34 | % | 16.23 | % | |||||||||||
| Dow Jones U.S. Health Care Index | 17.08 | % | 7.17 | % | 4.53 | % | 22.53 | % | |||||||||||
| S&P 500® Index | 17.24 | % | 1.74 | % | 2.62 | % | 12.56 | % | |||||||||||
| Fund | |||||||||||||||||||
| Net Asset Value ("NAV") Return | 22.31 | % | 6.82 | % | 5.23 | % | 26.07 | % | |||||||||||
| Share Price Return | 22.48 | % | 6.87 | % | 5.25 | % | 26.19 | % | |||||||||||
Fund Inception: October 12, 2006
Performance quoted represents past performance. Past performance is not a guarantee of future results and current performance may be higher or lower than performance quoted. Investment returns and principal value will fluctuate and shares, when redeemed, may be worth more or less than their original cost. The Adviser has waived fees and reimbursed other expenses, absent which, performance would have been lower. The Adviser has contractually agreed to waive fees and/or pay certain Fund expenses through August 31, 2012. According to the Fund's current prospectus, the total gross annual operating expense ratio was indicated as 0.72%. In the Financial Highlights section of this Shareholder Report, the Fund's net total operating expense ratio was determined to be 0.65%, while the Fund's gross total expense ratio was determined to be 0.83%. NAV and Share Price returns assume that dividends and capital gain distributions have been reinvested in the Fund at NAV and Share Price, respectively. The returns shown in the table above do not reflect the deduction of taxes that a shareholder would pay on Fund distributions or the redemption or sale of Fund Shares. See invescopowershares.com to find the most recent month-end performance numbers.
Index performance results are based upon a hypothetical investment in its constituent securities. Index returns do not represent Fund returns. An investor cannot invest directly in an index. The Index does not charge management fees or brokerage expenses, and no such fees or expenses were deducted from the hypothetical performance shown. In addition, the results actual investors might have achieved would have differed from those shown because of differences in the timing, amounts of their investments, and fees and expenses associated with an investment in the Fund.
The S&P Health Care Index, Dow Jones U.S. Healthcare Index and S&P 500® Index (the "Benchmark Indices") are unmanaged indices used as a measurement of change in stock market conditions based on the average performance of approximately 82, 126 and 500 common stocks, respectively.
† Fund and underlying Index returns are based on the inception date of the Fund. Returns for the Benchmark Indices are based on the closest month-end to the Fund's inception date.
†† Average annualized.
15
Manager's Analysis
PowerShares Dynamic Industrials Sector Portfolio (ticker: PRN)
The PowerShares Dynamic Industrials Sector Portfolio (the "Fund") seeks investment results that correspond (before fees and expenses) generally to the price and yield performance of the Dynamic Industrial Sector IntellidexSM Index (the "Index").
For the fiscal year ended April 30, 2010, the Fund returned 29.83%. Over this same year, the Index returned 30.93%, while the S&P Industrials Index returned 20.25%, the Dow Jones Industrial Index returned 19.44% and the S&P 500® Index returned 17.24%. The Fund benefited from positive performance of securities of companies in machinery, aerospace & defense and commercial services industries. The Fund suffered negative performance for securities of companies in professional services and marine industries.
Industry Breakdown (% of the Fund's
Net Assets) as of April 30, 2011
| Miscellaneous Manufacturing | 25.2 | ||||||
| Commercial Services | 12.9 | ||||||
| Aerospace/Defense | 12.2 | ||||||
| Transportation | 12.0 | ||||||
| Machinery-Diversified | 10.9 | ||||||
| Engineering & Construction | 5.3 | ||||||
| Machinery-Construction & Mining | 5.2 | ||||||
| Office Furnishings | 4.0 | ||||||
| Hand/Machine Tools | 2.8 | ||||||
| Electrical Components & Equipment | 2.6 | ||||||
| Computers | 1.4 | ||||||
| Household Products/Wares | 1.4 | ||||||
| Trucking & Leasing | 1.4 | ||||||
| Electronics | 1.4 | ||||||
| Semiconductors | 1.3 | ||||||
| Money Market Fund | 0.1 | ||||||
| Liabilities in excess of other assets | (0.1 | ) | |||||
Top Ten Fund Holdings (% of the Fund's
Net Assets) as of April 30, 2011
| Security | |||||||
| Caterpillar, Inc. | 2.7 | ||||||
| Union Pacific Corp. | 2.6 | ||||||
| AMETEK, Inc. | 2.6 | ||||||
| Tyco International Ltd. | 2.6 | ||||||
| Sauer-Danfoss, Inc. | 2.5 | ||||||
| United Technologies Corp. | 2.5 | ||||||
| Joy Global, Inc. | 2.5 | ||||||
| Honeywell International, Inc. | 2.5 | ||||||
| Parker Hannifin Corp. | 2.5 | ||||||
| Dover Corp. | 2.5 | ||||||
| Total | 25.5 | ||||||
Style Allocation (% of the Fund's
Total Investments) as of April 30, 2011
| Large-Cap Growth | 7.5 | ||||||
| Large-Cap Value | 21.9 | ||||||
| Mid-Cap Growth | 14.1 | ||||||
| Mid-Cap Value | 7.2 | ||||||
| Small-Cap Value | 31.7 | ||||||
| Small-Cap Growth | 17.6 | ||||||
16
Manager's Analysis (Continued)
PowerShares Dynamic Industrials Sector Portfolio (ticker: PRN)
Growth of a $10,000 Investment Since Inception†
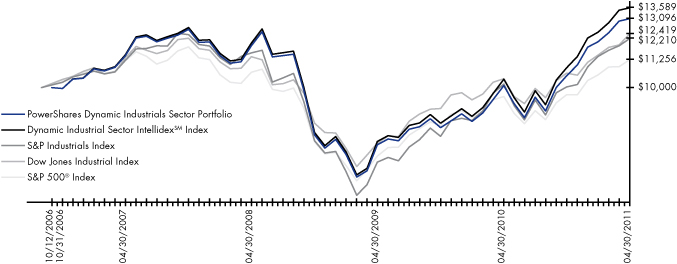
Fund Performance History (%) As of April 30, 2011
| Avg Ann†† | Fund Inception† | ||||||||||||||||||
| 1 Year | 3 Year | Avg Ann†† | Cumulative | ||||||||||||||||
| Index | |||||||||||||||||||
| Dynamic Industrial Sector IntellidexSM Index | 30.93 | % | 4.25 | % | 6.98 | % | 35.89 | % | |||||||||||
| S&P Industrials Index | 20.25 | % | 1.85 | % | 4.45 | % | 22.10 | % | |||||||||||
| Dow Jones Industrial Index | 19.44 | % | 2.94 | % | 4.84 | % | 24.19 | % | |||||||||||
| S&P 500® Index | 17.24 | % | 1.74 | % | 2.62 | % | 12.56 | % | |||||||||||
| Fund | |||||||||||||||||||
| Net Asset Value ("NAV") Return | 29.83 | % | 3.32 | % | 6.11 | % | 30.96 | % | |||||||||||
| Share Price Return | 29.92 | % | 3.33 | % | 6.13 | % | 31.05 | % | |||||||||||
Fund Inception: October 12, 2006
Performance quoted represents past performance. Past performance is not a guarantee of future results and current performance may be higher or lower than performance quoted. Investment returns and principal value will fluctuate and shares, when redeemed, may be worth more or less than their original cost. The Adviser has waived fees and reimbursed other expenses, absent which, performance would have been lower. The Adviser has contractually agreed to waive fees and/or pay certain Fund expenses through August 31, 2012. According to the Fund's current prospectus, the total gross annual operating expense ratio was indicated as 0.82%. In the Financial Highlights section of this Shareholder Report, the Fund's net total operating expense ratio was determined to be 0.65%, while the Fund's gross total expense ratio was determined to be 0.87%. NAV and Share Price returns assume that dividends and capital gain distributions have been reinvested in the Fund at NAV and Share Price, respectively. The returns shown in the table above do not reflect the deduction of taxes that a shareholder would pay on Fund distributions or the redemption or sale of Fund Shares. See invescopowershares.com to find the most recent month-end performance numbers.
Index performance results are based upon a hypothetical investment in its constituent securities. Index returns do not represent Fund returns. An investor cannot invest directly in an index. The Index does not charge management fees or brokerage expenses, and no such fees or expenses were deducted from the hypothetical performance shown. In addition, the results actual investors might have achieved would have differed from those shown because of differences in the timing, amounts of their investments, and fees and expenses associated with an investment in the Fund.
The S&P Industrials Index, Dow Jones Industrial Index and S&P 500® Index (the "Benchmark Indices") are unmanaged indices used as a measurement of change in stock market conditions based on the average performance of approximately 400, 30 and 500 common stocks, respectively.
† Fund and underlying Index returns are based on the inception date of the Fund. Returns for the Benchmark Indices are based on the closest month-end to the Fund's inception date.
†† Average annualized.
17
Manager's Analysis
PowerShares Dynamic Technology Sector Portfolio (ticker: PTF)
The PowerShares Dynamic Technology Sector Portfolio (the "Fund") seeks investment results that correspond (before fees and expenses) generally to the price and yield performance of the Dynamic Technology Sector IntellidexSM Index (the "Index").
For the fiscal year ended April 30, 2011, the Fund returned 17.26%. Over this same year, the Index returned 18.13%, while the S&P Information Technology Index returned 13.16%, the Dow Jones Technology Index returned 15.19% and the S&P 500® Index returned 17.24%. The Fund benefited from positive performance of securities of companies in IT services, Software, and office electronics industries. The Fund suffered from negative performance for securities of companies in internet software & services industries.
Industry Breakdown (% of the Fund's
Net Assets) as of April 30, 2011
| Computers | 21.6 | ||||||
| Software | 19.6 | ||||||
| Commercial Services | 15.8 | ||||||
| Electronics | 15.4 | ||||||
| Semiconductors | 13.1 | ||||||
| Telecommunications | 6.3 | ||||||
| Internet | 4.4 | ||||||
| Distribution/Wholesale | 2.4 | ||||||
| Media | 1.4 | ||||||
| Money Market Fund | 0.2 | ||||||
| Liabilities in excess of other assets | (0.2 | ) | |||||
Style Allocation (% of the Fund's
Total Investments) as of April 30, 2011
| Large-Cap Growth | 20.9 | ||||||
| Large-Cap Value | 8.0 | ||||||
| Mid-Cap Growth | 17.4 | ||||||
| Mid-Cap Value | 10.4 | ||||||
| Small-Cap Value | 12.2 | ||||||
| Small-Cap Growth | 31.1 | ||||||
Top Ten Fund Holdings (% of the Fund's
Net Assets) as of April 30, 2011
| Security | |||||||
| Agilent Technologies, Inc. | 2.9 | ||||||
| Automatic Data Processing, Inc. | 2.7 | ||||||
| Symantec Corp. | 2.7 | ||||||
| International Business Machines Corp. | 2.6 | ||||||
| BMC Software, Inc. | 2.5 | ||||||
| TE Connectivity Ltd. | 2.5 | ||||||
| Apple, Inc. | 2.5 | ||||||
| Texas Instruments, Inc. | 2.5 | ||||||
| CA, Inc. | 2.5 | ||||||
| Paychex, Inc. | 2.5 | ||||||
| Total | 25.9 | ||||||
18
Manager's Analysis (Continued)
PowerShares Dynamic Technology Sector Portfolio (ticker: PTF)
Growth of a $10,000 Investment Since Inception†
Fund Performance History (%) As of April 30, 2011
| Avg Ann†† | Fund Inception† | ||||||||||||||||||
| 1 Year | 3 Year | Avg Ann†† | Cumulative | ||||||||||||||||
| Index | |||||||||||||||||||
| Dynamic Technology Sector IntellidexSM Index | 18.13 | % | 4.41 | % | 2.49 | % | 11.83 | % | |||||||||||
| S&P Information Technology Index | 13.16 | % | 5.98 | % | 6.46 | % | 33.22 | % | |||||||||||
| Dow Jones Technology Index | 15.19 | % | 7.56 | % | 7.34 | % | 38.34 | % | |||||||||||
| S&P 500® Index | 17.24 | % | 1.74 | % | 2.62 | % | 12.56 | % | |||||||||||
| Fund | |||||||||||||||||||
| Net Asset Value ("NAV") Return | 17.26 | % | 3.68 | % | 1.78 | % | 8.36 | % | |||||||||||
| Share Price Return | 17.27 | % | 3.70 | % | 1.77 | % | 8.32 | % | |||||||||||
Fund Inception: October 12, 2006
Performance quoted represents past performance. Past performance is not a guarantee of future results and current performance may be higher or lower than performance quoted. Investment returns and principal value will fluctuate and shares, when redeemed, may be worth more or less than their original cost. The Adviser has waived fees and reimbursed other expenses, absent which, performance would have been lower. The Adviser has contractually agreed to waive fees and/or pay certain Fund expenses through August 31, 2012. According to the Fund's current prospectus, the total gross annual operating expense ratio was indicated as 0.90%. In the Financial Highlights section of this Shareholder Report, the Fund's net total operating expense ratio was determined to be 0.65%, while the Fund's gross total expense ratio was determined to be 0.91%. NAV and Share Price returns assume that dividends and capital gain distributions have been reinvested in the Fund at NAV and Share Price, respectively. The returns shown in the table above do not reflect the deduction of taxes that a shareholder would pay on Fund distributions or the redemption or sale of Fund Shares. See invescopowershares.com to find the most recent month-end performance numbers.
Index performance results are based upon a hypothetical investment in its constituent securities. Index returns do not represent Fund returns. An investor cannot invest directly in an index. The Index does not charge management fees or brokerage expenses, and no such fees or expenses were deducted from the hypothetical performance shown. In addition, the results actual investors might have achieved would have differed from those shown because of differences in the timing, amounts of their investments, and fees and expenses associated with an investment in the Fund.
The S&P Information Technology Index, Dow Jones Technology Index and S&P 500® Index (the "Benchmark Indices") are unmanaged indices used as a measurement of change in stock market conditions based on the average performance of approximately 119, 166 and 500 common stocks, respectively.
† Fund and underlying Index returns are based on the inception date of the Fund. Returns for the Benchmark Indices are based on the closest month-end to the Fund's inception date.
†† Average annualized.
19
Manager's Analysis
PowerShares Dynamic Utilities Portfolio (ticker: PUI)
The PowerShares Dynamic Utilities Portfolio (the "Fund") seeks investment results that correspond (before fees and expenses) generally to the price and yield performance of the Dynamic Utilities IntellidexSM Index (the "Index").
Effective October 1, 2010, the index methodology was amended to increase the number of common stocks of U.S. utilities companies in the Index from 30 to 60 and to include common stocks of U.S. utilities companies that provide telecommunications services.
For the fiscal year ended April 30, 2011, the Fund returned 18.36%. Over this same year, the Index returned 19.25%, while the S&P Utilities Index returned 13.85%, the Dow Jones U.S. Utilities Index returned 15.62% and the S&P 500® Index returned 17.24%. The Fund benefited from positive performance of securities of companies in multi-utilities, electric utilities and diversified telecommunication services. The Fund suffered negative performance for securities of companies in oil gas & consumable fuels and independent power producers & energy traders industries.
Industry Breakdown (% of the Fund's
Net Assets) as of April 30, 2011
| Electric-Integrated | 50.5 | ||||||
| Telephone-Integrated | 9.0 | ||||||
| Gas-Distribution | 7.7 | ||||||
| Cable/Satellite TV | 7.5 | ||||||
| Cellular Telecommunications | 6.9 | ||||||
| Telecommunication Services | 4.6 | ||||||
| Wireless Equipment | 3.2 | ||||||
| Telecommunication Equipment | 2.7 | ||||||
| Broadcast Services/Program | 1.4 | ||||||
| Water | 1.4 | ||||||
| Electric-Transmission | 1.3 | ||||||
| Independent Power Producer | 1.3 | ||||||
| Internet Connectivity Services | 1.3 | ||||||
| Electronic Measuring Instruments | 1.2 | ||||||
| Money Market Fund | 0.0 | ||||||
| Liabilities in excess of other assets | (0.0 | ) | |||||
Style Allocation (% of the Fund's
Total Investments) as of April 30, 2011
| Large-Cap Growth | 7.8 | ||||||
| Large-Cap Value | 33.2 | ||||||
| Mid-Cap Growth | 6.8 | ||||||
| Mid-Cap Value | 20.2 | ||||||
| Small-Cap Value | 17.9 | ||||||
| Small-Cap Growth | 14.1 | ||||||
Top Ten Fund Holdings (% of the Fund's
Net Assets) as of April 30, 2011
| Security | |||||||
| Sprint Nextel Corp. | 2.8 | ||||||
| AT&T, Inc. | 2.6 | ||||||
| Time Warner Cable, Inc. | 2.6 | ||||||
| Edison International | 2.6 | ||||||
| DIRECTV | 2.5 | ||||||
| Consolidated Edison, Inc. | 2.5 | ||||||
| Verizon Communications, Inc. | 2.5 | ||||||
| Duke Energy Corp. | 2.5 | ||||||
| Comcast Corp. | 2.4 | ||||||
| American Electric Power Co., Inc. | 2.4 | ||||||
| Total | 25.4 | ||||||
20
Manager's Analysis (Continued)
PowerShares Dynamic Utilities Portfolio (ticker: PUI)
Growth of a $10,000 Investment Since Inception†
Fund Performance History (%) As of April 30, 2011
| Avg Ann†† | Fund Inception† | ||||||||||||||||||||||
| 1 Year | 3 Year | 5 Year | Avg Ann†† | Cumulative | |||||||||||||||||||
| Index | |||||||||||||||||||||||
| Dynamic Utilities IntellidexSM Index | 19.25 | % | 0.93 | % | 4.83 | % | 5.89 | % | 37.07 | % | |||||||||||||
| S&P Utilities Index | 13.85 | % | -1.88 | % | 5.20 | % | 4.97 | % | 30.57 | % | |||||||||||||
| Dow Jones U.S. Utilities Index | 15.62 | % | -1.40 | % | 5.55 | % | 5.20 | % | 32.12 | % | |||||||||||||
| S&P 500® Index | 17.24 | % | 1.74 | % | 2.95 | % | 4.41 | % | 26.81 | % | |||||||||||||
| Fund | |||||||||||||||||||||||
| Net Asset Value ("NAV") Return | 18.36 | % | 0.22 | % | 4.13 | % | 5.17 | % | 32.01 | % | |||||||||||||
| Share Price Return | 18.42 | % | 0.24 | % | 4.15 | % | 5.20 | % | 32.25 | % | |||||||||||||
Fund Inception: October 26, 2005
Performance quoted represents past performance. Past performance is not a guarantee of future results and current performance may be higher or lower than performance quoted. Investment returns and principal value will fluctuate and shares, when redeemed, may be worth more or less than their original cost. The Adviser has waived fees and reimbursed other expenses, absent which, performance would have been lower. The Adviser has contractually agreed to waive fees and/or pay certain Fund expenses through August 31, 2012. According to the Fund's current prospectus, the total gross annual operating expense ratio was indicated as 0.95%. In the Financial Highlights section of this Shareholder Report, the Fund's net total operating expense ratio was determined to be 0.63%, while the Fund's gross total expense ratio was determined to be 0.89%. NAV and Share Price returns assume that dividends and capital gain distributions have been reinvested in the Fund at NAV and Share Price, respectively. The returns shown in the table above do not reflect the deduction of taxes that a shareholder would pay on Fund distributions or the redemption or sale of Fund Shares. See invescopowershares.com to find the most recent month-end performance numbers.
Index performance results are based upon a hypothetical investment in its constituent securities. Index returns do not represent Fund returns. An investor cannot invest directly in an index. The Index does not charge management fees or brokerage expenses, and no such fees or expenses were deducted from the hypothetical performance shown. In addition, the results actual investors might have achieved would have differed from those shown because of differences in the timing, amounts of their investments, and fees and expenses associated with an investment in the Fund.
The S&P Utilities Index, Dow Jones U.S. Utilities Index and S&P 500® Index (the "Benchmark Indices") are unmanaged indices used as a measurement of change in stock market conditions based on the average performance of approximately 33, 15 and 500 common stocks, respectively.
† Fund and underlying Index returns are based on the inception date of the Fund. Returns for the Benchmark Indices are based on the closest month-end to the Fund's inception date.
†† Average annualized.
21
Manager's Analysis
PowerShares NASDAQ Internet Portfolio (ticker: PNQI)
The PowerShares NASDAQ Internet Portfolio (the "Fund") seeks investment results that correspond (before fees and expenses) generally to the price and yield performance of the NASDAQ Internet IndexSM (the "Index").
For the fiscal year ended April 30, 2011, the Fund returned 47.80%. Over this same year the Index returned 48.70% while the NASDAQ-100® Index returned 21.07% and the S&P 500® Index returned 17.24%. The Fund benefited from positive performance of securities of companies in the information technology and consumer discretionary sectors. Fund performance was positive for securities of companies within each sector in which it was invested.
Industry Breakdown (% of the Fund's
Net Assets) as of April 30, 2011
| Web Portals/ISP | 28.8 | ||||||
| E-Commerce/Services | 27.9 | ||||||
| E-Commerce/Products | 11.8 | ||||||
| Web Hosting/Design | 6.1 | ||||||
| Internet Security | 3.4 | ||||||
| Internet Infrastructure Software | 3.4 | ||||||
| E-Marketing/Information | 2.9 | ||||||
| Enterprise Software/Services | 2.4 | ||||||
| Telecommunication Services | 2.0 | ||||||
| Internet Content-Information/Network | 1.9 | ||||||
| Internet Content-Information/News | 1.6 | ||||||
| E-Services/Consulting | 1.5 | ||||||
| Internet Application Software | 1.2 | ||||||
| Printing-Commercial | 1.2 | ||||||
| Human Resources | 1.1 | ||||||
| Internet Telephony | 0.7 | ||||||
| Internet Connectivity Services | 0.6 | ||||||
| Networking Products | 0.5 | ||||||
| Internet Content-Entertainment | 0.4 | ||||||
| Computer Services | 0.3 | ||||||
| Retail-Pet Food & Supplies | 0.2 | ||||||
| Internet Incubators | 0.1 | ||||||
| Liabilities in excess of other assets | (0.0 | ) | |||||
Top Ten Fund Holdings (% of the Fund's
Net Assets) as of April 30, 2011
| Security | |||||||
| Baidu, Inc. | 8.7 | ||||||
| Priceline.com, Inc. | 8.6 | ||||||
| Amazon.com, Inc. | 8.0 | ||||||
| eBay, Inc. | 7.3 | ||||||
| Google, Inc. | 6.3 | ||||||
| SINA Corp. | 4.2 | ||||||
| Netflix, Inc. | 4.0 | ||||||
| Yahoo!, Inc. | 3.8 | ||||||
| VeriSign, Inc. | 3.3 | ||||||
| Akamai Technologies, Inc. | 3.3 | ||||||
| Total | 57.5 | ||||||
Style Allocation (% of the Fund's
Total Investments) as of April 30, 2011
| Large-Cap Growth | 44.6 | ||||||
| Large-Cap Value | — | ||||||
| Mid-Cap Growth | 30.7 | ||||||
| Mid-Cap Value | 1.1 | ||||||
| Small-Cap Value | 1.0 | ||||||
| Small-Cap Growth | 22.6 | ||||||
22
Manager's Analysis (Continued)
PowerShares NASDAQ Internet Portfolio (ticker: PNQI)
Growth of a $10,000 Investment Since Inception†
Fund Performance History (%) As of April 30, 2011
| Avg Ann†† | Fund Inception† | ||||||||||||||
| 1 Year | Avg Ann†† | Cumulative | |||||||||||||
| Index | |||||||||||||||
| NASDAQ Internet IndexSM | 48.70 | % | 21.56 | % | 75.54 | % | |||||||||
| NASDAQ-100® Index | 21.07 | % | 6.64 | % | 20.62 | % | |||||||||
| S&P 500® Index | 17.24 | % | 1.34 | % | 3.96 | % | |||||||||
| Fund | |||||||||||||||
| Net Asset Value ("NAV") Return | 47.80 | % | 20.87 | % | 72.67 | % | |||||||||
| Share Price Return | 47.81 | % | 20.24 | % | 70.10 | % | |||||||||
Fund Inception: June 12, 2008
Performance quoted represents past performance. Past performance is not a guarantee of future results and current performance may be higher or lower than performance quoted. Investment returns and principal value will fluctuate and shares, when redeemed, may be worth more or less than their original cost. According to the Fund's current prospectus, the expense ratio of 0.60% is expressed as a unitary management fee to cover operating expenses and expenses incurred in connection with managing the portfolio. NAV and Share Price returns assume that dividends and capital gain distributions have been reinvested in the Fund at NAV and Share Price, respectively. The returns shown in the table above do not reflect the deduction of taxes that a shareholder would pay on Fund distributions or redemption or sale of Fund Shares. See invescopowershares.com to find the most recent month-end performance numbers.
Index performance results are based upon a hypothetical investment in its constituent securities. Index returns do not represent Fund returns. An investor cannot invest directly in an index. The Index does not charge management fees or brokerage expenses, and no such fees or expenses were deducted from the hypothetical performance shown. In addition, the results actual investors might have achieved would have differed from those shown because of differences in the timing, amounts of their investments, and fees and expenses associated with an investment in the Fund.
The NASDAQ-100® Index and S&P 500® Index (the "Benchmark Indices") are unmanaged indices used as a measurement of change in stock market conditions based on the average performance of approximately 100 and 500 common stocks, respectively.
† Fund and underlying Index returns are based on the inception date of the Fund. Returns for the Benchmark Indices are based on the closest month-end to the Fund's inception date.
†† Average annualized.
23
Frequency Distribution of Discounts & Premiums
Since Inception through April 30, 2011
| Closing Price Above NAV (bps) | |||||||||||||||||||||||||||||||||||||||
| Ticker | Fund Name | Inception | Trading Days | 0-24 | 25-49 | 50-99 | 100-149 | 150-199 | 200+ | ||||||||||||||||||||||||||||||
| PYZ | PowerShares Dynamic Basic Materials Sector Portfolio | 10/12/06 | 1145 | 507 | 21 | 4 | 0 | 0 | 0 | ||||||||||||||||||||||||||||||
| PEZ | PowerShares Dynamic Consumer Discretionary Sector Portfolio | 10/12/06 | 1145 | 446 | 17 | 4 | 0 | 0 | 2 | ||||||||||||||||||||||||||||||
| PSL | PowerShares Dynamic Consumer Staples Sector Portfolio | 10/12/06 | 1145 | 402 | 15 | 6 | 0 | 0 | 2 | ||||||||||||||||||||||||||||||
| PXI | PowerShares Dynamic Energy Sector Portfolio | 10/12/06 | 1145 | 473 | 15 | 8 | 2 | 0 | 0 | ||||||||||||||||||||||||||||||
| PFI | PowerShares Dynamic Financial Sector Portfolio | 10/12/06 | 1145 | 459 | 24 | 8 | 1 | 1 | 1 | ||||||||||||||||||||||||||||||
| PTH | PowerShares Dynamic Healthcare Sector Portfolio | 10/12/06 | 1145 | 357 | 13 | 12 | 0 | 0 | 0 | ||||||||||||||||||||||||||||||
| PRN | PowerShares Dynamic Industrials Sector Portfolio | 10/12/06 | 1145 | 524 | 13 | 8 | 0 | 0 | 1 | ||||||||||||||||||||||||||||||
| PTF | PowerShares Dynamic Technology Sector Portfolio | 10/12/06 | 1145 | 452 | 56 | 9 | 1 | 1 | 1 | ||||||||||||||||||||||||||||||
| PUI | PowerShares Dynamic Utilities Portfolio | 10/26/05 | 1387 | 545 | 27 | 5 | 1 | 1 | 1 | ||||||||||||||||||||||||||||||
| PNQI | PowerShares NASDAQ Internet Portfolio | 6/12/08 | 693 | 289 | 9 | 5 | 1 | 2 | 2 | ||||||||||||||||||||||||||||||
24
| Closing Price Below NAV (bps) | |||||||||||||||||||||||||||
| Ticker | -0-24 | -25-49 | -50-99 | -100-149 | -150-199 | -200+ | |||||||||||||||||||||
| PYZ | 597 | 13 | 3 | 0 | 0 | 0 | |||||||||||||||||||||
| PEZ | 665 | 9 | 1 | 0 | 0 | 1 | |||||||||||||||||||||
| PSL | 711 | 8 | 1 | 0 | 0 | 0 | |||||||||||||||||||||
| PXI | 629 | 10 | 6 | 1 | 0 | 1 | |||||||||||||||||||||
| PFI | 619 | 20 | 6 | 4 | 2 | 0 | |||||||||||||||||||||
| PTH | 754 | 9 | 0 | 0 | 0 | 0 | |||||||||||||||||||||
| PRN | 588 | 11 | 0 | 0 | 0 | 0 | |||||||||||||||||||||
| PTF | 609 | 13 | 1 | 0 | 0 | 2 | |||||||||||||||||||||
| PUI | 790 | 16 | 0 | 0 | 1 | 0 | |||||||||||||||||||||
| PNQI | 378 | 5 | 1 | 0 | 0 | 1 | |||||||||||||||||||||
25
Fees and Expenses
As a shareholder of a Fund of the PowerShares Exchange-Traded Fund Trust, you incur advisory fees and other Fund expenses. The expense examples below are intended to help you understand your ongoing costs (in dollars) of investing in the Funds and to compare these costs with the ongoing costs of investing in other funds.
The example is based on an investment of $1,000 invested at the beginning of the period and held through the six-month period ended April 30, 2011.
In pursuing its investment objective, PowerShares Dynamic Financial Sector Portfolio (the "Portfolio") may invest a portion of its assets in investment companies. The Fund indirectly bears a pro rata share of the fees and expenses of the investment companies in which the Fund invests. The effect of such expenses are included in the Portfolio's total return.
Actual Expenses
The first line in the following table provides information about actual account values and actual expenses. You may use the information in this line, together with the amount you invested, to estimate the expenses that you paid over the period. Simply divide your account value by $1,000 (for example, an $8,600 account value divided by $1,000 = 8.6), then multiply the result by the number in the first line under the heading "Expenses Paid During the Six-Month Period" to estimate the expenses you paid on your account during this period.
Hypothetical Example for Comparison Purposes
The second line in the following table provides information about hypothetical account values and hypothetical expenses based on each Fund's actual expense ratio and an assumed annualized rate of return of 5% per year before expenses, which is not the Fund's actual return. The hypothetical account values and expenses may not be used to estimate the actual ending account balance or expenses you paid for the period. You may use this information to compare the ongoing costs of investing in the Funds and other funds. To do so, compare this 5% hypothetical example with the 5% hypothetical examples that appear in the shareholder reports of the other funds.
Please note that the expenses shown in the table are meant to highlight your ongoing costs only, and do not reflect any transactional costs such as sales charges and brokerage commissions. Therefore the second line in the table is useful in comparing ongoing costs only, and will not help you determine the relative total costs of owning different funds. In addition, if these transactional costs were included, your costs would have been higher.
| Beginning Account Value November 1, 2010 | Ending Account Value April 30, 2011 | Annualized Expense Ratio Based on the Six-Month Period | Expenses Paid During the Six-Month Period (1) | ||||||||||||||||
| PowerShares Dynamic Basic Materials | |||||||||||||||||||
| Sector Portfolio Actual | $ | 1,000.00 | $ | 1,251.68 | 0.65 | % | $ | 3.63 | |||||||||||
| Hypothetical (5% return before expenses) | $ | 1,000.00 | $ | 1,021.57 | 0.65 | % | $ | 3.26 | |||||||||||
| PowerShares Dynamic Consumer | |||||||||||||||||||
| Discretionary Sector Portfolio | |||||||||||||||||||
| Actual | $ | 1,000.00 | $ | 1,179.37 | 0.65 | % | $ | 3.51 | |||||||||||
| Hypothetical (5% return before expenses) | $ | 1,000.00 | $ | 1,021.57 | 0.65 | % | $ | 3.26 | |||||||||||
| PowerShares Dynamic Consumer Staples | |||||||||||||||||||
| Sector Portfolio | |||||||||||||||||||
| Actual | $ | 1,000.00 | $ | 1,145.52 | 0.65 | % | $ | 3.46 | |||||||||||
| Hypothetical (5% return before expenses) | $ | 1,000.00 | $ | 1,021.57 | 0.65 | % | $ | 3.26 | |||||||||||
26
Fees and Expenses (Continued)
| Beginning Account Value November 1, 2010 | Ending Account Value April 30, 2011 | Annualized Expense Ratio Based on the Six-Month Period | Expenses Paid During the Six-Month Period (1) | ||||||||||||||||
| PowerShares Dynamic Energy Sector Portfolio Actual | $ | 1,000.00 | $ | 1,410.17 | 0.65 | % | $ | 3.88 | |||||||||||
| Hypothetical (5% return before expenses) | $ | 1,000.00 | $ | 1,021.57 | 0.65 | % | $ | 3.26 | |||||||||||
| PowerShares Dynamic Financial Sector Portfolio Actual | $ | 1,000.00 | $ | 1,168.45 | 0.65 | % | $ | 3.49 | |||||||||||
| Hypothetical (5% return before expenses) | $ | 1,000.00 | $ | 1,021.57 | 0.65 | % | $ | 3.26 | |||||||||||
| PowerShares Dynamic Healthcare Sector Portfolio Actual | $ | 1,000.00 | $ | 1,245.94 | 0.65 | % | $ | 3.62 | |||||||||||
| Hypothetical (5% return before expenses) | $ | 1,000.00 | $ | 1,021.57 | 0.65 | % | $ | 3.26 | |||||||||||
| PowerShares Dynamic Industrials Sector Portfolio Actual | $ | 1,000.00 | $ | 1,243.57 | 0.65 | % | $ | 3.62 | |||||||||||
| Hypothetical (5% return before expenses) | $ | 1,000.00 | $ | 1,021.57 | 0.65 | % | $ | 3.26 | |||||||||||
| PowerShares Dynamic Technology Sector | |||||||||||||||||||
| Portfolio | |||||||||||||||||||
| Actual | $ | 1,000.00 | $ | 1,154.03 | 0.65 | % | $ | 3.47 | |||||||||||
| Hypothetical (5% return before expenses) | $ | 1,000.00 | $ | 1,021.57 | 0.65 | % | $ | 3.26 | |||||||||||
| PowerShares Dynamic Utilities Portfolio Actual | $ | 1,000.00 | $ | 1,123.60 | 0.63 | % | $ | 3.32 | |||||||||||
| Hypothetical (5% return before expenses) | $ | 1,000.00 | $ | 1,021.67 | 0.63 | % | $ | 3.16 | |||||||||||
| PowerShares NASDAQ Internet Portfolio Actual | $ | 1,000.00 | $ | 1,197.41 | 0.60 | % | $ | 3.27 | |||||||||||
| Hypothetical (5% return before expenses) | $ | 1,000.00 | $ | 1,021.82 | 0.60 | % | $ | 3.01 | |||||||||||
(1) Expenses are calculated using the annualized expense ratio, which represents the ongoing expenses as a percentage of net assets for the six-month period ended April 30, 2011. Expenses are calculated by multiplying the Fund's annualized expense ratio by the average account value for the period; then multiplying the result by 181 and then dividing the result by 365. Expense ratios for the most recent six-month period may differ from expense ratios based on the annualized data in the Financial Highlights.
27
Schedule of Investments
PowerShares Dynamic Basic Materials Sector Portfolio
April 30, 2011
| Number of Shares | Value | ||||||||||
| Common Stocks—100.0% | |||||||||||
| Agricultural Chemicals—4.3% | |||||||||||
| 15,907 | CF Industries Holdings, Inc. | $ | 2,251,636 | ||||||||
| 26,234 | Mosaic Co. (The) | 1,963,877 | |||||||||
| 4,215,513 | |||||||||||
| Chemicals - Diversified—18.4% | |||||||||||
| 54,313 | Celanese Corp., Series A | 2,711,305 | |||||||||
| 41,202 | E.I. du Pont de Nemours & Co. | 2,339,862 | |||||||||
| 15,981 | FMC Corp. | 1,410,803 | |||||||||
| 37,845 | Georgia Gulf Corp.* | 1,490,336 | |||||||||
| 28,384 | Innophos Holdings, Inc. | 1,315,314 | |||||||||
| 45,074 | Innospec, Inc.* | 1,697,487 | |||||||||
| 25,482 | PPG Industries, Inc. | 2,412,381 | |||||||||
| 26,498 | Rockwood Holdings, Inc.* | 1,503,496 | |||||||||
| 52,743 | Solutia, Inc.* | 1,389,778 | |||||||||
| 25,971 | Westlake Chemical Corp. | 1,704,996 | |||||||||
| 17,975,758 | |||||||||||
| Chemicals - Plastics—1.3% | |||||||||||
| 86,863 | PolyOne Corp. | 1,257,776 | |||||||||
| Chemicals - Specialty—26.4% | |||||||||||
| 21,228 | Albemarle Corp. | 1,497,635 | |||||||||
| 33,597 | Arch Chemicals, Inc. | 1,299,196 | |||||||||
| 34,397 | Balchem Corp. | 1,365,217 | |||||||||
| 28,666 | Cabot Corp. | 1,285,670 | |||||||||
| 46,191 | Ecolab, Inc. | 2,437,037 | |||||||||
| 77,353 | Ferro Corp.* | 1,160,295 | |||||||||
| 57,159 | H.B. Fuller Co. | 1,248,924 | |||||||||
| 36,525 | Kraton Performance Polymers, Inc.* | 1,685,994 | |||||||||
| 20,539 | Lubrizol Corp. (The) | 2,762,906 | |||||||||
| 18,894 | Minerals Technologies, Inc. | 1,284,792 | |||||||||
| 9,555 | NewMarket Corp. | 1,761,178 | |||||||||
| 33,719 | OM Group, Inc.* | 1,221,977 | |||||||||
| 31,538 | Quaker Chemical Corp. | 1,424,887 | |||||||||
| 36,275 | Sensient Technologies Corp. | 1,374,460 | |||||||||
| 35,424 | Sigma-Aldrich Corp. | 2,500,226 | |||||||||
| 32,251 | W.R. Grace & Co.* | 1,462,905 | |||||||||
| 25,773,299 | |||||||||||
| Coatings/Paint—3.8% | |||||||||||
| 24,373 | Kronos Worldwide, Inc. | 1,500,402 | |||||||||
| 27,268 | Sherwin-Williams Co. (The) | 2,243,884 | |||||||||
| 3,744,286 | |||||||||||
| Containers - Metal/Glass—6.3% | |||||||||||
| 61,714 | Ball Corp. | 2,302,549 | |||||||||
| 31,554 | Crown Holdings, Inc.* | 1,180,120 | |||||||||
| 18,814 | Greif, Inc., Class A | 1,168,349 | |||||||||
| 33,038 | Silgan Holdings, Inc. | 1,515,123 | |||||||||
| 6,166,141 | |||||||||||
| Number of Shares | Value | ||||||||||
| Common Stocks (Continued) | |||||||||||
| Containers - Paper/Plastic—5.0% | |||||||||||
| 240,634 | Graphic Packaging Holding Co.* | $ | 1,321,081 | ||||||||
| 17,484 | Rock-Tenn Co., Class A | 1,207,620 | |||||||||
| 44,268 | Sealed Air Corp. | 1,140,786 | |||||||||
| 33,784 | Sonoco Products Co. | 1,167,575 | |||||||||
| 4,837,062 | |||||||||||
| Diversified Manufacturing Operations—3.1% | |||||||||||
| 29,960 | Koppers Holdings, Inc. | 1,370,071 | |||||||||
| 41,179 | LSB Industries, Inc.* | 1,661,572 | |||||||||
| 3,031,643 | |||||||||||
| Gold Mining—2.5% | |||||||||||
| 40,907 | Newmont Mining Corp. | 2,397,559 | |||||||||
| Industrial Gases—2.4% | |||||||||||
| 24,371 | Air Products & Chemicals, Inc. | 2,327,918 | |||||||||
| Metal - Aluminum—2.3% | |||||||||||
| 133,567 | Alcoa, Inc. | 2,270,639 | |||||||||
| Metal - Copper—4.4% | |||||||||||
| 42,476 | Freeport-McMoRan Copper & Gold, Inc. | 2,337,454 | |||||||||
| 52,531 | Southern Copper Corp. | 1,967,811 | |||||||||
| 4,305,265 | |||||||||||
| Miscellaneous Manufacturing—1.4% | |||||||||||
| 25,295 | AptarGroup, Inc. | 1,326,723 | |||||||||
| Non-Ferrous Metals—1.2% | |||||||||||
| 28,911 | Materion Corp.* | 1,207,323 | |||||||||
| Paper & Related Products—12.7% | |||||||||||
| 141,254 | Boise, Inc. | 1,387,114 | |||||||||
| 46,293 | Buckeye Technologies, Inc. | 1,303,611 | |||||||||
| 15,056 | Clearwater Paper Corp.* | 1,181,595 | |||||||||
| 13,766 | Domtar Corp. | 1,280,514 | |||||||||
| 79,340 | International Paper Co. | 2,450,019 | |||||||||
| 70,364 | KapStone Paper and Packaging Corp.* | 1,222,926 | |||||||||
| 40,901 | MeadWestvaco Corp. | 1,377,955 | |||||||||
| 89,222 | Mercer International, Inc.* | 1,085,832 | |||||||||
| 21,942 | Schweitzer-Mauduit International, Inc. | 1,137,473 | |||||||||
| 12,427,039 | |||||||||||
| Petrochemicals—1.8% | |||||||||||
| 43,107 | TPC Group, Inc.* | 1,700,140 | |||||||||
| Quarrying—1.3% | |||||||||||
| 13,208 | Compass Minerals International, Inc. | 1,289,233 | |||||||||
| Water Treatment Systems—1.4% | |||||||||||
| 47,213 | Nalco Holding Co. | 1,379,092 | |||||||||
| Total Common Stocks (Cost $76,995,897) | 97,632,409 | ||||||||||
See Notes to Financial Statements.
28
Schedule of Investments (Continued)
PowerShares Dynamic Basic Materials Sector Portfolio
April 30, 2011
| Number of Shares | Value | ||||||||||
| Money Market Fund—0.1% | |||||||||||
| 90,855 | Goldman Sachs Financial Square Prime Obligations Institutional Share Class (Cost $90,855) | $ | 90,855 | ||||||||
| Total Investments (Cost $77,086,752)—100.1% | 97,723,264 | ||||||||||
| Liabilities in excess of other assets—(0.1%) | (132,064 | ) | |||||||||
| Net Assets—100.0% | $ | 97,591,200 | |||||||||
Notes to Schedule of Investments:
* Non-income producing security.
See Notes to Financial Statements.
29
Schedule of Investments
PowerShares Dynamic Consumer Discretionary Sector Portfolio
April 30, 2011
| Number of Shares | Value | ||||||||||
| Common Stocks—100.0% | |||||||||||
| Advertising—2.1% | |||||||||||
| 21,017 | Harte-Hanks, Inc. | $ | 195,248 | ||||||||
| 20,833 | Interpublic Group of Cos., Inc. (The) | 244,788 | |||||||||
| 440,036 | |||||||||||
| Airlines—2.7% | |||||||||||
| 4,422 | Alaska Air Group, Inc.* | 291,277 | |||||||||
| 16,648 | SkyWest, Inc. | 275,191 | |||||||||
| 566,468 | |||||||||||
| Apparel—6.5% | |||||||||||
| 8,826 | Coach, Inc. | 527,883 | |||||||||
| 3,832 | Polo Ralph Lauren Corp. | 501,111 | |||||||||
| 7,196 | Timberland Co. (The), Class A* | 325,187 | |||||||||
| 1,354,181 | |||||||||||
| Auto Manufacturers—2.2% | |||||||||||
| 14,439 | General Motors Co.* | 463,347 | |||||||||
| Auto Parts & Equipment—7.1% | |||||||||||
| 3,525 | Autoliv, Inc. | 282,458 | |||||||||
| 4,928 | Lear Corp. | 252,018 | |||||||||
| 13,286 | Superior Industries International, Inc. | 335,737 | |||||||||
| 4,541 | TRW Automotive Holdings Corp.* | 259,110 | |||||||||
| 4,467 | WABCO Holdings, Inc.* | 329,888 | |||||||||
| 1,459,211 | |||||||||||
| Commercial Services—6.1% | |||||||||||
| 5,721 | Apollo Group, Inc., Class A* | 229,012 | |||||||||
| 6,526 | Arbitron, Inc. | 252,426 | |||||||||
| 14,232 | Bridgepoint Education, Inc.* | 249,772 | |||||||||
| 7,948 | Rent-A-Center, Inc. | 242,016 | |||||||||
| 34,321 | Stewart Enterprises, Inc., Class A | 278,343 | |||||||||
| 1,251,569 | |||||||||||
| Distribution/Wholesale—1.6% | |||||||||||
| 3,363 | Fossil, Inc.* | 322,108 | |||||||||
| Entertainment—1.3% | |||||||||||
| 6,404 | Churchill Downs, Inc. | 267,111 | |||||||||
| Home Furnishings—1.7% | |||||||||||
| 5,559 | Tempur-Pedic International, Inc.* | 348,994 | |||||||||
| Household Products/Wares—1.5% | |||||||||||
| 4,849 | Tupperware Brands Corp. | 308,736 | |||||||||
| Housewares—1.2% | |||||||||||
| 13,485 | Newell Rubbermaid, Inc. | 257,024 | |||||||||
| Internet—2.8% | |||||||||||
| 1,044 | Priceline.com, Inc.* | 571,078 | |||||||||
| Leisure Time—1.8% | |||||||||||
| 3,476 | Polaris Industries, Inc. | 366,475 | |||||||||
| Number of Shares | Value | ||||||||||
| Common Stocks (Continued) | |||||||||||
| Machinery - Diversified—1.3% | |||||||||||
| 2,910 | Middleby Corp. (The)* | $ | 260,940 | ||||||||
| Media—6.2% | |||||||||||
| 19,055 | Comcast Corp., Class A | 500,003 | |||||||||
| 27,888 | E.W. Scripps Co. (The), Class A* | 264,936 | |||||||||
| 6,752 | Time Warner Cable, Inc. | 527,534 | |||||||||
| 1,292,473 | |||||||||||
| Retail—52.7% | |||||||||||
| 17,071 | American Eagle Outfitters, Inc. | 265,625 | |||||||||
| 10,980 | Ann, Inc.* | 342,686 | |||||||||
| 8,374 | Ascena Retail Group, Inc.* | 262,023 | |||||||||
| 10,057 | Bed Bath & Beyond, Inc.* | 564,399 | |||||||||
| 625 | Biglari Holdings, Inc.* | 273,275 | |||||||||
| 8,447 | Bob Evans Farms, Inc. | 264,898 | |||||||||
| 10,994 | Brinker International, Inc. | 264,845 | |||||||||
| 6,836 | Buckle, Inc. (The) | 310,970 | |||||||||
| 11,278 | Collective Brands, Inc.* | 236,838 | |||||||||
| 5,231 | Cracker Barrel Old Country Store, Inc. | 267,984 | |||||||||
| 6,241 | Dillard's, Inc., Class A | 299,693 | |||||||||
| 5,189 | Dollar Tree, Inc.* | 298,368 | |||||||||
| 14,460 | Express, Inc.* | 312,191 | |||||||||
| 13,576 | Foot Locker, Inc. | 292,156 | |||||||||
| 21,157 | Gap, Inc. (The) | 491,689 | |||||||||
| 11,828 | Jack in the Box, Inc.* | 244,248 | |||||||||
| 14,889 | Limited Brands, Inc. | 612,831 | |||||||||
| 6,466 | McDonald's Corp. | 506,352 | |||||||||
| 10,580 | Nordstrom, Inc. | 503,079 | |||||||||
| 9,030 | Papa John's International, Inc.* | 271,442 | |||||||||
| 18,799 | Pep Boys - Manny, Moe & Jack (The) | 257,546 | |||||||||
| 6,361 | PetSmart, Inc. | 268,243 | |||||||||
| 26,776 | Pier 1 Imports, Inc.* | 326,132 | |||||||||
| 6,699 | Ross Stores, Inc. | 493,649 | |||||||||
| 29,325 | Sonic Corp.* | 329,027 | |||||||||
| 14,808 | Starbucks Corp. | 535,902 | |||||||||
| 9,193 | Target Corp. | 451,376 | |||||||||
| 9,562 | TJX Cos., Inc. (The) | 512,714 | |||||||||
| 7,184 | Williams-Sonoma, Inc. | 311,857 | |||||||||
| 9,624 | Yum! Brands, Inc. | 516,231 | |||||||||
| 10,888,269 | |||||||||||
| Textiles—1.2% | |||||||||||
| 4,639 | UniFirst Corp. | 240,115 | |||||||||
| Total Common Stocks (Cost $17,949,333) | 20,658,135 | ||||||||||
See Notes to Financial Statements.
30
Schedule of Investments (Continued)
PowerShares Dynamic Consumer Discretionary Sector Portfolio
April 30, 2011
| Number of Shares | Value | ||||||||||
| Money Market Fund—0.3% | |||||||||||
| 56,651 | Goldman Sachs Financial Square Prime Obligations Institutional Share Class (Cost $56,651) | $ | 56,651 | ||||||||
| Total Investments (Cost $18,005,984)—100.3% | 20,714,786 | ||||||||||
| Liabilities in excess of other assets—(0.3%) | (58,015 | ) | |||||||||
| Net Assets—100.0% | $ | 20,656,771 | |||||||||
Notes to Schedule of Investments:
* Non-income producing security.
See Notes to Financial Statements.
31
Schedule of Investments
PowerShares Dynamic Consumer Staples Sector Portfolio
April 30, 2011
| Number of Shares | Value | ||||||||||
| Common Stocks—100.0% | |||||||||||
| Agriculture—11.3% | |||||||||||
| 38,041 | Altria Group, Inc. | $ | 1,021,021 | ||||||||
| 25,660 | Archer-Daniels-Midland Co. | 949,933 | |||||||||
| 15,239 | Philip Morris International, Inc. | 1,058,196 | |||||||||
| 27,919 | Reynolds American, Inc. | 1,036,074 | |||||||||
| 12,387 | Universal Corp. | 537,348 | |||||||||
| 4,602,572 | |||||||||||
| Beverages—14.7% | |||||||||||
| 5,645 | Boston Beer Co., Inc., Class A* | 532,098 | |||||||||
| 7,511 | Brown-Forman Corp., Class B | 539,741 | |||||||||
| 9,274 | Coca-Cola Bottling Co. Consolidated | 653,353 | |||||||||
| 14,752 | Coca-Cola Co. (The) | 995,170 | |||||||||
| 19,435 | Coca-Cola Enterprises, Inc. | 552,148 | |||||||||
| 25,388 | Constellation Brands, Inc., Class A* | 568,437 | |||||||||
| 14,175 | Dr Pepper Snapple Group, Inc. | 555,660 | |||||||||
| 8,752 | Hansen Natural Corp.* | 578,945 | |||||||||
| 14,917 | PepsiCo, Inc. | 1,027,632 | |||||||||
| 6,003,184 | |||||||||||
| Cosmetics/Personal Care—11.4% | |||||||||||
| 12,127 | Colgate-Palmolive Co. | 1,022,913 | |||||||||
| 17,167 | Elizabeth Arden, Inc.* | 516,040 | |||||||||
| 10,177 | Estee Lauder Cos., Inc. (The), Class A | 987,169 | |||||||||
| 28,264 | Inter Parfums, Inc. | 537,864 | |||||||||
| 15,099 | Procter & Gamble Co. (The) | 979,925 | |||||||||
| 35,033 | Revlon, Inc., Class A* | 603,268 | |||||||||
| 4,647,179 | |||||||||||
| Electrical Components & Equipment—1.4% | |||||||||||
| 7,543 | Energizer Holdings, Inc.* | 569,723 | |||||||||
| Environmental Control—1.5% | |||||||||||
| 36,572 | Darling International, Inc.* | 591,369 | |||||||||
| Food—33.8% | |||||||||||
| 35,936 | B&G Foods, Inc. | 649,723 | |||||||||
| 22,452 | ConAgra Foods, Inc. | 548,951 | |||||||||
| 10,575 | Corn Products International, Inc. | 582,683 | |||||||||
| 19,211 | Flowers Foods, Inc. | 587,088 | |||||||||
| 18,656 | Fresh Del Monte Produce, Inc. | 505,764 | |||||||||
| 25,545 | General Mills, Inc. | 985,526 | |||||||||
| 10,328 | H.J. Heinz Co. | 529,103 | |||||||||
| 17,346 | Hain Celestial Group, Inc. (The)* | 589,937 | |||||||||
| 9,940 | Hershey Co. (The) | 573,637 | |||||||||
| 19,020 | Hormel Foods Corp. | 559,378 | |||||||||
| 7,537 | J.M. Smucker Co. (The) | 565,803 | |||||||||
| 17,850 | Kellogg Co. | 1,022,270 | |||||||||
| 22,589 | Kroger Co. (The) | 549,139 | |||||||||
| 8,974 | Lancaster Colony Corp. | 548,401 | |||||||||
| 10,908 | McCormick & Co., Inc. | 535,801 | |||||||||
| 14,002 | Ruddick Corp. | 581,363 | |||||||||
| 23,974 | Safeway, Inc. | 582,808 | |||||||||
| 30,128 | Sara Lee Corp. | 578,458 | |||||||||
| Number of Shares | Value | ||||||||||
| Common Stocks (Continued) | |||||||||||
| 227 | Seaboard Corp. | $ | 541,849 | ||||||||
| 22,550 | Smithfield Foods, Inc.* | 531,278 | |||||||||
| 27,366 | Tyson Foods, Inc., Class A | 544,583 | |||||||||
| 13,150 | Weis Markets, Inc. | 542,701 | |||||||||
| 8,922 | Whole Foods Market, Inc. | 559,945 | |||||||||
| 13,796,189 | |||||||||||
| Household Products/Wares—5.1% | |||||||||||
| 6,918 | Church & Dwight Co., Inc. | 570,597 | |||||||||
| 14,541 | Kimberly-Clark Corp. | 960,578 | |||||||||
| 12,732 | WD-40 Co. | 528,378 | |||||||||
| 2,059,553 | |||||||||||
| Pharmaceuticals—4.2% | |||||||||||
| 6,603 | Herbalife Ltd. (Cayman Islands) | 592,817 | |||||||||
| 8,507 | Mead Johnson Nutrition Co. | 568,948 | |||||||||
| 14,608 | USANA Health Sciences, Inc.* | 544,879 | |||||||||
| 1,706,644 | |||||||||||
| Retail—16.6% | |||||||||||
| 10,638 | BJ's Wholesale Club, Inc.* | 545,942 | |||||||||
| 12,333 | Casey's General Stores, Inc. | 481,357 | |||||||||
| 12,895 | Costco Wholesale Corp. | 1,043,463 | |||||||||
| 28,798 | CVS Caremark Corp. | 1,043,640 | |||||||||
| 16,173 | Nu Skin Enterprises, Inc., Class A | 518,992 | |||||||||
| 14,428 | PriceSmart, Inc. | 600,782 | |||||||||
| 39,180 | Sally Beauty Holdings, Inc.* | 579,472 | |||||||||
| 22,548 | Walgreen Co. | 963,251 | |||||||||
| 18,334 | Wal-Mart Stores, Inc. | 1,008,003 | |||||||||
| 6,784,902 | |||||||||||
| Total Common Stocks (Cost $32,737,053) | 40,761,315 | ||||||||||
| Money Market Fund—0.1% | |||||||||||
| 53,774 | Goldman Sachs Financial Square Prime Obligations Institutional Share Class (Cost $53,774) | 53,774 | |||||||||
| Total Investments (Cost $32,790,827)—100.1% | 40,815,089 | ||||||||||
| Liabilities in excess of other assets—(0.1%) | (43,319 | ) | |||||||||
| Net Assets—100.0% | $ | 40,771,770 | |||||||||
Notes to Schedule of Investments:
* Non-income producing security.
See Notes to Financial Statements.
32
Schedule of Investments
PowerShares Dynamic Energy Sector Portfolio
April 30, 2011
| Number of Shares | Value | ||||||||||
| Common Stocks and Other Equity Interests—99.9% | |||||||||||
| Coal—9.1% | |||||||||||
| 44,910 | Alliance Holdings GP LP | $ | 2,346,548 | ||||||||
| 45,015 | Alpha Natural Resources, Inc.* | 2,618,523 | |||||||||
| 73,654 | Arch Coal, Inc. | 2,526,332 | |||||||||
| 123,993 | Cloud Peak Energy, Inc.* | 2,581,534 | |||||||||
| 69,065 | Peabody Energy Corp. | 4,614,923 | |||||||||
| 20,490 | Walter Energy, Inc. | 2,832,128 | |||||||||
| 17,519,988 | |||||||||||
| Electric - Integrated—1.4% | |||||||||||
| 83,902 | NorthWestern Corp. | 2,731,010 | |||||||||
| Gas - Distribution—14.4% | |||||||||||
| 72,932 | Atmos Energy Corp. | 2,544,597 | |||||||||
| 40,357 | Energen Corp. | 2,623,609 | |||||||||
| 63,437 | Laclede Group, Inc. (The) | 2,434,078 | |||||||||
| 129,818 | NiSource, Inc. | 2,524,960 | |||||||||
| 139,062 | Questar Corp. | 2,443,319 | |||||||||
| 84,408 | Sempra Energy | 4,650,881 | |||||||||
| 87,113 | Southern Union Co. | 2,604,679 | |||||||||
| 63,192 | Southwest Gas Corp. | 2,513,146 | |||||||||
| 76,854 | UGI Corp. | 2,559,238 | |||||||||
| 93,752 | Vectren Corp. | 2,679,432 | |||||||||
| 27,577,939 | |||||||||||
| Oil & Gas Drilling—5.0% | |||||||||||
| 58,119 | Diamond Offshore Drilling, Inc. | 4,409,489 | |||||||||
| 37,975 | Helmerich & Payne, Inc. | 2,519,261 | |||||||||
| 41,331 | Unit Corp.* | 2,604,680 | |||||||||
| 9,533,430 | |||||||||||
| Oil Companies - Exploration & Production—16.9% | |||||||||||
| 47,945 | Berry Petroleum Co., Class A | 2,547,318 | |||||||||
| 110,413 | BreitBurn Energy Partners LP | 2,452,273 | |||||||||
| 24,247 | Clayton Williams Energy, Inc.* | 2,196,051 | |||||||||
| 40,064 | Contango Oil & Gas Co.* | 2,480,763 | |||||||||
| 150,184 | Energy Partners Ltd.* | 2,734,851 | |||||||||
| 83,702 | Gulfport Energy Corp.* | 2,849,216 | |||||||||
| 43,744 | Occidental Petroleum Corp. | 4,999,502 | |||||||||
| 281,791 | PetroQuest Energy, Inc.* | 2,468,489 | |||||||||
| 156,989 | Quicksilver Resources, Inc.* | 2,331,287 | |||||||||
| 310,218 | VAALCO Energy, Inc.* | 2,162,219 | |||||||||
| 96,888 | W&T Offshore, Inc. | 2,597,567 | |||||||||
| 37,605 | Whiting Petroleum Corp.* | 2,613,547 | |||||||||
| 32,433,083 | |||||||||||
| Oil Companies - Integrated—14.8% | |||||||||||
| 44,172 | Chevron Corp. | 4,834,184 | |||||||||
| 58,361 | ConocoPhillips | 4,606,434 | |||||||||
| 52,849 | Exxon Mobil Corp. | 4,650,712 | |||||||||
| 53,186 | Hess Corp. | 4,571,869 | |||||||||
| 92,759 | Marathon Oil Corp. | 5,012,696 | |||||||||
| 61,386 | Murphy Oil Corp. | 4,756,187 | |||||||||
| 28,432,082 | |||||||||||
| Number of Shares | Value | ||||||||||
| Common Stocks and Other Equity Interests (Continued) | |||||||||||
| Oil Field Machinery & Equipment—6.2% | |||||||||||
| 86,894 | Complete Production Services, Inc.* | $ | 2,949,182 | ||||||||
| 97,365 | FMC Technologies, Inc.* | 4,525,525 | |||||||||
| 56,495 | National Oilwell Varco, Inc. | 4,332,602 | |||||||||
| 11,807,309 | |||||||||||
| Oil Refining & Marketing—5.2% | |||||||||||
| 130,712 | CVR Energy, Inc.* | 2,905,728 | |||||||||
| 157,914 | Valero Energy Corp. | 4,468,966 | |||||||||
| 152,417 | Western Refining, Inc.* | 2,584,992 | |||||||||
| 9,959,686 | |||||||||||
| Oil - Field Services—7.7% | |||||||||||
| 127,136 | Basic Energy Services, Inc.* | 3,908,161 | |||||||||
| 95,899 | Halliburton Co. | 4,840,981 | |||||||||
| 130,022 | RPC, Inc. | 3,517,095 | |||||||||
| 25,599 | SEACOR Holdings, Inc. | 2,529,949 | |||||||||
| 14,796,186 | |||||||||||
| Pipelines—14.4% | |||||||||||
| 156,192 | Atlas Energy LP | 4,164,079 | |||||||||
| 85,446 | Atlas Pipeline Partners LP | 3,158,084 | |||||||||
| 96,094 | Chesapeake Midstream Partners LP* | 2,674,296 | |||||||||
| 243,918 | El Paso Corp. | 4,734,448 | |||||||||
| 66,976 | NuStar GP Holdings LLC | 2,654,259 | |||||||||
| 38,430 | ONEOK, Inc. | 2,687,794 | |||||||||
| 171,094 | Spectra Energy Corp. | 4,968,570 | |||||||||
| 68,697 | Western Gas Partners LP | 2,521,180 | |||||||||
| 27,562,710 | |||||||||||
| Retail - Petroleum Products—1.2% | |||||||||||
| 59,479 | World Fuel Services Corp. | 2,354,179 | |||||||||
| Seismic Data Collection—2.4% | |||||||||||
| 198,872 | ION Geophysical Corp.* | 2,513,742 | |||||||||
| 23,432 | OYO Geospace Corp.* | 2,185,737 | |||||||||
| 4,699,479 | |||||||||||
| Transportation - Services—1.2% | |||||||||||
| 51,154 | Bristow Group, Inc.* | 2,373,545 | |||||||||
| Total Common Stocks and Other Equity Interests (Cost $160,457,181) | 191,780,626 | ||||||||||
| Money Market Fund—0.1% | |||||||||||
| 167,030 | Goldman Sachs Financial Square Prime Obligations Institutional Share Class (Cost $167,030) | 167,030 | |||||||||
| Total Investments (Cost $160,624,211)—100.0% | 191,947,656 | ||||||||||
| Liabilities in excess of other assets—(0.0%) | (44,811 | ) | |||||||||
| Net Assets—100.0% | $ | 191,902,845 | |||||||||
Notes to Schedule of Investments:
* Non-income producing security.
See Notes to Financial Statements.
33
Schedule of Investments
PowerShares Dynamic Financial Sector Portfolio
April 30, 2011
| Number of Shares | Value | ||||||||||
| Common Stocks and Other Equity Interests—100.0% | |||||||||||
| Commercial Banks - Central U.S.—4.1% | |||||||||||
| 5,871 | BOK Financial Corp. | $ | 315,743 | ||||||||
| 7,502 | Commerce Bancshares, Inc. | 319,285 | |||||||||
| 15,768 | International Bancshares Corp. | 277,832 | |||||||||
| 912,860 | |||||||||||
| Commercial Banks - Eastern U.S.—6.4% | |||||||||||
| 39,339 | CapitalSource, Inc. | 262,785 | |||||||||
| 11,170 | Independent Bank Corp. | 327,393 | |||||||||
| 6,235 | M&T Bank Corp. | 550,987 | |||||||||
| 13,444 | NBT Bancorp, Inc. | 303,834 | |||||||||
| 1,444,999 | |||||||||||
| Commercial Banks - Southern U.S.—1.3% | |||||||||||
| 8,727 | City Holding Co. | 297,591 | |||||||||
| Commercial Services - Finance—2.8% | |||||||||||
| 15,666 | Cardtronics, Inc.* | 332,902 | |||||||||
| 12,987 | SEI Investments Co. | 290,000 | |||||||||
| 622,902 | |||||||||||
| Diversified Operations—2.9% | |||||||||||
| 16,748 | Leucadia National Corp. | 647,478 | |||||||||
| Fiduciary Banks—2.6% | |||||||||||
| 12,328 | State Street Corp. | 573,868 | |||||||||
| Finance - Auto Loans—1.5% | |||||||||||
| 4,268 | Credit Acceptance Corp.* | 345,281 | |||||||||
| Finance - Commercial—1.5% | |||||||||||
| 28,343 | NewStar Financial, Inc.* | 338,699 | |||||||||
| Finance - Consumer Loans—1.5% | |||||||||||
| 5,000 | World Acceptance Corp.* | 339,750 | |||||||||
| Finance - Credit Card—2.8% | |||||||||||
| 25,310 | Discover Financial Services | 628,700 | |||||||||
| Finance - Investment Banker/Broker—1.3% | |||||||||||
| 7,935 | Raymond James Financial, Inc. | 297,563 | |||||||||
| Finance - Other Services—2.9% | |||||||||||
| 31,330 | BGC Partners, Inc., Class A | 302,335 | |||||||||
| 13,987 | MarketAxess Holdings, Inc. | 340,583 | |||||||||
| 642,918 | |||||||||||
| Insurance Brokers—4.0% | |||||||||||
| 9,651 | Arthur J. Gallagher & Co. | 287,407 | |||||||||
| 11,450 | Brown & Brown, Inc. | 295,982 | |||||||||
| 4,362 | Erie Indemnity Co., Class A | 315,940 | |||||||||
| 899,329 | |||||||||||
| Number of Shares | Value | ||||||||||
| Common Stocks and Other Equity Interests (Continued) | |||||||||||
| Investment Management/Advisor Services—12.6% | |||||||||||
| 2,806 | Affiliated Managers Group, Inc.* | $ | 306,078 | ||||||||
| 8,697 | Ameriprise Financial, Inc. | 539,736 | |||||||||
| 10,971 | Federated Investors, Inc., Class B | 282,832 | |||||||||
| 4,421 | Franklin Resources, Inc. | 570,840 | |||||||||
| 18,635 | Och-Ziff Capital Management Group LLC, Class A | 299,464 | |||||||||
| 8,230 | T. Rowe Price Group, Inc. | 528,778 | |||||||||
| 7,290 | Waddell & Reed Financial, Inc., Class A | 298,963 | |||||||||
| 2,826,691 | |||||||||||
| Life/Health Insurance—11.2% | |||||||||||
| 9,548 | Aflac, Inc. | 536,502 | |||||||||
| 9,778 | FBL Financial Group, Inc., Class A | 298,229 | |||||||||
| 10,648 | Protective Life Corp. | 286,538 | |||||||||
| 8,530 | Prudential Financial, Inc. | 540,972 | |||||||||
| 4,665 | Torchmark Corp. | 312,182 | |||||||||
| 20,765 | Unum Group | 549,857 | |||||||||
| 2,524,280 | |||||||||||
| Multi-line Insurance—6.6% | |||||||||||
| 8,731 | American Financial Group, Inc. | 312,308 | |||||||||
| 17,689 | Horace Mann Educators Corp. | 316,279 | |||||||||
| 12,873 | Loews Corp. | 569,759 | |||||||||
| 14,651 | United Fire & Casualty Co. | 290,090 | |||||||||
| 1,488,436 | |||||||||||
| Private Equity—1.2% | |||||||||||
| 45,477 | Fortress Investment Group LLC, Class A* | 280,593 | |||||||||
| Property/Casualty Insurance—21.0% | |||||||||||
| 15,611 | AmTrust Financial Services, Inc. | 301,292 | |||||||||
| 9,190 | Chubb Corp. (The) | 599,096 | |||||||||
| 8,333 | Harleysville Group, Inc. | 267,323 | |||||||||
| 9,587 | HCC Insurance Holdings, Inc. | 311,961 | |||||||||
| 4,897 | Infinity Property & Casualty Corp. | 289,413 | |||||||||
| 733 | Markel Corp.* | 305,866 | |||||||||
| 29,255 | Meadowbrook Insurance Group, Inc. | 299,571 | |||||||||
| 4,686 | ProAssurance Corp.* | 311,150 | |||||||||
| 27,028 | Progressive Corp. (The) | 592,994 | |||||||||
| 5,236 | RLI Corp. | 310,181 | |||||||||
| 6,266 | Safety Insurance Group, Inc. | 293,374 | |||||||||
| 11,030 | Tower Group, Inc. | 252,256 | |||||||||
| 9,267 | Travelers Cos., Inc. (The) | 586,416 | |||||||||
| 4,720,893 | |||||||||||
| Real Estate Management/Services—4.0% | |||||||||||
| 22,183 | CB Richard Ellis Group, Inc., Class A* | 592,508 | |||||||||
| 3,079 | Jones Lang LaSalle, Inc. | 315,228 | |||||||||
| 907,736 | |||||||||||
See Notes to Financial Statements.
34
Schedule of Investments (Continued)
PowerShares Dynamic Financial Sector Portfolio
April 30, 2011
| Number of Shares | Value | ||||||||||
| Common Stocks and Other Equity Interests (Continued) | |||||||||||
| Reinsurance—4.0% | |||||||||||
| 8,313 | Axis Capital Holdings Ltd. (Bermuda) | $ | 293,947 | ||||||||
| 5,063 | Reinsurance Group of America, Inc. | 320,488 | |||||||||
| 5,975 | Transatlantic Holdings, Inc. | 294,508 | |||||||||
| 908,943 | |||||||||||
| REITs - Diversified—1.5% | |||||||||||
| 4,946 | Rayonier, Inc. REIT | 328,217 | |||||||||
| Super - Regional Banks - U.S.—2.3% | |||||||||||
| 20,071 | U.S. Bancorp | 518,233 | |||||||||
| Total Common Stocks and Other Equity Interests (Cost $19,463,730) | 22,495,960 | ||||||||||
| Money Market Fund—0.3% | |||||||||||
| 67,908 | Goldman Sachs Financial Square Prime Obligations Institutional Share Class (Cost $67,908) | 67,908 | |||||||||
| Total Investments (Cost $19,531,638)—100.3% | 22,563,868 | ||||||||||
| Liabilities in excess of other assets—(0.3%) | (71,394 | ) | |||||||||
| Net Assets—100.0% | $ | 22,492,474 | |||||||||
Investment Abbreviations:
REIT—Real Estate Investment Trust
Notes to Schedule of Investments:
* Non-income producing security.
See Notes to Financial Statements.
35
Schedule of Investments
PowerShares Dynamic Healthcare Sector Portfolio
April 30, 2011
| Number of Shares | Value | ||||||||||
| Common Stocks—100.0% | |||||||||||
| Biotechnology—8.2% | |||||||||||
| 26,966 | Amgen, Inc.* | $ | 1,533,017 | ||||||||
| 20,793 | Biogen Idec, Inc.* | 2,024,199 | |||||||||
| 44,459 | Medicines Co. (The)* | 698,006 | |||||||||
| 41,619 | Myriad Genetics, Inc.* | 892,311 | |||||||||
| 5,147,533 | |||||||||||
| Commercial Services—5.3% | |||||||||||
| 11,786 | Chemed Corp. | 820,659 | |||||||||
| 15,561 | CorVel Corp.* | 806,060 | |||||||||
| 27,201 | Pharmaceutical Product Development, Inc. | 839,151 | |||||||||
| 42,493 | Team Health Holdings, Inc.* | 844,761 | |||||||||
| 3,310,631 | |||||||||||
| Distribution/Wholesale—1.4% | |||||||||||
| 24,732 | Owens & Minor, Inc. | 852,017 | |||||||||
| Electronics—5.1% | |||||||||||
| 25,365 | Thermo Fisher Scientific, Inc.* | 1,521,646 | |||||||||
| 17,095 | Waters Corp.* | 1,675,310 | |||||||||
| 3,196,956 | |||||||||||
| Healthcare - Products—20.7% | |||||||||||
| 12,488 | Cooper Cos., Inc. (The) | 935,351 | |||||||||
| 23,260 | Cyberonics, Inc.* | 827,358 | |||||||||
| 11,073 | Henry Schein, Inc.* | 809,104 | |||||||||
| 20,188 | Hill-Rom Holdings, Inc. | 908,662 | |||||||||
| 37,388 | Hologic, Inc.* | 823,284 | |||||||||
| 9,900 | IDEXX Laboratories, Inc.* | 806,157 | |||||||||
| 39,179 | Immucor, Inc.* | 855,278 | |||||||||
| 15,527 | Integra LifeSciences Holdings Corp.* | 812,217 | |||||||||
| 16,239 | Kinetic Concepts, Inc.* | 958,588 | |||||||||
| 23,231 | Patterson Cos., Inc. | 806,348 | |||||||||
| 29,784 | PSS World Medical, Inc.* | 856,588 | |||||||||
| 15,283 | Sirona Dental Systems, Inc.* | 872,201 | |||||||||
| 22,349 | Stryker Corp. | 1,318,591 | |||||||||
| 20,526 | Varian Medical Systems, Inc.* | 1,440,925 | |||||||||
| 13,030,652 | |||||||||||
| Healthcare - Services—35.2% | |||||||||||
| 37,754 | Aetna, Inc. | 1,562,260 | |||||||||
| 13,438 | Air Methods Corp.* | 908,678 | |||||||||
| 13,277 | AMERIGROUP Corp.* | 906,819 | |||||||||
| 25,453 | Centene Corp.* | 922,162 | |||||||||
| 33,564 | CIGNA Corp. | 1,571,802 | |||||||||
| 19,242 | Community Health Systems, Inc.* | 591,307 | |||||||||
| 25,555 | Coventry Health Care, Inc.* | 824,660 | |||||||||
| 25,064 | Ensign Group, Inc. (The) | 693,270 | |||||||||
| 80,493 | Health Management Associates, Inc., Class A* | 907,961 | |||||||||
| 25,882 | Health Net, Inc.* | 861,871 | |||||||||
| 20,565 | Healthspring, Inc.* | 853,242 | |||||||||
| 22,513 | Humana, Inc.* | 1,713,690 | |||||||||
| 19,165 | IPC The Hospitalist Co., Inc.* | 993,897 | |||||||||
| 15,941 | Magellan Health Services, Inc.* | 829,251 | |||||||||
| Number of Shares | Value | ||||||||||
| Common Stocks (Continued) | |||||||||||
| 21,870 | Molina Healthcare, Inc.* | $ | 940,410 | ||||||||
| 24,869 | Quest Diagnostics, Inc. | 1,402,114 | |||||||||
| 57,110 | Skilled Healthcare Group, Inc., Class A* | 692,173 | |||||||||
| 74,851 | Sunrise Senior Living, Inc.* | 776,953 | |||||||||
| 33,144 | UnitedHealth Group, Inc. | 1,631,679 | |||||||||
| 17,000 | Universal Health Services, Inc., Class B | 931,260 | |||||||||
| 21,187 | WellPoint, Inc. | 1,626,950 | |||||||||
| 22,142,409 | |||||||||||
| Pharmaceuticals—21.6% | |||||||||||
| 37,692 | AmerisourceBergen Corp. | 1,531,803 | |||||||||
| 41,340 | Eli Lilly & Co. | 1,529,993 | |||||||||
| 22,411 | Endo Pharmaceuticals Holdings, Inc.* | 877,615 | |||||||||
| 25,425 | Express Scripts, Inc.* | 1,442,614 | |||||||||
| 44,206 | Forest Laboratories, Inc.* | 1,465,871 | |||||||||
| 36,904 | Impax Laboratories, Inc.* | 1,010,432 | |||||||||
| 31,401 | Jazz Pharmaceuticals, Inc.* | 1,002,006 | |||||||||
| 24,574 | Par Pharmaceutical Cos., Inc.* | 846,329 | |||||||||
| 10,131 | Perrigo Co. | 915,437 | |||||||||
| 60,961 | Questcor Pharmaceuticals, Inc.* | 1,249,700 | |||||||||
| 43,851 | ViroPharma, Inc.* | 845,886 | |||||||||
| 13,813 | Watson Pharmaceuticals, Inc.* | 856,682 | |||||||||
| 13,574,368 | |||||||||||
| Software—2.5% | |||||||||||
| 14,197 | Computer Programs & Systems, Inc. | 834,642 | |||||||||
| 29,703 | Medidata Solutions, Inc.* | 762,476 | |||||||||
| 1,597,118 | |||||||||||
| Total Common Stocks (Cost $50,770,644) | 62,851,684 | ||||||||||
| Money Market Fund—0.2% | |||||||||||
| 94,927 | Goldman Sachs Financial Square Prime Obligations Institutional Share Class (Cost $94,927) | 94,927 | |||||||||
| Total Investments (Cost $50,865,571)—100.2% | 62,946,611 | ||||||||||
| Liabilities in excess of other assets—(0.2%) | (124,678 | ) | |||||||||
| Net Assets—100.0% | $ | 62,821,933 | |||||||||
Notes to Schedule of Investments:
* Non-income producing security.
See Notes to Financial Statements.
36
Schedule of Investments
PowerShares Dynamic Industrials Sector Portfolio
April 30, 2011
| Number of Shares | Value | ||||||||||
| Common Stocks—100.0% | |||||||||||
| Aerospace/Defense—12.2% | |||||||||||
| 28,830 | Cubic Corp. | $ | 1,559,126 | ||||||||
| 39,858 | Curtiss-Wright Corp. | 1,325,278 | |||||||||
| 20,456 | Esterline Technologies Corp.* | 1,468,741 | |||||||||
| 35,277 | General Dynamics Corp. | 2,568,871 | |||||||||
| 33,426 | Lockheed Martin Corp. | 2,649,010 | |||||||||
| 32,064 | Moog, Inc., Class A* | 1,414,664 | |||||||||
| 32,132 | United Technologies Corp. | 2,878,385 | |||||||||
| 13,864,075 | |||||||||||
| Commercial Services—12.9% | |||||||||||
| 54,775 | ABM Industries, Inc. | 1,332,128 | |||||||||
| 57,701 | Deluxe Corp. | 1,562,543 | |||||||||
| 41,511 | Equifax, Inc. | 1,557,908 | |||||||||
| 193,259 | Great Lakes Dredge & Dock Corp. | 1,439,779 | |||||||||
| 65,836 | ICF International, Inc.* | 1,603,765 | |||||||||
| 69,070 | Kelly Services, Inc., Class A* | 1,319,928 | |||||||||
| 61,337 | Macquarie Infrastructure Co. LLC* | 1,539,559 | |||||||||
| 74,803 | Rollins, Inc. | 1,568,619 | |||||||||
| 82,435 | Verisk Analytics, Inc., Class A* | 2,712,111 | |||||||||
| 14,636,340 | |||||||||||
| Computers—1.4% | |||||||||||
| 79,752 | Sykes Enterprises, Inc.* | 1,597,432 | |||||||||
| Electrical Components & Equipment—2.6% | |||||||||||
| 63,568 | AMETEK, Inc. | 2,926,671 | |||||||||
| Electronics—1.4% | |||||||||||
| 26,479 | Thomas & Betts Corp.* | 1,534,988 | |||||||||
| Engineering & Construction—5.3% | |||||||||||
| 87,747 | Dycom Industries, Inc.* | 1,303,920 | |||||||||
| 37,415 | Exponent, Inc.* | 1,605,478 | |||||||||
| 44,562 | KBR, Inc. | 1,709,844 | |||||||||
| 31,430 | URS Corp.* | 1,406,492 | |||||||||
| 6,025,734 | |||||||||||
| Hand/Machine Tools—2.8% | |||||||||||
| 34,180 | Franklin Electric Co., Inc. | 1,541,860 | |||||||||
| 20,729 | Lincoln Electric Holdings, Inc. | 1,628,885 | |||||||||
| 3,170,745 | |||||||||||
| Household Products/Wares—1.4% | |||||||||||
| 37,117 | Avery Dennison Corp. | 1,549,264 | |||||||||
| Machinery - Construction & Mining—5.2% | |||||||||||
| 26,260 | Caterpillar, Inc. | 3,030,667 | |||||||||
| 28,512 | Joy Global, Inc. | 2,878,286 | |||||||||
| 5,908,953 | |||||||||||
| Machinery - Diversified—10.9% | |||||||||||
| 67,512 | Altra Holdings, Inc.* | 1,714,130 | |||||||||
| 45,024 | Applied Industrial Technologies, Inc. | 1,587,546 | |||||||||
| 30,886 | Cascade Corp. | 1,414,579 | |||||||||
| 32,373 | Chart Industries, Inc.* | 1,573,651 | |||||||||
| Number of Shares | Value | ||||||||||
| Common Stocks (Continued) | |||||||||||
| 20,395 | Gardner Denver, Inc. | $ | 1,762,332 | ||||||||
| 34,662 | Robbins & Myers, Inc. | 1,506,757 | |||||||||
| 48,867 | Sauer-Danfoss, Inc.* | 2,883,642 | |||||||||
| 12,442,637 | |||||||||||
| Miscellaneous Manufacturing—25.2% | |||||||||||
| 35,504 | CLARCOR, Inc. | 1,604,426 | |||||||||
| 66,233 | Colfax Corp.* | 1,447,191 | |||||||||
| 31,289 | Crane Co. | 1,561,634 | |||||||||
| 41,810 | Dover Corp. | 2,844,752 | |||||||||
| 50,090 | Eaton Corp. | 2,681,318 | |||||||||
| 128,647 | General Electric Co. | 2,630,831 | |||||||||
| 46,766 | Honeywell International, Inc. | 2,863,482 | |||||||||
| 46,220 | ITT Corp. | 2,671,054 | |||||||||
| 77,639 | John Bean Technologies Corp. | 1,569,084 | |||||||||
| 30,249 | Parker Hannifin Corp. | 2,853,086 | |||||||||
| 27,030 | Raven Industries, Inc. | 1,469,351 | |||||||||
| 67,641 | Trimas Corp.* | 1,569,947 | |||||||||
| 59,869 | Tyco International Ltd. (Switzerland) | 2,918,015 | |||||||||
| 28,684,171 | |||||||||||
| Office Furnishings—4.0% | |||||||||||
| 55,423 | Herman Miller, Inc. | 1,442,107 | |||||||||
| 71,021 | Knoll, Inc. | 1,394,142 | |||||||||
| 149,849 | Steelcase, Inc., Class A | 1,730,756 | |||||||||
| 4,567,005 | |||||||||||
| Semiconductors—1.3% | |||||||||||
| 133,545 | GT Solar International, Inc.* | 1,491,698 | |||||||||
| Transportation—12.0% | |||||||||||
| 185,165 | Air Transport Services Group, Inc.* | 1,514,650 | |||||||||
| 21,426 | Atlas Air Worldwide Holdings, Inc.* | 1,476,466 | |||||||||
| 35,567 | J.B. Hunt Transport Services, Inc. | 1,695,834 | |||||||||
| 27,138 | Kirby Corp.* | 1,540,896 | |||||||||
| 47,319 | Old Dominion Freight Line, Inc.* | 1,770,677 | |||||||||
| 28,490 | Union Pacific Corp. | 2,947,860 | |||||||||
| 36,468 | United Parcel Service, Inc., Class B | 2,734,006 | |||||||||
| 13,680,389 | |||||||||||
| Trucking & Leasing—1.4% | |||||||||||
| 15,177 | Amerco, Inc.* | 1,543,804 | |||||||||
| Total Common Stocks (Cost $103,391,073) | 113,623,906 | ||||||||||
See Notes to Financial Statements.
37
Schedule of Investments (Continued)
PowerShares Dynamic Industrials Sector Portfolio
April 30, 2011
| Number of Shares | Value | ||||||||||
| Money Market Fund—0.1% | |||||||||||
| 96,537 | Goldman Sachs Financial Square Prime Obligations Institutional Share Class (Cost $96,537) | $ | 96,537 | ||||||||
| Total Investments (Cost $103,487,610)—100.1% | 113,720,443 | ||||||||||
| Liabilities in excess of other assets—(0.1%) | (91,726 | ) | |||||||||
| Net Assets—100.0% | $ | 113,628,717 | |||||||||
Notes to Schedule of Investments:
* Non-income producing security.
See Notes to Financial Statements.
38
Schedule of Investments
PowerShares Dynamic Technology Sector Portfolio
April 30, 2011
| Number of Shares | Value | ||||||||||
| Common Stocks—100.0% | |||||||||||
| Commercial Services—15.8% | |||||||||||
| 24,965 | Automatic Data Processing, Inc. | $ | 1,356,848 | ||||||||
| 31,160 | ExlService Holdings, Inc.* | 645,635 | |||||||||
| 17,919 | Gartner, Inc.* | 768,904 | |||||||||
| 20,046 | Lender Processing Services, Inc. | 589,954 | |||||||||
| 9,149 | MAXIMUS, Inc. | 731,829 | |||||||||
| 37,474 | Paychex, Inc. | 1,225,775 | |||||||||
| 29,616 | TeleTech Holdings, Inc.* | 588,470 | |||||||||
| 38,318 | Total System Services, Inc. | 722,294 | |||||||||
| 57,022 | Western Union Co. (The) | 1,211,717 | |||||||||
| 7,841,426 | |||||||||||
| Computers—21.6% | |||||||||||
| 3,557 | Apple, Inc.* | 1,238,654 | |||||||||
| 11,566 | CACI International, Inc., Class A* | 706,798 | |||||||||
| 68,376 | Cadence Design Systems, Inc.* | 709,743 | |||||||||
| 13,212 | DST Systems, Inc. | 651,484 | |||||||||
| 37,365 | Insight Enterprises, Inc.* | 641,184 | |||||||||
| 7,632 | International Business Machines Corp. | 1,301,867 | |||||||||
| 21,257 | Jack Henry & Associates, Inc. | 722,100 | |||||||||
| 105,555 | Magma Design Automation, Inc.* | 671,330 | |||||||||
| 14,258 | MICROS Systems, Inc.* | 741,701 | |||||||||
| 15,137 | MTS Systems Corp. | 670,115 | |||||||||
| 35,314 | NCR Corp.* | 699,570 | |||||||||
| 26,968 | NetScout Systems, Inc.* | 690,111 | |||||||||
| 32,093 | Spansion, Inc., Class A* | 632,232 | |||||||||
| 12,807 | Syntel, Inc. | 700,287 | |||||||||
| 10,777,176 | |||||||||||
| Distribution/Wholesale—2.4% | |||||||||||
| 53,915 | Brightpoint, Inc.* | 545,620 | |||||||||
| 33,811 | Ingram Micro, Inc., Class A* | 633,280 | |||||||||
| 1,178,900 | |||||||||||
| Electronics—15.4% | |||||||||||
| 29,238 | Agilent Technologies, Inc.* | 1,459,269 | |||||||||
| 42,621 | AVX Corp. | 695,148 | |||||||||
| 19,963 | FEI Co.* | 647,999 | |||||||||
| 21,969 | Measurement Specialties, Inc.* | 764,082 | |||||||||
| 23,704 | Multi-Fineline Electronix, Inc.* | 631,238 | |||||||||
| 41,369 | Newport Corp.* | 774,841 | |||||||||
| 34,702 | TE Connectivity Ltd. (Switzerland) | 1,244,067 | |||||||||
| 38,167 | TTM Technologies, Inc.* | 729,753 | |||||||||
| 37,931 | Vishay Intertechnology, Inc.* | 723,723 | |||||||||
| 7,670,120 | |||||||||||
| Internet—4.4% | |||||||||||
| 68,238 | Symantec Corp.* | 1,340,877 | |||||||||
| 27,484 | TIBCO Software, Inc.* | 824,245 | |||||||||
| 2,165,122 | |||||||||||
| Media—1.4% | |||||||||||
| 6,434 | FactSet Research Systems, Inc. | 703,944 | |||||||||
| Number of Shares | Value | ||||||||||
| Common Stocks (Continued) | |||||||||||
| Semiconductors—13.1% | |||||||||||
| 76,831 | Applied Materials, Inc. | $ | 1,205,478 | ||||||||
| 25,296 | KLA-Tencor Corp. | 1,110,494 | |||||||||
| 22,376 | Lam Research Corp.* | 1,080,985 | |||||||||
| 105,226 | LSI Corp.* | 771,307 | |||||||||
| 16,763 | Novellus Systems, Inc.* | 538,092 | |||||||||
| 34,770 | Texas Instruments, Inc. | 1,235,378 | |||||||||
| 14,013 | Varian Semiconductor Equipment Associates, Inc.* | 587,565 | |||||||||
| 6,529,299 | |||||||||||
| Software—19.6% | |||||||||||
| 21,998 | ACI Worldwide, Inc.* | 726,814 | |||||||||
| 12,100 | ANSYS, Inc.* | 669,009 | |||||||||
| 25,312 | BMC Software, Inc.* | 1,271,422 | |||||||||
| 50,061 | CA, Inc. | 1,231,000 | |||||||||
| 19,659 | Fiserv, Inc.* | 1,205,293 | |||||||||
| 19,604 | Interactive Intelligence, Inc.* | 733,582 | |||||||||
| 46,648 | Microsoft Corp. | 1,213,781 | |||||||||
| 22,823 | Progress Software Corp.* | 676,702 | |||||||||
| 25,320 | Quest Software, Inc.* | 652,243 | |||||||||
| 13,026 | Solera Holdings, Inc. | 716,430 | |||||||||
| 20,058 | Verint Systems, Inc.* | 686,585 | |||||||||
| 9,782,861 | |||||||||||
| Telecommunications—6.3% | |||||||||||
| 17,488 | Black Box Corp. | 611,031 | |||||||||
| 13,966 | InterDigital, Inc. | 646,486 | |||||||||
| 8,538 | Loral Space & Communications, Inc.* | 596,806 | |||||||||
| 26,618 | NeuStar, Inc., Class A* | 715,758 | |||||||||
| 87,848 | RF Micro Devices, Inc.* | 585,068 | |||||||||
| 3,155,149 | |||||||||||
| Total Common Stocks (Cost $44,889,062) | 49,803,997 | ||||||||||
| Money Market Fund—0.2% | |||||||||||
| 67,262 | Goldman Sachs Financial Square Prime Obligations Institutional Share Class (Cost $67,262) | 67,262 | |||||||||
| Total Investments (Cost $44,956,324)—100.2% | 49,871,259 | ||||||||||
| Liabilities in excess of other assets—(0.2%) | (77,860 | ) | |||||||||
| Net Assets—100.0% | $ | 49,793,399 | |||||||||
Notes to Schedule of Investments:
* Non-income producing security.
See Notes to Financial Statements.
39
Schedule of Investments
PowerShares Dynamic Utilities Portfolio
April 30, 2011
| Number of Shares | Value | ||||||||||
| Common Stocks—100.0% | |||||||||||
| Broadcast Services/Program—1.4% | |||||||||||
| 14,096 | Liberty Global, Inc., Class A* | $ | 655,464 | ||||||||
| Cable/Satellite TV—7.5% | |||||||||||
| 43,900 | Comcast Corp., Class A | 1,151,936 | |||||||||
| 24,088 | DIRECTV, Class A* | 1,170,436 | |||||||||
| 15,553 | Time Warner Cable, Inc. | 1,215,156 | |||||||||
| 3,537,528 | |||||||||||
| Cellular Telecommunications—6.9% | |||||||||||
| 42,710 | MetroPCS Communications, Inc.* | 718,809 | |||||||||
| 14,203 | NII Holdings, Inc.* | 590,561 | |||||||||
| 257,208 | Sprint Nextel Corp.* | 1,332,338 | |||||||||
| 12,143 | United States Cellular Corp.* | 597,921 | |||||||||
| 3,239,629 | |||||||||||
| Electric - Integrated—50.5% | |||||||||||
| 16,044 | ALLETE, Inc. | 649,622 | |||||||||
| 15,608 | Alliant Energy Corp. | 617,140 | |||||||||
| 21,898 | Ameren Corp. | 641,830 | |||||||||
| 31,429 | American Electric Power Co., Inc. | 1,146,530 | |||||||||
| 31,502 | CMS Energy Corp. | 623,740 | |||||||||
| 22,439 | Consolidated Edison, Inc. | 1,169,521 | |||||||||
| 24,642 | Dominion Resources, Inc. | 1,143,882 | |||||||||
| 23,267 | DPL, Inc. | 704,757 | |||||||||
| 12,827 | DTE Energy Co. | 648,148 | |||||||||
| 62,044 | Duke Energy Corp. | 1,157,121 | |||||||||
| 30,790 | Edison International | 1,209,123 | |||||||||
| 21,709 | El Paso Electric Co.* | 672,545 | |||||||||
| 27,964 | Empire District Electric Co. (The) | 627,512 | |||||||||
| 15,576 | Entergy Corp. | 1,085,959 | |||||||||
| 26,857 | Exelon Corp. | 1,132,023 | |||||||||
| 31,436 | Great Plains Energy, Inc. | 646,953 | |||||||||
| 25,078 | Hawaiian Electric Industries, Inc. | 639,238 | |||||||||
| 14,749 | MGE Energy, Inc. | 619,606 | |||||||||
| 17,935 | Northeast Utilities | 638,486 | |||||||||
| 20,554 | NorthWestern Corp. | 669,033 | |||||||||
| 41,192 | NV Energy, Inc. | 625,706 | |||||||||
| 32,698 | Pepco Holdings, Inc. | 630,090 | |||||||||
| 45,073 | PNM Resources, Inc. | 690,969 | |||||||||
| 26,190 | Portland General Electric Co. | 653,702 | |||||||||
| 34,079 | Public Service Enterprise Group, Inc. | 1,096,321 | |||||||||
| 29,133 | Southern Co. | 1,137,352 | |||||||||
| 16,782 | Unisource Energy Corp. | 623,116 | |||||||||
| 23,277 | Westar Energy, Inc. | 633,367 | |||||||||
| 20,494 | Wisconsin Energy Corp. | 639,618 | |||||||||
| 25,299 | Xcel Energy, Inc. | 615,525 | |||||||||
| 23,788,535 | |||||||||||
| Electric - Transmission—1.3% | |||||||||||
| 8,892 | ITC Holdings Corp. | 630,709 | |||||||||
| Number of Shares | Value | ||||||||||
| Common Stocks (Continued) | |||||||||||
| Electronic Measuring Instruments—1.2% | |||||||||||
| 12,336 | Trimble Navigation Ltd.* | $ | 577,818 | ||||||||
| Gas - Distribution—7.7% | |||||||||||
| 17,866 | Atmos Energy Corp. | 623,345 | |||||||||
| 15,540 | Laclede Group, Inc. (The) | 596,270 | |||||||||
| 20,753 | Sempra Energy | 1,143,490 | |||||||||
| 15,480 | Southwest Gas Corp. | 615,640 | |||||||||
| 22,966 | Vectren Corp. | 656,368 | |||||||||
| 3,635,113 | |||||||||||
| Independent Power Producer—1.3% | |||||||||||
| 154,126 | GenOn Energy, Inc.* | 605,715 | |||||||||
| Internet Connectivity Services—1.3% | |||||||||||
| 9,057 | AboveNet, Inc. | 604,555 | |||||||||
| Telecommunication Equipment—2.7% | |||||||||||
| 22,237 | Comtech Telecommunications Corp. | 629,307 | |||||||||
| 17,422 | Plantronics, Inc. | 645,833 | |||||||||
| 1,275,140 | |||||||||||
| Telecommunication Services—4.6% | |||||||||||
| 38,556 | Global Crossing Ltd.* | 901,439 | |||||||||
| 35,016 | Neutral Tandem, Inc.* | 535,395 | |||||||||
| 140,474 | Vonage Holdings Corp.* | 724,846 | |||||||||
| 2,161,680 | |||||||||||
| Telephone - Integrated—9.0% | |||||||||||
| 39,409 | AT&T, Inc. | 1,226,408 | |||||||||
| 50,429 | General Communication, Inc., Class A* | 579,934 | |||||||||
| 22,853 | IDT Corp., Class B | 662,508 | |||||||||
| 17,946 | Telephone & Data Systems, Inc. | 602,268 | �� | ||||||||
| 30,822 | Verizon Communications, Inc. | 1,164,455 | |||||||||
| 4,235,573 | |||||||||||
| Water—1.4% | |||||||||||
| 22,018 | American Water Works Co., Inc. | 646,889 | |||||||||
| Wireless Equipment—3.2% | |||||||||||
| 158,587 | Powerwave Technologies, Inc.* | 724,743 | |||||||||
| 56,111 | TeleNav, Inc.* | 761,987 | |||||||||
| 1,486,730 | |||||||||||
| Total Common Stocks (Cost $41,968,322) | 47,081,078 | ||||||||||
See Notes to Financial Statements.
40
Schedule of Investments (Continued)
PowerShares Dynamic Utilities Portfolio
April 30, 2011
| Number of Shares | Value | ||||||||||
| Money Market Fund—0.0% | |||||||||||
| 28,793 | Goldman Sachs Financial Square Prime Obligations Institutional Share Class (Cost $28,793) | $ | 28,793 | ||||||||
| Total Investments (Cost $41,997,115)—100.0% | 47,109,871 | ||||||||||
| Liabilities in excess of other assets—(0.0%) | (21,030 | ) | |||||||||
| Net Assets—100.0% | $ | 47,088,841 | |||||||||
Notes to Schedule of Investments:
* Non-income producing security.
See Notes to Financial Statements.
41
Schedule of Investments
PowerShares NASDAQ Internet Portfolio
April 30, 2011
| Number of Shares | Value | ||||||||||
| Common Stocks and Other Equity Interests—100.0% | |||||||||||
| Computer Services—0.3% | |||||||||||
| 11,873 | LivePerson, Inc.* | $ | 158,623 | ||||||||
| E-Commerce/Products—11.8% | |||||||||||
| 18,630 | Amazon.com, Inc.* | 3,660,795 | |||||||||
| 3,348 | Blue Nile, Inc.* | 190,836 | |||||||||
| 10,294 | MercadoLibre, Inc. (Argentina) | 940,872 | |||||||||
| 6,246 | Nutrisystem, Inc. | 93,940 | |||||||||
| 5,434 | Overstock.com, Inc.* | 75,533 | |||||||||
| 6,627 | Shutterfly, Inc.* | 407,958 | |||||||||
| 4,996 | Vitacost.Com, Inc.* | 7,119 | |||||||||
| 5,377,053 | |||||||||||
| E-Commerce/Services—27.9% | |||||||||||
| 10,378 | Ancestry.com, Inc.* | 474,275 | |||||||||
| 96,345 | eBay, Inc.* | 3,314,268 | |||||||||
| 57,980 | Expedia, Inc. | 1,451,239 | |||||||||
| 19,511 | IAC/InterActiveCorp.* | 704,542 | |||||||||
| 7,947 | Makemytrip Ltd. (Mauritius)* | 250,569 | |||||||||
| 7,808 | Netflix, Inc.* | 1,816,687 | |||||||||
| 5,369 | OpenTable, Inc.* | 597,516 | |||||||||
| 23,919 | Orbitz Worldwide, Inc.* | 76,541 | |||||||||
| 7,112 | Priceline.com, Inc.* | 3,890,335 | |||||||||
| 20,570 | United Online, Inc. | 135,762 | |||||||||
| 12,711,734 | |||||||||||
| E-Marketing/Information—2.9% | |||||||||||
| 7,317 | comScore, Inc.* | 218,120 | |||||||||
| 6,765 | Constant Contact, Inc.* | 187,458 | |||||||||
| 9,094 | Digital River, Inc.* | 295,919 | |||||||||
| 6,347 | Liquidity Services, Inc.* | 123,449 | |||||||||
| 10,886 | QuinStreet, Inc.* | 196,819 | |||||||||
| 18,885 | ValueClick, Inc.* | 316,323 | |||||||||
| 1,338,088 | |||||||||||
| Enterprise Software/Services—2.4% | |||||||||||
| 13,308 | Open Text Corp. (Canada)* | 814,450 | |||||||||
| 7,533 | RightNow Technologies, Inc.* | 272,544 | |||||||||
| 1,086,994 | |||||||||||
| E-Services/Consulting—1.5% | |||||||||||
| 15,639 | GSI Commerce, Inc.* | 457,753 | |||||||||
| 3,596 | Keynote Systems, Inc. | 76,739 | |||||||||
| 6,946 | Perficient, Inc.* | 86,756 | |||||||||
| 6,642 | Saba Software, Inc.* | 67,416 | |||||||||
| 688,664 | |||||||||||
| Human Resources—1.1% | |||||||||||
| 30,364 | Monster Worldwide, Inc.* | 498,273 | |||||||||
| Internet Application Software—1.2% | |||||||||||
| 9,510 | DealerTrack Holdings, Inc.* | 213,595 | |||||||||
| 8,858 | KIT Digital, Inc.* | 101,955 | |||||||||
| Number of Shares | Value | ||||||||||
| Common Stocks and Other Equity Interests (Continued) | |||||||||||
| 31,708 | RealNetworks, Inc.* | $ | 117,320 | ||||||||
| 4,560 | Vocus, Inc.* | 135,113 | |||||||||
| 567,983 | |||||||||||
| Internet Connectivity Services—0.6% | |||||||||||
| 10,714 | Cogent Communications Group, Inc.* | 155,460 | |||||||||
| 12,139 | Internap Network Services Corp.* | 98,204 | |||||||||
| 253,664 | |||||||||||
| Internet Content - Entertainment—0.4% | |||||||||||
| 25,725 | Limelight Networks, Inc.* | 163,868 | |||||||||
| Internet Content - Information/Network—1.9% | |||||||||||
| 8,016 | Knot, Inc. (The)* | 81,844 | |||||||||
| 13,559 | WebMD Health Corp.* | 784,659 | |||||||||
| 866,503 | |||||||||||
| Internet Content - Information/News—1.6% | |||||||||||
| 15,163 | Dice Holdings, Inc.* | 277,938 | |||||||||
| 7,522 | LoopNet, Inc.* | 139,759 | |||||||||
| 3,829 | Travelzoo, Inc.* | 313,595 | |||||||||
| 731,292 | |||||||||||
| Internet Incubators—0.1% | |||||||||||
| 10,218 | ModusLink Global Solutions, Inc.* | 53,542 | |||||||||
| Internet Infrastructure Software—3.4% | |||||||||||
| 42,989 | Akamai Technologies, Inc.* | 1,480,541 | |||||||||
| 11,019 | Support.com, Inc.* | 63,139 | |||||||||
| 1,543,680 | |||||||||||
| Internet Security—3.4% | |||||||||||
| 40,481 | VeriSign, Inc. | 1,496,178 | |||||||||
| 15,120 | Zix Corp.* | 49,896 | |||||||||
| 1,546,074 | |||||||||||
| Internet Telephony—0.7% | |||||||||||
| 10,692 | j2 Global Communications, Inc.* | 314,986 | |||||||||
| Networking Products—0.5% | |||||||||||
| 5,573 | LogMeIn, Inc.* | 240,029 | |||||||||
| Printing - Commercial—1.2% | |||||||||||
| 9,982 | VistaPrint NV (Netherlands)* | 543,021 | |||||||||
| Retail - Pet Food & Supplies—0.2% | |||||||||||
| 5,263 | PetMed Express, Inc. | 79,419 | |||||||||
| Telecommunication Services—2.0% | |||||||||||
| 56,866 | Clearwire Corp., Class A* | 276,369 | |||||||||
| 10,070 | Motricity, Inc.* | 134,535 | |||||||||
| 13,087 | SAVVIS, Inc.* | 515,104 | |||||||||
| 926,008 | |||||||||||
See Notes to Financial Statements.
42
Schedule of Investments (Continued)
PowerShares NASDAQ Internet Portfolio
April 30, 2011
| Number of Shares | Value | ||||||||||
| Common Stocks and Other Equity Interests (Continued) | |||||||||||
| Web Hosting/Design—6.1% | |||||||||||
| 10,778 | Equinix, Inc.* | $ | 1,084,914 | ||||||||
| 14,821 | NIC, Inc. | 190,524 | |||||||||
| 29,827 | Rackspace Hosting, Inc.* | 1,377,709 | |||||||||
| 6,389 | Web.com Group, Inc.* | 100,818 | |||||||||
| 2,753,965 | |||||||||||
| Web Portals/ISP—28.8% | |||||||||||
| 24,929 | AOL, Inc.* | 508,053 | |||||||||
| 26,645 | Baidu, Inc. ADR (China)* | 3,957,315 | |||||||||
| 25,206 | EarthLink, Inc. | 207,193 | |||||||||
| 5,263 | Google, Inc., Class A* | 2,863,598 | |||||||||
| 8,446 | InfoSpace, Inc.* | 76,014 | |||||||||
| 17,498 | NetEase.com, Inc. ADR (China)* | 862,302 | |||||||||
| 14,273 | SINA Corp. (China)* | 1,923,287 | |||||||||
| 8,909 | Sohu.com, Inc.* | 942,216 | |||||||||
| 98,376 | Yahoo!, Inc.* | 1,746,174 | |||||||||
| 13,086,152 | |||||||||||
| Total Investments (Cost $34,564,884)—100.0% | 45,529,615 | ||||||||||
| Liabilities in excess of other assets—(0.0%) | (22,354 | ) | |||||||||
| Net Assets—100.0% | $ | 45,507,261 | |||||||||
Investment Abbreviations:
ADR—American Depositary Receipt
Notes to Schedule of Investments:
* Non-income producing security.
This Fund has holdings greater than 10% of net assets in the following countries:
| China | 14.8 | % | |||||
See Notes to Financial Statements.
43
Statements of Assets and Liabilities
April 30, 2011
| PowerShares Dynamic Basic Materials Sector Portfolio | PowerShares Dynamic Consumer Discretionary Sector Portfolio | PowerShares Dynamic Consumer Staples Sector Portfolio | PowerShares Dynamic Energy Sector Portfolio | PowerShares Dynamic Financial Sector Portfolio | |||||||||||||||||||
| ASSETS: | |||||||||||||||||||||||
| Investments, at value | $ | 97,723,264 | $ | 20,714,786 | $ | 40,815,089 | $ | 191,947,656 | $ | 22,563,868 | |||||||||||||
| Cash | 307 | 237 | 256 | 359 | 679 | ||||||||||||||||||
| Receivables: | |||||||||||||||||||||||
| Dividends | 46,969 | 7,385 | 48,430 | 126,020 | 3,383 | ||||||||||||||||||
| Expense waivers | 5,099 | 11,108 | 9,117 | 6,432 | 9,854 | ||||||||||||||||||
| Shares sold | — | — | — | 2,201,002 | — | ||||||||||||||||||
| Total Assets | 97,775,639 | 20,733,516 | 40,872,892 | 194,281,469 | 22,577,784 | ||||||||||||||||||
| LIABILITIES: | |||||||||||||||||||||||
| Due to custodian | — | — | — | — | — | ||||||||||||||||||
| Payables: | |||||||||||||||||||||||
| Investments purchased | 55,323 | — | — | 2,197,080 | — | ||||||||||||||||||
| Accrued advisory fees | 38,436 | 5,830 | 16,291 | 75,010 | 9,102 | ||||||||||||||||||
| Accrued expenses | 90,680 | 70,915 | 84,831 | 106,534 | 76,208 | ||||||||||||||||||
| Expense recapture | — | — | — | — | — | ||||||||||||||||||
| Total Liabilities | 184,439 | 76,745 | 101,122 | 2,378,624 | 85,310 | ||||||||||||||||||
| NET ASSETS | $ | 97,591,200 | $ | 20,656,771 | $ | 40,771,770 | $ | 191,902,845 | $ | 22,492,474 | |||||||||||||
| NET ASSETS CONSIST OF: | |||||||||||||||||||||||
| Shares of beneficial interest | $ | 88,196,956 | $ | 23,768,869 | $ | 41,397,343 | $ | 169,158,816 | $ | 28,444,319 | |||||||||||||
| Undistributed net investment income (loss) | 47,423 | 28,766 | 99,930 | 331,180 | 1,914 | ||||||||||||||||||
| Undistributed net realized gain (loss) | (11,289,691 | ) | (5,849,666 | ) | (8,749,765 | ) | (8,910,596 | ) | (8,985,989 | ) | |||||||||||||
| Net unrealized appreciation | 20,636,512 | 2,708,802 | 8,024,262 | 31,323,445 | 3,032,230 | ||||||||||||||||||
| Net Assets | $ | 97,591,200 | $ | 20,656,771 | $ | 40,771,770 | $ | 191,902,845 | $ | 22,492,474 | |||||||||||||
| Shares outstanding (unlimited amount authorized, $0.01 par value) | 2,400,000 | 750,000 | 1,300,000 | 4,300,000 | 1,100,000 | ||||||||||||||||||
| Net asset value | $ | 40.66 | $ | 27.54 | $ | 31.36 | $ | 44.63 | $ | 20.45 | |||||||||||||
| Share price | $ | 40.67 | $ | 27.53 | $ | 31.37 | $ | 44.65 | $ | 20.44 | |||||||||||||
| Investments, at cost | $ | 77,086,752 | $ | 18,005,984 | $ | 32,790,827 | $ | 160,624,211 | $ | 19,531,638 | |||||||||||||
See Notes to Financial Statements.
44
| PowerShares Dynamic Healthcare Sector Portfolio | PowerShares Dynamic Industrials Sector Portfolio | PowerShares Dynamic Technology Sector Portfolio | PowerShares Dynamic Utilities Portfolio | PowerShares NASDAQ Internet Portfolio | |||||||||||||||||||
| ASSETS: | |||||||||||||||||||||||
| Investments, at value | $ | 62,946,611 | $ | 113,720,443 | $ | 49,871,259 | $ | 47,109,871 | $ | 45,529,615 | |||||||||||||
| Cash | — | 1,337 | 263 | 260 | — | ||||||||||||||||||
| Receivables: | |||||||||||||||||||||||
| Dividends | 1,317 | 53,591 | 16,143 | 73,276 | 1 | ||||||||||||||||||
| Expense waivers | 9,911 | — | 9,003 | 9,269 | — | ||||||||||||||||||
| Shares sold | — | 1,618,018 | — | — | — | ||||||||||||||||||
| Total Assets | 62,957,839 | 115,393,389 | 49,896,668 | 47,192,676 | 45,529,616 | ||||||||||||||||||
| LIABILITIES: | |||||||||||||||||||||||
| Due to custodian | 6,878 | — | — | — | 1,006 | ||||||||||||||||||
| Payables: | |||||||||||||||||||||||
| Investments purchased | — | 1,617,389 | — | — | — | ||||||||||||||||||
| Accrued advisory fees | 23,761 | 41,114 | 20,205 | 18,691 | 21,349 | ||||||||||||||||||
| Accrued expenses | 105,267 | 104,896 | 83,064 | 85,144 | — | ||||||||||||||||||
| Expense recapture | — | 1,273 | — | — | — | ||||||||||||||||||
| Total Liabilities | 135,906 | 1,764,672 | 103,269 | 103,835 | 22,355 | ||||||||||||||||||
| NET ASSETS | $ | 62,821,933 | $ | 113,628,717 | $ | 49,793,399 | $ | 47,088,841 | $ | 45,507,261 | |||||||||||||
| NET ASSETS CONSIST OF: | |||||||||||||||||||||||
| Shares of beneficial interest | $ | 92,753,512 | $ | 135,416,813 | $ | 66,736,583 | $ | 53,793,290 | $ | 35,142,878 | |||||||||||||
| Undistributed net investment income (loss) | (6,329 | ) | 32,419 | (4,774 | ) | 113,908 | — | ||||||||||||||||
| Undistributed net realized gain (loss) | (42,006,290 | ) | (32,053,348 | ) | (21,853,345 | ) | (11,931,113 | ) | (600,348 | ) | |||||||||||||
| Net unrealized appreciation | 12,081,040 | 10,232,833 | 4,914,935 | 5,112,756 | 10,964,731 | ||||||||||||||||||
| Net Assets | $ | 62,821,933 | $ | 113,628,717 | $ | 49,793,399 | $ | 47,088,841 | $ | 45,507,261 | |||||||||||||
| Shares outstanding (unlimited amount authorized, $0.01 par value) | 2,000,000 | 3,500,000 | 1,800,000 | 2,750,000 | 1,100,000 | ||||||||||||||||||
| Net asset value | $ | 31.41 | $ | 32.47 | $ | 27.66 | $ | 17.12 | $ | 41.37 | |||||||||||||
| Share price | $ | 31.44 | $ | 32.48 | $ | 27.65 | $ | 17.13 | $ | 41.40 | |||||||||||||
| Investments, at cost | $ | 50,865,571 | $ | 103,487,610 | $ | 44,956,324 | $ | 41,997,115 | $ | 34,564,884 | |||||||||||||
45
Statements of Operations
Year Ended April 30, 2011
| PowerShares Dynamic Basic Materials Sector Portfolio | PowerShares Dynamic Consumer Discretionary Sector Portfolio | PowerShares Dynamic Consumer Staples Sector Portfolio | PowerShares Dynamic Energy Sector Portfolio | PowerShares Dynamic Financial Sector Portfolio | |||||||||||||||||||
| INVESTMENT INCOME: | |||||||||||||||||||||||
| Dividend income | $ | 2,032,448 | $ | 297,477 | $ | 977,802 | $ | 1,292,050 | $ | 392,827 | |||||||||||||
| EXPENSES: | |||||||||||||||||||||||
| Advisory fees | 316,209 | 98,746 | 190,981 | 413,837 | 91,322 | ||||||||||||||||||
| Accounting & Administration fees | 68,240 | 68,240 | 68,240 | 68,240 | 68,240 | ||||||||||||||||||
| Professional fees | 33,199 | 31,318 | 32,388 | 32,894 | 31,069 | ||||||||||||||||||
| Sub-licensing | 31,621 | 9,875 | 19,098 | 41,385 | 9,132 | ||||||||||||||||||
| Custodian & transfer agent fees | 21,003 | 14,146 | 18,625 | 21,095 | 15,014 | ||||||||||||||||||
| Printing | 12,352 | 5,330 | 9,973 | 11,025 | 5,305 | ||||||||||||||||||
| Recapture (See Note 3) | 2,259 | — | — | 1,381 | — | ||||||||||||||||||
| Other expenses | 18,626 | 17,779 | 18,880 | 24,894 | 17,875 | ||||||||||||||||||
| Total Expenses | 503,509 | 245,434 | 358,185 | 614,751 | 237,957 | ||||||||||||||||||
| Less Waivers | (92,440 | ) | (117,064 | ) | (109,908 | ) | (75,608 | ) | (119,238 | ) | |||||||||||||
| Net Expenses | 411,069 | 128,370 | 248,277 | 539,143 | 118,719 | ||||||||||||||||||
| Net Investment Income (Loss) | 1,621,379 | 169,107 | 729,525 | 752,907 | 274,108 | ||||||||||||||||||
| REALIZED AND UNREALIZED GAIN (LOSS): | |||||||||||||||||||||||
| Net realized gain (loss) from: | |||||||||||||||||||||||
| Investments | (2,014,729 | ) | (2,128,362 | ) | (1,560,798 | ) | (647,147 | ) | (1,011,937 | ) | |||||||||||||
| In-kind redemptions | 9,380,971 | 4,941,163 | 3,730,349 | 15,156,967 | 2,666,718 | ||||||||||||||||||
| Net realized gain | 7,366,242 | 2,812,801 | 2,169,551 | 14,509,820 | 1,654,781 | ||||||||||||||||||
| Net change in unrealized appreciation (depreciation) on investments | 12,431,129 | (540,674 | ) | 3,967,366 | 25,446,375 | 559,754 | |||||||||||||||||
| Net realized and unrealized gain | 19,797,371 | 2,272,127 | 6,136,917 | 39,956,195 | 2,214,535 | ||||||||||||||||||
| Net increase in net assets resulting from operations | $ | 21,418,750 | $ | 2,441,234 | $ | 6,866,442 | $ | 40,709,102 | $ | 2,488,643 | |||||||||||||
See Notes to Financial Statements.
46
| PowerShares Dynamic Healthcare Sector Portfolio | PowerShares Dynamic Industrials Sector Portfolio | PowerShares Dynamic Technology Sector Portfolio | PowerShares Dynamic Utilities Portfolio | PowerShares NASDAQ Internet Portfolio | |||||||||||||||||||
| INVESTMENT INCOME: | |||||||||||||||||||||||
| Dividend income | $ | 269,416 | $ | 597,342 | $ | 229,094 | $ | 1,531,324 | $ | 112,470 | |||||||||||||
| EXPENSES: | |||||||||||||||||||||||
| Advisory fees | 305,534 | 235,184 | 197,108 | 204,304 | 155,463 | ||||||||||||||||||
| Accounting & Administration fees | 68,240 | 68,240 | 68,240 | 68,240 | — | ||||||||||||||||||
| Professional fees | 36,811 | 31,878 | 32,315 | 33,836 | — | ||||||||||||||||||
| Sub-licensing | 30,554 | 23,519 | 19,711 | 12,258 | — | ||||||||||||||||||
| Custodian & transfer agent fees | 13,949 | 15,756 | 13,218 | 17,008 | — | ||||||||||||||||||
| Printing | 33,640 | 13,809 | 9,377 | 9,754 | — | ||||||||||||||||||
| Recapture (See Note 3) | — | 3,022 | — | 583 | — | ||||||||||||||||||
| Other expenses | 20,997 | 20,515 | 19,098 | 18,670 | — | ||||||||||||||||||
| Total Expenses | 509,725 | 411,923 | 359,067 | 364,653 | 155,463 | ||||||||||||||||||
| Less Waivers | (112,530 | ) | (106,180 | ) | (102,829 | ) | (107,230 | ) | — | ||||||||||||||
| Net Expenses | 397,195 | 305,743 | 256,238 | 257,423 | 155,463 | ||||||||||||||||||
| Net Investment Income (Loss) | (127,779 | ) | 291,599 | (27,144 | ) | 1,273,901 | (42,993 | ) | |||||||||||||||
| REALIZED AND UNREALIZED GAIN (LOSS): | |||||||||||||||||||||||
| Net realized gain (loss) from: | |||||||||||||||||||||||
| Investments | (2,942,265 | ) | (1,374,107 | ) | (3,501,656 | ) | (1,761,112 | ) | (314,269 | ) | |||||||||||||
| In-kind redemptions | 15,230,758 | 8,664,890 | 9,675,326 | 4,224,257 | 2,794,457 | ||||||||||||||||||
| Net realized gain | 12,288,493 | 7,290,783 | 6,173,670 | 2,463,145 | 2,480,188 | ||||||||||||||||||
| Net change in unrealized appreciation (depreciation) on investments | (5,044,165 | ) | 5,470,306 | 195,839 | 3,577,891 | 8,511,422 | |||||||||||||||||
| Net realized and unrealized gain | 7,244,328 | 12,761,089 | 6,369,509 | 6,041,036 | 10,991,610 | ||||||||||||||||||
| Net increase in net assets resulting from operations | $ | 7,116,549 | $ | 13,052,688 | $ | 6,342,365 | $ | 7,314,937 | $ | 10,948,617 | |||||||||||||
47
Statements of Changes in Net Assets
| PowerShares Dynamic Basic Materials Sector Portfolio | PowerShares Dynamic Consumer Discretionary Sector Portfolio | PowerShares Dynamic Consumer Staples Sector Portfolio | |||||||||||||||||||||||||
| Year Ended April 30, 2011 | Year Ended April 30, 2010 | Year Ended April 30, 2011 | Year Ended April 30, 2010 | Year Ended April 30, 2011 | Year Ended April 30, 2010 | ||||||||||||||||||||||
| OPERATIONS: | |||||||||||||||||||||||||||
| Net investment income (loss) | $ | 1,621,379 | $ | 359,169 | $ | 169,107 | $ | 46,955 | $ | 729,525 | $ | 592,710 | |||||||||||||||
| Net realized gain (loss) | 7,366,242 | 2,550,246 | 2,812,801 | 3,529,408 | 2,169,551 | 4,338,153 | |||||||||||||||||||||
| Net change in unrealized appreciation (depreciation) | 12,431,129 | 11,196,576 | (540,674 | ) | 1,633,591 | 3,967,366 | 5,799,571 | ||||||||||||||||||||
| Net increase in net assets resulting from operations | 21,418,750 | 14,105,991 | 2,441,234 | 5,209,954 | 6,866,442 | 10,730,434 | |||||||||||||||||||||
| Undistributed net investment income (loss) included in the price of units issued and redeemed | 469,589 | 46,497 | 14,507 | (12,574 | ) | (46,060 | ) | (93,966 | ) | ||||||||||||||||||
| DISTRIBUTIONS TO SHAREHOLDERS FROM: | |||||||||||||||||||||||||||
| Net investment income | (1,632,096 | ) | (372,907 | ) | (142,120 | ) | (42,516 | ) | (712,831 | ) | (710,824 | ) | |||||||||||||||
| Return of capital | — | — | — | — | — | — | |||||||||||||||||||||
| Total distributions to shareholders | (1,632,096 | ) | (372,907 | ) | (142,120 | ) | (42,516 | ) | (712,831 | ) | (710,824 | ) | |||||||||||||||
| SHAREHOLDER TRANSACTIONS: | |||||||||||||||||||||||||||
| Proceeds from shares sold | 67,091,633 | 32,708,442 | 30,811,179 | 21,715,269 | 16,225,994 | 21,673,659 | |||||||||||||||||||||
| Value of shares repurchased | (37,804,118 | ) | (16,053,293 | ) | (33,798,514 | ) | (19,195,521 | ) | (20,379,736 | ) | (30,374,655 | ) | |||||||||||||||
| Net income equalization | (469,589 | ) | (46,497 | ) | (14,507 | ) | 12,574 | 46,060 | 93,966 | ||||||||||||||||||
| Net increase (decrease) in net assets resulting from shares transactions | 28,817,926 | 16,608,652 | (3,001,842 | ) | 2,532,322 | (4,107,682 | ) | (8,607,030 | ) | ||||||||||||||||||
| Increase (Decrease) in Net Assets | 49,074,169 | 30,388,233 | (688,221 | ) | 7,687,186 | 1,999,869 | 1,318,614 | ||||||||||||||||||||
| NET ASSETS: | |||||||||||||||||||||||||||
| Beginning of year | 48,517,031 | 18,128,798 | 21,344,992 | 13,657,806 | 38,771,901 | 37,453,287 | |||||||||||||||||||||
| End of year | $ | 97,591,200 | $ | 48,517,031 | $ | 20,656,771 | $ | 21,344,992 | $ | 40,771,770 | $ | 38,771,901 | �� | ||||||||||||||
| Undistributed net investment income (loss) at end of year | $ | 47,423 | $ | 58,140 | $ | 28,766 | $ | 1,779 | $ | 99,930 | $ | 83,236 | |||||||||||||||
| CHANGES IN SHARES OUTSTANDING: | |||||||||||||||||||||||||||
| Shares sold | 1,950,000 | 1,250,000 | 1,300,000 | 1,100,000 | 600,000 | 900,000 | |||||||||||||||||||||
| Shares repurchased | (1,100,000 | ) | (600,000 | ) | (1,450,000 | ) | (1,000,000 | ) | (750,000 | ) | (1,250,000 | ) | |||||||||||||||
| Shares outstanding, beginning of year | 1,550,000 | 900,000 | 900,000 | 800,000 | 1,450,000 | 1,800,000 | |||||||||||||||||||||
| Shares outstanding, end of year | 2,400,000 | 1,550,000 | 750,000 | 900,000 | 1,300,000 | 1,450,000 | |||||||||||||||||||||
See Notes to Financial Statements.
48
| PowerShares Dynamic Energy Sector Portfolio | PowerShares Dynamic Financial Sector Portfolio | PowerShares Dynamic Healthcare Sector Portfolio | |||||||||||||||||||||||||
| Year Ended April 30, 2011 | Year Ended April 30, 2010 | Year Ended April 30, 2011 | Year Ended April 30, 2010 | Year Ended April 30, 2011 | Year Ended April 30, 2010 | ||||||||||||||||||||||
| OPERATIONS: | |||||||||||||||||||||||||||
| Net investment income (loss) | $ | 752,907 | $ | 259,521 | $ | 274,108 | $ | 217,441 | $ | (127,779 | ) | $ | 116,302 | ||||||||||||||
| Net realized gain (loss) | 14,509,820 | 7,032,754 | 1,654,781 | (748,544 | ) | 12,288,493 | 7,751,096 | ||||||||||||||||||||
| Net change in unrealized appreciation (depreciation) | 25,446,375 | 5,612,261 | 559,754 | 4,491,634 | (5,044,165 | ) | 23,695,539 | ||||||||||||||||||||
| Net increase in net assets resulting from operations | 40,709,102 | 12,904,536 | 2,488,643 | 3,960,531 | 7,116,549 | 31,562,937 | |||||||||||||||||||||
| Undistributed net investment income (loss) included in the price of units issued and redeemed | 248,162 | (53 | ) | 304 | (1,004 | ) | 132,547 | 3,968 | |||||||||||||||||||
| DISTRIBUTIONS TO SHAREHOLDERS FROM: | |||||||||||||||||||||||||||
| Net investment income | (444,392 | ) | (298,571 | ) | (315,046 | ) | (228,052 | ) | — | (214,570 | ) | ||||||||||||||||
| Return of capital | — | — | — | — | — | (116,320 | ) | ||||||||||||||||||||
| Total distributions to shareholders | (444,392 | ) | (298,571 | ) | (315,046 | ) | (228,052 | ) | — | (330,890 | ) | ||||||||||||||||
| SHAREHOLDER TRANSACTIONS: | |||||||||||||||||||||||||||
| Proceeds from shares sold | 183,166,148 | 39,626,811 | 21,741,962 | 13,906,402 | 62,165,104 | 74,249,218 | |||||||||||||||||||||
| Value of shares repurchased | (70,198,961 | ) | (39,439,871 | ) | (18,962,403 | ) | (14,729,644 | ) | (104,057,484 | ) | (79,459,523 | ) | |||||||||||||||
| Net income equalization | (248,162 | ) | 53 | (304 | ) | 1,004 | (132,547 | ) | (3,968 | ) | |||||||||||||||||
| Net increase (decrease) in net assets resulting from shares transactions | 112,719,025 | 186,993 | 2,779,255 | (822,238 | ) | (42,024,927 | ) | (5,214,273 | ) | ||||||||||||||||||
| Increase (Decrease) in Net Assets | 153,231,897 | 12,792,905 | 4,953,156 | 2,909,237 | (34,775,831 | ) | 26,021,742 | ||||||||||||||||||||
| NET ASSETS: | |||||||||||||||||||||||||||
| Beginning of year | 38,670,948 | 25,878,043 | 17,539,318 | 14,630,081 | 97,597,764 | 71,576,022 | |||||||||||||||||||||
| End of year | $ | 191,902,845 | $ | 38,670,948 | $ | 22,492,474 | $ | 17,539,318 | $ | 62,821,933 | $ | 97,597,764 | |||||||||||||||
| Undistributed net investment income (loss) at end of year | $ | 331,180 | $ | 7,289 | $ | 1,914 | $ | 46,098 | $ | (6,329 | ) | $ | (4,622 | ) | |||||||||||||
| CHANGES IN SHARES OUTSTANDING: | |||||||||||||||||||||||||||
| Shares sold | 5,000,000 | 1,550,000 | 1,200,000 | 850,000 | 2,400,000 | 3,450,000 | |||||||||||||||||||||
| Shares repurchased | (2,000,000 | ) | (1,550,000 | ) | (1,050,000 | ) | (900,000 | ) | (4,200,000 | ) | (3,650,000 | ) | |||||||||||||||
| Shares outstanding, beginning of year | 1,300,000 | 1,300,000 | 950,000 | 1,000,000 | 3,800,000 | 4,000,000 | |||||||||||||||||||||
| Shares outstanding, end of year | 4,300,000 | 1,300,000 | 1,100,000 | 950,000 | 2,000,000 | 3,800,000 | |||||||||||||||||||||
49
Statements of Changes in Net Assets (Continued)
| PowerShares Dynamic Industrials Sector Portfolio | PowerShares Dynamic Technology Sector Portfolio | ||||||||||||||||||
| Year Ended April 30, 2011 | Year Ended April 30, 2010 | Year Ended April 30, 2011 | Year Ended April 30, 2010 | ||||||||||||||||
| OPERATIONS: | |||||||||||||||||||
| Net investment income (loss) | $ | 291,599 | $ | 481,148 | $ | (27,144 | ) | $ | (84,100 | ) | |||||||||
| Net realized gain (loss) | 7,290,783 | 14,758,510 | 6,173,670 | 9,939,668 | |||||||||||||||
| Net change in unrealized appreciation (depreciation) | 5,470,306 | 3,451,740 | 195,839 | 974,199 | |||||||||||||||
| Net increase in net assets resulting from operations | 13,052,688 | 18,691,398 | 6,342,365 | 10,829,767 | |||||||||||||||
| Undistributed net investment income (loss) included in the price of units issued and redeemed | (15,439 | ) | (152,197 | ) | (9,019 | ) | (10,830 | ) | |||||||||||
| DISTRIBUTIONS TO SHAREHOLDERS FROM: | |||||||||||||||||||
| Net investment income | (298,462 | ) | (585,231 | ) | — | — | |||||||||||||
| Return of capital | — | — | (20,352 | ) | — | ||||||||||||||
| Total distributions to shareholders | (298,462 | ) | (585,231 | ) | (20,352 | ) | — | ||||||||||||
| SHAREHOLDER TRANSACTIONS: | |||||||||||||||||||
| Proceeds from shares sold | 126,307,101 | 102,731,657 | 55,920,728 | 46,780,788 | |||||||||||||||
| Value of shares repurchased | (58,211,661 | ) | (148,383,157 | ) | (51,391,309 | ) | (44,600,368 | ) | |||||||||||
| Net income equalization | 15,439 | 152,197 | 9,019 | 10,830 | |||||||||||||||
| Net increase (decrease) in net assets resulting from shares transactions | 68,110,879 | (45,499,303 | ) | 4,538,438 | 2,191,250 | ||||||||||||||
| Increase (Decrease) in Net Assets | 80,849,666 | (27,545,333 | ) | 10,851,432 | 13,010,187 | ||||||||||||||
| NET ASSETS: | |||||||||||||||||||
| Beginning of year | 32,779,051 | 60,324,384 | 38,941,967 | 25,931,780 | |||||||||||||||
| End of year | $ | 113,628,717 | $ | 32,779,051 | $ | 49,793,399 | $ | 38,941,967 | |||||||||||
| Undistributed net investment income (loss) at end of year | $ | 32,419 | $ | 38,292 | $ | (4,774 | ) | $ | (3,327 | ) | |||||||||
| CHANGES IN SHARES OUTSTANDING: | |||||||||||||||||||
| Shares sold | 4,350,000 | 5,100,000 | 2,250,000 | 2,350,000 | |||||||||||||||
| Shares repurchased | (2,150,000 | ) | (7,000,000 | ) | (2,100,000 | ) | (2,200,000 | ) | |||||||||||
| Shares outstanding, beginning of year | 1,300,000 | 3,200,000 | 1,650,000 | 1,500,000 | |||||||||||||||
| Shares outstanding, end of year | 3,500,000 | 1,300,000 | 1,800,000 | 1,650,000 | |||||||||||||||
See Notes to Financial Statements.
50
| PowerShares Dynamic Utilities Portfolio | PowerShares NASDAQ Internet Portfolio | ||||||||||||||||||
| Year Ended April 30, 2011 | Year Ended April 30, 2010 | Year Ended April 30, 2011 | Year Ended April 30, 2010 | ||||||||||||||||
| OPERATIONS: | |||||||||||||||||||
| Net investment income (loss) | $ | 1,273,901 | $ | 1,150,440 | $ | (42,993 | ) | $ | (44,029 | ) | |||||||||
| Net realized gain (loss) | 2,463,145 | (2,050,432 | ) | 2,480,188 | 509,051 | ||||||||||||||
| Net change in unrealized appreciation (depreciation) | 3,577,891 | 6,159,493 | 8,511,422 | 2,973,941 | |||||||||||||||
| Net increase in net assets resulting from operations | 7,314,937 | 5,259,501 | 10,948,617 | 3,438,963 | |||||||||||||||
| Undistributed net investment income (loss) included in the price of units issued and redeemed | (14,215 | ) | (377,901 | ) | (78,012 | ) | (50,661 | ) | |||||||||||
| DISTRIBUTIONS TO SHAREHOLDERS FROM: | |||||||||||||||||||
| Net investment income | (1,369,784 | ) | (1,469,967 | ) | — | — | |||||||||||||
| Return of capital | — | — | — | — | |||||||||||||||
| Total distributions to shareholders | (1,369,784 | ) | (1,469,967 | ) | — | — | |||||||||||||
| SHAREHOLDER TRANSACTIONS: | |||||||||||||||||||
| Proceeds from shares sold | 44,856,390 | 35,752,793 | 30,134,937 | 13,980,103 | |||||||||||||||
| Value of shares repurchased | (41,851,478 | ) | (43,474,177 | ) | (10,972,049 | ) | (3,811,934 | ) | |||||||||||
| Net income equalization | 14,215 | 377,901 | 78,012 | 50,661 | |||||||||||||||
| Net increase (decrease) in net assets resulting from shares transactions | 3,019,127 | (7,343,483 | ) | 19,240,900 | 10,218,830 | ||||||||||||||
| Increase (Decrease) in Net Assets | 8,950,065 | (3,931,850 | ) | 30,111,505 | 13,607,132 | ||||||||||||||
| NET ASSETS: | |||||||||||||||||||
| Beginning of year | 38,138,776 | 42,070,626 | 15,395,756 | 1,788,624 | |||||||||||||||
| End of year | $ | 47,088,841 | $ | 38,138,776 | $ | 45,507,261 | $ | 15,395,756 | |||||||||||
| Undistributed net investment income (loss) at end of year | $ | 113,908 | $ | 209,791 | $ | — | $ | — | |||||||||||
| CHANGES IN SHARES OUTSTANDING: | |||||||||||||||||||
| Shares sold | 2,950,000 | 2,500,000 | 900,000 | 600,000 | |||||||||||||||
| Shares repurchased | (2,750,000 | ) | (3,150,000 | ) | (350,000 | ) | (150,000 | ) | |||||||||||
| Shares outstanding, beginning of year | 2,550,000 | 3,200,000 | 550,000 | 100,000 | |||||||||||||||
| Shares outstanding, end of year | 2,750,000 | 2,550,000 | 1,100,000 | 550,000 | |||||||||||||||
51
Financial Highlights
PowerShares Dynamic Basic Materials Sector Portfolio
| Year Ended April 30, | For the Period October 12, 2006* Through | ||||||||||||||||||||||
| 2011 | 2010 | 2009 | 2008 | April 30, 2007 | |||||||||||||||||||
| PER SHARE OPERATING PERFORMANCE: | |||||||||||||||||||||||
| Net asset value at beginning of period | $ | 31.30 | $ | 20.14 | $ | 36.29 | $ | 31.65 | $ | 25.56 | |||||||||||||
| Net investment income** | 0.86 | ††† | 0.28 | 0.42 | 0.33 | 0.24 | |||||||||||||||||
| Net realized and unrealized gain (loss) on investments | 9.34 | 11.20 | (16.15 | ) | 4.55 | 6.05 | |||||||||||||||||
| Total from investment operations | 10.20 | 11.48 | (15.73 | ) | 4.88 | 6.29 | |||||||||||||||||
| Distributions to shareholders from: | |||||||||||||||||||||||
| Net investment income | (0.84 | ) | (0.32 | ) | (0.42 | ) | (0.24 | ) | (0.20 | ) | |||||||||||||
| Net asset value at end of period | $ | 40.66 | $ | 31.30 | $ | 20.14 | $ | 36.29 | $ | 31.65 | |||||||||||||
| Share price at end of period*** | $ | 40.67 | $ | 31.34 | $ | 20.15 | |||||||||||||||||
| NET ASSET VALUE, TOTAL RETURN**** | 33.12 | % | 57.46 | % | (43.63 | )% | 15.47 | % | 24.69 | % | |||||||||||||
| SHARE PRICE TOTAL RETURN**** | 32.98 | % | 57.59 | % | (43.59 | )% | |||||||||||||||||
| RATIOS/SUPPLEMENTAL DATA: | |||||||||||||||||||||||
| Net assets at end of period (000's omitted) | $ | 97,591 | $ | 48,517 | $ | 18,129 | $ | 43,550 | $ | 18,988 | |||||||||||||
| Ratio to average net assets of: | |||||||||||||||||||||||
| Expenses, after (Waivers) and/or Recapture | 0.65 | % | 0.65 | % | 0.65 | % | 0.68 | % | 0.71 | %† | |||||||||||||
| Expenses, prior to (Waivers) and/or Recapture | 0.79 | % | 0.91 | % | 0.97 | % | 0.96 | % | 1.32 | %† | |||||||||||||
| Net investment income, after (Waivers) and/or Recapture | 2.56 | %††† | 1.05 | % | 1.57 | % | 0.95 | % | 1.52 | %† | |||||||||||||
| Portfolio turnover rate †† | 28 | % | 46 | % | 47 | % | 28 | % | 9 | % | |||||||||||||
| Undistributed net investment income (loss) included in price of units issued and redeemed**# | $ | 0.25 | $ | 0.04 | $ | (0.01 | ) | $ | 0.03 | $ | 0.02 | ||||||||||||
PowerShares Dynamic Consumer Discretionary Sector Portfolio
| Year Ended April 30, | For the Period October 12, 2006* Through | ||||||||||||||||||||||
| 2011 | 2010 | 2009 | 2008 | April 30, 2007 | |||||||||||||||||||
| PER SHARE OPERATING PERFORMANCE: | |||||||||||||||||||||||
| Net asset value at beginning of period | $ | 23.72 | $ | 17.07 | $ | 22.45 | $ | 28.59 | $ | 25.43 | |||||||||||||
| Net investment income** | 0.20 | 0.06 | 0.13 | 0.10 | 0.09 | ||||||||||||||||||
| Net realized and unrealized gain (loss) on investments | 3.79 | 6.65 | (5.35 | ) | (6.11 | ) | 3.23 | ||||||||||||||||
| Total from investment operations | 3.99 | 6.71 | (5.22 | ) | (6.01 | ) | 3.32 | ||||||||||||||||
| Distributions to shareholders from: | |||||||||||||||||||||||
| Net investment income | (0.17 | ) | (0.06 | ) | (0.15 | ) | (0.11 | ) | (0.16 | ) | |||||||||||||
| Return of capital | — | — | (0.01 | ) | (0.02 | ) | — | ||||||||||||||||
| Total distributions | (0.17 | ) | (0.06 | ) | (0.16 | ) | (0.13 | ) | (0.16 | ) | |||||||||||||
| Net asset value at end of period | $ | 27.54 | $ | 23.72 | $ | 17.07 | $ | 22.45 | $ | 28.59 | |||||||||||||
| Share price at end of period*** | $ | 27.53 | $ | 23.74 | $ | 17.07 | |||||||||||||||||
| NET ASSET VALUE, TOTAL RETURN**** | 16.91 | % | 39.37 | % | (23.19 | )% | (21.10 | )% | 13.11 | % | |||||||||||||
| SHARE PRICE TOTAL RETURN**** | 16.77 | % | 39.49 | % | (23.22 | )% | |||||||||||||||||
| RATIOS/SUPPLEMENTAL DATA: | |||||||||||||||||||||||
| Net assets at end of period (000's omitted) | $ | 20,657 | $ | 21,345 | $ | 13,658 | $ | 11,227 | $ | 17,156 | |||||||||||||
| Ratio to average net assets of: | |||||||||||||||||||||||
| Expenses, after (Waivers) and/or Recapture | 0.65 | % | 0.65 | % | 0.64 | % | 0.70 | % | 0.72 | %† | |||||||||||||
| Expenses, prior to (Waivers) and/or Recapture | 1.24 | % | 1.32 | % | 1.68 | % | 1.31 | % | 1.41 | %† | |||||||||||||
| Net investment income, after (Waivers) and/or Recapture | 0.86 | % | 0.31 | % | 0.81 | % | 0.36 | % | 0.65 | %† | |||||||||||||
| Portfolio turnover rate †† | 68 | % | 86 | % | 157 | % | 95 | % | 20 | % | |||||||||||||
| Undistributed net investment income (loss) included in price of units issued and redeemed**# | $ | 0.02 | $ | (0.02 | ) | $ | (0.09 | ) | $ | 0.02 | $ | (0.11 | ) | ||||||||||
* Commencement of Investment Operations.
** Based on average shares outstanding.
*** The mean between the last bid and ask prices.
**** Net asset value total return is calculated assuming an initial investment made at the net asset value at the beginning of the period, reinvestment of all dividends and distributions at net asset value during the period, and redemption on the last day of the period. Share price total return is calculated assuming an initial investment made at the share price at the beginning of the period, reinvestment of all dividends and distributions at share price during the period, and sale at the share price on the last day of the period. Total investment returns calculated for a period of less than one year are not annualized.
† Annualized.
†† Portfolio turnover rate is not annualized and does not include securities received or delivered from processing creations or redemptions.
††† Net investment income per share and the ratio of net investment income to average net assets include a special cash dividend received of $1.65 per share owned of Weyerhaeuser Co. on July 20, 2010. Net investment income per share and the ratio of net investment income to average net assets excluding the special dividend are $0.26 and 0.78%, respectively.
# The per share amount of equalization is presented to show the impact of equalization on distributable earnings per share.
See Notes to Financial Statements.
52
Financial Highlights (Continued)
PowerShares Dynamic Consumer Staples Sector Portfolio
| Year Ended April 30, | For the Period October 12, 2006* Through | ||||||||||||||||||||||
| 2011 | 2010 | 2009 | 2008 | April 30, 2007 | |||||||||||||||||||
| PER SHARE OPERATING PERFORMANCE: | |||||||||||||||||||||||
| Net asset value at beginning of period | $ | 26.74 | $ | 20.81 | $ | 26.75 | $ | 28.16 | $ | 25.25 | |||||||||||||
| Net investment income** | 0.52 | 0.36 | 0.45 | 0.34 | 0.49 | ||||||||||||||||||
| Net realized and unrealized gain (loss) on investments | 4.61 | 5.99 | (6.04 | ) | (1.43 | ) | 2.69 | ||||||||||||||||
| Total from investment operations | 5.13 | 6.35 | (5.59 | ) | (1.09 | ) | 3.18 | ||||||||||||||||
| Distributions to shareholders from: | |||||||||||||||||||||||
| Net investment income | (0.51 | ) | (0.42 | ) | (0.35 | ) | (0.32 | ) | (0.27 | ) | |||||||||||||
| Net asset value at end of period | $ | 31.36 | $ | 26.74 | $ | 20.81 | $ | 26.75 | $ | 28.16 | |||||||||||||
| Share price at end of period*** | $ | 31.37 | $ | 26.74 | $ | 20.79 | |||||||||||||||||
| NET ASSET VALUE, TOTAL RETURN**** | 19.46 | % | 30.87 | % | (21.02 | )% | (3.94 | )% | 12.69 | % | |||||||||||||
| SHARE PRICE TOTAL RETURN**** | 19.50 | % | 30.99 | % | (21.09 | )% | |||||||||||||||||
| RATIOS/SUPPLEMENTAL DATA: | |||||||||||||||||||||||
| Net assets at end of period (000's omitted) | $ | 40,772 | $ | 38,772 | $ | 37,453 | $ | 24,072 | $ | 11,264 | |||||||||||||
| Ratio to average net assets of: | |||||||||||||||||||||||
| Expenses, after (Waivers) and/or Recapture | 0.65 | % | 0.65 | % | 0.65 | % | 0.69 | % | 0.73 | %† | |||||||||||||
| Expenses, prior to (Waivers) and/or Recapture | 0.94 | % | 0.87 | % | 0.94 | % | 1.18 | % | 1.46 | %† | |||||||||||||
| Net investment income, after (Waivers) and/or Recapture | 1.91 | % | 1.50 | % | 2.07 | % | 1.22 | % | 3.42 | %† | |||||||||||||
| Portfolio turnover rate †† | 54 | % | 67 | % | 48 | % | 44 | % | 18 | % | |||||||||||||
| Undistributed net investment income (loss) included in price of units issued and redeemed**# | $ | (0.03 | ) | $ | (0.06 | ) | $ | 0.15 | $ | 0.22 | $ | 0.04 | |||||||||||
PowerShares Dynamic Energy Sector Portfolio
| Year Ended April 30, | For the Period October 12, 2006* Through | ||||||||||||||||||||||
| 2011 | 2010 | 2009 | 2008 | April 30, 2007 | |||||||||||||||||||
| PER SHARE OPERATING PERFORMANCE: | |||||||||||||||||||||||
| Net asset value at beginning of period | $ | 29.75 | $ | 19.91 | $ | 38.80 | $ | 31.90 | $ | 25.80 | |||||||||||||
| Net investment income** | 0.32 | 0.20 | 0.18 | 0.14 | 0.05 | ||||||||||||||||||
| Net realized and unrealized gain (loss) on investments | 14.77 | 9.87 | (18.93 | ) | 6.84 | 6.08 | |||||||||||||||||
| Total from investment operations | 15.09 | 10.07 | (18.75 | ) | 6.98 | 6.13 | |||||||||||||||||
| Distributions to shareholders from: | |||||||||||||||||||||||
| Net investment income | (0.21 | ) | (0.23 | ) | (0.14 | ) | (0.08 | ) | (0.03 | ) | |||||||||||||
| Net asset value at end of period | $ | 44.63 | $ | 29.75 | $ | 19.91 | $ | 38.80 | $ | 31.90 | |||||||||||||
| Share price at end of period*** | $ | 44.65 | $ | 29.75 | $ | 19.92 | |||||||||||||||||
| NET ASSET VALUE, TOTAL RETURN**** | 51.01 | % | 50.81 | % | (48.52 | )% | 21.93 | % | 23.78 | % | |||||||||||||
| SHARE PRICE TOTAL RETURN**** | 51.07 | % | 50.73 | % | (48.44 | )% | |||||||||||||||||
| RATIOS/SUPPLEMENTAL DATA: | |||||||||||||||||||||||
| Net assets at end of period (000's omitted) | $ | 191,903 | $ | 38,671 | $ | 25,878 | $ | 42,675 | $ | 19,137 | |||||||||||||
| Ratio to average net assets of: | |||||||||||||||||||||||
| Expenses, after (Waivers) and/or Recapture | 0.65 | % | 0.65 | % | 0.65 | % | 0.68 | % | 0.71 | %† | |||||||||||||
| Expenses, prior to (Waivers) and/or Recapture | 0.74 | % | 0.93 | % | 0.98 | % | 0.96 | % | 1.22 | %† | |||||||||||||
| Net investment income, after (Waivers) and/or Recapture | 0.90 | % | 0.79 | % | 0.65 | % | 0.41 | % | 0.28 | %† | |||||||||||||
| Portfolio turnover rate †† | 35 | % | 63 | % | 67 | % | 50 | % | 12 | % | |||||||||||||
| Undistributed net investment income included in price of units issued and redeemed**# | $ | 0.11 | $ | 0.00 | (a) | $ | 0.03 | $ | 0.02 | $ | — | ||||||||||||
* Commencement of Investment Operations.
** Based on average shares outstanding.
*** The mean between the last bid and ask prices.
**** Net asset value total return is calculated assuming an initial investment made at the net asset value at the beginning of the period, reinvestment of all dividends and distributions at net asset value during the period, and redemption on the last day of the period. Share price total return is calculated assuming an initial investment made at the share price at the beginning of the period, reinvestment of all dividends and distributions at share price during the period, and sale at the share price on the last day of the period. Total investment returns calculated for a period of less than one year are not annualized.
† Annualized.
†† Portfolio turnover rate is not annualized and does not include securities received or delivered from processing creations or redemptions.
# The per share amount of equalization is presented to show the impact of equalization on distributable earnings per share.
(a) Amount represents less than $0.005.
See Notes to Financial Statements.
53
Financial Highlights (Continued)
PowerShares Dynamic Financial Sector Portfolio
| Year Ended April 30, | For the Period October 12, 2006* Through | ||||||||||||||||||||||
| 2011 | 2010 | 2009 | 2008 | April 30, 2007 | |||||||||||||||||||
| PER SHARE OPERATING PERFORMANCE: | |||||||||||||||||||||||
| Net asset value at beginning of period | $ | 18.46 | $ | 14.63 | $ | 22.94 | $ | 26.51 | $ | 25.16 | |||||||||||||
| Net investment income** | 0.27 | 0.21 | 0.24 | 0.25 | 0.13 | ||||||||||||||||||
| Net realized and unrealized gain (loss) on investments | 2.04 | 3.84 | (8.33 | ) | (3.59 | ) | 1.31 | ||||||||||||||||
| Total from investment operations | 2.31 | 4.05 | (8.09 | ) | (3.34 | ) | 1.44 | ||||||||||||||||
| Distributions to shareholders from: | |||||||||||||||||||||||
| Net investment income | (0.32 | ) | (0.22 | ) | (0.22 | ) | (0.23 | ) | (0.09 | ) | |||||||||||||
| Net asset value at end of period | $ | 20.45 | $ | 18.46 | $ | 14.63 | $ | 22.94 | $ | 26.51 | |||||||||||||
| Share price at end of period*** | $ | 20.44 | $ | 18.45 | $ | 14.60 | |||||||||||||||||
| NET ASSET VALUE, TOTAL RETURN**** | 12.76 | % | 27.90 | % | (35.53 | )% | (12.69 | )% | 5.72 | % | |||||||||||||
| SHARE PRICE TOTAL RETURN**** | 12.77 | % | 28.09 | % | (35.66 | )% | |||||||||||||||||
| RATIOS/SUPPLEMENTAL DATA: | |||||||||||||||||||||||
| Net assets at end of period (000's omitted) | $ | 22,492 | $ | 17,539 | $ | 14,630 | $ | 22,943 | $ | 7,954 | |||||||||||||
| Ratio to average net assets of: | |||||||||||||||||||||||
| Expenses, after (Waivers) and/or Recapture r | 0.65 | % | 0.65 | % | 0.65 | % | 0.72 | % | 0.72 | %† | |||||||||||||
| Expenses, prior to (Waivers) and/or Recapture | 1.30 | % | 1.25 | % | 1.13 | % | 1.42 | % | 1.38 | %† | |||||||||||||
| Net investment income, after (Waivers) and/or Recapture | 1.50 | % | 1.26 | % | 1.27 | % | 1.07 | % | 0.87 | %† | |||||||||||||
| Portfolio turnover rate †† | 59 | % | 97 | % | 66 | % | 50 | % | 33 | % | |||||||||||||
| Undistributed net investment income (loss) included in price of units issued and redeemed**# | $ | 0.00 | (a) | $ | 0.00 | (a) | $ | 0.00 | (a) | $ | 0.05 | $ | (0.02 | ) | |||||||||
PowerShares Dynamic Healthcare Sector Portfolio
| Year Ended April 30, | For the Period October 12, 2006* Through | ||||||||||||||||||||||
| 2011 | 2010 | 2009 | 2008 | April 30, 2007 | |||||||||||||||||||
| PER SHARE OPERATING PERFORMANCE: | |||||||||||||||||||||||
| Net asset value at beginning of period | $ | 25.68 | $ | 17.89 | $ | 25.87 | $ | 28.59 | $ | 25.01 | |||||||||||||
| Net investment income (loss)** | (0.05 | ) | 0.03 | 0.02 | (0.05 | ) | (0.04 | ) | |||||||||||||||
| Net realized and unrealized gain (loss) on investments | 5.78 | 7.84 | (8.00 | ) | (2.67 | ) | 3.62 | ||||||||||||||||
| Total from investment operations | 5.73 | 7.87 | (7.98 | ) | (2.72 | ) | 3.58 | ||||||||||||||||
| Distributions to shareholders from: | |||||||||||||||||||||||
| Net investment income | — | (0.05 | ) | — | — | — | |||||||||||||||||
| Return of capital | — | (0.03 | ) | — | — | — | |||||||||||||||||
| Total distributions | — | (0.08 | ) | — | — | — | |||||||||||||||||
| Net asset value at end of period | $ | 31.41 | $ | 25.68 | $ | 17.89 | $ | 25.87 | $ | 28.59 | |||||||||||||
| Share price at end of period*** | $ | 31.44 | $ | 25.67 | $ | 17.86 | |||||||||||||||||
| NET ASSET VALUE, TOTAL RETURN**** | 22.31 | % | 44.09 | % | (30.85 | )% | (9.51 | )% | 14.31 | % | |||||||||||||
| SHARE PRICE TOTAL RETURN**** | 22.48 | % | 44.28 | % | (30.94 | )% | |||||||||||||||||
| RATIOS/SUPPLEMENTAL DATA: | |||||||||||||||||||||||
| Net assets at end of period (000's omitted) | $ | 62,822 | $ | 97,598 | $ | 71,576 | $ | 119,019 | $ | 57,183 | |||||||||||||
| Ratio to average net assets of: | |||||||||||||||||||||||
| Expenses, after (Waivers) and/or Recapture | 0.65 | % | 0.65 | % | 0.65 | % | 0.66 | % | 0.71 | %† | |||||||||||||
| Expenses, prior to (Waivers) and/or Recapture | 0.84 | % | 0.72 | % | 0.71 | % | 0.72 | % | 1.20 | %† | |||||||||||||
| Net investment income (loss), after (Waivers) and/or Recapture | (0.21 | )% | 0.13 | % | 0.10 | % | (0.17 | )% | (0.31 | )%† | |||||||||||||
| Portfolio turnover rate †† | 63 | % | 79 | % | 96 | % | 75 | % | 14 | % | |||||||||||||
| Undistributed net investment income (loss) included in price of units issued and redeemed**# | $ | 0.06 | $ | 0.00 | (a) | $ | 0.01 | $ | (0.04 | ) | $ | (0.05 | ) | ||||||||||
* Commencement of Investment Operations.
** Based on average shares outstanding.
*** The mean between the last bid and ask prices.
**** Net asset value total return is calculated assuming an initial investment made at the net asset value at the beginning of the period, reinvestment of all dividends and distributions at net asset value during the period, and redemption on the last day of the period. Share price total return is calculated assuming an initial investment made at the share price at the beginning of the period, reinvestment of all dividends and distributions at share price during the period, and sale at the share price on the last day of the period. Total investment returns calculated for a period of less than one year are not annualized.
† Annualized.
†† Portfolio turnover rate is not annualized and does not include securities received or delivered from processing creations or redemptions.
# The per share amount of equalization is presented to show the impact of equalization on distributable earnings per share.
(a) Amount represents less than $0.005.
r In addition to the fees and expenses which the Fund bears directly; the Fund indirectly bears a pro rata share of the fees and expenses of the investment companies in which the Fund invests. Estimated investment companies expenses are not expenses that are incurred directly by your Fund. They are expenses that are incurred directly by the investment companies and are deducted from the value of the funds your Fund invests in. The effect of the estimated investment companies expenses that you bear indirectly is included in your Fund's total return.
See Notes to Financial Statements.
54
Financial Highlights (Continued)
PowerShares Dynamic Industrials Sector Portfolio
| Year Ended April 30, | For the Period October 12, 2006* Through | ||||||||||||||||||||||
| 2011 | 2010 | 2009 | 2008 | April 30, 2007 | |||||||||||||||||||
| PER SHARE OPERATING PERFORMANCE: | |||||||||||||||||||||||
| Net asset value at beginning of period | $ | 25.21 | $ | 18.85 | $ | 30.33 | $ | 29.34 | $ | 25.72 | |||||||||||||
| Net investment income** | 0.17 | 0.20 | 0.22 | 0.14 | 0.04 | ||||||||||||||||||
| Net realized and unrealized gain (loss) on investments | 7.29 | 6.48 | (11.55 | ) | 1.00 | 3.63 | |||||||||||||||||
| Total from investment operations | 7.46 | 6.68 | (11.33 | ) | 1.14 | 3.67 | |||||||||||||||||
| Distributions to shareholders from: | |||||||||||||||||||||||
| Net investment income | (0.20 | ) | (0.32 | ) | (0.15 | ) | (0.15 | ) | (0.04 | ) | |||||||||||||
| Return of capital | — | — | — | — | (0.01 | ) | |||||||||||||||||
| Total distributions | (0.20 | ) | (0.32 | ) | (0.15 | ) | (0.15 | ) | (0.05 | ) | |||||||||||||
| Net asset value at end of period | $ | 32.47 | $ | 25.21 | $ | 18.85 | $ | 30.33 | $ | 29.34 | |||||||||||||
| Share price at end of period*** | $ | 32.48 | $ | 25.20 | $ | 18.82 | |||||||||||||||||
| NET ASSET VALUE, TOTAL RETURN**** | 29.83 | % | 35.73 | % | (37.41 | )% | 3.90 | % | 14.28 | % | |||||||||||||
| SHARE PRICE TOTAL RETURN**** | 29.92 | % | 35.89 | % | (37.51 | )% | |||||||||||||||||
| RATIOS/SUPPLEMENTAL DATA: | |||||||||||||||||||||||
| Net assets at end of period (000's omitted) | $ | 113,629 | $ | 32,779 | $ | 60,324 | $ | 36,397 | $ | 26,409 | |||||||||||||
| Ratio to average net assets of: | |||||||||||||||||||||||
| Expenses, after (Waivers) and/or Recapture | 0.65 | % | 0.65 | % | 0.65 | % | 0.68 | % | 0.71 | %† | |||||||||||||
| Expenses, prior to (Waivers) and/or Recapture | 0.88 | % | 0.82 | % | 0.81 | % | 0.90 | % | 1.19 | %† | |||||||||||||
| Net investment income, after (Waivers) and/or Recapture | 0.62 | % | 0.93 | % | 1.05 | % | 0.45 | % | 0.30 | %† | |||||||||||||
| Portfolio turnover rate †† | 48 | % | 121 | % | 81 | % | 84 | % | 14 | % | |||||||||||||
| Undistributed net investment income (loss) included in price of units issued and redeemed**# | $ | (0.01 | ) | $ | (0.06 | ) | $ | 0.03 | $ | 0.00 | (a) | $ | 0.01 | ||||||||||
PowerShares Dynamic Technology Sector Portfolio
| Year Ended April 30, | For the Period October 12, 2006* Through | ||||||||||||||||||||||
| 2011 | 2010 | 2009 | 2008 | April 30, 2007 | |||||||||||||||||||
| PER SHARE OPERATING PERFORMANCE: | |||||||||||||||||||||||
| Net asset value at beginning of period | $ | 23.60 | $ | 17.29 | $ | 24.83 | $ | 27.76 | $ | 25.54 | |||||||||||||
| Net investment income (loss)** | (0.02 | ) | (0.05 | ) | (0.01 | ) | (0.09 | ) | (0.07 | ) | |||||||||||||
| Net realized and unrealized gain (loss) on investments | 4.09 | 6.36 | (7.53 | ) | (2.84 | ) | 2.29 | ||||||||||||||||
| Total from investment operations | 4.07 | 6.31 | (7.54 | ) | (2.93 | ) | 2.22 | ||||||||||||||||
| Distributions to shareholders from: | |||||||||||||||||||||||
| Return of capital | (0.01 | ) | — | — | — | — | |||||||||||||||||
| Net asset value at end of period | $ | 27.66 | $ | 23.60 | $ | 17.29 | $ | 24.83 | $ | 27.76 | |||||||||||||
| Share price at end of period*** | $ | 27.65 | $ | 23.59 | $ | 17.29 | |||||||||||||||||
| NET ASSET VALUE, TOTAL RETURN**** | 17.26 | % | 36.50 | % | (30.37 | )% | (10.55 | )% | 8.69 | % | |||||||||||||
| SHARE PRICE TOTAL RETURN**** | 17.27 | % | 36.44 | % | (30.31 | )% | |||||||||||||||||
| RATIOS/SUPPLEMENTAL DATA: | |||||||||||||||||||||||
| Net assets at end of period (000's omitted) | $ | 49,793 | $ | 38,942 | $ | 25,932 | $ | 37,246 | $ | 22,210 | |||||||||||||
| Ratio to average net assets of: | |||||||||||||||||||||||
| Expenses, after (Waivers) and/or Recapture | 0.65 | % | 0.65 | % | 0.65 | % | 0.68 | % | 0.71 | %† | |||||||||||||
| Expenses, prior to (Waivers) and/or Recapture | 0.91 | % | 0.90 | % | 0.89 | % | 0.94 | % | 1.25 | %† | |||||||||||||
| Net investment income (loss), after (Waivers) and/or Recapture | (0.07 | )% | (0.24 | )% | (0.04 | )% | (0.36 | )% | (0.49 | )%† | |||||||||||||
| Portfolio turnover rate †† | 67 | % | 71 | % | 90 | % | 77 | % | 27 | % | |||||||||||||
| Undistributed net investment income (loss) included in price of units issued and redeemed**# | $ | (0.01 | ) | $ | (0.01 | ) | $ | (0.02 | ) | $ | (0.05 | ) | $ | (0.02 | ) | ||||||||
* Commencement of Investment Operations.
** Based on average shares outstanding.
*** The mean between the last bid and ask prices.
**** Net asset value total return is calculated assuming an initial investment made at the net asset value at the beginning of the period, reinvestment of all dividends and distributions at net asset value during the period, and redemption on the last day of the period. Share price total return is calculated assuming an initial investment made at the share price at the beginning of the period, reinvestment of all dividends and distributions at share price during the period, and sale at the share price on the last day of the period. Total investment return calculated for a period of less than one year are not annualized.
† Annualized.
†† Portfolio turnover rate is not annualized and does not include securities received or delivered from processing creations or redemptions.
# The per share amount of equalization is presented to show the impact of equalization on distributable earnings per share.
(a) Amount represents less than $0.005.
See Notes to Financial Statements.
55
Financial Highlights (Continued)
PowerShares Dynamic Utilities Portfolio
| Year Ended April 30, | |||||||||||||||||||||||
| 2011 | 2010 | 2009 | 2008 | 2007 | |||||||||||||||||||
| PER SHARE OPERATING PERFORMANCE: | |||||||||||||||||||||||
| Net asset value at beginning of year | $ | 14.96 | $ | 13.15 | $ | 19.01 | $ | 20.54 | $ | 16.33 | |||||||||||||
| Net investment income** | 0.48 | 0.52 | 0.54 | 0.45 | 0.44 | ||||||||||||||||||
| Net realized and unrealized gain (loss) on investments | 2.19 | 2.04 | (5.95 | ) | (1.53 | ) | 4.16 | ||||||||||||||||
| Total from investment operations | 2.67 | 2.56 | (5.41 | ) | (1.08 | ) | 4.60 | ||||||||||||||||
| Distributions to shareholders from: | |||||||||||||||||||||||
| Net investment income | (0.51 | ) | (0.75 | ) | (0.45 | ) | (0.45 | ) | (0.39 | ) | |||||||||||||
| Net asset value at end of year | $ | 17.12 | $ | 14.96 | $ | 13.15 | $ | 19.01 | $ | 20.54 | |||||||||||||
| Share price at end of year*** | $ | 17.13 | $ | 14.96 | $ | 13.13 | |||||||||||||||||
| NET ASSET VALUE, TOTAL RETURN**** | 18.36 | % | 19.79 | % | (29.00 | )% | (5.34 | )% | 28.48 | % | |||||||||||||
| SHARE PRICE TOTAL RETURN**** | 18.42 | % | 19.97 | % | (29.11 | )% | |||||||||||||||||
| RATIOS/SUPPLEMENTAL DATA: | |||||||||||||||||||||||
| Net assets at end of year (000's omitted) | $ | 47,089 | $ | 38,139 | $ | 42,071 | $ | 39,929 | $ | 59,579 | |||||||||||||
| Ratio to average net assets of: | |||||||||||||||||||||||
| Expenses, after (Waivers) and/or Recapture | 0.63 | % | 0.63 | % | 0.63 | % | 0.63 | % | 0.63 | % | |||||||||||||
| Expenses, prior to (Waivers) and/or Recapture | 0.89 | % | 0.95 | % | 0.82 | % | 0.86 | % | 0.92 | % | |||||||||||||
| Net investment income, after (Waivers) and/or Recapture | 3.12 | % | 3.71 | % | 3.44 | % | 2.32 | % | 2.34 | % | |||||||||||||
| Portfolio turnover rate †† | 68 | % | 81 | % | 68 | % | 64 | % | 39 | % | |||||||||||||
| Undistributed net investment income (loss) included in price of units issued and redeemed***# | $ | (0.01 | ) | $ | (0.17 | ) | $ | 0.00 | (b) | $ | (0.05 | ) | $ | 0.05 | |||||||||
PowerShares NASDAQ Internet Portfolio
| Year Ended April 30 | For the Period June 10, 2008* Through | ||||||||||||||
| 2011 | 2010 | April 30, 2009 | |||||||||||||
| PER SHARE OPERATING PERFORMANCE: | |||||||||||||||
| Net asset value at beginning of period | $ | 27.99 | $ | 17.89 | $ | 24.72 | |||||||||
| Net investment income (loss)** | (0.06 | ) | (0.12 | ) | (0.08 | ) | |||||||||
| Net realized and unrealized gain (loss) on investments | 13.44 | 10.22 | (6.74 | ) | |||||||||||
| Total from investment operations | 13.38 | 10.10 | (6.82 | ) | |||||||||||
| Distributions to shareholders from: | |||||||||||||||
| Return of capital | — | — | (0.01 | ) | |||||||||||
| Net asset value at end of period | $ | 41.37 | $ | 27.99 | $ | 17.89 | |||||||||
| Share price at end of period*** | $ | 41.40 | $ | 28.01 | $ | 17.88 | |||||||||
| NET ASSET VALUE, TOTAL RETURN**** | 47.80 | % | 56.46 | % | (27.56 | )%(a) | |||||||||
| SHARE PRICE TOTAL RETURN**** | 47.81 | % | 56.65 | % | (27.60 | )%(a) | |||||||||
| RATIOS/SUPPLEMENTAL DATA: | |||||||||||||||
| Net assets at end of period (000's omitted) | $ | 45,507 | $ | 15,396 | $ | 1,789 | |||||||||
| Ratio to average net assets of: | |||||||||||||||
| Expenses | 0.60 | % | 0.60 | % | 0.60 | %† | |||||||||
| Net investment income (loss) | (0.17 | )% | (0.46 | )% | (0.51 | )%† | |||||||||
| Portfolio turnover rate †† | 20 | % | 23 | % | 25 | % | |||||||||
| Undistributed net investment income (loss) included in price of units issued and redeemed**# | $ | (0.10 | ) | $ | (0.13 | ) | $ | — | |||||||
* Commencement of Investment Operations.
** Based on average shares outstanding.
*** The mean between the last bid and ask prices.
**** Net asset value total return is calculated assuming an initial investment made at the net asset value at the beginning of the period, reinvestment of all dividends and distributions at net asset value during the period, and redemption on the last day of the period. Share price total return is calculated assuming an initial investment made at the share price at the beginning of the period, reinvestment of all dividends and distributions at share price during the period, and sale at the share price on the last day of the period. Total investment returns calculated for a period of less than one year are not annualized.
† Annualized.
†† Portfolio turnover rate is not annualized and does not include securities received or delivered from processing creations or redemptions.
# The per share amount of equalization is presented to show the impact of equalization on distributable earnings per share.
(a) The net asset value, total return from Fund Inception (June 12, 2008, first day of trading on the exchange) to April 30, 2009 was (25.33)%. The share price total return from Fund Inception to April 30, 2009 was (26.53)%.
(b) Amount represents less than $0.005.
See Notes to Financial Statements.
56
Notes to Financial Statements
PowerShares Exchange-Traded Fund Trust
April 30, 2011
Note 1. Organization
PowerShares Exchange-Traded Fund Trust (the "Trust") was organized as a Massachusetts business trust on June 9, 2000 and is authorized to have multiple series of portfolios. The Trust is an open-end management investment company registered under the Investment Company Act of 1940, as amended (the "1940 Act"). As of April 30, 2011, the Trust offered fifty-six portfolios. This report includes the following portfolios:
| Full Name | Short Name | ||||||
| PowerShares Dynamic Basic Materials Sector Portfolio | "Dynamic Basic Materials Sector Portfolio" | ||||||
| PowerShares Dynamic Consumer Discretionary Sector Portfolio | "Dynamic Consumer Discretionary Sector Portfolio" | ||||||
| PowerShares Dynamic Consumer Staples Sector Portfolio | "Dynamic Consumer Staples Sector Portfolio" | ||||||
| PowerShares Dynamic Energy Sector Portfolio | "Dynamic Energy Sector Portfolio" | ||||||
| PowerShares Dynamic Financial Sector Portfolio | "Dynamic Financial Sector Portfolio" | ||||||
| PowerShares Dynamic Healthcare Sector Portfolio | "Dynamic Healthcare Sector Portfolio" | ||||||
| PowerShares Dynamic Industrials Sector Portfolio | "Dynamic Industrials Sector Portfolio" | ||||||
| PowerShares Dynamic Technology Sector Portfolio | "Dynamic Technology Sector Portfolio" | ||||||
| PowerShares Dynamic Utilities Portfolio | "Dynamic Utilities Portfolio" | ||||||
| PowerShares NASDAQ Internet Portfolio | "NASDAQ Internet Portfolio" | ||||||
Each portfolio (the "Fund" and collectively the "Funds") represents a separate series of the Trust. The shares of the Funds are referred to herein as "Shares" or "Fund's Shares." Each Fund's Shares are listed and traded on the NYSE Arca, Inc. ("NYSE Arca") except for Shares of the NASDAQ Internet Portfolio, which are listed and traded on the NASDAQ Stock Market LLC.
The Funds' market prices may differ to some degree from the net asset value ("NAV") of the Shares of each Fund. Unlike conventional mutual funds, each Fund issues and redeems Shares on a continuous basis, at NAV, only in a large specified number of Shares, each called a "Creation Unit." Creation Units are issued and redeemed generally in-kind for securities included in the relevant index. Except when aggregated in Creation Units by Authorized Participants, Shares are not individually redeemable securities of the Funds.
The investment objective of each Fund is to seek investment results that correspond (before fees and expenses) generally to the price and yield performance of the following indices (each, an "Underlying Index"):
| Fund | Index | ||||||
| Dynamic Basic Materials Sector Portfolio | Dynamic Basic Materials Sector IntellidexSM Index | ||||||
| Dynamic Consumer Discretionary Sector Portfolio | Dynamic Consumer Discretionary Sector IntellidexSM Index | ||||||
| Dynamic Consumer Staples Sector Portfolio | Dynamic Consumer Staples Sector IntellidexSM Index | ||||||
| Dynamic Energy Sector Portfolio | Dynamic Energy Sector IntellidexSM Index | ||||||
| Dynamic Financial Sector Portfolio | Dynamic Financial Sector IntellidexSM Index | ||||||
| Dynamic Healthcare Sector Portfolio | Dynamic Healthcare Sector IntellidexSM Index | ||||||
| Dynamic Industrials Sector Portfolio | Dynamic Industrials Sector IntellidexSM Index | ||||||
| Dynamic Technology Sector Portfolio | Dynamic Technology Sector IntellidexSM Index | ||||||
| Dynamic Utilities Portfolio | Dynamic Utilities IntellidexSM Index | ||||||
| NASDAQ Internet Portfolio | NASDAQ Internet IndexSM | ||||||
57
Notes to Financial Statements (Continued)
PowerShares Exchange-Traded Fund Trust
April 30, 2011
Note 2. Significant Accounting Policies
The preparation of the financial statements in accordance with Generally Accepted Accounting Principles ("GAAP") in the United States of America requires management to make estimates and assumptions that affect the reported amounts and disclosures in the financial statements, including estimates and assumptions related to taxation. Actual results could differ from these estimates. In addition, the Funds monitor for material events or transactions that may occur or become known after the period-end date and before the date the financial statements are released to print.
A. Security Valuation
Securities, including restricted securities, are valued according to the following policies.
A security listed or traded on an exchange (except convertible bonds) is valued at its last sales price or official closing price as of the close of the customary trading session on the exchange where the security is principally traded, or lacking any sales or official closing price on a particular day, the security may be valued at the closing bid price on that day. Securities traded in the over-the-counter market are valued based on prices furnished by independent pricing services or market makers. Listed options, if no closing price is available, are valued at the mean between the last bid and ask prices from the exchange on which they are principally traded. Options not listed on an exchange are valued by an independent source at the mean between the last bid and ask prices.
Investments in open-end registered investment companies not traded on an exchange are valued at the end of day NAV per share.
Debt obligations (including convertible bonds) and unlisted equities are fair valued using an evaluated quote provided by an independent pricing service. Evaluated quotes provided by the pricing service may be determined without exclusive reliance on quoted prices, and may reflect appropriate factors such as institution-size trading in similar groups of securities, developments related to specific securities, dividend rate, yield, quality, type of issue, coupon rate, maturity, individual trading characteristics and other market data. Short-term obligations, including commercial paper, having 60 days or less to maturity are recorded at amortized cost which approximates value. Debt securities are subject to interest rate and credit risks. In addition, all debt securities involve some risk of default with respect to interest and/or principal payments.
Foreign securities (including foreign exchange contracts) are converted into U.S. dollar amounts using the applicable exchange rates as of the close of the London world markets. If market quotations are available and reliable for foreign exchange traded equity securities, the securities will be valued at the market quotations. Because trading hours for certain foreign securities end before the close of the New York Stock Exchange ("NYSE"), closing market quotations may become unreliable. If between the time trading ends on a particular security and the close of the customary trading session on the NYSE, events occur that are significant and make the closing price unreliable, the Fund may fair value the security. If the event is likely to have affected the closing price of the security, the security will be valued at fair value in good faith using procedures approved by the Board of Trustees. Adjustments to closing prices to reflect fair value may also be based on a screening process of an independent pricing service to indicate the degree of certainty, based on historical data, that the closing price in the principal market where a foreign security trades is not the current value as of the close of the NYSE. Foreign securities meeting the approved degree of certainty that the price is not reflective of current value will be priced at the indication of fair value from the independent pricing service. Multiple factors may be considered by the independent pricing service in determining adjustments to reflect fair value and may include information relating to sector indices,
58
Notes to Financial Statements (Continued)
PowerShares Exchange-Traded Fund Trust
April 30, 2011
American depository receipts and domestic and foreign index futures. Foreign securities may have additional risks including exchange rate changes, potential for sharply devalued currencies and high inflation, political and economic upheaval, the relative lack of issuer information, relatively low market liquidity and the potential lack of strict financial and accounting controls and standards.
Securities for which market prices are not provided by any of the above methods may be valued based upon quotes furnished by independent sources.
Securities for which market quotations are not readily available or are unreliable are valued at fair value as determined in good faith by or under the supervision of the Trust's officers following procedures approved by the Board of Trustees. Issuer specific events, market trends, bid/ask quotes of brokers and information providers and other market data may be reviewed in the course of making a good faith determination of a security's fair value.
Valuations change in response to many factors including the historical and prospective earnings of the issuer, the value of the issuer's assets, general economic conditions, interest rates, investor perceptions and market liquidity. Because of the inherent uncertainties of valuation, the values reflected in the financial statements may materially differ from the value received upon actual sale of those investments.
B. Other Risks
Replication Management Risk. Unlike many investment companies, the Funds do not utilize an investing strategy that seeks returns in excess of each Fund's respective Underlying Index. Therefore, a Fund would not necessarily sell a security unless that security is removed from its respective Underlying Index.
Non-Diversified Fund Risk. Dynamic Utilities Portfolio and NASDAQ Internet Portfolio are considered non-diversified and can invest a greater portion of assets in securities of individual issuers than a diversified fund. As a result, changes in the market value of a single investment could cause greater fluctuations in Share price than would occur in a diversified fund.
Non-Correlation Risk. Each Fund's return may not match the return of its Underlying Index for a number of reasons. For example, each Fund incurs operating expenses not applicable to its Underlying Index, and incurs costs in buying and selling securities, especially when rebalancing the securities holdings to reflect changes in the composition of its Underlying Index. In addition, the performance of each Fund and its Underlying Index may vary due to asset valuation differences and differences between each Fund's portfolio and its Underlying Index resulting from legal restrictions, cost or liquidity constraints.
Small and Medium Capitalization Company Risk. Investing in securities of small and medium capitalization companies involves greater risk than is customarily associated with investing in larger, more established companies. These companies' securities may be more volatile and less liquid than those of more established companies. These securities may have returns that vary, sometimes significantly, from the overall securities market. Often small and medium capitalization companies and the industries in which they are focused are still evolving and may make them be more sensitive to changing market conditions.
C. Federal Income Taxes
Each Fund intends to comply with the provisions of the Internal Revenue Code applicable to regulated investment companies and to distribute substantially all of the Fund's taxable earnings to its shareholders. As such, the Funds will not be subject to Federal income taxes on otherwise taxable income (including net
59
Notes to Financial Statements (Continued)
PowerShares Exchange-Traded Fund Trust
April 30, 2011
realized gains) that is distributed to the shareholders. Therefore, no provision for Federal income taxes is recorded in the financial statements.
Income and capital gain distributions are determined in accordance with Federal income tax regulations, which may differ from GAAP. These differences are primarily due to differing book and tax treatments for in-kind transactions, losses deferred due to wash sales, and passive foreign investment company adjustments, if any.
The Funds file tax returns in the United States Federal jurisdiction and certain other jurisdictions. Generally, a Fund is subject to examinations by such taxing authorities for up to three years after the filing of the return for the tax period.
D. Investment Income and Investment Transactions
Dividend income is recorded on the ex-dividend date, net of foreign taxes withheld, if any. Interest income is recorded on the accrual basis. Investment transactions are recorded on the trade date. Realized gains and losses from the sale or disposition of securities are calculated on the specific identified cost basis. Dividends and interest received by a Fund may give rise to withholding and other taxes imposed by foreign countries. Corporate actions (including cash dividends) are recorded net of non-reclaimable foreign tax withholdings on the ex-dividend date. Tax conventions between certain countries and the United States may reduce or eliminate such taxes.
E. Expenses
Expenses of the Trust, that are directly identifiable to a specific Fund, are applied to that Fund. Expenses that are not readily identifiable to a specific Fund are allocated in such a manner as deemed equitable, taking into consideration the nature and type of expense and the relative net assets of each Fund.
Each Fund (except for NASDAQ Internet Portfolio) is responsible for all of its expenses, including the investment advisory fees, costs of transfer agency, custody, fund administration, legal, audit and other services, interest, taxes, brokerage commissions and other expenses connected with executions of portfolio transactions, sub-licensing fees related to its respective Underlying Intellidex or Underlying Index, any distribution fees or expenses, litigation expenses, fees payable to the Trust's Board members and officers who are not "interested persons" of the Trust or the Adviser, expenses incurred in connection with the Board members' services, including travel expenses and legal fees of counsel for those members of the Board who are not "interested persons" of the Trust and extraordinary expenses.
Expenses included for Dynamic Financial Sector Portfolio, in the accompanying financial statements, reflect the expenses of the Fund and do not include any expenses of the investment companies, in which it invests. The effects of the investment companies' expenses are included in the realized and unrealized gain (loss) on the investments in the investment companies.
The NASDAQ Internet Portfolio has agreed to pay an annual unitary management fee to Invesco PowerShares Capital Management LLC (the "Adviser"). The Adviser has agreed to pay for substantially all expenses of the NASDAQ Internet Portfolio, including the cost of transfer agency, custody, fund administration, legal, audit and other services, except for distribution fees, if any, brokerage expenses, taxes, interest, litigation expenses and other extraordinary expenses.
60
Notes to Financial Statements (Continued)
PowerShares Exchange-Traded Fund Trust
April 30, 2011
F. Dividends and Distributions to Shareholders
Each Fund declares and pays dividends from net investment income, if any, to its shareholders quarterly and records on ex-dividend date. Each Fund distributes net realized taxable capital gains, if any, generally annually in cash and records them on ex-dividend date. Such distributions on a tax basis are determined in conformity with income tax regulations which may differ from GAAP. Distributions in excess of tax basis earnings and profits, if any, are reported in such Fund's financial statements as a tax return of capital at fiscal period-end.
G. Equalization
All of the Funds use the accounting practice of equalization. This accounting method is used to keep the continuing shareholder's per Share equity in undistributed net investment income from being affected by the continuous sales and redemptions of capital Shares. Equalization is calculated on a per Share basis whereby a portion of the proceeds from the sales and cost of repurchases of capital Shares is applied to undistributed net investment income. The amount of equalization is disclosed in the Statements of Changes in Net Assets as undistributed net investment income (loss) included in the price of capital Shares issued or redeemed. The distributions to shareholders of amounts so applied may be deemed to be a return of capital for tax purposes to the extent that such distributions exceed taxable income.
Note 3. Investment Advisory Agreement and Other Agreements
The Trust has entered into an Investment Advisory Agreement with the Adviser pursuant to which the Adviser has overall responsibility as the Funds' investment adviser for the selection and ongoing monitoring of the Funds' investments, managing the Funds' business affairs and providing certain clerical, bookkeeping and other administrative services. Each Fund (except for NASDAQ Internet Portfolio) has agreed to pay the Adviser an annual fee of 0.50% of the Fund's average daily net assets. The NASDAQ Internet Portfolio has agreed to pay the Adviser an annual unitary management fee of 0.60% of the Fund's average daily net assets and the Adviser has agreed to pay for substantially all expenses of the NASDAQ Internet Portfolio, including the cost of transfer agency, custody, fund administration, legal, audit and other services, except for distribution fees, if any, brokerage expenses, taxes, interest, litigation expenses and other extraordinary expenses.
The Adviser has entered into an Amended and Restated Excess Expense Agreement (the "Excess Expense Agreement") with the Trust, pursuant to which the Adviser has agreed to waive fees and/or pay Fund expenses to the extent necessary to prevent the operating expenses of each Fund other than the NASDAQ Internet Portfolio (excluding interest expense, brokerage commissions and other trading expenses, sub-licensing fees, offering costs, taxes, expenses of the investment companies that are paid indirectly as a result of share ownership of the investment companies and extraordinary expenses) from exceeding 0.60% of the Fund's average daily net assets per year (the "Expense Cap"), at least until August 31, 2012. Offering costs excluded from the Expense Cap are: (a) initial legal fees pertaining to the Funds' Shares offered for sale; (b) initial Securities and Exchange Commission and state registration fees; and (c) initial fees paid to be listed on an exchange.
The Excess Expense Agreement provides that the expenses borne by the Adviser are subject to recapture by the Adviser for up to three years from the date the fee or expense was borne by the Adviser, but no recapture payment will be made by a Fund if it would result in the Fund exceeding its Expense Cap as specified above. The Excess Expense Agreement does not apply to the NASDAQ Internet Portfolio.
61
Notes to Financial Statements (Continued)
PowerShares Exchange-Traded Fund Trust
April 30, 2011
The amounts available for potential future recapture by the Adviser under the Excess Expense Agreement and the expiration schedule at April 30, 2011 are as follows:
| Total Potential | Potential Recapture Amounts Expiring | ||||||||||||||||||
| Recapture Amounts | 04/30/12 | 04/30/13 | 04/30/14 | ||||||||||||||||
| Dynamic Basic Materials Sector Portfolio | $ | 277,118 | $ | 95,566 | $ | 89,112 | $ | 92,440 | |||||||||||
| Dynamic Consumer Discretionary Sector Portfolio | 325,452 | 106,300 | 102,088 | 117,064 | |||||||||||||||
| Dynamic Consumer Staples Sector Portfolio | 289,577 | 92,028 | 87,641 | 109,908 | |||||||||||||||
| Dynamic Energy Sector Portfolio | 265,196 | 97,775 | 91,813 | 75,608 | |||||||||||||||
| Dynamic Financial Sector Portfolio | 322,973 | 99,362 | 104,373 | 119,238 | |||||||||||||||
| Dynamic Healthcare Sector Portfolio | 239,082 | 68,849 | 57,703 | 112,530 | |||||||||||||||
| Dynamic Industrials Sector Portfolio | 275,486 | 80,755 | 88,551 | 106,180 | |||||||||||||||
| Dynamic Technology Sector Portfolio | 280,270 | 90,118 | 87,323 | 102,829 | |||||||||||||||
| Dynamic Utilities Portfolio | 293,134 | 87,649 | 98,255 | 107,230 | |||||||||||||||
The Trust has entered into a Distribution Agreement with Invesco Distributors, Inc. (the "Distributor"), which serves as the distributor of Creation Units for each Fund. The Distributor does not maintain a secondary market in the Shares. The Distributor is an affiliate of the Adviser.
The Adviser has entered into a licensing agreement for each Fund with the following Licensors:
| Fund | Licensor | ||||||
| Dynamic Basic Materials Sector Portfolio | NYSE Arca | ||||||
| Dynamic Consumer Discretionary Sector Portfolio | NYSE Arca | ||||||
| Dynamic Consumer Staples Sector Portfolio | NYSE Arca | ||||||
| Dynamic Energy Sector Portfolio | NYSE Arca | ||||||
| Dynamic Financial Sector Portfolio | NYSE Arca | ||||||
| Dynamic Healthcare Sector Portfolio | NYSE Arca | ||||||
| Dynamic Industrials Sector Portfolio | NYSE Arca | ||||||
| Dynamic Technology Sector Portfolio | NYSE Arca | ||||||
| Dynamic Utilities Portfolio | NYSE Arca | ||||||
| NASDAQ Internet Portfolio | NASDAQ OMX Group, Inc. | ||||||
Each Underlying Index name trademark is owned by the respective Licensors. These trademarks have been licensed to the Adviser for use with the Funds. The Funds are not sponsored, endorsed, sold or promoted by the Licensors and the Licensors make no representation regarding the advisability of investing in any of these Funds. The Trust has entered into a sub-licensing agreement under which the Funds (other than the NASDAQ Internet Portfolio) are required to pay the sub-licensing fees which are shown on the Statements of Operations.
The Trust has entered into service agreements whereby The Bank of New York Mellon, a wholly-owned subsidiary of The Bank of New York Mellon Corporation, serves as the administrator, custodian, fund accountant and transfer agent for each Fund.
62
Notes to Financial Statements (Continued)
PowerShares Exchange-Traded Fund Trust
April 30, 2011
Note 4. Additional Valuation Information
GAAP defines fair value as the price that would be received to sell an asset or paid to transfer a liability in an orderly transaction between market participants at the measurement date, under current market conditions. GAAP establishes a hierarchy that prioritizes the inputs to valuation methods giving the highest priority to readily available unadjusted quoted prices in an active market for identical assets (Level 1) and the lowest priority to significant unobservable inputs (Level 3) generally when market prices are not readily available or are unreliable. Based on the valuation inputs, the securities or other investments are tiered into one of three levels. Changes in valuation methods may result in transfers in or out of an investment's assigned level:
Level 1 – Prices are determined using quoted prices in an active market for identical assets.
Level 2 – Prices are determined using other significant observable inputs. Observable inputs are inputs that other market participants may use in pricing a security. These may include quoted prices for similar securities, interest rates, prepayment speeds, credit risk, yield curves, loss severities, default rates, discount rates, volatilities and others.
Level 3 – Prices are determined using significant unobservable inputs. In situations where quoted prices or observable inputs are unavailable (for example, when there is little or no market activity for an investment at the end of the period), unobservable inputs may be used. Unobservable inputs reflect the Fund's own assumptions about the factors market participants would use in determining fair value of the securities or instruments and would be based on the best available information.
Except for the Fund listed below, as of April 30, 2011, the securities in each Fund were valued based on Level 1 inputs. The level assigned to the securities valuations may not be an indication of the risk or liquidity associated with investing in those securities. Because of the inherent uncertainties of valuation, the values reflected in the financial statements may materially differ from the value received upon actual sale of those investments.
With respect to each Fund, during the fiscal year ended April 30, 2011, there were no significant transfers between investment levels.
| Investment in Securities | |||||||||||||||||||
| Level 1 | Level 2 | Level 3 | Total | ||||||||||||||||
| NASDAQ Internet Portfolio Equity Securities | $ | 45,522,496 | $ | — | $ | 7,119 | $ | 45,529,615 | |||||||||||
63
Notes to Financial Statements (Continued)
PowerShares Exchange-Traded Fund Trust
April 30, 2011
Note 5. Distributions to Shareholders and Tax Components of Net Assets
Tax Character of Distributions to Shareholders Paid During the Fiscal Years Ended April 30, 2011 and 2010:
| 2011 | 2010 | ||||||||||||||||||
| Ordinary Income | Return of Capital | Ordinary Income | Return of Capital | ||||||||||||||||
| Dynamic Basic Materials Sector Portfolio | $ | 1,632,096 | $ | — | $ | 372,907 | $ | — | |||||||||||
| Dynamic Consumer Discretionary Sector Portfolio | 142,120 | — | 42,516 | — | |||||||||||||||
| Dynamic Consumer Staples Sector Portfolio | 712,831 | — | 710,824 | — | |||||||||||||||
| Dynamic Energy Sector Portfolio | 444,392 | — | 298,571 | — | |||||||||||||||
| Dynamic Financial Sector Portfolio | 315,046 | — | 228,052 | — | |||||||||||||||
| Dynamic Healthcare Sector Portfolio | — | — | 214,570 | 116,320 | |||||||||||||||
| Dynamic Industrials Sector Portfolio | 298,462 | — | 585,231 | — | |||||||||||||||
| Dynamic Technology Sector Portfolio | — | 20,352 | — | — | |||||||||||||||
| Dynamic Utilities Portfolio | 1,369,784 | — | 1,469,967 | — | |||||||||||||||
Tax Components of Net Assets at Fiscal Year-End:
| Undistributed Ordinary Income | Temporary Book/Tax Differences | Net Unrealized Appreciation | Capital Loss Carryforward | Post-October Deferrals* | Shares of Beneficial Interest | Total Net Assets | |||||||||||||||||||||||||
| Dynamic Basic Materials Sector Portfolio | $ | 52,213 | $ | (4,790 | ) | $ | 20,392,543 | $ | (11,045,722 | ) | $ | — | $ | 88,196,956 | $ | 97,591,200 | |||||||||||||||
| Dynamic Consumer Discretionary Sector Portfolio | 32,901 | (4,135 | ) | 2,706,273 | (5,281,768 | ) | (565,369 | ) | 23,768,869 | 20,656,771 | |||||||||||||||||||||
| Dynamic Consumer Staples Sector Portfolio | 104,622 | (4,692 | ) | 7,972,104 | (7,907,453 | ) | (790,154 | ) | 41,397,343 | 40,771,770 | |||||||||||||||||||||
| Dynamic Energy Sector Portfolio | 336,007 | (4,827 | ) | 31,261,183 | (8,848,334 | ) | — | 169,158,816 | 191,902,845 | ||||||||||||||||||||||
| Dynamic Financial Sector Portfolio | 6,181 | (4,267 | ) | 3,023,246 | (8,830,865 | ) | (146,140 | ) | 28,444,319 | 22,492,474 | |||||||||||||||||||||
| Dynamic Healthcare Sector Portfolio | — | (6,329 | ) | 12,074,528 | (41,602,977 | ) | (396,801 | ) | 92,753,512 | 62,821,933 | |||||||||||||||||||||
| Dynamic Industrials Sector Portfolio | 261,862 | (5,117 | ) | 9,949,625 | (31,994,466 | ) | — | 135,416,813 | 113,628,717 | ||||||||||||||||||||||
| Dynamic Technology Sector Portfolio | — | (4,774 | ) | 4,902,967 | (21,361,976 | ) | (479,401 | ) | 66,736,583 | 49,793,399 | |||||||||||||||||||||
| Dynamic Utilities Portfolio | 118,809 | (4,901 | ) | 5,031,056 | (10,682,094 | ) | (1,167,319 | ) | 53,793,290 | 47,088,841 | |||||||||||||||||||||
| NASDAQ Internet Portfolio | — | — | 10,627,973 | (172,721 | ) | (90,869 | ) | 35,142,878 | 45,507,261 | ||||||||||||||||||||||
* Capital loss incurred after October 31 ("Post-October losses") within the taxable year are deemed to arise on the first business day of each Fund's next taxable year.
Capital loss carryforward is calculated and reported as of a specific date. Results of transactions and other activity after that date may affect the amount of capital loss carryforward actually available for the Funds to utilize. The ability to utilize capital loss carryforward in the future may be limited under Internal Revenue Code rules and related regulations based on the results of future transactions.
64
Notes to Financial Statements (Continued)
PowerShares Exchange-Traded Fund Trust
April 30, 2011
The following Funds have capital loss carryforward amounts as of April 30, 2011, which expire on April 30 of each year listed below:
| 2015 | 2016 | 2017 | 2018 | 2019 | Total* | ||||||||||||||||||||||
| Dynamic Basic Materials Sector Portfolio | $ | — | $ | 205,528 | $ | 3,783,798 | $ | 4,534,904 | $ | 2,521,492 | $ | 11,045,722 | |||||||||||||||
| Dynamic Consumer Discretionary Sector Portfolio | — | 1,246,058 | 1,993,654 | — | 2,042,056 | 5,281,768 | |||||||||||||||||||||
| Dynamic Consumer Staples Sector Portfolio | — | 634,544 | 2,156,980 | 3,935,363 | 1,180,566 | 7,907,453 | |||||||||||||||||||||
| Dynamic Energy Sector Portfolio | — | 880,885 | 2,869,667 | 3,914,682 | 1,183,100 | 8,848,334 | |||||||||||||||||||||
| Dynamic Financial Sector Portfolio | — | 614,940 | 1,821,971 | 4,413,894 | 1,980,060 | 8,830,865 | |||||||||||||||||||||
| Dynamic Healthcare Sector Portfolio | — | 2,234,184 | 17,890,879 | 18,737,951 | 2,739,963 | 41,602,977 | |||||||||||||||||||||
| Dynamic Industrials Sector Portfolio | — | 1,476,057 | 6,525,387 | 21,245,288 | 2,747,734 | 31,994,466 | |||||||||||||||||||||
| Dynamic Technology Sector Portfolio | — | 2,465,875 | 8,220,697 | 7,658,564 | 3,016,840 | 21,361,976 | |||||||||||||||||||||
| Dynamic Utilities Portfolio | 430,964 | 2,124,736 | 1,366,073 | 5,885,935 | 874,386 | 10,682,094 | |||||||||||||||||||||
| NASDAQ Internet Portfolio | — | — | 2,112 | 95,746 | 74,863 | 172,721 | |||||||||||||||||||||
* Capital loss carryforward as of the date listed above is reduced for limitations, if any, to the extent required by the Internal Revenue Code.
Note 6. Investment Transactions
For the fiscal year ended April 30, 2011, the cost of securities purchased and proceeds from sales of securities, excluding short-term securities, money market funds and in-kind transactions, were as follows:
| Purchases | Sales | ||||||||||
| Dynamic Basic Materials Sector Portfolio | $ | 18,755,492 | $ | 18,043,051 | |||||||
| Dynamic Consumer Discretionary Sector Portfolio | 13,415,021 | 13,362,493 | |||||||||
| Dynamic Consumer Staples Sector Portfolio | 20,657,777 | 20,502,752 | |||||||||
| Dynamic Energy Sector Portfolio | 32,984,063 | 30,537,090 | |||||||||
| Dynamic Financial Sector Portfolio | 11,136,137 | 10,743,680 | |||||||||
| Dynamic Healthcare Sector Portfolio | 39,858,488 | 39,615,669 | |||||||||
| Dynamic Industrials Sector Portfolio | 23,942,222 | 23,594,042 | |||||||||
| Dynamic Technology Sector Portfolio | 26,733,321 | 27,428,044 | |||||||||
| Dynamic Utilities Portfolio | 27,877,867 | 27,695,900 | |||||||||
| NASDAQ Internet Portfolio | 5,303,651 | 5,301,350 | |||||||||
For the fiscal year ended April 30, 2011, in-kind transactions associated with creations and redemptions were as follows:
| Securities Received | Securities Delivered | ||||||||||
| Dynamic Basic Materials Sector Portfolio | $ | 69,340,647 | $ | 40,713,387 | |||||||
| Dynamic Consumer Discretionary Sector Portfolio | 33,963,366 | 36,968,209 | |||||||||
| Dynamic Consumer Staples Sector Portfolio | 18,674,648 | 22,968,305 | |||||||||
| Dynamic Energy Sector Portfolio | 185,979,278 | 7,527,382 | |||||||||
| Dynamic Financial Sector Portfolio | 23,042,654 | 20,682,566 | |||||||||
| Dynamic Healthcare Sector Portfolio | 63,652,629 | 105,923,005 | |||||||||
| Dynamic Industrials Sector Portfolio | 128,915,837 | 61,169,987 | |||||||||
| Dynamic Technology Sector Portfolio | 57,622,402 | 52,467,694 | |||||||||
| Dynamic Utilities Portfolio | 46,258,564 | 43,539,835 | |||||||||
| NASDAQ Internet Portfolio | 26,087,406 | 6,955,322 | |||||||||
65
Notes to Financial Statements (Continued)
PowerShares Exchange-Traded Fund Trust
April 30, 2011
Gains and (losses) on in-kind transactions are generally not considered taxable gains and (losses) for Federal income tax purposes.
At April 30, 2011, the aggregate cost and the net unrealized appreciation of investments for tax purposes were as follows:
| Cost | Net Unrealized Appreciation | Gross Unrealized Appreciation | Gross Unrealized (Depreciation) | ||||||||||||||||
| Dynamic Basic Materials Sector Portfolio | $ | 77,330,721 | $ | 20,392,543 | $ | 20,820,892 | $ | (428,349 | ) | ||||||||||
| Dynamic Consumer Discretionary Sector Portfolio | 18,008,513 | 2,706,273 | 2,905,218 | (198,945 | ) | ||||||||||||||
| Dynamic Consumer Staples Sector Portfolio | 32,842,985 | 7,972,104 | 7,981,205 | (9,101 | ) | ||||||||||||||
| Dynamic Energy Sector Portfolio | 160,686,473 | 31,261,183 | 31,572,422 | (311,239 | ) | ||||||||||||||
| Dynamic Financial Sector Portfolio | 19,540,622 | 3,023,246 | 3,172,331 | (149,085 | ) | ||||||||||||||
| Dynamic Healthcare Sector Portfolio | 50,872,083 | 12,074,528 | 12,325,836 | (251,308 | ) | ||||||||||||||
| Dynamic Industrials Sector Portfolio | 103,770,818 | 9,949,625 | 10,619,963 | (670,338 | ) | ||||||||||||||
| Dynamic Technology Sector Portfolio | 44,968,292 | 4,902,967 | 5,817,570 | (914,603 | ) | ||||||||||||||
| Dynamic Utilities Portfolio | 42,078,815 | 5,031,056 | 5,396,089 | (365,033 | ) | ||||||||||||||
| NASDAQ Internet Portfolio | 34,901,642 | 10,627,973 | 11,442,192 | (814,219 | ) | ||||||||||||||
Note 7. Reclassification of Permanent Differences
Primarily as a result of differing book/tax treatment of investment activity, on April 30, 2011, amounts were reclassified between undistributed net investment income (loss), undistributed net realized gain (loss) and Shares of beneficial interest. These reclassifications had no effect on the net assets of each Fund. For the fiscal year ended April, 30, 2011, the reclassifications were as follow:
| Undistributed Net Investment Income (Loss) | Undistributed Net Realized Gain (Loss) | Shares of Beneficial Interest | |||||||||||||
| Dynamic Basic Materials Sector Portfolio | $ | (469,589 | ) | $ | (9,118,848 | ) | $ | 9,588,437 | |||||||
| Dynamic Consumer Discretionary Sector Portfolio | (14,507 | ) | (4,940,117 | ) | 4,954,624 | ||||||||||
| Dynamic Consumer Staples Sector Portfolio | 46,060 | (3,711,480 | ) | 3,665,420 | |||||||||||
| Dynamic Energy Sector Portfolio | (232,786 | ) | (15,104,392 | ) | 15,337,178 | ||||||||||
| Dynamic Financial Sector Portfolio | (3,550 | ) | (2,647,538 | ) | 2,651,088 | ||||||||||
| Dynamic Healthcare Sector Portfolio | (6,475 | ) | (15,124,808 | ) | 15,131,283 | ||||||||||
| Dynamic Industrials Sector Portfolio | 16,427 | (8,661,155 | ) | 8,644,728 | |||||||||||
| Dynamic Technology Sector Portfolio | 34,716 | (9,671,751 | ) | 9,637,035 | |||||||||||
| Dynamic Utilities Portfolio | 14,215 | (4,209,586 | ) | 4,195,371 | |||||||||||
| NASDAQ Internet Portfolio | 121,005 | (2,718,734 | ) | 2,597,729 | |||||||||||
Note 8. Trustees' Fees
The Fund compensates each Trustee who is not an "interested person" as defined in the 1940 Act (an "Independent Trustee"). The Adviser, as a result of the unitary management fee, pays for such compensation on behalf of the NASDAQ Internet Portfolio. The Non-Independent Trustees of the Trust do not receive any Trustees' fees.
66
Notes to Financial Statements (Continued)
PowerShares Exchange-Traded Fund Trust
April 30, 2011
The Trust has adopted a deferred compensation plan (the "Plan"). Under the Plan, an Independent Trustee who has executed a Deferred Fee Agreement (a "Participating Trustee") may defer receipt of all or a portion of his compensation ("Deferral Fees"). Such Deferral Fees are deemed to be invested in select PowerShares Funds. The Deferral Fees payable to the Participating Trustee are valued as of the date such Deferral Fees would have been paid to the Participating Trustee. The value increases with contributions or with increases in the value of the Shares selected, and the value decreases with distributions or with declines in the value of the Shares selected.
Note 9. Capital
Shares are created and redeemed by the Trust only in Creation Unit size aggregations of 50,000 Shares. Only Authorized Participants are permitted to purchase or redeem Creation Units from the Funds. Such transactions are generally permitted on an in-kind basis, with a balancing cash component to equate the transaction to the NAV per Share of each Fund of the Trust on the transaction date. Cash may be substituted equivalent to the value of certain securities generally when they are not available in sufficient quantity for delivery, not eligible for trading by the Authorized Participant or as a result of other market circumstances.
Note 10. Indemnifications
Under the Trust's organizational documents, its officers and Trustees are indemnified against certain liabilities arising out of the performance of their duties to the Trust. Each Independent Trustee is also indemnified against certain liabilities arising out of the performance of his duties to the Trust pursuant to an Indemnification Agreement between the Independent Trustee and the Trust. Additionally, in the normal course of business, the Trust enters into contracts with service providers that contain general indemnification clauses. The Trust's maximum exposure under these arrangements is unknown, as this would involve future claims that may be made against the Trust that have not yet occurred. However, based on experience, the Trust believes the risk of loss to be remote.
67
Report of Independent Registered Public Accounting Firm
To the Board of Trustees and Shareholders of PowerShares Exchange-Traded Fund Trust:
In our opinion, the accompanying statements of assets and liabilities, including the schedules of investments, and the related statements of operations and of changes in net assets and the financial highlights present fairly, in all material respects, the financial position of each of the portfolios indicated in Note 1 of the financial statements (each a portfolio of PowerShares Exchange-Traded Fund Trust, hereafter referred to as the "Trust") at April 30, 2011, and the results of each of their operations, the changes in each of their net assets, and the financial highlights for each of the periods presented, in conformity with accounting principles generally accepted in the United States of America. These financial statements and financial highlights (hereafter referred to as "financial statements") are the responsibility of the Trust's management; our responsibility is to express an opinion on these financial statements based on our audits. We conducted our audits of these financial statements in accordance with the standards of the Public Company Accounting Oversight Board (United States). Those standards require that we plan and perform the audit to obtain reasonable assurance about whether the financial statements are free of material misstatement. An audit includes examining, on a test basis, evidence supporting the amounts and disclosures in the financial statements, assessing the accounting principles used and significant estimates made by management, and evaluating the overall financial statement presentation. We believe that our audits, which included confirmation of securities at April 30, 2011 by correspondence with the custodian and brokers, and the application of alternative auditing procedures where securities purchased had not been received, provide a reasonable basis for our opinion.
/s/ PricewaterhouseCoopers LLP
New York, New York
June 24, 2011
68
Tax Information
Form 1099-DIV, Form 1042-S and other year-end tax information provide shareholders with actual calendar year amounts that should be included in their tax returns. Shareholders should consult their tax advisors.
The following distribution information is being provided as required by the Internal Revenue Code or to meet a specific state's requirement.
Each Fund designates the following amounts or, if subsequently determined to be different, the maximum amount allowable for its fiscal year ended April 30, 2011:
Federal Income Tax Information
| Qualified Dividend Income* | Corporate Dividend Received Deduction* | ||||||||||
| Dynamic Basic Materials Sector Portfolio | 100 | % | 100 | % | |||||||
| Dynamic Consumer Discretionary Sector Portfolio | 100 | % | 100 | % | |||||||
| Dynamic Consumer Staples Sector Portfolio | 100 | % | 100 | % | |||||||
| Dynamic Energy Sector Portfolio | 100 | % | 100 | % | |||||||
| Dynamic Financial Sector Portfolio | 100 | % | 100 | % | |||||||
| Dynamic Healthcare Sector Portfolio | 0 | % | 0 | % | |||||||
| Dynamic Industrials Sector Portfolio | 100 | % | 100 | % | |||||||
| Dynamic Technology Sector Portfolio | 0 | % | 0 | % | |||||||
| Dynamic Utilities Portfolio | 100 | % | 100 | % | |||||||
| NASDAQ Internet Portfolio | 0 | % | 0 | % | |||||||
* The above percentages are based on ordinary income dividends paid to shareholders during the Fund's fiscal year.
69
Supplemental Information
Trustees and Officers
The Independent Trustees, the Trustees who are affiliated with the Adviser (the "Non-Independent Trustees") and the executive officers of the Trust, their term of office and length of time served, their principal business occupations during at least the past five years, the number of portfolios in the Fund Complex overseen by each Trustee and the other directorships, if any, held by a Trustee, are shown below.
The Trustees and Officers information is current as of April 30, 2011.
| Name, Address and Age of Independent Trustees | Position(s) Held with Trust | Term of Office and Length of Time Served* | Principal Occupation(s) During Past 5 Years | Number of Portfolios in Fund Complex** Overseen by Independent Trustees | Other Directorships Held by Independent Trustees | ||||||||||||||||||
| Ronn R. Bagge (53) c/o Invesco PowerShares Capital Management LLC 301 West Roosevelt Road Wheaton, IL 60187 | Trustee | Since 2003 | Founder and Principal, YQA Capital Management LLC (1998-Present); formerly Owner/CEO of Electronic Dynamic Balancing Co., Inc. (high-speed rotating equipment service provider) | 107 | None | ||||||||||||||||||
| Todd J. Barre (53) c/o Invesco PowerShares Capital Management LLC 301 West Roosevelt Road Wheaton, IL 60187 | Trustee | Since 2010 | Assistant Professor of Business, Trinity Christian College (2010-Present); formerly Vice President and Senior Investment Strategist (2001-2008); Director of Open Architecture and Trading (2007-2008); Head of Fundamental Research (2004-2007); and Vice President and Senior Fixed Income Strategist (1994-2001). BMO Financial Group/Harris Private Bank | 107 | None | ||||||||||||||||||
* This is the date the Trustee began serving the Trust. Each Trustee serves an indefinite term, until his successor is elected.
** Fund Complex includes all open-end funds (including all of their portfolios) advised by the Adviser. At April 30, 2011, the Fund Complex consisted of the Trust's 56 portfolios and three other exchange-traded fund trusts with 51 portfolios advised by the Adviser.
70
Supplemental Information (Continued)
Trustees and Officers (Continued)
| Name, Address and Age of Independent Trustees | Position(s) Held with Trust | Term of Office and Length of Time Served* | Principal Occupation(s) During Past 5 Years | Number of Portfolios in Fund Complex** Overseen by Independent Trustees | Other Directorships Held by Independent Trustees | ||||||||||||||||||
| Marc M. Kole (50) c/o Invesco PowerShares Capital Management LLC 301 West Roosevelt Road Wheaton, IL 60187 | Trustee | Since 2006 | Chief Financial Officer, Hope Network (social services) (2008-Present); formerly Assistant Vice President and Controller, Priority Health (health insurance) (2005-2008); Senior Vice President of Finance, United Healthcare (2004-2005); Senior Vice President of Finance, Oxford Health Plans (2000-2004) | 107 | None | ||||||||||||||||||
| Philip M. Nussbaum (49) c/o Invesco PowerShares Capital Management LLC 301 West Roosevelt Road Wheaton, IL 60187 | Trustee | Since 2003 | Chairman, Performance Trust Capital Partners (2004-Present) | 107 | None | ||||||||||||||||||
* This is the date the Trustee began serving the Trust. Each Trustee serves an indefinite term, until his successor is elected.
** Fund Complex includes all open-end funds (including all of their portfolios) advised by the Adviser. At April 30, 2011, the Fund Complex consisted of the Trust's 56 portfolios and three other exchange-traded fund trusts with 51 portfolios advised by the Adviser.
71
Supplemental Information (Continued)
Trustees and Officers (Continued)
| Name, Address and Age of Independent Trustees | Position(s) Held with Trust | Term of Office and Length of Time Served* | Principal Occupation(s) During Past 5 Years | Number of Portfolios in Fund Complex** Overseen by Independent Trustees | Other Directorships Held by Independent Trustees | ||||||||||||||||||
| Donald H. Wilson (51) c/o Invesco PowerShares Capital Management LLC 301 West Roosevelt Road Wheaton, IL 60187 | Trustee | Since 2006 | Chairman and Chief Executive Officer, Stone Pillar Advisers, Ltd. (2010-Present); formerly, Chief Operating Officer, AMCORE Financial, Inc. (bank holding company) (2007-2009); Executive Vice President and Chief Financial Officer, AMCORE Financial, Inc. (2006-2007); Senior Vice President and Treasurer, Marshall & Ilsley Corp. (bank holding company) (1995-2006) | 107 | None | ||||||||||||||||||
* This is the date the Trustee began serving the Trust. Each Trustee serves an indefinite term, until his successor is elected.
** Fund Complex includes all open-end funds (including all of their portfolios) advised by the Adviser. At April 30, 2011, the Fund Complex consisted of the Trust's 56 portfolios and three other exchange-traded fund trusts with 51 portfolios advised by the Adviser.
72
Supplemental Information (Continued)
Trustees and Officers (Continued)
| Name, Address and Age of Interested Trustees | Position(s) Held with Trust | Term of Office and Length of Time Served* | Principal Occupation(s) During Past 5 Years | Number of Portfolios in Fund Complex** Overseen by Interested Trustees | Other Directorships Held by Interested Trustees | ||||||||||||||||||
| H. Bruce Bond (47) Invesco PowerShares Capital Management LLC 301 West Roosevelt Road Wheaton, IL 60187 | Chairman of the Board and Trustee | Since 2003 | Chairman, Invesco Power-Shares Capital Management LLC (2009-Present); formerly, Managing Director, Invesco PowerShares Capital Management LLC (2002-2009); Manager, Nuveen Investments (1998-2002) | 107 | None | ||||||||||||||||||
* This is the date the Trustee began serving the Trust. Each Trustee serves an indefinite term, until his successor is elected.
** Fund Complex includes all open-end funds (including all of their portfolios) advised by the Adviser. At April 30, 2011, the Fund Complex consisted of the Trust's 56 portfolios and three other exchange-traded fund trusts with 51 portfolios advised by the Adviser.
73
Supplemental Information (Continued)
Trustees and Officers (Continued)
| Name, Address and Age of Interested Trustees | Position(s) Held with Trust | Term of Office and Length of Time Served* | Principal Occupation(s) During Past 5 Years | Number of Portfolios in Fund Complex** Overseen by Interested Trustees | Other Directorships Held by Interested Trustees | ||||||||||||||||||
| Kevin M. Carome (54) Invesco Ltd. Two Peachtree Pointe 1555 Peachtree St., N.E. Suite 1800 Atlanta, GA 30309 | Trustee | Since 2010 | Senior Managing Director and General Counsel, Invesco Ltd. (2006-Present); formerly, Senior Vice President and General Counsel, Invesco Advisors, Inc. (2003-2005); Senior Vice President and General Counsel, Liberty Financial Companies, Inc. (2000-2001); General Counsel of certain investment management subsidiaries of Liberty Financial Companies, Inc. (1998-2000); Associate General Counsel, Liberty Financial Companies, Inc. (1993-1998); Associate, Ropes & Gray LLP | 107 | None | ||||||||||||||||||
* This is the date the Trustee began serving the Trust. Each Trustee serves an indefinite term, until his successor is elected.
** Fund Complex includes all open-end funds (including all of their portfolios) advised by the Adviser. At April 30, 2011, the Fund Complex consisted of the Trust's 56 portfolios and three other exchange-traded fund trusts with 51 portfolios advised by the Adviser.
74
Supplemental Information (Continued)
Trustees and Officers (Continued)
| Name, Address and Age of Executive Officer | Position(s) Held with Trust | Length of Time Served* | Principal Occupation(s) During Past 5 Years | ||||||||||||
| Andrew Schlossberg (36) Invesco Management Group, Inc. 11 Greenway Plaza Suite 100 Houston, TX 77046 | President | Since 2009 | Managing Director, U.S. head of business strategy and chief marketing officer for Invesco Ltd. in the United States (2008-Present); formerly, Mr. Schlossberg served in multiple roles within Invesco, including head of corporate development, as well as global leadership roles in strategy and product development in the company's North American Institutional and Retirement divisions (2002-2007) | ||||||||||||
| Bruce T. Duncan (56) Invesco PowerShares Capital Management LLC 301 West Roosevelt Road Wheaton, IL 60187 | Treasurer and Secretary | Treasurer since 2006 and Secretary since 2008 | Senior Vice President of Finance, Invesco PowerShares Capital Management LLC (2005-Present); formerly Private Practice Attorney (2000-2005); Vice President of Investor Relations. The ServiceMaster Company (1994-2000); Vice President of Taxes, The ServiceMaster Company (1990-2000) | ||||||||||||
| Benjamin Fulton (49) Invesco PowerShares Capital Management LLC 301 West Roosevelt Road Wheaton, IL 60187 | Vice President | Since 2009 | Executive Vice President – Global Product Development, Invesco PowerShares Capital Management LLC (2005-Present); formerly principal of Clermont Consulting, a consulting firm focused on the creation and development of retail investment products (2003-2005); President and a founding partner of Claymore Securities, a financial services firm in the Chicago land area (2001-2003); Managing Director of Structured Investments at Nuveen Investments (1998-2001) | ||||||||||||
| Peter Hubbard (29) Invesco PowerShares Capital Management LLC 301 West Roosevelt Road Wheaton, IL 60187 | Vice President | Since 2009 | Vice President and Director of Portfolio Management – Invesco PowerShares Capital Management LLC (2008-Present); formerly Portfolio Manager, Invesco PowerShares Capital Management LLC (2007-2008); Research Analyst, Invesco PowerShares Capital Management LLC (2005-2007); Research Analyst and Trader, Ritchie Capital, a hedge fund operator (2003-2005) | ||||||||||||
* This is the period for which the Officers began serving the Trust. Each Officer serves a one-year term, until his successor is elected.
75
Supplemental Information (Continued)
Trustees and Officers (Continued)
| Name, Address and Age of Executive Officer | Position(s) Held with Trust | Length of Time Served* | Principal Occupation(s) During Past 5 Years | ||||||||||||
| David Warren (53) Invesco Trimark Ltd. 5140 Yonge Street Suite 900 Toronto, Ontario M2N 6X7 | Vice President | Since 2009 | Director, Executive Vice President and Chief Financial Officer, Invesco Trimark Ltd. and Chief Administrative Officer, North American Retail, Invesco Ltd. (2007-Present); formerly Director, Executive Vice President and Chief Financial Officer, Invesco Trimark Ltd. (2000-2006) | ||||||||||||
| Todd Spillane (51) Invesco Management Group, Inc. 11 Greenway Plaza Suite 100 Houston, TX 77046 | Chief Compliance Officer | Since 2010 | Senior Vice President, Invesco Management Group, Inc.; Chief Compliance Officer, INVESCO Private Capital Investments, Inc. (holding company), Invesco Private Capital, Inc. (registered investment adviser) and Invesco Senior Secured Management, Inc. (registered investment adviser); Chief Compliance Officer and Senior Vice President, Invesco Advisers, Inc. (formerly Invesco Institutional (N.A.), Inc. – registered investment adviser) and Vice President, Invesco Distributors, Inc. and Invesco Investment Services, Inc.; formerly Chief Compliance Officer, Invesco Global Asset Management (N.A.), Inc. – (registered investment adviser) and Invesco Advisers, Inc. (formerly Invesco Institutional (N.A.), Inc.) (registered investment adviser); Senior Vice President and Chief Compliance Officer, Invesco Advisors, Inc., Invesco Capital Management, Inc. and Invesco Private Asset Management, Inc.; Vice President, Invesco Capital Management, Inc. and Fund Management Company | ||||||||||||
Availability of Additional Information About the Trustees
The Statement of Additional Information includes additional information about the Trustees and is available, without charge, upon request at (800) 983-0903.
* This is the period for which the Officers began serving the Trust. Each Officer serves a one-year term, until his successor is elected.
76
Board Considerations Regarding Continuation of Investment Advisory Agreement
At a meeting held on April 14, 2011, the Board of Trustees of the PowerShares Exchange-Traded Fund Trust (the "Trust"), including the Independent Trustees, unanimously approved the continuation of the Investment Advisory Agreement between Invesco PowerShares Capital Management LLC (the "Adviser") and the Trust for the following 54 series (each, a "Fund" and collectively, the "Funds"):
PowerShares Dynamic Market Portfolio
PowerShares Dynamic OTC Portfolio
PowerShares Golden Dragon Halter USX China Portfolio
PowerShares High Yield Equity Dividend AchieversTM Portfolio
PowerShares WilderHill Clean Energy Portfolio
PowerShares Dynamic Large Cap Growth Portfolio
PowerShares Dynamic Large Cap Value Portfolio
PowerShares Dynamic Mid Cap Growth Portfolio
PowerShares Dynamic Mid Cap Value Portfolio
PowerShares Dynamic Small Cap Growth Portfolio
PowerShares Dynamic Small Cap Value Portfolio
PowerShares Dynamic Biotechnology & Genome Portfolio
PowerShares Dynamic Food & Beverage Portfolio
PowerShares Dynamic Leisure and Entertainment Portfolio
PowerShares Dynamic Media Portfolio
PowerShares Dynamic Networking Portfolio
PowerShares Dynamic Pharmaceuticals Portfolio
PowerShares Dynamic Semiconductors Portfolio
PowerShares Dynamic Software Portfolio
PowerShares Zacks Micro Cap Portfolio
PowerShares Aerospace & Defense Portfolio
PowerShares Morningstar StockInvestor Core Portfolio
PowerShares Dividend AchieversTM Portfolio
PowerShares International Dividend AchieversTM Portfolio
PowerShares Dynamic Building and Construction Portfolio
PowerShares Dynamic Energy Exploration and Production Portfolio
PowerShares WilderHill Progressive Energy Portfolio
PowerShares Dynamic Insurance Portfolio
PowerShares Dynamic Oil and Gas Services Portfolio
PowerShares Dynamic Retail Portfolio
PowerShares Dynamic Utilities Portfolio
PowerShares Lux Nanotech Portfolio
PowerShares FTSE RAFI US 1000 Portfolio
PowerShares FTSE RAFI US 1500 Small-Mid Portfolio
PowerShares Water Resources Portfolio
PowerShares Dynamic Energy Sector Portfolio
PowerShares Dynamic Financial Sector Portfolio
PowerShares Dynamic Healthcare Sector Portfolio
PowerShares Dynamic Industrials Sector Portfolio
PowerShares Dynamic Large Cap Portfolio
PowerShares Dynamic MagniQuant Portfolio
PowerShares Dynamic Mid Cap Portfolio
PowerShares Dynamic Small Cap Portfolio
PowerShares Dynamic Technology Sector Portfolio
PowerShares Buyback AchieversTM Portfolio
PowerShares CleantechTM Portfolio
PowerShares Dynamic Banking Portfolio
PowerShares Dynamic Basic Materials Sector Portfolio
PowerShares Dynamic Consumer Discretionary Sector Portfolio
PowerShares Dynamic Consumer Staples Sector Portfolio
PowerShares Financial Preferred Portfolio
PowerShares Global Listed Private Equity Portfolio
PowerShares DWA Technical LeadersTM Portfolio
PowerShares S&P 500® High Quality Portfolio
77
Board Considerations Regarding Continuation of Investment Advisory Agreement (Continued)
The Trustees reviewed information from the Adviser describing: (i) the nature, extent and quality of services provided, (ii) the investment performance of the Funds and the Adviser, (iii) the costs of services provided and estimated profits realized by the Adviser, (iv) the extent to which economies of scale are realized as the Funds grow, (v) whether fee levels reflect any possible economies of scale for the benefit of Fund shareholders, (vi) comparisons of services rendered and amounts paid to other registered investment companies and (vii) any benefits realized by the Adviser from its relationship with each Fund. Based on all of the information considered and the conclusions reached, the Board, including the Independent Trustees, determined to approve the continuation of the Investment Advisory Agreement for each Fund. No single factor was determinative in the Board's analysis.
Nature, Extent and Quality of Services. In evaluating the nature, extent and quality of the Adviser's services, the Trustees reviewed information concerning the functions performed by the Adviser for the Funds, information describing the Adviser's current organization and projected staffing, including operations assistance provided by the Adviser's parent organization, Invesco Ltd., and the background and experience of the persons responsible for the day-to-day management of the Funds. The Trustees reviewed matters related to the Adviser's execution of portfolio transactions on behalf of the Funds. The Trustees also reviewed information on the performance of the Funds and the performance of their underlying indices through December 31, 2010, including reports on the correlation and tracking error between the underlying index and each Fund's performance, as well as the Adviser's analysis of the tracking error between each Fund and its underlying index. The Trustees noted that, in each case, the correlation and tracking error for each Fund was within the targeted range set forth in the Trust's registration statement. The Trustees concluded that each Fund was correlated to its underlying index and that the tracking error for each Fund was within an acceptable range given that Fund's particular circumstances.
The Trustees also considered the services provided by the Adviser in its oversight of the Funds' administrator, custodian and transfer agent. They noted the significant amount of time and effort that had been devoted to this oversight function.
Based on their review, the Trustees concluded that the nature, extent and quality of services provided by the Adviser to the Funds under the Investment Advisory Agreement were appropriate and reasonable.
Fees, Expenses and Profitability. The Trustees reviewed and discussed the information provided by the Adviser on each Fund's expense ratio and advisory fee, as compared to information compiled by the Adviser from Lipper Inc. databases on the expense ratios of comparable exchange-traded funds ("ETFs"), open-end (non-ETF) index funds and open-end actively-managed funds. The Trustees noted that the annual advisory fee charged to each Fund is:
• 0.50% of the Fund's average net assets, for each Fund other than PowerShares High Yield Equity Dividend Achievers(TM) Portfolio, PowerShares Dividend Achievers(TM) Portfolio, PowerShares International Dividend Achievers(TM) Portfolio, PowerShares FTSE RAFI US 1000 Portfolio and PowerShares FTSE RAFI US 1500 Small-Mid Portfolio;
• 0.40% of the Fund's average net assets, for each of PowerShares High Yield Equity Dividend Achievers(TM) Portfolio, PowerShares Dividend Achievers(TM) Portfolio and PowerShares International Dividend Achievers(TM) Portfolio; and
• 0.29% of the Fund's average net assets, for each of PowerShares FTSE RAFI US 1000 Portfolio and PowerShares FTSE RAFI US 1500 Small-Mid Portfolio.
78
Board Considerations Regarding Continuation of Investment Advisory Agreement (Continued)
The Trustees also noted that the Adviser has agreed to waive a portion of its advisory fee and/or pay expenses (an "Expense Cap") to the extent necessary to prevent the annual operating expenses of each Fund from exceeding the percentage of that Fund's average daily net assets, at least until August 31, 2012, as set forth below:
• 0.60%, excluding interest expenses, brokerage commissions and other trading expenses, taxes and extraordinary expenses, for each of PowerShares Dynamic OTC Portfolio and PowerShares Dynamic Market Portfolio;
• 0.50%, excluding interest expenses, licensing fees, offering costs, brokerage commissions and other trading expenses, taxes and extraordinary expenses, for each of PowerShares High Yield Equity Dividend Achievers(TM) Portfolio, PowerShares Dividend Achievers(TM) Portfolio and PowerShares International Dividend Achievers(TM) Portfolio;
• 0.50%, excluding interest expenses, offering costs, brokerage commissions and other trading expenses, taxes and extraordinary expenses, for each of PowerShares Morningstar StockInvestor Core Portfolio and PowerShares S&P 500® High Quality Portfolio (the Trustees noted that the Expense Cap for each of these Funds was reduced to 0.50% effective July 1, 2010);
• 0.39%, excluding interest expenses, offering costs, brokerage commissions and other trading expenses, taxes and extraordinary expenses, for each of PowerShares FTSE RAFI US 1000 Portfolio and PowerShares FTSE RAFI US 1500 Small-Mid Portfolio; and
• 0.60%, excluding interest expenses, licensing fees, offering costs, brokerage commissions and other trading expenses, taxes and extraordinary expenses, for each other Fund.
The Trustees noted that the Adviser represented that it does not provide investment advisory services to any clients other than the Funds and other ETFs overseen by the Board. The Trustees noted that each Fund's advisory fee was:
• higher than the median advisory fee of its ETF peer funds (except for the advisory fee of each of PowerShares Financial Preferred Portfolio, PowerShares FTSE RAFI US 1000 Portfolio, PowerShares Global Listed Private Equity Portfolio and PowerShares Golden Dragon Halter USX China Portfolio, which was equal to or lower than the median advisory fee of its ETF peer funds); and
• higher than the median advisory fee of its open-end index peer funds (except for the advisory fee of each of PowerShares DWA Technical Leaders(TM) Portfolio, PowerShares Dynamic Banking Portfolio, PowerShares Dynamic Basic Materials Sector Portfolio, PowerShares Dynamic Biotechnology & Genome Portfolio, PowerShares Dynamic Financial Sector Portfolio, PowerShares Dynamic Healthcare Portfolio, PowerShares Dynamic Insurance Portfolio, PowerShares Dynamic Mid Cap Growth Portfolio, PowerShares Dynamic Networking Portfolio, PowerShares Dynamic OTC Portfolio, PowerShares Dynamic Pharmaceuticals Portfolio, PowerShares Dynamic Semiconductors Portfolio, PowerShares Dynamic Small Cap Growth Portfolio, PowerShares Dynamic Software Portfolio, PowerShares Dynamic Technology Sector Portfolio, PowerShares Golden Dragon Halter USX China Portfolio, PowerShares Lux Nanotech Portfolio, PowerShares Morningstar StockInvestor Core Portfolio and PowerShares S&P 500® High Quality Portfolio, which was equal to or lower than
79
Board Considerations Regarding Continuation of Investment Advisory Agreement (Continued)
the median advisory fee of its open-end index peer funds, and there was no comparable data for PowerShares Financial Preferred Portfolio or PowerShares Global Listed Private Equity Portfolio); but
• lower than the median advisory fee of its open-end actively-managed peer funds.
The Trustees determined that the advisory fees were reasonable, noting the complexity of the indices, which generally require more frequent rebalancing of the portfolios, the distinguishing factors of the Funds, and the higher administrative, operational and management oversight costs for the Adviser. With respect to the Funds' expense ratios, the Trustees noted that the net expense ratio for each Fund was:
• higher than the median expense ratio of its ETF peer funds (except for the net expense ratio of each of PowerShares Dynamic Market Portfolio, PowerShares Dynamic OTC Portfolio, PowerShares FTSE RAFI US 1000 Portfolio, PowerShares Golden Dragon Halter USX China Portfolio and PowerShares S&P 500® High Quality Portfolio, which was equal to or less than the median expense ratio of its ETF peer funds); and
• higher than the median expense ratio of its open-end index peer funds (except for the net expense ratio of each of PowerShares Aerospace & Defense Portfolio, PowerShares Cleantech(TM) Portfolio, PowerShares DWA Technical Leaders(TM) Portfolio, PowerShares Dynamic Banking Portfolio, PowerShares Dynamic Basic Materials Sector Portfolio, PowerShares Dynamic Biotechnology & Genome Portfolio, PowerShares Dynamic Building & Construction Portfolio, PowerShares Dynamic Consumer Discretionary Sector Portfolio, PowerShares Dynamic Consumer Staples Sector Portfolio, PowerShares Dynamic Financial Sector Portfolio, PowerShares Dynamic Food & Beverage Portfolio, PowerShares Dynamic Healthcare Portfolio, PowerShares Dynamic Industrials Sector Portfolio, PowerShares Dynamic Insurance Portfolio, PowerShares Dynamic Large Cap Portfolio, PowerShares Dynamic Large Cap Growth Portfolio, PowerShares Dynamic Leisure and Entertainment Portfolio, PowerShares Dynamic Media Portfolio, PowerShares Dynamic Mid Cap Growth Portfolio, PowerShares Morningstar StockInvestor Core Portfolio, PowerShares Dynamic Networking Portfolio, PowerShares Dynamic OTC Portfolio, PowerShares Dynamic Pharmaceuticals Portfolio, PowerShares Dynamic Retail Portfolio, PowerShares Dynamic Semiconductors Portfolio, PowerShares Dynamic Small Cap Growth Portfolio, PowerShares Dynamic Small Cap Value Portfolio, PowerShares Dynamic Software Portfolio, PowerShares Dynamic Technology Sector Portfolio, PowerShares Dynamic Utilities Sector Portfolio, PowerShares FTSE RAFI US 1000 Portfolio, PowerShares FTSE RAFI US 1500 Small-Mid Portfolio, PowerShares Golden Dragon Halter USX China Portfolio, PowerShares Lux Nanotech Portfolio and PowerShares S&P 500® High Quality Portfolio, which was equal to or lower than the median expense ratio of its open-end index peer funds, and there was no comparable data for PowerShares Financial Preferred Portfolio or PowerShares Global Listed Private Equity Portfolio); but
• lower than the median expense ratio of its open-end actively-managed peer funds.
The Trustees noted that a significant component of the non-advisory fee expenses was the license fees paid by the Funds, and those Funds for which license fees are included in the Funds' Expense Caps.
The Board concluded that the advisory fee and expense ratio of each Fund (giving effect to the Fund's Expense Cap) were reasonable and appropriate in light of the services provided.
80
Board Considerations Regarding Continuation of Investment Advisory Agreement (Continued)
In conjunction with their review of fees, the Trustees also considered information provided by the Adviser on the revenues received by the Adviser under the Investment Advisory Agreement for each Fund, as well as the fees waived and expenses reimbursed by the Adviser for the Funds. The Trustees reviewed information provided by the Adviser on its profitability as well as any profits or losses realized by the Adviser from its relationship to each Fund. The Trustees concluded that the estimated profitability to the Adviser of the advisory services provided to any of the Funds was not unreasonable.
Also at the April 14, 2011 meeting, the Adviser proposed reducing the annual advisory fee for each of PowerShares Dynamic Large Cap Portfolio, PowerShares Dynamic Mid Cap Growth Portfolio, PowerShares Dynamic Mid Cap Portfolio, PowerShares Dynamic Mid Cap Value Portfolio, PowerShares Dynamic Small Cap Growth Portfolio, PowerShares Dynamic Small Cap Portfolio and PowerShares Dynamic Small Cap Value Portfolio (each, a "Style Fund") effective June 16, 2011. The Adviser also proposed revising each Style Fund's Expense Cap that is in place until August 31, 2012 to further reduce each Style Fund's annual operating expenses effective June 16, 2011. The Board considered the Adviser's representation that there would be no diminution in the quantity or quality of services provided to each Style Fund in connection with the amendment to the Investment Advisory Agreement to reflect the advisory fee changes. The Board concluded for each Style Fund that the reduced advisory fee was appropriate, and determined to approve the amended Investment Advisory Agreement and amended Expense Cap, effective June 16, 2011.
Economies of Scale and Whether Fee Levels Reflect These Economies of Scale. The Trustees reviewed the information provided by the Adviser as to the extent to which economies of scale are realized as each Fund grows and whether fee levels reflect economies of scale for the benefit of shareholders. The Trustees reviewed each Fund's asset size, expense ratio and expense limitation agreed to by the Adviser. The Trustees noted that, for Funds whose expenses are higher than their respective Expense Caps, any reduction in that Fund's expenses would be enjoyed by the Adviser, but that Fund shareholders benefit from the lower expense ratio as a result of the Fund's Expense Cap. The Trustees also noted that the Excess Expense Agreement with the Trust provides that the Adviser is entitled to be reimbursed by each Fund, other than PowerShares Dynamic Market Portfolio and PowerShares Dynamic OTC Portfolio, for fees waived or expenses absorbed pursuant to the Expense Cap for a period of three years from the date the fee or expense was incurred, provided that no reimbursement would be made that would result in a Fund exceeding its Expense Cap. The Trustees considered whether the advisory fee rate for each Fund was reasonable in relation to the asset size of that Fund, and concluded that the flat advisory fee was reasonable and appropriate, noting the Fund expenses the Adviser has borne as a result of the Expense Cap.
The Trustees noted that the Adviser had not identified any further benefits that it derived from its relationship with the Funds and had noted that it does not have any soft-dollar arrangements.
Based on all of the information considered and the conclusions reached, the Board, including the Independent Trustees, determined to approve the continuation of the Investment Advisory Agreement for each Fund. No single factor was determinative in the Board's analysis.
81
Board Considerations Regarding Continuation of Investment Advisory Agreement
At a meeting held on April 14, 2011, the Board of Trustees of the PowerShares Exchange-Traded Fund Trust (the "Trust"), including the Independent Trustees, unanimously approved the continuation of the Investment Advisory Agreement between Invesco PowerShares Capital Management LLC (the "Adviser") and the Trust for PowerShares NASDAQ Internet Portfolio and PowerShares S&P 500 BuyWrite Portfolio (each, a "Fund" and collectively, the "Funds").
The Trustees reviewed information from the Adviser describing: (i) the nature, extent and quality of services provided, (ii) the investment performance of the Funds and the Adviser, (iii) the costs of services provided and estimated profits realized by the Adviser, (iv) the extent to which economies of scale are realized as the Funds grow, (v) whether fee levels reflect any possible economies of scale for the benefit of Fund shareholders, (vi) comparisons of services rendered and amounts paid to other registered investment companies and (vii) any benefits realized by the Adviser from its relationship with each Fund. Based on all of the information considered and the conclusions reached, the Board, including the Independent Trustees, determined to approve the continuation of the Investment Advisory Agreement for each Fund. No single factor was determinative in the Board's analysis.
Nature, Extent and Quality of Services. In evaluating the nature, extent and quality of the Adviser's services, the Trustees reviewed information concerning the functions performed by the Adviser for the Funds, information describing the Adviser's current organization and projected staffing, including operations assistance provided by the Adviser's parent organization, Invesco Ltd., and the background and experience of the persons responsible for the day-to-day management of the Funds. The Trustees reviewed matters related to the Adviser's oversight of the execution of portfolio transactions on behalf of the Funds. The Trustees also reviewed information on the performance of the Funds and the performance of their underlying indices through December 31, 2010, including reports on the correlation and tracking error between the underlying index and each Fund's performance, as well as the Adviser's analysis of the tracking error between each Fund and its underlying index. The Trustees noted that, in each case, the correlation and tracking error for each Fund was within the targeted range set forth in the Trust's registration statement. The Trustees concluded that each Fund was correlated to its underlying index and that the tracking error for each Fund was within an acceptable range given that Fund's particular circumstances.
The Trustees also considered the services provided by the Adviser in its oversight of the Funds' administrator, custodian and transfer agent. They noted the significant amount of time and effort that had been devoted to this oversight function.
Based on their review, the Trustees concluded that the nature, extent and quality of services provided by the Adviser to the Funds under the Investment Advisory Agreement were appropriate and reasonable.
Fees, Expenses and Profitability. The Trustees reviewed and discussed the information provided by the Adviser on each Fund's total expense ratio and unitary advisory fee, as compared to information compiled by the Adviser from Lipper Inc. databases on the expense ratios of comparable exchange-traded funds ("ETFs"), open-end (non-ETF) index funds and open-end actively-managed funds. The Trustees noted that the annual unitary advisory fee is 0.60% for PowerShares NASDAQ Internet Portfolio and 0.75% for PowerShares S&P 500 BuyWrite Portfolio, and that the Adviser pays all other operating expenses of each Fund, except that each Fund pays its brokerage expenses, taxes, interest and extraordinary expenses.
82
Board Considerations Regarding Continuation of Investment Advisory Agreement (Continued)
The Trustees noted that the Adviser represented that it does not provide investment advisory services to any clients other than the Funds and other ETFs overseen by the Board. The Trustees noted that the advisory fee for each Fund was equal to or lower than the median expense ratios of its ETF peer funds, open-end index peer funds and open-end actively-managed peer funds. The Trustees noted that each Fund's advisory fee was reasonable because of the complexity of the indices, which generally require more frequent rebalancing of the portfolios, the distinguishing factors of the Funds and the higher administrative, operational and management oversight costs for the Adviser. The Trustees also noted that a portion of each Fund's advisory fee was attributable to a license fee payable out of the unitary fee charged to that Fund. The Board concluded that the unitary advisory fee charged to each Fund was reasonable and appropriate in light of the services provided.
In conjunction with their review of the unitary advisory fee, the Trustees also considered information provided by the Adviser on the revenues received by the Adviser under the Investment Advisory Agreement. The Trustees reviewed information provided by the Adviser on its profitability as well as any profits or losses realized by the Adviser from its relationship to each Fund. The Trustees concluded that the estimated profitability to the Adviser of the advisory services provided to any of the Funds was not unreasonable.
Economies of Scale and Whether Fee Levels Reflect These Economies of Scale. The Trustees reviewed the information provided by the Adviser as to the extent to which economies of scale are realized as each Fund grows and whether fee levels reflect economies of scale for the benefit of shareholders. The Trustees reviewed each Fund's asset size and expense ratio. The Trustees noted that any reduction in fixed costs associated with the management of the Funds would be enjoyed by the Adviser, but a unitary fee provides certainty in expenses for the Funds. The Trustees considered whether the advisory fee rate for each Fund was reasonable in relation to the asset size of that Fund, and concluded that the flat advisory fee was reasonable and appropriate.
The Trustees noted that the Adviser had not identified any further benefits that it derived from its relationship with the Funds and had noted that it does not have any soft-dollar arrangements.
Based on all of the information considered and the conclusions reached, the Board, including the Independent Trustees, determined to approve the continuation of the Investment Advisory Agreement for each Fund. No single factor was determinative in the Board's analysis.
83
This page intentionally left blank
PROXY VOTING POLICIES AND PROCEDURES
A description of the Funds' proxy voting policies and procedures that the Funds use to determine how to vote proxies relating to portfolio securities is available, without charge and upon request, by calling (800) 983-0903. This information is also available on the Securities and Exchange Commission's ("Commission") website at www.sec.gov.
Information regarding how the Funds voted proxies for portfolio securities, if applicable, during the most recent 12-month period ended June 30, is also available, without charge and upon request, by (i) calling (800) 983-0903; or (ii) accessing the Funds' Form N-PX on the Commission's website at www.sec.gov.
QUARTERLY PORTFOLIOS
The Funds file their complete schedules of portfolio holdings with the Commission for the first and third quarters of each fiscal year on Form N-Q. The Funds' Forms N-Q are available on the Commission's website at www.sec.gov. The Funds' Forms N-Q may also be reviewed and copied at the Commission's Public Reference Room in Washington, D.C.; information on the operation of the Public Reference Room may be obtained by calling (800) SEC-0330.


301 West Roosevelt Road
Wheaton, IL 60187
800.983.0903
www.invescopowershares.com
© 2011 Invesco PowerShares Capital Management LLC P-PS-AR-3


2011 Annual Report to Shareholders
April 30, 2011
PowerShares Dynamic Large Cap Growth Portfolio (PWB)
PowerShares Dynamic Large Cap Portfolio (PJF)
PowerShares Dynamic Large Cap Value Portfolio (PWV)
PowerShares Dynamic Mid Cap Growth Portfolio (PWJ)
PowerShares Dynamic Mid Cap Portfolio (PJG)
PowerShares Dynamic Mid Cap Value Portfolio (PWP)
PowerShares Dynamic Small Cap Growth Portfolio (PWT)
PowerShares Dynamic Small Cap Portfolio (PJM)
PowerShares Dynamic Small Cap Value Portfolio (PWY)
PowerShares Zacks Micro Cap Portfolio (PZI)

Table of Contents
| The Market Environment | 2 | ||||||
| Manager's Analysis | 4 | ||||||
| Frequency Distribution of Discounts & Premiums | 24 | ||||||
| Fees and Expenses | 26 | ||||||
| Style Portfolios | |||||||
| Schedules of Investments | |||||||
| PowerShares Dynamic Large Cap Growth Portfolio (PWB) | 28 | ||||||
| PowerShares Dynamic Large Cap Portfolio (PJF) | 29 | ||||||
| PowerShares Dynamic Large Cap Value Portfolio (PWV) | 31 | ||||||
| PowerShares Dynamic Mid Cap Growth Portfolio (PWJ) | 32 | ||||||
| PowerShares Dynamic Mid Cap Portfolio (PJG) | 34 | ||||||
| PowerShares Dynamic Mid Cap Value Portfolio (PWP) | 36 | ||||||
| PowerShares Dynamic Small Cap Growth Portfolio (PWT) | 38 | ||||||
| PowerShares Dynamic Small Cap Portfolio (PJM) | 40 | ||||||
| PowerShares Dynamic Small Cap Value Portfolio (PWY) | 43 | ||||||
| PowerShares Zacks Micro Cap Portfolio (PZI) | 45 | ||||||
| Statements of Assets and Liabilities | 50 | ||||||
| Statements of Operations | 52 | ||||||
| Statements of Changes in Net Assets | 54 | ||||||
| Financial Highlights | 58 | ||||||
| Notes to Financial Statements | 63 | ||||||
| Report of Independent Registered Public Accounting Firm | 76 | ||||||
| Tax Information | 77 | ||||||
| Trustees and Officers | 78 | ||||||
| Board Consideration Regarding Continuation of Investment Advisory Agreement | 85 | ||||||
The Market Environment
For the fiscal year ended April 30, 2011, the market environment saw continued improvement. Global equities ended up 18.25% after declining the first two months of the period. Emerging markets led equities up during the fiscal year with the MSCI Emerging Markets Index returning 20.67%. Developed International and U.S. Equities followed closely behind emerging markets with the MSCI EAFE Index up 19.18% and the S&P 500® Index up 17.24%. Volatility continued to decline on a year-over-year basis with the CBOE Volatility Index® (VIX®) dropping 33.11% for the fiscal year. Fixed income markets moved higher for the fiscal year with the Barclays Aggregate Bond Index ending up 5.37%.
2
This page intentionally left blank
Manager's Analysis
PowerShares Dynamic Large Cap Growth Portfolio (ticker: PWB)
The PowerShares Dynamic Large Cap Growth Portfolio (the "Fund") seeks investment results that correspond (before fees and expenses) generally to the price and yield performance of the Dynamic Large Cap Growth IntellidexSM Index (the "Index").
For the fiscal year ended April 30, 2011, the Fund returned 19.08%. Over this same year the Index returned 19.87% while the S&P Citigroup Large Cap Growth Index returned 18.99%, the Russell 1000® Growth Index returned 20.87% and the S&P 500® Index returned 17.24%. The Fund benefited from positive performance of securities of companies in information technology, consumer discretionary and industrials sectors. The Fund suffered negative performance of securities of companies in the health care sector.
Sector Breakdown (% of the Fund's
Net Assets) as of April 30, 2011
| Information Technology | 29.7 | ||||||
| Industrials | 24.3 | ||||||
| Consumer Discretionary | 18.2 | ||||||
| Consumer Staples | 9.8 | ||||||
| Health Care | 7.1 | ||||||
| Financials | 5.4 | ||||||
| Energy | 2.8 | ||||||
| Materials | 2.7 | ||||||
| Money Market Fund | 0.1 | ||||||
| Liabilities in excess of other assets | (0.1 | ) | |||||
Style Allocation (% of the Fund's
Total Investments) as of April 30, 2011
| Large-Cap Growth | 77.0 | ||||||
| Large-Cap Value | 17.0 | ||||||
| Mid-Cap Growth | 3.2 | ||||||
| Mid-Cap Value | 2.8 | ||||||
Top Ten Fund Holdings (% of the Fund's
Net Assets) as of April 30, 2011
| Security | |||||||
| Caterpillar, Inc. | 3.6 | ||||||
| Philip Morris International, Inc. | 3.6 | ||||||
| Union Pacific Corp. | 3.5 | ||||||
| Oracle Corp. | 3.5 | ||||||
| Honeywell International, Inc. | 3.4 | ||||||
| EMC Corp. | 3.4 | ||||||
| Coca-Cola Co. (The) | 3.3 | ||||||
| Visa, Inc. | 3.3 | ||||||
| United Parcel Service, Inc. | 3.3 | ||||||
| Emerson Electric Co. | 3.2 | ||||||
| Total | 34.1 | ||||||
4
Manager's Analysis (Continued)
PowerShares Dynamic Large Cap Growth Portfolio (ticker: PWB)
Growth of a $10,000 Investment Since Inception†
| Fund Performance History (%) | As of April 30, 2011 | ||||||||||||||||||||||
| Avg Ann†† | Fund Inception | ||||||||||||||||||||||
| 1 Year | 3 Year | 5 Year | Avg Ann†† | Cumulative | |||||||||||||||||||
| Index | |||||||||||||||||||||||
| Dynamic Large Cap Growth IntellidexSM Index | 19.87 | % | 1.97 | % | 2.70 | % | 3.96 | % | 27.00 | % | |||||||||||||
| S&P Citigroup Large Cap Growth Index | 18.99 | % | 3.89 | % | 4.80 | % | 4.98 | % | 34.95 | % | |||||||||||||
| Russell 1000® Growth Index | 20.87 | % | 4.55 | % | 5.06 | % | 5.85 | % | 41.95 | % | |||||||||||||
| S&P 500® Index | 17.24 | % | 1.74 | % | 2.95 | % | 4.17 | % | 28.64 | % | |||||||||||||
| Fund | |||||||||||||||||||||||
| Net Asset Value ("NAV") Return | 19.08 | % | 1.27 | % | 2.01 | % | 3.25 | % | 21.78 | % | |||||||||||||
| Share Price Return | 19.08 | % | 1.27 | % | 2.02 | % | 3.22 | % | 21.53 | % | |||||||||||||
Fund Inception: March 3, 2005
Performance quoted represents past performance. Past performance is not a guarantee of future results and current performance may be higher or lower than performance quoted. Investment returns and principal value will fluctuate and shares, when redeemed, may be worth more or less than their original cost. The Adviser has waived fees and reimbursed other expenses, absent which, performance would have been lower. The Adviser has contractually agreed to waive fees and/or pay certain Fund expenses through August 31, 2012. According to the Fund's current prospectus, the total gross annual operating expense ratio was indicated as 0.61%. In the Financial Highlights section of this Shareholder Report, the Fund's net total operating expense ratio was determined to be 0.63%, while the Fund's gross total expense ratio was determined to be 0.64%. NAV and Share Price returns assume that dividends and capital gain distributions have been reinvested in the Fund at NAV and Share Price, respectively. The returns shown in the table above do not reflect the deduction of taxes that a shareholder would pay on Fund distributions or the redemption or sale of Fund Shares. See invescopowershares.com to find the most recent month-end performance numbers.
Index performance results are based upon a hypothetical investment in its constituent securities. Index returns do not represent Fund returns. An investor cannot invest directly in an index. The Index does not charge management fees or brokerage expenses, and no such fees or expenses were deducted from the hypothetical performance shown. In addition, the results actual investors might have achieved would have differed from those shown because of differences in the timing, amounts of their investments, and fees and expenses associated with an investment in the Fund.
The S&P Citigroup Large Cap Growth Index, Russell 1000® Growth Index and S&P 500® Index (the "Benchmark Indices") are unmanaged indices used as a measurement of change in stock market conditions based on the average performance of approximately 1,987, 1,000 and 500 common stocks, respectively.
† Fund and underlying Index returns are based on the inception date of the Fund. Returns for the Benchmark Indices are based on the closest month-end to the Fund's inception date.
†† Average annualized.
5
Manager's Analysis
PowerShares Dynamic Large Cap Portfolio (ticker: PJF)
The PowerShares Dynamic Large Cap Portfolio (the "Fund") seeks investment results that correspond (before fees and expenses) generally to the price and yield performance of the Dynamic Large Cap IntellidexSM Index (the "Index").
For the fiscal year ended April 30, 2011, the Fund returned 15.40%. Over this same year the Index returned 16.21% while the S&P 500® Index returned 17.24% and the Russell Top 200® Index returned 15.81%. The Fund benefited from positive performance of securities of companies in information technology, industrials, and consumer staples sectors. Fund performance was positive for securities of companies within each sector in which it was invested.
Sector Breakdown (% of the Fund's
Net Assets) as of April 30, 2011
| Information Technology | 22.4 | ||||||
| Industrials | 17.0 | ||||||
| Consumer Discretionary | 15.1 | ||||||
| Health Care | 14.1 | ||||||
| Consumer Staples | 10.2 | ||||||
| Financials | 7.9 | ||||||
| Energy | 5.6 | ||||||
| Materials | 3.5 | ||||||
| Telecommunication Services | 3.5 | ||||||
| Utilities | 0.7 | ||||||
| Money Market Fund | 0.1 | ||||||
| Liabilities in excess of other assets | (0.1 | ) | |||||
Style Allocation (% of the Fund's
Total Investments) as of April 30, 2011
| Large-Cap Growth | 55.5 | ||||||
| Large-Cap Value | 43.0 | ||||||
| Mid-Cap Growth | 0.8 | ||||||
| Mid-Cap Value | 0.7 | ||||||
Top Ten Fund Holdings (% of the Fund's
Net Assets) as of April 30, 2011
| Security | |||||||
| Caterpillar, Inc. | 1.8 | ||||||
| Philip Morris International, Inc. | 1.8 | ||||||
| Pfizer, Inc. | 1.8 | ||||||
| AT&T, Inc. | 1.8 | ||||||
| Oracle Corp. | 1.7 | ||||||
| Abbott Laboratories | 1.7 | ||||||
| 3M Co. | 1.7 | ||||||
| Chevron Corp. | 1.7 | ||||||
| United Technologies Corp. | 1.7 | ||||||
| Intel Corp. | 1.7 | ||||||
| Total | 17.4 | ||||||
6
Manager's Analysis (Continued)
PowerShares Dynamic Large Cap Portfolio (ticker: PJF)
Growth of a $10,000 Investment Since Inception†
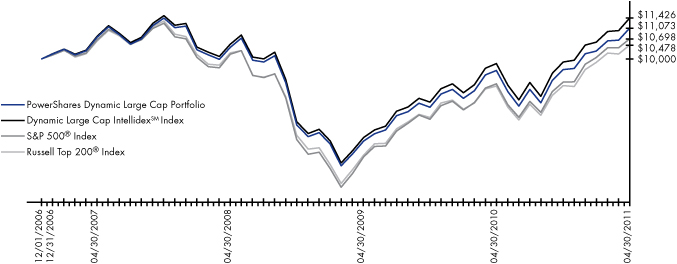
| Fund Performance History (%) | As of April 30, 2011 | ||||||||||||||||||
| Avg Ann†† | Fund Inception | ||||||||||||||||||
| 1 Year | 3 Year | Avg Ann†† | Cumulative | ||||||||||||||||
| Index | |||||||||||||||||||
| Dynamic Large Cap IntellidexSM Index | 16.21 | % | 2.83 | % | 3.07 | % | 14.26 | % | |||||||||||
| S&P 500® Index | 17.24 | % | 1.74 | % | 1.54 | % | 6.98 | % | |||||||||||
| Russell Top 200® Index | 15.81 | % | 0.87 | % | 1.06 | % | 4.78 | % | |||||||||||
| Fund | |||||||||||||||||||
| Net Asset Value ("NAV") Return | 15.40 | % | 2.10 | % | 2.34 | % | 10.73 | % | |||||||||||
| Share Price Return | 15.40 | % | 2.11 | % | 2.32 | % | 10.64 | % | |||||||||||
Fund Inception: December 1, 2006
Performance quoted represents past performance. Past performance is not a guarantee of future results and current performance may be higher or lower than performance quoted. Investment returns and principal value will fluctuate and shares, when redeemed, may be worth more or less than their original cost. The Adviser has waived fees and reimbursed other expenses, absent which, performance would have been lower. The Adviser has contractually agreed to waive fees and/or pay certain Fund expenses through August 31, 2012. According to the Fund's current prospectus, the total gross annual operating expense ratio was indicated as 0.88%. In the Financial Highlights section of this Shareholder Report, the Fund's net total operating expense ratio was determined to be 0.65%, while the Fund's gross total expense ratio was determined to be 0.99%. NAV and Share Price returns assume that dividends and capital gain distributions have been reinvested in the Fund at NAV and Share Price, respectively. The returns shown in the table above do not reflect the deduction of taxes that a shareholder would pay on Fund distributions or the redemption or sale of Fund Shares. See invescopowershares.com to find the most recent month-end performance numbers.
Index performance results are based upon a hypothetical investment in its constituent securities. Index returns do not represent Fund returns. An investor cannot invest directly in an index. The Index does not charge management fees or brokerage expenses, and no such fees or expenses were deducted from the hypothetical performance shown. In addition, the results actual investors might have achieved would have differed from those shown because of differences in the timing, amounts of their investments, and fees and expenses associated with an investment in the Fund.
The S&P 500® Index and Russell Top 200® Index (the "Benchmark Indices") are unmanaged indices used as a measurement of change in stock market conditions based on the average performance of approximately 500 and 200 common stocks, respectively.
† Fund and underlying Index returns are based on the inception date of the Fund. Returns for the Benchmark Indices are based on the closest month-end to the Fund's inception date.
†† Average annualized.
7
Manager's Analysis
PowerShares Dynamic Large Cap Value Portfolio (ticker: PWV)
The PowerShares Dynamic Large Cap Value Portfolio (the "Fund") seeks investment results that correspond (before fees and expenses) generally to the price and yield performance of the Dynamic Large Cap Value IntellidexSM Index (the "Index").
For the fiscal year ended April 30, 2011, the Fund returned 15.50%. Over this same year, the Index returned 16.26%, while the S&P Citigroup Large Cap Value Index returned 15.52%, the Russell 1000® Value Index returned 15.24% and the S&P 500® Index returned 17.24%. The Fund benefited from positive performance of securities of companies in health care, financials, and energy sectors. Fund performance was positive for securities of companies within each sector in which it was invested.
Sector Breakdown (% of the Fund's
Net Assets) as of April 30, 2011
| Health Care | 22.6 | ||||||
| Financials | 17.1 | ||||||
| Information Technology | 17.0 | ||||||
| Consumer Staples | 12.5 | ||||||
| Energy | 9.9 | ||||||
| Telecommunication Services | 6.9 | ||||||
| Industrials | 5.4 | ||||||
| Utilities | 4.2 | ||||||
| Materials | 2.9 | ||||||
| Consumer Discretionary | 1.4 | ||||||
| Other assets less liabilities | 0.1 | ||||||
Style Allocation (% of the Fund's
Total Investments) as of April 30, 2011
| Large-Cap Value | 72.3 | ||||||
| Large-Cap Growth | 27.7 | ||||||
Top Ten Fund Holdings (% of the Fund's
Net Assets) as of April 30, 2011
| Security | |||||||
| Pfizer, Inc. | 3.5 | ||||||
| AT&T, Inc. | 3.5 | ||||||
| Johnson & Johnson | 3.5 | ||||||
| Chevron Corp. | 3.4 | ||||||
| Wal-Mart Stores, Inc. | 3.4 | ||||||
| Intel Corp. | 3.4 | ||||||
| International Business Machines Corp. | 3.3 | ||||||
| Verizon Communications, Inc. | 3.3 | ||||||
| Procter & Gamble Co. (The) | 3.3 | ||||||
| Exxon Mobil Corp. | 3.3 | ||||||
| Total | 33.9 | ||||||
8
Manager's Analysis (Continued)
PowerShares Dynamic Large Cap Value Portfolio (ticker: PWV)
Growth of a $10,000 Investment Since Inception†
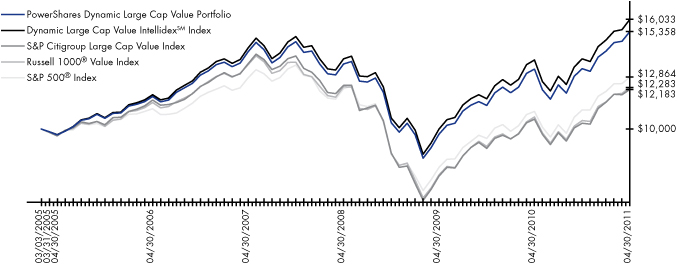
| Fund Performance History (%) | As of April 30, 2011 | ||||||||||||||||||||||
| Avg Ann†† | Fund Inception | ||||||||||||||||||||||
| 1 Year | 3 Year | 5 Year | Avg Ann†† | Cumulative | |||||||||||||||||||
| Index | |||||||||||||||||||||||
| Dynamic Large Cap Value IntellidexSM Index | 16.26 | % | 4.98 | % | 6.16 | % | 7.97 | % | 60.33 | % | |||||||||||||
| S&P Citigroup Large Cap Value Index | 15.52 | % | -0.58 | % | 1.00 | % | 3.25 | % | 21.83 | % | |||||||||||||
| Russell 1000® Value Index | 15.24 | % | -0.11 | % | 1.40 | % | 3.39 | % | 22.83 | % | |||||||||||||
| S&P 500® Index | 17.24 | % | 1.74 | % | 2.95 | % | 4.17 | % | 28.64 | % | |||||||||||||
| Fund | |||||||||||||||||||||||
| Net Asset Value ("NAV") Return | 15.50 | % | 4.22 | % | 5.43 | % | 7.21 | % | 53.58 | % | |||||||||||||
| Share Price Return | 15.49 | % | 4.25 | % | 5.44 | % | 7.20 | % | 53.45 | % | |||||||||||||
Fund Inception: March 3, 2005
Performance quoted represents past performance. Past performance is not a guarantee of future results and current performance may be higher or lower than performance quoted. Investment returns and principal value will fluctuate and shares, when redeemed, may be worth more or less than their original cost. The Adviser has waived fees and reimbursed other expenses, absent which, performance would have been lower. The Adviser has contractually agreed to waive fees and/or pay certain Fund expenses through August 31, 2012. According to the Fund's current prospectus, the total gross annual operating expense ratio was indicated as 0.63%. In the Financial Highlights section of this Shareholder Report, the Fund's total net and total gross operating expense ratio was determined to be 0.61%. NAV and Share Price returns assume that dividends and capital gain distributions have been reinvested in the Fund at NAV and Share Price, respectively. The returns shown in the table above do not reflect the deduction of taxes that a shareholder would pay on Fund distributions or the redemption or sale of Fund Shares. See invescopowershares.com to find the most recent month-end performance numbers.
Index performance results are based upon a hypothetical investment in its constituent securities. Index returns do not represent Fund returns. An investor cannot invest directly in an index. The Index does not charge management fees or brokerage expenses, and no such fees or expenses were deducted from the hypothetical performance shown. In addition, the results actual investors might have achieved would have differed from those shown because of differences in the timing, amounts of their investments, and fees and expenses associated with an investment in the Fund.
The S&P Citigroup Large Cap Value Index, Russell 1000® Value Index and S&P 500® Index (the "Benchmark Indices") are unmanaged indices used as a measurement of change in stock market conditions based on the average performance of approximately 1,086, 1,000 and 500 common stocks, respectively.
† Fund and underlying Index returns are based on the inception date of the Fund. Returns for the Benchmark Indices are based on the closest month-end to the Fund's inception date.
†† Average annualized.
9
Manager's Analysis
PowerShares Dynamic Mid Cap Growth Portfolio (ticker: PWJ)
The PowerShares Dynamic Mid Cap Growth Portfolio (the "Fund") seeks investment results that correspond (before fees and expenses) generally to the price and yield performance of the Dynamic Mid Cap Growth IntellidexSM Index (the "Index").
For the fiscal year ended April 30, 2011, the Fund returned 26.61%. Over this same year the Index returned 27.45% while the S&P Citigroup Mid Cap Growth Index returned 30.68%, the Russell Midcap® Growth Index returned 27.40% and the S&P 500® Index returned 17.24%. The Fund benefited from positive performance of securities of companies in industrials, information technology, and health care sectors. Fund performance was positive for securities of companies within each sector in which it was invested.
Sector Breakdown (% of the Fund's
Net Assets) as of April 30, 2011
| Industrials | 26.9 | ||||||
| Information Technology | 24.9 | ||||||
| Health Care | 19.7 | ||||||
| Consumer Discretionary | 14.0 | ||||||
| Financials | 6.8 | ||||||
| Materials | 3.9 | ||||||
| Consumer Staples | 3.8 | ||||||
| Money Market Fund | 0.1 | ||||||
| Liabilities in excess of other assets | (0.1 | ) | |||||
Style Allocation (% of the Fund's
Total Investments) as of April 30, 2011
| Mid-Cap Growth | 82.4 | ||||||
| Small-Cap Growth | 8.0 | ||||||
| Small-Cap Value | 4.0 | ||||||
| Large-Cap Growth | 3.2 | ||||||
| Mid-Cap Value | 2.4 | ||||||
Top Ten Fund Holdings (% of the Fund's
Net Assets) as of April 30, 2011
| Security | |||||||
| Perrigo Co. | 3.5 | ||||||
| Waters Corp. | 3.5 | ||||||
| Teradata Corp. | 3.5 | ||||||
| W.W. Grainger, Inc. | 3.4 | ||||||
| Red Hat, Inc. | 3.4 | ||||||
| Expeditors International of Washington, Inc. | 3.4 | ||||||
| Mylan, Inc. | 3.2 | ||||||
| Ecolab, Inc. | 3.2 | ||||||
| AMETEK, Inc. | 3.2 | ||||||
| Whole Foods Market, Inc. | 3.2 | ||||||
| Total | 33.5 | ||||||
10
Manager's Analysis (Continued)
PowerShares Dynamic Mid Cap Growth Portfolio (ticker: PWJ)
Growth of a $10,000 Investment Since Inception†
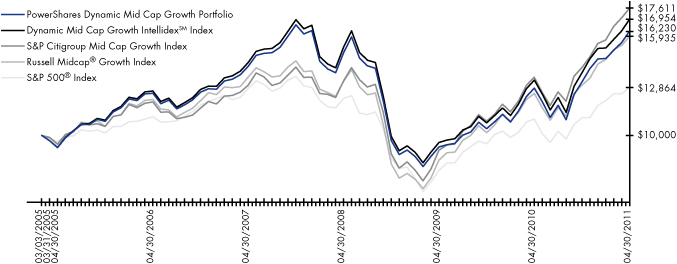
| Fund Performance History (%) | As of April 30, 2011 | ||||||||||||||||||||||
| Avg Ann†† | Fund Inception | ||||||||||||||||||||||
| 1 Year | 3 Year | 5 Year | Avg Ann†† | Cumulative | |||||||||||||||||||
| Index | |||||||||||||||||||||||
| Dynamic Mid Cap Growth IntellidexSM Index | 27.45 | % | 3.54 | % | 6.04 | % | 8.95 | % | 69.54 | % | |||||||||||||
| S&P Citigroup Mid Cap Growth Index | 30.68 | % | 9.93 | % | 7.98 | % | 9.61 | % | 76.11 | % | |||||||||||||
| Russell Midcap® Growth Index | 27.40 | % | 6.40 | % | 5.59 | % | 7.85 | % | 59.35 | % | |||||||||||||
| S&P 500® Index | 17.24 | % | 1.74 | % | 2.95 | % | 4.17 | % | 28.64 | % | |||||||||||||
| Fund | |||||||||||||||||||||||
| Net Asset Value ("NAV") Return | 26.61 | % | 2.80 | % | 5.33 | % | 8.18 | % | 62.30 | % | |||||||||||||
| Share Price Return | 26.67 | % | 2.80 | % | 5.33 | % | 8.16 | % | 62.09 | % | |||||||||||||
Fund Inception: March 3, 2005
Performance quoted represents past performance. Past performance is not a guarantee of future results and current performance may be higher or lower than performance quoted. Investment returns and principal value will fluctuate and shares, when redeemed, may be worth more or less than their original cost. The Adviser has waived fees and reimbursed other expenses, absent which, performance would have been lower. The Adviser has contractually agreed to waive fees and/or pay certain Fund expenses through August 31, 2012. According to the Fund's current prospectus, the total gross annual operating expense ratio was indicated as 0.66%. In the Financial Highlights section of this Shareholder Report, the Fund's net total operating expense ratio was determined to be 0.63%, while the Fund's gross total expense ratio was determined to be 0.69%. NAV and Share Price returns assume that dividends and capital gain distributions have been reinvested in the Fund at NAV and Share Price, respectively. The returns shown in the table above do not reflect the deduction of taxes that a shareholder would pay on Fund distributions or the redemption or sale of Fund Shares. See invescopowershares.com to find the most recent month-end performance numbers.
Index performance results are based upon a hypothetical investment in its constituent securities. Index returns do not represent Fund returns. An investor cannot invest directly in an index. The Index does not charge management fees or brokerage expenses, and no such fees or expenses were deducted from the hypothetical performance shown. In addition, the results actual investors might have achieved would have differed from those shown because of differences in the timing, amounts of their investments, and fees and expenses associated with an investment in the Fund.
The S&P Citigroup Mid Cap Growth Index, Russell Midcap® Growth Index and S&P 500® Index (the "Benchmark Indices") are unmanaged indices used as a measurement of change in stock market conditions based on the average performance of approximately 400, 494 and 500 common stocks, respectively.
† Fund and underlying Index returns are based on the inception date of the Fund. Returns for the Benchmark Indices are based on the closest month-end to the Fund's inception date.
†† Average annualized.
11
Manager's Analysis
PowerShares Dynamic Mid Cap Portfolio (ticker: PJG)
The PowerShares Dynamic Mid Cap Portfolio (the "Fund") seeks investment results that correspond (before fees and expenses) generally to the price and yield performance of the Dynamic Mid Cap IntellidexSM Index (the "Index").
For the fiscal year ended April 30, 2011, the Fund returned 18.84%. Over this same year the Index returned 19.69% while the S&P Mid Cap 400® Index returned 25.07%, the Russell Midcap® Index returned 23.36% and the S&P 500® Index returned 17.24%. The Fund benefited from positive performance of securities of companies in industrials, health care, and materials sectors. Fund performance was positive for securities of companies within each sector in which it was invested.
Sector Breakdown (% of the Fund's
Net Assets) as of April 30, 2011
| Information Technology | 20.1 | ||||||
| Health Care | 17.9 | ||||||
| Consumer Discretionary | 17.6 | ||||||
| Financials | 14.3 | ||||||
| Industrials | 14.3 | ||||||
| Consumer Staples | 6.8 | ||||||
| Utilities | 4.3 | ||||||
| Materials | 3.6 | ||||||
| Energy | 0.6 | ||||||
| Telecommunication Services | 0.5 | ||||||
| Money Market Fund | 0.3 | ||||||
| Liabilities in excess of other assets | (0.3 | ) | |||||
Style Allocation (% of the Fund's
Total Investments) as of April 30, 2011
| Mid-Cap Growth | 47.5 | ||||||
| Mid-Cap Value | 32.1 | ||||||
| Large-Cap Value | 7.8 | ||||||
| Small-Cap Value | 6.1 | ||||||
| Small-Cap Growth | 3.6 | ||||||
| Large-Cap Growth | 2.9 | ||||||
Top Ten Fund Holdings (% of the Fund's
Net Assets) as of April 30, 2011
| Security | |||||||
| Limited Brands, Inc. | 1.9 | ||||||
| Humana, Inc. | 1.8 | ||||||
| Waters Corp. | 1.8 | ||||||
| Leucadia National Corp. | 1.7 | ||||||
| Red Hat, Inc. | 1.7 | ||||||
| Discover Financial Services | 1.7 | ||||||
| CIGNA Corp. | 1.6 | ||||||
| Mylan, Inc. | 1.6 | ||||||
| Edison International | 1.6 | ||||||
| AmerisourceBergen Corp. | 1.6 | ||||||
| Total | 17.0 | ||||||
12
Manager's Analysis (Continued)
PowerShares Dynamic Mid Cap Portfolio (ticker: PJG)
Growth of a $10,000 Investment Since Inception†
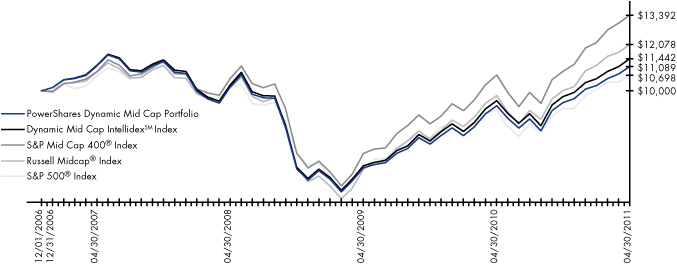
| Fund Performance History (%) | As of April 30, 2011 | ||||||||||||||||||
| Avg Ann†† | Fund Inception | ||||||||||||||||||
| 1 Year | 3 Year | Avg Ann†† | Cumulative | ||||||||||||||||
| Index | |||||||||||||||||||
| Dynamic Mid Cap IntellidexSM Index | 19.69 | % | 3.71 | % | 3.10 | % | 14.42 | % | |||||||||||
| S&P Mid Cap 400® Index | 25.07 | % | 8.28 | % | 6.84 | % | 33.92 | % | |||||||||||
| Russell Midcap® Index | 23.36 | % | 5.97 | % | 4.37 | % | 20.78 | % | |||||||||||
| S&P 500® Index | 17.24 | % | 1.74 | % | 1.54 | % | 6.98 | % | |||||||||||
| Fund | |||||||||||||||||||
| Net Asset Value ("NAV") Return | 18.84 | % | 2.97 | % | 2.37 | % | 10.89 | % | |||||||||||
| Share Price Return | 18.89 | % | 2.96 | % | 2.38 | % | 10.93 | % | |||||||||||
Fund Inception: December 1, 2006
Performance quoted represents past performance. Past performance is not a guarantee of future results and current performance may be higher or lower than performance quoted. Investment returns and principal value will fluctuate and shares, when redeemed, may be worth more or less than their original cost. The Adviser has waived fees and reimbursed other expenses, absent which, performance would have been lower. The Adviser has contractually agreed to waive fees and/or pay certain Fund expenses through August 31, 2012. According to the Fund's current prospectus, the total gross annual operating expense ratio was indicated as 1.11%. In the Financial Highlights section of this Shareholder Report, the Fund's net total operating expense ratio was determined to be 0.65%, while the Fund's gross total expense ratio was determined to be 1.20%. NAV and Share Price returns assume that dividends and capital gain distributions have been reinvested in the Fund at NAV and Share Price, respectively. The returns shown in the table above do not reflect the deduction of taxes that a shareholder would pay on Fund distributions or the redemption or sale of Fund Shares. See invescopowershares.com to find the most recent month-end performance numbers.
Index performance results are based upon a hypothetical investment in its constituent securities. Index returns do not represent Fund returns. An investor cannot invest directly in an index. The Index does not charge management fees or brokerage expenses, and no such fees or expenses were deducted from the hypothetical performance shown. In addition, the results actual investors might have achieved would have differed from those shown because of differences in the timing, amounts of their investments, and fees and expenses associated with an investment in the Fund.
The S&P Mid Cap 400® Index, Russell Midcap® Index and S&P 500® Index (the "Benchmark Indices") are unmanaged indices used as a measurement of change in stock market conditions based on the average performance of approximately 400, 800 and 500 common stocks, respectively.
† Fund and underlying Index returns are based on the inception date of the Fund. Returns for the Benchmark Indices are based on the closest month-end to the Fund's inception date.
†† Average annualized.
13
Manager's Analysis
PowerShares Dynamic Mid Cap Value Portfolio (ticker: PWP)
The PowerShares Dynamic Mid Cap Value Portfolio (the "Fund") seeks investment results that correspond (before fees and expenses) generally to the price and yield performance of the Dynamic Mid Cap Value IntellidexSM Index (the "Index").
For the fiscal year ended April 30, 2011, the Fund returned 12.16%. Over this same year the Index returned 12.88% while the S&P Citigroup Mid Cap Value Index returned 19.69%, the Russell Midcap® Value Index returned 19.84% and the S&P 500® Index returned 17.24%. The Fund benefited from positive performance of securities of companies in energy, materials, and health care sectors. The Fund suffered from negative performance of securities of companies in utilities and information technology sectors.
Sector Breakdown (% of the Fund's
Net Assets) as of April 30, 2011
| Health Care | 19.1 | ||||||
| Financials | 18.9 | ||||||
| Industrials | 16.3 | ||||||
| Consumer Discretionary | 14.6 | ||||||
| Information Technology | 12.6 | ||||||
| Materials | 6.2 | ||||||
| Consumer Staples | 5.6 | ||||||
| Utilities | 5.6 | ||||||
| Energy | 1.1 | ||||||
| Money Market Fund | 0.2 | ||||||
| Liabilities in excess of other assets | (0.2 | ) | |||||
Style Allocation (% of the Fund's
Total Investments) as of April 30, 2011
| Mid-Cap Value | 55.2 | ||||||
| Mid-Cap Growth | 18.8 | ||||||
| Large-Cap Value | 16.2 | ||||||
| Small-Cap Value | 6.2 | ||||||
| Large-Cap Growth | 3.1 | ||||||
| Small-Cap Growth | 0.5 | ||||||
Top Ten Fund Holdings (% of the Fund's
Net Assets) as of April 30, 2011
| Security | |||||||
| Humana, Inc. | 3.7 | ||||||
| Discover Financial Services | 3.5 | ||||||
| CIGNA Corp. | 3.4 | ||||||
| Edison International | 3.4 | ||||||
| Dr Pepper Snapple Group, Inc. | 3.3 | ||||||
| McGraw-Hill Cos., Inc. (The) | 3.3 | ||||||
| Forest Laboratories, Inc. | 3.2 | ||||||
| Life Technologies Corp. | 3.2 | ||||||
| Genuine Parts Co. | 3.2 | ||||||
| Goodrich Corp. | 3.1 | ||||||
| Total | 33.3 | ||||||
14
Manager's Analysis (Continued)
PowerShares Dynamic Mid Cap Value Portfolio (ticker: PWP)
Growth of a $10,000 Investment Since Inception†
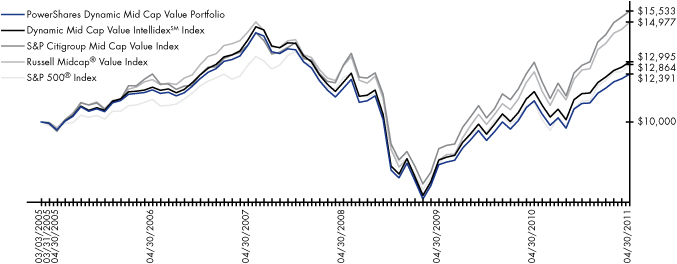
| Fund Performance History (%) | As of April 30, 2011 | ||||||||||||||||||||||
| Avg Ann†† | Fund Inception | ||||||||||||||||||||||
| 1 Year | 3 Year | 5 Year | Avg Ann†† | Cumulative | |||||||||||||||||||
| Index | |||||||||||||||||||||||
| Dynamic Mid Cap Value IntellidexSM Index | 12.88 | % | 2.75 | % | 2.07 | % | 4.34 | % | 29.95 | % | |||||||||||||
| S&P Citigroup Mid Cap Value Index | 19.69 | % | 6.59 | % | 4.64 | % | 7.40 | % | 55.33 | % | |||||||||||||
| Russell Midcap® Value Index | 19.84 | % | 5.37 | % | 4.34 | % | 6.77 | % | 49.77 | % | |||||||||||||
| S&P 500® Index | 17.24 | % | 1.74 | % | 2.95 | % | 4.17 | % | 28.64 | % | |||||||||||||
| Fund | |||||||||||||||||||||||
| Net Asset Value ("NAV") Return | 12.16 | % | 1.99 | % | 1.33 | % | 3.54 | % | 23.91 | % | |||||||||||||
| Share Price Return | 12.24 | % | 2.00 | % | 1.34 | % | 3.52 | % | 23.76 | % | |||||||||||||
Fund Inception: March 3, 2005
Performance quoted represents past performance. Past performance is not a guarantee of future results and current performance may be higher or lower than performance quoted. Investment returns and principal value will fluctuate and shares, when redeemed, may be worth more or less than their original cost. The Adviser has waived fees and reimbursed other expenses, absent which, performance would have been lower. The Adviser has contractually agreed to waive fees and/or pay certain Fund expenses through August 31, 2012. According to the Fund's current prospectus, the total gross annual operating expense ratio was indicated as 0.84%. In the Financial Highlights section of this Shareholder Report, the Fund's net total operating expense ratio was determined to be 0.63%, while the Fund's gross total expense ratio was determined to be 0.91%. NAV and Share Price returns assume that dividends and capital gain distributions have been reinvested in the Fund at NAV and Share Price, respectively. The returns shown in the table above do not reflect the deduction of taxes that a shareholder would pay on Fund distributions or the redemption or sale of Fund Shares. See invescopowershares.com to find the most recent month-end performance numbers.
Index performance results are based upon a hypothetical investment in its constituent securities. Index returns do not represent Fund returns. An investor cannot invest directly in an index. The Index does not charge management fees or brokerage expenses, and no such fees or expenses were deducted from the hypothetical performance shown. In addition, the results actual investors might have achieved would have differed from those shown because of differences in the timing, amounts of their investments, and fees and expenses associated with an investment in the Fund.
The S&P Citigroup Mid Cap Value Index, Russell Midcap® Value Index and S&P 500® Index (the "Benchmark Indices") are unmanaged indices used as a measurement of change in stock market conditions based on the average performance of approximately 293, 536 and 500 common stocks, respectively.
† Fund and underlying Index returns are based on the inception date of the Fund. Returns for the Benchmark Indices are based on the closest month-end to the Fund's inception date.
†† Average annualized.
15
Manager's Analysis
PowerShares Dynamic Small Cap Growth Portfolio (ticker: PWT)
The PowerShares Dynamic Small Cap Growth Portfolio (the "Fund") seeks investment results that correspond (before fees and expenses) generally to the price and yield performance of the Dynamic Small Cap Growth IntellidexSM Index (the "Index").
For the fiscal year ended April 30, 2011, the Fund returned 34.77%. Over this same year the Index returned 35.83% while the S&P Citigroup Small Cap Growth Index returned 29.05%, the Russell 2000® Growth Index returned 30.29% and the S&P 500® Index returned 17.24%. The Fund benefited from positive performance of securities of companies in information technology, health care and consumer discretionary sectors. Fund performance was positive for securities of companies within each sector in which it was invested.
Sector Breakdown (% of the Fund's
Net Assets) as of April 30, 2011
| Industrials | 39.4 | ||||||
| Information Technology | 24.4 | ||||||
| Consumer Discretionary | 8.5 | ||||||
| Health Care | 7.4 | ||||||
| Energy | 7.1 | ||||||
| Financials | 5.9 | ||||||
| Telecommunication Services | 3.5 | ||||||
| Consumer Staples | 2.8 | ||||||
| Materials | 1.0 | ||||||
| Money Market Fund | 0.1 | ||||||
| Liabilities in excess of other assets | (0.1 | ) | |||||
Style Allocation (% of the Fund's
Total Investments) as of April 30, 2011
| Small-Cap Growth | 74.3 | ||||||
| Small-Cap Value | 25.7 | ||||||
Top Ten Fund Holdings (% of the Fund's
Net Assets) as of April 30, 2011
| Security | |||||||
| Sauer-Danfoss, Inc. | 4.1 | ||||||
| Ancestry.com, Inc. | 2.8 | ||||||
| Impax Laboratories, Inc. | 2.8 | ||||||
| Ann, Inc. | 2.7 | ||||||
| Old Dominion Freight Line, Inc. | 2.5 | ||||||
| SAVVIS, Inc. | 2.5 | ||||||
| CVR Energy, Inc. | 2.5 | ||||||
| Hexcel Corp. | 2.4 | ||||||
| Darling International, Inc. | 2.4 | ||||||
| Crocs, Inc. | 2.4 | ||||||
| Total | 27.1 | ||||||
16
Manager's Analysis (Continued)
PowerShares Dynamic Small Cap Growth Portfolio (ticker: PWT)
Growth of a $10,000 Investment Since Inception†
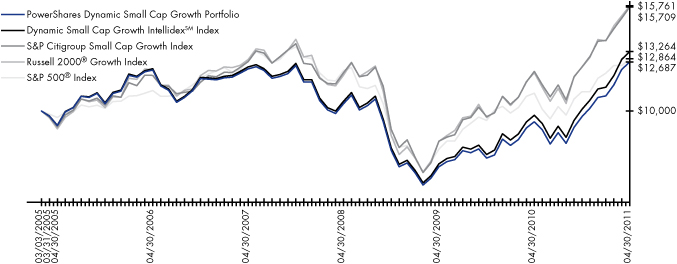
| Fund Performance History (%) | As of April 30, 2011 | ||||||||||||||||||||||
| Avg Ann†† | Fund Inception | ||||||||||||||||||||||
| 1 Year | 3 Year | 5 Year | Avg Ann†† | Cumulative | |||||||||||||||||||
| Index | |||||||||||||||||||||||
| Dynamic Small Cap Growth IntellidexSM Index | 35.83 | % | 7.98 | % | 1.50 | % | 4.69 | % | 32.64 | % | |||||||||||||
| S&P Citigroup Small Cap Growth Index | 29.05 | % | 9.10 | % | 5.62 | % | 7.60 | % | 57.09 | % | |||||||||||||
| Russell 2000® Growth Index | 30.29 | % | 9.62 | % | 5.14 | % | 7.66 | % | 57.61 | % | |||||||||||||
| S&P 500® Index | 17.24 | % | 1.74 | % | 2.95 | % | 4.17 | % | 28.64 | % | |||||||||||||
| Fund | |||||||||||||||||||||||
| Net Asset Value ("NAV") Return | 34.77 | % | 6.86 | % | 0.70 | % | 3.94 | % | 26.87 | % | |||||||||||||
| Share Price Return | 35.11 | % | 6.92 | % | 0.71 | % | 3.92 | % | 26.75 | % | |||||||||||||
Fund Inception: March 3, 2005
Performance quoted represents past performance. Past performance is not a guarantee of future results and current performance may be higher or lower than performance quoted. Investment returns and principal value will fluctuate and shares, when redeemed, may be worth more or less than their original cost. The Adviser has waived fees and reimbursed other expenses, absent which, performance would have been lower. The Adviser has contractually agreed to waive fees and/or pay certain Fund expenses through August 31, 2012. According to the Fund's current prospectus, the total gross annual operating expense ratio was indicated as 0.94%. In the Financial Highlights section of this Shareholder Report, the Fund's net total operating expense ratio was determined to be 0.63%, while the Fund's gross total expense ratio was determined to be 0.93%. NAV and Share Price returns assume that dividends and capital gain distributions have been reinvested in the Fund at NAV and Share Price, respectively. The returns shown in the table above do not reflect the deduction of taxes that a shareholder would pay on Fund distributions or the redemption or sale of Fund Shares. See invescopowershares.com to find the most recent month-end performance numbers.
Index performance results are based upon a hypothetical investment in its constituent securities. Index returns do not represent Fund returns. An investor cannot invest directly in an index. The Index does not charge management fees or brokerage expenses, and no such fees or expenses were deducted from the hypothetical performance shown. In addition, the results actual investors might have achieved would have differed from those shown because of differences in the timing, amounts of their investments, and fees and expenses associated with an investment in the Fund.
The S&P Citigroup Small Cap Growth Index, Russell 2000® Growth Index and S&P 500® Index (the "Benchmark Indices") are unmanaged indices used as a measurement of change in stock market conditions based on the average performance of approximately 600, 2,000 and 500 common stocks, respectively.
† Fund and underlying Index returns are based on the inception date of the Fund. Returns for the Benchmark Indices are based on the closest month-end to the Fund's inception date.
†† Average annualized.
17
Manager's Analysis
PowerShares Dynamic Small Cap Portfolio (ticker: PJM)
The PowerShares Dynamic Small Cap Portfolio (the "Fund") seeks investment results that correspond (before fees and expenses) generally to the price and yield performance of the Dynamic Small Cap IntellidexSM Index (the "Index").
For the fiscal year ended April 30, 2011, the Fund returned 20.64%. Over this same year the Index returned 21.65% while the S&P Small Cap 600® Index returned 21.42%, the Russell 2000® Index returned 22.20% and the S&P 500® Index returned 17.24%. The Fund benefited from positive performance of securities of companies in energy, materials, and telecommunications services sectors. Fund performance was positive for securities of companies within each sector in which it was invested.
Sector Breakdown (% of the Fund's
Net Assets) as of April 30, 2011
| Industrials | 22.0 | ||||||
| Information Technology | 16.0 | ||||||
| Financials | 14.3 | ||||||
| Consumer Discretionary | 12.9 | ||||||
| Health Care | 11.6 | ||||||
| Consumer Staples | 7.0 | ||||||
| Energy | 6.9 | ||||||
| Materials | 6.0 | ||||||
| Utilities | 1.8 | ||||||
| Telecommunication Services | 1.5 | ||||||
| Money Market Fund | 0.4 | ||||||
| Liabilities in excess of other assets | (0.4 | ) | |||||
Style Allocation (% of the Fund's
Total Investments) as of April 30, 2011
| Small-Cap Value | 56.8 | ||||||
| Small-Cap Growth | 39.8 | ||||||
| Mid-Cap Growth | 2.3 | ||||||
| Mid-Cap Value | 1.1 | ||||||
Top Ten Fund Holdings (% of the Fund's
Net Assets) as of April 30, 2011
| Security | |||||||
| NewMarket Corp. | 1.6 | ||||||
| Ancestry.com, Inc. | 1.4 | ||||||
| Impax Laboratories, Inc. | 1.4 | ||||||
| Alexander & Baldwin, Inc. | 1.4 | ||||||
| Timberland Co. (The) | 1.3 | ||||||
| Old Dominion Freight Line, Inc. | 1.3 | ||||||
| Aaron's, Inc. | 1.3 | ||||||
| Centene Corp. | 1.3 | ||||||
| Express, Inc. | 1.3 | ||||||
| Buckle, Inc. (The) | 1.3 | ||||||
| Total | 13.6 | ||||||
18
Manager's Analysis (Continued)
PowerShares Dynamic Small Cap Portfolio (ticker: PJM)
Growth of a $10,000 Investment Since Inception†
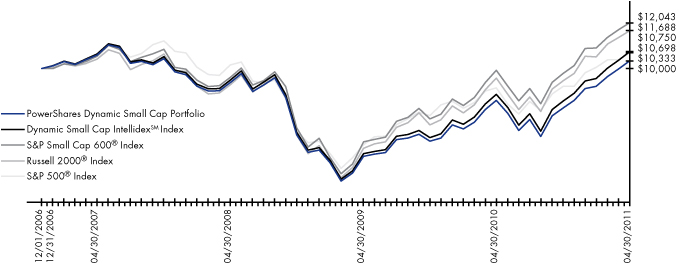
| Fund Performance History (%) | As of April 30, 2011 | ||||||||||||||||||
| Avg Ann†† | Fund Inception | ||||||||||||||||||
| 1 Year | 3 Year | Avg Ann†† | Cumulative | ||||||||||||||||
| Index | |||||||||||||||||||
| Dynamic Small Cap IntellidexSM Index | 21.65 | % | 4.29 | % | 1.65 | % | 7.50 | % | |||||||||||
| S&P Small Cap 600® Index | 21.42 | % | 7.87 | % | 4.30 | % | 20.43 | % | |||||||||||
| Russell 2000® Index | 22.20 | % | 8.03 | % | 3.59 | % | 16.88 | % | |||||||||||
| S&P 500® Index | 17.24 | % | 1.74 | % | 1.54 | % | 6.98 | % | |||||||||||
| Fund | |||||||||||||||||||
| Net Asset Value ("NAV") Return | 20.64 | % | 3.31 | % | 0.74 | % | 3.33 | % | |||||||||||
| Share Price Return | 20.80 | % | 3.36 | % | 0.75 | % | 3.37 | % | |||||||||||
Fund Inception: December 1, 2006
Performance quoted represents past performance. Past performance is not a guarantee of future results and current performance may be higher or lower than performance quoted. Investment returns and principal value will fluctuate and shares, when redeemed, may be worth more or less than their original cost. The Adviser has waived fees and reimbursed other expenses, absent which, performance would have been lower. The Adviser has contractually agreed to waive fees and/or pay certain Fund expenses through August 31, 2012. According to the Fund's current prospectus, the total gross annual operating expense ratio was indicated as 1.26%. In the Financial Highlights section of this Shareholder Report, the Fund's net total operating expense ratio was determined to be 0.65%, while the Fund's gross total expense ratio was determined to be 1.41%. NAV and Share Price returns assume that dividends and capital gain distributions have been reinvested in the Fund at NAV and Share Price, respectively. The returns shown in the table above do not reflect the deduction of taxes that a shareholder would pay on Fund distributions or the redemption or sale of Fund Shares. See invescopowershares.com to find the most recent month-end performance numbers.
Index performance results are based upon a hypothetical investment in its constituent securities. Index returns do not represent Fund returns. An investor cannot invest directly in an index. The Index does not charge management fees or brokerage expenses, and no such fees or expenses were deducted from the hypothetical performance shown. In addition, the results actual investors might have achieved would have differed from those shown because of differences in the timing, amounts of their investments, and fees and expenses associated with an investment in the Fund.
The S&P Small Cap 600® Index, Russell 2000® Index and S&P 500® Index (the "Benchmark Indices") are unmanaged indices used as a measurement of change in stock market conditions based on the average performance of approximately 600, 2,000 and 500 common stocks, respectively.
† Fund and underlying Index returns are based on the inception date of the Fund. Returns for the Benchmark Indices are based on the closest month-end to the Fund's inception date.
†† Average annualized.
19
Manager's Analysis
PowerShares Dynamic Small Cap Value Portfolio (ticker: PWY)
The PowerShares Dynamic Small Cap Value Portfolio (the "Fund") seeks investment results that correspond (before fees and expenses) generally to the price and yield performance of the Dynamic Small Cap Value IntellidexSM Index (the "Index").
For the fiscal year ended April 30, 2011, the Fund returned 18.03%. Over this same year the Index returned 18.88% while the S&P Citigroup Small Cap Value Index returned 14.40%, the Russell 2000® Value Index returned 14.57% and the S&P 500® Index returned 17.24%. The Fund benefited from positive performance of securities of companies in energy, telecommunication services, and health care sectors. The Fund suffered negative performance of securities of companies in telecommunication services sector, during the fiscal year.
Sector Breakdown (% of the Fund's
Net Assets) as of April 30, 2011
| Financials | 25.9 | ||||||
| Industrials | 15.6 | ||||||
| Consumer Discretionary | 15.4 | ||||||
| Information Technology | 13.9 | ||||||
| Consumer Staples | 7.8 | ||||||
| Materials | 7.3 | ||||||
| Health Care | 6.5 | ||||||
| Utilities | 3.7 | ||||||
| Energy | 3.5 | ||||||
| Telecommunication Services | 0.5 | ||||||
| Money Market Fund | 0.1 | ||||||
| Liabilities in excess of other assets | (0.2 | ) | |||||
Style Allocation (% of the Fund's
Total Investments) as of April 30, 2011
| Small-Cap Value | 77.5 | ||||||
| Small-Cap Growth | 20.3 | ||||||
| Mid-Cap Growth | 2.2 | ||||||
Top Ten Fund Holdings (% of the Fund's
Net Assets) as of April 30, 2011
| Security | |||||||
| NewMarket Corp. | 3.2 | ||||||
| Alexander & Baldwin, Inc. | 2.8 | ||||||
| Aaron's, Inc. | 2.6 | ||||||
| Express, Inc. | 2.6 | ||||||
| Buckle, Inc. (The) | 2.6 | ||||||
| CNO Financial Group, Inc. | 2.5 | ||||||
| Credit Acceptance Corp. | 2.5 | ||||||
| Sensient Technologies Corp. | 2.5 | ||||||
| Ruddick Corp. | 2.5 | ||||||
| Owens & Minor, Inc. | 2.4 | ||||||
| Total | 26.2 | ||||||
20
Manager's Analysis (Continued)
PowerShares Dynamic Small Cap Value Portfolio (ticker: PWY)
Growth of a $10,000 Investment Since Inception†
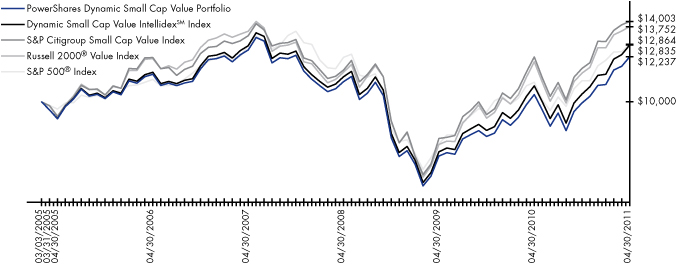
| Fund Performance History (%) | As of April 30, 2011 | ||||||||||||||||||||||
| Avg Ann†† | Fund Inception | ||||||||||||||||||||||
| 1 Year | 3 Year | 5 Year | Avg Ann†† | Cumulative | |||||||||||||||||||
| Index | |||||||||||||||||||||||
| Dynamic Small Cap Value IntellidexSM Index | 18.88 | % | 4.47 | % | 2.26 | % | 4.14 | % | 28.35 | % | |||||||||||||
| S&P Citigroup Small Cap Value Index | 14.40 | % | 6.52 | % | 2.77 | % | 5.61 | % | 40.03 | % | |||||||||||||
| Russell 2000® Value Index | 14.57 | % | 6.23 | % | 2.50 | % | 5.30 | % | 37.52 | % | |||||||||||||
| S&P 500® Index | 17.24 | % | 1.74 | % | 2.95 | % | 4.17 | % | 28.64 | % | |||||||||||||
| Fund | |||||||||||||||||||||||
| Net Asset Value ("NAV") Return | 18.03 | % | 3.59 | % | 1.47 | % | 3.33 | % | 22.37 | % | |||||||||||||
| Share Price Return | 18.26 | % | 3.63 | % | 1.50 | % | 3.32 | % | 22.29 | % | |||||||||||||
Fund Inception: March 3, 2005
Performance quoted represents past performance. Past performance is not a guarantee of future results and current performance may be higher or lower than performance quoted. Investment returns and principal value will fluctuate and shares, when redeemed, may be worth more or less than their original cost. The Adviser has waived fees and reimbursed other expenses, absent which, performance would have been lower. The Adviser has contractually agreed to waive fees and/or pay certain Fund expenses through August 31, 2012. According to the Fund's current prospectus, the total gross annual operating expense ratio was indicated as 0.74%. In the Financial Highlights section of this Shareholder Report, the Fund's net total operating expense ratio was determined to be 0.63%, while the Fund's gross total expense ratio was determined to be 0.80%. NAV and Share Price returns assume that dividends and capital gain distributions have been reinvested in the Fund at NAV and Share Price, respectively. The returns shown in the table above do not reflect the deduction of taxes that a shareholder would pay on Fund distributions or the redemption or sale of Fund Shares. See invescopowershares.com to find the most recent month-end performance numbers.
Index performance results are based upon a hypothetical investment in its constituent securities. Index returns do not represent Fund returns. An investor cannot invest directly in an index. The Index does not charge management fees or brokerage expenses, and no such fees or expenses were deducted from the hypothetical performance shown. In addition, the results actual investors might have achieved would have differed from those shown because of differences in the timing, amounts of their investments, and fees and expenses associated with an investment in the Fund.
The S&P Citigroup Small Cap Value Index, Russell 2000® Value Index and S&P 500® Index (the "Benchmark Indices") are unmanaged indices used as a measurement of change in stock market conditions based on the average performance of approximately 436, 2,000 and 500 common stocks, respectively.
† Fund and underlying Index returns are based on the inception date of the Fund. Returns for the Benchmark Indices are based on the closest month-end to the Fund's inception date.
†† Average annualized.
21
Manager's Analysis
PowerShares Zacks Micro Cap Portfolio (ticker: PZI)
The PowerShares Zacks Micro Cap Portfolio (the "Fund") seeks investment results that correspond (before fees and expenses) generally to the price and yield performance of the Zacks Micro Cap IndexTM (the "Index").
For the fiscal year ended April 30, 2011, the Fund returned 7.97%. Over this same year the Index returned 7.44% while the Russell Microcap® Index returned 12.16%, the Dow Jones Micro Cap Index returned 21.56% and the S&P 500® Index returned 17.24%. The Fund benefited from positive performance of securities of companies in telecommunications, information technology, and energy sectors. The Fund suffered from negative performance of securities of companies in financials and consumer discretionary sectors.
Sector Breakdown (% of the Fund's
Net Assets) as of April 30, 2011
| Financials | 25.4 | ||||||
| Information Technology | 19.6 | ||||||
| Industrials | 15.1 | ||||||
| Consumer Discretionary | 14.4 | ||||||
| Energy | 7.3 | ||||||
| Health Care | 6.8 | ||||||
| Materials | 5.9 | ||||||
| Consumer Staples | 3.5 | ||||||
| Telecommunication Services | 1.3 | ||||||
| Utilities | 0.8 | ||||||
| Money Market Fund | 0.0 | ||||||
| Liabilities in excess of other assets | (0.1 | ) | |||||
Style Allocation (% of the Fund's
Total Investments) as of April 30, 2011
| Small-Cap Value | 61.5 | ||||||
| Small-Cap Growth | 38.4 | ||||||
| Mid-Cap Growth | 0.1 | ||||||
Top Ten Fund Holdings (% of the Fund's
Net Assets) as of April 30, 2011
| Security | |||||||
| Conn's, Inc., 12/31/99 | 0.4 | ||||||
| TPC Group, Inc. | 0.3 | ||||||
| Gray Television, Inc. | 0.3 | ||||||
| EMS Technologies, Inc. | 0.3 | ||||||
| Zalicus, Inc. | 0.3 | ||||||
| Lithia Motors, Inc. | 0.3 | ||||||
| Ym Biosciences, Inc. | 0.3 | ||||||
| Titan Machinery, Inc. | 0.3 | ||||||
| Internap Network Services Corp. | 0.3 | ||||||
| Electronics for Imaging, Inc. | 0.3 | ||||||
| Total | 3.1 | ||||||
22
Manager's Analysis (Continued)
PowerShares Zacks Micro Cap Portfolio (ticker: PZI)
Growth of a $10,000 Investment Since Inception†
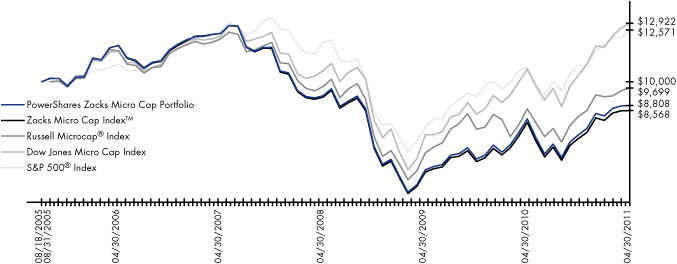
| Fund Performance History (%) | As of April 30, 2011 | ||||||||||||||||||||||
| Avg Ann†† | Fund Inception | ||||||||||||||||||||||
| 1 Year | 3 Year | 5 Year | Avg Ann†† | Cumulative | |||||||||||||||||||
| Index | |||||||||||||||||||||||
| Zacks Micro Cap IndexTM | 7.44 | % | -2.46 | % | -6.22 | % | -2.67 | % | -14.32 | % | |||||||||||||
| Russell Microcap® Index | 12.16 | % | -0.18 | % | -3.42 | % | -0.54 | % | -3.01 | % | |||||||||||||
| Dow Jones Micro Cap Index | 21.56 | % | 7.02 | % | 2.28 | % | 4.63 | % | 29.22 | % | |||||||||||||
| S&P 500® Index | 17.24 | % | 1.74 | % | 2.95 | % | 4.12 | % | 25.71 | % | |||||||||||||
| Fund | |||||||||||||||||||||||
| Net Asset Value ("NAV") Return | 7.97 | % | -1.79 | % | -5.71 | % | -2.20 | % | -11.92 | % | |||||||||||||
| Share Price Return | 7.97 | % | -1.79 | % | -5.73 | % | -2.24 | % | -12.11 | % | |||||||||||||
Fund Inception: August 18, 2005
Performance quoted represents past performance. Past performance is not a guarantee of future results and current performance may be higher or lower than performance quoted. Investment returns and principal value will fluctuate and shares, when redeemed, may be worth more or less than their original cost. The Adviser has waived fees and reimbursed other expenses, absent which, performance would have been lower. The Adviser has contractually agreed to waive fees and/or pay certain Fund expenses through August 31, 2012. According to the Fund's current prospectus, the total gross annual operating expense ratio was indicated as 0.97% and includes estimated acquired fund fees and expenses of 0.04%. In the Financial Highlights section of this Shareholder Report, the Fund's net total operating expense ratio was determined to be 0.70%, while the Fund's gross total expense ratio was determined to be 0.85%. NAV and Share Price returns assume that dividends and capital gain distributions have been reinvested in the Fund at NAV and Share Price, respectively. The returns shown in the table above do not reflect the deduction of taxes that a shareholder would pay on Fund distributions or the redemption or sale of Fund Shares. See invescopowershares.com to find the most recent month-end performance numbers.
Index performance results are based upon a hypothetical investment in its constituent securities. Index returns do not represent Fund returns. An investor cannot invest directly in an index. The Index does not charge management fees or brokerage expenses, and no such fees or expenses were deducted from the hypothetical performance shown. In addition, the results actual investors might have achieved would have differed from those shown because of differences in the timing, amounts of their investments, and fees and expenses associated with an investment in the Fund.
The Russell Microcap® Index, Dow Jones Micro Cap Index and S&P 500® Index (the "Benchmark Indices") are unmanaged indices used as a measurement of change in stock market conditions based on the average performance of approximately 1,000, 205 and 500 common stocks, respectively.
† Fund and underlying Index returns are based on the inception date of the Fund. Returns for the Benchmark Indices are based on the closest month-end to the Fund's inception date.
†† Average annualized.
23
Frequency Distribution of Discounts & Premiums
Since Inception through April 30, 2011
| Closing Price Above NAV (bps) | |||||||||||||||||||||||||||||||||||||||
| Ticker | Fund Name | Inception | Days | 0-24 | 25-49 | 50-99 | 100-149 | 150-199 | 200+ | ||||||||||||||||||||||||||||||
| PWB | PowerShares Dynamic Large Cap Growth Portfolio | 03/03/05 | 1552 | 696 | 35 | 3 | 1 | 0 | 0 | ||||||||||||||||||||||||||||||
| PJF | PowerShares Dynamic Large Cap Portfolio | 12/01/06 | 1110 | 398 | 16 | 4 | 2 | 1 | 0 | ||||||||||||||||||||||||||||||
| PWV | PowerShares Dynamic Large Cap Value Portfolio | 03/03/05 | 1552 | 830 | 34 | 11 | 1 | 0 | 1 | ||||||||||||||||||||||||||||||
| PWJ | PowerShares Dynamic Mid Cap Growth Portfolio | 03/03/05 | 1552 | 617 | 20 | 6 | 0 | 0 | 0 | ||||||||||||||||||||||||||||||
| PJG | PowerShares Dynamic Mid Cap Portfolio | 12/01/06 | 1110 | 446 | 28 | 1 | 1 | 1 | 1 | ||||||||||||||||||||||||||||||
| PWP | PowerShares Dynamic Mid Cap Value Portfolio | 03/03/05 | 1552 | 585 | 23 | 5 | 1 | 0 | 2 | ||||||||||||||||||||||||||||||
| PWT | PowerShares Dynamic Small Cap Growth Portfolio | 03/03/05 | 1552 | 633 | 54 | 6 | 5 | 0 | 2 | ||||||||||||||||||||||||||||||
| PJM | PowerShares Dynamic Small Cap Portfolio | 12/01/06 | 1110 | 377 | 29 | 5 | 1 | 0 | 0 | ||||||||||||||||||||||||||||||
| PWY | PowerShares Dynamic Small Cap Value Portfolio | 03/03/05 | 1552 | 613 | 47 | 10 | 1 | 1 | 0 | ||||||||||||||||||||||||||||||
| PZI | PowerShares Zacks Micro Cap Portfolio | 08/18/05 | 1435 | 488 | 56 | 15 | 0 | 1 | 0 | ||||||||||||||||||||||||||||||
24
| Closing Price Below NAV (bps) | |||||||||||||||||||||||||||
| Ticker | -0-24 | -25-49 | -50-99 | -100-149 | -150-199 | -200+ | |||||||||||||||||||||
| PWB | 792 | 21 | 4 | 0 | 0 | 0 | |||||||||||||||||||||
| PJF | 679 | 7 | 3 | 0 | 0 | 0 | |||||||||||||||||||||
| PWV | 653 | 15 | 7 | 0 | 0 | 0 | |||||||||||||||||||||
| PWJ | 891 | 16 | 2 | 0 | 0 | 0 | |||||||||||||||||||||
| PJG | 622 | 9 | 1 | 0 | 0 | 0 | |||||||||||||||||||||
| PWP | 912 | 17 | 5 | 1 | 1 | 0 | |||||||||||||||||||||
| PWT | 791 | 55 | 5 | 1 | 0 | 0 | |||||||||||||||||||||
| PJM | 664 | 29 | 3 | 2 | 0 | 0 | |||||||||||||||||||||
| PWY | 817 | 53 | 8 | 1 | 1 | 0 | |||||||||||||||||||||
| PZI | 798 | 69 | 7 | 1 | 0 | 0 | |||||||||||||||||||||
25
Fees and Expenses
As a shareholder of a Fund of the PowerShares Exchange-Traded Fund Trust, you incur advisory fees and other Fund expenses. The expense examples below are intended to help you understand your ongoing costs (in dollars) of investing in the Funds and to compare these costs with the ongoing costs of investing in other funds.
The example is based on an investment of $1,000 invested at the beginning of the period and held through the six-month period ended April 30, 2011.
In pursuing its investment objective, PowerShares Zacks Micro Cap Portfolio (the "Portfolio") may invest a portion of its assets in investment companies. The Fund indirectly bears a pro rata share of the fees and expenses of the investment companies in which the Fund invests. The effect of such expenses are included in the Portfolio's total return.
Actual Expenses
The first line in the following table provides information about actual account values and actual expenses. You may use the information in this line, together with the amount you invested, to estimate the expenses that you paid over the period. Simply divide your account value by $1,000 (for example, an $8,600 account value divided by $1,000 = 8.6), then multiply the result by the number in the first line under the heading "Expenses Paid During the Six-Month Period" to estimate the expenses you paid on your account during this period.
Hypothetical Example for Comparison Purposes
The second line in the following table provides information about hypothetical account values and hypothetical expenses based on each Fund's actual expense ratio and an assumed annualized rate of return of 5% per year before expenses, which is not the Fund's actual return. The hypothetical account values and expenses may not be used to estimate the actual ending account balance or expenses you paid for the period. You may use this information to compare the ongoing costs of investing in the Funds and other funds. To do so, compare this 5% hypothetical example with the 5% hypothetical examples that appear in the shareholder reports of the other funds.
Please note that the expenses shown in the table are meant to highlight your ongoing costs only, and do not reflect any transactional costs such as sales charges and brokerage commissions. Therefore the second line in the table is useful in comparing ongoing costs only, and will not help you determine the relative total costs of owning different funds. In addition, if these transactional costs were included, your costs would have been higher.
| Beginning Account Value November 1, 2010 | Ending Account Value April 30, 2011 | Annualized Expense Ratio Based on the Six-Month Period | Expenses Paid During the Six-Month Period (1) | ||||||||||||||||
| PowerShares Dynamic Large Cap Growth Portfolio Actual | $ | 1,000.00 | $ | 1,157.87 | 0.63 | % | $ | 3.37 | |||||||||||
| Hypothetical (5% return before expenses) | $ | 1,000.00 | $ | 1,021.67 | 0.63 | % | $ | 3.16 | |||||||||||
| PowerShares Dynamic Large Cap Portfolio Actual | $ | 1,000.00 | $ | 1,150.64 | 0.65 | % | $ | 3.47 | |||||||||||
| Hypothetical (5% return before expenses) | $ | 1,000.00 | $ | 1,021.57 | 0.65 | % | $ | 3.26 | |||||||||||
| PowerShares Dynamic Large Cap Value Portfolio Actual | $ | 1,000.00 | $ | 1,152.99 | 0.61 | % | $ | 3.26 | |||||||||||
| Hypothetical (5% return before expenses) | $ | 1,000.00 | $ | 1,021.77 | 0.61 | % | $ | 3.06 | |||||||||||
26
Fees and Expenses (Continued)
| Beginning Account Value November 1, 2010 | Ending Account Value April 30, 2011 | Annualized Expense Ratio Based on the Six-Month Period | Expenses Paid During the Six-Month Period (1) | ||||||||||||||||
| PowerShares Dynamic Mid Cap Growth Portfolio Actual | $ | 1,000.00 | $ | 1,229.40 | 0.63 | % | $ | 3.48 | |||||||||||
| Hypothetical (5% return before expenses) | $ | 1,000.00 | $ | 1,021.67 | 0.63 | % | $ | 3.16 | |||||||||||
| PowerShares Dynamic Mid Cap Portfolio Actual | $ | 1,000.00 | $ | 1,170.60 | 0.65 | % | $ | 3.50 | |||||||||||
| Hypothetical (5% return before expenses) | $ | 1,000.00 | $ | 1,021.57 | 0.65 | % | $ | 3.26 | |||||||||||
| PowerShares Dynamic Mid Cap Value Portfolio Actual | $ | 1,000.00 | $ | 1,135.29 | 0.63 | % | $ | 3.34 | |||||||||||
| Hypothetical (5% return before expenses) | $ | 1,000.00 | $ | 1,021.67 | 0.63 | % | $ | 3.16 | |||||||||||
| PowerShares Dynamic Small Cap Growth Portfolio Actual | $ | 1,000.00 | $ | 1,309.70 | 0.63 | % | $ | 3.61 | |||||||||||
| Hypothetical (5% return before expenses) | $ | 1,000.00 | $ | 1,021.67 | 0.63 | % | $ | 3.16 | |||||||||||
| PowerShares Dynamic Small Cap Portfolio Actual | $ | 1,000.00 | $ | 1,255.24 | 0.65 | % | $ | 3.63 | |||||||||||
| Hypothetical (5% return before expenses) | $ | 1,000.00 | $ | 1,021.57 | 0.65 | % | $ | 3.26 | |||||||||||
| PowerShares Dynamic Small Cap Value Portfolio Actual | $ | 1,000.00 | $ | 1,231.53 | 0.63 | % | $ | 3.49 | |||||||||||
| Hypothetical (5% return before expenses) | $ | 1,000.00 | $ | 1,021.67 | 0.63 | % | $ | 3.16 | |||||||||||
| PowerShares Zacks Micro Cap Portfolio Actual | $ | 1,000.00 | $ | 1,197.43 | 0.70 | % | $ | 3.81 | |||||||||||
| Hypothetical (5% return before expenses) | $ | 1,000.00 | $ | 1,021.32 | 0.70 | % | $ | 3.51 | |||||||||||
(1) Expenses are calculated using the annualized expense ratio, which represents the ongoing expenses as a percentage of net assets for the six-month ended April 30, 2011. Expenses are calculated by multiplying the Fund's annualized expense ratio by the average account value for the period; then multiplying the result by 181 and then dividing the result by 365. Expense ratios for the most recent half-year differ from expense ratios based on annualized data in the Financial Highlights.
27
Schedule of Investments
PowerShares Dynamic Large Cap Growth Portfolio
April 30, 2011
| Number of Shares | Value | ||||||||||
| Common Stocks—100.0% | |||||||||||
| Consumer Discretionary—18.2% | |||||||||||
| 56,206 | Bed Bath & Beyond, Inc.* | $ | 3,154,281 | ||||||||
| 114,252 | CBS Corp., Class B | 2,881,435 | |||||||||
| 49,322 | Coach, Inc. | 2,949,949 | |||||||||
| 58,428 | DIRECTV, Class A* | 2,839,017 | |||||||||
| 188,742 | General Motors Co.* | 6,056,731 | |||||||||
| 169,246 | Home Depot, Inc. (The) | 6,285,796 | |||||||||
| 30,569 | NIKE, Inc., Class B | 2,516,440 | |||||||||
| 5,847 | priceline.com, Inc.* | 3,198,368 | |||||||||
| 82,753 | Starbucks Corp. | 2,994,831 | |||||||||
| 53,780 | Yum! Brands, Inc. | 2,884,759 | |||||||||
| 35,761,607 | |||||||||||
| Consumer Staples—9.8% | |||||||||||
| 97,585 | Coca-Cola Co. (The) | 6,583,084 | |||||||||
| 36,555 | Costco Wholesale Corp. | 2,958,031 | |||||||||
| 28,920 | Estee Lauder Cos., Inc. (The), Class A | 2,805,240 | |||||||||
| 100,810 | Philip Morris International, Inc. | 7,000,246 | |||||||||
| 19,346,601 | |||||||||||
| Energy—2.8% | |||||||||||
| 57,189 | Halliburton Co. | 2,886,901 | |||||||||
| 33,690 | National Oilwell Varco, Inc. | 2,583,686 | |||||||||
| 5,470,587 | |||||||||||
| Financials—5.4% | |||||||||||
| 51,236 | Aon Corp. | 2,672,982 | |||||||||
| 13,190 | BlackRock, Inc. | 2,584,449 | |||||||||
| 21,530 | Franklin Resources, Inc. | 2,779,954 | |||||||||
| 40,074 | T. Rowe Price Group, Inc. | 2,574,754 | |||||||||
| 10,612,139 | |||||||||||
| Health Care—7.1% | |||||||||||
| 63,496 | Agilent Technologies, Inc.* | 3,169,085 | |||||||||
| 48,523 | Express Scripts, Inc.* | 2,753,195 | |||||||||
| 42,946 | Medco Health Solutions, Inc.* | 2,547,986 | |||||||||
| 56,020 | St. Jude Medical, Inc. | 2,993,709 | |||||||||
| 42,651 | Stryker Corp. | 2,516,409 | |||||||||
| 13,980,384 | |||||||||||
| Industrials—24.3% | |||||||||||
| 61,522 | Caterpillar, Inc. | 7,100,254 | |||||||||
| 36,685 | CSX Corp. | 2,886,743 | |||||||||
| 53,244 | Danaher Corp. | 2,941,199 | |||||||||
| 29,723 | Deere & Co. | 2,897,993 | |||||||||
| 104,644 | Emerson Electric Co. | 6,358,169 | |||||||||
| 109,557 | Honeywell International, Inc. | 6,708,175 | |||||||||
| 53,664 | PACCAR, Inc. | 2,850,095 | |||||||||
| 30,278 | Rockwell Automation, Inc. | 2,638,122 | |||||||||
| 66,739 | Union Pacific Corp. | 6,905,484 | |||||||||
| 85,426 | United Parcel Service, Inc., Class B | 6,404,387 | |||||||||
| 47,690,621 | |||||||||||
| Number of Shares | Value | ||||||||||
| Common Stocks (Continued) | |||||||||||
| Information Technology—29.7% | |||||||||||
| 63,087 | Altera Corp. | $ | 3,072,337 | ||||||||
| 18,024 | Apple, Inc.* | 6,276,497 | |||||||||
| 166,846 | Applied Materials, Inc. | 2,617,814 | |||||||||
| 54,212 | Automatic Data Processing, Inc. | 2,946,422 | |||||||||
| 37,916 | Citrix Systems, Inc.* | 3,197,835 | |||||||||
| 35,156 | Cognizant Technology Solutions Corp., Class A* | 2,914,432 | |||||||||
| 233,293 | EMC Corp.* | 6,611,524 | |||||||||
| 10,288 | Google, Inc., Class A* | 5,597,701 | |||||||||
| 10,900 | MasterCard, Inc., Class A | 3,007,201 | |||||||||
| 190,458 | Oracle Corp. | 6,866,011 | |||||||||
| 106,332 | QUALCOMM, Inc. | 6,043,911 | |||||||||
| 75,355 | TE Connectivity Ltd. (Switzerland) | 2,701,477 | |||||||||
| 84,035 | Visa, Inc., Class A | 6,564,814 | |||||||||
| 58,417,976 | |||||||||||
| Materials—2.7% | |||||||||||
| 31,666 | Mosaic Co. (The) | 2,370,516 | |||||||||
| 49,387 | Newmont Mining Corp. | 2,894,572 | |||||||||
| 5,265,088 | |||||||||||
| Total Common Stocks (Cost $156,750,006) | 196,545,003 | ||||||||||
| Money Market Fund—0.1% | |||||||||||
| 222,849 | Goldman Sachs Financial Square Prime Obligations Institutional Share Class (Cost $222,849) | 222,849 | |||||||||
| Total Investments (Cost $156,972,855)—100.1% | 196,767,852 | ||||||||||
| Liabilities in excess of other assets—(0.1%) | (193,641 | ) | |||||||||
| Net Assets—100.0% | $ | 196,574,211 | |||||||||
Notes to Schedule of Investments:
* Non-income producing security.
See Notes to Financial Statements.
28
Schedule of Investments
PowerShares Dynamic Large Cap Portfolio
April 30, 2011
| Number of Shares | Value | ||||||||||
| Common Stocks—100.0% | |||||||||||
| Consumer Discretionary—15.1% | |||||||||||
| 5,082 | Bed Bath & Beyond, Inc.* | $ | 285,202 | ||||||||
| 4,459 | Coach, Inc. | 266,693 | |||||||||
| 22,555 | Comcast Corp., Class A | 591,843 | |||||||||
| 10,688 | Gap, Inc. (The) | 248,389 | |||||||||
| 17,064 | General Motors Co.* | 547,584 | |||||||||
| 4,559 | Kohl's Corp. | 240,305 | |||||||||
| 7,652 | McDonald's Corp. | 599,228 | |||||||||
| 2,764 | NIKE, Inc., Class B | 227,532 | |||||||||
| 528 | priceline.com, Inc.* | 288,821 | |||||||||
| 7,482 | Starbucks Corp. | 270,774 | |||||||||
| 4,644 | Target Corp. | 228,020 | |||||||||
| 3,411 | Time Warner Cable, Inc. | 266,501 | |||||||||
| 6,416 | Time Warner, Inc. | 242,910 | |||||||||
| 4,831 | TJX Cos., Inc. (The) | 259,038 | |||||||||
| 13,260 | Walt Disney Co. (The) | 571,506 | |||||||||
| 4,862 | Yum! Brands, Inc. | 260,798 | |||||||||
| 5,395,144 | |||||||||||
| Consumer Staples—10.2% | |||||||||||
| 9,750 | Altria Group, Inc. | 261,690 | |||||||||
| 8,857 | Coca-Cola Co. (The) | 597,493 | |||||||||
| 3,305 | Costco Wholesale Corp. | 267,441 | |||||||||
| 7,382 | CVS Caremark Corp. | 267,524 | |||||||||
| 2,615 | Estee Lauder Cos., Inc. (The), Class A | 253,655 | |||||||||
| 4,863 | H.J. Heinz Co. | 249,131 | |||||||||
| 9,160 | Philip Morris International, Inc. | 636,070 | |||||||||
| 9,065 | Procter & Gamble Co. (The) | 588,319 | |||||||||
| 7,156 | Reynolds American, Inc. | 265,559 | |||||||||
| 5,794 | Walgreen Co. | 247,520 | |||||||||
| 3,634,402 | |||||||||||
| Energy—5.6% | |||||||||||
| 5,585 | Chevron Corp. | 611,222 | |||||||||
| 7,379 | ConocoPhillips | 582,425 | |||||||||
| 6,649 | Exxon Mobil Corp. | 585,112 | |||||||||
| 3,046 | National Oilwell Varco, Inc. | 233,598 | |||||||||
| 2,012,357 | |||||||||||
| Financials—7.9% | |||||||||||
| 4,204 | Aflac, Inc. | 236,223 | |||||||||
| 3,828 | Ameriprise Financial, Inc. | 237,566 | |||||||||
| 4,045 | Chubb Corp. (The) | 263,693 | |||||||||
| 1,946 | Franklin Resources, Inc. | 251,267 | |||||||||
| 12,155 | JPMorgan Chase & Co. | 554,633 | |||||||||
| 11,902 | Progressive Corp. (The) | 261,130 | |||||||||
| 3,754 | Prudential Financial, Inc. | 238,079 | |||||||||
| 4,080 | Travelers Cos., Inc. (The) | 258,182 | |||||||||
| 20,617 | U.S. Bancorp | 532,331 | |||||||||
| 2,833,104 | |||||||||||
| Health Care—14.1% | |||||||||||
| 11,954 | Abbott Laboratories | 622,086 | |||||||||
| 6,514 | Aetna, Inc. | 269,549 | |||||||||
| Number of Shares | Value | ||||||||||
| Common Stocks (Continued) | |||||||||||
| 5,740 | Agilent Technologies, Inc.* | $ | 286,484 | ||||||||
| 4,653 | Amgen, Inc.* | 264,523 | |||||||||
| 4,639 | Baxter International, Inc. | 263,959 | |||||||||
| 3,587 | Biogen Idec, Inc.* | 349,195 | |||||||||
| 5,894 | Cardinal Health, Inc. | 257,509 | |||||||||
| 4,793 | Covidien PLC (Ireland) | 266,922 | |||||||||
| 7,133 | Eli Lilly & Co. | 263,992 | |||||||||
| 4,387 | Express Scripts, Inc.* | 248,918 | |||||||||
| 3,070 | McKesson Corp. | 254,841 | |||||||||
| 30,231 | Pfizer, Inc. | 633,642 | |||||||||
| 3,856 | Stryker Corp. | 227,504 | |||||||||
| 4,377 | Thermo Fisher Scientific, Inc.* | 262,576 | |||||||||
| 5,719 | UnitedHealth Group, Inc. | 281,546 | |||||||||
| 3,655 | WellPoint, Inc. | 280,668 | |||||||||
| 5,033,914 | |||||||||||
| Industrials—17.0% | |||||||||||
| 6,312 | 3M Co. | 613,590 | |||||||||
| 5,584 | Caterpillar, Inc. | 644,449 | |||||||||
| 3,317 | CSX Corp. | 261,015 | |||||||||
| 4,814 | Danaher Corp. | 265,925 | |||||||||
| 2,687 | Deere & Co. | 261,983 | |||||||||
| 4,548 | Eaton Corp. | 243,454 | |||||||||
| 4,055 | Emerson Electric Co. | 246,382 | |||||||||
| 3,202 | General Dynamics Corp. | 233,170 | |||||||||
| 27,365 | General Electric Co. | 559,614 | |||||||||
| 4,245 | Honeywell International, Inc. | 259,921 | |||||||||
| 3,035 | Lockheed Martin Corp. | 240,524 | |||||||||
| 2,746 | Parker Hannifin Corp. | 259,003 | |||||||||
| 2,738 | Rockwell Automation, Inc. | 238,562 | |||||||||
| 5,435 | Tyco International Ltd. (Switzerland) | 264,902 | |||||||||
| 2,586 | Union Pacific Corp. | 267,573 | |||||||||
| 7,724 | United Parcel Service, Inc., Class B | 579,068 | |||||||||
| 6,806 | United Technologies Corp. | 609,681 | |||||||||
| 6,048,816 | |||||||||||
| Information Technology—22.4% | |||||||||||
| 5,704 | Altera Corp. | 277,785 | |||||||||
| 1,630 | Apple, Inc.* | 567,615 | |||||||||
| 15,085 | Applied Materials, Inc. | 236,684 | |||||||||
| 4,901 | Automatic Data Processing, Inc. | 266,369 | |||||||||
| 9,829 | CA, Inc. | 241,695 | |||||||||
| 7,230 | eBay, Inc.* | 248,712 | |||||||||
| 21,177 | EMC Corp.* | 600,156 | |||||||||
| 13,303 | Hewlett-Packard Co. | 537,042 | |||||||||
| 25,955 | Intel Corp. | 601,896 | |||||||||
| 3,514 | International Business Machines Corp. | 599,418 | |||||||||
| 986 | MasterCard, Inc., Class A | 272,028 | |||||||||
| 21,370 | Microsoft Corp. | 556,047 | |||||||||
| 17,308 | Oracle Corp. | 623,953 | |||||||||
| 9,613 | QUALCOMM, Inc. | 546,403 | |||||||||
| 13,397 | Symantec Corp.* | 263,251 | |||||||||
| 6,813 | TE Connectivity Ltd. (Switzerland) | 244,246 | |||||||||
See Notes to Financial Statements.
29
Schedule of Investments (Continued)
PowerShares Dynamic Large Cap Portfolio
April 30, 2011
| Number of Shares | Value | ||||||||||
| Common Stocks (Continued) | |||||||||||
| 6,826 | Texas Instruments, Inc. | $ | 242,528 | ||||||||
| 7,637 | Visa, Inc., Class A | 596,602 | |||||||||
| 11,195 | Western Union Co. (The) | 237,894 | |||||||||
| 22,683 | Xerox Corp. | 228,872 | |||||||||
| 7,989,196 | |||||||||||
| Materials—3.5% | |||||||||||
| 2,660 | Air Products & Chemicals, Inc. | 254,083 | |||||||||
| 4,497 | E.I. du Pont de Nemours & Co. | 255,385 | |||||||||
| 4,636 | Freeport-McMoRan Copper & Gold, Inc. | 255,119 | |||||||||
| 2,863 | Mosaic Co. (The) | 214,324 | |||||||||
| 2,781 | PPG Industries, Inc. | 263,277 | |||||||||
| 1,242,188 | |||||||||||
| Telecommunication Services—3.5% | |||||||||||
| 20,269 | AT&T, Inc. | 630,771 | |||||||||
| 15,853 | Verizon Communications, Inc. | 598,927 | |||||||||
| 1,229,698 | |||||||||||
| Utilities—0.7% | |||||||||||
| 6,389 | Southern Co. | 249,427 | |||||||||
| Total Common Stocks (Cost $29,411,177) | 35,668,246 | ||||||||||
| Money Market Fund—0.1% | |||||||||||
| 42,104 | Goldman Sachs Financial Square Prime Obligations Institutional Share Class (Cost $42,104) | 42,104 | |||||||||
| Total Investments (Cost $29,453,281)—100.1% | 35,710,350 | ||||||||||
| Liabilities in excess of other assets—(0.1%) | (37,557 | ) | |||||||||
| Net Assets—100.0% | $ | 35,672,793 | |||||||||
Notes to Schedule of Investments:
* Non-income producing security.
See Notes to Financial Statements.
30
Schedule of Investments
PowerShares Dynamic Large Cap Value Portfolio
April 30, 2011
| Number of Shares | Value | ||||||||||
| Common Stocks—99.9% | |||||||||||
| Consumer Discretionary—1.4% | |||||||||||
| 253,202 | Gap, Inc. (The) | $ | 5,884,415 | ||||||||
| Consumer Staples—12.5% | |||||||||||
| 230,967 | Altria Group, Inc. | 6,199,154 | |||||||||
| 174,870 | CVS Caremark Corp. | 6,337,289 | |||||||||
| 155,099 | General Mills, Inc. | 5,983,719 | |||||||||
| 213,888 | Procter & Gamble Co. (The) | 13,881,331 | |||||||||
| 169,518 | Reynolds American, Inc. | 6,290,813 | |||||||||
| 259,724 | Wal-Mart Stores, Inc. | 14,279,626 | |||||||||
| 52,971,932 | |||||||||||
| Energy—9.9% | |||||||||||
| 131,642 | Chevron Corp. | 14,406,901 | |||||||||
| 173,923 | ConocoPhillips | 13,727,742 | |||||||||
| 157,496 | Exxon Mobil Corp. | 13,859,648 | |||||||||
| 41,994,291 | |||||||||||
| Financials—17.1% | |||||||||||
| 90,684 | Ameriprise Financial, Inc. | 5,627,849 | |||||||||
| 95,829 | Chubb Corp. (The) | 6,247,092 | |||||||||
| 287,932 | JPMorgan Chase & Co. | 13,138,337 | |||||||||
| 93,090 | PNC Financial Services Group, Inc. | 5,803,231 | |||||||||
| 281,954 | Progressive Corp. (The) | 6,186,071 | |||||||||
| 88,936 | Prudential Financial, Inc. | 5,640,321 | |||||||||
| 128,578 | State Street Corp. | 5,985,306 | |||||||||
| 96,648 | Travelers Cos., Inc. (The) | 6,115,885 | |||||||||
| 209,313 | U.S. Bancorp | 5,404,462 | |||||||||
| 415,762 | Wells Fargo & Co. | 12,102,832 | |||||||||
| 72,251,386 | |||||||||||
| Health Care—22.6% | |||||||||||
| 120,915 | Abbott Laboratories | 6,292,417 | |||||||||
| 154,309 | Aetna, Inc. | 6,385,307 | |||||||||
| 110,224 | Amgen, Inc.* | 6,266,234 | |||||||||
| 109,888 | Baxter International, Inc. | 6,252,627 | |||||||||
| 84,984 | Biogen Idec, Inc.* | 8,273,192 | |||||||||
| 225,983 | Bristol-Myers Squibb Co. | 6,350,122 | |||||||||
| 168,972 | Eli Lilly & Co. | 6,253,654 | |||||||||
| 225,366 | Johnson & Johnson | 14,811,054 | |||||||||
| 712,656 | Pfizer, Inc. | 14,937,270 | |||||||||
| 103,678 | Thermo Fisher Scientific, Inc.* | 6,219,643 | |||||||||
| 135,474 | UnitedHealth Group, Inc. | 6,669,385 | |||||||||
| 86,595 | WellPoint, Inc. | 6,649,630 | |||||||||
| 95,360,535 | |||||||||||
| Industrials—5.4% | |||||||||||
| 75,852 | General Dynamics Corp. | 5,523,543 | |||||||||
| 71,906 | Lockheed Martin Corp. | 5,698,550 | |||||||||
| 95,501 | Northrop Grumman Corp. | 6,074,819 | |||||||||
| 112,417 | Raytheon Co. | 5,457,845 | |||||||||
| 22,754,757 | |||||||||||
| Number of Shares | Value | ||||||||||
| Common Stocks (Continued) | |||||||||||
| Information Technology—17.0% | |||||||||||
| 232,835 | CA, Inc. | $ | 5,725,413 | ||||||||
| 315,137 | Hewlett-Packard Co. | 12,722,081 | |||||||||
| 614,856 | Intel Corp. | 14,258,510 | |||||||||
| 82,824 | International Business Machines Corp. | 14,128,118 | |||||||||
| 506,241 | Microsoft Corp. | 13,172,391 | |||||||||
| 317,371 | Symantec Corp.* | 6,236,340 | |||||||||
| 537,340 | Xerox Corp. | 5,421,760 | |||||||||
| 71,664,613 | |||||||||||
| Materials—2.9% | |||||||||||
| 109,825 | Freeport-McMoRan Copper & Gold, Inc. | 6,043,670 | |||||||||
| 65,884 | PPG Industries, Inc. | 6,237,238 | |||||||||
| 12,280,908 | |||||||||||
| Telecommunication Services—6.9% | |||||||||||
| 477,806 | AT&T, Inc. | 14,869,323 | |||||||||
| 373,664 | Verizon Communications, Inc. | 14,117,026 | |||||||||
| 28,986,349 | |||||||||||
| Utilities—4.2% | |||||||||||
| 163,272 | American Electric Power Co., Inc. | 5,956,162 | |||||||||
| 116,581 | Consolidated Edison, Inc. | 6,076,202 | |||||||||
| 151,349 | Southern Co. | 5,908,665 | |||||||||
| 17,941,029 | |||||||||||
| Total Investments (Cost $369,501,643)—99.9% | 422,090,215 | ||||||||||
| Other assets less liabilities—0.1% | 229,164 | ||||||||||
| Net Assets—100.0% | $ | 422,319,379 | |||||||||
Notes to Schedule of Investments:
* Non-income producing security.
See Notes to Financial Statements.
31
Schedule of Investments
PowerShares Dynamic Mid Cap Growth Portfolio
April 30, 2011
| Number of Shares | Value | ||||||||||
| Common Stocks and Other Equity Interests—100.0% | |||||||||||
| Consumer Discretionary—14.0% | |||||||||||
| 8,765 | Fossil, Inc.* | $ | 839,512 | ||||||||
| 54,291 | Interpublic Group of Cos., Inc. (The) | 637,919 | |||||||||
| 69,320 | O'Reilly Automotive, Inc.* | 4,094,039 | |||||||||
| 5,870 | Panera Bread Co., Class A* | 710,916 | |||||||||
| 16,580 | PetSmart, Inc. | 699,178 | |||||||||
| 9,058 | Polaris Industries, Inc. | 954,985 | |||||||||
| 30,616 | Polo Ralph Lauren Corp. | 4,003,654 | |||||||||
| 73,843 | Scripps Networks Interactive, Inc., Class A | 3,797,007 | |||||||||
| 14,488 | Tempur-Pedic International, Inc.* | 909,557 | |||||||||
| 13,156 | Tractor Supply Co. | 813,962 | |||||||||
| 18,725 | Williams-Sonoma, Inc. | 812,852 | |||||||||
| 18,273,581 | |||||||||||
| Consumer Staples—3.8% | |||||||||||
| 11,568 | Hansen Natural Corp.* | 765,223 | |||||||||
| 66,276 | Whole Foods Market, Inc. | 4,159,482 | |||||||||
| 4,924,705 | |||||||||||
| Financials—6.8% | |||||||||||
| 6,378 | Affiliated Managers Group, Inc.* | 695,712 | |||||||||
| 26,028 | Brown & Brown, Inc. | 672,824 | |||||||||
| 154,127 | CB Richard Ellis Group, Inc., Class A* | 4,116,732 | |||||||||
| 103,404 | Fortress Investment Group LLC, Class A* | 638,003 | |||||||||
| 6,998 | Jones Lang LaSalle, Inc. | 716,455 | |||||||||
| 18,035 | Raymond James Financial, Inc. | 676,313 | |||||||||
| 29,534 | SEI Investments Co. | 659,494 | |||||||||
| 16,575 | Waddell & Reed Financial, Inc., Class A | 679,741 | |||||||||
| 8,855,274 | |||||||||||
| Health Care—19.7% | |||||||||||
| 11,787 | AMERIGROUP Corp.* | 805,052 | |||||||||
| 11,084 | Cooper Cos., Inc. (The) | 830,192 | |||||||||
| 44,401 | Edwards Lifesciences Corp.* | 3,834,026 | |||||||||
| 8,791 | IDEXX Laboratories, Inc.* | 715,851 | |||||||||
| 169,669 | Mylan, Inc.* | 4,228,151 | |||||||||
| 20,624 | Patterson Cos., Inc. | 715,859 | |||||||||
| 50,557 | Perrigo Co. | 4,568,330 | |||||||||
| 24,147 | Pharmaceutical Product Development, Inc. | 744,935 | |||||||||
| 13,566 | Sirona Dental Systems, Inc.* | 774,212 | |||||||||
| 55,874 | Varian Medical Systems, Inc.* | 3,922,355 | |||||||||
| 46,532 | Waters Corp.* | 4,560,136 | |||||||||
| 25,699,099 | |||||||||||
| Industrials—26.9% | |||||||||||
| 91,034 | AMETEK, Inc. | 4,191,205 | |||||||||
| 19,867 | BE Aerospace, Inc.* | 766,667 | |||||||||
| 16,582 | CLARCOR, Inc. | 749,341 | |||||||||
| 80,475 | Expeditors International of Washington, Inc. | 4,367,378 | |||||||||
| 9,532 | Gardner Denver, Inc. | 823,660 | |||||||||
| 16,761 | Graco, Inc. | 838,553 | |||||||||
| 16,612 | J.B. Hunt Transport Services, Inc. | 792,060 | |||||||||
| 40,842 | Joy Global, Inc. | 4,123,000 | |||||||||
| Number of Shares | Value | ||||||||||
| Common Stocks and Other Equity Interests (Continued) | |||||||||||
| 12,678 | Kirby Corp.* | $ | 719,857 | ||||||||
| 9,681 | Lincoln Electric Holdings, Inc. | 760,733 | |||||||||
| 14,974 | Moog, Inc., Class A* | 660,653 | |||||||||
| 10,849 | MSC Industrial Direct Co., Class A | 776,680 | |||||||||
| 12,465 | Pall Corp. | 728,455 | |||||||||
| 34,941 | Rollins, Inc. | 732,713 | |||||||||
| 46,102 | Roper Industries, Inc. | 3,987,362 | |||||||||
| 44,678 | Stericycle, Inc.* | 4,078,208 | |||||||||
| 21,008 | Verisk Analytics, Inc., Class A* | 691,163 | |||||||||
| 29,122 | W.W. Grainger, Inc. | 4,414,895 | |||||||||
| 12,338 | Wabtec Corp. | 880,686 | |||||||||
| 35,083,269 | |||||||||||
| Information Technology—24.9% | |||||||||||
| 14,860 | ADTRAN, Inc. | 613,272 | |||||||||
| 67,479 | Amphenol Corp., Class A | 3,772,751 | |||||||||
| 12,224 | ANSYS, Inc.* | 675,865 | |||||||||
| 45,557 | Atmel Corp.* | 697,022 | |||||||||
| 89,736 | Autodesk, Inc.* | 4,036,325 | |||||||||
| 78,402 | BMC Software, Inc.* | 3,938,133 | |||||||||
| 69,072 | Cadence Design Systems, Inc.* | 716,968 | |||||||||
| 6,500 | FactSet Research Systems, Inc. | 711,165 | |||||||||
| 18,099 | Gartner, Inc.* | 776,628 | |||||||||
| 14,228 | Global Payments, Inc. | 757,499 | |||||||||
| 14,107 | InterDigital, Inc. | 653,013 | |||||||||
| 21,474 | Jack Henry & Associates, Inc. | 729,472 | |||||||||
| 8,625 | Loral Space & Communications, Inc.* | 602,888 | |||||||||
| 14,406 | MICROS Systems, Inc.* | 749,400 | |||||||||
| 25,578 | Quest Software, Inc.* | 658,889 | |||||||||
| 92,798 | Red Hat, Inc.* | 4,405,121 | |||||||||
| 88,744 | RF Micro Devices, Inc.* | 591,035 | |||||||||
| 13,159 | Solera Holdings, Inc. | 723,745 | |||||||||
| 12,937 | Syntel, Inc. | 707,395 | |||||||||
| 80,797 | Teradata Corp.* | 4,518,168 | |||||||||
| 27,765 | TIBCO Software, Inc.* | 832,672 | |||||||||
| 14,156 | Varian Semiconductor Equipment Associates, Inc.* | 593,561 | |||||||||
| 32,460,987 | |||||||||||
| Materials—3.9% | |||||||||||
| 79,542 | Ecolab, Inc. | 4,196,636 | |||||||||
| 13,686 | Kronos Worldwide, Inc. | 842,510 | |||||||||
| 5,039,146 | |||||||||||
| Total Common Stocks and Other Equity Interests (Cost $107,716,385) | 130,336,061 | ||||||||||
See Notes to Financial Statements.
32
Schedule of Investments (Continued)
PowerShares Dynamic Mid Cap Growth Portfolio
April 30, 2011
| Number of Shares | Value | ||||||||||
| Money Market Fund—0.1% | |||||||||||
| 114,499 | Goldman Sachs Financial Square Prime Obligations Institutional Share Class (Cost $114,499) | $ | 114,499 | ||||||||
| Total Investments (Cost $107,830,884)—100.1% | 130,450,560 | ||||||||||
| Liabilities in excess of other assets—(0.1%) | (160,073 | ) | |||||||||
| Net Assets—100.0% | $ | 130,290,487 | |||||||||
Notes to Schedule of Investments:
* Non-income producing security.
See Notes to Financial Statements.
33
Schedule of Investments
PowerShares Dynamic Mid Cap Portfolio
April 30, 2011
| Number of Shares | Value | ||||||||||
| Common Stocks and Other Equity Interests—100.0% | |||||||||||
| Consumer Discretionary—17.6% | |||||||||||
| 1,367 | Apollo Group, Inc., Class A* | $ | 54,721 | ||||||||
| 2,001 | Ascena Retail Group, Inc.* | 62,611 | |||||||||
| 842 | Autoliv, Inc. | 67,470 | |||||||||
| 2,626 | Brinker International, Inc. | 63,260 | |||||||||
| 1,491 | Dillard's, Inc., Class A | 71,598 | |||||||||
| 1,240 | Dollar Tree, Inc.* | 71,300 | |||||||||
| 3,243 | Foot Locker, Inc. | 69,789 | |||||||||
| 803 | Fossil, Inc.* | 76,911 | |||||||||
| 6,509 | Genuine Parts Co. | 349,533 | |||||||||
| 4,977 | Interpublic Group of Cos., Inc. (The) | 58,480 | |||||||||
| 1,178 | Lear Corp. | 60,243 | |||||||||
| 10,539 | Limited Brands, Inc. | 433,785 | |||||||||
| 14,432 | Macy's, Inc. | 345,069 | |||||||||
| 8,947 | McGraw-Hill Cos., Inc. (The) | 362,085 | |||||||||
| 3,221 | Newell Rubbermaid, Inc. | 61,392 | |||||||||
| 7,487 | Nordstrom, Inc. | 356,007 | |||||||||
| 6,155 | O'Reilly Automotive, Inc.* | 363,514 | |||||||||
| 1,520 | PetSmart, Inc. | 64,098 | |||||||||
| 830 | Polaris Industries, Inc. | 87,507 | |||||||||
| 2,719 | Polo Ralph Lauren Corp. | 355,564 | |||||||||
| 1,899 | Rent-A-Center, Inc. | 57,825 | |||||||||
| 4,752 | Ross Stores, Inc. | 350,175 | |||||||||
| 1,085 | TRW Automotive Holdings Corp.* | 61,910 | |||||||||
| 1,159 | Tupperware Brands Corp. | 73,794 | |||||||||
| 1,716 | Williams-Sonoma, Inc. | 74,492 | |||||||||
| 4,053,133 | |||||||||||
| Consumer Staples—6.8% | |||||||||||
| 4,954 | Brown-Forman Corp., Class B | 355,994 | |||||||||
| 838 | Church & Dwight Co., Inc. | 69,118 | |||||||||
| 3,076 | Constellation Brands, Inc., Class A* | 68,872 | |||||||||
| 9,350 | Dr Pepper Snapple Group, Inc. | 366,520 | |||||||||
| 1,060 | Hansen Natural Corp.* | 70,119 | |||||||||
| 800 | Herbalife Ltd. (Cayman Islands) | 71,824 | |||||||||
| 2,304 | Hormel Foods Corp. | 67,761 | |||||||||
| 1,322 | McCormick & Co., Inc. | 64,937 | |||||||||
| 2,732 | Smithfield Foods, Inc.* | 64,366 | |||||||||
| 5,885 | Whole Foods Market, Inc. | 369,342 | |||||||||
| 1,568,853 | |||||||||||
| Energy—0.6% | |||||||||||
| 1,142 | Alliance Holdings GP LP | 59,670 | |||||||||
| 2,746 | McDermott International, Inc.* | 63,405 | |||||||||
| 123,075 | |||||||||||
| Financials—14.3% | |||||||||||
| 1,820 | American Financial Group, Inc. | 65,101 | |||||||||
| 1,732 | Axis Capital Holdings Ltd. (Bermuda) | 61,244 | |||||||||
| 1,216 | BOK Financial Corp. | 65,397 | |||||||||
| 2,386 | Brown & Brown, Inc. | 61,678 | |||||||||
| 8,199 | CapitalSource, Inc. | 54,769 | |||||||||
| Number of Shares | Value | ||||||||||
| Common Stocks and Other Equity Interests (Continued) | |||||||||||
| 13,684 | CB Richard Ellis Group, Inc., Class A* | $ | 365,500 | ||||||||
| 1,564 | Commerce Bancshares, Inc. | 66,564 | |||||||||
| 15,610 | Discover Financial Services | 387,752 | |||||||||
| 904 | Erie Indemnity Co., Class A | 65,477 | |||||||||
| 9,479 | Fortress Investment Group LLC, Class A* | 58,485 | |||||||||
| 1,999 | HCC Insurance Holdings, Inc. | 65,048 | |||||||||
| 642 | Jones Lang LaSalle, Inc. | 65,728 | |||||||||
| 10,331 | Leucadia National Corp.* | 399,396 | |||||||||
| 3,846 | M&T Bank Corp. | 339,871 | |||||||||
| 152 | Markel Corp.* | 63,427 | |||||||||
| 10,036 | Principal Financial Group, Inc. | 338,715 | |||||||||
| 2,219 | Protective Life Corp. | 59,713 | |||||||||
| 1,653 | Raymond James Financial, Inc. | 61,988 | |||||||||
| 1,055 | Reinsurance Group of America, Inc. | 66,782 | |||||||||
| 2,707 | SEI Investments Co. | 60,447 | |||||||||
| 972 | Torchmark Corp. | 65,046 | |||||||||
| 1,245 | Transatlantic Holdings, Inc. | 61,366 | |||||||||
| 12,805 | Unum Group | 339,076 | |||||||||
| 1,519 | Waddell & Reed Financial, Inc., Class A | 62,294 | |||||||||
| 3,300,864 | |||||||||||
| Health Care—17.9% | |||||||||||
| 1,081 | AMERIGROUP Corp.* | 73,832 | |||||||||
| 9,110 | AmerisourceBergen Corp. | 370,230 | |||||||||
| 8,112 | CIGNA Corp. | 379,885 | |||||||||
| 1,016 | Cooper Cos., Inc. (The) | 76,098 | |||||||||
| 2,080 | Coventry Health Care, Inc.* | 67,122 | |||||||||
| 1,824 | Endo Pharmaceuticals Holdings, Inc.* | 71,428 | |||||||||
| 10,684 | Forest Laboratories, Inc.* | 354,282 | |||||||||
| 6,551 | Health Management Associates, Inc., Class A* | 73,895 | |||||||||
| 2,106 | Health Net, Inc.* | 70,130 | |||||||||
| 1,674 | Healthspring, Inc.* | 69,454 | |||||||||
| 1,643 | Hill-Rom Holdings, Inc. | 73,951 | |||||||||
| 3,043 | Hologic, Inc.* | 67,007 | |||||||||
| 5,441 | Humana, Inc.* | 414,169 | |||||||||
| 1,322 | Kinetic Concepts, Inc.* | 78,038 | |||||||||
| 6,366 | Life Technologies Corp.* | 351,403 | |||||||||
| 15,064 | Mylan, Inc.* | 375,395 | |||||||||
| 6,010 | Quest Diagnostics, Inc. | 338,844 | |||||||||
| 1,244 | Sirona Dental Systems, Inc.* | 70,995 | |||||||||
| 4,961 | Varian Medical Systems, Inc.* | 348,262 | |||||||||
| 4,132 | Waters Corp.* | 404,936 | |||||||||
| 4,129,356 | |||||||||||
| Industrials—14.3% | |||||||||||
| 1,056 | Alaska Air Group, Inc.* | 69,559 | |||||||||
| 1,485 | AMETEK, Inc. | 68,369 | |||||||||
| 1,589 | Avery Dennison Corp. | 66,325 | |||||||||
| 1,520 | CLARCOR, Inc. | 68,689 | |||||||||
| 1,340 | Crane Co. | 66,879 | |||||||||
| 5,317 | Dover Corp. | 361,769 | |||||||||
| 1,777 | Equifax, Inc. | 66,691 | |||||||||
See Notes to Financial Statements.
34
Schedule of Investments (Continued)
PowerShares Dynamic Mid Cap Portfolio
April 30, 2011
| Number of Shares | Value | ||||||||||
| Common Stocks and Other Equity Interests (Continued) | |||||||||||
| 876 | Esterline Technologies Corp.* | $ | 62,897 | ||||||||
| 874 | Gardner Denver, Inc. | 75,522 | |||||||||
| 3,916 | Goodrich Corp. | 346,057 | |||||||||
| 5,878 | ITT Corp. | 339,690 | |||||||||
| 1,523 | J.B. Hunt Transport Services, Inc. | 72,617 | |||||||||
| 3,626 | Joy Global, Inc. | 366,045 | |||||||||
| 1,909 | KBR, Inc. | 73,248 | |||||||||
| 1,162 | Kirby Corp.* | 65,978 | |||||||||
| 4,260 | L-3 Communications Holdings, Inc. | 341,609 | |||||||||
| 888 | Lincoln Electric Holdings, Inc. | 69,779 | |||||||||
| 1,373 | Moog, Inc., Class A* | 60,577 | |||||||||
| 5,260 | Rockwell Collins, Inc. | 331,906 | |||||||||
| 3,203 | Rollins, Inc. | 67,167 | |||||||||
| 27 | Seaboard Corp. | 64,449 | |||||||||
| 1,134 | Thomas & Betts Corp.* | 65,738 | |||||||||
| 1,346 | URS Corp.* | 60,233 | |||||||||
| 1,926 | Verisk Analytics, Inc., Class A* | 63,365 | |||||||||
| 3,295,158 | |||||||||||
| Information Technology—20.1% | |||||||||||
| 4,176 | Atmel Corp.* | 63,893 | |||||||||
| 7,967 | Autodesk, Inc.* | 358,356 | |||||||||
| 6,961 | BMC Software, Inc.* | 349,651 | |||||||||
| 6,332 | Cadence Design Systems, Inc.* | 65,726 | |||||||||
| 7,010 | Computer Sciences Corp. | 357,370 | |||||||||
| 1,224 | DST Systems, Inc. | 60,355 | |||||||||
| 596 | FactSet Research Systems, Inc. | 65,208 | |||||||||
| 5,407 | Fiserv, Inc.* | 331,503 | |||||||||
| 1,659 | Gartner, Inc.* | 71,188 | |||||||||
| 3,131 | Ingram Micro, Inc., Class A* | 58,644 | |||||||||
| 1,969 | Jack Henry & Associates, Inc. | 66,887 | |||||||||
| 6,957 | KLA-Tencor Corp. | 305,412 | |||||||||
| 1,130 | Lam Research Corp.* | 54,590 | |||||||||
| 9,782 | Linear Technology Corp. | 340,414 | |||||||||
| 791 | Loral Space & Communications, Inc.* | 55,291 | |||||||||
| 12,327 | Maxim Integrated Products, Inc. | 337,020 | |||||||||
| 1,320 | MICROS Systems, Inc.* | 68,666 | |||||||||
| 3,270 | NCR Corp.* | 64,779 | |||||||||
| 1,552 | Novellus Systems, Inc.* | 49,819 | |||||||||
| 10,306 | Paychex, Inc. | 337,109 | |||||||||
| 2,345 | Quest Software, Inc.* | 60,407 | |||||||||
| 8,239 | Red Hat, Inc.* | 391,105 | |||||||||
| 6,788 | SanDisk Corp.* | 333,562 | |||||||||
| 1,206 | Solera Holdings, Inc. | 66,330 | |||||||||
| 1,186 | Syntel, Inc. | 64,851 | |||||||||
| 2,545 | TIBCO Software, Inc.* | 76,325 | |||||||||
| 3,548 | Total System Services, Inc. | 66,880 | |||||||||
| 1,298 | Varian Semiconductor Equipment Associates, Inc.* | 54,425 | |||||||||
| 3,513 | Vishay Intertechnology, Inc.* | 67,028 | |||||||||
| 4,642,794 | |||||||||||
| Number of Shares | Value | ||||||||||
| Common Stocks and Other Equity Interests (Continued) | |||||||||||
| Materials—3.6% | |||||||||||
| 1,093 | Albemarle Corp. | $ | 77,111 | ||||||||
| 1,302 | AptarGroup, Inc. | 68,290 | |||||||||
| 1,733 | Ball Corp. | 64,658 | |||||||||
| 1,476 | Cabot Corp. | 66,199 | |||||||||
| 2,432 | CF Industries Holdings, Inc. | 344,250 | |||||||||
| 709 | Domtar Corp. | 65,951 | |||||||||
| 823 | FMC Corp. | 72,654 | |||||||||
| 1,255 | Kronos Worldwide, Inc.* | 77,258 | |||||||||
| 836,371 | |||||||||||
| Telecommunication Services—0.5% | |||||||||||
| 2,780 | Fairpoint Communications, Inc.* | 46,537 | |||||||||
| 4,434 | MetroPCS Communications, Inc.* | 74,625 | |||||||||
| 121,162 | |||||||||||
| Utilities—4.3% | |||||||||||
| 1,620 | Alliant Energy Corp. | 64,055 | |||||||||
| 2,286 | American Water Works Co., Inc. | 67,163 | |||||||||
| 7,250 | DTE Energy Co. | 366,342 | |||||||||
| 9,459 | Edison International | 371,455 | |||||||||
| 16,000 | GenOn Energy, Inc.* | 62,880 | |||||||||
| 1,862 | Northeast Utilities | 66,287 | |||||||||
| 998,182 | |||||||||||
| Total Common Stocks and Other Equity Interests (Cost $19,444,699) | 23,068,948 | ||||||||||
| Money Market Fund—0.3% | |||||||||||
| 76,429 | Goldman Sachs Financial Square Prime Obligations Institutional Share Class (Cost $76,429) | 76,429 | |||||||||
| Total Investments (Cost $19,521,128)—100.3% | 23,145,377 | ||||||||||
| Liabilities in excess of other assets—(0.3%) | (64,635 | ) | |||||||||
| Net Assets—100.0% | $ | 23,080,742 | |||||||||
Notes to Schedule of Investments:
* Non-income producing security.
See Notes to Financial Statements.
35
Schedule of Investments
PowerShares Dynamic Mid Cap Value Portfolio
April 30, 2011
| Number of Shares | Value | ||||||||||
| Common Stocks and Other Equity Interests—100.0% | |||||||||||
| Consumer Discretionary—14.6% | |||||||||||
| 14,592 | American Eagle Outfitters, Inc. | $ | 227,051 | ||||||||
| 3,012 | Autoliv, Inc. | 241,351 | |||||||||
| 9,397 | Brinker International, Inc. | 226,374 | |||||||||
| 5,335 | Dillard's, Inc., Class A | 256,187 | |||||||||
| 24,101 | Genuine Parts Co. | 1,294,224 | |||||||||
| 4,212 | Lear Corp. | 215,402 | |||||||||
| 53,437 | Macy's, Inc. | 1,277,678 | |||||||||
| 33,053 | McGraw-Hill Cos., Inc. (The) | 1,337,655 | |||||||||
| 11,527 | Newell Rubbermaid, Inc. | 219,705 | |||||||||
| 6,795 | Rent-A-Center, Inc. | 206,908 | |||||||||
| 3,881 | TRW Automotive Holdings Corp.* | 221,450 | |||||||||
| 4,146 | Tupperware Brands Corp. | 263,976 | |||||||||
| 5,987,961 | |||||||||||
| Consumer Staples—5.6% | |||||||||||
| 11,006 | Constellation Brands, Inc., Class A* | 246,424 | |||||||||
| 34,620 | Dr Pepper Snapple Group, Inc. | 1,357,104 | |||||||||
| 8,244 | Hormel Foods Corp. | 242,456 | |||||||||
| 4,729 | McCormick & Co., Inc. | 232,289 | |||||||||
| 9,774 | Smithfield Foods, Inc.* | 230,275 | |||||||||
| 2,308,548 | |||||||||||
| Energy—1.1% | |||||||||||
| 4,086 | Alliance Holdings GP LP | 213,494 | |||||||||
| 9,826 | McDermott International, Inc.* | 226,882 | |||||||||
| 440,376 | |||||||||||
| Financials—18.9% | |||||||||||
| 6,512 | American Financial Group, Inc. | 232,934 | |||||||||
| 6,199 | Axis Capital Holdings Ltd. (Bermuda) | 219,197 | |||||||||
| 4,351 | BOK Financial Corp. | 233,997 | |||||||||
| 5,595 | Commerce Bancshares, Inc. | 238,123 | |||||||||
| 57,790 | Discover Financial Services | 1,435,504 | |||||||||
| 7,152 | HCC Insurance Holdings, Inc. | 232,726 | |||||||||
| 6,790 | Leucadia National Corp. | 262,501 | |||||||||
| 14,241 | M&T Bank Corp. | 1,258,477 | |||||||||
| 544 | Markel Corp.* | 227,000 | |||||||||
| 37,074 | Principal Financial Group, Inc. | 1,251,248 | |||||||||
| 7,942 | Protective Life Corp. | 213,719 | |||||||||
| 3,775 | Reinsurance Group of America, Inc. | 238,957 | |||||||||
| 3,478 | Torchmark Corp. | 232,748 | |||||||||
| 4,455 | Transatlantic Holdings, Inc. | 219,587 | |||||||||
| 47,304 | Unum Group | 1,252,610 | |||||||||
| 7,749,328 | |||||||||||
| Health Care—19.1% | |||||||||||
| 29,967 | CIGNA Corp. | 1,403,355 | |||||||||
| 7,442 | Coventry Health Care, Inc.* | 240,153 | |||||||||
| 39,560 | Forest Laboratories, Inc.* | 1,311,809 | |||||||||
| 7,537 | Health Net, Inc.* | 250,982 | |||||||||
| 5,988 | Healthspring, Inc.* | 248,442 | |||||||||
| 20,143 | Humana, Inc.* | 1,533,285 | |||||||||
| Number of Shares | Value | ||||||||||
| Common Stocks and Other Equity Interests (Continued) | |||||||||||
| 4,729 | Kinetic Concepts, Inc.* | $ | 279,153 | ||||||||
| 23,519 | Life Technologies Corp.* | 1,298,249 | |||||||||
| 22,205 | Quest Diagnostics, Inc. | 1,251,918 | |||||||||
| 7,817,346 | |||||||||||
| Industrials—16.3% | |||||||||||
| 3,779 | Alaska Air Group, Inc.* | 248,923 | |||||||||
| 5,688 | Avery Dennison Corp. | 237,417 | |||||||||
| 4,793 | Crane Co. | 239,219 | |||||||||
| 6,360 | Equifax, Inc. | 238,691 | |||||||||
| 3,135 | Esterline Technologies Corp.* | 225,093 | |||||||||
| 14,469 | Goodrich Corp. | 1,278,625 | |||||||||
| 21,714 | ITT Corp. | 1,254,852 | |||||||||
| 6,829 | KBR, Inc. | 262,029 | |||||||||
| 15,776 | L-3 Communications Holdings, Inc. | 1,265,077 | |||||||||
| 19,476 | Rockwell Collins, Inc. | 1,228,936 | |||||||||
| 4,815 | URS Corp.* | 215,471 | |||||||||
| 6,694,333 | |||||||||||
| Information Technology—12.6% | |||||||||||
| 4,607 | Computer Sciences Corp. | 234,865 | |||||||||
| 4,378 | DST Systems, Inc. | 215,879 | |||||||||
| 19,973 | Fiserv, Inc.* | 1,224,545 | |||||||||
| 11,204 | Ingram Micro, Inc., Class A* | 209,851 | |||||||||
| 25,701 | KLA-Tencor Corp. | 1,128,274 | |||||||||
| 4,045 | Lam Research Corp.* | 195,414 | |||||||||
| 11,701 | NCR Corp.* | 231,797 | |||||||||
| 25,076 | SanDisk Corp.* | 1,232,235 | |||||||||
| 12,698 | Total System Services, Inc. | 239,357 | |||||||||
| 12,568 | Vishay Intertechnology, Inc.* | 239,797 | |||||||||
| 5,152,014 | |||||||||||
| Materials—6.2% | |||||||||||
| 3,911 | Albemarle Corp. | 275,921 | |||||||||
| 4,660 | AptarGroup, Inc. | 244,417 | |||||||||
| 6,201 | Ball Corp. | 231,359 | |||||||||
| 8,986 | CF Industries Holdings, Inc. | 1,271,968 | |||||||||
| 2,535 | Domtar Corp. | 235,806 | |||||||||
| 2,945 | FMC Corp. | 259,985 | |||||||||
| 2,519,456 | |||||||||||
| Utilities—5.6% | |||||||||||
| 5,797 | Alliant Energy Corp. | 229,213 | |||||||||
| 8,179 | American Water Works Co., Inc. | 240,299 | |||||||||
| 35,023 | Edison International | 1,375,353 | |||||||||
| 57,250 | GenOn Energy, Inc.* | 224,993 | |||||||||
| 6,662 | Northeast Utilities | 237,167 | |||||||||
| 2,307,025 | |||||||||||
| Total Common Stocks and Other Equity Interests (Cost $35,837,507) | 40,976,387 | ||||||||||
See Notes to Financial Statements.
36
Schedule of Investments (Continued)
PowerShares Dynamic Mid Cap Value Portfolio
April 30, 2011
| Number of Shares | Value | ||||||||||
| Money Market Fund—0.2% | |||||||||||
| 64,660 | Goldman Sachs Financial Square Prime Obligations Institutional Share Class (Cost $64,660) | $ | 64,660 | ||||||||
| Total Investments (Cost $35,902,167)—100.2% | 41,041,047 | ||||||||||
| Liabilities in excess of other assets—(0.2%) | (70,563 | ) | |||||||||
| Net Assets—100.0% | $ | 40,970,484 | |||||||||
Notes to Schedule of Investments:
* Non-income producing security.
See Notes to Financial Statements.
37
Schedule of Investments
PowerShares Dynamic Small Cap Growth Portfolio
April 30, 2011
| Number of Shares | Value | ||||||||||
| Common Stocks—100.0% | |||||||||||
| Consumer Discretionary—8.5% | |||||||||||
| 95,964 | Ann, Inc.* | $ | 2,995,037 | ||||||||
| 10,477 | Arbitron, Inc. | 405,250 | |||||||||
| 10,306 | Churchill Downs, Inc. | 429,863 | |||||||||
| 129,343 | Crocs, Inc.* | 2,601,088 | |||||||||
| 44,910 | E.W. Scripps Co. (The), Class A* | 426,645 | |||||||||
| 18,624 | Ethan Allen Interiors, Inc. | 448,652 | |||||||||
| 35,400 | Exide Technologies* | 355,416 | |||||||||
| 66,293 | Krispy Kreme Doughnuts, Inc.* | 371,904 | |||||||||
| 12,767 | Monro Muffler Brake, Inc. | 387,862 | |||||||||
| 30,299 | Pep Boys - Manny, Moe & Jack (The) | 415,096 | |||||||||
| 16,448 | Zumiez, Inc.* | 462,353 | |||||||||
| 9,299,166 | |||||||||||
| Consumer Staples—2.8% | |||||||||||
| 4,602 | Boston Beer Co., Inc., Class A* | 433,785 | |||||||||
| 162,400 | Darling International, Inc.* | 2,626,008 | |||||||||
| 3,059,793 | |||||||||||
| Energy—7.1% | |||||||||||
| 121,580 | CVR Energy, Inc.* | 2,702,723 | |||||||||
| 185,376 | ION Geophysical Corp.* | 2,343,153 | |||||||||
| 4,020 | OYO Geospace Corp.* | 374,985 | |||||||||
| 141,759 | Western Refining, Inc.* | 2,404,233 | |||||||||
| 7,825,094 | |||||||||||
| Financials—5.9% | |||||||||||
| 32,149 | HFF, Inc., Class A* | 481,270 | |||||||||
| 171,002 | Investors Bancorp, Inc.* | 2,571,870 | |||||||||
| 19,651 | MarketAxess Holdings, Inc. | 478,502 | |||||||||
| 39,841 | NewStar Financial, Inc.* | 476,100 | |||||||||
| 26,910 | Portfolio Recovery Associates, Inc.* | 2,428,897 | |||||||||
| 6,436,639 | |||||||||||
| Health Care—7.4% | |||||||||||
| 32,529 | ABIOMED, Inc.* | 565,354 | |||||||||
| 7,361 | Air Methods Corp.* | 497,751 | |||||||||
| 7,783 | Computer Programs & Systems, Inc. | 457,562 | |||||||||
| 12,758 | Cyberonics, Inc.* | 453,802 | |||||||||
| 109,859 | Impax Laboratories, Inc.* | 3,007,939 | |||||||||
| 10,495 | IPC The Hospitalist Co., Inc.* | 544,271 | |||||||||
| 17,234 | Jazz Pharmaceuticals, Inc.* | 549,937 | |||||||||
| 16,310 | Medidata Solutions, Inc.* | 418,678 | |||||||||
| 11,969 | Molina Healthcare, Inc.* | 514,667 | |||||||||
| 33,442 | Questcor Pharmaceuticals, Inc.* | 685,561 | |||||||||
| 41,040 | Sunrise Senior Living, Inc.* | 425,995 | |||||||||
| 8,121,517 | |||||||||||
| Industrials—39.4% | |||||||||||
| 14,895 | Acacia Research - Acacia Technologies* | 612,333 | |||||||||
| 81,903 | Actuant Corp., Class A | 2,273,627 | |||||||||
| 19,458 | Altra Holdings, Inc.* | 494,039 | |||||||||
| 4,453 | American Science & Engineering, Inc. | 392,309 | |||||||||
| 70,667 | Applied Industrial Technologies, Inc. | 2,491,718 | |||||||||
| Number of Shares | Value | ||||||||||
| Common Stocks (Continued) | |||||||||||
| 9,323 | Chart Industries, Inc.* | $ | 453,191 | ||||||||
| 57,114 | Corporate Executive Board Co. (The) | 2,275,993 | |||||||||
| 9,877 | Franklin Electric Co., Inc. | 445,551 | |||||||||
| 11,309 | Gorman-Rupp Co. (The) | 457,449 | |||||||||
| 137,893 | Heartland Express, Inc. | 2,378,654 | |||||||||
| 51,436 | HEICO Corp. | 2,477,158 | |||||||||
| 86,993 | Herman Miller, Inc. | 2,263,558 | |||||||||
| 123,959 | Hexcel Corp.* | 2,668,837 | |||||||||
| 11,911 | Hub Group, Inc., Class A* | 479,775 | |||||||||
| 44,815 | II-VI, Inc.* | 2,592,548 | |||||||||
| 14,036 | Insperity, Inc. | 425,150 | |||||||||
| 25,506 | Interface, Inc., Class A | 475,432 | |||||||||
| 19,910 | Kelly Services, Inc., Class A* | 380,480 | |||||||||
| 20,473 | Knoll, Inc. | 401,885 | |||||||||
| 18,290 | Korn/Ferry International* | 378,786 | |||||||||
| 25,452 | Middleby Corp. (The)* | 2,282,281 | |||||||||
| 3,449 | NACCO Industries, Inc., Class A | 362,938 | |||||||||
| 74,257 | Old Dominion Freight Line, Inc.* | 2,778,697 | |||||||||
| 7,810 | Raven Industries, Inc. | 424,552 | |||||||||
| 11,565 | RBC Bearings, Inc.* | 454,042 | |||||||||
| 54,401 | Robbins & Myers, Inc. | 2,364,812 | |||||||||
| 165,692 | RSC Holdings, Inc.* | 2,182,164 | |||||||||
| 76,588 | Sauer-Danfoss, Inc.* | 4,519,458 | |||||||||
| 43,226 | Steelcase, Inc., Class A | 499,260 | |||||||||
| 11,844 | Sun Hydraulics Corp. | 550,628 | |||||||||
| 22,997 | Sykes Enterprises, Inc.* | 460,630 | |||||||||
| 16,094 | Team, Inc.* | 401,545 | |||||||||
| 16,897 | Titan Machinery, Inc.* | 531,580 | |||||||||
| 19,532 | Trimas Corp.* | 453,338 | |||||||||
| 43,084,398 | |||||||||||
| Information Technology—24.4% | |||||||||||
| 13,710 | ACI Worldwide, Inc.* | 452,978 | |||||||||
| 77,658 | Advent Software, Inc.* | 2,114,627 | |||||||||
| 66,759 | Ancestry.com, Inc.* | 3,050,886 | |||||||||
| 15,848 | Blackbaud, Inc. | 438,356 | |||||||||
| 8,583 | Cabot Microelectronics Corp.* | 419,280 | |||||||||
| 21,978 | Cardtronics, Inc.* | 467,033 | |||||||||
| 14,990 | Cognex Corp. | 468,887 | |||||||||
| 37,579 | Coherent, Inc.* | 2,349,063 | |||||||||
| 12,767 | DG FastChannel, Inc.* | 467,145 | |||||||||
| 17,125 | Ebix, Inc.* | 391,306 | |||||||||
| 19,433 | ExlService Holdings, Inc.* | 402,652 | |||||||||
| 36,749 | Hittite Microwave Corp.* | 2,366,268 | |||||||||
| 12,217 | Interactive Intelligence, Inc.* | 457,160 | |||||||||
| 226,783 | Lawson Software, Inc.* | 2,510,488 | |||||||||
| 35,295 | LoopNet, Inc.* | 655,781 | |||||||||
| 65,922 | Magma Design Automation, Inc.* | 419,264 | |||||||||
| 13,690 | Measurement Specialties, Inc.* | 476,138 | |||||||||
| 31,227 | Monotype Imaging Holdings, Inc.* | 424,687 | |||||||||
| 16,809 | NetScout Systems, Inc.* | 430,142 | |||||||||
| 13,370 | OPNET Technologies, Inc. | 523,569 | |||||||||
See Notes to Financial Statements.
38
Schedule of Investments (Continued)
PowerShares Dynamic Small Cap Growth Portfolio
April 30, 2011
| Number of Shares | Value | ||||||||||
| Common Stocks (Continued) | |||||||||||
| 11,142 | OSI Systems, Inc.* | $ | 427,741 | ||||||||
| 46,510 | Power-One, Inc.* | 384,173 | |||||||||
| 110,984 | Powerwave Technologies, Inc.* | 507,197 | |||||||||
| 24,482 | Radiant Systems, Inc.* | 487,681 | |||||||||
| 10,838 | Rofin-Sinar Technologies, Inc.* | 469,394 | |||||||||
| 69,193 | SAVVIS, Inc.* | 2,723,437 | |||||||||
| 102,672 | Solarwinds, Inc.* | 2,487,743 | |||||||||
| 26,773,076 | |||||||||||
| Materials—1.0% | |||||||||||
| 11,946 | Balchem Corp. | 474,137 | |||||||||
| 14,947 | TPC Group, Inc.* | 589,509 | |||||||||
| 1,063,646 | |||||||||||
| Telecommunication Services—3.5% | |||||||||||
| 34,464 | AboveNet, Inc. | 2,300,472 | |||||||||
| 35,284 | General Communication, Inc., Class A* | 405,766 | |||||||||
| 26,753 | Global Crossing Ltd.* | 625,485 | |||||||||
| 15,981 | IDT Corp., Class B | 463,289 | |||||||||
| 3,795,012 | |||||||||||
| Total Common Stocks (Cost $97,012,919) | 109,458,341 | ||||||||||
| Money Market Fund—0.1% | |||||||||||
| 98,375 | Goldman Sachs Financial Square Prime Obligations Institutional Share Class (Cost $98,375) | 98,375 | |||||||||
| Total Investments (Cost $97,111,294)—100.1% | 109,556,716 | ||||||||||
| Liabilities in excess of other assets—(0.1%) | (105,909 | ) | |||||||||
| Net Assets—100.0% | $ | 109,450,807 | |||||||||
Notes to Schedule of Investments:
* Non-income producing security.
See Notes to Financial Statements.
39
Schedule of Investments
PowerShares Dynamic Small Cap Portfolio
April 30, 2011
| Number of Shares | Value | ||||||||||
| Common Stocks and Other Equity Interests—100.0% | |||||||||||
| Consumer Discretionary—12.9% | |||||||||||
| 8,626 | Aaron's, Inc. | $ | 248,342 | ||||||||
| 1,584 | Ann, Inc.* | 49,437 | |||||||||
| 942 | Arbitron, Inc. | 36,437 | |||||||||
| 90 | Biglari Holdings, Inc.* | 39,352 | |||||||||
| 1,219 | Bob Evans Farms, Inc. | 38,228 | |||||||||
| 2,054 | Bridgepoint Education, Inc.* | 36,048 | |||||||||
| 5,370 | Buckle, Inc. (The) | 244,281 | |||||||||
| 7,114 | Cheesecake Factory, Inc. (The)* | 209,294 | |||||||||
| 816 | Children's Place Retail Stores, Inc. (The)* | 43,387 | |||||||||
| 924 | Churchill Downs, Inc. | 38,540 | |||||||||
| 1,627 | Collective Brands, Inc.* | 34,167 | |||||||||
| 755 | Cracker Barrel Old Country Store, Inc. | 38,679 | |||||||||
| 11,630 | Crocs, Inc.* | 233,879 | |||||||||
| 4,024 | E.W. Scripps Co. (The), Class A* | 38,228 | |||||||||
| 11,360 | Express, Inc.* | 245,262 | |||||||||
| 3,033 | Harte-Hanks, Inc. | 28,177 | |||||||||
| 9,051 | Iconix Brand Group, Inc.* | 221,659 | |||||||||
| 1,707 | Jack in the Box, Inc.* | 35,249 | |||||||||
| 1,303 | Papa John's International, Inc.* | 39,168 | |||||||||
| 2,713 | Pep Boys - Manny, Moe & Jack (The) | 37,168 | |||||||||
| 3,864 | Pier 1 Imports, Inc.* | 47,063 | |||||||||
| 2,816 | Ruby Tuesday, Inc.* | 29,596 | |||||||||
| 4,231 | Sonic Corp.* | 47,472 | |||||||||
| 4,952 | Stewart Enterprises, Inc., Class A | 40,161 | |||||||||
| 1,917 | Superior Industries International, Inc. | 48,443 | |||||||||
| 5,653 | Timberland Co. (The), Class A* | 255,459 | |||||||||
| 1,476 | Zumiez, Inc.* | 41,490 | |||||||||
| 2,444,666 | |||||||||||
| Consumer Staples—7.0% | |||||||||||
| 413 | Boston Beer Co., Inc., Class A* | 38,929 | |||||||||
| 4,913 | Casey's General Stores, Inc. | 191,754 | |||||||||
| 679 | Coca-Cola Bottling Co. Consolidated | 47,836 | |||||||||
| 14,570 | Darling International, Inc.* | 235,597 | |||||||||
| 1,256 | Elizabeth Arden, Inc.* | 37,755 | |||||||||
| 7,432 | Fresh Del Monte Produce, Inc. | 201,481 | |||||||||
| 2,068 | Inter Parfums, Inc. | 39,354 | |||||||||
| 3,575 | Lancaster Colony Corp. | 218,468 | |||||||||
| 1,056 | PriceSmart, Inc. | 43,972 | |||||||||
| 5,578 | Ruddick Corp. | 231,599 | |||||||||
| 962 | Weis Markets, Inc. | 39,702 | |||||||||
| 1,326,447 | |||||||||||
| Energy—6.9% | |||||||||||
| 2,399 | Atlas Energy LP | 63,957 | |||||||||
| 372 | Clayton Williams Energy, Inc.* | 33,692 | |||||||||
| 1,905 | Cloud Peak Energy, Inc.* | 39,662 | |||||||||
| 10,931 | CVR Energy, Inc.* | 242,996 | |||||||||
| 16,631 | ION Geophysical Corp.* | 210,216 | |||||||||
| 5,601 | NuStar GP Holdings LLC | 221,968 | |||||||||
| 360 | OYO Geospace Corp.* | 33,581 | |||||||||
| Number of Shares | Value | ||||||||||
| Common Stocks and Other Equity Interests (Continued) | |||||||||||
| 4,765 | VAALCO Energy, Inc.* | $ | 33,212 | ||||||||
| 8,103 | W&T Offshore, Inc. | 217,241 | |||||||||
| 12,746 | Western Refining, Inc.* | 216,172 | |||||||||
| 1,312,697 | |||||||||||
| Financials—14.3% | |||||||||||
| 1,965 | AmTrust Financial Services, Inc. | 37,924 | |||||||||
| 3,944 | BGC Partners, Inc., Class A | 38,060 | |||||||||
| 1,099 | City Holding Co. | 37,476 | |||||||||
| 29,306 | CNO Financial Group, Inc.* | 236,206 | |||||||||
| 1,503 | Community Bank System, Inc. | 37,605 | |||||||||
| 2,923 | Credit Acceptance Corp.* | 236,471 | |||||||||
| 6,727 | Delphi Financial Group, Inc., Class A | 214,928 | |||||||||
| 1,894 | Employers Holdings, Inc. | 38,183 | |||||||||
| 1,223 | FBL Financial Group, Inc., Class A | 37,301 | |||||||||
| 1,049 | Harleysville Group, Inc. | 33,652 | |||||||||
| 2,227 | Horace Mann Educators Corp. | 39,819 | |||||||||
| 1,406 | Independent Bank Corp. | 41,210 | |||||||||
| 616 | Infinity Property & Casualty Corp. | 36,406 | |||||||||
| 1,985 | International Bancshares Corp. | 34,976 | |||||||||
| 1,761 | MarketAxess Holdings, Inc. | 42,880 | |||||||||
| 3,683 | Meadowbrook Insurance Group, Inc. | 37,714 | |||||||||
| 1,692 | NBT Bancorp, Inc. | 38,239 | |||||||||
| 3,568 | NewStar Financial, Inc.* | 42,638 | |||||||||
| 8,030 | Primerica, Inc. | 185,654 | |||||||||
| 3,210 | ProAssurance Corp.* | 213,144 | |||||||||
| 4,987 | Prosperity Bancshares, Inc. | 228,654 | |||||||||
| 659 | RLI Corp. | 39,039 | |||||||||
| 784 | Safety Insurance Group, Inc. | 36,707 | |||||||||
| 14,865 | Symetra Financial Corp. | 206,326 | |||||||||
| 1,389 | Tower Group, Inc. | 31,766 | |||||||||
| 5,129 | UMB Financial Corp. | 215,982 | |||||||||
| 1,844 | United Fire & Casualty Co. | 36,511 | |||||||||
| 7,151 | Unitrin, Inc. | 216,246 | |||||||||
| 629 | World Acceptance Corp.* | 42,740 | |||||||||
| 2,714,457 | |||||||||||
| Health Care—11.6% | |||||||||||
| 660 | Air Methods Corp.* | 44,629 | |||||||||
| 6,812 | Centene Corp.* | 246,799 | |||||||||
| 3,154 | Chemed Corp. | 219,613 | |||||||||
| 698 | Computer Programs & Systems, Inc. | 41,035 | |||||||||
| 765 | CorVel Corp.* | 39,627 | |||||||||
| 1,143 | Cyberonics, Inc.* | 40,657 | |||||||||
| 1,232 | Ensign Group, Inc. (The) | 34,077 | |||||||||
| 1,926 | Immucor, Inc.* | 42,045 | |||||||||
| 9,876 | Impax Laboratories, Inc.* | 270,405 | |||||||||
| 4,155 | Integra LifeSciences Holdings Corp.* | 217,348 | |||||||||
| 942 | IPC The Hospitalist Co., Inc.* | 48,852 | |||||||||
| 4,266 | Magellan Health Services, Inc.* | 221,917 | |||||||||
| 2,185 | Medicines Co. (The)* | 34,304 | |||||||||
| 1,460 | Medidata Solutions, Inc.* | 37,478 | |||||||||
See Notes to Financial Statements.
40
Schedule of Investments (Continued)
PowerShares Dynamic Small Cap Portfolio
April 30, 2011
| Number of Shares | Value | ||||||||||
| Common Stocks and Other Equity Interests (Continued) | |||||||||||
| 11,138 | Myriad Genetics, Inc.* | $ | 238,799 | ||||||||
| 6,619 | Owens & Minor, Inc. | 228,025 | |||||||||
| 1,208 | Par Pharmaceutical Cos., Inc.* | 41,604 | |||||||||
| 1,464 | PSS World Medical, Inc.* | 42,105 | |||||||||
| 3,679 | Sunrise Senior Living, Inc.* | 38,188 | |||||||||
| 2,089 | Team Health Holdings, Inc.* | 41,529 | |||||||||
| 2,156 | ViroPharma, Inc.* | 41,589 | |||||||||
| 2,210,625 | |||||||||||
| Industrials—22.0% | |||||||||||
| 1,417 | ABM Industries, Inc. | 34,461 | |||||||||
| 7,347 | Actuant Corp., Class A | 203,953 | |||||||||
| 4,789 | Air Transport Services Group, Inc.* | 39,174 | |||||||||
| 4,969 | Alexander & Baldwin, Inc. | 261,866 | |||||||||
| 1,746 | Altra Holdings, Inc.* | 44,331 | |||||||||
| 2,136 | Amerco, Inc.* | 217,274 | |||||||||
| 399 | American Science & Engineering, Inc. | 35,152 | |||||||||
| 1,164 | Applied Industrial Technologies, Inc. | 41,043 | |||||||||
| 3,017 | Atlas Air Worldwide Holdings, Inc.* | 207,901 | |||||||||
| 5,699 | Belden, Inc. | 216,733 | |||||||||
| 1,223 | Brink's Co. (The) | 40,371 | |||||||||
| 799 | Cascade Corp. | 36,594 | |||||||||
| 837 | Chart Industries, Inc.* | 40,687 | |||||||||
| 1,713 | Colfax Corp.* | 37,429 | |||||||||
| 941 | Corporate Executive Board Co. (The) | 37,499 | |||||||||
| 745 | Cubic Corp. | 40,290 | |||||||||
| 5,613 | Curtiss-Wright Corp. | 186,632 | |||||||||
| 1,492 | Deluxe Corp. | 40,403 | |||||||||
| 2,269 | Dycom Industries, Inc.* | 33,717 | |||||||||
| 968 | Exponent, Inc.* | 41,537 | |||||||||
| 884 | Franklin Electric Co., Inc. | 39,877 | |||||||||
| 4,998 | Great Lakes Dredge & Dock Corp. | 37,235 | |||||||||
| 12,371 | Heartland Express, Inc. | 213,400 | |||||||||
| 7,805 | Herman Miller, Inc. | 203,086 | |||||||||
| 11,120 | Hexcel Corp.* | 239,414 | |||||||||
| 1,068 | Hub Group, Inc., Class A* | 43,019 | |||||||||
| 1,703 | ICF International, Inc.* | 41,485 | |||||||||
| 1,702 | Interline Brands, Inc.* | 35,946 | |||||||||
| 2,008 | John Bean Technologies Corp. | 40,582 | |||||||||
| 1,787 | Kelly Services, Inc., Class A* | 34,150 | |||||||||
| 1,837 | Knoll, Inc. | 36,060 | |||||||||
| 1,140 | Layne Christensen Co.* | 33,926 | |||||||||
| 1,507 | M&F Worldwide Corp.* | 37,811 | |||||||||
| 1,586 | Macquarie Infrastructure Co. LLC* | 39,809 | |||||||||
| 2,113 | MasTec, Inc.* | 47,923 | |||||||||
| 2,286 | Middleby Corp. (The)* | 204,986 | |||||||||
| 6,662 | Old Dominion Freight Line, Inc.* | 249,292 | |||||||||
| 699 | Raven Industries, Inc. | 37,998 | |||||||||
| 4,881 | Robbins & Myers, Inc. | 212,177 | |||||||||
| 1,264 | Sauer-Danfoss, Inc.* | 74,589 | |||||||||
| 2,402 | SkyWest, Inc. | 39,705 | |||||||||
| Number of Shares | Value | ||||||||||
| Common Stocks and Other Equity Interests (Continued) | |||||||||||
| 3,876 | Steelcase, Inc., Class A | $ | 44,768 | ||||||||
| 1,062 | Sun Hydraulics Corp. | 49,372 | |||||||||
| 2,063 | Sykes Enterprises, Inc.* | 41,322 | |||||||||
| 3,913 | Teledyne Technologies, Inc.* | 197,567 | |||||||||
| 1,749 | Trimas Corp.* | 40,594 | |||||||||
| 669 | UniFirst Corp. | 34,627 | |||||||||
| 4,187,767 | |||||||||||
| Information Technology—16.0% | |||||||||||
| 1,230 | ACI Worldwide, Inc.* | 40,639 | |||||||||
| 2,207 | Acxiom Corp.* | 32,134 | |||||||||
| 5,989 | Ancestry.com, Inc.* | 273,697 | |||||||||
| 978 | Black Box Corp. | 34,171 | |||||||||
| 3,016 | Brightpoint, Inc.* | 30,522 | |||||||||
| 3,522 | CACI International, Inc., Class A* | 215,229 | |||||||||
| 1,972 | Cardtronics, Inc.* | 41,905 | |||||||||
| 3,371 | Coherent, Inc.* | 210,721 | |||||||||
| 14,622 | Convergys Corp.* | 212,019 | |||||||||
| 2,447 | Electronics for Imaging, Inc.* | 43,948 | |||||||||
| 1,743 | ExlService Holdings, Inc.* | 36,115 | |||||||||
| 1,117 | FEI Co.* | 36,258 | |||||||||
| 3,454 | GT Solar International, Inc.* | 38,581 | |||||||||
| 2,090 | Insight Enterprises, Inc.* | 35,864 | |||||||||
| 1,097 | Interactive Intelligence, Inc.* | 41,050 | |||||||||
| 1,297 | j2 Global Communications, Inc.* | 38,210 | |||||||||
| 20,389 | Lawson Software, Inc.* | 225,706 | |||||||||
| 5,904 | Magma Design Automation, Inc.* | 37,549 | |||||||||
| 512 | MAXIMUS, Inc. | 40,955 | |||||||||
| 1,229 | Measurement Specialties, Inc.* | 42,745 | |||||||||
| 847 | MTS Systems Corp. | 37,497 | |||||||||
| 1,326 | Multi-Fineline Electronix, Inc.* | 35,311 | |||||||||
| 1,508 | NetScout Systems, Inc.* | 38,590 | |||||||||
| 8,106 | NeuStar, Inc., Class A* | 217,970 | |||||||||
| 2,314 | Newport Corp.* | 43,341 | |||||||||
| 1,200 | OPNET Technologies, Inc. | 46,992 | |||||||||
| 5,948 | Plantronics, Inc. | 220,492 | |||||||||
| 6,950 | Progress Software Corp.* | 206,068 | |||||||||
| 11,519 | QLogic Corp.* | 207,112 | |||||||||
| 1,030 | ScanSource, Inc.* | 36,843 | |||||||||
| 1,795 | Spansion, Inc., Class A* | 35,362 | |||||||||
| 3,518 | TeleNav, Inc.* | 47,775 | |||||||||
| 1,657 | TeleTech Holdings, Inc.* | 32,925 | |||||||||
| 2,135 | TTM Technologies, Inc.* | 40,821 | |||||||||
| 2,496 | ValueClick, Inc.* | 41,808 | |||||||||
| 1,122 | Verint Systems, Inc.* | 38,406 | |||||||||
| 3,035,331 | |||||||||||
| Materials—6.0% | |||||||||||
| 4,392 | Boise, Inc. | 43,129 | |||||||||
| 1,440 | Buckeye Technologies, Inc. | 40,550 | |||||||||
| 468 | Clearwater Paper Corp.* | 36,729 | |||||||||
| 2,405 | Ferro Corp.* | 36,075 | |||||||||
See Notes to Financial Statements.
41
Schedule of Investments (Continued)
PowerShares Dynamic Small Cap Portfolio
April 30, 2011
| Number of Shares | Value | ||||||||||
| Common Stocks and Other Equity Interests (Continued) | |||||||||||
| 40,738 | Graphic Packaging Holding Co.* | $ | 223,652 | ||||||||
| 1,402 | Innospec, Inc.* | 52,799 | |||||||||
| 899 | Materion Corp.* | 37,542 | |||||||||
| 2,774 | Mercer International, Inc.* | 33,760 | |||||||||
| 1,618 | NewMarket Corp. | 298,230 | |||||||||
| 981 | Quaker Chemical Corp. | 44,322 | |||||||||
| 6,141 | Sensient Technologies Corp. | 232,682 | |||||||||
| 1,340 | TPC Group, Inc.* | 52,850 | |||||||||
| 1,132,320 | |||||||||||
| Telecommunication Services—1.5% | |||||||||||
| 3,092 | AboveNet, Inc. | 206,391 | |||||||||
| 3,162 | General Communication, Inc., Class A* | 36,363 | |||||||||
| 8,808 | Vonage Holdings Corp.* | 45,449 | |||||||||
| 288,203 | |||||||||||
| Utilities—1.8% | |||||||||||
| 1,361 | El Paso Electric Co.* | 42,164 | |||||||||
| 974 | Laclede Group, Inc. (The) | 37,373 | |||||||||
| 925 | MGE Energy, Inc. | 38,859 | |||||||||
| 8,941 | Portland General Electric Co. | 223,167 | |||||||||
| 341,563 | |||||||||||
| Total Common Stocks and Other Equity Interests (Cost $15,883,242) | 18,994,076 | ||||||||||
| Money Market Fund—0.4% | |||||||||||
| 65,371 | Goldman Sachs Financial Square Prime Obligations Institutional Share Class (Cost $65,371) | 65,371 | |||||||||
| Total Investments (Cost $15,948,613)—100.4% | 19,059,447 | ||||||||||
| Liabilities in excess of other assets—(0.4%) | (68,104 | ) | |||||||||
| Net Assets—100.0% | $ | 18,991,343 | |||||||||
Notes to Schedule of Investments:
* Non-income producing security.
See Notes to Financial Statements.
42
Schedule of Investments
PowerShares Dynamic Small Cap Value Portfolio
April 30, 2011
| Number of Shares | Value | ||||||||||
| Common Stocks—100.1% | |||||||||||
| Consumer Discretionary—15.4% | |||||||||||
| 66,791 | Aaron's, Inc. | $ | 1,922,913 | ||||||||
| 17,594 | Ameristar Casinos, Inc. | 351,000 | |||||||||
| 9,438 | Bob Evans Farms, Inc. | 295,976 | |||||||||
| 41,581 | Buckle, Inc. (The) | 1,891,520 | |||||||||
| 6,318 | Children's Place Retail Stores, Inc. (The)* | 335,928 | |||||||||
| 12,601 | Collective Brands, Inc.* | 264,621 | |||||||||
| 5,845 | Cracker Barrel Old Country Store, Inc. | 299,439 | |||||||||
| 88,224 | Express, Inc.* | 1,904,756 | |||||||||
| 23,482 | Harte-Hanks, Inc. | 218,148 | |||||||||
| 10,342 | Helen of Troy Ltd.* | 321,843 | |||||||||
| 13,215 | Jack in the Box, Inc.* | 272,890 | |||||||||
| 45,063 | Meredith Corp. | 1,506,006 | |||||||||
| 10,089 | Papa John's International, Inc.* | 303,275 | |||||||||
| 29,917 | Pier 1 Imports, Inc.* | 364,389 | |||||||||
| 21,802 | Ruby Tuesday, Inc.* | 229,139 | |||||||||
| 32,764 | Sonic Corp.* | 367,612 | |||||||||
| 38,347 | Stewart Enterprises, Inc., Class A | 310,994 | |||||||||
| 11,160,449 | |||||||||||
| Consumer Staples—7.8% | |||||||||||
| 38,045 | Casey's General Stores, Inc. | 1,484,896 | |||||||||
| 5,255 | Coca-Cola Bottling Co. Consolidated | 370,215 | |||||||||
| 27,767 | Lancaster Colony Corp. | 1,696,841 | |||||||||
| 43,194 | Ruddick Corp. | 1,793,415 | |||||||||
| 7,450 | Weis Markets, Inc. | 307,462 | |||||||||
| 5,652,829 | |||||||||||
| Energy—3.5% | |||||||||||
| 2,883 | Clayton Williams Energy, Inc.* | 261,113 | |||||||||
| 14,747 | Cloud Peak Energy, Inc.* | 307,033 | |||||||||
| 36,896 | VAALCO Energy, Inc.* | 257,165 | |||||||||
| 62,740 | W&T Offshore, Inc. | 1,682,059 | |||||||||
| 2,507,370 | |||||||||||
| Financials—25.9% | |||||||||||
| 15,215 | AmTrust Financial Services, Inc. | 293,650 | |||||||||
| 30,542 | BGC Partners, Inc., Class A | 294,730 | |||||||||
| 8,508 | City Holding Co. | 290,123 | |||||||||
| 227,607 | CNO Financial Group, Inc.* | 1,834,513 | |||||||||
| 11,638 | Community Bank System, Inc. | 291,183 | |||||||||
| 22,637 | Credit Acceptance Corp.* | 1,831,333 | |||||||||
| 52,092 | Delphi Financial Group, Inc., Class A | 1,664,339 | |||||||||
| 14,665 | Employers Holdings, Inc. | 295,646 | |||||||||
| 9,472 | FBL Financial Group, Inc., Class A | 288,896 | |||||||||
| 102,939 | First American Financial Corp. | 1,605,848 | |||||||||
| 8,122 | Harleysville Group, Inc. | 260,554 | |||||||||
| 17,241 | Horace Mann Educators Corp. | 308,269 | |||||||||
| 10,889 | Independent Bank Corp. | 319,157 | |||||||||
| 4,772 | Infinity Property & Casualty Corp. | 282,025 | |||||||||
| 15,367 | International Bancshares Corp. | 270,767 | |||||||||
| 28,517 | Meadowbrook Insurance Group, Inc. | 292,014 | |||||||||
| 13,103 | NBT Bancorp, Inc. | 296,128 | |||||||||
| Number of Shares | Value | ||||||||||
| Common Stocks (Continued) | |||||||||||
| 24,859 | ProAssurance Corp.* | $ | 1,650,638 | ||||||||
| 5,101 | RLI Corp. | 302,183 | |||||||||
| 6,071 | Safety Insurance Group, Inc. | 284,244 | |||||||||
| 115,098 | Symetra Financial Corp. | 1,597,560 | |||||||||
| 10,752 | Tower Group, Inc. | 245,898 | |||||||||
| 39,715 | UMB Financial Corp. | 1,672,399 | |||||||||
| 14,279 | United Fire & Casualty Co. | 282,724 | |||||||||
| 55,534 | Unitrin, Inc. | 1,679,348 | |||||||||
| 4,872 | World Acceptance Corp.* | 331,052 | |||||||||
| 18,765,221 | |||||||||||
| Health Care—6.5% | |||||||||||
| 4,486 | Chemed Corp. | 312,360 | |||||||||
| 33,035 | Magellan Health Services, Inc.* | 1,718,481 | |||||||||
| 16,922 | Medicines Co. (The)* | 265,676 | |||||||||
| 51,254 | Owens & Minor, Inc. | 1,765,700 | |||||||||
| 9,354 | Par Pharmaceutical Cos., Inc.* | 322,152 | |||||||||
| 16,174 | Team Health Holdings, Inc.* | 321,539 | |||||||||
| 4,705,908 | |||||||||||
| Industrials—15.6% | |||||||||||
| 37,084 | Air Transport Services Group, Inc.* | 303,347 | |||||||||
| 38,591 | Alexander & Baldwin, Inc. | 2,033,746 | |||||||||
| 16,591 | Amerco, Inc.* | 1,687,637 | |||||||||
| 23,389 | Atlas Air Worldwide Holdings, Inc.* | 1,611,736 | |||||||||
| 9,469 | Brink's Co. (The) | 312,572 | |||||||||
| 43,464 | Curtiss-Wright Corp. | 1,445,178 | |||||||||
| 11,556 | Deluxe Corp. | 312,936 | |||||||||
| 8,937 | G&K Services, Inc., Class A | 295,815 | |||||||||
| 15,546 | John Bean Technologies Corp. | 314,185 | |||||||||
| 8,829 | Layne Christensen Co.* | 262,751 | |||||||||
| 11,671 | M&F Worldwide Corp.* | 292,825 | |||||||||
| 16,363 | MasTec, Inc.* | 371,113 | |||||||||
| 18,600 | SkyWest, Inc. | 307,458 | |||||||||
| 30,301 | Teledyne Technologies, Inc.* | 1,529,897 | |||||||||
| 5,183 | UniFirst Corp. | 268,272 | |||||||||
| 11,349,468 | |||||||||||
| Information Technology—13.9% | |||||||||||
| 7,574 | Black Box Corp. | 264,636 | |||||||||
| 23,351 | Brightpoint, Inc.* | 236,312 | |||||||||
| 27,354 | CACI International, Inc., Class A* | 1,671,603 | |||||||||
| 113,563 | Convergys Corp.* | 1,646,664 | |||||||||
| 26,744 | GT Solar International, Inc.* | 298,731 | |||||||||
| 16,183 | Insight Enterprises, Inc.* | 277,700 | |||||||||
| 10,044 | j2 Global Communications, Inc.* | 295,896 | |||||||||
| 10,266 | Multi-Fineline Electronix, Inc.* | 273,384 | |||||||||
| 62,764 | NeuStar, Inc., Class A* | 1,687,724 | |||||||||
| 17,917 | Newport Corp.* | 335,585 | |||||||||
| 31,699 | Photronics, Inc.* | 276,732 | |||||||||
| 89,191 | QLogic Corp.* | 1,603,654 | |||||||||
| 7,974 | ScanSource, Inc.* | 285,230 | |||||||||
| 13,899 | Spansion, Inc., Class A* | 273,810 | |||||||||
See Notes to Financial Statements.
43
Schedule of Investments (Continued)
PowerShares Dynamic Small Cap Value Portfolio
April 30, 2011
| Number of Shares | Value | ||||||||||
| Common Stocks (Continued) | |||||||||||
| 27,242 | TeleNav, Inc.* | $ | 369,946 | ||||||||
| 16,530 | TTM Technologies, Inc.* | 316,054 | |||||||||
| 10,113,661 | |||||||||||
| Materials—7.3% | |||||||||||
| 34,010 | Boise, Inc. | 333,978 | |||||||||
| 11,146 | Buckeye Technologies, Inc. | 313,871 | |||||||||
| 3,624 | Clearwater Paper Corp.* | 284,412 | |||||||||
| 21,482 | Mercer International, Inc.* | 261,436 | |||||||||
| 12,560 | NewMarket Corp. | 2,315,059 | |||||||||
| 47,690 | Sensient Technologies Corp. | 1,806,974 | |||||||||
| 5,315,730 | |||||||||||
| Telecommunication Services—0.5% | |||||||||||
| 68,201 | Vonage Holdings Corp.* | 351,917 | |||||||||
| Utilities—3.7% | |||||||||||
| 10,540 | El Paso Electric Co.* | 326,529 | |||||||||
| 7,545 | Laclede Group, Inc. (The) | 289,502 | |||||||||
| 7,161 | MGE Energy, Inc. | 300,833 | |||||||||
| 69,229 | Portland General Electric Co. | 1,727,956 | |||||||||
| 2,644,820 | |||||||||||
| Total Common Stocks (Cost $61,650,056) | 72,567,373 | ||||||||||
| Money Market Fund—0.1% | |||||||||||
| 94,203 | Goldman Sachs Financial Square Prime Obligations Institutional Share Class (Cost $94,203) | 94,203 | |||||||||
| Total Investments (Cost $61,744,259)—100.2% | 72,661,576 | ||||||||||
| Liabilities in excess of other assets—(0.2%) | (121,701 | ) | |||||||||
| Net Assets—100.0% | $ | 72,539,875 | |||||||||
Notes to Schedule of Investments:
* Non-income producing security.
See Notes to Financial Statements.
44
Schedule of Investments
PowerShares Zacks Micro Cap Portfolio
April 30, 2011
| Number of Shares | Value | ||||||||||
| Common Stocks and Other Equity Interests—100.1% | |||||||||||
| Consumer Discretionary—14.4% | |||||||||||
| 29,534 | AH Belo Corp., Class A* | $ | 245,723 | ||||||||
| 15,701 | Arctic Cat, Inc.* | 263,620 | |||||||||
| 13,363 | Asbury Automotive Group, Inc.* | 231,180 | |||||||||
| 5,006 | Ascent Media Corp., Class A* | 240,438 | |||||||||
| 30,874 | Audiovox Corp., Class A* | 227,850 | |||||||||
| 34,438 | Ballantyne Strong, Inc.* | 232,457 | |||||||||
| 54,055 | Beazer Homes USA, Inc.* | 251,896 | |||||||||
| 60,113 | Bluegreen Corp.* | 233,840 | |||||||||
| 15,946 | Bon-Ton Stores, Inc. (The) | 221,330 | |||||||||
| 1 | Brookfield Residential Properties, Inc. (Canada)* | 12 | |||||||||
| 40,821 | Build-A-Bear Workshop, Inc.* | 250,233 | |||||||||
| 36,203 | Callaway Golf Co. | 256,317 | |||||||||
| 55,118 | Conn's, Inc.* | 361,023 | |||||||||
| 7,476 | Core-Mark Holding Co., Inc.* | 250,521 | |||||||||
| 25,165 | Cost Plus, Inc.* | 274,047 | |||||||||
| 10,719 | Destination Maternity Corp. | 250,503 | |||||||||
| 5,867 | Dorman Products, Inc.* | 228,813 | |||||||||
| 24,931 | E.W. Scripps Co. (The), Class A* | 236,844 | |||||||||
| 18,525 | Fred's, Inc., Class A | 258,609 | |||||||||
| 54,281 | Furniture Brands International, Inc.* | 262,720 | |||||||||
| 6,509 | G-III Apparel Group Ltd.* | 291,994 | |||||||||
| 119,368 | Gray Television, Inc.* | 333,037 | |||||||||
| 51,787 | Hastings Entertainment, Inc.* | 259,971 | |||||||||
| 25,969 | Isle of Capri Casinos, Inc.* | 247,744 | |||||||||
| 12,777 | JAKKS Pacific, Inc.* | 268,828 | |||||||||
| 41,175 | Journal Communications, Inc., Class A* | 224,404 | |||||||||
| 33,615 | Kid Brands, Inc.* | 245,726 | |||||||||
| 16,291 | Lifetime Brands, Inc. | 259,353 | |||||||||
| 16,932 | Lithia Motors, Inc., Class A | 307,993 | |||||||||
| 62,874 | LJ International, Inc. (British Virgin Islands)* | 245,209 | |||||||||
| 46,695 | Luby's, Inc.* | 233,475 | |||||||||
| 16,457 | M/I Homes, Inc.* | 218,714 | |||||||||
| 15,315 | Modine Manufacturing Co.* | 272,760 | |||||||||
| 17,676 | Motorcar Parts of America, Inc.* | 246,050 | |||||||||
| 16,823 | Movado Group, Inc. | 280,776 | |||||||||
| 35,206 | New York & Co., Inc.* | 216,165 | |||||||||
| 27,426 | NIVS IntelliMedia Technology Group, Inc.* | 54,303 | |||||||||
| 19,430 | Pep Boys - Manny, Moe & Jack (The) | 266,191 | |||||||||
| 8,991 | Perry Ellis International, Inc.* | 253,366 | |||||||||
| 30,093 | Red Lion Hotels Corp.* | 263,314 | |||||||||
| 9,086 | Red Robin Gourmet Burgers, Inc.* | 247,048 | |||||||||
| 16,162 | Rocky Brands, Inc.* | 246,147 | |||||||||
| 47,892 | Ruth's Hospitality Group, Inc.* | 235,150 | |||||||||
| 8,819 | Shoe Carnival, Inc.* | 258,132 | |||||||||
| 36,000 | Spartan Motors, Inc. | 243,360 | |||||||||
| 17,852 | Standard Motor Products, Inc. | 254,391 | |||||||||
| 24,418 | Stein Mart, Inc.* | 265,668 | |||||||||
| 11,123 | Steinway Musical Instruments, Inc.* | 278,075 | |||||||||
| 32,348 | Stewart Enterprises, Inc., Class A | 262,342 | |||||||||
| Number of Shares | Value | ||||||||||
| Common Stocks and Other Equity Interests (Continued) | |||||||||||
| 16,884 | Stoneridge, Inc.* | $ | 258,325 | ||||||||
| 10,745 | Sturm Ruger & Co., Inc. | 255,516 | |||||||||
| 9,627 | Superior Industries International, Inc. | 243,274 | |||||||||
| 32,644 | TravelCenters of America LLC* | 256,582 | |||||||||
| 50,404 | Tuesday Morning Corp.* | 252,020 | |||||||||
| 14,544 | Unifi, Inc.* | 237,358 | |||||||||
| 8,345 | Universal Electronics, Inc.* | 231,073 | |||||||||
| 38,831 | ValueVision Media, Inc., Class A* | 247,742 | |||||||||
| 61,886 | Zale Corp.* | 227,740 | |||||||||
| 14,267,292 | |||||||||||
| Consumer Staples—3.5% | |||||||||||
| 61,420 | Alliance One International, Inc.* | 245,066 | |||||||||
| 26,793 | Central Garden & Pet Co., Class A* | 268,466 | |||||||||
| 26,773 | Craft Brewers Alliance, Inc.* | 246,579 | |||||||||
| 6,510 | Nash Finch Co. | 242,302 | |||||||||
| 11,597 | Oil-Dri Corp. of America | 256,178 | |||||||||
| 18,124 | Omega Protein Corp.* | 233,437 | |||||||||
| 16,653 | Pantry, Inc. (The)* | 257,789 | |||||||||
| 21,464 | Prestige Brands Holdings, Inc.* | 247,909 | |||||||||
| 8,272 | Seneca Foods Corp., Class A* | 231,285 | |||||||||
| 16,688 | Spartan Stores, Inc. | 260,500 | |||||||||
| 33,289 | SunOpta, Inc. (Canada)* | 235,020 | |||||||||
| 18,843 | Susser Holdings Corp.* | 259,845 | |||||||||
| 34,582 | Winn-Dixie Stores, Inc.* | 245,186 | |||||||||
| 16,286 | Zhongpin, Inc.* | 271,976 | |||||||||
| 3,501,538 | |||||||||||
| Energy—7.3% | |||||||||||
| 21,857 | Bronco Drilling Co., Inc.* | 239,990 | |||||||||
| 23,034 | Capital Product Partners LP (Marshall Islands) | 260,284 | |||||||||
| 24,836 | Crosstex Energy, Inc. | 262,020 | |||||||||
| 5,576 | Dawson Geophysical Co.* | 248,690 | |||||||||
| 51,359 | DHT Holdings, Inc. | 222,384 | |||||||||
| 13,595 | Energy Partners Ltd.* | 247,565 | |||||||||
| 7,824 | Georesources, Inc.* | 227,053 | |||||||||
| 9,495 | Global Partners LP | 266,430 | |||||||||
| 20,562 | Green Plains Renewable Energy, Inc.* | 257,436 | |||||||||
| 7,692 | Gulf Island Fabrication, Inc. | 271,835 | |||||||||
| 16,212 | Harvest Natural Resources, Inc.* | 224,050 | |||||||||
| 37,387 | Hercules Offshore, Inc.* | 234,603 | |||||||||
| 53,474 | Hyperdynamics Corp.* | 225,660 | |||||||||
| 9,873 | Knightsbridge Tankers Ltd. (Bermuda) | 221,056 | |||||||||
| 28,507 | Magnum Hunter Resources Corp.* | 232,617 | |||||||||
| 17,568 | Matrix Service Co.* | 254,033 | |||||||||
| 2,499 | OYO Geospace Corp.* | 233,107 | |||||||||
| 35,758 | Parker Drilling Co.* | 254,955 | |||||||||
| 26,390 | PetroQuest Energy, Inc.* | 231,176 | |||||||||
| 17,899 | Pioneer Drilling Co.* | 277,435 | |||||||||
| 15,490 | REX American Resources Corp.* | 267,667 | |||||||||
| 23,592 | Teekay Tankers Ltd., Class A (Marshall Islands) | 221,765 | |||||||||
| 6,794 | TransMontaigne Partners LP | 244,992 | |||||||||
See Notes to Financial Statements.
45
Schedule of Investments (Continued)
PowerShares Zacks Micro Cap Portfolio
April 30, 2011
| Number of Shares | Value | ||||||||||
| Common Stocks and Other Equity Interests (Continued) | |||||||||||
| 29,754 | Triangle Petroleum Corp.* | $ | 234,759 | ||||||||
| 22,233 | Tsakos Energy Navigation Ltd. (Bermuda) | 231,001 | |||||||||
| 77,429 | Uranerz Energy Corp.* | 215,253 | |||||||||
| 118,767 | Uranium Resources, Inc.* | 216,156 | |||||||||
| 31,844 | VAALCO Energy, Inc.* | 221,953 | |||||||||
| 56,144 | Voyager Oil & Gas, Inc.* | 239,173 | |||||||||
| 48,517 | Warren Resources, Inc.* | 219,782 | |||||||||
| 7,204,880 | |||||||||||
| Financials—25.4% | |||||||||||
| 11,011 | Agree Realty Corp. REIT | 257,547 | |||||||||
| 11,514 | American Safety Insurance Holdings Ltd. (Bermuda)* | 234,425 | |||||||||
| 24,296 | Ameris Bancorp* | 241,502 | |||||||||
| 11,054 | AMERISAFE, Inc.* | 246,836 | |||||||||
| 15,112 | Apollo Commercial Real Estate Finance, Inc. REIT | 246,930 | |||||||||
| 43,477 | Arbor Realty Trust, Inc. REIT* | 228,689 | |||||||||
| 8,121 | Arlington Asset Investment Corp., Class A | 247,690 | |||||||||
| 32,567 | ARMOUR Residential REIT, Inc. | 241,973 | |||||||||
| 22,422 | Ashford Hospitality Trust, Inc. REIT* | 279,602 | |||||||||
| 28,848 | Asta Funding, Inc. | 233,957 | |||||||||
| 12,470 | Avatar Holdings, Inc.* | 224,460 | |||||||||
| 14,150 | Banco Latinoamericano de Comercio Exterior SA, Class E (Panama) | 245,644 | |||||||||
| 26,775 | Bancorp, Inc. (The)* | 262,127 | |||||||||
| 104,217 | Banner Corp. | 286,597 | |||||||||
| 11,835 | Berkshire Hills Bancorp, Inc. | 263,920 | |||||||||
| 15,922 | BofI Holding, Inc.* | 267,490 | |||||||||
| 34,938 | Boston Private Financial Holdings, Inc. | 244,217 | |||||||||
| 23,432 | Brookline Bancorp, Inc. | 216,043 | |||||||||
| 14,726 | Calamos Asset Management, Inc., Class A | 239,592 | |||||||||
| 2,698 | Capital Southwest Corp. | 259,656 | |||||||||
| 45,066 | CapLease, Inc. REIT | 252,370 | |||||||||
| 40,951 | Cedar Shopping Centers, Inc. REIT | 241,611 | |||||||||
| 14,198 | Chesapeake Lodging Trust REIT | 255,280 | |||||||||
| 35,538 | CoBiz Financial, Inc. | 241,303 | |||||||||
| 16,735 | Dime Community Bancshares | 258,723 | |||||||||
| 24,528 | Dynex Capital, Inc. REIT | 242,337 | |||||||||
| 30,728 | Education Realty Trust, Inc. REIT | 261,495 | |||||||||
| 12,805 | Federal Agricultural Mortgage Corp., Class C | 242,655 | |||||||||
| 14,111 | Financial Institutions, Inc. | 239,887 | |||||||||
| 48,629 | First Busey Corp. | 255,302 | |||||||||
| 17,393 | First Community Bancshares, Inc. | 258,460 | |||||||||
| 29,865 | First Merchants Corp. | 276,849 | |||||||||
| 16,405 | Flushing Financial Corp. | 241,482 | |||||||||
| 17,536 | Fox Chase Bancorp, Inc. | 239,366 | |||||||||
| 6,519 | FPIC Insurance Group, Inc.* | 240,681 | |||||||||
| 21,840 | Gladstone Capital Corp. | 248,102 | |||||||||
| 31,827 | Gladstone Investment Corp. | 246,341 | |||||||||
| 58,257 | Gramercy Capital Corp. REIT* | 174,188 | |||||||||
| Number of Shares | Value | ||||||||||
| Common Stocks and Other Equity Interests (Continued) | |||||||||||
| 29,475 | Hallmark Financial Services, Inc.* | $ | 252,011 | ||||||||
| 22,467 | Hercules Technology Growth Capital, Inc. | 241,520 | |||||||||
| 16,436 | HFF, Inc., Class A* | 246,047 | |||||||||
| 24,592 | Hilltop Holdings, Inc.* | 238,542 | |||||||||
| 14,691 | Horace Mann Educators Corp. | 262,675 | |||||||||
| 9,133 | Independent Bank Corp. | 267,688 | |||||||||
| 17,394 | Internet Capital Group, Inc.* | 241,603 | |||||||||
| 9,723 | INTL FCStone, Inc.* | 257,465 | |||||||||
| 46,498 | Kite Realty Group Trust REIT | 241,790 | |||||||||
| 29,561 | Kohlberg Capital Corp. | 221,116 | |||||||||
| 32,956 | Maiden Holdings Ltd. (Bermuda) | 245,522 | |||||||||
| 13,397 | Main Street Capital Corp. | 251,998 | |||||||||
| 19,992 | Marlin Business Services Corp.* | 243,702 | |||||||||
| 38,005 | MCG Capital Corp. | 250,833 | |||||||||
| 23,862 | Meadowbrook Insurance Group, Inc. | 244,347 | |||||||||
| 37,574 | Mission West Properties, Inc. REIT | 288,568 | |||||||||
| 17,994 | MVC Capital, Inc. | 248,857 | |||||||||
| 25,665 | Nara Bancorp, Inc.* | 252,287 | |||||||||
| 16,577 | National Financial Partners Corp.* | 266,724 | |||||||||
| 1,510 | National Western Life Insurance Co., Class A | 243,216 | |||||||||
| 22,609 | NewStar Financial, Inc.* | 270,178 | |||||||||
| 25,626 | NGP Capital Resources Co. | 241,909 | |||||||||
| 46,162 | NorthStar Realty Finance Corp. REIT | 233,118 | |||||||||
| 16,384 | One Liberty Properties, Inc. REIT | 254,116 | |||||||||
| 7,383 | Oppenheimer Holdings, Inc., Class A | 226,732 | |||||||||
| 19,658 | Oriental Financial Group, Inc. | 254,768 | |||||||||
| 14,544 | Parkway Properties, Inc. REIT | 260,774 | |||||||||
| 20,723 | PennantPark Investment Corp. | 255,722 | |||||||||
| 13,420 | PennyMac Mortgage Investment Trust REIT | 245,854 | |||||||||
| 90,837 | Phoenix Cos., Inc. (The)* | 244,352 | |||||||||
| 14,774 | Pinnacle Financial Partners, Inc.* | 237,418 | |||||||||
| 91,461 | PMI Group, Inc. (The)* | 197,556 | |||||||||
| 25,919 | Presidential Life Corp. | 288,738 | |||||||||
| 23,899 | Provident New York Bancorp | 224,173 | |||||||||
| 100,398 | RAIT Financial Trust REIT | 244,971 | |||||||||
| 19,689 | Ramco-Gershenson Properties Trust REIT | 253,791 | |||||||||
| 14,536 | Renasant Corp. | 243,914 | |||||||||
| 12,676 | Republic Bancorp, Inc., Class A | 276,083 | |||||||||
| 37,457 | Resource Capital Corp. REIT | 242,721 | |||||||||
| 22,594 | Retail Opportunity Investments Corp. REIT | 255,086 | |||||||||
| 11,455 | S&T Bancorp, Inc. | 233,797 | |||||||||
| 14,036 | Sabra Healthcare REIT, Inc. REIT | 236,085 | |||||||||
| 12,021 | Safeguard Scientifics, Inc.* | 235,011 | |||||||||
| 5,349 | Safety Insurance Group, Inc. | 250,440 | |||||||||
| 30,851 | Sanders Morris Harris Group, Inc. | 266,244 | |||||||||
| 13,388 | Sandy Spring Bancorp, Inc. | 239,244 | |||||||||
| 17,210 | Southwest Bancorp, Inc.* | 244,038 | |||||||||
| 23,576 | Stewart Information Services Corp. | 239,061 | |||||||||
| 243 | Sun Bancorp, Inc.* | 885 | |||||||||
| 40,687 | SWS Group, Inc. | 248,191 | |||||||||
| 73,729 | Thomas Properties Group, Inc.* | 264,687 | |||||||||
See Notes to Financial Statements.
46
Schedule of Investments (Continued)
PowerShares Zacks Micro Cap Portfolio
April 30, 2011
| Number of Shares | Value | ||||||||||
| Common Stocks and Other Equity Interests (Continued) | |||||||||||
| 11,075 | Tower Bancorp, Inc. | $ | 240,438 | ||||||||
| 15,783 | TowneBank | 233,904 | |||||||||
| 13,681 | Triangle Capital Corp. | 244,343 | |||||||||
| 23,606 | Two Harbors Investment Corp. REIT | 246,919 | |||||||||
| 12,221 | United Fire & Casualty Co. | 241,976 | |||||||||
| 18,994 | ViewPoint Financial Group | 234,576 | |||||||||
| 4,204 | Virtus Investment Partners, Inc.* | 222,013 | |||||||||
| 15,326 | Walter Investment Management Corp. REIT | 273,109 | |||||||||
| 10,306 | Washington Trust Bancorp, Inc. | 241,470 | |||||||||
| 11,810 | WesBanco, Inc. | 239,743 | |||||||||
| 71,192 | West Coast Bancorp* | 254,867 | |||||||||
| 30,072 | Western Alliance Bancorp* | 248,695 | |||||||||
| 20,149 | Winthrop Realty Trust REIT | 244,407 | |||||||||
| 5,245 | WSFS Financial Corp. | 235,868 | |||||||||
| 25,203,825 | |||||||||||
| Health Care—6.8% | |||||||||||
| 34,539 | Achillion Pharmaceuticals, Inc.* | 192,728 | |||||||||
| 42,817 | Akorn, Inc.* | 283,449 | |||||||||
| 16,333 | AngioDynamics, Inc.* | 266,228 | |||||||||
| 60,523 | AVANIR Pharmaceuticals, Inc., Class A* | 264,485 | |||||||||
| 55,129 | BSD Medical Corp.* | 226,580 | |||||||||
| 36,543 | Caliper Life Sciences, Inc.* | 244,473 | |||||||||
| 9,604 | Cantel Medical Corp. | 249,032 | |||||||||
| 23,007 | Capital Senior Living Corp.* | 213,275 | |||||||||
| 36,424 | Endologix, Inc.* | 289,571 | |||||||||
| 7,643 | Ensign Group, Inc. (The) | 211,405 | |||||||||
| 30,394 | Five Star Quality Care, Inc.* | 254,702 | |||||||||
| 9,329 | Greatbatch, Inc.* | 252,536 | |||||||||
| 16,077 | Healthways, Inc.* | 272,023 | |||||||||
| 23,045 | Kendle International, Inc.* | 231,602 | |||||||||
| 17,695 | MedCath Corp.* | 239,059 | |||||||||
| 50,634 | Merge Healthcare, Inc.* | 249,626 | |||||||||
| 52,217 | Metropolitan Health Networks, Inc.* | 220,356 | |||||||||
| 14,691 | Natus Medical, Inc.* | 249,306 | |||||||||
| 16,626 | Palomar Medical Technologies, Inc.* | 266,182 | |||||||||
| 35,513 | QLT, Inc. (Canada)* | 289,431 | |||||||||
| 16,994 | Skilled Healthcare Group, Inc., Class A* | 205,967 | |||||||||
| 20,706 | Sunrise Senior Living, Inc.* | 214,928 | |||||||||
| 41,950 | Synergetics USA, Inc.* | 228,627 | |||||||||
| 18,937 | Syneron Medical Ltd. (Israel)* | 237,659 | |||||||||
| 11,990 | Triple-S Management Corp., Class B (Puerto Rico)* | 251,071 | |||||||||
| 93,554 | YM Biosciences, Inc. (Canada)* | 307,793 | |||||||||
| 102,080 | Zalicus, Inc.* | 312,365 | |||||||||
| 6,724,459 | |||||||||||
| Industrials—15.1% | |||||||||||
| 30,997 | Aceto Corp. | 248,286 | |||||||||
| 28,894 | Air Transport Services Group, Inc.* | 236,353 | |||||||||
| 8,989 | Alamo Group, Inc. | 257,175 | |||||||||
| 27,898 | Alexco Resource Corp. (Canada)* | 267,542 | |||||||||
| Number of Shares | Value | ||||||||||
| Common Stocks and Other Equity Interests (Continued) | |||||||||||
| 10,453 | Altra Holdings, Inc.* | $ | 265,402 | ||||||||
| 9,803 | American Railcar Industries, Inc.* | 277,719 | |||||||||
| 18,725 | Apogee Enterprises, Inc. | 267,393 | |||||||||
| 5,420 | AZZ, Inc. | 237,288 | |||||||||
| 9,463 | CAI International, Inc.* | 238,089 | |||||||||
| 5,538 | Cascade Corp. | 253,640 | |||||||||
| 34,249 | CBIZ, Inc.* | 251,045 | |||||||||
| 17,545 | Comfort Systems USA, Inc. | 214,224 | |||||||||
| 26,700 | Covenant Transport Group, Inc., Class A* | 254,718 | |||||||||
| 20,329 | Dolan Co. (The)* | 239,272 | |||||||||
| 10,241 | Ducommun, Inc. | 232,983 | |||||||||
| 10,714 | DXP Enterprises, Inc.* | 281,242 | |||||||||
| 14,077 | Dycom Industries, Inc.* | 209,184 | |||||||||
| 66,392 | Eagle Bulk Shipping, Inc.* | 227,725 | |||||||||
| 10,146 | Encore Wire Corp. | 283,175 | |||||||||
| 14,514 | Ennis, Inc. | 271,122 | |||||||||
| 57,593 | Excel Maritime Carriers Ltd. (Liberia)* | 230,948 | |||||||||
| 50,416 | Force Protection, Inc.* | 226,368 | |||||||||
| 7,518 | FreightCar America, Inc. | 225,390 | |||||||||
| 7,351 | G&K Services, Inc., Class A | 243,318 | |||||||||
| 22,939 | Genco Shipping & Trading Ltd.* | 192,458 | |||||||||
| 20,716 | Gibraltar Industries, Inc.* | 241,963 | |||||||||
| 34,679 | Global Ship Lease, Inc., Class A* | 217,437 | |||||||||
| 32,362 | Great Lakes Dredge & Dock Corp. | 241,097 | |||||||||
| 8,609 | Greenbrier Cos., Inc.* | 233,046 | |||||||||
| 12,018 | ICF International, Inc.* | 292,758 | |||||||||
| 21,804 | Industrial Services of America, Inc.* | 259,468 | |||||||||
| 9,349 | Kadant, Inc.* | 288,417 | |||||||||
| 11,247 | Kelly Services, Inc., Class A* | 214,930 | |||||||||
| 5,732 | LB Foster Co., Class A | 243,954 | |||||||||
| 12,077 | LMI Aerospace, Inc.* | 242,144 | |||||||||
| 27,784 | Lydall, Inc.* | 270,894 | |||||||||
| 9,732 | M&F Worldwide Corp.* | 244,176 | |||||||||
| 11,069 | Marten Transport Ltd. | 247,503 | |||||||||
| 15,044 | Miller Industries, Inc. | 237,996 | |||||||||
| 12,221 | Multi-Color Corp. | 252,486 | |||||||||
| 10,327 | MYR Group, Inc.* | 257,452 | |||||||||
| 24,708 | Navigant Consulting, Inc.* | 287,848 | |||||||||
| 43,326 | Navios Maritime Holdings, Inc. (Greece) | 229,195 | |||||||||
| 13,399 | NN, Inc.* | 234,884 | |||||||||
| 26,100 | On Assignment, Inc.* | 286,317 | |||||||||
| 86,670 | Paragon Shipping, Inc., Class A | 256,543 | |||||||||
| 6,276 | Powell Industries, Inc.* | 248,027 | |||||||||
| 3,585 | Preformed Line Products Co. | 257,582 | |||||||||
| 38,411 | Republic Airways Holdings, Inc.* | 207,227 | |||||||||
| 12,491 | Rush Enterprises, Inc., Class A* | 263,185 | |||||||||
| 15,068 | Saia, Inc.* | 250,129 | |||||||||
| 17,356 | SFN Group, Inc.* | 182,759 | |||||||||
| 31,777 | Sparton Corp.* | 258,665 | |||||||||
| 6,450 | Standex International Corp. | 235,812 | |||||||||
| 9,687 | Titan Machinery, Inc.* | 304,753 | |||||||||
See Notes to Financial Statements.
47
Schedule of Investments (Continued)
PowerShares Zacks Micro Cap Portfolio
April 30, 2011
| Number of Shares | Value | ||||||||||
| Common Stocks and Other Equity Interests (Continued) | |||||||||||
| 11,371 | Trimas Corp.* | $ | 263,921 | ||||||||
| 7,674 | Twin Disc, Inc. | 261,453 | |||||||||
| 48,616 | Ultrapetrol Bahamas Ltd.* | 264,957 | |||||||||
| 10,317 | Viad Corp. | 255,965 | |||||||||
| 41,175 | WCA Waste Corp.* | 245,815 | |||||||||
| 14,912,817 | |||||||||||
| Information Technology—19.6% | |||||||||||
| 15,783 | Allot Communications Ltd. (Israel)* | 258,052 | |||||||||
| 9,776 | Amtech Systems, Inc.* | 223,675 | |||||||||
| 55,138 | Anadigics, Inc.* | 215,590 | |||||||||
| 12,300 | Anaren, Inc.* | 204,057 | |||||||||
| 13,094 | ATMI, Inc.* | 260,702 | |||||||||
| 41,512 | AudioCodes Ltd. (Israel)* | 256,129 | |||||||||
| 93,200 | Axcelis Technologies, Inc.* | 174,284 | |||||||||
| 34,427 | AXT, Inc.* | 240,645 | |||||||||
| 7,035 | Black Box Corp. | 245,803 | |||||||||
| 17,809 | Brooks Automation, Inc.* | 217,804 | |||||||||
| 34,568 | Bsquare Corp.* | 245,778 | |||||||||
| 9,160 | CEVA, Inc.* | 280,113 | |||||||||
| 36,452 | CIBER, Inc.* | 208,505 | |||||||||
| 30,582 | Cogo Group, Inc.* | 251,078 | |||||||||
| 16,089 | Cohu, Inc. | 231,842 | |||||||||
| 38,280 | Cray, Inc.* | 257,242 | |||||||||
| 22,860 | CTS Corp. | 251,231 | |||||||||
| 22,968 | Daktronics, Inc. | 246,447 | |||||||||
| 23,364 | DDi Corp. | 224,528 | |||||||||
| 18,763 | DemandTec, Inc.* | 207,706 | |||||||||
| 14,224 | Electro Scientific Industries, Inc.* | 233,985 | |||||||||
| 16,784 | Electronics for Imaging, Inc.* | 301,441 | |||||||||
| 34,539 | eMagin Corp.* | 278,039 | |||||||||
| 12,571 | EMS Technologies, Inc.* | 317,543 | |||||||||
| 9,197 | ePlus, Inc.* | 254,297 | |||||||||
| 22,608 | EXFO, Inc. (Canada)* | 212,741 | |||||||||
| 70,613 | Extreme Networks, Inc.* | 221,019 | |||||||||
| 56,397 | FSI International, Inc.* | 259,426 | |||||||||
| 26,402 | Gerber Scientific, Inc.* | 252,403 | |||||||||
| 26,850 | GSI Technology, Inc.* | 239,233 | |||||||||
| 21,921 | Imation Corp.* | 225,129 | |||||||||
| 28,524 | InfoSpace, Inc.* | 256,716 | |||||||||
| 26,339 | Integrated Silicon Solution, Inc.* | 254,435 | |||||||||
| 37,589 | Internap Network Services Corp.* | 304,095 | |||||||||
| 67,142 | inTEST Corp.* | 266,554 | |||||||||
| 16,653 | Kemet Corp.* | 261,952 | |||||||||
| 8,966 | Kenexa Corp.* | 263,780 | |||||||||
| 13,312 | Keynote Systems, Inc. | 284,078 | |||||||||
| 20,503 | KIT Digital, Inc.* | 235,990 | |||||||||
| 26,432 | Kulicke & Soffa Industries, Inc.* | 239,474 | |||||||||
| 41,880 | Lattice Semiconductor Corp.* | 284,365 | |||||||||
| 18,498 | LeCroy Corp.* | 241,584 | |||||||||
| 34,506 | Limelight Networks, Inc.* | 219,803 | |||||||||
| Number of Shares | Value | ||||||||||
| Common Stocks and Other Equity Interests (Continued) | |||||||||||
| 32,712 | Magic Software Enterprises Ltd. (Israel)* | $ | 212,628 | ||||||||
| 78,155 | Majesco Entertainment Co.* | 293,081 | |||||||||
| 7,177 | Measurement Specialties, Inc.* | 249,616 | |||||||||
| 11,555 | Mercury Computer Systems, Inc.* | 223,127 | |||||||||
| 23,539 | MIPS Technologies, Inc.* | 195,844 | |||||||||
| 13,654 | Nanometrics, Inc.* | 220,785 | |||||||||
| 38,596 | Ness Technologies, Inc.* | 251,646 | |||||||||
| 13,860 | Newport Corp.* | 259,598 | |||||||||
| 25,197 | Nova Measuring Instruments Ltd. (Israel)* | 248,442 | |||||||||
| 12,668 | Oplink Communications, Inc.* | 250,826 | |||||||||
| 101,645 | Opnext, Inc.* | 239,882 | |||||||||
| 19,227 | Orbotech Ltd. (Israel)* | 246,490 | |||||||||
| 27,224 | Photronics, Inc.* | 237,666 | |||||||||
| 6,967 | RADWARE Ltd. (Israel)* | 245,447 | |||||||||
| 18,532 | Richardson Electronics Ltd. | 249,811 | |||||||||
| 8,929 | Rubicon Technology, Inc.* | 254,566 | |||||||||
| 22,336 | Rudolph Technologies, Inc.* | 252,620 | |||||||||
| 25,722 | SeaChange International, Inc.* | 275,483 | |||||||||
| 22,606 | Sierra Wireless, Inc. (Canada)* | 267,881 | |||||||||
| 19,063 | Sigma Designs, Inc.* | 243,244 | |||||||||
| 13,420 | Silicom Ltd. (Israel)* | 286,785 | |||||||||
| 27,562 | Silicon Image, Inc.* | 229,316 | |||||||||
| 31,436 | SMART Modular Technologies (WWH), Inc.* | 287,325 | |||||||||
| 84,596 | SMTC Corp.* | 221,642 | |||||||||
| 10,019 | Standard Microsystems Corp.* | 272,016 | |||||||||
| 47,596 | Support.com, Inc.* | 272,725 | |||||||||
| 34,031 | Telular Corp. | 237,877 | |||||||||
| 73,766 | TheStreet.com, Inc. | 265,558 | |||||||||
| 8,316 | Ultratech, Inc.* | 260,374 | |||||||||
| 39,150 | United Online, Inc. | 258,390 | |||||||||
| 105,145 | UTStarcom, Inc.* | 270,223 | |||||||||
| 13,190 | Virtusa Corp.* | 246,125 | |||||||||
| 16,732 | Web.com Group, Inc.* | 264,031 | |||||||||
| 70,586 | Westell Technologies, Inc., Class A* | 254,110 | |||||||||
| 22,086 | Xyratex Ltd. (Bermuda)* | 225,498 | |||||||||
| 19,379,971 | |||||||||||
| Materials—5.9% | |||||||||||
| 13,094 | A.M. Castle & Co.* | 247,215 | |||||||||
| 28,071 | Boise, Inc. | 275,657 | |||||||||
| 22,618 | China Agritech, Inc.* | 140,051 | |||||||||
| 45,903 | General Moly, Inc.* | 235,023 | |||||||||
| 6,009 | Hawkins, Inc. | 282,663 | |||||||||
| 4,404 | Haynes International, Inc. | 237,992 | |||||||||
| 41,898 | Headwaters, Inc.* | 228,763 | |||||||||
| 7,726 | Innospec, Inc.* | 290,961 | |||||||||
| 14,228 | KapStone Paper and Packaging Corp.* | 247,283 | |||||||||
| 6,171 | LSB Industries, Inc.* | 249,000 | |||||||||
| 18,225 | Mercer International, Inc.* | 221,798 | |||||||||
| 11,119 | Neenah Paper, Inc. | 259,406 | |||||||||
| 7,540 | Olympic Steel, Inc. | 221,450 | |||||||||
See Notes to Financial Statements.
48
Schedule of Investments (Continued)
PowerShares Zacks Micro Cap Portfolio
April 30, 2011
| Number of Shares | Value | ||||||||||
| Common Stocks and Other Equity Interests (Continued) | |||||||||||
| 18,531 | P.H. Glatfelter Co. | $ | 252,022 | ||||||||
| 20,146 | Puda Coal, Inc.* | 120,876 | |||||||||
| 6,141 | Quaker Chemical Corp. | 277,450 | |||||||||
| 30,087 | SinoCoking Coal and Coke Chemical Industries, Inc.* | 192,557 | |||||||||
| 8,552 | TPC Group, Inc.* | 337,291 | |||||||||
| 14,204 | UFP Technologies, Inc.* | 275,558 | |||||||||
| 7,259 | Universal Stainless & Alloy Products, Inc.* | 263,139 | |||||||||
| 39,469 | US Energy Corp. Wyoming* | 225,763 | |||||||||
| 61,741 | Vista Gold Corp. (Canada)* | 202,510 | |||||||||
| 32,886 | Zagg, Inc.* | 292,028 | |||||||||
| 18,191 | Zoltek Cos., Inc.* | 233,754 | |||||||||
| 5,810,210 | |||||||||||
| Telecommunication Services—1.3% | |||||||||||
| 22,562 | General Communication, Inc., Class A* | 259,463 | |||||||||
| 9,157 | IDT Corp., Class B | 265,461 | |||||||||
| 30,972 | Iridium Communications, Inc.* | 242,511 | |||||||||
| 17,052 | USA Mobility, Inc. | 263,453 | |||||||||
| 11,436 | Vocaltec Communications Ltd. (Israel)* | 241,300 | |||||||||
| 1,272,188 | |||||||||||
| Utilities—0.8% | |||||||||||
| 10,492 | Central Vermont Public Service Corp. | 245,618 | |||||||||
| 13,594 | Middlesex Water Co. | 256,654 | |||||||||
| 43,443 | Star Gas Partners LP | 258,486 | |||||||||
| 760,758 | |||||||||||
| Total Common Stocks and Other Equity Interests (Cost $90,722,825) | 99,037,938 | ||||||||||
| Money Market Fund—0.0% | |||||||||||
| 64,937 | Goldman Sachs Financial Square Prime Obligations Institutional Share Class (Cost $64,937) | 64,937 | |||||||||
| Total Investments (Cost $90,787,762)—100.1% | 99,102,875 | ||||||||||
| Liabilities in excess of other assets—(0.1%) | (138,646 | ) | |||||||||
| Net Assets—100.0% | $ | 98,964,229 | |||||||||
Investment Abbreviations:
REIT—Real Estate Investment Trust
Notes to Schedule of Investments:
* Non-income producing security.
See Notes to Financial Statements.
49
Statements of Assets and Liabilities
April 30, 2011
| PowerShares Dynamic Large Cap Growth Portfolio | PowerShares Dynamic Large Cap Portfolio | PowerShares Dynamic Large Cap Value Portfolio | PowerShares Dynamic Mid Cap Growth Portfolio | PowerShares Dynamic Mid Cap Portfolio | |||||||||||||||||||
| ASSETS: | |||||||||||||||||||||||
| Investments, at value | $ | 196,767,852 | $ | 35,710,350 | $ | 422,090,215 | $ | 130,450,560 | $ | 23,145,377 | |||||||||||||
| Cash | 459 | 250 | — | 364 | 237 | ||||||||||||||||||
| Foreign currencies, at value | — | — | — | — | — | ||||||||||||||||||
| Receivables: | |||||||||||||||||||||||
| Dividends | 73,505 | 47,177 | 931,384 | 17,544 | 9,847 | ||||||||||||||||||
| Expense waivers | 708 | 10,186 | 1,161 | 5,468 | 11,864 | ||||||||||||||||||
| Investments sold | — | — | — | — | — | ||||||||||||||||||
| Shares sold | — | — | — | — | — | ||||||||||||||||||
| Total Assets | 196,842,524 | 35,767,963 | 423,022,760 | 130,473,936 | 23,167,325 | ||||||||||||||||||
| LIABILITIES: | |||||||||||||||||||||||
| Due to custodian | — | — | 355,886 | — | — | ||||||||||||||||||
| Payables: | |||||||||||||||||||||||
| Investments purchased | — | — | — | — | — | ||||||||||||||||||
| Accrued advisory fees | 78,879 | 14,225 | 168,225 | 52,273 | 9,276 | ||||||||||||||||||
| Accrued expenses | 189,434 | 80,945 | 179,270 | 131,176 | 77,307 | ||||||||||||||||||
| Total Liabilities | 268,313 | 95,170 | 703,381 | 183,449 | 86,583 | ||||||||||||||||||
| NET ASSETS | $ | 196,574,211 | $ | 35,672,793 | $ | 422,319,379 | $ | 130,290,487 | $ | 23,080,742 | |||||||||||||
| NET ASSETS CONSIST OF: | |||||||||||||||||||||||
| Shares of beneficial interest | $ | 399,898,812 | $ | 39,147,914 | $ | 474,388,033 | $ | 272,677,114 | $ | 28,671,777 | |||||||||||||
| Undistributed net investment income (loss) | 227,518 | 142,744 | 1,301,921 | (9,959 | ) | 24,690 | |||||||||||||||||
| Undistributed net realized gain (loss) | (243,347,116 | ) | (9,874,934 | ) | (105,959,147 | ) | (164,996,344 | ) | (9,239,974 | ) | |||||||||||||
| Net unrealized appreciation | 39,794,997 | 6,257,069 | 52,588,572 | 22,619,676 | 3,624,249 | ||||||||||||||||||
| Net Assets | $ | 196,574,211 | $ | 35,672,793 | $ | 422,319,379 | $ | 130,290,487 | $ | 23,080,742 | |||||||||||||
| Shares outstanding (unlimited amount authorized, $0.01 par value) | 11,150,000 | 1,350,000 | 20,750,000 | 5,400,000 | 850,000 | ||||||||||||||||||
| Net asset value | $ | 17.63 | $ | 26.42 | $ | 20.35 | $ | 24.13 | $ | 27.15 | |||||||||||||
| Share price | $ | 17.63 | $ | 26.42 | $ | 20.36 | $ | 24.13 | $ | 27.15 | |||||||||||||
| Investments, at cost | $ | 156,972,855 | $ | 29,453,281 | $ | 369,501,643 | $ | 107,830,884 | $ | 19,521,128 | |||||||||||||
| Foreign currencies, at cost | $ | — | $ | — | $ | — | $ | — | $ | — | |||||||||||||
See Notes to Financial Statements.
50
| PowerShares Dynamic Mid Cap Value Portfolio | PowerShares Dynamic Small Cap Growth Portfolio | PowerShares Dynamic Small Cap Portfolio | PowerShares Dynamic Small Cap Value Portfolio | PowerShares Zacks Micro Cap Portfolio | |||||||||||||||||||
| ASSETS: | |||||||||||||||||||||||
| Investments, at value | $ | 41,041,047 | $ | 109,556,716 | $ | 19,059,447 | $ | 72,661,576 | $ | 99,102,875 | |||||||||||||
| Cash | 258 | 15,662 | 232 | 287 | 349 | ||||||||||||||||||
| Foreign currencies, at value | — | — | — | — | 28,640 | ||||||||||||||||||
| Receivables: | |||||||||||||||||||||||
| Dividends | 20,129 | 2,197 | 1,480 | 6,428 | 27,319 | ||||||||||||||||||
| Expense waivers | 10,284 | 7,974 | 10,748 | 11,803 | 9,317 | ||||||||||||||||||
| Investments sold | — | — | — | — | 4,144 | ||||||||||||||||||
| Shares sold | — | 2,821,499 | — | — | — | ||||||||||||||||||
| Total Assets | 41,071,718 | 112,404,048 | 19,071,907 | 72,680,094 | 99,172,644 | ||||||||||||||||||
| LIABILITIES: | |||||||||||||||||||||||
| Due to custodian | — | — | — | — | — | ||||||||||||||||||
| Payables: | |||||||||||||||||||||||
| Investments purchased | — | 2,825,210 | 1,720 | 13,320 | 10,813 | ||||||||||||||||||
| Accrued advisory fees | 16,528 | 40,079 | 7,560 | 29,045 | 42,998 | ||||||||||||||||||
| Accrued expenses | 84,706 | 87,952 | 71,284 | 97,854 | 154,604 | ||||||||||||||||||
| Total Liabilities | 101,234 | 2,953,241 | 80,564 | 140,219 | 208,415 | ||||||||||||||||||
| NET ASSETS | $ | 40,970,484 | $ | 109,450,807 | $ | 18,991,343 | $ | 72,539,875 | $ | 98,964,229 | |||||||||||||
| NET ASSETS CONSIST OF: | |||||||||||||||||||||||
| Shares of beneficial interest | $ | 79,653,167 | $ | 142,955,322 | $ | 24,318,187 | $ | 106,277,154 | $ | 172,707,061 | |||||||||||||
| Undistributed net investment income (loss) | 47,137 | (4,922 | ) | (1,090 | ) | 91,142 | 109,282 | ||||||||||||||||
| Undistributed net realized gain (loss) | (43,868,700 | ) | (45,945,015 | ) | (8,436,588 | ) | (44,745,738 | ) | (82,169,415 | ) | |||||||||||||
| Net unrealized appreciation | 5,138,880 | 12,445,422 | 3,110,834 | 10,917,317 | 8,317,301 | ||||||||||||||||||
| Net Assets | $ | 40,970,484 | $ | 109,450,807 | $ | 18,991,343 | $ | 72,539,875 | $ | 98,964,229 | |||||||||||||
| Shares outstanding (unlimited amount authorized, $0.01 par value) | 2,400,000 | 5,750,000 | 750,000 | 4,250,000 | 7,900,000 | ||||||||||||||||||
| Net asset value | $ | 17.07 | $ | 19.03 | $ | 25.32 | $ | 17.07 | $ | 12.53 | |||||||||||||
| Share price | $ | 17.07 | $ | 19.05 | $ | 25.33 | $ | 17.08 | $ | 12.52 | |||||||||||||
| Investments, at cost | $ | 35,902,167 | $ | 97,111,294 | $ | 15,948,613 | $ | 61,744,259 | $ | 90,787,762 | |||||||||||||
| Foreign currencies, at cost | $ | — | $ | — | $ | — | $ | — | $ | 26,452 | |||||||||||||
51
Statements of Operations
Year Ended April 30, 2011
| PowerShares Dynamic Large Cap Growth Portfolio | PowerShares Dynamic Large Cap Portfolio | PowerShares Dynamic Large Cap Value Portfolio | PowerShares Dynamic Mid Cap Growth Portfolio | PowerShares Dynamic Mid Cap Portfolio | |||||||||||||||||||
| INVESTMENT INCOME: | |||||||||||||||||||||||
| Dividend income | $ | 2,736,557 | $ | 746,461 | $ | 9,936,863 | $ | 668,986 | $ | 331,414 | |||||||||||||
| Foreign withholding tax | — | — | — | — | — | ||||||||||||||||||
| Total Income | 2,736,557 | 746,461 | 9,936,863 | 668,986 | 331,414 | ||||||||||||||||||
| EXPENSES: | |||||||||||||||||||||||
| Advisory fees | 1,009,836 | 165,216 | 1,759,705 | 582,335 | 108,330 | ||||||||||||||||||
| Accounting & administration fees | 68,240 | 68,240 | 85,772 | 68,240 | 68,240 | ||||||||||||||||||
| Printing | 64,549 | 7,187 | 60,372 | 37,013 | 5,026 | ||||||||||||||||||
| Sub-licensing | 60,590 | 16,522 | 105,582 | 34,940 | 10,833 | ||||||||||||||||||
| Professional fees | 42,361 | 32,208 | 50,725 | 36,774 | 31,458 | ||||||||||||||||||
| Custodian & transfer agent fees | 24,513 | 19,418 | 41,827 | 20,535 | 19,034 | ||||||||||||||||||
| Trustees | 11,592 | 5,974 | 15,722 | 8,656 | 5,598 | ||||||||||||||||||
| Listing fee and expenses | 10,679 | 10,678 | 10,678 | 10,678 | 10,678 | ||||||||||||||||||
| Recapture (See Note 3) | 1,125 | — | 32,265 | — | — | ||||||||||||||||||
| Other expenses | 5,593 | 2,064 | 9,728 | 2,119 | 1,766 | ||||||||||||||||||
| Total Expenses | 1,299,078 | 327,507 | 2,172,376 | 801,290 | 260,963 | ||||||||||||||||||
| Less: Waivers | (26,796 | ) | (112,727 | ) | (33,241 | ) | (67,548 | ) | (120,297 | ) | |||||||||||||
| Net Expenses | 1,272,282 | 214,780 | 2,139,135 | 733,742 | 140,666 | ||||||||||||||||||
| Net Investment Income (Loss) | 1,464,275 | 531,681 | 7,797,728 | (64,756 | ) | 190,748 | |||||||||||||||||
| REALIZED AND UNREALIZED GAIN (LOSS): | |||||||||||||||||||||||
| Net realized gain (loss) from: | |||||||||||||||||||||||
| Investments | (14,939,718 | ) | (1,463,976 | ) | (14,047,526 | ) | (9,639,919 | ) | (1,120,006 | ) | |||||||||||||
| In-kind redemptions | 42,750,136 | 4,142,925 | 42,390,086 | 36,441,079 | 5,271,073 | ||||||||||||||||||
| Foreign currencies | — | — | — | — | — | ||||||||||||||||||
| Net realized gain | 27,810,418 | 2,678,949 | 28,342,560 | 26,801,160 | 4,151,067 | ||||||||||||||||||
| Net change in unrealized appreciation (depreciation) on: | |||||||||||||||||||||||
| Investments | 4,025,216 | 988,315 | 18,953,298 | 166,817 | (833,011 | ) | |||||||||||||||||
| Foreign currencies | — | — | — | — | — | ||||||||||||||||||
| Net change in unrealized appreciation (depreciation) | 4,025,216 | 988,315 | 18,953,298 | 166,817 | (833,011 | ) | |||||||||||||||||
| Net realized and unrealized gain | 31,835,634 | 3,667,264 | 47,295,858 | 26,967,977 | 3,318,056 | ||||||||||||||||||
| Net increase in net assets resulting from operations | $ | 33,299,909 | $ | 4,198,945 | $ | 55,093,586 | $ | 26,903,221 | $ | 3,508,804 | |||||||||||||
See Notes to Financial Statements.
52
| PowerShares Dynamic Mid Cap Value Portfolio | PowerShares Dynamic Small Cap Growth Portfolio | PowerShares Dynamic Small Cap Portfolio | PowerShares Dynamic Small Cap Value Portfolio | PowerShares Zacks Micro Cap Portfolio | |||||||||||||||||||
| INVESTMENT INCOME: | |||||||||||||||||||||||
| Dividend income | $ | 641,931 | $ | 99,326 | $ | 181,542 | $ | 1,137,660 | $ | 829,483 | |||||||||||||
| Foreign withholding tax | — | — | — | — | (722 | ) | |||||||||||||||||
| Total Income | 641,931 | 99,326 | 181,542 | 1,137,660 | 828,761 | ||||||||||||||||||
| EXPENSES: | |||||||||||||||||||||||
| Advisory fees | 198,084 | 189,169 | 84,735 | 321,279 | 380,218 | ||||||||||||||||||
| Accounting & administration fees | 68,240 | 68,241 | 68,240 | 68,240 | 68,240 | ||||||||||||||||||
| Printing | 12,447 | 11,091 | 4,119 | 23,230 | 21,757 | ||||||||||||||||||
| Sub-licensing | 11,885 | 11,350 | 8,474 | 19,277 | 76,043 | ||||||||||||||||||
| Professional fees | 32,584 | 31,907 | 31,151 | 34,021 | 34,645 | ||||||||||||||||||
| Custodian & transfer agent fees | 19,013 | 19,727 | 23,884 | 25,683 | 49,106 | ||||||||||||||||||
| Trustees | 6,182 | 5,919 | 5,440 | 6,932 | 7,040 | ||||||||||||||||||
| Listing fee and expenses | 10,678 | 10,678 | 10,678 | 10,678 | 10,678 | ||||||||||||||||||
| Recapture (See Note 3) | — | — | 311 | — | — | ||||||||||||||||||
| Other expenses | 1,000 | 3,043 | 1,627 | 1,577 | — | ||||||||||||||||||
| Total Expenses | 360,113 | 351,125 | 238,659 | 510,917 | 647,727 | ||||||||||||||||||
| Less: Waivers | (110,527 | ) | (112,773 | ) | (128,503 | ) | (106,105 | ) | (115,423 | ) | |||||||||||||
| Net Expenses | 249,586 | 238,352 | 110,156 | 404,812 | 532,304 | ||||||||||||||||||
| Net Investment Income (Loss) | 392,345 | (139,026 | ) | 71,386 | 732,848 | 296,457 | |||||||||||||||||
| REALIZED AND UNREALIZED GAIN (LOSS): | |||||||||||||||||||||||
| Net realized gain (loss) from: | |||||||||||||||||||||||
| Investments | (3,259,506 | ) | (3,703,712 | ) | (2,054,544 | ) | (5,233,090 | ) | (7,717,757 | ) | |||||||||||||
| In-kind redemptions | 7,224,110 | 10,018,475 | 4,743,667 | 13,805,141 | 18,884,056 | ||||||||||||||||||
| Foreign currencies | — | — | — | — | 9 | ||||||||||||||||||
| Net realized gain | 3,964,604 | 6,314,763 | 2,689,123 | 8,572,051 | 11,166,308 | ||||||||||||||||||
| Net change in unrealized appreciation (depreciation) on: | |||||||||||||||||||||||
| Investments | (52,138 | ) | 8,382,513 | 339,405 | 1,243,542 | 275,445 | |||||||||||||||||
| Foreign currencies | — | — | — | — | 2,188 | ||||||||||||||||||
| Net change in unrealized appreciation (depreciation) | (52,138 | ) | 8,382,513 | 339,405 | 1,243,542 | 277,633 | |||||||||||||||||
| Net realized and unrealized gain | 3,912,466 | 14,697,276 | 3,028,528 | 9,815,593 | 11,443,941 | ||||||||||||||||||
| Net increase in net assets resulting from operations | $ | 4,304,811 | $ | 14,558,250 | $ | 3,099,914 | $ | 10,548,441 | $ | 11,740,398 | |||||||||||||
53
Statements of Changes in Net Assets
| PowerShares Dynamic Large Cap Growth Portfolio | PowerShares Dynamic Large Cap Portfolio | PowerShares Dynamic Large Cap Value Portfolio | |||||||||||||||||||||||||
| Year Ended April 30, 2011 | Year Ended April 30, 2010 | Year Ended April 30, 2011 | Year Ended April 30, 2010 | Year Ended April 30, 2011 | Year Ended April 30, 2010 | ||||||||||||||||||||||
| OPERATIONS: | |||||||||||||||||||||||||||
| Net investment income (loss) | $ | 1,464,275 | $ | 1,205,655 | $ | 531,681 | $ | 507,305 | $ | 7,797,728 | $ | 7,752,303 | |||||||||||||||
| Net realized gain | 27,810,418 | 35,493,648 | 2,678,949 | 3,251,182 | 28,342,560 | 42,778,948 | |||||||||||||||||||||
| Net change in unrealized appreciation (depreciation) | 4,025,216 | 47,840,479 | 988,315 | 7,535,604 | 18,953,298 | 45,537,586 | |||||||||||||||||||||
| Net increase in net assets resulting from operations | 33,299,909 | 84,539,782 | 4,198,945 | 11,294,091 | 55,093,586 | 96,068,837 | |||||||||||||||||||||
| Undistributed net investment income (loss) included in the price of units issued and redeemed | (33,540 | ) | (99,913 | ) | (41,024 | ) | (11,223 | ) | 89,029 | 103,798 | |||||||||||||||||
| DISTRIBUTIONS TO SHAREHOLDERS FROM: | |||||||||||||||||||||||||||
| Net investment income | (1,450,284 | ) | (2,004,571 | ) | (523,166 | ) | (600,837 | ) | (8,397,017 | ) | (7,967,039 | ) | |||||||||||||||
| Return of capital | — | — | — | — | — | — | |||||||||||||||||||||
| Total distributions to shareholders | (1,450,284 | ) | (2,004,571 | ) | (523,166 | ) | (600,837 | ) | (8,397,017 | ) | (7,967,039 | ) | |||||||||||||||
| SHAREHOLDER TRANSACTIONS: | |||||||||||||||||||||||||||
| Proceeds from shares sold | 157,999,083 | 210,435,034 | 24,211,429 | 25,831,453 | 369,332,330 | 345,199,877 | |||||||||||||||||||||
| Value of shares repurchased | (223,608,806 | ) | (343,808,377 | ) | (30,590,737 | ) | (31,503,303 | ) | (342,974,918 | ) | (346,735,324 | ) | |||||||||||||||
| Net income equalization | 33,540 | 99,913 | 41,024 | 11,223 | (89,029 | ) | (103,798 | ) | |||||||||||||||||||
| Net increase (decrease) in net assets resulting from shares transactions | (65,576,183 | ) | (133,273,430 | ) | (6,338,284 | ) | (5,660,627 | ) | 26,268,383 | (1,639,245 | ) | ||||||||||||||||
| Increase (Decrease) in Net Assets | (33,760,098 | ) | (50,838,132 | ) | (2,703,529 | ) | 5,021,404 | 73,053,981 | 86,566,351 | ||||||||||||||||||
| NET ASSETS: | |||||||||||||||||||||||||||
| Beginning of year | 230,334,309 | 281,172,441 | 38,376,322 | 33,354,918 | 349,265,398 | 262,699,047 | |||||||||||||||||||||
| End of year | $ | 196,574,211 | $ | 230,334,309 | $ | 35,672,793 | $ | 38,376,322 | $ | 422,319,379 | $ | 349,265,398 | |||||||||||||||
| Undistributed net investment income (loss) at end of year | $ | 227,518 | $ | 213,527 | $ | 142,744 | $ | 134,136 | $ | 1,301,921 | $ | 1,901,210 | |||||||||||||||
| CHANGES IN SHARES OUTSTANDING: | |||||||||||||||||||||||||||
| Shares sold | 10,450,000 | 16,300,000 | 1,050,000 | 1,300,000 | 20,950,000 | 21,400,000 | |||||||||||||||||||||
| Shares repurchased | (14,750,000 | ) | (26,350,000 | ) | (1,350,000 | ) | (1,550,000 | ) | (19,550,000 | ) | (21,450,000 | ) | |||||||||||||||
| Shares outstanding, beginning of year | 15,450,000 | 25,500,000 | 1,650,000 | 1,900,000 | 19,350,000 | 19,400,000 | |||||||||||||||||||||
| Shares outstanding, end of year | 11,150,000 | 15,450,000 | 1,350,000 | 1,650,000 | 20,750,000 | 19,350,000 | |||||||||||||||||||||
See Notes to Financial Statements.
54
| PowerShares Dynamic Mid Cap Growth Portfolio | PowerShares Dynamic Mid Cap Portfolio | ||||||||||||||||||
| Year Ended April 30, 2011 | Year Ended April 30, 2010 | Year Ended April 30, 2011 | Year Ended April 30, 2010 | ||||||||||||||||
| OPERATIONS: | |||||||||||||||||||
| Net investment income (loss) | $ | (64,756 | ) | $ | 34,203 | $ | 190,748 | $ | 202,756 | ||||||||||
| Net realized gain | 26,801,160 | 20,766,972 | 4,151,067 | 4,928,901 | |||||||||||||||
| Net change in unrealized appreciation (depreciation) | 166,817 | 21,155,475 | (833,011 | ) | 2,726,518 | ||||||||||||||
| Net increase in net assets resulting from operations | 26,903,221 | 41,956,650 | 3,508,804 | 7,858,175 | |||||||||||||||
| Undistributed net investment income (loss) included in the price of units issued and redeemed | 23,125 | (25,821 | ) | (4,393 | ) | (1,870 | ) | ||||||||||||
| DISTRIBUTIONS TO SHAREHOLDERS FROM: | |||||||||||||||||||
| Net investment income | — | (33,475 | ) | (196,204 | ) | (182,736 | ) | ||||||||||||
| Return of capital | (344,520 | ) | (67,025 | ) | — | — | |||||||||||||
| Total distributions to shareholders | (344,520 | ) | (100,500 | ) | (196,204 | ) | (182,736 | ) | |||||||||||
| SHAREHOLDER TRANSACTIONS: | |||||||||||||||||||
| Proceeds from shares sold | 148,851,208 | 145,511,108 | 25,358,610 | 20,468,037 | |||||||||||||||
| Value of shares repurchased | (173,163,736 | ) | (199,360,714 | ) | (30,943,293 | ) | (20,719,244 | ) | |||||||||||
| Net income equalization | (23,125 | ) | 25,821 | 4,393 | 1,870 | ||||||||||||||
| Net increase (decrease) in net assets resulting from shares transactions | (24,335,653 | ) | (53,823,785 | ) | (5,580,290 | ) | (249,337 | ) | |||||||||||
| Increase (Decrease) in Net Assets | 2,246,173 | (11,993,456 | ) | (2,272,083 | ) | 7,424,232 | |||||||||||||
| NET ASSETS: | |||||||||||||||||||
| Beginning of year | 128,044,314 | 140,037,770 | 25,352,825 | 17,928,593 | |||||||||||||||
| End of year | $ | 130,290,487 | $ | 128,044,314 | $ | 23,080,742 | $ | 25,352,825 | |||||||||||
| Undistributed net investment income (loss) at end of year | $ | (354,479 | ) | $ | (7,909 | ) | $ | 24,690 | $ | 31,725 | |||||||||
| CHANGES IN SHARES OUTSTANDING: | |||||||||||||||||||
| Shares sold | 7,500,000 | 9,250,000 | 1,100,000 | 1,050,000 | |||||||||||||||
| Shares repurchased | (8,800,000 | ) | (12,650,000 | ) | (1,350,000 | ) | (1,050,000 | ) | |||||||||||
| Shares outstanding, beginning of year | 6,700,000 | 10,100,000 | 1,100,000 | 1,100,000 | |||||||||||||||
| Shares outstanding, end of year | 5,400,000 | 6,700,000 | 850,000 | 1,100,000 | |||||||||||||||
55
Statements of Changes in Net Assets (Continued)
| PowerShares Dynamic Mid Cap Value Portfolio | PowerShares Dynamic Small Cap Growth Portfolio | PowerShares Dynamic Small Cap Portfolio | |||||||||||||||||||||||||
| Year Ended April 30, 2011 | Year Ended April 30, 2010 | Year Ended April 30, 2011 | Year Ended April 30, 2010 | Year Ended April 30, 2011 | Year Ended April 30, 2010 | ||||||||||||||||||||||
| OPERATIONS: | |||||||||||||||||||||||||||
| Net investment income (loss) | $ | 392,345 | $ | 747,768 | $ | (139,026 | ) | $ | 131,754 | $ | 71,386 | $ | 101,940 | ||||||||||||||
| Net realized gain | 3,964,604 | 8,860,754 | 6,314,763 | 7,810,078 | 2,689,123 | 4,526,914 | |||||||||||||||||||||
| Net change in unrealized appreciation (depreciation) | (52,138 | ) | 4,919,548 | 8,382,513 | 1,643,478 | 339,405 | 1,470,837 | ||||||||||||||||||||
| Net increase in net assets resulting from operations | 4,304,811 | 14,528,070 | 14,558,250 | 9,585,310 | 3,099,914 | 6,099,691 | |||||||||||||||||||||
| Undistributed net investment income (loss) included in the price of units issued and redeemed | (3,425 | ) | (12,087 | ) | (257,986 | ) | 28,509 | (3,569 | ) | 1,575 | |||||||||||||||||
| DISTRIBUTIONS TO SHAREHOLDERS FROM: | |||||||||||||||||||||||||||
| Net investment income | (393,205 | ) | (858,787 | ) | — | (193,877 | ) | (69,608 | ) | (130,765 | ) | ||||||||||||||||
| Return of capital | — | — | — | (41,471 | ) | — | (12,826 | ) | |||||||||||||||||||
| Total distributions to shareholders | (393,205 | ) | (858,787 | ) | — | (235,348 | ) | (69,608 | ) | (143,591 | ) | ||||||||||||||||
| SHAREHOLDER TRANSACTIONS: | |||||||||||||||||||||||||||
| Proceeds from shares sold | 45,052,478 | 52,444,863 | 113,814,335 | 42,804,831 | 22,902,290 | 23,140,278 | |||||||||||||||||||||
| Value of shares repurchased | (51,812,090 | ) | (61,351,368 | ) | (51,394,280 | ) | (51,166,233 | ) | (25,901,328 | ) | (23,666,253 | ) | |||||||||||||||
| Net income equalization | 3,425 | 12,087 | 257,986 | (28,509 | ) | 3,569 | (1,575 | ) | |||||||||||||||||||
| Net increase (decrease) in net assets resulting from shares transactions | (6,756,187 | ) | (8,894,418 | ) | 62,678,041 | (8,389,911 | ) | (2,995,469 | ) | (527,550 | ) | ||||||||||||||||
| Increase (Decrease) in Net Assets | (2,848,006 | ) | 4,762,778 | 76,978,305 | 988,560 | 31,268 | 5,430,125 | ||||||||||||||||||||
| NET ASSETS: | |||||||||||||||||||||||||||
| Beginning of year | 43,818,490 | 39,055,712 | 32,472,502 | 31,483,942 | 18,960,075 | 13,529,950 | |||||||||||||||||||||
| End of year | $ | 40,970,484 | $ | 43,818,490 | $ | 109,450,807 | $ | 32,472,502 | $ | 18,991,343 | $ | 18,960,075 | |||||||||||||||
| Undistributed net investment income (loss) at end of year | $ | 47,137 | $ | 44,286 | $ | (4,922 | ) | $ | (3,517 | ) | $ | (1,090 | ) | $ | (2,868 | ) | |||||||||||
| CHANGES IN SHARES OUTSTANDING: | |||||||||||||||||||||||||||
| Shares sold | 3,000,000 | 4,000,000 | 6,950,000 | 3,600,000 | 1,100,000 | 1,350,000 | |||||||||||||||||||||
| Shares repurchased | (3,450,000 | ) | (4,650,000 | ) | (3,500,000 | ) | (4,300,000 | ) | (1,250,000 | ) | (1,350,000 | ) | |||||||||||||||
| Shares outstanding, beginning of year | 2,850,000 | 3,500,000 | 2,300,000 | 3,000,000 | 900,000 | 900,000 | |||||||||||||||||||||
| Shares outstanding, end of year | 2,400,000 | 2,850,000 | 5,750,000 | 2,300,000 | 750,000 | 900,000 | |||||||||||||||||||||
See Notes to Financial Statements.
56
| PowerShares Dynamic Small Cap Value Portfolio | PowerShares Zacks Micro Cap Portfolio | ||||||||||||||||||
| Year Ended April 30, 2011 | Year Ended April 30, 2010 | Year Ended April 30, 2011 | Year Ended April 30, 2010 | ||||||||||||||||
| OPERATIONS: | |||||||||||||||||||
| Net investment income (loss) | $ | 732,848 | $ | 496,404 | $ | 296,457 | $ | 185,317 | |||||||||||
| Net realized gain | 8,572,051 | 21,572,025 | 11,166,308 | 3,172,875 | |||||||||||||||
| Net change in unrealized appreciation (depreciation) | 1,243,542 | 1,754,558 | 277,633 | 14,647,681 | |||||||||||||||
| Net increase in net assets resulting from operations | 10,548,441 | 23,822,987 | 11,740,398 | 18,005,873 | |||||||||||||||
| Undistributed net investment income (loss) included in the price of units issued and redeemed | (5,642 | ) | 5,750 | (231,417 | ) | 39,210 | |||||||||||||
| DISTRIBUTIONS TO SHAREHOLDERS FROM: | |||||||||||||||||||
| Net investment income | (788,255 | ) | (464,268 | ) | (446,555 | ) | (402,300 | ) | |||||||||||
| Return of capital | — | — | — | — | |||||||||||||||
| Total distributions to shareholders | (788,255 | ) | (464,268 | ) | (446,555 | ) | (402,300 | ) | |||||||||||
| SHAREHOLDER TRANSACTIONS: | |||||||||||||||||||
| Proceeds from shares sold | 71,421,872 | 100,268,941 | 115,364,266 | 42,740,058 | |||||||||||||||
| Value of shares repurchased | (81,095,287 | ) | (113,427,132 | ) | (81,452,188 | ) | (53,545,721 | ) | |||||||||||
| Net income equalization | 5,642 | (5,750 | ) | 231,417 | (39,210 | ) | |||||||||||||
| Net increase (decrease) in net assets resulting from shares transactions | (9,667,773 | ) | (13,163,941 | ) | 34,143,495 | (10,844,873 | ) | ||||||||||||
| Increase (Decrease) in Net Assets | 86,771 | 10,200,528 | 45,205,921 | 6,797,910 | |||||||||||||||
| NET ASSETS: | |||||||||||||||||||
| Beginning of year | 72,453,104 | 62,252,576 | 53,758,308 | 46,960,398 | |||||||||||||||
| End of year | $ | 72,539,875 | $ | 72,453,104 | $ | 98,964,229 | $ | 53,758,308 | |||||||||||
| Undistributed net investment income (loss) at end of year | $ | 91,142 | $ | 68,424 | $ | 109,282 | $ | 114,810 | |||||||||||
| CHANGES IN SHARES OUTSTANDING: | |||||||||||||||||||
| Shares sold | 5,000,000 | 8,400,000 | 10,300,000 | 4,550,000 | |||||||||||||||
| Shares repurchased | (5,700,000 | ) | (9,450,000 | ) | (7,000,000 | ) | (5,750,000 | ) | |||||||||||
| Shares outstanding, beginning of year | 4,950,000 | 6,000,000 | 4,600,000 | 5,800,000 | |||||||||||||||
| Shares outstanding, end of year | 4,250,000 | 4,950,000 | 7,900,000 | 4,600,000 | |||||||||||||||
57
Financial Highlights
PowerShares Dynamic Large Cap Growth Portfolio
| Year Ended April 30, | |||||||||||||||||||||||
| 2011 | 2010 | 2009 | 2008 | 2007 | |||||||||||||||||||
| PER SHARE OPERATING PERFORMANCE: | |||||||||||||||||||||||
| Net asset value at beginning of year | $ | 14.91 | $ | 11.03 | $ | 17.33 | $ | 17.46 | $ | 16.35 | |||||||||||||
| Net investment income** | 0.11 | 0.06 | 0.08 | 0.07 | 0.02 | ||||||||||||||||||
| Net realized and unrealized gain (loss) on investments | 2.72 | 3.91 | (6.30 | ) | (0.16 | ) | 1.11 | ||||||||||||||||
| Total from investment operations | 2.83 | 3.97 | (6.22 | ) | (0.09 | ) | 1.13 | ||||||||||||||||
| Distributions to shareholders from: | |||||||||||||||||||||||
| Net investment income | (0.11 | ) | (0.09 | ) | (0.08 | ) | (0.04 | ) | (0.02 | ) | |||||||||||||
| Return of capital | — | — | — | — | 0.00 | (a) | |||||||||||||||||
| Total distributions | (0.11 | ) | (0.09 | ) | (0.08 | ) | (0.04 | ) | (0.02 | ) | |||||||||||||
| Net asset value at end of year | $ | 17.63 | $ | 14.91 | $ | 11.03 | $ | 17.33 | $ | 17.46 | |||||||||||||
| Share price at end of year*** | $ | 17.63 | $ | 14.91 | $ | 11.03 | |||||||||||||||||
| NET ASSET VALUE, TOTAL RETURN**** | 19.08 | % | 36.15 | % | (35.93 | )% | (0.56 | )% | 6.92 | % | |||||||||||||
| SHARE PRICE TOTAL RETURN**** | 19.08 | % | 36.15 | % | (35.93 | )% | |||||||||||||||||
| RATIOS/SUPPLEMENTAL DATA: | |||||||||||||||||||||||
| Net assets at end of year (000's omitted) | $ | 196,574 | $ | 230,334 | $ | 281,172 | $ | 665,609 | $ | 277,598 | |||||||||||||
| Ratio to average net assets of: | |||||||||||||||||||||||
| Expenses, after (Waivers) and/or Recapture | 0.63 | % | 0.61 | % | 0.61 | % | 0.63 | % | 0.63 | % | |||||||||||||
| Expenses, prior to (Waivers) and/or Recapture | 0.64 | % | 0.61 | % | 0.60 | % | 0.60 | % | 0.68 | % | |||||||||||||
| Net investment income, after (Waivers) and/or Recapture | 0.73 | % | 0.45 | % | 0.60 | % | 0.37 | % | 0.13 | % | |||||||||||||
| Portfolio turnover rate † | 45 | % | 67 | % | 88 | % | 46 | % | 57 | % | |||||||||||||
| Undistributed net investment income (loss) included in price of units issued and redeemed**# | $ | (0.00 | )(a) | $ | (0.00 | )(a) | $ | (0.02 | ) | $ | 0.02 | $ | 0.00 | (a) | |||||||||
PowerShares Dynamic Large Cap Portfolio
| Year Ended April 30, | For the Period December 1, 2006* Through | ||||||||||||||||||||||
| 2011 | 2010 | 2009 | 2008 | April 30, 2007 | |||||||||||||||||||
| PER SHARE OPERATING PERFORMANCE: | |||||||||||||||||||||||
| Net asset value at beginning of period | $ | 23.26 | $ | 17.56 | $ | 25.92 | $ | 27.00 | $ | 25.18 | |||||||||||||
| Net investment income** | 0.37 | 0.27 | 0.34 | 0.27 | 0.12 | ||||||||||||||||||
| Net realized and unrealized gain (loss) on investments | 3.16 | 5.74 | (8.44 | ) | (1.14 | ) | 1.78 | ||||||||||||||||
| Total from investment operations | 3.53 | 6.01 | (8.10 | ) | (0.87 | ) | 1.90 | ||||||||||||||||
| Distributions to shareholders from: | |||||||||||||||||||||||
| Net investment income | (0.37 | ) | (0.31 | ) | (0.26 | ) | (0.21 | ) | (0.08 | ) | |||||||||||||
| Net asset value at end of period | $ | 26.42 | $ | 23.26 | $ | 17.56 | $ | 25.92 | $ | 27.00 | |||||||||||||
| Share price at end of period*** | $ | 26.42 | $ | 23.26 | $ | 17.55 | |||||||||||||||||
| NET ASSET VALUE, TOTAL RETURN**** | 15.40 | % | 34.56 | % | (31.47 | )% | (3.26 | )% | 7.55 | % | |||||||||||||
| SHARE PRICE TOTAL RETURN**** | 15.40 | % | 34.64 | % | (31.48 | )% | |||||||||||||||||
| RATIOS/SUPPLEMENTAL DATA: | |||||||||||||||||||||||
| Net assets at end of period (000's omitted) | $ | 35,673 | $ | 38,376 | $ | 33,355 | $ | 25,922 | $ | 10,798 | |||||||||||||
| Ratio to average net assets of: | |||||||||||||||||||||||
| Expenses, after (Waivers) and/or Recapture | 0.65 | % | 0.65 | % | 0.65 | % | 0.73 | % | 0.74 | %†† | |||||||||||||
| Expenses, prior to (Waivers) and/or Recapture | 0.99 | % | 0.88 | % | 0.93 | % | 1.38 | % | 1.45 | %†† | |||||||||||||
| Net investment income, after (Waivers) and/or Recapture | 1.61 | % | 1.32 | % | 1.71 | % | 1.03 | % | 1.05 | %†† | |||||||||||||
| Portfolio turnover rate † | 41 | % | 62 | % | 57 | % | 49 | % | 3 | % | |||||||||||||
| Undistributed net investment income (loss) included in price of units issued and redeemed**# | $ | (0.03 | ) | $ | (0.01 | ) | $ | 0.04 | $ | 0.06 | $ | (0.01 | ) | ||||||||||
* Commencement of Investment Operations.
** Based on average shares outstanding.
*** The mean between the last bid and ask prices.
**** Net asset value total return is calculated assuming an initial investment made at the net asset value at the beginning of the period, reinvestment of all dividends and distributions at net asset value during the period, and redemption on the last day of the period. Share price total return is calculated assuming an initial investment made at the share price at the beginning of the period, reinvestment of all dividends and distributions at share price during the period, and sale at the share price on the last day of the period. Total investment returns calculated for a period of less than one year are not annualized.
† Portfolio turnover rate is not annualized and does not include securities received or delivered from processing creations or redemptions.
†† Annualized.
# The per share amount of equalization is presented to show the impact of equalization on distributable earnings per share.
(a) Amount represents less than $0.005.
See Notes to Financial Statements.
58
Financial Highlights (Continued)
PowerShares Dynamic Large Cap Value Portfolio
| Year Ended April 30, | |||||||||||||||||||||||
| 2011 | 2010 | 2009 | 2008 | 2007 | |||||||||||||||||||
| PER SHARE OPERATING PERFORMANCE: | |||||||||||||||||||||||
| Net asset value at beginning of year | $ | 18.05 | $ | 13.54 | $ | 19.27 | $ | 20.72 | $ | 17.41 | |||||||||||||
| Net investment income* | 0.40 | 0.39 | 0.41 | 0.43 | 0.39 | ||||||||||||||||||
| Net realized and unrealized gain (loss) on investments | 2.33 | 4.52 | (5.81 | ) | (1.40 | ) | 3.21 | ||||||||||||||||
| Total from investment operations | 2.73 | 4.91 | (5.40 | ) | (0.97 | ) | 3.60 | ||||||||||||||||
| Distributions to shareholders from: | |||||||||||||||||||||||
| Net investment income | (0.43 | ) | (0.40 | ) | (0.33 | ) | (0.48 | ) | (0.29 | ) | |||||||||||||
| Net asset value at end of year | $ | 20.35 | $ | 18.05 | $ | 13.54 | $ | 19.27 | $ | 20.72 | |||||||||||||
| Share price at end of year** | $ | 20.36 | $ | 18.05 | $ | 13.55 | |||||||||||||||||
| NET ASSET VALUE, TOTAL RETURN*** | 15.50 | % | 36.69 | % | (28.30 | )% | (4.78 | )% | 20.85 | % | |||||||||||||
| SHARE PRICE TOTAL RETURN*** | 15.49 | % | 36.67 | % | (28.21 | )% | |||||||||||||||||
| RATIOS/SUPPLEMENTAL DATA: | |||||||||||||||||||||||
| Net assets at end of year (000's omitted) | $ | 422,319 | $ | 349,265 | $ | 262,699 | $ | 252,489 | $ | 292,130 | |||||||||||||
| Ratio to average net assets of: | |||||||||||||||||||||||
| Expenses, after (Waivers) and/or Recapture | 0.61 | % | 0.63 | % | 0.63 | % | 0.63 | % | 0.63 | % | |||||||||||||
| Expenses, prior to (Waivers) and/or Recapture | 0.61 | % | 0.60 | % | 0.61 | % | 0.59 | % | 0.67 | % | |||||||||||||
| Net investment income, after (Waivers) and/or Recapture | 2.22 | % | 2.46 | % | 2.71 | % | 2.14 | % | 2.00 | % | |||||||||||||
| Portfolio turnover rate † | 40 | % | 47 | % | 77 | % | 22 | % | 16 | % | |||||||||||||
| Undistributed net investment income included in price of units issued and redeemed*# | $ | 0.00 | (a) | $ | 0.01 | $ | 0.02 | $ | 0.00 | (a) | $ | 0.03 | |||||||||||
PowerShares Dynamic Mid Cap Growth Portfolio
| Year Ended April 30, | |||||||||||||||||||||||
| 2011 | 2010 | 2009 | 2008 | 2007 | |||||||||||||||||||
| PER SHARE OPERATING PERFORMANCE: | |||||||||||||||||||||||
| Net asset value at beginning of year | $ | 19.11 | $ | 13.87 | $ | 22.29 | $ | 21.09 | $ | 18.79 | |||||||||||||
| Net investment income (loss)* | (0.01 | ) | 0.00 | (a) | (0.01 | ) | 0.00 | (a) | (0.03 | ) | |||||||||||||
| Net realized and unrealized gain (loss) on investments | 5.09 | 5.25 | (8.41 | ) | 1.20 | 2.44 | |||||||||||||||||
| Total from investment operations | 5.08 | 5.25 | (8.42 | ) | 1.20 | 2.41 | |||||||||||||||||
| Distributions to shareholders from: | |||||||||||||||||||||||
| Net investment income | — | (0.00 | )(a) | — | — | (0.11 | ) | ||||||||||||||||
| Return of capital | (0.06 | ) | (0.01 | ) | — | 0.00 | (a) | 0.00 | (a) | ||||||||||||||
| Total distributions | (0.06 | ) | (0.01 | ) | — | — | (0.11 | ) | |||||||||||||||
| Net asset value at end of year | $ | 24.13 | $ | 19.11 | $ | 13.87 | $ | 22.29 | $ | 21.09 | |||||||||||||
| Share price at end of year** | $ | 24.13 | $ | 19.10 | $ | 13.85 | |||||||||||||||||
| NET ASSET VALUE, TOTAL RETURN*** | 26.61 | % | 37.89 | % | (37.78 | )% | 5.70 | % | 12.91 | % | |||||||||||||
| SHARE PRICE TOTAL RETURN*** | 26.67 | % | 38.02 | % | (37.86 | )% | |||||||||||||||||
| RATIOS/SUPPLEMENTAL DATA: | |||||||||||||||||||||||
| Net assets at end of year (000's omitted) | $ | 130,290 | $ | 128,044 | $ | 140,038 | $ | 390,146 | $ | 189,794 | |||||||||||||
| Ratio to average net assets of: | |||||||||||||||||||||||
| Expenses, after (Waivers) and/or Recapture | 0.63 | % | 0.63 | % | 0.63 | % | 0.63 | % | 0.63 | % | |||||||||||||
| Expenses, prior to (Waivers) and/or Recapture | 0.69 | % | 0.66 | % | 0.61 | % | 0.60 | % | 0.73 | % | |||||||||||||
| Net investment income (loss), after (Waivers) and/or Recapture | (0.06 | )% | 0.03 | % | (0.07 | )% | (0.01 | )% | (0.15 | )% | |||||||||||||
| Portfolio turnover rate † | 49 | % | 75 | % | 81 | % | 80 | % | 69 | % | |||||||||||||
| Undistributed net investment income (loss) included in price of units issued and redeemed*# | $ | 0.00 | (a) | $ | (0.00 | )(a) | $ | 0.01 | $ | (0.01 | ) | $ | 0.02 | ||||||||||
* Based on average shares outstanding.
** The mean between the last bid and ask prices.
*** Net asset value total return is calculated assuming an initial investment made at the net asset value at the beginning of the period, reinvestment of all dividends and distributions at net asset value during the period, and redemption on the last day of the period. Share price total return is calculated assuming an initial investment made at the share price at the beginning of the period, reinvestment of all dividends and distributions at share price during the period, and sale at the share price on the last day of the period. Total investment returns calculated for a period of less than one year are not annualized.
† Portfolio turnover rate is not annualized and does not include securities received or delivered from processing creations or redemptions.
# The per share amount of equalization is presented to show the impact of equalization on distributable earnings per share.
(a) Amount represents less than $0.005.
See Notes to Financial Statements.
59
Financial Highlights (Continued)
PowerShares Dynamic Mid Cap Portfolio
| Year Ended April 30, | For the Period December 1, 2006* Through | ||||||||||||||||||||||
| 2011 | 2010 | 2009 | 2008 | April 30, 2007 | |||||||||||||||||||
| PER SHARE OPERATING PERFORMANCE: | |||||||||||||||||||||||
| Net asset value at beginning of period | $ | 23.05 | $ | 16.30 | $ | 25.47 | $ | 27.98 | $ | 25.26 | |||||||||||||
| Net investment income** | 0.21 | 0.18 | 0.13 | 0.11 | 0.10 | ||||||||||||||||||
| Net realized and unrealized gain (loss) on investments | 4.10 | 6.73 | (9.17 | ) | (2.49 | ) | 2.68 | ||||||||||||||||
| Total from investment operations | 4.31 | 6.91 | (9.04 | ) | (2.38 | ) | 2.78 | ||||||||||||||||
| Distributions to shareholders from: | |||||||||||||||||||||||
| Net investment income | (0.21 | ) | (0.16 | ) | (0.13 | ) | (0.13 | ) | (0.06 | ) | |||||||||||||
| Net asset value at end of period | $ | 27.15 | $ | 23.05 | $ | 16.30 | $ | 25.47 | $ | 27.98 | |||||||||||||
| Share price at end of period*** | $ | 27.15 | $ | 23.04 | $ | 16.29 | |||||||||||||||||
| NET ASSET VALUE, TOTAL RETURN**** | 18.84 | % | 42.59 | % | (35.57 | )% | (8.54 | )% | 11.04 | % | |||||||||||||
| SHARE PRICE TOTAL RETURN**** | 18.89 | % | 42.62 | % | (35.63 | )% | |||||||||||||||||
| RATIOS/SUPPLEMENTAL DATA: | |||||||||||||||||||||||
| Net assets at end of period (000's omitted) | $ | 23,081 | $ | 25,353 | $ | 17,929 | $ | 25,469 | $ | 11,190 | |||||||||||||
| Ratio to average net assets of: | |||||||||||||||||||||||
| Expenses, after (Waivers) and/or Recapture | 0.65 | % | 0.65 | % | 0.65 | % | 0.73 | % | 0.74 | %† | |||||||||||||
| Expenses, prior to (Waivers) and/or Recapture | 1.20 | % | 1.11 | % | 1.17 | % | 1.34 | % | 1.55 | %† | |||||||||||||
| Net investment income, after (Waivers) and/or Recapture | 0.88 | % | 0.92 | % | 0.67 | % | 0.42 | % | 0.91 | %† | |||||||||||||
| Portfolio turnover rate †† | 47 | % | 76 | % | 79 | % | 99 | % | 7 | % | |||||||||||||
| Undistributed net investment income (loss) included in price of units issued and redeemed**# | $ | (0.00 | )(a) | $ | (0.00 | )(a) | $ | 0.01 | $ | (0.01 | ) | $ | 0.00 | (a) | |||||||||
PowerShares Dynamic Mid Cap Value Portfolio
| Year Ended April 30, | |||||||||||||||||||||||
| 2011 | 2010 | 2009 | 2008 | 2007 | |||||||||||||||||||
| PER SHARE OPERATING PERFORMANCE: | |||||||||||||||||||||||
| Net asset value at beginning of year | $ | 15.37 | $ | 11.16 | $ | 16.89 | $ | 20.25 | $ | 17.22 | |||||||||||||
| Net investment income** | 0.15 | 0.23 | 0.26 | 0.22 | 0.29 | ||||||||||||||||||
| Net realized and unrealized gain (loss) on investments | 1.70 | 4.24 | (5.75 | ) | (3.32 | ) | 2.97 | ||||||||||||||||
| Total from investment operations | 1.85 | 4.47 | (5.49 | ) | (3.10 | ) | 3.26 | ||||||||||||||||
| Distributions to shareholders from: | |||||||||||||||||||||||
| Net investment income | (0.15 | ) | (0.26 | ) | (0.24 | ) | (0.26 | ) | (0.23 | ) | |||||||||||||
| Net asset value at end of year | $ | 17.07 | $ | 15.37 | $ | 11.16 | $ | 16.89 | $ | 20.25 | |||||||||||||
| Share price at end of year*** | $ | 17.07 | $ | 15.36 | $ | 11.13 | |||||||||||||||||
| NET ASSET VALUE, TOTAL RETURN**** | 12.16 | % | 40.58 | % | (32.71 | )% | (15.47 | )% | 19.14 | % | |||||||||||||
| SHARE PRICE TOTAL RETURN**** | 12.24 | % | 40.88 | % | (32.89 | )% | |||||||||||||||||
| RATIOS/SUPPLEMENTAL DATA: | |||||||||||||||||||||||
| Net assets at end of year (000's omitted) | $ | 40,970 | $ | 43,818 | $ | 39,056 | $ | 79,380 | $ | 109,356 | |||||||||||||
| Ratio to average net assets of: | |||||||||||||||||||||||
| Expenses, after (Waivers) and/or Recapture | 0.63 | % | 0.63 | % | 0.63 | % | 0.63 | % | 0.63 | % | |||||||||||||
| Expenses, prior to (Waivers) and/or Recapture | 0.91 | % | 0.84 | % | 0.78 | % | 0.68 | % | 0.82 | % | |||||||||||||
| Net investment income, after (Waivers) and/or Recapture | 0.99 | % | 1.76 | % | 1.95 | % | 1.14 | % | 1.64 | % | |||||||||||||
| Portfolio turnover rate †† | 65 | % | 86 | % | 94 | % | 53 | % | 43 | % | |||||||||||||
| Undistributed net investment income (loss) included in price of units issued and redeemed**# | $ | (0.00 | )(a) | $ | (0.00 | )(a) | $ | (0.01 | ) | $ | 0.00 | (a) | $ | 0.01 | |||||||||
* Commencement of Investment Operations.
** Based on average shares outstanding.
*** The mean between the last bid and ask prices.
**** Net asset value total return is calculated assuming an initial investment made at the net asset value at the beginning of the period, reinvestment of all dividends and distributions at net asset value during the period, and redemption on the last day of the period. Share price total return is calculated assuming an initial investment made at the share price at the beginning of the period, reinvestment of all dividends and distributions at share price during the period, and sale at the share price on the last day of the period. Total investment returns calculated for a period of less than one year are not annualized.
† Annualized.
†† Portfolio turnover rate is not annualized and does not include securities received or delivered from processing creations or redemptions.
# The per share amount of equalization is presented to show the impact of equalization on distributable earnings per share.
(a) Amount represents less than $0.005.
See Notes to Financial Statements.
60
Financial Highlights (Continued)
PowerShares Dynamic Small Cap Growth Portfolio
| Year Ended April 30, | |||||||||||||||||||||||
| 2011 | 2010 | 2009 | 2008 | 2007 | |||||||||||||||||||
| PER SHARE OPERATING PERFORMANCE: | |||||||||||||||||||||||
| Net asset value at beginning of year | $ | 14.12 | $ | 10.49 | $ | 15.71 | $ | 18.59 | $ | 18.51 | |||||||||||||
| Net investment income (loss)** | (0.05 | ) | 0.05 | 0.01 | (0.05 | ) | (0.05 | ) | |||||||||||||||
| Net realized and unrealized gain (loss) on investments | 4.96 | 3.67 | (5.23 | ) | (2.83 | ) | 0.13 | ||||||||||||||||
| Total from investment operations | 4.91 | 3.72 | (5.22 | ) | (2.88 | ) | 0.08 | ||||||||||||||||
| Distributions to shareholders from: | |||||||||||||||||||||||
| Net investment income | — | (0.07 | ) | — | — | — | |||||||||||||||||
| Return of Capital | — | (0.02 | ) | — | — | — | |||||||||||||||||
| Total distributions | — | (0.09 | ) | — | — | — | |||||||||||||||||
| Net asset value at end of year | $ | 19.03 | $ | 14.12 | $ | 10.49 | $ | 15.71 | $ | 18.59 | |||||||||||||
| Share price at end of year*** | $ | 19.05 | $ | 14.10 | $ | 10.48 | |||||||||||||||||
| NET ASSET VALUE, TOTAL RETURN**** | 34.77 | % | 35.60 | % | (33.23 | )% | (15.49 | )% | 0.43 | % | |||||||||||||
| SHARE PRICE TOTAL RETURN**** | 35.11 | % | 35.54 | % | (33.25 | )% | |||||||||||||||||
| RATIOS/SUPPLEMENTAL DATA: | |||||||||||||||||||||||
| Net assets at end of year (000's omitted) | $ | 109,451 | $ | 32,473 | $ | 31,484 | $ | 51,846 | $ | 61,347 | |||||||||||||
| Ratio to average net assets of: | |||||||||||||||||||||||
| Expenses, after (Waivers) and/or Recapture | 0.63 | % | 0.63 | % | 0.63 | % | 0.63 | % | 0.63 | % | |||||||||||||
| Expenses, prior to (Waivers) and/or Recapture | 0.93 | % | 0.94 | % | 0.86 | % | 0.77 | % | 0.84 | % | |||||||||||||
| Net investment income (loss), after (Waivers) and/or Recapture | (0.37 | )% | 0.41 | % | 0.11 | % | (0.27 | )% | (0.32 | )% | |||||||||||||
| Portfolio turnover rate † | 57 | % | 113 | % | 109 | % | 78 | % | 114 | % | |||||||||||||
| Undistributed net investment income (loss) included in price of units issued and redeemed**# | $ | (0.10 | ) | $ | 0.01 | $ | 0.00 | (a) | $ | (0.00 | )(a) | $ | (0.02 | ) | |||||||||
PowerShares Dynamic Small Cap Portfolio
| Year Ended April 30, | For the Period December 1, 2006* Through | ||||||||||||||||||||||
| 2011 | 2010 | 2009 | 2008 | April 30, 2007 | |||||||||||||||||||
| PER SHARE OPERATING PERFORMANCE: | |||||||||||||||||||||||
| Net asset value at beginning of period | $ | 21.07 | $ | 15.03 | $ | 23.31 | $ | 26.68 | $ | 25.17 | |||||||||||||
| Net investment income** | 0.09 | 0.11 | 0.08 | 0.06 | 0.00 | (a) | |||||||||||||||||
| Net realized and unrealized gain (loss) on investments | 4.25 | 6.08 | (8.31 | ) | (3.13 | ) | 1.51 | ||||||||||||||||
| Total from investment operations | 4.34 | 6.19 | (8.23 | ) | (3.07 | ) | 1.51 | ||||||||||||||||
| Distributions to shareholders from: | |||||||||||||||||||||||
| Net investment income | (0.09 | ) | (0.14 | ) | (0.05 | ) | (0.08 | ) | 0.00 | (a) | |||||||||||||
| Return of capital | — | (0.01 | ) | — | (0.22 | ) | — | ||||||||||||||||
| Total distributions | (0.09 | ) | (0.15 | ) | (0.05 | ) | (0.30 | ) | — | ||||||||||||||
| Net asset value at end of period | $ | 25.32 | $ | 21.07 | $ | 15.03 | $ | 23.31 | $ | 26.68 | |||||||||||||
| Share price at end of period*** | $ | 25.33 | $ | 21.05 | $ | 15.00 | |||||||||||||||||
| NET ASSET VALUE, TOTAL RETURN**** | 20.64 | % | 41.37 | % | (35.34 | )% | (11.61 | )% | 6.01 | % | |||||||||||||
| SHARE PRICE TOTAL RETURN**** | 20.80 | % | 41.52 | % | (35.41 | )% | |||||||||||||||||
| RATIOS/SUPPLEMENTAL DATA: | |||||||||||||||||||||||
| Net assets at end of period (000's omitted) | $ | 18,991 | $ | 18,960 | $ | 13,530 | $ | 16,314 | $ | 8,005 | |||||||||||||
| Ratio to average net assets of: | |||||||||||||||||||||||
| Expenses, after (Waivers) and/or Recapture | 0.65 | % | 0.65 | % | 0.65 | % | 0.79 | % | 0.74 | %†† | |||||||||||||
| Expenses, prior to (Waivers) and/or Recapture | 1.41 | % | 1.26 | % | 1.35 | % | 1.96 | % | 1.55 | %†† | |||||||||||||
| Net investment income, after (Waivers) and/or Recapture | 0.42 | % | 0.59 | % | 0.47 | % | 0.26 | % | 0.04 | %†† | |||||||||||||
| Portfolio turnover rate † | 68 | % | 93 | % | 81 | % | 103 | % | 52 | % | |||||||||||||
| Undistributed net investment income (loss) included in price of units issued and redeemed**# | $ | (0.00 | )(a) | $ | 0.00 | (a) | $ | 0.01 | $ | 0.05 | $ | 0.00 | (a) | ||||||||||
* Commencement of Investment Operations.
** Based on average shares outstanding.
*** The mean between the last bid and ask prices.
**** Net assets value total return is calculated assuming an initial investment made at the net asset value at the beginning of the period, reinvestment of all dividends and distributions at net asset value during the period, and redemption on the last day of the period. Share price total return is calculated assuming an initial investment made at the share price at the beginning at the period, reinvestment of all dividends and distributions at share price during the period, and sale at the share price on the last day of the period. Total investment returns calculated for a period of less than one year are not annualized.
† Portfolio turnover rate is not annualized and does not include securities received or delivered from processing creations or redemptions.
†† Annualized.
# The per share amount of equalization is presented to show the impact of equalization on distributable earnings per share.
(a) Amount represents less than $0.005.
See Notes to Financial Statements.
61
Financial Highlights (Continued)
PowerShares Dynamic Small Cap Value Portfolio
| Year Ended April 30, | |||||||||||||||||||||||
| 2011 | 2010 | 2009 | 2008 | 2007 | |||||||||||||||||||
| PER SHARE OPERATING PERFORMANCE: | |||||||||||||||||||||||
| Net asset value at beginning of year | $ | 14.64 | $ | 10.38 | $ | 15.80 | $ | 18.68 | $ | 17.01 | |||||||||||||
| Net investment income* | 0.16 | 0.09 | 0.12 | 0.16 | 0.13 | ||||||||||||||||||
| Net realized and unrealized gain (loss) on investments | 2.45 | 4.25 | (5.43 | ) | (2.47 | ) | 1.67 | ||||||||||||||||
| Total from investment operations | 2.61 | 4.34 | (5.31 | ) | (2.31 | ) | 1.80 | ||||||||||||||||
| Distributions to shareholders from: | |||||||||||||||||||||||
| Net investment income | (0.18 | ) | (0.08 | ) | (0.11 | ) | (0.16 | ) | (0.13 | ) | |||||||||||||
| Return of capital | — | — | — | (0.41 | ) | — | |||||||||||||||||
| Total distributions | (0.18 | ) | (0.08 | ) | (0.11 | ) | (0.57 | ) | (0.13 | ) | |||||||||||||
| Net asset value at end of year | $ | 17.07 | $ | 14.64 | $ | 10.38 | $ | 15.80 | $ | 18.68 | |||||||||||||
| Share price at end of year** | $ | 17.08 | $ | 14.62 | $ | 10.36 | |||||||||||||||||
| NET ASSET VALUE, TOTAL RETURN*** | 18.03 | % | 42.03 | % | (33.69 | )% | (12.51 | )% | 10.64 | % | |||||||||||||
| SHARE PRICE TOTAL RETURN*** | 18.26 | % | 42.11 | % | (33.78 | )% | |||||||||||||||||
| RATIOS/SUPPLEMENTAL DATA: | |||||||||||||||||||||||
| Net assets at end of year (000's omitted) | $ | 72,540 | $ | 72,453 | $ | 62,253 | $ | 91,667 | $ | 117,680 | |||||||||||||
| Ratio to average net assets of: | |||||||||||||||||||||||
| Expenses, after (Waivers) and/or Recapture | 0.63 | % | 0.63 | % | 0.63 | % | 0.63 | % | 0.63 | % | |||||||||||||
| Expenses, prior to (Waivers) and/or Recapture | 0.80 | % | 0.74 | % | 0.73 | % | 0.67 | % | 0.80 | % | |||||||||||||
| Net investment income, after (Waivers) and/or Recapture | 1.14 | % | 0.73 | % | 1.00 | % | 0.91 | % | 0.73 | % | |||||||||||||
| Portfolio turnover rate † | 90 | % | 116 | % | 98 | % | 86 | % | 76 | % | |||||||||||||
| Undistributed net investment income (loss) included in price of units issued and redeemed*# | $ | (0.00 | )(a) | $ | 0.00 | (a) | $ | 0.00 | (a) | $ | (0.03 | ) | $ | 0.01 | |||||||||
PowerShares Zacks Micro Cap Portfolio
| Year Ended April 30, | |||||||||||||||||||||||
| 2011 | 2010 | 2009 | 2008 | 2007 | |||||||||||||||||||
| PER SHARE OPERATING PERFORMANCE: | |||||||||||||||||||||||
| Net asset value at beginning of year | $ | 11.69 | $ | 8.10 | $ | 13.63 | $ | 18.32 | $ | 17.47 | |||||||||||||
| Net investment income* | 0.04 | 0.04 | 0.12 | 0.16 | 0.06 | ||||||||||||||||||
| Net realized and unrealized gain (loss) on investments | 0.88 | 3.62 | (5.48 | ) | (4.73 | ) | 0.81 | ||||||||||||||||
| Total from investment operations | 0.92 | 3.66 | (5.36 | ) | (4.57 | ) | 0.87 | ||||||||||||||||
| Distributions to shareholders from: | |||||||||||||||||||||||
| Net investment income | (0.08 | ) | (0.07 | ) | (0.17 | ) | (0.12 | ) | (0.02 | ) | |||||||||||||
| Net asset value at end of year | $ | 12.53 | $ | 11.69 | $ | 8.10 | $ | 13.63 | $ | 18.32 | |||||||||||||
| Share price at end of year** | $ | 12.52 | $ | 11.68 | $ | 8.10 | |||||||||||||||||
| NET ASSET VALUE, TOTAL RETURN*** | 7.97 | % | 45.49 | % | (39.70 | )% | (25.07 | )% | 4.99 | % | |||||||||||||
| SHARE PRICE TOTAL RETURN*** | 7.97 | % | 45.37 | % | (39.66 | )% | |||||||||||||||||
| RATIOS/SUPPLEMENTAL DATA: | |||||||||||||||||||||||
| Net assets at end of year (000's omitted) | $ | 98,964 | $ | 53,758 | $ | 46,960 | $ | 94,068 | $ | 192,310 | |||||||||||||
| Ratio to average net assets of: | |||||||||||||||||||||||
| Expenses, after (Waivers) and/or Recapture r | 0.70 | % | 0.70 | % | 0.70 | % | 0.70 | % | 0.71 | % | |||||||||||||
| Expenses, prior to (Waivers) and/or Recapture r | 0.85 | % | 0.93 | % | 0.86 | % | 0.71 | % | 0.78 | % | |||||||||||||
| Net investment income, after (Waivers) and/or Recapture | 0.39 | % | 0.38 | % | 1.11 | % | 0.99 | % | 0.36 | % | |||||||||||||
| Portfolio turnover rate † | 61 | % | 78 | % | 51 | % | 54 | % | 72 | % | |||||||||||||
| Undistributed net investment income (loss) included in price of units issued and redeemed*# | $ | (0.03 | ) | $ | 0.01 | $ | 0.00 | (a) | $ | (0.03 | ) | $ | 0.01 | ||||||||||
* Based on average shares outstanding.
** The mean between the last bid and ask prices.
*** Net asset value total return is calculated assuming an initial investment made at the net asset value at the beginning of the period, reinvestment of all dividends and distributions at net asset value during the period, and redemption on the last day of the period. Share price total return is calculated assuming an initial investment made at the share price at the beginning of the period, reinvestment of all dividends and distributions at share price during the period, and sale at the share price on the last day of the period. Total investment returns calculated for a period of less than one year are not annualized.
r In addition to the fees and expenses which the Fund bears directly, the Fund indirectly bears a pro rata share of the fees and expenses of the underlying funds in which the Fund invests. Such indirect expenses are not included in the expense ratio shown. Estimated investment companies expenses are not expenses that are incurred directly by your Fund. They are expenses that are incurred directly by the investment companies and are deducted from the value of the funds your Fund invests in. The effect of the estimated investment companies expenses that you bear indirectly is included in your Fund's total return.
† Portfolio turnover rate is not annualized and does not include securities received or delivered from processing creations or redemptions.
# The per share amount of equalization is presented to show the impact of equalization on distributable earnings per share.
(a) Amount represents less than $0.005.
See Notes to Financial Statements.
62
Notes to Financial Statements
PowerShares Exchange-Traded Fund Trust
April 30, 2011
Note 1. Organization
PowerShares Exchange-Traded Fund Trust (the "Trust") was organized as a Massachusetts business trust on June 9, 2000 and is authorized to have multiple series of portfolios. The Trust is an open-end management investment company registered under the Investment Company Act of 1940, as amended (the "1940 Act"). As of April 30, 2011, the Trust offered fifty-six portfolios. This report includes the following portfolios:
| Full Name | Short Name | ||||||
| PowerShares Dynamic Large Cap Growth Portfolio | "Dynamic Large Cap Growth Portfolio" | ||||||
| PowerShares Dynamic Large Cap Portfolio | "Dynamic Large Cap Portfolio" | ||||||
| PowerShares Dynamic Large Cap Value Portfolio | "Dynamic Large Cap Value Portfolio" | ||||||
| PowerShares Dynamic Mid Cap Growth Portfolio | "Dynamic Mid Cap Growth Portfolio" | ||||||
| PowerShares Dynamic Mid Cap Portfolio | "Dynamic Mid Cap Portfolio" | ||||||
| PowerShares Dynamic Mid Cap Value Portfolio | "Dynamic Mid Cap Value Portfolio" | ||||||
| PowerShares Dynamic Small Cap Growth Portfolio | "Dynamic Small Cap Growth Portfolio" | ||||||
| PowerShares Dynamic Small Cap Portfolio | "Dynamic Small Cap Portfolio" | ||||||
| PowerShares Dynamic Small Cap Value Portfolio | "Dynamic Small Cap Value Portfolio" | ||||||
| PowerShares Zacks Micro Cap Portfolio | "Zacks Micro Cap Portfolio" | ||||||
Each portfolio (the "Fund" and collectively the "Funds") represents a separate series of the Trust. The shares of the Funds are referred to herein as "Shares" or "Fund's Shares." Each Fund's Shares are listed and traded on the NYSE Arca, Inc.
The Funds' market prices may differ to some degree from the net asset value ("NAV") of the Shares of each Fund. Unlike conventional mutual funds, each Fund issues and redeems Shares on a continuous basis, at NAV, only in a large specified number of Shares, each called a "Creation Unit." Creation Units of each Fund are issued and redeemed generally in-kind for securities included in the relevant index. Except when aggregated in Creation Units by Authorized Participants, the Shares are not individually redeemable securities of the Funds.
The investment objective of each Fund is to seek investment results that correspond (before fees and expenses) generally to the price and yield performance of the following indices (each, an "Underlying Index"):
| Fund | Index | ||||||
| Dynamic Large Cap Growth Portfolio | Dynamic Large Cap Growth IntellidexSM Index | ||||||
| Dynamic Large Cap Portfolio | Dynamic Large Cap IntellidexSM Index | ||||||
| Dynamic Large Cap Value Portfolio | Dynamic Large Cap Value IntellidexSM Index | ||||||
| Dynamic Mid Cap Growth Portfolio | Dynamic Mid Cap Growth IntellidexSM Index | ||||||
| Dynamic Mid Cap Portfolio | Dynamic Mid Cap IntellidexSM Index | ||||||
| Dynamic Mid Cap Value Portfolio | Dynamic Mid Cap Value IntellidexSM Index | ||||||
| Dynamic Small Cap Growth Portfolio | Dynamic Small Cap Growth IntellidexSM Index | ||||||
| Dynamic Small Cap Portfolio | Dynamic Small Cap IntellidexSM Index | ||||||
| Dynamic Small Cap Value Portfolio | Dynamic Small Cap Value IntellidexSM Index | ||||||
| Zacks Micro Cap Portfolio | Zacks Micro Cap IndexTM | ||||||
63
Notes to Financial Statements (Continued)
PowerShares Exchange-Traded Fund Trust
April 30, 2011
Note 2. Significant Accounting Policies
The preparation of the financial statements in accordance with Generally Accepted Accounting Principles ("GAAP") in the United States of America requires management to make estimates and assumptions that affect the reported amounts and disclosures in the financial statements, including estimates and assumptions related to taxation. Actual results could differ from these estimates. In addition, the Funds monitor for material events or transactions that may occur or become known after the period-end date and before the date the financial statements are released to print.
A. Security Valuation
Securities, including restricted securities, are valued according to the following policies.
A security listed or traded on an exchange (except convertible bonds) is valued at its last sales price or official closing price as of the close of the customary trading session on the exchange where the security is principally traded, or lacking any sales or official closing price on a particular day, the security may be valued at the closing bid price on that day. Securities traded in the over-the-counter market are valued based on prices furnished by independent pricing services or market makers. Listed options, if no closing price is available, are valued at the mean between the last bid and ask prices from the exchange on which they are principally traded. Options not listed on an exchange are valued by an independent source at the mean between the last bid and ask prices.
Investments in open-end registered investment companies not traded on an exchange are valued at the end of day NAV per share.
Debt obligations (including convertible bonds) and unlisted equities are fair valued using an evaluated quote provided by an independent pricing service. Evaluated quotes provided by the pricing service may be determined without exclusive reliance on quoted prices, and may reflect appropriate factors such as institution-size trading in similar groups of securities, developments related to specific securities, dividend rate, yield, quality, type of issue, coupon rate, maturity, individual trading characteristics and other market data. Short-term obligations, including commercial paper, having 60 days or less to maturity are recorded at amortized cost which approximates value. Debt securities are subject to interest rate and credit risks. In addition, all debt securities involve some risk of default with respect to interest and/or principal payments.
Foreign securities (including foreign exchange contracts) are converted into U.S. dollar amounts using the applicable exchange rates as of the close of the London world markets. If market quotations are available and reliable for foreign exchange traded equity securities, the securities will be valued at the market quotations. Because trading hours for certain foreign securities end before the close of the New York Stock Exchange ("NYSE"), closing market quotations may become unreliable. If between the time trading ends on a particular security and the close of the customary trading session on the NYSE, events occur that are significant and make the closing price unreliable, the Fund may fair value the security. If the event is likely to have affected the closing price of the security, the security will be valued at fair value in good faith using procedures approved by the Board of Trustees. Adjustments to closing prices to reflect fair value may also be based on a screening process of an independent pricing service to indicate the degree of certainty, based on historical data, that the closing price in the principal market where a foreign security trades is not the current value as of the close of the NYSE. Foreign securities meeting the approved degree of certainty that the price is not reflective of current value will be priced at the indication of fair value from the independent pricing service. Multiple factors may be considered by the independent pricing service in
64
Notes to Financial Statements (Continued)
PowerShares Exchange-Traded Fund Trust
April 30, 2011
determining adjustments to reflect fair value and may include information relating to sector indices, American depositary receipts ("ADRs") and domestic and foreign index futures. Foreign securities may have additional risks including exchange rate changes, potential for sharply devalued currencies and high inflation, political and economic upheaval, the relative lack of issuer information, relatively low market liquidity and the potential lack of strict financial and accounting controls and standards.
Securities for which market prices are not provided by any of the above methods may be valued based upon quotes furnished by independent sources.
Securities for which market quotations are not readily available or are unreliable are valued at fair value as determined in good faith by or under the supervision of the Trust's officers following procedures approved by the Board of Trustees. Issuer specific events, market trends, bid/ask quotes of brokers and information providers and other market data may be reviewed in the course of making a good faith determination of a security's fair value.
Valuations change in response to many factors, including the historical and prospective earnings of the issuer, the value of the issuer's assets, general economic conditions, interest rates, investor perceptions and market liquidity. Because of the inherent uncertainties of valuation, the values reflected in the financial statements may materially differ from the value received upon actual sale of those investments.
B. Other Risks
Replication Management Risk. Unlike many investment companies, the Funds do not utilize an investing strategy that seeks returns in excess of each Fund's respective Underlying Index. Therefore, a Fund would not necessarily sell a security unless that security is removed from its respective Underlying Index.
Concentration Risk. To the extent a Fund concentrates its investments in an industry or group of industries, the value of the Fund's Shares may rise and fall more than the value of Shares of a fund that invests in a broader range of securities.
Non-Correlation Risk. Each Fund's return may not match the return of its Underlying Index for a number of reasons. For example, each Fund incurs operating expenses not applicable to its Underlying Index, and incurs costs in buying and selling securities, especially when rebalancing the securities holdings to reflect changes in the composition of its Underlying Index. In addition, the performance of each Fund and its Underlying Index may vary due to asset valuation differences and differences between each Fund's portfolio and its Underlying Index resulting from legal restrictions, cost or liquidity constraints.
Small and Medium Capitalization Company Risk. Investing in securities of small and medium capitalization companies involves greater risk than is customarily associated with investing in larger, more established companies. These companies' securities may be more volatile and less liquid than those of more established companies. These securities may have returns that vary, sometimes significantly, from the overall securities market. Often small and medium capitalization companies and the industries in which they are focused are still evolving and may make them be more sensitive to changing market conditions.
Large Capitalization Company Risk. Returns on investments in securities of large capitalization U.S. companies could trail the returns on investments in stocks of smaller companies.
Micro Capitalization Company Risk. The Zacks Micro Cap Portfolio's investments in the securities of micro capitalization companies involve substantially greater risks of loss and price fluctuations. Micro
65
Notes to Financial Statements (Continued)
PowerShares Exchange-Traded Fund Trust
April 30, 2011
capitalization companies carry additional risks because their earnings and revenues tend to be less predictable (and some companies may be experiencing significant losses), and their share prices tend to be more volatile and their markets less liquid than companies with larger market capitalizations. Also, it may take a long time before the Fund realizes a gain, if any, on an investment in a micro capitalization company.
Growth Investing Style Risk. The Dynamic Large Cap Growth Portfolio, Mid Cap Growth Portfolio and Small Cap Growth Portfolio emphasize a "growth" style of investing. The market values of such securities may be more volatile than other types of investments. The returns on "growth" securities may or may not move in tandem with the returns on other styles of investing or the overall stock markets.
Value Investing Style Risk. The Dynamic Large Cap Value Portfolio, Mid Cap Value Portfolio and Small Cap Value Portfolio emphasize undervalued companies with characteristics for improved valuations. This style of investing is subject to the risk that the valuations never improve or that the returns on "value" equity securities are less than returns on other styles of investing or the overall stock market. Different types of stocks tend to shift in and out of favor depending on market and economic conditions. Thus, the value of the each Fund's investments will vary and at times may be lower or higher than that of other types of investments.
C. Federal Income Taxes
Each Fund intends to comply with the provisions of the Internal Revenue Code applicable to regulated investment companies and to distribute substantially all of the Fund's taxable earnings to its shareholders. As such, the Funds will not be subject to Federal income taxes on otherwise taxable income (including net realized gains) that is distributed to the shareholders. Therefore, no provision for Federal income taxes is recorded in the financial statements.
Income and capital gain distributions are determined in accordance with Federal income tax regulations, which may differ from GAAP. These differences are primarily due to differing book and tax treatments for in-kind transactions, losses deferred due to wash sales, and passive foreign investment company adjustments, if any.
The Funds file tax returns in the United States Federal jurisdiction and certain other jurisdictions. Generally, a Fund is subject to examinations by such taxing authorities for up to three years after the filing of the return for the tax period.
D. Investment Income and Investment Transactions
Dividend income is recorded on the ex-dividend date, net of foreign taxes withheld, if any. Interest income is recorded on the accrual basis. Investment transactions are recorded on the trade date. Realized gains and losses from the sale or disposition of securities are calculated on the specific identified cost basis. Dividends and interest received by a Fund may give rise to withholding and other taxes imposed by foreign countries. Corporate actions (including cash dividends) are recorded net of non-reclaimable foreign tax withholdings on the ex-dividend date. Tax conventions between certain countries and the United States may reduce or eliminate such taxes.
E. Expenses
Expenses of the Trust that are directly identifiable to a specific Fund are applied to that Fund. Expenses that are not readily identifiable to a specific Fund are allocated in such a manner as deemed equitable, taking into consideration the nature and type of expense and the relative net assets of each Fund.
66
Notes to Financial Statements (Continued)
PowerShares Exchange-Traded Fund Trust
April 30, 2011
Each Fund is responsible for all its expenses, including the investment advisory fees, costs of transfer agency, custody, fund administration, legal, audit and other services, interest, taxes, brokerage commissions and other expenses connected with executions of portfolio transactions, sub-licensing fees related to its respective Underlying Intellidex or Underlying Index, any distribution fees or expenses, litigation expenses, fees payable to the Trust's Board members and officers who are not "interested persons" of the Trust or the Adviser, expenses incurred in connection with the Board members' services, including travel expenses and legal fees of counsel for those members of the Board who are not "interested persons" of the Trust and extraordinary expenses.
Expenses included for Zacks Micro Cap Portfolio, in the accompanying financial statements, reflect the expenses of the Fund and do not include any expenses of the investment companies, in which it invests. The effects of the investment companies expenses are included in the realized and unrealized gain/loss on the investments in the investment companies.
F. Dividends and Distributions to Shareholders
Each Fund declares and pays dividends from net investment income, if any, to its shareholders quarterly and records on ex-dividend date. Each Fund distributes net realized taxable capital gains, if any, generally annually in cash and records them on ex-dividend date. Such distributions on a tax basis are determined in conformity with income tax regulations which may differ from GAAP. Distributions in excess of tax basis earnings and profits, if any, are reported in such Fund's financial statements as a tax return of capital at fiscal period-end.
G. Equalization
All of the Funds use the accounting practice of equalization. This accounting method is used to keep the continuing shareholder's per Share equity in undistributed net investment income from being affected by the continuous sales and redemptions of capital Shares. Equalization is calculated on a per Share basis whereby a portion of the proceeds from the sales and cost of repurchases of capital Shares is applied to undistributed net investment income. The amount of equalization is disclosed in the Statements of Changes in Net Assets as undistributed net investment income (loss) included in the price of capital Shares issued or redeemed. The distributions to shareholders of amounts so applied may be deemed to be a return of capital for tax purposes to the extent that such distributions exceed taxable income.
Note 3. Investment Advisory Agreement and Other Agreements
The Trust has entered into an Investment Advisory Agreement with Invesco PowerShares Capital Management LLC (the "Adviser") pursuant to which the Adviser has overall responsibility as the Funds' investment adviser for the selection and ongoing monitoring of the Funds' investments, managing the Funds' business affairs and providing certain clerical, bookkeeping and other administrative services. Each Fund has agreed to pay the Adviser an annual fee of 0.50% of the Fund's average daily net assets.
The Adviser has entered into an Amended and Restated Excess Expense Agreement (the "Excess Expense Agreement") with the Trust, pursuant to which the Adviser has agreed to waive fees and/or pay Fund expenses to the extent necessary to prevent the operating expenses of each Fund (excluding interest expense, brokerage commissions and other trading expenses, sub-licensing fees, offering costs, taxes, expenses of the investment companies that are paid indirectly as a result of share ownership of the investment companies, and extraordinary expenses) from exceeding 0.60% of the Fund's average daily net assets per year (the "Expense Cap"), at least until August 31, 2012. Offering costs excluded from the Expense Cap are: (a) initial legal fees pertaining to the Funds' Shares offered for sale; (b) initial Securities and Exchange Commission and state registration fees; and (c) initial fees paid to be listed on an exchange.
67
Notes to Financial Statements (Continued)
PowerShares Exchange-Traded Fund Trust
April 30, 2011
The Excess Expense Agreement provides that the expenses borne by the Adviser are subject to recapture by the Adviser for up to three years from the date the fee or expense was borne by the Adviser, but no recapture payment will be made by a Fund if it would result in the Fund exceeding its Expense Cap as specified above.
The amounts available for potential future recapture by the Adviser under the Excess Expense Agreement and the expiration schedule at April 30, 2011 are as follows:
| Total Potential | Potential Recapture Amounts Expiring | ||||||||||||||||||
| Recapture Amount | 04/30/12 | 04/30/13 | 04/30/14 | ||||||||||||||||
| Dynamic Large Cap Growth Portfolio | $ | 25,671 | $ | — | $ | — | $ | 25,671 | |||||||||||
| Dynamic Large Cap Portfolio | 288,861 | 88,796 | 87,338 | 112,727 | |||||||||||||||
| Dynamic Large Cap Value Portfolio | 976 | — | — | 976 | |||||||||||||||
| Dynamic Mid Cap Growth Portfolio | 142,531 | 34,730 | 40,253 | 67,548 | |||||||||||||||
| Dynamic Mid Cap Portfolio | 321,171 | 100,131 | 100,743 | 120,297 | |||||||||||||||
| Dynamic Mid Cap Value Portfolio | 286,192 | 86,712 | 88,953 | 110,527 | |||||||||||||||
| Dynamic Small Cap Growth Portfolio | 308,597 | 95,759 | 100,065 | 112,773 | |||||||||||||||
| Dynamic Small Cap Portfolio | 338,883 | 106,215 | 104,165 | 128,503 | |||||||||||||||
| Dynamic Small Cap Value Portfolio | 253,297 | 72,981 | 74,211 | 106,105 | |||||||||||||||
| Zacks Micro Cap Portfolio | 330,227 | 105,107 | 109,697 | 115,423 | |||||||||||||||
The Trust has entered into a Distribution Agreement with Invesco Distributors, Inc. (the "Distributor"), which serves as the distributor of Creation Units for each Fund. The Distributor does not maintain a secondary market in the Shares. The Distributor is an affiliate of the Adviser.
The Adviser has entered into a licensing agreement for each Fund with the following Licensors:
| Fund | Licensors | ||||||
| Dynamic Large Cap Growth Portfolio | NYSE Arca | ||||||
| Dynamic Large Cap Portfolio | NYSE Arca | ||||||
| Dynamic Large Cap Value Portfolio | NYSE Arca | ||||||
| Dynamic Mid Cap Growth Portfolio | NYSE Arca | ||||||
| Dynamic Mid Cap Portfolio | NYSE Arca | ||||||
| Dynamic Mid Cap Value Portfolio | NYSE Arca | ||||||
| Dynamic Small Cap Growth Portfolio | NYSE Arca | ||||||
| Dynamic Small Cap Portfolio | NYSE Arca | ||||||
| Dynamic Small Cap Value Portfolio | NYSE Arca | ||||||
| Zacks Micro Cap Portfolio | Zacks Investment Research, Inc. | ||||||
Each Underlying Index name trademark is owned by the respective Licensors. These trademarks have been licensed to the Adviser for use with the Funds. The Funds are not sponsored, endorsed, sold or promoted by the Licensors and the Licensors make no representation regarding the advisability of investing in any of these Funds. The Trust has entered into a sub-licensing agreement under which the Funds are required to pay the sub-licensing fees which are shown on the Statements of Operations.
The Trust has entered into service agreements whereby The Bank of New York Mellon, a wholly-owned subsidiary of The Bank of New York Mellon Corporation, serves as the administrator, custodian, fund
68
Notes to Financial Statements (Continued)
PowerShares Exchange-Traded Fund Trust
April 30, 2011
accountant and transfer agent for each Fund. The Distributor is a direct wholly-owned subsidiary of Invesco Ltd. and therefore, is considered to be affiliated with the Funds.
Note 4. Additional Valuation Information
GAAP defines fair value as the price that would be received to sell an asset or paid to transfer a liability in an orderly transaction between market participants at the measurement date, under current market conditions. GAAP establishes a hierarchy that prioritizes the inputs to valuation methods giving the highest priority to readily available unadjusted quoted prices in an active market for identical assets (Level 1) and the lowest priority to significant unobservable inputs (Level 3) generally when market prices are not readily available or are unreliable. Based on the valuation inputs, the securities or other investments are tiered into one of three levels. Changes in valuation methods may result in transfers in or out of an investment's assigned level:
Level 1 – Prices are determined using quoted prices in an active market for identical assets.
Level 2 – Prices are determined using other significant observable inputs. Observable inputs are inputs that other market participants may use in pricing a security. These may include quoted prices for similar securities, interest rates, prepayment speeds, credit risk yield curves, loss severities, default rates, discount rates, volatilities and others.
Level 3 – Prices are determined using significant unobservable inputs. In situations where quoted prices or observable inputs are unavailable (for example, when there is little or no market activity for an investment at the end of the period), unobservable inputs may be used. Unobservable inputs reflect the Fund's own assumptions about the factors market participants would use in determining fair value of the securities or instruments and would be based on the best available information.
Except for the Fund listed below, as of April 30, 2011, the securities in each Fund were valued based on Level 1 inputs. The level assigned to the securities valuations may not be an indication of the risk or liquidity associated with investing in those securities. Because of the inherent uncertainties of valuation, the values reflected in the financial statements may materially differ from the value received upon actual sale of those investments.
With respect to each Fund, during the fiscal year ended April 30, 2011, there were no significant transfers between investment levels.
| Investment in Securities | |||||||||||||||||||
| Level 1 | Level 2 | Level 3 | Total | ||||||||||||||||
| Zacks Micro Cap Portfolio | |||||||||||||||||||
| Equity Securities | $ | 98,722,708 | $ | 120,876 | $ | 194,354 | $ | 99,037,938 | |||||||||||
| Money Market Fund | 64,937 | — | — | 64,937 | |||||||||||||||
| Total | 98,787,645 | 120,876 | 194,354 | 99,102,875 | |||||||||||||||
69
Notes to Financial Statements (Continued)
PowerShares Exchange-Traded Fund Trust
April 30, 2011
Note 5. Distributions to Shareholders and Tax Components of Net Assets
Tax Character of Distributions to Shareholders Paid During the Fiscal Years Ended April 30, 2011 and 2010:
| 2011 | 2010 | ||||||||||||||||||
| Ordinary Income | Return of Capital | Ordinary Income | Return of Capital | ||||||||||||||||
| Dynamic Large Cap Growth Portfolio | $ | 1,450,284 | $ | — | $ | 2,004,571 | $ | — | |||||||||||
| Dynamic Large Cap Portfolio | 523,166 | — | 600,837 | — | |||||||||||||||
| Dynamic Large Cap Value Portfolio | 8,397,017 | — | 7,967,039 | — | |||||||||||||||
| Dynamic Mid Cap Growth Portfolio | — | 344,520 | 33,475 | 67,025 | |||||||||||||||
| Dynamic Mid Cap Portfolio | 196,204 | — | 182,736 | — | |||||||||||||||
| Dynamic Mid Cap Value Portfolio | 393,205 | — | 858,787 | — | |||||||||||||||
| Dynamic Small Cap Growth Portfolio | — | — | 193,877 | 41,471 | |||||||||||||||
| Dynamic Small Cap Portfolio | 69,608 | — | 130,765 | 12,826 | |||||||||||||||
| Dynamic Small Cap Value Portfolio | 788,255 | — | 464,268 | — | |||||||||||||||
| Zacks Micro Cap Portfolio | 446,555 | — | 402,300 | — | |||||||||||||||
Tax Components of Net Assets at Fiscal Year-End:
| Undistributed Ordinary Income | Temporary Book/Tax Differences | Net Unrealized Appreciation | Capital Loss Carryforward | Post-October* Deferrals | Shares of Beneficial Interest | Total Net Assets | |||||||||||||||||||||||||
| Dynamic Large Cap Growth Portfolio | $ | 242,180 | $ | (14,662 | ) | $ | 39,777,025 | $ | (241,473,163 | ) | $ | (1,855,981 | ) | $ | 399,898,812 | $ | 196,574,211 | ||||||||||||||
| Dynamic Large Cap Portfolio | 147,400 | (4,656 | ) | 6,246,391 | (9,663,550 | ) | (200,706 | ) | 39,147,914 | 35,672,793 | |||||||||||||||||||||
| Dynamic Large Cap Value Portfolio | 1,313,952 | (12,031 | ) | 50,946,705 | (101,575,279 | ) | (2,742,001 | ) | 474,388,033 | 422,319,379 | |||||||||||||||||||||
| Dynamic Mid Cap Growth Portfolio | — | (9,959 | ) | 22,602,248 | (162,768,314 | ) | (2,210,602 | ) | 272,677,114 | 130,290,487 | |||||||||||||||||||||
| Dynamic Mid Cap Portfolio | 29,011 | (4,321 | ) | 3,621,369 | (8,800,762 | ) | (436,332 | ) | 28,671,777 | 23,080,742 | |||||||||||||||||||||
| Dynamic Mid Cap Value Portfolio | 52,513 | (5,376 | ) | 5,138,467 | (42,414,990 | ) | (1,453,297 | ) | 79,653,167 | 40,970,484 | |||||||||||||||||||||
| Dynamic Small Cap Growth Portfolio | — | (4,922 | ) | 12,422,466 | (45,413,519 | ) | (508,540 | ) | 142,955,322 | 109,450,807 | |||||||||||||||||||||
| Dynamic Small Cap Portfolio | 3,072 | (4,162 | ) | 3,110,376 | (8,267,215 | ) | (168,915 | ) | 24,318,187 | 18,991,343 | |||||||||||||||||||||
| Dynamic Small Cap Value Portfolio | 97,098 | (5,956 | ) | 10,895,362 | (44,723,783 | ) | — | 106,277,154 | 72,539,875 | ||||||||||||||||||||||
| Zacks Micro Cap Portfolio | 207,455 | (5,922 | ) | 8,064,299 | (79,852,330 | ) | (2,156,334 | ) | 172,707,061 | 98,964,229 | |||||||||||||||||||||
* Capital loss incurred after October 31 ("Post-October losses") within the taxable year are deemed to arise on the first business day of each Fund's next taxable year.
Capital loss carryforward is calculated and reported as of a specific date. Results of transactions and other activity after that date may affect the amount of capital loss carryforward actually available for the Funds to utilize. The ability to utilize capital loss carryforward in the future may be limited under Internal Revenue Code rules and related regulations based on the results of future transactions.
70
Notes to Financial Statements (Continued)
PowerShares Exchange-Traded Fund Trust
April 30, 2011
The following Funds have capital loss carryforward amounts as of April 30, 2011, which expire as of April 30 of each year listed below:
| 2014 | 2015 | 2016 | 2017 | 2018 | 2019 | Total* | |||||||||||||||||||||||||
| Dynamic Large Cap Growth Portfolio | $ | 191,864 | $ | 10,916,066 | $ | 14,024,455 | $ | 68,715,641 | $ | 131,638,879 | $ | 15,986,258 | $ | 241,473,163 | |||||||||||||||||
| Dynamic Large Cap Portfolio | — | — | 87,112 | 2,328,337 | 5,621,834 | 1,626,267 | 9,663,550 | ||||||||||||||||||||||||
| Dynamic Large Cap Value Portfolio | 70,814 | 1,378,743 | 2,783,761 | 22,558,581 | 56,819,182 | 17,964,198 | 101,575,279 | ||||||||||||||||||||||||
| Dynamic Mid Cap Growth Portfolio | 422,220 | 8,055,857 | 5,112,579 | 54,769,394 | 82,364,246 | 12,044,018 | 162,768,314 | ||||||||||||||||||||||||
| Dynamic Mid Cap Portfolio | — | — | 628,828 | 3,815,763 | 3,611,366 | 744,805 | 8,800,762 | ||||||||||||||||||||||||
| Dynamic Mid Cap Value Portfolio | 237,806 | 2,384,765 | 5,347,255 | 12,697,113 | 18,996,863 | 2,751,188 | 42,414,990 | ||||||||||||||||||||||||
| Dynamic Small Cap Growth Portfolio | 823,782 | 13,094,039 | 6,666,558 | 9,888,431 | 10,392,627 | 4,548,082 | 45,413,519 | ||||||||||||||||||||||||
| Dynamic Small Cap Portfolio | — | — | 1,028,299 | 2,738,120 | 2,009,294 | 2,491,502 | 8,267,215 | ||||||||||||||||||||||||
| Dynamic Small Cap Value Portfolio | 703,862 | 3,929,009 | 8,615,687 | 16,547,947 | 9,588,502 | 5,338,776 | 44,723,783 | ||||||||||||||||||||||||
| Zacks Micro Cap Portfolio | 1,951,245 | 15,172,527 | 14,330,930 | 28,782,755 | 12,380,833 | 7,234,040 | 79,852,330 | ||||||||||||||||||||||||
* Capital loss carryforward as of the date listed above is reduced for limitations, if any, to the extent required by the Internal Revenue Code.
Note 6. Investment Transactions
For the fiscal year ended April 30, 2011, the cost of securities purchased and proceeds from sales of securities, excluding short-term securities and in-kind transactions, were as follows:
| Purchases | Sales | ||||||||||
| Dynamic Large Cap Growth Portfolio | $ | 90,964,949 | $ | 91,126,532 | |||||||
| Dynamic Large Cap Portfolio | 13,539,504 | 13,476,624 | |||||||||
| Dynamic Large Cap Value Portfolio | 142,292,697 | 141,855,390 | |||||||||
| Dynamic Mid Cap Growth Portfolio | 57,723,872 | 57,781,203 | |||||||||
| Dynamic Mid Cap Portfolio | 10,111,478 | 10,279,197 | |||||||||
| Dynamic Mid Cap Value Portfolio | 25,827,822 | 26,107,541 | |||||||||
| Dynamic Small Cap Growth Portfolio | 23,982,764 | 24,258,318 | |||||||||
| Dynamic Small Cap Portfolio | 11,679,832 | 11,866,455 | |||||||||
| Dynamic Small Cap Value Portfolio | 58,115,720 | 58,061,143 | |||||||||
| Zacks Micro Cap Portfolio | 46,239,503 | 47,830,101 | |||||||||
71
Notes to Financial Statements (Continued)
PowerShares Exchange-Traded Fund Trust
April 30, 2011
For the fiscal year ended April 30, 2011, in-kind transactions associated with creations and redemptions were as follows:
| Securities Received | Securities Delivered | ||||||||||
| Dynamic Large Cap Growth Portfolio | $ | 159,948,847 | $ | 225,410,425 | |||||||
| Dynamic Large Cap Portfolio | 26,082,577 | 32,506,262 | |||||||||
| Dynamic Large Cap Value Portfolio | 371,002,363 | 345,983,994 | |||||||||
| Dynamic Mid Cap Growth Portfolio | 151,193,921 | 175,828,540 | |||||||||
| Dynamic Mid Cap Portfolio | 26,751,959 | 32,186,178 | |||||||||
| Dynamic Mid Cap Value Portfolio | 46,688,223 | 53,165,548 | |||||||||
| Dynamic Small Cap Growth Portfolio | 116,453,808 | 53,910,661 | |||||||||
| Dynamic Small Cap Portfolio | 25,140,039 | 27,942,706 | |||||||||
| Dynamic Small Cap Value Portfolio | 72,979,565 | 82,693,578 | |||||||||
| Zacks Micro Cap Portfolio | 116,709,124 | 81,289,166 | |||||||||
Gains and (losses) on in-kind transactions are generally not considered taxable gains and (losses) for Federal income tax purposes.
At April 30, 2011, the aggregate cost and the net unrealized appreciation of investments for tax purposes were as follows:
| Cost | Net Unrealized Appreciation | Gross Unrealized Appreciation | Gross Unrealized (Depreciation) | ||||||||||||||||
| Dynamic Large Cap Growth Portfolio | $ | 156,990,827 | $ | 39,777,025 | $ | 40,517,081 | $ | (740,056 | ) | ||||||||||
| Dynamic Large Cap Portfolio | 29,463,959 | 6,246,391 | 6,502,121 | (255,730 | ) | ||||||||||||||
| Dynamic Large Cap Value Portfolio | 371,143,510 | 50,946,705 | 54,024,738 | (3,078,033 | ) | ||||||||||||||
| Dynamic Mid Cap Growth Portfolio | 107,848,312 | 22,602,248 | 22,800,096 | (197,848 | ) | ||||||||||||||
| Dynamic Mid Cap Portfolio | 19,524,008 | 3,621,369 | 3,734,234 | (112,865 | ) | ||||||||||||||
| Dynamic Mid Cap Value Portfolio | 35,902,580 | 5,138,467 | 5,327,476 | (189,009 | ) | ||||||||||||||
| Dynamic Small Cap Growth Portfolio | 97,134,250 | 12,422,466 | 12,751,564 | (329,098 | ) | ||||||||||||||
| Dynamic Small Cap Portfolio | 15,949,071 | 3,110,376 | 3,229,613 | (119,237 | ) | ||||||||||||||
| Dynamic Small Cap Value Portfolio | 61,766,214 | 10,895,362 | 11,458,548 | (563,186 | ) | ||||||||||||||
| Zacks Micro Cap Portfolio | 91,040,764 | 8,062,111 | 11,698,992 | (3,636,881 | ) | ||||||||||||||
72
Notes to Financial Statements (Continued)
PowerShares Exchange-Traded Fund Trust
April 30, 2011
Note 7. Reclassification of Permanent Differences
Primarily as a result of differing book/tax treatment of investment activity, on April 30, 2011, amounts were reclassified between undistributed net investment income (loss), undistributed net realized loss and Shares of beneficial interest. These reclassifications had no effect on the net assets of each Fund. For the fiscal year ended April 30, 2011, the reclassifications were as follows:
| Undistributed Net Investment Income (Loss) | Undistributed Net Realized Gain (Loss) | Shares of Beneficial Interest | |||||||||||||
| Dynamic Large Cap Growth Portfolio | $ | 33,540 | $ | (42,711,077 | ) | $ | 42,677,537 | ||||||||
| Dynamic Large Cap Portfolio | 41,117 | (4,063,792 | ) | 4,022,675 | |||||||||||
| Dynamic Large Cap Value Portfolio | (89,029 | ) | (41,944,044 | ) | 42,033,073 | ||||||||||
| Dynamic Mid Cap Growth Portfolio | 39,581 | (36,409,803 | ) | 36,370,222 | |||||||||||
| Dynamic Mid Cap Portfolio | 2,814 | (5,263,950 | ) | 5,261,136 | |||||||||||
| Dynamic Mid Cap Value Portfolio | 7,136 | (7,212,270 | ) | 7,205,134 | |||||||||||
| Dynamic Small Cap Growth Portfolio | 395,607 | (10,017,019 | ) | 9,621,412 | |||||||||||
| Dynamic Small Cap Portfolio | 3,569 | (4,736,877 | ) | 4,733,308 | |||||||||||
| Dynamic Small Cap Value Portfolio | 83,767 | (13,846,796 | ) | 13,763,029 | |||||||||||
| Zacks Micro Cap Portfolio | 375,987 | (18,743,590 | ) | 18,367,603 | |||||||||||
Note 8. Trustees' Fees
The Fund compensates each Trustee who is not an "interested person" as defined in the 1940 Act (an "Independent Trustee"). The Non-Independent Trustees of the Trust do not receive any Trustees' fees.
The Trust has adopted a deferred compensation plan (the "Plan"). Under the Plan, an Independent Trustee who has executed a Deferred Fee Agreement (a "Participating Trustee") may defer receipt of all or a portion of his compensation ("Deferral Fees"). Such Deferral Fees are deemed to be invested in select PowerShares Funds. The Deferral Fees payable to the Participating Trustee are valued as of the date such Fees would have been paid to the Participating Trustee. The value increases with contributions or with increases in the value of the Shares selected, and the value decreases with distributions or with declines in the value of the Shares selected.
Note 9. Capital
Shares are created and redeemed by the Trust only in Creation Unit size aggregations of 50,000 Shares. Only Authorized Participants are permitted to purchase or redeem Creation Units from the Funds. Such transactions are generally permitted on an in-kind basis, with a balancing cash component to equate the transaction to the NAV per Share of each Fund of the Trust on the transaction date. Cash may be substituted equivalent to the value of certain securities generally when they are not available in sufficient quantity for delivery, not eligible for trading by the Authorized Participant or as a result of other market circumstances.
73
Notes to Financial Statements (Continued)
PowerShares Exchange-Traded Fund Trust
April 30, 2011
Note 10. Indemnifications
Under the Trust's organizational documents, its officers and Trustees are indemnified against certain liabilities arising out of the performance of their duties to the Trust. Each Independent Trustee is also indemnified against certain liabilities arising out of the performance of his duties to the Trust pursuant to an Indemnification Agreement between the Independent Trustee and the Trust. Additionally, in the normal course of business, the Trust enters into contracts with service providers that contain general indemnification clauses. The Trust's maximum exposure under these arrangements is unknown, as this would involve future claims that may be made against the Trust that have not yet occurred. However, based on experience, the Trust believes the risk of loss to be remote.
Note 11. Subsequent Events
The Board of Trustees of the Trust approved a change to the name, the investment objective and the principal investment strategies of the PowerShares Dynamic Large Cap Portfolio (the "Fund"), effective June 16, 2011. The Fund's name will change to PowerShares Fundamental Pure Large Core Portfolio and the Fund's ticker symbol will change from "PJF" to "PXLC". At that time, the Fund will amend its current investment objective of seeking investment results that correspond (before fees and expenses) generally to the price and yield of the equity index called the Dynamic Large Cap IntellidexSM Index. Instead, the Fund will seek investment results that correspond (before fees and expenses) generally to the price and yield of the RAFI® Fundamental Large Core Index (the "Index"). The Fund will invest at least 90% of its total assets in the component securities that comprise the Index.
The Board of Trustees of the Trust approved a change to the name, the investment objective and the principal investment strategies of the PowerShares Dynamic Mid Cap Growth Portfolio (the "Fund"), effective June 16, 2011. The Fund's name will change to PowerShares Fundamental Pure Mid Growth Portfolio and the Fund's ticker symbol will change from "PWJ" to "PXMG". At that time, the Fund will amend its current investment objective of seeking investment results that correspond (before fees and expenses) generally to the price and yield of the equity index called the Dynamic Mid Cap Growth IntellidexSM Index. Instead, the Fund will seek investment results that correspond (before fees and expenses) generally to the price and yield of the RAFI® Fundamental Mid Growth Index (the "Index"). The Fund will invest at least 90% of its total assets in the component securities that comprise the Index.
The Board of Trustees of the Trust approved a change to the name, the investment objective and the principal investment strategies of the PowerShares Dynamic Mid Cap Portfolio (the "Fund"), effective June 16, 2011. The Fund's name will change to PowerShares Fundamental Pure Mid Core Portfolio and the Fund's ticker symbol will change from "PJG" to "PXMC". At that time, the Fund will amend its current investment objective of seeking investment results that correspond (before fees and expenses) generally to the price and yield of the equity index called the Dynamic Mid Cap IntellidexSM Index. Instead, the Fund will seek investment results that correspond (before fees and expenses) generally to the price and yield of the RAFI® Fundamental Mid Core Index (the "Index"). The Fund will invest at least 90% of its total assets in the component securities that comprise the Index.
The Board of Trustees of the Trust approved a change to the name, the investment objective and the principal investment strategies of the PowerShares Dynamic Mid Cap Value Portfolio (the "Fund"), effective June 16, 2011. The Fund's name will change to PowerShares Fundamental Pure Mid Value Portfolio and the Fund's ticker symbol will change from "PWP" to "PXMV". At that time, the Fund will amend its current investment objective of seeking investment results that correspond (before fees and expenses) generally to the price and yield of the equity index called the Dynamic Mid Cap Value
74
Notes to Financial Statements (Continued)
PowerShares Exchange-Traded Fund Trust
April 30, 2011
IntellidexSM Index. Instead, the Fund will seek investment results that correspond (before fees and expenses) generally to the price and yield of the RAFI® Fundamental Mid Value Index (the "Index"). The Fund will invest at least 90% of its total assets in the component securities that comprise the Index.
The Board of Trustees of the Trust approved a change to the name, the investment objective and the principal investment strategies of the PowerShares Dynamic Small Cap Growth Portfolio (the "Fund"), effective June 16, 2011. The Fund's name will change to PowerShares Fundamental Pure Small Growth Portfolio and the Fund's ticker symbol will change from "PWT" to "PXSG". At that time, the Fund will amend its current investment objective of seeking investment results that correspond (before fees and expenses) generally to the price and yield of the equity index called the Dynamic Small Cap Growth IntellidexSM Index. Instead, the Fund will seek investment results that correspond (before fees and expenses) generally to the price and yield of the RAFI® Fundamental Small Growth Index (the "Index"). The Fund will invest at least 90% of its total assets in the component securities that comprise the Index.
The Board of Trustees of the Trust approved a change to the name, the investment objective and the principal investment strategies of the PowerShares Dynamic Small Cap Portfolio (the "Fund"), effective June 16, 2011. The Fund's name will change to PowerShares Fundamental Pure Small Core Portfolio and the Fund's ticker symbol will change from "PJM" to "PXSC". At that time, the Fund will amend its current investment objective of seeking investment results that correspond (before fees and expenses) generally to the price and yield of the equity index called the Dynamic Small Cap IntellidexSM Index. Instead, the Fund will seek investment results that correspond (before fees and expenses) generally to the price and yield of the RAFI® Fundamental Small Core Index (the "Index"). The Fund will invest at least 90% of its total assets in the component securities that comprise the Index.
The Board of Trustees of the Trust approved a change to the name, the investment objective and the principal investment strategies of the PowerShares Dynamic Small Cap Value Portfolio (the "Fund"), effective June 16, 2011. The Fund's name will change to PowerShares Fundamental Pure Small Value Portfolio and the Fund's ticker symbol will change from "PWY" to "PXSV". At that time, the Fund will amend its current investment objective of seeking investment results that correspond (before fees and expenses) generally to the price and yield of the equity index called the Dynamic Small Cap Value IntellidexSM Index. Instead, the Fund will seek investment results that correspond (before fees and expenses) generally to the price and yield of the RAFI® Fundamental Small Value Index (the "Index"). The Fund will invest at least 90% of its total assets in the component securities that comprise the Index.
Effective June 16, 2011, in connection with the changes to the names, the investment objectives and the principal investment strategies of the PowerShares Dynamic Large Cap Portfolio, PowerShares Dynamic Mid Cap Growth Portfolio, PowerShares Dynamic Mid Cap Portfolio, PowerShares Dynamic Mid Cap Value Portfolio, PowerShares Dynamic Small Cap Growth Portfolio, PowerShares Dynamic Small Cap Portfolio and PowerShares Dynamic Small Cap Value Portfolio (the "Funds"), each Fund's management fee will be reduced to 0.29% of each Fund's average daily net assets per year, and Adviser has agreed to waive fees and/or pay Fund expenses to the extent necessary to prevent the operating expenses of each Fund (excluding interest expenses, offering costs, brokerage commissions and other trading expenses, taxes and extraordinary expenses) from exceeding 0.39% of each Fund's average daily net assets per year (the "Expense Cap") until at least August 31, 2012. The expenses borne by the Adviser are subject to recapture by the Adviser for up to three years from the date the fee or expense was borne by the Adviser, but no recapture payment will be made by a Fund if it would result in the Fund exceeding its Expense Cap.
75
Report of Independent Registered Public Accounting Firm
To the Board of Trustees and Shareholders of PowerShares Exchange-Traded Fund Trust:
In our opinion, the accompanying statements of assets and liabilities, including the schedules of investments, and the related statements of operations and of changes in net assets and the financial highlights present fairly, in all material respects, the financial position of each of the portfolios indicated in Note 1 of the financial statements (each a portfolio of PowerShares Exchange-Traded Fund Trust, hereafter referred to as the "Trust") at April 30, 2011, and the results of each of their operations, the changes in each of their net assets, and the financial highlights for each of the periods presented, in conformity with accounting principles generally accepted in the United States of America. These financial statements and financial highlights (hereafter referred to as "financial statements") are the responsibility of the Trust's management; our responsibility is to express an opinion on these financial statements based on our audits. We conducted our audits of these financial statements in accordance with the standards of the Public Company Accounting Oversight Board (United States). Those standards require that we plan and perform the audit to obtain reasonable assurance about whether the financial statements are free of material misstatement. An audit includes examining, on a test basis, evidence supporting the amounts and disclosures in the financial statements, assessing the accounting principles used and significant estimates made by management, and evaluating the overall financial statement presentation. We believe that our audits, which included confirmation of securities at April 30, 2011 by correspondence with the custodian and brokers, and the application of alternative auditing procedures where securities purchased had not been received, provide a reasonable basis for our opinion.
/s/ PricewaterhouseCoopers LLP
New York, New York
June 24, 2011
76
Tax Information
Form 1099-DIV, Form 1042-S and other year-end tax information provide shareholders with actual calendar year amounts that should be included in their tax returns. Shareholders should consult their tax advisers.
The following distribution information is being provided as required by the Internal Revenue Code or to meet a specific state's requirement.
Each Fund designates the following amounts or, if subsequently determined to be different, the maximum amount allowable for its fiscal year ended April 30, 2011:
Federal Income Tax Information
| Qualified dividend income* | Corporate dividends- received deduction* | ||||||||||
| Dynamic Large Cap Growth Portfolio | 100 | % | 100 | % | |||||||
| Dynamic Large Cap Portfolio | 100 | % | 100 | % | |||||||
| Dynamic Large Cap Value Portfolio | 100 | % | 100 | % | |||||||
| Dynamic Mid Cap Growth Portfolio | 0 | % | 0 | % | |||||||
| Dynamic Mid Cap Portfolio | 100 | % | 100 | % | |||||||
| Dynamic Mid Cap Value Portfolio | 100 | % | 100 | % | |||||||
| Dynamic Small Cap Growth Portfolio | 0 | % | 0 | % | |||||||
| Dynamic Small Cap Portfolio | 100 | % | 100 | % | |||||||
| Dynamic Small Cap Value Portfolio | 100 | % | 100 | % | |||||||
| Zacks Micro Cap Portfolio | 100 | % | 100 | % | |||||||
* The above percentages are based on ordinary income dividends paid to shareholders during the Fund's fiscal year.
77
Supplemental Information
Trustees and Officers
The Independent Trustees, the Trustees who are affiliated with the Adviser (the "Non-Independent Trustees") and the executive officers of the Trust, their term of office and length of time served, their principal business occupations during at least the past five years, the number of portfolios in the Fund Complex overseen by each Trustee and the other directorships, if any, held by a Trustee, are shown below.
The Trustees and Officers information is current as of April 30, 2011.
| Name, Address and Age of Independent Trustees | Position(s) Held with Trust | Term of Office and Length of Time Served* | Principal Occupation(s) During Past 5 Years | Number of Portfolios in Fund Complex** Overseen by Independent Trustees | Other Directorships Held by Independent Trustees | ||||||||||||||||||
| Ronn R. Bagge (53) c/o Invesco PowerShares Capital Management LLC 301 West Roosevelt Road Wheaton, IL 60187 | Trustee | Since 2003 | Founder and Principal, YQA Capital Management LLC (1998-Present); formerly Owner/CEO of Electronic Dynamic Balancing Co., Inc. (high-speed rotating equipment service provider) | 107 | None | ||||||||||||||||||
| Todd J. Barre (53) c/o Invesco PowerShares Capital Management LLC 301 West Roosevelt Road Wheaton, IL 60187 | Trustee | Since 2010 | Assistant Professor of Business, Trinity Christian College (2010-Present); formerly Vice President and Senior Investment Strategist (2001-2008), Director of Open Architecture and Trading (2007-2008); Head of Fundamental Research (2004-2007); and Vice President and Senior Fixed Income Strategist (1994-2001). BMO Financial Group/Harris Private Bank | 107 | None | ||||||||||||||||||
* This is the date the Trustee began serving the Trust. Each Trustee serves an indefinite term, until his successor is elected.
** Fund Complex includes all open-end funds (including all of their portfolios) advised by the Adviser. At April 30, 2011, the Fund Complex consisted of the Trust's 56 portfolios and three other exchange-traded fund trusts with 51 portfolios advised by the Adviser.
78
Supplemental Information (Continued)
Trustees and Officers (Continued)
| Name, Address and Age of Independent Trustees | Position(s) Held with Trust | Term of Office and Length of Time Served* | Principal Occupation(s) During Past 5 Years | Number of Portfolios in Fund Complex** Overseen by Independent Trustees | Other Directorships Held by Independent Trustees | ||||||||||||||||||
| Marc M. Kole (50) c/o Invesco PowerShares Capital Management LLC 301 West Roosevelt Road Wheaton, IL 60187 | Trustee | Since 2006 | Chief Financial Officer, Hope Network (social services) (2008-Present); formerly Assistant Vice President and Controller, Priority Health (health insurance) (2005-2008); Senior Vice President of Finance, United Healthcare (2004-2005); Senior Vice President of Finance, Oxford Health Plans (2000-2004) | 107 | None | ||||||||||||||||||
| Philip M. Nussbaum (49) c/o Invesco PowerShares Capital Management LLC 301 West Roosevelt Road Wheaton, IL 60187 | Trustee | Since 2003 | Chairman, Performance Trust Capital Partners (2004-Present) | 107 | None | ||||||||||||||||||
* This is the date the Trustee began serving the Trust. Each Trustee serves an indefinite term, until his successor is elected.
** Fund Complex includes all open-end funds (including all of their portfolios) advised by the Adviser. At April 30, 2011, the Fund Complex consisted of the Trust's 56 portfolios and three other exchange-traded fund trusts with 51 portfolios advised by the Adviser.
79
Supplemental Information (Continued)
Trustees and Officers (Continued)
| Name, Address and Age of Independent Trustees | Position(s) Held with Trust | Term of Office and Length of Time Served* | Principal Occupation(s) During Past 5 Years | Number of Portfolios in Fund Complex** Overseen by Independent Trustees | Other Directorships Held by Independent Trustees | ||||||||||||||||||
| Donald H. Wilson (51) c/o Invesco PowerShares Capital Management LLC 301 West Roosevelt Road Wheaton, IL 60187 | Trustee | Since 2006 | Chairman and Chief Executive Officer, Stone Pillar Advisers, Ltd. (2010-Present); formerly Chief Operating Officer, AMCORE Financial, Inc. (bank holding company) (2007-2009); Executive Vice President and Chief Financial Officer, AMCORE Financial, Inc. (2006-2007); Senior Vice President and Treasurer, Marshall & Ilsley Corp. (bank holding company) (1995-2006) | 107 | None | ||||||||||||||||||
* This is the date the Trustee began serving the Trust. Each Trustee serves an indefinite term, until his successor is elected.
** Fund Complex includes all open-end funds (including all of their portfolios) advised by the Adviser. At April 30, 2011, the Fund Complex consisted of the Trust's 56 portfolios and three other exchange-traded fund trusts with 51 portfolios advised by the Adviser.
80
Supplemental Information (Continued)
Trustees and Officers (Continued)
| Name, Address and Age of Interested Trustees | Position(s) Held with Trust | Term of Office and Length of Time Served* | Principal Occupation(s) During Past 5 Years | Number of Portfolios in Fund Complex** Overseen by Interested Trustees | Other Directorships Held by Interested Trustees | ||||||||||||||||||
| H. Bruce Bond (47) Invesco PowerShares Capital Management LLC 301 West Roosevelt Road Wheaton, IL 60187 | Chairman of the Board and Trustee | Since 2003 | Chairman, Invesco Power-Shares Capital Management LLC (2009-Present); formerly Managing Director, Invesco PowerShares Capital Management LLC (2002-2009); Manager, Nuveen Investments (1998-2002) | 107 | None | ||||||||||||||||||
* This is the date the Trustee began serving the Trust. Each Trustee serves an indefinite term, until his successor is elected.
** Fund Complex includes all open-end funds (including all of their portfolios) advised by the Adviser. At April 30, 2011, the Fund Complex consisted of the Trust's 56 portfolios and three other exchange-traded fund trusts with 51 portfolios advised by the Adviser.
81
Supplemental Information (Continued)
Trustees and Officers (Continued)
| Name, Address and Age of Interested Trustees | Position(s) Held with Trust | Term of Office and Length of Time Served* | Principal Occupation(s) During Past 5 Years | Number of Portfolios in Fund Complex** Overseen by Interested Trustees | Other Directorships Held by Interested Trustees | ||||||||||||||||||
| Kevin M. Carome (54) Invesco Ltd. Two Peachtree Pointe 1555 Peachtree St., N.E. Suite 1800 Atlanta, GA 30309 | Trustee | Since 2010 | Senior Managing Director and General Counsel, Invesco Ltd. (2006-Present); formerly Senior Vice President and General Counsel, Invesco Advisors, Inc. (2003-2005); Senior Vice President and General Counsel, Liberty Financial Companies, Inc. (2000-2001); General Counsel of certain investment management subsidiaries of Liberty Financial Companies, Inc. (1998-2000); Associate General Counsel, Liberty Financial Companies, Inc. (1993-1998); Associate, Ropes & Gray LLP | 107 | None | ||||||||||||||||||
* This is the date the Trustee began serving the Trust. Each Trustee serves an indefinite term, until his successor is elected.
** Fund Complex includes all open-end funds (including all of their portfolios) advised by the Adviser. At April 30, 2011, the Fund Complex consisted of the Trust's 56 portfolios and three other exchange-traded fund trusts with 51 portfolios advised by the Adviser.
82
Supplemental Information (Continued)
Trustees and Officers (Continued)
| Name, Address and Age of Executive Officer | Position(s) Held with Trust | Length of Time Served* | Principal Occupation(s) During Past 5 Years | ||||||||||||
| Andrew Schlossberg (36) Invesco Management Group, Inc. 11 Greenway Plaza Suite 100 Houston, TX 77046 | President | Since 2009 | Managing Director, U.S. head of business strategy and chief marketing officer for Invesco Ltd. in the United States (2008-Present); formerly Mr. Schlossberg served in multiple roles within Invesco, including head of corporate development, as well as global leadership roles in strategy and product development in the company's North American Institutional and Retirement divisions (2002-2007) | ||||||||||||
| Bruce T. Duncan (56) Invesco PowerShares Capital Management LLC 301 West Roosevelt Road Wheaton, IL 60187 | Treasurer and Secretary | Treasurer since 2006 and Secretary since 2008 | Senior Vice President of Finance, Invesco PowerShares Capital Management LLC (2005-Present); formerly Private Practice Attorney (2000-2005); Vice President of Investor Relations. The ServiceMaster Company (1994-2000); Vice President of Taxes, The ServiceMaster Company (1990-2000) | ||||||||||||
| Benjamin Fulton (49) Invesco PowerShares Capital Management LLC 301 West Roosevelt Road Wheaton, IL 60187 | Vice President | Since 2009 | Executive Vice President – Global Product Development, Invesco PowerShares Capital Management LLC (2005-Present); formerly principal of Clermont Consulting, a consulting firm focused on the creation and development of retail investment products (2003-2005); President and a founding partner of Claymore Securities, a financial services firm in the Chicagoland area (2001-2003); Managing Director of Structured Investments at Nuveen Investments (1998-2001) | ||||||||||||
| Peter Hubbard (29) Invesco PowerShares Capital Management LLC 301 West Roosevelt Road Wheaton, IL 60187 | Vice President | Since 2009 | Vice President and Director of Portfolio Management – Invesco PowerShares Capital Management LLC (2008-Present); formerly Portfolio Manager, Invesco PowerShares Capital Management LLC (2007-2008); Research Analyst, Invesco PowerShares Capital Management LLC (2005-2007); Research Analyst and Trader, Ritchie Capital, a hedge fund operator (2003-2005) | ||||||||||||
* This is the date the Officer began serving the Trust. Each Officer serves a one-year term, until his successor is elected.
83
Supplemental Information (Continued)
Trustees and Officers (Continued)
| Name, Address and Age of Executive Officer | Position(s) Held with Trust | Length of Time Served* | Principal Occupation(s) During Past 5 Years | ||||||||||||
| David Warren (53) Invesco Trimark Ltd. 5140 Yonge Street Suite 900 Toronto, Ontario M2N 6X7 | Vice President | Since 2009 | Director, Executive Vice President and Chief Financial Officer, Invesco Trimark Ltd. and Chief Administrative Officer, North American Retail, Invesco Ltd. (2007-Present); formerly Director, Executive Vice President and Chief Financial Officer, Invesco Trimark Ltd. (2000-2006) | ||||||||||||
| Todd Spillane (51) Invesco Management Group, Inc. 11 Greenway Plaza Suite 100 Houston, TX 77046 | Chief Compliance Officer | Since 2010 | Senior Vice President, Invesco Management Group, Inc.; Chief Compliance Officer, INVESCO Private Capital Investments, Inc. (holding company), Invesco Private Capital, Inc. (registered investment adviser) and Invesco Senior Secured Management, Inc. (registered investment adviser); Chief Compliance Officer and Senior Vice President, Invesco Advisers, Inc. (formerly Invesco Institutional (N.A.), Inc. – registered investment adviser) and Vice President, Invesco Distributors, Inc. and Invesco Investment Services, Inc.; formerly Chief Compliance Officer, Invesco Global Asset Management (N.A.), Inc. – (registered investment adviser) and Invesco Advisers, Inc. (formerly Invesco Institutional (N.A.), Inc.) (registered investment adviser); Senior Vice President and Chief Compliance Officer, Invesco Advisors, Inc., Invesco Capital Management, Inc. and Invesco Private Asset Management, Inc.; Vice President, Invesco Capital Management, Inc. and Fund Management Company | ||||||||||||
Availability of Additional Information About the Trustees
The Statement of Additional Information includes additional information about the Trustees and is available, without charge, upon request at (800) 983-0903.
* This is the date the Officer began serving the Trust. Each Officer serves a one-year term, until his successor is elected.
84
Board Considerations Regarding Continuation of Investment Advisory Agreement
At a meeting held on April 14, 2011, the Board of Trustees of the PowerShares Exchange-Traded Fund Trust (the "Trust"), including the Independent Trustees, unanimously approved the continuation of the Investment Advisory Agreement between Invesco PowerShares Capital Management LLC (the "Adviser") and the Trust for the following 54 series (each, a "Fund" and collectively, the "Funds"):
PowerShares Dynamic Market Portfolio
PowerShares Dynamic OTC Portfolio
PowerShares Golden Dragon Halter USX China Portfolio
PowerShares High Yield Equity Dividend AchieversTM Portfolio
PowerShares WilderHill Clean Energy Portfolio
PowerShares Dynamic Large Cap Growth Portfolio
PowerShares Dynamic Large Cap Value Portfolio
PowerShares Dynamic Mid Cap Growth Portfolio
PowerShares Dynamic Mid Cap Value Portfolio
PowerShares Dynamic Small Cap Growth Portfolio
PowerShares Dynamic Small Cap Value Portfolio
PowerShares Dynamic Biotechnology & Genome Portfolio
PowerShares Dynamic Food & Beverage Portfolio
PowerShares Dynamic Leisure and Entertainment Portfolio
PowerShares Dynamic Media Portfolio
PowerShares Dynamic Networking Portfolio
PowerShares Dynamic Pharmaceuticals Portfolio
PowerShares Dynamic Semiconductors Portfolio
PowerShares Dynamic Software Portfolio
PowerShares Zacks Micro Cap Portfolio
PowerShares Aerospace & Defense Portfolio
PowerShares Morningstar StockInvestor Core Portfolio
PowerShares Dividend AchieversTM Portfolio
PowerShares International Dividend AchieversTM Portfolio
PowerShares Dynamic Building and Construction Portfolio
PowerShares Dynamic Energy Exploration and Production Portfolio
PowerShares WilderHill Progressive Energy Portfolio
PowerShares Dynamic Insurance Portfolio
PowerShares Dynamic Oil and Gas Services Portfolio
PowerShares Dynamic Retail Portfolio
PowerShares Dynamic Utilities Portfolio
PowerShares Lux Nanotech Portfolio
PowerShares FTSE RAFI US 1000 Portfolio
PowerShares FTSE RAFI US 1500 Small-Mid Portfolio
PowerShares Water Resources Portfolio
PowerShares Dynamic Energy Sector Portfolio
PowerShares Dynamic Financial Sector Portfolio
PowerShares Dynamic Healthcare Sector Portfolio
PowerShares Dynamic Industrials Sector Portfolio
PowerShares Dynamic Large Cap Portfolio
PowerShares Dynamic MagniQuant Portfolio
PowerShares Dynamic Mid Cap Portfolio
PowerShares Dynamic Small Cap Portfolio
PowerShares Dynamic Technology Sector Portfolio
PowerShares Buyback AchieversTM Portfolio
PowerShares CleantechTM Portfolio
PowerShares Dynamic Banking Portfolio
PowerShares Dynamic Basic Materials Sector Portfolio
PowerShares Dynamic Consumer Discretionary Sector Portfolio
PowerShares Dynamic Consumer Staples Sector Portfolio
PowerShares Financial Preferred Portfolio
PowerShares Global Listed Private Equity Portfolio
PowerShares DWA Technical LeadersTM Portfolio
PowerShares S&P 500® High Quality Portfolio
85
Board Considerations Regarding Continuation of Investment Advisory Agreement (Continued)
The Trustees reviewed information from the Adviser describing: (i) the nature, extent and quality of services provided, (ii) the investment performance of the Funds and the Adviser, (iii) the costs of services provided and estimated profits realized by the Adviser, (iv) the extent to which economies of scale are realized as the Funds grow, (v) whether fee levels reflect any possible economies of scale for the benefit of Fund shareholders, (vi) comparisons of services rendered and amounts paid to other registered investment companies and (vii) any benefits realized by the Adviser from its relationship with each Fund. Based on all of the information considered and the conclusions reached, the Board, including the Independent Trustees, determined to approve the continuation of the Investment Advisory Agreement for each Fund. No single factor was determinative in the Board's analysis.
Nature, Extent and Quality of Services. In evaluating the nature, extent and quality of the Adviser's services, the Trustees reviewed information concerning the functions performed by the Adviser for the Funds, information describing the Adviser's current organization and projected staffing, including operations assistance provided by the Adviser's parent organization, Invesco Ltd., and the background and experience of the persons responsible for the day-to-day management of the Funds. The Trustees reviewed matters related to the Adviser's execution of portfolio transactions on behalf of the Funds. The Trustees also reviewed information on the performance of the Funds and the performance of their underlying indices through December 31, 2010, including reports on the correlation and tracking error between the underlying index and each Fund's performance, as well as the Adviser's analysis of the tracking error between each Fund and its underlying index. The Trustees noted that, in each case, the correlation and tracking error for each Fund was within the targeted range set forth in the Trust's registration statement. The Trustees concluded that each Fund was correlated to its underlying index and that the tracking error for each Fund was within an acceptable range given that Fund's particular circumstances.
The Trustees also considered the services provided by the Adviser in its oversight of the Funds' administrator, custodian and transfer agent. They noted the significant amount of time and effort that had been devoted to this oversight function.
Based on their review, the Trustees concluded that the nature, extent and quality of services provided by the Adviser to the Funds under the Investment Advisory Agreement were appropriate and reasonable.
Fees, Expenses and Profitability. The Trustees reviewed and discussed the information provided by the Adviser on each Fund's expense ratio and advisory fee, as compared to information compiled by the Adviser from Lipper Inc. databases on the expense ratios of comparable exchange-traded funds ("ETFs"), open-end (non-ETF) index funds and open-end actively-managed funds. The Trustees noted that the annual advisory fee charged to each Fund is:
• 0.50% of the Fund's average net assets, for each Fund other than PowerShares High Yield Equity Dividend Achievers(TM) Portfolio, PowerShares Dividend Achievers(TM) Portfolio, PowerShares International Dividend Achievers(TM) Portfolio, PowerShares FTSE RAFI US 1000 Portfolio and PowerShares FTSE RAFI US 1500 Small-Mid Portfolio;
• 0.40% of the Fund's average net assets, for each of PowerShares High Yield Equity Dividend Achievers(TM) Portfolio, PowerShares Dividend Achievers(TM) Portfolio and PowerShares International Dividend Achievers(TM) Portfolio; and
• 0.29% of the Fund's average net assets, for each of PowerShares FTSE RAFI US 1000 Portfolio and PowerShares FTSE RAFI US 1500 Small-Mid Portfolio.
86
Board Considerations Regarding Continuation of Investment Advisory Agreement (Continued)
The Trustees also noted that the Adviser has agreed to waive a portion of its advisory fee and/or pay expenses (an "Expense Cap") to the extent necessary to prevent the annual operating expenses of each Fund from exceeding the percentage of that Fund's average daily net assets, at least until August 31, 2012, as set forth below:
• 0.60%, excluding interest expenses, brokerage commissions and other trading expenses, taxes and extraordinary expenses, for each of PowerShares Dynamic OTC Portfolio and PowerShares Dynamic Market Portfolio;
• 0.50%, excluding interest expenses, licensing fees, offering costs, brokerage commissions and other trading expenses, taxes and extraordinary expenses, for each of PowerShares High Yield Equity Dividend Achievers(TM) Portfolio, PowerShares Dividend Achievers(TM) Portfolio and PowerShares International Dividend Achievers(TM) Portfolio;
• 0.50%, excluding interest expenses, offering costs, brokerage commissions and other trading expenses, taxes and extraordinary expenses, for each of PowerShares Morningstar StockInvestor Core Portfolio and PowerShares S&P 500® High Quality Portfolio (the Trustees noted that the Expense Cap for each of these Funds was reduced to 0.50% effective July 1, 2010);
• 0.39%, excluding interest expenses, offering costs, brokerage commissions and other trading expenses, taxes and extraordinary expenses, for each of PowerShares FTSE RAFI US 1000 Portfolio and PowerShares FTSE RAFI US 1500 Small-Mid Portfolio; and
• 0.60%, excluding interest expenses, licensing fees, offering costs, brokerage commissions and other trading expenses, taxes and extraordinary expenses, for each other Fund.
The Trustees noted that the Adviser represented that it does not provide investment advisory services to any clients other than the Funds and other ETFs overseen by the Board. The Trustees noted that each Fund's advisory fee was:
• higher than the median advisory fee of its ETF peer funds (except for the advisory fee of each of PowerShares Financial Preferred Portfolio, PowerShares FTSE RAFI US 1000 Portfolio, PowerShares Global Listed Private Equity Portfolio and PowerShares Golden Dragon Halter USX China Portfolio, which was equal to or lower than the median advisory fee of its ETF peer funds); and
• higher than the median advisory fee of its open-end index peer funds (except for the advisory fee of each of PowerShares DWA Technical Leaders(TM) Portfolio, PowerShares Dynamic Banking Portfolio, PowerShares Dynamic Basic Materials Sector Portfolio, PowerShares Dynamic Biotechnology & Genome Portfolio, PowerShares Dynamic Financial Sector Portfolio, PowerShares Dynamic Healthcare Portfolio, PowerShares Dynamic Insurance Portfolio, PowerShares Dynamic Mid Cap Growth Portfolio, PowerShares Dynamic Networking Portfolio, PowerShares Dynamic OTC Portfolio, PowerShares Dynamic Pharmaceuticals Portfolio, PowerShares Dynamic Semiconductors Portfolio, PowerShares Dynamic Small Cap Growth Portfolio, PowerShares Dynamic Software Portfolio, PowerShares Dynamic Technology Sector Portfolio, PowerShares Golden Dragon Halter USX China Portfolio, PowerShares Lux Nanotech Portfolio, PowerShares Morningstar StockInvestor Core Portfolio and PowerShares S&P 500® High Quality Portfolio, which was equal to or lower than
87
Board Considerations Regarding Continuation of Investment Advisory Agreement (Continued)
the median advisory fee of its open-end index peer funds, and there was no comparable data for PowerShares Financial Preferred Portfolio or PowerShares Global Listed Private Equity Portfolio); but
• lower than the median advisory fee of its open-end actively-managed peer funds.
The Trustees determined that the advisory fees were reasonable, noting the complexity of the indices, which generally require more frequent rebalancing of the portfolios, the distinguishing factors of the Funds, and the higher administrative, operational and management oversight costs for the Adviser. With respect to the Funds' expense ratios, the Trustees noted that the net expense ratio for each Fund was:
• higher than the median expense ratio of its ETF peer funds (except for the net expense ratio of each of PowerShares Dynamic Market Portfolio, PowerShares Dynamic OTC Portfolio, PowerShares FTSE RAFI US 1000 Portfolio, PowerShares Golden Dragon Halter USX China Portfolio and PowerShares S&P 500® High Quality Portfolio, which was equal to or less than the median expense ratio of its ETF peer funds); and
• higher than the median expense ratio of its open-end index peer funds (except for the net expense ratio of each of PowerShares Aerospace & Defense Portfolio, PowerShares Cleantech(TM) Portfolio, PowerShares DWA Technical Leaders(TM) Portfolio, PowerShares Dynamic Banking Portfolio, PowerShares Dynamic Basic Materials Sector Portfolio, PowerShares Dynamic Biotechnology & Genome Portfolio, PowerShares Dynamic Building & Construction Portfolio, PowerShares Dynamic Consumer Discretionary Sector Portfolio, PowerShares Dynamic Consumer Staples Sector Portfolio, PowerShares Dynamic Financial Sector Portfolio, PowerShares Dynamic Food & Beverage Portfolio, PowerShares Dynamic Healthcare Portfolio, PowerShares Dynamic Industrials Sector Portfolio, PowerShares Dynamic Insurance Portfolio, PowerShares Dynamic Large Cap Portfolio, PowerShares Dynamic Large Cap Growth Portfolio, PowerShares Dynamic Leisure and Entertainment Portfolio, PowerShares Dynamic Media Portfolio, PowerShares Dynamic Mid Cap Growth Portfolio, PowerShares Morningstar StockInvestor Core Portfolio, PowerShares Dynamic Networking Portfolio, PowerShares Dynamic OTC Portfolio, PowerShares Dynamic Pharmaceuticals Portfolio, PowerShares Dynamic Retail Portfolio, PowerShares Dynamic Semiconductors Portfolio, PowerShares Dynamic Small Cap Growth Portfolio, PowerShares Dynamic Small Cap Value Portfolio, PowerShares Dynamic Software Portfolio, PowerShares Dynamic Technology Sector Portfolio, PowerShares Dynamic Utilities Sector Portfolio, PowerShares FTSE RAFI US 1000 Portfolio, PowerShares FTSE RAFI US 1500 Small-Mid Portfolio, PowerShares Golden Dragon Halter USX China Portfolio, PowerShares Lux Nanotech Portfolio and PowerShares S&P 500® High Quality Portfolio, which was equal to or lower than the median expense ratio of its open-end index peer funds, and there was no comparable data for PowerShares Financial Preferred Portfolio or PowerShares Global Listed Private Equity Portfolio); but
• lower than the median expense ratio of its open-end actively-managed peer funds.
The Trustees noted that a significant component of the non-advisory fee expenses was the license fees paid by the Funds, and those Funds for which license fees are included in the Funds' Expense Caps.
The Board concluded that the advisory fee and expense ratio of each Fund (giving effect to the Fund's Expense Cap) were reasonable and appropriate in light of the services provided.
88
Board Considerations Regarding Continuation of Investment Advisory Agreement (Continued)
In conjunction with their review of fees, the Trustees also considered information provided by the Adviser on the revenues received by the Adviser under the Investment Advisory Agreement for each Fund, as well as the fees waived and expenses reimbursed by the Adviser for the Funds. The Trustees reviewed information provided by the Adviser on its profitability as well as any profits or losses realized by the Adviser from its relationship to each Fund. The Trustees concluded that the estimated profitability to the Adviser of the advisory services provided to any of the Funds was not unreasonable.
Also at the April 14, 2011 meeting, the Adviser proposed reducing the annual advisory fee for each of PowerShares Dynamic Large Cap Portfolio, PowerShares Dynamic Mid Cap Growth Portfolio, PowerShares Dynamic Mid Cap Portfolio, PowerShares Dynamic Mid Cap Value Portfolio, PowerShares Dynamic Small Cap Growth Portfolio, PowerShares Dynamic Small Cap Portfolio and PowerShares Dynamic Small Cap Value Portfolio (each, a "Style Fund") effective June 16, 2011. The Adviser also proposed revising each Style Fund's Expense Cap that is in place until August 31, 2012 to further reduce each Style Fund's annual operating expenses effective June 16, 2011. The Board considered the Adviser's representation that there would be no diminution in the quantity or quality of services provided to each Style Fund in connection with the amendment to the Investment Advisory Agreement to reflect the advisory fee changes. The Board concluded for each Style Fund that the reduced advisory fee was appropriate, and determined to approve the amended Investment Advisory Agreement and amended Expense Cap, effective June 16, 2011.
Economies of Scale and Whether Fee Levels Reflect These Economies of Scale. The Trustees reviewed the information provided by the Adviser as to the extent to which economies of scale are realized as each Fund grows and whether fee levels reflect economies of scale for the benefit of shareholders. The Trustees reviewed each Fund's asset size, expense ratio and expense limitation agreed to by the Adviser. The Trustees noted that, for Funds whose expenses are higher than their respective Expense Caps, any reduction in that Fund's expenses would be enjoyed by the Adviser, but that Fund shareholders benefit from the lower expense ratio as a result of the Fund's Expense Cap. The Trustees also noted that the Excess Expense Agreement with the Trust provides that the Adviser is entitled to be reimbursed by each Fund, other than PowerShares Dynamic Market Portfolio and PowerShares Dynamic OTC Portfolio, for fees waived or expenses absorbed pursuant to the Expense Cap for a period of three years from the date the fee or expense was incurred, provided that no reimbursement would be made that would result in a Fund exceeding its Expense Cap. The Trustees considered whether the advisory fee rate for each Fund was reasonable in relation to the asset size of that Fund, and concluded that the flat advisory fee was reasonable and appropriate, noting the Fund expenses the Adviser has borne as a result of the Expense Cap.
The Trustees noted that the Adviser had not identified any further benefits that it derived from its relationship with the Funds and had noted that it does not have any soft-dollar arrangements.
Based on all of the information considered and the conclusions reached, the Board, including the Independent Trustees, determined to approve the continuation of the Investment Advisory Agreement for each Fund. No single factor was determinative in the Board's analysis.
89
This page intentionally left blank
This page intentionally left blank
This page intentionally left blank
PROXY VOTING POLICIES AND PROCEDURES
A description of the Funds' proxy voting policies and procedures that the Funds use to determine how to vote proxies relating to portfolio securities is available, without charge and upon request, by calling (800) 983-0903. This information is also available on the Securities and Exchange Commission's ("Commission") website at www.sec.gov.
Information regarding how the Funds voted proxies for portfolio securities, if applicable, during the most recent 12-month period ended June 30, is also available, without charge and upon request, by (i) calling (800) 983-0903; or (ii) accessing the Funds' Form N-PX on the Commission's website at www.sec.gov.
QUARTERLY PORTFOLIOS
The Funds file their complete schedules of portfolio holdings with the Commission for the first and third quarters of each fiscal year on Form N-Q. The Funds' Forms N-Q are available on the Commission's website at www.sec.gov. The Funds' Forms N-Q may also be reviewed and copied at the Commission's Public Reference Room in Washington, D.C.; information on the operation of the Public Reference Room may be obtained by calling (800) SEC-0330.

301 West Roosevelt Road
Wheaton, IL 60187
800.983.0903
www.invescopowershares.com
© 2011 Invesco PowerShares Capital Management LLC P-PS-AR-5


2011 Annual Report to Shareholders
April 30, 2011
PowerShares Dynamic MagniQuant Portfolio (PIQ)
PowerShares Dynamic Market Portfolio (PWC)
PowerShares Dynamic OTC Portfolio (PWO)
PowerShares FTSE RAFI US 1000 Portfolio (PRF)
PowerShares FTSE RAFI US 1500 Small-Mid Portfolio (PRFZ)

Table of Contents
| The Market Environment | 2 | ||||||
| Manager's Analysis | 4 | ||||||
| Frequency Distribution of Discounts & Premiums | 14 | ||||||
| Fees and Expenses | 16 | ||||||
| Broad Market Portfolios | |||||||
| Schedules of Investments | |||||||
| PowerShares Dynamic MagniQuant Portfolio (PIQ) | 17 | ||||||
| PowerShares Dynamic Market Portfolio (PWC) | 20 | ||||||
| PowerShares Dynamic OTC Portfolio (PWO) | 22 | ||||||
| PowerShares FTSE RAFI US 1000 Portfolio (PRF) | 24 | ||||||
| PowerShares FTSE RAFI US 1500 Small-Mid Portfolio (PRFZ) | 35 | ||||||
| Statements of Assets and Liabilities | 52 | ||||||
| Statements of Operations | 53 | ||||||
| Statements of Changes in Net Assets | 54 | ||||||
| Financial Highlights | 56 | ||||||
| Notes to Financial Statements | 59 | ||||||
| Report of Independent Registered Public Accounting Firm | 69 | ||||||
| Tax Information | 70 | ||||||
| Trustees and Officers | 71 | ||||||
| Board Considerations Regarding Continuation of Investment Advisory Agreement | 78 | ||||||
The Market Environment
For the fiscal year ended April 30, 2011, the market environment saw continued improvement. Global equities ended up 18.25% after declining the first two months of the period. Emerging markets led equities up during the fiscal year with the MSCI Emerging Markets Index returning 20.67%. Developed International and U.S. Equities followed closely behind emerging markets with the MSCI EAFE Index up 19.18% and the S&P 500® Index up 17.24%. Volatility continued to decline on a year-over-year basis with the CBOE Volatility Index® (VIX®) dropping 33.11% for the fiscal year. Fixed income markets moved higher for the fiscal year with the Barclays Aggregate Bond Index ending up 5.37%.
2
This page intentionally left blank
Manager's Analysis
PowerShares Dynamic MagniQuant Portfolio (ticker: PIQ)
The PowerShares Dynamic MagniQuant Portfolio (the "Fund") seeks investment results that correspond (before fees and expenses) generally to the price and yield performance of the Dynamic Top 200 IntellidexSM Index (the "Index").
For the fiscal year ended April 30, 2011, the Fund returned 20.72%. Over this same year, the Index returned 21.64%, while the S&P 500® Equal Weight Index returned 21.39% and the Russell 3000® Index returned 18.35%. The Fund benefited from positive performance of securities of companies in energy, materials, and health care sectors. Fund performance was positive for securities of companies within each sector for the reporting period.
Sector Breakdown (% of the Fund's
Net Assets) as of April 30, 2011
| Industrials | 23.2 | ||||||
| Information Technology | 16.5 | ||||||
| Financials | 14.2 | ||||||
| Consumer Discretionary | 13.9 | ||||||
| Health Care | 13.4 | ||||||
| Consumer Staples | 7.6 | ||||||
| Materials | 5.8 | ||||||
| Energy | 3.6 | ||||||
| Utilities | 1.0 | ||||||
| Telecommunication Services | 0.8 | ||||||
| Money Market Fund | 0.3 | ||||||
| Liabilities in excess of other assets | (0.3 | ) | |||||
Style Allocation (% of the Fund's
Total Investments) as of April 30, 2011
| Small-Cap Value | 25.0 | ||||||
| Mid-Cap Value | 16.8 | ||||||
| Small-Cap Growth | 16.3 | ||||||
| Mid-Cap Growth | 15.4 | ||||||
| Large-Cap Value | 13.6 | ||||||
| Large-Cap Growth | 12.9 | ||||||
Top Ten Fund Holdings (% of the Fund's
Net Assets) as of April 30, 2011
| Security | |||||||
| Sauer-Danfoss, Inc. | 0.9 | ||||||
| Biogen Idec, Inc. | 0.7 | ||||||
| Polaris Industries, Inc. | 0.7 | ||||||
| TPC Group, Inc. | 0.6 | ||||||
| Limited Brands, Inc. | 0.6 | ||||||
| Coca-Cola Bottling Co. Consolidated | 0.6 | ||||||
| Kinetic Concepts, Inc. | 0.6 | ||||||
| Kronos Worldwide, Inc. | 0.6 | ||||||
| Albemarle Corp. | 0.6 | ||||||
| Cooper Cos., Inc. (The) | 0.6 | ||||||
| Total | 6.5 | ||||||
4
Manager's Analysis (Continued)
PowerShares Dynamic MagniQuant Portfolio (ticker: PIQ)
Growth of a $10,000 Investment Since Inception†
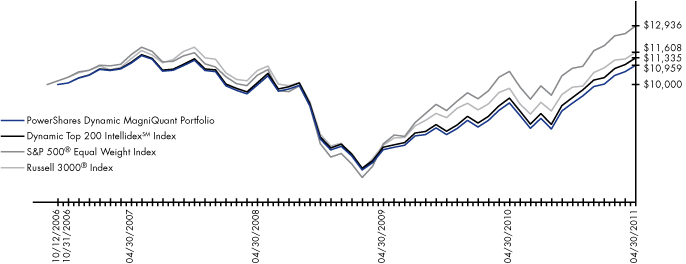
| Fund Performance History (%) | As of April 30, 2011 | ||||||||||||||||||
| Avg. Ann.†† | Fund Inception | ||||||||||||||||||
| 1 Year | 3 Year | Avg. Ann.†† | Cumulative | ||||||||||||||||
| Index | |||||||||||||||||||
| Dynamic Top 200 IntellidexSM Index | 21.64 | % | 3.97 | % | 2.79 | % | 13.35 | % | |||||||||||
| S&P 500® Equal Weight Index | 21.39 | % | 7.34 | % | 5.78 | % | 29.36 | % | |||||||||||
| Russell 3000® Index | 18.35 | % | 2.75 | % | 3.31 | % | 16.08 | % | |||||||||||
| Fund | |||||||||||||||||||
| Net Asset Value ("NAV") Return | 20.72 | % | 3.16 | % | 2.03 | % | 9.59 | % | |||||||||||
| Share Price Return | 20.76 | % | 3.19 | % | 2.07 | % | 9.76 | % | |||||||||||
Fund Inception: October 12, 2006
Performance quoted represents past performance. Past performance is not a guarantee of future results and current performance may be higher or lower than performance quoted. Investment returns and principal value will fluctuate and shares, when redeemed, may be worth more or less than their original cost. The Adviser has waived fees and reimbursed other expenses, absent which, performance would have been lower. The Adviser has contractually agreed to waive fees and/or pay certain Fund expenses through August 31, 2012. According to the Fund's current prospectus, the total gross annual operating expense ratio was indicated as 0.98%. In the Financial Highlights section of this Shareholder Report, the Fund's net total operating expense ratio was determined to be 0.65%, while the Fund's gross total expense ratio was determined to be 1.08%. NAV and Share Price returns assume that dividends and capital gain distributions have been reinvested in the Fund at NAV and Share Price, respectively. The returns shown in the table above do not reflect the deduction of taxes that a shareholder would pay on Fund distributions or the redemption or sale of Fund Shares. See invescopowershares.com to find the most recent month-end performance numbers.
Index performance results are based upon a hypothetical investment in its constituent securities. Index returns do not represent Fund returns. An investor cannot invest directly in an index. The Index does not charge management fees or brokerage expenses, and no such fees or expenses were deducted from the hypothetical performance shown. In addition, the results actual investors might have achieved would have differed from those shown because of differences in the timing, amounts of their investments, and fees and expenses associated with an investment in the Fund.
The S&P 500® Equal Weight Index and Russell 3000® Index (the "Benchmark Indices") are unmanaged indices used as a measurement of change in stock market conditions based on the average performance of approximately 500 and 3,000 common stocks, respectively.
† Fund and underlying Index returns are based on the inception date of the Fund. Returns for the Benchmark Indices are based on the closest month-end to the Fund's inception date.
†† Average annualized.
5
Manager's Analysis
PowerShares Dynamic Market Portfolio (ticker: PWC)
The PowerShares Dynamic Market Portfolio (the "Fund") seeks investment results that correspond (before fees and expenses) generally to the price and yield performance of the Dynamic Market IntellidexSM Index (the "Index").
For the fiscal year ended April 30, 2011, the Fund returned 21.34%. Over this same year, the Index returned 22.12%, while the Russell 3000® Index returned 18.35% and the S&P 500® Index returned 17.24%. The Fund benefited from positive performance of securities of companies in information technology, health care and consumer discretionary sectors. Fund performance was positive for securities of companies within each sector for the reporting period.
Sector Breakdown (% of the Fund's
Net Assets) as of April 30, 2011
| Information Technology | 17.9 | ||||||
| Financials | 14.8 | ||||||
| Consumer Discretionary | 12.7 | ||||||
| Energy | 12.6 | ||||||
| Industrials | 11.7 | ||||||
| Health Care | 11.0 | ||||||
| Consumer Staples | 9.3 | ||||||
| Materials | 4.1 | ||||||
| Utilities | 3.2 | ||||||
| Telecommunication Services | 2.7 | ||||||
| Money Market Fund | 0.1 | ||||||
| Liabilities in excess of other assets | (0.1 | ) | |||||
Style Allocation (% of the Fund's
Total Investments) as of April 30, 2011
| Large-Cap Value | 25.7 | ||||||
| Large-Cap Growth | 24.1 | ||||||
| Mid-Cap Growth | 21.9 | ||||||
| Small-Cap Value | 12.0 | ||||||
| Mid-Cap Value | 9.3 | ||||||
| Small-Cap Growth | 7.0 | ||||||
Top Ten Fund Holdings (% of the Fund's
Net Assets) as of April 30, 2011
| Security | |||||||
| Exxon Mobil Corp. | 4.6 | ||||||
| National Oilwell Varco, Inc. | 4.3 | ||||||
| Estee Lauder Cos., Inc. (The) | 3.2 | ||||||
| Walgreen Co. | 3.2 | ||||||
| Joy Global, Inc. | 2.7 | ||||||
| International Business Machines Corp. | 2.7 | ||||||
| Mosaic Co. (The) | 2.6 | ||||||
| United Parcel Service, Inc. | 2.6 | ||||||
| Limited Brands, Inc. | 2.6 | ||||||
| Verisk Analytics, Inc. | 2.6 | ||||||
| Total | 31.1 | ||||||
6
Manager's Analysis (Continued)
PowerShares Dynamic Market Portfolio (ticker: PWC)
Growth of a $10,000 Investment Since Inception†
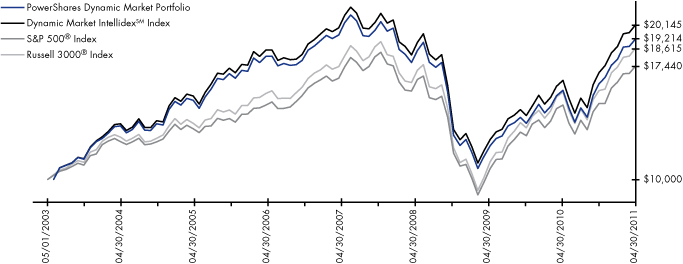
| Fund Performance History (%) | As of April 30, 2011 | ||||||||||||||||||||||
| Avg. Ann.†† | Fund Inception | ||||||||||||||||||||||
| 1 Year | 3 Year | 5 Year | Avg. Ann.†† | Cumulative | |||||||||||||||||||
| Index | |||||||||||||||||||||||
| Dynamic Market IntellidexSM Index | 22.12 | % | 2.00 | % | 1.74 | % | 9.15 | % | 101.45 | % | |||||||||||||
| S&P 500® Index | 17.24 | % | 1.74 | % | 2.95 | % | 7.20 | % | 74.40 | % | |||||||||||||
| Russell 3000® Index | 18.35 | % | 2.75 | % | 3.33 | % | 8.08 | % | 86.15 | % | |||||||||||||
| Fund | |||||||||||||||||||||||
| Net Asset Value ("NAV") Return | 21.34 | % | 1.36 | % | 1.24 | % | 8.51 | % | 92.14 | % | |||||||||||||
| Share Price Return | 21.29 | % | 1.37 | % | 1.22 | % | 8.50 | % | 92.04 | % | |||||||||||||
Fund Inception: May 1, 2003
Performance quoted represents past performance. Past performance is not a guarantee of future results and current performance may be higher or lower than performance quoted. Investment returns and principal value will fluctuate and shares, when redeemed, may be worth more or less than their original cost. The Adviser has waived fees and reimbursed other expenses, absent which, performance would have been lower. The Adviser has contractually agreed to waive fees and/or pay certain Fund expenses through August 31, 2012. According to the Fund's current prospectus, the total gross annual operating expense ratio was indicated as 0.60%. In the Financial Highlights section of this Shareholder Report, the Fund's net total operating expense ratio was determined to be 0.60%, while the Fund's gross total expense ratio was determined to be 0.64%. NAV and Share Price returns assume that dividends and capital gain distributions have been reinvested in the Fund at NAV and Share Price, respectively. The returns shown in the table above do not reflect the deduction of taxes that a shareholder would pay on Fund distributions or the redemption or sale of Fund Shares. See invescopowershares.com to find the most recent month-end performance numbers.
Index performance results are based upon a hypothetical investment in its constituent securities. Index returns do not represent Fund returns. An investor cannot invest directly in an index. The Index does not charge management fees or brokerage expenses, and no such fees or expenses were deducted from the hypothetical performance shown. In addition, the results actual investors might have achieved would have differed from those shown because of differences in the timing, amounts of their investments, and fees and expenses associated with an investment in the Fund.
The S&P 500® Index and Russell 3000® Index (the "Benchmark Indices") are unmanaged indices used as a measurement of change in stock market conditions based on the average performance of approximately 500 and 3,000 common stocks, respectively.
† Fund and underlying Index returns are based on the inception date of the Fund. Returns for the Benchmark Indices are based on the closest month-end to the Fund's inception date.
†† Average annualized.
7
Manager's Analysis
PowerShares Dynamic OTC Portfolio (ticker: PWO)
The PowerShares Dynamic OTC Portfolio (the "Fund") seeks investment results that correspond (before fees and expenses) generally to the price and yield performance of the Dynamic OTC IntellidexSM Index (the "Index").
For the fiscal year ended April 30, 2011, the Fund returned 19.34%. Over this same year, the Index returned 20.20%, while the NASDAQ-100® Index returned 21.07% and the NASDAQ Composite Index returned 16.75%. The Fund benefited from positive performance of securities of companies in information technology, industrials and consumer discretionary sectors.
Sector Breakdown (% of the Fund's
Net Assets) as of April 30, 2011
| Information Technology | 53.6 | ||||||
| Consumer Discretionary | 16.0 | ||||||
| Health Care | 13.3 | ||||||
| Financials | 6.7 | ||||||
| Industrials | 4.9 | ||||||
| Consumer Staples | 2.3 | ||||||
| Energy | 1.4 | ||||||
| Telecommunication Services | 1.0 | ||||||
| Materials | 0.8 | ||||||
| Money Market Fund | 0.2 | ||||||
| Liabilities in excess of other assets | (0.2 | ) | |||||
Style Allocation (% of the Fund's
Total Investments) as of April 30, 2011
| Large-Cap Growth | 26.5 | ||||||
| Mid-Cap Growth | 25.9 | ||||||
| Small-Cap Growth | 22.3 | ||||||
| Small-Cap Value | 12.8 | ||||||
| Mid-Cap Value | 6.3 | ||||||
| Large-Cap Value | 6.2 | ||||||
Top Ten Fund Holdings (% of the Fund's
Net Assets) as of April 30, 2011
| Security | |||||||
| TIBCO Software, Inc. | 3.7 | ||||||
| MICROS Systems, Inc. | 3.4 | ||||||
| Automatic Data Processing, Inc. | 3.4 | ||||||
| Symantec Corp. | 3.3 | ||||||
| BMC Software, Inc. | 3.2 | ||||||
| Bed Bath & Beyond, Inc. | 3.1 | ||||||
| Apple, Inc. | 3.1 | ||||||
| CA, Inc. | 3.0 | ||||||
| Paychex, Inc. | 3.0 | ||||||
| Microsoft Corp. | 3.0 | ||||||
| Total | 32.2 | ||||||
8
Manager's Analysis (Continued)
PowerShares Dynamic OTC Portfolio (ticker: PWO)
Growth of a $10,000 Investment Since Inception†
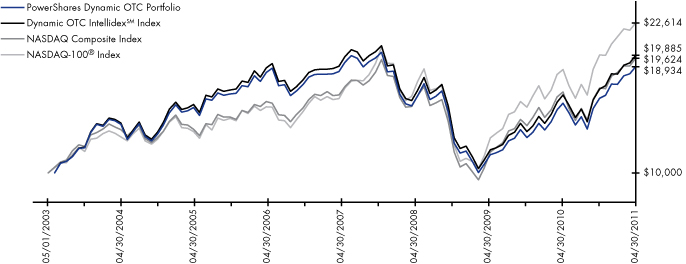
| Fund Performance History (%) | As of April 30, 2011 | ||||||||||||||||||||||
| Avg. Ann.†† | Fund Inception | ||||||||||||||||||||||
| 1 Year | 3 Year | 5 Year | Avg. Ann.†† | Cumulative | |||||||||||||||||||
| Index | |||||||||||||||||||||||
| Dynamic OTC IntellidexSM Index | 20.20 | % | 5.47 | % | 0.72 | % | 8.97 | % | 98.85 | % | |||||||||||||
| NASDAQ Composite Index | 16.75 | % | 6.00 | % | 4.35 | % | 8.79 | % | 96.24 | % | |||||||||||||
| NASDAQ-100® Index | 21.07 | % | 8.56 | % | 7.81 | % | 10.74 | % | 126.14 | % | |||||||||||||
| Fund | |||||||||||||||||||||||
| Net Asset Value ("NAV") Return | 19.34 | % | 4.77 | % | 0.16 | % | 8.31 | % | 89.34 | % | |||||||||||||
| Share Price Return | 19.31 | % | 4.75 | % | 0.15 | % | 8.29 | % | 89.08 | % | |||||||||||||
Fund Inception: May 1, 2003
Performance quoted represents past performance. Past performance is not a guarantee of future results and current performance may be higher or lower than performance quoted. Investment returns and principal value will fluctuate and shares, when redeemed, may be worth more or less than their original cost. The Adviser has waived fees and reimbursed other expenses, absent which, performance would have been lower. The Adviser has contractually agreed to waive fees and/or pay certain Fund expenses through August 31, 2012. According to the Fund's current prospectus, the total gross annual operating expense ratio was indicated as 0.85%. In the Financial Highlights section of this Shareholder Report, the Fund's net total operating expense ratio was determined to be 0.60%, while the Fund's gross total expense ratio was determined to be 0.91%. NAV and Share Price returns assume that dividends and capital gain distributions have been reinvested in the Fund at NAV and Share Price, respectively. The returns shown in the table above do not reflect the deduction of taxes that a shareholder would pay on Fund distributions or the redemption or sale of Fund Shares. See invescopowershares.com to find the most recent month-end performance numbers.
Index performance results are based upon a hypothetical investment in its constituent securities. Index returns do not represent Fund returns. An investor cannot invest directly in an index. The Index does not charge management fees or brokerage expenses, and no such fees or expenses were deducted from the hypothetical performance shown. In addition, the results actual investors might have achieved would have differed from those shown because of differences in the timing, amounts of their investments, and fees and expenses associated with an investment in the Fund.
The NASDAQ Composite Index and NASDAQ-100® Index (the "Benchmark Indices") are unmanaged indices used as a measurement of change in stock market conditions based on the average performance of approximately 2,995 and 100 common stocks, respectively.
† Fund and underlying Index returns are based on the inception date of the Fund. Returns for the Benchmark Indices are based on the closest month-end to the Fund's inception date.
†† Average annualized.
9
Manager's Analysis
PowerShares FTSE RAFI US 1000 Portfolio (ticker: PRF)
The PowerShares FTSE RAFI US 1000 Portfolio (the "Fund") seeks investment results that correspond (before fees and expenses) generally to the price and yield performance of the FTSE RAFI US 1000 Index (the "Index").
For the fiscal year ended April 30, 2011, the Fund returned 16.72%. Over this same year, the Index returned 17.16%, while the S&P 500® Index returned 17.24% and the Russell 1000® Index returned 18.02%. The Fund benefited from positive performance of securities of companies in the energy, industrials and consumer discretionary sectors.
Sector Breakdown (% of the Fund's
Net Assets) as of April 30, 2011
| Financials | 20.1 | ||||||
| Energy | 11.7 | ||||||
| Industrials | 11.5 | ||||||
| Health Care | 10.7 | ||||||
| Information Technology | 10.7 | ||||||
| Consumer Discretionary | 10.6 | ||||||
| Consumer Staples | 10.5 | ||||||
| Utilities | 5.6 | ||||||
| Telecommunication Services | 4.7 | ||||||
| Materials | 3.9 | ||||||
| Money Market Fund | 0.0 | ||||||
| Liabilities in excess of other assets | (0.0 | ) | |||||
Style Allocation (% of the Fund's
Total Investments) as of April 30, 2011
| Large-Cap Value | 44.2 | ||||||
| Large-Cap Growth | 30.3 | ||||||
| Mid-Cap Value | 12.7 | ||||||
| Mid-Cap Growth | 8.3 | ||||||
| Small-Cap Value | 3.2 | ||||||
| Small-Cap Growth | 1.3 | ||||||
Top Ten Fund Holdings (% of the Fund's
Net Assets) as of April 30, 2011
| Security | |||||||
| Exxon Mobil Corp. | 3.0 | ||||||
| AT&T, Inc. | 2.3 | ||||||
| General Electric Co. | 2.1 | ||||||
| Bank of America Corp. | 2.0 | ||||||
| Chevron Corp. | 1.9 | ||||||
| JPMorgan Chase & Co. | 1.7 | ||||||
| Citigroup, Inc. | 1.7 | ||||||
| Pfizer, Inc. | 1.6 | ||||||
| Wal-Mart Stores, Inc. | 1.5 | ||||||
| Verizon Communications, Inc. | 1.4 | ||||||
| Total | 19.2 | ||||||
10
Manager's Analysis (Continued)
PowerShares FTSE RAFI US 1000 Portfolio (ticker: PRF)
Growth of a $10,000 Investment Since Inception†
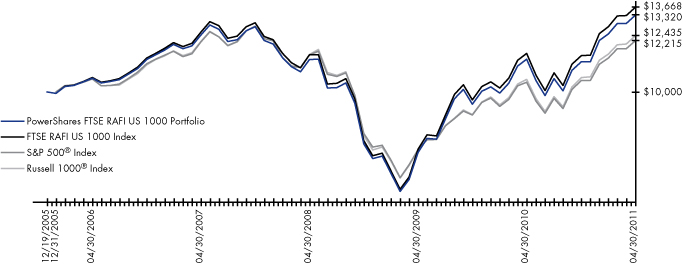
| Fund Performance History (%) | As of April 30, 2011 | ||||||||||||||||||||||
| Avg. Ann.†† | Fund Inception | ||||||||||||||||||||||
| 1 Year | 3 Year | 5 Year | Avg. Ann.†† | Cumulative | |||||||||||||||||||
| Index | |||||||||||||||||||||||
| FTSE RAFI US 1000 Index | 17.16 | % | 5.64 | % | 5.18 | % | 6.00 | % | 36.68 | % | |||||||||||||
| S&P 500® Index | 17.24 | % | 1.74 | % | 2.95 | % | 3.82 | % | 22.15 | % | |||||||||||||
| Russell 1000® Index | 18.02 | % | 2.30 | % | 3.30 | % | 4.17 | % | 24.35 | % | |||||||||||||
| Fund | |||||||||||||||||||||||
| Net Asset Value ("NAV") Return | 16.72 | % | 5.31 | % | 4.70 | % | 5.49 | % | 33.20 | % | |||||||||||||
| Share Price Return | 16.63 | % | 5.34 | % | 4.69 | % | 5.54 | % | 33.53 | % | |||||||||||||
Fund Inception: December 19, 2005
Performance quoted represents past performance. Past performance is not a guarantee of future results and current performance may be higher or lower than performance quoted. Investment returns and principal value will fluctuate and shares, when redeemed, may be worth more or less than their original cost. The Adviser has waived fees and reimbursed other expenses, absent which, performance would have been lower. The Adviser has contractually agreed to waive fees and/or pay certain Fund expenses through August 31, 2012. According to the Fund's current prospectus, the total gross annual operating expense ratio was indicated as 0.45%. In the Financial Highlights section of this Shareholder Report, the Fund's net total operating expense ratio was determined to be 0.39%, while the Fund's gross total expense ratio was determined to be 0.44%. NAV and Share Price returns that dividends and capital gain distributions have been reinvested in the Fund at NAV and Share Price, respectively. The returns shown in the table above do not reflect the deduction of taxes that a shareholder would pay on Fund distributions or the redemption or sale of Fund Shares. See invescopowershares.com to find the most recent month-end performance numbers.
Index performance results are based upon a hypothetical investment in its constituent securities. Index returns do not represent Fund returns. An investor cannot invest directly in an index. The Index does not charge management fees or brokerage expenses, and no such fees or expenses were deducted from the hypothetical performance shown. In addition, the results actual investors might have achieved would have differed from those shown because of differences in the timing, amounts of their investments, and fees and expenses associated with an investment in the Fund.
The S&P 500® Index and Russell 1000® Index (the "Benchmark Indices") are unmanaged indices used as a measurement of change in stock market conditions based on the average performance of approximately 500 and 1,000 common stocks, respectively.
† Fund and underlying Index returns are based on the inception date of the Fund. Returns for the Benchmark Indices are based on the closest month-end to the Fund's inception date.
†† Average annualized.
11
Manager's Analysis
PowerShares FTSE RAFI US 1500 Small-Mid Portfolio (ticker: PRFZ)
The PowerShares FTSE RAFI US 1500 Small-Mid Portfolio (the "Fund") seeks investment results that correspond (before fees and expenses) generally to the price and yield performance of the FTSE RAFI US 1500 Small-Mid Index (the "Index").
For the fiscal year ended April 30, 2011, the Fund returned 19.04%. Over this same year, the Index returned 19.39%, while the S&P Small Cap 600® Index returned 21.42% and the Russell 2000® Index returned 22.20%. The Fund benefited from positive performance of securities of companies in the information technology, industrials and energy sectors. The Fund was positive for securities of companies within each sector in which it was invested.
Sector Breakdown (% of the Fund's
Net Assets) as of April 30, 2011
| Financials | 18.9 | ||||||
| Industrials | 18.6 | ||||||
| Information Technology | 17.7 | ||||||
| Consumer Discretionary | 17.1 | ||||||
| Health Care | 8.7 | ||||||
| Energy | 6.7 | ||||||
| Materials | 6.2 | ||||||
| Consumer Staples | 3.1 | ||||||
| Utilities | 1.8 | ||||||
| Telecommunication Services | 1.2 | ||||||
| Money Market Fund | 0.1 | ||||||
| Liabilities in excess of other assets | (0.1 | ) | |||||
Style Allocation (% of the Fund's
Total Investments) as of April 30, 2011
| Small-Cap Value | 47.4 | ||||||
| Small-Cap Growth | 40.3 | ||||||
| Mid-Cap Growth | 9.3 | ||||||
| Mid-Cap Value | 2.7 | ||||||
| Large-Cap Growth | 0.3 | ||||||
Top Ten Fund Holdings (% of the Fund's
Net Assets) as of April 30, 2011
| Security | |||||||
| Hercules Offshore, Inc. | 0.2 | ||||||
| Georgia Gulf Corp. | 0.2 | ||||||
| Fairchild Semiconductor International, Inc. | 0.2 | ||||||
| Ashford Hospitality Trust, Inc. | 0.2 | ||||||
| Children's Place Retail Stores, Inc. (The) | 0.2 | ||||||
| SINA Corp. | 0.2 | ||||||
| Polycom, Inc. | 0.2 | ||||||
| Old Dominion Freight Line, Inc. | 0.2 | ||||||
| Century Aluminum Co. | 0.2 | ||||||
| WellCare Health Plans, Inc. | 0.2 | ||||||
| Total | 2.0 | ||||||
12
Manager's Analysis (Continued)
PowerShares FTSE RAFI US 1500 Small-Mid Portfolio (ticker: PRFZ)
Growth of a $10,000 Investment Since Inception†

| Fund Performance History (%) | As of April 30, 2011 | ||||||||||||||||||
| Avg. Ann.†† | Fund Inception | ||||||||||||||||||
| 1 Year | 3 Year | Avg. Ann.†† | Cumulative | ||||||||||||||||
| Index | |||||||||||||||||||
| FTSE RAFI US 1500 Small-Mid Index | 19.39 | % | 12.99 | % | 8.75 | % | 47.17 | % | |||||||||||
| S&P Small Cap 600® Index | 21.42 | % | 7.87 | % | 5.87 | % | 29.90 | % | |||||||||||
| Russell 2000® Index | 22.20 | % | 8.03 | % | 5.33 | % | 26.86 | % | |||||||||||
| Fund | |||||||||||||||||||
| Net Asset Value ("NAV") Return | 19.04 | % | 12.94 | % | 8.44 | % | 45.25 | % | |||||||||||
| Share Price Return | 19.06 | % | 12.97 | % | 8.43 | % | 45.21 | % | |||||||||||
Fund Inception: September 20, 2006
Performance quoted represents past performance. Past performance is not a guarantee of future results and current performance may be higher or lower than performance quoted. Investment returns and principal value will fluctuate and shares, when redeemed, may be worth more or less than their original cost. The Adviser has waived fees and reimbursed other expenses, absent which, performance would have been lower. The Adviser has contractually agreed to waive fees and/or pay certain Fund expenses through August 31, 2012. According to the Fund's current prospectus, the total gross annual operating expense ratio was indicated as 0.51%. In the Financial Highlights section of this Shareholder Report, the Fund's net total operating expense ratio was determined to be 0.39%, while the Fund's gross total expense ratio was determined to be 0.46%. NAV and Share Price returns that dividends and capital gain distributions have been reinvested in the Fund at NAV and Share Price, respectively. The returns shown in the table above do not reflect the deduction of taxes that a shareholder would pay on Fund distributions or the redemption or sale of Fund Shares. See invescopowershares.com to find the most recent month-end performance numbers.
Index performance results are based upon a hypothetical investment in its constituent securities. Index returns do not represent Fund returns. An investor cannot invest directly in an index. The Index does not charge management fees or brokerage expenses, and no such fees or expenses were deducted from the hypothetical performance shown. In addition, the results actual investors might have achieved would have differed from those shown because of differences in the timing, amounts of their investments, and fees and expenses associated with an investment in the Fund.
The difference in performance between the underlying index and the Fund was due to corporate actions on the index and Fund constituents which were not included in Index performance but have been realized by the Fund. The S&P Small Cap 600® Index and Russell 2000® Index (the "Benchmark Indices") are unmanaged indices used as a measurement of change in stock market conditions based on the average performance of approximately 600 and 2,000 common stocks, respectively.
† Fund and underlying Index returns are based on the inception date of the Fund. Returns for the Benchmark Indices are based on the closest month-end to the Fund's inception date.
†† Average annualized.
13
Frequency Distribution of Discounts & Premiums
Since Inception through April 30, 2011
| Closing Price Above NAV (bps) | |||||||||||||||||||||||||||||||||||||||
| Ticker | Fund Name | Inception | Trading Days | 0-24 | 25-49 | 50-99 | 100-149 | 150-199 | 200+ | ||||||||||||||||||||||||||||||
| PIQ | PowerShares Dynamic MagniQuant Portfolio | 10/12/06 | 1145 | 407 | 22 | 1 | 1 | 0 | 0 | ||||||||||||||||||||||||||||||
| PWC | PowerShares Dynamic Market Portfolio | 05/01/03 | 1901 | 844 | 72 | 12 | 2 | 0 | 0 | ||||||||||||||||||||||||||||||
| PWO | PowerShares Dynamic OTC Portfolio | 05/01/03 | 1901 | 833 | 39 | 16 | 1 | 1 | 0 | ||||||||||||||||||||||||||||||
| PRF | PowerShares FTSE RAFI US 1000 Portfolio | 12/19/05 | 1341 | 682 | 16 | 5 | 0 | 0 | 2 | ||||||||||||||||||||||||||||||
| PRFZ | PowerShares FTSE RAFI US 1500 Small-Mid Portfolio | 09/20/06 | 1161 | 503 | 22 | 4 | 0 | 2 | 2 | ||||||||||||||||||||||||||||||
14
| Closing Price Below NAV (bps) | |||||||||||||||||||||||||||
| Ticker | -0-24 | -25-49 | -50-99 | -100-149 | -150-199 | -200+ | |||||||||||||||||||||
| PIQ | 700 | 11 | 3 | 0 | 0 | 0 | |||||||||||||||||||||
| PWC | 956 | 11 | 4 | 0 | 0 | 0 | |||||||||||||||||||||
| PWO | 988 | 19 | 4 | 0 | 0 | 0 | |||||||||||||||||||||
| PRF | 601 | 24 | 9 | 2 | 0 | 0 | |||||||||||||||||||||
| PRFZ | 590 | 34 | 4 | 0 | 0 | 0 | |||||||||||||||||||||
15
Fees and Expenses
As a shareholder of a Fund of the PowerShares Exchange-Traded Fund Trust, you incur advisory fees and other Fund expenses. The expense examples below are intended to help you understand your ongoing costs (in dollars) of investing in the Funds and to compare these costs with the ongoing costs of investing in other funds.
The example is based on an investment of $1,000 invested at the beginning of the period and held through the six-month period ended April 30, 2011.
Actual Expenses
The first line in the following table provides information about actual account values and actual expenses. You may use the information in this line, together with the amount you invested, to estimate the expenses that you paid over the period. Simply divide your account value by $1,000 (for example, an $8,600 account value divided by $1,000 = 8.6), then multiply the result by the number in the first line under the heading "Expenses Paid During the Six-Month Period" to estimate the expenses you paid on your account during this period.
Hypothetical Example for Comparison Purposes
The second line in the following table provides information about hypothetical account values and hypothetical expenses based on each Fund's actual expense ratio and an assumed annualized rate of return of 5% per year before expenses, which is not the Fund's actual return. The hypothetical account values and expenses may not be used to estimate the actual ending account balance or expenses you paid for the period. You may use this information to compare the ongoing costs of investing in the Funds and other funds. To do so, compare this 5% hypothetical example with the 5% hypothetical examples that appear in the shareholder reports of the other funds.
Please note that the expenses shown in the table are meant to highlight your ongoing costs only, and do not reflect any transactional costs such as sales charges and brokerage commissions. Therefore the second line in the table is useful in comparing ongoing costs only, and will not help you determine the relative total costs of owning different funds. In addition, if these transactional costs were included, your costs would have been higher.
| Beginning Account Value November 1, 2010 | Ending Account Value April 30, 2011 | Annualized Expense Ratio Based on the Six-Month Period | Expenses Paid During the Six-Month Period(1) | ||||||||||||||||
| PowerShares Dynamic MagniQuant Portfolio Actual | $ | 1,000.00 | $ | 1,209.12 | 0.65 | % | $ | 3.56 | |||||||||||
| Hypothetical (5% return before expenses) | $ | 1,000.00 | $ | 1,021.57 | 0.65 | % | $ | 3.26 | |||||||||||
| PowerShares Dynamic Market Portfolio Actual | $ | 1,000.00 | $ | 1,181.40 | 0.60 | % | $ | 3.25 | |||||||||||
| Hypothetical (5% return before expenses) | $ | 1,000.00 | $ | 1,021.82 | 0.60 | % | $ | 3.01 | |||||||||||
| PowerShares Dynamic OTC Portfolio Actual | $ | 1,000.00 | $ | 1,163.15 | 0.60 | % | $ | 3.22 | |||||||||||
| Hypothetical (5% return before expenses) | $ | 1,000.00 | $ | 1,021.82 | 0.60 | % | $ | 3.01 | |||||||||||
| PowerShares FTSE RAFI US 1000 Portfolio Actual | $ | 1,000.00 | $ | 1,178.64 | 0.39 | % | $ | 2.11 | |||||||||||
| Hypothetical (5% return before expenses) | $ | 1,000.00 | $ | 1,022.86 | 0.39 | % | $ | 1.96 | |||||||||||
| PowerShares FTSE RAFI US 1500 Small-Mid | Portfolio | ||||||||||||||||||
| Actual | $ | 1,000.00 | $ | 1,231.11 | 0.39 | % | $ | 2.16 | |||||||||||
| Hypothetical (5% return before expenses) | $ | 1,000.00 | $ | 1,022.86 | 0.39 | % | $ | 1.96 | |||||||||||
(1) Expenses are calculated using the annualized expense ratio, which represents the ongoing expenses as a percentage of net assets for the six months ended April 30, 2011. Expenses are calculated by multiplying the Fund's annualized expense ratio by the average account value for the period; then multiplying the result by 181 and then dividing the result by 365. Expense ratios for the most recent half-year may differ from expense ratios based on the one year data in the Financial Highlights.
16
Schedule of Investments
PowerShares Dynamic MagniQuant Portfolio
April 30, 2011
| Number of Shares | Value | ||||||||||
| Common Stocks and Other Equity Interests—100.0% | |||||||||||
| Consumer Discretionary—13.9% | |||||||||||
| 4,080 | Ascena Retail Group, Inc.* | $ | 127,663 | ||||||||
| 1,725 | Autoliv, Inc. | 138,224 | |||||||||
| 2,666 | Bed Bath & Beyond, Inc.* | 149,616 | |||||||||
| 305 | Biglari Holdings, Inc.* | 133,358 | |||||||||
| 3,345 | Buckle, Inc. (The) | 152,164 | |||||||||
| 2,340 | Coach, Inc. | 139,955 | |||||||||
| 5,064 | Comcast Corp., Class A | 132,879 | |||||||||
| 3,043 | Dillard's, Inc., Class A | 146,125 | |||||||||
| 6,617 | Foot Locker, Inc. | 142,398 | |||||||||
| 3,840 | General Motors Co.* | 123,226 | |||||||||
| 2,402 | Lear Corp. | 122,838 | |||||||||
| 3,948 | Limited Brands, Inc. | 162,500 | |||||||||
| 1,720 | McDonald's Corp. | 134,693 | |||||||||
| 2,813 | Nordstrom, Inc. | 133,758 | |||||||||
| 4,414 | Papa John's International, Inc.* | 132,685 | |||||||||
| 9,162 | Pep Boys - Manny, Moe & Jack (The) | 125,519 | |||||||||
| 3,113 | PetSmart, Inc. | 131,275 | |||||||||
| 1,700 | Polaris Industries, Inc. | 179,231 | |||||||||
| 278 | priceline.com, Inc.* | 152,069 | |||||||||
| 1,788 | Ross Stores, Inc. | 131,758 | |||||||||
| 3,928 | Starbucks Corp. | 142,154 | |||||||||
| 2,445 | Target Corp. | 120,050 | |||||||||
| 1,796 | Time Warner Cable, Inc. | 140,322 | |||||||||
| 2,544 | TJX Cos., Inc. (The) | 136,409 | |||||||||
| 2,215 | TRW Automotive Holdings Corp.* | 126,388 | |||||||||
| 2,374 | Tupperware Brands Corp. | 151,153 | |||||||||
| 2,558 | Yum! Brands, Inc. | 137,211 | |||||||||
| 3,745,621 | |||||||||||
| Consumer Staples—7.6% | |||||||||||
| 1,396 | Boston Beer Co., Inc., Class A* | 131,587 | |||||||||
| 1,864 | Brown-Forman Corp., Class B | 133,947 | |||||||||
| 3,048 | Casey's General Stores, Inc. | 118,963 | |||||||||
| 2,302 | Coca-Cola Bottling Co. Consolidated | 162,176 | |||||||||
| 6,274 | Constellation Brands, Inc., Class A* | 140,475 | |||||||||
| 3,518 | Dr Pepper Snapple Group, Inc. | 137,906 | |||||||||
| 4,242 | Elizabeth Arden, Inc.* | 127,514 | |||||||||
| 1,377 | Estee Lauder Cos., Inc. (The), Class A | 133,569 | |||||||||
| 1,632 | Herbalife Ltd. (Cayman Islands) | 146,521 | |||||||||
| 4,703 | Hormel Foods Corp. | 138,315 | |||||||||
| 6,985 | Inter Parfums, Inc. | 132,925 | |||||||||
| 2,702 | McCormick & Co., Inc. | 132,722 | |||||||||
| 3,774 | Reynolds American, Inc. | 140,053 | |||||||||
| 5,571 | Smithfield Foods, Inc.* | 131,253 | |||||||||
| 3,048 | Walgreen Co. | 130,211 | |||||||||
| 2,038,137 | |||||||||||
| Energy—3.6% | |||||||||||
| 2,334 | Alliance Holdings GP LP | 121,951 | |||||||||
| 1,258 | Clayton Williams Energy, Inc.* | 113,937 | |||||||||
| 6,447 | Cloud Peak Energy, Inc.* | 134,227 | |||||||||
| Number of Shares | Value | ||||||||||
| Common Stocks and Other Equity Interests (Continued) | |||||||||||
| 5,620 | McDermott International, Inc.* | $ | 129,766 | ||||||||
| 1,599 | National Oilwell Varco, Inc. | 122,627 | |||||||||
| 1,221 | OYO Geospace Corp.* | 113,895 | |||||||||
| 16,096 | VAALCO Energy, Inc.* | 112,189 | |||||||||
| 5,031 | W&T Offshore, Inc. | 134,881 | |||||||||
| 983,473 | |||||||||||
| Financials—14.2% | |||||||||||
| 2,207 | Aflac, Inc. | 124,011 | |||||||||
| 3,712 | American Financial Group, Inc. | 132,778 | |||||||||
| 2,018 | Ameriprise Financial, Inc. | 125,237 | |||||||||
| 6,639 | AmTrust Financial Services, Inc. | 128,133 | |||||||||
| 3,542 | Axis Capital Holdings Ltd. (Bermuda) | 125,245 | |||||||||
| 4,875 | Brown & Brown, Inc. | 126,019 | |||||||||
| 5,125 | CB Richard Ellis Group, Inc., Class A* | 136,889 | |||||||||
| 2,132 | Chubb Corp. (The) | 138,985 | |||||||||
| 3,198 | Commerce Bancshares, Inc. | 136,107 | |||||||||
| 1,821 | Credit Acceptance Corp.* | 147,319 | |||||||||
| 5,864 | Discover Financial Services | 145,662 | |||||||||
| 1,845 | Erie Indemnity Co., Class A | 133,633 | |||||||||
| 4,131 | FBL Financial Group, Inc., Class A | 125,996 | |||||||||
| 19,335 | Fortress Investment Group LLC, Class A* | 119,297 | |||||||||
| 1,022 | Franklin Resources, Inc. | 131,961 | |||||||||
| 4,080 | HCC Insurance Holdings, Inc. | 132,763 | |||||||||
| 2,089 | Infinity Property & Casualty Corp. | 123,460 | |||||||||
| 3,884 | Leucadia National Corp. | 150,156 | |||||||||
| 310 | Markel Corp.* | 129,357 | |||||||||
| 5,948 | MarketAxess Holdings, Inc. | 144,834 | |||||||||
| 6,261 | Progressive Corp. (The) | 137,366 | |||||||||
| 3,384 | Raymond James Financial, Inc. | 126,900 | |||||||||
| 2,158 | Reinsurance Group of America, Inc. | 136,601 | |||||||||
| 2,648 | Safety Insurance Group, Inc. | 123,979 | |||||||||
| 5,519 | SEI Investments Co. | 123,239 | |||||||||
| 1,984 | Torchmark Corp. | 132,769 | |||||||||
| 4,800 | Unum Group | 127,104 | |||||||||
| 3,114 | Waddell & Reed Financial, Inc., Class A | 127,705 | |||||||||
| 2,129 | World Acceptance Corp.* | 144,666 | |||||||||
| 3,838,171 | |||||||||||
| Health Care—13.4% | |||||||||||
| 3,027 | Agilent Technologies, Inc.* | 151,078 | |||||||||
| 2,232 | Air Methods Corp.* | 150,928 | |||||||||
| 2,205 | AMERIGROUP Corp.* | 150,602 | |||||||||
| 3,422 | AmerisourceBergen Corp. | 139,070 | |||||||||
| 1,883 | Biogen Idec, Inc.* | 183,310 | |||||||||
| 3,045 | CIGNA Corp. | 142,597 | |||||||||
| 2,082 | Cooper Cos., Inc. (The) | 155,942 | |||||||||
| 2,596 | CorVel Corp.* | 134,473 | |||||||||
| 4,249 | Coventry Health Care, Inc.* | 137,115 | |||||||||
| 3,744 | Eli Lilly & Co. | 138,566 | |||||||||
| 3,736 | Endo Pharmaceuticals Holdings, Inc.* | 146,302 | |||||||||
See Notes to Financial Statements.
17
Schedule of Investments (Continued)
PowerShares Dynamic MagniQuant Portfolio
April 30, 2011
| Number of Shares | Value | ||||||||||
| Common Stocks and Other Equity Interests (Continued) | |||||||||||
| 13,369 | Health Management Associates, Inc., Class A* | $ | 150,802 | ||||||||
| 4,307 | Health Net, Inc.* | 143,423 | |||||||||
| 3,418 | Healthspring, Inc.* | 141,813 | |||||||||
| 3,351 | Hill-Rom Holdings, Inc. | 150,829 | |||||||||
| 6,505 | Immucor, Inc.* | 142,004 | |||||||||
| 2,581 | Integra LifeSciences Holdings Corp.* | 135,012 | |||||||||
| 2,707 | Kinetic Concepts, Inc.* | 159,794 | |||||||||
| 2,658 | Magellan Health Services, Inc.* | 138,269 | |||||||||
| 4,945 | PSS World Medical, Inc.* | 142,218 | |||||||||
| 2,256 | Quest Diagnostics, Inc. | 127,193 | |||||||||
| 12,427 | Sunrise Senior Living, Inc.* | 128,992 | |||||||||
| 3,006 | UnitedHealth Group, Inc. | 147,985 | |||||||||
| 1,866 | Varian Medical Systems, Inc.* | 130,993 | |||||||||
| 1,926 | WellPoint, Inc. | 147,898 | |||||||||
| 3,617,208 | |||||||||||
| Industrials—23.2% | |||||||||||
| 4,797 | ABM Industries, Inc. | 116,663 | |||||||||
| 16,178 | Air Transport Services Group, Inc.* | 132,336 | |||||||||
| 2,165 | Alaska Air Group, Inc.* | 142,609 | |||||||||
| 1,326 | Amerco, Inc.* | 134,881 | |||||||||
| 3,036 | AMETEK, Inc. | 139,777 | |||||||||
| 3,932 | Applied Industrial Technologies, Inc. | 138,642 | |||||||||
| 2,709 | Cascade Corp. | 124,072 | |||||||||
| 1,258 | Caterpillar, Inc. | 145,186 | |||||||||
| 3,103 | CLARCOR, Inc. | 140,225 | |||||||||
| 5,785 | Colfax Corp.* | 126,402 | |||||||||
| 2,734 | Crane Co. | 136,454 | |||||||||
| 2,522 | Cubic Corp. | 136,390 | |||||||||
| 1,995 | Dover Corp. | 135,740 | |||||||||
| 7,662 | Dycom Industries, Inc.* | 113,857 | |||||||||
| 2,396 | Eaton Corp. | 128,258 | |||||||||
| 2,135 | Emerson Electric Co. | 129,723 | |||||||||
| 3,625 | Equifax, Inc. | 136,046 | |||||||||
| 1,790 | Esterline Technologies Corp.* | 128,522 | |||||||||
| 1,786 | Gardner Denver, Inc. | 154,328 | |||||||||
| 1,689 | General Dynamics Corp. | 122,993 | |||||||||
| 6,138 | General Electric Co. | 125,522 | |||||||||
| 16,881 | Great Lakes Dredge & Dock Corp. | 125,763 | |||||||||
| 2,228 | Honeywell International, Inc. | 136,420 | |||||||||
| 2,203 | ITT Corp. | 127,311 | |||||||||
| 3,117 | J.B. Hunt Transport Services, Inc. | 148,619 | |||||||||
| 6,779 | John Bean Technologies Corp. | 137,004 | |||||||||
| 1,367 | Joy Global, Inc. | 137,999 | |||||||||
| 3,897 | KBR, Inc. | 149,528 | |||||||||
| 6,205 | Knoll, Inc. | 121,804 | |||||||||
| 1,593 | Lockheed Martin Corp. | 126,245 | |||||||||
| 5,357 | Macquarie Infrastructure Co. LLC * | 134,461 | |||||||||
| 1,419 | Middleby Corp. (The)* | 127,242 | |||||||||
| 1,442 | Parker Hannifin Corp. | 136,009 | |||||||||
| Number of Shares | Value | ||||||||||
| Common Stocks and Other Equity Interests (Continued) | |||||||||||
| 3,031 | Robbins & Myers, Inc. | $ | 131,758 | ||||||||
| 6,552 | Rollins, Inc. | 137,395 | |||||||||
| 4,266 | Sauer-Danfoss, Inc.* | 251,737 | |||||||||
| 56 | Seaboard Corp. | 133,672 | |||||||||
| 8,116 | SkyWest, Inc. | 134,158 | |||||||||
| 6,968 | Sykes Enterprises, Inc.* | 139,569 | |||||||||
| 2,319 | Thomas & Betts Corp.* | 134,432 | |||||||||
| 5,910 | Trimas Corp.* | 137,171 | |||||||||
| 2,865 | Tyco International Ltd. (Switzerland) | 139,640 | |||||||||
| 1,358 | Union Pacific Corp. | 140,512 | |||||||||
| 1,745 | United Parcel Service, Inc., Class B | 130,823 | |||||||||
| 1,533 | United Technologies Corp. | 137,326 | |||||||||
| 3,947 | Verisk Analytics, Inc., Class A* | 129,856 | |||||||||
| 6,275,080 | |||||||||||
| Information Technology—16.5% | |||||||||||
| 4,157 | ACI Worldwide, Inc.* | 137,347 | |||||||||
| 367 | Apple, Inc.* | 127,800 | |||||||||
| 7,919 | Applied Materials, Inc. | 124,249 | |||||||||
| 8,519 | Atmel Corp.* | 130,341 | |||||||||
| 2,571 | Automatic Data Processing, Inc. | 139,734 | |||||||||
| 3,304 | Black Box Corp. | 115,442 | |||||||||
| 2,615 | BMC Software, Inc.* | 131,351 | |||||||||
| 5,157 | CA, Inc. | 126,811 | |||||||||
| 1,223 | FactSet Research Systems, Inc. | 133,808 | |||||||||
| 3,771 | FEI Co.* | 122,407 | |||||||||
| 2,031 | Fiserv, Inc.* | 124,521 | |||||||||
| 11,665 | GT Solar International, Inc.* | 130,298 | |||||||||
| 789 | International Business Machines Corp. | 134,588 | |||||||||
| 4,030 | Jack Henry & Associates, Inc. | 136,899 | |||||||||
| 2,605 | KLA-Tencor Corp. | 114,359 | |||||||||
| 2,312 | Lam Research Corp.* | 111,693 | |||||||||
| 1,613 | Loral Space & Communications, Inc.* | 112,749 | |||||||||
| 19,944 | Magma Design Automation, Inc.* | 126,844 | |||||||||
| 4,808 | Microsoft Corp. | 125,104 | |||||||||
| 6,668 | NCR Corp.* | 132,093 | |||||||||
| 5,106 | NetScout Systems, Inc.* | 130,662 | |||||||||
| 3,177 | Novellus Systems, Inc.* | 101,982 | |||||||||
| 3,875 | Paychex, Inc. | 126,751 | |||||||||
| 2,472 | Solera Holdings, Inc. | 135,960 | |||||||||
| 7,028 | Symantec Corp.* | 138,100 | |||||||||
| 2,420 | Syntel, Inc. | 132,326 | |||||||||
| 3,585 | TE Connectivity Ltd. (Switzerland) | 128,522 | |||||||||
| 5,597 | TeleTech Holdings, Inc.* | 111,212 | |||||||||
| 3,583 | Texas Instruments, Inc. | 127,304 | |||||||||
| 5,196 | TIBCO Software, Inc.* | 155,828 | |||||||||
| 7,255 | Total System Services, Inc. | 136,757 | |||||||||
| 2,648 | Varian Semiconductor Equipment Associates, Inc.* | 111,031 | |||||||||
| 3,788 | Verint Systems, Inc.* | 129,663 | |||||||||
| 7,165 | Vishay Intertechnology, Inc.* | 136,708 | |||||||||
See Notes to Financial Statements.
18
Schedule of Investments (Continued)
PowerShares Dynamic MagniQuant Portfolio
April 30, 2011
| Number of Shares | Value | ||||||||||
| Common Stocks and Other Equity Interests (Continued) | |||||||||||
| 5,884 | Western Union Co. (The) | $ | 125,035 | ||||||||
| 4,466,279 | |||||||||||
| Materials—5.8% | |||||||||||
| 1,396 | Air Products & Chemicals, Inc. | 133,346 | |||||||||
| 2,229 | Albemarle Corp. | 157,256 | |||||||||
| 14,835 | Boise, Inc. | 145,680 | |||||||||
| 4,870 | Buckeye Technologies, Inc. | 137,139 | |||||||||
| 3,013 | Cabot Corp. | 135,133 | |||||||||
| 1,454 | Domtar Corp. | 135,251 | |||||||||
| 1,684 | FMC Corp. | 148,663 | |||||||||
| 2,434 | Freeport-McMoRan Copper & Gold, Inc. | 133,943 | |||||||||
| 2,563 | Kronos Worldwide, Inc. | 157,778 | |||||||||
| 1,503 | Mosaic Co. (The) | 112,515 | |||||||||
| 4,538 | TPC Group, Inc.* | 178,979 | |||||||||
| 1,575,683 | |||||||||||
| Telecommunication Services—0.8% | |||||||||||
| 5,674 | Fairpoint Communications, Inc.* | 94,983 | |||||||||
| 10,679 | General Communication, Inc., Class A* | 122,808 | |||||||||
| 217,791 | |||||||||||
| Utilities—1.0% | |||||||||||
| 3,319 | Alliant Energy Corp. | 131,233 | |||||||||
| 3,132 | MGE Energy, Inc. | 131,576 | |||||||||
| 262,809 | |||||||||||
| Total Common Stocks and Other Equity Interests (Cost $23,318,106) | 27,020,252 | ||||||||||
| Money Market Fund—0.3% | |||||||||||
| 84,329 | Goldman Sachs Financial Square Prime Obligations Institutional Share Class (Cost $84,329) | 84,329 | |||||||||
| Total Investments (Cost $23,402,435)—100.3% | 27,104,581 | ||||||||||
| Liabilities in excess of other assets—(0.3%) | (80,127 | ) | |||||||||
| Net Assets—100.0% | $ | 27,024,454 | |||||||||
Notes to Schedule of Investments:
* Non-income producing security.
See Notes to Financial Statements.
19
Schedule of Investments
PowerShares Dynamic Market Portfolio
April 30, 2011
| Number of Shares | Value | ||||||||||
| Common Stocks and Other Equity Interests—100.0% | |||||||||||
| Consumer Discretionary—12.7% | |||||||||||
| 20,832 | Ascena Retail Group, Inc.* | $ | 651,833 | ||||||||
| 8,769 | Autoliv, Inc. | 702,660 | |||||||||
| 1,554 | Biglari Holdings, Inc.* | 679,471 | |||||||||
| 17,004 | Buckle, Inc. (The) | 773,512 | |||||||||
| 15,525 | Dillard's, Inc., Class A | 745,510 | |||||||||
| 33,768 | Foot Locker, Inc. | 726,687 | |||||||||
| 117,567 | Limited Brands, Inc. | 4,839,058 | |||||||||
| 51,043 | McDonald's Corp. | 3,997,177 | |||||||||
| 22,463 | Papa John's International, Inc.* | 675,238 | |||||||||
| 15,821 | PetSmart, Inc. | 667,172 | |||||||||
| 8,647 | Polaris Industries, Inc. | 911,653 | |||||||||
| 53,017 | Ross Stores, Inc. | 3,906,823 | |||||||||
| 75,499 | TJX Cos., Inc. (The) | 4,048,256 | |||||||||
| 11,294 | TRW Automotive Holdings Corp.* | 644,436 | |||||||||
| 23,969,486 | |||||||||||
| Consumer Staples—9.3% | |||||||||||
| 9,125 | Boston Beer Co., Inc., Class A* | 860,123 | |||||||||
| 12,139 | Brown-Forman Corp., Class B | 872,309 | |||||||||
| 14,992 | Coca-Cola Bottling Co. Consolidated | 1,056,186 | |||||||||
| 27,747 | Elizabeth Arden, Inc.* | 834,075 | |||||||||
| 62,829 | Estee Lauder Cos., Inc. (The), Class A | 6,094,413 | |||||||||
| 30,744 | Hormel Foods Corp. | 904,181 | |||||||||
| 36,450 | Smithfield Foods, Inc.* | 858,762 | |||||||||
| 139,210 | Walgreen Co. | 5,947,051 | |||||||||
| 17,427,100 | |||||||||||
| Energy—12.6% | |||||||||||
| 33,014 | Alliance Holdings GP LP | 1,724,982 | |||||||||
| 17,820 | Clayton Williams Energy, Inc.* | 1,613,957 | |||||||||
| 98,892 | Exxon Mobil Corp. | 8,702,496 | |||||||||
| 105,715 | National Oilwell Varco, Inc. | 8,107,283 | |||||||||
| 228,047 | VAALCO Energy, Inc.* | 1,589,488 | |||||||||
| 71,228 | W&T Offshore, Inc. | 1,909,623 | |||||||||
| 23,647,829 | |||||||||||
| Financials—14.8% | |||||||||||
| 54,472 | Aflac, Inc. | 3,060,782 | |||||||||
| 19,644 | American Financial Group, Inc. | 702,666 | |||||||||
| 49,605 | Ameriprise Financial, Inc. | 3,078,486 | |||||||||
| 35,112 | AmTrust Financial Services, Inc. | 677,662 | |||||||||
| 18,697 | Axis Capital Holdings Ltd. (Bermuda) | 661,126 | |||||||||
| 25,751 | Brown & Brown, Inc. | 665,663 | |||||||||
| 126,592 | CB Richard Ellis Group, Inc., Class A* | 3,381,272 | |||||||||
| 16,881 | Commerce Bancshares, Inc. | 718,455 | |||||||||
| 9,595 | Credit Acceptance Corp.* | 776,236 | |||||||||
| 144,399 | Discover Financial Services | 3,586,871 | |||||||||
| 9,753 | Erie Indemnity Co., Class A | 706,410 | |||||||||
| 21,859 | FBL Financial Group, Inc., Class A | 666,700 | |||||||||
| 25,220 | Franklin Resources, Inc. | 3,256,406 | |||||||||
| 17,842 | Raymond James Financial, Inc. | 669,075 | |||||||||
| Number of Shares | Value | ||||||||||
| Common Stocks and Other Equity Interests (Continued) | |||||||||||
| 11,390 | Reinsurance Group of America, Inc. | $ | 720,987 | ||||||||
| 118,452 | Unum Group | 3,136,609 | |||||||||
| 16,397 | Waddell & Reed Financial, Inc., Class A | 672,441 | |||||||||
| 11,242 | World Acceptance Corp.* | 763,894 | |||||||||
| 27,901,741 | |||||||||||
| Health Care—11.0% | |||||||||||
| 8,927 | Air Methods Corp.* | 603,644 | |||||||||
| 87,628 | AmerisourceBergen Corp. | 3,561,202 | |||||||||
| 78,027 | CIGNA Corp. | 3,654,004 | |||||||||
| 8,311 | Cooper Cos., Inc. (The) | 622,494 | |||||||||
| 17,003 | Coventry Health Care, Inc.* | 548,687 | |||||||||
| 14,913 | Endo Pharmaceuticals Holdings, Inc.* | 583,993 | |||||||||
| 53,561 | Health Management Associates, Inc., Class A* | 604,168 | |||||||||
| 17,225 | Health Net, Inc.* | 573,593 | |||||||||
| 13,433 | Hill-Rom Holdings, Inc. | 604,619 | |||||||||
| 26,070 | Immucor, Inc.* | 569,108 | |||||||||
| 10,333 | Integra LifeSciences Holdings Corp.* | 540,519 | |||||||||
| 10,807 | Kinetic Concepts, Inc.* | 637,937 | |||||||||
| 10,607 | Magellan Health Services, Inc.* | 551,776 | |||||||||
| 57,818 | Quest Diagnostics, Inc. | 3,259,779 | |||||||||
| 77,057 | UnitedHealth Group, Inc. | 3,793,516 | |||||||||
| 20,709,039 | |||||||||||
| Industrials—11.7% | |||||||||||
| 12,941 | Alaska Air Group, Inc.* | 852,424 | |||||||||
| 34,737 | Colfax Corp.* | 759,003 | |||||||||
| 15,145 | Cubic Corp. | 819,042 | |||||||||
| 46,029 | Dycom Industries, Inc.* | 683,991 | |||||||||
| 10,730 | Esterline Technologies Corp.* | 770,414 | |||||||||
| 50,766 | Joy Global, Inc. | 5,124,828 | |||||||||
| 23,378 | KBR, Inc. | 897,014 | |||||||||
| 32,171 | Macquarie Infrastructure Co. LLC* | 807,492 | |||||||||
| 25,630 | Sauer-Danfoss, Inc.* | 1,512,426 | |||||||||
| 64,915 | United Parcel Service, Inc., Class B | 4,866,677 | |||||||||
| 146,769 | Verisk Analytics, Inc., Class A* | 4,828,700 | |||||||||
| 21,922,011 | |||||||||||
| Information Technology—17.9% | |||||||||||
| 30,224 | ACI Worldwide, Inc.* | 998,601 | |||||||||
| 13,684 | Apple, Inc.* | 4,765,179 | |||||||||
| 295,589 | Applied Materials, Inc. | 4,637,792 | |||||||||
| 24,029 | Black Box Corp. | 839,573 | |||||||||
| 192,599 | CA, Inc. | 4,736,010 | |||||||||
| 8,843 | FactSet Research Systems, Inc. | 967,513 | |||||||||
| 27,429 | FEI Co.* | 890,345 | |||||||||
| 75,633 | Fiserv, Inc.* | 4,637,059 | |||||||||
| 84,847 | GT Solar International, Inc.* | 947,741 | |||||||||
| 29,360 | International Business Machines Corp. | 5,008,229 | |||||||||
| 29,205 | Jack Henry & Associates, Inc. | 992,094 | |||||||||
| 23,034 | Novellus Systems, Inc.* | 739,391 | |||||||||
See Notes to Financial Statements.
20
Schedule of Investments (Continued)
PowerShares Dynamic Market Portfolio
April 30, 2011
| Number of Shares | Value | ||||||||||
| Common Stocks and Other Equity Interests (Continued) | |||||||||||
| 17,595 | Syntel, Inc. | $ | 962,095 | ||||||||
| 40,694 | TeleTech Holdings, Inc.* | 808,590 | |||||||||
| 52,651 | Total System Services, Inc. | 992,471 | |||||||||
| 19,253 | Varian Semiconductor Equipment Associates, Inc.* | 807,278 | |||||||||
| 33,729,961 | |||||||||||
| Materials—4.1% | |||||||||||
| 14,144 | Albemarle Corp. | 997,859 | |||||||||
| 30,842 | Buckeye Technologies, Inc. | 868,511 | |||||||||
| 10,644 | FMC Corp. | 939,652 | |||||||||
| 66,720 | Mosaic Co. (The) | 4,994,659 | |||||||||
| 7,800,681 | |||||||||||
| Telecommunication Services—2.7% | |||||||||||
| 57,012 | AT&T, Inc. | 1,774,213 | |||||||||
| 38,410 | General Communication, Inc., Class A* | 441,715 | |||||||||
| 32,534 | MetroPCS Communications, Inc.* | 547,547 | |||||||||
| 44,584 | Verizon Communications, Inc. | 1,684,384 | |||||||||
| 106,997 | Vonage Holdings Corp.* | 552,105 | |||||||||
| 4,999,964 | |||||||||||
| Utilities—3.2% | |||||||||||
| 22,025 | Alliant Energy Corp. | 870,869 | |||||||||
| 110,194 | Edison International | 4,327,318 | |||||||||
| 20,809 | MGE Energy, Inc. | 874,186 | |||||||||
| 6,072,373 | |||||||||||
| Total Common Stocks and Other Equity Interests (Cost $171,991,208) | 188,180,185 | ||||||||||
| Money Market Fund—0.1% | |||||||||||
| 142,624 | Goldman Sachs Financial Square Prime Obligations Institutional Share Class (Cost $142,624) | 142,624 | |||||||||
| Total Investments (Cost $172,133,832)—100.1% | 188,322,809 | ||||||||||
| Liabilities in excess of other assets—(0.1%) | (115,525 | ) | |||||||||
| Net Assets—100.0% | $ | 188,207,284 | |||||||||
Notes to Schedule of Investments:
* Non-income producing security.
See Notes to Financial Statements.
21
Schedule of Investments
PowerShares Dynamic OTC Portfolio
April 30, 2011
| Number of Shares | Value | ||||||||||
| Common Stocks and Other Equity Interests—100.0% | |||||||||||
| Consumer Discretionary—16.0% | |||||||||||
| 15,191 | AFC Enterprises, Inc.* | $ | 228,776 | ||||||||
| 7,234 | Ascena Retail Group, Inc.* | 226,352 | |||||||||
| 22,060 | Bed Bath & Beyond, Inc.* | 1,238,007 | |||||||||
| 7,297 | Bob Evans Farms, Inc. | 228,834 | |||||||||
| 10,145 | Destination Maternity Corp. | 237,089 | |||||||||
| 14,298 | Lincoln Educational Services Corp. | 238,777 | |||||||||
| 7,800 | Papa John's International, Inc.* | 234,468 | |||||||||
| 25,639 | PetSmart, Inc. | 1,081,197 | |||||||||
| 6,865 | Rent-A-Center, Inc. | 209,039 | |||||||||
| 14,728 | Ross Stores, Inc. | 1,085,306 | |||||||||
| 25,329 | Sonic Corp.* | 284,191 | |||||||||
| 32,479 | Starbucks Corp. | 1,175,415 | |||||||||
| 6,467,451 | |||||||||||
| Consumer Staples—2.3% | |||||||||||
| 4,253 | Coca-Cola Bottling Co. Consolidated | 299,624 | |||||||||
| 9,365 | Hansen Natural Corp.* | 619,495 | |||||||||
| 919,119 | |||||||||||
| Energy—1.4% | |||||||||||
| 7,475 | Alliance Holdings GP LP | 390,569 | |||||||||
| 1,725 | Clayton Williams Energy, Inc.* | 156,233 | |||||||||
| 546,802 | |||||||||||
| Financials—6.7% | |||||||||||
| 4,095 | AmTrust Financial Services, Inc. | 79,034 | |||||||||
| 8,952 | BOK Financial Corp. | 481,439 | |||||||||
| 4,655 | Calamos Asset Management, Inc., Class A | 75,737 | |||||||||
| 11,513 | Commerce Bancshares, Inc. | 489,993 | |||||||||
| 1,122 | Credit Acceptance Corp.* | 90,770 | |||||||||
| 6,652 | Erie Indemnity Co., Class A | 481,804 | |||||||||
| 2,440 | First Financial Corp. | 78,470 | |||||||||
| 2,082 | FPIC Insurance Group, Inc.* | 76,868 | |||||||||
| 1,284 | Infinity Property & Casualty Corp. | 75,884 | |||||||||
| 3,669 | MarketAxess Holdings, Inc. | 89,340 | |||||||||
| 8,385 | Provident New York Bancorp | 78,651 | |||||||||
| 1,634 | Safety Insurance Group, Inc. | 76,504 | |||||||||
| 19,927 | SEI Investments Co. | 444,970 | |||||||||
| 1,313 | World Acceptance Corp.* | 89,218 | |||||||||
| 2,708,682 | |||||||||||
| Health Care—13.3% | |||||||||||
| 2,662 | Air Methods Corp.* | 180,004 | |||||||||
| 23,410 | ArQule, Inc.* | 165,275 | |||||||||
| 11,819 | Biogen Idec, Inc.* | 1,150,580 | |||||||||
| 3,080 | CorVel Corp.* | 159,544 | |||||||||
| 23,356 | Endo Pharmaceuticals Holdings, Inc.* | 914,621 | |||||||||
| 14,453 | Express Scripts, Inc.* | 820,063 | |||||||||
| 7,755 | Immucor, Inc.* | 169,292 | |||||||||
| 3,074 | Integra LifeSciences Holdings Corp.* | 160,801 | |||||||||
| 3,804 | IPC The Hospitalist Co., Inc.* | 197,275 | |||||||||
| 3,165 | Magellan Health Services, Inc.* | 164,643 | |||||||||
| Number of Shares | Value | ||||||||||
| Common Stocks and Other Equity Interests (Continued) | |||||||||||
| 5,895 | PSS World Medical, Inc.* | $ | 169,540 | ||||||||
| 20,845 | Rigel Pharmaceuticals, Inc.* | 189,898 | |||||||||
| 15,927 | Sirona Dental Systems, Inc.* | 908,954 | |||||||||
| 5,350,490 | |||||||||||
| Industrials—4.9% | |||||||||||
| 14,990 | Great Lakes Dredge & Dock Corp. | 111,676 | |||||||||
| 7,058 | Joy Global, Inc. | 712,505 | |||||||||
| 2,720 | LB Foster Co., Class A | 115,763 | |||||||||
| 7,202 | SkyWest, Inc. | 119,049 | |||||||||
| 5,245 | Trimas Corp.* | 121,736 | |||||||||
| 6,735 | US Ecology, Inc. | 123,655 | |||||||||
| 20,406 | Verisk Analytics, Inc., Class A* | 671,357 | |||||||||
| 1,975,741 | |||||||||||
| Information Technology—53.6% | |||||||||||
| 6,088 | ACI Worldwide, Inc.* | 201,148 | |||||||||
| 10,921 | Acxiom Corp.* | 159,010 | |||||||||
| 8,884 | Anaren, Inc.* | 147,386 | |||||||||
| 3,550 | Apple, Inc.* | 1,236,216 | |||||||||
| 76,678 | Applied Materials, Inc. | 1,203,078 | |||||||||
| 24,915 | Automatic Data Processing, Inc. | 1,354,130 | |||||||||
| 4,830 | Black Box Corp. | 168,760 | |||||||||
| 25,262 | BMC Software, Inc.* | 1,268,910 | |||||||||
| 49,962 | CA, Inc. | 1,228,566 | |||||||||
| 18,924 | Cadence Design Systems, Inc.* | 196,431 | |||||||||
| 9,758 | Cardtronics, Inc.* | 207,357 | |||||||||
| 22,713 | Cogo Group, Inc.* | 186,474 | |||||||||
| 12,109 | Electronics for Imaging, Inc.* | 217,478 | |||||||||
| 8,624 | ExlService Holdings, Inc.* | 178,689 | |||||||||
| 5,525 | FEI Co.* | 179,341 | |||||||||
| 19,620 | Fiserv, Inc.* | 1,202,902 | |||||||||
| 17,045 | GT Solar International, Inc.* | 190,393 | |||||||||
| 10,341 | Insight Enterprises, Inc.* | 177,452 | |||||||||
| 5,426 | Interactive Intelligence, Inc.* | 203,041 | |||||||||
| 3,855 | InterDigital, Inc. | 178,448 | |||||||||
| 5,883 | Jack Henry & Associates, Inc. | 199,846 | |||||||||
| 25,246 | KLA-Tencor Corp. | 1,108,299 | |||||||||
| 2,357 | Loral Space & Communications, Inc.* | 164,754 | |||||||||
| 29,140 | Magma Design Automation, Inc.* | 185,330 | |||||||||
| 6,080 | Measurement Specialties, Inc.* | 211,462 | |||||||||
| 26,088 | MICROS Systems, Inc.* | 1,357,098 | |||||||||
| 46,556 | Microsoft Corp. | 1,211,387 | |||||||||
| 4,189 | MTS Systems Corp. | 185,447 | |||||||||
| 6,560 | Multi-Fineline Electronix, Inc.* | 174,693 | |||||||||
| 8,244 | NCI, Inc., Class A* | 202,885 | |||||||||
| 7,464 | NetScout Systems, Inc.* | 191,004 | |||||||||
| 11,422 | Newport Corp.* | 213,934 | |||||||||
| 4,639 | Novellus Systems, Inc.* | 148,912 | |||||||||
| 3,161 | NVE Corp.* | 186,373 | |||||||||
| 37,399 | Paychex, Inc. | 1,223,321 | |||||||||
| 14,957 | Perficient, Inc.* | 186,813 | |||||||||
See Notes to Financial Statements.
22
Schedule of Investments (Continued)
PowerShares Dynamic OTC Portfolio
April 30, 2011
| Number of Shares | Value | ||||||||||
| Common Stocks and Other Equity Interests (Continued) | |||||||||||
| 6,302 | Progress Software Corp.* | $ | 186,854 | ||||||||
| 7,008 | Quest Software, Inc.* | 180,526 | |||||||||
| 68,102 | Symantec Corp.* | 1,338,204 | |||||||||
| 3,535 | Syntel, Inc. | 193,294 | |||||||||
| 17,408 | TeleNav, Inc.* | 236,401 | |||||||||
| 8,176 | TeleTech Holdings, Inc.* | 162,457 | |||||||||
| 50,287 | TIBCO Software, Inc.* | 1,508,107 | |||||||||
| 10,535 | TTM Technologies, Inc.* | 201,429 | |||||||||
| 3,868 | Varian Semiconductor Equipment Associates, Inc.* | 162,185 | |||||||||
| 5,551 | Verint Systems, Inc.* | 190,011 | |||||||||
| 21,596,236 | |||||||||||
| Materials—0.8% | |||||||||||
| 3,107 | Sigma-Aldrich Corp. | 219,292 | |||||||||
| 2,960 | TPC Group, Inc.* | 116,743 | |||||||||
| 336,035 | |||||||||||
| Telecommunication Services—1.0% | |||||||||||
| 10,360 | General Communication, Inc., Class A* | 119,140 | |||||||||
| 6,829 | NII Holdings, Inc., Class B* | 283,950 | |||||||||
| 403,090 | |||||||||||
| Total Common Stocks and Other Equity Interests (Cost $34,403,964) | 40,303,646 | ||||||||||
| Money Market Fund—0.2% | |||||||||||
| 92,411 | Goldman Sachs Financial Square Prime Obligations Institutional Share Class (Cost $92,411) | 92,411 | |||||||||
| Total Investments (Cost $34,496,375)—100.2% | 40,396,057 | ||||||||||
| Liabilities in excess of other assets—(0.2%) | (75,379 | ) | |||||||||
| Net Assets—100.0% | $ | 40,320,678 | |||||||||
Notes to Schedule of Investments:
* Non-income producing security.
See Notes to Financial Statements.
23
Schedule of Investments
PowerShares FTSE RAFI US 1000 Portfolio
April 30, 2011
| Number of Shares | Value | ||||||||||
| Common Stocks and Other Equity Interests—100.0% | |||||||||||
| Consumer Discretionary—10.6% | |||||||||||
| 8,075 | Aaron's, Inc. | $ | 232,479 | ||||||||
| 6,536 | Abercrombie & Fitch Co., Class A | 462,749 | |||||||||
| 5,204 | Advance Auto Parts, Inc. | 340,654 | |||||||||
| 6,033 | Aeropostale, Inc.* | 154,023 | |||||||||
| 6,631 | Amazon.com, Inc.* | 1,302,992 | |||||||||
| 21,996 | American Eagle Outfitters, Inc. | 342,258 | |||||||||
| 7,130 | Ann, Inc.* | 222,527 | |||||||||
| 10,200 | Apollo Group, Inc., Class A* | 408,306 | |||||||||
| 9,963 | Asbury Automotive Group, Inc.* | 172,360 | |||||||||
| 5,538 | Ascena Retail Group, Inc.* | 173,284 | |||||||||
| 7,106 | Autoliv, Inc. | 569,404 | |||||||||
| 20,954 | AutoNation, Inc.* | 710,550 | |||||||||
| 1,681 | AutoZone, Inc.* | 474,681 | |||||||||
| 17,532 | Barnes & Noble, Inc. | 192,677 | |||||||||
| 15,345 | Bed Bath & Beyond, Inc.* | 861,161 | |||||||||
| 68,026 | Best Buy Co., Inc. | 2,123,772 | |||||||||
| 7,620 | Big Lots, Inc.* | 313,258 | |||||||||
| 4,899 | BorgWarner, Inc.* | 378,399 | |||||||||
| 16,983 | Boyd Gaming Corp.* | 151,828 | |||||||||
| 11,286 | Brinker International, Inc. | 271,880 | |||||||||
| 8,766 | Brunswick Corp. | 204,861 | |||||||||
| 5,496 | Cabela's, Inc., Class A* | 140,368 | |||||||||
| 14,251 | Cablevision Systems Corp., Class A | 502,063 | |||||||||
| 8,209 | Career Education Corp.* | 179,038 | |||||||||
| 13,690 | CarMax, Inc.* | 475,043 | |||||||||
| 37,910 | Carnival Corp. | 1,443,234 | |||||||||
| 75,512 | CBS Corp., Class B | 1,904,413 | |||||||||
| 51,139 | Charming Shoppes, Inc.* | 231,660 | |||||||||
| 13,196 | Chico's FAS, Inc. | 193,057 | |||||||||
| 7,374 | Cinemark Holdings, Inc. | 149,913 | |||||||||
| 7,063 | Coach, Inc. | 422,438 | |||||||||
| 9,784 | Collective Brands, Inc.* | 205,464 | |||||||||
| 154,227 | Comcast Corp., Class A | 4,046,916 | |||||||||
| 52,982 | Comcast Corp. Special Class A | 1,300,708 | |||||||||
| 6,735 | Cooper Tire & Rubber Co. | 181,710 | |||||||||
| 5,265 | Core-Mark Holding Co., Inc.* | 176,430 | |||||||||
| 51,948 | D.R. Horton, Inc. | 646,233 | |||||||||
| 20,446 | Dana Holding Corp.* | 371,504 | |||||||||
| 11,321 | Darden Restaurants, Inc. | 531,747 | |||||||||
| 2,695 | DeVry, Inc. | 142,566 | |||||||||
| 40,020 | Dex One Corp.* | 168,084 | |||||||||
| 4,461 | Dick's Sporting Goods, Inc.* | 182,589 | |||||||||
| 7,274 | Dillard's, Inc., Class A | 349,297 | |||||||||
| 38,594 | DIRECTV, Class A* | 1,875,282 | |||||||||
| 5,377 | Discovery Communications, Inc., Class A* | 237,986 | |||||||||
| 5,474 | Discovery Communications, Inc., Class C* | 216,004 | |||||||||
| 22,243 | DISH Network Corp., Class A* | 556,965 | |||||||||
| 7,586 | Dollar Tree, Inc.* | 436,195 | |||||||||
| 12,968 | Domino's Pizza, Inc.* | 240,816 | |||||||||
| 143,626 | Eastman Kodak Co.* | 399,280 | |||||||||
| Number of Shares | Value | ||||||||||
| Common Stocks and Other Equity Interests (Continued) | |||||||||||
| 15,461 | Exide Technologies* | $ | 155,228 | ||||||||
| 20,320 | Expedia, Inc. | 508,610 | |||||||||
| 9,240 | Family Dollar Stores, Inc. | 500,900 | |||||||||
| 20,386 | Foot Locker, Inc. | 438,707 | |||||||||
| 405,258 | Ford Motor Co.* | 6,269,341 | |||||||||
| 15,454 | Fortune Brands, Inc. | 1,005,746 | |||||||||
| 28,781 | GameStop Corp., Class A* | 739,096 | |||||||||
| 55,394 | Gannett Co., Inc. | 834,234 | |||||||||
| 44,093 | Gap, Inc. (The) | 1,024,721 | |||||||||
| 10,723 | Garmin Ltd. (Switzerland) | 367,048 | |||||||||
| 64,695 | General Motors Co.* | 2,076,063 | |||||||||
| 5,187 | Gentex Corp. | 162,612 | |||||||||
| 16,341 | Genuine Parts Co. | 877,512 | |||||||||
| 77,915 | Goodyear Tire & Rubber Co. (The)* | 1,414,157 | |||||||||
| 5,783 | Group 1 Automotive, Inc. | 248,900 | |||||||||
| 34,326 | H&R Block, Inc. | 593,497 | |||||||||
| 12,530 | Hanesbrands, Inc.* | 407,350 | |||||||||
| 17,494 | Harley-Davidson, Inc. | 651,826 | |||||||||
| 4,728 | Harman International Industries, Inc. | 229,450 | |||||||||
| 9,037 | Hasbro, Inc. | 423,293 | |||||||||
| 169,142 | Home Depot, Inc. (The) | 6,281,934 | |||||||||
| 5,634 | HSN, Inc.* | 186,936 | |||||||||
| 3,271 | Hyatt Hotels Corp., Class A* | 144,938 | |||||||||
| 27,087 | International Game Technology | 479,169 | |||||||||
| 37,250 | Interpublic Group of Cos., Inc. (The) | 437,688 | |||||||||
| 37,454 | J.C. Penney Co., Inc. | 1,440,106 | |||||||||
| 8,716 | Jack in the Box, Inc.* | 179,985 | |||||||||
| 9,267 | Jarden Corp. | 337,226 | |||||||||
| 53,612 | Johnson Controls, Inc. | 2,198,092 | |||||||||
| 20,963 | Jones Group, Inc. (The) | 285,726 | |||||||||
| 15,918 | KB Home | 187,992 | |||||||||
| 30,014 | Kohl's Corp. | 1,582,038 | |||||||||
| 7,312 | Lamar Advertising Co., Class A* | 237,786 | |||||||||
| 7,176 | Las Vegas Sands Corp.* | 337,344 | |||||||||
| 4,976 | Lear Corp. | 254,473 | |||||||||
| 19,540 | Leggett & Platt, Inc. | 513,707 | |||||||||
| 15,706 | Liberty Global, Inc., Class A* | 730,329 | |||||||||
| 15,040 | Liberty Global, Inc., Class C* | 667,626 | |||||||||
| 65,916 | Liberty Media Corp. - Interactive, Class A* | 1,152,212 | |||||||||
| 3,345 | Liberty Media Corp. - Starz, Class A* | 257,063 | |||||||||
| 27,138 | Limited Brands, Inc. | 1,117,000 | |||||||||
| 20,267 | Live Nation Entertainment, Inc.* | 224,761 | |||||||||
| 39,714 | Liz Claiborne, Inc.* | 249,801 | |||||||||
| 6,807 | LKQ Corp.* | 171,673 | |||||||||
| 143,375 | Lowe's Cos., Inc. | 3,763,594 | |||||||||
| 72,401 | Macy's, Inc. | 1,731,108 | |||||||||
| 17,864 | Marriott International, Inc., Class A | 630,599 | |||||||||
| 29,148 | Mattel, Inc. | 778,835 | |||||||||
| 57,636 | McDonald's Corp. | 4,513,475 | |||||||||
| 23,677 | McGraw-Hill Cos., Inc. (The) | 958,208 | |||||||||
See Notes to Financial Statements.
24
Schedule of Investments (Continued)
PowerShares FTSE RAFI US 1000 Portfolio
April 30, 2011
| Number of Shares | Value | ||||||||||
| Common Stocks and Other Equity Interests (Continued) | |||||||||||
| 6,481 | MDC Holdings, Inc. | $ | 189,180 | ||||||||
| 5,937 | Men's Wearhouse, Inc. (The) | 165,583 | |||||||||
| 6,240 | Meritage Homes Corp.* | 149,198 | |||||||||
| 50,548 | MGM Resorts International* | 639,938 | |||||||||
| 11,397 | Mohawk Industries, Inc.* | 684,276 | |||||||||
| 820 | Netflix, Inc.* | 190,789 | |||||||||
| 27,309 | New York Times Co. (The), Class A* | 222,022 | |||||||||
| 31,590 | Newell Rubbermaid, Inc. | 602,105 | |||||||||
| 132,925 | News Corp., Class A | 2,368,724 | |||||||||
| 43,829 | News Corp., Class B | 828,368 | |||||||||
| 13,239 | NIKE, Inc., Class B | 1,089,834 | |||||||||
| 14,951 | Nordstrom, Inc. | 710,920 | |||||||||
| 521 | NVR, Inc.* | 385,191 | |||||||||
| 141,355 | Office Depot, Inc.* | 609,240 | |||||||||
| 26,355 | OfficeMax, Inc.* | 262,496 | |||||||||
| 21,218 | Omnicom Group, Inc. | 1,043,713 | |||||||||
| 7,268 | O'Reilly Automotive, Inc.* | 429,248 | |||||||||
| 9,231 | Penn National Gaming, Inc.* | 369,332 | |||||||||
| 11,063 | Penske Automotive Group, Inc.* | 248,696 | |||||||||
| 7,625 | PetSmart, Inc. | 321,546 | |||||||||
| 2,989 | Phillips-Van Heusen Corp. | 210,456 | |||||||||
| 2,305 | Polaris Industries, Inc. | 243,016 | |||||||||
| 2,433 | Polo Ralph Lauren Corp. | 318,163 | |||||||||
| 438 | priceline.com, Inc.* | 239,590 | |||||||||
| 68,206 | Pulte Group, Inc.* | 554,515 | |||||||||
| 20,169 | RadioShack Corp. | 318,872 | |||||||||
| 24,747 | Regal Entertainment Group, Class A | 341,014 | |||||||||
| 10,171 | Regis Corp. | 172,907 | |||||||||
| 11,919 | Rent-A-Center, Inc. | 362,934 | |||||||||
| 5,442 | Ross Stores, Inc. | 401,021 | |||||||||
| 14,811 | Royal Caribbean Cruises Ltd.* | 589,774 | |||||||||
| 33,248 | Saks, Inc.* | 397,646 | |||||||||
| 18,428 | Sears Holdings Corp.* | 1,584,255 | |||||||||
| 22,989 | Service Corp. International | 270,581 | |||||||||
| 8,318 | Signet Jewelers Ltd. (United Kingdom)* | 363,913 | |||||||||
| 15,435 | Sonic Automotive, Inc., Class A | 217,634 | |||||||||
| 9,938 | Stanley Black & Decker, Inc. | 721,996 | |||||||||
| 69,050 | Staples, Inc. | 1,459,717 | |||||||||
| 23,435 | Starbucks Corp. | 848,113 | |||||||||
| 10,150 | Starwood Hotels & Resorts Worldwide, Inc. | 604,636 | |||||||||
| 23,637 | SuperMedia, Inc.* | 121,494 | |||||||||
| 79,897 | Target Corp. | 3,922,943 | |||||||||
| 7,424 | Tenneco, Inc.* | 343,063 | |||||||||
| 5,685 | Tiffany & Co. | 394,766 | |||||||||
| 29,255 | Time Warner Cable, Inc. | 2,285,693 | |||||||||
| 148,930 | Time Warner, Inc. | 5,638,490 | |||||||||
| 23,881 | TJX Cos., Inc. (The) | 1,280,499 | |||||||||
| 10,496 | Toll Brothers, Inc.* | 220,521 | |||||||||
| 3,451 | Tractor Supply Co. | 213,513 | |||||||||
| 15,263 | TRW Automotive Holdings Corp.* | 870,907 | |||||||||
| Number of Shares | Value | ||||||||||
| Common Stocks and Other Equity Interests (Continued) | |||||||||||
| 3,832 | Tupperware Brands Corp. | $ | 243,983 | ||||||||
| 4,204 | Urban Outfitters, Inc.* | 132,258 | |||||||||
| 8,789 | VF Corp. | 883,822 | |||||||||
| 36,430 | Viacom, Inc., Class B | 1,863,759 | |||||||||
| 26,144 | Virgin Media, Inc. | 791,117 | |||||||||
| 114,205 | Walt Disney Co. (The) | 4,922,236 | |||||||||
| 2,943 | Warnaco Group, Inc. (The)* | 189,411 | |||||||||
| 48,838 | Wendy's/Arby's Group, Inc., Class A | 235,399 | |||||||||
| 13,224 | Whirlpool Corp. | 1,139,644 | |||||||||
| 7,592 | Williams-Sonoma, Inc. | 329,569 | |||||||||
| 13,187 | Wyndham Worldwide Corp. | 456,402 | |||||||||
| 2,375 | Wynn Resorts Ltd. | 349,481 | |||||||||
| 20,039 | Yum! Brands, Inc. | 1,074,892 | |||||||||
| 128,565,835 | |||||||||||
| Consumer Staples—10.5% | |||||||||||
| 17,170 | Alberto-Culver Co. | 641,128 | |||||||||
| 311,441 | Altria Group, Inc. | 8,359,076 | |||||||||
| 87,592 | Archer-Daniels-Midland Co. | 3,242,656 | |||||||||
| 34,068 | Avon Products, Inc. | 1,000,918 | |||||||||
| 10,266 | BJ's Wholesale Club, Inc.* | 526,851 | |||||||||
| 6,002 | Brown-Forman Corp., Class B | 431,304 | |||||||||
| 24,723 | Bunge Ltd. | 1,865,103 | |||||||||
| 20,700 | Campbell Soup Co. | 695,313 | |||||||||
| 5,307 | Casey's General Stores, Inc. | 207,132 | |||||||||
| 8,235 | Central European Distribution Corp.* | 97,338 | |||||||||
| 10,485 | Chiquita Brands International, Inc.* | 166,921 | |||||||||
| 3,036 | Church & Dwight Co., Inc. | 250,409 | |||||||||
| 9,263 | Clorox Co. (The) | 645,261 | |||||||||
| 113,367 | Coca-Cola Co. (The) | 7,647,738 | |||||||||
| 47,215 | Coca-Cola Enterprises, Inc. | 1,341,378 | |||||||||
| 26,756 | Colgate-Palmolive Co. | 2,256,869 | |||||||||
| 54,428 | ConAgra Foods, Inc. | 1,330,765 | |||||||||
| 21,982 | Constellation Brands, Inc., Class A* | 492,177 | |||||||||
| 5,813 | Corn Products International, Inc. | 320,296 | |||||||||
| 44,407 | Costco Wholesale Corp. | 3,593,414 | |||||||||
| 150,745 | CVS Caremark Corp. | 5,462,999 | |||||||||
| 123,249 | Dean Foods Co.* | 1,379,156 | |||||||||
| 13,117 | Dole Food Co., Inc.* | 181,146 | |||||||||
| 19,307 | Dr Pepper Snapple Group, Inc. | 756,834 | |||||||||
| 6,750 | Energizer Holdings, Inc.* | 509,827 | |||||||||
| 3,910 | Estee Lauder Cos., Inc. (The), Class A | 379,270 | |||||||||
| 6,942 | Flowers Foods, Inc. | 212,148 | |||||||||
| 6,089 | Fresh Del Monte Produce, Inc. | 165,073 | |||||||||
| 47,470 | General Mills, Inc. | 1,831,393 | |||||||||
| 24,685 | H.J. Heinz Co. | 1,264,613 | |||||||||
| 2,190 | Herbalife Ltd. (Cayman Islands) | 196,618 | |||||||||
| 9,565 | Hershey Co. (The) | 551,996 | |||||||||
| 14,477 | Hormel Foods Corp. | 425,769 | |||||||||
| 8,906 | J.M. Smucker Co. (The) | 668,573 | |||||||||
| 19,867 | Kellogg Co. | 1,137,783 | |||||||||
See Notes to Financial Statements.
25
Schedule of Investments (Continued)
PowerShares FTSE RAFI US 1000 Portfolio
April 30, 2011
| Number of Shares | Value | ||||||||||
| Common Stocks and Other Equity Interests (Continued) | |||||||||||
| 37,452 | Kimberly-Clark Corp. | $ | 2,474,079 | ||||||||
| 165,593 | Kraft Foods, Inc., Class A | 5,560,613 | |||||||||
| 138,032 | Kroger Co. (The) | 3,355,558 | |||||||||
| 17,451 | Lorillard, Inc. | 1,858,531 | |||||||||
| 8,007 | McCormick & Co., Inc. | 393,304 | |||||||||
| 6,754 | Mead Johnson Nutrition Co. | 451,708 | |||||||||
| 14,694 | Molson Coors Brewing Co., Class B | 716,333 | |||||||||
| 4,641 | Nash Finch Co. | 172,738 | |||||||||
| 17,078 | Pantry, Inc. (The)* | 264,367 | |||||||||
| 95,607 | PepsiCo, Inc. | 6,586,366 | |||||||||
| 79,432 | Philip Morris International, Inc. | 5,515,758 | |||||||||
| 214,149 | Procter & Gamble Co. (The) | 13,898,270 | |||||||||
| 5,934 | Ralcorp Holdings, Inc.* | 461,665 | |||||||||
| 43,590 | Reynolds American, Inc. | 1,617,625 | |||||||||
| 390,549 | Rite Aid Corp.* | 433,509 | |||||||||
| 4,863 | Ruddick Corp. | 201,912 | |||||||||
| 93,987 | Safeway, Inc. | 2,284,824 | |||||||||
| 63,712 | Sara Lee Corp. | 1,223,270 | |||||||||
| 30,835 | Smithfield Foods, Inc.* | 726,473 | |||||||||
| 202,762 | SUPERVALU, Inc. | 2,283,100 | |||||||||
| 79,515 | Sysco Corp. | 2,298,779 | |||||||||
| 56,625 | Tyson Foods, Inc., Class A | 1,126,837 | |||||||||
| 4,538 | United Natural Foods, Inc.* | 193,727 | |||||||||
| 4,851 | Universal Corp. | 210,436 | |||||||||
| 83,115 | Walgreen Co. | 3,550,673 | |||||||||
| 334,094 | Wal-Mart Stores, Inc. | 18,368,488 | |||||||||
| 9,481 | Whole Foods Market, Inc. | 595,028 | |||||||||
| 53,157 | Winn-Dixie Stores, Inc.* | 376,883 | |||||||||
| 127,436,099 | |||||||||||
| Energy—11.7% | |||||||||||
| 6,084 | Alpha Natural Resources, Inc.* | 353,906 | |||||||||
| 28,039 | Anadarko Petroleum Corp. | 2,213,399 | |||||||||
| 16,493 | Apache Corp. | 2,199,671 | |||||||||
| 10,168 | Arch Coal, Inc. | 348,762 | |||||||||
| 3,574 | Atwood Oceanics, Inc.* | 160,580 | |||||||||
| 23,213 | Baker Hughes, Inc. | 1,796,918 | |||||||||
| 3,457 | Bristow Group, Inc.* | 160,405 | |||||||||
| 4,186 | Cabot Oil & Gas Corp. | 235,588 | |||||||||
| 10,078 | Cameron International Corp.* | 531,312 | |||||||||
| 44,359 | Chesapeake Energy Corp. | 1,493,568 | |||||||||
| 208,888 | Chevron Corp. | 22,860,703 | |||||||||
| 2,383 | Cimarex Energy Co. | 263,536 | |||||||||
| 205,047 | ConocoPhillips | 16,184,360 | |||||||||
| 9,987 | CONSOL Energy, Inc. | 540,197 | |||||||||
| 4,413 | Copano Energy LLC | 158,206 | |||||||||
| 7,653 | CVR Energy, Inc.* | 170,126 | |||||||||
| 11,068 | Denbury Resources, Inc.* | 249,805 | |||||||||
| 24,854 | Devon Energy Corp. | 2,261,714 | |||||||||
| 7,614 | Diamond Offshore Drilling, Inc. | 577,674 | |||||||||
| 4,079 | Dresser-Rand Group, Inc.* | 214,311 | |||||||||
| Number of Shares | Value | ||||||||||
| Common Stocks and Other Equity Interests (Continued) | |||||||||||
| 36,214 | El Paso Corp. | $ | 702,914 | ||||||||
| 9,964 | EOG Resources, Inc. | 1,125,035 | |||||||||
| 7,173 | EQT Corp. | 377,372 | |||||||||
| 15,661 | Exterran Holdings, Inc.* | 340,000 | |||||||||
| 416,585 | Exxon Mobil Corp. | 36,659,480 | |||||||||
| 7,058 | FMC Technologies, Inc.* | 328,056 | |||||||||
| 6,970 | Forest Oil Corp.* | 250,293 | |||||||||
| 8,180 | Frontier Oil Corp. | 228,549 | |||||||||
| 66,569 | General Maritime Corp. | 142,458 | |||||||||
| 43,042 | Halliburton Co. | 2,172,760 | |||||||||
| 18,407 | Helix Energy Solutions Group, Inc.* | 348,444 | |||||||||
| 5,179 | Helmerich & Payne, Inc. | 343,575 | |||||||||
| 33,151 | Hess Corp. | 2,849,660 | |||||||||
| 3,258 | Holly Corp. | 188,638 | |||||||||
| 11,252 | Key Energy Services, Inc.* | 204,786 | |||||||||
| 6,369 | Linn Energy LLC | 257,180 | |||||||||
| 97,965 | Marathon Oil Corp. | 5,294,029 | |||||||||
| 3,689 | Massey Energy Co. | 251,737 | |||||||||
| 18,876 | McDermott International, Inc.* | 435,847 | |||||||||
| 19,197 | Murphy Oil Corp. | 1,487,384 | |||||||||
| 30,768 | Nabors Industries Ltd. (Bermuda)* | 942,731 | |||||||||
| 17,807 | National Oilwell Varco, Inc. | 1,365,619 | |||||||||
| 6,556 | Newfield Exploration Co.* | 464,165 | |||||||||
| 17,194 | Noble Corp. (Switzerland) | 739,514 | |||||||||
| 7,927 | Noble Energy, Inc. | 763,132 | |||||||||
| 43,204 | Occidental Petroleum Corp. | 4,937,785 | |||||||||
| 2,600 | Oceaneering International, Inc.* | 227,292 | |||||||||
| 3,574 | Oil States International, Inc.* | 296,678 | |||||||||
| 7,418 | Overseas Shipholding Group, Inc. | 206,665 | |||||||||
| 12,964 | Patterson-UTI Energy, Inc. | 403,310 | |||||||||
| 10,676 | Peabody Energy Corp. | 713,370 | |||||||||
| 14,579 | Petrohawk Energy Corp.* | 393,779 | |||||||||
| 3,923 | Pioneer Natural Resources Co. | 401,048 | |||||||||
| 10,518 | Plains Exploration & Production Co.* | 400,105 | |||||||||
| 12,183 | Pride International, Inc.* | 534,956 | |||||||||
| 9,942 | QEP Resources, Inc. | 424,822 | |||||||||
| 4,373 | Range Resources Corp. | 246,856 | |||||||||
| 8,211 | Rowan Cos., Inc.* | 342,399 | |||||||||
| 49,042 | Schlumberger Ltd. | 4,401,519 | |||||||||
| 2,813 | SEACOR Holdings, Inc. | 278,009 | |||||||||
| 8,208 | Ship Finance International Ltd. (Bermuda) | 164,078 | |||||||||
| 2,209 | SM Energy Co. | 167,575 | |||||||||
| 11,843 | Southern Union Co. | 354,106 | |||||||||
| 9,413 | Southwestern Energy Co.* | 412,854 | |||||||||
| 58,894 | Spectra Energy Corp. | 1,710,282 | |||||||||
| 39,844 | Sunoco, Inc. | 1,699,745 | |||||||||
| 4,701 | Superior Energy Services, Inc.* | 180,612 | |||||||||
| 7,980 | Targa Resources Corp. | 279,460 | |||||||||
| 8,326 | Teekay Corp. (Bahamas) | 283,001 | |||||||||
| 41,376 | Tesoro Corp.* | 1,122,117 | |||||||||
| 4,457 | Tidewater, Inc. | 265,236 | |||||||||
See Notes to Financial Statements.
26
Schedule of Investments (Continued)
PowerShares FTSE RAFI US 1000 Portfolio
April 30, 2011
| Number of Shares | Value | ||||||||||
| Common Stocks and Other Equity Interests (Continued) | |||||||||||
| 3,428 | Ultra Petroleum Corp.* | $ | 174,108 | ||||||||
| 4,465 | Unit Corp.* | 281,384 | |||||||||
| 27,420 | USEC, Inc.* | 125,584 | |||||||||
| 165,147 | Valero Energy Corp. | 4,673,660 | |||||||||
| 57,909 | Weatherford International Ltd. (Switzerland)* | 1,249,676 | |||||||||
| 13,319 | Western Refining, Inc.* | 225,890 | |||||||||
| 4,235 | Whiting Petroleum Corp.* | 294,332 | |||||||||
| 47,959 | Williams Cos., Inc. (The) | 1,590,800 | |||||||||
| 10,444 | World Fuel Services Corp. | 413,373 | |||||||||
| 141,114,565 | |||||||||||
| Financials—20.1% | |||||||||||
| 34,452 | ACE Ltd. (Switzerland) | 2,316,897 | |||||||||
| 1,870 | Affiliated Managers Group, Inc.* | 203,980 | |||||||||
| 29,108 | Aflac, Inc. | 1,635,579 | |||||||||
| 2,832 | Alexandria Real Estate Equities, Inc. REIT | 232,649 | |||||||||
| 491 | Alleghany Corp.* | 161,539 | |||||||||
| 6,455 | Allied World Assurance Co. Holdings Ltd. (Switzerland) | 419,381 | |||||||||
| 102,532 | Allstate Corp. (The) | 3,469,683 | |||||||||
| 6,855 | Alterra Capital Holdings Ltd. (Bermuda) | 150,673 | |||||||||
| 10,688 | AMB Property Corp. REIT | 389,043 | |||||||||
| 96,043 | American Express Co. | 4,713,790 | |||||||||
| 7,319 | American Financial Group, Inc. | 261,801 | |||||||||
| 17,494 | American International Group, Inc.* | 544,938 | |||||||||
| 15,340 | Ameriprise Financial, Inc. | 952,000 | |||||||||
| 71,270 | Annaly Capital Management, Inc. REIT | 1,271,457 | |||||||||
| 16,851 | Aon Corp. | 879,117 | |||||||||
| 19,487 | Apartment Investment & Management Co., Class A REIT | 525,370 | |||||||||
| 5,881 | Arch Capital Group Ltd.* | 611,624 | |||||||||
| 8,594 | Arthur J. Gallagher & Co. | 255,929 | |||||||||
| 10,724 | Aspen Insurance Holdings Ltd. (Bermuda) | 306,385 | |||||||||
| 27,011 | Associated Banc-Corp. | 394,361 | |||||||||
| 17,479 | Assurant, Inc. | 693,916 | |||||||||
| 525 | Assured Guaranty Ltd. (Bermuda) | 8,925 | |||||||||
| 15,579 | Astoria Financial Corp. | 225,428 | |||||||||
| 4,044 | AvalonBay Communities, Inc. REIT | 512,011 | |||||||||
| 15,644 | Axis Capital Holdings Ltd. (Bermuda) | 553,172 | |||||||||
| 12,716 | BancorpSouth, Inc. | 172,302 | |||||||||
| 1,935,283 | Bank of America Corp. | 23,765,275 | |||||||||
| 4,727 | Bank of Hawaii Corp. | 230,630 | |||||||||
| 106,433 | Bank of New York Mellon Corp. (The) | 3,082,300 | |||||||||
| 91,900 | BB&T Corp. | 2,473,948 | |||||||||
| 160,365 | Berkshire Hathaway, Inc., Class B* | 13,358,405 | |||||||||
| 10,055 | BioMed Realty Trust, Inc. REIT | 199,491 | |||||||||
| 4,430 | BlackRock, Inc. | 868,014 | |||||||||
| 9,110 | Boston Properties, Inc. REIT | 952,268 | |||||||||
| 22,824 | Brandywine Realty Trust REIT | 289,865 | |||||||||
| 3,899 | BRE Properties, Inc. REIT | 197,757 | |||||||||
| Number of Shares | Value | ||||||||||
| Common Stocks and Other Equity Interests (Continued) | |||||||||||
| 7,332 | Brown & Brown, Inc. | $ | 189,532 | ||||||||
| 4,952 | Camden Property Trust REIT | 310,738 | |||||||||
| 61,974 | Capital One Financial Corp. | 3,391,837 | |||||||||
| 52,329 | CapitalSource, Inc. | 349,558 | |||||||||
| 13,606 | CB Richard Ellis Group, Inc., Class A* | 363,416 | |||||||||
| 15,674 | CBL & Associates Properties, Inc. REIT | 291,066 | |||||||||
| 64,550 | Charles Schwab Corp. (The) | 1,181,911 | |||||||||
| 42,159 | Chimera Investment Corp. REIT | 170,744 | |||||||||
| 36,820 | Chubb Corp. (The) | 2,400,296 | |||||||||
| 23,317 | Cincinnati Financial Corp. | 738,683 | |||||||||
| 14,979 | CIT Group, Inc.* | 636,008 | |||||||||
| 4,442,324 | Citigroup, Inc.* | 20,390,267 | |||||||||
| 4,338 | City National Corp. | 247,743 | |||||||||
| 4,502 | CME Group, Inc. | 1,331,557 | |||||||||
| 79,422 | CNO Financial Group, Inc.* | 640,141 | |||||||||
| 10,683 | Colonial Properties Trust REIT | 226,052 | |||||||||
| 21,651 | Comerica, Inc. | 821,222 | |||||||||
| 7,121 | Commerce Bancshares, Inc. | 303,070 | |||||||||
| 12,367 | CommonWealth REIT | 338,732 | |||||||||
| 4,486 | Corporate Office Properties Trust REIT | 157,952 | |||||||||
| 4,652 | Cullen/Frost Bankers, Inc. | 275,584 | |||||||||
| 27,627 | DCT Industrial Trust, Inc. REIT | 160,513 | |||||||||
| 4,880 | Delphi Financial Group, Inc., Class A | 155,916 | |||||||||
| 31,491 | Developers Diversified Realty Corp. REIT | 464,177 | |||||||||
| 2,639 | Digital Realty Trust, Inc. REIT | 159,237 | |||||||||
| 50,756 | Discover Financial Services | 1,260,779 | |||||||||
| 8,801 | Douglas Emmett, Inc. REIT | 183,149 | |||||||||
| 31,669 | Duke Realty Corp. REIT | 482,952 | |||||||||
| 28,206 | E*TRADE Financial Corp.* | 458,065 | |||||||||
| 8,111 | East West Bancorp, Inc. | 171,385 | |||||||||
| 5,996 | Eaton Vance Corp. | 202,485 | |||||||||
| 6,201 | Endurance Specialty Holdings Ltd. (Bermuda) | 274,952 | |||||||||
| 3,285 | Entertainment Properties Trust REIT | 156,399 | |||||||||
| 17,731 | Equity Residential REIT | 1,058,895 | |||||||||
| 2,121 | Erie Indemnity Co., Class A | 153,624 | |||||||||
| 1,580 | Essex Property Trust, Inc. REIT | 214,058 | |||||||||
| 6,949 | Everest Re Group Ltd. | 633,193 | |||||||||
| 14,508 | F.N.B. Corp. | 158,863 | |||||||||
| 3,138 | Federal Realty Investment Trust REIT | 274,763 | |||||||||
| 11,636 | Federated Investors, Inc., Class B | 299,976 | |||||||||
| 83,322 | Fidelity National Financial, Inc., Class A | 1,286,492 | |||||||||
| 99,675 | Fifth Third Bancorp | 1,322,687 | |||||||||
| 40,373 | First Horizon National Corp. | 442,084 | |||||||||
| 26,019 | First Niagara Financial Group, Inc. | 374,674 | |||||||||
| 12,553 | FirstMerit Corp. | 219,301 | |||||||||
| 7,639 | Franklin Resources, Inc. | 986,348 | |||||||||
| 22,743 | Fulton Financial Corp. | 265,638 | |||||||||
| 19,974 | General Growth Properties, Inc. REIT | 333,566 | |||||||||
| 102,461 | Genworth Financial, Inc., Class A* | 1,249,000 | |||||||||
| 48,675 | Goldman Sachs Group, Inc. (The) | 7,350,412 | |||||||||
See Notes to Financial Statements.
27
Schedule of Investments (Continued)
PowerShares FTSE RAFI US 1000 Portfolio
April 30, 2011
| Number of Shares | Value | ||||||||||
| Common Stocks and Other Equity Interests (Continued) | |||||||||||
| 5,674 | Hanover Insurance Group, Inc. (The) | $ | 239,556 | ||||||||
| 96,841 | Hartford Financial Services Group, Inc. (The) | 2,805,484 | |||||||||
| 5,259 | Hatteras Financial Corp. REIT | 149,408 | |||||||||
| 11,115 | HCC Insurance Holdings, Inc. | 361,682 | |||||||||
| 16,948 | HCP, Inc. REIT | 671,480 | |||||||||
| 6,948 | Health Care REIT, Inc. REIT | 373,594 | |||||||||
| 5,765 | Highwoods Properties, Inc. REIT | 212,729 | |||||||||
| 2,866 | Home Properties, Inc. REIT | 181,704 | |||||||||
| 22,160 | Hospitality Properties Trust REIT | 535,164 | |||||||||
| 49,526 | Host Hotels & Resorts, Inc. REIT | 881,068 | |||||||||
| 63,003 | Hudson City Bancorp, Inc. | 600,419 | |||||||||
| 98,590 | Huntington Bancshares, Inc. | 669,426 | |||||||||
| 15,178 | Interactive Brokers Group, Inc., Class A | 266,222 | |||||||||
| 1,988 | IntercontinentalExchange, Inc.* | 239,256 | |||||||||
| 28,527 | Invesco Ltd. (~) | 709,466 | |||||||||
| 39,865 | iStar Financial, Inc. REIT* | 383,501 | |||||||||
| 7,325 | Jefferies Group, Inc. | 177,045 | |||||||||
| 2,142 | Jones Lang LaSalle, Inc. | 219,298 | |||||||||
| 457,380 | JPMorgan Chase & Co. | 20,870,249 | |||||||||
| 141,110 | KeyCorp | 1,223,424 | |||||||||
| 4,413 | Kilroy Realty Corp. REIT | 185,081 | |||||||||
| 28,409 | Kimco Realty Corp. REIT | 555,112 | |||||||||
| 13,191 | Knight Capital Group, Inc., Class A* | 180,981 | |||||||||
| 17,972 | Legg Mason, Inc. | 667,660 | |||||||||
| 6,367 | Leucadia National Corp. | 246,148 | |||||||||
| 17,895 | Lexington Realty Trust REIT | 178,592 | |||||||||
| 12,131 | Liberty Property Trust REIT | 426,647 | |||||||||
| 41,646 | Lincoln National Corp. | 1,300,605 | |||||||||
| 47,051 | Loews Corp. | 2,082,477 | |||||||||
| 12,124 | M&T Bank Corp. | 1,071,398 | |||||||||
| 7,564 | Macerich Co. (The) REIT | 399,530 | |||||||||
| 9,952 | Mack-Cali Realty Corp. REIT | 351,505 | |||||||||
| 831 | Markel Corp.* | 346,760 | |||||||||
| 41,663 | Marsh & McLennan Cos., Inc. | 1,261,556 | |||||||||
| 105,855 | Marshall & Ilsley Corp. | 864,835 | |||||||||
| 18,035 | MBIA, Inc.* | 186,121 | |||||||||
| 4,203 | Mercury General Corp. | 167,027 | |||||||||
| 66,937 | MetLife, Inc. | 3,131,982 | |||||||||
| 30,484 | MF Global Holdings Ltd.* | 256,370 | |||||||||
| 27,567 | MFA Financial, Inc. REIT | 219,985 | |||||||||
| 18,777 | MGIC Investment Corp.* | 162,609 | |||||||||
| 12,484 | Montpelier Re Holdings Ltd. (Bermuda) | 225,836 | |||||||||
| 10,353 | Moody's Corp. | 405,216 | |||||||||
| 192,655 | Morgan Stanley | 5,037,928 | |||||||||
| 5,493 | MSCI, Inc., Class A* | 194,837 | |||||||||
| 17,898 | NASDAQ OMX Group, Inc. (The)* | 485,036 | |||||||||
| 5,952 | National Retail Properties, Inc. REIT | 156,776 | |||||||||
| 5,448 | Nationwide Health Properties, Inc. REIT | 238,622 | |||||||||
| 43,392 | New York Community Bancorp, Inc. | 720,307 | |||||||||
| 19,050 | Northern Trust Corp. | 952,310 | |||||||||
| Number of Shares | Value | ||||||||||
| Common Stocks and Other Equity Interests (Continued) | |||||||||||
| 20,804 | NYSE Euronext | $ | 833,200 | ||||||||
| 38,482 | Old Republic International Corp. | 487,567 | |||||||||
| 8,940 | PartnerRe Ltd. (Bermuda) | 718,418 | |||||||||
| 10,435 | Pennsylvania REIT | 164,769 | |||||||||
| 38,354 | People's United Financial, Inc. | 525,066 | |||||||||
| 18,982 | PHH Corp.* | 407,354 | |||||||||
| 63,832 | Phoenix Cos., Inc. (The)* | 171,708 | |||||||||
| 7,749 | Piedmont Office Realty Trust, Inc., Class A REIT | 154,205 | |||||||||
| 4,984 | Platinum Underwriters Holdings Ltd. (Bermuda) | 188,445 | |||||||||
| 12,458 | Plum Creek Timber Co., Inc. REIT | 536,815 | |||||||||
| 52,413 | PNC Financial Services Group, Inc. | 3,267,426 | |||||||||
| 166,283 | Popular, Inc.* | 523,791 | |||||||||
| 6,951 | Potlatch Corp. REIT | 268,934 | |||||||||
| 9,552 | Primerica, Inc. | 220,842 | |||||||||
| 31,995 | Principal Financial Group, Inc. | 1,079,831 | |||||||||
| 3,010 | ProAssurance Corp.* | 199,864 | |||||||||
| 66,560 | Progressive Corp. (The) | 1,460,326 | |||||||||
| 64,240 | ProLogis REIT | 1,046,470 | |||||||||
| 12,916 | Protective Life Corp. | 347,570 | |||||||||
| 51,273 | Prudential Financial, Inc. | 3,251,734 | |||||||||
| 5,153 | Public Storage REIT | 604,498 | |||||||||
| 8,652 | Raymond James Financial, Inc. | 324,450 | |||||||||
| 5,609 | Rayonier, Inc. REIT | 372,213 | |||||||||
| 5,086 | Realty Income Corp. REIT | 180,807 | |||||||||
| 14,060 | Redwood Trust, Inc. REIT | 222,570 | |||||||||
| 6,425 | Regency Centers Corp. REIT | 302,360 | |||||||||
| 244,230 | Regions Financial Corp. | 1,792,648 | |||||||||
| 7,720 | Reinsurance Group of America, Inc. | 488,676 | |||||||||
| 5,347 | RenaissanceRe Holdings Ltd. (Bermuda) | 375,787 | |||||||||
| 2,520 | RLI Corp. | 149,285 | |||||||||
| 6,995 | SEI Investments Co. | 156,198 | |||||||||
| 9,665 | Selective Insurance Group, Inc. | 170,491 | |||||||||
| 7,637 | Senior Housing Properties Trust REIT | 181,150 | |||||||||
| 11,751 | Simon Property Group, Inc. REIT | 1,345,960 | |||||||||
| 5,251 | SL Green Realty Corp. REIT | 433,365 | |||||||||
| 53,818 | SLM Corp.* | 892,841 | |||||||||
| 6,196 | StanCorp Financial Group, Inc. | 267,048 | |||||||||
| 43,247 | State Street Corp. | 2,013,148 | |||||||||
| 13,710 | Sunstone Hotel Investors, Inc. REIT* | 143,407 | |||||||||
| 80,747 | SunTrust Banks, Inc. | 2,276,258 | |||||||||
| 20,158 | Susquehanna Bancshares, Inc. | 185,857 | |||||||||
| 3,016 | SVB Financial Group* | 182,287 | |||||||||
| 199,515 | Synovus Financial Corp. | 498,787 | |||||||||
| 9,718 | T. Rowe Price Group, Inc. | 624,382 | |||||||||
| 17,853 | TCF Financial Corp. | 278,328 | |||||||||
| 24,050 | TD Ameritrade Holding Corp. | 518,037 | |||||||||
| 8,005 | Torchmark Corp. | 535,695 | |||||||||
| 8,316 | Transatlantic Holdings, Inc. | 409,896 | |||||||||
| 75,504 | Travelers Cos., Inc. (The) | 4,777,893 | |||||||||
See Notes to Financial Statements.
28
Schedule of Investments (Continued)
PowerShares FTSE RAFI US 1000 Portfolio
April 30, 2011
| Number of Shares | Value | ||||||||||
| Common Stocks and Other Equity Interests (Continued) | |||||||||||
| 7,316 | Trustmark Corp. | $ | 170,024 | ||||||||
| 191,266 | U.S. Bancorp | 4,938,488 | |||||||||
| 12,554 | UDR, Inc. REIT | 325,023 | |||||||||
| 13,191 | Umpqua Holdings Corp. | 153,148 | |||||||||
| 10,835 | Unitrin, Inc. | 327,650 | |||||||||
| 38,909 | Unum Group | 1,030,310 | |||||||||
| 10,398 | Validus Holdings Ltd. | 338,351 | |||||||||
| 19,125 | Valley National Bancorp | 273,870 | |||||||||
| 7,655 | Ventas, Inc. REIT | 428,144 | |||||||||
| 11,387 | Vornado Realty Trust REIT | 1,100,895 | |||||||||
| 17,363 | W.R. Berkley Corp. | 566,207 | |||||||||
| 11,895 | Washington Federal, Inc. | 191,391 | |||||||||
| 4,668 | Washington Real Estate Investment Trust REIT | 151,243 | |||||||||
| 8,835 | Webster Financial Corp. | 190,129 | |||||||||
| 12,241 | Weingarten Realty Investors REIT | 323,285 | |||||||||
| 485,915 | Wells Fargo & Co. | 14,144,986 | |||||||||
| 56,357 | Weyerhaeuser Co. REIT | 1,296,775 | |||||||||
| 1,149 | White Mountains Insurance Group Ltd. | 410,779 | |||||||||
| 13,880 | Whitney Holding Corp. | 187,935 | |||||||||
| 11,812 | Willis Group Holdings PLC (Ireland) | 488,072 | |||||||||
| 46,449 | XL Group PLC (Ireland) | 1,134,285 | |||||||||
| 27,967 | Zions Bancorp | 683,793 | |||||||||
| 242,633,059 | |||||||||||
| Health Care—10.7% | |||||||||||
| 114,787 | Abbott Laboratories | 5,973,515 | |||||||||
| 45,839 | Aetna, Inc. | 1,896,818 | |||||||||
| 13,641 | Agilent Technologies, Inc.* | 680,822 | |||||||||
| 7,111 | Alere, Inc.* | 264,103 | |||||||||
| 7,546 | Allergan, Inc. | 600,360 | |||||||||
| 4,405 | AMERIGROUP Corp.* | 300,861 | |||||||||
| 63,820 | AmerisourceBergen Corp. | 2,593,645 | |||||||||
| 69,758 | Amgen, Inc.* | 3,965,742 | |||||||||
| 32,923 | Baxter International, Inc. | 1,873,319 | |||||||||
| 3,779 | Beckman Coulter, Inc. | 313,090 | |||||||||
| 14,018 | Becton, Dickinson and Co. | 1,204,707 | |||||||||
| 12,880 | Biogen Idec, Inc.* | 1,253,868 | |||||||||
| 222,894 | Boston Scientific Corp.* | 1,669,476 | |||||||||
| 183,619 | Bristol-Myers Squibb Co. | 5,159,694 | |||||||||
| 6,547 | Brookdale Senior Living, Inc.* | 178,340 | |||||||||
| 3,577 | C.R. Bard, Inc. | 381,845 | |||||||||
| 84,415 | Cardinal Health, Inc. | 3,688,091 | |||||||||
| 22,363 | CareFusion Corp.* | 656,801 | |||||||||
| 8,349 | Celgene Corp.* | 491,589 | |||||||||
| 5,680 | Centene Corp.* | 205,786 | |||||||||
| 5,799 | Cephalon, Inc.* | 445,363 | |||||||||
| 2,393 | Cerner Corp.* | 287,591 | |||||||||
| 5,512 | Charles River Laboratories International, Inc.* | 232,551 | |||||||||
| 26,484 | CIGNA Corp. | 1,240,246 | |||||||||
| Number of Shares | Value | ||||||||||
| Common Stocks and Other Equity Interests (Continued) | |||||||||||
| 16,282 | Community Health Systems, Inc.* | $ | 500,346 | ||||||||
| 2,405 | Cooper Cos., Inc. (The) | 180,135 | |||||||||
| 3,896 | Covance, Inc.* | 243,890 | |||||||||
| 27,830 | Coventry Health Care, Inc.* | 898,074 | |||||||||
| 27,531 | Covidien PLC (Ireland) | 1,533,201 | |||||||||
| 7,051 | DaVita, Inc.* | 621,123 | |||||||||
| 6,575 | DENTSPLY International, Inc. | 246,825 | |||||||||
| 2,085 | Edwards Lifesciences Corp.* | 180,040 | |||||||||
| 123,954 | Eli Lilly & Co. | 4,587,538 | |||||||||
| 6,533 | Endo Pharmaceuticals Holdings, Inc.* | 255,832 | |||||||||
| 23,208 | Express Scripts, Inc.* | 1,316,822 | |||||||||
| 20,580 | Forest Laboratories, Inc.* | 682,433 | |||||||||
| 32,279 | Gilead Sciences, Inc.* | 1,253,716 | |||||||||
| 28,878 | Health Management Associates, Inc., Class A* | 325,744 | |||||||||
| 25,827 | Health Net, Inc.* | 860,039 | |||||||||
| 6,741 | Henry Schein, Inc.* | 492,565 | |||||||||
| 5,090 | Hill-Rom Holdings, Inc. | 229,101 | |||||||||
| 16,093 | Hologic, Inc.* | 354,368 | |||||||||
| 8,442 | Hospira, Inc.* | 478,915 | |||||||||
| 24,854 | Humana, Inc.* | 1,891,886 | |||||||||
| 739 | Intuitive Surgical, Inc.* | 258,428 | |||||||||
| 205,006 | Johnson & Johnson | 13,472,994 | |||||||||
| 8,482 | Kindred Healthcare, Inc.* | 213,916 | |||||||||
| 5,365 | Kinetic Concepts, Inc.* | 316,696 | |||||||||
| 5,787 | Laboratory Corp. of America Holdings* | 558,272 | |||||||||
| 8,377 | Life Technologies Corp.* | 462,410 | |||||||||
| 8,141 | LifePoint Hospitals, Inc.* | 338,747 | |||||||||
| 7,662 | Lincare Holdings, Inc. | 240,740 | |||||||||
| 4,013 | Magellan Health Services, Inc.* | 208,756 | |||||||||
| 47,339 | McKesson Corp. | 3,929,610 | |||||||||
| 44,490 | Medco Health Solutions, Inc.* | 2,639,592 | |||||||||
| 2,734 | MEDNAX, Inc.* | 193,895 | |||||||||
| 68,182 | Medtronic, Inc. | 2,846,599 | |||||||||
| 271,306 | Merck & Co., Inc. | 9,753,451 | |||||||||
| 1,078 | Mettler-Toledo International, Inc.* | 202,017 | |||||||||
| 13,956 | Mylan, Inc.* | 347,784 | |||||||||
| 17,112 | Omnicare, Inc. | 537,659 | |||||||||
| 9,301 | Owens & Minor, Inc. | 320,419 | |||||||||
| 6,711 | Patterson Cos., Inc. | 232,939 | |||||||||
| 7,880 | PerkinElmer, Inc. | 222,768 | |||||||||
| 2,280 | Perrigo Co. | 206,021 | |||||||||
| 911,127 | Pfizer, Inc. | 19,097,222 | |||||||||
| 7,344 | Pharmaceutical Product Development, Inc. | 226,562 | |||||||||
| 13,138 | Quest Diagnostics, Inc. | 740,720 | |||||||||
| 14,932 | St. Jude Medical, Inc. | 797,966 | |||||||||
| 4,620 | STERIS Corp. | 166,505 | |||||||||
| 12,210 | Stryker Corp. | 720,390 | |||||||||
| 4,297 | Teleflex, Inc. | 270,754 | |||||||||
| 74,281 | Tenet Healthcare Corp.* | 514,767 | |||||||||
| 27,982 | Thermo Fisher Scientific, Inc.* | 1,678,640 | |||||||||
See Notes to Financial Statements.
29
Schedule of Investments (Continued)
PowerShares FTSE RAFI US 1000 Portfolio
April 30, 2011
| Number of Shares | Value | ||||||||||
| Common Stocks and Other Equity Interests (Continued) | |||||||||||
| 121,537 | UnitedHealth Group, Inc. | $ | 5,983,267 | ||||||||
| 8,516 | Universal American Financial Corp. | 196,720 | |||||||||
| 7,452 | Universal Health Services, Inc., Class B | 408,221 | |||||||||
| 3,854 | Varian Medical Systems, Inc.* | 270,551 | |||||||||
| 6,264 | VCA Antech, Inc.* | 154,094 | |||||||||
| 2,789 | Waters Corp.* | 273,322 | |||||||||
| 5,628 | Watson Pharmaceuticals, Inc.* | 349,049 | |||||||||
| 77,220 | WellPoint, Inc. | 5,929,724 | |||||||||
| 14,016 | Zimmer Holdings, Inc.* | 914,544 | |||||||||
| 128,887,547 | |||||||||||
| Industrials—11.5% | |||||||||||
| 45,814 | 3M Co. | 4,453,579 | |||||||||
| 2,843 | Acuity Brands, Inc. | 167,168 | |||||||||
| 13,757 | Aecom Technology Corp.* | 375,016 | |||||||||
| 11,983 | AerCap Holdings NV (Netherlands)* | 171,597 | |||||||||
| 9,499 | AGCO Corp.* | 546,952 | |||||||||
| 5,159 | Alaska Air Group, Inc.* | 339,823 | |||||||||
| 4,612 | Alexander & Baldwin, Inc. | 243,052 | |||||||||
| 4,613 | Alliant Techsystems, Inc. | 325,908 | |||||||||
| 1,790 | Amerco, Inc.* | 182,079 | |||||||||
| 6,144 | AMETEK, Inc. | 282,870 | |||||||||
| 173,090 | AMR Corp.* | 1,016,038 | |||||||||
| 2,241 | Atlas Air Worldwide Holdings, Inc.* | 154,427 | |||||||||
| 13,945 | Avery Dennison Corp. | 582,064 | |||||||||
| 43,181 | Avis Budget Group, Inc.* | 818,712 | |||||||||
| 6,337 | BE Aerospace, Inc.* | 244,545 | |||||||||
| 61,238 | Boeing Co. (The) | 4,885,568 | |||||||||
| 4,158 | Brady Corp., Class A | 156,798 | |||||||||
| 8,739 | Briggs & Stratton Corp. | 206,153 | |||||||||
| 5,976 | Brink's Co. (The) | 197,268 | |||||||||
| 1,865 | Bucyrus International, Inc. | 170,554 | |||||||||
| 6,835 | C.H. Robinson Worldwide, Inc. | 548,030 | |||||||||
| 5,168 | Carlisle Cos., Inc. | 256,023 | |||||||||
| 38,013 | Caterpillar, Inc. | 4,387,080 | |||||||||
| 15,152 | Cintas Corp. | 470,470 | |||||||||
| 8,086 | Con-way, Inc. | 314,707 | |||||||||
| 10,257 | Cooper Industries PLC (Ireland) | 676,449 | |||||||||
| 9,649 | Corrections Corp. of America* | 240,164 | |||||||||
| 10,998 | Covanta Holding Corp. | 188,836 | |||||||||
| 4,712 | Crane Co. | 235,176 | |||||||||
| 21,931 | CSX Corp. | 1,725,750 | |||||||||
| 8,388 | Cummins, Inc. | 1,008,070 | |||||||||
| 3,966 | Curtiss-Wright Corp. | 131,870 | |||||||||
| 27,435 | Danaher Corp. | 1,515,509 | |||||||||
| 23,231 | Deere & Co. | 2,265,023 | |||||||||
| 120,513 | Delta Air Lines, Inc.* | 1,250,925 | |||||||||
| 7,078 | Deluxe Corp. | 191,672 | |||||||||
| 4,484 | Dollar Thrifty Automotive Group, Inc.* | 309,082 | |||||||||
| 3,341 | Donaldson Co., Inc. | 204,569 | |||||||||
| 12,748 | Dover Corp. | 867,374 | |||||||||
| Number of Shares | Value | ||||||||||
| Common Stocks and Other Equity Interests (Continued) | |||||||||||
| 36,429 | DryShips, Inc. (Greece)* | $ | 171,945 | ||||||||
| 2,265 | Dun & Bradstreet Corp. (The) | 186,138 | |||||||||
| 12,054 | Eaton Corp. | 645,251 | |||||||||
| 10,965 | EMCOR Group, Inc.* | 339,586 | |||||||||
| 48,436 | Emerson Electric Co. | 2,942,971 | |||||||||
| 4,293 | EnerSys* | 162,662 | |||||||||
| 7,048 | Equifax, Inc. | 264,511 | |||||||||
| 2,634 | Esterline Technologies Corp.* | 189,121 | |||||||||
| 7,494 | Expeditors International of Washington, Inc. | 406,699 | |||||||||
| 5,169 | Fastenal Co. | 346,788 | |||||||||
| 29,188 | FedEx Corp. | 2,792,416 | |||||||||
| 2,508 | Flowserve Corp. | 317,563 | |||||||||
| 12,867 | Fluor Corp. | 899,918 | |||||||||
| 9,777 | Foster Wheeler AG (Switzerland)* | 347,768 | |||||||||
| 4,836 | FTI Consulting, Inc.* | 192,956 | |||||||||
| 2,041 | Gardner Denver, Inc. | 176,363 | |||||||||
| 6,436 | GATX Corp. | 272,050 | |||||||||
| 7,608 | General Cable Corp.* | 368,988 | |||||||||
| 36,533 | General Dynamics Corp. | 2,660,333 | |||||||||
| 1,236,995 | General Electric Co. | 25,296,548 | |||||||||
| 7,394 | Goodrich Corp. | 653,408 | |||||||||
| 6,160 | Granite Construction, Inc. | 167,429 | |||||||||
| 10,111 | Harsco Corp. | 359,952 | |||||||||
| 77,031 | Hertz Global Holdings, Inc.* | 1,325,704 | |||||||||
| 5,679 | HNI Corp. | 156,286 | |||||||||
| 55,972 | Honeywell International, Inc. | 3,427,166 | |||||||||
| 3,996 | Hubbell, Inc., Class B | 279,680 | |||||||||
| 6,677 | Huntington Ingalls Industries, Inc.* | 267,080 | |||||||||
| 37,581 | Illinois Tool Works, Inc. | 2,195,106 | |||||||||
| 24,738 | Ingersoll-Rand PLC (Ireland) | 1,249,269 | |||||||||
| 15,666 | Iron Mountain, Inc. | 498,962 | |||||||||
| 13,906 | ITT Corp. | 803,628 | |||||||||
| 5,172 | J.B. Hunt Transport Services, Inc. | 246,601 | |||||||||
| 13,801 | Jacobs Engineering Group, Inc.* | 684,668 | |||||||||
| 36,853 | JetBlue Airways Corp.* | 208,588 | |||||||||
| 3,557 | Joy Global, Inc. | 359,079 | |||||||||
| 5,537 | Kansas City Southern* | 321,755 | |||||||||
| 15,273 | KBR, Inc. | 586,025 | |||||||||
| 9,091 | Kelly Services, Inc., Class A* | 173,729 | |||||||||
| 5,714 | Kennametal, Inc. | 241,245 | |||||||||
| 3,179 | Kirby Corp.* | 180,504 | |||||||||
| 14,940 | L-3 Communications Holdings, Inc. | 1,198,039 | |||||||||
| 4,666 | Lennox International, Inc. | 226,814 | |||||||||
| 2,856 | Lincoln Electric Holdings, Inc. | 224,424 | |||||||||
| 41,346 | Lockheed Martin Corp. | 3,276,670 | |||||||||
| 11,091 | Manitowoc Co., Inc. (The) | 246,109 | |||||||||
| 13,040 | Manpower, Inc. | 863,900 | |||||||||
| 74,584 | Masco Corp. | 1,000,917 | |||||||||
| 12,237 | Meritor, Inc.* | 210,599 | |||||||||
| 4,413 | Mueller Industries, Inc. | 172,637 | |||||||||
See Notes to Financial Statements.
30
Schedule of Investments (Continued)
PowerShares FTSE RAFI US 1000 Portfolio
April 30, 2011
| Number of Shares | Value | ||||||||||
| Common Stocks and Other Equity Interests (Continued) | |||||||||||
| 11,938 | Navistar International Corp.* | $ | 829,930 | ||||||||
| 7,086 | Nielsen Holdings NV (Netherlands)* | 211,801 | |||||||||
| 28,586 | Norfolk Southern Corp. | 2,134,802 | |||||||||
| 40,047 | Northrop Grumman Corp. | 2,547,390 | |||||||||
| 11,378 | Oshkosh Corp.* | 360,227 | |||||||||
| 15,016 | Owens Corning* | 568,205 | |||||||||
| 30,462 | PACCAR, Inc. | 1,617,837 | |||||||||
| 5,054 | Pall Corp. | 295,356 | |||||||||
| 10,385 | Parker Hannifin Corp. | 979,513 | |||||||||
| 8,991 | Pentair, Inc. | 361,079 | |||||||||
| 30,583 | Pitney Bowes, Inc. | 751,118 | |||||||||
| 4,916 | Precision Castparts Corp. | 759,620 | |||||||||
| 15,935 | Quanta Services, Inc.* | 345,471 | |||||||||
| 49,879 | R.R. Donnelley & Sons Co. | 940,718 | |||||||||
| 42,940 | Raytheon Co. | 2,084,737 | |||||||||
| 2,344 | Regal-Beloit Corp. | 177,652 | |||||||||
| 26,382 | Republic Airways Holdings, Inc.* | 142,331 | |||||||||
| 28,445 | Republic Services, Inc. | 899,431 | |||||||||
| 9,573 | Robert Half International, Inc. | 290,349 | |||||||||
| 6,472 | Rockwell Automation, Inc. | 563,905 | |||||||||
| 8,061 | Rockwell Collins, Inc. | 508,649 | |||||||||
| 3,780 | Roper Industries, Inc. | 326,932 | |||||||||
| 10,979 | Ryder System, Inc. | 587,377 | |||||||||
| 10,313 | Shaw Group, Inc. (The)* | 401,176 | |||||||||
| 14,636 | SkyWest, Inc. | 241,933 | |||||||||
| 4,722 | Snap-On, Inc. | 291,678 | |||||||||
| 71,217 | Southwest Airlines Co. | 836,800 | |||||||||
| 9,657 | Spirit Aerosystems Holdings, Inc., Class A* | 237,562 | |||||||||
| 4,795 | SPX Corp. | 414,528 | |||||||||
| 1,768 | Stericycle, Inc.* | 161,383 | |||||||||
| 3,110 | Teledyne Technologies, Inc.* | 157,024 | |||||||||
| 15,816 | Terex Corp.* | 550,080 | |||||||||
| 34,144 | Textron, Inc. | 891,158 | |||||||||
| 4,546 | Thomas & Betts Corp.* | 263,532 | |||||||||
| 7,948 | Timken Co. (The) | 448,188 | |||||||||
| 9,433 | Trinity Industries, Inc. | 341,475 | |||||||||
| 8,580 | Tutor Perini Corp.* | 228,743 | |||||||||
| 50,922 | Tyco International Ltd. (Switzerland) | 2,481,938 | |||||||||
| 26,438 | Union Pacific Corp. | 2,735,540 | |||||||||
| 67,188 | United Continental Holdings, Inc.* | 1,533,230 | |||||||||
| 48,287 | United Parcel Service, Inc., Class B | 3,620,076 | |||||||||
| 11,848 | United Rentals, Inc.* | 348,568 | |||||||||
| 4,197 | United Stationers, Inc. | 302,436 | |||||||||
| 65,628 | United Technologies Corp. | 5,878,956 | |||||||||
| 12,608 | URS Corp.* | 564,208 | |||||||||
| 12,461 | USG Corp.* | 192,149 | |||||||||
| 9,859 | UTi Worldwide, Inc. (British Virgin Islands) | 220,940 | |||||||||
| 4,457 | W.W. Grainger, Inc. | 675,681 | |||||||||
| 2,558 | WABCO Holdings, Inc.* | 188,908 | |||||||||
| 6,593 | Waste Connections, Inc. | 202,867 | |||||||||
| 50,161 | Waste Management, Inc. | 1,979,353 | |||||||||
| Number of Shares | Value | ||||||||||
| Common Stocks and Other Equity Interests (Continued) | |||||||||||
| 6,718 | Werner Enterprises, Inc. | $ | 175,810 | ||||||||
| 5,629 | WESCO International, Inc.* | 348,717 | |||||||||
| 157,588 | YRC Worldwide, Inc.* | 312,024 | |||||||||
| 138,604,589 | |||||||||||
| Information Technology—10.7% | |||||||||||
| 31,012 | Accenture PLC, Class A (Ireland) | 1,771,716 | |||||||||
| 38,133 | Activision Blizzard, Inc. | 434,335 | |||||||||
| 20,912 | Adobe Systems, Inc.* | 701,598 | |||||||||
| 48,525 | Advanced Micro Devices, Inc.* | 441,578 | |||||||||
| 4,896 | Akamai Technologies, Inc.* | 168,618 | |||||||||
| 2,738 | Alliance Data Systems Corp.* | 260,110 | |||||||||
| 7,168 | Altera Corp. | 349,082 | |||||||||
| 14,983 | Amdocs Ltd. (Guernsey)* | 460,727 | |||||||||
| 25,975 | Amkor Technology, Inc.* | 174,032 | |||||||||
| 5,987 | Amphenol Corp., Class A | 334,733 | |||||||||
| 15,586 | Analog Devices, Inc. | 628,272 | |||||||||
| 4,153 | Anixter International, Inc. | 312,056 | |||||||||
| 37,605 | AOL, Inc.* | 766,390 | |||||||||
| 19,202 | Apple, Inc.* | 6,686,712 | |||||||||
| 77,052 | Applied Materials, Inc. | 1,208,946 | |||||||||
| 22,999 | Arrow Electronics, Inc.* | 1,048,524 | |||||||||
| 10,167 | Atmel Corp.* | 155,555 | |||||||||
| 4,777 | Autodesk, Inc.* | 214,869 | |||||||||
| 29,984 | Automatic Data Processing, Inc. | 1,629,630 | |||||||||
| 5,067 | Avago Technologies Ltd. (Singapore) | 169,542 | |||||||||
| 29,340 | Avnet, Inc.* | 1,065,629 | |||||||||
| 10,548 | Benchmark Electronics, Inc.* | 178,261 | |||||||||
| 5,622 | BMC Software, Inc.* | 282,393 | |||||||||
| 13,127 | Brightpoint, Inc.* | 132,845 | |||||||||
| 10,387 | Broadcom Corp., Class A | 365,415 | |||||||||
| 9,416 | Broadridge Financial Solutions, Inc. | 218,828 | |||||||||
| 39,970 | Brocade Communications Systems, Inc.* | 249,813 | |||||||||
| 20,351 | CA, Inc. | 500,431 | |||||||||
| 3,665 | CACI International, Inc., Class A* | 223,968 | |||||||||
| 6,019 | Check Point Software Technologies Ltd. (Israel)* | 330,624 | |||||||||
| 354,099 | Cisco Systems, Inc. | 6,217,978 | |||||||||
| 4,266 | Citrix Systems, Inc.* | 359,794 | |||||||||
| 4,618 | Cognizant Technology Solutions Corp., Class A* | 382,832 | |||||||||
| 32,868 | Computer Sciences Corp. | 1,675,611 | |||||||||
| 13,470 | Compuware Corp.* | 152,615 | |||||||||
| 18,485 | Convergys Corp.* | 268,033 | |||||||||
| 74,038 | Corning, Inc. | 1,550,356 | |||||||||
| 3,534 | Cree, Inc.* | 143,975 | |||||||||
| 225,267 | Dell, Inc.* | 3,493,891 | |||||||||
| 7,087 | Diebold, Inc. | 239,541 | |||||||||
| 4,712 | DST Systems, Inc. | 232,349 | |||||||||
| 55,645 | eBay, Inc.* | 1,914,188 | |||||||||
| 16,471 | Electronic Arts, Inc.* | 332,385 | |||||||||
See Notes to Financial Statements.
31
Schedule of Investments (Continued)
PowerShares FTSE RAFI US 1000 Portfolio
April 30, 2011
| Number of Shares | Value | ||||||||||
| Common Stocks and Other Equity Interests (Continued) | |||||||||||
| 75,964 | EMC Corp.* | $ | 2,152,820 | ||||||||
| 26,385 | Fidelity National Information Services, Inc. | 873,343 | |||||||||
| 1,350 | First Solar, Inc.* | 188,419 | |||||||||
| 9,440 | Fiserv, Inc.* | 578,766 | |||||||||
| 160,207 | Flextronics International Ltd. (Singapore)* | 1,116,643 | |||||||||
| 5,179 | FLIR Systems, Inc. | 182,404 | |||||||||
| 6,855 | Google, Inc., Class A* | 3,729,806 | |||||||||
| 10,205 | Harris Corp. | 542,192 | |||||||||
| 197,032 | Hewlett-Packard Co. | 7,954,182 | |||||||||
| 12,735 | IAC/InterActiveCorp.* | 459,861 | |||||||||
| 58,286 | Ingram Micro, Inc., Class A* | 1,091,697 | |||||||||
| 12,185 | Insight Enterprises, Inc.* | 209,095 | |||||||||
| 429,591 | Intel Corp. | 9,962,215 | |||||||||
| 64,337 | International Business Machines Corp. | 10,974,605 | |||||||||
| 11,547 | Intersil Corp., Class A | 170,549 | |||||||||
| 9,621 | Intuit, Inc.* | 534,543 | |||||||||
| 3,143 | Itron, Inc.* | 171,073 | |||||||||
| 27,462 | Jabil Circuit, Inc. | 544,846 | |||||||||
| 16,071 | Juniper Networks, Inc.* | 616,001 | |||||||||
| 7,375 | KLA-Tencor Corp. | 323,763 | |||||||||
| 5,452 | Lam Research Corp.* | 263,386 | |||||||||
| 6,009 | Lender Processing Services, Inc. | 176,845 | |||||||||
| 10,433 | Lexmark International, Inc., Class A* | 336,464 | |||||||||
| 10,028 | Linear Technology Corp. | 348,974 | |||||||||
| 38,293 | LSI Corp.* | 280,688 | |||||||||
| 25,102 | Marvell Technology Group Ltd. (Bermuda)* | 387,324 | |||||||||
| 2,330 | MasterCard, Inc., Class A | 642,824 | |||||||||
| 18,329 | Maxim Integrated Products, Inc. | 501,115 | |||||||||
| 24,573 | MEMC Electronic Materials, Inc.* | 290,699 | |||||||||
| 11,790 | Microchip Technology, Inc. | 483,862 | |||||||||
| 105,457 | Micron Technology, Inc.* | 1,190,610 | |||||||||
| 476,444 | Microsoft Corp. | 12,397,073 | |||||||||
| 5,800 | Molex, Inc. | 156,600 | |||||||||
| 7,058 | Molex, Inc., Class A | 158,946 | |||||||||
| 9,270 | Monster Worldwide, Inc.* | 152,121 | |||||||||
| 20,785 | Motorola Mobility Holdings, Inc.* | 541,657 | |||||||||
| 53,524 | Motorola Solutions, Inc.* | 2,455,681 | |||||||||
| 15,711 | National Semiconductor Corp. | 378,949 | |||||||||
| 17,122 | NCR Corp.* | 339,187 | |||||||||
| 7,364 | NetApp, Inc.* | 382,781 | |||||||||
| 4,654 | Novellus Systems, Inc.* | 149,393 | |||||||||
| 9,125 | Nuance Communications, Inc.* | 188,887 | |||||||||
| 17,632 | NVIDIA Corp.* | 352,640 | |||||||||
| 18,932 | ON Semiconductor Corp.* | 198,975 | |||||||||
| 121,266 | Oracle Corp. | 4,371,639 | |||||||||
| 20,924 | Paychex, Inc. | 684,424 | |||||||||
| 50,793 | QUALCOMM, Inc. | 2,887,074 | |||||||||
| 41,815 | SAIC, Inc.* | 727,581 | |||||||||
| 12,932 | SanDisk Corp.* | 635,478 | |||||||||
| 25,022 | Sanmina-SCI Corp.* | 293,258 | |||||||||
| Number of Shares | Value | ||||||||||
| Common Stocks and Other Equity Interests (Continued) | |||||||||||
| 73,187 | Seagate Technology PLC (Ireland) | $ | 1,289,555 | ||||||||
| 4,038 | Skyworks Solutions, Inc.* | 127,035 | |||||||||
| 48,797 | Symantec Corp.* | 958,861 | |||||||||
| 9,298 | Synopsys, Inc.* | 254,672 | |||||||||
| 35,780 | TE Connectivity Ltd. (Switzerland) | 1,282,713 | |||||||||
| 21,595 | Tech Data Corp.* | 1,147,342 | |||||||||
| 34,311 | Tellabs, Inc. | 168,810 | |||||||||
| 4,427 | Teradata Corp.* | 247,558 | |||||||||
| 8,802 | Teradyne, Inc.* | 141,712 | |||||||||
| 60,977 | Texas Instruments, Inc. | 2,166,513 | |||||||||
| 23,430 | Total System Services, Inc. | 441,656 | |||||||||
| 3,397 | Trimble Navigation Ltd.* | 159,115 | |||||||||
| 8,164 | Unisys Corp.* | 242,308 | |||||||||
| 7,303 | VeriSign, Inc. | 269,919 | |||||||||
| 19,722 | Visa, Inc., Class A | 1,540,683 | |||||||||
| 16,297 | Vishay Intertechnology, Inc.* | 310,947 | |||||||||
| 27,557 | Western Digital Corp.* | 1,096,769 | |||||||||
| 20,299 | Western Union Co. (The) | 431,354 | |||||||||
| 147,577 | Xerox Corp. | 1,489,052 | |||||||||
| 11,957 | Xilinx, Inc. | 416,821 | |||||||||
| 83,788 | Yahoo!, Inc.* | 1,487,237 | |||||||||
| 128,831,370 | |||||||||||
| Materials—3.9% | |||||||||||
| 14,374 | Air Products & Chemicals, Inc. | 1,373,004 | |||||||||
| 4,057 | Airgas, Inc. | 281,759 | |||||||||
| 19,839 | AK Steel Holding Corp. | 322,384 | |||||||||
| 3,377 | Albemarle Corp. | 238,247 | |||||||||
| 144,885 | Alcoa, Inc. | 2,463,045 | |||||||||
| 6,532 | Allegheny Technologies, Inc. | 470,304 | |||||||||
| 4,528 | AptarGroup, Inc. | 237,494 | |||||||||
| 12,831 | Ashland, Inc. | 796,548 | |||||||||
| 13,979 | Ball Corp. | 521,556 | |||||||||
| 11,419 | Bemis Co., Inc. | 357,871 | |||||||||
| 5,776 | Cabot Corp. | 259,054 | |||||||||
| 3,591 | Carpenter Technology Corp. | 184,075 | |||||||||
| 9,587 | Celanese Corp., Series A | 478,583 | |||||||||
| 2,007 | CF Industries Holdings, Inc. | 284,091 | |||||||||
| 3,344 | Cliffs Natural Resources, Inc. | 313,400 | |||||||||
| 24,907 | Commercial Metals Co. | 417,441 | |||||||||
| 13,412 | Crown Holdings, Inc.* | 501,609 | |||||||||
| 4,534 | Cytec Industries, Inc. | 266,055 | |||||||||
| 6,720 | Domtar Corp. | 625,094 | |||||||||
| 129,465 | Dow Chemical Co. (The) | 5,306,770 | |||||||||
| 65,134 | E.I. du Pont de Nemours & Co. | 3,698,960 | |||||||||
| 6,338 | Eastman Chemical Co. | 679,751 | |||||||||
| 11,531 | Ecolab, Inc. | 608,376 | |||||||||
| 3,271 | FMC Corp. | 288,764 | |||||||||
| 41,368 | Freeport-McMoRan Copper & Gold, Inc. | 2,276,481 | |||||||||
| 3,142 | Greif, Inc., Class A | 195,118 | |||||||||
| 25,178 | Huntsman Corp. | 524,961 | |||||||||
See Notes to Financial Statements.
32
Schedule of Investments (Continued)
PowerShares FTSE RAFI US 1000 Portfolio
April 30, 2011
| Number of Shares | Value | ||||||||||
| Common Stocks and Other Equity Interests (Continued) | |||||||||||
| 4,644 | International Flavors & Fragrances, Inc. | $ | 294,987 | ||||||||
| 70,526 | International Paper Co. | 2,177,843 | |||||||||
| 17,136 | Louisiana-Pacific Corp.* | 159,365 | |||||||||
| 4,000 | Lubrizol Corp. (The) | 538,080 | |||||||||
| 32,958 | LyondellBasell Industries NV, Class A (Netherlands)* | 1,466,631 | |||||||||
| 3,093 | Martin Marietta Materials, Inc. | 282,051 | |||||||||
| 22,060 | MeadWestvaco Corp. | 743,201 | |||||||||
| 24,315 | Monsanto Co. | 1,654,393 | |||||||||
| 5,439 | Mosaic Co. (The) | 407,164 | |||||||||
| 10,638 | Nalco Holding Co. | 310,736 | |||||||||
| 26,482 | Newmont Mining Corp. | 1,552,110 | |||||||||
| 39,096 | Nucor Corp. | 1,835,948 | |||||||||
| 10,235 | Olin Corp. | 263,449 | |||||||||
| 23,258 | Owens-Illinois, Inc.* | 690,065 | |||||||||
| 8,112 | Packaging Corp. of America | 231,435 | |||||||||
| 13,789 | PPG Industries, Inc. | 1,305,405 | |||||||||
| 15,735 | Praxair, Inc. | 1,674,519 | |||||||||
| 7,931 | Reliance Steel & Aluminum Co. | 448,974 | |||||||||
| 2,350 | Rock-Tenn Co., Class A | 162,314 | |||||||||
| 4,876 | Rockwood Holdings, Inc.* | 276,664 | |||||||||
| 14,193 | RPM International, Inc. | 333,536 | |||||||||
| 4,685 | Scotts Miracle-Gro Co. (The), Class A | 264,562 | |||||||||
| 16,256 | Sealed Air Corp. | 418,917 | |||||||||
| 4,365 | Sensient Technologies Corp. | 165,390 | |||||||||
| 7,693 | Sherwin-Williams Co. (The) | 633,057 | |||||||||
| 4,765 | Sigma-Aldrich Corp. | 336,314 | |||||||||
| 4,352 | Silgan Holdings, Inc. | 199,583 | |||||||||
| 6,735 | Smurfit-Stone Container Corp.* | 259,163 | |||||||||
| 8,451 | Solutia, Inc.* | 222,684 | |||||||||
| 10,983 | Sonoco Products Co. | 379,572 | |||||||||
| 15,990 | Southern Copper Corp. | 598,985 | |||||||||
| 24,512 | Steel Dynamics, Inc. | 445,873 | |||||||||
| 25,580 | Temple-Inland, Inc. | 601,897 | |||||||||
| 17,427 | United States Steel Corp. | 831,442 | |||||||||
| 7,991 | Valspar Corp. (The) | 314,126 | |||||||||
| 13,335 | Vulcan Materials Co. | 602,742 | |||||||||
| 5,492 | W.R. Grace & Co.* | 249,117 | |||||||||
| 10,254 | Worthington Industries, Inc. | 221,179 | |||||||||
| 47,524,268 | |||||||||||
| Telecommunication Services—4.7% | |||||||||||
| 7,960 | American Tower Corp., Class A* | 416,388 | |||||||||
| 897,348 | AT&T, Inc. | 27,925,470 | |||||||||
| 58,663 | CenturyLink, Inc. | 2,392,277 | |||||||||
| 62,652 | Cincinnati Bell, Inc.* | 187,329 | |||||||||
| 9,081 | Crown Castle International Corp.* | 389,212 | |||||||||
| 78,559 | Frontier Communications Corp. | 649,683 | |||||||||
| 15,246 | Leap Wireless International, Inc.* | 226,251 | |||||||||
| 243,475 | Level 3 Communications, Inc.* | 379,821 | |||||||||
| 19,338 | MetroPCS Communications, Inc.* | 325,458 | |||||||||
| Number of Shares | Value | ||||||||||
| Common Stocks and Other Equity Interests (Continued) | |||||||||||
| 5,127 | Millicom International Cellular SA (Luxembourg) | $ | 555,459 | ||||||||
| 12,353 | NII Holdings, Inc., Class B* | 513,638 | |||||||||
| 852,316 | Sprint Nextel Corp.* | 4,414,997 | |||||||||
| 16,208 | Telephone & Data Systems, Inc. | 543,940 | |||||||||
| 8,752 | tw telecom, inc.* | 188,518 | |||||||||
| 4,876 | United States Cellular Corp.* | 240,094 | |||||||||
| 440,767 | Verizon Communications, Inc. | 16,652,177 | |||||||||
| 59,801 | Windstream Corp. | 766,051 | |||||||||
| 56,766,763 | |||||||||||
| Utilities—5.6% | |||||||||||
| 144,268 | AES Corp. (The)* | 1,910,108 | |||||||||
| 10,684 | AGL Resources, Inc. | 443,493 | |||||||||
| 3,918 | ALLETE, Inc. | 158,640 | |||||||||
| 13,600 | Alliant Energy Corp. | 537,744 | |||||||||
| 54,001 | Ameren Corp. | 1,582,769 | |||||||||
| 67,927 | American Electric Power Co., Inc. | 2,477,977 | |||||||||
| 16,615 | American Water Works Co., Inc. | 488,149 | |||||||||
| 8,864 | Aqua America, Inc. | 199,883 | |||||||||
| 15,481 | Atmos Energy Corp. | 540,132 | |||||||||
| 8,028 | Avista Corp. | 195,482 | |||||||||
| 5,500 | Black Hills Corp. | 191,125 | |||||||||
| 45,479 | Calpine Corp.* | 761,773 | |||||||||
| 61,062 | CenterPoint Energy, Inc. | 1,135,753 | |||||||||
| 5,612 | Cleco Corp. | 196,981 | |||||||||
| 29,140 | CMS Energy Corp. | 576,972 | |||||||||
| 39,684 | Consolidated Edison, Inc. | 2,068,330 | |||||||||
| 50,887 | Constellation Energy Group, Inc. | 1,853,305 | |||||||||
| 62,949 | Dominion Resources, Inc. | 2,922,093 | |||||||||
| 9,433 | DPL, Inc. | 285,726 | |||||||||
| 27,636 | DTE Energy Co. | 1,396,447 | |||||||||
| 199,465 | Duke Energy Corp. | 3,720,022 | |||||||||
| 70,577 | Dynegy, Inc., Class A* | 447,458 | |||||||||
| 51,052 | Edison International | 2,004,812 | |||||||||
| 4,695 | Energen Corp. | 305,222 | |||||||||
| 26,675 | Entergy Corp. | 1,859,781 | |||||||||
| 88,191 | Exelon Corp. | 3,717,251 | |||||||||
| 58,891 | FirstEnergy Corp. | 2,353,284 | |||||||||
| 165,453 | GenOn Energy, Inc.* | 650,230 | |||||||||
| 22,704 | Great Plains Energy, Inc. | 467,248 | |||||||||
| 13,737 | Hawaiian Electric Industries, Inc. | 350,156 | |||||||||
| 5,809 | IDACORP, Inc. | 227,771 | |||||||||
| 13,613 | Integrys Energy Group, Inc. | 712,777 | |||||||||
| 2,169 | ITC Holdings Corp. | 153,847 | |||||||||
| 23,723 | MDU Resources Group, Inc. | 566,742 | |||||||||
| 5,094 | National Fuel Gas Co. | 373,390 | |||||||||
| 5,243 | New Jersey Resources Corp. | 229,539 | |||||||||
| 49,488 | NextEra Energy, Inc. | 2,799,536 | |||||||||
| 5,843 | Nicor, Inc. | 323,878 | |||||||||
| 52,667 | NiSource, Inc. | 1,024,373 | |||||||||
See Notes to Financial Statements.
33
Schedule of Investments (Continued)
PowerShares FTSE RAFI US 1000 Portfolio
April 30, 2011
| Number of Shares | Value | ||||||||||
| Common Stocks and Other Equity Interests (Continued) | |||||||||||
| 19,439 | Northeast Utilities | $ | 692,028 | ||||||||
| 5,567 | NorthWestern Corp. | 181,206 | |||||||||
| 59,299 | NRG Energy, Inc.* | 1,435,036 | |||||||||
| 11,172 | NSTAR | 517,264 | |||||||||
| 29,538 | NV Energy, Inc. | 448,682 | |||||||||
| 9,978 | OGE Energy Corp. | 530,530 | |||||||||
| 13,254 | ONEOK, Inc. | 926,985 | |||||||||
| 48,873 | Pepco Holdings, Inc. | 941,783 | |||||||||
| 46,954 | PG&E Corp. | 2,163,640 | |||||||||
| 8,149 | Piedmont Natural Gas Co., Inc. | 258,731 | |||||||||
| 15,821 | Pinnacle West Capital Corp. | 686,473 | |||||||||
| 19,153 | PNM Resources, Inc. | 293,616 | |||||||||
| 10,503 | Portland General Electric Co. | 262,155 | |||||||||
| 54,853 | PPL Corp. | 1,504,618 | |||||||||
| 42,247 | Progress Energy, Inc. | 2,004,620 | |||||||||
| 64,176 | Public Service Enterprise Group, Inc. | 2,064,542 | |||||||||
| 32,464 | Questar Corp. | 570,393 | |||||||||
| 17,667 | SCANA Corp. | 733,534 | |||||||||
| 28,305 | Sempra Energy | 1,559,606 | |||||||||
| 91,109 | Southern Co. | 3,556,895 | |||||||||
| 5,681 | Southwest Gas Corp. | 225,933 | |||||||||
| 28,481 | TECO Energy, Inc. | 548,829 | |||||||||
| 15,067 | UGI Corp. | 501,731 | |||||||||
| 5,126 | Unisource Energy Corp. | 190,328 | |||||||||
| 12,171 | Vectren Corp. | 347,847 | |||||||||
| 14,308 | Westar Energy, Inc. | 389,321 | |||||||||
| 7,143 | WGL Holdings, Inc. | 282,291 | |||||||||
| 10,210 | Wisconsin Energy Corp. | 318,654 | |||||||||
| 61,879 | Xcel Energy, Inc. | 1,505,516 | |||||||||
| 67,852,986 | |||||||||||
| Total Common Stocks and Other Equity Interests (Cost $1,069,944,653) | 1,208,217,081 | ||||||||||
| Money Market Fund—0.0% | |||||||||||
| 42,055 | Goldman Sachs Financial Square Prime Obligations Institutional Share Class (Cost $42,055) | 42,055 | |||||||||
| Total Investments (Cost $1,069,986,708)—100.0% | 1,208,259,136 | ||||||||||
| Liabilities in excess of other assets—(0.0%) | (12,914 | ) | |||||||||
| Net Assets—100.0% | $ | 1,208,246,222 | |||||||||
Investment Abbreviations:
REIT—Real Estate Investment Trust
Notes to Schedule of Investments:
* Non-income producing security.
(~) Affiliated company. The Fund's Adviser is a subsidiary of Invesco Ltd. and therefore, Invesco Ltd. is considered to be affiliated with the Fund. See Note 4.
See Notes to Financial Statements.
34
Schedule of Investments
PowerShares FTSE RAFI US 1500 Small-Mid Portfolio
April 30, 2011
| Number of Shares | Value | ||||||||||
| Common Stocks and Other Equity Interests—100.0% | |||||||||||
| Consumer Discretionary—17.1% | |||||||||||
| 36,169 | 1-800-FLOWERS.COM, Inc., Class A* | $ | 121,166 | ||||||||
| 21,491 | 99 Cents Only Stores* | 433,259 | |||||||||
| 16,346 | AFC Enterprises, Inc.* | 246,171 | |||||||||
| 14,885 | AH Belo Corp., Class A* | 123,843 | |||||||||
| 9,703 | Ambassadors Group, Inc. | 97,806 | |||||||||
| 66,345 | American Apparel, Inc.* | 96,200 | |||||||||
| 38,188 | American Axle & Manufacturing Holdings, Inc.* | 488,806 | |||||||||
| 27,648 | American Greetings Corp., Class A | 680,141 | |||||||||
| 1,435 | American Public Education, Inc.* | 60,629 | |||||||||
| 4,420 | America's Car-Mart, Inc.* | 108,202 | |||||||||
| 14,041 | Ameristar Casinos, Inc. | 280,118 | |||||||||
| 4,852 | Arbitron, Inc. | 187,675 | |||||||||
| 9,528 | Arctic Cat, Inc.* | 159,975 | |||||||||
| 7,156 | Ascent Media Corp., Class A* | 343,703 | |||||||||
| 19,918 | Audiovox Corp., Class A* | 146,995 | |||||||||
| 13,584 | Bally Technologies, Inc.* | 529,640 | |||||||||
| 120,987 | Beazer Homes USA, Inc.* | 563,799 | |||||||||
| 27,932 | Bebe Stores, Inc. | 187,703 | |||||||||
| 69,398 | Belo Corp., Class A* | 586,413 | |||||||||
| 12,232 | Big 5 Sporting Goods Corp. | 146,172 | |||||||||
| 476 | Biglari Holdings, Inc.* | 208,126 | |||||||||
| 4,667 | BJ's Restaurants, Inc.* | 219,116 | |||||||||
| 1,138 | Blue Nile, Inc.* | 64,866 | |||||||||
| 6,514 | Blyth, Inc. | 307,070 | |||||||||
| 20,342 | Bob Evans Farms, Inc. | 637,925 | |||||||||
| 25,280 | Bon-Ton Stores, Inc. (The) | 350,886 | |||||||||
| 3,908 | Bravo Brio Restaurant Group, Inc.* | 80,661 | |||||||||
| 37,466 | Brown Shoe Co., Inc. | 473,945 | |||||||||
| 9,281 | Buckle, Inc. (The) | 422,193 | |||||||||
| 2,606 | Buffalo Wild Wings, Inc.* | 159,227 | |||||||||
| 21,152 | Build-A-Bear Workshop, Inc.* | 129,662 | |||||||||
| 14,172 | California Pizza Kitchen, Inc.* | 226,752 | |||||||||
| 56,528 | Callaway Golf Co. | 400,218 | |||||||||
| 1,903 | Capella Education Co.* | 94,389 | |||||||||
| 17,057 | Carmike Cinemas, Inc.* | 123,834 | |||||||||
| 12,802 | Carrols Restaurant Group, Inc.* | 124,948 | |||||||||
| 11,235 | Carter's, Inc.* | 347,386 | |||||||||
| 29,918 | Casual Male Retail Group, Inc.* | 126,254 | |||||||||
| 13,868 | Cato Corp. (The), Class A | 353,773 | |||||||||
| 1,937 | Cavco Industries, Inc.* | 90,032 | |||||||||
| 10,829 | CEC Entertainment, Inc. | 409,661 | |||||||||
| 30,282 | Central European Media Enterprises Ltd., Class A (Bermuda)* | 693,761 | |||||||||
| 21,527 | Cheesecake Factory, Inc. (The)* | 633,324 | |||||||||
| 6,293 | Cherokee, Inc. | 122,084 | |||||||||
| 15,204 | Children's Place Retail Stores, Inc. (The)* | 808,397 | |||||||||
| 12,976 | ChinaCast Education Corp.* | 79,283 | |||||||||
| 2,418 | Chipotle Mexican Grill, Inc.* | 645,098 | |||||||||
| 11,610 | Choice Hotels International, Inc. | 433,982 | |||||||||
| Number of Shares | Value | ||||||||||
| Common Stocks and Other Equity Interests (Continued) | |||||||||||
| 32,630 | Christopher & Banks Corp. | $ | 200,675 | ||||||||
| 4,185 | Churchill Downs, Inc. | 174,556 | |||||||||
| 5,959 | Citi Trends, Inc.* | 132,647 | |||||||||
| 39,187 | CKX, Inc.* | 179,085 | |||||||||
| 16,644 | Clear Channel Outdoor Holdings, Inc., Class A* | 229,021 | |||||||||
| 9,557 | Coinstar, Inc.* | 515,887 | |||||||||
| 82,032 | Coldwater Creek, Inc.* | 250,198 | |||||||||
| 4,599 | Columbia Sportswear Co. | 312,686 | |||||||||
| 46,782 | Conn's, Inc.* | 306,422 | |||||||||
| 116,645 | Corinthian Colleges, Inc.* | 519,070 | |||||||||
| 22,485 | Cost Plus, Inc.* | 244,862 | |||||||||
| 5,189 | CPI Corp. | 93,246 | |||||||||
| 13,390 | Cracker Barrel Old Country Store, Inc. | 685,970 | |||||||||
| 15,139 | Crocs, Inc.* | 304,445 | |||||||||
| 4,118 | CSS Industries, Inc. | 79,395 | |||||||||
| 7,614 | CTC Media, Inc. | 179,462 | |||||||||
| 4,302 | Deckers Outdoor Corp.* | 365,068 | |||||||||
| 71,694 | Denny's Corp.* | 293,228 | |||||||||
| 3,204 | Destination Maternity Corp. | 74,877 | |||||||||
| 6,728 | DineEquity, Inc.* | 336,198 | |||||||||
| 21,302 | Dollar General Corp.* | 694,232 | |||||||||
| 3,743 | Dorman Products, Inc.* | 145,977 | |||||||||
| 20,196 | DreamWorks Animation SKG, Inc., Class A* | 534,992 | |||||||||
| 8,146 | Drew Industries, Inc. | 196,074 | |||||||||
| 37,893 | drugstore.com, Inc.* | 143,236 | |||||||||
| 5,295 | DSW, Inc., Class A* | 251,407 | |||||||||
| 52,574 | E.W. Scripps Co. (The), Class A* | 499,453 | |||||||||
| 23,702 | Education Management Corp.* | 439,435 | |||||||||
| 21,402 | Entercom Communications Corp., Class A* | 226,219 | |||||||||
| 17,049 | Ethan Allen Interiors, Inc. | 410,710 | |||||||||
| 5,551 | Express, Inc. | 119,846 | |||||||||
| 27,517 | Federal-Mogul Corp.* | 729,200 | |||||||||
| 22,371 | Finish Line, Inc. (The), Class A | 480,753 | |||||||||
| 3,250 | Fisher Communications, Inc.* | 98,313 | |||||||||
| 5,116 | Fossil, Inc.* | 490,010 | |||||||||
| 29,544 | Fred's, Inc., Class A | 412,434 | |||||||||
| 6,053 | Fuel Systems Solutions, Inc.* | 179,925 | |||||||||
| 81,004 | Furniture Brands International, Inc.* | 392,059 | |||||||||
| 17,885 | Gaylord Entertainment Co.* | 641,535 | |||||||||
| 15,328 | Genesco, Inc.* | 618,945 | |||||||||
| 5,536 | G-III Apparel Group Ltd.* | 248,345 | |||||||||
| 5,043 | Grand Canyon Education, Inc.* | 72,922 | |||||||||
| 34,864 | Gray Television, Inc.* | 97,271 | |||||||||
| 7,839 | Guess?, Inc. | 336,999 | |||||||||
| 29,755 | Harte-Hanks, Inc. | 276,424 | |||||||||
| 10,546 | Helen of Troy Ltd.* | 328,192 | |||||||||
| 10,367 | hhgregg, Inc.* | 128,136 | |||||||||
| 7,172 | Hibbett Sports, Inc.* | 270,958 | |||||||||
| 25,064 | Hillenbrand, Inc. | 574,467 | |||||||||
| 7,397 | Hooker Furniture Corp. | 92,019 | |||||||||
See Notes to Financial Statements.
35
Schedule of Investments (Continued)
PowerShares FTSE RAFI US 1500 Small-Mid Portfolio
April 30, 2011
| Number of Shares | Value | ||||||||||
| Common Stocks and Other Equity Interests (Continued) | |||||||||||
| 56,193 | Hot Topic, Inc. | $ | 377,055 | ||||||||
| 101,299 | Hovnanian Enterprises, Inc., Class A* | 325,170 | |||||||||
| 17,122 | Iconix Brand Group, Inc.* | 419,318 | |||||||||
| 13,797 | International Speedway Corp., Class A | 422,188 | |||||||||
| 12,253 | Interval Leisure Group, Inc.* | 196,906 | |||||||||
| 23,259 | Isle of Capri Casinos, Inc.* | 221,891 | |||||||||
| 7,613 | ITT Educational Services, Inc.* | 546,080 | |||||||||
| 145,057 | Jackson Hewitt Tax Service, Inc.* | 75,444 | |||||||||
| 20,152 | JAKKS Pacific, Inc.* | 423,998 | |||||||||
| 7,650 | Jos. A. Bank Clothiers, Inc.* | 401,013 | |||||||||
| 28,875 | Journal Communications, Inc., Class A* | 157,369 | |||||||||
| 4,310 | K12, Inc.* | 169,685 | |||||||||
| 7,860 | Kenneth Cole Productions, Inc., Class A* | 105,874 | |||||||||
| 7,648 | Kid Brands, Inc.* | 55,907 | |||||||||
| 6,011 | Kirkland's, Inc.* | 90,706 | |||||||||
| 12,385 | Knology, Inc.* | 188,871 | |||||||||
| 19,500 | Krispy Kreme Doughnuts, Inc.* | 109,395 | |||||||||
| 20,697 | K-Swiss, Inc., Class A* | 254,780 | |||||||||
| 40,664 | La-Z-Boy, Inc.* | 478,209 | |||||||||
| 19,827 | Leapfrog Enterprises, Inc.* | 84,661 | |||||||||
| 61,040 | Lee Enterprises, Inc.* | 87,287 | |||||||||
| 10,750 | Libbey, Inc.* | 183,288 | |||||||||
| 6,601 | Liberty Media Corp. - Capital, Series A* | 543,064 | |||||||||
| 7,170 | Life Time Fitness, Inc.* | 280,490 | |||||||||
| 6,973 | Lifetime Brands, Inc. | 111,010 | |||||||||
| 19,230 | LIN TV Corp., Class A* | 102,881 | |||||||||
| 13,542 | Lincoln Educational Services Corp. | 226,151 | |||||||||
| 53,790 | Lions Gate Entertainment Corp. (Canada)* | 341,029 | |||||||||
| 31,507 | Lithia Motors, Inc., Class A | 573,112 | |||||||||
| 57,765 | LodgeNet Interactive Corp.* | 202,755 | |||||||||
| 890 | Lululemon Athletica, Inc.* | 89,027 | |||||||||
| 4,960 | Lumber Liquidators Holdings, Inc.* | 128,712 | |||||||||
| 17,963 | M/I Homes, Inc.* | 238,728 | |||||||||
| 4,425 | Mac-Gray Corp. | 74,960 | |||||||||
| 18,531 | Madison Square Garden, Inc., Class A* | 506,823 | |||||||||
| 7,146 | Maidenform Brands, Inc.* | 226,242 | |||||||||
| 11,971 | Marcus Corp. | 132,758 | |||||||||
| 22,481 | MarineMax, Inc.* | 214,918 | |||||||||
| 10,064 | Matthews International Corp., Class A | 403,969 | |||||||||
| 136,963 | McClatchy Co. (The), Class A* | 391,714 | |||||||||
| 11,578 | McCormick & Schmick's Seafood Restaurants, Inc.* | 105,707 | |||||||||
| 26,386 | Media General, Inc., Class A* | 142,221 | |||||||||
| 13,985 | Meredith Corp. | 467,379 | |||||||||
| 8,420 | Midas, Inc.* | 61,213 | |||||||||
| 31,540 | Modine Manufacturing Co.* | 561,727 | |||||||||
| 5,949 | Monro Muffler Brake, Inc. | 180,731 | |||||||||
| 14,216 | Morgans Hotel Group Co.* | 122,968 | |||||||||
| 3,516 | Morningstar, Inc. | 202,522 | |||||||||
| 10,555 | Morton's Restaurant Group, Inc.* | 78,107 | |||||||||
| 4,782 | Motorcar Parts of America, Inc.* | 66,565 | |||||||||
| Number of Shares | Value | ||||||||||
| Common Stocks and Other Equity Interests (Continued) | |||||||||||
| 11,104 | Movado Group, Inc. | $ | 185,326 | ||||||||
| 21,146 | Multimedia Games Holding Co., Inc.* | 124,127 | |||||||||
| 13,213 | National CineMedia, Inc. | 230,435 | |||||||||
| 35,233 | Nautilus, Inc.* | 114,155 | |||||||||
| 20,989 | New York & Co., Inc.* | 128,872 | |||||||||
| 18,190 | Nutrisystem, Inc. | 273,578 | |||||||||
| 28,686 | O'Charley's, Inc.* | 187,606 | |||||||||
| 41,536 | Orbitz Worldwide, Inc.* | 132,915 | |||||||||
| 25,109 | Orient-Express Hotels Ltd., Class A* | 308,087 | |||||||||
| 5,781 | Overstock.com, Inc.* | 80,356 | |||||||||
| 11,790 | Oxford Industries, Inc. | 404,986 | |||||||||
| 9,397 | P.F. Chang's China Bistro, Inc. | 376,820 | |||||||||
| 102,094 | Pacific Sunwear of California, Inc.* | 325,680 | |||||||||
| 4,775 | Panera Bread Co., Class A* | 578,300 | |||||||||
| 9,537 | Papa John's International, Inc.* | 286,682 | |||||||||
| 2,998 | Peet's Coffee & Tea, Inc.* | 139,347 | |||||||||
| 42,843 | Pep Boys - Manny, Moe & Jack (The) | 586,949 | |||||||||
| 7,918 | Perry Ellis International, Inc.* | 223,129 | |||||||||
| 3,989 | PetMed Express, Inc. | 60,194 | |||||||||
| 33,838 | Pier 1 Imports, Inc.* | 412,147 | |||||||||
| 35,266 | Pinnacle Entertainment, Inc.* | 489,492 | |||||||||
| 21,933 | Pool Corp. | 663,693 | |||||||||
| 1,945 | Pre-Paid Legal Services, Inc.* | 128,273 | |||||||||
| 14,794 | PRIMEDIA, Inc. | 72,491 | |||||||||
| 143,844 | Quiksilver, Inc.* | 625,721 | |||||||||
| 35,519 | Radio One, Inc., Class D* | 103,360 | |||||||||
| 11,165 | Red Lion Hotels Corp.* | 97,694 | |||||||||
| 10,091 | Red Robin Gourmet Burgers, Inc.* | 274,374 | |||||||||
| 22,277 | Retail Ventures, Inc.* | 457,347 | |||||||||
| 38,450 | Ruby Tuesday, Inc.* | 404,109 | |||||||||
| 2,918 | Rue21, Inc.* | 87,890 | |||||||||
| 23,065 | Ruth's Hospitality Group, Inc.* | 113,249 | |||||||||
| 30,995 | Ryland Group, Inc. | 536,523 | |||||||||
| 33,750 | Sally Beauty Holdings, Inc.* | 499,163 | |||||||||
| 21,935 | Scholastic Corp. | 576,452 | |||||||||
| 53,167 | Scientific Games Corp., Class A* | 559,317 | |||||||||
| 13,264 | Scripps Networks Interactive, Inc., Class A | 682,035 | |||||||||
| 59,663 | Sealy Corp.* | 157,510 | |||||||||
| 18,171 | Select Comfort Corp.* | 288,374 | |||||||||
| 6,866 | Shoe Carnival, Inc.* | 200,968 | |||||||||
| 15,755 | Shuffle Master, Inc.* | 172,202 | |||||||||
| 3,042 | Shutterfly, Inc.* | 187,266 | |||||||||
| 13,014 | Sinclair Broadcast Group, Inc., Class A | 149,531 | |||||||||
| 132,280 | Sirius XM Radio, Inc.* | 263,237 | |||||||||
| 21,750 | Skechers U.S.A., Inc., Class A* | 414,338 | |||||||||
| 5,314 | Skyline Corp. | 104,208 | |||||||||
| 35,301 | Smith & Wesson Holding Corp.* | 127,437 | |||||||||
| 40,008 | Sonic Corp.* | 448,890 | |||||||||
| 10,053 | Sotheby's | 507,878 | |||||||||
| 26,686 | Spartan Motors, Inc. | 180,397 | |||||||||
| 10,831 | Speedway Motorsports, Inc. | 168,747 | |||||||||
See Notes to Financial Statements.
36
Schedule of Investments (Continued)
PowerShares FTSE RAFI US 1500 Small-Mid Portfolio
April 30, 2011
| Number of Shares | Value | ||||||||||
| Common Stocks and Other Equity Interests (Continued) | |||||||||||
| 26,273 | Stage Stores, Inc. | $ | 506,018 | ||||||||
| 19,162 | Standard Motor Products, Inc. | 273,059 | |||||||||
| 40,388 | Standard Pacific Corp.* | 155,898 | |||||||||
| 35,165 | Stein Mart, Inc. | 382,595 | |||||||||
| 4,667 | Steiner Leisure Ltd.* | 226,536 | |||||||||
| 5,055 | Steven Madden Ltd.* | 268,673 | |||||||||
| 40,840 | Stewart Enterprises, Inc., Class A | 331,212 | |||||||||
| 13,702 | Stoneridge, Inc.* | 209,641 | |||||||||
| 2,479 | Strayer Education, Inc. | 307,099 | |||||||||
| 4,274 | Sturm Ruger & Co., Inc. | 101,636 | |||||||||
| 15,781 | Superior Industries International, Inc. | 398,786 | |||||||||
| 13,484 | Systemax, Inc.* | 174,618 | |||||||||
| 77,408 | Talbots, Inc. (The)* | 416,455 | |||||||||
| 9,170 | Tempur-Pedic International, Inc.* | 575,693 | |||||||||
| 15,043 | Texas Roadhouse, Inc. | 244,750 | |||||||||
| 19,583 | Thor Industries, Inc. | 607,269 | |||||||||
| 10,291 | Timberland Co. (The), Class A* | 465,050 | |||||||||
| 13,086 | Tower International, Inc.* | 217,358 | |||||||||
| 22,810 | TravelCenters of America LLC* | 179,287 | |||||||||
| 4,974 | True Religion Apparel, Inc.* | 150,314 | |||||||||
| 41,343 | Tuesday Morning Corp.* | 206,715 | |||||||||
| 6,538 | Ulta Salon, Cosmetics & Fragrance, Inc.* | 347,756 | |||||||||
| 3,537 | Under Armour, Inc., Class A* | 242,143 | |||||||||
| 13,154 | Unifi, Inc.* | 214,673 | |||||||||
| 4,678 | Universal Electronics, Inc.* | 129,534 | |||||||||
| 6,285 | Universal Technical Institute, Inc. | 113,570 | |||||||||
| 13,657 | Vail Resorts, Inc.* | 669,056 | |||||||||
| 21,185 | Valassis Communications, Inc.* | 610,764 | |||||||||
| 17,213 | ValueVision Media, Inc., Class A* | 109,819 | |||||||||
| 6,665 | Vitamin Shoppe, Inc.* | 260,068 | |||||||||
| 6,888 | Volcom, Inc. | 135,900 | |||||||||
| 50,450 | Warner Music Group Corp.* | 376,861 | |||||||||
| 1,354 | Washington Post Co. (The), Class B | 590,209 | |||||||||
| 6,661 | Weight Watchers International, Inc. | 517,893 | |||||||||
| 13,884 | West Marine, Inc.* | 151,058 | |||||||||
| 55,746 | Wet Seal, Inc. (The), Class A* | 245,282 | |||||||||
| 12,014 | Winnebago Industries, Inc.* | 148,733 | |||||||||
| 14,674 | WMS Industries, Inc.* | 481,307 | |||||||||
| 13,625 | Wolverine World Wide, Inc. | 540,640 | |||||||||
| 11,052 | Wonder Auto Technology, Inc.* | 65,428 | |||||||||
| 16,212 | World Wrestling Entertainment, Inc., Class A | 170,388 | |||||||||
| 123,671 | Zale Corp.* | 455,109 | |||||||||
| 4,868 | Zumiez, Inc.* | 136,839 | |||||||||
| 70,128,882 | |||||||||||
| Consumer Staples—3.1% | |||||||||||
| 7,954 | Adecoagro SA (Luxembourg)* | 98,152 | |||||||||
| 133,586 | Alliance One International, Inc.* | 533,008 | |||||||||
| 93,081 | American Oriental Bioengineering, Inc. (China)* | 140,552 | |||||||||
| Number of Shares | Value | ||||||||||
| Common Stocks and Other Equity Interests (Continued) | |||||||||||
| 10,799 | Andersons, Inc. (The) | $ | 536,170 | ||||||||
| 22,572 | B&G Foods, Inc. | 408,102 | |||||||||
| 1,253 | Boston Beer Co., Inc., Class A* | 118,108 | |||||||||
| 5,034 | Calavo Growers, Inc. | 105,714 | |||||||||
| 9,090 | Cal-Maine Foods, Inc. | 262,610 | |||||||||
| 16,763 | Central Garden & Pet Co.* | 163,775 | |||||||||
| 48,111 | Central Garden & Pet Co., Class A* | 482,072 | |||||||||
| 3,940 | Coca-Cola Bottling Co. Consolidated | 277,573 | |||||||||
| 16,138 | Darling International, Inc.* | 260,951 | |||||||||
| 4,214 | Diamond Foods, Inc. | 276,438 | |||||||||
| 13,880 | Elizabeth Arden, Inc.* | 417,233 | |||||||||
| 2,173 | Fresh Market, Inc. (The)* | 90,875 | |||||||||
| 9,750 | Green Mountain Coffee Roasters, Inc.* | 652,860 | |||||||||
| 17,202 | Hain Celestial Group, Inc. (The)* | 585,040 | |||||||||
| 7,379 | Hansen Natural Corp.* | 488,121 | |||||||||
| 17,593 | Heckmann Corp.* | 110,836 | |||||||||
| 20,792 | Imperial Sugar Co. | 284,435 | |||||||||
| 7,148 | Ingles Markets, Inc., Class A | 135,883 | |||||||||
| 3,687 | Inter Parfums, Inc. | 70,164 | |||||||||
| 4,753 | J & J Snack Foods Corp. | 241,547 | |||||||||
| 8,323 | Lancaster Colony Corp. | 508,619 | |||||||||
| 7,153 | National Beverage Corp. | 99,570 | |||||||||
| 16,696 | Nu Skin Enterprises, Inc., Class A | 535,775 | |||||||||
| 4,301 | Nutraceutical International Corp.* | 68,214 | |||||||||
| 8,270 | Omega Protein Corp.* | 106,518 | |||||||||
| 51,410 | Pilgrim's Pride Corp.* | 302,291 | |||||||||
| 12,336 | Prestige Brands Holdings, Inc.* | 142,481 | |||||||||
| 9,319 | PriceSmart, Inc. | 388,043 | |||||||||
| 20,432 | Reddy Ice Holdings, Inc.* | 66,200 | |||||||||
| 8,729 | Revlon, Inc., Class A* | 150,313 | |||||||||
| 13,342 | Sanderson Farms, Inc. | 635,079 | |||||||||
| 7,711 | Schiff Nutrition International, Inc. | 76,724 | |||||||||
| 35,587 | Smart Balance, Inc.* | 170,106 | |||||||||
| 13,307 | Snyders-Lance, Inc. | 262,813 | |||||||||
| 19,472 | Spartan Stores, Inc. | 303,958 | |||||||||
| 10,986 | Susser Holdings Corp.* | 151,497 | |||||||||
| 8,178 | Tootsie Roll Industries, Inc. | 242,396 | |||||||||
| 11,113 | TreeHouse Foods, Inc.* | 674,226 | |||||||||
| 2,451 | USANA Health Sciences, Inc.* | 91,422 | |||||||||
| 20,544 | Vector Group Ltd. | 377,188 | |||||||||
| 2,209 | Village Super Market, Inc., Class A | 59,731 | |||||||||
| 5,449 | WD-40 Co. | 226,134 | |||||||||
| 6,972 | Weis Markets, Inc. | 287,734 | |||||||||
| 7,556 | Zhongpin, Inc.* | 126,185 | |||||||||
| 12,793,436 | |||||||||||
| Energy—6.7% | |||||||||||
| 13,412 | Alon USA Energy, Inc. | 184,415 | |||||||||
| 2,562 | Approach Resources, Inc.* | 75,425 | |||||||||
| 7,063 | Atlas Energy LP | 188,300 | |||||||||
| 13,576 | Atlas Energy, Inc.* | 1,358 | |||||||||
See Notes to Financial Statements.
37
Schedule of Investments (Continued)
PowerShares FTSE RAFI US 1500 Small-Mid Portfolio
April 30, 2011
| Number of Shares | Value | ||||||||||
| Common Stocks and Other Equity Interests (Continued) | |||||||||||
| 16,842 | ATP Oil & Gas Corp.* | $ | 299,451 | ||||||||
| 24,395 | Basic Energy Services, Inc.* | 749,902 | |||||||||
| 10,635 | Berry Petroleum Co., Class A | 565,038 | |||||||||
| 8,428 | Bill Barrett Corp.* | 351,700 | |||||||||
| 12,740 | BPZ Resources, Inc.* | 60,642 | |||||||||
| 4,410 | Brigham Exploration Co.* | 147,867 | |||||||||
| 12,634 | Bronco Drilling Co., Inc.* | 138,721 | |||||||||
| 79,748 | Cal Dive International, Inc.* | 626,819 | |||||||||
| 13,891 | Callon Petroleum Co.* | 95,153 | |||||||||
| 1,874 | CARBO Ceramics, Inc. | 301,602 | |||||||||
| 4,941 | Carrizo Oil & Gas, Inc.* | 196,849 | |||||||||
| 1,363 | Clayton Williams Energy, Inc.* | 123,447 | |||||||||
| 5,321 | Clean Energy Fuels Corp.* | 90,670 | |||||||||
| 29,607 | Cloud Peak Energy, Inc.* | 616,418 | |||||||||
| 12,952 | Cobalt International Energy, Inc.* | 181,328 | |||||||||
| 21,203 | Complete Production Services, Inc.* | 719,630 | |||||||||
| 23,407 | Comstock Resources, Inc.* | 750,428 | |||||||||
| 6,125 | Concho Resources, Inc.* | 654,456 | |||||||||
| 3,007 | Contango Oil & Gas Co.* | 186,193 | |||||||||
| 3,165 | Continental Resources, Inc.* | 217,372 | |||||||||
| 3,530 | Core Laboratories NV (Netherlands) | 338,809 | |||||||||
| 21,601 | Crimson Exploration, Inc.* | 87,484 | |||||||||
| 49,080 | Crosstex Energy, Inc. | 517,794 | |||||||||
| 3,176 | Dawson Geophysical Co.* | 141,650 | |||||||||
| 7,286 | Delek US Holdings, Inc. | 97,851 | |||||||||
| 148,654 | Delta Petroleum Corp.* | 124,438 | |||||||||
| 55,676 | DHT Holdings, Inc. | 241,077 | |||||||||
| 4,438 | Dril-Quip, Inc.* | 339,773 | |||||||||
| 7,196 | Endeavour International Corp.* | 104,342 | |||||||||
| 17,199 | Energy Partners Ltd.* | 313,194 | |||||||||
| 10,164 | Energy XXI Bermuda Ltd. (Bermuda)* | 368,445 | |||||||||
| 14,269 | ENGlobal Corp.* | 58,218 | |||||||||
| 14,258 | Gastar Exploration Ltd. (Canada)* | 64,161 | |||||||||
| 11,109 | Geokinetics, Inc.* | 106,091 | |||||||||
| 1,974 | Georesources, Inc.* | 57,286 | |||||||||
| 5,908 | Global Geophysical Services, Inc.* | 112,193 | |||||||||
| 51,861 | Global Industries Ltd.* | 511,349 | |||||||||
| 23,763 | GMX Resources, Inc.* | 139,726 | |||||||||
| 8,697 | Goodrich Petroleum Corp.* | 195,422 | |||||||||
| 33,056 | Gran Tierra Energy, Inc.* | 245,276 | |||||||||
| 5,242 | Green Plains Renewable Energy, Inc.* | 65,630 | |||||||||
| 5,647 | Gulf Island Fabrication, Inc. | 199,565 | |||||||||
| 11,971 | Gulfmark Offshore, Inc., Class A* | 509,605 | |||||||||
| 2,665 | Gulfport Energy Corp.* | 90,717 | |||||||||
| 7,881 | Harvest Natural Resources, Inc.* | 108,915 | |||||||||
| 136,028 | Hercules Offshore, Inc.* | 853,576 | |||||||||
| 17,120 | Hornbeck Offshore Services, Inc.* | 500,418 | |||||||||
| 48,357 | International Coal Group, Inc.* | 533,378 | |||||||||
| 3,359 | InterOil Corp. (Canada)* | 213,632 | |||||||||
| 22,877 | ION Geophysical Corp.* | 289,165 | |||||||||
| 9,874 | James River Coal Co.* | 230,262 | |||||||||
| Number of Shares | Value | ||||||||||
| Common Stocks and Other Equity Interests (Continued) | |||||||||||
| 10,589 | Knightsbridge Tankers Ltd. (Bermuda) | $ | 237,088 | ||||||||
| 4,374 | Lufkin Industries, Inc. | 403,851 | |||||||||
| 9,500 | Magnum Hunter Resources Corp.* | 77,520 | |||||||||
| 15,196 | Matrix Service Co.* | 219,734 | |||||||||
| 35,349 | McMoRan Exploration Co.* | 647,240 | |||||||||
| 10,932 | Miller Energy Resources, Inc.* | 63,078 | |||||||||
| 5,494 | Mitcham Industries, Inc.* | 87,794 | |||||||||
| 4,171 | Natural Gas Services Group, Inc.* | 75,203 | |||||||||
| 44,663 | Newpark Resources, Inc.* | 403,307 | |||||||||
| 23,654 | Nordic American Tanker Shipping Ltd. (Bermuda) | 543,569 | |||||||||
| 204,093 | Oilsands Quest, Inc.* | 91,332 | |||||||||
| 618 | OYO Geospace Corp.* | 57,647 | |||||||||
| 98,851 | Pacific Ethanol, Inc.* | 46,460 | |||||||||
| 104,441 | Parker Drilling Co.* | 744,664 | |||||||||
| 24,749 | Patriot Coal Corp.* | 623,180 | |||||||||
| 39,742 | Penn Virginia Corp. | 614,411 | |||||||||
| 7,741 | Petroleum Development Corp.* | 308,247 | |||||||||
| 25,651 | PetroQuest Energy, Inc.* | 224,703 | |||||||||
| 6,960 | PHI, Inc.* | 155,765 | |||||||||
| 30,076 | Pioneer Drilling Co.* | 466,178 | |||||||||
| 12,207 | Quicksilver Resources, Inc.* | 181,274 | |||||||||
| 4,805 | Resolute Energy Corp.* | 85,000 | |||||||||
| 5,161 | REX American Resources Corp.* | 89,182 | |||||||||
| 5,711 | Rex Energy Corp.* | 73,272 | |||||||||
| 9,130 | Rosetta Resources, Inc.* | 419,341 | |||||||||
| 11,105 | RPC, Inc. | 300,390 | |||||||||
| 50,219 | SandRidge Energy, Inc.* | 620,707 | |||||||||
| 21,978 | Stone Energy Corp.* | 777,142 | |||||||||
| 14,958 | Swift Energy Co.* | 586,204 | |||||||||
| 18,880 | Teekay Tankers Ltd., Class A (Marshall Islands) | 177,472 | |||||||||
| 13,862 | Tesco Corp. (Canada)* | 260,744 | |||||||||
| 42,450 | TETRA Technologies, Inc.* | 626,987 | |||||||||
| 49,394 | Tsakos Energy Navigation Ltd. (Bermuda) | 513,204 | |||||||||
| 10,602 | Union Drilling, Inc.* | 143,763 | |||||||||
| 17,096 | VAALCO Energy, Inc.* | 119,159 | |||||||||
| 2,585 | Vanguard Natural Resources LLC | 85,538 | |||||||||
| 74,920 | Vantage Drilling Co. (Cayman Islands)* | 133,358 | |||||||||
| 5,268 | Venoco, Inc.* | 97,932 | |||||||||
| 11,461 | W&T Offshore, Inc. | 307,269 | |||||||||
| 14,991 | Warren Resources, Inc.* | 67,909 | |||||||||
| 36,586 | Willbros Group, Inc.* | 393,300 | |||||||||
| 27,432,744 | |||||||||||
| Financials—18.9% | |||||||||||
| 5,079 | 1st Source Corp. | 107,776 | |||||||||
| 6,957 | Abington Bancorp, Inc. | 84,319 | |||||||||
| 14,727 | Acadia Realty Trust REIT | 307,058 | |||||||||
| 78,994 | Advance America Cash Advance Centers, Inc. | 464,485 | |||||||||
| 4,198 | Agree Realty Corp. REIT | 98,191 | |||||||||
See Notes to Financial Statements.
38
Schedule of Investments (Continued)
PowerShares FTSE RAFI US 1500 Small-Mid Portfolio
April 30, 2011
| Number of Shares | Value | ||||||||||
| Common Stocks and Other Equity Interests (Continued) | |||||||||||
| 191 | Alexander's, Inc. REIT | $ | 83,904 | ||||||||
| 3,711 | Altisource Portfolio Solutions SA (Luxembourg)* | 120,533 | |||||||||
| 2,997 | American Assets Trust, Inc. REIT | 66,174 | |||||||||
| 14,181 | American Campus Communities, Inc. REIT | 498,462 | |||||||||
| 9,247 | American Capital Agency Corp. REIT | 269,180 | |||||||||
| 36,839 | American Equity Investment Life Holding Co. | 473,750 | |||||||||
| 3,300 | American National Insurance Co. | 261,030 | |||||||||
| 6,622 | American Safety Insurance Holdings Ltd. (Bermuda)* | 134,824 | |||||||||
| 10,296 | Ameris Bancorp* | 102,342 | |||||||||
| 10,553 | AMERISAFE, Inc.* | 235,649 | |||||||||
| 8,381 | AmTrust Financial Services, Inc. | 161,753 | |||||||||
| 77,347 | Anworth Mortgage Asset Corp. REIT | 555,351 | |||||||||
| 10,539 | Arbor Realty Trust, Inc. REIT* | 55,435 | |||||||||
| 14,735 | Argo Group International Holdings Ltd. (Bermuda) | 462,826 | |||||||||
| 4,004 | Arrow Financial Corp. | 99,499 | |||||||||
| 65,188 | Ashford Hospitality Trust, Inc. REIT | 812,894 | |||||||||
| 7,094 | Associated Estates Realty Corp. REIT | 118,044 | |||||||||
| 7,470 | Avatar Holdings, Inc.* | 134,460 | |||||||||
| 2,545 | BancFirst Corp. | 102,487 | |||||||||
| 22,563 | Banco Latinoamericano de Comercio Exterior SA, Class E (Panama) | 391,694 | |||||||||
| 12,265 | Bancorp, Inc. (The)* | 120,074 | |||||||||
| 29,690 | Bank Mutual Corp. | 121,432 | |||||||||
| 1,895 | Bank of Marin Bancorp | 71,328 | |||||||||
| 3,225 | Bank of the Ozarks, Inc. | 143,609 | |||||||||
| 92,206 | BankAtlantic Bancorp, Inc., Class A* | 83,843 | |||||||||
| 7,233 | BankFinancial Corp. | 66,110 | |||||||||
| 78,953 | Banner Corp. | 217,121 | |||||||||
| 8,129 | Beneficial Mutual Bancorp, Inc.* | 70,153 | |||||||||
| 7,470 | Berkshire Hills Bancorp, Inc. | 166,581 | |||||||||
| 10,232 | BGC Partners, Inc., Class A | 98,739 | |||||||||
| 8,678 | BOK Financial Corp. | 466,703 | |||||||||
| 41,967 | Boston Private Financial Holdings, Inc. | 293,349 | |||||||||
| 35,497 | Brookline Bancorp, Inc. | 327,282 | |||||||||
| 3,553 | Bryn Mawr Bank Corp. | 71,593 | |||||||||
| 18,444 | Calamos Asset Management, Inc., Class A | 300,084 | |||||||||
| 2,139 | Camden National Corp. | 73,902 | |||||||||
| 48,105 | Capitol Federal Financial, Inc. | 544,549 | |||||||||
| 32,817 | CapLease, Inc. REIT | 183,775 | |||||||||
| 45,508 | Capstead Mortgage Corp. REIT | 602,526 | |||||||||
| 7,881 | Cardinal Financial Corp. | 88,582 | |||||||||
| 12,006 | Cash America International, Inc. | 569,685 | |||||||||
| 32,490 | Cathay General Bancorp | 553,955 | |||||||||
| 50,473 | Cedar Shopping Centers, Inc. REIT | 297,791 | |||||||||
| 12,441 | Center Financial Corp.* | 90,695 | |||||||||
| 11,232 | Centerstate Banks, Inc. | 69,863 | |||||||||
| 135 | Central Pacific Financial Corp.* | 2,036 | |||||||||
| 11,571 | Chemical Financial Corp. | 232,924 | |||||||||
| Number of Shares | Value | ||||||||||
| Common Stocks and Other Equity Interests (Continued) | |||||||||||
| 4,927 | Citizens & Northern Corp. | $ | 84,597 | ||||||||
| 523,934 | Citizens Republic Bancorp, Inc.* | 480,971 | |||||||||
| 15,104 | Citizens, Inc.* | 112,525 | |||||||||
| 8,266 | City Holding Co. | 281,871 | |||||||||
| 13,607 | CNA Financial Corp. | 422,361 | |||||||||
| 8,090 | CNA Surety Corp.* | 214,304 | |||||||||
| 18,980 | CoBiz Financial, Inc. | 128,874 | |||||||||
| 24,727 | Cogdell Spencer, Inc. REIT | 149,598 | |||||||||
| 2,638 | Cohen & Steers, Inc. | 82,992 | |||||||||
| 2,815 | Colony Financial, Inc. REIT | 52,584 | |||||||||
| 11,071 | Columbia Banking System, Inc. | 208,799 | |||||||||
| 15,770 | Community Bank System, Inc. | 394,565 | |||||||||
| 5,884 | Community Trust Bancorp, Inc. | 166,517 | |||||||||
| 27,787 | Compass Diversified Holdings | 465,710 | |||||||||
| 10,903 | CompuCredit Holdings Corp.* | 46,447 | |||||||||
| 59,795 | Cousins Properties, Inc. REIT | 538,155 | |||||||||
| 21,565 | Cowen Group, Inc., Class A* | 89,710 | |||||||||
| 1,537 | Credit Acceptance Corp.* | 124,343 | |||||||||
| 4,631 | Crexus Investment Corp. REIT | 53,997 | |||||||||
| 55,592 | CVB Financial Corp. | 541,466 | |||||||||
| 20,009 | Cypress Sharpridge Investments, Inc. REIT | 247,111 | |||||||||
| 4,278 | Danvers Bancorp, Inc. | 96,469 | |||||||||
| 57,085 | DiamondRock Hospitality Co. REIT | 687,303 | |||||||||
| 16,293 | Dime Community Bancshares | 251,890 | |||||||||
| 14,387 | Dollar Financial Corp.* | 330,757 | |||||||||
| 98,838 | Doral Financial Corp. (Puerto Rico)* | 148,257 | |||||||||
| 5,054 | Duff & Phelps Corp., Class A | 77,781 | |||||||||
| 8,555 | DuPont Fabros Technology, Inc. REIT | 209,255 | |||||||||
| 5,950 | Dynex Capital, Inc. REIT | 58,786 | |||||||||
| 4,916 | Eagle Bancorp, Inc.* | 68,234 | |||||||||
| 9,436 | EastGroup Properties, Inc. REIT | 434,622 | |||||||||
| 29,118 | Education Realty Trust, Inc. REIT | 247,794 | |||||||||
| 6,169 | eHealth, Inc.* | 83,898 | |||||||||
| 17,691 | Employers Holdings, Inc. | 356,651 | |||||||||
| 4,739 | Encore Capital Group, Inc.* | 141,886 | |||||||||
| 2,248 | Enstar Group Ltd. (Bermuda)* | 252,113 | |||||||||
| 6,633 | Enterprise Financial Services Corp. | 98,832 | |||||||||
| 5,868 | Equity Lifestyle Properties, Inc. REIT | 351,024 | |||||||||
| 19,462 | Equity One, Inc. REIT | 385,737 | |||||||||
| 4,610 | ESSA Bancorp, Inc. | 57,856 | |||||||||
| 2,282 | Evercore Partners, Inc., Class A | 79,619 | |||||||||
| 28,821 | Extra Space Storage, Inc. REIT | 623,975 | |||||||||
| 11,678 | EZCORP, Inc., Class A* | 367,740 | |||||||||
| 9,588 | FBL Financial Group, Inc., Class A | 292,434 | |||||||||
| 22,391 | FBR Capital Markets Corp.* | 80,608 | |||||||||
| 64,555 | FelCor Lodging Trust, Inc. REIT* | 410,570 | |||||||||
| 4,560 | Financial Institutions, Inc. | 77,520 | |||||||||
| 6,400 | First Bancorp | 89,344 | |||||||||
| 63,586 | First BanCorp* | 317,294 | |||||||||
| 24,276 | First Busey Corp. | 127,449 | |||||||||
| 5,795 | First Cash Financial Services, Inc.* | 227,396 | |||||||||
See Notes to Financial Statements.
39
Schedule of Investments (Continued)
PowerShares FTSE RAFI US 1500 Small-Mid Portfolio
April 30, 2011
| Number of Shares | Value | ||||||||||
| Common Stocks and Other Equity Interests (Continued) | |||||||||||
| 1,845 | First Citizens BancShares, Inc., Class A | $ | 369,018 | ||||||||
| 72,762 | First Commonwealth Financial Corp. | 451,124 | |||||||||
| 10,065 | First Community Bancshares, Inc. | 149,566 | |||||||||
| 21,605 | First Financial Bancorp | 356,050 | |||||||||
| 7,071 | First Financial Bankshares, Inc. | 391,875 | |||||||||
| 3,764 | First Financial Corp. | 121,050 | |||||||||
| 9,718 | First Financial Holdings, Inc. | 106,704 | |||||||||
| 62,192 | First Industrial Realty Trust, Inc. REIT* | 778,644 | |||||||||
| 9,103 | First Interstate BancSystem, Inc. | 124,529 | |||||||||
| 31,923 | First Marblehead Corp. (The)* | 68,634 | |||||||||
| 16,388 | First Merchants Corp. | 151,917 | |||||||||
| 47,186 | First Midwest Bancorp, Inc. | 618,137 | |||||||||
| 2,421 | First of Long Island Corp. (The) | 65,488 | |||||||||
| 17,985 | First Potomac Realty Trust REIT | 291,897 | |||||||||
| 123,716 | Flagstar Bancorp, Inc.* | 192,997 | |||||||||
| 34,106 | Flagstone Reinsurance Holdings SA (Luxembourg) | 286,831 | |||||||||
| 15,774 | Flushing Financial Corp. | 232,193 | |||||||||
| 12,541 | Forestar Group, Inc.* | 246,681 | |||||||||
| 5,770 | FPIC Insurance Group, Inc.* | 213,028 | |||||||||
| 30,665 | Franklin Street Properties Corp. REIT | 433,603 | |||||||||
| 1,698 | GAMCO Investors, Inc., Class A | 87,362 | |||||||||
| 5,717 | Getty Realty Corp. REIT | 145,269 | |||||||||
| 37,735 | GFI Group, Inc. | 192,826 | |||||||||
| 32,236 | Glacier Bancorp, Inc. | 484,507 | |||||||||
| 5,107 | Gladstone Commercial Corp. REIT | 93,152 | |||||||||
| 37,415 | Gleacher & Co., Inc.* | 70,714 | |||||||||
| 49,519 | Glimcher Realty Trust REIT | 472,906 | |||||||||
| 6,987 | Global Indemnity PLC (Ireland)* | 178,448 | |||||||||
| 4,476 | Government Properties Income Trust REIT | 122,732 | |||||||||
| 75,835 | Gramercy Capital Corp. REIT* | 226,747 | |||||||||
| 4,225 | Great Southern Bancorp, Inc. | 87,458 | |||||||||
| 4,047 | Greenhill & Co., Inc. | 238,773 | |||||||||
| 8,174 | Greenlight Capital Re Ltd., Class A (Cayman Islands)* | 230,098 | |||||||||
| 60,496 | Grubb & Ellis Co.* | 44,162 | |||||||||
| 7,878 | Hallmark Financial Services, Inc.* | 67,357 | |||||||||
| 15,579 | Hancock Holding Co. | 508,810 | |||||||||
| 50,326 | Hanmi Financial Corp.* | 66,430 | |||||||||
| 7,517 | Harleysville Group, Inc. | 241,145 | |||||||||
| 28,334 | Healthcare Realty Trust, Inc. REIT | 647,149 | |||||||||
| 3,926 | Heartland Financial USA, Inc. | 61,717 | |||||||||
| 38,906 | Hersha Hospitality Trust REIT | 231,102 | |||||||||
| 17,421 | Hilltop Holdings, Inc.* | 168,984 | |||||||||
| 5,571 | Home Bancshares, Inc. | 133,537 | |||||||||
| 27,808 | Horace Mann Educators Corp. | 497,207 | |||||||||
| 8,859 | Howard Hughes Corp. (The)* | 573,797 | |||||||||
| 8,661 | Hudson Valley Holding Corp. | 195,825 | |||||||||
| 9,107 | IBERIABANK Corp. | 546,511 | |||||||||
| 8,887 | Independent Bank Corp. | 260,478 | |||||||||
| 7,076 | Infinity Property & Casualty Corp. | 418,192 | |||||||||
| Number of Shares | Value | ||||||||||
| Common Stocks and Other Equity Interests (Continued) | |||||||||||
| 51,244 | Inland Real Estate Corp. REIT | $ | 500,654 | ||||||||
| 11,702 | Institutional Financial Markets, Inc. | 53,361 | |||||||||
| 32,350 | International Bancshares Corp. | 570,007 | |||||||||
| 6,780 | Internet Capital Group, Inc.* | 94,174 | |||||||||
| 4,697 | INTL FCStone, Inc.* | 124,377 | |||||||||
| 4,083 | Invesco Mortgage Capital, Inc. REIT(~) | 92,847 | |||||||||
| 31,216 | Investment Technology Group, Inc.* | 534,106 | |||||||||
| 14,418 | Investors Bancorp, Inc.* | 216,847 | |||||||||
| 40,463 | Investors Real Estate Trust REIT | 380,757 | |||||||||
| 51,285 | Janus Capital Group, Inc. | 624,138 | |||||||||
| 2,013 | Kansas City Life Insurance Co. | 64,476 | |||||||||
| 7,943 | KBW, Inc. | 180,465 | |||||||||
| 40,476 | Kite Realty Group Trust REIT | 210,475 | |||||||||
| 42,643 | LaBranche & Co., Inc.* | 171,851 | |||||||||
| 9,744 | Lakeland Bancorp, Inc. | 104,163 | |||||||||
| 6,622 | Lakeland Financial Corp. | 145,088 | |||||||||
| 24,456 | LaSalle Hotel Properties REIT | 688,192 | |||||||||
| 7,177 | LPL Investment Holdings, Inc.* | 263,252 | |||||||||
| 6,850 | LTC Properties, Inc. REIT | 201,527 | |||||||||
| 39,824 | Maiden Holdings Ltd. (Bermuda) | 296,689 | |||||||||
| 9,824 | MainSource Financial Group, Inc. | 94,605 | |||||||||
| 3,664 | MarketAxess Holdings, Inc. | 89,218 | |||||||||
| 25,687 | MB Financial, Inc. | 531,464 | |||||||||
| 22,343 | Meadowbrook Insurance Group, Inc. | 228,792 | |||||||||
| 10,367 | Medallion Financial Corp. | 95,687 | |||||||||
| 36,176 | Medical Properties Trust, Inc. REIT | 446,412 | |||||||||
| 7,693 | Metro Bancorp, Inc.* | 96,163 | |||||||||
| 8,752 | Mid-America Apartment Communities, Inc. REIT | 585,071 | |||||||||
| 14,858 | Mission West Properties, Inc. REIT | 114,109 | |||||||||
| 14,307 | Monmouth Real Estate Investment Corp., Class A REIT | 119,607 | |||||||||
| 77,952 | MPG Office Trust, Inc. REIT* | 259,580 | |||||||||
| 13,395 | Nara Bancorp, Inc.* | 131,673 | |||||||||
| 31,983 | National Financial Partners Corp.* | 514,607 | |||||||||
| 5,775 | National Health Investors, Inc. REIT | 280,838 | |||||||||
| 67,197 | National Penn Bancshares, Inc. | 551,687 | |||||||||
| 610 | National Western Life Insurance Co., Class A | 98,253 | |||||||||
| 6,094 | Navigators Group, Inc. (The)* | 315,852 | |||||||||
| 16,284 | NBT Bancorp, Inc. | 368,018 | |||||||||
| 12,348 | Nelnet, Inc., Class A | 284,374 | |||||||||
| 8,739 | New York Mortgage Trust, Inc. REIT | 59,338 | |||||||||
| 78,280 | Newcastle Investment Corp. REIT* | 493,947 | |||||||||
| 16,790 | NewStar Financial, Inc.* | 200,641 | |||||||||
| 4,928 | Northfield Bancorp, Inc. | 69,337 | |||||||||
| 105,215 | NorthStar Realty Finance Corp. REIT | 531,336 | |||||||||
| 45,962 | Northwest Bancshares, Inc. | 578,662 | |||||||||
| 7,281 | OceanFirst Financial Corp. | 105,575 | |||||||||
| 46,627 | Ocwen Financial Corp.* | 558,125 | |||||||||
| 50,343 | Old National Bancorp | 521,050 | |||||||||
| 21,876 | OMEGA Healthcare Investors, Inc. REIT | 502,273 | |||||||||
See Notes to Financial Statements.
40
Schedule of Investments (Continued)
PowerShares FTSE RAFI US 1500 Small-Mid Portfolio
April 30, 2011
| Number of Shares | Value | ||||||||||
| Common Stocks and Other Equity Interests (Continued) | |||||||||||
| 7,582 | One Liberty Properties, Inc. REIT | $ | 117,597 | ||||||||
| 13,807 | OneBeacon Insurance Group Ltd., Class A | 193,988 | |||||||||
| 4,778 | Oppenheimer Holdings, Inc., Class A | 146,732 | |||||||||
| 9,903 | optionsXpress Holdings, Inc. | 182,611 | |||||||||
| 19,609 | Oriental Financial Group, Inc. | 254,133 | |||||||||
| 5,297 | Oritani Financial Corp. | 64,941 | |||||||||
| 2,561 | Orrstown Financial Services, Inc. | 69,762 | |||||||||
| 7,767 | Pacific Continental Corp. | 74,175 | |||||||||
| 15,322 | PacWest Bancorp | 352,253 | |||||||||
| 7,041 | Park National Corp. | 486,392 | |||||||||
| 20,662 | Parkway Properties, Inc. REIT | 370,470 | |||||||||
| 12,178 | Penson Worldwide, Inc.* | 73,920 | |||||||||
| 4,651 | Peoples Bancorp, Inc. | 63,393 | |||||||||
| 5,365 | Pico Holdings, Inc.* | 172,324 | |||||||||
| 16,421 | Pinnacle Financial Partners, Inc.* | 263,886 | |||||||||
| 8,962 | Piper Jaffray Cos.* | 321,288 | |||||||||
| 122,793 | PMI Group, Inc. (The)* | 265,233 | |||||||||
| 2,340 | Portfolio Recovery Associates, Inc.* | 211,208 | |||||||||
| 17,835 | Post Properties, Inc. REIT | 724,101 | |||||||||
| 12,934 | Presidential Life Corp. | 144,085 | |||||||||
| 25,588 | PrivateBancorp, Inc. | 402,755 | |||||||||
| 12,043 | Prosperity Bancshares, Inc. | 552,172 | |||||||||
| 30,943 | Provident Financial Services, Inc. | 449,292 | |||||||||
| 12,867 | Provident New York Bancorp | 120,692 | |||||||||
| 5,441 | PS Business Parks, Inc. REIT | 327,875 | |||||||||
| 89,690 | Radian Group, Inc. | 531,862 | |||||||||
| 193,187 | RAIT Financial Trust REIT | 471,376 | |||||||||
| 22,098 | Ramco-Gershenson Properties Trust REIT | 284,843 | |||||||||
| 12,754 | Renasant Corp. | 214,012 | |||||||||
| 7,086 | Republic Bancorp, Inc., Class A | 154,333 | |||||||||
| 9,412 | Resource America, Inc., Class A | 57,884 | |||||||||
| 34,783 | Resource Capital Corp. REIT | 225,394 | |||||||||
| 16,781 | S&T Bancorp, Inc. | 342,500 | |||||||||
| 4,506 | S.Y. Bancorp, Inc. | 112,515 | |||||||||
| 27,342 | Sabra Health Care REIT, Inc. REIT | 459,892 | |||||||||
| 3,426 | Safeguard Scientifics, Inc.* | 66,978 | |||||||||
| 8,435 | Safety Insurance Group, Inc. | 394,927 | |||||||||
| 10,774 | Sandy Spring Bancorp, Inc. | 192,531 | |||||||||
| 4,293 | Saul Centers, Inc. REIT | 187,990 | |||||||||
| 5,073 | SCBT Financial Corp. | 163,554 | |||||||||
| 19,957 | Seabright Holdings, Inc. | 203,961 | |||||||||
| 58,793 | Seacoast Banking Corp. of Florida* | 105,240 | |||||||||
| 9,718 | Signature Bank* | 565,685 | |||||||||
| 7,149 | Simmons First National Corp., Class A | 188,662 | |||||||||
| 7,424 | Southside Bancshares, Inc. | 161,472 | |||||||||
| 11,042 | Southwest Bancorp, Inc.* | 156,576 | |||||||||
| 12,739 | Sovran Self Storage, Inc. REIT | 544,974 | |||||||||
| 17,875 | St. Joe Co. (The)* | 466,895 | |||||||||
| 5,433 | State Auto Financial Corp. | 92,252 | |||||||||
| 5,846 | State Bancorp, Inc. | 77,167 | |||||||||
| 8,220 | StellarOne Corp. | 115,080 | |||||||||
| Number of Shares | Value | ||||||||||
| Common Stocks and Other Equity Interests (Continued) | |||||||||||
| 16,647 | Sterling Bancorp | $ | 172,296 | ||||||||
| 34,587 | Sterling Bancshares, Inc. | 307,478 | |||||||||
| 7,787 | Sterling Financial Corp.* | 137,363 | |||||||||
| 21,082 | Stewart Information Services Corp. | 213,772 | |||||||||
| 10,228 | Stifel Financial Corp.* | 467,215 | |||||||||
| 67,163 | Strategic Hotels & Resorts, Inc. REIT* | 458,052 | |||||||||
| 4,663 | Suffolk Bancorp | 76,520 | |||||||||
| 9,094 | Sun Communities, Inc. REIT | 349,937 | |||||||||
| 56,406 | SWS Group, Inc. | 344,077 | |||||||||
| 16,781 | Tanger Factory Outlet Centers, Inc. REIT | 463,659 | |||||||||
| 9,268 | Taubman Centers, Inc. REIT | 538,934 | |||||||||
| 3,457 | Territorial Bancorp, Inc. | 69,382 | |||||||||
| 11,455 | Texas Capital Bancshares, Inc.* | 295,539 | |||||||||
| 23,579 | TFS Financial Corp. | 256,540 | |||||||||
| 2,651 | Tompkins Financial Corp. | 108,002 | |||||||||
| 3,275 | Tower Bancorp, Inc. | 71,100 | |||||||||
| 15,377 | Tower Group, Inc. | 351,672 | |||||||||
| 9,058 | TowneBank | 134,240 | |||||||||
| 9,575 | TradeStation Group, Inc.* | 92,399 | |||||||||
| 5,185 | TriCo Bancshares | 84,567 | |||||||||
| 49,810 | TrustCo Bank Corp. NY | 298,860 | |||||||||
| 10,899 | UMB Financial Corp. | 458,957 | |||||||||
| 8,702 | Union First Market Bankshares Corp. | 110,776 | |||||||||
| 22,603 | United Bankshares, Inc. | 591,295 | |||||||||
| 195,960 | United Community Banks, Inc.* | 470,304 | |||||||||
| 5,474 | United Financial Bancorp, Inc. | 89,445 | |||||||||
| 10,837 | United Fire & Casualty Co. | 214,573 | |||||||||
| 2,503 | Universal Health Realty Income Trust REIT | 107,904 | |||||||||
| 18,094 | Universal Insurance Holdings, Inc. | 97,889 | |||||||||
| 5,046 | Univest Corp. of Pennsylvania | 84,874 | |||||||||
| 9,234 | Urstadt Biddle Properties, Inc., Class A REIT | 181,725 | |||||||||
| 45,829 | U-Store-It Trust REIT | 520,617 | |||||||||
| 6,217 | ViewPoint Financial Group | 76,780 | |||||||||
| 18,310 | Virginia Commerce Bancorp, Inc.* | 110,043 | |||||||||
| 16,594 | Waddell & Reed Financial, Inc., Class A | 680,520 | |||||||||
| 20,895 | Walter Investment Management Corp. REIT | 372,349 | |||||||||
| 4,600 | Washington Banking Co. | 64,354 | |||||||||
| 4,785 | Washington Trust Bancorp, Inc. | 112,113 | |||||||||
| 10,186 | WesBanco, Inc. | 206,776 | |||||||||
| 486 | Wesco Financial Corp. | 190,512 | |||||||||
| 39,963 | West Coast Bancorp* | 143,068 | |||||||||
| 9,883 | Westamerica Bancorp | 501,958 | |||||||||
| 32,878 | Western Alliance Bancorp* | 271,901 | |||||||||
| 13,096 | Westfield Financial, Inc. | 118,912 | |||||||||
| 150,731 | Wilmington Trust Corp. | 679,797 | |||||||||
| 14,450 | Wilshire Bancorp, Inc.* | 57,800 | |||||||||
| 8,567 | Winthrop Realty Trust REIT | 103,918 | |||||||||
| 16,181 | Wintrust Financial Corp. | 545,138 | |||||||||
| 6,084 | World Acceptance Corp.* | 413,408 | |||||||||
| 3,337 | WSFS Financial Corp. | 150,065 | |||||||||
| 77,301,304 | |||||||||||
See Notes to Financial Statements.
41
Schedule of Investments (Continued)
PowerShares FTSE RAFI US 1500 Small-Mid Portfolio
April 30, 2011
| Number of Shares | Value | ||||||||||
| Common Stocks and Other Equity Interests (Continued) | |||||||||||
| Health Care—8.7% | |||||||||||
| 3,100 | Abaxis, Inc.* | $ | 90,055 | ||||||||
| 7,747 | Accuray, Inc.* | 68,871 | |||||||||
| 44,860 | Affymetrix, Inc.* | 242,244 | |||||||||
| 3,403 | Air Methods Corp.* | 230,111 | |||||||||
| 19,270 | Albany Molecular Research, Inc.* | 94,230 | |||||||||
| 2,432 | Alexion Pharmaceuticals, Inc.* | 235,636 | |||||||||
| 10,351 | Align Technology, Inc.* | 249,873 | |||||||||
| 14,797 | Alkermes, Inc.* | 213,373 | |||||||||
| 31,687 | Alliance HealthCare Services, Inc.* | 140,057 | |||||||||
| 2,434 | Almost Family, Inc.* | 84,387 | |||||||||
| 5,608 | Alnylam Pharmaceuticals, Inc.* | 57,538 | |||||||||
| 15,140 | Amedisys, Inc.* | 504,465 | |||||||||
| 5,074 | America Service Group, Inc. | 130,909 | |||||||||
| 6,709 | American Dental Partners, Inc.* | 88,492 | |||||||||
| 12,867 | American Medical Systems Holdings, Inc.* | 379,576 | |||||||||
| 42,486 | AMN Healthcare Services, Inc.* | 366,654 | |||||||||
| 20,766 | AmSurg Corp., Class A* | 557,775 | |||||||||
| 15,659 | Amylin Pharmaceuticals, Inc.* | 208,265 | |||||||||
| 2,770 | Analogic Corp. | 159,746 | |||||||||
| 9,825 | AngioDynamics, Inc.* | 160,147 | |||||||||
| 5,281 | Arthrocare Corp.* | 186,578 | |||||||||
| 4,389 | Assisted Living Concepts, Inc., Class A* | 158,267 | |||||||||
| 1,483 | athenahealth, Inc.* | 68,559 | |||||||||
| 377 | Atrion Corp. | 65,278 | |||||||||
| 5,445 | BioMarin Pharmaceutical, Inc.* | 146,416 | |||||||||
| 5,217 | Bio-Rad Laboratories, Inc., Class A* | 652,751 | |||||||||
| 7,133 | Bio-Reference Labs, Inc.* | 179,823 | |||||||||
| 51,274 | BioScrip, Inc.* | 236,373 | |||||||||
| 8,454 | Bruker Corp.* | 166,882 | |||||||||
| 14,542 | Cambrex Corp.* | 76,491 | |||||||||
| 3,797 | Cantel Medical Corp. | 98,456 | |||||||||
| 14,181 | CardioNet, Inc.* | 64,665 | |||||||||
| 12,602 | Catalyst Health Solutions, Inc.* | 750,575 | |||||||||
| 29,897 | Celera Corp.* | 236,485 | |||||||||
| 2,736 | Cepheid, Inc.* | 88,400 | |||||||||
| 6,277 | Chemed Corp. | 437,067 | |||||||||
| 3,553 | Chindex International, Inc.* | 61,076 | |||||||||
| 1,253 | Computer Programs & Systems, Inc. | 73,664 | |||||||||
| 15,251 | CONMED Corp.* | 428,248 | |||||||||
| 9,489 | Continucare Corp.* | 50,861 | |||||||||
| 2,037 | CorVel Corp.* | 105,517 | |||||||||
| 12,988 | Cross Country Healthcare, Inc.* | 96,371 | |||||||||
| 9,148 | Cubist Pharmaceuticals, Inc.* | 309,660 | |||||||||
| 4,569 | Dendreon Corp.* | 198,432 | |||||||||
| 2,054 | Dionex Corp.* | 243,091 | |||||||||
| 8,557 | Emdeon, Inc., Class A* | 134,003 | |||||||||
| 9,221 | Emergency Medical Services Corp., Class A* | 588,300 | |||||||||
| 5,413 | Emergent Biosolutions, Inc.* | 125,636 | |||||||||
| 10,159 | Emeritus Corp.* | 248,997 | |||||||||
| 1,999 | Ensign Group, Inc. (The) | 55,292 | |||||||||
| Number of Shares | Value | ||||||||||
| Common Stocks and Other Equity Interests (Continued) | |||||||||||
| 8,021 | Enzon Pharmaceuticals, Inc.* | $ | 92,081 | ||||||||
| 15,915 | eResearchTechnology, Inc.* | 101,219 | |||||||||
| 3,457 | Exactech, Inc.* | 61,915 | |||||||||
| 36,746 | Five Star Quality Care, Inc.* | 307,931 | |||||||||
| 7,437 | Gen-Probe, Inc.* | 616,676 | |||||||||
| 17,363 | Gentiva Health Services, Inc.* | 486,164 | |||||||||
| 10,399 | Greatbatch, Inc.* | 281,501 | |||||||||
| 6,505 | Haemonetics Corp.* | 456,651 | |||||||||
| 8,896 | Hanger Orthopedic Group, Inc.* | 241,704 | |||||||||
| 27,358 | Healthsouth Corp.* | 701,186 | |||||||||
| 15,644 | Healthspring, Inc.* | 649,070 | |||||||||
| 25,616 | Healthways, Inc.* | 433,423 | |||||||||
| 1,818 | HMS Holdings Corp.* | 143,095 | |||||||||
| 9,722 | Human Genome Sciences, Inc.* | 286,507 | |||||||||
| 3,169 | ICU Medical, Inc.* | 142,954 | |||||||||
| 7,524 | IDEXX Laboratories, Inc.* | 612,679 | |||||||||
| 6,239 | Illumina, Inc.* | 442,844 | |||||||||
| 15,991 | Immucor, Inc.* | 349,084 | |||||||||
| 8,429 | Impax Laboratories, Inc.* | 230,786 | |||||||||
| 4,966 | Integra LifeSciences Holdings Corp.* | 259,771 | |||||||||
| 17,153 | Invacare Corp. | 564,334 | |||||||||
| 3,015 | IPC The Hospitalist Co., Inc.* | 156,358 | |||||||||
| 10,647 | Isis Pharmaceuticals, Inc.* | 99,869 | |||||||||
| 9,716 | Jiangbo Pharmaceuticals, Inc.* | 45,859 | |||||||||
| 18,295 | Kendle International, Inc.* | 183,865 | |||||||||
| 2,688 | Kensey Nash Corp.* | 66,474 | |||||||||
| 9,384 | KV Pharmaceutical Co., Class A* | 36,879 | |||||||||
| 2,654 | Landauer, Inc. | 159,691 | |||||||||
| 14,384 | LCA-Vision, Inc.* | 96,948 | |||||||||
| 4,585 | LHC Group, Inc.* | 135,808 | |||||||||
| 4,649 | Luminex Corp.* | 90,144 | |||||||||
| 6,676 | Masimo Corp. | 232,258 | |||||||||
| 12,311 | MedAssets, Inc.* | 197,222 | |||||||||
| 13,995 | MedCath Corp.* | 189,072 | |||||||||
| 14,270 | Medical Action Industries, Inc.* | 124,149 | |||||||||
| 5,432 | Medicines Co. (The)* | 85,282 | |||||||||
| 10,521 | Medicis Pharmaceutical Corp., Class A | 373,075 | |||||||||
| 6,630 | Medquist Holdings, Inc.* | 68,422 | |||||||||
| 7,219 | Meridian Bioscience, Inc. | 178,381 | |||||||||
| 8,446 | Merit Medical Systems, Inc.* | 196,961 | |||||||||
| 14,718 | Metropolitan Health Networks, Inc.* | 62,110 | |||||||||
| 16,704 | Molina Healthcare, Inc.* | 718,272 | |||||||||
| 4,075 | MWI Veterinary Supply, Inc.* | 338,918 | |||||||||
| 14,954 | Myriad Genetics, Inc.* | 320,614 | |||||||||
| 3,728 | National Healthcare Corp. | 173,203 | |||||||||
| 7,337 | Natus Medical, Inc.* | 124,509 | |||||||||
| 2,307 | Neogen Corp.* | 96,663 | |||||||||
| 4,909 | NovaMed, Inc.* | 65,044 | |||||||||
| 3,354 | NuVasive, Inc.* | 103,605 | |||||||||
| 5,575 | Obagi Medical Products, Inc.* | 71,527 | |||||||||
| 10,206 | Omnicell, Inc.* | 156,968 | |||||||||
See Notes to Financial Statements.
42
Schedule of Investments (Continued)
PowerShares FTSE RAFI US 1500 Small-Mid Portfolio
April 30, 2011
| Number of Shares | Value | ||||||||||
| Common Stocks and Other Equity Interests (Continued) | |||||||||||
| 7,044 | Onyx Pharmaceuticals, Inc.* | $ | 264,643 | ||||||||
| 7,363 | Orthofix International NV (Netherlands)* | 250,857 | |||||||||
| 11,479 | Par Pharmaceutical Cos., Inc.* | 395,337 | |||||||||
| 20,230 | PAREXEL International Corp.* | 561,585 | |||||||||
| 111,868 | PDL BioPharma, Inc. | 718,193 | |||||||||
| 44,635 | PharMerica Corp.* | 587,397 | |||||||||
| 8,147 | Providence Service Corp. (The)* | 120,087 | |||||||||
| 23,373 | PSS World Medical, Inc.* | 672,207 | |||||||||
| 2,440 | Quality Systems, Inc. | 218,917 | |||||||||
| 7,343 | Quidel Corp.* | 97,442 | |||||||||
| 22,275 | Radnet, Inc.* | 81,749 | |||||||||
| 4,224 | Regeneron Pharmaceuticals, Inc.* | 215,889 | |||||||||
| 8,400 | RehabCare Group, Inc.* | 315,588 | |||||||||
| 18,961 | ResMed, Inc.* | 604,666 | |||||||||
| 35,754 | RTI Biologics, Inc.* | 103,687 | |||||||||
| 7,652 | Rural/Metro Corp.* | 130,314 | |||||||||
| 4,507 | Salix Pharmaceuticals Ltd.* | 177,080 | |||||||||
| 4,322 | Seattle Genetics, Inc.* | 71,788 | |||||||||
| 36,877 | Select Medical Holdings Corp.* | 328,943 | |||||||||
| 8,286 | Sirona Dental Systems, Inc.* | 472,882 | |||||||||
| 13,460 | Skilled Healthcare Group, Inc., Class A* | 163,135 | |||||||||
| 3,557 | SonoSite, Inc.* | 123,428 | |||||||||
| 47,210 | Sunrise Senior Living, Inc.* | 490,040 | |||||||||
| 7,942 | SurModics, Inc.* | 121,989 | |||||||||
| 16,940 | Symmetry Medical, Inc.* | 168,553 | |||||||||
| 7,188 | Syneron Medical Ltd. (Israel)* | 90,209 | |||||||||
| 14,466 | Talecris Biotherapeutics Holdings Corp.* | 403,891 | |||||||||
| 6,575 | Team Health Holdings, Inc.* | 130,711 | |||||||||
| 4,621 | Techne Corp. | 359,098 | |||||||||
| 8,945 | Thoratec Corp.* | 274,611 | |||||||||
| 24,033 | TomoTherapy, Inc.* | 110,071 | |||||||||
| 13,885 | Triple-S Management Corp., Class B (Puerto Rico)* | 290,752 | |||||||||
| 3,629 | United Therapeutics Corp.* | 242,998 | |||||||||
| 4,322 | US Physical Therapy, Inc. | 105,241 | |||||||||
| 7,637 | Vertex Pharmaceuticals, Inc.* | 420,188 | |||||||||
| 21,288 | ViroPharma, Inc.* | 410,645 | |||||||||
| 8,227 | Vivus, Inc.* | 64,006 | |||||||||
| 2,608 | Volcano Corp.* | 69,529 | |||||||||
| 21,335 | Warner Chilcott PLC, Class A (Ireland) | 491,772 | |||||||||
| 17,879 | WellCare Health Plans, Inc.* | 783,279 | |||||||||
| 12,319 | West Pharmaceutical Services, Inc. | 581,950 | |||||||||
| 8,441 | Wright Medical Group, Inc.* | 139,530 | |||||||||
| 4,493 | Zoll Medical Corp.* | 254,663 | |||||||||
| 35,683,883 | |||||||||||
| Industrials—18.6% | |||||||||||
| 17,015 | A.O. Smith Corp. | 748,150 | |||||||||
| 17,213 | A123 Systems, Inc.* | 103,967 | |||||||||
| 2,906 | AAON, Inc. | 95,462 | |||||||||
| 22,393 | AAR Corp. | 583,114 | |||||||||
| Number of Shares | Value | ||||||||||
| Common Stocks and Other Equity Interests (Continued) | |||||||||||
| 24,394 | ABM Industries, Inc. | $ | 593,262 | ||||||||
| 56,764 | ACCO Brands Corp.* | 551,178 | |||||||||
| 14,917 | Aceto Corp. | 119,485 | |||||||||
| 19,265 | Actuant Corp., Class A | 534,796 | |||||||||
| 2,301 | Advisory Board Co. (The)* | 107,503 | |||||||||
| 34,173 | Aegean Marine Petroleum Network, Inc. (Greece) | 295,255 | |||||||||
| 3,724 | Aerovironment, Inc.* | 106,693 | |||||||||
| 54,481 | Air Transport Services Group, Inc.* | 445,655 | |||||||||
| 52,946 | Aircastle Ltd. (Bermuda) | 659,707 | |||||||||
| 92,771 | AirTran Holdings, Inc.* | 696,710 | |||||||||
| 4,081 | Alamo Group, Inc. | 116,757 | |||||||||
| 15,396 | Albany International Corp., Class A | 389,673 | |||||||||
| 4,159 | Allegiant Travel Co. | 186,614 | |||||||||
| 9,962 | Altra Holdings, Inc.* | 252,935 | |||||||||
| 5,647 | American Railcar Industries, Inc.* | 159,980 | |||||||||
| 29,986 | American Reprographics Co.* | 268,375 | |||||||||
| 1,445 | American Science & Engineering, Inc. | 127,304 | |||||||||
| 4,020 | American Superconductor Corp.* | 47,637 | |||||||||
| 3,180 | American Woodmark Corp. | 64,586 | |||||||||
| 4,727 | Ameron International Corp. | 332,497 | |||||||||
| 4,506 | Ampco-Pittsburgh Corp. | 121,076 | |||||||||
| 11,895 | APAC Customer Services, Inc.* | 67,920 | |||||||||
| 21,786 | Apogee Enterprises, Inc. | 311,104 | |||||||||
| 17,502 | A-Power Energy Generation Systems Ltd.* | 70,883 | |||||||||
| 20,556 | Applied Industrial Technologies, Inc. | 724,805 | |||||||||
| 23,240 | Arkansas Best Corp. | 534,752 | |||||||||
| 14,549 | Armstrong World Industries, Inc. | 651,068 | |||||||||
| 10,773 | Astec Industries, Inc.* | 417,777 | |||||||||
| 3,442 | AZZ, Inc. | 150,691 | |||||||||
| 3,296 | Badger Meter, Inc. | 124,951 | |||||||||
| 21,531 | Barnes Group, Inc. | 532,677 | |||||||||
| 27,873 | Beacon Roofing Supply, Inc.* | 622,125 | |||||||||
| 15,191 | Belden, Inc. | 577,714 | |||||||||
| 15,171 | Blount International, Inc.* | 251,839 | |||||||||
| 29,208 | Builders FirstSource, Inc.* | 77,401 | |||||||||
| 3,093 | CAI International, Inc.* | 77,820 | |||||||||
| 4,359 | Cascade Corp. | 199,642 | |||||||||
| 21,587 | Casella Waste Systems, Inc., Class A* | 145,928 | |||||||||
| 38,999 | CBIZ, Inc.* | 285,863 | |||||||||
| 14,875 | CDI Corp. | 220,447 | |||||||||
| 13,606 | Celadon Group, Inc.* | 200,961 | |||||||||
| 67,362 | Cenveo, Inc.* | 436,506 | |||||||||
| 13,046 | Ceradyne, Inc.* | 611,336 | |||||||||
| 8,233 | Chart Industries, Inc.* | 400,206 | |||||||||
| 38,702 | China BAK Battery, Inc.* | 60,762 | |||||||||
| 16,169 | China Yuchai International Ltd. (Bermuda)* | 535,517 | |||||||||
| 4,629 | CIRCOR International, Inc. | 210,295 | |||||||||
| 13,122 | CLARCOR, Inc. | 592,983 | |||||||||
| 5,508 | Clean Harbors, Inc.* | 542,538 | |||||||||
| 9,374 | Coleman Cable, Inc.* | 93,927 | |||||||||
See Notes to Financial Statements.
43
Schedule of Investments (Continued)
PowerShares FTSE RAFI US 1500 Small-Mid Portfolio
April 30, 2011
| Number of Shares | Value | ||||||||||
| Common Stocks and Other Equity Interests (Continued) | |||||||||||
| 8,494 | Colfax Corp.* | $ | 185,594 | ||||||||
| 13,851 | Columbus McKinnon Corp.* | 277,020 | |||||||||
| 23,058 | Comfort Systems USA, Inc. | 281,538 | |||||||||
| 13,143 | Commercial Vehicle Group, Inc.* | 226,848 | |||||||||
| 7,793 | Consolidated Graphics, Inc.* | 437,577 | |||||||||
| 8,176 | Copa Holdings SA, Class A (Panama) | 475,434 | |||||||||
| 13,288 | Copart, Inc.* | 602,877 | |||||||||
| 9,944 | Corporate Executive Board Co. (The) | 396,268 | |||||||||
| 5,720 | Costamare, Inc. (Marshall Islands) | 98,727 | |||||||||
| 3,177 | CoStar Group, Inc.* | 216,100 | |||||||||
| 5,986 | Courier Corp. | 82,008 | |||||||||
| 9,040 | Covenant Transport Group, Inc., Class A* | 86,242 | |||||||||
| 5,701 | CRA International, Inc.* | 162,193 | |||||||||
| 5,054 | Cubic Corp. | 273,320 | |||||||||
| 40,462 | Diana Shipping, Inc. (Greece)* | 455,602 | |||||||||
| 8,508 | DigitalGlobe, Inc.* | 246,732 | |||||||||
| 11,964 | Dolan Co. (The)* | 140,816 | |||||||||
| 4,988 | Douglas Dynamics, Inc. | 77,264 | |||||||||
| 6,235 | Ducommun, Inc. | 141,846 | |||||||||
| 5,179 | DXP Enterprises, Inc.* | 135,949 | |||||||||
| 26,362 | Dycom Industries, Inc.* | 391,739 | |||||||||
| 3,299 | Dynamic Materials Corp. | 85,840 | |||||||||
| 107,455 | Eagle Bulk Shipping, Inc.* | 368,571 | |||||||||
| 13,231 | Encore Wire Corp. | 369,277 | |||||||||
| 75,160 | EnergySolutions, Inc. | 424,654 | |||||||||
| 18,954 | Ennis, Inc. | 354,061 | |||||||||
| 9,206 | EnPro Industries, Inc.* | 368,976 | |||||||||
| 7,715 | ESCO Technologies, Inc. | 282,986 | |||||||||
| 84,614 | Excel Maritime Carriers Ltd. (Liberia)* | 339,302 | |||||||||
| 3,045 | Exponent, Inc.* | 130,661 | |||||||||
| 52,380 | Federal Signal Corp. | 353,565 | |||||||||
| 17,323 | Flow International Corp.* | 74,662 | |||||||||
| 50,063 | Force Protection, Inc.* | 224,783 | |||||||||
| 7,205 | Forward Air Corp. | 242,232 | |||||||||
| 5,405 | Franklin Electric Co., Inc. | 243,820 | |||||||||
| 8,830 | FreightCar America, Inc.* | 264,723 | |||||||||
| 12,727 | Furmanite Corp.* | 106,652 | |||||||||
| 10,004 | Fushi Copperweld, Inc.* | 80,532 | |||||||||
| 10,954 | G&K Services, Inc., Class A | 362,577 | |||||||||
| 53,450 | Genco Shipping & Trading Ltd.* | 448,445 | |||||||||
| 33,205 | GenCorp, Inc.* | 216,829 | |||||||||
| 12,044 | Generac Holdings, Inc.* | 250,756 | |||||||||
| 8,148 | Genesee & Wyoming, Inc., Class A* | 505,013 | |||||||||
| 19,941 | Geo Group, Inc. (The)* | 532,026 | |||||||||
| 4,438 | GeoEye, Inc.* | 164,605 | |||||||||
| 27,369 | Gibraltar Industries, Inc.* | 319,670 | |||||||||
| 3,926 | Gorman-Rupp Co. (The) | 158,807 | |||||||||
| 6,778 | GP Strategies Corp.* | 88,724 | |||||||||
| 14,794 | Graco, Inc. | 740,144 | |||||||||
| 24,876 | GrafTech International Ltd.* | 577,123 | |||||||||
| 23,206 | Great Lakes Dredge & Dock Corp. | 172,885 | |||||||||
| Number of Shares | Value | ||||||||||
| Common Stocks and Other Equity Interests (Continued) | |||||||||||
| 13,066 | Greenbrier Cos., Inc.* | $ | 353,697 | ||||||||
| 34,782 | Griffon Corp.* | 443,123 | |||||||||
| 11,758 | H&E Equipment Services, Inc.* | 233,984 | |||||||||
| 49,113 | Hawaiian Holdings, Inc.* | 287,311 | |||||||||
| 15,139 | Healthcare Services Group, Inc. | 268,869 | |||||||||
| 28,967 | Heartland Express, Inc. | 499,681 | |||||||||
| 2,332 | HEICO Corp. | 112,309 | |||||||||
| 4,707 | HEICO Corp., Class A | 167,381 | |||||||||
| 7,695 | Heidrick & Struggles International, Inc. | 180,063 | |||||||||
| 19,651 | Herman Miller, Inc. | 511,319 | |||||||||
| 33,315 | Hexcel Corp.* | 717,272 | |||||||||
| 15,558 | Hill International, Inc.* | 78,879 | |||||||||
| 55,326 | Horizon Lines, Inc., Class A | 97,927 | |||||||||
| 8,153 | Houston Wire & Cable Co. | 136,889 | |||||||||
| 15,153 | Hub Group, Inc., Class A* | 610,363 | |||||||||
| 11,923 | Hudson Highland Group, Inc.* | 71,896 | |||||||||
| 2,759 | Hurco Cos., Inc.* | 89,585 | |||||||||
| 9,946 | Huron Consulting Group, Inc.* | 286,445 | |||||||||
| 8,107 | ICF International, Inc.* | 197,487 | |||||||||
| 16,077 | IDEX Corp. | 754,333 | |||||||||
| 6,399 | IHS, Inc., Class A* | 564,648 | |||||||||
| 4,970 | II-VI, Inc.* | 287,514 | |||||||||
| 10,471 | Innerworkings, Inc.* | 93,925 | |||||||||
| 12,609 | Insituform Technologies, Inc., Class A* | 319,134 | |||||||||
| 12,836 | Insperity, Inc. | 388,802 | |||||||||
| 10,320 | Insteel Industries, Inc. | 154,078 | |||||||||
| 17,011 | Interface, Inc., Class A | 317,085 | |||||||||
| 15,687 | Interline Brands, Inc.* | 331,309 | |||||||||
| 5,294 | International Shipholding Corp. | 127,003 | |||||||||
| 13,265 | John Bean Technologies Corp. | 268,086 | |||||||||
| 5,805 | Kadant, Inc.* | 179,084 | |||||||||
| 11,157 | Kaman Corp. | 415,040 | |||||||||
| 21,450 | KAR Auction Services, Inc.* | 418,275 | |||||||||
| 10,311 | Kaydon Corp. | 399,036 | |||||||||
| 17,318 | Kforce, Inc.* | 271,027 | |||||||||
| 1,066 | KHD Humboldt Wedag International AG (Germany)* | 11,355 | |||||||||
| 13,561 | Kimball International, Inc., Class B | 101,436 | |||||||||
| 17,112 | Knight Transportation, Inc. | 308,187 | |||||||||
| 17,976 | Knoll, Inc. | 352,869 | |||||||||
| 15,617 | Korn/Ferry International* | 323,428 | |||||||||
| 6,780 | Kratos Defense & Security Solutions, Inc.* | 92,683 | |||||||||
| 5,407 | LaBarge, Inc.* | 103,490 | |||||||||
| 3,688 | Ladish Co., Inc.* | 209,110 | |||||||||
| 13,700 | Landstar System, Inc. | 649,380 | |||||||||
| 3,322 | Lawson Products, Inc. | 73,184 | |||||||||
| 11,538 | Layne Christensen Co.* | 343,371 | |||||||||
| 4,474 | LB Foster Co., Class A | 190,413 | |||||||||
| 2,186 | Lindsay Corp. | 160,278 | |||||||||
| 4,225 | LMI Aerospace, Inc.* | 84,711 | |||||||||
| 16,757 | LSI Industries, Inc. | 138,916 | |||||||||
See Notes to Financial Statements.
44
Schedule of Investments (Continued)
PowerShares FTSE RAFI US 1500 Small-Mid Portfolio
April 30, 2011
| Number of Shares | Value | ||||||||||
| Common Stocks and Other Equity Interests (Continued) | |||||||||||
| 11,750 | Lydall, Inc.* | $ | 114,562 | ||||||||
| 13,209 | M&F Worldwide Corp.* | 331,414 | |||||||||
| 27,687 | Macquarie Infrastructure Co. LLC* | 694,944 | |||||||||
| 7,460 | Marten Transport Ltd. | 166,806 | |||||||||
| 18,890 | MasTec, Inc.* | 428,425 | �� | ||||||||
| 11,136 | McGrath Rentcorp | 316,151 | |||||||||
| 22,590 | Metalico, Inc.* | 143,221 | |||||||||
| 4,672 | Michael Baker Corp.* | 115,118 | |||||||||
| 3,464 | Middleby Corp. (The)* | 310,617 | |||||||||
| 7,644 | Miller Industries, Inc. | 120,928 | |||||||||
| 10,549 | Mine Safety Appliances Co. | 418,584 | |||||||||
| 5,551 | Mistras Group, Inc.* | 101,694 | |||||||||
| 16,626 | Mobile Mini, Inc.* | 414,154 | |||||||||
| 10,229 | MSC Industrial Direct Co., Class A | 732,294 | |||||||||
| 136,252 | Mueller Water Products, Inc., Class A | 599,509 | |||||||||
| 5,297 | Multi-Color Corp. | 109,436 | |||||||||
| 9,471 | MYR Group, Inc.* | 236,112 | |||||||||
| 4,285 | NACCO Industries, Inc., Class A | 450,911 | |||||||||
| 1,905 | National Presto Industries, Inc. | 211,512 | |||||||||
| 41,592 | Navigant Consulting, Inc.* | 484,547 | |||||||||
| 71,513 | Navios Maritime Holdings, Inc. (Greece) | 378,304 | |||||||||
| 30,967 | NCI Building Systems, Inc.* | 383,371 | |||||||||
| 7,113 | NN, Inc.* | 124,691 | |||||||||
| 7,766 | Nordson Corp. | 442,429 | |||||||||
| 7,586 | Northwest Pipe Co.* | 182,519 | |||||||||
| 91,250 | OceanFreight, Inc., Class A (Marshall Islands)* | 51,109 | |||||||||
| 21,039 | Old Dominion Freight Line, Inc.* | 787,279 | |||||||||
| 17,515 | On Assignment, Inc.* | 192,140 | |||||||||
| 24,457 | Orbital Sciences Corp.* | 460,525 | |||||||||
| 12,014 | Orion Marine Group, Inc.* | 124,105 | |||||||||
| 61,484 | Pacer International, Inc.* | 368,289 | |||||||||
| 65,699 | Paragon Shipping, Inc., Class A | 194,469 | |||||||||
| 9,091 | Park-Ohio Holdings Corp.* | 193,820 | |||||||||
| 13,478 | Pike Electric Corp.* | 136,936 | |||||||||
| 17,187 | Pinnacle Airlines Corp.* | 93,669 | |||||||||
| 4,727 | Polypore International, Inc.* | 291,987 | |||||||||
| 4,881 | Powell Industries, Inc.* | 192,897 | |||||||||
| 9,507 | Quality Distribution, Inc.* | 113,133 | |||||||||
| 17,982 | Quanex Building Products Corp. | 376,903 | |||||||||
| 10,606 | RailAmerica, Inc.* | 180,514 | |||||||||
| 3,240 | Raven Industries, Inc. | 176,126 | |||||||||
| 5,833 | RBC Bearings, Inc.* | 229,004 | |||||||||
| 15,696 | Resources Connection, Inc. | 232,144 | |||||||||
| 7,333 | Robbins & Myers, Inc. | 318,766 | |||||||||
| 12,123 | Rollins, Inc. | 254,219 | |||||||||
| 23,626 | RSC Holdings, Inc.* | 311,154 | |||||||||
| 23,569 | Rush Enterprises, Inc., Class A* | 496,599 | |||||||||
| 12,156 | Safe Bulkers, Inc. (Marshall Islands) | 99,071 | |||||||||
| 15,115 | Saia, Inc.* | 250,909 | |||||||||
| 5,420 | Sauer-Danfoss, Inc.* | 319,834 | |||||||||
| Number of Shares | Value | ||||||||||
| Common Stocks and Other Equity Interests (Continued) | |||||||||||
| 5,511 | Schawk, Inc. | $ | 103,937 | ||||||||
| 14,973 | School Specialty, Inc.* | 221,750 | |||||||||
| 141 | Seaboard Corp. | 336,567 | |||||||||
| 11,092 | SeaCube Container Leasing Ltd. (Bermuda) | 180,023 | |||||||||
| 39,291 | Seaspan Corp. (Hong Kong) | 747,708 | |||||||||
| 11,601 | Sensata Technologies Holding NV (Netherlands)* | 407,311 | |||||||||
| 39,000 | SFN Group, Inc.* | 410,670 | |||||||||
| 12,749 | Simpson Manufacturing Co., Inc. | 355,952 | |||||||||
| 8,798 | Standard Parking Corp.* | 153,877 | |||||||||
| 22,086 | Standard Register Co. (The) | 75,976 | |||||||||
| 6,523 | Standex International Corp. | 238,481 | |||||||||
| 33,873 | Star Bulk Carriers Corp. | 79,602 | |||||||||
| 63,613 | Steelcase, Inc., Class A | 734,730 | |||||||||
| 10,804 | Sterling Construction Co., Inc.* | 161,952 | |||||||||
| 2,103 | Sun Hydraulics Corp. | 97,768 | |||||||||
| 28,588 | Swift Transportation Co.* | 401,090 | |||||||||
| 14,520 | Sykes Enterprises, Inc.* | 290,836 | |||||||||
| 5,642 | TAL International Group, Inc. | 203,394 | |||||||||
| 16,023 | Taser International, Inc.* | 71,463 | |||||||||
| 18,735 | TBS International PLC, Class A (Ireland)* | 32,224 | |||||||||
| 6,697 | Team, Inc.* | 167,090 | |||||||||
| 15,244 | Tecumseh Products Co., Class A* | 156,099 | |||||||||
| 5,537 | Tennant Co. | 227,128 | |||||||||
| 25,225 | Tetra Tech, Inc.* | 595,814 | |||||||||
| 3,434 | Textainer Group Holdings Ltd. | 121,770 | |||||||||
| 9,320 | Titan International, Inc. | 287,895 | |||||||||
| 5,234 | Titan Machinery, Inc.* | 164,662 | |||||||||
| 9,980 | Toro Co. (The) | 677,742 | |||||||||
| 10,370 | Towers Watson & Co., Class A | 594,823 | |||||||||
| 8,371 | TransDigm Group, Inc.* | 697,304 | |||||||||
| 12,996 | Tredegar Corp. | 284,352 | |||||||||
| 8,768 | Trimas Corp.* | 203,505 | |||||||||
| 5,814 | Triumph Group, Inc. | 500,702 | |||||||||
| 26,319 | TrueBlue, Inc.* | 370,572 | |||||||||
| 3,350 | Twin Disc, Inc. | 114,134 | |||||||||
| 13,530 | Ultrapetrol Bahamas Ltd.* | 73,738 | |||||||||
| 5,957 | UniFirst Corp. | 308,334 | |||||||||
| 12,831 | Universal Forest Products, Inc. | 414,313 | |||||||||
| 80,161 | US Airways Group, Inc.* | 728,663 | |||||||||
| 5,667 | US Ecology, Inc. | 104,046 | |||||||||
| 4,588 | Valmont Industries, Inc. | 483,116 | |||||||||
| 13,470 | Verisk Analytics, Inc., Class A* | 443,163 | |||||||||
| 12,896 | Viad Corp. | 319,950 | |||||||||
| 4,280 | Vicor Corp. | 71,519 | |||||||||
| 3,257 | VSE Corp. | 91,815 | |||||||||
| 19,535 | Wabash National Corp.* | 215,471 | |||||||||
| 9,457 | Wabtec Corp. | 675,041 | |||||||||
| 9,777 | Watsco, Inc. | 693,092 | |||||||||
| 12,181 | Watts Water Technologies, Inc., Class A | 471,405 | |||||||||
| 18,418 | Woodward, Inc. | 682,387 | |||||||||
See Notes to Financial Statements.
45
Schedule of Investments (Continued)
PowerShares FTSE RAFI US 1500 Small-Mid Portfolio
April 30, 2011
| Number of Shares | Value | ||||||||||
| Common Stocks and Other Equity Interests (Continued) | |||||||||||
| 6,643 | Xerium Technologies, Inc.* | $ | 153,188 | ||||||||
| 76,315,072 | |||||||||||
| Information Technology—17.7% | |||||||||||
| 6,462 | ACI Worldwide, Inc.* | 213,504 | |||||||||
| 1,080 | Acme Packet, Inc.* | 89,219 | |||||||||
| 13,719 | Actuate Corp.* | 79,982 | |||||||||
| 38,151 | Acxiom Corp.* | 555,479 | |||||||||
| 9,807 | ADTRAN, Inc. | 404,735 | |||||||||
| 11,725 | Advanced Energy Industries, Inc.* | 165,909 | |||||||||
| 5,086 | Advent Software, Inc.* | 138,492 | |||||||||
| 4,242 | Aeroflex Holding Corp.* | 75,083 | |||||||||
| 30,000 | Agilysys, Inc.* | 156,600 | |||||||||
| 6,859 | Alpha & Omega Semiconductor Ltd. (Bermuda)* | 97,261 | |||||||||
| 10,776 | American Software, Inc., Class A | 83,837 | |||||||||
| 16,651 | Anadigics, Inc.* | 65,105 | |||||||||
| 4,873 | Anaren, Inc.* | 80,843 | |||||||||
| 4,266 | Ancestry.com, Inc.* | 194,956 | |||||||||
| 11,411 | ANSYS, Inc.* | 630,914 | |||||||||
| 12,283 | Applied Micro Circuits Corp.* | 128,726 | |||||||||
| 7,169 | Ariba, Inc.* | 249,266 | |||||||||
| 47,980 | Arris Group, Inc.* | 575,760 | |||||||||
| 13,139 | AsiaInfo-Linkage, Inc.* | 248,327 | |||||||||
| 7,425 | Atheros Communications, Inc.* | 333,086 | |||||||||
| 13,404 | ATMI, Inc.* | 266,874 | |||||||||
| 34,592 | Aviat Networks, Inc.* | 177,111 | |||||||||
| 15,377 | Avid Technology, Inc.* | 285,705 | |||||||||
| 23,533 | AVX Corp. | 383,823 | |||||||||
| 46,693 | Axcelis Technologies, Inc.* | 87,316 | |||||||||
| 5,122 | Bel Fuse, Inc., Class B | 103,106 | |||||||||
| 10,176 | Black Box Corp. | 355,549 | |||||||||
| 7,004 | Blackbaud, Inc. | 193,731 | |||||||||
| 4,217 | Blackboard, Inc.* | 202,880 | |||||||||
| 7,249 | Blue Coat Systems, Inc.* | 208,771 | |||||||||
| 4,250 | Bottomline Technologies, Inc.* | 118,065 | |||||||||
| 19,631 | Brooks Automation, Inc.* | 240,087 | |||||||||
| 6,107 | Cabot Microelectronics Corp.* | 298,327 | |||||||||
| 53,849 | Cadence Design Systems, Inc.* | 558,953 | |||||||||
| 11,062 | Canadian Solar, Inc. (China)* | 119,359 | |||||||||
| 8,244 | Cardtronics, Inc.* | 175,185 | |||||||||
| 1,695 | Cass Information Systems, Inc. | 67,664 | |||||||||
| 43,652 | CDC Corp., Class A (Cayman Islands)* | 139,686 | |||||||||
| 2,585 | CEVA, Inc.* | 79,049 | |||||||||
| 18,460 | Checkpoint Systems, Inc.* | 388,768 | |||||||||
| 39,278 | China Security & Surveillance Technology, Inc. (China)* | 211,316 | |||||||||
| 90,168 | CIBER, Inc.* | 515,761 | |||||||||
| 8,114 | Ciena Corp.* | 229,139 | |||||||||
| 5,390 | Cirrus Logic, Inc.* | 89,258 | |||||||||
| 8,457 | Cognex Corp. | 264,535 | |||||||||
| Number of Shares | Value | ||||||||||
| Common Stocks and Other Equity Interests (Continued) | |||||||||||
| 11,901 | Cogo Group, Inc.* | $ | 97,707 | ||||||||
| 5,681 | Coherent, Inc.* | 355,119 | |||||||||
| 9,191 | Cohu, Inc. | 132,442 | |||||||||
| 2,942 | CommVault Systems, Inc.* | 115,885 | |||||||||
| 5,781 | Computer Task Group, Inc.* | 85,848 | |||||||||
| 16,532 | Comtech Telecommunications Corp. | 467,856 | |||||||||
| 5,279 | Concur Technologies, Inc.* | 305,496 | |||||||||
| 11,284 | Cray, Inc.* | 75,828 | |||||||||
| 14,293 | CSG Systems International, Inc.* | 303,583 | |||||||||
| 18,076 | CTS Corp. | 198,655 | |||||||||
| 7,099 | Cymer, Inc.* | 341,533 | |||||||||
| 20,709 | Cypress Semiconductor Corp.* | 450,628 | |||||||||
| 14,495 | Daktronics, Inc. | 155,531 | |||||||||
| 8,081 | DealerTrack Holdings, Inc.* | 181,499 | |||||||||
| 5,065 | DG FastChannel, Inc.* | 185,328 | |||||||||
| 11,751 | Digi International, Inc.* | 138,779 | |||||||||
| 10,945 | Digital River, Inc.* | 356,150 | |||||||||
| 7,478 | Diodes, Inc.* | 255,897 | |||||||||
| 8,523 | Dolby Laboratories, Inc., Class A* | 426,661 | |||||||||
| 19,217 | Dot Hill Systems Corp.* | 56,690 | |||||||||
| 17,996 | DSP Group, Inc.* | 145,408 | |||||||||
| 1,562 | DTS, Inc.* | 68,822 | |||||||||
| 64,685 | EarthLink, Inc. | 531,711 | |||||||||
| 2,355 | Ebix, Inc.* | 53,812 | |||||||||
| 16,590 | EchoStar Corp., Class A* | 615,157 | |||||||||
| 6,639 | Electro Rent Corp. | 104,564 | |||||||||
| 9,920 | Electro Scientific Industries, Inc.* | 163,184 | |||||||||
| 20,041 | Electronics for Imaging, Inc.* | 359,936 | |||||||||
| 23,864 | EMCORE Corp.* | 62,285 | |||||||||
| 8,089 | EMS Technologies, Inc.* | 204,328 | |||||||||
| 32,703 | Emulex Corp.* | 316,892 | |||||||||
| 27,781 | Energy Conversion Devices, Inc.* | 55,562 | |||||||||
| 31,642 | Entegris, Inc.* | 273,070 | |||||||||
| 23,009 | Epicor Software Corp.* | 287,613 | |||||||||
| 14,005 | EPIQ Systems, Inc. | 199,291 | |||||||||
| 2,252 | ePlus, Inc.* | 62,268 | |||||||||
| 7,422 | Equinix, Inc.* | 747,099 | |||||||||
| 25,063 | Euronet Worldwide, Inc.* | 469,931 | |||||||||
| 61,778 | Evergreen Solar, Inc.* | 89,578 | |||||||||
| 15,194 | Exar Corp.* | 92,835 | |||||||||
| 30,146 | Extreme Networks, Inc.* | 94,357 | |||||||||
| 5,051 | F5 Networks, Inc.* | 511,969 | |||||||||
| 3,716 | FactSet Research Systems, Inc. | 406,568 | |||||||||
| 13,903 | Fair Isaac Corp. | 415,422 | |||||||||
| 39,586 | Fairchild Semiconductor International, Inc.* | 830,118 | |||||||||
| 2,982 | FARO Technologies, Inc.* | 128,733 | |||||||||
| 9,842 | FEI Co.* | 319,471 | |||||||||
| 5,414 | Finisar Corp.* | 152,079 | |||||||||
| 1,871 | FleetCor Technologies, Inc.* | 70,181 | |||||||||
| 25,113 | FormFactor, Inc.* | 260,422 | |||||||||
| 3,480 | Forrester Research, Inc. | 137,495 | |||||||||
See Notes to Financial Statements.
46
Schedule of Investments (Continued)
PowerShares FTSE RAFI US 1500 Small-Mid Portfolio
April 30, 2011
| Number of Shares | Value | ||||||||||
| Common Stocks and Other Equity Interests (Continued) | |||||||||||
| 2,458 | Fortinet, Inc.* | $ | 119,705 | ||||||||
| 8,452 | Gartner, Inc.* | 362,675 | |||||||||
| 38,803 | Genpact Ltd.* | 624,340 | |||||||||
| 12,768 | Gerber Scientific, Inc.* | 122,062 | |||||||||
| 71,758 | GigaMedia Ltd. (Taiwan)* | 111,942 | |||||||||
| 56,324 | Global Cash Access Holdings, Inc.* | 185,869 | |||||||||
| 14,092 | Global Payments, Inc. | 750,258 | |||||||||
| 8,639 | Globecomm Systems, Inc.* | 123,710 | |||||||||
| 16,327 | GSI Commerce, Inc.* | 477,891 | |||||||||
| 20,925 | GT Solar International, Inc.* | 233,732 | |||||||||
| 21,146 | Harmonic, Inc.* | 175,089 | |||||||||
| 16,978 | Heartland Payment Systems, Inc. | 338,881 | |||||||||
| 2,174 | Hittite Microwave Corp.* | 139,984 | |||||||||
| 57,177 | Hutchinson Technology, Inc.* | 152,663 | |||||||||
| 9,492 | Hypercom Corp.* | 113,619 | |||||||||
| 3,777 | iGATE Corp. | 64,058 | |||||||||
| 32,611 | Imation Corp.* | 334,915 | |||||||||
| 22,419 | Infinera Corp.* | 175,317 | |||||||||
| 8,279 | Informatica Corp.* | 463,707 | |||||||||
| 16,277 | InfoSpace, Inc.* | 146,493 | |||||||||
| 5,297 | Integral Systems, Inc.* | 66,160 | |||||||||
| 55,369 | Integrated Device Technology, Inc.* | 450,427 | |||||||||
| 10,044 | Integrated Silicon Solution, Inc.* | 97,025 | |||||||||
| 5,400 | InterDigital, Inc. | 249,966 | |||||||||
| 23,691 | Intermec, Inc.* | 271,973 | |||||||||
| 17,530 | Internap Network Services Corp.* | 141,818 | |||||||||
| 20,160 | International Rectifier Corp.* | 696,730 | |||||||||
| 7,589 | Intevac, Inc.* | 92,813 | |||||||||
| 6,041 | IXYS Corp.* | 95,810 | |||||||||
| 8,471 | j2 Global Communications, Inc.* | 249,556 | |||||||||
| 18,859 | Jack Henry & Associates, Inc. | 640,640 | |||||||||
| 8,719 | JDA Software Group, Inc.* | 285,722 | |||||||||
| 24,701 | JDS Uniphase Corp.* | 514,769 | |||||||||
| 20,585 | Kemet Corp.* | 323,802 | |||||||||
| 4,210 | Kenexa Corp.* | 123,858 | |||||||||
| 12,924 | Key Tronic Corp.* | 68,109 | |||||||||
| 9,256 | Knot, Inc. (The)* | 94,504 | |||||||||
| 16,047 | Kopin Corp.* | 77,186 | |||||||||
| 24,372 | Kulicke & Soffa Industries, Inc.* | 220,810 | |||||||||
| 28,144 | L-1 Identity Solutions, Inc.* | 330,129 | |||||||||
| 24,330 | Lattice Semiconductor Corp.* | 165,201 | |||||||||
| 30,187 | Lawson Software, Inc.* | 334,170 | |||||||||
| 30,099 | Lionbridge Technologies, Inc.* | 101,434 | |||||||||
| 4,611 | Liquidity Services, Inc.* | 89,684 | |||||||||
| 5,174 | Littelfuse, Inc. | 321,875 | |||||||||
| 13,034 | LoJack Corp.* | 59,696 | |||||||||
| 2,274 | Loral Space & Communications, Inc.* | 158,953 | |||||||||
| 10,138 | LTX-Credence Corp.* | 87,896 | |||||||||
| 5,098 | Manhattan Associates, Inc.* | 184,293 | |||||||||
| 9,922 | ManTech International Corp., Class A* | 435,477 | |||||||||
| 23,563 | Mattson Technology, Inc.* | 54,666 | |||||||||
| Number of Shares | Value | ||||||||||
| Common Stocks and Other Equity Interests (Continued) | |||||||||||
| 4,030 | MAXIMUS, Inc. | $ | 322,360 | ||||||||
| 3,909 | Measurement Specialties, Inc.* | 135,955 | |||||||||
| 27,906 | Mentor Graphics Corp.* | 411,614 | |||||||||
| 920 | MercadoLibre, Inc. (Argentina) | 84,088 | |||||||||
| 5,405 | Mercury Computer Systems, Inc.* | 104,371 | |||||||||
| 17,882 | Methode Electronics, Inc. | 221,022 | |||||||||
| 10,064 | Micrel, Inc. | 128,920 | |||||||||
| 11,983 | MICROS Systems, Inc.* | 623,356 | |||||||||
| 18,371 | Microsemi Corp.* | 433,556 | |||||||||
| 1,378 | MicroStrategy, Inc., Class A* | 194,711 | |||||||||
| 10,519 | Mitel Networks Corp. (Canada)* | 55,646 | |||||||||
| 14,003 | MKS Instruments, Inc. | 397,405 | |||||||||
| 36,261 | ModusLink Global Solutions, Inc. | 190,008 | |||||||||
| 61,223 | MoneyGram International, Inc.* | 242,443 | |||||||||
| 8,100 | Monolithic Power Systems, Inc.* | 137,538 | |||||||||
| 5,914 | Monotype Imaging Holdings, Inc.* | 80,430 | |||||||||
| 37,302 | Move, Inc.* | 89,152 | |||||||||
| 4,218 | MTS Systems Corp. | 186,731 | |||||||||
| 4,483 | Multi-Fineline Electronix, Inc.* | 119,382 | |||||||||
| 18,442 | Nam Tai Electronics, Inc. (Hong Kong) | 113,234 | |||||||||
| 13,489 | National Instruments Corp. | 409,256 | |||||||||
| 3,404 | NCI, Inc., Class A* | 83,772 | |||||||||
| 29,833 | Ness Technologies, Inc.* | 194,511 | |||||||||
| 25,186 | Net 1 UEPS Technologies, Inc.* | 211,059 | |||||||||
| 7,177 | NETGEAR, Inc.* | 299,640 | |||||||||
| 3,778 | Netlogic Microsystems, Inc.* | 162,945 | |||||||||
| 5,774 | NetScout Systems, Inc.* | 147,757 | |||||||||
| 12,624 | NeuStar, Inc., Class A* | 339,459 | |||||||||
| 12,199 | Newport Corp.* | 228,487 | |||||||||
| 6,065 | NIC, Inc. | 77,966 | |||||||||
| 23,714 | Novatel Wireless, Inc.* | 147,027 | |||||||||
| 5,211 | NXP Semiconductor NV (Netherlands)* | 174,047 | |||||||||
| 6,725 | Oclaro, Inc.* | 75,421 | |||||||||
| 10,907 | OmniVision Technologies, Inc.* | 366,475 | |||||||||
| 13,698 | Online Resources Corp.* | 52,326 | |||||||||
| 72,029 | Openwave Systems, Inc.* | 151,261 | |||||||||
| 3,677 | Oplink Communications, Inc.* | 72,805 | |||||||||
| 22,589 | Opnext, Inc.* | 53,310 | |||||||||
| 14,585 | Orbotech Ltd. (Israel)* | 186,980 | |||||||||
| 6,238 | OSI Systems, Inc.* | 239,477 | |||||||||
| 23,875 | Parametric Technology Corp.* | 579,446 | |||||||||
| 7,838 | Park Electrochemical Corp. | 250,581 | |||||||||
| 8,043 | PC Connection, Inc.* | 71,422 | |||||||||
| 9,614 | PC Mall, Inc.* | 93,929 | |||||||||
| 8,624 | Perficient, Inc.* | 107,714 | |||||||||
| 10,597 | Pericom Semiconductor Corp.* | 96,327 | |||||||||
| 39,139 | Photronics, Inc.* | 341,683 | |||||||||
| 10,852 | Plantronics, Inc. | 402,284 | |||||||||
| 20,596 | Plexus Corp.* | 751,548 | |||||||||
| 64,749 | PMC - Sierra, Inc.* | 519,287 | |||||||||
| 13,352 | Polycom, Inc.* | 798,850 | |||||||||
See Notes to Financial Statements.
47
Schedule of Investments (Continued)
PowerShares FTSE RAFI US 1500 Small-Mid Portfolio
April 30, 2011
| Number of Shares | Value | ||||||||||
| Common Stocks and Other Equity Interests (Continued) | |||||||||||
| 3,043 | Power Integrations, Inc. | $ | 122,755 | ||||||||
| 14,881 | Power-One, Inc.* | 122,917 | |||||||||
| 48,594 | Powerwave Technologies, Inc.* | 222,075 | |||||||||
| 14,746 | PRGX Global, Inc.* | 115,609 | |||||||||
| 14,159 | Progress Software Corp.* | 419,814 | |||||||||
| 47,885 | Pulse Electronics Corp. | 286,352 | |||||||||
| 19,433 | Qiao Xing Mobile Communication Co. Ltd. (China)* | 53,441 | |||||||||
| �� | 27,333 | QLogic Corp.* | 491,447 | ||||||||
| 95,271 | Quantum Corp.* | 302,962 | |||||||||
| 14,432 | Quest Software, Inc.* | 371,768 | |||||||||
| 6,090 | QuinStreet, Inc.* | 110,107 | |||||||||
| 7,831 | Rackspace Hosting, Inc.* | 361,714 | |||||||||
| 7,377 | Radiant Systems, Inc.* | 146,950 | |||||||||
| 13,384 | RadiSys Corp.* | 117,913 | |||||||||
| 1,586 | RADWARE Ltd. (Israel)* | 55,875 | |||||||||
| 8,481 | Rambus, Inc.* | 168,772 | |||||||||
| 39,496 | RealNetworks, Inc.* | 146,135 | |||||||||
| 10,009 | Red Hat, Inc.* | 475,127 | |||||||||
| 55,978 | RF Micro Devices, Inc.* | 372,813 | |||||||||
| 7,746 | Richardson Electronics Ltd. | 104,416 | |||||||||
| 4,758 | Rimage Corp. | 71,180 | |||||||||
| 6,079 | Riverbed Technology, Inc.* | 213,616 | |||||||||
| 7,635 | Rofin-Sinar Technologies, Inc.* | 330,672 | |||||||||
| 3,277 | Rogers Corp.* | 136,061 | |||||||||
| 5,043 | Rosetta Stone, Inc.* | 71,005 | |||||||||
| 11,137 | Rovi Corp.* | 540,813 | |||||||||
| 6,389 | Rudolph Technologies, Inc.* | 72,260 | |||||||||
| 20,468 | S1 Corp.* | 140,615 | |||||||||
| 3,363 | Salesforce.com, Inc.* | 466,112 | |||||||||
| 16,299 | Sapient Corp.* | 205,775 | |||||||||
| 5,734 | SAVVIS, Inc.* | 225,690 | |||||||||
| 16,843 | ScanSource, Inc.* | 602,474 | |||||||||
| 9,842 | SeaChange International, Inc.* | 105,408 | |||||||||
| 9,706 | Semtech Corp.* | 272,447 | |||||||||
| 11,967 | Sigma Designs, Inc.* | 152,699 | |||||||||
| 6,483 | Silicon Graphics International Corp.* | 119,158 | |||||||||
| 17,140 | Silicon Image, Inc.* | 142,605 | |||||||||
| 5,492 | Silicon Laboratories, Inc.* | 239,341 | |||||||||
| 5,978 | SINA Corp. (China)* | 805,536 | |||||||||
| 31,264 | SMART Modular Technologies (WWH), Inc.* | 285,753 | |||||||||
| 8,536 | Smith Micro Software, Inc.* | 65,898 | |||||||||
| 4,344 | Sohu.com, Inc.* | 459,421 | |||||||||
| 6,713 | Solera Holdings, Inc. | 369,215 | |||||||||
| 58,253 | Sonus Networks, Inc.* | 229,517 | |||||||||
| 5,987 | Spectrum Control, Inc.* | 119,081 | |||||||||
| 13,955 | SRA International, Inc., Class A* | 432,465 | |||||||||
| 3,505 | SS&C Technologies Holdings, Inc.* | 71,502 | |||||||||
| 7,994 | Standard Microsystems Corp.* | 217,037 | |||||||||
| 6,232 | STEC, Inc.* | 130,373 | |||||||||
| Number of Shares | Value | ||||||||||
| Common Stocks and Other Equity Interests (Continued) | |||||||||||
| 1,760 | Stratasys, Inc.* | $ | 94,776 | ||||||||
| 23,099 | SunPower Corp., Class A* | 502,865 | |||||||||
| 16,956 | SunPower Corp., Class B* | 362,350 | |||||||||
| 9,952 | Super Micro Computer, Inc.* | 169,781 | |||||||||
| 3,945 | Supertex, Inc.* | 85,173 | |||||||||
| 7,385 | Sycamore Networks, Inc. | 180,932 | |||||||||
| 20,714 | Symmetricom, Inc.* | 126,355 | |||||||||
| 7,105 | Synaptics, Inc.* | 201,924 | |||||||||
| 2,018 | Synchronoss Technologies, Inc.* | 65,101 | |||||||||
| 16,042 | SYNNEX Corp.* | 537,888 | |||||||||
| 3,079 | Syntel, Inc. | 168,360 | |||||||||
| 32,928 | Take-Two Interactive Software, Inc.* | 532,775 | |||||||||
| 4,256 | Taleo Corp., Class A* | 154,365 | |||||||||
| 43,249 | Tekelec* | 361,129 | |||||||||
| 23,227 | TeleCommunication Systems, Inc., Class A* | 107,076 | |||||||||
| 17,624 | TeleTech Holdings, Inc.* | 350,189 | |||||||||
| 4,421 | Telvent GIT SA (Spain)* | 136,123 | |||||||||
| 22,258 | Tessera Technologies, Inc.* | 439,818 | |||||||||
| 84,859 | THQ, Inc.* | 342,830 | |||||||||
| 20,788 | TIBCO Software, Inc.* | 623,432 | |||||||||
| 9,840 | TiVo, Inc.* | 94,169 | |||||||||
| 14,235 | TNS, Inc.* | 233,881 | |||||||||
| 22,709 | TriQuint Semiconductor, Inc.* | 312,703 | |||||||||
| 12,373 | TTM Technologies, Inc.* | 236,572 | |||||||||
| 5,671 | Tyler Technologies, Inc.* | 140,584 | |||||||||
| 7,446 | Ultra Clean Holdings, Inc.* | 85,555 | |||||||||
| 4,045 | Ultratech, Inc.* | 126,649 | |||||||||
| 71,907 | United Online, Inc. | 474,586 | |||||||||
| 129,925 | UTStarcom, Inc.* | 333,907 | |||||||||
| 22,646 | ValueClick, Inc.* | 379,321 | |||||||||
| 10,947 | Varian Semiconductor Equipment Associates, Inc.* | 459,008 | |||||||||
| 4,748 | Veeco Instruments, Inc.* | 242,765 | |||||||||
| 5,750 | VeriFone Systems, Inc.* | 315,215 | |||||||||
| 23,342 | Verigy Ltd. (Singapore)* | 337,525 | |||||||||
| 2,839 | Verint Systems, Inc.* | 97,179 | |||||||||
| 9,831 | ViaSat, Inc.* | 392,454 | |||||||||
| 4,239 | Virtusa Corp.* | 79,100 | |||||||||
| 3,866 | VistaPrint NV (Netherlands)* | 210,310 | |||||||||
| 4,969 | VMware, Inc., Class A* | 474,192 | |||||||||
| 2,870 | Volterra Semiconductor Corp.* | 75,452 | |||||||||
| 4,147 | WebMD Health Corp.* | 239,987 | |||||||||
| 6,298 | Websense, Inc.* | 162,425 | |||||||||
| 19,773 | Westell Technologies, Inc., Class A* | 71,183 | |||||||||
| 12,399 | Wright Express Corp.* | 698,436 | |||||||||
| 30,904 | Xyratex Ltd. (Bermuda)* | 315,530 | |||||||||
| 14,781 | Zebra Technologies Corp., Class A* | 580,745 | |||||||||
| 22,223 | Zoran Corp.* | 232,675 | |||||||||
| 4,345 | Zygo Corp.* | 64,958 | |||||||||
| 72,378,413 | |||||||||||
See Notes to Financial Statements.
48
Schedule of Investments (Continued)
PowerShares FTSE RAFI US 1500 Small-Mid Portfolio
April 30, 2011
| Number of Shares | Value | ||||||||||
| Common Stocks and Other Equity Interests (Continued) | |||||||||||
| Materials—6.2% | |||||||||||
| 23,560 | A. Schulman, Inc. | $ | 596,539 | ||||||||
| 13,883 | A.M. Castle & Co.* | 262,111 | |||||||||
| 2,867 | AEP Industries, Inc.* | 86,956 | |||||||||
| 2,228 | Allied Nevada Gold Corp.* | 95,938 | |||||||||
| 9,327 | AMCOL International Corp. | 347,151 | |||||||||
| 9,532 | American Vanguard Corp. | 85,025 | |||||||||
| 14,334 | Arch Chemicals, Inc. | 554,296 | |||||||||
| 2,537 | Balchem Corp. | 100,694 | |||||||||
| 55,982 | Boise, Inc. | 549,743 | |||||||||
| 12,174 | Buckeye Technologies, Inc. | 342,820 | |||||||||
| 11,222 | Calgon Carbon Corp.* | 192,570 | |||||||||
| 39,331 | Century Aluminum Co.* | 785,833 | |||||||||
| 6,072 | Clearwater Paper Corp.* | 476,531 | |||||||||
| 22,038 | Coeur d'Alene Mines Corp.* | 698,825 | |||||||||
| 4,846 | Compass Minerals International, Inc. | 473,018 | |||||||||
| 201 | Contango ORE, Inc.* | 3,497 | |||||||||
| 1,861 | Deltic Timber Corp. | 126,176 | |||||||||
| 15,968 | Eagle Materials, Inc. | 464,509 | |||||||||
| 42,355 | Ferro Corp.* | 635,325 | |||||||||
| 65,058 | General Steel Holdings, Inc. (China)* | 147,031 | |||||||||
| 21,433 | Georgia Gulf Corp.* | 844,032 | |||||||||
| 8,702 | Globe Specialty Metals, Inc. | 195,882 | |||||||||
| 18,002 | Graham Packaging Co., Inc.* | 414,046 | |||||||||
| 64,892 | Graphic Packaging Holding Co.* | 356,257 | |||||||||
| 25,845 | H.B. Fuller Co. | 564,713 | |||||||||
| 7,789 | Handy & Harman Ltd.* | 96,194 | |||||||||
| 2,760 | Hawkins, Inc. | 129,830 | |||||||||
| 3,862 | Haynes International, Inc. | 208,702 | |||||||||
| 85,373 | Headwaters, Inc.* | 466,137 | |||||||||
| 35,185 | Hecla Mining Co.* | 331,091 | |||||||||
| 15,398 | Horsehead Holding Corp.* | 242,826 | |||||||||
| 6,243 | Innophos Holdings, Inc. | 289,301 | |||||||||
| 7,820 | Innospec, Inc.* | 294,501 | |||||||||
| 6,914 | Intrepid Potash, Inc.* | 236,874 | |||||||||
| 7,590 | Kaiser Aluminum Corp. | 380,335 | |||||||||
| 12,390 | KapStone Paper and Packaging Corp.* | 215,338 | |||||||||
| 8,877 | Koppers Holdings, Inc. | 405,945 | |||||||||
| 11,907 | Kraton Performance Polymers, Inc.* | 549,627 | |||||||||
| 16,010 | Landec Corp.* | 103,745 | |||||||||
| 5,282 | LSB Industries, Inc.* | 213,129 | |||||||||
| 7,352 | Materion Corp.* | 307,019 | |||||||||
| 19,463 | Mercer International, Inc.* | 236,865 | |||||||||
| 12,691 | Metals USA Holdings Corp.* | 215,747 | |||||||||
| 7,181 | Minerals Technologies, Inc. | 488,308 | |||||||||
| 20,933 | Myers Industries, Inc. | 223,355 | |||||||||
| 10,876 | Neenah Paper, Inc. | 253,737 | |||||||||
| 3,794 | NewMarket Corp. | 699,310 | |||||||||
| 6,390 | Noranda Aluminum Holding Corp.* | 108,566 | |||||||||
| 9,070 | Olympic Steel, Inc. | 266,386 | |||||||||
| 19,619 | OM Group, Inc.* | 710,993 | |||||||||
| Number of Shares | Value | ||||||||||
| Common Stocks and Other Equity Interests (Continued) | |||||||||||
| 33,553 | Omnova Solutions, Inc.* | $ | 285,200 | ||||||||
| 37,411 | P.H. Glatfelter Co. | 508,790 | |||||||||
| 50,825 | PolyOne Corp. | 735,946 | |||||||||
| 52,606 | Qiao Xing Universal Resources, Inc. (China)* | 112,051 | |||||||||
| 4,796 | Quaker Chemical Corp. | 216,683 | |||||||||
| 8,418 | Royal Gold, Inc. | 513,330 | |||||||||
| 14,178 | RTI International Metals, Inc.* | 452,845 | |||||||||
| 9,857 | Schnitzer Steel Industries, Inc., Class A | 611,824 | |||||||||
| 6,139 | Schweitzer-Mauduit International, Inc. | 318,246 | |||||||||
| 6,136 | ShengdaTech, Inc.* | 16,383 | |||||||||
| 39,485 | Spartech Corp.* | 281,923 | |||||||||
| 5,167 | Stepan Co. | 371,869 | |||||||||
| 13,934 | Stillwater Mining Co.* | 317,835 | |||||||||
| 8,566 | STR Holdings, Inc.* | 141,082 | |||||||||
| 28,507 | Terra Nova Royalty Corp. (Canada) | 228,626 | |||||||||
| 10,866 | Texas Industries, Inc. | 458,219 | |||||||||
| 19,100 | Titanium Metals Corp.* | 382,573 | |||||||||
| 14,776 | TPC Group, Inc.* | 582,765 | |||||||||
| 3,306 | Universal Stainless & Alloy Products, Inc.* | 119,842 | |||||||||
| 19,193 | Verso Paper Corp.* | 90,399 | |||||||||
| 4,632 | Walter Energy, Inc. | 640,235 | |||||||||
| 45,465 | Wausau Paper Corp. | 306,889 | |||||||||
| 6,327 | Westlake Chemical Corp. | 415,368 | |||||||||
| 9,993 | Yongye International, Inc.* | 52,363 | |||||||||
| 9,544 | Zep, Inc. | 181,336 | |||||||||
| 9,582 | Zoltek Cos., Inc.* | 123,129 | |||||||||
| 25,539,130 | |||||||||||
| Telecommunication Services—1.2% | |||||||||||
| 4,993 | AboveNet, Inc. | 333,283 | |||||||||
| 35,843 | Alaska Communications Systems Group, Inc. | 346,602 | |||||||||
| 3,943 | Atlantic Tele-Network, Inc. | 144,826 | |||||||||
| 7,768 | Cbeyond, Inc.* | 99,120 | |||||||||
| 5,730 | Cogent Communications Group, Inc.* | 83,142 | |||||||||
| 15,751 | Consolidated Communications Holdings, Inc. | 289,661 | |||||||||
| 30,650 | FiberTower Corp.* | 41,378 | |||||||||
| 21,481 | General Communication, Inc., Class A* | 247,032 | |||||||||
| 18,500 | Global Crossing Ltd.* | 432,530 | |||||||||
| 2,418 | Hughes Communications, Inc.* | 144,717 | |||||||||
| 11,284 | IDT Corp., Class B | 327,123 | |||||||||
| 15,482 | Iridium Communications, Inc.* | 121,224 | |||||||||
| 7,428 | Neutral Tandem, Inc.* | 113,574 | |||||||||
| 14,221 | NTELOS Holdings Corp. | 280,580 | |||||||||
| 83,903 | PAETEC Holding Corp.* | 302,051 | |||||||||
| 41,132 | Premiere Global Services, Inc.* | 325,354 | |||||||||
| 11,853 | SBA Communications Corp., Class A* | 457,881 | |||||||||
| 6,770 | Shenandoah Telecommunications Co. | 127,412 | |||||||||
| 8,162 | SureWest Communications | 118,920 | |||||||||
| 28,031 | USA Mobility, Inc. | 433,079 | |||||||||
| 21,824 | Vonage Holdings Corp.* | 112,612 | |||||||||
| 4,882,101 | |||||||||||
See Notes to Financial Statements.
49
Schedule of Investments (Continued)
PowerShares FTSE RAFI US 1500 Small-Mid Portfolio
April 30, 2011
| Number of Shares | Value | ||||||||||
| Common Stocks and Other Equity Interests (Continued) | |||||||||||
| Utilities—1.8% | |||||||||||
| 8,713 | American States Water Co. | $ | 304,171 | ||||||||
| 10,527 | California Water Service Group | 397,079 | |||||||||
| 8,671 | Central Vermont Public Service Corp. | 202,988 | |||||||||
| 8,636 | CH Energy Group, Inc. | 463,062 | |||||||||
| 3,895 | Chesapeake Utilities Corp. | 166,667 | |||||||||
| 3,512 | Connecticut Water Service, Inc. | 90,399 | |||||||||
| 6,007 | Consolidated Water Co. Ltd. (Cayman Islands) | 58,929 | |||||||||
| 22,683 | El Paso Electric Co.* | 702,719 | |||||||||
| 24,668 | Empire District Electric Co. (The) | 553,550 | |||||||||
| 15,884 | Laclede Group, Inc. (The) | 609,469 | |||||||||
| 11,092 | MGE Energy, Inc. | 465,975 | |||||||||
| 6,245 | Middlesex Water Co. | 117,906 | |||||||||
| 14,664 | Northwest Natural Gas Co. | 678,063 | |||||||||
| 6,036 | Ormat Technologies, Inc. | 150,296 | |||||||||
| 28,029 | Otter Tail Corp. | 655,318 | |||||||||
| 6,152 | SJW Corp. | 142,973 | |||||||||
| 10,125 | South Jersey Industries, Inc. | 581,681 | |||||||||
| 21,104 | UIL Holdings Corp. | 671,529 | |||||||||
| 7,329 | Unitil Corp. | 185,131 | |||||||||
| 3,790 | York Water Co. | 66,173 | |||||||||
| 7,264,078 | |||||||||||
| Total Common Stocks and Other Equity Interests (Cost $356,042,088) | 409,719,043 | ||||||||||
| Rights—0.0% | |||||||||||
| Financials—0.0% | |||||||||||
| 5,625 | Central Pacific Financial Corp., expiring 05/06/11* | 30,656 | |||||||||
| 40,156 | TBS International PLC (Ireland), expiring 07/18/11* | — | |||||||||
| Total Rights (Cost $129,968) | 30,656 | ||||||||||
| Money Market Fund—0.1% | |||||||||||
| 298,871 | Goldman Sachs Financial Square Prime Obligations Institutional Share Class (Cost $298,871) | 298,871 | |||||||||
| Total Investments (Cost $356,470,927)—100.1% | 410,048,570 | ||||||||||
| Liabilities in excess of other assets—(0.1%) | (222,529 | ) | |||||||||
| Net Assets—100.0% | $ | 409,826,041 | |||||||||
Investment Abbreviations:
REIT—Real Estate Investment Trust
Notes to Schedule of Investments:
* Non-income producing security.
(~) Affiliated company. The Fund's Adviser is a subsidiary of Invesco Mortgage Capital, Inc. REIT and therefore, Invesco Mortgage Capital, Inc. REIT is considered to be affiliated with the Fund. See Note 4.
See Notes to Financial Statements.
50
This page intentionally left blank
Statements of Assets and Liabilities
April 30, 2011
| PowerShares Dynamic MagniQuant Portfolio | PowerShares Dynamic Market Portfolio | PowerShares Dynamic OTC Portfolio | PowerShares FTSE RAFI US 1000 Portfolio | PowerShares FTSE RAFI US 1500 Small-Mid Portfolio | |||||||||||||||||||
| ASSETS: | |||||||||||||||||||||||
| Unaffiliated investments, at value | $ | 27,104,581 | $ | 188,322,809 | $ | 40,396,057 | $ | 1,207,549,670 | $ | 409,955,723 | |||||||||||||
| Affiliated investments, at value (Note 4) | — | — | — | 709,466 | 92,847 | ||||||||||||||||||
| Total investments, at value | 27,104,581 | 188,322,809 | 40,396,057 | 1,208,259,136 | 410,048,570 | ||||||||||||||||||
| Cash | 241 | 435 | 254 | 1,379 | — | ||||||||||||||||||
| Foreign currencies, at value | — | — | — | — | 20,522 | ||||||||||||||||||
| Receivables: | |||||||||||||||||||||||
| Dividends | 12,141 | 122,153 | 14,806 | 1,505,178 | 156,939 | ||||||||||||||||||
| Expense waivers | 11,300 | 4,333 | 8,919 | 67,905 | 24,800 | ||||||||||||||||||
| Investments sold | — | — | — | — | 777,292 | ||||||||||||||||||
| Total Assets | 27,128,263 | 188,449,730 | 40,420,036 | 1,209,833,598 | 411,028,123 | ||||||||||||||||||
| LIABILITIES: | |||||||||||||||||||||||
| Due to custodian | — | — | — | — | 6,480 | ||||||||||||||||||
| Payables: | |||||||||||||||||||||||
| Investments purchased | 5,810 | — | — | 333,191 | 684,106 | ||||||||||||||||||
| Accrued advisory fees | 11,042 | 76,842 | 16,190 | 279,659 | 96,535 | ||||||||||||||||||
| Accrued expenses | 86,957 | 165,604 | 83,168 | 974,526 | 414,961 | ||||||||||||||||||
| Total Liabilities | 103,809 | 242,446 | 99,358 | 1,587,376 | 1,202,082 | ||||||||||||||||||
| NET ASSETS | $ | 27,024,454 | $ | 188,207,284 | $ | 40,320,678 | $ | 1,208,246,222 | $ | 409,826,041 | |||||||||||||
| NET ASSETS CONSIST OF: | |||||||||||||||||||||||
| Shares of beneficial interest | $ | 50,196,324 | $ | 521,377,907 | $ | 114,168,819 | $ | 1,247,392,742 | $ | 382,709,371 | |||||||||||||
| Undistributed net investment income (loss) | 29,111 | 114,986 | (5,634 | ) | 3,544,038 | 364,261 | |||||||||||||||||
| Undistributed net realized gain (loss) | (26,903,127 | ) | (349,474,586 | ) | (79,742,189 | ) | (180,962,986 | ) | (26,826,802 | ) | |||||||||||||
| Net unrealized appreciation | 3,702,146 | 16,188,977 | 5,899,682 | 138,272,428 | 53,579,211 | ||||||||||||||||||
| Net Assets | $ | 27,024,454 | $ | 188,207,284 | $ | 40,320,678 | $ | 1,208,246,222 | $ | 409,826,041 | |||||||||||||
| Shares outstanding (unlimited amount authorized, $0.01 par value) | 1,000,000 | 3,900,000 | 750,000 | 19,900,000 | 5,800,000 | ||||||||||||||||||
| Net asset value | $ | 27.02 | $ | 48.26 | $ | 53.76 | $ | 60.72 | $ | 70.66 | |||||||||||||
| Share price | $ | 27.03 | $ | 48.24 | $ | 53.75 | $ | 60.71 | $ | 70.64 | |||||||||||||
| Unaffiliated investments, at cost | $ | 23,402,435 | $ | 172,133,832 | $ | 34,496,375 | $ | 1,069,445,844 | $ | 356,380,448 | |||||||||||||
| Affiliated investments, at cost | $ | — | $ | — | $ | — | $ | 540,864 | $ | 90,479 | |||||||||||||
| Total investments, at cost | $ | 23,402,435 | $ | 172,133,832 | $ | 34,496,375 | $ | 1,069,986,708 | $ | 356,470,927 | |||||||||||||
| Foreign currencies, at cost | $ | — | $ | — | $ | — | $ | — | $ | 18,954 | |||||||||||||
See Notes to Financial Statements.
52
Statements of Operations
Year Ended April 30, 2011
| PowerShares Dynamic MagniQuant Portfolio | PowerShares Dynamic Market Portfolio | PowerShares Dynamic OTC Portfolio | PowerShares FTSE RAFI US 1000 Portfolio | PowerShares FTSE RAFI US 1500 Small-Mid Portfolio | |||||||||||||||||||
| INVESTMENT INCOME: | |||||||||||||||||||||||
| Unaffiliated dividend income | $ | 413,000 | $ | 3,768,693 | $ | 280,176 | $ | 20,305,195 | $ | 4,020,182 | |||||||||||||
| Affiliated dividend income | — | — | — | 7,208 | — | ||||||||||||||||||
| Foreign withholding tax | — | — | — | (4,450 | ) | (2,101 | ) | ||||||||||||||||
| Total Income | 413,000 | 3,768,693 | 280,176 | 20,307,953 | 4,018,081 | ||||||||||||||||||
| EXPENSES: | |||||||||||||||||||||||
| Advisory fees | 139,660 | 950,434 | 186,228 | 2,453,188 | 960,772 | ||||||||||||||||||
| Accounting & administration fees | 68,240 | 68,240 | 68,240 | 205,782 | 82,804 | ||||||||||||||||||
| Professional fees | 32,146 | 41,676 | 32,309 | 73,537 | 49,387 | ||||||||||||||||||
| Custodian & transfer agent fees | 24,048 | 23,431 | 12,524 | 91,117 | 85,853 | ||||||||||||||||||
| Sub-licensing | 13,966 | 57,026 | 11,174 | 761,338 | 298,172 | ||||||||||||||||||
| Trustees | 5,891 | 10,800 | 6,073 | 28,602 | 14,551 | ||||||||||||||||||
| Recapture (See Note 3) | — | — | — | 1,377 | — | ||||||||||||||||||
| Other expenses | 19,020 | 70,460 | 22,550 | 124,120 | 41,410 | ||||||||||||||||||
| Total Expenses | 302,971 | 1,222,067 | 339,098 | 3,739,061 | 1,532,949 | ||||||||||||||||||
| Less: Waivers | (121,412 | ) | (80,701 | ) | (115,449 | ) | (439,944 | ) | (240,876 | ) | |||||||||||||
| Net Expenses | 181,559 | 1,141,366 | 223,649 | 3,299,117 | 1,292,073 | ||||||||||||||||||
| Net Investment Income | 231,441 | 2,627,327 | 56,527 | 17,008,836 | 2,726,008 | ||||||||||||||||||
| REALIZED AND UNREALIZED GAIN (LOSS): | |||||||||||||||||||||||
| Net realized gain (loss) from: | |||||||||||||||||||||||
| Investments | (3,158,477 | ) | (15,314,769 | ) | (3,309,176 | ) | (20,082,654 | ) | (5,431,230 | ) | |||||||||||||
| In-kind redemptions | 6,204,397 | 47,063,906 | 9,776,592 | 26,244,109 | 51,565,595 | ||||||||||||||||||
| Foreign currencies | — | — | — | — | (173 | ) | |||||||||||||||||
| Net realized gain | 3,045,920 | 31,749,137 | 6,467,416 | 6,161,455 | 46,134,192 | ||||||||||||||||||
| Net change in unrealized appreciation (depreciation) on: | |||||||||||||||||||||||
| Investments | 110,912 | (1,021,537 | ) | 62,498 | 140,652,771 | 22,724,251 | |||||||||||||||||
| Foreign currencies | — | — | — | — | 1,568 | ||||||||||||||||||
| Net change in unrealized appreciation (depreciation) | 110,912 | (1,021,537 | ) | 62,498 | 140,652,771 | 22,725,819 | |||||||||||||||||
| Net realized and unrealized gain | 3,156,832 | 30,727,600 | 6,529,914 | 146,814,226 | 68,860,011 | ||||||||||||||||||
| Net increase in net assets resulting from operations | $ | 3,388,273 | $ | 33,354,927 | $ | 6,586,441 | $ | 163,823,062 | $ | 71,586,019 | |||||||||||||
See Notes to Financial Statements.
53
Statements of Changes in Net Assets
| PowerShares Dynamic MagniQuant Portfolio | PowerShares Dynamic Market Portfolio | PowerShares Dynamic OTC Portfolio | |||||||||||||||||||||||||
| Year Ended April 30, 2011 | Year Ended April 30, 2010 | Year Ended April 30, 2011 | Year Ended April 30, 2010 | Year Ended April 30, 2011 | Year Ended April 30, 2010 | ||||||||||||||||||||||
| OPERATIONS: | |||||||||||||||||||||||||||
| Net investment income | $ | 231,441 | $ | 135,709 | $ | 2,627,327 | $ | 2,432,781 | $ | 56,527 | $ | 5,379 | |||||||||||||||
| Net realized gain (loss) | 3,045,920 | 7,474,762 | 31,749,137 | 65,647,496 | 6,467,416 | 9,501,282 | |||||||||||||||||||||
| Net increase from payment by affiliate (see Note 3) | — | — | — | — | — | — | |||||||||||||||||||||
| Net change in unrealized appreciation (depreciation) | 110,912 | 938,651 | (1,021,537 | ) | 1,137,502 | 62,498 | 3,802,752 | ||||||||||||||||||||
| Net increase in net assets resulting from operations | 3,388,273 | 8,549,122 | 33,354,927 | 69,217,779 | 6,586,441 | 13,309,413 | |||||||||||||||||||||
| Undistributed net investment income (loss) included in the price of units issued and redeemed | (14,028 | ) | (5,701 | ) | (12,104 | ) | 2,383 | (13,179 | ) | (11,386 | ) | ||||||||||||||||
| DISTRIBUTIONS TO SHAREHOLDERS FROM: | |||||||||||||||||||||||||||
| Net investment income | (213,106 | ) | (149,699 | ) | (2,885,329 | ) | (2,569,156 | ) | (84,849 | ) | (61,560 | ) | |||||||||||||||
| SHAREHOLDER TRANSACTIONS: | |||||||||||||||||||||||||||
| Proceeds from shares sold | 50,752,466 | 34,234,568 | 336,045,030 | 440,326,158 | 42,792,852 | 45,391,077 | |||||||||||||||||||||
| Value of shares repurchased | (53,976,300 | ) | (44,212,083 | ) | (408,458,005 | ) | (537,603,548 | ) | (49,608,534 | ) | (57,397,632 | ) | |||||||||||||||
| Net income (loss) equalization | 14,028 | 5,701 | 12,104 | (2,383 | ) | 13,179 | 11,386 | ||||||||||||||||||||
| Net increase (decrease) in net assets resulting from shares transactions | (3,209,806 | ) | (9,971,814 | ) | (72,400,871 | ) | (97,279,773 | ) | (6,802,503 | ) | (11,995,169 | ) | |||||||||||||||
| Increase (Decrease) in Net Assets | (48,667 | ) | (1,578,092 | ) | (41,943,377 | ) | (30,628,767 | ) | (314,090 | ) | 1,241,298 | ||||||||||||||||
| NET ASSETS: | |||||||||||||||||||||||||||
| Beginning of year | 27,073,121 | 28,651,213 | 230,150,661 | 260,779,428 | 40,634,768 | 39,393,470 | |||||||||||||||||||||
| End of year | $ | 27,024,454 | $ | 27,073,121 | $ | 188,207,284 | $ | 230,150,661 | $ | 40,320,678 | $ | 40,634,768 | |||||||||||||||
| Undistributed net investment income (loss) at end of year | $ | 29,111 | $ | 8,384 | $ | 114,986 | $ | 221,358 | $ | (5,634 | ) | $ | (2,794 | ) | |||||||||||||
| CHANGES IN SHARES OUTSTANDING: | |||||||||||||||||||||||||||
| Shares sold | 2,250,000 | 1,800,000 | 8,100,000 | 12,350,000 | 950,000 | 1,200,000 | |||||||||||||||||||||
| Shares repurchased | (2,450,000 | ) | (2,300,000 | ) | (9,900,000 | ) | (14,950,000 | ) | (1,100,000 | ) | (1,500,000 | ) | |||||||||||||||
| Shares outstanding, beginning of year | 1,200,000 | 1,700,000 | 5,700,000 | 8,300,000 | 900,000 | 1,200,000 | |||||||||||||||||||||
| Shares outstanding, end of year | 1,000,000 | 1,200,000 | 3,900,000 | 5,700,000 | 750,000 | 900,000 | |||||||||||||||||||||
See Notes to Financial Statements.
54
| PowerShares FTSE RAFI US 1000 Portfolio | PowerShares FTSE RAFI US 1500 Small-Mid Portfolio | ||||||||||||||||||
| Year Ended April 30, 2011 | Year Ended April 30, 2010 | Year Ended April 30, 2011 | Year Ended April 30, 2010 | ||||||||||||||||
| OPERATIONS: | |||||||||||||||||||
| Net investment income | $ | 17,008,836 | $ | 7,089,225 | $ | 2,726,008 | $ | 1,123,580 | |||||||||||
| Net realized gain (loss) | 6,161,455 | (34,026,720 | ) | 46,134,192 | 23,389,483 | ||||||||||||||
| Net increase from payment by affiliate (see Note 3) | — | — | — | 818,480 | |||||||||||||||
| Net change in unrealized appreciation (depreciation) | 140,652,771 | 239,935,703 | 22,725,819 | 60,075,407 | |||||||||||||||
| Net increase in net assets resulting from operations | 163,823,062 | 212,998,208 | 71,586,019 | 85,406,950 | |||||||||||||||
| Undistributed net investment income (loss) included in the price of units issued and redeemed | 2,192,781 | 107,266 | 161,384 | 266,740 | |||||||||||||||
| DISTRIBUTIONS TO SHAREHOLDERS FROM: | |||||||||||||||||||
| Net investment income | (14,549,503 | ) | (7,652,691 | ) | (2,570,205 | ) | (1,105,854 | ) | |||||||||||
| SHAREHOLDER TRANSACTIONS: | |||||||||||||||||||
| Proceeds from shares sold | 487,427,763 | 230,021,021 | 213,860,921 | 211,958,906 | |||||||||||||||
| Value of shares repurchased | (76,883,089 | ) | (183,381,082 | ) | (157,185,855 | ) | (106,523,770 | ) | |||||||||||
| Net income (loss) equalization | (2,192,781 | ) | (107,266 | ) | (161,384 | ) | (266,740 | ) | |||||||||||
| Net increase (decrease) in net assets resulting from shares transactions | 408,351,893 | 46,532,673 | 56,513,682 | 105,168,396 | |||||||||||||||
| Increase (Decrease) in Net Assets | 559,818,233 | 251,985,456 | 125,690,880 | 189,736,232 | |||||||||||||||
| NET ASSETS: | |||||||||||||||||||
| Beginning of year | 648,427,989 | 396,442,533 | 284,135,161 | 94,398,929 | |||||||||||||||
| End of year | $ | 1,208,246,222 | $ | 648,427,989 | $ | 409,826,041 | $ | 284,135,161 | |||||||||||
| Undistributed net investment income (loss) at end of year | $ | 3,544,038 | $ | 1,058,714 | $ | 364,261 | $ | 200,492 | |||||||||||
| CHANGES IN SHARES OUTSTANDING: | |||||||||||||||||||
| Shares sold | 9,000,000 | 4,700,000 | 3,500,000 | 4,050,000 | |||||||||||||||
| Shares repurchased | (1,350,000 | ) | (3,850,000 | ) | (2,450,000 | ) | (2,000,000 | ) | |||||||||||
| Shares outstanding, beginning of year | 12,250,000 | 11,400,000 | 4,750,000 | 2,700,000 | |||||||||||||||
| Shares outstanding, end of year | 19,900,000 | 12,250,000 | 5,800,000 | 4,750,000 | |||||||||||||||
55
Financial Highlights
PowerShares Dynamic MagniQuant Portfolio
| Year Ended April 30, | For the Period October 12, 2006* Through | ||||||||||||||||||||||
| 2011 | 2010 | 2009 | 2008 | April 30, 2007 | |||||||||||||||||||
| PER SHARE OPERATING PERFORMANCE: | |||||||||||||||||||||||
| Net asset value at beginning of period | $ | 22.56 | $ | 16.85 | $ | 25.08 | $ | 28.02 | $ | 25.37 | |||||||||||||
| Net investment income** | 0.19 | 0.09 | 0.14 | 0.14 | 0.15 | ||||||||||||||||||
| Net realized and unrealized gain (loss) on investments | 4.45 | 5.71 | (8.24 | ) | (2.87 | ) | 2.55 | ||||||||||||||||
| Total from investment operations | 4.64 | 5.80 | (8.10 | ) | (2.73 | ) | 2.70 | ||||||||||||||||
| Distributions to shareholders from: | |||||||||||||||||||||||
| Net investment income | (0.18 | ) | (0.09 | ) | (0.13 | ) | (0.20 | ) | (0.05 | ) | |||||||||||||
| Return of capital | — | — | — | (0.01 | ) | — | |||||||||||||||||
| Total distributions | (0.18 | ) | (0.09 | ) | (0.13 | ) | (0.21 | ) | (0.05 | ) | |||||||||||||
| Net asset value at end of period | $ | 27.02 | $ | 22.56 | $ | 16.85 | $ | 25.08 | $ | 28.02 | |||||||||||||
| Share price at end of period*** | $ | 27.03 | $ | 22.56 | $ | 16.84 | |||||||||||||||||
| NET ASSET VALUE TOTAL RETURN**** | 20.72 | % | 34.54 | % | (32.40 | )% | (9.81 | )% | 10.67 | % | |||||||||||||
| SHARE PRICE TOTAL RETURN**** | 20.76 | % | 34.62 | % | (32.41 | )% | |||||||||||||||||
| RATIOS/SUPPLEMENTAL DATA: | |||||||||||||||||||||||
| Net assets at end of period (000's omitted) | $ | 27,024 | $ | 27,073 | $ | 28,651 | $ | 62,700 | $ | 81,269 | |||||||||||||
| Ratio to average net assets of: | |||||||||||||||||||||||
| Expenses, after (Waivers) and/or Recapture | 0.65 | % | 0.65 | % | 0.65 | % | 0.67 | % | 0.67 | %† | |||||||||||||
| Expenses, prior to (Waivers) and/or Recapture | 1.08 | % | 0.98 | % | 0.87 | % | 0.72 | % | 0.84 | %† | |||||||||||||
| Net investment income, after (Waivers) and/or Recapture | 0.83 | % | 0.45 | % | 0.70 | % | 0.53 | % | 1.04 | %† | |||||||||||||
| Portfolio turnover rate †† | 93 | % | 98 | % | 102 | % | 76 | % | 23 | % | |||||||||||||
| Undistributed net investment income (loss) included in price of units issued and redeemed**# | $ | (0.01 | ) | $ | (0.00 | )(a) | $ | (0.01 | ) | $ | 0.00 | (a) | $ | 0.02 | |||||||||
PowerShares Dynamic Market Portfolio
| Year Ended April 30, | |||||||||||||||||||||||
| 2011 | 2010 | 2009 | 2008 | 2007 | |||||||||||||||||||
| PER SHARE OPERATING PERFORMANCE: | |||||||||||||||||||||||
| Net asset value at beginning of year | $ | 40.38 | $ | 31.42 | $ | 48.12 | $ | 53.32 | $ | 47.87 | |||||||||||||
| Net investment income** | 0.57 | 0.33 | 0.50 | 0.37 | 0.42 | ||||||||||||||||||
| Net realized and unrealized gain (loss) on investments | 7.94 | 8.97 | (16.72 | ) | (5.09 | ) | 5.35 | ||||||||||||||||
| Total from investment operations | 8.51 | 9.30 | (16.22 | ) | (4.72 | ) | 5.77 | ||||||||||||||||
| Distributions to shareholders from: | |||||||||||||||||||||||
| Net investment income | (0.63 | ) | (0.34 | ) | (0.48 | ) | (0.48 | ) | (0.32 | ) | |||||||||||||
| Net asset value at end of year | $ | 48.26 | $ | 40.38 | $ | 31.42 | $ | 48.12 | $ | 53.32 | |||||||||||||
| Share price at end of year*** | $ | 48.24 | $ | 40.38 | $ | 31.41 | |||||||||||||||||
| NET ASSET VALUE TOTAL RETURN**** | 21.34 | % | 29.75 | % | (33.86 | )% | (8.93 | )% | 12.12 | % | |||||||||||||
| SHARE PRICE TOTAL RETURN**** | 21.29 | % | 29.80 | % | (33.84 | )% | |||||||||||||||||
| RATIOS/SUPPLEMENTAL DATA: | |||||||||||||||||||||||
| Net assets at end of year (000's omitted) | $ | 188,207 | $ | 230,151 | $ | 260,779 | $ | 620,703 | $ | 973,105 | |||||||||||||
| Ratio to average net assets of: | |||
| Expenses, after (Waivers) and/or Recapture | 0.60 | % | 0.60 | % | 0.60 | % | 0.58 | % | 0.60 | % | |||||||||||||
| Expenses, prior to (Waivers) and/or Recapture | 0.64 | % | 0.60 | % | 0.60 | % | 0.59 | % | 0.62 | % | |||||||||||||
| Net investment income, after (Waivers) and/or Recapture | 1.38 | % | 0.92 | % | 1.28 | % | 0.72 | % | 0.87 | % | |||||||||||||
| Portfolio turnover rate †† | 107 | % | 98 | % | 113 | % | 121 | % | 114 | % | |||||||||||||
| Undistributed net investment income (loss) included in price of units issued and redeemed**# | $ | 0.00 | (a) | $ | 0.00 | (a) | $ | (0.01 | ) | $ | (0.01 | ) | $ | 0.00 | (a) | ||||||||
* Commencement of Investment Operations.
** Based on average shares outstanding.
*** The mean between the last bid and ask prices.
**** Net asset value total return is calculated assuming an initial investment made at the net asset value at the beginning of the period, reinvestment of all dividends and distributions at net asset value during the period, and redemption on the last day of the period. Share price total return is calculated assuming an initial investment made at the share price at the beginning of the period, reinvestment of all dividends and distributions at share price during the period, and sale at the share price on the last day of the period. Total investment returns calculated for a period of less than one year are not annualized.
† Annualized.
†† Portfolio turnover rate is not annualized and does not include securities received or delivered from processing creations or redemptions.
# The per share amount of equalization is presented to show the impact of equalization on distributable earnings per share.
(a) Amount represents less than $0.005.
See Notes to Financial Statements.
56
Financial Highlights (Continued)
PowerShares Dynamic OTC Portfolio
| Year Ended April 30, | |||||||||||||||||||||||
| 2011 | 2010 | 2009 | 2008 | 2007 | |||||||||||||||||||
| PER SHARE OPERATING PERFORMANCE: | |||||||||||||||||||||||
| Net asset value at beginning of year | $ | 45.15 | $ | 32.83 | $ | 46.92 | $ | 55.03 | $ | 53.60 | |||||||||||||
| Net investment income (loss)* | 0.07 | 0.01 | 0.03 | (0.11 | ) | (0.07 | ) | ||||||||||||||||
| Net realized and unrealized gain (loss) on investments | 8.65 | 12.36 | (14.12 | ) | (7.94 | ) | 1.50 | ||||||||||||||||
| Total from investment operations | 8.72 | 12.37 | (14.09 | ) | (8.05 | ) | 1.43 | ||||||||||||||||
| Distributions to shareholders from: | |||||||||||||||||||||||
| Net investment income | (0.11 | ) | (0.05 | ) | — | — | — | ||||||||||||||||
| Return of capital | — | — | — | (0.06 | ) | — | |||||||||||||||||
| Total distributions | (0.11 | ) | (0.05 | ) | — | (0.06 | ) | — | |||||||||||||||
| Net asset value at end of year | $ | 53.76 | $ | 45.15 | $ | 32.83 | $ | 46.92 | $ | 55.03 | |||||||||||||
| Share price at end of year** | $ | 53.75 | $ | 45.15 | $ | 32.83 | |||||||||||||||||
| NET ASSET VALUE TOTAL RETURN*** | 19.34 | % | 37.73 | % | (30.03 | )% | (14.65 | )% | 2.67 | % | |||||||||||||
| SHARE PRICE TOTAL RETURN*** | 19.31 | % | 37.73 | % | (30.06 | )% | |||||||||||||||||
| RATIOS/SUPPLEMENTAL DATA: | |||||||||||||||||||||||
| Net assets at end of year (000's omitted) | $ | 40,321 | $ | 40,635 | $ | 39,393 | $ | 96,187 | $ | 159,599 | |||||||||||||
| Ratio to average net assets of: | |||
| Expenses, after (Waivers) and/or Recapture | 0.60 | % | 0.60 | % | 0.59 | % | 0.59 | % | 0.60 | % | |||||||||||||
| Expenses, prior to (Waivers) and/or Recapture | 0.91 | % | 0.85 | % | 0.74 | % | 0.64 | % | 0.69 | % | |||||||||||||
| Net investment income (loss), after (Waivers) and/or Recapture | 0.15 | % | 0.01 | % | 0.08 | % | (0.21 | )% | (0.15 | )% | |||||||||||||
| Portfolio turnover rate † | 75 | % | 90 | % | 77 | % | 60 | % | 107 | % | |||||||||||||
| Undistributed net investment income (loss) included in price of units issued and redeemed*# | $ | (0.02 | ) | $ | (0.01 | ) | $ | (0.02 | ) | $ | (0.01 | ) | $ | 0.03 | |||||||||
PowerShares FTSE RAFI US 1000 Portfolio
| Year Ended April 30, | |||||||||||||||||||||||
| 2011 | 2010 | 2009 | 2008 | 2007 | |||||||||||||||||||
| PER SHARE OPERATING PERFORMANCE: | |||||||||||||||||||||||
| Net asset value at beginning of year | $ | 52.93 | $ | 34.78 | $ | 55.15 | $ | 60.99 | $ | 52.44 | |||||||||||||
| Net investment income* | 1.07 | 0.62 | 0.97 | 0.89 | 0.78 | ||||||||||||||||||
| Net realized and unrealized gain (loss) on investments | 7.63 | 18.21 | (20.26 | ) | (5.96 | ) | 8.38 | ||||||||||||||||
| Total from investment operations | 8.70 | 18.83 | (19.29 | ) | (5.07 | ) | 9.16 | ||||||||||||||||
| Distributions to shareholders from: | |||||||||||||||||||||||
| Net investment income | (0.91 | ) | (0.68 | ) | (1.08 | ) | (0.77 | ) | (0.61 | ) | |||||||||||||
| Net asset value at end of year | $ | 60.72 | $ | 52.93 | $ | 34.78 | $ | 55.15 | $ | 60.99 | |||||||||||||
| Share price at end of year** | $ | 60.71 | $ | 52.96 | $ | 34.78 | |||||||||||||||||
| NET ASSET VALUE TOTAL RETURN*** | 16.72 | % | 54.57 | % | (35.26 | )% | (8.42 | )% | 17.60 | % | |||||||||||||
| SHARE PRICE TOTAL RETURN*** | 16.63 | % | 54.66 | % | (35.20 | )% | |||||||||||||||||
| RATIOS/SUPPLEMENTAL DATA: | |||||||||||||||||||||||
| Net assets at end of year (000's omitted) | $ | 1,208,246 | $ | 648,428 | $ | 396,443 | $ | 876,964 | $ | 1,055,189 | |||||||||||||
| Ratio to average net assets of: | |||
| Expenses, after (Waivers) and/or Recapture | 0.39 | % | 0.39 | % | 0.58 | % | 0.67 | % | 0.70 | % | |||||||||||||
| Expenses, prior to (Waivers) and/or Recapture | 0.44 | % | 0.45 | % | 0.60 | % | 0.66 | % | 0.71 | % | |||||||||||||
| Net investment income, after (Waivers) and/or Recapture | 2.01 | % | 1.38 | % | 2.34 | % | 1.50 | % | 1.40 | % | |||||||||||||
| Portfolio turnover rate † | 9 | % | 24 | % | 15 | % | 12 | % | 8 | % | |||||||||||||
| Undistributed net investment income (loss) included in price of units issued and redeemed*# | $ | 0.14 | $ | 0.01 | $ | (0.07 | ) | $ | (0.04 | ) | $ | 0.33 | |||||||||||
* Based on average shares outstanding.
** The mean between the last bid and ask prices.
*** Net asset value total return is calculated assuming an initial investment made at the net asset value at the beginning of the period, reinvestment of all dividends and distributions at net asset value during the period, and redemption on the last day of the period. Share price total return is calculated assuming an initial investment made at the share price at the beginning of the period, reinvestment of all dividends and distributions at share price during the period, and sale at the share price on the last day of the period. Total investment returns calculated for a period of less than one year are not annualized.
† Portfolio turnover rate is not annualized and does not include securities received or delivered from processing creations or redemptions.
# The per share amount of equalization is presented to show the impact of equalization on distributable earnings per share.
See Notes to Financial Statements.
57
Financial Highlights (Continued)
PowerShares FTSE RAFI US 1500 Small-Mid Portfolio
| Year Ended April 30, | For the Period September 20, 2006* Through | ||||||||||||||||||||||
| 2011 | 2010 | 2009 | 2008 | April 30, 2007 | |||||||||||||||||||
| PER SHARE OPERATING PERFORMANCE: | |||||||||||||||||||||||
| Net asset value at beginning of period | $ | 59.82 | $ | 34.96 | $ | 50.36 | $ | 57.12 | $ | 50.52 | |||||||||||||
| Net investment income** | 0.50 | 0.32 | 0.46 | 0.50 | 0.27 | ||||||||||||||||||
| Net realized and unrealized gain (loss) on investments | 10.80 | 24.88 | (15.42 | ) | (6.81 | ) | 6.50 | ||||||||||||||||
| Total from investment operations | 11.30 | 25.20 | (14.96 | ) | (6.31 | ) | 6.77 | ||||||||||||||||
| Distributions to shareholders from: | |||||||||||||||||||||||
| Net investment income | (0.46 | ) | (0.34 | ) | (0.44 | ) | (0.45 | ) | (0.17 | ) | |||||||||||||
| Net asset value at end of period | $ | 70.66 | $ | 59.82 | $ | 34.96 | $ | 50.36 | $ | 57.12 | |||||||||||||
| Share price at end of period*** | $ | 70.64 | $ | 59.79 | $ | 34.90 | |||||||||||||||||
| NET ASSET VALUE TOTAL RETURN**** | 19.04 | % | 72.38 | %(a) | (29.79 | )% | (11.10 | )% | 13.42 | % | |||||||||||||
| SHARE PRICE TOTAL RETURN**** | 19.06 | % | 72.59 | % | (29.84 | )% | |||||||||||||||||
| RATIOS/SUPPLEMENTAL DATA: | |||||||||||||||||||||||
| Net assets at end of period (000's omitted) | $ | 409,826 | $ | 284,135 | $ | 94,399 | $ | 130,944 | $ | 85,680 | |||||||||||||
| Ratio to average net assets of: | |||||||||||||||||||||||
| Expenses, after (Waivers) and/or Recapture | 0.39 | % | 0.39 | % | 0.58 | % | 0.71 | % | 0.73 | %† | |||||||||||||
| Expenses, prior to (Waivers) and/or Recapture | 0.46 | % | 0.51 | % | 0.79 | % | 0.76 | % | 0.92 | %† | |||||||||||||
| Net investment income, after (Waivers) and/or Recapture | 0.82 | % | 0.67 | % | 1.22 | % | 0.92 | % | 0.83 | %† | |||||||||||||
| Portfolio turnover rate †† | 19 | % | 16 | % | 15 | % | 42 | % | 9 | % | |||||||||||||
| Undistributed net investment income included in price of units issued and redeemed**# | $ | 0.03 | $ | 0.08 | $ | 0.00 | (b) | $ | 0.09 | $ | 0.05 | ||||||||||||
* Commencement of Investment Operations.
** Based on average shares outstanding.
*** The mean between the last bid and ask prices.
**** Net asset value total return is calculated assuming an initial investment made at the net asset value at the beginning of the period, reinvestment of all dividends and distributions at net asset value during the period, and redemption on the last day of the period. Share price total return is calculated assuming an initial investment made at the share price at the beginning of the period, reinvestment of all dividends and distributions at share price during the period, and sale at the share price on the last day of the period. Total investment returns calculated for a period of less than one year are not annualized.
† Annualized.
†† Portfolio turnover rate is not annualized and does not include securities received or delivered from processing creations or redemptions.
# The per share amount of equalization is presented to show the impact of equalization on distributable earnings per share.
(a) Amount includes the effect of the Adviser pay-in for an economic loss of $0.17 per share. Had the pay-in not been made, the Net Asset Value Total Return would have been 71.89%.
(b) Amount represents less than $0.005.
See Notes to Financial Statements.
58
Notes to Financial Statements
PowerShares Exchange-Traded Fund Trust
April 30, 2011
Note 1. Organization
PowerShares Exchange-Traded Fund Trust (the "Trust") was organized as a Massachusetts business trust on June 9, 2000 and is authorized to have multiple series of portfolios. The Trust is an open-end management investment company registered under the Investment Company Act of 1940, as amended (the "1940 Act"). As of April 30, 2011, the Trust offered fifty-six portfolios. This report includes the following portfolios:
| Full Name | Short Name | ||||||
| PowerShares Dynamic MagniQuant Portfolio | "Dynamic MagniQuant Portfolio" | ||||||
| PowerShares Dynamic Market Portfolio | "Dynamic Market Portfolio" | ||||||
| PowerShares Dynamic OTC Portfolio | "Dynamic OTC Portfolio" | ||||||
| PowerShares FTSE RAFI US 1000 Portfolio | "FTSE RAFI US 1000 Portfolio" | ||||||
| PowerShares FTSE RAFI US 1500 Small-Mid Portfolio | "FTSE RAFI US 1500 Small-Mid Portfolio" | ||||||
Each portfolio (the "Fund" and collectively the "Funds") represents a separate series of the Trust. The shares of the Funds are referred to herein as "Shares" or "Fund's Shares." Each Fund's Shares are listed and traded on the NYSE Arca, Inc. ("NYSE Arca"), except for Shares of the FTSE RAFI US 1500 Small-Mid Portfolio which is listed and traded on The NASDAQ Stock Market LLC.
The Funds' market prices may differ to some degree from the net asset value ("NAV") of the Shares of each Fund. Unlike conventional mutual funds, each Fund issues and redeems Shares on a continuous basis, at NAV, only in a large specified number of Shares, each called a "Creation Unit." Creation Units are issued and redeemed generally in-kind for securities included in the relevant index. Except when aggregated in Creation Units by Authorized Participants, the Shares are not individually redeemable securities of the Funds.
The investment objective of each Fund is to seek investment results that correspond (before the Fund's fees and expenses) generally to the price and yield performance of the following indices (each, an "Underlying Index"):
| Fund | Index | ||||||
| Dynamic MagniQuant Portfolio | Dynamic Top 200 IntellidexSM Index | ||||||
| Dynamic Market Portfolio | Dynamic Market IntellidexSM Index | ||||||
| Dynamic OTC Portfolio | Dynamic OTC IntellidexSM Index | ||||||
| FTSE RAFI US 1000 Portfolio | FTSE RAFI US 1000 Index | ||||||
| FTSE RAFI US 1500 Small-Mid Portfolio | FTSE RAFI US 1500 Small-Mid Index | ||||||
Note 2. Significant Accounting Policies
The preparation of the financial statements in accordance with Generally Accepted Accounting Principles ("GAAP") in the United States of America requires management to make estimates and assumptions that affect the reported amounts and disclosures in the financial statements, including estimates and assumptions related to taxation. Actual results could differ from these estimates. In addition, the Funds monitor for material events or transactions that may occur or become known after the period-end date and before the date the financial statements are released to print.
59
Notes to Financial Statements (Continued)
PowerShares Exchange-Traded Fund Trust
April 30, 2011
A. Security Valuation
Securities, including restricted securities, are valued according to the following policies.
A security listed or traded on an exchange (except convertible bonds) is valued at its last sales price or official closing price as of the close of the customary trading session on the exchange where the security is principally traded, or lacking any sales or official closing price on a particular day, the security may be valued at the closing bid price on that day. Securities traded in the over-the-counter market are valued based on prices furnished by independent pricing services or market makers. Listed options, if no closing price is available, are valued at the mean between the last bid and ask prices from the exchange on which they are principally traded. Options not listed on an exchange are valued by an independent source at the mean between the last bid and ask prices.
Investments in open-end registered investment companies not traded on an exchange are valued at the end of day NAV per share.
Debt obligations (including convertible bonds) and unlisted equities are fair valued using an evaluated quote provided by an independent pricing service. Evaluated quotes provided by the pricing service may be determined without exclusive reliance on quoted prices, and may reflect appropriate factors such as institution-size trading in similar groups of securities, developments related to specific securities, dividend rate, yield, quality, type of issue, coupon rate, maturity, individual trading characteristics and other market data. Short-term obligations, including commercial paper, having 60 days or less to maturity are recorded at amortized cost which approximates value. Debt securities are subject to interest rate and credit risks. In addition, all debt securities involve some risk of default with respect to interest and/or principal payments.
Foreign securities (including foreign exchange contracts) are converted into U.S. dollar amounts using the applicable exchange rates as of the close of the London world markets. If market quotations are available and reliable for foreign exchange traded equity securities, the securities will be valued at the market quotations. Because trading hours for certain foreign securities end before the close of the New York Stock Exchange ("NYSE"), closing market quotations may become unreliable. If between the time trading ends on a particular security and the close of the customary trading session on the NYSE, events occur that are significant and make the closing price unreliable, the Fund may fair value the security. If the event is likely to have affected the closing price of the security, the security will be valued at fair value in good faith using procedures approved by the Board of Trustees. Adjustments to closing prices to reflect fair value may also be based on a screening process of an independent pricing service to indicate the degree of certainty, based on historical data, that the closing price in the principal market where a foreign security trades is not the current value as of the close of the NYSE. Foreign securities meeting the approved degree of certainty that the price is not reflective of current value will be priced at the indication of fair value from the independent pricing service. Multiple factors may be considered by the independent pricing service in determining adjustments to reflect fair value and may include information relating to sector indices, American depositary receipts and domestic and foreign index futures. Foreign securities may have additional risks including exchange rate changes, potential for sharply devalued currencies and high inflation, political and economic upheaval, the relative lack of issuer information, relatively low market liquidity and the potential lack of strict financial and accounting controls and standards.
Securities for which market prices are not provided by any of the above methods may be valued based upon quotes furnished by independent sources.
60
Notes to Financial Statements (Continued)
PowerShares Exchange-Traded Fund Trust
April 30, 2011
Securities for which market quotations are not readily available or are unreliable are valued at fair value as determined in good faith by or under the supervision of the Trust's officers following procedures approved by the Board of Trustees. Issuer specific events, market trends, bid/ask quotes of brokers and information providers and other market data may be reviewed in the course of making a good faith determination of a security's fair value.
Valuations change in response to many factors, including the historical and prospective earnings of the issuer, the value of the issuer's assets, general economic conditions, interest rates, investor perceptions and market liquidity. Because of the inherent uncertainties of valuation, the values reflected in the financial statements may materially differ from the value received upon actual sale of those investments.
B. Other Risks
Replication Management Risk. Unlike many investment companies, the Funds do not utilize an investing strategy that seeks returns in excess of each Fund's respective Underlying Index. Therefore, a Fund would not necessarily sell a security unless that security is removed from its respective Underlying Index.
Concentration Risk. To the extent a Fund concentrates its investments in an industry or group of industries, the value of the Fund's Shares may rise and fall more than the value of Shares of a fund that invests in a broader range of securities.
Non-Correlation Risk. Each Fund's return may not match the return of its Underlying Index for a number of reasons. For example, each Fund incurs operating expenses not applicable to its Underlying Index, and incurs costs in buying and selling securities, especially when rebalancing the securities holdings to reflect changes in the composition of its Underlying Index. In addition, the performance of each Fund and its Underlying Index may vary due to asset valuation differences and differences between each Fund's portfolio and its Underlying Index resulting from legal restrictions, cost or liquidity constraints.
Small and Medium Capitalization Company Risk. Investing in securities of small and medium capitalization companies involves greater risk than is customarily associated with investing in larger, more established companies. These companies' securities may be more volatile and less liquid than those of more established companies. These securities may have returns that vary, sometimes significantly, from the overall securities market. Often small and medium capitalization companies and the industries in which they are focused are still evolving and may make them be more sensitive to changing market conditions.
C. Federal Income Taxes
Each Fund intends to comply with the provisions of the Internal Revenue Code applicable to regulated investment companies and to distribute substantially all of the Fund's taxable earnings to its shareholders. As such, the Funds will not be subject to Federal income taxes on otherwise taxable income (including net realized gains) that is distributed to the shareholders. Therefore, no provision for Federal income taxes is recorded in the financial statements.
Income and capital gain distributions are determined in accordance with Federal income tax regulations, which may differ from GAAP. These differences are primarily due to differing book and tax treatments for in-kind transactions, losses deferred due to wash sales, and passive foreign investment company adjustments, if any.
61
Notes to Financial Statements (Continued)
PowerShares Exchange-Traded Fund Trust
April 30, 2011
The Funds file tax returns in the United States Federal jurisdiction and certain other jurisdictions. Generally, a Fund is subject to examinations by such taxing authorities for up to three years after the filing of the return for the tax period.
D. Investment Income and Investment Transactions
Dividend income is recorded on the ex-dividend date, net of foreign taxes withheld, if any. Interest income is recorded on the accrual basis. Investment transactions are recorded on the trade date. Realized gains and losses from the sale or disposition of securities are calculated on the specific identified cost basis. Dividends and interest received by a Fund may give rise to withholding and other taxes imposed by foreign countries. Corporate actions (including cash dividends) are recorded net of non-reclaimable foreign tax withholdings on the ex-dividend date. Tax conventions between certain countries and the United States may reduce or eliminate such taxes.
E. Expenses
Expenses of the Trust that are directly identifiable to a specific Fund are applied to that Fund. Expenses that are not readily identifiable to a specific Fund are allocated in such a manner as deemed equitable, taking into consideration the nature and type of expense and the relative net assets of each Fund.
Each Fund is responsible for all its expenses, including the investment advisory fees, costs of transfer agency, custody, fund administration, legal, audit and other services, interest, taxes, brokerage commissions and other expenses connected with executions of portfolio transactions, sub-licensing fees related to its respective Underlying Intellidex or Underlying Index, any distribution fees or expenses, litigation expenses, fees payable to the Trust's Board members and officers who are not "interested persons" of the Trust or the Adviser, expenses incurred in connection with the Board members' services, including travel expenses and legal fees of counsel for those members of the Board who are not "interested persons" of the Trust and extraordinary expenses.
F. Dividends and Distributions to Shareholders
Each Fund declares and pays dividends from net investment income, if any, to its shareholders quarterly and records them on ex-dividend date. Each Fund distributes net realized taxable capital gains, if any, generally annually in cash and records on ex-dividend date. Such distributions on a tax basis are determined in conformity with income tax regulations which may differ from GAAP. Distributions in excess of tax basis earnings and profits, if any, are reported in such Fund's financial statements as a tax return of capital at fiscal period-end.
G. Equalization
All Funds use the accounting practice of equalization. This accounting method is used to keep the continuing shareholder's per Share equity in undistributed net investment income from being affected by the continuous sales and redemptions of capital Shares. Equalization is calculated on a per Share basis whereby a portion of the proceeds from the sales and cost of repurchases of capital Shares is applied to undistributed net investment income. The amount of equalization is disclosed in the Statements of Changes in Net Assets as undistributed net investment income included in the price of capital Shares issued or redeemed. The distributions to shareholders of amounts so applied may be deemed to be a return of capital for tax purposes to the extent that such distributions exceed taxable income.
62
Notes to Financial Statements (Continued)
PowerShares Exchange-Traded Fund Trust
April 30, 2011
Note 3. Investment Advisory Agreement and Other Agreements
The Trust has entered into an Investment Advisory Agreement with Invesco PowerShares Capital Management LLC (the "Adviser") pursuant to which the Adviser has overall responsibility as the Funds' investment adviser for the selection and ongoing monitoring of the Funds' investments, managing the Funds' business affairs and providing certain clerical, bookkeeping and other administrative services. Each Fund (except for the FTSE RAFI US 1000 Portfolio and the FTSE RAFI US 1500 Small-Mid Portfolio) has agreed to pay the Adviser an annual fee of 0.50% of the Fund's average daily net assets. Each of the FTSE RAFI US 1000 Portfolio and the FTSE RAFI US 1500 Small-Mid Portfolio has agreed to pay the Adviser an annual fee of 0.29% of the Fund's average daily net assets.
The Adviser has entered into an Amended and Restated Excess Expense Agreement (the "Excess Expense Agreement") with the Trust. For the Dynamic MagniQuant Portfolio, Dynamic Market Portfolio and the Dynamic OTC Portfolio, the Adviser has agreed to waive fees and/or pay Fund expenses to the extent necessary to prevent the operating expenses of the Fund (excluding interest expense, brokerage commissions and other trading expenses, sub-licensing fees, offering costs, taxes and extraordinary expenses) from exceeding 0.60% of the Fund's average daily net assets per year (the "Expense Cap"), at least until August 31, 2012. The FTSE RAFI US 1000 Portfolio's and the FTSE RAFI US 1500 Small-Mid Portfolio's Expense Cap is 0.39% of the Fund's average daily net assets per year, at least until August 31, 2012, and sub-licensing fees are included in the expenses subject to the Expense Cap. Offering costs excluded from the Expense Cap are: (a) initial legal fees pertaining to the Funds' Shares offered for sale; (b) initial Securities and Exchange Commission and state registration fees; and (c) initial fees paid to be listed on an exchange.
For the Dynamic MagniQuant Portfolio, the FTSE RAFI US 1000 Portfolio and the FTSE RAFI US 1500 Small-Mid Portfolio, the Excess Expense Agreement provides that the expenses borne by the Adviser are subject to recapture by the Adviser for up to three years from the date the fee or expense was borne by the Adviser, but no recapture payment will be made by a Fund if it would result in the Fund exceeding its Expense Cap as specified above. For the Dynamic Market Portfolio and the Dynamic OTC Portfolio, the expenses borne by the Adviser are not subject to recapture.
The amounts available for potential future recapture by the Adviser under the Excess Expense Agreement and the expiration schedule at April 30, 2011 are as follows:
| Total Potential | Potential Recapture Amounts Expiring | ||||||||||||||||||
| Recapture Amounts | 04/30/12 | 04/30/13 | 04/30/14 | ||||||||||||||||
| Dynamic MagniQuant Portfolio | $ | 317,352 | $ | 96,659 | $ | 99,281 | $ | 121,412 | |||||||||||
| FTSE RAFI US 1000 Portfolio | 836,821 | 77,826 | 319,051 | 439,944 | |||||||||||||||
| FTSE RAFI US 1500 Small-Mid Portfolio | 671,653 | 228,798 | 201,979 | 240,876 | |||||||||||||||
The Trust has entered into a Distribution Agreement with Invesco Distributors, Inc. (the "Distributor"), which serves as the distributor of Creation Units for each Fund. The Distributor does not maintain a secondary market in the Shares. The Distributor is an affiliate of the Adviser.
63
Notes to Financial Statements (Continued)
PowerShares Exchange-Traded Fund Trust
April 30, 2011
The Adviser has entered into a licensing agreement for each Fund with the following Licensors:
| Fund | Licensor | ||||||
| Dynamic MagniQuant Portfolio | NYSE Arca | ||||||
| Dynamic Market Portfolio | NYSE Arca | ||||||
| Dynamic OTC Portfolio | NYSE Arca | ||||||
| FTSE RAFI US 1000 Portfolio | FTSE International Ltd. | ||||||
| FTSE RAFI US 1500 Small-Mid Portfolio | FTSE International Ltd. | ||||||
Each Underlying Index name trademark is owned by the respective Licensors. These trademarks have been licensed to the Adviser for use with the Funds. The Funds are not sponsored, endorsed, sold or promoted by the Licensors and the Licensors make no representation regarding the advisability of investing in any of these Funds. The Trust has entered into a sub-licensing agreement under which the Funds are required to pay the sub-licensing fees which are shown on the Statements of Operations.
The Trust has entered into service agreements whereby The Bank of New York Mellon, a wholly-owned subsidiary of The Bank of New York Mellon Corporation, serves as the administrator, custodian, fund accountant and transfer agent for each Fund.
Note 4. Investments in Affiliates
The Fund's Adviser is a subsidiary of Invesco Ltd. and therefore, Invesco Ltd. and Invesco Mortgage Capital, Inc. REIT are considered to be affiliated with the Fund. The table below shows the transactions in and earnings from the investment in Invesco Ltd. and Invesco Mortgage Capital, Inc. REIT for the fiscal year ended April 30, 2011.
FTSE RAFI US 1000 Portfolio
| Value 04/30/10 | Purchases at Cost | Proceeds from Sales | Change in Unrealized Appreciation | Realized Gain | Value 04/30/11 | Dividend Income | |||||||||||||||||||||||||
| Invesco Ltd. | $ | 279,926 | $ | 387,666 | $ | (4,500 | ) | $ | 44,270 | $ | 2,104 | $ | 709,466 | $ | 7,208 | ||||||||||||||||
FTSE RAFI US 1500 Small-Mid Portfolio
| Value 04/30/10 | Purchases at Cost | Proceeds from Sales | Change in Unrealized Appreciation | Realized Gain | Value 04/30/11 | Dividend Income | |||||||||||||||||||||||||
| Invesco Mortgage Capital, Inc. REIT | $ | — | $ | 102,113 | $ | (11,432 | ) | $ | 2,368 | $ | (202 | ) | $ | 92,847 | $ | — | |||||||||||||||
Note 5. Additional Valuation Information
GAAP defines fair value as the price that would be received to sell an asset or paid to transfer a liability in an orderly transaction between market participants at the measurement date, under current market conditions. GAAP establishes a hierarchy that prioritizes the inputs to valuation methods giving the highest priority to readily available unadjusted quoted prices in an active market for identical assets (Level 1) and the lowest priority to significant unobservable inputs (Level 3) generally when market prices are not readily available or are unreliable. Based on the valuation inputs, the securities or other
64
Notes to Financial Statements (Continued)
PowerShares Exchange-Traded Fund Trust
April 30, 2011
investments are tiered into one of three levels. Changes in valuation methods may result in transfers in or out of an investment's assigned level:
Level 1 – Prices are determined using quoted prices in an active market for identical assets.
Level 2 – Prices are determined using other significant observable inputs. Observable inputs are inputs that other market participants may use in pricing a security. These may include quoted prices for similar securities, interest rates, prepayment speeds, credit risk yield curves, loss severities, default rates, discount rates, volatilities and others.
Level 3 – Prices are determined using significant unobservable inputs. In situations where quoted prices or observable inputs are unavailable (for example, when there is little or no market activity for an investment at the end of the period), unobservable inputs may be used. Unobservable inputs reflect the Fund's own assumptions about the factors market participants would use in determining fair value of the securities or instruments and would be based on the best available information.
Except for the Fund listed below, as of April 30, 2011, the securities in each Fund were valued based on Level 1 inputs. The level assigned to the securities valuations may not be an indication of the risk or liquidity associated with investing in those securities. Because of the inherent uncertainties of valuation, the values reflected in the financial statements may materially differ from the value received upon actual sale of those investments.
With respect to each Fund, during the fiscal year ended April 30, 2011, there were no significant transfers between investment levels.
| Investment in Securities | |||||||||||||||||||
| Level 1 | Level 2 | Level 3 | Total | ||||||||||||||||
| FTSE RAFI US 1500 Small-Mid Portfolio | |||||||||||||||||||
| Equity Securities | $ | 409,731,958 | $ | — | $ | 17,741 | $ | 409,749,699 | |||||||||||
| Money Market Fund | 298,871 | — | — | 298,871 | |||||||||||||||
| Total Investments | $ | 410,030,829 | $ | — | $ | 17,741 | $ | 410,048,570 | |||||||||||
Note 6. Distributions to Shareholders and Tax Components of Net Assets
Tax Character of Distributions to Shareholders Paid During the Fiscal Years Ended April 30, 2011 and 2010:
| 2011 | 2010 | ||||||||||||||||||
| Ordinary Income | Return of Capital | Ordinary Income | Return of Capital | ||||||||||||||||
| Dynamic MagniQuant Portfolio | $ | 213,106 | $ | — | $ | 149,699 | $ | — | |||||||||||
| Dynamic Market Portfolio | 2,885,329 | — | 2,569,156 | — | |||||||||||||||
| Dynamic OTC Portfolio | 84,849 | — | 61,560 | — | |||||||||||||||
| FTSE RAFI US 1000 Portfolio | 14,549,503 | — | 7,652,691 | — | |||||||||||||||
| FTSE RAFI US 1500 Small-Mid Portfolio | 2,570,205 | — | 1,105,854 | — | |||||||||||||||
65
Notes to Financial Statements (Continued)
PowerShares Exchange-Traded Fund Trust
April 30, 2011
Tax Components of Net Assets at Fiscal Year-End:
| Undistributed Ordinary Income | Temporary Book/Tax Differences | Net Unrealized Appreciation on Investments | Net Unrealized Appreciation on Other Investments | Capital Loss Carryforward | Post-October Deferrals* | Shares of Beneficial Interest | Total Net Assets | ||||||||||||||||||||||||||||
| Dynamic MagniQuant Portfolio | $ | 34,147 | $ | (5,036 | ) | $ | 3,699,446 | $ | — | $ | (26,523,046 | ) | $ | (377,381 | ) | $ | 50,196,324 | $ | 27,024,454 | ||||||||||||||||
| Dynamic Market Portfolio | 130,164 | (15,178 | ) | 16,186,177 | — | (349,412,599 | ) | (59,187 | ) | 521,377,907 | 188,207,284 | ||||||||||||||||||||||||
| Dynamic OTC Portfolio | — | (5,634 | ) | 5,899,163 | — | (78,915,217 | ) | (826,453 | ) | 114,168,819 | 40,320,678 | ||||||||||||||||||||||||
| FTSE RAFI US 1000 Portfolio | 3,567,518 | (23,480 | ) | 97,801,365 | — | (134,372,307 | ) | (6,119,616 | ) | 1,247,392,742 | 1,208,246,222 | ||||||||||||||||||||||||
| FTSE RAFI US 1500 Small-Mid Portfolio | 794,373 | (8,622 | ) | 46,451,839 | 1,568 | (16,003,048 | ) | (4,119,440 | ) | 382,709,371 | 409,826,041 | ||||||||||||||||||||||||
* Capital losses incurred after October 31 ("Post-October losses") within the taxable year are deemed to arise on the first business day of each Fund's next taxable year.
Capital loss carryforward is calculated and reported as of a specific date. Results of transactions and other activity after that date may affect the amount of capital loss carryforward actually available for the Funds to utilize. The ability to utilize capital loss carryforward in the future may be limited under Internal Revenue Code rules and related regulations based on the results of future transactions.
The following Funds have capital loss carryforward amounts as of April 30, 2011, which expire on April 30 of each year listed below:
| 2012 | 2013 | 2014 | 2015 | 2016 | 2017 | 2018 | 2019 | Total* | |||||||||||||||||||||||||||||||
| Dynamic MagniQuant Portfolio | $ | — | $ | — | $ | — | $ | — | $ | 5,211,608 | $ | 10,595,808 | $ | 7,191,135 | $ | 3,524,495 | $ | 26,523,046 | |||||||||||||||||||||
| Dynamic Market Portfolio | 8,920,879 | 5,021,729 | 13,686,812 | 65,552,628 | 39,899,556 | 96,635,542 | 104,214,879 | 15,480,574 | 349,412,599 | ||||||||||||||||||||||||||||||
| Dynamic OTC Portfolio | 651,452 | 5,297,385 | 5,449,844 | 21,767,708 | 11,353,752 | 15,764,010 | 14,947,690 | 3,683,376 | 78,915,217 | ||||||||||||||||||||||||||||||
| FTSE RAFI US 1000 Portfolio | — | — | — | 44,432 | 1,148,192 | 44,806,580 | 49,808,238 | 38,564,865 | 134,372,307 | ||||||||||||||||||||||||||||||
| FTSE RAFI US 1500 Small-Mid Portfolio | — | — | — | 5,818 | 128,460 | 8,229,508 | 5,168,127 | 2,471,135 | 16,003,048 | ||||||||||||||||||||||||||||||
* Capital loss carryforward as of the date listed above is reduced for limitations, if any, to the extent required by the Internal Revenue Code.
66
Notes to Financial Statements (Continued)
PowerShares Exchange-Traded Fund Trust
April 30, 2011
During the fiscal year ended April 30, 2011, the following capital loss carryforwards were expired:
| Amount | |||||||
| Dynamic Market Portfolio | $ | 225,469 | |||||
| Dynamic OTC Portfolio | 252,044 | ||||||
Note 7. Investment Transactions
For the fiscal year ended April 30, 2011, the cost of securities purchased and proceeds from sales of securities, excluding short-term securities, money market funds and in-kind transactions, were as follows:
| Purchases | Sales | ||||||||||
| Dynamic MagniQuant Portfolio | $ | 25,736,649 | $ | 25,673,178 | |||||||
| Dynamic Market Portfolio | 203,028,825 | 204,562,434 | |||||||||
| Dynamic OTC Portfolio | 28,324,705 | 28,006,087 | |||||||||
| FTSE RAFI US 1000 Portfolio | 82,167,342 | 79,315,928 | |||||||||
| FTSE RAFI US 1500 Small-Mid Portfolio | 62,887,073 | 62,781,972 | |||||||||
For the fiscal year ended April 30, 2011, in-kind transactions associated with creations and redemptions were as follows:
| Securities Received | Securities Delivered | ||||||||||
| Dynamic MagniQuant Portfolio | $ | 54,335,577 | $ | 57,597,474 | |||||||
| Dynamic Market Portfolio | 342,941,113 | 413,906,390 | |||||||||
| Dynamic OTC Portfolio | 48,235,614 | 55,409,724 | |||||||||
| FTSE RAFI US 1000 Portfolio | 485,763,270 | 75,591,145 | |||||||||
| FTSE RAFI US 1500 Small-Mid Portfolio | 214,503,734 | 157,822,176 | |||||||||
Gains and (losses) on in-kind transactions are generally not considered taxable gains and (losses) for Federal income tax purposes.
At April 30, 2011, the aggregate cost and the net unrealized appreciation of investments for tax purposes were as follows:
| Cost | Net Unrealized Appreciation | Gross Unrealized Appreciation | Gross Unrealized (Depreciation) | ||||||||||||||||
| Dynamic MagniQuant Portfolio | $ | 23,405,135 | $ | 3,699,446 | $ | 3,949,145 | $ | (249,699 | ) | ||||||||||
| Dynamic Market Portfolio | 172,136,632 | 16,186,177 | 18,086,794 | (1,900,617 | ) | ||||||||||||||
| Dynamic OTC Portfolio | 34,496,894 | 5,899,163 | 6,247,297 | (348,134 | ) | ||||||||||||||
| FTSE RAFI US 1000 Portfolio | 1,110,457,771 | 97,801,365 | 143,514,820 | (45,713,455 | ) | ||||||||||||||
| FTSE RAFI US 1500 Small-Mid Portfolio | 363,596,731 | 46,453,407 | 61,806,123 | (15,352,716 | ) | ||||||||||||||
Note 8. Reclassification of Permanent Differences
Primarily as a result of differing book/tax treatment of investment activity and expiring capital loss carryforwards, on April 30, 2011, amounts were reclassified between undistributed net investment income
67
Notes to Financial Statements (Continued)
PowerShares Exchange-Traded Fund Trust
April 30, 2011
(loss), undistributed net realized gain (loss) and Shares of beneficial interest. These reclassifications had no effect on the net assets of each Fund. For the fiscal year ended April 30, 2011, the reclassifications were as follows:
| Undistributed Net Investment Income (Loss) | Undistributed Net Realized Gain (Loss) | Shares of Beneficial Interest | |||||||||||||
| Dynamic MagniQuant Portfolio | $ | 16,420 | $ | (6,184,165 | ) | $ | 6,167,745 | ||||||||
| Dynamic Market Portfolio | 163,734 | (46,987,292 | ) | 46,823,558 | |||||||||||
| Dynamic OTC Portfolio | 38,661 | (9,528,255 | ) | 9,489,594 | |||||||||||
| FTSE RAFI US 1000 Portfolio | (2,166,790 | ) | (20,633,659 | ) | 22,800,449 | ||||||||||
| FTSE RAFI US 1500 Small-Mid Portfolio | (153,418 | ) | (46,798,123 | ) | 46,951,541 | ||||||||||
Note 9. Trustees' Fees
The Fund compensates each Trustee who is not an 'interested person" as defined in the 1940 Act (an "Independent Trustee"). The Non-Independent Trustees of the Trust do not receive any Trustees' fees.
The Trust has adopted a deferred compensation plan (the "Plan"). Under the Plan, an Independent Trustee who has executed a Deferred Fee Agreement (a "Participating Trustee") may defer receipt of all or a portion of his compensation ("Deferral Fees"). Such Deferral Fees are deemed to be invested in select PowerShares Funds. The Deferral Fees payable to the Participating Trustee are valued as of the date such Deferral Fees would have been paid to the Participating Trustee. The value increases with contributions or with increases in the value of the Shares selected, and the value decreases with distributions or with declines in the value of the Shares selected.
Note 10. Capital
Shares are created and redeemed by the Trust only in Creation Unit size aggregations of 50,000 Shares. Only Authorized Participants are permitted to purchase or redeem Creation Units from the Funds. Such transactions are generally permitted on an in-kind basis, with a balancing cash component to equate the transaction to the NAV per Share of each Fund of the Trust on the transaction date. Cash may be substituted equivalent to the value of certain securities generally when they are not available in sufficient quantity for delivery, not eligible for trading by the Authorized Participant or as a result of other market circumstances.
Note 11. Indemnifications
Under the Trust's organizational documents, its officers and Trustees are indemnified against certain liabilities arising out of the performance of their duties to the Trust. Each Independent Trustee is also indemnified against certain liabilities arising out of the performance of his duties to the Trust pursuant to an Indemnification Agreement between the Independent Trustee and the Trust. Additionally, in the normal course of business, the Trust enters into contracts with service providers that contain general indemnification clauses. The Trust's maximum exposure under these arrangements is unknown, as this would involve future claims that may be made against the Trust that have not yet occurred. However, based on experience, the Trust believes the risk of loss to be remote.
68
Report of Independent Registered Public Accounting Firm
To the Board of Trustees and Shareholders of PowerShares Exchange-Traded Fund Trust:
In our opinion, the accompanying statements of assets and liabilities, including the schedules of investments, and the related statements of operations and of changes in net assets and the financial highlights present fairly, in all material respects, the financial position of each of the portfolios indicated in Note 1 of the financial statements (each a portfolio of PowerShares Exchange-Traded Fund Trust, hereafter referred to as the "Trust") at April 30, 2011, and the results of each of their operations, the changes in each of their net assets, and the financial highlights for each of the periods presented, in conformity with accounting principles generally accepted in the United States of America. These financial statements and financial highlights (hereafter referred to as "financial statements") are the responsibility of the Trust's management; our responsibility is to express an opinion on these financial statements based on our audits. We conducted our audits of these financial statements in accordance with the standards of the Public Company Accounting Oversight Board (United States). Those standards require that we plan and perform the audit to obtain reasonable assurance about whether the financial statements are free of material misstatement. An audit includes examining, on a test basis, evidence supporting the amounts and disclosures in the financial statements, assessing the accounting principles used and significant estimates made by management, and evaluating the overall financial statement presentation. We believe that our audits, which included confirmation of securities at April 30, 2011 by correspondence with the custodian and brokers, and the application of alternative auditing procedures where securities purchased had not been received, provide a reasonable basis for our opinion.
/s/ PricewaterhouseCoopers LLP
New York, New York
June 24, 2011
69
Tax Information
Form 1099-DIV, Form 1042-S and other year-end tax information provide shareholders with actual calendar year amounts that should be included in their tax returns. Shareholders should consult their tax advisors.
The following distribution information is being provided as required by the Internal Revenue Code or to meet a specific state's requirement.
Each Fund designates the following amounts or, if subsequently determined to be different the maximum amount allowable for its fiscal year ended April 30, 2011:
Federal Income Tax Information
| Qualified Dividend Income* | Corporate Dividends Received Deduction* | ||||||||||
| Dynamic MagniQuant Portfolio | 100 | % | 100 | % | |||||||
| Dynamic Market Portfolio | 100 | % | 100 | % | |||||||
| Dynamic OTC Portfolio | 100 | % | 100 | % | |||||||
| FTSE RAFI US 1000 Portfolio | 100 | % | 100 | % | |||||||
| FTSE RAFI US 1500 Small-Mid Portfolio | 100 | % | 100 | % | |||||||
* The above percentages are based on ordinary income dividends paid to shareholders during the Fund's fiscal year.
70
Trustees and Officers
The Independent Trustees, the Trustees who are affiliated with the Adviser (the "Non-Independent Trustees") and the executive officers of the Trust, their term of office and length of time served, their principal business occupations during at least the past five years, the number of portfolios in the Fund Complex overseen by each Trustee and the other directorships, if any, held by a Trustee, are shown below.
The Trustees and officers information is current as of April 30, 2011.
| Name, Address, and Age of Independent Trustees | Position(s) Held with Trust | Term of Office and Length of Time Served* | Principal Occupation(s) During Past 5 Years | Number of Portfolios in Fund Complex Overseen by Independent Trustees | Other Directorships Held by Independent Trustees | ||||||||||||||||||
| Ronn R. Bagge (53) c/o Invesco PowerShares Capital Management LLC 301 West Roosevelt Road Wheaton, IL 60187 | Trustee | Since 2003 | Founder and Principal, YQA Capital Management LLC (1998-Present); formerly Owner/CEO of Electronic Dynamic Balancing Co., Inc. (high-speed rotating equipment service provider) | 107 | None | ||||||||||||||||||
| Todd J. Barre (53) c/o Invesco PowerShares Capital Management LLC 301 West Roosevelt Road Wheaton, IL 60187 | Trustee | Since 2010 | Assistant Professor of Business, Trinity Christian College (2010-Present); formerly Vice President and Senior Investment Strategist (2001-2008); Director of Open Architecture and Trading (2007- 2008); Head of Fundamental Research (2004-2007); and Vice President and Senior Fixed Income Strategist (1994-2001), BMO Financial Group/Harris Private Bank | 107 | None | ||||||||||||||||||
* This is the date the Trustee began serving the Trust. Each Trustee serves an indefinite term, until his successor is elected.
** Fund Complex includes all open-end funds (including all of their portfolios) advised by the Adviser. At April 30, 2011, the Fund Complex consisted of the Trust's 56 portfolios and three other exchange-traded fund trusts with 51 portfolios advised by the Adviser.
71
Trustees and Officers (Continued)
| Name, Address, and Age of Independent Trustees | Position(s) Held with Trust | Term of Office and Length of Time Served* | Principal Occupation(s) During Past 5 Years | Number of Portfolios in Fund Complex Overseen by Independent Trustees | Other Directorships Held by Independent Trustees | ||||||||||||||||||
| Marc M. Kole (50) c/o Invesco PowerShares Capital Management LLC 301 West Roosevelt Road Wheaton, IL 60187 | Trustee | Since 2006 | Chief Financial Officer, Hope Network (social services) (2008-Present); formerly Assistant Vice President and Controller, Priority Health (health insurance) (2005-2008); Senior Vice President of Finance, United Healthcare (2004-2005); Senior Vice President of Finance, Oxford Health Plans (2000-2004) | 107 | None | ||||||||||||||||||
| Philip M. Nussbaum (49) c/o Invesco PowerShares Capital Management LLC 301 West Roosevelt Road Wheaton, IL 60187 | Trustee | Since 2003 | Chairman, Performance Trust Capital Partners (2004-Present) | 107 | None | ||||||||||||||||||
* This is the date the Trustee began serving the Trust. Each Trustee serves an indefinite term, until his successor is elected.
** Fund Complex includes all open-end funds (including all of their portfolios) advised by the Adviser. At April 30, 2011, the Fund Complex consisted of the Trust's 56 portfolios and three other exchange-traded fund trusts with 51 portfolios advised by the Adviser.
72
Trustees and Officers (Continued)
| Name, Address, and Age of Independent Trustees | Position(s) Held with Trust | Term of Office and Length of Time Served* | Principal Occupation(s) During Past 5 Years | Number of Portfolios in Fund Complex Overseen by Independent Trustees | Other Directorships Held by Independent Trustees | ||||||||||||||||||
| Donald H. Wilson (51) c/o Invesco PowerShares Capital Management LLC 301 West Roosevelt Road Wheaton, IL 60187 | Trustee | Since 2006 | Chairman and Chief Executive Officer, Stone Pillar Advisers, Ltd. (2010-Present); formerly, Chief Operating Officer, AMCORE Financial, Inc. (bank holding company) (2007-2009); Executive Vice President and Chief Financial Officer, AMCORE Financial, Inc. (2006-2007); Senior Vice President and Treasurer, Marshall & Ilsley Corp. (bank holding company) (1995-2006) | 107 | None | ||||||||||||||||||
* This is the date the Trustee began serving the Trust. Each Trustee serves an indefinite term, until his successor is elected.
** Fund Complex includes all open-end funds (including all of their portfolios) advised by the Adviser. At April 30, 2011, the Fund Complex consisted of the Trust's 56 portfolios and three other exchange-traded fund trusts with 51 portfolios advised by the Adviser.
73
Trustees and Officers (Continued)
| Name, Address, and Age of Interested Trustees | Position(s) Held with Trust | Term of Office and Length of Time Served* | Principal Occupation(s) During Past 5 Years | Number of Portfolios in Fund Complex Overseen by Interested Trustees | Other Directorships Held by Interested Trustees | ||||||||||||||||||
| H. Bruce Bond (47) Invesco PowerShares Capital Management LLC 301 West Roosevelt Road Wheaton, IL 60187 | Chairman of the Board and Trustee | Since 2003 | Chairman, Invesco PowerShares Capital Management LLC (2009-Present); formerly, Managing Director, Invesco PowerShares Capital Management LLC (2002-2009); Manager, Nuveen Investments (1998-2002) | 107 | None | ||||||||||||||||||
* This is the date the Interested Trustee began serving the Trust. Each Trustee serves an indefinite term, until his successor is elected.
** Fund Complex includes all open-end funds (including all of their portfolios) advised by the Adviser. At April 30, 2011, the Fund Complex consists of the Trust's 56 portfolios and three other exchange-traded fund trusts with 51 portfolios advised by the Adviser.
74
Trustees and Officers (Continued)
| Name, Address, and Age of Interested Trustees | Position(s) Held with Trust | Term of Office and Length of Time Served* | Principal Occupation(s) During Past 5 Years | Number of Portfolios in Fund Complex Overseen by Interested Trustees | Other Directorships Held by Interested Trustees | ||||||||||||||||||
| Kevin M. Carome (54) Invesco Ltd. Two Peachtree Pointe 1555 Peachtree St., N.E., Suite 1800 Atlanta, GA 30309 | Trustee | Since 2010 | Senior Managing Director and General Counsel, Invesco Ltd. (2006-Present); formerly, Senior Vice President and General Counsel, Invesco Advisors, Inc. (2003-2005); Senior Vice President and General Counsel, Liberty Financial Companies, Inc. (2000-2001); General Counsel of certain investment management subsidiaries of Liberty Financial Companies, Inc. (1998-2000); Associate General Counsel, Liberty Financial Companies, Inc. (1993-1998); Associate, Ropes & Gray LLP | 107 | None | ||||||||||||||||||
* This is the date the Interested Trustee began serving the Trust. Each Trustee serves an indefinite term, until his successor is elected.
** Fund Complex includes all open-end funds (including all of their portfolios) advised by the Adviser. At April 30, 2011, the Fund Complex consisted of the Trust's 56 portfolios and three other exchange-traded fund trusts with 51 portfolios advised by the Adviser.
75
Trustees and Officers (Continued)
| Name, Address, and Age of Executive Officer | Position(s) Held with Trust | Length of Time Served* | Principal Occupation(s) During Past 5 Years | ||||||||||||
| Andrew Schlossberg (36) Invesco Management Group, Inc. 11 Greenway Plaza Suite 100 Houston, Texas 77046 | President | Since 2009 | Managing Director, U.S. head of business strategy and chief marketing officer for Invesco Ltd. In the United States (2008-Present); formerly, Mr. Schlossberg served in multiple roles within Invesco, including head of corporate development, as well as global leadership roles in strategy and product development in the company's North American Institutional and Retirement divisions (2002-2007) | ||||||||||||
| Bruce T. Duncan (56) Invesco PowerShares Capital Management LLC 301 West Roosevelt Road Wheaton, IL 60187 | Treasurer and Secretary | Treasurer since 2006 and Secretary since 2008 | Senior Vice President of Finance, Invesco PowerShares Capital Management LLC (2005-Present); formerly Private Practice Attorney (2000-2005); Vice President of Investor Relations, The ServiceMaster Company (1994-2000); Vice President of Taxes, The ServiceMaster Company (1990-2000) | ||||||||||||
| Benjamin Fulton (49) Invesco PowerShares Capital Management LLC 301 West Roosevelt Road Wheaton, IL 60187 | Vice President | Since 2009 | Executive Vice President – Global Product Development, Invesco PowerShares Capital Management LLC (2005-Present); formerly principal of Clermont Consulting, a consulting firm focused on the creation and development of retail investment products (2003-2005); President and a founding partner of Claymore Securities, a financial services firm in the Chicago land area (2001-2003); Managing Director of Structured Investments at Nuveen Investments (1998-2001) | ||||||||||||
| Peter Hubbard (29) Invesco PowerShares Capital Management LLC 301 West Roosevelt Road Wheaton, IL 60187 | Vice President | Since 2009 | Vice President and Director of Portfolio Management – Invesco PowerShares Capital Management LLC (2008- Present); formerly Portfolio Manager, Invesco PowerShares Capital Management LLC (2007-2008); Research Analyst, Invesco PowerShares Capital Management LLC (2005-2007); Research Analyst and Trader, Ritchie Capital, a hedge fund operator (2003-2005) | ||||||||||||
* This is the period for which the Officers began serving the Trust. Each Officer serves a one-year term, until his successor is elected.
76
Trustees and Officers (Continued)
| Name, Address, and Age of Executive Officer | Position(s) Held with Trust | Length of Time Served* | Principal Occupation(s) During Past 5 Years | ||||||||||||
| David Warren (53) Invesco Trimark Ltd. 5140 Yonge Street Suite 900 Toronto, Ontario M2N 6X7 | Vice President | Since 2009 | Director, Executive Vice President and Chief Financial Officer, Invesco Trimark Ltd. and Chief Administrative Officer, North American Retail, Invesco Ltd (2007-Present); formerly, Director, Executive Vice President and Chief Financial Officer, Invesco Trimark Ltd. (2000-2006) | ||||||||||||
| Todd Spillane (51) Invesco Management Group, Inc. 11 Greenway Plaza Suite 100 Houston, Texas 77046 | Chief Compliance Officer | Since 2010 | Senior Vice President, Invesco Management Group, Inc.; Chief Compliance Officer, INVESCO Private Capital Investments, Inc. (holding company), Invesco Private Capital, Inc. (registered investment adviser) and Invesco Senior Secured Management, Inc. (registered investment adviser); Chief Compliance Officer and Senior Vice President, Invesco Advisers, Inc. (formerly Invesco Institutional, (N.A.), Inc. – registered investment adviser) and Vice President, Invesco Distributors, Inc. and Invesco Investment Services, Inc.; formerly Chief Compliance Officer, Invesco Global Asset Management (N.A.), Inc. – registered investment adviser) and Invesco Advisers, Inc. (formerly Invesco Institutional (N.A.), Inc.) (registered investment adviser); Senior Vice President and Chief Compliance Officer, Invesco Advisors, Inc., Invesco Capital Management, Inc. and Invesco Private Asset Management, Inc.; Vice President, Invesco Capital Management, Inc. and Fund Management Company | ||||||||||||
Availability of Additional Information About the Trustees
The Statement of Additional Information includes additional information about the Trustees and is available, without charge, upon request at (800) 983-0903.
* This is the period for which the Officers began serving the Trust. Each Officer serves a one-year term, until his successor is elected.
77
Board Considerations Regarding Continuation of Investment Advisory Agreement
At a meeting held on April 14, 2011, the Board of Trustees of the PowerShares Exchange-Traded Fund Trust (the "Trust"), including the Independent Trustees, unanimously approved the continuation of the Investment Advisory Agreement between Invesco PowerShares Capital Management LLC (the "Adviser") and the Trust for the following 54 series (each, a "Fund" and collectively, the "Funds"):
PowerShares Dynamic Market Portfolio
PowerShares Dynamic OTC Portfolio
PowerShares Golden Dragon Halter USX China Portfolio
PowerShares High Yield Equity Dividend AchieversTM Portfolio
PowerShares WilderHill Clean Energy Portfolio
PowerShares Dynamic Large Cap Growth Portfolio
PowerShares Dynamic Large Cap Value Portfolio
PowerShares Dynamic Mid Cap Growth Portfolio
PowerShares Dynamic Mid Cap Value Portfolio
PowerShares Dynamic Small Cap Growth Portfolio
PowerShares Dynamic Small Cap Value Portfolio
PowerShares Dynamic Biotechnology & Genome Portfolio
PowerShares Dynamic Food & Beverage Portfolio
PowerShares Dynamic Leisure and Entertainment Portfolio
PowerShares Dynamic Media Portfolio
PowerShares Dynamic Networking Portfolio
PowerShares Dynamic Pharmaceuticals Portfolio
PowerShares Dynamic Semiconductors Portfolio
PowerShares Dynamic Software Portfolio
PowerShares Zacks Micro Cap Portfolio
PowerShares Aerospace & Defense Portfolio
PowerShares Morningstar StockInvestor Core Portfolio
PowerShares Dividend AchieversTM Portfolio
PowerShares International Dividend AchieversTM Portfolio
PowerShares Dynamic Building and Construction Portfolio
PowerShares Dynamic Energy Exploration and Production Portfolio
PowerShares WilderHill Progressive Energy Portfolio
PowerShares Dynamic Insurance Portfolio
PowerShares Dynamic Oil and Gas Services Portfolio
PowerShares Dynamic Retail Portfolio
PowerShares Dynamic Utilities Portfolio
PowerShares Lux Nanotech Portfolio
PowerShares FTSE RAFI US 1000 Portfolio
PowerShares FTSE RAFI US 1500 Small-Mid Portfolio
PowerShares Water Resources Portfolio
PowerShares Dynamic Energy Sector Portfolio
PowerShares Dynamic Financial Sector Portfolio
PowerShares Dynamic Healthcare Sector Portfolio
PowerShares Dynamic Industrials Sector Portfolio
PowerShares Dynamic Large Cap Portfolio
PowerShares Dynamic MagniQuant Portfolio
PowerShares Dynamic Mid Cap Portfolio
PowerShares Dynamic Small Cap Portfolio
PowerShares Dynamic Technology Sector Portfolio
PowerShares Buyback AchieversTM Portfolio
PowerShares CleantechTM Portfolio
PowerShares Dynamic Banking Portfolio
PowerShares Dynamic Basic Materials Sector Portfolio
PowerShares Dynamic Consumer Discretionary Sector Portfolio
PowerShares Dynamic Consumer Staples Sector Portfolio
PowerShares Financial Preferred Portfolio
PowerShares Global Listed Private Equity Portfolio
PowerShares DWA Technical LeadersTM Portfolio
PowerShares S&P 500® High Quality Portfolio
The Trustees reviewed information from the Adviser describing: (i) the nature, extent and quality of services provided, (ii) the investment performance of the Funds and the Adviser, (iii) the costs of services provided and estimated profits realized by the Adviser, (iv) the extent to which economies of scale are
78
Board Considerations Regarding Continuation of Investment Advisory Agreement (Continued)
realized as the Funds grow, (v) whether fee levels reflect any possible economies of scale for the benefit of Fund shareholders, (vi) comparisons of services rendered and amounts paid to other registered investment companies and (vii) any benefits realized by the Adviser from its relationship with each Fund. Based on all of the information considered and the conclusions reached, the Board, including the Independent Trustees, determined to approve the continuation of the Investment Advisory Agreement for each Fund. No single factor was determinative in the Board's analysis.
Nature, Extent and Quality of Services. In evaluating the nature, extent and quality of the Adviser's services, the Trustees reviewed information concerning the functions performed by the Adviser for the Funds, information describing the Adviser's current organization and projected staffing, including operations assistance provided by the Adviser's parent organization, Invesco Ltd., and the background and experience of the persons responsible for the day-to-day management of the Funds. The Trustees reviewed matters related to the Adviser's execution of portfolio transactions on behalf of the Funds. The Trustees also reviewed information on the performance of the Funds and the performance of their underlying indices through December 31, 2010, including reports on the correlation and tracking error between the underlying index and each Fund's performance, as well as the Adviser's analysis of the tracking error between each Fund and its underlying index. The Trustees noted that, in each case, the correlation and tracking error for each Fund was within the targeted range set forth in the Trust's registration statement. The Trustees concluded that each Fund was correlated to its underlying index and that the tracking error for each Fund was within an acceptable range given that Fund's particular circumstances.
The Trustees also considered the services provided by the Adviser in its oversight of the Funds' administrator, custodian and transfer agent. They noted the significant amount of time and effort that had been devoted to this oversight function.
Based on their review, the Trustees concluded that the nature, extent and quality of services provided by the Adviser to the Funds under the Investment Advisory Agreement were appropriate and reasonable.
Fees, Expenses and Profitability. The Trustees reviewed and discussed the information provided by the Adviser on each Fund's expense ratio and advisory fee, as compared to information compiled by the Adviser from Lipper Inc. databases on the expense ratios of comparable exchange-traded funds ("ETFs"), open-end (non-ETF) index funds and open-end actively-managed funds. The Trustees noted that the annual advisory fee charged to each Fund is:
• 0.50% of the Fund's average net assets, for each Fund other than PowerShares High Yield Equity Dividend AchieversTM Portfolio, PowerShares Dividend AchieversTM Portfolio, PowerShares International Dividend AchieversTM Portfolio, PowerShares FTSE RAFI US 1000 Portfolio and PowerShares FTSE RAFI US 1500 Small-Mid Portfolio;
• 0.40% of the Fund's average net assets, for each of PowerShares High Yield Equity Dividend AchieversTM Portfolio, PowerShares Dividend AchieversTM Portfolio and PowerShares International Dividend AchieversTM Portfolio; and
• 0.29% of the Fund's average net assets, for each of PowerShares FTSE RAFI US 1000 Portfolio and PowerShares FTSE RAFI US 1500 Small-Mid Portfolio.
79
Board Considerations Regarding Continuation of Investment Advisory Agreement (Continued)
The Trustees also noted that the Adviser has agreed to waive a portion of its advisory fee and/or pay expenses (an "Expense Cap") to the extent necessary to prevent the annual operating expenses of each Fund from exceeding the percentage of that Fund's average daily net assets, at least until August 31, 2012, as set forth below:
• 0.60%, excluding interest expenses, brokerage commissions and other trading expenses, taxes and extraordinary expenses, for each of PowerShares Dynamic OTC Portfolio and PowerShares Dynamic Market Portfolio;
• 0.50%, excluding interest expenses, licensing fees, offering costs, brokerage commissions and other trading expenses, taxes and extraordinary expenses, for each of PowerShares High Yield Equity Dividend AchieversTM Portfolio, PowerShares Dividend AchieversTM Portfolio and PowerShares International Dividend AchieversTM Portfolio;
• 0.50%, excluding interest expenses, offering costs, brokerage commissions and other trading expenses, taxes and extraordinary expenses, for each of PowerShares Morningstar StockInvestor Core Portfolio and PowerShares S&P 500® High Quality Portfolio (the Trustees noted that the Expense Cap for each of these Funds was reduced to 0.50% effective July 1, 2010);
• 0.39%, excluding interest expenses, offering costs, brokerage commissions and other trading expenses, taxes and extraordinary expenses, for each of PowerShares FTSE RAFI US 1000 Portfolio and PowerShares FTSE RAFI US 1500 Small-Mid Portfolio; and
• 0.60%, excluding interest expenses, licensing fees, offering costs, brokerage commissions and other trading expenses, taxes and extraordinary expenses, for each other Fund.
The Trustees noted that the Adviser represented that it does not provide investment advisory services to any clients other than the Funds and other ETFs overseen by the Board. The Trustees noted that each Fund's advisory fee was:
• higher than the median advisory fee of its ETF peer funds (except for the advisory fee of each of PowerShares Financial Preferred Portfolio, PowerShares FTSE RAFI US 1000 Portfolio, PowerShares Global Listed Private Equity Portfolio and PowerShares Golden Dragon Halter USX China Portfolio, which was equal to or lower than the median advisory fee of its ETF peer funds); and
• higher than the median advisory fee of its open-end index peer funds (except for the advisory fee of each of PowerShares DWA Technical LeadersTM Portfolio, PowerShares Dynamic Banking Portfolio, PowerShares Dynamic Basic Materials Sector Portfolio, PowerShares Dynamic Biotechnology & Genome Portfolio, PowerShares Dynamic Financial Sector Portfolio, PowerShares Dynamic Healthcare Portfolio, PowerShares Dynamic Insurance Portfolio, PowerShares Dynamic Mid Cap Growth Portfolio, PowerShares Dynamic Networking Portfolio, PowerShares Dynamic OTC Portfolio, PowerShares Dynamic Pharmaceuticals Portfolio, PowerShares Dynamic Semiconductors Portfolio, PowerShares Dynamic Small Cap Growth Portfolio, PowerShares Dynamic Software Portfolio, PowerShares Dynamic Technology Sector Portfolio, PowerShares Golden Dragon Halter USX China Portfolio, PowerShares Lux Nanotech Portfolio, PowerShares Morningstar StockInvestor Core Portfolio and PowerShares S&P 500® High Quality Portfolio, which was equal to or lower than
80
Board Considerations Regarding Continuation of Investment Advisory Agreement (Continued)
the median advisory fee of its open-end index peer funds, and there was no comparable data for PowerShares Financial Preferred Portfolio or PowerShares Global Listed Private Equity Portfolio); but
• lower than the median advisory fee of its open-end actively-managed peer funds.
The Trustees determined that the advisory fees were reasonable, noting the complexity of the indices, which generally require more frequent rebalancing of the portfolios, the distinguishing factors of the Funds, and the higher administrative, operational and management oversight costs for the Adviser. With respect to the Funds' expense ratios, the Trustees noted that the net expense ratio for each Fund was:
• higher than the median expense ratio of its ETF peer funds (except for the net expense ratio of each of PowerShares Dynamic Market Portfolio, PowerShares Dynamic OTC Portfolio, PowerShares FTSE RAFI US 1000 Portfolio, PowerShares Golden Dragon Halter USX China Portfolio and PowerShares S&P 500® High Quality Portfolio, which was equal to or less than the median expense ratio of its ETF peer funds); and
• higher than the median expense ratio of its open-end index peer funds (except for the net expense ratio of each of PowerShares Aerospace & Defense Portfolio, PowerShares CleantechTM Portfolio, PowerShares DWA Technical LeadersTM Portfolio, PowerShares Dynamic Banking Portfolio, PowerShares Dynamic Basic Materials Sector Portfolio, PowerShares Dynamic Biotechnology & Genome Portfolio, PowerShares Dynamic Building & Construction Portfolio, PowerShares Dynamic Consumer Discretionary Sector Portfolio, PowerShares Dynamic Consumer Staples Sector Portfolio, PowerShares Dynamic Financial Sector Portfolio, PowerShares Dynamic Food & Beverage Portfolio, PowerShares Dynamic Healthcare Portfolio, PowerShares Dynamic Industrials Sector Portfolio, PowerShares Dynamic Insurance Portfolio, PowerShares Dynamic Large Cap Portfolio, PowerShares Dynamic Large Cap Growth Portfolio, PowerShares Dynamic Leisure and Entertainment Portfolio, PowerShares Dynamic Media Portfolio, PowerShares Dynamic Mid Cap Growth Portfolio, PowerShares Morningstar StockInvestor Core Portfolio, PowerShares Dynamic Networking Portfolio, PowerShares Dynamic OTC Portfolio, PowerShares Dynamic Pharmaceuticals Portfolio, PowerShares Dynamic Retail Portfolio, PowerShares Dynamic Semiconductors Portfolio, PowerShares Dynamic Small Cap Growth Portfolio, PowerShares Dynamic Small Cap Value Portfolio, PowerShares Dynamic Software Portfolio, PowerShares Dynamic Technology Sector Portfolio, PowerShares Dynamic Utilities Sector Portfolio, PowerShares FTSE RAFI US 1000 Portfolio, PowerShares FTSE RAFI US 1500 Small-Mid Portfolio, PowerShares Golden Dragon Halter USX China Portfolio, PowerShares Lux Nanotech Portfolio and PowerShares S&P 500® High Quality Portfolio, which was equal to or lower than the median expense ratio of its open-end index peer funds, and there was no comparable data for PowerShares Financial Preferred Portfolio or PowerShares Global Listed Private Equity Portfolio); but
• lower than the median expense ratio of its open-end actively-managed peer funds.
The Trustees noted that a significant component of the non-advisory fee expenses was the license fees paid by the Funds, and those Funds for which license fees are included in the Funds' Expense Caps.
The Board concluded that the advisory fee and expense ratio of each Fund (giving effect to the Fund's Expense Cap) were reasonable and appropriate in light of the services provided.
81
Board Considerations Regarding Continuation of Investment Advisory Agreement (Continued)
In conjunction with their review of fees, the Trustees also considered information provided by the Adviser on the revenues received by the Adviser under the Investment Advisory Agreement for each Fund, as well as the fees waived and expenses reimbursed by the Adviser for the Funds. The Trustees reviewed information provided by the Adviser on its profitability as well as any profits or losses realized by the Adviser from its relationship to each Fund. The Trustees concluded that the estimated profitability to the Adviser of the advisory services provided to any of the Funds was not unreasonable.
Also at the April 14, 2011 meeting, the Adviser proposed reducing the annual advisory fee for each of PowerShares Dynamic Large Cap Portfolio, PowerShares Dynamic Mid Cap Growth Portfolio, PowerShares Dynamic Mid Cap Portfolio, PowerShares Dynamic Mid Cap Value Portfolio, PowerShares Dynamic Small Cap Growth Portfolio, PowerShares Dynamic Small Cap Portfolio and PowerShares Dynamic Small Cap Value Portfolio (each, a "Style Fund") effective June 16, 2011. The Adviser also proposed revising each Style Fund's Expense Cap that is in place until August 31, 2012 to further reduce each Style Fund's annual operating expenses effective June 16, 2011. The Board considered the Adviser's representation that there would be no diminution in the quantity or quality of services provided to each Style Fund in connection with the amendment to the Investment Advisory Agreement to reflect the advisory fee changes. The Board concluded for each Style Fund that the reduced advisory fee was appropriate, and determined to approve the amended Investment Advisory Agreement and amended Expense Cap, effective June 16, 2011.
Economies of Scale and Whether Fee Levels Reflect These Economies of Scale. The Trustees reviewed the information provided by the Adviser as to the extent to which economies of scale are realized as each Fund grows and whether fee levels reflect economies of scale for the benefit of shareholders. The Trustees reviewed each Fund's asset size, expense ratio and expense limitation agreed to by the Adviser. The Trustees noted that, for Funds whose expenses are higher than their respective Expense Caps, any reduction in that Fund's expenses would be enjoyed by the Adviser, but that Fund shareholders benefit from the lower expense ratio as a result of the Fund's Expense Cap. The Trustees also noted that the Excess Expense Agreement with the Trust provides that the Adviser is entitled to be reimbursed by each Fund, other than PowerShares Dynamic Market Portfolio and PowerShares Dynamic OTC Portfolio, for fees waived or expenses absorbed pursuant to the Expense Cap for a period of three years from the date the fee or expense was incurred, provided that no reimbursement would be made that would result in a Fund exceeding its Expense Cap. The Trustees considered whether the advisory fee rate for each Fund was reasonable in relation to the asset size of that Fund, and concluded that the flat advisory fee was reasonable and appropriate, noting the Fund expenses the Adviser has borne as a result of the Expense Cap.
The Trustees noted that the Adviser had not identified any further benefits that it derived from its relationship with the Funds and had noted that it does not have any soft-dollar arrangements.
Based on all of the information considered and the conclusions reached, the Board, including the Independent Trustees, determined to approve the continuation of the Investment Advisory Agreement for each Fund. No single factor was determinative in the Board's analysis.
82
This page intentionally left blank
This page intentionally left blank
PROXY VOTING POLICIES AND PROCEDURES
A description of the Funds' proxy voting policies and procedures that the Funds use to determine how to vote proxies relating to portfolio securities is available, without charge and upon request, by calling (800) 983-0903. This information is also available on the Securities and Exchange Commission's ("Commission") website at www.sec.gov.
Information regarding how the Funds voted proxies for portfolio securities, if applicable, during the most recent 12-month period ended June 30, is also available, without charge and upon request, by (i) calling (800) 983-0903; or (ii) accessing the Funds' Form N-PX on the Commission's website at www.sec.gov.
QUARTERLY PORTFOLIOS
The Funds file their complete schedules of portfolio holdings with the Commission for the first and third quarters of each fiscal year on Form N-Q. The Funds' Form N-Qs are available on the Commission's website at www.sec.gov. The Funds' Form N-Qs may also be reviewed and copied at the Commission's Public Reference Room in Washington, D.C.; information on the operation of the Public Reference Room may be obtained by calling (800) SEC-0330.


301 West Roosevelt Road
Wheaton, IL 60187
800.983.0903
www.invescopowershares.com
© 2011 Invesco PowerShares Capital Management LLC P-PS-AR-2


2011 Annual Report to Shareholders
April 30, 2011
PowerShares Dynamic Banking Portfolio (PJB)
PowerShares Dynamic Biotechnology & Genome Portfolio (PBE)
PowerShares Dynamic Building & Construction Portfolio (PKB)
PowerShares Dynamic Energy Exploration & Production Portfolio (PXE)
PowerShares Dynamic Food & Beverage Portfolio (PBJ)
PowerShares Dynamic Insurance Portfolio (PIC)
PowerShares Dynamic Leisure and Entertainment Portfolio (PEJ)
PowerShares Dynamic Media Portfolio (PBS)
PowerShares Dynamic Networking Portfolio (PXQ)
PowerShares Dynamic Oil & Gas Services Portfolio (PXJ)
PowerShares Dynamic Pharmaceuticals Portfolio (PJP)
PowerShares Dynamic Retail Portfolio (PMR)
PowerShares Dynamic Semiconductors Portfolio (PSI)
PowerShares Dynamic Software Portfolio (PSJ)

Table of Contents
| The Market Environment | 2 | ||||||
| Manager's Analysis | 4 | ||||||
| Frequency Distribution of Discounts & Premiums | 32 | ||||||
| Fees and Expenses | 34 | ||||||
| Industry Portfolios | |||||||
| Schedules of Investments | |||||||
| PowerShares Dynamic Banking Portfolio (PJB) | 36 | ||||||
| PowerShares Dynamic Biotechnology & Genome Portfolio (PBE) | 37 | ||||||
| PowerShares Dynamic Building & Construction Portfolio (PKB) | 38 | ||||||
| PowerShares Dynamic Energy Exploration & Production Portfolio (PXE) | 39 | ||||||
| PowerShares Dynamic Food & Beverage Portfolio (PBJ) | 40 | ||||||
| PowerShares Dynamic Insurance Portfolio (PIC) | 41 | ||||||
| PowerShares Dynamic Leisure and Entertainment Portfolio (PEJ) | 42 | ||||||
| PowerShares Dynamic Media Portfolio (PBS) | 43 | ||||||
| PowerShares Dynamic Networking Portfolio (PXQ) | 44 | ||||||
| PowerShares Dynamic Oil & Gas Services Portfolio (PXJ) | 45 | ||||||
| PowerShares Dynamic Pharmaceuticals Portfolio (PJP) | 46 | ||||||
| PowerShares Dynamic Retail Portfolio (PMR) | 47 | ||||||
| PowerShares Dynamic Semiconductors Portfolio (PSI) | 48 | ||||||
| PowerShares Dynamic Software Portfolio (PSJ) | 49 | ||||||
| Statements of Assets and Liabilities | 50 | ||||||
| Statements of Operations | 52 | ||||||
| Statements of Changes in Net Assets | 54 | ||||||
| Financial Highlights | 59 | ||||||
| Notes to Financial Statements | 66 | ||||||
| Report of Independent Registered Public Accounting Firm | 78 | ||||||
| Tax Information | 79 | ||||||
| Trustees and Officers | 80 | ||||||
| Board Considerations Regarding Continuation of Investment Advisory Agreement | 87 | ||||||
The Market Environment
For the fiscal year ended April 30, 2011, the market environment saw continued improvement. Global equities ended up 18.25% after declining the first two months of the period. Emerging markets led equities up during the fiscal year with the MSCI Emerging Markets Index returning 20.67%. Developed International and U.S. Equities followed closely behind emerging markets with the MSCI EAFE Index up 19.18% and the S&P 500® Index up 17.24%. Volatility continued to decline on a year-over-year basis with the CBOE Volatility Index® (VIX®) dropping 33.11% for the fiscal year. Fixed income markets moved higher for the fiscal year with the Barclays Aggregate Bond Index ending up 5.37%.
2
This page intentionally left blank
Manager's Analysis
PowerShares Dynamic Banking Portfolio (ticker: PJB)
The PowerShares Dynamic Banking Portfolio (the "Fund") seeks investment results that correspond (before fees and expenses) generally to the price and yield performance of the Dynamic Banking IntellidexSM Index (the "Index").
For the fiscal year ended April 30, 2011, the Fund returned (6.98)%. Over this same year, the Index returned (6.29)%, while the S&P SuperComposite Commercial Banks Index returned (8.25)%, the Dow Jones U.S. Total Markets Bank Index returned (9.01)% and the S&P 500® Index returned 17.24%. The Fund was deterred by negative performance of securities of companies in regional banks, diversified banks and thrifts & mortgage finance sub-industries. Fund performance was negative for securities of companies within each sub-industry in which it was invested.
Industry Breakdown (% of the Fund's
Net Assets) as of April 30, 2011
| Commercial Banks-Eastern U.S. | 27.3 | ||||||
| Super-Regional Banks-U.S. | 23.8 | ||||||
| Commercial Banks-Central U.S. | 20.1 | ||||||
| Commercial Banks-Southern U.S. | 10.8 | ||||||
| S&L/Thrifts-Eastern U.S. | 10.2 | ||||||
| Diversified Banking Institution | 5.0 | ||||||
| Commercial Banks-Western U.S. | 2.8 | ||||||
| Money Market Fund | 0.5 | ||||||
| Liabilities in excess of other assets | (0.5 | ) | |||||
Style Allocation (% of the Fund's
Total Investments) as of April 30, 2011
| Small-Cap Value | 44.9 | ||||||
| Mid-Cap Value | 16.6 | ||||||
| Large-Cap Value | 14.4 | ||||||
| Large-Cap Growth | 14.3 | ||||||
| Small-Cap Growth | 5.5 | ||||||
| Mid-Cap Growth | 4.3 | ||||||
Top Ten Fund Holdings (% of the Fund's
Net Assets) as of April 30, 2011
| Security | |||||||
| PNC Financial Services Group, Inc. | 5.1 | ||||||
| M&T Bank Corp. | 5.1 | ||||||
| JPMorgan Chase & Co. | 5.0 | ||||||
| U.S. Bancorp | 4.8 | ||||||
| SunTrust Banks, Inc. | 4.7 | ||||||
| Fifth Third Bancorp | 4.6 | ||||||
| Wells Fargo & Co. | 4.6 | ||||||
| Hudson City Bancorp, Inc. | 4.3 | ||||||
| Investors Bancorp, Inc. | 3.1 | ||||||
| Prosperity Bancshares, Inc. | 3.1 | ||||||
| Total | 44.4 | ||||||
4
Manager's Analysis (Continued)
PowerShares Dynamic Banking Portfolio (ticker: PJB)
Growth of a $10,000 Investment Since Inception†
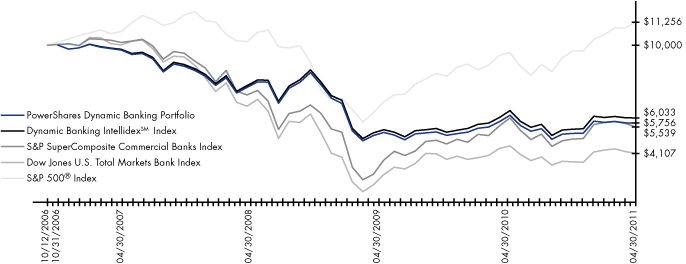
| Fund Performance History (%) | As of April 30, 2011 | ||||||||||||||||||
| Avg Ann†† | Fund Inception | ||||||||||||||||||
| 1 Year | 3 Year | Avg Ann†† | Cumulative | ||||||||||||||||
| Index | |||||||||||||||||||
| Dynamic Banking IntellidexSM Index | -6.29 | % | -9.38 | % | -10.52 | % | -39.67 | % | |||||||||||
| S&P SuperComposite Commercial Banks Index | -8.25 | % | -9.75 | % | -12.09 | % | -44.61 | % | |||||||||||
| Dow Jones U.S. Total Markets Bank Index | -9.01 | % | -16.51 | % | -17.65 | % | -58.93 | % | |||||||||||
| S&P 500® Index | 17.24 | % | 1.74 | % | 2.62 | % | 12.56 | % | |||||||||||
| Fund | |||||||||||||||||||
| Net Asset Value ("NAV") Return | -6.98 | % | -10.37 | % | -11.44 | % | -42.44 | % | |||||||||||
| Share Price Return | -6.99 | % | -10.36 | % | -11.43 | % | -42.43 | % | |||||||||||
Fund Inception: October 12, 2006
Performance quoted represents past performance. Past performance is not a guarantee of future results and curent performance may be higher or lower than performance quoted. Investment returns and principal value will fluctuate and shares, when redeemed, may be worth more or less than their original cost. The Adviser has waived fees and reimbursed other expenses, absent which, performance would have been lower. The Adviser has contractually agreed to waive fees and/or pay certain Fund expenses through August 31, 2012. According to the Fund's current prospectus, the total gross annual operating expense ratio was indicated as 1.07%. In the Financial Highlights section of this Shareholder Report, the Fund's net total operating expense ratio was determined to be 0.65%, while the Fund's gross total expense ratio was determined to be 1.17%. NAV and Share Price returns assume that dividends and capital gain distributions have been reinvested in the Fund at NAV and Share Price, respectively. The returns shown in the table above do not reflect the deduction of taxes that a shareholder would pay on Fund distributions or the redemption or sale of Fund Shares. See invescopowershares.com to find the most recent month-end performance numbers.
Index performance results are based upon a hypothetical investment in its constituent securities. Index returns do not represent Fund returns. An investor cannot invest directly in an index. The Index does not charge management fees or brokerage expenses, and no such fees or expenses were deducted from the hypothetical performance shown. In addition, the results actual investors might have achieved would have differed from those shown because of differences in the timing, amounts of their investments, and fees and expenses associated with an investment in the Fund.
The S&P SuperComposite Commercial Banks Index, Dow Jones U.S. Total Markets Bank Index and S&P 500® Index (the "Benchmark Indices") are unmanaged indices used as a measurement of change in stock market conditions based on the average performance of approximately 30, 64 and 500 common stocks, respectively.
† Fund and underlying Index returns are based on the inception date of the Fund. Returns for the Benchmark Indices are based on the closest month-end to the Fund's inception date.
†† Average annualized.
5
Manager's Analysis
PowerShares Dynamic Biotechnology & Genome Portfolio (ticker: PBE)
The PowerShares Dynamic Biotechnology & Genome Portfolio (the "Fund") seeks investment results that correspond (before fees and expenses) generally to the price and yield performance of the Dynamic Biotechnology & Genome IntellidexSM Index (the "Index").
For the fiscal year ended April 30, 2011, the Fund returned 17.64%. Over this same year, the Index returned 18.55%, while the S&P SuperComposite Biotech Index returned 14.24% and the S&P 500® Index returned 17.24%. The Fund benefited from positive performance of securities of companies in biotechnology, life sciences tools & services and pharmaceuticals sub-industries. The Fund suffered negative performance of securities of companies in health care equipment sub-industry.
Industry Breakdown (% of the Fund's
Net Assets) as of April 30, 2011
| Biotechnology | 64.0 | ||||||
| Pharmaceuticals | 20.5 | ||||||
| Electronics | 5.3 | ||||||
| Healthcare-Products | 5.2 | ||||||
| Chemicals | 5.0 | ||||||
| Money Market Fund | 0.1 | ||||||
| Liabilities in excess of other assets | (0.1 | ) | |||||
Style Allocation (% of the Fund's
Total Investments) as of April 30, 2011
| Small-Cap Growth | 49.5 | ||||||
| Mid-Cap Growth | 34.7 | ||||||
| Large-Cap Value | 11.3 | ||||||
| Large-Cap Growth | 4.5 | ||||||
Top Ten Fund Holdings (% of the Fund's
Net Assets) as of April 30, 2011
| Security | |||||||
| Biogen Idec, Inc. | 6.5 | ||||||
| Waters Corp. | 5.3 | ||||||
| Sigma-Aldrich Corp. | 5.0 | ||||||
| Amgen, Inc. | 4.9 | ||||||
| Life Technologies Corp. | 4.6 | ||||||
| Alexion Pharmaceuticals, Inc. | 4.6 | ||||||
| Illumina, Inc. | 4.6 | ||||||
| Gilead Sciences, Inc. | 4.5 | ||||||
| Ariad Pharmaceuticals, Inc. | 3.5 | ||||||
| Momenta Pharmaceuticals, Inc. | 3.4 | ||||||
| Total | 46.9 | ||||||
6
Manager's Analysis (Continued)
PowerShares Dynamic Biotechnology & Genome Portfolio (ticker: PBE)
Growth of a $10,000 Investment Since Inception†

| Fund Performance History (%) | As of April 30, 2011 | ||||||||||||||||||||||
| Avg Ann†† | Fund Inception | ||||||||||||||||||||||
| 1 Year | 3 Year | 5 Year | Avg Ann†† | Cumulative | |||||||||||||||||||
| Index | |||||||||||||||||||||||
| Dynamic Biotechnology & Genome IntellidexSM Index | 18.55 | % | 10.50 | % | 6.70 | % | 8.61 | % | 62.13 | % | |||||||||||||
| S&P SuperComposite Biotech Index | 14.24 | % | 4.93 | % | 4.61 | % | 6.68 | % | 45.80 | % | |||||||||||||
| S&P 500® Index | 17.24 | % | 1.74 | % | 2.95 | % | 4.49 | % | 29.19 | % | |||||||||||||
| Fund | |||||||||||||||||||||||
| Net Asset Value ("NAV") Return | 17.64 | % | 9.37 | % | 6.16 | % | 8.14 | % | 58.04 | % | |||||||||||||
| Share Price Return | 17.78 | % | 9.41 | % | 6.17 | % | 8.15 | % | 58.21 | % | |||||||||||||
Fund Inception: June 23, 2005
Performance quoted represents past performance. Past performance is not a guarantee of future results and current performance may be higher or lower than performance quoted. Investment returns and principal value will fluctuate and shares, when redeemed, may be worth more or less than their original cost. The Adviser has waived fees and reimbursed other expenses, absent which, performance would have been lower. The Adviser has contractually agreed to waive fees and/or pay certain Fund expenses through August 31, 2012. According to the Fund's current prospectus, the total gross annual operating expense ratio was indicated as 0.63%. In the Financial Highlights section of this Shareholder Report, the Fund's net total operating expense ratio was determined to be 0.63%, while the Fund's gross total expense ratio was determined to be 0.65%. NAV and Share Price returns assume that dividends and capital gain distributions have been reinvested in the Fund at NAV and Share Price, respectively. The returns shown in the table above do not reflect the deduction of taxes that a shareholder would pay on Fund distributions or the redemption or sale of Fund Shares. See invescopowershares.com to find the most recent month-end performance numbers.
Index performance results are based upon a hypothetical investment in its constituent securities. Index returns do not represent Fund returns. An investor cannot invest directly in an index. The Index does not charge management fees or brokerage expenses, and no such fees or expenses were deducted from the hypothetical performance shown. In addition, the results actual investors might have achieved would have differed from those shown because of differences in the timing, amounts of their investments, and fees and expenses associated with an investment in the Fund.
The S&P SuperComposite Biotech Index and S&P 500® Index (the "Benchmark Indices") are unmanaged indices used as a measurement of change in stock market conditions based on the average performance of approximately 19 and 500 common stocks, respectively.
† Fund and underlying Index returns are based on the inception date of the Fund. Returns for the Benchmark Indices are based on the closest month-end to the Fund's inception date.
†† Average annualized.
7
Manager's Analysis
PowerShares Dynamic Building & Construction Portfolio (ticker: PKB)
The PowerShares Dynamic Building & Construction Portfolio (the "Fund") seeks investment results that correspond (before fees and expenses) generally to the price and yield performance of the Dynamic Building & Construction IntellidexSM Index (the "Index").
For the fiscal year ended April 30, 2011, the Fund returned 7.49%. Over this same year, the Index returned 8.29%, while the S&P SuperComposite Construction & Engineering Index returned 13.74%, the S&P SuperComposite Homebuilders Index returned (15.14)% and the S&P 500® Index returned 17.24%. The Fund benefited from positive performance of securities of companies in specialty stores, construction & engineering, and specialized REITs retail sub-industries. Fund performance was positive for securities of companies within each sub-industry in which it was invested.
Industry Breakdown (% of the Fund's
Net Assets) as of April 30, 2011
| Engineering & Construction | 28.8 | ||||||
| Retail | 13.0 | ||||||
| Commercial Services | 12.4 | ||||||
| Building Materials | 8.0 | ||||||
| Miscellaneous Manufacturing | 6.4 | ||||||
| Textiles | 4.9 | ||||||
| Home Builders | 4.9 | ||||||
| Machinery-Diversified | 4.8 | ||||||
| REITs | 4.6 | ||||||
| Agriculture | 3.6 | ||||||
| Office Furnishings | 3.0 | ||||||
| Forest Products & Paper | 2.9 | ||||||
| Environmental Control | 2.7 | ||||||
| Money Market Fund | 0.2 | ||||||
| Liabilities in excess of other assets | (0.2 | ) | |||||
Style Allocation (% of the Fund's
Total Investments) as of April 30, 2011
| Small-Cap Value | 30.8 | ||||||
| Small-Cap Growth | 25.4 | ||||||
| Mid-Cap Growth | 21.6 | ||||||
| Mid-Cap Value | 12.4 | ||||||
| Large-Cap Growth | 9.8 | ||||||
Top Ten Fund Holdings (% of the Fund's
Net Assets) as of April 30, 2011
| Security | |||||||
| Lowe's Cos., Inc. | 5.0 | ||||||
| Mohawk Industries, Inc. | 4.9 | ||||||
| NVR, Inc. | 4.9 | ||||||
| Fluor Corp. | 4.9 | ||||||
| Home Depot, Inc. (The) | 4.8 | ||||||
| Jacobs Engineering Group, Inc. | 4.8 | ||||||
| Quanta Services, Inc. | 4.7 | ||||||
| Weyerhaeuser Co. | 4.6 | ||||||
| LSB Industries, Inc. | 3.6 | ||||||
| Tejon Ranch Co. | 3.6 | ||||||
| Total | 45.8 | ||||||
8
Manager's Analysis (Continued)
PowerShares Dynamic Building & Construction Portfolio (ticker: PKB)
Growth of a $10,000 Investment Since Inception†
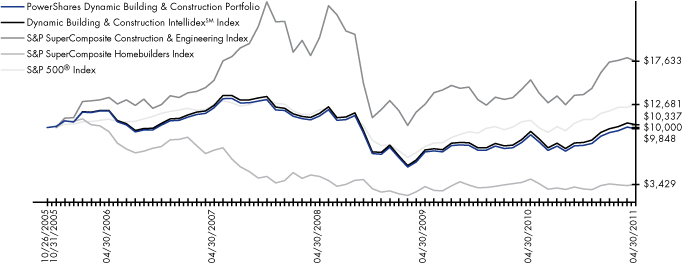
| Fund Performance History (%) | As of April 30, 2011 | ||||||||||||||||||||||
| Avg Ann†† | Fund Inception | ||||||||||||||||||||||
| 1 Year | 3 Year | 5 Year | Avg Ann†† | Cumulative | |||||||||||||||||||
| Index | |||||||||||||||||||||||
| Dynamic Building & Construction IntellidexSM Index | 8.29 | % | -3.84 | % | -2.88 | % | 0.60 | % | 3.37 | % | |||||||||||||
| S&P SuperComposite Construction & Engineering Index | 13.74 | % | -4.72 | % | 5.55 | % | 10.86 | % | 76.33 | % | |||||||||||||
| S&P SuperComposite Homebuilders Index | -15.14 | % | -7.57 | % | -18.48 | % | -17.68 | % | -65.71 | % | |||||||||||||
| S&P 500® Index | 17.24 | % | 1.74 | % | 2.95 | % | 4.41 | % | 26.81 | % | |||||||||||||
| Fund | |||||||||||||||||||||||
| Net Asset Value ("NAV") Return | 7.49 | % | -4.55 | % | -3.71 | % | -0.28 | % | -1.52 | % | |||||||||||||
| Share Price Return | 7.34 | % | -4.57 | % | -3.73 | % | -0.32 | % | -1.73 | % | |||||||||||||
Fund Inception: October 26, 2005
Performance quoted represents past performance. Past performance is not a guarantee of future results and current performance may be higher or lower than performance quoted. Investment returns and principal value will fluctuate and shares, when redeemed, may be worth more or less than their original cost. The Adviser has waived fees and reimbursed other expenses, absent which, performance would have been lower. The Adviser has contractually agreed to waive fees and/or pay certain Fund expenses through August 31, 2012. According to the Fund's current prospectus, the total gross annual operating expense ratio was indicated as 0.76%. In the Financial Highlights section of this Shareholder Report, the Fund's net total operating expense ratio was determined to be 0.63%, while the Fund's gross total expense ratio was determined to be 0.91%. NAV and Share Price returns assume that dividends and capital gain distributions have been reinvested in the Fund at NAV and Share Price, respectively. The returns shown in the table above do not reflect the deduction of taxes that a shareholder would pay on Fund distributions or the redemption or sale of Fund Shares. See invescopowershares.com to find the most recent month-end performance numbers.
Index performance results are based upon a hypothetical investment in its constituent securities. Index returns do not represent Fund returns. An investor cannot invest directly in an index. The Index does not charge management fees or brokerage expenses, and no such fees or expenses were deducted from the hypothetical performance shown. In addition, the results actual investors might have achieved would have differed from those shown because of differences in the timing, amounts of their investments, and fees and expenses associated with an investment in the Fund.
The S&P SuperComposite Construction & Engineering Index, S&P SuperComposite Homebuilders Index and S&P 500® Index (the "Benchmark Indices") are unmanaged indices used as a measurement of change in stock market conditions based on the average performance of approximately 19, 14 and 500 common stocks, respectively.
† Fund and underlying Index returns are based on the inception date of the Fund. Returns for the Benchmark Indices are based on the closest month-end to the Fund's inception date.
†† Average annualized.
9
Manager's Analysis
PowerShares Dynamic Energy Exploration & Production Portfolio (ticker: PXE)
The PowerShares Dynamic Energy Exploration & Production Portfolio (the "Fund") seeks investment results that correspond (before fees and expenses) generally to the price and yield performance of the Dynamic Energy Exploration & Production IntellidexSM Index (the "Index").
For the fiscal year ended April 30, 2011, the Fund returned 50.80%. Over this same year, the Index returned 51.97%, while the S&P SuperComposite Oil & Gas Exploration & Production Index returned 27.63% and the S&P 500® Index returned 17.24%. The Fund benefited from positive performance of securities of companies in oil & gas exploration & production, integrated oil & gas and oil & gas refining & marketing sub-industries.
Industry Breakdown (% of the Fund's
Net Assets) as of April 30, 2011
| Oil Companies-Exploration & Production | 40.4 | ||||||
| Oil Companies-Integrated | 30.4 | ||||||
| Oil Refining & Marketing | 16.0 | ||||||
| Oil Components-Exploration & Production | 7.8 | ||||||
| Gas-Distribution | 5.4 | ||||||
| Money Market Fund | 0.1 | ||||||
| Liabilities in excess of other assets | (0.1 | ) | |||||
Style Allocation (% of the Fund's
Total Investments) as of April 30, 2011
| Large-Cap Value | 40.5 | ||||||
| Small-Cap Value | 30.2 | ||||||
| Mid-Cap Value | 13.5 | ||||||
| Small-Cap Growth | 8.0 | ||||||
| Mid-Cap Growth | 7.8 | ||||||
Top Ten Fund Holdings (% of the Fund's
Net Assets) as of April 30, 2011
| Security | |||||||
| Marathon Oil Corp. | 5.4 | ||||||
| Occidental Petroleum Corp. | 5.4 | ||||||
| Chevron Corp. | 5.2 | ||||||
| Murphy Oil Corp. | 5.1 | ||||||
| Exxon Mobil Corp. | 5.0 | ||||||
| ConocoPhillips | 4.9 | ||||||
| Hess Corp. | 4.9 | ||||||
| Valero Energy Corp. | 4.8 | ||||||
| Stone Energy Corp. | 3.1 | ||||||
| CVR Energy, Inc. | 3.1 | ||||||
| Total | 46.9 | ||||||
10
Manager's Analysis (Continued)
PowerShares Dynamic Energy Exploration & Production Portfolio (ticker: PXE)
Growth of a $10,000 Investment Since Inception†
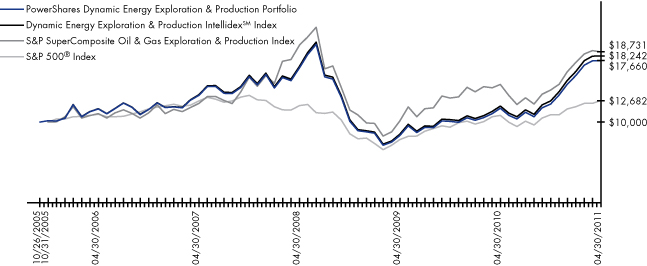
| Fund Performance History (%) | As of April 30, 2011 | ||||||||||||||||||||||
| Avg Ann†† | Fund Inception | ||||||||||||||||||||||
| 1 Year | 3 Year | 5 Year | Avg Ann†† | Cumulative | |||||||||||||||||||
| Index | |||||||||||||||||||||||
| Dynamic Energy Exploration & Production IntellidexSM Index | 51.97 | % | 2.42 | % | 9.34 | % | 11.53 | % | 82.42 | % | |||||||||||||
| S&P SuperComposite Oil & Gas Exploration & Production Index | 27.63 | % | -1.50 | % | 11.16 | % | 12.09 | % | 87.31 | % | |||||||||||||
| S&P 500® Index | 17.24 | % | 1.74 | % | 2.95 | % | 4.41 | % | 26.82 | % | |||||||||||||
| Fund | |||||||||||||||||||||||
| Net Asset Value ("NAV") Return | 50.80 | % | 1.75 | % | 8.71 | % | 10.87 | % | 76.60 | % | |||||||||||||
| Share Price Return | 50.69 | % | 1.76 | % | 8.66 | % | 10.83 | % | 76.25 | % | |||||||||||||
Fund Inception: October 26, 2005
Performance quoted represents past performance. Past performance is not a guarantee of future results and current performance may be higher or lower than performance quoted. Investment returns and principal value will fluctuate and shares, when redeemed, may be worth more or less than their original cost. The Adviser has waived fees and reimbursed other expenses, absent which, performance would have been lower. The Adviser has contractually agreed to waive fees and/or pay certain Fund expenses through August 31, 2012. According to the Fund's current prospectus, the total gross annual operating expense ratio was indicated as 0.76%. In the Financial Highlights section of this Shareholder Report, the Fund's net total operating expense ratio was determined to be 0.63%, while the Fund's gross total expense ratio was determined to be 0.76%. NAV and Share Price returns assume that dividends and capital gain distributions have been reinvested in the Fund at NAV and Share Price, respectively. The returns shown in the table above do not reflect the deduction of taxes that a shareholder would pay on Fund distributions or the redemption or sale of Fund Shares. See invescopowershares.com to find the most recent month-end performance numbers.
Index performance results are based upon a hypothetical investment in its constituent securities. Index returns do not represent Fund returns. An investor cannot invest directly in an index. The Index does not charge management fees or brokerage expenses, and no such fees or expenses were deducted from the hypothetical performance shown. In addition, the results actual investors might have achieved would have differed from those shown because of differences in the timing, amounts of their investments, and fees and expenses associated with an investment in the Fund.
The S&P SuperComposite Oil & Gas Exploration & Production Index and S&P 500® Index (the "Benchmark Indices") are unmanaged indices used as a measurement of change in stock market conditions based on the average performance of approximately 19 and 500 common stocks, respectively.
† Fund and underlying Index returns are based on the inception date of the Fund. Returns for the Benchmark Indices are based on the closest month-end to the Fund's inception date.
†† Average annualized.
11
Manager's Analysis
PowerShares Dynamic Food & Beverage Portfolio (ticker: PBJ)
The PowerShares Dynamic Food & Beverage Portfolio (the "Fund") seeks investment results that correspond (before fees and expenses) generally to the price and yield performance of the Dynamic Food & Beverage IntellidexSM Index (the "Index").
For the fiscal year ended April 30, 2011, the Fund returned 24.99%. Over this same year, the Index returned 25.88%, while the S&P SuperComposite Food Beverage & Tobacco Index returned 26.83% and the S&P 500® Index returned 17.24%. The Fund benefited from positive performance of securities of companies in restaurant, packaged foods & meats, and soft drink sub-industries. Fund performance was positive for securities of companies within each sub-industry.
Industry Breakdown (% of the Fund's
Net Assets) as of April 30, 2011
| Retail-Restaurants | 28.3 | ||||||
| Food-Miscellaneous/Diversified | 20.4 | ||||||
| Beverages-Non-alcoholic | 18.8 | ||||||
| Food-Retail | 8.3 | ||||||
| Beverages-Wine/Spirits | 5.5 | ||||||
| Food-Meat Products | 5.4 | ||||||
| Vitamins & Nutrition Products | 5.2 | ||||||
| Alternative Waste Technologies | 2.9 | ||||||
| Brewery | 2.6 | ||||||
| Food-Wholesale/Distribution | 2.5 | ||||||
| Money Market Fund | 0.1 | ||||||
| Liabilities in excess of other assets | (0.0 | ) | |||||
Style Allocation (% of the Fund's
Total Investments) as of April 30, 2011
| Large-Cap Growth | 30.3 | ||||||
| Small-Cap Value | 25.3 | ||||||
| Mid-Cap Growth | 13.6 | ||||||
| Mid-Cap Value | 13.5 | ||||||
| Large-Cap Value | 12.4 | ||||||
| Small-Cap Growth | 4.9 | ||||||
Top Ten Fund Holdings (% of the Fund's
Net Assets) as of April 30, 2011
| Security | |||||||
| Starbucks Corp. | 5.2 | ||||||
| Mead Johnson Nutrition Co. | 5.2 | ||||||
| PepsiCo, Inc. | 5.1 | ||||||
| Yum! Brands, Inc. | 5.0 | ||||||
| McDonald's Corp. | 4.9 | ||||||
| Coca-Cola Co. (The) | 4.9 | ||||||
| General Mills, Inc. | 4.9 | ||||||
| H.J. Heinz Co. | 4.8 | ||||||
| Coca-Cola Bottling Co. Consolidated | 3.2 | ||||||
| Sonic Corp. | 3.2 | ||||||
| Total | 46.4 | ||||||
12
Manager's Analysis (Continued)
PowerShares Dynamic Food & Beverage Portfolio (ticker: PBJ)
Growth of a $10,000 Investment Since Inception†
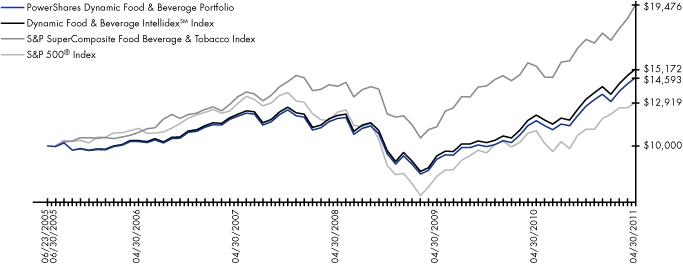
| Fund Performance History (%) | As of April 30, 2011 | ||||||||||||||||||||||
| Avg Ann†† | Fund Inception | ||||||||||||||||||||||
| 1 Year | 3 Year | 5 Year | Avg Ann†† | Cumulative | |||||||||||||||||||
| Index | |||||||||||||||||||||||
| Dynamic Food & Beverage IntellidexSM Index | 25.88 | % | 7.99 | % | 7.97 | % | 7.38 | % | 51.72 | % | |||||||||||||
| S&P SuperComposite Food Beverage & Tobacco Index | 26.83 | % | 11.65 | % | 12.28 | % | 12.11 | % | 94.76 | % | |||||||||||||
| S&P 500® Index | 17.24 | % | 1.74 | % | 2.95 | % | 4.49 | % | 29.19 | % | |||||||||||||
| Fund | |||||||||||||||||||||||
| Net Asset Value ("NAV") Return | 24.99 | % | 7.23 | % | 7.26 | % | 6.67 | % | 45.93 | % | |||||||||||||
| Share Price Return | 25.23 | % | 7.34 | % | 7.32 | % | 6.72 | % | 46.29 | % | |||||||||||||
Fund Inception: June 23, 2005
Performance quoted represents past performance. Past performance is not a guarantee of future results and current performance may be higher or lower than performance quoted. Investment returns and principal value will fluctuate and shares, when redeemed, may be worth more or less than their original cost. The Adviser has waived fees and reimbursed other expenses, absent which, performance would have been lower. The Adviser has contractually agreed to waive fees and/or pay certain Fund expenses through August 31, 2012. According to the Fund's current prospectus, the total gross annual operating expense ratio was indicated as 0.74%. In the Financial Highlights section of this Shareholder Report, the Fund's net total operating expense ratio was determined to be 0.63%, while the Fund's gross total expense ratio was determined to be 0.71%. NAV and Share Price returns assume that dividends and capital gain distributions have been reinvested in the Fund at NAV and Share Price, respectively. The returns shown in the table above do not reflect the deduction of taxes that a shareholder would pay on Fund distributions or the redemption or sale of Fund Shares. See invescopowershares.com to find the most recent month-end performance numbers.
Index performance results are based upon a hypothetical investment in its constituent securities. Index returns do not represent Fund returns. An investor cannot invest directly in an index. The Index does not charge management fees or brokerage expenses, and no such fees or expenses were deducted from the hypothetical performance shown. In addition, the results actual investors might have achieved would have differed from those shown because of differences in the timing, amounts of their investments, and fees and expenses associated with an investment in the Fund.
The S&P SuperComposite Food Beverage & Tobacco Index and S&P 500® Index (the "Benchmark Indices") are unmanaged indices used as a measurement of change in stock market conditions based on the average performance of approximately 48 and 500 common stocks, respectively.
† Fund and underlying Index returns are based on the inception date of the Fund. Returns for the Benchmark Indices are based on the closest month-end to the Fund's inception date.
†† Average annualized.
13
Manager's Analysis
PowerShares Dynamic Insurance Portfolio (ticker: PIC)
The PowerShares Dynamic Insurance Portfolio (the "Fund") seeks investment results that correspond (before fees and expenses) generally to the price and yield performance of the Dynamic Insurance IntellidexSM Index (the "Index").
For the fiscal year ended April 30, 2011, the Fund returned 13.38%. Over this same year, the Index returned 14.10%, while the S&P SuperComposite Insurance Index returned 11.67% and the S&P 500® Index returned 17.24%. The Fund benefited from positive performance of securities of companies in property & casualty insurance, life & health insurance and multi-line insurance sub-industries. Fund performance was positive for securities of companies within each sub-industry in which it was invested.
Industry Breakdown (% of the Fund's
Net Assets) as of April 30, 2011
| Property/Casualty Insurance | 42.6 | ||||||
| Life/Health Insurance | 22.8 | ||||||
| Multi-line Insurance | 13.4 | ||||||
| Insurance Brokers | 13.0 | ||||||
| Reinsurance | 8.2 | ||||||
| Money Market Fund | 0.8 | ||||||
| Liabilities in excess of other assets | (0.8 | ) | |||||
Style Allocation (% of the Fund's
Total Investments) as of April 30, 2011
| Large-Cap Value | 31.0 | ||||||
| Small-Cap Value | 29.4 | ||||||
| Mid-Cap Value | 27.1 | ||||||
| Mid-Cap Growth | 5.4 | ||||||
| Large-Cap Growth | 4.8 | ||||||
| Small-Cap Growth | 2.3 | ||||||
Top Ten Fund Holdings (% of the Fund's
Net Assets) as of April 30, 2011
| Security | |||||||
| Chubb Corp. (The) | 5.4 | ||||||
| Progressive Corp. (The) | 5.4 | ||||||
| Travelers Cos., Inc. (The) | 5.3 | ||||||
| Loews Corp. | 5.1 | ||||||
| Unum Group | 5.0 | ||||||
| Aon Corp. | 4.9 | ||||||
| Prudential Financial, Inc. | 4.9 | ||||||
| Aflac, Inc. | 4.8 | ||||||
| Reinsurance Group of America, Inc. | 2.9 | ||||||
| Horace Mann Educators Corp. | 2.9 | ||||||
| Total | 46.6 | ||||||
14
Manager's Analysis (Continued)
PowerShares Dynamic Insurance Portfolio (ticker: PIC)
Growth of a $10,000 Investment Since Inception†
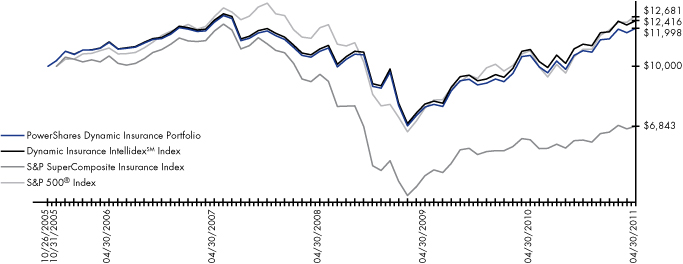
| Fund Performance History (%) | As of April 30, 2011 | ||||||||||||||||||||||
| Avg Ann†† | Fund Inception | ||||||||||||||||||||||
| 1 Year | 3 Year | 5 Year | Avg Ann†† | Cumulative | |||||||||||||||||||
| Index | |||||||||||||||||||||||
| Dynamic Insurance IntellidexSM Index | 14.10 | % | 4.36 | % | 1.92 | % | 4.01 | % | 24.16 | % | |||||||||||||
| S&P SuperComposite Insurance Index | 11.67 | % | -10.59 | % | -8.28 | % | -6.67 | % | -31.57 | % | |||||||||||||
| S&P 500® Index | 17.24 | % | 1.74 | % | 2.95 | % | 4.41 | % | 26.81 | % | |||||||||||||
| Fund | |||||||||||||||||||||||
| Net Asset Value ("NAV") Return | 13.38 | % | 3.61 | % | 1.29 | % | 3.36 | % | 19.98 | % | |||||||||||||
| Share Price Return | 13.31 | % | 3.63 | % | 1.28 | % | 3.36 | % | 19.98 | % | |||||||||||||
Fund Inception: October 26, 2005
Performance quoted represents past performance. Past performance is not a guarantee of future results and current performance may be higher or lower than performance quoted. Investment returns and principal value will fluctuate and shares, when redeemed, may be worth more or less than their original cost. The Adviser has waived fees and reimbursed other expenses, absent which, performance would have been lower. The Adviser has contractually agreed to waive fees and/or pay certain Fund expenses through August 31, 2012. According to the Fund's current prospectus, the total gross annual operating expense ratio was indicated as 1.23%. In the Financial Highlights section of this Shareholder Report, the Fund's net total operating expense ratio was determined to be 0.63%, while the Fund's gross total expense ratio was determined to be 1.36%. NAV and Share Price returns assume that dividends and capital gain distributions have been reinvested in the Fund at NAV and Share Price, respectively. The returns shown in the table above do not reflect the deduction of taxes that a shareholder would pay on Fund distributions or the redemption or sale of Fund Shares. See invescopowershares.com to find the most recent month-end performance numbers.
Index performance results are based upon a hypothetical investment in its constituent securities. Index returns do not represent Fund returns. An investor cannot invest directly in an index. The Index does not charge management fees or brokerage expenses, and no such fees or expenses were deducted from the hypothetical performance shown. In addition, the results actual investors might have achieved would have differed from those shown because of differences in the timing, amounts of their investments, and fees and expenses associated with an investment in the Fund.
The S&P SuperComposite Insurance Index and S&P 500® Index (the "Benchmark Indices") are unmanaged indices used as a measurement of change in stock market conditions based on the average performance of approximately 56 and 500 common stocks, respectively.
† Fund and underlying Index returns are based on the inception date of the Fund. Returns for the Benchmark Indices are based on the closest month-end to the Fund's inception date.
†† Average annualized.
15
Manager's Analysis
PowerShares Dynamic Leisure and Entertainment Portfolio (ticker: PEJ)
The PowerShares Dynamic Leisure and Entertainment Portfolio (the "Fund") seeks investment results that correspond (before fees and expenses) generally to the price and yield performance of the Dynamic Leisure and Entertainment IntellidexSM Index (the "Index").
For the fiscal year ended April 30, 2011, the Fund returned 18.03%. Over this same year, the Index returned 18.84%, while the S&P SuperComposite Hotels, Restaurants & Leisure Index returned 16.92% and the S&P 500® Index returned 17.24%. The Fund benefited from positive performance of securities of companies in restaurants, casinos & gaming, and broadcasting sub-industries. The Fund suffered from negative performance of securities of companies in data processing & outsourced services, leisure facilities, and internet software & services sub-industries.
Industry Breakdown (% of the Fund's
Net Assets) as of April 30, 2011
| Retail | 52.3 | ||||||
| Media | 12.9 | ||||||
| Entertainment | 11.2 | ||||||
| Lodging | 11.0 | ||||||
| Leisure Time | 6.8 | ||||||
| Internet | 5.8 | ||||||
| Money Market Fund | 0.1 | ||||||
| Liabilities in excess of other assets | (0.1 | ) | |||||
Style Allocation (% of the Fund's
Total Investments) as of April 30, 2011
| Large-Cap Growth | 35.5 | ||||||
| Small-Cap Value | 29.5 | ||||||
| Small-Cap Growth | 18.7 | ||||||
| Mid-Cap Value | 10.7 | ||||||
| Mid-Cap Growth | 5.6 | ||||||
Top Ten Fund Holdings (% of the Fund's
Net Assets) as of April 30, 2011
| Security | |||||||
| priceline.com, Inc. | 5.8 | ||||||
| Starbucks Corp. | 5.4 | ||||||
| Yum! Brands, Inc. | 5.2 | ||||||
| CBS Corp. | 5.2 | ||||||
| McDonald's Corp. | 5.1 | ||||||
| Las Vegas Sands Corp. | 4.9 | ||||||
| Walt Disney Co. (The) | 4.8 | ||||||
| Carnival Corp. | 4.3 | ||||||
| Sonic Corp. | 3.3 | ||||||
| Ameristar Casinos, Inc. | 3.2 | ||||||
| Total | 47.2 | ||||||
16
Manager's Analysis (Continued)
PowerShares Dynamic Leisure and Entertainment Portfolio (ticker: PEJ)
Growth of a $10,000 Investment Since Inception†
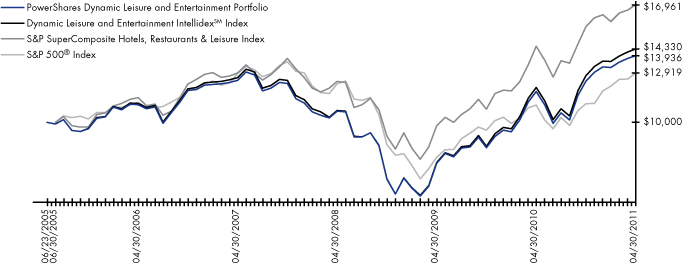
| Fund Performance History (%) | As of April 30, 2011 | ||||||||||||||||||||||
| Avg Ann†† | Fund Inception | ||||||||||||||||||||||
| 1 Year | 3 Year | 5 Year | Avg Ann†† | Cumulative | |||||||||||||||||||
| Index | |||||||||||||||||||||||
| Dynamic Leisure and Entertainment IntellidexSM Index | 18.84 | % | 10.24 | % | 5.23 | % | 6.34 | % | 43.30 | % | |||||||||||||
| S&P SuperComposite Hotels, Restaurants & Leisure Index | 16.92 | % | 10.97 | % | 8.17 | % | 9.48 | % | 69.61 | % | |||||||||||||
| S&P 500® Index | 17.24 | % | 1.74 | % | 2.95 | % | 4.49 | % | 29.19 | % | |||||||||||||
| Fund | |||||||||||||||||||||||
| Net Asset Value ("NAV") Return | 18.03 | % | 9.34 | % | 4.77 | % | 5.84 | % | 39.36 | % | |||||||||||||
| Share Price Return | 17.89 | % | 9.32 | % | 4.76 | % | 5.84 | % | 39.39 | % | |||||||||||||
Fund Inception: June 23, 2005
Performance quoted represents past performance. Past performance is not a guarantee of future results and current performance may be higher or lower than performance quoted. Investment returns and principal value will fluctuate and shares, when redeemed, may be worth more or less than their original cost. The Adviser has waived fees and reimbursed other expenses, absent which, performance would have been lower. The Adviser has contractually agreed to waive fees and/or pay certain Fund expenses through August 31, 2012. According to the Fund's current prospectus, the total gross annual operating expense ratio was indicated as 1.06%. In the Financial Highlights section of this Shareholder Report, the Fund's net total operating expense ratio was determined to be 0.63%, while the Fund's gross total expense ratio was determined to be 0.78%. NAV and Share Price returns assume that dividends and capital gain distributions have been reinvested in the Fund at NAV and Share Price, respectively. The returns shown in the table above do not reflect the deduction of taxes that a shareholder would pay on Fund distributions or the redemption or sale of Fund Shares. See invescopowershares.com to find the most recent month-end performance numbers.
Index performance results are based upon a hypothetical investment in its constituent securities. Index returns do not represent Fund returns. An investor cannot invest directly in an index. The Index does not charge management fees or brokerage expenses, and no such fees or expenses were deducted from the hypothetical performance shown. In addition, the results actual investors might have achieved would have differed from those shown because of differences in the timing, amounts of their investments, and fees and expenses associated with an investment in the Fund.
The S&P SuperComposite Hotels, Restaurants & Leisure Index and S&P 500® Index (the "Benchmark Indices") are unmanaged indices used as a measurement of change in stock market conditions based on the average performance of approximately 56 and 500 common stocks, respectively.
† Fund and underlying Index returns are based on the inception date of the Fund. Returns for the Benchmark Indices are based on the closest month-end to the Fund's inception date.
†† Average annualized.
17
Manager's Analysis
PowerShares Dynamic Media Portfolio (ticker: PBS)
The PowerShares Dynamic Media Portfolio (the "Fund") seeks investment results that correspond (before fees and expenses) generally to the price and yield performance of the Dynamic Media IntellidexSM Index (the "Index").
For the fiscal year ended April 30, 2011, the Fund returned 14.68%. Over this same year, the Index returned 15.60%, while the S&P SuperComposite Media Index returned 24.74% and the S&P 500® Index returned 17.24%. The Fund benefited from positive performance of securities of companies in movies & entertainment, cable & satellite, and internet software & services sub-industries. The Fund suffered from negative performance of securities of companies in catalog retail and publishing sub-industries.
Industry Breakdown (% of the Fund's
Net Assets) as of April 30, 2011
| Multimedia | 22.5 | ||||||
| Cable/Satellite TV | 15.4 | ||||||
| Television | 10.3 | ||||||
| Broadcast Services/Program | 8.6 | ||||||
| Publishing-Books | 5.1 | ||||||
| Publishing-Newspapers | 5.1 | ||||||
| Advertising Agencies | 5.0 | ||||||
| Web Portals/ISP | 4.3 | ||||||
| Internet Content-Information/News | 4.1 | ||||||
| E-Commerce/Services | 3.5 | ||||||
| Commercial Services | 3.2 | ||||||
| E-Marketing/Information | 2.9 | ||||||
| Computer Services | 2.8 | ||||||
| Professional Sports | 2.6 | ||||||
| Advertising Sales | 2.6 | ||||||
| Direct Marketing | 2.0 | ||||||
| Money Market Fund | 0.1 | ||||||
| Liabilities in excess of other assets | (0.1 | ) | |||||
Style Allocation (% of the Fund's
Total Investments) as of April 30, 2011
| Large-Cap Growth | 24.0 | ||||||
| Small-Cap Growth | 18.9 | ||||||
| Mid-Cap Growth | 16.3 | ||||||
| Large-Cap Value | 15.6 | ||||||
| Mid-Cap Value | 13.5 | ||||||
| Small-Cap Value | 11.7 | ||||||
Top Ten Fund Holdings (% of the Fund's
Net Assets) as of April 30, 2011
| Security | |||||||
| Time Warner Cable, Inc. | 5.3 | ||||||
| CBS Corp. | 5.2 | ||||||
| DIRECTV | 5.1 | ||||||
| Comcast Corp. | 5.0 | ||||||
| News Corp. | 4.9 | ||||||
| Walt Disney Co. (The) | 4.8 | ||||||
| Time Warner, Inc. | 4.8 | ||||||
| Google, Inc. | 4.3 | ||||||
| LoopNet, Inc. | 4.1 | ||||||
| Ancestry.com, Inc. | 3.5 | ||||||
| Total | 47.0 | ||||||
18
Manager's Analysis (Continued)
PowerShares Dynamic Media Portfolio (ticker: PBS)
Growth of a $10,000 Investment Since Inception†
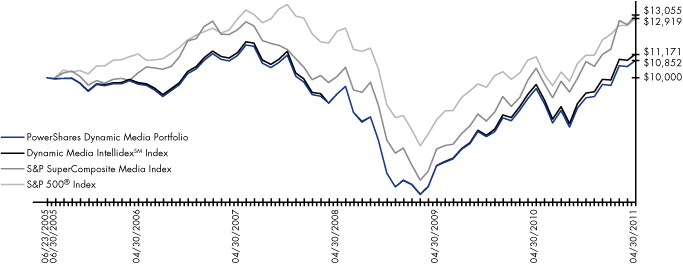
| Fund Performance History (%) | As of April 30, 2011 | ||||||||||||||||||||||
| Avg Ann†† | Fund Inception | ||||||||||||||||||||||
| 1 Year | 3 Year | 5 Year | Avg Ann†† | Cumulative | |||||||||||||||||||
| Index | |||||||||||||||||||||||
| Dynamic Media IntellidexSM Index | 15.60 | % | 6.68 | % | 2.74 | % | 1.91 | % | 11.71 | % | |||||||||||||
| S&P SuperComposite Media Index | 24.74 | % | 9.08 | % | 4.98 | % | 4.68 | % | 30.55 | % | |||||||||||||
| S&P 500® Index | 17.24 | % | 1.74 | % | 2.95 | % | 4.49 | % | 29.19 | % | |||||||||||||
| Fund | |||||||||||||||||||||||
| Net Asset Value ("NAV") Return | 14.68 | % | 5.63 | % | 2.30 | % | 1.41 | % | 8.52 | % | |||||||||||||
| Share Price Return | 14.51 | % | 5.58 | % | 2.30 | % | 1.41 | % | 8.52 | % | |||||||||||||
Fund Inception: June 23, 2005
Performance quoted represents past performance. Past performance is not a guarantee of future results and current performance may be higher or lower than performance quoted. Investment returns and principal value will fluctuate and shares, when redeemed, may be worth more or less than their original cost. The Adviser has waived fees and reimbursed other expenses, absent which, performance would have been lower. The Adviser has contractually agreed to waive fees and/or pay certain Fund expenses through August 31, 2012. According to the Fund's current prospectus, the total gross annual operating expense ratio was indicated as 0.77%. In the Financial Highlights section of this Shareholder Report, the Fund's net total operating expense ratio was determined to be 0.63%, while the Fund's gross total expense ratio was determined to be 0.69%. NAV and Share Price returns assume that dividends and capital gain distributions have been reinvested in the Fund at NAV and Share Price, respectively. The returns shown in the table above do not reflect the deduction of taxes that a shareholder would pay on Fund distributions or the redemption or sale of Fund Shares. See invescopowershares.com to find the most recent month-end performance numbers.
Index performance results are based upon a hypothetical investment in its constituent securities. Index returns do not represent Fund returns. An investor cannot invest directly in an index. The Index does not charge management fees or brokerage expenses, and no such fees or expenses were deducted from the hypothetical performance shown. In addition, the results actual investors might have achieved would have differed from those shown because of differences in the timing, amounts of their investments, and fees and expenses associated with an investment in the Fund.
The S&P SuperComposite Media Index and S&P 500® Index (the "Benchmark Indices") are unmanaged indices used as a measurement of change in stock market conditions based on the average performance of approximately 26 and 500 common stocks, respectively.
† Fund and underlying Index returns are based on the inception date of the Fund. Returns for the Benchmark Indices are based on the closest month-end to the Fund's inception date.
†† Average annualized.
19
Manager's Analysis
PowerShares Dynamic Networking Portfolio (ticker: PXQ)
The PowerShares Dynamic Networking Portfolio (the "Fund") seeks investment results that correspond (before fees and expenses) generally to the price and yield performance of the Dynamic Networking IntellidexSM Index (the "Index").
For the fiscal year ended April 30, 2011, the Fund returned 39.08%. Over this same year, the Index returned 40.03%, while the S&P SuperComposite Communications Equipment Index returned (0.47)% and the S&P 500® Index returned 17.24%. The Fund benefited from positive performance of securities of companies in communications equipment, systems software and application software sub-industries. The Fund suffered from negative performance of securities of companies in semiconductors and electronic manufacturing services sub-industries.
Industry Breakdown (% of the Fund's
Net Assets) as of April 30, 2011
| Telecommunications | 39.7 | ||||||
| Software | 17.5 | ||||||
| Internet | 13.6 | ||||||
| Computers | 10.8 | ||||||
| Semiconductors | 8.3 | ||||||
| Electrical Components & Equipment | 5.4 | ||||||
| Electronics | 4.8 | ||||||
| Money Market Fund | 0.0 | ||||||
| Liabilities in excess of other assets | (0.1 | ) | |||||
Style Allocation (% of the Fund's
Total Investments) as of April 30, 2011
| Small-Cap Growth | 43.6 | ||||||
| Large-Cap Growth | 20.3 | ||||||
| Mid-Cap Growth | 19.3 | ||||||
| Small-Cap Value | 8.4 | ||||||
| Large-Cap Value | 5.6 | ||||||
| Mid-Cap Value | 2.8 | ||||||
Top Ten Fund Holdings (% of the Fund's
Net Assets) as of April 30, 2011
| Security | |||||||
| Motorola Solutions, Inc. | 5.9 | ||||||
| Citrix Systems, Inc. | 5.8 | ||||||
| VMware, Inc. | 5.5 | ||||||
| Symantec Corp. | 5.3 | ||||||
| Amphenol Corp. | 4.8 | ||||||
| QUALCOMM, Inc. | 4.7 | ||||||
| Cisco Systems, Inc. | 4.6 | ||||||
| Juniper Networks, Inc. | 4.3 | ||||||
| NETGEAR, Inc. | 3.5 | ||||||
| OPNET Technologies, Inc. | 3.3 | ||||||
| Total | 47.7 | ||||||
20
Manager's Analysis (Continued)
PowerShares Dynamic Networking Portfolio (ticker: PXQ)
Growth of a $10,000 Investment Since Inception†

| Fund Performance History (%) | As of April 30, 2011 | ||||||||||||||||||||||
| Avg Ann†† | Fund Inception | ||||||||||||||||||||||
| 1 Year | 3 Year | 5 Year | Avg Ann†† | Cumulative | |||||||||||||||||||
| Index | |||||||||||||||||||||||
| Dynamic Networking IntellidexSM Index | 40.03 | % | 23.18 | % | 11.81 | % | 12.88 | % | 103.19 | % | |||||||||||||
| S&P SuperComposite Communications Equipment Index | -0.47 | % | -0.98 | % | -1.50 | % | 2.80 | % | 17.46 | % | |||||||||||||
| S&P 500® Index | 17.24 | % | 1.74 | % | 2.95 | % | 4.49 | % | 29.19 | % | |||||||||||||
| Fund | |||||||||||||||||||||||
| Net Asset Value ("NAV") Return | 39.08 | % | 22.27 | % | 11.02 | % | 12.18 | % | 95.98 | % | |||||||||||||
| Share Price Return | 38.89 | % | 22.29 | % | 11.06 | % | 12.18 | % | 95.98 | % | |||||||||||||
Fund Inception: June 23, 2005
Performance quoted represents past performance. Past performance is not a guarantee of future results and current performance may be higher or lower than performance quoted. Investment returns and principal value will fluctuate and shares, when redeemed, may be worth more or less than their original cost. The Adviser has waived fees and reimbursed other expenses, absent which, performance would have been lower. The Adviser has contractually agreed to waive fees and/or pay certain Fund expenses through August 31, 2012. According to the Fund's current prospectus, the total gross annual operating expense ratio was indicated as 0.95%. In the Financial Highlights section of this Shareholder Report, the Fund's net total operating expense ratio was determined to be 0.63%, while the Fund's gross total expense ratio was determined to be 0.70%. NAV and Share Price returns assume that dividends and capital gain distributions have been reinvested in the Fund at NAV and Share Price, respectively. The returns shown in the table above do not reflect the deduction of taxes that a shareholder would pay on Fund distributions or the redemption or sale of Fund Shares. See invescopowershares.com to find the most recent month-end performance numbers.
Index performance results are based upon a hypothetical investment in its constituent securities. Index returns do not represent Fund returns. An investor cannot invest directly in an index. The Index does not charge management fees or brokerage expenses, and no such fees or expenses were deducted from the hypothetical performance shown. In addition, the results actual investors might have achieved would have differed from those shown because of differences in the timing, amounts of their investments, and fees and expenses associated with an investment in the Fund.
The S&P SuperComposite Communications Equipment Index and S&P 500® Index (the "Benchmark Indices") are unmanaged indices used as a measurement of change in stock market conditions based on the average performance of approximately 30 and 500 common stocks, respectively.
† Fund and underlying Index returns are based on the inception date of the Fund. Returns for the Benchmark Indices are based on the closest month-end to the Fund's inception date.
†† Average annualized.
21
Manager's Analysis
PowerShares Dynamic Oil & Gas Services Portfolio (ticker: PXJ)
The PowerShares Dynamic Oil & Gas Services Portfolio (the "Fund") seeks investment results that correspond (before fees and expenses) generally to the price and yield performance of the Dynamic Oil & Gas Services IntellidexSM Index (the "Index").
For the fiscal year ended April 30, 2011, the Fund returned 46.84%. Over this same year, the Index returned 47.96%, while the S&P SuperComposite Energy Equipment & Services Index returned 42.84% and the S&P 500® Index returned 17.24%. The Fund benefited from positive performance of securities of companies in oil & gas equipment & services and oil & gas drilling, and construction & engineering sub-industries. Fund performance was positive for securities of companies within each sub-industry in which it was invested.
Industry Breakdown (% of the Fund's
Net Assets) as of April 30, 2011
| Oil-Field Services | 42.5 | ||||||
| Oil Field Machinery & Equipment | 21.6 | ||||||
| Oil & Gas Drilling | 20.8 | ||||||
| Engineering/R&D Services | 5.1 | ||||||
| Seismic Data Collection | 4.9 | ||||||
| Transportation-Marine | 2.5 | ||||||
| Transportation-Services | 2.5 | ||||||
| Money Market Fund | 0.1 | ||||||
| Liabilities in excess of other assets | (0.0 | ) | |||||
Style Allocation (% of the Fund's
Total Investments) as of April 30, 2011
| Small-Cap Growth | 25.4 | ||||||
| Large-Cap Growth | 23.5 | ||||||
| Mid-Cap Growth | 17.4 | ||||||
| Mid-Cap Value | 15.7 | ||||||
| Small-Cap Value | 13.5 | ||||||
| Large-Cap Value | 4.5 | ||||||
Top Ten Fund Holdings (% of the Fund's
Net Assets) as of April 30, 2011
| Security | |||||||
| Baker Hughes, Inc. | 5.1 | ||||||
| Nabors Industries Ltd. | 5.1 | ||||||
| Halliburton Co. | 5.1 | ||||||
| FMC Technologies, Inc. | 4.7 | ||||||
| Diamond Offshore Drilling, Inc. | 4.6 | ||||||
| Schlumberger Ltd. | 4.5 | ||||||
| National Oilwell Varco, Inc. | 4.5 | ||||||
| Cameron International Corp. | 4.1 | ||||||
| Basic Energy Services, Inc. | 4.1 | ||||||
| RPC, Inc. | 3.7 | ||||||
| Total | 45.5 | ||||||
22
Manager's Analysis (Continued)
PowerShares Dynamic Oil & Gas Services Portfolio (ticker: PXJ)
Growth of a $10,000 Investment Since Inception†
| Fund Performance History (%) | As of April 30, 2011 | ||||||||||||||||||||||
| Avg Ann†† | Fund Inception | ||||||||||||||||||||||
| 1 Year | 3 Year | 5 Year | Avg Ann†† | Cumulative | |||||||||||||||||||
| Index | |||||||||||||||||||||||
| Dynamic Oil & Gas Services IntellidexSM Index | 47.96 | % | -2.25 | % | 5.07 | % | 9.82 | % | 67.53 | % | |||||||||||||
| S&P SuperComposite Energy Equipment & Services Index | 42.84 | % | -0.57 | % | 6.24 | % | 11.71 | % | 83.86 | % | |||||||||||||
| S&P 500® Index | 17.24 | % | 1.74 | % | 2.95 | % | 4.41 | % | 26.81 | % | |||||||||||||
| Fund | |||||||||||||||||||||||
| Net Asset Value ("NAV") Return | 46.84 | % | -2.96 | % | 4.52 | % | 9.22 | % | 62.58 | % | |||||||||||||
| Share Price Return | 46.93 | % | -2.93 | % | 4.48 | % | 9.22 | % | 62.57 | % | |||||||||||||
Fund Inception: October 26, 2005
Performance quoted represents past performance. Past performance is not a guarantee of future results and current performance may be higher or lower than performance quoted. Investment returns and principal value will fluctuate and shares, when redeemed, may be worth more or less than their original cost. The Adviser has waived fees and reimbursed other expenses, absent which, performance would have been lower. The Adviser has contractually agreed to waive fees and/or pay certain Fund expenses through August 31, 2012. According to the Fund's current prospectus, the total gross annual operating expense ratio was indicated as 0.63%. In the Financial Highlights section of this Shareholder Report, the Fund's net total operating expense ratio was determined to be 0.63%, while the Fund's gross total expense ratio was determined to be 0.64%. NAV and Share Price returns assume that dividends and capital gain distributions have been reinvested in the Fund at NAV and Share Price, respectively. The returns shown in the table above do not reflect the deduction of taxes that a shareholder would pay on Fund distributions or the redemption or sale of Fund Shares. See invescopowershares.com to find the most recent month-end performance numbers.
Index performance results are based upon a hypothetical investment in its constituent securities. Index returns do not represent Fund returns. An investor cannot invest directly in an index. The Index does not charge management fees or brokerage expenses, and no such fees or expenses were deducted from the hypothetical performance shown. In addition, the results actual investors might have achieved would have differed from those shown because of differences in the timing, amounts of their investments, and fees and expenses associated with an investment in the Fund.
The S&P SuperComposite Energy Equipment & Services Index and S&P 500® Index (the "Benchmark Indices") are unmanaged indices used as a measurement of change in stock market conditions based on the average performance of approximately 30 and 500 common stocks, respectively.
† Fund and underlying Index returns are based on the inception date of the Fund. Returns for the Benchmark Indices are based on the closest month-end to the Fund's inception date.
†† Average annualized.
23
Manager's Analysis
PowerShares Dynamic Pharmaceuticals Portfolio (ticker: PJP)
The PowerShares Dynamic Pharmaceuticals Portfolio (the "Fund") seeks investment results that correspond (before fees and expenses) generally to the price and yield performance of the Dynamic Pharmaceuticals IntellidexSM Index (the "Index").
For the fiscal year ended April 30, 2011, the Fund returned 34.55%. Over this same year, the Index returned 35.46%, while the S&P SuperComposite Pharmaceuticals Index returned 14.73% and the S&P 500® Index returned 17.24%. The Fund benefited from positive performance of securities of companies in personal products and biotechnology sub-industries. Fund performance was positive for securities of companies within each sub-industry in which it was invested.
Industry Breakdown (% of the Fund's
Net Assets) as of April 30, 2011
| Medical-Drugs | 49.8 | ||||||
| Medical-Biomedical/Genetics | 17.4 | ||||||
| Medical-Generic Drugs | 13.9 | ||||||
| Medical Products | 10.0 | ||||||
| Therapeutics | 3.9 | ||||||
| Consumer Products-Miscellaneous | 2.5 | ||||||
| Drug Delivery Systems | 2.5 | ||||||
| Money Market Fund | 0.1 | ||||||
| Liabilities in excess of other assets | (0.1 | ) | |||||
Style Allocation (% of the Fund's
Total Investments) as of April 30, 2011
| Large-Cap Value | 32.5 | ||||||
| Small-Cap Growth | 25.5 | ||||||
| Large-Cap Growth | 17.0 | ||||||
| Mid-Cap Value | 11.2 | ||||||
| Mid-Cap Growth | 8.0 | ||||||
| Small-Cap Value | 5.8 | ||||||
Top Ten Fund Holdings (% of the Fund's
Net Assets) as of April 30, 2011
| Security | |||||||
| Merck & Co., Inc. | 4.9 | ||||||
| Pfizer, Inc. | 4.9 | ||||||
| Bristol-Myers Squibb Co. | 4.8 | ||||||
| Johnson & Johnson | 4.8 | ||||||
| Abbott Laboratories | 4.8 | ||||||
| Amgen, Inc. | 4.8 | ||||||
| Eli Lilly & Co. | 4.8 | ||||||
| Gilead Sciences, Inc. | 4.4 | ||||||
| Questcor Pharmaceuticals, Inc. | 3.9 | ||||||
| Biogen Idec, Inc. | 3.4 | ||||||
| Total | 45.5 | ||||||
24
Manager's Analysis (Continued)
PowerShares Dynamic Pharmaceuticals Portfolio (ticker: PJP)
Growth of a $10,000 Investment Since Inception†

| Fund Performance History (%) | As of April 30, 2011 | ||||||||||||||||||||||
| Avg Ann†† | Fund Inception | ||||||||||||||||||||||
| 1 Year | 3 Year | 5 Year | Avg Ann†† | Cumulative | |||||||||||||||||||
| Index | |||||||||||||||||||||||
| Dynamic Pharmaceuticals IntellidexSM Index | 35.46 | % | 16.93 | % | 11.17 | % | 11.61 | % | 90.15 | % | |||||||||||||
| S&P SuperComposite Pharmaceuticals Index | 14.73 | % | 7.20 | % | 5.01 | % | 4.01 | % | 25.77 | % | |||||||||||||
| S&P 500® Index | 17.24 | % | 1.74 | % | 2.95 | % | 4.49 | % | 29.19 | % | |||||||||||||
| Fund | |||||||||||||||||||||||
| Net Asset Value ("NAV") Return | 34.55 | % | 16.09 | % | 10.42 | % | 10.92 | % | 83.38 | % | |||||||||||||
| Share Price Return | 34.73 | % | 16.14 | % | 10.42 | % | 10.95 | % | 83.65 | % | |||||||||||||
Fund Inception: June 23, 2005
Performance quoted represents past performance. Past performance is not a guarantee of future results and current performance may be higher or lower than performance quoted. Investment returns and principal value will fluctuate and shares, when redeemed, may be worth more or less than their original cost. The Adviser has waived fees and reimbursed other expenses, absent which, performance would have been lower. The Adviser has contractually agreed to waive fees and/or pay certain Fund expenses through August 31, 2012. According to the Fund's current prospectus, the total gross annual operating expense ratio was indicated as 0.74%. In the Financial Highlights section of this Shareholder Report, the Fund's net total operating expense ratio was determined to be 0.63%, while the Fund's gross total expense ratio was determined to be 0.76%. NAV and Share Price returns assume that dividends and capital gain distributions have been reinvested in the Fund at NAV and Share Price, respectively. The returns shown in the table above do not reflect the deduction of taxes that a shareholder would pay on Fund distributions or the redemption or sale of Fund Shares. See invescopowershares.com to find the most recent month-end performance numbers.
Index performance results are based upon a hypothetical investment in its constituent securities. Index returns do not represent Fund returns. An investor cannot invest directly in an index. The Index does not charge management fees or brokerage expenses, and no such fees or expenses were deducted from the hypothetical performance shown. In addition, the results actual investors might have achieved would have differed from those shown because of differences in the timing, amounts of their investments, and fees and expenses associated with an investment in the Fund.
The S&P SuperComposite Pharmaceuticals Index and S&P 500® Index (the "Benchmark Indices") are unmanaged indices used as a measurement of change in stock market conditions based on the average performance of approximately 19 and 500 common stocks, respectively.
† Fund and underlying Index returns are based on the inception date of the Fund. Returns for the Benchmark Indices are based on the closest month-end to the Fund's inception date.
†† Average annualized.
25
Manager's Analysis
PowerShares Dynamic Retail Portfolio (ticker: PMR)
The PowerShares Dynamic Retail Portfolio (the "Fund") seeks investment results that correspond (before fees and expenses) generally to the price and yield performance of the Dynamic Retail IntellidexSM Index (the "Index").
For the fiscal year ended April 30, 2011, the Fund returned 18.35%. Over this same year, the Index returned 19.07%, while the S&P SuperComposite Retailing Index returned 16.94% and the S&P 500® Index returned 17.24%. The Fund benefited from positive performance of securities of companies in apparel retail, automotive retail, and hypermarkets & super centers sub-industries. The Fund suffered negative performance of securities of companies in computer & electronics retail and home improvement retail sub-industries.
Industry Breakdown (% of the Fund's
Net Assets) as of April 30, 2011
| Retail-Apparel/Shoe | 29.9 | ||||||
| Retail-Major Department Store | 9.7 | ||||||
| E-Commerce/Services | 7.4 | ||||||
| Retail-Discount | 7.2 | ||||||
| Food-Retail | 5.5 | ||||||
| Retail-Bedding | 5.4 | ||||||
| Retail-Auto Parts | 5.1 | ||||||
| Retail-Drug Store | 4.7 | ||||||
| Retail-Home Furnishings | 3.1 | ||||||
| Retail-Gardening Products | 3.0 | ||||||
| Retail-Mail Order | 3.0 | ||||||
| Retail-Miscellaneous/Diversified | 2.9 | ||||||
| Retail-Regional Department Store | 2.9 | ||||||
| Retail-Sporting Goods | 2.8 | ||||||
| Distribution/Wholesale | 2.6 | ||||||
| Property/Casualty Insurance | 2.5 | ||||||
| Rental Auto/Equipment | 2.3 | ||||||
| Money Market Fund | 0.5 | ||||||
| Liabilities in excess of other assets | (0.5 | ) | |||||
Style Allocation (% of the Fund's
Total Investments) as of April 30, 2011
| Large-Cap Growth | 24.1 | ||||||
| Small-Cap Value | 22.1 | ||||||
| Mid-Cap Growth | 21.3 | ||||||
| Small-Cap Growth | 16.9 | ||||||
| Mid-Cap Value | 10.9 | ||||||
| Large-Cap Value | 4.7 | ||||||
Top Ten Fund Holdings (% of the Fund's
Net Assets) as of April 30, 2011
| Security | |||||||
| Limited Brands, Inc. | 5.8 | ||||||
| Bed Bath & Beyond, Inc. | 5.4 | ||||||
| TJX Cos., Inc. (The) | 4.9 | ||||||
| Nordstrom, Inc. | 4.8 | ||||||
| eBay, Inc. | 4.7 | ||||||
| Gap, Inc. (The) | 4.7 | ||||||
| Walgreen Co. | 4.7 | ||||||
| Target Corp. | 4.3 | ||||||
| Ann, Inc. | 3.3 | ||||||
| Pier 1 Imports, Inc. | 3.1 | ||||||
| Total | 45.7 | ||||||
26
Manager's Analysis (Continued)
PowerShares Dynamic Retail Portfolio (ticker: PMR)
Growth of a $10,000 Investment Since Inception†

| Fund Performance History (%) | As of April 30, 2011 | ||||||||||||||||||||||
| Avg Ann†† | Fund Inception | ||||||||||||||||||||||
| 1 Year | 3 Year | 5 Year | Avg Ann†† | Cumulative | |||||||||||||||||||
| Index | |||||||||||||||||||||||
| Dynamic Retail IntellidexSM Index | 19.07 | % | 12.53 | % | 4.94 | % | 8.19 | % | 54.32 | % | |||||||||||||
| S&P SuperComposite Retailing Index | 16.94 | % | 13.08 | % | 4.48 | % | 5.79 | % | 36.30 | % | |||||||||||||
| S&P 500® Index | 17.24 | % | 1.74 | % | 2.95 | % | 4.41 | % | 26.81 | % | |||||||||||||
| Fund | |||||||||||||||||||||||
| Net Asset Value ("NAV") Return | 18.35 | % | 11.80 | % | 4.32 | % | 7.57 | % | 49.47 | % | |||||||||||||
| Share Price Return | 18.39 | % | 11.83 | % | 4.35 | % | 7.57 | % | 49.50 | % | |||||||||||||
Fund Inception: October 26, 2005
Performance quoted represents past performance. Past performance is not a guarantee of future results and current performance may be higher or lower than performance quoted. Investment returns and principal value will fluctuate and shares, when redeemed, may be worth more or less than their original cost. The Adviser has waived fees and reimbursed other expenses, absent which, performance would have been lower. The Adviser has contractually agreed to waive fees and/or pay certain Fund expenses through August 31, 2012. According to the Fund's current prospectus, the total gross annual operating expense ratio was indicated as 0.89%. In the Financial Highlights section of this Shareholder Report, the Fund's net total operating expense ratio was determined to be 0.63%, while the Fund's gross total expense ratio was determined to be 1.63%. NAV and Share Price returns assume that dividends and capital gain distributions have been reinvested in the Fund at NAV and Share Price, respectively. The returns shown in the table above do not reflect the deduction of taxes that a shareholder would pay on Fund distributions or the redemption or sale of Fund Shares. See invescopowershares.com to find the most recent month-end performance numbers.
Index performance results are based upon a hypothetical investment in its constituent securities. Index returns do not represent Fund returns. An investor cannot invest directly in an index. The Index does not charge management fees or brokerage expenses, and no such fees or expenses were deducted from the hypothetical performance shown. In addition, the results actual investors might have achieved would have differed from those shown because of differences in the timing, amounts of their investments, and fees and expenses associated with an investment in the Fund.
The S&P SuperComposite Retailing Index and S&P 500® Index (the "Benchmark Indices") are unmanaged indices used as a measurement of change in stock market conditions based on the average performance of approximately 92 and 500 common stocks, respectively.
† Fund and underlying Index returns are based on the inception date of the Fund. Returns for the Benchmark Indices are based on the closest month-end to the Fund's inception date.
†† Average annualized.
27
Manager's Analysis
PowerShares Dynamic Semiconductors Portfolio (ticker: PSI)
The PowerShares Dynamic Semiconductors Portfolio (the "Fund") seeks investment results that correspond (before fees and expenses) generally to the price and yield performance of the Dynamic Semiconductors IntellidexSM Index (the "Index").
For the fiscal year ended April 30, 2011, the Fund returned 27.57%. Over this same year, the Index returned 28.45%, while the S&P SuperComposite Semiconductor Index returned 19.17% and the S&P 500® Index returned 17.24%. The Fund benefited from positive performance of securities of companies in semiconductor equipment and electronic components sub-industries. Fund performance was positive for securities of companies within each sub-industry in which it was invested.
Industry Breakdown (% of the Fund's
Net Assets) as of April 30, 2011
| Electronic Components-Semiconductors | 34.8 | ||||||
| Semiconductor Equipment | 27.2 | ||||||
| Semiconductor Components-Integrated Circuits | 20.4 | ||||||
| Wireless Equipment | 9.6 | ||||||
| Electronic Components-Miscellaneous | 2.9 | ||||||
| Instruments-Scientific | 2.6 | ||||||
| Computers-Memory Devices | 2.5 | ||||||
| Money Market Fund | 0.2 | ||||||
| Liabilities in excess of other assets | (0.2 | ) | |||||
Style Allocation (% of the Fund's
Total Investments) as of April 30, 2011
| Mid-Cap Growth | 31.5 | ||||||
| Small-Cap Growth | 22.6 | ||||||
| Small-Cap Value | 18.7 | ||||||
| Large-Cap Growth | 14.8 | ||||||
| Mid-Cap Value | 7.5 | ||||||
| Large-Cap Value | 4.9 | ||||||
Top Ten Fund Holdings (% of the Fund's
Net Assets) as of April 30, 2011
| Security | |||||||
| Altera Corp. | 5.6 | ||||||
| Intel Corp. | 5.2 | ||||||
| Linear Technology Corp. | 4.9 | ||||||
| Texas Instruments, Inc. | 4.9 | ||||||
| Maxim Integrated Products, Inc. | 4.9 | ||||||
| Applied Materials, Inc. | 4.8 | ||||||
| QUALCOMM, Inc. | 4.7 | ||||||
| KLA-Tencor Corp. | 4.4 | ||||||
| National Semiconductor Corp. | 4.2 | ||||||
| CEVA, Inc. | 3.5 | ||||||
| Total | 47.1 | ||||||
28
Manager's Analysis (Continued)
PowerShares Dynamic Semiconductors Portfolio (ticker: PSI)
Growth of a $10,000 Investment Since Inception†
| Fund Performance History (%) | As of April 30, 2011 | ||||||||||||||||||||||
| Avg Ann†† | Fund Inception | ||||||||||||||||||||||
| 1 Year | 3 Year | 5 Year | Avg Ann†† | Cumulative | |||||||||||||||||||
| Index | |||||||||||||||||||||||
| Dynamic Semiconductors IntellidexSM Index | 28.45 | % | 4.85 | % | -1.12 | % | 4.37 | % | 28.42 | % | |||||||||||||
| S&P SuperComposite Semiconductor Index | 19.17 | % | 8.37 | % | 2.78 | % | 3.33 | % | 21.07 | % | |||||||||||||
| S&P 500® Index | 17.24 | % | 1.74 | % | 2.95 | % | 4.49 | % | 29.19 | % | |||||||||||||
| Fund | |||||||||||||||||||||||
| Net Asset Value ("NAV") Return | 27.57 | % | 4.09 | % | -1.82 | % | 3.64 | % | 23.27 | % | |||||||||||||
| Share Price Return | 27.64 | % | 4.11 | % | -1.81 | % | 3.64 | % | 23.26 | % | |||||||||||||
Fund Inception: June 23, 2005
Performance quoted represents past performance. Past performance is not a guarantee of future results and current performance may be higher or lower than performance quoted. Investment returns and principal value will fluctuate and shares, when redeemed, may be worth more or less than their original cost. The Adviser has waived fees and reimbursed other expenses, absent which, performance would have been lower. The Adviser has contractually agreed to waive fees and/or pay certain Fund expenses through August 31, 2012. According to the Fund's current prospectus, the total gross annual operating expense ratio was indicated as 0.90%. In the Financial Highlights section of this Shareholder Report, the Fund's net total operating expense ratio was determined to be 0.63%, while the Fund's gross total expense ratio was determined to be 0.97%. NAV and Share Price returns assume that dividends and capital gain distributions have been reinvested in the Fund at NAV and Share Price, respectively. The returns shown in the table above do not reflect the deduction of taxes that a shareholder would pay on Fund distributions or the redemption or sale of Fund Shares. See invescopowershares.com to find the most recent month-end performance numbers.
Index performance results are based upon a hypothetical investment in its constituent securities. Index returns do not represent Fund returns. An investor cannot invest directly in an index. The Index does not charge management fees or brokerage expenses, and no such fees or expenses were deducted from the hypothetical performance shown. In addition, the results actual investors might have achieved would have differed from those shown because of differences in the timing, amounts of their investments, and fees and expenses associated with an investment in the Fund.
The S&P SuperComposite Semiconductor Index and S&P 500® Index (the "Benchmark Indices") are unmanaged indices used as a measurement of change in stock market conditions based on the average performance of approximately 23 and 500 common stocks, respectively.
† Fund and underlying Index returns are based on the inception date of the Fund. Returns for the Benchmark Indices are based on the closest month-end to the Fund's inception date.
†† Average annualized.
29
Manager's Analysis
PowerShares Dynamic Software Portfolio (ticker: PSJ)
The PowerShares Dynamic Software Portfolio (the "Fund") seeks investment results that correspond (before fees and expenses) generally to the price and yield performance of the Dynamic Software IntellidexSM Index (the "Index").
For the fiscal year ended April 30, 2011, the Fund returned 21.87%. Over this same year, the Index returned 22.66%, while the S&P SuperComposite Software & Services Index returned 16.96% and the S&P 500® Index returned 17.24%. The Fund benefited from positive performance of securities of companies in applications software, systems software, and semiconductor equipment sub-industries. The Fund suffered negative performance of securities of companies in home entertainment software, electronic components, and health care technology sub-industries.
Industry Breakdown (% of the Fund's
Net Assets) as of April 30, 2011
| Applications Software | 23.1 | ||||||
| Enterprise Software/Services | 21.1 | ||||||
| Electronic Design Automation | 8.0 | ||||||
| Computer Aided Design | 7.7 | ||||||
| Computers-Integrated Systems | 5.7 | ||||||
| Transactional Software | 5.6 | ||||||
| Internet Security | 5.2 | ||||||
| Data Processing/Management | 4.7 | ||||||
| Internet Infrastructure Software | 3.2 | ||||||
| Semiconductor Equipment | 3.0 | ||||||
| Decision Support Software | 2.8 | ||||||
| Computer Graphics | 2.6 | ||||||
| Medical Information Systems | 2.6 | ||||||
| Computer Services | 2.5 | ||||||
| Commercial Services-Finance | 2.3 | ||||||
| Money Market Fund | 0.0 | ||||||
| Liabilities in excess of other assets | (0.1 | ) | |||||
Style Allocation (% of the Fund's
Total Investments) as of April 30, 2011
| Small-Cap Growth | 39.0 | ||||||
| Mid-Cap Growth | 28.4 | ||||||
| Large-Cap Growth | 14.7 | ||||||
| Small-Cap Value | 7.8 | ||||||
| Large-Cap Value | 5.2 | ||||||
| Mid-Cap Value | 4.9 | ||||||
Top Ten Fund Holdings (% of the Fund's
Net Assets) as of April 30, 2011
| Security | |||||||
| Red Hat, Inc. | 5.5 | ||||||
| Oracle Corp. | 5.2 | ||||||
| Symantec Corp. | 5.2 | ||||||
| Autodesk, Inc. | 5.1 | ||||||
| BMC Software, Inc. | 4.9 | ||||||
| CA, Inc. | 4.8 | ||||||
| Microsoft Corp. | 4.7 | ||||||
| Fiserv, Inc. | 4.7 | ||||||
| OPNET Technologies, Inc. | 3.3 | ||||||
| TIBCO Software, Inc. | 3.2 | ||||||
| Total | 46.6 | ||||||
30
Manager's Analysis (Continued)
PowerShares Dynamic Software Portfolio (ticker: PSJ)
Growth of a $10,000 Investment Since Inception†
| Fund Performance History (%) | As of April 30, 2011 | ||||||||||||||||||||||
| Avg Ann†† | Fund Inception | ||||||||||||||||||||||
| 1 Year | 3 Year | 5 Year | Avg Ann†† | Cumulative | |||||||||||||||||||
| Index | |||||||||||||||||||||||
| Dynamic Software IntellidexSM Index | 22.66 | % | 16.94 | % | 8.92 | % | 11.56 | % | 89.72 | % | |||||||||||||
| S&P SuperComposite Software & Services Index | 16.96 | % | 6.21 | % | 6.15 | % | 6.48 | % | 44.21 | % | |||||||||||||
| S&P 500® Index | 17.24 | % | 1.74 | % | 2.95 | % | 4.49 | % | 29.19 | % | |||||||||||||
| Fund | |||||||||||||||||||||||
| Net Asset Value ("NAV") Return | 21.87 | % | 16.15 | % | 8.30 | % | 10.92 | % | 83.38 | % | |||||||||||||
| Share Price Return | 21.86 | % | 16.14 | % | 8.28 | % | 10.91 | % | 83.32 | % | |||||||||||||
Fund Inception: June 23, 2005
Performance quoted represents past performance. Past performance is not a guarantee of future results and current performance may be higher or lower than performance quoted. Investment returns and principal value will fluctuate and shares, when redeemed, may be worth more or less than their original cost. The Adviser has waived fees and reimbursed other expenses, absent which, performance would have been lower. The Adviser has contractually agreed to waive fees and/or pay certain Fund expenses through August 31, 2012. According to the Fund's current prospectus, the total gross annual operating expense ratio was indicated as 0.75%. In the Financial Highlights section of this Shareholder Report, the Fund's net total operating expense ratio was determined to be 0.63%, while the Fund's gross total expense ratio was determined to be 0.77%. NAV and Share Price returns assume that dividends and capital gain distributions have been reinvested in the Fund at NAV and Share Price, respectively. The returns shown in the table above do not reflect the deduction of taxes that a shareholder would pay on Fund distributions or the redemption or sale of Fund Shares. See invescopowershares.com to find the most recent month-end performance numbers.
Index performance results are based upon a hypothetical investment in its constituent securities. Index returns do not represent Fund returns. An investor cannot invest directly in an index. The Index does not charge management fees or brokerage expenses, and no such fees or expenses were deducted from the hypothetical performance shown. In addition, the results actual investors might have achieved would have differed from those shown because of differences in the timing, amounts of their investments, and fees and expenses associated with an investment in the Fund.
The S&P SuperComposite Software & Services Index and S&P 500® Index (the "Benchmark Indices") are unmanaged indices used as a measurement of change in stock market conditions based on the average performance of approximately 17 and 500 common stocks, respectively.
† Fund and underlying Index returns are based on the inception date of the Fund. Returns for the Benchmark Indices are based on the closest month-end to the Fund's inception date.
†† Average annualized.
31
Frequency Distribution of Discounts & Premiums
Since Inception through April 30, 2011
| Closing Price Above NAV (bps) | |||||||||||||||||||||||||||||||||||||||
| Ticker | Fund Name | Inception | Days | 0-24 | 25-49 | 50-99 | 100-149 | 150-199 | 200+ | ||||||||||||||||||||||||||||||
| PJB | PowerShares Dynamic Banking Portfolio | 10/12/06 | 1145 | 418 | 40 | 9 | 7 | 1 | 3 | ||||||||||||||||||||||||||||||
| PBE | PowerShares Dynamic Biotechnology & Genome Portfolio | 6/23/05 | 1474 | 548 | 43 | 4 | 1 | 0 | 0 | ||||||||||||||||||||||||||||||
| PKB | PowerShares Dynamic Building & Construction Portfolio | 10/26/05 | 1387 | 469 | 44 | 15 | 1 | 1 | 2 | ||||||||||||||||||||||||||||||
| PXE | PowerShares Dynamic Energy Exploration & Production Portfolio | 10/26/05 | 1387 | 587 | 23 | 6 | 1 | 1 | 1 | ||||||||||||||||||||||||||||||
| PBJ | PowerShares Dynamic Food & Beverage Portfolio | 6/23/05 | 1474 | 616 | 32 | 8 | 3 | 0 | 0 | ||||||||||||||||||||||||||||||
| PIC | PowerShares Dynamic Insurance Portfolio | 10/26/05 | 1387 | 574 | 29 | 16 | 1 | 3 | 1 | ||||||||||||||||||||||||||||||
| PEJ | PowerShares Dynamic Leisure and Entertainment Portfolio | 6/23/05 | 1474 | 577 | 30 | 14 | 0 | 0 | 0 | ||||||||||||||||||||||||||||||
| PBS | PowerShares Dynamic Media Portfolio | 6/23/05 | 1474 | 571 | 33 | 5 | 1 | 0 | 1 | ||||||||||||||||||||||||||||||
| PXQ | PowerShares Dynamic Networking Portfolio | 6/23/05 | 1474 | 636 | 32 | 10 | 0 | 0 | 0 | ||||||||||||||||||||||||||||||
| PXJ | PowerShares Dynamic Oil & Gas Services Portfolio | 10/26/05 | 1387 | 530 | 52 | 16 | 0 | 0 | 1 | ||||||||||||||||||||||||||||||
| PJP | PowerShares Dynamic Pharmaceuticals Portfolio | 6/23/05 | 1474 | 650 | 18 | 9 | 2 | 0 | 0 | ||||||||||||||||||||||||||||||
| PMR | PowerShares Dynamic Retail Portfolio | 10/26/05 | 1387 | 541 | 30 | 8 | 1 | 0 | 0 | ||||||||||||||||||||||||||||||
| PSI | PowerShares Dynamic Semiconductors Portfolio | 6/23/05 | 1474 | 581 | 34 | 7 | 2 | 2 | 2 | ||||||||||||||||||||||||||||||
| PSJ | PowerShares Dynamic Software Portfolio | 6/23/05 | 1474 | 690 | 28 | 12 | 5 | 2 | 0 | ||||||||||||||||||||||||||||||
32
| Closing Price Below NAV (bps) | |||||||||||||||||||||||||||
| Ticker | -0-24 | -25-49 | -50-99 | -100-149 | -150-199 | -200+ | |||||||||||||||||||||
| PJB | 621 | 40 | 5 | 0 | 1 | 0 | |||||||||||||||||||||
| PBE | 820 | 47 | 10 | 1 | 0 | 0 | |||||||||||||||||||||
| PKB | 814 | 34 | 6 | 0 | 1 | 0 | |||||||||||||||||||||
| PXE | 725 | 33 | 7 | 1 | 1 | 1 | |||||||||||||||||||||
| PBJ | 792 | 23 | 0 | 0 | 0 | 0 | |||||||||||||||||||||
| PIC | 729 | 26 | 3 | 4 | 1 | 0 | |||||||||||||||||||||
| PEJ | 833 | 17 | 2 | 0 | 0 | 1 | |||||||||||||||||||||
| PBS | 825 | 35 | 3 | 0 | 0 | 0 | |||||||||||||||||||||
| PXQ | 772 | 23 | 1 | 0 | 0 | 0 | |||||||||||||||||||||
| PXJ | 758 | 23 | 5 | 1 | 1 | 0 | |||||||||||||||||||||
| PJP | 776 | 17 | 2 | 0 | 0 | 0 | |||||||||||||||||||||
| PMR | 768 | 37 | 2 | 0 | 0 | 0 | |||||||||||||||||||||
| PSI | 824 | 17 | 2 | 2 | 0 | 1 | |||||||||||||||||||||
| PSJ | 725 | 8 | 3 | 0 | 1 | 0 | |||||||||||||||||||||
33
Fees and Expenses
As a shareholder of a Fund of the PowerShares Exchange-Traded Fund Trust, you incur advisory fees and other Fund expenses. The expense examples below are intended to help you understand your ongoing costs (in dollars) of investing in the Funds and to compare these costs with the ongoing costs of investing in other funds.
The example is based on an investment of $1,000 invested at the beginning of the period and held through the six-month period ended April 30, 2011.
Actual Expenses
The first line in the following tables provides information about actual account values and actual expenses. You may use the information in this line, together with the amount you invested, to estimate the expenses that you paid over the period. Simply divide your account value by $1,000 (for example, an $8,600 account value divided by $1,000 = 8.6), then multiply the result by the number in the first line under the heading "Expenses Paid During the Six-Month Period" to estimate the expenses you paid on your account during this period.
Hypothetical Example for Comparison Purposes
The second line in the following tables provides information about hypothetical account values and hypothetical expenses based on the Funds' actual expense ratio and an assumed annualized rate of return of 5% per year before expenses, which is not the Funds' actual return. The hypothetical account values and expenses may not be used to estimate the actual ending account balance or expenses you paid for the period. You may use this information to compare the ongoing costs of investing in the Funds and other funds. To do so, compare this 5% hypothetical example with the 5% hypothetical examples that appear in the shareholder reports of the other funds.
Please note that the expenses shown in the tables are meant to highlight your ongoing costs only, and do not reflect any transactional costs such as sales charges and brokerage commission. Therefore the second line in the table is useful in comparing ongoing costs only, and will not help you determine the relative total costs of owning different funds. In addition, if these transactional costs were included, your costs would have been higher.
| Beginning Account Value November 1, 2010 | Ending Account Value April 30, 2011 | Annualized Expense Ratio Based on the Six-Month Period | Expenses Paid During the Six-Month Period (1) | ||||||||||||||||
| PowerShares Dynamic Banking Portfolio Actual | $ | 1,000.00 | $ | 1,107.00 | 0.65 | % | $ | 3.40 | |||||||||||
| Hypothetical (5% return before expenses) | $ | 1,000.00 | $ | 1,021.57 | 0.65 | % | $ | 3.26 | |||||||||||
| PowerShares Dynamic Biotechnology & Genome Portfolio Actual | $ | 1,000.00 | $ | 1,158.16 | 0.63 | % | $ | 3.37 | |||||||||||
| Hypothetical (5% return before expenses) | $ | 1,000.00 | $ | 1,021.67 | 0.63 | % | $ | 3.16 | |||||||||||
| PowerShares Dynamic Building & Construction Portfolio Actual | $ | 1,000.00 | $ | 1,242.74 | 0.63 | % | $ | 3.50 | |||||||||||
| Hypothetical (5% return before expenses) | $ | 1,000.00 | $ | 1,021.67 | 0.63 | % | $ | 3.16 | |||||||||||
34
Fees and Expenses (Continued)
| Beginning Account Value November 1, 2010 | Ending Account Value April 30, 2011 | Annualized Expense Ratio Based on the Six-Month Period | Expenses Paid During the Six-Month Period (1) | ||||||||||||||||
| PowerShares Dynamic Energy Exploration & Production Portfolio Actual | $ | 1,000.00 | $ | 1,440.83 | 0.63 | % | $ | 3.81 | |||||||||||
| Hypothetical (5% return before expenses) | $ | 1,000.00 | $ | 1,021.67 | 0.63 | % | $ | 3.16 | |||||||||||
| PowerShares Dynamic Food & Beverage Portfolio Actual | $ | 1,000.00 | $ | 1,151.91 | 0.63 | % | $ | 3.36 | |||||||||||
| Hypothetical (5% return before expenses) | $ | 1,000.00 | $ | 1,021.67 | 0.63 | % | $ | 3.16 | |||||||||||
| PowerShares Dynamic Insurance Portfolio Actual | $1,000.00 | $1,108.10 | 0.63% | $3.29 | |||||||||||||||
| Hypothetical (5% return before expenses) | $ | 1,000.00 | $ | 1,021.67 | 0.63 | % | $ | 3.16 | |||||||||||
| PowerShares Dynamic Leisure and | |||||||||||||||||||
| Entertainment Portfolio | |||||||||||||||||||
| Actual | $ | 1,000.00 | $ | 1,120.08 | 0.63 | % | $ | 3.31 | |||||||||||
| Hypothetical (5% return before expenses) | $ | 1,000.00 | $ | 1,021.67 | 0.63 | % | $ | 3.16 | |||||||||||
| PowerShares Dynamic Media Portfolio Actual | $1,000.00 | $1,202.52 | 0.63% | $3.44 | |||||||||||||||
| Hypothetical (5% return before expenses) | $ | 1,000.00 | $ | 1,021.67 | 0.63 | % | $ | 3.16 | |||||||||||
| PowerShares Dynamic Networking Portfolio Actual | $1,000.00 | $1,229.82 | 0.63% | $3.48 | |||||||||||||||
| Hypothetical (5% return before expenses) | $ | 1,000.00 | $ | 1,021.67 | 0.63 | % | $ | 3.16 | |||||||||||
| PowerShares Dynamic Oil & Gas Services | |||||||||||||||||||
| Portfolio | |||||||||||||||||||
| Actual | $ | 1,000.00 | $ | 1,446.78 | 0.63 | % | $ | 3.82 | |||||||||||
| Hypothetical (5% return before expenses) | $ | 1,000.00 | $ | 1,021.67 | 0.63 | % | $ | 3.16 | |||||||||||
| PowerShares Dynamic Pharmaceuticals | |||||||||||||||||||
| Portfolio | |||||||||||||||||||
| Actual | $ | 1,000.00 | $ | 1,166.45 | 0.63 | % | $ | 3.38 | |||||||||||
| Hypothetical (5% return before expenses) | $ | 1,000.00 | $ | 1,021.67 | 0.63 | % | $ | 3.16 | |||||||||||
| PowerShares Dynamic Retail Portfolio Actual | $1,000.00 | $1,232.87 | 0.63% | $3.49 | |||||||||||||||
| Hypothetical (5% return before expenses) | $ | 1,000.00 | $ | 1,021.67 | 0.63 | % | $ | 3.16 | |||||||||||
| PowerShares Dynamic Semiconductors Portfolio Actual | $1,000.00 | $1,260.31 | 0.63% | $3.53 | |||||||||||||||
| Hypothetical (5% return before expenses) | $ | 1,000.00 | $ | 1,021.67 | 0.63 | % | $ | 3.16 | |||||||||||
| PowerShares Dynamic Software Portfolio Actual | $1,000.00 | $1,155.66 | 0.63% | $3.37 | |||||||||||||||
| Hypothetical (5% return before expenses) | $ | 1,000.00 | $ | 1,021.67 | 0.63 | % | $ | 3.16 | |||||||||||
(1) Expenses are calculated using the annualized expense ratio, which represents the ongoing expenses as a percentage of net assets for the six-month period ended April 30, 2011. Expenses are calculated by multiplying the Fund's annualized expense ratio by the average account value for the period; then multiplying the result by 181 and then dividing the result by 365. Expense ratios for the most recent half-year differ from expense ratios based on annualized data in the Financial Highlights.
35
Schedule of Investments
PowerShares Dynamic Banking Portfolio
April 30, 2011
| Number of Shares | Value | ||||||||||
| Common Stocks—100.0% | |||||||||||
| Commercial Banks - Central U.S.—20.1% | |||||||||||
| 10,864 | BOK Financial Corp. | $ | 584,266 | ||||||||
| 13,971 | Commerce Bancshares, Inc. | 594,606 | |||||||||
| 9,429 | Cullen/Frost Bankers, Inc. | 558,574 | |||||||||
| 29,432 | International Bancshares Corp. | 518,592 | |||||||||
| 13,578 | Prosperity Bancshares, Inc. | 622,551 | |||||||||
| 22,460 | Texas Capital Bancshares, Inc.* | 579,468 | |||||||||
| 13,932 | UMB Financial Corp. | 586,676 | |||||||||
| 4,044,733 | |||||||||||
| Commercial Banks - Eastern U.S.—27.3% | |||||||||||
| 73,165 | CapitalSource, Inc. | 488,742 | |||||||||
| 22,269 | Community Bank System, Inc. | 557,170 | |||||||||
| 55,284 | F.N.B. Corp. | 605,360 | |||||||||
| 20,856 | Independent Bank Corp. | 611,289 | |||||||||
| 11,569 | M&T Bank Corp. | 1,022,353 | |||||||||
| 25,094 | NBT Bancorp, Inc. | 567,124 | |||||||||
| 25,037 | S&T Bancorp, Inc. | 511,005 | |||||||||
| 13,763 | Tompkins Financial Corp. | 560,705 | |||||||||
| 94,345 | TrustCo Bank Corp. NY | 566,070 | |||||||||
| 5,489,818 | |||||||||||
| Commercial Banks - Southern U.S.—10.8% | |||||||||||
| 16,286 | City Holding Co. | 555,353 | |||||||||
| 2,772 | First Citizens BancShares, Inc., Class A | 554,428 | |||||||||
| 19,619 | United Bankshares, Inc. | 513,233 | |||||||||
| 26,984 | WesBanco, Inc. | 547,775 | |||||||||
| 2,170,789 | |||||||||||
| Commercial Banks - Western U.S.—2.8% | |||||||||||
| 11,680 | Bank of Hawaii Corp. | 569,867 | |||||||||
| Diversified Banking Institution—5.0% | |||||||||||
| 21,948 | JPMorgan Chase & Co. | 1,001,487 | |||||||||
| S&L/Thrifts - Eastern U.S.—10.2% | |||||||||||
| 39,804 | Astoria Financial Corp. | 575,964 | |||||||||
| 90,030 | Hudson City Bancorp, Inc. | 857,986 | |||||||||
| 41,674 | Investors Bancorp, Inc.* | 626,777 | |||||||||
| 2,060,727 | |||||||||||
| Super - Regional Banks - U.S.—23.8% | |||||||||||
| 70,174 | Fifth Third Bancorp | 931,209 | |||||||||
| 16,557 | PNC Financial Services Group, Inc. | 1,032,164 | |||||||||
| 33,243 | SunTrust Banks, Inc. | 937,120 | |||||||||
| 37,229 | U.S. Bancorp | 961,253 | |||||||||
| 31,693 | Wells Fargo & Co. | 922,583 | |||||||||
| 4,784,329 | |||||||||||
| Total Common Stocks (Cost $20,476,819) | 20,121,750 | ||||||||||
| Number of Shares | Value | ||||||||||
| Money Market Fund—0.5% | |||||||||||
| 106,189 | Goldman Sachs Financial Square Prime Obligations Institutional Share Class (Cost $106,189) | $ | 106,189 | ||||||||
| Total Investments (Cost $20,583,008)—100.5% | 20,227,939 | ||||||||||
| Liabilities in excess of other assets—(0.5%) | (107,939 | ) | |||||||||
| Net Assets—100.0% | $ | 20,120,000 | |||||||||
Notes to Schedule of Investments:
* Non-income producing security.
See Notes to Financial Statements.
36
Schedule of Investments
PowerShares Dynamic Biotechnology & Genome Portfolio
April 30, 2011
| Number of Shares | Value | ||||||||||
| Common Stocks—100.0% | |||||||||||
| Biotechnology—64.0% | |||||||||||
| 102,969 | Alexion Pharmaceuticals, Inc.* | $ | 9,976,666 | ||||||||
| 187,020 | Amgen, Inc.* | 10,632,087 | |||||||||
| 876,812 | Ariad Pharmaceuticals, Inc.* | 7,496,743 | |||||||||
| 144,196 | Biogen Idec, Inc.* | 14,037,481 | |||||||||
| 250,990 | Emergent Biosolutions, Inc.* | 5,825,478 | |||||||||
| 497,761 | Enzon Pharmaceuticals, Inc.* | 5,714,296 | |||||||||
| 1,096,919 | Geron Corp.* | 5,265,211 | |||||||||
| 250,473 | Gilead Sciences, Inc.* | 9,728,371 | |||||||||
| 140,545 | Illumina, Inc.* | 9,975,884 | |||||||||
| 383,251 | Incyte Corp.* | 7,082,478 | |||||||||
| 142,618 | InterMune, Inc.* | 6,366,468 | |||||||||
| 182,686 | Life Technologies Corp.* | 10,084,267 | |||||||||
| 935,267 | Micromet, Inc.* | 6,322,405 | |||||||||
| 386,024 | Momenta Pharmaceuticals, Inc.* | 7,284,273 | |||||||||
| 288,630 | Myriad Genetics, Inc.* | 6,188,227 | |||||||||
| 1,096,919 | PDL BioPharma, Inc. | 7,042,220 | |||||||||
| 698,690 | Protalix BioTherapeutics, Inc.* | 4,869,869 | |||||||||
| 78,408 | United Therapeutics Corp.* | 5,250,200 | |||||||||
| 139,142,624 | |||||||||||
| Chemicals—5.0% | |||||||||||
| 155,407 | Sigma-Aldrich Corp. | 10,968,626 | |||||||||
| Electronics—5.3% | |||||||||||
| 118,554 | Waters Corp.* | 11,618,292 | |||||||||
| Healthcare - Products—5.2% | |||||||||||
| 283,263 | Bruker Corp.* | 5,591,612 | |||||||||
| 74,486 | Techne Corp. | 5,788,307 | |||||||||
| 11,379,919 | |||||||||||
| Pharmaceuticals—20.5% | |||||||||||
| 378,087 | Alkermes, Inc.* | 5,452,014 | |||||||||
| 587,116 | Isis Pharmaceuticals, Inc.* | 5,507,148 | |||||||||
| 141,818 | Neogen Corp.* | 5,942,174 | |||||||||
| 152,488 | Onyx Pharmaceuticals, Inc.* | 5,728,974 | |||||||||
| 1,184,668 | Opko Health, Inc.* | 4,714,979 | |||||||||
| 198,477 | Targacept, Inc.* | 4,799,174 | |||||||||
| 233,407 | Theravance, Inc.* | 6,477,044 | |||||||||
| 304,109 | ViroPharma, Inc.* | 5,866,263 | |||||||||
| 44,487,770 | |||||||||||
| Total Common Stocks (Cost $174,560,971) | 217,597,231 | ||||||||||
| Number of Shares | Value | ||||||||||
| Money Market Fund—0.1% | |||||||||||
| 169,217 | Goldman Sachs Financial Square Prime Obligations Institutional Share Class (Cost $169,217) | $ | 169,217 | ||||||||
| Total Investments (Cost $174,730,188)—100.1% | 217,766,448 | ||||||||||
| Liabilities in excess of other assets—(0.1%) | (213,281 | ) | |||||||||
| Net Assets—100.0% | $ | 217,553,167 | |||||||||
Notes to Schedule of Investments:
* Non-income producing security.
See Notes to Financial Statements.
37
Schedule of Investments
PowerShares Dynamic Building & Construction Portfolio
April 30, 2011
| Number of Shares | Value | ||||||||||
| Common Stocks and Other Equity Interests—100.0% | |||||||||||
| Agriculture—3.6% | |||||||||||
| 40,415 | Tejon Ranch Co.* | $ | 1,440,391 | ||||||||
| Building Materials—8.0% | |||||||||||
| 34,558 | AAON, Inc. | 1,135,230 | |||||||||
| 24,074 | Armstrong World Industries, Inc. | 1,077,312 | |||||||||
| 82,496 | Comfort Systems USA, Inc. | 1,007,276 | |||||||||
| 3,219,818 | |||||||||||
| Commercial Services—12.4% | |||||||||||
| 139,680 | Great Lakes Dredge & Dock Corp. | 1,040,616 | |||||||||
| 37,728 | McGrath Rentcorp | 1,071,098 | |||||||||
| 86,891 | Quanta Services, Inc.* | 1,883,797 | |||||||||
| 40,315 | Team, Inc.* | 1,005,859 | |||||||||
| 5,001,370 | |||||||||||
| Engineering & Construction—28.8% | |||||||||||
| 63,423 | Dycom Industries, Inc.* | 942,466 | |||||||||
| 34,129 | EMCOR Group, Inc.* | 1,056,975 | |||||||||
| 27,996 | Fluor Corp. | 1,958,040 | |||||||||
| 38,977 | Jacobs Engineering Group, Inc.* | 1,933,649 | |||||||||
| 31,867 | Layne Christensen Co. * | 948,362 | |||||||||
| 59,061 | MasTec, Inc.* | 1,339,503 | |||||||||
| 46,852 | MYR Group, Inc.* | 1,168,020 | |||||||||
| 45,069 | Tutor Perini Corp.* | 1,201,540 | |||||||||
| 22,709 | URS Corp.* | 1,016,228 | |||||||||
| 11,564,783 | |||||||||||
| Environmental Control—2.7% | |||||||||||
| 45,439 | Tetra Tech, Inc.* | 1,073,269 | |||||||||
| Forest Products & Paper—2.9% | |||||||||||
| 17,355 | Deltic Timber Corp. | 1,176,669 | |||||||||
| Home Builders—4.9% | |||||||||||
| 2,655 | NVR, Inc.* | 1,962,921 | |||||||||
| Machinery - Diversified—4.8% | |||||||||||
| 22,322 | Cascade Corp. | 1,022,348 | |||||||||
| 8,637 | NACCO Industries, Inc., Class A | 908,871 | |||||||||
| 1,931,219 | |||||||||||
| Miscellaneous Manufacturing—6.4% | |||||||||||
| 26,065 | A.O. Smith Corp. | 1,146,078 | |||||||||
| 35,784 | LSB Industries, Inc.* | 1,443,885 | |||||||||
| 2,589,963 | |||||||||||
| Office Furnishings—3.0% | |||||||||||
| 63,846 | Interface, Inc., Class A | 1,190,089 | |||||||||
| REITs—4.6% | |||||||||||
| 79,998 | Weyerhaeuser Co. | 1,840,754 | |||||||||
| Number of Shares | Value | ||||||||||
| Common Stocks and Other Equity Interests (Continued) | |||||||||||
| Retail—13.0% | |||||||||||
| 52,214 | Home Depot, Inc. (The) | $ | 1,939,228 | ||||||||
| 76,613 | Lowe's Cos., Inc. | 2,011,091 | |||||||||
| 20,362 | Tractor Supply Co. | 1,259,797 | |||||||||
| 5,210,116 | |||||||||||
| Textiles—4.9% | |||||||||||
| 33,125 | Mohawk Industries, Inc.* | 1,988,825 | |||||||||
| Total Common Stocks and Other Equity Interests (Cost $33,456,826) | 40,190,187 | ||||||||||
| Money Market Fund—0.2% | |||||||||||
| 81,852 | Goldman Sachs Financial Square Prime Obligations Institutional Share Class (Cost $81,852) | 81,852 | |||||||||
| Total Investments (Cost $33,538,678)—100.2% | 40,272,039 | ||||||||||
| Liabilities in excess of other assets—(0.2%) | (67,850 | ) | |||||||||
| Net Assets—100.0% | $ | 40,204,189 | |||||||||
Investment Abbreviations:
REIT Real Estate Investment Trust
Notes to Schedule of Investments:
* Non-income producing security.
See Notes to Financial Statements.
38
Schedule of Investments
PowerShares Dynamic Energy Exploration & Production Portfolio
April 30, 2011
| Number of Shares | Value | ||||||||||
| Common Stocks and Other Equity Interests—100.0% | |||||||||||
| Gas - Distribution—5.4% | |||||||||||
| 51,380 | Energen Corp. | $ | 3,340,214 | ||||||||
| 177,049 | Questar Corp. | 3,110,751 | |||||||||
| 6,450,965 | |||||||||||
| Oil Companies - Exploration & Production—40.4% | |||||||||||
| 61,042 | Berry Petroleum Co., Class A | 3,243,161 | |||||||||
| 140,576 | BreitBurn Energy Partners LP | 3,122,193 | |||||||||
| 30,867 | Clayton Williams Energy, Inc.* | 2,795,624 | |||||||||
| 28,529 | Concho Resources, Inc.* | 3,048,324 | |||||||||
| 51,009 | Contango Oil & Gas Co.* | 3,158,477 | |||||||||
| 191,211 | Energy Partners Ltd.* | 3,481,952 | |||||||||
| 106,565 | Gulfport Energy Corp.* | 3,627,473 | |||||||||
| 55,695 | Occidental Petroleum Corp. | 6,365,382 | |||||||||
| 358,764 | PetroQuest Energy, Inc.* | 3,142,773 | |||||||||
| 199,874 | Quicksilver Resources, Inc.* | 2,968,129 | |||||||||
| 105,452 | Stone Energy Corp.* | 3,728,783 | |||||||||
| 394,954 | VAALCO Energy, Inc.* | 2,752,829 | |||||||||
| 123,358 | W&T Offshore, Inc. | 3,307,228 | |||||||||
| 47,877 | Whiting Petroleum Corp.* | 3,327,451 | |||||||||
| 48,069,779 | |||||||||||
| Oil Companies - Integrated—30.4% | |||||||||||
| 56,240 | Chevron Corp. | 6,154,906 | |||||||||
| 74,302 | ConocoPhillips | 5,864,657 | |||||||||
| 67,284 | Exxon Mobil Corp. | 5,920,992 | |||||||||
| 67,711 | Hess Corp. | 5,820,437 | |||||||||
| 118,099 | Marathon Oil Corp. | 6,382,070 | |||||||||
| 78,155 | Murphy Oil Corp. | 6,055,449 | |||||||||
| 36,198,511 | |||||||||||
| Oil Components - Exploration & Production—7.8% | |||||||||||
| 99,841 | Georesources, Inc.* | 2,897,386 | |||||||||
| 81,991 | Plains Exploration & Production Co.* | 3,118,938 | |||||||||
| 43,455 | SM Energy Co. | 3,296,496 | |||||||||
| 9,312,820 | |||||||||||
| Oil Refining & Marketing—16.0% | |||||||||||
| 166,417 | CVR Energy, Inc.* | 3,699,451 | |||||||||
| 54,169 | Holly Corp. | 3,136,385 | |||||||||
| 74,255 | Sunoco, Inc. | 3,167,718 | |||||||||
| 201,050 | Valero Energy Corp. | 5,689,715 | |||||||||
| 194,054 | Western Refining, Inc.* | 3,291,156 | |||||||||
| 18,984,425 | |||||||||||
| Total Common Stocks and Other Equity Interests (Cost $94,971,726) | 119,016,500 | ||||||||||
| Number of Shares | Value | ||||||||||
| Money Market Fund—0.1% | |||||||||||
| 94,862 | Goldman Sachs Financial Square Prime | ||||||||||
| Obligations Institutional Share Class | |||||||||||
| (Cost $94,862) | $ | 94,862 | |||||||||
| Total Investments (Cost $95,066,588)—100.1% | 119,111,362 | ||||||||||
| Liabilities in excess of other assets—(0.1%) | (135,896 | ) | |||||||||
| Net Assets—100.0% | $ | 118,975,466 | |||||||||
Notes to Schedule of Investments:
* Non-income producing security.
See Notes to Financial Statements.
39
Schedule of Investments
PowerShares Dynamic Food & Beverage Portfolio
April 30, 2011
| Number of Shares | Value | ||||||||||
| Common Stocks—99.9% | |||||||||||
| Alternative Waste Technologies—2.9% | |||||||||||
| 166,139 | Darling International, Inc.* | $ | 2,686,468 | ||||||||
| Beverages - Non-alcoholic—18.8% | |||||||||||
| 42,132 | Coca-Cola Bottling Co. Consolidated | 2,968,199 | |||||||||
| 66,874 | Coca-Cola Co. (The) | 4,511,320 | |||||||||
| 64,397 | Dr Pepper Snapple Group, Inc. | 2,524,362 | |||||||||
| 39,759 | Hansen Natural Corp.* | 2,630,058 | |||||||||
| 67,620 | PepsiCo, Inc. | 4,658,342 | |||||||||
| 17,292,281 | |||||||||||
| Beverages - Wine/Spirits—5.5% | |||||||||||
| 34,122 | Brown-Forman Corp., Class B | 2,452,007 | |||||||||
| 115,333 | Constellation Brands, Inc., Class A* | 2,582,306 | |||||||||
| 5,034,313 | |||||||||||
| Brewery—2.6% | |||||||||||
| 25,645 | Boston Beer Co., Inc., Class A* | 2,417,298 | |||||||||
| Food - Meat Products—5.4% | |||||||||||
| 86,406 | Hormel Foods Corp. | 2,541,200 | |||||||||
| 102,444 | Smithfield Foods, Inc.* | 2,413,581 | |||||||||
| 4,954,781 | |||||||||||
| Food - Miscellaneous/Diversified—20.4% | |||||||||||
| 101,996 | ConAgra Foods, Inc. | 2,493,802 | |||||||||
| 115,799 | General Mills, Inc. | 4,467,526 | |||||||||
| 86,019 | H.J. Heinz Co. | 4,406,753 | |||||||||
| 40,768 | Lancaster Colony Corp. | 2,491,333 | |||||||||
| 49,551 | McCormick & Co., Inc. | 2,433,945 | |||||||||
| 1,029 | Seaboard Corp. | 2,456,223 | |||||||||
| 18,749,582 | |||||||||||
| Food - Retail—8.3% | |||||||||||
| 63,607 | Ruddick Corp. | 2,640,963 | |||||||||
| 59,739 | Weis Markets, Inc. | 2,465,428 | |||||||||
| 40,533 | Whole Foods Market, Inc. | 2,543,851 | |||||||||
| 7,650,242 | |||||||||||
| Food - Wholesale/Distribution—2.5% | |||||||||||
| 84,751 | Fresh Del Monte Produce, Inc. | 2,297,600 | |||||||||
| Retail - Restaurants—28.3% | |||||||||||
| 105,954 | Jack in the Box, Inc.* | 2,187,950 | |||||||||
| 368,850 | Krispy Kreme Doughnuts, Inc.* | 2,069,249 | |||||||||
| 57,778 | McDonald's Corp. | 4,524,595 | |||||||||
| 20,165 | Panera Bread Co., Class A* | 2,442,183 | |||||||||
| 80,895 | Papa John's International, Inc.* | 2,431,704 | |||||||||
| 262,701 | Sonic Corp.* | 2,947,505 | |||||||||
| 132,330 | Starbucks Corp. | 4,789,023 | |||||||||
| 85,997 | Yum! Brands, Inc. | 4,612,879 | |||||||||
| 26,005,088 | |||||||||||
| Number of Shares | Value | ||||||||||
| Common Stocks (Continued) | |||||||||||
| Vitamins & Nutrition Products—5.2% | |||||||||||
| 70,855 | Mead Johnson Nutrition Co. | $ | 4,738,782 | ||||||||
| Total Common Stocks (Cost $82,169,894) | 91,826,435 | ||||||||||
| Money Market Fund—0.1% | |||||||||||
| 88,200 | Goldman Sachs Financial Square Prime Obligations Institutional Share Class (Cost $88,200) | 88,200 | |||||||||
| Total Investments (Cost $82,258,094)—100.0% | 91,914,635 | ||||||||||
| Liabilities in excess of other assets—(0.0%) | (33,474 | ) | |||||||||
| Net Assets—100.0% | $ | 91,881,161 | |||||||||
Notes to Schedule of Investments:
* Non-income producing security.
See Notes to Financial Statements.
40
Schedule of Investments
PowerShares Dynamic Insurance Portfolio
April 30, 2011
| Number of Shares | Value | ||||||||||
| Common Stocks—100.0% | |||||||||||
| Insurance Brokers—13.0% | |||||||||||
| 8,948 | Aon Corp. | $ | 466,817 | ||||||||
| 8,235 | Arthur J. Gallagher & Co. | 245,238 | |||||||||
| 9,770 | Brown & Brown, Inc. | 252,555 | |||||||||
| 3,700 | Erie Indemnity Co., Class A | 267,991 | |||||||||
| 1,232,601 | |||||||||||
| Life/Health Insurance—22.8% | |||||||||||
| 8,120 | Aflac, Inc. | 456,263 | |||||||||
| 8,293 | FBL Financial Group, Inc., Class A | 252,937 | |||||||||
| 9,088 | Protective Life Corp. | 244,558 | |||||||||
| 7,267 | Prudential Financial, Inc. | 460,873 | |||||||||
| 3,980 | Torchmark Corp. | 266,342 | |||||||||
| 17,694 | Unum Group | 468,537 | |||||||||
| 2,149,510 | |||||||||||
| Multi-line Insurance—13.4% | |||||||||||
| 7,454 | American Financial Group, Inc. | 266,630 | |||||||||
| 15,096 | Horace Mann Educators Corp. | 269,916 | |||||||||
| 10,968 | Loews Corp. | 485,444 | |||||||||
| 12,503 | United Fire & Casualty Co. | 247,559 | |||||||||
| 1,269,549 | |||||||||||
| Property/Casualty Insurance—42.6% | |||||||||||
| 13,322 | AmTrust Financial Services, Inc. | 257,115 | |||||||||
| 7,829 | Chubb Corp. (The) | 510,372 | |||||||||
| 7,112 | Harleysville Group, Inc. | 228,153 | |||||||||
| 8,185 | HCC Insurance Holdings, Inc. | 266,340 | |||||||||
| 4,178 | Infinity Property & Casualty Corp. | 246,920 | |||||||||
| 622 | Markel Corp.* | 259,548 | |||||||||
| 24,969 | Meadowbrook Insurance Group, Inc. | 255,683 | |||||||||
| 3,998 | ProAssurance Corp.* | 265,467 | |||||||||
| 23,036 | Progressive Corp. (The) | 505,410 | |||||||||
| 4,466 | RLI Corp. | 264,566 | |||||||||
| 5,315 | Safety Insurance Group, Inc. | 248,848 | |||||||||
| 9,415 | Tower Group, Inc. | 215,321 | |||||||||
| 7,897 | Travelers Cos., Inc. (The) | 499,722 | |||||||||
| 4,023,465 | |||||||||||
| Reinsurance—8.2% | |||||||||||
| 7,094 | Axis Capital Holdings Ltd. (Bermuda) | 250,844 | |||||||||
| 4,322 | Reinsurance Group of America, Inc. | 273,582 | |||||||||
| 5,099 | Transatlantic Holdings, Inc. | 251,330 | |||||||||
| 775,756 | |||||||||||
| Total Common Stocks (Cost $8,455,268) | 9,450,881 | ||||||||||
| Number of Shares | Value | ||||||||||
| Money Market Fund—0.8% | |||||||||||
| 72,189 | Goldman Sachs Financial Square Prime Obligations Institutional Share Class (Cost $72,189) | $ | 72,189 | ||||||||
| Total Investments (Cost $8,527,457)—100.8% | 9,523,070 | ||||||||||
| Liabilities in excess of other assets—(0.8%) | (71,183 | ) | |||||||||
| Net Assets—100.0% | $ | 9,451,887 | |||||||||
Notes to Schedule of Investments:
* Non-income producing security.
See Notes to Financial Statements.
41
Schedule of Investments
PowerShares Dynamic Leisure and Entertainment Portfolio
April 30, 2011
| Number of Shares | Value | ||||||||||
| Common Stocks—100.0% | |||||||||||
| Entertainment—11.2% | |||||||||||
| 39,270 | Churchill Downs, Inc.* | $ | 1,637,952 | ||||||||
| 98,767 | International Game Technology | 1,747,188 | |||||||||
| 58,589 | Madison Square Garden, Inc., Class A* | 1,602,409 | |||||||||
| 46,075 | Penn National Gaming, Inc.* | 1,843,461 | |||||||||
| 6,831,010 | |||||||||||
| Internet—5.8% | |||||||||||
| 6,407 | priceline.com, Inc.* | 3,504,693 | |||||||||
| Leisure Time—6.8% | |||||||||||
| 68,825 | Carnival Corp. | 2,620,168 | |||||||||
| 94,743 | Interval Leisure Group, Inc.* | 1,522,520 | |||||||||
| 4,142,688 | |||||||||||
| Lodging—11.0% | |||||||||||
| 96,565 | Ameristar Casinos, Inc. | 1,926,472 | |||||||||
| 64,003 | Las Vegas Sands Corp.* | 3,008,781 | |||||||||
| 51,210 | Wyndham Worldwide Corp. | 1,772,378 | |||||||||
| 6,707,631 | |||||||||||
| Media—12.9% | |||||||||||
| 125,068 | CBS Corp., Class B | 3,154,215 | |||||||||
| 48,696 | DG FastChannel, Inc.* | 1,781,786 | |||||||||
| 68,549 | Walt Disney Co. (The) | 2,954,462 | |||||||||
| 7,890,463 | |||||||||||
| Retail—52.3% | |||||||||||
| 3,828 | Biglari Holdings, Inc.* | 1,673,755 | |||||||||
| 51,801 | Bob Evans Farms, Inc. | 1,624,479 | |||||||||
| 67,420 | Brinker International, Inc. | 1,624,148 | |||||||||
| 42,479 | CEC Entertainment, Inc.* | 1,606,980 | |||||||||
| 55,521 | Cheesecake Factory, Inc. (The)* | 1,633,428 | |||||||||
| 32,075 | Cracker Barrel Old Country Store, Inc. | 1,643,202 | |||||||||
| 33,959 | Darden Restaurants, Inc. | 1,595,054 | |||||||||
| 27,770 | DineEquity, Inc.* | 1,387,667 | |||||||||
| 72,538 | Jack in the Box, Inc.* | 1,497,910 | |||||||||
| 252,494 | Krispy Kreme Doughnuts, Inc.* | 1,416,491 | |||||||||
| 39,554 | McDonald's Corp. | 3,097,474 | |||||||||
| 13,806 | Panera Bread Co., Class A* | 1,672,045 | |||||||||
| 55,378 | Papa John's International, Inc.* | 1,664,663 | |||||||||
| 119,658 | Ruby Tuesday, Inc.* | 1,257,606 | |||||||||
| 179,828 | Sonic Corp.* | 2,017,670 | |||||||||
| 90,585 | Starbucks Corp. | 3,278,271 | |||||||||
| 58,863 | Yum! Brands, Inc. | 3,157,411 | |||||||||
| 31,848,254 | |||||||||||
| Total Common Stocks (Cost $54,758,680) | 60,924,739 | ||||||||||
| Number of Shares | Value | ||||||||||
| Money Market Fund—0.1% | |||||||||||
| 65,352 | Goldman Sachs Financial Square Prime Obligations Institutional Share Class (Cost $65,352) | $ | 65,352 | ||||||||
| Total Investments (Cost $54,824,032)—100.1% | 60,990,091 | ||||||||||
| Liabilities in excess of other assets—(0.1%) | (56,940 | ) | |||||||||
| Net Assets—100.0% | $ | 60,933,151 | |||||||||
Notes to Schedule of Investments:
* Non-income producing security.
See Notes to Financial Statements.
42
Schedule of Investments
PowerShares Dynamic Media Portfolio
April 30, 2011
| Number of Shares | Value | ||||||||||
| Common Stocks—100.0% | |||||||||||
| Advertising Agencies—5.0% | |||||||||||
| 327,881 | Interpublic Group of Cos., Inc. (The) | $ | 3,852,602 | ||||||||
| 82,569 | Omnicom Group, Inc. | 4,061,569 | |||||||||
| 7,914,171 | |||||||||||
| Advertising Sales—2.6% | |||||||||||
| 292,098 | Clear Channel Outdoor Holdings, Inc., Class A* | 4,019,268 | |||||||||
| Broadcast Services/Program—8.6% | |||||||||||
| 124,977 | DG FastChannel, Inc.* | 4,572,908 | |||||||||
| 59,839 | Liberty Media Corp. - Capital, Series A* | 4,922,955 | |||||||||
| 79,344 | Scripps Networks Interactive, Inc., Class A | 4,079,868 | |||||||||
| 13,575,731 | |||||||||||
| Cable/Satellite TV—15.4% | |||||||||||
| 299,133 | Comcast Corp., Class A | 7,849,250 | |||||||||
| 164,164 | DIRECTV, Class A* | 7,976,729 | |||||||||
| 105,975 | Time Warner Cable, Inc. | 8,279,826 | |||||||||
| 24,105,805 | |||||||||||
| Commercial Services—3.2% | |||||||||||
| 52,612 | Alliance Data Systems Corp.* | 4,998,140 | |||||||||
| Computer Services—2.8% | |||||||||||
| 48,979 | IHS, Inc., Class A* | 4,321,907 | |||||||||
| Direct Marketing—2.0% | |||||||||||
| 330,784 | Harte-Hanks, Inc. | 3,072,983 | |||||||||
| E-Commerce/Services—3.5% | |||||||||||
| 119,985 | Ancestry.com, Inc.* | 5,483,315 | |||||||||
| E-Marketing/Information—2.9% | |||||||||||
| 272,222 | ValueClick, Inc.* | 4,559,719 | |||||||||
| Internet Content - Information/News—4.1% | |||||||||||
| 345,181 | LoopNet, Inc.* | 6,413,463 | |||||||||
| Multimedia—22.5% | |||||||||||
| 438,925 | E.W. Scripps Co. (The), Class A* | 4,169,787 | |||||||||
| 108,272 | McGraw-Hill Cos., Inc. (The) | 4,381,768 | |||||||||
| 116,586 | Meredith Corp. | 3,896,304 | |||||||||
| 436,274 | News Corp., Class A | 7,774,403 | |||||||||
| 199,369 | Time Warner, Inc. | 7,548,110 | |||||||||
| 175,919 | Walt Disney Co. (The) | 7,582,109 | |||||||||
| 35,352,481 | |||||||||||
| Professional Sports—2.6% | |||||||||||
| 150,359 | Madison Square Garden, Inc., Class A* | 4,112,319 | |||||||||
| Publishing - Books—5.1% | |||||||||||
| 86,547 | John Wiley & Sons, Inc., Class A | 4,407,839 | |||||||||
| 136,619 | Scholastic Corp. | 3,590,347 | |||||||||
| 7,998,186 | |||||||||||
| Number of Shares | Value | ||||||||||
| Common Stocks (Continued) | |||||||||||
| Publishing - Newspapers—5.1% | |||||||||||
| 252,232 | Gannett Co., Inc. | $ | 3,798,614 | ||||||||
| 9,609 | Washington Post Co. (The), Class B | 4,188,563 | |||||||||
| 7,987,177 | |||||||||||
| Television—10.3% | |||||||||||
| 526,375 | Belo Corp., Class A* | 4,447,869 | |||||||||
| 320,981 | CBS Corp., Class B | 8,095,141 | |||||||||
| 319,745 | Sinclair Broadcast Group, Inc., Class A | 3,673,870 | |||||||||
| 16,216,880 | |||||||||||
| Web Portals/ISP—4.3% | |||||||||||
| 12,400 | Google, Inc., Class A* | 6,746,840 | |||||||||
| Total Common Stocks (Cost $137,329,888) | 156,878,385 | ||||||||||
| Money Market Fund—0.1% | |||||||||||
| 108,126 | Goldman Sachs Financial Square Prime Obligations Institutional Share Class (Cost $108,126) | 108,126 | |||||||||
| Total Investments (Cost $137,438,014)—100.1% | 156,986,511 | ||||||||||
| Liabilities in excess of other assets—(0.1%) | (105,022 | ) | |||||||||
| Net Assets—100.0% | $ | 156,881,489 | |||||||||
Notes to Schedule of Investments:
* Non-income producing security.
See Notes to Financial Statements.
43
Schedule of Investments
PowerShares Dynamic Networking Portfolio
April 30, 2011
| Number of Shares | Value | ||||||||||
| Common Stocks—100.1% | |||||||||||
| Computers—10.8% | |||||||||||
| 724,906 | Brocade Communications Systems, Inc.* | $ | 4,530,663 | ||||||||
| 110,915 | Fortinet, Inc.* | 5,401,560 | |||||||||
| 183,758 | NetScout Systems, Inc.* | 4,702,367 | |||||||||
| 110,157 | Riverbed Technology, Inc.* | 3,870,917 | |||||||||
| 18,505,507 | |||||||||||
| Electrical Components & Equipment—5.4% | |||||||||||
| 127,515 | Belden, Inc. | 4,849,396 | |||||||||
| 166,906 | Molex, Inc. | 4,506,462 | |||||||||
| 9,355,858 | |||||||||||
| Electronics—4.8% | |||||||||||
| 148,440 | Amphenol Corp., Class A | 8,299,280 | |||||||||
| Internet—13.6% | |||||||||||
| 166,236 | Blue Coat Systems, Inc.* | 4,787,597 | |||||||||
| 38,297 | F5 Networks, Inc.* | 3,881,784 | |||||||||
| 464,964 | Symantec Corp.* | 9,136,543 | |||||||||
| 215,202 | Websense, Inc.* | 5,550,059 | |||||||||
| 23,355,983 | |||||||||||
| Semiconductors—8.3% | |||||||||||
| 105,439 | Cavium Networks, Inc.* | 4,978,830 | |||||||||
| 575,389 | PMC - Sierra, Inc.* | 4,614,620 | |||||||||
| 257,736 | QLogic Corp.* | 4,634,093 | |||||||||
| 14,227,543 | |||||||||||
| Software—17.5% | |||||||||||
| 118,980 | Citrix Systems, Inc.* | 10,034,773 | |||||||||
| 146,174 | OPNET Technologies, Inc. | 5,724,174 | |||||||||
| 206,419 | Solarwinds, Inc.* | 5,001,532 | |||||||||
| 98,602 | VMware, Inc., Class A* | 9,409,589 | |||||||||
| 30,170,068 | |||||||||||
| Telecommunications—39.7% | |||||||||||
| 60,050 | Acme Packet, Inc.* | 4,960,730 | |||||||||
| 100,250 | ADTRAN, Inc. | 4,137,317 | |||||||||
| 349,514 | Arris Group, Inc.* | 4,194,168 | |||||||||
| 452,744 | Cisco Systems, Inc. | 7,950,185 | |||||||||
| 111,997 | Finisar Corp.* | 3,145,996 | |||||||||
| 479,491 | Harmonic, Inc.* | 3,970,185 | |||||||||
| 192,231 | Juniper Networks, Inc.* | 7,368,214 | |||||||||
| 121,493 | LogMeIn, Inc.* | 5,232,704 | |||||||||
| 221,266 | Motorola Solutions, Inc.* | 10,151,684 | |||||||||
| 142,773 | NETGEAR, Inc.* | 5,960,773 | |||||||||
| 164,573 | Oplink Communications, Inc.* | 3,258,545 | |||||||||
| 142,984 | QUALCOMM, Inc. | 8,127,211 | |||||||||
| 68,457,712 | |||||||||||
| Total Common Stocks (Cost $154,213,632) | 172,371,951 | ||||||||||
| Number of Shares | Value | ||||||||||
| Money Market Fund—0.0% | |||||||||||
| 60,761 | Goldman Sachs Financial Square Prime Obligations Institutional Share Class (Cost $60,761) | $ | 60,761 | ||||||||
| Total Investments (Cost $154,274,393)—100.1% | 172,432,712 | ||||||||||
| Liabilities in excess of other assets—(0.1%) | (141,228 | ) | |||||||||
| Net Assets—100.0% | $ | 172,291,484 | |||||||||
Notes to Schedule of Investments:
* Non-income producing security.
See Notes to Financial Statements.
44
Schedule of Investments
PowerShares Dynamic Oil & Gas Services Portfolio
April 30, 2011
| Number of Shares | Value | ||||||||||
| Common Stocks—99.9% | |||||||||||
| Engineering/R&D Services—5.1% | |||||||||||
| 221,987 | Foster Wheeler AG (Switzerland)* | $ | 7,896,077 | ||||||||
| 349,067 | McDermott International, Inc.* | 8,059,957 | |||||||||
| 15,956,034 | |||||||||||
| Oil & Gas Drilling—20.8% | |||||||||||
| 187,865 | Diamond Offshore Drilling, Inc. | 14,253,318 | |||||||||
| 122,751 | Helmerich & Payne, Inc. | 8,143,301 | |||||||||
| 1,596,725 | Hercules Offshore, Inc.* | 10,019,449 | |||||||||
| 514,398 | Nabors Industries Ltd. (Bermuda)* | 15,761,155 | |||||||||
| 187,319 | Rowan Cos., Inc.* | 7,811,202 | |||||||||
| 133,600 | Unit Corp.* | 8,419,472 | |||||||||
| 64,407,897 | |||||||||||
| Oil Field Machinery & Equipment—21.6% | |||||||||||
| 244,104 | Cameron International Corp.* | 12,869,163 | |||||||||
| 280,880 | Complete Production Services, Inc.* | 9,533,067 | |||||||||
| 159,543 | Dresser-Rand Group, Inc.* | 8,382,389 | |||||||||
| 100,630 | Dril-Quip, Inc.* | 7,704,233 | |||||||||
| 314,728 | FMC Technologies, Inc.* | 14,628,558 | |||||||||
| 182,615 | National Oilwell Varco, Inc. | 14,004,744 | |||||||||
| 67,122,154 | |||||||||||
| Oil - Field Services—42.5% | |||||||||||
| 203,886 | Baker Hughes, Inc. | 15,782,815 | |||||||||
| 410,938 | Basic Energy Services, Inc.* | 12,632,234 | |||||||||
| 66,502 | CARBO Ceramics, Inc. | 10,702,832 | |||||||||
| 78,027 | Core Laboratories NV (Netherlands) | 7,489,032 | |||||||||
| 922,470 | Global Industries Ltd.* | 9,095,554 | |||||||||
| 309,974 | Halliburton Co. | 15,647,488 | |||||||||
| 533,314 | Helix Energy Solutions Group, Inc.* | 10,095,634 | |||||||||
| 96,373 | Oceaneering International, Inc.* | 8,424,928 | |||||||||
| 420,282 | RPC, Inc. | 11,368,628 | |||||||||
| 157,007 | Schlumberger Ltd. | 14,091,378 | |||||||||
| 82,753 | SEACOR Holdings, Inc. | 8,178,479 | |||||||||
| 213,470 | Superior Energy Services, Inc.* | 8,201,517 | |||||||||
| 131,710,519 | |||||||||||
| Seismic Data Collection—4.9% | |||||||||||
| 642,822 | ION Geophysical Corp.* | 8,125,270 | |||||||||
| 75,747 | OYO Geospace Corp.* | 7,065,680 | |||||||||
| 15,190,950 | |||||||||||
| Transportation - Marine—2.5% | |||||||||||
| 182,796 | Gulfmark Offshore, Inc., Class A* | 7,781,626 | |||||||||
| Transportation - Services—2.5% | |||||||||||
| 165,347 | Bristow Group, Inc.* | 7,672,101 | |||||||||
| Total Common Stocks (Cost $238,964,548) | 309,841,281 | ||||||||||
| Number of Shares | Value | ||||||||||
| Money Market Fund—0.1% | |||||||||||
| 211,541 | Goldman Sachs Financial Square Prime Obligations Institutional Share Class (Cost $211,541) | $ | 211,541 | ||||||||
| Total Investments (Cost $239,176,089)—100.0% | 310,052,822 | ||||||||||
| Liabilities in excess of other assets—(0.0%) | (80,725 | ) | |||||||||
| Net Assets—100.0% | $ | 309,972,097 | |||||||||
Notes to Schedule of Investments:
* Non-income producing security.
See Notes to Financial Statements.
45
Schedule of Investments
PowerShares Dynamic Pharmaceuticals Portfolio
April 30, 2011
| Number of Shares | Value | ||||||||||
| Common Stocks—100.0% | |||||||||||
| Consumer Products - Miscellaneous—2.5% | |||||||||||
| 188,948 | Prestige Brands Holdings, Inc.* | $ | 2,182,349 | ||||||||
| Drug Delivery Systems—2.5% | |||||||||||
| 244,379 | Depomed, Inc.* | 2,157,867 | |||||||||
| Medical Products—10.0% | |||||||||||
| 40,046 | Baxter International, Inc. | 2,278,617 | |||||||||
| 39,377 | Hospira, Inc.* | 2,233,857 | |||||||||
| 64,530 | Johnson & Johnson | 4,240,912 | |||||||||
| 8,753,386 | |||||||||||
| Medical - Biomedical/Genetics—17.4% | |||||||||||
| 73,643 | Amgen, Inc.* | 4,186,605 | |||||||||
| 30,971 | Biogen Idec, Inc.* | 3,015,027 | |||||||||
| 39,223 | Celgene Corp.* | 2,309,450 | |||||||||
| 98,630 | Gilead Sciences, Inc.* | 3,830,789 | |||||||||
| 121,412 | Medicines Co. (The)* | 1,906,168 | |||||||||
| 15,248,039 | |||||||||||
| Medical - Drugs—49.8% | |||||||||||
| 80,784 | Abbott Laboratories | 4,203,999 | |||||||||
| 383,769 | Akorn, Inc.* | 2,540,551 | |||||||||
| 28,174 | Allergan, Inc. | 2,241,524 | |||||||||
| 150,983 | Bristol-Myers Squibb Co. | 4,242,622 | |||||||||
| 37,339 | Cephalon, Inc.* | 2,867,635 | |||||||||
| 112,894 | Eli Lilly & Co. | 4,178,207 | |||||||||
| 61,202 | Endo Pharmaceuticals Holdings, Inc.* | 2,396,670 | |||||||||
| 65,847 | Forest Laboratories, Inc.* | 2,183,487 | |||||||||
| 85,752 | Jazz Pharmaceuticals, Inc.* | 2,736,346 | |||||||||
| 81,302 | Medicis Pharmaceutical Corp., Class A | 2,882,969 | |||||||||
| 119,558 | Merck & Co., Inc. | 4,298,110 | |||||||||
| 204,059 | Pfizer, Inc. | 4,277,077 | |||||||||
| 62,682 | Salix Pharmaceuticals Ltd.* | 2,462,776 | |||||||||
| 275,126 | Vivus, Inc.* | 2,140,480 | |||||||||
| 43,652,453 | |||||||||||
| Medical - Generic Drugs—13.9% | |||||||||||
| 100,779 | Impax Laboratories, Inc.* | 2,759,329 | |||||||||
| 92,845 | Mylan, Inc.* | 2,313,697 | |||||||||
| 67,110 | Par Pharmaceutical Cos., Inc.* | 2,311,268 | |||||||||
| 27,665 | Perrigo Co. | 2,499,810 | |||||||||
| 37,722 | Watson Pharmaceuticals, Inc.* | 2,339,519 | |||||||||
| 12,223,623 | |||||||||||
| Therapeutics—3.9% | |||||||||||
| 166,472 | Questcor Pharmaceuticals, Inc.* | 3,412,676 | |||||||||
| Total Common Stocks (Cost $77,845,562) | 87,630,393 | ||||||||||
| Number of Shares | Value | ||||||||||
| Money Market Fund—0.1% | |||||||||||
| 28,205 | Goldman Sachs Financial Square Prime Obligations Institutional Share Class (Cost $28,205) | $ | 28,205 | ||||||||
| Total Investments (Cost $77,873,767)—100.1% | 87,658,598 | ||||||||||
| Liabilities in excess of other assets—(0.1%) | (52,146 | ) | |||||||||
| Net Assets—100.0% | $ | 87,606,452 | |||||||||
Notes to Schedule of Investments:
* Non-income producing security.
See Notes to Financial Statements.
46
Schedule of Investments
PowerShares Dynamic Retail Portfolio
April 30, 2011
| Number of Shares | Value | ||||||||||
| Common Stocks—100.0% | |||||||||||
| Distribution/Wholesale—2.6% | |||||||||||
| 6,297 | Genuine Parts Co. | $ | 338,149 | ||||||||
| E-Commerce/Services—7.4% | |||||||||||
| 17,993 | eBay, Inc.* | 618,959 | |||||||||
| 53,578 | United Online, Inc. | 353,615 | |||||||||
| 972,574 | |||||||||||
| Food - Retail—5.5% | |||||||||||
| 8,935 | Ruddick Corp. | 370,981 | |||||||||
| 8,391 | Weis Markets, Inc. | 346,297 | |||||||||
| 717,278 | |||||||||||
| Property/Casualty Insurance—2.5% | |||||||||||
| 845 | Wesco Financial Corp. | 331,240 | |||||||||
| Rental Auto/Equipment—2.3% | |||||||||||
| 10,000 | Rent-A-Center, Inc. | 304,500 | |||||||||
| Retail - Apparel/Shoe—29.9% | |||||||||||
| 21,480 | American Eagle Outfitters, Inc. | 334,229 | |||||||||
| 13,843 | Ann, Inc.* | 432,040 | |||||||||
| 8,601 | Buckle, Inc. (The) | 391,259 | |||||||||
| 7,115 | Children's Place Retail Stores, Inc. (The)* | 378,304 | |||||||||
| 14,191 | Collective Brands, Inc.* | 298,011 | |||||||||
| 17,082 | Foot Locker, Inc. | 367,605 | |||||||||
| 26,596 | Gap, Inc. (The) | 618,091 | |||||||||
| 18,717 | Limited Brands, Inc. | 770,392 | |||||||||
| 4,598 | Ross Stores, Inc. | 338,827 | |||||||||
| 3,928,758 | |||||||||||
| Retail - Auto Parts—5.1% | |||||||||||
| 5,954 | O'Reilly Automotive, Inc.* | 351,643 | |||||||||
| 23,654 | Pep Boys - Manny, Moe & Jack (The) | 324,060 | |||||||||
| 675,703 | |||||||||||
| Retail - Bedding—5.4% | |||||||||||
| 12,643 | Bed Bath & Beyond, Inc.* | 709,525 | |||||||||
| Retail - Discount—7.2% | |||||||||||
| 6,529 | Dollar Tree, Inc.* | 375,417 | |||||||||
| 11,557 | Target Corp. | 567,449 | |||||||||
| 942,866 | |||||||||||
| Retail - Drug Store—4.7% | |||||||||||
| 14,417 | Walgreen Co. | 615,894 | |||||||||
| Retail - Gardening Products—3.0% | |||||||||||
| 6,353 | Tractor Supply Co. | 393,060 | |||||||||
| Retail - Home Furnishings—3.1% | |||||||||||
| 33,734 | Pier 1 Imports, Inc.* | 410,880 | |||||||||
| Retail - Mail Order—3.0% | |||||||||||
| 9,040 | Williams-Sonoma, Inc. | 392,426 | |||||||||
| Number of Shares | Value | ||||||||||
| Common Stocks (Continued) | |||||||||||
| Retail - Major Department Store—9.7% | |||||||||||
| 13,300 | Nordstrom, Inc. | $ | 632,415 | ||||||||
| 12,022 | TJX Cos., Inc. (The) | 644,620 | |||||||||
| 1,277,035 | |||||||||||
| Retail - Miscellaneous/Diversified—2.9% | |||||||||||
| 9,207 | PriceSmart, Inc. | 383,380 | |||||||||
| Retail - Regional Department Store—2.9% | |||||||||||
| 7,853 | Dillard's, Inc., Class A | 377,101 | |||||||||
| Retail - Sporting Goods—2.8% | |||||||||||
| 12,871 | Zumiez, Inc.* | 361,804 | |||||||||
| Total Common Stocks (Cost $11,710,947) | 13,132,173 | ||||||||||
| Money Market Fund—0.5% | |||||||||||
| 64,897 | Goldman Sachs Financial Square Prime Obligations Institutional Share Class (Cost $64,897) | 64,897 | |||||||||
| Total Investments (Cost $11,775,844)—100.5% | 13,197,070 | ||||||||||
| Liabilities in excess of other assets—(0.5%) | (66,835 | ) | |||||||||
| Net Assets—100.0% | $ | 13,130,235 | |||||||||
Notes to Schedule of Investments:
* Non-income producing security.
See Notes to Financial Statements.
47
Schedule of Investments
PowerShares Dynamic Semiconductors Portfolio
April 30, 2011
| Number of Shares | Value | ||||||||||
| Common Stocks—100.0% | |||||||||||
| Computers - Memory Devices—2.5% | |||||||||||
| 54,528 | Spansion, Inc., Class A* | $ | 1,074,201 | ||||||||
| Electronic Components - Miscellaneous—2.9% | |||||||||||
| 64,613 | Vishay Intertechnology, Inc.* | 1,232,816 | |||||||||
| Electronic Components - Semiconductors—34.8% | |||||||||||
| 49,486 | Altera Corp. | 2,409,968 | |||||||||
| 48,594 | CEVA, Inc.* | 1,486,005 | |||||||||
| 62,576 | Fairchild Semiconductor International, Inc.* | 1,312,219 | |||||||||
| 96,510 | Intel Corp. | 2,238,067 | |||||||||
| 35,681 | International Rectifier Corp.* | 1,233,135 | |||||||||
| 179,248 | LSI Corp.* | 1,313,888 | |||||||||
| 73,815 | National Semiconductor Corp. | 1,780,418 | |||||||||
| 31,887 | Skyworks Solutions, Inc.* | 1,003,165 | |||||||||
| 59,227 | Texas Instruments, Inc. | 2,104,335 | |||||||||
| 14,881,200 | |||||||||||
| Instruments - Scientific—2.6% | |||||||||||
| 34,010 | FEI Co.* | 1,103,965 | |||||||||
| Semiconductor Components - Integrated Circuits—20.4% | |||||||||||
| 76,820 | Atmel Corp.* | 1,175,346 | |||||||||
| 18,488 | Hittite Microwave Corp.* | 1,190,442 | |||||||||
| 60,588 | Linear Technology Corp. | 2,108,463 | |||||||||
| 76,358 | Maxim Integrated Products, Inc. | 2,087,628 | |||||||||
| 84,351 | Micrel, Inc. | 1,080,536 | |||||||||
| 83,129 | Sigma Designs, Inc.* | 1,060,726 | |||||||||
| 8,703,141 | |||||||||||
| Semiconductor Equipment—27.2% | |||||||||||
| 130,876 | Applied Materials, Inc. | 2,053,444 | |||||||||
| 129,004 | Entegris, Inc.* | 1,113,305 | |||||||||
| 43,087 | KLA-Tencor Corp. | 1,891,519 | |||||||||
| 20,793 | Lam Research Corp.* | 1,004,510 | |||||||||
| 38,851 | MKS Instruments, Inc. | 1,102,591 | |||||||||
| 28,483 | Novellus Systems, Inc.* | 914,304 | |||||||||
| 124,390 | Photronics, Inc.* | 1,085,925 | |||||||||
| 46,648 | Ultratech, Inc.* | 1,460,549 | |||||||||
| 23,812 | Varian Semiconductor Equipment Associates, Inc.* | 998,437 | |||||||||
| 11,624,584 | |||||||||||
| Wireless Equipment—9.6% | |||||||||||
| 23,758 | InterDigital, Inc. | 1,099,758 | |||||||||
| 35,750 | QUALCOMM, Inc. | 2,032,030 | |||||||||
| 149,238 | RF Micro Devices, Inc.* | 993,925 | |||||||||
| 4,125,713 | |||||||||||
| Total Common Stocks (Cost $35,660,961) | 42,745,620 | ||||||||||
| Number of Shares | Value | ||||||||||
| Money Market Fund—0.2% | |||||||||||
| 85,557 | Goldman Sachs Financial Square Prime Obligations Institutional Share Class (Cost $85,557) | $ | 85,557 | ||||||||
| Total Investments (Cost $35,746,518)—100.2% | 42,831,177 | ||||||||||
| Liabilities in excess of other assets—(0.2%) | (82,276 | ) | |||||||||
| Net Assets—100.0% | $ | 42,748,901 | |||||||||
Notes to Schedule of Investments:
* Non-income producing security.
See Notes to Financial Statements.
48
Schedule of Investments
PowerShares Dynamic Software Portfolio
April 30, 2011
| Number of Shares | Value | ||||||||||
| Common Stocks—100.1% | |||||||||||
| Applications Software—23.1% | |||||||||||
| 196,083 | Compuware Corp.* | $ | 2,221,620 | ||||||||
| 89,202 | Ebix, Inc.* | 2,038,266 | |||||||||
| 151,651 | Microsoft Corp. | 3,945,959 | |||||||||
| 74,194 | Progress Software Corp.* | 2,199,852 | |||||||||
| 82,314 | Quest Software, Inc.* | 2,120,409 | |||||||||
| 97,397 | Red Hat, Inc.* | 4,623,435 | |||||||||
| 65,207 | Verint Systems, Inc.* | 2,232,036 | |||||||||
| 19,381,577 | |||||||||||
| Commercial Services - Finance—2.3% | |||||||||||
| 65,167 | Lender Processing Services, Inc. | 1,917,865 | |||||||||
| Computer Aided Design—7.7% | |||||||||||
| 39,338 | ANSYS, Inc.* | 2,174,998 | |||||||||
| 94,183 | Autodesk, Inc.* | 4,236,351 | |||||||||
| 6,411,349 | |||||||||||
| Computer Graphics—2.6% | |||||||||||
| 162,561 | Monotype Imaging Holdings, Inc.* | 2,210,830 | |||||||||
| Computer Services—2.5% | |||||||||||
| 42,952 | DST Systems, Inc. | 2,117,963 | |||||||||
| Computers - Integrated Systems—5.7% | |||||||||||
| 69,106 | Jack Henry & Associates, Inc. | 2,347,531 | |||||||||
| 46,354 | MICROS Systems, Inc.* | 2,411,335 | |||||||||
| 4,758,866 | |||||||||||
| Data Processing/Management—4.7% | |||||||||||
| 63,912 | Fiserv, Inc.* | 3,918,445 | |||||||||
| Decision Support Software—2.8% | |||||||||||
| 63,732 | Interactive Intelligence, Inc.* | 2,384,851 | |||||||||
| Electronic Design Automation—8.0% | |||||||||||
| 222,285 | Cadence Design Systems, Inc.* | 2,307,318 | |||||||||
| 343,151 | Magma Design Automation, Inc.* | 2,182,440 | |||||||||
| 79,197 | Synopsys, Inc.* | 2,169,206 | |||||||||
| 6,658,964 | |||||||||||
| Enterprise Software/Services—21.1% | |||||||||||
| 82,287 | BMC Software, Inc.* | 4,133,276 | |||||||||
| 162,746 | CA, Inc. | 4,001,924 | |||||||||
| 217,658 | Lawson Software, Inc.* | 2,409,474 | |||||||||
| 69,741 | OPNET Technologies, Inc. | 2,731,057 | |||||||||
| 122,194 | Oracle Corp. | 4,405,094 | |||||||||
| 17,680,825 | |||||||||||
| Internet Infrastructure Software—3.2% | |||||||||||
| 89,350 | TIBCO Software, Inc.* | 2,679,607 | |||||||||
| Internet Security—5.2% | |||||||||||
| 221,837 | Symantec Corp.* | 4,359,097 | |||||||||
| Number of Shares | Value | ||||||||||
| Common Stocks (Continued) | |||||||||||
| Medical Information Systems—2.6% | |||||||||||
| 84,859 | Medidata Solutions, Inc.* | $ | 2,178,331 | ||||||||
| Semiconductor Equipment—3.0% | |||||||||||
| 125,136 | Tessera Technologies, Inc.* | 2,472,687 | |||||||||
| Transactional Software—5.6% | |||||||||||
| 71,512 | ACI Worldwide, Inc.* | 2,362,756 | |||||||||
| 42,347 | Solera Holdings, Inc. | 2,329,085 | |||||||||
| 4,691,841 | |||||||||||
| Total Common Stocks (Cost $72,105,041) | 83,823,098 | ||||||||||
| Money Market Fund—0.0% | |||||||||||
| 48,986 | Goldman Sachs Financial Square Prime Obligations Institutional Share Class (Cost $48,986) | 48,986 | |||||||||
| Total Investments (Cost $72,154,027)—100.1% | 83,872,084 | ||||||||||
| Liabilities in excess of other assets—(0.1%) | (98,261 | ) | |||||||||
| Net Assets—100.0% | $ | 83,773,823 | |||||||||
Notes to Schedule of Investments:
* Non-income producing security.
See Notes to Financial Statements.
49
Statements of Assets and Liabilities
April 30, 2011
| PowerShares Dynamic Banking Portfolio | PowerShares Dynamic Biotechnology & Genome Portfolio | PowerShares Dynamic Building & Construction Portfolio | PowerShares Dynamic Energy Exploration & Production Portfolio | PowerShares Dynamic Food & Beverage Portfolio | PowerShares Dynamic Insurance Portfolio | PowerShares Dynamic Leisure and Entertainment Portfolio | |||||||||||||||||||||||||
| ASSETS: | |||||||||||||||||||||||||||||||
| Investments, at value | $ | 20,227,939 | $ | 217,766,448 | $ | 40,272,039 | $ | 119,111,362 | $ | 91,914,635 | $ | 9,523,070 | $ | 60,990,091 | |||||||||||||||||
| Cash | 261 | 312 | 262 | 315 | 300 | 229 | 296 | ||||||||||||||||||||||||
| Receivables: | |||||||||||||||||||||||||||||||
| Dividends | 15,045 | 9 | 19,159 | 2,181 | 81,264 | 2,984 | 35,407 | ||||||||||||||||||||||||
| Expense waivers | 9,653 | 5,003 | 10,310 | 7,055 | 8,064 | 11,398 | 10,881 | ||||||||||||||||||||||||
| Investments sold | — | — | 6,312,434 | — | — | — | — | ||||||||||||||||||||||||
| Shares sold | — | 3,471,534 | — | — | 1,975,906 | — | — | ||||||||||||||||||||||||
| Total Assets | 20,252,898 | 221,243,306 | 46,614,204 | 119,120,913 | 93,980,169 | 9,537,681 | 61,036,675 | ||||||||||||||||||||||||
| LIABILITIES: | |||||||||||||||||||||||||||||||
| Payables: | |||||||||||||||||||||||||||||||
| Shares repurchased | — | — | 6,310,947 | — | — | — | — | ||||||||||||||||||||||||
| Investments purchased | — | 3,471,479 | — | — | 1,970,916 | — | — | ||||||||||||||||||||||||
| Accrued advisory fees | 8,234 | 83,431 | 19,011 | 47,347 | 33,739 | 3,817 | 26,048 | ||||||||||||||||||||||||
| Accrued expenses | 124,664 | 135,229 | 80,057 | 98,100 | 94,353 | 81,977 | 77,476 | ||||||||||||||||||||||||
| Total Liabilities | 132,898 | 3,690,139 | 6,410,015 | 145,447 | 2,099,008 | 85,794 | 103,524 | ||||||||||||||||||||||||
| NET ASSETS | $ | 20,120,000 | $ | 217,553,167 | $ | 40,204,189 | $ | 118,975,466 | $ | 91,881,161 | $ | 9,451,887 | $ | 60,933,151 | |||||||||||||||||
| NET ASSETS CONSIST OF: | |||||||||||||||||||||||||||||||
| Shares of beneficial interest | $ | 70,814,774 | $ | 310,730,847 | $ | 49,856,946 | $ | 128,642,349 | $ | 101,803,019 | $ | 20,477,733 | $ | 68,735,912 | |||||||||||||||||
| Undistributed net investment income (loss) | 134,000 | (9,385 | ) | (4,765 | ) | 154,125 | 212,015 | 45,502 | 65,212 | ||||||||||||||||||||||
| Undistributed net realized gain (loss) | (50,473,705 | ) | (136,204,555 | ) | (16,381,353 | ) | (33,865,782 | ) | (19,790,414 | ) | (12,066,961 | ) | (14,034,032 | ) | |||||||||||||||||
| Net unrealized appreciation (depreciation) | (355,069 | ) | 43,036,260 | 6,733,361 | 24,044,774 | 9,656,541 | 995,613 | 6,166,059 | |||||||||||||||||||||||
| Net Assets | $ | 20,120,000 | $ | 217,553,167 | $ | 40,204,189 | $ | 118,975,466 | $ | 91,881,161 | $ | 9,451,887 | $ | 60,933,151 | |||||||||||||||||
| Shares outstanding (unlimited amount authorized, $0.01 par value) | 1,550,000 | 9,400,000 | 2,850,000 | 4,300,000 | 4,650,000 | 550,000 | 3,150,000 | ||||||||||||||||||||||||
| Net asset value | $ | 12.98 | $ | 23.14 | $ | 14.11 | $ | 27.67 | $ | 19.76 | $ | 17.19 | $ | 19.34 | |||||||||||||||||
| Share Price | $ | 12.98 | $ | 23.18 | $ | 14.09 | $ | 27.65 | $ | 19.81 | $ | 17.19 | $ | 19.34 | |||||||||||||||||
| Investments, at cost | $ | 20,583,008 | $ | 174,730,188 | $ | 33,538,678 | $ | 95,066,588 | $ | 82,258,094 | $ | 8,527,457 | $ | 54,824,032 | |||||||||||||||||
See Notes to Financial Statements.
50
| PowerShares Dynamic Media Portfolio | PowerShares Dynamic Networking Portfolio | PowerShares Dynamic Oil & Gas Services Portfolio | PowerShares Dynamic Pharmaceuticals Portfolio | PowerShares Dynamic Retail Portfolio | PowerShares Dynamic Semiconductors Portfolio | PowerShares Dynamic Software Portfolio | |||||||||||||||||||||||||
| ASSETS: | |||||||||||||||||||||||||||||||
| Investments, at value | $ | 156,986,511 | $ | 172,432,712 | $ | 310,052,822 | $ | 87,658,598 | $ | 13,197,070 | $ | 42,831,177 | $ | 83,872,084 | |||||||||||||||||
| Cash | 309 | 393 | 318 | 322 | 226 | 260 | 295 | ||||||||||||||||||||||||
| Receivables: | |||||||||||||||||||||||||||||||
| Dividends | 37,018 | 9,105 | 194,413 | 88,528 | 1,856 | 7,704 | 7,217 | ||||||||||||||||||||||||
| Expense waivers | 6,922 | 16,454 | 2,501 | 6,354 | 8,183 | 10,073 | 8,581 | ||||||||||||||||||||||||
| Investments sold | 2,305,584 | 1,451,995 | — | — | — | — | — | ||||||||||||||||||||||||
| Shares sold | — | — | — | — | — | — | — | ||||||||||||||||||||||||
| Total Assets | 159,336,344 | 173,910,659 | 310,250,054 | 87,753,802 | 13,207,335 | 42,849,214 | 83,888,177 | ||||||||||||||||||||||||
| LIABILITIES: | |||||||||||||||||||||||||||||||
| Payables: | |||||||||||||||||||||||||||||||
| Shares repurchased | 2,304,480 | 1,452,086 | — | — | — | — | — | ||||||||||||||||||||||||
| Investments purchased | — | — | — | — | — | — | — | ||||||||||||||||||||||||
| Accrued advisory fees | 62,805 | 70,941 | 127,226 | 34,801 | 5,250 | 17,368 | 33,514 | ||||||||||||||||||||||||
| Accrued expenses | 87,570 | 96,148 | 150,731 | 112,549 | 71,850 | 82,945 | 80,840 | ||||||||||||||||||||||||
| Total Liabilities | 2,454,855 | 1,619,175 | 277,957 | 147,350 | 77,100 | 100,313 | 114,354 | ||||||||||||||||||||||||
| NET ASSETS | $ | 156,881,489 | $ | 172,291,484 | $ | 309,972,097 | $ | 87,606,452 | $ | 13,130,235 | $ | 42,748,901 | $ | 83,773,823 | |||||||||||||||||
| NET ASSETS CONSIST OF: | |||||||||||||||||||||||||||||||
| Shares of beneficial interest | $ | 160,079,783 | $ | 164,510,852 | $ | 408,033,511 | $ | 101,041,486 | $ | 21,397,174 | $ | 83,026,696 | $ | 90,048,763 | |||||||||||||||||
| Undistributed net investment income (loss) | 154,702 | (4,573 | ) | (10,714 | ) | 167,020 | 4,752 | (5,279 | ) | (5,106 | ) | ||||||||||||||||||||
| Undistributed net realized gain (loss) | (22,901,493 | ) | (10,373,114 | ) | (168,927,433 | ) | (23,386,885 | ) | (9,692,917 | ) | (47,357,175 | ) | (17,987,891 | ) | |||||||||||||||||
| Net unrealized appreciation (depreciation) | 19,548,497 | 18,158,319 | 70,876,733 | 9,784,831 | 1,421,226 | 7,084,659 | 11,718,057 | ||||||||||||||||||||||||
| Net Assets | $ | 156,881,489 | $ | 172,291,484 | $ | 309,972,097 | $ | 87,606,452 | $ | 13,130,235 | $ | 42,748,901 | $ | 83,773,823 | |||||||||||||||||
| Shares outstanding (unlimited amount authorized, $0.01 par value) | 10,050,000 | 5,900,000 | 11,750,000 | 3,350,000 | 600,000 | 2,350,000 | 3,050,000 | ||||||||||||||||||||||||
| Net asset value | $ | 15.61 | $ | 29.20 | $ | 26.38 | $ | 26.15 | $ | 21.88 | $ | 18.19 | $ | 27.47 | |||||||||||||||||
| Share Price | $ | 15.61 | $ | 29.20 | $ | 26.38 | $ | 26.17 | $ | 21.90 | $ | 18.20 | $ | 27.48 | |||||||||||||||||
| Investments, at cost | $ | 137,438,014 | $ | 154,274,393 | $ | 239,176,089 | $ | 77,873,767 | $ | 11,775,844 | $ | 35,746,518 | $ | 72,154,027 | |||||||||||||||||
51
Statements of Operations
Year Ended April 30, 2011
| PowerShares Dynamic Banking Portfolio | PowerShares Dynamic Biotechnology & Genome Portfolio | PowerShares Dynamic Building & Construction Portfolio | PowerShares Dynamic Energy Exploration & Production Portfolio | PowerShares Dynamic Food & Beverage Portfolio | PowerShares Dynamic Insurance Portfolio | PowerShares Dynamic Leisure and Entertainment Portfolio | |||||||||||||||||||||||||
| INVESTMENT INCOME: | |||||||||||||||||||||||||||||||
| Dividend income | $ | 540,304 | $ | 744,224 | $ | 2,417,163 | $ | 878,155 | $ | 1,866,382 | $ | 516,232 | $ | 918,344 | |||||||||||||||||
| Foreign withholding tax | — | — | — | — | — | — | — | ||||||||||||||||||||||||
| Total Income | 540,304 | 744,224 | 2,417,163 | 878,155 | 1,866,382 | 516,232 | 918,344 | ||||||||||||||||||||||||
| EXPENSES: | |||||||||||||||||||||||||||||||
| Advisory fees | 126,087 | 936,313 | 205,532 | 365,447 | 462,290 | 85,367 | 295,565 | ||||||||||||||||||||||||
| Accounting & administration fees | 68,240 | 68,240 | 68,241 | 68,240 | 68,240 | 68,240 | 68,240 | ||||||||||||||||||||||||
| Professional fees | 31,231 | 41,874 | 32,614 | 33,614 | 35,032 | 31,158 | 33,583 | ||||||||||||||||||||||||
| Printing | 25,314 | 63,702 | 12,799 | 22,541 | 16,985 | 11,223 | 12,266 | ||||||||||||||||||||||||
| Custodian & transfer agent fees | 13,259 | 24,026 | 21,927 | 20,282 | 25,386 | 13,305 | 15,997 | ||||||||||||||||||||||||
| Sub-licensing | 12,609 | 56,179 | 12,332 | 21,927 | 27,737 | 5,122 | 17,734 | ||||||||||||||||||||||||
| Listing fee and expenses | 10,678 | 10,678 | 10,678 | 10,678 | 10,678 | 10,678 | 10,678 | ||||||||||||||||||||||||
| Trustees | 5,599 | 11,024 | 6,214 | 6,864 | 7,848 | 5,465 | 6,610 | ||||||||||||||||||||||||
| Recapture (See Note 3) | — | 887 | — | — | 1,484 | — | — | ||||||||||||||||||||||||
| Other expenses | 1,551 | 4,346 | 1,992 | 4,713 | 2,499 | 1,440 | 1,718 | ||||||||||||||||||||||||
| Total Expenses | 294,568 | 1,217,269 | 372,329 | 554,306 | 658,179 | 231,998 | 462,391 | ||||||||||||||||||||||||
| Less: Waivers | (130,655 | ) | (37,515 | ) | (113,361 | ) | (92,366 | ) | (75,695 | ) | (124,433 | ) | (89,979 | ) | |||||||||||||||||
| Net Expenses | 163,913 | 1,179,754 | 258,968 | 461,940 | 582,484 | 107,565 | 372,412 | ||||||||||||||||||||||||
| Net Investment Income (Loss) | 376,391 | (435,530 | ) | 2,158,195 | 416,215 | 1,283,898 | 408,667 | 545,932 | |||||||||||||||||||||||
| REALIZED AND UNREALIZED GAIN (LOSS): | |||||||||||||||||||||||||||||||
| Net realized gain (loss) from: | |||||||||||||||||||||||||||||||
| Investments | (2,005,607 | ) | (13,226,988 | ) | (4,778,094 | ) | (795,105 | ) | 1,688,359 | (356,169 | ) | (3,827,667 | ) | ||||||||||||||||||
| In-kind redemptions | 2,523,806 | 23,483,129 | 7,394,996 | 15,575,661 | 17,341,940 | 2,624,000 | 11,228,646 | ||||||||||||||||||||||||
| Net realized gain (loss) | 518,199 | 10,256,141 | 2,616,902 | 14,780,556 | 19,030,299 | 2,267,831 | 7,400,979 | ||||||||||||||||||||||||
| Net change in unrealized appreciation (depreciation) on: | |||||||||||||||||||||||||||||||
| Investments | (3,847,300 | ) | 19,153,819 | (3,168,649 | ) | 16,596,744 | 1,766,666 | (753,033 | ) | (97,341 | ) | ||||||||||||||||||||
| Net realized and unrealized gain (loss) | (3,329,101 | ) | 29,409,960 | (551,747 | ) | 31,377,300 | 20,796,965 | 1,514,798 | 7,303,638 | ||||||||||||||||||||||
| Net increase (decrease) in net assets resulting from operations | $ | (2,952,710 | ) | $ | 28,974,430 | $ | 1,606,448 | $ | 31,793,515 | $ | 22,080,863 | $ | 1,923,465 | $ | 7,849,570 | ||||||||||||||||
See Notes to Financial Statements.
52
| PowerShares Dynamic Media Portfolio | PowerShares Dynamic Networking Portfolio | PowerShares Dynamic Oil & Gas Services Portfolio | PowerShares Dynamic Pharmaceuticals Portfolio | PowerShares Dynamic Retail Portfolio | PowerShares Dynamic Semiconductors Portfolio | PowerShares Dynamic Software Portfolio | |||||||||||||||||||||||||
| INVESTMENT INCOME: | |||||||||||||||||||||||||||||||
| Dividend income | $ | 1,191,245 | $ | 245,095 | $ | 1,854,877 | $ | 1,010,579 | $ | 203,275 | $ | 221,248 | $ | 221,032 | |||||||||||||||||
| Foreign withholding tax | — | — | (2,951 | ) | — | — | — | — | |||||||||||||||||||||||
| Total Income | 1,191,245 | 245,095 | 1,851,926 | 1,010,579 | 203,275 | 221,248 | 221,032 | ||||||||||||||||||||||||
| EXPENSES: | |||||||||||||||||||||||||||||||
| Advisory fees | 497,074 | 487,650 | 938,179 | 359,152 | 62,054 | 164,692 | 322,205 | ||||||||||||||||||||||||
| Accounting & administration fees | 68,240 | 68,240 | 68,240 | 68,240 | 68,240 | 68,240 | 68,240 | ||||||||||||||||||||||||
| Professional fees | 36,926 | 33,499 | 39,189 | 33,553 | 30,702 | 31,744 | 34,019 | ||||||||||||||||||||||||
| Printing | 16,664 | 18,057 | 53,434 | 26,836 | 6,229 | 12,952 | 16,936 | ||||||||||||||||||||||||
| Custodian & transfer agent fees | 18,607 | 20,629 | 25,028 | 13,944 | 13,860 | 15,151 | 13,565 | ||||||||||||||||||||||||
| Sub-licensing | 29,825 | 29,259 | 56,290 | 21,549 | 3,723 | 9,881 | 19,332 | ||||||||||||||||||||||||
| Listing fee and expenses | 10,678 | 10,678 | 10,678 | 10,678 | 10,678 | 10,678 | 10,678 | ||||||||||||||||||||||||
| Trustees | 7,874 | 7,062 | 10,123 | 7,121 | 5,304 | 5,864 | 6,852 | ||||||||||||||||||||||||
| Recapture (See Note 3) | 4 | 3,328 | 11,200 | — | — | — | — | ||||||||||||||||||||||||
| Other expenses | 3,564 | 7,977 | 7,270 | 2,616 | 1,186 | 1,873 | 2,536 | ||||||||||||||||||||||||
| Total Expenses | 689,456 | 686,379 | 1,219,631 | 543,689 | 201,976 | 321,075 | 494,363 | ||||||||||||||||||||||||
| Less: Waivers | (63,143 | ) | (71,940 | ) | (41,047 | ) | (91,158 | ) | (123,788 | ) | (113,566 | ) | (88,387 | ) | |||||||||||||||||
| Net Expenses | 626,313 | 614,439 | 1,178,584 | 452,531 | 78,188 | 207,509 | 405,976 | ||||||||||||||||||||||||
| Net Investment Income (Loss) | 564,932 | (369,344 | ) | 673,342 | 558,048 | 125,087 | 13,739 | (184,944 | ) | ||||||||||||||||||||||
| REALIZED AND UNREALIZED GAIN (LOSS): | |||||||||||||||||||||||||||||||
| Net realized gain (loss) from: | |||||||||||||||||||||||||||||||
| Investments | (6,698,254 | ) | (4,540,723 | ) | (10,690,083 | ) | (568,894 | ) | (2,285,589 | ) | (2,239,584 | ) | (2,847,910 | ) | |||||||||||||||||
| In-kind redemptions | 12,273,516 | 24,642,055 | 43,529,681 | 10,989,313 | 1,342,993 | 5,218,106 | 11,912,129 | ||||||||||||||||||||||||
| Net realized gain (loss) | 5,575,262 | 20,101,332 | 32,839,598 | 10,420,419 | (942,596 | ) | 2,978,522 | 9,064,219 | |||||||||||||||||||||||
| Net change in unrealized appreciation (depreciation) on: | |||||||||||||||||||||||||||||||
| Investments | 3,373,815 | 10,562,510 | 46,256,386 | 10,464,256 | 2,278,984 | 4,860,820 | 3,438,040 | ||||||||||||||||||||||||
| Net realized and unrealized gain (loss) | 8,949,077 | 30,663,842 | 79,095,984 | 20,884,675 | 1,336,388 | 7,839,342 | 12,502,259 | ||||||||||||||||||||||||
| Net increase (decrease) in net assets resulting from operations | $ | 9,514,009 | $ | 30,294,498 | $ | 79,769,326 | $ | 21,442,723 | $ | 1,461,475 | $ | 7,853,081 | $ | 12,317,315 | |||||||||||||||||
53
Statements of Changes in Net Assets
| PowerShares Dynamic Banking Portfolio | PowerShares Dynamic Biotechnology & Genome Portfolio | PowerShares Dynamic Building & Construction Portfolio | |||||||||||||||||||||||||
| Year Ended April 30, 2011 | Year Ended April 30, 2010 | Year Ended April 30, 2011 | Year Ended April 30, 2010 | Year Ended April 30, 2011 | Year Ended April 30, 2010 | ||||||||||||||||||||||
| OPERATIONS: | |||||||||||||||||||||||||||
| Net investment income (loss) | $ | 376,391 | $ | 619,706 | $ | (435,530 | ) | $ | 647,033 | $ | 2,158,195 | $ | 36,974 | ||||||||||||||
| Net realized gain (loss) | 518,199 | (13,834,864 | ) | 10,256,141 | 25,368,958 | 2,616,902 | 5,280,257 | ||||||||||||||||||||
| Net change in unrealized appreciation (depreciation) | (3,847,300 | ) | 16,275,482 | 19,153,819 | 46,416,191 | (3,168,649 | ) | 6,505,844 | |||||||||||||||||||
| Net increase (decrease) in net assets resulting from operations | (2,952,710 | ) | 3,060,324 | 28,974,430 | 72,432,182 | 1,606,448 | 11,823,075 | ||||||||||||||||||||
| Undistributed net investment income (loss) included in the price of units issued and redeemed | (30,629 | ) | (11,158 | ) | 9,394 | (63,453 | ) | 97,010 | (20,556 | ) | |||||||||||||||||
| DISTRIBUTIONS TO SHAREHOLDERS FROM: | |||||||||||||||||||||||||||
| Net investment income | (237,874 | ) | (1,325,518 | ) | — | (647,086 | ) | (2,169,779 | ) | (71,961 | ) | ||||||||||||||||
| Return of capital | — | (13,214 | ) | — | (217,733 | ) | (404,914 | ) | — | ||||||||||||||||||
| Total distributions to shareholders | (237,874 | ) | (1,338,732 | ) | — | (864,819 | ) | (2,574,693 | ) | (71,961 | ) | ||||||||||||||||
| SHAREHOLDER TRANSACTIONS: | |||||||||||||||||||||||||||
| Proceeds from shares sold | 32,063,583 | 28,346,551 | 74,034,028 | 126,426,292 | 38,196,035 | 40,602,688 | |||||||||||||||||||||
| Value of shares repurchased | (34,156,888 | ) | (79,438,109 | ) | (99,845,800 | ) | (122,899,742 | ) | (47,137,974 | ) | (51,381,416 | ) | |||||||||||||||
| Net income equalization | 30,629 | 11,158 | (9,394 | ) | 63,453 | (97,010 | ) | 20,556 | |||||||||||||||||||
| Net increase (decrease) in net assets resulting from shares transactions | (2,062,676 | ) | (51,080,400 | ) | (25,821,166 | ) | 3,590,003 | (9,038,949 | ) | (10,758,172 | ) | ||||||||||||||||
| Increase (Decrease) in Net Assets | (5,283,889 | ) | (49,369,966 | ) | 3,162,658 | 75,093,913 | (9,910,184 | ) | 972,386 | ||||||||||||||||||
| NET ASSETS: | |||||||||||||||||||||||||||
| Beginning of year | 25,403,889 | 74,773,855 | 214,390,509 | 139,296,596 | 50,114,373 | 49,141,987 | |||||||||||||||||||||
| End of year | $ | 20,120,000 | $ | 25,403,889 | $ | 217,553,167 | $ | 214,390,509 | $ | 40,204,189 | $ | 50,114,373 | |||||||||||||||
| Undistributed net investment income (loss) at end of year | $ | 134,000 | $ | (4,517 | ) | $ | (9,385 | ) | $ | (6,773 | ) | $ | (4,765 | ) | $ | 6,819 | |||||||||||
| CHANGES IN SHARES OUTSTANDING: | |||||||||||||||||||||||||||
| Shares sold | 2,450,000 | 2,350,000 | 3,850,000 | 7,600,000 | 2,950,000 | 3,500,000 | |||||||||||||||||||||
| Shares repurchased | (2,700,000 | ) | (6,550,000 | ) | (5,350,000 | ) | (7,500,000 | ) | (3,700,000 | ) | (4,400,000 | ) | |||||||||||||||
| Shares outstanding, beginning of year | 1,800,000 | 6,000,000 | 10,900,000 | 10,800,000 | 3,600,000 | 4,500,000 | |||||||||||||||||||||
| Shares outstanding, end of year | 1,550,000 | 1,800,000 | 9,400,000 | 10,900,000 | 2,850,000 | 3,600,000 | |||||||||||||||||||||
See Notes to Financial Statements.
54
| PowerShares Dynamic Energy Exploration & Production Portfolio | PowerShares Dynamic Food & Beverage Portfolio | PowerShares Dynamic Insurance Portfolio | |||||||||||||||||||||||||
| Year Ended April 30, 2011 | Year Ended April 30, 2010 | Year Ended April 30, 2011 | Year Ended April 30, 2010 | Year Ended April 30, 2011 | Year Ended April 30, 2010 | ||||||||||||||||||||||
| OPERATIONS: | |||||||||||||||||||||||||||
| Net investment income (loss) | $ | 416,215 | $ | 355,809 | $ | 1,283,898 | $ | 850,097 | $ | 408,667 | $ | 224,268 | |||||||||||||||
| Net realized gain (loss) | 14,780,556 | 7,292,712 | 19,030,299 | 9,779,655 | 2,267,831 | (102,817 | ) | ||||||||||||||||||||
| Net change in unrealized appreciation (depreciation) | 16,596,744 | 11,435,753 | 1,766,666 | 5,379,206 | (753,033 | ) | 5,556,072 | ||||||||||||||||||||
| Net increase (decrease) in net assets resulting from operations | 31,793,515 | 19,084,274 | 22,080,863 | 16,008,958 | 1,923,465 | 5,677,523 | |||||||||||||||||||||
| Undistributed net investment income (loss) included in the price of units issued and redeemed | (6,807 | ) | (11,946 | ) | 95,051 | (275,996 | ) | 17,420 | 15,651 | ||||||||||||||||||
| DISTRIBUTIONS TO SHAREHOLDERS FROM: | |||||||||||||||||||||||||||
| Net investment income | (381,171 | ) | (238,490 | ) | (1,251,575 | ) | (1,083,897 | ) | (389,896 | ) | (260,945 | ) | |||||||||||||||
| Return of capital | — | (49,129 | ) | — | — | — | — | ||||||||||||||||||||
| Total distributions to shareholders | (381,171 | ) | (287,619 | ) | (1,251,575 | ) | (1,083,897 | ) | (389,896 | ) | (260,945 | ) | |||||||||||||||
| SHAREHOLDER TRANSACTIONS: | |||||||||||||||||||||||||||
| Proceeds from shares sold | 99,574,499 | 45,781,891 | 126,890,276 | 73,142,785 | 16,161,395 | 12,074,164 | |||||||||||||||||||||
| Value of shares repurchased | (71,993,971 | ) | (55,939,908 | ) | (128,633,086 | ) | (101,865,601 | ) | (26,834,729 | ) | (25,707,970 | ) | |||||||||||||||
| Net income equalization | 6,807 | 11,946 | (95,051 | ) | 275,996 | (17,420 | ) | (15,651 | ) | ||||||||||||||||||
| Net increase (decrease) in net assets resulting from shares transactions | 27,587,335 | (10,146,071 | ) | (1,837,861 | ) | (28,446,820 | ) | (10,690,754 | ) | (13,649,457 | ) | ||||||||||||||||
| Increase (Decrease) in Net Assets | 58,992,872 | 8,638,638 | 19,086,478 | (13,797,755 | ) | (9,139,765 | ) | (8,217,228 | ) | ||||||||||||||||||
| NET ASSETS: | |||||||||||||||||||||||||||
| Beginning of year | 59,982,594 | 51,343,956 | 72,794,683 | 86,592,438 | 18,591,652 | 26,808,880 | |||||||||||||||||||||
| End of year | $ | 118,975,466 | $ | 59,982,594 | $ | 91,881,161 | $ | 72,794,683 | $ | 9,451,887 | $ | 18,591,652 | |||||||||||||||
| Undistributed net investment income (loss) at end of year | $ | 154,125 | $ | (4,673 | ) | $ | 212,015 | $ | 179,692 | $ | 45,502 | $ | 26,643 | ||||||||||||||
| CHANGES IN SHARES OUTSTANDING: | |||||||||||||||||||||||||||
| Shares sold | 4,500,000 | 2,850,000 | 7,500,000 | 5,200,000 | 1,050,000 | 900,000 | |||||||||||||||||||||
| Shares repurchased | (3,450,000 | ) | (3,500,000 | ) | (7,400,000 | ) | (7,450,000 | ) | (1,700,000 | ) | (2,000,000 | ) | |||||||||||||||
| Shares outstanding, beginning of year | 3,250,000 | 3,900,000 | 4,550,000 | 6,800,000 | 1,200,000 | 2,300,000 | |||||||||||||||||||||
| Shares outstanding, end of year | 4,300,000 | 3,250,000 | 4,650,000 | 4,550,000 | 550,000 | 1,200,000 | |||||||||||||||||||||
55
Statements of Changes in Net Assets (Continued)
| PowerShares Dynamic Leisure and Entertainment Portfolio | PowerShares Dynamic Media Portfolio | PowerShares Dynamic Networking Portfolio | |||||||||||||||||||||||||
| Year Ended April 30, 2011 | Year Ended April 30, 2010 | Year Ended April 30, 2011 | Year Ended April 30, 2010 | Year Ended April 30, 2011 | Year Ended April 30, 2010 | ||||||||||||||||||||||
| OPERATIONS: | |||||||||||||||||||||||||||
| Net investment income (loss) | $ | 545,932 | $ | 89,940 | $ | 564,932 | $ | 252,031 | $ | (369,344 | ) | $ | (141,097 | ) | |||||||||||||
| Net realized gain (loss) | 7,400,979 | 4,451,677 | 5,575,262 | 6,580,216 | 20,101,332 | 5,499,729 | |||||||||||||||||||||
| Net change in unrealized appreciation (depreciation) | (97,341 | ) | 6,079,935 | 3,373,815 | 17,466,146 | 10,562,510 | 6,663,272 | ||||||||||||||||||||
| Net increase in net assets resulting from operations | 7,849,570 | 10,621,552 | 9,514,009 | 24,298,393 | 30,294,498 | 12,021,904 | |||||||||||||||||||||
| Undistributed net investment income (loss) included in the price of units issued and redeemed | 181,536 | (764,293 | ) | (54,203 | ) | (518,652 | ) | 58,770 | 27,812 | ||||||||||||||||||
| DISTRIBUTIONS TO SHAREHOLDERS FROM: | |||||||||||||||||||||||||||
| Net investment income | (501,284 | ) | (72,405 | ) | (407,112 | ) | (252,182 | ) | — | — | |||||||||||||||||
| Return of capital | — | — | — | (22,607 | ) | (461,519 | ) | — | |||||||||||||||||||
| Total distributions to shareholders | (501,284 | ) | (72,405 | ) | (407,112 | ) | (274,789 | ) | (461,519 | ) | — | ||||||||||||||||
| SHAREHOLDER TRANSACTIONS: | |||||||||||||||||||||||||||
| Proceeds from shares sold | 68,818,149 | 73,178,081 | 128,723,685 | 129,819,265 | 188,768,082 | 39,996,959 | |||||||||||||||||||||
| Value of shares repurchased | (78,027,663 | ) | (33,708,559 | ) | (106,824,157 | ) | (36,222,010 | ) | (93,746,582 | ) | (20,858,030 | ) | |||||||||||||||
| Net income equalization | (181,536 | ) | 764,293 | 54,203 | 518,652 | (58,770 | ) | (27,812 | ) | ||||||||||||||||||
| Net increase (decrease) in net assets resulting from shares transactions | (9,391,050 | ) | 40,233,815 | 21,953,731 | 94,115,907 | 94,962,730 | 19,111,117 | ||||||||||||||||||||
| Increase (Decrease) in Net Assets | (1,861,228 | ) | 50,018,669 | 31,006,425 | 117,620,859 | 124,854,479 | 31,160,833 | ||||||||||||||||||||
| NET ASSETS: | |||||||||||||||||||||||||||
| Beginning of year | 62,794,379 | 12,775,710 | 125,875,064 | 8,254,205 | 47,437,005 | 16,276,172 | |||||||||||||||||||||
| End of year | $ | 60,933,151 | $ | 62,794,379 | $ | 156,881,489 | $ | 125,875,064 | $ | 172,291,484 | $ | 47,437,005 | |||||||||||||||
| Undistributed net investment income (loss) at end of year | $ | 65,212 | $ | 20,564 | $ | 154,702 | $ | (3,118 | ) | $ | (4,573 | ) | $ | (2,894 | ) | ||||||||||||
| CHANGES IN SHARES OUTSTANDING: | |||||||||||||||||||||||||||
| Shares sold | 3,950,000 | 5,200,000 | 9,250,000 | 11,300,000 | 7,550,000 | 2,250,000 | |||||||||||||||||||||
| Shares repurchased | (4,600,000 | ) | (2,600,000 | ) | (8,400,000 | ) | (3,100,000 | ) | (3,900,000 | ) | (1,200,000 | ) | |||||||||||||||
| Shares outstanding, beginning of year | 3,800,000 | 1,200,000 | 9,200,000 | 1,000,000 | 2,250,000 | 1,200,000 | |||||||||||||||||||||
| Shares outstanding, end of year | 3,150,000 | 3,800,000 | 10,050,000 | 9,200,000 | 5,900,000 | 2,250,000 | |||||||||||||||||||||
See Notes to Financial Statements.
56
| PowerShares Dynamic Oil & Gas Services Portfolio | PowerShares Dynamic Pharmaceuticals Portfolio | PowerShares Dynamic Retail Portfolio | |||||||||||||||||||||||||
| Year Ended April 30, 2011 | Year Ended April 30, 2010 | Year Ended April 30, 2011 | Year Ended April 30, 2010 | Year Ended April 30, 2011 | Year Ended April 30, 2010 | ||||||||||||||||||||||
| OPERATIONS: | |||||||||||||||||||||||||||
| Net investment income (loss) | $ | 673,342 | $ | 437,145 | $ | 558,048 | $ | 571,818 | $ | 125,087 | $ | 157,134 | |||||||||||||||
| Net realized gain (loss) | 32,839,598 | (15,162,993 | ) | 10,420,419 | (9,541,016 | ) | (942,596 | ) | 23,771,134 | ||||||||||||||||||
| Net change in unrealized appreciation (depreciation) | 46,256,386 | 71,087,526 | 10,464,256 | 35,342,985 | 2,278,984 | (17,762,532 | ) | ||||||||||||||||||||
| Net increase in net assets resulting from operations | 79,769,326 | 56,361,678 | 21,442,723 | 26,373,787 | 1,461,475 | 6,165,736 | |||||||||||||||||||||
| Undistributed net investment income (loss) included in the price of units issued and redeemed | 93,367 | (3,035 | ) | (28,877 | ) | (161,901 | ) | 93,007 | 241,079 | ||||||||||||||||||
| DISTRIBUTIONS TO SHAREHOLDERS FROM: | |||||||||||||||||||||||||||
| Net investment income | (682,880 | ) | (642,185 | ) | (420,073 | ) | (992,451 | ) | (139,474 | ) | (196,273 | ) | |||||||||||||||
| Return of capital | — | (258,092 | ) | — | — | — | — | ||||||||||||||||||||
| Total distributions to shareholders | (682,880 | ) | (900,277 | ) | (420,073 | ) | (992,451 | ) | (139,474 | ) | (196,273 | ) | |||||||||||||||
| SHAREHOLDER TRANSACTIONS: | |||||||||||||||||||||||||||
| Proceeds from shares sold | 202,997,550 | 83,424,925 | 49,850,080 | 19,257,512 | 21,841,312 | 82,184,260 | |||||||||||||||||||||
| Value of shares repurchased | (142,469,635 | ) | (124,244,327 | ) | (40,928,257 | ) | (91,325,601 | ) | (34,305,896 | ) | (141,487,827 | ) | |||||||||||||||
| Net income equalization | (93,367 | ) | 3,035 | 28,877 | 161,901 | (93,007 | ) | (241,079 | ) | ||||||||||||||||||
| Net increase (decrease) in net assets resulting from shares transactions | 60,434,548 | (40,816,367 | ) | 8,950,700 | (71,906,188 | ) | (12,557,591 | ) | (59,544,646 | ) | |||||||||||||||||
| Increase (Decrease) in Net Assets | 139,614,361 | 14,641,999 | 29,944,473 | (46,686,753 | ) | (11,142,583 | ) | (53,334,104 | ) | ||||||||||||||||||
| NET ASSETS: | |||||||||||||||||||||||||||
| Beginning of year | 170,357,736 | 155,715,737 | 57,661,979 | 104,348,732 | 24,272,818 | 77,606,922 | |||||||||||||||||||||
| End of year | $ | 309,972,097 | $ | 170,357,736 | $ | 87,606,452 | $ | 57,661,979 | $ | 13,130,235 | $ | 24,272,818 | |||||||||||||||
| Undistributed net investment income (loss) at end of year | $ | (10,714 | ) | $ | (8,321 | ) | $ | 167,020 | $ | 29,045 | $ | 4,752 | $ | 19,139 | |||||||||||||
| CHANGES IN SHARES OUTSTANDING: | |||||||||||||||||||||||||||
| Shares sold | 9,300,000 | 5,250,000 | 2,300,000 | 1,150,000 | 1,150,000 | 5,050,000 | |||||||||||||||||||||
| Shares repurchased | (7,000,000 | ) | (7,700,000 | ) | (1,900,000 | ) | (5,700,000 | ) | (1,850,000 | ) | (9,050,000 | ) | |||||||||||||||
| Shares outstanding, beginning of year | 9,450,000 | 11,900,000 | 2,950,000 | 7,500,000 | 1,300,000 | 5,300,000 | |||||||||||||||||||||
| Shares outstanding, end of year | 11,750,000 | 9,450,000 | 3,350,000 | 2,950,000 | 600,000 | 1,300,000 | |||||||||||||||||||||
57
Statements of Changes in Net Assets (Continued)
| PowerShares Dynamic Semiconductors Portfolio | PowerShares Dynamic Software Portfolio | ||||||||||||||||||
| Year Ended April 30, 2011 | Year Ended April 30, 2010 | Year Ended April 30, 2011 | Year Ended April 30, 2010 | ||||||||||||||||
| OPERATIONS: | |||||||||||||||||||
| Net investment income (loss) | $ | 13,739 | $ | 136,811 | $ | (184,944 | ) | $ | (211,494 | ) | |||||||||
| Net realized gain | 2,978,522 | 2,724,384 | 9,064,219 | 13,968,040 | |||||||||||||||
| Net change in unrealized appreciation | 4,860,820 | 7,568,493 | 3,438,040 | 6,367,617 | |||||||||||||||
| Net increase in net assets resulting from operations | 7,853,081 | 10,429,688 | 12,317,315 | 20,124,163 | |||||||||||||||
| Undistributed net investment income (loss) included in the price of units issued and redeemed | 270 | (26,642 | ) | 30,155 | 7,870 | ||||||||||||||
| DISTRIBUTIONS TO SHAREHOLDERS FROM: | |||||||||||||||||||
| Net investment income | (15,131 | ) | (146,532 | ) | — | — | |||||||||||||
| Return of capital | (55,929 | ) | (8,521 | ) | — | — | |||||||||||||
| Total distributions to shareholders | (71,060 | ) | (155,053 | ) | — | — | |||||||||||||
| SHAREHOLDER TRANSACTIONS: | |||||||||||||||||||
| Proceeds from shares sold | 39,421,025 | 34,613,789 | 72,699,105 | 65,333,131 | |||||||||||||||
| Value of shares repurchased | (33,027,565 | ) | (52,688,497 | ) | (68,868,869 | ) | (54,727,511 | ) | |||||||||||
| Net income equalization | (270 | ) | 26,642 | (30,155 | ) | (7,870 | ) | ||||||||||||
| Net increase (decrease) in net assets resulting from shares transactions | 6,393,190 | (18,048,066 | ) | 3,800,081 | 10,597,750 | ||||||||||||||
| Increase (Decrease) in Net Assets | 14,175,481 | (7,800,073 | ) | 16,147,551 | 30,729,783 | ||||||||||||||
| NET ASSETS: | |||||||||||||||||||
| Beginning of year | 28,573,420 | 36,373,493 | 67,626,272 | 36,896,489 | |||||||||||||||
| End of year | $ | 42,748,901 | $ | 28,573,420 | $ | 83,773,823 | $ | 67,626,272 | |||||||||||
| Undistributed net investment income (loss) at end of year | $ | (5,279 | ) | $ | (3,887 | ) | $ | (5,106 | ) | $ | (3,480 | ) | |||||||
| CHANGES IN SHARES OUTSTANDING: | |||||||||||||||||||
| Shares sold | 2,500,000 | 2,900,000 | 3,050,000 | 3,450,000 | |||||||||||||||
| Shares repurchased | (2,150,000 | ) | (4,400,000 | ) | (3,000,000 | ) | (2,850,000 | ) | |||||||||||
| Shares outstanding, beginning of year | 2,000,000 | 3,500,000 | 3,000,000 | 2,400,000 | |||||||||||||||
| Shares outstanding, end of year | 2,350,000 | 2,000,000 | 3,050,000 | 3,000,000 | |||||||||||||||
See Notes to Financial Statements.
58
Financial Highlights
PowerShares Dynamic Banking Portfolio
| Year Ended April 30, | For the Period October 12, 2006* Through | ||||||||||||||||||||||
| 2011 | 2010 | 2009 | 2008 | April 30, 2007 | |||||||||||||||||||
| PER SHARE OPERATING PERFORMANCE: | |||||||||||||||||||||||
| Net asset value at beginning of period | $ | 14.11 | $ | 12.46 | $ | 19.57 | $ | 23.68 | $ | 25.17 | |||||||||||||
| Net investment income** | 0.20 | 0.24 | 0.46 | 0.52 | 0.22 | ||||||||||||||||||
| Net realized and unrealized gain (loss) on investments | (1.19 | ) | 1.89 | (7.04 | ) | (4.22 | ) | (1.49 | ) | ||||||||||||||
| Total from investment operations | (0.99 | ) | 2.13 | (6.58 | ) | (3.70 | ) | (1.27 | ) | ||||||||||||||
| Distributions to shareholders from: | |||||||||||||||||||||||
| Net investment income | (0.14 | ) | (0.48 | ) | (0.53 | ) | (0.41 | ) | (0.22 | ) | |||||||||||||
| Return of capital | — | (0.00 | )(a) | — | — | — | |||||||||||||||||
| Total distributions | (0.14 | ) | (0.48 | ) | (0.53 | ) | (0.41 | ) | (0.22 | ) | |||||||||||||
| Net asset value at end of period | $ | 12.98 | $ | 14.11 | $ | 12.46 | $ | 19.57 | $ | 23.68 | |||||||||||||
| Share price at end of period*** | $ | 12.98 | $ | 14.11 | $ | 12.43 | |||||||||||||||||
| NET ASSET VALUE, TOTAL RETURN:**** | (6.98 | )% | 17.91 | % | (34.34 | )% | (15.80 | )% | (5.08 | )% | |||||||||||||
| SHARE PRICE TOTAL RETURN**** | (6.99 | )% | 18.21 | % | (34.49 | )% | |||||||||||||||||
| RATIOS/SUPPLEMENTAL DATA: | |||||||||||||||||||||||
| Net assets at end of period (000's omitted) | $ | 20,120 | $ | 25,404 | $ | 74,774 | $ | 107,648 | $ | 4,736 | |||||||||||||
| Ratio to average net assets of: | |||||||||||||||||||||||
| Expenses, after (Waivers) and/or Recapture | 0.65 | % | 0.65 | % | 0.65 | % | 0.66 | % | 0.76 | %† | |||||||||||||
| Expenses, prior to (Waivers) and/or Recapture | 1.17 | % | 1.07 | % | 0.72 | % | 0.78 | % | 1.88 | %† | |||||||||||||
| Net investment income, after (Waivers) and/or Recapture | 1.49 | % | 2.12 | % | 2.82 | % | 2.71 | % | 1.58 | %† | |||||||||||||
| Portfolio turnover rate †† | 114 | % | 84 | % | 93 | % | 111 | % | 57 | % | |||||||||||||
| Undistributed net investment loss included in price of units issued and redeemed**# | $ | (0.02 | ) | $ | (0.00 | )(a) | $ | (0.01 | ) | $ | (0.05 | ) | $ | (0.06 | ) | ||||||||
PowerShares Dynamic Biotechnology & Genome Portfolio
| Year Ended April 30, | |||||||||||||||||||||||
| 2011 | 2010 | 2009 | 2008 | 2007 | |||||||||||||||||||
| PER SHARE OPERATING PERFORMANCE: | |||||||||||||||||||||||
| Net asset value at beginning of year | $ | 19.67 | $ | 12.90 | $ | 17.77 | $ | 19.30 | $ | 17.24 | |||||||||||||
| Net investment income (loss)** | (0.05 | ) | 0.06 | ††† | (0.06 | ) | (0.11 | ) | (0.10 | ) | |||||||||||||
| Net realized and unrealized gain (loss) on investments | 3.52 | 6.79 | (4.81 | ) | (1.42 | ) | 2.16 | ||||||||||||||||
| Total from investment operations | 3.47 | 6.85 | (4.87 | ) | (1.53 | ) | 2.06 | ||||||||||||||||
| Distributions to shareholders from: | |||||||||||||||||||||||
| Net investment income | — | (0.06 | ) | — | — | — | |||||||||||||||||
| Return of capital | — | (0.02 | ) | — | — | — | |||||||||||||||||
| Total distributions | — | (0.08 | ) | — | — | — | |||||||||||||||||
| Net asset value at end of year | $ | 23.14 | $ | 19.67 | $ | 12.90 | $ | 17.77 | $ | 19.30 | |||||||||||||
| Share price at end of year*** | $ | 23.18 | $ | 19.68 | $ | 12.87 | |||||||||||||||||
| NET ASSET VALUE, TOTAL RETURN:**** | 17.64 | % | 53.19 | % | (27.41 | )% | (7.93 | )% | 11.95 | % | |||||||||||||
| SHARE PRICE TOTAL RETURN**** | 17.78 | % | 53.63 | % | (27.62 | )% | |||||||||||||||||
| RATIOS/SUPPLEMENTAL DATA: | |||||||||||||||||||||||
| Net assets at end of year (000's omitted) | $ | 217,553 | $ | 214,391 | $ | 139,297 | $ | 199,000 | $ | 258,616 | |||||||||||||
| Ratio to average net assets of: | |||||||||||||||||||||||
| Expenses, after (Waivers) and/or Recapture | 0.63 | % | 0.63 | % | 0.63 | % | 0.63 | % | 0.63 | % | |||||||||||||
| Expenses, prior to (Waivers) and/or Recapture | 0.65 | % | 0.61 | % | 0.62 | % | 0.62 | % | 0.66 | % | |||||||||||||
| Net investment income (loss), after (Waivers) and/or Recapture | (0.23 | )% | 0.36 | %††† | (0.38 | )% | (0.57 | )% | (0.56 | )% | |||||||||||||
| Portfolio turnover rate †† | 81 | % | 80 | % | 93 | % | 91 | % | 82 | % | |||||||||||||
| Undistributed net investment income (loss) included in price of units issued and redeemed**# | $ | 0.00 | (a) | $ | (0.01 | ) | $ | (0.01 | ) | $ | 0.01 | $ | 0.01 | ||||||||||
* Commencement of Investment Operations.
** Based on average shares outstanding.
*** The mean between the last bid and ask prices.
**** Net asset value total return is calculated assuming an initial investment made at the net asset value at the beginning of the period, reinvestment of all dividends and distributions at net asset value during the period, and redemption on the last day of the period. Share price total return is calculated assuming an initial investment made at the share price at the beginning of the period, reinvestment of all dividends and distributions at share price during the period, and sale at the share price on the last day of the period. Total investment returns calculated for a period of less than one year are not annualized.
† Annualized.
†† Portfolio turnover rate is not annualized and does not include securities received or delivered from processing creations or redemptions.
††† Net investment income per share and the ratio of net investment income to average net assets include a special cash dividend received of $1.41 per share owned of PDL BioPharma, Inc. on December 15, 2009. Net investment loss per share and the ratio of net investment loss to average net assets excluding the special dividend are $(0.03) and (0.18)%, respectively.
# The per share amount of equalization is presented to show the impact of equalization on distributable earnings per share.
(a) Amount represents less than $0.005.
See Notes to Financial Statements.
59
Financial Highlights (Continued)
PowerShares Dynamic Building & Construction Portfolio
| Year Ended April 30, | |||||||||||||||||||||||
| 2011 | 2010 | 2009 | 2008 | 2007 | |||||||||||||||||||
| PER SHARE OPERATING PERFORMANCE: | |||||||||||||||||||||||
| Net asset value at beginning of year | $ | 13.92 | $ | 10.92 | $ | 17.25 | $ | 18.70 | $ | 18.15 | |||||||||||||
| Net investment income* | 0.68 | †† | 0.01 | 0.02 | 0.02 | 0.02 | |||||||||||||||||
| Net realized and unrealized gain (loss) on investments | 0.29 | > | 3.01 | (6.33 | ) | (1.45 | ) | 0.53 | |||||||||||||||
| Total from investment operations | 0.97 | 3.02 | (6.31 | ) | (1.43 | ) | 0.55 | ||||||||||||||||
| Distributions to shareholders from: | |||||||||||||||||||||||
| Net investment income | (0.66 | ) | (0.02 | ) | (0.02 | ) | (0.02 | ) | 0.00 | (a) | |||||||||||||
| Return of capital | (0.12 | ) | — | — | — | — | |||||||||||||||||
| Total distributions | (0.78 | ) | (0.02 | ) | (0.02 | ) | (0.02 | ) | 0.00 | �� | |||||||||||||
| Net asset value at end of year | $ | 14.11 | $ | 13.92 | $ | 10.92 | $ | 17.25 | $ | 18.70 | |||||||||||||
| Share price at end of year** | $ | 14.09 | $ | 13.92 | $ | 10.94 | |||||||||||||||||
| NET ASSET VALUE, TOTAL RETURN:*** | 7.49 | % | 27.65 | % | (36.61 | )% | (7.66 | )% | 3.06 | % | |||||||||||||
| SHARE PRICE TOTAL RETURN*** | 7.34 | % | 27.42 | % | (36.46 | )% | |||||||||||||||||
| RATIOS/SUPPLEMENTAL DATA: | |||||||||||||||||||||||
| Net assets at end of year (000's omitted) | $ | 40,204 | $ | 50,114 | $ | 49,142 | $ | 15,523 | $ | 18,699 | |||||||||||||
| Ratio to average net assets of: | |||||||||||||||||||||||
| Expenses, after (Waivers) and/or Recapture | 0.63 | % | 0.63 | % | 0.63 | % | 0.63 | % | 0.63 | % | |||||||||||||
| Expenses, prior to (Waivers) and/or Recapture | 0.91 | % | 0.76 | % | 1.06 | % | 1.18 | % | 1.65 | % | |||||||||||||
| Net investment income (loss), after (Waivers) and/or Recapture | 5.25 | %†† | 0.07 | % | 0.19 | % | 0.09 | % | 0.15 | % | |||||||||||||
| Portfolio turnover rate † | 75 | % | 59 | % | 50 | % | 75 | % | 59 | % | |||||||||||||
| Undistributed net investment income (loss) included in price of units issued and redeemed*# | $ | 0.03 | $ | (0.00 | )(a) | $ | 0.05 | $ | (0.02 | ) | $ | 0.01 | |||||||||||
PowerShares Dynamic Energy Exploration & Production Portfolio
| Year Ended April 30 | |||||||||||||||||||||||
| 2011 | 2010 | 2009 | 2008 | 2007 | |||||||||||||||||||
| PER SHARE OPERATING PERFORMANCE: | |||||||||||||||||||||||
| Net asset value at beginning of year | $ | 18.46 | $ | 13.17 | $ | 26.69 | $ | 21.29 | $ | 18.63 | |||||||||||||
| Net investment income* | 0.12 | 0.10 | 0.06 | 0.05 | 0.09 | ||||||||||||||||||
| Net realized and unrealized gain (loss) on investments | 9.21 | 5.27 | (13.50 | ) | 5.41 | 2.63 | |||||||||||||||||
| Total from investment operations | 9.33 | 5.37 | (13.44 | ) | 5.46 | 2.72 | |||||||||||||||||
| Distributions to shareholders from: | |||||||||||||||||||||||
| Net investment income | (0.12 | ) | (0.07 | ) | (0.08 | ) | (0.06 | ) | (0.06 | ) | |||||||||||||
| Return of capital | — | (0.01 | ) | — | 0.00 | (a) | — | ||||||||||||||||
| Total distributions | (0.12 | ) | (0.08 | ) | (0.08 | ) | (0.06 | ) | (0.06 | ) | |||||||||||||
| Net asset value at end of year | $ | 27.67 | $ | 18.46 | $ | 13.17 | $ | 26.69 | $ | 21.29 | |||||||||||||
| Share price at end of year** | $ | 27.65 | $ | 18.46 | $ | 13.15 | |||||||||||||||||
| NET ASSET VALUE, TOTAL RETURN:*** | 50.80 | % | 40.87 | % | (50.42 | )% | 25.69 | % | 14.66 | % | |||||||||||||
| SHARE PRICE TOTAL RETURN*** | 50.69 | % | 41.08 | % | (50.44 | )% | |||||||||||||||||
| RATIOS/SUPPLEMENTAL DATA: | |||||||||||||||||||||||
| Net assets at end of year (000's omitted) | $ | 118,975 | $ | 59,983 | $ | 51,344 | $ | 138,802 | $ | 123,488 | |||||||||||||
| Ratio to average net assets of: | |||||||||||||||||||||||
| Expenses, after (Waivers) and/or Recapture | 0.63 | % | 0.63 | % | 0.63 | % | 0.63 | % | 0.63 | % | |||||||||||||
| Expenses, prior to (Waivers) and/or Recapture | 0.76 | % | 0.76 | % | 0.69 | % | 0.65 | % | 0.74 | % | |||||||||||||
| Net investment income, after (Waivers) and/or Recapture | 0.57 | % | 0.62 | % | 0.30 | % | 0.23 | % | 0.47 | % | |||||||||||||
| Portfolio turnover rate † | 57 | % | 68 | % | 68 | % | 39 | % | 59 | % | |||||||||||||
| Undistributed net investment income (loss) included in price of units issued and redeemed*# | $ | (0.00 | )(a) | $ | (0.00 | )(a) | $ | 0.00 | (a) | $ | 0.00 | (a) | $ | (0.01 | ) | ||||||||
* Based on average shares outstanding.
** The mean between the last bid and ask prices.
*** Net asset value total return is calculated assuming an initial investment made at the net asset value at the beginning of the period, reinvestment of all dividends and distributions at net asset value during the period, and redemption on the last day of the period. Share price total return is calculated assuming an initial investment made at the share price at the beginning of the period, reinvestment of all dividends and distributions at share price during the period, and sale at the share price on the last day of the period. Total investment returns calculated for a period of less than one year are not annualized.
> Due to the timing of creations and redemptions of capital shares, the net realized and unrealized gain (loss) per share is not in accord with the Fund's change in net realized and unrealized gain (loss) on investment securities and in-kind transactions for the period.
† Portfolio turnover rate is not annualized and does not include securities received or delivered from processing creations or redemptions.
†† Net investment income per share and the ratio of net investment income to average net assets include a special cash dividend received of $1.65 per share owned of Weyerhaeuser Co. on July 20, 2010. Net investment income per share and the ratio of net investment income to average net assets excluding the special dividend are $0.03 and 0.26%, respectively.
# The per share amount of equalization is presented to show the impact of equalization on distributable earnings per share.
(a) Amount represents less than $0.005 or 0.005%.
See Notes to Financial Statements.
60
Financial Highlights (Continued)
PowerShares Dynamic Food & Beverage Portfolio
| Year Ended April 30, | |||||||||||||||||||||||
| 2011 | 2010 | 2009 | 2008 | 2007 | |||||||||||||||||||
| PER SHARE OPERATING PERFORMANCE: | |||||||||||||||||||||||
| Net asset value at beginning of year | $ | 16.00 | $ | 12.73 | $ | 16.73 | $ | 17.53 | $ | 15.17 | |||||||||||||
| Net investment income* | 0.24 | 0.20 | 0.25 | 0.18 | 0.39 | ||||||||||||||||||
| Net realized and unrealized gain (loss) on investments | 3.73 | 3.33 | (4.08 | ) | (0.42 | ) | 2.14 | ||||||||||||||||
| Total from investment operations | 3.97 | 3.53 | (3.83 | ) | (0.24 | ) | 2.53 | ||||||||||||||||
| Distributions to shareholders from: | |||||||||||||||||||||||
| Net investment income | (0.21 | ) | (0.26 | ) | (0.17 | ) | (0.40 | ) | (0.17 | ) | |||||||||||||
| Return of capital | — | — | — | (0.16 | ) | — | |||||||||||||||||
| Total distributions | (0.21 | ) | (0.26 | ) | (0.17 | ) | (0.56 | ) | (0.17 | ) | |||||||||||||
| Net asset value at end of year | $ | 19.76 | $ | 16.00 | $ | 12.73 | $ | 16.73 | $ | 17.53 | |||||||||||||
| Share price at end of year** | $ | 19.81 | $ | 16.01 | $ | 12.74 | |||||||||||||||||
| NET ASSET VALUE, TOTAL RETURN:*** | 24.99 | % | 28.08 | % | (22.99 | )% | (1.40 | )% | 16.79 | % | |||||||||||||
| SHARE PRICE TOTAL RETURN*** | 25.23 | % | 28.06 | % | (22.89 | )% | |||||||||||||||||
| RATIOS/SUPPLEMENTAL DATA: | |||||||||||||||||||||||
| Net assets at end of year (000's omitted) | $ | 91,881 | $ | 72,795 | $ | 86,592 | $ | 87,013 | $ | 33,314 | |||||||||||||
| Ratio to average net assets of: | |||||||||||||||||||||||
| Expenses, after (Waivers) and/or Recapture | 0.63 | % | 0.63 | % | 0.63 | % | 0.63 | % | 0.64 | % | |||||||||||||
| Expenses, prior to (Waivers) and/or Recapture | 0.71 | % | 0.74 | % | 0.71 | % | 0.88 | % | 1.15 | % | |||||||||||||
| Net investment income, after (Waivers) and/or Recapture | 1.39 | % | 1.41 | % | 1.80 | % | 1.11 | % | 2.42 | % | |||||||||||||
| Portfolio turnover rate † | 73 | % | 65 | % | 65 | % | 64 | % | 50 | % | |||||||||||||
| Undistributed net investment income (loss) included in price of units issued and redeemed*# | $ | 0.02 | $ | (0.06 | ) | $ | 0.04 | $ | 0.07 | $ | 0.02 | ||||||||||||
PowerShares Dynamic Insurance Portfolio
| Year Ended April 30, | |||||||||||||||||||||||
| 2011 | 2010 | 2009 | 2008 | 2007 | |||||||||||||||||||
| PER SHARE OPERATING PERFORMANCE: | |||||||||||||||||||||||
| Net asset value at beginning of year | $ | 15.49 | $ | 11.66 | $ | 16.20 | $ | 18.84 | $ | 17.31 | |||||||||||||
| Net investment income* | 0.38 | 0.16 | 0.15 | 0.27 | †† | 0.15 | |||||||||||||||||
| Net realized and unrealized gain (loss) on investments | 1.66 | 3.86 | (4.54 | ) | (2.61 | ) | 1.51 | ||||||||||||||||
| Total from investment operations | 2.04 | 4.02 | (4.39 | ) | (2.34 | ) | 1.66 | ||||||||||||||||
| Distributions to shareholders from: | |||||||||||||||||||||||
| Net investment income | (0.34 | ) | (0.19 | ) | (0.15 | ) | (0.30 | ) | (0.13 | ) | |||||||||||||
| Net asset value at end of year | $ | 17.19 | $ | 15.49 | $ | 11.66 | $ | 16.20 | $ | 18.84 | |||||||||||||
| Share price at end of year** | $ | 17.19 | $ | 15.50 | $ | 11.61 | |||||||||||||||||
| NET ASSET VALUE, TOTAL RETURN:*** | 13.38 | % | 34.85 | % | (27.26 | )% | (12.56 | )% | 9.62 | % | |||||||||||||
| SHARE PRICE TOTAL RETURN*** | 13.31 | % | 35.53 | % | (27.53 | )% | |||||||||||||||||
| RATIOS/SUPPLEMENTAL DATA: | |||||||||||||||||||||||
| Net assets at end of year (000's omitted) | $ | 9,452 | $ | 18,592 | $ | 26,809 | $ | 34,012 | $ | 58,401 | |||||||||||||
| Ratio to average net assets of: | |||||||||||||||||||||||
| Expenses, after (Waivers) and/or Recapture | 0.63 | % | 0.63 | % | 0.63 | % | 0.63 | % | 0.63 | % | |||||||||||||
| Expenses, prior to (Waivers) and/or Recapture | 1.36 | % | 1.23 | % | 0.98 | % | 0.82 | % | 0.96 | % | |||||||||||||
| Net investment income, after (Waivers) and/or Recapture | 2.39 | % | 1.20 | % | 1.13 | % | 1.54 | %†† | 0.87 | % | |||||||||||||
| Portfolio turnover rate † | 66 | % | 72 | % | 52 | % | 82 | % | 40 | % | |||||||||||||
| Undistributed net investment income (loss) included in price of units issued and redeemed*# | $ | 0.02 | $ | 0.01 | $ | (0.01 | ) | $ | (0.03 | ) | $ | 0.01 | |||||||||||
* Based on average shares outstanding.
** The mean between the last bid and ask prices.
*** Net asset value total return is calculated assuming an initial investment made at the net asset value at the beginning of the period, reinvestment of all dividends and distributions at net asset value during the period, and redemption on the last day of the period. Share price total return is calculated assuming an initial investment made at the share price at the beginning of the period, reinvestment of all dividends and distributions at share price during the period, and sale at the share price on the last day of the period. Total investment returns calculated for a period of less than one year are not annualized.
† Portfolio turnover rate is not annualized and does not include securities received or delivered from processing creations or redemptions.
†† Net investment income per share and the ratio of net investment income to average net assets include a special cash dividend received of $2.00 per share owned of Progressive Corp. (The) on September 14, 2007. Net investment income per share and the ratio of net investment income to average net assets excluding the special dividend are $0.17 and 0.96%, respectively.
# The per share amount of equalization is presented to show the impact of equalization on distributable earnings per share.
See Notes to Financial Statements.
61
Financial Highlights (Continued)
PowerShares Dynamic Leisure and Entertainment Portfolio
| Year Ended April 30, | |||||||||||||||||||||||
| 2011 | 2010 | 2009 | 2008 | 2007 | |||||||||||||||||||
| PER SHARE OPERATING PERFORMANCE: | |||||||||||||||||||||||
| Net asset value at beginning of year | $ | 16.52 | $ | 10.65 | $ | 15.11 | $ | 18.32 | $ | 16.29 | |||||||||||||
| Net investment income* | 0.16 | 0.05 | 0.10 | 0.12 | 0.07 | ||||||||||||||||||
| Net realized and unrealized gain (loss) on investments | 2.81 | 5.88 | (4.46 | ) | (2.75 | ) | 2.05 | ||||||||||||||||
| Total from investment operations | 2.97 | 5.93 | (4.36 | ) | (2.63 | ) | 2.12 | ||||||||||||||||
| Distributions to shareholders from: | |||||||||||||||||||||||
| Net investment income | (0.15 | ) | (0.06 | ) | (0.10 | ) | (0.19 | ) | (0.08 | ) | |||||||||||||
| Return of capital | — | — | — | (0.39 | ) | (0.01 | ) | ||||||||||||||||
| Total distributions | (0.15 | ) | (0.06 | ) | (0.10 | ) | (0.58 | ) | (0.09 | ) | |||||||||||||
| Net asset value at end of year | $ | 19.34 | $ | 16.52 | $ | 10.65 | $ | 15.11 | $ | 18.32 | |||||||||||||
| Share price at end of year** | $ | 19.34 | $ | 16.54 | $ | 10.63 | |||||||||||||||||
| NET ASSET VALUE, TOTAL RETURN:*** | 18.03 | % | 55.81 | % | (28.91 | )% | (14.58 | )% | 13.02 | % | |||||||||||||
| SHARE PRICE TOTAL RETURN*** | 17.89 | % | 56.29 | % | (29.09 | )% | |||||||||||||||||
| RATIOS/SUPPLEMENTAL DATA: | |||||||||||||||||||||||
| Net assets at end of year (000's omitted) | $ | 60,933 | $ | 62,794 | $ | 12,776 | $ | 15,115 | $ | 49,472 | |||||||||||||
| Ratio to average net assets of: | |||||||||||||||||||||||
| Expenses, after (Waivers) and/or Recapture | 0.63 | % | 0.63 | % | 0.63 | % | 0.63 | % | 0.64 | % | |||||||||||||
| Expenses, prior to (Waivers) and/or Recapture | 0.78 | % | 1.06 | % | 1.65 | % | 0.95 | % | 1.07 | % | |||||||||||||
| Net investment income, after (Waivers) and/or Recapture | 0.92 | % | 0.41 | % | 0.96 | % | 0.70 | % | 0.42 | % | |||||||||||||
| Portfolio turnover rate † | 58 | % | 68 | % | 50 | % | 58 | % | 35 | % | |||||||||||||
| Undistributed net investment income (loss) included in price of units issued and redeemed*# | $ | 0.05 | $ | (0.44 | ) | $ | (0.04 | ) | $ | (0.16 | ) | $ | 0.01 | ||||||||||
PowerShares Dynamic Media Portfolio
| Year Ended April 30, | |||||||||||||||||||||||
| 2011 | 2010 | 2009 | 2008 | 2007 | |||||||||||||||||||
| PER SHARE OPERATING PERFORMANCE: | |||||||||||||||||||||||
| Net asset value at beginning of year | $ | 13.68 | $ | 8.25 | $ | 13.44 | $ | 16.48 | $ | 14.44 | |||||||||||||
| Net investment income* | 0.07 | 0.06 | 0.05 | 0.06 | 0.04 | ||||||||||||||||||
| Net realized and unrealized gain (loss) on investments | 1.93 | 5.42 | (5.18 | ) | (2.82 | ) | 2.04 | ||||||||||||||||
| Total from investment operations | 2.00 | 5.48 | (5.13 | ) | (2.76 | ) | 2.08 | ||||||||||||||||
| Distributions to shareholders from: | |||||||||||||||||||||||
| Net investment income | (0.07 | ) | (0.05 | ) | (0.04 | ) | (0.06 | ) | (0.04 | ) | |||||||||||||
| Return of capital | — | (0.00 | )(a) | (0.02 | ) | (0.22 | ) | — | |||||||||||||||
| Total distributions | (0.07 | ) | (0.05 | ) | (0.06 | ) | (0.28 | ) | (0.04 | ) | |||||||||||||
| Net asset value at end of year | $ | 15.61 | $ | 13.68 | $ | 8.25 | $ | 13.44 | $ | 16.48 | |||||||||||||
| Share price at end of year** | $ | 15.61 | $ | 13.70 | $ | 8.26 | |||||||||||||||||
| NET ASSET VALUE, TOTAL RETURN:*** | 14.68 | % | 66.55 | % | (38.30 | )% | (16.91 | )% | 14.42 | % | |||||||||||||
| SHARE PRICE TOTAL RETURN*** | 14.51 | % | 66.59 | % | (38.31 | )% | |||||||||||||||||
| RATIOS/SUPPLEMENTAL DATA: | |||||||||||||||||||||||
| Net assets at end of year (000's omitted) | $ | 156,881 | $ | 125,875 | $ | 8,254 | $ | 30,923 | $ | 31,305 | |||||||||||||
| Ratio to average net assets of: | |||||||||||||||||||||||
| Expenses, after (Waivers) and/or Recapture | 0.63 | % | 0.63 | % | 0.63 | % | 0.63 | % | 0.64 | % | |||||||||||||
| Expenses, prior to (Waivers) and/or Recapture | 0.69 | % | 0.77 | % | 1.22 | % | 0.85 | % | 1.24 | % | |||||||||||||
| Net investment income, after (Waivers) and/or Recapture | 0.57 | % | 0.51 | % | 0.52 | % | 0.36 | % | 0.25 | % | |||||||||||||
| Portfolio turnover rate † | 53 | % | 50 | % | 69 | % | 62 | % | 43 | % | |||||||||||||
| Undistributed net investment income (loss) included in price of units issued and redeemed*# | $ | (0.01 | ) | $ | (0.12 | ) | $ | 0.05 | $ | (0.04 | ) | $ | (0.01 | ) | |||||||||
* Based on average shares outstanding.
** The mean between the last bid and ask prices.
*** Net asset value total return is calculated assuming an initial investment made at the net asset value at the beginning of the period, reinvestment of all dividends and distributions at net asset value during the period, and redemption on the last day of the period. Share price total return is calculated assuming an initial investment made at the share price at the beginning of the period, reinvestment of all dividends and distributions at share price during the period, and sale at the share price on the last day of the period. Total investment returns calculated for a period of less than one year are not annualized.
† Portfolio turnover rate is not annualized and does not include securities received or delivered from processing creations or redemptions.
# The per share amount of equalization is presented to show the impact of equalization on distributable earnings per share.
(a) Amount represents less than $0.005.
See Notes to Financial Statements.
62
Financial Highlights (Continued)
PowerShares Dynamic Networking Portfolio
| Year Ended April 30, | |||||||||||||||||||||||
| 2011 | 2010 | 2009 | 2008 | 2007 | |||||||||||||||||||
| PER SHARE OPERATING PERFORMANCE: | |||||||||||||||||||||||
| Net asset value at beginning of year | $ | 21.08 | $ | 13.56 | $ | 16.04 | $ | 18.68 | $ | 17.38 | |||||||||||||
| Net investment income (loss)* | (0.10 | ) | (0.09 | ) | (0.06 | ) | (0.09 | ) | (0.09 | ) | |||||||||||||
| Net realized and unrealized gain (loss) on investments | 8.33 | 7.61 | (2.42 | ) | (2.55 | ) | 1.39 | ||||||||||||||||
| Total from investment operations | 8.23 | 7.52 | (2.48 | ) | (2.64 | ) | 1.30 | ||||||||||||||||
| Distributions to shareholders from: | |||||||||||||||||||||||
| Return of capital | (0.11 | ) | — | — | — | — | |||||||||||||||||
| Net asset value at end of year | $ | 29.20 | $ | 21.08 | $ | 13.56 | $ | 16.04 | $ | 18.68 | |||||||||||||
| Share price at end of year** | $ | 29.20 | $ | 21.11 | $ | 13.58 | |||||||||||||||||
| NET ASSET VALUE, TOTAL RETURN:*** | 39.08 | % | 55.46 | % | (15.46 | )% | (14.13 | )% | 7.48 | % | |||||||||||||
| SHARE PRICE TOTAL RETURN*** | 38.89 | % | 55.45 | % | (15.28 | )% | |||||||||||||||||
| RATIOS/SUPPLEMENTAL DATA: | |||||||||||||||||||||||
| Net assets at end of year (000's omitted) | $ | 172,291 | $ | 47,437 | $ | 16,276 | $ | 12,831 | $ | 18,677 | |||||||||||||
| Ratio to average net assets of: | |||||||||||||||||||||||
| Expenses, after (Waivers) and/or Recapture | 0.63 | % | 0.63 | % | 0.63 | % | 0.63 | % | 0.64 | % | |||||||||||||
| Expenses, prior to (Waivers) and/or Recapture | 0.70 | % | 0.95 | % | 1.92 | % | 1.25 | % | 1.24 | % | |||||||||||||
| Net investment income (loss), after (Waivers) and/or Recapture | (0.38 | )% | (0.50 | )% | (0.49 | )% | (0.51 | )% | (0.54 | )% | |||||||||||||
| Portfolio turnover rate † | 61 | % | 29 | % | 23 | % | 17 | % | 62 | % | |||||||||||||
| Undistributed net investment income included in price of units issued and redeemed*# | $ | 0.02 | $ | 0.02 | $ | 0.11 | $ | 0.01 | $ | 0.03 | |||||||||||||
PowerShares Dynamic Oil & Gas Services Portfolio
| Year Ended April 30, | |||||||||||||||||||||||
| 2011 | 2010 | 2009 | 2008 | 2007 | |||||||||||||||||||
| PER SHARE OPERATING PERFORMANCE: | |||||||||||||||||||||||
| Net asset value at beginning of year | $ | 18.03 | $ | 13.09 | $ | 29.23 | $ | 22.70 | $ | 21.41 | |||||||||||||
| Net investment income (loss)* | 0.07 | 0.04 | 0.06 | (0.02 | ) | 0.00 | (a) | ||||||||||||||||
| Net realized and unrealized gain (loss) on investments | 8.36 | 4.98 | (16.16 | ) | 6.55 | 1.29 | |||||||||||||||||
| Total from investment operations | 8.43 | 5.02 | (16.10 | ) | 6.53 | 1.29 | |||||||||||||||||
| Distributions to shareholders from: | |||||||||||||||||||||||
| Net investment income | (0.08 | ) | (0.06 | ) | (0.04 | ) | — | — | |||||||||||||||
| Return of capital | — | (0.02 | ) | — | — | — | |||||||||||||||||
| Total distributions | (0.08 | ) | (0.08 | ) | (0.04 | ) | — | — | |||||||||||||||
| Net asset value at end of year | $ | 26.38 | $ | 18.03 | $ | 13.09 | $ | 29.23 | $ | 22.70 | |||||||||||||
| Share price at end of year** | $ | 26.38 | $ | 18.02 | $ | 13.11 | |||||||||||||||||
| NET ASSET VALUE, TOTAL RETURN:*** | 46.84 | % | 38.41 | % | (55.04 | )% | 28.77 | % | 6.03 | % | |||||||||||||
| SHARE PRICE TOTAL RETURN*** | 46.93 | % | 38.13 | % | (54.93 | )% | |||||||||||||||||
| RATIOS/SUPPLEMENTAL DATA: | |||||||||||||||||||||||
| Net assets at end of year (000's omitted) | $ | 309,972 | $ | 170,358 | $ | 155,716 | $ | 379,939 | $ | 272,456 | |||||||||||||
| Ratio to average net assets of: | |||||||||||||||||||||||
| Expenses, after (Waivers) and/or Recapture | 0.63 | % | 0.63 | % | 0.62 | % | 0.62 | % | 0.63 | % | |||||||||||||
| Expenses, prior to (Waivers) and/or Recapture | 0.64 | % | 0.63 | % | 0.61 | % | 0.60 | % | 0.65 | % | |||||||||||||
| Net investment income (loss), after (Waivers) and/or Recapture | 0.36 | % | 0.24 | % | 0.29 | % | (0.06 | )% | 0.02 | % | |||||||||||||
| Portfolio turnover rate † | 39 | % | 56 | % | 48 | % | 67 | % | 76 | % | |||||||||||||
| Undistributed net investment income (loss) included in price of units issued and redeemed*# | $ | 0.01 | $ | (0.00 | )(a) | $ | 0.00 | (a) | $ | 0.00 | (a) | $ | 0.00 | (a) | |||||||||
* Based on average shares outstanding.
** The mean between the last bid and ask prices.
*** Net asset value total return is calculated assuming an initial investment made at the net asset value at the beginning of the period, reinvestment of all dividends and distributions at net asset value during the period, and redemption on the last day of the period. Share price total return is calculated assuming an initial investment made at the share price at the beginning of the period, reinvestment of all dividends and distributions at share price during the period, and sale at the share price on the last day of the period. Total investment returns calculated for a period of less than one year are not annualized.
† Portfolio turnover rate is not annualized and does not include securities received or delivered from processing creations or redemptions.
# The per share amount of equalization is presented to show the impact of equalization on distributable earnings per share.
(a) Amount represents less than $0.005.
See Notes to Financial Statements.
63
Financial Highlights (Continued)
PowerShares Dynamic Pharmaceuticals Portfolio
| Year Ended April 30 | |||||||||||||||||||||||
| 2011 | 2010 | 2009' | 2008 | 2007 | |||||||||||||||||||
| PER SHARE OPERATING PERFORMANCE: | |||||||||||||||||||||||
| Net asset value at beginning of year | $ | 19.55 | $ | 13.91 | $ | 17.20 | $ | 19.61 | $ | 16.54 | |||||||||||||
| Net investment income* | 0.17 | 0.14 | 0.15 | 0.10 | 0.08 | ||||||||||||||||||
| Net realized and unrealized gain (loss) on investments | 6.56 | 5.76 | (3.32 | ) | (2.45 | ) | 3.08 | ||||||||||||||||
| Total from investment operations | 6.73 | 5.90 | (3.17 | ) | (2.35 | ) | 3.16 | ||||||||||||||||
| Distributions to shareholders from: | |||||||||||||||||||||||
| Net investment income | (0.13 | ) | (0.26 | ) | (0.12 | ) | (0.06 | ) | (0.08 | ) | |||||||||||||
| Return of capital | — | — | — | — | (0.01 | ) | |||||||||||||||||
| Total distributions | (0.13 | ) | (0.26 | ) | (0.12 | ) | (0.06 | ) | (0.09 | ) | |||||||||||||
| Net asset value at end of year | $ | 26.15 | $ | 19.55 | $ | 13.91 | $ | 17.20 | $ | 19.61 | |||||||||||||
| Share price at end of year** | $ | 26.17 | $ | 19.54 | $ | 13.92 | |||||||||||||||||
| NET ASSET VALUE, TOTAL RETURN:*** | 34.55 | % | 42.69 | % | (18.52 | )% | (11.99 | )% | 19.20 | % | |||||||||||||
| SHARE PRICE TOTAL RETURN*** | 34.73 | % | 42.51 | % | (18.41 | )% | |||||||||||||||||
| RATIOS/SUPPLEMENTAL DATA: | |||||||||||||||||||||||
| Net assets at end of year (000's omitted) | $ | 87,606 | $ | 57,662 | $ | 104,349 | $ | 106,615 | $ | 82,345 | |||||||||||||
| Ratio to average net assets of: | |||||||||||||||||||||||
| Expenses, after (Waivers) and/or Recapture | 0.63 | % | 0.63 | % | 0.63 | % | 0.63 | % | 0.63 | % | |||||||||||||
| Expenses, prior to (Waivers) and/or Recapture | 0.76 | % | 0.74 | % | 0.66 | % | 0.69 | % | 0.80 | % | |||||||||||||
| Net investment income, after (Waivers) and/or Recapture | 0.78 | % | 0.83 | % | 0.95 | % | 0.52 | % | 0.43 | % | |||||||||||||
| Portfolio turnover rate † | 9 | % | 35 | % | 31 | % | 45 | % | 29 | % | |||||||||||||
| Undistributed net investment income (loss) included in price of units issued and redeemed*# | $ | (0.01 | ) | $ | (0.04 | ) | $ | 0.00 | (a) | $ | (0.01 | ) | $ | (0.01 | ) | ||||||||
PowerShares Dynamic Retail Portfolio
| Year Ended April 30, | |||||||||||||||||||||||
| 2011 | 2010 | 2009 | 2008 | 2007 | |||||||||||||||||||
| PER SHARE OPERATING PERFORMANCE: | |||||||||||||||||||||||
| Net asset value at beginning of year | $ | 18.67 | $ | 14.64 | $ | 15.99 | $ | 20.02 | $ | 18.29 | |||||||||||||
| Net investment income* | 0.18 | 0.06 | 0.05 | 0.04 | 0.07 | ||||||||||||||||||
| Net realized and unrealized gain (loss) on investments | 3.21 | 4.08 | (1.36 | ) | (3.92 | ) | 1.71 | ||||||||||||||||
| Total from investment operations | 3.39 | 4.14 | (1.31 | ) | (3.88 | ) | 1.78 | ||||||||||||||||
| Distributions to shareholders from: | |||||||||||||||||||||||
| Net investment income | (0.18 | ) | (0.11 | ) | (0.04 | ) | (0.10 | ) | (0.05 | ) | |||||||||||||
| Return of capital | — | — | — | (0.05 | ) | — | |||||||||||||||||
| Total distributions | (0.18 | ) | (0.11 | ) | (0.04 | ) | (0.15 | ) | (0.05 | ) | |||||||||||||
| Net asset value at end of year | $ | 21.88 | $ | 18.67 | $ | 14.64 | $ | 15.99 | $ | 20.02 | |||||||||||||
| Share price at end of year** | $ | 21.90 | $ | 18.68 | $ | 14.64 | |||||||||||||||||
| NET ASSET VALUE, TOTAL RETURN:*** | 18.35 | % | 28.49 | % | (8.11 | )% | (19.41 | )% | 9.72 | % | |||||||||||||
| SHARE PRICE TOTAL RETURN*** | 18.39 | % | 28.56 | % | (8.11 | )% | |||||||||||||||||
| RATIOS/SUPPLEMENTAL DATA: | |||||||||||||||||||||||
| Net assets at end of year (000's omitted) | $ | 13,130 | $ | 24,273 | $ | 77,607 | $ | 14,391 | $ | 24,029 | |||||||||||||
| Ratio to average net assets of: | |||||||||||||||||||||||
| Expenses, after (Waivers) and/or Recapture | 0.63 | % | 0.63 | % | 0.63 | % | 0.63 | % | 0.64 | % | |||||||||||||
| Expenses, prior to (Waivers) and/or Recapture | 1.63 | % | 0.89 | % | 1.08 | % | 1.46 | % | 1.41 | % | |||||||||||||
| Net investment income, after (Waivers) and/or Recapture | 1.01 | % | 0.44 | % | 0.45 | % | 0.22 | % | 0.35 | % | |||||||||||||
| Portfolio turnover rate † | 102 | % | 52 | % | 53 | % | 198 | % | 73 | % | |||||||||||||
| Undistributed net investment income (loss) included in price of units issued and redeemed*# | $ | 0.13 | $ | 0.10 | $ | (0.17 | ) | $ | (0.07 | ) | $ | 0.00 | (a) | ||||||||||
* Based on average shares outstanding.
** The mean between the last bid and ask prices.
*** Net asset value total return is calculated assuming an initial investment made at the net asset value at the beginning of the period, reinvestment of all dividends and distributions at net asset value during the period, and redemption on the last day of the period. Share price total return is calculated assuming an initial investment made at the share price at the beginning of the period, reinvestment of all dividends and distributions at share price during the period, and sale at the share price on the last day of the period. Total investment returns calculated for a period of less than one year are not annualized.
† Portfolio turnover rate is not annualized and does not include securities received or delivered from processing creations or redemptions.
# The per share amount of equalization is presented to show the impact of equalization on distributable earnings per share.
(a) Amount represents less than $0.005.
See Notes to Financial Statements.
64
Financial Highlights (Continued)
PowerShares Dynamic Semiconductors Portfolio
| Year Ended April 30, | |||||||||||||||||||||||
| 2011 | 2010 | 2009 | 2008 | 2007 | |||||||||||||||||||
| PER SHARE OPERATING PERFORMANCE: | |||||||||||||||||||||||
| Net asset value at beginning of year | $ | 14.29 | $ | 10.39 | $ | 16.32 | $ | 19.05 | $ | 20.18 | |||||||||||||
| Net investment income (loss)* | 0.01 | 0.05 | 0.04 | (0.01 | ) | (0.04 | ) | ||||||||||||||||
| Net realized and unrealized gain (loss) on investments | 3.92 | 3.91 | (5.92 | ) | (2.72 | ) | (1.09 | ) | |||||||||||||||
| Total from investment operations | 3.93 | 3.96 | (5.88 | ) | (2.73 | ) | (1.13 | ) | |||||||||||||||
| Distribution to shareholder from: | |||||||||||||||||||||||
| Net investment income | (0.01 | ) | (0.06 | ) | (0.05 | ) | — | — | |||||||||||||||
| Return of capital | (0.02 | ) | (0.00 | )(a) | — | — | — | ||||||||||||||||
| Total distributions | (0.03 | ) | (0.06 | ) | (0.05 | ) | — | — | |||||||||||||||
| Net asset value at end of year | $ | 18.19 | $ | 14.29 | $ | 10.39 | $ | 16.32 | $ | 19.05 | |||||||||||||
| Share price at end of year** | $ | 18.20 | $ | 14.29 | $ | 10.39 | |||||||||||||||||
| NET ASSET VALUE, TOTAL RETURN:*** | 27.57 | % | 38.16 | % | (36.01 | )% | (14.33 | )% | (5.60 | )% | |||||||||||||
| SHARE PRICE TOTAL RETURN*** | 27.64 | % | 38.16 | % | (36.01 | )% | |||||||||||||||||
| RATIOS/SUPPLEMENTAL DATA: | |||||||||||||||||||||||
| Net assets at end of year (000's omitted) | $ | 42,749 | $ | 28,573 | $ | 36,373 | $ | 75,056 | $ | 161,886 | |||||||||||||
| Ratio to average net assets of: | |||||||||||||||||||||||
| Expenses, after (Waivers) and/or Recapture | 0.63 | % | 0.63 | % | 0.63 | % | 0.63 | % | 0.63 | % | |||||||||||||
| Expenses, prior to (Waivers) and/or Recapture | 0.97 | % | 0.90 | % | 0.82 | % | 0.67 | % | 0.78 | % | |||||||||||||
| Net investment income (loss), after (Waivers) and/or Recapture | 0.04 | % | 0.39 | % | 0.32 | % | (0.04 | )% | (0.23 | )% | |||||||||||||
| Portfolio turnover rate † | 64 | % | 68 | % | 65 | % | 56 | % | 51 | % | |||||||||||||
| Undistributed net investment income (loss) included in price of units issued and redeemed*# | $ | 0.00 | (a) | $ | (0.01 | ) | $ | (0.01 | ) | $ | 0.02 | $ | (0.01 | ) | |||||||||
PowerShares Dynamic Software Portfolio
| Year Ended April 30, | |||||||||||||||||||||||
| 2011 | 2010 | 2009 | 2008 | 2007 | |||||||||||||||||||
| PER SHARE OPERATING PERFORMANCE: | |||||||||||||||||||||||
| Net asset value at beginning of year | $ | 22.54 | $ | 15.37 | $ | 17.53 | $ | 20.39 | $ | 18.44 | |||||||||||||
| Net investment income (loss)* | (0.07 | ) | (0.07 | ) | (0.06 | ) | (0.10 | ) | (0.10 | ) | |||||||||||||
| Net realized and unrealized gain (loss) on investments | 5.00 | 7.24 | (2.10 | ) | (2.76 | ) | 2.05 | ||||||||||||||||
| Total from investment operations | 4.93 | 7.17 | (2.16 | ) | (2.86 | ) | 1.95 | ||||||||||||||||
| Net asset value at end of year | $ | 27.47 | $ | 22.54 | $ | 15.37 | $ | 17.53 | $ | 20.39 | |||||||||||||
| Share price at end of year** | $ | 27.48 | $ | 22.55 | $ | 15.37 | |||||||||||||||||
| NET ASSET VALUE, TOTAL RETURN:*** | 21.87 | % | 46.65 | % | (12.32 | )% | (14.03 | )% | 10.57 | % | |||||||||||||
| SHARE PRICE TOTAL RETURN*** | 21.86 | % | 46.71 | % | (12.37 | )% | |||||||||||||||||
| RATIOS/SUPPLEMENTAL DATA: | |||||||||||||||||||||||
| Net assets at end of year (000's omitted) | $ | 83,774 | $ | 67,626 | $ | 36,896 | $ | 35,055 | $ | 71,369 | |||||||||||||
| Ratio to average net assets of: | |||||||||||||||||||||||
| Expenses, after (Waivers) and/or Recapture | 0.63 | % | 0.63 | % | 0.63 | % | 0.63 | % | 0.63 | % | |||||||||||||
| Expenses, prior to (Waivers) and/or Recapture | 0.77 | % | 0.75 | % | 0.97 | % | 0.78 | % | 0.83 | % | |||||||||||||
| Net investment income (loss), after (Waivers) and/or Recapture | (0.29 | )% | (0.38 | )% | (0.42 | )% | (0.49 | )% | (0.51 | )% | |||||||||||||
| Portfolio turnover rate † | 46 | % | 33 | % | 53 | % | 64 | % | 59 | % | |||||||||||||
| Undistributed net investment income included in price of units issued and redeemed*# | $ | 0.01 | $ | 0.00 | (a) | $ | 0.02 | $ | 0.05 | $ | 0.00 | (a) | |||||||||||
* Based on average shares outstanding.
** The mean between the last bid and ask prices.
*** Net asset value total return is calculated assuming an initial investment made at the net asset value at the beginning of the period, reinvestment of all dividends and distributions at net asset value during the period, and redemption on the last day of the period. Share price total return is calculated assuming an initial investment made at the share price at the beginning of the period, reinvestment of all dividends and distributions at share price during the period, and sale at the share price on the last day of the period. Total investment returns calculated for a period of less than one year are not annualized.
† Portfolio turnover rate is not annualized and does not include securities received or delivered from processing creations or redemptions.
# The per share amount of equalization is presented to show the impact of equalization on distributable earnings per share.
(a) Amount represents less than $0.005.
See Notes to Financial Statements.
65
Notes to Financial Statements
PowerShares Exchange-Traded Fund Trust
April 30, 2011
Note 1. Organization
PowerShares Exchange-Traded Fund Trust (the "Trust") was organized as a Massachusetts business trust on June 9, 2000 and is authorized to have multiple series of portfolios. The Trust is an open-end management investment company registered under the Investment Company Act of 1940, as amended (the "1940 Act"). As of April 30, 2011, the Trust offered fifty-six portfolios. This report includes the following portfolios:
| Full Name | Short Name | ||||||
| PowerShares Dynamic Banking Portfolio | "Dynamic Banking Portfolio" | ||||||
| PowerShares Dynamic Biotechnology & Genome Portfolio | "Dynamic Biotechnology & Genome Portfolio" | ||||||
| PowerShares Dynamic Building & Construction Portfolio | "Dynamic Building & Construction Portfolio" | ||||||
| PowerShares Dynamic Energy Exploration & Production Portfolio | "Dynamic Energy Exploration & Production Portfolio" | ||||||
| PowerShares Dynamic Food & Beverage Portfolio | "Dynamic Food & Beverage Portfolio" | ||||||
| PowerShares Dynamic Insurance Portfolio | "Dynamic Insurance Portfolio" | ||||||
| PowerShares Dynamic Leisure and Entertainment Portfolio | "Dynamic Leisure and Entertainment Portfolio" | ||||||
| PowerShares Dynamic Media Portfolio | "Dynamic Media Portfolio" | ||||||
| PowerShares Dynamic Networking Portfolio | "Dynamic Networking Portfolio" | ||||||
| PowerShares Dynamic Oil & Gas Services Portfolio | "Dynamic Oil & Gas Services Portfolio" | ||||||
| PowerShares Dynamic Pharmaceuticals Portfolio | "Dynamic Pharmaceuticals Portfolio" | ||||||
| PowerShares Dynamic Retail Portfolio | "Dynamic Retail Portfolio" | ||||||
| PowerShares Dynamic Semiconductors Portfolio | "Dynamic Semiconductors Portfolio" | ||||||
| PowerShares Dynamic Software Portfolio | "Dynamic Software Portfolio" | ||||||
Each portfolio (the "Fund" and collectively the "Funds") represents a separate series of the Trust. The shares of the Funds are referred to herein as "Shares" or "Fund's Shares." Each Fund's Shares are listed and traded on the NYSE Arca, Inc.
The Funds' market prices may differ to some degree from the net asset value ("NAV") of the Shares of each Fund. Unlike conventional mutual funds, each Fund issues and redeems Shares on a continuous basis, at NAV, only in a large specified number of Shares, each called a "Creation Unit." Creation Units of each Fund are issued and redeemed generally in-kind for securities included in the relevant index. Except when aggregated in Creation Units by Authorized Participants, the Shares are not individually redeemable securities of the Funds.
66
Notes to Financial Statements (Continued)
PowerShares Exchange-Traded Fund Trust
April 30, 2011
The investment objective of each Fund is to seek investment results that correspond (before fees and expenses) generally to the price and yield performance of the following indices (each, an "Underlying Index"):
| Fund | Index | ||||||
| Dynamic Banking Portfolio | Dynamic Banking IntellidexSM Index | ||||||
| Dynamic Biotechnology & Genome Portfolio | Dynamic Biotechnology & Genome IntellidexSM Index | ||||||
| Dynamic Building & Construction Portfolio | Dynamic Building & Construction IntellidexSM Index | ||||||
| Dynamic Energy Exploration & Production Portfolio | Dynamic Energy Exploration & Production IntellidexSM Index | ||||||
| Dynamic Food & Beverage Portfolio | Dynamic Food & Beverage IntellidexSM Index | ||||||
| Dynamic Insurance Portfolio | Dynamic Insurance IntellidexSM Index | ||||||
| Dynamic Leisure and Entertainment Portfolio | Dynamic Leisure and Entertainment IntellidexSM Index | ||||||
| Dynamic Media Portfolio | Dynamic Media IntellidexSM Index | ||||||
| Dynamic Networking Portfolio | Dynamic Networking IntellidexSM Index | ||||||
| Dynamic Oil & Gas Services Portfolio | Dynamic Oil Services IntellidexSM Index | ||||||
| Dynamic Pharmaceuticals Portfolio | Dynamic Pharmaceuticals IntellidexSM Index | ||||||
| Dynamic Retail Portfolio | Dynamic Retail IntellidexSM Index | ||||||
| Dynamic Semiconductors Portfolio | Dynamic Semiconductors IntellidexSM Index | ||||||
| Dynamic Software Portfolio | Dynamic Software IntellidexSM Index | ||||||
Note 2. Significant Accounting Policies
The preparation of the financial statements in accordance with Generally Accepted Accounting Principles ("GAAP") in the United States of America requires management to make estimates and assumptions that affect the reported amounts and disclosures in the financial statements, including estimates and assumptions related to taxation. Actual results could differ from these estimates. In addition, the Funds monitor for material events or transactions that may occur or become known after the period-end date and before the date the financial statements are released to print.
A. Security Valuation
Securities, including restricted securities, are valued according to the following policies.
A security listed or traded on an exchange (except convertible bonds) is valued at its last sales price or official closing price as of the close of the customary trading session on the exchange where the security is principally traded, or lacking any sales or official closing price on a particular day, the security may be valued at the closing bid price on that day. Securities traded in the over-the-counter market are valued based on prices furnished by independent pricing services or market makers. Listed options, if no closing price is available, are valued at the mean between the last bid and ask prices from the exchange on which they are principally traded. Options not listed on an exchange are valued by an independent source at the mean between the last bid and ask prices.
Investments in open-end registered investment companies not traded on an exchange are valued at the end of day NAV per share.
67
Notes to Financial Statements (Continued)
PowerShares Exchange-Traded Fund Trust
April 30, 2011
Debt obligations (including convertible bonds) and unlisted equities are fair valued using an evaluated quote provided by an independent pricing service. Evaluated quotes provided by the pricing service may be determined without exclusive reliance on quoted prices, and may reflect appropriate factors such as institution-size trading in similar groups of securities, developments related to specific securities, dividend rate, yield, quality, type of issue, coupon rate, maturity, individual trading characteristics and other market data. Short-term obligations, including commercial paper, having 60 days or less to maturity are recorded at amortized cost which approximates value. Debt securities are subject to interest rate and credit risks. In addition, all debt securities involve some risk of default with respect to interest and/or principal payments.
Foreign securities (including foreign exchange contracts) are converted into U.S. dollar amounts using the applicable exchange rates as of the close of the London world markets. If market quotations are available and reliable for foreign exchange traded equity securities, the securities will be valued at the market quotations. Because trading hours for certain foreign securities end before the close of the New York Stock Exchange ("NYSE"), closing market quotations may become unreliable. If between the time trading ends on a particular security and the close of the customary trading session on the NYSE, events occur that are significant and make the closing price unreliable, the Fund may fair value the security. If the event is likely to have affected the closing price of the security, the security will be valued at fair value in good faith using procedures approved by the Board of Trustees. Adjustments to closing prices to reflect fair value may also be based on a screening process of an independent pricing service to indicate the degree of certainty, based on historical data, that the closing price in the principal market where a foreign security trades is not the current value as of the close of the NYSE. Foreign securities meeting the approved degree of certainty that the price is not reflective of current value will be priced at the indication of fair value from the independent pricing service. Multiple factors may be considered by the independent pricing service in determining adjustments to reflect fair value and may include information relating to sector indices, American depositary receipts and domestic and foreign index futures. Foreign securities may have additional risks including exchange rate changes, potential for sharply devalued currencies and high inflation, political and economic upheaval, the relative lack of issuer information, relatively low market liquidity and the potential lack of strict financial and accounting controls and standards.
Securities for which market prices are not provided by any of the above methods may be valued based upon quotes furnished by independent sources.
Securities for which market quotations are not readily available or are unreliable are valued at fair value as determined in good faith by or under the supervision of the Trust's officers following procedures approved by the Board of Trustees. Issuer specific events, market trends, bid/ask quotes of brokers and information providers and other market data may be reviewed in the course of making a good faith determination of a security's fair value.
Valuations change in response to many factors including the historical and prospective earnings of the issuer, the value of the issuer's assets, general economic conditions, interest rates, investor perceptions and market liquidity. Because of the inherent uncertainties of valuation, the values reflected in the financial statements may materially differ from the value received upon actual sale of those investments.
68
Notes to Financial Statements (Continued)
PowerShares Exchange-Traded Fund Trust
April 30, 2011
B. Other Risks
Replication Management Risk. Unlike many investment companies, the Funds do not utilize an investing strategy that seeks returns in excess of each Fund's respective Underlying Index. Therefore, a Fund would not necessarily sell a security unless that security is removed from its respective Underlying Index.
Non-Diversified Fund Risk. Each Fund is considered non-diversified and can invest a greater portion of its assets in securities of individual issuers than a diversified fund. As a result, changes in the market value of a single investment could cause greater fluctuations in Share price than would occur in a diversified fund.
Concentration Risk. To the extent a Fund concentrates its investments in an industry or group of industries, the value of the Fund's Shares may rise and fall more than the value of Shares of a fund that invests in a broader range of securities.
Non-Correlation Risk. Each Fund's return may not match the return of its Underlying Index for a number of reasons. For example, each Fund incurs operating expenses not applicable to its Underlying Index, and incurs costs in buying and selling securities, especially when rebalancing the securities holdings to reflect changes in the composition of its Underlying Index. In addition, the performance of each Fund and its Underlying Index may vary due to asset valuation differences and differences between each Fund's portfolio and its Underlying Index resulting from legal restrictions, cost or liquidity constraints.
Small and Medium Capitalization Company Risk. Investing in securities of small and medium capitalization companies involves greater risk than is customarily associated with investing in larger, more established companies. These companies' securities may be more volatile and less liquid than those of more established companies. These securities may have returns that vary, sometimes significantly, from the overall securities market. Often small and medium capitalization companies and the industries in which they are focused are still evolving and may make them be more sensitive to changing market conditions.
C. Federal Income Taxes
Each Fund intends to comply with the provisions of the Internal Revenue Code applicable to regulated investment companies and to distribute substantially all of the Fund's taxable earnings to its shareholders. As such, the Funds will not be subject to Federal income taxes on otherwise taxable income (including net realized gains) that is distributed to the shareholders. Therefore, no provision for Federal income taxes is recorded in the financial statements.
Income and capital gain distributions are determined in accordance with Federal income tax regulations, which may differ from GAAP. These differences are primarily due to differing book and tax treatments for in-kind transactions, losses deferred due to wash sales, and passive foreign investment company adjustments, if any.
The Funds file tax returns in the United States Federal jurisdiction and certain other jurisdictions. Generally, a Fund is subject to examinations by such taxing authorities for up to three years after the filing of the return for the tax period.
D. Investment Income and Investment Transactions
Dividend income is recorded on the ex-dividend date net of foreign taxes withheld, if any. Interest income is recorded on the accrual basis. Investment transactions are recorded on the trade date. Realized gains and losses from the sale or disposition of securities are calculated on the specific identified cost basis. Dividends and interest received by a Fund may give rise to withholding and other taxes imposed by
69
Notes to Financial Statements (Continued)
PowerShares Exchange-Traded Fund Trust
April 30, 2011
foreign countries. Corporate actions (including cash dividends) are recorded net of non-reclaimable foreign tax withholdings on the ex-dividend date. Tax conventions between certain countries and the United States may reduce or eliminate such taxes.
E. Expenses
Expenses of the Trust that are directly identifiable to a specific Fund are applied to that Fund. Expenses that are not readily identifiable to a specific Fund are allocated in such a manner as deemed equitable, taking into consideration the nature and type of expense and the relative net assets of each Fund.
Each Fund is responsible for all its expenses, including the investment advisory fees, costs of transfer agency, custody, fund administration, legal, audit and other services, interest, taxes, brokerage commissions and other expenses connected with executions of portfolio transactions, sub-licensing fees related to its respective Underlying Intellidex or Underlying Index, any distribution fees or expenses, litigation expenses, fees payable to the Trust's Board members and officers who are not "interested persons" of the Trust or the Adviser, expenses incurred in connection with the Board members' services, including travel expenses and legal fees of counsel for those members of the Board who are not "interested persons" of the Trust and extraordinary expenses.
F. Dividends and Distributions to Shareholders
Each Fund declares and pays dividends from net investment income, if any, to its shareholders quarterly and records on ex-dividend date. Each Fund distributes net realized taxable capital gains, if any, generally annually in cash and records them on ex-dividend date. Such distributions on a tax basis are determined in conformity with income tax regulations which may differ from GAAP. Distributions in excess of tax basis earnings and profits, if any, are reported in such Fund's financial statements as a tax return of capital at fiscal period-end.
G. Equalization
All of the Funds use the accounting practice of equalization. This accounting method is used to keep the continuing shareholder's per Share equity in undistributed net investment income from being affected by the continuous sales and redemptions of capital Shares. Equalization is calculated on a per Share basis whereby a portion of the proceeds from the sales and cost of repurchases of capital Shares is applied to undistributed net investment income. The amount of equalization is disclosed in the Statements of Changes in Net Assets as undistributed net investment income (loss) included in the price of capital Shares issued or redeemed. The distributions to shareholders of amounts so applied may be deemed to be a return of capital for tax purposes to the extent that such distributions exceed taxable income.
Note 3. Investment Advisory Agreement and Other Agreements
The Trust has entered into an Investment Advisory Agreement with Invesco PowerShares Capital Management LLC (the "Adviser") pursuant to which the Adviser has overall responsibility as the Funds' investment adviser for the selection and ongoing monitoring of the Funds' investments, managing the Funds' business affairs and providing certain clerical, bookkeeping and other administrative services. Each Fund has agreed to pay the Adviser an annual fee of 0.50% of the Fund's average daily net assets.
The Adviser has entered into an Amended and Restated Excess Expense Agreement (the "Excess Expense Agreement") with the Trust, pursuant to which the Adviser has agreed to waive fees and/or pay Fund expenses to the extent necessary to prevent the operating expenses of each Fund (excluding interest
70
Notes to Financial Statements (Continued)
PowerShares Exchange-Traded Fund Trust
April 30, 2011
expense, brokerage commissions and other trading expenses, sub-licensing fees, offering costs, taxes and extraordinary expenses) from exceeding 0.60% of the Fund's average daily net assets per year (the "Expense Cap"), at least until August 31, 2012. Offering costs excluded from the Expense Cap are: (a) initial legal fees pertaining to the Funds' Shares offered for sale; (b) initial Securities and Exchange Commission and state registration fees; and (c) initial fees paid to be listed on an exchange.
The Excess Expense Agreement provides that the expenses borne by the Adviser are subject to recapture by the Adviser for up to three years from the date the fee or expense was borne by the Adviser, but no recapture payment will be made by a Fund if it would result in the Fund exceeding its Expense Cap as specified above.
The amounts available for potential future recapture by the Adviser under the Excess Expense Agreement and the expiration schedule at April 30, 2011 are as follows:
| Total Potential | Potential Recapture Amounts Expiring | ||||||||||||||||||
| Recapture Amounts | 04/30/12 | 04/30/13 | 04/30/14 | ||||||||||||||||
| Dynamic Banking Portfolio | $ | 336,114 | $ | 81,730 | $ | 123,729 | $ | 130,655 | |||||||||||
| Dynamic Biotechnology & Genome Portfolio | 67,129 | 18,040 | 11,574 | 37,515 | |||||||||||||||
| Dynamic Building & Construction Portfolio | 288,734 | 104,482 | 70,891 | 113,361 | |||||||||||||||
| Dynamic Energy Exploration & Production Portfolio | 240,575 | 71,755 | 76,454 | 92,366 | |||||||||||||||
| Dynamic Food & Beverage Portfolio | 205,489 | 63,035 | 66,759 | 75,695 | |||||||||||||||
| Dynamic Insurance Portfolio | 338,322 | 101,777 | 112,112 | 124,433 | |||||||||||||||
| Dynamic Leisure and Entertainment Portfolio | 296,076 | 111,337 | 94,760 | 89,979 | |||||||||||||||
| Dynamic Media Portfolio | 242,378 | 108,094 | 71,141 | 63,143 | |||||||||||||||
| Dynamic Networking Portfolio | 272,480 | 109,817 | 90,723 | 71,940 | |||||||||||||||
| Dynamic Oil & Gas Services Portfolio | 29,844 | — | — | 29,844 | |||||||||||||||
| Dynamic Pharmaceuticals Portfolio | 207,923 | 42,897 | 73,868 | 91,158 | |||||||||||||||
| Dynamic Retail Portfolio | 325,264 | 107,811 | 93,665 | 123,788 | |||||||||||||||
| Dynamic Semiconductors Portfolio | 297,754 | 92,088 | 92,100 | 113,566 | |||||||||||||||
| Dynamic Software Portfolio | 256,057 | 98,470 | 69,200 | 88,387 | |||||||||||||||
The Trust has entered into a Distribution Agreement with Invesco Distributors, Inc. (the "Distributor"), which serves as the distributor of Creation Units for each Fund. The Distributor does not maintain a secondary market in the Shares. The Distributor is an affiliate of the Adviser.
The Adviser has entered into a licensing agreement for each Fund with the NYSE Arca (the "Licensor"). Each Underlying Index name trademark is owned by the Licensor. These trademarks have been licensed to the Adviser for use with the Funds. The Funds are not sponsored, endorsed, sold or promoted by the Licensor and the Licensor makes no representation regarding the advisability of investing in any of these Funds. The Trust has entered into a sub-licensing agreement under which the Funds are required to pay the sub-licensing fees which are shown on the Statements of Operations.
The Trust has entered into service agreements whereby The Bank of New York Mellon, a wholly-owned subsidiary of The Bank of New York Mellon Corporation, serves as the administrator, custodian, fund accountant and transfer agent for each Fund.
71
Notes to Financial Statements (Continued)
PowerShares Exchange-Traded Fund Trust
April 30, 2011
Note 4. Additional Valuation Information
GAAP defines fair value as the price that would be received to sell an asset or paid to transfer a liability in an orderly transaction between market participants at the measurement date, under current market conditions. GAAP establishes a hierarchy that prioritizes the inputs to valuation methods giving the highest priority to readily available unadjusted quoted prices in an active market for identical assets (Level 1) and the lowest priority to significant unobservable inputs (Level 3) generally when market prices are not readily available or are unreliable. Based on the valuation inputs, the securities or other investments are tiered into one of three levels. Changes in valuation methods may result in transfers in or out of an investment's assigned level:
Level 1 – Prices are determined using quoted prices in an active market for identical assets.
Level 2 – Prices are determined using other significant observable inputs. Observable inputs are inputs that other market participants may use in pricing a security. These may include quoted prices for similar securities, interest rates, prepayment speeds, credit risk yield curves, loss severities, default rates, discount rates, volatilities and others.
Level 3 – Prices are determined using significant unobservable inputs. In situations where quoted prices or observable inputs are unavailable (for example, when there is little or no market activity for an investment at the end of the period), unobservable inputs may be used. Unobservable inputs reflect the Fund's own assumptions about the factors market participants would use in determining fair value of the securities or instruments and would be based on the best available information.
As of April 30, 2011, the securities in each Fund were valued based on Level 1 inputs. The level assigned to the securities valuations may not be an indication of the risk or liquidity associated with investing in those securities. Because of the inherent uncertainties of valuation, the values reflected in the financial statements may materially differ from the value received upon actual sale of those investments.
With respect to each Fund, during the fiscal year ended April 30, 2011, there were no significant transfers between investment levels.
Note 5. Distributions to Shareholders and Tax Components of Net Assets
Tax Character of Distributions to Shareholders Paid During the Fiscal Years Ended April 30, 2011 and 2010:
| 2011 | 2010 | ||||||||||||||||||
| Ordinary Income | Return of Capital | Ordinary Income | Return of Capital | ||||||||||||||||
| Dynamic Banking Portfolio | $ | 237,874 | $ | — | $ | 1,325,518 | $ | 13,214 | |||||||||||
| Dynamic Biotechnology & Genome Portfolio | — | — | 647,086 | 217,733 | |||||||||||||||
| Dynamic Building & Construction Portfolio | 2,169,779 | 404,914 | 71,961 | — | |||||||||||||||
| Dynamic Energy Exploration & Production Portfolio | 381,171 | — | 238,490 | 49,129 | |||||||||||||||
| Dynamic Food & Beverage Portfolio | 1,251,575 | — | 1,083,897 | — | |||||||||||||||
| Dynamic Insurance Portfolio | 389,896 | — | 260,945 | — | |||||||||||||||
| Dynamic Leisure and Entertainment Portfolio | 501,284 | — | 72,405 | — | |||||||||||||||
72
Notes to Financial Statements (Continued)
PowerShares Exchange-Traded Fund Trust
April 30, 2011
| 2011 | 2010 | ||||||||||||||||||
| Ordinary Income | Return of Capital | Ordinary Income | Return of Capital | ||||||||||||||||
| Dynamic Media Portfolio | $ | 407,112 | $ | — | $ | 252,182 | $ | 22,607 | |||||||||||
| Dynamic Networking Portfolio | — | 461,519 | — | — | |||||||||||||||
| Dynamic Oil & Gas Services Portfolio | 682,880 | — | 642,185 | 258,092 | |||||||||||||||
| Dynamic Pharmaceuticals Portfolio | 420,073 | — | 992,451 | — | |||||||||||||||
| Dynamic Retail Portfolio | 139,474 | — | 196,273 | — | |||||||||||||||
| Dynamic Semiconductors Portfolio | 15,131 | 55,929 | 146,532 | 8,521 | |||||||||||||||
| Dynamic Software Portfolio | — | — | — | — | |||||||||||||||
Tax Components of Net Assets at Fiscal Year-End:
| Undistributed Ordinary Income | Temporary Book/Tax Differences | Net Unrealized Appreciation (Depreciation) | Capital Loss Carryforward | Post-October* Deferrals | Shares of Beneficial Interest | Total Net Assets | |||||||||||||||||||||||||
| Dynamic Banking Portfolio | $ | 139,848 | $ | (5,848 | ) | $ | (377,015 | ) | $ | (50,213,573 | ) | $ | (238,186 | ) | $ | 70,814,774 | $ | 20,120,000 | |||||||||||||
| Dynamic Biotechnology & Genome Portfolio | — | (9,385 | ) | 42,295,533 | (133,334,333 | ) | (2,129,495 | ) | 310,730,847 | 217,553,167 | |||||||||||||||||||||
| Dynamic Building & Construction Portfolio | — | (4,765 | ) | 5,907,463 | (15,504,095 | ) | (51,360 | ) | 49,856,946 | 40,204,189 | |||||||||||||||||||||
| Dynamic Energy Exploration & Production Portfolio | 160,430 | (6,305 | ) | 23,934,997 | (33,756,005 | ) | — | 128,642,349 | 118,975,466 | ||||||||||||||||||||||
| Dynamic Food & Beverage Portfolio | 217,957 | (5,942 | ) | 9,554,975 | (19,329,778 | ) | (359,070 | ) | 101,803,019 | 91,881,161 | |||||||||||||||||||||
| Dynamic Insurance Portfolio | 50,034 | (4,532 | ) | 993,753 | (11,995,621 | ) | (69,480 | ) | 20,477,733 | 9,451,887 | |||||||||||||||||||||
| Dynamic Leisure and Entertainment Portfolio | 69,704 | (4,492 | ) | 6,079,447 | (12,617,039 | ) | (1,330,381 | ) | 68,735,912 | 60,933,151 | |||||||||||||||||||||
| Dynamic Media Portfolio | 159,689 | (4,987 | ) | 19,272,047 | (22,625,043 | ) | — | 160,079,783 | 156,881,489 | ||||||||||||||||||||||
| Dynamic Networking Portfolio | — | (4,573 | ) | 17,648,282 | (6,605,772 | ) | (3,257,305 | ) | 164,510,852 | 172,291,484 | |||||||||||||||||||||
| Dynamic Oil & Gas Services Portfolio | — | (10,714 | ) | 70,473,263 | (168,523,963 | ) | — | 408,033,511 | 309,972,097 | ||||||||||||||||||||||
| Dynamic Pharmaceuticals Portfolio | 173,602 | (6,582 | ) | 9,446,304 | (21,846,329 | ) | (1,202,029 | ) | 101,041,486 | 87,606,452 | |||||||||||||||||||||
| Dynamic Retail Portfolio | 9,204 | (4,452 | ) | 1,420,128 | (9,265,836 | ) | (425,983 | ) | 21,397,174 | 13,130,235 | |||||||||||||||||||||
| Dynamic Semiconductors Portfolio | — | (5,279 | ) | 7,061,163 | (46,651,971 | ) | (681,708 | ) | 83,026,696 | 42,748,901 | |||||||||||||||||||||
| Dynamic Software Portfolio | — | (5,106 | ) | 11,674,342 | (17,944,176 | ) | — | 90,048,763 | 83,773,823 | ||||||||||||||||||||||
* Capital loss incurred after October 31 ("Post-October losses") within the taxable year are deemed to arise on the first business day of each Fund's next taxable year.
Capital loss carryforward is calculated and reported as of a specific date. Results of transactions and other activity after that date may affect the amount of capital loss carryforward actually available for the Funds to utilize. The ability to utilize capital loss carryforward in the future may be limited under Internal Revenue Code rules and related regulations based on the results of future transactions.
73
Notes to Financial Statements (Continued)
PowerShares Exchange-Traded Fund Trust
April 30, 2011
The following Funds have capital loss carryforward amounts as of April 30, 2011, which expire on April 30 of each year listed below:
| 2013* | 2014 | 2015 | 2016 | 2017 | 2018 | 2019 | Total** | ||||||||||||||||||||||||||||
| Dynamic Banking Portfolio | $ | — | $ | — | $ | — | $ | 1,146,630 | $ | 16,399,927 | $ | 28,757,166 | $ | 3,909,850 | $ | 50,213,573 | |||||||||||||||||||
| Dynamic Biotechnology & Genome Portfolio | — | 321,497 | 19,612,223 | 15,818,255 | 34,286,844 | 50,397,332 | 12,898,182 | 133,334,333 | |||||||||||||||||||||||||||
| Dynamic Building & Construction Portfolio | — | — | 2,263,182 | 742,893 | 2,843,349 | 3,001,058 | 6,653,613 | 15,504,095 | |||||||||||||||||||||||||||
| Dynamic Energy Exploration & Production Portfolio | — | — | 285,311 | 3,232,521 | 7,646,917 | 21,471,013 | 1,120,243 | 33,756,005 | |||||||||||||||||||||||||||
| Dynamic Food & Beverage Portfolio*** | — | — | 239,185 | 1,260,041 | 7,585,250 | 10,245,302 | — | 19,329,778 | |||||||||||||||||||||||||||
| Dynamic Insurance Portfolio | — | — | 774,301 | 2,181,744 | 4,422,035 | 3,738,972 | 878,569 | 11,995,621 | |||||||||||||||||||||||||||
| Dynamic Leisure and Entertainment Portfolio | — | 751,908 | 1,611,839 | 2,111,801 | 2,895,936 | 2,889,449 | 2,356,106 | 12,617,039 | |||||||||||||||||||||||||||
| Dynamic Media Portfolio | — | 545,973 | 3,187,134 | 2,505,039 | 4,930,761 | 5,161,647 | 6,294,489 | 22,625,043 | |||||||||||||||||||||||||||
| Dynamic Networking Portfolio | — | 383,187 | 1,939,441 | 1,064,275 | 1,975,581 | 512,618 | 730,670 | 6,605,772 | |||||||||||||||||||||||||||
| Dynamic Oil & Gas Services Portfolio | — | — | 15,026,862 | 7,909,602 | 24,680,663 | 85,028,926 | 35,877,910 | 168,523,963 | |||||||||||||||||||||||||||
| Dynamic Pharmaceuticals Portfolio | 164,751 | 66,659 | 644,797 | 1,727,610 | 2,128,715 | 15,494,879 | 1,618,918 | 21,846,329 | |||||||||||||||||||||||||||
| Dynamic Retail Portfolio | — | — | 937,070 | 1,908,967 | 2,427,604 | 1,816,180 | 2,176,015 | 9,265,836 | |||||||||||||||||||||||||||
| Dynamic Semiconductors Portfolio | — | 271,588 | 9,158,832 | 10,196,415 | 14,001,359 | 10,902,954 | 2,120,823 | 46,651,971 | |||||||||||||||||||||||||||
| Dynamic Software Portfolio | — | 108,427 | 3,017,278 | 1,542,190 | 7,095,351 | 2,938,722 | 3,242,208 | 17,944,176 | |||||||||||||||||||||||||||
* Capital loss carryforward amount will expire on November 30, 2013.
** Capital loss carryforward as of the date listed above is reduced for limitations, if any, to the extent required by the Internal Revenue Code.
*** During the year ended April 30, 2011, the Dynamic Food & Beverage Portfolio utilized capital loss carryforward of $2,160,087 to offset realized gains.
74
Notes to Financial Statements (Continued)
PowerShares Exchange-Traded Fund Trust
April 30, 2011
Note 6. Investment Transactions
For the fiscal year ended April 30, 2011, the cost of securities purchased and proceeds from sales of securities, excluding short-term securities, money market funds and in-kind transactions, were as follows:
| Purchases | Sales | ||||||||||
| Dynamic Banking Portfolio | $ | 27,518,024 | $ | 28,260,422 | |||||||
| Dynamic Biotechnology & Genome Portfolio | 157,299,333 | 153,405,352 | |||||||||
| Dynamic Building & Construction Portfolio | 33,942,391 | 30,363,991 | |||||||||
| Dynamic Energy Exploration & Production Portfolio | 42,170,853 | 42,897,644 | |||||||||
| Dynamic Food & Beverage Portfolio | 68,741,028 | 65,948,442 | |||||||||
| Dynamic Insurance Portfolio | 10,974,115 | 11,642,534 | |||||||||
| Dynamic Leisure and Entertainment Portfolio | 36,243,025 | 34,445,649 | |||||||||
| Dynamic Media Portfolio | 54,540,069 | 55,024,365 | |||||||||
| Dynamic Networking Portfolio | 60,283,783 | 62,898,957 | |||||||||
| Dynamic Oil & Gas Services Portfolio | 93,228,810 | 74,961,383 | |||||||||
| Dynamic Pharmaceuticals Portfolio | 6,903,752 | 6,332,340 | |||||||||
| Dynamic Retail Portfolio | 13,389,009 | 13,555,532 | |||||||||
| Dynamic Semiconductors Portfolio | 21,416,345 | 22,044,870 | |||||||||
| Dynamic Software Portfolio | 29,743,352 | 30,769,517 | |||||||||
For the fiscal year ended April 30, 2011, in-kind transactions associated with creations and redemptions were as follows:
| Securities Received | Securities Delivered | ||||||||||
| Dynamic Banking Portfolio | $ | 33,386,598 | $ | 34,574,310 | |||||||
| Dynamic Biotechnology & Genome Portfolio | 72,031,026 | 102,286,736 | |||||||||
| Dynamic Building & Construction Portfolio | 34,928,543 | 47,873,123 | |||||||||
| Dynamic Energy Exploration & Production Portfolio | 102,124,037 | 73,685,729 | |||||||||
| Dynamic Food & Beverage Portfolio | 125,144,250 | 129,682,057 | |||||||||
| Dynamic Insurance Portfolio | 17,172,112 | 27,165,084 | |||||||||
| Dynamic Leisure and Entertainment Portfolio | 68,987,321 | 79,948,244 | |||||||||
| Dynamic Media Portfolio | 131,984,365 | 109,447,887 | |||||||||
| Dynamic Networking Portfolio | 193,501,077 | 96,646,602 | |||||||||
| Dynamic Oil & Gas Services Portfolio | 185,558,088 | 143,582,672 | |||||||||
| Dynamic Pharmaceuticals Portfolio | 51,904,996 | 43,402,632 | |||||||||
| Dynamic Retail Portfolio | 22,467,149 | 34,779,437 | |||||||||
| Dynamic Semiconductors Portfolio | 41,514,579 | 34,564,148 | |||||||||
| Dynamic Software Portfolio | 76,340,789 | 71,666,861 | |||||||||
Gains and (losses) on in-kind transactions are generally not considered taxable gains and (losses) for Federal income tax purposes.
75
Notes to Financial Statements (Continued)
PowerShares Exchange-Traded Fund Trust
April 30, 2011
At April 30, 2011, the aggregate cost and the net unrealized appreciation (depreciation) of investments for tax purposes were as follows:
| Cost | Net Unrealized Appreciation (Depreciation) | Gross Unrealized Appreciation | Gross Unrealized (Depreciation) | ||||||||||||||||
| Dynamic Banking Portfolio | $ | 20,604,954 | $ | (377,015 | ) | $ | 373,733 | $ | (750,748 | ) | |||||||||
| Dynamic Biotechnology & Genome Portfolio | 175,470,915 | 42,295,533 | 46,669,313 | (4,373,780 | ) | ||||||||||||||
| Dynamic Building & Construction Portfolio | 34,364,576 | 5,907,463 | 6,207,510 | (300,047 | ) | ||||||||||||||
| Dynamic Energy Exploration & Production Portfolio | 95,176,365 | 23,934,997 | 24,235,276 | (300,279 | ) | ||||||||||||||
| Dynamic Food & Beverage Portfolio | 82,359,660 | 9,554,975 | 9,884,649 | (329,674 | ) | ||||||||||||||
| Dynamic Insurance Portfolio | 8,529,317 | 993,753 | 1,104,235 | (110,482 | ) | ||||||||||||||
| Dynamic Leisure and Entertainment Portfolio | 54,910,644 | 6,079,447 | 6,769,598 | (690,151 | ) | ||||||||||||||
| Dynamic Media Portfolio | 137,714,464 | 19,272,047 | 21,781,622 | (2,509,575 | ) | ||||||||||||||
| Dynamic Networking Portfolio | 154,784,430 | 17,648,282 | 20,644,434 | (2,996,152 | ) | ||||||||||||||
| Dynamic Oil & Gas Services Portfolio | 239,579,559 | 70,473,263 | 71,185,867 | (712,604 | ) | ||||||||||||||
| Dynamic Pharmaceuticals Portfolio | 78,212,294 | 9,446,304 | 13,174,690 | (3,728,386 | ) | ||||||||||||||
| Dynamic Retail Portfolio | 11,776,942 | 1,420,128 | 1,491,872 | (71,744 | ) | ||||||||||||||
| Dynamic Semiconductors Portfolio | 35,770,014 | 7,061,163 | 7,461,121 | (399,958 | ) | ||||||||||||||
| Dynamic Software Portfolio | 72,197,742 | 11,674,342 | 12,682,524 | (1,008,182 | ) | ||||||||||||||
Note 7. Reclassification of Permanent Differences
Primarily as a result of differing book/tax treatment of investment activity, on April 30, 2011, amounts were reclassified between undistributed net investment income (loss), undistributed net realized gain (loss) and Shares of beneficial interest. These reclassifications had no effect on the net assets of each Fund. For the fiscal year ended April 30, 2011, the reclassifications were as follows:
| Undistributed Net Investment Income (Loss) | Undistributed Net Realized Gain (Loss) | Shares of Beneficial Interest | |||||||||||||
| Dynamic Banking Portfolio | $ | 30,629 | $ | (2,504,277 | ) | $ | 2,473,648 | ||||||||
| Dynamic Biotechnology & Genome Portfolio | 423,524 | (22,961,653 | ) | 22,538,129 | |||||||||||
| Dynamic Building & Construction Portfolio | (97,010 | ) | (6,082,148 | ) | 6,179,158 | ||||||||||
| Dynamic Energy Exploration & Production Portfolio | 130,561 | (15,623,794 | ) | 15,493,233 | |||||||||||
| Dynamic Food & Beverage Portfolio | (95,051 | ) | (17,248,736 | ) | 17,343,787 | ||||||||||
| Dynamic Insurance Portfolio | (17,332 | ) | (2,590,913 | ) | 2,608,245 | ||||||||||
| Dynamic Leisure and Entertainment Portfolio | (181,536 | ) | (11,068,487 | ) | 11,250,023 | ||||||||||
| Dynamic Media Portfolio | 54,203 | (11,717,810 | ) | 11,663,607 | |||||||||||
| Dynamic Networking Portfolio | 308,895 | (24,454,426 | ) | 24,145,531 | |||||||||||
| Dynamic Oil & Gas Services Portfolio | (86,222 | ) | (43,232,021 | ) | 43,318,243 | ||||||||||
| Dynamic Pharmaceuticals Portfolio | 28,877 | (10,752,912 | ) | 10,724,035 | |||||||||||
76
Notes to Financial Statements (Continued)
PowerShares Exchange-Traded Fund Trust
April 30, 2011
| Undistributed Net Investment Income (Loss) | Undistributed Net Realized Gain (Loss) | Shares of Beneficial Interest | |||||||||||||
| Dynamic Retail Portfolio | $ | (93,007 | ) | $ | (1,318,908 | ) | $ | 1,411,915 | |||||||
| Dynamic Semiconductors Portfolio | (270 | ) | (5,161,975 | ) | 5,162,245 | ||||||||||
| Dynamic Software Portfolio | 153,163 | (11,853,889 | ) | 11,700,726 | |||||||||||
Note 8. Trustees' Fees
The Fund compensates each Trustee who is not an "interested person" as defined in the 1940 Act (an "Independent Trustee"). The Non-Independent Trustees of the Trust do not receive any Trustees' fees.
The Trust has adopted a deferred compensation plan (the "Plan"). Under the Plan, an Independent Trustee who has executed a Deferred Fee Agreement (a "Participating Trustee") may defer receipt of all or a portion of his compensation ("Deferral Fees"). Such Deferral Fees are deemed to be invested in select PowerShares Funds. The Deferral Fees payable to the Participating Trustee are valued as of the date such Fees would have been paid to the Participating Trustee. The value increases with contributions or with increases in the value of the Shares selected, and the value decreases with distributions or with declines in the value of the Shares selected.
Note 9. Capital
Shares are created and redeemed by the Trust only in Creation Unit size aggregations of 50,000 Shares. Only Authorized Participants are permitted to purchase or redeem Creation Units from the Funds. Such transactions are generally permitted on an in-kind basis, with a balancing cash component to equate the transaction to the NAV per Share of each Fund of the Trust on the transaction date. Cash may be substituted equivalent to the value of certain securities generally when they are not available in sufficient quantity for delivery, not eligible for trading by the Authorized Participant or as a result of other market circumstances.
Note 10. Indemnifications
Under the Trust's organizational documents, its officers and Trustees are indemnified against certain liabilities arising out of the performance of their duties to the Trust. Each Independent Trustee is also indemnified against certain liabilities arising out of the performance of his duties to the Trust pursuant to an Indemnification Agreement between the Independent Trustee and the Trust. Additionally, in the normal course of business, the Trust enters into contracts with service providers that contain general indemnification clauses. The Trust's maximum exposure under these arrangements is unknown, as this would involve future claims that may be made against the Trust that have not yet occurred. However, based on experience, the Trust believes the risk of loss to be remote.
77
Report of Independent Registered Public Accounting Firm
To the Board of Trustees and Shareholders of PowerShares Exchange-Traded Fund Trust:
In our opinion, the accompanying statements of assets and liabilities, including the schedules of investments, and the related statements of operations and of changes in net assets and the financial highlights present fairly, in all material respects, the financial position of each of the portfolios indicated in Note 1 of the financial statements (each a portfolio of PowerShares Exchange-Traded Fund Trust, hereafter referred to as the "Trust") at April 30, 2011, and the results of each of their operations, the changes in each of their net assets, and the financial highlights for each of the periods presented, in conformity with accounting principles generally accepted in the United States of America. These financial statements and financial highlights (hereafter referred to as "financial statements") are the responsibility of the Trust's management; our responsibility is to express an opinion on these financial statements based on our audits. We conducted our audits of these financial statements in accordance with the standards of the Public Company Accounting Oversight Board (United States). Those standards require that we plan and perform the audit to obtain reasonable assurance about whether the financial statements are free of material misstatement. An audit includes examining, on a test basis, evidence supporting the amounts and disclosures in the financial statements, assessing the accounting principles used and significant estimates made by management, and evaluating the overall financial statement presentation. We believe that our audits, which included confirmation of securities at April 30, 2011 by correspondence with the custodian and brokers, and the application of alternative auditing procedures where securities purchased had not been received, provide a reasonable basis for our opinion.
/s/ PricewaterhouseCoopers LLP
New York, New York
June 24, 2011
78
Tax Information
Form 1099-DIV, Form 1042-S and other year-end tax information provide shareholders with actual calendar year amounts that should be included in their tax returns. Shareholders should consult their tax advisers.
The following distribution information is being provided as required by the Internal Revenue Code or to meet a specific state's requirement.
Each Fund designates the following amounts or, if subsequently determined to be different, the maximum amount allowable for its fiscal year ended April 30, 2011:
Federal Income Tax Information
| Qualified dividend income* | Corporate dividends- received deduction* | ||||||||||
| Dynamic Banking Portfolio | 100 | % | 100 | % | |||||||
| Dynamic Biotechnology & Genome Portfolio | 0 | % | 0 | % | |||||||
| Dynamic Building & Construction Portfolio | 100 | % | 100 | % | |||||||
| Dynamic Energy Exploration & Production Portfolio | 100 | % | 100 | % | |||||||
| Dynamic Food & Beverage Portfolio | 100 | % | 100 | % | |||||||
| Dynamic Insurance Portfolio | 100 | % | 100 | % | |||||||
| Dynamic Leisure and Entertainment Portfolio | 100 | % | 100 | % | |||||||
| Dynamic Media Portfolio | 100 | % | 100 | % | |||||||
| Dynamic Networking Portfolio | 0 | % | 0 | % | |||||||
| Dynamic Oil & Gas Services Portfolio | 100 | % | 100 | % | |||||||
| Dynamic Pharmaceuticals Portfolio | 100 | % | 100 | % | |||||||
| Dynamic Retail Portfolio | 100 | % | 100 | % | |||||||
| Dynamic Semiconductors Portfolio | 100 | % | 100 | % | |||||||
| Dynamic Software Portfolio | 0 | % | 0 | % | |||||||
* The above percentages are based on ordinary income dividends paid to shareholders during the Fund's fiscal year.
79
Supplemental Information
Trustees and Officers
The Independent Trustees, the Trustees who are affiliated with the Adviser (the "Non-Independent Trustees") and the executive officers of the Trust, their term of office and length of time served, their principal business occupations during at least the past five years, the number of portfolios in the Fund Complex overseen by each Trustee and the other directorships, if any, held by a Trustee, are shown below.
The Trustees and Officers information is current as of April 30, 2011.
| Name, Address and Age of Independent Trustees | Position(s) Held with Trust | Term of Office and Length of Time Served* | Principal Occupation(s) During Past 5 Years | Number of Portfolios in Fund Complex** Overseen by Independent Trustees | Other Directorships Held by Independent Trustees | ||||||||||||||||||
| Ronn R. Bagge (53) c/o Invesco PowerShares Capital Management LLC 301 West Roosevelt Road Wheaton, IL 60187 | Trustee | Since 2003 | Founder and Principal, YQA Capital Management LLC (1998-Present); formerly Owner/CEO of Electronic Dynamic Balancing Co., Inc. (high-speed rotating equipment service provider) | 107 | None | ||||||||||||||||||
| Todd J. Barre (53) c/o Invesco PowerShares Capital Management LLC 301 West Roosevelt Road Wheaton, IL 60187 | Trustee | Since 2010 | Assistant Professor of Business, Trinity Christian College (2010-Present); formerly Vice President and Senior Investment Strategist (2001-2008); Director of Open Architecture and Trading (2007-2008); Head of Fundamental Research (2004-2007); and Vice President and Senior Fixed Income Strategist (1994-2001). BMO Financial Group/Harris Private Bank | 107 | None | ||||||||||||||||||
* This is the date the Trustee began serving the Trust. Each Trustee serves an indefinite term, until his successor is elected.
** Fund Complex includes all open-end funds (including all of their portfolios) advised by the Adviser. At April 30, 2011, the Fund Complex consisted of the Trust's 56 portfolios and three other exchange-traded fund trusts with 51 portfolios advised by the Adviser.
80
Supplemental Information (Continued)
Trustees and Officers (Continued)
| Name, Address and Age of Independent Trustees | Position(s) Held with Trust | Term of Office and Length of Time Served* | Principal Occupation(s) During Past 5 Years | Number of Portfolios in Fund Complex** Overseen by Independent Trustees | Other Directorships Held by Independent Trustees | ||||||||||||||||||
| Marc M. Kole (50) c/o Invesco PowerShares Capital Management LLC 301 West Roosevelt Road Wheaton, IL 60187 | Trustee | Since 2006 | Chief Financial Officer, Hope Network (social services) (2008-Present); formerly Assistant Vice President and Controller, Priority Health (health insurance) (2005-2008); Senior Vice President of Finance, United Healthcare (2004-2005); Senior Vice President of Finance, Oxford Health Plans (2000-2004) | 107 | None | ||||||||||||||||||
| Philip M. Nussbaum (49) c/o Invesco PowerShares Capital Management LLC 301 West Roosevelt Road Wheaton, IL 60187 | Trustee | Since 2003 | Chairman, Performance Trust Capital Partners (2004-Present) | 107 | None | ||||||||||||||||||
* This is the date the Trustee began serving the Trust. Each Trustee serves an indefinite term, until his successor is elected.
** Fund Complex includes all open-end funds (including all of their portfolios) advised by the Adviser. At April 30, 2011, the Fund Complex consisted of the Trust's 56 portfolios and three other exchange-traded fund trusts with 51 portfolios advised by the Adviser.
81
Supplemental Information (Continued)
Trustees and Officers (Continued)
| Name, Address and Age of Independent Trustees | Position(s) Held with Trust | Term of Office and Length of Time Served* | Principal Occupation(s) During Past 5 Years | Number of Portfolios in Fund Complex** Overseen by Independent Trustees | Other Directorships Held by Independent Trustees | ||||||||||||||||||
| Donald H. Wilson (51) c/o Invesco PowerShares Capital Management LLC 301 West Roosevelt Road Wheaton, IL 60187 | Trustee | Since 2006 | Chairman and Chief Executive Officer, Stone Pillar Advisers, Ltd. (2010-Present); formerly Chief Operating Officer, AMCORE Financial, Inc. (bank holding company) (2007-2009); Executive Vice President and Chief Financial Officer, AMCORE Financial, Inc. (2006-2007); Senior Vice President and Treasurer, Marshall & Ilsley Corp. (bank holding company) (1995-2006) | 107 | None | ||||||||||||||||||
* This is the date the Trustee began serving the Trust. Each Trustee serves an indefinite term, until his successor is elected.
** Fund Complex includes all open-end funds (including all of their portfolios) advised by the Adviser. At April 30, 2011, the Fund Complex consisted of the Trust's 56 portfolios and three other exchange-traded fund trusts with 51 portfolios advised by the Adviser.
82
Supplemental Information (Continued)
Trustees and Officers (Continued)
| Name, Address and Age of Interested Trustees | Position(s) Held with Trust | Term of Office and Length of Time Served* | Principal Occupation(s) During Past 5 Years | Number of Portfolios in Fund Complex** Overseen by Interested Trustees | Other Directorships Held by Interested Trustees | ||||||||||||||||||
| H. Bruce Bond (47) Invesco PowerShares Capital Management LLC 301 West Roosevelt Road Wheaton, IL 60187 | Chairman of the Board and Trustee | Since 2003 | Chairman, Invesco Power-Shares Capital Management LLC (2009-Present); formerly Managing Director, Invesco PowerShares Capital Management LLC (2002-2009); Manager, Nuveen Investments (1998-2002) | 107 | None | ||||||||||||||||||
* This is the date the Trustee began serving the Trust. Each Trustee serves an indefinite term, until his successor is elected.
** Fund Complex includes all open-end funds (including all of their portfolios) advised by the Adviser. At April 30, 2011, the Fund Complex consisted of the Trust's 56 portfolios and three other exchange-traded fund trusts with 51 portfolios advised by the Adviser.
83
Supplemental Information (Continued)
Trustees and Officers (Continued)
| Name, Address and Age of Interested Trustees | Position(s) Held with Trust | Term of Office and Length of Time Served* | Principal Occupation(s) During Past 5 Years | Number of Portfolios in Fund Complex** Overseen by Interested Trustees | Other Directorships Held by Interested Trustees | ||||||||||||||||||
| Kevin M. Carome (54) Invesco Ltd. Two Peachtree Pointe 1555 Peachtree St., N.E. Suite 1800 Atlanta, GA 30309 | Trustee | Since 2010 | Senior Managing Director and General Counsel, Invesco Ltd. (2006-Present); formerly Senior Vice President and General Counsel, Invesco Advisors, Inc. (2003-2005); Senior Vice President and General Counsel, Liberty Financial Companies, Inc. (2000-2001); General Counsel of certain investment management subsidiaries of Liberty Financial Companies, Inc. (1998-2000); Associate General Counsel, Liberty Financial Companies, Inc. (1993-1998); Associate, Ropes & Gray LLP | 107 | None | ||||||||||||||||||
* This is the date the Trustee began serving the Trust. Each Trustee serves an indefinite term, until his successor is elected.
** Fund Complex includes all open-end funds (including all of their portfolios) advised by the Adviser. At April 30, 2011, the Fund Complex consisted of the Trust's 56 portfolios and three other exchange-traded fund trusts with 51 portfolios advised by the Adviser.
84
Supplemental Information (Continued)
Trustees and Officers (Continued)
| Name, Address and Age of Executive Officer | Position(s) Held with Trust | Length of Time Served* | Principal Occupation(s) During Past 5 Years | ||||||||||||
| Andrew Schlossberg (36) Invesco Management Group, Inc. 11 Greenway Plaza Suite 100 Houston, TX 77046 | President | Since 2009 | Managing Director, U.S. head of business strategy and chief marketing officer for Invesco Ltd. in the United States (2008-Present); formerly Mr. Schlossberg served in multiple roles within Invesco, including head of corporate development, as well as global leadership roles in strategy and product development in the company's North American Institutional and Retirement divisions (2002-2007) | ||||||||||||
| Bruce T. Duncan (56) Invesco PowerShares Capital Management LLC 301 West Roosevelt Road Wheaton, IL 60187 | Treasurer and Secretary | Treasurer since 2006 and Secretary since 2008 | Senior Vice President of Finance, Invesco PowerShares Capital Management LLC (2005-Present); formerly Private Practice Attorney (2000-2005); Vice President of Investor Relations. The ServiceMaster Company (1994-2000); Vice President of Taxes, The ServiceMaster Company (1990-2000) | ||||||||||||
| Benjamin Fulton (49) Invesco PowerShares Capital Management LLC 301 West Roosevelt Road Wheaton, IL 60187 | Vice President | Since 2009 | Executive Vice President – Global Product Development, Invesco PowerShares Capital Management LLC (2005-Present); formerly principal of Clermont Consulting, a consulting firm focused on the creation and development of retail investment products (2003-2005); President and a founding partner of Claymore Securities, a financial services firm in the Chicagoland area (2001-2003); Managing Director of Structured Investments at Nuveen Investments (1998-2001) | ||||||||||||
| Peter Hubbard (29) Invesco PowerShares Capital Management LLC 301 West Roosevelt Road Wheaton, IL 60187 | Vice President | Since 2009 | Vice President and Director of Portfolio Management – Invesco PowerShares Capital Management LLC (2008- Present); formerly Portfolio Manager, Invesco PowerShares Capital Management LLC (2007-2008); Research Analyst, Invesco PowerShares Capital Management LLC (2005-2007); Research Analyst and Trader, Ritchie Capital, a hedge fund operator (2003-2005) | ||||||||||||
* This is the date the Officer began serving the Trust. Each Officer serves a one-year term, until his successor is elected.
85
Supplemental Information (Continued)
Trustees and Officers (Continued)
| Name, Address and Age of Executive Officer | Position(s) Held with Trust | Length of Time Served* | Principal Occupation(s) During Past 5 Years | ||||||||||||
| David Warren (53) Invesco Trimark Ltd. 5140 Yonge Street Suite 900 Toronto, Ontario M2N 6X7 | Vice President | Since 2009 | Director, Executive Vice President and Chief Financial Officer, Invesco Trimark Ltd. and Chief Administrative Officer, North American Retail, Invesco Ltd. (2007-Present); formerly Director, Executive Vice President and Chief Financial Officer, Invesco Trimark Ltd. (2000-2006) | ||||||||||||
| Todd Spillane (51) Invesco Management Group, Inc. 11 Greenway Plaza Suite 100 Houston, TX 77046 | Chief Compliance Officer | Since 2010 | Senior Vice President, Invesco Management Group, Inc.; Chief Compliance Officer, INVESCO Private Capital Investments, Inc. (holding company), Invesco Private Capital, Inc. (registered investment adviser) and Invesco Senior Secured Management, Inc. (registered investment adviser); Chief Compliance Officer and Senior Vice President, Invesco Advisers, Inc. (formerly Invesco Institutional (N.A.), Inc. – registered investment adviser) and Vice President, Invesco Distributors, Inc. and Invesco Investment Services, Inc.; formerly Chief Compliance Officer, Invesco Global Asset Management (N.A.), Inc. – (registered investment adviser) and Invesco Advisers, Inc. (formerly Invesco Institutional (N.A.), Inc.) (registered investment adviser); Senior Vice President and Chief Compliance Officer, Invesco Advisors, Inc., Invesco Capital Management, Inc. and Invesco Private Asset Management, Inc.; Vice President, Invesco Capital Management, Inc. and Fund Management Company | ||||||||||||
Availability of Additional Information About the Trustees
The Statement of Additional Information includes additional information about the Trustees and is available, without charge, upon request at (800) 983-0903.
* This is the date the Officer began serving the Trust. Each Officer serves a one-year term, until his successor is elected.
86
Board Considerations Regarding Continuation of Investment Advisory Agreement
At a meeting held on April 14, 2011, the Board of Trustees of the PowerShares Exchange-Traded Fund Trust (the "Trust"), including the Independent Trustees, unanimously approved the continuation of the Investment Advisory Agreement between Invesco PowerShares Capital Management LLC (the "Adviser") and the Trust for the following 54 series (each, a "Fund" and collectively, the "Funds"):
PowerShares Dynamic Market Portfolio
PowerShares Dynamic OTC Portfolio
PowerShares Golden Dragon Halter USX China Portfolio
PowerShares High Yield Equity Dividend AchieversTM Portfolio
PowerShares WilderHill Clean Energy Portfolio
PowerShares Dynamic Large Cap Growth Portfolio
PowerShares Dynamic Large Cap Value Portfolio
PowerShares Dynamic Mid Cap Growth Portfolio
PowerShares Dynamic Mid Cap Value Portfolio
PowerShares Dynamic Small Cap Growth Portfolio
PowerShares Dynamic Small Cap Value Portfolio
PowerShares Dynamic Biotechnology & Genome Portfolio
PowerShares Dynamic Food & Beverage Portfolio
PowerShares Dynamic Leisure and Entertainment Portfolio
PowerShares Dynamic Media Portfolio
PowerShares Dynamic Networking Portfolio
PowerShares Dynamic Pharmaceuticals Portfolio
PowerShares Dynamic Semiconductors Portfolio
PowerShares Dynamic Software Portfolio
PowerShares Zacks Micro Cap Portfolio
PowerShares Aerospace & Defense Portfolio
PowerShares Morningstar StockInvestor Core Portfolio
PowerShares Dividend AchieversTM Portfolio
PowerShares International Dividend AchieversTM Portfolio
PowerShares Dynamic Building and Construction Portfolio
PowerShares Dynamic Energy Exploration and Production Portfolio
PowerShares WilderHill Progressive Energy Portfolio
PowerShares Dynamic Insurance Portfolio
PowerShares Dynamic Oil and Gas Services Portfolio
PowerShares Dynamic Retail Portfolio
PowerShares Dynamic Utilities Portfolio
PowerShares Lux Nanotech Portfolio
PowerShares FTSE RAFI US 1000 Portfolio
PowerShares FTSE RAFI US 1500 Small-Mid Portfolio
PowerShares Water Resources Portfolio
PowerShares Dynamic Energy Sector Portfolio
PowerShares Dynamic Financial Sector Portfolio
PowerShares Dynamic Healthcare Sector Portfolio
PowerShares Dynamic Industrials Sector Portfolio
PowerShares Dynamic Large Cap Portfolio
PowerShares Dynamic MagniQuant Portfolio
PowerShares Dynamic Mid Cap Portfolio
PowerShares Dynamic Small Cap Portfolio
PowerShares Dynamic Technology Sector Portfolio
PowerShares Buyback AchieversTM Portfolio
PowerShares CleantechTM Portfolio
PowerShares Dynamic Banking Portfolio
PowerShares Dynamic Basic Materials Sector Portfolio
PowerShares Dynamic Consumer Discretionary Sector Portfolio
PowerShares Dynamic Consumer Staples Sector Portfolio
PowerShares Financial Preferred Portfolio
PowerShares Global Listed Private Equity Portfolio
PowerShares DWA Technical LeadersTM Portfolio
PowerShares S&P 500® High Quality Portfolio
The Trustees reviewed information from the Adviser describing: (i) the nature, extent and quality of services provided, (ii) the investment performance of the Funds and the Adviser, (iii) the costs of services provided and estimated profits realized by the Adviser, (iv) the extent to which economies of scale are
87
Board Considerations Regarding Continuation of Investment Advisory Agreement (Continued)
realized as the Funds grow, (v) whether fee levels reflect any possible economies of scale for the benefit of Fund shareholders, (vi) comparisons of services rendered and amounts paid to other registered investment companies and (vii) any benefits realized by the Adviser from its relationship with each Fund. Based on all of the information considered and the conclusions reached, the Board, including the Independent Trustees, determined to approve the continuation of the Investment Advisory Agreement for each Fund. No single factor was determinative in the Board's analysis.
Nature, Extent and Quality of Services. In evaluating the nature, extent and quality of the Adviser's services, the Trustees reviewed information concerning the functions performed by the Adviser for the Funds, information describing the Adviser's current organization and projected staffing, including operations assistance provided by the Adviser's parent organization, Invesco Ltd., and the background and experience of the persons responsible for the day-to-day management of the Funds. The Trustees reviewed matters related to the Adviser's execution of portfolio transactions on behalf of the Funds. The Trustees also reviewed information on the performance of the Funds and the performance of their underlying indices through December 31, 2010, including reports on the correlation and tracking error between the underlying index and each Fund's performance, as well as the Adviser's analysis of the tracking error between each Fund and its underlying index. The Trustees noted that, in each case, the correlation and tracking error for each Fund was within the targeted range set forth in the Trust's registration statement. The Trustees concluded that each Fund was correlated to its underlying index and that the tracking error for each Fund was within an acceptable range given that Fund's particular circumstances.
The Trustees also considered the services provided by the Adviser in its oversight of the Funds' administrator, custodian and transfer agent. They noted the significant amount of time and effort that had been devoted to this oversight function.
Based on their review, the Trustees concluded that the nature, extent and quality of services provided by the Adviser to the Funds under the Investment Advisory Agreement were appropriate and reasonable.
Fees, Expenses and Profitability. The Trustees reviewed and discussed the information provided by the Adviser on each Fund's expense ratio and advisory fee, as compared to information compiled by the Adviser from Lipper Inc. databases on the expense ratios of comparable exchange-traded funds ("ETFs"), open-end (non-ETF) index funds and open-end actively-managed funds. The Trustees noted that the annual advisory fee charged to each Fund is:
• 0.50% of the Fund's average net assets, for each Fund other than PowerShares High Yield Equity Dividend AchieversTM Portfolio, PowerShares Dividend AchieversTM Portfolio, PowerShares International Dividend AchieversTM Portfolio, PowerShares FTSE RAFI US 1000 Portfolio and PowerShares FTSE RAFI US 1500 Small-Mid Portfolio;
• 0.40% of the Fund's average net assets, for each of PowerShares High Yield Equity Dividend AchieversTM Portfolio, PowerShares Dividend AchieversTM Portfolio and PowerShares International Dividend AchieversTM Portfolio; and
• 0.29% of the Fund's average net assets, for each of PowerShares FTSE RAFI US 1000 Portfolio and PowerShares FTSE RAFI US 1500 Small-Mid Portfolio.
88
Board Considerations Regarding Continuation of Investment Advisory Agreement (Continued)
The Trustees also noted that the Adviser has agreed to waive a portion of its advisory fee and/or pay expenses (an "Expense Cap") to the extent necessary to prevent the annual operating expenses of each Fund from exceeding the percentage of that Fund's average daily net assets, at least until August 31, 2012, as set forth below:
• 0.60%, excluding interest expenses, brokerage commissions and other trading expenses, taxes and extraordinary expenses, for each of PowerShares Dynamic OTC Portfolio and PowerShares Dynamic Market Portfolio;
• 0.50%, excluding interest expenses, licensing fees, offering costs, brokerage commissions and other trading expenses, taxes and extraordinary expenses, for each of PowerShares High Yield Equity Dividend AchieversTM Portfolio, PowerShares Dividend AchieversTM Portfolio and PowerShares International Dividend AchieversTM Portfolio;
• 0.50%, excluding interest expenses, offering costs, brokerage commissions and other trading expenses, taxes and extraordinary expenses, for each of PowerShares Morningstar StockInvestor Core Portfolio and PowerShares S&P 500® High Quality Portfolio (the Trustees noted that the Expense Cap for each of these Funds was reduced to 0.50% effective July 1, 2010);
• 0.39%, excluding interest expenses, offering costs, brokerage commissions and other trading expenses, taxes and extraordinary expenses, for each of PowerShares FTSE RAFI US 1000 Portfolio and PowerShares FTSE RAFI US 1500 Small-Mid Portfolio; and
• 0.60%, excluding interest expenses, licensing fees, offering costs, brokerage commissions and other trading expenses, taxes and extraordinary expenses, for each other Fund.
The Trustees noted that the Adviser represented that it does not provide investment advisory services to any clients other than the Funds and other ETFs overseen by the Board. The Trustees noted that each Fund's advisory fee was:
• higher than the median advisory fee of its ETF peer funds (except for the advisory fee of each of PowerShares Financial Preferred Portfolio, PowerShares FTSE RAFI US 1000 Portfolio, PowerShares Global Listed Private Equity Portfolio and PowerShares Golden Dragon Halter USX China Portfolio, which was equal to or lower than the median advisory fee of its ETF peer funds); and
• higher than the median advisory fee of its open-end index peer funds (except for the advisory fee of each of PowerShares DWA Technical LeadersTM Portfolio, PowerShares Dynamic Banking Portfolio, PowerShares Dynamic Basic Materials Sector Portfolio, PowerShares Dynamic Biotechnology & Genome Portfolio, PowerShares Dynamic Financial Sector Portfolio, PowerShares Dynamic Healthcare Portfolio, PowerShares Dynamic Insurance Portfolio, PowerShares Dynamic Mid Cap Growth Portfolio, PowerShares Dynamic Networking Portfolio, PowerShares Dynamic OTC Portfolio, PowerShares Dynamic Pharmaceuticals Portfolio, PowerShares Dynamic Semiconductors Portfolio, PowerShares Dynamic Small Cap Growth Portfolio, PowerShares Dynamic Software Portfolio, PowerShares Dynamic Technology Sector Portfolio, PowerShares Golden Dragon Halter USX China Portfolio, PowerShares Lux Nanotech Portfolio, PowerShares Morningstar StockInvestor Core Portfolio and PowerShares S&P 500® High Quality Portfolio, which was equal to or lower than
89
Board Considerations Regarding Continuation of Investment Advisory Agreement (Continued)
the median advisory fee of its open-end index peer funds, and there was no comparable data for PowerShares Financial Preferred Portfolio or PowerShares Global Listed Private Equity Portfolio); but
• lower than the median advisory fee of its open-end actively-managed peer funds.
The Trustees determined that the advisory fees were reasonable, noting the complexity of the indices, which generally require more frequent rebalancing of the portfolios, the distinguishing factors of the Funds, and the higher administrative, operational and management oversight costs for the Adviser. With respect to the Funds' expense ratios, the Trustees noted that the net expense ratio for each Fund was:
• higher than the median expense ratio of its ETF peer funds (except for the net expense ratio of each of PowerShares Dynamic Market Portfolio, PowerShares Dynamic OTC Portfolio, PowerShares FTSE RAFI US 1000 Portfolio, PowerShares Golden Dragon Halter USX China Portfolio and PowerShares S&P 500® High Quality Portfolio, which was equal to or less than the median expense ratio of its ETF peer funds); and
• higher than the median expense ratio of its open-end index peer funds (except for the net expense ratio of each of PowerShares Aerospace & Defense Portfolio, PowerShares CleantechTM Portfolio, PowerShares DWA Technical LeadersTM Portfolio, PowerShares Dynamic Banking Portfolio, PowerShares Dynamic Basic Materials Sector Portfolio, PowerShares Dynamic Biotechnology & Genome Portfolio, PowerShares Dynamic Building & Construction Portfolio, PowerShares Dynamic Consumer Discretionary Sector Portfolio, PowerShares Dynamic Consumer Staples Sector Portfolio, PowerShares Dynamic Financial Sector Portfolio, PowerShares Dynamic Food & Beverage Portfolio, PowerShares Dynamic Healthcare Portfolio, PowerShares Dynamic Industrials Sector Portfolio, PowerShares Dynamic Insurance Portfolio, PowerShares Dynamic Large Cap Portfolio, PowerShares Dynamic Large Cap Growth Portfolio, PowerShares Dynamic Leisure and Entertainment Portfolio, PowerShares Dynamic Media Portfolio, PowerShares Dynamic Mid Cap Growth Portfolio, PowerShares Morningstar StockInvestor Core Portfolio, PowerShares Dynamic Networking Portfolio, PowerShares Dynamic OTC Portfolio, PowerShares Dynamic Pharmaceuticals Portfolio, PowerShares Dynamic Retail Portfolio, PowerShares Dynamic Semiconductors Portfolio, PowerShares Dynamic Small Cap Growth Portfolio, PowerShares Dynamic Small Cap Value Portfolio, PowerShares Dynamic Software Portfolio, PowerShares Dynamic Technology Sector Portfolio, PowerShares Dynamic Utilities Sector Portfolio, PowerShares FTSE RAFI US 1000 Portfolio, PowerShares FTSE RAFI US 1500 Small-Mid Portfolio, PowerShares Golden Dragon Halter USX China Portfolio, PowerShares Lux Nanotech Portfolio and PowerShares S&P 500® High Quality Portfolio, which was equal to or lower than the median expense ratio of its open-end index peer funds, and there was no comparable data for PowerShares Financial Preferred Portfolio or PowerShares Global Listed Private Equity Portfolio); but
• lower than the median expense ratio of its open-end actively-managed peer funds.
The Trustees noted that a significant component of the non-advisory fee expenses was the license fees paid by the Funds, and those Funds for which license fees are included in the Funds' Expense Caps.
The Board concluded that the advisory fee and expense ratio of each Fund (giving effect to the Fund's Expense Cap) were reasonable and appropriate in light of the services provided.
90
Board Considerations Regarding Continuation of Investment Advisory Agreement (Continued)
In conjunction with their review of fees, the Trustees also considered information provided by the Adviser on the revenues received by the Adviser under the Investment Advisory Agreement for each Fund, as well as the fees waived and expenses reimbursed by the Adviser for the Funds. The Trustees reviewed information provided by the Adviser on its profitability as well as any profits or losses realized by the Adviser from its relationship to each Fund. The Trustees concluded that the estimated profitability to the Adviser of the advisory services provided to any of the Funds was not unreasonable.
Also at the April 14, 2011 meeting, the Adviser proposed reducing the annual advisory fee for each of PowerShares Dynamic Large Cap Portfolio, PowerShares Dynamic Mid Cap Growth Portfolio, PowerShares Dynamic Mid Cap Portfolio, PowerShares Dynamic Mid Cap Value Portfolio, PowerShares Dynamic Small Cap Growth Portfolio, PowerShares Dynamic Small Cap Portfolio and PowerShares Dynamic Small Cap Value Portfolio (each, a "Style Fund") effective June 16, 2011. The Adviser also proposed revising each Style Fund's Expense Cap that is in place until August 31, 2012 to further reduce each Style Fund's annual operating expenses effective June 16, 2011. The Board considered the Adviser's representation that there would be no diminution in the quantity or quality of services provided to each Style Fund in connection with the amendment to the Investment Advisory Agreement to reflect the advisory fee changes. The Board concluded for each Style Fund that the reduced advisory fee was appropriate, and determined to approve the amended Investment Advisory Agreement and amended Expense Cap, effective June 16, 2011.
Economies of Scale and Whether Fee Levels Reflect These Economies of Scale. The Trustees reviewed the information provided by the Adviser as to the extent to which economies of scale are realized as each Fund grows and whether fee levels reflect economies of scale for the benefit of shareholders. The Trustees reviewed each Fund's asset size, expense ratio and expense limitation agreed to by the Adviser. The Trustees noted that, for Funds whose expenses are higher than their respective Expense Caps, any reduction in that Fund's expenses would be enjoyed by the Adviser, but that Fund shareholders benefit from the lower expense ratio as a result of the Fund's Expense Cap. The Trustees also noted that the Excess Expense Agreement with the Trust provides that the Adviser is entitled to be reimbursed by each Fund, other than PowerShares Dynamic Market Portfolio and PowerShares Dynamic OTC Portfolio, for fees waived or expenses absorbed pursuant to the Expense Cap for a period of three years from the date the fee or expense was incurred, provided that no reimbursement would be made that would result in a Fund exceeding its Expense Cap. The Trustees considered whether the advisory fee rate for each Fund was reasonable in relation to the asset size of that Fund, and concluded that the flat advisory fee was reasonable and appropriate, noting the Fund expenses the Adviser has borne as a result of the Expense Cap.
The Trustees noted that the Adviser had not identified any further benefits that it derived from its relationship with the Funds and had noted that it does not have any soft-dollar arrangements.
Based on all of the information considered and the conclusions reached, the Board, including the Independent Trustees, determined to approve the continuation of the Investment Advisory Agreement for each Fund. No single factor was determinative in the Board's analysis.
91
This page intentionally left blank
PROXY VOTING POLICIES AND PROCEDURES
A description of the Funds' proxy voting policies and procedures that the Funds use to determine how to vote proxies relating to portfolio securities is available, without charge and upon request, by calling (800) 983-0903. This information is also available on the Securities and Exchange Commission's ("Commission") website at www.sec.gov.
Information regarding how the Funds voted proxies for portfolio securities, if applicable, during the most recent 12-month period ended June 30, is also available, without charge and upon request, by (i) calling (800) 983-0903; or (ii) accessing the Funds' Form N-PX on the Commission's website at www.sec.gov.
QUARTERLY PORTFOLIOS
The Funds file their complete schedules of portfolio holdings with the Commission for the first and third quarters of each fiscal year on Form N-Q. The Funds' Forms N-Q are available on the Commission's website at www.sec.gov. The Funds' Forms N-Q may also be reviewed and copied at the Commission's Public Reference Room in Washington, D.C.; information on the operation of the Public Reference Room may be obtained by calling (800) SEC-0330.


301 West Roosevelt Road
Wheaton, IL 60187
800.983.0903
www.invescopowershares.com
© 2011 Invesco PowerShares Capital Management LLC P-PS-AR-7
Item 2. Code of Ethics.
The Registrant has adopted a Code of Ethics that applies to the Registrant’s principal executive officer and principal financial officer. This Code is filed as an exhibit to this report on Form N-CSR under Item 12(a)(1). No substantive amendments to this Code were made during the reporting period. There were no waivers for the fiscal year ended April 30, 2011.
Item 3. Audit Committee Financial Expert.
The Registrant’s Board of Trustees has determined that the Registrant has three “audit committee financial experts” serving on its audit committee: Mr. Marc M. Kole, Mr. Philip M. Nussbaum, and Mr. Donald H. Wilson. Each of these audit committee members is “independent,” meaning that he is not an “interested person” of the Registrant (as that term is defined in Section 2(a)(19) of the Investment Company Act of 1940) and he does not accept any consulting, advisory, or other compensatory fee from the Registrant (except in the capacity as a Board or committee member).
An “audit committee financial expert” is not an “expert” for any purpose, including for purposes of Section 11 of the Securities Act of 1933, as a result of being designated as an “audit committee financial expert.” Further, the designation of a person as an “audit committee financial expert” does not mean that the person has any greater duties, obligations, or liability than those imposed on the person without the “audit committee financial expert” designation. Similarly, the designation of a person as an “audit committee financial expert” does not affect the duties, obligations, or liability of any other member of the audit committee or board of trustees.
Item 4. Principal Accountant Fees and Services.
PricewaterhouseCoopers LLP (“PwC”) billed the Registrant aggregate fees for services rendered to the Registrant for the last two fiscal years as follows:
|
| Fees Billed by |
| Percentage of |
| Fees Billed by |
| Percentage of |
| ||
|
|
|
|
|
|
|
|
|
| ||
Audit Fees |
| $ | 761,600 |
| N/A |
| $ | 1,054,000 |
| N/A |
|
Audit-Related Fees |
| $ | 0 |
| 0 | % | $ | 0 |
| 0 | % |
Tax Fees(2) |
| $ | 393,015 |
| 0 | % | $ | 542,250 |
| 0 | % |
|
|
|
|
|
|
|
|
|
| ||
All Other Fees |
| $ | 0 |
| 0 | % | $ | 0 |
| 0 | % |
|
|
|
|
|
|
|
|
|
| ||
Total Fees |
| $ | 1,154,615 |
| 0 | % | $ | 1,596,250 |
| 0 | % |
PwC billed the Registrant aggregate fees of $ 393,015 for the fiscal year ended April 30, 2011 and $542,250 for the fiscal year ended April 30, 2010, for non-audit services rendered to the Registrant.
(1) For the provision of non-audit services, the pre-approval requirement is waived pursuant to a de minimis exception if (i) such services were not recognized as non-audit services by the Registrant at the time of engagement, (ii) the aggregate amount of all such services provided is no more than 5% of the aggregate audit and non-audit fees paid by the Registrant during the fiscal year in which the services are provided; and (iii) such services are promptly brought to the attention of the Registrant’s Audit Committee and approved by the Registrant’s Audit Committee prior to the completion of the audit.
(2) Tax fees for the fiscal year ended April 30, 2011 includes fees billed for reviewing tax returns and 2010 excise tax returns and excise tax distribution calculations ..Tax fees for the fiscal year ended April 30, 2010 included fees billed for reviewing tax returns, excise tax returns and excise distribution calculations in addition to preparing the final tax returns for the thirteen liquidating portfolios.
PwC did not bill any fees for non-audit services rendered to the Registrant’s investment adviser (not including any sub-adviser whose role is primarily portfolio management and is subcontracted with or overseen by another investment adviser) or any entity controlling, controlled by or under common control with the Registrant’s investment adviser that provides ongoing services to the Registrant for the fiscal years ended April 30, 2011 and April 30, 2010.
Audit Committee Pre Approval Policies and Procedures
PRE-APPROVAL OF AUDIT AND NON-AUDIT SERVICES
POLICIES AND PROCEDURES
As Adopted by the Audit Committee of
the PowerShares Funds (the “Funds”)
June 26, 2009
Statement of Principles
Under the Sarbanes-Oxley Act of 2002 and rules adopted by the Securities and Exchange Commission (“SEC”) (“Rules”), the Audit Committee of the Funds’ (the “Audit Committee”) Board of Trustees (the “Board”) is responsible for the appointment, compensation and oversight of the work of independent accountants (an “Auditor”). As part of this responsibility and to assure that the Auditor’s independence is not impaired, the Audit Committee pre-approves the audit and non-audit services provided to the Funds by each Auditor, as well as all non-audit services provided by the Auditor to the Funds’ investment adviser and to affiliates of the adviser that provide ongoing services to the Funds (“Service Affiliates”) if the services directly impact the Funds’ operations or financial reporting. The SEC Rules also specify the types of services that an Auditor may not provide to its audit client. The following policies and procedures comply with the requirements for pre-approval and provide a mechanism by which management of the Funds may request and secure pre-approval of audit and non-audit services in an orderly manner with minimal disruption to normal business operations.
Proposed services either may be pre-approved without consideration of specific case-by-case services by the Audit Committee (“general pre-approval”) or require the specific pre-approval of the Audit Committee (“specific pre-approval”). As set forth in these policies and procedures, unless a type of service has received general pre-approval, it will require specific pre-approval by the Audit Committee. Additionally, any fees exceeding 110% of estimated pre-approved fee levels provided at the time the service was pre-approved will also require specific approval by the Audit Committee before payment is made. The Audit Committee will also consider the impact of additional fees on the Auditor’s independence when determining whether to approve any additional fees for previously pre-approved services.
The Audit Committee will annually review and generally pre-approve the services that may be provided by each Auditor without obtaining specific pre-approval from the Audit Committee. The term of any general pre-approval runs from the date of such pre-approval through June 30th of the following year, unless the Audit Committee considers a different period and states otherwise. The Audit Committee will add to or subtract from the list of general pre-approved services from time to time, based on subsequent determinations.
The purpose of these policies and procedures is to set forth the guidelines to assist the Audit Committee in fulfilling its responsibilities.
Delegation
The Chairman of the Audit Committee (or, in his or her absence, any member of the Audit Committee) may grant specific pre-approval for non-prohibited services for engagements of less than $20,000. All such delegated pre-approvals shall be presented to the Audit Committee no later than the next Audit Committee meeting.
Audit Services
The annual audit services engagement terms will be subject to specific pre-approval of the Audit Committee. Audit services include the annual financial statement audit and other procedures such as tax provision work that is required to be performed by the independent auditor to be able to form an opinion on the Funds’ financial statements. The Audit Committee will obtain, review and consider sufficient information concerning the proposed Auditor to make a reasonable evaluation of the Auditor’s qualifications and independence.
In addition to the annual Audit services engagement, the Audit Committee may grant either general or specific pre-approval of other Audit services, which are those services that only the independent auditor reasonably can provide. Other Audit services may include services such as issuing consents for the inclusion of audited financial statements with SEC registration statements, periodic reports and other documents filed with the SEC or other documents issued in connection with securities offerings.
Non-Audit Services
The Audit Committee may provide either general or specific pre-approval of any non-audit services to the Funds and its Service Affiliates if the Audit Committee believes that the provision of the service will not impair the independence of the Auditor, is consistent with the SEC’s Rules on auditor independence, and otherwise conforms to the Audit Committee’s general principles and policies as set forth herein.
Audit-Related Services
“Audit-related services” are assurance and related services that are reasonably related to the performance of the audit or review of the Funds’ financial statements or that are traditionally performed by the independent auditor. Audit-related services include, among others, accounting consultations related to accounting, financial reporting or disclosure matters not classified as “Audit services”; and assistance with understanding and implementing new accounting and financial reporting guidance from rulemaking authorities.
Tax Services
“Tax services” include, but are not limited to, the review and signing of the Funds’ federal tax returns, the review of required distributions by the Funds and consultations regarding tax matters such as the tax treatment of new investments or the impact of new regulations. The Audit Committee will scrutinize carefully the retention of the Auditor in connection with a transaction initially recommended by the Auditor, the major business purpose of which may be tax avoidance or the tax treatment of which may not be supported in the Internal Revenue Code and related regulations. The Audit Committee will consult with the Funds’ Treasurer (or his or her designee) and may consult with outside counsel or advisors as necessary to ensure the consistency of Tax services rendered by the Auditor with the foregoing policy.
No Auditor shall represent any Fund or any Service Affiliate before a tax court, district court or federal court of claims.
Under rules adopted by the Public Company Accounting Oversight Board and approved by the SEC, in connection with seeking Audit Committee pre-approval of permissible Tax services, the Auditor shall:
1. Describe in writing to the Audit Committee, which writing may be in the form of the proposed engagement letter:
a. The scope of the service, the fee structure for the engagement, and any side letter or amendment to the engagement letter, or any other agreement between the Auditor and the Fund, relating to the service; and
b. Any compensation arrangement or other agreement, such as a referral agreement, a referral fee or fee-sharing arrangement, between the Auditor and any person (other than the Fund) with respect to the promoting, marketing, or recommending of a transaction covered by the service;
2. Discuss with the Audit Committee the potential effects of the services on the independence of the Auditor; and
3. Document the substance of its discussion with the Audit Committee.
All Other Auditor Services
The Audit Committee may pre-approve non-audit services classified as “All other services” that are not categorically prohibited by the SEC, as listed in Exhibit 1 to this policy.
Pre-Approval Fee Levels or Established Amounts
Pre-approval of estimated fees or established amounts for services to be provided by the Auditor under general or specific pre-approval policies will be set periodically by the Audit Committee. Any proposed fees exceeding 110% of the maximum estimated pre-approved fees or established amounts for pre-approved audit and non-audit services will be reported to the Audit Committee at the quarterly Audit Committee meeting and will require specific approval by the Audit Committee before payment is made. The Audit Committee will always factor in the overall relationship of fees for audit and non-audit services in determining whether to pre-approve any such services and in determining whether to approve any additional fees exceeding 110% of the maximum pre-approved fees or established amounts for previously pre-approved services.
Procedures
On an annual basis, the Auditor will submit to the Audit Committee for general pre-approval, a list of non-audit services that the Funds or Service Affiliates of the Funds may request from the Auditor. The list will describe the non-audit services in reasonable detail and will include an estimated range of fees and such other information as the Audit Committee may request.
Each request for services to be provided by the Auditor under the general pre-approval of the Audit Committee will be submitted to the Funds’ Treasurer (or his or her designee) and must include a detailed description of the services to be rendered. The Treasurer or his or her designee will ensure that such services are included within the list of services that have received the general pre-approval of the Audit Committee. The Audit Committee will be informed at the next quarterly scheduled Audit Committee meeting of any such services for which the Auditor rendered an invoice and whether such services and fees had been pre-approved and if so, by what means.
Each request to provide services that require specific approval by the Audit Committee shall be submitted to the Audit Committee jointly by the Funds’ Treasurer or his or her designee and the Auditor, and must include a joint statement that, in their view, such request is consistent with the pre-approval policies and procedures and the SEC Rules.
Each request to provide Tax services under either the general or specific pre-approval of the Audit Committee will describe in writing: (i) the scope of the service, the fee structure for the engagement, and any side letter or amendment to the engagement letter, or any other agreement between the Auditor and the audit client, relating to the service; and (ii) any compensation arrangement or other agreement between the Auditor and any person (other than the audit client) with respect to the promoting, marketing, or recommending of a transaction covered by the service. The Auditor will discuss with the Audit Committee the potential effects of the services on the Auditor’s independence and will document the substance of the discussion.
Non-audit services pursuant to the de minimis exception provided by the SEC Rules will be promptly brought to the attention of the Audit Committee for approval, including documentation that each of the conditions for this exception, as set forth in the SEC Rules, has been satisfied.
On at least an annual basis, the Auditor will prepare a summary of all the services provided to any entity in the investment company complex as defined in section 2-01(f)(14) of Regulation S-X in sufficient detail as to the nature of the engagement and the fees associated with those services.
The Audit Committee has designated the Funds’ Treasurer to monitor the performance of all services provided by the Auditor and to ensure such services are in compliance with these policies and procedures. The Funds’ Treasurer will report to the Audit Committee on a periodic basis as to the results of such monitoring. Both the Funds’ Treasurer and management will immediately report to the Chairman of the Audit Committee any breach of these policies and procedures that comes to the attention of the Funds’ Treasurer or senior management.
Exhibit 1 to Pre-Approval of Audit and Non-Audit Services Policies and Procedures
Conditionally Prohibited Non-Audit Services (not prohibited if the Fund can reasonably conclude that the results of the service would not be subject to audit procedures in connection with the audit of the Fund’s financial statements)
· Bookkeeping or other services related to the accounting records or financial statements of the audit client
· Financial information systems design and implementation
· Appraisal or valuation services, fairness opinions, or contribution-in-kind reports
· Actuarial services
· Internal audit outsourcing services
Categorically Prohibited Non-Audit Services
· Management functions
· Human resources
· Broker-dealer, investment adviser, or investment banking services
· Legal services
· Expert services unrelated to the audit
· Any service or product provided for a contingent fee or a commission
· Services related to marketing, planning, or opining in favor of the tax treatment of confidential transactions or aggressive tax position transactions, a significant purpose of which is tax avoidance
· Tax services for persons in financial reporting oversight roles at the Fund
· Any other service that the Public Company Oversight Board determines by regulation is impermissible.
PwC advised the Registrant’s Audit Committee that PwC had identified a matter for consideration under the SEC’s auditor independence rules. PwC stated that an immediate family member of a partner of PwC had invested in an affiliate of the Registrant, which constituted an investment in an affiliate of an audit client in violation of Rule 2-01(c)(1) of Regulation S-X.
PwC advised the Audit Committee that it believes its independence had not been adversely affected by this matter as it related to the audit of the Registrant. In reaching this conclusion, PwC noted that during the time of its audit the engagement team was not aware of the investment, the violation was inadvertent, the violation was self-reported upon discovery and the investment disposed of, and the PwC partner was not involved in the Registrant’s audit.
Item 5. Audit Committee of Listed Registrants.
The Registrant has a separately designated Audit Committee established in accordance with Section 3(a)(58)(A) of the Securities Exchange Act of 1934, as amended, which consists of the independent trustees. The Audit Committee members are Ronn R. Bagge, Todd J. Barre, Marc M. Kole, Philip M. Nussbaum, and Donald H. Wilson.
Item 6. Schedule of Investments.
The Schedules of Investments are included as a part of the report to shareholders filed under Item 1 of this Form N-CSR.
Item 7. Disclosure of Proxy Voting Policies and Procedures for Closed-End Management Investment Companies.
Not applicable.
Item 8. Portfolio Managers of Closed-End Management Investment Companies.
Not applicable.
Item 9. Purchases of Equity Securities by Closed-End Management Investment Company and Affiliated Purchasers.
Not applicable.
Item 10. Submission of Matters to a Vote of Security Holders.
There have been no changes to the procedures by which shareholders may recommend nominees to the Registrant’s Board of Trustees that would require disclosure herein.
Item 11. Controls and Procedures.
a) Based on their evaluation of the Registrant’s disclosure controls and procedures (as defined in Rule 30a-3(c) under the Investment Company Act of 1940) as of a date within 90 days of the filing date of this report, the Registrant’s President (principal executive officer) and Treasurer (principal financial officer) have concluded that such disclosure controls and procedures are effective.
b) There were no significant changes in the Registrant’s internal control over financial reporting (as defined in Rule 30a-3(d) under the Investment Company Act of 1940) that occurred during the fourth fiscal quarter of the period covered by this report that have materially affected, or are reasonably likely to materially affect, the Registrant’s internal control over financial reporting.
Item 12. Exhibits.
(a)(1) Code of Ethics.
(a)(2) Certifications of the Registrant’s President and Treasurer pursuant to Section 302 of the Sarbanes-Oxley Act of 2002 are attached as Exhibit 99.CERT.
(a)(3) Not applicable.
(b) Certifications of the Registrant’s President and Treasurer pursuant to Section 906 of the Sarbanes-Oxley Act of 2002 are attached as Exhibit 99.906CERT.
SIGNATURES
Pursuant to the requirements of the Securities Exchange Act of 1934 and the Investment Company Act of 1940, the Registrant has duly caused this report to be signed on its behalf by the undersigned, thereunto duly authorized.
(Registrant) PowerShares Exchange-Traded Fund Trust
By: | /s/ Andrew Schlossberg |
|
|
|
|
Name: | Andrew Schlossberg |
|
|
|
|
Title: | President |
|
|
|
|
Date: | June 30, 2011 |
|
Pursuant to the requirements of the Securities Exchange Act of 1934 and the Investment Company Act of 1940, this report has been signed below by the following persons on behalf of the Registrant and in the capacities and on the dates indicated.
By: | /s/ Andrew Schlossberg |
|
|
|
|
Name: | Andrew Schlossberg |
|
|
|
|
Title: | President |
|
|
|
|
Date: | June 30, 2011 |
|
|
|
|
By: | /s/ Bruce T. Duncan |
|
|
|
|
Name: | Bruce T. Duncan |
|
|
|
|
Title: | Treasurer |
|
|
|
|
Date: | June 30 2011 |
|