UNITED STATES
SECURITIES AND EXCHANGE COMMISSION
Washington, D.C. 20549
FORMN-CSR
CERTIFIED SHAREHOLDER REPORT OF REGISTERED MANAGEMENT
INVESTMENT COMPANIES
Investment Company Act file number 811-21265
Invesco Exchange-Traded Fund Trust
(Exact name of registrant as specified in charter)
3500 Lacey Road
Downers Grove, IL 60515
(Address of principal executive offices) (Zip code)
Daniel E. Draper
President
3500 Lacey Road
Downers Grove, IL 60515
(Name and address of agent for service)
Registrant’s telephone number, including area code:800-983-0903
Date of fiscal year end: April 30
Date of reporting period: April 30, 2019
FormN-CSR is to be used by management investment companies to file reports with the Commission not later than 10 days after the transmission to stockholders of any report that is required to be transmitted to stockholders under Rule30e-1 under the Investment Company Act of 1940 (17 CFR270.30e-1). The Commission may use the information provided on FormN-CSR in its regulatory, disclosure review, inspection, and policymaking roles.
A registrant is required to disclose the information specified by FormN-CSR, and the Commission will make this information public. A registrant is not required to respond to the collection of information contained in FormN-CSR unless the Form displays a currently valid Office of Management and Budget (“OMB”) control number. Please direct comments concerning the accuracy of the information collection burden estimate and any suggestions for reducing the burden to Secretary, Securities and Exchange Commission, 100 F Street, NE, Washington, DC 20549. The OMB has reviewed this collection of information under the clearance requirements of 44 U.S.C. § 3507.
Item 1. Reports to Stockholders.
The Registrant’s annual report transmitted to shareholders pursuant to Rule30e-1 under the Investment Company Act of 1940 is as follows:

Invesco Annual Report to Shareholders
April 30, 2019
| | |
| |
| DWAQ | | Invesco DWA NASDAQ Momentum ETF |
| |
| PWC | | Invesco Dynamic Market ETF |
| |
| PRF | | Invesco FTSE RAFI US 1000 ETF |
| |
| PRFZ | | Invesco FTSE RAFI US 1500 Small-Mid ETF |
Beginning on January 1, 2021, as permitted by regulations adopted by the Securities and Exchange Commission, paper copies of the Funds’ shareholder reports will no longer be sent by mail, unless you specifically request paper copies of the reports from your financial intermediary, such as a broker-dealer or bank. Instead, the reports will be made available on a website, and you will be notified by mail each time a report is posted and provided with a website link to access the report.
If you already elected to receive shareholder reports electronically, you will not be affected by this change and you need not take any action. If you hold accounts through a financial intermediary, you may contact your financial intermediary to enroll in electronic delivery. Please note that not all financial intermediaries may offer this service.
You may elect to receive all future reports in paper free of charge. If you hold accounts through a financial intermediary, you can follow the instructions included with this disclosure, if applicable, or contact your financial intermediary to request that you continue to receive paper copies of your shareholder reports. Please note that not all financial intermediaries may offer this service. Your election to receive reports in paper will apply to all funds held with your financial intermediary.
Table of Contents
The Market Environment
Domestic Equity
The fiscal year proved to be an increasingly volatile time for U.S. equities. Throughout the summer, U.S. equities moved higher as corporate profits surged amid the benefit of corporate tax cuts and improving global economic growth. Several U.S. equity indexes reached new highs despite potential headwinds, including trade tensions, tariff announcements and contagion concerns over a Turkish currency crisis. After a relatively quiet summer, market volatility noticeably rose in October 2018, as U.S. equity markets suffered a sharpsell-off throughyear-end 2018, amid ongoing trade concerns between the U.S. and China, fears of a global economic slowdown and lower oil prices from a supply glut, with oil prices plummeting from near $75 per barrel in early October 2018 to around $45 per barrel in late December 2018.1 In this environment, there was a flight to safety, as investors fled to defensive areas of the markets, such as health care, utilities and U.S. Treasuries.
Given signs of a strong economy, the U.S. Federal Reserve (the “Fed”) raised interest rates three times during the fiscal year: in June, September and December 2018. Following December’s Fed meeting, the Fed raised interest rates by 25 basis points to a targeted range of 2.25% to 2.50%, which signaled a slightly more dovish stance than expected.2 In contrast, the European Central Bank and central banks in several other countries maintained extraordinarily accommodative monetary policies.
Equity markets rebounded at the start of 2019, fueled by optimism about a potential U.S.-China trade deal and the Fed’s indication that there would be no interest rate hikes in 2019, a surprising shift in monetary policy. The Fed’s more accommodative stance provided a supportive environment for equities and fixed income, even as U.S. economic data were mixed and overseas growth appeared to be slowing. By the end of the fiscal year, the U.S. equity market generally recovered the losses from fourth quarter 2018, backed by improving investor sentiment, low unemployment and a growing economy.
| 2 | Source: U.S. Federal Reserve |
| | |
| DWAQ | | Manager’s Analysis |
| | Invesco DWA NASDAQ Momentum ETF (DWAQ) |
As an index fund, the Invesco DWA NASDAQ Momentum ETF (the “Fund”) is passively managed and seeks to track the returns of an underlying index. The Fund seeks to track the investment results (before fees and expenses) of the Dorsey Wright®NASDAQ Technical Leaders Index (the “Index”). The Fund generally will invest at least 90% of its total assets in the securities that comprise the Index.
After giving each eligible security a momentum score, Dorsey, Wright and Associates LLC (the “Index Provider”) Index Provider selects approximately 100 common stocks for inclusion in the Index from an eligible universe of approximately 1,000 securities of large capitalization companies that trade on The NASDAQ Stock Market LLC and that are included in the NASDAQ Composite Index (the “Benchmark Index”). Strictly in accordance with its guidelines and mandated procedures, the Index Provider uses its proprietary methodology to determine a “momentum” score for each security within the universe of eligible securities. In general, momentum is the tendency of an investment to exhibit persistence in its relative performance; a “momentum” style of investing emphasizes investing in securities that have had better recent performance compared to other securities. The momentum score for each security included in the Index is based on intermediate and long-term upward price movements of the security as compared to a representative benchmark and other eligible securities within the universe. The Index Provider includes in the Index the 100 securities with the highest momentum scores, with higher scoring securities receiving larger weights within the Index. The Fund generally invests in all of the securities comprising the Index in proportion to their weightings in the Index.
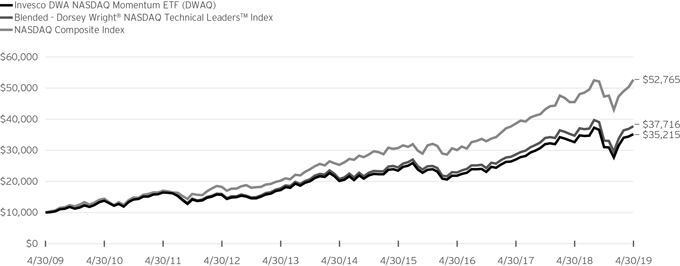
For the fiscal year ended April 30, 2019, on a market price basis, the Fund returned 7.72%. On a net asset value (“NAV”) basis, the Fund returned 7.92%. During the same time period, the Index returned 8.59%. During the fiscal year, the Fund fully replicated the components of the Index; therefore, the Fund’s performance, on a NAV basis, differed from the return of the Index primarily due to fees and operating expenses that the Fund incurred as well as trading costs associated with portfolio rebalances during the period.
During this same time period, the NASDAQ Composite Index (the “Benchmark Index”) returned 15.82%. The Benchmark Index is an unmanaged index weighted by market capitalization based on the average performance of approximately 2,639 securities. The Benchmark Index was selected for its recognition in the marketplace, and because its performance comparison is a useful measure for investors as a broad representation of the U.S. equity market.
The performance of the Fund differed from the Benchmark Index because the Fund seeks to track an Index that employs a proprietary stock selection and weighting methodology, whereas the Benchmark Index selects and weights stocks based primarily on market capitalization.
Relative to the Benchmark Index, the Fund was most overweight in the health care sector and most underweight in the information technology sector during the fiscal year ended April 30, 2019. The majority of the Fund’s underperformance relative to the Benchmark Index during that period can be attributed to the Fund being underweight in the information technology sector.
For the fiscal year ended April 30, 2019, the information technology sector contributed most significantly to the Fund’s return, followed by the industrials and financials sectors, respectively. The real estate sector detracted most significantly from the Fund’s return, followed by the health care sector.
Positions that contributed most significantly to the Fund’s return for the fiscal year ended April 30, 2019, included Tandem Diabetes Care, Inc., a health care company (portfolio average weight of 1.81%) and Mirati Therapeutics Inc., a health care company (portfolio average weight of 1.78%). Positions that detracted most significantly from the Fund’s return during this period included Viking Therapeutics, a health care company (no longer held at fiscalyear-end), and Inogen, Inc., a health care company (no longer held at fiscalyear-end).
| | | | |
Sector Breakdown
(% of the Fund’s Net Assets)
as of April 30, 2019 | |
| Health Care | | | 35.8 | |
| Information Technology | | | 27.9 | |
| Consumer Discretionary | | | 9.9 | |
| Industrials | | | 7.5 | |
| Financials | | | 7.2 | |
| Communication Services | | | 5.0 | |
| Consumer Staples | | | 3.5 | |
| Sector Types Each Less Than 3% | | | 3.2 | |
| Money Market Funds Plus Other Assets Less Liabilities | | | (0.0) | |
Invesco DWA NASDAQ Momentum ETF (DWAQ)(continued)
| | | | |
Top Ten Fund Holdings*
(% of the Fund’s Net Assets)
as of April 30, 2019 | |
| Security | | | | |
| Exact Sciences Corp. | | | 2.9 | |
| Credit Acceptance Corp. | | | 2.8 | |
| MGP Ingredients, Inc. | | | 2.5 | |
| Tandem Diabetes Care, Inc. | | | 2.4 | |
| Amazon.com, Inc. | | | 2.4 | |
| Five9, Inc. | | | 2.2 | |
| Mirati Therapeutics, Inc. | | | 2.2 | |
| Intuit, Inc. | | | 2.2 | |
| Atrion Corp. | | | 2.2 | |
| CareDx, Inc. | | | 2.2 | |
| Total | | | 24.0 | |
| * | Excluding money market fund holdings. |
Growth of a $10,000 Investment
Fund Performance History as of April 30, 2019
| | | | | | | | | | | | | | | | | | | | | | | | | | | | | | | | | | | | | | | | |
| | | 1 Year | | | 3 Years
Average
Annualized | | | 3 Years
Cumulative | | | 5 Years
Average
Annualized | | | 5 Years
Cumulative | | | 10 Years
Average
Annualized | | | 10 Years
Cumulative | | | | | | Fund Inception | |
| Index | | | | | Average
Annualized | | | Cumulative | |
| Blended-Dorsey Wright® NASDAQ Technical LeadersTM Index | | | 8.59 | % | | | 18.04 | % | | | 64.46 | % | | | 12.59 | % | | | 80.95 | % | | | 14.20 | % | | | 277.16 | % | | | | | | | 9.86 | % | | | 349.96 | % |
| NASDAQ Composite Index | | | 15.82 | | | | 20.58 | | | | 75.31 | | | | 15.82 | | | | 108.37 | | | | 18.10 | | | | 427.65 | | | | | | | | 12.31 | | | | 540.76 | |
| Fund | | | | | | | | | �� | | | | | | | | | | | | | | | | | | | | | | | | | | | | | | | |
| NAV Return | | | 7.92 | | | | 17.29 | | | | 61.34 | | | | 11.87 | | | | 75.22 | | | | 13.42 | | | | 252.15 | | | | | | | | 9.15 | | | | 305.61 | |
| Market Price Return | | | 7.72 | | | | 17.27 | | | | 61.28 | | | | 11.86 | | | | 75.15 | | | | 13.41 | | | | 251.93 | | | | | | | | 9.13 | | | | 304.86 | |
Invesco DWA NASDAQ Momentum ETF (DWAQ)(continued)
Fund Inception: May 1, 2003
Performance quoted above represents past performance. Past performance is not a guarantee of future results and current performance may be higher or lower than performance quoted. Investment returns and principal value will fluctuate, and shares of the Fund (“Fund Shares”), when redeemed or sold, may be worth more or less than their original cost. Fund performance reflects any applicable fee waivers and/or expense reimbursements. Had the adviser not waived fees and/or reimbursed expenses currently or in the past, returns would have been lower. See current prospectus for more information. The adviser has contractually agreed to waive fees and/or pay certain Fund expenses through August 31, 2021. According to the Fund’s current prospectus, the total gross annual operating expense ratio was indicated as 0.82% and the net annual operating expense ratio was indicated as 0.60%. The Financial Highlights section of the Shareholder Report presents the expense ratios based on expenses incurred during the period covered by this report. NAV and Market Price returns assume that dividends and capital gain distributions have been reinvested in the Fund at NAV and Market Price, respectively. The returns shown in the table above do not reflect the deduction of taxes that a shareholder would pay on Fund distributions or the redemption or sale of Fund Shares. See invesco.com to find the most recentmonth-end performance numbers.
Blended-Index and Benchmark Index performance results are based upon a hypothetical investment in their respective constituent securities. Blended-Index and Benchmark Index returns do not represent Fund returns. An investor cannot invest directly in an index. The Blended-Index and Benchmark Index do not charge management fees or brokerage expenses, and no such fees or expenses were deducted from the hypothetical performance shown. In addition, the results actual investors might have achieved would have differed from those shown because of differences in the timing, amounts of their investments, and fees and expenses associated with an investment in the Fund.
Notes Regarding Indexes and Fund Performance History:
| - | The Blended-Dorsey Wright® NASDAQ Technical Leaders Index performance is comprised of the performance of the Dynamic OTC IntellidexSM Index, the Fund’s previous underlying index, from Fund inception through the conversion date, February 19, 2014, followed by the performance of the Index, starting from the conversion date through April 30, 2019. |
| - | Average Annualized and Cumulative Inception returns for the Fund, Blended-Index and Benchmark Index are based on the inception date of the Fund. |
| | |
| PWC | | Manager’s Analysis |
| | Invesco Dynamic Market ETF (PWC) |
As an index fund, the Invesco Dynamic Market ETF (the “Fund”) is passively managed and seeks to track the returns of an underlying index. The Fund seeks to track the investment results (before fees and expenses) of the Dynamic Market IntellidexSMIndex (the “Index”). The Fund generally will invest at least 90% of its total assets in common stocks that comprise the Index.
The Index is composed of stocks that ICE Data Indices, LLC (the “Index Provider”), strictly in accordance with its guidelines and mandated procedures, includes pursuant to a proprietary selection methodology. Stocks are selected from the top of each sector and size category in a manner designed to produce an index with sector and size dispersion similar to the overall broad market. The Fund generally invests in all of the securities comprising the Index in proportion to their weightings in the Index.
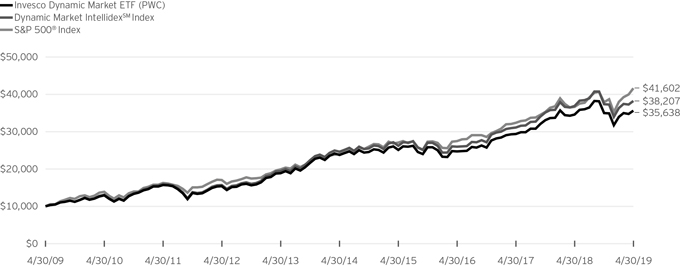
For the fiscal year ended April 30, 2019, on a market price basis, the Fund returned 2.89%. On a net asset value (“NAV”) basis, the Fund returned 3.00%. During the same time period, the Index returned 3.70%. During the fiscal year, the Fund fully replicated the components of the Index; therefore, the Fund’s performance, on a NAV basis, differed from the return of the Index primarily due to fees and operating expenses, as well as trading costs around the rebalances that the Fund incurred during the period.
During this same time period, the S&P 500®Index (the “Benchmark Index”) returned 13.49%. The Benchmark Index is an unmanaged index weighted by market capitalization based on the average performance of approximately 505 securities. The Benchmark Index was selected for its recognition in the marketplace, and because its performance comparison is a useful measure for investors as a broad representation of the U.S. stock market.
The performance of the Fund differed from the Benchmark Index in part because the Fund seeks to track an Index that employs a modified equal weighting and stock selection methodology, whereas the Benchmark Index selects and weights stocks based primarily on market capitalization.
Relative to the Benchmark Index, the Fund was most overweight in the communication services sector and most underweight in the real estate sector during the fiscal year ended April 30, 2019. The majority of the Fund’s underperformance relative to the Benchmark Index during that period can be attributed to stock selection in the information technology, health care, and industrial sectors.
For the fiscal year ended April 30, 2019, the information technology sector contributed most significantly to the Fund’s return, followed by the consumer discretionary and financial sectors, respectively. The health care and materials sectors were the largest detracting sectors.
Positions that contributed most significantly to the Fund’s return for the fiscal year ended April 30, 2019, included lululemon athletica Inc., a consumer discretionary company (no longer held at fiscalyear-end) and Mastercard Inc., Class A., an information technology company (no longer held at fiscalyear-end). Positions that detracted most significantly from the Fund’s return during this period included Micron Technology, Inc., an information technology company (no longer held at fiscalyear-end) and NetApp, Inc., an information technology company (no longer held at fiscalyear-end).
| | | | |
Sector Breakdown
(% of the Fund’s Net Assets)
as of April 30, 2019 | |
| Information Technology | | | 20.7 | |
| Financials | | | 14.9 | |
| Health Care | | | 14.0 | |
| Consumer Discretionary | | | 11.3 | |
| Industrials | | | 10.1 | |
| Communication Services | | | 9.7 | |
| Consumer Staples | | | 7.5 | |
| Energy | | | 5.7 | |
| Utilities | | | 3.3 | |
| Materials | | | 2.8 | |
| Money Market Funds Plus Other Assets Less Liabilities | | | 0.0 | |
|
Top Ten Fund Holdings*
(% of the Fund’s Net Assets)
as of April 30, 2019 | |
| Security | | | | |
| Verizon Communications, Inc. | | | 3.6 | |
| Automatic Data Processing, Inc. | | | 3.2 | |
| Keysight Technologies, Inc. | | | 3.1 | |
| Sprint Corp. | | | 3.0 | |
| First Data Corp., Class A | | | 3.0 | |
| Xilinx, Inc. | | | 3.0 | |
| Procter & Gamble Co. (The) | | | 2.7 | |
| Allergan PLC | | | 2.7 | |
| Keurig Dr Pepper, Inc. | | | 2.7 | |
| Baxter International, Inc. | | | 2.6 | |
| Total | | | 29.6 | |
| * | Excluding money market fund holdings. |
Invesco Dynamic Market ETF (PWC)(continued)
Growth of a $10,000 Investment
Fund Performance History as of April 30, 2019
| | | | | | | | | | | | | | | | | | | | | | | | | | | | | | | | | | | | | | | | |
| | | 1 Year | | | 3 Years
Average
Annualized | | | 3 Years
Cumulative | | | 5 Years
Average
Annualized | | | 5 Years
Cumulative | | | 10 Years
Average
Annualized | | | 10 Years
Cumulative | | | | | | Fund Inception | |
| Index | | | | | Average
Annualized | | | Cumulative | |
| Dynamic Market IntellidexSM Index | | | 3.70 | % | | | 13.71 | % | | | 47.02 | % | | | 9.18 | % | | | 55.15 | % | | | 14.34 | % | | | 282.07 | % | | | | | | | 10.33 | % | | | 381.98 | % |
| S&P 500® Index | | | 13.49 | | | | 14.87 | | | | 51.58 | | | | 11.63 | | | | 73.32 | | | | 15.32 | | | | 316.02 | | | | | | | | 9.80 | | | | 346.03 | |
| Fund | | | | | | | | | | | | | | | | | | | | | | | | | | | | | | | | | | | | | | | | |
| NAV Return | | | 3.00 | | | | 12.95 | | | | 44.11 | | | | 8.42 | | | | 49.79 | | | | 13.55 | | | | 256.38 | | | | | | | | 9.63 | | | | 335.04 | |
| Market Price Return | | | 2.89 | | | | 12.91 | | | | 43.96 | | | | 8.40 | | | | 49.64 | | | | 13.54 | | | | 256.17 | | | | | | | | 9.62 | | | | 334.52 | |
Fund Inception: May 1, 2003
Performance quoted above represents past performance. Past performance is not a guarantee of future results and current performance may be higher or lower than performance quoted. Investment returns and principal value will fluctuate, and shares of the Fund (“Fund Shares”), when redeemed or sold, may be worth more or less than their original cost. Fund performance reflects any applicable fee waivers and/or expense reimbursements. Had the adviser not waived fees and/or reimbursed expenses currently or in the past, returns would have been lower. See current prospectus for more information. The adviser has contractually agreed to waive fees and/or pay certain Fund expenses through August 31, 2021. According to the Fund’s current prospectus, the total gross annual operating expense ratio was indicated as 0.61% and the net annual operating expense ratio was indicated as 0.60%. The Financial Highlights section of the Shareholder Report presents the expense ratios based on expenses incurred during the period covered by this report. NAV and Market Price returns assume that dividends and capital gain distributions have been reinvested in the Fund at NAV and Market Price, respectively. The returns shown in the table
above do not reflect the deduction of taxes that a shareholder would pay on Fund distributions or the redemption or sale of Fund Shares. See invesco.com to find the most recentmonth-end performance numbers.
Index and Benchmark Index performance results are based upon a hypothetical investment in their respective constituent securities. Index and Benchmark Index returns do not represent Fund returns. An investor cannot invest directly in an index. The Index and Benchmark Index do not charge management fees or brokerage expenses, and no such fees or expenses were deducted from the hypothetical performance shown. In addition, the results actual investors might have achieved would have differed from those shown because of differences in the timing, amounts of their investments, and fees and expenses associated with an investment in the Fund.
Notes Regarding Indexes and Fund Performance History:
| - | Average Annualized and Cumulative Inception returns for the Fund, Index and Benchmark Index are based on the inception date of the Fund. |
| | |
| PRF | | Manager’s Analysis |
| | Invesco FTSE RAFI US 1000 ETF (PRF) |
As an index fund, the Invesco FTSE RAFI US 1000 ETF (the “Fund”) is passively managed and seeks to track the returns of an underlying index. The Fund seeks to track the investment results (before fees and expenses) of the FTSE RAFITMUS 1000 Index (the “Index”). The Fund generally will invest at least 90% of its total assets in common stocks that comprise the Index.
The Index is composed of 1,000 common stocks that FTSE International Limited and Research Affiliates LLC, strictly in accordance with their guidelines and mandated procedures, include to track the performance of the largest U.S. companies based on the following four fundamental measures: book value, cash flow, sales and dividends. The Fund generally invests in all of the securities comprising the Index in proportion to their weightings in the Index.
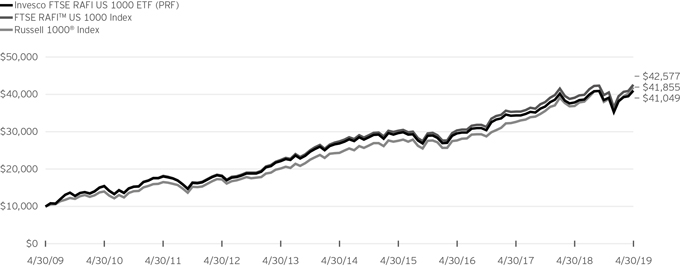
For the fiscal year ended April 30, 2019, on a market price basis, the Fund returned 8.32%. On a net asset value (“NAV”) basis, the Fund returned 8.40%. During the same time period, the Index returned 8.77%. During the fiscal year, the Fund fully replicated the components of the Index; therefore, the Fund’s performance, on a NAV basis, differed from the return of the Index primarily due to fees and operating expenses that the Fund incurred during the period.
During this same time period, the Russell 1000®Index (the “Benchmark Index”) returned 13.33%. The Benchmark Index is an unmanaged index weighted by market capitalization based on the average performance of approximately 980 securities. The Benchmark Index was selected for its recognition in the marketplace, and because its performance comparison is a useful measure for investors as a broad representation of the U.S.large-cap market.
The performance of the Fund differed from the Benchmark Index in part because the Fund seeks to track an Index that employs a fundamental weighting and stock selection methodology, whereas the Benchmark Index selects and weights stocks based primarily on market capitalization.
Relative to the Benchmark Index, the Fund was most overweight in the energy sector and most underweight in the information technology sector during the fiscal year ended April 30, 2019. The majority of the Fund’s underperformance relative to the Benchmark Index during that period can be attributed to its underweight allocation to the information technology sector.
For the fiscal year ended April 30, 2019, the information technology sector contributed most significantly to the Fund’s return, followed by the consumer discretionary and health care sectors, respectively. The energy sector detracted most significantly from the Fund’s return.
Positions that contributed most significantly to the Fund’s return for the fiscal year ended April 30, 2019, included Microsoft Corp., an information technology company (portfolio average weight of 1.57%) and Apple, Inc., an information technology company (portfolio average weight of 2.58%). Positions that detracted most significantly from the Fund’s return during this period included General Electric Co., an industrials company (portfolio average weight of 1.02%) and CVS Health Corp., a health care company (portfolio average weight of 0.64%).
| | | | |
Sector Breakdown
(% of the Fund’s Net Assets)
as of April 30, 2019 | |
| Financials | | | 19.3 | |
| Information Technology | | | 13.8 | |
| Health Care | | | 10.3 | |
| Industrials | | | 10.2 | |
| Consumer Discretionary | | | 9.4 | |
| Energy | | | 8.6 | |
| Communication Services | | | 8.5 | |
| Consumer Staples | | | 8.4 | |
| Utilities | | | 4.6 | |
| Materials | | | 3.6 | |
| Real Estate | | | 3.3 | |
| Money Market Funds Plus Other Assets Less Liabilities | | | 0.0 | |
|
Top Ten Fund Holdings*
(% of the Fund’s Net Assets)
as of April 30, 2019 | |
| Security | | | | |
| Apple, Inc. | | | 2.7 | |
| Exxon Mobil Corp. | | | 2.4 | |
| Berkshire Hathaway, Inc., Class B | | | 2.0 | |
| AT&T, Inc. | | | 1.9 | |
| JPMorgan Chase & Co. | | | 1.9 | |
| Microsoft Corp. | | | 1.7 | |
| Chevron Corp. | | | 1.5 | |
| Verizon Communications, Inc. | | | 1.5 | |
| Wells Fargo & Co. | | | 1.4 | |
| Bank of America Corp. | | | 1.3 | |
| Total | | | 18.3 | |
| * | Excluding money market fund holdings. |
Invesco FTSE RAFI US 1000 ETF (PRF)(continued)
Growth of a $10,000 Investment
Fund Performance History as of April 30, 2019
| | | | | | | | | | | | | | | | | | | | | | | | | | | | | | | | | | | | | | | | |
| | | 1 Year | | | 3 Years Average
Annualized | | | 3 Years Cumulative | | | 5 Years Average
Annualized | | | 5 Years Cumulative | | | 10 Years Average
Annualized | | | 10 Years Cumulative | | | | | | Fund Inception | |
| Index | | | | | Average
Annualized | | | Cumulative | |
| FTSE RAFITM US 1000 Index | | | 8.77 | % | | | 11.96 | % | | | 40.36 | % | | | 9.22 | % | | | 55.40 | % | | | 15.59 | % | | | 325.77 | % | | | | | | | 9.10 | % | | | 220.35 | % |
| Russell 1000® Index | | | 13.33 | | | | 14.82 | | | | 51.38 | | | | 11.41 | | | | 71.63 | | | | 15.39 | | | | 318.55 | | | | | | | | 8.89 | | | | 212.30 | |
| Fund | | | | | | | | | | | | | | | | | | | | | | | | | | | | | | | | | | | | | | | | |
| NAV Return | | | 8.40 | | | | 11.56 | | | | 38.83 | | | | 8.82 | | | | 52.60 | | | | 15.17 | | | | 310.49 | | | | | | | | 8.65 | | | | 203.11 | |
| Market Price Return | | | 8.32 | | | | 11.57 | | | | 38.86 | | | | 8.83 | | | | 52.68 | | | | 15.17 | | | | 310.53 | | | | | | | | 8.67 | | | | 203.90 | |
Fund Inception: December 19, 2005
Performance quoted above represents past performance. Past performance is not a guarantee of future results and current performance may be higher or lower than performance quoted. Investment returns and principal value will fluctuate, and shares of the Fund (“Fund Shares”), when redeemed or sold, may be worth more or less than their original cost. Fund performance reflects any applicable fee waivers and/or expense reimbursements. Had the adviser not waived fees and/or reimbursed expenses currently or in the past, returns would have been lower. See current prospectus for more information. The adviser has contractually agreed to waive fees and/or pay certain Fund expenses through August 31, 2021. According to the Fund’s current prospectus, the total gross annual operating expense ratio was indicated as 0.41% and the net annual operating expense ratio was indicated as 0.39%. The Financial Highlights section of the Shareholder Report presents the expense ratios based on expenses incurred during the period covered by this report. NAV and Market Price returns assume that dividends and capital gain distributions have been reinvested in the Fund at NAV and Market Price, respectively. The returns shown in the table
above do not reflect the deduction of taxes that a shareholder would pay on Fund distributions or the redemption or sale of Fund Shares. See invesco.com to find the most recentmonth-end performance numbers.
Index and Benchmark Index performance results are based upon a hypothetical investment in their respective constituent securities. Index and Benchmark Index returns do not represent Fund returns. An investor cannot invest directly in an index. The Index and Benchmark Index do not charge management fees or brokerage expenses, and no such fees or expenses were deducted from the hypothetical performance shown. In addition, the results actual investors might have achieved would have differed from those shown because of differences in the timing, amounts of their investments, and fees and expenses associated with an investment in the Fund.
Notes Regarding Indexes and Fund Performance History:
| - | Average Annualized and Cumulative Inception returns for the Fund, Index and Benchmark Index are based on the inception date of the Fund. |
| | |
| PRFZ | | Manager’s Analysis |
| | Invesco FTSE RAFI US 1500Small-Mid ETF (PRFZ) |
As an index fund, the Invesco FTSE RAFI US 1500Small-Mid ETF (the “Fund”) is passively managed and seeks to track the returns of an underlying index. The Fund seeks to track the investment results (before fees and expenses) of the FTSE RAFITMUS Mid Small 1500 Index (the “Index”). The Fund generally will invest at least 90% of its total assets in common stocks that comprise the Index.
The Index is composed of 1,500 common stocks that FTSE International Limited and Research Affiliates LLC, strictly in accordance with their guidelines and mandated procedures, include to track the performance of small- andmedium-sized U.S. companies based on the following four fundamental measures of firm size: book value, sales, cash flow and dividends. The Fund generally invests in all of the securities comprising the Index in proportion to their weightings in the Index.
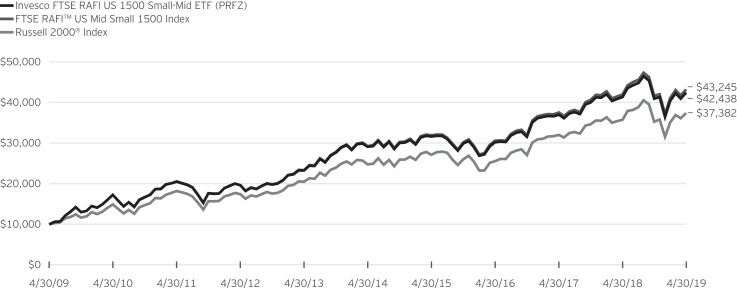
For the fiscal year ended April 30, 2019, on a market price basis, the Fund returned 2.60%. On a net asset value (“NAV”) basis, the Fund returned 2.75%. During the same time period, the Index returned 3.01%. During the fiscal year, the Fund fully replicated the components of the Index; therefore, the Fund’s performance, on a NAV basis, differed from the return of the Index primarily due to fees and operating expenses that the Fund incurred during the period, partially offset by revenue generated through the Fund’s securities lending program.
During this same time period, the Russell 2000®Index (the “Benchmark Index”) returned 4.61%. The Benchmark Index is an unmanaged index weighted by market capitalization based on the average performance of approximately 2,000 securities. The Benchmark Index was selected for its recognition in the marketplace, and because its performance comparison is a useful measure for investors as a broad representation of the U.S.small-cap market.
The performance of the Fund differed from the Benchmark Index in part because the Fund seeks to track an Index that employs a fundamental weighting and stock selection methodology, whereas the Benchmark Index selects and weights stocks based primarily on market capitalization.
Relative to the Benchmark Index, the Fund was most overweight in the consumer discretionary sector and most underweight in the health care sector during the fiscal year ended April 30, 2019. The majority of the Fund’s underperformance relative to the Benchmark Index during that period can be attributed to the Fund’s overweight allocation to the energy sector.
For the fiscal year ended April 30, 2019, the information technology sector contributed most significantly to the Fund’s return, followed by the industrials and real estate sectors, respectively. The energy sector detracted most significantly from the Fund’s return.
Positions that contributed most significantly to the Fund’s return for the fiscal year ended April 30, 2019, includedRent-A-Center, Inc., a consumer discretionary company (portfolio average weight 0.18%) and Iridium Communications, Inc., a communication services company (portfolio average weight 0.17%). Positions that detracted most significantly from the Fund’s return during this period included Bristow Group, Inc., an energy company (portfolio average weight of 0.09%) and Windstream Holdings, Inc., a communication services company (no longer held at fiscal year-end).
| | | | |
Sector Breakdown
(% of the Fund’s Net Assets)
as of April 30, 2019 | |
| Industrials | | | 18.5 | |
| Financials | | | 17.6 | |
| Information Technology | | | 14.0 | |
| Consumer Discretionary | | | 13.7 | |
| Health Care | | | 8.1 | |
| Real Estate | | | 7.0 | |
| Energy | | | 6.4 | |
| Materials | | | 5.9 | |
| Communication Services | | | 3.9 | |
| Consumer Staples | | | 3.1 | |
| Utilities | | | 1.8 | |
| Money Market Funds Plus Other Assets Less Liabilities | | | 0.0 | |
|
Top Ten Fund Holdings*
(% of the Fund’s Net Assets)
as of April 30, 2019 | |
| Security | | | | |
| Copart, Inc. | | | 0.2 | |
| FactSet Research Systems, Inc. | | | 0.2 | |
| Hain Celestial Group, Inc. (The) | | | 0.2 | |
| West Pharmaceutical Services, Inc. | | | 0.2 | |
| FTI Consulting, Inc. | | | 0.2 | |
| RLI Corp. | | | 0.2 | |
| G-III Apparel Group Ltd. | | | 0.2 | |
| Cirrus Logic, Inc. | | | 0.2 | |
| Tronox Holdings PLC, Class A | | | 0.2 | |
| Align Technology, Inc. | | | 0.2 | |
| Total | | | 2.0 | |
| * | Excluding money market fund holdings. |
Invesco FTSE RAFI US 1500Small-Mid ETF (PRFZ)(continued)
Growth of a $10,000 Investment
Fund Performance History as of April 30, 2019
| | | | | | | | | | | | | | | | | | | | | | | | | | | | | | | | | | | | | | | | |
| | | 1 Year | | | 3 Years
Average
Annualized | | | 3 Years Cumulative | | | 5 Years
Average
Annualized | | | 5 Years Cumulative | | | 10 Years
Average
Annualized | | | 10 Years
Cumulative | | | | | | Fund Inception | |
| Index | | | | | Average
Annualized | | | Cumulative | |
| FTSE RAFITM US Mid Small 1500 Index | | | 3.01 | % | | | 12.27 | % | | | 41.52 | % | | | 8.11 | % | | | 47.68 | % | | | 15.77 | % | | | 332.45 | % | | | | | | | 9.38 | % | | | 209.68 | % |
| Russell 2000® Index | | | 4.61 | | | | 13.60 | | | | 46.58 | | | | 8.63 | | | | 51.25 | | | | 14.10 | | | | 273.82 | | | | | | | | 7.79 | | | | 157.56 | |
| Fund | | | | | | | | | | | | | | | | | | | | | | | | | | | | | | | | | | | | | | | | |
| NAV Return | | | 2.75 | | | | 12.02 | | | | 40.55 | | | | 7.87 | | | | 46.03 | | | | 15.55 | | | | 324.38 | | | | | | | | 9.11 | | | | 200.42 | |
| Market Price Return | | | 2.60 | | | | 12.03 | | | | 40.62 | | | | 7.87 | | | | 46.05 | | | | 15.58 | | | | 325.30 | | | | | | | | 9.12 | | | | 200.55 | |
Fund Inception: September 20, 2006
Performance quoted above represents past performance. Past performance is not a guarantee of future results and current performance may be higher or lower than performance quoted. Investment returns and principal value will fluctuate, and shares of the Fund (“Fund Shares”), when redeemed or sold, may be worth more or less than their original cost. Fund performance reflects any applicable fee waivers and/or expense reimbursements. Had the adviser not waived fees and/or reimbursed expenses currently or in the past, returns would have been lower. See current prospectus for more information. The adviser has contractually agreed to waive fees and/or pay certain Fund expenses through August 31, 2021. According to the Fund’s current prospectus, the total gross annual operating expense ratio was indicated as 0.41% and the net annual operating expense ratio was indicated as 0.39%. The Financial Highlights section of the Shareholder Report presents the expense ratios based on expenses incurred during the period covered by this report. NAV and Market Price returns assume that dividends and capital gain distributions have been reinvested in the Fund at NAV and Market Price, respectively. The returns shown in the table
above do not reflect the deduction of taxes that a shareholder would pay on Fund distributions or the redemption or sale of Fund Shares. See invesco.com to find the most recentmonth-end performance numbers.
Index and Benchmark Index performance results are based upon a hypothetical investment in their respective constituent securities. Index and Benchmark Index returns do not represent Fund returns. An investor cannot invest directly in an index. The Index and Benchmark Index do not charge management fees or brokerage expenses, and no such fees or expenses were deducted from the hypothetical performance shown. In addition, the results actual investors might have achieved would have differed from those shown because of differences in the timing, amounts of their investments, and fees and expenses associated with an investment in the Fund.
Notes Regarding Indexes and Fund Performance History:
| - | Average Annualized and Cumulative Inception returns for the Fund, Index and Benchmark Index are based on the inception date of the Fund. |
Schedule of Investments(a)
Invesco DWA NASDAQ Momentum ETF (DWAQ)
April 30, 2019
| | | | | | | | |
Number
of Shares | | | | | Value | |
| | | | Common Stocks & Other Equity Interests—100.0% | |
| | | | Communication Services—5.0% | |
| | 3,700 | | | Bandwidth, Inc., Class A(b) | | $ | 279,054 | |
| | 766 | | | Charter Communications, Inc., Class A(b) | | | 284,331 | |
| | 1,885 | | | Facebook, Inc., Class A(b) | | | 364,559 | |
| | 23,257 | | | Glu Mobile, Inc.(b) | | | 254,432 | |
| | 1,205 | | | IAC/InterActiveCorp.(b) | | | 270,932 | |
| | 8,796 | | | Iridium Communications, Inc.(b) | | | 241,538 | |
| | 5,092 | | | Match Group, Inc. | | | 307,557 | |
| | 652 | | | Netflix, Inc.(b) | | | 241,592 | |
| | | | | | | | |
| | | | | | | 2,243,995 | |
| | | | | | | | |
| | | | Consumer Discretionary—9.9% | |
| | 558 | | | Amazon.com, Inc.(b) | | | 1,074,998 | |
| | 18,524 | | | Eldorado Resorts, Inc.(b) | | | 914,530 | |
| | 11,237 | | | Etsy, Inc.(b) | | | 758,947 | |
| | 2,066 | | | Five Below, Inc.(b) | | | 302,442 | |
| | 2,359 | | | Grand Canyon Education, Inc.(b) | | | 273,384 | |
| | 611 | | | MercadoLibre, Inc. (Argentina)(b) | | | 295,810 | |
| | 1,468 | | | O’Reilly Automotive, Inc.(b) | | | 555,741 | |
| | 1,489 | | | Pool Corp. | | | 273,589 | |
| | | | | | | | |
| | | | | | | 4,449,441 | |
| | | | | | | | |
| | | | Consumer Staples—3.5% | |
| | 10,984 | | | Freshpet, Inc.(b) | | | 490,545 | |
| | 12,526 | | | MGP Ingredients, Inc.(c) | | | 1,100,660 | |
| | | | | | | | |
| | | | | | | 1,591,205 | |
| | | | | | | | |
| | | | Energy—2.0% | |
| | 12,897 | | | DMC Global, Inc. | | | 893,762 | |
| | | | | | | | |
| | |
| | | | Financials-7.2% | | | |
| | 2,501 | | | Credit Acceptance Corp.(b) | | | 1,241,046 | |
| | 9,989 | | | eHealth, Inc.(b) | | | 606,732 | |
| | 3,489 | | | Kinsale Capital Group, Inc. | | | 253,301 | |
| | 813 | | | LendingTree, Inc.(b)(c) | | | 312,859 | |
| | 3,166 | | | LPL Financial Holdings, Inc. | | | 234,569 | |
| | 11,624 | | | NMI Holdings, Inc., Class A(b) | | | 326,402 | |
| | 2,113 | | | World Acceptance Corp.(b) | | | 274,669 | |
| | | | | | | | |
| | | | | | | 3,249,578 | |
| | | | | | | | |
| | | | Health Care—35.8% | |
| | 8,242 | | | Akcea Therapeutics, Inc.(b)(c) | | | 206,792 | |
| | 4,891 | | | Amedisys, Inc.(b) | | | 625,168 | |
| | 1,122 | | | Atrion Corp. | | | 987,360 | |
| | 30,485 | | | AxoGen, Inc.(b)(c) | | | 715,788 | |
| | 10,931 | | | BioTelemetry, Inc.(b) | | | 594,646 | |
| | 6,582 | | | Cardiovascular Systems, Inc.(b) | | | 233,924 | |
| | 36,197 | | | CareDx, Inc.(b) | | | 984,920 | |
| | 36,730 | | | Cerus Corp.(b) | | | 225,155 | |
| | 20,971 | | | Codexis, Inc.(b) | | | 413,129 | |
| | 1,680 | | | DexCom, Inc.(b) | | | 203,398 | |
| | 13,049 | | | Exact Sciences Corp.(b) | | | 1,287,806 | |
| | 29,306 | | | Fluidigm Corp.(b) | | | 402,664 | |
| | 2,900 | | | Guardant Health, Inc.(b) | | | 189,979 | |
| | 1,859 | | | ICON PLC (Ireland)(b) | | | 253,902 | |
| | 3,154 | | | IDEXX Laboratories, Inc.(b) | | | 731,728 | |
| | 413 | | | Intuitive Surgical, Inc.(b) | | | 210,890 | |
| | 2,570 | | | iRhythm Technologies, Inc.(b) | | | 196,117 | |
| | 2,567 | | | Masimo Corp.(b) | | | 334,095 | |
| | 4,187 | | | Merit Medical Systems, Inc.(b) | | | 235,226 | |
| | | | | | | | |
Number
of Shares | | | | | Value | |
| | | | Common Stocks & Other Equity Interests (continued) | |
| | | | Health Care (continued) | |
| | 16,913 | | | Mirati Therapeutics, Inc.(b) | | $ | 1,006,154 | |
| | 15,424 | | | Novocure Ltd.(b) | | | 679,736 | |
| | 5,223 | | | OrthoPediatrics Corp.(b) | | | 212,785 | |
| | 2,685 | | | PRA Health Sciences, Inc.(b) | | | 259,962 | |
| | 3,585 | | | Quidel Corp.(b) | | | 229,225 | |
| | 47,535 | | | R1 RCM, Inc.(b) | | | 497,691 | |
| | 16,411 | | | Ra Pharmaceuticals, Inc.(b) | | | 364,324 | |
| | 4,057 | | | Reata Pharmaceuticals, Inc., Class A(b) | | | 318,312 | |
| | 1,838 | | | Sage Therapeutics, Inc.(b) | | | 309,207 | |
| | 12,934 | | | STAAR Surgical Co.(b) | | | 420,096 | |
| | 17,909 | | | Tandem Diabetes Care, Inc.(b) | | | 1,099,792 | |
| | 3,643 | | | uniQure N.V. (Netherlands)(b) | | | 204,700 | |
| | 14,508 | | | Veracyte, Inc.(b) | | | 331,798 | |
| | 42,069 | | | Vericel Corp.(b) | | | 714,752 | |
| | 9,911 | | | Zogenix, Inc.(b) | | | 386,430 | |
| | | | | | | | |
| | | | | | | 16,067,651 | |
| | | | | | | | |
| | | | Industrials—7.5% | |
| | 19,096 | | | Casella Waste Systems, Inc., Class A(b) | | | 712,663 | |
| | 3,777 | | | Chart Industries, Inc.(b) | | | 333,396 | |
| | 1,144 | | | Cintas Corp. | | | 248,408 | |
| | 780 | | | CoStar Group, Inc.(b) | | | 387,075 | |
| | 16,576 | | | Kratos Defense & Security Solutions, Inc.(b) | | | 263,227 | |
| | 5,302 | | | Mercury Systems, Inc.(b) | | | 387,152 | |
| | 2,154 | | | Old Dominion Freight Line, Inc. | | | 321,549 | |
| | 3,271 | | | Omega Flex, Inc. | | | 276,923 | |
| | 7,283 | | | SkyWest, Inc. | | | 448,560 | |
| | | | | | | | |
| | | | | | | 3,378,953 | |
| | | | | | | | |
| | | | Information Technology—27.9% | |
| | 1,101 | | | Adobe, Inc.(b) | | | 318,464 | |
| | 4,426 | | | Alarm.com Holdings, Inc.(b) | | | 313,715 | |
| | 4,460 | | | AppFolio, Inc., Class A(b) | | | 433,111 | |
| | 2,510 | | | Atlassian Corp. PLC, Class A(b) | | | 276,476 | |
| | 1,839 | | | Broadcom, Inc. | | | 585,538 | |
| | 7,015 | | | Cadence Design Systems, Inc.(b) | | | 486,701 | |
| | 2,720 | | | Coupa Software, Inc.(b) | | | 281,058 | |
| | 5,572 | | | Domo, Inc., Class B(b)(c) | | | 213,463 | |
| | 1,961 | | | Euronet Worldwide, Inc.(b) | | | 293,934 | |
| | 3,946 | | | Everbridge, Inc.(b) | | | 291,570 | |
| | 2,789 | | | Fiserv, Inc.(b) | | | 243,312 | |
| | 19,021 | | | Five9, Inc.(b) | | | 1,009,444 | |
| | 3,976 | | | Intuit, Inc. | | | 998,215 | |
| | 12,330 | | | LivePerson, Inc.(b) | | | 361,639 | |
| | 8,519 | | | Mimecast Ltd.(b) | | | 438,814 | |
| | 4,080 | | | MongoDB, Inc.(b)(c) | | | 574,954 | |
| | 6,157 | | | Novanta, Inc.(b) | | | 535,782 | |
| | 4,106 | | | NVIDIA Corp. | | | 743,186 | |
| | 2,970 | | | Okta, Inc.(b) | | | 308,969 | |
| | 3,671 | | | Proofpoint, Inc.(b) | | | 460,417 | |
| | 2,826 | | | Qualys, Inc.(b) | | | 255,075 | |
| | 5,095 | | | Rapid7, Inc.(b) | | | 276,862 | |
| | 4,006 | | | SS&C Technologies Holdings, Inc. | | | 271,046 | |
| | 3,825 | | | Trade Desk, Inc. (The), Class A(b) | | | 847,161 | |
| | 2,059 | | | Universal Display Corp.(c) | | | 328,616 | |
| | 9,780 | | | Upland Software, Inc.(b) | | | 454,672 | |
| | 3,257 | | | Wix.com Ltd. (Israel)(b) | | | 436,959 | |
See accompanying Notes to Financial Statements which are an integral part of the financial statements.
Invesco DWA NASDAQ Momentum ETF (DWAQ)(continued)
April 30, 2019
| | | | | | | | |
Number
of Shares | | | | | Value | |
| | | | Common Stocks & Other Equity Interests (continued) | |
| | | | Information Technology (continued) | |
| | 1,150 | | | Zebra Technologies Corp., Class A(b) | | $ | 242,811 | |
| | 3,499 | | | Zscaler, Inc.(b) | | | 239,017 | |
| | | | | | | | |
| | | | | | | 12,520,981 | |
| | | | | | | | |
| | | | Real Estate—1.2% | |
| | 4,901 | | | RMR Group, Inc. (The), Class A | | | 283,474 | |
| | 1,361 | | | SBA Communications Corp., Class A(b) | | | 277,276 | |
| | | | | | | | |
| | | | | | | 560,750 | |
| | | | | | | | |
| | | | Total Common Stocks & Other Equity Interests
(Cost $37,608,125) | | | 44,956,316 | |
| | | | | | | | |
| | |
| | | | | | | | |
| | | | Money Market Funds—0.3% | |
| | 137,292 | | | Invesco Premier U.S. Government Money Portfolio—Institutional Class, 2.32%(d)
(Cost $137,292) | | | 137,292 | |
| | | | | | | | |
| | |
| | | | Total Investments in Securities
(excluding investments purchased with cash collateral from securities on loan) (Cost $37,745,417)—100.3% | | | 45,093,608 | |
| | | | | | | | |
| | |
| | | | | | | | |
| | | | Investments Purchased with Cash Collateral from
Securities on Loan | |
| | |
| | | | | | | | |
| | | | Money Market Funds—6.4% | |
| | 2,147,115 | | | Invesco Government & Agency Portfolio— Institutional Class, 2.34%(d)(e) | | | 2,147,115 | |
| | 715,492 | | | Invesco Liquid Assets Portfolio—Institutional Class, 2.48%(d)(e) | | | 715,707 | |
| | | | | | | | |
| | |
| | | | Total Money Market Funds
(Cost $2,862,822) | | | 2,862,822 | |
| | | | | | | | |
| | |
| | | | Total Investments in Securities
(Cost $40,608,239)—106.7% | | | 47,956,430 | |
| | |
| | | | Other assets less liabilities—(6.7)% | | | (3,029,235 | ) |
| | | | | | | | |
| | |
| | | | Net Assets—100.0% | | $ | 44,927,195 | |
| | | | | | | | |
Notes to Schedule of Investments:
| (a) | Industry and/or sector classifications used in this report are generally according to the Global Industry Classification Standard, which was developed by and is the exclusive property and a service mark of MSCI Inc. and Standard & Poor’s. |
| (b) | Non-income producing security. |
| (c) | All or a portion of this security was out on loan at April 30, 2019. |
| (d) | The security and the Fund are advised by wholly-owned subsidiaries of Invesco Ltd. and are therefore considered to be affiliated. The rate shown is the7-day SEC standardized yield as of April 30, 2019. |
| (e) | The security has been segregated to satisfy the commitment to return the cash collateral received in securities lending transactions upon the borrower’s return of the securities loaned. See Note 2J. |
See accompanying Notes to Financial Statements which are an integral part of the financial statements.
Schedule of Investments(a)
Invesco Dynamic Market ETF (PWC)
April 30, 2019
| | | | | | | | |
Number
of Shares | | | | | Value | |
| | | | Common Stocks & Other Equity Interests—100.0% | |
| | | | Communication Services—9.7% | |
| | 5,392 | | | Madison Square Garden Co. (The), Class A(b) | | $ | 1,684,676 | |
| | 859,194 | | | Sprint Corp.(b) | | | 4,794,303 | |
| | 18,161 | | | Take-Two Interactive Software, Inc.(b) | | | 1,758,530 | |
| | 43,321 | | | Telephone & Data Systems, Inc. | | | 1,381,073 | |
| | 99,156 | | | Verizon Communications, Inc. | | | 5,670,732 | |
| | | | | | | | |
| | | | | | | 15,289,314 | |
| | | | | | | | |
| | | | Consumer Discretionary—11.3% | |
| | 29,140 | | | 1-800-Flowers.com, Inc., Class A(b) | | | 620,391 | |
| | 18,213 | | | Burlington Stores, Inc.(b) | | | 3,076,358 | |
| | 18,116 | | | Crocs, Inc.(b) | | | 504,531 | |
| | 3,553 | | | Deckers Outdoor Corp.(b) | | | 562,120 | |
| | 8,483 | | | Foot Locker, Inc. | | | 485,312 | |
| | 15,481 | | | Home Depot, Inc. (The) | | | 3,153,480 | |
| | 15,587 | | | K12, Inc.(b) | | | 469,480 | |
| | 7,804 | | | O’Reilly Automotive, Inc.(b) | | | 2,954,360 | |
| | 28,250 | | | Rent-A-Center, Inc.(b) | | | 704,272 | |
| | 3,542 | | | RH(b)(c) | | | 377,967 | |
| | 11,817 | | | Sleep Number Corp.(b) | | | 411,232 | |
| | 45,698 | | | Sonos, Inc.(b)(c) | | | 499,022 | |
| | 42,003 | | | Starbucks Corp. | | | 3,262,793 | |
| | 21,534 | | | YETI Holdings, Inc.(b)(c) | | | 768,333 | |
| | | | | | | | |
| | | | | | | 17,849,651 | |
| | | | | | | | |
| | | | Consumer Staples—7.5% | |
| | 4,328 | | | Casey’s General Stores, Inc. | | | 572,811 | |
| | 10,318 | | | Herbalife Nutrition Ltd.(b) | | | 545,306 | |
| | 7,887 | | | Inter Parfums, Inc. | | | 571,729 | |
| | 143,912 | | | Keurig Dr Pepper, Inc.(c) | | | 4,183,522 | |
| | 20,264 | | | Kroger Co. (The) | | | 522,406 | |
| | 3,598 | | | Lancaster Colony Corp. | | | 535,058 | |
| | 40,629 | | | Procter & Gamble Co. (The) | | | 4,326,176 | |
| | 33,227 | | | SpartanNash Co. | | | 537,281 | |
| | | | | | | | |
| | | | | | | 11,794,289 | |
| | | | | | | | |
| | | | Energy—5.7% | |
| | 19,718 | | | Cactus, Inc., Class A(b) | | | 715,763 | |
| | 90,032 | | | Gulfport Energy Corp.(b) | | | 589,710 | |
| | 199,374 | | | Laredo Petroleum, Inc.(b) | | | 602,109 | |
| | 51,657 | | | Marathon Petroleum Corp. | | | 3,144,362 | |
| | 34,502 | | | Phillips 66 | | | 3,252,503 | |
| | 26,938 | | | Renewable Energy Group, Inc.(b) | | | 649,745 | |
| | | | | | | | |
| | | | | | | 8,954,192 | |
| | | | | | | | |
| | | | Financials—14.9% | |
| | 52,708 | | | Aflac, Inc. | | | 2,655,429 | |
| | 13,299 | | | Assured Guaranty Ltd. | | | 634,362 | |
| | 133,615 | | | AXA Equitable Holdings, Inc. | | | 3,031,724 | |
| | 9,659 | | | BancFirst Corp. | | | 544,768 | |
| | 1,261 | | | Credit Acceptance Corp.(b) | | | 625,733 | |
| | 21,978 | | | Enova International, Inc.(b) | | | 602,857 | |
| | 48,194 | | | First BanCorp | | | 544,592 | |
| | 121,653 | | | Genworth Financial, Inc., Class A(b) | | | 461,065 | |
| | 13,383 | | | James River Group Holdings Ltd. | | | 565,030 | |
| | 7,202 | | | LPL Financial Holdings, Inc. | | | 533,596 | |
| | 42,064 | | | MGIC Investment Corp.(b) | | | 615,817 | |
| | 26,089 | | | OFG Bancorp | | | 526,476 | |
| | 9,756 | | | Popular, Inc. | | | 563,019 | |
| | | | | | | | |
Number
of Shares | | | | | Value | |
| | | | Common Stocks & Other Equity Interests
(continued) | |
| | | | Financials (continued) | |
| | 27,277 | | | Prudential Financial, Inc. | | $ | 2,883,452 | |
| | 31,087 | | | Raymond James Financial, Inc. | | | 2,846,637 | |
| | 81,102 | | | Synchrony Financial | | | 2,811,806 | |
| | 45,870 | | | TD Ameritrade Holding Corp. | | | 2,411,845 | |
| | 44,649 | | | Victory Capital Holdings, Inc., Class A(b) | | | 736,262 | |
| | | | | | | | |
| | | | | | | 23,594,470 | |
| | | | | | | | |
| | | | Health Care—14.0% | |
| | 28,843 | | | Allergan PLC | | | 4,239,921 | |
| | 4,846 | | | Amedisys, Inc.(b) | | | 619,416 | |
| | 21,240 | | | Amgen, Inc. | | | 3,808,757 | |
| | 34,074 | | | Arrowhead Pharmaceuticals, Inc.(b) | | | 612,651 | |
| | 26,117 | | | Bausch Health Cos. Inc.(b) | | | 603,042 | |
| | 53,221 | | | Baxter International, Inc. | | | 4,060,762 | |
| | 8,372 | | | BioTelemetry, Inc.(b) | | | 455,437 | |
| | 98,204 | | | Boston Scientific Corp.(b) | | | 3,645,332 | |
| | 11,464 | | | Ensign Group, Inc. (The) | | | 590,625 | |
| | 28,936 | | | Exelixis, Inc.(b) | | | 568,882 | |
| | 41,237 | | | Innoviva, Inc.(b) | | | 578,555 | |
| | 7,352 | | | National HealthCare Corp. | | | 554,561 | |
| | 20,744 | | | Principia Biopharma, Inc.(b) | | | 620,453 | |
| | 10,885 | | | SurModics, Inc.(b) | | | 472,844 | |
| | 5,914 | | | West Pharmaceutical Services, Inc. | | | 732,094 | |
| | | | | | | | |
| | | | | | | 22,163,332 | |
| | | | | | | | |
| | | | Industrials—10.1% | |
| | 9,859 | | | Alaska Air Group, Inc. | | | 610,272 | |
| | 16,416 | | | ArcBest Corp. | | | 501,673 | |
| | 5,073 | | | Carlisle Cos., Inc. | | | 717,424 | |
| | 10,840 | | | CSW Industrials, Inc.(b) | | | 649,858 | |
| | 5,122 | | | National Presto Industries, Inc.(c) | | | 545,493 | |
| | 23,046 | | | Navigant Consulting, Inc. | | | 526,140 | |
| | 55,747 | | | PACCAR, Inc. | | | 3,995,388 | |
| | 71,000 | | | Southwest Airlines Co. | | | 3,850,330 | |
| | 10,468 | | | Tetra Tech, Inc. | | | 677,489 | |
| | 43,404 | | | United Continental Holdings, Inc.(b) | | | 3,856,879 | |
| | | | | | | | |
| | | | | | | 15,930,946 | |
| | | | | | | | |
| | | | Information Technology—20.7% | |
| | 30,655 | | | Automatic Data Processing, Inc. | | | 5,039,375 | |
| | 40,650 | | | Canadian Solar, Inc. (Canada)(b)(c) | | | 812,187 | |
| | 6,867 | | | Euronet Worldwide, Inc.(b) | | | 1,029,295 | |
| | 31,826 | | | EVERTEC, Inc. | | | 996,472 | |
| | 16,049 | | | Fabrinet (Thailand)(b) | | | 971,285 | |
| | 183,664 | | | First Data Corp., Class A(b) | | | 4,749,551 | |
| | 197,876 | | | HP, Inc. | | | 3,947,626 | |
| | 15,807 | | | Insight Enterprises, Inc.(b) | | | 894,360 | |
| | 56,616 | | | Keysight Technologies, Inc.(b) | | | 4,927,291 | |
| | 17,436 | | | LiveRamp Holdings, Inc.(b) | | | 1,017,042 | |
| | 21,805 | | | PC Connection, Inc. | | | 810,274 | |
| | 43,960 | | | SecureWorks Corp., Class A(b)(c) | | | 853,703 | |
| | 8,468 | | | Tech Data Corp.(b) | | | 902,773 | |
| | 6,330 | | | Ubiquiti Networks, Inc. | | | 1,078,949 | |
| | 38,809 | | | Xilinx, Inc. | | | 4,662,513 | |
| | | | | | | | |
| | | | | | | 32,692,696 | |
| | | | | | | | |
| | | | Materials—2.8% | |
| | 39,538 | | | Eastman Chemical Co. | | | 3,118,758 | |
See accompanying Notes to Financial Statements which are an integral part of the financial statements.
Invesco Dynamic Market ETF (PWC)(continued)
April 30, 2019
| | | | | | | | |
Number
of Shares | | | | | Value | |
| | | | Common Stocks & Other Equity Interests (continued) | |
| | | | Materials (continued) | |
| | 56,140 | | | Resolute Forest Products, Inc. | | $ | 444,067 | |
| | 19,007 | | | Verso Corp., Class A(b) | | | 424,236 | |
| | 16,328 | | | Warrior Met Coal, Inc. | | | 506,168 | |
| | | | | | | | |
| | | | | | | 4,493,229 | |
| | | | | | | | |
| | | | Utilities—3.3% | | | |
| | 42,272 | | | AES Corp. (The) | | | 723,696 | |
| | 70,462 | | | Exelon Corp. | | | 3,590,039 | |
| | 37,740 | | | PG&E Corp.(b) | | | 849,905 | |
| | | | | | | | |
| | | | | | | 5,163,640 | |
| | | | | | | | |
| | | | Total Common Stocks & Other Equity Interests
(Cost $154,060,357) | | | 157,925,759 | |
| | | | | | | | |
| | |
| | | | | | | | |
| | | | Money Market Funds—0.1% | |
| | 175,671 | | | Invesco Premier U.S. Government Money Portfolio—Institutional Class, 2.32%(d)
(Cost $175,671) | | | 175,671 | |
| | | | | | | | |
| | |
| | | | Total Investments in Securities
(excluding investments purchased with cash collateral from securities on loan)
(Cost $154,236,028)—100.1% | | | 158,101,430 | |
| | | | | | | | |
| | |
| | | | | | | | |
| | | | Investments Purchased with Cash Collateral from
Securities on Loan | |
| | |
| | | | | | | | |
| | | | Money Market Funds—3.6% | |
| | 4,307,129 | | | Invesco Government & Agency Portfolio—Institutional Class, 2.34%(d)(e) | | | 4,307,129 | |
| | 1,435,280 | | | Invesco Liquid Assets Portfolio—Institutional Class, 2.48%(d)(e) | | | 1,435,710 | |
| | | | | | | | |
| | | | Total Money Market Funds
(Cost $5,742,839) | | | 5,742,839 | |
| | | | | | | | |
| | |
| | | | Total Investments in Securities
(Cost $159,978,867)—103.7% | | | 163,844,269 | |
| | |
| | | | Other assets less liabilities—(3.7)% | | | (5,869,517 | ) |
| | | | | | | | |
| | |
| | | | Net Assets—100.0% | | $ | 157,974,752 | |
| | | | | | | | |
Notes to Schedule of Investments:
| (a) | Industry and/or sector classifications used in this report are generally according to the Global Industry Classification Standard, which was developed by and is the exclusive property and a service mark of MSCI Inc. and Standard & Poor’s. |
| (b) | Non-income producing security. |
| (c) | All or a portion of this security was out on loan at April 30, 2019. |
| (d) | The security and the Fund are advised by wholly-owned subsidiaries of Invesco Ltd. and are therefore considered to be affiliated. The rate shown is the7-day SEC standardized yield as of April 30, 2019. |
| (e) | The security has been segregated to satisfy the commitment to return the cash collateral received in securities lending transactions upon the borrower’s return of the securities loaned. See Note 2J. |
See accompanying Notes to Financial Statements which are an integral part of the financial statements.
Schedule of Investments(a)
Invesco FTSE RAFI US 1000 ETF (PRF)
April 30, 2019
| | | | | | | | |
Number
of Shares | | | | | Value | |
| | | | Common Stocks & Other Equity Interests—100.0% | |
| | | | Communication Services—8.5% | | | |
| | 88,558 | | | Activision Blizzard, Inc. | | $ | 4,269,381 | |
| | 24,977 | | | Alphabet, Inc., Class A(b) | | | 29,946,424 | |
| | 25,375 | | | Alphabet, Inc., Class C(b) | | | 30,157,680 | |
| | 127,077 | | | Altice USA, Inc., Class A | | | 2,993,934 | |
| | 12,331 | | | AMC Networks, Inc., Class A(b) | | | 720,254 | |
| | 3,442,301 | | | AT&T, Inc. | | | 106,573,639 | |
| | 81,047 | | | CBS Corp., Class B | | | 4,155,280 | |
| | 905,921 | | | CenturyLink, Inc. | | | 10,345,618 | |
| | 32,740 | | | Charter Communications, Inc., Class A(b) | | | 12,152,761 | |
| | 32,792 | | | Cinemark Holdings, Inc. | | | 1,378,904 | |
| | 1,155,378 | | | Comcast Corp., Class A | | | 50,293,604 | |
| | 27,675 | | | Discovery, Inc., Class A(b) | | | 855,158 | |
| | 61,790 | | | Discovery, Inc., Class C(b) | | | 1,777,080 | |
| | 90,557 | | | DISH Network Corp., Class A(b) | | | 3,180,362 | |
| | 24,784 | | | Electronic Arts, Inc.(b) | | | 2,345,806 | |
| | 140,441 | | | Facebook, Inc., Class A(b) | | | 27,161,289 | |
| | 43,560 | | | Fox Corp., Class A(b) | | | 1,698,404 | |
| | 20,436 | | | Fox Corp., Class B(b) | | | 786,786 | |
| | 362,825 | | | Frontier Communications Corp.(b)(c) | | | 1,034,051 | |
| | 72,957 | | | Gannett Co., Inc. | | | 680,689 | |
| | 4,671 | | | IAC/InterActiveCorp.(b) | | | 1,050,228 | |
| | 107,466 | | | Interpublic Group of Cos., Inc. (The) | | | 2,471,718 | |
| | 3,268 | | | Liberty Broadband Corp., Class A(b) | | | 321,539 | |
| | 13,392 | | | Liberty Broadband Corp., Class C(b) | | | 1,321,924 | |
| | 265,570 | | | Liberty Global PLC, Class C
(United Kingdom)(b) | | | 6,944,656 | |
| | 102,340 | | | Liberty Global PLC, Series A (United Kingdom)(b) | | | 2,764,203 | |
| | 19,447 | | | Liberty Latin America Ltd., Class A (Chile)(b) | | | 407,026 | |
| | 51,257 | | | Liberty Latin America Ltd., Class C (Chile)(b) | | | 1,068,196 | |
| | 5,513 | | | Liberty Media Corp.-Liberty Formula One, Class A(b) | | | 208,171 | |
| | 44,148 | | | Liberty Media Corp.-Liberty Formula One, Series C(b) | | | 1,713,384 | |
| | 29,150 | | | Liberty Media Corp.-Liberty SiriusXM, Series A(b) | | | 1,164,251 | |
| | 57,320 | | | Liberty Media Corp.-Liberty SiriusXM, Series C(b) | | | 2,301,971 | |
| | 14,971 | | | Lions Gate Entertainment Corp., Class A | | | 218,427 | |
| | 30,209 | | | Lions Gate Entertainment Corp., Class B | | | 410,842 | |
| | 21,566 | | | Live Nation Entertainment, Inc.(b) | | | 1,409,122 | |
| | 12,252 | | | Meredith Corp. | | | 722,868 | |
| | 6,003 | | | Netflix, Inc.(b) | | | 2,224,352 | |
| | 145,074 | | | News Corp., Class A. | | | 1,801,819 | |
| | 45,766 | | | News Corp., Class B | | | 571,617 | |
| | 7,672 | | | Nexstar Media Group, Inc., Class A | | | 898,008 | |
| | 69,304 | | | Omnicom Group, Inc. | | | 5,546,399 | |
| | 24,974 | | | Sinclair Broadcast Group, Inc., Class A | | | 1,143,559 | |
| | 428,347 | | | Sprint Corp.(b) | | | 2,390,176 | |
| | 8,293 | | | Take-Two Interactive Software, Inc.(b) | | | 803,011 | |
| | 76,720 | | | TEGNA, Inc. | | | 1,221,382 | |
| | 49,500 | | | Telephone & Data Systems, Inc. | | | 1,578,060 | |
| | 81,112 | | | T-Mobile US, Inc.(b) | | | 5,920,365 | |
| | 33,267 | | | Tribune Media Co., Class A | | | 1,536,935 | |
| | 37,713 | | | Twitter, Inc.(b) | | | 1,505,126 | |
| | | | | | | | |
Number
of Shares | | | | | Value | |
| | | | Common Stocks & Other Equity Interests (continued) | |
| | | | Communication Services (continued) | | | |
| | 1,454,030 | | | Verizon Communications, Inc. | | $ | 83,155,976 | |
| | 190,402 | | | Viacom, Inc., Class B | | | 5,504,522 | |
| | 292,093 | | | Walt Disney Co. (The) | | | 40,007,978 | |
| | 21,558 | | | Yandex N.V., Class A (Russia)(b) | | | 806,916 | |
| | 39,384 | | | Zayo Group Holdings, Inc.(b) | | | 1,232,325 | |
| | | | | | | | |
| | | | | | | 474,854,156 | |
| | | | | | | | |
| | | | Consumer Discretionary—9.4% | | | |
| | 14,880 | | | Aaron’s, Inc. | | | 828,667 | |
| | 46,175 | | | Abercrombie & Fitch Co., Class A | | | 1,380,171 | |
| | 161,732 | | | Adient PLC | | | 3,736,009 | |
| | 12,501 | | | Advance Auto Parts, Inc. | | | 2,079,166 | |
| | 16,054 | | | Amazon.com, Inc.(b) | | | 30,928,352 | |
| | 85,600 | | | American Axle & Manufacturing Holdings, Inc.(b) | | | 1,262,600 | |
| | 51,967 | | | American Eagle Outfitters, Inc. | | | 1,235,775 | |
| | 49,221 | | | Aptiv PLC | | | 4,218,240 | |
| | 91,416 | | | Aramark | | | 2,841,209 | |
| | 17,090 | | | Asbury Automotive Group, Inc.(b) | | | 1,370,276 | |
| | 395,370 | | | Ascena Retail Group, Inc.(b) | | | 470,490 | |
| | 28,165 | | | Autoliv, Inc. (Sweden) | | | 2,210,671 | |
| | 66,559 | | | AutoNation, Inc.(b) | | | 2,790,819 | |
| | 3,798 | | | AutoZone, Inc.(b) | | | 3,905,521 | |
| | 163,451 | | | Bed Bath & Beyond, Inc.(c) | | | 2,731,266 | |
| | 110,598 | | | Best Buy Co., Inc. | | | 8,229,597 | |
| | 31,220 | | | Big Lots, Inc. | | | 1,160,135 | |
| | 32,614 | | | Bloomin’ Brands, Inc. | | | 651,954 | |
| | 3,567 | | | Booking Holdings, Inc.(b) | | | 6,616,749 | |
| | 62,425 | | | BorgWarner, Inc. | | | 2,607,492 | |
| | 18,569 | | | Brinker International, Inc. | | | 794,196 | |
| | 21,467 | | | Brunswick Corp. | | | 1,099,325 | |
| | 7,447 | | | Burlington Stores, Inc.(b) | | | 1,257,873 | |
| | 159,400 | | | Caesars Entertainment Corp.(b) | | | 1,491,984 | |
| | 43,349 | | | Capri Holdings Ltd.(b) | | | 1,910,824 | |
| | 62,300 | | | CarMax, Inc.(b) | | | 4,850,678 | |
| | 111,009 | | | Carnival Corp. | | | 6,089,954 | |
| | 10,162 | | | Carter’s, Inc. | | | 1,076,257 | |
| | 2,056 | | | Chipotle Mexican Grill, Inc.(b) | | | 1,414,610 | |
| | 26,075 | | | Cooper Tire & Rubber Co. | | | 778,600 | |
| | 14,323 | | | Cooper-Standard Holdings, Inc.(b) | | | 725,746 | |
| | 46,242 | | | Core-Mark Holding Co., Inc. | | | 1,680,897 | |
| | 5,068 | | | Cracker Barrel Old Country Store, Inc.(c) | | | 855,174 | |
| | 76,477 | | | D.R. Horton, Inc. | | | 3,388,696 | |
| | 73,085 | | | Dana, Inc. | | | 1,425,158 | |
| | 22,995 | | | Darden Restaurants, Inc. | | | 2,704,212 | |
| | 65,466 | | | Delphi Technologies PLC | | | 1,448,763 | |
| | 25,393 | | | Designer Brands Inc., Class A | | | 564,994 | |
| | 36,246 | | | Dick’s Sporting Goods, Inc. | | | 1,341,102 | |
| | 44,101 | | | Dollar General Corp. | | | 5,560,695 | |
| | 51,822 | | | Dollar Tree, Inc.(b) | | | 5,766,752 | |
| | 2,735 | | | Domino’s Pizza, Inc. | | | 740,036 | |
| | 10,122 | | | Dunkin’ Brands Group, Inc. | | | 755,405 | |
| | 119,457 | | | eBay, Inc. | | | 4,628,959 | |
| | 16,333 | | | Expedia Group, Inc. | | | 2,120,677 | |
| | 58,784 | | | Extended Stay America, Inc. | | | 1,052,821 | |
| | 38,136 | | | Foot Locker, Inc. | | | 2,181,761 | |
| | 4,601,444 | | | Ford Motor Co. | | | 48,085,090 | |
See accompanying Notes to Financial Statements which are an integral part of the financial statements.
Invesco FTSE RAFI US 1000 ETF (PRF)(continued)
April 30, 2019
| | | | | | | | |
Number
of Shares | | | | | Value | |
| | | | Common Stocks & Other Equity Interests (continued) | |
| | | | Consumer Discretionary (continued) | | | |
| | 52,961 | | | Fossil Group, Inc.(b) | | $ | 692,200 | |
| | 196,543 | | | GameStop Corp., Class A(c) | | | 1,700,097 | |
| | 111,733 | | | Gap, Inc. (The) | | | 2,913,997 | |
| | 22,425 | | | Garmin Ltd. | | | 1,922,719 | |
| | 48,863 | | | Garrett Motion, Inc. (Switzerland)(b) | | | 918,624 | |
| | 904,369 | | | General Motors Co. | | | 35,225,173 | |
| | 15,671 | | | Genesco, Inc.(b) | | | 702,218 | |
| | 56,753 | | | Gentex Corp. | | | 1,307,022 | |
| | 38,829 | | | Genuine Parts Co. | | | 3,981,526 | |
| | 223,709 | | | Goodyear Tire & Rubber Co. (The) | | | 4,297,450 | |
| | 1,189 | | | Graham Holdings Co., Class B | | | 883,938 | |
| | 24,666 | | | Group 1 Automotive, Inc. | | | 1,931,594 | |
| | 71,426 | | | H&R Block, Inc. | | | 1,943,501 | |
| | 91,607 | | | Hanesbrands, Inc. | | | 1,655,338 | |
| | 71,628 | | | Harley-Davidson, Inc. | | | 2,666,710 | |
| | 23,017 | | | Hasbro, Inc. | | | 2,344,512 | |
| | 23,049 | | | Hilton Worldwide Holdings, Inc. | | | 2,005,033 | |
| | 156,794 | | | Home Depot, Inc. (The) | | | 31,938,938 | |
| | 10,163 | | | Hyatt Hotels Corp., Class A | | | 779,807 | |
| | 57,998 | | | International Game Technology PLC | | | 848,511 | |
| | 1,497,764 | | | J.C. Penney Co., Inc.(b)(c) | | | 2,051,937 | |
| | 29,801 | | | KB Home | | | 772,144 | |
| | 85,967 | | | Kohl’s Corp. | | | 6,112,254 | |
| | 177,483 | | | L Brands, Inc. | | | 4,550,664 | |
| | 89,033 | | | Las Vegas Sands Corp. | | | 5,969,663 | |
| | 24,997 | | | Lear Corp. | | | 3,574,571 | |
| | 32,978 | | | Leggett & Platt, Inc. | | | 1,298,014 | |
| | 55,361 | | | Lennar Corp., Class A | | | 2,880,433 | |
| | 18,505 | | | Liberty Expedia Holdings, Inc., Series A(b) | | | 859,002 | |
| | 15,510 | | | Lithia Motors, Inc., Class A | | | 1,760,695 | |
| | 98,221 | | | LKQ Corp.(b) | | | 2,956,452 | |
| | 150,332 | | | Lowe’s Cos., Inc. | | | 17,008,562 | |
| | 5,108 | | | lululemon athletica, Inc.(b) | | | 900,796 | |
| | 299,533 | | | Macy’s, Inc. | | | 7,051,007 | |
| | 30,505 | | | Marriott International, Inc., Class A | | | 4,161,492 | |
| | 214,305 | | | Mattel, Inc.(b)(c) | | | 2,612,378 | |
| | 114,210 | | | McDonald’s Corp. | | | 22,564,470 | |
| | 18,736 | | | Meritage Homes Corp.(b) | | | 958,346 | |
| | 124,906 | | | MGM Resorts International | | | 3,326,247 | |
| | 63,954 | | | Michaels Cos., Inc. (The)(b) | | | 718,843 | |
| | 22,724 | | | Mohawk Industries, Inc.(b) | | | 3,096,145 | |
| | 27,985 | | | Murphy USA, Inc.(b) | | | 2,391,878 | |
| | 256,913 | | | Newell Brands, Inc. | | | 3,694,409 | |
| | 112,331 | | | NIKE, Inc., Class B | | | 9,866,032 | |
| | 68,391 | | | Nordstrom, Inc. | | | 2,805,399 | |
| | 51,059 | | | Norwegian Cruise Line Holdings
Ltd.(b) | | | 2,879,217 | |
| | 589 | | | NVR, Inc.(b) | | | 1,856,811 | |
| | 545,127 | | | Office Depot, Inc. | | | 1,308,305 | |
| | 7,053 | | | O’Reilly Automotive, Inc.(b) | | | 2,670,054 | |
| | 31,769 | | | Penn National Gaming, Inc.(b) | | | 688,434 | |
| | 29,052 | | | Penske Automotive Group, Inc. | | | 1,334,068 | |
| | 17,869 | | | Polaris Industries, Inc. | | | 1,722,572 | |
| | 80,598 | | | PulteGroup, Inc. | | | 2,535,613 | |
| | 21,079 | | | PVH Corp. | | | 2,718,980 | |
| | 183,075 | | | Qurate Retail, Inc.(b) | | | 3,121,429 | |
| | 13,282 | | | Ralph Lauren Corp. | | | 1,747,646 | |
| | 38,262 | | | Ross Stores, Inc. | | | 3,736,667 | |
| | | | | | | | |
Number
of Shares | | | | | Value | |
| | | | Common Stocks & Other Equity Interests (continued) | |
| | | | Consumer Discretionary (continued) | | | |
| | 33,101 | | | Royal Caribbean Cruises Ltd. | | $ | 4,003,235 | |
| | 58,085 | | | Sally Beauty Holdings, Inc.(b) | | | 1,028,105 | |
| | 27,989 | | | Service Corp. International | | | 1,164,622 | |
| | 18,031 | | | ServiceMaster Global Holdings,
Inc.(b) | | | 884,060 | |
| | 68,144 | | | Signet Jewelers Ltd. | | | 1,579,578 | |
| | 17,684 | | | Six Flags Entertainment Corp. | | | 938,844 | |
| | 27,660 | | | Skechers U.S.A., Inc., Class A(b) | | | 875,716 | |
| | 125,666 | | | Starbucks Corp. | | | 9,761,735 | |
| | 83,632 | | | Tapestry, Inc. | | | 2,698,805 | |
| | 261,010 | | | Target Corp. | | | 20,207,394 | |
| | 62,090 | | | Taylor Morrison Home Corp.,
Class A(b) | | | 1,202,062 | |
| | 11,862 | | | Tempur Sealy International, Inc.(b) | | | 728,327 | |
| | 26,386 | | | Tenneco, Inc., Class A | | | 578,381 | |
| | 4,838 | | | Tesla, Inc.(b)(c) | | | 1,154,782 | |
| | 17,667 | | | Thor Industries, Inc. | | | 1,163,725 | |
| | 24,524 | | | Tiffany & Co. | | | 2,644,178 | |
| | 182,123 | | | TJX Cos., Inc. (The) | | | 9,994,910 | |
| | 37,149 | | | Toll Brothers, Inc. | | | 1,415,377 | |
| | 17,993 | | | Tractor Supply Co. | | | 1,862,275 | |
| | 64,080 | | | TRI Pointe Group, Inc.(b) | | | 836,244 | |
| | 33,727 | | | Tupperware Brands Corp. | | | 802,703 | |
| | 4,951 | | | Ulta Beauty, Inc.(b) | | | 1,727,800 | |
| | 27,033 | | | Under Armour, Inc., Class A(b) | | | 624,192 | |
| | 28,037 | | | Under Armour, Inc., Class C(b) | | | 580,927 | |
| | 26,688 | | | Urban Outfitters, Inc.(b) | | | 793,434 | |
| | 5,112 | | | Vail Resorts, Inc. | | | 1,169,881 | |
| | 47,099 | | | VF Corp. | | | 4,446,617 | |
| | 23,970 | | | Visteon Corp.(b) | | | 1,582,499 | |
| | 35,010 | | | Whirlpool Corp. | | | 4,860,088 | |
| | 28,533 | | | Williams-Sonoma, Inc.(c) | | | 1,631,232 | |
| | 20,214 | | | Wyndham Destinations, Inc. | | | 880,522 | |
| | 16,085 | | | Wyndham Hotels & Resorts, Inc. | | | 896,256 | |
| | 23,161 | | | Wynn Resorts, Ltd. | | | 3,345,606 | |
| | 39,375 | | | Yum China Holdings, Inc. (China) | | | 1,871,887 | |
| | 50,473 | | | Yum! Brands, Inc. | | | 5,268,876 | |
| | | | | | | | |
| | | | | | | 523,171,810 | |
| | | | | | | | |
| | | | Consumer Staples—8.4% | | | |
| | 517,676 | | | Altria Group, Inc. | | | 28,125,337 | |
| | 350,401 | | | Archer-Daniels-Midland Co. | | | 15,627,885 | |
| | 492,336 | | | Avon Products, Inc.
(United Kingdom)(b) | | | 1,565,628 | |
| | 26,689 | | | B&G Foods, Inc.(c) | | | 693,914 | |
| | 74,291 | | | BJs Wholesale Club Holdings, Inc.(b) | | | 2,106,150 | |
| | 37,565 | | | Brown-Forman Corp., Class B | | | 2,001,839 | |
| | 156,498 | | | Bunge Ltd. | | | 8,202,060 | |
| | 59,217 | | | Campbell Soup Co. | | | 2,291,106 | |
| | 10,834 | | | Casey’s General Stores, Inc. | | | 1,433,880 | |
| | 28,380 | | | Church & Dwight Co., Inc. | | | 2,127,081 | |
| | 18,222 | | | Clorox Co. (The) | | | 2,910,600 | |
| | 684,882 | | | Coca-Cola Co. (The) | | | 33,600,311 | |
| | 36,148 | | | Coca-Cola European Partners PLC (United Kingdom) | | | 1,937,171 | |
| | 133,587 | | | Colgate-Palmolive Co. | | | 9,723,798 | |
| | 139,662 | | | Conagra Brands, Inc. | | | 4,298,796 | |
| | 19,369 | | | Constellation Brands, Inc., Class A | | | 4,099,836 | |
| | 118,433 | | | Costco Wholesale Corp. | | | 29,078,854 | |
| | 150,207 | | | Coty, Inc., Class A(c) | | | 1,625,240 | |
See accompanying Notes to Financial Statements which are an integral part of the financial statements.
Invesco FTSE RAFI US 1000 ETF (PRF)(continued)
April 30, 2019
| | | | | | | | |
Number
of Shares | | | | | Value | |
| | | | Common Stocks & Other Equity Interests (continued) | |
| | | | Consumer Staples (continued) | | | |
| | 58,467 | | | Darling Ingredients, Inc.(b) | | $ | 1,275,165 | |
| | 216,166 | | | Dean Foods Co. | | | 367,482 | |
| | 19,013 | | | Edgewell Personal Care Co.(b) | | | 783,906 | |
| | 17,592 | | | Estee Lauder Cos., Inc. (The), Class A | | | 3,022,482 | |
| | 52,459 | | | Flowers Foods, Inc. | | | 1,140,459 | |
| | 190,164 | | | General Mills, Inc. | | | 9,787,741 | |
| | 13,248 | | | Herbalife Nutrition Ltd.(b) | | | 700,157 | |
| | 22,103 | | | Hershey Co. (The) | | | 2,759,560 | |
| | 41,171 | | | Hormel Foods Corp. | | | 1,644,370 | |
| | 22,678 | | | Ingredion, Inc. | | | 2,148,740 | |
| | 36,211 | | | JM Smucker Co. (The) | | | 4,440,555 | |
| | 72,216 | | | Kellogg Co. | | | 4,354,625 | |
| | 76,807 | | | Kimberly-Clark Corp. | | | 9,860,483 | |
| | 233,496 | | | Kraft Heinz Co. (The) | | | 7,761,407 | |
| | 606,091 | | | Kroger Co. (The) | | | 15,625,026 | |
| | 11,862 | | | Lamb Weston Holdings, Inc. | | | 830,933 | |
| | 14,765 | | | McCormick & Co., Inc. | | | 2,273,367 | |
| | 64,152 | | | Molson Coors Brewing Co., Class B | | | 4,117,917 | |
| | 294,877 | | | Mondelez International, Inc., Class A | | | 14,994,495 | |
| | 24,672 | | | Monster Beverage Corp.(b) | | | 1,470,451 | |
| | 48,034 | | | Nomad Foods Ltd.
(United Kingdom)(b) | | | 999,107 | |
| | 14,274 | | | Nu Skin Enterprises, Inc., Class A | | | 726,118 | |
| | 267,774 | | | PepsiCo, Inc. | | | 34,288,461 | |
| | 52,054 | | | Performance Food Group Co.(b) | | | 2,131,611 | |
| | 400,687 | | | Philip Morris International, Inc. | | | 34,683,467 | |
| | 13,261 | | | Post Holdings, Inc.(b) | | | 1,495,576 | |
| | 522,496 | | | Procter & Gamble Co. (The) | | | 55,635,374 | |
| | 119,316 | | | Rite Aid Corp.(b)(c) | | | 1,092,935 | |
| | 6,727 | | | Sanderson Farms, Inc. | | | 1,020,015 | |
| | 20,423 | | | Spectrum Brands Holdings, Inc. | | | 1,257,444 | |
| | 35,642 | | | Sprouts Farmers Market, Inc.(b) | | | 763,452 | |
| | 130,983 | | | Sysco Corp. | | | 9,217,274 | |
| | 20,034 | | | TreeHouse Foods, Inc.(b) | | | 1,341,877 | |
| | 104,848 | | | Tyson Foods, Inc., Class A | | | 7,864,648 | |
| | 112,997 | | | United Natural Foods, Inc.(b) | | | 1,459,921 | |
| | 13,064 | | | Universal Corp. | | | 703,627 | |
| | 129,372 | | | US Foods Holding Corp.(b) | | | 4,728,547 | |
| | 275,190 | | | Walgreens Boots Alliance, Inc. | | | 14,741,928 | |
| | 530,478 | | | Walmart, Inc. | | | 54,554,358 | |
| | | | | | | | |
| | | | | | | 469,514,547 | |
| | | | | | | | |
| | | | Energy—8.6% | |
| | 145,181 | | | Anadarko Petroleum Corp. | | | 10,576,436 | |
| | 232,404 | | | Antero Resources Corp.(b) | | | 1,684,929 | |
| | 99,160 | | | Apache Corp. | | | 3,263,356 | |
| | 389,972 | | | Baker Hughes, a GE Co., Class A | | | 9,367,127 | |
| | 43,173 | | | Cabot Oil & Gas Corp. | | | 1,117,749 | |
| | 715,408 | | | Chesapeake Energy Corp.(b)(c) | | | 2,081,837 | |
| | 700,581 | | | Chevron Corp. | | | 84,111,755 | |
| | 11,530 | | | Cimarex Energy Co. | | | 791,650 | |
| | 98,033 | | | CNX Resources Corp.(b) | | | 878,376 | |
| | 26,776 | | | Concho Resources, Inc. | | | 3,089,415 | |
| | 343,173 | | | ConocoPhillips | | | 21,661,080 | |
| | 14,428 | | | Continental Resources, Inc.(b) | | | 663,544 | |
| | 99,882 | | | Cosan Ltd., Class A (Brazil) | | | 1,220,558 | |
| | 32,465 | | | Delek US Holdings, Inc. | | | 1,203,153 | |
| | 142,638 | | | Devon Energy Corp. | | | 4,584,385 | |
| | | | | | | | |
Number
of Shares | | | | | Value | |
| | | | Common Stocks & Other Equity Interests (continued) | |
| | | | Energy (continued) | |
| | 86,627 | | | Diamond Offshore Drilling, Inc.(b)(c) | | $ | 841,148 | |
| | 13,499 | | | Diamondback Energy, Inc. | | | 1,436,159 | |
| | 223,199 | | | Ensco Rowan PLC, Class A | | | 3,118,090 | |
| | 74,935 | | | EOG Resources, Inc. | | | 7,197,507 | |
| | 87,155 | | | EQT Corp. | | | 1,782,320 | |
| | 1,643,256 | | | Exxon Mobil Corp. | | | 131,920,592 | |
| | 86,506 | | | Gulfport Energy Corp.(b) | | | 566,614 | |
| | 233,583 | | | Halliburton Co. | | | 6,617,406 | |
| | 42,340 | | | Helmerich & Payne, Inc. | | | 2,477,737 | |
| | 75,520 | | | Hess Corp. | | | 4,842,342 | |
| | 73,627 | | | HollyFrontier Corp. | | | 3,514,217 | |
| | 762,146 | | | Kinder Morgan, Inc. | | | 15,143,841 | |
| | 316,874 | | | Marathon Oil Corp. | | | 5,399,533 | |
| | 237,266 | | | Marathon Petroleum Corp. | | | 14,442,381 | |
| | 117,607 | | | McDermott International, Inc.(b) | | | 951,441 | |
| | 89,481 | | | Murphy Oil Corp. | | | 2,437,462 | |
| | 480,590 | | | Nabors Industries Ltd. | | | 1,682,065 | |
| | 199,250 | | | National Oilwell Varco, Inc. | | | 5,208,395 | |
| | 713,091 | | | Noble Corp. PLC(b) | | | 1,875,429 | |
| | 163,857 | | | Noble Energy, Inc. | | | 4,433,970 | |
| | 185,992 | | | Oasis Petroleum, Inc.(b) | | | 1,134,551 | |
| | 224,189 | | | Occidental Petroleum Corp. | | | 13,200,248 | |
| | 74,115 | | | Oceaneering International, Inc.(b) | | | 1,423,008 | |
| | 69,919 | | | ONEOK, Inc. | | | 4,749,598 | |
| | 52,622 | | | Parsley Energy, Inc., Class A(b) | | | 1,050,335 | |
| | 93,674 | | | Patterson-UTI Energy, Inc. | | | 1,273,030 | |
| | 86,786 | | | PBF Energy, Inc., Class A | | | 2,914,274 | |
| | 20,942 | | | PDC Energy, Inc.(b) | | | 910,768 | |
| | 32,240 | | | Peabody Energy Corp. | | | 927,545 | |
| | 209,634 | | | Phillips 66 | | | 19,762,197 | |
| | 22,555 | | | Pioneer Natural Resources Co. | | | 3,754,505 | |
| | 144,067 | | | QEP Resources, Inc.(b) | | | 1,083,384 | |
| | 128,824 | | | Range Resources Corp. | | | 1,164,569 | |
| | 509,377 | | | Schlumberger Ltd. | | | 21,740,210 | |
| | 45,666 | | | SemGroup Corp., Class A | | | 596,398 | |
| | 52,865 | | | SM Energy Co. | | | 842,139 | |
| | 72,494 | | | Targa Resources Corp. | | | 2,910,634 | |
| | 434,200 | | | Transocean Ltd.(b) | | | 3,412,812 | |
| | 255,512 | | | Valero Energy Corp. | | | 23,164,718 | |
| | 1,906,438 | | | Weatherford International PLC(b) | | | 1,054,832 | |
| | 42,511 | | | Whiting Petroleum Corp.(b) | | | 1,164,376 | |
| | 302,406 | | | Williams Cos., Inc. (The) | | | 8,567,162 | |
| | 64,574 | | | World Fuel Services Corp. | | | 1,992,108 | |
| | 102,048 | | | WPX Energy, Inc.(b) | | | 1,417,447 | |
| | | | | | | | |
| | | | | | | 482,394,847 | |
| | | | | | | | |
| |
| | | | Financials—19.3% | |
| | 13,233 | | | Affiliated Managers Group, Inc. | | | 1,467,804 | |
| | 229,991 | | | Aflac, Inc. | | | 11,586,947 | |
| | 159,663 | | | AGNC Investment Corp. | | | 2,840,405 | |
| | 4,876 | | | Alleghany Corp.(b) | | | 3,202,947 | |
| | 122,545 | | | Allstate Corp. (The) | | | 12,139,308 | |
| | 233,198 | | | Ally Financial, Inc. | | | 6,928,313 | |
| | 38,585 | | | American Equity Investment Life Holding Co. | | | 1,134,785 | |
| | 128,339 | | | American Express Co. | | | 15,045,181 | |
| | 25,965 | | | American Financial Group, Inc. | | | 2,688,156 | |
See accompanying Notes to Financial Statements which are an integral part of the financial statements.
Invesco FTSE RAFI US 1000 ETF (PRF)(continued)
April 30, 2019
| | | | | | | | |
Number
of Shares | | | | | Value | |
| | | | Common Stocks & Other Equity Interests (continued) | |
| | | | Financials (continued) | |
| | 629,668 | | | American International Group, Inc. | | $ | 29,953,307 | |
| | 41,048 | | | Ameriprise Financial, Inc. | | | 6,024,615 | |
| | 501,674 | | | Annaly Capital Management, Inc. | | | 5,061,891 | |
| | 25,122 | | | Aon PLC | | | 4,525,477 | |
| | 94,558 | | | Arch Capital Group Ltd.(b) | | | 3,194,169 | |
| | 30,806 | | | Arthur J. Gallagher & Co. | | | 2,575,998 | |
| | 44,379 | | | Associated Banc-Corp | | | 1,006,960 | |
| | 20,887 | | | Assurant, Inc. | | | 1,984,265 | |
| | 49,916 | | | Assured Guaranty Ltd. | | | 2,380,993 | |
| | 63,676 | | | Athene Holding Ltd., Class A(b) | | | 2,875,608 | |
| | 115,124 | | | AXA Equitable Holdings, Inc. | | | 2,612,164 | |
| | 33,689 | | | Axis Capital Holdings Ltd. | | | 1,915,220 | |
| | 2,278,763 | | | Bank of America Corp. | | | 69,684,573 | |
| | 8,601 | | | Bank of Hawaii Corp. | | | 708,550 | |
| | 239,609 | | | Bank of New York Mellon Corp. (The) | | | 11,898,983 | |
| | 27,469 | | | Bank OZK | | | 896,863 | |
| | 31,016 | | | BankUnited, Inc. | | | 1,134,565 | |
| | 210,858 | | | BB&T Corp. | | | 10,795,930 | |
| | 521,503 | | | Berkshire Hathaway, Inc., Class B(b) | | | 113,014,915 | |
| | 25,520 | | | BlackRock, Inc. | | | 12,383,325 | |
| | 27,995 | | | Blackstone Mortgage Trust, Inc., Class A | | | 996,342 | |
| | 92,076 | | | Brighthouse Financial, Inc.(b) | | | 3,847,856 | |
| | 32,717 | | | Brown & Brown, Inc. | | | 1,038,765 | |
| | 254,877 | | | Capital One Financial Corp. | | | 23,660,232 | |
| | 11,162 | | | Cboe Global Markets, Inc. | | | 1,134,171 | |
| | 117,887 | | | Charles Schwab Corp. (The) | | | 5,396,867 | |
| | 15,014 | | | Chemical Financial Corp. | | | 659,565 | |
| | 89,565 | | | Chimera Investment Corp. | | | 1,716,961 | |
| | 123,409 | | | Chubb Ltd. | | | 17,918,987 | |
| | 38,508 | | | Cincinnati Financial Corp. | | | 3,703,699 | |
| | 49,158 | | | CIT Group, Inc. | | | 2,618,647 | |
| | 949,047 | | | Citigroup, Inc. | | | 67,097,623 | |
| | 173,455 | | | Citizens Financial Group, Inc. | | | 6,279,071 | |
| | 46,496 | | | CME Group, Inc., Class A | | | 8,318,134 | |
| | 106,359 | | | CNO Financial Group, Inc. | | | 1,760,241 | |
| | 31,769 | | | Comerica, Inc. | | | 2,496,726 | |
| | 16,042 | | | Commerce Bancshares, Inc. | | | 969,418 | |
| | 11,503 | | | Cullen/Frost Bankers, Inc. | | | 1,169,740 | |
| | 106,250 | | | Discover Financial Services | | | 8,658,312 | |
| | 47,017 | | | E*TRADE Financial Corp. | | | 2,381,881 | |
| | 27,609 | | | East West Bancorp, Inc. | | | 1,421,311 | |
| | 25,721 | | | Eaton Vance Corp. | | | 1,069,222 | |
| | 14,709 | | | Everest Re Group, Ltd. | | | 3,463,969 | |
| | 104,128 | | | F.N.B. Corp. | | | 1,263,073 | |
| | 28,340 | | | Federated Investors, Inc., Class B | | | 870,888 | |
| | 68,558 | | | Fidelity National Financial, Inc. | | | 2,738,892 | |
| | 266,916 | | | Fifth Third Bancorp | | | 7,692,519 | |
| | 34,471 | | | First American Financial Corp. | | | 1,966,915 | |
| | 25,271 | | | First Hawaiian, Inc. | | | 698,743 | |
| | 73,608 | | | First Horizon National Corp. | | | 1,110,745 | |
| | 22,031 | | | First Republic Bank | | | 2,326,914 | |
| | 118,725 | | | Franklin Resources, Inc. | | | 4,106,698 | |
| | 47,741 | | | Fulton Financial Corp. | | | 823,532 | |
| | 641,640 | | | Genworth Financial, Inc., Class A(b) | | | 2,431,816 | |
| | 126,633 | | | Goldman Sachs Group, Inc. (The) | | | 26,076,267 | |
| | 24,167 | | | Hancock Whitney Corp. | | | 1,057,065 | |
| | 13,034 | | | Hanover Insurance Group, Inc. (The) | | | 1,572,031 | |
| | | | | | | | |
Number
of Shares | | | | | Value | |
| | | | Common Stocks & Other Equity Interests (continued) | |
| | | | Financials (continued) | |
| | 158,599 | | | Hartford Financial Services Group, Inc. (The) | | $ | 8,296,314 | |
| | 257,124 | | | Huntington Bancshares, Inc. | | | 3,579,166 | |
| | 12,328 | | | IBERIABANK Corp. | | | 980,076 | |
| | 66,632 | | | Intercontinental Exchange, Inc. | | | 5,420,513 | |
| | 224,813 | | | Invesco Ltd.(d) | | | 4,939,142 | |
| | 55,602 | | | Invesco Mortgage Capital, Inc.(d) | | | 907,425 | |
| | 64,376 | | | Investors Bancorp, Inc. | | | 756,418 | |
| | 70,584 | | | Janus Henderson Group PLC (United Kingdom) | | | 1,769,541 | |
| | 144,675 | | | Jefferies Financial Group, Inc. | | | 2,975,965 | |
| | 903,601 | | | JPMorgan Chase & Co. | | | 104,862,896 | |
| | 9,338 | | | Kemper Corp. | | | 839,299 | |
| | 273,939 | | | KeyCorp | | | 4,807,629 | |
| | 46,656 | | | Legg Mason, Inc. | | | 1,560,643 | |
| | 95,508 | | | Lincoln National Corp. | | | 6,372,294 | |
| | 122,851 | | | Loews Corp. | | | 6,301,028 | |
| | 15,961 | | | LPL Financial Holdings, Inc. | | | 1,182,550 | |
| | 33,702 | | | M&T Bank Corp. | | | 5,731,699 | |
| | 3,199 | | | Markel Corp.(b) | | | 3,427,760 | |
| | 72,993 | | | Marsh & McLennan Cos., Inc. | | | 6,882,510 | |
| | 459,827 | | | MetLife, Inc. | | | 21,211,819 | |
| | 153,758 | | | MFA Financial, Inc. | | | 1,154,723 | |
| | 93,132 | | | MGIC Investment Corp.(b) | | | 1,363,452 | |
| | 11,426 | | | Moody’s Corp. | | | 2,246,580 | |
| | 427,297 | | | Morgan Stanley | | | 20,617,080 | |
| | 4,178 | | | MSCI, Inc. | | | 941,638 | |
| | 18,270 | | | Nasdaq, Inc. | | | 1,684,494 | |
| | 276,897 | | | Navient Corp. | | | 3,740,878 | |
| | 127,518 | | | New Residential Investment Corp. | | | 2,143,578 | |
| | 236,036 | | | New York Community Bancorp, Inc. | | | 2,745,099 | |
| | 41,816 | | | Northern Trust Corp. | | | 4,120,967 | |
| | 118,690 | | | Old Republic International Corp. | | | 2,653,908 | |
| | 36,211 | | | OneMain Holdings, Inc. | | | 1,230,088 | |
| | 41,281 | | | PacWest Bancorp | | | 1,632,664 | |
| | 37,771 | | | PennyMac Mortgage Investment Trust | | | 793,191 | |
| | 115,808 | | | People’s United Financial, Inc. | | | 2,002,320 | |
| | 12,797 | | | Pinnacle Financial Partners, Inc. | | | 743,122 | |
| | 133,897 | | | PNC Financial Services Group, Inc. (The) | | | 18,334,516 | |
| | 27,123 | | | Popular, Inc. | | | 1,565,268 | |
| | 6,866 | | | Primerica, Inc. | | | 894,571 | |
| | 118,567 | | | Principal Financial Group, Inc. | | | 6,777,290 | |
| | 27,205 | | | ProAssurance Corp. | | | 1,021,004 | |
| | 100,246 | | | Progressive Corp. (The) | | | 7,834,225 | |
| | 14,960 | | | Prosperity Bancshares, Inc. | | | 1,101,654 | |
| | 230,610 | | | Prudential Financial, Inc. | | | 24,377,783 | |
| | 41,511 | | | Radian Group, Inc. | | | 972,188 | |
| | 25,735 | | | Raymond James Financial, Inc. | | | 2,356,554 | |
| | 339,582 | | | Regions Financial Corp. | | | 5,273,708 | |
| | 25,455 | | | Reinsurance Group of America, Inc. | | | 3,856,687 | |
| | 9,036 | | | RenaissanceRe Holdings Ltd. (Bermuda) | | | 1,403,833 | |
| | 16,782 | | | S&P Global, Inc. | | | 3,703,116 | |
| | 60,071 | | | Santander Consumer USA Holdings, Inc. | | | 1,282,516 | |
| | 13,971 | | | SEI Investments Co. | | | 760,721 | |
| | 11,878 | | | Selective Insurance Group, Inc. | | | 847,020 | |
| | 10,767 | | | Signature Bank | | | 1,421,998 | |
| | 84,495 | | | SLM Corp. | | | 858,469 | |
See accompanying Notes to Financial Statements which are an integral part of the financial statements.
Invesco FTSE RAFI US 1000 ETF (PRF)(continued)
April 30, 2019
| | | | | | | | |
Number
of Shares | | | | | Value | |
| | | | Common Stocks & Other Equity Interests (continued) | |
| | | | Financials (continued) | |
| | 92,889 | | | Starwood Property Trust, Inc. | | $ | 2,141,091 | |
| | 108,896 | | | State Street Corp. | | | 7,367,903 | |
| | 41,387 | | | Sterling Bancorp. | | | 886,510 | |
| | 20,044 | | | Stifel Financial Corp. | | | 1,196,025 | |
| | 125,893 | | | SunTrust Banks, Inc. | | | 8,243,474 | |
| | 7,830 | | | SVB Financial Group(b) | | | 1,970,968 | |
| | 277,886 | | | Synchrony Financial. | | | 9,634,308 | |
| | 25,694 | | | Synovus Financial Corp. | | | 947,081 | |
| | 47,426 | | | T. Rowe Price Group, Inc. | | | 5,098,295 | |
| | 43,175 | | | TCF Financial Corp. | | | 955,463 | |
| | 33,497 | | | TD Ameritrade Holding Corp. | | | 1,761,272 | |
| | 12,741 | | | Texas Capital Bancshares, Inc.(b) | | | 824,725 | |
| | 27,356 | | | Torchmark Corp. | | | 2,398,027 | |
| | 120,170 | | | Travelers Cos., Inc. (The) | | | 17,274,437 | |
| | 91,882 | | | Two Harbors Investment Corp. | | | 1,273,485 | |
| | 393,276 | | | U.S. Bancorp. | | | 20,969,476 | |
| | 9,959 | | | UMB Financial Corp. | | | 695,736 | |
| | 76,288 | | | Umpqua Holdings Corp. | | | 1,324,360 | |
| | 25,874 | | | United Bankshares, Inc. | | | 1,015,296 | |
| | 107,638 | | | Unum Group | | | 3,973,995 | |
| | 88,369 | | | Valley National Bancorp | | | 926,107 | |
| | 71,689 | | | Voya Financial, Inc. | | | 3,935,009 | |
| | 39,415 | | | W.R. Berkley Corp. | | | 2,416,139 | |
| | 55,005 | | | Waddell & Reed Financial, Inc., Class A(c) | | | 1,030,244 | |
| | 23,730 | | | Washington Federal, Inc. | | | 786,412 | |
| | 18,008 | | | Webster Financial Corp. | | | 956,765 | |
| | 1,614,111 | | | Wells Fargo & Co. | | | 78,139,113 | |
| | 16,012 | | | Western Alliance Bancorp(b) | | | 765,053 | |
| | 793 | | | White Mountains Insurance Group Ltd. | | | 744,659 | |
| | 21,238 | | | Willis Towers Watson PLC | | | 3,915,013 | |
| | 11,277 | | | Wintrust Financial Corp. | | | 859,307 | |
| | 38,649 | | | Zions Bancorp. N.A. | | | 1,906,555 | |
| | | | | | | | |
| | | | | | | 1,077,769,948 | |
| | | | | | | | |
| |
| | | | Health Care—10.3% | |
| | 193,731 | | | Abbott Laboratories | | | 15,413,238 | |
| | 259,121 | | | AbbVie, Inc. | | | 20,571,616 | |
| | 36,348 | | | Acadia Healthcare Co., Inc.(b) | | | 1,163,863 | |
| | 26,912 | | | Agilent Technologies, Inc. | | | 2,112,592 | |
| | 21,551 | | | Alexion Pharmaceuticals, Inc.(b) | | | 2,933,738 | |
| | 94,755 | | | Allergan PLC | | | 13,928,985 | |
| | 135,251 | | | AmerisourceBergen Corp. | | | 10,111,365 | |
| | 112,365 | | | Amgen, Inc. | | | 20,149,292 | |
| | 60,097 | | | Anthem, Inc. | | | 15,807,314 | |
| | 61,083 | | | Baxter International, Inc. | | | 4,660,633 | |
| | 23,532 | | | Becton, Dickinson and Co. | | | 5,665,094 | |
| | 25,230 | | | Biogen, Inc.(b) | | | 5,783,725 | |
| | 7,296 | | | BioMarin Pharmaceutical, Inc.(b) | | | 624,027 | |
| | 3,022 | | | Bio-Rad Laboratories, Inc.,
Class A(b) | | | 909,410 | |
| | 85,901 | | | Boston Scientific Corp.(b) | | | 3,188,645 | |
| | 287,871 | | | Bristol-Myers Squibb Co. | | | 13,365,850 | |
| | 184,771 | | | Brookdale Senior Living, Inc.(b) | | | 1,141,885 | |
| | 292,855 | | | Cardinal Health, Inc. | | | 14,264,967 | |
| | 17,860 | | | Catalent, Inc.(b) | | | 800,485 | |
| | 63,098 | | | Celgene Corp.(b) | | | 5,972,857 | |
| | 95,324 | | | Centene Corp.(b) | | | 4,914,905 | |
| | 43,466 | | | Cerner Corp.(b) | | | 2,888,316 | |
| | | | | | | | |
Number
of Shares | | | | | Value | |
| | | | Common Stocks & Other Equity Interests (continued) | |
| | | | Health Care (continued) | |
| | 4,960 | | | Charles River Laboratories
International, Inc.(b) | | $ | 696,731 | |
| | 42,895 | | | Cigna Corp. | | | 6,813,442 | |
| | 285,792 | | | Community Health Systems, Inc.(b) | | | 983,124 | |
| | 3,558 | | | Cooper Cos., Inc. (The) | | | 1,031,535 | |
| | 515,178 | | | CVS Health Corp. | | | 28,015,380 | |
| | 67,271 | | | Danaher Corp. | | | 8,909,371 | |
| | 61,015 | | | DaVita, Inc.(b) | | | 3,370,469 | |
| | 37,384 | | | DENTSPLY SIRONA, Inc. | | | 1,911,444 | |
| | 9,945 | | | Edwards Lifesciences Corp.(b) | | | 1,751,016 | |
| | 106,816 | | | Eli Lilly and Co. | | | 12,501,745 | |
| | 18,079 | | | Encompass Health Corp. | | | 1,165,192 | |
| | 282,290 | | | Gilead Sciences, Inc. | | | 18,360,142 | |
| | 69,036 | | | HCA Healthcare, Inc. | | | 8,783,450 | |
| | 47,263 | | | Henry Schein, Inc.(b) | | | 3,027,668 | |
| | 7,560 | | | Hill-Rom Holdings, Inc. | | | 766,735 | |
| | 34,186 | | | Hologic, Inc.(b) | | | 1,585,547 | |
| | 31,529 | | | Humana, Inc. | | | 8,052,822 | |
| | 5,098 | | | ICON PLC (Ireland)(b) | | | 696,285 | |
| | 4,681 | | | Illumina, Inc.(b) | | | 1,460,472 | |
| | 3,852 | | | Intuitive Surgical, Inc.(b) | | | 1,966,947 | |
| | 19,129 | | | IQVIA Holdings, Inc.(b) | | | 2,657,018 | |
| | 9,461 | | | Jazz Pharmaceuticals PLC(b) | | | 1,227,754 | |
| | 451,852 | | | Johnson & Johnson | | | 63,801,502 | |
| | 25,724 | | | Laboratory Corp. of America
Holdings(b) | | | 4,113,782 | |
| | 17,108 | | | Magellan Health, Inc.(b) | | | 1,197,560 | |
| | 109,246 | | | Mallinckrodt PLC(b) | | | 1,688,943 | |
| | 186,769 | | | McKesson Corp. | | | 22,272,203 | |
| | 40,794 | | | MEDNAX, Inc.(b) | | | 1,141,008 | |
| | 233,802 | | | Medtronic PLC | | | 20,763,956 | |
| | 449,491 | | | Merck & Co., Inc. | | | 35,379,437 | |
| | 1,497 | | | Mettler-Toledo International, Inc.(b) | | | 1,115,654 | |
| | 18,116 | | | Molina Healthcare, Inc.(b) | | | 2,348,377 | |
| | 189,081 | | | Mylan N.V.(b) | | | 5,103,296 | |
| | 198,474 | | | Owens & Minor, Inc. | | | 676,796 | |
| | 47,706 | | | Patterson Cos., Inc. | | | 1,041,899 | |
| | 10,087 | | | PerkinElmer, Inc. | | | 966,738 | |
| | 36,467 | | | Perrigo Co. PLC | | | 1,747,499 | |
| | 1,254,064 | | | Pfizer, Inc. | | | 50,927,539 | |
| | 37,824 | | | Quest Diagnostics, Inc. | | | 3,645,477 | |
| | 5,338 | | | Regeneron Pharmaceuticals, Inc.(b) | | | 1,831,681 | |
| | 13,068 | | | ResMed, Inc. | | | 1,365,737 | |
| | 44,857 | | | Select Medical Holdings Corp.(b) | | | 644,595 | |
| | 9,946 | | | STERIS PLC | | | 1,302,727 | |
| | 28,960 | | | Stryker Corp. | | | 5,470,834 | |
| | 3,661 | | | Teleflex, Inc. | | | 1,047,705 | |
| | 133,868 | | | Tenet Healthcare Corp.(b) | | | 2,931,709 | |
| | 36,099 | | | Thermo Fisher Scientific, Inc. | | | 10,015,667 | |
| | 10,433 | | | United Therapeutics Corp.(b) | | | 1,070,113 | |
| | 147,658 | | | UnitedHealth Group, Inc. | | | 34,414,650 | |
| | 19,285 | | | Universal Health Services, Inc., Class B | | | 2,446,688 | |
| | 8,242 | | | Varian Medical Systems, Inc.(b) | | | 1,122,313 | |
| | 5,733 | | | Waters Corp.(b) | | | 1,224,225 | |
| | 10,274 | | | WellCare Health Plans, Inc.(b) | | | 2,654,288 | |
See accompanying Notes to Financial Statements which are an integral part of the financial statements.
Invesco FTSE RAFI US 1000 ETF (PRF)(continued)
April 30, 2019
| | | | | | | | |
Number
of Shares | | | | | Value | |
| | | | Common Stocks & Other Equity Interests (continued) | |
| | | | Health Care (continued) | |
| | 32,595 | | | Zimmer Biomet Holdings, Inc. | | $ | 4,014,400 | |
| | 24,196 | | | Zoetis, Inc. | | | 2,464,121 | |
| | | | | | | | |
| | | | | | | 574,060,210 | |
| | | | | | | | |
| |
| | | | Industrials—10.2% | |
| | 89,793 | | | 3M Co. | | | 17,016,671 | |
| | 17,162 | | | A.O. Smith Corp. | | | 902,206 | |
| | 26,985 | | | ABM Industries, Inc. | | | 1,024,620 | |
| | 6,961 | | | Acuity Brands, Inc. | | | 1,018,603 | |
| | 111,609 | | | AECOM(b) | | | 3,783,545 | |
| | 72,780 | | | AerCap Holdings N.V. (Ireland)(b) | | | 3,612,799 | |
| | 26,865 | | | AGCO Corp. | | | 1,901,505 | |
| | 27,739 | | | Air Lease Corp. | | | 1,069,616 | |
| | 7,716 | | | Allegion PLC | | | 765,659 | |
| | 19,583 | | | Allison Transmission Holdings, Inc. | | | 917,659 | |
| | 66,690 | | | American Airlines Group, Inc. | | | 2,279,464 | |
| | 24,753 | | | AMETEK, Inc. | | | 2,182,472 | |
| | 182,561 | | | Arconic, Inc. | | | 3,921,410 | |
| | 23,708 | | | Arcosa, Inc. | | | 738,030 | |
| | 114,665 | | | Avis Budget Group, Inc.(b) | | | 4,076,341 | |
| | 26,602 | | | Beacon Roofing Supply, Inc.(b) | | | 1,001,831 | |
| | 58,012 | | | Boeing Co. (The) | | | 21,910,552 | |
| | 60,208 | | | Builders FirstSource, Inc.(b) | | | 829,666 | |
| | 33,478 | | | C.H. Robinson Worldwide, Inc. | | | 2,711,718 | |
| | 11,263 | | | Carlisle Cos., Inc. | | | 1,592,814 | |
| | 126,475 | | | Caterpillar, Inc. | | | 17,633,145 | |
| | 8,628 | | | Cintas Corp. | | | 1,873,484 | |
| | 16,411 | | | Clean Harbors, Inc.(b) | | | 1,247,236 | |
| | 44,405 | | | Colfax Corp.(b) | | | 1,339,699 | |
| | 2,139 | | | CoStar Group, Inc.(b) | | | 1,061,479 | |
| | 48,453 | | | Covanta Holding Corp. | | | 875,546 | |
| | 10,132 | | | Crane Co. | | | 861,727 | |
| | 117,679 | | | CSX Corp. | | | 9,370,779 | |
| | 42,379 | | | Cummins, Inc. | | | 7,047,204 | |
| | 6,750 | | | Curtiss-Wright Corp. | | | 769,095 | |
| | 73,676 | | | Deere & Co. | | | 12,202,956 | |
| | 61,914 | | | Delta Air Lines, Inc. | | | 3,608,967 | |
| | 16,742 | | | Deluxe Corp. | | | 748,702 | |
| | 18,814 | | | Donaldson Co., Inc. | | | 1,007,302 | |
| | 27,436 | | | Dover Corp. | | | 2,689,825 | |
| | 10,769 | | | Dycom Industries, Inc.(b) | | | 534,035 | |
| | 131,334 | | | Eaton Corp. PLC. | | | 10,877,082 | |
| | 19,090 | | | EMCOR Group, Inc. | | | 1,606,233 | |
| | 146,464 | | | Emerson Electric Co. | | | 10,397,479 | |
| | 9,685 | | | EnerSys | | | 670,105 | |
| | 17,332 | | | Equifax, Inc. | | | 2,182,965 | |
| | 26,277 | | | Expeditors International of Washington, Inc. | | | 2,086,919 | |
| | 38,612 | | | Fastenal Co. | | | 2,724,077 | |
| | 73,850 | | | FedEx Corp. | | | 13,991,621 | |
| | 30,808 | | | Flowserve Corp. | | | 1,510,516 | |
| | 107,603 | | | Fluor Corp. | | | 4,275,067 | |
| | 24,876 | | | Fortive Corp. | | | 2,147,794 | |
| | 33,889 | | | Fortune Brands Home & Security, Inc. | | | 1,788,661 | |
| | 13,508 | | | GATX Corp. | | | 1,041,872 | |
| | 55,392 | | | General Dynamics Corp. | | | 9,899,658 | |
| | 5,845,078 | | | General Electric Co. | | | 59,444,443 | |
| | | | | | | | |
Number
of Shares | | | | | Value | |
| | | | Common Stocks & Other Equity Interests (continued) | |
| | | | Industrials (continued) | |
| | 17,719 | | | Genesee & Wyoming, Inc., Class A(b) | | $ | 1,570,789 | |
| | 14,942 | | | Graco, Inc. | | | 765,778 | |
| | 15,533 | | | Harris Corp. | | | 2,617,311 | |
| | 40,919 | | | HD Supply Holdings, Inc.(b) | | | 1,869,589 | |
| | 181,834 | | | Hertz Global Holdings, Inc.(b) | | | 3,305,742 | |
| | 10,905 | | | Hexcel Corp. | | | 771,093 | |
| | 110,494 | | | Honeywell International, Inc. | | | 19,185,073 | |
| | 17,042 | | | Hub Group, Inc., Class A(b) | | | 708,436 | |
| | 12,352 | | | Hubbell, Inc. | | | 1,576,115 | |
| | 8,549 | | | Huntington Ingalls Industries, Inc. | | | 1,902,836 | |
| | 8,633 | | | IDEX Corp. | | | 1,352,446 | |
| | 40,103 | | | IHS Markit Ltd.(b) | | | 2,296,298 | |
| | 50,574 | | | Illinois Tool Works, Inc. | | | 7,870,832 | |
| | 45,706 | | | Ingersoll-Rand PLC | | | 5,604,013 | |
| | 16,248 | | | ITT, Inc. | | | 983,816 | |
| | 13,601 | | | J.B. Hunt Transport Services, Inc. | | | 1,285,023 | |
| | 41,867 | | | Jacobs Engineering Group, Inc. | | | 3,263,114 | |
| | 41,719 | | | JetBlue Airways Corp.(b) | | | 773,887 | |
| | 252,198 | | | Johnson Controls International PLC | | | 9,457,425 | |
| | 19,722 | | | Kansas City Southern | | | 2,428,567 | |
| | 27,053 | | | KAR Auction Services, Inc. | | | 1,527,953 | |
| | 19,034 | | | Kennametal, Inc. | | | 774,684 | |
| | 17,653 | | | Kirby Corp.(b) | | | 1,442,603 | |
| | 32,136 | | | Knight-Swift Transportation Holdings, Inc. | | | 1,071,736 | |
| | 16,203 | | | L3 Technologies, Inc. | | | 3,541,652 | |
| | 6,744 | | | Landstar System, Inc. | | | 734,826 | |
| | 3,280 | | | Lennox International, Inc. | | | 890,356 | |
| | 10,620 | | | Lincoln Electric Holdings, Inc. | | | 926,807 | |
| | 44,880 | | | Lockheed Martin Corp. | | | 14,959,850 | |
| | 42,953 | | | Macquarie Infrastructure Corp. | | | 1,740,026 | |
| | 43,081 | | | ManpowerGroup, Inc. | | | 4,137,499 | |
| | 49,734 | | | Masco Corp. | | | 1,942,610 | |
| | 25,106 | | | MasTec, Inc.(b) | | | 1,271,619 | |
| | 33,162 | | | Meritor, Inc.(b) | | | 804,510 | |
| | 6,989 | | | Middleby Corp. (The)(b) | | | 923,457 | |
| | 8,553 | | | Moog, Inc., Class A | | | 800,903 | |
| | 48,266 | | | MRC Global, Inc.(b) | | | 836,450 | |
| | 11,573 | | | MSC Industrial Direct Co., Inc., Class A | | | 968,081 | |
| | 24,926 | | | Mueller Industries, Inc. | | | 727,091 | |
| | 22,244 | | | Navistar International Corp.(b) | | | 759,410 | |
| | 142,537 | | | Nielsen Holdings PLC | | | 3,638,970 | |
| | 6,025 | | | Nordson Corp. | | | 879,349 | |
| | 48,456 | | | Norfolk Southern Corp. | | | 9,885,993 | |
| | 26,763 | | | Northrop Grumman Corp. | | | 7,758,861 | |
| | 46,088 | | | NOW, Inc.(b) | | | 673,807 | |
| | 46,071 | | | nVent Electric PLC | | | 1,287,684 | |
| | 6,082 | | | Old Dominion Freight Line, Inc. | | | 907,921 | |
| | 22,402 | | | Oshkosh Corp. | | | 1,850,181 | |
| | 37,024 | | | Owens Corning | | | 1,898,221 | |
| | 106,724 | | | PACCAR, Inc. | | | 7,648,909 | |
| | 24,957 | | | Parker-Hannifin Corp. | | | 4,519,214 | |
| | 37,778 | | | Pentair PLC | | | 1,472,964 | |
| | 206,947 | | | Pitney Bowes, Inc. | | | 1,471,393 | |
| | 66,260 | | | Quanta Services, Inc. | | | 2,690,156 | |
| | 54,657 | | | Raytheon Co. | | | 9,706,537 | |
| | 13,119 | | | Regal Beloit Corp. | | | 1,116,165 | |
| | 45,334 | | | Republic Services, Inc. | | | 3,754,562 | |
See accompanying Notes to Financial Statements which are an integral part of the financial statements.
Invesco FTSE RAFI US 1000 ETF (PRF)(continued)
April 30, 2019
| | | | | | | | |
Number
of Shares | | | | | Value | |
| | | | Common Stocks & Other Equity Interests (continued) | |
| | | | Industrials (continued) | |
| | 55,760 | | | Resideo Technologies, Inc.(b) | | $ | 1,265,752 | |
| | 28,602 | | | Rexnord Corp.(b) | | | 818,017 | |
| | 20,993 | | | Robert Half International, Inc. | | | 1,303,455 | |
| | 17,536 | | | Rockwell Automation, Inc. | | | 3,168,931 | |
| | 8,359 | | | Roper Technologies, Inc. | | | 3,006,732 | |
| | 18,786 | | | Rush Enterprises, Inc., Class A | | | 796,714 | |
| | 39,167 | | | Ryder System, Inc. | | | 2,467,521 | |
| | 29,641 | | | Sensata Technologies Holding
PLC(b) | | | 1,480,272 | |
| | 11,572 | | | Snap-on, Inc. | | | 1,947,336 | |
| | 30,632 | | | Southwest Airlines Co. | | | 1,661,173 | |
| | 15,052 | | | Spirit AeroSystems Holdings, Inc., Class A | | | 1,308,019 | |
| | 34,282 | | | Stanley Black & Decker, Inc. | | | 5,025,741 | |
| | 27,500 | | | Stericycle, Inc.(b) | | | 1,605,725 | |
| | 4,483 | | | Teledyne Technologies, Inc.(b) | | | 1,114,070 | |
| | 30,339 | | | Terex Corp. | | | 1,011,199 | |
| | 61,973 | | | Textron, Inc. | | | 3,284,569 | |
| | 20,007 | | | Timken Co. (The) | | | 959,336 | |
| | 11,862 | | | Toro Co. (The) | | | 867,705 | |
| | 8,377 | | | TransDigm Group, Inc.(b) | | | 4,042,070 | |
| | 15,911 | | | TransUnion | | | 1,108,201 | |
| | 63,512 | | | Trinity Industries, Inc. | | | 1,369,319 | |
| | 54,010 | | | Tutor Perini Corp.(b) | | | 1,078,580 | |
| | 111,078 | | | Union Pacific Corp. | | | 19,665,249 | |
| | 33,834 | | | United Continental Holdings, Inc.(b) | | | 3,006,489 | |
| | 157,776 | | | United Parcel Service, Inc., Class B | | | 16,758,967 | |
| | 29,434 | | | United Rentals, Inc.(b) | | | 4,147,839 | |
| | 183,875 | | | United Technologies Corp. | | | 26,222,414 | |
| | 67,873 | | | Univar, Inc.(b) | | | 1,515,604 | |
| | 6,073 | | | Valmont Industries, Inc. | | | 818,883 | |
| | 11,213 | | | Verisk Analytics, Inc., Class A | | | 1,582,603 | |
| | 8,492 | | | W.W. Grainger, Inc. | | | 2,394,744 | |
| | 8,893 | | | WABCO Holdings, Inc.(b) | | | 1,177,789 | |
| | 14,604 | | | Wabtec Corp. | | | 1,081,718 | |
| | 72,233 | | | Waste Management, Inc. | | | 7,753,490 | |
| | 7,096 | | | Watsco, Inc. | | | 1,124,503 | |
| | 34,645 | | | WESCO International, Inc.(b) | | | 1,983,080 | |
| | 45,182 | | | XPO Logistics, Inc.(b)(c) | | | 3,075,991 | |
| | 21,244 | | | Xylem, Inc. | | | 1,771,750 | |
| | 123,618 | | | YRC Worldwide, Inc.(b) | | | 841,839 | |
| | | | | | | | |
| | | | | | | 567,917,436 | |
| | | | | | | | |
| |
| | | | Information Technology—13.8% | |
| | 81,139 | | | Accenture PLC, Class A | | | 14,821,661 | |
| | 14,203 | | | Adobe, Inc.(b) | | | 4,108,218 | |
| | 34,190 | | | Advanced Micro Devices, Inc.(b) | | | 944,670 | |
| | 22,225 | | | Akamai Technologies, Inc.(b) | | | 1,779,333 | |
| | 11,859 | | | Alliance Data Systems Corp. | | | 1,898,626 | |
| | 30,723 | | | Amdocs Ltd. | | | 1,692,223 | |
| | 29,625 | | | Amphenol Corp., Class A | | | 2,949,465 | |
| | 41,216 | | | Analog Devices, Inc. | | | 4,790,948 | |
| | 18,202 | | | Anixter International, Inc.(b) | | | 1,144,360 | |
| | 5,554 | | | ANSYS, Inc.(b) | | | 1,087,473 | |
| | 757,340 | | | Apple, Inc. | | | 151,975,418 | |
| | 145,275 | | | Applied Materials, Inc. | | | 6,402,269 | |
| | 64,593 | | | Arrow Electronics, Inc.(b) | | | 5,458,754 | |
| | 41,960 | | | Automatic Data Processing, Inc. | | | 6,897,804 | |
| | 42,281 | | | Avaya Holdings Corp.(b) | | | 806,721 | |
| | | | | | | | |
Number
of Shares | | | | | Value | |
| | | | Common Stocks & Other Equity Interests (continued) | |
| | | | Information Technology (continued) | |
| | 91,010 | | | Avnet, Inc. | | $ | 4,423,996 | |
| | 12,327 | | | Belden, Inc. | | | 684,765 | |
| | 26,835 | | | Benchmark Electronics, Inc. | | | 725,350 | |
| | 16,229 | | | Black Knight, Inc.(b) | | | 915,640 | |
| | 29,018 | | | Booz Allen Hamilton Holding Corp. | | | 1,720,477 | |
| | 29,536 | | | Broadcom, Inc. | | | 9,404,262 | |
| | 12,666 | | | Broadridge Financial Solutions, Inc. | | | 1,496,235 | |
| | 6,549 | | | CACI International, Inc., Class A(b) | | | 1,276,662 | |
| | 14,521 | | | Cadence Design Systems, Inc.(b) | | | 1,007,467 | |
| | 11,623 | | | CDK Global, Inc. | | | 701,099 | |
| | 24,799 | | | CDW Corp. | | | 2,618,774 | |
| | 10,412 | | | Check Point Software Technologies Ltd. (Israel)(b) | | | 1,257,353 | |
| | 22,201 | | | Ciena Corp.(b) | | | 851,630 | |
| | 796,705 | | | Cisco Systems, Inc. | | | 44,575,645 | |
| | 10,239 | | | Citrix Systems, Inc. | | | 1,033,729 | |
| | 63,405 | | | Cognizant Technology Solutions Corp., Class A | | | 4,626,029 | |
| | 68,491 | | | CommScope Holding Co., Inc.(b) | | | 1,697,207 | |
| | 135,491 | | | Conduent, Inc.(b) | | | 1,738,350 | |
| | 18,975 | | | CoreLogic, Inc.(b) | | | 770,575 | |
| | 188,721 | | | Corning, Inc. | | | 6,010,764 | |
| | 15,801 | | | Cree, Inc.(b) | | | 1,044,288 | |
| | 51,601 | | | Cypress Semiconductor Corp. | | | 886,505 | |
| | 54,785 | | | Dell Technologies, Inc., Class C(b) | | | 3,693,057 | |
| | 87,396 | | | Diebold Nixdorf, Inc.(b) | | | 881,826 | |
| | 71,324 | | | DXC Technology Co. | | | 4,688,840 | |
| | 21,530 | | | EchoStar Corp., Class A(b) | | | 857,970 | |
| | 5,553 | | | Euronet Worldwide, Inc.(b) | | | 832,339 | |
| | 5,986 | | | F5 Networks, Inc.(b) | | | 939,203 | |
| | 45,562 | | | Fidelity National Information Services, Inc. | | | 5,282,003 | |
| | 89,377 | | | First Data Corp., Class A(b) | | | 2,311,289 | |
| | 29,871 | | | First Solar, Inc.(b) | | | 1,837,963 | |
| | 33,330 | | | Fiserv, Inc.(b) | | | 2,907,709 | |
| | 7,961 | | | FleetCor Technologies, Inc.(b) | | | 2,077,423 | |
| | 513,804 | | | Flex Ltd.(b) | | | 5,672,396 | |
| | 16,763 | | | FLIR Systems, Inc. | | | 887,433 | |
| | 5,530 | | | Gartner, Inc.(b) | | | 879,104 | |
| | 10,731 | | | Global Payments, Inc. | | | 1,567,477 | |
| | 682,527 | | | Hewlett Packard Enterprise Co. | | | 10,790,752 | |
| | 408,011 | | | HP, Inc. | | | 8,139,819 | |
| | 20,619 | | | Insight Enterprises, Inc.(b) | | | 1,166,623 | |
| | 940,306 | | | Intel Corp. | | | 47,993,218 | |
| | 305,021 | | | International Business Machines Corp. | | | 42,785,296 | |
| | 10,637 | | | Intuit, Inc. | | | 2,670,525 | |
| | 109,771 | | | Jabil, Inc. | | | 3,316,182 | |
| | 6,727 | | | Jack Henry & Associates, Inc. | | | 1,002,727 | |
| | 76,918 | | | Juniper Networks, Inc. | | | 2,136,013 | |
| | 53,808 | | | KBR, Inc. | | | 1,195,614 | |
| | 16,926 | | | Keysight Technologies, Inc.(b) | | | 1,473,070 | |
| | 38,260 | | | KLA-Tencor Corp. | | | 4,877,385 | |
| | 16,516 | | | Lam Research Corp. | | | 3,425,914 | |
| | 44,002 | | | Leidos Holdings, Inc. | | | 3,233,267 | |
| | 66,633 | | | Marvell Technology Group Ltd. | | | 1,667,158 | |
| | 31,058 | | | Mastercard, Inc., Class A | | | 7,896,186 | |
| | 38,494 | | | Maxim Integrated Products, Inc. | | | 2,309,640 | |
| | 25,979 | | | Microchip Technology, Inc. | | | 2,595,042 | |
See accompanying Notes to Financial Statements which are an integral part of the financial statements.
Invesco FTSE RAFI US 1000 ETF (PRF)(continued)
April 30, 2019
| | | | | | | | |
Number
of Shares | | | | | Value | |
| | | | Common Stocks & Other Equity Interests (continued) | |
| | | | Information Technology (continued) | |
| | 248,562 | | | Micron Technology, Inc.(b) | | $ | 10,454,518 | |
| | 726,132 | | | Microsoft Corp. | | | 94,832,839 | |
| | 16,592 | | | Motorola Solutions, Inc. | | | 2,404,347 | |
| | 64,176 | | | NCR Corp.(b) | | | 1,857,895 | |
| | 36,723 | | | NetApp, Inc. | | | 2,675,271 | |
| | 54,918 | | | Nuance Communications, Inc.(b) | | | 924,270 | |
| | 23,314 | | | NVIDIA Corp. | | | 4,219,834 | |
| | 61,685 | | | NXP Semiconductors NV (Netherlands) | | | 6,515,170 | |
| | 72,743 | | | ON Semiconductor Corp.(b) | | | 1,677,454 | |
| | 402,351 | | | Oracle Corp. | | | 22,262,081 | |
| | 42,643 | | | Paychex, Inc. | | | 3,595,231 | |
| | 67,901 | | | PayPal Holdings, Inc.(b) | | | 7,657,196 | |
| | 52,426 | | | Perspecta, Inc. | | | 1,209,992 | |
| | 11,761 | | | Plexus Corp.(b) | | | 707,777 | |
| | 26,854 | | | Qorvo, Inc.(b) | | | 2,030,431 | |
| | 422,147 | | | QUALCOMM, Inc. | | | 36,359,521 | |
| | 5,279 | | | Red Hat, Inc.(b) | | | 963,576 | |
| | 56,103 | | | Sabre Corp. | | | 1,164,698 | |
| | 21,146 | | | salesforce.com, inc.(b) | | | 3,496,491 | |
| | 46,237 | | | Sanmina Corp.(b) | | | 1,568,359 | |
| | 9,542 | | | Science Applications International Corp. | | | 715,173 | |
| | 117,440 | | | Seagate Technology PLC | | | 5,674,701 | |
| | 24,169 | | | Skyworks Solutions, Inc. | | | 2,131,222 | |
| | 12,446 | | | SS&C Technologies Holdings, Inc. | | | 842,096 | |
| | 196,014 | | | Symantec Corp. | | | 4,745,499 | |
| | 17,674 | | | SYNNEX Corp. | | | 1,906,671 | |
| | 13,805 | | | Synopsys, Inc.(b) | | | 1,671,509 | |
| | 72,141 | | | TE Connectivity Ltd. | | | 6,900,287 | |
| | 48,836 | | | Tech Data Corp.(b) | | | 5,206,406 | |
| | 17,924 | | | Teradata Corp.(b) | | | 815,004 | |
| | 20,924 | | | Teradyne, Inc. | | | 1,025,276 | |
| | 112,283 | | | Texas Instruments, Inc. | | | 13,230,306 | |
| | 16,055 | | | Total System Services, Inc. | | | 1,641,463 | |
| | 30,102 | | | Trimble, Inc.(b) | | | 1,228,764 | |
| | 9,850 | | | ViaSat, Inc.(b) | | | 894,577 | |
| | 86,528 | | | Visa, Inc., Class A. | | | 14,227,799 | |
| | 32,950 | | | Vishay Intertechnology, Inc. | | | 652,740 | |
| | 4,044 | | | VMware, Inc., Class A | | | 825,502 | |
| | 139,421 | | | Western Digital Corp. | | | 7,127,202 | |
| | 135,408 | | | Western Union Co. (The) | | | 2,632,332 | |
| | 4,415 | | | WEX, Inc.(b) | | | 928,474 | |
| | 13,319 | | | Worldpay, Inc., Class A(b) | | | 1,561,120 | |
| | 97,103 | | | Xerox Corp. | | | 3,239,356 | |
| | 18,816 | | | Xilinx, Inc. | | | 2,260,554 | |
| | 4,294 | | | Zebra Technologies Corp.,
Class A(b) | | | 906,635 | |
| | | | | | | | |
| | | | | | | 769,782,827 | |
| | | | | | | | |
| |
| | | | Materials—3.6% | |
| | 34,980 | | | Air Products and Chemicals, Inc. | | | 7,198,534 | |
| | 416,798 | | | AK Steel Holding Corp.(b)(c) | | | 1,008,651 | |
| | 22,165 | | | Albemarle Corp. | | | 1,663,705 | |
| | 110,600 | | | Alcoa Corp.(b) | | | 2,950,808 | |
| | 29,696 | | | Allegheny Technologies, Inc.(b) | | | 740,024 | |
| | 10,017 | | | AptarGroup, Inc. | | | 1,114,291 | |
| | 15,509 | | | Ashland Global Holdings, Inc. | | | 1,248,940 | |
| | 18,135 | | | Avery Dennison Corp. | | | 2,006,638 | |
| | 47,509 | | | Axalta Coating Systems Ltd.(b) | | | 1,281,793 | |
| | | | | | | | |
Number
of Shares | | | | | Value | |
| | | | Common Stocks & Other Equity Interests (continued) | |
| | | | Materials (continued) | |
| | 47,529 | | | Ball Corp. | | $ | 2,848,888 | |
| | 25,600 | | | Bemis Co., Inc. | | | 1,469,952 | |
| | 35,507 | | | Berry Global Group, Inc.(b) | | | 2,087,812 | |
| | 21,018 | | | Cabot Corp. | | | 953,797 | |
| | 15,133 | | | Carpenter Technology Corp. | | | 751,656 | |
| | 24,747 | | | Celanese Corp., Series A | | | 2,669,954 | |
| | 74,631 | | | CF Industries Holdings, Inc. | | | 3,341,976 | |
| | 35,839 | | | Chemours Co. (The) | | | 1,290,562 | |
| | 77,506 | | | Cleveland-Cliffs, Inc.(c) | | | 774,285 | |
| | 75,470 | | | Commercial Metals Co. | | | 1,304,876 | |
| | 13,603 | | | Compass Minerals International, Inc. | | | 780,676 | |
| | 96,364 | | | Constellium N.V., Class A(b) | | | 900,040 | |
| | 43,766 | | | Crown Holdings, Inc.(b) | | | 2,544,118 | |
| | 30,753 | | | Domtar Corp. | | | 1,503,822 | |
| | 248,079 | | | Dow, Inc.(b) | | | 14,073,522 | |
| | 748,182 | | | DowDuPont, Inc. | | | 28,767,598 | |
| | 48,613 | | | Eastman Chemical Co. | | | 3,834,593 | |
| | 30,968 | | | Ecolab, Inc. | | | 5,700,589 | |
| | 88,641 | | | Element Solutions, Inc.(b) | | | 962,641 | |
| | 14,494 | | | FMC Corp. | | | 1,145,896 | |
| | 605,736 | | | Freeport-McMoRan, Inc. | | | 7,456,610 | |
| | 98,937 | | | Graphic Packaging Holding Co. | | | 1,373,246 | |
| | 99,421 | | | Huntsman Corp. | | | 2,211,123 | |
| | 11,591 | | | International Flavors & Fragrances, Inc. | | | 1,597,124 | |
| | 162,100 | | | International Paper Co. | | | 7,587,901 | |
| | 108,283 | | | Linde PLC (United Kingdom) | | | 19,519,094 | |
| | 32,380 | | | Louisiana-Pacific Corp. | | | 811,119 | |
| | 135,773 | | | LyondellBasell Industries N.V., Class A | | | 11,979,252 | |
| | 9,844 | | | Martin Marietta Materials, Inc. | | | 2,184,384 | |
| | 132,838 | | | Mosaic Co. (The) | | | 3,468,400 | |
| | 111,019 | | | Newmont Goldcorp Corp. | | | 3,448,250 | |
| | 105,139 | | | Nucor Corp. | | | 6,000,283 | |
| | 57,361 | | | Olin Corp. | | | 1,244,160 | |
| | 105,941 | | | Owens-Illinois, Inc. | | | 2,093,394 | |
| | 24,838 | | | Packaging Corp. of America | | | 2,462,936 | |
| | 24,899 | | | PolyOne Corp. | | | 688,208 | |
| | 48,729 | | | PPG Industries, Inc. | | | 5,725,657 | |
| | 30,543 | | | Reliance Steel & Aluminum Co. | | | 2,808,734 | |
| | 7,659 | | | Royal Gold, Inc. | | | 666,793 | |
| | 28,277 | | | RPM International, Inc. | | | 1,715,000 | |
| | 10,529 | | | Scotts Miracle-Gro Co. (The) | | | 895,176 | |
| | 39,861 | | | Sealed Air Corp. | | | 1,858,320 | |
| | 8,020 | | | Sherwin-Williams Co. (The) | | | 3,647,737 | |
| | 24,436 | | | Silgan Holdings, Inc. | | | 731,614 | |
| | 28,155 | | | Sonoco Products Co. | | | 1,775,454 | |
| | 60,424 | | | Steel Dynamics, Inc. | | | 1,914,232 | |
| | 18,755 | | | Trinseo SA | | | 843,037 | |
| | 95,042 | | | United States Steel Corp.(c) | | | 1,482,655 | |
| | 16,411 | | | Vulcan Materials Co. | | | 2,069,591 | |
| | 26,634 | | | Warrior Met Coal, Inc. | | | 825,654 | |
| | 8,475 | | | Westlake Chemical Corp. | | | 591,131 | |
| | 115,689 | | | WestRock Co. | | | 4,440,144 | |
| | | | | | | | |
| | | | | | | 203,037,050 | |
| | | | | | | | |
| | | | Real Estate—3.3% | |
| | 15,573 | | | Alexandria Real Estate Equities, Inc. | | | 2,217,439 | |
| | 32,518 | | | American Campus Communities, Inc. | | | 1,534,850 | |
See accompanying Notes to Financial Statements which are an integral part of the financial statements.
Invesco FTSE RAFI US 1000 ETF (PRF)(continued)
April 30, 2019
| | | | | | | | |
Number
of Shares | | | | | Value | |
| | | | Common Stocks & Other Equity Interests (continued) | |
| | | | Real Estate (continued) | |
| | 37,326 | | | American Homes 4 Rent, Class A | | $ | 895,077 | |
| | 32,297 | | | American Tower Corp. | | | 6,307,604 | |
| | 26,189 | | | Apartment Investment & Management Co., Class A | | | 1,292,689 | |
| | 90,068 | | | Apple Hospitality REIT, Inc. | | | 1,481,619 | |
| | 21,781 | | | AvalonBay Communities, Inc. | | | 4,376,456 | |
| | 32,598 | | | Boston Properties, Inc. | | | 4,486,137 | |
| | 54,690 | | | Brandywine Realty Trust | | | 841,679 | |
| | 101,863 | | | Brixmor Property Group, Inc. | | | 1,821,310 | |
| | 36,736 | | | Brookfield Property REIT, Inc., Class A | | | 765,211 | |
| | 17,079 | | | Camden Property Trust | | | 1,719,001 | |
| | 490,387 | | | CBL & Associates Properties, Inc.(c) | | | 495,291 | |
| | 63,405 | | | CBRE Group, Inc., Class A(b) | | | 3,301,498 | |
| | 286,463 | | | Colony Capital, Inc. | | | 1,472,420 | |
| | 47,399 | | | Columbia Property Trust, Inc. | | | 1,076,431 | |
| | 88,809 | | | CoreCivic, Inc. | | | 1,848,115 | |
| | 28,584 | | | Corporate Office Properties Trust | | | 796,922 | |
| | 76,007 | | | Cousins Properties, Inc. | | | 727,387 | |
| | 53,275 | | | Crown Castle International Corp. | | | 6,700,930 | |
| | 27,794 | | | CubeSmart | | | 886,907 | |
| | 11,925 | | | CyrusOne, Inc. | | | 664,103 | |
| | 76,558 | | | DiamondRock Hospitality Co. | | | 831,420 | |
| | 35,147 | | | Digital Realty Trust, Inc. | | | 4,137,153 | |
| | 26,930 | | | Douglas Emmett, Inc. | | | 1,109,247 | |
| | 63,813 | | | Duke Realty Corp. | | | 1,985,861 | |
| | 13,387 | | | EPR Properties | | | 1,055,699 | |
| | 8,688 | | | Equinix, Inc. | | | 3,950,434 | |
| | 22,622 | | | Equity Commonwealth | | | 719,380 | |
| | 8,091 | | | Equity LifeStyle Properties, Inc. | | | 944,220 | |
| | 70,165 | | | Equity Residential. | | | 5,362,009 | |
| | 9,073 | | | Essex Property Trust, Inc. | | | 2,563,123 | |
| | 14,375 | | | Extra Space Storage, Inc. | | | 1,490,544 | |
| | 10,426 | | | Federal Realty Investment Trust | | | 1,395,520 | |
| | 33,418 | | | Gaming and Leisure Properties, Inc. | | | 1,349,419 | |
| | 54,498 | | | GEO Group, Inc. (The) | | | 1,091,050 | |
| | 113,778 | | | HCP, Inc. | | | 3,388,309 | |
| | 25,148 | | | Healthcare Realty Trust, Inc. | | | 776,570 | |
| | 39,287 | | | Healthcare Trust of America, Inc., Class A | | | 1,083,535 | |
| | 25,462 | | | Highwoods Properties, Inc. | | | 1,135,096 | |
| | 76,268 | | | Hospitality Properties Trust | | | 1,982,968 | |
| | 235,788 | | | Host Hotels & Resorts, Inc. | | | 4,536,561 | |
| | 7,348 | | | Howard Hughes Corp. (The)(b) | | | 815,628 | |
| | 28,686 | | | Hudson Pacific Properties, Inc. | | | 999,994 | |
| | 45,150 | | | Invitation Homes, Inc. | | | 1,122,429 | |
| | 92,436 | | | Iron Mountain, Inc. | | | 3,002,321 | |
| | 9,850 | | | Jones Lang LaSalle, Inc. | | | 1,522,515 | |
| | 16,636 | | | Kilroy Realty Corp. | | | 1,279,475 | |
| | 121,053 | | | Kimco Realty Corp. | | | 2,105,112 | |
| | 16,349 | | | Lamar Advertising Co., Class A | | | 1,351,572 | |
| | 72,956 | | | Lexington Realty Trust | | | 661,711 | |
| | 32,542 | | | Liberty Property Trust | | | 1,615,385 | |
| | 8,721 | | | Life Storage, Inc. | | | 831,024 | |
| | 47,829 | | | Macerich Co. (The) | | | 1,919,856 | |
| | 32,758 | | | Mack-Cali Realty Corp. | | | 762,606 | |
| | 66,537 | | | Medical Properties Trust, Inc. | | | 1,161,736 | |
| | 21,795 | | | Mid-America Apartment Communities, Inc. | | | 2,384,591 | |
| | | | | | | | |
Number
of Shares | | | | | Value | |
| | | | Common Stocks & Other Equity Interests (continued) | |
| | | | Real Estate (continued) | |
| | 22,626 | | | National Retail Properties, Inc. | | $ | 1,190,580 | |
| | 42,172 | | | Omega Healthcare Investors, Inc.(c) | | | 1,492,467 | |
| | 67,912 | | | Outfront Media, Inc. REIT | | | 1,618,343 | |
| | 67,918 | | | Paramount Group, Inc. | | | 984,132 | |
| | 62,353 | | | Park Hotels & Resorts, Inc. | | | 2,000,284 | |
| | 47,027 | | | Piedmont Office Realty Trust, Inc., | | | | |
| | | | Class A | | | 979,102 | |
| | 77,112 | | | Prologis, Inc. | | | 5,912,177 | |
| | 17,341 | | | Public Storage | | | 3,835,482 | |
| | 36,796 | | | Rayonier, Inc. | | | 1,169,745 | |
| | 83,758 | | | Realogy Holdings Corp.(c) | | | 1,090,529 | |
| | 36,934 | | | Realty Income Corp. | | | 2,585,749 | |
| | 26,098 | | | Regency Centers Corp. | | | 1,753,003 | |
| | 76,349 | | | Retail Properties of America, Inc., Class A | | | 938,329 | |
| | 69,439 | | | RLJ Lodging Trust | | | 1,278,372 | |
| | 8,470 | | | Ryman Hospitality Properties, Inc. | | | 674,212 | |
| | 42,979 | | | Sabra Health Care REIT, Inc. | | | 840,669 | |
| | 5,013 | | | SBA Communications Corp.,
Class A(b) | | | 1,021,299 | |
| | 130,446 | | | Senior Housing Properties Trust | | | 1,047,481 | |
| | 44,051 | | | Simon Property Group, Inc. | | | 7,651,659 | |
| | 81,264 | | | SITE Centers Corp. | | | 1,075,935 | |
| | 25,458 | | | SL Green Realty Corp. | | | 2,248,960 | |
| | 30,256 | | | Spirit Realty Capital, Inc. | | | 1,224,158 | |
| | 24,491 | | | STORE Capital Corp. REIT | | | 816,040 | |
| | 9,908 | | | Sun Communities, Inc. | | | 1,219,477 | |
| | 79,906 | | | Sunstone Hotel Investors, Inc. | | | 1,150,646 | |
| | 18,625 | | | Taubman Centers, Inc. | | | 918,213 | |
| | 38,421 | | | UDR, Inc. | | | 1,727,024 | |
| | 59,097 | | | Uniti Group, Inc. | | | 649,476 | |
| | 92,721 | | | Ventas, Inc. | | | 5,666,180 | |
| | 339,192 | | | VEREIT, Inc. | | | 2,801,726 | |
| | 48,025 | | | VICI Properties, Inc. | | | 1,094,970 | |
| | 35,829 | | | Vornado Realty Trust | | | 2,477,217 | |
| | 184,918 | | | Washington Prime Group, Inc.(c) | | | 822,885 | |
| | 31,981 | | | Weingarten Realty Investors | | | 925,530 | |
| | 96,081 | | | Welltower, Inc. | | | 7,160,917 | |
| | 208,804 | | | Weyerhaeuser Co. | | | 5,595,947 | |
| | 22,291 | | | WP Carey, Inc. | | | 1,768,122 | |
| | 47,176 | | | Xenia Hotels & Resorts, Inc. | | | 1,021,360 | |
| | | | | | | | |
| | | | | | | 186,561,546 | |
| | | | | | | | |
| | | | Utilities—4.6% | |
| | 301,235 | | | AES Corp. (The) | | | 5,157,143 | |
| | 12,773 | | | ALLETE, Inc. | | | 1,040,361 | |
| | 55,644 | | | Alliant Energy Corp. | | | 2,628,066 | |
| | 65,726 | | | Ameren Corp. | | | 4,782,881 | |
| | 144,332 | | | American Electric Power Co., Inc. | | | 12,347,603 | |
| | 30,405 | | | American Water Works Co., Inc. | | | 3,289,517 | |
| | 29,979 | | | Aqua America, Inc. | | | 1,170,980 | |
| | 20,501 | | | Atmos Energy Corp. | | | 2,098,072 | |
| | 15,267 | | | Avangrid, Inc. | | | 781,823 | |
| | 23,584 | | | Avista Corp. | | | 1,017,414 | �� |
| | 12,350 | | | Black Hills Corp. | | | 898,586 | |
| | 145,665 | | | CenterPoint Energy, Inc. | | | 4,515,615 | |
| | 72,159 | | | CMS Energy Corp. | | | 4,008,432 | |
| | 111,429 | | | Consolidated Edison, Inc. | | | 9,600,723 | |
| | 165,102 | | | Dominion Energy, Inc. | | | 12,856,493 | |
See accompanying Notes to Financial Statements which are an integral part of the financial statements.
Invesco FTSE RAFI US 1000 ETF (PRF)(continued)
April 30, 2019
| | | | | | | | |
Number
of Shares | | | | | Value | |
| | | | Common Stocks & Other Equity Interests (continued) | |
| | | | Utilities (continued) | |
| | 50,741 | | | DTE Energy Co. | | $ | 6,378,651 | |
| | 260,702 | | | Duke Energy Corp. | | | 23,755,166 | |
| | 123,872 | | | Edison International | | | 7,899,317 | |
| | 71,319 | | | Entergy Corp. | | | 6,910,811 | |
| | 12,947 | | | Evergy, Inc. | | | 748,595 | |
| | 85,516 | | | Eversource Energy | | | 6,128,077 | |
| | 356,748 | | | Exelon Corp. | | | 18,176,311 | |
| | 124,524 | | | FirstEnergy Corp. | | | 5,233,744 | |
| | 37,328 | | | Hawaiian Electric Industries, Inc. | | | 1,548,365 | |
| | 11,151 | | | IDACORP, Inc. | | | 1,104,172 | |
| | 19,198 | | | National Fuel Gas Co. | | | 1,136,714 | |
| | 19,600 | | | New Jersey Resources Corp. | | | 981,568 | |
| | 86,722 | | | NextEra Energy, Inc. | | | 16,862,226 | |
| | 89,724 | | | NiSource, Inc. | | | 2,492,533 | |
| | 14,236 | | | NorthWestern Corp. | | | 994,385 | |
| | 57,197 | | | NRG Energy, Inc. | | | 2,354,800 | |
| | 50,329 | | | OGE Energy Corp. | | | 2,130,930 | |
| | 10,772 | | | ONE Gas, Inc. | | | 953,537 | |
| | 704,359 | | | PG&E Corp.(b) | | | 15,862,165 | |
| | 33,318 | | | Pinnacle West Capital Corp. | | | 3,174,206 | |
| | 22,083 | | | PNM Resources, Inc. | | | 1,025,534 | |
| | 27,068 | | | Portland General Electric Co. | | | 1,415,927 | |
| | 271,546 | | | PPL Corp. | | | 8,474,951 | |
| | 149,627 | | | Public Service Enterprise Group, Inc. | | | 8,925,250 | |
| | 65,751 | | | Sempra Energy | | | 8,412,840 | |
| | 21,614 | | | South Jersey Industries, Inc. | | | 694,242 | |
| | 348,390 | | | Southern Co. (The) | | | 18,541,316 | |
| | 12,753 | | | Southwest Gas Holdings, Inc. | | | 1,060,922 | |
| | 12,179 | | | Spire, Inc. | | | 1,025,350 | |
| | 48,751 | | | UGI Corp. | | | 2,657,417 | |
| | 118,190 | | | Vistra Energy Corp. | | | 3,220,677 | |
| | 68,274 | | | WEC Energy Group, Inc. | | | 5,354,730 | |
| | 138,862 | | | Xcel Energy, Inc. | | | 7,845,703 | |
| | | | | | | | |
| | | | | | | 259,674,841 | |
| | | | | | | | |
| | | | Total Common Stocks & Other Equity Interests
(Cost $4,760,568,508) | | | 5,588,739,218 | |
| | | | | | | | |
| | |
| | | | | | | | |
| | | | Money Market Funds—0.0% | |
| | 1,842,197 | | | Invesco Premier U.S. Government Money Portfolio—Institutional Class, 2.32%(e)
(Cost $1,842,197) | | | 1,842,197 | |
| | | | | | | | |
| | | | Total Investments in Securities | |
| | | | (excluding investments purchased with cash collateral from securities on loan)
(Cost $4,762,410,705)—100.0% | | | 5,590,581,415 | |
| | | | | | | | |
| | |
| | | | | | | | |
| | | | Investments Purchased with Cash Collateral from
Securities on Loan | |
| | |
| | | | | | | | |
| | | | Money Market Funds—0.4% | |
| | 18,438,410 | | | Invesco Government & Agency Portfolio—Institutional Class, 2.34%(e)(f) | | | 18,438,410 | |
| | | | | | | | |
| | | | | | | | |
Number
of Shares | | | | | Value | |
| | | | Money Market Funds (continued) | |
| | 6,144,298 | | | Invesco Liquid Assets Portfolio— | | | | |
| | | | Institutional Class, 2.48%(e)(f) | | $ | 6,146,141 | |
| | | | | | | | |
| | | | Total Money Market Funds
(Cost $24,584,551) | | | 24,584,551 | |
| | | | | | | | |
| | |
| | | | Total Investments in Securities
(Cost $4,786,995,256)—100.4% | | | 5,615,165,966 | |
| | |
| | | | Other assets less liabilities—(0.4)% | | | (25,141,415 | ) |
| | | | | | | | |
| | |
| | | | Net Assets—100.0% | | $ | 5,590,024,551 | |
| | | | | | | | |
Abbreviations:
REIT-Real Estate Investment Trust
Notes to Schedule of Investments:
| (a) | Industry and/or sector classifications used in this report are generally according to the Global Industry Classification Standard, which was developed by and is the exclusive property and a service mark of MSCI Inc. and Standard & Poor’s. |
| (b) | Non-income producing security. |
| (c) | All or a portion of this security was out on loan at April 30, 2019. |
| (d) | Affiliated company. See Note 4. |
| (e) | The security and the Fund are advised by wholly-owned subsidiaries of Invesco Ltd. and are therefore considered to be affiliated. The rate shown is the7-day SEC standardized yield as of April 30, 2019. |
| (f) | The security has been segregated to satisfy the commitment to return the cash collateral received in securities lending transactions upon the borrower’s return of the securities loaned. See Note 2J. |
See accompanying Notes to Financial Statements which are an integral part of the financial statements.
Schedule of Investments(a)
Invesco FTSE RAFI US 1500 Small-Mid ETF (PRFZ)
April 30, 2019
| | | | | | | | |
Number
of Shares | | | | | Value | |
| | | | Common Stocks & Other Equity Interests—100.0% | |
| | | | Communication Services—3.9% | |
| | 272,145 | | | AMC Entertainment Holdings, Inc.(b) | | $ | 4,125,718 | |
| | 14,977 | | | ATN International, Inc. | | | 914,346 | |
| | 14,252 | | | Boingo Wireless, Inc.(c) | | | 324,090 | |
| | 2,244 | | | Cable One, Inc. | | | 2,379,829 | |
| | 144,380 | | | Cars.com, Inc.(c) | | | 3,004,548 | |
| | 277,772 | | | Cincinnati Bell, Inc.(c) | | | 2,472,171 | |
| | 37,544 | | | Cogent Communications Holdings, Inc. | | | 2,073,555 | |
| | 345,979 | | | Consolidated Communications Holdings, Inc.(b) | | | 1,785,252 | |
| | 59,417 | | | E.W. Scripps Co. (The), Class A | | | 1,354,113 | |
| | 36,169 | | | Emerald Expositions Events, Inc. | | | 508,174 | |
| | 272,869 | | | Entercom Communications Corp., Class A | | | 1,877,339 | |
| | 209,505 | | | Entravision Communications Corp., Class A | | | 601,279 | |
| | 95,847 | | | Eros International PLC (India)(b)(c) | | | 831,952 | |
| | 42,314 | | | GCI Liberty, Inc.(c) | | | 2,522,761 | |
| | 78,412 | | | Global Eagle Entertainment, Inc.(b)(c) | | | 50,262 | |
| | 29,551 | | | Glu Mobile, Inc.(c) | | | 323,288 | |
| | 118,082 | | | Gogo, Inc.(b)(c) | | | 621,111 | |
| | 129,984 | | | Gray Television, Inc.(c) | | | 3,045,525 | |
| | 108,604 | | | IDT Corp., Class B(c) | | | 773,261 | |
| | 58,686 | | | IMAX Corp.(c) | | | 1,430,765 | |
| | 124,456 | | | Intelsat S.A.(b)(c) | | | 2,518,989 | |
| | 121,140 | | | Iridium Communications, Inc.(c) | | | 3,326,504 | |
| | 73,071 | | | John Wiley & Sons, Inc., Class A | | | 3,374,419 | |
| | 5,206 | | | Liberty Media Corp.-Liberty Braves, Class A(c) | | | 147,642 | |
| | 18,537 | | | Liberty Media Corp.-Liberty Braves, Series C(c) | | | 521,817 | |
| | 101,725 | | | Liberty TripAdvisor Holdings, Inc., Series A(c) | | | 1,499,427 | |
| | 12,063 | | | Madison Square Garden Co. (The), Class A(c) | | | 3,768,964 | |
| | 25,467 | | | Marcus Corp. (The) | | | 958,069 | |
| | 391,339 | | | MDC Partners, Inc., Class A(c) | | | 821,812 | |
| | 46,623 | | | Meet Group, Inc. (The)(c) | | | 259,224 | |
| | 48,429 | | | MSG Networks, Inc., Class A(c) | | | 1,115,320 | |
| | 315,581 | | | National CineMedia, Inc. | | | 2,202,755 | |
| | 175,835 | | | New Media Investment Group, Inc. | | | 1,879,676 | |
| | 75,242 | | | New York Times Co. (The), Class A | | | 2,494,272 | |
| | 325,412 | | | NII Holdings, Inc.(c) | | | 637,808 | |
| | 50,087 | | | ORBCOMM, Inc.(c) | | | 362,630 | |
| | 25,118 | | | QuinStreet, Inc.(c) | | | 358,434 | |
| | 28,059 | | | Reading International, Inc., Class A(c) | | | 428,180 | |
| | 10,441 | | | Rosetta Stone, Inc.(c) | | | 263,322 | |
| | 58,349 | | | Scholastic Corp. | | | 2,326,958 | |
| | 27,043 | | | Shenandoah Telecommunications Co. | | | 1,117,687 | |
| | 474,202 | | | Sirius XM Holdings, Inc.(b) | | | 2,755,114 | |
| | 50,520 | | | Spok Holdings, Inc. | | | 699,702 | |
| | 13,599 | | | TechTarget, Inc.(c) | | | 226,967 | |
| | 44,526 | | | Townsquare Media, Inc., Class A | | | 251,572 | |
| | 76,731 | | | Tribune Publishing Co.(c) | | | 825,626 | |
| | 58,345 | | | TripAdvisor, Inc.(c) | | | 3,105,704 | |
| | 66,190 | | | TrueCar, Inc.(c) | | | 426,264 | |
| | 28,163 | | | United States Cellular Corp.(c) | | | 1,354,640 | |
| | 178,285 | | | Vonage Holdings Corp.(c) | | | 1,732,930 | |
| | 135,487 | | | WideOpenWest, Inc.(c) | | | 1,082,541 | |
| | | | | | | | |
Number
of Shares | | | | | Value | |
| | | | Common Stocks & Other Equity Interests
(continued) | |
| | | | Communication Services (continued) | |
| | 10,050 | | | World Wrestling Entertainment, Inc., Class A | | $ | 842,693 | |
| | 49,206 | | | Yelp, Inc.(c) | | | 1,971,192 | |
| | 27,457 | | | Zillow Group, Inc., Class A(c) | | | 911,847 | |
| | 60,055 | | | Zillow Group, Inc., Class C, Class A(c) | | | 2,005,837 | |
| | 439,065 | | | Zynga, Inc., Class A(c) | | | 2,485,108 | |
| | | | | | | | |
| | | | | | | 82,080,985 | |
| | | | | | | | |
| | | | Consumer Discretionary—13.7% | |
| | 37,632 | | | 1-800-Flowers.com, Inc., Class A(c) | | | 801,185 | |
| | 50,928 | | | Acushnet Holdings Corp. | | | 1,283,895 | |
| | 78,875 | | | Adtalem Global Education, Inc.(c) | | | 3,890,115 | |
| | 151,674 | | | American Outdoor Brands Corp.(c) | | | 1,493,989 | |
| | 29,977 | | | American Public Education, Inc.(c) | | | 959,264 | |
| | 7,109 | | | America’s Car-Mart, Inc.(c) | | | 704,146 | |
| | 50,767 | | | At Home Group, Inc.(c) | | | 1,192,517 | |
| | 278,974 | | | Barnes & Noble Education, Inc.(c) | | | 1,199,588 | |
| | 489,887 | | | Barnes & Noble, Inc. | | | 2,464,132 | |
| | 26,681 | | | Bassett Furniture Industries, Inc. | | | 473,855 | |
| | 147,618 | | | BBX Capital Corp. | | | 817,804 | |
| | 181,715 | | | Beazer Homes USA, Inc.(c) | | | 2,414,992 | |
| | 242,183 | | | Big 5 Sporting Goods Corp. | | | 636,941 | |
| | 3,603 | | | Biglari Holdings, Inc., Class B(c) | | | 502,006 | |
| | 23,002 | | | BJ’s Restaurants, Inc. | | | 1,148,030 | |
| | 139,876 | | | Blue Apron Holdings, Inc., Class A(b)(c) | | | 144,072 | |
| | 33,529 | | | Boot Barn Holdings, Inc.(c) | | | 965,300 | |
| | 122,864 | | | Boyd Gaming Corp. | | | 3,536,026 | |
| | 28,446 | | | Bright Horizons Family Solutions, Inc.(c) | | | 3,645,355 | |
| | 144,596 | | | Buckle, Inc. (The)(b) | | | 2,672,134 | |
| | 51,661 | | | Build-A-Bear Workshop, Inc.(c) | | | 289,302 | |
| | 107,169 | | | Caleres, Inc. | | | 2,811,043 | |
| | 85,375 | | | Callaway Golf Co. | | | 1,499,185 | |
| | 78,952 | | | Camping World Holdings, Inc.,
Class A(b) | | | 1,177,964 | |
| | 72,823 | | | Career Education Corp.(c) | | | 1,321,737 | |
| | 28,210 | | | Carriage Services, Inc. | | | 495,085 | |
| | 126,018 | | | Carrols Restaurant Group, Inc.(c) | | | 1,236,237 | |
| | 106,113 | | | Cato Corp. (The), Class A | | | 1,608,673 | |
| | 9,415 | | | Cavco Industries, Inc.(c) | | | 1,174,710 | |
| | 45,102 | | | Century Casinos, Inc.(c) | | | 410,428 | |
| | 64,384 | | | Century Communities, Inc.(c) | | | 1,637,285 | |
| | 72,696 | | | Cheesecake Factory, Inc. (The) | | | 3,607,176 | |
| | 17,720 | | | Chegg, Inc.(c) | | | 631,718 | |
| | 683,600 | | | Chico’s FAS, Inc. | | | 2,392,600 | |
| | 26,753 | | | Children’s Place, Inc. (The) | | | 3,018,273 | |
| | 18,485 | | | Choice Hotels International, Inc. | | | 1,534,994 | |
| | 22,024 | | | Churchill Downs, Inc. | | | 2,221,120 | |
| | 27,344 | | | Chuy’s Holdings, Inc.(c) | | | 543,872 | |
| | 34,915 | | | Citi Trends, Inc. | | | 646,277 | |
| | 16,770 | | | Collectors Universe, Inc. | | | 291,630 | |
| | 19,994 | | | Columbia Sportswear Co. | | | 1,998,800 | |
| | 74,586 | | | Conn’s, Inc.(c) | | | 1,929,540 | |
| | 64,965 | | | Container Store Group, Inc. (The)(b)(c) | | | 561,298 | |
| | 47,169 | | | Crocs, Inc.(c) | | | 1,313,657 | |
| | 40,286 | | | CSS Industries, Inc. | | | 282,405 | |
| | 45,968 | | | Dave & Buster’s Entertainment, Inc. | | | 2,612,821 | |
| | 25,860 | | | Deckers Outdoor Corp.(c) | | | 4,091,311 | |
| | 77,300 | | | Del Friscos Restaurant Group, Inc.(b)(c) | | | 517,910 | |
See accompanying Notes to Financial Statements which are an integral part of the financial statements.
Invesco FTSE RAFI US 1500 Small-Mid ETF (PRFZ)(continued)
April 30, 2019
| | | | | | | | |
Number
of Shares | | | | | Value | |
| | | | Common Stocks & Other Equity Interests
(continued) | |
| | | | Consumer Discretionary (continued) | |
| | 80,145 | | | Del Taco Restaurants, Inc.(c) | | $ | 805,457 | |
| | 46,152 | | | Denny’s Corp.(c) | | | 859,350 | |
| | 19,019 | | | Despegar.com Corp. (Argentina)(c) | | | 277,487 | |
| | 56,653 | | | Dillard’s, Inc., Class A(b) | | | 3,877,898 | |
| | 23,673 | | | Dine Brands Global, Inc. | | | 2,098,848 | |
| | 20,604 | | | Dorman Products, Inc.(c) | | | 1,806,353 | |
| | 197,188 | | | Drive Shack, Inc.(c) | | | 1,013,546 | |
| | 32,328 | | | El Pollo Loco Holdings, Inc.(c) | | | 413,152 | |
| | 44,952 | | | Eldorado Resorts, Inc.(c) | | | 2,219,280 | |
| | 69,680 | | | Ethan Allen Interiors, Inc. | | | 1,539,928 | |
| | 14,991 | | | Etsy, Inc.(c) | | | 1,012,492 | |
| | 142,037 | | | Everi Holdings, Inc.(c) | | | 1,461,561 | |
| | 698,837 | | | Express, Inc.(c) | | | 2,571,720 | |
| | 65,718 | | | Fiesta Restaurant Group, Inc.(c) | | | 831,990 | |
| | 14,897 | | | Five Below, Inc.(c) | | | 2,180,772 | |
| | 21,817 | | | Flexsteel Industries, Inc. | | | 472,556 | |
| | 24,021 | | | Floor & Decor Holdings, Inc.,
Class A(c) | | | 1,153,488 | |
| | 13,565 | | | Fox Factory Holding Corp.(c) | | | 1,052,644 | |
| | 925,302 | | | Francesca’s Holdings Corp.(c) | | | 640,031 | |
| | 365,979 | | | Freds, Inc., Class A(c) | | | 534,329 | |
| | 77,850 | | | frontdoor, Inc.(c) | | | 2,743,434 | |
| | 168,976 | | | FTD Cos., Inc.(c) | | | 121,257 | |
| | 9,450 | | | Funko, Inc., Class A(c) | | | 187,393 | |
| | 47,972 | | | Gentherm, Inc.(c) | | | 2,032,094 | |
| | 104,045 | | | G-III Apparel Group Ltd.(c) | | | 4,489,542 | |
| | 1,167,187 | | | GNC Holdings, Inc., Class A(b)(c) | | | 2,591,155 | |
| | 25,509 | | | Golden Entertainment, Inc.(b)(c) | | | 401,257 | |
| | 182,716 | | | GoPro, Inc., Class A(b)(c) | | | 1,079,852 | |
| | 32,151 | | | Grand Canyon Education, Inc.(c) | | | 3,725,979 | |
| | 756,596 | | | Groupon, Inc.(c) | | | 2,663,218 | |
| | 25,129 | | | GrubHub, Inc.(c) | | | 1,678,366 | |
| | 160,614 | | | Guess?, Inc. | | | 3,271,707 | |
| | 30,900 | | | Habit Restaurants, Inc. (The),
Class A(c) | | | 329,394 | |
| | 17,603 | | | Hamilton Beach Brands Holding Co., Class A | | | 318,614 | |
| | 56,986 | | | Haverty Furniture Cos., Inc. | | | 1,357,407 | |
| | 29,356 | | | Helen of Troy Ltd.(c) | | | 4,227,264 | |
| | 100,966 | | | Hibbett Sports, Inc.(c) | | | 2,089,996 | |
| | 115,294 | | | Hilton Grand Vacations, Inc.(c) | | | 3,694,020 | |
| | 21,184 | | | Hooker Furniture Corp. | | | 631,495 | |
| | 313,513 | | | Horizon Global Corp.(b)(c) | | | 871,566 | |
| | 282,213 | | | Houghton Mifflin Harcourt Co.(c) | | | 2,012,179 | |
| | 58,133 | | | Hovnanian Enterprises Inc.,
Class A(b)(c) | | | 884,784 | |
| | 19,231 | | | Installed Building Products, Inc.(c) | | | 923,665 | |
| | 34,817 | | | International Speedway Corp., Class A | | | 1,536,126 | |
| | 11,939 | | | iRobot Corp.(b)(c) | | | 1,236,164 | |
| | 71,831 | | | J. Jill, Inc. | | | 402,972 | |
| | 31,345 | | | Jack in the Box, Inc. | | | 2,416,699 | |
| | 5,341 | | | Johnson Outdoors, Inc., Class A | | | 409,494 | |
| | 56,363 | | | K12, Inc.(c) | | | 1,697,654 | |
| | 68,818 | | | Kirkland’s, Inc.(c) | | | 404,650 | |
| | 34,545 | | | Lands’ End, Inc.(c) | | | 604,883 | |
| | 246,278 | | | Laureate Education, Inc., Class A(c) | | | 3,876,416 | |
| | 75,532 | | | La-Z-Boy, Inc. | | | 2,477,450 | |
| | 36,930 | | | LCI Industries | | | 3,244,300 | |
| | 21,219 | | | LGI Homes, Inc.(c) | | | 1,470,689 | |
| | 90,187 | | | Libbey, Inc.(c) | | | 225,467 | |
| | | | | | | | |
Number
of Shares | | | | | Value | |
| | | | Common Stocks & Other Equity Interests
(continued) | |
| | | | Consumer Discretionary (continued) | |
| | 17,524 | | | Lindblad Expeditions Holdings, Inc.(c) | | $ | 284,064 | |
| | 59,514 | | | Liquidity Services, Inc.(c) | | | 404,100 | |
| | 100,716 | | | Lumber Liquidators Holdings, Inc.(b)(c) | | | 1,331,466 | |
| | 94,993 | | | M/I Homes, Inc.(c) | | | 2,675,953 | |
| | 28,710 | | | MakeMyTrip Ltd. (India)(c) | | | 723,779 | |
| | 9,587 | | | Malibu Boats, Inc., Class A(c) | | | 399,011 | |
| | 46,018 | | | MarineMax, Inc.(c) | | | 795,651 | |
| | 29,627 | | | Marriott Vacations Worldwide Corp. | | | 3,129,500 | |
| | 25,162 | | | MasterCraft Boat Holdings, Inc.(c) | | | 622,508 | |
| | 106,392 | | | MDC Holdings, Inc. | | | 3,251,340 | |
| | 4,808 | | | MercadoLibre, Inc. (Argentina)(c) | | | 2,327,745 | |
| | 154,378 | | | Modine Manufacturing Co.(c) | | | 2,283,251 | |
| | 10,966 | | | Monarch Casino & Resort, Inc.(c) | | | 468,139 | |
| | 27,124 | | | Monro, Inc. | | | 2,273,805 | |
| | 40,325 | | | Motorcar Parts of America, Inc.(c) | | | 833,114 | |
| | 25,389 | | | Movado Group, Inc. | | | 905,118 | |
| | 6,815 | | | Nathan’s Famous, Inc. | | | 470,576 | |
| | 56,980 | | | National Vision Holdings, Inc.(c) | | | 1,538,460 | |
| | 84,365 | | | Nautilus, Inc.(c) | | | 451,353 | |
| | 68,627 | | | New Home Co., Inc. (The)(b)(c) | | | 316,370 | |
| | 19,036 | | | Ollie’s Bargain Outlet Holdings, Inc.(c) | | | 1,820,603 | |
| | 61,237 | | | Overstock.com, Inc.(b)(c) | | | 807,104 | |
| | 22,658 | | | Oxford Industries, Inc. | | | 1,881,973 | |
| | 34,356 | | | Papa John’s International, Inc.(b) | | | 1,757,653 | |
| | 251,940 | | | Party City Holdco, Inc.(b)(c) | | | 1,687,998 | |
| | 28,905 | | | PetMed Express, Inc.(b) | | | 631,574 | |
| | 2,590,306 | | | Pier 1 Imports, Inc.(b)(c) | | | 2,349,148 | |
| | 13,878 | | | Planet Fitness, Inc., Class A(c) | | | 1,050,565 | |
| | 88,521 | | | Playa Hotels & Resorts N.V.(c) | | | 708,168 | |
| | 10,144 | | | PlayAGS, Inc.(c) | | | 244,673 | |
| | 23,348 | | | Pool Corp. | | | 4,289,961 | |
| | 63,709 | | | Potbelly Corp.(c) | | | 567,010 | |
| | 54,875 | | | Quotient Technology, Inc.(c) | | | 509,789 | |
| | 12,320 | | | RCI Hospitality Holdings, Inc. | | | 280,526 | |
| | 31,504 | | | Red Lion Hotels Corp.(c) | | | 249,512 | |
| | 63,566 | | | Red Robin Gourmet Burgers, Inc.(c) | | | 2,036,019 | |
| | 73,995 | | | Red Rock Resorts, Inc., Class A | | | 1,996,385 | |
| | 80,782 | | | Regis Corp.(c) | | | 1,512,239 | |
| | 133,500 | | | Rent-A-Center, Inc.(c) | | | 3,328,155 | |
| | 16,481 | | | RH(b)(c) | | | 1,758,687 | |
| | 14,094 | | | Rocky Brands, Inc. | | | 359,538 | |
| | 3,993 | | | Roku, Inc.(c) | | | 253,915 | |
| | 115,691 | | | RTW RetailWinds, Inc.(c) | | | 268,403 | |
| | 62,248 | | | Rubicon Project, Inc. (The)(c) | | | 397,765 | |
| | 26,152 | | | Ruth’s Hospitality Group, Inc. | | | 679,429 | |
| | 103,202 | | | Scientific Games Corp.(c) | | | 2,387,062 | |
| | 76,738 | | | SeaWorld Entertainment, Inc.(c) | | | 2,042,766 | |
| | 6,382 | | | Shake Shack, Inc., Class A(c) | | | 391,217 | |
| | 42,455 | | | Shiloh Industries, Inc.(c) | | | 242,843 | |
| | 21,660 | | | Shoe Carnival, Inc.(b) | | | 772,396 | |
| | 47,521 | | | Shutterfly, Inc.(c) | | | 2,082,845 | |
| | 12,750 | | | Shutterstock, Inc. | | | 515,737 | |
| | 42,456 | | | Sleep Number Corp.(c) | | | 1,477,469 | |
| | 140,646 | | | Sonic Automotive, Inc., Class A | | | 2,845,269 | |
| | 60,673 | | | Sotheby’s(c) | | | 2,559,187 | |
| | 32,202 | | | Speedway Motorsports, Inc. | | | 590,907 | |
| | 152,717 | | | Sportsmans Warehouse Holdings,
Inc.(c) | | | 681,118 | |
See accompanying Notes to Financial Statements which are an integral part of the financial statements.
Invesco FTSE RAFI US 1500 Small-Mid ETF (PRFZ)(continued)
April 30, 2019
| | | | | | | | |
Number
of Shares | | | | | Value | |
| | | | Common Stocks & Other Equity Interests
(continued) | |
| | | | Consumer Discretionary (continued) | |
| | 199,695 | | | Stage Stores, Inc.(b) | | $ | 207,683 | |
| | 5,821 | | | Stamps.com, Inc.(c) | | | 499,442 | |
| | 33,632 | | | Standard Motor Products, Inc. | | | 1,680,591 | |
| | 162,969 | | | Stein Mart, Inc.(b)(c) | | | 150,469 | |
| | 90,709 | | | Steven Madden Ltd. | | | 3,297,272 | |
| | 11,904 | | | Stitch Fix, Inc., Class A(c) | | | 317,242 | |
| | 41,453 | | | Stoneridge, Inc.(c) | | | 1,302,868 | |
| | 8,630 | | | Strategic Education, Inc. | | | 1,237,110 | |
| | 6,005 | | | Strattec Security Corp. | | | 181,891 | |
| | 28,479 | | | Sturm Ruger & Co., Inc. | | | 1,594,539 | |
| | 13,514 | | | Superior Group of Cos.Inc. | | | 226,224 | |
| | 239,178 | | | Superior Industries International, Inc. | | | 1,183,931 | |
| | 228,333 | | | Tailored Brands, Inc. | | | 1,860,914 | |
| | 53,865 | | | Texas Roadhouse, Inc. | | | 2,909,249 | |
| | 56,359 | | | Tile Shop Holdings, Inc. | | | 273,905 | |
| | 43,717 | | | Tilly’s, Inc., Class A | | | 514,112 | |
| | 54,993 | | | TopBuild Corp.(c) | | | 3,917,151 | |
| | 85,208 | | | Tower International, Inc. | | | 1,988,755 | |
| | 51,931 | | | Town Sports International Holdings, Inc.(c) | | | 188,510 | |
| | 47,333 | | | Unifi, Inc.(c) | | | 956,127 | |
| | 36,946 | | | Universal Electronics, Inc.(c) | | | 1,405,795 | |
| | 93,879 | | | Veoneer, Inc. (Sweden)(b)(c) | | | 2,071,910 | |
| | 76,418 | | | Vera Bradley, Inc.(c) | | | 938,413 | |
| | 389,225 | | | Vista Outdoor, Inc.(c) | | | 3,359,012 | |
| | 189,800 | | | Vitamin Shoppe, Inc.(c) | | | 1,191,944 | |
| | 11,221 | | | Wayfair, Inc., Class A(c) | | | 1,819,485 | |
| | 44,238 | | | Weight Watchers International, Inc.(c) | | | 903,340 | |
| | 205,439 | | | Wendy’s Co. (The) | | | 3,823,220 | |
| | 13,765 | | | Weyco Group, Inc. | | | 472,277 | |
| | 140,199 | | | William Lyon Homes, Class A(c) | | | 2,363,755 | |
| | 9,438 | | | Wingstop, Inc. | | | 710,398 | |
| | 47,376 | | | Winnebago Industries, Inc. | | | 1,675,689 | |
| | 93,350 | | | Wolverine World Wide, Inc. | | | 3,436,213 | |
| | 48,404 | | | ZAGG, Inc.(c) | | | 398,849 | |
| | 77,842 | | | Zovio Inc.(c) | | | 468,609 | |
| | 46,765 | | | Zumiez, Inc.(c) | | | 1,245,352 | |
| | | | | | | | |
| | | | | | | 286,227,038 | |
| | | | | | | | |
| | | | Consumer Staples—3.1% | |
| | 281,543 | | | Adecoagro S.A. (Argentina)(c) | | | 1,914,492 | |
| | 311,424 | | | Amira Nature Foods Ltd. (United Arab Emirates)(c) | | | 451,565 | |
| | 82,598 | | | Andersons, Inc. (The) | | | 2,700,955 | |
| | 5,834 | | | Boston Beer Co., Inc. (The),
Class A(c) | | | 1,808,598 | |
| | 13,233 | | | Calavo Growers, Inc.(b) | | | 1,267,854 | |
| | 50,633 | | | Cal-Maine Foods, Inc. | | | 2,081,523 | |
| | 77,493 | | | Central Garden & Pet Co., Class A(c) | | | 1,897,029 | |
| | 30,512 | | | Chefs’ Warehouse, Inc. (The)(c) | | | 997,132 | |
| | 6,604 | | | Coca-Cola Bottling Co. Consolidated, Inc. | | | 2,146,498 | |
| | 15,416 | | | Craft Brew Alliance, Inc.(c) | | | 217,520 | |
| | 32,852 | | | elf Beauty, Inc.(c) | | | 420,177 | |
| | 54,672 | | | Energizer Holdings, Inc. | | | 2,618,242 | |
| | 22,097 | | | Farmer Brothers Co.(c) | | | 445,476 | |
| | 96,092 | | | Fresh Del Monte Produce, Inc. | | | 2,835,675 | |
| | 4,620 | | | Freshpet, Inc.(c) | | | 206,329 | |
| | 221,745 | | | Hain Celestial Group, Inc. (The)(c) | | | 4,838,476 | |
| | 152,598 | | | Hostess Brands, Inc.(c) | | | 2,044,813 | |
| | | | | | | | |
Number
of Shares | | | | | Value | |
| | | | Common Stocks & Other Equity Interests
(continued) | |
| | | | Consumer Staples (continued) | |
| | 48,118 | | | Ingles Markets, Inc., Class A | | $ | 1,320,839 | |
| | 11,867 | | | Inter Parfums, Inc. | | | 860,239 | |
| | 11,742 | | | J & J Snack Foods Corp. | | | 1,845,608 | |
| | 16,036 | | | John B. Sanfilippo & Son, Inc. | | | 1,156,356 | |
| | 110,128 | | | Keurig Dr Pepper, Inc. | | | 3,201,421 | |
| | 17,601 | | | Lancaster Colony Corp. | | | 2,617,445 | |
| | 9,883 | | | Limoneira Co. | | | 225,728 | |
| | 3,923 | | | Medifast, Inc. | | | 575,465 | |
| | 6,094 | | | MGP Ingredients, Inc.(b) | | | 535,480 | |
| | 8,180 | | | National Beverage Corp.(b) | | | 458,080 | |
| | 24,093 | | | Natural Grocers by Vitamin Cottage, Inc.(c) | | | 298,271 | |
| | 18,170 | | | Natural Health Trends Corp.(b) | | | 210,045 | |
| | 159,820 | | | Pilgrim’s Pride Corp.(c) | | | 4,300,756 | |
| | 39,878 | | | PriceSmart, Inc. | | | 2,385,103 | |
| | 18,052 | | | Primo Water Corp.(c) | | | 284,319 | |
| | 114,275 | | | Pyxus International, Inc.(b)(c) | | | 2,608,898 | |
| | 18,474 | | | Revlon, Inc., Class A(b)(c) | | | 394,420 | |
| | 14,951 | | | Seneca Foods Corp., Class A(c) | | | 370,037 | |
| | 30,065 | | | Simply Good Foods Co. (The)(c) | | | 675,260 | |
| | 203,485 | | | Smart & Final Stores, Inc.(c) | | | 1,328,757 | |
| | 135,691 | | | SpartanNash Co. | | | 2,194,123 | |
| | 13,165 | | | Tootsie Roll Industries, Inc. | | | 511,197 | |
| | 5,247 | | | Turning Point Brands, Inc. | | | 224,414 | |
| | 9,600 | | | USANA Health Sciences, Inc.(c) | | | 801,216 | |
| | 315,448 | | | Vector Group Ltd. | | | 3,006,219 | |
| | 17,647 | | | Village Super Market, Inc., Class A | | | 518,469 | |
| | 6,241 | | | WD-40 Co. | | | 1,050,048 | |
| | 27,371 | | | Weis Markets, Inc. | | | 1,150,951 | |
| | | | | | | | |
| | | | | | | 64,001,518 | |
| | | | | | | | |
| | | | Energy—6.4% | |
| | 183,968 | | | Abraxas Petroleum Corp.(c) | | | 253,876 | |
| | 298,120 | | | Alta Mesa Resources, Inc., Class A(c) | | | 65,586 | |
| | 99,949 | | | Apergy Corp.(c) | | | 3,966,976 | |
| | 210,301 | | | Approach Resources, Inc.(c) | | | 71,881 | |
| | 25,559 | | | Arch Coal, Inc., Class A | | | 2,478,712 | |
| | 283,856 | | | Archrock, Inc. | | | 2,869,784 | |
| | 122,523 | | | Ardmore Shipping Corp. (Ireland)(c) | | | 855,211 | |
| | 238,399 | | | Basic Energy Services, Inc.(c) | | | 600,766 | |
| | 19,234 | | | Berry Petroleum Corp. | | | 218,498 | |
| | 40,983 | | | Bonanza Creek Energy, Inc.(c) | | | 986,461 | |
| | 1,630,400 | | | Bristow Group, Inc.(b)(c) | | | 823,352 | |
| | 145,664 | | | C&J Energy Services, Inc.(c) | | | 2,046,579 | |
| | 7,270 | | | Cactus, Inc., Class A(c) | | | 263,901 | |
| | 83,254 | | | California Resources Corp.(b)(c) | | | 1,754,994 | |
| | 321,345 | | | Callon Petroleum Co.(c) | | | 2,413,301 | |
| | 147,327 | | | CARBO Ceramics, Inc.(c) | | | 400,729 | |
| | 97,590 | | | Carrizo Oil & Gas, Inc.(c) | | | 1,251,104 | |
| | 207,446 | | | Centennial Resource Development, Inc., Class A(c) | | | 2,184,406 | |
| | 33,034 | | | Cheniere Energy, Inc.(c) | | | 2,125,738 | |
| | 290,233 | | | Clean Energy Fuels Corp.(c) | | | 911,332 | |
| | 89,636 | | | CONSOL Energy, Inc.(c) | | | 3,038,660 | |
| | 79,862 | | | Contango Oil & Gas Co.(c) | | | 241,183 | |
| | 49,748 | | | Core Laboratories N.V.(b) | | | 3,153,526 | |
| | 69,280 | | | CVR Energy, Inc. | | | 3,159,861 | |
See accompanying Notes to Financial Statements which are an integral part of the financial statements.
Invesco FTSE RAFI US 1500 Small-Mid ETF (PRFZ)(continued)
April 30, 2019
| | | | | | | | |
Number
of Shares | | | | | Value | |
| | | | Common Stocks & Other Equity Interests
(continued) | |
| | | | Energy (continued) | |
| | 1,069,143 | | | Denbury Resources, Inc.(c) | | $ | 2,384,189 | |
| | 306,062 | | | DHT Holdings, Inc. | | | 1,631,310 | |
| | 7,452 | | | DMC Global, Inc. | | | 516,424 | |
| | 126,146 | | | Dorian LPG Ltd.(c) | | | 1,011,691 | |
| | 80,361 | | | Dril-Quip, Inc.(c) | | | 3,500,525 | |
| | 699,974 | | | EP Energy Corp., Class A(c) | | | 199,073 | |
| | 192,058 | | | Equitrans Midstream Corp. | | | 4,000,568 | |
| | 41,139 | | | Era Group, Inc.(c) | | | 396,580 | |
| | 126,506 | | | Exterran Corp.(c) | | | 1,798,915 | |
| | 394,824 | | | Extraction Oil & Gas, Inc.(b)(c) | | | 1,855,673 | |
| | 335,790 | | | Forum Energy Technologies, Inc.(c) | | | 2,008,024 | |
| | 171,461 | | | Frank’s International N.V.(b)(c) | | | 1,001,332 | |
| | 39,422 | | | FTS International, Inc.(c) | | | 408,018 | |
| | 71,639 | | | GasLog Ltd. (Monaco) | | | 1,119,718 | |
| | 34,172 | | | Geopark Ltd. (Colombia)(c) | | | 536,500 | |
| | 27,301 | | | Geospace Technologies Corp.(c) | | | 367,198 | |
| | 93,748 | | | Golar LNG Ltd. (Bermuda) | | | 1,831,836 | |
| | 249,616 | | | Green Plains, Inc. | | | 4,335,830 | |
| | 33,621 | | | Gulf Island Fabrication, Inc.(c) | | | 289,141 | |
| | 859,602 | | | Halcon Resources Corp.(b)(c) | | | 1,117,483 | |
| | 40,422 | | | Hallador Energy Co. | | | 208,578 | |
| | 398,252 | | | Helix Energy Solutions Group, Inc.(c) | | | 3,114,331 | |
| | 234,708 | | | HighPoint Resources Corp.(c) | | | 643,100 | |
| | 217,134 | | | Hornbeck Offshore Services, Inc.(c) | | | 282,274 | |
| | 62,711 | | | Independence Contract Drilling, Inc.(c) | | | 177,472 | |
| | 87,011 | | | International Seaways, Inc.(c) | | | 1,550,536 | |
| | 27,261 | | | ION Geophysical Corp.(c) | | | 348,668 | |
| | 24,290 | | | Jagged Peak Energy, Inc.(b)(c) | | | 256,745 | |
| | 62,290 | | | Keane Group, Inc.(c) | | | 653,422 | |
| | 169,949 | | | Key Energy Services, Inc.(b)(c) | | | 710,387 | |
| | 14,637 | | | KLX Energy Services Holdings, Inc.(c) | | | 410,568 | |
| | 267,397 | | | Kosmos Energy Ltd. (Ghana) | | | 1,788,886 | |
| | 268,306 | | | Laredo Petroleum, Inc.(c) | | | 810,284 | |
| | 820,156 | | | Legacy Reserves Inc.(c) | | | 369,070 | |
| | 37,398 | | | Liberty Oilfield Services, Inc., Class A(b) | | | 557,604 | |
| | 62,730 | | | Lonestar Resources US Inc., Class A(c) | | | 249,665 | |
| | 16,012 | | | Mammoth Energy Services, Inc | | | 249,627 | |
| | 83,937 | | | Matador Resources Co.(c) | | | 1,652,720 | |
| | 78,012 | | | Matrix Service Co.(c) | | | 1,529,815 | |
| | 58,503 | | | Midstates Petroleum Co., Inc.(c) | | | 747,083 | |
| | 15,111 | | | Montage Resources Corp.(c) | | | 168,034 | |
| | 9,262 | | | NACCO Industries, Inc., Class A | | | 378,723 | |
| | 105,086 | | | Navigator Holdings Ltd.(c) | | | 1,179,065 | |
| | 172,689 | | | Newpark Resources, Inc.(c) | | | 1,260,630 | |
| | 19,124 | | | Nine Energy Service, Inc.(c) | | | 384,966 | |
| | 961,934 | | | Nordic American Tankers Ltd. | | | 2,058,539 | |
| | 170,860 | | | Oil States International, Inc.(c) | | | 3,301,015 | |
| | 301,724 | | | Overseas Shipholding Group, Inc., Class A(c) | | | 549,138 | |
| | 384,580 | | | Pacific Ethanol, Inc.(c) | | | 419,192 | |
| | 97,000 | | | Par Pacific Holdings, Inc.(c) | | | 1,895,380 | |
| | 8,077 | | | Penn Virginia Corp.(c) | | | 362,657 | |
| | 472,982 | | | Pioneer Energy Services Corp.(c) | | | 822,989 | |
| | 36,781 | | | ProPetro Holding Corp.(c) | | | 813,964 | |
| | 86,206 | | | Renewable Energy Group, Inc.(c) | | | 2,079,289 | |
| | 13,863 | | | REX American Resources Corp.(c) | | | 1,171,562 | |
| | 25,835 | | | RigNet, Inc.(c) | | | 242,591 | |
| | | | | | | | |
Number
of Shares | | | | | Value | |
| | | | Common Stocks & Other Equity Interests
(continued) | |
| | | | Energy (continued) | |
| | 68,881 | | | Ring Energy, Inc.(c) | | $ | 356,804 | |
| | 104,161 | | | RPC, Inc. | | | 1,071,817 | |
| | 189,701 | | | SandRidge Energy, Inc.(c) | | | 1,585,900 | |
| | 147,485 | | | Scorpio Tankers, Inc. (Monaco) | | | 3,802,163 | |
| | 38,035 | | | SEACOR Holdings, Inc.(c) | | | 1,694,079 | |
| | 30,306 | | | SEACOR Marine Holdings, Inc.(c) | | | 411,556 | |
| | 53,642 | | | Select Energy Services, Inc.,
Class A(c) | | | 617,956 | |
| | 225,358 | | | Ship Finance International Ltd. (Norway)(b) | | | 2,875,568 | |
| | 13,696 | | | SilverBow Resources, Inc.(c) | | | 248,445 | |
| | 76,932 | | | Smart Sand, Inc.(b)(c) | | | 302,343 | |
| | 741,719 | | | Southwestern Energy Co.(c) | | | 2,929,790 | |
| | 434,303 | | | SRC Energy, Inc.(c) | | | 2,670,963 | |
| | 807,798 | | | Superior Energy Services, Inc.(c) | | | 2,899,995 | |
| | 14,746 | | | Talos Energy, Inc.(c) | | | 437,956 | |
| | 583,984 | | | Teekay Corp. (Bermuda) | | | 2,429,373 | |
| | 1,202,766 | | | Teekay Tankers Ltd., Class A (Bermuda)(c) | | | 1,311,015 | |
| | 541,070 | | | TETRA Technologies, Inc.(c) | | | 1,287,747 | |
| | 72,219 | | | Tidewater, Inc.(c) | | | 1,624,928 | |
| | 856,202 | | | Ultra Petroleum Corp.(c) | | | 359,947 | |
| | 165,575 | | | Unit Corp.(c) | | | 2,245,197 | |
| | 188,503 | | | US Silica Holdings, Inc.(b) | | | 2,982,117 | |
| | 158,714 | | | W&T Offshore, Inc.(c) | | | 1,012,595 | |
| | | | | | | | |
| | | | | | | 135,003,268 | |
| | | | | | | | |
| | | | Financials—17.6% | |
| | 20,766 | | | 1st Source Corp. | | | 972,472 | |
| | 80,080 | | | AG Mortgage Investment Trust, Inc. | | | 1,370,169 | |
| | 9,036 | | | Allegiance Bancshares, Inc.(c) | | | 312,375 | |
| | 202,527 | | | Ambac Financial Group, Inc.(c) | | | 3,787,255 | |
| | 17,949 | | | American National Insurance Co. | | | 2,033,442 | |
| | 31,010 | | | Ameris Bancorp | | | 1,130,625 | |
| | 31,891 | | | AMERISAFE, Inc. | | | 1,888,585 | |
| | 336,938 | | | Anworth Mortgage Asset Corp. | | | 1,411,770 | |
| | 161,824 | | | Apollo Commercial Real Estate Finance, Inc. | | | 3,032,582 | |
| | 73,705 | | | Arbor Realty Trust, Inc.(b) | | | 1,006,810 | |
| | 72,112 | | | Ares Commercial Real Estate Corp. | | | 1,096,102 | |
| | 54,967 | | | Argo Group International Holdings Ltd. | | | 4,291,274 | |
| | 66,356 | | | Arlington Asset Investment Corp., Class A | | | 520,895 | |
| | 52,678 | | | ARMOUR Residential REIT, Inc. | | | 1,005,096 | |
| | 81,451 | | | Artisan Partners Asset Management, Inc., Class A | | | 2,308,321 | |
| | 26,170 | | | Atlantic Capital Bancshares, Inc.(c) | | | 456,405 | |
| | 56,763 | | | Axos Financial, Inc.(c) | | | 1,857,285 | |
| | 81,450 | | | Banc of California, Inc. | | | 1,181,839 | |
| | 17,372 | | | BancFirst Corp. | | | 979,781 | |
| | 86,702 | | | Banco Latinoamericano de Comercio Exterior S.A., Class E (Panama) | | | 1,875,364 | |
| | 57,845 | | | Bancorp, Inc. (The)(c) | | | 590,597 | |
| | 102,567 | | | BancorpSouth Bank | | | 3,126,242 | |
| | 11,887 | | | Bank of Marin Bancorp | | | 503,414 | |
| | 64,833 | | | Bank of NT Butterfield & Son Ltd. (The) (Bermuda) | | | 2,594,617 | |
| | 16,733 | | | BankFinancial Corp. | | | 251,162 | |
| | 35,014 | | | Banner Corp. | | | 1,856,442 | |
| | 8,814 | | | Baycom Corp.(c) | | | 203,163 | |
See accompanying Notes to Financial Statements which are an integral part of the financial statements.
Invesco FTSE RAFI US 1500 Small-Mid ETF (PRFZ)(continued)
April 30, 2019
| | | | | | | | |
Number
of Shares | | | | | Value | |
| | | | Common Stocks & Other Equity Interests
(continued) | |
| | | | Financials (continued) | |
| | 68,716 | | | Berkshire Hills Bancorp, Inc. | | $ | 2,060,793 | |
| | 339,177 | | | BGC Partners, Inc., Class A | | | 1,831,556 | |
| | 45,363 | | | Blucora, Inc.(c) | | | 1,587,705 | |
| | 41,054 | | | BOK Financial Corp. | | | 3,577,446 | |
| | 156,122 | | | Boston Private Financial Holdings, Inc. | | | 1,787,597 | |
| | 21,714 | | | Bridge Bancorp, Inc. | | | 672,917 | |
| | 107,607 | | | Brookline Bancorp, Inc. | | | 1,619,485 | |
| | 25,458 | | | Bryn Mawr Bank Corp. | | | 969,695 | |
| | 17,677 | | | Byline Bancorp, Inc.(c) | | | 353,894 | |
| | 69,910 | | | Cadence BanCorp. | | | 1,590,452 | |
| | 115,106 | | | Cannae Holdings, Inc.(c) | | | 2,954,771 | |
| | 277,268 | | | Capitol Federal Financial, Inc. | | | 3,826,298 | |
| | 348,591 | | | Capstead Mortgage Corp. | | | 2,994,397 | |
| | 15,104 | | | Carolina Financial Corp. | | | 545,103 | |
| | 91,486 | | | Cathay General Bancorp | | | 3,365,770 | |
| | 16,065 | | | CBTX, Inc. | | | 509,260 | |
| | 71,154 | | | CenterState Bank Corp. | | | 1,756,081 | |
| | 38,937 | | | Central Pacific Financial Corp. | | | 1,168,499 | |
| | 15,162 | | | Central Valley Community Bancorp | | | 310,215 | |
| | 29,629 | | | Cherry Hill Mortgage Investment Corp. | | | 511,397 | |
| | 17,484 | | | City Holding Co. | | | 1,387,880 | |
| | 13,090 | | | Civista Bancshares, Inc. | | | 287,980 | |
| | 83,393 | | | CNA Financial Corp. | | | 3,863,598 | |
| | 29,571 | | | Cohen & Steers, Inc. | | | 1,482,986 | |
| | 102,991 | | | Columbia Banking System, Inc. | | | 3,866,282 | |
| | 27,029 | | | Columbia Financial, Inc.(c) | | | 428,680 | |
| | 53,024 | | | Community Bank System, Inc. | | | 3,523,975 | |
| | 27,020 | | | Community Trust Bancorp, Inc. | | | 1,141,595 | |
| | 38,556 | | | ConnectOne Bancorp, Inc. | | | 841,677 | |
| | 77,387 | | | Cowen, Inc., Class A(c) | | | 1,296,232 | |
| | 6,349 | | | Credit Acceptance Corp.(c) | | | 3,150,501 | |
| | 37,011 | | | Curo Group Holdings Corp.(c) | | | 492,987 | |
| | 69,415 | | | Customers Bancorp, Inc.(c) | | | 1,572,250 | |
| | 94,910 | | | CVB Financial Corp. | | | 2,059,547 | |
| | 4,933 | | | Diamond Hill Investment Group, Inc. | | | 712,720 | |
| | 61,353 | | | Dime Community Bancshares, Inc. | | | 1,236,263 | |
| | 13,143 | | | Donegal Group, Inc., Class A | | | 177,431 | |
| | 116,719 | | | Donnelley Financial Solutions, Inc.(c) | | | 1,786,968 | |
| | 171,949 | | | Dynex Capital, Inc. | | | 1,048,889 | |
| | 32,473 | | | Eagle Bancorp, Inc.(c) | | | 1,794,458 | |
| | 3,196 | | | eHealth, Inc.(c) | | | 194,125 | |
| | 52,838 | | | Elevate Credit, Inc.(c) | | | 236,714 | |
| | 24,164 | | | Ellington Residential Mortgage REIT | | | 285,618 | |
| | 19,020 | | | EMC Insurance Group, Inc. | | | 610,732 | |
| | 43,354 | | | Employers Holdings, Inc. | | | 1,860,754 | |
| | 59,983 | | | Encore Capital Group, Inc.(c) | | | 1,695,120 | |
| | 73,305 | | | Enova International, Inc.(c) | | | 2,010,756 | |
| | 18,684 | | | Enstar Group Ltd. (Bermuda)(c) | | | 3,311,926 | |
| | 11,407 | | | Entegra Financial Corp.(c) | | | 336,506 | |
| | 21,395 | | | Enterprise Financial Services Corp. | | | 910,143 | |
| | 15,713 | | | Equity Bancshares, Inc., Class A(c) | | | 412,623 | |
| | 76,837 | | | Essent Group Ltd.(c) | | | 3,645,916 | |
| | 33,995 | | | Evercore, Inc., Class A | | | 3,312,133 | |
| | 122,568 | | | Exantas Capital Corp. REIT | | | 1,342,120 | |
| | 17,625 | | | FactSet Research Systems, Inc. | | | 4,862,209 | |
| | 19,186 | | | FB Financial Corp. | | | 704,894 | |
| | 19,468 | | | FBL Financial Group, Inc., Class A | | | 1,216,166 | |
| | | | | | | | |
Number
of Shares | | | | | Value | |
| | | | Common Stocks & Other Equity Interests
(continued) | |
| | | | Financials (continued) | |
| | 14,728 | | | Federal Agricultural Mortgage Corp., Class C | | $ | 1,126,397 | |
| | 25,246 | | | FedNat Holding Co. | | | 410,752 | |
| | 417,922 | | | FGL Holdings | | | 3,564,875 | |
| | 23,946 | | | Fidelity Southern Corp. | | | 697,068 | |
| | 27,682 | | | Financial Institutions, Inc. | | | 761,255 | |
| | 337,391 | | | First BanCorp | | | 3,812,518 | |
| | 27,474 | | | First Bancorp/Southern Pines NC | | | 1,041,539 | |
| | 7,766 | | | First Bancshares, Inc. (The) | | | 239,814 | |
| | 55,537 | | | First Busey Corp. | | | 1,435,076 | |
| | 8,587 | | | First Choice Bancorp | | | 182,560 | |
| | 9,226 | | | First Citizens BancShares, Inc., Class A | | | 4,135,554 | |
| | 132,034 | | | First Commonwealth Financial Corp. | | | 1,796,983 | |
| | 23,208 | | | First Defiance Financial Corp. | | | 684,868 | |
| | 82,977 | | | First Financial Bancorp | | | 2,082,723 | |
| | 36,488 | | | First Financial Bankshares, Inc. | | | 2,244,742 | |
| | 22,389 | | | First Financial Corp. | | | 921,755 | |
| | 12,358 | | | First Financial Northwest, Inc. | | | 206,749 | |
| | 40,972 | | | First Foundation, Inc. | | | 582,212 | |
| | 14,464 | | | First Internet Bancorp | | | 316,617 | |
| | 37,270 | | | First Interstate BancSystem, Inc., Class A | | | 1,575,030 | |
| | 51,099 | | | First Merchants Corp. | | | 1,873,800 | |
| | 12,539 | | | FirstMid-Illinois Bancshares, Inc. | | | 432,470 | |
| | 137,091 | | | First Midwest Bancorp, Inc. | | | 2,943,344 | |
| | 32,916 | | | First of Long Island Corp. (The) | | | 765,955 | |
| | 31,784 | | | FirstCash, Inc. | | | 3,104,661 | |
| | 50,141 | | | Flagstar Bancorp, Inc. | | | 1,792,541 | |
| | 44,984 | | | Flushing Financial Corp. | | | 1,016,638 | |
| | 7,555 | | | Focus Financial Partners, Inc., Class A(c) | | | 283,313 | |
| | 15,738 | | | Franklin Financial Network, Inc. | | | 435,156 | |
| | 3,676 | | | FS Bancorp, Inc. | | | 190,012 | |
| | 77,297 | | | GAIN Capital Holdings, Inc.(b) | | | 407,355 | |
| | 21,135 | | | German American Bancorp, Inc. | | | 630,880 | |
| | 84,060 | | | Glacier Bancorp, Inc. | | | 3,580,115 | |
| | 65,207 | | | Granite Point Mortgage Trust, Inc. | | | 1,253,931 | |
| | 33,591 | | | Great Ajax Corp. | | | 481,023 | |
| | 15,487 | | | Great Southern Bancorp, Inc. | | | 897,472 | |
| | 83,137 | | | Great Western Bancorp, Inc. | | | 2,923,928 | |
| | 25,750 | | | Green Dot Corp., Class A(c) | | | 1,642,077 | |
| | 63,400 | | | Greenhill & Co., Inc. | | | 1,313,014 | |
| | 97,885 | | | Greenlight Capital Re Ltd., Class A(c) | | | 1,172,662 | |
| | 9,688 | | | Guaranty Bancshares, Inc. | | | 271,942 | |
| | 53,866 | | | Hanmi Financial Corp. | | | 1,277,702 | |
| | 16,160 | | | HarborOne Bancorp, Inc.(b)(c) | | | 302,515 | |
| | 14,741 | | | HCI Group, Inc. | | | 628,261 | |
| | 5,038 | | | Health Insurance Innovations, Inc., Class A(b)(c) | | | 117,486 | |
| | 31,353 | | | Heartland Financial USA, Inc. | | | 1,407,750 | |
| | 40,725 | | | Heritage Commerce Corp. | | | 509,877 | |
| | 32,790 | | | Heritage Financial Corp. | | | 992,553 | |
| | 57,896 | | | Heritage Insurance Holdings, Inc. | | | 789,701 | |
| | 140,283 | | | Hilltop Holdings, Inc. | | | 2,950,151 | |
| | 10,034 | | | Home Bancorp, Inc. | | | 367,646 | |
| | 176,433 | | | Home BancShares, Inc. | | | 3,385,749 | |
| | 40,423 | | | HomeStreet, Inc.(c) | | | 1,137,503 | |
| | 226,835 | | | Hope Bancorp, Inc. | | | 3,189,300 | |
| | 87,353 | | | Horace Mann Educators Corp. | | | 3,370,079 | |
See accompanying Notes to Financial Statements which are an integral part of the financial statements.
Invesco FTSE RAFI US 1500 Small-Mid ETF (PRFZ)(continued)
April 30, 2019
| | | | | | | | |
Number
of Shares | | | | | Value | |
| | | | Common Stocks & Other Equity Interests
(continued) | |
| | | | Financials (continued) | |
| | 42,684 | | | Horizon Bancorp, Inc. | | $ | 694,469 | |
| | 26,065 | | | Houlihan Lokey, Inc. | | | 1,285,526 | |
| | 28,473 | | | Independent Bank Corp. | | | 2,284,389 | |
| | 19,469 | | | Independent Bank Corp./MI | | | 419,168 | |
| | 22,484 | | | Independent Bank Group, Inc. | | | 1,281,588 | |
| | 16,684 | | | Interactive Brokers Group, Inc., Class A | | | 904,940 | |
| | 80,421 | | | International Bancshares Corp. | | | 3,335,059 | |
| | 26,368 | | | INTL. FCStone, Inc.(c) | | | 1,069,486 | |
| | 63,052 | | | James River Group Holdings Ltd. | | | 2,662,055 | |
| | 81,699 | | | Kearny Financial Corp. | | | 1,143,786 | |
| | 10,299 | | | Kingstone Cos.Inc. | | | 119,571 | |
| | 6,468 | | | Kinsale Capital Group, Inc. | | | 469,577 | |
| | 25,636 | | | KKR Real Estate Finance Trust, Inc. | | | 517,078 | |
| | 144,955 | | | Ladder Capital Corp. | | | 2,522,217 | |
| | 23,139 | | | Lakeland Financial Corp. | | | 1,104,887 | |
| | 14,273 | | | LCNB Corp. | | | 242,641 | |
| | 45,592 | | | LegacyTexas Financial Group, Inc. | | | 1,827,327 | |
| | 374,547 | | | LendingClub Corp.(c) | | | 1,191,059 | |
| | 1,490 | | | LendingTree, Inc.(b)(c) | | | 573,382 | |
| | 36,830 | | | Live Oak Bancshares, Inc.(b) | | | 643,420 | |
| | 48,833 | | | Luther Burbank Corp. | | | 514,211 | |
| | 610,708 | | | Maiden Holdings Ltd. | | | 399,098 | |
| | 8,179 | | | MarketAxess Holdings, Inc. | | | 2,276,461 | |
| | 405,189 | | | MBIA, Inc.(c) | | | 3,918,178 | |
| | 24,697 | | | Mercantile Bank Corp. | | | 834,759 | |
| | 64,430 | | | Mercury General Corp. | | | 3,465,045 | |
| | 50,588 | | | Meridian Bancorp, Inc. | | | 871,125 | |
| | 22,809 | | | Meta Financial Group, Inc. | | | 587,560 | |
| | 8,912 | | | Metropolitan Bank Holding Corp.(c) | | | 355,678 | |
| | 29,409 | | | Midland States Bancorp, Inc. | | | 788,749 | |
| | 20,049 | | | MidWestOne Financial Group, Inc. | | | 564,981 | |
| | 36,203 | | | Moelis & Co., Class A | | | 1,482,513 | |
| | 9,502 | | | Morningstar, Inc. | | | 1,363,062 | |
| | 25,293 | | | National Bank Holdings Corp., Class A | | | 967,204 | |
| | 92,968 | | | National General Holdings Corp. | | | 2,291,661 | |
| | 5,505 | | | National Western Life Group, Inc., Class A | | | 1,468,294 | |
| | 23,203 | | | Navigators Group, Inc. (The) | | | 1,622,818 | |
| | 62,116 | | | NBT Bancorp, Inc. | | | 2,361,650 | |
| | 43,722 | | | Nelnet, Inc., Class A | | | 2,538,062 | |
| | 458,059 | | | New York Mortgage Trust, Inc. | | | 2,885,772 | |
| | 10,137 | | | Nicolet Bankshares, Inc.(c) | | | 618,864 | |
| | 25,787 | | | NMI Holdings, Inc., Class A(c) | | | 724,099 | |
| | 66,991 | | | Northfield Bancorp, Inc. | | | 1,004,865 | |
| | 11,586 | | | Northrim BanCorp, Inc. | | | 411,187 | |
| | 169,110 | | | Northwest Bancshares, Inc. | | | 2,947,587 | |
| | 36,539 | | | OceanFirst Financial Corp. | | | 920,052 | |
| | 998,249 | | | Ocwen Financial Corp.(c) | | | 1,687,041 | |
| | 82,760 | | | OFG Bancorp | | | 1,670,097 | |
| | 4,853 | | | Ohio Valley Banc Corp. | | | 182,376 | |
| | 11,841 | | | Old Line Bancshares, Inc. | | | 296,025 | |
| | 208,554 | | | Old National Bancorp | | | 3,562,102 | |
| | 108,411 | | | On Deck Capital, Inc.(c) | | | 591,924 | |
| | 38,194 | | | Opus Bank | | | 835,303 | |
| | 84,900 | | | Orchid Island Capital, Inc.(b) | | | 557,793 | |
| | 17,387 | | | Origin Bancorp, Inc. | | | 605,763 | |
| | 88,660 | | | Oritani Financial Corp. | | | 1,538,251 | |
| | 44,883 | | | Pacific Premier Bancorp, Inc. | | | 1,304,749 | |
| | | | | | | | |
Number
of Shares | | | | | Value | |
| | | | Common Stocks & Other Equity Interests
(continued) | |
| | | | Financials (continued) | |
| | 17,215 | | | PCSB Financial Corp. | | $ | 327,946 | |
| | 22,089 | | | Peapack-Gladstone Financial Corp. | | | 639,035 | |
| | 31,779 | | | PennyMac Financial Services, Inc. | | | 708,672 | |
| | 24,417 | | | Peoples Bancorp, Inc. | | | 797,948 | |
| | 17,648 | | | Piper Jaffray Cos | | | 1,422,429 | |
| | 4,274 | | | PJT Partners, Inc., Class A | | | 184,295 | |
| | 101,715 | | | PRA Group, Inc.(c) | | | 2,860,226 | |
| | 12,506 | | | Preferred Bank | | | 615,170 | |
| | 93,411 | | | Provident Financial Services, Inc. | | | 2,477,260 | |
| | 13,124 | | | QCR Holdings, Inc. | | | 448,972 | |
| | 15,927 | | | RBB Bancorp. | | | 308,347 | |
| | 46,455 | | | Ready Capital Corp. | | | 701,935 | |
| | 200,819 | | | Redwood Trust, Inc. | | | 3,285,399 | |
| | 28,008 | | | Regional Management Corp.(c) | | | 693,758 | |
| | 55,152 | | | Renasant Corp. | | | 1,999,812 | |
| | 14,802 | | | Republic Bancorp, Inc., Class A | �� | | 699,543 | |
| | 55,863 | | | RLI Corp. | | | 4,543,338 | |
| | 44,232 | | | S&T Bancorp, Inc. | | | 1,772,819 | |
| | 24,032 | | | Safety Insurance Group, Inc. | | | 2,233,053 | |
| | 39,594 | | | Sandy Spring Bancorp, Inc. | | | 1,381,435 | |
| | 35,541 | | | Seacoast Banking Corp. of Florida(c) | | | 1,007,943 | |
| | 28,834 | | | ServisFirst Bancshares, Inc. | | | 978,626 | |
| | 16,876 | | | Sierra Bancorp | | | 446,539 | |
| | 110,350 | | | Simmons First National Corp., Class A | | | 2,801,786 | |
| | 12,957 | | | SmartFinancial, Inc.(c) | | | 269,376 | |
| | 50,922 | | | South State Corp. | | | 3,852,759 | |
| | 7,709 | | | Southern First Bancshares, Inc.(c) | | | 283,768 | |
| | 24,987 | | | Southern National Bancorp of Virginia, Inc. | | | 372,806 | |
| | 41,398 | | | Southside Bancshares, Inc. | | | 1,454,312 | |
| | 24,490 | | | State Auto Financial Corp. | | | 823,599 | |
| | 58,341 | | | Stewart Information Services Corp. | | | 2,480,076 | |
| | 23,948 | | | Stock Yards Bancorp, Inc. | | | 822,614 | |
| | 39,801 | | | TFS Financial Corp. | | | 662,289 | |
| | 197,297 | | | Third Point Reinsurance Ltd.
(Bermuda)(c) | | | 2,290,618 | |
| | 69,859 | | | Towne Bank | | | 1,821,923 | |
| | 64,361 | | | TPG RE Finance Trust, Inc. | | | 1,268,555 | |
| | 22,406 | | | TriCo Bancshares | | | 894,223 | |
| | 29,303 | | | TriState Capital Holdings, Inc.(c) | | | 681,588 | |
| | 22,208 | | | Triumph Bancorp, Inc.(c) | | | 688,670 | |
| | 156,611 | | | TrustCo Bank Corp. NY | | | 1,252,888 | |
| | 111,534 | | | Trustmark Corp. | | | 4,010,763 | |
| | 59,430 | | | Union Bankshares Corp. | | | 2,169,195 | |
| | 78,866 | | | United Community Banks, Inc. | | | 2,214,557 | |
| | 86,068 | | | United Financial Bancorp, Inc. | | | 1,135,237 | |
| | 35,027 | | | United Fire Group, Inc. | | | 1,527,527 | |
| | 28,665 | | | United Insurance Holdings Corp. | | | 439,148 | |
| | 40,451 | | | Universal Insurance Holdings, Inc. | | | 1,205,035 | |
| | 44,998 | | | Univest Financial Corp. | | | 1,134,850 | |
| | 11,043 | | | Veritex Holdings, Inc. | | | 292,750 | |
| | 12,358 | | | Virtus Investment Partners, Inc. | | | 1,515,214 | |
| | 43,002 | | | Walker & Dunlop, Inc. | | | 2,362,960 | |
| | 20,104 | | | Washington Trust Bancorp, Inc. | | | 1,041,588 | |
| | 60,810 | | | WesBanco, Inc. | | | 2,451,859 | |
| | 27,904 | | | Westamerica Bancorp | | | 1,791,995 | |
| | 167,218 | | | Western Asset Mortgage Capital Corp. | | | 1,759,133 | |
| | 16,338 | | | Westwood Holdings Group, Inc. | | | 511,216 | |
See accompanying Notes to Financial Statements which are an integral part of the financial statements.
Invesco FTSE RAFI US 1500 Small-Mid ETF (PRFZ)(continued)
April 30, 2019
| | | | | | | | |
Number
of Shares | | | | | Value | |
| | | | Common Stocks & Other Equity Interests
(continued) | |
| | | | Financials (continued) | |
| | 164,879 | | | WisdomTree Investments, Inc. | | $ | 1,187,129 | |
| | 13,501 | | | World Acceptance Corp.(c) | | | 1,754,995 | |
| | 30,269 | | | WSFS Financial Corp. | | | 1,307,015 | |
| | | | | | | | |
| | | | | | | 368,771,518 | |
| | | | | | | | |
| | | | Health Care—8.1% | |
| | 78,016 | | | AAC Holdings, Inc.(b)(c) | | | 125,606 | |
| | 3,939 | | | ABIOMED, Inc.(c) | | | 1,092,718 | |
| | 11,991 | | | ACADIA Pharmaceuticals, Inc.(c) | | | 288,384 | |
| | 7,768 | | | Acceleron Pharma, Inc.(c) | | | 316,391 | |
| | 73,059 | | | Accuray, Inc.(c) | | | 302,464 | |
| | 158,575 | | | Achillion Pharmaceuticals, Inc.(c) | | | 469,382 | |
| | 29,972 | | | Aclaris Therapeutics, Inc.(c) | | | 188,824 | |
| | 64,287 | | | Acorda Therapeutics, Inc.(c) | | | 671,799 | |
| | 6,775 | | | Addus HomeCare Corp.(c) | | | 460,023 | |
| | 59,818 | | | Aduro Biotech, Inc.(c) | | | 244,656 | |
| | 48,419 | | | Adverum Biotechnologies, Inc.(b)(c) | | | 312,303 | |
| | 7,054 | | | Agios Pharmaceuticals, Inc.(c) | | | 394,460 | |
| | 461,203 | | | Akorn, Inc.(c) | | | 1,245,248 | |
| | 19,865 | | | Alder Biopharmaceuticals, Inc.(c) | | | 269,965 | |
| | 13,404 | | | Align Technology, Inc.(c) | | | 4,352,011 | |
| | 60,393 | | | Alkermes PLC(c) | | | 1,831,116 | |
| | 284,587 | | | Allscripts Healthcare Solutions, Inc.(c) | | | 2,808,874 | |
| | 20,887 | | | Alnylam Pharmaceuticals, Inc.(c) | | | 1,866,045 | |
| | 85,652 | | | AMAG Pharmaceuticals, Inc.(c) | | | 955,876 | |
| | 11,482 | | | Amedisys, Inc.(c) | | | 1,467,629 | |
| | 37,081 | | | American Renal Associates Holdings, Inc.(c) | | | 255,117 | |
| | 36,041 | | | Amicus Therapeutics, Inc.(c) | | | 480,787 | |
| | 48,504 | | | AMN Healthcare Services, Inc.(c) | | | 2,525,118 | |
| | 50,132 | | | Amneal Pharmaceuticals, Inc.(c) | | | 645,199 | |
| | 20,973 | | | Amphastar Pharmaceuticals, Inc.(c) | | | 452,807 | |
| | 4,184 | | | AnaptysBio, Inc.(c) | | | 304,260 | |
| | 46,341 | | | AngioDynamics, Inc.(c) | | | 951,844 | |
| | 5,039 | | | ANI Pharmaceuticals, Inc.(c) | | | 357,668 | |
| | 15,920 | | | Anika Therapeutics, Inc.(c) | | | 507,052 | |
| | 5,704 | | | Arena Pharmaceuticals, Inc.(c) | | | 260,958 | |
| | 212,679 | | | Assertio Therapeutics, Inc.(c) | | | 886,871 | |
| | 4,634 | | | Atara Biotherapeutics, Inc.(c) | | | 155,702 | |
| | 8,534 | | | AtriCure, Inc.(c) | | | 256,191 | |
| | 591 | | | Atrion Corp | | | 520,080 | |
| | 52,954 | | | Avanos Medical, Inc.(c) | | | 2,221,420 | |
| | 207,277 | | | BioScrip, Inc.(c) | | | 397,972 | |
| | 14,582 | | | Bio-Techne Corp. | | | 2,983,331 | |
| | 7,051 | | | BioTelemetry, Inc.(c) | | | 383,574 | |
| | 13,718 | | | Bluebird Bio, Inc.(c) | | | 1,945,624 | |
| | 8,953 | | | Blueprint Medicines Corp.(c) | | | 676,936 | |
| | 47,726 | | | Bruker Corp. | | | 1,842,224 | |
| | 42,716 | | | Cambrex Corp.(c) | | | 1,837,642 | |
| | 14,039 | | | Cantel Medical Corp | | | 967,849 | |
| | 96,807 | | | Capital Senior Living Corp.(c) | | | 406,589 | |
| | 7,921 | | | Cardiovascular Systems, Inc.(c) | | | 281,512 | |
| | 43,367 | | | Celldex Therapeutics, Inc.(b)(c) | | | 158,723 | |
| | 7,972 | | | Chemed Corp. | | | 2,605,090 | |
| | 112,636 | | | Chimerix, Inc.(c) | | | 304,117 | |
| | 15,329 | | | Clovis Oncology, Inc.(c) | | | 280,061 | |
| | 21,191 | | | Computer Programs & Systems, Inc. | | | 643,994 | |
| | | | | | | | |
Number
of Shares | | | | | Value | |
| | | | Common Stocks & Other Equity Interests
(continued) | |
| | | | Health Care (continued) | |
| | 18,453 | | | Concert Pharmaceuticals, Inc.(c) | | $ | 189,697 | |
| | 23,185 | | | CONMED Corp. | | | 1,855,496 | |
| | 19,669 | | | Corcept Therapeutics, Inc.(c) | | | 243,502 | |
| | 7,117 | | | CorVel Corp.(c) | | | 511,001 | |
| | 91,252 | | | Cross Country Healthcare, Inc.(c) | | | 643,327 | |
| | 16,277 | | | CryoLife, Inc.(c) | | | 499,053 | |
| | 10,189 | | | Cutera, Inc.(c) | | | 180,753 | |
| | 5,877 | | | DexCom, Inc.(c) | | | 711,528 | |
| | 217,186 | | | Diplomat Pharmacy, Inc.(c) | | | 1,211,898 | |
| | 21,056 | | | Dynavax Technologies Corp.(b)(c) | | | 140,022 | |
| | 6,840 | | | Eagle Pharmaceuticals, Inc.(c) | | | 351,644 | |
| | 11,644 | | | Editas Medicine, Inc.(b)(c) | | | 288,189 | |
| | 18,621 | | | Elanco Animal Health, Inc.(c) | | | 586,561 | |
| | 28,057 | | | Emergent BioSolutions, Inc.(c) | | | 1,449,986 | |
| | 5,419 | | | Enanta Pharmaceuticals, Inc.(c) | | | 472,483 | |
| | 299,330 | | | Endo International PLC(c) | | | 2,244,975 | |
| | 40,914 | | | Endologix, Inc.(c) | | | 262,668 | |
| | 32,768 | | | Ensign Group, Inc. (The) | | | 1,688,207 | |
| | 59,193 | | | Enzo Biochem, Inc.(c) | | | 205,400 | |
| | 16,977 | | | Epizyme, Inc.(c) | | | 210,685 | |
| | 5,230 | | | Esperion Therapeutics, Inc.(c) | | | 225,413 | |
| | 64,711 | | | Evolent Health, Inc., Class A(c) | | | 876,834 | |
| | 7,411 | | | Exact Sciences Corp.(c) | | | 731,392 | |
| | 20,137 | | | Exelixis, Inc.(c) | | | 395,893 | |
| | 11,725 | | | FibroGen, Inc.(c) | | | 547,909 | |
| | 31,338 | | | Five Prime Therapeutics, Inc.(c) | | | 347,225 | |
| | 18,074 | | | Flexion Therapeutics, Inc.(c) | | | 191,584 | |
| | 9,488 | | | FONAR Corp.(c) | | | 188,242 | |
| | 185,766 | | | Genesis Healthcare, Inc.(c) | | | 241,496 | |
| | 3,329 | | | Genomic Health, Inc.(c) | | | 214,155 | |
| | 3,112 | | | Glaukos Corp.(c) | | | 224,469 | |
| | 6,276 | | | Global Blood Therapeutics, Inc.(c) | | | 347,690 | |
| | 38,311 | | | Globus Medical, Inc., Class A(c) | | | 1,727,443 | |
| | 24,931 | | | Haemonetics Corp.(c) | | | 2,175,978 | |
| | 18,421 | | | Halozyme Therapeutics, Inc.(c) | | | 297,131 | |
| | 8,199 | | | HealthEquity, Inc.(c) | | | 555,482 | |
| | 19,799 | | | HealthStream, Inc.(c) | | | 518,338 | |
| | 2,495 | | | Heska Corp.(c) | | | 193,762 | |
| | 51,337 | | | HMS Holdings Corp.(c) | | | 1,562,185 | |
| | 79,195 | | | Horizon Pharma PLC(c) | | | 2,021,848 | |
| | 6,736 | | | ICU Medical, Inc.(c) | | | 1,532,440 | |
| | 16,325 | | | IDEXX Laboratories, Inc.(c) | | | 3,787,400 | |
| | 27,269 | | | Incyte Corp.(c) | | | 2,094,259 | |
| | 33,437 | | | Innoviva, Inc.(c) | | | 469,121 | |
| | 3,191 | | | Inogen, Inc.(c) | | | 278,574 | |
| | 45,992 | | | Inovio Pharmaceuticals, Inc.(b)(c) | | | 172,930 | |
| | 15,278 | | | Insmed, Inc.(c) | | | 465,062 | |
| | 5,200 | | | Insulet Corp.(c) | | | 448,500 | |
| | 31,344 | | | Integer Holdings Corp.(c) | | | 2,165,557 | |
| | 41,281 | | | Integra LifeSciences Holdings Corp.(c) | | | 2,154,455 | |
| | 19,658 | | | Intellia Therapeutics, Inc.(b)(c) | | | 302,340 | |
| | 5,420 | | | Intersect ENT, Inc.(c) | | | 176,096 | |
| | 30,419 | | | Intra-Cellular Therapies, Inc.(c) | | | 400,618 | |
| | 48,544 | | | Intrexon Corp.(b)(c) | | | 210,196 | |
| | 116,207 | | | Invacare Corp. | | | 859,932 | |
| | 9,830 | | | Ionis Pharmaceuticals, Inc.(c) | | | 730,664 | |
| | 130,509 | | | Lannett Co., Inc.(b)(c) | | | 1,003,614 | |
See accompanying Notes to Financial Statements which are an integral part of the financial statements.
Invesco FTSE RAFI US 1500 Small-Mid ETF (PRFZ)(continued)
April 30, 2019
| | | | | | | | |
Number
of Shares | | | | | Value | |
| | | | Common Stocks & Other Equity Interests
(continued) | |
| | | | Health Care (continued) | |
| | 29,968 | | | Lantheus Holdings, Inc.(c) | | $ | 724,027 | |
| | 8,627 | | | LeMaitre Vascular, Inc. | | | 249,148 | |
| | 13,685 | | | LHC Group, Inc.(c) | | | 1,520,540 | |
| | 6,241 | | | Ligand Pharmaceuticals, Inc.(c) | | | 785,430 | |
| | 31,441 | | | LivaNova PLC(c) | | | 2,165,970 | |
| | 33,733 | | | Luminex Corp. | | | 769,450 | |
| | 17,835 | | | MacroGenics, Inc.(c) | | | 299,093 | |
| | 16,340 | | | Masimo Corp.(c) | | | 2,126,651 | |
| | 12,973 | | | Medicines Co. (The)(b)(c) | | | 414,487 | |
| | 14,772 | | | Medidata Solutions, Inc.(c) | | | 1,334,502 | |
| | 12,281 | | | Medpace Holdings, Inc.(c) | | | 689,824 | |
| | 66,908 | | | Meridian Bioscience, Inc | | | 770,111 | |
| | 27,029 | | | Merit Medical Systems, Inc.(c) | | | 1,518,489 | |
| | 55,787 | | | Merrimack Pharmaceuticals, Inc.(c) | | | 364,847 | |
| | 999 | | | Mesa Laboratories, Inc. | | | 236,453 | |
| | 28,806 | | | Momenta Pharmaceuticals, Inc.(c) | | | 402,996 | |
| | 5,757 | | | MyoKardia, Inc.(c) | | | 276,221 | |
| | 74,969 | | | Myriad Genetics, Inc.(c) | | | 2,360,024 | |
| | 10,235 | | | National Research Corp. | | | 405,101 | |
| | 39,613 | | | Natus Medical, Inc.(c) | | | 1,060,044 | |
| | 6,498 | | | Nektar Therapeutics(c) | | | 208,066 | |
| | 19,924 | | | Neogen Corp.(c) | | | 1,208,590 | |
| | 12,199 | | | NeoGenomics, Inc.(c) | | | 254,105 | |
| | 5,424 | | | Neurocrine Biosciences, Inc.(c) | | | 391,830 | |
| | 8,025 | | | Nevro Corp.(c) | | | 495,223 | |
| | 115,301 | | | NewLink Genetics Corp.(c) | | | 197,165 | |
| | 62,696 | | | NextGen Healthcare, Inc.(c) | | | 1,178,058 | |
| | 43,283 | | | NuVasive, Inc.(c) | | | 2,622,950 | |
| | 16,649 | | | Omnicell, Inc.(c) | | | 1,337,914 | |
| | 534,276 | | | OPKO Health, Inc.(b)(c) | | | 1,276,920 | |
| | 41,832 | | | OraSure Technologies, Inc.(c) | | | 395,731 | |
| | 12,755 | | | Orthofix Medical, Inc.(c) | | | 698,846 | |
| | 12,189 | | | Pacira BioSciences, Inc.(c) | | | 485,366 | |
| | 914,621 | | | PDL BioPharma, Inc.(c) | | | 2,990,811 | |
| | 3,714 | | | Penumbra, Inc.(b)(c) | | | 499,533 | |
| | 5,896 | | | PetIQ, Inc.(b)(c) | | | 161,963 | |
| | 21,861 | | | Phibro Animal Health Corp., Class A | | | 758,795 | |
| | 13,138 | | | Portola Pharmaceuticals, Inc.(b)(c) | | | 463,771 | |
| | 26,672 | | | PRA Health Sciences, Inc.(c) | | | 2,582,383 | |
| | 47,594 | | | Premier, Inc., Class A(c) | | | 1,581,549 | |
| | 116,223 | | | Prestige Consumer Healthcare, Inc.(c) | | | 3,419,281 | |
| | 36,699 | | | Prothena Corp. PLC (Ireland)(c) | | | 381,670 | |
| | 22,590 | | | Providence Service Corp. (The)(c) | | | 1,498,395 | |
| | 6,453 | | | PTC Therapeutics, Inc.(c) | | | 241,471 | |
| | 7,703 | | | Quidel Corp.(c) | | | 492,530 | |
| | 174,264 | | | Quorum Health Corp.(c) | | | 357,241 | |
| | 57,972 | | | R1 RCM, Inc.(c) | | | 606,967 | |
| | 13,618 | | | Radius Health, Inc.(c) | | | 299,868 | |
| | 78,599 | | | RadNet, Inc.(c) | | | 951,834 | |
| | 3,987 | | | REGENXBIO, Inc.(c) | | | 200,945 | |
| | 12,841 | | | Repligen Corp.(c) | | | 865,227 | |
| | 18,829 | | | Retrophin, Inc.(c) | | | 359,257 | |
| | 13,013 | | | Revance Therapeutics, Inc.(c) | | | 172,292 | |
| | 3,317 | | | Sage Therapeutics, Inc.(c) | | | 558,019 | |
| | 27,575 | | | Sangamo Therapeutics, Inc.(c) | | | 322,352 | |
| | 6,397 | | | Sarepta Therapeutics, Inc.(c) | | | 748,065 | |
| | 11,518 | | | SeaSpine Holdings Corp.(c) | | | 169,660 | |
| | | | | | | | |
Number
of Shares | | | | | Value | |
| | | | Common Stocks & Other Equity Interests
(continued) | |
| | | | Health Care (continued) | |
| | 10,292 | | | Seattle Genetics, Inc.(c) | | $ | 697,592 | |
| | 103,088 | | | Sorrento Therapeutics, Inc.(b)(c) | | | 376,271 | |
| | 9,527 | | | Spark Therapeutics, Inc.(b)(c) | | | 1,016,436 | |
| | 43,395 | | | Spectrum Pharmaceuticals, Inc.(c) | | | 406,611 | |
| | 14,510 | | | Supernus Pharmaceuticals, Inc.(c) | | | 532,952 | |
| | 69,493 | | | Surgery Partners, Inc.(b)(c) | | | 752,609 | |
| | 4,982 | | | SurModics, Inc.(c) | | | 216,418 | |
| | 61,924 | | | Syneos Health, Inc.(c) | | | 2,906,093 | |
| | 3,914 | | | Tabula Rasa HealthCare, Inc.(c) | | | 208,460 | |
| | 2,244 | | | Tactile Systems Technology, Inc.(c) | | | 111,661 | |
| | 14,553 | | | Taro Pharmaceutical Industries Ltd. | | | 1,563,138 | |
| | 10,022 | | | Teladoc Health, Inc.(b)(c) | | | 570,051 | |
| | 68,595 | | | Tivity Health, Inc.(c) | | | 1,483,024 | |
| | 57,001 | | | TransEnterix, Inc.(b)(c) | | | 114,002 | |
| | 125,876 | | | Triple-S Management Corp.,
Class B(c) | | | 2,859,903 | |
| | 7,301 | | | Ultragenyx Pharmaceutical, Inc.(c) | | | 481,866 | |
| | 6,648 | | | US Physical Therapy, Inc. | | | 774,426 | |
| | 2,556 | | | Utah Medical Products, Inc. | | | 215,726 | |
| | 11,020 | | | Vanda Pharmaceuticals, Inc.(c) | | | 179,516 | |
| | 54,848 | | | Varex Imaging Corp.(c) | | | 1,801,208 | |
| | 13,592 | | | Veeva Systems, Inc., Class A(c) | | | 1,901,113 | |
| | 18,838 | | | Vertex Pharmaceuticals, Inc.(c) | | | 3,183,245 | |
| | 7,225 | | | Vocera Communications, Inc.(c) | | | 230,116 | |
| | 37,603 | | | West Pharmaceutical Services, Inc. | | | 4,654,875 | |
| | 34,263 | | | Wright Medical Group N.V.(c) | | | 1,013,157 | |
| | 7,998 | | | Xencor, Inc.(c) | | | 245,619 | |
| | 6,915 | | | Zogenix, Inc.(c) | | | 269,616 | |
| | | | | | | | |
| | | | | | | 169,617,143 | |
| | | | | | | | |
| | | | Industrials—18.5% | |
| | 19,812 | | | AAON, Inc. | | | 994,761 | |
| | 63,815 | | | AAR Corp. | | | 2,155,033 | |
| | 379,627 | | | ACCO Brands Corp. | | | 3,469,791 | |
| | 70,348 | | | Actuant Corp., Class A | | | 1,799,502 | |
| | 158,099 | | | ADT, Inc.(b) | | | 1,041,872 | |
| | 122,753 | | | Advanced Disposal Services, Inc.(c) | | | 3,969,832 | |
| | 47,874 | | | Advanced Drainage Systems, Inc. | | | 1,342,866 | |
| | 95,794 | | | Aegion Corp.(c) | | | 1,907,259 | |
| | 50,001 | | | Aerojet Rocketdyne Holdings, Inc.(c) | | | 1,693,034 | |
| | 8,662 | | | Aerovironment, Inc.(c) | | | 593,867 | |
| | 82,095 | | | Air Transport Services Group, Inc.(c) | | | 1,931,695 | |
| | 181,431 | | | Aircastle Ltd. | | | 3,614,106 | |
| | 12,352 | | | Alamo Group, Inc. | | | 1,280,161 | |
| | 56,991 | | | Alaska Air Group, Inc. | | | 3,527,743 | |
| | 23,009 | | | Albany International Corp., Class A | | | 1,701,976 | |
| | 6,452 | | | Allegiant Travel Co. | | | 947,670 | |
| | 5,758 | | | Allied Motion Technologies, Inc. | | | 210,800 | |
| | 44,322 | | | Altra Industrial Motion Corp. | | | 1,661,632 | |
| | 10,027 | | | AMERCO | | | 3,741,776 | |
| | 31,160 | | | Ameresco, Inc., Class A(c) | | | 469,270 | |
| | 22,483 | | | American Woodmark Corp.(c) | | | 2,021,896 | |
| | 50,866 | | | Apogee Enterprises, Inc. | | | 2,049,900 | |
| | 66,923 | | | Applied Industrial Technologies, Inc. | | | 4,011,365 | |
| | 177,551 | | | ARC Document Solutions, Inc.(c) | | | 422,571 | |
| | 75,660 | | | ArcBest Corp. | | | 2,312,170 | |
| | 24,527 | | | Argan, Inc. | | | 1,172,881 | |
| | 105,856 | | | Armstrong Flooring, Inc.(c) | | | 1,533,853 | |
See accompanying Notes to Financial Statements which are an integral part of the financial statements.
Invesco FTSE RAFI US 1500 Small-Mid ETF (PRFZ)(continued)
April 30, 2019
| | | | | | | | |
Number
of Shares | | | | | Value | |
| | | | Common Stocks & Other Equity Interests
(continued) | |
| | | | Industrials (continued) | |
| | 40,361 | | | Armstrong World Industries, Inc. | | $ | 3,498,088 | |
| | 52,566 | | | Arotech Corp.(c) | | | 152,441 | |
| | 59,898 | | | ASGN, Inc.(c) | | | 3,775,970 | |
| | 45,677 | | | Astec Industries, Inc. | | | 1,539,772 | |
| | 26,516 | | | Astronics Corp.(c) | | | 884,043 | |
| | 107,795 | | | Atento S.A. (Spain)(c) | | | 393,452 | |
| | 84,366 | | | Atkore International Group, Inc.(c) | | | 2,088,902 | |
| | 24,994 | | | Atlas Air Worldwide Holdings, Inc.(c) | | | 1,206,960 | |
| | 9,988 | | | Axon Enterprise, Inc.(c) | | | 634,238 | |
| | 40,537 | | | AZZ, Inc. | | | 1,925,102 | |
| | 486,719 | | | Babcock & Wilcox Enterprises, Inc.(c) | | | 169,914 | |
| | 52,397 | | | Barnes Group, Inc. | | | 2,914,321 | |
| | 10,165 | | | Barrett Business Services, Inc. | | | 740,622 | |
| | 10,044 | | | BG Staffing, Inc. | | | 234,728 | |
| | 19,323 | | | Blue Bird Corp.(c) | | | 334,481 | |
| | 55,420 | | | BlueLinx Holdings, Inc.(b)(c) | | | 1,425,402 | |
| | 176,536 | | | BMC Stock Holdings, Inc.(c) | | | 3,633,111 | |
| | 50,744 | | | Brady Corp., Class A | | | 2,475,800 | |
| | 184,627 | | | Briggs & Stratton Corp. | | | 2,252,449 | |
| | 48,529 | | | BrightView Holdings, Inc.(c) | | | 778,405 | |
| | 50,449 | | | Brink’s Co. (The) | | | 4,032,389 | |
| | 63,696 | | | BWX Technologies, Inc. | | | 3,254,866 | |
| | 49,712 | | | Caesarstone Ltd. | | | 752,143 | |
| | 53,625 | | | CAI International, Inc.(c) | | | 1,331,509 | |
| | 22,539 | | | Casella Waste Systems, Inc., Class A(c) | | | 841,156 | |
| | 75,225 | | | CBIZ, Inc.(c) | | | 1,452,595 | |
| | 58,269 | | | CECO Environmental Corp.(c) | | �� | 452,167 | |
| | 25,230 | | | Chart Industries, Inc.(c) | | | 2,227,052 | |
| | 50,292 | | | China Yuchai International Ltd. (China) | | | 837,362 | |
| | 19,671 | | | Cimpress N.V. (Netherlands)(c) | | | 1,778,258 | |
| | 33,253 | | | CIRCOR International, Inc.(c) | | | 1,121,291 | |
| | 403,281 | | | Civeo Corp.(c) | | | 810,595 | |
| | 27,913 | | | Columbus McKinnon Corp. | | | 1,098,656 | |
| | 37,944 | | | Comfort Systems USA, Inc. | | | 2,052,770 | |
| | 112,784 | | | Commercial Vehicle Group, Inc.(c) | | | 1,006,033 | |
| | 48,965 | | | Continental Building Products, Inc.(c) | | | 1,255,952 | |
| | 16,204 | | | Copa Holdings SA, Class A (Panama) | | | 1,349,145 | |
| | 73,170 | | | Copart, Inc.(c) | | | 4,925,804 | |
| | 92,487 | | | Corporacion America Airports S.A. (Argentina)(c) | | | 712,150 | |
| | 318,219 | | | Costamare, Inc. (Monaco) | | | 1,922,043 | |
| | 40,202 | | | Covenant Transportation Group, Inc., Class A(c) | | | 785,145 | |
| | 14,381 | | | CRA International, Inc. | | | 748,962 | |
| | 14,163 | | | CSW Industrials, Inc.(c) | | | 849,072 | |
| | 25,905 | | | Cubic Corp. | | | 1,470,886 | |
| | 274,696 | | | Daseke, Inc.(b)(c) | | | 1,417,431 | |
| | 198,198 | | | Diana Shipping, Inc. (Greece)(c) | | | 630,270 | |
| | 31,409 | | | Douglas Dynamics, Inc. | | | 1,186,004 | |
| | 179,218 | | | DryShips, Inc. (Greece) | | | 747,339 | |
| | 22,704 | | | Ducommun, Inc.(c) | | | 921,328 | |
| | 42,082 | | | DXP Enterprises, Inc.(c) | | | 1,804,897 | |
| | 90,173 | | | Eagle Bulk Shipping, Inc.(c) | | | 491,443 | |
| | 72,967 | | | Echo Global Logistics, Inc.(c) | | | 1,673,863 | |
| | 28,606 | | | Encore Wire Corp. | | | 1,696,050 | |
| | 55,255 | | | Ennis, Inc. | | | 1,115,046 | |
| | 27,953 | | | Enphase Energy, Inc.(b)(c) | | | 280,648 | |
| | | | | | | | |
Number
of Shares | | | | | Value | |
| | | | Common Stocks & Other Equity Interests
(continued) | |
| | | | Industrials (continued) | |
| | 29,459 | | | EnPro Industries, Inc. | | $ | 2,189,393 | |
| | 20,901 | | | ESCO Technologies, Inc. | | | 1,567,575 | |
| | 90,889 | | | Evoqua Water Technologies Corp.(c) | | | 1,237,908 | |
| | 18,610 | | | Exponent, Inc. | | | 1,053,698 | |
| | 65,843 | | | Federal Signal Corp. | | | 1,894,303 | |
| | 8,390 | | | Forrester Research, Inc. | | | 426,715 | |
| | 26,353 | | | Forward Air Corp. | | | 1,668,672 | |
| | 64,092 | | | Foundation Building Materials, Inc.(c) | | | 871,010 | |
| | 10,254 | | | Franklin Covey Co.(c) | | | 292,342 | |
| | 42,416 | | | Franklin Electric Co., Inc. | | | 2,072,446 | |
| | 78,969 | | | FreightCar America, Inc.(c) | | | 546,465 | |
| | 54,536 | | | FTI Consulting, Inc.(c) | | | 4,634,469 | |
| | 335,089 | | | FuelCell Energy, Inc.(c) | | | 87,793 | |
| | 108,914 | | | Gardner Denver Holdings, Inc.(c) | | | 3,675,848 | |
| | 59,025 | | | Gates Industrial Corp. PLC(c) | | | 949,122 | |
| | 36,152 | | | Genco Shipping & Trading Ltd.(c) | | | 365,135 | |
| | 75,540 | | | Generac Holdings, Inc.(c) | | | 4,153,945 | |
| | 24,753 | | | General Finance Corp.(c) | | | 230,203 | |
| | 45,015 | | | Gibraltar Industries, Inc.(c) | | | 1,785,745 | |
| | 47,423 | | | Global Brass & Copper Holdings, Inc. | | | 2,057,684 | |
| | 112,774 | | | GMS, Inc.(c) | | | 1,987,078 | |
| | 19,105 | | | Gorman-Rupp Co. (The) | | | 636,197 | |
| | 38,962 | | | GP Strategies Corp.(c) | | | 495,986 | |
| | 20,140 | | | GrafTech International Ltd. | | | 230,603 | |
| | 10,857 | | | Graham Corp. | | | 224,740 | |
| | 68,677 | | | Granite Construction, Inc. | | | 3,082,911 | |
| | 88,262 | | | Greenbrier Cos., Inc. (The) | | | 3,135,949 | |
| | 96,954 | | | Griffon Corp. | | | 1,902,238 | |
| | 80,727 | | | H&E Equipment Services, Inc. | | | 2,454,908 | |
| | 138,752 | | | Harsco Corp.(c) | | | 3,141,345 | |
| | 43,613 | | | Hawaiian Holdings, Inc. | | | 1,230,323 | |
| | 306,884 | | | HC2 Holdings, Inc.(b)(c) | | | 656,732 | |
| | 67,320 | | | Healthcare Services Group, Inc. | | | 2,278,782 | |
| | 50,968 | | | Heartland Express, Inc. | | | 1,003,050 | |
| | 13,136 | | | HEICO Corp. | | | 1,386,242 | |
| | 25,556 | | | HEICO Corp., Class A | | | 2,285,473 | |
| | 24,977 | | | Heidrick & Struggles International, Inc. | | | 893,677 | |
| | 56,641 | | | Herc Holdings, Inc.(c) | | | 2,727,831 | |
| | 17,020 | | | Heritage-Crystal Clean, Inc.(c) | | | 488,985 | |
| | 95,987 | | | Herman Miller, Inc. | | | 3,726,215 | |
| | 81,948 | | | Hillenbrand, Inc. | | | 3,525,403 | |
| | 85,331 | | | HNI Corp. | | | 3,132,501 | |
| | 191,505 | | | Hudson Technologies, Inc.(c) | | | 258,532 | |
| | 32,495 | | | Huron Consulting Group, Inc.(c) | | | 1,570,483 | |
| | 26,189 | | | Hyster-Yale Materials Handling, Inc. | | | 1,744,711 | |
| | 28,441 | | | ICF International, Inc. | | | 2,214,701 | |
| | 167,883 | | | InnerWorkings, Inc.(c) | | | 567,445 | |
| | 20,822 | | | Insperity, Inc. | | | 2,489,478 | |
| | 37,401 | | | Insteel Industries, Inc. | | | 783,177 | |
| | 93,057 | | | Interface, Inc. | | | 1,492,634 | |
| | 184,769 | | | JELD-WEN Holding, Inc.(c) | | | 3,649,188 | |
| | 21,222 | | | John Bean Technologies Corp. | | | 2,329,963 | |
| | 10,399 | | | Kadant, Inc. | | | 1,020,038 | |
| | 35,065 | | | Kaman Corp. | | | 2,170,874 | |
| | 85,338 | | | Kelly Services, Inc., Class A | | | 1,899,624 | |
| | 100,692 | | | KeyW Holding Corp. (The)(c) | | | 1,141,847 | |
| | 32,111 | | | Kforce, Inc. | | | 1,156,638 | |
See accompanying Notes to Financial Statements which are an integral part of the financial statements.
Invesco FTSE RAFI US 1500 Small-Mid ETF (PRFZ)(continued)
April 30, 2019
| | | | | | | | |
Number
of Shares | | | | | Value | |
| | | | Common Stocks & Other Equity Interests
(continued) | |
| | | | Industrials (continued) | |
| | 55,514 | | | Kimball International, Inc., Class B | | $ | 869,349 | |
| | 89,908 | | | Knoll, Inc. | | | 1,963,591 | |
| | 57,664 | | | Korn Ferry. | | | 2,711,361 | |
| | 8,747 | | | Kornit Digital Ltd. (Israel)(c) | | | 252,176 | |
| | 70,575 | | | Kratos Defense & Security Solutions, Inc.(c) | | | 1,120,731 | |
| | 7,785 | | | Lawson Products, Inc.(c) | | | 255,659 | |
| | 24,970 | | | LB Foster Co., Class A(c) | | | 536,605 | |
| | 12,828 | | | Lindsay Corp. | | | 1,090,380 | |
| | 345,025 | | | LSC Communications, Inc. | | | 2,411,725 | |
| | 57,443 | | | LSI Industries, Inc. | | | 195,306 | |
| | 42,938 | | | Lydall, Inc.(c) | | | 1,056,704 | |
| | 35,037 | | | Manitex International, Inc.(c) | | | 267,683 | |
| | 74,019 | | | Manitowoc Co., Inc. (The)(c) | | | 1,321,979 | |
| | 55,913 | | | Marten Transport Ltd. | | | 1,105,959 | |
| | 56,105 | | | Masonite International Corp.(c) | | | 2,888,846 | |
| | 21,058 | | | Matson, Inc. | | | 834,107 | |
| | 57,563 | | | Matthews International Corp., Class A | | | 2,305,974 | |
| | 35,662 | | | McGrath RentCorp | | | 2,211,044 | |
| | 18,227 | | | Mercury Systems, Inc.(c) | | | 1,330,936 | |
| | 64,681 | | | Mesa Air Group, Inc.(c) | | | 591,184 | |
| | 166,076 | | | Milacron Holdings Corp.(c) | | | 2,426,370 | |
| | 47,390 | | | Mistras Group, Inc.(c) | | | 649,717 | |
| | 59,999 | | | Mobile Mini, Inc. | | | 2,161,164 | |
| | 26,350 | | | MSA Safety, Inc. | | | 2,896,129 | |
| | 181,751 | | | Mueller Water Products, Inc., Class A | | | 1,950,188 | |
| | 27,294 | | | Multi-Color Corp. | | | 1,361,971 | |
| | 44,531 | | | MYR Group, Inc.(c) | | | 1,609,796 | |
| | 7,592 | | | National Presto Industries, Inc.(b) | | | 808,548 | |
| | 77,058 | | | Navigant Consulting, Inc. | | | 1,759,234 | |
| | 98,438 | | | NCI Building Systems, Inc.(c) | | | 563,065 | |
| | 113,290 | | | NN, Inc. | | | 1,024,142 | |
| | 19,367 | | | Northwest Pipe Co.(c) | | | 464,227 | |
| | 4,533 | | | NV5 Global, Inc.(c) | | | 287,120 | |
| | 146,699 | | | Orion Group Holdings, Inc.(c) | | | 379,950 | |
| | 5,849 | | | PAM Transportation Services, Inc.(c) | | | 292,567 | |
| | 20,989 | | | Park-Ohio Holdings Corp. | | | 768,827 | |
| | 36,605 | | | Patrick Industries, Inc.(c) | | | 1,825,491 | |
| | 355,558 | | | Performance Shipping Inc. (Greece)(c) | | | 412,447 | |
| | 46,777 | | | PGT Innovations, Inc.(c) | | | 685,751 | |
| | 33,185 | | | PICO Holdings, Inc.(c) | | | 379,305 | |
| | 22,613 | | | Powell Industries, Inc. | | | 661,430 | |
| | 6,721 | | | Preformed Line Products Co. | | | 378,997 | |
| | 99,252 | | | Primoris Services Corp. | | | 2,175,604 | |
| | 10,372 | | | Proto Labs, Inc.(c) | | | 1,138,742 | |
| | 229,934 | | | Quad/Graphics, Inc.(b) | | | 2,807,494 | |
| | 69,985 | | | Quanex Building Products Corp. | | | 1,170,149 | |
| | 26,585 | | | Raven Industries, Inc. | | | 1,034,422 | |
| | 11,948 | | | RBC Bearings, Inc.(c) | | | 1,643,447 | |
| | 57,933 | | | Resources Connection, Inc. | | | 930,404 | |
| | 101,841 | | | REV Group, Inc.(b) | | | 1,292,362 | |
| | 12,369 | | | Roadrunner Transportation Systems, Inc.(c) | | | 137,420 | |
| | 52,599 | | | Rollins, Inc. | | | 2,034,003 | |
| | 607,441 | | | RR Donnelley & Sons Co. | | | 2,806,377 | |
| | 288,391 | | | Safe Bulkers, Inc. (Greece)(c) | | | 516,220 | |
| | 36,417 | | | Saia, Inc.(c) | | | 2,344,891 | |
| | | | | | | | |
Number
of Shares | | | | | Value | |
| | | | Common Stocks & Other Equity Interests
(continued) | |
| | | | Industrials (continued) | |
| | 74,446 | | | Schneider National, Inc., Class B | | $ | 1,555,921 | |
| | 136,785 | | | Scorpio Bulkers, Inc. | | | 735,903 | |
| | 314,953 | | | Seaspan Corp. (Hong Kong) | | | 3,193,623 | |
| | 36,345 | | | Simpson Manufacturing Co., Inc. | | | 2,314,450 | |
| | 37,790 | | | SiteOne Landscape Supply, Inc.(b)(c) | | | 2,543,267 | |
| | 24,113 | | | SkyWest, Inc. | | | 1,485,120 | |
| | 57,687 | | | SP Plus Corp.(c) | | | 1,991,355 | |
| | 67,060 | | | Spartan Motors, Inc. | | | 623,658 | |
| | 26,047 | | | Spirit Airlines, Inc.(c) | | | 1,416,436 | |
| | 39,874 | | | SPX Corp.(c) | | | 1,455,401 | |
| | 110,675 | | | SPX FLOW, Inc.(c) | | | 3,977,660 | |
| | 15,970 | | | Standex International Corp. | | | 1,055,138 | |
| | 52,639 | | | Star Bulk Carriers Corp. (Greece)(c) | | | 457,433 | |
| | 194,766 | | | Steelcase, Inc., Class A | | | 3,367,504 | |
| | 55,280 | | | Sterling Construction Co.Inc.(c) | | | 749,597 | |
| | 23,944 | | | Sun Hydraulics Corp. | | | 1,253,229 | |
| | 67,981 | | | Sunrun, Inc.(c) | | | 1,033,991 | |
| | 22,678 | | | Systemax, Inc. | | | 515,017 | |
| | 103,337 | | | Team, Inc.(c) | | | 1,746,395 | |
| | 22,191 | | | Tennant Co. | | | 1,473,039 | |
| | 50,134 | | | Tetra Tech, Inc. | | | 3,244,673 | |
| | 96,882 | | | Textainer Group Holdings Ltd.
(China)(c) | | | 929,098 | |
| | 37,784 | | | Thermon Group Holdings, Inc.(c) | | | 974,449 | |
| | 233,000 | | | Titan International, Inc. | | | 1,614,690 | |
| | 83,692 | | | Titan Machinery, Inc.(c) | | | 1,439,502 | |
| | 11,550 | | | TPI Composites, Inc.(c) | | | 357,473 | |
| | 15,246 | | | Trex Co., Inc.(c) | | | 1,056,090 | |
| | 57,116 | | | TriMas Corp.(c) | | | 1,766,598 | |
| | 28,477 | | | TriNet Group, Inc.(c) | | | 1,775,256 | |
| | 108,109 | | | Triton International Ltd. (Bermuda) | | | 3,562,192 | |
| | 131,254 | | | Triumph Group, Inc. | | | 3,114,657 | |
| | 131,744 | | | TrueBlue, Inc.(c) | | | 3,182,935 | |
| | 14,642 | | | Twin Disc, Inc.(c) | | | 277,319 | |
| | 17,593 | | | UniFirst Corp. | | | 2,781,981 | |
| | 114,500 | | | Universal Forest Products, Inc. | | | 4,230,775 | |
| | 17,970 | | | Universal Logistics Holdings, Inc. | | | 438,827 | |
| | 19,129 | | | US Ecology, Inc. | | | 1,167,060 | |
| | 76,368 | | | US Xpress Enterprises, Inc., Class A(c) | | | 514,720 | |
| | 37,120 | | | USA Truck, Inc.(c) | | | 528,589 | |
| | 46,592 | | | Vectrus, Inc.(c) | | | 1,889,306 | |
| | 82,376 | | | Veritiv Corp.(c) | | | 2,297,467 | |
| | 34,459 | | | Viad Corp. | | | 2,112,681 | |
| | 52,409 | | | Vivint Solar, Inc.(c) | | | 283,533 | |
| | 23,665 | | | VSE Corp. | | | 723,439 | |
| | 164,500 | | | Wabash National Corp. | | | 2,480,660 | |
| | 23,862 | | | WageWorks, Inc.(c) | | | 1,164,227 | |
| | 26,707 | | | Watts Water Technologies, Inc., Class A | | | 2,285,852 | |
| | 164,734 | | | Welbilt, Inc.(c) | | | 2,772,473 | |
| | 77,911 | | | Werner Enterprises, Inc. | | | 2,610,019 | |
| | 144,550 | | | Wesco Aircraft Holdings, Inc.(c) | | | 1,220,002 | |
| | 6,621 | | | Willdan Group, Inc.(c) | | | 261,728 | |
| | 5,380 | | | Willis Lease Finance Corp.(c) | | | 267,494 | |
| | 39,624 | | | Woodward, Inc. | | | 4,315,054 | |
| | | | | | | | |
| | | | | | | 388,231,002 | |
| | | | | | | | |
| | | | Information Technology—14.0% | |
| | 8,168 | | | 2U, Inc.(c) | | | 494,164 | |
See accompanying Notes to Financial Statements which are an integral part of the financial statements.
Invesco FTSE RAFI US 1500 Small-Mid ETF (PRFZ)(continued)
April 30, 2019
| | | | | | | | |
Number
of Shares | | | | | Value | |
| | | | Common Stocks & Other Equity Interests
(continued) | |
| | | | Information Technology (continued) | |
| | 86,804 | | | 3D Systems Corp.(b)(c) | | $ | 923,595 | |
| | 21,341 | | | 8x8, Inc.(c) | | | 510,477 | |
| | 29,546 | | | A10 Networks, Inc.(c) | | | 190,867 | |
| | 16,153 | | | Acacia Communications, Inc.(c) | | | 934,936 | |
| | 94,277 | | | ACI Worldwide, Inc.(c) | | | 3,348,719 | |
| | 96,812 | | | ADTRAN, Inc. | | | 1,659,358 | |
| | 32,004 | | | Advanced Energy Industries, Inc.(c) | | | 1,848,551 | |
| | 4,841 | | | Alarm.com Holdings, Inc.(c) | | | 343,130 | |
| | 53,964 | | | Alpha & Omega Semiconductor Ltd.(c) | | | 669,154 | |
| | 25,644 | | | Ambarella, Inc.(c) | | | 1,285,277 | |
| | 37,279 | | | American Software, Inc., Class A | | | 482,763 | |
| | 403,817 | | | Amkor Technology, Inc.(c) | | | 3,658,582 | |
| | 47,859 | | | Applied Optoelectronics, Inc.(b)(c) | | | 599,195 | |
| | 11,394 | | | Arista Networks, Inc.(c) | | | 3,558,232 | |
| | 12,308 | | | Aspen Technology, Inc.(c) | | | 1,500,468 | |
| | 4,929 | | | Atlassian Corp. PLC, Class A(c) | | | 542,929 | |
| | 12,665 | | | Autodesk, Inc.(c) | | | 2,257,030 | |
| | 89,912 | | | Avid Technology, Inc.(c) | | | 683,331 | |
| | 74,382 | | | AVX Corp. | | | 1,213,170 | |
| | 32,315 | | | Axcelis Technologies, Inc.(c) | | | 687,986 | |
| | 66,635 | | | AXT, Inc.(c) | | | 379,820 | |
| | 15,968 | | | Badger Meter, Inc. | | | 885,905 | |
| | 16,643 | | | Bel Fuse, Inc., Class B | | | 394,439 | |
| | 19,938 | | | Blackbaud, Inc. | | | 1,580,884 | |
| | 5,602 | | | Blackline, Inc.(c) | | | 286,150 | |
| | 15,047 | | | Bottomline Technologies (DE), Inc.(c) | | | 760,927 | |
| | 9,316 | | | Box, Inc., Class A(c) | | | 192,096 | |
| | 22,095 | | | Brightcove, Inc.(c) | | | 221,613 | |
| | 44,111 | | | Brooks Automation, Inc. | | | 1,654,604 | |
| | 13,456 | | | Cabot Microelectronics Corp. | | | 1,698,820 | |
| | 42,950 | | | CalAmp Corp.(c) | | | 627,500 | |
| | 54,938 | | | Calix, Inc.(c) | | | 376,325 | |
| | 8,005 | | | Carbonite, Inc.(c) | | | 196,363 | |
| | 77,902 | | | Cardtronics PLC, Class A(c) | | | 2,785,776 | |
| | 25,975 | | | Casa Systems, Inc.(c) | | | 249,100 | |
| | 11,479 | | | Cass Information Systems, Inc. | | | 566,259 | |
| | 92,918 | | | Ceragon Networks Ltd. (Israel)(c) | | | 355,876 | |
| | 11,240 | | | Ceridian HCM Holding, Inc.(c) | | | 597,406 | |
| | 13,381 | | | CEVA, Inc.(c) | | | 337,067 | |
| | 13,029 | | | ChannelAdvisor Corp.(c) | | | 153,091 | |
| | 93,222 | | | Cirrus Logic, Inc.(c) | | | 4,435,503 | |
| | 38,619 | | | Cision Ltd.(c) | | | 465,745 | |
| | 31,316 | | | Cloudera, Inc.(c) | | | 348,547 | |
| | 41,936 | | | Cognex Corp. | | | 2,114,832 | |
| | 25,217 | | | Coherent, Inc.(c) | | | 3,732,368 | |
| | 32,850 | | | Cohu, Inc. | | | 487,166 | |
| | 15,219 | | | CommVault Systems, Inc.(c) | | | 800,519 | |
| | 44,214 | | | Comtech Telecommunications Corp. | | | 1,040,355 | |
| | 22,998 | | | Control4 Corp.(c) | | | 400,395 | |
| | 5,079 | | | Cornerstone OnDemand, Inc.(c) | | | 277,567 | |
| | 3,629 | | | Coupa Software, Inc.(c) | | | 374,985 | |
| | 45,880 | | | Cray, Inc.(c) | | | 1,204,809 | |
| | 43,344 | | | CSG Systems International, Inc. | | | 1,935,310 | |
| | 27,604 | | | CTS Corp. | | | 826,740 | |
| | 6,710 | | | CyberArk Software Ltd. (Israel)(c) | | | 865,120 | |
| | 97,651 | | | Daktronics, Inc. | | | 740,195 | |
| | 44,793 | | | Digi International, Inc.(c) | | | 576,486 | |
| | | | | | | | |
Number
of Shares | | | | | Value | |
| | | | Common Stocks & Other Equity Interests
(continued) | |
| | | | Information Technology (continued) | |
| | 47,331 | | | Diodes, Inc.(c) | | $ | 1,723,795 | |
| | 40,980 | | | Dolby Laboratories, Inc., Class A | | | 2,650,996 | |
| | 20,685 | | | DSP Group, Inc.(c) | | | 295,589 | |
| | 220,465 | | | Eastman Kodak Co.(b)(c) | | | 542,344 | |
| | 15,522 | | | Ebix, Inc.(b) | | | 783,551 | |
| | 81,650 | | | Electronics For Imaging, Inc.(c) | | | 3,036,564 | |
| | 73,702 | | | EMCORE Corp.(c) | | | 288,912 | |
| | 109,158 | | | Endurance International Group Holdings, Inc.(c) | | | 603,644 | |
| | 70,404 | | | Entegris, Inc. | | | 2,876,707 | |
| | 19,415 | | | Envestnet, Inc.(c) | | | 1,378,271 | |
| | 16,370 | | | EPAM Systems, Inc.(c) | | | 2,936,123 | |
| | 21,003 | | | ePlus, Inc.(c) | | | 1,980,373 | |
| | 42,716 | | | EVERTEC, Inc. | | | 1,337,438 | |
| | 7,322 | | | Evo Payments, Inc., Class A(c) | | | 217,537 | |
| | 25,970 | | | ExlService Holdings, Inc.(c) | | | 1,542,618 | |
| | 73,908 | | | Extreme Networks, Inc.(c) | | | 591,264 | |
| | 35,958 | | | Fabrinet (Thailand)(c) | | | 2,176,178 | |
| | 7,279 | | | Fair Isaac Corp.(c) | | | 2,036,300 | |
| | 17,780 | | | FARO Technologies, Inc.(c) | | | 1,000,125 | |
| | 165,299 | | | Finisar Corp.(c) | | | 3,985,359 | |
| | 74,890 | | | FireEye, Inc.(c) | | | 1,199,738 | |
| | 321,333 | | | Fitbit, Inc., Class A(c) | | | 1,696,638 | |
| | 3,068 | | | Five9, Inc.(c) | | | 162,819 | |
| | 57,995 | | | FormFactor, Inc.(c) | | | 1,099,005 | |
| | 20,865 | | | Fortinet, Inc.(c) | | | 1,949,208 | |
| | 109,041 | | | Genpact Ltd. | | | 3,958,188 | |
| | 9,290 | | | Globant S.A. (Argentina)(c) | | | 780,267 | |
| | 35,802 | | | GoDaddy, Inc., Class A(c) | | | 2,917,863 | |
| | 25,576 | | | GTT Communications, Inc.(b)(c) | | | 1,072,913 | |
| | 16,517 | | | Guidewire Software, Inc.(c) | | | 1,759,061 | |
| | 20,781 | | | Hackett Group, Inc. (The) | | | 318,988 | |
| | 106,262 | | | Harmonic, Inc.(c) | | | 601,443 | |
| | 2,362 | | | HubSpot, Inc.(c) | | | 435,765 | |
| | 34,306 | | | Ichor Holdings Ltd.(b)(c) | | | 863,825 | |
| | 60,391 | | | II-VI, Inc.(c) | | | 2,405,977 | |
| | 8,938 | | | Impinj, Inc.(c) | | | 261,615 | |
| | 253,020 | | | Infinera Corp.(c) | | | 1,098,107 | |
| | 17,245 | | | Inphi Corp.(c) | | | 787,407 | |
| | 35,347 | | | InterDigital, Inc. | | | 2,311,340 | |
| | 76,732 | | | Internap Corp.(b)(c) | | | 302,324 | |
| | 34,576 | | | InterXion Holding N.V. (Netherlands)(c) | | | 2,392,313 | |
| | 23,055 | | | IPG Photonics Corp.(c) | | | 4,028,400 | |
| | 45,803 | | | Itron, Inc.(c) | | | 2,457,789 | |
| | 43,023 | | | j2 Global, Inc. | | | 3,769,675 | |
| | 87,551 | | | KEMET Corp. | | | 1,564,536 | |
| | 8,936 | | | KLA-Tencor Corp. | | | 1,139,161 | |
| | 175,690 | | | Knowles Corp.(c) | | | 3,317,027 | |
| | 90,070 | | | Kulicke & Soffa Industries, Inc. (Singapore) | | | 2,095,929 | |
| | 56,537 | | | Lattice Semiconductor Corp.(c) | | | 732,154 | |
| | 100,644 | | | Limelight Networks, Inc.(c) | | | 298,913 | |
| | 13,812 | | | Littelfuse, Inc. | | | 2,776,903 | |
| | 13,018 | | | LivePerson, Inc.(c) | | | 381,818 | |
| | 40,059 | | | LiveRamp Holdings, Inc.(c) | | | 2,336,641 | |
| | 41,224 | | | LogMeIn, Inc. | | | 3,396,858 | |
| | 38,673 | | | Lumentum Holdings, Inc.(c) | | | 2,396,566 | |
See accompanying Notes to Financial Statements which are an integral part of the financial statements.
Invesco FTSE RAFI US 1500 Small-Mid ETF (PRFZ)(continued)
April 30, 2019
| | | | | | | | |
Number
of Shares | | | | | Value | |
| | | | Common Stocks & Other Equity Interests
(continued) | |
| | | | Information Technology (continued) | |
| | 18,008 | | | Luxoft Holding, Inc.(c) | | $ | 1,052,027 | |
| | 62,261 | | | MACOM Technology Solutions Holdings, Inc.(c) | | | 864,805 | |
| | 78,752 | | | MagnaChip Semiconductor Corp. (South Korea)(b)(c) | | | 696,955 | |
| | 27,803 | | | Manhattan Associates, Inc.(c) | | | 1,875,312 | |
| | 38,366 | | | ManTech International Corp., Class A | | | 2,378,308 | |
| | 47,995 | | | MAXIMUS, Inc. | | | 3,534,832 | |
| | 32,088 | | | MaxLinear, Inc.(c) | | | 863,488 | |
| | 48,657 | | | Maxwell Technologies, Inc.(b)(c) | | | 213,604 | |
| | 18,923 | | | Mellanox Technologies Ltd.(c) | | | 2,276,437 | |
| | 64,540 | | | Methode Electronics, Inc. | | | 1,904,575 | |
| | 10,203 | | | MicroStrategy, Inc., Class A(c) | | | 1,527,389 | |
| | 43,740 | | | MKS Instruments, Inc. | | | 3,980,777 | |
| | 328,251 | | | MoneyGram International, Inc.(c) | | | 1,086,511 | |
| | 9,651 | | | Monolithic Power Systems, Inc. | | | 1,502,757 | |
| | 48,661 | | | Monotype Imaging Holdings, Inc. | | | 838,916 | |
| | 28,227 | | | MTS Systems Corp. | | | 1,551,920 | |
| | 17,411 | | | Nanometrics, Inc.(c) | | | 518,674 | |
| | 82,367 | | | National Instruments Corp. | | | 3,879,486 | |
| | 54,884 | | | NeoPhotonics Corp.(c) | | | 374,858 | |
| | 236,020 | | | Net 1 UEPS Technologies, Inc. (South Africa)(b)(c) | | | 842,591 | |
| | 44,815 | | | NETGEAR, Inc.(c) | | | 1,390,609 | |
| | 132,838 | | | NetScout Systems, Inc.(c) | | | 3,905,437 | |
| | 3,039 | | | New Relic, Inc.(c) | | | 319,824 | |
| | 62,237 | | | NIC, Inc. | | | 1,074,211 | |
| | 11,834 | | | Novanta, Inc.(c) | | | 1,029,795 | |
| | 8,014 | | | Nutanix, Inc., Class A(c) | | | 346,125 | |
| | 3,246 | | | NVE Corp. | | | 310,999 | |
| | 3,171 | | | Okta, Inc.(c) | | | 329,879 | |
| | 29,320 | | | OneSpan, Inc.(c) | | | 543,593 | |
| | 21,410 | | | OSI Systems, Inc.(c) | | | 1,929,683 | |
| | 22,693 | | | Pagseguro Digital Ltd., Class A
(Brazil)(c) | | | 591,380 | |
| | 7,631 | | | Palo Alto Networks, Inc.(c) | | | 1,898,822 | |
| | 8,114 | | | PAR Technology Corp.(b)(c) | | | 192,383 | |
| | 56,233 | | | Park Electrochemical Corp. | | | 925,033 | |
| | 2,938 | | | Paycom Software, Inc.(c) | | | 595,033 | |
| | 2,337 | | | Paylocity Holding Corp.(c) | | | 225,637 | |
| | 27,013 | | | PC Connection, Inc. | | | 1,003,803 | |
| | 35,600 | | | PCM, Inc.(c) | | | 982,204 | |
| | 30,858 | | | PDF Solutions, Inc.(c) | | | 400,537 | |
| | 10,171 | | | Pegasystems, Inc. | | | 762,927 | |
| | 39,031 | | | Perficient, Inc.(c) | | | 1,149,073 | |
| | 160,881 | | | Photronics, Inc.(c) | | | 1,502,629 | |
| | 31,179 | | | Plantronics, Inc. | | | 1,605,095 | |
| | 17,360 | | | Power Integrations, Inc. | | | 1,371,787 | |
| | 109,963 | | | Presidio, Inc. | | | 1,651,644 | |
| | 25,788 | | | Progress Software Corp. | | | 1,176,191 | |
| | 3,972 | | | Proofpoint, Inc.(c) | | | 498,168 | |
| | 32,026 | | | PTC, Inc.(c) | | | 2,897,392 | |
| | 34,765 | | | Pure Storage, Inc., Class A(c) | | | 794,728 | |
| | 2,871 | | | Q2 Holdings, Inc.(c) | | | 216,531 | |
| | 5,406 | | | QAD, Inc., Class A | | | 253,379 | |
| | 7,747 | | | Qualys, Inc.(c) | | | 699,244 | |
| | 15,721 | | | Quantenna Communications, Inc.(c) | | | 382,806 | |
| | 24,162 | | | Radware Ltd. (Israel)(c) | | | 630,387 | |
| | | | | | | | |
Number
of Shares | | | | | Value | |
| | | | Common Stocks & Other Equity Interests
(continued) | |
| | | | Information Technology (continued) | |
| | 140,408 | | | Rambus, Inc.(c) | | $ | 1,609,076 | |
| | 16,751 | | | RealPage, Inc.(c) | | | 1,092,333 | |
| | 82,728 | | | Ribbon Communications, Inc.(c) | | | 443,422 | |
| | 3,776 | | | RingCentral, Inc., Class A(c) | | | 439,413 | |
| | 15,107 | | | Rogers Corp.(c) | | | 2,530,725 | |
| | 32,763 | | | Rudolph Technologies, Inc.(c) | | | 792,537 | |
| | 13,973 | | | SailPoint Technologies Holding, Inc.(c) | | | 394,877 | |
| | 98,235 | | | ScanSource, Inc.(c) | | | 3,698,548 | |
| | 31,067 | | | Semtech Corp.(c) | | | 1,673,579 | |
| | 6,788 | | | ServiceNow, Inc.(c) | | | 1,843,010 | |
| | 248,813 | | | ServiceSource International, Inc.(c) | | | 263,742 | |
| | 8,291 | | | Silicom Ltd. (Israel)(c) | | | 254,368 | |
| | 24,340 | | | Silicon Laboratories, Inc.(c) | | | 2,620,444 | |
| | 14,693 | | | SMART Global Holdings, Inc.(c) | | | 319,426 | |
| | 18,661 | | | SolarEdge Technologies, Inc.(c) | | | 826,682 | |
| | 14,113 | | | Splunk, Inc.(c) | | | 1,948,159 | |
| | 4,816 | | | SPS Commerce, Inc.(c) | | | 499,612 | |
| | 19,053 | | | Square, Inc., Class A(c) | | | 1,387,439 | |
| | 61,810 | | | Stratasys Ltd.(c) | | | 1,437,083 | |
| | 157,792 | | | SunPower Corp.(b)(c) | | | 1,139,258 | |
| | 18,056 | | | Switch, Inc., Class A(b) | | | 196,269 | |
| | 88,475 | | | Sykes Enterprises, Inc.(c) | | | 2,455,181 | |
| | 68,610 | | | Synaptics, Inc.(c) | | | 2,584,539 | |
| | 9,143 | | | Tableau Software, Inc., Class A(c) | | | 1,113,709 | |
| | 49,267 | | | Telaria, Inc.(c) | | | 355,215 | |
| | 267,271 | | | TiVo Corp. | | | 2,504,329 | |
| | 3,230 | | | Trade Desk, Inc. (The), Class A(c) | | | 715,380 | |
| | 249,492 | | | Travelport Worldwide Ltd. | | | 3,912,035 | |
| | 20,207 | | | TTEC Holdings, Inc. | | | 736,747 | |
| | 317,634 | | | TTM Technologies, Inc.(c) | | | 4,205,474 | |
| | 4,143 | | | Tucows, Inc., Class A(c) | | | 365,371 | |
| | 4,030 | | | Twilio, Inc., Class A(c) | | | 552,674 | |
| | 11,980 | | | Tyler Technologies, Inc.(c) | | | 2,778,282 | |
| | 2,977 | | | Ubiquiti Networks, Inc. | | | 507,430 | |
| | 4,454 | | | Ultimate Software Group, Inc. (The)(c) | | | 1,472,715 | |
| | 83,723 | | | Ultra Clean Holdings, Inc.(c) | | | 1,002,164 | |
| | 279,279 | | | Unisys Corp.(c) | | | 3,130,718 | |
| | 8,156 | | | Universal Display Corp. | | | 1,301,698 | |
| | 4,134 | | | Varonis Systems, Inc.(c) | | | 294,134 | |
| | 111,236 | | | Veeco Instruments, Inc.(c) | | | 1,354,854 | |
| | 58,735 | | | Verint Systems, Inc.(c) | | | 3,547,007 | |
| | 18,618 | | | VeriSign, Inc.(c) | | | 3,676,124 | |
| | 43,334 | | | Versum Materials, Inc. | | | 2,261,168 | |
| | 137,027 | | | Viavi Solutions, Inc.(c) | | | 1,822,459 | |
| | 25,629 | | | Virtusa Corp.(c) | | | 1,423,691 | |
| | 12,277 | | | Vishay Precision Group, Inc.(c) | | | 464,930 | |
| | 10,011 | | | Workday, Inc., Class A(c) | | | 2,058,562 | |
| | 78,141 | | | Xperi Corp. | | | 1,941,804 | |
| | 8,806 | | | Yext, Inc.(c) | | | 192,939 | |
| | 7,097 | | | Zendesk, Inc.(c) | | | 622,975 | |
| | | | | | | | |
| | | | | | | 293,484,939 | |
| | | | | | | | |
| | | | Materials—5.9% | |
| | 44,161 | | | A. Schulman, Inc., CVR(c)(d) | | | 23,096 | |
| | 13,871 | | | Advanced Emissions Solutions, Inc.(b) | | | 156,742 | |
| | 80,339 | | | AdvanSix, Inc.(c) | | | 2,428,648 | |
| | 115,746 | | | AgroFresh Solutions, Inc.(b)(c) | | | 369,230 | |
See accompanying Notes to Financial Statements which are an integral part of the financial statements.
Invesco FTSE RAFI US 1500 Small-Mid ETF (PRFZ)(continued)
April 30, 2019
| | | | | | | | |
Number
of Shares | | | | | Value | |
| | | | Common Stocks & Other Equity Interests
(continued) | |
| | | | Materials (continued) | |
| | 39,017 | | | American Vanguard Corp. | | $ | 614,128 | |
| | 51,366 | | | Ampco-Pittsburgh Corp.(c) | | | 165,399 | |
| | 17,933 | | | Balchem Corp. | | | 1,820,379 | |
| | 128,183 | | | Boise Cascade Co. | | | 3,549,387 | |
| | 178,653 | | | Century Aluminum Co.(c) | | | 1,502,472 | |
| | 93,356 | | | Clearwater Paper Corp.(c) | | | 1,882,991 | |
| | 269,422 | | | Coeur Mining, Inc.(c) | | | 972,613 | |
| | 46,376 | | | Eagle Materials, Inc. | | | 4,216,042 | |
| | 118,133 | | | Ferro Corp.(c) | | | 2,111,037 | |
| | 475,006 | | | Ferroglobe PLC | | | 1,021,263 | |
| | 261,589 | | | Flotek Industries, Inc.(b)(c) | | | 933,873 | |
| | 63,394 | | | Forterra, Inc.(b)(c) | | | 294,148 | |
| | 49,496 | | | FutureFuel Corp. | | | 727,096 | |
| | 106,054 | | | GCP Applied Technologies, Inc.(c) | | | 3,053,295 | |
| | 86,821 | | | Gold Resource Corp. | | | 317,765 | |
| | 82,268 | | | Greif, Inc., Class A | | | 3,251,231 | |
| | 75,429 | | | H.B. Fuller Co. | | | 3,693,758 | |
| | 16,862 | | | Hawkins, Inc. | | | 622,376 | |
| | 27,526 | | | Haynes International, Inc. | | | 889,365 | |
| | 786,600 | | | Hecla Mining Co. | | | 1,651,860 | |
| | 20,420 | | | Ingevity Corp.(c) | | | 2,348,504 | |
| | 63,209 | | | Innophos Holdings, Inc. | | | 2,034,698 | |
| | 29,967 | | | Innospec, Inc. | | | 2,541,801 | |
| | 133,654 | | | Intrepid Potash, Inc.(c) | | | 497,193 | |
| | 23,071 | | | Kaiser Aluminum Corp. | | | 2,270,186 | |
| | 66,000 | | | Koppers Holdings, Inc.(c) | | | 1,764,840 | |
| | 96,103 | | | Kraton Corp.(c) | | | 3,154,100 | |
| | 47,447 | | | Kronos Worldwide, Inc. | | | 645,279 | |
| | 93,133 | | | LSB Industries, Inc.(c) | | | 544,828 | |
| | 27,899 | | | Materion Corp. | | | 1,618,979 | |
| | 255,346 | | | McEwen Mining, Inc.(b) | | | 352,377 | |
| | 74,016 | | | Mercer International, Inc. (Canada) | | | 1,048,067 | |
| | 57,498 | | | Minerals Technologies, Inc. | | | 3,609,149 | |
| | 58,676 | | | Myers Industries, Inc. | | | 1,049,714 | |
| | 25,293 | | | Neenah, Inc. | | | 1,716,130 | |
| | 7,722 | | | NewMarket Corp. | | | 3,239,997 | |
| | 109,626 | | | Nexa Resourses S.A. (Peru) | | | 1,297,972 | |
| | 49,256 | | | Olympic Steel, Inc. | | | 798,932 | |
| | 46,033 | | | Orion Engineered Carbons S.A. (Luxembourg) | | | 933,089 | |
| | 190,434 | | | PH Glatfelter Co. | | | 3,005,049 | |
| | 65,141 | | | PQ Group Holdings, Inc.(c) | | | 1,029,879 | |
| | 7,520 | | | Quaker Chemical Corp. | | | 1,683,126 | |
| | 147,552 | | | Rayonier Advanced Materials, Inc. | | | 2,189,672 | |
| | 356,251 | | | Resolute Forest Products, Inc. | | | 2,817,945 | |
| | 109,670 | | | Ryerson Holding Corp.(c) | | | 948,646 | |
| | 87,812 | | | Schnitzer Steel Industries, Inc. | | | 2,082,901 | |
| | 75,953 | | | Schweitzer-Mauduit International, Inc., Class A | | | 2,701,648 | |
| | 56,175 | | | Sensient Technologies Corp. | | | 3,938,991 | |
| | 89,102 | | | Southern Copper Corp. (Peru) | | | 3,423,299 | |
| | 28,523 | | | Stepan Co. | | | 2,639,518 | |
| | 243,379 | | | Summit Materials, Inc., Class A(c) | | | 4,264,000 | |
| | 213,743 | | | SunCoke Energy, Inc.(c) | | | 1,840,327 | |
| | 119,769 | | | TimkenSteel Corp.(c) | | | 1,214,458 | |
| | 61,904 | | | Tredegar Corp. | | | 1,115,510 | |
| | 308,372 | | | Tronox Holdings PLC, Class A | | | 4,360,380 | |
| | | | | | | | |
Number
of Shares | | | | | Value | |
| | | | Common Stocks & Other Equity Interests
(continued) | |
| | | | Materials (continued) | |
| | 26,251 | | | Universal Stainless & Alloy Products, Inc.(c) | | $ | 377,752 | |
| | 41,118 | | | US Concrete, Inc.(b)(c) | | | 1,937,891 | |
| | 52,679 | | | Valhi, Inc. | | | 132,224 | |
| | 157,993 | | | Valvoline, Inc. | | | 2,922,871 | |
| | 237,582 | | | Venator Materials PLC(c) | | | 1,439,747 | |
| | 121,631 | | | Verso Corp., Class A(c) | | | 2,714,804 | |
| | 45,232 | | | W.R. Grace & Co. | | | 3,418,635 | |
| | 89,054 | | | Worthington Industries, Inc. | | | 3,573,737 | |
| | | | | | | | |
| | | | | | | 123,507,039 | |
| | | | | | | | |
| | | | Real Estate—7.0% | |
| | 103,674 | | | Acadia Realty Trust | | | 2,927,754 | |
| | 19,498 | | | Agree Realty Corp. | | | 1,276,534 | |
| | 154,606 | | | Alexander & Baldwin, Inc. REIT | | | 3,651,794 | |
| | 2,426 | | | Alexanders, Inc. | | | 920,982 | |
| | 50,448 | | | Altisource Portfolio Solutions S.A.(c) | | | 1,194,104 | |
| | 42,544 | | | American Assets Trust, Inc. | | | 1,965,107 | |
| | 37,250 | | | Americold Realty Trust | | | 1,192,373 | |
| | 71,517 | | | Armada Hoffler Properties, Inc. | | | 1,155,000 | |
| | 491,031 | | | Ashford Hospitality Trust, Inc. | | | 2,705,581 | |
| | 51,466 | | | Bluerock Residential Growth REIT, Inc. | | | 576,934 | |
| | 79,099 | | | Braemar Hotels & Resorts, Inc. | | | 1,099,476 | |
| | 13,901 | | | BRT Apartments Corp. | | | 195,031 | |
| | 58,526 | | | CareTrust REIT, Inc. | | | 1,419,256 | |
| | 81,486 | | | CatchMark Timber Trust, Inc., Class A | | | 814,860 | |
| | 289,260 | | | Cedar Realty Trust, Inc. | | | 888,028 | |
| | 92,338 | | | Chatham Lodging Trust | | | 1,818,135 | |
| | 113,007 | | | Chesapeake Lodging Trust | | | 3,220,700 | |
| | 48,739 | | | City Office REIT, Inc. | | | 565,372 | |
| | 4,632 | | | Community Healthcare Trust, Inc. | | | 168,975 | |
| | 22,817 | | | CorEnergy Infrastructure Trust, Inc.(b) | | | 862,254 | |
| | 173,081 | | | CorePoint Lodging, Inc. REIT | | | 2,163,513 | |
| | 16,635 | | | CoreSite Realty Corp. | | | 1,820,035 | |
| | 66,958 | | | Cushman & Wakefield PLC(c) | | | 1,315,055 | |
| | 56,161 | | | Easterly Government Properties, Inc. | | | 1,010,898 | |
| | 25,263 | | | EastGroup Properties, Inc. | | | 2,888,319 | |
| | 176,883 | | | Empire State Realty Trust, Inc., Class A | | | 2,734,611 | |
| | 12,525 | | | Essential Properties Realty Trust, Inc. | | | 259,017 | |
| | 76,963 | | | Farmland Partners, Inc.(b) | | | 504,877 | |
| | 103,492 | | | First Industrial Realty Trust, Inc. | | | 3,650,163 | |
| | 19,131 | | | Forestar Group, Inc.(c) | | | 368,654 | |
| | 36,436 | | | Four Corners Property Trust, Inc. | | | 1,036,240 | |
| | 343,584 | | | Franklin Street Properties Corp. | | | 2,700,570 | |
| | 143,766 | | | Front Yard Residential Corp. REIT | | | 1,424,721 | |
| | 34,711 | | | Getty Realty Corp. | | | 1,125,678 | |
| | 41,667 | | | Gladstone Commercial Corp. | | | 906,257 | |
| | 18,264 | | | Global Medical REIT, Inc. | | | 186,293 | |
| | 122,694 | | | Global NET Lease, Inc. | | | 2,339,775 | |
| | 36,226 | | | Hannon Armstrong Sustainable Infrastructure Capital, Inc. | | | 963,249 | |
| | 104,681 | | | Hersha Hospitality Trust | | | 1,943,926 | |
| | 40,246 | | | HFF, Inc., Class A | | | 1,915,307 | |
| | 125,432 | | | Independence Realty Trust, Inc. | | | 1,328,325 | |
| | 17,040 | | | Industrial Logistics Properties Trust | | | 338,244 | |
| | 72,822 | | | InfraREIT, Inc.(c) | | | 1,532,903 | |
| | 32,245 | | | Investors Real Estate Trust | | | 1,943,729 | |
See accompanying Notes to Financial Statements which are an integral part of the financial statements.
Invesco FTSE RAFI US 1500 Small-Mid ETF (PRFZ)(continued)
April 30, 2019
| | | | | | | | |
Number
of Shares | | | | | Value | |
| | | | Common Stocks & Other Equity Interests
(continued) | |
| | | | Real Estate (continued) | |
| | 141,164 | | | iStar, Inc. | | $ | 1,223,892 | |
| | 93,068 | | | JBG SMITH Properties | | | 3,960,043 | |
| | 11,668 | | | Jernigan Capital, Inc. | | | 245,845 | |
| | 141,506 | | | Kennedy-Wilson Holdings, Inc. | | | 3,048,039 | |
| | 211,915 | | | Kite Realty Group Trust | | | 3,346,138 | |
| | 38,804 | | | LTC Properties, Inc. | | | 1,748,508 | |
| | 17,248 | | | Marcus & Millichap, Inc.(c) | | | 743,389 | |
| | 62,246 | | | MedEquities Realty Trust, Inc. | | | 666,655 | |
| | 74,874 | | | Monmouth Real Estate Investment Corp. | | | 1,028,769 | |
| | 34,071 | | | National Health Investors, Inc. | | | 2,569,976 | |
| | 32,165 | | | National Storage Affiliates Trust | | | 941,148 | |
| | 404,484 | | | New Senior Investment Group, Inc. | | | 2,261,066 | |
| | 14,694 | | | NexPoint Residential Trust, Inc. | | | 550,878 | |
| | 62,869 | | | NorthStar Realty Europe Corp. | | | 1,120,954 | |
| | 108,756 | | | Office Properties Income Trust | | | 2,951,638 | |
| | 23,118 | | | One Liberty Properties, Inc. REIT | | | 654,239 | |
| | 118,842 | | | Pebblebrook Hotel Trust | | | 3,869,496 | |
| | 322,278 | | | Pennsylvania Real Estate Investment Trust(b) | | | 1,940,114 | |
| | 189,727 | | | Physicians Realty Trust | | | 3,426,470 | |
| | 62,741 | | | PotlatchDeltic Corp. | | | 2,425,567 | |
| | 114,321 | | | Preferred Apartment Communities, Inc., Class A | | | 1,787,980 | |
| | 16,517 | | | PS Business Parks, Inc. | | | 2,537,342 | |
| | 53,558 | | | QTS Realty Trust, Inc., Class A | | | 2,428,855 | |
| | 15,448 | | | RE/MAX Holdings, Inc., Class A | | | 669,362 | |
| | 21,061 | | | Redfin Corp.(b)(c) | | | 435,542 | |
| | 150,886 | | | Retail Opportunity Investments Corp. | | | 2,648,049 | |
| | 7,227 | | | Retail Value, Inc. REIT | | | 242,105 | |
| | 50,132 | | | Rexford Industrial Realty, Inc. | | | 1,899,502 | |
| | 2,623 | | | RMR Group, Inc. (The), Class A | | | 151,714 | |
| | 186,449 | | | RPT Realty | | | 2,261,626 | |
| | 10,960 | | | Safehold, Inc. | | | 276,521 | |
| | 14,133 | | | Saul Centers, Inc. | | | 753,996 | |
| | 44,143 | | | Seritage Growth Properties, Class A(b) | | | 1,968,336 | |
| | 167,862 | | | Spirit MTA REIT | | | 1,131,390 | |
| | 51,829 | | | St. Joe Co. (The)(c) | | | 883,166 | |
| | 91,457 | | | STAG Industrial, Inc. | | | 2,632,132 | |
| | 220,858 | | | Summit Hotel Properties, Inc. | | | 2,564,161 | |
| | 174,406 | | | Tanger Factory Outlet Centers, Inc.(b) | | | 3,149,772 | |
| | 20,949 | | | Tejon Ranch Co.(c) | | | 361,370 | |
| | 39,576 | | | Terreno Realty Corp. | | | 1,767,068 | |
| | 69,271 | | | Tier REIT, Inc. | | | 1,963,140 | |
| | 48,905 | | | UMH Properties, Inc. REIT | | | 687,115 | |
| | 9,034 | | | Universal Health Realty Income Trust | | | 731,935 | |
| | 141,676 | | | Urban Edge Properties | | | 2,630,923 | |
| | 47,224 | | | Urstadt Biddle Properties, Inc., Class A | | | 1,035,622 | |
| | 129,393 | | | Washington REIT | | | 3,654,058 | |
| | 71,957 | | | Whitestone REIT | | | 923,208 | |
| | | | | | | | |
| | | | | | | 145,917,423 | |
| | | | | | | | |
| | | | Utilities—1.8% | |
| | 29,335 | | | American States Water Co. | | | 2,087,772 | |
| | 11,648 | | | AquaVenture Holdings Ltd.(c) | | | 226,554 | |
| | 10,279 | | | Artesian Resources Corp., Class A | | | 372,922 | |
| | 167,141 | | | Atlantica Yield PLC (Spain) | | | 3,424,719 | |
| | 45,422 | | | California Water Service Group | | | 2,288,815 | |
| | | | | | | | |
Number
of Shares | | | | | Value | |
| | | | Common Stocks & Other Equity Interests
(continued) | |
| | | | Utilities (continued) | |
| | 16,645 | | | Chesapeake Utilities Corp. | | $ | 1,541,993 | |
| | 66,274 | | | Clearway Energy, Inc., Class A | | | 1,018,631 | |
| | 137,251 | | | Clearway Energy, Inc., Class C | | | 2,178,173 | |
| | 10,497 | | | Connecticut Water Service, Inc. | | | 719,779 | |
| | 22,672 | | | Consolidated Water Co. Ltd.
(Cayman Islands) | | | 287,028 | |
| | 70,041 | | | El Paso Electric Co. | | | 4,280,206 | |
| | 39,760 | | | MGE Energy, Inc. | | | 2,695,330 | |
| | 12,500 | | | Middlesex Water Co. | | | 724,875 | |
| | 44,945 | | | Northwest Natural Holding Co. | | | 3,006,371 | |
| | 38,609 | | | Ormat Technologies, Inc. | | | 2,253,221 | |
| | 54,195 | | | Otter Tail Corp. | | | 2,780,204 | |
| | 160,568 | | | Pattern Energy Group, Inc., Class A | | | 3,712,332 | |
| | 14,886 | | | SJW Group | | | 923,825 | |
| | 26,588 | | | Spark Energy, Inc., Class A(b) | | | 251,522 | |
| | 111,525 | | | TerraForm Power, Inc., Class A | | | 1,512,279 | |
| | 25,200 | | | Unitil Corp. | | | 1,434,132 | |
| | | | | | | | |
| | | | | | | 37,720,683 | |
| | | | | | | | |
| | |
| | | | Total Investments in Securities (excluding investments purchased with cash collateral from securities on loan)
(Cost $1,962,113,112)—100.0% | | | 2,094,562,556 | |
| | | �� | | | | | |
| | |
| | | | | | | | |
| | | | Investments Purchased with Cash Collateral from
Securities on Loan | |
| | |
| | | | | | | | |
| | | | Money Market Funds—3.4% | |
| | 53,947,133 | | | Invesco Government & Agency Portfolio—Institutional Class, 2.34%(e)(f) | | | 53,947,133 | |
| | 18,006,829 | | | Invesco Liquid Assets Portfolio— Institutional Class, 2.48%(e)(f) | | | 18,012,231 | |
| | | | | | | | |
| | |
| | | | | | | | |
| | | | Total Money Market Funds
(Cost $71,959,364) | | | 71,959,364 | |
| | | | | | | | |
| | |
| | | | Total Investments in Securities
(Cost $2,034,072,476)—103.4% | | | 2,166,521,920 | |
| | | | Other assets less liabilities—(3.4)% | | | (71,690,801 | ) |
| | | | | | | | |
| | |
| | | | Net Assets—100.0% | | $ | 2,094,831,119 | |
| | | | | | | | |
Abbreviations:
REIT—Real Estate Investment Trust
CVR—Contingent Value Rights
See accompanying Notes to Financial Statements which are an integral part of the financial statements.
Invesco FTSE RAFI US 1500 Small-Mid ETF (PRFZ)(continued)
April 30, 2019
Notes to Schedule of Investments:
| (a) | Industry and/or sector classifications used in this report are generally according to the Global Industry Classification Standard, which was developed by and is the exclusive property and a service mark of MSCI Inc. and Standard & Poor’s. |
| (b) | All or a portion of this security was out on loan at April 30, 2019. |
| (c) | Non-income producing security. |
| (d) | Security valued using significant unobservable inputs (Level 3). See Note 5. |
| (e) | The security and the Fund are advised by wholly-owned subsidiaries of Invesco Ltd. and are therefore considered to be affiliated. The rate shown is the7-day SEC standardized yield as of April 30, 2019. |
| (f) | The security has been segregated to satisfy the commitment to return the cash collateral received in securities lending transactions upon the borrower’s return of the securities loaned. See Note 2J. |
See accompanying Notes to Financial Statements which are an integral part of the financial statements.
Statements of Assets and Liabilities
April 30, 2019
| | | | | | | | | | | | | | | | |
| | | Invesco DWA
NASDAQ
Momentum ETF
(DWAQ) | | | Invesco Dynamic
Market ETF (PWC) | | | Invesco FTSE RAFI
US 1000 ETF (PRF) | | | Invesco FTSE RAFI
US 1500Small-Mid
ETF (PRFZ) | |
| Assets: | | | | | | | | | | | | | | | | |
Unaffiliated investments in securities, at
value(a) | | $ | 44,956,316 | | | $ | 157,925,759 | | | $ | 5,582,892,651 | | | $ | 2,094,562,556 | |
Affiliated investments in securities, at value | | | 3,000,114 | | | | 5,918,510 | | | | 32,273,315 | | | | 71,959,364 | |
Cash | | | — | | | | — | | | | 41,702 | | | | 693,051 | |
Receivable for: | | | | | | | | | | | | | | | | |
Dividends | | | 1,985 | | | | 105,257 | | | | 6,821,043 | | | | 838,632 | |
Securities lending | | | 2,115 | | | | 7,376 | | | | 22,009 | | | | 157,136 | |
Investments sold | | | — | | | | — | | | | — | | | | 9,752,800 | |
Fund shares sold | | | — | | | | — | | | | — | | | | 23,371 | |
Foreign tax reclaims | | | 1,180 | | | | — | | | | — | | | | — | |
| | | | | | | | | | | | | | | | |
Total assets | | | 47,961,710 | | | | 163,956,902 | | | | 5,622,050,720 | | | | 2,177,986,910 | |
| | | | | | | | | | | | | | | | |
| | | | |
| Liabilities: | | | | | | | | | | | | | | | | |
Payable for: | | | | | | | | | | | | | | | | |
Investments purchased | | | — | | | | — | | | | — | | | | 1,652,296 | |
Collateral upon return of securities loaned | | | 2,862,822 | | | | 5,742,839 | | | | 24,584,551 | | | | 71,959,364 | |
Collateral upon receipt of securitiesin-kind | | | — | | | | — | | | | — | | | | 24,540 | |
Fund shares repurchased | | | — | | | | — | | | | — | | | | 6,642,394 | |
Accrued advisory fees | | | 10,753 | | | | 64,439 | | | | 1,343,043 | | | | 490,851 | |
Accrued trustees’ and officer’s fees | | | 35,045 | | | | 58,305 | | | | 272,473 | | | | 103,686 | |
Accrued expenses | | | 125,895 | | | | 116,567 | | | | 5,826,102 | | | | 2,282,660 | |
| | | | | | | | | | | | | | | | |
Total liabilities | | | 3,034,515 | | | | 5,982,150 | | | | 32,026,169 | | | | 83,155,791 | |
| | | | | | | | | | | | | | | | |
| Net Assets | | $ | 44,927,195 | | | $ | 157,974,752 | | | $ | 5,590,024,551 | | | $ | 2,094,831,119 | |
| | | | | | | | | | | | | | | | |
| | | | |
| Net assets consist of: | | | | | | | | | | | | | | | | |
Shares of beneficial interest | | $ | 65,380,107 | | | $ | 281,785,078 | | | $ | 4,914,322,968 | | | $ | 2,145,069,326 | |
Distributable earnings | | | (20,452,912 | ) | | | (123,810,326 | ) | | | 675,701,583 | | | | (50,238,207 | ) |
| | | | | | | | | | | | | | | | |
| Net Assets | | $ | 44,927,195 | | | $ | 157,974,752 | | | $ | 5,590,024,551 | | | $ | 2,094,831,119 | |
| | | | | | | | | | | | | | | | |
Shares outstanding (unlimited amount authorized, $0.01 par value) | | | 400,000 | | | | 1,600,000 | | | | 47,450,000 | | | | 15,850,000 | |
Net asset value | | $ | 112.32 | | | $ | 98.73 | | | $ | 117.81 | | | $ | 132.17 | |
| | | | | | | | | | | | | | | | |
Market price | | $ | 112.25 | | | $ | 98.63 | | | $ | 117.82 | | | $ | 132.22 | |
| | | | | | | | | | | | | | | | |
Unaffiliated investments in securities, at cost | | $ | 37,608,125 | | | $ | 154,060,357 | | | $ | 4,753,783,131 | | | $ | 1,962,113,112 | |
| | | | | | | | | | | | | | | | |
Affiliated investments in securities, at cost | | $ | 3,000,114 | | | $ | 5,918,510 | | | $ | 33,212,125 | | | $ | 71,959,364 | |
| | | | | | | | | | | | | | | | |
(a) Includes securities on loan with an aggregate value of | | $ | 2,879,858 | | | $ | 5,668,996 | | | $ | 23,488,938 | | | $ | 68,637,237 | |
| | | | | | | | | | | | | | | | |
See accompanying Notes to Financial Statements which are an integral part of the financial statements.
Statements of Operations
For the year ended April 30, 2019
| | | | | | | | | | | | | | | | |
| | | Invesco DWA
NASDAQ
Momentum ETF
(DWAQ) | | | Invesco Dynamic
Market ETF (PWC) | | | Invesco FTSE RAFI
US 1000 ETF (PRF) | | | Invesco FTSE RAFI
US 1500Small-Mid
ETF (PRFZ) | |
| Investment income: | | | | | | | | | | | | | | | | |
Unaffiliated dividend income | | $ | 140,868 | | | $ | 2,186,670 | | | $ | 128,214,580 | | | $ | 29,734,636 | |
Affiliated dividend income | | | 2,334 | | | | 3,827 | | | | 347,572 | | | | 39,012 | |
Non-cash dividend income | | | — | | | | 228,055 | | | | 2,556,700 | | | | 3,001,586 | |
Securities lending income | | | 11,400 | | | | 24,405 | | | | 405,167 | | | | 2,463,109 | |
Foreign witholding tax | | | — | | | | (2,396 | ) | | | (9,517 | ) | | | (56,274 | ) |
| | | | | | | | | | | | | | | | |
Total investment income | | | 154,602 | | | | 2,440,561 | | | | 131,514,502 | | | | 35,182,069 | |
| | | | | | | | | | | | | | | | |
| | | | |
| Expenses: | | | | | | | | | | | | | | | | |
Advisory fees | | | 245,212 | | | | 813,705 | | | | 15,160,982 | | | | 5,925,397 | |
Sub-licensing fees | | | 48,787 | | | | 48,957 | | | | 4,718,009 | | | | 1,843,949 | |
Accounting & administration fees | | | 29,562 | | | | 35,466 | | | | 380,113 | | | | 155,284 | |
Professional fees | | | 24,344 | | | | 26,008 | | | | 66,197 | | | | 39,668 | |
Custodian & transfer agent fees | | | 5,856 | | | | 10,660 | | | | 94,880 | | | | 72,540 | |
Trustees’ and officer’s fees | | | 7,268 | | | | 9,101 | | | | 66,107 | | | | 28,610 | |
Other expenses | | | 16,315 | | | | 20,925 | | | | 178,987 | | | | 85,828 | |
| | | | | | | | | | | | | | | | |
Total expenses | | | 377,344 | | | | 964,822 | | | | 20,665,275 | | | | 8,151,276 | |
| | | | | | | | | | | | | | | | |
Less: Waivers | | | (83,295 | ) | | | (329 | ) | | | (281,921 | ) | | | (186,219 | ) |
| | | | | | | | | | | | | | | | |
Net expenses | | | 294,049 | | | | 964,493 | | | | 20,383,354 | | | | 7,965,057 | |
| | | | | | | | | | | | | | | | |
Net investment income (loss) | | | (139,447 | ) | | | 1,476,068 | | | | 111,131,148 | | | | 27,217,012 | |
| | | | | | | | | | | | | | | | |
| | | |
| Realized and unrealized gain (loss) from: | | | | | | | | | | | | | |
Net realized gain (loss) from: | | | | | | | | | | | | | | | | |
Unaffiliated investment securities | | | (7,297,768 | ) | | | (23,420,179 | ) | | | (27,009,374 | ) | | | (66,790,105 | ) |
Affiliated investment securities | | | — | | | | — | | | | (8,025 | ) | | | — | |
Unaffiliatedin-kind redemptions | | | 10,393,574 | | | | 31,578,369 | | | | 280,926,314 | | | | 184,454,445 | |
Affiliatedin-kind redemptions | | | — | | | | — | | | | 20,007 | | | | — | |
Foreign currencies | | | — | | | | — | | | | — | | | | 59 | |
| | | | | | | | | | | | | | | | |
Net realized gain | | | 3,095,806 | | | | 8,158,190 | | | | 253,928,922 | | | | 117,664,399 | |
| | | | | | | | | | | | | | | | |
Change in net unrealized appreciation (depreciation) of: | | | | | | | | | | | | | | | | |
Unaffiliated investment securities | | | 129,608 | | | | (6,019,994 | ) | | | 101,139,478 | | | | (67,887,495 | ) |
Affiliated investment securities | | | — | | | | — | | | | (540,396 | ) | | | — | |
| | | | | | | | | | | | | | | | |
Change in unrealized appreciation (depreciation) | | | 129,608 | | | | (6,019,994 | ) | | | 100,599,082 | | | | (67,887,495 | ) |
| | | | | | | | | | | | | | | | |
Net realized and unrealized gain | | | 3,225,414 | | | | 2,138,196 | | | | 354,528,004 | | | | 49,776,904 | |
| | | | | | | | | | | | | | | | |
Net increase in net assets resulting from operations | | $ | 3,085,967 | | | $ | 3,614,264 | | | $ | 465,659,152 | | | $ | 76,993,916 | |
| | | | | | | | | | | | | | | | |
See accompanying Notes to Financial Statements which are an integral part of the financial statements.
Statements of Changes in Net Assets
For the years ended April 30, 2019 and 2018
| | | | | | | | | | | | | | | | |
| | | Invesco DWA NASDAQ
Momentum ETF (DWAQ) | | | Invesco Dynamic
Market ETF (PWC) | |
| | | 2019 | | | 2018 | | | 2019 | | | 2018 | |
| Operations: | | | | | | | | | | | | | | | | |
Net investment income (loss) | | $ | (139,447 | ) | | $ | (49,936 | ) | | $ | 1,476,068 | | | $ | 3,449,899 | |
Net realized gain | | | 3,095,806 | | | | 7,061,616 | | | | 8,158,190 | | | | 20,829,508 | |
Change in net unrealized appreciation (depreciation) | | | 129,608 | | | | 531,713 | | | | (6,019,994 | ) | | | (470,940 | ) |
| | | | | | | | | | | | | | | | |
Net increase in net assets resulting from operations | | | 3,085,967 | | | | 7,543,393 | | | | 3,614,264 | | | | 23,808,467 | |
| | | | | | | | | | | | | | | | |
| | | | |
| Distributions to Shareholders from: | | | | | | | | | | | | | | | | |
Distributable earnings | | | — | | | | (52,590 | ) | | | (1,826,550 | ) | | | (3,141,857 | ) |
| | | | | | | | | | | | | | | | |
| | | | |
| Shareholder Transactions: | | | | | | | | | | | | | | | | |
Proceeds from shares sold | | | 55,298,250 | | | | 45,322,131 | | | | 247,458,643 | | | | 219,756,077 | |
Value of shares repurchased | | | (65,497,189 | ) | | | (35,342,392 | ) | | | (246,405,339 | ) | | | (228,340,706 | ) |
| | | | | | | | | | | | | | | | |
Net increase (decrease) in net assets resulting from share transactions | | | (10,198,939 | ) | | | 9,979,739 | | | | 1,053,304 | | | | (8,584,629 | ) |
| | | | | | | | | | | | | | | | |
Net increase (decrease) in net assets | | | (7,112,972 | ) | | | 17,470,542 | | | | 2,841,018 | | | | 12,081,981 | |
| | | | | | | | | | | | | | | | |
| | | | |
| Net assets: | | | | | | | | | | | | | | | | |
Beginning of year | | | 52,040,167 | | | | 34,569,625 | | | | 155,133,734 | | | | 143,051,753 | |
| | | | | | | | | | | | | | | | |
End of year | | $ | 44,927,195 | | | $ | 52,040,167 | | | $ | 157,974,752 | | | $ | 155,133,734 | |
| | | | | | | | | | | | | | | | |
| | | | |
| Changes in Shares Outstanding: | | | | | | | | | | | | | | | | |
Shares sold | | | 500,000 | | | | 450,000 | | | | 2,450,000 | | | | 2,400,000 | |
Shares repurchased | | | (600,000 | ) | | | (350,000 | ) | | | (2,450,000 | ) | | | (2,500,000 | ) |
Shares outstanding, beginning of year | | | 500,000 | | | | 400,000 | | | | 1,600,000 | | | | 1,700,000 | |
| | | | | | | | | | | | | | | | |
Shares outstanding, end of year | | | 400,000 | | | | 500,000 | | | | 1,600,000 | | | | 1,600,000 | |
| | | | | | | | | | | | | | | | |
See accompanying Notes to Financial Statements which are an integral part of the financial statements.
| | | | | | | | | | | | | | |
Invesco FTSE RAFI US
1000 ETF (PRF) | | | Invesco FTSE RAFI US
1500Small-Mid ETF (PRFZ) | |
| 2019 | | | 2018 | | | 2019 | | | 2018 | |
| | | | | | | | | | | | | | |
| $ | 111,131,148 | | | $ | 101,981,304 | | | $ | 27,217,012 | | | $ | 20,340,584 | |
| | 253,928,922 | | | | 352,123,324 | | | | 117,664,399 | | | | 176,707,427 | |
| | 100,599,082 | | | | 38,529,597 | | | | (67,887,495 | ) | | | (1,012,950 | ) |
| | | | | | | | | | | | | | |
| | 465,659,152 | | | | 492,634,225 | | | | 76,993,916 | | | | 196,035,061 | |
| | | | | | | | | | | | | | |
| | | |
| | | | | | | | | | | | | | |
| | (107,823,504 | ) | | | (97,645,991 | ) | | | (25,325,031 | ) | | | (18,546,404 | ) |
| | | | | | | | | | | | | | |
| | | |
| | | | | | | | | | | | | | |
| | 892,856,882 | | | | 745,176,748 | | | | 678,476,197 | | | | 559,752,314 | |
| | (785,088,112 | ) | | | (912,832,186 | ) | | | (524,646,991 | ) | | | (480,435,328 | ) |
| | | | | | | | | | | | | | |
| | 107,768,770 | | | | (167,655,438 | ) | | | 153,829,206 | | | | 79,316,986 | |
| | | | | | | | | | | | | | |
| | 465,604,418 | | | | 227,332,796 | | | | 205,498,091 | | | | 256,805,643 | |
| | | | | | | | | | | | | | |
| | | |
| | | | | | | | | | | | | | |
| | 5,124,420,133 | | | | 4,897,087,337 | | | | 1,889,333,028 | | | | 1,632,527,385 | |
| | | | | | | | | | | | | | |
| $ | 5,590,024,551 | | | $ | 5,124,420,133 | | | $ | 2,094,831,119 | | | $ | 1,889,333,028 | |
| | | | | | | | | | | | | | |
| | | |
| | | | | | | | | | | | | | |
| | 8,250,000 | | | | 6,650,000 | | | | 5,400,000 | | | | 4,300,000 | |
| | (6,950,000 | ) | | | (8,200,000 | ) | | | (4,050,000 | ) | | | (3,650,000 | ) |
| | 46,150,000 | | | | 47,700,000 | | | | 14,500,000 | | | | 13,850,000 | |
| | | | | | | | | | | | | | |
| | 47,450,000 | | | | 46,150,000 | | | | 15,850,000 | | | | 14,500,000 | |
| | | | | | | | | | | | | | |
Financial Highlights
Invesco DWA NASDAQ Momentum ETF (DWAQ)
| | | | | | | | | | | | | | | | | | | | |
| | | Years Ended April 30, | |
| | | 2019 | | | 2018 | | | 2017 | | | 2016 | | | 2015 | |
| Per Share Operating Performance: | | | | | | | | | | | | | | | | | | | | |
Net asset value at beginning of year | | $ | 104.08 | | | $ | 86.42 | | | $ | 69.83 | | | $ | 75.06 | | | $ | 64.34 | |
Net investment income (loss)(a) | | | (0.30 | ) | | | (0.11 | ) | | | 0.07 | | | | (0.06 | ) | | | 0.06 | |
Net realized and unrealized gain (loss) on investments | | | 8.54 | | | | 17.88 | | | | 16.65 | | | | (5.11 | ) | | | 10.66 | |
Total from investment operations | | | 8.24 | | | | 17.77 | | | | 16.72 | | | | (5.17 | ) | | | 10.72 | |
Distributions to shareholders from: | | | | | | | | | | | | | | | | | | | | |
Net investment income | | | — | | | | (0.11 | ) | | | (0.06 | ) | | | (0.05 | ) | | | — | |
Return of capital | | | — | | | | — | | | | (0.07 | ) | | | (0.01 | ) | | | — | |
Total distributions | | | — | | | | (0.11 | ) | | | (0.13 | ) | | | (0.06 | ) | | | — | |
Net asset value at end of year | | $ | 112.32 | | | $ | 104.08 | | | $ | 86.42 | | | $ | 69.83 | | | $ | 75.06 | |
Market price at end of year(b) | | $ | 112.25 | | | $ | 104.23 | | | $ | 86.38 | | | $ | 69.82 | | | $ | 75.10 | |
| Net Asset Value Total Return(c) | | | 7.92 | % | | | 20.56 | % | | | 23.98 | % | | | (6.90 | )% | | | 16.66 | % |
| Market Price Total Return(c) | | | 7.72 | % | | | 20.79 | % | | | 23.95 | % | | | (6.96 | )% | | | 16.76 | % |
| Ratios/Supplemental Data: | | | | | | | | | | | | | | | | | | | | |
Net assets at end of year (000’s omitted) | | $ | 44,927 | | | $ | 52,040 | | | $ | 34,570 | | | $ | 34,913 | | | $ | 30,023 | |
Ratio to average net assets of: | | | | | | | | | | | | | | | | | | | | |
Expenses, after Waivers | | | 0.60 | % | | | 0.60 | % | | | 0.60 | % | | | 0.60 | % | | | 0.60 | % |
Expenses, prior to Waivers | | | 0.77 | % | | | 0.82 | % | | | 0.85 | % | | | 0.81 | % | | | 0.96 | % |
Net investment income (loss), after Waivers | | | (0.28 | )% | | | (0.11 | )% | | | 0.09 | % | | | (0.09 | )% | | | 0.09 | % |
Portfolio turnover rate(d) | | | 156 | % | | | 80 | % | | | 89 | % | | | 118 | % | | | 154 | % |
| (a) | Based on average shares outstanding. |
| (b) | The mean between the last bid and ask prices. |
| (c) | Net asset value total return is calculated assuming an initial investment made at the net asset value at the beginning of the period, reinvestment of all dividends and distributions at net asset value during the period, and redemption on the last day of the period. Net asset value total return includes adjustments in accordance with accounting principles generally accepted in the United States of America and as such, the net asset value for financial reporting purposes and the returns based upon those net asset values may differ from the net asset value and returns for shareholder transactions. Market price total return is calculated assuming an initial investment made at the market price at the beginning of the period, reinvestment of all dividends and distributions at market price during the period, and sale at the market price on the last day of the period. Total investment returns calculated for a period of less than one year are not annualized. |
| (d) | Portfolio turnover rate is not annualized for periods less than one year, if applicable, and does not include securities received or delivered from processing creations or redemptions. |
See accompanying Notes to Financial Statements which are an integral part of the financial statements.
Financial Highlights(continued)
Invesco Dynamic Market ETF (PWC)
| | | | | | | | | | | | | | | | | | | | |
| | | Years Ended April 30, | |
| | | 2019 | | | 2018 | | | 2017 | | | 2016 | | | 2015 | |
| Per Share Operating Performance: | | | | | | | | | | | | | | | | | | | | |
Net asset value at beginning of year | | $ | 96.96 | | | $ | 84.15 | | | $ | 71.56 | | | $ | 73.46 | | | $ | 70.27 | |
Net investment income(a) | | | 0.90 | | | | 2.11 | (b) | | | 0.43 | | | | 0.82 | | | | 0.68 | |
Net realized and unrealized gain (loss) on investments | | | 1.99 | | | | 12.64 | | | | 12.98 | | | | (1.91 | ) | | | 3.25 | |
Total from investment operations | | | 2.89 | | | | 14.75 | | | | 13.41 | | | | (1.09 | ) | | | 3.93 | |
Distributions to shareholders from: | | | | | | | | | | | | | | | | | | | | |
Net investment income | | | (1.12 | ) | | | (1.94 | ) | | | (0.82 | ) | | | (0.81 | ) | | | (0.74 | ) |
Net asset value at end of year | | $ | 98.73 | | | $ | 96.96 | | | $ | 84.15 | | | $ | 71.56 | | | $ | 73.46 | |
Market price at end of year(c) | | $ | 98.63 | | | $ | 96.98 | | | $ | 84.16 | | | $ | 71.55 | | | $ | 73.40 | |
| Net Asset Value Total Return(d) | | | 3.00 | % | | | 17.67 | % | | | 18.88 | % | | | (1.50 | )% | | | 5.58 | % |
| Market Price Total Return(d) | | | 2.89 | % | | | 17.68 | % | | | 18.91 | % | | | (1.43 | )% | | | 5.49 | % |
| Ratios/Supplemental Data: | | | | | | | | | | | | | | | | | | | | |
Net assets at end of year (000’s omitted) | | $ | 157,975 | | | $ | 155,134 | | | $ | 143,052 | | | $ | 143,122 | | | $ | 168,950 | |
Ratio to average net assets of: | | | | | | | | | | | | | | | | | | | | |
Expenses, after Waivers | | | 0.59 | % | | | 0.60 | % | | | 0.60 | % | | | 0.60 | % | | | 0.59 | % |
Expenses, prior to Waivers | | | 0.59 | % | | | 0.61 | % | | | 0.61 | % | | | 0.60 | % | | | 0.59 | % |
Net investment income, after Waivers | | | 0.91 | % | | | 2.30 | %(b) | | | 0.56 | % | | | 1.13 | % | | | 0.93 | % |
Portfolio turnover rate(e) | | | 240 | % | | | 215 | % | | | 231 | % | | | 231 | % | | | 237 | % |
| (a) | Based on average shares outstanding. |
| (b) | Net investment income per share and the ratio of net investment income to average net assets include a significant dividend received during the period.Net investment income per share and the ratio of net investment income to average net assets excluding the significant dividend are $1.10 and 1.19%, respectively. |
| (c) | The mean between the last bid and ask prices. |
| (d) | Net asset value total return is calculated assuming an initial investment made at the net asset value at the beginning of the period, reinvestment of all dividends and distributions at net asset value during the period, and redemption on the last day of the period. Net asset value total return includes adjustments in accordance with accounting principles generally accepted in the United States of America and as such, the net asset value for financial reporting purposes and the returns based upon those net asset values may differ from the net asset value and returns for shareholder transactions. Market price total return is calculated assuming an initial investment made at the market price at the beginning of the period, reinvestment of all dividends and distributions at market price during the period, and sale at the market price on the last day of the period. Total investment returns calculated for a period of less than one year are not annualized. |
| (e) | Portfolio turnover rate is not annualized for periods less than one year, if applicable, and does not include securities received or delivered from processing creations or redemptions. |
Invesco FTSE RAFI US 1000 ETF (PRF)
| | | | | | | | | | | | | | | | | | | | |
| | | Years Ended April 30, | |
| | | 2019 | | | 2018 | | | 2017 | | | 2016 | | | 2015 | |
| Per Share Operating Performance: | | | | | | | | | | | | | | | | | | | | |
Net asset value at beginning of year | | $ | 111.04 | | | $ | 102.66 | | | $ | 90.15 | | | $ | 92.45 | | | $ | 85.42 | |
Net investment income(a) | | | 2.40 | | | | 2.18 | | | | 1.86 | | | | 1.93 | | | | 1.72 | |
Net realized and unrealized gain (loss) on investments | | | 6.72 | | | | 8.29 | | | | 12.56 | | | | (2.23 | ) | | | 6.93 | |
Total from investment operations | | | 9.12 | | | | 10.47 | | | | 14.42 | | | | (0.30 | ) | | | 8.65 | |
Distributions to shareholders from: | | | | | | | | | | | | | | | | | | | | |
Net investment income | | | (2.35 | ) | | | (2.09 | ) | | | (1.91 | ) | | | (2.00 | ) | | | (1.62 | ) |
Net asset value at end of year | | $ | 117.81 | | | $ | 111.04 | | | $ | 102.66 | | | $ | 90.15 | | | $ | 92.45 | |
Market price at end of year(b) | | $ | 117.82 | | | $ | 111.12 | | | $ | 102.67 | | | $ | 90.13 | | | $ | 92.43 | |
| Net Asset Value Total Return(c) | | | 8.40 | % | | | 10.26 | % | | | 16.16 | % | | | (0.23 | )% | | | 10.19 | % |
| Market Price Total Return(c) | | | 8.32 | % | | | 10.33 | % | | | 16.19 | % | | | (0.24 | )% | | | 10.23 | % |
| Ratios/Supplemental Data: | | | | | | | | | | | | | | | | | | | | |
Net assets at end of year (000’s omitted) | | $ | 5,590,025 | | | $ | 5,124,420 | | | $ | 4,897,087 | | | $ | 4,142,401 | | | $ | 4,558,017 | |
Ratio to average net assets of: | | | | | | | | | | | | | | | | | | | | |
Expenses, after Waivers | | | 0.39 | % | | | 0.39 | % | | | 0.39 | % | | | 0.39 | % | | | 0.39 | % |
Expenses, prior to Waivers | | | 0.40 | % | | | 0.41 | % | | | 0.41 | % | | | 0.41 | % | | | 0.41 | % |
Net investment income, after Waivers | | | 2.13 | % | | | 2.00 | % | | | 1.93 | % | | | 2.19 | % | | | 1.92 | % |
Portfolio turnover rate(d) | | | 10 | % | | | 9 | % | | | 11 | % | | | 12 | % | | | 10 | % |
| (a) | Based on average shares outstanding. |
| (b) | The mean between the last bid and ask prices. |
| (c) | Net asset value total return is calculated assuming an initial investment made at the net asset value at the beginning of the period, reinvestment of all dividends and distributions at net asset value during the period, and redemption on the last day of the period. Net asset value total return includes adjustments in accordance with accounting principles generally accepted in the United States of America and as such, the net asset value for financial reporting purposes and the returns based upon those net asset values may differ from the net asset value and returns for shareholder transactions. Market price total return is calculated assuming an initial investment made at the market price at the beginning of the period, reinvestment of all dividends and distributions at market price during the period, and sale at the market price on the last day of the period. Total investment returns calculated for a period of less than one year are not annualized. |
| (d) | Portfolio turnover rate is not annualized for periods less than one year, if applicable, and does not include securities received or delivered from processing creations or redemptions. |
See accompanying Notes to Financial Statements which are an integral part of the financial statements.
Financial Highlights(continued)
Invesco FTSE RAFI US 1500Small-Mid ETF (PRFZ)
| | | | | | | | | | | | | | | | | | | | |
| | | Years Ended April 30, | |
| | | 2019 | | | 2018 | | | 2017 | | | 2016 | | | 2015 | |
| Per Share Operating Performance: | | | | | | | | | | | | | | | | | | | | |
Net asset value at beginning of year | | $ | 130.30 | | | $ | 117.87 | | | $ | 97.56 | | | $ | 103.44 | | | $ | 96.35 | |
Net investment income(a) | | | 1.76 | | | | 1.44 | | | | 1.30 | | | | 1.25 | | | | 1.38 | |
Net realized and unrealized gain (loss) on investments | | | 1.75 | | | | 12.31 | | | | 20.46 | | | | (5.93 | ) | | | 7.04 | |
Total from investment operations | | | 3.51 | | | | 13.75 | | | | 21.76 | | | | (4.68 | ) | | | 8.42 | |
Distributions to shareholders from: | | | | | | | | | | | | | | | | | | | | |
Net investment income | | | (1.64 | ) | | | (1.32 | ) | | | (1.45 | ) | | | (1.20 | ) | | | (1.33 | ) |
Net asset value at end of year | | $ | 132.17 | | | $ | 130.30 | | | $ | 117.87 | | | $ | 97.56 | | | $ | 103.44 | |
Market price at end of year(b) | | $ | 132.22 | | | $ | 130.51 | | | $ | 117.82 | | | $ | 97.55 | | | $ | 103.45 | |
| Net Asset Value Total Return(c) | | | 2.75 | % | | | 11.73 | % | | | 22.44 | % | | | (4.49 | )% | | | 8.80 | % |
| Market Price Total Return(c) | | | 2.60 | % | | | 11.96 | % | | | 22.40 | % | | | (4.52 | )% | | | 8.78 | % |
| Ratios/Supplemental Data: | | | | | | | | | | | | | | | | | | | | |
Net assets at end of year (000’s omitted) | | $ | 2,094,831 | | | $ | 1,889,333 | | | $ | 1,632,527 | | | $ | 1,107,295 | | | $ | 1,158,510 | |
Ratio to average net assets of: | | | | | | | | | | | | | | | | | | | | |
Expenses, after Waivers | | | 0.39 | % | | | 0.39 | % | | | 0.39 | % | | | 0.39 | % | | | 0.39 | % |
Expenses, prior to Waivers | | | 0.40 | % | | | 0.41 | % | | | 0.41 | % | | | 0.41 | % | | | 0.42 | % |
Net investment income, after Waivers | | | 1.33 | % | | | 1.15 | % | | | 1.20 | % | | | 1.30 | % | | | 1.39 | % |
Portfolio turnover rate(d) | | | 24 | % | | | 26 | % | | | 29 | % | | | 28 | % | | | 26 | % |
| (a) | Based on average shares outstanding. |
| (b) | The mean between the last bid and ask prices. |
| (c) | Net asset value total return is calculated assuming an initial investment made at the net asset value at the beginning of the period, reinvestment of all dividends and distributions at net asset value during the period, and redemption on the last day of the period. Net asset value total return includes adjustments in accordance with accounting principles generally accepted in the United States of America and as such, the net asset value for financial reporting purposes and the returns based upon those net asset values may differ from the net asset value and returns for shareholder transactions. Market price total return is calculated assuming an initial investment made at the market price at the beginning of the period, reinvestment of all dividends and distributions at market price during the period, and sale at the market price on the last day of the period. Total investment returns calculated for a period of less than one year are not annualized. |
| (d) | Portfolio turnover rate is not annualized for periods less than one year, if applicable, and does not include securities received or delivered from processing creations or redemptions. |
See accompanying Notes to Financial Statements which are an integral part of the financial statements.
Notes to Financial Statements
Invesco Exchange-Traded Fund Trust
April 30, 2019
NOTE 1—Organization
Invesco Exchange-Traded Fund Trust (the “Trust”) was organized as a Massachusetts business trust on June 9, 2000 and is authorized to have multiple series of portfolios. The Trust is anopen-end management investment company registered under the Investment Company Act of 1940, as amended (the “1940 Act”). This report includes the following portfolios:
| | |
Full Name | | Short Name |
| Invesco DWA NASDAQ Momentum ETF (DWAQ) | | “DWA NASDAQ Momentum ETF” |
| Invesco Dynamic Market ETF (PWC) | | “Dynamic Market ETF” |
| Invesco FTSE RAFI US 1000 ETF (PRF) | | “FTSE RAFI US 1000 ETF” |
| Invesco FTSE RAFI US 1500Small-Mid ETF (PRFZ) | | “FTSE RAFI US 1500Small-Mid ETF” |
Each portfolio (each, a “Fund”, and collectively, the “Funds”) represents a separate series of the Trust. The shares of the Funds are referred to herein as “Shares “or “Fund’s Shares. “Shares of Dynamic Market ETF and FTSE RAFI US 1000 ETF are listed and traded on NYSE Arca, Inc., and Shares of DWA NASDAQ Momentum ETF and FTSE RAFI US 1500Small-Mid ETF are listed and traded on The Nasdaq Stock Market.
The market price of each Share may differ to some degree from a Fund’s net asset value (“NAV”). Unlike conventional mutual funds, each Fund issues and redeems Shares on a continuous basis, at NAV, only in a large specified number of Shares, each called a “Creation Unit. “Creation Units are issued and redeemed principally in exchange for the deposit or delivery of a basket of securities (“Deposit Securities”). Except when aggregated in Creation Units by Authorized Participants, the Shares are not individually redeemable securities of the Funds.
The investment objective of each Fund is to seek to track the investment results (before fees and expenses) of its respective index listed below (each, an “Underlying Index”):
| | |
Fund | | Underlying Index |
| DWA NASDAQ Momentum ETF | | Dorsey Wright®NASDAQ Technical Leaders Index |
| Dynamic Market ETF | | Dynamic Market IntellidexSMIndex |
| FTSE RAFI US 1000 ETF | | FTSE RAFITMUS 1000 Index |
| FTSE RAFI US 1500Small-Mid ETF | | FTSE RAFITMUS 1500 Mid Small Index |
NOTE 2—Significant Accounting Policies
The following is a summary of the significant accounting policies followed by the Funds in preparation of their financial statements.
Each Fund is an investment company and accordingly follows the investment company accounting and reporting guidance in accordance with Financial Accounting Standards Board Accounting Standards Codification Topic 946,Financial Services—Investment Companies.
| A. | Security Valuation— Securities, including restricted securities, are valued according to the following policies: |
A security listed or traded on an exchange (except convertible securities) is generally valued at its last sales price or official closing price as of the close of the customary trading session on the exchange where the security is principally traded or, lacking any sales or official closing price on a particular day, the security may be valued at the closing bid price on that day. Securities traded in theover-the-counter market are valued based on prices furnished by independent pricing services or market makers. When such securities are valued by an independent pricing service they may be considered fair valued. Futures contracts are valued at the final settlement price set by an exchange on which they are principally traded. Listed options are valued at the mean between the last bid and asked prices from the exchange on which they are principally traded, or at the final settlement price set by such exchange. Swaps and options not listed on an exchange are valued by an independent source. For purposes of determining NAV per Share, futures and option contracts generally are valued 15 minutes after the close of the customary trading session of the New York Stock Exchange (“NYSE”).
Investment companies are valued using such company’s NAV per share, unless the shares are exchange-traded, in which case they are valued at the last sales price or official closing price as of the close of the customary trading session on the exchange where the security is principally traded.
Debt obligations (including convertible securities) and unlisted equities are fair valued using an evaluated quote provided by an independent pricing service. Evaluated quotes provided by the pricing service may be determined without exclusive reliance on quoted prices, and may reflect appropriate factors such asinstitution-size trading in similar groups of securities, developments related to specific securities, dividend rate (for unlisted equities), yield (for debt obligations), quality, type of
issue, coupon rate (for debt obligations), maturity (for debt obligations), individual trading characteristics and other market data. Securities with a demand feature exercisable within one to seven days are valued at par. Pricing services generally value debt obligations assuming orderly transactions of institutional round lot size, but a Fund may hold or transact in the same securities in smaller, odd lot sizes. Odd lots often trade at lower prices than institutional round lots. Debt obligations are subject to interest rate and credit risks. In addition, all debt obligations involve some risk of default with respect to interest and/or principal payments.
Foreign securities’ (including foreign exchange contracts’) prices are converted into U.S. dollar amounts using the applicable exchange rates as of the close of the London world markets. If market quotations are available and reliable for foreign exchange-traded equity securities, the securities will be valued at the market quotations. Because trading hours for certain foreign securities end before the close of the NYSE, closing market quotations may become unreliable. If between the time trading ends on a particular security and the close of the customary trading session on the NYSE, events occur that Invesco Capital Management LLC (the “Adviser”) determines are significant and make the closing price unreliable, a Fund may fair value the security. If the event is likely to have affected the closing price of the security, the security will be valued at fair value in good faith using procedures approved by the Board of Trustees. Adjustments to closing prices to reflect fair value may also be based on a screening process of an independent pricing service to indicate the degree of certainty, based on historical data, that the closing price in the principal market where a foreign security trades is not the current value as of the close of the NYSE. Foreign securities’ prices meeting the approved degree of certainty that the price is not reflective of current value will be priced at the indication of fair value from the independent pricing service. Multiple factors may be considered by the independent pricing service in determining adjustments to reflect fair value and may include information relating to sector indices, American Depositary Receipts and domestic and foreign index futures. Foreign securities may have additional risks including exchange rate changes, the potential for sharply devalued currencies and high inflation, political and economic upheaval, the relative lack of issuer information, relatively low market liquidity and the potential lack of strict financial and accounting controls and standards.
Securities for which market prices are not provided by any of the above methods may be valued based upon quotes furnished by independent sources. The last bid price may be used to value exchange-traded equity securities. The mean between the last bid and asked prices may be used to value debt obligations, including corporate loans, and unlisted equity securities.
Securities for which market quotations are not readily available or became unreliable are valued at fair value as determined in good faith following procedures approved by the Board of Trustees. Issuer-specific events, market trends, bid/asked quotes of brokers and information providers and other market data may be reviewed in the course of making a good faith determination of a security’s fair value.
Each Fund may invest in securities that are subject to interest rate risk, meaning the risk that the prices will generally fall as interest rates rise and, conversely, the prices will generally rise as interest rates fall. Specific securities differ in their sensitivity to changes in interest rates depending on their individual characteristics. Changes in interest rates may result in increased market volatility, which may affect the value and/or liquidity of certain Fund investments.
Valuations change in response to many factors, including the historical and prospective earnings of the issuer, the value of the issuer’s assets, general economic conditions, interest rates, investor perceptions and market liquidity. Because of the inherent uncertainties of valuation, the values reflected in the financial statements may materially differ from the value received upon actual sale of those investments.
Index Risk. Unlike many investment companies, the Funds do not utilize investing strategies that seek returns in excess of their Underlying Indexes. Therefore, a Fund would not necessarily buy or Sella security unless that security is added or removed, respectively, from its respective Underlying Index, even if that security generally is underperforming.
Authorized Participant Concentration Risk. Only Authorized Participants (“APs”) may engage in creation or redemption transactions directly with each Fund. Each Fund has a limited number of institutions that may act as APs, and such APs have no obligation to submit creation or redemption orders. Consequently, there is no assurance that those APs will establish or maintain an active trading market for the Shares. This risk may be heightened to the extent that securities underlying each Fund are traded outside a collateralized settlement system. In that case, APs may be required to post collateral on certain trades on an agency basis (i.e., on behalf of other market participants), which only a limited number of APs may be able to do. In addition, to the extent that APs exit the business or are unable to proceed with creation and/or redemption orders with respect to each Fund and no other AP is able to step forward to create or redeem Creation Units, this may result in a significantly diminished trading market for Fund Shares, which may be more likely to trade at a premium or discount to each Fund’s NAV and possibly face trading halts and/or delisting. This risk may be heightened for Funds that invest innon-U.S. securities, which may have lower trading volumes.
Equity Risk. Equity risk is the risk that the value of equity securities, including common stocks, may fall due to both changes in general economic conditions that impact the market as a whole, as well as factors that directly relate to a specific company or its industry. Such general economic conditions include changes in interest rates, periods of market turbulence or instability, or general and prolonged periods of economic decline and cyclical change. It is possible that a drop in the stock market may depress the price of most or all of the common stocks that each Fund holds. In addition, equity risk includes the risk that
investor sentiment toward particular industries will become negative. The value of a company’s common stock may fall solely because of factors, such as an increase in production costs, that negatively impact other companies in the same region, industry or sector of the market. A company’s common stock also may decline significantly in price over a short period of time due to factors specific to that company, including decisions made by its management or lower demand for the company’s products or services. For example, an adverse event, such as an unfavorable earnings report or the failure to make anticipated dividend payments, may depress the value of common stock.
Industry Concentration Risk. In following its methodology, each Fund’s Underlying Index from time to time may be concentrated to a significant degree in securities of issuers operating in a single industry or industry group. To the extent that each Underlying Index concentrates in the securities of issuers in a particular industry or industry group, the corresponding Fund will also concentrate its investments to approximately the same extent. By concentrating its investments in an industry or industry group, each Fund faces more risks than if it were diversified broadly over numerous industries or industry groups. Such industry-based risks, any of which may adversely affect the companies in which each Fund invests, may include, but are not limited to, legislative or regulatory changes, adverse market conditions and/or increased competition within the industry or industry group. In addition, at times, such industry or industry group may be out of favor and underperform other industries, industry groups or the market as a whole.
Non-Correlation Risk. Each Fund’s return may not match the return of its Underlying Index for a number of reasons. For example, each Fund incurs operating expenses not applicable to its Underlying Index, and incurs costs in buying and selling securities, especially when rebalancing the Fund’s securities holdings to reflect changes in the composition of its Underlying Index. In addition, the performance of each Fund and its Underlying Index may vary due to asset valuation differences and differences between each Fund’s portfolio and its Underlying Index resulting from legal restrictions, costs or liquidity constraints.
Momentum Investing Risk. Certain Funds employ a “momentum “style of investing that is subject to the risk that the securities may be more volatile than the market as a whole, or that the returns on securities that have previously exhibited price momentum are less than returns on other styles of investing. Momentum can turn quickly, and stocks that previously exhibited high momentum may not experience continued positive momentum. In addition, there may be periods when the momentum style of investing is out of favor and therefore, the investment performance of the Fund may suffer.
Small- andMid-Capitalization Company Risk. For certain Funds, investing in securities of small- andmid-capitalization companies involves greater risk than customarily is associated with investing in larger, more established companies. These companies’ securities may be more volatile and less liquid than those of more established companies. These securities may have returns that vary, sometimes significantly, from the overall securities market. Often small- andmid-capitalization companies and the industries in which they focus are still evolving and, as a result, they may be more sensitive to changing market conditions.
Portfolio Turnover Risk. Certain Funds may engage in frequent trading of its portfolio securities in connection with the rebalancing or adjustment of its Underlying Index. A portfolio turnover rate of 200%, for example, is equivalent to the Fund buying and selling all of its securities two times during the course of a year. A high portfolio turnover rate (such as 100% or more) could result in high brokerage costs for the Fund. While a high portfolio turnover rate can result in an increase in taxable capital gain distributions to the Fund’s shareholders, the Fund will seek to utilize anin-kind creation and redemption mechanism to minimize realization of capital gains to the extent possible.
| C. | Investment Transactions and Investment Income— Investment transactions are accounted for on a trade date basis. Realized gains and losses from the sale or disposition of securities are computed on the specific identified cost basis. Interest income is recorded on the accrual basis from settlement date.Pay-in-kind interest income andnon-cash dividend income received in the form of securitiesin-lieu of cash are recorded at the fair value of the securities received. Dividend income (net of withholding tax, if any) is recorded on theex-dividend date. Realized gains, dividends and interest received by a Fund may give rise to withholding and other taxes imposed by foreign countries. Tax conventions between certain countries and the United States may reduce or eliminate such taxes. |
The Funds may periodically participate in litigation related to each Fund’s investments. As such, the Funds may receive proceeds from litigation settlements. Any proceeds received are included in the Statements of Operations as realized gain (loss) for investments no longer held and as unrealized gain (loss) for investments still held.
Brokerage commissions and mark ups are considered transaction costs and are recorded as an increase to the cost basis of securities purchased and/or a reduction of proceeds on a sale of securities. Such transaction costs are included in the determination of net realized and unrealized gain (loss) from investment securities reported in the Statements of Operations and the Statements of Changes in Net Assets and the net realized and unrealized gains (losses) on securities per share in the Financial Highlights. Transaction costs are included in the calculation of each Fund’s NAV and, accordingly, they reduce each Fund’s total returns. These transaction costs are not considered operating expenses and are not reflected in net investment income reported in the Statements of Operations and the Statements of Changes in Net Assets, or the net investment income per share and the ratios of expenses and net investment income reported in the Financial Highlights, nor are they limited by any expense limitation arrangements between each Fund and the Adviser.
| D. | Country Determination— For the purposes of presentation in the Schedules of Investments, the Adviser may determine the country in which an issuer is located and/or credit risk exposure based on various factors. These factors include whether each |
Fund’s Underlying Index has made a country determination and may include the laws of the country under which the issuer is organized, where the issuer maintains a principal office, the country in which the issuer derives 50% or more of its total revenues and the country that has the primary market for the issuer’s securities, as well as other criteria. Among the other criteria that may be evaluated for making this determination are the country in which the issuer maintains 50% or more of its assets, the type of security, financial guarantees and enhancements, the nature of the collateral and the sponsor organization. Country of issuer and/or credit risk exposure has been determined to be the United States of America, unless otherwise noted.
| E. | Dividends and Distributions to Shareholders— Each Fund declares and pays dividends from net investment income, if any, to its shareholders quarterly and records such dividends onex-dividend date. Generally, each Fund distributes net realized taxable capital gains, if any, annually in cash and records them onex-dividend date. Such distributions on a tax basis are determined in conformity with federal income tax regulations, which may differ from accounting principles generally accepted in the United States of America (“GAAP”). Distributions in excess of tax basis earnings and profits, if any, are reported in such Fund’s financial statements as a tax return of capital at fiscalyear-end. |
| F. | Federal Income Taxes— Each Fund intends to comply with the provisions of the Internal Revenue Code of 1986, as amended (the “Internal Revenue Code”), applicable to regulated investment companies and to distribute substantially all of the Fund’s taxable earnings to its shareholders. As such, the Funds will not be subject to federal income taxes on otherwise taxable income (including net realized gains) that is distributed to the shareholders. Therefore, no provision for federal income taxes is recorded in the financial statements. |
Each Fund recognizes the tax benefits of uncertain tax positions only when the position is more likely than not to be sustained. Management has analyzed each Fund’s uncertain tax positions and concluded that no liability for unrecognized tax benefits should be recorded related to uncertain tax positions. Management is not aware of any tax positions for which it is reasonably possible that the total amounts of unrecognized tax benefits will change materially in the next 12 months.
Income and capital gain distributions are determined in accordance with federal income tax regulations, which may differ from GAAP. These differences are primarily due to differing book and tax treatments forin-kind transactions, losses deferred due to wash sales, and passive foreign investment company adjustments, if any.
The Funds file U.S. federal tax returns and tax returns in certain other jurisdictions. Generally, a Fund is subject to examinations by such taxing authorities for up to three years after the filing of the return for the tax period.
| G. | Expenses— Expenses of the Trust that are directly identifiable to a specific Fund are applied to that Fund. Expenses of the Trust that are not readily identifiable to a specific Fund are allocated in such a manner as deemed equitable, taking into consideration the nature and type of expense and the relative net assets of each Fund. |
Each Fund is responsible for all of its expenses, including the investment advisory fees, costs of transfer agency, custody, fund administration, legal, audit and other services, interest, taxes, brokerage commissions and other expenses connected with executions of portfolio transactions,sub-licensing fees related to its respective Underlying Index, any distribution fees or expenses, litigation expenses, fees payable to the Trust’s Board members who are not “interested persons” (as defined in the 1940 Act) of the Trust (the “Independent Trustees”) or the Adviser, expenses incurred in connection with the Board members’ services, including travel expenses and legal fees of counsel for the Independent Trustees, acquired fund fees and expenses, if any, and extraordinary expenses.
To the extent a Fund invests in other investment companies, the expenses shown in the accompanying financial statements reflect the expenses of the Fund and do not include any expenses of the investment companies in which it invests. The effects of such investment companies’ expenses are included in the realized and unrealized gain or loss on the investments in the investment companies.
| H. | Accounting Estimates— The preparation of the financial statements in accordance with GAAP requires management to make estimates and assumptions that affect the reported amounts and disclosures in the financial statements, including estimates and assumptions related to taxation. Actual results could differ from these estimates. In addition, the Funds monitor for material events or transactions that may occur or become known after theperiod-end date and before the date the financial statements are released to print. |
| I. | Indemnifications— Under the Trust’s organizational documents, its Officers and Trustees are indemnified against certain liabilities arising out of the performance of their duties to the Trust. Each Independent Trustee is also indemnified against certain liabilities arising out of the performance of his duties to the Trust pursuant to an Indemnification Agreement between such trustee and the Trust. Additionally, in the normal course of business, the Trust enters into contracts with service providers that contain general indemnification clauses. The Trust’s maximum exposure under these arrangements is unknown, as this would involve future claims that may be made against the Trust that have not yet occurred. However, based on experience, the Trust believes the risk of loss to be remote. |
| J. | Securities Lending— During the fiscal year ended April 30, 2019, each Fund participated in securities lending. Each Fund loaned portfolio securities having a market value up toone-third of each Fund’s total assets. Such loans are secured by cash collateral equal to no less than 102% (105% for international securities) of the market value of the loaned securities determined daily by the securities lending provider. Cash collateral received in connection with these loans is generally invested in an affiliated money market fund and is shown as such on the Schedules of Investments. Each Fund bears the risk of loss with respect to the investment of collateral. It is the policy of these Funds to obtain additional collateral from or return excess collateral to the borrower by the end of the next business day, following the valuation date of the securities loaned. |
Therefore, the value of the collateral held may be temporarily less than the value of the securities on loan. When loaning securities, each Fund retains certain benefits of owning the securities, including the economic equivalent of dividends or interest generated by the security. Lending securities entails a risk of loss to each Fund if, and to the extent that, the market value of the securities loaned were to increase, and the borrower did not increase the collateral accordingly, and the borrower failed to return the securities. The securities loaned are subject to termination at the option of the borrower or each Fund. Upon termination, the borrower will return to each Fund the securities loaned and each Fund will return the collateral. Upon the failure of the borrower to return the securities, collateral may be liquidated and the securities may be purchased on the open market to replace the loaned securities. Each Fund could experience delays and costs in gaining access to the collateral and the securities may lose value during the delay which could result in potential losses to each Fund. Some of these losses may be indemnified by the lending agent. Each Fund bears the risk of any deficiency in the amount of the collateral available for return to the borrower due to any loss on the collateral invested. Dividends received on cash collateral investments for securities lending transactions, which are net of compensation to counterparties, are included inSecurities lending incomeon the Statements of Operations. The aggregate value of securities out on loan, if any, is shown on the Statements of Assets and Liabilities.
| K. | Distributions from Distributable Earnings— In accordance with the Securities and Exchange Commission’s issuance of Disclosure Update and Simplification, the Funds have presented the total, rather than the components, of distributions to shareholders, except for tax return of capital distributions, if any, in the Statements of Changes in Net Assets. |
For the year ended April 30, 2018, distributions from distributable earnings consisted of distributions from net investment income.
NOTE 3—Investment Advisory Agreement and Other Agreements
The Trust has entered into an Investment Advisory Agreement with the Adviser on behalf of each Fund, pursuant to which the Adviser has overall responsibility for the selection and ongoing monitoring of the Funds’ investments, managing the Funds’ business affairs and providing certain clerical, bookkeeping and other administrative services. Pursuant to that Investment Advisory Agreement, each of DWA NASDAQ Momentum ETF and Dynamic Market ETF accrues daily and pays monthly to the Adviser an annual fee of 0.50% of the Fund’s average daily net assets, and each of FTSE RAFI US 1000 ETF and FTSE RAFI US 1500Small-Mid ETF accrues daily and pays monthly to the Adviser an annual fee of 0.29% of the Fund’s average daily net assets.
The Trust also has entered into an Amended and Restated Excess Expense Agreement (the “Expense Agreement”) with the Adviser on behalf of each Fund. For the FTSE RAFI US 1000 ETF and the FTSE RAFI US 1500Small-Mid ETF, the Adviser has agreed to waive fees and/or pay Fund expenses to the extent necessary to prevent the operating expenses (excluding interest expenses, brokerage commissions and other trading expenses, offering costs, taxes, acquired fund fees and expenses, if any, and extraordinary expenses) of each Fund from exceeding 0.39% of the Fund’s average daily net assets per year (the “Expense Cap”), through at least August 31, 2021. For the DWA NASDAQ Momentum ETF and the Dynamic Market ETF, the Adviser has agreed to waive fees and/or pay Fund expenses to the extent necessary to prevent the operating expenses (excluding interest expenses, brokerage commissions and other trading expenses, taxes, acquired fund fees and expenses, if any, and extraordinary expenses) of each Fund from exceeding 0.60% of the Fund’s average daily net assets per year, through at least August 31, 2021. Unless the Adviser continues the Expense Agreement, it will terminate on August 31, 2021. During its term, the Expense Agreement cannot be terminated or amended to increase the Expense Cap without approval of the Board of Trustees. The Adviser did not waive fees and/or pay Fund expenses during the period under this Expense Cap for Dynamic Market ETF.
Further, through August 31, 2021, the Adviser has contractually agreed to waive a portion of each Fund’s management fee in an amount equal to 100% of the net advisory fees an affiliate of the Adviser receives that are attributable to certain of the Fund’s investments in money market funds managed by that affiliate (excluding investments of cash collateral from securities lending). The Adviser cannot discontinue this waiver prior to its expiration. This agreement is not subject to recapture by the Adviser.
For the fiscal year ended April 30, 2019, the Adviser waived fees and/or paid Fund expenses for each Fund in the following amounts:
| | | | |
| DWA NASDAQ Momentum ETF | | $ | 83,295 | |
| Dynamic Market ETF | | | 329 | |
| FTSE RAFI US 1000 ETF | | | 281,921 | |
| FTSE RAFI US 1500Small-Mid ETF | | | 186,219 | |
For FTSE RAFI US 1000 ETF and FTSE RAFI US 1500Small-Mid ETF, the fees waived and/or expenses borne by the Adviser are subject to recapture by the Adviser up to three years from the date the fees were waived or the expenses were incurred, but no recapture payment will be made by the Funds if it would result in the Funds exceeding (i) the Expense Cap or (ii) the expense cap in effect at the time the fees and/or expenses subject to recapture were waived and/or borne by the Adviser. For DWA NASDAQ Momentum ETF and Dynamic Market ETF, the expenses borne by the Adviser are not subject to recapture.
For the following Funds, the amounts available for potential future recapture by the Adviser under the Expense Agreement and the expiration schedule at April 30, 2019 are as follows:
| | | | | | | | | | | | | | | | |
| | | Total
Potential
Recapture
Amounts | | | Potential Recapture Amounts
Expiring | |
| | | 4/30/20 | | | 4/30/21 | | | 4/30/22 | |
| FTSE RAFI US 1000 ETF | | $ | 2,060,825 | | | $ | 803,840 | | | $ | 984,797 | | | $ | 272,188 | |
| FTSE RAFI US 1500Small-Mid ETF | | | 884,042 | | | | 297,485 | | | | 403,807 | | | | 182,750 | |
The Trust has entered into a Distribution Agreement with Invesco Distributors, Inc. (the “Distributor”), which serves as the distributor of Creation Units for each Fund. The Distributor does not maintain a secondary market in the Shares. The Funds are not charged any fees pursuant to the Distribution Agreement. The Distributor is an affiliate of the Adviser.
The Adviser has entered into a licensing agreement for each Fund with the following entities (each, a “Licensor”):
| | |
Fund | | Licensor |
| DWA NASDAQ Momentum ETF | | Dorsey Wright & Associates, LLC |
| Dynamic Market ETF | | ICE Data Indices, LLC |
| FTSE RAFI US 1000 ETF | | FTSE International Limited and Research Affiliates LLC |
| FTSE RAFI US 1500Small-Mid ETF | | FTSE International Limited and Research Affiliates LLC |
Each Underlying Index name trademark is owned by its respective Licensor. These trademarks have been licensed to the Adviser for use by the Funds. Each Fund is entitled to use its Underlying Index pursuant to the Trust’ssub-licensing agreement with the Adviser. The Funds are required to pay thesub-licensing fees that are shown on the Statements of Operations. The Funds are not sponsored, endorsed, sold or promoted by the Licensors, and the Licensors make no representation regarding the advisability of investing in any of the Funds.
The Trust has entered into service agreements whereby The Bank of New York Mellon, a wholly-owned subsidiary of The Bank of New York Mellon Corporation, serves as the administrator, custodian, fund accountant and transfer agent for each Fund.
NOTE 4—Investments in Affiliates
The Adviser and Invesco Mortgage Capital, Inc. are wholly-owned subsidiaries of Invesco Ltd. and therefore, Invesco Ltd. and Invesco Mortgage Capital, Inc. are considered to be affiliated with the Funds. The tables below show certain Funds’ transactions in, and earnings from, investments in affiliates (excluding affiliated money market funds) for the fiscal year ended April 30, 2019.
FTSE RAFI US 1000 ETF
| | | | | | | | | | | | | | | | | | | | | | | | | | | | |
| | | Value
April 30, 2018 | | | Purchases
at Cost | | | Proceeds
from Sales | | | Change in
Unrealized
Appreciation
(Depreciation) | | | Realized
Gain
(Loss) | | | Value
April 30, 2019 | | | Dividend
Income | |
| Invesco Ltd. | | $ | 3,399,369 | | | $ | 2,309,560 | | | $ | (229,973 | ) | | $ | (545,429 | ) | | $ | 5,615 | | | $ | 4,939,142 | | | $ | 140,733 | |
| Invesco Mortgage Capital, Inc. | | | 915,583 | | | | 153,827 | | | | (173,385 | ) | | | 5,033 | | | | 6,367 | | | | 907,425 | | | | 95,284 | |
| | | | | | | | | | | | | | | | | | | | | | | | | | | | |
| Total Investments in Affiliates | | $ | 4,314,952 | | | $ | 2,463,387 | | | $ | (403,358 | ) | | $ | (540,396 | ) | | $ | 11,982 | | | $ | 5,846,567 | | | $ | 236,017 | |
| | | | | | | | | | | | | | | | | | | | | | | | | | | | |
NOTE 5—Additional Valuation Information
GAAP defines fair value as the price that would be received to sell an asset or paid to transfer a liability in an orderly transaction between market participants at the measurement date, under current market conditions. GAAP establishes a hierarchy that prioritizes the inputs to valuation methods, giving the highest priority to readily available unadjusted quoted prices in an active market for identical assets (Level 1) and the lowest priority to significant unobservable inputs (Level 3), generally when market prices are not readily available or are unreliable. Based on the valuation inputs, the securities or other investments are tiered into one of three levels. Changes in valuation methods may result in transfers in or out of an investment’s assigned level:
| | Level 1 — | Prices are determined using quoted prices in an active market for identical assets. |
| | Level 2 — | Prices are determined using other significant observable inputs. Observable inputs are inputs that other market participants may use in pricing a security. These may include quoted prices for similar securities, interest rates, prepayment speeds, credit risk, yield curves, loss severities, default rates, discount rates, volatilities and others. |
| | Level 3 — | Prices are determined using significant unobservable inputs. In situations where quoted prices or observable inputs are unavailable (for example, when there is little or no market activity for an investment at the end of the period), unobservable inputs may be used. Unobservable inputs reflect a Fund’s own assumptions about the factors market participants would use in determining fair value of the securities or instruments and would be based on the best available information. |
Except for the Fund listed below, as of April 30, 2019, all of the securities in each Fund were valued based on Level 1 inputs (see the Schedules of Investments for security categories). The level assigned to the securities valuations may not be an indication of the risk or liquidity associated with investing in those securities. Because of the inherent uncertainties of valuation, the values reflected in the financial statements may materially differ from the value received upon actual sale of those investments.
| | | | | | | | | | | | | | | | |
| | | Level 1 | | | Level 2 | | | Level 3 | | | Total | |
| FTSE RAFI US 1500Small-Mid ETF | | | | | | | | | | | | | | | | |
| Investments in Securities | | | | | | | | | | | | | | | | |
Common Stocks & Other Equity Interests | | $ | 2,094,539,460 | | | $ | — | | | $ | 23,096 | | | $ | 2,094,562,556 | |
Money Market Funds | | | 71,959,364 | | | | — | | | | — | | | | 71,959,364 | |
| | | | | | | | | | | | | | | | |
Total Investments | | $ | 2,166,498,824 | | | $ | — | | | $ | 23,096 | | | $ | 2,166,521,920 | |
| | | | | | | | | | | | | | | | |
NOTE 6—Distributions to Shareholders and Tax Components of Net Assets
Tax Character of Distributions to Shareholders Paid During the Fiscal Years Ended April 30, 2019 and 2018:
| | | | | | | | |
| | | 2019 | | | 2018 | |
| | | Ordinary
Income | | | Ordinary
Income | |
| DWA NASDAQ Momentum ETF | | $ | — | | | $ | 52,590 | |
| Dynamic Market ETF | | | 1,826,550 | | | | 3,141,857 | |
| FTSE RAFI US 1000 ETF | | | 107,823,504 | | | | 97,645,991 | |
| FTSE RAFI US 1500Small-Mid ETF | | | 25,325,031 | | | | 18,546,404 | |
Tax Components of Net Assets at FiscalYear-End:
| | | | | | | | | | | | | | | | | | | | | | | | | | | | | | | | | | | |
| | | Undistributed
Ordinary
Income | | Temporary
Book/Tax
Differences | | Net
Unrealized
Appreciation—
Investments | | Capital Loss
Carryforwards | | Late-Year
Ordinary
Loss
Deferral | | Shares of
Beneficial
Interest | | Total Net
Assets |
| DWA NASDAQ Momentum ETF | | | $ | — | | | | $ | (32,622 | ) | | | $ | 7,084,088 | | | | $ | (27,453,889 | ) | | | $ | (50,489 | ) | | | $ | 65,380,107 | | | | $ | 44,927,195 | |
| Dynamic Market ETF | | | | 205,408 | | | | | (55,254 | ) | | | | 2,400,187 | | | | | (126,360,667 | ) | | | | — | | | | | 281,785,078 | | | | | 157,974,752 | |
| FTSE RAFI US 1000 ETF | | | | 16,666,809 | | | | | (248,217 | ) | | | | 743,649,699 | | | | | (84,366,708 | ) | | | | — | | | | | 4,914,322,968 | | | | | 5,590,024,551 | |
| FTSE RAFI US 1500Small-Mid ETF | | | | 5,931,548 | | | | | (93,869 | ) | | | | 71,953,566 | | | | | (128,029,452 | ) | | | | — | | | | | 2,145,069,326 | | | | | 2,094,831,119 | |
Capital loss carryforwards are calculated and reported as of a specific date. Results of transactions and other activity after that date may affect the amount of capital loss carryforwards actually available for the Funds to utilize. Capital losses generated in years beginning after December 22, 2010 can be carried forward for an unlimited period, whereas previous losses expire in eight tax years. Capital losses with an expiration period may not be used to offset capital gains until all net capital losses without an expiration date have been utilized. Capital loss carryforwards with no expiration date will retain their character as either short-term or long-term capital losses instead of as short-term capital losses as under prior law. The ability to utilize capital loss carryforwards in the future may be limited under the Internal Revenue Code and related regulations based on the results of future transactions.
The following table presents available capital loss carryforwards for each Fund as of April 30, 2019:
| | | | | | | | | | | | |
| | | Post-effective/no expiration | | | | |
| | | Short-Term | | | Long-Term | | | Total* | |
| DWA NASDAQ Momentum ETF | | $ | 27,453,889 | | | $ | — | | | $ | 27,453,889 | |
| Dynamic Market ETF | | | 125,076,065 | | | | 1,284,602 | | | | 126,360,667 | |
| FTSE RAFI US 1000 ETF | | | 1,133,273 | | | | 83,233,435 | | | | 84,366,708 | |
| FTSE RAFI US 1500Small-Mid ETF | | | 30,484,499 | | | | 97,544,953 | | | | 128,029,452 | |
| * | Capital loss carryforward as of the date listed above is reduced for limitations, if any, to the extent required by the Internal Revenue Code and may be further limited depending upon a variety of factors, including the realization of net unrealized gains or losses as of the date of any reorganization. |
NOTE 7—Investment Transactions
For the fiscal year ended April 30, 2019, the cost of securities purchased and proceeds from sales of securities (other than short-term securities, U.S. Treasury obligations, money market funds andin-kind transactions, if any) were as follows:
| | | | | | | | |
| | | Purchases | | | Sales | |
| DWA NASDAQ Momentum ETF | | $ | 81,977,981 | | | $ | 85,297,268 | |
| Dynamic Market ETF | | | 388,218,392 | | | | 385,608,929 | |
| FTSE RAFI US 1000 ETF | | | 520,093,014 | | | | 508,320,165 | |
| FTSE RAFI US 1500Small-Mid ETF | | | 500,156,625 | | | | 489,848,435 | |
For the fiscal year ended April 30, 2019,in-kind transactions associated with creations and redemptions were as follows:
| | | | | | | | |
| | | Cost of
Securities
Received | | | Value of
Securities
Delivered | |
| DWA NASDAQ Momentum ETF | | $ | 55,341,561 | | | $ | 62,339,842 | |
| Dynamic Market ETF | | | 247,134,217 | | | | 248,701,439 | |
| FTSE RAFI US 1000 ETF | | | 891,457,935 | | | | 786,222,372 | |
| FTSE RAFI US 1500Small-Mid ETF | | | 674,519,907 | | | | 524,507,026 | |
Gains (losses) onin-kind transactions are generally not considered taxable gains (losses) for federal income tax purposes.
At April 30, 2019, the aggregate cost of investments, including any derivatives, on a tax basis includes adjustments for financial reporting purposes as of the most recently completed federal income tax reportingperiod-end:
| | | | | | | | | | | | | | | | |
| | | Gross
Unrealized
Appreciation | | | Gross
Unrealized
(Depreciation) | | | Net
Unrealized
Appreciation
(Depreciation) | | | Cost | |
| DWA NASDAQ Momentum ETF | | $ | 7,731,885 | | | $ | (647,797) | | | $ | 7,084,088 | | | $ | 40,872,342 | |
| Dynamic Market ETF | | | 9,510,369 | | | | (7,110,182) | | | | 2,400,187 | | | | 161,444,082 | |
| FTSE RAFI US 1000 ETF | | | 1,089,477,560 | | | | (345,827,861) | | | | 743,649,699 | | | | 4,871,516,267 | |
| FTSE RAFI US 1500Small-Mid ETF | | | 282,439,947 | | | | (210,486,381) | | | | 71,953,566 | | | | 2,094,568,354 | |
NOTE 8—Reclassification of Permanent Differences
Primarily as a result of differing book/tax treatment ofin-kind transactions and expired capital loss carryforwards, amounts were reclassified between undistributed net investment income (loss), undistributed net realized gain (loss) and Shares of beneficial interest. These reclassifications had no effect on the net assets of each Fund. For the fiscal year ended April 30, 2019, the reclassifications were as follows:
| | | | | | | | | | | | | | | |
| | | Undistributed
Net Investment
Income (Loss) | | Undistributed
Net Realized
Gain (Loss) | | Shares of
Beneficial
Interest |
| DWA NASDAQ Momentum ETF | | | $ | 195,145 | | | | $ | (6,539,596) | | | | $ | 6,344,451 | |
| Dynamic Market ETF | | | | (47,480 | ) | | | | (15,518,348) | | | | | 15,565,828 | |
| FTSE RAFI US 1000 ETF | | | | — | | | | | (233,350,030) | | | | | 233,350,030 | |
| FTSE RAFI US 1500Small-Mid ETF | | | | 72 | | | | | (175,977,790) | | | | | 175,977,718 | |
NOTE 9—Trustees’ and Officer’s Fees
Trustees’ and Officer’s Fees include amounts accrued by the Funds to pay remuneration to the Independent Trustees and an Officer of the Trust. The Trustee who is an “interested person” of the Trust does not receive any Trustees’ fees.
The Trust has adopted a deferred compensation plan (the “Plan”). Under the Plan, each Independent Trustee who has executed a Deferred Fee Agreement (a “Participating Trustee”) may defer receipt of all or a portion of his compensation (“Deferral Fees”). Such Deferral Fees are deemed to be invested in select Invesco Funds. The Deferral Fees payable to the Participating Trustee are valued as of the date such Deferral Fees would have been paid to the Participating Trustee. The value increases with contributions or with increases in the value of the Shares selected, and the value decreases with distributions or with declines in the value of the Shares selected. Obligations under the Plan represent unsecured claims against the general assets of the Funds.
NOTE 10—Capital
Shares are created and redeemed by each Fund only in Creation Units of 50,000 Shares. Only Authorized Participants are permitted to purchase or redeem Creation Units from the Funds. Such transactions are principally permitted in exchange for Deposit Securities, with a balancing cash component to equate the transaction to the NAV per Share of a Fund of the Trust on the transaction date. However, for all Funds, cash in an amount equivalent to the value of certain securities may be substituted, generally when the securities are not available in sufficient quantity for delivery, not eligible for trading by the Authorized Participant or as a result of other market circumstances.
To the extent that the Funds permit transactions in exchange for Deposit Securities, each Fund may issue Shares in advance of receipt of Deposit Securities subject to various conditions, including a requirement to maintain on deposit with the Trust cash at least equal to 105% of the market value of the missing Deposit Securities. In accordance with the Trust’s Participant Agreement, Creation Units will be issued to an Authorized Participant, notwithstanding the fact that the corresponding Deposit Securities have not been received in part or in whole, in reliance on the undertaking of the Authorized Participant to deliver the missing Deposit Securities as soon as possible, which undertaking shall be secured by the Authorized Participant’s delivery and maintenance of collateral consisting of cash in the form of U.S. dollars in immediately available funds having a value(marked-to-market daily) at least equal to 105%, which the Adviser may change from time to time, of the value of the missing Deposit Securities.
Certain transaction fees may be charged by the Funds for creations and redemptions, which are treated as increases in capital.
Transactions in each Fund’s Shares are disclosed in detail in the Statements of Changes in Net Assets.
Report of Independent Registered Public Accounting Firm
To the Board of Trustees of Invesco Exchange-Traded Fund Trust and Shareholders of Invesco DWA NASDAQ Momentum ETF, Invesco Dynamic Market ETF, Invesco FTSE RAFI US 1000 ETF and Invesco FTSE RAFI US 1500Small-Mid ETF
Opinions on the Financial Statements
We have audited the accompanying statements of assets and liabilities, including the schedules of investments, of Invesco DWA NASDAQ Momentum ETF, Invesco Dynamic Market ETF, Invesco FTSE RAFI US 1000 ETF and Invesco FTSE RAFI US 1500Small-Mid ETF (four of the funds constituting Invesco Exchange-Traded Fund Trust, hereafter collectively referred to as the “Funds”) as of April 30, 2019, the related statements of operations for the year ended April 30, 2019, the statements of changes in net assets for each of the two years in the period ended April 30, 2019, including the related notes, and the financial highlights for each of the five years in the period ended April 30, 2019 (collectively referred to as the “financial statements”). In our opinion, the financial statements present fairly, in all material respects, the financial position of each of the Funds as of April 30, 2019, the results of each of their operations for the year then ended, the changes in each of their net assets for each of the two years in the period ended April 30, 2019, and each of the financial highlights for each of the five years in the period ended April 30, 2019 in conformity with accounting principles generally accepted in the United States of America.
Basis for Opinions
These financial statements are the responsibility of the Funds’ management. Our responsibility is to express an opinion on the Funds’ financial statements based on our audits. We are a public accounting firm registered with the Public Company Accounting Oversight Board (United States) (“PCAOB”) and are required to be independent with respect to the Funds in accordance with the U.S. federal securities laws and the applicable rules and regulations of the Securities and Exchange Commission and the PCAOB.
We conducted our audits of these financial statements in accordance with the standards of the PCAOB. Those standards require that we plan and perform the audit to obtain reasonable assurance about whether the financial statements are free of material misstatement, whether due to error or fraud.
Our audits included performing procedures to assess the risks of material misstatement of the financial statements, whether due to error or fraud, and performing procedures that respond to those risks. Such procedures included examining, on a test basis, evidence regarding the amounts and disclosures in the financial statements. Our audits also included evaluating the accounting principles used and significant estimates made by management, as well as evaluating the overall presentation of the financial statements. Our procedures included confirmation of securities owned as of April 30, 2019 by correspondence with the custodian, transfer agent and brokers; when replies were not received from brokers, we performed other auditing procedures. We believe that our audits provide a reasonable basis for our opinions.
PricewaterhouseCoopers LLP
Chicago, Illinois
June 26, 2019
We have served as the auditor of one or more of the investment companies in the Invesco group of investment companies since at least 1995. We have not determined the specific year we began serving as auditor.
Calculating your ongoing Fund expenses
Example
As a shareholder of a Fund of the Invesco Exchange-Traded Fund Trust, you incur advisory fees and other Fund expenses. The expense examples below are intended to help you understand your ongoing costs (in dollars) of investing in the Funds and to compare these costs with the ongoing costs of investing in other funds.
The example is based on an investment of $1,000 invested at the beginning of the period and held through thesix-month period ended April 30, 2019.
Actual Expenses
The first line in the following table provides information about actual account values and actual expenses. You may use the information in this line, together with the amount you invested, to estimate the expenses that you paid over the period. Simply divide your account value by $1,000 (for example, an $8,600 account value divided by $1,000 = 8.6), then multiply the result by the number in the first line under the heading “Expenses Paid During theSix-Month Period” to estimate the expenses you paid on your account during this period.
Hypothetical Example for Comparison Purposes
The second line in the following table provides information about hypothetical account values and hypothetical expenses based on each Fund’s actual expense ratio and an assumed annualized rate of return of 5% per year before expenses, which is not the Fund’s actual return. The hypothetical account values and expenses may not be used to estimate the actual ending account balance or expenses you paid for the period. You may use this information to compare the ongoing costs of investing in the Funds and other funds. To do so, compare this 5% hypothetical example with the 5% hypothetical examples that appear in the shareholder reports of the other funds.
Please note that the expenses shown in the table are meant to highlight your ongoing costs only, and do not reflect any transactional costs such as sales charges and brokerage commissions. Therefore the second line in the table is useful in comparing ongoing costs only, and will not help you determine the relative total costs of owning different funds. In addition, if these transactional costs were included, your costs would have been higher.
| | | | | | | | | | | | | | | | |
| | | Beginning
Account Value
November 1, 2018 | | | Ending
Account Value
April 30, 2019 | | | Annualized
Expense Ratio
Based on the
Six-Month Period | | | Expenses Paid
During the
Six-Month Period(1) | |
| Invesco DWA NASDAQ Momentum ETF (DWAQ) | | | | | | | | | | | | | | | | |
Actual | | $ | 1,000.00 | | | $ | 1,134.80 | | | | 0.60 | % | | $ | 3.18 | |
Hypothetical (5% return before expenses) | | | 1,000.00 | | | | 1,021.82 | | | | 0.60 | | | | 3.01 | |
| Invesco Dynamic Market ETF (PWC) | | | | | | | | | | | | | | | | |
Actual | | | 1,000.00 | | | | 1,019.50 | | | | 0.59 | | | | 2.95 | |
Hypothetical (5% return before expenses) | | | 1,000.00 | | | | 1,021.87 | | | | 0.59 | | | | 2.96 | |
| Invesco FTSE RAFI US 1000 ETF (PRF) | | | | | | | | | | | | | | | | |
Actual | | | 1,000.00 | | | | 1,066.80 | | | | 0.39 | | | | 2.00 | |
Hypothetical (5% return before expenses) | | | 1,000.00 | | | | 1,022.86 | | | | 0.39 | | | | 1.96 | |
| Invesco FTSE RAFI US 1500Small-Mid ETF (PRFZ) | | | | | | | | | | | | | | | | |
Actual | | | 1,000.00 | | | | 1,037.30 | | | | 0.39 | | | | 1.97 | |
Hypothetical (5% return before expenses) | | | 1,000.00 | | | | 1,022.86 | | | | 0.39 | | | | 1.96 | |
| (1) | Expenses are calculated using the annualized expense ratio, which represents the ongoing expenses as a percentage of net assets for thesix-month period ended April 30, 2019. Expenses are calculated by multiplying the Fund’s annualized expense ratio by the average account value for the period, then multiplying the result by 181/365. Expense ratios for the most recentsix-month period may differ from expense ratios based on the annualized data in the Financial Highlights. |
Tax Information
Form1099-DIV, Form1042-S and other year–end tax information provide shareholders with actual calendar year amounts that should be included in their tax returns. Shareholders should consult their tax advisers.
The following distribution information is being provided as required by the Internal Revenue Code or to meet a specific state’s requirement.
Each Fund designates the following amounts or, if subsequently determined to be different, the maximum amount allowable for its fiscal year ended April 30, 2019:
| | | | | | | | | | | | | | | |
| | | Qualified Business
Income* | | Qualified Dividend
Income* | | Dividends-Received
Deduction* |
| Invesco DWA NASDAQ Momentum ETF | | | | 0 | % | | | | 0 | % | | | | 0 | % |
| Invesco Dynamic Market ETF | | | | 0 | % | | | | 100 | % | | | | 100 | % |
| Invesco FTSE RAFI US 1000 ETF | | | | 0 | % | | | | 100 | % | | | | 100 | % |
| Invesco FTSE RAFI US 1500Small-Mid ETF | | | | 20 | % | | | | 100 | % | | | | 89 | % |
| * | The above percentages are based on ordinary income dividends paid to shareholders during the fiscal year. |
Trustees and Officers
The Independent Trustees of the Trust, their term of office and length of time served, their principal business occupations during at least the past five years, the number of portfolios in the Fund Complex (as defined below) overseen by each Independent Trustee and the other directorships, if any, held by each Independent Trustee are shown below.
| | | | | | | | | | |
Name, Address and Year of
Birth of Independent Trustees | | Position(s)
Held
with Trust | | Term of
Office
and
Length of
Time
Served* | | Principal
Occupation(s) During
Past 5 Years | | Number of
Portfolios
in Fund
Complex**
Overseen by
Independent
Trustees | | Other
Directorships
Held by
Independent
Trustees During
the Past 5 Years |
Ronn R. Bagge—1958
c/o Invesco Capital Management LLC
3500 Lacey Road, Suite 700
Downers Grove, IL 60515 | | Vice Chairman of the Board; Chairman of the Nominating and Governance Committee and Trustee | | Vice Chairman since 2018; Chairman of the Nominating and Governance Committee and Trustee since 2003 | | Founder and Principal, YQA Capital Management LLC (1998-Present); formerly, Owner/CEO of Electronic Dynamic Balancing Co., Inc. (high-speed rotating equipment service provider). | | 241 | | Trustee and Investment Oversight Committee member, Mission Aviation Fellowship (2017-Present). |
| | | | | |
Todd J. Barre—1957
c/o Invesco Capital Management LLC
3500 Lacey Road, Suite 700
Downers Grove, IL 60515 | | Trustee | | Since 2010 | | Assistant Professor of Business, Trinity Christian College (2010-2016); formerly, Vice President and Senior Investment Strategist (2001-2008), Director of Open Architecture and Trading (2007-2008), Head of Fundamental Research (2004-2007), and Vice President and Senior Fixed Income Strategist (1994-2001), BMO Financial Group/Harris Private Bank. | | 241 | | None. |
| | | | | |
Marc M. Kole—1960
c/o Invesco Capital Management LLC
3500 Lacey Road, Suite 700
Downers Grove, IL 60515 | | Chairman of the Audit Committee and Trustee | | Chairman of the Audit Committee since 2008; Trustee since 2006 | | Senior Director of Finance, By The Hand Club For Kids (not-for-profit) (2015-Present); formerly, Chief Financial Officer, Hope Network (social services) (2008-2012); Assistant Vice President and Controller, Priority Health (health insurance) (2005-2008); Regional Chief Financial Officer, United Healthcare (2005); Chief Accounting Officer, Senior Vice President of Finance, Oxford Health Plans (2000-2004); Audit Partner, Arthur Andersen LLP (1996-2000). | | 241 | | Treasurer (2018-Present), Finance Committee Member (2015-Present) and Audit Committee Member (2015), Thornapple Evangelical Covenant Church; formerly, Board and Finance Committee Member (2009-2017) and Treasurer (2010-2015, 2017), NorthPointe Christian Schools. |
| * | This is the date the Independent Trustee began serving the Trust. Each Independent Trustee serves an indefinite term, until his successor is elected. |
| ** | Fund Complex includes all open- and closed-end funds (including all of their portfolios) advised by the Adviser and any affiliated person of the Adviser. |
Trustees and Officers(continued)
| | | | | | | | | | |
Name, Address and Year of
Birth of Independent Trustees | | Position(s)
Held
with Trust | | Term of
Office
and
Length of
Time
Served* | | Principal
Occupation(s) During
Past 5 Years | | Number of
Portfolios
in Fund
Complex**
Overseen by
Independent
Trustees | | Other
Directorships
Held by
Independent
Trustees During
the Past 5 Years |
Yung Bong Lim—1964
c/o Invesco Capital Management LLC
3500 Lacey Road, Suite 700
Downers Grove, IL 60515 | | Chairman of the Investment Oversight Committee and Trustee | | Chairman of the Investment Oversight Committee since 2014; Trustee since 2013 | | Managing Partner, RDG Funds LLC (real estate) (2008-Present); formerly, Managing Director, Citadel LLC (1999-2007). | | 241 | | Advisory Board Member, Performance Trust Capital Partners, LLC (2008-Present); Board Director, Beacon Power Services, Corp. (2019-Present). |
| | | | | |
Gary R. Wicker—1961
c/o Invesco Capital Management LLC
3500 Lacey Road, Suite 700
Downers Grove, IL 60515 | | Trustee | | Since 2013 | | Senior Vice President of Global Finance and Chief Financial Officer at RBC Ministries (publishing company) (2013-Present); formerly, Executive Vice President and Chief Financial Officer, Zondervan Publishing (a division of Harper Collins/NewsCorp) (2007-2012); Senior Vice President and Group Controller (2005-2006), Senior Vice President and Chief Financial Officer (2003-2004), Chief Financial Officer (2001-2003), Vice President, Finance and Controller (1999-2001) and Assistant Controller (1997-1999), divisions of The Thomson Corporation (information services provider); Senior Audit Manager (1994-1997), PricewaterhouseCoopers LLP. | | 241 | | Board Member and Treasurer, Our Daily Bread Ministries Canada (2015-Present); Board and Finance Committee Member, West Michigan Youth For Christ (2010-Present). |
| | | | | |
Donald H. Wilson—1959
c/o Invesco Capital Management LLC
3500 Lacey Road, Suite 700
Downers Grove, IL 60515 | | Chairman of the Board and Trustee | | Chairman since 2012; Trustee since 2006 | | Chairman, President and Chief Executive Officer, McHenry Bancorp Inc. and McHenry Savings Bank (subsidiary) (2018-Present); Chairman and Chief Executive Officer, Stone Pillar Advisors, Ltd. (advisory services to the financial sector) (2010-Present); formerly, President and Chief Executive Officer, Stone Pillar Investments, Ltd. (2016-2018); Chairman, President and Chief Executive Officer, Community Financial Shares, Inc. and Community Bank—Wheaton/Glen Ellyn (subsidiary) (2013-2015); Chief Operating Officer, AMCORE Financial, Inc. (bank holding company) (2007-2009); Executive Vice President and Chief Financial Officer, AMCORE Financial, Inc. (2006-2007); Senior Vice President and Treasurer, Marshall & Ilsley Corp. (bank holding company) (1995-2006). | | 241 | | Director, Penfield Children’s Center (2004-present); Board Chairman, Gracebridge Alliance, Inc. (2015-present). |
| * | This is the date the Independent Trustee began serving the Trust. Each Independent Trustee serves an indefinite term, until his successor is elected. |
| ** | Fund Complex includes all open- and closed-end funds (including all of their portfolios) advised by the Adviser and any affiliated person of the Adviser. |
Trustees and Officers(continued)
The Interested Trustee and the executive officers of the Trust, their term of office and length of time served, their principal business occupations during at least the past five years, the number of portfolios in the Fund Complex (as defined below) overseen by the Interested Trustee and the other directorships, if any, held by the Interested Trustee are shown below.
| | | | | | | | | | |
Name, Address and Year of
Birth of Interested Trustee | | Position(s)
Held
with Trust | | Term of
Office
and
Length of
Time
Served* | | Principal
Occupation(s) During
Past 5 Years | | Number of
Portfolios
in Fund
Complex**
Overseen by
Interested
Trustee | | Other
Directorships
Held by
Interested
Trustee During
the Past 5 Years |
Kevin M. Carome—1956
Invesco Ltd.
Two Peachtree Pointe,
1555 Peachtree St., N.E.,
Suite 1800
Atlanta, GA 30309 | | Trustee | | Since 2010 | | Senior Managing Director, Secretary and General Counsel, Invesco Ltd. (2007-Present); Director, Invesco Advisers, Inc. (2009-Present); Director (2006-Present) and Executive Vice President (2008–Present), Invesco North American Holdings, Inc.; Executive Vice President (2008–Present), Invesco Investments (Bermuda) Ltd.; Manager, Horizon Flight Works LLC, and Director, Invesco Finance PLC (2011- Present); Director and Secretary (2012–Present), Invesco Services (Bahamas) Private Limited; and Director and Executive Vice President (2014–Present), INVESCO Asset Management (Bermuda) Ltd.; formerly, Director and Executive Vice President, Invesco Finance, Inc. (2011-2018); Director (2006-2018) and Executive Vice President (2008–2018), Invesco Group Services, Inc., Invesco Holding Company (US), Inc.; Director, Invesco Holding Company Limited (2007-2018); Director and Chairman, INVESCO Funds Group, Inc., Senior Vice President, Secretary and General Counsel, Invesco Advisers, Inc. (2003-2006); Director, Invesco Investments (Bermuda) Ltd. (2008-2016); Senior Vice President and General Counsel, Liberty Financial Companies, Inc. (2000-2001); General Counsel of certain investment management subsidiaries of Liberty Financial Companies, Inc. (1998-2000); Associate General Counsel, Liberty Financial Companies, Inc. (1993-1998); Associate, Ropes & Gray LLP. | | 241 | | None |
| * | This is the date the Interested Trustee began serving the Trust. The Interested Trustee serves an indefinite term, until his successor is elected. |
| ** | Fund Complex includes all open- andclosed-end funds (including all of their portfolios) advised by the Adviser and any affiliated person of the Adviser. |
Trustees and Officers(continued)
| | | | | | |
Name, Address and Year of
Birth of Executive Officers | | Position(s)
Held
with Trust | | Length of
Time
Served* | | Principal Occupation(s) During Past 5 Years |
Daniel E. Draper—1968 Invesco Capital
Management LLC 3500 Lacey Road, Suite 700 Downers Grove, IL 60515 | | President and Principal Executive Officer | | Since 2015 | | Chief Executive Officer, Manager and Principal Executive Officer, Invesco Specialized Products, LLC (2018-Present); President and Principal Executive Officer, Invesco Exchange-Traded Fund Trust, Invesco Exchange-Traded Fund Trust II, Invesco India Exchange-Traded Fund Trust, Invesco Actively Managed Exchange-Traded Fund Trust and Invesco Actively Managed Exchange-Traded Commodity Fund Trust (2015-Present) and Invesco Exchange-Traded Self-Indexed Fund Trust (2016-Present); Chief Executive Officer and Principal Executive Officer (2016-Present) and Managing Director (2013-Present), Invesco Capital Management LLC; Senior Vice President, Invesco Distributors, Inc. (2014-Present); formerly, Vice President, Invesco Exchange-Traded Fund Trust, Invesco Exchange-Traded Fund Trust II, Invesco India Exchange-Traded Fund Trust, Invesco Actively Managed Exchange-Traded Fund Trust (2013-2015) and Invesco Actively Managed Exchange-Traded Commodity Fund Trust (2014-2015); Managing Director, Credit Suisse Asset Management (2010-2013) and Lyxor Asset Management/Societe Generale (2007-2010). |
| | | |
Kelli Gallegos—1970 Invesco Capital Management LLC 3500 Lacey Road, Suite 700 Downers Grove, IL 60515 | | Vice President
and Treasurer | | Since 2018 | | Assistant Treasurer, Invesco Specialized Products, LLC (2018-Present); Vice President and Treasurer, Invesco Exchange-Traded Fund Trust, Invesco Exchange-Traded Fund Trust II, Invesco India Exchange-Traded Fund Trust, Invesco Actively Managed Exchange-Traded Fund Trust, Invesco Actively Managed Exchange-Traded Commodity Fund Trust and Invesco Exchange-Traded Self-Indexed Fund Trust (2018-Present); Principal Financial and Accounting Officer-Pooled Investments, Invesco Capital Management LLC (2018-Present); Vice President, Principal Financial Officer (2016-Present) and Assistant Treasurer (2008-Present), The Invesco Funds; formerly, Assistant Treasurer Invesco Exchange-Traded Fund Trust, Invesco Exchange-Traded Fund Trust II, Invesco India Exchange-Traded Fund Trust and Invesco Actively Managed Exchange-Traded Fund Trust (2012-2018), Invesco Actively Managed Exchange-Traded Commodity Fund Trust (2014-2018) and Invesco Exchange-Traded Self-Indexed Fund Trust (2016-2018); Assistant Treasurer, Invesco Capital Management LLC (2013-2018); and Assistant Vice President, The Invesco Funds (2008-2016). |
| | | |
Peter Hubbard—1981 Invesco Capital Management LLC 3500 Lacey Road, Suite 700 Downers Grove, IL 60515 | | Vice President | | Since 2009 | | Vice President, Invesco Specialized Products, LLC (2018-Present); Vice President, Invesco Exchange-Traded Fund Trust, Invesco Exchange-Traded Fund Trust II, Invesco India Exchange-Traded Fund Trust, Invesco Actively Managed Exchange-Traded Fund Trust (2009-Present), Invesco Actively Managed Exchange-Traded Commodity Fund Trust (2014-Present) and Invesco Exchange-Traded Self-Indexed Fund Trust (2016-Present); Vice President and Director of Portfolio Management, Invesco Capital Management LLC (2010-Present); formerly, Vice President of Portfolio Management, Invesco Capital Management LLC (2008-2010); Portfolio Manager, Invesco Capital Management LLC (2007-2008); Research Analyst, Invesco Capital Management LLC (2005-2007); Research Analyst and Trader, Ritchie Capital, a hedge fund operator (2003-2005). |
| * | This is the date each Officer began serving the Trust. Each Officer serves an indefinite term, until his or her successor is elected. |
Trustees and Officers(continued)
| | | | | | |
Name, Address and Year of
Birth of Executive Officers | | Position(s)
Held
with Trust | | Length of
Time
Served* | | Principal Occupation(s) During Past 5 Years |
Sheri Morris—1964 Invesco Capital Management LLC 3500 Lacey Road, Suite 700 Downers Grove, IL 60515 | | Vice President | | Since 2012 | | President and Principal Executive Officer, The Invesco Funds (2016-Present); Treasurer, The Invesco Funds (2008-Present); Vice President, Invesco Advisers, Inc. (formerly known as Invesco Institutional (N.A.), Inc.) (registered investment adviser) (2009-Present) and Vice President, Invesco Exchange-Traded Fund Trust, Invesco Exchange-Traded Fund Trust II, Invesco India Exchange-Traded Fund Trust, Invesco Actively Managed Exchange-Traded Fund Trust (2012-Present), Invesco Actively Managed Exchange-Traded Commodity Fund Trust (2014-Present) and Invesco Exchange-Traded Self-Indexed Fund Trust (2016-Present); formerly, Vice President and Principal Financial Officer, The Invesco Funds (2008-2016); Treasurer, Invesco Exchange-Traded Fund Trust, Invesco Exchange-Traded Fund Trust II, Invesco India Exchange-Traded Fund Trust and Invesco Actively Managed Exchange-Traded Fund Trust (2011-2013); Vice President, Invesco Aim Advisers, Inc., Invesco Aim Capital Management, Inc. and Invesco Aim Private Asset Management, Inc.; Assistant Vice President and Assistant Treasurer, The Invesco Funds and Assistant Vice President, Invesco Advisers, Inc., Invesco Aim Capital Management, Inc. and Invesco Aim Private Asset Management, Inc. |
| | | |
Anna Paglia—1974 Invesco Capital Management LLC 3500 Lacey Road, Suite 700 Downers Grove, IL 60515 | | Secretary | | Since 2011 | | Secretary, Invesco Specialized Products, LLC (2018-Present); Secretary, Invesco Exchange-Traded Fund Trust, Invesco Exchange-Traded Fund Trust II, Invesco India Exchange-Traded Fund Trust, Invesco Actively Managed Exchange-Traded Fund Trust (2011-Present), Invesco Actively Managed Exchange-Traded Commodity Fund Trust (2014-Present) and Invesco Exchange-Traded Self-Indexed Fund Trust (2015-Present); Head of Legal (2010-Present) and Secretary (2015-Present), Invesco Capital Management LLC; Manager and Assistant Secretary, Invesco Indexing LLC (2017-Present); formerly, Partner, K&L Gates LLP (formerly, Bell Boyd & Lloyd LLP) (2007-2010); Associate Counsel at Barclays Global Investors Ltd. (2004-2006). |
| | | |
Rudolf E. Reitmann—1971 Invesco Capital Management LLC 3500 Lacey Road, Suite 700 Downers Grove, IL 60515 | | Vice President | | Since 2013 | | Head of Global Exchange Traded Funds Services, Invesco Specialized Products, LLC (2018-Present); Vice President, Invesco Exchange-Traded Fund Trust, Invesco Exchange-Traded Fund Trust II, Invesco India Exchange-Traded Fund Trust, Invesco Actively Managed Exchange-Traded Fund Trust (2013-Present), Invesco Actively Managed Exchange-Traded Commodity Fund Trust (2014-Present) and Invesco Exchange-Traded Self-Indexed Fund Trust (2016-Present); Head of Global Exchange Traded Funds Services, Invesco Capital Management LLC (2013-Present); Vice President, Invesco Capital Markets, Inc. (2018-Present). |
| * | This is the date each Officer began serving the Trust. Each Officer serves an indefinite term, until his or her successor is elected. |
Trustees and Officers(continued)
| | | | | | |
Name, Address and Year of
Birth of Executive Officers | | Position(s)
Held
with Trust | | Length of
Time
Served* | | Principal Occupation(s) During Past 5 Years |
David Warren—1957 Invesco Canada Ltd. 5140 Yonge Street, Suite 800 Toronto, Ontario M2N 6X7 | | Vice President | | Since 2009 | | Manager, Invesco Specialized Products, LLC (2018-Present); Vice President, Invesco Exchange-Traded Fund Trust, Invesco Exchange-Traded Fund Trust II, Invesco India Exchange-Traded Fund Trust, and Invesco Actively Managed Exchange-Traded Fund Trust (2009-Present), Invesco Actively Managed Exchange-Traded Commodity Fund Trust (2014-Present) and Invesco Exchange-Traded Self-Indexed Fund Trust (2016-Present); Managing Director—Chief Administrative Officer, Americas, Invesco Capital Management LLC; Senior Vice President, Invesco Advisers, Inc. (2009-Present); Director, Invesco Inc. (2009-Present); Director, Executive Vice President and Chief Financial Officer, Invesco Canada Ltd. (formerly, Invesco Trimark Ltd.) (2011-Present); Chief Administrative Officer, North American Retail, Invesco Ltd. (2007-Present); Director, Invesco Corporate Class Inc. (2014-Present); Director, Invesco Global Direct Real Estate Feeder GP Ltd. (2015-Present); Director, Invesco Canada Holdings Inc. (2002-Present); Director, Invesco Financial Services Ltd. / Services Financiers Invesco Ltée and Trimark Investments Ltd./Placements Trimark Ltée (2014-Present); Director, Invesco IP Holdings (Canada) Ltd. (2016-Present); Director, Invesco Global Direct Real Estate GP Ltd. (2015-Present); formerly, Senior Vice President, Invesco Management Group, Inc. (2007-2018); Executive Vice President and Chief Financial Officer, Invesco Inc. (2009-2015); Director, Executive Vice President and Chief Financial Officer, Invesco Canada Ltd. (formerly, Invesco Trimark Ltd.) (2000-2011). |
| | | |
Melanie Zimdars—1976 Invesco Capital
Management LLC 3500 Lacey Road, Suite 700 Downers Grove, IL 60515 | | Chief Compliance
Officer | | Since 2017 | | Chief Compliance Officer, Invesco Specialized Products, LLC (2018-Present); Chief Compliance Officer, Invesco Capital Management LLC (2017-Present); Chief Compliance Officer, Invesco Exchange-Traded Fund Trust, Invesco Exchange-Traded Fund Trust II, Invesco India Exchange-Traded Fund Trust, Invesco Actively Managed Exchange-Traded Fund Trust, Invesco Actively Managed Exchange-Traded Commodity Fund Trust and Invesco Exchange-Traded Self-Indexed Fund Trust (2017-Present); formerly, Vice President and Deputy Chief Compliance Officer at ALPS Holding, Inc. (2009-2017); Mutual Fund Treasurer/Chief Financial Officer at Wasatch Advisors, Inc. (2005-2008); Compliance Officer, U.S. Bancorp Fund Services, LLC (2001-2005). |
Availability of Additional Information About the Trustees
The Statement of Additional Information includes additional information about the Trustees and is available, without charge, upon request at (800)983-0903.
| * | This is the date each Officer began serving the Trust. Each Officer serves an indefinite term, until his or her successor is elected. |
Board Considerations Regarding Continuation of Investment Advisory Agreement
At a meeting held on April 11, 2019, the Board of Trustees of the Invesco Exchange-Traded Fund Trust (the “Trust”), including the Independent Trustees, approved the continuation of the Investment Advisory Agreement between Invesco Capital Management LLC (the “Adviser”) and the Trust for the following 53 series (each, a “Fund” and collectively, the “Funds”):
Invesco Aerospace & Defense ETF
Invesco BRIC ETF
Invesco BuyBack AchieversTM ETF
Invesco CleantechTM ETF
Invesco Dividend AchieversTM ETF
Invesco DWA Basic Materials Momentum ETF
Invesco DWA Consumer Cyclicals Momentum ETF
Invesco DWA Consumer Staples Momentum ETF
Invesco DWA Energy Momentum ETF
Invesco DWA Financial Momentum ETF
Invesco DWA Healthcare Momentum ETF
Invesco DWA Industrials Momentum ETF
Invesco DWA Momentum ETF
Invesco DWA NASDAQ Momentum ETF
Invesco DWA Technology Momentum ETF
Invesco DWA Utilities Momentum ETF
Invesco Dynamic Biotechnology & Genome ETF
Invesco Dynamic Building & Construction ETF
Invesco Dynamic Energy Exploration & Production ETF
Invesco Dynamic Food & Beverage ETF
Invesco Dynamic Large Cap Growth ETF
Invesco Dynamic Large Cap Value ETF
Invesco Dynamic Leisure and Entertainment ETF
Invesco Dynamic Market ETF
Invesco Dynamic Media ETF
Invesco Dynamic Networking ETF
Invesco Dynamic Oil & Gas Services ETF
Invesco Dynamic Pharmaceuticals ETF
Invesco Dynamic Retail ETF
Invesco Dynamic Semiconductors ETF
Invesco Dynamic Software ETF
Invesco Financial Preferred ETF
Invesco FTSE RAFI US 1000 ETF
Invesco FTSE RAFI US 1500Small-Mid ETF
Invesco Global Listed Private Equity ETF
Invesco Golden Dragon China ETF
Invesco High Yield Equity Dividend AchieversTM ETF
Invesco Insider Sentiment ETF
Invesco International Dividend AchieversTM ETF
Invesco Russell 2000 Pure Growth ETF
Invesco Russell 2000 Pure Value ETF
Invesco Russell Midcap Equal Weight ETF
Invesco Russell Midcap Pure Growth ETF
Invesco Russell Midcap Pure Value ETF
Invesco Russell Top 200 Equal Weight ETF
Invesco Russell Top 200 Pure Growth ETF
Invesco Russell Top 200 Pure Value ETF
Invesco S&P 500® Quality ETF
Invesco S&PSpin-Off ETF
Invesco Water Resources ETF
Invesco WilderHill Clean Energy ETF Invesco ZacksMid-Cap ETF
Invesco Zacks Multi-Asset Income ETF
The Trustees reviewed information from the Adviser describing: (i) the nature, extent and quality of services provided, (ii) the investment performance of the Funds and the Adviser, (iii) the fees and expenses paid by the Funds and comparisons to amounts paid by other comparable registered investment companies, (iv) the costs of services provided and estimated profits realized by the Adviser, (v) the extent to which economies of scale may be realized as a Fund grows and whether fee levels reflect any possible economies of scale for the benefit of Fund shareholders, and (vi) any further benefits realized by the Adviser from its relationships with the Funds.
Nature, Extent and Quality of Services. In evaluating the nature, extent and quality of the Adviser’s services, the Trustees reviewed information concerning the functions performed by the Adviser for the Funds, information describing the Adviser’s current organization and staffing, including operational support provided by the Adviser’s parent organization, Invesco Ltd. (“Invesco”), and the background and experience of the persons responsible for theday-to-day management of the Funds. The Trustees reviewed matters related to the Adviser’s execution and/or oversight of execution of portfolio transactions on behalf of the Funds. The Trustees also reviewed information on the performance of the Funds and their underlying indexes for theone-year, three-year, five-year,ten-year and since-inception periods ended December 31, 2018, as applicable, including reports for each of those periods on the correlation and tracking error between each Fund’s performance and the performance of its underlying index, as well as the Adviser’s analysis of the tracking error between certain Funds and their underlying indexes. In reviewing the tracking error reports, the Trustees considered information provided by Invesco’s Global Performance Measurement and Risk Group, an independent organization within Invesco, with respect to general expected tracking error ranges. The Trustees also considered that certain Funds were created in connection with the purchase by Invesco of the exchange-traded funds business of Guggenheim Capital LLC (the “Transaction”) and that such Funds’ performance
Board Considerations Regarding Continuation of Investment Advisory Agreement(continued)
prior to the closing of the Transaction on April 6, 2018 or May 18, 2018, as applicable, is that of their predecessor Guggenheim ETFs. The Trustees noted that, for each applicable period, the correlation and tracking error for each Fund was within the targeted range set forth in the Trust’s registration statement and concluded that each Fund was correlated to its underlying index and that the tracking error for each Fund was within an acceptable range given that Fund’s particular circumstances.
The Trustees also considered the services provided by the Adviser in its oversight of the Funds’ administrator, custodian and transfer agent. They noted the significant amount of time, effort and resources that had been devoted to this oversight function.
Based on their review, the Trustees concluded that the nature, extent and quality of services provided by the Adviser to the Funds under the Investment Advisory Agreement were appropriate and reasonable.
Fees, Expenses and Profitability. The Trustees reviewed and discussed the information provided by the Adviser on each Fund’s contractual advisory fee, net advisory fee, and gross and net expense ratios. The Trustees also compared each Fund’s contractual advisory fee and net expense ratio to information compiled by the Adviser from Lipper Inc. databases on the net advisory fees and net expense ratios of comparable exchange-traded funds (“ETFs”),open-end(non-ETF) index funds andopen-end(non-ETF) actively-managed funds, as applicable. The Trustees noted that the annual contractual advisory fee charged to each Fund is:
| | ● | | 0.50% of the Fund’s average daily net assets for each Fund other than Invesco Dividend AchieversTM ETF, Invesco FTSE RAFI US 1000 ETF, Invesco FTSE RAFI US 1500Small-Mid ETF, Invesco High Yield Equity Dividend AchieversTM ETF, Invesco International Dividend AchieversTM ETF, Invesco Russell 2000 Pure Growth ETF, Invesco Russell 2000 Pure Value ETF, Invesco Russell Midcap Equal Weight ETF, Invesco Russell Midcap Pure Growth ETF, Invesco Russell Midcap Pure Value ETF, Invesco Russell Top 200 Equal Weight ETF, Invesco Russell Top 200 Pure Growth ETF, Invesco Russell Top 200 Pure Value ETF and Invesco S&P 500® Quality ETF (The net advisory fee, after giving effect to the Expense Cap, as defined below, was-0.16% for Invesco Dynamic Retail ETF.); |
| | ● | | 0.40% of the Fund’s average daily net assets for each of Invesco Dividend AchieversTM ETF, Invesco High Yield Equity Dividend AchieversTM ETF and Invesco International Dividend AchieversTM ETF; |
| | ● | | 0.29% of the Fund’s average daily net assets for each of Invesco FTSE RAFI US 1000 ETF, Invesco FTSE RAFI US 1500Small-Mid ETF, Invesco Russell 2000 Pure Growth ETF, Invesco Russell 2000 Pure Value ETF, Invesco Russell Midcap Pure Growth ETF, Invesco Russell Midcap Pure Value ETF, Invesco Russell Top 200 Pure Growth ETF and Invesco Russell Top 200 Pure Value ETF; |
| | ● | | 0.25% of the Fund’s average daily net assets for each of Invesco Russell Midcap Equal Weight ETF and Invesco Russell Top 200 Equal Weight ETF (The net advisory fee, after giving effect to the Expense Cap, as defined below, was-0.17% for Invesco Russell Midcap Equal Weight ETF.); and |
| | ● | | 0.15% of the Fund’s average daily net assets for Invesco S&P 500® Quality ETF (The Trustees noted that, prior to September 24, 2018, the Fund’s advisory fee was 0.29%.). |
The Trustees also noted that the Adviser has agreed to waive a portion of its contractual advisory fee and/or pay expenses (an “Expense Cap”) to the extent necessary to prevent the annual operating expenses of each Fund from exceeding the percentage of that Fund’s average daily net assets, at least until August 31, 2021, as set forth below:
| | ● | | 0.60%, excluding interest expenses, brokerage commissions and other trading expenses, taxes, acquired fund fees and expenses, if applicable, and extraordinary expenses, for each of Invesco DWA NASDAQ Momentum ETF and Invesco Dynamic Market ETF; |
| | ● | | 0.60%, excluding interest expenses, offering costs, brokerage commissions and other trading expenses, taxes, acquired fund fees and expenses, if applicable, and extraordinary expenses, for each of Invesco DWA Basic Materials Momentum ETF, Invesco DWA Consumer Cyclicals Momentum ETF, Invesco DWA Consumer Staples Momentum ETF, Invesco DWA Energy Momentum ETF, Invesco DWA Financial Momentum ETF, Invesco DWA Healthcare Momentum ETF, Invesco DWA Industrials Momentum ETF, Invesco DWA Technology Momentum ETF and Invesco DWA Utilities Momentum ETF; |
| | ● | | 0.50%, excluding interest expenses,sub-licensing fees, offering costs, brokerage commissions and other trading expenses, taxes, acquired fund fees and expenses, if applicable, and extraordinary expenses, for each of Invesco Dividend AchieversTM ETF, Invesco High Yield Equity Dividend AchieversTM ETF and Invesco International Dividend AchieversTM ETF; |
| | ● | | 0.39%, excluding interest expenses, offering costs, brokerage commissions and other trading expenses, taxes, acquired fund fees and expenses, if applicable, and extraordinary expenses, for each of Invesco FTSE RAFI US 1000 ETF, Invesco FTSE RAFI US 1500Small-Mid ETF, Invesco Russell 2000 Pure Growth ETF, Invesco Russell 2000 Pure Value ETF, Invesco Russell Midcap Pure Growth ETF, Invesco Russell Midcap Pure Value ETF, Invesco Russell Top 200 Pure Growth ETF and Invesco Russell Top 200 Pure Value ETF; |
Board Considerations Regarding Continuation of Investment Advisory Agreement(continued)
| | ● | | 0.25%, excluding interest expenses, offering costs, brokerage commissions and other trading expenses, taxes, acquired fund fees and expenses, if applicable, and extraordinary expenses, for each of Invesco Russell Midcap Equal Weight ETF and Invesco Russell Top 200 Equal Weight ETF; |
| | ● | | 0.15%, excluding interest expenses, offering costs, brokerage commissions and other trading expenses, taxes, acquired fund fees and expenses, if applicable, and extraordinary expenses, for Invesco S&P 500 Quality ETF; and |
| | ● | | 0.60%, excluding interest expenses,sub-licensing fees, offering costs, brokerage commissions and other trading expenses, taxes, acquired fund fees and expenses, if applicable, and extraordinary expenses, for each other Fund. |
The Trustees noted that the Adviser represented that it does not serve as the investment adviser to any clients, other than other ETFs also overseen by the Trustees, with comparable investment strategies as the Funds, but that it providessub-advisory services to other clients. The Trustees further noted the Adviser’s explanation with respect to thesub-advisory fees it receives for such services in comparison to the advisory fees charged to the Funds. The Trustees noted that the contractual advisory fees for certain Funds were equal to or lower than the median net advisory fees of their ETF andopen-end index peer funds, as applicable, as illustrated in the table below. The Trustees also noted that the contractual advisory fees for all of the Funds were lower than the median net advisory fees of theiropen-end actively-managed peer funds.
| | | | | | |
Invesco Fund | | Equal to/Lower
than ETF Median | | Equal to/Lower
than Open-End
Index Fund
Median* | | Equal to/Lower
than Open-End
Active Fund
Median |
| Invesco Aerospace & Defense ETF | | | | | | X |
| Invesco BRIC ETF | | | | | | X |
| Invesco Buyback AchieversTM ETF | | | | | | X |
| Invesco CleantechTM ETF | | | | | | X |
| Invesco Dividend AchieversTM ETF | | | | | | X |
| Invesco DWA Basic Materials Momentum ETF | | | | | | X |
| Invesco DWA Consumer Cyclicals Momentum ETF | | | | | | X |
| Invesco DWA Consumer Staples Momentum ETF | | | | | | X |
| Invesco DWA Energy Momentum ETF | | | | | | X |
| Invesco DWA Financial Momentum ETF | | | | | | X |
| Invesco DWA Healthcare Momentum ETF | | | | | | X |
| Invesco DWA Industrials Momentum ETF | | | | | | X |
| Invesco DWA Momentum ETF | | X | | | | X |
| Invesco DWA NASDAQ Momentum ETF | | | | | | X |
| Invesco DWA Technology Momentum ETF | | | | | | X |
| Invesco DWA Utilities Momentum ETF | | | | | | X |
| Invesco Dynamic Biotechnology & Genome ETF | | | | | | X |
| Invesco Dynamic Building & Construction ETF | | | | | | X |
| Invesco Dynamic Energy Exploration & Production ETF | | | | | | X |
| Invesco Dynamic Food & Beverage ETF | | | | | | X |
| Invesco Dynamic Large Cap Growth ETF | | | | | | X |
| Invesco Dynamic Large Cap Value ETF | | | | | | X |
| Invesco Dynamic Leisure and Entertainment ETF | | | | | | X |
| Invesco Dynamic Market ETF | | | | | | X |
| Invesco Dynamic Media ETF | | | | | | X |
| Invesco Dynamic Networking ETF | | | | | | X |
| Invesco Dynamic Oil & Gas Services ETF | | | | N/A | | X |
| Invesco Dynamic Pharmaceuticals ETF | | | | | | X |
Board Considerations Regarding Continuation of Investment Advisory Agreement(continued)
| | | | | | |
Invesco Fund | | Equal to/Lower
than ETF Median | | Equal to/Lower
than Open-End
Index Fund
Median* | | Equal to/Lower
than Open-End
Active Fund
Median |
| Invesco Dynamic Retail ETF | | | | | | X |
| Invesco Dynamic Semiconductors ETF | | | | | | X |
| Invesco Dynamic Software ETF | | | | | | X |
| Invesco Financial Preferred ETF | | | | N/A | | X |
| Invesco FTSE RAFI US 1000 ETF | | | | | | X |
| Invesco FTSE RAFI US 1500Small-Mid ETF | | | | | | X |
| Invesco Global Listed Private Equity ETF | | | | N/A | | X |
| Invesco Golden Dragon China ETF | | X | | N/A | | X |
| Invesco High Yield Equity Dividend AchieversTM ETF | | | | | | X |
| Invesco Insider Sentiment ETF | | | | | | X |
| Invesco International Dividend AchieversTM ETF | | X | | | | X |
| Invesco Russell 2000 Pure Growth ETF | | | | X | | X |
| Invesco Russell 2000 Pure Value ETF | | | | X | | X |
| Invesco Russell Midcap Equal Weight ETF | | | | | | X |
| Invesco Russell Midcap Pure Growth ETF | | X | | | | X |
| Invesco Russell Midcap Pure Value ETF | | X | | | | X |
| Invesco Russell Top 200 Equal Weight ETF | | X | | | | X |
| Invesco Russell Top 200 Pure Growth ETF | | | | | | X |
| Invesco Russell Top 200 Pure Value ETF | | | | | | X |
| Invesco S&P 500® Quality ETF | | X | | | | X |
| Invesco S&PSpin-Off | | | | | | X |
| Invesco Water Resources ETF | | | | | | X |
| Invesco WilderHill Clean Energy ETF | | | | | | X |
| Invesco ZacksMid-Cap ETF | | | | | | X |
| Invesco Zacks Multi-Asset Income ETF | | | | | | X |
| * | The information provided by the Adviser indicated that certain Funds did not haveopen-end index fund peers. Those Funds have been designated with an “N/A” for not available. |
The Trustees determined that the contractual advisory fees were reasonable, noting the nature of the indexes, the distinguishing factors of the Funds, and the administrative, operational and management oversight costs for the Adviser. The Trustees noted that the net expense ratios for certain Funds were equal to or lower than the median net expense ratios of their ETF andopen-end index peer funds, as applicable, as illustrated in the table below. The Trustees also noted that the net expense ratios for all of the Funds were lower than the median net expense ratios of theiropen-end actively-managed peer funds.
| | | | | | |
Invesco Fund | | Equal to/Lower
than ETF Median | | Equal to/Lower
than Open-End
Index Fund
Median* | | Equal to/Lower
than Open-End
Active Fund
Median |
| Invesco Aerospace & Defense ETF | | | | | | X |
| Invesco BRIC ETF | | | | | | X |
| Invesco Buyback AchieversTM ETF | | | | | | X |
| Invesco CleantechTM ETF | | | | | | X |
| Invesco Dividend AchieversTM ETF | | | | X | | X |
| Invesco DWA Basic Materials Momentum ETF | | | | | | X |
| Invesco DWA Consumer Cyclicals Momentum ETF | | | | | | X |
| Invesco DWA Consumer Staples Momentum ETF | | | | | | X |
Board Considerations Regarding Continuation of Investment Advisory Agreement(continued)
| | | | | | |
Invesco Fund | | Equal to/Lower
than ETF Median | | Equal to/Lower
than Open-End
Index Fund
Median* | | Equal to/Lower
than Open-End
Active Fund
Median |
| Invesco DWA Energy Momentum ETF | | | | | | X |
| Invesco DWA Financial Momentum ETF | | | | | | X |
| Invesco DWA Healthcare Momentum ETF | | | | | | X |
| Invesco DWA Industrials Momentum ETF | | | | | | X |
| Invesco DWA Momentum ETF | | | | X | | X |
| Invesco DWA NASDAQ Momentum ETF | | | | | | X |
| Invesco DWA Technology Momentum ETF | | | | | | X |
| Invesco DWA Utilities Momentum ETF | | | | | | X |
| Invesco Dynamic Biotechnology & Genome ETF | | | | | | X |
| Invesco Dynamic Building & Construction ETF | | | | | | X |
| Invesco Dynamic Energy Exploration & Production ETF | | | | | | X |
| Invesco Dynamic Food & Beverage ETF | | | | | | X |
| Invesco Dynamic Large Cap Growth ETF | | | | | | X |
| Invesco Dynamic Large Cap Value ETF | | | | | | X |
| Invesco Dynamic Leisure and Entertainment ETF | | | | | | X |
| Invesco Dynamic Market ETF | | | | | | X |
| Invesco Dynamic Media ETF | | | | | | X |
| Invesco Dynamic Networking ETF | | | | | | X |
| Invesco Dynamic Oil & Gas Services ETF | | | | N/A | | X |
| Invesco Dynamic Pharmaceuticals ETF | | | | | | X |
| Invesco Dynamic Retail ETF | | | | | | X |
| Invesco Dynamic Semiconductors ETF | | | | | | X |
| Invesco Dynamic Software ETF | | | | | | X |
| Invesco Financial Preferred ETF | | | | N/A | | X |
| Invesco FTSE RAFI US 1000 ETF | | | | | | X |
| Invesco FTSE RAFI US 1500Small-Mid ETF | | | | | | X |
| Invesco Global Listed Private Equity ETF | | | | N/A | | X |
| Invesco Golden Dragon China ETF | | | | N/A | | X |
| Invesco High Yield Equity Dividend AchieversTM ETF | | | | X | | X |
| Invesco Insider Sentiment ETF | | | | | | X |
| Invesco International Dividend AchieversTM ETF | | | | | | X |
| Invesco Russell 2000 Pure Growth ETF | | | | X | | X |
| Invesco Russell 2000 Pure Value ETF | | | | X | | X |
| Invesco Russell Midcap Equal Weight ETF | | | | | | X |
| Invesco Russell Midcap Pure Growth ETF | | | | | | X |
| Invesco Russell Midcap Pure Value ETF | | | | | | X |
| Invesco Russell Top 200 Equal Weight ETF | | X | | | | X |
| Invesco Russell Top 200 Pure Growth ETF | | | | | | X |
| Invesco Russell Top 200 Pure Value ETF | | | | | | X |
| Invesco S&P 500® Quality ETF | | X | | | | X |
| Invesco S&PSpin-Off ETF | | | | | | X |
| Invesco Water Resources ETF | | | | | | X |
| Invesco WilderHill Clean Energy ETF | | | | | | X |
| Invesco ZacksMid-Cap ETF | | | | | | X |
| Invesco Zacks Multi-Asset Income ETF | | | | | | X |
| * | The information provided by the Adviser indicated that certain Funds did not haveopen-end index fund peers. Those Funds have been designated with an “N/A” for not available. |
Board Considerations Regarding Continuation of Investment Advisory Agreement(continued)
In response to questions from the Independent Trustees, the Adviser provided supplemental information regarding each of Invesco Dynamic Energy Exploration & Production ETF, Invesco Dynamic Large Cap Growth ETF and Invesco WilderHill Clean Energy ETF’s advisory fees and total expenses and the Lipper peer data. The Adviser explained in detail its view that it believes that the advisory fees and total expenses for these Funds are competitive and generally in line with other comparable funds in the marketplace, noting, in particular, the unique underlying investment strategy and complexity of each Fund, the limited number of peers in the Lipper data, and/or the differing pricing philosophy of certain of the peers.
The Trustees noted that a significant component of thenon-advisory fee expenses was the license fees paid by the Funds, and noted those Funds for which license fees are included in the Funds’ Expense Caps. The Trustees also noted that the Adviser has agreed to reimburse certain Funds in the amount equal to the licensing fee paid that causes that Fund’s annual operating expenses (excluding interest expenses, offering costs, brokerage commissions and other trading expenses, taxes, acquired fund fees and expenses and extraordinary expenses) to exceed a percentage of that Fund’s average daily net assets through April 6, 2020 (May 18, 2020 for Invesco BRIC ETF) as set forth below:
| | | | |
| Invesco BRIC ETF | | | 0.64 | % |
| Invesco Insider Sentiment ETF | | | 0.60 | % |
| Invesco S&PSpin-Off ETF | | | 0.64 | % |
| Invesco ZacksMid-Cap ETF | | | 0.65 | % |
| Invesco Zacks Multi-Asset Income ETF | | | 0.65 | % |
The Board concluded that the advisory fee and expense ratio of each Fund (giving effect to the Fund’s Expense Cap) were reasonable and appropriate in light of the services provided.
In conjunction with their review of fees, the Trustees considered information provided by the Adviser on the revenues received by the Adviser under the Investment Advisory Agreement for the Funds, as well as the fees waived and expenses reimbursed by the Adviser for the Funds. The Trustees reviewed information provided by the Adviser on its overall profitability, as well as the estimated profitability to the Adviser from its relationship to each Fund. The Trustees concluded that the overall and estimated profitability to the Adviser was not unreasonable.
Economies of Scale and Whether Fee Levels Reflect These Economies of Scale. The Trustees reviewed the information provided by the Adviser as to the extent to which economies of scale may be realized as each Fund grows and whether fee levels reflect economies of scale for the benefit of shareholders. The Trustees reviewed each Fund’s asset size, advisory fee, expense ratio and Expense Cap agreed to by the Adviser. The Trustees also noted that the Amended and Restated Excess Expense Agreement with the Trust provides that the Adviser is entitled to be reimbursed by each Fund, other than Invesco Dynamic Market ETF and Invesco DWA NASDAQ Momentum ETF, for fees waived or expenses absorbed pursuant to the Expense Cap for a period of three years from the date the fee or expense was incurred, provided that no reimbursement would be made that would result in a Fund exceeding its Expense Cap then in effect or in effect at the time the fees and/or expenses subject to reimbursement were waived and/or borne by the Adviser. The Trustees considered whether the advisory fee rate for each Fund was reasonable in relation to the asset size of that Fund, and concluded that the flat advisory fee was reasonable and appropriate.
The Trustees noted that the Adviser had not identified any further benefits that it derived from its relationships with the Funds and had noted that it does not have any soft-dollar arrangements.
Based on all of the information considered and the conclusions reached, the Board, including the Independent Trustees, determined to approve the continuation of the Investment Advisory Agreement for each Fund. No single factor was determinative in the Board’s analysis.
Proxy Voting Policies and Procedures
A description of the Trust’s proxy voting policies and procedures that the Funds use to determine how to vote proxies relating to portfolio securities is available, without charge and upon request, by calling(800) 983-0903. This information is also available on the Securities and Exchange Commission’s (the “Commission”) website atwww.sec.gov.
Information regarding how each Fund voted proxies for portfolio securities, if applicable, during the most recent 12-month period ended June 30, is available, without charge and upon request, by (i) calling(800) 983-0903; or (ii) accessing the Trust’sForm N-PX on the Commission’s website atwww.sec.gov.
Quarterly Portfolios
The Trust files its complete schedule of portfolio holdings for the Funds with the Commission for the first and third quarters of each fiscal year onForm N-Q (or any successor Form). The Trust’sForms N-Q (or any successor Form) are available on the Commission’s website atwww.sec.gov.
Frequency Distribution of Discounts and Premiums
A table showing the number of days the market price of each Fund’s shares was greater than the Fund’s net asset value, and the number of days it was less than the Fund’s net asset value (i.e., premium or discount) for the most recently completed calendar year, and the calendar quarters since that year end (or the life of the Fund, if shorter) may be found at the Fund’s website atwww.invesco.com/ETFs.
| | | | |
©2019 Invesco Capital Management LLC 3500 Lacey Road, Suite 700 Downers Grove, IL 60515 | | P-PS-AR-2 | | invesco.com/ETFs |

Invesco Annual Report to Shareholders
April 30, 2019
| | |
| |
| PWB | | Invesco Dynamic Large Cap Growth ETF |
| |
| PWV | | Invesco Dynamic Large Cap Value ETF |
| |
| PXSG | | Invesco Russell 2000 Pure Growth ETF |
| |
| PXSV | | Invesco Russell 2000 Pure Value ETF |
| |
| EQWM | | Invesco Russell Midcap Equal Weight ETF |
| |
| PXMG | | Invesco Russell Midcap Pure Growth ETF |
| |
| PXMV | | Invesco Russell Midcap Pure Value ETF |
| |
| EQWL | | Invesco Russell Top 200 Equal Weight ETF |
| |
| PXLG | | Invesco Russell Top 200 Pure Growth ETF |
| |
| PXLV | | Invesco Russell Top 200 Pure Value ETF |
| |
| CZA | | Invesco Zacks Mid-Cap ETF |
| |
| CVY | | Invesco Zacks Multi-Asset Income ETF |
Beginning on January 1, 2021, as permitted by regulations adopted by the Securities and Exchange Commission, paper copies of the Funds’ shareholder reports will no longer be sent by mail, unless you specifically request paper copies of the reports from your financial intermediary, such as a broker-dealer or bank. Instead, the reports will be made available on a website, and you will be notified by mail each time a report is posted and provided with a website link to access the report.
If you already elected to receive shareholder reports electronically, you will not be affected by this change and you need not take any action. If you hold accounts through a financial intermediary, you may contact your financial intermediary to enroll in electronic delivery. Please note that not all financial intermediaries may offer this service.
You may elect to receive all future reports in paper free of charge. If you hold accounts through a financial intermediary, you can follow the instructions included with this disclosure, if applicable, or contact your financial intermediary to request that you continue to receive paper copies of your shareholder reports. Please note that not all financial intermediaries may offer this service. Your election to receive reports in paper will apply to all funds held with your financial intermediary.
Table of Contents
The Market Environment
Domestic Equity
The fiscal year proved to be an increasingly volatile time for U.S. equities. Throughout the summer, U.S. equities moved higher as corporate profits surged amid the benefit of corporate tax cuts and improving global economic growth. Several U.S. equity indexes reached new highs despite potential headwinds, including trade tensions, tariff announcements and contagion concerns over a Turkish currency crisis. After a relatively quiet summer, market volatility noticeably rose in October 2018, as U.S. equity markets suffered a sharpsell-off throughyear-end 2018, amid ongoing trade concerns between the U.S. and China, fears of a global economic slowdown and lower oil prices from a supply glut, with oil prices plummeting from near $75 per barrel in early October 2018 to around $45 per barrel in late December 2018.1 In this environment, there was a flight to safety, as investors fled to defensive areas of the markets, such as health care, utilities and U.S. Treasuries.
Given signs of a strong economy, the U.S. Federal Reserve (the “Fed”) raised interest rates three times during the fiscal year: in June, September and December 2018. Following December’s Fed meeting, the Fed raised interest rates by 25 basis points to a targeted range of 2.25% to 2.50%, which signaled a slightly more dovish stance than expected.2 In contrast, the European Central Bank and central banks in several other countries maintained extraordinarily accommodative monetary policies.
Equity markets rebounded at the start of 2019, fueled by optimism about a potential U.S.-China trade deal and the Fed’s indication that there would be no interest rate hikes in 2019, a surprising shift in monetary policy. The Fed’s more accommodative stance provided a supportive environment for equities and fixed income, even as U.S. economic data were mixed and overseas growth appeared to be slowing. By the end of the fiscal year, the U.S. equity market generally recovered the losses from fourth quarter 2018, backed by improving investor sentiment, low unemployment and a growing economy.
| 2 | Source: U.S. Federal Reserve |
| | |
| PWB | | Manager’s Analysis |
| | Invesco Dynamic Large Cap Growth ETF (PWB) |
As an index fund, the Invesco Dynamic Large Cap Growth ETF (the “Fund”) is passively managed and seeks to track the returns of an underlying index. The Fund seeks to track the investment results (before fees and expenses) of the Dynamic Large Cap Growth IntellidexSMIndex (the “Index”). The Fund generally will invest at least 90% of its total assets in common stocks of large capitalization companies that comprise the Index.
Ice Data Indices, LLC (the “Index Provider”) considers a company to be a large capitalization company if it falls within the Index model. The Index for the Fund is composed of 50 large capitalization U.S. growth stocks that, strictly in accordance with its guidelines and mandated procedures, the Index Provider includes principally on the basis of their capital appreciation potential. The Index Provider ranks the 2,000 largest U.S. stocks (by market capitalization) traded on the New York Stock Exchange (“NYSE”), NYSE American and The Nasdaq Stock Market for investment potential using a proprietary Index Provider Intellidex model.
The Fund generally invests in all of the securities comprising the Index in proportion to their weightings in the Index.
For the fiscal year ended April 30, 2019, on a market price basis, the Fund returned 13.57%. On a net asset value (“NAV”) basis, the Fund returned 13.69%. During the same time period, the Index returned 14.31%. During the fiscal year, the Fund fully replicated the components of the Index; therefore, the Fund’s performance, on a NAV basis, differed from the return of the Index primarily due to fees and operating expenses that the Fund incurred during the period.
During this same time period, the Russell 1000® Growth Index (the “Benchmark Index”) returned 17.43%. The Benchmark Index is an unmanaged index weighted by market capitalization based on the average performance of approximately 550 securities. The Benchmark Index was selected for its recognition in the marketplace, and because its performance comparison is a useful measure for investors as a broad representation of the U.S. large cap growth market.
The performance of the Fund differed from the Benchmark Index in part because the Fund seeks to track an Index that employs a modified equal weighting and stock selection methodology, whereas the Benchmark Index selects and weights stocks based primarily on market capitalization.
Relative to the Benchmark Index, the Fund was most overweight in the health care sector and most underweight in the information technology sector during the fiscal year ended April 30, 2019. The majority of the Fund’s underperformance relative to the Benchmark Index during the period can be attributed to the Fund’s stock selection of companies in the consumer staples and consumer discretionary sectors.
For the fiscal year ended April 30, 2019, the information technology sector contributed most significantly to the Fund’s return, followed by the consumer discretionary and health care sectors, respectively. The consumer staples and real estate sectors were the only detracting sectors.
Positions that contributed most significantly to the Fund’s return for the fiscal year ended April 30, 2019, included Mastercard Inc., Class A, an information technology company (portfolio average weight of 2.61%) and Microsoft Corp., an information technology company (portfolio average weight of 3.05%). Positions that detracted most significantly from the Fund’s return during this period included Humana Inc., a health care company (portfolio average weight of 1.68%) and Emerson Electric Co., an industrials company (no longer held at fiscalyear-end).
| | | | |
Sector Breakdown
(% of the Fund’s Net Assets)
as of April 30, 2019 | |
| Health Care | | | 33.9 | |
| Consumer Discretionary | | | 20.6 | |
| Information Technology | | | 16.5 | |
| Industrials | | | 9.1 | |
| Energy | | | 6.1 | |
| Financials | | | 4.8 | |
| Communication Services | | | 4.5 | |
| Materials | | | 3.0 | |
| Consumer Staples | | | 1.5 | |
| Money Market Fund Plus Other Assets Less Liabilities | | | (0.0) | |
|
Top Ten Fund Holdings*
(% of the Fund’s Net Assets)
as of April 30, 2019 | |
| Security | | | | |
| Accenture PLC, Class A | | | 3.7 | |
| Roper Technologies, Inc. | | | 3.7 | |
| Thermo Fisher Scientific, Inc. | | | 3.5 | |
| TJX Cos., Inc. (The) | | | 3.5 | |
| Lowe’s Cos., Inc. | | | 3.4 | |
| Home Depot, Inc. (The) | | | 3.4 | |
| Abbott Laboratories | | | 3.4 | |
| Berkshire Hathaway, Inc., Class B | | | 3.4 | |
| Baxter International, Inc. | | | 3.3 | |
| Agilent Technologies, Inc. | | | 3.2 | |
| Total | | | 34.5 | |
| * | Excluding money market fund holdings. |
Invesco Dynamic Large Cap Growth ETF (PWB)(continued)
Growth of a $10,000 Investment
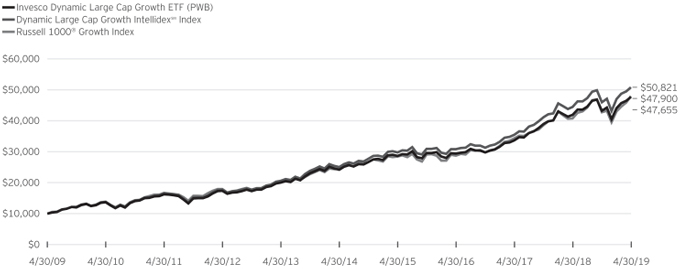
Fund Performance History as of April 30, 2019
| | | | | | | | | | | | | | | | | | | | | | | | | | | | | | | | | | | | | | | | |
| | | 1 Year | | | 3 Years Average
Annualized | | | 3 Years Cumulative | | | 5 Years Average
Annualized | | | 5 Years Cumulative | | | 10 Years Average
Annualized | | | 10 Years Cumulative | | | | | | Fund Inception | |
| Index | | | | | Average
Annualized | | | Cumulative | |
| Dynamic Large Cap Growth IntellidexSM Index | | | 14.31 | % | | | 18.20 | % | | | 65.12 | % | | | 15.26 | % | | | 103.39 | % | | | 17.65 | % | | | 408.21 | % | | | | | | | 10.13 | % | | | 292.04 | % |
| Russell 1000® Growth Index | | | 17.43 | | | | 18.62 | | | | 66.93 | | | | 14.50 | | | | 96.84 | | | | 16.96 | | | | 379.00 | | | | | | | | 10.38 | | | | 304.88 | |
| Fund | | | | | | | | | | | | | | | | | | | | | | | | | | | | | | | | | | | | | | | | |
| NAV Return | | | 13.69 | | | | 17.49 | | | | 62.17 | | | | 14.57 | | | | 97.41 | | | | 16.90 | | | | 376.55 | | | | | | | | 9.42 | | | | 257.95 | |
| Market Price Return | | | 13.57 | | | | 17.52 | | | | 62.29 | | | | 14.58 | | | | 97.48 | | | | 16.90 | | | | 376.75 | | | | | | | | 9.41 | | | | 257.38 | |
Fund Inception: March 3, 2005
Performance quoted above represents past performance. Past performance is not a guarantee of future results and current performance may be higher or lower than performance quoted. Investment returns and principal value will fluctuate, and shares of the Fund (“Fund Shares”), when redeemed or sold, may be worth more or less than their original cost. Fund performance reflects any applicable fee waivers and/or expense reimbursements. Had the adviser not waived fees and/or reimbursed expenses currently or in the past, returns would have been lower. See current prospectus for more information. According to the Fund’s current prospectus, the total annual operating expense ratio was indicated as 0.57%. The Financial Highlights section of the Shareholder Report presents the expense ratios based on expenses incurred during the period covered by this report. NAV and Market Price returns assume that dividends and capital gain distributions have been reinvested in the Fund at NAV and Market Price, respectively. The returns shown in the table above do not reflect the deduction of taxes that a shareholder would pay on Fund distributions or the redemption or
sale of Fund Shares. See invesco.com/ETFs to find the most recentmonth-end performance numbers.
Index and Benchmark Index performance results are based upon a hypothetical investment in their respective constituent securities. Index and Benchmark Index returns do not represent Fund returns. An investor cannot invest directly in an index. The Index and Benchmark Index do not charge management fees or brokerage expenses, and no such fees or expenses were deducted from the hypothetical performance shown. In addition, the results actual investors might have achieved would have differed from those shown because of differences in the timing, amounts of their investments, and fees and expenses associated with an investment in the Fund.
Notes Regarding Indexes and Fund Performance History:
| - | Average Annualized and Cumulative Inception returns for the Fund, Index and Benchmark Index are based on the inception date of the Fund. |
| | |
| PWV | | Manager’s Analysis |
| | Invesco Dynamic Large Cap Value ETF (PWV) |
As an index fund, the Invesco Dynamic Large Cap Value ETF (the “Fund”) is passively managed and seeks to track the returns of an underlying index. The Fund seeks to track the investment results (before fees and expenses) of the Dynamic Large Cap Value IntellidexSMIndex (the “Index”). The Fund generally will invest at least 90% of its total assets in common stocks of large capitalization companies that comprise the Index.
ICE Data Indices, LLC (the “Index Provider”) considers a company to be a large capitalization company if it falls within the Index model. The Index for the Fund is composed of 50 large capitalization U.S. value stocks that, strictly in accordance with its guidelines and mandated procedures, the Index Provider includes principally on the basis of their capital appreciation potential. The Index Provider ranks the 2,000 largest U.S. stocks (by market capitalization) traded on the New York Stock Exchange (“NYSE”), NYSE American and The Nasdaq Stock Market for investment potential using a proprietary Index Provider Intellidex model. The Fund generally invests in all of the securities comprising the Index in proportion to their weightings in the Index.
For the fiscal year ended April 30, 2019, on a market price basis, the Fund returned 4.26%. On a net asset value (“NAV”) basis, the Fund returned 4.32%. During the same time period, the Index returned 4.72%. During the fiscal year, the Fund fully replicated the components of the Index; therefore, the Fund’s performance, on a NAV basis, differed from the return of the Index primarily due to fees and operating expenses including trading expenses. Securities lending was able to offset some of those costs that the Fund incurred during the period.
During this same time period, the Russell 1000® Value Index (the “Benchmark Index”) returned 9.06%. The Benchmark Index is an unmanaged index weighted by market capitalization based on the average performance of approximately 710 securities. The Benchmark Index was selected for its recognition in the marketplace, and because its performance comparison is a useful measure for investors as a broad representation of the U.S. large cap value market.
The performance of the Fund differed from the Benchmark Index in part because the Fund seeks to track an Index that employs a modified equal weighting and stock selection methodology, whereas the Benchmark Index selects and weights stocks based primarily on market capitalization.
Relative to the Benchmark Index, the Fund was most overweight in the information technology sector and most underweight in the energy sector during the fiscal year ended April 30, 2019. The majority of the Fund’s underperformance relative to the Benchmark Index during the period can be attributed to the Fund’s stock selection of companies in the information technology and health care sectors.
For the fiscal year ended April 30, 2019, the consumer staples sector contributed most significantly to the Fund’s return followed by the consumer discretionary sector. The health care sector detracted most significantly from the Fund’s return followed by the financial sector.
Positions that contributed most significantly to the Fund’s return for the fiscal year ended April 30, 2019, included Procter & Gamble Co., a consumer staples company (no longer held as of fiscalyear-end) and Walt Disney Co. (The), a communication services company (portfolio average weight of 2.37%). Positions that detracted most significantly from the Fund’s return during this period included Biogen Inc. a health care company (portfolio average weight of 0.93%), and QUALCOMM Inc., an information technology company (no longer held as of fiscalyear-end).
| | | | |
Sector Breakdown
(% of the Fund’s Net Assets)
as of April 30, 2019 | |
| Financials | | | 24.7 | |
| Industrials | | | 17.5 | |
| Information Technology | | | 17.2 | |
| Health Care | | | 14.3 | |
| Communication Services | | | 8.2 | |
| Consumer Staples | | | 6.8 | |
| Energy | | | 5.5 | |
| Utilities | | | 4.4 | |
| Consumer Discretionary | | | 1.4 | |
| Money Market Funds Plus Other Assets Less Liabilities | | | 0.0 | |
|
Top Ten Fund Holdings*
(% of the Fund’s Net Assets)
as of April 30, 2019 | |
| Security | | | | |
| Apple, Inc. | | | 3.8 | |
| Comcast Corp., Class A | | | 3.7 | |
| Travelers Cos., Inc. (The) | | | 3.6 | |
| CSX Corp. | | | 3.6 | |
| Mondelez International, Inc., Class A | | | 3.4 | |
| Johnson & Johnson | | | 3.4 | |
| Walmart, Inc. | | | 3.4 | |
| Southwest Airlines Co. | | | 3.3 | |
| Intel Corp. | | | 3.2 | |
| M&T Bank Corp. | | | 3.2 | |
| Total | | | 34.6 | |
| * | Excluding money market fund holdings. |
Invesco Dynamic Large Cap Value ETF (PWV)(continued)
Growth of a $10,000 Investment
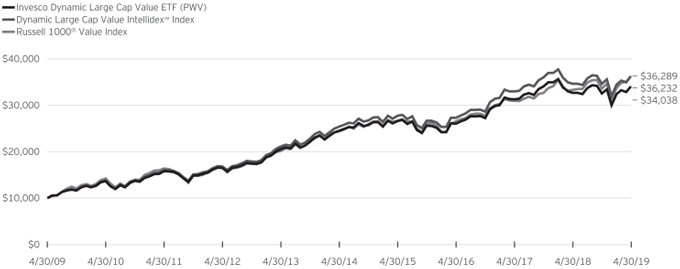
Fund Performance History as of April 30, 2019
| | | | | | | | | | | | | | | | | | | | | | | | | | | | | | | | | | | | | | | | |
| | | 1 Year | | | 3 Years Average
Annualized | | | 3 Years Cumulative | | | 5 Years Average
Annualized | | | 5 Years Cumulative | | | 10 Years Average
Annualized | | | 10 Years Cumulative | | | | | | Fund Inception | |
| Index | | | | | Average
Annualized | | | Cumulative | |
| Dynamic Large Cap Value IntellidexSM Index | | | 4.72 | % | | | 9.93 | % | | | 32.85 | % | | | 7.39 | % | | | 42.84 | % | | | 13.74 | % | | | 262.32 | % | | | | | | | 9.52 | % | | | 262.55 | % |
| Russell 1000® Value Index | | | 9.06 | | | | 10.97 | | | | 36.65 | | | | 8.27 | | | | 48.77 | | | | 13.76 | | | | 262.89 | | | | | | | | 7.28 | | | | 170.31 | |
| Fund | | | | | | | | | | | | | | | | | | | | | | | | | | | | | | | | | | | | | | | | |
| NAV Return | | | 4.32 | | | | 9.35 | | | | 30.75 | | | | 6.79 | | | | 38.85 | | | | 13.03 | | | | 240.38 | | | | | | | | 8.82 | | | | 231.10 | |
| Market Price Return | | | 4.26 | | | | 9.37 | | | | 30.82 | | | | 6.80 | | | | 38.98 | | | | 13.03 | | | | 240.23 | | | | | | | | 8.82 | | | | 230.74 | |
Fund Inception: March 3, 2005
Performance quoted above represents past performance. Past performance is not a guarantee of future results and current performance may be higher or lower than performance quoted. Investment returns and principal value will fluctuate, and shares of the Fund (“Fund Shares”), when redeemed or sold, may be worth more or less than their original cost. Fund performance reflects any applicable fee waivers and/or expense reimbursements. Had the adviser not waived fees and/or reimbursed expenses currently or in the past, returns would have been lower. See current prospectus for more information. According to the Fund’s current prospectus, the total annual operating expense ratio was indicated as 0.56%. The Financial Highlights section of the Shareholder Report presents the expense ratios based on expenses incurred during the period covered by this report. NAV and Market Price returns assume that dividends and capital gain distributions have been reinvested in the Fund at NAV and Market Price, respectively. The returns shown in the table above do not reflect the deduction of taxes that a shareholder would pay on Fund distributions or the redemption or
sale of Fund Shares. See invesco.com/ETFs to find the most recentmonth-end performance numbers.
Index and Benchmark Index performance results are based upon a hypothetical investment in their respective constituent securities. Index and Benchmark Index returns do not represent Fund returns. An investor cannot invest directly in an index. The Index and Benchmark Index do not charge management fees or brokerage expenses, and no such fees or expenses were deducted from the hypothetical performance shown. In addition, the results actual investors might have achieved would have differed from those shown because of differences in the timing, amounts of their investments, and fees and expenses associated with an investment in the Fund.
Notes Regarding Indexes and Fund Performance History:
| - | Average Annualized and Cumulative Inception returns for the Fund, Index and Benchmark Index are based on the inception date of the Fund. |
| | |
| PXSG | | Manager’s Analysis |
| | Invesco Russell 2000 Pure Growth ETF (PXSG) |
Effective after the close of markets on June 21, 2019, the Fund’s name changed from Invesco Russell 2000 Pure Growth ETF to Invesco S&P SmallCap Momentum ETF and the underlying index changed from Russell 2000® Pure Growth Index (the “Previous Index”) to S&P SmallCap 600 Momentum Index (the “Index”). At that time, the Fund also changed its ticker symbol from PXSG to XSMO and changed its investment objective and investment policies. The discussion that follows pertains to the Fund’s performance tracking the Previous Index for the fiscal year ended April 30, 2019.
As an index fund, the Invesco Russell 2000 Pure Growth ETF (the “Fund”) is passively managed and seeks to track the returns of an underlying index. The Fund seeks to track the investment results (before fees and expenses) of the Index and, through June 21, 2019, the Previous Index. The Fund generally will invest at least 90% of its total assets in the component securities that comprise the Index and, through June 21, 2019, the Previous Index.
The Previous Index is composed of a subset of securities from the Russell 2000® Index, which is composed of the smallest 2,000 securities of the Russell 3000® Index, an index designed to measure the performance of the largest 3,000 companies in the U.S. equity market.
Frank Russell Company (the “Index Provider”) first identifies securities in the Russell 2000® Index with higherprice-to-book ratios and higher forecasting growth values. The Previous Index’s constituent securities are then assigned a Composite Value Score (“CVS”), which is calculated based on three characteristics (book to price (a value characteristic), sales per share growth (a growth characteristic) and medium-term growth forecast (a growth characteristic)) to identify whether they are growth or value securities. In general, stocks with lower CVS are considered growth stocks. The Previous Index then weights securities in proportion to their CVS, giving greatest weight to the securities demonstrating the most growth characteristics.
The Fund generally invests in all of the securities comprising the Index in proportion to their weightings in the Index, and through June 21, 2019, in all of the securities comprising the Previous Index in proportion to their weightings in the Previous Index.
For the fiscal year ended April 30, 2019, on a market price basis, the Fund returned 12.41%. On a net asset value (“NAV”) basis, the Fund returned 12.55%. During the same time period, the Previous Index returned 12.55%. During the fiscal year, the Fund fully replicated the components of the Previous Index; the Fund’s performance, on a NAV basis, matched the return of the Previous Index. Revenue generated through the Fund’s securities lending program, partially offset by fees and operating expenses that the Fund incurred during the period affected the return of the Fund.
During this same time period, the Russell 2000® Growth Index (the “Benchmark Index”) returned 6.91%. The Benchmark Index
is an unmanaged index weighted by market capitalization based on the average performance of approximately 1,230 securities. The Benchmark Index was selected for its recognition in the marketplace, and because its performance comparison is a useful measure for investors as a broad representation of the U.S. small cap growth market.
The performance of the Fund differed from the Benchmark Index in part because the Fund seeks to track an index that employs a fundamental weighting and stock selection methodology, whereas the Benchmark Index selects and weights stocks based primarily on market capitalization.
Relative to the Benchmark Index, the Fund was most overweight in the information technology sector and most underweight in the real estate sector during the fiscal year ended April 30, 2019. The majority of the Fund’s outperformance relative to the Benchmark Index during the period can be attributed to the Fund’s stock selection in the health care sector as well as revenue generated through the Fund’s securities lending program, partially offset by fees and operating expenses that the Fund incurred.
For the fiscal year ended April 30, 2019, the information technology sector contributed most significantly to the Fund’s return, followed by the health care and consumer discretionary sectors, respectively. The energy sector detracted most significantly from the Fund’s return, followed by the materials sector.
Positions that contributed most significantly to the Fund’s return, for the fiscal year ended April 30, 2019, included Tandem Diabetes Care, Inc., a health care company (portfolio average weight of 1.14%) and NeoGenomics, Inc., a health care company (portfolio average weight of 0.95%). Positions that detracted most significantly from the Fund’s return during this period included Cutera, Inc., a health care company (portfolio average weight of 0.43%) and Profire Energy, Inc., an energy company (portfolio average weight of 0.32%).
| | | | |
Sector Breakdown
(% of the Fund’s Net Assets)
as of April 30, 2019 | |
| Health Care | | | 29.8 | |
| Information Technology | | | 24.6 | |
| Industrials | | | 17.0 | |
| Consumer Discretionary | | | 13.7 | |
| Financials | | | 5.0 | |
| Communication Services | | | 3.8 | |
| Consumer Staples | | | 3.1 | |
| Sector Types Each Less than 3% | | | 3.0 | |
| Money Market Funds Plus Other Assets Less Liabilities | | | 0.0 | |
Invesco Russell 2000 Pure Growth ETF (PXSG)(continued)
| | | | |
Top Ten Fund Holdings*
(% of the Fund’s Net Assets)
as of April 30, 2019 | |
| Security | | | | |
| Tandem Diabetes Care, Inc. | | | 2.0 | |
| Paylocity Holding Corp. | | | 1.4 | |
| NeoGenomics, Inc. | | | 1.3 | |
| LendingTree, Inc. | | | 1.2 | |
| HubSpot, Inc. | | | 1.1 | |
| Five Below, Inc. | | | 1.0 | |
| Pacira Biosciences, Inc. | | | 1.0 | |
| AppFolio, Inc., Class A | | | 1.0 | |
| Shenandoah Telecommunications Co. | | | 0.9 | |
| Energy Recovery, Inc. | | | 0.9 | |
| Total | | | 11.8 | |
| * | Excluding money market fund holdings. |
Growth of a $10,000 Investment
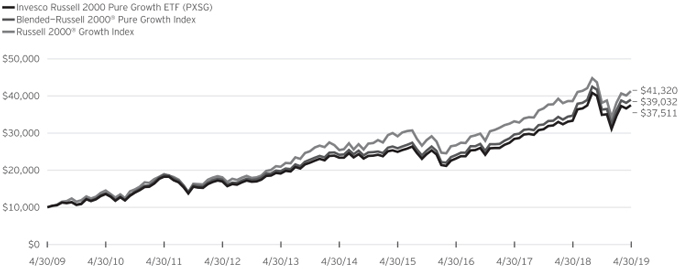
Fund Performance History as of April 30, 2019
| | | | | | | | | | | | | | | | | | | | | | | | | | | | | | | | | | | | | | | | |
| | | 1 Year | | | 3 Years Average
Annualized | | | 3 Years Cumulative | | | 5 Years Average
Annualized | | | 5 Years Cumulative | | | 10 Years Average
Annualized | | | 10 Years Cumulative | | | | | | Fund Inception | |
| Index | | | | | Average
Annualized | | | Cumulative | |
| Blended—Russell 2000® Pure Growth Index | | | 12.55 | % | | | 17.49 | % | | | 62.19 | % | | | 10.03 | % | | | 61.27 | % | | | 14.59 | % | | | 290.32 | % | | | | | | | 7.47 | % | | | 177.15 | % |
| Russell 2000® Growth Index | | | 6.91 | | | | 15.64 | | | | 54.65 | | | | 10.22 | | | | 62.66 | | | | 15.24 | | | | 313.21 | | | | | | | | 9.10 | | | | 243.08 | |
| Fund | | | | | | | | | | | | | | | | | | | | | | | | | | | | | | | | | | | | | | | | |
| NAV Return | | | 12.55 | | | | 17.51 | | | | 62.26 | | | | 9.93 | | | | 60.53 | | | | 14.13 | | | | 275.07 | | | | | | | | 6.99 | | | | 160.37 | |
| Market Price Return | | | 12.41 | | | | 17.48 | | | | 62.14 | | | | 9.95 | | | | 60.68 | | | | 14.15 | | | | 275.61 | | | | | | | | 6.98 | | | | 160.01 | |
Invesco Russell 2000 Pure Growth ETF (PXSG)(continued)
Fund Inception: March 3, 2005
Performance quoted above represents past performance. Past performance is not a guarantee of future results and current performance may be higher or lower than performance quoted. Investment returns and principal value will fluctuate, and shares of the Fund (“Fund Shares”), when redeemed or sold, may be worth more or less than their original cost. Fund performance reflects any applicable fee waivers and/or expense reimbursements. Had the adviser not waived fees and/or reimbursed expenses currently or in the past, returns would have been lower. See current prospectus for more information. The adviser has contractually agreed to waive fees and/or pay certain Fund expenses through August 31, 2021. According to the Fund’s current prospectus, the total gross annual operating expense ratio was indicated as 0.59% and the net annual operating expense ratio was indicated as 0.39%. The Financial Highlights section of the Shareholder Report presents the expense ratios based on expenses incurred during the period covered by this report. NAV and Market Price returns assume that dividends and capital gain distributions have been reinvested in the Fund at NAV and Market Price, respectively. The returns shown in the table above do not reflect the deduction of taxes that a shareholder would pay on Fund distributions or the redemption or sale of Fund Shares. See invesco.com/ETFs to find the most recentmonth-end performance numbers.
Blended-Index and Benchmark Index performance results are based upon a hypothetical investment in their respective constituent securities. Blended-Index and Benchmark Index returns do not represent Fund returns. An investor cannot invest directly in an index. The Blended-Index and Benchmark Index do not charge management fees or brokerage expenses, and no such fees or expenses were deducted from the hypothetical performance shown. In addition, the results actual investors might have achieved would have differed from those shown because of differences in the timing, amounts of their investments, and fees and expenses associated with an investment in the Fund.
Notes Regarding Indexes and Fund Performance History:
| - | The Blended—Russell 2000® Pure Growth Index is comprised of the performance of the Dynamic Small Cap Growth IntellidexSM Index, the Fund’s underlying index from Fund inception through the conversion date, June 16, 2011, followed by the performance of the RAFI® Fundamental Small Growth Index for the period June 16, 2011 through May 22, 2015, followed by the performance of the Index for the period May 22, 2015 through April 30, 2019. |
| - | Average Annualized and Cumulative Inception returns for the Fund, Blended-Index and Benchmark Index are based on the inception date of the Fund. |
| | |
| PXSV | | Manager’s Analysis |
| | Invesco Russell 2000 Pure Value ETF (PXSV) |
Effective after the close of markets on June 21, 2019, the Fund’s name changed from Invesco Russell 2000 Pure Value ETF to Invesco S&P SmallCap Value with Momentum ETF and the underlying index changed from Russell 2000® Pure Value Index (the “Previous Index”) to S&P 600 High Momentum Value Index (the “Index”). At that time, the Fund also changed its ticker symbol from PXSV to XSVM and changed its investment objective and investment policies. The discussion that follows pertains to the Fund’s performance tracking the Previous Index for the fiscal year ended April 30, 2019.
As an index fund, the Invesco Russell 2000 Pure Value ETF (the “Fund”) is passively managed and seeks to track the returns of an underlying index. The Fund seeks to track the investment results (before fees and expenses) of the Index and, through June 21, 2019, the Previous Index. The Fund generally will invest at least 90% of its total assets in the component securities that comprise the Index and, through June 21, 2019, the Previous Index.
The Previous Index is composed of a subset of securities from the Russell 2000® Index, which is composed of the smallest 2,000 securities of the Russell 3000® Index, an index designed to measure the performance of the largest 3,000 companies in the U.S. equity market.
Frank Russell Company (the “Index Provider”) first identifies securities in the Russell 2000® Index with lowerprice-to-book ratios and lower forecasting growth values. The Previous Index’s constituent securities are then assigned a Composite Value Score (“CVS”), which is calculated based on three characteristics (book to price (a value characteristic), sales per share growth (a growth characteristic) and medium-term growth forecast (a growth characteristic)) to identify whether they are growth or value securities. In general, stocks with higher CVS are considered value stocks. The Previous Index then weights securities in proportion to their CVS, giving greatest weight to the securities demonstrating the most value characteristics.
The Fund generally invests in all of the securities comprising the Index in proportion to their weightings in the Index, and through June 21, 2019, in all of the securities comprising the Previous Index in proportion to their weightings in the Previous Index.
For the fiscal year ended April 30, 2019, on a market price basis, the Fund returned 2.00%. On a net asset value (“NAV”) basis, the Fund returned 2.13%. During the same time period, the Previous Index returned 2.40%. During the fiscal year, the Fund fully replicated the components of the Previous Index; therefore, the Fund’s performance, on a NAV basis, differed from the return of the Previous Index primarily due fees and operating expenses that the Fund incurred during the period, partially offset by income received from the securities lending program in which the Fund participates.
During this same time period, the Russell 2000® Value Index (the “Benchmark Index”) returned 2.19%. The Benchmark Index is an unmanaged index weighted by market capitalization based on the average performance of approximately 1360 securities. The Benchmark Index was selected for its recognition in the marketplace, and because its performance comparison is a useful measure for investors as a broad representation of the U.S. small cap value market.
The performance of the Fund differed from the Benchmark Index in part because the Fund seeks to track an index that employs a fundamental weighting and stock selection methodology, whereas the Benchmark Index selects and weights stocks based primarily on market capitalization.
Relative to the Benchmark Index, the Fund was most overweight in the energy sector and most underweight in the information technology sector during the fiscal year ended April 30, 2019. The majority of the Fund’s underperformance relative to the Benchmark Index during the period can be attributed to the Fund’s underweight exposure to and security selection in the information technology sector.
For the fiscal year ended April 30, 2019, the financials sector contributed most significantly to the Fund’s return, followed by the information technology and real estate sectors, respectively. The energy sector detracted most significantly from the Fund’s return, followed by the health care sector.
Positions that contributed most significantly to the Fund’s return, for the fiscal year ended April 30, 2019, included Iridium Communications, Inc., a communication services company (portfolio average weight 1.03%) and Fluent, Inc., a communication services company (portfolio average weight of 0.48%). Positions that detracted most significantly from the Fund’s return during this period included Cloud Peak Energy, Inc., an energy company (no longer held at fiscalyear-end), and Dean Foods Co., a consumer staples company (portfolio average weight of 0.37%).
Invesco Russell 2000 Pure Value ETF (PXSV)(continued)
| | | | |
Sector Breakdown
(% of the Fund’s Net Assets)
as of April 30, 2019 | |
| Financials | | | 28.1 | |
| Real Estate | | | 15.7 | |
| Information Technology | | | 9.9 | |
| Industrials | | | 9.2 | |
| Consumer Discretionary | | | 9.2 | |
| Energy | | | 8.7 | |
| Communication Services | | | 5.7 | |
| Utilities | | | 5.3 | |
| Health Care | | | 3.3 | |
| Consumer Staples | | | 3.0 | |
| Materials | | | 1.8 | |
| Money Market Funds Plus Other Assets Less Liabilities | | | 0.1 | |
| | | | |
Top Ten Fund Holdings*
(% of the Fund’s Net Assets)
as of April 30, 2019 | |
| Security | | | | |
| Iridium Communications, Inc. | | | 1.4 | |
| Fluent, Inc. | | | 1.1 | |
| MGIC Investment Corp. | | | 1.0 | |
| DHT Holdings, Inc. | | | 1.0 | |
| PDL BioPharma, Inc. | | | 1.0 | |
| Knowles Corp. | | | 1.0 | |
| World Fuel Services Corp. | | | 0.9 | |
| Frontline Ltd. (Norway) | | | 0.9 | |
| NorthWestern Corp. | | | 0.9 | |
| Cooper Tire & Rubber Co. | | | 0.9 | |
| Total | | | 10.1 | |
| * | Excluding money market fund holdings. |
Growth of a $10,000 Investment
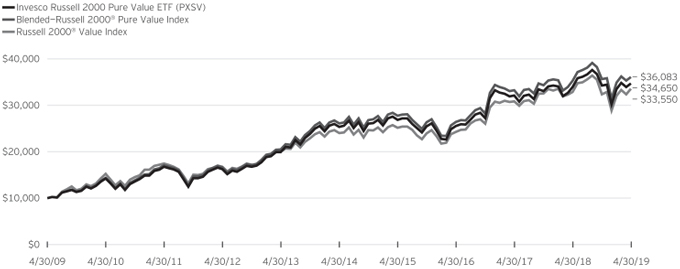
Fund Performance History as of April 30, 2019
| | | | | | | | | | | | | | | | | | | | | | | | | | | | | | | | | | | | | | | | |
| | | 1 Year | | | 3 Years Average
Annualized | | | 3 Years Cumulative | | | 5 Years Average
Annualized | | | 5 Years Cumulative | | | 10 Years Average
Annualized | | | 10 Years Cumulative | | | | | | Fund Inception | |
| Index | | | | | Average
Annualized | | | Cumulative | |
| Blended—Russell 2000® Pure Value Index | | | 2.40 | % | | | 10.99 | % | | | 36.72 | % | | | 6.70 | % | | | 38.28 | % | | | 13.69 | % | | | 260.83 | % | | | | | | | 7.30 | % | | | 171.10 | % |
| Russell 2000® Value Index | | | 2.19 | | | | 11.46 | | | | 38.46 | | | | 6.94 | | | | 39.84 | | | | 12.87 | | | | 235.50 | | | | | | | | 7.03 | | | | 161.65 | |
| Fund | | | | | | | | | | | | | | | | | | | | | | | | | | | | | | | | | | | | | | | | |
| NAV Return | | | 2.13 | | | | 10.70 | | | | 35.66 | | | | 6.44 | | | | 36.60 | | | | 13.23 | | | | 246.50 | | | | | | | | 6.77 | | | | 152.92 | |
| Market Price Return | | | 2.00 | | | | 10.67 | | | | 35.56 | | | | 6.42 | | | | 36.51 | | | | 13.25 | | | | 247.07 | | | | | | | | 6.76 | | | | 152.55 | |
Invesco Russell 2000 Pure Value ETF (PXSV)(continued)
Fund Inception: March 3, 2005
Performance quoted above represents past performance. Past performance is not a guarantee of future results and current performance may be higher or lower than performance quoted. Investment returns and principal value will fluctuate, and shares of the Fund (“Fund Shares”), when redeemed or sold, may be worth more or less than their original cost. Fund performance reflects any applicable fee waivers and/or expense reimbursements. Had the adviser not waived fees and/or reimbursed expenses currently or in the past, returns would have been lower. See current prospectus for more information. The adviser has contractually agreed to waive fees and/or pay certain Fund expenses through August 31, 2021. According to the Fund’s current prospectus, the total gross annual operating expense ratio was indicated as 0.46% and the net annual operating expense ratio was indicated as 0.39%. The Financial Highlights section of the Shareholder Report presents the expense ratios based on expenses incurred during the period covered by this report. NAV and Market Price returns assume that dividends and capital gain distributions have been reinvested in the Fund at NAV and Market Price, respectively. The returns shown in the table above do not reflect the deduction of taxes that a shareholder would pay on Fund distributions or the redemption or sale of Fund Shares. See invesco.com/ETFs to find the most recentmonth-end performance numbers.
Blended-Index and Benchmark Index performance results are based upon a hypothetical investment in their respective constituent securities. Blended-Index and Benchmark Index returns do not represent Fund returns. An investor cannot invest directly in an index. The Blended-Index and Benchmark Index do not charge management fees or brokerage expenses, and no such fees or expenses were deducted from the hypothetical performance shown. In addition, the results actual investors might have achieved would have differed from those shown because of differences in the timing, amounts of their investments, and fees and expenses associated with an investment in the Fund.
Notes Regarding Indexes and Fund Performance History:
| - | The Blended—Russell 2000® Pure Value Index is comprised of the performance of the Dynamic Small Cap Value IntellidexSM Index, the Fund’s underlying index from Fund inception through the conversion date, June 16, 2011, followed by the performance of the RAFI® Fundamental Small Value Index for the period June 16, 2011 through May 22, 2015, followed by the performance of the Index for the period May 22, 2015 through April 30, 2019. |
| - | Average Annualized and Cumulative Inception returns for the Fund, Blended-Index and Benchmark Index are based on the inception date of the Fund. |
| | |
| EQWM | | Manager’s Analysis |
| | Invesco Russell Midcap Equal Weight ETF (EQWM) |
Effective after the close of markets on June 21, 2019, the Fund’s name changed from Invesco Russell Midcap Equal Weight ETF to Invesco S&P MidCap Quality ETF and the underlying index changed from Russell Midcap® Equal Weight Index (the “Previous Index”) to S&P MidCap 400 Quality Index (the “Index”). At that time, the Fund also changed its ticker symbol from EQWM to XMHQ and changed its investment objective and investment policies. The discussion that follows pertains to the Fund’s performance tracking the Previous Index for the fiscal year ended April 30, 2019.
As an index fund, the Invesco Russell Midcap Equal Weight ETF (the “Fund”) is passively managed and seeks to track the returns of an underlying index. The Fund seeks to track the investment results (before fees and expenses) of the Index and, through June 21, 2019, the Previous Index. The Fund generally will invest at least 90% of its total assets in the component securities that comprise the Index, and through June 21, 2019, the Previous Index.
The Previous Index is designed to measure the performance of approximately 800 equally-weighted securities of mid-capitalization U.S. companies. The Previous Index generally is composed of all of the securities included in the Russell Midcap® Index, which is composed of the smallest 800 securities of the Russell 1000® Index, an index designed to measure the performance of the largest 1,000 companies in the U.S. equity market.
Each quarter, Frank Russell Company (the “Index Provider”) groups each component security in the Russell Midcap® Index based on the Russell Global Sectors (“RGS”) classification system. The RGS classification system is composed of nine economic sectors: consumer discretionary, consumer staples, energy, financial services, health care, materials & processing, producer durables, technology and utilities. Once the component securities are grouped, the Index Provider allocates an equal weight to each sector and then assigns an equal weight to each constituent security within each sector.
The Index Provider applies a “capacity screen” to the Index to eliminate securities of companies with limited “free float”—that is, with a limited number of outstanding shares readily available in the market. A potential constituent will be eligible for inclusion in the Previous Index only if the number of shares of the component security does not exceed 5% of the float-adjusted outstanding shares of that company.
Unlike the Russell Midcap® Index, which employs a market capitalization weighted methodology, the Previous Index’s equal weighting methodology provides equal exposure to the smallest components and underweighted sectors of the Russell Midcap® Index.
The Fund generally invests in all of the securities comprising the Index in proportion to their weightings in the Index, and through June 21, 2019, in all of the securities comprising the Previous Index in proportion to their weightings in the Previous Index.
For the fiscal year ended April 30, 2019, on a market price basis, the Fund returned 8.78%. On a net asset value (“NAV”) basis, the Fund returned 8.85%. During the same time period, the Previous Index returned 9.09%. During the fiscal year, the Fund fully replicated the components of the Previous Index; therefore, the Fund’s performance, on a NAV basis, differed from the return of the Previous Index primarily due to fees and operating expenses that the Fund incurred during the period.
During this same time period, the Russell Midcap® Index (the “Benchmark Index”) returned 10.69%. The Benchmark Index is an unmanaged index weighted by market capitalization based on the average performance of approximately 770 securities. The Benchmark Index was selected for its recognition in the marketplace, and because its performance comparison is a useful measure for investors as a broad representation of the U.S. mid-cap market.
The performance of the Fund differed from the Benchmark Index in part because the Fund seeks to track an index that employs an equal weight methodology, whereas the Benchmark Index selects and weights stocks based primarily on market capitalization.
Relative to the Benchmark Index, the Fund was most overweight in the consumer staples sector and most underweight in the financials sector during the fiscal year ended April 30, 2019. The majority of the Fund’s underperformance relative to the Benchmark Index during the period can be attributed to the Fund’s overweight allocation to the energy sector and the Fund’s underweight allocation to the information technology sector.
For the fiscal year ended April 30, 2019, the information technology sector contributed most significantly to the Fund’s return, followed by the industrials sector. The energy sector detracted most significantly from the Fund’s return.
Positions that contributed most significantly to the Fund’s return, for the fiscal year ended April 30, 2019, included TreeHouse Foods, Inc., a consumer staples company (portfolio average weight of 0.35%) and Church & Dwight Co., Inc., a consumer staples company (portfolio average weight of 0.37%). Positions that detracted most significantly from the Fund’s return during this period included Antero Resources Corp., an energy company (portfolio average weight of 0.23%) and Extraction Oil & Gas, Inc., an energy company (portfolio average weight of 0.23%).
Invesco Russell Midcap Equal Weight ETF (EQWM)(continued)
| | | | |
Sector Breakdown
(% of the Fund’s Net Assets)
as of April 30, 2019 | |
| Industrials | | | 13.2 | |
| Information Technology | | | 13.2 | |
| Consumer Staples | | | 11.6 | |
| Health Care | | | 11.2 | |
| Energy | | | 10.2 | |
| Utilities | | | 9.5 | |
| Consumer Discretionary | | | 8.6 | |
| Materials | | | 8.4 | |
| Financials | | | 6.0 | |
| Communication Services | | | 4.0 | |
| Real Estate | | | 4.0 | |
| Money Market Funds Plus Other Assets Less Liabilities | | | 0.1 | |
| | | | |
Top Ten Fund Holdings*
(% of the Fund’s Net Assets)
as of April 30, 2019 | |
| Security | | | | |
| Conagra Brands, Inc. | | | 0.5 | |
| Pilgrim’s Pride Corp. | | | 0.4 | |
| JM Smucker Co. (The) | | | 0.4 | |
| Tyson Foods, Inc., Class A | | | 0.4 | |
| Church & Dwight Co., Inc. | | | 0.4 | |
| Seaboard Corp. | | | 0.4 | |
| McCormick & Co., Inc. | | | 0.4 | |
| Post Holdings, Inc. | | | 0.4 | |
| TreeHouse Foods, Inc. | | | 0.4 | |
| Spectrum Brands Holdings, Inc. | | | 0.4 | |
| Total | | | 4.1 | |
| * | Excluding money market fund holdings. |
Growth of a $10,000 Investment
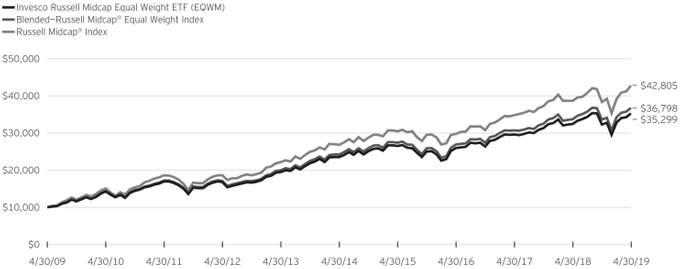
Fund Performance History as of April 30, 2019
| | | | | | | | | | | | | | | | | | | | | | | | | | | | | | | | | | | | | | | | |
| | | 1 Year | | | 3 Years Average
Annualized | | | 3 Years Cumulative | | | 5 Years Average
Annualized | | | 5 Years Cumulative | | | 10 Years Average
Annualized | | | 10 Years Cumulative | | | | | | Fund Inception | |
| Index | | | | | Average
Annualized | | | Cumulative | |
| Blended—Russell Midcap® Equal Weight Index | | | 9.09 | % | | | 10.99 | % | | | 36.73 | % | | | 8.68 | % | | | 51.62 | % | | | 13.92 | % | | | 267.98 | % | | | | | | | 7.46 | % | | | 144.33 | % |
| Russell Midcap® Index | | | 10.69 | | | | 12.82 | | | | 43.60 | | | | 9.75 | | | | 59.22 | | | | 15.65 | | | | 328.05 | | | | | | | | 8.60 | | | | 178.52 | |
| Fund | | | | | | | | | | | | | | | | | | | | | | | | | | | | | | | | | | | | | | | | |
| NAV Return | | | 8.85 | | | | 10.75 | | | | 35.86 | | | | 8.42 | | | | 49.79 | | | | 13.44 | | | | 252.99 | | | | | | | | 6.98 | | | | 131.00 | |
| Market Price Return | | | 8.78 | | | | 10.78 | | | | 35.94 | | | | 8.44 | | | | 49.96 | | | | 13.45 | | | | 253.07 | | | | | | | | 6.98 | | | | 131.01 | |
Invesco Russell Midcap Equal Weight ETF (EQWM)(continued)
Fund Inception: December 1, 2006
Performance quoted above represents past performance. Past performance is not a guarantee of future results and current performance may be higher or lower than performance quoted. Investment returns and principal value will fluctuate, and shares of the Fund (“Fund Shares”), when redeemed or sold, may be worth more or less than their original cost. Fund performance reflects any applicable fee waivers and/or expense reimbursements. Had the adviser not waived fees and/or reimbursed expenses currently or in the past, returns would have been lower. See current prospectus for more information. The adviser has contractually agreed to waive fees and/or pay certain Fund expenses through August 31, 2021. According to the Fund’s current prospectus, the total gross annual operating expense ratio was indicated as 0.66% and the net annual operating expense ratio was indicated as 0.25%. The Financial Highlights section of the Shareholder Report presents the expense ratios based on expenses incurred during the period covered by this report. NAV and Market Price returns assume that dividends and capital gain distributions have been reinvested in the Fund at NAV and Market Price, respectively. The returns shown in the table above do not reflect the deduction of taxes that a shareholder would pay on Fund distributions or the redemption or sale of Fund Shares. See invesco.com/ETFs to find the most recentmonth-end performance numbers.
Blended-Index and Benchmark Index performance results are based upon a hypothetical investment in their respective constituent securities. Blended-Index and Benchmark Index returns do not represent Fund returns. An investor cannot invest directly in an index. The Blended-Index and Benchmark Index do not charge management fees or brokerage expenses, and no such fees or expenses were deducted from the hypothetical performance shown. In addition, the results actual investors might have achieved would have differed from those shown because of differences in the timing, amounts of their investments, and fees and expenses associated with an investment in the Fund.
Notes Regarding Indexes and Fund Performance History:
| - | The Blended—Russell Midcap® Equal Weight Index is comprised of the performance of the Dynamic Mid Cap IntellidexSM Index, the Fund’s underlying index from Fund inception through the conversion date, June 16, 2011, followed by the performance of the RAFI® Fundamental Mid Core Index for the period June 16, 2011 through May 22, 2015, followed by the performance of the Index for the period May 22, 2015 through April 30, 2019. |
| - | Average Annualized and Cumulative Inception returns for the Fund, Blended-Index and Benchmark Index are based on the inception date of the Fund. |
| | |
| PXMG | | Manager’s Analysis |
| | Invesco Russell Midcap Pure Growth ETF (PXMG) |
Effective after the close of markets on June 21, 2019, the Fund’s name changed from Invesco Russell Midcap Pure Growth ETF to Invesco S&P MidCap Momentum ETF and the underlying index changed from Russell Midcap® Pure Growth Index (the “Previous Index”) to S&P MidCap 400 Momentum Index (the “Index”). At that time, the Fund also changed its ticker symbol from PXMG to XMMO and changed its investment objective and investment policies. The discussion that follows pertains to the Fund’s performance tracking the Previous Index for the fiscal year ended April 30, 2019.
As an index fund, the Invesco Russell Midcap Pure Growth ETF (the “Fund”) is passively managed and seeks to track the returns of an underlying index. The Fund seeks to track the investment results (before fees and expenses) of the Index, and through June 21, 2019, the Previous Index. The Fund generally will invest at least 90% of its total assets in the component securities that comprise the Index, and through June 21, 2019, the Previous Index.
The Previous Index is composed of a subset of securities from the Russell Midcap® Index, which is composed of the smallest 800 securities of the Russell 1000® Index, an index designed to measure the performance of the largest 1,000 companies in the U.S. equity market.
Frank Russell Company (the “Index Provider”) first identifies securities in the Russell Midcap® Index with higher price-to-book ratios and higher forecasting growth values. The Previous Index’s constituent securities are then assigned a Composite Value Score (“CVS”), which is calculated based on three characteristics (book to price (a value characteristic), sales per share growth (a growth characteristic) and medium-term growth forecast (a growth characteristic)) to identify whether they are growth or value securities. In general, stocks with lower CVS are considered growth stocks. The Previous Index then weights securities in proportion to their CVS, giving greatest weight to the securities demonstrating the most growth characteristics.
The Fund generally invests in all of the securities comprising the Index in proportion to their weightings in the Index, and through June 21, 2019, in all of the securities comprising the Previous Index in proportion to their weightings in the Previous Index.
For the fiscal year ended April 30, 2019, on a market price basis, the Fund returned 29.48%. On a net asset value (“NAV”) basis, the Fund returned 29.72%. During the same time period, the Previous Index returned 30.14%. During the fiscal year, the Fund fully replicated the components of the Previous Index; therefore, the Fund’s performance, on a NAV basis, differed from the return of the Previous Index primarily due to fees and operating expenses that the Fund incurred during the period.
During this same time period, the Russell Midcap® Growth Index (the “Benchmark Index”) returned 17.64%. The Benchmark Index
is an unmanaged index weighted by market capitalization based on the average performance of approximately 420 securities. The Benchmark Index was selected for its recognition in the marketplace, and because its performance comparison is a useful measure for investors as a broad representation of the U.S. mid-cap growth market.
The performance of the Fund differed from the Benchmark Index in part because the Fund seeks to track an index that employs a fundamental weighting and stock selection methodology, whereas the Benchmark Index selects and weights stocks based primarily on market capitalization.
Relative to the Benchmark Index, the Fund was most overweight in the information technology sector and most underweight in the industrials sector during the fiscal year ended April 30, 2019. The majority of the Fund’s outperformance relative to the Benchmark Index during the period can be attributed to the Fund’s overweight exposure to and stock selection in the information technology sector.
For the fiscal year ended April 30, 2019, the information technology sector contributed most significantly to the Fund’s return, followed by the consumer discretionary and health care sectors, respectively. The consumer staples services sector was the only detracting sector.
Positions that contributed most significantly to the Fund’s return, for the fiscal year ended April 30, 2019, included Paycom Software, Inc., an information technology company (portfolio average weight of 1.98%) and Chipotle Mexican Grill, Inc., a consumer discretionary company (portfolio average weight of 2.39%). Positions that detracted most significantly from the Fund’s return during this period included GrubHub, Inc., a consumer discretionary company (portfolio average weight of 1.21%) and Alliance Data Systems Corp., an information technology company (portfolio average weight of 1.17%).
| | | | |
Sector Breakdown
(% of the Fund’s Net Assets)
as of April 30, 2019 | |
| Information Technology | | | 46.1 | |
| Consumer Discretionary | | | 21.2 | |
| Health Care | | | 12.3 | |
| Industrials | | | 10.7 | |
| Financials | | | 6.5 | |
| Communication Services | | | 3.1 | |
| Materials | | | 0.0 | |
| Money Market Funds Plus Other Assets Less Liabilities | | | 0.1 | |
Invesco Russell Midcap Pure Growth ETF (PXMG)(continued)
| | | | |
Top Ten Fund Holdings*
(% of the Fund’s Net Assets)
as of April 30, 2019 | |
| Security | | | | |
| Chipotle Mexican Grill, Inc. | | | 3.0 | |
| Paycom Software, Inc. | | | 2.9 | |
| Ulta Beauty, Inc. | | | 2.6 | |
| Square, Inc., Class A | | | 2.5 | |
| Universal Display Corp. | | | 2.4 | |
| RingCentral, Inc., Class A | | | 2.3 | |
| ServiceNow, Inc. | | | 2.2 | |
| Ubiquiti Networks, Inc. | | | 2.1 | |
| Fortinet, Inc. | | | 2.1 | |
| O’Reilly Automotive, Inc. | | | 2.1 | |
| Total | | | 24.2 | |
| * | Excluding money market fund holdings. |
Growth of a $10,000 Investment
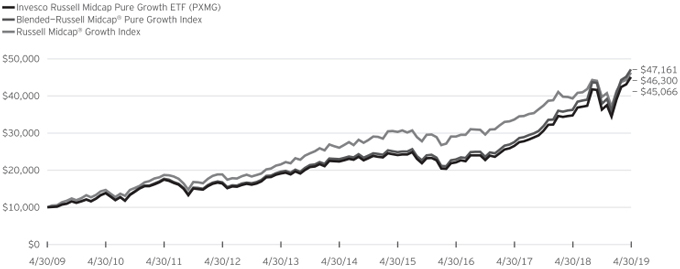
Fund Performance History as of April 30, 2019
| | | | | | | | | | | | | | | | | | | | | | | | | | | | | | | | | | | | | | | | |
| | | 1 Year | | | 3 Years Average
Annualized | | | 3 Years Cumulative | | | 5 Years Average
Annualized | | | 5 Years Cumulative | | | 10 Years Average
Annualized | | | 10 Years Cumulative | | | | | | Fund Inception | |
| Index | | | | | Average
Annualized | | | Cumulative | |
| Blended—Russell Midcap® Pure Growth Index | | | 30.14 | % | | | 27.22 | % | | | 105.92 | % | | | 15.48 | % | | | 105.35 | % | | | 16.78 | % | | | 371.61 | % | | | | | | | 11.23 | % | | | 351.20 | % |
| Russell Midcap® Growth Index | | | 17.64 | | | | 16.78 | | | | 59.25 | | | | 12.20 | | | | 77.80 | | | | 16.56 | | | | 363.00 | | | | | | | | 10.13 | | | | 292.10 | |
| Fund | | | | | | | | | | | | | | | | | | | | | | | | | | | | | | | | | | | | | | | | |
| NAV Return | | | 29.72 | | | | 26.79 | | | | 103.82 | | | | 15.07 | | | | 101.73 | | | | 16.25 | | | | 350.66 | | | | | | | | 10.65 | | | | 318.98 | |
| Market Price Return | | | 29.48 | | | | 26.83 | | | | 104.03 | | | | 15.10 | | | | 102.00 | | | | 16.27 | | | | 351.47 | | | | | | | | 10.64 | | | | 318.58 | |
Invesco Russell Midcap Pure Growth ETF (PXMG)(continued)
Fund Inception: March 3, 2005
Performance quoted above represents past performance. Past performance is not a guarantee of future results and current performance may be higher or lower than performance quoted. Investment returns and principal value will fluctuate, and shares of the Fund (“Fund Shares”), when redeemed or sold, may be worth more or less than their original cost. Fund performance reflects any applicable fee waivers and/or expense reimbursements. Had the adviser not waived fees and/or reimbursed expenses currently or in the past, returns would have been lower. See current prospectus for more information. The adviser has contractually agreed to waive fees and/or pay certain Fund expenses through August 31, 2021. According to the Fund’s current prospectus, the total gross annual operating expense ratio was indicated as 0.43% and the net annual operating expense ratio was indicated as 0.39%. The Financial Highlights section of the Shareholder Report presents the expense ratios based on expenses incurred during the period covered by this report. NAV and Market Price returns assume that dividends and capital gain distributions have been reinvested in the Fund at NAV and Market Price, respectively. The returns shown in the table above do not reflect the deduction of taxes that a shareholder would pay on Fund distributions or the redemption or sale of Fund Shares. See invesco.com/ETFs to find the most recentmonth-end performance numbers.
Blended-Index and Benchmark Index performance results are based upon a hypothetical investment in their respective constituent securities. Blended-Index and Benchmark Index returns do not represent Fund returns. An investor cannot invest directly in an index. The Blended-Index and Benchmark Index do not charge management fees or brokerage expenses, and no such fees or expenses were deducted from the hypothetical performance shown. In addition, the results actual investors might have achieved would have differed from those shown because of differences in the timing, amounts of their investments, and fees and expenses associated with an investment in the Fund.
| Notes | Regarding Indexes and Fund Performance History: |
| - | The Blended—Russell Midcap® Pure Growth Index is comprised of the performance of the Dynamic Mid Cap Growth IntellidexSM Index, the Fund’s underlying index from Fund inception through the conversion date, June 16, 2011, followed by the performance of the RAFI® Fundamental Mid Growth Index for the period June 16, 2011 through May 22, 2015, followed by the performance of the Index for the period May 22, 2015 through April 30, 2019. |
| - | Average Annualized and Cumulative Inception returns for the Fund, Blended-Index and Benchmark Index are based on the inception date of the Fund. |
| | |
| PXMV | | Manager’s Analysis |
| | Invesco Russell Midcap Pure Value ETF (PXMV) |
Effective after the close of markets on June 21, 2019, the Fund’s name changed from Invesco Russell Midcap Pure Value ETF to Invesco S&P MidCap Value with Momentum ETF and the underlying index changed from Russell Midcap® Pure Value Index (the “Previous Index”) to S&P 400 High Momentum Value Index (the “Index”). At that time, the Fund also changed its ticker symbol from PXMV to XMVM and changed its investment objective and investment policies. The discussion that follows pertains to the Fund’s performance tracking the Previous Index for the fiscal year ended April 30, 2019.
As an index fund, the Invesco Russell Midcap Pure Value ETF (the “Fund”) is passively managed and seeks to track the returns of an underlying index. The Fund seeks to track the investment results (before fees and expenses) of the Index and, through June 21, 2019, the Previous Index. The Fund generally will invest at least 90% of its total assets in the component securities that comprise the Index and, through June 21, 2019, the Previous Index.
The Previous Index is composed of a subset of securities from the Russell Midcap® Index, which is composed of the smallest 800 securities of the Russell 1000® Index, an index designed to measure the performance of the largest 1,000 companies in the U.S. equity market.
Frank Russell Company (the “Index Provider”) first identifies securities in the Russell Midcap® Index with lower price-to-book ratios and lower forecasting growth values. The Previous Index’s constituent securities are then assigned a Composite Value Score (“CVS”), which is calculated based on three characteristics (book to price (a value characteristic), sales per share growth (a growth characteristic) and medium-term growth forecast (a growth characteristic)) to identify whether they are growth or value securities. In general, stocks with higher CVS are considered value stocks. The Previous Index then weights securities in proportion to their CVS, giving greatest weight to the securities demonstrating the most value characteristics.
The Fund generally invests in all of the securities comprising the Index in proportion to their weightings in the Index, and through June 21, 2019, in all of the securities comprising the Previous Index in proportion to their weightings in the Previous Index.
For the fiscal year ended April 30, 2019, on a market price basis, the Fund returned 8.30%. On a net asset value (“NAV”) basis, the Fund returned 8.36%. During the same time period, the Previous Index returned 8.76%. During the fiscal year, the Fund fully replicated the components of the Previous Index; therefore, the Fund’s performance, on a NAV basis, differed from the return of the Previous Index primarily due to fees and operating expenses that the Fund incurred during the period.
During this same time period, the Russell Midcap® Value Index (the “Benchmark Index”) returned 5.76%. The Benchmark Index is an unmanaged index weighted by market capitalization based
on the average performance of approximately 590 securities. The Benchmark Index was selected for its recognition in the marketplace, and because its performance comparison is a useful measure for investors as a broad representation of the U.S. mid-cap value market.
The performance of the Fund differed from the Benchmark Index in part because the Fund seeks to track an index that employs a fundamental weighting and stock selection methodology, whereas the Benchmark Index selects and weights stocks based primarily on market capitalization.
Relative to the Benchmark Index, the Fund was most overweight in the utilities sector and most underweight in the energy sector during the fiscal year ended April 30, 2019. The majority of the Fund’s outperformance relative to the Benchmark Index during the period can be attributed to the Fund’s overweight exposure to and stock selection in the real estate sector.
For the fiscal year ended April 30, 2019, the real estate sector contributed most significantly to the Fund’s return, followed by the utilities and industrials sectors, respectively. The communication services sector detracted most significantly from the Fund’s return, followed by the energy sector.
Positions that contributed most significantly to the Fund’s return, for the fiscal year ended April 30, 2019, included Endo International PLC, a health care company (no longer held at fiscal year-end), and Avnet, Inc., an information technology company (portfolio average weight of 1.43%). Positions that detracted most significantly from the Fund’s return during this period included Adient PLC, a consumer discretionary company (portfolio average weight of 0.68%) and Perrigo Co. PLC, a health care company (portfolio average weight of 0.85%).
| | | | |
Sector Breakdown
(% of the Fund’s Net Assets)
as of April 30, 2019 | |
| Real Estate | | | 22.3 | |
| Utilities | | | 20.7 | |
| Financials | | | 14.1 | |
| Industrials | | | 8.3 | |
| Information Technology | | | 7.4 | |
| Communication Services | | | 6.8 | |
| Consumer Discretionary | | | 6.0 | |
| Materials | | | 5.4 | |
| Consumer Staples | | | 5.0 | |
| Sector Types Each Less than 3% | | | 3.9 | |
| Money Market Funds Plus Other Assets Less Liabilities | | | 0.1 | |
Invesco Russell Midcap Pure Value ETF (PXMV)(continued)
| | | | |
Top Ten Fund Holdings*
(% of the Fund’s Net Assets)
as of April 30, 2019 | |
| Security | | | | |
| Evergy, Inc. | | | 1.6 | |
| Avnet, Inc. | | | 1.6 | |
| Ashland Global Holdings, Inc. | | | 1.3 | |
| DISH Network Corp., Class A | | | 1.3 | |
| Brixmor Property Group, Inc. | | | 1.3 | |
| Annaly Capital Management, Inc. | | | 1.2 | |
| Arconic, Inc. | | | 1.2 | |
| MFA Financial, Inc. | | | 1.2 | |
| HCP, Inc. | | | 1.2 | |
| New York Community Bancorp, Inc. | | | 1.2 | |
| Total | | | 13.1 | |
| * | Excluding money market fund holdings. |
Growth of a $10,000 Investment
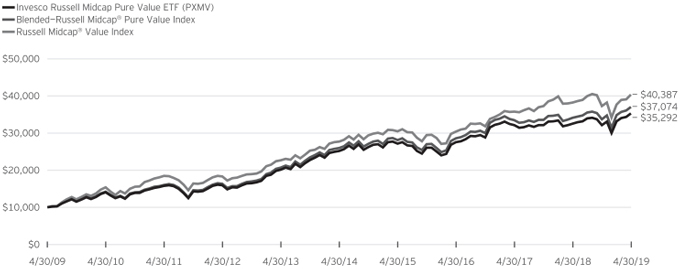
Fund Performance History as of April 30, 2019
| | | | | | | | | | | | | | | | | | | | | | | | | | | | | | | | | | | | | | | | |
| | | 1 Year | | | 3 Years Average
Annualized | | | 3 Years Cumulative | | | 5 Years Average
Annualized | | | 5 Years Cumulative | | | 10 Years Average
Annualized | | | 10 Years Cumulative | | | | | | Fund Inception | |
| Index | | Average
Annualized | | | Cumulative | |
| Blended—Russell Midcap® Pure Value Index | | | 8.76 | % | | | 9.01 | % | | | 29.54 | % | | | 7.37 | % | | | 42.73 | % | | | 14.00 | % | | | 270.74 | % | | | | | | | 8.07 | % | | | 200.04 | % |
| Russell Midcap® Value Index | | | 5.76 | | | | 9.91 | | | | 32.77 | | | | 7.83 | | | | 45.75 | | | | 14.98 | | | | 303.87 | | | | | | | | 8.65 | | | | 223.81 | |
| Fund | | | | | | | | | | | | | | | | | | | | | | | | | | | | | | | | | | | | | | | | |
| NAV Return | | | 8.36 | | | | 8.61 | | | | 28.10 | | | | 6.99 | | | | 40.20 | | | | 13.44 | | | | 252.92 | | | | | | | | 7.47 | | | | 177.35 | |
| Market Price Return | | | 8.30 | | | | 8.60 | | | | 28.07 | | | | 6.99 | | | | 40.17 | | | | 13.47 | | | | 253.70 | | | | | | | | 7.46 | | | | 176.86 | |
Invesco Russell Midcap Pure Value ETF (PXMV)(continued)
Fund Inception: March 3, 2005
Performance quoted above represents past performance. Past performance is not a guarantee of future results and current performance may be higher or lower than performance quoted. Investment returns and principal value will fluctuate, and shares of the Fund (“Fund Shares”), when redeemed or sold, may be worth more or less than their original cost. Fund performance reflects any applicable fee waivers and/or expense reimbursements. Had the adviser not waived fees and/or reimbursed expenses currently or in the past, returns would have been lower. See current prospectus for more information. The adviser has contractually agreed to waive fees and/or pay certain Fund expenses through August 31, 2021. According to the Fund’s current prospectus, the total gross annual operating expense ratio was indicated as 0.51% and the net annual operating expense ratio was indicated as 0.39%. The Financial Highlights section of the Shareholder Report presents the expense ratios based on expenses incurred during the period covered by this report. NAV and Market Price returns assume that dividends and capital gain distributions have been reinvested in the Fund at NAV and Market Price, respectively. The returns shown in the table above do not reflect the deduction of taxes that a shareholder would pay on Fund distributions or the redemption or sale of Fund Shares. See invesco.com/ETFs to find the most recent month-end performance numbers.
Blended-Index and Benchmark Index performance results are based upon a hypothetical investment in their respective constituent securities. Blended-Index and Benchmark Index returns do not represent Fund returns. An investor cannot invest directly in an index. The Blended-Index and Benchmark Index do not charge management fees or brokerage expenses, and no such fees or expenses were deducted from the hypothetical performance shown. In addition, the results actual investors might have achieved would have differed from those shown because of differences in the timing, amounts of their investments, and fees and expenses associated with an investment in the Fund.
Notes Regarding Indexes and Fund Performance History:
| - | The Blended—Russell Midcap® Pure Value Index is comprised of the performance of the Dynamic Mid Cap Value IntellidexSM Index, the Fund’s underlying index from Fund inception through the conversion date, June 16, 2011, followed by the performance of the RAFI® Fundamental Mid Value Index for the period June 16, 2011 through May 22, 2015, followed by the performance of the Index for the period May 22, 2015 through April 30, 2019. |
| - | Average Annualized and Cumulative Inception returns for the Fund, Blended-Index and Benchmark Index are based on the inception date of the Fund. |
| | |
| EQWL | | Manager’s Analysis |
| | Invesco Russell Top 200 Equal Weight ETF (EQWL) |
Effective after the close of markets on June 21, 2019, the Fund’s name changed from Invesco Russell Top 200 Equal Weight ETF to Invesco S&P 100 Equal Weight ETF and the underlying index changed from Russell Top 200® Equal Weight Index (the “Previous Index”) to S&P 100 Equal Weight Index (the “Index”). At that time, the Fund also changed its investment objective and investment policies. The discussion that follows pertains to the Fund’s performance tracking the Previous Index for the fiscal year ended April 30, 2019.
As an index fund, the Invesco Russell Top 200 Equal Weight ETF (the “Fund”) is passively managed and seeks to track the returns of an underlying index. The Fund seeks to track the investment results (before fees and expenses) of the Index and, through June 21, 2019, the Previous Index. The Fund generally will invest at least 90% of its total assets in the component securities that comprise the Index, and through June 21, 2019, the Previous Index.
The Previous Index is designed to provide measure the performance of approximately 200 equally-weighted securities of large U.S. companies. The Previous Index generally is composed of all of the securities included in the Russell Top 200® Index, which is composed of the largest 200 securities of the Russell 3000® Index, an index designed to measure the performance of the largest 3,000 companies in the U.S. equity market.
Each quarter, Frank Russell Company (the “Index Provider”) groups each component security in the Russell Top 200® Index based on the Russell Global Sectors (“RGS”) classification system. The RGS classification system is composed of nine economic sectors: consumer discretionary, consumer staples, energy, financial services, health care, materials & processing, producer durables, technology and utilities. Once the component securities are grouped, the Index Provider allocates an equal weight to each sector and then assigns an equal weight to each constituent security within each sector.
The Index Provider applies a “capacity screen” to the Index to eliminate securities of companies with limited “free float”—that is, with a limited number of outstanding shares readily available in the market. A potential constituent will be eligible for inclusion in the Index only if the number of shares of the component security does not exceed 5% of the float-adjusted outstanding shares of that company.
Unlike the Russell Top 200® Index, which employs a market capitalization-weighted methodology, the Previous Index’s methodology equally weighed the smallest components and underweighted sectors of the Russell Top 200® Index.
The Fund generally invests in all of the securities comprising the Index in proportion to their weightings in the Index, and through
June 21, 2019, in all of the securities comprising the Previous Index in proportion to their weightings in the Previous Index.
For the fiscal year ended April 30, 2019, on a market price basis, the Fund returned 10.98%. On a net asset value (“NAV”) basis, the Fund returned 11.04%. During the same time period, the Index returned 11.32%. During the fiscal year, the Fund fully replicated the components of the Previous Index; therefore, the Fund’s performance, on a NAV basis, differed from the return of the Previous Index primarily due to fees and operating expenses that the Fund incurred during the period.
During this same time period, the Russell 1000® Index (the “Benchmark Index”) returned 13.33%. The Benchmark Index is an unmanaged index weighted by market capitalization based on the average performance of approximately 970 securities. The Benchmark Index was selected for its recognition in the marketplace, and because its performance comparison is a useful measure for investors as a broad representation of the U.S. large cap market.
The performance of the Fund differed from the Benchmark Index in part because the Fund seeks to track an Index that employs an equal weight methodology, whereas the Benchmark Index selects and weights stocks based primarily on market capitalization.
Relative to the Benchmark Index, the Fund was most overweight in the materials and energy sectors and most underweight in the information technology sector during the fiscal year ended April 30, 2019. The majority of the Fund’s underperformance relative to the Benchmark Index during the period can be attributed to the Fund’s relative underweight allocation to the information technology sector.
For the fiscal year ended April 30, 2019, the information technology sector contributed most significantly to the Fund’s return, followed by the financials and energy sectors, respectively. The telecommunication services sector and consumer staples sector detracted most significantly from the Fund’s return.
Positions that contributed most significantly to the Fund’s return for the fiscal year ended April 30, 2019, included Air Products and Chemicals, Inc., a materials company (portfolio average weight of 1.40%) and Sherwin-Williams Co., a materials company (portfolio average weight of 1.40%). Positions that detracted most significantly from the Fund’s return during this period included Halliburton Co., an energy company (portfolio average weight of 0.68%) and Kraft Heinz Co., a consumer staples company (portfolio average weight of 0.80%).
Invesco Russell Top 200 Equal Weight ETF (EQWL)(continued)
| | | | |
Sector Breakdown
(% of the Fund’s Net Assets)
as of April 30, 2019 | |
| Consumer Staples | | | 11.8 | |
| Information Technology | | | 11.6 | |
| Materials | | | 11.3 | |
| Energy | | | 11.1 | |
| Health Care | | | 11.1 | |
| Industrials | | | 10.3 | |
| Financials | | | 8.6 | |
| Consumer Discretionary | | | 7.8 | |
| Communication Services | | | 7.5 | |
| Utilities | | | 7.2 | |
| Real Estate | | | 1.7 | |
| Money Market Funds Plus Other Assets Less Liabilities | | | 0.0 | |
| | | | |
Top Ten Fund Holdings*
(% of the Fund’s Net Assets)
as of April 30, 2019 | |
| Security | | | | |
| Air Products & Chemicals, Inc. | | | 1.5 | |
| Sherwin-Williams Co. (The) | | | 1.5 | |
| Ecolab, Inc. | | | 1.4 | |
| Linde PLC | | | 1.4 | |
| Southern Copper Corp. | | | 1.4 | |
| PPG Industries, Inc. | | | 1.4 | |
| LyondellBasell Industries NV, Class A | | | 1.3 | |
| Anadarko Petroleum Corp. | | | 1.3 | |
| Southern Co. (The) | | | 1.2 | |
| American Electric Power Co., Inc. | | | 1.2 | |
| Total | | | 13.6 | |
| * | Excluding money market fund holdings. |
Growth of a $10,000 Investment
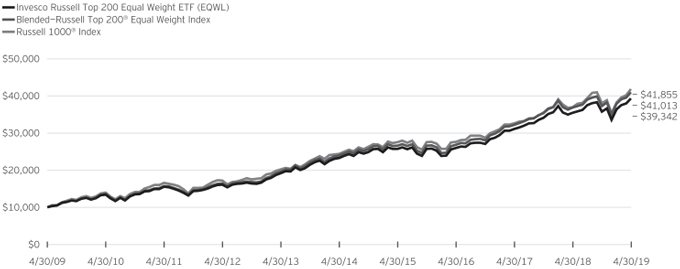
Fund Performance History as of April 30, 2019
| | | | | | | | | | | | | | | | | | | | | | | | | | | | | | | | | | | | | | | | |
| | | 1 Year | | | 3 Years Average
Annualized | | | 3 Years Cumulative | | | 5 Years Average
Annualized | | | 5 Years Cumulative | | | 10 Years Average
Annualized | | | 10 Years Cumulative | | | | | | Fund Inception | |
| Index | | Average
Annualized | | | Cumulative | |
| Blended—Russell Top 200® Equal Weight Index | | | 11.32 | % | | | 15.13 | % | | | 52.59 | % | | | 11.34 | % | | | 71.09 | % | | | 15.16 | % | | | 310.13 | % | | | | | | | 9.18 | % | | | 197.40 | % |
| Russell 1000® Index | | | 13.33 | | | | 14.82 | | | | 51.38 | | | | 11.41 | | | | 71.63 | | | | 15.39 | | | | 318.55 | | | | | | | | 8.54 | | | | 176.57 | |
| Fund | | | | | | | | | | | | | | | | | | | | | | | | | | | | | | | | | | | | | | | | |
| NAV Return | | | 11.04 | | | | 14.82 | | | | 51.39 | | | | 11.02 | | | | 68.69 | | | | 14.68 | | | | 293.42 | | | | | | | | 8.66 | | | | 180.53 | |
| Market Price Return | | | 10.98 | | | | 14.87 | | | | 51.56 | | | | 11.01 | | | | 68.60 | | | | 14.69 | | | | 293.70 | | | | | | | | 8.66 | | | | 180.35 | |
Invesco Russell Top 200 Equal Weight ETF (EQWL)(continued)
Fund Inception: December 1, 2006
Performance quoted above represents past performance. Past performance is not a guarantee of future results and current performance may be higher or lower than performance quoted. Investment returns and principal value will fluctuate, and shares of the Fund (“Fund Shares”), when redeemed or sold, may be worth more or less than their original cost. Fund performance reflects any applicable fee waivers and/or expense reimbursements. Had the adviser not waived fees and/or reimbursed expenses currently or in the past, returns would have been lower. See current prospectus for more information. The adviser has contractually agreed to waive fees and/or pay certain Fund expenses through August 31, 2021. According to the Fund’s current prospectus, the total gross annual operating expense ratio was indicated as 0.47% and the net annual operating expense ratio was indicated as 0.25%. The Financial Highlights section of the Shareholder Report presents the expense ratios based on expenses incurred during the period covered by this report. NAV and Market Price returns assume that dividends and capital gain distributions have been reinvested in the Fund at NAV and Market Price, respectively. The returns shown in the table above do not reflect the deduction of taxes that a shareholder would pay on Fund distributions or the redemption or sale of Fund Shares. See invesco.com/ETFs to find the most recent month-end performance numbers.
Blended-Index and Benchmark Index performance results are based upon a hypothetical investment in their respective constituent securities. Blended-Index and Benchmark Index returns do not represent Fund returns. An investor cannot invest directly in an index. The Blended-Index and Benchmark Index do not charge management fees or brokerage expenses, and no such fees or expenses were deducted from the hypothetical performance shown. In addition, the results actual investors might have achieved would have differed from those shown because of differences in the timing, amounts of their investments, and fees and expenses associated with an investment in the Fund.
Notes Regarding Indexes and Fund Performance History:
| - | The Blended—Russell Top 200® Equal Weight Index is comprised of the performance of the Dynamic Large Cap IntellidexSM Index, the Fund’s underlying index from Fund inception through the conversion date, June 16, 2011, followed by the performance of the RAFI® Fundamental Large Core Index for the period June 16, 2011 through May 22, 2015, followed by the performance of the Index for the period May 22, 2015 through April 30, 2019. |
| - | Average Annualized and Cumulative Inception returns for the Fund, Blended-Index and Benchmark Index are based on the inception date of the Fund. |
| | |
| PXLG | | Manager’s Analysis |
| | Invesco Russell Top 200 Pure Growth ETF (PXLG) |
Effective after the close of markets on June 21, 2019, the Fund’s name changed from Invesco Russell Top 200 Pure Growth ETF to Invesco S&P 500 GARP ETF and the underlying index changed from Russell Top 200® Pure Growth Index (the “Previous Index”) to S&P 500 Growth at a Reasonable Price Index (the “Index”). At that time, the Fund also changed its ticker symbol from PXLG to SPGP and changed its investment objective and investment policies. The discussion that follows pertains to the Fund’s performance tracking the Previous Index for the fiscal year ended April 30, 2019.
As an index fund, the Invesco Russell Top 200 Pure Growth ETF (the “Fund”) is passively managed and seeks to track the returns of an underlying index. The Fund seeks to track the investment results (before fees and expenses) of the Index and, through June 21, 2019, the Previous Index. The Fund generally will invest at least 90% of its total assets in the component securities that comprise the Index, and through June 21, 2019, the Previous Index.
The Previous Index is composed of a subset of securities from the Russell Top 200® Index, which is composed of the largest 200 securities of the Russell 3000® Index, an index designed to measure the performance of the largest 3,000 companies in the U.S. equity market.
Frank Russell Company (the “Index Provider”) first identifies securities in the Russell Top 200® Index with higher price-to-book ratios and higher forecasting growth values. The Previous Index’s constituent securities are then assigned a Composite Value Score (“CVS”), which is calculated based on three characteristics (book to price (a value characteristic), sales per share growth (a growth characteristic) and medium-term growth forecast (a growth characteristic)) to identify whether they are growth or value securities. In general, stocks with lower CVS are considered growth stocks. The Previous Index then weights securities in proportion to their CVS, giving greatest weight to the securities demonstrating the most growth characteristics.
The Fund generally invests in all of the securities comprising the Index in proportion to their weightings in the Index, and through June 21, 2019, in all of the securities comprising the Previous Index in proportion to their weightings in the Previous Index.
For the fiscal year ended April 30, 2019, on a market price basis, the Fund returned 16.20%. On a net asset value (“NAV”) basis, the Fund returned 16.35%. During the same time period, the Previous Index returned 16.74%. During the fiscal year, the Fund fully replicated the components of the Previous Index; therefore, the Fund’s performance, on a NAV basis, differed from the return of the Previous Index primarily due to fees and operating expenses that the Fund incurred during the period.
During this same time period, the Russell 1000® Growth Index (the “Benchmark Index”) returned 17.43%. The Benchmark Index
is an unmanaged index weighted by market capitalization based on the average performance of approximately 550 securities. The Benchmark Index was selected for its recognition in the marketplace, and because its performance comparison is a useful measure for investors as a broad representation of the U.S. large cap growth market.
The performance of the Fund differed from the Benchmark Index in part because the Fund seeks to track an index that employs a fundamental weighting and stock selection methodology, whereas the Benchmark Index selects and weights stocks based primarily on market capitalization.
Relative to the Benchmark Index, the Fund was most overweight in the consumer discretionary sector and most underweight in the industrials sector during the fiscal year ended April 30, 2019. The majority of the Fund’s underperformance relative to the Benchmark Index during the period can be attributed to the Fund’s underweight exposure to and stock selection in the consumer staples sector.
For the fiscal year ended April 30, 2019, the information technology sector contributed most significantly to the Fund’s return, followed by the consumer discretionary and health care sectors, respectively. The energy sector was the only detracting sector.
Positions that contributed most significantly to the Fund’s return, for the fiscal year ended April 30, 2019, included Mastercard Inc., Class A, an information technology company (portfolio average weight of 3.93%) and salesforce.com, Inc., an information technology company (portfolio average weight of 4.06%). Positions that detracted most significantly from the Fund’s return during this period included NVIDIA Corp., an information technology (portfolio average weight of 2.34%) and Tesla Inc., a consumer discretionary company (portfolio average weight of 1.91%).
| | | | |
Sector Breakdown
(% of the Fund’s Net Assets)
as of April 30, 2019 | |
| Information Technology | | | 33.3 | |
| Consumer Discretionary | | | 22.3 | |
| Health Care | | | 16.1 | |
| Communication Services | | | 7.8 | |
| Consumer Staples | | | 5.4 | |
| Industrials | | | 5.2 | |
| Financials | | | 3.4 | |
| Real Estate | | | 3.4 | |
| Materials | | | 3.1 | |
| Energy | | | 0.0 | |
| Money Market Funds Plus Other Assets Less Liabilities | | | 0.0 | |
Invesco Russell Top 200 Pure Growth ETF (PXLG)(continued)
| | | | |
Top Ten Fund Holdings*
(% of the Fund’s Net Assets)
as of April 30, 2019 | |
| Security | | | | |
| Mastercard, Inc., Class A | | | 4.5 | |
| salesforce.com, Inc. | | | 4.3 | |
| Amazon.com, Inc. | | | 4.0 | |
| Visa, Inc., Class A | | | 3.8 | |
| Adobe, Inc. | | | 3.6 | |
| Vertex Pharmaceuticals, Inc. | | | 3.5 | |
| Netflix, Inc. | | | 3.5 | |
| PayPal Holdings, Inc. | | | 3.4 | |
| Lowe’s Cos., Inc. | | | 3.4 | |
| TJX Cos., Inc. (The) | | | 3.0 | |
| Total | | | 37.0 | |
| * | Excluding money market fund holdings. |
Growth of a $10,000 Investment Since Inception
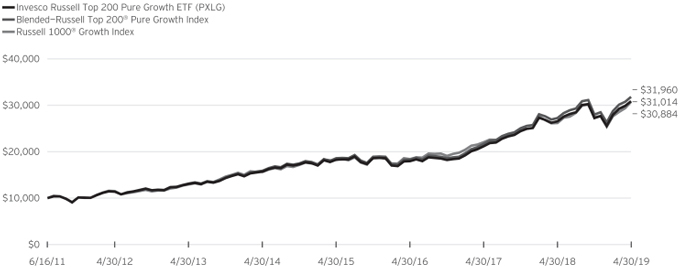
Fund Performance History as of April 30, 2019
| | | | | | | | | | | | | | | | | | | | | | | | | | | | | | | | |
| | | 1 Year | | | 3 Years Average
Annualized | | | 3 Years Cumulative | | | 5 Years Average
Annualized | | | 5 Years Cumulative | | | | | | Fund Inception | |
| Index | | Average
Annualized | | | Cumulative | |
| Blended—Russell Top 200® Pure Growth Index | | | 16.74 | % | | | 20.31 | % | | | 74.13 | % | | | 14.94 | % | | | 100.57 | % | | | | | | | 15.90 | % | | | 219.60 | % |
| Russell 1000® Growth Index | | | 17.43 | | | | 18.62 | | | | 66.93 | | | | 14.50 | | | | 96.84 | | | | | | | | 15.40 | | | | 208.84 | |
| Fund | | | | | | | | | | | | | | | | | | | | | | | | | | | | | | | | |
| NAV Return | | | 16.35 | | | | 19.86 | | | | 72.21 | | | | 14.50 | | | | 96.82 | | | | | | | | 15.46 | | | | 210.14 | |
| Market Price Return | | | 16.20 | | | | 19.85 | | | | 72.14 | | | | 14.50 | | | | 96.81 | | | | | | | | 15.47 | | | | 210.34 | |
Invesco Russell Top 200 Pure Growth ETF (PXLG)(continued)
Fund Inception: June 16, 2011
Performance quoted above represents past performance. Past performance is not a guarantee of future results and current performance may be higher or lower than performance quoted. Investment returns and principal value will fluctuate, and shares of the Fund (“Fund Shares”), when redeemed or sold, may be worth more or less than their original cost. Fund performance reflects any applicable fee waivers and/or expense reimbursements. Had the adviser not waived fees and/or reimbursed expenses currently or in the past, returns would have been lower. See current prospectus for more information. According to the Fund’s current prospectus, the total annual operating expense ratio was indicated as 0.39%. The Financial Highlights section of the Shareholder Report presents the expense ratios based on expenses incurred during the period covered by this report. NAV and Market Price returns assume that dividends and capital gain distributions have been reinvested in the Fund at NAV and Market Price, respectively. The returns shown in the table above do not reflect the deduction of taxes that a shareholder would pay on Fund distributions or the redemption or sale of Fund Shares. See invesco.com/ETFs to find the most recent month-end performance numbers.
Blended-Index and Benchmark Index performance results are based upon a hypothetical investment in their respective constituent securities. Blended-Index and Benchmark Index returns do not represent Fund returns. An investor cannot invest directly in an index. The Blended-Index and Benchmark Index do not charge management fees or brokerage expenses, and no such fees or expenses were deducted from the hypothetical performance shown. In addition, the results actual investors might have achieved would have differed from those shown because of differences in the timing, amounts of their investments, and fees and expenses associated with an investment in the Fund.
Notes Regarding Indexes and Fund Performance History:
| - | The Blended—Russell Top 200® Pure Growth Index performance is comprised of the performance of the RAFI® Fundamental Large Growth Index from Fund inception through the conversion date, May 22, 2015, followed by the performance of the Index starting from the conversion date through April 30, 2019. |
| - | Average Annualized and Cumulative Inception returns for the Fund, Blended-Index and Benchmark Index are based on the inception date of the Fund. |
| | |
| PXLV | | Manager’s Analysis |
| | Invesco Russell Top 200 Pure Value ETF (PXLV) |
Effective after the close of markets on June 21, 2019, the Fund’s name changed from Invesco Russell Top 200 Pure Value ETF to Invesco S&P 500 Value with Momentum ETF and the underlying index changed from Russell Top 200® Pure Value Index (the “Previous Index”) to S&P 500 High Momentum Value Index (the “Index”). At that time, the Fund also changed its ticker symbol from PXLV to SPVM and changed its investment objective and investment policies. The discussion that follows pertains to the Fund’s performance tracking the Previous Index for the fiscal year ended April 30, 2019.
As an index fund, the Invesco Russell Top 200 Pure Value ETF (the “Fund”) is passively managed and seeks to track the returns of an underlying index. The Fund seeks to track the investment results (before fees and expenses) of the Index and, through June 21, 2019, the Previous Index. The Fund generally will invest at least 90% of its total assets in the component securities that comprise the Index and, through June 21, 2019, the Previous Index.
The Previous Index is composed of a subset of securities from the Russell Top 200® Index, which is composed of the largest 200 securities of the Russell 3000® Index, an index designed to measure the performance of the largest 3,000 companies in the U.S. equity market.
Frank Russell Company (the “Index Provider”) first identifies securities in the Russell Top 200® Index with lower price-to-book ratios and lower forecasting growth values. The Previous Index’s constituent securities are then assigned a Composite Value Score (“CVS”), which is calculated based on three characteristics (book to price (a value characteristic), sales per share growth (a growth characteristic) and medium-term growth forecast (a growth characteristic)) to identify whether they are growth or value securities. In general, stocks with higher CVS are considered value stocks. The Previous Index then weights securities in proportion to their CVS, giving greatest weight to the securities demonstrating the most value characteristics.
The Fund generally invests in all of the securities comprising the Index in proportion to their weightings in the Index, and through June 21, 2019, in all of the securities comprising the Previous Index in proportion to their weightings in the Previous Index.
For the fiscal year ended April 30, 2019, on a market price basis, the Fund returned 8.31%. On a net asset value (“NAV”) basis, the Fund returned 8.40%. During the same time period, the Previous Index returned 8.79%. During the fiscal year, the Fund fully replicated the components of the Previous Index; therefore, the Fund’s performance, on a NAV basis, differed from the return of the Previous Index primarily due to fees and operating expenses that the Fund incurred during the period.
During this same time period, the Russell 1000® Value Index (the “Benchmark Index”) returned 9.06%. The Benchmark Index is an
unmanaged index weighted by market capitalization based on the average performance of approximately 720 securities. The Benchmark Index was selected for its recognition in the marketplace, and because its performance comparison is a useful measure for investors as a broad representation of the U.S. large cap value market.
The performance of the Fund differed from the Benchmark Index in part because the Fund seeks to track an Index that employs a fundamental weighting and stock selection methodology, whereas the Benchmark Index selects and weights stocks based primarily on market capitalization.
Relative to the Benchmark Index, the Fund was most overweight in the utilities sector and most underweight in the health care sector during the fiscal year ended April 30, 2019. The majority of the Fund’s underperformance relative to the Benchmark Index during the period can be attributed to the Fund’s underweight exposure to and stock selection in the information technology sector.
For the fiscal year ended April 30, 2019, the utilities sector contributed most significantly to the Fund’s return, followed by the consumer staples and financials sectors, respectively. There were no sectors that detracted from the Fund’s return.
Positions that contributed most significantly to the Fund’s return, for the fiscal year ended April 30, 2019, included Danaher Corp., a health care company (portfolio average weight of 2.48%) and Mondelez International, Inc., Class A, a consumer staples company (portfolio average weight of 2.83%). Positions that detracted most significantly from the Fund’s return during this period included Allergan PLC, a health care company (portfolio average weight of 3.25%) and General Electric Co., an industrials company (portfolio average weight of 1.86%).
| | | | |
Sector Breakdown
(% of the Fund’s Net Assets)
as of April 30, 2019 | |
| Financials | | | 25.4 | |
| Utilities | | | 16.6 | |
| Health Care | | | 10.1 | |
| Consumer Staples | | | 8.8 | |
| Industrials | | | 8.7 | |
| Consumer Discretionary | | | 8.0 | |
| Energy | | | 6.9 | |
| Communication Services | | | 5.3 | |
| Information Technology | | | 4.8 | |
| Materials | | | 3.3 | |
| Real Estate | | | 2.0 | |
| Money Market Funds Plus Other Assets Less Liabilities | | | 0.1 | |
Invesco Russell Top 200 Pure Value ETF (PXLV)(continued)
| | | | |
Top Ten Fund Holdings*
(% of the Fund’s Net Assets)
as of April 30, 2019 | |
| Security | | | | |
| AT&T, Inc. | | | 3.5 | |
| Mondelez International, Inc., Class A | | | 3.5 | |
| Prudential Financial, Inc. | | | 3.4 | |
| American Electric Power Co., Inc. | | | 3.4 | |
| Duke Energy Corp. | | | 3.3 | |
| Aflac, Inc. | | | 3.2 | |
| Allergan PLC | | | 3.2 | |
| Danaher Corp. | | | 3.1 | |
| Eaton Corp. PLC | | | 3.1 | |
| Hewlett Packard Enterprise Co. | | | 3.0 | |
| Total | | | 32.7 | |
| * | Excluding money market fund holdings. |
Growth of a $10,000 Investment Since Inception
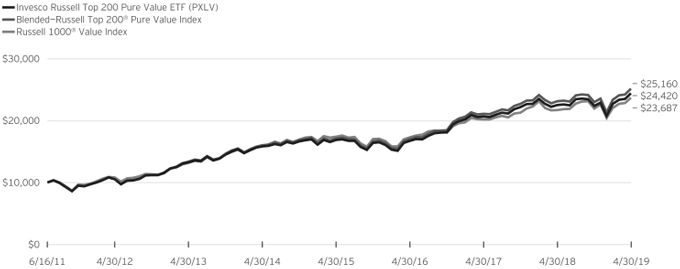
Fund Performance History as of April 30, 2019
| | | | | | | | | | | | | | | | | | | | | | | | | | | | | | | | |
| | | 1 Year | | | 3 Years Average
Annualized | | | 3 Years Cumulative | | | 5 Years Average
Annualized | | | 5 Years Cumulative | | | | | | Fund Inception | |
| Index | | Average
Annualized | | | Cumulative | |
| Blended—Russell Top 200® Pure Value Index | | | 8.79 | % | | | 13.89 | % | | | 47.74 | % | | | 9.44 | % | | | 56.98 | % | | | | | | | 12.43 | % | | | 151.60 | % |
| Russell 1000® Value Index | | | 9.06 | | | | 10.97 | | | | 36.65 | | | | 8.27 | | | | 48.77 | | | | | | | | 11.58 | | | | 136.87 | |
| Fund | | | | | | | | | | | | | | | | | | | | | | | | | | | | | | | | |
| NAV Return | | | 8.40 | | | | 13.44 | | | | 45.99 | | | | 9.02 | | | | 54.02 | | | | | | | | 12.01 | | | | 144.20 | |
| Market Price Return | | | 8.31 | | | | 13.47 | | | | 46.10 | | | | 9.02 | | | | 54.03 | | | | | | | | 12.03 | | | | 144.50 | |
Invesco Russell Top 200 Pure Value ETF (PXLV)(continued)
Fund Inception: June 16, 2011
Performance quoted above represents past performance. Past performance is not a guarantee of future results and current performance may be higher or lower than performance quoted. Investment returns and principal value will fluctuate, and shares of the Fund (“Fund Shares”), when redeemed or sold, may be worth more or less than their original cost. Fund performance reflects any applicable fee waivers and/or expense reimbursements. Had the adviser not waived fees and/or reimbursed expenses currently or in the past, returns would have been lower. See current prospectus for more information. The adviser has contractually agreed to waive fees and/or pay certain Fund expenses through August 31, 2021. According to the Fund’s current prospectus, the total gross annual operating expense ratio was indicated as 0.44% and the net annual operating expense ratio was indicated as 0.39%. The Financial Highlights section of the Shareholder Report presents the expense ratios based on expenses incurred during the period covered by this report. NAV and Market Price returns assume that dividends and capital gain distributions have been reinvested in the Fund at NAV and Market Price, respectively. The returns shown in the table above do not reflect the deduction of taxes that a shareholder would pay on Fund distributions or the redemption or sale of Fund Shares. See invesco.com/ETFs to find the most recent month-end performance numbers.
Blended-Index and Benchmark Index performance results are based upon a hypothetical investment in their respective constituent securities. Blended-Index and Benchmark Index returns do not represent Fund returns. An investor cannot invest directly in an index. The Blended-Index and Benchmark Index do not charge management fees or brokerage expenses, and no such fees or expenses were deducted from the hypothetical performance shown. In addition, the results actual investors might have achieved would have differed from those shown because of differences in the timing, amounts of their investments, and fees and expenses associated with an investment in the Fund.
Notes Regarding Indexes and Fund Performance History:
| - | The Blended—Russell Top 200® Pure Value Index performance is comprised of the performance of the RAFI® Fundamental Large Value Index from Fund inception through the conversion date, May 22, 2015, followed by the performance of the Index starting from the conversion date through April 30, 2019. |
| - | Average Annualized and Cumulative Inception returns for the Fund, Blended-Index and Benchmark Index are based on the inception date of the Fund. |
| | |
| CZA | | Manager’s Analysis |
| | Invesco ZacksMid-Cap ETF (CZA) |
As an index fund, the Invesco ZacksMid-Cap ETF (the “Fund”) is passively managed and seeks to track the returns of an underlying index. The Fund seeks to track the investment results (before fees and expenses) of the ZacksMid-Cap Core Index (the “Index”). The Fund will invest at least 90% of its total assets in securities that comprise the Index and depositary receipts representing securities that comprise the Index (or underlying securities representing American Depositary Receipts (“ADRs”) that comprise the Index).
Securities in the Index are selected by Zacks Investment Research, Inc. (the “Index Provider”). As of June 30, 2018, the Index was composed of 100 securities selected, according to the investment and other creiteria in the Index medthodology, from a universe ofmid-capitalization securities including common stocks, master limited partnerships (“MLPs”), ADRs, real estate investment trusts (“REITS”) and business development companies (“BDCs”). The depositary receipts included in the Index may be sponsored or unsponsored. The Index Provider, (in accordance with the Index methodology, seeks to identify companies with potentially superior risk-return profiles by using a proprietary strategy that evaluates stocks on multiple factors, including their high long-term earnings growth rate, price earnings ratio and short interest. The Fund generally will invest in all of the securities comprising the Index in proportion to their weightings in the Index.
For the fiscal year ended April 30, 2019, on a market price basis, the Fund returned 10.72%. On a net asset value (“NAV”) basis, the Fund returned 10.68%. During the same time period, the Index returned 11.43%. During the fiscal year, the Fund fully replicated the components of the Index; therefore, the Fund’s performance, on a NAV basis, differed from the return of the Index primarily due to fees and operating expenses that the Fund incurred during the period.
During this same time period, the Russell Midcap® Index (the “Benchmark Index”) returned 10.69%. The Benchmark Index is an unmanaged index weighted by market capitalization based on the average performance of approximately 780 equity securities. The Benchmark Index was selected for its recognition in the marketplace, and because its performance comparison is a useful measure for investors as a broad representation of the U.S.mid-cap equity market.
The performance of the Fund differed from the Benchmark Index in part because the Fund seeks to track an Index that employs a proprietary stock selection and weighting methodology, whereas the Benchmark Index selects and weights stocks based primarily on market capitalization.
Relative to the Benchmark Index, the Fund was most overweight in the financials sector and most underweight in the information technology sector during the fiscal year ended April 30, 2019. The majority of the Fund’s underperformance relative to the Benchmark Index during that period can be attributed to the
Fund’s underweight exposure to and security selection in the information technology sector.
For the fiscal year ended April 30, 2019, the industrials sector contributed most significantly to the Fund’s return, followed by the financials and real estate sectors, respectively. The health care sector detracted most significantly from the Fund’s return, followed by the materials sector.
Positions that contributed most significantly to the Fund’s return, for the fiscal year ended April 30, 2019, included Parker-Hannifin Corp., an industrials company (portfolio average weight of 1.16%) and Discover Financial Services, a financials company (portfolio average weight of 0.71%). Positions that detracted most significantly from the Fund’s return during this period included TechnipFMC PLC, an energy company (no longer held at fiscalyear-end) and SVB Financial Group, a financials company (no longer held at fiscalyear-end).
| | | | |
Sector Breakdown
(% of the Fund’s Net Assets)
as of April 30, 2019 | |
| Financials | | | 27.3 | |
| Real Estate | | | 21.0 | |
| Industrials | | | 12.9 | |
| Utilities | | | 10.2 | |
| Materials | | | 7.8 | |
| Consumer Discretionary | | | 7.7 | |
| Information Technology | | | 5.3 | |
| Energy | | | 4.0 | |
| Health Care | | | 3.8 | |
| Money Market Funds Plus Other Assets Less Liabilities | | | 0.0 | |
|
Top Ten Fund Holdings*
(% of the Fund’s Net Assets)
as of April 30, 2019 | |
| Security | | | | |
| Discover Financial Services | | | 2.5 | |
| IHS Markit Ltd. | | | 2.3 | |
| Willis Towers Watson PLC | | | 2.2 | |
| M&T Bank Corp. | | | 2.2 | |
| Parker-Hannifin Corp. | | | 2.2 | |
| Cintas Corp. | | | 2.1 | |
| Aptiv PLC | | | 2.0 | |
| Ventas, Inc. | | | 2.0 | |
| Northern Trust Corp. | | | 2.0 | |
| Boston Properties, Inc. | | | 2.0 | |
| Total | | | 21.5 | |
| * | Excluding money market fund holdings. |
Invesco Zacks Mid-Cap ETF (CZA)(continued)
Growth of a $10,000 Investment
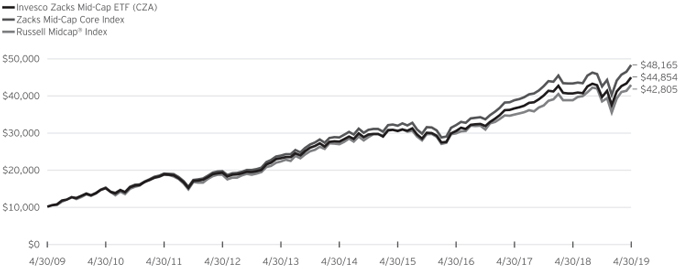
Fund Performance History as of April 30, 2019
| | | | | | | | | | | | | | | | | | | | | | | | | | | | | | | | | | | | | | | | |
| | | 1 Year | | | 3 Years Average
Annualized | | | 3 Years Cumulative | | | 5 Years Average
Annualized | | | 5 Years Cumulative | | | 10 Years Average
Annualized | | | 10 Years Cumulative | | | | | | Fund Inception | |
| Index | | Average
Annualized | | | Cumulative | |
| Zacks Mid-Cap Core Index | | | 11.43 | % | | | 14.63 | % | | | 50.62 | % | | | 10.92 | % | | | 67.91 | % | | | 17.02 | % | | | 381.65 | % | | | | | | | 10.80 | % | | | 245.01 | % |
| Russell Midcap® Index | | | 10.69 | | | | 12.82 | | | | 43.60 | | | | 9.75 | | | | 59.22 | | | | 15.65 | | | | 328.05 | | | | | | | | 8.40 | | | | 164.82 | |
| Fund | | | | | | | | | | | | | | | | | | | | | | | | | | | | | | | | | | | | | | | | |
| NAV Return | | | 10.68 | | | | 13.83 | | | | 47.49 | | | | 10.21 | | | | 62.59 | | | | 16.19 | | | | 348.54 | | | | | | | | 9.95 | | | | 214.28 | |
| Market Price Return | | | 10.72 | | | | 13.87 | | | | 47.66 | | | | 10.25 | | | | 62.91 | | | | 16.19 | | | | 348.51 | | | | | | | | 9.95 | | | | 214.61 | |
Guggenheim Mid-Cap Core ETF (Predecessor Fund) Inception: April 2, 2007
Performance quoted above represents past performance. Past performance is not a guarantee of future results and current performance may be higher or lower than performance quoted. Investment returns and principal value will fluctuate, and shares of the Fund (“Fund Shares”), when redeemed or sold, may be worth more or less than their original cost. Fund performance reflects any applicable fee waivers and/or expense reimbursements. Had the adviser not waived fees and/or reimbursed expenses currently or in the past, returns would have been lower. See current prospectus for more information. The adviser has contractually agreed to waive fees and/or pay certain Fund expenses through August 31, 2021. According to the Fund’s current prospectus, the total gross annual operating expense ratio was indicated as 0.77% including acquired fund fees and expenses of 0.03%, and the net annual operating expense ratio was indicated as 0.68%. The Financial Highlights section of the Shareholder Report presents the expense ratios based on expenses incurred during the period covered by this report. NAV and Market Price returns assume that dividends and capital gain distributions have been reinvested in the Fund at NAV and Market Price, respectively. The returns shown in the table above do not reflect the deduction of taxes that a shareholder would pay on Fund
distributions or the redemption or sale of Fund Shares. See invesco.com/ETFs to find the most recent month-end performance numbers.
Index and Benchmark Index performance results are based upon a hypothetical investment in their respective constituent securities. Index and Benchmark Index returns do not represent Fund returns. An investor cannot invest directly in an index. The Index and Benchmark Index do not charge management fees or brokerage expenses, and no such fees or expenses were deducted from the hypothetical performance shown. In addition, the results actual investors might have achieved would have differed from those shown because of differences in the timing, amounts of their investments, and fees and expenses associated with an investment in the Fund.
Notes Regarding Indexes and Fund Performance History:
| - | Average Annualized and Cumulative Inception returns for the Fund, Index and Benchmark Index are based on the inception date of the Predecessor Fund. |
| - | Effective after the close of business on April 6, 2018, the Predecessor Fund was reorganized into the Fund. Returns shown are blended returns of the Predecessor Fund and the Fund. |

| | |
| CVY | | Manager’s Analysis |
| | Invesco Zacks Multi-Asset Income ETF (CVY) |
As an index fund, the Invesco Zacks Multi-Asset Income ETF (the “Fund”) is passively managed and seeks to track the returns of an underlying index. The Fund seeks to track the investment results (before fees and expenses) of the Zacks Multi-Asset Income Index (the “Index”). The Fund will invest at least 90% of its total assets in securities that comprise the Index and depositary receipts representing securities that comprise the Index (or underlying securities representing American Depositary Receipts (“ADRs“) that comprise the Index).
The securities comprising the Index include stocks of large, medium andsmall-sized companies from a universe of domestic and international companies listed on a major U.S. exchange. The universe of securities within the Index includes U.S. listed common stocks and ADRs paying dividends, real estate investment trusts (“REITs”), master limited partnerships (“MLPs”),closed-end funds and traditional preferred stocks. The ADRs included in the Index may be sponsored or unsponsored. The companies in the universe are selected using a proprietary methodology developed by Zacks Investment Research, Inc. (the “Index Provider”). The Index Provider seeks to identify companies with potentially greater yield and superior risk-return profiles by using a proprietary strategy that evaluates stocks on multiple factors, including dividend yield and market capitalization. The Fund generally will invest in all of the securities comprising the Index in proportion to their weightings in the Index.
For the fiscal year ended April 30, 2019, on a market price basis, the Fund returned 5.76%. On a net asset value (“NAV”) basis, the Fund returned 5.67%. During the same time period, the Index returned 6.37%. During the fiscal year, the Fund fully replicated the components of the Index; therefore, the Fund’s performance, on a NAV basis, differed from the return of the Index primarily due to fees and operating expenses that the Fund incurred, as well as trading costs associated with portfolio rebalances during the period.
During this same time period, the S&P 500® Index (the “Benchmark Index”) returned 13.49%. The Benchmark Index is an unmanaged index weighted by market capitalization based on the average performance of approximately 505 equity securities. The Benchmark Index was selected for its recognition in the marketplace, and because its performance comparison is a useful measure for investors as a broad representation of the U.S. stock market.
The performance of the Fund differed from the Benchmark Index in part because the Fund seeks to track an Index that employs a proprietary stock selection and weighting methodology, whereas the Benchmark Index selects and weights stocks based primarily on market capitalization.
Relative to the Benchmark Index, the Fund was most overweight in the financials sector and most underweight in the information
technology sector during the fiscal year ended April 30, 2019. The majority of the Fund’s underperformance relative to the Benchmark Index during that period can be attributed to the Fund’s underweight exposure to and stock selection in the energy sector.
For the fiscal year ended April 30, 2019, the real estate sector contributed most significantly to the Fund’s return, followed by the financials and consumer discretionary sectors, respectively. The energy sector detracted most significantly from the Fund’s return, followed by the communication services sector.
Positions that contributed most significantly to the Fund’s return, for the fiscal year ended April 30, 2019, included Companhia Energetica de Minas Gerais SA Sponsored ADR, a utilities company (no longer held at fiscalyear-end), and Broadcom Inc., an information technology company (portfolio average weight of 1.05%). Positions that detracted most significantly from the Fund’s return during this period includedHi-Crush Partners LP, an energy company (no longer held at fiscalyear-end), and CVR Refining LP an energy company, (no longer held at fiscalyear-end).
| | | | |
Sector Breakdown
(% of the Fund’s Net Assets)
as of April 30, 2019 | |
| Financials | | | 34.5 | |
| Energy | | | 14.2 | |
| Real Estate | | | 10.1 | |
| Closed-End Funds | | | 10.1 | |
| Consumer Discretionary | | | 8.3 | |
| Materials | | | 6.9 | |
| Industrials | | | 4.4 | |
| Communication Services | | | 3.6 | |
| Information Technology | | | 3.4 | |
| Sector Types Each Less than 3% | | | 4.2 | |
| Money Market Funds Plus Other Assets Less Liabilities | | | 0.3 | |
Invesco Zacks Multi-Asset Income ETF (CVY)(continued)
| | | | |
Top Ten Fund Holdings*
(% of the Fund’s Net Assets)
as of April 30, 2019 | |
| Security | | | | |
| USA Compression Partners LP | | | 1.5 | |
| Best Buy Co., Inc. | | | 1.2 | |
| NGL Energy Partners LP | | | 1.2 | |
| Broadcom, Inc. | | | 1.1 | |
| First Trust Intermediate Duration Preferred & Income Fund | | | 1.1 | |
| Bank of America Corp., 5.88%, Series HH | | | 1.1 | |
| PIMCO Dynamic Credit and Mortgage Income Fund | | | 1.1 | |
| Citigroup, Inc., 6.88%, 02/15/2166, Series K | | | 1.1 | |
| PNC Financial Services Group, Inc. (The) | | | 1.1 | |
| Prudential Financial, Inc. | | | 1.1 | |
| Total | | | 11.6 | |
| * | Excluding money market fund holdings. |
Growth of a $10,000 Investment
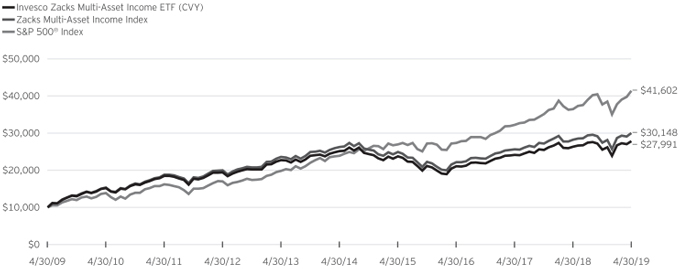
Fund Performance History as of April 30, 2019
| | | | | | | | | | | | | | | | | | | | | | | | | | | | | | | | | | | | | | | | |
| | | 1 Year | | | 3 Years Average
Annualized | | | 3 Years Cumulative | | | 5 Years Average
Annualized | | | 5 Years Cumulative | | | 10 Years Average
Annualized | | | 10 Years Cumulative | | | | | | Fund Inception | |
| Index | | Average
Annualized | | | Cumulative | |
| Zacks Multi-Asset Income Index | | | 6.37 | % | | | 10.58 | % | | | 35.21 | % | | | 2.70 | % | | | 14.22 | % | | | 11.67 | % | | | 201.48 | % | | | | | | | 5.37 | % | | | 93.33 | % |
| S&P 500® Index | | | 13.49 | | | | 14.87 | | | | 51.58 | | | | 11.63 | | | | 73.32 | | | | 15.32 | | | | 316.02 | | | | | | | | 8.86 | | | | 191.62 | |
| Fund | | | | | | | | | | | | | | | | | | | | | | | | | | | | | | | | | | | | | | | | |
| NAV Return | | | 5.67 | | | | 9.80 | | | | 32.38 | | | | 2.08 | | | | 10.84 | | | | 10.84 | | | | 179.91 | | | | | | | | 4.52 | | | | 74.71 | |
| Market Price Return | | | 5.76 | | | | 9.89 | | | | 32.70 | | | | 2.08 | | | | 10.85 | | | | 10.86 | | | | 180.27 | | | | | | | | 4.53 | | | | 74.80 | |
Invesco Zacks Multi-Asset Income ETF (CVY)(continued)
Guggenheim MultiAsset Income ETF (Predecessor Fund) Inception: September 21, 2006
Performance quoted above represents past performance. Past performance is not a guarantee of future results and current performance may be higher or lower than performance quoted. Investment returns and principal value will fluctuate, and shares of the Fund (“Fund Shares”), when redeemed or sold, may be worth more or less than their original cost. Fund performance reflects any applicable fee waivers and/or expense reimbursements. Had the adviser not waived fees and/or reimbursed expenses currently or in the past, returns would have been lower. See current prospectus for more information. The adviser has contractually agreed to waive fees and/or pay certain Fund expenses through August 31, 2021. According to the Fund’s current prospectus, the total gross annual operating expense ratio was indicated as 0.97%, including acquired fund fees and expenses of 0.23%, and the net annual operating expense ratio was indicated as 0.88%. The Financial Highlights section of the Shareholder Report presents the expense ratios based on expenses incurred during the period covered by this report. NAV and Market Price returns assume that dividends and capital gain distributions have been reinvested in the Fund at NAV and Market Price, respectively. The returns shown in the table above do not reflect the deduction of taxes that a shareholder would pay on Fund
distributions or the redemption or sale of Fund Shares. See invesco.com/ETFs to find the most recent month-end performance numbers.
Index and Benchmark Indexes performance results are based upon a hypothetical investment in their respective constituent securities. Index and Benchmark Indexes returns do not represent Fund returns. An investor cannot invest directly in an index. The Index and Benchmark Indexes do not charge management fees or brokerage expenses, and no such fees or expenses were deducted from the hypothetical performance shown. In addition, the results actual investors might have achieved would have differed from those shown because of differences in the timing, amounts of their investments, and fees and expenses associated with an investment in the Fund.
Notes Regarding Indexes and Fund Performance History:
| - | Average Annualized and Cumulative Inception returns for the Fund, Index and Benchmark Index are based on the inception date of the Predecessor Fund. |
| - | Effective after the close of business on April 6, 2018, the Predecessor Fund was reorganized into the Fund. Returns shown are blended returns of the Predecessor Fund and the Fund. |
Schedule of Investments(a)
Invesco Dynamic Large Cap Growth ETF (PWB)
April 30, 2019
| | | | | | | | |
Number
of Shares | | | | | Value | |
| | | | Common Stocks & Other Equity Interests—100.0% | |
| | | | Communication Services—4.5% | |
| | 248,326 | | | Activision Blizzard, Inc. | | $ | 11,971,796 | |
| | 9,425 | | | Alphabet, Inc., Class A(b) | | | 11,300,198 | |
| | 29,767 | | | Charter Communications, Inc.,
Class A(b) | | | 11,049,213 | |
| | | | | | | | |
| | | | | | | 34,321,207 | |
| | | | | | | | |
| | | | Consumer Discretionary—20.6% | |
| | 5,457 | | | Booking Holdings, Inc.(b) | | | 10,122,681 | |
| | 87,840 | | | Dollar General Corp. | | | 11,075,746 | |
| | 126,572 | | | Home Depot, Inc. (The) | | | 25,782,716 | |
| | 230,087 | | | Lowe’s Cos., Inc. | | | 26,032,043 | |
| | 81,693 | | | Marriott International, Inc., Class A | | | 11,144,559 | |
| | 123,945 | | | NIKE, Inc., Class B | | | 10,886,089 | |
| | 147,175 | | | Starbucks Corp. | | | 11,432,554 | |
| | 484,322 | | | TJX Cos., Inc. (The) | | | 26,579,591 | |
| | 121,274 | | | VF Corp. | | | 11,449,478 | |
| | 109,666 | | | Yum! Brands, Inc. | | | 11,448,034 | |
| | | | | | | | |
| | | | | | | 155,953,491 | |
| | | | | | | | |
| | | | Consumer Staples—1.5% | |
| | 214,941 | | | Brown-Forman Corp., Class B | | | 11,454,206 | |
| | | | | | | | |
| |
| | | | Energy—6.1% | |
| | 237,347 | | | Anadarko Petroleum Corp. | | | 17,290,729 | |
| | 109,128 | | | EOG Resources, Inc. | | | 10,481,744 | |
| | 331,590 | | | Halliburton Co. | | | 9,393,945 | |
| | 156,238 | | | Occidental Petroleum Corp. | | | 9,199,293 | |
| | | | | | | | |
| | | | | | | 46,365,711 | |
| | | | | | | | |
| | | | Financials—4.8% | |
| | 118,246 | | | Berkshire Hathaway, Inc., Class B(b) | | | 25,625,091 | |
| | 58,955 | | | CME Group, Inc. | | | 10,547,049 | |
| | | | | | | | |
| | | | | | | 36,172,140 | |
| | | | | | | | |
| | | | Health Care—33.9% | |
| | 323,115 | | | Abbott Laboratories | | | 25,707,029 | |
| | 311,709 | | | Agilent Technologies, Inc. | | | 24,469,156 | |
| | 81,579 | | | Alexion Pharmaceuticals, Inc.(b) | | | 11,105,349 | |
| | 327,959 | | | Baxter International, Inc. | | | 25,023,272 | |
| | 42,010 | | | Becton, Dickinson and Co. | | | 10,113,487 | |
| | 163,835 | | | Centene Corp.(b) | | | 8,447,333 | |
| | 54,231 | | | Cigna Corp. | | | 8,614,052 | |
| | 197,841 | | | Eli Lilly & Co. | | | 23,155,311 | |
| | 170,967 | | | HCA Healthcare, Inc. | | | 21,752,131 | |
| | 78,939 | | | Humana, Inc. | | | 20,161,810 | |
| | 73,264 | | | IQVIA Holdings, Inc.(b) | | | 10,176,370 | |
| | 58,006 | | | Regeneron Pharmaceuticals, Inc.(b) | | | 19,904,179 | |
| | 96,559 | | | Thermo Fisher Scientific, Inc. | | | 26,790,295 | |
| | 91,137 | | | UnitedHealth Group, Inc. | | | 21,241,301 | |
| | | | | | | | |
| | | | | | | 256,661,075 | |
| | | | | | | | |
| | | | Industrials—9.1% | |
| | 24,984 | | | Boeing Co. (The) | | | 9,436,207 | |
| | 74,923 | | | Caterpillar, Inc. | | | 10,445,765 | |
| | 63,895 | | | Deere & Co. | | | 10,582,929 | |
| | 129,082 | | | Fortive Corp. | | | 11,144,940 | |
| | 77,126 | | | Roper Technologies, Inc. | | | 27,742,222 | |
| | | | | | | | |
| | | | | | | 69,352,063 | |
| | | | | | | | |
| | | | | | | | |
Number
of Shares | | | | | Value | |
| | | | Common Stocks & Other Equity Interests
(continued) | |
| | | | Information Technology—16.5% | |
| | 152,191 | | | Accenture PLC, Class A | | $ | 27,800,730 | |
| | 111,499 | | | Amphenol Corp., Class A | | | 11,100,841 | |
| | 68,916 | | | Automatic Data Processing, Inc. | | | 11,329,101 | |
| | 145,855 | | | Cognizant Technology Solutions Corp., Class A | | | 10,641,581 | |
| | 47,443 | | | Mastercard, Inc., Class A | | | 12,061,908 | |
| | 95,114 | | | Microsoft Corp. | | | 12,421,889 | |
| | 75,187 | | | Motorola Solutions, Inc. | | | 10,895,348 | |
| | 198,764 | | | QUALCOMM, Inc. | | | 17,119,543 | |
| | 72,259 | | | Visa, Inc., Class A | | | 11,881,547 | |
| | | | | | | | |
| | | | | | | 125,252,488 | |
| | | | | | | | |
| | | | Materials—3.0% | |
| | 58,238 | | | Air Products & Chemicals, Inc. | | | 11,984,798 | |
| | 23,666 | | | Sherwin-Williams Co. (The) | | | 10,764,007 | |
| | | | | | | | |
| | | | | | | 22,748,805 | |
| | | | | | | | |
| | |
| | | | Total Investments in Securities
(Cost $709,156,831)—100.0% | | | 758,281,186 | |
| | |
| | | | Other assets less liabilities—(0.0)% | | | (224,619 | ) |
| | | | | | | | |
| | |
| | | | Net Assets—100.0% | | $ | 758,056,567 | |
| | | | | | | | |
Notes to Schedule of Investments:
| (a) | Industry and/or sector classifications used in this report are generally according to the Global Industry Classification Standard, which was developed by and is the exclusive property and a service mark of MSCI Inc. and Standard & Poor’s. |
| (b) | Non-income producing security. |
See accompanying Notes to Financial Statements which are an integral part of the financial statements.
Schedule of Investments(a)
Invesco Dynamic Large Cap Value ETF (PWV)
April 30, 2019
| | | | | | | | |
Number
of Shares | | | | | Value | |
| | | | Common Stocks & Other Equity Interests—100.0% | |
| | | | Communication Services—8.2% | |
| | 472,535 | | | AT&T, Inc. | | $ | 14,629,684 | |
| | 883,596 | | | Comcast Corp., Class A | | | 38,462,934 | |
| | 259,423 | | | Verizon Communications, Inc. | | | 14,836,401 | |
| | 127,455 | | | Walt Disney Co. (The) | | | 17,457,511 | |
| | | | | | | | |
| | | | | | | 85,386,530 | |
| | | | | | | | |
| | | | Consumer Discretionary—1.4% | |
| | 367,699 | | | General Motors Co. | | | 14,321,876 | |
| | | | | | | | |
| |
| | | | Consumer Staples—6.8% | |
| | 702,173 | | | Mondelez International, Inc., Class A | | | 35,705,497 | |
| | 342,007 | | | Walmart, Inc. | | | 35,172,000 | |
| | | | | | | | |
| | | | | | | 70,877,497 | |
| | | | | | | | |
| | | | Energy—5.5% | |
| | 122,257 | | | Chevron Corp. | | | 14,678,176 | |
| | 207,391 | | | ConocoPhillips | | | 13,090,520 | |
| | 150,496 | | | Phillips 66 | | | 14,187,258 | |
| | 172,446 | | | Valero Energy Corp. | | | 15,633,954 | |
| | | | | | | | |
| | | | | | | 57,589,908 | |
| | | | | | | | |
| | | | Financials—24.7% | |
| | 297,927 | | | Aflac, Inc. | | | 15,009,562 | |
| | 338,724 | | | American International Group, Inc. | | | 16,113,101 | |
| | 497,370 | | | Bank of America Corp. | | | 15,209,575 | |
| | 226,510 | | | Citigroup, Inc. | | | 16,014,257 | |
| | 204,565 | | | Discover Financial Services | | | 16,670,002 | |
| | 138,103 | | | JPMorgan Chase & Co. | | | 16,026,853 | |
| | 196,407 | | | M&T Bank Corp. | | | 33,402,938 | |
| | 325,465 | | | MetLife, Inc. | | | 15,013,700 | |
| | 154,170 | | | Prudential Financial, Inc. | | | 16,297,311 | |
| | 218,558 | | | SunTrust Banks, Inc. | | | 14,311,178 | |
| | 458,415 | | | Synchrony Financial | | | 15,893,248 | |
| | 261,824 | | | Travelers Cos., Inc. (The) | | | 37,637,200 | |
| | 285,373 | | | US Bancorp | | | 15,216,088 | |
| | 293,959 | | | Wells Fargo & Co. | | | 14,230,555 | |
| | | | | | | | |
| | | | | | | 257,045,568 | |
| | | | | | | | |
| | | | Health Care—14.3% | |
| | 183,249 | | | Amgen, Inc. | | | 32,860,211 | |
| | 109,175 | | | Anthem, Inc. | | | 28,716,300 | |
| | 105,820 | | | Biogen, Inc.(b) | | | 24,258,177 | |
| | 250,992 | | | Johnson & Johnson | | | 35,440,070 | |
| | 110,392 | | | McKesson Corp. | | | 13,164,246 | |
| | 345,686 | | | Pfizer, Inc. | | | 14,038,308 | |
| | | | | | | | |
| | | | | | | 148,477,312 | |
| | | | | | | | |
| | | | Industrials—17.5% | |
| | 468,400 | | | CSX Corp. | | | 37,298,692 | |
| | 84,865 | | | General Dynamics Corp. | | | 15,167,073 | |
| | 101,734 | | | Illinois Tool Works, Inc. | | | 15,832,862 | |
| | 138,034 | | | Ingersoll-Rand PLC | | | 16,924,349 | |
| | 210,627 | | | PACCAR, Inc. | | | 15,095,637 | |
| | 187,628 | | | Republic Services, Inc. | | | 15,539,351 | |
| | 625,870 | | | Southwest Airlines Co. | | | 33,940,930 | |
| | 304,166 | | | United Parcel Service, Inc., Class B | | | 32,308,513 | |
| | | | | | | | |
| | | | | | | 182,107,407 | |
| | | | | | | | |
| | | | | | | | |
Number
of Shares | | | | | Value | |
| | | | Common Stocks & Other Equity Interests
(continued) | |
| | | | Information Technology—17.2% | |
| | 198,732 | | | Apple, Inc. | | $ | 39,879,550 | |
| | 262,273 | | | Dell Technologies, Inc., Class C(b) | | | 17,679,823 | |
| | 897,582 | | | Hewlett Packard Enterprise Co. | | | 14,190,771 | |
| | 1,453,248 | | | HP, Inc. | | | 28,992,298 | |
| | 661,188 | | | Intel Corp. | | | 33,747,036 | |
| | 105,702 | | | International Business Machines Corp. | | | 14,826,820 | |
| | 350,762 | | | Micron Technology, Inc.(b) | | | 14,753,050 | |
| | 279,559 | | | Oracle Corp. | | | 15,467,999 | |
| | | | | | | | |
| | | | | | | 179,537,347 | |
| | | | | | | | |
| | | | Utilities—4.4% | |
| | 206,559 | | | Eversource Energy | | | 14,802,018 | |
| | 300,421 | | | Exelon Corp. | | | 15,306,450 | |
| | 256,000 | | | Public Service Enterprise Group, Inc. | | | 15,270,400 | |
| | | | | | | | |
| | | | | | | 45,378,868 | |
| | | | | | | | |
| | | | Total Common Stocks
(Cost $1,006,646,422) | | | 1,040,722,313 | |
| | | | | | | | |
| | |
| | | | | | | | |
| | | | Money Market Funds—0.1% | |
| | 1,227,488 | | | Invesco Premier U.S. Government Money Portfolio—Institutional Class, 2.32%(c)
(Cost $1,227,488) | | | 1,227,488 | |
| | | | | | | | |
| | |
| | | | Total Investments in Securities
(Cost $1,007,873,910)—100.1% | | | 1,041,949,801 | |
| | |
| | | | Other assets less liabilities—(0.1)% | | | (587,800 | ) |
| | | | | | | | |
| | |
| | | | Net Assets—100.0% | | $ | 1,041,362,001 | |
| | | | | | | | |
Notes to Schedule of Investments:
| (a) | Industry and/or sector classifications used in this report are generally according to the Global Industry Classification Standard, which was developed by and is the exclusive property and a service mark of MSCI Inc. and Standard & Poor’s. |
| (b) | Non-income producing security. |
| (c) | The security and the Fund are advised bywholly-owned subsidiaries of Invesco Ltd. and are therefore considered to be affiliated. The rate shown is the7-day SEC standardized yield as of April 30, 2019. |
See accompanying Notes to Financial Statements which are an integral part of the financial statements.
Schedule of Investments(a)
Invesco Russell 2000 Pure Growth ETF (PXSG)
April 30, 2019
| | | | | | | | |
Number
of Shares | | | | | Value | |
| | | | Common Stocks & Other Equity Interests—100.0% | |
| | | | Communication Services—3.8% | |
| | 10,462 | | | Boingo Wireless, Inc.(b) | | $ | 237,906 | |
| | 9,188 | | | Cargurus, Inc.(b) | | | 374,319 | |
| | 535 | | | Cogent Communications Holdings, Inc. | | | 29,548 | |
| | 12,173 | | | Glu Mobile, Inc.(b) | | | 133,173 | |
| | 91 | | | Loral Space & Communications, Inc.(b) | | | 3,351 | |
| | 15,202 | | | Ooma, Inc.(b) | | | 205,075 | |
| | 3,446 | | | QuinStreet, Inc.(b) | | | 49,174 | |
| | 20,331 | | | Shenandoah Telecommunications Co. | | | 840,280 | |
| | 19,574 | | | TechTarget, Inc.(b) | | | 326,690 | |
| | 35,275 | | | TrueCar, Inc.(b) | | | 227,171 | |
| | 80 | | | Vonage Holdings Corp.(b) | | | 778 | |
| | 6,701 | | | World Wrestling Entertainment, Inc., Class A | | | 561,879 | |
| | 9,902 | | | Yelp, Inc.(b) | | | 396,674 | |
| | | | | | | | |
| | | | | | | 3,386,018 | |
| | | | | | | | |
| | | | Consumer Discretionary—13.7% | |
| | 615 | | | Asbury Automotive Group, Inc.(b) | | | 49,311 | |
| | 3,497 | | | At Home Group, Inc.(b) | | | 82,144 | |
| | 8,676 | | | BJ’s Restaurants, Inc. | | | 433,019 | |
| | 13,552 | | | Boot Barn Holdings, Inc.(b) | | | 390,162 | |
| | 24,452 | | | Camping World Holdings, Inc., Class A(c) | | | 364,824 | |
| | 1,061 | | | Cavco Industries, Inc.(b) | | | 132,381 | |
| | 84 | | | Chegg, Inc.(b) | | | 2,995 | |
| | 3,676 | | | Churchill Downs, Inc. | | | 370,725 | |
| | 8,159 | | | Crocs, Inc.(b) | | | 227,228 | |
| | 3,264 | | | Deckers Outdoor Corp.(b) | | | 516,397 | |
| | 2,918 | | | Dorman Products, Inc.(b) | | | 255,821 | |
| | 15,254 | | | Duluth Holdings, Inc., Class B(b) | | | 242,844 | |
| | 10,742 | | | Eldorado Resorts, Inc.(b) | | | 530,332 | |
| | 2,816 | | | Etsy, Inc.(b) | | | 190,193 | |
| | 6,305 | | | Five Below, Inc.(b) | | | 922,989 | |
| | 6,949 | | | Fox Factory Holding Corp.(b) | | | 539,242 | |
| | 34,919 | | | Funko, Inc., Class A(b) | | | 692,444 | |
| | 38,457 | | | GoPro, Inc., Class A(b) | | | 227,281 | |
| | 123,465 | | | Groupon, Inc.(b) | | | 434,597 | |
| | 7,110 | | | Hudson Ltd., Class A(b) | | | 109,067 | |
| | 12,125 | | | Installed Building Products, Inc.(b) | | | 582,364 | |
| | 2,305 | | | iRobot Corp.(b)(c) | | | 238,660 | |
| | 2,913 | | | LCI Industries | | | 255,907 | |
| | 9,273 | | | Lindblad Expeditions Holdings, Inc.(b) | | | 150,315 | |
| | 318 | | | Malibu Boats, Inc., Class A(b) | | | 13,235 | |
| | 12,349 | | | MasterCraft Boat Holdings, Inc.(b) | | | 305,514 | |
| | 2,302 | | | Monro, Inc. | | | 192,977 | |
| | 13,267 | | | National Vision Holdings, Inc.(b) | | | 358,209 | |
| | 3,659 | | | Ollie’s Bargain Outlet Holdings, Inc.(b) | | | 349,947 | |
| | 2,208 | | | Overstock.com, Inc.(b)(c) | | | 29,101 | |
| | 13,356 | | | PlayAGS, Inc.(b) | | | 322,147 | |
| | 32,106 | | | Remark Holdings, Inc.(b)(c) | | | 40,454 | |
| | 7,018 | | | Shake Shack, Inc., Class A(b) | | | 430,203 | |
| | 5,317 | | | Shutterfly, Inc.(b) | | | 233,044 | |
| | 9,536 | | | Shutterstock, Inc. | | | 385,731 | |
| | 1,351 | | | Skyline Champion Corp. | | | 28,520 | |
| | 22,404 | | | Sleep Number Corp.(b) | | | 779,659 | |
| | 6,763 | | | Sotheby’s(b) | | | 285,263 | |
| | 686 | | | Tailored Brands, Inc. | | | 5,591 | |
| | 3,757 | | | Texas Roadhouse, Inc. | | | 202,916 | |
| | 1,906 | | | TopBuild Corp.(b) | | | 135,764 | |
| | 5,250 | | | Turtle Beach Corp.(b)(c) | | | 53,760 | |
| | | | | | | | |
Number
of Shares | | | | | Value | |
| | | | Common Stocks & Other Equity Interests
(continued) | |
| | | | Consumer Discretionary (continued) | |
| | 20,146 | | | ZAGG, Inc.(b) | | $ | 166,003 | |
| | | | | | | | |
| | | | | | | 12,259,280 | |
| | | | | | | | |
| | | | Consumer Staples—3.1% | |
| | 88,351 | | | 22nd Century Group, Inc.(b)(c) | | | 193,489 | |
| | 4,457 | | | Calavo Growers, Inc.(c) | | | 427,025 | |
| | 15,403 | | | Chefs’ Warehouse, Inc. (The)(b) | | | 503,370 | |
| | 1,027 | | | Coca-Cola Consolidated, Inc. | | | 333,806 | |
| | 14,808 | | | Freshpet, Inc.(b) | | | 661,325 | |
| | 4,604 | | | National Beverage Corp.(c) | | | 257,824 | |
| | 20,144 | | | Primo Water Corp.(b) | | | 317,268 | |
| | 738 | | | Turning Point Brands, Inc. | | | 31,564 | |
| | 1,048 | | | USANA Health Sciences, Inc.(b) | | | 87,466 | |
| | | | | | | | |
| | | | | | | 2,813,137 | |
| | | | | | | | |
| | | | Energy—1.4% | |
| | 1,470 | | | Cactus, Inc., Class A(b) | | | 53,361 | |
| | 59,409 | | | Evolution Petroleum Corp. | | | 417,645 | |
| | 9,299 | | | Jagged Peak Energy, Inc.(b)(c) | | | 98,291 | |
| | 11,756 | | | Key Energy Services, Inc.(b)(c) | | | 49,140 | |
| | 1,624 | | | Liberty Oilfield Services, Inc., Class A(c) | | | 24,214 | |
| | 7,508 | | | Penn Virginia Corp.(b) | | | 337,109 | |
| | 140,793 | | | Profire Energy, Inc.(b) | | | 222,453 | |
| | 1,200 | | | Solaris Oilfield Infrastructure, Inc., Class A | | | 20,388 | |
| | 4,765 | | | Zion Oil & Gas, Inc.(b) | | | 2,660 | |
| | | | | | | | |
| | | | | | | 1,225,261 | |
| | | | | | | | |
| | | | Financials—5.0% | |
| | 2,025 | | | Axos Financial, Inc.(b) | | | 66,258 | |
| | 11,531 | | | Curo Group Holdings Corp.(b) | | | 153,593 | |
| | 1,129 | | | Diamond Hill Investment Group, Inc. | | | 163,118 | |
| | 6,078 | | | Elevate Credit, Inc.(b) | | | 27,229 | |
| | 1,731 | | | FirstCash, Inc. | | | 169,084 | |
| | 14,057 | | | Hamilton Lane, Inc., Class A | | | 686,825 | |
| | 21,407 | | | Health Insurance Innovations, Inc., Class A(b)(c) | | | 499,211 | |
| | 7,313 | | | Kinsale Capital Group, Inc. | | | 530,924 | |
| | 2,727 | | | LendingTree, Inc.(b)(c) | | | 1,049,404 | |
| | 3,629 | | | Moelis & Co., Class A | | | 148,608 | |
| | 4,686 | | | ServisFirst Bancshares, Inc. | | | 159,043 | |
| | 8,527 | | | Trupanion, Inc.(b)(c) | | | 279,686 | |
| | 3,053 | | | Westwood Holdings Group, Inc. | | | 95,528 | |
| | 66,902 | | | WisdomTree Investments, Inc. | | | 481,694 | |
| | | | | | | | |
| | | | | | | 4,510,205 | |
| | | | | | | | |
| | | | Health Care—29.8% | |
| | 17,317 | | | ACADIA Pharmaceuticals, Inc.(b) | | | 416,474 | |
| | 15,613 | | | Accelerate Diagnostics, Inc.(b)(c) | | | 304,453 | |
| | 5,774 | | | Addus HomeCare Corp.(b) | | | 392,055 | |
| | 56,449 | | | ADMA Biologics, Inc.(b)(c) | | | 261,359 | |
| | 14,580 | | | Agenus, Inc.(b) | | | 37,471 | |
| | 2,082 | | | Amicus Therapeutics, Inc.(b) | | | 27,774 | |
| | 5,964 | | | AMN Healthcare Services, Inc.(b) | | | 310,486 | |
| | 7,361 | | | ANI Pharmaceuticals, Inc.(b) | | | 522,484 | |
| | 118,666 | | | Antares Pharma, Inc.(b) | | | 319,212 | |
| | 15,563 | | | Array BioPharma, Inc.(b) | | | 351,879 | |
| | 29,102 | | | Arrowhead Pharmaceuticals, Inc.(b) | | | 523,254 | |
| | 114 | | | Atrion Corp. | | | 100,320 | |
| | 12,109 | | | Avid Bioservices, Inc.(b) | | | 58,002 | |
See accompanying Notes to Financial Statements which are an integral part of the financial statements.
Invesco Russell 2000 Pure Growth ETF (PXSG)(continued)
April 30, 2019
| | | | | | | | |
Number
of Shares | | | | | Value | |
| | | | Common Stocks & Other Equity Interests
(continued) | |
| | | | Health Care (continued) | |
| | 5,190 | | | AxoGen, Inc.(b) | | $ | 121,861 | |
| | 9,106 | | | BioSpecifics Technologies Corp.(b) | | | 610,102 | |
| | 10,068 | | | BioTelemetry, Inc.(b) | | | 547,699 | |
| | 67,207 | | | ChromaDex Corp.(b)(c) | | | 299,071 | |
| | 3,119 | | | Coherus Biosciences, Inc.(b) | | | 49,654 | |
| | 26,680 | | | Corcept Therapeutics, Inc.(b) | | | 330,298 | |
| | 7,216 | | | CorVel Corp.(b) | | | 518,109 | |
| | 29,228 | | | CryoPort, Inc.(b)(c) | | | 411,238 | |
| | 13,079 | | | Cutera, Inc.(b) | | | 232,021 | |
| | 1,144 | | | Cyclerion Therapeutics, Inc.(b) | | | 17,423 | |
| | 27,819 | | | CytoSorbents Corp.(b) | | | 200,297 | |
| | 1,490 | | | Eloxx Pharmaceuticals, Inc.(b) | | | 17,791 | |
| | 9,120 | | | Ensign Group, Inc. (The) | | | 469,862 | |
| | 658 | | | Esperion Therapeutics, Inc.(b)(c) | | | 28,360 | |
| | 770 | | | Evolus, Inc.(b)(c) | | | 18,773 | |
| | 248 | | | FibroGen, Inc.(b) | | | 11,589 | |
| | 29,602 | | | Fluidigm Corp.(b) | | | 406,731 | |
| | 27,177 | | | GenMark Diagnostics, Inc.(b) | | | 196,761 | |
| | 10,389 | | | Genomic Health, Inc.(b) | | | 668,324 | |
| | 77,221 | | | Geron Corp.(b)(c) | | | 140,542 | |
| | 4,554 | | | Glaukos Corp.(b) | | | 328,480 | |
| | 94 | | | Global Blood Therapeutics, Inc.(b) | | | 5,208 | |
| | 9,994 | | | HealthEquity, Inc.(b) | | | 677,094 | |
| | 16,077 | | | Horizon Pharma PLC(b) | | | 410,446 | |
| | 14,984 | | | Idera Pharmaceuticals, Inc.(b) | | | 45,102 | |
| | 17,118 | | | ImmunoGen, Inc.(b) | | | 40,912 | |
| | 23,185 | | | Innoviva, Inc.(b) | | | 325,286 | |
| | 62,382 | | | Inovio Pharmaceuticals, Inc.(b)(c) | | | 234,556 | |
| | 839 | | | Intercept Pharmaceuticals, Inc.(b)(c) | | | 72,305 | |
| | 6,045 | | | Intersect ENT, Inc.(b) | | | 196,402 | |
| | 3,120 | | | IntriCon Corp.(b) | | | 72,914 | |
| | 751 | | | iRhythm Technologies, Inc.(b) | | | 57,309 | |
| | 11,444 | | | Ironwood Pharmaceuticals, Inc.(b) | | | 136,069 | |
| | 807 | | | LeMaitre Vascular, Inc. | | | 23,306 | |
| | 35,589 | | | Lexicon Pharmaceuticals, Inc.(b)(c) | | | 206,416 | |
| | 3,216 | | | LHC Group, Inc.(b) | | | 357,330 | |
| | 3,565 | | | Ligand Pharmaceuticals, Inc.(b) | | | 448,655 | |
| | 7,749 | | | Medidata Solutions, Inc.(b) | | | 700,045 | |
| | 4,400 | | | Merit Medical Systems, Inc.(b) | | | 247,192 | |
| | 2,682 | | | Mesa Laboratories, Inc. | | | 634,803 | |
| | 10,958 | | | Momenta Pharmaceuticals, Inc.(b) | | | 153,302 | |
| | 5,934 | | | Neogen Corp.(b) | | | 359,956 | |
| | 54,818 | | | NeoGenomics, Inc.(b) | | | 1,141,859 | |
| | 2,368 | | | Nevro Corp.(b) | | | 146,129 | |
| | 4,493 | | | Novocure Ltd.(b) | | | 198,007 | |
| | 30,903 | | | Ocular Therapeutix, Inc.(b)(c) | | | 115,886 | |
| | 8,395 | | | Omnicell, Inc.(b) | | | 674,622 | |
| | 351 | | | Optinose, Inc.(b)(c) | | | 3,496 | |
| | 22,204 | | | Oxford Immunotec Global PLC(b) | | | 360,371 | |
| | 19,092 | | | Pacific Biosciences of California, Inc.(b) | | | 141,090 | |
| | 22,476 | | | Pacira Biosciences, Inc.(b) | | | 894,994 | |
| | 9,223 | | | PTC Therapeutics, Inc.(b) | | | 345,125 | |
| | 231 | | | Puma Biotechnology, Inc.(b) | | | 7,420 | |
| | 3,447 | | | Quanterix Corp.(b) | | | 78,316 | |
| | 10,902 | | | Quidel Corp.(b) | | | 697,074 | |
| | 7,680 | | | Radius Health, Inc.(b) | | | 169,114 | |
| | | | | | | | |
Number
of Shares | | | | | Value | |
| | | | Common Stocks & Other Equity Interests
(continued) | |
| | | | Health Care (continued) | |
| | 13,640 | | | RadNet, Inc.(b) | | $ | 165,180 | |
| | 5,531 | | | Revance Therapeutics, Inc.(b) | | | 73,230 | |
| | 17,037 | | | Simulations Plus, Inc. | | | 383,844 | |
| | 374 | | | Spark Therapeutics, Inc.(b)(c) | | | 39,902 | |
| | 15,718 | | | Stemline Therapeutics, Inc.(b) | | | 235,770 | |
| | 13,613 | | | Supernus Pharmaceuticals, Inc.(b) | | | 500,005 | |
| | 27,777 | | | T2 Biosystems, Inc.(b)(c) | | | 71,387 | |
| | 7,218 | | | Tabula Rasa HealthCare, Inc.(b) | | | 384,431 | |
| | 805 | | | Tactile Systems Technology, Inc.(b) | | | 40,057 | |
| | 28,586 | | | Tandem Diabetes Care, Inc.(b) | | | 1,755,466 | |
| | 78,228 | | | Teligent, Inc.(b)(c) | | | 76,656 | |
| | 65,601 | | | TherapeuticsMD, Inc.(b)(c) | | | 282,084 | |
| | 13,156 | | | Theravance Biopharma, Inc.(b)(c) | | | 313,771 | |
| | 37,104 | | | TransEnterix, Inc.(b)(c) | | | 74,208 | |
| | 1,639 | | | US Physical Therapy, Inc. | | | 190,927 | |
| | 19,452 | | | Vanda Pharmaceuticals, Inc.(b) | | | 316,873 | |
| | 31,038 | | | Veracyte, Inc.(b) | | | 709,839 | |
| | 23,936 | | | Vericel Corp.(b) | | | 406,673 | |
| | 62,208 | | | ViewRay, Inc.(b)(c) | | | 432,968 | |
| | 12,235 | | | Vocera Communications, Inc.(b) | | | 389,685 | |
| | 5,889 | | | Xencor, Inc.(b) | | | 180,851 | |
| | | | | | | | |
| | | | | | | 26,652,127 | |
| | | | | | | | |
| | | | Industrials—17.0% | |
| | 11,917 | | | AAON, Inc. | | | 598,352 | |
| | 13,531 | | | Advanced Drainage Systems, Inc. | | | 379,545 | |
| | 13,262 | | | Aerojet Rocketdyne Holdings, Inc.(b) | | | 449,051 | |
| | 10,192 | | | Air Transport Services Group, Inc.(b) | | | 239,818 | |
| | 471 | | | Allegiant Travel Co. | | | 69,180 | |
| | 7,714 | | | Allied Motion Technologies, Inc. | | | 282,410 | |
| | 4,641 | | | American Woodmark Corp.(b) | | | 417,365 | |
| | 3,009 | | | ASGN, Inc.(b) | | | 189,687 | |
| | 10,996 | | | Atkore International Group, Inc.(b) | | | 272,261 | |
| | 6,089 | | | Avis Budget Group, Inc.(b) | | | 216,464 | |
| | 11,744 | | | Axon Enterprise, Inc.(b) | | | 745,744 | |
| | 3,052 | | | Barrett Business Services, Inc. | | | 222,369 | |
| | 25,989 | | | BG Staffing, Inc. | | | 607,363 | |
| | 39,592 | | | Builders FirstSource, Inc.(b) | | | 545,578 | |
| | 2,667 | | | Cimpress N.V. (Netherlands)(b) | | | 241,097 | |
| | 5,885 | | | Comfort Systems USA, Inc. | | | 318,378 | |
| | 4,398 | | | Douglas Dynamics, Inc. | | | 166,068 | |
| | 2,937 | | | Dycom Industries, Inc.(b) | | | 145,646 | |
| | 23,035 | | | Energous Corp.(b)(c) | | | 116,787 | |
| | 84,935 | | | Energy Recovery, Inc.(b)(c) | | | 826,418 | |
| | 16,232 | | | Evoqua Water Technologies Corp.(b) | | | 221,080 | |
| | 3,224 | | | Forward Air Corp. | | | 204,144 | |
| | 4,382 | | | Franklin Covey Co.(b) | | | 124,931 | |
| | 481 | | | Generac Holdings, Inc.(b) | | | 26,450 | |
| | 62,824 | | | HC2 Holdings, Inc.(b)(c) | | | 134,443 | |
| | 8,971 | | | Healthcare Services Group, Inc. | | | 303,668 | |
| | 1,636 | | | Heidrick & Struggles International, Inc. | | | 58,536 | |
| | 5,201 | | | Insperity, Inc. | | | 621,832 | |
| | 14,337 | | | JELD-WEN Holding, Inc.(b) | | | 283,156 | |
| | 1,471 | | | John Bean Technologies Corp. | | | 161,501 | |
| | 16,887 | | | Kforce, Inc. | | | 608,270 | |
| | 110 | | | Lindsay Corp. | | | 9,350 | |
| | 4,688 | | | Omega Flex, Inc. | | | 396,886 | |
See accompanying Notes to Financial Statements which are an integral part of the financial statements.
Invesco Russell 2000 Pure Growth ETF (PXSG)(continued)
April 30, 2019
| | | | | | | | |
Number
of Shares | | | | | Value | |
| | | | Common Stocks & Other Equity Interests
(continued) | |
| | | | Industrials (continued) | |
| | 7,937 | | | Patrick Industries, Inc.(b) | | $ | 395,818 | |
| | 32,914 | | | PGT Innovations, Inc.(b) | | | 482,519 | |
| | 3,649 | | | Proto Labs, Inc.(b) | | | 400,624 | |
| | 1,619 | | | RBC Bearings, Inc.(b) | | | 222,693 | |
| | 618 | | | Saia, Inc.(b) | | | 39,793 | |
| | 3,809 | | | Simpson Manufacturing Co., Inc. | | | 242,557 | |
| | 9,432 | | | SiteOne Landscape Supply, Inc.(b)(c) | | | 634,774 | |
| | 15,140 | | | Spartan Motors, Inc. | | | 140,802 | |
| | 4,569 | | | Tennant Co. | | | 303,290 | |
| | 16,169 | | | TPI Composites, Inc.(b) | | | 500,431 | |
| | 3,744 | | | Trex Co., Inc.(b) | | | 259,347 | |
| | 12,162 | | | TriNet Group, Inc.(b) | | | 758,179 | |
| | 430 | | | Universal Logistics Holdings, Inc. | | | 10,501 | |
| | 8,645 | | | US Ecology, Inc. | | | 527,431 | |
| | 2,770 | | | Willdan Group, Inc.(b) | | | 109,498 | |
| | | | | | | | |
| | | | | | | 15,232,085 | |
| | | | | | | | |
| | | | Information Technology—24.6% | |
| | 54,353 | | | A10 Networks, Inc.(b) | | | 351,120 | |
| | 23,558 | | | ACM Research, Inc., Class A(b) | | | 405,904 | |
| | 68,306 | | | Aerohive Networks, Inc.(b) | | | 230,874 | |
| | 8,035 | | | Alarm.com Holdings, Inc.(b) | | | 569,521 | |
| | 9,583 | | | Altair Engineering, Inc., Class A(b) | | | 377,953 | |
| | 2,859 | | | Alteryx, Inc., Class A(b) | | | 253,422 | |
| | 34,671 | | | Amber Road, Inc.(b) | | | 313,426 | |
| | 9,110 | | | AppFolio, Inc., Class A(b) | | | 884,672 | |
| | 7,280 | | | Asure Software, Inc.(b)(c) | | | 50,669 | |
| | 3,154 | | | Badger Meter, Inc. | | | 174,984 | |
| | 1,889 | | | Benefitfocus, Inc.(b) | | | 76,939 | |
| | 3,595 | | | Blackbaud, Inc. | | | 285,047 | |
| | 2,196 | | | Blackline, Inc.(b) | | | 112,172 | |
| | 2,492 | | | Bottomline Technologies (DE), Inc.(b) | | | 126,020 | |
| | 13,914 | | | Box, Inc., Class A(b) | | | 286,907 | |
| | 13,935 | | | Carbonite, Inc.(b) | | | 341,826 | |
| | 20,526 | | | Cision Ltd.(b) | | | 247,544 | |
| | 33,915 | | | Cloudera, Inc.(b) | | | 377,474 | |
| | 3,523 | | | CommVault Systems, Inc.(b) | | | 185,310 | |
| | 12,656 | | | Cornerstone OnDemand, Inc.(b) | | | 691,650 | |
| | 1,870 | | | Coupa Software, Inc.(b) | | | 193,227 | |
| | 57,250 | | | Eastman Kodak Co.(b)(c) | | | 140,835 | |
| | 3,447 | | | Ebix, Inc. | | | 174,005 | |
| | 31,374 | | | Endurance International Group Holdings, Inc.(b) | | | 173,498 | |
| | 10,052 | | | Entegris, Inc. | | | 410,725 | |
| | 7,937 | | | Envestnet, Inc.(b) | | | 563,448 | |
| | 2,106 | | | ePlus, Inc.(b) | | | 198,575 | |
| | 8,086 | | | Everbridge, Inc.(b) | | | 597,474 | |
| | 57,933 | | | Extreme Networks, Inc.(b) | | | 463,464 | |
| | 10,485 | | | Five9, Inc.(b) | | | 556,439 | |
| | 3,951 | | | ForeScout Technologies, Inc.(b) | | | 166,100 | |
| | 4,221 | | | GTT Communications, Inc.(b)(c) | | | 177,071 | |
| | 5,187 | | | HubSpot, Inc.(b) | | | 956,950 | |
| | 5,553 | | | Ichor Holdings Ltd.(b) | | | 139,824 | |
| | 22,213 | | | Immersion Corp.(b) | | | 209,913 | |
| | 4,184 | | | Impinj, Inc.(b) | | | 122,466 | |
| | 10,204 | | | Instructure, Inc.(b) | | | 439,588 | |
| | 49,693 | | | Iteris, Inc.(b) | | | 215,668 | |
| | 36,051 | | | Lattice Semiconductor Corp.(b) | | | 466,860 | |
| | | | | | | | |
Number
of Shares | | | | | Value | |
| | | | Common Stocks & Other Equity Interests
(continued) | |
| | | | Information Technology (continued) | |
| | 12,105 | | | LivePerson, Inc.(b) | | $ | 355,040 | |
| | 30,086 | | | Mitek Systems, Inc.(b) | | | 358,023 | |
| | 82,745 | | | MobileIron, Inc.(b) | | | 490,678 | |
| | 9,585 | | | Nanometrics, Inc.(b) | | | 285,537 | |
| | 3,476 | | | New Relic, Inc.(b) | | | 365,814 | |
| | 6,244 | | | Novanta, Inc.(b) | | | 543,353 | |
| | 3,261 | | | OneSpan, Inc.(b) | | | 60,459 | |
| | 868 | | | Park City Group, Inc.(b) | | | 6,710 | |
| | 13,065 | | | Paylocity Holding Corp.(b) | | | 1,261,426 | |
| | 4,180 | | | Plantronics, Inc. | | | 215,186 | |
| | 1,579 | | | Progress Software Corp. | | | 72,018 | |
| | 10,867 | | | Q2 Holdings, Inc.(b) | | | 819,589 | |
| | 1,757 | | | Quantenna Communications, Inc.(b) | | | 42,783 | |
| | 11,624 | | | Rapid7, Inc.(b) | | | 631,648 | |
| | 1,236 | | | Rudolph Technologies, Inc.(b) | | | 29,899 | |
| | 4,264 | | | ShotSpotter, Inc.(b)(c) | | | 224,713 | |
| | 11,057 | | | SMART Global Holdings, Inc.(b) | | | 240,379 | |
| | 6,831 | | | SPS Commerce, Inc.(b) | | | 708,648 | |
| | 1,401 | | | Trade Desk, Inc. (The), Class A(b) | | | 310,293 | |
| | 8,541 | | | Tucows, Inc., Class A(b) | | | 753,231 | |
| | 2,712 | | | Upland Software, Inc.(b) | | | 126,081 | |
| | 24,006 | | | USA Technologies, Inc.(b)(c) | | | 136,114 | |
| | 4,691 | | | Varonis Systems, Inc.(b) | | | 333,765 | |
| | 5,003 | | | Veritone, Inc.(b)(c) | | | 30,969 | |
| | 7,862 | | | Virtusa Corp.(b) | | | 436,734 | |
| | 4,109 | | | Workiva, Inc.(b) | | | 218,352 | |
| | 8,029 | | | Yext, Inc.(b) | | | 175,915 | |
| | 2,731 | | | Zix Corp.(b) | | | 22,258 | |
| | | | | | | | |
| | | | | | | 21,965,179 | |
| | | | | | | | |
| | | | Materials—1.5% | |
| | 279 | | | Balchem Corp. | | | 28,321 | |
| | 2,695 | | | Chase Corp. | | | 252,441 | |
| | 77,943 | | | Forterra, Inc.(b)(c) | | | 361,655 | |
| | 11,550 | | | Summit Materials, Inc., Class A(b) | | | 202,356 | |
| | 11,204 | | | US Concrete, Inc.(b) | | | 528,045 | |
| | | | | | | | |
| | | | | | | 1,372,818 | |
| | | | | | | | |
| | | | Real Estate—0.1% | |
| | 6,282 | | | Newmark Group, Inc., Class A | | | 53,523 | |
| | | | | | | | |
| |
| | | | Utilities—0.0% | |
| | 2,053 | | | Spark Energy, Inc., Class A(c) | | | 19,421 | |
| | | | | | | | |
| | | | Total Common Stocks & Other Equity Interests
(Cost $90,546,376) | | | 89,489,054 | |
| | | | | | | | |
| | |
| | | | | | | | |
| | | | Money Market Funds—0.2% | |
| | 142,181 | | | Invesco Premier U.S. Government Money Portfolio—Institutional Class, 2.32%(d)
(Cost $142,181) | | | 142,181 | |
| | | | | | | | |
| | |
| | | | Total Investments in Securities
(excluding investments purchased with cash collateral from securities on loan)
(Cost $90,688,557)—100.2% | | | 89,631,235 | |
| | | | | | | | |
| | |
| | | | | | | | |
See accompanying Notes to Financial Statements which are an integral part of the financial statements.
Invesco Russell 2000 Pure Growth ETF (PXSG)(continued)
April 30, 2019
| | | | | | | | |
Number
of Shares | | | | | Value | |
| | | | Investments Purchased with Cash Collateral from
Securities on Loan | |
| | |
| | | | | | | | |
| | | | Money Market Funds—7.7% | |
| | 5,200,518 | | | Invesco Government & Agency Portfolio—Institutional Class 2.34%(d)(e) | | $ | 5,200,518 | |
| | 1,732,987 | | | Invesco Liquid Assets Portfolio—Institutional Class, 2.48%(d)(e) | | | 1,733,506 | |
| | | | | | | | |
| | | | Total Investments Purchased with Cash Collateral from Securities on Loan
(Cost $6,934,024) | | | 6,934,024 | |
| | | | | | | | |
| | |
| | | | Total Investments in Securities
(Cost $97,622,581)—107.9% | | | 96,565,259 | |
| | |
| | | | Other assets less liabilities—(7.9)% | | | (7,070,750 | ) |
| | | | | | | | |
| | |
| | | | Net Assets—100.0% | | $ | 89,494,509 | |
| | | | | | | | |
Notes to Schedule of Investments:
| (a) | Industry and/or sector classifications used in this report are generally according to the Global Industry Classification Standard, which was developed by and is the exclusive property and a service mark of MSCI Inc. and Standard & Poor’s. |
| (b) | Non-income producing security. |
| (c) | All or a portion of this security was out on loan at April 30, 2019. |
| (d) | The security and the Fund are advised bywholly-owned subsidiaries of Invesco Ltd. and are therefore considered to be affiliated. The rate shown is the7-day SEC standardized yield as of April 30, 2019. |
| (e) | The security has been segregated to satisfy the commitment to return the cash collateral received in securities lending transactions upon the borrower’s return of the securities loaned. See Note 2J. |
See accompanying Notes to Financial Statements which are an integral part of the financial statements.
Schedule of Investments(a)
Invesco Russell 2000 Pure Value ETF (PXSV)
April 30, 2019
| | | | | | | | |
Number
of Shares | | | | | Value | |
| | | | Common Stocks & Other Equity Interests—99.9% | |
| | | | Communication Services—5.7% | |
| | 4,521 | | | AMC Entertainment Holdings, Inc., Class A(b) | | $ | 68,538 | |
| | 8,416 | | | ATN International, Inc. | | | 513,797 | |
| | 5,802 | | | Cars.com, Inc.(c) | | | 120,740 | |
| | 36,449 | | | Consolidated Communications Holdings, Inc.(b) | | | 188,077 | |
| | 9,110 | | | E.W. Scripps Co. (The), Class A | | | 207,617 | |
| | 3,471 | | | Emerald Expositions Events, Inc. | | | 48,768 | |
| | 118,313 | | | Fluent, Inc.(c) | | | 831,740 | |
| | 34,761 | | | Gannett Co., Inc. | | | 324,320 | |
| | 275 | | | Gray Television, Inc.(c) | | | 6,443 | |
| | 41,436 | | | Iridium Communications, Inc.(c) | | | 1,137,833 | |
| | 13,900 | | | National CineMedia, Inc. | | | 97,022 | |
| | 13,160 | | | Scholastic Corp. | | | 524,821 | |
| | 30,864 | | | Spok Holdings, Inc. | | | 427,466 | |
| | | | | | | | |
| | | | | | | 4,497,182 | |
| | | | | | | | |
| | | | Consumer Discretionary—9.2% | |
| | 3,454 | | | Abercrombie & Fitch Co., Class A | | | 103,240 | |
| | 1,082 | | | Acushnet Holdings Corp. | | | 27,277 | |
| | 10,473 | | | Adtalem Global Education, Inc.(c) | | | 516,528 | |
| | 7,943 | | | American Axle & Manufacturing Holdings, Inc.(c) | | | 117,159 | |
| | 6,439 | | | Ascena Retail Group, Inc.(c) | | | 7,662 | |
| | 88,575 | | | Barnes & Noble, Inc. | | | 445,532 | |
| | 30,659 | | | Big 5 Sporting Goods Corp. | | | 80,633 | |
| | 10,160 | | | Cato Corp. (The), Class A | | | 154,026 | |
| | 4,006 | | | Chico’s FAS, Inc. | | | 14,021 | |
| | 25,364 | | | Container Store Group, Inc. (The)(b)(c) | | | 219,145 | |
| | 22,763 | | | Cooper Tire & Rubber Co. | | | 679,703 | |
| | 20,611 | | | Del Taco Restaurants, Inc.(c) | | | 207,141 | |
| | 894 | | | Dillard’s, Inc., Class A(b) | | | 61,194 | |
| | 27,877 | | | El Pollo Loco Holdings, Inc.(c) | | | 356,268 | |
| | 7,319 | | | Ethan Allen Interiors, Inc. | | | 161,750 | |
| | 5,890 | | | Express, Inc.(c) | | | 21,675 | |
| | 26,271 | | | GameStop Corp., Class A(b) | | | 227,244 | |
| | 731 | | | Genesco, Inc.(c) | | | 32,756 | |
| | 4,190 | | | Haverty Furniture Cos., Inc. | | | 99,806 | |
| | 2,338 | | | International Speedway Corp., Class A | | | 103,153 | |
| | 258,787 | | | J.C. Penney Co., Inc.(b)(c) | | | 354,538 | |
| | 23,882 | | | Motorcar Parts of America, Inc.(c) | | | 493,402 | |
| | 189,883 | | | Office Depot, Inc. | | | 455,719 | |
| | 64,720 | | | Pier 1 Imports, Inc.(b)(c) | | | 58,695 | |
| | 10,972 | | | Red Lion Hotels Corp.(c) | | | 86,898 | |
| | 23,499 | | | Regis Corp.(c) | | | 439,901 | |
| | 2,622 | | | Rocky Brands, Inc. | | | 66,887 | |
| | 30,769 | | | Speedway Motorsports, Inc. | | | 564,611 | |
| | 4,887 | | | Superior Industries International, Inc. | | | 24,191 | |
| | 6,063 | | | Tower International, Inc. | | | 141,511 | |
| | 10,363 | | | Unifi, Inc.(c) | | | 209,333 | |
| | 38,520 | | | Vera Bradley, Inc.(c) | | | 473,026 | |
| | 5,999 | | | Weyco Group, Inc. | | | 205,826 | |
| | | | | | | | |
| | | | | | | 7,210,451 | |
| | | | | | | | |
| | | | Consumer Staples—3.0% | |
| | 1,052 | | | Andersons, Inc. (The) | | | 34,400 | |
| | 60,890 | | | Dean Foods Co. | | | 103,513 | |
| | 13,715 | | | Edgewell Personal Care Co.(c) | | | 565,470 | |
| | 45,509 | | | Natural Grocers by Vitamin Cottage,
Inc.(c) | | | 563,402 | |
| | 12,381 | | | Pyxus International, Inc.(b)(c) | | | 282,658 | |
| | 1,689 | | | Rite AID Corp.(b)(c) | | | 15,471 | |
| | | | | | | | |
Number
of Shares | | | | | Value | |
| | | | Common Stocks & Other Equity Interests
(continued) | |
| | | | Consumer Staples (continued) | |
| | 2,356 | | | Sanderson Farms, Inc. | | $ | 357,240 | |
| | 36,256 | | | Smart & Final Stores, Inc.(c) | | | 236,752 | |
| | 61 | | | SpartanNash Co. | | | 986 | |
| | 3,232 | | | Universal Corp. | | | 174,076 | |
| | 1,602 | | | Weis Markets, Inc. | | | 67,364 | |
| | | | | | | | |
| | | | | | | 2,401,332 | |
| | | | | | | | |
| | | | Energy—8.7% | |
| | 26,208 | | | Approach Resources, Inc.(c) | | | 8,958 | |
| | 3,218 | | | Basic Energy Services, Inc.(b)(c) | | | 8,109 | |
| | 14,291 | | | Bristow Group, Inc.(b)(c) | | | 7,217 | |
| | 105,790 | | | Clean Energy Fuels Corp.(c) | | | 332,181 | |
| | 152,457 | | | DHT Holdings, Inc. | | | 812,596 | |
| | 34,963 | | | Diamond Offshore Drilling, Inc.(b)(c) | | | 339,491 | |
| | 16,161 | | | Era Group, Inc.(c) | | | 155,792 | |
| | 87,131 | | | Frontline Ltd. (Norway)(c) | | | 713,603 | |
| | 3,453 | | | Green Plains, Inc. | | | 59,979 | |
| | 10,880 | | | Gulfport Energy Corp.(c) | | | 71,264 | |
| | 18,344 | | | Halcon Resources Corp.(b)(c) | | | 23,847 | |
| | 11,235 | | | HighPoint Resources Corp.(c) | | | 30,784 | |
| | 20,150 | | | International Seaways, Inc.(c) | | | 359,073 | |
| | 28,529 | | | McDermott International, Inc.(c) | | | 230,800 | |
| | 6,042 | | | Midstates Petroleum Co., Inc.(c) | | | 77,156 | |
| | 41,885 | | | Noble Corp. PLC(c) | | | 110,158 | |
| | 164,492 | | | Nordic American Tankers Ltd. | | | 352,013 | |
| | 138,071 | | | Overseas Shipholding Group, Inc.,
Class A(c) | | | 251,289 | |
| | 5,325 | | | Peabody Energy Corp. | | | 153,200 | |
| | 3,798 | | | Scorpio Tankers, Inc. (Monaco) | | | 97,912 | |
| | 3,703 | | | SEACOR Holdings, Inc.(c) | | | 164,932 | |
| | 7,764 | | | SEACOR Marine Holdings, Inc.(c) | | | 105,435 | |
| | 6,874 | | | SemGroup Corp., Class A | | | 89,774 | |
| | 40,054 | | | Ship Finance International Ltd. (Norway)(b) | | | 511,089 | |
| | 8,267 | | | SilverBow Resources, Inc.(c) | | | 149,963 | |
| | 659 | | | Talos Energy, Inc.(c) | | | 19,572 | |
| | 53,909 | | | Teekay Corp. (Bermuda) | | | 224,261 | |
| | 27,846 | | | Tidewater, Inc.(c) | | | 626,535 | |
| | 31,324 | | | Ultra Petroleum Corp.(c) | | | 13,169 | |
| | 3,714 | | | Unit Corp.(c) | | | 50,362 | |
| | 23,673 | | | World Fuel Services Corp. | | | 730,312 | |
| | | | | | | | |
| | | | | | | 6,880,826 | |
| | | | | | | | |
| | | | Financials—28.1% | |
| | 8,782 | | | American Equity Investment Life Holding Co. | | | 258,279 | |
| | 117,969 | | | Anworth Mortgage Asset Corp. | | | 494,290 | |
| | 23,598 | | | Arbor Realty Trust, Inc.(b) | | | 322,349 | |
| | 30,779 | | | Arlington Asset Investment Corp., Class A | | | 241,615 | |
| | 16,771 | | | ARMOUR Residential REIT, Inc. | | | 319,991 | |
| | 1,373 | | | Associated Capital Group, Inc., Class A(b) | | | 56,719 | |
| | 7,259 | | | Banco Latinoamericano de Comercio Exterior SA, Class E (Panama) | | | 157,012 | |
| | 14,638 | | | Bancorp, Inc. (The)(c) | | | 149,454 | |
| | 188 | | | BankFinancial Corp. | | | 2,822 | |
| | 9,133 | | | Berkshire Hills Bancorp, Inc. | | | 273,899 | |
| | 8,362 | | | Boston Private Financial Holdings, Inc. | | | 95,745 | |
| | 16,560 | | | Cannae Holdings, Inc.(c) | | | 425,095 | |
| | 10,805 | | | Capitol Federal Financial, Inc. | | | 149,109 | |
| | 67,430 | | | Capstead Mortgage Corp. | | | 579,224 | |
See accompanying Notes to Financial Statements which are an integral part of the financial statements.
Invesco Russell 2000 Pure Value ETF (PXSV)(continued)
April 30, 2019
| | | | | | | | |
Number
of Shares | | | | | Value | |
| | | | Common Stocks & Other Equity Interests
(continued) | |
| | | | Financials (continued) | |
| | 5,162 | | | CBTX, Inc. | | $ | 163,635 | |
| | 8,042 | | | Civista Bancshares, Inc. | | | 176,924 | |
| | 2,084 | | | CNO Financial Group, Inc. | | | 34,490 | |
| | 4,085 | | | Community Bank System, Inc. | | | 271,489 | |
| | 7,213 | | | Community Trust Bancorp, Inc. | | | 304,749 | |
| | 28,424 | | | Dime Community Bancshares, Inc. | | | 572,744 | |
| | 76,057 | | | Dynex Capital, Inc. | | | 463,948 | |
| | 7,968 | | | eHealth, Inc.(c) | | | 483,976 | |
| | 10,319 | | | Employers Holdings, Inc. | | | 442,891 | |
| | 58,304 | | | Exantas Capital Corp. | | | 638,429 | |
| | 25,447 | | | EZCORP, Inc., Class A(c) | | | 276,609 | |
| | 2,181 | | | FBL Financial Group, Inc., Class A | | | 136,247 | |
| | 28,740 | | | FGL Holdings | | | 245,152 | |
| | 5,206 | | | Financial Institutions, Inc. | | | 143,165 | |
| | 3,981 | | | First Bancshares, Inc. (The) | | | 122,933 | |
| | 1,508 | | | First Commonwealth Financial Corp. | | | 20,524 | |
| | 3,217 | | | First Community Bancshares, Inc. | | | 111,823 | |
| | 7,822 | | | First Financial Corp. | | | 322,032 | |
| | 4,116 | | | First Internet Bancorp | | | 90,099 | |
| | 6,423 | | | First MID Bancshares, Inc. | | | 221,529 | |
| | 8,998 | | | First United Corp.(b) | | | 170,242 | |
| | 4,586 | | | Flagstar Bancorp, Inc. | | | 163,949 | |
| | 9,230 | | | Flushing Financial Corp. | | | 208,598 | |
| | 368 | | | Franklin Financial Network, Inc. | | | 10,175 | |
| | 867 | | | Fulton Financial Corp. | | | 14,956 | |
| | 178,639 | | | Genworth Financial, Inc., Class A(c) | | | 677,042 | |
| | 8,190 | | | Great Southern Bancorp, Inc. | | | 474,610 | |
| | 2,979 | | | Heartland Financial USA, Inc. | | | 133,757 | |
| | 19,815 | | | HomeStreet, Inc.(c) | | | 557,594 | |
| | 4,843 | | | Hope Bancorp, Inc. | | | 68,093 | |
| | 92 | | | Horace Mann Educators Corp. | | | 3,549 | |
| | 5,239 | | | Horizon Bancorp, Inc. | | | 85,239 | |
| | 1,507 | | | IBERIABANK Corp. | | | 119,806 | |
| | 1,850 | | | International Bancshares Corp. | | | 76,719 | |
| | 13,978 | | | Invesco Mortgage Capital, Inc.(d) | | | 228,121 | |
| | 12,227 | | | Lakeland Bancorp, Inc. | | | 202,479 | |
| | 27,892 | | | Luther Burbank Corp. | | | 293,703 | |
| | 5,812 | | | Mercantile Bank Corp. | | | 196,446 | |
| | 56,357 | | | MGIC Investment Corp.(c) | | | 825,066 | |
| | 7,787 | | | Mr Cooper Group, Inc.(c) | | | 66,968 | |
| | 861 | | | National Western Life Group, Inc., Class A | | | 229,646 | |
| | 4,611 | | | NBT Bancorp, Inc. | | | 175,310 | |
| | 4,566 | | | Nelnet, Inc., Class A | | | 265,056 | |
| | 101,403 | | | New York Mortgage Trust, Inc. | | | 638,839 | |
| | 6,342 | | | Nicolet Bankshares, Inc.(c) | | | 387,179 | |
| | 23,950 | | | Northwest Bancshares, Inc. | | | 417,449 | |
| | 46,453 | | | Ocwen Financial Corp.(c) | | | 78,506 | |
| | 7,805 | | | OFG Bancorp | | | 157,505 | |
| | 17,496 | | | Old National Bancorp | | | 298,832 | |
| | 9,047 | | | Oppenheimer Holdings, Inc., Class A | | | 237,484 | |
| | 63,903 | | | Orchid Island Capital, Inc.(b) | | | 419,843 | |
| | 24,384 | | | Oritani Financial Corp. | | | 423,062 | |
| | 7,675 | | | Parke Bancorp, Inc. | | | 175,604 | |
| | 19,949 | | | PennyMac Financial Services, Inc. | | | 444,863 | |
| | 18,762 | | | PennyMac Mortgage Investment Trust | | | 394,002 | |
| | 5,152 | | | Peoples Bancorp, Inc. | | | 168,367 | |
| | | | | | | | |
Number
of Shares | | | | | Value | |
| | | | Common Stocks & Other Equity Interests
(continued) | |
| | | | Financials (continued) | |
| | 4,539 | | | ProAssurance Corp. | | $ | 170,349 | |
| | 9,679 | | | Provident Financial Services, Inc. | | | 256,687 | |
| | 11,123 | | | Radian Group, Inc. | | | 260,501 | |
| | 35,860 | | | Redwood Trust, Inc. | | | 586,670 | |
| | 991 | | | Safety Insurance Group, Inc. | | | 92,084 | |
| | 137 | | | SmartFinancial, Inc.(c) | | | 2,848 | |
| | 3,577 | | | Towne Bank | | | 93,288 | |
| | 5,241 | | | TPG RE Finance Trust, Inc. | | | 103,300 | |
| | 24,307 | | | TrustCo Bank Corp. NY | | | 194,456 | |
| | 10,450 | | | Trustmark Corp. | | | 375,782 | |
| | 1,420 | | | Union Bankshares Corp. | | | 51,830 | |
| | 10,699 | | | United Bankshares, Inc. | | | 419,829 | |
| | 6,800 | | | United Community Financial Corp. | | | 62,628 | |
| | 280 | | | United Financial Bancorp, Inc. | | | 3,693 | |
| | 8,563 | | | Univest Financial Corp. | | | 215,959 | |
| | 15,601 | | | Waddell & Reed Financial, Inc., Class A(b) | | | 292,207 | |
| | 7,852 | | | Washington Federal, Inc. | | | 260,215 | |
| | 11,828 | | | WesBanco, Inc. | | | 476,905 | |
| | | | | | | | |
| | | | | | | 22,176,881 | |
| | | | | | | | |
| | | | Health Care—3.3% | |
| | 13,313 | | | AngioDynamics, Inc.(c) | | | 273,449 | |
| | 9,207 | | | Ardelyx, Inc.(c) | | | 31,304 | |
| | 3,745 | | | Avanos Medical, Inc.(c) | | | 157,103 | |
| | 3,077 | | | Brookdale Senior Living, Inc.(c) | | | 19,016 | |
| | 57,672 | | | Chimerix, Inc.(c) | | | 155,714 | |
| | 4,890 | | | Concert Pharmaceuticals, Inc.(c) | | | 50,269 | |
| | 12,418 | | | Five Prime Therapeutics, Inc.(c) | | | 137,591 | |
| | 18,162 | | | Invacare Corp. | | | 134,399 | |
| | 36,149 | | | Mallinckrodt PLC(c) | | | 558,864 | |
| | 235,071 | | | PDL BioPharma, Inc.(c) | | | 768,682 | |
| | 24,089 | | | Prothena Corp. PLC (Ireland)(c) | | | 250,526 | |
| | 51,274 | | | Tetraphase Pharmaceuticals, Inc.(c) | | | 54,350 | |
| | | | | | | | |
| | | | | | | 2,591,267 | |
| | | | | | | | |
| | | | Industrials—9.2% | |
| | 4,606 | | | ABM Industries, Inc. | | | 174,890 | |
| | 131,026 | | | Acacia Research Corp.(c) | | | 416,663 | |
| | 10,750 | | | ACCO Brands Corp. | | | 98,255 | |
| | 22,608 | | | Aircastle Ltd. | | | 450,351 | |
| | 10,362 | | | Ameresco, Inc., Class A(c) | | | 156,052 | |
| | 1,642 | | | Atlas Air Worldwide Holdings, Inc.(c) | | | 79,292 | |
| | 47,095 | | | Babcock & Wilcox Enterprises, Inc.(c) | | | 16,441 | |
| | 20,240 | | | Briggs & Stratton Corp. | | | 246,928 | |
| | 3,815 | | | CBIZ, Inc.(c) | | | 73,668 | |
| | 3,845 | | | CECO Environmental Corp.(c) | | | 29,837 | |
| | 49,349 | | | Costamare, Inc. (Monaco) | | | 298,068 | |
| | 86,708 | | | Eagle Bulk Shipping, Inc.(c) | | | 472,559 | |
| | 5,929 | | | Encore Wire Corp. | | | 351,530 | |
| | 9,236 | | | Ennis, Inc. | | | 186,382 | |
| | 5,862 | | | FreightCar America, Inc.(c) | | | 40,565 | |
| | 948 | | | FTI Consulting, Inc.(c) | | | 80,561 | |
| | 2,127 | | | GATX Corp. | | | 164,056 | |
| | 27,512 | | | Genco Shipping & Trading Ltd.(c) | | | 277,871 | |
| | 4,849 | | | Great Lakes Dredge & Dock Corp.(c) | | | 49,605 | |
| | 18,429 | | | Hertz Global Holdings, Inc.(c) | | | 335,039 | |
| | 10,289 | | | Huron Consulting Group, Inc.(c) | | | 497,267 | |
See accompanying Notes to Financial Statements which are an integral part of the financial statements.
Invesco Russell 2000 Pure Value ETF (PXSV)(continued)
April 30, 2019
| | | | | | | | |
Number
of Shares | | | | | Value | |
| | | | Common Stocks & Other Equity Interests
(continued) | |
| | | | Industrials (continued) | |
| | 12,085 | | | Kelly Services, Inc., Class A | | $ | 269,012 | |
| | 24,929 | | | LSC Communications, Inc.(b) | | | 174,254 | |
| | 8,963 | | | Manitowoc Co., Inc. (The)(c) | | | 160,079 | |
| | 91 | | | Navigant Consulting, Inc. | | | 2,078 | |
| | 14,913 | | | Northwest Pipe Co.(c) | | | 357,465 | |
| | 4,308 | | | NOW, Inc.(c) | | | 62,983 | |
| | 1,721 | | | Park-Ohio Holdings Corp. | | | 63,040 | |
| | 27,532 | | | PICO Holdings, Inc.(c) | | | 314,691 | |
| | 13,294 | | | Powell Industries, Inc. | | | 388,849 | |
| | 119 | | | Preformed Line Products Co. | | | 6,710 | |
| | 4,804 | | | Quanex Building Products Corp. | | | 80,323 | |
| | 12,674 | | | RR Donnelley & Sons Co. | | | 58,554 | |
| | 140,348 | | | Safe Bulkers, Inc. (Greece)(c) | | | 251,223 | |
| | 1,987 | | | Scorpio Bulkers, Inc. | | | 10,690 | |
| | 17,864 | | | Titan Machinery, Inc.(c) | | | 307,261 | |
| | 6,773 | | | Triumph Group, Inc. | | | 160,723 | |
| | 1,747 | | | Veritiv Corp.(c) | | | 48,724 | |
| | | | | | | | |
| | | | | | | 7,212,539 | |
| | | | | | | | |
| | | | Information Technology—9.9% | |
| | 11,949 | | | ADTRAN, Inc. | | | 204,806 | |
| | 8,946 | | | Alpha & Omega Semiconductor Ltd.(c) | | | 110,930 | |
| | 2,558 | | | Anixter International, Inc.(c) | | | 160,821 | |
| | 17,114 | | | Avaya Holdings Corp.(c) | | | 326,535 | |
| | 28,855 | | | AVX Corp. | | | 470,625 | |
| | 17,077 | | | Benchmark Electronics, Inc. | | | 461,591 | |
| | 14,689 | | | Ciena Corp.(c) | | | 563,470 | |
| | 45,709 | | | Digi International, Inc.(c) | | | 588,275 | |
| | 24,259 | | | Finisar Corp.(c) | | | 584,884 | |
| | 64,585 | | | Harmonic, Inc.(c) | | | 365,551 | |
| | 25,763 | | | KBR, Inc. | | | 572,454 | |
| | 2,738 | | | Kimball Electronics, Inc.(c) | | | 41,426 | |
| | 40,033 | | | Knowles Corp.(c) | | | 755,823 | |
| | 7,984 | | | ManTech International Corp., Class A | | | 494,928 | |
| | 13,400 | | | Maxwell Technologies, Inc.(b)(c) | | | 58,826 | |
| | 43,712 | | | NeoPhotonics Corp.(c) | | | 298,553 | |
| | 5,507 | | | NetScout Systems, Inc.(c) | | | 161,906 | |
| | 54,308 | | | Ribbon Communications, Inc.(c) | | | 291,091 | |
| | 8,515 | | | Sanmina Corp.(c) | | | 288,829 | |
| | 13,714 | | | Stratasys Ltd.(c) | | | 318,851 | |
| | 3,532 | | | Sykes Enterprises, Inc.(c) | | | 98,013 | |
| | 1,684 | | | Tech Data Corp.(c) | | | 179,531 | |
| | 31,796 | | | TiVo Corp. | | | 297,929 | |
| | 1,028 | | | ViaSat, Inc.(c) | | | 93,363 | |
| | | | | | | | |
| | | | | | | 7,789,011 | |
| | | | | | | | |
| | | | Materials—1.8% | |
| | 36,573 | | | AgroFresh Solutions, Inc.(b)(c) | | | 116,668 | |
| | 12,142 | | | Clearwater Paper Corp.(c) | | | 244,904 | |
| | 1,886 | | | FutureFuel Corp. | | | 27,705 | |
| | 63,605 | | | Intrepid Potash, Inc.(c) | | | 236,611 | |
| | 24,541 | | | LSB Industries, Inc.(c) | | | 143,565 | |
| | 32 | | | Materion Corp. | | | 1,857 | |
| | 6,148 | | | Olympic Steel, Inc. | | | 99,721 | |
| | 17,867 | | | P.H. Glatfelter Co. | | | 281,941 | |
| | 1,093 | | | Stepan Co. | | | 101,146 | |
| | 10,187 | | | SunCoke Energy, Inc.(c) | | | 87,710 | |
| | | | | | | | |
Number
of Shares | | | | | Value | |
| | | | Common Stocks & Other Equity Interests
(continued) | |
| | | | Materials (continued) | |
| | 9,158 | | | TimkenSteel Corp.(c) | | $ | 92,862 | |
| | | | | | | | |
| | | | | | | 1,434,690 | |
| | | | | | | | |
| | | | Real Estate—15.7% | |
| | 15,780 | | | Acadia Realty Trust | | | 445,627 | |
| | 5,732 | | | Agree Realty Corp. | | | 375,274 | |
| | 2,445 | | | Alexander & Baldwin, Inc. | | | 57,751 | |
| | 29,591 | | | Ashford Hospitality Trust, Inc. | | | 163,046 | |
| | 46,281 | | | Braemar Hotels & Resorts, Inc. | | | 643,306 | |
| | 29,451 | | | CatchMark Timber Trust, Inc., Class A | | | 294,510 | |
| | 115,765 | | | CBL & Associates Properties, Inc.(b) | | | 116,923 | |
| | 104,134 | | | Cedar Realty Trust, Inc. | | | 319,691 | |
| | 15,132 | | | Chatham Lodging Trust | | | 297,949 | |
| | 1,518 | | | Chesapeake Lodging Trust | | | 43,263 | |
| | 14,252 | | | CoreCivic, Inc. | | | 296,584 | |
| | 15,855 | | | CorEnergy Infrastructure Trust, Inc.(b) | | | 599,160 | |
| | 48,816 | | | Cousins Properties, Inc. | | | 467,169 | |
| | 33,156 | | | DiamondRock Hospitality Co. | | | 360,074 | |
| | 41,271 | | | Franklin Street Properties Corp. | | | 324,390 | |
| | 33,773 | | | Front Yard Residential Corp. | | | 334,690 | |
| | 3,261 | | | Getty Realty Corp. | | | 105,754 | |
| | 59,824 | | | Global Medical REIT, Inc. | | | 610,205 | |
| | 12,931 | | | Hannon Armstrong Sustainable Infrastructure Capital, Inc. | | | 343,835 | |
| | 9,473 | | | Healthcare Realty Trust, Inc. | | | 292,526 | |
| | 62,575 | | | Independence Realty Trust, Inc. | | | 662,669 | |
| | 9,207 | | | Industrial Logistics Properties Trust | | | 182,759 | |
| | 4,200 | | | Investors Real Estate Trust | | | 253,176 | |
| | 10,706 | | | Kite Realty Group Trust | | | 169,048 | |
| | 34,568 | | | Lexington Realty Trust | | | 313,532 | |
| | 18,144 | | | Mack-Cali Realty Corp. | | | 422,392 | |
| | 24,804 | | | MedEquities Realty Trust, Inc. | | | 265,651 | |
| | 10,710 | | | NorthStar Realty Europe Corp. | | | 190,959 | |
| | 9,579 | | | Office Properties Income Trust | | | 259,974 | |
| | 7,925 | | | Piedmont Office Realty Trust, Inc., Class A | | | 164,999 | |
| | 1,155 | | | RLJ Lodging Trust | | | 21,264 | |
| | 31,598 | | | RPT Realty | | | 383,284 | |
| | 13,787 | | | Sabra Health Care REIT, Inc. | | | 269,674 | |
| | 16,920 | | | Safehold, Inc. | | | 426,892 | |
| | 3,267 | | | Seritage Growth Properties, Class A(b) | | | 145,676 | |
| | 31,952 | | | Summit Hotel Properties, Inc. | | | 370,963 | |
| | 33,352 | | | Sunstone Hotel Investors, Inc. | | | 480,269 | |
| | 3,427 | | | Tejon Ranch Co.(c) | | | 59,116 | |
| | 15,624 | | | Tier REIT, Inc. | | | 442,784 | |
| | 56,756 | | | Washington Prime Group, Inc.(b) | | | 252,564 | |
| | 8,279 | | | Whitestone | | | 106,220 | |
| | 1,693 | | | Xenia Hotels & Resorts, Inc. | | | 36,653 | |
| | | | | | | | |
| | | | | | | 12,372,245 | |
| | | | | | | | |
| | | | Utilities—5.3% | |
| | 1,584 | | | ALLETE, Inc. | | | 129,017 | |
| | 17,278 | | | AquaVenture Holdings Ltd.(c) | | | 336,057 | |
| | 102,870 | | | Atlantic Power Corp.(c) | | | 237,630 | |
| | 9,584 | | | Avista Corp. | | | 413,454 | |
| | 5,764 | | | Black Hills Corp. | | | 419,389 | |
| | 3,522 | | | Clearway Energy, Inc., Class C | | | 55,894 | |
| | 10,286 | | | Consolidated Water Co. Ltd. (Cayman Islands) | | | 130,221 | |
See accompanying Notes to Financial Statements which are an integral part of the financial statements.
Invesco Russell 2000 Pure Value ETF (PXSV)(continued)
April 30, 2019
| | | | | | | | |
Number
of Shares | | | | | Value | |
| | | | Common Stocks & Other Equity Interests
(continued) | |
| | | | Utilities (continued) | |
| | 757 | | | El Paso Electric Co. | | $ | 46,260 | |
| | 2,498 | | | Northwest Natural Holding Co. | | | 167,091 | |
| | 9,958 | | | NorthWestern Corp. | | | 695,566 | |
| | 574 | | | ONE Gas, Inc. | | | 50,810 | |
| | 641 | | | Ormat Technologies, Inc. | | | 37,409 | |
| | 200 | | | Pattern Energy Group, Inc., Class A | | | 4,624 | |
| | 6,601 | | | PNM Resources, Inc. | | | 306,550 | |
| | 11,728 | | | Portland General Electric Co. | | | 613,492 | |
| | 6,342 | | | Spire, Inc. | | | 533,933 | |
| | | | | | | | |
| | | | | | | 4,177,397 | |
| | | | | | | | |
| | | | Total Common Stocks & Other Equity Interests
(Cost $78,868,965) | | | 78,743,821 | |
| | | | | | | | |
| | |
| | | | | | | | |
| | | | Money Market Funds—0.2% | |
| | 125,271 | | | Invesco Premier U.S. Government Money Portfolio—Institutional Class, 2.32%(e)
(Cost $125,271) | | | 125,271 | |
| | | | | | | | |
| | |
| | | | Total Investments in Securities
(excluding investments purchased with cash collateral from securities on loan)
(Cost $78,994,236)—100.1% | | | 78,869,092 | |
| | | | | | | | |
| | |
| | | | | | | | |
| | | | Investments Purchased with Cash Collateral from
Securities on Loan | |
| | |
| | | | | | | | |
| | | | Money Market Funds—5.0% | |
| | 2,936,817 | | | Invesco Government & Agency Portfolio—Institutional Class 2.34%(e)(f) | | | 2,936,817 | |
| | 978,646 | | | Invesco Liquid Assets Portfolio—Institutional Class, 2.48%(e)(f) | | | 978,939 | |
| | | | | | | | |
| | | | Total Investments Purchased with Cash Collateral from Securities on Loan
(Cost $3,915,756) | | | 3,915,756 | |
| | | | | | | | |
| | |
| | | | Total Investments in Securities
(Cost $82,909,992)—105.1% | | | 82,784,848 | |
| | |
| | | | Other assets less liabilities—(5.1)% | | | (3,991,206 | ) |
| | | | | | | | |
| | |
| | | | Net Assets—100.0% | | $ | 78,793,642 | |
| | | | | | | | |
Abbreviations:
REIT—Real Estate Investment Trust
Notes to Schedule of Investments:
| (a) | Industry and/or sector classifications used in this report are generally according to the Global Industry Classification Standard, which was developed by and is the exclusive property and a service mark of MSCI Inc. and Standard & Poor’s. |
| (b) | All or a portion of this security was out on loan at April 30, 2019. |
| (c) | Non-income producing security. |
| (d) | Affiliated company. See Note 4. |
| (e) | The security and the Fund are advised bywholly-owned subsidiaries of Invesco Ltd. and are therefore considered to be affiliated. The rate shown is the7-day SEC standardized yield as of April 30, 2019. |
| (f) | The security has been segregated to satisfy the commitment to return the cash collateral received in securities lending transactions upon the borrower’s return of the securities loaned. See Note 2J. |
See accompanying Notes to Financial Statements which are an integral part of the financial statements.
Schedule of Investments(a)
Invesco Russell Midcap Equal Weight ETF (EQWM)
April 30, 2019
| | | | | | | | |
Number
of Shares | | | | | Value | |
| | | | Common Stocks & Other Equity Interests—99.9% | |
| | | | Communication Services—4.0% | |
| | 350 | | | AMC Networks, Inc., Class A(b) | | $ | 20,443 | |
| | 24 | | | Cable One, Inc. | | | 25,453 | |
| | 442 | | | CBS Corp., Class B | | | 22,661 | |
| | 6,216 | | | CenturyLink, Inc. | | | 70,987 | |
| | 568 | | | Cinemark Holdings, Inc. | | | 23,884 | |
| | 764 | | | Discovery, Inc., Class A(b) | | | 23,608 | |
| | 675 | | | DISH Network Corp., Class A(b) | | | 23,706 | |
| | 405 | | | GCI Liberty, Inc., Class A(b) | | | 24,146 | |
| | 129 | | | IAC/InterActiveCorp.(b) | | | 29,004 | |
| | 972 | | | Interpublic Group of Cos., Inc. (The) | | | 22,356 | |
| | 485 | | | John Wiley & Sons, Inc., Class A | | | 22,397 | |
| | 245 | | | Liberty Broadband Corp., Class C(b) | | | 24,184 | |
| | 649 | | | Liberty Media Corp.-Liberty Formula One, Class C(b) | | | 25,188 | |
| | 536 | | | Liberty Media Corp.-Liberty SiriusXM, Class C(b) | | | 21,526 | |
| | 1,324 | | | Lions Gate Entertainment Corp., Class A | | | 19,317 | |
| | 357 | | | Live Nation Entertainment, Inc.(b) | | | 23,326 | |
| | 74 | | | Madison Square Garden Co. (The), Class A(b) | | | 23,121 | |
| | 502 | | | Match Group, Inc. | | | 30,321 | |
| | 1,683 | | | News Corp., Class A | | | 20,903 | |
| | 292 | | | Omnicom Group, Inc. | | | 23,369 | |
| | 3,625 | | | Sirius XM Holdings, Inc.(c) | | | 21,061 | |
| | 11,776 | | | Sprint Corp.(b) | | | 65,710 | |
| | 305 | | | Take-Two Interactive Software, Inc.(b) | | | 29,533 | |
| | 2,418 | | | Telephone & Data Systems, Inc. | | | 77,086 | |
| | 469 | | | Tribune Media Co., Class A | | | 21,668 | |
| | 425 | | | TripAdvisor, Inc.(b) | | | 22,623 | |
| | 896 | | | Twitter, Inc.(b) | | | 35,759 | |
| | 1,633 | | | United States Cellular Corp.(b) | | | 78,547 | |
| | 745 | | | Viacom, Inc., Class B | | | 21,538 | |
| | 2,731 | | | Zayo Group Holdings, Inc.(b) | | | 85,453 | |
| | 334 | | | Zillow Group, Inc., Class C(b) | | | 11,156 | |
| | 5,310 | | | Zynga, Inc., Class A(b) | | | 30,055 | |
| | | | | | | | |
| | | | | | | 1,020,089 | |
| | | | | | | | |
| | | | Consumer Discretionary—8.6% | |
| | 1,404 | | | Adient PLC | | | 32,432 | |
| | 141 | | | Advance Auto Parts, Inc. | | | 23,451 | |
| | 264 | | | Aptiv PLC | | | 22,625 | |
| | 725 | | | Aramark | | | 22,533 | |
| | 644 | | | AutoNation, Inc.(b) | | | 27,003 | |
| | 23 | | | AutoZone, Inc.(b) | | | 23,651 | |
| | 321 | | | Best Buy Co., Inc. | | | 23,886 | |
| | 562 | | | BorgWarner, Inc. | | | 23,475 | |
| | 176 | | | Bright Horizons Family Solutions, Inc.(b) | | | 22,554 | |
| | 417 | | | Brunswick Corp. | | | 21,355 | |
| | 147 | | | Burlington Stores, Inc.(b) | | | 24,830 | |
| | 2,531 | | | Caesars Entertainment Corp.(b) | | | 23,690 | |
| | 486 | | | Capri Holdings Ltd.(b) | | | 21,423 | |
| | 364 | | | CarMax, Inc.(b) | | | 28,341 | |
| | 232 | | | Carter’s, Inc. | | | 24,571 | |
| | 36 | | | Chipotle Mexican Grill, Inc.(b) | | | 24,769 | |
| | 276 | | | Choice Hotels International, Inc. | | | 22,919 | |
| | 214 | | | Columbia Sportswear Co. | | | 21,394 | |
| | 535 | | | D.R. Horton, Inc. | | | 23,706 | |
| | 200 | | | Darden Restaurants, Inc. | | | 23,520 | |
| | 574 | | | Dick’s Sporting Goods, Inc. | | | 21,238 | |
| | 183 | | | Dollar General Corp. | | | 23,074 | |
| | | | | | | | |
Number
of Shares | | | | | Value | |
| | | | Common Stocks & Other Equity Interests
(continued) | |
| | | | Consumer Discretionary (continued) | |
| | 210 | | | Dollar Tree, Inc.(b) | | $ | 23,369 | |
| | 88 | | | Domino’s Pizza, Inc. | | | 23,811 | |
| | 303 | | | Dunkin’ Brands Group, Inc. | | | 22,613 | |
| | 176 | | | Expedia Group, Inc. | | | 22,852 | |
| | 1,169 | | | Extended Stay America, Inc. | | | 20,937 | |
| | 567 | | | Floor & Decor Holdings, Inc., Class A(b) | | | 27,227 | |
| | 350 | | | Foot Locker, Inc. | | | 20,023 | |
| | 594 | | | frontdoor, Inc.(b) | | | 20,933 | |
| | 813 | | | Gap, Inc. (The) | | | 21,203 | |
| | 262 | | | Garmin Ltd. | | | 22,464 | |
| | 1,057 | | | Gentex Corp. | | | 24,343 | |
| | 203 | | | Genuine Parts Co. | | | 20,816 | |
| | 1,212 | | | Goodyear Tire & Rubber Co. (The) | | | 23,283 | |
| | 32 | | | Graham Holdings Co., Class B | | | 23,790 | |
| | 188 | | | Grand Canyon Education, Inc.(b) | | | 21,787 | |
| | 366 | | | GrubHub, Inc.(b) | | | 24,445 | |
| | 899 | | | H&R Block, Inc. | | | 24,462 | |
| | 1,185 | | | Hanesbrands, Inc. | | | 21,413 | |
| | 580 | | | Harley-Davidson, Inc. | | | 21,593 | |
| | 250 | | | Hasbro, Inc. | | | 25,465 | |
| | 678 | | | Hilton Grand Vacations, Inc.(b) | | | 21,723 | |
| | 262 | | | Hilton Worldwide Holdings, Inc. | | | 22,791 | |
| | 297 | | | Hyatt Hotels Corp., Class A | | | 22,789 | |
| | 1,513 | | | International Game Technology PLC | | | 22,135 | |
| | 315 | | | Kohl’s Corp. | | | 22,396 | |
| | 826 | | | L Brands, Inc. | | | 21,179 | |
| | 149 | | | Lear Corp. | | | 21,307 | |
| | 490 | | | Leggett & Platt, Inc. | | | 19,286 | |
| | 457 | | | Lennar Corp., Class A | | | 23,778 | |
| | 781 | | | LKQ Corp.(b) | | | 23,508 | |
| | 147 | | | Lululemon Athletica, Inc.(b) | | | 25,923 | |
| | 932 | | | Macy’s, Inc. | | | 21,939 | |
| | 1,492 | | | Mattel, Inc.(b)(c) | | | 18,187 | |
| | 821 | | | MGM Resorts International | | | 21,863 | |
| | 1,666 | | | Michaels Cos., Inc. (The)(b) | | | 18,726 | |
| | 168 | | | Mohawk Industries, Inc.(b) | | | 22,890 | |
| | 1,401 | | | Newell Brands, Inc. | | | 20,146 | |
| | 485 | | | Nordstrom, Inc. | | | 19,895 | |
| | 397 | | | Norwegian Cruise Line Holdings Ltd.(b) | | | 22,387 | |
| | 8 | | | NVR, Inc.(b) | | | 25,220 | |
| | 59 | | | O’Reilly Automotive, Inc.(b) | | | 22,336 | |
| | 514 | | | Penske Automotive Group, Inc. | | | 23,603 | |
| | 253 | | | Polaris Industries, Inc. | | | 24,389 | |
| | 138 | | | Pool Corp. | | | 25,356 | |
| | 789 | | | PulteGroup, Inc. | | | 24,822 | |
| | 197 | | | PVH Corp. | | | 25,411 | |
| | 1,263 | | | Qurate Retail, Inc.(b) | | | 21,534 | |
| | 176 | | | Ralph Lauren Corp. | | | 23,158 | |
| | 235 | | | Ross Stores, Inc. | | | 22,950 | |
| | 188 | | | Royal Caribbean Cruises Ltd. | | | 22,737 | |
| | 544 | | | Service Corp. International | | | 22,636 | |
| | 455 | | | ServiceMaster Global Holdings, Inc.(b) | | | 22,309 | |
| | 423 | | | Six Flags Entertainment Corp. | | | 22,457 | |
| | 663 | | | Skechers U.S.A., Inc., Class A(b) | | | 20,991 | |
| | 635 | | | Tapestry, Inc. | | | 20,491 | |
| | 380 | | | Tempur Sealy International, Inc.(b) | | | 23,332 | |
See accompanying Notes to Financial Statements which are an integral part of the financial statements.
Invesco Russell Midcap Equal Weight ETF (EQWM)(continued)
April 30, 2019
| | | | | | | | |
Number
of Shares | | | | | Value | |
| | | | Common Stocks & Other Equity Interests
(continued) | |
| | | | Consumer Discretionary (continued) | |
| | 343 | | | Thor Industries, Inc. | | $ | 22,593 | |
| | 230 | | | Tiffany & Co. | | | 24,799 | |
| | 611 | | | Toll Brothers, Inc. | | | 23,279 | |
| | 235 | | | Tractor Supply Co. | | | 24,322 | |
| | 71 | | | Ulta Beauty, Inc.(b) | | | 24,778 | |
| | 1,003 | | | Under Armour, Inc., Class A(b) | | | 23,159 | |
| | 733 | | | Urban Outfitters, Inc.(b) | | | 21,792 | |
| | 107 | | | Vail Resorts, Inc. | | | 24,487 | |
| | 255 | | | VF Corp. | | | 24,075 | |
| | 273 | | | Visteon Corp.(b) | | | 18,023 | |
| | 133 | | | Wayfair, Inc., Class A(b)(c) | | | 21,566 | |
| | 1,320 | | | Wendy’s Co. (The) | | | 24,565 | |
| | 158 | | | Whirlpool Corp. | | | 21,934 | |
| | 376 | | | Williams-Sonoma, Inc.(c) | | | 21,496 | |
| | 283 | | | Wyndham Destinations, Inc. | | | 12,327 | |
| | 416 | | | Wyndham Hotels & Resorts, Inc. | | | 23,180 | |
| | 183 | | | Wynn Resorts Ltd. | | | 26,434 | |
| | 531 | | | Yum China Holdings, Inc. (China) | | | 25,244 | |
| | | | | | | | |
| | | | | | | 2,197,902 | |
| | | | | | | | |
| | | | Consumer Staples—11.6% | |
| | 2,065 | | | Archer-Daniels-Midland Co. | | | 92,099 | |
| | 1,749 | | | Brown-Forman Corp., Class B | | | 93,204 | |
| | 1,721 | | | Bunge Ltd. | | | 90,198 | |
| | 2,422 | | | Campbell Soup Co.(c) | | | 93,707 | |
| | 664 | | | Casey’s General Stores, Inc. | | | 87,880 | |
| | 1,326 | | | Church & Dwight Co., Inc. | | | 99,384 | |
| | 554 | | | Clorox Co. (The) | | | 88,490 | |
| | 3,884 | | | Conagra Brands, Inc. | | | 119,549 | |
| | 1,999 | | | Coty, Inc., Class A(c) | | | 21,629 | |
| | 1,965 | | | Energizer Holdings, Inc. | | | 94,104 | |
| | 4,298 | | | Flowers Foods, Inc. | | | 93,439 | |
| | 4,039 | | | Hain Celestial Group, Inc. (The)(b) | | | 88,131 | |
| | 1,544 | | | Herbalife Nutrition Ltd.(b) | | | 81,600 | |
| | 779 | | | Hershey Co. (The) | | | 97,258 | |
| | 2,005 | | | Hormel Foods Corp. | | | 80,080 | |
| | 952 | | | Ingredion, Inc. | | | 90,202 | |
| | 848 | | | JM Smucker Co. (The) | | | 103,990 | |
| | 1,605 | | | Kellogg Co. | | | 96,781 | |
| | 3,280 | | | Keurig Dr Pepper, Inc.(c) | | | 95,350 | |
| | 3,406 | | | Kroger Co. (The) | | | 87,807 | |
| | 1,237 | | | Lamb Weston Holdings, Inc. | | | 86,652 | |
| | 641 | | | McCormick & Co., Inc. | | | 98,695 | |
| | 1,450 | | | Molson Coors Brewing Co., Class B | | | 93,075 | |
| | 1,519 | | | Nu Skin Enterprises, Inc., Class A | | | 77,272 | |
| | 4,364 | | | Pilgrim’s Pride Corp.(b) | | | 117,435 | |
| | 874 | | | Post Holdings, Inc.(b) | | | 98,570 | |
| | 22 | | | Seaboard Corp. | | | 98,903 | |
| | 1,595 | | | Spectrum Brands Holdings, Inc. | | | 98,204 | |
| | 3,813 | | | Sprouts Farmers Market, Inc.(b) | | | 81,674 | |
| | 1,471 | | | TreeHouse Foods, Inc.(b) | | | 98,528 | |
| | 1,357 | | | Tyson Foods, Inc., Class A | | | 101,789 | |
| | 2,546 | | | US Foods Holding Corp.(b) | | | 93,056 | |
| | | | | | | | |
| | | | | | | 2,938,735 | |
| | | | | | | | |
| | | | | | | | |
Number
of Shares | | | | | Value | |
| | | | Common Stocks & Other Equity Interests
(continued) | |
| | | | Energy—10.2% | |
| | 7,661 | | | Antero Resources Corp.(b) | | $ | 55,542 | |
| | 1,940 | | | Apache Corp. | | | 63,845 | |
| | 1,608 | | | Apergy Corp.(b) | | | 63,822 | |
| | 2,571 | | | Cabot Oil & Gas Corp. | | | 66,563 | |
| | 7,417 | | | Centennial Resource Development, Inc., Class A(b) | | | 78,101 | |
| | 953 | | | Cheniere Energy, Inc.(b) | | | 61,326 | |
| | 21,411 | | | Chesapeake Energy Corp.(b)(c) | | | 62,306 | |
| | 891 | | | Cimarex Energy Co. | | | 61,176 | |
| | 6,085 | | | CNX Resources Corp.(b) | | | 54,522 | |
| | 621 | | | Concho Resources, Inc. | | | 71,651 | |
| | 1,547 | | | Continental Resources, Inc.(b) | | | 71,147 | |
| | 2,296 | | | Devon Energy Corp. | | | 73,793 | |
| | 659 | | | Diamondback Energy, Inc. | | | 70,111 | |
| | 3,420 | | | EQT Corp. | | | 69,939 | |
| | 3,399 | | | Equitrans Midstream Corp. | | | 70,801 | |
| | 16,650 | | | Extraction Oil & Gas, Inc.(b)(c) | | | 78,255 | |
| | 1,181 | | | Helmerich & Payne, Inc. | | | 69,112 | |
| | 1,139 | | | Hess Corp. | | | 73,033 | |
| | 1,276 | | | HollyFrontier Corp. | | | 60,903 | |
| | 10,597 | | | Kosmos Energy Ltd. (Ghana) | | | 70,894 | |
| | 3,772 | | | Marathon Oil Corp. | | | 64,275 | |
| | 2,120 | | | Murphy Oil Corp. | | | 57,749 | |
| | 19,361 | | | Nabors Industries Ltd. | | | 67,764 | |
| | 2,430 | | | National Oilwell Varco, Inc. | | | 63,520 | |
| | 2,847 | | | Noble Energy, Inc. | | | 77,040 | |
| | 965 | | | ONEOK, Inc. | | | 65,552 | |
| | 3,594 | | | Parsley Energy, Inc., Class A(b) | | | 71,736 | |
| | 4,980 | | | Patterson-UTI Energy, Inc. | | | 67,678 | |
| | 2,134 | | | PBF Energy, Inc., Class A | | | 71,660 | |
| | 8,700 | | | QEP Resources, Inc.(b) | | | 65,424 | |
| | 6,162 | | | Range Resources Corp. | | | 55,704 | |
| | 6,535 | | | RPC, Inc.(c) | | | 67,245 | |
| | 4,084 | | | SM Energy Co. | | | 65,058 | |
| | 1,586 | | | Targa Resources Corp. | | | 63,678 | |
| | 7,707 | | | Transocean Ltd.(b) | | | 60,577 | |
| | 97,500 | | | Weatherford International PLC(b) | | | 53,947 | |
| | 2,698 | | | Whiting Petroleum Corp.(b) | | | 73,898 | |
| | 2,397 | | | Williams Cos., Inc. (The) | | | 67,907 | |
| | 5,400 | | | WPX Energy, Inc.(b) | | | 75,006 | |
| | | | | | | | |
| | | | | | | 2,602,260 | |
| | | | | | | | |
| | | | Financials—6.0% | |
| | 121 | | | Affiliated Managers Group, Inc. | | | 13,421 | |
| | 709 | | | AGNC Investment Corp. | | | 12,613 | |
| | 20 | | | Alleghany Corp.(b) | | | 13,138 | |
| | 480 | | | Ally Financial, Inc. | | | 14,261 | |
| | 130 | | | American Financial Group, Inc. | | | 13,459 | |
| | 87 | | | American National Insurance Co. | | | 9,856 | |
| | 100 | | | Ameriprise Financial, Inc. | | | 14,677 | |
| | 1,241 | | | Annaly Capital Management, Inc. | | | 12,522 | |
| | 389 | | | Arch Capital Group Ltd.(b) | | | 13,140 | |
| | 160 | | | Arthur J. Gallagher & Co. | | | 13,379 | |
| | 562 | | | Associated Banc-Corp. | | | 12,752 | |
| | 125 | | | Assurant, Inc. | | | 11,875 | |
| | 287 | | | Assured Guaranty Ltd. | | | 13,690 | |
| | 299 | | | Athene Holding Ltd., Class A(b) | | | 13,503 | |
See accompanying Notes to Financial Statements which are an integral part of the financial statements.
Invesco Russell Midcap Equal Weight ETF (EQWM)(continued)
April 30, 2019
| | | | | | | | |
Number
of Shares | | | | | Value | |
| | | | Common Stocks & Other Equity Interests
(continued) | |
| | | | Financials (continued) | |
| | 637 | | | AXA Equitable Holdings, Inc. | | $ | 14,454 | |
| | 225 | | | Axis Capital Holdings Ltd. | | | 12,791 | |
| | 155 | | | Bank of Hawaii Corp. | | | 12,769 | |
| | 406 | | | Bank OZK | | | 13,256 | |
| | 357 | | | BankUnited, Inc. | | | 13,059 | |
| | 2,219 | | | BGC Partners, Inc., Class A | | | 11,983 | |
| | 145 | | | BOK Financial Corp. | | | 12,635 | |
| | 334 | | | Brighthouse Financial, Inc.(b) | | | 13,958 | |
| | 431 | | | Brown & Brown, Inc. | | | 13,684 | |
| | 135 | | | Cboe Global Markets, Inc. | | | 13,717 | |
| | 675 | | | Chimera Investment Corp. | | | 12,940 | |
| | 148 | | | Cincinnati Financial Corp. | | | 14,235 | |
| | 257 | | | CIT Group, Inc. | | | 13,690 | |
| | 359 | | | Citizens Financial Group, Inc. | | | 12,996 | |
| | 293 | | | CNA Financial Corp. | | | 13,575 | |
| | 151 | | | Comerica, Inc. | | | 11,867 | |
| | 208 | | | Commerce Bancshares, Inc. | | | 12,569 | |
| | 29 | | | Credit Acceptance Corp.(b) | | | 14,390 | |
| | 124 | | | Cullen/Frost Bankers, Inc. | | | 12,610 | |
| | 179 | | | Discover Financial Services | | | 14,587 | |
| | 265 | | | E*TRADE Financial Corp. | | | 13,425 | |
| | 240 | | | East West Bancorp, Inc. | | | 12,355 | |
| | 313 | | | Eaton Vance Corp. | | | 13,011 | |
| | 69 | | | Erie Indemnity Co., Class A | | | 13,063 | |
| | 142 | | | Evercore, Inc., Class A | | | 13,835 | |
| | 57 | | | Everest Re Group Ltd. | | | 13,424 | |
| | 1,079 | | | F.N.B. Corp. | | | 13,088 | |
| | 54 | | | FactSet Research Systems, Inc. | | | 14,897 | |
| | 357 | | | Fidelity National Financial, Inc. | | | 14,262 | |
| | 471 | | | Fifth Third Bancorp | | | 13,574 | |
| | 250 | | | First American Financial Corp. | | | 14,265 | |
| | 30 | | | First Citizens BancShares, Inc., Class A | | | 13,448 | |
| | 481 | | | First Hawaiian, Inc. | | | 13,300 | |
| | 845 | | | First Horizon National Corp. | | | 12,751 | |
| | 123 | | | First Republic Bank | | | 12,991 | |
| | 401 | | | Franklin Resources, Inc. | | | 13,871 | |
| | 106 | | | Hanover Insurance Group, Inc. (The) | | | 12,785 | |
| | 261 | | | Hartford Financial Services Group, Inc. (The) | | | 13,653 | |
| | 916 | | | Huntington Bancshares, Inc. | | | 12,751 | |
| | 234 | | | Interactive Brokers Group, Inc., Class A | | | 12,692 | |
| | 672 | | | Invesco Ltd.(d) | | | 14,764 | |
| | 664 | | | Jefferies Financial Group, Inc. | | | 13,658 | |
| | 751 | | | KeyCorp | | | 13,180 | |
| | 355 | | | Lazard Ltd., Class A | | | 13,802 | |
| | 454 | | | Legg Mason, Inc. | | | 15,186 | |
| | 208 | | | Lincoln National Corp. | | | 13,878 | |
| | 268 | | | Loews Corp. | | | 13,746 | |
| | 171 | | | LPL Financial Holdings, Inc. | | | 12,669 | |
| | 75 | | | M&T Bank Corp. | | | 12,755 | |
| | 13 | | | Markel Corp.(b) | | | 13,930 | |
| | 56 | | | MarketAxess Holdings, Inc. | | | 15,586 | |
| | 245 | | | Mercury General Corp. | | | 13,176 | |
| | 1,729 | | | MFA Financial, Inc. | | | 12,985 | |
| | 74 | | | Moody’s Corp. | | | 14,550 | |
| | 104 | | | Morningstar, Inc. | | | 14,919 | |
| | 69 | | | MSCI, Inc. | | | 15,551 | |
| | | | | | | | |
Number
of Shares | | | | | Value | |
| | | | Common Stocks & Other Equity Interests
(continued) | |
| | | | Financials (continued) | |
| | 146 | | | Nasdaq, Inc. | | $ | 13,461 | |
| | 1,087 | | | Navient Corp. | | | 14,685 | |
| | 764 | | | New Residential Investment Corp. | | | 12,843 | |
| | 1,026 | | | New York Community Bancorp, Inc. | | | 11,932 | |
| | 139 | | | Northern Trust Corp. | | | 13,698 | |
| | 610 | | | Old Republic International Corp. | | | 13,640 | |
| | 388 | | | OneMain Holdings, Inc. | | | 13,180 | |
| | 319 | | | PacWest Bancorp | | | 12,616 | |
| | 733 | | | People’s United Financial, Inc. | | | 12,674 | |
| | 221 | | | Pinnacle Financial Partners, Inc. | | | 12,833 | |
| | 239 | | | Popular, Inc. | | | 13,793 | |
| | 251 | | | Principal Financial Group, Inc. | | | 14,347 | |
| | 173 | | | Prosperity Bancshares, Inc. | | | 12,740 | |
| | 156 | | | Raymond James Financial, Inc. | | | 14,285 | |
| | 813 | | | Regions Financial Corp. | | | 12,626 | |
| | 87 | | | Reinsurance Group of America, Inc. | | | 13,181 | |
| | 88 | | | RenaissanceRe Holdings Ltd. (Bermuda) | | | 13,672 | |
| | 612 | | | Santander Consumer USA Holdings, Inc. | | | 13,066 | |
| | 251 | | | SEI Investments Co. | | | 13,667 | |
| | 94 | | | Signature Bank | | | 12,415 | |
| | 1,186 | | | SLM Corp. | | | 12,050 | |
| | 563 | | | Starwood Property Trust, Inc. | | | 12,977 | |
| | 653 | | | Sterling Bancorp | | | 13,987 | |
| | 198 | | | SunTrust Banks, Inc. | | | 12,965 | |
| | 52 | | | SVB Financial Group(b) | | | 13,089 | |
| | 398 | | | Synchrony Financial | | | 13,799 | |
| | 331 | | | Synovus Financial Corp. | | | 12,201 | |
| | 130 | | | T. Rowe Price Group, Inc. | | | 13,975 | |
| | 583 | | | TCF Financial Corp. | | | 12,902 | |
| | 213 | | | Texas Capital Bancshares, Inc.(b) | | | 13,787 | |
| | 754 | | | TFS Financial Corp. | | | 12,547 | |
| | 154 | | | Torchmark Corp. | | | 13,500 | |
| | 903 | | | Two Harbors Investment Corp. | | | 12,516 | |
| | 715 | | | Umpqua Holdings Corp. | | | 12,412 | |
| | 348 | | | Unum Group | | | 12,848 | |
| | 497 | | | Virtu Financial, Inc., Class A | | | 12,216 | |
| | 255 | | | Voya Financial, Inc. | | | 13,997 | |
| | 226 | | | W.R. Berkley Corp. | | | 13,854 | |
| | 227 | | | Webster Financial Corp. | | | 12,061 | |
| | 286 | | | Western Alliance Bancorp(b) | | | 13,665 | |
| | 14 | | | White Mountains Insurance Group Ltd. | | | 13,147 | |
| | 74 | | | Willis Towers Watson PLC | | | 13,641 | |
| | 177 | | | Wintrust Financial Corp. | | | 13,487 | |
| | 257 | | | Zions Bancorp NA | | | 12,678 | |
| | | | | | | | |
| | | | | | | 1,519,482 | |
| | | | | | | | |
| | | | Health Care—11.2% | |
| | 126 | | | ABIOMED, Inc.(b) | | | 34,954 | |
| | 1,399 | | | Acadia Healthcare Co., Inc.(b)(c) | | | 44,796 | |
| | 506 | | | Agilent Technologies, Inc. | | | 39,721 | |
| | 632 | | | Agios Pharmaceuticals, Inc.(b) | | | 35,341 | |
| | 173 | | | Align Technology, Inc.(b) | | | 56,170 | |
| | 1,222 | | | Alkermes PLC(b) | | | 37,051 | |
| | 478 | | | Alnylam Pharmaceuticals, Inc.(b) | | | 42,705 | |
| | 522 | | | AmerisourceBergen Corp. | | | 39,025 | |
| | 437 | | | BioMarin Pharmaceutical, Inc.(b) | | | 37,377 | |
| | 132 | | | Bio-Rad Laboratories, Inc., Class A(b) | | | 39,723 | |
See accompanying Notes to Financial Statements which are an integral part of the financial statements.
Invesco Russell Midcap Equal Weight ETF (EQWM)(continued)
April 30, 2019
| | | | | | | | |
Number
of Shares | | | | | Value | |
| | | | Common Stocks & Other Equity Interests
(continued) | |
| | | | Health Care (continued) | |
| | 209 | | | Bio-Techne Corp. | | $ | 42,759 | |
| | 285 | | | Bluebird Bio, Inc.(b) | | | 40,422 | |
| | 1,058 | | | Bruker Corp. | | | 40,839 | |
| | 608 | | | Cantel Medical Corp. | | | 41,916 | |
| | 839 | | | Cardinal Health, Inc. | | | 40,868 | |
| | 936 | | | Catalent, Inc.(b) | | | 41,952 | |
| | 706 | | | Centene Corp.(b) | | | 36,401 | |
| | 720 | | | Cerner Corp.(b) | | | 47,844 | |
| | 288 | | | Charles River Laboratories International, Inc.(b) | | | 40,455 | |
| | 123 | | | Chemed Corp. | | | 40,194 | |
| | 138 | | | Cooper Cos., Inc. (The) | | | 40,009 | |
| | 834 | | | Covetrus, Inc.(b) | | | 27,414 | |
| | 789 | | | DaVita, Inc.(b) | | | 43,584 | |
| | 827 | | | DENTSPLY SIRONA, Inc. | | | 42,284 | |
| | 279 | | | DexCom, Inc.(b) | | | 33,779 | |
| | 233 | | | Edwards Lifesciences Corp.(b) | | | 41,024 | |
| | 1,361 | | | Elanco Animal Health, Inc., Class W(b) | | | 42,871 | |
| | 676 | | | Encompass Health Corp. | | | 43,568 | |
| | 472 | | | Exact Sciences Corp.(b) | | | 46,582 | |
| | 1,723 | | | Exelixis, Inc.(b) | | | 33,874 | |
| | 378 | | | Henry Schein, Inc.(b) | | | 24,215 | |
| | 385 | | | Hill-Rom Holdings, Inc. | | | 39,047 | |
| | 852 | | | Hologic, Inc.(b) | | | 39,516 | |
| | 172 | | | ICU Medical, Inc.(b) | | | 39,130 | |
| | 196 | | | IDEXX Laboratories, Inc.(b) | | | 45,472 | |
| | 483 | | | Incyte Corp.(b) | | | 37,094 | |
| | 428 | | | Insulet Corp.(b)(c) | | | 36,915 | |
| | 726 | | | Integra LifeSciences Holdings Corp.(b) | | | 37,890 | |
| | 571 | | | Ionis Pharmaceuticals, Inc.(b) | | | 42,442 | |
| | 289 | | | IQVIA Holdings, Inc.(b) | | | 40,142 | |
| | 293 | | | Jazz Pharmaceuticals PLC(b) | | | 38,023 | |
| | 273 | | | Laboratory Corp. of America Holdings(b) | | | 43,658 | |
| | 307 | | | Masimo Corp.(b) | | | 39,956 | |
| | 1,322 | | | MEDNAX, Inc.(b) | | | 36,976 | |
| | 40 | | | Mettler-Toledo International, Inc.(b) | | | 29,810 | |
| | 1,936 | | | Moderna, Inc.(b)(c) | | | 50,394 | |
| | 306 | | | Molina Healthcare, Inc.(b) | | | 39,667 | |
| | 1,486 | | | Mylan N.V.(b) | | | 40,107 | |
| | 1,113 | | | Nektar Therapeutics(b) | | | 35,638 | |
| | 517 | | | Neurocrine Biosciences, Inc.(b) | | | 37,348 | |
| | 287 | | | Penumbra, Inc.(b)(c) | | | 38,601 | |
| | 428 | | | PerkinElmer, Inc. | | | 41,020 | |
| | 856 | | | Perrigo Co. PLC | | | 41,020 | |
| | 391 | | | PRA Health Sciences, Inc.(b) | | | 37,857 | |
| | 1,186 | | | Premier, Inc., Class A(b) | | | 39,411 | |
| | 1,024 | | | QIAGEN N.V.(b) | | | 39,895 | |
| | 479 | | | Quest Diagnostics, Inc. | | | 46,166 | |
| | 397 | | | ResMed, Inc. | | | 41,490 | |
| | 265 | | | Sage Therapeutics, Inc.(b)(c) | | | 44,581 | |
| | 298 | | | Sarepta Therapeutics, Inc.(b)(c) | | | 34,848 | |
| | 579 | | | Seattle Genetics, Inc.(b) | | | 39,245 | |
| | 333 | | | STERIS PLC | | | 43,616 | |
| | 139 | | | Teleflex, Inc. | | | 39,779 | |
| | 359 | | | United Therapeutics Corp.(b) | | | 36,823 | |
| | 308 | | | Universal Health Services, Inc., Class B | | | 39,076 | |
| | 300 | | | Varian Medical Systems, Inc.(b) | | | 40,851 | |
| | | | | | | | |
Number
of Shares | | | | | Value | |
| | | | Common Stocks & Other Equity Interests
(continued) | |
| | | | Health Care (continued) | |
| | 350 | | | Veeva Systems, Inc., Class A(b) | | $ | 48,954 | |
| | 110 | | | Waters Corp.(b) | | | 23,489 | |
| | 169 | | | WellCare Health Plans, Inc.(b) | | | 43,661 | |
| | 389 | | | West Pharmaceutical Services, Inc. | | | 48,154 | |
| | 328 | | | Zimmer Biomet Holdings, Inc. | | | 40,396 | |
| | | | | | | | |
| | | | | | | 2,837,875 | |
| | | | | | | | |
| | | | Industrials—13.2% | |
| | 516 | | | A.O. Smith Corp. | | | 27,126 | |
| | 336 | | | Acuity Brands, Inc. | | | 49,167 | |
| | 3,454 | | | ADT, Inc.(c) | | | 22,762 | |
| | 868 | | | AECOM(b) | | | 29,425 | |
| | 395 | | | AGCO Corp. | | | 27,958 | |
| | 750 | | | Air Lease Corp. | | | 28,920 | |
| | 468 | | | Alaska Air Group, Inc. | | | 28,969 | |
| | 298 | | | Allegion PLC | | | 29,571 | |
| | 565 | | | Allison Transmission Holdings, Inc. | | | 26,476 | |
| | 59 | | | AMERCO | | | 22,017 | |
| | 813 | | | American Airlines Group, Inc. | | | 27,788 | |
| | 332 | | | AMETEK, Inc. | | | 29,272 | |
| | 1,429 | | | Arconic, Inc. | | | 30,695 | |
| | 1,915 | | | Arcosa, Inc. | | | 59,614 | |
| | 608 | | | Armstrong World Industries, Inc. | | | 52,695 | |
| | 531 | | | BWX Technologies, Inc. | | | 27,134 | |
| | 299 | | | C.H. Robinson Worldwide, Inc. | | | 24,219 | |
| | 215 | | | Carlisle Cos., Inc. | | | 30,405 | |
| | 129 | | | Cintas Corp. | | | 28,011 | |
| | 382 | | | Clean Harbors, Inc.(b) | | | 29,032 | |
| | 1,009 | | | Colfax Corp.(b) | | | 30,442 | |
| | 316 | | | Copa Holdings SA, Class A (Panama) | | | 26,310 | |
| | 449 | | | Copart, Inc.(b) | | | 30,227 | |
| | 59 | | | CoStar Group, Inc.(b) | | | 29,279 | |
| | 315 | | | Crane Co. | | | 26,791 | |
| | 170 | | | Cummins, Inc. | | | 28,269 | |
| | 226 | | | Curtiss-Wright Corp. | | | 25,750 | |
| | 538 | | | Donaldson Co., Inc. | | | 28,805 | |
| | 290 | | | Dover Corp. | | | 28,432 | |
| | 115 | | | Equifax, Inc. | | | 14,484 | |
| | 352 | | | Expeditors International of Washington, Inc. | | | 27,956 | |
| | 724 | | | Fastenal Co. | | | 51,078 | |
| | 608 | | | Flowserve Corp. | | | 29,810 | |
| | 720 | | | Fluor Corp. | | | 28,606 | |
| | 323 | | | Fortive Corp. | | | 27,888 | |
| | 472 | | | Fortune Brands Home & Security, Inc. | | | 24,912 | |
| | 1,004 | | | Gardner Denver Holdings, Inc.(b) | | | 33,885 | |
| | 1,706 | | | Gates Industrial Corp. PLC(b) | | | 27,433 | |
| | 323 | | | Genesee & Wyoming, Inc., Class A(b) | | | 28,634 | |
| | 553 | | | Graco, Inc. | | | 28,341 | |
| | 3,607 | | | GrafTech International Ltd. | | | 41,300 | |
| | 167 | | | Harris Corp. | | | 28,140 | |
| | 609 | | | HD Supply Holdings, Inc.(b) | | | 27,825 | |
| | 289 | | | HEICO Corp. | | | 30,498 | |
| | 632 | | | Hexcel Corp. | | | 44,689 | |
| | 219 | | | Hubbell, Inc. | | | 27,944 | |
| | 130 | | | Huntington Ingalls Industries, Inc. | | | 28,935 | |
| | 182 | | | IDEX Corp. | | | 28,512 | |
| | 510 | | | IHS Markit Ltd.(b) | | | 29,203 | |
See accompanying Notes to Financial Statements which are an integral part of the financial statements.
Invesco Russell Midcap Equal Weight ETF (EQWM)(continued)
April 30, 2019
| | | | | | | | |
Number
of Shares | | | | | Value | |
| | | | Common Stocks & Other Equity Interests
(continued) | |
| | | | Industrials (continued) | |
| | 426 | | | Ingersoll-Rand PLC | | $ | 52,232 | |
| | 460 | | | ITT, Inc. | | | 27,853 | |
| | 257 | | | J.B. Hunt Transport Services, Inc. | | | 24,281 | |
| | 363 | | | Jacobs Engineering Group, Inc. | | | 28,292 | |
| | 1,617 | | | JetBlue Airways Corp.(b) | | | 29,995 | |
| | 234 | | | Kansas City Southern | | | 28,815 | |
| | 449 | | | KAR Auction Services, Inc. | | | 25,360 | |
| | 365 | | | Kirby Corp.(b) | | | 29,828 | |
| | 796 | | | Knight-Swift Transportation Holdings, Inc. | | | 26,547 | |
| | 126 | | | L3 Technologies, Inc. | | | 27,541 | |
| | 248 | | | Landstar System, Inc. | | | 27,022 | |
| | 185 | | | Lennox International, Inc. | | | 50,218 | |
| | 307 | | | Lincoln Electric Holdings, Inc. | | | 26,792 | |
| | 667 | | | Macquarie Infrastructure Corp. | | | 27,020 | |
| | 322 | | | ManpowerGroup, Inc. | | | 30,925 | |
| | 1,142 | | | Masco Corp. | | | 44,607 | |
| | 212 | | | Middleby Corp. (The)(b) | | | 28,012 | |
| | 314 | | | MSC Industrial Direct Co., Inc., Class A | | | 26,266 | |
| | 831 | | | Nielsen Holdings PLC | | | 21,215 | |
| | 197 | | | Nordson Corp. | | | 28,752 | |
| | 971 | | | nVent Electric PLC | | | 27,140 | |
| | 186 | | | Old Dominion Freight Line, Inc. | | | 27,766 | |
| | 336 | | | Oshkosh Corp. | | | 27,750 | |
| | 946 | | | Owens Corning | | | 48,501 | |
| | 390 | | | PACCAR, Inc. | | | 27,951 | |
| | 154 | | | Parker-Hannifin Corp. | | | 27,886 | |
| | 627 | | | Pentair PLC | | | 24,447 | |
| | 748 | | | Quanta Services, Inc. | | | 30,369 | |
| | 327 | | | Regal Beloit Corp. | | | 27,821 | |
| | 334 | | | Republic Services, Inc. | | | 27,662 | |
| | 400 | | | Robert Half International, Inc. | | | 24,836 | |
| | 149 | | | Rockwell Automation, Inc. | | | 26,926 | |
| | 655 | | | Rollins, Inc. | | | 25,329 | |
| | 82 | | | Roper Technologies, Inc. | | | 29,495 | |
| | 436 | | | Ryder System, Inc. | | | 27,468 | |
| | 1,247 | | | Schneider National, Inc., Class B | | | 26,062 | |
| | 535 | | | Sensata Technologies Holding PLC(b) | | | 26,718 | |
| | 163 | | | Snap-on, Inc. | | | 27,430 | |
| | 272 | | | Spirit AeroSystems Holdings, Inc., Class A | | | 23,637 | |
| | 200 | | | Stanley Black & Decker, Inc. | | | 29,320 | |
| | 550 | | | Stericycle, Inc.(b) | | | 32,115 | |
| | 114 | | | Teledyne Technologies, Inc.(b) | | | 28,330 | |
| | 771 | | | Terex Corp. | | | 25,697 | |
| | 504 | | | Textron, Inc. | | | 26,712 | |
| | 1,043 | | | Timken Co. (The) | | | 50,012 | |
| | 389 | | | Toro Co. (The) | | | 28,455 | |
| | 63 | | | TransDigm Group, Inc.(b) | | | 30,399 | |
| | 196 | | | TransUnion | | | 13,651 | |
| | 1,167 | | | Trinity Industries, Inc. | | | 25,161 | |
| | 317 | | | United Continental Holdings, Inc.(b) | | | 28,169 | |
| | 207 | | | United Rentals, Inc.(b) | | | 29,170 | |
| | 1,952 | | | Univar, Inc.(b) | | | 43,588 | |
| | 329 | | | Valmont Industries, Inc. | | | 44,362 | |
| | 207 | | | Verisk Analytics, Inc. | | | 29,216 | |
| | 88 | | | W.W. Grainger, Inc. | | | 24,816 | |
| | 157 | | | WABCO Holdings, Inc.(b) | | | 20,793 | |
| | | | | | | | |
Number
of Shares | | | | | Value | |
| | | | Common Stocks & Other Equity Interests
(continued) | |
| | | | Industrials (continued) | |
| | 376 | | | Wabtec Corp.(c) | | $ | 27,850 | |
| | 316 | | | Watsco, Inc. | | | 50,077 | |
| | 1,695 | | | Welbilt, Inc.(b) | | | 28,527 | |
| | 500 | | | WESCO International, Inc.(b) | | | 28,620 | |
| | 550 | | | XPO Logistics, Inc.(b)(c) | | | 37,444 | |
| | 348 | | | Xylem, Inc. | | | 29,023 | |
| | | | | | | | |
| | | | | | | 3,353,908 | |
| | | | | | | | |
| | | | Information Technology—13.2% | |
| | 320 | | | 2U, Inc.(b) | | | 19,360 | |
| | 1,222 | | | Advanced Micro Devices, Inc.(b) | | | 33,764 | |
| | 383 | | | Akamai Technologies, Inc.(b) | | | 30,663 | |
| | 76 | | | Alliance Data Systems Corp. | | | 12,168 | |
| | 498 | | | Amdocs Ltd. | | | 27,430 | |
| | 289 | | | Amphenol Corp., Class A | | | 28,773 | |
| | 255 | | | Analog Devices, Inc. | | | 29,641 | |
| | 151 | | | ANSYS, Inc.(b) | | | 29,566 | |
| | 98 | | | Arista Networks, Inc.(b) | | | 30,604 | |
| | 348 | | | Arrow Electronics, Inc.(b) | | | 29,409 | |
| | 275 | | | Aspen Technology, Inc.(b) | | | 33,525 | |
| | 259 | | | Atlassian Corp. PLC, Class A(b) | | | 28,529 | |
| | 177 | | | Autodesk, Inc.(b) | | | 31,543 | |
| | 641 | | | Avnet, Inc. | | | 31,159 | |
| | 521 | | | Black Knight, Inc.(b) | | | 29,395 | |
| | 496 | | | Booz Allen Hamilton Holding Corp. | | | 29,408 | |
| | 127 | | | Broadridge Financial Solutions, Inc. | | | 15,003 | |
| | 459 | | | Cadence Design Systems, Inc.(b) | | | 31,845 | |
| | 467 | | | CDK Global, Inc. | | | 28,169 | |
| | 294 | | | CDW Corp. | | | 31,046 | |
| | 559 | | | Ceridian HCM Holding, Inc.(b) | | | 29,711 | |
| | 262 | | | Citrix Systems, Inc. | | | 26,452 | |
| | 518 | | | Cognex Corp. | | | 26,123 | |
| | 206 | | | Coherent, Inc.(b) | | | 30,490 | |
| | 1,220 | | | CommScope Holding Co., Inc.(b) | | | 30,232 | |
| | 1,885 | | | Conduent, Inc.(b) | | | 24,185 | |
| | 341 | | | CoreLogic, Inc.(b) | | | 13,848 | |
| | 794 | | | Corning, Inc. | | | 25,289 | |
| | 1,825 | | | Cypress Semiconductor Corp. | | | 31,353 | |
| | 508 | | | Dell Technologies, Inc., Class C(b) | | | 34,244 | |
| | 486 | | | DocuSign, Inc.(b) | | | 27,542 | |
| | 423 | | | Dolby Laboratories, Inc., Class A | | | 27,364 | |
| | 419 | | | DXC Technology Co. | | | 27,545 | |
| | 720 | | | EchoStar Corp., Class A(b) | | | 28,692 | |
| | 318 | | | Elastic N.V.(b) | | | 27,205 | |
| | 169 | | | EPAM Systems, Inc.(b) | | | 30,312 | |
| | 92 | | | Euronet Worldwide, Inc.(b) | | | 13,790 | |
| | 170 | | | F5 Networks, Inc.(b) | | | 26,673 | |
| | 51 | | | Fair Isaac Corp.(b) | | | 14,267 | |
| | 119 | | | Fidelity National Information Services, Inc. | | | 13,796 | |
| | 1,668 | | | FireEye, Inc.(b) | | | 26,721 | |
| | 495 | | | First Data Corp., Class A(b) | | | 12,801 | |
| | 1,281 | | | First Solar, Inc.(b) | | | 78,820 | |
| | 147 | | | Fiserv, Inc.(b) | | | 12,824 | |
| | 55 | | | FleetCor Technologies, Inc.(b) | | | 14,352 | |
| | 523 | | | FLIR Systems, Inc. | | | 27,688 | |
| | 327 | | | Fortinet, Inc.(b) | | | 30,548 | |
| | 190 | | | Gartner, Inc.(b) | | | 30,204 | |
See accompanying Notes to Financial Statements which are an integral part of the financial statements.
Invesco Russell Midcap Equal Weight ETF (EQWM)(continued)
April 30, 2019
| | | | | | | | |
Number
of Shares | | | | | Value | |
| | | | Common Stocks & Other Equity Interests
(continued) | |
| | | | Information Technology (continued) | |
| | 787 | | | Genpact Ltd. | | $ | 28,568 | |
| | 97 | | | Global Payments, Inc. | | | 14,169 | |
| | 368 | | | GoDaddy, Inc., Class A(b) | | | 29,992 | |
| | 299 | | | Guidewire Software, Inc.(b) | | | 31,843 | |
| | 182 | | | IPG Photonics Corp.(b) | | | 31,801 | |
| | 992 | | | Jabil, Inc. | | | 29,968 | |
| | 96 | | | Jack Henry & Associates, Inc. | | | 14,310 | |
| | 1,040 | | | Juniper Networks, Inc. | | | 28,881 | |
| | 310 | | | Keysight Technologies, Inc.(b) | | | 26,979 | |
| | 235 | | | KLA-Tencor Corp. | | | 29,958 | |
| | 161 | | | Lam Research Corp. | | | 33,396 | |
| | 432 | | | Leidos Holdings, Inc. | | | 31,743 | |
| | 139 | | | Littelfuse, Inc. | | | 27,946 | |
| | 335 | | | LogMeIn, Inc. | | | 27,604 | |
| | 503 | | | Manhattan Associates, Inc.(b) | | | 33,927 | |
| | 1,407 | | | Marvell Technology Group Ltd. | | | 35,203 | |
| | 515 | | | Maxim Integrated Products, Inc. | | | 30,900 | |
| | 319 | | | Microchip Technology, Inc. | | | 31,865 | |
| | 342 | | | MKS Instruments, Inc. | | | 31,125 | |
| | 201 | | | Monolithic Power Systems, Inc. | | | 31,298 | |
| | 193 | | | Motorola Solutions, Inc. | | | 27,968 | |
| | 581 | | | National Instruments Corp. | | | 27,365 | |
| | 1,005 | | | NCR Corp.(b) | | | 29,095 | |
| | 425 | | | NetApp, Inc. | | | 30,961 | |
| | 1,641 | | | Nuance Communications, Inc.(b) | | | 27,618 | |
| | 772 | | | Nutanix, Inc., Class A(b) | | | 33,343 | |
| | 332 | | | Okta, Inc.(b) | | | 34,538 | |
| | 1,265 | | | ON Semiconductor Corp.(b) | | | 29,171 | |
| | 115 | | | Palo Alto Networks, Inc.(b) | | | 28,615 | |
| | 344 | | | Paychex, Inc. | | | 29,003 | |
| | 153 | | | Paycom Software, Inc.(b) | | | 30,987 | |
| | 419 | | | Pegasystems, Inc. | | | 31,429 | |
| | 932 | | | Pluralsight, Inc., Class A(b) | | | 33,077 | |
| | 238 | | | Proofpoint, Inc.(b) | | | 29,850 | |
| | 301 | | | PTC, Inc.(b) | | | 27,231 | |
| | 1,376 | | | Pure Storage, Inc., Class A(b) | | | 31,455 | |
| | 395 | | | Qorvo, Inc.(b) | | | 29,866 | |
| | 459 | | | RealPage, Inc.(b) | | | 29,931 | |
| | 150 | | | Red Hat, Inc.(b) | | | 27,380 | |
| | 266 | | | RingCentral, Inc., Class A(b) | | | 30,954 | |
| | 1,271 | | | Sabre Corp. | | | 26,386 | |
| | 116 | | | ServiceNow, Inc.(b) | | | 31,495 | |
| | 339 | | | Skyworks Solutions, Inc. | | | 29,893 | |
| | 1,507 | | | Solarwinds Corp.(b) | | | 29,462 | |
| | 219 | | | Splunk, Inc.(b) | | | 30,231 | |
| | 169 | | | Square, Inc., Class A(b) | | | 12,307 | |
| | 443 | | | SS&C Technologies Holdings, Inc. | | | 29,973 | |
| | 3,322 | | | Switch, Inc., Class A(c) | | | 36,110 | |
| | 1,232 | | | Symantec Corp. | | | 29,827 | |
| | 261 | | | Synopsys, Inc.(b) | | | 31,602 | |
| | 218 | | | Tableau Software, Inc., Class A(b) | | | 26,555 | |
| | 567 | | | Teradata Corp.(b) | | | 25,781 | |
| | 694 | | | Teradyne, Inc. | | | 34,006 | |
| | 135 | | | Total System Services, Inc. | | | 13,802 | |
| | 682 | | | Trimble, Inc.(b) | | | 27,839 | |
| | 234 | | | Twilio, Inc., Class A(b) | | | 32,091 | |
| | | | | | | | |
Number
of Shares | | | | | Value | |
| | | | Common Stocks & Other Equity Interests
(continued) | |
| | | | Information Technology (continued) | |
| | 135 | | | Tyler Technologies, Inc.(b) | | $ | 31,308 | |
| | 193 | | | Ubiquiti Networks, Inc. | | | 32,897 | |
| | 81 | | | Ultimate Software Group, Inc. (The)(b) | | | 26,783 | |
| | 182 | | | Universal Display Corp.(c) | | | 29,047 | |
| | 152 | | | VeriSign, Inc.(b) | | | 30,012 | |
| | 917 | | | Versum Materials, Inc. | | | 47,849 | |
| | 574 | | | Western Digital Corp. | | | 29,343 | |
| | 708 | | | Western Union Co. (The) | | | 13,764 | |
| | 72 | | | WEX, Inc.(b) | | | 15,142 | |
| | 148 | | | Workday, Inc., Class A(b) | | | 30,433 | |
| | 132 | | | Worldpay, Inc., Class A(b) | | | 15,472 | |
| | 866 | | | Xerox Corp. | | | 28,890 | |
| | 225 | | | Xilinx, Inc. | | | 27,032 | |
| | 130 | | | Zebra Technologies Corp., Class A(b) | | | 27,448 | |
| | 355 | | | Zendesk, Inc.(b) | | | 31,162 | |
| | | | | | | | |
| | | | | | | 3,349,326 | |
| | | | | | | | |
| | | | Materials—8.4% | |
| | 526 | | | Albemarle Corp. | | | 39,482 | |
| | 1,627 | | | Alcoa Corp.(b) | | | 43,408 | |
| | 446 | | | AptarGroup, Inc. | | | 49,613 | |
| | 3,421 | | | Ardagh Group SA | | | 47,483 | |
| | 573 | | | Ashland Global Holdings, Inc. | | | 46,144 | |
| | 243 | | | Avery Dennison Corp. | | | 26,888 | |
| | 1,721 | | | Axalta Coating Systems Ltd.(b) | | | 46,433 | |
| | 814 | | | Ball Corp. | | | 48,791 | |
| | 843 | | | Bemis Co., Inc. | | | 48,405 | |
| | 861 | | | Berry Global Group, Inc.(b) | | | 50,627 | |
| | 967 | | | Cabot Corp. | | | 43,882 | |
| | 438 | | | Celanese Corp. | | | 47,256 | |
| | 1,105 | | | CF Industries Holdings, Inc. | | | 49,482 | |
| | 1,166 | | | Chemours Co. (The) | | | 41,988 | |
| | 824 | | | Crown Holdings, Inc.(b) | | | 47,899 | |
| | 890 | | | Domtar Corp. | | | 43,521 | |
| | 565 | | | Eagle Materials, Inc. | | | 51,364 | |
| | 557 | | | Eastman Chemical Co. | | | 43,936 | |
| | 4,047 | | | Element Solutions, Inc.(b) | | | 43,950 | |
| | 572 | | | FMC Corp. | | | 45,222 | |
| | 3,616 | | | Freeport-McMoRan, Inc. | | | 44,513 | |
| | 3,631 | | | Graphic Packaging Holding Co. | | | 50,398 | |
| | 1,879 | | | Huntsman Corp. | | | 41,789 | |
| | 358 | | | International Flavors & Fragrances,
Inc.(c) | | | 49,329 | |
| | 971 | | | International Paper Co. | | | 45,453 | |
| | 226 | | | Martin Marietta Materials, Inc. | | | 50,149 | |
| | 1,594 | | | Mosaic Co. (The) | | | 41,619 | |
| | 100 | | | NewMarket Corp. | | | 41,958 | |
| | 1,340 | | | Newmont Goldcorp Corp. | | | 41,620 | |
| | 754 | | | Nucor Corp. | | | 43,031 | |
| | 1,833 | | | Olin Corp. | | | 39,758 | |
| | 2,275 | | | Owens-Illinois, Inc. | | | 44,954 | |
| | 456 | | | Packaging Corp. of America | | | 45,217 | |
| | 509 | | | Reliance Steel & Aluminum Co. | | | 46,808 | |
| | 510 | | | Royal Gold, Inc. | | | 44,401 | |
| | 782 | | | RPM International, Inc. | | | 47,428 | |
| | 548 | | | Scotts Miracle-Gro Co. (The) | | | 46,591 | |
| | 1,000 | | | Sealed Air Corp. | | | 46,620 | |
| | 1,566 | | | Silgan Holdings, Inc. | | | 46,886 | |
See accompanying Notes to Financial Statements which are an integral part of the financial statements.
Invesco Russell Midcap Equal Weight ETF (EQWM)(continued)
April 30, 2019
| | | | | | | | |
Number
of Shares | | | | | Value | |
| | | | Common Stocks & Other Equity Interests
(continued) | |
| | | | Materials (continued) | |
| | 766 | | | Sonoco Products Co. | | $ | 48,304 | |
| | 1,235 | | | Steel Dynamics, Inc. | | | 39,125 | |
| | 2,226 | | | United States Steel Corp. | | | 34,726 | |
| | 3,366 | | | Valvoline, Inc. | | | 62,271 | |
| | 390 | | | Vulcan Materials Co. | | | 49,183 | |
| | 578 | | | W.R. Grace & Co. | | | 43,685 | |
| | 646 | | | Westlake Chemical Corp. | | | 45,059 | |
| | 1,190 | | | WestRock Co. | | | 45,672 | |
| | | | | | | | |
| | | | | | | 2,132,321 | |
| | | | | | | | |
| | | | Real Estate—4.0% | |
| | 92 | | | Alexandria Real Estate Equities, Inc. | | | 13,100 | |
| | 275 | | | American Campus Communities, Inc. | | | 12,980 | |
| | 570 | | | American Homes 4 Rent, Class A | | | 13,669 | |
| | 261 | | | Apartment Investment & Management Co., Class A | | | 12,883 | |
| | 770 | | | Apple Hospitality REIT, Inc. | | | 12,666 | |
| | 64 | | | AvalonBay Communities, Inc. | | | 12,859 | |
| | 95 | | | Boston Properties, Inc. | | | 13,074 | |
| | 808 | | | Brandywine Realty Trust | | | 12,435 | |
| | 732 | | | Brixmor Property Group, Inc. | | | 13,088 | |
| | 642 | | | Brookfield Property REIT, Inc., Class A | | | 13,373 | |
| | 127 | | | Camden Property Trust | | | 12,783 | |
| | 251 | | | CBRE Group, Inc., Class A(b) | | | 13,070 | |
| | 2,407 | | | Colony Capital, Inc. | | | 12,372 | |
| | 571 | | | Columbia Property Trust, Inc. | | | 12,967 | |
| | 124 | | | CoreSite Realty Corp. | | | 13,567 | |
| | 481 | | | Corporate Office Properties Trust | | | 13,410 | |
| | 412 | | | CubeSmart | | | 13,147 | |
| | 247 | | | CyrusOne, Inc. | | | 13,755 | |
| | 111 | | | Digital Realty Trust, Inc. | | | 13,066 | |
| | 320 | | | Douglas Emmett, Inc. | | | 13,181 | |
| | 423 | | | Duke Realty Corp. | | | 13,164 | |
| | 784 | | | Empire State Realty Trust, Inc., Class A | | | 12,121 | |
| | 170 | | | EPR Properties | | | 13,406 | |
| | 382 | | | Equity Commonwealth | | | 12,148 | |
| | 112 | | | Equity LifeStyle Properties, Inc. | | | 13,070 | |
| | 171 | | | Equity Residential | | | 13,068 | |
| | 47 | | | Essex Property Trust, Inc. | | | 13,277 | |
| | 129 | | | Extra Space Storage, Inc. | | | 13,376 | |
| | 95 | | | Federal Realty Investment Trust | | | 12,716 | |
| | 353 | | | Gaming and Leisure Properties, Inc. | | | 14,254 | |
| | 412 | | | HCP, Inc. | | | 12,269 | |
| | 446 | | | Healthcare Trust of America, Inc., Class A | | | 12,301 | |
| | 281 | | | Highwoods Properties, Inc. | | | 12,527 | |
| | 476 | | | Hospitality Properties Trust | | | 12,376 | |
| | 647 | | | Host Hotels & Resorts, Inc. | | | 12,448 | |
| | 115 | | | Howard Hughes Corp. (The)(b) | | | 12,765 | |
| | 378 | | | Hudson Pacific Properties, Inc. | | | 13,177 | |
| | 537 | | | Invitation Homes, Inc. | | | 13,350 | |
| | 360 | | | Iron Mountain, Inc. | | | 11,693 | |
| | 311 | | | JBG SMITH Properties | | | 13,233 | |
| | 79 | | | Jones Lang LaSalle, Inc. | | | 12,211 | |
| | 170 | | | Kilroy Realty Corp. | | | 13,075 | |
| | 721 | | | Kimco Realty Corp. | | | 12,538 | |
| | 161 | | | Lamar Advertising Co., Class A | | | 13,310 | |
| | 262 | | | Liberty Property Trust | | | 13,006 | |
| | | | | | | | |
Number
of Shares | | | | | Value | |
| | | | Common Stocks & Other Equity Interests
(continued) | |
| | | | Real Estate (continued) | |
| | 131 | | | Life Storage, Inc. | | $ | 12,483 | |
| | 295 | | | Macerich Co. (The) | | | 11,841 | |
| | 691 | | | Medical Properties Trust, Inc. | | | 12,065 | |
| | 119 | | | Mid-America Apartment Communities, Inc. | | | 13,020 | |
| | 241 | | | National Retail Properties, Inc. | | | 12,681 | |
| | 348 | | | Omega Healthcare Investors, Inc.(c) | | | 12,316 | |
| | 563 | | | Outfront Media, Inc. | | | 13,416 | |
| | 881 | | | Paramount Group, Inc. | | | 12,766 | |
| | 404 | | | Park Hotels & Resorts, Inc. | | | 12,960 | |
| | 434 | | | Rayonier, Inc. | | | 13,797 | |
| | 1,011 | | | Realogy Holdings Corp.(c) | | | 13,163 | |
| | 181 | | | Realty Income Corp. | | | 12,672 | |
| | 196 | | | Regency Centers Corp. | | | 13,165 | |
| | 1,039 | | | Retail Properties of America, Inc., Class A | | | 12,769 | |
| | 403 | | | Retail Value, Inc. | | | 13,500 | |
| | 68 | | | SBA Communications Corp. (b) | | | 13,854 | |
| | 1,055 | | | Senior Housing Properties Trust | | | 8,472 | |
| | 972 | | | SITE Centers Corp. | | | 12,869 | |
| | 139 | | | SL Green Realty Corp. | | | 12,279 | |
| | 334 | | | Spirit Realty Capital, Inc. | | | 13,514 | |
| | 387 | | | STORE Capital Corp. | | | 12,895 | |
| | 108 | | | Sun Communities, Inc. | | | 13,293 | |
| | 242 | | | Taubman Centers, Inc. | | | 11,931 | |
| | 281 | | | UDR, Inc. | | | 12,631 | |
| | 1,509 | | | Uniti Group, Inc. | | | 16,584 | |
| | 203 | | | Ventas, Inc. | | | 12,405 | |
| | 1,565 | | | VEREIT, Inc. | | | 12,927 | |
| | 599 | | | VICI Properties, Inc. | | | 13,657 | |
| | 186 | | | Vornado Realty Trust | | | 12,860 | |
| | 460 | | | Weingarten Realty Investors | | | 13,312 | |
| | 167 | | | Welltower, Inc. | | | 12,446 | |
| | 515 | | | Weyerhaeuser Co. | | | 13,802 | |
| | 168 | | | WP Carey, Inc. | | | 13,326 | |
| | | | | | | | |
| | | | | | | 1,007,995 | |
| | | | | | | | |
| | | | Utilities—9.5% | |
| | 4,259 | | | AES Corp. | | | 72,914 | |
| | 1,629 | | | Alliant Energy Corp. | | | 76,938 | |
| | 1,042 | | | Ameren Corp. | | | 75,826 | |
| | 740 | | | American Water Works Co., Inc. | | | 80,061 | |
| | 2,125 | | | Aqua America, Inc. | | | 83,002 | |
| | 757 | | | Atmos Energy Corp. | | | 77,471 | |
| | 1,560 | | | Avangrid, Inc. | | | 79,888 | |
| | 2,500 | | | CenterPoint Energy, Inc. | | | 77,500 | |
| | 1,387 | | | CMS Energy Corp. | | | 77,048 | |
| | 901 | | | Consolidated Edison, Inc. | | | 77,630 | |
| | 606 | | | DTE Energy Co. | | | 76,180 | |
| | 1,210 | | | Edison International | | | 77,162 | |
| | 815 | | | Entergy Corp. | | | 78,973 | |
| | 1,355 | | | Evergy, Inc. | | | 78,346 | |
| | 1,082 | | | Eversource Energy | | | 77,536 | |
| | 1,845 | | | FirstEnergy Corp. | | | 77,545 | |
| | 1,922 | | | Hawaiian Electric Industries, Inc. | | | 79,725 | |
| | 2,817 | | | MDU Resources Group, Inc. | | | 73,665 | |
| | 1,254 | | | National Fuel Gas Co. | | | 74,249 | |
| | 2,754 | | | NiSource, Inc. | | | 76,506 | |
| | 1,825 | | | NRG Energy, Inc. | | | 75,135 | |
See accompanying Notes to Financial Statements which are an integral part of the financial statements.
Invesco Russell Midcap Equal Weight ETF (EQWM)(continued)
April 30, 2019
| | | | | | | | |
Number
of Shares | | | | | Value | |
| | | | Common Stocks & Other Equity Interests
(continued) | |
| | | | Utilities (continued) | |
| | 1,788 | | | OGE Energy Corp. | | $ | 75,704 | |
| | 3,940 | | | PG&E Corp.(b) | | | 88,729 | |
| | 811 | | | Pinnacle West Capital Corp. | | | 77,264 | |
| | 2,348 | | | PPL Corp. | | | 73,281 | |
| | 1,273 | | | Public Service Enterprise Group, Inc. | | | 75,934 | |
| | 610 | | | Sempra Energy | | | 78,050 | |
| | 1,380 | | | UGI Corp. | | | 75,224 | |
| | 3,016 | | | Vistra Energy Corp. | | | 82,186 | |
| | 966 | | | WEC Energy Group, Inc. | | | 75,763 | |
| | 1,353 | | | Xcel Energy, Inc. | | | 76,445 | |
| | | | | | | | |
| | | | | | | 2,401,880 | |
| | | | | | | | |
| | | | Total Common Stocks & Other Equity Interests
(Cost $21,358,379) | | | 25,361,773 | |
| | | | | | | | |
| | |
| | | | | | | | |
| | | | Money Market Funds—0.5% | |
| | 118,097 | | | Invesco Premier U.S. Government Money Portfolio—Institutional Class, 2.32%(e)
(Cost $118,097) | | | 118,097 | |
| | | | | | | | |
| | |
| | | | Total Investments in Securities
(excluding investments purchased with cash collateral from securities on loan)
(Cost $21,476,476)—100.4% | | | 25,479,870 | |
| | | | | | | | |
| | |
| | | | | | | | |
| | | | Investments Purchased with Cash Collateral from
Securities on Loan | |
| | |
| | | | | | | | |
| | | | Money Market Funds—3.5% | |
| | 669,789 | | | Invesco Government & Agency Portfolio—Institutional Class 2.34%(e)(f) | | | 669,789 | |
| | 223,196 | | | Invesco Liquid Assets Portfolio—Institutional Class, 2.48%(e)(f) | | | 223,263 | |
| | | | | | | | |
| | | | Total Investments Purchased with Cash Collateral from Securities on Loan
(Cost $893,052) | | | 893,052 | |
| | | | | | | | |
| | |
| | | | Total Investments in Securities
(Cost $22,369,528)—103.9% | | | 26,372,922 | |
| | |
| | | | Other assets less liabilities—(3.9)% | | | (1,000,633 | ) |
| | | | | | | | |
| | |
| | | | Net Assets—100.0% | | $ | 25,372,289 | |
| | | | | | | | |
Abbreviations:
REIT—Real Estate Investment Trust
Notes to Schedule of Investments:
| (a) | Industry and/or sector classifications used in this report are generally according to the Global Industry Classification Standard, which was developed by and is the exclusive property and a service mark of MSCI Inc. and Standard & Poor’s. |
| (b) | Non-income producing security. |
| (c) | All or a portion of this security was out on loan at April 30, 2019. |
| (d) | Affiliated company. See Note 4. |
| (e) | The security and the Fund are advised bywholly-owned subsidiaries of Invesco Ltd. and are therefore considered to be affiliated. The rate shown is the7-day SEC standardized yield as of April 30, 2019. |
| (f) | The security has been segregated to satisfy the commitment to return the cash collateral received in securities lending transactions upon the borrower’s return of the securities loaned. See Note 2J. |
See accompanying Notes to Financial Statements which are an integral part of the financial statements.
Schedule of Investments(a)
Invesco Russell Midcap Pure Growth ETF (PXMG)
April 30, 2019
| | | | | | | | |
Number
of Shares | | | | | Value | |
| | | | Common Stocks & Other Equity Interests—99.9% | |
| | | | Communication Services—3.1% | |
| | 15,207 | | | IAC/InterActiveCorp.(b) | | $ | 3,419,142 | |
| | 184,498 | | | Match Group, Inc. | | | 11,143,679 | |
| | 9,934 | | | TripAdvisor, Inc.(b) | | | 528,787 | |
| | 104,111 | | | Twitter, Inc.(b) | | | 4,155,070 | |
| | | | | | | | |
| | | | | | | 19,246,678 | |
| | | | | | | | |
| | | | Consumer Discretionary—21.2% | |
| | 27,193 | | | Chipotle Mexican Grill, Inc.(b) | | | 18,709,872 | |
| | 23,955 | | | Domino’s Pizza, Inc. | | | 6,481,744 | |
| | 248,887 | | | Floor & Decor Holdings, Inc., Class A(b) | | | 11,951,554 | |
| | 80,405 | | | GrubHub, Inc.(b)(c) | | | 5,370,250 | |
| | 45,131 | | | Hilton Grand Vacations, Inc.(b) | | | 1,445,997 | |
| | 65,499 | | | Lululemon Athletica, Inc.(b) | | | 11,550,749 | |
| | 2,584 | | | NVR, Inc.(b) | | | 8,146,008 | |
| | 34,127 | | | O’Reilly Automotive, Inc.(b) | | | 12,919,458 | |
| | 87,286 | | | Polaris Industries, Inc. | | | 8,414,370 | |
| | 62,050 | | | Pool Corp. | | | 11,401,067 | |
| | 48,300 | | | Ross Stores, Inc. | | | 4,716,978 | |
| | 23,556 | | | Tractor Supply Co. | | | 2,438,046 | |
| | 47,108 | | | Ulta Beauty, Inc.(b) | | | 16,439,750 | |
| | 22,202 | | | Vail Resorts, Inc. | | | 5,080,928 | |
| | 76,268 | | | Wyndham Destinations, Inc. | | | 3,322,234 | |
| | 76,268 | | | Wyndham Hotels & Resorts, Inc. | | | 4,249,653 | |
| | | | | | | | |
| | | | | | | 132,638,658 | |
| | | | | | | | |
| | | | Financials—6.5% | |
| | 50,418 | | | Evercore, Inc., Class A | | | 4,912,226 | |
| | 2,533 | | | FactSet Research Systems, Inc. | | | 698,778 | |
| | 28,386 | | | LPL Financial Holdings, Inc. | | | 2,103,119 | |
| | 10,963 | | | MarketAxess Holdings, Inc. | | | 3,051,332 | |
| | 37,131 | | | Moody’s Corp. | | | 7,300,697 | |
| | 56,666 | | | MSCI, Inc. | | | 12,771,383 | |
| | 56,805 | | | SEI Investments Co. | | | 3,093,032 | |
| | 273,274 | | | Virtu Financial, Inc., Class A | | | 6,717,075 | |
| | | | | | | | |
| | | | | | | 40,647,642 | |
| | | | | | | | |
| | | | Health Care—12.3% | |
| | 31,858 | | | ABIOMED, Inc.(b) | | | 8,837,728 | |
| | 25,604 | | | Align Technology, Inc.(b) | | | 8,313,107 | |
| | 44,750 | | | Alkermes PLC(b) | | | 1,356,820 | |
| | 13,633 | | | BioMarin Pharmaceutical, Inc.(b) | | | 1,166,030 | |
| | 41,360 | | | Cantel Medical Corp. | | | 2,851,358 | |
| | 3,387 | | | Chemed Corp. | | | 1,106,804 | |
| | 44,110 | | | DexCom, Inc.(b) | | | 5,340,398 | |
| | 63,329 | | | Edwards Lifesciences Corp.(b) | | | 11,150,337 | |
| | 63,011 | | | Exact Sciences Corp.(b) | | | 6,218,556 | |
| | 566,032 | | | Exelixis, Inc.(b) | | | 11,128,189 | |
| | 21,151 | | | Insulet Corp.(b) | | | 1,824,274 | |
| | 66,078 | | | Ionis Pharmaceuticals, Inc.(b) | | | 4,911,578 | |
| | 22,919 | | | Nektar Therapeutics(b) | | | 733,866 | |
| | 6,323 | | | Neurocrine Biosciences, Inc.(b) | | | 456,773 | |
| | 50,838 | | | PRA Health Sciences, Inc.(b) | | | 4,922,135 | |
| | 101,341 | | | Seattle Genetics, Inc.(b) | | | 6,868,893 | |
| | | | | | | | |
| | | | | | | 77,186,846 | |
| | | | | | | | |
| | | | Industrials—10.7% | |
| | 124,599 | | | Allison Transmission Holdings, Inc. | | | 5,838,709 | |
| | 15,916 | | | C.H. Robinson Worldwide, Inc. | | | 1,289,196 | |
| | 41,749 | | | Cintas Corp. | | | 9,065,378 | |
| | | | | | | | |
Number
of Shares | | | | | Value | |
| | | | Common Stocks & Other Equity Interests
(continued) | |
| | | | Industrials (continued) | |
| | 179,586 | | | Copart, Inc.(b) | | $ | 12,089,730 | |
| | 11,848 | | | CoStar Group, Inc.(b) | | | 5,879,570 | |
| | 117,399 | | | Graco, Inc. | | | 6,016,699 | |
| | 84,097 | | | HEICO Corp. | | | 8,874,756 | |
| | 42,180 | | | J.B. Hunt Transport Services, Inc. | | | 3,985,166 | |
| | 54,976 | | | Landstar System, Inc. | | | 5,990,185 | |
| | 26,459 | | | Old Dominion Freight Line, Inc. | | | 3,949,800 | |
| | 23,925 | | | Robert Half International, Inc. | | | 1,485,503 | |
| | 5,139 | | | United Rentals, Inc.(b) | | | 724,188 | |
| | 7,577 | | | W.W. Grainger, Inc. | | | 2,136,714 | |
| | | | | | | | |
| | | | | | | 67,325,594 | |
| | | | | | | | |
| | | | Information Technology—46.1% | |
| | 13,129 | | | 2U, Inc.(b) | | | 794,305 | |
| | 33,553 | | | Alliance Data Systems Corp. | | | 5,371,835 | |
| | 23,807 | | | Arista Networks, Inc.(b) | | | 7,434,688 | |
| | 47,734 | | | Atlassian Corp. PLC, Class A(b) | | | 5,257,900 | |
| | 68,219 | | | Broadridge Financial Solutions, Inc. | | | 8,058,711 | |
| | 36,674 | | | EPAM Systems, Inc.(b) | | | 6,577,849 | |
| | 39,847 | | | Fair Isaac Corp.(b) | | | 11,147,198 | |
| | 47,693 | | | Fiserv, Inc.(b) | | | 4,160,737 | |
| | 9,391 | | | FleetCor Technologies, Inc.(b) | | | 2,450,581 | |
| | 139,509 | | | Fortinet, Inc.(b) | | | 13,032,931 | |
| | 31,628 | | | Gartner, Inc.(b) | | | 5,027,903 | |
| | 131,846 | | | GoDaddy, Inc., Class A(b) | | | 10,745,449 | |
| | 5,883 | | | IPG Photonics Corp.(b) | | | 1,027,937 | |
| | 11,049 | | | Lam Research Corp. | | | 2,291,894 | |
| | 55,993 | | | Monolithic Power Systems, Inc. | | | 8,718,670 | |
| | 6,968 | | | NetApp, Inc. | | | 507,619 | |
| | 30,713 | | | Nutanix, Inc., Class A(b) | | | 1,326,495 | |
| | 29,423 | | | Okta, Inc.(b) | | | 3,060,875 | |
| | 32,237 | | | Palo Alto Networks, Inc.(b) | | | 8,021,533 | |
| | 89,254 | | | Paycom Software, Inc.(b) | | | 18,076,613 | |
| | 112,936 | | | Pegasystems, Inc. | | | 8,471,329 | |
| | 80,388 | | | Proofpoint, Inc.(b) | | | 10,082,263 | |
| | 144,370 | | | RealPage, Inc.(b) | | | 9,414,368 | |
| | 16,161 | | | Red Hat, Inc.(b) | | | 2,949,867 | |
| | 124,067 | | | RingCentral, Inc., Class A(b) | | | 14,437,677 | |
| | 51,049 | | | ServiceNow, Inc.(b) | | | 13,860,314 | |
| | 61,283 | | | Splunk, Inc.(b) | | | 8,459,505 | |
| | 213,050 | | | Square, Inc., Class A(b) | | | 15,514,301 | |
| | 74,679 | | | Total System Services, Inc. | | | 7,635,181 | |
| | 27,824 | | | Twilio, Inc., Class A(b) | | | 3,815,783 | |
| | 13,075 | | | Tyler Technologies, Inc.(b) | | | 3,032,223 | |
| | 79,443 | | | Ubiquiti Networks, Inc. | | | 13,541,059 | |
| | 34,351 | | | Ultimate Software Group, Inc. (The)(b) | | | 11,358,158 | |
| | 93,488 | | | Universal Display Corp. | | | 14,920,685 | |
| | 53,445 | | | Workday, Inc., Class A(b) | | | 10,989,895 | |
| | 46,016 | | | Zebra Technologies Corp., Class A(b) | | | 9,715,818 | |
| | 81,248 | | | Zendesk, Inc.(b) | | | 7,131,949 | |
| | | | | | | | |
| | | | | | | 288,422,098 | |
| | | | | | | | |
| | | | Materials—0.0% | |
| | 1,660 | | | Packaging Corp. of America | | | 164,606 | |
| | | | | | | | |
| | |
| | | | Total Common Stocks & Other Equity Interests
(Cost $556,969,342) | | | 625,632,122 | |
| | | | | | | | |
See accompanying Notes to Financial Statements which are an integral part of the financial statements.
Invesco Russell Midcap Pure Growth ETF (PXMG)(continued)
April 30, 2019
| | | | | | | | |
Number
of Shares | | | | | Value | |
| | | | Money Market Funds—0.1% | |
| | 652,119 | | | Invesco Premier U.S. Government Money Portfolio—Institutional Class, 2.32%(d)
(Cost $652,119) | | $ | 652,119 | |
| | | | | | | | |
| | |
| | | | Total Investments in Securities
(excluding investments purchased with cash collateral from securities on loan)
(Cost $557,621,461)—100.0% | | | 626,284,241 | |
| | | | | | | | |
| | |
| | | | | | | | |
| | | | Investments Purchased with Cash Collateral from
Securities on Loan | |
| | |
| | | | | | | | |
| | | | Money Market Funds—0.3% | |
| | 1,281,604 | | | Invesco Government & Agency Portfolio—Institutional Class, 2.34%(d)(e) | | | 1,281,604 | |
| | 427,077 | | | Invesco Liquid Assets Portfolio—Institutional Class, 2.48%(d)(e) | | | 427,205 | |
| | | | | | | | |
| | | | Total Investments Purchased with Cash Collateral from Securities on Loan
(Cost $1,708,809) | | | 1,708,809 | |
| | | | | | | | |
| | |
| | | | Total Investments in Securities
(Cost $559,330,270)—100.3% | | | 627,993,050 | |
| | |
| | | | Other assets less liabilities—(0.3)% | | | (2,094,166 | ) |
| | | | | | | | |
| | |
| | | | Net Assets—100.0% | | $ | 625,898,884 | |
| | | | | | | | |
Notes to Schedule of Investments:
| (a) | Industry and/or sector classifications used in this report are generally according to the Global Industry Classification Standard, which was developed by and is the exclusive property and a service mark of MSCI Inc. and Standard & Poor’s. |
| (b) | Non-income producing security. |
| (c) | All or a portion of this security was out on loan at April 30, 2019. |
| (d) | The security and the Fund are advised bywholly-owned subsidiaries of Invesco Ltd. and are therefore considered to be affiliated. The rate shown is the7-day SEC standardized yield as of April 30, 2019. |
| (e) | The security has been segregated to satisfy the commitment to return the cash collateral received in securities lending transactions upon the borrower’s return of the securities loaned. See Note 2J. |
See accompanying Notes to Financial Statements which are an integral part of the financial statements.
Schedule of Investments(a)
Invesco Russell Midcap Pure Value ETF (PXMV)
April 30, 2019
| | | | | | | | |
Number
of Shares | | | | | Value | |
| | | | Common Stocks & Other Equity Interests—99.9% | |
| | | | Communication Services—6.8% | |
| | 21,819 | | | CenturyLink, Inc. | | $ | 249,173 | |
| | 5,652 | | | Cinemark Holdings, Inc. | | | 237,667 | |
| | 19,174 | | | DISH Network Corp., Class A(b) | | | 673,391 | |
| | 883 | | | GCI Liberty, Inc., Class A(b) | | | 52,644 | |
| | 3,410 | | | John Wiley & Sons, Inc., Class A | | | 157,474 | |
| | 5,686 | | | Liberty Broadband Corp., Class C(b) | | | 561,265 | |
| | 14,444 | | | Liberty Media Corp.-Liberty Formula One, Class C(b) | | | 560,572 | |
| | 5,791 | | | Liberty Media Corp.-Liberty SiriusXM, Class C(b) | | | 232,566 | |
| | 16,125 | | | News Corp., Class A | | | 200,272 | |
| | 28,958 | | | Sprint Corp.(b) | | | 161,586 | |
| | 15,019 | | | Viacom, Inc., Class B | | | 434,199 | |
| | | | | | | | |
| | | | | | | 3,520,809 | |
| | | | | | | | |
| | | | Consumer Discretionary—6.0% | |
| | 12,397 | | | Adient PLC | | | 286,371 | |
| | 4,798 | | | Garmin Ltd. | | | 411,380 | |
| | 13,659 | | | Goodyear Tire & Rubber Co. (The) | | | 262,389 | |
| | 802 | | | Graham Holdings Co., Class B | | | 596,231 | |
| | 58 | | | Kohl’s Corp. | | | 4,124 | |
| | 4,972 | | | Macy’s, Inc. | | | 117,041 | |
| | 32 | | | Mohawk Industries, Inc.(b) | | | 4,360 | |
| | 780 | | | Newell Brands, Inc. | | | 11,216 | |
| | 6,944 | | | Norwegian Cruise Line Holdings Ltd.(b) | | | 391,572 | |
| | 1,063 | | | PVH Corp. | | | 137,116 | |
| | 20,491 | | | Qurate Retail, Inc.(b) | | | 349,372 | |
| | 3,022 | | | Ralph Lauren Corp. | | | 397,635 | |
| | 607 | | | Royal Caribbean Cruises Ltd. | | | 73,411 | |
| | 545 | | | Whirlpool Corp. | | | 75,657 | |
| | | | | | | | |
| | | | | | | 3,117,875 | |
| | | | | | | | |
| | | | Consumer Staples—5.0% | |
| | 5,104 | | | Archer-Daniels-Midland Co. | | | 227,638 | |
| | 3,121 | | | Casey’s General Stores, Inc. | | | 413,064 | |
| | 16,648 | | | Coty, Inc., Class A(c) | | | 180,131 | |
| | 952 | | | Ingredion, Inc. | | | 90,202 | |
| | 3,617 | | | JM Smucker Co. (The) | | | 443,553 | |
| | 14,673 | | | Pilgrim’s Pride Corp.(b) | | | 394,851 | |
| | 83 | | | Seaboard Corp. | | | 373,133 | |
| | 4,159 | | | Spectrum Brands Holdings, Inc. | | | 256,070 | |
| | 3,094 | | | Tyson Foods, Inc., Class A | | | 232,081 | |
| | | | | | | | |
| | | | | | | 2,610,723 | |
| | | | | | | | |
| | | | Energy—1.8% | |
| | 98,404 | | | Chesapeake Energy Corp.(b)(c) | | | 286,356 | |
| | 361 | | | CNX Resources Corp.(b) | | | 3,235 | |
| | 744 | | | Helmerich & Payne, Inc. | | | 43,539 | |
| | 91 | | | Hess Corp. | | | 5,835 | |
| | 6,950 | | | Nabors Industries Ltd. | | | 24,325 | |
| | 1,373 | | | National Oilwell Varco, Inc. | | | 35,890 | |
| | 2,371 | | | Patterson-UTI Energy, Inc. | | | 32,222 | |
| | 17,801 | | | Williams Cos., Inc. (The) | | | 504,302 | |
| | | | | | | | |
| | | | | | | 935,704 | |
| | | | | | | | |
| | | | Financials—14.1% | |
| | 1,567 | | | Affiliated Managers Group, Inc. | | | 173,812 | |
| | 1,170 | | | American National Insurance Co. | | | 132,549 | |
| | 63,038 | | | Annaly Capital Management, Inc. | | | 636,053 | |
| | 1,965 | | | Bank of Hawaii Corp. | | | 161,877 | |
| | | | | | | | |
Number
of Shares | | | | | Value | |
| | | | Common Stocks & Other Equity Interests
(continued) | |
| | | | Financials (continued) | |
| | 1,648 | | | BankUnited, Inc. | | $ | 60,284 | |
| | 561 | | | BOK Financial Corp. | | | 48,886 | |
| | 4,566 | | | Cincinnati Financial Corp. | | | 439,158 | |
| | 12,455 | | | CNA Financial Corp. | | | 577,040 | |
| | 25,173 | | | F.N.B. Corp. | | | 305,349 | |
| | 7,395 | | | Fidelity National Financial, Inc. | | | 295,430 | |
| | 6,132 | | | Fifth Third Bancorp | | | 176,724 | |
| | 1,408 | | | First American Financial Corp. | | | 80,341 | |
| | 14,858 | | | Franklin Resources, Inc. | | | 513,938 | |
| | 12,485 | | | Invesco Ltd.(d) | | | 274,295 | |
| | 16,892 | | | Jefferies Financial Group, Inc. | | | 347,468 | |
| | 382 | | | Legg Mason, Inc. | | | 12,778 | |
| | 5,840 | | | Loews Corp. | | | 299,534 | |
| | 627 | | | M&T Bank Corp. | | | 106,634 | |
| | 83,443 | | | MFA Financial, Inc. | | | 626,657 | |
| | 16,848 | | | Navient Corp. | | | 227,616 | |
| | 52,929 | | | New York Community Bancorp, Inc. | | | 615,564 | |
| | 2,533 | | | PacWest Bancorp | | | 100,180 | |
| | 318 | | | Principal Financial Group, Inc. | | | 18,177 | |
| | 3,279 | | | Prosperity Bancshares, Inc. | | | 241,466 | |
| | 938 | | | Reinsurance Group of America, Inc. | | | 142,116 | |
| | 2,925 | | | SunTrust Banks, Inc. | | | 191,529 | |
| | 721 | | | TFS Financial Corp. | | | 11,997 | |
| | 4,623 | | | Two Harbors Investment Corp. | | | 64,075 | |
| | 14 | | | White Mountains Insurance Group Ltd. | | | 13,147 | |
| | 2,255 | | | Willis Towers Watson PLC | | | 415,687 | |
| | | | | | | | |
| | | | | | | 7,310,361 | |
| | | | | | | | |
| | | | Health Care—2.1% | |
| | 10,346 | | | DENTSPLY SIRONA, Inc. | | | 528,991 | |
| | 375 | | | IQVIA Holdings, Inc.(b) | | | 52,087 | |
| | 7,905 | | | Perrigo Co. PLC | | | 378,808 | |
| | 1,034 | | | STERIS PLC | | | 135,433 | |
| | | | | | | | |
| | | | | | | 1,095,319 | |
| | | | | | | | |
| | | | Industrials—8.3% | |
| | 18,663 | | | ADT, Inc.(c) | | | 122,989 | |
| | 3,383 | | | AGCO Corp. | | | 239,449 | |
| | 137 | | | AMERCO | | | 51,124 | |
| | 29,349 | | | Arconic, Inc. | | | 630,417 | |
| | 6,261 | | | Arcosa, Inc. | | | 194,905 | |
| | 1,206 | | | Colfax Corp.(b) | | | 36,385 | |
| | 2,911 | | | Copa Holdings SA, Class A (Panama) | | | 242,370 | |
| | 4,312 | | | Dover Corp. | | | 422,748 | |
| | 337 | | | Fluor Corp. | | | 13,389 | |
| | 3,282 | | | JetBlue Airways Corp.(b) | | | 60,881 | |
| | 4,331 | | | Macquarie Infrastructure Corp. | | | 175,449 | |
| | 7,235 | | | Nielsen Holdings PLC | | | 184,710 | |
| | 639 | | | PACCAR, Inc. | | | 45,797 | |
| | 14,486 | | | Pentair PLC | | | 564,809 | |
| | 5,583 | | | Regal Beloit Corp. | | | 475,002 | |
| | 439 | | | Ryder System, Inc. | | | 27,657 | |
| | 18,588 | | | Trinity Industries, Inc. | | | 400,757 | |
| | 1,975 | | | United Continental Holdings, Inc.(b) | | | 175,498 | |
| | 387 | | | Valmont Industries, Inc. | | | 52,183 | |
| | 2,963 | | | WESCO International, Inc.(b) | | | 169,602 | |
| | | | | | | | |
| | | | | | | 4,286,121 | |
| | | | | | | | |
See accompanying Notes to Financial Statements which are an integral part of the financial statements.
Invesco Russell Midcap Pure Value ETF (PXMV)(continued)
April 30, 2019
| | | | | | | | |
Number
of Shares | | | | | Value | |
| | | | Common Stocks & Other Equity Interests
(continued) | |
| | | | Information Technology—7.4% | |
| | 197 | | | Arrow Electronics, Inc.(b) | | $ | 16,648 | |
| | 16,634 | | | Avnet, Inc. | | | 808,579 | |
| | 9,949 | | | Conduent, Inc.(b) | | | 127,646 | |
| | 8,545 | | | First Solar, Inc.(b) | | | 525,774 | |
| | 5,649 | | | Leidos Holdings, Inc. | | | 415,088 | |
| | 17,533 | | | Marvell Technology Group Ltd. | | | 438,676 | |
| | 26,773 | | | Nuance Communications, Inc.(b) | | | 450,589 | |
| | 20,203 | | | Symantec Corp. | | | 489,115 | |
| | 16,261 | | | Xerox Corp. | | | 542,467 | |
| | | | | | | | |
| | | | | | | 3,814,582 | |
| | | | | | | | |
| | | | Materials—5.4% | |
| | 2,474 | | | Albemarle Corp. | | | 185,698 | |
| | 59 | | | Alcoa Corp.(b) | | | 1,574 | |
| | 8,405 | | | Ashland Global Holdings, Inc. | | | 676,855 | |
| | 2,265 | | | Bemis Co., Inc. | | | 130,056 | |
| | 1,258 | | | Cabot Corp. | | | 57,088 | |
| | 180 | | | Domtar Corp. | | | 8,802 | |
| | 1,951 | | | Eastman Chemical Co. | | | 153,895 | |
| | 19,430 | | | Freeport-McMoRan, Inc. | | | 239,183 | |
| | 5,468 | | | Huntsman Corp. | | | 121,608 | |
| | 5,707 | | | Mosaic Co. (The) | | | 149,010 | |
| | 15,984 | | | Newmont Goldcorp Corp. | | | 496,463 | |
| | 10,951 | | | Owens-Illinois, Inc. | | | 216,392 | |
| | 37 | | | Sonoco Products Co. | | | 2,333 | |
| | 18,427 | | | Valvoline, Inc. | | | 340,900 | |
| | | | | | | | |
| | | | | | | 2,779,857 | |
| | | | | | | | |
| | | | Real Estate—22.3% | |
| | 6,650 | | | Apple Hospitality REIT, Inc. | | | 109,392 | |
| | 17,815 | | | Brandywine Realty Trust | | | 274,173 | |
| | 36,450 | | | Brixmor Property Group, Inc. | | | 651,726 | |
| | 2,580 | | | Camden Property Trust | | | 259,677 | |
| | 82 | | | CyrusOne, Inc. | | | 4,567 | |
| | 14,607 | | | Duke Realty Corp. | | | 454,570 | |
| | 16,848 | | | Empire State Realty Trust, Inc., Class A | | | 260,470 | |
| | 1,618 | | | EPR Properties | | | 127,595 | |
| | 14,844 | | | Equity Commonwealth | | | 472,039 | |
| | 4,921 | | | Equity Residential | | | 376,063 | |
| | 20,939 | | | HCP, Inc. | | | 623,563 | |
| | 3,734 | | | Highwoods Properties, Inc. | | | 166,462 | |
| | 6,373 | | | Hospitality Properties Trust | | | 165,698 | |
| | 21,219 | | | Host Hotels & Resorts, Inc. | | | 408,254 | |
| | 3,870 | | | Invitation Homes, Inc. | | | 96,208 | |
| | 8,934 | | | JBG SMITH Properties | | | 380,142 | |
| | 2,148 | | | Kilroy Realty Corp. | | | 165,203 | |
| | 27,209 | | | Kimco Realty Corp. | | | 473,164 | |
| | 8,229 | | | Liberty Property Trust | | | 408,488 | |
| | 2,287 | | | Macerich Co. (The) | | | 91,800 | |
| | 5,448 | | | Mid-America Apartment Communities, Inc. | | | 596,066 | |
| | 8,621 | | | National Retail Properties, Inc. | | | 453,637 | |
| | 19,316 | | | Outfront Media, Inc. | | | 460,300 | |
| | 14,279 | | | Park Hotels & Resorts, Inc. | | | 458,070 | |
| | 11,211 | | | Rayonier, Inc. | | | 356,398 | |
| | 4,738 | | | Realogy Holdings Corp.(c) | | | 61,689 | |
| | 6,754 | | | Realty Income Corp. | | | 472,848 | |
| | 12,209 | | | Retail Properties of America, Inc., Class A | | | 150,049 | |
| | | | | | | | |
Number
of Shares | | | | | Value | |
| | | | Common Stocks & Other Equity Interests
(continued) | |
| | | | Real Estate (continued) | |
| | 3,009 | | | Retail Value, Inc. | | $ | 100,801 | |
| | 29,639 | | | SITE Centers Corp. | | | 392,420 | |
| | 9,434 | | | Ventas, Inc. | | | 576,512 | |
| | 36,055 | | | VEREIT, Inc. | | | 297,814 | |
| | 15,914 | | | Weingarten Realty Investors | | | 460,551 | |
| | 4,904 | | | Welltower, Inc. | | | 365,495 | |
| | 4,940 | | | WP Carey, Inc. | | | 391,841 | |
| | | | | | | | |
| | | | | | | 11,563,745 | |
| | | | | | | | |
| | | | Utilities—20.7% | |
| | 21,924 | | | AES Corp. | | | 375,339 | |
| | 5,310 | | | Alliant Energy Corp. | | | 250,791 | |
| | 7,110 | | | Ameren Corp. | | | 517,395 | |
| | 475 | | | American Water Works Co., Inc. | | | 51,390 | |
| | 4,044 | | | Atmos Energy Corp. | | | 413,863 | |
| | 1,078 | | | Avangrid, Inc. | | | 55,204 | |
| | 10,690 | | | CenterPoint Energy, Inc. | | | 331,390 | |
| | 4,909 | | | CMS Energy Corp. | | | 272,695 | |
| | 6,289 | | | Consolidated Edison, Inc. | | | 541,860 | |
| | 783 | | | DTE Energy Co. | | | 98,431 | |
| | 8,032 | | | Edison International | | | 512,201 | |
| | 4,258 | | | Entergy Corp. | | | 412,600 | |
| | 14,751 | | | Evergy, Inc. | | | 852,903 | |
| | 7,204 | | | Eversource Energy | | | 516,239 | |
| | 13,838 | | | FirstEnergy Corp. | | | 581,611 | |
| | 10,509 | | | Hawaiian Electric Industries, Inc. | | | 435,913 | |
| | 5,921 | | | MDU Resources Group, Inc. | | | 154,834 | |
| | 6,934 | | | National Fuel Gas Co. | | | 410,562 | |
| | 13,795 | | | NiSource, Inc. | | | 383,225 | |
| | 13,266 | | | OGE Energy Corp. | | | 561,683 | |
| | 9,562 | | | PG&E Corp.(b) | | | 215,336 | |
| | 5,845 | | | Pinnacle West Capital Corp. | | | 556,853 | |
| | 11,395 | | | PPL Corp. | | | 355,638 | |
| | 6,453 | | | Public Service Enterprise Group, Inc. | | | 384,922 | |
| | 3,544 | | | Sempra Energy | | | 453,455 | |
| | 6,477 | | | UGI Corp. | | | 353,061 | |
| | 1,400 | | | WEC Energy Group, Inc. | | | 109,802 | |
| | 9,877 | | | Xcel Energy, Inc. | | | 558,051 | |
| | | | | | | | |
| | | | | | | 10,717,247 | |
| | | | | | | | |
| | | | Total Common Stocks & Other Equity Interests
(Cost $49,708,510) | | | 51,752,343 | |
| | | | | | | | |
| | |
| | | | | | | | |
| | | | Money Market Funds—0.3% | |
| | 142,559 | | | Invesco Premier U.S. Government Money Portfolio—Institutional Class, 2.32%(e)
(Cost $142,559) | | | 142,559 | |
| | | | | | | | |
| | |
| | | | Total Investments in Securities
(excluding investments purchased with cash collateral from securities on loan)
(Cost $49,851,069)—100.2% | | | 51,894,902 | |
| | | | | | | | |
See accompanying Notes to Financial Statements which are an integral part of the financial statements.
Invesco Russell Midcap Pure Value ETF (PXMV)(continued)
April 30, 2019
| | | | | | | | |
Number
of Shares | | | | | Value | |
| | | | Investments Purchased with Cash Collateral from
Securities on Loan | |
| | |
| | | | | | | | |
| | | | Money Market Funds—1.2% | |
| | 473,759 | | | Invesco Government & Agency Portfolio—Institutional Class, 2.34%(e)(f) | | $ | 473,759 | |
| | 157,721 | | | Invesco Liquid Assets Portfolio—Institutional Class, 2.48%(e)(f) | | | 157,769 | |
| | | | | | | | |
| | | | Total Investments Purchased with Cash Collateral from Securities on Loan
(Cost $631,528) | | | 631,528 | |
| | | | | | | | |
| | |
| | | | Total Investments in Securities
(Cost $50,482,597)—101.4% | | | 52,526,430 | |
| | |
| | | | Other assets less liabilities—(1.4)% | | | (717,713 | ) |
| | | | | | | | |
| | |
| | | | Net Assets—100.0% | | $ | 51,808,717 | |
| | | | | | | | |
Abbreviations:
REIT—Real Estate Investment Trust
Notes to Schedule of Investments:
| (a) | Industry and/or sector classifications used in this report are generally according to the Global Industry Classification Standard, which was developed by and is the exclusive property and a service mark of MSCI Inc. and Standard & Poor’s. |
| (b) | Non-income producing security. |
| (c) | All or a portion of this security was out on loan at April 30, 2019. |
| (d) | Affiliated company. See Note 4. |
| (e) | The security and the Fund are advised bywholly-owned subsidiaries of Invesco Ltd. and are therefore considered to be affiliated. The rate shown is the7-day SEC standardized yield as of April 30, 2019. |
| (f) | The security has been segregated to satisfy the commitment to return the cash collateral received in securities lending transactions upon the borrower’s return of the securities loaned. See Note 2J. |
See accompanying Notes to Financial Statements which are an integral part of the financial statements.
Schedule of Investments(a)
Invesco Russell Top 200 Equal Weight ETF (EQWL)
April 30, 2019
| | | | | | | | |
Number
of Shares | | | | | Value | |
| | | | Common Stocks & Other Equity Interests—100.0% | |
| | | | Communication Services—7.5% | |
| | 6,321 | | | Activision Blizzard, Inc. | | $ | 304,735 | |
| | 227 | | | Alphabet, Inc., Class C(b) | | | 269,785 | |
| | 23,223 | | | AT&T, Inc. | | | 718,984 | |
| | 704 | | | Charter Communications, Inc., Class A(b) | | | 261,318 | |
| | 6,239 | | | Comcast Corp., Class A | | | 271,584 | |
| | 2,611 | | | Electronic Arts, Inc.(b) | | | 247,131 | |
| | 1,534 | | | Facebook, Inc., Class A(b) | | | 296,675 | |
| | 1,577 | | | Fox Corp., Class A(b) | | | 61,487 | |
| | 679 | | | Netflix, Inc.(b) | | | 251,597 | |
| | 9,739 | | | T-Mobile US, Inc.(b) | | | 710,850 | |
| | 12,342 | | | Verizon Communications, Inc. | | | 705,839 | |
| | 2,906 | | | Walt Disney Co. (The) | | | 398,035 | |
| | | | | | | | |
| | | | | | | 4,498,020 | |
| | | | | | | | |
| | | | Consumer Discretionary—7.8% | |
| | 149 | | | Amazon.com, Inc.(b) | | | 287,051 | |
| | 140 | | | Booking Holdings, Inc.(b) | | | 259,699 | |
| | 4,324 | | | Carnival Corp. | | | 237,215 | |
| | 6,613 | | | eBay, Inc. | | | 256,254 | |
| | 28,237 | | | Ford Motor Co. | | | 295,077 | |
| | 15,429 | | | Garrett Motion, Inc. (Switzerland)(b) | | | 290,065 | |
| | 6,295 | | | General Motors Co. | | | 245,190 | |
| | 1,312 | | | Home Depot, Inc. (The) | | | 267,254 | |
| | 3,992 | | | Las Vegas Sands Corp. | | | 267,664 | |
| | 2,378 | | | Lowe’s Cos., Inc. | | | 269,047 | |
| | 1,960 | | | Marriott International, Inc., Class A | | | 267,383 | |
| | 1,327 | | | McDonald’s Corp. | | | 262,175 | |
| | 2,808 | | | NIKE, Inc., Class B | | | 246,627 | |
| | 3,391 | | | Starbucks Corp. | | | 263,413 | |
| | 3,143 | | | Target Corp. | | | 243,331 | |
| | 866 | | | Tesla, Inc.(b)(c) | | | 206,705 | |
| | 4,627 | | | TJX Cos., Inc. (The) | | | 253,930 | |
| | 2,480 | | | Yum! Brands, Inc. | | | 258,887 | |
| | | | | | | | |
| | | | | | | 4,676,967 | |
| | | | | | | | |
| | | | Consumer Staples—11.8% | |
| | 7,631 | | | Altria Group, Inc. | | | 414,592 | |
| | 9,224 | | | Coca-Cola Co. (The) | | | 452,529 | |
| | 6,392 | | | Colgate-Palmolive Co. | | | 465,274 | |
| | 2,490 | | | Constellation Brands, Inc., Class A | | | 527,058 | |
| | 1,115 | | | Costco Wholesale Corp. | | | 273,766 | |
| | 1,541 | | | Estee Lauder Cos., Inc. (The), Class A | | | 264,759 | |
| | 8,998 | | | General Mills, Inc. | | | 463,127 | |
| | 3,625 | | | Kimberly-Clark Corp. | | | 465,377 | |
| | 13,098 | | | Kraft Heinz Co. (The) | | | 435,378 | |
| | 8,922 | | | Mondelez International, Inc., Class A | | | 453,684 | |
| | 6,789 | | | Monster Beverage Corp.(b) | | | 404,624 | |
| | 3,597 | | | PepsiCo, Inc. | | | 460,596 | |
| | 4,805 | | | Philip Morris International, Inc. | | | 415,921 | |
| | 4,237 | | | Procter & Gamble Co. (The) | | | 451,156 | |
| | 6,342 | | | Sysco Corp. | | | 446,287 | |
| | 6,985 | | | Walgreens Boots Alliance, Inc. | | | 374,186 | |
| | 2,457 | | | Walmart, Inc. | | | 252,678 | |
| | | | | | | | |
| | | | | | | 7,020,992 | |
| | | | | | | | |
| | | | Energy—11.1% | |
| | 10,345 | | | Anadarko Petroleum Corp. | | | 753,633 | |
| | 17,168 | | | Baker Hughes a GE Co. | | | 412,375 | |
| | 3,669 | | | Chevron Corp. | | | 440,500 | |
| | | | | | | | |
Number
of Shares | | | | | Value | |
| | | | Common Stocks & Other Equity Interests
(continued) | |
| | | | Energy (continued) | |
| | 6,585 | | | ConocoPhillips | | $ | 415,645 | |
| | 4,897 | | | EOG Resources, Inc. | | | 470,357 | |
| | 5,581 | | | Exxon Mobil Corp. | | | 448,043 | |
| | 16,014 | | | Halliburton Co. | | | 453,677 | |
| | 22,552 | | | Kinder Morgan, Inc. | | | 448,108 | |
| | 7,602 | | | Marathon Petroleum Corp. | | | 462,734 | |
| | 6,805 | | | Occidental Petroleum Corp. | | | 400,678 | |
| | 4,638 | | | Phillips 66 | | | 437,224 | |
| | 3,281 | | | Pioneer Natural Resources Co. | | | 546,155 | |
| | 10,529 | | | Schlumberger Ltd. | | | 449,378 | |
| | 5,551 | | | Valero Energy Corp. | | | 503,254 | |
| | | | | | | | |
| | | | | | | 6,641,761 | |
| | | | | | | | |
| | | | Financials—8.6% | |
| | 3,283 | | | Aflac, Inc. | | | 165,398 | |
| | 1,712 | | | Allstate Corp. (The) | | | 169,591 | |
| | 1,480 | | | American Express Co. | | | 173,500 | |
| | 3,818 | | | American International Group, Inc. | | | 181,622 | |
| | 982 | | | Aon PLC | | | 176,897 | |
| | 5,592 | | | Bank of America Corp. | | | 171,003 | |
| | 3,116 | | | Bank of New York Mellon Corp. (The) | | | 154,741 | |
| | 3,223 | | | BB&T Corp. | | | 165,018 | |
| | 801 | | | Berkshire Hathaway, Inc., Class B(b) | | | 173,585 | |
| | 377 | | | BlackRock, Inc. | | | 182,935 | |
| | 1,964 | | | Capital One Financial Corp. | | | 182,318 | |
| | 3,626 | | | Charles Schwab Corp. (The) | | | 165,998 | |
| | 1,203 | | | Chubb Ltd. | | | 174,676 | |
| | 2,579 | | | Citigroup, Inc. | | | 182,335 | |
| | 926 | | | CME Group, Inc. | | | 165,661 | |
| | 829 | | | Goldman Sachs Group, Inc. (The) | | | 170,708 | |
| | 2,168 | | | Intercontinental Exchange, Inc. | | | 176,367 | |
| | 1,550 | | | JPMorgan Chase & Co. | | | 179,878 | |
| | 1,777 | | | Marsh & McLennan Cos., Inc. | | | 167,553 | |
| | 3,601 | | | MetLife, Inc. | | | 166,114 | |
| | 3,877 | | | Morgan Stanley | | | 187,065 | |
| | 1,267 | | | PNC Financial Services Group, Inc. (The) | | | 173,490 | |
| | 2,211 | | | Progressive Corp. (The) | | | 172,790 | |
| | 1,696 | | | Prudential Financial, Inc. | | | 179,284 | |
| | 812 | | | S&P Global, Inc. | | | 179,176 | |
| | 2,335 | | | State Street Corp. | | | 157,986 | |
| | 2,924 | | | TD Ameritrade Holding Corp. | | | 153,744 | |
| | 1,214 | | | Travelers Cos., Inc. (The) | | | 174,513 | |
| | 3,150 | | | US Bancorp | | | 167,958 | |
| | 3,213 | | | Wells Fargo & Co. | | | 155,541 | |
| | | | | | | | |
| | | | | | | 5,147,445 | |
| | | | | | | | |
| | | | Health Care—11.1% | |
| | 2,615 | | | Abbott Laboratories | | | 208,049 | |
| | 2,567 | | | AbbVie, Inc. | | | 203,794 | |
| | 1,567 | | | Alexion Pharmaceuticals, Inc.(b) | | | 213,316 | |
| | 1,404 | | | Allergan PLC | | | 206,388 | |
| | 1,106 | | | Amgen, Inc. | | | 198,328 | |
| | 689 | | | Anthem, Inc. | | | 181,228 | |
| | 2,688 | | | Baxter International, Inc. | | | 205,094 | |
| | 814 | | | Becton, Dickinson and Co. | | | 195,962 | |
| | 637 | | | Biogen, Inc.(b) | | | 146,026 | |
| | 5,072 | | | Boston Scientific Corp.(b) | | | 188,273 | |
See accompanying Notes to Financial Statements which are an integral part of the financial statements.
Invesco Russell Top 200 Equal Weight ETF (EQWL)(continued)
April 30, 2019
| | | | | | | | |
Number
of Shares | | | | | Value | |
| | | | Common Stocks & Other Equity Interests
(continued) | |
| | | | Health Care (continued) | |
| | 3,899 | | | Bristol-Myers Squibb Co. | | $ | 181,031 | |
| | 2,342 | | | Celgene Corp.(b) | | | 221,694 | |
| | 1,226 | | | Cigna Corp. | | | 194,738 | |
| | 7,975 | | | CVS Health Corp. | | | 433,680 | |
| | 1,613 | | | Danaher Corp. | | | 213,626 | |
| | 1,589 | | | Eli Lilly & Co. | | | 185,977 | |
| | 3,212 | | | Gilead Sciences, Inc. | | | 208,908 | |
| | 1,583 | | | HCA Healthcare, Inc. | | | 201,405 | |
| | 748 | | | Humana, Inc. | | | 191,047 | |
| | 696 | | | Illumina, Inc.(b) | | | 217,152 | |
| | 377 | | | Intuitive Surgical, Inc.(b) | | | 192,507 | |
| | 1,453 | | | Johnson & Johnson | | | 205,164 | |
| | 1,789 | | | McKesson Corp. | | | 213,338 | |
| | 2,205 | | | Medtronic PLC | | | 195,826 | |
| | 2,496 | | | Merck & Co., Inc. | | | 196,460 | |
| | 4,852 | | | Pfizer, Inc. | | | 197,040 | |
| | 491 | | | Regeneron Pharmaceuticals, Inc.(b) | | | 168,482 | |
| | 1,074 | | | Stryker Corp. | | | 202,889 | |
| | 801 | | | Thermo Fisher Scientific, Inc. | | | 222,237 | |
| | 849 | | | UnitedHealth Group, Inc. | | | 197,876 | |
| | 1,124 | | | Vertex Pharmaceuticals, Inc.(b) | | | 189,934 | |
| | 2,170 | | | Zoetis, Inc. | | | 220,993 | |
| | | | | | | | |
| | | | | | | 6,598,462 | |
| | | | | | | | |
| | | | Industrials—10.3% | |
| | 1,198 | | | 3M Co. | | | 227,033 | |
| | 567 | | | Boeing Co. (The) | | | 214,150 | |
| | 1,803 | | | Caterpillar, Inc. | | | 251,374 | |
| | 3,325 | | | CSX Corp. | | | 264,770 | |
| | 1,516 | | | Deere & Co. | | | 251,095 | |
| | 4,829 | | | Delta Air Lines, Inc. | | | 281,482 | |
| | 2,995 | | | Eaton Corp. PLC | | | 248,046 | |
| | 3,558 | | | Emerson Electric Co. | | | 252,582 | |
| | 1,385 | | | FedEx Corp. | | | 262,402 | |
| | 1,439 | | | General Dynamics Corp. | | | 257,178 | |
| | 25,339 | | | General Electric Co. | | | 257,698 | |
| | 1,570 | | | Honeywell International, Inc. | | | 272,599 | |
| | 1,701 | | | Illinois Tool Works, Inc. | | | 264,727 | |
| | 6,713 | | | Johnson Controls International PLC | | | 251,738 | |
| | 790 | | | Lockheed Martin Corp. | | | 263,331 | |
| | 1,340 | | | Norfolk Southern Corp. | | | 273,387 | |
| | 866 | | | Northrop Grumman Corp. | | | 251,062 | |
| | 1,329 | | | Raytheon Co. | | | 236,017 | |
| | 12,630 | | | Resideo Technologies, Inc.(b) | | | 286,701 | |
| | 4,567 | | | Southwest Airlines Co. | | | 247,668 | |
| | 1,452 | | | Union Pacific Corp. | | | 257,062 | |
| | 2,241 | | | United Parcel Service, Inc., Class B | | | 238,039 | |
| | 1,924 | | | United Technologies Corp. | | | 274,382 | |
| | 2,402 | | | Waste Management, Inc. | | | 257,831 | |
| | | | | | | | |
| | | | | | | 6,142,354 | |
| | | | | | | | |
| | | | Information Technology—11.6% | |
| | 1,480 | | | Accenture PLC, Class A | | | 270,352 | |
| | 1,016 | | | Adobe, Inc.(b) | | | 293,878 | |
| | 1,517 | | | Apple, Inc. | | | 304,416 | |
| | 6,905 | | | Applied Materials, Inc. | | | 304,303 | |
| | 1,592 | | | Automatic Data Processing, Inc. | | | 261,709 | |
| | | | | | | | |
Number
of Shares | | | | | Value | |
| | | | Common Stocks & Other Equity Interests
(continued) | |
| | | | Information Technology (continued) | |
| | 986 | | | Broadcom, Inc. | | $ | 313,942 | |
| | 5,058 | | | Cisco Systems, Inc. | | | 282,995 | |
| | 3,586 | | | Cognizant Technology Solutions Corp., Class A | | | 261,635 | |
| | 16,555 | | | Hewlett Packard Enterprise Co. | | | 261,735 | |
| | 13,784 | | | HP, Inc. | | | 274,991 | |
| | 4,932 | | | Intel Corp. | | | 251,729 | |
| | 1,917 | | | International Business Machines Corp. | | | 268,898 | |
| | 1,057 | | | Intuit, Inc. | | | 265,370 | |
| | 718 | | | Mastercard, Inc., Class A | | | 182,544 | |
| | 6,857 | | | Micron Technology, Inc.(b) | | | 288,405 | |
| | 2,350 | | | Microsoft Corp. | | | 306,910 | |
| | 1,752 | | | NVIDIA Corp. | | | 317,112 | |
| | 2,758 | | | NXP Semiconductors N.V. (Netherlands) | | | 291,300 | |
| | 4,934 | | | Oracle Corp. | | | 272,998 | |
| | 1,659 | | | PayPal Holdings, Inc.(b) | | | 187,086 | |
| | 4,801 | | | QUALCOMM, Inc. | | | 413,510 | |
| | 1,668 | | | salesforce.com, Inc.(b) | | | 275,804 | |
| | 2,495 | | | Texas Instruments, Inc. | | | 293,986 | |
| | 1,087 | | | Visa, Inc., Class A | | | 178,735 | |
| | 1,535 | | | VMware, Inc., Class A | | | 313,340 | |
| | | | | | | | |
| | | | | | | 6,937,683 | |
| | | | | | | | |
| | | | Materials—11.3% | |
| | 4,349 | | | Air Products & Chemicals, Inc. | | | 894,981 | |
| | 4,777 | | | Dow, Inc.(b) | | | 270,999 | |
| | 14,332 | | | DowDuPont, Inc. | | | 551,065 | |
| | 4,607 | | | Ecolab, Inc. | | | 848,057 | |
| | 4,665 | | | Linde PLC (United Kingdom) | | | 840,913 | |
| | 8,970 | | | LyondellBasell Industries N.V., Class A | | | 791,423 | |
| | 7,114 | | | PPG Industries, Inc. | | | 835,895 | |
| | 1,887 | | | Sherwin-Williams Co. (The) | | | 858,264 | |
| | 21,838 | | | Southern Copper Corp. (Peru) | | | 839,016 | |
| | | | | | | | |
| | | | | | | 6,730,613 | |
| | | | | | | | |
| | | | Real Estate—1.7% | |
| | 878 | | | American Tower Corp. | | | 171,473 | |
| | 1,322 | | | Crown Castle International Corp. | | | 166,281 | |
| | 374 | | | Equinix, Inc. | | | 170,058 | |
| | 2,297 | | | Prologis, Inc. | | | 176,111 | |
| | 745 | | | Public Storage | | | 164,779 | |
| | 911 | | | Simon Property Group, Inc. | | | 158,241 | |
| | | | | | | | |
| | | | | | | 1,006,943 | |
| | | | | | | | |
| | | | Utilities—7.2% | |
| | 8,531 | | | American Electric Power Co., Inc. | | | 729,827 | |
| | 9,126 | | | Dominion Energy, Inc. | | | 710,642 | |
| | 7,755 | | | Duke Energy Corp. | | | 706,635 | |
| | 14,307 | | | Exelon Corp. | | | 728,942 | |
| | 3,697 | | | NextEra Energy, Inc. | | | 718,845 | |
| | 13,757 | | | Southern Co. (The) | | | 732,147 | |
| | | | | | | | |
| | | | | | | 4,327,038 | |
| | | | | | | | |
| | | | Total Common Stocks & Other Equity Interests
(Cost $50,990,030) | | | 59,728,278 | |
| | | | | | | | |
See accompanying Notes to Financial Statements which are an integral part of the financial statements.
Invesco Russell Top 200 Equal Weight ETF (EQWL)(continued)
April 30, 2019
| | | | | | | | |
Number
of Shares | | | | | Value | |
| | | | Money Market Funds—0.1% | |
| | 83,718 | | | Invesco Premier U.S. Government Money Portfolio—Institutional Class, 2.32%(d)
(Cost $83,718) | | $ | 83,718 | |
| | | | | | | | |
| | |
| | | | Total Investments in Securities
(excluding investments purchased with cash collateral from securities on loan)
(Cost $51,073,748)—100.1% | | | 59,811,996 | |
| | | | | | | | |
| | |
| | | | | | | | |
| | | | Investments Purchased with Cash Collateral from
Securities on Loan | |
| | |
| | | | | | | | |
| | | | Money Market Funds—0.3% | |
| | 144,018 | | | Invesco Government & Agency Portfolio—Institutional Class, 2.34%(d)(e) | | | 144,018 | |
| | 47,992 | | | Invesco Liquid Assets Portfolio—Institutional Class, 2.48%(d)(e) | | | 48,006 | |
| | | | | | | | |
| | | | Total Investments Purchased with Cash Collateral from Securities on Loan
(Cost $192,024) | | | 192,024 | |
| | | | | | | | |
| | |
| | | | Total Investments in Securities
(Cost $51,265,772)—100.4% | | | 60,004,020 | |
| | |
| | | | Other assets less liabilities—(0.4)% | | | (255,294 | ) |
| | | | | | | | |
| | |
| | | | Net Assets—100.0% | | $ | 59,748,726 | |
| | | | | | | | |
Notes to Schedule of Investments:
| (a) | Industry and/or sector classifications used in this report are generally according to the Global Industry Classification Standard, which was developed by and is the exclusive property and a service mark of MSCI Inc. and Standard & Poor’s. |
| (b) | Non-income producing security. |
| (c) | All or a portion of this security was out on loan at April 30, 2019. |
| (d) | The security and the Fund are advised bywholly-owned subsidiaries of Invesco Ltd. and are therefore considered to be affiliated. The rate shown is the7-day SEC standardized yield as of April 30, 2019. |
| (e) | The security has been segregated to satisfy the commitment to return the cash collateral received in securities lending transactions upon the borrower’s return of the securities loaned. See Note 2J. |
See accompanying Notes to Financial Statements which are an integral part of the financial statements.
Schedule of Investments(a)
Invesco Russell Top 200 Pure Growth ETF (PXLG)
April 30, 2019
| | | | | | | | |
Number
of Shares | | | | | Value | |
| | | | Common Stocks & Other Equity Interests—100.0% | |
| | | | Communication Services—7.8% | |
| | 25,243 | | | Activision Blizzard, Inc. | | $ | 1,216,965 | |
| | 913 | | | Alphabet, Inc., Class C(b) | | | 1,085,082 | |
| | 16,977 | | | Electronic Arts, Inc.(b) | | | 1,606,873 | |
| | 30,779 | | | Facebook, Inc., Class A(b) | | | 5,952,659 | |
| | 21,781 | | | Netflix, Inc.(b) | | | 8,070,732 | |
| | | | | | | | |
| | | | | | | 17,932,311 | |
| | | | | | | | |
| | | | Consumer Discretionary—22.3% | |
| | 4,725 | | | Amazon.com, Inc.(b) | | | 9,102,807 | |
| | 1,743 | | | Booking Holdings, Inc.(b) | | | 3,233,248 | |
| | 25,943 | | | Home Depot, Inc. (The) | | | 5,284,589 | |
| | 68,483 | | | Lowe’s Cos., Inc. | | | 7,748,167 | |
| | 42,946 | | | Marriott International, Inc., Class A | | | 5,858,693 | |
| | 42,874 | | | NIKE, Inc., Class B | | | 3,765,623 | |
| | 73,628 | | | Starbucks Corp. | | | 5,719,423 | |
| | 14,061 | | | Tesla, Inc.(b)(c) | | | 3,356,220 | |
| | 126,950 | | | TJX Cos., Inc. (The) | | | 6,967,016 | |
| | | | | | | | |
| | | | | | | 51,035,786 | |
| | | | | | | | |
| | | | Consumer Staples—5.4% | |
| | 3,814 | | | Altria Group, Inc. | | | 207,215 | |
| | 2,848 | | | Constellation Brands, Inc., Class A | | | 602,836 | |
| | 1,928 | | | Costco Wholesale Corp. | | | 473,382 | |
| | 24,352 | | | Estee Lauder Cos., Inc. (The), Class A | | | 4,183,917 | |
| | 62,942 | | | Monster Beverage Corp.(b) | | | 3,751,343 | |
| | 45,923 | | | Sysco Corp. | | | 3,231,601 | |
| | | | | | | | |
| | | | | | | 12,450,294 | |
| | | | | | | | |
| | | | Energy—0.0% | |
| | 1,806 | | | Halliburton Co. | | | 51,164 | |
| | | | | | | | |
| |
| | | | Financials—3.4% | |
| | 10,929 | | | Aon PLC | | | 1,968,750 | |
| | 50,643 | | | Charles Schwab Corp. (The) | | | 2,318,437 | |
| | 4,233 | | | Progressive Corp. (The) | | | 330,809 | |
| | 6,558 | | | S&P Global, Inc. | | | 1,447,088 | |
| | 34,333 | | | TD Ameritrade Holding Corp. | | | 1,805,229 | |
| | | | | | | | |
| | | | | | | 7,870,313 | |
| | | | | | | | |
| | | | Health Care—16.1% | |
| | 65,798 | | | AbbVie, Inc. | | | 5,223,703 | |
| | 64,939 | | | Celgene Corp.(b) | | | 6,147,126 | |
| | 18,655 | | | Illumina, Inc.(b) | | | 5,820,360 | |
| | 8,061 | | | Intuitive Surgical, Inc.(b) | | | 4,116,188 | |
| | 2,363 | | | Regeneron Pharmaceuticals, Inc.(b) | | | 810,840 | |
| | 2,187 | | | Stryker Corp. | | | 413,146 | |
| | 11,067 | | | UnitedHealth Group, Inc. | | | 2,579,386 | |
| | 47,770 | | | Vertex Pharmaceuticals, Inc.(b) | | | 8,072,175 | |
| | 35,047 | | | Zoetis, Inc. | | | 3,569,186 | |
| | | | | | | | |
| | | | | | | 36,752,110 | |
| | | | | | | | |
| | | | Industrials—5.2% | |
| | 15,659 | | | Boeing Co. (The) | | | 5,914,248 | |
| | 4,472 | | | Deere & Co. | | | 740,697 | |
| | 2,410 | | | FedEx Corp. | | | 456,599 | |
| | 5,642 | | | Illinois Tool Works, Inc. | | | 878,064 | |
| | 2,697 | | | Northrop Grumman Corp. | | | 781,887 | |
| | 7,084 | | | Raytheon Co. | | | 1,258,048 | |
| | 16,525 | | | United Parcel Service, Inc., Class B | | | 1,755,286 | |
| | | | | | | | |
| | | | | | | 11,784,829 | |
| | | | | | | | |
| | | | | | | | |
Number
of Shares | | | | | Value | |
| | | | Common Stocks & Other Equity Interests
(continued) | |
| | | | Information Technology—33.3% | |
| | 14,373 | | | Accenture PLC, Class A | | $ | 2,625,516 | |
| | 28,846 | | | Adobe, Inc.(b) | | | 8,343,706 | |
| | 26,138 | | | Apple, Inc. | | | 5,245,112 | |
| | 123,498 | | | Applied Materials, Inc. | | | 5,442,557 | |
| | 3,929 | | | Automatic Data Processing, Inc. | | | 645,888 | |
| | 27,252 | | | Intuit, Inc. | | | 6,841,887 | |
| | 40,169 | | | Mastercard, Inc., Class A | | | 10,212,567 | |
| | 23,121 | | | NVIDIA Corp. | | | 4,184,901 | |
| | 69,675 | | | PayPal Holdings, Inc.(b) | | | 7,857,250 | |
| | 59,809 | | | salesforce.com, Inc.(b) | | | 9,889,418 | |
| | 12,847 | | | Texas Instruments, Inc. | | | 1,513,762 | |
| | 52,139 | | | Visa, Inc., Class A | | | 8,573,216 | |
| | 23,949 | | | VMware, Inc., Class A | | | 4,888,709 | |
| | | | | | | | |
| | | | | | | 76,264,489 | |
| | | | | | | | |
| | | | Materials—3.1% | |
| | 12,076 | | | Sherwin-Williams Co. (The) | | | 5,492,527 | |
| | 41,507 | | | Southern Copper Corp. (Peru) | | | 1,594,699 | |
| | | | | | | | |
| | | | | | | 7,087,226 | |
| | | | | | | | |
| | | | Real Estate—3.4% | |
| | 17,072 | | | American Tower Corp. | | | 3,334,162 | |
| | 5,265 | | | Equinix, Inc. | | | 2,393,995 | |
| | 9,466 | | | Public Storage | | | 2,093,690 | |
| | | | | | | | |
| | | | | | | 7,821,847 | |
| | | | | | | | |
| | | | Total Common Stocks & Other Equity Interests
(Cost $209,953,328) | | | 229,050,369 | |
| | | | | | | | |
| | |
| | | | | | | | |
| | | | Money Market Funds—0.0% | |
| | 72,452 | | | Invesco Premier U.S. Government Money Portfolio—Institutional Class, 2.32%(d)
(Cost $72,452) | | | 72,452 | |
| | | | | | | | |
| | |
| | | | Total Investments in Securities
(excluding investments purchased with cash collateral from securities on loan)
(Cost $210,025,780)—100.0% | | | 229,122,821 | |
| | | | | | | | |
| | |
| | | | | | | | |
| | | | Investments Purchased with Cash Collateral from
Securities on Loan | |
| | |
| | | | | | | | |
| | | | Money Market Funds—2.1% | |
| | 3,583,972 | | | Invesco Government & Agency Portfolio—Institutional Class, 2.34%(d)(e) | | | 3,583,972 | |
| | 1,194,320 | | | Invesco Liquid Assets Portfolio—Institutional Class, 2.48%(d)(e) | | | 1,194,678 | |
| | | | | | | | |
| | | | Total Investments Purchased with Cash Collateral from Securities on Loan
(Cost $4,778,650) | | | 4,778,650 | |
| | | | | | | | |
| | |
| | | | Total Investments in Securities
(Cost $214,804,430)—102.1% | | | 233,901,471 | |
| | |
| | | | Other assets less liabilities—(2.1)% | | | (4,813,362 | ) |
| | | | | | | | |
| | |
| | | | Net Assets—100.0% | | $ | 229,088,109 | |
| | | | | | | | |
See accompanying Notes to Financial Statements which are an integral part of the financial statements.
Invesco Russell Top 200 Pure Growth ETF (PXLG)(continued)
April 30, 2019
Notes to Schedule of Investments:
| (a) | Industry and/or sector classifications used in this report are generally according to the Global Industry Classification Standard, which was developed by and is the exclusive property and a service mark of MSCI Inc. and Standard & Poor’s. |
| (b) | Non-income producing security. |
| (c) | All or a portion of this security was out on loan at April 30, 2019. |
| (d) | The security and the Fund are advised bywholly-owned subsidiaries of Invesco Ltd. and are therefore considered to be affiliated. The rate shown is the7-day SEC standardized yield as of April 30, 2019. |
| (e) | The security has been segregated to satisfy the commitment to return the cash collateral received in securities lending transactions upon the borrower’s return of the securities loaned. See Note 2J. |
See accompanying Notes to Financial Statements which are an integral part of the financial statements.
Schedule of Investments(a)
Invesco Russell Top 200 Pure Value ETF (PXLV)
April 30, 2019
| | | | | | | | |
Number
of Shares | | | | | Value | |
| | | | Common Stocks & Other Equity Interests—99.9% | |
| | | | Communication Services—5.3% | |
| | 109,649 | | | AT&T, Inc. | | $ | 3,394,733 | |
| | 6,427 | | | Comcast Corp., Class A | | | 279,768 | |
| | 9,116 | | | Fox Corp., Class A(b) | | | 355,433 | |
| | 18,696 | | | Verizon Communications, Inc. | | | 1,069,224 | |
| | 101 | | | Walt Disney Co. (The) | | | 13,834 | |
| | | | | | | | |
| | | | | | | 5,112,992 | |
| | | | | | | | |
| | | | Consumer Discretionary—8.0% | |
| | 21,623 | | | Carnival Corp. | | | 1,186,238 | |
| | 236,072 | | | Ford Motor Co. | | | 2,466,952 | |
| | 59,763 | | | General Motors Co. | | | 2,327,769 | |
| | 21,493 | | | Target Corp. | | | 1,663,988 | |
| | | | | | | | |
| | | | | | | 7,644,947 | |
| | | | | | | | |
| | | | Consumer Staples—8.8% | |
| | 13,933 | | | Kraft Heinz Co. (The) | | | 463,133 | |
| | 65,418 | | | Mondelez International, Inc., Class A | | | 3,326,505 | |
| | 12,852 | | | Philip Morris International, Inc. | | | 1,112,469 | |
| | 21,303 | | | Procter & Gamble Co. (The) | | | 2,268,344 | |
| | 10,255 | | | Walgreens Boots Alliance, Inc. | | | 549,360 | |
| | 7,441 | | | Walmart, Inc. | | | 765,233 | |
| | | | | | | | |
| | | | | | | 8,485,044 | |
| | | | | | | | |
| | | | Energy—6.9% | |
| | 34,753 | | | Baker Hughes a GE Co. | | | 834,767 | |
| | 8,600 | | | Chevron Corp. | | | 1,032,516 | |
| | 3,768 | | | ConocoPhillips | | | 237,836 | |
| | 8,921 | | | Exxon Mobil Corp. | | | 716,178 | |
| | 98,290 | | | Kinder Morgan, Inc. | | | 1,953,022 | |
| | 3,592 | | | Marathon Petroleum Corp. | | | 218,645 | |
| | 829 | | | Occidental Petroleum Corp. | | | 48,812 | |
| | 7,044 | | | Phillips 66 | | | 664,038 | |
| | 4,812 | | | Schlumberger Ltd. | | | 205,376 | |
| | 7,755 | | | Valero Energy Corp. | | | 703,068 | |
| | | | | | | | |
| | | | | | | 6,614,258 | |
| | | | | | | | |
| | | | Financials—25.4% | |
| | 60,803 | | | Aflac, Inc. | | | 3,063,255 | |
| | 7,152 | | | Allstate Corp. (The) | | | 708,477 | |
| | 38,940 | | | Bank of America Corp. | | | 1,190,785 | |
| | 21,219 | | | Bank of New York Mellon Corp. (The) | | | 1,053,736 | |
| | 28,344 | | | BB&T Corp. | | | 1,451,213 | |
| | 416 | | | BlackRock, Inc. | | | 201,860 | |
| | 970 | | | Chubb Ltd. | | | 140,844 | |
| | 27,010 | | | Citigroup, Inc. | | | 1,909,607 | |
| | 8,608 | | | Goldman Sachs Group, Inc. (The) | | | 1,772,559 | |
| | 15,230 | | | JPMorgan Chase & Co. | | | 1,767,441 | |
| | 29,750 | | | MetLife, Inc. | | | 1,372,368 | |
| | 23,063 | | | Morgan Stanley | | | 1,112,790 | |
| | 9,954 | | | PNC Financial Services Group, Inc. (The) | | | 1,363,001 | |
| | 30,906 | | | Prudential Financial, Inc. | | | 3,267,073 | |
| | 39,365 | | | US Bancorp | | | 2,098,942 | |
| | 40,198 | | | Wells Fargo & Co. | | | 1,945,985 | |
| | | | | | | | |
| | | | | | | 24,419,936 | |
| | | | | | | | |
| | | | Health Care—10.1% | |
| | 6,083 | | | Abbott Laboratories | | | 483,963 | |
| | 20,763 | | | Allergan PLC | | | 3,052,161 | |
| | 1,190 | | | Anthem, Inc. | | | 313,006 | |
| | 5,723 | | | CVS Health Corp. | | | 311,217 | |
| | 22,747 | | | Danaher Corp. | | | 3,012,613 | |
| | | | | | | | |
Number
of Shares | | | | | Value | |
| | | | Common Stocks & Other Equity Interests
(continued) | |
| | | | Health Care (continued) | |
| | 15,501 | | | Medtronic PLC | | $ | 1,376,644 | |
| | 27,189 | | | Pfizer, Inc. | | | 1,104,145 | |
| | | | | | | | |
| | | | | | | 9,653,749 | |
| | | | | | | | |
| | | | Industrials—8.7% | |
| | 35,613 | | | Eaton Corp. PLC | | | 2,949,469 | |
| | 190,617 | | | General Electric Co. | | | 1,938,575 | |
| | 44,509 | | | Johnson Controls International PLC | | | 1,669,087 | |
| | 4,355 | | | Norfolk Southern Corp. | | | 888,507 | |
| | 6,456 | | | United Technologies Corp. | | | 920,690 | |
| | | | | | | | |
| | | | | | | 8,366,328 | |
| | | | | | | | |
| | | | Information Technology—4.8% | |
| | 10,794 | | | Cisco Systems, Inc. | | | 603,924 | |
| | 181,540 | | | Hewlett Packard Enterprise Co. | | | 2,870,147 | |
| | 1,028 | | | HP, Inc. | | | 20,509 | |
| | 8,197 | | | Intel Corp. | | | 418,375 | |
| | 8,270 | | | QUALCOMM, Inc. | | | 712,295 | |
| | | | | | | | |
| | | | | | | 4,625,250 | |
| | | | | | | | |
| | | | Materials—3.3% | |
| | 8,838 | | | Air Products & Chemicals, Inc. | | | 1,818,772 | |
| | 7,843 | | | Dow, Inc.(b) | | | 444,933 | |
| | 23,528 | | | DowDuPont, Inc. | | | 904,652 | |
| | | | | | | | |
| | | | | | | 3,168,357 | |
| | | | | | | | |
| | | | Real Estate—2.0% | |
| | 24,403 | | | Prologis, Inc. | | | 1,870,978 | |
| | | | | | | | |
| |
| | | | Utilities—16.6% | |
| | 37,706 | | | American Electric Power Co., Inc. | | | 3,225,748 | |
| | 34,969 | | | Dominion Energy, Inc. | | | 2,723,036 | |
| | 35,391 | | | Duke Energy Corp. | | | 3,224,828 | |
| | 45,275 | | | Exelon Corp. | | | 2,306,761 | |
| | 8,801 | | | NextEra Energy, Inc. | | | 1,711,267 | |
| | 52,109 | | | Southern Co. (The) | | | 2,773,241 | |
| | | | | | | | |
| | | | | | | 15,964,881 | |
| | | | | | | | |
| | | | Total Common Stocks & Other Equity Interests
(Cost $90,328,864) | | | 95,926,720 | |
| | | | | | | | |
| | | | Money Market Funds—0.1% | |
| | 65,834 | | | Invesco Premier U.S. Government Money Portfolio—Institutional Class, 2.32%(c)
(Cost $65,834) | | | 65,834 | |
| | | | | | | | |
| | |
| | | | Total Investments in Securities
(Cost $90,394,698)—100.0% | | | 95,992,554 | |
| | |
| | | | Other assets less liabilities—0.0% | | | 16,563 | |
| | | | | | | | |
| | |
| | | | Net Assets—100.0% | | $ | 96,009,117 | |
| | | | | | | | |
Notes to Schedule of Investments:
| (a) | Industry and/or sector classifications used in this report are generally according to the Global Industry Classification Standard, which was developed by and is the exclusive property and a service mark of MSCI Inc. and Standard & Poor’s. |
| (b) | Non-income producing security. |
| (c) | The security and the Fund are advised bywholly-owned subsidiaries of Invesco Ltd. and are therefore considered to be affiliated. The rate shown is the7-day SEC standardized yield as of April 30, 2019. |
See accompanying Notes to Financial Statements which are an integral part of the financial statements.
Schedule of Investments(a)
Invesco Zacks Mid-Cap ETF (CZA)
April 30, 2019
| | | | | | | | |
Number
of Shares | | | | | Value | |
| | | | Common Stocks & Other Equity Interests—100.0% | |
| | | | Consumer Discretionary—7.7% | |
| | 62,940 | | | Aptiv PLC | | $ | 5,393,958 | |
| | 50,799 | | | BorgWarner, Inc. | | | 2,121,874 | |
| | 16,641 | | | Columbia Sportswear Co. | | | 1,663,601 | |
| | 55,206 | | | Norwegian Cruise Line Holdings Ltd.(b) | | | 3,113,067 | |
| | 884 | | | NVR, Inc.(b) | | | 2,786,792 | |
| | 18,316 | | | PVH Corp. | | | 2,362,581 | |
| | 29,404 | | | Tractor Supply Co. | | | 3,043,314 | |
| | | | | | | | |
| | | | | | | 20,485,187 | |
| | | | | | | | |
| | | | Energy—4.0% | |
| | 60,862 | | | Andeavor Logistics LP | | | 2,040,703 | |
| | 63,088 | | | Equitrans Midstream Corp. | | | 1,314,123 | |
| | 127,511 | | | Pembina Pipeline Corp. (Canada) | | | 4,559,793 | |
| | 31,254 | | | Phillips 66 Partners LP | | | 1,548,011 | |
| | 55,500 | | | Shell Midstream Partners LP | | | 1,116,105 | |
| | | | | | | | |
| | | | | | | 10,578,735 | |
| | | | | | | | |
| | | | Financials—27.3% | |
| | 21,870 | | | American Financial Group, Inc. | | | 2,264,201 | |
| | 49,717 | | | Apollo Global Management LLC, Class A | | | 1,625,249 | |
| | 100,284 | | | Arch Capital Group Ltd.(b) | | | 3,387,594 | |
| | 105,937 | | | Ares Capital Corp. | | | 1,906,866 | |
| | 45,823 | | | Arthur J. Gallagher & Co. | | | 3,831,719 | |
| | 20,811 | | | Axis Capital Holdings Ltd. | | | 1,183,105 | |
| | 17,263 | | | BOK Financial Corp. | | | 1,504,298 | |
| | 68,681 | | | Brown & Brown, Inc. | | | 2,180,622 | |
| | 67,499 | | | CNA Financial Corp. | | | 3,127,229 | |
| | 19,863 | | | Credicorp Ltd. (Peru) | | | 4,705,545 | |
| | 81,292 | | | Discover Financial Services | | | 6,624,485 | |
| | 60,342 | | | E*TRADE Financial Corp. | | | 3,056,926 | |
| | 35,425 | | | East West Bancorp, Inc. | | | 1,823,679 | |
| | 24,732 | | | Essent Group Ltd.(b) | | | 1,173,533 | |
| | 27,188 | | | First American Financial Corp. | | | 1,551,347 | |
| | 88,259 | | | Hartford Financial Services Group, Inc. (The) | | | 4,616,828 | |
| | 50,397 | | | Lincoln National Corp. | | | 3,362,488 | |
| | 33,992 | | | M&T Bank Corp. | | | 5,781,019 | |
| | 87,655 | | | MGIC Investment Corp.(b) | | | 1,283,269 | |
| | 53,708 | | | Northern Trust Corp. | | | 5,292,923 | |
| | 34,074 | | | OneMain Holdings, Inc. | | | 1,157,494 | |
| | 52,546 | | | Radian Group, Inc. | | | 1,230,627 | |
| | 37,765 | | | SEI Investments Co. | | | 2,056,304 | |
| | 13,464 | | | Signature Bank | | | 1,778,191 | |
| | 31,534 | | | Willis Towers Watson PLC | | | 5,812,978 | |
| | | | | | | | |
| | | | | | | 72,318,519 | |
| | | | | | | | |
| | | | Health Care—3.8% | |
| | 35,992 | | | Catalent, Inc.(b) | | | 1,613,161 | |
| | 71,753 | | | Hologic, Inc.(b) | | | 3,327,904 | |
| | 21,198 | | | Integra LifeSciences Holdings Corp.(b) | | | 1,106,324 | |
| | 25,003 | | | Laboratory Corp. of America Holdings(b) | | | 3,998,480 | |
| | | | | | | | |
| | | | | | | 10,045,869 | |
| | | | | | | | |
| | | | Industrials—12.9% | |
| | 25,335 | | | Cintas Corp. | | | 5,501,242 | |
| | 14,697 | | | Crane Co. | | | 1,249,980 | |
| | 35,364 | | | Dover Corp. | | | 3,467,087 | |
| | 40,267 | | | Graco, Inc. | | | 2,063,684 | |
| | 42,356 | | | HD Supply Holdings, Inc.(b) | | | 1,935,246 | |
| | 13,460 | | | Hubbell, Inc. | | | 1,717,496 | |
| | | | | | | | |
Number
of Shares | | | | | Value | |
| | | | Common Stocks & Other Equity Interests
(continued) | |
| | | | Industrials (continued) | |
| | 18,523 | | | IDEX Corp. | | $ | 2,901,813 | |
| | 107,973 | | | IHS Markit Ltd.(b) | | | 6,182,534 | |
| | 13,677 | | | MSC Industrial Direct Co., Inc., Class A | | | 1,144,081 | |
| | 31,744 | | | Parker-Hannifin Corp. | | | 5,748,203 | |
| | 8,851 | | | Teledyne Technologies, Inc.(b) | | | 2,199,562 | |
| | | | | | | | |
| | | | | | | 34,110,928 | |
| | | | | | | | |
| | | | Information Technology—5.3% | |
| | 28,619 | | | Broadridge Financial Solutions, Inc. | | | 3,380,763 | |
| | 6,068 | | | CACI International, Inc., Class A(b) | | | 1,182,896 | |
| | 46,267 | | | Genpact Ltd. | | | 1,679,492 | |
| | 40,552 | | | Logitech International SA (Switzerland) | | | 1,570,173 | |
| | 156,226 | | | Symantec Corp. | | | 3,782,232 | |
| | 61,376 | | | Trimble, Inc.(b) | | | 2,505,368 | |
| | | | | | | | |
| | | | | | | 14,100,924 | |
| | | | | | | | |
| | | | Materials—7.8% | |
| | 15,391 | | | AptarGroup, Inc. | | | 1,712,095 | |
| | 20,503 | | | Avery Dennison Corp. | | | 2,268,657 | |
| | 32,159 | | | Celanese Corp. | | | 3,469,634 | |
| | 34,826 | | | Eastman Chemical Co. | | | 2,747,075 | |
| | 324,235 | | | Israel Chemicals Ltd. (Israel)(c) | | | 1,711,961 | |
| | 22,791 | | | Packaging Corp. of America | | | 2,259,956 | |
| | 16,413 | | | Reliance Steel & Aluminum Co. | | | 1,509,339 | |
| | 32,360 | | | RPM International, Inc. | | | 1,962,634 | |
| | 55,268 | | | Steel Dynamics, Inc. | | | 1,750,890 | |
| | 16,541 | | | W.R. Grace & Co. | | | 1,250,169 | |
| | | | | | | | |
| | | | | | | 20,642,410 | |
| | | | | | | | |
| | | | Real Estate—21.0% | |
| | 73,062 | | | American Homes 4 Rent, Class A | | | 1,752,027 | |
| | 35,524 | | | Apartment Investment & Management Co., Class A | | | 1,753,465 | |
| | 38,009 | | | Boston Properties, Inc. | | | 5,230,799 | |
| | 72,473 | | | Brixmor Property Group, Inc. | | | 1,295,817 | |
| | 23,605 | | | Camden Property Trust | | | 2,375,843 | |
| | 82,433 | | | CBRE Group, Inc., Class A(b) | | | 4,292,286 | |
| | 41,622 | | | Douglas Emmett, Inc. | | | 1,714,410 | |
| | 88,931 | | | Duke Realty Corp. | | | 2,767,533 | |
| | 22,094 | | | Equity LifeStyle Properties, Inc. | | | 2,578,370 | |
| | 16,195 | | | Essex Property Trust, Inc. | | | 4,575,087 | |
| | 30,878 | | | First Industrial Realty Trust, Inc. | | | 1,089,067 | |
| | 52,700 | | | Gaming and Leisure Properties, Inc. | | | 2,128,026 | |
| | 25,860 | | | Highwoods Properties, Inc. | | | 1,152,839 | |
| | 37,984 | | | Hudson Pacific Properties, Inc. | | | 1,324,122 | |
| | 36,048 | | | Liberty Property Trust | | | 1,789,423 | |
| | 27,941 | | | Mid-America Apartment Communities, Inc. | | | 3,057,025 | |
| | 40,984 | | | Regency Centers Corp. | | | 2,752,895 | |
| | 12,542 | | | Ryman Hospitality Properties, Inc. | | | 998,343 | |
| | 20,878 | | | SL Green Realty Corp. | | | 1,844,363 | |
| | 21,305 | | | Sun Communities, Inc. | | | 2,622,219 | |
| | 87,245 | | | Ventas, Inc. | | | 5,331,542 | |
| | 47,039 | | | Vornado Realty Trust | | | 3,252,276 | |
| | | | | | | | |
| | | | | | | 55,677,777 | |
| | | | | | | | |
See accompanying Notes to Financial Statements which are an integral part of the financial statements.
Invesco Zacks Mid-Cap ETF (CZA)(continued)
April 30, 2019
| | | | | | | | |
Number
of Shares | | | | | Value | |
| | | | Common Stocks & Other Equity Interests
(continued) | |
| | | | Utilities—10.2% | |
| | 28,778 | | | Atmos Energy Corp. | | $ | 2,945,140 | |
| | 76,105 | | | Avangrid, Inc. | | | 3,897,337 | |
| | 85,154 | | | Brookfield Infrastructure Partners LP (Canada)(c) | | | 3,523,673 | |
| | 62,752 | | | Evergy, Inc. | | | 3,628,321 | |
| | 105,755 | | | Fortis, Inc. (Canada)(c) | | | 3,912,935 | |
| | 48,005 | | | MDU Resources Group, Inc. | | | 1,255,331 | |
| | 12,925 | | | ONE Gas, Inc. | | | 1,144,121 | |
| | 141,754 | | | PG&E Corp.(b) | | | 3,192,300 | |
| | 21,885 | | | Portland General Electric Co. | | | 1,144,804 | |
| | 42,632 | | | UGI Corp. | | | 2,323,870 | |
| | | | | | | | |
| | | | | | | 26,967,832 | |
| | | | | | | | |
| | | | Total Common Stocks & Other Equity Interests
(Cost $241,049,676) | | | 264,928,181 | |
| | | | | | | | |
| | |
| | | | | | | | |
| | | | Money Market Funds—0.1% | |
| | 308,843 | | | Invesco Premier U.S. Government Money Portfolio—Institutional Class, 2.32%(d)
(Cost $308,843) | | | 308,843 | |
| | | | | | | | |
| | |
| | | | Total Investments in Securities
(excluding investments purchased with cash collateral from securities on loan)
(Cost $241,358,519)-100.1% | | | 265,237,024 | |
| | | | | | | | |
| | |
| | | | | | | | |
| | | | Investments Purchased with Cash Collateral from
Securities on Loan | |
| | |
| | | | | | | | |
| | | | Money Market Funds—1.2% | |
| | 2,387,283 | | | Invesco Government & Agency Portfolio—Institutional Class 2.34%(d)(e) | | | 2,387,283 | |
| | 734,740 | | | Invesco Liquid Assets Portfolio—Institutional Class, 2.48%(d)(e) | | | 734,961 | |
| | | | | | | | |
| | | | Total Investments Purchased with Cash Collateral from Securities on Loan
(Cost $3,122,244) | | | 3,122,244 | |
| | | | | | | | |
| | |
| | | | Total Investments in Securities
(Cost $244,480,763)—101.3% | | | 268,359,268 | |
| | |
| | | | Other assets less liabilities—(1.3)% | | | (3,340,654 | ) |
| | | | | | | | |
| | |
| | | | Net Assets—100.0% | | $ | 265,018,614 | |
| | | | | | | | |
Notes to Schedule of Investments:
| (a) | Industry and/or sector classifications used in this report are generally according to the Global Industry Classification Standard, which was developed by and is the exclusive property and a service mark of MSCI Inc. and Standard & Poor’s. |
| (b) | Non-income producing security. |
| (c) | All or a portion of this security was out on loan at April 30, 2019. |
| (d) | The security and the Fund are advised bywholly-owned subsidiaries of Invesco Ltd. and are therefore considered to be affiliated. The rate shown is the7-day SEC standardized yield as of April 30, 2019. |
| (e) | The security has been segregated to satisfy the commitment to return the cash collateral received in securities lending transactions upon the borrower’s return of the securities loaned. See Note 2J. |
See accompanying Notes to Financial Statements which are an integral part of the financial statements.
Schedule of Investments(a)
Invesco Zacks Multi-Asset Income ETF (CVY)
April 30, 2019
| | | | | | | | |
Number
of Shares | | | | | Value | |
| | | | Common Stocks & Other Equity Interests—79.6% | |
| | | | Communication Services—3.6% | |
| | 37,008 | | | Chunghwa Telecom Co. Ltd. ADR (Taiwan) | | $ | 1,333,768 | |
| | 63,884 | | | Interpublic Group of Cos., Inc. (The) | | | 1,469,332 | |
| | 69,613 | | | PLDT, Inc. ADR (Philippines) | | | 1,646,348 | |
| | 174,388 | | | Telefonica SA ADR (Spain) | | | 1,447,420 | |
| | 39,912 | | | Verizon Communications, Inc. | | | 2,282,567 | |
| | | | | | | | |
| | | | | | | 8,179,435 | |
| | | | | | | | |
| | | | Consumer Discretionary—8.3% | |
| | 71,267 | | | Adient PLC | | | 1,646,268 | |
| | 89,720 | | | Bed Bath & Beyond, Inc.(b) | | | 1,499,221 | |
| | 37,427 | | | Best Buy Co., Inc. | | | 2,784,943 | |
| | 47,125 | | | Big Lots, Inc. | | | 1,751,165 | |
| | 52,571 | | | Designer Brands, Inc., Class A | | | 1,169,705 | |
| | 56,459 | | | General Motors Co. | | | 2,199,078 | |
| | 75,242 | | | Goodyear Tire & Rubber Co. (The) | | | 1,445,399 | |
| | 79,352 | | | Hanesbrands, Inc. | | | 1,433,891 | |
| | 25,529 | | | MDC Holdings, Inc. | | | 780,166 | |
| | 17,359 | | | Penske Automotive Group, Inc. | | | 797,125 | |
| | 32,310 | | | PetMed Express, Inc.(b) | | | 705,973 | |
| | 55,854 | | | Signet Jewelers Ltd. | | | 1,294,696 | |
| | 10,442 | | | Whirlpool Corp. | | | 1,449,558 | |
| | | | | | | | |
| | | | | | | 18,957,188 | |
| | | | | | | | |
| | | | Energy—14.2% | |
| | 126,846 | | | Alliance Resource Partners LP(b) | | | 2,444,322 | |
| | 50,165 | | | BP PLC ADR (United Kingdom) | | | 2,193,715 | |
| | 40,593 | | | Delek US Holdings, Inc. | | | 1,504,377 | |
| | 57,098 | | | Ecopetrol SA ADR (Colombia) | | | 1,055,742 | |
| | 118,018 | | | Enable Midstream Partners LP | | | 1,642,811 | |
| | 47,676 | | | Enterprise Products Partners LP | | | 1,364,964 | |
| | 52,548 | | | Eqm Midstream Partners LP | | | 2,417,208 | |
| | 48,921 | | | MPLX LP | | | 1,578,191 | |
| | 185,646 | | | NGL Energy Partners LP | | | 2,647,312 | |
| | 75,203 | | | NuStar Energy LP(b) | | | 2,044,770 | |
| | 23,295 | | | Phillips 66 | | | 2,196,020 | |
| | 28,833 | | | Phillips 66 Partners LP | | | 1,428,098 | |
| | 45,401 | | | Plains All American Pipeline LP | | | 1,051,033 | |
| | 29,942 | | | Royal Dutch Shell PLC, Class A ADR (Netherlands) | | | 1,902,215 | |
| | 69,944 | | | RPC, Inc. | | | 719,724 | |
| | 28,471 | | | TOTAL SA ADR (France) | | | 1,584,981 | |
| | 194,641 | | | USA Compression Partners LP(b) | | | 3,297,219 | |
| | 49,206 | | | Western Midstream Partners LP | | | 1,553,925 | |
| | | | | | | | |
| | | | | | | 32,626,627 | |
| | | | | | | | |
| | | | Financials—24.5% | |
| | 32,012 | | | Associated Banc-Corp. | | | 726,352 | |
| | 40,118 | | | Banco Santander Chile ADR (Chile) | | | 1,123,304 | |
| | 9,099 | | | Bank of Hawaii Corp. | | | 749,576 | |
| | 20,075 | | | Bank of Montreal (Canada) | | | 1,585,323 | |
| | 44,209 | | | BB&T Corp. | | | 2,263,501 | |
| | 24,378 | | | Berkshire Hills Bancorp, Inc. | | | 731,096 | |
| | 5,163 | | | BlackRock, Inc. | | | 2,505,294 | |
| | 74,903 | | | Cadence BanCorp | | | 1,704,043 | |
| | 19,133 | | | Cathay General Bancorp | | | 703,903 | |
| | 16,193 | | | Chemical Financial Corp. | | | 711,359 | |
| | 61,184 | | | Citizens Financial Group, Inc. | | | 2,214,861 | |
| | 17,486 | | | CNA Financial Corp. | | | 810,126 | |
| | | | | | | | |
Number
of Shares | | | | | Value | |
| | | | Common Stocks & Other Equity Interests
(continued) | |
| | | | Financials (continued) | |
| | 19,893 | | | Columbia Banking System, Inc. | | $ | 746,783 | |
| | 81,816 | | | Fifth Third Bancorp | | | 2,357,937 | |
| | 96,233 | | | First Horizon National Corp. | | | 1,452,156 | |
| | 18,111 | | | First Interstate BancSystem, Inc., Class A | | | 765,371 | |
| | 46,516 | | | Franklin Resources, Inc. | | | 1,608,988 | |
| | 157,380 | | | Huntington Bancshares, Inc. | | | 2,190,730 | |
| | 21,358 | | | JPMorgan Chase & Co. | | | 2,478,596 | |
| | 128,691 | | | KeyCorp | | | 2,258,527 | |
| | 41,642 | | | Ladder Capital Corp. | | | 724,571 | |
| | 25,610 | | | Legg Mason, Inc. | | | 856,655 | |
| | 440,771 | | | Lloyds Banking Group PLC ADR (United Kingdom)(b) | | | 1,432,506 | |
| | 87,435 | | | Manulife Financial Corp. (Canada) | | | 1,609,678 | |
| | 50,072 | | | MetLife, Inc. | | | 2,309,821 | |
| | 60,004 | | | Navient Corp. | | | 810,654 | |
| | 24,831 | | | Pacific Premier Bancorp, Inc. | | | 721,837 | |
| | 18,322 | | | PNC Financial Services Group, Inc. (The) | | | 2,508,831 | |
| | 28,459 | | | Principal Financial Group, Inc. | | | 1,626,716 | |
| | 23,716 | | | Prudential Financial, Inc. | | | 2,507,018 | |
| | 138,441 | | | Regions Financial Corp. | | | 2,149,989 | |
| | 37,211 | | | Santander Consumer USA Holdings, Inc. | | | 794,455 | |
| | 167,007 | | | Sumitomo Mitsui Financial Group, Inc. ADR (Japan)(b) | | | 1,217,481 | |
| | 19,760 | | | Sun Life Financial, Inc. (Canada) | | | 820,633 | |
| | 23,100 | | | T. Rowe Price Group, Inc. | | | 2,483,250 | |
| | 40,354 | | | Unum Group | | | 1,489,870 | |
| | 43,912 | | | US Bancorp | | | 2,341,388 | |
| | | | | | | | |
| | | | | | | 56,093,179 | |
| | | | | | | | |
| | | | Health Care—1.7% | |
| | 28,226 | | | AbbVie, Inc. | | | 2,240,862 | |
| | 42,051 | | | GlaxoSmithKline PLC ADR (United Kingdom) | | | 1,729,558 | |
| | | | | | | | |
| | | | | | | 3,970,420 | |
| | | | | | | | |
| | | | Industrials—4.4% | |
| | 37,141 | | | Aircastle Ltd. | | | 739,849 | |
| | 16,682 | | | Copa Holdings SA, Class A (Panama) | | | 1,388,943 | |
| | 14,522 | | | Cummins, Inc. | | | 2,414,863 | |
| | 7,407 | | | Lockheed Martin Corp. | | | 2,468,975 | |
| | 17,647 | | | MSC Industrial Direct Co., Inc., Class A | | | 1,476,172 | |
| | 23,914 | | | Ryder System, Inc. | | | 1,506,582 | |
| | | | | | | | |
| | | | | | | 9,995,384 | |
| | | | | | | | |
| | | | Information Technology—3.4% | |
| | 8,137 | | | Broadcom, Inc. | | | 2,590,821 | |
| | 48,788 | | | Canon, Inc. ADR (Japan)(b) | | | 1,350,452 | |
| | 44,126 | | | Western Digital Corp. | | | 2,255,721 | |
| | 47,994 | | | Xerox Corp. | | | 1,601,080 | |
| | | | | | | | |
| | | | | | | 7,798,074 | |
| | | | | | | | |
| | | | Materials—6.9% | |
| | 41,718 | | | Braskem SA ADR (Brazil) | | | 1,020,005 | |
| | 44,672 | | | Commercial Metals Co. | | | 772,379 | |
| | 28,947 | | | Domtar Corp. | | | 1,415,508 | |
| | 17,884 | | | Eastman Chemical Co. | | | 1,410,690 | |
| | 47,622 | | | International Paper Co. | | | 2,229,186 | |
| | 25,582 | | | LyondellBasell Industries N.V., Class A | | | 2,257,100 | |
| | 50,364 | | | Mercer International, Inc. (Canada) | | | 713,154 | |
See accompanying Notes to Financial Statements which are an integral part of the financial statements.
Invesco Zacks Multi-Asset Income ETF (CVY)(continued)
April 30, 2019
| | | | | | | | |
Number
of Shares | | | | | Value | |
| | | | Common Stocks & Other Equity Interests
(continued) | |
| | | | Materials (continued) | |
| | 15,181 | | | Packaging Corp. of America | | $ | 1,505,348 | |
| | 30,171 | | | Schnitzer Steel Industries, Inc., Class A | | | 715,656 | |
| | 19,020 | | | Schweitzer-Mauduit International, Inc. | | | 676,541 | |
| | 41,427 | | | Ternium SA ADR (Luxembourg) | | | 1,021,176 | |
| | 14,649 | | | Trinseo SA | | | 658,473 | |
| | 38,085 | | | WestRock Co. | | | 1,461,702 | |
| | | | | | | | |
| | | | | | | 15,856,918 | |
| | | | | | | | |
| | | | Real Estate—10.1% | |
| | 17,801 | | | Four Corners Property Trust, Inc. | | | 506,260 | |
| | 24,859 | | | Hannon Armstrong Sustainable Infrastructure Capital, Inc. | | | 661,001 | |
| | 73,581 | | | HCP, Inc. | | | 2,191,242 | |
| | 35,906 | | | Kennedy-Wilson Holdings, Inc. | | | 773,415 | |
| | 80,054 | | | Lexington Realty Trust | | | 726,090 | |
| | 10,269 | | | LTC Properties, Inc. | | | 462,721 | |
| | 122,966 | | | Medical Properties Trust, Inc. | | | 2,146,986 | |
| | 10,812 | | | National Health Investors, Inc. | | | 815,549 | |
| | 76,929 | | | Newmark Group, Inc., Class A | | | 655,435 | |
| | 63,161 | | | Omega Healthcare Investors, Inc.(b) | | | 2,235,268 | |
| | 59,127 | | | Physicians Realty Trust | | | 1,067,834 | |
| | 32,654 | | | Realty Income Corp. | | | 2,286,107 | |
| | 69,817 | | | STORE Capital Corp. | | | 2,326,302 | |
| | 164,495 | | | Uniti Group, Inc. | | | 1,807,800 | |
| | 35,707 | | | Ventas, Inc. | | | 2,182,055 | |
| | 30,460 | | | Welltower, Inc. | | | 2,270,184 | |
| | | | | | | | |
| | | | | | | 23,114,249 | |
| | | | | | | | |
| | | | Telecommunication Services—0.8% | |
| | 161,620 | | | Telefonica Brasil SA (Preference Shares) ADR (Brazil) | | | 1,923,278 | |
| | | | | | | | |
| | | | Utilities—1.7% | |
| | 48,366 | | | Brookfield Renewable Partners LP (Canada)(b) | | | 1,524,496 | |
| | 24,514 | | | Entergy Corp. | | | 2,375,407 | |
| | | | | | | | |
| | | | | | | 3,899,903 | |
| | | | | | | | |
| | | | Total Common Stocks & Other Equity Interests
(Cost $178,042,155) | | | 182,414,655 | |
| | | | | | | | |
| | | | Closed-End Funds—10.1% | | | |
| | 119,004 | | | AllianceBernstein Global High Income Fund, Inc. | | | 1,398,297 | |
| | 39,442 | | | Barings Global Short Duration High Yield Fund | | | 732,043 | |
| | 63,317 | | | BlackRock Multi-Sector Income Trust | | | 1,078,288 | |
| | 99,896 | | | Blackstone/GSO Strategic Credit Fund | | | 1,440,500 | |
| | 116,096 | | | First Trust Intermediate Duration Preferred & Income Fund | | | 2,588,941 | |
| | 288,645 | | | Gamco Global Gold Natural Resources & Income Trust | | | 1,255,606 | |
| | 52,543 | | | KKR Income Opportunities Fund | | | 837,535 | |
| | 166,817 | | | Morgan Stanley Emerging Markets Domestic Debt Fund, Inc. | | | 1,097,656 | |
| | 45,756 | | | Nexpoint Strategic Opportunities Fund | | | 920,611 | |
| | 45,756 | | | Nexpoint Strategic Opportunities Fund Rts. expiring 06/22/19(c) | | | 9,461 | |
| | 29,809 | | | Nuveen Global High Income Fund | | | 468,896 | |
| | | | | | | | |
Number
of Shares | | | | | Value | |
| | | | Closed-End Funds (continued) | |
| | 162,468 | | | Nuveen Preferred & Income Opportunities Fund | | $ | 1,564,567 | |
| | 34,809 | | | Nuveen Preferred & Income Term Fund | | | 810,353 | |
| | 75,191 | | | PGIM Global High Yield Fund, Inc. | | | 1,067,712 | |
| | 66,273 | | | PGIM High Yield Bond Fund, Inc. | | | 962,947 | |
| | 108,737 | | | PIMCO Dynamic Credit and Mortgage Income Fund | | | 2,560,756 | |
| | 107,939 | | | Templeton Emerging Markets Income Fund | | | 1,093,422 | |
| | 109,098 | | | Wells Fargo Income Opportunities Fund | | | 882,603 | |
| | 88,756 | | | Western Asset Global High Income Fund, Inc. | | | 861,821 | |
| | 134,981 | | | Western Asset High Income Fund II, Inc. | | | 903,023 | |
| | 38,133 | | | Western Asset High Yield Defined Opportunity Fund, Inc. | | | 568,182 | |
| | | | | | | | |
| | |
| | | | Total Closed-End Funds
(Cost $22,892,693) | | | 23,103,220 | |
| | | | | | | | |
| | | | Preferred Stocks—10.0% | | | |
| | | | Financials—10.0% | |
| | 98,029 | | | Bank of America Corp., 5.88%, Series HH | | | 2,572,281 | |
| | 48,864 | | | Bank of America Corp., 6.50%, Series Y | | | 1,256,782 | |
| | 92,160 | | | Citigroup, Inc., 6.88%, Series K | | | 2,554,675 | |
| | 61,512 | | | Citigroup, Inc., 7.13%, Series J | | | 1,704,498 | |
| | 85,098 | | | Hartford Financial Services Group, Inc. (The), 6.00%, Series G | | | 2,235,524 | |
| | 44,773 | | | JPMorgan Chase & Co., 6.15%, Series BB | | | 1,180,664 | |
| | 71,077 | | | KeyCorp, 5.65%, Series F | | | 1,786,876 | |
| | 64,498 | | | MetLife, Inc., 5.63%, Series E | | | 1,684,688 | |
| | 79,007 | | | Morgan Stanley, 5.85%, Series K | | | 2,074,724 | |
| | 81,183 | | | PNC Financial Services Group, Inc. (The), 6.13%, Series P | | | 2,160,280 | |
| | 47,721 | | | Wells Fargo & Co., 6.63%, Series R | | | 1,329,984 | |
| | 1,912 | | | Wells Fargo & Co., 7.50%, Series L | | | 2,499,825 | |
| | | | | | | | |
| | |
| | | | Total Preferred Stocks
(Cost $22,267,235) | | | 23,040,801 | |
| | | | | | | | |
| | |
| | | | | | | | |
| | | | Money Market Funds—0.1% | |
| | 319,271 | | | Invesco Premier U.S. Government Money Portfolio—Institutional Class, 2.32%(d)
(Cost $319,271) | | | 319,271 | |
| | | | | | | | |
| | |
| | | | Total Investments in Securities
(excluding investments purchased with cash collateral from securities on loan)
(Cost $223,521,354)—99.8% | | | 228,877,947 | |
| | | | | | | | |
| | |
| | | | | | | | |
See accompanying Notes to Financial Statements which are an integral part of the financial statements.
Invesco Zacks Multi-Asset Income ETF (CVY)(continued)
April 30, 2019
| | | | | | | | |
Number
of Shares | | | | | Value | |
| | | | Investments Purchased with Cash Collateral from
Securities on Loan | |
| | |
| | | | | | | | |
| | | | Money Market Funds—5.7% | |
| | 9,407,906 | | | Invesco Government & Agency Portfolio—Institutional Class, 2.34%(d)(e) | | $ | 9,407,906 | |
| | 3,645,525 | | | Invesco Liquid Assets Portfolio—Institutional Class, 2.48%(d)(e) | | | 3,646,618 | |
| | | | | | | | |
| | |
| | | | Total Investments Purchased with Cash Collateral from Securities on Loan
(Cost $13,054,524) | | | 13,054,524 | |
| | | | | | | | |
| | |
| | | | Total Investments in Securities
(Cost $236,575,878)—105.5% | | | 241,932,471 | |
| | |
| | | | Other assets less liabilities—(5.5)% | | | (12,712,159 | ) |
| | | | | | | | |
| | |
| | | | Net Assets—100.0% | | $ | 229,220,312 | |
| | | | | | | | |
Investment Abbreviations:
ADR—American Depositary Receipt
Rts.—Rights
Notes to Schedule of Investments:
| (a) | Industry and/or sector classifications used in this report are generally according to the Global Industry Classification Standard, which was developed by and is the exclusive property and a service mark of MSCI Inc. and Standard & Poor’s. |
| (b) | All or a portion of this security was out on loan at April 30, 2019. |
| (c) | Non-income producing security. |
| (d) | The security and the Fund are advised bywholly-owned subsidiaries of Invesco Ltd. and are therefore considered to be affiliated. The rate shown is the7-day SEC standardized yield as of April 30, 2019. |
| (e) | The security has been segregated to satisfy the commitment to return the cash collateral received in securities lending transactions upon the borrower’s return of the securities loaned. See Note 2J. |
See accompanying Notes to Financial Statements which are an integral part of the financial statements.
(This Page Intentionally Left Blank)
Statements of Assets and Liabilities
April 30, 2019
| | | | | | | | | | | | | | | | |
| | | Invesco
Dynamic Large
Cap Growth
ETF (PWB) | | | Invesco
Dynamic Large
Cap Value
ETF (PWV) | | | Invesco
Russell 2000
Pure Growth
ETF (PXSG) | | | Invesco
Russell 2000
Pure Value
ETF (PXSV) | |
| Assets: | | | | | | | | | | | | | | | | |
Unaffiliated investments in securities, at value(a) | | $ | 758,281,186 | | | $ | 1,040,722,313 | | | $ | 89,489,054 | | | $ | 78,515,700 | |
Affiliated investments in securities, at value | | | — | | | | 1,227,488 | | | | 7,076,205 | | | | 4,269,148 | |
Cash | | | — | | | | — | | | | 26 | | | | — | |
Receivable for: | | | | | | | | | | | | | | | | |
Dividends | | | 717,476 | | | | 495,199 | | | | 2,282 | | | | 76,225 | |
Securities lending | | | — | | | | — | | | | 23,427 | | | | 5,208 | |
Investments sold | | | — | | | | 1,835,303 | | | | — | | | | — | |
Fund shares sold | | | 2,437,481 | | | | — | | | | — | | | | — | |
Foreign tax reclaims | | | 24,998 | | | | — | | | | — | | | | — | |
| | | | | | | | | | | | | | | | |
Total assets | | | 761,461,141 | | | | 1,044,280,303 | | | | 96,590,994 | | | | 82,866,281 | |
| | | | | | | | | | | | | | | | |
| | | | |
| Liabilities: | | | | | | | | | | | | | | | | |
Due to custodian | | | 304,795 | | | | — | | | | — | | | | 3 | |
Payable for: | | | | | | | | | | | | | | | | |
Fund shares repurchased | | | — | | | | 1,836,617 | | | | — | | | | — | |
Investments purchased | | | 2,438,733 | | | | — | | | | — | | | | — | |
Collateral upon return of securities loaned | | | — | | | | — | | | | 6,934,024 | | | | 3,915,756 | |
Accrued advisory fees | | | 304,564 | | | | 429,485 | | | | 16,784 | | | | 14,782 | |
Accrued trustees’ and officer’s fees | | | 68,182 | | | | 96,889 | | | | 34,011 | | | | 37,409 | |
Accrued expenses | | | 288,300 | | | | 555,311 | | | | 111,666 | | | | 104,689 | |
| | | | | | | | | | | | | | | | |
Total liabilities | | | 3,404,574 | | | | 2,918,302 | | | | 7,096,485 | | | | 4,072,639 | |
| | | | | | | | | | | | | | | | |
| Net Assets | | $ | 758,056,567 | | | $ | 1,041,362,001 | | | $ | 89,494,509 | | | $ | 78,793,642 | |
| | | | | | | | | | | | | | | | |
| | | | |
| Net assets consist of: | | | | | | | | | | | | | | | | |
Shares of beneficial interest | | $ | 805,056,124 | | | $ | 1,364,945,065 | | | $ | 105,350,037 | | | $ | 100,103,457 | |
Distributable earnings | | | (46,999,557 | ) | | | (323,583,064 | ) | | | (15,855,528 | ) | | | (21,309,815 | ) |
| | | | | | | | | | | | | | | | |
| Net Assets | | $ | 758,056,567 | | | $ | 1,041,362,001 | | | $ | 89,494,509 | | | $ | 78,793,642 | |
| | | | | | | | | | | | | | | | |
Shares outstanding (unlimited amount authorized, $0.01 par value) | | | 15,550,000 | | | | 28,350,000 | | | | 2,400,000 | | | | 2,600,000 | |
Net asset value | | $ | 48.75 | | | $ | 36.73 | | | $ | 37.29 | | | $ | 30.31 | |
| | | | | | | | | | | | | | | | |
Market price | | $ | 48.77 | | | $ | 36.74 | | | $ | 37.31 | | | $ | 30.30 | |
| | | | | | | | | | | | | | | | |
Unaffiliated investments in securities, at cost | | $ | 709,156,831 | | | $ | 1,006,646,422 | | | $ | 90,546,376 | | | $ | 78,647,934 | |
| | | | | | | | | | | | | | | | |
Affiliated investments in securities, at cost | | $ | — | | | $ | 1,227,488 | | | $ | 7,076,205 | | | $ | 4,262,058 | |
| | | | | | | | | | | | | | | | |
(a) Includes securities on loan with an aggregate value of | | $ | — | | | $ | — | | | $ | 6,647,932 | | | $ | 3,699,526 | |
| | | | | | | | | | | | | | | | |
See accompanying Notes to Financial Statements which are an integral part of the financial statements.
| | | | | | | | | | | | | | | | | | | | | | | | | | | | | | |
Invesco
Russell Midcap
Equal Weight
ETF (EQWM) | | | Invesco
Russell Midcap
Pure Growth
ETF (PXMG) | | | Invesco
Russell Midcap
Pure Value
ETF (PXMV) | | | Invesco
Russell Top 200
Equal Weight
ETF (EQWL) | | | Invesco
Russell Top 200
Pure Growth
ETF (PXLG) | | | Invesco
Russell Top 200
Pure Value
ETF (PXLV) | | | Invesco
Zacks Mid-Cap
ETF (CZA) | | | Invesco Zacks
Multi-Asset
Income
ETF (CVY) | |
| | | | | | | | | | | | | | | | | | | | | | | | | | | | | | |
| $ | 25,347,009 | | | $ | 625,632,122 | | | $ | 51,478,048 | | | $ | 59,728,278 | | | $ | 229,050,369 | | | $ | 95,926,720 | | | $ | 264,928,181 | | | $ | 228,558,676 | |
| | 1,025,913 | | | | 2,360,928 | | | | 1,048,382 | | | | 275,742 | | | | 4,851,102 | | | | 65,834 | | | | 3,431,087 | | | | 13,373,795 | |
| | 21 | | | | — | | | | — | | | | — | | | | — | | | | — | | | | — | | | | 10,707 | |
| | | | | | | | | | | | | | | | | | | | | | | | | | | | | | |
| | 13,848 | | | | 19,823 | | | | 44,498 | | | | 70,944 | | | | 242,970 | | | | 185,374 | | | | 204,163 | | | | 636,837 | |
| | 862 | | | | 351 | | | | 145 | | | | 22 | | | | 595 | | | | — | | | | 3,860 | | | | 31,148 | |
| | — | | | | — | | | | — | | | | — | | | | 121,439,843 | | | | — | | | | 26,410 | | | | 1,191,384 | |
| | — | | | | — | | | | — | | | | — | | | | — | | | | — | | | | — | | | | — | |
| | — | | | | — | | | | — | | | | — | | | | — | | | | — | | | | — | | | | 81,445 | |
| | | | | | | | | | | | | | | | | | | | | | | | | | | | | | |
| | 26,387,653 | | | | 628,013,224 | | | | 52,571,073 | | | | 60,074,986 | | | | 355,584,879 | | | | 96,177,928 | | | | 268,593,701 | | | | 243,883,992 | |
| | | | | | | | | | | | | | | | | | | | | | | | | | | | | | |
| | | | | | | |
| | | | | | | | | | | | | | | | | | | | | | | | | | | | | | |
| | — | | | | — | | | | — | | | | 39 | | | | — | | | | 36 | | | | — | | | | — | |
| | | | | | | | | | | | | | | | | | | | | | | | | | | | | | |
| | — | | | | — | | | | — | | | | — | | | | 121,444,299 | | | | — | | | | — | | | | 1,112,637 | |
| | — | | | | — | | | | — | | | | — | | | | — | | | | — | | | | — | | | | — | |
| | 893,052 | | | | 1,708,809 | | | | 631,528 | | | | 192,024 | | | | 4,778,650 | | | | — | | | | 3,122,244 | | | | 13,054,524 | |
| | 7,527 | | | | 164,527 | | | | 8,145 | | | | 2,631 | | | | 77,015 | | | | 20,741 | | | | 98,101 | | | | 72,185 | |
| | 32,281 | | | | 46,326 | | | | 35,092 | | | | 33,559 | | | | 30,273 | | | | 25,652 | | | | 4,658 | | | | 4,686 | |
| | 82,504 | | | | 194,678 | | | | 87,591 | | | | 98,007 | | | | 166,533 | | | | 122,382 | | | | 350,084 | | | | 419,648 | |
| | | | | | | | | | | | | | | | | | | | | | | | | | | | | | |
| | 1,015,364 | | | | 2,114,340 | | | | 762,356 | | | | 326,260 | | | | 126,496,770 | | | | 168,811 | | | | 3,575,087 | | | | 14,663,680 | |
| | | | | | | | | | | | | | | | | | | | | | | | | | | | | | |
| $ | 25,372,289 | | | $ | 625,898,884 | | | $ | 51,808,717 | | | $ | 59,748,726 | | | $ | 229,088,109 | | | $ | 96,009,117 | | | $ | 265,018,614 | | | $ | 229,220,312 | |
| | | | | | | | | | | | | | | | | | | | | | | | | | | | | | |
| | | | | | | |
| | | | | | | | | | | | | | | | | | | | | | | | | | | | | | |
| $ | 26,058,041 | | | $ | 581,179,209 | | | $ | 62,838,378 | | | $ | 53,435,557 | | | $ | 224,864,900 | | | $ | 95,438,913 | | | $ | 300,467,040 | | | $ | 630,083,515 | |
| | (685,752 | ) | | | 44,719,675 | | | | (11,029,661 | ) | | | 6,313,169 | | | | 4,223,209 | | | | 570,204 | | | | (35,448,426 | ) | | | (400,863,203 | ) |
| | | | | | | | | | | | | | | | | | | | | | | | | | | | | | |
| $ | 25,372,289 | | | $ | 625,898,884 | | | $ | 51,808,717 | | | $ | 59,748,726 | | | $ | 229,088,109 | | | $ | 96,009,117 | | | $ | 265,018,614 | | | $ | 229,220,312 | |
| | | | | | | | | | | | | | | | | | | | | | | | | | | | | | |
| | 500,000 | | | | 10,600,000 | | | | 1,600,000 | | | | 1,050,000 | | | | 4,150,000 | | | | 2,400,000 | | | | 3,750,000 | | | | 10,300,800 | |
| $ | 50.74 | | | $ | 59.05 | | | $ | 32.38 | | | $ | 56.90 | | | $ | 55.20 | | | $ | 40.00 | | | $ | 70.67 | | | $ | 22.25 | |
| | | | | | | | | | | | | | | | | | | | | | | | | | | | | | |
| $ | 50.72 | | | $ | 59.07 | | | $ | 32.36 | | | $ | 56.91 | | | $ | 55.18 | | | $ | 39.99 | | | $ | 70.75 | | | $ | 22.27 | |
| | | | | | | | | | | | | | | | | | | | | | | | | | | | | | |
| $ | 21,337,642 | | | $ | 556,969,342 | | | $ | 49,372,753 | | | $ | 50,990,030 | | | $ | 209,953,328 | | | $ | 90,328,864 | | | $ | 241,049,676 | | | $ | 223,202,083 | |
| | | | | | | | | | | | | | | | | | | | | | | | | | | | | | |
| $ | 1,031,886 | | | $ | 2,360,928 | | | $ | 1,109,844 | | | $ | 275,742 | | | $ | 4,851,102 | | | $ | 65,834 | | | $ | 3,431,087 | | | $ | 13,373,795 | |
| | | | | | | | | | | | | | | | | | | | | | | | | | | | | | |
| $ | 862,720 | | | $ | 1,703,412 | | | $ | 586,037 | | | $ | 185,940 | | | $ | 4,627,245 | | | $ | — | | | $ | 3,046,290 | | | $ | 12,656,717 | |
| | | | | | | | | | | | | | | | | | | | | | | | | | | | | | |
Statements of Operations
For the year ended April 30, 2019
| | | | | | | | | | | | | | | | |
| | | Invesco
Dynamic Large
Cap Growth
ETF (PWB) | | | Invesco
Dynamic Large
Cap Value
ETF (PWV) | | | Invesco
Russell 2000
Pure Growth
ETF (PXSG) | | | Invesco
Russell 2000
Pure Value
ETF (PXSV) | |
| Investment income: | | | | | | | | | | | | | | | | |
Unaffiliated dividend income | | $ | 10,417,722 | | | $ | 33,390,404 | | | $ | 266,284 | | | $ | 1,555,722 | |
Affiliated dividend income | | | 7,031 | | | | 18,624 | | | | 2,548 | | | | 23,187 | |
Non-cash dividend income | | | — | | | | — | | | | — | | | | — | |
Securities lending income | | | 248,422 | | | | 2,699,481 | | | | 340,611 | | | | 112,067 | |
Foreign withholding tax | | | — | | | | — | | | | — | | | | (177 | ) |
| | | | | | | | | | | | | | | | |
Total investment income | | | 10,673,175 | | | | 36,108,509 | | | | 609,443 | | | | 1,690,799 | |
| | | | | | | | | | | | | | | | |
| | | | |
| Expenses: | | | | | | | | | | | | | | | | |
Advisory fees | | | 3,314,831 | | | | 6,255,455 | | | | 233,272 | | | | 215,742 | |
Sub-licensing fees | | | 198,886 | | | | 375,320 | | | | 29,980 | | | | 15,796 | |
Accounting & administration fees | | | 63,668 | | | | 120,124 | | | | 28,100 | | | | 29,740 | |
Professional fees | | | 28,273 | | | | 35,580 | | | | 24,743 | | | | 25,129 | |
Trustees’ and officer’s fees | | | 13,938 | | | | 21,862 | | | | 7,264 | | | | 7,402 | |
Custodian & transfer agent fees | | | 9,376 | | | | 46,439 | | | | 11,611 | | | | 13,293 | |
Pricing fees | | | 7,000 | | | | 9,500 | | | | 7,000 | | | | 7,000 | |
Recapture (Note 3) | | | — | | | | — | | | | — | | | | — | |
Other expenses | | | 36,196 | | | | 73,077 | | | | 9,623 | | | | 11,949 | |
| | | | | | | | | | | | | | | | |
Total expenses | | | 3,672,168 | | | | 6,937,357 | | | | 351,593 | | | | 326,051 | |
| | | | | | | | | | | | | | | | |
Less: Waivers | | | (653 | ) | | | (1,706 | ) | | | (38,107 | ) | | | (36,121 | ) |
| | | | | | | | | | | | | | | | |
Net expenses | | | 3,671,515 | | | | 6,935,651 | | | | 313,486 | | | | 289,930 | |
| | | | | | | | | | | | | | | | |
Net investment income | | | 7,001,660 | | | | 29,172,858 | | | | 295,957 | | | | 1,400,869 | |
| | | | | | | | | | | | | | | | |
| | | | |
| Realized and unrealized gain (loss) from: | | | | | | | | | | | | | | | | |
Net realized gain (loss) from: | | | | | | | | | | | | | | | | |
Unaffiliated investment securities | | | (35,600,044 | ) | | | (155,980,326 | ) | | | (2,723,525 | ) | | | (3,054,165 | ) |
Affiliated investment securities | | | — | | | | — | | | | — | | | | (1,788 | ) |
Unaffiliatedin-kind redemptions | | | 141,573,150 | | | | 169,379,075 | | | | 13,332,823 | | | | 8,868,039 | |
Affiliatedin-kind redemptions | | | — | | | | — | | | | — | | | | 17,586 | |
| | | | | | | | | | | | | | | | |
Net realized gain (loss) | | | 105,973,106 | | | | 13,398,749 | | | | 10,609,298 | | | | 5,829,672 | |
| | | | | | | | | | | | | | | | |
Change in net unrealized appreciation (depreciation) on: | | | | | | | | | | | | | | | | |
Unaffiliated investment securities | | | (35,132,757 | ) | | | (6,337,818 | ) | | | (8,272,119 | ) | | | (4,265,412 | ) |
Affiliated investment securities | | | — | | | | — | | | | — | | | | (10,764 | ) |
| | | | | | | | | | | | | | | | |
Change in net unrealized appreciation (depreciation) | | | (35,132,757 | ) | | | (6,337,818 | ) | | | (8,272,119 | ) | | | (4,276,176 | ) |
| | | | | | | | | | | | | | | | |
Net realized and unrealized gain | | | 70,840,349 | | | | 7,060,931 | | | | 2,337,179 | | | | 1,553,496 | |
| | | | | | | | | | | | | | | | |
Net increase in net assets resulting from operations | | $ | 77,842,009 | | | $ | 36,233,789 | | | $ | 2,633,136 | | | $ | 2,954,365 | |
| | | | | | | | | | | | | | | | |
See accompanying Notes to Financial Statements which are an integral part of the financial statements.
| | | | | | | | | | | | | | | | | | | | | | | | | | | | | | |
Invesco
Russell Midcap
Equal Weight
ETF (EQWM) | | | Invesco
Russell Midcap
Pure Growth
ETF (PXMG) | | | Invesco
Russell Midcap
Pure Value
ETF (PXMV) | | | Invesco
Russell Top 200
Equal Weight
ETF (EQWL) | | | Invesco
Russell Top 200
Pure Growth
ETF (PXLG) | | | Invesco
Russell Top 200
Pure Value
ETF (PXLV) | | | Invesco
Zacks Mid-Cap
ETF (CZA) | | | Invesco Zacks
Multi-Asset
Income ETF
(CVY) | |
| | | | | | | | | | | | | | | | | | | | | | | | | | | | | | |
| $ | 375,964 | | | $ | 1,410,459 | | | $ | 1,411,721 | | | $ | 1,430,417 | | | $ | 3,191,191 | | | $ | 3,041,381 | | | $ | 5,102,775 | | | $ | 10,644,174 | |
| | 2,513 | | | | 6,652 | | | | 12,279 | | | | 1,923 | | | | 4,423 | | | | 2,521 | | | | 4,857 | | | | 47,241 | |
| | 3,653 | | | | — | | | | 80,651 | | | | 13,879 | | | | — | | | | 80,596 | | | | — | | | | 312,534 | |
| | 8,802 | | | | 137,505 | | | | 2,143 | | | | 659 | | | | 27,122 | | | | — | | | | 23,106 | | | | 596,262 | |
| | (353 | ) | | | — | | | | (582 | ) | | | (362 | ) | | | — | | | | — | | | | (32,113 | ) | | | (169,333 | ) |
| | | | | | | | | | | | | | | | | | | | | | | | | | | | | | |
| | 390,579 | | | | 1,554,616 | | | | 1,506,212 | | | | 1,446,516 | | | | 3,222,736 | | | | 3,124,498 | | | | 5,098,625 | | | | 11,430,878 | |
| | | | | | | | | | | | | | | | | | | | | | | | | | | | | | |
| | | | | | | |
| | | | | | | | | | | | | | | | | | | | | | | | | | | | | | |
| | 60,624 | | | | 887,750 | | | | 139,938 | | | | 151,948 | | | | 732,879 | | | | 293,128 | | | | 1,265,401 | | | | 1,311,014 | |
| | 4,244 | | | | 113,228 | | | | 9,804 | | | | 15,522 | | | | 74,760 | | | | 37,662 | | | | 354,623 | | | | 368,307 | |
| | 26,865 | | | | 33,661 | | | | 28,145 | | | | 29,003 | | | | 38,729 | | | | 31,906 | | | | 48,370 | | | | 52,637 | |
| | 23,543 | | | | 24,334 | | | | 24,573 | | | | 24,881 | | | | 25,318 | | | | 23,904 | | | | 26,114 | | | | 27,041 | |
| | 6,739 | | | | 9,199 | | | | 7,077 | | | | 7,157 | | | | 8,645 | | | | 7,198 | | | | 6,996 | | | | 7,162 | |
| | 12,816 | | | | 3,559 | | | | 6,093 | | | | 7,161 | | | | 5,447 | | | | 8,231 | | | | 23,485 | | | | 41,141 | |
| | 7,000 | | | | 7,000 | | | | 7,000 | | | | 7,000 | | | | 7,000 | | | | 7,000 | | | | 3,000 | | | | 4,000 | |
| | — | | | | 101,969 | | | | — | | | | — | | | | — | | | | — | | | | — | | | | — | |
| | 6,991 | | | | 13,280 | | | | 10,379 | | | | 9,557 | | | | 12,878 | | | | 9,869 | | | | 32,629 | | | | 37,426 | |
| | | | | | | | | | | | | | | | | | | | | | | | | | | | | | |
| | 148,822 | | | | 1,193,980 | | | | 233,009 | | | | 252,229 | | | | 905,656 | | | | 418,898 | | | | 1,760,618 | | | | 1,848,728 | |
| | | | | | | | | | | | | | | | | | | | | | | | | | | | | | |
| | (88,365 | ) | | | (578 | ) | | | (44,978 | ) | | | (100,450 | ) | | | (369 | ) | | | (24,914 | ) | | | (115,956 | ) | | | (145,107 | ) |
| | | | | | | | | | | | | | | | | | | | | | | | | | | | | | |
| | 60,457 | | | | 1,193,402 | | | | 188,031 | | | | 151,779 | | | | 905,287 | | | | 393,984 | | | | 1,644,662 | | | | 1,703,621 | |
| | | | | | | | | | | | | | | | | | | | | | | | | | | | | | |
| | 330,122 | | | | 361,214 | | | | 1,318,181 | | | | 1,294,737 | | | | 2,317,449 | | | | 2,730,514 | | | | 3,453,963 | | | | 9,727,257 | |
| | | | | | | | | | | | | | | | | | | | | | | | | | | | | | |
| | | | | | | |
| | | | | | | | | | | | | | | | | | | | | | | | | | | | | | |
| | | | | | | | | | | | | | | | | | | | | | | | | | | | | | |
| | (775,933 | ) | | | (3,333,194 | ) | | | (2,478,450 | ) | | | (507,916 | ) | | | (2,718,833 | ) | | | (3,059,067 | ) | | | (21,409,153 | ) | | | (36,306,192 | ) |
| | (208 | ) | | | — | | | | — | | | | — | | | | — | | | | — | | | | — | | | | (678,712 | ) |
| | 910,447 | | | | 33,411,393 | | | | 3,589,282 | | | | 2,657,267 | | | | 67,316,374 | | | | 9,264,861 | | | | 32,035,794 | | | | 36,556,710 | |
| | — | | | | — | | | | 224 | | | | — | | | | — | | | | — | | | | — | | | | (6,083 | ) |
| | | | | | | | | | | | | | | | | | | | | | | | | | | | | | |
| | 134,306 | | | | 30,078,199 | | | | 1,111,056 | | | | 2,149,351 | | | | 64,597,541 | | | | 6,205,794 | | | | 10,626,641 | | | | (434,277 | ) |
| | | | | | | | | | | | | | | | | | | | | | | | | | | | | | |
| | | | | | | | | | | | | | | | | | | | | | | | | | | | | | |
| | 1,536,508 | | | | 48,819,462 | | | | 1,705,959 | | | | 2,515,237 | | | | (28,437,893 | ) | | | (688,220 | ) | | | 12,178,808 | | | | 1,500,608 | |
| | (2,505 | ) | | | — | | | | (61,462 | ) | | | — | | | | — | | | | — | | | | — | | | | 198,754 | |
| | | | | | | | | | | | | | | | | | | | | | | | | | | | | | |
| | 1,534,003 | | | | 48,819,462 | | | | 1,644,497 | | | | 2,515,237 | | | | (28,437,893 | ) | | | (688,220 | ) | | | 12,178,808 | | | | 1,699,362 | |
| | | | | | | | | | | | | | | | | | | | | | | | | | | | | | |
| | 1,668,309 | | | | 78,897,661 | | | | 2,755,553 | | | | 4,664,588 | | | | 36,159,648 | | | | 5,517,574 | | | | 22,805,449 | | | | 1,265,085 | |
| | | | | | | | | | | | | | | | | | | | | | | | | | | | | | |
| $ | 1,998,431 | | | $ | 79,258,875 | | | $ | 4,073,734 | | | $ | 5,959,325 | | | $ | 38,477,097 | | | $ | 8,248,088 | | | $ | 26,259,412 | | | $ | 10,992,342 | |
| | | | | | | | | | | | | | | | | | | | | | | | | | | | | | |
Statements of Changes in Net Assets
For the years ended April 30, 2019 and 2018
| | | | | | | | | | | | | | | | |
| | | Invesco Dynamic
Large Cap Growth ETF (PWB) | | | Invesco Dynamic
Large Cap Value ETF (PWV) | |
| | | Year Ended
April 30, 2019 | | | Year Ended
April 30, 2018 | | | Year Ended
April 30, 2019 | | | Year Ended
April 30, 2018 | |
| Operations: | | | | | | | | | | | | | | | | |
Net investment income | | $ | 7,001,660 | | | $ | 3,454,223 | | | $ | 29,172,858 | | | $ | 27,337,906 | |
Net realized gain | | | 105,973,106 | | | | 74,740,094 | | | | 13,398,749 | | | | 98,655,316 | |
Net change in unrealized appreciation (depreciation) | | | (35,132,757 | ) | | | 28,967,508 | | | | (6,337,818 | ) | | | (67,600,380 | ) |
| | | | | | | | | | | | | | | | |
Net increase in net assets resulting from operations | | | 77,842,009 | | | | 107,161,825 | | | | 36,233,789 | | | | 58,392,842 | |
| | | | | | | | | | | | | | | | |
| | | | |
| Distributions to Shareholders from: | | | | | | | | | | | | | | | | |
Distributable earnings | | | (6,443,887 | ) | | | (3,410,983 | ) | | | (30,425,316 | ) | | | (26,977,108 | ) |
| | | | | | | | | | | | | | | | |
| | | | |
| Shareholder Transactions: | | | | | | | | | | | | | | | | |
Proceeds from shares sold | | | 1,092,157,365 | | | | 522,513,512 | | | | 1,132,813,955 | | | | 1,289,401,199 | |
Value of shares repurchased | | | (975,214,347 | ) | | | (497,601,512 | ) | | | (1,470,780,669 | ) | | | (1,204,269,368 | ) |
| | | | | | | | | | | | | | | | |
Net increase (decrease) in net assets resulting from shares transactions | | | 116,943,018 | | | | 24,912,000 | | | | (337,966,714 | ) | | | 85,131,831 | |
| | | | | | | | | | | | | | | | |
Increase (Decrease) in Net Assets | | | 188,341,140 | | | | 128,662,842 | | | | (332,158,241 | ) | | | 116,547,565 | |
| | | | | | | | | | | | | | | | |
| | | | |
| Net Assets: | | | | | | | | | | | | | | | | |
Beginning of year | | | 569,715,427 | | | | 441,052,585 | | | | 1,373,520,242 | | | | 1,256,972,677 | |
| | | | | | | | | | | | | | | | |
End of year | | $ | 758,056,567 | | | $ | 569,715,427 | | | $ | 1,041,362,001 | | | $ | 1,373,520,242 | |
| | | | | | | | | | | | | | | | |
| | | | |
| Changes in Shares Outstanding: | | | | | | | | | | | | | | | | |
Shares sold | | | 23,450,000 | | | | 12,950,000 | | | | 30,700,000 | | | | 34,550,000 | |
Shares repurchased | | | (21,050,000 | ) | | | (12,400,000 | ) | | | (40,400,000 | ) | | | (32,150,000 | ) |
Shares outstanding, beginning of year | | | 13,150,000 | | | | 12,600,000 | | | | 38,050,000 | | | | 35,650,000 | |
| | | | | | | | | | | | | | | | |
Shares outstanding, end of year | | | 15,550,000 | | | | 13,150,000 | | | | 28,350,000 | | | | 38,050,000 | |
| | | | | | | | | | | | | | | | |
See accompanying Notes to Financial Statements which are an integral part of the financial statements.
| | | | | | | | | | | | | | | | | | | | | | | | | | | | | | |
Invesco Russell 2000
Pure Growth ETF (PXSG) | | | Invesco Russell 2000
Pure Value ETF (PXSV) | | | Invesco Russell
Midcap Equal Weight ETF (EQWM) | | | Invesco Russell
Midcap Pure Growth ETF (PXMG) | |
Year Ended
April 30, 2019 | | | Year Ended
April 30, 2018 | | | Year Ended
April 30, 2019 | | | Year Ended
April 30, 2018 | | | Year Ended
April 30, 2019 | | | Year Ended
April 30, 2018 | | | Year Ended
April 30, 2019 | | | Year Ended
April 30, 2018 | |
| | | | | | | | | | | | | | | | | | | | | | | | | | | | | | |
| $ | 295,957 | | | $ | 183,573 | | | $ | 1,400,869 | | | $ | 1,625,876 | | | $ | 330,122 | | | $ | 336,422 | | | $ | 361,214 | | | $ | 42,737 | |
| | 10,609,298 | | | | 2,708,602 | | | | 5,829,672 | | | | 5,732,044 | | | | 134,306 | | | | 1,358,337 | | | | 30,078,199 | | | | 14,998,112 | |
| | (8,272,119 | ) | | | 3,386,657 | | | | (4,276,176 | ) | | | (2,921,729 | ) | | | 1,534,003 | | | | 652,263 | | | | 48,819,462 | | | | 9,275,479 | |
| | | | | | | | | | | | | | | | | | | | | | | | | | | | | | |
| | 2,633,136 | | | | 6,278,832 | | | | 2,954,365 | | | | 4,436,191 | | | | 1,998,431 | | | | 2,347,022 | | | | 79,258,875 | | | | 24,316,328 | |
| | | | | | | | | | | | | | | | | | | | | | | | | | | | | | |
| | | | | | | |
| | | | | | | | | | | | | | | | | | | | | | | | | | | | | | |
| | (300,605 | ) | | | (179,332 | ) | | | (1,557,211 | ) | | | (1,477,472 | ) | | | (332,865 | ) | | | (331,455 | ) | | | (462,502 | ) | | | (96,720 | ) |
| | | | | | | | | | | | | | | | | | | | | | | | | | | | | | |
| | | | | | | |
| | | | | | | | | | | | | | | | | | | | | | | | | | | | | | |
| | 95,646,223 | | | | 19,931,622 | | | | 35,535,262 | | | | 31,417,370 | | | | 4,602,453 | | | | 2,399,353 | | | | 563,499,131 | | | | 83,105,211 | |
| | (56,698,990 | ) | | | (12,011,668 | ) | | | (31,021,428 | ) | | | (44,908,556 | ) | | | (4,540,537 | ) | | | (7,012,532 | ) | | | (148,655,440 | ) | | | (43,033,101 | ) |
| | | | | | | | | | | | | | | | | | | | | | | | | | | | | | |
| | 38,947,233 | | | | 7,919,954 | | | | 4,513,834 | | | | (13,491,186 | ) | | | 61,916 | | | | (4,613,179 | ) | | | 414,843,691 | | | | 40,072,110 | |
| | | | | | | | | | | | | | | | | | | | | | | | | | | | | | |
| | 41,279,764 | | | | 14,019,454 | | | | 5,910,988 | | | | (10,532,467 | ) | | | 1,727,482 | | | | (2,597,612 | ) | | | 493,640,064 | | | | 64,291,718 | |
| | | | | | | | | | | | | | | | | | | | | | | | | | | | | | |
| | | | | | | |
| | | | | | | | | | | | | | | | | | | | | | | | | | | | | | |
| | 48,214,745 | | | | 34,195,291 | | | | 72,882,654 | | | | 83,415,121 | | | | 23,644,807 | | | | 26,242,419 | | | | 132,258,820 | | | | 67,967,102 | |
| | | | | | | | | | | | | | | | | | | | | | | | | | | | | | |
| $ | 89,494,509 | | | $ | 48,214,745 | | | $ | 78,793,642 | | | $ | 72,882,654 | | | $ | 25,372,289 | | | $ | 23,644,807 | | | $ | 625,898,884 | | | $ | 132,258,820 | |
| | | | | | | | | | | | | | | | | | | | | | | | | | | | | | |
| | | | | | | |
| | | | | | | | | | | | | | | | | | | | | | | | | | | | | | |
| | 2,550,000 | | | | 650,000 | | | | 1,150,000 | | | | 1,100,000 | | | | 100,000 | | | | 50,000 | | | | 10,700,000 | | | | 2,000,000 | |
| | (1,600,000 | ) | | | (400,000 | ) | | | (950,000 | ) | | | (1,550,000 | ) | | | (100,000 | ) | | | (150,000 | ) | | | (3,000,000 | ) | | | (1,050,000 | ) |
| | 1,450,000 | | | | 1,200,000 | | | | 2,400,000 | | | | 2,850,000 | | | | 500,000 | | | | 600,000 | | | | 2,900,000 | | | | 1,950,000 | |
| | | | | | | | | | | | | | | | | | | | | | | | | | | | | | |
| | 2,400,000 | | | | 1,450,000 | | | | 2,600,000 | | | | 2,400,000 | | | | 500,000 | | | | 500,000 | | | | 10,600,000 | | | | 2,900,000 | |
| | | | | | | | | | | | | | | | | | | | | | | | | | | | | | |
Statements of Changes in Net Assets(continued)
For the years ended April 30, 2019 and 2018
| | | | | | | | | | | | | | | | |
| | | Invesco Russell
Midcap Pure Value ETF (PXMV) | | | Invesco Russell
Top 200 Equal Weight ETF (EQWL) | |
| | | Year Ended
April 30, 2019 | | | Year Ended
April 30, 2018 | | | Year Ended
April 30, 2019 | | | Year Ended
April 30, 2018 | |
| Operations: | | | | | | | | | | | | | | | | |
Net investment income | | $ | 1,318,181 | | | $ | 1,232,927 | | | $ | 1,294,737 | | | $ | 919,893 | |
Net realized gain | | | 1,111,056 | | | | 332,256 | | | | 2,149,351 | | | | 4,223,541 | |
Net change in unrealized appreciation (depreciation) | | | 1,644,497 | | | | (936,467 | ) | | | 2,515,237 | | | | 1,488,025 | |
| | | | | | | | | | | | | | | | |
Net increase (decrease) in net assets resulting from operations | | | 4,073,734 | | | | 628,716 | | | | 5,959,325 | | | | 6,631,459 | |
| | | | | | | | | | | | | | | | |
| | | | |
| Distributions to Shareholders from: | | | | | | | | | | | | | | | | |
Distributable earnings | | | (1,232,093 | ) | | | (1,357,922 | ) | | | (1,304,748 | ) | | | (870,869 | ) |
| | | | | | | | | | | | | | | | |
| | | | |
| Shareholder Transactions: | | | | | | | | | | | | | | | | |
Proceeds from shares sold | | | 22,829,725 | | | | 18,033,951 | | | | 7,797,449 | | | | 29,975,273 | |
Value of shares repurchased | | | (19,891,008 | ) | | | (39,479,696 | ) | | | (12,935,448 | ) | | | (15,207,146 | ) |
| | | | | | | | | | | | | | | | |
Net increase (decrease) in net assets resulting from shares transactions | | | 2,938,717 | | | | (21,445,745 | ) | | | (5,137,999 | ) | | | 14,768,127 | |
| | | | | | | | | | | | | | | | |
Increase (Decrease) in Net Assets | | | 5,780,358 | | | | (22,174,951 | ) | | | (483,422 | ) | | | 20,528,717 | |
| | | | | | | | | | | | | | | | |
| | | | |
| Net Assets: | | | | | | | | | | | | | | | | |
Beginning of year | | | 46,028,359 | | | | 68,203,310 | | | | 60,232,148 | | | | 39,703,431 | |
| | | | | | | | | | | | | | | | |
End of year | | $ | 51,808,717 | | | $ | 46,028,359 | | | $ | 59,748,726 | | | $ | 60,232,148 | |
| | | | | | | | | | | | | | | | |
| | | | |
| Changes in Shares Outstanding: | | | | | | | | | | | | | | | | |
Shares sold | | | 750,000 | | | | 600,000 | | | | 150,000 | | | | 600,000 | |
Shares repurchased | | | (650,000 | ) | | | (1,300,000 | ) | | | (250,000 | ) | | | (300,000 | ) |
Shares outstanding, beginning of year | | | 1,500,000 | | | | 2,200,000 | | | | 1,150,000 | | | | 850,000 | |
| | | | | | | | | | | | | | | | |
Shares outstanding, end of year | | | 1,600,000 | | | | 1,500,000 | | | | 1,050,000 | | | | 1,150,000 | |
| | | | | | | | | | | | | | | | |
See accompanying Notes to Financial Statements which are an integral part of the financial statements.
| | | | | | |
Invesco Russell
Top 200 Pure Growth ETF (PXLG) | |
Year Ended
April 30, 2019 | | | Year Ended
April 30, 2018 | |
| | | | | | |
| $ | 2,317,449 | | | $ | 1,492,860 | |
| | 64,597,541 | | | | 13,199,033 | |
| | (28,437,893 | ) | | | 26,852,828 | |
| | | | | | |
| | 38,477,097 | | | | 41,544,721 | |
| | | | | | |
| |
| | | | | | |
| | (2,249,583 | ) | | | (1,352,332 | ) |
| | | | | | |
| |
| | | | | | |
| | 185,270,437 | | | | 77,741,709 | |
| | (200,765,120 | ) | | | (55,834,444 | ) |
| | | | | | |
| | (15,494,683 | ) | | | 21,907,265 | |
| | | | | | |
| | 20,732,831 | | | | 62,099,654 | |
| | | | | | |
| |
| | | | | | |
| | 208,355,278 | | | | 146,255,624 | |
| | | | | | |
| $ | 229,088,109 | | | $ | 208,355,278 | |
| | | | | | |
| |
| | | | | | |
| | 3,550,000 | | | | 1,850,000 | |
| | (3,750,000 | ) | | | (1,300,000 | ) |
| | 4,350,000 | | | | 3,800,000 | |
| | | | | | |
| | 4,150,000 | | | | 4,350,000 | |
| | | | | | |
Statements of Changes in Net Assets(continued)
For the years ended April 30, 2019 and 2018(a)
| | | | | | | | |
| | | Invesco Russell
Top 200 Pure Value ETF (PXLV) | |
| | | Year Ended
April 30, 2019 | | | Year Ended
April 30, 2018 | |
| Operations: | | | | | | | | |
Net investment income | | $ | 2,730,514 | | | $ | 2,180,032 | |
Net realized gain (loss) | | | 6,205,794 | | | | 5,606,647 | |
Net change in unrealized appreciation (depreciation) | | | (688,220 | ) | | | (792,954 | ) |
| | | | | | | | |
Net increase in net assets resulting from operations | | | 8,248,088 | | | | 6,993,725 | |
| | | | | | | | |
| | |
| Distributions to Shareholders from: | | | | | | | | |
Distributable earnings | | | (2,896,174 | ) | | | (1,878,389 | ) |
Return of capital | | | — | | | | — | |
| | | | | | | | |
Total distributions to shareholders | | | (2,896,174 | ) | | | (1,878,389 | ) |
| | | | | | | | |
| | |
| Shareholder Transactions: | | | | | | | | |
Proceeds from shares sold | | | 37,879,375 | | | | 60,840,213 | |
Value of shares repurchased | | | (51,760,892 | ) | | | (36,187,259 | ) |
| | | | | | | | |
Net increase (decrease) in net assets resulting from shares transactions | | | (13,881,517 | ) | | | 24,652,954 | |
| | | | | | | | |
Increase (Decrease) in Net Assets | | | (8,529,603 | ) | | | 29,768,290 | |
| | | | | | | | |
| | |
| Net Assets: | | | | | | | | |
Beginning of period | | | 104,538,720 | | | | 74,770,430 | |
| | | | | | | | |
End of period | | $ | 96,009,117 | | | $ | 104,538,720 | |
| | | | | | | | |
| | |
| Changes in Shares Outstanding: | | | | | | | | |
Shares sold | | | 1,000,000 | | | | 1,650,000 | |
Shares repurchased | | | (1,350,000 | ) | | | (1,000,000 | ) |
Shares outstanding, beginning of period | | | 2,750,000 | | | | 2,100,000 | |
| | | | | | | | |
Shares outstanding, end of period | | | 2,400,000 | | | | 2,750,000 | |
| | | | | | | | |
| (a) | Effective April 30, 2018, Invesco Zacks Mid-Cap ETF and Invesco Zacks Multi-Asset Income ETF changed their fiscal year end to April 30. |
See accompanying Notes to Financial Statements which are an integral part of the financial statements.
| | | | | | | | | | | | | | | | | | | | | | |
Invesco Zacks
Mid-Cap ETF (CZA) | | | Invesco Zacks
Multi-Asset Income ETF (CVY) | |
Year Ended
April 30, 2019 | | | Eight Months Ended
April 30, 2018 | | | Year Ended
August 31, 2017 | | | Year Ended
April 30, 2019 | | | Eight Months Ended
April 30, 2018 | | | Year Ended
August 31, 2017 | |
| | | | | | | | | | | | | | | | | | | | | | |
| $ | 3,453,963 | | | $ | 1,959,915 | | | $ | 2,340,703 | | | $ | 9,727,257 | | | $ | 7,301,169 | | | $ | 15,348,687 | |
| | 10,626,641 | | | | 15,590,695 | | | | 19,406,979 | | | | (434,277 | ) | | | 19,533,870 | | | | 28,526,178 | |
| | 12,178,808 | | | | (4,347,151 | ) | | | 6,190,483 | | | | 1,699,362 | | | | (3,774,891 | ) | | | (879,948 | ) |
| | | | | | | | | | | | | | | | | | | | | | |
| | 26,259,412 | | | | 13,203,459 | | | | 27,938,165 | | | | 10,992,342 | | | | 23,060,148 | | | | 42,994,917 | |
| | | | | | | | | | | | | | | | | | | | | | |
| | | | | |
| | | | | | | | | | | | | | | | | | | | | | |
| | (2,835,826 | ) | | | (2,665,110 | ) | | | (2,792,900 | ) | | | (9,787,271 | ) | | | (8,796,889 | ) | | | (11,665,472 | ) |
| | — | | | | — | | | | — | | | | — | | | | (1,180,314 | ) | | | (5,893,641 | ) |
| | | | | | | | | | | | | | | | | | | | | | |
| | (2,835,826 | ) | | | (2,665,110 | ) | | | (2,792,900 | ) | | | (9,787,271 | ) | | | (9,977,203 | ) | | | (17,559,113 | ) |
| | | | | | | | | | | | | | | | | | | | | | |
| | | | | |
| | | | | | | | | | | | | | | | | | | | | | |
| | 255,472,076 | | | | 158,343,390 | | | | 192,593,073 | | | | 300,491,601 | | | | 80,564,691 | | | | 200,977,596 | |
| | (269,461,073 | ) | | | (116,581,724 | ) | | | (157,554,788 | ) | | | (358,936,477 | ) | | | (153,331,824 | ) | | | (307,926,999 | ) |
| | | | | | | | | | | | | | | | | | | | | | |
| | (13,988,997 | ) | | | 41,761,666 | | | | 35,038,285 | | | | (58,444,876 | ) | | | (72,767,133 | ) | | | (106,949,403 | ) |
| | | | | | | | | | | | | | | | | | | | | | |
| | 9,434,589 | | | | 52,300,015 | | | | 60,183,550 | | | | (57,239,805 | ) | | | (59,684,188 | ) | | | (81,513,599 | ) |
| | | | | | | | | | | | | | | | | | | | | | |
| | | | | |
| | | | | | | | | | | | | | | | | | | | | | |
| | 255,584,025 | | | | 203,284,010 | | | | 143,100,460 | | | | 286,460,117 | | | | 346,144,305 | | | | 427,657,904 | |
| | | | | | | | | | | | | | | | | | | | | | |
| $ | 265,018,614 | | | $ | 255,584,025 | | | $ | 203,284,010 | | | $ | 229,220,312 | | | $ | 286,460,117 | | | $ | 346,144,305 | |
| | | | | | | | | | | | | | | | | | | | | | |
| | | | | |
| | | | | | | | | | | | | | | | | | | | | | |
| | 3,800,000 | | | | 2,450,000 | | | | 3,400,000 | | | | 13,550,000 | | | | 3,700,000 | | | | 9,800,000 | |
| | (4,000,000 | ) | | | (1,800,000 | ) | | | (2,800,000 | ) | | | (16,350,000 | ) | | | (7,000,000 | ) | | | (15,050,000 | ) |
| | 3,950,000 | | | | 3,300,000 | | | | 2,700,000 | | | | 13,100,800 | | | | 16,400,800 | | | | 21,650,800 | |
| | | | | | | | | | | | | | | | | | | | | | |
| | 3,750,000 | | | | 3,950,000 | | | | 3,300,000 | | | | 10,300,800 | | | | 13,100,800 | | | | 16,400,800 | |
| | | | | | | | | | | | | | | | | | | | | | |
Financial Highlights
Invesco Dynamic Large Cap Growth ETF (PWB)
| | | | | | | | | | | | | | | | | | | | |
| | | Years Ended April 30, | |
| | | 2019 | | | 2018 | | | 2017 | | | 2016 | | | 2015 | |
| Per Share Operating Performance: | | | | | | | | | | | | | | | | | | | | |
Net asset value at beginning of year | | $ | 43.32 | | | $ | 35.00 | | | $ | 30.82 | | | $ | 30.19 | | | $ | 25.62 | |
Net investment income(a) | | | 0.48 | | | | 0.27 | | | | 0.24 | | | | 0.19 | | | | 0.18 | |
Net realized and unrealized gain on investments | | | 5.39 | | | | 8.32 | | | | 4.19 | | | | 0.62 | | | | 4.56 | |
Total from investment operations | | | 5.87 | | | | 8.59 | | | | 4.43 | | | | 0.81 | | | | 4.74 | |
Distributions to shareholders from: | | | | | | | | | | | | | | | | | | | | |
Net investment income | | | (0.44 | ) | | | (0.27 | ) | | | (0.25 | ) | | | (0.18 | ) | | | (0.17 | ) |
Net asset value at end of year | | $ | 48.75 | | | $ | 43.32 | | | $ | 35.00 | | | $ | 30.82 | | | $ | 30.19 | |
Market price at end of year(b) | | $ | 48.77 | | | $ | 43.38 | | | $ | 35.02 | | | $ | 30.81 | | | $ | 30.17 | |
| Net Asset Value Total Return(c) | | | 13.69 | % | | | 24.63 | % | | | 14.46 | % | | | 2.70 | % | | | 18.52 | % |
| Market Price Total Return(c) | | | 13.57 | % | | | 24.73 | % | | | 14.57 | % | | | 2.73 | % | | | 18.44 | % |
| Ratios/Supplemental Data: | | | | | | | | | | | | | | | | | | | | |
Net assets at end of year (000’s omitted) | | $ | 758,057 | | | $ | 569,715 | | | $ | 441,053 | | | $ | 443,752 | | | $ | 327,579 | |
Ratio to average net assets of: | | | | | | | | | | | | | | | | | | | | |
Expenses, after Waivers | | | 0.55 | % | | | 0.57 | % | | | 0.57 | % | | | 0.57 | % | | | 0.58 | % |
Expenses, prior to Waivers | | | 0.55 | % | | | 0.57 | % | | | 0.57 | % | | | 0.57 | % | | | 0.58 | % |
Net investment income, after Waivers | | | 1.06 | % | | | 0.68 | % | | | 0.74 | % | | | 0.64 | % | | | 0.63 | % |
Portfolio turnover rate(d) | | | 181 | % | | | 119 | % | | | 116 | % | | | 97 | % | | | 143 | % |
| (a) | Based on average shares outstanding. |
| (b) | The mean between the last bid and ask prices. |
| (c) | Net asset value total return is calculated assuming an initial investment made at the net asset value at the beginning of the period, reinvestment of all dividends and distributions at net asset value during the period, and redemption on the last day of the period. Net asset value total return includes adjustments in accordance with accounting principles generally accepted in the United States of America and as such, the net asset value for financial reporting purposes and the returns based upon those net asset values may differ from the net asset value and returns for shareholder transactions. Market price total return is calculated assuming an initial investment made at the market price at the beginning of the period, reinvestment of all dividends and distributions at market price during the period, and sale at the market price on the last day of the period. Total investment returns calculated for a period of less than one year are not annualized. |
| (d) | Portfolio turnover rate is not annualized for periods less than one year, if applicable, and does not include securities received or delivered from processing creations or redemptions. |
Invesco Dynamic Large Cap Value ETF (PWV)
| | | | | | | | | | | | | | | | | | | | |
| | �� | Years Ended April 30, | |
| | | 2019 | | | 2018 | | | 2017 | | | 2016 | | | 2015 | |
| Per Share Operating Performance: | | | | | | | | | | | | | | | | | | | | |
Net asset value at beginning of year | | $ | 36.10 | | | $ | 35.26 | | | $ | 30.01 | | | $ | 31.43 | | | $ | 29.51 | |
Net investment income(a) | | | 0.84 | | | | 0.73 | | | | 0.67 | | | | 0.73 | | | | 0.64 | |
Net realized and unrealized gain (loss) on investments | | | 0.68 | | | | 0.83 | | | | 5.28 | | | | (1.43 | ) | | | 1.88 | |
Total from investment operations | | | 1.52 | | | | 1.56 | | | | 5.95 | | | | (0.70 | ) | | | 2.52 | |
Distributions to shareholders from: | | | | | | | | | | | | | | | | | | | | |
Net investment income | | | (0.89 | ) | | | (0.72 | ) | | | (0.70 | ) | | | (0.72 | ) | | | (0.60 | ) |
Net asset value at end of year | | $ | 36.73 | | | $ | 36.10 | | | $ | 35.26 | | | $ | 30.01 | | | $ | 31.43 | |
Market price at end of year(b) | | $ | 36.74 | | | $ | 36.13 | | | $ | 35.27 | | | $ | 30.00 | | | $ | 31.42 | |
| Net Asset Value Total Return(c) | | | 4.32 | % | | | 4.39 | % | | | 20.06 | % | | | (2.17 | )% | | | 8.56 | % |
| Market Price Total Return(c) | | | 4.26 | % | | | 4.44 | % | | | 20.14 | % | | | (2.18 | )% | | | 8.60 | % |
| Ratios/Supplemental Data: | | | | | | | | | | | | | | | | | | | | |
Net assets at end of year (000’s omitted) | | $ | 1,041,362 | | | $ | 1,373,520 | | | $ | 1,256,973 | | | $ | 975,299 | | | $ | 1,087,343 | |
Ratio to average net assets of: | | | | | | | | | | | | | | | | | | | | |
Expenses, after Waivers | | | 0.55 | % | | | 0.56 | % | | | 0.56 | % | | | 0.57 | % | | | 0.57 | % |
Expenses, prior to Waivers | | | 0.55 | % | | | 0.56 | % | | | 0.56 | % | | | 0.57 | % | | | 0.57 | % |
Net investment income, after Waivers | | | 2.33 | % | | | 1.96 | % | | | 2.04 | % | | | 2.44 | % | | | 2.10 | % |
Portfolio turnover rate(d) | | | 189 | % | | | 128 | % | | | 118 | % | | | 98 | % | | | 82 | % |
| (a) | Based on average shares outstanding. |
| (b) | The mean between the last bid and ask prices. |
| (c) | Net asset value total return is calculated assuming an initial investment made at the net asset value at the beginning of the period, reinvestment of all dividends and distributions at net asset value during the period, and redemption on the last day of the period. Net asset value total return includes adjustments in accordance with accounting principles generally accepted in the United States of America and as such, the net asset value for financial reporting purposes and the returns based upon those net asset values may differ from the net asset value and returns for shareholder transactions. Market price total return is calculated assuming an initial investment made at the market price at the beginning of the period, reinvestment of all dividends and distributions at market price during the period, and sale at the market price on the last day of the period. Total investment returns calculated for a period of less than one year are not annualized. |
| (d) | Portfolio turnover rate is not annualized for periods less than one year, if applicable, and does not include securities received or delivered from processing creations or redemptions. |
See accompanying Notes to Financial Statements which are an integral part of the financial statements.
Financial Highlights(continued)
Invesco Russell 2000 Pure Growth ETF (PXSG)
| | | | | | | | | | | | | | | | | | | | |
| | | Years Ended April 30, | |
| | | 2019 | | | 2018 | | | 2017 | | | 2016 | | | 2015 | |
| Per Share Operating Performance: | | | | | | | | | | | | | | | | | | | | |
Net asset value at beginning of year | | $ | 33.25 | | | $ | 28.50 | | | $ | 23.23 | | | $ | 25.22 | | | $ | 23.90 | |
Net investment income(a) | | | 0.13 | | | | 0.14 | | | | 0.07 | | | | 0.06 | | | | 0.25 | |
Net realized and unrealized gain (loss) on investments | | | 4.04 | | | | 4.75 | | | | 5.27 | | | | (1.93 | ) | | | 1.39 | |
Total from investment operations | | | 4.17 | | | | 4.89 | | | | 5.34 | | | | (1.87 | ) | | | 1.64 | |
Distributions to shareholders from: | | | | | | | | | | | | | | | | | | | | |
Net investment income | | | (0.13 | ) | | | (0.14 | ) | | | (0.07 | ) | | | (0.12 | ) | | | (0.32 | ) |
Net asset value at end of year | | $ | 37.29 | | | $ | 33.25 | | | $ | 28.50 | | | $ | 23.23 | | | $ | 25.22 | |
Market price at end of year(b) | | $ | 37.31 | | | $ | 33.31 | | | $ | 28.49 | | | $ | 23.26 | | | $ | 25.21 | |
| Net Asset Value Total Return(c) | | | 12.55 | % | | | 17.18 | % | | | 23.02 | % | | | (7.47 | )% | | | 6.92 | % |
| Market Price Total Return(c) | | | 12.41 | % | | | 17.43 | % | | | 22.82 | % | | | (7.31 | )% | | | 6.92 | % |
| Ratios/Supplemental Data: | | | | | | | | | | | | | | | | | | | | |
Net assets at end of year (000’s omitted) | | $ | 89,495 | | | $ | 48,215 | | | $ | 34,195 | | | $ | 26,719 | | | $ | 32,791 | |
Ratio to average net assets of: | | | | | | | | | | | | | | | | | | | | |
Expenses, after Waivers | | | 0.39 | % | | | 0.39 | % | | | 0.39 | % | | | 0.39 | %(d) | | | 0.39 | %(d) |
Expenses, prior to Waivers | | | 0.44 | % | | | 0.59 | % | | | 0.65 | % | | | 0.67 | %(d) | | | 0.69 | %(d) |
Net investment income, after Waivers | | | 0.37 | % | | | 0.47 | % | | | 0.29 | % | | | 0.27 | % | | | 1.02 | % |
Portfolio turnover rate(e) | | | 44 | % | | | 43 | % | | | 55 | % | | | 144 | % | | | 6 | % |
| (a) | Based on average shares outstanding. |
| (b) | The mean between the last bid and ask prices. |
| (c) | Net asset value total return is calculated assuming an initial investment made at the net asset value at the beginning of the period, reinvestment of all dividends and distributions at net asset value during the period, and redemption on the last day of the period. Net asset value total return includes adjustments in accordance with accounting principles generally accepted in the United States of America and as such, the net asset value for financial reporting purposes and the returns based upon those net asset values may differ from the net asset value and returns for shareholder transactions. Market price total return is calculated assuming an initial investment made at the market price at the beginning at the period, reinvestment of all dividends and distributions at market price during the period, and sale at the market price on the last day of the period. Total investment returns calculated for a period of less than one year are not annualized. |
| (d) | In addition to the fees and expenses which the Fund bears directly, the Fund indirectly bears a pro rata share of the fees and expenses of the investment companies in which the Fund invests. Estimated investment companies’ expenses are not expenses that are incurred directly by the Fund. They are expenses that are incurred directly by the investment companies and are deducted from the value of the investment companies the Fund invests in. The effect of the estimated investment companies’ expenses that the Fund bears indirectly is included in the Fund’s total return. |
| (e) | Portfolio turnover rate is not annualized for periods less than one year, if applicable, and does not include securities received or delivered from processing creations or redemptions. For the year ended April 30, 2016, the portfolio turnover calculation includes the value of securities purchased and sold in the effort to realign the Fund’s portfolio holdings due to the underlying index change. |
See accompanying Notes to Financial Statements which are an integral part of the financial statements.
Financial Highlights(continued)
Invesco Russell 2000 Pure Value ETF (PXSV)
| | | | | | | | | | | | | | | | | | | | |
| | | Years Ended April 30, | |
| | | 2019 | | | 2018 | | | 2017 | | | 2016 | | | 2015 | |
| Per Share Operating Performance: | | | | | | | | | | | | | | | | | | | | |
Net asset value at beginning of year | | $ | 30.37 | | | $ | 29.27 | | | $ | 23.87 | | | $ | 25.75 | | | $ | 24.67 | |
Net investment income(a) | | | 0.58 | | | | 0.63 | | | | 0.52 | | | | 0.63 | | | | 0.42 | |
Net realized and unrealized gain (loss) on investments | | | 0.03 | | | | 1.04 | | | | 5.55 | | | | (1.91 | ) | | | 1.03 | |
Total from investment operations | | | 0.61 | | | | 1.67 | | | | 6.07 | | | | (1.28 | ) | | | 1.45 | |
Distributions to shareholders from: | | | | | | | | | | | | | | | | | | | | |
Net investment income | | | (0.67 | ) | | | (0.57 | ) | | | (0.67 | ) | | | (0.60 | ) | | | (0.37 | ) |
Net asset value at end of year | | $ | 30.31 | | | $ | 30.37 | | | $ | 29.27 | | | $ | 23.87 | | | $ | 25.75 | |
Market price at end of year(b) | | $ | 30.30 | | | $ | 30.40 | | | $ | 29.26 | | | $ | 23.88 | | | $ | 25.75 | |
| Net Asset Value Total Return(c) | | | 2.13 | % | | | 5.73 | % | | | 25.64 | % | | | (4.93 | )% | | | 5.91 | % |
| Market Price Total Return(c) | | | 2.00 | % | | | 5.87 | % | | | 25.54 | % | | | (4.90 | )% | | | 5.87 | % |
| Ratios/Supplemental Data: | | | | | | | | | | | | | | | | | | | | |
Net assets at end of year (000’s omitted) | | $ | 78,794 | | | $ | 72,883 | | | $ | 83,415 | | | $ | 59,668 | | | $ | 72,093 | |
Ratio to average net assets of: | | | | | | | | | | | | | | | | | | | | |
Expenses, after Waivers | | | 0.39 | % | | | 0.39 | % | | | 0.39 | % | | | 0.39 | % | | | 0.39 | % |
Expenses, prior to Waivers | | | 0.44 | % | | | 0.46 | % | | | 0.46 | % | | | 0.50 | % | | | 0.55 | % |
Net investment income, after Waivers | | | 1.88 | % | | | 2.12 | % | | | 1.90 | % | | | 2.67 | % | | | 1.65 | % |
Portfolio turnover rate(d) | | | 52 | % | | | 56 | % | | | 50 | % | | | 137 | % | | | 5 | % |
| (a) | Based on average shares outstanding. |
| (b) | The mean between the last bid and ask prices. |
| (c) | Net asset value total return is calculated assuming an initial investment made at the net asset value at the beginning of the period, reinvestment of all dividends and distributions at net asset value during the period, and redemption on the last day of the period. Net asset value total return includes adjustments in accordance with accounting principles generally accepted in the United States of America and as such, the net asset value for financial reporting purposes and the returns based upon those net asset values may differ from the net asset value and returns for shareholder transactions. Market price total return is calculated assuming an initial investment made at the market price at the beginning of the period, reinvestment of all dividends and distributions at market price during the period, and sale at the market price on the last day of the period. Total investment returns calculated for a period of less than one year are not annualized. |
| (d) | Portfolio turnover rate is not annualized for periods less than one year, if applicable, and does not include securities received or delivered from processing creations or redemptions. For the year ended April 30, 2016, the portfolio turnover calculation includes the value of securities purchased and sold in the effort to realign the Fund’s portfolio holdings due to the underlying index change. |
Invesco Russell Midcap Equal Weight ETF (EQWM)
| | | | | | | | | | | | | | | | | | | | |
| | | Years Ended April 30, | |
| | | 2019 | | | 2018 | | | 2017 | | | 2016 | | | 2015 | |
| Per Share Operating Performance: | | | | | | | | | | | | | | | | | | | | |
Net asset value at beginning of year | | $ | 47.29 | | | $ | 43.74 | | | $ | 38.93 | | | $ | 40.34 | | | $ | 36.31 | |
Net investment income(a) | | | 0.66 | | | | 0.60 | | | | 0.54 | | | | 0.56 | | | | 0.50 | |
Net realized and unrealized gain (loss) on investments | | | 3.46 | | | | 3.53 | | | | 4.86 | | | | (1.41 | ) | | | 4.03 | |
Total from investment operations | | | 4.12 | | | | 4.13 | | | | 5.40 | | | | (0.85 | ) | | | 4.53 | |
Distributions to shareholders from: | | | | | | | | | | | | | | | | | | | | |
Net investment income | | | (0.67 | ) | | | (0.58 | ) | | | (0.59 | ) | | | (0.56 | ) | | | (0.50 | ) |
Net asset value at end of year | | $ | 50.74 | | | $ | 47.29 | | | $ | 43.74 | | | $ | 38.93 | | | $ | 40.34 | |
Market price at end of year(b) | | $ | 50.72 | | | $ | 47.30 | | | $ | 43.74 | | | $ | 38.89 | | | $ | 40.35 | |
| Net Asset Value Total Return(c) | | | 8.85 | % | | | 9.50 | % | | | 14.00 | % | | | (2.02 | )% | | | 12.52 | % |
| Market Price Total Return(c) | | | 8.78 | % | | | 9.52 | % | | | 14.11 | % | | | (2.14 | )% | | | 12.73 | % |
| Ratios/Supplemental Data: | | | | | | | | | | | | | | | | | | | | |
Net assets at end of year (000’s omitted) | | $ | 25,372 | | | $ | 23,645 | | | $ | 26,242 | | | $ | 23,357 | | | $ | 34,292 | |
Ratio to average net assets of: | | | | | | | | | | | | | | | | | | | | |
Expenses, after Waivers | | | 0.25 | % | | | 0.25 | % | | | 0.25 | % | | | 0.26 | % | | | 0.39 | % |
Expenses, prior to Waivers | | | 0.61 | % | | | 0.66 | % | | | 0.68 | % | | | 0.69 | % | | | 0.66 | % |
Net investment income, after Waivers | | | 1.36 | % | | | 1.31 | % | | | 1.32 | % | | | 1.50 | % | | | 1.31 | % |
Portfolio turnover rate(d) | | | 30 | % | | | 28 | % | | | 36 | % | | | 135 | % | | | 5 | % |
| (a) | Based on average shares outstanding. |
| (b) | The mean between the last bid and ask prices. |
| (c) | Net asset value total return is calculated assuming an initial investment made at the net asset value at the beginning of the period, reinvestment of all dividends and distributions at net asset value during the period, and redemption on the last day of the period. Net asset value total return includes adjustments in accordance with accounting principles generally accepted in the United States of America and as such, the net asset value for financial reporting purposes and the returns based upon those net asset values may differ from the net asset value and returns for shareholder transactions. Market price total return is calculated assuming an initial investment made at the market price at the beginning of the period, reinvestment of all dividends and distributions at market price during the period, and sale at the market price on the last day of the period. Total investment returns calculated for a period of less than one year are not annualized. |
| (d) | Portfolio turnover rate is not annualized for periods less than one year, if applicable, and does not include securities received or delivered from processing creations or redemptions. For the year ended April 30, 2016, the portfolio turnover calculation includes the value of securities purchased and sold in the effort to realign the Fund’s portfolio holdings due to the underlying index change. |
See accompanying Notes to Financial Statements which are an integral part of the financial statements.
Financial Highlights(continued)
Invesco Russell Midcap Pure Growth ETF (PXMG)
| | | | | | | | | | | | | | | | | | | | |
| | | Years Ended April 30, | |
| | | 2019 | | | 2018 | | | 2017 | | | 2016 | | | 2015 | |
| Per Share Operating Performance: | | | | | | | | | | | | | | | | | | | | |
Net asset value at beginning of year | | $ | 45.61 | | | $ | 34.85 | | | $ | 29.14 | | | $ | 31.95 | | | $ | 30.02 | |
Net investment income(a) | | | 0.06 | | | | 0.02 | | | | 0.09 | | | | 0.07 | | | | 0.47 | |
Net realized and unrealized gain (loss) on investments | | | 13.47 | | | | 10.79 | | | | 5.70 | | | | (2.72 | ) | | | 1.92 | |
Total from investment operations | | | 13.53 | | | | 10.81 | | | | 5.79 | | | | (2.65 | ) | | | 2.39 | |
Distributions to shareholders from: | | | | | | | | | | | | | | | | | | | | |
Net investment income | | | (0.09 | ) | | | (0.05 | ) | | | (0.08 | ) | | | (0.16 | ) | | | (0.46 | ) |
Net asset value at end of year | | $ | 59.05 | | | $ | 45.61 | | | $ | 34.85 | | | $ | 29.14 | | | $ | 31.95 | |
Market price at end of year(b) | | $ | 59.07 | | | $ | 45.71 | | | $ | 34.85 | | | $ | 29.12 | | | $ | 31.95 | |
| Net Asset Value Total Return(c) | | | 29.72 | % | | | 31.05 | % | | | 19.89 | % | | | (8.34 | )% | | | 7.98 | % |
| Market Price Total Return(c) | | | 29.48 | % | | | 31.34 | % | | | 19.98 | % | | | (8.40 | )% | | | 8.09 | % |
| Ratios/Supplemental Data: | | | | | | | | | | | | | | | | | | | | |
Net assets at end of year (000’s omitted) | | $ | 625,899 | | | $ | 132,259 | | | $ | 67,967 | | | $ | 67,015 | | | $ | 87,870 | |
Ratio to average net assets of: | | | | | | | | | | | | | | | | | | | | |
Expenses, after Waivers | | | 0.39 | % | | | 0.39 | % | | | 0.39 | % | | | 0.39 | % | | | 0.39 | % |
Expenses, prior to Waivers | | | 0.39 | % | | | 0.43 | % | | | 0.46 | % | | | 0.44 | % | | | 0.46 | % |
Net investment income, after Waivers | | | 0.12 | % | | | 0.05 | % | | | 0.30 | % | | | 0.25 | % | | | 1.51 | % |
Portfolio turnover rate(d) | | | 30 | % | | | 29 | % | | | 49 | % | | | 147 | % | | | 3 | % |
| (a) | Based on average shares outstanding. |
| (b) | The mean between the last bid and ask prices. |
| (c) | Net asset value total return is calculated assuming an initial investment made at the net asset value at the beginning of the period, reinvestment of all dividends and distributions at net asset value during the period, and redemption on the last day of the period. Net asset value total return includes adjustments in accordance with accounting principles generally accepted in the United States of America and as such, the net asset value for financial reporting purposes and the returns based upon those net asset values may differ from the net asset value and returns for shareholder transactions. Market price total return is calculated assuming an initial investment made at the market price at the beginning of the period, reinvestment of all dividends and distributions at market price during the period, and sale at the market price on the last day of the period. Total investment returns calculated for a period of less than one year are not annualized. |
| (d) | Portfolio turnover rate is not annualized for periods less than one year, if applicable, and does not include securities received or delivered from processing creations or redemptions. For the year ended April 30, 2016, the portfolio turnover calculation includes the value of securities purchased and sold in the effort to realign the Fund’s portfolio holdings due to the underlying index change. |
Invesco Russell Midcap Pure Value ETF (PXMV)
| | | | | | | | | | | | | | | | | | | | |
| | | Years Ended April 30, | |
| | | 2019 | | | 2018 | | | 2017 | | | 2016 | | | 2015 | |
| Per Share Operating Performance: | | | | | | | | | | | | | | | | | | | | |
Net asset value at beginning of year | | $ | 30.69 | | | $ | 31.00 | | | $ | 27.22 | | | $ | 27.55 | | | $ | 25.88 | |
Net investment income(a) | | | 0.84 | | | | 0.69 | | | | 0.68 | | | | 0.68 | | | | 0.43 | |
Net realized and unrealized gain (loss) on investments | | | 1.64 | | | | (0.26 | ) | | | 3.80 | | | | (0.37 | ) | | | 1.63 | |
Total from investment operations | | | 2.48 | | | | 0.43 | | | | 4.48 | | | | 0.31 | | | | 2.06 | |
Distributions to shareholders from: | | | | | | | | | | | | | | | | | | | | |
Net investment income | | | (0.79 | ) | | | (0.74 | ) | | | (0.70 | ) | | | (0.64 | ) | | | (0.39 | ) |
Net asset value at end of year | | $ | 32.38 | | | $ | 30.69 | | | $ | 31.00 | | | $ | 27.22 | | | $ | 27.55 | |
Market price at end of year(b) | | $ | 32.36 | | | $ | 30.69 | | | $ | 31.00 | | | $ | 27.21 | | | $ | 27.53 | |
| Net Asset Value Total Return(c) | | | 8.36 | % | | | 1.39 | % | | | 16.60 | % | | | 1.35 | % | | | 7.98 | % |
| Market Price Total Return(c) | | | 8.30 | % | | | 1.39 | % | | | 16.64 | % | | | 1.39 | % | | | 7.94 | % |
| Ratios/Supplemental Data: | | | | | | | | | | | | | | | | | | | | |
Net assets at end of year (000’s omitted) | | $ | 51,809 | | | $ | 46,028 | | | $ | 68,203 | | | $ | 50,364 | | | $ | 52,338 | |
Ratio to average net assets of: | | | | | | | | | | | | | | | | | | | | |
Expenses, after Waivers | | | 0.39 | % | | | 0.39 | % | | | 0.39 | % | | | 0.39 | %(d) | | | 0.39 | %(d) |
Expenses, prior to Waivers | | | 0.48 | % | | | 0.51 | % | | | 0.49 | % | | | 0.54 | %(d) | | | 0.56 | %(d) |
Net investment income, after Waivers | | | 2.73 | % | | | 2.24 | % | | | 2.28 | % | | | 2.62 | % | | | 1.58 | % |
Portfolio turnover rate(e) | | | 49 | % | | | 52 | % | | | 39 | % | | | 131 | % | | | 4 | % |
| (a) | Based on average shares outstanding. |
| (b) | The mean between the last bid and ask prices. |
| (c) | Net asset value total return is calculated assuming an initial investment made at the net asset value at the beginning of the period, reinvestment of all dividends and distributions at net asset value during the period, and redemption on the last day of the period. Net asset value total return includes adjustments in accordance with accounting principles generally accepted in the United States of America and as such, the net asset value for financial reporting purposes and the returns based upon those net asset values may differ from the net asset value and returns for shareholder transactions. Market price total return is calculated assuming an initial investment made at the market price at the beginning of the period, reinvestment of all dividends and distributions at market price during the period, and sale at the market price on the last day of the period. Total investment returns calculated for a period of less than one year are not annualized. |
| (d) | In addition to the fees and expenses which the Fund bears directly, the Fund indirectly bears a pro rata share of the fees and expenses of the investment companies in which the Fund invests. Estimated investment companies’ expenses are not expenses that are incurred directly by the Fund. They are expenses that are incurred directly by the investment companies and are deducted from the value of the investment companies the Fund invests in. The effect of the estimated investment companies’ expenses that the Fund bears indirectly is included in the Fund’s total return. |
| (e) | Portfolio turnover rate is not annualized for periods less than one year, if applicable, and does not include securities received or delivered from processing creations or redemptions. For the year ended April 30, 2016, the portfolio turnover calculation includes the value of securities purchased and sold in the effort to realign the Fund’s portfolio holdings due to the underlying index change. |
See accompanying Notes to Financial Statements which are an integral part of the financial statements.
Financial Highlights(continued)
Invesco Russell Top 200 Equal Weight ETF (EQWL)
| | | | | | | | | | | | | | | | | | | | |
| | | Years Ended April 30, | |
| | | 2019 | | | 2018 | | | 2017 | | | 2016 | | | 2015 | |
| Per Share Operating Performance: | | | | | | | | | | | | | | | | | | | | |
Net asset value at beginning of year | | $ | 52.38 | | | $ | 46.71 | | | $ | 39.77 | | | $ | 40.24 | | | $ | 37.06 | |
Net investment income(a) | | | 1.14 | | | | 0.88 | | | | 0.74 | | | | 0.78 | | | | 0.75 | |
Net realized and unrealized gain (loss) on investments | | | 4.52 | | | | 5.63 | | | | 6.95 | | | | (0.48 | ) | | | 3.14 | |
Total from investment operations | | | 5.66 | | | | 6.51 | | | | 7.69 | | | | 0.30 | | | | 3.89 | |
Distributions to shareholders from: | | | | | | | | | | | | | | | | | | | | |
Net investment income | | | (1.14 | ) | | | (0.84 | ) | | | (0.75 | ) | | | (0.77 | ) | | | (0.71 | ) |
Net asset value at end of year | | $ | 56.90 | | | $ | 52.38 | | | $ | 46.71 | | | $ | 39.77 | | | $ | 40.24 | |
Market price at end of year(b) | | $ | 56.91 | | | $ | 52.42 | | | $ | 46.75 | | | $ | 39.73 | | | $ | 40.21 | |
| Net Asset Value Total Return(c) | | | 11.04 | % | | | 14.02 | % | | | 19.58 | % | | | 0.81 | % | | | 10.52 | % |
| Market Price Total Return(c) | | | 10.98 | % | | | 14.01 | % | | | 19.80 | % | | | 0.78 | % | | | 10.38 | % |
| Ratios/Supplemental Data: | | | | | | | | | | | | | | | | | | | | |
Net assets at end of year (000’s omitted) | | $ | 59,749 | | | $ | 60,232 | | | $ | 39,703 | | | $ | 33,805 | | | $ | 42,249 | |
Ratio to average net assets of: | | | | | | | | | | | | | | | | | | | | |
Expenses, after Waivers | | | 0.25 | % | | | 0.25 | % | | | 0.25 | % | | | 0.26 | % | | | 0.39 | % |
Expenses, prior to Waivers | | | 0.41 | % | | | 0.47 | % | | | 0.54 | % | | | 0.54 | % | | | 0.57 | % |
Net investment income, after Waivers | | | 2.13 | % | | | 1.74 | % | | | 1.74 | % | | | 1.99 | % | | | 1.92 | % |
Portfolio turnover rate(d) | | | 24 | % | | | 32 | % | | | 27 | % | | | 101 | % | | | 3 | % |
| (a) | Based on average shares outstanding. |
| (b) | The mean between the last bid and ask prices. |
| (c) | Net asset value total return is calculated assuming an initial investment made at the net asset value at the beginning of the period, reinvestment of all dividends and distributions at net asset value during the period, and redemption on the last day of the period. Net asset value total return includes adjustments in accordance with accounting principles generally accepted in the United States of America and as such, the net asset value for financial reporting purposes and the returns based upon those net asset values may differ from the net asset value and returns for shareholder transactions. Market price total return is calculated assuming an initial investment made at the market price at the beginning of the period, reinvestment of all dividends and distributions at market price during the period, and sale at the market price on the last day of the period. Total investment returns calculated for a period of less than one year are not annualized. |
| (d) | Portfolio turnover rate is not annualized for periods less than one year, if applicable, and does not include securities received or delivered from processing creations or redemptions. For the year ended April 30, 2016, the portfolio turnover calculation includes the value of securities purchased and sold in the effort to realign the Fund’s portfolio holdings due to the underlying index change. |
Invesco Russell Top 200 Pure Growth ETF (PXLG)
| | | | | | | | | | | | | | | | | | | | |
| | | Years Ended April 30, | |
| | | 2019 | | | 2018 | | | 2017 | | | 2016 | | | 2015 | |
| Per Share Operating Performance: | | | | | | | | | | | | | | | | | | | | |
Net asset value at beginning of year | | $ | 47.90 | | | $ | 38.49 | | | $ | 32.92 | | | $ | 33.84 | | | $ | 29.53 | |
Net investment income(a) | | | 0.47 | | | | 0.35 | | | | 0.29 | | | | 0.28 | | | | 0.55 | |
Net realized and unrealized gain (loss) on investments | | | 7.29 | | | | 9.38 | | | | 5.61 | | | | (0.91 | ) | | | 4.29 | |
Total from investment operations | | | 7.76 | | | | 9.73 | | | | 5.90 | | | | (0.63 | ) | | | 4.84 | |
Distributions to shareholders from: | | | | | | | | | | | | | | | | | | | | |
Net investment income | | | (0.46 | ) | | | (0.32 | ) | | | (0.33 | ) | | | (0.29 | ) | | | (0.53 | ) |
Net asset value at end of year | | $ | 55.20 | | | $ | 47.90 | | | $ | 38.49 | | | $ | 32.92 | | | $ | 33.84 | |
Market price at end of year(b) | | $ | 55.18 | | | $ | 47.94 | | | $ | 38.50 | | | $ | 32.92 | | | $ | 33.82 | |
| Net Asset Value Total Return(c) | | | 16.35 | % | | | 25.36 | % | | | 18.06 | % | | | (1.89 | )% | | | 16.49 | % |
| Market Price Total Return(c) | | | 16.20 | % | | | 25.44 | % | | | 18.09 | % | | | (1.83 | )% | | | 16.46 | % |
| Ratios/Supplemental Data: | | | | | | | | | | | | | | | | | | | | |
Net assets at end of year (000’s omitted) | | $ | 229,088 | | | $ | 208,355 | | | $ | 146,256 | | | $ | 151,415 | | | $ | 145,502 | |
Ratio to average net assets of: | | | | | | | | | | | | | | | | | | | | |
Expenses, after Waivers | | | 0.36 | % | | | 0.39 | % | | | 0.39 | % | | | 0.39 | % | | | 0.39 | % |
Expenses, prior to Waivers | | | 0.36 | % | | | 0.39 | % | | | 0.39 | % | | | 0.39 | % | | | 0.43 | % |
Net investment income, after Waivers | | | 0.92 | % | | | 0.80 | % | | | 0.84 | % | | | 0.85 | % | | | 1.73 | % |
Portfolio turnover rate(d) | | | 17 | % | | | 19 | % | | | 30 | % | | | 105 | % | | | 2 | % |
| (a) | Based on average shares outstanding. |
| (b) | The mean between the last bid and ask prices. |
| (c) | Net asset value total return is calculated assuming an initial investment made at the net asset value at the beginning of the period, reinvestment of all dividends and distributions at net asset value during the period, and redemption on the last day of the period. Net asset value total return includes adjustments in accordance with accounting principles generally accepted in the United States of America and as such, the net asset value for financial reporting purposes and the returns based upon those net asset values may differ from the net asset value and returns for shareholder transactions. Market price total return is calculated assuming an initial investment made at the market price at the beginning of the period, reinvestment of all dividends and distributions at market price during the period, and sale at the market price on the last day of the period. Total investment returns calculated for a period of less than one year are not annualized. |
| (d) | Portfolio turnover rate is not annualized for periods less than one year, if applicable, and does not include securities received or delivered from processing creations or redemptions. For the year ended April 30, 2016, the portfolio turnover calculation includes the value of securities purchased and sold in the effort to realign the Fund’s portfolio holdings due to the underlying index change. |
See accompanying Notes to Financial Statements which are an integral part of the financial statements.
Financial Highlights(continued)
Invesco Russell Top 200 Pure Value ETF (PXLV)
| | | | | | | | | | | | | | | | | | | | |
| | | Years Ended April 30, | |
| | | 2019 | | | 2018 | | | 2017 | | | 2016 | | | 2015 | |
| Per Share Operating Performance: | | | | | | | | | | | | | | | | | | | | |
Net asset value at beginning of year | | $ | 38.01 | | | $ | 35.60 | | | $ | 29.58 | | | $ | 30.63 | | | $ | 29.40 | |
Net investment income(a) | | | 1.03 | | | | 0.93 | | | | 0.73 | | | | 0.80 | | | | 0.72 | |
Net realized and unrealized gain (loss) on investments | | | 2.06 | | | | 2.28 | | | | 6.13 | | | | (1.09 | ) | | | 1.16 | |
Total from investment operations | | | 3.09 | | | | 3.21 | | | | 6.86 | | | | (0.29 | ) | | | 1.88 | |
Distributions to shareholders from: | | | | | | | | | | | | | | | | | | | | |
Net investment income | | | (1.10 | ) | | | (0.80 | ) | | | (0.84 | ) | | | (0.76 | ) | | | (0.65 | ) |
Net asset value at end of year | | $ | 40.00 | | | $ | 38.01 | | | $ | 35.60 | | | $ | 29.58 | | | $ | 30.63 | |
Market price at end of year(b) | | $ | 39.99 | | | $ | 38.03 | | | $ | 35.63 | | | $ | 29.55 | | | $ | 30.62 | |
| Net Asset Value Total Return(c) | | | 8.40 | % | | | 9.07 | % | | | 23.47 | % | | | (0.84 | )% | | | 6.41 | % |
| Market Price Total Return(c) | | | 8.31 | % | | | 9.04 | % | | | 23.69 | % | | | (0.92 | )% | | | 6.41 | % |
| Ratios/Supplemental Data: | | | | | | | | | | | | | | | | | | | | |
Net assets at end of year (000’s omitted) | | $ | 96,009 | | | $ | 104,539 | | | $ | 74,770 | | | $ | 68,029 | | | $ | 41,348 | |
Ratio to average net assets of: | | | | | | | | | | | | | | | | | | | | |
Expenses, after Waivers | | | 0.39 | % | | | 0.39 | % | | | 0.39 | % | | | 0.39 | % | | | 0.39 | % |
Expenses, prior to Waivers | | | 0.41 | % | | | 0.44 | % | | | 0.46 | % | | | 0.55 | % | | | 0.62 | % |
Net investment income, after Waivers | | | 2.70 | % | | | 2.49 | % | | | 2.23 | % | | | 2.78 | % | | | 2.37 | % |
Portfolio turnover rate(d) | | | 32 | % | | | 25 | % | | | 28 | % | | | 77 | % | | | 2 | % |
| (a) | Based on average shares outstanding. |
| (b) | The mean between the last bid and ask prices. |
| (c) | Net asset value total return is calculated assuming an initial investment made at the net asset value at the beginning of the period, reinvestment of all dividends and distributions at net asset value during the period, and redemption on the last day of the period. Net asset value total return includes adjustments in accordance with accounting principles generally accepted in the United States of America and as such, the net asset value for financial reporting purposes and the returns based upon those net asset values may differ from the net asset value and returns for shareholder transactions. Market price total return is calculated assuming an initial investment made at the market price at the beginning of the period, reinvestment of all dividends and distributions at market price during the period, and sale at the market price on the last day of the period. Total investment returns calculated for a period of less than one year are not annualized. |
| (d) | Portfolio turnover rate is not annualized for periods less than one year, if applicable, and does not include securities received or delivered from processing creations or redemptions. For the year ended April 30, 2016, the portfolio turnover calculation includes the value of securities purchased and sold in the effort to realign the Fund’s portfolio holdings due to the underlying index change. |
See accompanying Notes to Financial Statements which are an integral part of the financial statements.
Financial Highlights(continued)
Invesco Zacks Mid-Cap ETF (CZA)
| | | | | | | | | | | | | | | | | | | | | | | | |
| | | Year Ended
April 30, 2019 | | | Eight Months Ended
April 30, 2018 | | | Years Ended August 31, | |
| | | 2017 | | | 2016 | | | 2015 | | | 2014 | |
| Per Share Operating Performance: | | | | | | | | | | | | | | | | | | | | | | | | |
Net asset value at beginning of period | | $ | 64.70 | | | $ | 61.60 | | | $ | 53.00 | | | $ | 49.05 | | | $ | 49.97 | | | $ | 40.44 | |
Net investment income(a) | | | 0.90 | | | | 0.53 | | | | 0.81 | | | | 0.87 | | | | 0.50 | | | | 0.41 | |
Net realized and unrealized gain (loss) on investments | | | 5.82 | | | | 3.29 | | | | 8.81 | | | | 3.73 | | | | (1.05 | ) | | | 9.58 | |
Total from investment operations | | | 6.72 | | | | 3.82 | | | | 9.62 | | | | 4.60 | | | | (0.55 | ) | | | 9.99 | |
Distributions to shareholders from: | | | | | | | | | | | | | | | | | | | | | | | | |
Net investment income | | | (0.75 | ) | | | (0.72 | ) | | | (1.02 | ) | | | (0.65 | ) | | | (0.37 | ) | | | (0.46 | ) |
Net asset value at end of period | | $ | 70.67 | | | $ | 64.70 | | | $ | 61.60 | | | $ | 53.00 | | | $ | 49.05 | | | $ | 49.97 | |
Market price at end of period | | $ | 70.75 | (b) | | $ | 64.75 | (b) | | $ | 61.67 | | | $ | 52.94 | | | $ | 49.09 | | | $ | 50.04 | |
| Net Asset Value Total Return(c) | | | 10.68 | % | | | 6.19 | % | | | 18.40 | % | | | 9.53 | % | | | (1.11 | )% | | | 24.81 | % |
| Market Price Total Return(c) | | | 10.72 | % | | | 6.14 | % | | | | | | | | | | | | | | | | |
| Ratios/Supplemental Data: | | | | | | | | | | | | | | | | | | | | | | | | |
Net assets at end of period (000’s omitted) | | $ | 265,019 | | | $ | 255,584 | | | $ | 203,284 | | | $ | 143,100 | | | $ | 149,597 | | | $ | 132,428 | |
Ratio to average net assets of: | | | | | | | | | | | | | | | | | | | | | | | | |
Expenses, after Waivers | | | 0.65 | %(e) | | | 0.65 | %(d) | | | 0.65 | % | | | 0.65 | % | | | 0.65 | % | | | 0.66 | % |
Expenses, prior to Waivers | | | 0.70 | %(e) | | | 0.74 | %(d) | | | 0.74 | % | | | 0.74 | % | | | 0.73 | % | | | 0.73 | % |
Net investment income, after Waivers | | | 1.36 | % | | | 1.23 | %(d) | | | 1.43 | % | | | 1.78 | % | | | 1.01 | % | | | 0.89 | % |
Portfolio turnover rate(f) | | | 170 | % | | | 136 | % | | | 181 | % | | | 172 | % | | | 164 | % | | | 175 | % |
| (a) | Based on average shares outstanding. |
| (b) | The mean between the last bid and ask prices. |
| (c) | Net asset value total return is calculated assuming an initial investment made at the net asset value at the beginning of the period, reinvestment of all dividends and distributions at net asset value during the period, and redemption on the last day of the period. Net asset value total return includes adjustments in accordance with accounting principles generally accepted in the United States of America and as such, the net asset value for financial reporting purposes and the returns based upon those net asset values may differ from the net asset value and returns for shareholder transactions. Market price total return is calculated assuming an initial investment made at the market price at the beginning of the period, reinvestment of all dividends and distributions at market price during the period, and sale at the market price on the last day of the period. Total investment returns calculated for a period of less than one year are not annualized. |
| (e) | In addition to the fees and expenses which the Fund bears directly, the Fund indirectly bears a pro rata share of the fees and expenses of the investment companies in which the Fund invests. Estimated investment companies’ expenses are not expenses that are incurred directly by the Fund. They are expenses that are incurred directly by the investment companies and are deducted from the value of the investment companies the Fund invests in. The effect of the estimated investment companies’ expenses that the Fund bears indirectly is included in the Fund’s total return. |
| (f) | Portfolio turnover rate is not annualized for periods less than one year, if applicable, and does not include securities received or delivered from processing creations or redemptions. |
See accompanying Notes to Financial Statements which are an integral part of the financial statements.
Financial Highlights(continued)
Invesco Zacks Multi-Asset Income ETF (CVY)
| | | | | | | | | | | | | | | | | | | | | | | | |
| | | Year Ended
April 30, 2019 | | | Eight Months Ended
April 30, 2018 | | | Years Ended August 31, | |
| | | 2017 | | | 2016 | | | 2015 | | | 2014 | |
| Per Share Operating Performance: | | | | | | | | | | | | | | | | | | | | | | | | |
Net asset value at beginning of period | | $ | 21.87 | | | $ | 21.11 | | | $ | 19.75 | | | $ | 19.92 | | | $ | 26.06 | | | $ | 23.34 | |
Net investment income(a) | | | 0.81 | | | | 0.49 | | | | 0.80 | | | | 0.87 | | | | 1.30 | | | | 1.38 | |
Net realized and unrealized gain (loss) on investments | | | 0.38 | | | | 0.94 | | | | 1.46 | | | | (0.06 | ) | | | (6.10 | ) | | | 2.57 | |
Total from investment operations | | | 1.19 | | | | 1.43 | | | | 2.26 | | | | 0.81 | | | | (4.80 | ) | | | 3.95 | |
Distributions to shareholders from: | | | | | | | | | | | | | | | | | | | | | | | | |
Net investment income | | | (0.81 | ) | | | (0.59 | ) | | | (0.60 | ) | | | (0.98 | ) | | | (1.31 | ) | | | (1.23 | ) |
Return of capital | | | — | | | | (0.08 | ) | | | (0.30 | ) | | | — | | | | (0.03 | ) | | | — | |
Total distributions | | | (0.81 | ) | | | (0.67 | ) | | | (0.90 | ) | | | (0.98 | ) | | | (1.34 | ) | | | (1.23 | ) |
Net asset value at end of period | | $ | 22.25 | | | $ | 21.87 | | | $ | 21.11 | | | $ | 19.75 | | | $ | 19.92 | | | $ | 26.06 | |
Market price at end of period | | $ | 22.27 | (b) | | $ | 21.87 | (b) | | $ | 21.08 | | | $ | 19.74 | | | $ | 19.89 | | | $ | 26.05 | |
| Net Asset Value Total Return(c) | | | 5.67 | % | | | 6.83 | % | | | 11.73 | % | | | 4.49 | % | | | (18.90 | )% | | | 17.29 | % |
| Market Price Total Return(c) | | | 5.76 | % | | | 6.98 | % | | | | | | | | | | | | | | | | |
| Ratios/Supplemental Data: | | | | | | | | | | | | | | | | | | | | | | | | |
Net assets at end of period (000’s omitted) | | $ | 229,220 | | | $ | 286,460 | | | $ | 346,144 | | | $ | 427,658 | | | $ | 647,321 | | | $ | 1,485,282 | |
Ratio to average net assets of: | | | | | | | | | | | | | | | | | | | | | | | | |
Expenses, after Waivers | | | 0.65 | %(e) | | | 0.65 | %(d)(e) | | | 0.65 | % | | | 0.65 | % | | | 0.65 | % | | | 0.66 | % |
Expenses, prior to Waivers | | | 0.71 | %(e) | | | 0.74 | %(d)(e) | | | 0.72 | % | | | 0.73 | % | | | 0.71 | % | | | 0.71 | % |
Net investment income, after Waivers | | | 3.71 | % | | | 3.38 | %(d) | | | 3.93 | % | | | 4.62 | % | | | 5.68 | % | | | 5.54 | % |
Portfolio turnover rate(f) | | | 196 | % | | | 142 | % | | | 203 | % | | | 228 | % | | | 213 | % | | | 180 | % |
| (a) | Based on average shares outstanding. |
| (b) | The mean between the last bid and ask prices. |
| (c) | Net asset value total return is calculated assuming an initial investment made at the net asset value at the beginning of the period, reinvestment of all dividends and distributions at net asset value during the period, and redemption on the last day of the period. Net asset value total return includes adjustments in accordance with accounting principles generally accepted in the United States of America and as such, the net asset value for financial reporting purposes and the returns based upon those net asset values may differ from the net asset value and returns for shareholder transactions. Market price total return is calculated assuming an initial investment made at the market price at the beginning of the period, reinvestment of all dividends and distributions at market price during the period, and sale at the market price on the last day of the period. Total investment returns calculated for a period of less than one year are not annualized. |
| (e) | In addition to the fees and expenses which the Fund bears directly, the Fund indirectly bears a pro rata share of the fees and expenses of the investment companies in which the Fund invests. Estimated investment companies’ expenses are not expenses that are incurred directly by the Fund. They are expenses that are incurred directly by the investment companies and are deducted from the value of the investment companies the Fund invests in. The effect of the estimated investment companies’ expenses that the Fund bears indirectly is included in the Fund’s total return. |
| (f) | Portfolio turnover rate is not annualized for periods less than one year, if applicable, and does not include securities received or delivered from processing creations or redemptions. |
See accompanying Notes to Financial Statements which are an integral part of the financial statements.
Notes to Financial Statements
Invesco Exchange-Traded Fund Trust
April 30, 2019
Note 1—Organization
Invesco Exchange-Traded Fund Trust (the “Trust”) was organized as a Massachusetts business trust on June 9, 2000 and is authorized to have multiple series of portfolios. The Trust is anopen-end management investment company registered under the Investment Company Act of 1940, as amended (the “1940 Act”). This report includes the following portfolios:
| | |
Full Name | | Short Name |
| Invesco Dynamic Large Cap Growth ETF (PWB) | | “Dynamic Large Cap Growth ETF” |
| Invesco Dynamic Large Cap Value ETF (PWV) | | “Dynamic Large Cap Value ETF” |
| Invesco Russell 2000 Pure Growth ETF (PXSG) | | “Russell 2000 Pure Growth ETF” |
| Invesco Russell 2000 Pure Value ETF (PXSV) | | “Russell 2000 Pure Value ETF” |
| Invesco Russell Midcap Equal Weight ETF (EQWM) | | “Russell Midcap Equal Weight ETF” |
| Invesco Russell Midcap Pure Growth ETF (PXMG) | | “Russell Midcap Pure Growth ETF” |
| Invesco Russell Midcap Pure Value ETF (PXMV) | | “Russell Midcap Pure Value ETF” |
| Invesco Russell Top 200 Equal Weight ETF (EQWL) | | “Russell Top 200 Equal Weight ETF” |
| Invesco Russell Top 200 Pure Growth ETF (PXLG) | | “Russell Top 200 Pure Growth ETF” |
| Invesco Russell Top 200 Pure Value ETF (PXLV) | | “Russell Top 200 Pure Value ETF” |
| Invesco ZacksMid-Cap ETF (CZA) | | “ZacksMid-Cap ETF” |
| Invesco Zacks Multi-Asset Income ETF (CVY) | | “Zacks Multi-Asset Income ETF” |
Each portfolio (each, a “Fund”, and collectively, the “Funds”) represents a separate series of the Trust. The shares of the Funds are referred to herein as “Shares” or “Fund’s Shares.” Each Fund’s Shares are listed and traded on NYSE Arca, Inc.
The market price of each Share may differ to some degree from a Fund’s net asset value (“NAV”). Unlike conventional mutual funds, each Fund issues and redeems Shares on a continuous basis, at NAV, only in a large specified number of Shares, each called a “Creation Unit.” Creation Units are issued and redeemed principally in exchange for the deposit or delivery of a basket of securities (“Deposit Securities”). Except when aggregated in Creation Units by Authorized Participants, the Shares are not individually redeemable securities of the Funds.
The investment objective of each Fund is to seek to track the investment results (before fees and expenses) of its respective index listed below (each, an “Underlying Index”):
| | |
Fund | | Underlying Index |
| Dynamic Large Cap Growth ETF | | Dynamic Large Cap Growth IntellidexSM Index |
| Dynamic Large Cap Value ETF | | Dynamic Large Cap Value IntellidexSM Index |
| Russell 2000 Pure Growth ETF | | Russell 2000® Pure Growth Index |
| Russell 2000 Pure Value ETF | | Russell 2000® Pure Value Index |
| Russell Midcap Equal Weight ETF | | Russell Midcap® Equal Weight Index |
| Russell Midcap Pure Growth ETF | | Russell Midcap® Pure Growth Index |
| Russell Midcap Pure Value ETF | | Russell Midcap® Pure Value Index |
| Russell Top 200 Equal Weight ETF | | Russell Top 200® Equal Weight Index |
| Russell Top 200 Pure Growth ETF | | Russell Top 200® Pure Growth Index |
| Russell Top 200 Pure Value ETF | | Russell Top 200® Pure Value Index |
| ZacksMid-Cap ETF | | ZacksMid-Cap Core Index |
| Zacks Multi-Asset Income ETF | | Zacks Multi-Asset Income Index |
Note 2—Significant Accounting Policies
The following is a summary of the significant accounting policies followed by the Funds in preparation of their financial statements.
Each Fund is an investment company and accordingly follows the investment company accounting and reporting guidance in accordance with Financial Accounting Standards Board Accounting Standards Codification Topic 946,Financial Services—Investment Companies.
| A. | Security Valuation — Securities, including restricted securities, are valued according to the following policies: |
A security listed or traded on an exchange (except convertible securities) is generally valued at its last sales price or official closing price as of the close of the customary trading session on the exchange where the security is principally traded or, lacking any sales or official closing price on a particular day, the security may be valued at the closing bid price on that day. Securities traded in theover-the-counter market are valued based on prices furnished by independent pricing services or market makers. When such securities are valued by an independent pricing service they may be considered fair valued. Futures contracts are valued at the final settlement price set by an exchange on which they are principally traded. Listed options are valued at the mean between the last bid and asked prices from the exchange on which they are principally traded, or at the final settlement price set by such exchange. Swaps and options not listed on an exchange are valued by an independent source. For purposes of determining NAV per Share, futures and option contracts generally are valued 15 minutes after the close of the customary trading session of the New York Stock Exchange (“NYSE”).
Investment companies are valued using such company’s NAV per share, unless the shares are exchange-traded, in which case they are valued at the last sales price or official closing price as of the close of the customary trading session on the exchange where the security is principally traded.
Debt obligations (including convertible securities) and unlisted equities are fair valued using an evaluated quote provided by an independent pricing service. Evaluated quotes provided by the pricing service may be determined without exclusive reliance on quoted prices, and may reflect appropriate factors such asinstitution-size trading in similar groups of securities, developments related to specific securities, dividend rate (for unlisted equities), yield (for debt obligations), quality, type of issue, coupon rate (for debt obligations), maturity (for debt obligations), individual trading characteristics and other market data. Securities with a demand feature exercisable within one to seven days are valued at par. Pricing services generally value debt obligations assuming orderly transactions of institutional round lot size, but a Fund may hold or transact in the same securities in smaller, odd lot sizes. Odd lots often trade at lower prices than institutional round lots. Debt obligations are subject to interest rate and credit risks. In addition, all debt obligations involve some risk of default with respect to interest and/or principal payments.
Foreign securities’ (including foreign exchange contracts’) prices are converted into U.S. dollar amounts using the applicable exchange rates as of the close of the London world markets. If market quotations are available and reliable for foreign exchange-traded equity securities, the securities will be valued at the market quotations. Because trading hours for certain foreign securities end before the close of the NYSE, closing market quotations may become unreliable. If between the time trading ends on a particular security and the close of the customary trading session on the NYSE, events occur that Invesco Capital Management LLC (the “Adviser”) determines are significant and make the closing price unreliable, a Fund may fair value the security. If the event is likely to have affected the closing price of the security, the security will be valued at fair value in good faith using procedures approved by the Board of Trustees. Adjustments to closing prices to reflect fair value may also be based on a screening process of an independent pricing service to indicate the degree of certainty, based on historical data, that the closing price in the principal market where a foreign security trades is not the current value as of the close of the NYSE. Foreign securities’ prices meeting the approved degree of certainty that the price is not reflective of current value will be priced at the indication of fair value from the independent pricing service. Multiple factors may be considered by the independent pricing service in determining adjustments to reflect fair value and may include information relating to sector indices, American Depositary Receipts and domestic and foreign index futures. Foreign securities may have additional risks including exchange rate changes, the potential for sharply devalued currencies and high inflation, political and economic upheaval, the relative lack of issuer information, relatively low market liquidity and the potential lack of strict financial and accounting controls and standards.
Securities for which market prices are not provided by any of the above methods may be valued based upon quotes furnished by independent sources. The last bid price may be used to value exchange-traded equity securities. The mean between the last bid and asked prices may be used to value debt obligations, including corporate loans, and unlisted equity securities.
Securities for which market quotations are not readily available or became unreliable are valued at fair value as determined in good faith following procedures approved by the Board of Trustees. Issuer-specific events, market trends, bid/asked quotes of brokers and information providers and other market data may be reviewed in the course of making a good faith determination of a security’s fair value.
Each Fund may invest in securities that are subject to interest rate risk, meaning the risk that the prices will generally fall as interest rates rise and, conversely, the prices will generally rise as interest rates fall. Specific securities differ in their sensitivity to changes in interest rates depending on their individual characteristics. Changes in interest rates may result in increased market volatility, which may affect the value and/or liquidity of certain Fund investments. Valuations change in response to many factors, including the historical and prospective earnings of the issuer, the value of the issuer’s assets, general economic conditions, interest rates, investor perceptions and market liquidity. Because of the inherent uncertainties of valuation, the values reflected in the financial statements may materially differ from the value received upon actual sale of those investments.
Index Risk. Unlike many investment companies, the Funds do not utilize investing strategies that seek returns in excess of their Underlying Indexes. Therefore, a Fund would not necessarily buy or sell a security unless that security is added or removed, respectively, from its respective Underlying Index, even if that security generally is underperforming.
Authorized Participant Concentration Risk.Only Authorized Participants (“APs”) may engage in creation or redemption transactions directly with each Fund. Each Fund has a limited number of institutions that may act as APs, and such APs have no
obligation to submit creation or redemption orders. Consequently, there is no assurance that those APs will establish or maintain an active trading market for the Shares. This risk may be heightened to the extent that securities underlying each Fund are traded outside a collateralized settlement system. In that case, APs may be required to post collateral on certain trades on an agency basis (i.e., on behalf of other market participants), which only a limited number of APs may be able to do. In addition, to the extent that APs exit the business or are unable to proceed with creation and/or redemption orders with respect to each Fund and no other AP is able to step forward to create or redeem Creation Units, this may result in a significantly diminished trading market for Fund Shares, which may be more likely to trade at a premium or discount to each Fund’s NAV and possibly face trading halts and/or delisting. This risk may be heightened for Funds that invest innon-U.S. securities, which may have lower trading volumes.
Equity Risk. Equity risk is the risk that the value of equity securities, including common stocks, may fall due to both changes in general economic conditions that impact the market as a whole, as well as factors that directly relate to a specific company or its industry. Such general economic conditions include changes in interest rates, periods of market turbulence or instability, or general and prolonged periods of economic decline and cyclical change. It is possible that a drop in the stock market may depress the price of most or all of the common stocks that each Fund holds. In addition, equity risk includes the risk that investor sentiment toward particular industries will become negative. The value of a company’s common stock may fall solely because of factors, such as an increase in production costs that negatively impact other companies in the same region, industry or sector of the market. A company’s common stock also may decline significantly in price over a short period of time due to factors specific to that company, including decisions made by its management or lower demand for the company’s products or services. For example, an adverse event, such as an unfavorable earnings report or the failure to make anticipated dividend payments, may depress the value of common stock.
Industry Concentration Risk. In following its methodology, each Fund’s Underlying Index from time to time may be concentrated to a significant degree in securities of issuers operating in a single industry or industry group. To the extent that each Underlying Index concentrates in the securities of issuers in a particular industry or industry group, the corresponding Fund will also concentrate its investments to approximately the same extent. By concentrating its investments in an industry or industry group, each Fund faces more risks than if it were diversified broadly over numerous industries or industry groups. Such industry-based risks, any of which may adversely affect the companies in which each Fund invests, may include, but are not limited to, legislative or regulatory changes, adverse market conditions and/or increased competition within the industry or industry group. In addition, at times, such industry or industry group may be out of favor and underperform other industries, industry groups or the market as a whole.
Non-Diversified Fund Risk. ZacksMid-Cap ETF and Zacks Multi-Asset Income ETF arenon-diversified and can invest a greater portion of their assets in securities of individual issuers than diversified funds. As a result, changes in the market value of a single investment could cause greater fluctuations in Share price than would occur in a diversified fund. This may increase a Fund’s volatility and cause the performance of a relatively small number of issuers to have a greater impact on a Fund’s performance.
Non-Correlation Risk. Each Fund’s return may not match the return of its Underlying Index for a number of reasons. For example, each Fund incurs operating expenses not applicable to its Underlying Index, and incurs costs in buying and selling securities, especially when rebalancing the Fund’s securities holdings to reflect changes in the composition of its Underlying Index. In addition, the performance of each Fund and its Underlying Index may vary due to asset valuation differences and differences between each Fund’s portfolio and its Underlying Index resulting from legal restrictions, cost or liquidity constraints.
REIT Risk.For certain Funds, in addition to the risks pertaining to real estate investments more generally, REITs are subject to additional risks. The value of a REIT can depend on the structure of and cash flow generated by the REIT. REITs whose investments are concentrated in a limited number or type of properties, investments or narrow geographic area are subject to the risks affecting those properties or areas to a greater extent than a REIT with less concentrated investments. REITs are also subject to certain requirements under federal tax law. In addition, REITs may have expenses, including advisory and administration expenses, and each Fund and its shareholders will incur its pro rata share of the underlying expenses.
Small- andMid-Capitalization Securities Risk.For certain Funds, investing in securities of small- andmid-capitalization companies involves greater risk than customarily is associated with investing in larger, more established companies. These companies’ securities may be more volatile and less liquid than those of more established companies. These securities may have returns that vary, sometimes significantly, from the overall securities market. Often small- andmid-capitalization companies and the industries in which they focus are still evolving and, as a result, they may be more sensitive to changing market conditions.
Growth Risk. For certain Funds, the market values of “growth” securities may be more volatile than other types of investments. The returns on “growth” securities may or may not move in tandem with the returns on other styles of investing or the overall stock market. Thus, the value of each Fund’s investments will vary and at times may be lower or higher than that of other types of investments.
Value Risk. For certain Funds, “value” securities are subject to the risk that the valuations never improve or that the returns on “value” securities are less than returns on other styles of investing or the overall stock market. Thus, the value of each Fund’s investments will vary and at times may be lower or higher than that of other types of investments.
Investment in Investment Companies Risk.For certain Funds, investing in other investment companies, including exchange-traded funds (“ETFs”), business development companies andclosed-end funds, subjects each Fund to those risks affecting the investment company, including the possibility that the value of the underlying securities held by the investment company could decrease or the portfolio becomes illiquid. Moreover, each Fund and its shareholders will incur its pro rata share of the underlying
investment companies’ expenses, which will reduce each Fund’s performance, and the purchase of shares of some investment companies (in the case ofclosed-end investment companies) may sometimes require the payment of substantial premiums above the value of such companies’ portfolio securities or NAVs. In addition, investments by each Fund in another ETF orclosed-end fund are subject to, among other risks, the risk that the ETF’s or closed end fund’s shares may trade at a discount or premium relative to the NAV of the shares and the listing exchange may halt trading of the ETF’s orclosed-end fund’s shares.
Depositary Receipt Risk.Certain Funds may hold the securities ofnon-U.S. companies in the form of depositary receipts. The underlying securities of the depositary receipts in each Fund’s portfolio are subject to fluctuations in foreign currency exchange rates that may affect the value of each Fund’s portfolio. In addition, the value of the securities underlying the depositary receipts may change materially when U.S. markets are not open for trading. Investments in the underlying foreign securities also involve political and economic risks distinct from those associated with investing in the securities of U.S. issuers.
Portfolio Turnover Risk.For certain Funds, each may engage in active and frequent trading of its portfolio securities to reflect the rebalancing of its Underlying Index. A portfolio turnover rate of 200%, for example, is equivalent to a Fund buying and selling all of its securities two times during the course of a year. A high portfolio turnover rate (such as 100% or more) could result in high brokerage costs for a Fund. While a high portfolio turnover rate can result in an increase in taxable capital gain distributions to a Fund’s shareholders, each Fund will seek to utilize thein-kind creation and redemption mechanism to minimize realization of capital gains to the extent possible.
| C. | Investment Transactions and Investment Income — Investment transactions are accounted for on a trade date basis. Realized gains and losses from the sale or disposition of securities are computed on the specific identified cost basis. Interest income is recorded on the accrual basis from settlement date.Pay-in-kind interest income andnon-cash dividend income received in the form of securitiesin-lieu of cash are recorded at the fair value of the securities received. Dividend income (net of withholding tax, if any) is recorded on theex-dividend date. Realized gains, dividends and interest received by a Fund may give rise to withholding and other taxes imposed by foreign countries. Tax conventions between certain countries and the United States may reduce or eliminate such taxes. |
The Funds may periodically participate in litigation related to each Fund’s investments. As such, the Funds may receive proceeds from litigation settlements. Any proceeds received are included in the Statements of Operations as realized gain (loss) for investments no longer held and as unrealized gain (loss) for investments still held.
Brokerage commissions and mark ups are considered transaction costs and are recorded as an increase to the cost basis of securities purchased and/or a reduction of proceeds on a sale of securities. Such transaction costs are included in the determination of net realized and unrealized gain (loss) from investment securities reported in the Statements of Operations and the Statements of Changes in Net Assets and the net realized and unrealized gains (losses) on securities per share in the Financial Highlights. Transaction costs are included in the calculation of each Fund’s NAV and, accordingly, they reduce each Fund’s total returns. These transaction costs are not considered operating expenses and are not reflected in net investment income reported in the Statements of Operations and the Statements of Changes in Net Assets, or the net investment income per share and the ratios of expenses and net investment income reported in the Financial Highlights, nor are they limited by any expense limitation arrangements between each Fund and the Adviser.
| D. | Country Determination — For the purposes of presentation in the Schedules of Investments, the Adviser may determine the country in which an issuer is located and/or credit risk exposure based on various factors. These factors include whether each Fund’s Underlying Index has made a country determination and may include the laws of the country under which the issuer is organized, where the issuer maintains a principal office, the country in which the issuer derives 50% or more of its total revenues and the country that has the primary market for the issuer’s securities, as well as other criteria. Among the other criteria that may be evaluated for making this determination are the country in which the issuer maintains 50% or more of its assets, the type of security, financial guarantees and enhancements, the nature of the collateral and the sponsor organization. Country of issuer and/or credit risk exposure has been determined to be the United States of America, unless otherwise noted. |
| E. | Dividends and Distributions to Shareholders — Each Fund declares and pays dividends from net investment income, if any, to its shareholders quarterly (except for ZacksMid-Cap ETF, which declare and pay dividends from net investment income, if any, to shareholders annually) and records such dividends onex-dividend date. Generally, each Fund distributes net realized taxable capital gains, if any, annually in cash and records them onex-dividend date. Such distributions on a tax basis are determined in conformity with federal income tax regulations, which may differ from accounting principles generally accepted in the United States of America (“GAAP”). Distributions in excess of tax basis earnings and profits, if any, are reported in such Fund’s financial statements as a tax return of capital at fiscalyear-end. |
| F. | Federal Income Taxes — Each Fund intends to comply with the provisions of the Internal Revenue Code of 1986, as amended (the “Internal Revenue Code”), applicable to regulated investment companies and to distribute substantially all of the Fund’s taxable earnings to its shareholders. As such, the Funds will not be subject to federal income taxes on otherwise taxable income (including net realized gains) that is distributed to the shareholders. Therefore, no provision for federal income taxes is recorded in the financial statements. |
Each Fund recognizes the tax benefits of uncertain tax positions only when the position is more likely than not to be sustained. Management has analyzed each Fund’s uncertain tax positions and concluded that no liability for unrecognized tax benefits should be recorded related to uncertain tax positions. Management is not aware of any tax positions for which it is reasonably possible that the total amounts of unrecognized tax benefits will change materially in the next 12 months.
Income and capital gain distributions are determined in accordance with federal income tax regulations, which may differ from GAAP. These differences are primarily due to differing book and tax treatments forin-kind transactions, losses deferred due to wash sales, and passive foreign investment company adjustments, if any.
The Funds file U.S. federal tax returns and tax returns in certain other jurisdictions. Generally, a Fund is subject to examinations by such taxing authorities for up to three years after the filing of the return for the tax period.
| G. | Expenses — Expenses of the Trust that are directly identifiable to a specific Fund are applied to that Fund. Expenses of the Trust that are not readily identifiable to a specific Fund are allocated in such a manner as deemed equitable, taking into consideration the nature and type of expense and the relative net assets of each Fund. |
Each Fund is responsible for all of its expenses, including the investment advisory fees, costs of transfer agency, custody, fund administration, legal, audit and other services, interest, taxes, brokerage commissions and other expenses connected with executions of portfolio transactions,sub-licensing fees related to its respective Underlying Index, any distribution fees or expenses, litigation expenses, fees payable to the Trust’s Board members who are not “interested persons” (as defined in the 1940 Act) of the Trust (the “Independent Trustees”), or the Adviser, expenses incurred in connection with the Board members’ services, including travel expenses and legal fees of counsel for the Independent Trustees, acquired fund fees and expenses, if any, and extraordinary expenses.
To the extent a Fund invests in other investment companies, the expenses shown in the accompanying financial statements reflect the expenses of the Fund and do not include any expenses of the investment companies in which it invests. The effects of such investment companies’ expenses are included in the realized and unrealized gain or loss on the investments in the investment companies.
| H. | Accounting Estimates — The preparation of the financial statements in accordance with GAAP requires management to make estimates and assumptions that affect the reported amounts and disclosures in the financial statements, including estimates and assumptions related to taxation. Actual results could differ from these estimates. In addition, the Funds monitor for material events or transactions that may occur or become known after theperiod-end date and before the date the financial statements are released to print. |
| I. | Indemnifications — Under the Trust’s organizational documents, its Officers and Trustees are indemnified against certain liabilities arising out of the performance of their duties to the Trust. Each Board member who is not an “interested person” (as defined in the 1940 Act) of the Trust (each, an “Independent Trustee”) is also indemnified against certain liabilities arising out of the performance of his duties to the Trust pursuant to an Indemnification Agreement between such trustee and the Trust. Additionally, in the normal course of business, the Trust enters into contracts with service providers that contain general indemnification clauses. The Trust’s maximum exposure under these arrangements is unknown, as this would involve future claims that may be made against the Trust that have not yet occurred. However, based on experience, the Trust believes the risk of loss to be remote. |
| J. | Securities Lending — During the fiscal year ended April 30, 2019, each Fund (except Invesco Russell Top 200 Pure Value ETF) participated in securities lending. Each Fund loaned portfolio securities having a market value up toone-third of each Fund’s total assets. Such loans are secured by cash collateral equal to no less than 102% (105% for international securities) of the market value of the loaned securities determined daily by the securities lending provider. Cash collateral received in connection with these loans is generally invested in an affiliated money market fund and is shown as such on the Schedules of Investments. Each Fund bears the risk of loss with respect to the investment of collateral. It is the policy of these Funds to obtain additional collateral from or return excess collateral to the borrower by the end of the next business day, following the valuation date of the securities loaned. Therefore, the value of the collateral held may be temporarily less than the value of the securities on loan. When loaning securities, each Fund retains certain benefits of owning the securities, including the economic equivalent of dividends or interest generated by the security. Lending securities entails a risk of loss to each Fund if, and to the extent that, the market value of the securities loaned were to increase, and the borrower did not increase the collateral accordingly, and the borrower failed to return the securities. The securities loaned are subject to termination at the option of the borrower or each Fund. Upon termination, the borrower will return to each Fund the securities loaned and each Fund will return the collateral. Upon the failure of the borrower to return the securities, collateral may be liquidated and the securities may be purchased on the open market to replace the loaned securities. Each Fund could experience delays and costs in gaining access to the collateral and the securities may lose value during the delay which could result in potential losses to each Fund. Some of these losses may be indemnified by the lending agent. Each Fund bears the risk of any deficiency in the amount of the collateral available for return to the borrower due to any loss on the collateral invested. Dividends received on cash collateral investments for securities lending transactions, which are net of compensation to counterparties, are included inSecurities lending incomeon the Statements of Operations. The aggregate value of securities out on loan, if any, is shown on the Statements of Assets and Liabilities. |
| K. | Distributions from Distributable Earnings — In accordance with the Securities and Exchange Commission’s issuance of Disclosure Update and Simplification, the Funds have presented the total, rather than the components, of distributions to shareholders, except for tax return of capital distributions, if any, in the Statements of Changes in Net Assets. |
For the year ended April 30, 2018, distributions from distributable earnings consisted of distributions from net investment income. For the year ended August 31, 2017, distributions from distributable earnings for ZacksMid-Cap ETF and Zacks Multi-Asset Income ETF consisted of distributions from net investment income.
Note 3—Investment Advisory Agreement and Other Agreements
The Trust has entered into an Investment Advisory Agreement with the Adviser on behalf of each Fund, pursuant to which the Adviser has overall responsibility for the selection and ongoing monitoring of the Funds’ investments, managing the Funds’ business affairs and providing certain clerical, bookkeeping and other administrative services. Pursuant to the Investment Advisory Agreement, each of Russell 2000 Pure Growth ETF, Russell 2000 Pure Value ETF, Russell Midcap Pure Growth ETF, Russell Midcap Pure Value ETF, Russell Top 200 Pure Growth ETF and Russell Top 200 Pure Value ETF accrues daily and pays monthly to the Adviser an annual fee of 0.29% of the Fund’s average daily net assets. Each of Russell Midcap Equal Weight ETF and Russell Top 200 Equal Weight ETF accrues daily and pays monthly to the Adviser an annual fee of 0.25% of the Fund’s average daily net assets. Each of Dynamic Large Cap Growth ETF, Dynamic Large Cap Value ETF, ZacksMid-Cap ETF, and Zacks Multi-Asset Income ETF accrues daily and pays monthly to the Adviser an annual fee of 0.50% of the Fund’s average daily net assets.
The Trust also has entered into an Amended and Restated Excess Expense Agreement (the “Expense Agreement”) with the Adviser on behalf of each Fund, pursuant to which the Adviser has agreed to waive fees and/or pay Fund expenses to the extent necessary to prevent the operating expenses (excluding interest expenses, brokerage commissions and other trading expenses, offering costs, taxes, acquired fund fees and expenses, if any, and extraordinary expenses) of each of Russell 2000 Pure Growth ETF, Russell 2000 Pure Value ETF, Russell Midcap Pure Growth ETF, Russell Midcap Pure Value ETF, Russell Top 200 Pure Growth ETF and Russell Top 200 Pure Value ETF from exceeding 0.39% of the Fund’s average daily net assets per year (the “Expense Cap”), through at least August 31, 2021. The Expense Cap for each of Russell Midcap Equal Weight ETF and Russell Top 200 Equal Weight ETF is 0.25% of the Fund’s average daily net assets per year, through at least August 31, 2021. The Expense Cap for each of Dynamic Large Cap Growth ETF, Dynamic Large Cap Value ETF, ZacksMid-Cap ETF, and Zacks Multi-Asset Income ETF is 0.60% of the Fund’s average daily net assets per year, through at least August 31, 2021 andsub-licensing fees are excluded from the expenses subject to the Expense Cap for these Funds in addition to the excluded expenses above. Unless the Adviser continues the Expense Agreement, it will terminate on August 31, 2021. During its term, the Expense Agreement cannot be terminated or amended to increase the Expense Cap without approval of the Board of Trustees. The Adviser did not waive fees and/or pay Fund expenses during the fiscal year ended April 30, 2019 under this Expense Cap for Dynamic Large Cap Growth ETF, Dynamic Large Cap Value ETF, Russell Mid Cap Pure Growth ETF and Russell Top 200 Pure Growth ETF.
Further, the Adviser agrees to reimburse ZacksMid-Cap ETF and Zacks Multi-Asset Income ETF in the amount equal to the licensing fees that each Fund pays that cause the Fund’s operating expenses (excluding interest expenses, offering costs, brokerage commissions and other trading expenses, taxes, acquired fund fees and expenses and extraordinary expenses) to exceed 0.65% through at least April 6, 2020.
Further, through August 31, 2021, the Adviser has contractually agreed to waive a portion of each Fund’s management fee in an amount equal to 100% of the net advisory fees an affiliate of the Adviser receives that are attributable to certain of the Fund’s investments in money market funds managed by that affiliate (excluding investments of cash collateral from securities lending). The Adviser cannot discontinue this waiver prior to its expiration. This agreement is not subject to recapture by the Adviser.
For the fiscal year ended April 30, 2019, the Adviser waived fees and/or paid Fund expenses for each Fund in the following amounts:
| | | | |
| Dynamic Large Cap Growth ETF | | $ | 653 | |
| Dynamic Large Cap Value ETF | | | 1,706 | |
| Russell 2000 Pure Growth ETF | | | 38,107 | |
| Russell 2000 Pure Value ETF | | | 36,121 | |
| Russell Midcap Equal Weight ETF | | | 88,365 | |
| Russell Midcap Pure Growth ETF | | | 578 | |
| Russell Midcap Pure Value ETF | | | 44,978 | |
| Russell Top 200 Equal Weight ETF | | | 100,450 | |
| Russell Top 200 Pure Growth ETF | | | 369 | |
| Russell Top 200 Pure Value ETF | | | 24,914 | |
| ZacksMid-Cap ETF | | | 115,956 | |
| Zacks Multi-Asset Income ETF | | | 145,107 | |
The fees waived and/or expenses borne by the Adviser pursuant to the Expense Cap are subject to recapture by the Adviser up to three years from the date the fees were waived or the expenses were incurred, but no recapture payment will be made by the Funds if it would result in the Funds exceeding (i) the Expense Cap or (ii) the expense cap in effect at the time the fees and/or expenses subject to recapture were waived and/or borne by the Adviser.
For the following Funds, the amounts available for potential recapture by the Adviser under the Expense Agreement and the expiration schedule at April 30, 2019 are as follows:
| | | | | | | | | | | | | | | | |
| | | Total
Potential
Recapture
Amounts | | | Potential Recapture Amounts
Expiring | |
| | | 4/30/20 | | | 4/30/21 | | | 4/30/22 | |
| Russell 2000 Pure Growth ETF | | $ | 191,015 | | | $ | 74,308 | | | $ | 78,817 | | | $ | 37,890 | |
| Russell 2000 Pure Value ETF | | | 138,413 | | | | 48,568 | | | | 53,922 | | | | 35,923 | |
| Russell Midcap Equal Weight ETF | | | 300,486 | | | | 106,293 | | | | 105,995 | | | | 88,198 | |
| Invesco Russell Midcap Pure Growth ETF | | | 21,413 | | | | — | | | | 21,413 | | | | — | |
| Invesco Russell Midcap Pure Value ETF | | | 164,022 | | | | 54,220 | | | | 64,988 | | | | 44,814 | |
| Invesco Russell Top 200 Equal Weight ETF | | | 315,118 | | | | 97,104 | | | | 117,735 | | | | 100,279 | |
| Invesco Russell Top 200 Pure Value ETF | | | 114,664 | | | | 45,267 | | | | 44,708 | | | | 24,689 | |
| Invesco Zacks Mid-Cap ETF | | | 151,783 | | | | — | | | | 36,226 | | | | 115,557 | |
| Invesco Zacks Multi-Asset Income ETF | | | 199,252 | | | | — | | | | 54,833 | | | | 144,419 | |
The Trust has entered into a Distribution Agreement with Invesco Distributors, Inc. (the “Distributor”), which serves as the distributor of Creation Units for each Fund. The Distributor does not maintain a secondary market in the Shares. The Funds are not charged any fees pursuant to the Distribution Agreement. The Distributor is an affiliate of the Adviser.
The Adviser has entered into a licensing agreement for each Fund with the following entities (each, a “Licensor”):
| | |
Fund | | Licensor |
| Dynamic Large Cap Growth ETF | | ICE Data Indices, LLC |
| Dynamic Large Cap Value ETF | | ICE Data Indices, LLC |
| Russell 2000 Pure Growth ETF | | Frank Russell Company |
| Russell 2000 Pure Value ETF | | Frank Russell Company |
| Russell Midcap Equal Weight ETF | | Frank Russell Company |
| Russell Midcap Pure Growth ETF | | Frank Russell Company |
| Russell Midcap Pure Value ETF | | Frank Russell Company |
| Russell Top 200 Equal Weight ETF | | Frank Russell Company |
| Russell Top 200 Pure Growth ETF | | Frank Russell Company |
| Russell Top 200 Pure Value ETF | | Frank Russell Company |
| ZacksMid-Cap ETF | | Zacks Investment Research, Inc. |
| Zacks Multi-Asset Income ETF | | Zacks Investment Research, Inc. |
Each Underlying Index name trademark is owned by its respective Licensor. These trademarks have been licensed to the Adviser for use by the Funds. Each Fund is entitled to use its Underlying Index pursuant to the Trust’ssub-licensing agreement with the Adviser. Each Fund is required to pay thesub-licensing fees that are shown on the Statements of Operations. The Funds are not sponsored, endorsed, sold or promoted by the Licensors, and the Licensors make no representation regarding the advisability of investing in any of the Funds.
The Trust has entered into service agreements whereby The Bank of New York Mellon, a wholly-owned subsidiary of The Bank of New York Mellon Corporation, serves as the administrator, custodian, fund accountant and transfer agent for each Fund.
Note 4—Investments in Affiliates
The Adviser and Invesco Mortgage Capital, Inc. are wholly-owned subsidiaries of Invesco Ltd. and therefore, Invesco Ltd. and Invesco Mortgage Capital, Inc. are considered to be affiliated with the Funds. The tables below show certain Funds’ transactions in, and earnings from, investments in affiliates (excluding affiliated money market funds) for the fiscal year ended April 30, 2019.
Russell 2000 Pure Value ETF
| | | | | | | | | | | | | | | | | | | | | | | | | | | | |
| | | Value
April 30, 2018 | | | Purchases
at Cost | | | Proceeds
from Sales | | | Change in
Unrealized
Appreciation
(Depreciation) | | | Realized
Gain | | | Value
April 30, 2019 | | | Dividend
Income | |
| Invesco Mortgage Capital, Inc. | | $ | 407,568 | | | $ | 180,480 | | | $ | (364,961 | ) | | $ | (10,764 | ) | | $ | 15,798 | | | $ | 228,121 | | | $ | 20,957 | |
Russell Midcap Equal Weight ETF
| | | | | | | | | | | | | | | | | | | | | | | | | | | | |
| | | Value
April 30, 2018 | | | Purchases
at Cost | | | Proceeds
from Sales | | | Change in
Unrealized
Appreciation
(Depreciation) | | | Realized
Gain (Loss) | | | Value
April 30, 2019 | | | Dividend
Income | |
| Invesco Ltd. | | $ | 10,748 | | | $ | 6,927 | | | $ | (198 | ) | | $ | (2,505 | ) | | $ | (208 | ) | | $ | 14,764 | | | $ | 626 | |
Russell Midcap Pure Value ETF
| | | | | | | | | | | | | | | | | | | | | | | | | | | | |
| | | Value
April 30, 2018 | | | Purchases
at Cost | | | Proceeds
from Sales | | | Change in
Unrealized
Appreciation
(Depreciation) | | | Realized
Gain | | | Value
April 30, 2019 | | | Dividend
Income | |
| Invesco Ltd. | | $ | — | | | $ | 355,875 | | | $ | (20,342 | ) | | $ | (61,462 | ) | | $ | 224 | | | $ | 274,295 | | | $ | 10,473 | |
Zacks Multi-Asset Income ETF
| | | | | | | | | | | | | | | | | | | | | | | | | | | | |
| | | Value
April 30, 2018 | | | Purchases
at Cost | | | Proceeds
from Sales | | | Change in
Unrealized
Appreciation
(Depreciation) | | | Realized
Gain (Loss) | | | Value
April 30, 2019 | | | Dividend
Income | |
| Invesco Ltd.* | | $ | 1,693,818 | | | $ | 2,725,911 | | | $ | (3,933,688 | ) | | $ | 198,754 | | | $ | (684,795 | ) | | $ | — | | | $ | 39,843 | |
| * | At April 30, 2019, this security was no longer held. |
Note 5—Additional Valuation Information
GAAP defines fair value as the price that would be received to sell an asset or paid to transfer a liability in an orderly transaction between market participants at the measurement date, under current market conditions. GAAP establishes a hierarchy that prioritizes the inputs to valuation methods, giving the highest priority to readily available unadjusted quoted prices in an active market for identical assets (Level 1) and the lowest priority to significant unobservable inputs (Level 3), generally when market prices are not readily available or are unreliable. Based on the valuation inputs, the securities or other investments are tiered into one of three levels. Changes in valuation methods may result in transfers in or out of an investment’s assigned level:
| | Level 1 — | Prices are determined using quoted prices in an active market for identical assets. |
| | Level 2 — | Prices are determined using other significant observable inputs. Observable inputs are inputs that other market participants may use in pricing a security. These may include quoted prices for similar securities, interest rates, prepayment speeds, credit risk, yield curves, loss severities, default rates, discount rates, volatilities and others. |
| | Level 3 — | Prices are determined using significant unobservable inputs. In situations where quoted prices or observable inputs are unavailable (for example, when there is little or no market activity for an investment at the end of the period), unobservable inputs may be used. Unobservable inputs reflect a Fund’s own assumptions about the factors market participants would use in determining fair value of the securities or instruments and would be based on the best available information. |
Except for the Fund listed below, as of April 30, 2019, all of the securities in each Fund were valued based on Level 1 inputs (see the Schedules of Investments for security categories). The level assigned to the securities valuations may not be an indication of the risk or liquidity associated with investing in those securities. Because of the inherent uncertainties of valuation, the values reflected in the financial statements may materially differ from the value received upon actual sale of those investments.
| | | | | | | | | | | | | | | | |
| | | Level 1 | | | Level 2 | | | Level 3 | | | Total | |
| Zacks Multi-Asset Income ETF | | | | | | | | | | | | | | | | |
| Investments in Securities | | | | | | | | | | | | | | | | |
Common Stocks & Other Equity Interests | | $ | 228,549,215 | | | $ | 9,461 | | | $ | — | | | $ | 228,558,676 | |
Money Market Funds | | | 13,373,795 | | | | — | | | | — | | | | 13,373,795 | |
| | | | | | | | | | | | | | | | |
Total Investments | | $ | 241,923,010 | | | $ | 9,461 | | | $ | — | | | $ | 241,932,471 | |
| | | | | | | | | | | | | | | | |
Note 6—Distributions to Shareholders and Tax Components of Net Assets
Tax Character of Distributions to Shareholders Paid During the Fiscal Years Ended April 30, 2019 and 2018:
| | | | | | | | |
| | | 2019 | | | 2018 | |
| | | Ordinary
Income | | | Ordinary
Income | |
| Dynamic Large Cap Growth ETF | | $ | 6,443,887 | | | $ | 3,410,983 | |
| Dynamic Large Cap Value ETF | | | 30,425,316 | | | | 26,977,108 | |
| Russell 2000 Pure Growth ETF | | | 300,605 | | | | 179,332 | |
| Russell 2000 Pure Value ETF | | | 1,557,211 | | | | 1,477,472 | |
| Russell Midcap Equal Weight ETF | | | 332,865 | | | | 331,455 | |
| Russell Midcap Pure Growth ETF | | | 462,502 | | | | 96,720 | |
| Russell Midcap Pure Value ETF | | | 1,232,093 | | | | 1,357,922 | |
| Russell Top 200 Equal Weight ETF | | | 1,304,748 | | | | 870,869 | |
| Russell Top 200 Pure Growth ETF | | | 2,249,583 | | | | 1,352,332 | |
| Russell Top 200 Pure Value ETF | | | 2,896,174 | | | | 1,878,389 | |
Tax Character of Distributions to Shareholders Paid During the Fiscal Year Ended April 30, 2019, Period September 1, 2017 to April 30, 2018 and Year Ended August 31, 2017:
| | | | | | | | | | | | | | | | | | | | | | | | |
| | | 2019 | | | 2018 | | | 2017 | |
| | | Ordinary
Income | | | Return of
Capital | | | Ordinary
Income | | | Return of
Capital | | | Ordinary
Income | | | Return of
Capital | |
| ZacksMid-Cap ETF | | $ | 2,835,826 | | | | — | | | $ | 2,665,110 | | | $ | — | | | $ | 2,792,900 | | | $ | — | |
| Zacks Multi-Asset Income ETF | | | 9,787,271 | | | | — | | | | 8,796,889 | | | | 1,180,314 | | | | 11,665,472 | | | | 5,893,641 | |
Tax Components of Net Assets at FiscalYear-End:
| | | | | | | | | | | | | | | | | | | | | | | | | | | | | | | | |
| | | Undistributed
Ordinary
Income | | | Temporary
Book/Tax
Differences | | | Net
Unrealized
Appreciation—
Investment
Securities | | | Net Unrealized
Appreciation
(Depreciation)—
Other Investments | | | Capital Loss
Carryforwards | | | Late Year
Ordinary
Loss
Deferral | | | Shares of
Beneficial
Interest | | | Total Net
Assets | |
| Dynamic Large Cap Growth ETF | | $ | 1,236,089 | | | $ | (63,717 | ) | | $ | 47,516,721 | | | $ | — | | | $ | (95,688,650 | ) | | $ | — | | | $ | 805,056,124 | | | $ | 758,056,567 | |
| Dynamic Large Cap Value ETF | | | 1,731,019 | | | | (89,512 | ) | | | 25,941,892 | | | | — | | | | (351,166,463 | ) | | | — | | | | 1,364,945,065 | | | | 1,041,362,001 | |
| Russell 2000 Pure Growth ETF | | | 50,902 | | | | (31,537 | ) | | | (1,765,954 | ) | | | — | | | | (14,108,939 | ) | | | — | | | | 105,350,037 | | | | 89,494,509 | |
| Russell 2000 Pure Value ETF | | | 305,854 | | | | (34,869 | ) | | | (1,548,683 | ) | | | — | | | | (20,032,117 | ) | | | — | | | | 100,103,457 | | | | 78,793,642 | |
| Russell Midcap Equal Weight ETF | | | 53,458 | | | | (29,944 | ) | | | 3,449,526 | | | | — | | | | (4,158,792 | ) | | | — | | | | 26,058,041 | | | | 25,372,289 | |
| Russell Midcap Pure Growth ETF | | | — | | | | (43,306 | ) | | | 67,438,031 | | | | — | | | | (22,622,657 | ) | | | (52,393 | ) | | | 581,179,209 | | | | 625,898,884 | |
| Russell Midcap Pure Value ETF | | | 285,294 | | | | (32,621 | ) | | | 1,150,847 | | | | — | | | | (12,433,181 | ) | | | — | | | | 62,838,378 | | | | 51,808,717 | |
| Russell Top 200 Equal Weight ETF | | | 139,562 | | | | (31,070 | ) | | | 8,161,254 | | | | — | | | | (1,956,577 | ) | | | — | | | | 53,435,557 | | | | 59,748,726 | |
| Russell Top 200 Pure Growth ETF | | | 378,248 | | | | (27,188 | ) | | | 18,324,429 | | | | — | | | | (14,452,280 | ) | | | — | | | | 224,864,900 | | | | 229,088,109 | |
| Russell Top 200 Pure Value ETF | | | 293,866 | | | | (23,078 | ) | | | 4,859,786 | | | | — | | | | (4,560,370 | ) | | | — | | | | 95,438,913 | | | | 96,009,117 | |
| ZacksMid-Cap ETF | | | 1,604,330 | | | | (1,011,033 | ) | | | 23,269,180 | | | | — | | | | (59,310,903 | ) | | | — | | | | 300,467,040 | | | | 265,018,614 | |
| Zacks Multi-Asset Income ETF | | | — | | | | (677,322 | ) | | | 2,582,440 | | | | — | | | | (402,768,321 | ) | | | — | | | | 630,083,515 | | | | 229,220,312 | |
Capital loss carryforwards are calculated and reported as of a specific date. Results of transactions and other activity after that date may affect the amount of capital loss carryforwards actually available for the Funds to utilize. Capital losses generated in years beginning after December 22, 2010 can be carried forward for an unlimited period, whereas previous losses expire in eight tax years. Capital losses with an expiration period may not be used to offset capital gains until all net capital losses without an expiration date have been utilized. Capital loss carryforwards with no expiration date will retain their character as either short-term or long-term capital losses instead of as short-term capital losses as under prior law. The ability to utilize capital loss carryforwards in the future may be limited under the Internal Revenue Code and related regulations based on the results of future transactions.
The following table presents available capital loss carryforwards for each Fund as of April 30, 2019:
| | | | | | | | | | | | |
| | | Post-effective/no
expiration | | | | |
| | | Short-Term | | | Long-Term | | | Total* | |
| Dynamic Large Cap Growth ETF | | $ | 95,688,650 | | | $ | — | | | $ | 95,688,650 | |
| Dynamic Large Cap Value ETF | | | 312,854,755 | | | | 38,311,708 | | | | 351,166,463 | |
| Russell 2000 Pure Growth ETF | | | 8,216,975 | | | | 5,891,964 | | | | 14,108,939 | |
| Russell 2000 Pure Value ETF | | | 10,105,893 | | | | 9,926,224 | | | | 20,032,117 | |
| Russell Midcap Equal Weight ETF | | | 1,624,887 | | | | 2,533,905 | | | | 4,158,792 | |
| Russell Midcap Pure Growth ETF | | | 13,336,653 | | | | 9,286,004 | | | | 22,622,657 | |
| Russell Midcap Pure Value ETF | | | 8,307,220 | | | | 4,125,961 | | | | 12,433,181 | |
| Russell Top 200 Equal Weight ETF | | | 818,579 | | | | 1,137,998 | | | | 1,956,577 | |
| Russell Top 200 Pure Growth ETF | | | 4,627,302 | | | | 9,824,978 | | | | 14,452,280 | |
| Russell Top 200 Pure Value ETF | | | 2,671,757 | | | | 1,888,613 | | | | 4,560,370 | |
| ZacksMid-Cap ETF | | | 55,638,018 | | | | 3,672,885 | | | | 59,310,903 | |
| Zacks Multi-Asset Income ETF | | | 332,268,698 | | | | 70,499,623 | | | | 402,768,321 | |
| * | Capital loss carryforwards as of the date listed above is reduced for limitations, if any, to the extent required by the Internal Revenue Code and may be further limited depending upon a variety of factors, including the realization of net unrealized gains or losses as of the date of any reorganization. |
Note 7—Investment Transactions
For the fiscal year ended April 30, 2019, the cost of securities purchased and proceeds from sales of securities (other than short-term securities, U.S. Treasury obligations, money market funds andin-kind transactions, if any) were as follows:
| | | | | | | | |
| | | Purchases | | | Sales | |
| Dynamic Large Cap Growth ETF | | $ | 1,198,577,837 | | | $ | 1,199,169,248 | |
| Dynamic Large Cap Value ETF | | | 2,336,706,515 | | | | 2,336,050,198 | |
| Russell 2000 Pure Growth ETF | | | 34,752,255 | | | | 35,008,103 | |
| Russell 2000 Pure Value ETF | | | 38,816,455 | | | | 38,272,340 | |
| Russell Midcap Equal Weight ETF | | | 7,165,231 | | | | 9,216,808 | |
| Russell Midcap Pure Growth ETF | | | 93,536,742 | | | | 92,154,641 | |
| Russell Midcap Pure Value ETF | | | 23,565,796 | | | | 24,188,201 | |
| Russell Top 200 Equal Weight ETF | | | 14,719,297 | | | | 16,986,158 | |
| Russell Top 200 Pure Growth ETF | | | 44,171,214 | | | | 42,681,892 | |
| Russell Top 200 Pure Value ETF | | | 32,985,979 | | | | 32,530,133 | |
| ZacksMid-Cap ETF | | | 428,571,359 | | | | 427,297,381 | |
| Zacks Multi-Asset Income ETF | | | 534,499,677 | | | | 507,783,536 | |
For the fiscal year ended April 30, 2019,in-kind transactions associated with creations and redemptions were as follows:
| | | | | | | | |
| | | Cost of
Securities
Received | | | Value of
Securities
Delivered | |
| Dynamic Large Cap Growth ETF | | $ | 1,091,075,846 | | | $ | 971,740,286 | |
| Dynamic Large Cap Value ETF | | | 1,131,147,036 | | | | 1,471,258,435 | |
| Russell 2000 Pure Growth ETF | | | 95,572,493 | | | | 56,354,023 | |
| Russell 2000 Pure Value ETF | | | 34,910,499 | | | | 30,524,211 | |
| Russell Midcap Equal Weight ETF | | | 4,600,813 | | | | 2,400,241 | |
| Russell Midcap Pure Growth ETF | | | 562,248,056 | | | | 149,123,592 | |
| Russell Midcap Pure Value ETF | | | 22,841,353 | | | | 19,031,763 | |
| Russell Top 200 Equal Weight ETF | | | 7,768,900 | | | | 10,616,485 | |
| Russell Top 200 Pure Growth ETF | | | 183,300,487 | | | | 199,912,766 | |
| Russell Top 200 Pure Value ETF | | | 37,870,225 | | | | 52,309,255 | |
| ZacksMid-Cap ETF | | | 255,251,708 | | | | 268,435,443 | |
| Zacks Multi-Asset Income ETF | | | 270,092,855 | | | | 351,724,303 | |
Gains (losses) onin-kind transactions are generally not considered taxable gains (losses) for federal income tax purposes.
At April 30, 2019, the aggregate cost of investments, including any derivatives, on a tax basis includes adjustments for financial reporting purposes as of the most recently completed federal income tax reportingperiod-end:
| | | | | | | | | | | | | | | | |
| | | Gross
Unrealized
Appreciation | | | Gross
Unrealized
Depreciation | | | Net
Unrealized
Appreciation
(Depreciation) | | | Cost | |
| Dynamic Large Cap Growth ETF | | $ | 66,427,557 | | | $ | (18,910,836 | ) | | $ | 47,516,721 | | | $ | 710,764,465 | |
| Dynamic Large Cap Value ETF | | | 58,987,631 | | | | (33,045,739 | ) | | | 25,941,892 | | | | 1,016,007,909 | |
| Russell 2000 Pure Growth ETF | | | 10,283,697 | | | | (12,049,651 | ) | | | (1,765,954 | ) | | | 98,331,213 | |
| Russell 2000 Pure Value ETF | | | 8,173,736 | | | | (9,722,419 | ) | | | (1,548,683 | ) | | | 84,333,531 | |
| Russell Midcap Equal Weight ETF | | | 4,990,238 | | | | (1,540,712 | ) | | | 3,449,526 | | | | 22,923,396 | |
| Russell Midcap Pure Growth ETF | | | 81,537,607 | | | | (14,099,576 | ) | | | 67,438,031 | | | | 560,555,019 | |
| Russell Midcap Pure Value ETF | | | 5,017,564 | | | | (3,866,717 | ) | | | 1,150,847 | | | | 51,375,583 | |
| Russell Top 200 Equal Weight ETF | | | 10,480,476 | | | | (2,319,222 | ) | | | 8,161,254 | | | | 51,842,766 | |
| Russell Top 200 Pure Growth ETF | | | 24,893,463 | | | | (6,569,034 | ) | | | 18,324,429 | | | | 215,577,042 | |
| Russell Top 200 Pure Value ETF | | | 9,456,413 | | | | (4,596,627 | ) | | | 4,859,786 | | | | 91,132,768 | |
| ZacksMid-Cap ETF | | | 26,345,207 | | | | (3,076,027 | ) | | | 23,269,180 | | | | 245,090,088 | |
| Zacks Multi-Asset Income ETF | | | 5,917,163 | | | | (3,334,723 | ) | | | 2,582,440 | | | | 239,350,031 | |
Note 8—Reclassification of Permanent Differences
Primarily as a result of differing book/tax treatment ofin-kind transactions, foreign currency transactions, the use of a portion of the proceeds from redemptions as distributions and passive foreign investment companies, amounts were reclassified between undistributed net investment income (loss), undistributed net realized gain (loss) and Shares of beneficial interest. These reclassifications had no effect on the net assets of each Fund. For the fiscal year ended April 30, 2019, the reclassifications were as follows:
| | | | | | | | | | | | |
| | | Undistributed
Net Investment
Income | | | Undistributed
Net Realized
Gain (Loss) | | | Shares of
Beneficial
Interest | |
| Dynamic Large Cap Growth ETF | | $ | — | | | $ | (123,739,503 | ) | | $ | 123,739,503 | |
| Dynamic Large Cap Value ETF | | | (412,501 | ) | | | (138,934,933 | ) | | | 139,347,434 | |
| Russell 2000 Pure Growth ETF | | | — | | | | (8,383,459 | ) | | | 8,383,459 | |
| Russell 2000 Pure Value ETF | | | 59,554 | | | | (3,100,072 | ) | | | 3,040,518 | |
| Russell Midcap Equal Weight ETF | | | 208 | | | | (136,970 | ) | | | 136,762 | |
| Russell Midcap Pure Growth ETF | | | 14,083 | | | | (20,809,720 | ) | | | 20,795,637 | |
| Russell Midcap Pure Value ETF | | | — | | | | (509,440 | ) | | | 509,440 | |
| Russell Top 200 Equal Weight ETF | | | — | | | | (880,460 | ) | | | 880,460 | |
| Russell Top 200 Pure Growth ETF | | | — | | | | (66,490,989 | ) | | | 66,490,989 | |
| Russell Top 200 Pure Value ETF | | | — | | | | (8,052,459 | ) | | | 8,052,459 | |
| ZacksMid-Cap ETF | | | (313,658 | ) | | | (30,526,542 | ) | | | 30,840,200 | |
| Zacks Multi-Asset Income ETF | | | (303,322 | ) | | | (31,116,850 | ) | | | 31,420,172 | |
Note 9—Trustees’ and Officer’s Fees
Trustees’ and Officer’s Fees include amounts accrued by the Funds to pay remuneration to the Independent Trustees and an Officer of the Trust. The Trustee who is an “interested person” of the Trust does not receive any Trustees’ fees.
The Trust has adopted a deferred compensation plan (the “Plan”). Under the Plan, each Independent Trustee who has executed a Deferred Fee Agreement (a “Participating Trustee”) may defer receipt of all or a portion of his compensation (“Deferral Fees”). Such Deferral Fees are deemed to be invested in select Invesco Funds. The Deferral Fees payable to the Participating Trustee are valued as of the date such Deferral Fees would have been paid to the Participating Trustee. The value increases with contributions or with increases in the value of the Shares selected, and the value decreases with distributions or with declines in the value of the Shares selected. Obligations under the Plan represent unsecured claims against the general assets of the Funds.
Note 10—Capital
Shares are created and redeemed by each Fund only in Creation Units of 50,000 Shares. Only Authorized Participants are permitted to purchase or redeem Creation Units from the Funds. Such transactions are principally permitted in exchange for Deposit Securities, with a balancing cash component to equate the transaction to the NAV per Share of a Fund of the Trust on the transaction date. However, for all Funds, cash in an amount equivalent to the value of certain securities may be substituted, generally when the securities are not available in sufficient quantity for delivery, not eligible for trading by the Authorized Participant or as a result of other market circumstances.
To the extent that the Funds permit transactions in exchange for Deposit Securities, each Fund may issue Shares in advance of receipt of Deposit Securities subject to various conditions, including a requirement to maintain on deposit with the Trust cash at least equal to 105% of the market value of the missing Deposit Securities. In accordance with the Trust’s Participant Agreement, Creation Units will be issued to an Authorized Participant, notwithstanding the fact that the corresponding Deposit Securities have not been received in part or in whole, in reliance on the undertaking of the Authorized Participant to deliver the missing Deposit Securities as soon as possible, which undertaking shall be secured by the Authorized Participant’s delivery and maintenance of collateral consisting of cash in the form of U.S. dollars in immediately available funds having a value(marked-to-market daily) at least equal to 105%, which the Adviser may change from time to time, of the value of the missing Deposit Securities.
Certain transaction fees may be charged by the Funds for creations and redemptions, which are treated as increases in capital.
Transactions in each Fund’s Shares are disclosed in detail in the Statements of Changes in Net Assets.
Note 11—Subsequent Events
Effective as of the close of markets on June 21, 2019, each Fund below changed its name, ticker, index provider, underlying index, investment objective and principal investment strategy. The new name, ticker and underlying index are as follows:
| | | | | | | | | | |
Current Fund Name | | New Fund Name | | Current
Ticker
Symbol | | New
Ticker
Symbol | | Current Underlying Index | | New
Underlying
Index |
| Invesco Russell Top 200 Equal Weight ETF | | Invesco S&P 100 Equal Weight ETF | | EQWL | | No Change | | Russell Top 200® Equal Weight Index | | S&P 100 Equal
Weight Index |
| Invesco Russell Midcap Equal Weight ETF | | Invesco S&P MidCap Quality ETF | | EQWM | | XMHQ | | Russell Midcap® Equal Weight Index | | S&P MidCap
400 Quality
Index |
| Invesco Russell Top 200 Pure Growth ETF | | Invesco S&P 500 GARP ETF | | PXLG | | SPGP | | Russell Top 200® Pure Growth Index | | S&P 500 Growth
at a Reasonable
Price Index |
| Invesco Russell Midcap Pure Growth ETF | | Invesco S&P MidCap Momentum ETF | | PXMG | | XMMO | | Russell Midcap® Pure Growth Index | | S&P MidCap
400 Momentum
Index |
| Invesco Russell 2000 Pure Growth ETF | | Invesco S&P SmallCap Momentum ETF | | PXSG | | XSMO | | Russell 2000® Pure Growth Index | | S&P SmallCap
600 Momentum
Index |
| Invesco Russell Top 200 Pure Value ETF | | Invesco S&P 500 Value with Momentum ETF | | PXLV | | SPVM | | Russell Top 200® Pure Value Index | | S&P 500 High
Momentum
Value Index |
| Invesco Russell Midcap Pure Value ETF | | Invesco S&P MidCap Value with Momentum ETF | | PXMV | | XMVM | | Russell Midcap® Pure Value Index | | S&P 400 High
Momentum
Value Index |
| Invesco Russell 2000 Pure Value ETF | | Invesco S&P SmallCap Value with Momentum ETF | | PXSV | | XSVM | | Russell 2000® Pure Value Index | | S&P 600 High
Momentum
Value Index |
Report of Independent Registered Public Accounting Firm
TotheBoard of Trustees of Invesco Exchange-Traded Fund Trust and Shareholders of Invesco Dynamic Large Cap Growth ETF, Invesco Dynamic Large Cap Value ETF, Invesco S&P SmallCap Momentum ETF, Invesco S&P SmallCap Value with Momentum ETF, Invesco S&P MidCap Quality ETF, Invesco S&P MidCap Momentum ETF, Invesco S&P MidCap Value with Momentum ETF, Invesco S&P 100 Equal Weight ETF, Invesco S&P 500 GARP ETF, Invesco S&P 500 Value with Momentum ETF, Invesco ZacksMid-Cap ETF and Invesco Zacks Multi-Asset Income ETF
Opinions on the Financial Statements
We have audited the accompanying statements of assets and liabilities, including the schedules of investments, of Invesco Dynamic Large Cap Growth ETF, Invesco Dynamic Large Cap Value ETF, Invesco Russell 2000 Pure Growth ETF, Invesco Russell 2000 Pure Value ETF, Invesco Russell Midcap Equal Weight ETF, Invesco Russell Midcap Pure Growth ETF, Invesco Russell Midcap Pure Value ETF, Invesco Russell Top 200 Equal Weight ETF, Invesco Russell Top 200 Pure Growth ETF, Invesco Russell Top 200 Pure Value ETF, Invesco ZacksMid-Cap ETF and Invesco Zacks Multi-Asset Income ETF (twelve of the funds constituting Invesco Exchange-Traded Fund Trust, hereafter collectively referred to as the “Funds”) as of April 30, 2019, the related statements of operations for the year ended April 30, 2019, the statements of changes in net assets for each of the two years in the period ended April 30, 2019 (or for Invesco ZacksMid-Cap ETF and Invesco Zacks Multi-Asset Income ETF, for the year ended April 30, 2019 and for the eight months ended April 30, 2018), including the related notes,and the financial highlights for each of the five years in the period ended April 30, 2019 (or for Invesco ZacksMid-Cap ETF and Invesco Zacks Multi-Asset Income ETF, for the year ended April 30, 2019 and for the eight months ended April 30, 2018) (collectively referred to as the “financial statements”). In our opinion, the financial statements present fairly, in all material respects, the financial position of each of the Funds as of April 30, 2019, the results of each of their operations for the year then ended, the changes in each of their net assets for each of the two years in the period ended April 30, 2019 (or for Invesco ZacksMid-Cap ETF and Invesco Zacks Multi-Asset Income ETF, for the year ended April 30, 2019 and for the eight months ended April 30, 2018), and each of the financial highlights for each of the five years in the period ended April 30, 2019 (or for Invesco ZacksMid-Cap ETF and Invesco Zacks Multi-Asset Income ETF, for the year ended April 30, 2019 and for the eight months ended April 30, 2018), in conformity with accounting principles generally accepted in the United States of America.
The financial statements of Invesco ZacksMid-Cap ETF (Predecessor Fund GuggenheimMid-Cap Core ETF ) and Invesco Zacks Multi-Asset Income ETF (Predecessor Fund Guggenheim Multi-Asset Income ETF ) as of and for the year ended August 31, 2017 and the financial highlights for each of the periods ended on or prior to August 31, 2017 (not presented herein, other than the statements of changes in net assets and the financial highlights) were audited by other auditors whose report dated October 30, 2017, expressed an unqualified opinion on those financial statements and financial highlights.
Basis for Opinions
These financial statements are the responsibility of the Funds’ management. Our responsibility is to express an opinion on the Funds’ financial statements based on our audits. We are a public accounting firm registered with the Public Company Accounting Oversight Board (United States) (PCAOB) and are required to be independent with respect to the Funds in accordance with the U.S. federal securities laws and the applicable rules and regulations of the Securities and Exchange Commission and the PCAOB.
We conducted our audits of these financial statements in accordance with the standards of the PCAOB. Those standards require that we plan and perform the audit to obtain reasonable assurance about whether the financial statements are free of material misstatement, whether due to error or fraud.
Our audits included performing procedures to assess the risks of material misstatement of the financial statements, whether due to error or fraud, and performing procedures that respond to those risks. Such procedures included examining, on a test basis, evidence regarding the amounts and disclosures in the financial statements. Our audits also included evaluating the accounting principles used and significant estimates made by management, as well as evaluating the overall presentation of the financial statements. Our procedures included confirmation of securities owned as of April 30, 2019 by correspondence with the custodian, transfer agent and brokers; when replies were not received from brokers, we performed other auditing procedures. We believe that our audits provide a reasonable basis for our opinions.
PricewaterhouseCoopers LLP
Chicago, Illinois
June 26, 2019
We have served as the auditor of one or more of the investment companies in the Invesco group of investment companies since at least 1995. We have not determined the specific year we began serving as auditor.
Calculating your ongoing Fund expenses
Example
As a shareholder of a Fund of the Invesco Exchange-Traded Fund Trust, you incur advisory fees and other Fund expenses. The expense examples below are intended to help you understand your ongoing costs (in dollars) of investing in the Funds and to compare these costs with the ongoing costs of investing in other funds.
The example is based on an investment of $1,000 invested at the beginning of the period and held through thesix-month period ended April 30, 2019.
In addition to the fees and expenses which the Invesco Zacks Mid-Cap ETF and Invesco Zacks Multi-Asset Income ETF (collectively, the “Portfolios”) bear directly, the Portfolios indirectly bear a pro rata share of the fees and expenses of the investment companies in which the Portfolios invest. The amount of fees and expenses incurred indirectly by the Portfolios will vary because the investment companies have varied expenses and fee levels and the Portfolios may own different proportions of the investment companies at different times. Estimated investment companies’ expenses are not expenses that are incurred directly by the Portfolios. They are expenses that are incurred directly by the investment companies and are deducted from the value of the investment companies the Portfolios invest in. The effect of the estimated investment companies’ expenses that the Portfolios bear indirectly is included in each Portfolio’s total return.
Actual Expenses
The first line in the following table provides information about actual account values and actual expenses. You may use the information in this line, together with the amount you invested, to estimate the expenses that you paid over the period. Simply divide your account value by $1,000 (for example, an $8,600 account value divided by $1,000 = 8.6), then multiply the result by the number in the first line under the heading “Expenses Paid During theSix-Month Period” to estimate the expenses you paid on your account during this period.
Hypothetical Example for Comparison Purposes
The second line in the following table provides information about hypothetical account values and hypothetical expenses based on each Fund’s actual expense ratio and an assumed annualized rate of return of 5% per year before expenses, which is not the Fund’s actual return. The hypothetical account values and expenses may not be used to estimate the actual ending account balance or expenses you paid for the period. You may use this information to compare the ongoing costs of investing in the Funds and other funds. To do so, compare this 5% hypothetical example with the 5% hypothetical examples that appear in the shareholder reports of the other funds.
Please note that the expenses shown in the table are meant to highlight your ongoing costs only, and do not reflect any transactional costs, such as sales charges and brokerage commissions. Therefore, the second line in the table is useful in comparing ongoing costs only, and will not help you determine the relative total costs of owning different funds. In addition, expenses shown in the table do not include the expenses of the underlying funds, which are borne indirectly by the Fund. If transaction costs and indirect expenses were included, your costs would have been higher.
| | | | | | | | | | | | | | | | |
| | | Beginning
Account Value
November 1, 2018 | | | Ending
Account Value
April 30, 2019 | | | Annualized
Expense Ratio
Based on the
Six-Month Period | | | Expenses Paid
During the
Six-Month Period(1) | |
| Invesco Dynamic Large Cap Growth ETF (PWB) | | | | | | | | | | | | | | | | |
Actual | | $ | 1,000.00 | | | $ | 1,103.70 | | |
| 0.55
| %
| | $ | 2.87 | |
Hypothetical (5% return before expenses) | | | 1,000.00 | | | | 1,022.07 | | |
| 0.55
|
| | | 2.76 | |
| Invesco Dynamic Large Cap Value ETF (PWV) | | | | | | | | | | | | | | | | |
Actual | | | 1,000.00 | | | | 1,045.70 | | | | 0.54 | | |
| 2.74
|
|
Hypothetical (5% return before expenses) | | | 1,000.00 | | | | 1,022.12 | | | | 0.54 | | |
| 2.71
|
|
| Invesco Russell 2000 Pure Growth ETF (PXSG) | | | | | | | | | | | | | | | | |
Actual | | | 1,000.00 | | | | 1,074.70 | | |
| 0.39
|
| |
| 2.01
|
|
Hypothetical (5% return before expenses) | | | 1,000.00 | | | | 1,022.86 | | |
| 0.39
|
| | | 1.96 | |
| Invesco Russell 2000 Pure Value ETF (PXSV) | | | | | | | | | | | | | | | | |
Actual | | | 1,000.00 | | | | 1,011.20 | | | | 0.39 | | | | 1.94 | |
Hypothetical (5% return before expenses) | | | 1,000.00 | | | | 1,022.86 | | | | 0.39 | | |
| 1.96
|
|
Calculating your ongoing Fund expenses(continued)
| | | | | | | | | | | | | | | | |
| | | Beginning
Account Value
November 1, 2018 | | | Ending
Account Value
April 30, 2019 | | | Annualized
Expense Ratio
Based on the
Six-Month Period | | | Expenses Paid
During the
Six-Month Period(1) | |
| Invesco Russell Midcap Equal Weight ETF (EQWM) | | | | | | | | | | | | | | | | |
Actual | | $ | 1,000.00 | | | $
| 1,092.80
|
| | | 0.25 | % | | $
| 1.30
|
|
Hypothetical (5% return before expenses) | | | 1,000.00 | | | | 1,023.55 | | |
| 0.25
|
| | | 1.25 | |
| Invesco Russell Midcap Pure Growth ETF (PXMG) | | | | | | | | | | | | | | | | |
Actual | | | 1,000.00 | | | | 1,241.40 | | | | 0.39 | | |
| 2.17
|
|
Hypothetical (5% return before expenses) | | | 1,000.00 | | | | 1,022.86 | | | | 0.39 | | |
| 1.96
|
|
| Invesco Russell Midcap Pure Value ETF (PXMV) | | | | | | | | | | | | | | | | |
Actual | | | 1,000.00 | | | | 1,098.70 | | |
| 0.39
|
| | | 2.03 | |
Hypothetical (5% return before expenses) | | | 1,000.00 | | | | 1,022.86 | | | | 0.39 | | | | 1.96 | |
| Invesco Russell Top 200 Equal Weight ETF (EQWL) | | | | | | | | | | | | | | | | |
Actual | | | 1,000.00 | | | | 1,099.40 | | | | 0.25 | | |
| 1.30
|
|
Hypothetical (5% return before expenses) | | | 1,000.00 | | | | 1,023.55 | | | | 0.25 | | |
| 1.25
|
|
| Invesco Russell Top 200 Pure Growth ETF (PXLG) | | | | | | | | | | | | | | | | |
Actual | | | 1,000.00 | | | | 1,133.60 | | |
| 0.36
|
| |
| 1.90
|
|
Hypothetical (5% return before expenses) | | | 1,000.00 | | | | 1,023.01 | | |
| 0.36
|
| |
| 1.81
|
|
| Invesco Russell Top 200 Pure Value ETF (PXLV) | | | | | | | | | | | | | | | | |
Actual | | | 1,000.00 | | | | 1,091.20 | | | | 0.39 | | | | 2.02 | |
Hypothetical (5% return before expenses) | | | 1,000.00 | | | | 1,022.86 | | | | 0.39 | | | | 1.96 | |
| Invesco ZacksMid-Cap ETF (CZA) | | | | | | | | | | | | | | | | |
Actual | | | 1,000.00 | | | | 1,133.19 | | | | 0.65 | | | | 3.44 | |
Hypothetical (5% return before expenses) | | | 1,000.00 | | | | 1,021.57 | | | | 0.65 | | | | 3.26 | |
| Invesco Zacks Multi-Asset Income ETF (CVY) | | | | | | | | | | | | | | | | |
Actual | | | 1,000.00 | | | | 1,089.58 | | | | 0.65 | | | | 3.37 | |
Hypothetical (5% return before expenses) | | | 1,000.00 | | | | 1,021.57 | | | | 0.65 | | | | 3.26 | |
| (1) | Expenses are calculated using the annualized expense ratio, which represents the ongoing expenses as a percentage of net assets for thesix-month period ended April 30, 2019. Expenses are calculated by multiplying the Fund’s annualized expense ratio by the average account value for the period, then multiplying the result by 181/365. Expense ratios for the most recent six-month period may differ from expense ratios based on the annualized data in the Financial Highlights. |
Tax Information
Form1099-DIV, Form1042-S and otheryear-end tax information provide shareholders with actual calendar year amounts that should be included in their tax returns. Shareholders should consult their tax advisers.
The following distribution information is being provided as required by the Internal Revenue Code or to meet a specific state’s requirement.
Each Fund designates the following amounts or, if subsequently determined to be different, the maximum amount allowable for its fiscal year ended April 30, 2019:
| | | | | | | | | | | | | | | |
| | | Qualified Business
Income* | | Qualified Dividend
Income* | | Corporate
Dividends-Received
Deduction* |
| Invesco Dynamic Large Cap Growth ETF | | | | 0 | % | | | | 100 | % | | | | 100 | % |
| Invesco Dynamic Large Cap Value ETF | | | | 0 | % | | | | 100 | % | | | | 100 | % |
| Invesco Russell 2000 Pure Growth ETF | | | | 0 | % | | | | 76 | % | | | | 76 | % |
| Invesco Russell 2000 Pure Value ETF | | | | 37 | % | | | | 75 | % | | | | 69 | % |
| Invesco Russell Midcap Equal Weight ETF | | | | 0 | % | | | | 100 | % | | | | 100 | % |
| Invesco Russell Midcap Pure Growth ETF | | | | 0 | % | | | | 100 | % | | | | 100 | % |
| Invesco Russell Midcap Pure Value ETF | | | | 42 | % | | | | 86 | % | | | | 81 | % |
| Invesco Russell Top 200 Equal Weight ETF | | | | 0 | % | | | | 100 | % | | | | 100 | % |
| Invesco Russell Top 200 Pure Growth ETF | | | | 0 | % | | | | 100 | % | | | | 100 | % |
| Invesco Russell Top 200 Pure Value ETF | | | | 0 | % | | | | 100 | % | | | | 100 | % |
| Invesco Zacks Mid-Cap ETF | | | | 0 | % | | | | 100 | % | | | | 88 | % |
| Invesco Zacks Multi-Asset Income ETF | | | | 0 | % | | | | 89 | % | | | | 72 | % |
| * | The above percentages are based on ordinary income dividends paid to shareholders during the Fund’s fiscal year. |
Trustees and Officers
The Independent Trustees of the Trust, their term of office and length of time served, their principal business occupations during at least the past five years, the number of portfolios in the Fund Complex (as defined below) overseen by each Independent Trustee and the other directorships, if any, held by each Independent Trustee are shown below.
| | | | | | | | | | |
Name, Address and Year of
Birth of Independent Trustees | | Position(s)
Held
with Trust | | Term of
Office and
Length of
Time
Served* | | Principal
Occupation(s) During
Past 5 Years | | Number of
Portfolios
in Fund
Complex**
Overseen by
Independent
Trustees | | Other
Directorships
Held by
Independent
Trustees During
the Past 5 Years |
Ronn R. Bagge—1958
c/o Invesco Capital Management LLC
3500 Lacey Road, Suite 700
Downers Grove, IL 60515 | | Vice Chairman of the Board; Chairman of the Nominating and Governance Committee and Trustee | | Vice Chairman since 2018; Chairman of the Nominating and Governance Committee and Trustee since 2003 | | Founder and Principal, YQA Capital Management LLC (1998-Present); formerly, Owner/CEO of Electronic Dynamic Balancing Co., Inc. (high-speed rotating equipment service provider). | | 241 | | Trustee and Investment Oversight Committee member, Mission Aviation Fellowship (2017-Present). |
| | | | | |
Todd J. Barre—1957
c/o Invesco Capital Management LLC
3500 Lacey Road, Suite 700
Downers Grove, IL 60515 | | Trustee | | Since 2010 | | Assistant Professor of Business, Trinity Christian College (2010-2016); formerly, Vice President and Senior Investment Strategist (2001-2008), Director of Open Architecture and Trading (2007-2008), Head of Fundamental Research (2004-2007), and Vice President and Senior Fixed Income Strategist (1994-2001), BMO Financial Group/Harris Private Bank. | | 241 | | None. |
| | | | | |
Marc M. Kole—1960
c/o Invesco Capital Management LLC
3500 Lacey Road, Suite 700
Downers Grove, IL 60515 | | Chairman of the Audit Committee and Trustee | | Chairman of the Audit Committee since 2008; Trustee since 2006 | | Senior Director of Finance, By The Hand Club For Kids (not-for-profit) (2015-Present); formerly, Chief Financial Officer, Hope Network (social services) (2008-2012); Assistant Vice President and Controller, Priority Health (health insurance) (2005-2008); Regional Chief Financial Officer, United Healthcare (2005); Chief Accounting Officer, Senior Vice President of Finance, Oxford Health Plans (2000-2004); Audit Partner, Arthur Andersen LLP (1996-2000). | | 241 | | Treasurer (2018-Present), Finance Committee Member (2015-Present) and Audit Committee Member (2015), Thornapple Evangelical Covenant Church; formerly, Board and Finance Committee Member (2009-2017) and Treasurer (2010-2015, 2017), NorthPointe Christian Schools. |
| * | This is the date the Independent Trustee began serving the Trust. Each Independent Trustee serves an indefinite term, until his successor is elected. |
| ** | Fund Complex includes all open- and closed-end funds (including all of their portfolios) advised by the Adviser and any affiliated person of the Adviser. |
Trustees and Officers(continued)
| | | | | | | | | | |
Name, Address and Year of
Birth of Independent Trustees | | Position(s)
Held
with Trust | | Term of
Office and
Length of
Time
Served* | | Principal
Occupation(s) During
Past 5 Years | | Number of
Portfolios
in Fund
Complex**
Overseen by
Independent
Trustees | | Other
Directorships
Held by
Independent
Trustees During
the Past 5 Years |
Yung Bong Lim—1964
c/o Invesco Capital Management LLC
3500 Lacey Road, Suite 700
Downers Grove, IL 60515 | | Chairman of the Investment Oversight Committee and Trustee | | Chairman of the Investment Oversight Committee since 2014; Trustee since 2013 | | Managing Partner, RDG Funds LLC (real estate) (2008-Present); formerly, Managing Director, Citadel LLC (1999-2007). | | 241 | | Advisory Board Member, Performance Trust Capital Partners, LLC (2008-Present); Board Director, Beacon Power Services, Corp. (2019-Present). |
| | | | | |
Gary R. Wicker—1961
c/o Invesco Capital Management LLC
3500 Lacey Road, Suite 700
Downers Grove, IL 60515 | | Trustee | | Since 2013 | | Senior Vice President of Global Finance and Chief Financial Officer at RBC Ministries (publishing company) (2013-Present); formerly, Executive Vice President and Chief Financial Officer, Zondervan Publishing (a division of Harper Collins/NewsCorp) (2007-2012); Senior Vice President and Group Controller (2005-2006), Senior Vice President and Chief Financial Officer (2003-2004), Chief Financial Officer (2001-2003), Vice President, Finance and Controller (1999-2001) and Assistant Controller (1997-1999), divisions of The Thomson Corporation (information services provider); Senior Audit Manager (1994-1997), PricewaterhouseCoopers LLP. | | 241 | | Board Member and Treasurer, Our Daily Bread Ministries Canada (2015-Present); Board and Finance Committee Member, West Michigan Youth For Christ (2010-Present). |
| | | | | |
Donald H. Wilson—1959
c/o Invesco Capital Management LLC
3500 Lacey Road, Suite 700
Downers Grove, IL 60515 | | Chairman of the Board and Trustee | | Chairman since 2012; Trustee since 2006 | | Chairman, President and Chief Executive Officer, McHenry Bancorp Inc. and McHenry Savings Bank (subsidiary) (2018-Present); Chairman and Chief Executive Officer, Stone Pillar Advisors, Ltd. (advisory services to the financial sector) (2010-Present); formerly, President and Chief Executive Officer, Stone Pillar Investments, Ltd. (2016-2018); Chairman, President and Chief Executive Officer, Community Financial Shares, Inc. and Community Bank—Wheaton/Glen Ellyn (subsidiary) (2013-2015); Chief Operating Officer, AMCORE Financial, Inc. (bank holding company) (2007-2009); Executive Vice President and Chief Financial Officer, AMCORE Financial, Inc. (2006-2007); Senior Vice President and Treasurer, Marshall & Ilsley Corp. (bank holding company) (1995-2006). | | 241 | | Director, Penfield Children’s Center (2004-present); Board Chairman, Gracebridge Alliance, Inc. (2015-present). |
| * | This is the date the Independent Trustee began serving the Trust. Each Independent Trustee serves an indefinite term, until his successor is elected. |
| ** | Fund Complex includes all open- and closed-end funds (including all of their portfolios) advised by the Adviser and any affiliated person of the Adviser. |
Trustees and Officers(continued)
The Interested Trustee and the executive officers of the Trust, their term of office and length of time served, their principal business occupations during at least the past five years, the number of portfolios in the Fund Complex (as defined below) overseen by the Interested Trustee and the other directorships, if any, held by the Interested Trustee are shown below.
| | | | | | | | | | |
Name, Address and Year of
Birth of Interested Trustee | | Position(s)
Held
with Trust | | Term of
Office
and
Length of
Time
Served* | | Principal
Occupation(s) During
Past 5 Years | | Number of
Portfolios
in Fund
Complex**
Overseen by
Interested
Trustee | | Other
Directorships
Held by
Interested
Trustee During
the Past 5 Years |
Kevin M. Carome—1956
Invesco Ltd.
Two Peachtree Pointe,
1555 Peachtree St., N.E.,
Suite 1800
Atlanta, GA 30309 | | Trustee | | Since 2010 | | Senior Managing Director, Secretary and General Counsel, Invesco Ltd. (2007-Present); Director, Invesco Advisers, Inc. (2009-Present); Director (2006-Present) and Executive Vice President (2008–Present), Invesco North American Holdings, Inc.; Executive Vice President (2008–Present), Invesco Investments (Bermuda) Ltd.; Manager, Horizon Flight Works LLC, and Director, Invesco Finance PLC (2011- Present); Director and Secretary (2012–Present), Invesco Services (Bahamas) Private Limited; and Director and Executive Vice President (2014–Present), INVESCO Asset Management (Bermuda) Ltd.; formerly, Director and Executive Vice President, Invesco Finance, Inc. (2011-2018); Director (2006-2018) and Executive Vice President (2008–2018), Invesco Group Services, Inc., Invesco Holding Company (US), Inc.; Director, Invesco Holding Company Limited (2007-2018); Director and Chairman, INVESCO Funds Group, Inc., Senior Vice President, Secretary and General Counsel, Invesco Advisers, Inc. (2003-2006); Director, Invesco Investments (Bermuda) Ltd. (2008-2016); Senior Vice President and General Counsel, Liberty Financial Companies, Inc. (2000-2001); General Counsel of certain investment management subsidiaries of Liberty Financial Companies, Inc. (1998-2000); Associate General Counsel, Liberty Financial Companies, Inc. (1993-1998); Associate, Ropes & Gray LLP. | | 241 | | None |
| * | This is the date the Interested Trustee began serving the Trust. The Interested Trustee serves an indefinite term, until his successor is elected. |
| ** | Fund Complex includes all open- andclosed-end funds (including all of their portfolios) advised by the Adviser and any affiliated person of the Adviser. |
Trustees and Officers(continued)
| | | | | | |
Name, Address and Year of
Birth of Executive Officers | | Position(s)
Held
with Trust | | Length of
Time
Served* | | Principal Occupation(s) During Past 5 Years |
Daniel E. Draper—1968 Invesco Capital
Management LLC 3500 Lacey Road, Suite 700 Downers Grove, IL 60515 | | President and Principal Executive Officer | | Since 2015 | | Chief Executive Officer, Manager and Principal Executive Officer, Invesco Specialized Products, LLC (2018-Present); President and Principal Executive Officer, Invesco Exchange-Traded Fund Trust, Invesco Exchange-Traded Fund Trust II, Invesco India Exchange-Traded Fund Trust, Invesco Actively Managed Exchange-Traded Fund Trust and Invesco Actively Managed Exchange-Traded Commodity Fund Trust (2015-Present) and Invesco Exchange-Traded Self-Indexed Fund Trust (2016-Present); Chief Executive Officer and Principal Executive Officer (2016-Present) and Managing Director (2013-Present), Invesco Capital Management LLC; Senior Vice President, Invesco Distributors, Inc. (2014-Present); formerly, Vice President, Invesco Exchange-Traded Fund Trust, Invesco Exchange-Traded Fund Trust II, Invesco India Exchange-Traded Fund Trust, Invesco Actively Managed Exchange-Traded Fund Trust (2013-2015) and Invesco Actively Managed Exchange-Traded Commodity Fund Trust (2014-2015); Managing Director, Credit Suisse Asset Management (2010-2013) and Lyxor Asset Management/Societe Generale (2007-2010). |
| | | |
Kelli Gallegos—1970 Invesco Capital Management LLC 3500 Lacey Road, Suite 700 Downers Grove, IL 60515 | | Vice President
and Treasurer | | Since 2018 | | Assistant Treasurer, Invesco Specialized Products, LLC (2018-Present); Vice President and Treasurer, Invesco Exchange-Traded Fund Trust, Invesco Exchange-Traded Fund Trust II, Invesco India Exchange-Traded Fund Trust, Invesco Actively Managed Exchange-Traded Fund Trust, Invesco Actively Managed Exchange-Traded Commodity Fund Trust and Invesco Exchange-Traded Self-Indexed Fund Trust (2018-Present); Principal Financial and Accounting Officer-Pooled Investments, Invesco Capital Management LLC (2018-Present); Vice President, Principal Financial Officer (2016-Present) and Assistant Treasurer (2008-Present), The Invesco Funds; formerly, Assistant Treasurer Invesco Exchange-Traded Fund Trust, Invesco Exchange-Traded Fund Trust II, Invesco India Exchange-Traded Fund Trust and Invesco Actively Managed Exchange-Traded Fund Trust (2012-2018), Invesco Actively Managed Exchange-Traded Commodity Fund Trust (2014-2018) and Invesco Exchange-Traded Self-Indexed Fund Trust (2016-2018); Assistant Treasurer, Invesco Capital Management LLC (2013-2018); and Assistant Vice President, The Invesco Funds (2008-2016). |
| | | |
Peter Hubbard—1981 Invesco Capital Management LLC 3500 Lacey Road, Suite 700 Downers Grove, IL 60515 | | Vice President | | Since 2009 | | Vice President, Invesco Specialized Products, LLC (2018-Present); Vice President, Invesco Exchange-Traded Fund Trust, Invesco Exchange-Traded Fund Trust II, Invesco India Exchange-Traded Fund Trust, Invesco Actively Managed Exchange-Traded Fund Trust (2009-Present), Invesco Actively Managed Exchange-Traded Commodity Fund Trust (2014-Present) and Invesco Exchange-Traded Self-Indexed Fund Trust (2016-Present); Vice President and Director of Portfolio Management, Invesco Capital Management LLC (2010-Present); formerly, Vice President of Portfolio Management, Invesco Capital Management LLC (2008-2010); Portfolio Manager, Invesco Capital Management LLC (2007-2008); Research Analyst, Invesco Capital Management LLC (2005-2007); Research Analyst and Trader, Ritchie Capital, a hedge fund operator (2003-2005). |
| * | This is the date each Officer began serving the Trust. Each Officer serves an indefinite term, until his or her successor is elected. |
Trustees and Officers(continued)
| | | | | | |
Name, Address and Year of
Birth of Executive Officers | | Position(s)
Held
with Trust | | Length of
Time
Served* | | Principal Occupation(s) During Past 5 Years |
Sheri Morris—1964 Invesco Capital Management LLC 3500 Lacey Road, Suite 700 Downers Grove, IL 60515 | | Vice President | | Since 2012 | | President and Principal Executive Officer, The Invesco Funds (2016-Present); Treasurer, The Invesco Funds (2008-Present); Vice President, Invesco Advisers, Inc. (formerly known as Invesco Institutional (N.A.), Inc.) (registered investment adviser) (2009-Present) and Vice President, Invesco Exchange-Traded Fund Trust, Invesco Exchange-Traded Fund Trust II, Invesco India Exchange-Traded Fund Trust, Invesco Actively Managed Exchange-Traded Fund Trust (2012-Present), Invesco Actively Managed Exchange-Traded Commodity Fund Trust (2014-Present) and Invesco Exchange-Traded Self-Indexed Fund Trust (2016-Present); formerly, Vice President and Principal Financial Officer, The Invesco Funds (2008-2016); Treasurer, Invesco Exchange-Traded Fund Trust, Invesco Exchange-Traded Fund Trust II, Invesco India Exchange-Traded Fund Trust and Invesco Actively Managed Exchange-Traded Fund Trust (2011-2013); Vice President, Invesco Aim Advisers, Inc., Invesco Aim Capital Management, Inc. and Invesco Aim Private Asset Management, Inc.; Assistant Vice President and Assistant Treasurer, The Invesco Funds and Assistant Vice President, Invesco Advisers, Inc., Invesco Aim Capital Management, Inc. and Invesco Aim Private Asset Management, Inc. |
| | | |
Anna Paglia—1974 Invesco Capital Management LLC 3500 Lacey Road, Suite 700 Downers Grove, IL 60515 | | Secretary | | Since 2011 | | Secretary, Invesco Specialized Products, LLC (2018-Present); Secretary, Invesco Exchange-Traded Fund Trust, Invesco Exchange-Traded Fund Trust II, Invesco India Exchange-Traded Fund Trust, Invesco Actively Managed Exchange-Traded Fund Trust (2011-Present), Invesco Actively Managed Exchange-Traded Commodity Fund Trust (2014-Present) and Invesco Exchange-Traded Self-Indexed Fund Trust (2015-Present); Head of Legal (2010-Present) and Secretary (2015-Present), Invesco Capital Management LLC; Manager and Assistant Secretary, Invesco Indexing LLC (2017-Present); formerly, Partner, K&L Gates LLP (formerly, Bell Boyd & Lloyd LLP) (2007-2010); Associate Counsel at Barclays Global Investors Ltd. (2004-2006). |
| | | |
Rudolf E. Reitmann—1971 Invesco Capital Management LLC 3500 Lacey Road, Suite 700 Downers Grove, IL 60515 | | Vice President | | Since 2013 | | Head of Global Exchange Traded Funds Services, Invesco Specialized Products, LLC (2018-Present); Vice President, Invesco Exchange-Traded Fund Trust, Invesco Exchange-Traded Fund Trust II, Invesco India Exchange-Traded Fund Trust, Invesco Actively Managed Exchange-Traded Fund Trust (2013-Present), Invesco Actively Managed Exchange-Traded Commodity Fund Trust (2014-Present) and Invesco Exchange-Traded Self-Indexed Fund Trust (2016-Present); Head of Global Exchange Traded Funds Services, Invesco Capital Management LLC (2013-Present); Vice President, Invesco Capital Markets, Inc. (2018-Present). |
| * | This is the date each Officer began serving the Trust. Each Officer serves an indefinite term, until his or her successor is elected. |
Trustees and Officers(continued)
| | | | | | |
Name, Address and Year of
Birth of Executive Officers | | Position(s)
Held
with Trust | | Length of
Time
Served* | | Principal Occupation(s) During Past 5 Years |
David Warren—1957 Invesco Canada Ltd. 5140 Yonge Street, Suite 800 Toronto, Ontario M2N 6X7 | | Vice President | | Since 2009 | | Manager, Invesco Specialized Products, LLC (2018-Present); Vice President, Invesco Exchange-Traded Fund Trust, Invesco Exchange-Traded Fund Trust II, Invesco India Exchange-Traded Fund Trust, and Invesco Actively Managed Exchange-Traded Fund Trust (2009-Present), Invesco Actively Managed Exchange-Traded Commodity Fund Trust (2014-Present) and Invesco Exchange-Traded Self-Indexed Fund Trust (2016-Present); Managing Director—Chief Administrative Officer, Americas, Invesco Capital Management LLC; Senior Vice President, Invesco Advisers, Inc. (2009-Present); Director, Invesco Inc. (2009-Present); Director, Executive Vice President and Chief Financial Officer, Invesco Canada Ltd. (formerly, Invesco Trimark Ltd.) (2011-Present); Chief Administrative Officer, North American Retail, Invesco Ltd. (2007-Present); Director, Invesco Corporate Class Inc. (2014-Present); Director, Invesco Global Direct Real Estate Feeder GP Ltd. (2015-Present); Director, Invesco Canada Holdings Inc. (2002-Present); Director, Invesco Financial Services Ltd. / Services Financiers Invesco Ltée and Trimark Investments Ltd./Placements Trimark Ltée (2014-Present); Director, Invesco IP Holdings (Canada) Ltd. (2016-Present); Director, Invesco Global Direct Real Estate GP Ltd. (2015-Present); formerly, Senior Vice President, Invesco Management Group, Inc. (2007-2018); Executive Vice President and Chief Financial Officer, Invesco Inc. (2009-2015); Director, Executive Vice President and Chief Financial Officer, Invesco Canada Ltd. (formerly, Invesco Trimark Ltd.) (2000-2011). |
| | | |
Melanie Zimdars—1976 Invesco Capital
Management LLC 3500 Lacey Road, Suite 700 Downers Grove, IL 60515 | | Chief Compliance
Officer | | Since 2017 | | Chief Compliance Officer, Invesco Specialized Products, LLC (2018-Present); Chief Compliance Officer, Invesco Capital Management LLC (2017-Present); Chief Compliance Officer, Invesco Exchange-Traded Fund Trust, Invesco Exchange-Traded Fund Trust II, Invesco India Exchange-Traded Fund Trust, Invesco Actively Managed Exchange-Traded Fund Trust, Invesco Actively Managed Exchange-Traded Commodity Fund Trust and Invesco Exchange-Traded Self-Indexed Fund Trust (2017-Present); formerly, Vice President and Deputy Chief Compliance Officer at ALPS Holding, Inc. (2009-2017); Mutual Fund Treasurer/Chief Financial Officer at Wasatch Advisors, Inc. (2005-2008); Compliance Officer, U.S. Bancorp Fund Services, LLC (2001-2005). |
Availability of Additional Information About the Trustees
The Statement of Additional Information includes additional information about the Trustees and is available, without charge, upon request at (800)983-0903.
| * | This is the date each Officer began serving the Trust. Each Officer serves an indefinite term, until his or her successor is elected. |
Board Considerations Regarding Continuation of Investment Advisory Agreement
At a meeting held on April 11, 2019, the Board of Trustees of the Invesco Exchange-Traded Fund Trust (the “Trust”), including the Independent Trustees, approved the continuation of the Investment Advisory Agreement between Invesco Capital Management LLC (the “Adviser”) and the Trust for the following 53 series (each, a “Fund” and collectively, the “Funds”):
Invesco Aerospace & Defense ETF
Invesco BRIC ETF
Invesco BuyBack AchieversTM ETF
Invesco CleantechTM ETF
Invesco Dividend AchieversTM ETF
Invesco DWA Basic Materials Momentum ETF
Invesco DWA Consumer Cyclicals Momentum ETF
Invesco DWA Consumer Staples Momentum ETF
Invesco DWA Energy Momentum ETF
Invesco DWA Financial Momentum ETF
Invesco DWA Healthcare Momentum ETF
Invesco DWA Industrials Momentum ETF
Invesco DWA Momentum ETF
Invesco DWA NASDAQ Momentum ETF
Invesco DWA Technology Momentum ETF
Invesco DWA Utilities Momentum ETF
Invesco Dynamic Biotechnology & Genome ETF
Invesco Dynamic Building & Construction ETF
Invesco Dynamic Energy Exploration & Production ETF
Invesco Dynamic Food & Beverage ETF
Invesco Dynamic Large Cap Growth ETF
Invesco Dynamic Large Cap Value ETF
Invesco Dynamic Leisure and Entertainment ETF
Invesco Dynamic Market ETF
Invesco Dynamic Media ETF
Invesco Dynamic Networking ETF
Invesco Dynamic Oil & Gas Services ETF
Invesco Dynamic Pharmaceuticals ETF
Invesco Dynamic Retail ETF
Invesco Dynamic Semiconductors ETF
Invesco Dynamic Software ETF
Invesco Financial Preferred ETF
Invesco FTSE RAFI US 1000 ETF
Invesco FTSE RAFI US 1500Small-Mid ETF
Invesco Global Listed Private Equity ETF
Invesco Golden Dragon China ETF
Invesco High Yield Equity Dividend AchieversTM ETF
Invesco Insider Sentiment ETF
Invesco International Dividend AchieversTM ETF
Invesco Russell 2000 Pure Growth ETF
Invesco Russell 2000 Pure Value ETF
Invesco Russell Midcap Equal Weight ETF
Invesco Russell Midcap Pure Growth ETF
Invesco Russell Midcap Pure Value ETF
Invesco Russell Top 200 Equal Weight ETF
Invesco Russell Top 200 Pure Growth ETF
Invesco Russell Top 200 Pure Value ETF
Invesco S&P 500® Quality ETF
Invesco S&PSpin-Off ETF
Invesco Water Resources ETF
Invesco WilderHill Clean Energy ETF
Invesco ZacksMid-Cap ETF
Invesco Zacks Multi-Asset Income ETF
The Trustees reviewed information from the Adviser describing: (i) the nature, extent and quality of services provided, (ii) the investment performance of the Funds and the Adviser, (iii) the fees and expenses paid by the Funds and comparisons to amounts paid by other comparable registered investment companies, (iv) the costs of services provided and estimated profits realized by the Adviser, (v) the extent to which economies of scale may be realized as a Fund grows and whether fee levels reflect any possible economies of scale for the benefit of Fund shareholders, and (vi) any further benefits realized by the Adviser from its relationships with the Funds.
Nature, Extent and Quality of Services. In evaluating the nature, extent and quality of the Adviser’s services, the Trustees reviewed information concerning the functions performed by the Adviser for the Funds, information describing the Adviser’s current organization and staffing, including operational support provided by the Adviser’s parent organization, Invesco Ltd. (“Invesco”), and the background and experience of the persons responsible for theday-to-day management of the Funds. The Trustees reviewed matters related to the Adviser’s execution and/or oversight of execution of portfolio transactions on behalf of the Funds. The Trustees also reviewed information on the performance of the Funds and their underlying indexes for theone-year, three-year, five-year,ten-year and since-inception periods ended December 31, 2018, as applicable, including reports for each of those periods on the correlation and tracking error between each Fund’s performance and the performance of its underlying index, as well as the Adviser’s analysis of the tracking error between certain Funds and their underlying indexes. In reviewing the tracking error reports, the Trustees considered information provided by Invesco’s Global Performance Measurement and Risk Group, an independent organization within Invesco, with respect to general expected tracking error ranges. The Trustees also considered that certain Funds were created in connection with the purchase
Board Considerations Regarding Continuation of Investment Advisory Agreement(continued)
by Invesco of the exchange-traded funds business of Guggenheim Capital LLC (the “Transaction”) and that such Funds’ performance prior to the closing of the Transaction on April 6, 2018 or May 18, 2018, as applicable, is that of their predecessor Guggenheim ETFs. The Trustees noted that, for each applicable period, the correlation and tracking error for each Fund was within the targeted range set forth in the Trust’s registration statement and concluded that each Fund was correlated to its underlying index and that the tracking error for each Fund was within an acceptable range given that Fund’s particular circumstances.
The Trustees also considered the services provided by the Adviser in its oversight of the Funds’ administrator, custodian and transfer agent. They noted the significant amount of time, effort and resources that had been devoted to this oversight function.
Based on their review, the Trustees concluded that the nature, extent and quality of services provided by the Adviser to the Funds under the Investment Advisory Agreement were appropriate and reasonable.
Fees, Expenses and Profitability. The Trustees reviewed and discussed the information provided by the Adviser on each Fund’s contractual advisory fee, net advisory fee, and gross and net expense ratios. The Trustees also compared each Fund’s contractual advisory fee and net expense ratio to information compiled by the Adviser from Lipper Inc. databases on the net advisory fees and net expense ratios of comparable exchange-traded funds (“ETFs”),open-end(non-ETF) index funds andopen-end(non-ETF) actively-managed funds, as applicable. The Trustees noted that the annual contractual advisory fee charged to each Fund is:
| | ● | | 0.50% of the Fund’s average daily net assets for each Fund other than Invesco Dividend AchieversTM ETF, Invesco FTSE RAFI US 1000 ETF, Invesco FTSE RAFI US 1500Small-Mid ETF, Invesco High Yield Equity Dividend AchieversTM ETF, Invesco International Dividend Achievers™ ETF, Invesco Russell 2000 Pure Growth ETF, Invesco Russell 2000 Pure Value ETF, Invesco Russell Midcap Equal Weight ETF, Invesco Russell Midcap Pure Growth ETF, Invesco Russell Midcap Pure Value ETF, Invesco Russell Top 200 Equal Weight ETF, Invesco Russell Top 200 Pure Growth ETF, Invesco Russell Top 200 Pure Value ETF and Invesco S&P 500® Quality ETF (The net advisory fee, after giving effect to the Expense Cap, as defined below, was-0.16% for Invesco Dynamic Retail ETF.); |
| | ● | | 0.40% of the Fund’s average daily net assets for each of Invesco Dividend AchieversTM ETF, Invesco High Yield Equity Dividend AchieversTM ETF and Invesco International Dividend AchieversTM ETF; |
| | ● | | 0.29% of the Fund’s average daily net assets for each of Invesco FTSE RAFI US 1000 ETF, Invesco FTSE RAFI US 1500Small-Mid ETF, Invesco Russell 2000 Pure Growth ETF, Invesco Russell 2000 Pure Value ETF, Invesco Russell Midcap Pure Growth ETF, Invesco Russell Midcap Pure Value ETF, Invesco Russell Top 200 Pure Growth ETF and Invesco Russell Top 200 Pure Value ETF; |
| | ● | | 0.25% of the Fund’s average daily net assets for each of Invesco Russell Midcap Equal Weight ETF and Invesco Russell Top 200 Equal Weight ETF (The net advisory fee, after giving effect to the Expense Cap, as defined below, was-0.17% for Invesco Russell Midcap Equal Weight ETF.); and |
| | ● | | 0.15% of the Fund’s average daily net assets for Invesco S&P 500® Quality ETF (The Trustees noted that, prior to September 24, 2018, the Fund’s advisory fee was 0.29%.). |
The Trustees also noted that the Adviser has agreed to waive a portion of its contractual advisory fee and/or pay expenses (an “Expense Cap”) to the extent necessary to prevent the annual operating expenses of each Fund from exceeding the percentage of that Fund’s average daily net assets, at least until August 31, 2021, as set forth below:
| | ● | | 0.60%, excluding interest expenses, brokerage commissions and other trading expenses, taxes, acquired fund fees and expenses, if applicable, and extraordinary expenses, for each of Invesco DWA NASDAQ Momentum ETF and Invesco Dynamic Market ETF; |
| | ● | | 0.60%, excluding interest expenses, offering costs, brokerage commissions and other trading expenses, taxes, acquired fund fees and expenses, if applicable, and extraordinary expenses, for each of Invesco DWA Basic Materials Momentum ETF, Invesco DWA Consumer Cyclicals Momentum ETF, Invesco DWA Consumer Staples Momentum ETF, Invesco DWA Energy Momentum ETF, Invesco DWA Financial Momentum ETF, Invesco DWA Healthcare Momentum ETF, Invesco DWA Industrials Momentum ETF, Invesco DWA Technology Momentum ETF and Invesco DWA Utilities Momentum ETF; |
| | ● | | 0.50%, excluding interest expenses,sub-licensing fees, offering costs, brokerage commissions and other trading expenses, taxes, acquired fund fees and expenses, if applicable, and extraordinary expenses, for each of Invesco Dividend AchieversTM ETF, Invesco High Yield Equity Dividend AchieversTM ETF and Invesco International Dividend AchieversTM ETF; |
| | ● | | 0.39%, excluding interest expenses, offering costs, brokerage commissions and other trading expenses, taxes, acquired fund fees and expenses, if applicable, and extraordinary expenses, for each of Invesco FTSE RAFI US 1000 ETF, Invesco FTSE RAFI US |
Board Considerations Regarding Continuation of Investment Advisory Agreement(continued)
| | 1500Small-Mid ETF, Invesco Russell 2000 Pure Growth ETF, Invesco Russell 2000 Pure Value ETF, Invesco Russell Midcap Pure Growth ETF, Invesco Russell Midcap Pure Value ETF, Invesco Russell Top 200 Pure Growth ETF and Invesco Russell Top 200 Pure Value ETF; |
| | ● | | 0.25%, excluding interest expenses, offering costs, brokerage commissions and other trading expenses, taxes, acquired fund fees and expenses, if applicable, and extraordinary expenses, for each of Invesco Russell Midcap Equal Weight ETF and Invesco Russell Top 200 Equal Weight ETF; |
| | ● | | 0.15%, excluding interest expenses, offering costs, brokerage commissions and other trading expenses, taxes, acquired fund fees and expenses, if applicable, and extraordinary expenses, for Invesco S&P 500 Quality ETF; and |
| | ● | | 0.60%, excluding interest expenses,sub-licensing fees, offering costs, brokerage commissions and other trading expenses, taxes, acquired fund fees and expenses, if applicable, and extraordinary expenses, for each other Fund. |
The Trustees noted that the Adviser represented that it does not serve as the investment adviser to any clients, other than other ETFs also overseen by the Trustees, with comparable investment strategies as the Funds, but that it providessub-advisory services to other clients. The Trustees further noted the Adviser’s explanation with respect to thesub-advisory fees it receives for such services in comparison to the advisory fees charged to the Funds. The Trustees noted that the contractual advisory fees for certain Funds were equal to or lower than the median net advisory fees of their ETF andopen-end index peer funds, as applicable, as illustrated in the table below. The Trustees also noted that the contractual advisory fees for all of the Funds were lower than the median net advisory fees of theiropen-end actively-managed peer funds.
| | | | | | | | | | | | |
Invesco Fund | | Equal to/Lower
than ETF Median | | | Equal to/Lower
than Open-End
Index Fund
Median* | | | Equal to/Lower
than Open-End
Active Fund
Median | |
| Invesco Aerospace & Defense ETF | | | | | | | | | | | X | |
| Invesco BRIC ETF | | | | | | | | | | | X | |
| Invesco Buyback AchieversTM ETF | | | | | | | | | | | X | |
| Invesco CleantechTM ETF | | | | | | | | | | | X | |
| Invesco Dividend AchieversTM ETF | | | | | | | | | | | X | |
| Invesco DWA Basic Materials Momentum ETF | | | | | | | | | | | X | |
| Invesco DWA Consumer Cyclicals Momentum ETF | | | | | | | | | | | X | |
| Invesco DWA Consumer Staples Momentum ETF | | | | | | | | | | | X | |
| Invesco DWA Energy Momentum ETF | | | | | | | | | | | X | |
| Invesco DWA Financial Momentum ETF | | | | | | | | | | | X | |
| Invesco DWA Healthcare Momentum ETF | | | | | | | | | | | X | |
| Invesco DWA Industrials Momentum ETF | | | | | | | | | | | X | |
| Invesco DWA Momentum ETF | | | X | | | | | | | | X | |
| Invesco DWA NASDAQ Momentum ETF | | | | | | | | | | | X | |
| Invesco DWA Technology Momentum ETF | | | | | | | | | | | X | |
| Invesco DWA Utilities Momentum ETF | | | | | | | | | | | X | |
| Invesco Dynamic Biotechnology & Genome ETF | | | | | | | | | | | X | |
| Invesco Dynamic Building & Construction ETF | | | | | | | | | | | X | |
| Invesco Dynamic Energy Exploration & Production ETF | | | | | | | | | | | X | |
| Invesco Dynamic Food & Beverage ETF | | | | | | | | | | | X | |
| Invesco Dynamic Large Cap Growth ETF | | | | | | | | | | | X | |
| Invesco Dynamic Large Cap Value ETF | | | | | | | | | | | X | |
| Invesco Dynamic Leisure and Entertainment ETF | | | | | | | | | | | X | |
| Invesco Dynamic Market ETF | | | | | | | | | | | X | |
| Invesco Dynamic Media ETF | | | | | | | | | | | X | |
| Invesco Dynamic Networking ETF | | | | | | | | | | | X | |
Board Considerations Regarding Continuation of Investment Advisory Agreement(continued)
| | | | | | | | | | | | |
Invesco Fund | | Equal to/Lower
than ETF Median | | | Equal to/Lower
than Open-End
Index Fund
Median* | | | Equal to/Lower
than Open-End
Active Fund
Median | |
| Invesco Dynamic Oil & Gas Services ETF | | | | | | | N/A | | | | X | |
| Invesco Dynamic Pharmaceuticals ETF | | | | | | | | | | | X | |
| Invesco Dynamic Retail ETF | | | | | | | | | | | X | |
| Invesco Dynamic Semiconductors ETF | | | | | | | | | | | X | |
| Invesco Dynamic Software ETF | | | | | | | | | | | X | |
| Invesco Financial Preferred ETF | | | | | | | N/A | | | | X | |
| Invesco FTSE RAFI US 1000 ETF | | | | | | | | | | | X | |
| Invesco FTSE RAFI US 1500Small-Mid ETF | | | | | | | | | | | X | |
| Invesco Global Listed Private Equity ETF | | | | | | | N/A | | | | X | |
| Invesco Golden Dragon China ETF | | | X | | | | N/A | | | | X | |
| Invesco High Yield Equity Dividend AchieversTM ETF | | | | | | | | | | | X | |
| Invesco Insider Sentiment ETF | | | | | | | | | | | X | |
| Invesco International Dividend AchieversTM ETF | | | X | | | | | | | | X | |
| Invesco Russell 2000 Pure Growth ETF | | | | | | | X | | | | X | |
| Invesco Russell 2000 Pure Value ETF | | | | | | | X | | | | X | |
| Invesco Russell Midcap Equal Weight ETF | | | | | | | | | | | X | |
| Invesco Russell Midcap Pure Growth ETF | | | X | | | | | | | | X | |
| Invesco Russell Midcap Pure Value ETF | | | X | | | | | | | | X | |
| Invesco Russell Top 200 Equal Weight ETF | | | X | | | | | | | | X | |
| Invesco Russell Top 200 Pure Growth ETF | | | | | | | | | | | X | |
| Invesco Russell Top 200 Pure Value ETF | | | | | | | | | | | X | |
| Invesco S&P 500® Quality ETF | | | X | | | | | | | | X | |
| Invesco S&PSpin-Off | | | | | | | | | | | X | |
| Invesco Water Resources ETF | | | | | | | | | | | X | |
| Invesco WilderHill Clean Energy ETF | | | | | | | | | | | X | |
| Invesco ZacksMid-Cap ETF | | | | | | | | | | | X | |
| Invesco Zacks Multi-Asset Income ETF | | | | | | | | | | | X | |
| * | The information provided by the Adviser indicated that certain Funds did not haveopen-end index fund peers. Those Funds have been designated with an “N/A” for not available. |
The Trustees determined that the contractual advisory fees were reasonable, noting the nature of the indexes, the distinguishing factors of the Funds, and the administrative, operational and management oversight costs for the Adviser. The Trustees noted that the net expense ratios for certain Funds were equal to or lower than the median net expense ratios of their ETF andopen-end index peer funds, as applicable, as illustrated in the table below. The Trustees also noted that the net expense ratios for all of the Funds were lower than the median net expense ratios of theiropen-end actively-managed peer funds.
| | | | | | | | | | | | |
Invesco Fund | | Equal to/Lower
than ETF Median | | | Equal to/Lower
than Open-End
Index Fund
Median* | | | Equal to/Lower
than Open-End
Active Fund
Median | |
| Invesco Aerospace & Defense ETF | | | | | | | | | | | X | |
| Invesco BRIC ETF | | | | | | | | | | | X | |
| Invesco Buyback AchieversTM ETF | | | | | | | | | | | X | |
| Invesco CleantechTM ETF | | | | | | | | | | | X | |
| Invesco Dividend AchieversTM ETF | | | | | | | X | | | | X | |
| Invesco DWA Basic Materials Momentum ETF | | | | | | | | | | | X | |
Board Considerations Regarding Continuation of Investment Advisory Agreement(continued)
| | | | | | | | | | | | |
Invesco Fund | | Equal to/Lower
than ETF Median | | | Equal to/Lower
than Open-End
Index Fund
Median* | | | Equal to/Lower
than Open-End
Active Fund
Median | |
| Invesco DWA Consumer Cyclicals Momentum ETF | | | | | | | | | | | X | |
| Invesco DWA Consumer Staples Momentum ETF | | | | | | | | | | | X | |
| Invesco DWA Energy Momentum ETF | | | | | | | | | | | X | |
| Invesco DWA Financial Momentum ETF | | | | | | | | | | | X | |
| Invesco DWA Healthcare Momentum ETF | | | | | | | | | | | X | |
| Invesco DWA Industrials Momentum ETF | | | | | | | | | | | X | |
| Invesco DWA Momentum ETF | | | | | | | X | | | | X | |
| Invesco DWA NASDAQ Momentum ETF | | | | | | | | | | | X | |
| Invesco DWA Technology Momentum ETF | | | | | | | | | | | X | |
| Invesco DWA Utilities Momentum ETF | | | | | | | | | | | X | |
| Invesco Dynamic Biotechnology & Genome ETF | | | | | | | | | | | X | |
| Invesco Dynamic Building & Construction ETF | | | | | | | | | | | X | |
| Invesco Dynamic Energy Exploration & Production ETF | | | | | | | | | | | X | |
| Invesco Dynamic Food & Beverage ETF | | | | | | | | | | | X | |
| Invesco Dynamic Large Cap Growth ETF | | | | | | | | | | | X | |
| Invesco Dynamic Large Cap Value ETF | | | | | | | | | | | X | |
| Invesco Dynamic Leisure and Entertainment ETF | | | | | | | | | | | X | |
| Invesco Dynamic Market ETF | | | | | | | | | | | X | |
| Invesco Dynamic Media ETF | | | | | | | | | | | X | |
| Invesco Dynamic Networking ETF | | | | | | | | | | | X | |
| Invesco Dynamic Oil & Gas Services ETF | | | | | | | N/A | | | | X | |
| Invesco Dynamic Pharmaceuticals ETF | | | | | | | | | | | X | |
| Invesco Dynamic Retail ETF | | | | | | | | | | | X | |
| Invesco Dynamic Semiconductors ETF | | | | | | | | | | | X | |
| Invesco Dynamic Software ETF | | | | | | | | | | | X | |
| Invesco Financial Preferred ETF | | | | | | | N/A | | | | X | |
| Invesco FTSE RAFI US 1000 ETF | | | | | | | | | | | X | |
| Invesco FTSE RAFI US 1500Small-Mid ETF | | | | | | | | | | | X | |
| Invesco Global Listed Private Equity ETF | | | | | | | N/A | | | | X | |
| Invesco Golden Dragon China ETF | | | | | | | N/A | | | | X | |
| Invesco High Yield Equity Dividend AchieversTM ETF | | | | | | | X | | | | X | |
| Invesco Insider Sentiment ETF | | | | | | | | | | | X | |
| Invesco International Dividend AchieversTM ETF | | | | | | | | | | | X | |
| Invesco Russell 2000 Pure Growth ETF | | | | | | | X | | | | X | �� |
| Invesco Russell 2000 Pure Value ETF | | | | | | | X | | | | X | |
| Invesco Russell Midcap Equal Weight ETF | | | | | | | | | | | X | |
| Invesco Russell Midcap Pure Growth ETF | | | | | | | | | | | X | |
| Invesco Russell Midcap Pure Value ETF | | | | | | | | | | | X | |
| Invesco Russell Top 200 Equal Weight ETF | | | X | | | | | | | | X | |
| Invesco Russell Top 200 Pure Growth ETF | | | | | | | | | | | X | |
| Invesco Russell Top 200 Pure Value ETF | | | | | | | | | | | X | |
| Invesco S&P 500® Quality ETF | | | X | | | | | | | | X | |
Board Considerations Regarding Continuation of Investment Advisory Agreement(continued)
| | | | | | | | | | | | |
Invesco Fund | | Equal to/Lower
than ETF Median | | | Equal to/Lower
than Open-End
Index Fund
Median* | | | Equal to/Lower
than Open-End
Active Fund
Median | |
| Invesco S&PSpin-Off ETF | | | | | | | | | | | X | |
| Invesco Water Resources ETF | | | | | | | | | | | X | |
| Invesco WilderHill Clean Energy ETF | | | | | | | | | | | X | |
| Invesco ZacksMid-Cap ETF | | | | | | | | | | | X | |
| Invesco Zacks Multi-Asset Income ETF | | | | | | | | | | | X | |
| * | The information provided by the Adviser indicated that certain Funds did not haveopen-end index fund peers. Those Funds have been designated with an “N/A” for not available. |
In response to questions from the Independent Trustees, the Adviser provided supplemental information regarding each of Invesco Dynamic Energy Exploration & Production ETF, Invesco Dynamic Large Cap Growth ETF and Invesco WilderHill Clean Energy ETF’s advisory fees and total expenses and the Lipper peer data. The Adviser explained in detail its view that it believes that the advisory fees and total expenses for these Funds are competitive and generally in line with other comparable funds in the marketplace, noting, in particular, the unique underlying investment strategy and complexity of each Fund, the limited number of peers in the Lipper data, and/or the differing pricing philosophy of certain of the peers.
The Trustees noted that a significant component of thenon-advisory fee expenses was the license fees paid by the Funds, and noted those Funds for which license fees are included in the Funds’ Expense Caps. The Trustees also noted that the Adviser has agreed to reimburse certain Funds in the amount equal to the licensing fee paid that causes that Fund’s annual operating expenses (excluding interest expenses, offering costs, brokerage commissions and other trading expenses, taxes, acquired fund fees and expenses and extraordinary expenses) to exceed a percentage of that Fund’s average daily net assets through April 6, 2020 (May 18, 2020 for Invesco BRIC ETF) as set forth below:
| | | | |
| Invesco BRIC ETF | | | 0.64 | % |
| Invesco Insider Sentiment ETF | | | 0.60 | % |
| Invesco S&PSpin-Off ETF | | | 0.64 | % |
| Invesco ZacksMid-Cap ETF | | | 0.65 | % |
| Invesco Zacks Multi-Asset Income ETF | | | 0.65 | % |
The Board concluded that the advisory fee and expense ratio of each Fund (giving effect to the Fund’s Expense Cap) were reasonable and appropriate in light of the services provided.
In conjunction with their review of fees, the Trustees considered information provided by the Adviser on the revenues received by the Adviser under the Investment Advisory Agreement for the Funds, as well as the fees waived and expenses reimbursed by the Adviser for the Funds. The Trustees reviewed information provided by the Adviser on its overall profitability, as well as the estimated profitability to the Adviser from its relationship to each Fund. The Trustees concluded that the overall and estimated profitability to the Adviser was not unreasonable.
Economies of Scale and Whether Fee Levels Reflect These Economies of Scale. The Trustees reviewed the information provided by the Adviser as to the extent to which economies of scale may be realized as each Fund grows and whether fee levels reflect economies of scale for the benefit of shareholders. The Trustees reviewed each Fund’s asset size, advisory fee, expense ratio and Expense Cap agreed to by the Adviser. The Trustees also noted that the Amended and Restated Excess Expense Agreement with the Trust provides that the Adviser is entitled to be reimbursed by each Fund, other than Invesco Dynamic Market ETF and Invesco DWA NASDAQ Momentum ETF, for fees waived or expenses absorbed pursuant to the Expense Cap for a period of three years from the date the fee or expense was incurred, provided that no reimbursement would be made that would result in a Fund exceeding its Expense Cap then in effect or in effect at the time the fees and/or expenses subject to reimbursement were waived and/or borne by the Adviser. The Trustees considered whether the advisory fee rate for each Fund was reasonable in relation to the asset size of that Fund, and concluded that the flat advisory fee was reasonable and appropriate.
Board Considerations Regarding Continuation of Investment Advisory Agreement(continued)
The Trustees noted that the Adviser had not identified any further benefits that it derived from its relationships with the Funds and had noted that it does not have any soft-dollar arrangements.
Based on all of the information considered and the conclusions reached, the Board, including the Independent Trustees, determined to approve the continuation of the Investment Advisory Agreement for each Fund. No single factor was determinative in the Board’s analysis.
Proxy Voting Policies and Procedures
A description of the Trust’s proxy voting policies and procedures that the Funds use to determine how to vote proxies relating to portfolio securities is available, without charge and upon request, by calling(800) 983-0903. This information is also available on the Securities and Exchange Commission’s (the “Commission”) website atwww.sec.gov.
Information regarding how each Fund voted proxies for portfolio securities, if applicable, during the most recent 12-month period ended June 30, is available, without charge and upon request, by (i) calling(800) 983-0903; or (ii) accessing the Trust’sForm N-PX on the Commission’s website atwww.sec.gov.
Quarterly Portfolios
The Trust files its complete schedule of portfolio holdings for the Funds with the Commission for the first and third quarters of each fiscal year onForm N-Q (or any successor Form). The Trust’sForms N-Q (or any successor Form) are available on the Commission’s website atwww.sec.gov.
Frequency Distribution of Discounts and Premiums
A table showing the number of days the market price of each Fund’s shares was greater than the Fund’s net asset value, and the number of days it was less than the Fund’s net asset value (i.e., premium or discount) for the most recently completed calendar year, and the calendar quarters since that year end (or the life of the Fund, if shorter) may be found at the Fund’s website atwww.invesco.com/ETFs.
| | | | |
©2019 Invesco Capital Management LLC 3500 Lacey Road, Suite 700 Downers Grove, IL 60515 | | P-PS-AR-5 | | invesco.com/ETFs |

Invesco Annual Report to Shareholders
April 30, 2019
| | |
| |
| PPA | | Invesco Aerospace & Defense ETF |
| |
| EEB | | Invesco BRIC ETF |
| |
| PZD | | Invesco CleantechTM ETF |
| |
| PDP | | Invesco DWA Momentum ETF |
| |
| PSP | | Invesco Global Listed Private Equity ETF |
| |
| PGJ | | Invesco Golden Dragon China ETF |
| |
| NFO | | Invesco Insider Sentiment ETF |
| |
| RYJ | | Invesco Raymond James SB-1 Equity ETF |
| |
| PBP | | Invesco S&P 500 BuyWrite ETF |
| |
| SPHQ | | Invesco S&P 500® Quality ETF |
| |
| CSD | | Invesco S&P Spin-Off ETF |
| |
| PHO | | Invesco Water Resources ETF |
| |
| PBW | | Invesco WilderHill Clean Energy ETF |

Beginning on January 1, 2021, as permitted by regulations adopted by the Securities and Exchange Commission, paper copies of the Funds’ shareholder reports will no longer be sent by mail, unless you specifically request paper copies of the reports from your financial intermediary, such as a broker-dealer or bank. Instead, the reports will be made available on a website, and you will be notified by mail each time a report is posted and provided with a website link to access the report.
If you already elected to receive shareholder reports electronically, you will not be affected by this change and you need not take any action. If you hold accounts through a financial intermediary, you may contact your financial intermediary to enroll in electronic delivery. Please note that not all financial intermediaries may offer this service.
You may elect to receive all future reports in paper free of charge. If you hold accounts through a financial intermediary, you can follow the instructions included with this disclosure, if applicable, or contact your financial intermediary to request that you continue to receive paper copies of your shareholder reports. Please note that not all financial intermediaries may offer this service. Your election to receive reports in paper will apply to all funds held with your financial intermediary.
Table of Contents
The Market Environment
Domestic Equity
The fiscal year proved to be an increasingly volatile time for U.S. equities. Throughout the summer, U.S. equities moved higher as corporate profits surged amid the benefit of corporate tax cuts and improving global economic growth. Several U.S. equity indexes reached new highs despite potential headwinds, including trade tensions, tariff announcements and contagion concerns over a Turkish currency crisis. After a relatively quiet summer, market volatility noticeably rose in October 2018, as U.S. equity markets suffered a sharpsell-off throughyear-end 2018, amid ongoing trade concerns between the U.S. and China, fears of a global economic slowdown and lower oil prices from a supply glut, with oil prices plummeting from near $75 per barrel in early October 2018 to around $45 per barrel in late December 2018.1 In this environment, there was a flight to safety, as investors fled to defensive areas of the markets, such as health care, utilities and U.S. Treasuries.
Given signs of a strong economy, the U.S. Federal Reserve (the “Fed”) raised interest rates three times during the fiscal year: in June, September and December 2018. Following December’s Fed meeting, the Fed raised interest rates by 25 basis points to a targeted range of 2.25% to 2.50%, which signaled a slightly more dovish stance than expected.2 In contrast, the European Central Bank and central banks in several other countries maintained extraordinarily accommodative monetary policies.
Equity markets rebounded at the start of 2019, fueled by optimism about a potential U.S.-China trade deal and the Fed’s indication that there would be no interest rate hikes in 2019, a surprising shift in monetary policy. The Fed’s more accommodative stance provided a supportive environment for equities and fixed income, even as U.S. economic data were mixed and overseas growth appeared to be slowing. By the end of the fiscal year, the U.S. equity market generally recovered the losses from fourth quarter 2018, backed by improving investor sentiment, low unemployment and a growing economy.
| 2 | Source: U.S. Federal Reserve |
Global Equity
The fiscal year began with significant market and currency volatility. While most domestic equity indexes delivered positive performance at the beginning of the fiscal year, most major international indexes had negative results. Many international stocks struggled as investors worried that heightened global trade tensions would derail economic growth. Other concerns, such as geopolitical uncertainty and the potential impact of higher interest rates, also weakened investor sentiment. In this environment, developed markets held up better than emerging markets. After a relatively quiet summer, market volatility markedly rose again in October 2018. Global equity markets (particularly the U.S.) declined sharply in the fourth quarter of 2018 amid rising interest rates and concerns that higher inflation could result in a more restrictive monetary policy. Investors also had concerns over the Brexit negotiations, ongoing U.S.-China trade tensions, declining oil prices and fears of slowing economic growth, particularly in the eurozone.
Following the sharpsell-off in the later part of 2018, global equities rebounded in the beginning of 2019, fueled by accommodative central bank policy and the potential for a U.S.-China trade deal. Central bank policy provided a supportive environment for equities and fixed income, even as global economic growth appeared to be slowing. In January, China’s central bank initiated a stimulus program to counteract its slowing economy, while the European Central Bank and U.S. Federal Reserve later indicated they would not raise interest rates for the remainder of 2019. Lack of consensus on a deal for the U.K.’s withdrawal from the European Union prompted additional concerns for the U.K. and eurozone economies, though equity markets across the region posted gains. U.S. and Chinese equities also delivered robust gains. Both emerging and developed markets had positive returns for the first quarter of 2019.
Despite concerns over a decline in global growth for 20191, global equity indexes, in general, ended the fiscal year in positive territory, with developed markets outperforming emerging markets.
| 1 | Source: International Monetary Fund World |
| | |
| PPA | | Manager’s Analysis |
| | Invesco Aerospace & Defense ETF (PPA) |
As an index fund, the Invesco Aerospace & Defense ETF (the “Fund”) is passively managed and seeks to track the returns of an underlying index. The Fund seeks to track the investment results (before fees and expenses) of the SPADE® Defense Index (the “Index”). The Fund generally will invest at least 90% of its total assets in common stocks that comprise the Index. These companies are engaged principally in the development, manufacture, operation and support of U.S. defense, military, homeland security and space operations. These may include, for example, companies that provide the following products or services: defense electronics, aircraft, naval vessels, missiles, spacecraft and launch vehicles, ground vehicles, communications, sensors, information technology and network centric warfare, unmanned vehicles, satellite-based services and ground-based equipment and electronics, products or services.
Strictly in accordance with its guidelines and mandated procedures, SPADE Indexes, LLC (the “Index Provider”) identifies common stocks for inclusion in the Index and weights them according to its modified market capitalization methodology. The Fund generally invests in all of the securities comprising the Index in proportion to their weightings in the Index.
For the fiscal year ended April 30, 2019, on a market price basis, the Fund returned 12.27%. On a net asset value (“NAV”) basis, the Fund returned 12.33%. During the same time period, the Index returned 12.97%. During the fiscal year, the Fund fully replicated the components of the Index; therefore, the Fund’s performance, on a NAV basis, differed from the return of the Index primarily due to fees and operating expenses that the Fund incurred during the period.
During this same time period, the S&P Composite 1500® Aerospace & Defense Index (the “Benchmark Index”) returned 8.66%. The Benchmark Index is an unmanaged index weighted by market capitalization based on the average performance of approximately 30 securities. The Benchmark Index was selected for its recognition in the marketplace, and because its performance comparison is a useful measure for investors due primarily to its exposure to the aerospace and defense industry.
The performance of the Fund differed from the Benchmark Index in part because the Fund seeks to track an Index that limits its constituents to companies that are involved in U.S. defense, military, homeland security and space operations, whereas the Benchmark Index includes companies that are involved in the commercial aerospace industry as well.
Relative to the Benchmark Index, the Fund was most overweight in the IT consulting & other services industry and most underweight in the aerospace & defense industry during the fiscal year ended April 30, 2019. The majority of the Fund’s outperformance relative to the Benchmark Index during that period can be attributed to the overweight allocation to the
industrial conglomerates, metal & glass containers and IT consulting & other services industries.
For the fiscal year ended April 30, 2019, the aerospace & defense industry contributed most significantly to the Fund’s return, followed by the industrial conglomerates and metal & glass containers industries, respectively. The systems software detracted most significantly from the Fund’s return, followed by the diversified support services industry.
Positions that contributed most significantly to the Fund’s return for the fiscal year ended April 30, 2019, included TransDigm Group Inc., an aerospace & defense company (portfolio average weight of 4.12%) and Honeywell International Inc., an industrial conglomerates company (portfolio average weight of 7.01%). Positions that detracted most significantly from the Fund’s return during this period included Raytheon Co., an aerospace & defense company (portfolio average weight of 5.62%) and General Dynamics Corp., an aerospace & defense company (portfolio average weight of 5.67%).
| | | | |
Industry Breakdown
(% of the Fund’s Net Assets)
as of April 30, 2019 | |
| Aerospace & Defense | | | 71.2 | |
| IT Services | | | 9.1 | |
| Industrial Conglomerates | | | 7.3 | |
| Containers & Packaging | | | 3.8 | |
| Machinery | | | 3.1 | |
| Industry Type Each Less Than 3% | | | 5.5 | |
| Money Market Funds Plus Other Assets Less Liabilities | | | (0.0) | |
|
Top Ten Fund Holdings*
(% of the Fund’s Net Assets)
as of April 30, 2019 | |
| Security | | | | |
| United Technologies Corp. | | | 7.4 | |
| Lockheed Martin Corp. | | | 7.4 | |
| Honeywell International, Inc. | | | 7.3 | |
| Boeing Co. (The) | | | 6.6 | |
| General Dynamics Corp. | | | 5.5 | |
| Raytheon Co. | | | 5.3 | |
| Northrop Grumman Corp. | | | 5.3 | |
| TransDigm Group, Inc. | | | 4.0 | |
| L3 Technologies, Inc. | | | 3.9 | |
| Harris Corp. | | | 3.9 | |
| Total | | | 56.6 | |
| * | Excluding money market fund holdings. |
Invesco Aerospace & Defense ETF (PPA)(continued)
Growth of a $10,000 Investment
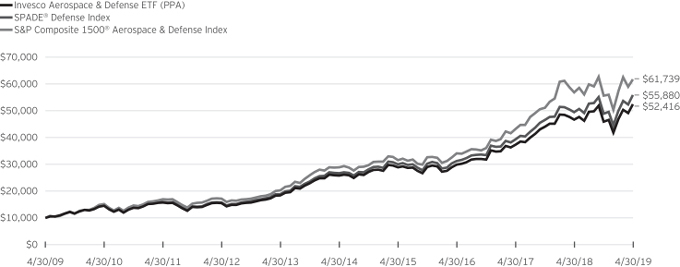
Fund Performance History as of April 30, 2019
| | | | | | | | | | | | | | | | | | | | | | | | | | | | | | | | | | | | | | | | |
| | | 1 Year | | | 3 Years Average
Annualized | | | 3 Years Cumulative | | | 5 Years Average
Annualized | | | 5 Years Cumulative | | | 10 Years Average
Annualized | | | 10 Years Cumulative | | | | | | Fund Inception | |
| Index | | | | | Average
Annualized | | | Cumulative | |
| SPADE® Defense Index | | | 12.97 | % | | | 21.40 | % | | | 78.93 | % | | | 15.98 | % | | | 109.89 | % | | | 18.78 | % | | | 458.80 | % | | | | | | | 12.99 | % | | | 421.05 | % |
| S&P Composite 1500® Aerospace & Defense Index | | | 8.66 | | | | 22.00 | | | | 81.60 | | | | 16.43 | | | | 113.97 | | | | 19.97 | | | | 517.39 | | | | | | | | 14.31 | | | | 509.62 | |
| Fund | | | | | | | | | | | | | | | | | | | | | | | | | | | | | | | | | | | | | | | | |
| NAV Return | | | 12.33 | | | | 20.69 | | | | 75.79 | | | | 15.28 | | | | 103.63 | | | | 18.02 | | | | 424.16 | | | | | | | | 12.28 | | | | 378.16 | |
| Market Price Return | | | 12.27 | | | | 20.71 | | | | 75.87 | | | | 15.29 | | | | 103.71 | | | | 18.03 | | | | 424.65 | | | | | | | | 12.28 | | | | 378.58 | |
Fund Inception: October 26, 2005
Performance quoted above represents past performance. Past performance is not a guarantee of future results and current performance may be higher or lower than performance quoted. Investment returns and principal value will fluctuate, and shares of the Fund (“Fund Shares”), when redeemed or sold, may be worth more or less than their original cost. Fund performance reflects any applicable fee waivers and/or expense reimbursements. Had the adviser not waived fees and/or reimbursed expenses currently or in the past, returns would have been lower. See current prospectus for more information. According to the Fund’s current prospectus, the total annual operating expense ratio was indicated as 0.60%. The Financial Highlights section of the Shareholder Report presents the expense ratios based on expenses incurred during the period covered by this report. NAV and Market Price returns assume that dividends and capital gain distributions have been reinvested in the Fund at NAV and Market Price, respectively. The returns shown in the table above do not reflect the deduction of taxes that a shareholder would pay on Fund distributions or the redemption or
sale of Fund Shares. See invesco.com/ETFs to find the most recentmonth-end performance numbers.
Index and Benchmark Index performance results are based upon a hypothetical investment in their respective constituent securities. Index and Benchmark Index returns do not represent Fund returns. An investor cannot invest directly in an index. The Index and Benchmark Index do not charge management fees or brokerage expenses, and no such fees or expenses were deducted from the hypothetical performance shown. In addition, the results actual investors might have achieved would have differed from those shown because of differences in the timing, amounts of their investments, and fees and expenses associated with an investment in the Fund.
Notes Regarding Indexes and Fund Performance History:
| - | Average Annualized and Cumulative Inception returns for the Fund, Index and Benchmark Index are based on the inception date of the Fund. |
| | |
| EEB | | Manager’s Analysis |
| | Invesco BRIC ETF (EEB) |
As an index fund, the Invesco BRIC ETF (the “Fund”) is passively managed and seeks to track the returns of an underlying index. The Fund seeks to track the investment results (before fees and expenses) of the S&P/BNY Mellon BRIC Select DR Index (the “Index”). The Fund generally will invest at least 90% of its total assets in the securities that comprise the Index.
Strictly in accordance with its guidelines and mandated procedures, S&P Dow Jones Indices LLC (the “Index Provider” or “S&P DJI”) compiles, maintains, and calculates the Index, which is comprised of exchange-listed American depositary receipts (“ADRs”) and global depositary receipts (“GDRs”) that represent securities of companies from Brazil, Russia, India and China and, when appropriate, ChinaH-shares (securities issued by companies incorporated in mainland China and listed on the Hong Kong Stock Exchange). The Fund generally will invest in all of the securities comprising the Index in proportion to their weightings in the Index.
The Board of Trustees approved a change in the fiscal year end for the Fund from August 31 to April 30. For the fiscal period from September 1, 2018 to April 30, 2019, on a market price basis, the Fund returned 8.47%. On a net asset value (“NAV”) basis, the Fund returned 8.34%. During the same time period, the Index returned 8.71%. During the fiscal period, the Fund’s performance, on a NAV basis, differed from the return of the Index primarily due to fees and operating expenses incurred by the Fund during the period.
During this same time period, the MSCI Emerging Markets IndexSM (Net) (the “Benchmark Index”) returned 3.30%. The Benchmark Index is an unmanaged index weighted by market capitalization based on the average performance of approximately 1,140 securities. The Benchmark Index was selected for its recognition in the marketplace, and its performance comparison is a useful measure for investors as a broad representation of emerging market equities.
Relative to the Benchmark Index, the Fund was most overweight in the energy sector and most underweight in the information technology sector during the fiscal period ended April 30, 2019. The majority of the Fund’s outperformance relative to the Benchmark Index during that period can be attributed to stock selection in the financials sector.
For the fiscal period ended April 30, 2019, the financials sector contributed most significantly to the Fund’s return, followed by the energy and materials sectors, respectively. The real estate sector was the greatest detractor from the Fund’s return, followed by the health care sector.
Positions that contributed most significantly to the Fund’s return for the fiscal period ended April 30, 2019, included Reliance Banco Bradesco S.A. Sponsored ADR Pfd, a financials company (portfolio average weight of 2.25%), and Itau Unibanco Holding S.A. Sponsored ADR Pfd, a financials company (portfolio average
weight of 2.94%). Positions that detracted most significantly from the Fund’s return during this period included Baidu, Inc. Sponsored ADR, Class A, a communication services company (portfolio average weight of 3.21%), and China Petroleum & Chemical Corp., Class H, an energy company (portfolio average weight of 1.67%).
| | | | |
Sector Breakdown
(% of the Fund’s Net Assets)
as of April 30, 2019 | |
| Energy | | | 21.2 | |
| Financials | | | 19.9 | |
| Consumer Discretionary | | | 17.4 | |
| Communication Services | | | 15.7 | |
| Materials | | | 8.3 | |
| Information Technology | | | 5.1 | |
| Industrials | | | 4.5 | |
| Consumer Staples | | | 3.6 | |
| Sector Type Each Less Than 3% | | | 4.3 | |
| Money Market Funds Plus Other Assets Less Liabilities | | | (0.0) | |
|
Top Ten Fund Holdings*
(% of the Fund’s Net Assets)
as of April 30, 2019 | |
| Security | | | | |
| Alibaba Group Holding Ltd. ADR | | | 9.3 | |
| HDFC Bank Ltd. ADR | | | 4.5 | |
| Reliance Industries Ltd. GDR | | | 3.8 | |
| China Mobile Ltd. | | | 3.2 | |
| Baidu, Inc. ADR | | | 2.9 | |
| Itau Unibanco Holding SA (Preference Shares) ADR | | | 2.7 | |
| Infosys Ltd. ADR | | | 2.7 | |
| Vale SA ADR | | | 2.6 | |
| Sberbank of Russia PJSC ADR | | | 2.6 | |
| Banco Bradesco SA ADR | | | 2.4 | |
| Total | | | 36.7 | |
| * | Excluding money market fund holdings. |
Invesco BRIC ETF (EEB)(continued)
Growth of a $10,000 Investment
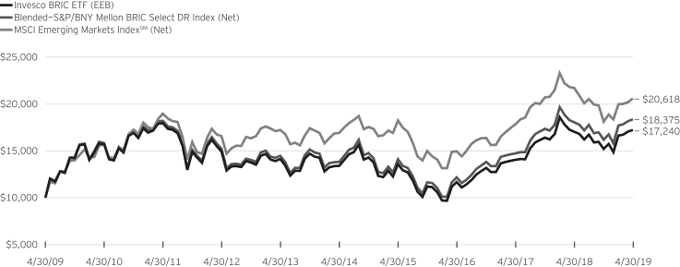
Fund Performance History as of April 30, 2019
| | | | | | | | | | | | | | | | | | | | | | | | | | | | | | | | | | | | | | | | |
| | | 1 Year | | | 3 Years Average
Annualized | | | 3 Years Cumulative | | | 5 Years Average
Annualized | | | 5 Years Cumulative | | | 10 Years Average
Annualized | | | 10 Years Cumulative | | | | | | Fund Inception | |
| Index | | | | | Average
Annualized | | | Cumulative | |
| Blended—S&P/BNY Mellon BRIC Select DR Index (Net) | | | 1.78 | % | | | 14.71 | % | | | 50.94 | % | | | 5.87 | % | | | 33.02 | % | | | 6.27 | % | | | 83.75 | % | | | | | | | 6.48 | % | | | 120.68 | % |
| MSCI Emerging Markets IndexSM (Net) | | | (5.04 | ) | | | 11.25 | | | | 37.69 | | | | 4.04 | | | | 21.91 | | | | 7.50 | | | | 106.18 | | | | | | | | 5.07 | | | | 86.66 | |
| Fund | | | | | | | | | | | | | | | | | | | | | | | | | | | | | | | | | | | | | | | | |
| NAV Return | | | 1.14 | | | | 13.89 | | | | 47.72 | | | | 5.14 | | | | 28.50 | | | | 5.60 | | | | 72.40 | | | | | | | | 5.72 | | | | 101.64 | |
| Market Price Return | | | 1.32 | | | | 14.14 | | | | 48.70 | | | | 5.22 | | | | 29.00 | | | | 5.59 | | | | 72.24 | | | | | | | | 5.73 | | | | 101.93 | |
Guggenheim BRIC ETF (the “Predecessor Fund”) Inception: September 21, 2006
Performance quoted above represents past performance. Past performance is not a guarantee of future results and current performance may be higher or lower than performance quoted. Investment returns and principal value will fluctuate, and shares of the Fund (“Fund Shares”), when redeemed or sold, may be worth more or less than their original cost. Fund performance reflects any applicable fee waivers and/or expense reimbursements. Had the adviser not waived fees and/or reimbursed expenses currently or in the past, returns would have been lower. See current prospectus for more information. The adviser has contractually agreed to waive fees and/or pay certain Fund expenses through August 31, 2021. According to the Fund’s current prospectus, the total gross annual operating expense ratio was indicated as 0.73% and the net annual operating expense ratio was indicated as 0.64%. The Financial Highlights section of the Shareholder Report presents the expense ratios based on expenses incurred during the period covered by this report. NAV and Market Price returns assume that dividends and capital gain distributions have been reinvested in the Fund at NAV and Market Price, respectively. The returns shown in the table above do not reflect the deduction of taxes that a shareholder would pay on Fund distributions or the redemption or sale of Fund Shares. See invesco.com/ETFs to find the most recentmonth-end performance numbers.
Blended-Index and Benchmark Index performance results are based upon a hypothetical investment in their respective constituent securities. Blended-Index and Benchmark Index returns do not represent Fund returns. An investor cannot invest directly in an index. The Blended-Index and Benchmark Index do not charge management fees or brokerage expenses, and no such fees or expenses were deducted from the hypothetical performance shown. In addition, the results actual investors might have achieved would have differed from those shown because of differences in the timing, amounts of their investments, and fees and expenses associated with an investment in the Fund.
Notes Regarding Indexes and Fund Performance History:
| - | The Blended—BNY Mellon BRIC Select DR Index (Net) performance is comprised of the performance of the BNY Mellon BRIC Select ADR Index (Net) the Fund’s previous underlying index, prior to the conversion date, October 31, 2013, followed by the performance of the Index, starting from the conversion date through April 30, 2019. |
| - | Net returns reflect reinvested dividends net of withholding taxes. |
| - | Effective after the close of business on May 18, 2018, the Predecessor Fund was reorganized into the Fund. Fund returns shown are blended returns of the Predecessor Fund and the Fund. |
| - | Average Annualized and Cumulative Inception returns for the Fund, Blended-Index and Benchmark Index are based on the inception date of the Predecessor Fund. |
| | |
| PZD | | Manager’s Analysis |
| | Invesco CleantechTM ETF (PZD) |
As an index fund, the Invesco CleantechTM ETF (the “Fund”) is passively managed and seeks to track the returns of an underlying index. The Fund seeks to track the investment results (before fees and expenses) of The Cleantech IndexTM (the “Index”). The Fund generally will invest at least 90% of its total assets in securities (including American depositary receipts (“ADRs”) and global depositary receipts (“GDRs”)) that comprise the Index, which is designed to track the performance of publicly traded clean technology (or “cleantech”) companies.
Strictly in accordance with its guidelines and mandated procedures, Cleantech Indices LLC (the “Index Provider”) identifies securities for inclusion in the Index. The Index Provider considers a company to be a cleantech company when it derives at least 50% of its revenues or operating profits from cleantech businesses, which are defined as: businesses that provide knowledge-based products (or services) that add economic value by reducing cost and raising productivity and/or product performance, while reducing the consumption of resources and the negative impact on the environment and public health. The Index focuses on companies that are leaders in the innovation and commercial deployment of cleantech products/services across a broad range of industries, including, but not limited to, clean energy, energy efficiency and transmission, clean water, advanced materials,eco-friendly agriculture, transportation, manufacturing efficiency, recycling and pollution prevention/remediation. The Fund generally invests in all of the securities comprising the Index in proportion to their weightings in the Index.
For the fiscal year ended April 30, 2019, on a market price basis, the Fund returned 7.55%. On a net asset value “NAV”) basis, the Fund returned 7.48%. During the same time period, the Index returned 7.97%. During the fiscal year, the Fund fully replicated the components of the Index; therefore, the Fund’s performance, on a NAV basis, differed from the return of the Index primarily due to fees and operating expenses that the Fund incurred during the period, partially offset by income received from the securities lending program in which the Fund participates. Performance compared to the Index was also negatively impacted as a result of differences in the valuation of certain holdings as part of the Fund’s fair valuation policies.
During this same time period, the S&P 500® Index (the “Benchmark Index”) returned 13.49%. The Benchmark Index is an unmanaged index weighted by market capitalization based on the average performance of approximately 505 securities. The Benchmark Index was selected for its recognition in the marketplace and because its performance comparison is a useful measure for investors of a broad representation of the overall U.S. stock market.
The performance of the Fund differed from the Benchmark Index in part because the Fund seeks to track an Index that employs a proprietary stock selection and weighting methodology, whereas
the Benchmark Index selects and weights stocks based primarily on market capitalization.
Relative to the Benchmark Index, the Fund was most overweight in the electrical components & equipment industry and most underweight in the interactive media & services industry during the fiscal year ended April 30, 2019. The majority of the Fund’s underperformance relative to the Benchmark Index during the period can be attributed to its significant overweight position in the semiconductor equipment industry and underweight position in the systems software industry.
For the fiscal year ended April 30, 2019, the industrial machinery industry contributed most significantly to the Fund’s return, followed by the semiconductors and heavy electrical equipment industries, respectively. The semiconductor equipment industry was the largest detracting industry, followed by the electrical components & equipment and specialty chemicals industries, respectively.
Positions that contributed most significantly to the Fund’s return for the fiscal year ended April 30, 2019, included Cree, Inc., a semiconductors company (portfolio average weight of 2.57%), and Vestas Wind Systems A/S, a heavy electrical equipment company (portfolio average weight of 3.05%). Positions that detracted most significantly from the Fund’s return during this period included Umicore, a specialty chemicals company (portfolio average weight of 2.86%) and SMA Solar Technology AG, a semiconductor equipment company (portfolio average weight of 0.85%).
| | | | |
Industry Breakdown
(% of the Fund’s Net Assets)
as of April 30, 2019 | |
| Electrical Equipment | | | 20.7 | |
| Machinery | | | 11.6 | |
| Electronic Equipment, Instruments & Components | | | 10.1 | |
| Semiconductors & Semiconductor Equipment | | | 9.4 | |
| Professional Services | | | 7.4 | |
| Chemicals | | | 7.1 | |
| Software | | | 6.2 | |
| Building Products | | | 6.0 | |
| Industrial Conglomerates | | | 4.4 | |
| Auto Components | | | 3.1 | |
| Life Sciences Tools & Services | | | 3.1 | |
| Industry Type Each Less Than 3% | | | 10.9 | |
| Money Market Funds Plus Other Assets Less Liabilities | | | 0.0 | |
Invesco CleantechTM ETF (PZD)(continued)
| | | | |
Top Ten Fund Holdings*
(% of the Fund’s Net Assets)
as of April 30, 2019 | |
| Security | | | | |
| Autodesk, Inc. | | | 3.2 | |
| Intertek Group PLC | | | 3.2 | |
| Kingspan Group PLC | | | 3.2 | |
| Siemens Gamesa Renewable Energy SA | | | 3.1 | |
| BorgWarner, Inc. | | | 3.1 | |
| Eurofins Scientific SE | | | 3.1 | |
| Schneider Electric SE | | | 3.1 | |
| Roper Technologies, Inc. | | | 3.0 | |
| ANSYS, Inc. | | | 3.0 | |
| ABB Ltd. | | | 3.0 | |
| Total | | | 31.0 | |
| * | Excluding money market fund holdings. |
Growth of a $10,000 Investment
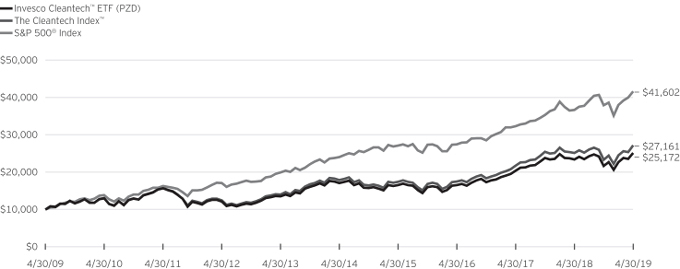
Fund Performance History as of April 30, 2019
| | | | | | | | | | | | | | | | | | | | | | | | | | | | | | | | | | | | | | | | |
| | | 1 Year | | | 3 Years Average
Annualized | | | 3 Years Cumulative | | | 5 Years Average
Annualized | | | 5 Years Cumulative | | | 10 Years Average
Annualized | | | 10 Years Cumulative | | | | | | Fund Inception | |
| Index | | | | | Average
Annualized | | | Cumulative | |
| The Cleantech Index™ | | | 7.97 | % | | | 15.79 | % | | | 55.24 | % | | | 8.72 | % | | | 51.91 | % | | | 10.51 | % | | | 171.61 | % | | | | | | | 6.30 | % | | | 114.81 | % |
| S&P 500® Index | | | 13.49 | | | | 14.87 | | | | 51.58 | | | | 11.63 | | | | 73.32 | | | | 15.32 | | | | 316.02 | | | | | | | | 8.53 | | | | 178.75 | |
| Fund | | | | | | | | | | | | | | | | | | | | | | | | | | | | | | | | | | | | | | | | |
| NAV Return | | | 7.48 | | | | 14.96 | | | | 51.93 | | | | 8.02 | | | | 47.04 | | | | 9.67 | | | | 151.72 | | | | | | | | 5.53 | | | | 96.19 | |
| Market Price Return | | | 7.55 | | | | 15.26 | | | | 53.13 | | | | 8.09 | | | | 47.52 | | | | 9.66 | | | | 151.44 | | | | | | | | 5.56 | | | | 96.98 | |
Invesco CleantechTM ETF (PZD)(continued)
Fund Inception: October 24, 2006
Performance quoted above represents past performance. Past performance is not a guarantee of future results and current performance may be higher or lower than performance quoted. Investment returns and principal value will fluctuate, and shares of the Fund (“Fund Shares”), when redeemed or sold, may be worth more or less than their original cost. Fund performance reflects any applicable fee waivers and/or expense reimbursements. Had the adviser not waived fees and/or reimbursed expenses currently or in the past, returns would have been lower. See current prospectus for more information. The adviser has contractually agreed to waive fees and/or pay certain Fund expenses through August 31, 2021. According to the Fund’s current prospectus, the total gross annual operating expense ratio was indicated as 0.68% and the net annual operating expense ratio was indicated as 0.67%. The Financial Highlights section of the Shareholder Report presents the expense ratios based on expenses incurred during the period covered by this report. NAV and Market Price returns assume that dividends and capital gain distributions have been reinvested in the Fund at NAV and Market Price, respectively. The returns shown in the table
above do not reflect the deduction of taxes that a shareholder would pay on Fund distributions or the redemption or sale of Fund Shares. See invesco.com/ETFs to find the most recentmonth-end performance numbers.
Index and Benchmark Index performance results are based upon a hypothetical investment in their respective constituent securities. Index and Benchmark Index returns do not represent Fund returns. An investor cannot invest directly in an index. The Index and Benchmark Index do not charge management fees or brokerage expenses, and no such fees or expenses were deducted from the hypothetical performance shown. In addition, the results actual investors might have achieved would have differed from those shown because of differences in the timing, amounts of their investments, and fees and expenses associated with an investment in the Fund.
Notes Regarding Indexes and Fund Performance History:
| - | Average Annualized and Cumulative Inception returns for the Fund, Index and Benchmark Index are based on the inception date of the Fund. |
| | |
| PDP | | Manager’s Analysis |
| | Invesco DWA Momentum ETF (PDP) |
As an index fund, the Invesco DWA Momentum ETF (the “Fund”) is passively managed and seeks to track the returns of an underlying index. The Fund seeks to track the investment results (before fees and expenses) of the Dorsey Wright® Technical Leaders Index (the “Index”). The Fund generally will invest at least 90% of its total assets in securities that comprise the Index. The Index is composed of approximately 100 securities from an eligible universe of approximately 1,000 securities of the largest constituents by market capitalization within the NASDAQ US Benchmark Index.
Dorsey, Wright & Associates, LLC (the “Index Provider”) selects securities for the Index pursuant to a proprietary selection methodology that is designed to identify companies that demonstrate powerful relative strength characteristics. “Relative strength” is an investing technique that seeks to determine the strongest performing securities by measuring certain factors, such as a security’s relative performance against the overall market over a set period, or a security’s relative strength value, which is derived by comparing the rate of increase of the security’s price as compared to that of a benchmark index. Strictly in accordance with its guidelines and mandated procedures, the Index Provider uses a proprietary methodology to analyze the relative strength of each security within the universe of eligible securities and determine a “momentum” score. In general, momentum is the tendency of an investment to exhibit persistence in its relative performance; a “momentum” style of investing emphasizes investing in securities that have had better recent performance compared to other securities. The momentum score for each security included in the Index is based on intermediate and long-term upward price movements of the security as compared to a representative benchmark index. After giving each eligible security a momentum score, the Index Provider selects approximately 100 securities with the highest momentum scores from the universe of eligible securities for inclusion in the Index. The Index Provider weights each security by its momentum score, with higher scoring securities representing a greater weight in the Index. The Fund generally invests in all of the securities comprising the Index in proportion to their weightings in the Index.
For the fiscal year ended April 30, 2019, on a market price basis, the Fund returned 11.70%. On a net asset value (“NAV”) basis, the Fund returned 11.81%. During the same time period, the Index returned 12.45%. During the fiscal year, the Fund fully replicated the components of the Index; therefore, the Fund’s performance, on a NAV basis, differed from the return of the Index primarily due to fees and operating expenses that the Fund incurred during the period.
During this same time period, the Russell 3000® Growth Index (the “Benchmark Index”) returned 16.61%. The Benchmark Index is an unmanaged index weighted by market capitalization based on the average performance of approximately 1,777 securities. The Benchmark Index was selected for its recognition in the
marketplace, and because its performance comparison is a useful measure for investors as a broad representation of the U.S. growth equity market.
The performance of the Fund differed from the Benchmark Index in part because the Fund seeks to track an Index that employs a proprietary stock selection and weighting methodology, whereas the Benchmark Index selects and weights stocks based primarily on market capitalization.
Relative to the Benchmark Index, the Fund was overweight in the industrials sector and underweight in the information technology sector during the fiscal year ended April 30, 2019. The majority of the Fund’s underperformance relative to the Benchmark Index during that period can be attributed to the Fund being underweight and security selection in the information technology sector and security selection in the consumer discretionary sector.
For the fiscal year ended April 30, 2019, the information technology sector contributed most significantly to the Fund’s return, followed by the industrials and materials sectors, respectively. The consumer staples sector detracted most significantly from the Fund’s return.
Positions that contributed most significantly to the Fund’s return for the fiscal year ended April 30, 2019, included O’Reilly Automotive, Inc., a consumer discretionary company (portfolio average weight of 2.90%) and ABIOMED, Inc., a health care company (no longer held at fiscal year-end). Positions that detracted most significantly from the Fund’s return during this period included NVIDIA Corp., an information technology company (no longer held at fiscalyear-end) and Nektar Therapeutics, a health care company (no longer held at fiscalyear-end).
| | | | |
Sector Breakdown
(% of the Fund’s Net Assets)
as of April 30, 2019 | |
| Information Technology | | | 25.6 | |
| Consumer Discretionary | | | 17.2 | |
| Industrials | | | 15.3 | |
| Health Care | | | 14.3 | |
| Materials | | | 6.9 | |
| Financials | | | 5.8 | |
| Real Estate | | | 5.5 | |
| Consumer Staples | | | 4.1 | |
| Sector Type Each Less Than 3% | | | 5.4 | |
| Money Market Funds Plus Other Assets Less Liabilities | | | (0.1) | |
Invesco DWA Momentum ETF (PDP)(continued)
| | | | |
Top Ten Fund Holdings*
(% of the Fund’s Net Assets)
as of April 30, 2019 | |
| Security | | | | |
| American Tower Corp. | | | 2.9 | |
| Domino’s Pizza, Inc. | | | 2.9 | |
| Mastercard, Inc., Class A | | | 2.8 | |
| O’Reilly Automotive, Inc. | | | 2.8 | |
| Roper Technologies, Inc. | | | 2.4 | |
| Credit Acceptance Corp. | | | 2.4 | |
| Ball Corp. | | | 2.4 | |
| Church & Dwight Co., Inc. | | | 2.3 | |
| Rollins, Inc. | | | 2.3 | |
| W.R. Berkley Corp. | | | 2.2 | |
| Total | | | 25.4 | |
| * | Excluding money market fund holdings. |
Growth of a $10,000 Investment
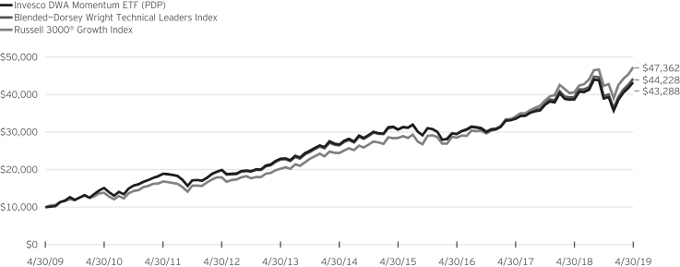
Fund Performance History as of April 30, 2019
| | | | | | | | | | | | | | | | | | | | | | | | | | | | | | | | | | | | | | | | |
| | | 1 Year | | | 3 Years Average
Annualized | | | 3 Years Cumulative | | | 5 Years Average
Annualized | | | 5 Years Cumulative | | | 10 Years Average
Annualized | | | 10 Years Cumulative | | | | | | Fund Inception | |
| Index | | | | | Average
Annualized | | | Cumulative | |
| Blended—Dorsey Wright Technical Leaders Index | | | 12.45 | % | | | 14.41 | % | | | 49.77 | % | | | 10.83 | % | | | 67.22 | % | | | 16.03 | % | | | 342.28 | % | | | | | | | 8.26 | % | | | 162.62 | % |
| Russell 3000® Growth Index | | | 16.61 | | | | 18.40 | | | | 65.98 | | | | 14.17 | | | | 93.99 | | | | 16.83 | | | | 373.62 | | | | | | | | 10.58 | | | | 239.75 | |
| Fund | | | | | | | | | | | | | | | | | | | | | | | | | | | | | | | | | | | | | | | | |
| NAV Return | | | 11.81 | | | | 13.69 | | | | 46.95 | | | | 10.12 | | | | 61.92 | | | | 15.78 | | | | 332.88 | | | | | | | | 8.05 | | | | 156.51 | |
| Market Price Return | | | 11.70 | | | | 13.71 | | | | 47.01 | | | | 10.14 | | | | 62.08 | | | | 15.79 | | | | 333.25 | | | | | | | | 8.03 | | | | 156.02 | |
Invesco DWA Momentum ETF (PDP)(continued)
Fund Inception: March 1, 2007
Performance quoted above represents past performance. Past performance is not a guarantee of future results and current performance may be higher or lower than performance quoted. Investment returns and principal value will fluctuate, and shares of the Fund (“Fund Shares”), when redeemed or sold, may be worth more or less than their original cost. Fund performance reflects any applicable fee waivers and/or expense reimbursements. Had the adviser not waived fees and/or reimbursed expenses currently or in the past, returns would have been lower. See current prospectus for more information. According to the Fund’s current prospectus, the total annual operating expense ratio was indicated as 0.63%. The Financial Highlights section of the Shareholder Report presents the expense ratios based on expenses incurred during the period covered by this report. NAV and Market Price returns assume that dividends and capital gain distributions have been reinvested in the Fund at NAV and Market Price, respectively. The returns shown in the table above do not reflect the deduction of taxes that a shareholder would pay on Fund distributions or the redemption or sale of Fund Shares. See invesco.com/ETFs to find the most recentmonth-end performance numbers.
Blended-Index and Benchmark Index performance results are based upon a hypothetical investment in their respective constituent securities. Blended-Index and Benchmark Index returns do not represent Fund returns. An investor cannot invest directly in an index. The Blended-Index and Benchmark Index do not charge management fees or brokerage expenses, and no such fees or expenses were deducted from the hypothetical performance shown. In addition, the results actual investors might have achieved would have differed from those shown because of differences in the timing, amounts of their investments, and fees and expenses associated with an investment in the Fund.
Notes Regarding Indexes and Fund Performance History:
| - | The Blended—Dorsey Wright® Technical Leaders Index is comprised of price only returns from Fund inception through the conversion date, December 31, 2013, and total returns starting at the conversion date through April 30, 2019. |
| - | Average Annualized and Cumulative Inception returns for the Fund, Blended-Index and Benchmark Index are based on the inception date of the Fund. |
| | |
| PSP | | Manager’s Analysis |
| | Invesco Global Listed Private Equity ETF (PSP) |
As an index fund, the Invesco Global Listed Private Equity ETF (the “Fund”) is passively managed and seeks to track the returns of an underlying index. The Fund seeks to track the investment results (before fees and expenses) of the Red Rocks Global Listed Private Equity Index (the “Index”). The Fund generally will invest at least 90% of its total assets in securities (including American depositary receipts (“ADRs”) and global depositary receipts (“GDRs”)) that comprise the Index.
Strictly in accordance with its guidelines and mandated procedures, Red Rocks Capital LLC (the “Index Provider”) includes securities in the Index pursuant to a proprietary selection methodology. The Index is comprised of securities, ADRs and GDRs of 40 to 75 private equity companies, including business development companies, master limited partnerships and other vehicles that are listed on a nationally recognized exchange, all of whose principal businesses are to invest in, lend capital to, or provide services to privately held companies. The Fund generally invests in all of the securities comprising the Index in proportion to their weightings in the Index.
For the fiscal year ended April 30, 2019, on a market price basis, the Fund returned 2.36%. On a net asset value (“NAV”) basis, the Fund returned 2.28%. During the same time period, the Index returned 2.81%. During the fiscal year, the Fund fully replicated the components of the Index; therefore, the Fund’s performance, on a NAV basis, differed from the return of the Index primarily due to fees and operating expenses that the Fund incurred during the period, as well as slippage around the reinvestment of dividends received from the underlying portfolio holdings and trading costs incurred around portfolio rebalances.
During the same time period, the MSCI All Country World Index (Net) (the “Benchmark Index”) returned 5.06%. The Benchmark Index is an unmanaged index weighted by market capitalization based on the average performance of approximately 1,636 securities. The Benchmark Index was selected for its recognition in the marketplace, and because its performance comparison is a useful measure for investors as a broad representation of the global developed equity markets. The Fund has elected to use the Benchmark Index to represent its broad-based index rather than the MSCI EAFE® Index (Net) because the Benchmark Index more closely reflects the performance of the types of securities in which the Fund invests.
The performance of the Fund differed from the Benchmark Index in part because the Fund seeks to track an Index that employs a proprietary stock selection and weighting methodology, whereas the Benchmark Index selects and weights stocks based primarily on market capitalization.
Relative to the Benchmark Index, the Fund was most overweight in the asset management & custody industry and most underweight in the diversified banks industry during the fiscal year ended April 30, 2019. The majority of the Fund’s
underperformance relative to the Benchmark Index during that period can be attributed to its overweight allocation to the multi-sector holdings and asset management & custody industries.
For the fiscal year ended April 30, 2019, the interactive media & services industry contributed most significantly to the Fund’s return, followed by the cable & satellite and wireless telecommunication services industries, respectively. The multi-sector holdings and industrial conglomerates industries were the largest detracting industries.
Positions that contributed most significantly to the Fund’s return for the fiscal year ended April 30, 2019, included IAC/ InterActiveCorp., an interactive media & services company (portfolio average weight 4.99%) and Naspers Ltd., Class N, an internet & direct marketing company (portfolio average weight 4.37%). Positions that detracted most significantly from the Fund’s return during this period included Brait SE, a capital markets company (portfolio average weight of 1.14%) and Fosun International Ltd., an industrial conglomerate company (portfolio average weight of 2.52%).
| | | | |
Industry Breakdown
(% of the Fund’s Net Assets)
as of April 30, 2019 | |
| Capital Markets | | | 49.6 | |
| Diversified Financial Services | | | 15.4 | |
| Internet & Direct Marketing Retail | | | 7.6 | |
| Interactive Media & Services | | | 5.3 | |
| Electrical Equipment | | | 3.6 | |
| Industry Type Each Less Than 3% | | | 4.9 | |
| Money Market Funds Plus Other Assets Less Liabilities | | | 13.6 | |
|
Top Ten Fund Holdings*
(% of the Fund’s Net Assets)
as of April 30, 2019 | |
| Security | | | | |
| Naspers Ltd., Class N | | | 5.9 | |
| IAC/InterActiveCorp. | | | 5.3 | |
| 3i Group PLC | | | 3.9 | |
| Melrose Industries PLC | | | 3.5 | |
| Partners Group Holding AG | | | 3.3 | |
| Ares Capital Corp. | | | 3.2 | |
| Apollo Global Management LLC, Class A | | | 2.7 | |
| Wendel SA | | | 2.3 | |
| Kinnevik AB, Class B | | | 2.1 | |
| Onex Corp. | | | 2.0 | |
| Total | | | 34.2 | |
| * | Excluding money market fund holdings. |
Invesco Global Listed Private Equity ETF (PSP)(continued)
Growth of a $10,000 Investment
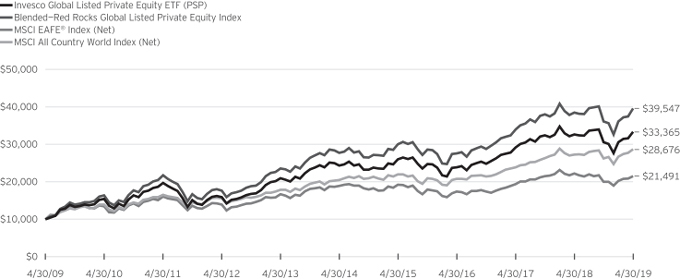
Fund Performance History as of April 30, 2019
| | | | | | | | | | | | | | | | | | | | | | | | | | | | | | | | | | | | | | | | |
| | | 1 Year | | | 3 Years Average
Annualized | | | 3 Years Cumulative | | | 5 Years Average
Annualized | | | 5 Years Cumulative | | | 10 Years Average
Annualized | | | 10 Years Cumulative | | | | | | Fund Inception | |
| Index | | | | | Average
Annualized | | | Cumulative | |
| Blended—Red Rocks Global Listed Private Equity Index | | | 2.81 | % | | | 12.78 | % | | | 43.46 | % | | | 7.37 | % | | | 42.69 | % | | | 14.74 | % | | | 295.47 | % | | | | | | | 2.25 | % | | | 32.15 | % |
| MSCI EAFE® Index (Net) | | | (3.22 | ) | | | 7.24 | | | | 23.34 | | | | 2.60 | | | | 13.70 | | | | 7.95 | | | | 114.91 | | | | | | | | 2.77 | | | | 40.76 | |
| MSCI All Country World Index (Net) | | | 5.06 | | | | 11.36 | | | | 38.10 | | | | 6.96 | | | | 39.99 | | | | 11.11 | | | | 186.76 | | | | | | | | 5.50 | | | | 95.43 | |
| Fund | | | | | | | | | | | | | | | | | | | | | | | | | | | | | | | | | | | | | | | | |
| NAV Return | | | 2.28 | | | | 11.79 | | | | 39.70 | | | | 6.52 | | | | 37.12 | | | | 12.81 | | | | 233.65 | | | | | | | | 0.19 | | | | 2.42 | |
| Market Price Return | | | 2.36 | | | | 12.09 | | | | 40.85 | | | | 6.46 | | | | 36.77 | | | | 12.84 | | | | 234.72 | | | | | | | | 0.20 | | | | 2.57 | |
Fund Inception: October 24, 2006
Performance quoted above represents past performance. Past performance is not a guarantee of future results and current performance may be higher or lower than performance quoted. Investment returns and principal value will fluctuate, and shares of the Fund (“Fund Shares”), when redeemed or sold, may be worth more or less than their original cost. Fund performance reflects any applicable fee waivers and/or expense reimbursements. Had the adviser not waived fees and/or reimbursed expenses currently or in the past, returns would have been lower. See current prospectus for more information. The adviser has contractually agreed to waive fees and/or pay certain Fund expenses through August 31, 2021. According to the Fund’s current prospectus, the total gross annual operating expense ratio was indicated as 2.05%, including acquired fund fees and expenses of 1.40% and the net annual operating expense ratio was indicated as 2.03%. The Financial Highlights section of the Shareholder Report presents the expense ratios based on expenses incurred during the period covered by this report. NAV and Market Price returns assume that dividends and capital gain distributions have been reinvested in the Fund at NAV and Market Price, respectively. The returns shown in the table above do not reflect the deduction of taxes that a shareholder would pay on Fund distributions or the redemption or sale of Fund Shares. See invesco.com/ETFs to find the most recentmonth-end performance numbers.
Blended-Index and Benchmark Index performance results are based upon a hypothetical investment in their respective constituent securities. Blended-Index and Benchmark Index returns do not represent Fund returns. An investor cannot invest directly in an index. The Blended-Index and Benchmark Index do not charge management fees or brokerage expenses, and no such fees or expenses were deducted from the hypothetical performance shown. In addition, the results actual investors might have achieved would have differed from those shown because of differences in the timing, amounts of their investments, and fees and expenses associated with an investment in the Fund.
Notes Regarding Indexes and Fund Performance History:
| - | The Blended—Red Rocks Global Listed Private Equity Index is comprised of the Red Rocks Capital Listed Private Equity Index from Fund inception until September 30, 2009, followed by the performance of the Red Rocks Global Listed Private Equity Index from September 30, 2009 through April 30, 2019. |
| - | Net returns reflect invested dividends net of withholding taxes. |
| - | Average Annualized and Cumulative Inception returns for the Fund, Blended-Index and Benchmark Index are based on the inception date of the Fund. |
| | |
| PGJ | | Manager’s Analysis |
| | Invesco Golden Dragon China ETF (PGJ) |
As an index fund, the Invesco Golden Dragon China ETF (the “Fund”) is passively managed and seeks to track the returns of an underlying index. The Fund seeks to track the investment results (before fees and expenses) of the NASDAQ Golden Dragon China Index (the “Index”). The Fund generally will invest at least 90% of its total assets in equity securities that comprise the Index. The Index is composed of U.S. exchange-listed companies that are headquartered or incorporated in the People’s Republic of China.
Strictly in accordance with its guidelines and mandated procedures, Nasdaq, Inc. (the “Index Provider”) includes securities in the Index to seek to provide access to the unique economic opportunities taking place in China while still providing investors with the transparency offered with U.S. exchange listed securities. Securities in the Index may include common stocks, ordinary shares, American depository receipts (“ADRs”), shares of beneficial interest, limited partnership interests or tracking stocks. The Fund generally invests in all of the securities comprising the Index in proportion to their weightings in the Index.
For the fiscal year ended April 30, 2019, on a market price basis, the Fund returned (7.39)%. On a net asset value (“NAV”) basis, the Fund returned (7.46)%. During the same time period, the Index returned (7.04)%. During the fiscal year, the Fund fully replicated the components of the Index; therefore, the Fund’s performance, on a NAV basis, differed from the return of the Index primarily due to fees and operating expenses that the Fund incurred during the period, partially offset by income received from the securities lending program in which the Fund participates.
During this same time period, the FTSE China 50 Index (the “Benchmark Index”) returned (3.06)%. The Benchmark Index is an unmanaged index weighted by market capitalization based on the average performance of approximately 50 securities. The Benchmark Index was selected for its recognition in the marketplace, and because its performance comparison is a useful measure for investors as a broad representation of equity exposure to Chinese companies.
The performance of the Fund differed from the Benchmark Index primarily because the Fund seeks to track an Index that has substantially different individual company components and sector weightings. Additionally, the Fund invests in Chinese companies, as defined by the Index methodology, listed on U.S. exchanges, whereas the Benchmark Index is composed of Chinese stocks listed on the Hong Kong stock exchange. A comparison to the Benchmark Index is still relevant as the Fund and Benchmark Index both represent exposure to Chinese companies.
Relative to the Benchmark Index, the Fund was most overweight in the consumer discretionary sector and most underweight in the financials sector during the fiscal year ended April 30, 2019. The majority of the Fund’s underperformance relative to the
Benchmark Index during that period can be attributed to the Fund’s underweight position and stock selection in the communication services sector.
For the fiscal year ended April 30, 2019, the industrials sector contributed most significantly to the Fund’s return followed by the consumer discretionary and communication services sectors, respectively. The information technology sector detracted most significantly from the Fund’s return, followed by the financials and energy sectors, respectively.
Positions that contributed most significantly to the Fund’s return for the fiscal year ended April 30, 2019, included New Oriental Education & Technology Group, Inc. Sponsored ADR, a consumer discretionary company (portfolio average weight of 4.50%) and NetEase, Inc. Sponsored ADR, a communication services company (portfolio average weight of 8.81%). Positions that detracted most significantly from the Fund’s return during this period included Baidu, Inc. Sponsored ADR, Class A, a communication services company (portfolio average weight of 7.87%) and Weibo Corp Sponsored ADR, Class A, a communication services company (portfolio average weight of 2.86%).
| | | | |
Sector Breakdown
(% of the Fund’s Net Assets)
as of April 30, 2019 | |
| Consumer Discretionary | | | 42.1 | |
| Communication Services | | | 42.0 | |
| Industrials | | | 5.4 | |
| Information Technology | | | 3.2 | |
| Sector Type Each Less Than 3% | | | 7.3 | |
| Money Market Funds Plus Other Assets Less Liabilities | | | 0.0 | |
|
Top Ten Fund Holdings*
(% of the Fund’s Net Assets)
as of April 30, 2019 | |
| Security | | | | |
| Ctrip.com International Ltd. ADR | | | 9.6 | |
| NetEase, Inc. ADR | | | 9.5 | |
| JD.com, Inc. ADR | | | 8.2 | |
| Baidu, Inc. ADR | | | 7.6 | |
| Alibaba Group Holding Ltd. ADR | | | 7.6 | |
| New Oriental Education & Technology Group, Inc. ADR | | | 4.3 | |
| TAL Education Group ADR | | | 4.0 | |
| 58.com, Inc. ADR | | | 3.7 | |
| ZTO Express Cayman, Inc. ADR | | | 3.7 | |
| Autohome, Inc. ADR | | | 3.3 | |
| Total | | | 61.5 | |
| * | Excluding money market fund holdings. |
Invesco Golden Dragon China ETF (PGJ)(continued)
Growth of a $10,000 Investment
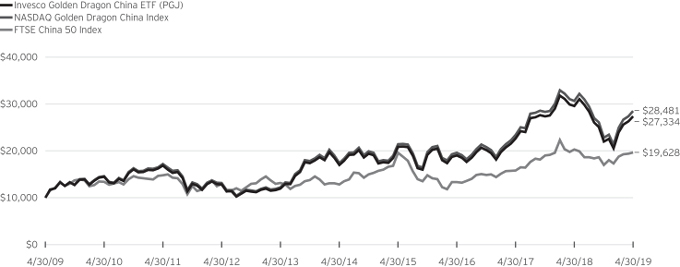
Fund Performance History as of April 30, 2019
| | | | | | | | | | | | | | | | | | | | | | | | | | | | | | | | | | | | | | | | |
| | | 1 Year | | | 3 Years Average
Annualized | | | 3 Years Cumulative | | | 5 Years Average
Annualized | | | 5 Years Cumulative | | | 10 Years Average
Annualized | | | 10 Years Cumulative | | | | | | Fund Inception | |
| Index | | | | | Average
Annualized | | | Cumulative | |
| NASDAQ Golden Dragon China Index | | | (7.04 | )% | | | 13.31 | % | | | 45.48 | % | | | 10.35 | % | | | 63.66 | % | | | 11.03 | % | | | 184.81 | % | | | | | | | 9.40 | % | | | 264.16 | % |
| FTSE China 50 Index | | | (3.06 | ) | | | 13.70 | | | | 46.98 | | | | 8.91 | | | | 53.26 | | | | 6.98 | | | | 96.28 | | | | | | | | 9.55 | | | | 271.62 | |
| Fund | | | | | | | | | | | | | | | | | | | | | | | | | | | | | | | | | | | | | | | | |
| NAV Return | | | (7.46 | ) | | | 12.91 | | | | 43.95 | | | | 9.96 | | | | 60.78 | | | | 10.58 | | | | 173.34 | | | | | | | | 8.92 | | | | 241.83 | |
| Market Price Return | | | (7.39 | ) | | | 12.96 | | | | 44.14 | | | | 10.02 | | | | 61.18 | | | | 10.58 | | | | 173.40 | | | | | | | | 8.90 | | | | 241.16 | |
Fund Inception: December 9, 2004
Performance quoted above represents past performance. Past performance is not a guarantee of future results and current performance may be higher or lower than performance quoted. Investment returns and principal value will fluctuate, and shares of the Fund (“Fund Shares”), when redeemed or sold, may be worth more or less than their original cost. Fund performance reflects any applicable fee waivers and/or expense reimbursements. Had the adviser not waived
fees and/or reimbursed expenses currently or in the past, returns would have been lower. See current prospectus for more information. According to the Fund’s current prospectus, the total annual operating expense ratio was indicated as 0.70%. The Financial Highlights section of the Shareholder Report presents the expense ratios based on expenses incurred during the period covered by this report. NAV and Market Price returns assume that dividends and capital gain distributions have been reinvested in the Fund at NAV and Market Price, respectively. The returns shown in the table above do not reflect the deduction of taxes that a shareholder would pay on Fund distributions or the redemption or
sale of Fund Shares. See invesco.com/ETFs to find the most recentmonth-end performance numbers.
Index and Benchmark Index performance results are based upon a hypothetical investment in their respective constituent securities. Index and Benchmark Index returns do not represent Fund returns. An investor cannot invest directly in an index. The Index and Benchmark Index do not charge management fees or brokerage expenses, and no such fees or expenses were deducted from the hypothetical performance shown. In addition, the results actual investors might have achieved would have differed from those shown because of differences in the timing, amounts of their investments, and fees and expenses associated with an investment in the Fund.
Notes Regarding Indexes and Fund Performance History:
| - | Average Annualized and Cumulative Inception returns for the Fund, Index and Benchmark Index are based on the inception date of the Fund. |
| | |
| NFO | | Manager’s Analysis |
| | Invesco Insider Sentiment ETF (NFO) |
As an index fund, the Invesco Insider Sentiment ETF (the “Fund”) is passively managed and seeks to track the returns of an underlying index. The Fund seeks to track the investment results (before fees and expenses) of the Nasdaq US Insider Sentiment Index (the “Index”). The Fund generally will invest at least 90% of its total assets in securities that comprise the Index and depositary receipts representing common stocks included in the Index (or underlying securities representing depositary receipts included in the Index).
The Index is designed to provide exposure to U.S. companies that Nasdaq, Inc. (the “Index Provider”), strictly in accordance with its guidelines and mandated procedures, has selected for inclusion in the Index based on a company’s corporate insider buying trends. The companies eligible for the Index are derived from its starting universe, the Nasdaq US Large Mid Cap Index, which is designed to track the performance ofmid-to large-capitalization U.S. companies. The Index Provider selects securities for the Index using a rules-based selection criteria designed to increase the Index’s exposure, relative to the starting universe, to securities that reflect favorable corporate insider buying trends by considering the following factors: insider buying trends, momentum and volatility. Eligible securities are ranked based on the above three factors and the top 100 ranking securities are selected for inclusion in the Index. The Fund generally will invest in all of the securities comprising the Index in proportion to their weightings in the Index.
For the fiscal year ended April 30, 2019, on a market price basis, the Fund returned 7.56%. On a net asset value (“NAV”) basis, the Fund returned 7.70%. During the same time period, the Index returned 8.36%. During the fiscal year, the Fund fully replicated the components of the Index; therefore, the Fund’s performance, on a NAV basis, differed from the return of the Index primarily due to fees and operating expenses that the Fund incurred during the period.
During this same time period, the S&P 500® Index (the “Benchmark Index”) returned 13.49%. The Benchmark Index is an unmanaged index weighted by market capitalization based on the average performance of approximately 505 equity securities. The Benchmark Index was selected for its recognition in the marketplace, and its performance comparison is a useful measure for investors as a broad representation of the overall U.S. stock market.
The performance of the Fund differed from the Benchmark Index in part because the Fund seeks to track an Index that employs a proprietary stock selection and weighting methodology, whereas the Benchmark Index selects and weights stocks based primarily on market capitalization.
Relative to the Benchmark Index, the Fund was most overweight in the utilities sector and most underweight in the information
technology sector during the fiscal year ended April 30, 2019. The majority of the Fund’s underperformance relative to the Benchmark Index during that period can be attributed to the Fund’s security selection in the consumer discretionary sector and the underweight allocation to the information technology sector.
For the fiscal year ended April 30, 2019, the utilities sector contributed most significantly to the Fund’s return, followed by the information technology and industrials sectors, respectively. The energy sector detracted most significantly from the Fund’s return, followed by the consumer discretionary sector.
Positions that contributed most significantly to the Fund’s return for the fiscal year ended April 30, 2019, included Twilio, Inc., Class A, an information technology company (portfolio average weight of 0.65%) and Fair Isaac Corp., an information technology company (portfolio average weight of 1.10%). Positions that detracted most significantly from the Fund’s return during this period included Oasis Petroleum Inc., an energy company (no longer held at fiscalyear-end) and Tapestry, Inc., a consumer discretionary company (no longer held at fiscalyear-end).
| | | | |
Sector Breakdown
(% of the Fund’s Net Assets)
as of April 30, 2019 | |
| Utilities | | | 20.6 | |
| Information Technology | | | 17.8 | |
| Health Care | | | 13.1 | |
| Real Estate | | | 12.7 | |
| Industrials | | | 11.5 | |
| Financials | | | 7.3 | |
| Communication Services | | | 6.1 | |
| Consumer Staples | | | 4.0 | |
| Consumer Discretionary | | | 4.0 | |
| Materials | | | 3.0 | |
| Money Market Funds Plus Other Assets Less Liabilities | | | (0.1) | |
Invesco Insider Sentiment ETF (NFO)(continued)
| | | | |
Top Ten Fund Holdings*
(% of the Fund’s Net Assets)
as of April 30, 2019 | |
| Security | | | | |
| Okta, Inc. | | | 1.2 | |
| Carlisle Cos., Inc. | | | 1.1 | |
| Dell Technologies, Inc., Class C | | | 1.1 | |
| Ingersoll-Rand PLC | | | 1.1 | |
| Trade Desk, Inc. (The), Class A | | | 1.1 | |
| US Bancorp | | | 1.1 | |
| United Technologies Corp. | | | 1.1 | |
| Fastenal Co. | | | 1.1 | |
| Arrow Electronics, Inc. | | | 1.1 | |
| Honeywell International, Inc. | | | 1.0 | |
| Total | | | 11.0 | |
| * | Excluding money market fund holdings. |
Growth of a $10,000 Investment
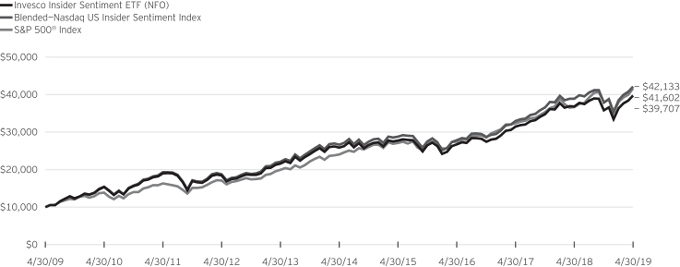
Fund Performance History as of April 30, 2019
| | | | | | | | | | | | | | | | | | | | | | | | | | | | | | | | | | | | | | | | |
| | | 1 Year | | | 3 Years Average
Annualized | | | 3 Years Cumulative | | | 5 Years Average
Annualized | | | 5 Years Cumulative | | | 10 Years Average
Annualized | | | 10 Years Cumulative | | | | | | Fund Inception | |
| Index | | | | | Average
Annualized | | | Cumulative | |
| Blended—Nasdaq US Insider Sentiment Index | | | 8.36 | % | | | 14.80 | % | | | 51.31 | % | | | 9.60 | % | | | 58.16 | % | | | 15.47 | % | | | 321.33 | % | | | | | | | 10.41 | % | | | 248.47 | % |
| S&P 500® Index | | | 13.49 | | | | 14.87 | | | | 51.58 | | | | 11.63 | | | | 73.32 | | | | 15.32 | | | | 316.02 | | | | | | | | 8.86 | | | | 191.62 | |
| Fund | | | | | | | | | | | | | | | | | | | | | | | | | | | | | | | | | | | | | | | | |
| NAV Return | | | 7.70 | | | | 14.09 | | | | 48.51 | | | | 8.98 | | | | 53.71 | | | | 14.79 | | | | 297.07 | | | | | | | | 9.64 | | | | 219.23 | |
| Market Price Return | | | 7.56 | | | | 14.02 | | | | 48.22 | | | | 8.96 | | | | 53.62 | | | | 14.78 | | | | 296.98 | | | | | | | | 9.63 | | | | 218.90 | |
Invesco Insider Sentiment ETF (NFO)(continued)
Guggenheim Insider Sentiment ETF (the “Predecessor Fund”) Inception: September 21, 2006
Performance quoted above represents past performance. Past performance is not a guarantee of future results and current performance may be higher or lower than performance quoted. Investment returns and principal value will fluctuate, and shares of the Fund (“Fund Shares”), when redeemed or sold, may be worth more or less than their original cost. Fund performance reflects any applicable fee waivers and/or expense reimbursements. Had the adviser not waived fees and/or reimbursed expenses currently or in the past, returns would have been lower. See current prospectus for more information. The adviser has contractually agreed to waive fees and/or pay certain Fund expenses through August 31, 2021. According to the Fund’s current prospectus, the total gross annual operating expense ratio was indicated as 0.73% and the net annual operating expense ratio was indicated as 0.60%. The Financial Highlights section of the Shareholder Report presents the expense ratios based on expenses incurred during the period covered by this report. NAV and Market Price returns assume that dividends and capital gain distributions have been reinvested in the Fund at NAV and Market Price, respectively. The returns shown in the table above do not reflect the deduction of taxes that a shareholder would pay on Fund distributions or the redemption or sale of Fund Shares. See invesco.com/ETFs to find the most recentmonth-end performance numbers.
Blended-Index and Benchmark Index performance results are based upon a hypothetical investment in their respective constituent securities. Blended-Index and Benchmark Index returns do not represent Fund returns. An investor cannot invest directly in an index. The Blended-Index and Benchmark Index do not charge management fees or brokerage expenses, and no such fees or expenses were deducted from the hypothetical performance shown. In addition, the results actual investors might have achieved would have differed from those shown because of differences in the timing, amounts of their investments, and fees and expenses associated with an investment in the Fund.
Notes Regarding Indexes and Fund Performance History:
| - | The Blended—Nasdaq US Insider Sentiment Index performance is comprised of the performance of the Sabrient Insider Sentiment Index, the Fund’s previous underlying index, prior to the conversion date, October 24, 2016, followed by the performance of the Index, starting from the conversion date through April 30, 2019. |
| - | Average Annualized and Cumulative Inception returns for the Fund, Blended-Index and Benchmark Index are based on the inception date of the Predecessor Fund. |
| - | Effective after the close of business on April 6, 2018, the Predecessor Fund was reorganized into the Fund. Returns shown are blended returns of the Predecessor Fund and the Fund. |
| | |
| RYJ | | Manager’s Analysis |
| | Invesco Raymond JamesSB-1 Equity ETF (RYJ) |
As an index fund, the Invesco Raymond JamesSB-1 Equity ETF (the “Fund”) is passively managed and seeks to track the returns of an underlying index. The Fund seeks to track the investment results (before fees and expenses) of the Raymond JamesSB-1 Equity Index (the “Index”). The Fund generally will invest at least 90% of its total assets in the securities that comprise the Index.
Strictly in accordance with its guidelines and mandated procedures, Raymond James Research Services, LLC (the “Index Provider”) compiles, maintains, and calculates the Index, which is comprised of U.S.-listed equity securities that are rated Strong Buy 1(“SB-1”) by an affiliate of the Index Provider (together, the affiliate and the Index Provider are referred to as “Raymond James”). The Index will include equity securities of all market capitalizations, including common stocks, sponsored American depositary receipts (“ADRs”), real estate investment trusts (“REITs”) and master limited partnerships (“MLPs”) and business development companies (“BDCs”) that are ratedSB-1 by Raymond James. The Fund generally will invest in all of the securities comprising the Index in proportion to their weightings in the Index.
The Board of Trustees approved a change in the fiscal year end for the Fund from August 31 to April 30. For the fiscal period from September 1, 2018 to April 30, 2019, on a market price basis, the Fund returned (6.51)%. On a net asset value (“NAV”) basis, the Fund returned (6.60)%. During the same time period, the Index returned (6.17)%. During the fiscal period, the Fund’s performance, on a NAV basis, differed from the return of the Index primarily due to fees and operating expenses incurred by the Fund during the period.
During this same time period, the S&P MidCap 400® Index (the “Benchmark Index”) returned (2.56)%. The Benchmark Index is an unmanaged index weighted by market capitalization based on the average performance of approximately 400 securities. The Benchmark Index was selected for its recognition in the marketplace, and its performance comparison is a useful measure for investors as a broad representation of the overall U.S.mid-cap equity market.
The performance of the Fund differed from the Benchmark Index because the Fund seeks to track an Index that employs a proprietary stock selection and weighting methodology, whereas the Benchmark Index selects and weights stocks based primarily on market capitalization.
Relative to the Benchmark Index, the Fund was most overweight in the energy sector and most underweight in the materials sector during the fiscal period ended April 30, 2019. The majority of the Fund’s underperformance relative to the Benchmark Index during that period can be attributed to the Fund’s overweight exposure to the energy sector.
For the fiscal period ended April 30, 2019, the information technology sector contributed most significantly to the Fund’s return, followed by the industrials and health care sectors, respectively. The energy sector detracted most significantly to the Fund’s return, followed by the financials sector and real estate sector, respectively.
Positions that contributed most significantly to the Fund’s return for the fiscal period ended April 30, 2019, included Spark Therapeutics, Inc., a health care company (no longer held at fiscalyear-end) and Loxo Oncology Inc., a health care company (no longer held at fiscalyear-end). Positions that detracted most significantly from the Fund’s return during this period included Internap Corp., an information technology company (portfolio average weight of 0.58%) and Nabors Industries Ltd., an energy company (no longer held at fiscalyear-end).
| | | | |
Sector Breakdown
(% of the Fund’s Net Assets)
as of April 30, 2019 | |
| Financials | | | 21.1 | |
| Information Technology | | | 16.7 | |
| Energy | | | 15.8 | |
| Health Care | | | 15.6 | |
| Industrials | | | 11.3 | |
| Consumer Discretionary | | | 9.4 | |
| Real Estate | | | 5.7 | |
| Communication Services | | | 4.3 | |
| Money Market Funds Plus Other Assets Less Liabilities | | | 0.1 | |
|
Top Ten Fund Holdings*
(% of the Fund’s Net Assets)
as of April 30, 2019 | |
| Security | | | | |
| Bancorp, Inc. (The) | | | 0.7 | |
| G1 Therapeutics, Inc. | | | 0.7 | |
| Meta Financial Group, Inc. | | | 0.7 | |
| Cadence BanCorp | | | 0.7 | |
| ServiceNow, Inc. | | | 0.7 | |
| Knoll, Inc. | | | 0.7 | |
| Rent-A-Center, Inc. | | | 0.7 | |
| Itron, Inc. | | | 0.7 | |
| Acadia Healthcare Co., Inc. | | | 0.7 | |
| ConnectOne Bancorp, Inc. | | | 0.7 | |
| Total | | | 7.0 | |
| * | Excluding money market fund holdings. |
Invesco Raymond JamesSB-1 Equity ETF (RYJ)(continued)
Growth of a $10,000 Investment
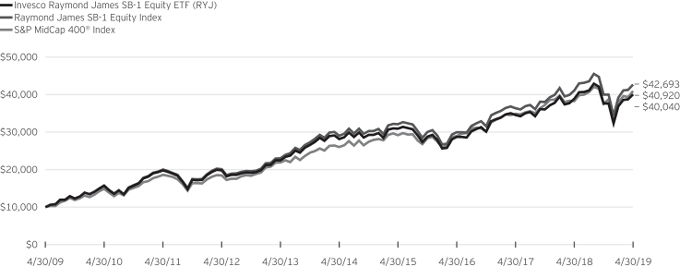
Fund Performance History as of April 30, 2019
| | | | | | | | | | | | | | | | | | | | | | | | | | | | | | | | | | | | | | | | |
| | | 1 Year | | | 3 Years Average
Annualized | | | 3 Years Cumulative | | | 5 Years Average
Annualized | | | 5 Years Cumulative | | | 10 Years Average
Annualized | | | 10 Years Cumulative | | | | | | Fund Inception | |
| Index | | | | | Average
Annualized | | | Cumulative | |
| Raymond JamesSB-1 Equity Index | | | 3.81 | % | | | 12.53 | % | | | 42.50 | % | | | 8.05 | % | | | 47.27 | % | | | 15.62 | % | | | 326.93 | % | | | | | | | N/A | | | | N/A | |
| S&P MidCap 400® Index | | | 6.99 | | | | 12.26 | | | | 41.47 | | | | 9.49 | | | | 57.35 | | | | 15.13 | | | | 309.20 | | | | | | | | 9.24 | % | | | 214.01 | % |
| Fund | | | | | | | | | | | | | | | | | | | | | | | | | | | | | | | | | | | | | | | | |
| NAV Return | | | 3.07 | | | | 11.79 | | | | 39.70 | | | | 7.33 | | | | 42.43 | | | | 14.88 | | | | 300.40 | | | | | | | | 8.14 | | | | 175.45 | |
| Market Price Return | | | 3.02 | | | | 11.80 | | | | 39.75 | | | | 7.34 | | | | 42.51 | | | | 14.92 | | | | 301.75 | | | | | | | | 7.85 | | | | 165.97 | |
Guggenheim Raymond James SB-1 Equity ETF (the “Predecessor Fund”) Inception: May 19, 2006
Performance quoted above represents past performance. Past performance is not a guarantee of future results and current performance may be higher or lower than performance quoted. Investment returns and principal value will fluctuate, and shares of the Fund (“Fund Shares”), when redeemed or sold, may be worth more or less than their original cost. Fund performance reflects any applicable fee waivers and/or expense reimbursements. Had the adviser not waived fees and/or reimbursed expenses currently or in the past, returns would have been lower. See current prospectus for more information. According to the Fund’s current prospectus, the Fund’s expense ratio of 0.75% is expressed as a unitary management fee to cover operating expenses and expenses incurred in connection with managing the portfolio. NAV and Market Price returns assume that dividends and capital gain distributions have been reinvested in the Fund at NAV and Market Price, respectively. The returns shown in the table above do not reflect the deduction of taxes that a shareholder would pay on Fund distributions or the redemption or sale of Fund Shares. See invesco.com/ETFs to find the most recentmonth-end performance numbers.
Index and Benchmark Index performance results are based upon a hypothetical investment in their respective constituent securities. Index and Benchmark Index returns do not represent Fund returns. An investor cannot invest directly in an index. The Index and Benchmark Index do not charge management fees or brokerage expenses, and no such fees or expenses were deducted from the hypothetical performance shown. In addition, the results actual investors might have achieved would have differed from those shown because of differences in the timing, amounts of their investments, and fees and expenses associated with an investment in the Fund.
Notes Regarding Indexes and Fund Performance History:
| - | Effective after the close of business on May 18, 2018, the Predecessor Fund was reorganized into the Fund. Fund returns shown are blended returns of the Predecessor Fund and the Fund. |
| - | Average Annualized and Cumulative Inception returns for the Fund, Index and Benchmark Index are based on the inception date of the Predecessor Fund. |
| | |
| PBP | | Manager’s Analysis |
| | Invesco S&P 500 BuyWrite ETF (PBP) |
As an index fund, the Invesco S&P 500 BuyWrite ETF (the “Fund”) is passively managed and seeks to track the returns of an underlying index. The Fund seeks to track the investment results (before fees and expenses) of the CBOE S&P 500 BuyWrite IndexSM (the “Index”). The Fund generally will invest at least 90% of its total assets in securities that comprise the Index and will write (sell) call options thereon. The Index is a total return benchmark index that is designed to track the performance of a hypothetical“buy-write” strategy on the S&P 500® Index.
Strictly in accordance with its guidelines and mandated procedures, the Chicago Board Options Exchange, Incorporated (the “Index Provider”) compiles, calculates and maintains the Index. The Index is based on (1) buying an S&P 500 stock index portfolio, and (2) “writing” (or selling) the near-term S&P 500® Index “covered” call option, generally on the third Friday of each month. A“buy-write,” also called a covered call, generally is considered an investment strategy in which an investor buys a stock or basket of stocks, and sells call options that correspond to the stock or basket of stocks. In return for a premium, the Fund gives the right to the purchaser of the option written by the Fund to receive a cash payment equal to the difference between the value of the S&P 500® Index and exercise price, if the value on the expiration date is above the exercise price. In addition, covered call options partially hedge against a decline in the price of the securities on which they are written to the extent of the premium the Fund receives. The Fund will write options that are traded on national securities exchanges. The Fund generally invests in all of the securities comprising the Index in proportion to their weightings in the Index.
For the fiscal year ended April 30, 2019, on a market price basis, the Fund returned 2.97%. On a net asset value (“NAV”) basis, the Fund returned 3.16%. During the same time period, the Index returned 3.53%. During the fiscal year, the Fund fully replicated the components of the Index; therefore, the Fund’s performance, on a NAV basis, differed from the return of the Index primarily due to fees and operating expenses that the Fund incurred during the period.
During this same time period, the S&P 500® Index (the “Benchmark Index”) returned 13.49%. The Benchmark Index is an unmanaged index weighted by market capitalization based on the average performance of approximately 505 securities. The Benchmark Index was selected for its recognition in the marketplace, and because its performance comparison is a useful measure for investors as a broad representation of the U.S. equity market that does not contain a covered call component.
The performance of the Fund differed from the Benchmark Index because the Fund seeks to track an Index that employs abuy-write strategy on the S&P 500® Index whereas the Benchmark Index selects and weights stocks based primarily on market capitalization.
The majority of the Fund’s underperformance relative to the Benchmark Index during that period can be attributed to the covered call feature of the Fund during the months of January, September and April. The sale of call options during a period of rising markets, while providing benefit in the form of cash flow to the Fund, resulted in the call options being exercised, with the impact of the exercise being underperformance versus the Benchmark Index.
For the fiscal year ended April 30, 2019, the information technology sector contributed most significantly to the Fund’s return, followed by the consumer discretionary and real estate sectors, respectively. Energy was the only sector that detracted from the Fund’s return.
Positions that contributed most significantly to the Fund’s return for the fiscal year ended April 30, 2019, included SPX 12/21/2018 call contract, a short S&P 500 Index call contract (no longer held at fiscal year-end) and Microsoft Corp., an information technology company (portfolio average weight of 3.59%). Positions that detracted most significantly from the Fund’s return during this period included SPX 1/18/2019 call contract, a short S&P 500 Index call contract (no longer held at fiscal year-end) and Schlumberger NV, an energy company (portfolio average weight of 0.25%).
| | | | |
Sector Breakdown
(% of the Fund’s Net Assets)
as of April 30, 2019 | |
| Information Technology | | | 22.1 | |
| Health Care | | | 13.9 | |
| Financials | | | 13.6 | |
| Communication Services | | | 10.5 | |
| Consumer Discretionary | | | 10.5 | |
| Industrials | | | 9.7 | |
| Consumer Staples | | | 7.4 | |
| Energy | | | 5.3 | |
| Utilities | | | 3.3 | |
| Real Estate | | | 3.0 | |
| Materials | | | 2.7 | |
| Other Assets Less Liabilities | | | (2.0) | |
Invesco S&P 500 BuyWrite ETF (PBP)(continued)
| | | | |
Top Ten Fund Holdings
(% of the Fund’s Net Assets)
as of April 30, 2019 | |
| Security | | | | |
| Microsoft Corp. | | | 4.2 | |
| Apple, Inc. | | | 3.7 | |
| Amazon.com, Inc. | | | 3.3 | |
| Facebook, Inc., Class A | | | 1.9 | |
| Berkshire Hathaway, Inc., Class B | | | 1.7 | |
| JPMorgan Chase & Co. | | | 1.6 | |
| Johnson & Johnson | | | 1.6 | |
| Alphabet, Inc., Class C | | | 1.5 | |
| Alphabet, Inc., Class A | | | 1.5 | |
| Exxon Mobil Corp. | | | 1.4 | |
| Total | | | 22.4 | |
Growth of a $10,000 Investment

Fund Performance History as of April 30, 2019
| | | | | | | | | | | | | | | | | | | | | | | | | | | | | | | | | | | | | | | | |
| | | 1 Year | | | 3 Years Average
Annualized | | | 3 Years Cumulative | | | 5 Years Average
Annualized | | | 5 Years Cumulative | | | 10 Years Average
Annualized | | | 10 Years Cumulative | | | | | | Fund Inception | |
| Index | | | | | Average
Annualized | | | Cumulative | |
| CBOE S&P 500 BuyWrite IndexSM | | | 3.53 | % | | | 7.82 | % | | | 25.33 | % | | | 6.07 | % | | | 34.24 | % | | | 8.72 | % | | | 130.72 | % | | | | | | | 4.62 | % | | | 67.07 | % |
| S&P 500® Index | | | 13.49 | | | | 14.87 | | | | 51.58 | | | | 11.63 | | | | 73.32 | | | | 15.32 | | | | 316.02 | | | | | | | | 8.67 | | | | 157.12 | |
| Fund | | | | | | | | | | | | | | | | | | | | | | | | | | | | | | | | | | | | | | | | |
| NAV Return | | | 3.16 | | | | 7.14 | | | | 23.00 | | | | 5.33 | | | | 29.67 | | | | 7.90 | | | | 113.82 | | | | | | | | 3.82 | | | | 53.10 | |
| Market Price Return | | | 2.97 | | | | 7.21 | | | | 23.23 | | | | 5.29 | | | | 29.42 | | | | 7.86 | | | | 113.10 | | | | | | | | 3.82 | | | | 53.06 | |
Invesco S&P 500 BuyWrite ETF (PBP)(continued)
Fund Inception: December 20, 2007
Performance quoted above represents past performance. Past performance is not a guarantee of future results and current performance may be higher or lower than performance quoted. Investment returns and principal value will fluctuate, and shares of the Fund (“Fund Shares”), when redeemed or sold, may be worth more or less than their original cost. Fund performance reflects any applicable fee waivers and/or expense reimbursements. Had the adviser not waived fees and/or reimbursed expenses currently or in the past, returns would have been lower. See current prospectus for more information. According to the Fund’s current prospectus, the Fund’s expense ratio of 0.49% is expressed as a unitary management fee to cover operating expenses and expenses incurred in connection with managing the portfolio. NAV and Market Price returns assume that dividends and capital gain distributions have been reinvested in the Fund at NAV and Market Price, respectively. The returns shown in the table above do not reflect the deduction of taxes that a shareholder would pay on Fund distributions or the redemption or sale of Fund Shares. See
invesco.com/ETFs to find the most recentmonth-end performance numbers.
Index and Benchmark Index performance results are based upon a hypothetical investment in their respective constituent securities. Index and Benchmark Index returns do not represent Fund returns. An investor cannot invest directly in an index. The Index and Benchmark Index do not charge management fees or brokerage expenses, and no such fees or expenses were deducted from the hypothetical performance shown. In addition, the results actual investors might have achieved would have differed from those shown because of differences in the timing, amounts of their investments, and fees and expenses associated with an investment in the Fund.
Notes Regarding Indexes and Fund Performance History:
| - | Average Annualized and Cumulative Inception returns for the Fund, Index and Benchmark Index are based on the inception date of the Fund. |
| | |
| SPHQ | | Manager’s Analysis |
| | Invesco S&P 500® Quality ETF (SPHQ) |
As an index fund, the Invesco S&P 500® Quality ETF (the “Fund”) is passively managed and seeks to track the returns of an underlying index. The Fund seeks to track the investment results (before fees and expenses) of the S&P 500® Quality Index (the “Index”). The Fund generally will invest at least 90% of its total assets in securities that comprise the Index.
Strictly in accordance with its guidelines and mandated procedures, S&P Dow Jones Indices LLC (the “Index Provider”) compiles, maintains and calculates the Index, which is constructed from the constituents of the S&P 500® Index. In selecting constituent securities for the Index, the Index Provider first calculates the quality score of each security in the S&P 500® Index. The quality score of each component stock is derived by the Index Provider from each component stock’sreturn-on-equity, accruals ratio and financial leverage ratio. Return on equity is calculated as the company’s trailing12-month earnings per share divided by the company’s latest book value per share. Accruals ratio is computed using the change of the company’s net operating assets over the last year divided by the company’s average net operating assets over the last two years. Financial leverage is calculated as the company’s latest total debt divided by the company’s book value. The Index Provider then selects the 100 stocks with the highest quality score for inclusion in the Index. The Index Provider weights each component stock of the Index by the total quality score multiplied by its market capitalization. The Fund generally invests in all of the securities comprising the Index in proportion to their weightings in the Index.
For the fiscal year ended April 30, 2019, on a market price basis, the Fund returned 14.59%. On a net asset value (“NAV”) basis, the Fund returned 14.63%. During the same time period, the Index returned 14.86%. During the fiscal year, the Fund fully replicated the components of the Index; therefore, the Fund’s performance, on a NAV basis, differed from the return of the Index primarily due to fees and operating expenses that the Fund incurred during the period.
During this same time period, the S&P 500® Index (the “Benchmark Index”) returned 13.49%. The Benchmark Index is an unmanaged index weighted by market capitalization based on the average performance of approximately 505 securities. The Benchmark Index was selected for its recognition in the market place, and because its performance comparison is a useful measure for investors as a broad representation of the overall U.S. stock market.
The performance of the Fund differed from the Benchmark Index in part because the Fund seeks to track an Index that selects stocks based primarily upon quality scores as computed by the Index Provider, while the Benchmark Index does not.
Relative to the Benchmark Index, the Fund was most overweight in the information technology sector and most underweight in the financials sector during the fiscal year ended April 30, 2019.
The majority of the Fund’s outperformance relative to the Benchmark Index during that period can be attributed to the Fund’s overweight exposure to and stock selection in the consumer staples sector, as well as the Fund’s underweight exposure to and stock selection in the financials sector.
For the fiscal year ended April 30, 2019, the information technology sector contributed most significantly to the Fund’s return, followed by the consumer discretionary and consumer staples sectors, respectively. The materials sector detracted most significantly from the Fund’s return.
Positions that contributed most significantly to the Fund’s return for the fiscal year ended April 30, 2019, included Procter & Gamble Co., a consumer staples company (portfolio average weight of 4.44%) and Mastercard, Inc., Class A, an information technology company (portfolio average weight of 4.32%). Positions that detracted most significantly from the Fund’s return during this period included NVIDIA Corp., an information technology company (portfolio average weight of 3.08%) and Activision Blizzard, Inc., a communication services company (portfolio average weight of 0.78%).
| | | | |
Sector Breakdown
(% of the Fund’s Net Assets)
as of April 30, 2019 | |
| Information Technology | | | 42.6 | |
| Health Care | | | 10.4 | |
| Consumer Discretionary | | | 10.1 | |
| Consumer Staples | | | 9.8 | |
| Industrials | | | 8.1 | |
| Energy | | | 6.7 | |
| Communication Services | | | 5.9 | |
| Financials | | | 4.3 | |
| Sector Types Each Less Than 3% | | | 2.0 | |
| Money Market Funds Plus Other Assets Less Liabilities | | | 0.1 | |
Invesco S&P 500® Quality ETF (SPHQ)(continued)
| | | | |
Top Ten Fund Holdings*
(% of the Fund’s Net Assets)
as of April 30, 2019 | |
| Security | | | | |
| Microsoft Corp. | | | 4.7 | |
| Apple, Inc. | | | 4.6 | |
| Visa, Inc., Class A | | | 4.4 | |
| Procter & Gamble Co. (The) | | | 4.4 | |
| Cisco Systems, Inc. | | | 4.4 | |
| Mastercard, Inc., Class A | | | 4.1 | |
| Chevron Corp. | | | 3.9 | |
| Walt Disney Co. (The) | | | 3.6 | |
| Merck & Co., Inc. | | | 3.6 | |
| NIKE, Inc., Class B | | | 2.6 | |
| Total | | | 40.3 | |
| * | Excluding money market fund holdings. |
Growth of a $10,000 Investment
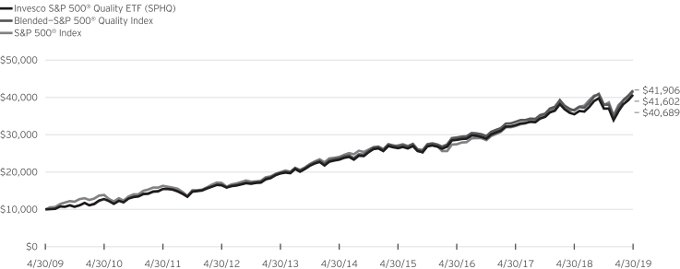
Fund Performance History as of April 30, 2019
| | | | | | | | | | | | | | | | | | | | | | | | | | | | | | | | | | | | | | | | |
| | | 1 Year | | | 3 Years Average
Annualized | | | 3 Years Cumulative | | | 5 Years Average
Annualized | | | 5 Years Cumulative | | | 10 Years Average
Annualized | | | 10 Years Cumulative | | | | | | Fund Inception | |
| Index | | | | | Average
Annualized | | | Cumulative | |
| Blended—S&P 500® Quality Index | | | 14.86 | % | | | 12.74 | % | | | 43.30 | % | | | 12.07 | % | | | 76.82 | % | | | 15.41 | % | | | 319.06 | % | | | | | | | 7.32 | % | | | 157.67 | % |
| S&P 500® Index | | | 13.49 | | | | 14.87 | | | | 51.58 | | | | 11.63 | | | | 73.32 | | | | 15.32 | | | | 316.02 | | | | | | | | 8.78 | | | | 208.76 | |
| Fund | | | | | | | | | | | | | | | | | | | | | | | | | | | | | | | | | | | | | | | | |
| NAV Return | | | 14.63 | | | | 12.44 | | | | 42.16 | | | | 11.76 | | | | 74.37 | | | | 15.07 | | | | 306.89 | | | | | | | | 7.14 | | | | 151.97 | |
| Market Price Return | | | 14.59 | | | | 12.45 | | | | 42.20 | | | | 11.78 | | | | 74.50 | | | | 15.07 | | | | 306.98 | | | | | | | | 7.10 | | | | 150.88 | |
Invesco S&P 500® Quality ETF (SPHQ)(continued)
Fund Inception: December 6, 2005
Performance quoted above represents past performance. Past performance is not a guarantee of future results and current performance may be higher or lower than performance quoted. Investment returns and principal value will fluctuate, and shares of the Fund (“Fund Shares”), when redeemed or sold, may be worth more or less than their original cost. Fund performance reflects any applicable fee waivers and/or expense reimbursements. Had the adviser not waived fees and/or reimbursed expenses currently or in the past, returns would have been lower. See current prospectus for more information. The adviser has contractually agreed to waive fees and/or pay certain Fund expenses through August 31, 2021. According to the Fund’s current prospectus, the total gross annual operating expense ratio was indicated as 0.23% and the net annual operating expense ratio was indicated as 0.15%. The Financial Highlights section of the Shareholder Report presents the expense ratios based on expenses incurred during the period covered by this report. NAV and Market Price returns assume that dividends and capital gain distributions have been reinvested in the Fund at NAV and Market Price, respectively. The returns shown in the table above do not reflect the deduction of taxes that a shareholder would pay on Fund distributions or the redemption or sale of Fund Shares. See invesco.com/ETFs to find the most recentmonth-end performance numbers.
Blended-Index and Benchmark Index performance results are based upon a hypothetical investment in their respective constituent securities. Blended-Index and Benchmark Index returns do not represent Fund returns. An investor cannot invest directly in an index. The Blended-Index and Benchmark Index do not charge management fees or brokerage expenses, and no such fees or expenses were deducted from the hypothetical performance shown. In addition, the results actual investors might have achieved would have differed from those shown because of differences in the timing, amounts of their investments, and fees and expenses associated with an investment in the Fund.
Notes Regarding Indexes and Fund Performance History:
| - | The Blended—S&P 500® Quality Index is comprised of the performance of the Value Line Timeliness Select Index, the Fund’s underlying index from Fund inception through the conversion date, June 29, 2010, followed by the performance of the S&P 500® High Quality Rankings Index, the Fund’s underlying index for the period June 29, 2010 through March 18, 2016, followed by the performance of the Index for the period March 18, 2016 through April 30, 2019. |
| - | Average Annualized and Cumulative Inception returns for the Fund, Blended-Index and Benchmark Index are based on the inception date of the Fund. |
| | |
| CSD | | Manager’s Analysis |
| | Invesco S&PSpin-Off ETF (CSD) |
As an index fund, the Invesco S&PSpin-Off ETF (the “Fund”) is passively managed and seeks to track the returns of an underlying index. The Fund seeks to track the investment results (before fees and expenses) of the S&P U.S.Spin-Off Index (the “Index”). The Fund generally will invest at least 90% of its total assets in the securities that comprise the Index.
The Index is designed to measure the performance of U.S. companies that have been spun off from larger corporations within the past four years. The Index is comprised of equity securities of U.S. companies added to the S&P U.S. BMI, a countrysub-index of the S&P Global BMI, that have been spun off and have a float-adjusted market capitalization of at least $1 billion. S&P Dow Jones Indices LLC (the “Index Provider”) defines aspin-off company as any company resulting from one of the following events:spin-off,carve-out orsplit-off. The Fund generally invests in all of the securities comprising the Index in proportion to their weightings in the Index.
For the fiscal year ended April 30, 2019, on a market price basis, the Fund returned 0.78%. On a net asset value (“NAV”) basis, the Fund returned 0.71%. During the same time period, the Index returned 1.34%. During the fiscal year, the Fund fully replicated the components of the Index; therefore, the Fund’s performance, on a NAV basis, differed from the return of the Index primarily due to fees and operating expenses that the Fund incurred, as well as trading costs associated with portfolio rebalances during the period.
During this same time period, the Russell Midcap® Index (the “Benchmark Index”) returned 10.69%. The Benchmark Index is an unmanaged index weighted by market capitalization based on the average performance of approximately 780 equity securities. The Benchmark Index was selected for its recognition in the marketplace, and because its performance comparison is a useful measure for investors as a broad representation of the U.S. midcap equity market.
The performance of the Fund differed from the Benchmark Index in part because the Fund seeks to track an Index that employs a proprietary stock selection and weighting methodology, whereas the Benchmark Index selects and weights stocks based primarily on market capitalization.
Relative to the Benchmark Index, the Fund was most overweight in the information technology sector and most underweight in the health care sector during the fiscal year ended April 30, 2019. The majority of the Fund’s underperformance relative to the Benchmark Index during that period can be attributed to the Fund’s overweight exposure to and stock selection in the materials sector.
For the fiscal year ended April 30, 2019, the information technology sector contributed most significantly to the Fund’s return, followed by the industrials and financials sectors,
respectively. The materials sector detracted most significantly from the Fund’s return, followed by the energy sector.
Positions that contributed most significantly to the Fund’s return for the fiscal year ended April 30, 2019, included PayPal Holdings Inc, an information technology company (portfolio average weight of 7.70%) and Fortive Corp., an industrials company (portfolio average weight of 7.64%). Positions that detracted most significantly from the Fund’s return during this period included Alcoa Corp., a materials company (portfolio average weight of 3.04%) and Adient PLC, a consumer discretionary company (portfolio average weight of 1.29%).
| | | | |
Sector Breakdown
(% of the Fund’s Net Assets)
as of April 30, 2019 | |
| Information Technology | | | 20.3 | |
| Materials | | | 15.9 | |
| Industrials | | | 13.8 | |
| Consumer Discretionary | | | 12.2 | |
| Financials | | | 10.2 | |
| Communication Services | | | 9.1 | |
| Real Estate | | | 6.5 | |
| Consumer Staples | | | 6.2 | |
| Energy | | | 3.7 | |
| Health Care | | | 2.1 | |
| Money Market Funds Plus Other Assets Less Liabilities | | | 0.0 | |
|
Top Ten Fund Holdings*
(% of the Fund’s Net Assets)
as of April 30, 2019 | |
| Security | | | | |
| Synchrony Financial | | | 7.9 | |
| PayPal Holdings, Inc. | | | 7.8 | |
| Dow, Inc. | | | 7.6 | |
| Fortive Corp. | | | 7.5 | |
| Hewlett Packard Enterprise Co. | | | 7.2 | |
| Lamb Weston Holdings, Inc. | | | 4.8 | |
| Park Hotels & Resorts, Inc. | | | 3.0 | |
| Chemours Co. (The) | | | 2.8 | |
| Versum Materials, Inc. | | | 2.7 | |
| Wyndham Hotels & Resorts, Inc. | | | 2.5 | |
| Total | | | 53.8 | |
| * | Excluding money market fund holdings. |
Invesco S&PSpin-Off ETF (CSD)(continued)
Growth of a $10,000 Investment
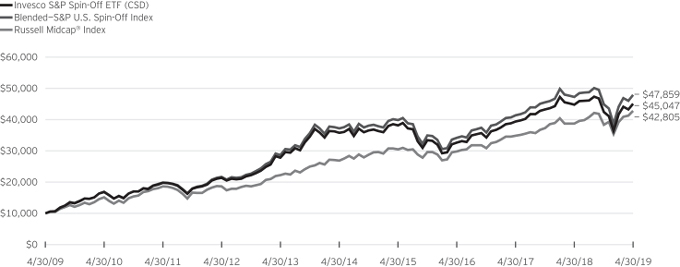
Fund Performance History as of April 30, 2019
| | | | | | | | | | | | | | | | | | | | | | | | | | | | | | | | | | | | | | | | |
| | | 1 Year | | | 3 Years Average
Annualized | | | 3 Years Cumulative | | | 5 Years Average
Annualized | | | 5 Years Cumulative | | | 10 Years Average
Annualized | | | 10 Years Cumulative | | | | | | Fund Inception | |
| Index | | | | | Average
Annualized | | | Cumulative | |
| Blended—S&P U.S.Spin-Off Index | | | 1.34 | % | | | 11.91 | % | | | 40.16 | % | | | 5.20 | % | | | 28.83 | % | | | 16.95 | % | | | 378.59 | % | | | | | | | 8.07 | % | | | 161.21 | % |
| Russell Midcap® Index | | | 10.69 | | | | 12.82 | | | | 43.60 | | | | 9.75 | | | | 59.22 | | | | 15.65 | | | | 328.05 | | | | | | | | 8.51 | | | | 174.88 | |
| Fund | | | | | | | | | | | | | | | | | | | | | | | | | | | | | | | | | | | | | | | | |
| NAV Return | | | 0.71 | | | | 11.31 | | | | 37.90 | | | | 4.72 | | | | 25.95 | | | | 16.24 | | | | 350.47 | | | | | | | | 7.40 | | | | 141.89 | |
| Market Price Return | | | 0.78 | | | | 11.35 | | | | 38.04 | | | | 4.72 | | | | 25.93 | | | | 16.08 | | | | 344.01 | | | | | | | | 7.39 | | | | 141.75 | |
Guggenheim S&P Spin-Off ETF (the “Predecessor Fund”) Inception: December 15, 2006
Performance quoted above represents past performance. Past performance is not a guarantee of future results and current performance may be higher or lower than performance quoted. Investment returns and principal value will fluctuate, and shares of the Fund (“Fund Shares”), when redeemed or sold, may be worth more or less than their original cost. Fund performance reflects any applicable fee waivers and/or expense reimbursements. Had the adviser not waived fees and/or reimbursed expenses currently or in the past, returns would have been lower. See current prospectus for more information. The adviser has contractually agreed to waive fees and/or pay certain Fund expenses through August 31, 2021. According to the Fund’s current prospectus, the total gross annual operating expense ratio was indicated as 0.65% and the net annual operating expense ratio was indicated as 0.64%. The Financial Highlights section of the Shareholder Report presents the expense ratios based on expenses incurred during the period covered by this report. NAV and Market Price returns assume that dividends and capital gain distributions have been reinvested in the Fund at NAV and Market Price, respectively. The returns shown in the table above do not reflect the deduction of taxes that a shareholder would pay on Fund distributions or the redemption or sale of Fund Shares. See invesco.com/ETFs to find the most recentmonth-end performance numbers.
Blended-Index and Benchmark Index performance results are based upon a hypothetical investment in their respective constituent securities. Blended-Index and Benchmark Index returns do not represent Fund returns. An investor cannot invest directly in an index. The Blended-Index and Benchmark Index do not charge management fees or brokerage expenses, and no such fees or expenses were deducted from the hypothetical performance shown. In addition, the results actual investors might have achieved would have differed from those shown because of differences in the timing, amounts of their investments, and fees and expenses associated with an investment in the Fund.
Notes Regarding Indexes and Fund Performance History:
| - | The Blended—S&P U.S.Spin-Off Index performance is comprised of the performance of the BeaconSpin-Off Index, the Fund’s previous underlying index, prior to the conversion date, May 20, 2016, followed by the performance of the Index, starting from the conversion date through April 30, 2019. |
| - | Effective after the close of business on April 6, 2018, the Predecessor Fund was reorganized into the Fund. Returns shown are blended returns of the Predecessor Fund and the Fund. |
| - | Average Annualized and Cumulative Inception returns for the Fund, Blended-Index and Benchmark Index are based on the inception date of the Predecessor Fund. |
| | |
| PHO | | Manager’s Analysis |
| | Invesco Water Resources ETF (PHO) |
As an index fund, the Invesco Water Resources ETF (the “Fund”) is passively managed and seeks to track the returns of an underlying index. The Fund seeks to track the investment results (before fees and expenses) of the NASDAQ OMX US Water IndexSM (the “Index”). The Fund generally will invest at least 90% of its total assets in securities of companies in the water industry that comprise the Index.
The Index seeks to track the performance of U.S. exchange-listed companies that create products designed to conserve and purify water for homes, businesses and industries. The Index may include common stocks, ordinary shares, American depositary receipts (“ADRs”) and global depositary receipts (“GDRs”), shares of beneficial interest or limited partnership interests and tracking stocks. Nasdaq, Inc. (the “Index Provider”) compiles the Index strictly in accordance with its guidelines and mandated procedures. The Fund generally invests in all of the securities comprising the Index in proportion to their weightings in the Index.
For the fiscal year ended April 30, 2019, on a market price basis, the Fund returned 15.84%. On a net asset value (“NAV”) basis, the Fund returned 15.74%. During the same time period, the Index returned 16.34%. During the fiscal year, the Fund fully replicated the components of the Index; therefore, the Fund’s performance, on a NAV basis, differed from the return of the Index primarily due to fees and operating expenses that the Fund incurred during the period.
During this same time period, the S&P 500® Index (the “Benchmark Index”) returned 13.49%. The Benchmark Index is an unmanaged index weighted by market capitalization based on the average performance of approximately 505 securities. The Benchmark Index was selected for its recognition in the marketplace, and because its performance comparison is a useful measure for investors as a broad representation of the overall U.S. stock market.
The performance of the Fund differed from the Benchmark Index because the Fund seeks to track an Index that employs a proprietary stock selection and weighting methodology whereas the Benchmark Index selects and weights stocks based primarily on market capitalization.
Relative to the Benchmark Index, the Fund was most overweight in the industrial machinery industry and most underweight in the interactive media & services industry during the fiscal year ended April 30, 2019. The majority of the Fund’s outperformance relative to the Benchmark Index during that period can be attributed to the overweight allocation in the water utilities industry.
For the fiscal year ended April 30, 2019, the water utilities industry contributed most significantly to the Fund’s return, followed by the industrial conglomerates and health care equipment industries, respectively. The electronic equipment &
instruments and the construction & engineering industries were the only detracting industries.
Positions that contributed most significantly to the Fund’s return for the fiscal year ended April 30, 2019, included Roper Technologies, Inc., an industrial conglomerates company (portfolio average weight of 8.05%) and Danaher Corp., a health care equipment company (portfolio average weight of 8.10%). Positions that detracted most significantly from the Fund’s return during this period included Evoqua Water Technologies Corp., an industrial machinery company (portfolio average weight of 2.19%) and Itron, Inc., an electronic equipment & instruments company (portfolio average weight of 2.63%).
| | | | |
Industry Breakdown
(% of the Fund’s Net Assets)
as of April 30, 2019 | |
| Machinery | | | 26.8 | |
| Water Utilities | | | 23.0 | |
| Industrial Conglomerates | | | 8.6 | |
| Chemicals | | | 8.4 | |
| Health Care Equipment & Supplies | | | 8.0 | |
| Life Sciences Tools & Services | | | 6.8 | |
| Building Products | | | 5.1 | |
| Trading Companies & Distributors | | | 4.1 | |
| Commercial Services & Supplies | | | 3.5 | |
| Industry Types Each Less Than 3% | | | 5.6 | |
| Money Market Funds Plus Other Assets Less Liabilities | | | 0.1 | |
|
Top Ten Fund Holdings*
(% of the Fund’s Net Assets)
as of April 30, 2019 | |
| Security | | | | |
| Roper Technologies, Inc. | | | 8.6 | |
| Ecolab, Inc. | | | 8.4 | |
| American Water Works Co., Inc. | | | 8.2 | |
| Danaher Corp. | | | 8.0 | |
| Waters Corp. | | | 6.8 | |
| Cia de Saneamento Basico do Estado de Sao Paulo ADR | | | 4.4 | |
| Xylem, Inc. | | | 4.2 | |
| IDEX Corp. | | | 4.2 | |
| Aqua America, Inc. | | | 4.2 | |
| Toro Co. (The) | | | 4.1 | |
| Total | | | 61.1 | |
| * | Excluding money market fund holdings. |
Invesco Water Resources ETF (PHO)(continued)
Growth of a $10,000 Investment
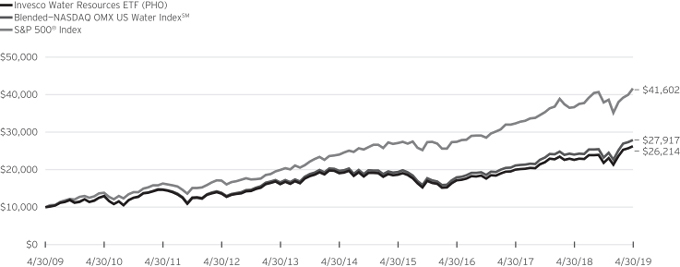
Fund Performance History as of April 30, 2019
| | | | | | | | | | | | | | | | | | | | | | | | | | | | | | | | | | | | | | | | |
| | | 1 Year | | | 3 Years Average
Annualized | | | 3 Years Cumulative | | | 5 Years Average
Annualized | | | 5 Years Cumulative | | | 10 Years Average
Annualized | | | 10 Years Cumulative | | | | | | Fund Inception | |
| Index | | | | | Average
Annualized | | | Cumulative | |
| Blended—NASDAQ OMX US Water IndexSM | | | 16.34 | % | | | 15.88 | % | | | 55.59 | % | | | 7.21 | % | | | 41.63 | % | | | 10.81 | % | | | 179.17 | % | | | | | | | 8.01 | % | | | 180.89 | % |
| S&P 500® Index | | | 13.49 | | | | 14.87 | | | | 51.58 | | | | 11.63 | | | | 73.32 | | | | 15.32 | | | | 316.02 | | | | | | | | 8.78 | | | | 208.76 | |
| Fund | | | | | | | | | | | | | | | | | | | | | | | | | | | | | | | | | | | | | | | | |
| NAV Return | | | 15.74 | | | | 15.17 | | | | 52.75 | | | | 6.54 | | | | 37.24 | | | | 10.12 | | | | 162.14 | | | | | | | | 6.92 | | | | 145.09 | |
| Market Price Return | | | 15.84 | | | | 15.22 | | | | 52.94 | | | | 6.56 | | | | 37.41 | | | | 10.14 | | | | 162.76 | | | | | | | | 6.84 | | | | 142.63 | |
Fund Inception: December 6, 2005
Performance quoted above represents past performance. Past performance is not a guarantee of future results and current performance may be higher or lower than performance quoted. Investment returns and principal value will fluctuate, and shares of the Fund (“Fund Shares”), when redeemed or sold, may be worth more or less than their original cost. Fund performance reflects any applicable fee waivers and/or expense reimbursements. Had the adviser not waived fees and/or reimbursed expenses currently or in the past, returns would have been lower. See current prospectus for more information. According to the Fund’s current prospectus, the total annual operating expense ratio was indicated as 0.62%. The Financial Highlights section of the Shareholder Report presents the expense ratios based on expenses incurred during the period covered by this report. NAV and Market Price returns assume that dividends and capital gain distributions have been reinvested in the Fund at NAV and Market Price, respectively. The returns shown in the table above do not reflect the deduction of taxes that a shareholder would pay on Fund distributions or the redemption or sale of Fund Shares. See invesco.com/ETFs to find the most recentmonth-end performance numbers.
Blended-Index and Benchmark Index performance results are based upon a hypothetical investment in their respective constituent securities. Blended-Index and Benchmark Index returns do not represent Fund returns. An investor cannot invest directly in an index. The Blended-Index and Benchmark Index do not charge management fees or brokerage expenses, and no such fees or expenses were deducted from the hypothetical performance shown. In addition, the results actual investors might have achieved would have differed from those shown because of differences in the timing, amounts of their investments, and fees and expenses associated with an investment in the Fund.
Notes Regarding Indexes and Fund Performance History:
| - | The Blended—NASDAQ OMX US Water IndexSM is comprised of the performance of the Palisades Water Index, from Fund inception through the conversion date, March 1, 2012, followed by the performance of the NASDAQ OMX US Water IndexSM starting at the conversion date and through April 30, 2019. |
| - | Average Annualized and Cumulative Inception returns for the Fund, Blended-Index and Benchmark Index are based on the inception date of the Fund. |
| | |
| PBW | | Manager’s Analysis |
| | Invesco WilderHill Clean Energy ETF (PBW) |
As an index fund, the Invesco WilderHill Clean Energy ETF (the “Fund”) is passively managed and seeks to track the returns of an underlying index. The Fund seeks to track the investment results (before fees and expenses) of the WilderHill Clean Energy Index (the “Index”). The Fund generally will invest at least 90% of its total assets in common stocks of companies that comprise the Index.
Strictly in accordance with its guidelines and mandated procedures, WilderShares (the “Index Provider”) includes stocks in the Index based on its evaluation that such companies will substantially benefit from a societal transition toward the use of cleaner energy and conservation. At its discretion, the Index Provider reviews the Index’s component stocks quarterly. The Fund generally invests in all of the securities comprising the Index in proportion to their weightings in the Index.
For the fiscal year ended April 30, 2019, on a market price basis, the Fund returned 16.70%. On a net asset value (“NAV”) basis, the Fund returned 16.76%. During the same time period, the Index returned 15.41%. During the fiscal year, the Fund fully replicated the components of the Index; therefore, the Fund’s performance, on a NAV basis, differed from the return of the Index primarily due to income received from the securities lending program in which the Fund participates, partially offset by fees and operating expenses that the Fund incurred during the period.
During this same time period, the NASDAQ Composite Index (Price Only) (the “Benchmark Index”) returned 14.56%. The Benchmark Index is an unmanaged index weighted by market capitalization based on the average performance of approximately 2,639 securities. The Benchmark Index performance is price only, and does not reflect dividends paid by the holdings in the Benchmark Index. The Benchmark Index was selected for its recognition in the marketplace, and because its performance comparison is a useful measure for investors as a broad representation of the equity market.
The performance of the Fund differed from the Benchmark Index because the Fund seeks to track an Index that employs a proprietary stock selection and weighting methodology whereas the Benchmark Index selects and weights stocks based primarily on market capitalization.
Relative to the Benchmark Index, the Fund was most overweight in the electrical components & equipment industry and most underweight in the interactive media & services industry during the fiscal year ended April 30, 2019. The majority of the Fund’s outperformance relative to the Benchmark Index during that period can be attributed to the overweight allocation to electrical components & equipment industry.
For the fiscal year ended April 30, 2019, the electrical components & equipment industry contributed most significantly to the Fund’s return, followed by the semiconductors and oil & gas
refining & marketing industries, respectively. The semiconductor equipment industry detracted most significantly from the Fund’s return, followed by the fertilizer & agriculture chemicals industry.
Positions that contributed most significantly to the Fund’s return for the fiscal year ended April 30, 2019, included Enphase Energy, Inc. an electrical components & equipment company (portfolio average weight of 3.29%) and Renewable Energy Group, Inc., an oil & gas refining & marketing company (portfolio average weight of 2.97%). Positions that detracted most significantly from the Fund’s return during this period included Bloom Energy Corp., Class A, a heavy electrical equipment company (portfolio average weight of 1.38%) and Sociedad Quimica Y Minera De Chile S.A. Sponsored ADR Pfd, Class B, a fertilizer & agricultural chemicals company (portfolio average weight of 2.85%).
| | | | |
Industry Breakdown
(% of the Fund’s Net Assets)
as of April 30, 2019 | |
| Semiconductors & Semiconductor Equipment | | | 31.9 | |
| Electrical Equipment | | | 20.9 | |
| Independent Power & Renewable Electricity Producers | | | 11.0 | |
| Chemicals | | | 8.2 | |
| Construction & Engineering | | | 7.7 | |
| Automobiles | | | 5.3 | |
| Aerospace & Defense | | | 3.1 | |
| Auto Components | | | 3.0 | |
| Industry Types Each Less Than 3% | | | 8.8 | |
| Money Market Funds Plus Other Assets Less Liabilities | | | 0.1 | |
|
Top Ten Fund Holdings*
(% of the Fund’s Net Assets)
as of April 30, 2019 | |
| Security | | | | |
| First Solar, Inc. | | | 3.5 | |
| SunPower Corp. | | | 3.4 | |
| Daqo New Energy Corp. ADR | | | 3.4 | |
| JinkoSolar Holding Co. Ltd. ADR | | | 3.3 | |
| Enphase Energy, Inc. | | | 3.2 | |
| Canadian Solar, Inc. | | | 3.2 | |
| TPI Composites, Inc. | | | 3.1 | |
| Ormat Technologies, Inc. | | | 3.1 | |
| Advanced Energy Industries, Inc. | | | 3.1 | |
| SolarEdge Technologies, Inc. | | | 3.1 | |
| Total | | | 32.4 | |
| * | Excluding money market fund holdings. |
Invesco WilderHill Clean Energy ETF (PBW)(continued)
Growth of a $10,000 Investment
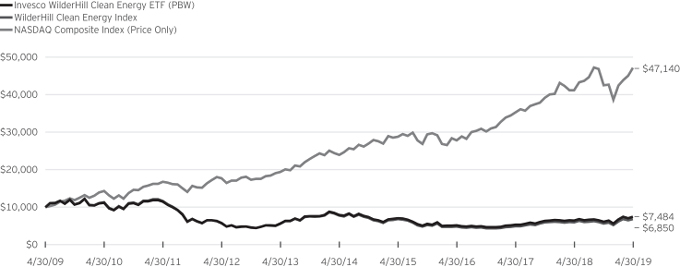
Fund Performance History as of April 30, 2019
| | | | | | | | | | | | | | | | | | | | | | | | | | | | | | | | | | | | | | | | |
| | | 1 Year | | | 3 Years Average
Annualized | | | 3 Years Cumulative | | | 5 Years Average
Annualized | | | 5 Years Cumulative | | | 10 Years Average
Annualized | | | 10 Years Cumulative | | | | | | Fund Inception | |
| Index | | | | | Average
Annualized | | | Cumulative | |
| WilderHill Clean Energy Index | | | 15.41 | % | | | 12.14 | % | | | 41.02 | % | | | (2.42 | )% | | | (11.54 | )% | | | (3.71 | )% | | | (31.50 | )% | | | | | | | (6.58 | )% | | | (61.86 | )% |
| NASDAQ Composite Index (Price Only) | | | 14.56 | | | | 19.24 | | | | 69.52 | | | | 14.49 | | | | 96.75 | | | | 16.77 | | | | 371.40 | | | | | | | | 10.15 | | | | 293.29 | |
| Fund | | | | | | | | | | | | | | | | | | | | | | | | | | | | | | | | | | | | | | | | |
| NAV Return | | | 16.76 | | | | 13.15 | | | | 44.87 | | | | (1.11 | ) | | | (5.44 | ) | | | (2.86 | ) | | | (25.16 | ) | | | | | | | (5.72 | ) | | | (56.60 | ) |
| Market Price Return | | | 16.70 | | | | 13.17 | | | | 44.92 | | | | (1.11 | ) | | | (5.41 | ) | | | (2.81 | ) | | | (24.81 | ) | | | | | | | (5.72 | ) | | | (56.55 | ) |
Fund Inception: March 3, 2005
Performance quoted above represents past performance. Past performance is not a guarantee of future results and current performance may be higher or lower than performance quoted. Investment returns and principal value will fluctuate, and shares of the Fund (“Fund Shares”), when redeemed or sold, may be worth more or less than their original cost. Fund performance reflects any applicable fee waivers and/or expense reimbursements. Had the adviser not waived fees and/or reimbursed expenses currently or in the past, returns would have been lower. See current prospectus for more information. The adviser has contractually agreed to waive fees and/or pay certain Fund expenses through August 31, 2021. According to the Fund’s current prospectus, the total gross annual operating expense ratio was indicated as 0.77% and the net annual operating expense ratio was indicated as 0.70%. The Financial Highlights section of the Shareholder Report presents the expense ratios based on expenses incurred during the period covered by this report. NAV and Market Price returns assume that dividends and capital gain distributions have been reinvested in the Fund at NAV and Market Price, respectively. The returns shown in the table above do not reflect the deduction of taxes that a shareholder would pay
on Fund distributions or the redemption or sale of Fund Shares. See invesco.com/ETFs to find the most recentmonth-end performance numbers.
Index and Benchmark Index performance results are based upon a hypothetical investment in their respective constituent securities. Index and Benchmark Index returns do not represent Fund returns. An investor cannot invest directly in an index. The Index and Benchmark Index do not charge management fees or brokerage expenses, and no such fees or expenses were deducted from the hypothetical performance shown. In addition, the results actual investors might have achieved would have differed from those shown because of differences in the timing, amounts of their investments, and fees and expenses associated with an investment in the Fund.
Notes Regarding Indexes and Fund Performance History:
| - | Returns of the Benchmark Index are price only, and do not reflect dividends paid by the holdings in the Benchmark Index. |
| - | Average Annualized and Cumulative Inception returns for the Fund, Index and Benchmark Index are based on the inception date of the Fund. |
Schedule of Investments(a)
Invesco Aerospace & Defense ETF (PPA)
April 30, 2019
| | | | | | | | |
Number
of Shares | | | | | Value | |
| | | | Common Stocks—100.0% | |
| | | | Aerospace & Defense—71.2% | |
| | 80,493 | | | AAR Corp. | | $ | 2,718,249 | |
| | 176,216 | | | Aerojet Rocketdyne Holdings, Inc.(b) | | | 5,966,674 | |
| | 55,435 | | | Aerovironment, Inc.(b) | | | 3,800,624 | |
| | 136,358 | | | Axon Enterprise, Inc.(b) | | | 8,658,733 | |
| | 165,247 | | | Boeing Co. (The) | | | 62,412,139 | |
| | 220,840 | | | BWX Technologies, Inc. | | | 11,284,924 | |
| | 63,196 | | | Cubic Corp. | | | 3,588,269 | |
| | 99,171 | | | Curtiss-Wright Corp. | | | 11,299,544 | |
| | 26,472 | | | Ducommun, Inc.(b) | | | 1,074,234 | |
| | 99,127 | | | Elbit Systems Ltd. (Israel)(c) | | | 13,849,033 | |
| | 287,731 | | | General Dynamics Corp. | | | 51,423,284 | |
| | 216,602 | | | Harris Corp. | | | 36,497,437 | |
| | 308,213 | | | HEICO Corp. | | | 32,525,718 | |
| | 196,618 | | | Hexcel Corp. | | | 13,902,859 | |
| | 97,151 | | | Huntington Ingalls Industries, Inc. | | | 21,623,869 | |
| | 115,923 | | | KeyW Holding Corp. (The)(b) | | | 1,314,567 | |
| | 240,594 | | | Kratos Defense & Security Solutions, Inc.(b) | | | 3,820,633 | |
| | 167,911 | | | L3 Technologies, Inc. | | | 36,701,986 | |
| | 208,141 | | | Lockheed Martin Corp. | | | 69,379,639 | |
| | 137,727 | | | Maxar Technologies, Inc.(c) | | | 678,994 | |
| | 108,798 | | | Mercury Systems, Inc.(b) | | | 7,944,430 | |
| | 80,681 | | | Moog, Inc., Class A | | | 7,554,969 | |
| | 170,034 | | | Northrop Grumman Corp. | | | 49,294,557 | |
| | 281,056 | | | Raytheon Co. | | | 49,912,735 | |
| | 83,671 | | | Teledyne Technologies, Inc.(b) | | | 20,793,080 | |
| | 546,264 | | | Textron, Inc. | | | 28,951,992 | |
| | 77,404 | | | TransDigm Group, Inc.(b) | | | 37,348,978 | |
| | 115,164 | | | Triumph Group, Inc. | | | 2,732,842 | |
| | 488,183 | | | United Technologies Corp. | | | 69,619,778 | |
| | 26,122 | | | Vectrus, Inc.(b) | | | 1,059,247 | |
| | | | | | | | |
| | | | | | | 667,734,017 | |
| | | | | | | | |
| | | | Communications Equipment—1.4% | |
| | 55,244 | | | Comtech Telecommunications Corp. | | | 1,299,891 | |
| | 136,579 | | | ViaSat, Inc.(b) | | | 12,404,105 | |
| | | | | | | | |
| | | | | | | 13,703,996 | |
| | | | | | | | |
| | | | Containers & Packaging—3.8% | |
| | 595,422 | | | Ball Corp. | | | 35,689,595 | |
| | | | | | | | |
| |
| | | | Diversified Telecommunication Services—0.7% | |
| | 319,967 | | | Intelsat SA(b)(c) | | | 6,476,132 | |
| | | | | | | | |
| |
| | | | Electronic Equipment, Instruments & Components—2.2% | |
| | 314,208 | | | FLIR Systems, Inc. | | | 16,634,172 | |
| | 43,334 | | | OSI Systems, Inc.(b) | | | 3,905,693 | |
| | | | | | | | |
| | | | | | | 20,539,865 | |
| | | | | | | | |
| | | | Industrial Conglomerates—7.3% | |
| | 392,602 | | | Honeywell International, Inc. | | | 68,167,485 | |
| | | | | | | | |
| |
| | | | IT Services—9.1% | |
| | 332,597 | | | Booz Allen Hamilton Holding Corp. | | | 19,719,676 | |
| | 57,281 | | | CACI International, Inc., Class A(b) | | | 11,166,358 | |
| | 326,690 | | | KBR, Inc. | | | 7,259,052 | |
| | 338,515 | | | Leidos Holdings, Inc. | | | 24,874,083 | |
| | 92,190 | | | ManTech International Corp., Class A | | | 5,714,858 | |
| | 384,189 | | | Perspecta, Inc. | | | 8,867,082 | |
| | 99,700 | | | Science Applications International Corp. | | | 7,472,515 | |
| | | | | | | | |
| | | | | | | 85,073,624 | |
| | | | | | | | |
| | | | | | | | |
Number
of Shares | | | | | Value | |
| | | | Common Stocks (continued) | |
| | | | Machinery—3.1% | |
| | 167,800 | | | Oshkosh Corp. | | $ | 13,858,602 | |
| | 143,192 | | | Woodward, Inc. | | | 15,593,609 | |
| | | | | | | | |
| | | | | | | 29,452,211 | |
| | | | | | | | |
| | | | Software—0.8% | |
| | 462,819 | | | FireEye, Inc.(b) | | | 7,414,360 | |
| | | | | | | | |
| |
| | | | Trading Companies & Distributors—0.4% | |
| | 64,622 | | | Kaman Corp. | | | 4,000,748 | |
| | | | | | | | |
| | | | Total Common Stocks
(Cost $740,289,097) | | | 938,252,033 | |
| | | | | | | | |
| | |
| | | | | | | | |
| | | | Money Market Funds—0.1% | |
| | 537,146 | | | Invesco Premier U.S. Government Money Portfolio—Institutional Class, 2.32%(d)
(Cost $537,146) | | | 537,146 | |
| | | | | | | | |
| | |
| | | | Total Investments in Securities
(excluding investments purchased with cash collateral from securities on loan)
(Cost $740,826,243)—100.1% | | | 938,789,179 | |
| | | | | | | | |
| | |
| | | | | | | | |
| | | | Investments Purchased with Cash Collateral from
Securities on Loan | |
| | |
| | | | | | | | |
| | | | Money Market Funds—0.7% | |
| | 5,459,377 | | | Invesco Government & Agency Portfolio—Institutional Class 2.34%(d)(e) | | | 5,459,377 | |
| | 1,819,247 | | | Invesco Liquid Assets Portfolio—Institutional Class, 2.48%(d)(e) | | | 1,819,792 | |
| | | | | | | | |
| | | | Total Investments Purchased with Cash Collateral from Securities on Loan
(Cost $7,279,169) | | | 7,279,169 | |
| | | | | | | | |
| | |
| | | | Total Investments in Securities
(Cost $748,105,412)—100.8% | | | 946,068,348 | |
| | |
| | | | Other assets less liabilities—(0.8)% | | | (7,822,494 | ) |
| | | | | | | | |
| | |
| | | | Net Assets—100.0% | | $ | 938,245,854 | |
| | | | | | | | |
Notes to Schedule of Investments:
| (a) | Industry and/or sector classifications used in this report are generally according to the Global Industry Classification Standard, which was developed by and is the exclusive property and a service mark of MSCI Inc. and Standard & Poor’s. |
| (b) | Non-income producing security. |
| (c) | All or a portion of this security was out on loan at April 30, 2019. |
| (d) | The security and the Fund are advised bywholly-owned subsidiaries of Invesco Ltd. and are therefore considered to be affiliated. The rate shown is the7-day SEC standardized yield as of April 30, 2019. |
| (e) | The security has been segregated to satisfy the commitment to return the cash collateral received in securities lending transactions upon the borrower’s return of the securities loaned. See Note 2M. |
See accompanying Notes to Financial Statements which are an integral part of the financial statements.
Schedule of Investments(a)
Invesco BRIC ETF (EEB)
April 30, 2019
| | | | | | | | |
Number
of Shares | | | | | Value | |
| | | | Common Stocks & Other Equity Interests—100.0% | |
| | | | Communication Services—15.7% | |
| | 6,533 | | | 58.com, Inc. ADR (China)(b) | | $ | 469,004 | |
| | 4,156 | | | Autohome, Inc. ADR (China)(b) | | | 479,976 | |
| | 12,748 | | | Baidu, Inc. ADR (China)(b) | | | 2,119,100 | |
| | 18,288 | | | Bilibili, Inc. ADR (China)(b) | | | 325,526 | |
| | 11,164 | | | Bitauto Holdings Ltd. ADR (China)(b)(c) | | | 143,346 | |
| | 11,064 | | | Changyou.com Ltd. ADR (China)(b) | | | 215,195 | |
| | 244,056 | | | China Mobile Ltd. (China) | | | 2,325,335 | |
| | 951,371 | | | China Telecom Corp. Ltd., H-Shares (China) | | | 492,335 | |
| | 402,100 | | | China Unicom Hong Kong Ltd. (China) | | | 477,165 | |
| | 17,226 | | | HUYA, Inc. ADR (China)(b)(c) | | | 411,529 | |
| | 10,359 | | | iQIYI, Inc. ADR (China)(b)(c) | | | 229,038 | |
| | 8,863 | | | Mail.Ru Group Ltd. GDR (Russia)(b)(d) | | | 204,735 | |
| | 38,136 | | | Mobile TeleSystems PJSC ADR (Russia) | | | 300,512 | |
| | 10,386 | | | Momo, Inc. ADR (China) | | | 364,237 | |
| | 4,209 | | | NetEase, Inc. ADR (China) | | | 1,197,587 | |
| | 31,592 | | | Rostelecom PJSC ADR (Russia) | | | 217,037 | |
| | 71,259 | | | Sistema PJSFC GDR (Russia)(d) | | | 187,554 | |
| | 31,184 | | | Sogou, Inc. ADR (China)(b)(c) | | | 177,437 | |
| | 10,223 | | | Sohu.com Ltd. ADR (China)(b) | | | 211,309 | |
| | 13,947 | | | TIM Participacoes SA ADR (Brazil) | | | 206,555 | |
| | 4,884 | | | Weibo Corp. ADR (China)(b) | | | 334,554 | |
| | 3,839 | | | YY, Inc. ADR (China)(b) | | | 324,818 | |
| | | | | | | | |
| | | | | | | 11,413,884 | |
| | | | | | | | |
| | | | Consumer Discretionary—17.4% | |
| | 36,415 | | | Alibaba Group Holding Ltd. ADR (China)(b) | | | 6,757,532 | |
| | 5,361 | | | Baozun, Inc. ADR (China)(b)(c) | | | 260,009 | |
| | 22,061 | | | Ctrip.com International Ltd. ADR (China)(b) | | | 971,787 | |
| | 8,421 | | | Huazhu Group Ltd. ADR (China) | | | 357,050 | |
| | 43,661 | | | JD.com, Inc. ADR (China)(b) | | | 1,321,618 | |
| | 60,430 | | | Mahindra & Mahindra Ltd. GDR (India)(d) | | | 552,935 | |
| | 7,596 | | | New Oriental Education & Technology Group, Inc. ADR (China)(b) | | | 725,114 | |
| | 26,162 | | | NIO, Inc. ADR (China)(b)(c) | | | 126,886 | |
| | 8,013 | | | Pinduoduo, Inc. ADR (China)(b)(c) | | | 178,129 | |
| | 21,681 | | | TAL Education Group ADR (China)(b) | | | 834,068 | |
| | 17,138 | | | Tata Motors Ltd. ADR (India)(b) | | | 263,925 | |
| | 34,335 | | | Vipshop Holdings Ltd. ADR (China)(b) | | | 295,624 | |
| | | | | | | | |
| | | | | | | 12,644,677 | |
| | | | | | | | |
| | | | Consumer Staples—3.6% | |
| | 247,325 | | | Ambev SA ADR (Brazil) | | | 1,164,901 | |
| | 59,506 | | | BRF SA ADR (Brazil)(b) | | | 465,932 | |
| | 12,487 | | | Cia Brasileira de Distribuicao ADR (Brazil) | | | 306,681 | |
| | 24,300 | | | Magnit PJSC GDR (Russia)(d) | | | 346,518 | |
| | 9,404 | | | X5 Retail Group NV GDR (Russia)(d) | | | 285,411 | |
| | | | | | | | |
| | | | | | | 2,569,443 | |
| | | | | | | | |
| | | | Energy—21.2% | |
| | 1,387,244 | | | China Petroleum & Chemical Corp., H-Shares (China) | | | 1,066,240 | |
| | 8,310 | | | CNOOC Ltd. ADR (China) | | | 1,509,761 | |
| | 8,374 | | | Gazprom Neft PJSC ADR (Russia) | | | 236,984 | |
| | 311,199 | | | Gazprom PJSC ADR (Russia) | | | 1,554,128 | |
| | 18,734 | | | LUKOIL PJSC ADR (Russia) | | | 1,588,269 | |
| | 5,015 | | | Novatek PJSC GDR (Russia)(d) | | | 966,390 | |
| | 1,262,183 | | | PetroChina Co. Ltd., H-Shares (China) | | | 801,192 | |
| | 80,104 | | | Petroleo Brasileiro SA ADR (Brazil) | | | 1,219,984 | |
| | 110,522 | | | Petroleo Brasileiro SA (Preference Shares) ADR (Brazil) | | | 1,525,204 | |
| | | | | | | | |
Number
of Shares | | | | | Value | |
| | | | Common Stocks & Other Equity Interests
(continued) | |
| | | | Energy (continued) | |
| | 68,736 | | | Reliance Industries Ltd. GDR (India)(d) | | $ | 2,752,877 | |
| | 80,845 | | | Rosneft Oil Co. PJSC GDR (Russia)(d) | | | 537,781 | |
| | 72,453 | | | Surgutneftegas PJSC ADR (Russia) | | | 271,119 | |
| | 14,763 | | | Tatneft PJSC ADR (Russia) | | | 1,037,248 | |
| | 62,922 | | | Ultrapar Participacoes SA ADR (Brazil) | | | 337,262 | |
| | | | | | | | |
| | | | | | | 15,404,439 | |
| | | | | | | | |
| | | | Financials—19.9% | |
| | 20,017 | | | Axis Bank Ltd. GDR (India)(b)(d) | | | 1,088,925 | |
| | 195,695 | | | Banco Bradesco SA ADR (Brazil) | | | 1,772,997 | |
| | 28,982 | | | Banco Santander Brasil SA ADR (Brazil) | | | 331,844 | |
| | 406,483 | | | China Life Insurance Co. Ltd., H-Shares (China) | | | 1,150,218 | |
| | 28,384 | | | HDFC Bank Ltd. ADR (India) | | | 3,254,225 | |
| | 90,559 | | | ICICI Bank Ltd. ADR (India) | | | 1,036,900 | |
| | 226,432 | | | Itau Unibanco Holding SA (Preference Shares) ADR (Brazil) | | | 1,958,637 | |
| | 17,821 | | | LexinFintech Holdings Ltd. ADR (China)(b) | | | 229,891 | |
| | 36,838 | | | Qudian, Inc. ADR (China)(b) | | | 259,339 | |
| | 133,152 | | | Sberbank of Russia PJSC ADR (Russia) | | | 1,903,408 | |
| | 22,098 | | | State Bank of India GDR (India)(b)(c)(d) | | | 987,781 | |
| | 11,332 | | | TCS Group Holding PLC GDR (Russia)(d) | | | 225,507 | |
| | 211,922 | | | VTB Bank PJSC GDR (Russia)(d) | | | 236,505 | |
| | | | | | | | |
| | | | | | | 14,436,177 | |
| | | | | | | | |
| | | | Health Care—1.2% | |
| | 2,830 | | | BeiGene Ltd. ADR (China)(b) | | | 351,571 | |
| | 6,700 | | | Dr Reddy’s Laboratories Ltd. ADR (India) | | | 280,663 | |
| | 7,484 | | | Zai Lab Ltd. ADR (China)(b) | | | 199,448 | |
| | | | | | | | |
| | | | | | | 831,682 | |
| | | | | | | | |
| | | | Industrials—4.5% | |
| | 7,267 | | | Azul SA ADR (Brazil)(b) | | | 188,651 | |
| | 321,979 | | | China Eastern Airlines Corp. Ltd., H-Shares (China) | | | 228,596 | |
| | 251,434 | | | China Southern Airlines Co. Ltd., H-Shares (China) | | | 219,212 | |
| | 14,162 | | | Embraer SA ADR (Brazil) | | | 283,382 | |
| | 21,168 | | | Globaltrans Investment PLC GDR (Russia)(d) | | | 204,695 | |
| | 15,196 | | | GOL Linhas Aereas Inteligentes SA ADR (Brazil)(b) | | | 171,867 | |
| | 9,521 | | | Guangshen Railway Co. Ltd. ADR (China)(c) | | | 174,710 | |
| | 65,955 | | | Larsen & Toubro Ltd. GDR (India)(c)(d) | | | 1,268,974 | |
| | 25,252 | | | ZTO Express Cayman, Inc. ADR (China) | | | 503,272 | |
| | | | | | | | |
| | | | | | | 3,243,359 | |
| | | | | | | | |
| | | | Information Technology—5.1% | |
| | 24,188 | | | 21Vianet Group, Inc. ADR (China)(b) | | | 190,118 | |
| | 5,935 | | | Daqo New Energy Corp. ADR (China)(b)(c) | | | 219,892 | |
| | 5,985 | | | GDS Holdings Ltd. ADR (China)(b)(c) | | | 234,193 | |
| | 180,680 | | | Infosys Ltd. ADR (India) | | | 1,944,117 | |
| | 12,508 | | | JinkoSolar Holding Co. Ltd. ADR (China)(b)(c) | | | 243,405 | |
| | 255,293 | | | Semiconductor Manufacturing International Corp. (China)(b)(c) | | | 273,014 | |
| | 78,124 | | | Wipro Ltd. ADR (India) | | | 357,027 | |
| | 4,282 | | | WNS Holdings Ltd. ADR (India)(b) | | | 244,716 | |
| | | | | | | | |
| | | | | | | 3,706,482 | |
| | | | | | | | |
See accompanying Notes to Financial Statements which are an integral part of the financial statements.
Invesco BRIC ETF (EEB)(continued)
April 30, 2019
| | | | | | | | |
Number
of Shares | | | | | Value | |
| | | | Common Stocks & Other Equity Interests
(continued) | |
| | | | Materials—8.3% | |
| | 483,168 | | | Aluminum Corp. of China Ltd., H-Shares (China)(b) | | $ | 189,069 | |
| | 8,079 | | | Braskem SA ADR (Brazil) | | | 197,532 | |
| | 54,224 | | | Cia Siderurgica Nacional SA ADR (Brazil)(b) | | | 197,918 | |
| | 81,351 | | | Gerdau SA (Preference Shares) ADR (Brazil) | | | 291,237 | |
| | 24,358 | | | Magnitogorsk Iron & Steel Works PJSC GDR (Russia)(d) | | | 215,812 | |
| | 36,281 | | | MMC Norilsk Nickel PJSC ADR (Russia) | | | 805,438 | |
| | 8,307 | | | Novolipetsk Steel PJSC GDR (Russia)(d) | | | 218,806 | |
| | 15,560 | | | PhosAgro PJSC GDR (Russia)(d) | | | 195,900 | |
| | 5,305 | | | Polyus PJSC GDR (Russia)(d) | | | 207,956 | |
| | 16,018 | | | Severstal PJSC GDR (Russia)(d) | | | 259,331 | |
| | 396,075 | | | Sinopec Shanghai Petrochemical Co. Ltd., H-Shares (China) | | | 179,222 | |
| | 20,515 | | | Suzano SA ADR (Brazil) | | | 423,430 | |
| | 49,723 | | | Tata Steel Ltd. GDR (India)(c)(d) | | | 397,784 | |
| | 149,613 | | | Vale SA ADR (Brazil) | | | 1,912,054 | |
| | 32,426 | | | Vedanta Ltd. ADR (India) | | | 309,993 | |
| | | | | | | | |
| | | | | | | 6,001,482 | |
| | | | | | | | |
| | | | Telecommunication Services—0.5% | |
| | 31,101 | | | Telefonica Brasil SA (Preference Shares) ADR (Brazil) | | | 370,102 | |
| | | | | | | | |
| |
| | | | Utilities—2.6% | |
| | 26,464 | | | Centrais Eletricas Brasileiras SA ADR (Brazil)(b) | | | 224,415 | |
| | 27,598 | | | Cia de Saneamento Basico do Estado de Sao Paulo ADR (Brazil) | | | 330,072 | |
| | 78,324 | | | Cia Energetica de Minas Gerais ADR (Brazil) | | | 289,799 | |
| | 22,887 | | | Cia Paranaense de Energia ADR (Brazil) | | | 238,482 | |
| | 11,301 | | | GAIL India Ltd. GDR (India)(c)(d) | | | 345,811 | |
| | 361,384 | | | Huaneng Power International, Inc., H-Shares (China) | | | 231,237 | |
| | 298,289 | | | RusHydro PJSC ADR (Russia) | | | 235,052 | |
| | | | | | | | |
| | | | | | | 1,894,868 | |
| | | | | | | | |
| | | | Total Common Stocks & Other Equity Interests
(Cost $63,165,236) | | | 72,516,595 | |
| | | | | | | | |
| | |
| | | | | | | | |
| | | | Money Market Funds—0.1% | |
| | 77,034 | | | Invesco Premier U.S. Government Money Portfolio—Institutional Class, 2.32%(e)
(Cost $77,034) | | | 77,034 | |
| | | | | | | | |
| | |
| | | | Total Investments in Securities
(excluding investments purchased with cash collateral from securities on loan)
(Cost $63,242,270)—100.1% | | | 72,593,629 | |
| | | | | | | | |
| | |
| | | | | | | | |
| | | | | | | | |
Number
of Shares | | | | | Value | |
| | | | Investments Purchased with Cash Collateral from
Securities on Loan | |
| | |
| | | | | | | | |
| | | | Money Market Funds—5.8% | |
| | 3,160,485 | | | Invesco Government & Agency Portfolio—Institutional Class 2.34%(e)(f) | | $ | 3,160,485 | |
| | 1,053,179 | | | Invesco Liquid Assets Portfolio—Institutional Class, 2.48%(e)(f) | | | 1,053,495 | |
| | | | | | | | |
| | | | Total Investments Purchased with Cash Collateral from Securities on Loan
(Cost $4,213,980) | | | 4,213,980 | |
| | | | | | | | |
| | |
| | | | Total Investments in Securities
(Cost $67,456,250)—105.9% | | | 76,807,609 | |
| | |
| | | | Other assets less liabilities—(5.9)% | | | (4,291,191 | ) |
| | | | | | | | |
| | |
| | | | Net Assets—100.0% | | $ | 72,516,418 | |
| | | | | | | | |
Abbreviations:
ADR—American Depositary Receipt
GDR—Global Depositary Receipt
Notes to Schedule of Investments:
| (a) | Industry and/or sector classifications used in this report are generally according to the Global Industry Classification Standard, which was developed by and is the exclusive property and a service mark of MSCI Inc. and Standard & Poor’s. |
| (b) | Non-income producing security. |
| (c) | All or a portion of this security was out on loan at April 30, 2019. |
| (d) | Security purchased or received in a transaction exempt from registration under the Securities Act of 1933, as amended (the “1933 Act”). The security may be resold pursuant to an exemption from registration under the 1933 Act, typically to qualified institutional buyers. The aggregate value of these securities at April 30, 2019 was $11,687,988, which represented 16.12% of the Fund’s Net Assets. |
| (e) | The security and the Fund are advised bywholly-owned subsidiaries of Invesco Ltd. and are therefore considered to be affiliated. The rate shown is the7-day SEC standardized yield as of April 30, 2019. |
| (f) | The security has been segregated to satisfy the commitment to return the cash collateral received in securities lending transactions upon the borrower’s return of the securities loaned. See Note 2M. |
This Fund has holdings greater than 10% of net assets in the following countries:
| | | | |
| China | | | 42.1 | % |
| India | | | 20.8 | |
| Brazil | | | 19.9 | |
| Russia | | | 17.2 | |
See accompanying Notes to Financial Statements which are an integral part of the financial statements.
Schedule of Investments(a)
Invesco Cleantech™ ETF (PZD)
April 30, 2019
| | | | | | | | |
Number
of Shares | | | | | Value | |
| | | | Common Stocks & Other Equity
Interests—100.0% | |
| | | | Aerospace & Defense—2.6% | |
| | 65,724 | | | Hexcel Corp. | | $ | 4,647,344 | |
| | | | | | | | |
| |
| | | | Auto Components—3.1% | |
| | 134,588 | | | BorgWarner, Inc. | | | 5,621,741 | |
| | | | | | | | |
| |
| | | | Building Products—6.0% | |
| | 137,574 | | | Johnson Controls International PLC | | | 5,159,025 | |
| | 108,163 | | | Kingspan Group PLC (Ireland) | | | 5,682,716 | |
| | | | | | | | |
| | | | | | | 10,841,741 | |
| | | | | | | | |
| | | | Capital Markets—0.5% | |
| | 31,387 | | | Invesco India ETF (India)(b) | | | 800,368 | |
| | | | | | | | |
| |
| | | | Chemicals—7.1% | |
| | 1,104 | | | Gurit Holding AG (Switzerland) | | | 1,191,756 | |
| | 105,233 | | | Novozymes A/S, Class B (Denmark) | | | 4,900,179 | |
| | 150,754 | | | PQ Group Holdings, Inc.(c) | | | 2,383,421 | |
| | 109,166 | | | Umicore SA (Belgium) | | | 4,220,813 | |
| | | | | | | | |
| | | | | | | 12,696,169 | |
| | | | | | | | |
| | | | Commercial Services & Supplies—2.7% | |
| | 159,429 | | | Tomra Systems ASA (Norway) | | | 4,789,784 | |
| | | | | | | | |
| |
| | | | Communications Equipment—0.6% | |
| | 81,153 | | | Digi International, Inc.(c) | | | 1,044,439 | |
| | | | | | | | |
| |
| | | | Electrical Equipment—20.7% | |
| | 263,516 | | | ABB Ltd. (Switzerland) | | | 5,422,895 | |
| | 48,623 | | | EnerSys | | | 3,364,225 | |
| | 65,747 | | | Schneider Electric SE (France) | | | 5,560,097 | |
| | 108,140 | | | Sensata Technologies Holding PLC(c) | | | 5,400,512 | |
| | 192,247 | | | SGL Carbon SE (Germany)(c)(d) | | | 1,714,993 | |
| | 315,197 | | | Siemens Gamesa Renewable Energy SA (Spain) | | | 5,648,331 | |
| | 186,292 | | | Sunrun, Inc.(c) | | | 2,833,501 | |
| | 61,137 | | | TPI Composites, Inc.(c) | | | 1,892,190 | |
| | 59,982 | | | Vestas Wind Systems A/S (Denmark) | | | 5,420,453 | |
| | | | | | | | |
| | | | | | | 37,257,197 | |
| | | | | | | | |
| | | | Electronic Equipment, Instruments & Components—10.1% | |
| | 48,803 | | | Badger Meter, Inc. | | | 2,707,591 | |
| | 91,445 | | | Hollysys Automation Technologies Ltd. (China) | | | 1,913,944 | |
| | 61,007 | | | Horiba Ltd. (Japan) | | | 3,670,006 | |
| | 54,952 | | | Itron, Inc.(c) | | | 2,948,724 | |
| | 1,415,225 | | | Opus Group AB (Sweden)(d) | | | 745,811 | |
| | 124,687 | | | Trimble, Inc.(c) | | | 5,089,723 | |
| | 55,353 | | | Vaisala OYJ, Class A (Finland) | | | 1,199,740 | |
| | | | | | | | |
| | | | | | | 18,275,539 | |
| | | | | | | | |
| | | | Equity REITs—1.7% | |
| | 112,117 | | | Hannon Armstrong Sustainable Infrastructure Capital, Inc. REIT | | | 2,981,191 | |
| | | | | | | | |
| |
| | | | Independent Power & Renewable Electricity Producers—2.8% | |
| | 59,428 | | | Ormat Technologies, Inc. | | | 3,468,218 | |
| | 173,033 | | | Scatec Solar ASA (Norway)(e) | | | 1,636,785 | |
| | | | | | | | |
| | | | | | | 5,105,003 | |
| | | | | | | | |
| | | | | | | | |
Number
of Shares | | | | | Value | |
| | | | Common Stocks & Other Equity Interests
(continued) | |
| | | | Industrial Conglomerates—4.4% | |
| | 64,489 | | | Raven Industries, Inc. | | $ | 2,509,267 | |
| | 15,223 | | | Roper Technologies, Inc. | | | 5,475,713 | |
| | | | | | | | |
| | | | | | | 7,984,980 | |
| | | | | | | | |
| | | | Life Sciences Tools & Services—3.1% | |
| | 12,169 | | | Eurofins Scientific SE (Luxembourg)(d) | | | 5,564,225 | |
| | | | | | | | |
| |
| | | | Machinery—11.6% | |
| | 91,688 | | | Donaldson Co., Inc. | | | 4,908,976 | |
| | 20,036 | | | Kadant, Inc. | | | 1,965,331 | |
| | 67,750 | | | Kornit Digital Ltd. (Israel)(c) | | | 1,953,232 | |
| | 19,917 | | | Lindsay Corp. | | | 1,692,945 | |
| | 46,669 | | | Woodward, Inc. | | | 5,082,254 | |
| | 64,160 | | | Xylem, Inc. | | | 5,350,944 | |
| | | | | | | | |
| | | | | | | 20,953,682 | |
| | | | | | | | |
| | | | Professional Services—7.4% | |
| | 81,546 | | | Intertek Group PLC (United Kingdom) | | | 5,687,449 | |
| | 127,956 | | | Ricardo PLC (United Kingdom) | | | 1,281,100 | |
| | 1,962 | | | SGS SA (Switzerland) | | | 5,177,446 | |
| | 30,228 | | | Willdan Group, Inc.(c) | | | 1,194,913 | |
| | | | | | | | |
| | | | | | | 13,340,908 | |
| | | | | | | | |
| | | | Semiconductors & Semiconductor Equipment—9.4% | |
| | 55,461 | | | Advanced Energy Industries, Inc.(c) | | | 3,203,427 | |
| | 76,294 | | | Cree, Inc.(c) | | | 5,042,271 | |
| | 1,653,749 | | | Meyer Burger Technology AG (Switzerland)(c) | | | 1,135,228 | |
| | 39,773 | | | Power Integrations, Inc. | | | 3,142,862 | |
| | 54,009 | | | SMA Solar Technology AG (Germany)(d) | | | 1,227,506 | |
| | 72,425 | | | SolarEdge Technologies, Inc.(c)(d) | | | 3,208,428 | |
| | | | | | | | |
| | | | | | | 16,959,722 | |
| | | | | | | | |
| | | | Software—6.2% | |
| | 27,888 | | | ANSYS, Inc.(c) | | | 5,460,470 | |
| | 32,015 | | | Autodesk, Inc.(c) | | | 5,705,393 | |
| | | | | �� | | | |
| | | | | | | 11,165,863 | |
| | | | | | | | |
| | | | Total Common Stocks & Other Equity Interests
(Cost $128,213,097) | | | 180,029,896 | |
| | | | | | | | |
| | |
| | | | | | | | |
| | | | Money Market Funds—0.0% | |
| | 74,602 | | | Invesco Premier U.S. Government Money Portfolio—Institutional Class, 2.32%(f)
(Cost $74,602) | | | 74,602 | |
| | | | | | | | |
| | |
| | | | Total Investments in Securities(excluding investments purchased with cash collateral from securities on loan)
(Cost $128,287,699)—100.0% | | | 180,104,498 | |
| | | | | | | | |
| | |
| | | | | | | | |
See accompanying Notes to Financial Statements which are an integral part of the financial statements.
Invesco Cleantech™ ETF (PZD)(continued)
April 30, 2019
| | | | | | | | |
Number
of Shares | | | | | Value | |
| | | | Investments Purchased with Cash Collateral from
Securities on Loan | |
| | |
| | | | | | | | |
| | | | Money Market Funds—6.7% | |
| | 8,996,556 | | | Invesco Government & Agency Portfolio— Institutional Class 2.34%(f)(g) | | $ | 8,996,556 | |
| | 2,997,953 | | | Invesco Liquid Assets Portfolio—Institutional Class, 2.48%(f)(g) | | | 2,998,852 | |
| | | | | | | | |
| | | | Total Investments Purchased with Cash Collateral from Securities on Loan
(Cost $11,995,408) | | | 11,995,408 | |
| | | | | | | | |
| | |
| | | | Total Investments in Securities
(Cost $140,283,107)—106.7% | | | 192,099,906 | |
| | |
| | | | Other assets less liabilities—(6.7)% | | | (11,979,217 | ) |
| | | | | | | | |
| | |
| | | | Net Assets—100.0% | | $ | 180,120,689 | |
| | | | | | | | |
Abbreviations:
ETF—Exchange-Traded Fund
REIT—Real Estate Investment Trust
Notes to Schedule of Investments:
| (a) | Industry and/or sector classifications used in this report are generally according to the Global Industry Classification Standard, which was developed by and is the exclusive property and a service mark of MSCI Inc. and Standard & Poor’s. |
| (b) | Affiliated company. See Note 4. |
| (c) | Non-income producing security. |
| (d) | All or a portion of this security was out on loan at April 30, 2019. |
| (e) | Security purchased or received in a transaction exempt from registration under the Securities Act of 1933, as amended (the “1933 Act”). The security may be resold pursuant to an exemption from registration under the 1933 Act, typically to qualified institutional buyers. The value of this security at April 30, 2019 represented less than 1% of the Fund’s Net Assets. |
| (f) | The security and the Fund are advised bywholly-owned subsidiaries of Invesco Ltd. and are therefore considered to be affiliated. The rate shown is the7-day SEC standardized yield as of April 30, 2019. |
| (g) | The security has been segregated to satisfy the commitment to return the cash collateral received in securities lending transactions upon the borrower’s return of the securities loaned. See Note 2M. |
See accompanying Notes to Financial Statements which are an integral part of the financial statements.
Schedule of Investments(a)
Invesco DWA Momentum ETF (PDP)
April 30, 2019
| | | | | | | | |
Number
of Shares | | | | | Value | |
| | | | Common Stocks & Other Equity
Interests—100.1% | |
| | | | Communication Services—2.4% | |
| | 22,631 | | | Charter Communications, Inc., Class A(b) | | $ | 8,400,401 | |
| | 122,300 | | | Live Nation Entertainment, Inc.(b) | | | 7,991,082 | |
| | 139,726 | | | Match Group, Inc. | | | 8,439,450 | |
| | 143,063 | | | World Wrestling Entertainment, Inc.,
Class A | | | 11,995,833 | |
| | | | | | | | |
| | | | | | | 36,826,766 | |
| | | | | | | | |
| | | | Consumer Discretionary—17.2% | |
| | 10,400 | | | AutoZone, Inc.(b) | | | 10,694,424 | |
| | 485,430 | | | Chegg, Inc.(b) | | | 17,305,579 | |
| | 165,930 | | | Domino’s Pizza, Inc. | | | 44,897,339 | |
| | 455,414 | | | Eldorado Resorts, Inc.(b) | | | 22,483,789 | |
| | 205,061 | | | Etsy, Inc.(b) | | | 13,849,820 | |
| | 41,804 | | | Home Depot, Inc. (The) | | | 8,515,475 | |
| | 338,412 | | | NIKE, Inc., Class B | | | 29,722,726 | |
| | 95,868 | | | Ollie’s Bargain Outlet Holdings, Inc.(b) | | | 9,168,816 | |
| | 112,444 | | | O’Reilly Automotive, Inc.(b) | | | 42,567,925 | |
| | 114,801 | | | Planet Fitness, Inc., Class A(b) | | | 8,690,436 | |
| | 51,426 | | | Pool Corp. | | | 9,449,013 | |
| | 280,191 | | | Service Corp. International | | | 11,658,748 | |
| | 164,075 | | | TJX Cos., Inc. (The) | | | 9,004,436 | |
| | 219,650 | | | VF Corp. | | | 20,737,156 | |
| | 46,150 | | | Wayfair, Inc., Class A(b) | | | 7,483,223 | |
| | | | | | | | |
| | | | | | | 266,228,905 | |
| | | | | | | | |
| | | | Consumer Staples—4.1% | |
| | 481,761 | | | Church & Dwight Co., Inc. | | | 36,107,987 | |
| | 32,518 | | | Costco Wholesale Corp. | | | 7,984,145 | |
| | 51,105 | | | Estee Lauder Cos., Inc. (The), Class A | | | 8,780,350 | |
| | 269,997 | | | Hormel Foods Corp. | | | 10,783,680 | |
| | | | | | | | |
| | | | | | | 63,656,162 | |
| | | | | | | | |
| | | | Energy—0.8% | |
| | 201,667 | | | Cheniere Energy, Inc.(b) | | | 12,977,271 | |
| | | | | | | | |
| |
| | | | Financials—5.8% | |
| | 74,506 | | | Credit Acceptance Corp.(b) | | | 36,971,367 | |
| | 23,395 | | | LendingTree, Inc.(b) | | | 9,002,864 | |
| | 45,989 | | | MSCI, Inc. | | | 10,365,001 | |
| | 552,609 | | | W.R. Berkley Corp. | | | 33,874,932 | |
| | | | | | | | |
| | | | | | | 90,214,164 | |
| | | | | | | | |
| | | | Health Care—14.3% | |
| | 62,326 | | | Align Technology, Inc.(b) | | | 20,236,006 | |
| | 108,828 | | | Amedisys, Inc.(b) | | | 13,910,395 | |
| | 41,374 | | | Becton, Dickinson and Co. | | | 9,960,377 | |
| | 203,100 | | | Boston Scientific Corp.(b) | | | 7,539,072 | |
| | 58,523 | | | Cooper Cos., Inc. (The) | | | 16,966,988 | |
| | 163,542 | | | Danaher Corp. | | | 21,659,502 | |
| | 41,417 | | | Edwards Lifesciences Corp.(b) | | | 7,292,291 | |
| | 40,603 | | | IDEXX Laboratories, Inc.(b) | | | 9,419,896 | |
| | 63,619 | | | Masimo Corp.(b) | | | 8,280,013 | |
| | 28,795 | | | Mettler-Toledo International, Inc.(b) | | | 21,459,762 | |
| | 252,721 | | | Novocure Ltd.(b) | | | 11,137,414 | |
| | 74,726 | | | PRA Health Sciences, Inc.(b) | | | 7,234,971 | |
| | 51,983 | | | Sage Therapeutics, Inc.(b) | | | 8,745,100 | |
| | 61,725 | | | Sarepta Therapeutics, Inc.(b)(c) | | | 7,218,122 | |
| | 67,788 | | | Veeva Systems, Inc., Class A(b) | | | 9,481,508 | |
| | | | | | | | |
Number
of Shares | | | | | Value | |
| | | | Common Stocks & Other Equity Interests
(continued) | |
| | | | Health Care (continued) | |
| | 35,697 | | | Waters Corp.(b) | | $ | 7,622,737 | |
| | 258,790 | | | West Pharmaceutical Services, Inc. | | | 32,035,614 | |
| | | | | | | | |
| | | | | | | 220,199,768 | |
| | | | | | | | |
| | | | Industrials—15.3% | |
| | 21,924 | | | Boeing Co. (The) | | | 8,280,476 | |
| | 25,498 | | | CoStar Group, Inc.(b) | | | 12,653,382 | |
| | 104,149 | | | HEICO Corp. | | | 10,990,844 | |
| | 100,004 | | | IDEX Corp. | | | 15,666,627 | |
| | 93,992 | | | Insperity, Inc. | | | 11,237,684 | |
| | 31,115 | | | Lennox International, Inc. | | | 8,446,167 | |
| | 918,629 | | | Rollins, Inc. | | | 35,523,383 | |
| | 103,846 | | | Roper Technologies, Inc. | | | 37,353,406 | |
| | 82,460 | | | Teledyne Technologies, Inc.(b) | | | 20,492,135 | |
| | 114,288 | | | Toro Co. (The) | | | 8,360,167 | |
| | 54,687 | | | TransDigm Group, Inc.(b) | | | 26,387,571 | |
| | 232,511 | | | Trex Co., Inc.(b) | | | 16,106,037 | |
| | 141,074 | | | Union Pacific Corp. | | | 24,975,741 | |
| | | | | | | | |
| | | | | | | 236,473,620 | |
| | | | | | | | |
| | | | Information Technology—25.6% | |
| | 32,107 | | | Adobe, Inc.(b) | | | 9,286,950 | |
| | 265,346 | | | Amphenol Corp., Class A | | | 26,417,848 | |
| | 25,575 | | | Arista Networks, Inc.(b) | | | 7,986,817 | |
| | 100,668 | | | Aspen Technology, Inc.(b) | | | 12,272,436 | |
| | 34,105 | | | Broadcom, Inc. | | | 10,859,032 | |
| | 294,343 | | | Cadence Design Systems, Inc.(b) | | | 20,421,517 | |
| | 45,254 | | | EPAM Systems, Inc.(b) | | | 8,116,757 | |
| | 58,167 | | | Euronet Worldwide, Inc.(b) | | | 8,718,651 | |
| | 49,997 | | | Fair Isaac Corp.(b) | | | 13,986,661 | |
| | 280,905 | | | Fiserv, Inc.(b) | | | 24,506,152 | |
| | 119,849 | | | Gartner, Inc.(b) | | | 19,052,395 | |
| | 46,675 | | | HubSpot, Inc.(b) | | | 8,611,071 | |
| | 42,362 | | | Intuit, Inc. | | | 10,635,404 | |
| | 63,364 | | | Jack Henry & Associates, Inc. | | | 9,445,038 | |
| | 168,928 | | | Mastercard, Inc., Class A | | | 42,948,255 | |
| | 147,603 | | | MAXIMUS, Inc. | | | 10,870,961 | |
| | 79,824 | | | Monolithic Power Systems, Inc. | | | 12,429,395 | |
| | 144,011 | | | Paycom Software, Inc.(b) | | | 29,166,548 | |
| | 88,801 | | | Paylocity Holding Corp.(b) | | | 8,573,736 | |
| | 134,578 | | | RingCentral, Inc., Class A(b) | | | 15,660,842 | |
| | 37,121 | | | ServiceNow, Inc.(b) | | | 10,078,723 | |
| | 160,662 | | | Square, Inc., Class A(b) | | | 11,699,407 | |
| | 123,579 | | | SS&C Technologies Holdings, Inc. | | | 8,361,355 | |
| | 78,178 | | | Trade Desk, Inc. (The), Class A(b) | | | 17,314,863 | |
| | 70,091 | | | Twilio, Inc., Class A(b) | | | 9,612,280 | |
| | 55,326 | | | Ubiquiti Networks, Inc. | | | 9,430,317 | |
| | 53,167 | | | Universal Display Corp.(c) | | | 8,485,453 | |
| | 62,265 | | | Visa, Inc., Class A | | | 10,238,234 | |
| | | | | | | | |
| | | | | | | 395,187,098 | |
| | | | | | | | |
| | | | Materials—6.9% | |
| | 89,939 | | | AptarGroup, Inc. | | | 10,004,814 | |
| | 615,229 | | | Ball Corp. | | | 36,876,826 | |
| | 70,756 | | | Ecolab, Inc. | | | 13,024,765 | |
| | 20,138 | | | NewMarket Corp. | | | 8,449,502 | |
| | 131,953 | | | RPM International, Inc. | | | 8,002,949 | |
See accompanying Notes to Financial Statements which are an integral part of the financial statements.
Invesco DWA Momentum ETF (PDP)(continued)
April 30, 2019
| | | | | | | | |
Number
of Shares | | | | | Value | |
| | | | Common Stocks & Other Equity Interests
(continued) | |
| | | | Materials (continued) | |
| | 65,785 | | | Sherwin-Williams Co. (The) | | $ | 29,920,992 | |
| | | | | | | | |
| | | | | | | 106,279,848 | |
| | | | | | | | |
| | | | Real Estate—5.5% | |
| | 229,995 | | | American Tower Corp. REIT | | | 44,918,023 | |
| | 338,731 | | | CubeSmart REIT | | | 10,808,906 | |
| | 84,645 | | | Equity LifeStyle Properties, Inc. REIT | | | 9,878,072 | |
| | 98,737 | | | Extra Space Storage, Inc. REIT | | | 10,238,040 | |
| | 48,025 | | | SBA Communications Corp. REIT(b) | | | 9,784,133 | |
| | | | | | | | |
| | | | | | | 85,627,174 | |
| | | | | | | | |
| | | | Utilities—2.2% | |
| | 153,663 | | | CMS Energy Corp. | | | 8,535,980 | |
| | 47,321 | | | NextEra Energy, Inc. | | | 9,201,095 | |
| | 287,481 | | | UGI Corp. | | | 15,670,589 | |
| | | | | | | | |
| | | | | | | 33,407,664 | |
| | | | | | | | |
| | | | Total Common Stocks & Other Equity Interests
(Cost $1,221,060,112) | | | 1,547,078,440 | |
| | | | | | | | |
| | |
| | | | | | | | |
| | | | Money Market Funds—0.1% | |
| | 973,358 | | | Invesco Premier U.S. Government Money Portfolio—Institutional Class, 2.32%(d)
(Cost $973,358) | | | 973,358 | |
| | | | | | | | |
| | |
| | | | Total Investments in Securities
(excluding investments purchased with cash collateral from securities on loan)
(Cost $1,222,033,470)—100.2% | | | 1,548,051,798 | |
| | | | | | | | |
| | |
| | | | | | | | |
| | | | Investments Purchased with Cash Collateral from
Securities on Loan | |
| | |
| | | | | | | | |
| | | | Money Market Funds—0.4% | |
| | 4,835,006 | | | Invesco Government & Agency Portfolio—Institutional Class 2.34%(d)(e) | | | 4,835,006 | |
| | 1,611,204 | | | Invesco Liquid Assets Portfolio—Institutional Class,
2.48%(d)(e) | | | 1,611,687 | |
| | | | | | | | |
| | | | Total Investments Purchased with Cash Collateral from Securities on Loan
(Cost $6,446,693) | | | 6,446,693 | |
| | | | | | | | |
| | |
| | | | Total Investments in Securities
(Cost $1,228,480,163)—100.6% | | | 1,554,498,491 | |
| | |
| | | | Other assets less liabilities—(0.6)% | | | (8,551,262 | ) |
| | | | | | | | |
| | |
| | | | Net Assets—100.0% | | $ | 1,545,947,229 | |
| | | | | | | | |
Abbreviations:
REIT—Real Estate Investment Trust
Notes to Schedule of Investments:
| (a) | Industry and/or sector classifications used in this report are generally according to the Global Industry Classification Standard, which was developed by and is the exclusive property and a service mark of MSCI Inc. and Standard & Poor’s. |
| (b) | Non-income producing security. |
| (c) | All or a portion of this security was out on loan at April 30, 2019. |
| (d) | The security and the Fund are advised bywholly-owned subsidiaries of Invesco Ltd. and are therefore considered to be affiliated. The rate shown is the7-day SEC standardized yield as of April 30, 2019. |
| (e) | The security has been segregated to satisfy the commitment to return the cash collateral received in securities lending transactions upon the borrower’s return of the securities loaned. See Note 2M. |
See accompanying Notes to Financial Statements which are an integral part of the financial statements.
Schedule of Investments(a)
Invesco Global Listed Private Equity ETF (PSP)
April 30, 2019
| | | | | | | | |
Number
of Shares | | | | | Value | |
| | | | Common Stocks & Other Equity
Interests—86.4% | |
| | | | Capital Markets—49.6% | |
| | 680,865 | | | 3i Group PLC (United Kingdom) | | $ | 9,501,862 | |
| | 148,517 | | | Alaris Royalty Corp. (Canada)(b) | | | 2,001,645 | |
| | 1,718,808 | | | Allied Minds PLC (United Kingdom)(c) | | | 1,454,230 | |
| | 96,809 | | | Altamir (France) | | | 1,712,685 | |
| | 200,643 | | | Apollo Global Management LLC, Class A | | | 6,559,020 | |
| | 151,616 | | | Apollo Investment Corp. | | | 2,369,758 | |
| | 439,717 | | | Ares Capital Corp. | | | 7,914,906 | |
| | 63,079 | | | AURELIUS Equity Opportunities SE & Co. KGaA (Germany)(b) | | | 3,128,858 | |
| | 191,727 | | | BlackRock Capital Investment Corp. | | | 1,192,542 | |
| | 1,325,741 | | | Brait SE (South Africa)(c) | | | 2,126,919 | |
| | 147,467 | | | Bure Equity AB (Sweden) | | | 2,736,271 | |
| | 212,069 | | | Carlyle Group LP (The)(b) | | | 4,442,845 | |
| | 60,981 | | | Deutsche Beteiligungs AG (Germany) | | | 2,419,287 | |
| | 663,335 | | | FS KKR Capital Corp. | | | 4,198,911 | |
| | 123,531 | | | Georgia Capital PLC (Georgia)(c) | | | 1,629,737 | |
| | 49,247 | | | Gimv NV (Belgium) | | | 2,958,245 | |
| | 83,734 | | | Goldman Sachs BDC, Inc.(b) | | | 1,733,294 | |
| | 129,825 | | | Golub Capital BDC, Inc.(b) | | | 2,392,675 | |
| | 1,655,248 | | | Gozde Girisim Sermayesi Yatirim Ortakligi As (Turkey)(c) | | | 923,356 | |
| | 78,967 | | | GSV Capital Corp.(b)(c) | | | 560,666 | |
| | 53,108 | | | Hamilton Lane, Inc., Class A | | | 2,594,857 | |
| | 17,346 | | | HBM Healthcare Investments AG, Class A (Switzerland) | | | 2,839,365 | |
| | 186,464 | | | Hercules Capital, Inc.(b) | | | 2,422,167 | |
| | 286,738 | | | Intermediate Capital Group PLC (United Kingdom) | | | 4,418,387 | |
| | 2,270,963 | | | IP Group PLC (United Kingdom)(c) | | | 2,960,541 | |
| | 78,976 | | | JAFCO Co. Ltd. (Japan) | | | 2,967,583 | |
| | 76,702 | | | Main Street Capital Corp.(b) | | | 3,027,428 | |
| | 173,330 | | | New Mountain Finance Corp.(b) | | | 2,437,020 | |
| | 336,075 | | | Oaktree Specialty Lending Corp. | | | 1,774,476 | |
| | 91,574 | | | Oxford Square Capital Corp.(b) | | | 590,652 | |
| | 10,577 | | | Partners Group Holding AG (Switzerland) | | | 7,967,522 | |
| | 162,827 | | | Portman Ridge Finance Corp.(b) | | | 496,622 | |
| | 214,400 | | | Princess Private Equity Holding Ltd. (Guernsey) | | | 2,408,789 | |
| | 437,249 | | | Prospect Capital Corp.(b) | | | 2,951,431 | |
| | 1,108,309 | | | Ratos AB, Class B (Sweden) | | | 2,513,479 | |
| | 82,385 | | | Solar Capital Ltd. | | | 1,764,687 | |
| | 994,248 | | | Syncona Ltd. (United Kingdom) | | | 3,311,667 | |
| | 409,329 | | | Tamburi Investment Partners SpA (Italy) | | | 2,908,381 | |
| | 115,999 | | | TCG BDC, Inc. | | | 1,735,345 | |
| | 116,600 | | | TPG Specialty Lending, Inc. | | | 2,365,814 | |
| | 264,034 | | | VinaCapital Vietnam Opportunity Fund Ltd. (Vietnam) | | | 1,147,933 | |
| | 3,312,066 | | | Woodford Patient Capital Trust PLC (The) Fund (United Kingdom)(b)(c) | | | 3,579,436 | |
| | | | | | | | |
| | | | | | | 121,141,294 | |
| | | | | | | | |
| | | | Diversified Financial Services—15.4% | |
| | 26,270 | | | Ackermans & van Haaren NV (Belgium) | | | 4,221,811 | |
| | 1,209,094 | | | Apax Global Alpha Ltd. (Guernsey)(d) | | | 2,356,472 | |
| | 123,357 | | | Cannae Holdings, Inc.(c) | | | 3,166,574 | |
| | 144,692 | | | Compass Diversified Holdings LP | | | 2,393,206 | |
| | 59,394 | | | Eurazeo SE (France) | | | 4,656,074 | |
| | | | | | | | |
Number
of Shares | | | | | Value | |
| | | | Common Stocks & Other Equity Interests
(continued) | |
| | | | Diversified Financial Services (continued) | |
| | 101,456 | | | HgCapital Trust PLC (United Kingdom) | | $ | 2,870,110 | |
| | 175,498 | | | Kinnevik AB, Class B (Sweden)(b) | | | 5,104,262 | |
| | 159,382 | | | NB Private Equity Partners Ltd. (United Kingdom) | | | 2,295,951 | |
| | 83,853 | | | Onex Corp. (Canada)(b) | | | 4,844,051 | |
| | 40,554 | | | Wendel SA (France) | | | 5,608,393 | |
| | | | | | | | |
| | | | | | | 37,516,904 | |
| | | | | | | | |
| | | | Diversified Telecommunication Services—0.8% | |
| | 31,351 | | | ATN International, Inc. | | | 1,913,979 | |
| | | | | | | | |
| |
| | | | Electrical Equipment—3.6% | |
| | 3,291,930 | | | Melrose Industries PLC (United Kingdom) | | | 8,677,463 | |
| | | | | | | | |
| |
| | | | Food Products—1.1% | |
| | 37,735 | | | Schouw & Co. A/S (Denmark) | | | 2,680,447 | |
| | | | | | | | |
| |
| | | | Industrial Conglomerates—1.8% | |
| | 2,894,749 | | | Fosun International Ltd. (China) | | | 4,486,724 | |
| | | | | | | | |
| |
| | | | Interactive Media & Services—5.3% | |
| | 58,077 | | | IAC/InterActiveCorp.(c) | | | 13,058,033 | |
| | | | | | | | |
| |
| | | | Internet & Direct Marketing Retail—7.6% | |
| | 57,082 | | | Naspers Ltd., Class N (South Africa) | | | 14,553,347 | |
| | 155,657 | | | Rocket Internet SE (Germany)(c)(d) | | | 4,099,455 | |
| | | | | | | | |
| | | | | | | 18,652,802 | |
| | | | | | | | |
| | | | IT Services—1.2% | |
| | 103,520 | | | Digital Garage, Inc. (Japan) | | | 3,002,196 | |
| | | | | | | | |
| | | | Total Common Stocks & Other Equity Interests
(Cost $191,058,508) | | | 211,129,842 | |
| | | | | | | | |
| | |
| | | | | | | | |
| | | | Money Market Funds—10.3% | |
| | 25,144,739 | | | Invesco Premier U.S. Government Money Portfolio—Institutional Class, 2.32%(e)
(Cost $25,144,739) | | | 25,144,739 | |
| | | | | | | | |
| | |
| | | | Total Investments in Securities
(excluding investments purchased with cash collateral from securities on loan)
(Cost $216,203,247)—96.7% | | | 236,274,581 | |
| | | | | | | | |
| | |
| | | | | | | | |
| | | | Investments Purchased with Cash Collateral from
Securities on Loan | |
| | |
| | | | | | | | |
| | | | Money Market Funds—10.4% | |
| | 19,183,307 | | | Invesco Government & Agency Portfolio—Institutional Class 2.34%(e)(f) | | | 19,183,307 | |
| | 6,392,540 | | | Invesco Liquid Assets Portfolio—Institutional Class, 2.48%(e)(f) | | | 6,394,458 | |
| | | | | | | | |
| | | | Total Investments Purchased with Cash Collateral from Securities on Loan
(Cost $25,577,765) | | | 25,577,765 | |
| | | | | | | | |
| | |
| | | | Total Investments in Securities
(Cost $241,781,012)—107.1% | | | 261,852,346 | |
| | |
| | | | Other assets less liabilities—(7.1)% | | | (17,409,557 | ) |
| | | | | | | | |
| | |
| | | | Net Assets—100.0% | | $ | 244,442,789 | |
| | | | | | | | |
See accompanying Notes to Financial Statements which are an integral part of the financial statements.
Invesco Global Listed Private Equity ETF (PSP)(continued)
April 30, 2019
Notes to Schedule of Investments:
| (a) | Industry and/or sector classifications used in this report are generally according to the Global Industry Classification Standard, which was developed by and is the exclusive property and a service mark of MSCI Inc. and Standard & Poor’s. |
| (b) | All or a portion of this security was out on loan at April 30, 2019. |
| (c) | Non-income producing security. |
| (d) | Security purchased or received in a transaction exempt from registration under the Securities Act of 1933, as amended (the “1933 Act”). The security may be resold pursuant to an exemption from registration under the 1933 Act, typically to qualified institutional buyers. The aggregate value of these securities at April 30, 2019 was $6,455,927, which represented 2.64% of the Fund’s Net Assets. |
| (e) | The security and the Fund are advised bywholly-owned subsidiaries of Invesco Ltd. and are therefore considered to be affiliated. The rate shown is the7-day SEC standardized yield as of April 30, 2019. |
| (f) | The security has been segregated to satisfy the commitment to return the cash collateral received in securities lending transactions upon the borrower’s return of the securities loaned. See Note 2M. |
This Fund has holdings greater than 10% of net assets in the following country:
| | | | | | | | | | | | | | | | | | | | | | | | | | | | |
| Open Over-The-Counter Total Return Swap Agreements | |
| Counterparty | | Pay/Receive | | Reference Entity | | Rate | | Payment
Frequency | | Maturity
Date | | | Notional
Value(a) | | | Upfront
Payments
Paid
(Received) | | | Value | | | Unrealized
Appreciation
(Depreciation) | |
| Equity Risk | | | | | | | | | | | | | | | | | | | | | | | | | | | | |
| Citibank, N.A. | | Receive | | KKR & Co. LP | | 1-Month LIBOR plus 65 basis points | | Monthly | | | October-2019 | | | $ | 8,114,165 | | | $ | — | | | $ | 112,282 | | | $ | 112,282 | |
| | | | | | | | | | | | | | | | | | | | | | | | | | | | |
| Subtotal—Appreciation | | | | | | | | | | | | | | | | | | | — | | | | 112,282 | | | | 112,282 | |
| | | | | | | | | | | | | | | | | | | | | | | | | | | | |
| Equity Risk | | | | | | | | | | | | | | | | | | | | | | | | | | | | |
| Citibank, N.A. | | Receive | | Brookfield Business Partners LP | | 1-Month CDOR plus 65 basis points | | Monthly | | | October-2019 | | | CAD | 5,347,486 | | | | — | | | | (66,605 | ) | | | (66,605 | ) |
Morgan Stanley
Capital Services LLC | | Receive | | Riverstone Energy Ltd. | | 1-Month LIBOR plus 85 basis points | | Monthly | | | August-2020 | | | GBP | 1,691,244 | | | | — | | | | (2,861 | ) | | | (2,861 | ) |
| Citibank, N.A. | | Receive | | The Blackstone Group LP | | 1-Month LIBOR plus 65 basis points | | Monthly | | | October-2019 | | | $ | 9,666,023 | | | | — | | | | (77,150 | ) | | | (77,150 | ) |
| | | | | | | | | | | | | | | | | | | | | | | | | | | | |
| Subtotal—Depreciation | | | | | | | | | | | | | | | | | — | | | | (146,616 | ) | | | (146,616 | ) |
| | | | | | | | | | | | | | | | | | | | | | | | | | | | |
| Total Over-The-Counter Total Return Swap Agreements | | | $ | — | | | $ | (34,334 | ) | | $ | (34,334 | ) |
| | | | | | | | | | | | | | | | | | | | | | | | | | | | |
Investment Abbreviations:
CAD—Canadian Dollar
CDOR—Canadian Dollar Offered Rate
GBP—Pound Sterling
LIBOR—London Interbank Offered Rate
| (a) | Notional Value is denominated in U.S. Dollars unless otherwise noted. |
See accompanying Notes to Financial Statements which are an integral part of the financial statements.
Schedule of Investments(a)
Invesco Golden Dragon China ETF (PGJ)
April 30, 2019
| | | | | | | | |
Number
of Shares | | | | | Value | |
| | | | Common Stocks & Other Equity
Interests—100.0% | |
| | | | Communication Services—42.0% | |
| | 110,891 | | | 58.com, Inc. ADR (China)(b) | | $ | 7,960,865 | |
| | 61,756 | | | Autohome, Inc. ADR (China)(b) | | | 7,132,200 | |
| | 99,484 | | | Baidu, Inc. ADR (China)(b) | | | 16,537,225 | |
| | 95,228 | | | Bilibili, Inc. ADR (China)(b) | | | 1,695,058 | |
| | 35,027 | | | Bitauto Holdings Ltd. ADR (China)(b)(c) | | | 449,747 | |
| | 21,447 | | | Changyou.com Ltd. ADR (China)(b) | | | 417,144 | |
| | 126,701 | | | China Mobile Ltd. ADR (China) | | | 6,039,837 | |
| | 6,858 | | | China Telecom Corp. Ltd. ADR (China) | | | 355,519 | |
| | 41,680 | | | China Unicom Hong Kong Ltd. ADR (China) | | | 494,742 | |
| | 326,159 | | | Fang Holdings Ltd. ADR (China)(b) | | | 495,762 | |
| | 297,681 | | | iQIYI, Inc. ADR (China)(b)(c) | | | 6,581,727 | |
| | 171,925 | | | Momo, Inc. ADR (China) | | | 6,029,410 | |
| | 72,439 | | | NetEase, Inc. ADR (China) | | | 20,611,069 | |
| | 35,701 | | | Phoenix New Media Ltd. ADR
(China)(b)(c) | | | 155,299 | |
| | 15,127 | | | Qutoutiao, Inc. ADR (China)(b)(c) | | | 100,141 | |
| | 78,344 | | | SINA Corp. (China)(b) | | | 4,930,971 | |
| | 43,335 | | | Sohu.com Ltd. ADR (China)(b) | | | 895,734 | |
| | 81,760 | | | Weibo Corp. ADR (China)(b) | | | 5,600,560 | |
| | 54,274 | | | YY, Inc. ADR (China)(b) | | | 4,592,123 | |
| | | | | | | | |
| | | | | | | 91,075,133 | |
| | | | | | | | |
| | | | Consumer Discretionary—42.1% | |
| | 33,142 | | | 500.com Ltd., Class A ADR (China)(b)(c) | | | 422,229 | |
| | 88,347 | | | Alibaba Group Holding Ltd. ADR
(China)(b) | | | 16,394,553 | |
| | 47,491 | | | Baozun, Inc. ADR (China)(b)(c) | | | 2,303,313 | |
| | 29,870 | | | Bright Scholar Education Holdings Ltd. ADR (China)(b) | | | 362,024 | |
| | 473,779 | | | Ctrip.com International Ltd. ADR
(China)(b) | | | 20,869,965 | |
| | 3,252 | | | Hailiang Education Group, Inc. ADR
(China)(b)(c) | | | 187,283 | |
| | 159,829 | | | Huazhu Group Ltd. ADR (China) | | | 6,776,750 | |
| | 583,547 | | | JD.com, Inc. ADR (China)(b) | | | 17,663,968 | |
| | 110,305 | | | Jumei International Holding Ltd. ADR (China)(b) | | | 268,041 | |
| | 56,433 | | | Kandi Technologies Group, Inc.
(China)(b)(c) | | | 297,966 | |
| | 98,527 | | | New Oriental Education & Technology Group, Inc. ADR (China)(b) | | | 9,405,387 | |
| | 100,556 | | | Pinduoduo, Inc. ADR (China)(b)(c) | | | 2,235,360 | |
| | 26,045 | | | RISE Education Cayman Ltd. ADR
(China)(b)(c) | | | 263,836 | |
| | 227,108 | | | TAL Education Group ADR (China)(b) | | | 8,736,845 | |
| | 39,394 | | | Tarena International, Inc. ADR (China)(c) | | | 200,122 | |
| | 39,035 | | | Tuniu Corp. ADR (China)(b) | | | 179,561 | |
| | 128,233 | | | Uxin Ltd. ADR (China)(b)(c) | | | 357,770 | |
| | 511,538 | | | Vipshop Holdings Ltd. ADR (China)(b) | | | 4,404,342 | |
| | | | | | | | |
| | | | | | | 91,329,315 | |
| | | | | | | | |
| | | | Energy—1.9% | |
| | 17,692 | | | China Petroleum & Chemical Corp. ADR (China) | | | 1,357,684 | |
| | 11,489 | | | CNOOC Ltd. ADR (China) | | | 2,087,322 | |
| | 8,714 | | | PetroChina Co. Ltd. ADR (China) | | | 551,509 | |
| | 26,179 | | | Sino Clean Energy, Inc. (China)(b)(d) | | | 0 | |
| | | | | | | | |
| | | | | | | 3,996,515 | |
| | | | | | | | |
| | | | Financials—2.8% | |
| | 30,176 | | | China Life Insurance Co. Ltd. ADR (China) | | | 427,292 | |
| | | | | | | | |
Number
of Shares | | | | | Value | |
| | | | Common Stocks & Other Equity Interests
(continued) | |
| | | | Financials (continued) | |
| | 28,854 | | | CM Seven Star Acquisiton Corp. (Hong Kong)(b) | | $ | 143,982 | |
| | 39,589 | | | Fanhua, Inc. ADR (China)(c) | | | 1,028,522 | |
| | 74,860 | | | LexinFintech Holdings Ltd. ADR (China)(b) | | | 965,694 | |
| | 34,316 | | | Noah Holdings Ltd. ADR (China)(b)(c) | | | 1,864,731 | |
| | 193,718 | | | Qudian, Inc. ADR (China)(b) | | | 1,363,775 | |
| | 17,615 | | | Yintech Investment Holdings Ltd. ADR (China)(b)(c) | | | 102,343 | |
| | 14,018 | | | Yirendai Ltd. ADR (China)(c) | | | 222,045 | |
| | | | | | | | |
| | | | | | | 6,118,384 | |
| | | | | | | | |
| | | | Health Care—2.3% | |
| | 43,146 | | | China Biologic Products Holdings, Inc. (China)(b)(c) | | | 4,325,818 | |
| | 22,783 | | | Zai Lab Ltd. ADR (China)(b) | | | 607,167 | |
| | | | | | | | |
| | | | | | | 4,932,985 | |
| | | | | | | | |
| | | | Industrials—5.4% | |
| | 39,138 | | | 51job, Inc. ADR (China)(b) | | | 3,614,003 | |
| | 20,092 | | | China Customer Relations Center, Inc. (China)(b)(c) | | | 255,771 | |
| | 396,384 | | | ZTO Express Cayman, Inc. ADR (China) | | | 7,899,933 | |
| | | | | | | | |
| | | | | | | 11,769,707 | |
| | | | | | | | |
| | | | Information Technology—3.2% | |
| | 68,267 | | | 21Vianet Group, Inc. ADR (China)(b) | | | 536,579 | |
| | 64,215 | | | Canadian Solar, Inc. (Canada)(b)(c) | | | 1,283,016 | |
| | 49,489 | | | Cheetah Mobile, Inc. ADR (China)(b) | | | 311,781 | |
| | 11,041 | | | Daqo New Energy Corp. ADR (China)(b) | | | 409,069 | |
| | 58,710 | | | GDS Holdings Ltd. ADR (China)(b)(c) | | | 2,297,322 | |
| | 66,144 | | | Hollysys Automation Technologies Ltd. (China) | | | 1,384,394 | |
| | 15,610 | | | Huami Corp. ADR (China)(b) | | | 157,036 | |
| | 31,275 | | | JinkoSolar Holding Co. Ltd. ADR (China)(b)(c) | | | 608,611 | |
| | | | | | | | |
| | | | | | | 6,987,808 | |
| | | | | | | | |
| | | | Materials—0.1% | |
| | 4,407 | | | Sinopec Shanghai Petrochemical Co. Ltd. ADR (China) | | | 197,786 | |
| | | | | | | | |
| |
| | | | Real Estate—0.1% | |
| | 40,166 | | | Xinyuan Real Estate Co. Ltd. ADR (China) | | | 178,739 | |
| | | | | | | | |
| |
| | | | Utilities—0.1% | |
| | 5,265 | | | Huaneng Power International, Inc. ADR (China) | | | 133,889 | |
| | | | | | | | |
| | | | Total Common Stocks & Other Equity Interests
(Cost $200,941,214) | | | 216,720,261 | |
| | | | | | | | |
| | |
| | | | | | | | |
| | | | Money Market Funds—0.1% | |
| | 219,325 | | | Invesco Premier U.S. Government Money Portfolio—Institutional Class, 2.32%(e)
(Cost $219,325) | | | 219,325 | |
| | | | | | | | |
| | |
| | | | Total Investments in Securities
(excluding investments purchased with cash collateral from securities on loan)
(Cost $201,160,539)—100.1% | | | 216,939,586 | |
| | | | | | | | |
| | |
| | | | | | | | |
See accompanying Notes to Financial Statements which are an integral part of the financial statements.
Invesco Golden Dragon China ETF (PGJ)(continued)
April 30, 2019
| | | | | | | | |
Number
of Shares | | | | | Value | |
| | | | Investments Purchased with Cash Collateral from
Securities on Loan | |
| | |
| | | | | | | | |
| | | | Money Market Funds—8.6% | |
| | 13,993,774 | | | Invesco Government & Agency Portfolio— Institutional Class
2.34%(e)(f) | | $ | 13,993,774 | |
| | 4,663,192 | | | Invesco Liquid Assets Portfolio—Institutional Class,
2.48%(e)(f) | | | 4,664,591 | |
| | | | | | | | |
| | | | Total Investments Purchased with Cash Collateral from Securities on Loan
(Cost $18,658,365) | | | 18,658,365 | |
| | | | | | | | |
| | |
| | | | Total Investments in Securities
(Cost $219,818,904)—108.7% | | | 235,597,951 | |
| | |
| | | | Other assets less liabilities—(8.7)% | | | (18,868,167 | ) |
| | | | | | | | |
| | |
| | | | Net Assets—100.0% | | $ | 216,729,784 | |
| | | | | | | | |
Abbreviations:
ADR—American Depositary Receipt
Notes to Schedule of Investments:
| (a) | Industry and/or sector classifications used in this report are generally according to the Global Industry Classification Standard, which was developed by and is the exclusive property and a service mark of MSCI Inc. and Standard & Poor’s. |
| (b) | Non-income producing security. |
| (c) | All or a portion of this security was out on loan at April 30, 2019. |
| (d) | Security valued using significant unobservable inputs (Level 3). See Note 5. |
| (e) | The security and the Fund are advised bywholly-owned subsidiaries of Invesco Ltd. and are therefore considered to be affiliated. The rate shown is the7-day SEC standardized yield as of April 30, 2019. |
| (f) | The security has been segregated to satisfy the commitment to return the cash collateral received in securities lending transactions upon the borrower’s return of the securities loaned. See Note 2M. |
This Fund has holdings greater than 10% of net assets in the following country:
See accompanying Notes to Financial Statements which are an integral part of the financial statements.
Schedule of Investments(a)
Invesco Insider Sentiment ETF (NFO)
April 30, 2019
| | | | | | | | |
Number
of Shares | | | | | Value | |
| | | | Common Stocks & Other Equity Interests—100.1% | |
| | | | Communication Services—6.1% | |
| | 7,526 | | | Liberty Broadband Corp., Class A(b) | | $ | 740,483 | |
| | 24,686 | | | Liberty Media Corp.-Liberty Braves, Class A(b) | | | 700,095 | |
| | 2,353 | | | Madison Square Garden Co. (The), Class A(b) | | | 735,171 | |
| | 12,184 | | | Match Group, Inc. | | | 735,914 | |
| | 11,665 | | | Verizon Communications, Inc. | | | 667,122 | |
| | 129,405 | | | Zynga, Inc., Class A(b) | | | 732,432 | |
| | | | | | | | |
| | | | | | | 4,311,217 | |
| | | | | | | | |
| | | | Consumer Discretionary—4.0% | |
| | 5,781 | | | Dollar General Corp. | | | 728,926 | |
| | 6,157 | | | Genuine Parts Co. | | | 631,339 | |
| | 3,632 | | | McDonald’s Corp. | | | 717,574 | |
| | 7,055 | | | Tractor Supply Co. | | | 730,193 | |
| | | | | | | | |
| | | | | | | 2,808,032 | |
| | | | | | | | |
| | | | Consumer Staples—4.0% | |
| | 4,298 | | | Clorox Co. (The) | | | 686,520 | |
| | 13,817 | | | Mondelez International, Inc., Class A | | | 702,594 | |
| | 5,628 | | | PepsiCo, Inc. | | | 720,665 | |
| | 6,305 | | | Post Holdings, Inc.(b) | | | 711,078 | |
| | | | | | | | |
| | | | | | | 2,820,857 | |
| | | | | | | | |
| | | | Financials—7.3% | |
| | 15,524 | | | Assured Guaranty Ltd. | | | 740,495 | |
| | 3,864 | | | Erie Indemnity Co., Class A | | | 731,533 | |
| | 6,866 | | | First Republic Bank | | | 725,187 | |
| | 13,872 | | | Hartford Financial Services Group, Inc. (The) | | | 725,644 | |
| | 3,276 | | | S&P Global, Inc. | | | 722,882 | |
| | 30,860 | | | Starwood Property Trust, Inc. REIT | | | 711,323 | |
| | 14,313 | | | US Bancorp | | | 763,169 | |
| | | | | | | | |
| | | | | | | 5,120,233 | |
| | | | | | | | |
| | | | Health Care—13.1% | |
| | 8,581 | | | Agilent Technologies, Inc. | | | 673,608 | |
| | 28,291 | | | Array BioPharma, Inc.(b) | | | 639,660 | |
| | 8,483 | | | Baxter International, Inc. | | | 647,253 | |
| | 2,762 | | | Becton, Dickinson and Co. | | | 664,924 | |
| | 13,909 | | | DENTSPLY SIRONA, Inc. | | | 711,167 | |
| | 14,251 | | | Hologic, Inc.(b) | | | 660,961 | |
| | 8,497 | | | Ionis Pharmaceuticals, Inc.(b) | | | 631,582 | |
| | 4,934 | | | Johnson & Johnson | | | 696,681 | |
| | 8,293 | | | Merck & Co., Inc. | | | 652,742 | |
| | 16,240 | | | Pfizer, Inc. | | | 659,506 | |
| | 13,325 | | | Syneos Health, Inc.(b) | | | 625,342 | |
| | 5,156 | | | Universal Health Services, Inc., Class B | | | 654,142 | |
| | 21,931 | | | Wright Medical Group NV(b) | | | 648,500 | |
| | 6,851 | | | Zoetis, Inc. | | | 697,706 | |
| | | | | | | | |
| | | | | | | 9,263,774 | |
| | | | | | | | |
| | | | Industrials—11.5% | |
| | 5,625 | | | Carlisle Cos., Inc. | | | 795,488 | |
| | 10,725 | | | Fastenal Co. | | | 756,649 | |
| | 4,340 | | | Honeywell International, Inc. | | | 753,554 | |
| | 4,545 | | | IDEX Corp. | | | 712,020 | |
| | 4,805 | | | Illinois Tool Works, Inc. | | | 747,802 | |
| | 6,389 | | | Ingersoll-Rand PLC | | | 783,355 | |
| | 8,581 | | | Republic Services, Inc. | | | 710,678 | |
| | 7,536 | | | Spirit AeroSystems Holdings, Inc., Class A | | | 654,878 | |
| | 1,519 | | | TransDigm Group, Inc.(b) | | | 732,948 | |
| | | | | | | | |
Number
of Shares | | | | | Value | |
| | | | Common Stocks & Other Equity Interests
(continued) | |
| | | | Industrials (continued) | |
| | 5,351 | | | United Technologies Corp. | | $ | 763,106 | |
| | 5,186 | | | Verisk Analytics, Inc. | | | 731,952 | |
| | | | | | | | |
| | | | | | | 8,142,430 | |
| | | | | | | | |
| | | | Information Technology—17.8% | |
| | 3,918 | | | Accenture PLC, Class A | | | 715,701 | |
| | 20,983 | | | ACI Worldwide, Inc.(b) | | | 745,316 | |
| | 8,951 | | | Arrow Electronics, Inc.(b) | | | 756,449 | |
| | 4,318 | | | Automatic Data Processing, Inc. | | | 709,836 | |
| | 2,294 | | | Broadcom, Inc. | | | 730,410 | |
| | 11,752 | | | Dell Technologies, Inc., Class C(b) | | | 792,202 | |
| | 2,539 | | | Fair Isaac Corp.(b) | | | 710,285 | |
| | 2,797 | | | FleetCor Technologies, Inc.(b) | | | 729,877 | |
| | 5,052 | | | Global Payments, Inc. | | | 737,946 | |
| | 7,965 | | | j2 Global, Inc. | | | 697,893 | |
| | 4,971 | | | Jack Henry & Associates, Inc. | | | 740,977 | |
| | 9,717 | | | MAXIMUS, Inc. | | | 715,657 | |
| | 8,337 | | | Okta, Inc.(b) | | | 867,298 | |
| | 15,801 | | | Teradata Corp.(b) | | | 718,472 | |
| | 3,484 | | | Trade Desk, Inc. (The), Class A(b) | | | 771,636 | |
| | 5,339 | | | Twilio, Inc., Class A(b) | | | 732,191 | |
| | 3,576 | | | Workday, Inc., Class A(b) | | | 735,333 | |
| | | | | | | | |
| | | | | | | 12,607,479 | |
| | | | | | | | |
| | | | Materials—3.0% | |
| | 3,612 | | | Air Products & Chemicals, Inc. | | | 743,313 | |
| | 3,907 | | | Ecolab, Inc. | | | 719,201 | |
| | 8,838 | | | W.R. Grace & Co. | | | 667,976 | |
| | | | | | | | |
| | | | | | | 2,130,490 | |
| | | | | | | | |
| | | | Real Estate—12.7% | |
| | 4,838 | | | Alexandria Real Estate Equities, Inc. REIT | | | 688,883 | |
| | 14,496 | | | American Campus Communities, Inc. REIT | | | 684,211 | |
| | 30,358 | | | American Homes 4 Rent, Class A REIT | | | 727,985 | |
| | 3,500 | | | American Tower Corp. REIT | | | 683,550 | |
| | 13,715 | | | Apartment Investment & Management Co., Class A REIT | | | 676,973 | |
| | 5,796 | | | Digital Realty Trust, Inc. REIT | | | 682,247 | |
| | 8,969 | | | EPR Properties REIT | | | 707,295 | |
| | 21,099 | | | Equity Commonwealth REIT | | | 670,948 | |
| | 2,385 | | | Essex Property Trust, Inc. REIT | | | 673,763 | |
| | 17,882 | | | Gaming and Leisure Properties, Inc. REIT | | | 722,075 | |
| | 8,702 | | | Lamar Advertising Co., Class A REIT | | | 719,394 | |
| | 20,589 | | | STORE Capital Corp. REIT | | | 686,026 | |
| | 15,172 | | | UDR, Inc. REIT | | | 681,981 | |
| | | | | | | | |
| | | | | | | 9,005,331 | |
| | | | | | | | |
| | | | Utilities—20.6% | |
| | 38,149 | | | AES Corp. | | | 653,111 | |
| | 8,388 | | | ALLETE, Inc. | | | 683,203 | |
| | 9,378 | | | Ameren Corp. | | | 682,437 | |
| | 8,236 | | | American Electric Power Co., Inc. | | | 704,590 | |
| | 6,615 | | | American Water Works Co., Inc. | | | 715,677 | |
| | 18,928 | | | Aqua America, Inc. | | | 739,328 | |
| | 8,997 | | | Dominion Energy, Inc. | | | 700,596 | |
| | 5,529 | | | DTE Energy Co. | | | 695,051 | |
| | 7,664 | | | Duke Energy Corp. | �� | | 698,344 | |
| | 7,212 | | | Entergy Corp. | | | 698,843 | |
See accompanying Notes to Financial Statements which are an integral part of the financial statements.
Invesco Insider Sentiment ETF (NFO)(continued)
April 30, 2019
| | | | | | | | |
Number
of Shares | | | | | Value | |
| | | | Common Stocks & Other Equity Interests
(continued) | |
| | | | Utilities (continued) | |
| | 13,759 | | | Exelon Corp. | | $ | 701,021 | |
| | 16,576 | | | FirstEnergy Corp. | | | 696,689 | |
| | 15,996 | | | OGE Energy Corp. | | | 677,271 | |
| | 7,747 | | | ONE Gas, Inc. | | | 685,764 | |
| | 14,570 | | | PNM Resources, Inc. | | | 676,631 | |
| | 13,305 | | | Portland General Electric Co. | | | 695,985 | |
| | 21,731 | | | PPL Corp. | | | 678,224 | |
| | 5,480 | | | Sempra Energy | | | 701,166 | |
| | 13,346 | | | Southern Co. (The) | | | 710,274 | |
| | 8,722 | | | WEC Energy Group, Inc. | | | 684,066 | |
| | 12,271 | | | Xcel Energy, Inc. | | | 693,311 | |
| | | | | | | | |
| | | | | | | 14,571,582 | |
| | | | | | | | |
| | | | Total Common Stocks & Other Equity Interests
(Cost $64,569,489) | | | 70,781,425 | |
| | | | | | | | |
| | |
| | | | | | | | |
| | | | Money Market Funds—0.1% | |
| | 40,087 | | | Invesco Premier U.S. Government Money Portfolio—Institutional Class, 2.32%(c)
(Cost $40,087) | | | 40,087 | |
| | | | | | | | |
| | |
| | | | Total Investments in Securities
(Cost $64,609,576)—100.2% | | | 70,821,512 | |
| | |
| | | | Other assets less liabilities—(0.2)% | | | (125,920 | ) |
| | | | | | | | |
| | |
| | | | Net Assets—100.0% | | $ | 70,695,592 | |
| | | | | | | | |
Abbreviations:
REIT—Real Estate Investment Trust
Notes to Schedule of Investments:
| (a) | Industry and/or sector classifications used in this report are generally according to the Global Industry Classification Standard, which was developed by and is the exclusive property and a service mark of MSCI Inc. and Standard & Poor’s. |
| (b) | Non-income producing security. |
| (c) | The security and the Fund are advised bywholly-owned subsidiaries of Invesco Ltd. and are therefore considered to be affiliated. The rate shown is the7-day SEC standardized yield as of April 30, 2019. |
See accompanying Notes to Financial Statements which are an integral part of the financial statements.
Schedule of Investments(a)
Invesco Raymond James SB-1 Equity ETF (RYJ)
April 30, 2019
| | | | | | | | |
Number
of Shares | | | | | Value | |
| | | | Common Stocks & Other Equity
Interests—99.9% | | | |
| | | | Communication Services—4.3% | | | |
| | 3,011 | | | Charter Communications, Inc., Class A(b) | | $ | 1,117,653 | |
| | 40,538 | | | Iridium Communications, Inc.(b) | | | 1,113,173 | |
| | 2,857 | | | Netflix, Inc.(b) | | | 1,058,633 | |
| | 147,511 | | | ORBCOMM, Inc.(b) | | | 1,067,980 | |
| | 7,933 | | | Spotify Technology SA(b) | | | 1,077,063 | |
| | 14,627 | | | T-Mobile US, Inc.(b) | | | 1,067,625 | |
| | 119,150 | | | WideOpenWest, Inc.(b) | | | 952,009 | |
| | | | | | | | |
| | | | | | | 7,454,136 | |
| | | | | | | | |
| | | | Consumer Discretionary—9.4% | |
| | 20,761 | | | Aaron’s, Inc. | | | 1,156,180 | |
| | 5,817 | | | Alibaba Group Holding Ltd. ADR (China)(b) | | | 1,079,461 | |
| | 64,492 | | | Bed Bath & Beyond, Inc.(c) | | | 1,077,661 | |
| | 14,853 | | | Best Buy Co., Inc. | | | 1,105,212 | |
| | 12,227 | | | Dine Brands Global, Inc. | | | 1,084,046 | |
| | 8,727 | | | Dollar General Corp. | | | 1,100,387 | |
| | 103,485 | | | Everi Holdings, Inc.(b) | | | 1,064,861 | |
| | 12,266 | | | Hilton Worldwide Holdings, Inc. | | | 1,067,019 | |
| | 26,326 | | | Malibu Boats, Inc., Class A(b) | | | 1,095,688 | |
| | 56,933 | | | MarineMax, Inc.(b) | | | 984,372 | |
| | 45,383 | | | MasterCraft Boat Holdings, Inc.(b) | | | 1,122,775 | |
| | 2,742 | | | O’Reilly Automotive, Inc.(b) | | | 1,038,039 | |
| | 10,896 | | | Polaris Industries, Inc. | | | 1,050,374 | |
| | 47,088 | | | Rent-A-Center, Inc.(b) | | | 1,173,904 | |
| | 17,835 | | | Tempur Sealy International, Inc.(b) | | | 1,095,069 | |
| | | | | | | | |
| | | | | | | 16,295,048 | |
| | | | | | | | |
| | | | Energy—15.8% | |
| | 27,333 | | | Cactus, Inc., Class A(b) | | | 992,188 | |
| | 77,856 | | | Carrizo Oil & Gas, Inc.(b) | | | 998,114 | |
| | 8,968 | | | Concho Resources, Inc. | | | 1,034,728 | |
| | 20,810 | | | Continental Resources, Inc.(b) | | | 957,052 | |
| | 28,228 | | | Delek US Holdings, Inc. | | | 1,046,130 | |
| | 69,211 | | | Energy Transfer Equity LP | | | 1,046,470 | |
| | 36,739 | | | Enterprise Products Partners LP | | | 1,051,838 | |
| | 39,294 | | | Green Plains Partners LP(c) | | | 629,490 | |
| | 34,683 | | | Halliburton Co. | | | 982,569 | |
| | 39,743 | | | Kimbell Royalty Partners LP | | | 707,028 | |
| | 57,418 | | | Marathon Oil Corp. | | | 978,403 | |
| | 17,639 | | | Marathon Petroleum Corp. | | | 1,073,686 | |
| | 120,346 | | | Newpark Resources, Inc.(b) | | | 878,526 | |
| | 49,036 | | | Nine Energy Service, Inc.(b) | | | 987,095 | |
| | 153,386 | | | Oasis Petroleum, Inc.(b) | | | 935,655 | |
| | 17,103 | | | Occidental Petroleum Corp. | | | 1,007,025 | |
| | 56,963 | | | Oil States International, Inc.(b) | | | 1,100,525 | |
| | 49,532 | | | Parsley Energy, Inc., Class A(b) | | | 988,659 | |
| | 66,727 | | | Patterson-UTI Energy, Inc. | | | 906,820 | |
| | 6,131 | | | Pioneer Natural Resources Co. | | | 1,020,566 | |
| | 44,356 | | | Plains All American Pipeline LP | | | 1,026,841 | |
| | 43,851 | | | Plains GP Holdings LP, Class A | | | 1,034,884 | |
| | 133,453 | | | QEP Resources, Inc.(b) | | | 1,003,566 | |
| | 161,908 | | | SRC Energy, Inc.(b) | | | 995,734 | |
| | 31,483 | | | Viper Energy Partners LP | | | 1,058,458 | |
| | 36,739 | | | Whiting Petroleum Corp.(b) | | | 1,006,281 | |
| | 70,801 | | | WPX Energy, Inc.(b) | | | 983,426 | |
| | 74,831 | | | YPF SA ADR (Argentina) | | | 1,012,463 | |
| | | | | | | | |
| | | | | | | 27,444,220 | |
| | | | | | | | |
| | | | | | | | |
Number
of Shares | | | | | Value | |
| | | | Common Stocks & Other Equity Interests
(continued) | |
| | | | Financials—21.1% | |
| | 22,205 | | | Aflac, Inc. | | $ | 1,118,688 | |
| | 30,011 | | | Allegiance Bancshares, Inc.(b) | | | 1,037,480 | |
| | 11,108 | | | Allstate Corp. (The) | | | 1,100,358 | |
| | 17,874 | | | American National Bankshares, Inc. | | | 675,995 | |
| | 70,386 | | | Ares Commercial Real Estate Corp. REIT | | | 1,069,867 | |
| | 14,692 | | | Argo Group International Holdings Ltd. | | | 1,147,004 | |
| | 34,795 | | | Axos Financial, Inc.(b) | | | 1,138,492 | |
| | 130,704 | | | Bancorp, Inc. (The)(b) | | | 1,334,488 | |
| | 196,771 | | | BGC Partners, Inc., Class A | | | 1,062,563 | |
| | 53,276 | | | Cadence BanCorp | | | 1,212,029 | |
| | 25,259 | | | Chemical Financial Corp. | | | 1,109,628 | |
| | 53,276 | | | ConnectOne Bancorp, Inc. | | | 1,163,015 | |
| | 52,866 | | | FedNat Holding Co. | | | 860,130 | |
| | 70,111 | | | Fidus Investment Corp. | | | 1,100,743 | |
| | 13,483 | | | FVCBankcorp, Inc.(b) | | | 221,121 | |
| | 52,755 | | | Goldman Sachs BDC, Inc.(c) | | | 1,092,029 | |
| | 56,308 | | | Granite Point Mortgage Trust, Inc. REIT | | | 1,082,803 | |
| | 12,765 | | | Kemper Corp. | | | 1,147,318 | |
| | 63,654 | | | Ladder Capital Corp. REIT | | | 1,107,580 | |
| | 47,989 | | | Meta Financial Group, Inc. | | | 1,236,197 | |
| | 51,569 | | | Old Republic International Corp. | | | 1,153,083 | |
| | 31,659 | | | Origin Bancorp, Inc. | | | 1,103,000 | |
| | 27,777 | | | PacWest Bancorp | | | 1,098,580 | |
| | 23,275 | | | Preferred Bank | | | 1,144,897 | |
| | 14,462 | | | Progressive Corp. (The) | | | 1,130,205 | |
| | 70,755 | | | Regions Financial Corp. | | | 1,098,825 | |
| | 15,427 | | | State Street Corp. | | | 1,043,791 | |
| | 4,444 | | | SVB Financial Group(b) | | | 1,118,644 | |
| | 30,256 | | | Synovus Financial Corp. | | | 1,115,236 | |
| | 50,153 | | | TCF Financial Corp. | | | 1,109,886 | |
| | 31,165 | | | Union Bankshares Corp. | | | 1,137,523 | |
| | 6,083 | | | Willis Towers Watson PLC | | | 1,121,340 | |
| | 14,305 | | | Wintrust Financial Corp. | | | 1,090,041 | |
| | 23,085 | | | Zions Bancorp NA | | | 1,138,783 | |
| | | | | | | | |
| | | | | | | 36,621,362 | |
| | | | | | | | |
| | | | Health Care—15.6% | |
| | 36,380 | | | Acadia Healthcare Co., Inc.(b)(c) | | | 1,164,888 | |
| | 15,671 | | | ANI Pharmaceuticals, Inc.(b) | | | 1,112,327 | |
| | 392,111 | | | Antares Pharma, Inc.(b) | | | 1,054,779 | |
| | 4,792 | | | Becton, Dickinson and Co. | | | 1,153,626 | |
| | 7,957 | | | Bluebird Bio, Inc.(b) | | | 1,128,541 | |
| | 30,871 | | | Boston Scientific Corp.(b) | | | 1,145,931 | |
| | 41,827 | | | CareDx, Inc.(b) | | | 1,138,113 | |
| | 87,101 | | | ChemoCentryx, Inc.(b) | | | 1,155,830 | |
| | 20,566 | | | CVS Health Corp. | | | 1,118,379 | |
| | 105,406 | | | Flexion Therapeutics, Inc.(b)(c) | | | 1,117,304 | |
| | 58,224 | | | G1 Therapeutics, Inc.(b) | | | 1,245,994 | |
| | 9,433 | | | Galapagos NV ADR (Belgium)(b) | | | 1,084,795 | |
| | 17,428 | | | Gilead Sciences, Inc. | | | 1,133,517 | |
| | 4,778 | | | ICU Medical, Inc.(b) | | | 1,086,995 | |
| | 14,639 | | | Incyte Corp.(b) | | | 1,124,275 | |
| | 12,393 | | | Intercept Pharmaceuticals, Inc.(b)(c) | | | 1,068,029 | |
| | 294,619 | | | Ocular Therapeutix, Inc.(b)(c) | | | 1,104,821 | |
| | 17,906 | | | Quidel Corp.(b) | | | 1,144,910 | |
| | 50,720 | | | Ra Pharmaceuticals, Inc.(b) | | | 1,125,984 | |
See accompanying Notes to Financial Statements which are an integral part of the financial statements.
Invesco Raymond James SB-1 Equity ETF (RYJ)(continued)
April 30, 2019
| | | | | | | | |
Number
of Shares | | | | | Value | |
| | | | Common Stocks & Other Equity Interests
(continued) | |
| | | | Health Care (continued) | |
| | 21,399 | | | REGENXBIO, Inc.(b) | | $ | 1,078,510 | |
| | 13,304 | | | Sol-Gel Technologies Ltd. (Israel)(b) | | | 96,321 | |
| | 3,928 | | | Teleflex, Inc. | | | 1,124,115 | |
| | 4,748 | | | UnitedHealth Group, Inc. | | | 1,106,616 | |
| | 123,659 | | | Viking Therapeutics, Inc.(b)(c) | | | 968,250 | |
| | 54,792 | | | Voyager Therapeutics, Inc.(b) | | | 1,156,111 | |
| | | | | | | | |
| | | | | | | 26,938,961 | |
| | | | | | | | |
| | | | Industrials—11.3% | |
| | 17,882 | | | Alaska Air Group, Inc. | | | 1,106,896 | |
| | 17,753 | | | Axon Enterprise, Inc.(b) | | | 1,127,316 | |
| | 30,341 | | | Casella Waste Systems, Inc., Class A(b) | | | 1,132,326 | |
| | 54,924 | | | Construction Partners, Inc., Class A(b) | | | 719,504 | |
| | 62,366 | | | Covanta Holding Corp. | | | 1,126,954 | |
| | 77,354 | | | Evoqua Water Technologies Corp.(b) | | | 1,053,561 | |
| | 15,382 | | | Fastenal Co. | | | 1,085,200 | |
| | 82,947 | | | Foundation Building Materials, Inc.(b) | | | 1,127,250 | |
| | 62,474 | | | GMS, Inc.(b) | | | 1,100,792 | |
| | 8,694 | | | Kansas City Southern | | | 1,070,579 | |
| | 54,432 | | | Knoll, Inc. | | | 1,188,795 | |
| | 125,093 | | | Mesa Air Group, Inc.(b) | | | 1,143,350 | |
| | 18,338 | | | SkyWest, Inc. | | | 1,129,437 | |
| | 19,377 | | | Spirit Airlines, Inc.(b) | | | 1,053,721 | |
| | 66,235 | | | Steelcase, Inc., Class A | | | 1,145,203 | |
| | 6,068 | | | Union Pacific Corp. | | | 1,074,279 | |
| | 9,490 | | | United Parcel Service, Inc., Class B | | | 1,008,028 | |
| | 12,143 | | | Waste Connections, Inc. | | | 1,126,506 | |
| | | | | | | | |
| | | | | | | 19,519,697 | |
| | | | | | | | |
| | | | Information Technology—16.7% | |
| | 15,677 | | | Alarm.com Holdings, Inc.(b) | | | 1,111,186 | |
| | 12,883 | | | Arrow Electronics, Inc.(b) | | | 1,088,742 | |
| | 23,416 | | | Avnet, Inc. | | | 1,138,252 | |
| | 22,316 | | | Bottomline Technologies (DE), Inc.(b) | | | 1,128,520 | |
| | 83,331 | | | Carbon Black, Inc.(b) | | | 1,144,968 | |
| | 41,489 | | | CommScope Holding Co., Inc.(b) | | | 1,028,097 | |
| | 26,991 | | | EchoStar Corp., Class A(b) | | | 1,075,591 | |
| | 15,388 | | | Envestnet, Inc.(b) | | | 1,092,394 | |
| | 9,610 | | | Fidelity National Information Services, Inc. | | | 1,114,087 | |
| | 27,635 | | | GDS Holdings Ltd. ADR (China)(b)(c) | | | 1,081,358 | |
| | 240,157 | | | Internap Corp.(b)(c) | | | 946,219 | |
| | 6,108 | | | IPG Photonics Corp.(b) | | | 1,067,251 | |
| | 21,744 | | | Itron, Inc.(b) | | | 1,166,783 | |
| | 35,067 | | | Jabil, Inc. | | | 1,059,374 | |
| | 17,898 | | | Lumentum Holdings, Inc.(b) | | | 1,109,139 | |
| | 8,713 | | | Microsoft Corp. | | | 1,137,918 | |
| | 64,646 | | | MiX Telematics Ltd. ADR (South Africa) | | | 1,162,982 | |
| | 43,480 | | | nLight, Inc.(b) | | | 1,136,132 | |
| | 21,172 | | | Rapid7, Inc.(b) | | | 1,150,486 | |
| | 9,950 | | | RingCentral, Inc., Class A(b) | | | 1,157,882 | |
| | 6,792 | | | salesforce.com, Inc.(b) | | | 1,123,057 | |
| | 4,444 | | | ServiceNow, Inc.(b) | | | 1,206,590 | |
| | 16,584 | | | SS&C Technologies Holdings, Inc. | | | 1,122,073 | |
| | 100,028 | | | Switch, Inc., Class A(c) | | | 1,087,304 | |
| | 10,229 | | | SYNNEX Corp. | | | 1,103,505 | |
| | 9,569 | | | Worldpay, Inc., Class A(b) | | | 1,121,583 | |
| | | | | | | | |
| | | | | | | 28,861,473 | |
| | | | | | | | |
| | | | | | | | |
Number
of Shares | | | | | Value | |
| | | | Common Stocks & Other Equity Interests
(continued) | |
| | | | Real Estate—5.7% | |
| | 16,731 | | | Agree Realty Corp. REIT | | $ | 1,095,378 | |
| | 46,599 | | | CareTrust REIT, Inc. REIT | | | 1,130,026 | |
| | 21,349 | | | CBRE Group, Inc., Class A(b) | | | 1,111,642 | |
| | 19,242 | | | CyrusOne, Inc. REIT | | | 1,071,587 | |
| | 2,411 | | | Equinix, Inc. REIT | | | 1,096,282 | |
| | 44,948 | | | Invitation Homes, Inc. REIT | | | 1,117,407 | |
| | 65,432 | | | Landmark Infrastructure Partners LP(c) | | | 1,064,579 | |
| | 63,956 | | | Retail Opportunity Investments Corp. REIT | | | 1,122,428 | |
| | 41,860 | | | Weyerhaeuser Co. REIT | | | 1,121,848 | |
| | | | | | | | |
| | | | | | | 9,931,177 | |
| | | | | | | | |
| | | | Total Common Stocks & Other Equity Interests
(Cost $155,302,064) | | | 173,066,074 | |
| | | | | | | | |
| | |
| | | | | | | | |
| | | | Money Market Funds—0.1% | |
| | 106,382 | | | Invesco Premier U.S. Government Money Portfolio—Institutional Class, 2.32%(d)
(Cost $106,382) | | | 106,382 | |
| | | | | | | | |
| | |
| | | | Total Investments in Securities
(excluding investments purchased with cash collateral from securities on loan)
(Cost $155,408,446)—100.0% | | | 173,172,456 | |
| | | | | | | | |
| | |
| | | | | | | | |
| | | | Investments Purchased with Cash Collateral from
Securities on Loan | |
| | |
| | | | | | | | |
| | | | Money Market Funds—4.3% | |
| | 5,540,732 | | | Invesco Government & Agency Portfolio— Institutional Class 2.34%(d)(e) | | | 5,540,732 | |
| | 1,846,784 | | | Invesco Liquid Assets Portfolio—Institutional Class, 2.48%(d)(e) | | | 1,847,338 | |
| | | | | | | | |
| | |
| | | | Total Investments Purchased with Cash Collateral from Securities on Loan
(Cost $7,388,070) | | | 7,388,070 | |
| | | | | | | | |
| | |
| | | | Total Investments in Securities
(Cost $162,796,516)—104.3% | | | 180,560,526 | |
| | |
| | | | Other assets less liabilities—(4.3)% | | | (7,404,465 | ) |
| | | | | | | | |
| | |
| | | | Net Assets—100.0% | | $ | 173,156,061 | |
| | | | | | | | |
Abbreviations:
ADR—American Depositary Receipt
REIT—Real Estate Investment Trust
Notes to Schedule of Investments:
| (a) | Industry and/or sector classifications used in this report are generally according to the Global Industry Classification Standard, which was developed by and is the exclusive property and a service mark of MSCI Inc. and Standard & Poor’s. |
| (b) | Non-income producing security. |
| (c) | All or a portion of this security was out on loan at April 30, 2019. |
| (d) | The security and the Fund are advised bywholly-owned subsidiaries of Invesco Ltd. and are therefore considered to be affiliated. The rate shown is the7-day SEC standardized yield as of April 30, 2019. |
| (e) | The security has been segregated to satisfy the commitment to return the cash collateral received in securities lending transactions upon the borrower’s return of the securities loaned. See Note 2M. |
See accompanying Notes to Financial Statements which are an integral part of the financial statements.
Schedule of Investments(a)
Invesco S&P 500 BuyWrite ETF (PBP)
April 30, 2019
| | | | | | | | |
Number
of Shares | | | | | Value | |
| | | | Common Stocks & Other Equity Interests—102.0%(b) | |
| | | | Communication Services—10.5% | |
| | 10,176 | | | Activision Blizzard, Inc. | | $ | 490,585 | |
| | 3,988 | | | Alphabet, Inc., Class A(c) | | | 4,781,452 | |
| | 4,095 | | | Alphabet, Inc., Class C(c) | | | 4,866,826 | |
| | 97,048 | | | AT&T, Inc. | | | 3,004,606 | |
| | 4,632 | | | CBS Corp., Class B | | | 237,483 | |
| | 12,669 | | | CenturyLink, Inc. | | | 144,680 | |
| | 2,311 | | | Charter Communications, Inc., Class A(c) | | | 857,820 | |
| | 60,171 | | | Comcast Corp., Class A | | | 2,619,244 | |
| | 2,092 | | | Discovery, Inc., Class A(c) | | | 64,643 | |
| | 4,802 | | | Discovery, Inc., Class C(c) | | | 138,105 | |
| | 3,057 | | | DISH Network Corp., Class A(c) | | | 107,362 | |
| | 3,992 | | | Electronic Arts, Inc.(c) | | | 377,843 | |
| | 31,781 | | | Facebook, Inc., Class A(c) | | | 6,146,445 | |
| | 4,700 | | | Fox Corp., Class A(c) | | | 183,253 | |
| | 2,162 | | | Fox Corp., Class B(c) | | | 83,237 | |
| | 5,128 | | | Interpublic Group of Cos., Inc. (The) | | | 117,944 | |
| | 5,817 | | | Netflix, Inc.(c) | | | 2,155,431 | |
| | 5,133 | | | News Corp., Class A | | | 63,752 | |
| | 1,649 | | | News Corp., Class B | | | 20,596 | |
| | 2,980 | | | Omnicom Group, Inc. | | | 238,489 | |
| | 1,508 | | | Take-Two Interactive Software, Inc.(c) | | | 146,020 | |
| | 1,369 | | | TripAdvisor, Inc.(c) | | | 72,872 | |
| | 9,706 | | | Twitter, Inc.(c) | | | 387,366 | |
| | 55,048 | | | Verizon Communications, Inc. | | | 3,148,195 | |
| | 4,712 | | | Viacom, Inc., Class B | | | 136,224 | |
| | 23,264 | | | Walt Disney Co. (The) | | | 3,186,470 | |
| | | | | | | | |
| | | | | | | 33,776,943 | |
| | | | | | | | |
| | | | Consumer Discretionary—10.5% | |
| | 954 | | | Advance Auto Parts, Inc. | | | 158,669 | |
| | 5,497 | | | Amazon.com, Inc.(c) | | | 10,590,080 | |
| | 3,464 | | | Aptiv PLC | | | 296,865 | |
| | 333 | | | AutoZone, Inc.(c) | | | 342,427 | |
| | 3,119 | | | Best Buy Co., Inc. | | | 232,085 | |
| | 600 | | | Booking Holdings, Inc.(c) | | | 1,112,994 | |
| | 2,767 | | | BorgWarner, Inc. | | | 115,578 | |
| | 2,033 | | | Capri Holdings Ltd.(c) | | | 89,615 | |
| | 2,266 | | | CarMax, Inc.(c) | | | 176,431 | |
| | 5,335 | | | Carnival Corp. | | | 292,678 | |
| | 325 | | | Chipotle Mexican Grill, Inc.(c) | | | 223,613 | |
| | 4,527 | | | D.R. Horton, Inc. | | | 200,591 | |
| | 1,645 | | | Darden Restaurants, Inc. | | | 193,452 | |
| | 3,502 | | | Dollar General Corp. | | | 441,567 | |
| | 3,171 | | | Dollar Tree, Inc.(c) | | | 352,869 | |
| | 11,457 | | | eBay, Inc. | | | 443,959 | |
| | 1,558 | | | Expedia Group, Inc. | | | 202,291 | |
| | 1,504 | | | Foot Locker, Inc. | | | 86,044 | |
| | 52,060 | | | Ford Motor Co. | | | 544,027 | |
| | 2,845 | | | Gap, Inc. (The) | | | 74,198 | |
| | 1,616 | | | Garmin Ltd. | | | 138,556 | |
| | 17,464 | | | General Motors Co. | | | 680,223 | |
| | 1,944 | | | Genuine Parts Co. | | | 199,338 | |
| | 2,738 | | | H&R Block, Inc. | | | 74,501 | |
| | 4,815 | | | Hanesbrands, Inc. | | | 87,007 | |
| | 2,125 | | | Harley-Davidson, Inc. | | | 79,114 | |
| | 1,542 | | | Hasbro, Inc. | | | 157,068 | |
| | 3,902 | | | Hilton Worldwide Holdings, Inc. | | | 339,435 | |
| | 15,048 | | | Home Depot, Inc. (The) | | | 3,065,278 | |
| | | | | | | | |
Number
of Shares | | | | | Value | |
| | | | Common Stocks & Other Equity Interests
(continued) | |
| | | | Consumer Discretionary (continued) | |
| | 2,200 | | | Kohl’s Corp. | | $ | 156,420 | |
| | 3,042 | | | L Brands, Inc. | | | 77,997 | |
| | 1,746 | | | Leggett & Platt, Inc. | | | 68,722 | |
| | 3,810 | | | Lennar Corp., Class A | | | 198,234 | |
| | 4,194 | | | LKQ Corp.(c) | | | 126,239 | |
| | 10,671 | | | Lowe’s Cos., Inc. | | | 1,207,317 | |
| | 4,097 | | | Macy’s, Inc. | | | 96,443 | |
| | 3,756 | | | Marriott International, Inc., Class A | | | 512,393 | |
| | 4,602 | | | Mattel, Inc.(c) | | | 56,098 | |
| | 10,196 | | | McDonald’s Corp. | | | 2,014,424 | |
| | 6,796 | | | MGM Resorts International | | | 180,977 | |
| | 819 | | | Mohawk Industries, Inc.(c) | | | 111,589 | |
| | 5,182 | | | Newell Brands, Inc. | | | 74,517 | |
| | 16,770 | | | NIKE, Inc., Class B | | | 1,472,909 | |
| | 1,428 | | | Nordstrom, Inc. | | | 58,577 | |
| | 2,900 | | | Norwegian Cruise Line Holdings Ltd.(c) | | | 163,531 | |
| | 1,044 | | | O’Reilly Automotive, Inc.(c) | | | 395,227 | |
| | 3,397 | | | PulteGroup, Inc. | | | 106,870 | |
| | 1,009 | | | PVH Corp. | | | 130,151 | |
| | 703 | | | Ralph Lauren Corp. | | | 92,501 | |
| | 4,937 | | | Ross Stores, Inc. | | | 482,147 | |
| | 2,285 | | | Royal Caribbean Cruises Ltd. | | | 276,348 | |
| | 16,568 | | | Starbucks Corp. | | | 1,287,002 | |
| | 3,863 | | | Tapestry, Inc. | | | 124,659 | |
| | 6,952 | | | Target Corp. | | | 538,224 | |
| | 1,445 | | | Tiffany & Co. | | | 155,800 | |
| | 16,487 | | | TJX Cos., Inc. (The) | | | 904,807 | |
| | 1,616 | | | Tractor Supply Co. | | | 167,256 | |
| | 750 | | | Ulta Beauty, Inc.(c) | | | 261,735 | |
| | 2,501 | | | Under Armour, Inc., Class A(c) | | | 57,748 | |
| | 2,565 | | | Under Armour, Inc., Class C(c) | | | 53,147 | |
| | 4,321 | | | VF Corp. | | | 407,946 | |
| | 847 | | | Whirlpool Corp. | | | 117,580 | |
| | 1,290 | | | Wynn Resorts Ltd. | | | 186,340 | |
| | 4,082 | | | Yum! Brands, Inc. | | | 426,120 | |
| | | | | | | | |
| | | | | | | 33,738,548 | |
| | | | | | | | |
| | | | Consumer Staples—7.4% | |
| | 24,972 | | | Altria Group, Inc. | | | 1,356,729 | |
| | 7,462 | | | Archer-Daniels-Midland Co. | | | 332,805 | |
| | 2,215 | | | Brown-Forman Corp., Class B | | | 118,037 | |
| | 2,567 | | | Campbell Soup Co. | | | 99,317 | |
| | 3,276 | | | Church & Dwight Co., Inc. | | | 245,536 | |
| | 1,708 | | | Clorox Co. (The) | | | 272,819 | |
| | 51,262 | | | Coca-Cola Co. (The) | | | 2,514,914 | |
| | 11,480 | | | Colgate-Palmolive Co. | | | 835,629 | |
| | 6,470 | | | Conagra Brands, Inc. | | | 199,147 | |
| | 2,218 | | | Constellation Brands, Inc., Class A | | | 469,484 | |
| | 5,868 | | | Costco Wholesale Corp. | | | 1,440,770 | |
| | 6,005 | | | Coty, Inc., Class A | | | 64,974 | |
| | 2,908 | | | Estee Lauder Cos., Inc. (The), Class A | | | 499,623 | |
| | 7,950 | | | General Mills, Inc. | | | 409,187 | |
| | 1,852 | | | Hershey Co. (The) | | | 231,222 | |
| | 3,632 | | | Hormel Foods Corp. | | | 145,062 | |
| | 1,516 | | | JM Smucker Co. (The) | | | 185,907 | |
| | 3,345 | | | Kellogg Co. | | | 201,704 | |
| | 4,588 | | | Kimberly-Clark Corp. | | | 589,007 | |
See accompanying Notes to Financial Statements which are an integral part of the financial statements.
Invesco S&P 500 BuyWrite ETF (PBP)(continued)
April 30, 2019
| | | | | | | | |
Number
of Shares | | | | | Value | |
| | | | Common Stocks & Other Equity Interests
(continued) | |
| | | | Consumer Staples (continued) | |
| | 8,285 | | | Kraft Heinz Co. (The) | | $ | 275,393 | |
| | 10,628 | | | Kroger Co. (The) | | | 273,990 | |
| | 1,951 | | | Lamb Weston Holdings, Inc. | | | 136,668 | |
| | 1,633 | | | McCormick & Co., Inc. | | | 251,433 | |
| | 2,500 | | | Molson Coors Brewing Co., Class B | | | 160,475 | |
| | 19,240 | | | Mondelez International, Inc., Class A | | | 978,354 | |
| | 5,210 | | | Monster Beverage Corp.(c) | | | 310,516 | |
| | 18,713 | | | PepsiCo, Inc. | | | 2,396,200 | |
| | 20,710 | | | Philip Morris International, Inc. | | | 1,792,658 | |
| | 33,327 | | | Procter & Gamble Co. (The) | | | 3,548,659 | |
| | 6,293 | | | Sysco Corp. | | | 442,838 | |
| | 3,933 | | | Tyson Foods, Inc., Class A | | | 295,014 | |
| | 10,683 | | | Walgreens Boots Alliance, Inc. | | | 572,288 | |
| | 18,965 | | | Walmart, Inc. | | | 1,950,361 | |
| | | | | | | | |
| | | | | | | 23,596,720 | |
| | | | | | | | |
| | | | Energy—5.3% | |
| | 6,656 | | | Anadarko Petroleum Corp. | | | 484,890 | |
| | 5,001 | | | Apache Corp. | | | 164,583 | |
| | 6,840 | | | Baker Hughes a GE Co. | | | 164,297 | |
| | 5,640 | | | Cabot Oil & Gas Corp. | | | 146,020 | |
| | 25,314 | | | Chevron Corp. | | | 3,039,199 | |
| | 1,352 | | | Cimarex Energy Co. | | | 92,828 | |
| | 2,672 | | | Concho Resources, Inc. | | | 308,295 | |
| | 15,113 | | | ConocoPhillips | | | 953,933 | |
| | 5,839 | | | Devon Energy Corp. | | | 187,666 | |
| | 2,059 | | | Diamondback Energy, Inc. | | | 219,057 | |
| | 7,728 | | | EOG Resources, Inc. | | | 742,274 | |
| | 56,447 | | | Exxon Mobil Corp. | | | 4,531,565 | |
| | 11,625 | | | Halliburton Co. | | | 329,336 | |
| | 1,458 | | | Helmerich & Payne, Inc. | | | 85,322 | |
| | 3,391 | | | Hess Corp. | | | 217,431 | |
| | 2,093 | | | HollyFrontier Corp. | | | 99,899 | |
| | 25,936 | | | Kinder Morgan, Inc. | | | 515,348 | |
| | 10,905 | | | Marathon Oil Corp. | | | 185,821 | |
| | 8,975 | | | Marathon Petroleum Corp. | | | 546,308 | |
| | 5,108 | | | National Oilwell Varco, Inc. | | | 133,523 | |
| | 6,443 | | | Noble Energy, Inc. | | | 174,348 | |
| | 9,986 | | | Occidental Petroleum Corp. | | | 587,976 | |
| | 5,483 | | | ONEOK, Inc. | | | 372,460 | |
| | 5,589 | | | Phillips 66 | | | 526,875 | |
| | 2,243 | | | Pioneer Natural Resources Co. | | | 373,370 | |
| | 18,465 | | | Schlumberger Ltd. | | | 788,086 | |
| | 5,668 | | | TechnipFMC PLC (United Kingdom) | | | 139,376 | |
| | 5,564 | | | Valero Energy Corp. | | | 504,432 | |
| | 16,133 | | | Williams Cos., Inc. (The) | | | 457,048 | |
| | | | | | | | |
| | | | | | | 17,071,566 | |
| | | | | | | | |
| | | | Financials—13.6% | |
| | 694 | | | Affiliated Managers Group, Inc. | | | 76,978 | |
| | 9,997 | | | Aflac, Inc. | | | 503,649 | |
| | 4,423 | | | Allstate Corp. (The) | | | 438,142 | |
| | 9,213 | | | American Express Co. | | | 1,080,040 | |
| | 11,584 | | | American International Group, Inc. | | | 551,051 | |
| | 1,805 | | | Ameriprise Financial, Inc. | | | 264,920 | |
| | 3,197 | | | Aon PLC | | | 575,908 | |
| | 2,452 | | | Arthur J. Gallagher & Co. | | | 205,036 | |
| | | | | | | | |
Number
of Shares | | | | | Value | |
| | | | Common Stocks & Other Equity Interests
(continued) | |
| | | | Financials (continued) | |
| | 822 | | | Assurant, Inc. | | $ | 78,090 | |
| | 119,671 | | | Bank of America Corp. | | | 3,659,539 | |
| | 11,703 | | | Bank of New York Mellon Corp. (The) | | | 581,171 | |
| | 10,174 | | | BB&T Corp. | | | 520,909 | |
| | 25,906 | | | Berkshire Hathaway, Inc., Class B(c) | | | 5,614,089 | |
| | 1,621 | | | BlackRock, Inc. | | | 786,574 | |
| | 6,233 | | | Capital One Financial Corp. | | | 578,609 | |
| | 1,494 | | | Cboe Global Markets, Inc. | | | 151,805 | |
| | 15,804 | | | Charles Schwab Corp. (The) | | | 723,507 | |
| | 6,107 | | | Chubb Ltd. | | | 886,736 | |
| | 2,019 | | | Cincinnati Financial Corp. | | | 194,187 | |
| | 31,328 | | | Citigroup, Inc. | | | 2,214,890 | |
| | 6,133 | | | Citizens Financial Group, Inc. | | | 222,015 | |
| | 4,766 | | | CME Group, Inc. | | | 852,637 | |
| | 2,118 | | | Comerica, Inc. | | | 166,454 | |
| | 4,375 | | | Discover Financial Services | | | 356,519 | |
| | 3,281 | | | E*TRADE Financial Corp. | | | 166,215 | |
| | 542 | | | Everest Re Group Ltd. | | | 127,641 | |
| | 10,255 | | | Fifth Third Bancorp | | | 295,549 | |
| | 2,195 | | | First Republic Bank | | | 231,836 | |
| | 3,937 | | | Franklin Resources, Inc. | | | 136,181 | |
| | 4,563 | | | Goldman Sachs Group, Inc. (The) | | | 939,613 | |
| | 4,789 | | | Hartford Financial Services Group, Inc. (The) | | | 250,513 | |
| | 13,946 | | | Huntington Bancshares, Inc. | | | 194,128 | |
| | 7,574 | | | Intercontinental Exchange, Inc. | | | 616,145 | |
| | 5,290 | | | Invesco Ltd.(d) | | | 116,221 | |
| | 3,503 | | | Jefferies Financial Group, Inc. | | | 72,057 | |
| | 43,621 | | | JPMorgan Chase & Co. | | | 5,062,217 | |
| | 13,440 | | | KeyCorp | | | 235,872 | |
| | 2,722 | | | Lincoln National Corp. | | | 181,612 | |
| | 3,650 | | | Loews Corp. | | | 187,209 | |
| | 1,845 | | | M&T Bank Corp. | | | 313,779 | |
| | 6,729 | | | Marsh & McLennan Cos., Inc. | | | 634,477 | |
| | 12,753 | | | MetLife, Inc. | | | 588,296 | |
| | 2,213 | | | Moody’s Corp. | | | 435,120 | |
| | 17,302 | | | Morgan Stanley | | | 834,822 | |
| | 1,123 | | | MSCI, Inc. | | | 253,102 | |
| | 1,543 | | | Nasdaq, Inc. | | | 142,265 | |
| | 2,910 | | | Northern Trust Corp. | | | 286,781 | |
| | 5,239 | | | People’s United Financial, Inc. | | | 90,582 | |
| | 6,043 | | | PNC Financial Services Group, Inc. (The) | | | 827,468 | |
| | 3,448 | | | Principal Financial Group, Inc. | | | 197,088 | |
| | 7,779 | | | Progressive Corp. (The) | | | 607,929 | |
| | 5,449 | | | Prudential Financial, Inc. | | | 576,014 | |
| | 1,692 | | | Raymond James Financial, Inc. | | | 154,936 | |
| | 13,559 | | | Regions Financial Corp. | | | 210,571 | |
| | 3,312 | | | S&P Global, Inc. | | | 730,826 | |
| | 5,044 | | | State Street Corp. | | | 341,277 | |
| | 5,905 | | | SunTrust Banks, Inc. | | | 386,659 | |
| | 701 | | | SVB Financial Group(c) | | | 176,456 | |
| | 8,701 | | | Synchrony Financial | | | 301,664 | |
| | 3,148 | | | T. Rowe Price Group, Inc. | | | 338,410 | |
| | 1,351 | | | Torchmark Corp. | | | 118,429 | |
| | 3,509 | | | Travelers Cos., Inc. (The) | | | 504,419 | |
| | 2,859 | | | Unum Group | | | 105,554 | |
| | 20,045 | | | US Bancorp | | | 1,068,799 | |
See accompanying Notes to Financial Statements which are an integral part of the financial statements.
Invesco S&P 500 BuyWrite ETF (PBP)(continued)
April 30, 2019
| | | | | | | | |
Number
of Shares | | | | | Value | |
| | | | Common Stocks & Other Equity Interests
(continued) | |
| | | | Financials (continued) | |
| | 54,549 | | | Wells Fargo & Co. | | $ | 2,640,717 | |
| | 1,720 | | | Willis Towers Watson PLC | | | 317,065 | |
| | 2,480 | | | Zions Bancorp NA | | | 122,338 | |
| | | | | | | | |
| | | | | | | 43,402,307 | |
| | | | | | | | |
| | | | Health Care—13.9% | |
| | 23,399 | | | Abbott Laboratories | | | 1,861,624 | |
| | 19,652 | | | AbbVie, Inc. | | | 1,560,172 | |
| | 601 | | | ABIOMED, Inc.(c) | | | 166,723 | |
| | 4,231 | | | Agilent Technologies, Inc. | | | 332,134 | |
| | 2,977 | | | Alexion Pharmaceuticals, Inc.(c) | | | 405,259 | |
| | 970 | | | Align Technology, Inc.(c) | | | 314,940 | |
| | 4,166 | | | Allergan PLC | | | 612,402 | |
| | 2,081 | | | AmerisourceBergen Corp. | | | 155,576 | |
| | 8,290 | | | Amgen, Inc. | | | 1,486,563 | |
| | 3,424 | | | Anthem, Inc. | | | 900,615 | |
| | 6,351 | | | Baxter International, Inc. | | | 484,581 | |
| | 3,584 | | | Becton, Dickinson and Co. | | | 862,812 | |
| | 2,621 | | | Biogen, Inc.(c) | | | 600,838 | |
| | 18,465 | | | Boston Scientific Corp.(c) | | | 685,421 | |
| | 21,751 | | | Bristol-Myers Squibb Co. | | | 1,009,899 | |
| | 3,971 | | | Cardinal Health, Inc. | | | 193,427 | |
| | 9,357 | | | Celgene Corp.(c) | | | 885,734 | |
| | 5,504 | | | Centene Corp.(c) | | | 283,786 | |
| | 4,321 | | | Cerner Corp.(c) | | | 287,130 | |
| | 5,064 | | | Cigna Corp. | | | 804,366 | |
| | 657 | | | Cooper Cos., Inc. (The) | | | 190,477 | |
| | 17,281 | | | CVS Health Corp. | | | 939,741 | |
| | 8,371 | | | Danaher Corp. | | | 1,108,655 | |
| | 1,684 | | | DaVita, Inc.(c) | | | 93,024 | |
| | 2,965 | | | DENTSPLY SIRONA, Inc. | | | 151,600 | |
| | 2,768 | | | Edwards Lifesciences Corp.(c) | | | 487,362 | |
| | 11,506 | | | Eli Lilly & Co. | | | 1,346,662 | |
| | 16,993 | | | Gilead Sciences, Inc. | | | 1,105,225 | |
| | 3,558 | | | HCA Healthcare, Inc. | | | 452,684 | |
| | 2,017 | | | Henry Schein, Inc.(c) | | | 129,209 | |
| | 3,567 | | | Hologic, Inc.(c) | | | 165,438 | |
| | 1,806 | | | Humana, Inc. | | | 461,271 | |
| | 1,146 | | | IDEXX Laboratories, Inc.(c) | | | 265,872 | |
| | 1,958 | | | Illumina, Inc.(c) | | | 610,896 | |
| | 2,367 | | | Incyte Corp.(c) | | | 181,786 | |
| | 1,526 | | | Intuitive Surgical, Inc.(c) | | | 779,221 | |
| | 2,108 | | | IQVIA Holdings, Inc.(c) | | | 292,801 | |
| | 35,479 | | | Johnson & Johnson | | | 5,009,635 | |
| | 1,313 | | | Laboratory Corp. of America Holdings(c) | | | 209,975 | |
| | 2,556 | | | McKesson Corp. | | | 304,803 | |
| | 17,867 | | | Medtronic PLC | | | 1,586,768 | |
| | 34,389 | | | Merck & Co., Inc. | | | 2,706,758 | |
| | 331 | | | Mettler-Toledo International, Inc.(c) | | | 246,681 | |
| | 6,869 | | | Mylan NV(c) | | | 185,394 | |
| | 2,319 | | | Nektar Therapeutics(c) | | | 74,254 | |
| | 1,476 | | | PerkinElmer, Inc. | | | 141,460 | |
| | 1,665 | | | Perrigo Co. PLC | | | 79,787 | |
| | 73,964 | | | Pfizer, Inc. | | | 3,003,678 | |
| | 1,789 | | | Quest Diagnostics, Inc. | | | 172,424 | |
| | 1,044 | | | Regeneron Pharmaceuticals, Inc.(c) | | | 358,238 | |
| | 1,909 | | | ResMed, Inc. | | | 199,510 | |
| | | | | | | | |
Number
of Shares | | | | | Value | |
| | | | Common Stocks & Other Equity Interests
(continued) | |
| | | | Health Care (continued) | |
| | 4,121 | | | Stryker Corp. | | $ | 778,498 | |
| | 613 | | | Teleflex, Inc. | | | 175,428 | |
| | 5,363 | | | Thermo Fisher Scientific, Inc. | | | 1,487,964 | |
| | 12,783 | | | UnitedHealth Group, Inc. | | | 2,979,334 | |
| | 1,113 | | | Universal Health Services, Inc., Class B | | | 141,206 | |
| | 1,209 | | | Varian Medical Systems, Inc.(c) | | | 164,630 | |
| | 3,406 | | | Vertex Pharmaceuticals, Inc.(c) | | | 575,546 | |
| | 952 | | | Waters Corp.(c) | | | 203,290 | |
| | 666 | | | WellCare Health Plans, Inc.(c) | | | 172,061 | |
| | 2,724 | | | Zimmer Biomet Holdings, Inc. | | | 335,488 | |
| | 6,378 | | | Zoetis, Inc. | | | 649,536 | |
| | | | | | | | |
| | | | | | | 44,598,272 | |
| | | | | | | | |
| | | | Industrials—9.7% | |
| | 7,671 | | | 3M Co. | | | 1,453,731 | |
| | 1,889 | | | A.O. Smith Corp. | | | 99,305 | |
| | 1,640 | | | Alaska Air Group, Inc. | | | 101,516 | |
| | 1,259 | | | Allegion PLC | | | 124,931 | |
| | 5,324 | | | American Airlines Group, Inc. | | | 181,974 | |
| | 3,026 | | | AMETEK, Inc. | | | 266,802 | |
| | 5,372 | | | Arconic, Inc. | | | 115,391 | |
| | 7,000 | | | Boeing Co. (The) | | | 2,643,830 | |
| | 1,823 | | | C.H. Robinson Worldwide, Inc. | | | 147,663 | |
| | 7,667 | | | Caterpillar, Inc. | | | 1,068,933 | |
| | 1,128 | | | Cintas Corp. | | | 244,934 | |
| | 2,675 | | | Copart, Inc.(c) | | | 180,081 | |
| | 10,323 | | | CSX Corp. | | | 822,020 | |
| | 1,928 | | | Cummins, Inc. | | | 320,607 | |
| | 4,244 | | | Deere & Co. | | | 702,934 | |
| | 8,231 | | | Delta Air Lines, Inc. | | | 479,785 | |
| | 1,931 | | | Dover Corp. | | | 189,315 | |
| | 5,643 | | | Eaton Corp. PLC | | | 467,353 | |
| | 8,188 | | | Emerson Electric Co. | | | 581,266 | |
| | 1,608 | | | Equifax, Inc. | | | 202,528 | |
| | 2,287 | | | Expeditors International of Washington, Inc. | | | 181,634 | |
| | 3,812 | | | Fastenal Co. | | | 268,937 | |
| | 3,199 | | | FedEx Corp. | | | 606,083 | |
| | 1,745 | | | Flowserve Corp. | | | 85,557 | |
| | 1,859 | | | Fluor Corp. | | | 73,858 | |
| | 3,923 | | | Fortive Corp. | | | 338,712 | |
| | 1,873 | | | Fortune Brands Home & Security, Inc. | | | 98,857 | |
| | 3,610 | | | General Dynamics Corp. | | | 645,179 | |
| | 115,973 | | | General Electric Co. | | | 1,179,445 | |
| | 1,571 | | | Harris Corp. | | | 264,714 | |
| | 9,714 | | | Honeywell International, Inc. | | | 1,686,642 | |
| | 553 | | | Huntington Ingalls Industries, Inc. | | | 123,087 | |
| | 4,842 | | | IHS Markit Ltd.(c) | | | 277,253 | |
| | 4,021 | | | Illinois Tool Works, Inc. | | | 625,788 | |
| | 3,226 | | | Ingersoll-Rand PLC | | | 395,540 | |
| | 1,159 | | | J.B. Hunt Transport Services, Inc. | | | 109,502 | |
| | 1,561 | | | Jacobs Engineering Group, Inc. | | | 121,664 | |
| | 12,159 | | | Johnson Controls International PLC | | | 455,963 | |
| | 1,345 | | | Kansas City Southern | | | 165,623 | |
| | 1,057 | | | L3 Technologies, Inc. | | | 231,039 | |
| | 3,275 | | | Lockheed Martin Corp. | | | 1,091,656 | |
| | 3,923 | | | Masco Corp. | | | 153,232 | |
| | 4,735 | | | Nielsen Holdings PLC | | | 120,885 | |
See accompanying Notes to Financial Statements which are an integral part of the financial statements.
Invesco S&P 500 BuyWrite ETF (PBP)(continued)
April 30, 2019
| | | | | | | | |
Number
of Shares | | | | | Value | |
| | | | Common Stocks & Other Equity Interests
(continued) | |
| | | | Industrials (continued) | |
| | 3,563 | | | Norfolk Southern Corp. | | $ | 726,923 | |
| | 2,261 | | | Northrop Grumman Corp. | | | 655,487 | |
| | 4,619 | | | PACCAR, Inc. | | | 331,044 | |
| | 1,724 | | | Parker-Hannifin Corp. | | | 312,182 | |
| | 2,100 | | | Pentair PLC | | | 81,879 | |
| | 1,884 | | | Quanta Services, Inc. | | | 76,490 | |
| | 3,760 | | | Raytheon Co. | | | 667,738 | |
| | 2,871 | | | Republic Services, Inc. | | | 237,776 | |
| | 1,586 | | | Robert Half International, Inc. | | | 98,475 | |
| | 1,592 | | | Rockwell Automation, Inc. | | | 287,690 | |
| | 1,964 | | | Rollins, Inc. | | | 75,948 | |
| | 1,380 | | | Roper Technologies, Inc. | | | 496,386 | |
| | 741 | | | Snap-on, Inc. | | | 124,695 | |
| | 6,627 | | | Southwest Airlines Co. | | | 359,382 | |
| | 2,016 | | | Stanley Black & Decker, Inc. | | | 295,546 | |
| | 3,126 | | | Textron, Inc. | | | 165,678 | |
| | 648 | | | TransDigm Group, Inc.(c) | | | 312,673 | |
| | 9,631 | | | Union Pacific Corp. | | | 1,705,072 | |
| | 2,985 | | | United Continental Holdings, Inc.(c) | | | 265,247 | |
| | 9,272 | | | United Parcel Service, Inc., Class B | | | 984,872 | |
| | 1,061 | | | United Rentals, Inc.(c) | | | 149,516 | |
| | 10,800 | | | United Technologies Corp. | | | 1,540,188 | |
| | 2,178 | | | Verisk Analytics, Inc. | | | 307,403 | |
| | 601 | | | W.W. Grainger, Inc. | | | 169,482 | |
| | 1,860 | | | Wabtec Corp. | | | 137,770 | |
| | 5,194 | | | Waste Management, Inc. | | | 557,524 | |
| | 2,392 | | | Xylem, Inc. | | | 199,493 | |
| | | | | | | | |
| | | | | | | 31,018,308 | |
| | | | | | | | |
| | | | Information Technology—22.1% | |
| | 8,492 | | �� | Accenture PLC, Class A | | | 1,551,234 | |
| | 6,497 | | | Adobe, Inc.(c) | | | 1,879,257 | |
| | 11,737 | | | Advanced Micro Devices, Inc.(c) | | | 324,293 | |
| | 2,175 | | | Akamai Technologies, Inc.(c) | | | 174,131 | |
| | 608 | | | Alliance Data Systems Corp. | | | 97,341 | |
| | 3,972 | | | Amphenol Corp., Class A | | | 395,452 | |
| | 4,907 | | | Analog Devices, Inc. | | | 570,390 | |
| | 1,116 | | | ANSYS, Inc.(c) | | | 218,513 | |
| | 59,678 | | | Apple, Inc. | | | 11,975,584 | |
| | 12,648 | | | Applied Materials, Inc. | | | 557,397 | |
| | 697 | | | Arista Networks, Inc.(c) | | | 217,666 | |
| | 2,918 | | | Autodesk, Inc.(c) | | | 520,017 | |
| | 5,804 | | | Automatic Data Processing, Inc. | | | 954,120 | |
| | 5,277 | | | Broadcom, Inc. | | | 1,680,197 | |
| | 1,541 | | | Broadridge Financial Solutions, Inc. | | | 182,038 | |
| | 3,735 | | | Cadence Design Systems, Inc.(c) | | | 259,134 | |
| | 58,646 | | | Cisco Systems, Inc. | | | 3,281,244 | |
| | 1,667 | | | Citrix Systems, Inc. | | | 168,300 | |
| | 7,662 | | | Cognizant Technology Solutions Corp., Class A | | | 559,020 | |
| | 10,482 | | | Corning, Inc. | | | 333,852 | |
| | 3,574 | | | DXC Technology Co. | | | 234,955 | |
| | 792 | | | F5 Networks, Inc.(c) | | | 124,265 | |
| | 4,302 | | | Fidelity National Information Services, Inc. | | | 498,731 | |
| | 5,217 | | | Fiserv, Inc.(c) | | | 455,131 | |
| | 1,144 | | | FleetCor Technologies, Inc.(c) | | | 298,527 | |
| | 1,805 | | | FLIR Systems, Inc. | | | 95,557 | |
| | 1,932 | | | Fortinet, Inc.(c) | | | 180,487 | |
| | | | | | | | |
Number
of Shares | | | | | Value | |
| | | | Common Stocks & Other Equity Interests
(continued) | |
| | | | Information Technology (continued) | |
| | 1,195 | | | Gartner, Inc.(c) | | $ | 189,969 | |
| | 2,100 | | | Global Payments, Inc. | | | 306,747 | |
| | 18,344 | | | Hewlett Packard Enterprise Co. | | | 290,019 | |
| | 20,430 | | | HP, Inc. | | | 407,579 | |
| | 59,911 | | | Intel Corp. | | | 3,057,857 | |
| | 11,855 | | | International Business Machines Corp. | | | 1,662,901 | |
| | 3,452 | | | Intuit, Inc. | | | 866,659 | |
| | 473 | | | IPG Photonics Corp.(c) | | | 82,647 | |
| | 1,028 | | | Jack Henry & Associates, Inc. | | | 153,234 | |
| | 4,635 | | | Juniper Networks, Inc. | | | 128,714 | |
| | 2,501 | | | Keysight Technologies, Inc.(c) | | | 217,662 | |
| | 2,201 | | | KLA-Tencor Corp. | | | 280,583 | |
| | 2,033 | | | Lam Research Corp. | | | 421,705 | |
| | 12,026 | | | Mastercard, Inc., Class A | | | 3,057,490 | |
| | 3,642 | | | Maxim Integrated Products, Inc. | | | 218,520 | |
| | 3,157 | | | Microchip Technology, Inc. | | | 315,353 | |
| | 14,935 | | | Micron Technology, Inc.(c) | | | 628,166 | |
| | 102,212 | | | Microsoft Corp. | | | 13,348,887 | |
| | 2,183 | | | Motorola Solutions, Inc. | | | 316,339 | |
| | 3,290 | | | NetApp, Inc. | | | 239,677 | |
| | 8,074 | | | NVIDIA Corp. | | | 1,461,394 | |
| | 33,948 | | | Oracle Corp. | | | 1,878,343 | |
| | 4,258 | | | Paychex, Inc. | | | 358,992 | |
| | 15,630 | | | PayPal Holdings, Inc.(c) | | | 1,762,595 | |
| | 1,636 | | | Qorvo, Inc.(c) | | | 123,698 | |
| | 16,124 | | | QUALCOMM, Inc. | | | 1,388,760 | |
| | 2,355 | | | Red Hat, Inc.(c) | | | 429,858 | |
| | 10,192 | | | salesforce.com, Inc.(c) | | | 1,685,247 | |
| | 3,415 | | | Seagate Technology PLC | | | 165,013 | |
| | 2,319 | | | Skyworks Solutions, Inc. | | | 204,489 | |
| | 8,515 | | | Symantec Corp. | | | 206,148 | |
| | 1,994 | | | Synopsys, Inc.(c) | | | 241,434 | |
| | 4,515 | | | TE Connectivity Ltd. | | | 431,860 | |
| | 12,503 | | | Texas Instruments, Inc. | | | 1,473,228 | |
| | 2,169 | | | Total System Services, Inc. | | | 221,759 | |
| | 1,403 | | | VeriSign, Inc.(c) | | | 277,022 | |
| | 23,317 | | | Visa, Inc., Class A | | | 3,834,014 | |
| | 3,875 | | | Western Digital Corp. | | | 198,090 | |
| | 5,807 | | | Western Union Co. (The) | | | 112,888 | |
| | 2,662 | | | Xerox Corp. | | | 88,804 | |
| | 3,373 | | | Xilinx, Inc. | | | 405,232 | |
| | | | | | | | |
| | | | | | | 70,926,409 | |
| | | | | | | | |
| | | | Materials—2.7% | |
| | 2,926 | | | Air Products & Chemicals, Inc. | | | 602,141 | |
| | 1,408 | | | Albemarle Corp. | | | 105,684 | |
| | 1,119 | | | Avery Dennison Corp. | | | 123,817 | |
| | 4,454 | | | Ball Corp. | | | 266,973 | |
| | 1,707 | | | Celanese Corp. | | | 184,168 | |
| | 2,970 | | | CF Industries Holdings, Inc. | | | 132,997 | |
| | 10,013 | | | Dow, Inc.(c) | | | 568,037 | |
| | 30,039 | | | DowDuPont, Inc. | | | 1,155,000 | |
| | 1,862 | | | Eastman Chemical Co. | | | 146,875 | |
| | 3,375 | | | Ecolab, Inc. | | | 621,270 | |
| | 1,794 | | | FMC Corp. | | | 141,834 | |
| | 19,305 | | | Freeport-McMoRan, Inc. | | | 237,645 | |
| | 1,350 | | | International Flavors & Fragrances, Inc. | | | 186,016 | |
See accompanying Notes to Financial Statements which are an integral part of the financial statements.
Invesco S&P 500 BuyWrite ETF (PBP)(continued)
April 30, 2019
| | | | | | | | |
Number
of Shares | | | | | Value | |
| | | | Common Stocks & Other Equity Interests
(continued) | |
| | | | Materials (continued) | |
| | 5,333 | | | International Paper Co. | | $ | 249,638 | |
| | 7,342 | | | Linde PLC (United Kingdom) | | | 1,323,469 | |
| | 4,055 | | | LyondellBasell Industries NV, Class A | | | 357,773 | |
| | 832 | | | Martin Marietta Materials, Inc. | | | 184,621 | |
| | 4,725 | | | Mosaic Co. (The) | | | 123,370 | |
| | 10,888 | | | Newmont Goldcorp Corp. | | | 338,181 | |
| | 4,069 | | | Nucor Corp. | | | 232,218 | |
| | 1,259 | | | Packaging Corp. of America | | | 124,842 | |
| | 3,142 | | | PPG Industries, Inc. | | | 369,185 | |
| | 2,074 | | | Sealed Air Corp. | | | 96,690 | |
| | 1,087 | | | Sherwin-Williams Co. (The) | | | 494,400 | |
| | 1,756 | | | Vulcan Materials Co. | | | 221,449 | |
| | 3,402 | | | WestRock Co. | | | 130,569 | |
| | | | | | | | |
| | | | | | | 8,718,862 | |
| | | | | | | | |
| | | | Real Estate—3.0% | |
| | 1,501 | | | Alexandria Real Estate Equities, Inc. REIT | | | 213,727 | |
| | 5,877 | | | American Tower Corp. REIT | | | 1,147,778 | |
| | 2,071 | | | Apartment Investment & Management Co., Class A REIT | | | 102,225 | |
| | 1,845 | | | AvalonBay Communities, Inc. REIT | | | 370,716 | |
| | 2,059 | | | Boston Properties, Inc. REIT | | | 283,360 | |
| | 4,161 | | | CBRE Group, Inc., Class A(c) | | | 216,663 | |
| | 5,537 | | | Crown Castle International Corp. REIT | | | 696,444 | |
| | 2,768 | | | Digital Realty Trust, Inc. REIT | | | 325,821 | |
| | 4,786 | | | Duke Realty Corp. REIT | | | 148,940 | |
| | 1,110 | | | Equinix, Inc. REIT | | | 504,717 | |
| | 4,928 | | | Equity Residential REIT | | | 376,598 | |
| | 876 | | | Essex Property Trust, Inc. REIT | | | 247,470 | |
| | 1,696 | | | Extra Space Storage, Inc. REIT | | | 175,858 | |
| | 991 | | | Federal Realty Investment Trust REIT | | | 132,645 | |
| | 6,365 | | | HCP, Inc. REIT | | | 189,550 | |
| | 9,865 | | | Host Hotels & Resorts, Inc. REIT | | | 189,803 | |
| | 3,815 | | | Iron Mountain, Inc. REIT | | | 123,911 | |
| | 5,614 | | | Kimco Realty Corp. REIT | | | 97,628 | |
| | 1,410 | | | Macerich Co. (The) REIT | | | 56,597 | |
| | 1,518 | | | Mid-America Apartment Communities, Inc. REIT | | | 166,084 | |
| | 8,398 | | | Prologis, Inc. REIT | | | 643,875 | |
| | 1,999 | | | Public Storage REIT | | | 442,139 | |
| | 4,047 | | | Realty Income Corp. REIT | | | 283,331 | |
| | 2,231 | | | Regency Centers Corp. REIT | | | 149,856 | |
| | 1,499 | | | SBA Communications Corp. REIT(c) | | | 305,391 | |
| | 4,116 | | | Simon Property Group, Inc. REIT | | | 714,949 | |
| | 1,115 | | | SL Green Realty Corp. REIT | | | 98,499 | |
| | 3,672 | | | UDR, Inc. REIT | | | 165,056 | |
| | 4,745 | | | Ventas, Inc. REIT | | | 289,967 | |
| | 2,310 | | | Vornado Realty Trust REIT | | | 159,713 | |
| | 5,148 | | | Welltower, Inc. REIT | | | 383,681 | |
| | 9,945 | | | Weyerhaeuser Co. REIT | | | 266,526 | |
| | | | | | | | |
| | | | | | | 9,669,518 | |
| | | | | | | | |
| | | | Utilities—3.3% | |
| | 8,824 | | | AES Corp. | | | 151,067 | |
| | 3,146 | | | Alliant Energy Corp. | | | 148,586 | |
| | 3,259 | | | Ameren Corp. | | | 237,157 | |
| | 6,572 | | | American Electric Power Co., Inc. | | | 562,235 | |
| | | | | | | | |
Number
of Shares | | | | | Value | |
| | | | Common Stocks & Other Equity Interests
(continued) | |
| | | | Utilities (continued) | |
| | 2,408 | | | American Water Works Co., Inc. | | $ | 260,522 | |
| | 1,557 | | | Atmos Energy Corp. | | | 159,343 | |
| | 6,677 | | | CenterPoint Energy, Inc. | | | 206,987 | |
| | 3,775 | | | CMS Energy Corp. | | | 209,701 | |
| | 4,278 | | | Consolidated Edison, Inc. | | | 368,593 | |
| | 10,649 | | | Dominion Energy, Inc. | | | 829,238 | |
| | 2,424 | | | DTE Energy Co. | | | 304,721 | |
| | 9,685 | | | Duke Energy Corp. | | | 882,497 | |
| | 4,341 | | | Edison International | | | 276,826 | |
| | 2,526 | | | Entergy Corp. | | | 244,769 | |
| | 3,392 | | | Evergy, Inc. | | | 196,125 | |
| | 4,223 | | | Eversource Energy | | | 302,620 | |
| | 12,920 | | | Exelon Corp. | | | 658,274 | |
| | 6,710 | | | FirstEnergy Corp. | | | 282,021 | |
| | 6,370 | | | NextEra Energy, Inc. | | | 1,238,583 | |
| | 4,962 | | | NiSource, Inc. | | | 137,844 | |
| | 3,743 | | | NRG Energy, Inc. | | | 154,099 | |
| | 1,494 | | | Pinnacle West Capital Corp. | | | 142,333 | |
| | 9,604 | | | PPL Corp. | | | 299,741 | |
| | 6,734 | | | Public Service Enterprise Group, Inc. | | | 401,683 | |
| | 3,651 | | | Sempra Energy | | | 467,146 | |
| | 13,783 | | | Southern Co. (The) | | | 733,531 | |
| | 4,202 | | | WEC Energy Group, Inc. | | | 329,563 | |
| | 6,850 | | | Xcel Energy, Inc. | | | 387,025 | |
| | | | | | | | |
| | | | | | | 10,572,830 | |
| | | | | | | | |
| | |
| | | | Total Investments in Securities
(Cost $257,093,108)—102.0% | | | 327,090,283 | |
| | |
| | | | Other assets less liabilities—(2.0)% | | | (6,312,612 | ) |
| | | | | | | | |
| | |
| | | | Net Assets—100.0% | | $ | 320,777,671 | |
| | | | | | | | |
Abbreviations:
REIT—Real Estate Investment Trust
Notes to Schedule of Investments:
| (a) | Industry and/or sector classifications used in this report are generally according to the Global Industry Classification Standard, which was developed by and is the exclusive property and a service mark of MSCI Inc. and Standard & Poor’s. |
| (b) | A portion of the securities in the Fund are subject to covered call options written. See Note 2K and Note 6. |
| (c) | Non-income producing security. |
| (d) | Affiliated company. See Note 4. |
See accompanying Notes to Financial Statements which are an integral part of the financial statements.
Invesco S&P 500 BuyWrite ETF (PBP)(continued)
April 30, 2019
| | | | | | | | | | | | | | | | | | | | | | | | | | |
Open Exchange-Traded Index Options Written | |
Description | | Type of
Contract | | Expiration
Date | | Number of
Contracts | | | Exercise
Price | | Premiums
Received | | | Notional
Value* | | | Value | | | Unrealized
Appreciation
(Depreciation) | |
| Equity Risk | | | | | | | | | | | | | | | | | | | | | | | | | | |
| S&P 500 Index | | Call | | 05/17/2019 | | | 1,109 | | | $2,900 | | $ | (3,786,538 | ) | | $ | 321,610,000 | | | $ | (6,332,390 | ) | | $ | (2,545,852 | ) |
| * | Notional Value is calculated by multiplying the Number of Contracts by the Exercise Price by the multiplier. |
See accompanying Notes to Financial Statements which are an integral part of the financial statements.
Schedule of Investments(a)
Invesco S&P 500® Quality ETF (SPHQ)
April 30, 2019
| | | | | | | | |
Number
of Shares | | | | | Value | |
| | | | Common Stocks & Other Equity Interests—99.9% | |
| | | | Communication Services—5.9% | |
| | 215,921 | | | Activision Blizzard, Inc. | | $ | 10,409,551 | |
| | 119,091 | | | Electronic Arts, Inc.(b) | | | 11,271,963 | |
| | 58,985 | | | Omnicom Group, Inc. | | | 4,720,570 | |
| | 26,854 | | | TripAdvisor, Inc.(b) | | | 1,429,439 | |
| | 155,987 | | | Twitter, Inc.(b) | | | 6,225,441 | |
| | 387,358 | | | Walt Disney Co. (The) | | | 53,056,425 | |
| | | | | | | | |
| | | | | | | 87,113,389 | |
| | | | | | | | |
| | | | Consumer Discretionary—10.1% | |
| | 67,597 | | | Aptiv PLC | | | 5,793,063 | |
| | 73,349 | | | Best Buy Co., Inc. | | | 5,457,899 | |
| | 7,097 | | | Chipotle Mexican Grill, Inc.(b) | | | 4,883,020 | |
| | 33,250 | | | Darden Restaurants, Inc. | | | 3,910,200 | |
| | 70,627 | | | Dollar General Corp. | | | 8,905,358 | |
| | 31,974 | | | Foot Locker, Inc. | | | 1,829,232 | |
| | 53,949 | | | Gap, Inc. (The) | | | 1,406,990 | |
| | 30,159 | | | Hasbro, Inc. | | | 3,071,996 | |
| | 78,375 | | | Macy’s, Inc. | | | 1,844,947 | |
| | 442,058 | | | NIKE, Inc., Class B | | | 38,825,954 | |
| | 15,598 | | | Ralph Lauren Corp. | | | 2,052,385 | |
| | 127,801 | | | Ross Stores, Inc. | | | 12,481,046 | |
| | 306,270 | | | Starbucks Corp. | | | 23,791,054 | |
| | 131,595 | | | Target Corp. | | | 10,188,085 | |
| | 370,027 | | | TJX Cos., Inc. (The) | | | 20,307,082 | |
| | 34,521 | | | Tractor Supply Co. | | | 3,572,923 | |
| | | | | | | | |
| | | | | | | 148,321,234 | |
| | | | | | | | |
| | | | Consumer Staples—9.8% | |
| | 531,389 | | | Altria Group, Inc. | | | 28,870,364 | |
| | 41,791 | | | Brown-Forman Corp., Class B | | | 2,227,042 | |
| | 106,824 | | | Costco Wholesale Corp. | | | 26,228,497 | |
| | 65,484 | | | Estee Lauder Cos., Inc. (The), Class A | | | 11,250,806 | |
| | 33,905 | | | Hershey Co. (The) | | | 4,233,039 | |
| | 100,631 | | | Monster Beverage Corp.(b) | | | 5,997,608 | |
| | 607,364 | | | Procter & Gamble Co. (The) | | | 64,672,119 | |
| | | | | | | | |
| | | | | | | 143,479,475 | |
| | | | | | | | |
| | | | Energy—6.7% | |
| | 476,656 | | | Chevron Corp. | | | 57,227,319 | |
| | 388,660 | | | ConocoPhillips | | | 24,532,219 | |
| | 278,614 | | | Marathon Oil Corp. | | | 4,747,583 | |
| | 204,899 | | | Occidental Petroleum Corp. | | | 12,064,453 | |
| | | | | | | | |
| | | | | | | 98,571,574 | |
| | | | | | | | |
| | | | Financials—4.3% | |
| | 14,392 | | | Affiliated Managers Group, Inc. | | | 1,596,361 | |
| | 46,759 | | | Ameriprise Financial, Inc. | | | 6,862,818 | |
| | 61,322 | | | Aon PLC | | | 11,046,545 | |
| | 84,698 | | | CME Group, Inc. | | | 15,152,472 | |
| | 10,195 | | | Everest Re Group Ltd. | | | 2,400,923 | |
| | 110,719 | | | Franklin Resources, Inc. | | | 3,829,770 | |
| | 67,682 | | | S&P Global, Inc. | | | 14,934,710 | |
| | 67,578 | | | T. Rowe Price Group, Inc. | | | 7,264,635 | |
| | | | | | | | |
| | | | | | | 63,088,234 | |
| | | | | | | | |
| | | | Health Care—10.4% | |
| | 18,772 | | | Align Technology, Inc.(b) | | | 6,094,893 | |
| | 51,683 | | | Biogen, Inc.(b) | | | 11,847,811 | |
| | 495,624 | | | Bristol-Myers Squibb Co. | | | 23,011,822 | |
| | | | | | | | |
Number
of Shares | | | | | Value | |
| | | | Common Stocks & Other Equity Interests
(continued) | |
| | | | Health Care (continued) | |
| | 35,465 | | | Humana, Inc. | | $ | 9,058,115 | |
| | 35,057 | | | Intuitive Surgical, Inc.(b) | | | 17,901,156 | |
| | 667,652 | | | Merck & Co., Inc. | | | 52,550,889 | |
| | 6,941 | | | Mettler-Toledo International, Inc.(b) | | | 5,172,850 | |
| | 49,198 | | | Nektar Therapeutics(b) | | | 1,575,320 | |
| | 36,263 | | | Perrigo Co. PLC | | | 1,737,723 | |
| | 36,387 | | | ResMed, Inc. | | | 3,802,805 | |
| | 25,029 | | | Varian Medical Systems, Inc.(b) | | | 3,408,199 | |
| | 71,496 | | | Vertex Pharmaceuticals, Inc.(b) | | | 12,081,394 | |
| | 18,539 | | | WellCare Health Plans, Inc.(b) | | | 4,789,551 | |
| | | | | | | | |
| | | | | | | 153,032,528 | |
| | | | | | | | |
| | | | Industrials—8.1% | |
| | 34,993 | | | C.H. Robinson Worldwide, Inc. | | | 2,834,433 | |
| | 51,266 | | | Copart, Inc.(b) | | | 3,451,227 | |
| | 208,593 | | | CSX Corp. | | | 16,610,261 | |
| | 50,118 | | | Expeditors International of Washington, Inc. | | | 3,980,372 | |
| | 83,506 | | | Fastenal Co. | | | 5,891,348 | |
| | 12,126 | | | Huntington Ingalls Industries, Inc. | | | 2,699,005 | |
| | 79,188 | | | Illinois Tool Works, Inc. | | | 12,324,028 | |
| | 236,602 | | | Johnson Controls International PLC | | | 8,872,575 | |
| | 58,501 | | | Pentair PLC | | | 2,280,954 | |
| | 75,937 | | | Raytheon Co. | | | 13,485,652 | |
| | 38,929 | | | Robert Half International, Inc. | | | 2,417,102 | |
| | 37,485 | | | Rockwell Automation, Inc. | | | 6,773,914 | |
| | 192,094 | | | Union Pacific Corp. | | | 34,008,322 | |
| | 13,040 | | | W.W. Grainger, Inc. | | | 3,677,280 | |
| | | | | | | | |
| | | | | | | 119,306,473 | |
| | | | | | | | |
| | | | Information Technology—42.6% | |
| | 166,176 | | | Accenture PLC, Class A | | | 30,355,370 | |
| | 115,637 | | | Adobe, Inc.(b) | | | 33,448,002 | |
| | 18,186 | | | ANSYS, Inc.(b) | | | 3,560,819 | |
| | 338,302 | | | Apple, Inc. | | | 67,887,062 | |
| | 282,028 | | | Applied Materials, Inc. | | | 12,428,974 | |
| | 103,021 | | | Automatic Data Processing, Inc. | | | 16,935,622 | |
| | 103,412 | | | Broadcom, Inc. | | | 32,926,381 | |
| | 25,535 | | | Broadridge Financial Solutions, Inc. | | | 3,016,450 | |
| | 1,152,004 | | | Cisco Systems, Inc. | | | 64,454,624 | |
| | 26,195 | | | Citrix Systems, Inc. | | | 2,644,647 | |
| | 122,667 | | | Cognizant Technology Solutions Corp., Class A | | | 8,949,784 | |
| | 28,568 | | | FLIR Systems, Inc. | | | 1,512,390 | |
| | 349,702 | | | Hewlett Packard Enterprise Co. | | | 5,528,789 | |
| | 70,829 | | | Intuit, Inc. | | | 17,782,329 | |
| | 47,479 | | | KLA-Tencor Corp. | | | 6,052,623 | |
| | 60,045 | | | Lam Research Corp. | | | 12,455,134 | |
| | 236,105 | | | Mastercard, Inc., Class A | | | 60,027,335 | |
| | 253,759 | | | Micron Technology, Inc.(b) | | | 10,673,104 | |
| | 524,466 | | | Microsoft Corp. | | | 68,495,260 | |
| | 69,824 | | | NetApp, Inc. | | | 5,086,678 | |
| | 207,679 | | | NVIDIA Corp. | | | 37,589,899 | |
| | 89,430 | | | Paychex, Inc. | | | 7,539,843 | |
| | 26,959 | | | Qorvo, Inc.(b) | | | 2,038,370 | |
| | 54,902 | | | Red Hat, Inc.(b) | | | 10,021,262 | |
| | 249,410 | | | Texas Instruments, Inc. | | | 29,387,980 | |
| | 396,432 | | | Visa, Inc., Class A | | | 65,185,314 | |
See accompanying Notes to Financial Statements which are an integral part of the financial statements.
Invesco S&P 500® Quality ETF (SPHQ)(continued)
April 30, 2019
| | | | | | | | |
Number
of Shares | | | | | Value | |
| | | | Common Stocks & Other Equity Interests
(continued) | |
| | | | Information Technology (continued) | |
| | 77,682 | | | Xilinx, Inc. | | $ | 9,332,715 | |
| | | | | | | | |
| | | | | | | 625,316,760 | |
| | | | | | | | |
| | | | Materials—0.9% | |
| | 411,334 | | | Freeport-McMoRan, Inc. | | | 5,063,522 | |
| | 95,740 | | | LyondellBasell Industries NV, Class A | | | 8,447,140 | |
| | | | | | | | |
| | | | | | | 13,510,662 | |
| | | | | | | | |
| | | | Real Estate—1.1% | |
| | 40,618 | | | Apartment Investment & Management Co., Class A REIT | | | 2,004,905 | |
| | 41,466 | | | Public Storage REIT | | | 9,171,450 | |
| | 196,179 | | | Weyerhaeuser Co. REIT | | | 5,257,597 | |
| | | | | | | | |
| | | | | | | 16,433,952 | |
| | | | | | | | |
| | | | Total Common Stocks & Other Equity Interests
(Cost $1,251,872,809) | | | 1,468,174,281 | |
| | | | | | | | |
| | | | Money Market Funds—0.1% | |
| | 1,596,170 | | | Invesco Premier U.S. Government Money Portfolio—Institutional Class, 2.32%(c)
(Cost $1,596,170) | | | 1,596,170 | |
| | | | | | | | |
| | |
| | | | Total Investments in Securities
(Cost $1,253,468,979)—100.0% | | | 1,469,770,451 | |
| | |
| | | | Other assets less liabilities—0.0% | | | 14,667 | |
| | | | | | | | |
| | |
| | | | Net Assets—100.0% | | $ | 1,469,785,118 | |
| | | | | | | | |
Abbreviations:
REIT—Real Estate Investment Trust
Notes to Schedule of Investments:
| (a) | Industry and/or sector classifications used in this report are generally according to the Global Industry Classification Standard, which was developed by and is the exclusive property and a service mark of MSCI Inc. and Standard & Poor’s. |
| (b) | Non-income producing security. |
| (c) | The security and the Fund are advised bywholly-owned subsidiaries of Invesco Ltd. and are therefore considered to be affiliated. The rate shown is the7-day SEC standardized yield as of April 30, 2019. |
See accompanying Notes to Financial Statements which are an integral part of the financial statements.
Schedule of Investments(a)
Invesco S&P Spin-Off ETF (CSD)
April 30, 2019
| | | | | | | | |
Number
of Shares | | | | | Value | |
| | | | Common Stocks & Other Equity Interests—100.0% | |
| | | | Communication Services—9.1% | |
| | 3,399 | | | Cable One, Inc. | | $ | 3,604,741 | |
| | 42,489 | | | Cars.com, Inc.(b) | | | 884,196 | |
| | 78,438 | | | Gannett Co., Inc. | | | 731,827 | |
| | 82,299 | | | Liberty Latin America Ltd., Class C (Chile)(b) | | | 1,715,111 | |
| | 11,860 | | | Madison Square Garden Co. (The), Class A(b) | | | 3,705,538 | |
| | 79,779 | | | Zillow Group, Inc., Class C(b)(c) | | | 2,664,619 | |
| | | | | | | | |
| | | | | | | 13,306,032 | |
| | | | | | | | |
| | | | Consumer Discretionary—12.2% | |
| | 59,607 | | | Adient PLC | | | 1,376,922 | |
| | 60,639 | | | Delphi Technologies PLC | | | 1,341,941 | |
| | 57,930 | | | frontdoor, Inc.(b) | | | 2,041,453 | |
| | 50,721 | | | Garrett Motion, Inc. (Switzerland)(b) | | | 953,555 | |
| | 66,406 | | | Hilton Grand Vacations, Inc.(b) | | | 2,127,648 | |
| | 37,344 | | | Liberty Expedia Holdings, Inc., Class A(b) | | | 1,733,508 | |
| | 72,860 | | | Penn National Gaming, Inc.(b) | | | 1,578,876 | |
| | 23,824 | | | TopBuild Corp.(b) | | | 1,696,984 | |
| | 59,681 | | | Veoneer, Inc. (Sweden)(b)(c) | | | 1,317,160 | |
| | 67,079 | | | Wyndham Hotels & Resorts, Inc. | | | 3,737,642 | |
| | | | | | | | |
| | | | | | | 17,905,689 | |
| | | | | | | | |
| | | | Consumer Staples—6.2% | |
| | 43,572 | | | Energizer Holdings, Inc. | | | 2,086,663 | |
| | 100,384 | | | Lamb Weston Holdings, Inc. | | | 7,031,899 | |
| | | | | | | | |
| | | | | | | 9,118,562 | |
| | | | | | | | |
| | | | Energy—3.7% | |
| | 53,007 | | | Apergy Corp.(b) | | | 2,103,848 | |
| | 139,390 | | | Equitrans Midstream Corp. | | | 2,903,494 | |
| | 15,324 | | | KLX Energy Services Holdings, Inc.(b) | | | 429,838 | |
| | | | | | | | |
| | | | | | | 5,437,180 | |
| | | | | | | | |
| | | | Financials—10.2% | |
| | 79,949 | | | Brighthouse Financial, Inc.(b) | | | 3,341,069 | |
| | 335,571 | | | Synchrony Financial | | | 11,634,246 | |
| | | | | | | | |
| | | | | | | 14,975,315 | |
| | | | | | | | |
| | | | Health Care—2.1% | |
| | 65,528 | | | Covetrus, Inc.(b) | | | 2,153,905 | |
| | 26,122 | | | Varex Imaging Corp.(b) | | | 857,847 | |
| | | | | | | | |
| | | | | | | 3,011,752 | |
| | | | | | | | |
| | | | Industrials—13.8% | |
| | 33,327 | | | Arcosa, Inc. | | | 1,037,470 | |
| | 115,836 | | | Babcock & Wilcox Enterprises, Inc.(b) | | | 40,438 | |
| | 126,966 | | | Fortive Corp. | | | 10,962,244 | |
| | 37,385 | | | Hertz Global Holdings, Inc.(b) | | | 679,659 | |
| | 110,513 | | | nVent Electric PLC | | | 3,088,838 | |
| | 84,264 | | | Resideo Technologies, Inc.(b) | | | 1,912,793 | |
| | 29,158 | | | SPX FLOW, Inc.(b) | | | 1,047,939 | |
| | 89,381 | | | Welbilt, Inc.(b)(c) | | | 1,504,282 | |
| | | | | | | | |
| | | | | | | 20,273,663 | |
| | | | | | | | |
| | | | Information Technology—20.3% | |
| | 125,965 | | | Conduent, Inc.(b) | | | 1,616,131 | |
| | 671,346 | | | Hewlett Packard Enterprise Co. | | | 10,613,980 | |
| | 101,598 | | | PayPal Holdings, Inc.(b) | | | 11,457,207 | |
| | 96,370 | | | Perspecta, Inc. | | | 2,224,220 | |
| | 74,768 | | | Versum Materials, Inc. | | | 3,901,394 | |
| | | | | | | | |
| | | | | | | 29,812,932 | |
| | | | | | | | |
| | | | | | | | |
Number
of Shares | | | | | Value | |
| | | | Common Stocks & Other Equity Interests
(continued) | |
| | | | Materials—15.9% | |
| | 127,796 | | | Alcoa Corp.(b) | | $ | 3,409,597 | |
| | 114,462 | | | Chemours Co. (The) | | | 4,121,777 | |
| | 196,065 | | | Dow, Inc.(b) | | | 11,122,768 | |
| | 49,451 | | | GCP Applied Technologies, Inc.(b) | | | 1,423,694 | |
| | 28,520 | | | Ingevity Corp.(b) | | | 3,280,085 | |
| | | | | | | | |
| | | | | | | 23,357,921 | |
| | | | | | | | |
| | | | Real Estate—6.5% | |
| | 27,388 | | | CorePoint Lodging, Inc. REIT | | | 342,350 | |
| | 81,885 | | | JBG SMITH Properties REIT | | | 3,484,207 | |
| | 137,882 | | | Park Hotels & Resorts, Inc. REIT | | | 4,423,255 | |
| | 122,648 | | | Uniti Group, Inc. REIT | | | 1,347,901 | |
| | | | | | | | |
| | | | | | | 9,597,713 | |
| | | | | | | | |
| | |
| | | | Total Common Stocks & Other Equity Interests
(Cost $135,861,656) | | | 146,796,759 | |
| | | | | | | | |
| | | | Money Market Funds—0.2% | | | |
| | 303,919 | | | Invesco Premier U.S. Government Money Portfolio—Institutional Class, 2.32%(d)
(Cost $303,919) | | | 303,919 | |
| | | | | | | | |
| | |
| | | | Total Investments in Securities
(excluding investments purchased with cash collateral from securities on loan)
(Cost $136,165,575)—100.2% | | | 147,100,678 | |
| | | | | | | | |
| | |
| | | | | | | | |
| | | | Investments Purchased with Cash Collateral from
Securities on Loan | |
| | |
| | | | | | | | |
| | | | Money Market Funds—1.0% | |
| | 1,228,487 | | | Invesco Government & Agency Portfolio—Institutional Class 2.34%(d)(e) | | | 1,228,487 | |
| | 309,207 | | | Invesco Liquid Assets Portfolio—Institutional Class, 2.48%(d)(e) | | | 309,300 | |
| | | | | | | | |
| | |
| | | | Total Investments Purchased with Cash Collateral from Securities on Loan
(Cost $1,537,787) | | | 1,537,787 | |
| | | | | | | | |
| | |
| | | | Total Investments in Securities
(Cost $137,703,362)—101.2% | | | 148,638,465 | |
| | |
| | | | Other assets less liabilities—(1.2)% | | | (1,824,052 | ) |
| | | | | | | | |
| | |
| | | | Net Assets—100.0% | | $ | 146,814,413 | |
| | | | | | | | |
Abbreviations:
REIT—Real Estate Investment Trust
Notes to Schedule of Investments:
| (a) | Industry and/or sector classifications used in this report are generally according to the Global Industry Classification Standard, which was developed by and is the exclusive property and a service mark of MSCI Inc. and Standard & Poor’s. |
| (b) | Non-income producing security. |
| (c) | All or a portion of this security was out on loan at April 30, 2019. |
| (d) | The security and the Fund are advised bywholly-owned subsidiaries of Invesco Ltd. and are therefore considered to be affiliated. The rate shown is the7-day SEC standardized yield as of April 30, 2019. |
| (e) | The security has been segregated to satisfy the commitment to return the cash collateral received in securities lending transactions upon the borrower’s return of the securities loaned. See Note 2M. |
See accompanying Notes to Financial Statements which are an integral part of the financial statements.
Schedule of Investments(a)
Invesco Water Resources ETF (PHO)
April 30, 2019
| | | | | | | | |
Number
of Shares | | | | | Value | |
| | | | Common Stocks & Other Equity Interests—99.9% | |
| | | | Building Products—5.1% | |
| | 697,682 | | | A.O. Smith Corp. | | $ | 36,677,142 | |
| | 386,397 | | | Advanced Drainage Systems, Inc. | | | 10,838,436 | |
| | | | | | | | |
| | | | | | | 47,515,578 | |
| | | | | | | | |
| | | | Chemicals—8.4% | |
| | 428,983 | | | Ecolab, Inc. | | | 78,967,191 | |
| | | | | | | | |
| |
| | | | Commercial Services & Supplies—3.5% | |
| | 509,804 | | | Tetra Tech, Inc. | | | 32,994,515 | |
| | | | | | | | |
| | |
| | | | Construction & Engineering—2.9% | | | |
| | 220,631 | | | Aegion Corp.(b) | | | 4,392,763 | |
| | 173,210 | | | Valmont Industries, Inc. | | | 23,355,637 | |
| | | | | | | | |
| | | | | | | 27,748,400 | |
| | | | | | | | |
| | | | Electronic Equipment, Instruments & Components—2.7% | |
| | 157,180 | | | Badger Meter, Inc. | | | 8,720,346 | |
| | 319,151 | | | Itron, Inc.(b) | | | 17,125,643 | |
| | | | | | | | |
| | | | | | | 25,845,989 | |
| | | | | | | | |
| | | | Health Care Equipment & Supplies—8.0% | |
| | 570,450 | | | Danaher Corp. | | | 75,550,398 | |
| | | | | | | | |
| |
| | | | Industrial Conglomerates—8.6% | |
| | 223,888 | | | Roper Technologies, Inc. | | | 80,532,513 | |
| | | | | | | | |
| |
| | | | Life Sciences Tools & Services—6.8% | |
| | 299,168 | | | Waters Corp.(b) | | | 63,884,335 | |
| | | | | | | | |
| |
| | | | Machinery—26.8% | |
| | 274,844 | | | Energy Recovery, Inc.(b)(c) | | | 2,674,232 | |
| | 1,167,734 | | | Evoqua Water Technologies Corp.(b) | | | 15,904,537 | |
| | 173,480 | | | Franklin Electric Co., Inc. | | | 8,476,233 | |
| | 67,124 | | | Gorman-Rupp Co. (The) | | | 2,235,229 | |
| | 251,421 | | | IDEX Corp. | | | 39,387,614 | |
| | 137,042 | | | Lindsay Corp.(c) | | | 11,648,570 | |
| | 278,028 | | | Mueller Industries, Inc. | | | 8,110,077 | |
| | 1,325,399 | | | Mueller Water Products, Inc., Class A | | | 14,221,531 | |
| | 851,671 | | | Pentair PLC | | | 33,206,652 | |
| | 827,823 | | | Rexnord Corp.(b) | | | 23,675,738 | |
| | 528,282 | | | Toro Co. (The) | | | 38,643,828 | |
| | 163,737 | | | Watts Water Technologies, Inc., Class A | | | 14,014,250 | |
| | 479,549 | | | Xylem, Inc. | | | 39,994,387 | |
| | | | | | | | |
| | | | | | | 252,192,878 | |
| | | | | | | | |
| | | | Trading Companies & Distributors—4.1% | |
| | 842,361 | | | HD Supply Holdings, Inc.(b) | | | 38,487,474 | |
| | | | | | | | |
| |
| | | | Water Utilities—23.0% | |
| | 260,474 | | | American States Water Co. | | | 18,537,935 | |
| | 713,046 | | | American Water Works Co., Inc. | | | 77,144,447 | |
| | 1,008,070 | | | Aqua America, Inc. | | | 39,375,214 | |
| | 104,711 | | | AquaVenture Holdings Ltd.(b) | | | 2,036,629 | |
| | 19,270 | | | Artesian Resources Corp., Class A | | | 699,116 | |
| | 292,655 | | | California Water Service Group | | | 14,746,885 | |
| | 3,483,618 | | | Cia de Saneamento Basico do Estado de Sao Paulo ADR (Brazil) | | | 41,664,071 | |
| | 48,274 | | | Consolidated Water Co. Ltd. (Cayman Islands) | | | 611,149 | |
| | 76,591 | | | Middlesex Water Co. | | | 4,441,512 | |
| | | | | | | | |
Number
of Shares | | | | | Value | |
| | | | Common Stocks & Other Equity Interests
(continued) | |
| | | | Water Utilities (continued) | |
| | 278,491 | | | SJW Group | | $ | 17,283,151 | |
| | | | | | | | |
| | | | | | | 216,540,109 | |
| | | | | | | | |
| | | | Total Common Stocks & Other Equity Interests
(Cost $670,661,110) | | | 940,259,380 | |
| | | | | | | | |
| | |
| | | | | | | | |
| | | | Money Market Funds—0.1% | | | |
| | 1,003,803 | | | Invesco Premier U.S. Government Money Portfolio—Institutional Class, 2.32%(d)
(Cost $1,003,803) | | | 1,003,803 | |
| | | | | | | | |
| | |
| | | | Total Investments in Securities
(excluding investments purchased with cash collateral from securities on loan)
(Cost $671,664,913)-100.0% | | | 941,263,183 | |
| | | | | | | | |
| | |
| | | | | | | | |
| | | | Investments Purchased with Cash Collateral from
Securities on Loan | |
| | |
| | | | | | | | |
| | | | Money Market Funds—0.2% | | | |
| | 1,588,060 | | | Invesco Government & Agency Portfolio—Institutional Class 2.34%(d)(e) | | | 1,588,060 | |
| | 529,195 | | | Invesco Liquid Assets Portfolio—Institutional Class, 2.48%(d)(e) | | | 529,354 | |
| | | | | | | | |
| | | | Total Investments Purchased with Cash Collateral from Securities on Loan
(Cost $2,117,414) | | | 2,117,414 | |
| | | | | | | | |
| | |
| | | | Total Investments in Securities
(Cost $673,782,327)—100.2% | | | 943,380,597 | |
| | |
| | | | Other assets less liabilities—(0.2)% | | | (2,111,780 | ) |
| | | | | | | | |
| | |
| | | | Net Assets—100.0% | | $ | 941,268,817 | |
| | | | | | | | |
Abbreviations:
ADR—American Depositary Receipt
Notes to Schedule of Investments:
| (a) | Industry and/or sector classifications used in this report are generally according to the Global Industry Classification Standard, which was developed by and is the exclusive property and a service mark of MSCI Inc. and Standard & Poor’s. |
| (b) | Non-income producing security. |
| (c) | All or a portion of this security was out on loan at April 30, 2019. |
| (d) | The security and the Fund are advised bywholly-owned subsidiaries of Invesco Ltd. and are therefore considered to be affiliated. The rate shown is the7-day SEC standardized yield as of April 30, 2019. |
| (e) | The security has been segregated to satisfy the commitment to return the cash collateral received in securities lending transactions upon the borrower’s return of the securities loaned. See Note 2M. |
See accompanying Notes to Financial Statements which are an integral part of the financial statements.
Schedule of Investments(a)
Invesco WilderHill Clean Energy ETF (PBW)
April 30, 2019
| | | | | | | | |
Number
of Shares | | | | | Value | |
| | | | Common Stocks & Other Equity Interests—99.9% | |
| | | | Aerospace & Defense—3.1% | |
| | 62,708 | | | Hexcel Corp. | | $ | 4,434,083 | |
| | | | | | | | |
| |
| | | | Auto Components—3.0% | |
| | 102,166 | | | Gentherm, Inc.(b) | | | 4,327,752 | |
| | | | | | | | |
| |
| | | | Automobiles—5.3% | |
| | 785,456 | | | NIO, Inc. ADR (China)(b)(c) | | | 3,809,462 | |
| | 16,137 | | | Tesla, Inc.(b)(c) | | | 3,851,740 | |
| | | | | | | | |
| | | | | | | 7,661,202 | |
| | | | | | | | |
| | | | Chemicals—8.2% | |
| | 20,058 | | | Air Products & Chemicals, Inc. | | | 4,127,736 | |
| | 51,502 | | | Albemarle Corp.(c) | | | 3,865,740 | |
| | 110,251 | | | Sociedad Quimica y Minera de Chile SA ADR (Chile) | | | 3,929,346 | |
| | | | | | | | |
| | | | | | | 11,922,822 | |
| | | | | | | | |
| | | | Commercial Services & Supplies—0.4% | |
| | 228,886 | | | Aqua Metals, Inc.(b)(c) | | | 574,504 | |
| | | | | | | | |
| |
| | | | Construction & Engineering—7.7% | |
| | 222,104 | | | Ameresco, Inc., Class A(b) | | | 3,344,886 | |
| | 105,060 | | | MYR Group, Inc.(b) | | | 3,797,919 | |
| | 98,176 | | | Quanta Services, Inc. | | | 3,985,946 | |
| | | | | | | | |
| | | | | | | 11,128,751 | |
| | | | | | | | |
| | | | Electrical Equipment—20.9% | |
| | 277,116 | | | American Superconductor Corp.(b) | | | 3,059,361 | |
| | 1,244,947 | | | Ballard Power Systems, Inc.
(Canada)(b)(c) | | | 4,133,224 | |
| | 319,411 | | | Bloom Energy Corp., Class A(b)(c) | | | 4,350,378 | |
| | 465,311 | | | Enphase Energy, Inc.(b)(c) | | | 4,671,722 | |
| | 84,723 | | | Hydrogenics Corp. (Canada)(b)(c) | | | 696,423 | |
| | 259,697 | | | LSI Industries, Inc. | | | 882,970 | |
| | 1,593,108 | | | Plug Power, Inc.(b)(c) | | | 3,966,839 | |
| | 264,145 | | | Sunrun, Inc.(b) | | | 4,017,645 | |
| | 146,992 | | | TPI Composites, Inc.(b) | | | 4,549,402 | |
| | | | | | | | |
| | | | | | | 30,327,964 | |
| | | | | | | | |
| | | | Electronic Equipment, Instruments & Components—2.8% | |
| | 76,538 | | | Itron, Inc.(b) | | | 4,107,029 | |
| | | | | | | | |
| |
| | | | Independent Power & Renewable Electricity Producers—11.0% | |
| | 191,615 | | | Atlantica Yield PLC (Spain) | | | 3,926,192 | |
| | 77,456 | | | Ormat Technologies, Inc. | | | 4,520,332 | |
| | 168,450 | | | Pattern Energy Group, Inc., Class A | | | 3,894,564 | |
| | 269,904 | | | TerraForm Power, Inc., Class A | | | 3,659,898 | |
| | | | | | | | |
| | | | | | | 16,000,986 | |
| | | | | | | | |
| | | | Oil, Gas & Consumable Fuels—2.8% | |
| | 166,634 | | | Renewable Energy Group, Inc.(b) | | | 4,019,212 | |
| | | | | | | | |
| |
| | | | Professional Services—2.8% | |
| | 102,099 | | | Willdan Group, Inc.(b) | | | 4,035,973 | |
| | | | | | | | |
| |
| | | | Semiconductors & Semiconductor Equipment—31.9% | |
| | 77,633 | | | Advanced Energy Industries, Inc.(b) | | | 4,484,082 | |
| | 129,102 | | | Amtech Systems, Inc.(b) | | | 854,655 | |
| | 228,339 | | | Canadian Solar, Inc. (Canada)(b)(c) | | | 4,562,213 | |
| | 66,855 | | | Cree, Inc.(b) | | | 4,418,447 | |
| | 133,374 | | | Daqo New Energy Corp. ADR
(China)(b)(c) | | | 4,941,507 | |
| | 81,763 | | | First Solar, Inc.(b) | | | 5,030,877 | |
| | 243,717 | | | JinkoSolar Holding Co. Ltd. ADR (China)(b)(c) | | | 4,742,733 | |
| | | | | | | | |
Number
of Shares | | | | | Value | |
| | | | Common Stocks & Other Equity Interests
(continued) | |
| | | | Semiconductors & Semiconductor Equipment (continued) | |
| | 100,717 | | | SolarEdge Technologies, Inc.(b) | | $ | 4,461,763 | |
| | 688,641 | | | SunPower Corp.(b)(c) | | | 4,971,988 | |
| | 23,334 | | | Universal Display Corp. | | | 3,724,107 | |
| | 331,632 | | | Veeco Instruments, Inc.(b) | | | 4,039,278 | |
| | | | | | | | |
| | | | | | | 46,231,650 | |
| | | | | | | | |
| | |
| | | | Total Common Stocks & Other Equity Interests
(Cost $123,125,666) | | | 144,771,928 | |
| | | | | | | | |
| | |
| | | | | | | | |
| | | | Money Market Funds—0.2% | |
| | 287,282 | | | Invesco Premier U.S. Government Money Portfolio—Institutional Class, 2.32%(d)
(Cost $287,282) | | | 287,282 | |
| | | | | | | | |
| | | | Total Investments in Securities
(excluding investments purchased with cash collateral from securities on loan)
(Cost $123,412,948)—100.1% | | | 145,059,210 | |
| | | | | | | | |
| | |
| | | | | | | | |
| | | | Investments Purchased with Cash Collateral from
Securities on Loan | |
| | |
| | | | | | | | |
| | | | Money Market Funds—24.6% | |
| | 26,703,238 | | | Invesco Government & Agency Portfolio—Institutional Class
2.34%(d)(e) | | | 26,703,238 | |
| | 8,898,410 | | | Invesco Liquid Assets Portfolio—Institutional Class,
2.48%(d)(e) | | | 8,901,079 | |
| | | | | | | | |
| | |
| | | | Total Investments Purchased with Cash Collateral from Securities on Loan
(Cost $35,604,317) | | | 35,604,317 | |
| | | | | | | | |
| | |
| | | | Total Investments in Securities
(Cost $159,017,265)—124.7% | | | 180,663,527 | |
| | |
| | | | Other assets less liabilities—(24.7)% | | | (35,806,323 | ) |
| | | | | | | | |
| | | | Net Assets—100.0% | | $144,857,204 | |
| | | | | | | | |
Abbreviations:
ADR—American Depositary Receipt
Notes to Schedule of Investments:
| (a) | Industry and/or sector classifications used in this report are generally according to the Global Industry Classification Standard, which was developed by and is the exclusive property and a service mark of MSCI Inc. and Standard & Poor’s. |
| (b) | Non-income producing security. |
| (c) | All or a portion of this security was out on loan at April 30, 2019. |
| (d) | The security and the Fund are advised bywholly-owned subsidiaries of Invesco Ltd. and are therefore considered to be affiliated. The rate shown is the7-day SEC standardized yield as of April 30, 2019. |
| (e) | The security has been segregated to satisfy the commitment to return the cash collateral received in securities lending transactions upon the borrower’s return of the securities loaned. See Note 2M. |
See accompanying Notes to Financial Statements which are an integral part of the financial statements.
(This Page Intentionally Left Blank)
Statements of Assets and Liabilities
April 30, 2019
| | | | | | | | | | | | | | | | | | | | |
| | |
Invesco
Aerospace &
Defense
ETF (PPA) | | | Invesco
BRIC
ETF (EEB) | | | Invesco
Cleantech™
ETF (PZD) | | | Invesco
DWA Momentum
ETF (PDP) | | | Invesco
Global Listed
Private Equity
ETF (PSP) | |
| Assets: | | | | | | | | | | | | | | | | | | | | |
Unaffiliated investments in securities, at value(a) | | $ | 938,252,033 | | | $ | 72,516,595 | | | $ | 179,229,528 | | | $ | 1,547,078,440 | | | $ | 211,129,842 | |
Affiliated investments in securities, at value | | | 7,816,315 | | | | 4,291,014 | | | | 12,870,378 | | | | 7,420,051 | | | | 50,722,504 | |
Other investments: | | | | | | | | | | | | | | | | | | | | |
Unrealized appreciation on swap agreements—OTC | | | — | | | | — | | | | — | | | | — | | | | 112,282 | |
Cash | | | — | | | | 208 | | | | — | | | | — | | | | 5,887 | |
Cash segregated as collateral | | | — | | | | — | | | | 2,357,158 | | | | — | | | | 259,051 | |
Foreign currencies, at value | | | — | | | | — | | | | 6,396 | | | | — | | | | 320,078 | |
Receivable for: | | | | | | | | | | | | | | | | | | | | |
Dividends | | | 565,583 | | | | 95,417 | | | | 227,349 | | | | 184,451 | | | | 383,458 | |
Securities lending | | | 2,234 | | | | 8,073 | | | | 16,433 | | | | 2,416 | | | | 25,005 | |
Investments sold | | | — | | | | 8,553 | | | | 484 | | | | — | | | | 7,297,434 | |
Fund shares sold | | | 12,386,084 | | | | 8,462 | | | | 2,244,912 | | | | 5,878,126 | | | | 242,981 | |
Foreign tax reclaims | | | — | | | | 564 | | | | 261,134 | | | | — | | | | 669,587 | |
Expenses absorbed | | | — | | | | 20,312 | | | | — | | | | — | | | | — | |
| | | | | | | | | | | | | | | | | | | | |
Total assets | | | 959,022,249 | | | | 76,949,198 | | | | 197,213,772 | | | | 1,560,563,484 | | | | 271,168,109 | |
| | | | | | | | | | | | | | | | | | | | |
| | | | | |
| Liabilities: | | | | | | | | | | | | | | | | | | | | |
Other investments: | | | | | | | | | | | | | | | | | | | | |
Open written options, at value | | | — | | | | — | | | | — | | | | — | | | | — | |
Unrealized depreciation on swap agreements—OTC | | | — | | | | — | | | | — | | | | — | | | | 146,616 | |
Payable for swaps | | | — | | | | — | | | | — | | | | — | | | | 2,474 | |
Due to custodian | | | — | | | | — | | | | — | | | | — | | | | — | |
Payable for: | | | | | | | | | | | | | | | | | | | | |
Investments purchased | | | 12,385,310 | | | | 8,462 | | | | 2,415,026 | | | | 5,882,897 | | | | 251,414 | |
Collateral upon return of securities loaned | | | 7,279,169 | | | | 4,213,980 | | | | 11,995,408 | | | | 6,446,693 | | | | 25,577,765 | |
Fund shares repurchased | | | — | | | | — | | | | — | | | | — | | | | — | |
Collateral upon receipt of securitiesin-kind | | | — | | | | — | | | | 2,357,158 | | | | — | | | | 259,051 | |
Expenses recaptured | | | — | | | | — | | | | 2,794 | | | | — | | | | — | |
Accrued advisory fees | | | 366,994 | | | | — | | | | 71,589 | | | | 622,327 | | | | 93,123 | |
Accrued unitary management fees | | | — | | | | — | | | | — | | | | — | | | | — | |
Accrued trustees’ and officer’s fees | | | 54,829 | | | | 6,302 | | | | 41,603 | | | | 120,953 | | | | 62,405 | |
Accrued expenses | | | 690,093 | | | | 204,036 | | | | 209,505 | | | | 1,543,385 | | | | 332,472 | |
| | | | | | | | | | | | | | | | | | | | |
Total liabilities | | | 20,776,395 | | | | 4,432,780 | | | | 17,093,083 | | | | 14,616,255 | | | | 26,725,320 | |
| | | | | | | | | | | | | | | | | | | | |
| Net Assets | | $ | 938,245,854 | | | $ | 72,516,418 | | | $ | 180,120,689 | | | $ | 1,545,947,229 | | | $ | 244,442,789 | |
| | | | | | | | | | | | | | | | | | | | |
| | | | | |
| Net assets consist of: | | | | | | | | | | | | | | | | | | | | |
Shares of beneficial interest | | $ | 745,215,785 | | | $ | 235,153,340 | | | $ | 162,264,645 | | | $ | 1,638,409,319 | | | $ | 312,166,724 | |
Distributable earnings | | | 193,030,069 | | | | (162,636,922 | ) | | | 17,856,044 | | | | (92,462,090 | ) | | | (67,723,935 | ) |
| | | | | | | | | | | | | | | | | | | | |
| Net Assets | | $ | 938,245,854 | | | $ | 72,516,418 | | | $ | 180,120,689 | | | $ | 1,545,947,229 | | | $ | 244,442,789 | |
| | | | | | | | | | | | | | | | | | | | |
Shares outstanding (unlimited amount authorized, $0.01 par value) | | | 15,150,000 | | | | 1,950,800 | | | | 4,000,000 | | | | 26,300,000 | | | | 20,200,000 | |
Net asset value | | $ | 61.93 | | | $ | 37.17 | | | $ | 45.03 | | | $ | 58.78 | | | $ | 12.10 | |
| | | | | | | | | | | | | | | | | | | | |
Market price | | $ | 61.94 | | | $ | 37.21 | | | $ | 45.21 | | | $ | 58.79 | | | $ | 12.13 | |
| | | | | | | | | | | | | | | | | | | | |
Unaffiliated investments in securities, at cost | | $ | 740,289,097 | | | $ | 63,165,236 | | | $ | 127,419,927 | | | $ | 1,221,060,112 | | | $ | 191,058,508 | |
| | | | | | | | | | | | | | | | | | | | |
Affiliated investments in securities, at cost | | $ | 7,816,315 | | | $ | 4,291,014 | | | $ | 12,863,180 | | | $ | 7,420,051 | | | $ | 50,722,504 | |
| | | | | | | | | | | | | | | | | | | | |
Foreign currencies, at cost | | $ | — | | | $ | — | | | $ | 6,400 | | | $ | — | | | $ | 319,777 | |
| | | | | | | | | | | | | | | | | | | | |
Premium received on written options | | $ | — | | | $ | — | | | $ | — | | | $ | — | | | $ | — | |
| | | | | | | | | | | | | | | | | | | | |
(a) Includes securities on loan with an aggregate value of | | $ | 7,029,688 | | | $ | 4,052,492 | | | $ | 7,271,617 | | | $ | 6,234,415 | | | $ | 24,576,618 | |
| | | | | | | | | | | | | | | | | | | | |
See accompanying Notes to Financial Statements which are an integral part of the financial statements.
| | | | | | | | | | | | | | | | | | | | | | | | | | | | | | |
Invesco
Golden
Dragon China
ETF (PGJ) | | | Invesco
Insider
Sentiment
ETF (NFO) | | | Invesco
Raymond
James
SB-1 Equity
ETF (RYJ) | | | Invesco
S&P 500
BuyWrite
ETF (PBP) | | | Invesco
S&P 500®
Quality
ETF (SPHQ) | | | Invesco
S&PSpin-Off
ETF (CSD) | | |
Invesco
Water
Resources
ETF (PHO) | | | Invesco
WilderHill
Clean Energy
ETF (PBW) | |
| | | | | | | | | | | | | | | | | | | | | | | | | | | | | | |
| $ | 216,720,261 | | | $ | 70,781,425 | | | $ | 173,066,074 | | | $ | 326,974,062 | | | $ | 1,468,174,281 | | | $ | 146,796,759 | | | $ | 940,259,380 | | | $ | 144,771,928 | |
| | 18,877,690 | | | | 40,087 | | | | 7,494,452 | | | | 116,221 | | | | 1,596,170 | | | | 1,841,706 | | | | 3,121,217 | | | | 35,891,599 | |
| | | | | | | | | | | | | | | | | | | | | | | | | | | | | | |
| | — | | | | — | | | | — | | | | — | | | | — | | | | — | | | | — | | | | — | |
| | — | | | | — | | | | — | | | | — | | | | — | | | | — | | | | — | | | | — | |
| | — | | | | — | | | | — | | | | — | | | | — | | | | — | | | | — | | | | — | |
| | — | | | | — | | | | — | | | | — | | | | — | | | | — | | | | — | | | | — | |
| | | | | | | | | | | | | | | | | | | | | | | | | | | | | | |
| | 192,790 | | | | 38,433 | | | | 87,711 | | | | 290,718 | | | | 1,294,495 | | | | 22,869 | | | | 1,153,110 | | | | 21,249 | |
| | 43,063 | | | | 33 | | | | 4,961 | | | | — | | | | — | | | | 1,543 | | | | 1,097 | | | | 137,138 | |
| | — | | | | — | | | | 12,413,463 | | | | — | | | | — | | | | — | | | | — | | | | — | |
| | — | | | | — | | | | — | | | | — | | | | 1,664,536 | | | | — | | | | — | | | | — | |
| | — | | | | — | | | | 6,724 | | | | — | | | | — | | | | — | | | | — | | | | — | |
| | — | | | | — | | | | — | | | | — | | | | — | | | | — | | | | — | | | | — | |
| | | | | | | | | | | | | | | | | | | | | | | | | | | | | | |
| | 235,833,804 | | | | 70,859,978 | | | | 193,073,385 | | | | 327,381,001 | | | | 1,472,729,482 | | | | 148,662,877 | | | | 944,534,804 | | | | 180,821,914 | |
| | | | | | | | | | | | | | | | | | | | | | | | | | | | | | |
| | | | | | | |
| | | | | | | | | | | | | | | | | | | | | | | | | | | | | | |
| | | | | | | | | | | | | | | | | | | | | | | | | | | | | | |
| | — | | | | — | | | | — | | | | 6,332,390 | | | | — | | | | — | | | | — | | | | — | |
| | — | | | | — | | | | — | | | | — | | | | — | | | | — | | | | — | | | | — | |
| | — | | | | — | | | | — | | | | — | | | | — | | | | — | | | | — | | | | — | |
| | — | | | | 5 | | | | — | | | | 143,506 | | | | — | | | | — | | | | — | | | | — | |
| | | | | | | | | | | | | | | | | | | | | | | | | | | | | | |
| | — | | | | — | | | | 7,805,129 | | | | — | | | | 1,663,189 | | | | — | | | | — | | | | — | |
| | 18,658,365 | | | | — | | | | 7,388,070 | | | | — | | | | — | | | | 1,537,787 | | | | 2,117,414 | | | | 35,604,317 | |
| | — | | | | — | | | | 4,541,272 | | | | — | | | | — | | | | — | | | | — | | | | — | |
| | — | | | | — | | | | — | | | | — | | | | — | | | | — | | | | — | | | | — | |
| | — | | | | — | | | | — | | | | — | | | | — | | | | 81 | | | | — | | | | — | |
| | 87,316 | | | | 30,121 | | | | — | | | | — | | | | 357,801 | | | | 62,140 | | | | 384,945 | | | | 57,786 | |
| | — | | | | — | | | | 182,853 | | | | 127,434 | | | | — | | | | — | | | | — | | | | — | |
| | 65,002 | | | | 3,663 | | | | — | | | | — | | | | 69,680 | | | | 4,270 | | | | 159,693 | | | | 82,085 | |
| | 293,337 | | | | 130,597 | | | | — | | | | — | | | | 853,694 | | | | 244,186 | | | | 603,935 | | | | 220,522 | |
| | | | | | | | | | | | | | | | | | | | | | | | | | | | | | |
| | 19,104,020 | | | | 164,386 | | | | 19,917,324 | | | | 6,603,330 | | | | 2,944,364 | | | | 1,848,464 | | | | 3,265,987 | | | | 35,964,710 | |
| | | | | | | | | | | | | | | | | | | | | | | | | | | | | | |
| $ | 216,729,784 | | | $ | 70,695,592 | | | $ | 173,156,061 | | | $ | 320,777,671 | | | $ | 1,469,785,118 | | | $ | 146,814,413 | | | $ | 941,268,817 | | | $ | 144,857,204 | |
| | | | | | | | | | | | | | | | | | | | | | | | | | | | | | |
| | | | | | | |
| | | | | | | | | | | | | | | | | | | | | | | | | | | | | | |
| $ | 413,084,606 | | | $ | 124,520,357 | | | $ | 212,475,776 | | | $ | 318,434,175 | | | $ | 1,415,330,921 | | | $ | 269,561,281 | | | $ | 964,886,777 | | | $ | 569,344,166 | |
| | (196,354,822 | ) | | | (53,824,765 | ) | | | (39,319,715 | ) | | | 2,343,496 | | | | 54,454,197 | | | | (122,746,868 | ) | | | (23,617,960 | ) | | | (424,486,962 | ) |
| | | | | | | | | | | | | | | | | | | | | | | | | | | | | | |
| $ | 216,729,784 | | | $ | 70,695,592 | | | $ | 173,156,061 | | | $ | 320,777,671 | | | $ | 1,469,785,118 | | | $ | 146,814,413 | | | $ | 941,268,817 | | | $ | 144,857,204 | |
| | | | | | | | | | | | | | | | | | | | | | | | | | | | | | |
|
5,150,000 |
| | | 1,050,800 | | | | 3,822,822 | | | | 15,000,000 | | | | 44,150,000 | | | | 2,800,000 | | | | 27,150,000 | | | | 5,118,273 | |
| $ | 42.08 | | | $ | 67.28 | | | $ | 45.30 | | | $ | 21.39 | | | $ | 33.29 | | | $ | 52.43 | | | $ | 34.67 | | | $ | 28.30 | |
| | | | | | | | | | | | | | | | | | | | | | | | | | | | | | |
| $ | 42.11 | | | $ | 67.21 | | | $ | 45.30 | | | $ | 21.39 | | | $ | 33.30 | | | $ | 52.41 | | | $ | 34.70 | | | $ | 28.31 | |
| | | | | | | | | | | | | | | | | | | | | | | | | | | | | | |
| $ | 200,941,214 | | | $ | 64,569,489 | | | $ | 155,302,064 | | | $ | 256,917,681 | | | $ | 1,251,872,809 | | | $ | 135,861,656 | | | $ | 670,661,110 | | | $ | 123,125,666 | |
| | | | | | | | | | | | | | | | | | | | | | | | | | | | | | |
| $ | 18,877,690 | | | $ | 40,087 | | | $ | 7,494,452 | | | $ | 175,427 | | | $ | 1,596,170 | | | $ | 1,841,706 | | | $ | 3,121,217 | | | $ | 35,891,599 | |
| | | | | | | | | | | | | | | | | | | | | | | | | | | | | | |
| $ | — | | | $ | — | | | $ | — | | | $ | — | | | $ | — | | | $ | — | | | $ | — | | | $ | — | |
| | | | | | | | | | | | | | | | | | | | | | | | | | | | | | |
| $ | — | | | $ | — | | | $ | — | | | $ | 3,786,538 | | | $ | — | | | $ | — | | | $ | — | | | $ | — | |
| | | | | | | | | | | | | | | | | | | | | | | | | | | | | | |
| $ | 18,242,335 | | | $ | — | | | $ | 7,011,892 | | | $ | — | | | $ | — | | | $ | 1,489,615 | | | $ | 2,010,198 | | | $ | 33,917,557 | |
| | | | | | | | | | | | | | | | | | | | | | | | | | | | | | |
Statements of Operations
For the year ended April 30, 2019(a)
| | | | | | | | | | | | | | | | | | | | | | | | |
| | | Invesco Aerospace &
Defense ETF (PPA) | | | Invesco BRIC ETF (EEB) | | | Invesco
Cleantech™
ETF (PZD) | | | Invesco DWA
Momentum
ETF (PDP) | | | Invesco Global
Listed Private
Equity
ETF (PSP) | |
| | | Year Ended
April 30, 2019 | | | Eight Months Ended
April 30, 2019(b) | | | Year Ended
August 31, 2018 | | | Year Ended
April 30, 2019 | | | Year Ended
April 30, 2019 | | | Year Ended
April 30, 2019 | |
| Investment Income: | | | | | | | | | | | | | | | | | | | | | | | | |
Unaffiliated dividend income | | $ | 13,617,375 | | | $ | 679,015 | | | $ | 2,158,356 | | | $ | 1,895,916 | | | $ | 11,972,466 | | | $ | 7,515,184 | |
Affiliated dividend income | | | 16,112 | | | | 1,759 | | | | 190 | | | | 818 | | | | 25,070 | | | | 510,449 | |
Non-cash dividend income | | | — | | | | — | | | | — | | | | — | | | | — | | | | 213,480 | |
Securities lending income | | | 4,646 | | | | 36,403 | | | | 101,143 | | | | 113,907 | | | | 200,913 | | | | 216,026 | |
Foreign withholding tax | | | (50,665 | ) | | | (45,527 | ) | | | (188,145 | ) | | | (144,148 | ) | | | — | | | | (296,897 | ) |
| | | | | | | | | | | | | | | | | | | | | | | | |
Total Investment Income | | | 13,587,468 | | | | 671,650 | | | | 2,071,544 | | | | 1,866,493 | | | | 12,198,449 | | | | 8,158,242 | |
| | | | | | | | | | | | | | | | | | | | | | | | |
| | | | | | |
| Expenses: | | | | | | | | | | | | | | | | | | | | | | | | |
Unitary management fees | | | — | | | | — | | | | — | | | | — | | | | — | | | | — | |
Advisory fees | | | 4,702,920 | | | | 216,625 | | | | 390,986 | | | | 816,552 | | | | 7,474,101 | | | | 1,195,293 | |
Sub-licensing fees | | | 564,340 | | | | 17,330 | | | | 35,374 | | | | 122,483 | | | | 1,494,809 | | | | 239,057 | |
Accounting & administration fees | | | 94,521 | | | | 21,325 | | | | 30,594 | | | | 36,032 | | | | 142,080 | | | | 41,508 | |
Professional fees | | | 33,228 | | | | 23,220 | | | | 31,619 | | | | 25,868 | | | | 34,169 | | | | 27,160 | |
Trustees’ and officer’s fees | | | 16,885 | | | | 3,126 | | | | 10,732 | | | | 8,460 | | | | 25,515 | | | | 10,091 | |
Custodian & transfer agent fees | | | 11,545 | | | | 66,766 | | | | 67,712 | | | | 18,276 | | | | 16,815 | | | | 30,534 | |
Recapture (Note 3) | | | — | | | | — | | | | — | | | | 43,239 | | | | — | | | | — | |
Other expenses | | | 98,960 | | | | 20,715 | | | | 25,670 | | | | 32,968 | | | | 102,132 | | | | 23,266 | |
| | | | | | | | | | | | | | | | | | | | | | | | |
Total expenses | | | 5,522,399 | | | | 369,107 | | |
| 592,687
|
| |
| 1,103,878
|
| | | 9,289,621 | | | | 1,566,909 | |
| | | | | | | | | | | | | | | | | | | | | | | | |
Less: Waivers | | | (1,300 | ) | | | (91,952 | ) | | | (67,581 | ) | | | (80 | ) | | | (2,155 | ) | | | (46,624 | ) |
| | | | | | | | | | | | | | | | | | | | | | | | |
Net expenses | | | 5,521,099 | | | | 277,155 | | |
| 525,106
|
| |
| 1,103,798
|
| | | 9,287,466 | | | | 1,520,285 | |
| | | | | | | | | | | | | | | | | | | | | | | | |
Net Investment Income | | | 8,066,369 | | | | 394,495 | | |
| 1,546,438
|
| |
| 762,695
|
| | | 2,910,983 | | | | 6,637,957 | |
| | | | | | | | | | | | | | | | | | | | | | | | |
| | | | | | |
| Realized and unrealized gain (loss): | | | | | | | | | | | | | | | | | | | | | | | | |
Net realized gain (loss) from: | | | | | | | | | | | | | | | | | | | | | | | | |
Unaffiliated Investment securities | | | 7,984,505 | | | | (8,017,951 | ) | | | (8,137,259 | ) | | | (1,742,307 | ) | | | (108,630,779 | ) | | | (8,156,419 | ) |
Affiliated investment securities | | | — | | | | — | | | | — | | | | — | | | | — | | | | — | |
Unaffiliated in-kind redemptions | | | 81,858,796 | | | | 1,497,014 | | | | 7,203,835 | | | | 2,156,918 | | | | 229,283,216 | | | | 11,048,817 | |
Affiliatedin-kind redemptions | | | — | | | | — | | | | — | | | | — | | | | — | | | | — | |
Short sales | | | — | | | | — | | | | — | | | | — | | | | — | | | | — | |
Swap agreements | | | — | | | | — | | | | — | | | | — | | | | — | | | | 4,307,709 | |
Foreign currencies | | | — | | | | (2,024 | ) | | | 591 | | | | 384 | | | | — | | | | (36,711 | ) |
Written options | | | — | | | | — | | | | — | | | | — | | | | — | | | | — | |
| | | | | | | | | | | | | | | | | | | | | | | | |
Net realized gain (loss) | | | 89,843,301 | | | | (6,522,961 | ) | | | (932,833 | ) | | | 414,995 | | | | 120,652,437 | | | | 7,163,396 | |
| | | | | | | | | | | | | | | | | | | | | | | | |
Change in net unrealized appreciation (depreciation) on: | | | | | | | | | | | | | | | | | | | | | | | | |
Unaffiliated Investment securities | | | 209,762 | | | | 10,946,472 | | | | 440,634 | | | | 10,918,831 | | | | 28,031,961 | | | | (9,998,711 | ) |
Affiliated investment securities | | | — | | | | — | | | | — | | | | 7,198 | | | | — | | | | — | |
Swap agreements | | | — | | | | — | | | | — | | | | — | | | | — | | | | 58,786 | |
Foreign currencies | | | — | | | | — | | | | — | | | | (10,408 | ) | | | — | | | | (29,643 | ) |
Written options | | | — | | | | — | | | | — | | | | — | | | | — | | | | — | |
| | | | | | | | | | | | | | | | | | | | | | | | |
Net change in unrealized appreciation (depreciation) | | | 209,762 | | | | 10,946,472 | | | | 440,634 | | | | 10,915,621 | | | | 28,031,961 | | | | (9,969,568 | ) |
| | | | | | | | | | | | | | | | | | | | | | | | |
Net realized and unrealized gain (loss) | | | 90,053,063 | | | | 4,423,511 | | | | (492,199 | ) | | | 11,330,616 | | | | 148,684,398 | | | | (2,806,172 | ) |
| | | | | | | | | | | | | | | | | | | | | | | | |
Net increase (decrease) in net assets resulting from operations | | $ | 98,119,432 | | | | $ 4,818,006 | | | | $ 1,054,239 | | | | $12,093,311 | | | | $ 151,595,381 | | | $ | 3,831,785 | |
| | | | | | | | | | | | | | | | | | | | | | | | |
| (a) | Effective April 30, 2019, Invesco BRIC ETF and Invesco Raymond James SB-1 Equity ETF changed fiscal year end to April 30. |
| (b) | For the period September 1, 2018 through April 30, 2019. |
See accompanying Notes to Financial Statements which are an integral part of the financial statements.
| | | | | | | | | | | | | | | | | | | | | | | | | | | | | | | | | | |
Invesco Golden
Dragon China
ETF (PGJ) | | | Invesco Insider
Sentiment
ETF (NFO) | | | Invesco Raymond James
SB-1 Equity ETF (RYJ) | | | Invesco S&P
500 BuyWrite
ETF (PBP) | | | Invesco S&P
500® Quality
ETF (SPHQ) | | | Invesco S&P
Spin-Off
ETF (CSD) | | | Invesco Water
Resources
ETF (PHO) | | | Invesco
WilderHill
Clean Energy
ETF (PBW) | |
Year Ended
April 30, 2019 | | | Year Ended
April 30, 2019 | | | Eight Months Ended
April 30, 2019(b) | | | Year Ended
August 31, 2018 | | | Year Ended
April 30, 2019 | | | Year Ended
April 30, 2019 | | | Year Ended
April 30, 2019 | | | Year Ended
April 30, 2019 | | | Year Ended
April 30, 2019 | |
| | | | | | | | | | | | | | | | | | | | | | | | | | | | | | | | | | |
| $ | 1,499,972 | | | $ | 1,182,945 | | | $ | 1,275,199 | | | $ | 2,193,878 | | | $ | 6,485,087 | | | $ | 24,827,504 | | | $ | 2,162,065 | | | $ | 9,327,101 | | | $ | 353,449 | |
| | 4,641 | | | | 2,486 | | | | 5,908 | | | | 117 | | | | 10,016 | | | | 57,441 | | | | 4,664 | | | | 19,816 | | | | 3,337 | |
| | — | | | | — | | | | — | | | | — | | | | 48,994 | | | | — | | | | 480,625 | | | | — | | | | — | |
| | 649,364 | | | | 632 | | | | 73,961 | | | | 302,578 | | | | — | | | | — | | | | 6,303 | | | | 30,360 | | | | 2,245,840 | |
| | (81,852 | ) | | | — | | | | (1,824 | ) | | | (1,408 | ) | | | — | | | | — | | | | — | | | | — | | | | (40,677 | ) |
| | | | | | | | | | | | | | | | | | | | | | | | | | | | | | | | | | |
| | 2,072,125 | | | | 1,186,063 | | | | 1,353,244 | | | | 2,495,165 | | | | 6,544,097 | | | | 24,884,945 | | | | 2,653,657 | | | | 9,377,277 | | | | 2,561,949 | |
| | | | | | | | | | | | | | | | | | | | | | | | | | | | | | | | | | |
| | | | | | | | |
| | | | | | | | | | | | | | | | | | | | | | | | | | | | | | | | | | |
| | — | | | | — | | | | 850,297 | | | | 1,345,917 | | | | 1,736,106 | | | | — | | | | — | | | | — | | | | — | |
| | 1,071,033 | | | | 349,579 | | | | — | | | | — | | | | — | | | | 2,764,621 | | | | 905,308 | | | | 4,215,575 | | | | 566,379 | |
| | 214,205 | | | | 41,949 | | | | — | | | | — | | | | — | | | | 373,236 | | | | 90,534 | | | | 632,339 | | | | 113,275 | |
| | 43,433 | | | | 26,604 | | | | — | | | | — | | | | — | | | | 119,699 | | | | 45,618 | | | | 81,901 | | | | 32,738 | |
| | 29,171 | | | | 25,688 | | | | — | | | | — | | | | — | | | | 31,966 | | | | 25,718 | | | | 27,869 | | | | 24,006 | |
| | 10,096 | | | | 5,404 | | | | — | | | | — | | | | — | | | | 20,847 | | | | 6,504 | | | | 19,634 | | | | 9,621 | |
| | 88,361 | | | | 12,020 | | | | — | | | | — | | | | — | | | | 34,165 | | | | 7,355 | | | | 6,352 | | | | 25,200 | |
| | 12,430 | | | | — | | | | — | | | | — | | | | — | | | | — | | | | 14,562 | | | | — | | | | — | |
| | 30,754 | | | | 20,842 | | | | — | | | | — | | | | — | | | | 80,773 | | | | 35,046 | | | | 100,545 | | | | 38,452 | |
| | | | | | | | | | | | | | | | | | | | | | | | | | | | | | | | | | |
| | 1,499,483 | | | | 482,086 | | | | 850,297 | | | | 1,345,917 | | | | 1,736,106 | | | | 3,425,307 | | | | 1,130,645 | | | | 5,084,215 | | | | 809,671 | |
| | | | | | | | | | | | | | | | | | | | | | | | | | | | | | | | | | |
| | (422 | ) | | | (62,793 | ) | | | (490 | ) | | | (12 | ) | | | (273 | ) | | | (845,827 | ) | | | (371 | ) | | | (1,681 | ) | | | (16,898 | ) |
| | | | | | | | | | | | | | | | | | | | | | | | | | | | | | | | | | |
| | 1,499,061 | | | | 419,293 | | | | 849,807 | | | | 1,345,905 | | | | 1,735,833 | | | | 2,579,480 | | | | 1,130,274 | | | | 5,082,534 | | | | 792,773 | |
| | | | | | | | | | | | | | | | | | | | | | | | | | | | | | | | | | |
| | 573,064 | | | | 766,770 | | | | 503,437 | | | | 1,149,260 | | | | 4,808,264 | | | | 22,305,465 | | | | 1,523,383 | | | | 4,294,743 | | | | 1,769,176 | |
| | | | | | | | | | | | | | | | | | | | | | | | | | | | | | | | | | |
| | | | | | | | |
| | | | | | | | | | | | | | | | | | | | | | | | | | | | | | | | | | |
| | | | | | | | | | | | | | | | | | | | | | | | | | | | | | | | | | |
| | (24,178,466 | ) | | | (1,400,094 | ) | | | (11,717,153 | ) | | | (9,820,039 | ) | | | (4,140,970 | ) | | | (129,037,487 | ) | | | (8,995,628 | ) | | | (11,515,050 | ) | | | (4,919,621 | ) |
| | — | | | | — | | | | — | | | | | | | | (20,205 | ) | | | (868,341 | ) | | | — | | | | — | | | | — | |
| | 36,079,816 | | | | 3,128,499 | | | | 10,556,912 | | | | 34,177,825 | | | | 24,067,881 | | | | 152,568,271 | | | | 18,141,116 | | | | 56,137,984 | | | | 10,594,328 | |
| | — | | | | — | | | | — | | | | — | | | | (1,092 | ) | | | (14,859 | ) | | | — | | | | — | | | | — | |
| | — | | | | — | | | | — | | | | — | | | | (195,252 | ) | | | — | | | | — | | | | — | | | | — | |
| | — | | | | — | | | | — | | | | — | | | | — | | | | — | | | | — | | | | — | | | | — | |
| | — | | | | — | | | | — | | | | — | | | | — | | | | — | | | | — | | | | — | | | | — | |
| | — | | | | — | | | | — | | | | — | | | | (25,251,191 | ) | | | — | | | | — | | | | — | | | | — | |
| | | | | | | | | | | | | | | | | | | | | | | | | | | | | | | | | | |
| | 11,901,350 | | | | 1,728,405 | | | | (1,160,241 | ) | | | 24,357,786 | | | | (5,540,829 | ) | | | 22,647,584 | | | | 9,145,488 | | | | 44,622,934 | | | | 5,674,707 | |
| | | | | | | | | | | | | | | | | | | | | | | | | | | | | | | | | | |
|
|
| | | | | | | | | | | | | | | | | | | | | | | | | | | | | | | | |
| | (33,512,069 | ) | | | 2,296,044 | | | | (14,274,311 | ) | | | 17,075,286 | | | | 12,650,501 | | | | 131,935,043 | | | | (14,390,165 | ) | | | 75,770,242 | | | | 9,670,394 | |
| | — | | | | — | | | | — | | | | — | | | | (21,645 | ) | | | 712,040 | | | | — | | | | — | | | | — | |
| | — | | | | — | | | | — | | | | — | | | | — | | | | — | | | | — | | | | — | | | | — | |
| | — | | | | — | | | | — | | | | — | | | | — | | | | — | | | | — | | | | — | | | | — | |
| | — | | | | — | | | | — | | | | — | | | | (4,728,379 | ) | | | — | | | | — | | | | — | | | | — | |
| | | | | | | | | | | | | | | | | | | | | | | | | | | | | | | | | | |
| (33,512,069 | ) | | | 2,296,044 | | | | (14,274,311 | ) | | | 17,075,286 | | | | 7,900,477 | | | | 132,647,083 | | | | (14,390,165 | ) | | | 75,770,242 | | | | 9,670,394 | |
| | | | | | | | | | | | | | | | | | | | | | | | | | | | | | | | | | |
| | (21,610,719 | ) | | | 4,024,449 | | | | (15,434,552 | ) | | | 41,433,072 | | | | 2,359,648 | | | | 155,294,667 | | | | (5,244,677 | ) | | | 120,393,176 | | | | 15,345,101 | |
| | | | | | | | | | | | | | | | | | | | | | | | | | | | | | | | | | |
$ | (21,037,655 | ) | | $ | 4,791,219 | | | $ | (14,931,115 | ) | | $ | 42,582,332 | | | $ | 7,167,912 | | �� | $ | 177,600,132 | | | $ | (3,721,294 | ) | | $ | 124,687,919 | | | $ | 17,114,277 | |
| | | | | | | | | | | | | | | | | | | | | | | | | | | | | | | | | | |
Statements of Changes in Net Assets
For the year ended April 30, 2019 and 2018(a)
| | | | | | | | | | | | | | | | | | | | | | | | | | | | |
| | | Invesco Aerospace & Defense
ETF (PPA) | | | Invesco BRIC ETF (EEB) | | | Invesco Cleantech™
ETF (PZD) | |
| | | Year Ended
April 30, 2019 | | | Year Ended
April 30, 2018 | | | Eight Months Ended
April 30, 2019(b) | | | Year Ended
August 31, 2018 | | | Year Ended
August 31, 2017 | | | Year Ended
April 30, 2019 | | | Year Ended
April 30, 2018 | |
| Operations: | | | | | | | | | | | | | | | | | | | | | | | | | | | | |
Net investment income | | $ | 8,066,369 | | | $ | 6,482,073 | | | $ | 394,495 | | | $ | 1,546,438 | | | $ | 1,338,868 | | | $ | 762,695 | | | $ | 800,030 | |
Net realized gain (loss) | | | 89,843,301 | | | | 34,945,173 | | | | (6,522,961 | ) | | | (932,833 | ) | | | (10,451,107 | ) | | | 414,995 | | | | 26,168 | |
Change in unrealized appreciation (depreciation) | | | 209,762 | | | | 121,310,441 | | | | 10,946,472 | | | | 440,634 | | | | 28,431,956 | | | | 10,915,621 | | | | 14,324,263 | |
| | | | | | | | | | | | | | | | | | | | | | | | | | | | |
Net increase (decrease) in net assets resulting from operations | | | 98,119,432 | | | | 162,737,687 | | | | 4,818,006 | | | | 1,054,239 | | | | 19,319,717 | | | | 12,093,311 | | | | 15,150,461 | |
| | | | | | | | | | | | | | | | | | | | | | | | | | | | |
| | | | | | | |
| Distributions to Shareholders from: | | | | | | | | | | | | | | | | | | | | | | | | | | | | |
Distributable earnings | | | (8,051,313 | ) | | | (5,890,874 | ) | | | (1,731,261 | ) | | | (1,588,508 | ) | | | (1,048,634 | ) | | | (870,880 | ) | | | (1,006,758 | ) |
Return of capital | | | — | | | | — | | | | — | | | | — | | | | — | | | | — | | | | — | |
| | | | | | | | | | | | | | | | | | | | | | | | | | | | |
Total distributions to shareholders | | | (8,051,313 | ) | | | (5,890,874 | ) | | | (1,731,261 | ) | | | (1,588,508 | ) | | | (1,048,634 | ) | | | (870,880 | ) | | | (1,006,758 | ) |
| | | | | | | | | | | | | | | | | | | | | | | | | | | | |
| | | | | | | |
| Shareholder Transactions: | | | | | | | | | | | | | | | | | | | | | | | | | | | | |
Proceeds from shares sold | | | 67,402,990 | | | | 357,161,751 | | | | 9,001,851 | | | | 7,466,289 | | | | 4,620,024 | | | | 13,011,807 | | | | 57,512,328 | |
Value of shares repurchased | | | (225,933,878 | ) | | | (76,449,431 | ) | | | (8,639,382 | ) | | | (24,294,005 | ) | | | (10,941,555 | ) | | | (4,170,443 | ) | | | (4,238,208 | ) |
| | | | | | | | | | | | | | | | | | | | | | | | | | | | |
Net increase (decrease) in net assets resulting from share transactions | | | (158,530,888 | ) | | | 280,712,320 | | | | 362,469 | | | | (16,827,716 | ) | | | (6,321,531 | ) | | | 8,841,364 | | | | 53,274,120 | |
| | | | | | | | | | | | | | | | | | | | | | | | | | | | |
Net increase (decrease) in net assets | | | (68,462,769 | ) | | | 437,559,133 | | | | 3,449,214 | | | | (17,361,985 | ) | | | 11,949,552 | | | | 20,063,795 | | | | 67,417,823 | |
| | | | | | | | | | | | | | | | | | | | | | | | | | | | |
| | | | | | | |
| Net assets: | | | | | | | | | | | | | | | | | | | | | | | | | | | | |
Beginning of period | | | 1,006,708,623 | | | | 569,149,490 | | | | 69,067,204 | | | | 86,429,189 | | | | 74,479,637 | | | | 160,056,894 | | | | 92,639,071 | |
| | | | | | | | | | | | | | | | | | | | | | | | | | | | |
End of period | | $ | 938,245,854 | | | $ | 1,006,708,623 | | | $ | 72,516,418 | | | $ | 69,067,204 | | | $ | 86,429,189 | | | $ | 180,120,689 | | | $ | 160,056,894 | |
| | | | | | | | | | | | | | | | | | | | | | | | | | | | |
| | | | | | | |
| Changes in Shares Outstanding: | | | | | | | | | | | | | | | | | | | | | | | | | | | | |
Shares sold | | | 1,150,000 | | | | 6,850,000 | | | | 250,000 | | | | 200,000 | | | | 150,000 | | | | 300,000 | | | | 1,400,000 | |
Shares repurchased | | | (4,100,000 | ) | | | (1,450,000 | ) | | | (250,000 | ) | | | (650,000 | ) | | | (350,000 | ) | | | (100,000 | ) | | | (100,000 | ) |
Shares outstanding, beginning of period | | | 18,100,000 | | | | 12,700,000 | | | | 1,950,800 | | | | 2,400,800 | | | | 2,600,800 | | | | 3,800,000 | | | | 2,500,000 | |
| | | | | | | | | | | | | | | | | | | | | | | | | | | | |
Shares outstanding, end of period | | | 15,150,000 | | | | 18,100,000 | | | | 1,950,800 | | | | 1,950,800 | | | | 2,400,800 | | | | 4,000,000 | | | | 3,800,000 | |
| | | | | | | | | | | | | | | | | | | | | | | | | | | | |
| (a) | Effective April 30, 2019, Invesco BRIC ETF and Invesco Raymond James SB-1 Equity ETF changed fiscal year end to April 30. |
| (b) | For the period September 1, 2018 through April 30, 2019. |
See accompanying Notes to Financial Statements which are an integral part of the financial statements.
| | | | | | | | | | | | | | | | | | | | | | | | | | | | | | | | | | |
Invesco DWA Momentum
ETF (PDP) | | | Invesco Global Listed Private
Equity ETF (PSP) | | | Invesco Golden Dragon
China ETF (PGJ) | | | Invesco Insider Sentiment ETF (NFO) | |
Year Ended
April 30, 2019 | | | Year Ended
April 30, 2018 | | | Year Ended
April 30, 2019 | | | Year Ended
April 30, 2018 | | | Year Ended
April 30, 2019 | | | Year Ended
April 30, 2018 | | | Year Ended
April 30, 2019 | | | Eight Months Ended
April 30, 2018 | | | Year Ended
August 31, 2017 | |
| | | | | | | | | | | | | | | | | | | | | | | | | | | | | | | | | | |
| $ | 2,910,983 | | | $ | 3,907,326 | | | $ | 6,637,957 | | | $ | 8,919,591 | | | $ | 573,064 | | | $ | 1,596,220 | | | $ | 766,770 | | | $ | 528,856 | | | $ | 846,653 | |
| | 120,652,437 | | | | 123,565,986 | | | | 7,163,396 | | | | 11,410,748 | | | | 11,901,350 | | | | 15,709,466 | | | | 1,728,405 | | | | 10,792,154 | | | | 8,611,615 | |
| 28,031,961 | | | | 78,799,951 | | | | (9,969,568 | ) | | | 10,322,795 | | | | (33,512,069 | ) | | | 31,163,538 | | | | 2,296,044 | | | | (3,503,720 | ) | | | 1,141,424 | |
| | | | | | | | | | | | | | | | | | | | | | | | | | | | | | | | | | |
| 151,595,381 | | | | 206,273,263 | | | | 3,831,785 | | | | 30,653,134 | | | | (21,037,655 | ) | | | 48,469,224 | | | | 4,791,219 | | | | 7,817,290 | | | | 10,599,692 | |
| | | | | | | | | | | | | | | | | | | | | | | | | | | | | | | | | | |
| | | | | | | | |
|
|
| | | | | | | | | | | | | | | | | | | | | | | | | | | | | | | | |
| | (2,302,714 | ) | | | (3,926,777 | ) | | | (8,142,823 | ) | | | (30,958,567 | ) | | | (536,515 | ) | | | (4,673,478 | ) | | | (651,057 | ) | | | (1,099,212 | ) | | | (1,266,043 | ) |
| | — | | | | (231,609 | ) | | | — | | | | (1,046,678 | ) | | | — | | | | — | | | | — | | | | — | | | | — | |
| | | | | | | | | | | | | | | | | | | | | | | | | | | | | | | | | | |
| (2,302,714 | ) | | | (4,158,386 | ) | | | (8,142,823 | ) | | | (32,005,245 | ) | | | (536,515 | ) | | | (4,673,478 | ) | | | (651,057 | ) | | | (1,099,212 | ) | | | (1,266,043 | ) |
| | | | | | | | | | | | | | | | | | | | | | | | | | | | | | | | | | |
| | | | | | | | |
| | | | | | | | | | | | | | | | | | | | | | | | | | | | | | | | | | |
| | 978,754,798 | | | | 775,260,655 | | | | 62,756,056 | | | | 56,982,533 | | | | 45,958,312 | | | | 120,208,928 | | | | 19,121,597 | | | | 61,785,509 | | | | 69,469,888 | |
| | (1,104,009,298 | ) | | | (872,536,302 | ) | | | (59,054,014 | ) | | | (96,721,963 | ) | | | (78,862,572 | ) | | | (46,256,021 | ) | | | (25,251,063 | ) | | | (67,946,474 | ) | | | (84,658,617 | ) |
| | | | | | | | | | | | | | | | | | | | | | | | | | | | | | | | | | |
| (125,254,500 | ) | | | (97,275,647 | ) | | | 3,702,042 | | | | (39,739,430 | ) | | | (32,904,260 | ) | | | 73,952,907 | | | | (6,129,466 | ) | | | (6,160,965 | ) | | | (15,188,729 | ) |
| | | | | | | | | | | | | | | | | | | | | | | | | | | | | | | | | | |
| 24,038,167 | | | | 104,839,230 | | | | (608,996 | ) | | | (41,091,541 | ) | | | (54,478,430 | ) | | | 117,748,653 | | | | (1,989,304 | ) | | | 557,113 | | | | (5,855,080 | ) |
| | | | | | | | | | | | | | | | | | | | | | | | | | | | | | | | | | |
| | | | | | | | |
| | | | | | | | | | | | | | | | | | | | | | | | | | | | | | | | | | |
| | 1,521,909,062 | | | | 1,417,069,832 | | | | 245,051,785 | | | | 286,143,326 | | | | 271,208,214 | | | | 153,459,561 | | | | 72,684,896 | | | | 72,127,783 | | | | 77,982,863 | |
| | | | | | | | | | | | | | | | | | | | | | | | | | | | | | | | | | |
| $ | 1,545,947,229 | | | $ | 1,521,909,062 | | | $ | 244,442,789 | | | $ | 245,051,785 | | | $ | 216,729,784 | | | $ | 271,208,214 | | | $ | 70,695,592 | | | $ | 72,684,896 | | | $ | 72,127,783 | |
| | | | | | | | | | | | | | | | | | | | | | | | | | | | | | | | | | |
| | | | | | | | |
|
|
| | | | | | | | | | | | | | | | | | | | | | | | | | | | | | | | |
| | 18,100,000 | | | | 15,450,000 | | | | 5,350,000 | | | | 4,500,000 | | | | 950,000 | | | | 2,700,000 | | | | 300,000 | | | | 1,000,000 | | | | 1,350,000 | |
| | (20,700,000 | ) | | | (17,450,000 | ) | | | (5,250,000 | ) | | | (7,750,000 | ) | | | (1,750,000 | ) | | | (1,050,000 | ) | | | (400,000 | ) | | | (1,100,000 | ) | | | (1,650,000 | ) |
| 28,900,000 | | | | 30,900,000 | | | | 20,100,000 | | | | 23,350,000 | | | | 5,950,000 | | | | 4,300,000 | | | | 1,150,800 | | | | 1,250,800 | | | | 1,550,800 | |
| | | | | | | | | | | | | | | | | | | | | | | | | | | | | | | | | | |
| 26,300,000 | | | | 28,900,000 | | | | 20,200,000 | | | | 20,100,000 | | | | 5,150,000 | | | | 5,950,000 | | | | 1,050,800 | | | | 1,150,800 | | | | 1,250,800 | |
| | | | | | | | | | | | | | | | | | | | | | | | | | | | | | | | | | |
Statements of Changes in Net Assets(continued)
For the year ended April 30, 2019 and 2018(a)
| | | | | | | | | | | | | | | | | | | | |
| | | Invesco Raymond James SB-1 Equity ETF (RYJ) | | | Invesco S&P 500 BuyWrite
ETF (PBP) | |
| | | Eight Months Ended
April 30, 2019(b) | | | Year Ended
August 31, 2018 | | | Year Ended
August 31, 2017 | | | Year Ended
April 30, 2019 | | | Year Ended
April 30, 2018 | |
| Operations: | | | | | | | | | | | | | | | | | | | | |
Net investment income | | $ | 503,437 | | | $ | 1,149,260 | | | $ | 564,317 | | | $ | 4,808,264 | | | $ | 4,051,094 | |
Net realized gain (loss) | | | (1,160,241 | ) | | | 24,357,786 | | | | 24,322,348 | | | | (5,540,829 | ) | | | 291,784 | |
Change in unrealized appreciation (depreciation) | | | (14,274,311 | ) | | | 17,075,286 | | | | (6,053,102 | ) | | | 7,900,477 | | | | 16,313,957 | |
| | | | | | | | | | | | | | | | | | | | |
Net increase (decrease) in net assets resulting from operations | | | (14,931,115 | ) | | | 42,582,332 | | | | 18,833,563 | | | | 7,167,912 | | | | 20,656,835 | |
| | | | | | | | | | | | | | | | | | | | |
| | | | | |
| Distributions to Shareholders from: | | | | | | | | | | | | | | | | | | | | |
Distributable earnings | | | (2,047,360 | ) | | | — | | | | (2,566,671 | ) | | | (8,385,502 | ) | | | (35,632,329 | ) |
Return of capital | | | — | | | | — | | | | (331,196 | ) | | | — | | | | — | |
| | | | | | | | | | | | | | | | | | | | |
Total distributions to shareholders | | | (2,047,360 | ) | | | — | | | | (2,897,867 | ) | | | (8,385,502 | ) | | | (35,632,329 | ) |
| | | | | | | | | | | | | | | | | | | | |
| | | | | |
| Shareholder Transactions: | | | | | | | | | | | | | | | | | | | | |
Proceeds from shares sold | | | 28,666,826 | | | | 81,954,730 | | | | 68,210,447 | | | | 94,564,629 | | | | 70,858,906 | |
Value of shares repurchased | | | (39,092,608 | ) | | | (109,778,150 | ) | | | (79,129,012 | ) | | | (74,865,327 | ) | | | (81,183,674 | ) |
| | | | | | | | | | | | | | | | | | | | |
Net increase (decrease) in net assets resulting from share transactions | | | (10,425,782 | ) | | | (27,823,420 | ) | | | (10,918,565 | ) | | | 19,699,302 | | | | (10,324,768 | ) |
| | | | | | | | | | | | | | | | | | | | |
Net increase (decrease) in net assets | | | (27,404,257 | ) | | | 14,758,912 | | | | 5,017,131 | | | | 18,481,712 | | | | (25,300,262 | ) |
| | | | | | | | | | | | | | | | | | | | |
| | | | | |
| Net assets: | | | | | | | | | | | | | | | | | | | | |
Beginning of period | | | 200,560,318 | | | | 185,801,406 | | | | 180,784,275 | | | | 302,295,959 | | | | 327,596,221 | |
| | | | | | | | | | | | | | | | | | | | |
End of period | | $ | 173,156,061 | | | $ | 200,560,318 | | | $ | 185,801,406 | | | $ | 320,777,671 | | | $ | 302,295,959 | |
| | | | | | | | | | | | | | | | | | | | |
| | | | | |
| Changes in Shares Outstanding: | | | | | | | | | | | | | | | | | | | | |
Shares sold | | | 650,000 | | | | 1,800,000 | | | | 1,750,000 | | | | 4,400,000 | | | | 3,200,000 | |
Shares repurchased | | | (900,000 | ) | | | (2,450,000 | ) | | | (2,050,000 | ) | | | (3,600,000 | ) | | | (3,750,000 | ) |
Shares outstanding, beginning of period | | | 4,072,822 | | | | 4,722,822 | | | | 5,022,822 | | | | 14,200,000 | | | | 14,750,000 | |
| | | | | | | | | | | | | | | | | | | | |
Shares outstanding, end of period | | | 3,822,822 | | | | 4,072,822 | | | | 4,722,822 | | | | 15,000,000 | | | | 14,200,000 | |
| | | | | | | | | | | | | | | | | | | | |
| (a) | Effective April 30, 2019, Invesco BRIC ETF and Invesco Raymond James SB-1 Equity ETF changed fiscal year end to April 30. |
| (b) | For the period September 1, 2018 through April 30, 2019. |
| (c) | Changes in shares outstanding have been restated to reflect a one-for-five reverse stock split effective after the close of business on October 20, 2017. |
See accompanying Notes to Financial Statements which are an integral part of the financial statements.
| | | | | | | | | | | | | | | | | | | | | | | | | | | | | | | | | | |
Invesco S&P 500® Quality
ETF (SPHQ) | | | Invesco S&P Spin-Off ETF (CSD) | | | Invesco Water Resources
ETF (PHO) | | | Invesco WilderHill Clean
Energy ETF (PBW) | |
Year Ended
April 30, 2019 | | | Year Ended
April 30, 2018 | | | Year Ended
April 30, 2019 | | | Eight Months Ended
April 30, 2018 | | | Year Ended
August 31, 2017 | | | Year Ended
April 30, 2019 | | | Year Ended
April 30, 2018 | | | Year Ended
April 30, 2019 | | | Year Ended
April 30, 2018 | |
| | | | | | | | | | | | | | | | | | | | | | | | | | | | | | | | | | |
| $ | 22,305,465 | | | $ | 25,754,531 | | | $ | 1,523,383 | | | $ | 161,649 | | | $ | 1,750,605 | | | $ | 4,294,743 | | | $ | 2,565,991 | | | $ | 1,769,176 | | | $ | 1,389,936 | |
| | 22,647,584 | | | | 122,490,848 | | | | 9,145,488 | | | | 20,463,166 | | | | 21,344,035 | | | | 44,622,934 | | | | 94,312,738 | | | | 5,674,707 | | | | 9,444,312 | |
| | 132,647,083 | | | | (35,985,754 | ) | | | (14,390,165 | ) | | | (6,277,380 | ) | | | 11,070,738 | | | | 75,770,242 | | | | 6,550,510 | | | | 9,670,394 | | | | 7,305,875 | |
| | | | | | | | | | | | | | | | | | | | | | | | | | | | | | | | | | |
| | 177,600,132 | | | | 112,259,625 | | | | (3,721,294 | ) | | | 14,347,435 | | | | 34,165,378 | | | | 124,687,919 | | | | 103,429,239 | | | | 17,114,277 | | | | 18,140,123 | |
| | | | | | | | | | | | | | | | | | | | | | | | | | | | | | | | | | |
| | | | | | | | |
| | | | | | | | | | | | | | | | | | | | | | | | | | | | | | | | | | |
| | (21,455,885 | ) | | | (26,665,792 | ) | | | (1,410,652 | ) | | | (836,626 | ) | | | (3,264,300 | ) | | | (3,503,105 | ) | | | (3,090,361 | ) | | | (1,768,255 | ) | | | (1,382,506 | ) |
| | — | | | | — | | | | — | | | | (438,719 | ) | | | — | | | | — | | | | — | | | | — | | | | — | |
| | | | | | | | | | | | | | | | | | | | | | | | | | | | | | | | | | |
| | (21,455,885 | ) | | | (26,665,792 | ) | | | (1,410,652 | ) | | | (1,275,345 | ) | | | (3,264,300 | ) | | | (3,503,105 | ) | | | (3,090,361 | ) | | | (1,768,255 | ) | | | (1,382,506 | ) |
| | | | | | | | | | | | | | | | | | | | | | | | | | | | | | | | | | |
| | | | | | | | |
| | | | | | | | | | | | | | | | | | | | | | | | | | | | | | | | | | |
| | 738,880,207 | | | | 852,029,039 | | | | 38,961,813 | | | | 57,422,266 | | | | 47,467,855 | | | | 164,167,797 | | | | 130,879,008 | | | | 43,306,082 | | | | 40,526,760 | |
| | (752,396,827 | ) | | | (832,688,672 | ) | | | (89,549,926 | ) | | | (63,168,204 | ) | | | (99,479,219 | ) | | | (165,631,704 | ) | | | (206,816,747 | ) | | | (30,057,580 | ) | | | (44,198,575 | ) |
| | | | | | | | | | | | | | | | | | | | | | | | | | | | | | | | | | |
| | | | | | | | |
| | (13,516,620 | ) | | | 19,340,367 | | | | (50,588,113 | ) | | | (5,745,938 | ) | | | (52,011,364 | ) | | | (1,463,907 | ) | | | (75,937,739 | ) | | | 13,248,502 | | | | (3,671,815 | ) |
| | | | | | | | | | | | | | | | | | | | | | | | | | | | | | | | | | |
| | 142,627,627 | | | | 104,934,200 | | | | (55,720,059 | ) | | | 7,326,152 | | | | (21,110,286 | ) | | | 119,720,907 | | | | 24,401,139 | | | | 28,594,524 | | | | 13,085,802 | |
| | | | | | | | | | | | | | | | | | | | | | | | | | | | | | | | | | |
| | | | | | | | |
| | | | | | | | | | | | | | | | | | | | | | | | | | | | | | | | | | |
| | 1,327,157,491 | | | | 1,222,223,291 | | | | 202,534,472 | | | | 195,208,320 | | | | 216,318,606 | | | | 821,547,910 | | | | 797,146,771 | | | | 116,262,680 | | | | 103,176,878 | |
| | | | | | | | | | | | | | | | | | | | | | | | | | | | | | | | | | |
| $ | 1,469,785,118 | | | $ | 1,327,157,491 | | | $ | 146,814,413 | | | $ | 202,534,472 | | | $ | 195,208,320 | | | $ | 941,268,817 | | | $ | 821,547,910 | | | $ | 144,857,204 | | | $ | 116,262,680 | |
| | | | | | | | | | | | | | | | | | | | | | | | | | | | | | | | | | |
| | | | | | | | |
| | | | | | | | | | | | | | | | | | | | | | | | | | | | | | | | | | |
| | 24,350,000 | | | | 29,300,000 | | | | 750,000 | | | | 1,100,000 | | | | 1,050,000 | | | | 5,000,000 | | | | 4,550,000 | | | | 1,600,000 | | | | 1,630,000 | (c) |
| | (25,150,000 | ) | | | (28,600,000 | ) | | | (1,800,000 | ) | | | (1,200,000 | ) | | | (2,200,000 | ) | | | (5,150,000 | ) | | | (7,100,000 | ) | | | (1,200,000 | ) | | | (1,861,727 | )(c) |
| | 44,950,000 | | | | 44,250,000 | | | | 3,850,000 | | | | 3,950,000 | | | | 5,100,000 | | | | 27,300,000 | | | | 29,850,000 | | | | 4,718,273 | | | | 4,950,000 | (c) |
| | | | | | | | | | | | | | | | | | | | | | | | | | | | | | | | | | |
| | 44,150,000 | | | | 44,950,000 | | | | 2,800,000 | | | | 3,850,000 | | | | 3,950,000 | | | | 27,150,000 | | | | 27,300,000 | | | | 5,118,273 | | | | 4,718,273 | (c) |
| | | | | | | | | | | | | | | | | | | | | | | | | | | | | | | | | | |
Financial Highlights
Invesco Aerospace & Defense ETF (PPA)
| | | | | | | | | | | | | | | | | | | | |
| | | Years Ended April 30, | |
| | | 2019 | | | 2018 | | | 2017 | | | 2016 | | | 2015 | |
| Per Share Operating Performance: | | | | | | | | | | | | | | | | | | | | |
Net asset value at beginning of year | | $ | 55.62 | | | $ | 44.81 | | | $ | 36.43 | | | $ | 35.73 | | | $ | 32.16 | |
Net investment income(a) | | | 0.49 | | | | 0.42 | | | | 0.60 | | | | 0.53 | (b) | | | 0.32 | |
Net realized and unrealized gain on investments | | | 6.30 | | | | 10.79 | | | | 8.43 | | | | 0.67 | | | | 3.52 | |
Total from investment operations | | | 6.79 | | | | 11.21 | | | | 9.03 | | | | 1.20 | | | | 3.84 | |
Distributions to shareholders from: | | | | | | | | | | | | | | | | | | | | |
Net investment income | | | (0.48 | ) | | | (0.40 | ) | | | (0.65 | ) | | | (0.50 | ) | | | (0.27 | ) |
Net asset value at end of year | | $ | 61.93 | | | $ | 55.62 | | | $ | 44.81 | | | $ | 36.43 | | | $ | 35.73 | |
Market price at end of year(c) | | $ | 61.94 | | | $ | 55.66 | | | $ | 44.84 | | | $ | 36.42 | | | $ | 35.71 | |
| Net Asset Value Total Return(d) | | | 12.33 | % | | | 25.13 | % | | | 25.06 | % | | | 3.43 | % | | | 11.99 | % |
| Market Price Total Return(d) | | | 12.27 | % | | | 25.14 | % | | | 25.18 | % | | | 3.46 | % | | | 11.96 | % |
| Ratios/Supplemental Data: | | | | | | | | | | | | | | | | | | | | |
Net assets at end of year (000’s omitted) | | $ | 938,246 | | | $ | 1,006,709 | | | $ | 569,149 | | | $ | 298,735 | | | $ | 262,613 | |
Ratio to average net assets of: | | | | | | | | | | | | | | | | | | | | |
Expenses, after Waivers | | | 0.59 | % | | | 0.60 | % | | | 0.61 | % | | | 0.64 | % | | | 0.66 | % |
Expenses, prior to Waivers | | | 0.59 | % | | | 0.60 | % | | | 0.61 | % | | | 0.64 | % | | | 0.66 | % |
Net investment income, after Waivers | | | 0.86 | % | | | 0.80 | % | | | 1.47 | % | | | 1.50 | %(b) | | | 0.94 | % |
Portfolio turnover rate(e) | | | 15 | % | | | 7 | % | | | 10 | % | | | 16 | % | | | 13 | % |
| (a) | Based on average shares outstanding. |
| (b) | Net Investment income per share and the ratio of net investment income to average net assets include a significant dividend received during the year. Net investment income per share and the ratio of net investment income to average net assets excluding the significant dividends are $0.33 and 0.93%, respectively. |
| (c) | The mean between the last bid and ask prices. |
| (d) | Net asset value total return is calculated assuming an initial investment made at the net asset value at the beginning of the period, reinvestment of all dividends and distributions at net asset value during the period, and redemption on the last day of the period. Net asset value total return includes adjustments in accordance with accounting principles generally accepted in the United States of America and as such, the net asset value for financial reporting purposes and the returns based upon those net asset values may differ from the net asset value and returns for shareholder transactions. Market price total return is calculated assuming an initial investment made at the market price at the beginning of the period, reinvestment of all dividends and distributions at market price during the period, and sale at the market price on the last day of the period. Total investment returns calculated for a period of less than one year are not annualized. |
| (e) | Portfolio turnover rate is not annualized for periods less than one year, if applicable, and does not include securities received or delivered from processing creations or redemptions. |
Invesco BRIC ETF (EEB)
| | | | | | | | | | | | | | | | | | | | | | | | |
| | | Eight Months
Ended
April 30, 2019 | | | Years Ended August 31, | |
| | | 2018 | | | 2017 | | | 2016 | | | 2015 | | | 2014 | |
| Per Share Operating Performance: | | | | | | | | | | | | | | | | | | | | | | | | |
Net asset value at beginning of period | | $ | 35.40 | | | $ | 36.00 | | | $ | 28.64 | | | $ | 24.97 | | | $ | 37.98 | | | $ | 31.99 | |
Net investment income(a) | | | 0.21 | | | | 0.66 | | | | 0.53 | | | | 0.36 | | | | 0.56 | | | | 0.75 | |
Net realized and unrealized gain (loss) on investments | | | 2.55 | | | | (0.62 | ) | | | 7.24 | | | | 3.79 | | | | (12.54 | ) | | | 6.10 | |
Total from investment operations | | | 2.76 | | | | 0.04 | | | | 7.77 | | | | 4.15 | | | | (11.98 | ) | | | 6.85 | |
Distributions to shareholders from: | | | | | | | | | | | | | | | | | | | | | | | | |
Net investment income | | | (0.99 | ) | | | (0.64 | ) | | | (0.41 | ) | | | (0.48 | ) | | | (1.03 | ) | | | (0.86 | ) |
Net asset value at end of period | | $ | 37.17 | | | $ | 35.40 | | | $ | 36.00 | | | $ | 28.64 | | | $ | 24.97 | | | $ | 37.98 | |
Market price at end of period | | $ | 37.21 | (b) | | $ | 35.39 | (b) | | $ | 36.03 | | | $ | 28.54 | | | $ | 24.95 | | | $ | 37.84 | |
| Net asset value Total Return(c) | | | 8.34 | % | | | 0.01 | % | | | 27.49 | % | | | 16.97 | % | | | (31.90 | )% | | | 21.68 | % |
| Market Price Total Return(c) | | | 8.47 | % | | | (0.10 | )% | | | | | | | | | | | | | | | | |
| Ratios/Supplemental Data: | | | | | | | | | | | | | | | | | | | | | | | | |
Net assets at end of period (000’s omitted) | | $ | 72,516 | | | $ | 69,067 | | | $ | 86,429 | | | $ | 74,480 | | | $ | 86,177 | | | $ | 180,427 | |
Ratio to average net assets of: | | | | | | | | | | | | | | | | | | | | | | | | |
Expenses, after waivers | | | 0.64 | %(d) | | | 0.59 | % | | | 0.64 | % | | | 0.64 | % | | | 0.64 | % | | | 0.64 | % |
Expenses, prior to waivers | | | 0.85 | %(d) | | | 0.67 | % | | | 0.75 | % | | | 0.78 | % | | | 0.70 | % | | | 0.66 | % |
Net investment income, after waivers | | | 0.91 | %(d) | | | 1.75 | % | | | 1.69 | % | | | 1.41 | % | | | 1.81 | % | | | 2.17 | % |
Portfolio turnover rate(e) | | | 42 | % | | | 39 | % | | | 41 | % | | | 24 | % | | | 24 | % | | | 68 | % |
| (a) | Based on average shares outstanding. |
| (b) | The mean between the last bid and ask prices. |
| (c) | Net asset value total return is calculated assuming an initial investment made at the net asset value at the beginning of the period, reinvestment of all dividends and distributions at net asset value during the period, and redemption on the last day of the period. Net asset value total return includes adjustments in accordance with accounting principles generally accepted in the United States of America and as such, the net asset value for financial reporting purposes and the returns based upon those net asset values may differ from the net asset value and returns for shareholder transactions. Market price total return is calculated assuming an initial investment made at the market price at the beginning of the period, reinvestment of all dividends and distributions at market price during the period, and sale at the market price on the last day of the period. Total investment returns calculated for a period of less than one year are not annualized. |
| (e) | Portfolio turnover rate is not annualized for periods less than one year, if applicable, and does not include securities received or delivered from processing creations or redemptions. |
See accompanying Notes to Financial Statements which are an integral part of the financial statements.
Financial Highlights(continued)
Invesco CleantechTM ETF (PZD)
| | | | | | | | | | | | | | | | | | | | |
| | | Years Ended April 30, | |
| | | 2019 | | | 2018 | | | 2017 | | | 2016 | | | 2015 | |
| Per Share Operating Performance: | | | | | | | | | | | | | | | | | | | | |
Net asset value at beginning of year | | $ | 42.12 | | | $ | 37.06 | | | $ | 30.41 | | | $ | 30.60 | | | $ | 31.90 | |
Net investment income(a) | | | 0.19 | | | | 0.25 | | | | 0.59 | (b) | | | 0.22 | | | | 0.27 | |
Net realized and unrealized gain (loss) on investments | | | 2.95 | | | | 5.18 | | | | 6.41 | | | | (0.18 | ) | | | (1.33 | ) |
Total from investment operations | | | 3.14 | | | | 5.43 | | | | 7.00 | | | | 0.04 | | | | (1.06 | ) |
Distributions to shareholders from: | | | | | | | | | | | | | | | | | | | | |
Net investment income | | | (0.23 | ) | | | (0.37 | ) | | | (0.35 | ) | | | (0.23 | ) | | | (0.24 | ) |
Net asset value at end of year | | $ | 45.03 | | | $ | 42.12 | | | $ | 37.06 | | | $ | 30.41 | | | $ | 30.60 | |
Market price at end of year(c) | | $ | 45.21 | | | $ | 42.26 | | | $ | 37.19 | | | $ | 30.29 | | | $ | 30.54 | |
| Net Asset Value Total Return(d) | | | 7.48 | % | | | 14.74 | % | | | 23.21 | % | | | 0.15 | % | | | (3.36 | )% |
| Market Price Total Return(d) | | | 7.55 | % | | | 14.72 | % | | | 24.13 | % | | | (0.05 | )% | | | (3.61 | )% |
| Ratios/Supplemental Data: | | | | | | | | | | | | | | | | | | | | |
Net assets at end of year (000’s omitted) | | $ | 180,121 | | | $ | 160,057 | | | $ | 92,639 | | | $ | 71,466 | | | $ | 76,512 | |
Ratio to average net assets of: | | | | | | | | | | | | | | | | | | | | |
Expenses, after Waivers | | | 0.68 | % | | | 0.67 | % | | | 0.68 | % | | | 0.67 | % | | | 0.67 | % |
Expenses, prior to Waivers | | | 0.68 | % | | | 0.68 | % | | | 0.73 | % | | | 0.73 | % | | | 0.72 | % |
Net investment income, after Waivers | | | 0.47 | % | | | 0.61 | % | | | 1.81 | %(b) | | | 0.76 | % | | | 0.89 | % |
Portfolio turnover rate(e) | | | 21 | % | | | 17 | % | | | 24 | % | | | 25 | % | | | 22 | % |
| (a) | Based on average shares outstanding. |
| (b) | Net Investment income per share and the ratio of net investment income to average net assets include a significant dividend received during the year. Net investment income per share and the ratio of net investment income to average net assets excluding the significant dividends are $0.39 and 1.20%, respectively. |
| (c) | The mean between the last bid and ask prices. |
| (d) | Net asset value total return is calculated assuming an initial investment made at the net asset value at the beginning of the period, reinvestment of all dividends and distributions at net asset value during the period, and redemption on the last day of the period. Net asset value total return includes adjustments in accordance with accounting principles generally accepted in the United States of America and as such, the net asset value for financial reporting purposes and the returns based upon those net asset values may differ from the net asset value and returns for shareholder transactions. Market price total return is calculated assuming an initial investment made at the market price at the beginning of the period, reinvestment of all dividends and distributions at market price during the period, and sale at the market price on the last day of the period. Total investment returns calculated for a period of less than one year are not annualized. |
| (e) | Portfolio turnover rate is not annualized for periods less than one year, if applicable, and does not include securities received or delivered from processing creations or redemptions. |
Invesco DWA Momentum ETF (PDP)
| | | | | | | | | | | | | | | | | | | | |
| | | Years Ended April 30, | |
| | | 2019 | | | 2018 | | | 2017 | | | 2016 | | | 2015 | |
| Per Share Operating Performance: | | | | | | | | | | | | | | | | | | | | |
Net asset value at beginning of year | | $ | 52.66 | | | $ | 45.86 | | | $ | 40.51 | | | $ | 42.44 | | | $ | 36.96 | |
Net investment income(a) | | | 0.11 | | | | 0.13 | | | | 0.28 | | | | 0.12 | | | | 0.16 | |
Net realized and unrealized gain (loss) on investments | | | 6.10 | | | | 6.81 | | | | 5.41 | | | | (1.94 | ) | | | 5.43 | |
Total from investment operations | | | 6.21 | | | | 6.94 | | | | 5.69 | | | | (1.82 | ) | | | 5.59 | |
Distributions to shareholders from: | | | | | | | | | | | | | | | | | | | | |
Net investment income | | | (0.09 | ) | | | (0.13 | ) | | | (0.34 | ) | | | (0.11 | ) | | | (0.11 | ) |
Return of capital | | | — | | | | (0.01 | ) | | | — | | | | — | | | | — | |
Total distributions | | | (0.09 | ) | | | (0.14 | ) | | | (0.34 | ) | | | (0.11 | ) | | | (0.11 | ) |
Net asset value at end of year | | $ | 58.78 | | | $ | 52.66 | | | $ | 45.86 | | | $ | 40.51 | | | $ | 42.44 | |
Market price at end of year(b) | | $ | 58.79 | | | $ | 52.72 | | | $ | 45.87 | | | $ | 40.50 | | | $ | 42.43 | |
| Net Asset Value Total Return(c) | | | 11.81 | % | | | 15.17 | % | | | 14.12 | % | | | (4.29 | )% | | | 15.13 | % |
| Market Price Total Return(c) | | | 11.70 | % | | | 15.28 | % | | | 14.17 | % | | | (4.29 | )% | | | 15.19 | % |
| Ratios/Supplemental Data: | | | | | | | | | | | | | | | | | | | | |
Net assets at end of year (000’s omitted) | | $ | 1,545,947 | | | $ | 1,521,909 | | | $ | 1,417,070 | | | $ | 1,438,022 | | | $ | 1,871,780 | |
Ratio to average net assets of: | | | | | | | | | | | | | | | | | | | | |
Expenses, after Waivers | | | 0.62 | % | | | 0.63 | % | | | 0.63 | % | | | 0.64 | % | | | 0.63 | %(d) |
Expenses, prior to Waivers | | | 0.62 | % | | | 0.63 | % | | | 0.63 | % | | | 0.64 | % | | | 0.63 | %(d) |
Net investment income, after Waivers | | | 0.20 | % | | | 0.26 | % | | | 0.65 | % | | | 0.29 | % | | | 0.39 | % |
Portfolio turnover rate(e) | | | 82 | % | | | 68 | % | | | 68 | % | | | 100 | % | | | 73 | % |
| (a) | Based on average shares outstanding. |
| (b) | The mean between the last bid and ask prices. |
| (c) | Net asset value total return is calculated assuming an initial investment made at the net asset value at the beginning of the period, reinvestment of all dividends and distributions at net asset value during the period, and redemption on the last day of the period. Net asset value total return includes adjustments in accordance with accounting principles generally accepted in the United States of America and as such, the net asset value for financial reporting purposes and the returns based upon those net asset values may differ from the net asset value and returns for shareholder transactions. Market price total return is calculated assuming an initial investment made at the market price at the beginning of the period, reinvestment of all dividends and distributions at market price during the period, and sale at the market price on the last day of the period. Total investment returns calculated for a period of less than one year are not annualized. |
| (d) | In addition to the fees and expenses which the Fund bears directly, the Fund indirectly bears a pro rata share of the fees and expenses of the investment companies in which the Fund invests. Estimated investment companies’ expenses are not expenses that are incurred directly by the Fund. They are expenses that are incurred directly by the investment companies and are deducted from the value of the investment companies the Fund invests in. The effect of the estimated investment companies’ expenses that the Fund bears indirectly is included in the Fund’s total return. |
| (e) | Portfolio turnover rate is not annualized for periods less than one year, if applicable, and does not include securities received or delivered from processing creations or redemptions. |
See accompanying Notes to Financial Statements which are an integral part of the financial statements.
Financial Highlights(continued)
Invesco Global Listed Private Equity ETF (PSP)
| | | | | | | | | | | | | | | | | | | | |
| | | Years Ended April 30, | |
| | | 2019 | | | 2018 | | | 2017 | | | 2016 | | | 2015 | |
| Per Share Operating Performance: | | | | | | | | | | | | | | | | | | | | |
Net asset value at beginning of year | | $ | 12.19 | | | $ | 12.25 | | | $ | 10.45 | | | $ | 11.95 | | | $ | 11.79 | |
Net investment income(a) | | | 0.32 | | | | 0.40 | (b) | | | 0.41 | | | | 0.60 | (c) | | | 0.35 | |
Net realized and unrealized gain (loss) on investments | | | (0.03 | ) | | | 0.99 | | | | 1.85 | | | | (1.53 | ) | | | 0.41 | |
Total from investment operations | | | 0.29 | | | | 1.39 | | | | 2.26 | | | | (0.93 | ) | | | 0.76 | |
Distributions to shareholders from: | | | | | | | | | | | | | | | | | | | | |
Net investment income | | | (0.38 | ) | | | (1.40 | ) | | | (0.46 | ) | | | (0.57 | ) | | | (0.60 | ) |
Return of capital | | | — | | | | (0.05 | ) | | | — | | | | — | | | | — | |
Total distributions | | | (0.38 | ) | | | (1.45 | ) | | | (0.46 | ) | | | (0.57 | ) | | | (0.60 | ) |
Net asset value at end of year | | $ | 12.10 | | | $ | 12.19 | | | $ | 12.25 | | | $ | 10.45 | | | $ | 11.95 | |
Market price at end of year(d) | | $ | 12.13 | | | $ | 12.21 | | | $ | 12.29 | | | $ | 10.39 | | | $ | 11.93 | |
| Net Asset Value Total Return(e) | | | 2.28 | % | | | 11.76 | % | | | 22.21 | % | | | (8.09 | )% | | | 6.79 | % |
| Market Price Total Return(e) | | | 2.36 | % | | | 11.57 | % | | | 23.32 | % | | | (8.47 | )% | | | 6.09 | % |
| Ratios/Supplemental Data: | | | | | | | | | | | | | | | | | | | | |
Net assets at end of year (000’s omitted) | | $ | 244,443 | | | $ | 245,052 | | | $ | 286,143 | | | $ | 325,925 | | | $ | 476,606 | |
Ratio to average net assets of: | | | | | | | | | | | | | | | | | | | | |
Expenses, after Waivers(f) | | | 0.64 | % | | | 0.64 | % | | | 0.66 | % | | | 0.64 | % | | | 0.64 | % |
Expenses, prior to Waivers(f) | | | 0.66 | % | | | 0.65 | % | | | 0.67 | % | | | 0.66 | % | | | 0.66 | % |
Net investment income, after Waivers | | | 2.79 | % | | | 3.16 | %(b) | | | 3.77 | % | | | 5.51 | %(c) | | | 3.04 | % |
Portfolio turnover rate(g) | | | 64 | % | | | 44 | % | | | 39 | % | | | 35 | % | | | 30 | % |
| (a) | Based on average shares outstanding. |
| (b) | Net Investment income per share and the ratio of net investment income to average net assets include a significant dividend received during the period. Net investment income per share and the ratio of net investment income to average net assets excluding the significant dividends are $0.30 and 2.37%, respectively. |
| (c) | Net Investment income per share and the ratio of net investment income to average net assets include a significant dividend received during the year. Net investment income per share and the ratio of net investment income to average net assets excluding the significant dividends are $0.34 and 3.12%, respectively. |
| (d) | The mean between the last bid and ask prices. |
| (e) | Net asset value total return is calculated assuming an initial investment made at the net asset value at the beginning of the period, reinvestment of all dividends and distributions at net asset value during the period, and redemption on the last day of the period. Net asset value total return includes adjustments in accordance with accounting principles generally accepted in the United States of America and as such, the net asset value for financial reporting purposes and the returns based upon those net asset values may differ from the net asset value and returns for shareholder transactions. Market price total return is calculated assuming an initial investment made at the market price at the beginning of the period, reinvestment of all dividends and distributions at market price during the period, and sale at the market price on the last day of the period. Total investment returns calculated for a period of less than one year are not annualized. |
| (f) | In addition to the fees and expenses which the Fund bears directly, the Fund indirectly bears a pro rata share of the fees and expenses of the investment companies in which the Fund invests. Estimated investment companies’ expenses are not expenses that are incurred directly by the Fund. They are expenses that are incurred directly by the investment companies and are deducted from the value of the investment companies the Fund invests in. The effect of the estimated investment companies’ expenses that the Fund bears indirectly is included in the Fund’s total return. |
| (g) | Portfolio turnover rate is not annualized for periods less than one year, if applicable, and does not include securities received or delivered from processing creations or redemptions. |
See accompanying Notes to Financial Statements which are an integral part of the financial statements.
Financial Highlights(continued)
Invesco Golden Dragon China ETF (PGJ)
| | | | | | | | | | | | | | | | | | | | |
| | | Years Ended April 30, | |
| | | 2019 | | | 2018 | | | 2017 | | | 2016 | | | 2015 | |
| Per Share Operating Performance: | | | | | | | | | | | | | | | | | | | | |
Net asset value at beginning of year | | $ | 45.58 | | | $ | 35.69 | | | $ | 30.51 | | | $ | 33.67 | | | $ | 27.65 | |
Net investment income(a) | | | 0.11 | | | | 0.31 | | | | 0.19 | | | | 0.06 | | | | 0.21 | |
Net realized and unrealized gain (loss) on investments | | | (3.51 | ) | | | 10.50 | | | | 5.54 | | | | (3.10 | ) | | | 6.06 | |
Total from investment operations | | | (3.40 | ) | | | 10.81 | | | | 5.73 | | | | (3.04 | ) | | | 6.27 | |
Distributions to shareholders from: | | | | | | | | | | | | | | | | | | | | |
Net investment income | | | (0.10 | ) | | | (0.92 | ) | | | (0.55 | ) | | | (0.09 | ) | | | (0.25 | ) |
Return of capital | | | — | | | | — | | | | — | | | | (0.03 | ) | | | — | |
Total distributions | | | (0.10 | ) | | | (0.92 | ) | | | (0.55 | ) | | | (0.12 | ) | | | (0.25 | ) |
Net asset value at end of year | | $ | 42.08 | | | $ | 45.58 | | | $ | 35.69 | | | $ | 30.51 | | | $ | 33.67 | |
Market price at end of year(b) | | $ | 42.11 | | | $ | 45.58 | | | $ | 35.69 | | | $ | 30.49 | | | $ | 33.62 | |
| Net Asset Value Total Return(c) | | | (7.46 | )% | | | 30.46 | % | | | 19.23 | % | | | (9.04 | )% | | | 22.79 | % |
| Market Price Total Return(c) | | | (7.39 | )% | | | 30.46 | % | | | 19.31 | % | | | (8.97 | )% | | | 22.83 | % |
| Ratios/Supplemental Data: | | | | | | | | | | | | | | | | | | | | |
Net assets at end of year (000’s omitted) | | $ | 216,730 | | | $ | 271,208 | | | $ | 153,460 | | | $ | 163,248 | | | $ | 230,631 | |
Ratio to average net assets of: | | | | | | | | | | | | | | | | | | | | |
Expenses, after Waivers | | | 0.70 | % | | | 0.70 | % | | | 0.70 | % | | | 0.70 | % | | | 0.70 | % |
Expenses, prior to Waivers | | | 0.70 | % | | | 0.70 | % | | | 0.73 | % | | | 0.70 | % | | | 0.70 | % |
Net investment income, after Waivers | | | 0.27 | % | | | 0.70 | % | | | 0.61 | % | | | 0.18 | % | | | 0.68 | % |
Portfolio turnover rate(d) | | | 36 | % | | | 25 | % | | | 30 | % | | | 47 | % | | | 25 | % |
| (a) | Based on average shares outstanding. |
| (b) | The mean between the last bid and ask prices. |
| (c) | Net asset value total return is calculated assuming an initial investment made at the net asset value at the beginning of the period, reinvestment of all dividends and distributions at net asset value during the period, and redemption on the last day of the period. Net asset value total return includes adjustments in accordance with accounting principles generally accepted in the United States of America and as such, the net asset value for financial reporting purposes and the returns based upon those net asset values may differ from the net asset value and returns for shareholder transactions. Market price total return is calculated assuming an initial investment made at the market price at the beginning of the period, reinvestment of all dividends and distributions at market price during the period, and sale at the market price on the last day of the period. Total investment returns calculated for a period of less than one year are not annualized. |
| (d) | Portfolio turnover rate is not annualized for periods less than one year, if applicable, and does not include securities received or delivered from processing creations or redemptions. |
Invesco Insider Sentiment ETF (NFO)
| | | | | | | | | | | | | | | | | | | | | | | | |
| | | Year Ended
April 30, 2019 | | | Eight Months
Ended
April 30, 2018 | | | Years Ended August 31, | |
| | | 2017 | | | 2016 | | | 2015 | | | 2014 | |
| Per Share Operating Performance: | | | | | | | | | | | | | | | | | | | | | | | | |
Net asset value at beginning of period | | $ | 63.16 | | | $ | 57.67 | | | $ | 50.29 | | | $ | 47.50 | | | $ | 49.25 | | | $ | 41.15 | |
Net investment income(a) | | | 0.70 | | | | 0.44 | | | | 0.61 | | | | 0.69 | | | | 0.55 | | | | 0.56 | |
Net realized and unrealized gain (loss) on investments | | | 4.01 | | | | 5.97 | | | | 7.67 | | | | 2.82 | | | | (1.72 | ) | | | 7.98 | |
Total from investment operations | | | 4.71 | | | | 6.41 | | | | 8.28 | | | | 3.51 | | | | (1.17 | ) | | | 8.54 | |
Distributions to shareholders from: | | | | | | | | | | | | | | | | | | | | | | | | |
Net investment income | | | (0.59 | ) | | | (0.92 | ) | | | (0.90 | ) | | | (0.72 | ) | | | (0.58 | ) | | | (0.44 | ) |
Net asset value at end of period | | $ | 67.28 | | | $ | 63.16 | | | $ | 57.67 | | | $ | 50.29 | | | $ | 47.50 | | | $ | 49.25 | |
Market price at end of period | | $ | 67.21 | (b) | | $ | 63.18 | (b) | | $ | 57.51 | | | $ | 50.23 | | | $ | 47.52 | | | $ | 49.22 | |
| Net Asset Value Total Return(c) | | | 7.70 | % | | | 11.14 | % | | | 16.79 | % | | | 7.51 | % | | | (2.40 | )% | | | 20.80 | % |
| Market Price Total Return(c) | | | 7.56 | % | | | 11.48 | % | | | | | | | | | | | | | | | | |
| Ratios/Supplemental Data: | | | | | | | | | | | | | | | | | | | | | | | | |
Net assets at end of period (000’s omitted) | | $ | 70,696 | | | $ | 72,685 | | | $ | 72,128 | | | $ | 77,983 | | | $ | 123,547 | | | $ | 184,735 | |
Ratio to average net assets of: | | | | | | | | | | | | | | | | | | | | | | | | |
Expenses, after Waivers | | | 0.60 | % | | | 0.60 | %(d) | | | 0.61 | % | | | 0.65 | % | | | 0.65 | % | | | 0.66 | % |
Expenses, prior to Waivers | | | 0.69 | % | | | 0.73 | %(d) | | | 0.74 | % | | | 0.76 | % | | | 0.73 | % | | | 0.74 | % |
Net investment income, after Waivers | | | 1.10 | % | | | 1.08 | %(d) | | | 1.18 | % | | | 1.47 | % | | | 1.13 | % | | | 1.21 | % |
Portfolio turnover rate(e) | | | 116 | % | | | 108 | % | | | 189 | % | | | 117 | % | | | 112 | % | | | 106 | % |
| (a) | Based on average shares outstanding. |
| (b) | The mean between the last bid and ask prices. |
| (c) | Net asset value total return is calculated assuming an initial investment made at the net asset value at the beginning of the period, reinvestment of all dividends and distributions at net asset value during the period, and redemption on the last day of the period. Net asset value total return includes adjustments in accordance with accounting principles generally accepted in the United States of America and as such, the net asset value for financial reporting purposes and the returns based upon those net asset values may differ from the net asset value and returns for shareholder transactions. Market price total return is calculated assuming an initial investment made at the market price at the beginning of the period, reinvestment of all dividends and distributions at market price during the period, and sale at the market price on the last day of the period. Total investment returns calculated for a period of less than one year are not annualized. |
| (e) | Portfolio turnover rate is not annualized for periods less than one year, if applicable, and does not include securities received or delivered from processing creations or redemptions. |
See accompanying Notes to Financial Statements which are an integral part of the financial statements.
Financial Highlights(continued)
Invesco Raymond James SB-1 Equity ETF (RYJ)
| | | | | | | | | | | | | | | | | | | | | | | | |
| | | Eight Months
Ended
April 30, 2019 | | | Years Ended August 31, | |
| | | 2018 | | | 2017 | | | 2016 | | | 2015 | | | 2014 | |
| Per Share Operating Performance: | | | | | | | | | | | | | | | | | | | | | | | | |
Net asset value at beginning of period | | $ | 49.24 | | | $ | 39.34 | | | $ | 35.99 | | | $ | 34.24 | | | $ | 35.26 | | | $ | 29.06 | |
Net investment income(a) | | | 0.13 | | | | 0.27 | | | | 0.12 | | | | 0.29 | | | | 0.21 | | | | 0.12 | |
Net realized and unrealized gain (loss) on investments | | | (3.55 | ) | | | 9.63 | | | | 3.82 | | | | 1.76 | | | | (1.14 | ) | | | 6.19 | |
Total from investment operations | | | (3.42 | ) | | | 9.90 | | | | 3.94 | | | | 2.05 | | | | (0.93 | ) | | | 6.31 | |
Distributions to shareholders from: | | | | | | | | | | | | | | | | | | | | | | | | |
Net investment income | | | (0.52 | ) | | | — | | | | (0.52 | ) | | | (0.30 | ) | | | (0.09 | ) | | | (0.11 | ) |
Return of capital | | | — | | | | — | | | | (0.07 | ) | | | — | | | | — | | | | — | |
Total distributions to shareholders | | | (0.52 | ) | | | — | | | | (0.59 | ) | | | (0.30 | ) | | | (0.09 | ) | | | (0.11 | ) |
Net asset value at end of period | | $ | 45.30 | | | $ | 49.24 | | | $ | 39.34 | | | $ | 35.99 | | | $ | 34.24 | | | $ | 35.26 | |
Market price at end of period | | $ | 45.30 | (b) | | $ | 49.19 | (b) | | $ | 39.32 | | | $ | 36.01 | | | $ | 34.19 | | | $ | 35.28 | |
Net asset value Total Return(c) | | | (6.60 | )% | | | 25.16 | % | | | 11.00 | % | | | 6.08 | % | | | (2.64 | )% | | | 21.75 | % |
Market Price Total Return(c) | | | (6.51 | )% | | | 25.10 | % | | | | | | | | | | | | | | | | |
| Ratios/Supplemental Data: | | | | | | | | | | | | | | | | | | | | | | | | |
Net assets at end of period (000’s omitted) | | $ | 173,156 | | | $ | 200,560 | | | $ | 185,801 | | | $ | 180,784 | | | $ | 240,495 | | | $ | 267,054 | |
Ratio to average net assets of: | | | | | | | | | | | | | | | | | | | | | | | | |
Expenses, after waivers | | | 0.75 | %(d)(e) | | | 0.71 | % | | | 0.75 | % | | | 0.75 | % | | | 0.75 | % | | | 0.76 | % |
Expenses, prior to waivers | | | 0.75 | %(d)(e) | | | 0.71 | % | | | 0.75 | % | | | 0.75 | % | | | 0.75 | % | | | 0.76 | % |
Net investment income, after waivers | | | 0.44 | %(e) | | | 0.60 | % | | | 0.30 | % | | | 0.87 | % | | | 0.59 | % | | | 0.36 | % |
Portfolio turnover rate(f) | | | 65 | % | | | 82 | % | | | 90 | % | | | 118 | % | | | 95 | % | | | 114 | % |
| (a) | Based on average shares outstanding. |
| (b) | The mean between the last bid and ask prices. |
| (c) | Net asset value total return is calculated assuming an initial investment made at the net asset value at the beginning of the period, reinvestment of all dividends and distributions at net asset value during the period, and redemption on the last day of the period. Net asset value total return includes adjustments in accordance with accounting principles generally accepted in the United States of America and as such, the net asset value for financial reporting purposes and the returns based upon those net asset values may differ from the net asset value and returns for shareholder transactions. Market price total return is calculated assuming an initial investment made at the market price at the beginning of the period, reinvestment of all dividends and distributions at market price during the period, and sale at the market price on the last day of the period. Total investment returns calculated for a period of less than one year are not annualized. |
| (d) | In addition to the fees and expenses which the Fund bears directly, the Fund indirectly bears a pro rata share of the fees and expenses of the investment companies in which the Fund invests. Estimated investment companies’ expenses are not expenses that are incurred directly by the Fund. They are expenses that are incurred directly by the investment companies and are deducted from the value of the investment companies the Fund invests in. The effect of the estimated investment companies’ expenses that the Fund bears indirectly is included in the Fund’s total return. |
| (f) | Portfolio turnover rate is not annualized for periods less than one year, if applicable, and does not include securities received or delivered from processing creations or redemptions. |
See accompanying Notes to Financial Statements which are an integral part of the financial statements.
Financial Highlights(continued)
Invesco S&P 500 BuyWrite ETF (PBP)
| | | | | | | | | | | | | | | | | | | | |
| | | Years Ended April 30, | |
| | | 2019 | | | 2018 | | | 2017 | | | 2016 | | | 2015 | |
| Per Share Operating Performance: | | | | | | | | | | | | | | | | | | | | |
Net asset value at beginning of year | | $ | 21.29 | | | $ | 22.21 | | | $ | 20.33 | | | $ | 21.22 | | | $ | 21.32 | |
Net investment income(a) | | | 0.32 | | | | 0.28 | | | | 0.29 | | | | 0.30 | | | | 0.28 | |
Net realized and unrealized gain (loss) on investments | | | 0.32 | | | | 1.16 | | | | 2.10 | | | | (0.11 | ) | | | 0.65 | |
Total from investment operations | | | 0.64 | | | | 1.44 | | | | 2.39 | | | | 0.19 | | | | 0.93 | |
Distributions to shareholders from: | | | | | | | | | | | | | | | | | | | | |
Net investment income | | | (0.31 | ) | | | (1.09 | ) | | | (0.33 | ) | | | (0.34 | ) | | | (0.86 | ) |
Net realized gains | | | (0.23 | ) | | | (1.27 | ) | | | (0.18 | ) | | | (0.74 | ) | | | (0.17 | ) |
Total distributions | | | (0.54 | ) | | | (2.36 | ) | | | (0.51 | ) | | | (1.08 | ) | | | (1.03 | ) |
Net asset value at end of year | | $ | 21.39 | | | $ | 21.29 | | | $ | 22.21 | | | $ | 20.33 | | | $ | 21.22 | |
Market price at end of year(b) | | $ | 21.39 | | | $ | 21.33 | | | $ | 22.23 | | | $ | 20.29 | | | $ | 21.22 | |
| Net Asset Value Total Return(c) | | | 3.16 | % | | | 6.59 | % | | | 11.86 | % | | | 0.90 | % | | | 4.48 | % |
| Market Price Total Return(c) | | | 2.97 | % | | | 6.68 | % | | | 12.18 | % | | | 0.67 | % | | | 4.32 | % |
| Ratios/Supplemental Data: | | | | | | | | | | | | | | | | | | | | |
Net assets at end of year (000’s omitted) | | $ | 320,778 | | | $ | 302,296 | | | $ | 327,596 | | | $ | 297,895 | | | $ | 404,270 | |
Ratio to average net assets of: | | | | | | | | | | | | | | | | | | | | |
Expenses | | | 0.53 | % | | | 0.75 | % | | | 0.75 | % | | | 0.75 | % | | | 0.75 | % |
Net investment income | | | 1.47 | % | | | 1.25 | % | | | 1.37 | % | | | 1.47 | % | | | 1.33 | % |
Portfolio turnover rate(d) | | | 15 | % | | | 16 | % | | | 24 | % | | | 43 | % | | | 50 | % |
| (a) | Based on average shares outstanding. |
| (b) | The mean between the last bid and ask prices. |
| (c) | Net asset value total return is calculated assuming an initial investment made at the net asset value at the beginning of the period, reinvestment of all dividends and distributions at net asset value during the period, and redemption on the last day of the period. Net asset value total return includes adjustments in accordance with accounting principles generally accepted in the United States of America and as such, the net asset value for financial reporting purposes and the returns based upon those net asset values may differ from the net asset value and returns for shareholder transactions. Market price total return is calculated assuming an initial investment made at the market price at the beginning of the period, reinvestment of all dividends and distributions at market price during the period, and sale at the market price on the last day of the period. Total investment returns calculated for a period of less than one year are not annualized. |
| (d) | Portfolio turnover rate is not annualized for periods less than one year, if applicable, and does not include securities received or delivered from processing creations or redemptions. |
Invesco S&P 500® Quality ETF (SPHQ)
| | | | | | | | | | | | | | | | | | | | |
| | | Years Ended April 30, | |
| | | 2019 | | | 2018 | | | 2017 | | | 2016 | | | 2015 | |
| Per Share Operating Performance: | | | | | | | | | | | | | | | | | | | | |
Net asset value at beginning of year | | $ | 29.53 | | | $ | 27.62 | | | $ | 24.70 | | | $ | 23.25 | | | $ | 20.90 | |
Net investment income(a) | | | 0.51 | | | | 0.57 | | | | 0.54 | | | | 0.45 | | | | 0.41 | |
Net realized and unrealized gain on investments | | | 3.75 | | | | 1.89 | | | | 2.84 | | | | 1.46 | | | | 2.33 | |
Total from investment operations | | | 4.26 | | | | 2.46 | | | | 3.38 | | | | 1.91 | | | | 2.74 | |
Distributions to shareholders from: | | | | | | | | | | | | | | | | | | | | |
Net investment income | | | (0.50 | ) | | | (0.55 | ) | | | (0.46 | ) | | | (0.46 | ) | | | (0.39 | ) |
Net asset value at end of year | | $ | 33.29 | | | $ | 29.53 | | | $ | 27.62 | | | $ | 24.70 | | | $ | 23.25 | |
Market price at end of year(b) | | $ | 33.30 | | | $ | 29.55 | | | $ | 27.63 | | | $ | 24.70 | | | $ | 23.24 | |
| Net Asset Value Total Return(c) | | | 14.63 | % | | | 8.94 | % | | | 13.84 | % | | | 8.39 | % | | | 13.17 | % |
| Market Price Total Return(c) | | | 14.59 | % | | | 8.98 | % | | | 13.88 | % | | | 8.43 | % | | | 13.18 | % |
| Ratios/Supplemental Data: | | | | | | | | | | | | | | | | | | | | |
Net assets at end of year (000’s omitted) | | $ | 1,469,785 | | | $ | 1,327,157 | | | $ | 1,222,223 | | | $ | 899,078 | | | $ | 533,537 | |
Ratio to average net assets of: | | | | | | | | | | | | | | | | | | | | |
Expenses, after Waivers | | | 0.19 | % | | | 0.29 | % | | | 0.29 | % | | | 0.29 | % | | | 0.29 | % |
Expenses, prior to Waivers | | | 0.26 | % | | | 0.37 | % | | | 0.38 | % | | | 0.38 | % | | | 0.38 | % |
Net investment income, after Waivers | | | 1.67 | % | | | 1.95 | % | | | 2.10 | % | | | 1.92 | % | | | 1.83 | % |
Portfolio turnover rate(d) | | | 73 | % | | | 60 | % | | | 49 | % | | | 102 | % | | | 18 | % |
| (a) | Based on average shares outstanding. |
| (b) | The mean between the last bid and ask prices. |
| (c) | Net asset value total return is calculated assuming an initial investment made at the net asset value at the beginning of the period, reinvestment of all dividends and distributions at net asset value during the period, and redemption on the last day of the period. Net asset value total return includes adjustments in accordance with accounting principles generally accepted in the United States of America and as such, the net asset value for financial reporting purposes and the returns based upon those net asset values may differ from the net asset value and returns for shareholder transactions. Market price total return is calculated assuming an initial investment made at the market price at the beginning of the period, reinvestment of all dividends and distributions at market price during the period, and sale at the market price on the last day of the period. Total investment returns calculated for a period of less than one year are not annualized. |
| (d) | Portfolio turnover rate is not annualized for periods less than one year, if applicable, and does not include securities received or delivered from processing creations or redemptions. For the year ended April 30, 2016, the portfolio turnover calculation includes the value of securities purchased and sold in the effort to realign the Fund’s portfolio holdings due to the underlying index change. |
See accompanying Notes to Financial Statements which are an integral part of the financial statements.
Financial Highlights(continued)
Invesco S&P Spin-Off ETF (CSD)
| | | | | | | | | | | | | | | | | | | | | | | | |
| | | Year Ended
April 30, 2019 | | | Eight Months
Ended
April 30, 2018 | | | Years Ended August 31, | |
| | | 2017 | | | 2016 | | | 2015 | | | 2014 | |
| Per Share Operating Performance: | | | | | | | | | | | | | | | | | | | | | | | | |
Net asset value at beginning of period | | $ | 52.61 | | | $ | 49.42 | | | $ | 42.42 | | | $ | 40.90 | | | $ | 46.47 | | | $ | 37.96 | |
Net investment income(a) | | | 0.43 | | | | 0.04 | | | | 0.39 | | | | 0.61 | | | | 0.72 | | | | 0.45 | |
Net realized and unrealized gain (loss) on investments | | | (0.19 | ) | | | 3.46 | | | | 7.31 | | | | 1.91 | | | | (5.55 | ) | | | 8.15 | |
Total from investment operations | | | 0.24 | | | | 3.50 | | | | 7.70 | | | | 2.52 | | | | (4.83 | ) | | | 8.60 | |
Distributions to shareholders from: | | | | | | | | | | | | | | | | | | | | | | | | |
Net investment income | | | (0.42 | ) | | | (0.20 | ) | | | (0.70 | ) | | | (1.00 | ) | | | (0.74 | ) | | | (0.09 | ) |
Return of capital | | | — | | | | (0.11 | ) | | | — | | | | — | | | | — | | | | — | |
Total distributions to shareholders | | | (0.42 | ) | | | (0.31 | ) | | | (0.70 | ) | | | (1.00 | ) | | | (0.74 | ) | | | (0.09 | ) |
Net asset value at end of period | | $ | 52.43 | | | $ | 52.61 | | | $ | 49.42 | | | $ | 42.42 | | | $ | 40.90 | | | $ | 46.47 | |
Market price at end of period | | $ | 52.41 | (b) | | $ | 52.55 | (b) | | $ | 49.34 | | | $ | 42.42 | | | $ | 40.85 | | | $ | 46.46 | |
| Net Asset Value Total Return(c) | | | 0.71 | % | | | 7.10 | % | | | 18.39 | % | | | 6.42 | % | | | (10.54 | )% | | | 22.65 | % |
| Market Price Total Return(c) | | | 0.78 | % | | | 7.15 | % | | | | | | | | | | | | | | | | |
| Ratios/Supplemental Data: | | | | | | | | | | | | | | | | | | | | | | | | |
Net assets at end of period (000’s omitted) | | $ | 146,814 | | | $ | 202,534 | | | $ | 195,208 | | | $ | 216,319 | | | $ | 413,092 | | | $ | 615,693 | |
Ratio to average net assets of: | | | | | | | | | | | | | | | | | | | | | | | | |
Expenses, after Waivers | | | 0.62 | % | | | 0.64 | %(d) | | | 0.64 | % | | | 0.65 | % | | | 0.65 | % | | | 0.66 | % |
Expenses, prior to Waivers | | | 0.62 | % | | | 0.65 | %(d) | | | 0.64 | % | | | 0.71 | % | | | 0.71 | % | | | 0.72 | % |
Net investment income, after Waivers | | | 0.84 | % | | | 0.12 | %(d) | | | 0.86 | % | | | 1.54 | % | | | 1.57 | % | | | 1.00 | % |
Portfolio turnover rate(e) | | | 49 | % | | | 24 | % | | | 44 | % | | | 116 | % | | | 56 | % | | | 81 | % |
| (a) | Based on average shares outstanding. |
| (b) | The mean between the last bid and ask prices. |
| (c) | Net asset value total return is calculated assuming an initial investment made at the net asset value at the beginning of the period, reinvestment of all dividends and distributions at net asset value during the period, and redemption on the last day of the period. Net asset value total return includes adjustments in accordance with accounting principles generally accepted in the United States of America and as such, the net asset value for financial reporting purposes and the returns based upon those net asset values may differ from the net asset value and returns for shareholder transactions. Market price total return is calculated assuming an initial investment made at the market price at the beginning of the period, reinvestment of all dividends and distributions at market price during the period, and sale at the market price on the last day of the period. Total investment returns calculated for a period of less than one year are not annualized. |
| (e) | Portfolio turnover rate is not annualized for periods less than one year, if applicable, and does not include securities received or delivered from processing creations or redemptions. |
Invesco Water Resources ETF (PHO)
| | | | | | | | | | | | | | | | | | | | |
| | | Years Ended April 30, | |
| | | 2019 | | | 2018 | | | 2017 | | | 2016 | | | 2015 | |
| Per Share Operating Performance: | | | | | | | | | | | | | | | | | | | | |
Net asset value at beginning of year | | $ | 30.09 | | | $ | 26.71 | | | $ | 22.99 | | | $ | 25.19 | | | $ | 25.92 | |
Net investment income(a) | | | 0.16 | | | | 0.09 | | | | 0.16 | | | | 0.13 | | | | 0.14 | |
Net realized and unrealized gain (loss) on investments | | | 4.55 | | | | 3.39 | | | | 3.68 | | | | (2.17 | ) | | | (0.72 | ) |
Total from investment operations | | | 4.71 | | | | 3.48 | | | | 3.84 | | | | (2.04 | ) | | | (0.58 | ) |
Distributions to shareholders from: | | | | | | | | | | | | | | | | | | | | |
Net investment income | | | (0.13 | ) | | | (0.10 | ) | | | (0.12 | ) | | | (0.16 | ) | | | (0.15 | ) |
Net asset value at end of year | | $ | 34.67 | | | $ | 30.09 | | | $ | 26.71 | | | $ | 22.99 | | | $ | 25.19 | |
Market price at end of year(b) | | $ | 34.70 | | | $ | 30.09 | | | $ | 26.70 | | | $ | 22.98 | | | $ | 25.17 | |
| Net Asset Value Total Return(c) | | | 15.74 | % | | | 13.07 | % | | | 16.73 | % | | | (8.09 | )% | | | (2.25 | )% |
| Market Price Total Return(c) | | | 15.84 | % | | | 13.11 | % | | | 16.74 | % | | | (8.06 | )% | | | (2.29 | )% |
| Ratios/Supplemental Data: | | | | | | | | | | | | | | | | | | | | |
Net assets at end of year (000’s omitted) | | $ | 941,269 | | | $ | 821,548 | | | $ | 797,147 | | | $ | 680,463 | | | $ | 855,159 | |
Ratio to average net assets of: | | | | | | | | | | | | | | | | | | | | |
Expenses, after Waivers | | | 0.60 | % | | | 0.62 | % | | | 0.62 | % | | | 0.61 | % | | | 0.61 | % |
Expenses, prior to Waivers | | | 0.60 | % | | | 0.62 | % | | | 0.62 | % | | | 0.61 | % | | | 0.61 | % |
Net investment income, after Waivers | | | 0.51 | % | | | 0.31 | % | | | 0.64 | % | | | 0.58 | % | | | 0.56 | % |
Portfolio turnover rate(d) | | | 31 | % | | | 23 | % | | | 44 | % | | | 89 | % | | | 25 | % |
| (a) | Based on average shares outstanding. |
| (b) | The mean between the last bid and ask prices. |
| (c) | Net asset value total return is calculated assuming an initial investment made at the net asset value at the beginning of the period, reinvestment of all dividends and distributions at net asset value during the period, and redemption on the last day of the period. Net asset value total return includes adjustments in accordance with accounting principles generally accepted in the United States of America and as such, the net asset value for financial reporting purposes and the returns based upon those net asset values may differ from the net asset value and returns for shareholder transactions. Market price total return is calculated assuming an initial investment made at the market price at the beginning of the period, reinvestment of all dividends and distributions at market price during the period, and sale at the market price on the last day of the period. Total investment returns calculated for a period of less than one year are not annualized. |
| (d) | Portfolio turnover rate is not annualized for periods less than one year, if applicable, and does not include securities received or delivered from processing creations or redemptions. |
See accompanying Notes to Financial Statements which are an integral part of the financial statements.
Financial Highlights(continued)
Invesco WilderHill Clean Energy ETF (PBW)
| | | | | | | | | | | | | | | | | | | | |
| | | Years Ended April 30, | |
| | | 2019 | | | 2018 | | | 2017(a) | | | 2016(a) | | | 2015(a) | |
| Per Share Operating Performance: | | | | | | | | | | | | | | | | | | | | |
Net asset value at beginning of year | | $ | 24.64 | | | $ | 20.85 | | | $ | 20.55 | | | $ | 28.80 | | | $ | 32.95 | |
Net investment income(b) | | | 0.39 | | | | 0.31 | | | | 0.30 | | | | 0.55 | | | | 0.70 | |
Net realized and unrealized gain (loss) on investments | | | 3.66 | | | | 3.78 | | | | 0.40 | | | | (8.30 | ) | | | (4.10 | ) |
Total from investment operations | | | 4.05 | | | | 4.09 | | | | 0.70 | | | | (7.75 | ) | | | (3.40 | ) |
Distributions to shareholders from: | | | | | | | | | | | | | | | | | | | | |
Net investment income | | | (0.39 | ) | | | (0.30 | ) | | | (0.40 | ) | | | (0.50 | ) | | | (0.75 | ) |
Net asset value at end of year | | $ | 28.30 | | | $ | 24.64 | | | $ | 20.85 | | | $ | 20.55 | | | $ | 28.80 | |
Market price at end of year(c) | | $ | 28.31 | | | $ | 24.66 | | | $ | 20.85 | | | $ | 20.55 | | | $ | 28.80 | |
| Net Asset Value Total Return(d) | | | 16.76 | % | | | 19.78 | % | | | 3.60 | % | | | (27.19 | )% | | | (10.36 | )% |
| Market Price Total Return(d) | | | 16.70 | % | | | 19.87 | % | | | 3.60 | % | | | (27.19 | )% | | | (10.36 | )% |
| Ratios/Supplemental Data: | | | | | | | | | | | | | | | | | | | | |
Net assets at end of year (000’s omitted) | | $ | 144,857 | | | $ | 116,263 | | | $ | 103,177 | | | $ | 101,255 | | | $ | 143,790 | |
Ratio to average net assets of: | | | | | | | | | | | | | | | | | | | | |
Expenses, after Waivers | | | 0.70 | % | | | 0.70 | % | | | 0.70 | % | | | 0.70 | % | | | 0.70 | % |
Expenses, prior to Waivers | | | 0.71 | % | | | 0.77 | % | | | 0.76 | % | | | 0.76 | % | | | 0.72 | % |
Net investment income, after Waivers | | | 1.56 | % | | | 1.30 | % | | | 1.59 | % | | | 2.37 | % | | | 2.39 | % |
Portfolio turnover rate(e) | | | 40 | % | | | 43 | % | | | 59 | % | | | 60 | % | | | 48 | % |
| (a) | Per share amounts have been adjusted to reflect aone-for-five reverse stock split effective after the close of business on October 20, 2017. |
| (b) | Based on average shares outstanding. |
| (c) | The mean between the last bid and ask prices. |
| (d) | Net asset value total return is calculated assuming an initial investment made at the net asset value at the beginning of the period, reinvestment of all dividends and distributions at net asset value during the period, and redemption on the last day of the period. Net asset value total return includes adjustments in accordance with accounting principles generally accepted in the United States of America and as such, the net asset value for financial reporting purposes and the returns based upon those net asset values may differ from the net asset value and returns for shareholder transactions. Market price total return is calculated assuming an initial investment made at the market price at the beginning of the period, reinvestment of all dividends and distributions at market price during the period, and sale at the market price on the last day of the period. Total investment returns calculated for a period of less than one year are not annualized. |
| (e) | Portfolio turnover rate is not annualized for periods less than one year, if applicable, and does not include securities received or delivered from processing creations or redemptions. |
See accompanying Notes to Financial Statements which are an integral part of the financial statements.
Notes to Financial Statements
Invesco Exchange-Traded Fund Trust
April 30, 2019
Note 1—Organization
Invesco Exchange-Traded Fund Trust (the “Trust”) was organized as a Massachusetts business trust on June 9, 2000 and is authorized to have multiple series of portfolios. The Trust is anopen-end management investment company registered under the Investment Company Act of 1940, as amended (the “1940 Act”). This report includes the following portfolios:
| | |
Full Name | | Short Name |
| Invesco Aerospace & Defense ETF (PPA) | | “Aerospace & Defense ETF” |
| Invesco BRIC ETF (EEB) | | “BRIC ETF” |
| Invesco CleantechTM ETF (PZD) | | “CleantechTM ETF” |
| Invesco DWA Momentum ETF (PDP) | | “DWA Momentum ETF” |
| Invesco Global Listed Private Equity ETF (PSP) | | “Global Listed Private Equity ETF” |
| Invesco Golden Dragon China ETF (PGJ) | | “Golden Dragon China ETF” |
| Invesco Insider Sentiment ETF (NFO) | | “Insider Sentiment ETF” |
| Invesco Raymond JamesSB-1 Equity ETF (RYJ) | | “Raymond JamesSB-1 Equity ETF” |
| Invesco S&P 500 BuyWrite ETF (PBP) | | “S&P 500 BuyWrite ETF” |
| Invesco S&P 500® Quality ETF (SPHQ) | | “S&P 500® Quality ETF” |
| Invesco S&PSpin-Off ETF (CSD) | | “S&PSpin-Off ETF” |
| Invesco Water Resources ETF (PHO) | | “Water Resources ETF” |
| Invesco WilderHill Clean Energy ETF (PBW) | | “WilderHill Clean Energy ETF” |
Each portfolio (each, a “Fund”, and collectively, the “Funds”) represents a separate series of the Trust. The shares of the Funds are referred to herein as “Shares” or “Fund’s Shares.” Each Fund’s Shares are listed and traded on NYSE Arca, Inc., except for Shares of DWA Momentum ETF, Golden Dragon China ETF and Water Resources ETF, which are listed and traded on The Nasdaq Stock Market.
Effective April 30, 2019, the fiscalyear-end changed for BRIC ETF and Raymond JamesSB-1 Equity ETF from August 31 to April 30.
The market price of each Share may differ to some degree from a Fund’s net asset value (“NAV”). Unlike conventional mutual funds, each Fund issues and redeems Shares on a continuous basis, at NAV, only in a large specified number of Shares, each called a “Creation Unit.” Creation Units are issued and redeemed principally in exchange for the deposit or delivery of a basket of securities (“Deposit Securities”). Except when aggregated in Creation Units by Authorized Participants, the Shares are not individually redeemable securities of the Funds.
The investment objective of each Fund is to seek to track the investment results (before fees and expenses) of its respective index listed below (each, an “Underlying Index”):
| | |
Fund | | Underlying Index |
| Aerospace & Defense ETF | | SPADE® Defense Index |
| BRIC ETF | | S&P/BNY Mellon BRIC Select DR Index (USD) |
| CleantechTM ETF | | The Cleantech IndexTM |
| DWA Momentum ETF | | Dorsey Wright® Technical Leaders Index |
| Global Listed Private Equity ETF | | Red Rocks Global Listed Private Equity Index |
| Golden Dragon China ETF | | NASDAQ Golden Dragon China Index |
| Insider Sentiment ETF | | Nasdaq US Insider Sentiment Index |
| Raymond JamesSB-1 Equity ETF | | Raymond JamesSB-1 Equity Index |
| S&P 500 BuyWrite ETF | | CBOE S&P 500 BuyWrite IndexSM |
| S&P 500® Quality ETF | | S&P 500® Quality Index |
| S&PSpin-Off ETF | | S&P U.S.Spin-Off Index |
| Water Resources ETF | | NASDAQ OMX US Water IndexSM |
| WilderHill Clean Energy ETF | | WilderHill Clean Energy Index |
Note 2—Significant Accounting Policies
The following is a summary of the significant accounting policies followed by the Funds in preparation of their financial statements.
Each Fund is an investment company and accordingly follows the investment company accounting and reporting guidance in accordance with Financial Accounting Standards Board Accounting Standards Codification Topic 946,Financial Services—Investment Companies.
| A. | Security Valuation — Securities, including restricted securities, are valued according to the following policies: |
A security listed or traded on an exchange (except convertible securities) is generally valued at its last sales price or official closing price as of the close of the customary trading session on the exchange where the security is principally traded or, lacking any sales or official closing price on a particular day, the security may be valued at the closing bid price on that day. Securities traded in theover-the-counter (“OTC”) market are valued based on prices furnished by independent pricing services or market makers. When such securities are valued by an independent pricing service they may be considered fair valued. Futures contracts are valued at the final settlement price set by an exchange on which they are principally traded. Listed options are valued at the mean between the last bid and asked prices from the exchange on which they are principally traded, or at the final settlement price set by such exchange. Swaps and options not listed on an exchange are valued by an independent source. For purposes of determining NAV per Share, futures and option contracts generally are valued 15 minutes after the close of the customary trading session of the New York Stock Exchange (“NYSE”).
Investment companies are valued using such company’s NAV per share, unless the shares are exchange-traded, in which case they are valued at the last sales price or official closing price as of the close of the customary trading session on the exchange where the security is principally traded.
Debt obligations (including convertible securities) and unlisted equities are fair valued using an evaluated quote provided by an independent pricing service. Evaluated quotes provided by the pricing service may be determined without exclusive reliance on quoted prices, and may reflect appropriate factors such asinstitution-size trading in similar groups of securities, developments related to specific securities, dividend rate (for unlisted equities), yield (for debt obligations), quality, type of issue, coupon rate (for debt obligations), maturity (for debt obligations), individual trading characteristics and other market data. Securities with a demand feature exercisable within one to seven days are valued at par. Pricing services generally value debt obligations assuming orderly transactions of institutional round lot size, but a Fund may hold or transact in the same securities in smaller, odd lot sizes. Odd lots often trade at lower prices than institutional round lots. Debt obligations are subject to interest rate and credit risks. In addition, all debt obligations involve some risk of default with respect to interest and/or principal payments.
Foreign securities’ (including foreign exchange contracts’) prices are converted into U.S. dollar amounts using the applicable exchange rates as of the close of the London world markets. If market quotations are available and reliable for foreign exchange-traded equity securities, the securities will be valued at the market quotations. Because trading hours for certain foreign securities end before the close of the NYSE, closing market quotations may become unreliable. If between the time trading ends on a particular security and the close of the customary trading session on the NYSE, events occur that Invesco Capital Management LLC (the “Adviser”) determines are significant and make the closing price unreliable, a Fund may fair value the security. If the event is likely to have affected the closing price of the security, the security will be valued at fair value in good faith using procedures approved by the Board of Trustees. Adjustments to closing prices to reflect fair value may also be based on a screening process of an independent pricing service to indicate the degree of certainty, based on historical data, that the closing price in the principal market where a foreign security trades is not the current value as of the close of the NYSE. Foreign securities’ prices meeting the approved degree of certainty that the price is not reflective of current value will be priced at the indication of fair value from the independent pricing service. Multiple factors may be considered by the independent pricing service in determining adjustments to reflect fair value and may include information relating to sector indices, American Depositary Receipts (“ADRs”) and domestic and foreign index futures. Foreign securities may have additional risks including exchange rate changes, the potential for sharply devalued currencies and high inflation, political and economic upheaval, the relative lack of issuer information, relatively low market liquidity and the potential lack of strict financial and accounting controls and standards.
Swap agreements are fair valued using an evaluated quote provided by an independent pricing service. Evaluated quotes provided by the pricing service are valued based on a model which may include end of day net present values, spreads, ratings, industry, and company performance. Centrally cleared swap agreements are valued at the daily settlement price determined by the relevant exchange or clearinghouse.
Securities for which market prices are not provided by any of the above methods may be valued based upon quotes furnished by independent sources. The last bid price may be used to value exchange-traded equity securities. The mean between the last bid and asked prices may be used to value debt obligations, including corporate loans, and unlisted equity securities.
Securities for which market quotations are not readily available or became unreliable are valued at fair value as determined in good faith following procedures approved by the Board of Trustees. Issuer-specific events, market trends, bid/asked quotes of brokers and information providers and other market data may be reviewed in the course of making a good faith determination of a security’s fair value.
Each Fund may invest in securities that are subject to interest rate risk, meaning the risk that the prices will generally fall as interest rates rise and, conversely, the prices will generally rise as interest rates fall. Specific securities differ in their sensitivity to
changes in interest rates depending on their individual characteristics. Changes in interest rates may result in increased market volatility, which may affect the value and/or liquidity of certain Fund investments.
Valuations change in response to many factors, including the historical and prospective earnings of the issuer, the value of the issuer’s assets, general economic conditions, interest rates, investor perceptions and market liquidity. Because of the inherent uncertainties of valuation, the values reflected in the financial statements may materially differ from the value received upon actual sale of those investments.
Index Risk. Unlike many investment companies, the Funds do not utilize investing strategies that seek returns in excess of their Underlying Indexes. Therefore, a Fund would not necessarily buy or sell a security unless that security is added or removed, respectively, from its respective Underlying Index, even if that security generally is underperforming.
Authorized Participant Concentration Risk.Only Authorized Participants (“APs”) may engage in creation or redemption transactions directly with each Fund. Each Fund has a limited number of institutions that may act as APs, and such APs have no obligation to submit creation or redemption orders. Consequently, there is no assurance that those APs will establish or maintain an active trading market for the Shares. This risk may be heightened to the extent that securities underlying each Fund are traded outside a collateralized settlement system. In that case, APs may be required to post collateral on certain trades on an agency basis (i.e., on behalf of other market participants), which only a limited number of APs may be able to do. In addition, to the extent that APs exit the business or are unable to proceed with creation and/or redemption orders with respect to each Fund and no other AP is able to step forward to create or redeem Creation Units, this may result in a significantly diminished trading market for Fund Shares, which may be more likely to trade at a premium or discount to each Fund’s NAV and possibly face trading halts and/or delisting. This risk may be heightened for Funds that invest innon-U.S. securities, which may have lower trading volumes.
Equity Risk. Equity risk is the risk that the value of equity securities, including common stocks, may fall due to both changes in general economic conditions that impact the market as a whole, as well as factors that directly relate to a specific company or its industry. Such general economic conditions include changes in interest rates, periods of market turbulence or instability, or general and prolonged periods of economic decline and cyclical change. It is possible that a drop in the stock market may depress the price of most or all of the common stocks that each Fund holds. In addition, equity risk includes the risk that investor sentiment toward particular industries will become negative. The value of a company’s common stock may fall solely because of factors, such as an increase in production costs, that negatively impact other companies in the same region, industry or sector of the market. A company’s common stock also may decline significantly in price over a short period of time due to factors specific to that company, including decisions made by its management or lower demand for the company’s products or services. For example, an adverse event, such as an unfavorable earnings report or the failure to make anticipated dividend payments, may depress the value of common stock.
Non-Correlation Risk.Each Fund’s return may not match the return of its Underlying Index for a number of reasons. For example, each Fund incurs operating expenses not applicable to its Underlying Index, and incurs costs in buying and selling securities, especially when rebalancing the Fund’s securities holdings to reflect changes in the composition of its Underlying Index. In addition, the performance of each Fund and its Underlying Index may vary due to asset valuation differences and differences between each Fund’s portfolio and its Underlying Index resulting from legal restrictions, costs or liquidity constraints.
Industry Concentration Risk. In following its methodology, each Fund’s Underlying Index from time to time may be concentrated to a significant degree in securities of issuers operating in a single industry or industry group. To the extent that each Underlying Index concentrates in the securities of issuers in a particular industry or industry group, the corresponding Fund will also concentrate its investments to approximately the same extent. By concentrating its investments in an industry or industry group, each Fund faces more risks than if it were diversified broadly over numerous industries or industry groups. Such industry-based risks, any of which may adversely affect the companies in which each Fund invests, may include, but are not limited to, legislative or regulatory changes, adverse market conditions and/or increased competition within the industry or industry group. In addition, at times, such industry or industry group may be out of favor and underperform other industries, industry groups or the market as a whole.
Momentum Investing Risk. Certain Funds employ a “momentum” style of investing that is subject to the risk that the securities may be more volatile than the market as a whole, or that the returns on securities that have previously exhibited price momentum are less than returns on other styles of investing. Momentum can turn quickly, and stocks that previously exhibited high momentum may not experience continued positive momentum. In addition, there may be periods when the momentum style of investing is out of favor and therefore, the investment performance of the Fund may suffer.
Non-Diversified Fund Risk. Aerospace & Defense ETF, Golden Dragon China ETF, Insider Sentiment ETF, S&PSpin-Off ETF, and Water Resources ETF arenon-diversified and can invest a greater portion of its assets in securities of individual issuers than diversified funds. As a result, changes in the market value of a single investment could cause greater fluctuations in Share price than would occur in a diversified fund. This may increase a Fund’s volatility and cause the performance of a relatively small number of issuers to have a greater impact on a Fund’s performance.
Micro-Capitalization Securities Risk.For certain Funds, micro-capitalization stocks involve substantially greater risks of loss and price fluctuations because their earnings and revenues tend to be less predictable (and some companies may be experiencing significant losses), and their share prices tend to be more volatile and their markets less liquid than companies with larger market capitalizations.
Small- andMid-Capitalization Company Risk. For certain Funds, investing in securities of small- andmid-capitalization companies involves greater risk than customarily is associated with investing in larger, more established companies. These companies’ securities may be more volatile and less liquid than those of more established companies. These securities may have returns that vary, sometimes significantly, from the overall securities market. Often small- andmid-capitalization companies and the industries in which they focus are still evolving and, as a result, they may be more sensitive to changing market conditions.
Emerging Markets Investment Risk.For certain Funds, investments in the securities of issuers in emerging market countries involve risks often not associated with investments in the securities of issuers in developed countries. Securities in emerging markets may be subject to greater price fluctuations than securities in more developed markets. Fluctuations in the value of the U.S. dollar relative to the values of other currencies may adversely affect investments in emerging market securities, and emerging market securities may have relatively low market liquidity, decreased publicly available information about issuers, and inconsistent and potentially less stringent accounting, auditing and financial reporting requirements and standards of practice comparable to those applicable to domestic issuers. Emerging market securities also are subject to the risks of expropriation, nationalization or other adverse political or economic developments and the difficulty of enforcing obligations in other countries. Investments in emerging market securities also may be subject to dividend withholding or confiscatory taxes, currency blockage and/or transfer restrictions. Emerging markets usually are subject to greater market volatility, lower trading volume, political and economic instability, uncertainty regarding the existence of trading markets and more governmental limitations on foreign investment than are more developed markets. Securities law in many emerging market countries is relatively new and unsettled. Therefore, laws regarding foreign investment in emerging market securities, securities regulation, title to securities, and shareholder rights may change quickly and unpredictably. In addition, the enforcement of systems of taxation at federal, regional and local levels in emerging market countries may be inconsistent and subject to sudden change.
REIT Risk.For certain Funds, in addition to the risks pertaining to real estate investments more generally, REITs are subject to additional risks. The value of a REIT can depend on the structure of and cash flow generated by the REIT. REITs whose investments are concentrated in a limited number or type of properties, investments or narrow geographic area are subject to the risks affecting those properties or areas to a greater extent than a REIT with less concentrated investments. REITs are also subject to certain requirements under federal tax law. In addition, REITs may have expenses, including advisory and administration expenses, and each Fund and its shareholders will incur its pro rata share of the underlying expenses.Investment in Investment Companies Risk.For certain Funds, investing in other investment companies, including exchange-traded funds (“ETFs”), business development companies andclosed-end funds, subjects the Fund to those risks affecting the investment company, including the possibility that the value of the underlying securities held by the investment company could decrease or the portfolio becomes illiquid. Moreover, the Fund and its shareholders will incur its pro rata share of the underlying investment companies’ expenses, which will reduce the Fund’s performance, and the purchase of shares of some investment companies (in the case ofclosed-end investment companies) may sometimes require the payment of substantial premiums above the value of such companies’ portfolio securities or NAVs. In addition, investments by the Fund in another ETF orclosed-end fund are subject to, among other risks, the risk that the ETF’s or closed end fund’s shares may trade at a discount or premium relative to the NAV of the shares and the listing exchange may halt trading of the ETF’s orclosed-end fund’s shares.
Depositary Receipt Risk.Certain Funds may hold the securities ofnon-U.S. companies in the form of depositary receipts. The underlying securities of the depositary receipts in each Fund’s portfolio are subject to fluctuations in foreign currency exchange rates that may affect the value of each Fund’s portfolio. In addition, the value of the securities underlying the depositary receipts may change materially when U.S. markets are not open for trading. Investments in the underlying foreign securities also involve political and economic risks distinct from those associated with investing in the securities of U.S. issuers.
Currency Risk.For certain Funds, because the Fund’s NAV is determined in U.S. dollars, the Fund’s NAV could decline if the currency of anon-U.S. market in which the Fund invests depreciates against the U.S. dollar. Generally, an increase in the value of the U.S. dollar against a foreign currency will reduce the value of a security denominated in that foreign currency, thereby decreasing the Fund’s overall NAV. Exchange rates may be volatile and may change quickly and unpredictably in response to both global economic developments and economic conditions, causing an adverse impact on the Fund. As a result, investors have the potential for losses regardless of the length of time they intend to hold Shares.
Foreign Investment Risk. Investments in the securities ofnon-U.S. issuers involve risks beyond those associated with investments in U.S. securities. Foreign securities may have relatively low market liquidity, greater market volatility, decreased publicly available information and less reliable financial information about issuers, and inconsistent and potentially less stringent accounting, auditing and financial reporting requirements and standards of practice comparable to those applicable to domestic issuers. Foreign securities also are subject to the risks of expropriation, nationalization, political instability or other adverse political or economic developments and the difficulty of enforcing obligations in other countries. As the Funds may invest in securities denominated in foreign currencies, fluctuations in the value of the U.S. dollar relative to the values of other currencies may adversely affect investments in foreign securities and may negatively impact the Funds’ returns. Such risks may be exacerbated in emerging markets, where securities laws are relatively new and unsettled.
Risk of Investing in Listed Private Equity Companies. For certain Funds, there are certain risks inherent in investing in listed private equity companies, which encompass business development companies (“BDCs”), and other financial institutions or vehicles whose principal business is to invest in and lend capital to, or provide services to privately held companies. The 1940 Act imposes certain restraints upon the operations of BDCs. For example, BDCs are required to invest at least 70% of their total assets
primarily in securities of private companies or thinly traded U.S. public companies, cash, cash equivalents, U.S. government securities and high quality debt investments that mature in one year or less. Generally, little public information exists for private and thinly traded companies, and there is a risk that investors may not be able to make a fully informed investment decision. With investments in debt instruments, there is a risk that the issuer may default on its payments or declare bankruptcy. Additionally, a BDC may incur indebtedness only in amounts such that the BDC’s asset coverage equals at least 200% after such incurrence. These limitations on asset mix and leverage may prohibit the way that the BDC raises capital. BDCs generally invest in less mature private companies, which involve greater risk than well-established, publicly-traded companies.
Portfolio Turnover Risk.Certain Funds may engage in active and frequent trading of its portfolio securities to reflect the rebalancing of the Underlying Index. A portfolio turnover rate of 200%, for example, is equivalent to the Fund buying and selling all of its securities two times during the course of a year. A high portfolio turnover rate (such as 100% or more) could result in high brokerage costs for the Fund. While a high portfolio turnover rate can result in an increase in taxable capital gain distributions to the Fund’s shareholders, the Fund will seek to utilize thein-kind creation and redemption mechanism to minimize realization of capital gains to the extent possible.
| C. | Investment Transactions and Investment Income — Investment transactions are accounted for on a trade date basis. Realized gains and losses from the sale or disposition of securities are computed on the specific identified cost basis. Interest income is recorded on the accrual basis from settlement date.Pay-in-kind interest income andnon-cash dividend income received in the form of securitiesin-lieu of cash are recorded at the fair value of the securities received. Dividend income (net of withholding tax, if any) is recorded on theex-dividend date. Realized gains, dividends and interest received by a Fund may give rise to withholding and other taxes imposed by foreign countries. Tax conventions between certain countries and the United States may reduce or eliminate such taxes. |
The Funds may periodically participate in litigation related to each Fund’s investments. As such, the Funds may receive proceeds from litigation settlements. Any proceeds received are included in the Statements of Operations as realized gain (loss) for investments no longer held and as unrealized gain (loss) for investments still held.
Brokerage commissions and mark ups are considered transaction costs and are recorded as an increase to the cost basis of securities purchased and/or a reduction of proceeds on a sale of securities. Such transaction costs are included in the determination of net realized and unrealized gain (loss) from investment securities reported in the Statements of Operations and the Statements of Changes in Net Assets and the net realized and unrealized gains (losses) on securities per share in the Financial Highlights. Transaction costs are included in the calculation of each Fund’s NAV and, accordingly, they reduce each Fund’s total returns. These transaction costs are not considered operating expenses and are not reflected in net investment income reported in the Statements of Operations and the Statements of Changes in Net Assets, or the net investment income per share and the ratios of expenses and net investment income reported in the Financial Highlights, nor are they limited by any expense limitation arrangements between each Fund and the Adviser.
| D. | Country Determination — For the purposes of presentation in the Schedules of Investments, the Adviser may determine the country in which an issuer is located and/or credit risk exposure based on various factors. These factors include whether each Fund’s Underlying Index has made a country determination and may include the laws of the country under which the issuer is organized, where the issuer maintains a principal office, the country in which the issuer derives 50% or more of its total revenues and the country that has the primary market for the issuer’s securities, as well as other criteria. Among the other criteria that may be evaluated for making this determination are the country in which the issuer maintains 50% or more of its assets, the type of security, financial guarantees and enhancements, the nature of the collateral and the sponsor organization. Country of issuer and/or credit risk exposure has been determined to be the United States of America, unless otherwise noted. |
| E. | Dividends and Distributions to Shareholders — Each Fund (except BRIC ETF, Insider Sentiment ETF, Raymond JamesSB-1 Equity ETF and S&PSpin-Off ETF) declares and pays dividends from net investment income, if any, to its shareholders quarterly and records such dividends onex-dividend date. BRIC ETF, Insider Sentiment ETF, Raymond JamesSB-1 Equity ETF and S&PSpin-Off ETF declare and pay dividends from net investment income, if any, to shareholders annually and records such dividends onex-dividend date. Generally, each Fund distributes net realized taxable capital gains, if any, annually in cash and records them onex-dividend date. Such distributions on a tax basis are determined in conformity with federal income tax regulations, which may differ from accounting principles generally accepted in the United States of America (“GAAP”). Distributions in excess of tax basis earnings and profits, if any, are reported in such Fund’s financial statements as a tax return of capital at fiscalyear-end. |
| F. | Federal Income Taxes — Each Fund intends to comply with the provisions of the Internal Revenue Code of 1986, as amended (the “Internal Revenue Code”), applicable to regulated investment companies and to distribute substantially all of the Fund’s taxable earnings to its shareholders. As such, the Funds will not be subject to federal income taxes on otherwise taxable income (including net realized gains) that is distributed to the shareholders. Therefore, no provision for federal income taxes is recorded in the financial statements. |
Each Fund recognizes the tax benefits of uncertain tax positions only when the position is more likely than not to be sustained. Management has analyzed each Fund’s uncertain tax positions and concluded that no liability for unrecognized tax benefits should be recorded related to uncertain tax positions. Management is not aware of any tax positions for which it is reasonably possible that the total amounts of unrecognized tax benefits will change materially in the next 12 months.
Income and capital gain distributions are determined in accordance with federal income tax regulations, which may differ from GAAP. These differences are primarily due to differing book and tax treatments forin-kind transactions, losses deferred due to wash sales, and passive foreign investment company adjustments, if any.
The Funds file U.S. federal tax returns and tax returns in certain other jurisdictions. Generally, a Fund is subject to examinations by such taxing authorities for up to three years after the filing of the return for the tax period.
| G. | Expenses — Expenses of the Trust that are directly identifiable to a specific Fund are applied to that Fund. Expenses of the Trust that are not readily identifiable to a specific Fund are allocated in such a manner as deemed equitable, taking into consideration the nature and type of expense and the relative net assets of each Fund. |
Each Fund (except for S&P 500 BuyWrite ETF and Raymond JamesSB-1 Equity ETF) is responsible for all of its expenses, including the investment advisory fees, costs of transfer agency, custody, fund administration, legal, audit and other services, interest, taxes, brokerage commissions and other expenses connected with executions of portfolio transactions,sub-licensing fees related to its respective Underlying Index, any distribution fees or expenses, litigation expenses, fees payable to the Trust’s Board members who are not “interested persons” (as defined in the 1940 Act) of the Trust (the “Independent Trustees”) or the Adviser, expenses incurred in connection with the Board members’ services, including travel expenses and legal fees of counsel for the Independent Trustees acquired fund fees and expenses, if any, and extraordinary expenses.
S&P 500 BuyWrite ETF and Raymond JamesSB-1 Equity ETF has agreed to pay an annual unitary management fee to the Adviser. Out of the unitary management fee, the Adviser has agreed to pay for substantially all expenses of the Fund, including the costs of transfer agency, custody, fund administration, legal, audit and other services, except for advisory fees, distribution fees, if any, brokerage expenses, taxes, interest, acquired fund fees and expenses, if any, litigation expenses and other extraordinary expenses.
To the extent a Fund invests in other investment companies, the expenses shown in the accompanying financial statements reflect the expenses of the Fund and do not include any expenses of the investment companies in which it invests. The effects of such investment companies’ expenses are included in the realized and unrealized gain or loss on the investments in the investment companies.
| H. | Accounting Estimates — The preparation of the financial statements in accordance with GAAP requires management to make estimates and assumptions that affect the reported amounts and disclosures in the financial statements, including estimates and assumptions related to taxation. Actual results could differ from these estimates. In addition, the Funds monitor for material events or transactions that may occur or become known after theperiod-end date and before the date the financial statements are released to print. |
| I. | Indemnifications — Under the Trust’s organizational documents, its Officers and Trustees are indemnified against certain liabilities arising out of the performance of their duties to the Trust. Each Independent Trustee is also indemnified against certain liabilities arising out of the performance of his duties to the Trust pursuant to an Indemnification Agreement between such trustee and the Trust. Additionally, in the normal course of business, the Trust enters into contracts with service providers that contain general indemnification clauses. The Trust’s maximum exposure under these arrangements is unknown, as this would involve future claims that may be made against the Trust that have not yet occurred. However, based on experience, the Trust believes the risk of loss to be remote. |
| J. | Foreign Currency Translations — Foreign currency is valued at the close of the NYSE based on quotations posted by banks and major currency dealers. Portfolio securities and other assets and liabilities denominated in foreign currencies are translated into U.S. dollar amounts at date of valuation. Purchases and sales of portfolio securities (net of foreign taxes withheld on disposition) and income items denominated in foreign currencies are translated into U.S. dollar amounts on the respective dates of such transactions. The Funds do not separately account for the portion of the results of operations resulting from changes in foreign exchange rates on investments and the fluctuations arising from changes in market prices of securities held. The combined results of changes in foreign exchange rates and the fluctuation of market prices on investments (net of estimated foreign tax withholding) are included with the net realized and unrealized gain or loss from investments in the Statements of Operations. Reported net realized foreign currency gains or losses arise from (1) sales of foreign currencies, (2) currency gains or losses realized between the trade and settlement dates on securities transactions, and (3) the difference between the amounts of dividends, interest, and foreign withholding taxes recorded on each Fund’s books and the U.S. dollar equivalent of the amounts actually received or paid. Net unrealized foreign currency gains and losses arise from changes in the fair values of assets and liabilities, other than investments in securities at fiscalperiod-end, resulting from changes in exchange rates. |
The Funds may invest in foreign securities, which may be subject to foreign taxes on income, gains on investments or currency repatriation, a portion of which may be recoverable. Foreign taxes, if any, are recorded based on the tax regulations and rates that exist in the foreign markets in which each Fund invests.
| K. | Option Contracts Written — S&P 500 BuyWrite ETF engaged in certain strategies involving options to manage or minimize the risk of its investments or for investment purposes. A call option gives the purchaser of such option the right to buy, and the writer (the Fund) the obligation to sell, the underlying security at the stated exercise price during the option period. When the Fund writes (sells) call options, the amount of the premium received is recorded as a liability in the Statements of Assets and Liabilities and is subsequently“marked-to-market” to reflect the current value of the option written. The difference between the premium received and the current value of the option is recorded as unrealized appreciation or depreciation. The net change in unrealized appreciation (depreciation) is reported in the Statements of Operations. If a written call option expires, or if the Fund enters into a closing purchase transaction, the Fund realizes a gain (or a loss if the closing purchase transaction exceeds the premium received when the option was written) without regard to any unrealized gain or loss on the underlying security, and the liability related to |
| | such option is extinguished. If a written option is exercised, the Fund realizes a gain or loss from the sale of the underlying security and the proceeds of the sale are increased by the premium originally received. |
Writing Covered Call Option Risk. The primary risk in writing a call option is market risk. By writing covered call options in return for the receipt of premiums, the S&P 500 BuyWrite ETF will give up the opportunity to benefit from potential increases in the value of the S&P 500® Index above the exercise prices of the written options, but will continue to bear the risk of declines in the value of the S&P 500® Index. The premiums received from the options may not be sufficient to offset any losses sustained from the volatility of the underlying stocks over time. In addition, the Fund’s ability to sell the underlying securities will be limited while the option is in effect unless the Fund extinguishes the option position through the purchase of an offsetting identical option prior to the expiration of the written option. There is also a risk the Fund may not be able to enter into a closing transaction because of an illiquid market. If trading of options is suspended, the Fund may be unable to write options at times that may be desirable or advantageous to the Fund to do so.
| L. | Swap Agreements — Global Listed Private Equity ETF may enter into various swap transactions, including interest rate, total return, index, currency exchange rate and credit default swap contracts (“CDS”) for investment purposes or to manage interest rate, currency or credit risk. Such transactions are agreements between two parties (“Counterparties”). These agreements may contain, among other conditions, events of default and termination events, and various covenants and representations such as provisions that require the Fund to maintain apre-determined level of net assets, and/or provide limits regarding the decline of the Fund’s NAV over specific periods of time. If the Fund were to trigger such provisions and have open derivative positions at that time, the Counterparty may be able to terminate such agreement and request immediate payment in an amount equal to the net liability positions, if any. |
Interest rate, total return, index and currency exchange rate swap agreements aretwo-party contracts entered into primarily to exchange the returns (or differentials in rates of returns) earned or realized on particular predetermined investments or instruments. The gross returns to be exchanged or “swapped” between the parties are calculated with respect to a notional amount, i.e., the return on or increase in value of a particular dollar amount invested at a particular interest rate or return of an underlying asset, in a particular foreign currency, or in a “basket” of securities representing a particular index.
Changes in the value of swap agreements are recognized as unrealized gains (losses) in the Statements of Operations by “marking to market” on a daily basis to reflect the value of the swap agreement at the end of each trading day. Payments received or paid at the beginning of the agreement are reflected as such on the Statements of Assets and Liabilities and may be referred to as upfront payments. The Fund accrues for the fixed payment stream and amortizes upfront payments, if any, on swap agreements on a daily basis with the net amount, recorded as a component of realized gain (loss) on the Statements of Operations. A liquidation payment received or made at the termination of a swap agreement is recorded as realized gain (loss) on the Statements of Operations. The Fund segregates cash or liquid securities having a value at least equal to the amount of the potential obligation of the Fund under any swap transaction. Cash held as collateral is recorded as deposits with brokers on the Statements of Assets and Liabilities. Entering into these agreements involves, to varying degrees, lack of liquidity and elements of credit, market, and counterparty risk in excess of amounts recognized on the Statements of Assets and Liabilities. Such risks involve the possibility that a swap is difficult to sell or liquidate, the Counterparty does not honor its obligations under the agreement and unfavorable interest rates and market fluctuations. It is possible that developments in the swaps market, including potential government regulation, could adversely affect the Fund’s ability to terminate existing swap agreements or to realize amounts to be received under such agreements.
| M. | Securities Lending — During the fiscal year ended April 30, 2019, Aerospace & Defense ETF, BRIC ETF, CleantechTM ETF, DWA Momentum ETF, Global Listed Private Equity ETF, Golden Dragon China ETF, Insider Sentiment ETF, Raymond JamesSB-1 Equity ETF, S&PSpin-Off ETF, Water Resources ETF, and WilderHill Clean Energy ETF participated in securities lending. Each Fund loaned portfolio securities having a market value up toone-third of each Fund’s total assets. Such loans are secured by cash collateral equal to no less than 102% (105% for international securities) of the market value of the loaned securities determined daily by the securities lending provider. Cash collateral received in connection with these loans is generally invested in an affiliated money market fund and is shown as such on the Schedules of Investments. Each Fund bears the risk of loss with respect to the investment of collateral. It is the policy of these Funds to obtain additional collateral from or return excess collateral to the borrower by the end of the next business day, following the valuation date of the securities loaned. Therefore, the value of the collateral held may be temporarily less than the value of the securities on loan. When loaning securities, each Fund retains certain benefits of owning the securities, including the economic equivalent of dividends or interest generated by the security. Lending securities entails a risk of loss to each Fund if, and to the extent that, the market value of the securities loaned were to increase, and the borrower did not increase the collateral accordingly, and the borrower failed to return the securities. The securities loaned are subject to termination at the option of the borrower or each Fund. Upon termination, the borrower will return to each Fund the securities loaned and each Fund will return the collateral. Upon the failure of the borrower to return the securities, collateral may be liquidated and the securities may be purchased on the open market to replace the loaned securities. Each Fund could experience delays and costs in gaining access to the collateral and the securities may lose value during the delay which could result in potential losses to each Fund. Some of these losses may be indemnified by the lending agent. Each Fund bears the risk of any deficiency in the amount of the collateral available for return to the borrower due to any loss on the collateral invested. Dividends received on cash collateral investments for securities lending transactions, which are net of compensation to Counterparties, are included inSecurities lending income on the Statements of Operations. The aggregate value of securities out on loan, if any, is shown on the Statements of Assets and Liabilities. |
| N. | Distributions from Distributable Earnings — In accordance with the Securities and Exchange Commission’s issuance of Disclosure Update and Simplification, the Funds have presented the total, rather than the components, of distributions to shareholders, except for tax return of capital distributions, if any, in the Statements of Changes in Net Assets. |
For the year ended April 30, 2018, distributions from distributable earnings consisted of:
| | | | | | | | |
| | | Distributions to
shareholders from net
investment income | | | Distributions to
shareholders from net
realized gains | |
| Aerospace & Defense ETF | | $ | 5,890,874 | | | $ | — | |
| BRIC ETF(1) | | | 1,588,508 | | | | | |
| CleantechTM ETF | | | 1,006,758 | | | | — | |
| DWA Momentum ETF | | | 3,926,777 | | | | — | |
| Global Listed Private Equity ETF | | | 30,958,567 | | | | — | |
| Golden Dragon China ETF | | | 4,673,478 | | | | — | |
| Insider Sentiment ETF(2) | | | 1,099,212 | | | | — | |
| Raymond JamesSB-1 Equity ETF(1) | | | — | | | | — | |
| S&P 500 BuyWrite ETF | | | 15,918,964 | | | | 19,713,365 | |
| S&P 500® Quality ETF | | | 26,665,792 | | | | — | |
| S&PSpin-Off ETF(2) | | | 836,626 | | | | — | |
| Water Resources ETF | | | 3,090,361 | | | | — | |
| WilderHill Clean Energy ETF | | | 1,382,506 | | | | — | |
| WilderHill Progressive Energy ETF | | | 140,441 | | | | — | |
| (1) | For the fiscal period September 1, 2017 to August 31, 2018. |
| (2) | For the fiscal period September 1, 2017 to April 30, 2018. |
For the fiscal year ended August 31, 2017, distributions from distributable earnings for BRIC ETF, Insider Sentiment ETF, Raymond JamesSB-1 Equity ETF and S&PSpin-Off ETF consisted of distributions from net investment income.
Note 3—Investment Advisory Agreement and Other Agreements
The Trust has entered into Investment Advisory Agreements with the Adviser on behalf of the Funds, pursuant to which the Adviser has overall responsibility for the selection and ongoing monitoring of the Funds’ investments, managing the Funds’ business affairs and providing certain clerical, bookkeeping and other administrative services. Pursuant to an Investment Advisory Agreement, each Fund (except for Raymond JamesSB-1 Equity ETF, S&P 500 BuyWrite ETF and S&P 500® Quality ETF) accrues daily and pays monthly to the Adviser an annual fee of 0.50% of the Fund’s average daily net assets. S&P 500® Quality ETF accrues daily and pays monthly to the Adviser an annual fee of 0.15% of the Fund’s average daily net assets. Prior to August 20, 2018 the advisory fee was 0.29%. Effective August 20, 2018, the Adviser voluntarily agreed to permanently waive a portion of the S&P 500® Quality ETF’s advisory fee. After giving effect to such waiver, the advisory fee was 0.15%. Effective September 24, 2018, the Adviser contractually reduced S&P 500® Quality ETF’s advisory fee from 0.29% to 0.15%.
Pursuant to another Investment Advisory Agreement, Raymond JamesSB-1 Equity ETF and S&P 500 BuyWrite ETF accrue daily and pay monthly to the Adviser, as compensation for its services, an annual unitary management fee of 0.75% and 0.49%, respectively, of the Fund’s average daily net assets. Prior to July 1, 2018, S&P 500 BuyWrite ETF’s unitary fee was 0.75% of its average daily net assets. Out of the unitary management fee, the Adviser has agreed to pay for substantially all expenses of Raymond JamesSB-1 Equity ETF and S&P 500 BuyWrite ETF, including the cost of transfer agency, custody, fund administration, legal, audit and other services, except for advisory fees, distribution fees, if any, brokerage expenses, taxes, interest, acquired fund fees and expenses, if any, litigation expenses and other extraordinary expenses.
The Trust also has entered into an Amended and Restated Excess Expense Agreement (the “Expense Agreement”) with the Adviser on behalf of each Fund (except Raymond JamesSB-1 Equity ETF and S&P 500 BuyWrite ETF), pursuant to which the Adviser has agreed to waive fees and/or pay Fund expenses to the extent necessary to prevent the operating expenses (excluding interest expenses, brokerage commissions and other trading expenses,sub-licensing fees, offering costs, taxes, acquired fund fees and expenses, if any, and extraordinary expenses) of each Fund (except for Raymond JamesSB-1 Equity ETF, S&P 500 BuyWrite ETF and S&P 500® Quality ETF) from exceeding 0.60% of the Fund’s average daily net assets per year (the “Expense Cap”), through at least August 31, 2021. The Expense Cap (includingsub-licensing fees) for S&P 500® Quality ETF is 0.15% (0.29% prior to August 20, 2018) of the Fund’s average daily net assets per year through at least August 31, 2021. Unless the Adviser continues the Expense Agreement, it will terminate on August 31, 2021. During its term, the Expense Agreement cannot be terminated or amended to increase the Expense Cap without approval of the Board of Trustees. The Adviser did not waive fees and/or pay Fund expenses during the period under this Expense Cap for Aerospace & Defense ETF, CleantechTM ETF, DWA Momentum ETF, Global Listed Private Equity ETF, Golden Dragon China ETF, S&PSpin-Off ETF and Water Resources ETF.
Further, the Adviser agrees to reimburse BRIC ETF, Insider Sentiment ETF and S&PSpin-Off ETF in the amount equal to the licensing fees that each Fund pays that cause the Fund’s operating expenses (excluding interest expenses, offering costs, brokerage commissions and other trading expenses, taxes, acquired fund fees and expenses and extraordinary expenses) to exceed 0.64%, 0.60% and 0.64%, respectively, through April 6, 2020 (for Insider Sentiment ETF and S&PSpin-Off ETF) and May 18, 2020 (for BRIC ETF). The Adviser also has agreed to waive a portion of the unitary management fee for Raymond James SB-1 Equity ETF through at least May 18, 2020 to prevent the expenses (excluding interest expenses, brokerage commissions and other trading expenses, acquired fund fees and expenses, if any, taxes, and litigation expenses and other extraordinary expenses) from exceeding 0.75%. Neither the Adviser nor the Fund can discontinue the agreement prior to its expiration.
Additionally, through August 31, 2021, the Adviser has contractually agreed to waive a portion of each Fund’s management fee in an amount equal to 100% of the net advisory fees an affiliate of the Adviser receives that are attributable to certain of the Fund’s investments in money market funds managed by that affiliate (excluding investments of cash collateral from securities lending). The Adviser cannot discontinue this waiver prior to its expiration. This agreement is not subject to recapture by the Adviser.
For the fiscal year ended April 30, 2019, the Adviser waived fees and/or paid Fund expenses for each Fund in the following amounts:
| | | | |
| Aerospace & Defense ETF | | $ | 1,300 | |
| BRIC ETF* | | | 91,952 | |
| CleantechTM ETF | | | 80 | |
| DWA Momentum ETF | | | 2,155 | |
| Global Listed Private Equity ETF | | | 46,624 | |
| Golden Dragon China ETF | | | 422 | |
| Insider Sentiment ETF | | | 62,793 | |
| Raymond JamesSB-1 Equity ETF* | | | 490 | |
| S&P 500 BuyWrite ETF | | | 273 | |
| S&P 500® Quality ETF | | | 845,827 | |
| S&PSpin-Off ETF | | | 371 | |
| Water Resources ETF | | | 1,681 | |
| WilderHill Clean Energy ETF | | | 16,898 | |
| * | For the period September 1, 2018 through April 30, 2019. |
For the period September 1, 2017 to May 18, 2018, Guggenheim Funds Investment Advisor LLC waived fees and/or paid Fund expenses for each Predecessor Fund and for the period after the close of business on May 18, 2018 to August 31, 2018, the Adviser waived fees in the following amounts:
| | | | | | | | |
Fund | | Period after the close of business
May 18, 2018 to August 31, 2018 | | | Period September 1, 2017
to May 18, 2018 | |
| BRIC ETF | | $ | 35,321 | | | $ | 32,260 | |
| Raymond James SB-1 Equity ETF | | | 12 | | | | — | |
The fees waived and/or expenses borne by the Adviser are subject to recapture by the Adviser up to three years from the date the fees were waived or the expenses were incurred, but no recapture payment will be made by the Funds if it would result in the Funds exceeding (i) the Expense Cap or (ii) the expense cap in effect at the time the fees and/or expenses subject to recapture were waived and/or borne by the Adviser.
For the following Funds, the amounts available for potential future recapture by the Adviser under the Expense Agreement and the expiration schedule at April 30, 2019 are as follows:
| | | | | | | | | | | | | | | | |
| | | Total
Potential
Recapture
Amounts | | | Potential Recapture Amounts
Expiring | |
| | | 04/30/20 | | | 04/30/21 | | | 04/30/22 | |
| CleantechTM ETF | | $ | 39,193 | | | $ | 39,193 | | | $ | — | | | $ | — | |
| Golden Dragon China ETF | | | 2,056 | | | | 2,056 | | | | — | | | | — | |
| Inside Sentiment ETF | | | 79,804 | | | | — | | | | 17,225 | | | | 62,579 | |
| S&P 500® Quality ETF | | | 2,825,732 | | | | 919,351 | | | | 1,062,417 | | | | 843,964 | |
| WilderHill Clean Energy ETF | | | 143,264 | | | | 56,660 | | | | 70,007 | | | | 16,597 | |
| | | | | | | | | | | | | | | | | | | | |
| | |
| | | Total
Potential
Recapture
Amounts | | | Potential Recapture Amounts
Expiring | |
| | | 08/31/19 | | | 08/31/20 | | | 08/31/21 | | | 04/30/22 | |
| BRIC ETF | | | $126,925 | | | | $— | | | | $— | | | | $35,110 | | | | $91,815 | |
The Trust has entered into a Distribution Agreement with Invesco Distributors, Inc. (the “Distributor”), which serves as the distributor of Creation Units for each Fund. The Distributor does not maintain a secondary market in the Shares. The Funds are not charged any fees pursuant to the Distribution Agreement. The Distributor is an affiliate of the Adviser.
The Adviser has entered into a licensing agreement for each Fund with the following entities (each, a “Licensor”):
��
| | |
Fund | | Licensor |
| Aerospace & Defense ETF | | SPADE Indexes |
| BRIC ETF | | The Bank of New York Mellon |
| CleantechTM ETF | | Cleantech Indices LLC |
| DWA Momentum ETF | | Dorsey Wright & Associates, LLC |
| Global Listed Private Equity ETF | | Red Rocks Capital, LLC |
| Golden Dragon China ETF | | Nasdaq, Inc. |
| Insider Sentiment ETF | | Nasdaq, Inc. |
| Raymond JamesSB-1 Equity ETF | | Raymond James Research
Services, LLC |
| S&P 500 BuyWrite ETF | | S&P Dow Jones Indices LLC |
| S&P 500® Quality ETF | | S&P Dow Jones Indices LLC |
| S&PSpin-Off ETF | | S&P Dow Jones Indices LLC |
| Water Resources ETF | | Nasdaq, Inc. |
| WilderHill Clean Energy ETF | | WilderHill |
Each Underlying Index name trademark is owned by its respective Licensor. These trademarks have been licensed to the Adviser for use by the Funds. Each Fund is entitled to use its Underlying Index pursuant to the Trust’ssub-licensing agreement with the Adviser. The Funds (except for Raymond JamesSB-1 Equity ETF and S&P 500 BuyWrite ETF) are required to pay thesub-licensing fees that are shown on the Statements of Operations. The Funds are not sponsored, endorsed, sold or promoted by the Licensors, and the Licensors make no representation regarding the advisability of investing in any of the Funds.
The Trust has entered into service agreements whereby The Bank of New York Mellon, a wholly-owned subsidiary of The Bank of New York Mellon Corporation, serves as the administrator, custodian, fund accountant and transfer agent for each Fund.
Note 4—Investments in Affiliates
The Adviser serves as the adviser for Invesco India ETF, and therefore Invesco India ETF is considered to be affiliated with the Funds. The table below shows CleantechTM ETF’s transactions in, and earnings from, investments in affiliates (excluding affiliated money market funds) for the fiscal year ended April 30, 2019.
CleantechTM ETF
| | | | | | | | | | | | | | | | | | | | | | | | | | | | |
| | | Value
April 30, 2018 | | | Purchases
at Cost | | | Proceeds
from Sales | | | Change in
Unrealized
Appreciation | | | Realized
Gain | | | Value
April 30, 2019 | | | Dividend
Income | |
| Invesco India ETF | | $ | — | | | $ | 793,170 | | | $ | — | | | $ | 7,198 | | | $ | — | | | $ | 800,368 | | | $ | — | |
The Adviser is a wholly-owned subsidiary of Invesco Ltd. and therefore, Invesco Ltd. is considered to be affiliated with the Funds. The tables below show certain Funds’ transactions in, and earnings from, investments in affiliates (excluding affiliated money market funds) for the fiscal year ended April 30, 2019.
S&P 500 BuyWrite ETF
| | | | | | | | | | | | | | | | | | | | | | | | | | | | |
| | | Value
April 30, 2018 | | | Purchases
at Cost | | | Proceeds
from Sales | | | Change in
Unrealized
Appreciation
(Depreciation) | | | Realized
Gain (Loss) | | | Value
April 30, 2019 | | | Dividend
Income | |
| Invesco Ltd. | | $ | 156,844 | | | $ | 60,523 | | | $ | (58,204 | ) | | $ | (21,645 | ) | | $ | (21,297 | ) | | $ | 116,221 | | | $ | 6,896 | |
S&P 500® Quality ETF
| | | | | | | | | | | | | | | | | | | | | | | | | | | | |
| | | Value
April 30, 2018 | | | Purchases
at Cost | | | Proceeds
from Sales | | | Change in
Unrealized
Appreciation | | | Realized
Gain (Loss) | | | Value
April 30, 2019 | | | Dividend
Income | |
| Invesco Ltd.* | | $ | 3,553,402 | | | $ | 832,626 | | | $ | (4,214,868 | ) | | $ | 712,040 | | | $ | (883,200 | ) | | $ | — | | | $ | 36,757 | |
| * | At April 30, 2019, this security was no longer held. |
Note 5—Additional Valuation Information
GAAP defines fair value as the price that would be received to sell an asset or paid to transfer a liability in an orderly transaction between market participants at the measurement date, under current market conditions. GAAP establishes a hierarchy that prioritizes the inputs to valuation methods, giving the highest priority to readily available unadjusted quoted prices in an active market for identical assets (Level 1) and the lowest priority to significant unobservable inputs (Level 3), generally when market prices are not readily available or are unreliable. Based on the valuation inputs, the securities or other investments are tiered into one of three levels. Changes in valuation methods may result in transfers in or out of an investment’s assigned level:
| | Level 1 — | Prices are determined using quoted prices in an active market for identical assets. |
| | Level 2 — | Prices are determined using other significant observable inputs. Observable inputs are inputs that other market participants may use in pricing a security. These may include quoted prices for similar securities, interest rates, prepayment speeds, credit risk, yield curves, loss severities, default rates, discount rates, volatilities and others. |
| | Level 3 — | Prices are determined using significant unobservable inputs. In situations where quoted prices or observable inputs are unavailable (for example, when there is little or no market activity for an investment at the end of the period), unobservable inputs may be used. Unobservable inputs reflect a Fund’s own assumptions about the factors market participants would use in determining fair value of the securities or instruments and would be based on the best available information. |
Except for the Funds listed below, as of April 30, 2019, all of the securities in each Fund were valued based on Level 1 inputs (see the Schedules of Investments for security categories). The value on options held in S&P 500 BuyWrite ETF was based on Level 1 inputs. The level assigned to the securities valuations may not be an indication of the risk or liquidity associated with investing in those securities. Because of the inherent uncertainties of valuation, the values reflected in the financial statements may materially differ from the value received upon actual sale of those investments.
| | | | | | | | | | | | | | | | |
| | | Level 1 | | | Level 2 | | | Level 3 | | | Total | |
| Global Listed Private Equity ETF | | | | | | | | | | | | | | | | |
| Investments in Securities | | | | | | | | | | | | | | | | |
Common Stocks & Other Equity Interests | | $ | 211,129,842 | | | $ | — | | | $ | — | | | $ | 211,129,842 | |
Money Market Funds | | | 50,722,504 | | | | — | | | | — | | | | 50,722,504 | |
| | | | | | | | | | | | | | | | |
Total Investments | | $ | 261,852,346 | | | $ | — | | | $ | — | | | $ | 261,852,346 | |
| | | | | | | | | | | | | | | | |
| Other Investments-Assets* | | | | | | | | | | | | | | | | |
Swap Agreements | | | — | | | | 112,282 | | | | — | | | | 112,282 | |
| | | | | | | | | | | | | | | | |
| Other Investments-Liabilites* | | | | | | | | | | | | | | | | |
Swap Agreements | | | — | | | | (146,616 | ) | | | — | | | | (146,616 | ) |
| | | | | | | | | | | | | | | | |
Total Other Investments | | | — | | | | (34,334 | ) | | | — | | | | (34,334 | ) |
| | | | | | | | | | | | | | | | |
Total Investments | | $ | 261,852,346 | | | $ | (34,334 | ) | | $ | — | | | $ | 261,818,012 | |
| | | | | | | | | | | | | | | | |
| Golden Dragon China ETF | | | | | | | | | | | | | | | | |
| Investments in Securities | | | | | | | | | | | | | | | | |
Common Stocks and Other Equity Interests | | $ | 216,720,261 | | | $ | — | | | $ | 0 | | | $ | 216,720,261 | |
Money Market Funds | | | 18,877,690 | | | | — | | | | — | | | | 18,877,690 | |
| | | | | | | | | | | | | | | | |
Total Investments | | $ | 235,597,951 | | | $ | — | | | $ | 0 | | | $ | 235,597,951 | |
| | | | | | | | | | | | | | | | |
| * | Unrealized appreciation (depreciation) |
Note 6—Derivative Investments
The Funds may enter into an International Swaps and Derivatives Association Master Agreement (“ISDA Master Agreement”) under which a Fund may trade OTC derivatives. An OTC transaction entered into under an ISDA Master Agreement typically involves a collateral posting arrangement, payment netting provisions andclose-out netting provisions. These netting provisions allow for reduction of credit risk through netting of contractual obligations. The enforceability of the netting provisions of the ISDA Master Agreement depends on the governing law of the ISDA Master Agreement, among other factors.
For financial reporting purposes, the Funds do not offset OTC derivative assets or liabilities that are subject to ISDA Master Agreements in the Statements of Assets and Liabilities.
Value of Derivative Investments at FiscalYear-End
The table below summarizes the value of each Fund’s derivative investments, detailed by primary risk exposure, held as of April 30, 2019:
| | | | | | | | |
| | | Value | |
| | | Global Listed
Private Equity
ETF | | | S&P 500
BuyWrite ETF | |
Derivative Assets | | Equity Risk | |
| Unrealized appreciation on swap agreements—OTC | | $ | 112,282 | | | $ | — | |
| Derivatives not subject to master netting agreements | | | — | | | | — | |
| | | | | | | | |
| Total Derivative Assets subject to master netting agreements | | $ | 112,282 | | | $ | — | |
| | | | | | | | |
| |
Derivative Liabilities | | Equity Risk | |
| Options written, at value—Exchange-Traded | | $ | — | | | $ | (6,332,390 | ) |
| Unrealized depreciation on swap agreements—OTC | | | (146,616 | ) | | | — | |
| | | | | | | | |
| Total Derivative Liabilities | | | (146,616 | ) | | | (6,332,390 | ) |
| | | | | | | | |
| Derivatives not subject to master netting agreements | | | — | | | | 6,332,390 | |
| | | | | | | | |
| Total Derivative Liabilities subject to master netting agreements | | $ | (146,616 | ) | | $ | — | |
| | | | | | | | |
Offsetting Assets and Liabilities
The table below reflects the Fund’s exposure to Counterparties subject to either an ISDA Master Agreement or other agreement for OTC derivative transactions as of April 30, 2019:
Global Listed Private Equity ETF
| | | | | | | | | | | | | | | | | | | | | | | | |
| | | Financial
Derivative
Assets | | | Financial
Derivative
Liabilities | | | | | | Collateral
(Received)/
Pledged | | | | |
Counterparty | | Swap
agreements | | | Swap
agreements | | | Net Value of
Derivatives | | | Non-Cash | | | Cash | | | Net
Amount | |
| Citibank, N.A. | | $ | 112,282 | | | $ | (143,755 | ) | | $ | (31,473 | ) | | $ | — | | | $ | — | | | $ | (31,473 | ) |
| Morgan Stanley Capital Services LLC | | | — | | | | (2,861 | ) | | | (2,861 | ) | | | — | | | | — | | | | (2,861 | ) |
| | | | | | | | | | | | | | | | | | | | | | | | |
| Total | | $ | 112,282 | | | $ | (146,616 | ) | | $ | (34,334 | ) | | $ | — | | | $ | — | | | $ | (34,334 | ) |
| | | | | | | | | | | | | | | | | | | | | | | | |
Effect of Derivative Investments for the Fiscal Year Ended April 30, 2019
The table below summarizes each Fund’s gains (losses) on derivative investments, detailed by primary risk exposure, recognized in earnings during the period:
| | | | | | | | |
| | | Location of Gain (Loss) on
Statements of Operations | |
| | | Global Listed
Private Equity
ETF | | | S&P 500
BuyWrite ETF | |
| | | Equity Risk | |
| Realized Gain (Loss): | | | | | | | | |
Options written | | $ | — | | | $ | (25,251,191 | ) |
Swap agreements | | | 4,307,709 | | | | — | |
| Change in Net Unrealized Appreciation (Depreciation): | | | | | | | | |
Options written | | | — | | | | (4,728,379 | ) |
Swap agreements | | | 58,786 | | | | — | |
| | | | | | | | |
| Total | | $ | 4,366,495 | | | $ | (29,979,570 | ) |
| | | | | | | | |
The table below summarizes the average notional value of derivatives held during the period.
| | | | | | | | |
| | | Average Notional Value | |
| | | Global Listed
Private
Equity ETF | | | S&P 500
BuyWrite ETF | |
| Options written | | $ | — | | | $ | 327,746,308 | |
| Swap agreements | | | 24,791,843 | | | | — | |
Note 7—Distributions to Shareholders and Tax Components of Net Assets
Tax Character of Distributions to Shareholders Paid During the Fiscal Years Ended April 30, 2019 and 2018:
| | | | | | | | | | | | | | | | | | | | | | | | |
| | | 2019 | | | 2018 | |
| | | Ordinary
Income | | | Long-Term
Capital Gains | | | Return of
Capital | | | Ordinary
Income | | | Long-Term
Capital Gains | | | Return of
Capital | |
| Aerospace & Defense ETF | | $ | 8,051,313 | | | $ | — | | | $ | — | | | $ | 5,890,874 | | | $ | — | | | $ | — | |
| CleantechTM ETF | | | 870,880 | | | | — | | | | — | | | | 1,006,758 | | | | — | | | | — | |
| DWA Momentum ETF | | | 2,302,714 | | | | — | | | | — | | | | 3,926,777 | | | | — | | | | 231,609 | |
| Global Listed Private Equity ETF | | | 8,142,823 | | | | — | | | | — | | | | 30,958,567 | | | | — | | | | 1,046,678 | |
| Golden Dragon China ETF | | | 536,515 | | | | — | | | | — | | | | 4,673,478 | | | | — | | | | — | |
| S&P 500 BuyWrite ETF | | | 5,929,392 | | | | 2,456,110 | | | | — | | | | 33,621,824 | | | | 2,010,505 | | | | — | |
| S&P 500® Quality ETF | | | 21,455,885 | | | | — | | | | — | | | | 26,665,792 | | | | — | | | | — | |
| Water Resources ETF | | | 3,503,105 | | | | — | | | | — | | | | 3,090,361 | | | | — | | | | — | |
| WilderHill Clean Energy ETF | | | 1,768,255 | | | | — | | | | — | | | | 1,382,506 | | | | — | | | | — | |
Tax Character of Distributions to Shareholders Paid During the Fiscal Year Ended April 30, 2019, the Period September 1, 2017 to April 30, 2018 and Year Ended August 31, 2017:
| | | | | | | | | | | | | | | | | | | | | | | | | | | | | | | | | | | | |
| | | 2019 | | | 2018 | | | 2017 | |
| | | Ordinary
Income | | | Long-Term
Capital Gains | | | Return of
Capital | | | Ordinary
Income | | | Long-Term
Capital Gains | | | Return of
Capital | | | Ordinary
Income | | | Long-Term
Capital Gains | | | Return of
Capital | |
| Insider Sentiment ETF | | $ | 651,057 | | | $ | — | | | $ | — | | | $ | 1,099,212 | | | $ | — | | | $ | — | | | $ | 1,266,043 | | | $ | — | | | $ | — | |
| S&PSpin-Off ETF | | | 1,410,652 | | | | — | | | | — | | | | 836,626 | | | | — | | | | 438,719 | | | | 3,264,300 | | | | — | | | | — | |
Tax Character of Distributions to Shareholders Paid During the Period September 1, 2018 to April 30, 2019 and Years Ended August 31, 2018 and 2017:
| | | | | | | | | | | | | | | | | | | | | | | | | | | | | | | | | | | | |
| | | 2019 | | | 2018 | | | 2017 | |
| | | Ordinary
Income | | | Long-Term
Capital Gains | | | Return of
Capital | | | Ordinary
Income | | | Long-Term
Capital Gains | | | Return of
Capital | | | Ordinary
Income | | | Long-Term
Capital Gains | | | Return of
Capital | |
| BRIC ETF | | $ | 1,731,261 | | | $ | — | | | $ | — | | | $ | 1,588,508 | | | $ | — | | | $ | — | | | $ | 1,048,634 | | | $ | — | | | $ | — | |
| Raymond JamesSB-1 Equity ETF | | | 2,047,360 | | | | — | | | | — | | | | — | | | | — | | | | — | | | | 2,566,671 | | | | — | | | | 331,196 | |
Tax Components of Net Assets at FiscalYear-End:
| | | | | | | | | | | | | | | | | | | | | | | | | | | | | | | | | | | | |
| | | Undistributed
Ordinary
Income | | | Undistributed
Long-Term
Capital Gains | | | Temporary
Book/Tax
Differences | | | Net
Unrealized
Appreciation
(Depreciation)—
Investments | | | Net Unrealized
Appreciation
(Depreciation)—
Foreign
Currencies | | | Capital Loss
Carryforwards | | | Late-Year
Ordinary
Loss
Deferral | | | Shares of
Beneficial
Interest | | | Total Net
Assets | |
| Aerospace & Defense ETF | | $ | 824,571 | | | $ | — | | | $ | (49,576 | ) | | $ | 192,255,074 | | | $ | — | | | $ | — | | | $ | — | | | $ | 745,215,785 | | | $ | 938,245,854 | |
| BRIC ETF | | | 204,014 | | | | — | | | | (1,408 | ) | | | 7,924,664 | | | | — | | | | (170,764,192 | ) | | | — | | | | 235,153,340 | | | | 72,516,418 | |
| CleantechTM ETF | | | 520,208 | | | | — | | | | (38,777 | ) | | | 49,170,247 | | | | (9,371 | ) | | | (31,786,263 | ) | | | — | | | | 162,264,645 | | | | 180,120,689 | |
| DWA Momentum ETF | | | 619,251 | | | | — | | | | (113,456 | ) | | | 313,365,552 | | | | — | | | | (406,333,437 | ) | | | — | | | | 1,638,409,319 | | | | 1,545,947,229 | |
| Global Listed Private Equity ETF | | | 4,574,535 | | | | — | | | | (58,371 | ) | | | (1,609,354 | ) | | | (51,789 | ) | | | (70,578,956 | ) | | | — | | | | 312,166,724 | | | | 244,442,789 | |
| Golden Dragon China ETF | | | — | | | | — | | | | (61,713 | ) | | | 3,927,660 | | | | — | | | | (200,155,899 | ) | | | (64,870 | ) | | | 413,084,606 | | | | 216,729,784 | |
| Insider Sentiment ETF | | | 216,058 | | | | — | | | | (1,781 | ) | | | 6,179,645 | | | | — | | | | (60,218,687 | ) | | | — | | | | 124,520,357 | | | | 70,695,592 | |
| Raymond JamesSB-1 Equity ETF | | | — | | | | — | | | | (1,045,074 | ) | | | 9,204,335 | | | | — | | | | (46,814,053 | ) | | | (664,923 | ) | | | 212,475,776 | | | | 173,156,061 | |
| S&P 500 BuyWrite ETF | | | 1,868,128 | | | | 475,368 | | | | — | | | | — | | | | — | | | | — | | | | — | | | | 318,434,175 | | | | 320,777,671 | |
| S&P 500® Quality ETF | | | 3,337,786 | | | | — | | | | (62,577 | ) | | | 197,921,852 | | | | — | | | | (146,742,864 | ) | | | — | | | | 1,415,330,921 | | | | 1,469,785,118 | |
| S&PSpin-Off ETF | | | 114,753 | | | | — | | | | (2,116 | ) | | | 8,454,676 | | | | — | | | | (131,314,181 | ) | | | — | | | | 269,561,281 | | | | 146,814,413 | |
| Water Resources ETF | | | 1,662,418 | | | | — | | | | (153,384 | ) | | | 261,920,584 | | | | — | | | | (287,047,578 | ) | | | — | | | | 964,886,777 | | | | 941,268,817 | |
| WilderHill Clean Energy ETF | | | 484,910 | | | | — | | | | (79,408 | ) | | | 16,178,201 | | | | — | | | | (441,070,665 | ) | | | — | | | | 569,344,166 | | | | 144,857,204 | |
Capital loss carryforwards are calculated and reported as of a specific date. Results of transactions and other activity after that date may affect the amount of capital loss carryforwards actually available for the Funds to utilize. Capital losses generated in years beginning after December 22, 2010 can be carried forward for an unlimited period, whereas previous losses expire in eight tax years. Capital losses with an expiration period may not be used to offset capital gains until all net capital losses without an expiration date have been utilized. Capital loss carryforwards with no expiration date will retain their character as either short-term or long-term capital losses instead of as short-term capital losses as under prior law. The ability to utilize capital loss carryforwards in the future may be limited under the Internal Revenue Code and related regulations based on the results of future transactions.
The following table presents available capital loss carryforwards for each Fund as of April 30, 2019:
| | | | | | | | | | | | |
| | | Post-effective/
no expiration | | | | |
| | | Short-Term | | | Long-Term | | | Total* | |
| Aerospace & Defense ETF | | $ | — | | | $ | — | | | $ | — | |
| BRIC ETF | | | 2,851,241 | | | | 167,912,951 | | | | 170,764,192 | |
| CleantechTM ETF | | | 1,261,711 | | | | 30,524,552 | | | | 31,786,263 | |
| DWA Momentum ETF | | | 403,707,292 | | | | 2,626,145 | | | | 406,333,437 | |
| Global Listed Private Equity ETF | | | 17,346,934 | | | | 53,232,022 | | | | 70,578,956 | |
| Golden Dragon China ETF | | | 31,264,781 | | | | 168,891,118 | | | | 200,155,899 | |
| Insider Sentiment ETF | | | 50,437,272 | | | | 9,781,415 | | | | 60,218,687 | |
| Raymond JamesSB-1 Equity ETF | | | 30,644,498 | | | | 16,169,555 | | | | 46,814,053 | |
| S&P 500 BuyWrite ETF | | | — | | | | — | | | | — | |
| S&P 500® Quality ETF | | | 94,847,255 | | | | 51,895,609 | | | | 146,742,864 | |
| S&PSpin-Off ETF | | | 58,176,176 | | | | 73,138,005 | | | | 131,314,181 | |
| Water Resources ETF | | | 163,791,855 | | | | 123,255,723 | | | | 287,047,578 | |
| WilderHill Clean Energy ETF | | | 85,090,913 | | | | 355,979,752 | | | | 441,070,665 | |
| * | Capital loss carryforwards as of the date listed above are reduced for limitations, if any, to the extent required by the Internal Revenue Code and may be further limited depending upon a variety of factors, including the realization of net unrealized gains or losses as of the date of any reorganization. |
Note 8—Investment Transactions
For the fiscal year ended April 30, 2019, the cost of securities purchased and proceeds from sales of securities (other than short-term securities, U.S. Treasury obligations, money market funds andin-kind transactions, if any) were as follows:
| | | | | | | | |
| | | Purchases | | | Sales | |
| Aerospace & Defense ETF | | $ | 145,560,489 | | | $ | 144,803,563 | |
| BRIC ETF* | | | 27,822,020 | | | | 29,006,229 | |
| CleantechTM ETF | | | 34,133,278 | | | | 34,559,211 | |
| DWA Momentum ETF | | | 1,270,187,306 | | | | 1,266,837,033 | |
| Global Listed Private Equity ETF | | | 141,464,778 | | | | 135,423,418 | |
| Golden Dragon China ETF | | | 79,817,502 | | | | 78,580,717 | |
| Insider Sentiment ETF | | | 82,728,130 | | | | 81,352,048 | |
| Raymond JamesSB-1 Equity ETF* | | | 114,075,384 | | | | 112,456,627 | |
| S&P 500 BuyWrite ETF | | | 48,550,975 | | | | 77,600,483 | |
| S&P 500® Quality ETF | | | 984,560,185 | | | | 979,196,001 | |
| S&PSpin-Off ETF | | | 87,884,194 | | | | 88,900,531 | |
| Water Resources ETF | | | 260,662,758 | | | | 261,786,748 | |
| WilderHill Clean Energy ETF | | | 46,901,091 | | | | 46,084,123 | |
| * | For the period September 1, 2018 through April 30, 2019. |
For the fiscal year ended April 30, 2019,in-kind transactions associated with creations and redemptions were as follows:
| | | | | | | | |
| | | Cost of
Securities
Received | | | Value of
Securities
Delivered | |
| Aerospace & Defense ETF | | $ | 67,400,337 | | | $ | 226,733,530 | |
| BRIC ETF* | | | 8,996,621 | | | | 8,629,794 | |
| CleantechTM ETF | | | 13,011,912 | | | | 4,170,485 | |
| DWA Momentum ETF | | | 973,478,866 | | | | 1,100,451,872 | |
| Global Listed Private Equity ETF | | | 53,384,461 | | | | 53,005,185 | |
| Golden Dragon China ETF | | | 45,922,441 | | | | 79,742,068 | |
| Insider Sentiment ETF | | | 19,119,828 | | | | 26,296,943 | |
| Raymond JamesSB-1 Equity ETF* | | | 28,601,824 | | | | 41,572,066 | |
| S&P 500 BuyWrite ETF | | | 95,715,698 | | | | 76,037,074 | |
| S&P 500® Quality ETF | | | 738,044,959 | | | | 756,495,680 | |
| S&PSpin-Off ETF | | | 38,951,395 | | | | 88,090,197 | |
| Water Resources ETF | | | 164,065,859 | | | | 164,837,359 | |
| WilderHill Clean Energy ETF | | | 43,281,754 | | | | 30,150,671 | |
| * | For the period September 1, 2018 through April 30, 2019. |
Gains (losses) onin-kind transactions are generally not considered taxable gains (losses) for federal income tax purposes.
At April 30, 2019, the aggregate cost of investments, including any derivatives, on a tax basis includes adjustments for financial reporting purposes as of the most recently completed federal income tax reportingperiod-end:
| | | | | | | | | | | | | | | | |
| | | Gross
Unrealized
Appreciation | | | Gross
Unrealized
(Depreciation) | | | Net
Unrealized
Appreciation
(Depreciation) | | | Cost | |
| Aerospace & Defense ETF | | $ | 203,924,383 | | | $ | (11,669,309 | ) | | $ | 192,255,074 | | | $ | 753,813,274 | |
| BRIC ETF | | | 15,484,380 | | | | (7,559,716 | ) | | | 7,924,664 | | | | 68,882,945 | |
| CleantechTM ETF | | | 53,169,156 | | | | (3,998,909 | ) | | | 49,170,247 | | | | 142,929,659 | |
| DWA Momentum ETF | | | 318,355,397 | | | | (4,989,845 | ) | | | 313,365,552 | | | | 1,241,132,939 | |
| Global Listed Private Equity ETF | | | 20,015,689 | | | | (21,625,043 | ) | | | (1,609,354 | ) | | | 263,427,366 | |
| Golden Dragon China ETF | | | 28,509,725 | | | | (24,582,065 | ) | | | 3,927,660 | | | | 231,670,291 | |
| Insider Sentiment ETF | | | 6,369,245 | | | | (189,600 | ) | | | 6,179,645 | | | | 64,641,867 | |
| Raymond JamesSB-1 Equity ETF | | | 18,143,091 | | | | (8,938,756 | ) | | | 9,204,335 | | | | 171,356,191 | |
| S&P 500 BuyWrite ETF | | | — | | | | — | | | | — | | | | 320,757,893 | |
| S&P 500® Quality ETF | | | 245,186,189 | | | | (47,264,337 | ) | | | 197,921,852 | | | | 1,271,848,599 | |
| S&PSpin-Off ETF | | | 23,847,388 | | | | (15,392,712 | ) | | | 8,454,676 | | | | 140,183,789 | |
| Water Resources ETF | | | 265,661,036 | | | | (3,740,452 | ) | | | 261,920,584 | | | | 681,460,013 | |
| WilderHill Clean Energy ETF | | | 23,720,510 | | | | (7,542,309 | ) | | | 16,178,201 | | | | 164,485,326 | |
Note 9—Reclassification of Permanent Differences
Primarily as a result of differing book/tax treatment ofin-kind transactions, foreign currency transactions, the use of a portion of the proceeds from redemptions as distributions and passive foreign investment companies, amounts were reclassified between undistributed net investment income, undistributed net realized gain (loss) and Shares of beneficial interest. These reclassifications had no effect on the net assets of each Fund. For the fiscal year ended April 30, 2019, the reclassifications were as follows:
| | | | | | | | | | | | |
| | | Undistributed
Net Investment
Income | | | Undistributed
Net Realized
Gain (Loss) | | | Shares of
Beneficial
Interest | |
| Aerospace & Defense ETF | | $ | — | | | $ | (78,475,935 | ) | | $ | 78,475,935 | |
| BRIC ETF | | | 13,939 | | | | 7,543,282 | | | | (7,557,221 | ) |
| CleantechTM ETF | | | 384 | | | | 10,066,902 | | | | (10,067,286 | ) |
| DWA Momentum ETF | | | (26,011 | ) | | | (211,632,532 | ) | | | 211,658,543 | |
| Global Listed Private Equity ETF | | | 8,561,525 | | | | (13,200,043 | ) | | | 4,638,518 | |
| Golden Dragon China ETF | | | 2,367,821 | | | | 2,650,834 | | | | (5,018,655 | ) |
| Insider Sentiment ETF | | | (3,412 | ) | | | 1,295,162 | | | | (1,291,750 | ) |
| Raymond JamesSB-1 Equity ETF | | | 372,182 | | | | (6,875,293 | ) | | | 6,503,111 | |
| S&P 500 BuyWrite ETF | | | 44 | | | | (44 | ) | | | — | |
| S&P 500® Quality ETF | | | — | | | | (126,624,657 | ) | | | 126,624,657 | |
| S&PSpin-Off ETF | | | (94 | ) | | | (13,941,169 | ) | | | 13,941,263 | |
| Water Resources ETF | | | — | | | | (21,573,310 | ) | | | 21,573,310 | |
| WilderHill Clean Energy ETF | | | — | | | | 232,317,594 | | | | (232,317,594 | ) |
Note 10—Trustees’ and Officer’s Fees
Trustees’ and Officer’s Fees include amounts accrued by the Funds to pay remuneration to the Independent Trustees and an Officer of the Trust. The Adviser, as a result of the unitary management fee, pays for such compensation for Raymond JamesSB-1 Equity ETF and S&P 500 BuyWrite ETF. The Trustee who is an “interested person” of the Trust does not receive any Trustees’ fees.
The Trust has adopted a deferred compensation plan (the “Plan”). Under the Plan, each Independent Trustee who has executed a Deferred Fee Agreement (a “Participating Trustee”) may defer receipt of all or a portion of his compensation (“Deferral Fees”). Such Deferral Fees are deemed to be invested in select Invesco Funds. The Deferral Fees payable to the Participating Trustee are valued as of the date such Deferral Fees would have been paid to the Participating Trustee. The value increases with contributions or with increases in the value of the Shares selected, and the value decreases with distributions or with declines in the value of the Shares selected. Obligations under the Plan represent unsecured claims against the general assets of the Funds.
Note 11—Capital
Shares are created and redeemed by each Fund only in Creation Units of 50,000 Shares. Only Authorized Participants are permitted to purchase or redeem Creation Units from the Funds. Such transactions are principally permitted in exchange for Deposit Securities, with a balancing cash component to equate the transaction to the NAV per Share of a Fund of the Trust on the transaction date. However, for all Funds, cash in an amount equivalent to the value of certain securities may be substituted, generally when the securities are not available in sufficient quantity for delivery, not eligible for trading by the Authorized Participant or as a result of other market circumstances.
To the extent that the Funds permit transactions in exchange for Deposit Securities, each Fund may issue Shares in advance of receipt of Deposit Securities subject to various conditions, including a requirement to maintain on deposit with the Trust cash at least equal to 105% of the market value of the missing Deposit Securities. In accordance with the Trust’s Participant Agreement, Creation Units will be issued to an Authorized Participant, notwithstanding the fact that the corresponding Deposit Securities have not been received in part or in whole, in reliance on the undertaking of the Authorized Participant to deliver the missing Deposit Securities as soon as possible, which undertaking shall be secured by the Authorized Participant’s delivery and maintenance of collateral consisting of cash in the form of U.S. dollars in immediately available funds having a value(marked-to-market daily) at least equal to 105%, which the Adviser may change from time to time, of the value of the missing Deposit Securities.
Certain transaction fees may be charged by the Funds for creations and redemptions, which are treated as increases in capital.
Transactions in each Fund’s Shares are disclosed in detail in the Statements of Changes in Net Assets.
Report of Independent Registered Public Accounting Firm
TotheBoard of Trustees of Invesco Exchange-Traded Fund Trust and Shareholders of Invesco Aerospace & Defense ETF, Invesco BRIC ETF, Invesco CleantechTM ETF, Invesco DWA Momentum ETF, Invesco Global Listed Private Equity ETF, Invesco Golden Dragon China ETF, Invesco Insider Sentiment ETF, Invesco Raymond JamesSB-1 Equity ETF, Invesco S&P 500 BuyWrite ETF, Invesco S&P 500® Quality ETF, Invesco S&PSpin-Off ETF, Invesco Water Resources ETF and Invesco WilderHill Clean Energy ETF
Opinions on the Financial Statements
We have audited the accompanying statements of assets and liabilities, including the schedules of investments, of each of the funds listed in the table below (thirteen of the funds constituting Invesco Exchange-Traded Fund Trust, hereafter collectively referred to as the “Funds”) as of April 30, 2019, the related statements of operations and changes in net assets for each of periods indicated in the table below, including the related notes,and the financial highlights for each of the periods indicated in the table below (collectively referred to as the “financial statements”). In our opinion, the financial statements present fairly, in all material respects, the financial position of each of the Funds as of April 30, 2019, the results of each of their operations, the changes in each of their net assets, and each of the financial highlights for each of the periods indicated in the table below in conformity with accounting principles generally accepted in the United States of America.
|
Fund Name |
| Invesco Aerospace & Defense ETF(1) |
| Invesco BRIC ETF(2) |
| Invesco CleantechTM ETF(1) |
| Invesco DWA Momentum ETF(1) |
| Invesco Global Listed Private Equity ETF(1) |
| Invesco Golden Dragon China ETF(1) |
| Invesco Insider Sentiment ETF(3) |
| Invesco Raymond JamesSB-1 Equity ETF(2) |
| Invesco S&P 500 BuyWrite ETF(1) |
| Invesco S&P 500® Quality ETF(1) |
| Invesco S&PSpin-Off ETF(3) |
| Invesco Water Resources ETF(1) |
| Invesco WilderHill Clean Energy ETF(1) |
| (1) | Statements of operations for the year ended April 30, 2019, the statements of changes in net assets for each of the two years in the period ended April 30, 2019 and the financial highlights for each of the five years in the period ended April 30, 2019 |
| (2) | Statements of operations and changes in net assets and the financial highlights for the eight months ended April 30, 2019 and for the year ended August 31, 2018 |
| (3) | Statements of operations for the year ended April 30, 2019 and statements of changes in net assets and the financial highlights for the year ended April 30, 2019 and the eight months ended April 30, 2018 |
The financial statements of Invesco BRIC ETF (Predecessor Fund Guggenheim BRIC ETF), Invesco Insider Sentiment ETF (Predecessor Fund Guggenheim Insider Sentiment ETF), Invesco Raymond JamesSB-1 Equity ETF (Predecessor Fund Guggenheim Raymond JamesSB-1 Equity ETF) and Invesco S&PSpin-Off ETF (Predecessor Fund Guggenheim S&PSpin-Off ETF) as of and for the year ended August 31, 2017 and the financial highlights for each of the periods ended on or prior to August 31, 2017 (not presented herein, other than the statements of changes in net assets and the financial highlights) were audited by other auditors whose report dated October 30, 2017, expressed an unqualified opinion on those financial statements and financial highlights.
Basis for Opinions
These financial statements are the responsibility of the Funds’ management. Our responsibility is to express an opinion on the Funds’ financial statements based on our audits. We are a public accounting firm registered with the Public Company Accounting Oversight Board (United States) (PCAOB) and are required to be independent with respect to the Funds in accordance with the U.S. federal securities laws and the applicable rules and regulations of the Securities and Exchange Commission and the PCAOB.
We conducted our audits of these financial statements in accordance with the standards of the PCAOB. Those standards require that we plan and perform the audit to obtain reasonable assurance about whether the financial statements are free of material misstatement, whether due to error or fraud.
Report of Independent Registered Public Accounting Firm(continued)
Our audits included performing procedures to assess the risks of material misstatement of the financial statements, whether due to error or fraud, and performing procedures that respond to those risks. Such procedures included examining, on a test basis, evidence regarding the amounts and disclosures in the financial statements. Our audits also included evaluating the accounting principles used and significant estimates made by management, as well as evaluating the overall presentation of the financial statements. Our procedures included confirmation of securities owned as of April 30, 2019 by correspondence with the custodian, transfer agent and brokers; when replies were not received from brokers, we performed other auditing procedures. We believe that our audits provide a reasonable basis for our opinions.
PricewaterhouseCoopers LLP
Chicago, Illinois
June 26, 2019
We have served as the auditor of one or more of the investment companies in the Invesco group of investment companies since at least 1995. We have not determined the specific year we began serving as auditor.
Calculating your ongoing Fund expenses
Example
As a shareholder of a Fund of the Invesco Exchange-Traded Fund Trust (excluding Invesco S&P 500 BuyWrite ETF and Invesco Raymond James SB-1 Equity ETF), you incur advisory fees and other Fund expenses. As a shareholder of Invesco S&P 500 BuyWrite ETF or Invesco Raymond James SB-1 Equity ETF, you incur a unitary management fee. In addition to the unitary management fee, a shareholder may pay distribution fees, if any, brokerage expenses, taxes, interest, acquired fund fees and expenses, if any, litigation expenses and other extraordinary expenses. The expense examples below are intended to help you understand your ongoing costs (in dollars) of investing in the Funds and to compare these costs with the ongoing costs of investing in other funds.
The example is based on an investment of $1,000 invested at the beginning of the period and held through thesix-month period ended April 30, 2019.
In addition to the fees and expenses which the Invesco Global Listed Private Equity ETF and Invesco Raymond James SB-1 Equity ETF (the “Portfolios”) bear directly, the Portfolios indirectly bear a pro rata share of the fees and expenses of the investment companies in which the Portfolios invest. The amount of fees and expenses incurred indirectly by the Portfolios will vary because the investment companies have varied expenses and fee levels and the Portfolios may own different proportions of the investment companies at different times. Estimated investment companies’ expenses are not expenses that are incurred directly by the Portfolios. They are expenses that are incurred directly by the investment companies and are deducted from the value of the investment companies the Portfolios invest in. The effect of the estimated investment companies’ expenses that the Portfolios bear indirectly are included in the Portfolios total returns.
Actual Expenses
The first line in the following table provides information about actual account values and actual expenses. You may use the information in this line, together with the amount you invested, to estimate the expenses that you paid over the period. Simply divide your account value by $1,000 (for example, an $8,600 account value divided by $1,000 = 8.6), then multiply the result by the number in the first line under the heading “Expenses Paid During theSix-Month Period” to estimate the expenses you paid on your account during this period.
Hypothetical Example for Comparison Purposes
The second line in the following table provides information about hypothetical account values and hypothetical expenses based on each Fund’s actual expense ratio and an assumed annualized rate of return of 5% per year before expenses, which is not the Fund’s actual return. The hypothetical account values and expenses may not be used to estimate the actual ending account balance or expenses you paid for the period. You may use this information to compare the ongoing costs of investing in the Funds and other funds. To do so, compare this 5% hypothetical example with the 5% hypothetical examples that appear in the shareholder reports of the other funds.
Please note that the expenses shown in the table are meant to highlight your ongoing costs only, and do not reflect any transactional costs, such as sales charges and brokerage commissions. Therefore, the second line in the table is useful in comparing ongoing costs only, and will not help you determine the relative total costs of owning different funds. In addition, expenses shown in the table do not include the expenses of the underlying funds, which are borne indirectly by a Fund. If transaction costs and indirect expenses were included, your costs would have been higher.
| | | | | | | | | | | | | | | | |
| | | Beginning
Account Value
May 1, 2018 | | | Ending
Account Value
April 30, 2019 | | | Annualized Expense Ratio Based on the
Six-Month Period | | | Expenses Paid
During the Six-Month Period(1) | |
| Invesco Aerospace & Defense ETF (PPA) | | | | | | | | | | | | | | | | |
Actual | | $ | 1,000.00 | | | $ | 1,141.90 | | | | 0.58 | % | | $ | 3.08 | |
Hypothetical (5% return before expenses) | | | 1,000.00 | | | | 1,021.92 | | | | 0.58 | | | | 2.91 | |
| Invesco BRIC ETF (EEB) | | | | | | | | | | | | | | | | |
Actual | | | 1,000.00 | | | | 1,132.68 | | | | 0.64 | | | | 3.38 | |
Hypothetical (5% return before expenses) | | | 1,000.00 | | | | 1,021.62 | | | | 0.64 | | | | 3.21 | |
| Invesco CleantechTM ETF (PZD) | | | | | | | | | | | | | | | | |
Actual | | | 1,000.00 | | | | 1,159.90 | | | | 0.68 | | | | 3.64 | |
Hypothetical (5% return before expenses) | | | 1,000.00 | | | | 1,021.42 | | | | 0.68 | | | | 3.41 | |
Calculating your ongoing Fund expenses(continued)
| | | | | | | | | | | | | | | | |
| | | Beginning
Account Value
May 1, 2018 | | | Ending
Account Value
April 30, 2019 | | | Annualized Expense Ratio Based on the
Six-Month Period | | | Expenses Paid
During the Six-Month Period(1) | |
| Invesco DWA Momentum ETF (PDP) | | | | | | | | | | | | | | | | |
Actual | | $ | 1,000.00 | | | $ | 1,110.50 | | | | 0.61 | % | | $ | 3.19 | |
Hypothetical (5% return before expenses) | | | 1,000.00 | | | | 1,021.77 | | | | 0.61 | | | | 3.06 | |
| Invesco Global Listed Private Equity ETF (PSP) | | | | | | | | | | | | | | | | |
Actual | | | 1,000.00 | | | | 1,091.10 | | | | 0.63 | | | | 3.27 | |
Hypothetical (5% return before expenses) | | | 1,000.00 | | | | 1,021.67 | | | | 0.63 | | | | 3.16 | |
| Invesco Golden Dragon China ETF (PGJ) | | | | | | | | | | | | | | | | |
Actual | | | 1,000.00 | | | | 1,244.20 | | | | 0.70 | | | | 3.90 | |
Hypothetical (5% return before expenses) | | | 1,000.00 | | | | 1,021.32 | | | | 0.70 | | | | 3.51 | |
| Invesco Insider Sentiment ETF (NFO) | | | | | | | | | | | | | | | | |
Actual | | | 1,000.00 | | | | 1,109.92 | | | | 0.60 | | | | 3.14 | |
Hypothetical (5% return before expenses) | | | 1,000.00 | | | | 1,021.82 | | | | 0.60 | | | | 3.01 | |
| Invesco Raymond James SB-1 Equity ETF (RYJ) | | | | | | | | | | | | | | | | |
Actual | | | 1,000.00 | | | | 1,064.87 | | | | 0.75 | | | | 3.84 | |
Hypothetical (5% return before expenses) | | | 1,000.00 | | | | 1,021.08 | | | | 0.75 | | | | 3.76 | |
| Invesco S&P 500 BuyWrite ETF (PBP) | | | | | | | | | | | | | | | | |
Actual | | | 1,000.00 | | | | 1,022.10 | | | | 0.49 | | | | 2.46 | |
Hypothetical (5% return before expenses) | | | 1,000.00 | | | | 1,022.36 | | | | 0.49 | | | | 2.46 | |
| Invesco S&P 500® Quality ETF (SPHQ) | | | | | | | | | | | | | | | | |
Actual | | | 1,000.00 | | | | 1,100.70 | | | | 0.15 | | | | 0.78 | |
Hypothetical (5% return before expenses) | | | 1,000.00 | | | | 1,024.05 | | | | 0.15 | | | | 0.75 | |
| Invesco S&P Spin-Off ETF (CSD) | | | | | | | | | | | | | | | | |
Actual | | | 1,000.00 | | | | 1,062.86 | | | | 0.63 | | | | 3.22 | |
Hypothetical (5% return before expenses) | | | 1,000.00 | | | | 1,021.67 | | | | 0.63 | | | | 3.16 | |
| Invesco Water Resources ETF (PHO) | | | | | | | | | | | | | | | | |
Actual | | | 1,000.00 | | | | 1,199.80 | | | | 0.59 | | | | 3.22 | |
Hypothetical (5% return before expenses) | | | 1,000.00 | | | | 1,021.87 | | | | 0.59 | | | | 2.96 | |
| Invesco WilderHill Clean Energy ETF (PBW) | | | | | | | | | | | | | | | | |
Actual | | | 1,000.00 | | | | 1,224.70 | | | | 0.70 | | | | 3.86 | |
Hypothetical (5% return before expenses) | | | 1,000.00 | | | | 1,021.32 | | | | 0.70 | | | | 3.51 | |
| (1) | Expenses are calculated using the annualized expense ratio, which represents the ongoing expenses as a percentage of net assets for the six-month period ended April 30, 2019. Expenses are calculated by multiplying the Fund’s annualized expense ratio by the average account value for the period, then multiplying the result by 181/365. Expense ratios for the most recent six-month period may differ from expense ratios based on the annualized data in the Financial Highlights. |
Tax Information
Form 1099-DIV, Form 1042-S and other year-end tax information provide shareholders with actual calendar year amounts that should be included in their tax returns. Shareholders should consult their tax advisers.
The following distribution information is being provided as required by the Internal Revenue Code or to meet a specific state’s requirement.
Each Fund designates the following amounts or, if subsequently determined to be different, the maximum amount allowable for its fiscal year ended April 30, 2019:
| | | | | | | | | | | | | | | | | | | | |
| | | Qualified Business
Income* | | Qualified Dividend
Income* | | Dividends
Received Deduction* | | Long-Term
Capital Gains |
| Aerospace & Defense ETF | | | | 0 | % | | | | 100 | % | | | | 100 | % | | | $ | — | |
| BRIC ETF | | | | 0 | % | | | | 80 | % | | | | 0 | % | | | | — | |
| CleantechTM ETF | | | | 0 | % | | | | 100 | % | | | | 35 | % | | | | — | |
| DWA Momentum ETF | | | | 7 | % | | | | 100 | % | | | | 100 | % | | | | — | |
| Global Listed Private Equity ETF | | | | 0 | % | | | | 42 | % | | | | 12 | % | | | | — | |
| Golden Dragon China ETF | | | | 0 | % | | | | 53 | % | | | | 0 | % | | | | — | |
| Insider Sentiment ETF | | | | 0 | % | | | | 100 | % | | | | 100 | % | | | | — | |
| Raymond James SB-1 Equity ETF | | | | 0 | % | | | | 100 | % | | | | 96 | % | | | | — | |
| S&P 500 BuyWrite ETF | | | | 0 | % | | | | 0 | % | | | | 0 | % | | | | 2,456,110 | |
| S&P 500® Quality ETF | | | | 0 | % | | | | 100 | % | | | | 100 | % | | | | — | |
| S&P Spin-Off ETF | | | | 0 | % | | | | 100 | % | | | | 90 | % | | | | — | |
| Water Resources ETF | | | | 0 | % | | | | 100 | % | | | | 100 | % | | | | — | |
| WilderHill Clean Energy ETF | | | | 0 | % | | | | 26 | % | | | | 15 | % | | | | — | |
| * | The above percentages are based on ordinary income dividends paid to shareholders during the Fund’s fiscal year. |
Trustees and Officers
The Independent Trustees of the Trust, their term of office and length of time served, their principal business occupations during at least the past five years, the number of portfolios in the Fund Complex (as defined below) overseen by each Independent Trustee and the other directorships, if any, held by each Independent Trustee are shown below.
| | | | | | | | | | |
Name, Address and Year of
Birth of Independent Trustees | | Position(s)
Held
with Trust | | Term of
Office and Length of
Time
Served* | | Principal
Occupation(s) During
Past 5 Years | | Number of
Portfolios
in Fund
Complex**
Overseen by
Independent
Trustees | | Other
Directorships
Held by
Independent
Trustees During
the Past 5 Years |
Ronn R. Bagge—1958
c/o Invesco Capital Management LLC
3500 Lacey Road, Suite 700
Downers Grove, IL 60515 | | Vice Chairman of the Board; Chairman of the Nominating and Governance Committee and Trustee | | Vice Chairman since 2018; Chairman of the Nominating and Governance Committee and Trustee since 2003 | | Founder and Principal, YQA Capital Management LLC (1998-Present); formerly, Owner/CEO of Electronic Dynamic Balancing Co., Inc. (high-speed rotating equipment service provider). | | 241 | | Trustee and Investment Oversight Committee member, Mission Aviation Fellowship (2017-Present). |
| | | | | |
Todd J. Barre—1957
c/o Invesco Capital Management LLC
3500 Lacey Road, Suite 700
Downers Grove, IL 60515 | | Trustee | | Since 2010 | | Assistant Professor of Business, Trinity Christian College (2010-2016); formerly, Vice President and Senior Investment Strategist (2001-2008), Director of Open Architecture and Trading (2007-2008), Head of Fundamental Research (2004-2007), and Vice President and Senior Fixed Income Strategist (1994-2001), BMO Financial Group/Harris Private Bank. | | 241 | | None. |
| | | | | |
Marc M. Kole—1960
c/o Invesco Capital Management LLC
3500 Lacey Road, Suite 700
Downers Grove, IL 60515 | | Chairman of the Audit Committee and Trustee | | Chairman of the Audit Committee since 2008; Trustee since 2006 | | Senior Director of Finance, By The Hand Club For Kids (not-for-profit) (2015-Present); formerly, Chief Financial Officer, Hope Network (social services) (2008-2012); Assistant Vice President and Controller, Priority Health (health insurance) (2005-2008); Regional Chief Financial Officer, United Healthcare (2005); Chief Accounting Officer, Senior Vice President of Finance, Oxford Health Plans (2000-2004); Audit Partner, Arthur Andersen LLP (1996-2000). | | 241 | | Treasurer (2018-Present), Finance Committee Member (2015-Present) and Audit Committee Member (2015), Thornapple Evangelical Covenant Church; formerly, Board and Finance Committee Member (2009-2017) and Treasurer (2010-2015, 2017), NorthPointe Christian Schools. |
| * | This is the date the Independent Trustee began serving the Trust. Each Independent Trustee serves an indefinite term, until his successor is elected. |
| ** | Fund Complex includes all open- and closed-end funds (including all of their portfolios) advised by the Adviser and any affiliated person of the Adviser. |
Trustees and Officers(continued)
| | | | | | | | | | |
Name, Address and Year of
Birth of Independent Trustees | | Position(s)
Held
with Trust | | Term of
Office and
Length of
Time
Served* | | Principal
Occupation(s) During
Past 5 Years | | Number of
Portfolios
in Fund
Complex**
Overseen by
Independent
Trustees | | Other
Directorships
Held by
Independent
Trustees During
the Past 5 Years |
Yung Bong Lim—1964
c/o Invesco Capital Management LLC
3500 Lacey Road, Suite 700
Downers Grove, IL 60515 | | Chairman of the Investment Oversight Committee and Trustee | | Chairman of the Investment Oversight Committee since 2014; Trustee since 2013 | | Managing Partner, RDG Funds LLC (real estate) (2008-Present); formerly, Managing Director, Citadel LLC (1999-2007). | | 241 | | Advisory Board Member, Performance Trust Capital Partners, LLC (2008-Present); Board Director, Beacon Power Services, Corp. (2019-Present). |
| | | | | |
Gary R. Wicker—1961
c/o Invesco Capital Management LLC
3500 Lacey Road, Suite 700
Downers Grove, IL 60515 | | Trustee | | Since 2013 | | Senior Vice President of Global Finance and Chief Financial Officer at RBC Ministries (publishing company) (2013-Present); formerly, Executive Vice President and Chief Financial Officer, Zondervan Publishing (a division of Harper Collins/NewsCorp) (2007-2012); Senior Vice President and Group Controller (2005-2006), Senior Vice President and Chief Financial Officer (2003-2004), Chief Financial Officer (2001-2003), Vice President, Finance and Controller (1999-2001) and Assistant Controller (1997-1999), divisions of The Thomson Corporation (information services provider); Senior Audit Manager (1994-1997), PricewaterhouseCoopers LLP. | | 241 | | Board Member and Treasurer, Our Daily Bread Ministries Canada (2015-Present); Board and Finance Committee Member, West Michigan Youth For Christ (2010-Present). |
| | | | | |
Donald H. Wilson—1959
c/o Invesco Capital Management LLC
3500 Lacey Road, Suite 700
Downers Grove, IL 60515 | | Chairman of the Board and Trustee | | Chairman since 2012; Trustee since 2006 | | Chairman, President and Chief Executive Officer, McHenry Bancorp Inc. and McHenry Savings Bank (subsidiary) (2018-Present); Chairman and Chief Executive Officer, Stone Pillar Advisors, Ltd. (advisory services to the financial sector) (2010-Present); formerly, President and Chief Executive Officer, Stone Pillar Investments, Ltd. (2016-2018); Chairman, President and Chief Executive Officer, Community Financial Shares, Inc. and Community Bank—Wheaton/Glen Ellyn (subsidiary) (2013-2015); Chief Operating Officer, AMCORE Financial, Inc. (bank holding company) (2007-2009); Executive Vice President and Chief Financial Officer, AMCORE Financial, Inc. (2006-2007); Senior Vice President and Treasurer, Marshall & Ilsley Corp. (bank holding company) (1995-2006). | | 241 | | Director, Penfield Children’s Center (2004-present); Board Chairman, Gracebridge Alliance, Inc. (2015-present). |
| * | This is the date the Independent Trustee began serving the Trust. Each Independent Trustee serves an indefinite term, until his successor is elected. |
| ** | Fund Complex includes all open- and closed-end funds (including all of their portfolios) advised by the Adviser and any affiliated person of the Adviser. |
Trustees and Officers(continued)
The Interested Trustee and the executive officers of the Trust, their term of office and length of time served, their principal business occupations during at least the past five years, the number of portfolios in the Fund Complex (as defined below) overseen by the Interested Trustee and the other directorships, if any, held by the Interested Trustee are shown below.
| | | | | | | | | | |
Name, Address and Year of
Birth of Interested Trustee | | Position(s)
Held
with Trust | | Term of
Office
and
Length of
Time
Served* | | Principal
Occupation(s) During
Past 5 Years | | Number of
Portfolios
in Fund
Complex**
Overseen by
Interested
Trustee | | Other
Directorships
Held by
Interested
Trustee During
the Past 5 Years |
Kevin M. Carome—1956
Invesco Ltd.
Two Peachtree Pointe,
1555 Peachtree St., N.E.,
Suite 1800
Atlanta, GA 30309 | | Trustee | | Since 2010 | | Senior Managing Director, Secretary and General Counsel, Invesco Ltd. (2007-Present); Director, Invesco Advisers, Inc. (2009-Present); Director (2006-Present) and Executive Vice President (2008–Present), Invesco North American Holdings, Inc.; Executive Vice President (2008–Present), Invesco Investments (Bermuda) Ltd.; Manager, Horizon Flight Works LLC, and Director, Invesco Finance PLC (2011- Present); Director and Secretary (2012–Present), Invesco Services (Bahamas) Private Limited; and Director and Executive Vice President (2014–Present), INVESCO Asset Management (Bermuda) Ltd.; formerly, Director and Executive Vice President, Invesco Finance, Inc. (2011-2018); Director (2006-2018) and Executive Vice President (2008–2018), Invesco Group Services, Inc., Invesco Holding Company (US), Inc.; Director, Invesco Holding Company Limited (2007-2018); Director and Chairman, INVESCO Funds Group, Inc., Senior Vice President, Secretary and General Counsel, Invesco Advisers, Inc. (2003-2006); Director, Invesco Investments (Bermuda) Ltd. (2008-2016); Senior Vice President and General Counsel, Liberty Financial Companies, Inc. (2000-2001); General Counsel of certain investment management subsidiaries of Liberty Financial Companies, Inc. (1998-2000); Associate General Counsel, Liberty Financial Companies, Inc. (1993-1998); Associate, Ropes & Gray LLP. | | 241 | | None |
| * | This is the date the Interested Trustee began serving the Trust. The Interested Trustee serves an indefinite term, until his successor is elected. |
| ** | Fund Complex includes all open- andclosed-end funds (including all of their portfolios) advised by the Adviser and any affiliated person of the Adviser. |
Trustees and Officers(continued)
| | | | | | |
Name, Address and Year of
Birth of Executive Officers | | Position(s)
Held
with Trust | | Length of
Time
Served* | | Principal Occupation(s) During Past 5 Years |
Daniel E. Draper—1968 Invesco Capital
Management LLC 3500 Lacey Road, Suite 700 Downers Grove, IL 60515 | | President and Principal Executive Officer | | Since 2015 | | Chief Executive Officer, Manager and Principal Executive Officer, Invesco Specialized Products, LLC (2018-Present); President and Principal Executive Officer, Invesco Exchange-Traded Fund Trust, Invesco Exchange-Traded Fund Trust II, Invesco India Exchange-Traded Fund Trust, Invesco Actively Managed Exchange-Traded Fund Trust and Invesco Actively Managed Exchange-Traded Commodity Fund Trust (2015-Present) and Invesco Exchange-Traded Self-Indexed Fund Trust (2016-Present); Chief Executive Officer and Principal Executive Officer (2016-Present) and Managing Director (2013-Present), Invesco Capital Management LLC; Senior Vice President, Invesco Distributors, Inc. (2014-Present); formerly, Vice President, Invesco Exchange-Traded Fund Trust, Invesco Exchange-Traded Fund Trust II, Invesco India Exchange-Traded Fund Trust, Invesco Actively Managed Exchange-Traded Fund Trust (2013-2015) and Invesco Actively Managed Exchange-Traded Commodity Fund Trust (2014-2015); Managing Director, Credit Suisse Asset Management (2010-2013) and Lyxor Asset Management/Societe Generale (2007-2010). |
| | | |
Kelli Gallegos—1970 Invesco Capital Management LLC 3500 Lacey Road, Suite 700 Downers Grove, IL 60515 | | Vice President
and Treasurer | | Since 2018 | | Assistant Treasurer, Invesco Specialized Products, LLC (2018-Present); Vice President and Treasurer, Invesco Exchange-Traded Fund Trust, Invesco Exchange-Traded Fund Trust II, Invesco India Exchange-Traded Fund Trust, Invesco Actively Managed Exchange-Traded Fund Trust, Invesco Actively Managed Exchange-Traded Commodity Fund Trust and Invesco Exchange-Traded Self-Indexed Fund Trust (2018-Present); Principal Financial and Accounting Officer-Pooled Investments, Invesco Capital Management LLC (2018-Present); Vice President, Principal Financial Officer (2016-Present) and Assistant Treasurer (2008-Present), The Invesco Funds; formerly, Assistant Treasurer Invesco Exchange-Traded Fund Trust, Invesco Exchange-Traded Fund Trust II, Invesco India Exchange-Traded Fund Trust and Invesco Actively Managed Exchange-Traded Fund Trust (2012-2018), Invesco Actively Managed Exchange-Traded Commodity Fund Trust (2014-2018) and Invesco Exchange-Traded Self-Indexed Fund Trust (2016-2018); Assistant Treasurer, Invesco Capital Management LLC (2013-2018); and Assistant Vice President, The Invesco Funds (2008-2016). |
| | | |
Peter Hubbard—1981 Invesco Capital Management LLC 3500 Lacey Road, Suite 700 Downers Grove, IL 60515 | | Vice President | | Since 2009 | | Vice President, Invesco Specialized Products, LLC (2018-Present); Vice President, Invesco Exchange-Traded Fund Trust, Invesco Exchange-Traded Fund Trust II, Invesco India Exchange-Traded Fund Trust, Invesco Actively Managed Exchange-Traded Fund Trust (2009-Present), Invesco Actively Managed Exchange-Traded Commodity Fund Trust (2014-Present) and Invesco Exchange-Traded Self-Indexed Fund Trust (2016-Present); Vice President and Director of Portfolio Management, Invesco Capital Management LLC (2010-Present); formerly, Vice President of Portfolio Management, Invesco Capital Management LLC (2008-2010); Portfolio Manager, Invesco Capital Management LLC (2007-2008); Research Analyst, Invesco Capital Management LLC (2005-2007); Research Analyst and Trader, Ritchie Capital, a hedge fund operator (2003-2005). |
| * | This is the date each Officer began serving the Trust. Each Officer serves an indefinite term, until his or her successor is elected. |
Trustees and Officers(continued)
| | | | | | |
Name, Address and Year of
Birth of Executive Officers | | Position(s)
Held
with Trust | | Length of
Time
Served* | | Principal Occupation(s) During Past 5 Years |
Sheri Morris—1964 Invesco Capital Management LLC 3500 Lacey Road, Suite 700 Downers Grove, IL 60515 | | Vice President | | Since 2012 | | President and Principal Executive Officer, The Invesco Funds (2016-Present); Treasurer, The Invesco Funds (2008-Present); Vice President, Invesco Advisers, Inc. (formerly known as Invesco Institutional (N.A.), Inc.) (registered investment adviser) (2009-Present) and Vice President, Invesco Exchange-Traded Fund Trust, Invesco Exchange-Traded Fund Trust II, Invesco India Exchange-Traded Fund Trust, Invesco Actively Managed Exchange-Traded Fund Trust (2012-Present), Invesco Actively Managed Exchange-Traded Commodity Fund Trust (2014-Present) and Invesco Exchange-Traded Self-Indexed Fund Trust (2016-Present); formerly, Vice President and Principal Financial Officer, The Invesco Funds (2008-2016); Treasurer, Invesco Exchange-Traded Fund Trust, Invesco Exchange-Traded Fund Trust II, Invesco India Exchange-Traded Fund Trust and Invesco Actively Managed Exchange-Traded Fund Trust (2011-2013); Vice President, Invesco Aim Advisers, Inc., Invesco Aim Capital Management, Inc. and Invesco Aim Private Asset Management, Inc.; Assistant Vice President and Assistant Treasurer, The Invesco Funds and Assistant Vice President, Invesco Advisers, Inc., Invesco Aim Capital Management, Inc. and Invesco Aim Private Asset Management, Inc. |
| | | |
Anna Paglia—1974 Invesco Capital Management LLC 3500 Lacey Road, Suite 700 Downers Grove, IL 60515 | | Secretary | | Since 2011 | | Secretary, Invesco Specialized Products, LLC (2018-Present); Secretary, Invesco Exchange-Traded Fund Trust, Invesco Exchange-Traded Fund Trust II, Invesco India Exchange-Traded Fund Trust, Invesco Actively Managed Exchange-Traded Fund Trust (2011-Present), Invesco Actively Managed Exchange-Traded Commodity Fund Trust (2014-Present) and Invesco Exchange-Traded Self-Indexed Fund Trust (2015-Present); Head of Legal (2010-Present) and Secretary (2015-Present), Invesco Capital Management LLC; Manager and Assistant Secretary, Invesco Indexing LLC (2017-Present); formerly, Partner, K&L Gates LLP (formerly, Bell Boyd & Lloyd LLP) (2007-2010); Associate Counsel at Barclays Global Investors Ltd. (2004-2006). |
| | | |
Rudolf E. Reitmann—1971 Invesco Capital Management LLC 3500 Lacey Road, Suite 700 Downers Grove, IL 60515 | | Vice President | | Since 2013 | | Head of Global Exchange Traded Funds Services, Invesco Specialized Products, LLC (2018-Present); Vice President, Invesco Exchange-Traded Fund Trust, Invesco Exchange-Traded Fund Trust II, Invesco India Exchange-Traded Fund Trust, Invesco Actively Managed Exchange-Traded Fund Trust (2013-Present), Invesco Actively Managed Exchange-Traded Commodity Fund Trust (2014-Present) and Invesco Exchange-Traded Self-Indexed Fund Trust (2016-Present); Head of Global Exchange Traded Funds Services, Invesco Capital Management LLC (2013-Present); Vice President, Invesco Capital Markets, Inc. (2018-Present). |
| * | This is the date each Officer began serving the Trust. Each Officer serves an indefinite term, until his or her successor is elected. |
Trustees and Officers(continued)
| | | | | | |
Name, Address and Year of
Birth of Executive Officers | | Position(s)
Held
with Trust | | Length of
Time
Served* | | Principal Occupation(s) During Past 5 Years |
David Warren—1957 Invesco Canada Ltd. 5140 Yonge Street, Suite 800 Toronto, Ontario M2N 6X7 | | Vice President | | Since 2009 | | Manager, Invesco Specialized Products, LLC (2018-Present); Vice President, Invesco Exchange-Traded Fund Trust, Invesco Exchange-Traded Fund Trust II, Invesco India Exchange-Traded Fund Trust, and Invesco Actively Managed Exchange-Traded Fund Trust (2009-Present), Invesco Actively Managed Exchange-Traded Commodity Fund Trust (2014-Present) and Invesco Exchange-Traded Self-Indexed Fund Trust (2016-Present); Managing Director—Chief Administrative Officer, Americas, Invesco Capital Management LLC; Senior Vice President, Invesco Advisers, Inc. (2009-Present); Director, Invesco Inc. (2009-Present); Director, Executive Vice President and Chief Financial Officer, Invesco Canada Ltd. (formerly, Invesco Trimark Ltd.) (2011-Present); Chief Administrative Officer, North American Retail, Invesco Ltd. (2007-Present); Director, Invesco Corporate Class Inc. (2014-Present); Director, Invesco Global Direct Real Estate Feeder GP Ltd. (2015-Present); Director, Invesco Canada Holdings Inc. (2002-Present); Director, Invesco Financial Services Ltd. / Services Financiers Invesco Ltée and Trimark Investments Ltd./Placements Trimark Ltée (2014-Present); Director, Invesco IP Holdings (Canada) Ltd. (2016-Present); Director, Invesco Global Direct Real Estate GP Ltd. (2015-Present); formerly, Senior Vice President, Invesco Management Group, Inc. (2007-2018); Executive Vice President and Chief Financial Officer, Invesco Inc. (2009-2015); Director, Executive Vice President and Chief Financial Officer, Invesco Canada Ltd. (formerly, Invesco Trimark Ltd.) (2000-2011). |
| | | |
Melanie Zimdars—1976 Invesco Capital
Management LLC 3500 Lacey Road, Suite 700 Downers Grove, IL 60515 | | Chief Compliance
Officer | | Since 2017 | | Chief Compliance Officer, Invesco Specialized Products, LLC (2018-Present); Chief Compliance Officer, Invesco Capital Management LLC (2017-Present); Chief Compliance Officer, Invesco Exchange-Traded Fund Trust, Invesco Exchange-Traded Fund Trust II, Invesco India Exchange-Traded Fund Trust, Invesco Actively Managed Exchange-Traded Fund Trust, Invesco Actively Managed Exchange-Traded Commodity Fund Trust and Invesco Exchange-Traded Self-Indexed Fund Trust (2017-Present); formerly, Vice President and Deputy Chief Compliance Officer at ALPS Holding, Inc. (2009-2017); Mutual Fund Treasurer/Chief Financial Officer at Wasatch Advisors, Inc. (2005-2008); Compliance Officer, U.S. Bancorp Fund Services, LLC (2001-2005). |
Availability of Additional Information About the Trustees
The Statement of Additional Information includes additional information about the Trustees and is available, without charge, upon request at (800)983-0903.
| * | This is the date each Officer began serving the Trust. Each Officer serves an indefinite term, until his or her successor is elected. |
Board Considerations Regarding Continuation of Investment Advisory Agreement
At a meeting held on April 11, 2019, the Board of Trustees of the Invesco Exchange-Traded Fund Trust (the “Trust”), including the Independent Trustees, approved the continuation of the Investment Advisory Agreement between Invesco Capital Management LLC (the “Adviser”) and the Trust for the following 53 series (each, a “Fund” and collectively, the “Funds”):
Invesco Aerospace & Defense ETF
Invesco BRIC ETF
Invesco BuyBack AchieversTM ETF
Invesco CleantechTM ETF
Invesco Dividend AchieversTM ETF
Invesco DWA Basic Materials Momentum ETF
Invesco DWA Consumer Cyclicals Momentum ETF
Invesco DWA Consumer Staples Momentum ETF
Invesco DWA Energy Momentum ETF
Invesco DWA Financial Momentum ETF
Invesco DWA Healthcare Momentum ETF
Invesco DWA Industrials Momentum ETF
Invesco DWA Momentum ETF
Invesco DWA NASDAQ Momentum ETF
Invesco DWA Technology Momentum ETF
Invesco DWA Utilities Momentum ETF
Invesco Dynamic Biotechnology & Genome ETF
Invesco Dynamic Building & Construction ETF
Invesco Dynamic Energy Exploration & Production ETF
Invesco Dynamic Food & Beverage ETF
Invesco Dynamic Large Cap Growth ETF
Invesco Dynamic Large Cap Value ETF
Invesco Dynamic Leisure and Entertainment ETF
Invesco Dynamic Market ETF
Invesco Dynamic Media ETF
Invesco Dynamic Networking ETF
Invesco Dynamic Oil & Gas Services ETF
Invesco Dynamic Pharmaceuticals ETF
Invesco Dynamic Retail ETF
Invesco Dynamic Semiconductors ETF
Invesco Dynamic Software ETF
Invesco Financial Preferred ETF
Invesco FTSE RAFI US 1000 ETF
Invesco FTSE RAFI US 1500Small-Mid ETF
Invesco Global Listed Private Equity ETF
Invesco Golden Dragon China ETF
Invesco High Yield Equity Dividend AchieversTM ETF
Invesco Insider Sentiment ETF
Invesco International Dividend AchieversTM ETF
Invesco Russell 2000 Pure Growth ETF
Invesco Russell 2000 Pure Value ETF
Invesco Russell Midcap Equal Weight ETF
Invesco Russell Midcap Pure Growth ETF
Invesco Russell Midcap Pure Value ETF
Invesco Russell Top 200 Equal Weight ETF
Invesco Russell Top 200 Pure Growth ETF
Invesco Russell Top 200 Pure Value ETF
Invesco S&P 500® Quality ETF
Invesco S&PSpin-Off ETF
Invesco Water Resources ETF
Invesco WilderHill Clean Energy ETF
Invesco ZacksMid-Cap ETF
Invesco Zacks Multi-Asset Income ETF
The Trustees reviewed information from the Adviser describing: (i) the nature, extent and quality of services provided, (ii) the investment performance of the Funds and the Adviser, (iii) the fees and expenses paid by the Funds and comparisons to amounts paid by other comparable registered investment companies, (iv) the costs of services provided and estimated profits realized by the Adviser, (v) the extent to which economies of scale may be realized as a Fund grows and whether fee levels reflect any possible economies of scale for the benefit of Fund shareholders, and (vi) any further benefits realized by the Adviser from its relationships with the Funds.
Nature, Extent and Quality of Services. In evaluating the nature, extent and quality of the Adviser’s services, the Trustees reviewed information concerning the functions performed by the Adviser for the Funds, information describing the Adviser’s current organization and staffing, including operational support provided by the Adviser’s parent organization, Invesco Ltd. (“Invesco”), and the background and experience of the persons responsible for theday-to-day management of the Funds. The Trustees reviewed matters related to the Adviser’s execution and/or oversight of execution of portfolio transactions on behalf of the Funds. The Trustees also reviewed information on the performance of the Funds and their underlying indexes for theone-year, three-year, five-year,ten-year and since-inception periods ended December 31, 2018, as applicable, including reports for each of those periods on the correlation and tracking error between each Fund’s performance and the performance of its underlying index, as well as the Adviser’s analysis of the tracking error between certain Funds and their underlying indexes. In reviewing the tracking error reports, the Trustees considered information provided by Invesco’s Global Performance Measurement and Risk Group, an independent organization within Invesco, with respect to general expected tracking error ranges. The Trustees also considered that certain Funds were created in connection with the purchase
Board Considerations Regarding Continuation of Investment Advisory Agreement(continued)
by Invesco of the exchange-traded funds business of Guggenheim Capital LLC (the “Transaction”) and that such Funds’ performance prior to the closing of the Transaction on April 6, 2018 or May 18, 2018, as applicable, is that of their predecessor Guggenheim ETFs. The Trustees noted that, for each applicable period, the correlation and tracking error for each Fund was within the targeted range set forth in the Trust’s registration statement and concluded that each Fund was correlated to its underlying index and that the tracking error for each Fund was within an acceptable range given that Fund’s particular circumstances.
The Trustees also considered the services provided by the Adviser in its oversight of the Funds’ administrator, custodian and transfer agent. They noted the significant amount of time, effort and resources that had been devoted to this oversight function.
Based on their review, the Trustees concluded that the nature, extent and quality of services provided by the Adviser to the Funds under the Investment Advisory Agreement were appropriate and reasonable.
Fees, Expenses and Profitability. The Trustees reviewed and discussed the information provided by the Adviser on each Fund’s contractual advisory fee, net advisory fee, and gross and net expense ratios. The Trustees also compared each Fund’s contractual advisory fee and net expense ratio to information compiled by the Adviser from Lipper Inc. databases on the net advisory fees and net expense ratios of comparable exchange-traded funds (“ETFs”),open-end(non-ETF) index funds andopen-end(non-ETF) actively-managed funds, as applicable. The Trustees noted that the annual contractual advisory fee charged to each Fund is:
| | ● | | 0.50% of the Fund’s average daily net assets for each Fund other than Invesco Dividend AchieversTM ETF, Invesco FTSE RAFI US 1000 ETF, Invesco FTSE RAFI US 1500Small-Mid ETF, Invesco High Yield Equity Dividend AchieversTM ETF, Invesco International Dividend AchieversTM ETF, Invesco Russell 2000 Pure Growth ETF, Invesco Russell 2000 Pure Value ETF, Invesco Russell Midcap Equal Weight ETF, Invesco Russell Midcap Pure Growth ETF, Invesco Russell Midcap Pure Value ETF, Invesco Russell Top 200 Equal Weight ETF, Invesco Russell Top 200 Pure Growth ETF, Invesco Russell Top 200 Pure Value ETF and Invesco S&P 500® Quality ETF (The net advisory fee, after giving effect to the Expense Cap, as defined below, was-0.16% for Invesco Dynamic Retail ETF.); |
| | ● | | 0.40% of the Fund’s average daily net assets for each of Invesco Dividend AchieversTM ETF, Invesco High Yield Equity Dividend AchieversTM ETF and Invesco International Dividend AchieversTM ETF; |
| | ● | | 0.29% of the Fund’s average daily net assets for each of Invesco FTSE RAFI US 1000 ETF, Invesco FTSE RAFI US 1500Small-Mid ETF, Invesco Russell 2000 Pure Growth ETF, Invesco Russell 2000 Pure Value ETF, Invesco Russell Midcap Pure Growth ETF, Invesco Russell Midcap Pure Value ETF, Invesco Russell Top 200 Pure Growth ETF and Invesco Russell Top 200 Pure Value ETF; |
| | ● | | 0.25% of the Fund’s average daily net assets for each of Invesco Russell Midcap Equal Weight ETF and Invesco Russell Top 200 Equal Weight ETF (The net advisory fee, after giving effect to the Expense Cap, as defined below, was -0.17% for Invesco Russell Midcap Equal Weight ETF.); and |
| | ● | | 0.15% of the Fund’s average daily net assets for Invesco S&P 500® Quality ETF (The Trustees noted that, prior to September 24, 2018, the Fund’s advisory fee was 0.29%.). |
The Trustees also noted that the Adviser has agreed to waive a portion of its contractual advisory fee and/or pay expenses (an “Expense Cap”) to the extent necessary to prevent the annual operating expenses of each Fund from exceeding the percentage of that Fund’s average daily net assets, at least until August 31, 2021, as set forth below:
| | ● | | 0.60%, excluding interest expenses, brokerage commissions and other trading expenses, taxes, acquired fund fees and expenses, if applicable, and extraordinary expenses, for each of Invesco DWA NASDAQ Momentum ETF and Invesco Dynamic Market ETF; |
| | ● | | 0.60%, excluding interest expenses, offering costs, brokerage commissions and other trading expenses, taxes, acquired fund fees and expenses, if applicable, and extraordinary expenses, for each of Invesco DWA Basic Materials Momentum ETF, Invesco DWA Consumer Cyclicals Momentum ETF, Invesco DWA Consumer Staples Momentum ETF, Invesco DWA Energy Momentum ETF, Invesco DWA Financial Momentum ETF, Invesco DWA Healthcare Momentum ETF, Invesco DWA Industrials Momentum ETF, Invesco DWA Technology Momentum ETF and Invesco DWA Utilities Momentum ETF; |
| | ● | | 0.50%, excluding interest expenses,sub-licensing fees, offering costs, brokerage commissions and other trading expenses, taxes, acquired fund fees and expenses, if applicable, and extraordinary expenses, for each of Invesco Dividend AchieversTM ETF, Invesco High Yield Equity Dividend AchieversTM ETF and Invesco International Dividend AchieversTM ETF; |
| | ● | | 0.39%, excluding interest expenses, offering costs, brokerage commissions and other trading expenses, taxes, acquired fund fees and expenses, if applicable, and extraordinary expenses, for each of Invesco FTSE RAFI US 1000 ETF, Invesco FTSE RAFI US 1500Small-Mid ETF, Invesco Russell 2000 Pure Growth ETF, Invesco Russell 2000 Pure Value ETF, Invesco Russell Midcap Pure |
Board Considerations Regarding Continuation of Investment Advisory Agreement(continued)
| | Growth ETF, Invesco Russell Midcap Pure Value ETF, Invesco Russell Top 200 Pure Growth ETF and Invesco Russell Top 200 Pure Value ETF; |
| | ● | | 0.25%, excluding interest expenses, offering costs, brokerage commissions and other trading expenses, taxes, acquired fund fees and expenses, if applicable, and extraordinary expenses, for each of Invesco Russell Midcap Equal Weight ETF and Invesco Russell Top 200 Equal Weight ETF; |
| | ● | | 0.15%, excluding interest expenses, offering costs, brokerage commissions and other trading expenses, taxes, acquired fund fees and expenses, if applicable, and extraordinary expenses, for Invesco S&P 500 Quality ETF; and |
| | ● | | 0.60%, excluding interest expenses,sub-licensing fees, offering costs, brokerage commissions and other trading expenses, taxes, acquired fund fees and expenses, if applicable, and extraordinary expenses, for each other Fund. |
The Trustees noted that the Adviser represented that it does not serve as the investment adviser to any clients, other than other ETFs also overseen by the Trustees, with comparable investment strategies as the Funds, but that it providessub-advisory services to other clients. The Trustees further noted the Adviser’s explanation with respect to thesub-advisory fees it receives for such services in comparison to the advisory fees charged to the Funds. The Trustees noted that the contractual advisory fees for certain Funds were equal to or lower than the median net advisory fees of their ETF andopen-end index peer funds, as applicable, as illustrated in the table below. The Trustees also noted that the contractual advisory fees for all of the Funds were lower than the median net advisory fees of theiropen-end actively-managed peer funds.
| | | | | | |
Invesco Fund | | Equal to/Lower
than ETF Median | | Equal to/Lower
than Open-End
Index Fund
Median* | | Equal to/Lower
than Open-End
Active Fund
Median |
| Invesco Aerospace & Defense ETF | | | | | | X |
| Invesco BRIC ETF | | | | | | X |
| Invesco Buyback AchieversTM ETF | | | | | | X |
| Invesco CleantechTM ETF | | | | | | X |
| Invesco Dividend AchieversTM ETF | | | | | | X |
| Invesco DWA Basic Materials Momentum ETF | | | | | | X |
| Invesco DWA Consumer Cyclicals Momentum ETF | | | | | | X |
| Invesco DWA Consumer Staples Momentum ETF | | | | | | X |
| Invesco DWA Energy Momentum ETF | | | | | | X |
| Invesco DWA Financial Momentum ETF | | | | | | X |
| Invesco DWA Healthcare Momentum ETF | | | | | | X |
| Invesco DWA Industrials Momentum ETF | | | | | | X |
| Invesco DWA Momentum ETF | | X | | | | X |
| Invesco DWA NASDAQ Momentum ETF | | | | | | X |
| Invesco DWA Technology Momentum ETF | | | | | | X |
| Invesco DWA Utilities Momentum ETF | | | | | | X |
| Invesco Dynamic Biotechnology & Genome ETF | | | | | | X |
| Invesco Dynamic Building & Construction ETF | | | | | | X |
| Invesco Dynamic Energy Exploration & Production ETF | | | | | | X |
| Invesco Dynamic Food & Beverage ETF | | | | | | X |
| Invesco Dynamic Large Cap Growth ETF | | | | | | X |
| Invesco Dynamic Large Cap Value ETF | | | | | | X |
| Invesco Dynamic Leisure and Entertainment ETF | | | | | | X |
| Invesco Dynamic Market ETF | | | | | | X |
| Invesco Dynamic Media ETF | | | | | | X |
| Invesco Dynamic Networking ETF | | | | | | X |
Board Considerations Regarding Continuation of Investment Advisory Agreement(continued)
| | | | | | |
Invesco Fund | | Equal to/Lower
than ETF Median | | Equal to/Lower
than Open-End
Index Fund
Median* | | Equal to/Lower
than Open-End
Active Fund
Median |
| Invesco Dynamic Oil & Gas Services ETF | | | | N/A | | X |
| Invesco Dynamic Pharmaceuticals ETF | | | | | | X |
| Invesco Dynamic Retail ETF | | | | | | X |
| Invesco Dynamic Semiconductors ETF | | | | | | X |
| Invesco Dynamic Software ETF | | | | | | X |
| Invesco Financial Preferred ETF | | | | N/A | | X |
| Invesco FTSE RAFI US 1000 ETF | | | | | | X |
| Invesco FTSE RAFI US 1500Small-Mid ETF | | | | | | X |
| Invesco Global Listed Private Equity ETF | | | | N/A | | X |
| Invesco Golden Dragon China ETF | | X | | N/A | | X |
| Invesco High Yield Equity Dividend AchieversTM ETF | | | | | | X |
| Invesco Insider Sentiment ETF | | | | | | X |
| Invesco International Dividend AchieversTM ETF | | X | | | | X |
| Invesco Russell 2000 Pure Growth ETF | | | | X | | X |
| Invesco Russell 2000 Pure Value ETF | | | | X | | X |
| Invesco Russell Midcap Equal Weight ETF | | | | | | X |
| Invesco Russell Midcap Pure Growth ETF | | X | | | | X |
| Invesco Russell Midcap Pure Value ETF | | X | | | | X |
| Invesco Russell Top 200 Equal Weight ETF | | X | | | | X |
| Invesco Russell Top 200 Pure Growth ETF | | | | | | X |
| Invesco Russell Top 200 Pure Value ETF | | | | | | X |
| Invesco S&P 500® Quality ETF | | X | | | | X |
| Invesco S&PSpin-Off | | | | | | X |
| Invesco Water Resources ETF | | | | | | X |
| Invesco WilderHill Clean Energy ETF | | | | | | X |
| Invesco ZacksMid-Cap ETF | | | | | | X |
| Invesco Zacks Multi-Asset Income ETF | | | | | | X |
| * | information provided by the Adviser indicated that certain Funds did not haveopen-end index fund peers. Those Funds have been designated with an “N/A” for not available. |
The Trustees determined that the contractual advisory fees were reasonable, noting the nature of the indexes, the distinguishing factors of the Funds, and the administrative, operational and management oversight costs for the Adviser. The Trustees noted that the net expense ratios for certain Funds were equal to or lower than the median net expense ratios of their ETF andopen-end index peer funds, as applicable, as illustrated in the table below. The Trustees also noted that the net expense ratios for all of the Funds were lower than the median net expense ratios of theiropen-end actively-managed peer funds.
| | | | | | |
Invesco Fund | | Equal to/Lower
than ETF Median | | Equal to/Lower
thanOpen-End
Index Fund
Median* | | Equal to/Lower
thanOpen-End
Active Fund
Median |
| Invesco Aerospace & Defense ETF | | | | | | X |
| Invesco BRIC ETF | | | | | | X |
| Invesco Buyback AchieversTM ETF | | | | | | X |
| Invesco CleantechTM ETF | | | | | | X |
| Invesco Dividend AchieversTM ETF | | | | X | | X |
| Invesco DWA Basic Materials Momentum ETF | | | | | | X |
Board Considerations Regarding Continuation of Investment Advisory Agreement(continued)
| | | | | | |
Invesco Fund | | Equal to/Lower
than ETF Median | | Equal to/Lower
thanOpen-End
Index Fund
Median* | | Equal to/Lower
thanOpen-End
Active Fund
Median |
| Invesco DWA Consumer Cyclicals Momentum ETF | | | | | | X |
| Invesco DWA Consumer Staples Momentum ETF | | | | | | X |
| Invesco DWA Energy Momentum ETF | | | | | | X |
| Invesco DWA Financial Momentum ETF | | | | | | X |
| Invesco DWA Healthcare Momentum ETF | | | | | | X |
| Invesco DWA Industrials Momentum ETF | | | | | | X |
| Invesco DWA Momentum ETF | | | | X | | X |
| Invesco DWA NASDAQ Momentum ETF | | | | | | X |
| Invesco DWA Technology Momentum ETF | | | | | | X |
| Invesco DWA Utilities Momentum ETF | | | | | | X |
| Invesco Dynamic Biotechnology & Genome ETF | | | | | | X |
| Invesco Dynamic Building & Construction ETF | | | | | | X |
| Invesco Dynamic Energy Exploration & Production ETF | | | | | | X |
| Invesco Dynamic Food & Beverage ETF | | | | | | X |
| Invesco Dynamic Large Cap Growth ETF | | | | | | X |
| Invesco Dynamic Large Cap Value ETF | �� | | | | | X |
| Invesco Dynamic Leisure and Entertainment ETF | | | | | | X |
| Invesco Dynamic Market ETF | | | | | | X |
| Invesco Dynamic Media ETF | | | | | | X |
| Invesco Dynamic Networking ETF | | | | | | X |
| Invesco Dynamic Oil & Gas Services ETF | | | | N/A | | X |
| Invesco Dynamic Pharmaceuticals ETF | | | | | | X |
| Invesco Dynamic Retail ETF | | | | | | X |
| Invesco Dynamic Semiconductors ETF | | | | | | X |
| Invesco Dynamic Software ETF | | | | | | X |
| Invesco Financial Preferred ETF | | | | N/A | | X |
| Invesco FTSE RAFI US 1000 ETF | | | | | | X |
| Invesco FTSE RAFI US 1500Small-Mid ETF | | | | | | X |
| Invesco Global Listed Private Equity ETF | | | | N/A | | X |
| Invesco Golden Dragon China ETF | | | | N/A | | X |
| Invesco High Yield Equity Dividend AchieversTM ETF | | | | X | | X |
| Invesco Insider Sentiment ETF | | | | | | X |
| Invesco International Dividend AchieversTM ETF | | | | | | X |
| Invesco Russell 2000 Pure Growth ETF | | | | X | | X |
| Invesco Russell 2000 Pure Value ETF | | | | X | | X |
| Invesco Russell Midcap Equal Weight ETF | | | | | | X |
| Invesco Russell Midcap Pure Growth ETF | | | | | | X |
| Invesco Russell Midcap Pure Value ETF | | | | | | X |
| Invesco Russell Top 200 Equal Weight ETF | | X | | | | X |
| Invesco Russell Top 200 Pure Growth ETF | | | | | | X |
| Invesco Russell Top 200 Pure Value ETF | | | | | | X |
| Invesco S&P 500® Quality ETF | | X | | | | X |
| Invesco S&PSpin-Off ETF | | | | | | X |
| Invesco Water Resources ETF | | | | | | X |
Board Considerations Regarding Continuation of Investment Advisory Agreement(continued)
| | | | | | |
Invesco Fund | | Equal to/Lower
than ETF Median | | Equal to/Lower
thanOpen-End
Index Fund
Median* | | Equal to/Lower
thanOpen-End
Active Fund
Median |
| Invesco WilderHill Clean Energy ETF | | | | | | X |
| Invesco ZacksMid-Cap ETF | | | | | | X |
| Invesco Zacks Multi-Asset Income ETF | | | | | | X |
| * | information provided by the Adviser indicated that certain Funds did not haveopen-end index fund peers. Those Funds have been designated with an “N/A” for not available. |
In response to questions from the Independent Trustees, the Adviser provided supplemental information regarding each of Invesco Dynamic Energy Exploration & Production ETF, Invesco Dynamic Large Cap Growth ETF and Invesco WilderHill Clean Energy ETF’s advisory fees and total expenses and the Lipper peer data. The Adviser explained in detail its view that it believes that the advisory fees and total expenses for these Funds are competitive and generally in line with other comparable funds in the marketplace, noting, in particular, the unique underlying investment strategy and complexity of each Fund, the limited number of peers in the Lipper data, and/or the differing pricing philosophy of certain of the peers.
The Trustees noted that a significant component of thenon-advisory fee expenses was the license fees paid by the Funds, and noted those Funds for which license fees are included in the Funds’ Expense Caps. The Trustees also noted that the Adviser has agreed to reimburse certain Funds in the amount equal to the licensing fee paid that causes that Fund’s annual operating expenses (excluding interest expenses, offering costs, brokerage commissions and other trading expenses, taxes, acquired fund fees and expenses and extraordinary expenses) to exceed a percentage of that Fund’s average daily net assets through April 6, 2020 (May 18, 2020 for Invesco BRIC ETF) as set forth below:
| | | | |
| Invesco BRIC ETF | | | 0.64 | % |
| Invesco Insider Sentiment ETF | | | 0.60 | % |
| Invesco S&PSpin-Off ETF | | | 0.64 | % |
| Invesco ZacksMid-Cap ETF | | | 0.65 | % |
| Invesco Zacks Multi-Asset Income ETF | | | 0.65 | % |
The Board concluded that the advisory fee and expense ratio of each Fund (giving effect to the Fund’s Expense Cap) were reasonable and appropriate in light of the services provided.
In conjunction with their review of fees, the Trustees considered information provided by the Adviser on the revenues received by the Adviser under the Investment Advisory Agreement for the Funds, as well as the fees waived and expenses reimbursed by the Adviser for the Funds. The Trustees reviewed information provided by the Adviser on its overall profitability, as well as the estimated profitability to the Adviser from its relationship to each Fund. The Trustees concluded that the overall and estimated profitability to the Adviser was not unreasonable.
Economies of Scale and Whether Fee Levels Reflect These Economies of Scale. The Trustees reviewed the information provided by the Adviser as to the extent to which economies of scale may be realized as each Fund grows and whether fee levels reflect economies of scale for the benefit of shareholders. The Trustees reviewed each Fund’s asset size, advisory fee, expense ratio and Expense Cap agreed to by the Adviser. The Trustees also noted that the Amended and Restated Excess Expense Agreement with the Trust provides that the Adviser is entitled to be reimbursed by each Fund, other than Invesco Dynamic Market ETF and Invesco DWA NASDAQ Momentum ETF, for fees waived or expenses absorbed pursuant to the Expense Cap for a period of three years from the date the fee or expense was incurred, provided that no reimbursement would be made that would result in a Fund exceeding its Expense Cap then in effect or in effect at the time the fees and/or expenses subject to reimbursement were waived and/or borne by the Adviser. The Trustees considered whether the advisory fee rate for each Fund was reasonable in relation to the asset size of that Fund, and concluded that the flat advisory fee was reasonable and appropriate.
The Trustees noted that the Adviser had not identified any further benefits that it derived from its relationships with the Funds and had noted that it does not have any soft-dollar arrangements.
Based on all of the information considered and the conclusions reached, the Board, including the Independent Trustees, determined to approve the continuation of the Investment Advisory Agreement for each Fund. No single factor was determinative in the Board’s analysis.
Board Considerations Regarding Continuation of Investment Advisory Agreement(continued)
At a meeting held on April 11, 2019, the Board of Trustees of the Invesco Exchange-Traded Fund Trust (the “Trust”), including the Independent Trustees, approved the continuation of the Investment Advisory Agreement between Invesco Capital Management LLC (the “Adviser”) and the Trust for the following 24 series (each, a “Fund” and together, the “Funds”):
Invesco Dow Jones Industrial Average Dividend ETF
Invesco NASDAQ Internet ETF
Invesco Raymond JamesSB-1 Equity ETF
Invesco S&P 500 BuyWrite ETF
Invesco S&P 500®Equal Weight Consumer Discretionary ETF
Invesco S&P 500®Equal Weight Consumer Staples ETF
Invesco S&P 500®Equal Weight Energy ETF
Invesco S&P 500®Equal Weight ETF
Invesco S&P 500®Equal Weight Financials ETF
Invesco S&P 500®Equal Weight Health Care ETF
Invesco S&P 500®Equal Weight Industrials ETF
Invesco S&P 500®Equal Weight Materials ETF
Invesco S&P 500®Equal Weight Real Estate ETF
Invesco S&P 500®Equal Weight Technology ETF
Invesco S&P 500®Equal Weight Utilities ETF
Invesco S&P 500®Pure Growth ETF
Invesco S&P 500®Pure Value ETF
Invesco S&P 500®Top 50 ETF
Invesco S&P MidCap 400® Equal Weight ETF
Invesco S&P MidCap 400® Pure Growth ETF
Invesco S&P MidCap 400® Pure Value ETF
Invesco S&P SmallCap 600® Equal Weight ETF
Invesco S&P SmallCap 600® Pure Growth ETF
Invesco S&P SmallCap 600® Pure Value ETF
The Trustees reviewed information from the Adviser describing: (i) the nature, extent and quality of services provided, (ii) the investment performance of the Funds and the Adviser, (iii) the fees paid by the Funds and comparisons to amounts paid by other comparable registered investment companies, (iv) the costs of services provided and estimated profits realized by the Adviser, (v) the extent to which economies of scale may be realized as a Fund grows and whether fee levels reflect any possible economies of scale for the benefit of Fund shareholders, and (vi) any further benefits realized by the Adviser from its relationships with the Funds.
Nature, Extent and Quality of Services. In evaluating the nature, extent and quality of the Adviser’s services, the Trustees reviewed information concerning the functions performed by the Adviser for the Funds, information describing the Adviser’s current organization and staffing, including operational support provided by the Adviser’s parent organization, Invesco Ltd. (“Invesco”), and the background and experience of the persons responsible for theday-to-day management of the Funds. The Trustees reviewed matters related to the Adviser’s execution and/or oversight of execution of portfolio transactions on behalf of the Funds.
The Trustees also reviewed information on the performance of the Funds and their underlying indexes for theone-year, three-year, five-year,ten-year and since-inception periods ended December 31, 2018, as applicable, including reports for each of those periods on the correlation and tracking error between each Fund’s performance and the performance of its underlying index, as well as the Adviser’s analysis of the tracking error between the Funds and their underlying indexes. In reviewing the tracking error reports, the Trustees considered information provided by Invesco’s Global Performance Measurement and Risk Group, an independent organization within Invesco, with respect to general expected tracking error ranges. The Trustees also considered that certain Funds were created in connection with the purchase by Invesco of the exchange-traded funds business of Guggenheim Capital LLC (the “Transaction”) and that such Funds’ performance prior to the closing of the Transaction on April 6, 2018 is that of their predecessor Guggenheim ETFs. The Trustees noted that, for each applicable period, the correlation and tracking error for each Fund were within the targeted range set forth in the Trust’s registration statement and concluded that each Fund was correlated to its underlying index and that the tracking error for each Fund was within an acceptable range given that Fund’s particular circumstances.
The Trustees also considered the services provided by the Adviser in its oversight of the Funds’ administrator, custodian and transfer agent. They noted the significant amount of time, effort and resources that had been devoted to this oversight function.
Based on their review, the Trustees concluded that the nature, extent and quality of services provided by the Adviser to the Funds under the Investment Advisory Agreement were appropriate and reasonable.
Fees, Expenses and Profitability. The Trustees reviewed and discussed the information provided by the Adviser on each Fund’s net expense ratio and unitary advisory fee, as compared to information compiled by the Adviser from Lipper Inc. databases on the net expense ratios of comparable exchange-traded funds (“ETFs”),open-end(non-ETF) index funds andopen-end(non-ETF) actively-managed funds. The Trustees noted that the annual unitary advisory fee charged to each Fund is as follows, with the Adviser paying all
Board Considerations Regarding Continuation of Investment Advisory Agreement(continued)
other operating expenses of each Fund, except that each Fund pays its own distribution fees, if any, brokerage expenses, taxes, interest, litigation expenses, acquired fund fees and expenses, if any, and other extraordinary expenses:
| | ● | | 0.75% of the Fund’s average daily net assets for Invesco Raymond JamesSB-1 Equity ETF; |
| | ● | | 0.60% of the Fund’s average daily net assets for Invesco NASDAQ Internet ETF; |
| | ● | | 0.49% of the Fund’s average daily net assets for Invesco S&P 500 BuyWrite ETF (The Trustees noted that prior to July 1, 2018, the Fund’s annual unitary advisory fee was 0.75%.); |
| | ● | | 0.35% of the Fund’s average daily net assets for each of Invesco S&P 500® Pure Growth ETF, Invesco S&P 500® Pure Value ETF, Invesco S&P MidCap 400® Pure Growth ETF, Invesco S&P MidCap 400® Pure Value ETF, Invesco S&P SmallCap 600® Pure Growth ETF and Invesco S&P SmallCap 600® Pure Value ETF; |
| | ● | | 0.20% of the Fund’s average daily net assets for each of Invesco S&P 500® Equal Weight ETF and Invesco S&P 500® Top 50 ETF; |
| | ● | | 0.07% of the Fund’s average daily net assets for Invesco Dow Jones Industrial Average Dividend ETF (The Trustees noted that prior to September 24, 2018, the Fund’s annual unitary advisory fee was 0.30%.); and |
| | ● | | 0.40% of the Fund’s average daily net assets for each other Fund. |
The Trustees noted that the Adviser represented that it does not serve as the investment adviser to any clients, other than other ETFs also overseen by the Trustees, with comparable investment strategies as the Funds, but that it providessub-advisory services to other clients. The Trustees further noted the Adviser’s explanation with respect to thesub-advisory fees it receives for such services in comparison to the advisory fees charged to the Funds. The Trustees noted that the net expense ratios for certain Funds were equal to or lower than the median net expense ratios of their ETF andopen-end index peer funds as illustrated in the table below. The Trustees also noted that the net expense ratios for all of the Funds were lower than the median net expense ratios of theiropen-end actively-managed peer funds.
| | | | | | |
Invesco Fund | | Equal to/Lower
than ETF Median | | Equal to/Lower
thanOpen-End
Index Fund
Median | | Equal to/Lower
thanOpen-End
Active Fund
Median |
| Invesco Dow Jones Industrial Average Dividend ETF | | X | | X | | X |
| Invesco NASDAQ Internet ETF | | | | | | X |
| Invesco Raymond JamesSB-1 Equity ETF | | | | | | X |
| Invesco S&P 500 BuyWrite ETF | | X | | X | | X |
| Invesco S&P 500®Equal Weight Consumer Discretionary ETF | | X | | | | X |
| Invesco S&P 500®Equal Weight Consumer Staples ETF | | X | | | | X |
| Invesco S&P 500®Equal Weight Energy ETF | | X | | | | X |
| Invesco S&P 500®Equal Weight ETF | | X | | X | | X |
| Invesco S&P 500®Equal Weight Financials ETF | | X | | | | X |
| Invesco S&P 500®Equal Weight Health Care ETF | | X | | | | X |
| Invesco S&P 500®Equal Weight Industrials ETF | | X | | | | X |
| Invesco S&P 500®Equal Weight Materials ETF | | X | | | | X |
| Invesco S&P 500®Equal Weight Real Estate ETF | | X | | | | X |
| Invesco S&P 500®Equal Weight Technology ETF | | X | | | | X |
| Invesco S&P 500®Equal Weight Utilities ETF | | X | | X | | X |
| Invesco S&P 500®Pure Growth ETF | | X | | X | | X |
| Invesco S&P 500®Pure Value ETF | | | | | | X |
| Invesco S&P 500®Top 50 ETF | | X | | X | | X |
| Invesco S&P MidCap 400® Equal Weight ETF | | | | | | X |
| Invesco S&P MidCap 400® Pure Growth ETF | | | | X | | X |
| Invesco S&P MidCap 400® Pure Value ETF | | | | X | | X |
| Invesco S&P SmallCap 600® Equal Weight ETF | | | | | | X |
Board Considerations Regarding Continuation of Investment Advisory Agreement(continued)
| | | | | | |
Invesco Fund | | Equal to/Lower
than ETF Median | | Equal to/Lower
thanOpen-End
Index Fund
Median | | Equal to/Lower
thanOpen-End
Active Fund
Median |
| Invesco S&P SmallCap 600® Pure Growth ETF | | | | X | | X |
| Invesco S&P SmallCap 600® Pure Value ETF | | | | X | | X |
The Trustees determined that each Fund’s unitary advisory fee was reasonable, noting the nature of the indexes, the distinguishing factors of the Funds, and the administrative, operational and management oversight costs for the Adviser. The Trustees also noted that a portion of each Fund’s operating expenses was attributable to a license fee payable out of the unitary advisory fee charged to that Fund. The Board concluded that the unitary advisory fee charged to each Fund was reasonable and appropriate in light of the services provided.
In conjunction with their review of the unitary advisory fees, the Trustees considered information provided by the Adviser on the revenues received by the Adviser under the Investment Advisory Agreement for the Funds. The Trustees reviewed information provided by the Adviser on its overall profitability, as well as the estimated profitability to the Adviser from its relationship to each Fund. The Trustees concluded that the overall and estimated profitability to the Adviser was not unreasonable.
Economies of Scale and Whether Fee Levels Reflect These Economies of Scale. The Trustees reviewed the information provided by the Adviser as to the extent to which economies of scale may be realized as each Fund grows and whether fee levels reflect economies of scale for the benefit of shareholders. The Trustees reviewed each Fund’s asset size and unitary advisory fee. The Trustees noted that any reduction in fixed costs associated with the management of the Funds would be enjoyed by the Adviser, but a unitary advisory fee provides a level of certainty in expenses for the Funds. The Trustees considered whether the unitary advisory fee rate for each Fund was reasonable in relation to the asset size of that Fund, and concluded that the unitary advisory fee was reasonable and appropriate.
The Trustees noted that the Adviser had not identified any further benefits that it derived from its relationships with the Funds and had noted that it does not have any soft-dollar arrangements.
Based on all of the information considered and the conclusions reached, the Board, including the Independent Trustees, determined to approve the continuation of the Investment Advisory Agreement for each Fund. No single factor was determinative in the Board’s analysis.
Proxy Voting Policies and Procedures
A description of the Trust’s proxy voting policies and procedures that the Funds use to determine how to vote proxies relating to portfolio securities is available, without charge and upon request, by calling(800) 983-0903. This information is also available on the Securities and Exchange Commission’s (the “Commission”) website atwww.sec.gov.
Information regarding how each Fund voted proxies for portfolio securities, if applicable, during the most recent 12-month period ended June 30, is available, without charge and upon request, by (i) calling(800) 983-0903; or (ii) accessing the Trust’sForm N-PX on the Commission’s website atwww.sec.gov.
Quarterly Portfolios
The Trust files its complete schedule of portfolio holdings for the Funds with the Commission for the first and third quarters of each fiscal year onForm N-Q (or any successor Form). The Trust’sForms N-Q (or any successor Form) are available on the Commission’s website atwww.sec.gov.
Frequency Distribution of Discounts and Premiums
A table showing the number of days the market price of each Fund’s shares was greater than the Fund’s net asset value, and the number of days it was less than the Fund’s net asset value (i.e., premium or discount) for the most recently completed calendar year, and the calendar quarters since that year end (or the life of the Fund, if shorter) may be found at the Fund’s website atwww.invesco.com/ETFs.
| | | | |
©2019 Invesco Capital Management LLC 3500 Lacey Road, Suite 700 Downers Grove, IL 60515 | | P-PS-AR-4 | | invesco.com/ETFs |

Invesco Annual Report to Shareholders
April 30, 2019
| | |
| |
| PKW | | Invesco BuyBack AchieversTM ETF |
| |
| PFM | | Invesco Dividend AchieversTM ETF |
| |
| DJD | | Invesco Dow Jones Industrial Average Dividend ETF |
| |
| PGF | | Invesco Financial Preferred ETF |
| |
| PEY | | Invesco High Yield Equity Dividend AchieversTM ETF |
| |
| PID | | Invesco International Dividend AchieversTM ETF |
Beginning on January 1, 2021, as permitted by regulations adopted by the Securities and Exchange Commission, paper copies of the Funds’ shareholder reports will no longer be sent by mail, unless you specifically request paper copies of the reports from your financial intermediary, such as a broker-dealer or bank. Instead, the reports will be made available on a website, and you will be notified by mail each time a report is posted and provided with a website link to access the report.
If you already elected to receive shareholder reports electronically, you will not be affected by this change and you need not take any action. If you hold accounts through a financial intermediary, you may contact your financial intermediary to enroll in electronic delivery. Please note that not all financial intermediaries may offer this service.
You may elect to receive all future reports in paper free of charge. If you hold accounts through a financial intermediary, you can follow the instructions included with this disclosure, if applicable, or contact your financial intermediary to request that you continue to receive paper copies of your shareholder reports. Please note that not all financial intermediaries may offer this service. Your election to receive reports in paper will apply to all funds held with your financial intermediary.
Table of Contents
The Market Environment
Domestic Equity
The fiscal year proved to be an increasingly volatile time for U.S. equities. Throughout the summer, U.S. equities moved higher as corporate profits surged amid the benefit of corporate tax cuts and improving global economic growth. Several U.S. equity indexes reached new highs despite potential headwinds, including trade tensions, tariff announcements and contagion concerns over a Turkish currency crisis. After a relatively quiet summer, market volatility noticeably rose in October 2018, as U.S. equity markets suffered a sharpsell-off throughyear-end 2018, amid ongoing trade concerns between the U.S. and China, fears of a global economic slowdown and lower oil prices from a supply glut, with oil prices plummeting from near $75 per barrel in early October 2018 to around $45 per barrel in late December 2018.1 In this environment, there was a flight to safety, as investors fled to defensive areas of the markets, such as health care, utilities and U.S. Treasuries.
Given signs of a strong economy, the U.S. Federal Reserve (the “Fed”) raised interest rates three times during the fiscal year: in June, September and December 2018. Following December’s Fed meeting, the Fed raised interest rates by 25 basis points to a targeted range of 2.25% to 2.50%, which signaled a slightly more dovish stance than expected.2 In contrast, the European Central Bank and central banks in several other countries maintained extraordinarily accommodative monetary policies.
Equity markets rebounded at the start of 2019, fueled by optimism about a potential U.S.-China trade deal and the Fed’s indication that there would be no interest rate hikes in 2019, a surprising shift in monetary policy. The Fed’s more accommodative stance provided a supportive environment for equities and fixed income, even as U.S. economic data were mixed and overseas growth appeared to be slowing. By the end of the fiscal year, the U.S. equity market generally recovered the losses from fourth quarter 2018, backed by improving investor sentiment, low unemployment and a growing economy.
| 2 | Source: U.S. Federal Reserve |
Global Equity
The fiscal year began with significant market and currency volatility. While most domestic equity indexes delivered positive performance at the beginning of the fiscal year, most major international indexes had negative results. Many international stocks struggled as investors worried that heightened global trade tensions would derail economic growth. Other concerns, such as geopolitical uncertainty and the potential impact of higher interest rates, also weakened investor sentiment. In this environment, developed markets held up better than emerging markets. After a relatively quiet summer, market volatility markedly rose again in October 2018. Global equity markets (particularly the U.S.) declined sharply in the fourth quarter of 2018 amid rising interest rates and concerns that higher inflation could result in a more restrictive monetary policy. Investors also had concerns over the Brexit negotiations, ongoing U.S.-China trade tensions, declining oil prices and fears of slowing economic growth, particularly in the eurozone.
Following the sharpsell-off in the later part of 2018, global equities rebounded in the beginning of 2019, fueled by accommodative central bank policy and the potential for a U.S.-China trade deal. Central bank policy provided a supportive environment for equities and fixed income, even as global economic growth appeared to be slowing. In January, China’s central bank initiated a stimulus program to counteract its slowing economy, while the European Central Bank and U.S. Federal Reserve later indicated they would not raise interest rates for the remainder of 2019. Lack of consensus on a deal for the U.K.’s withdrawal from the European Union prompted additional concerns for the U.K. and eurozone economies, though equity markets across the region posted gains. U.S. and Chinese equities also delivered robust gains. Both emerging and developed markets had positive returns for the first quarter of 2019.
Despite concerns over a decline in global growth for 20191, global equity indexes, in general, ended the fiscal year in positive territory, with developed markets outperforming emerging markets.
| 1 | Source: International Monetary Fund World |
| | |
| PKW | | Manager’s Analysis |
| | Invesco BuyBack AchieversTM ETF (PKW) |
As an index fund, the Invesco BuyBack Achievers™ ETF (the “Fund”) is passively managed and seeks to track the returns of an underlying index. The Fund seeks to track the investment results (before fees and expenses) of the NASDAQ US BuyBack Achievers™ Index (the “Index”). The Fund generally will invest at least 90% of its total assets in common stocks that comprise the Index.
Strictly in accordance with its guidelines and mandated procedures, Nasdaq, Inc. (the “Index Provider”) includes common stocks in the Index pursuant to a proprietary selection methodology that identifies a universe of “BuyBack AchieversTM”. To qualify for the universe of “BuyBack AchieversTM,” an issuer must have effected a net reduction in shares outstanding of 5% or more in the past 12 months.
The Fund generally invests in all of the securities comprising the Index in proportion to their weightings in the Index.
For the fiscal year ended April 30, 2019, on a market price basis, the Fund returned 13.16%. On a net asset value (“NAV”) basis, the Fund returned 13.16%. During the same time period, the Index returned 13.86%. During the fiscal year, the Fund fully replicated the components of the Index; therefore, the Fund’s performance, on a NAV basis, differed from the return of the Index primarily due to fees and operating expenses that the Fund incurred during the period.
During this same time period, the S&P 500®Index (the “Benchmark Index”) returned 13.49%. The Benchmark Index is an unmanaged index weighted by market capitalization based on the average performance of approximately 505 securities. The Benchmark Index was selected for its recognition in the marketplace, and because its performance comparison is a useful measure for investors as a broad representation of the U.S. stock market.
The performance of the Fund differed from the Benchmark Index in part because the Fund seeks to track an Index that employs a modified market capitalization weighting methodology and stock selection methodology based on stock buybacks, whereas the Benchmark Index selects and weights stocks based on market capitalization and does not have a buyback methodology.
Relative to the Benchmark Index, the Fund was most overweight in the consumer discretionary sector and most underweight in the information technology sector during the fiscal year ended April 30, 2019. The majority of the Fund’s underperformance relative to the Benchmark Index during that period can be attributed to the Fund’s overweight exposure to and stock selection in the financials sector as well as the stock selection in the consumer discretionary sector.
For the fiscal year ended April 30, 2019, the information technology sector contributed most significantly to the Fund’s
return, followed by the consumer discretionary and industrials sectors, respectively. The financials sector detracted most significantly from the Fund’s return.
Positions that contributed most significantly to the Fund’s return, for the fiscal year ended April 30, 2019, included QUALCOMM, Inc., an information technology company (portfolio average weight of 0.67%) and Procter & Gamble Co. (The), a consumer staples company (no longer held at fiscalyear-end). Positions that detracted most significantly from the Fund’s return during this period included Goldman Sachs Group, Inc. (The), a financials company (no longer held at fiscalyear-end) and American International Group, Inc., Class A, a financials company (no longer held at fiscalyear-end).
| | | | |
Sector Breakdown
(% of the Fund’s Net Assets)
as of April 30, 2019 | |
| Information Technology | | | 26.9 | |
| Consumer Discretionary | | | 18.7 | |
| Financials | | | 17.5 | |
| Industrials | | | 13.3 | |
| Health Care | | | 10.5 | |
| Energy | | | 4.9 | |
| Communication Services | | | 3.9 | |
| Sector Types Each Less Than 3% | | | 4.3 | |
| Money Market Funds Plus Other Assets Less Liabilities | | | 0.0 | |
|
Top Ten Fund Holdings*
(% of the Fund’s Net Assets)
as of April 30, 2019 | |
| Security | | | | |
| Citigroup, Inc. | | | 5.3 | |
| Apple, Inc. | | | 5.0 | |
| Cisco Systems, Inc. | | | 4.9 | |
| Oracle Corp. | | | 4.8 | |
| Union Pacific Corp. | | | 4.8 | |
| AbbVie, Inc. | | | 4.4 | |
| Amgen, Inc. | | | 4.1 | |
| QUALCOMM, Inc. | | | 3.9 | |
| Starbucks Corp. | | | 3.6 | |
| Charter Communications, Inc., Class A | | | 3.1 | |
| Total | | | 43.9 | |
| * | Excluding money market fund holdings. |
Invesco BuyBack AchieversTM ETF (PKW)(continued)
Growth of a $10,000 Investment
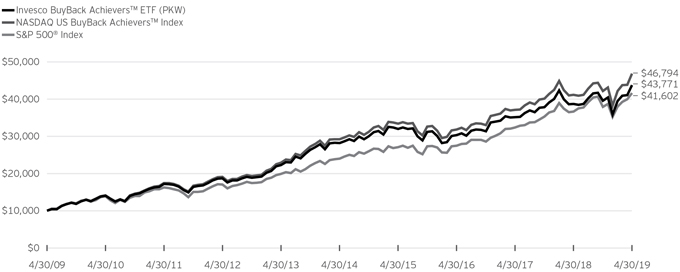
Fund Performance History as of April 30, 2019
| | | | | | | | | | | | | | | | | | | | | | | | | | | | | | | | | | | | | | | | |
| | | 1 Year | | | 3 Years
Average
Annualized | | | 3 Years
Cumulative | | | 5 Years
Average
Annualized | | | 5 Years
Cumulative | | | 10 Years
Average
Annualized | | | 10 Years
Cumulative | | | | | | Fund Inception | |
| Index | | | | | Average
Annualized | | | Cumulative | |
| NASDAQ US BuyBack AchieversTM Index | | | 13.86 | % | | | 13.70 | % | | | 46.98 | % | | | 9.90 | % | | | 60.35 | % | | | 16.69 | % | | | 367.94 | % | | | | | | | 9.68 | % | | | 213.33 | % |
| S&P 500® Index | | | 13.49 | | | | 14.87 | | | | 51.58 | | | | 11.63 | | | | 73.32 | | | | 15.32 | | | | 316.02 | | | | | | | | 8.33 | | | | 168.79 | |
| Fund | | | | | | | | | | | | | | | | | | | | | | | | | | | | | | | | | | | | | | | | |
| NAV Return | | | 13.16 | | | | 12.99 | | | | 44.24 | | | | 9.22 | | | | 55.41 | | | | 15.91 | | | | 337.71 | | | | | | | | 8.92 | | | | 187.54 | |
| Market Price Return | | | 13.16 | | | | 13.02 | | | | 44.36 | | | | 9.23 | | | | 55.46 | | | | 15.91 | | | | 337.58 | | | | | | | | 8.91 | | | | 187.19 | |
Fund Inception: December 20, 2006
Performance quoted above represents past performance. Past performance is not a guarantee of future results and current performance may be higher or lower than performance quoted. Investment returns and principal value will fluctuate, and shares of the Fund (“Fund Shares”), when redeemed or sold, may be worth more or less than their original cost. Fund performance reflects any applicable fee waivers and/or expense reimbursements. Had the adviser not waived fees and/or reimbursed expenses currently or in the past, returns would have been lower. See current prospectus for more information. According to the Fund’s current prospectus, the total annual operating expense ratio was indicated as 0.63%. The Financial Highlights section of the Shareholder Report presents the expense ratios based on expenses incurred during the period covered by this report. NAV and Market Price returns assume that dividends and capital gain distributions have been reinvested in the Fund at NAV and Market Price, respectively. The returns shown in the table above do not reflect the deduction of taxes that a shareholder would pay on Fund distributions or the redemption or
sale of Fund Shares. See invesco.com/ETFs to find the most recentmonth-end performance numbers.
Index and Benchmark Index performance results are based upon a hypothetical investment in their respective constituent securities. Index and Benchmark Index returns do not represent Fund returns. An investor cannot invest directly in an index. The Index and Benchmark Index do not charge management fees or brokerage expenses, and no such fees or expenses were deducted from the hypothetical performance shown. In addition, the results actual investors might have achieved would have differed from those shown because of differences in the timing, amounts of their investments, and fees and expenses associated with an investment in the Fund.
Notes Regarding Indexes and Fund Performance History:
| - | Average Annualized and Cumulative Inception returns for the Fund, Index and Benchmark Index are based on the inception date of the Fund. |
| | |
| PFM | | Manager’s Analysis |
| | Invesco Dividend AchieversTM ETF (PFM) |
As an index fund, the Invesco Dividend Achievers™ ETF (the “Fund”) is passively managed and seeks to track the returns of an underlying index. The Fund seeks to track the investment results (before fees and expenses) of the NASDAQ US Broad Dividend Achievers™ Index (the “Index”). The Fund generally will invest at least 90% of its total assets in common stocks of companies that comprise the Index.
Strictly in accordance with its guidelines and mandated procedures, Nasdaq, Inc. (the “Index Provider”) includes common stocks in the Index pursuant to a proprietary selection methodology that identifies a universe of “Dividend AchieversTM.” To qualify for the universe of “Dividend AchieversTM,” an issuer must have increased its annual regular cash dividend payments for at least each of its last ten or more calendar or fiscal years. The Fund generally invests in all of the securities comprising the Index in proportion to their weightings in the Index.
For the fiscal year ended April 30, 2019, on a market price basis, the Fund returned 15.53%. On a net asset value (“NAV”) basis, the Fund returned 15.63%. During the same time period, the Index returned 16.20%. During the fiscal year, the Fund fully replicated the components of the Index; therefore, the Fund’s performance, on a NAV basis, differed from the return of the Index primarily due to fees and operating expenses that the Fund incurred during the period.
During this same time period, the Russell 3000® Value Index (the “Benchmark Index”) returned 8.58%. The Benchmark Index is an unmanaged index weighted by market capitalization based on the average performance of approximately 2,080 securities. The Benchmark Index was selected for its recognition in the marketplace, and because its performance comparison is a useful measure for investors as a broad representation of the value segment of the U.S. equity universe.
The performance of the Fund differed from the Benchmark Index in part because the Fund seeks to track an Index that employs a modified market capitalization weighting methodology and stock selection methodology based on dividend-paying stocks, whereas the Benchmark Index selects and weights stocks based on market capitalization and focuses on stocks of companies with lowerprice-to-book and lower forecasted growth values.
Relative to the Benchmark Index, the Fund was most overweight in the consumer staples sector and most underweight in the financials sector during the fiscal year ended April 30, 2019. The majority of the Fund’s outperformance relative to the Benchmark Index during that period can be attributed to the Fund’s overweight exposure to and stock selection in the information technology sector as well as the overweight exposure to and stock selection in the consumer staples sector.
For the fiscal year ended April 30, 2019, the information technology sector contributed most significantly to the Fund’s
return, followed by the consumer staples and consumer discretionary sectors, respectively. There were no sectors that detracted from the Fund’s performance.
Positions that contributed most significantly to the Fund’s return for the fiscal year ended April 30, 2019, included Microsoft Corp., an information technology company (portfolio average weight of 4.06%) and Procter & Gamble Co. (The), a consumer staples company (portfolio average weight of 2.88%). Positions that detracted most significantly from the Fund’s return during this period included FedEx Corp., an industrials company (portfolio average weight of 0.75%) and CVS Health Corp., a health care company (no longer held at fiscal year-end).
| | | | |
Sector Breakdown
(% of the Fund’s Net Assets)
as of April 30, 2019 | |
| Consumer Staples | | | 19.7 | |
| Information Technology | | | 15.3 | |
| Industrials | | | 14.9 | |
| Health Care | | | 9.3 | |
| Energy | | | 8.7 | |
| Communication Services | | | 7.6 | |
| Consumer Discretionary | | | 7.2 | |
| Utilities | | | 6.9 | |
| Financials | | | 6.0 | |
| Materials | | | 3.0 | |
| Real Estate | | | 1.4 | |
| Money Market Funds Plus Other Assets Less Liabilities | | | 0.0 | |
|
Top Ten Fund Holdings*
(% of the Fund’s Net Assets)
as of April 30, 2019 | |
| Security | | | | |
| Microsoft Corp. | | | 4.4 | |
| Johnson & Johnson | | | 3.9 | |
| Exxon Mobil Corp. | | | 3.9 | |
| Walmart, Inc. | | | 3.4 | |
| Visa, Inc., Class A | | | 3.3 | |
| Procter & Gamble Co. (The) | | | 3 | |
| Verizon Communications, Inc. | | | 2.7 | |
| Chevron Corp. | | | 2.6 | |
| AT&T, Inc. | | | 2.6 | |
| Coca-Cola Co. (The) | | | 2.4 | |
| Total | | | 32.2 | |
| * | Excluding money market fund holdings. |
Invesco Dividend AchieversTM ETF (PFM)(continued)
Growth of a $10,000 Investment
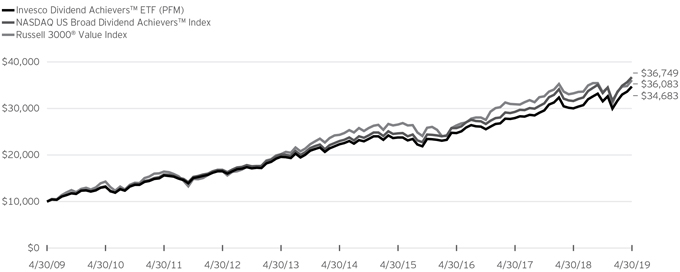
Fund Performance History as of April 30, 2019
| | | | | | | | | | | | | | | | | | | | | | | | | | | | | | | | | | | | | | | | |
| | | 1 Year | | | 3 Years
Average
Annualized | | | 3 Years
Cumulative | | | 5 Years
Average
Annualized | | | 5 Years
Cumulative | | | 10 Years
Average
Annualized | | | 10 Years Cumulative | | | | | | Fund Inception | |
| Index | | | | | Average
Annualized | | | Cumulative | |
| NASDAQ US Broad Dividend AchieversTM Index | | | 16.20 | % | | | 12.51 | % | | | 42.41 | % | | | 9.78 | % | | | 59.48 | % | | | 13.90 | % | | | 267.49 | % | | | | | | | 7.85 | % | | | 180.02 | % |
| Russell 3000® Value Index | | | 8.58 | | | | 11.03 | | | | 36.86 | | | | 8.17 | | | | 48.11 | | | | 13.69 | | | | 260.83 | | | | | | | | 7.29 | | | | 160.73 | |
| Fund | | | | | | | | | | | | | | | | | | | | | | | | | | | | | | | | | | | | | | | | |
| NAV Return | | | 15.63 | | | | 11.90 | | | | 40.11 | | | | 9.19 | | | | 55.22 | | | | 13.24 | | | | 246.83 | | | | | | | | 7.22 | | | | 158.38 | |
| Market Price Return | | | 15.53 | | | | 11.90 | | | | 40.11 | | | | 9.19 | | | | 55.22 | | | | 13.24 | | | | 246.82 | | | | | | | | 7.22 | | | | 158.37 | |
Fund Inception: September 15, 2005
Performance quoted above represents past performance. Past performance is not a guarantee of future results and current performance may be higher or lower than performance quoted. Investment returns and principal value will fluctuate, and shares of the Fund (“Fund Shares”), when redeemed or sold, may be worth more or less than their original cost. Fund performance reflects any applicable fee waivers and/or expense reimbursements. Had the adviser not waived fees and/or reimbursed expenses currently or in the past, returns would have been lower. See current prospectus for more information. According to the Fund’s current prospectus, the total annual operating expense ratio was indicated as 0.55%. The Financial Highlights section of the Shareholder Report presents the expense ratios based on expenses incurred during the period covered by this report. NAV and Market Price returns assume that dividends and capital gain distributions have been reinvested in the Fund at NAV and Market Price, respectively. The returns shown in the table above do not reflect the deduction of taxes that a shareholder would pay on Fund distributions or the redemption or
sale of Fund Shares. See invesco.com/ETFs to find the most recentmonth-end performance numbers.
Index and Benchmark Index performance results are based upon a hypothetical investment in their respective constituent securities. Index and Benchmark Index returns do not represent Fund returns. An investor cannot invest directly in an index. The Index and Benchmark Index do not charge management fees or brokerage expenses, and no such fees or expenses were deducted from the hypothetical performance shown. In addition, the results actual investors might have achieved would have differed from those shown because of differences in the timing, amounts of their investments, and fees and expenses associated with an investment in the Fund.
Notes Regarding Indexes and Fund Performance History:
| - | Average Annualized and Cumulative Inception returns for the Fund, Index and Benchmark Index are based on the inception date of the Fund. |
| | |
| DJD | | Manager’s Analysis |
| | Invesco Dow Jones Industrial Average Dividend ETF (DJD) |
As an index fund, the Invesco Dow Jones Industrial Average Dividend ETF (the “Fund”) is passively managed and seeks to track the returns of an underlying index. The Fund seeks to track the investment results (before fees and expenses) of the Dow Jones Industrial Average Yield Weighted (the “Index”). The Fund will invest at least 90% of its total assets in common stocks that comprise the Index.
The Index is designed to provide exposure to dividend-paying equity securities of companies included in the Dow Jones Industrial Average™ (the “Benchmark Index”), which is a price-weighted index of 30 U.S. blue-chip companies that meet certain size, listing and liquidity requirements. The Index includes all constituents of the Benchmark Index that pay dividends. The Index is calculated using a yield-weighted methodology that weights all dividend-paying constituents of the Benchmark Index by their twelve-month dividend yield over the prior twelve months.
The Fund generally will invest in all of the securities comprising the Index in proportion to their weightings in the Index.
For the fiscal year ended April 30, 2019, on a market price basis, the Fund returned 14.25%. On a net asset value (“NAV”) basis, the Fund returned 14.24%. During the same time period, the Index returned 14.37%. During the fiscal year, the Fund fully replicated the components of the Index; therefore, the Fund’s performance, on a NAV basis, differed from the return of the Index primarily due to fees and operating expenses that the Fund incurred, as well as trading costs associated with portfolio rebalances during the period.
During this same time period, the Benchmark Index returned 12.63%. The Benchmark Index was selected for its recognition in the marketplace, and because its performance comparison is a useful measure for investors as a broad representation of the U.S. equity market.
The performance of the Fund differed from the Benchmark Index in part because the Fund seeks to track an Index that employs a proprietary stock selection and weighting methodology, whereas the Benchmark Index selects and weights stocks based on market capitalization.
Relative to the Benchmark Index, the Fund was most overweight in the consumer staples sector and most underweight in the industrials sector during the fiscal year ended April 30, 2019. The majority of the Fund’s outperformance relative to the Benchmark Index during that period can be attributed to the Fund’s overweight exposure to and stock selection in the health care sector as well as the Fund’s underweight exposure to and stock selection in the financials sector.
For the fiscal year ended April 30, 2019, the health care sector contributed most significantly to the Fund’s return, followed by the information technology and consumer staples sectors,
respectively. The materials sector detracted most significantly from the Fund’s return.
Positions that contributed most significantly to the Fund’s return, for the fiscal year ended April 30, 2019, included Procter & Gamble Co. (The), a consumer staples company (portfolio average weight of 4.93%) and Merck & Co., Inc., a health care company (portfolio average weight of 4.70%). Positions that detracted most significantly from the Fund’s return during this period included Walgreens Boots Alliance, Inc., a consumer staples company (portfolio average weight of 2.19%) and General Electric Co., an industrials company (no longer held at fiscalyear-end).
| | | | |
Sector Breakdown
(% of the Fund’s Net Assets)
as of April 30, 2019 | |
| Information Technology | | | 19.1 | |
| Consumer Staples | | | 14.9 | |
| Health Care | | | 13.2 | |
| Industrials | | | 12.6 | |
| Financials | | | 12.1 | |
| Energy | | | 10.6 | |
| Consumer Discretionary | | | 9.3 | |
| Communication Services | | | 8.0 | |
| Money Market Funds Plus Other Assets Less Liabilities | | | 0.2 | |
|
Top Ten Fund Holdings*
(% of the Fund’s Net Assets)
as of April 30, 2019 | |
| Security | | | | |
| International Business Machines Corp. | | | 6.2 | |
| Verizon Communications, Inc. | | | 5.6 | |
| Exxon Mobil Corp. | | | 5.5 | |
| Chevron Corp. | | | 5.1 | |
| Coca-Cola Co. (The) | | | 5.0 | |
| JPMorgan Chase & Co. | | | 4.5 | |
| Home Depot, Inc. (The) | | | 4.3 | |
| Pfizer, Inc. | | | 4.3 | |
| Procter & Gamble Co. (The) | | | 4.1 | |
| Cisco Systems, Inc. | | | 3.9 | |
| Total | | | 48.5 | |
| * | Excluding money market fund holdings. |
Invesco Dow Jones Industrial Average Dividend ETF (DJD)(continued)
Growth of a $10,000 Investment Since Inception
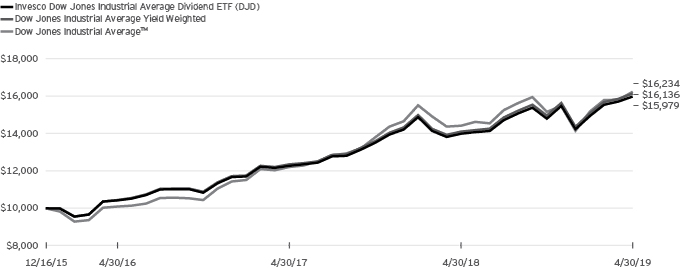
Fund Performance History as of April 30, 2019
| | | | | | | | | | | | | | | | | | | | | | | | |
| | | 1 Year | | | 3 Years
Average
Annualized | | | 3 Years
Cumulative | | | | | | Fund Inception | |
| Index | | | | | Average
Annualized | | | Cumulative | |
| Dow Jones Industrial Average Yield Weighted | | | 14.37 | % | | | 15.65 | % | | | 54.69 | % | | | | | | | 15.24 | % | | | 61.36 | % |
| Dow Jones Industrial Average™ | | | 12.63 | | | | 17.16 | | | | 60.80 | | | | | | | | 15.45 | | | | 62.34 | |
| Fund | | | | | | | | | | | | | | | | | | | | | | | | |
| NAV Return | | | 14.24 | | | | 15.33 | | | | 53.42 | | | | | | | | 14.90 | | | | 59.79 | |
| Market Price Return | | | 14.25 | | | | 14.80 | | | | 51.31 | | | | | | | | 14.94 | | | | 59.95 | |
Guggenheim Dow Jones Industrial Average Dividend ETF (Predecessor Fund) Inception: December 16, 2015
Performance quoted above represents past performance. Past performance is not a guarantee of future results and current performance may be higher or lower than performance quoted. Investment returns and principal value will fluctuate, and shares of the Fund (“Fund Shares”), when redeemed or sold, may be worth more or less than their original cost. Fund performance reflects any applicable fee waivers and/or expense reimbursements. Had the adviser not waived fees and/or reimbursed expenses currently or in the past, returns would have been lower. See current prospectus for more information. According to the Fund’s current prospectus, the Fund’s expense ratio of 0.07% is expressed as a unitary management fee to cover operating expenses and expenses incurred in connection with managing the portfolio. The Financial Highlights section of the Shareholder Report presents the expense ratios based on expenses incurred during the period covered by this report. NAV and Market Price returns assume that dividends and capital gain distributions have been reinvested in the Fund at NAV and Market Price, respectively. The returns shown in the table above do not reflect the deduction of taxes that a shareholder would pay on Fund distributions or the redemption or sale of Fund Shares. See invesco.com/ETFs to find the most recentmonth-end performance numbers.
Index and Benchmark Index performance results are based upon a hypothetical investment in their respective constituent securities. Index and Benchmark Index returns do not represent Fund returns. An investor cannot invest directly in an index. The Index and Benchmark Index do not charge management fees or brokerage expenses, and no such fees or expenses were deducted from the hypothetical performance shown. In addition, the results actual investors might have achieved would have differed from those shown because of differences in the timing, amounts of their investments, and fees and expenses associated with an investment in the Fund.
Notes Regarding Indexes and Fund Performance History:
| - | Average Annualized and Cumulative Inception returns for the Fund, Index and Benchmark Index are based on the inception date of the Predecessor Fund. |
| - | Effective after the close of business on April 6, 2018, the Predecessor Fund was reorganized into the Fund. Returns shown are blended returns of the Predecessor Fund and the Fund. |
| | |
| PGF | | Manager’s Analysis |
| | Invesco Financial Preferred ETF (PGF) |
As an index fund, the Invesco Financial Preferred ETF (the “Fund”) is passively managed and seeks to track the returns of an underlying index. The Fund seeks to track the investment results (before fees and expenses) of the Wells Fargo®Hybrid and Preferred Securities Financial Index (the “Index”). The Fund generally will invest at least 90% of its total assets in preferred securities of financial institutions that comprise the Index.
The Index is a market capitalization weighted index designed to track the performance of preferred securities and securities that Wells Fargo Securities, LLC (together with Wells Fargo & Company, the “Index Provider”) believes are functionally equivalent to preferred securities, including, but not limited to, depositary preferred securities, perpetual subordinated debt and certain capital securities. The Index is composed of preferred and equivalent securities with either fixed or fixed to floating rate dividends or coupons, issued by the financial institutions that have received an industry sector classification of “financial” from the Bloomberg Professional Service® and that are traded in the U.S. market. Strictly in accordance with its guidelines and mandated procedures, the Index Provider includes securities in the Index pursuant to a proprietary selection methodology.
In general, preferred stock is a class of equity security that pays distributions to preferred stockholders. Preferred stockholders have priority over common stockholders in the payment of specified dividends, such that preferred stockholders receive dividends before any dividends are paid to common stockholders. In addition, preferred stock takes precedence over common stock in receiving proceeds from an issuer in the event of the issuer’s liquidation, but is generally junior to debt, including senior and subordinated debt.
The Index may include fixed or variable rate securities, meaning that dividends and coupons (as applicable) may be paid either on a fixed rate or a floating rate percentage of the fixed par value at which the preferred stock or other securities are issued. Floating rate preferred securities are securities that pay interest at rates that adjust whenever a specified benchmark interest rate (e.g., the LIBOR or aT-Bill rate) changes, float at a fixed margin above a generally recognized base lending rate, or are reset orre-determined on specified dates (such as the last day of a month or calendar quarter). Preferred stocks often have a liquidation value that equals the original purchase price of the stock at the time of issuance.
The Fund does not purchase all of the securities in the Index; instead, the Fund utilizes a “sampling” methodology to seek to achieve its investment objective.
For the fiscal year ended April 30, 2019, on a market price basis, the Fund returned 5.97%. On a net asset value (“NAV”) basis, the Fund returned 5.79%. During the same time period, the Index returned 6.41%. The Fund’s performance, on a NAV basis,
differed from the return of the Index primarily due to the fees and operating expenses that the Fund incurred during the period.
During this same time period, the S&P U.S. Preferred Stock Index (the “Benchmark Index”) returned 5.69%. The Benchmark Index is an unmanaged index weighted by modified market capitalization based on the average performance of approximately 300 securities. The Benchmark Index was selected for its recognition in the marketplace, and because its performance comparison is a useful measure for investors as a broad representation of the U.S. preferred stock market.
The performance of the Fund differed from the Benchmark Index primarily because the Fund seeks to track an Index that employs a methodology that focuses on financial sector preferred securities, whereas the Benchmark Index includes preferred stocks from across the U.S. preferred stock market, including convertible preferred stocks. As such, the Fund was overweight financial securities compared to the benchmark.
Relative to the Benchmark Index, the majority of the Fund’s outperformance during the period can be primarily attributed to under-performingnon-financial sector preferred securities that were included in the Benchmark Index but not held by the Fund.
For the fiscal year ended April 30, 2019, the banks industry contributed most significantly to the Fund’s return, followed by the capital markets and insurance industries, respectively. There were no industries that detracted from the Fund’s performance.
Positions that contributed most significantly to the Fund’s return, for the fiscal year ended April 30, 2019, included JPMorgan Chase & Co., 5.75%, Series DD, a banks company (portfolio average weight of 1.61%), BB&T Corp., 5.63%, Series E, a banks company (portfolio average weight of 3.06%), and Bank of America Corp., 6.00%, Series GG, a banks company (portfolio average weight of 1.76%). Positions that detracted most significantly from the Fund’s return during this period included HSBC Holdings PLC, 8.00%, Series 2 (United Kingdom), a banks company (no longer held at fiscal year-end), and HSBC Holdings PLC, 8.13%, (United Kingdom), a banks company (no longer held at fiscal year-end).
| | | | |
Industry Breakdown
(% of the Fund’s Net Assets)
as of April 30, 2019 | |
| Banks | | | 63.1 | |
| Capital Markets | | | 18.1 | |
| Insurance | | | 13.6 | |
| Consumer Finance | | | 4.6 | |
| Industry Types Each Less Than 3% | | | 0.9 | |
| Money Market Funds Plus Other Assets Less Liabilities | | | (0.3) | |
Invesco Financial Preferred ETF (PGF)(continued)
| | | | |
Top Ten Fund Holdings*
(% of the Fund’s Net Assets)
as of April 30, 2019 | |
| Security | | | | |
| BB&T Corp., Series E, Pfd., 5.63% | | | 3.1 | |
| JPMorgan Chase & Co., Series DD, Pfd., 5.75% | | | 3.0 | |
| PNC Financial Services Group, Inc. (The), Series P, Pfd., 6.13% | | | 2.9 | |
| Wells Fargo & Co., Series Q, Pfd., 5.85% | | | 2.9 | |
| JPMorgan Chase & Co., Series BB, Pfd., 6.15% | | | 2.6 | |
| JPMorgan Chase & Co., Series EE, Pfd., 6.00% | | | 2.3 | |
| JPMorgan Chase & Co., Series Y, Pfd., 6.13% | | | 2.3 | |
| JPMorgan Chase & Co., Series AA, Pfd., 6.10% | | | 2.2 | |
| Bank of America Corp., Series GG, Pfd., 6.00% | | | 2.0 | |
| Wells Fargo & Co., Series X, Pfd., 5.50% | | | 1.9 | |
| Total | | | 25.2 | |
| * | Excluding money market fund holdings. |
Growth of a $10,000 Investment
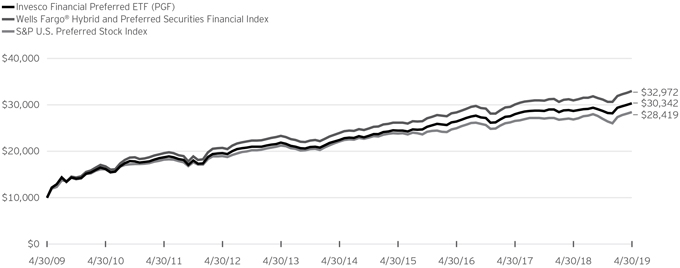
Fund Performance History as of April 30, 2019
| | | | | | | | | | | | | | | | | | | | | | | | | | | | | | | | | | | | | | | | |
| | | 1 Year | | | 3 Years
Average
Annualized | | | 3 Years
Cumulative | | | 5 Years
Average
Annualized | | | 5 Years
Cumulative | | | 10 Years
Average
Annualized | | | 10 Years
Cumulative | | | | | | Fund Inception | |
| Index | | | | | Average
Annualized | | | Cumulative | |
| Wells Fargo® Hybrid and Preferred Securities Financial Index | | | 6.41 | % | | | 5.14 | % | | | 16.24 | % | | | 6.60 | % | | | 37.65 | % | | | 12.67 | % | | | 229.72 | % | | | | | | | 5.16 | % | | | 86.77 | % |
| S&P U.S. Preferred Stock Index | | | 5.69 | | | | 4.38 | | | | 13.73 | | | | 5.12 | | | | 28.36 | | | | 11.01 | | | | 184.19 | | | | | | | | 4.81 | | | | 79.15 | |
| Fund | | | | | | | | | | | | | | | | | | | | | | | | | | | | | | | | | | | | | | | | |
| NAV Return | | | 5.79 | | | | 4.75 | | | | 14.93 | | | | 6.18 | | | | 34.97 | | | | 11.74 | | | | 203.42 | | | | | | | | 4.33 | | | | 69.29 | |
| Market Price Return | | | 5.97 | | | | 4.73 | | | | 14.87 | | | | 6.22 | | | | 35.19 | | | | 11.75 | | | | 203.73 | | | | | | | | 4.28 | | | | 68.19 | |
Invesco Financial Preferred ETF (PGF)(continued)
Fund Inception: December 1, 2006
Performance quoted above represents past performance. Past performance is not a guarantee of future results and current performance may be higher or lower than performance quoted. Investment returns and principal value will fluctuate, and shares of the Fund (“Fund Shares”), when redeemed or sold, may be worth more or less than their original cost. Fund performance reflects any applicable fee waivers and/or expense reimbursements. Had the adviser not waived fees and/or reimbursed expenses currently or in the past, returns would have been lower. See current prospectus for more information. According to the Fund’s current prospectus, the total annual operating expense ratio was indicated as 0.63%. The Financial Highlights section of the Shareholder Report presents the expense ratios based on expenses incurred during the period covered by this report. NAV and Market Price returns assume that dividends and capital gain distributions have been reinvested in the Fund at NAV and Market Price, respectively. The returns shown in the table above do not reflect the deduction of taxes that a shareholder would pay on Fund distributions or the redemption or
sale of Fund Shares. See invesco.com/ETFs to find the most recentmonth-end performance numbers.
Index and Benchmark Index performance results are based upon a hypothetical investment in their respective constituent securities. Index and Benchmark Index returns do not represent Fund returns. An investor cannot invest directly in an index. The Index and Benchmark Index do not charge management fees or brokerage expenses, and no such fees or expenses were deducted from the hypothetical performance shown. In addition, the results actual investors might have achieved would have differed from those shown because of differences in the timing, amounts of their investments, and fees and expenses associated with an investment in the Fund.
Notes Regarding Indexes and Fund Performance History:
| - | Average Annualized and Cumulative Inception returns for the Fund, Index and Benchmark Index are based on the inception date of the Fund. |
| | |
| PEY | | Manager’s Analysis |
| | Invesco High Yield Equity Dividend AchieversTM ETF (PEY) |
As an index fund, the Invesco High Yield Equity Dividend AchieversTM ETF (the “Fund”) is passively managed and seeks to track the returns of an underlying index. The Fund seeks to track the investment results (before fees and expenses) of the NASDAQ US Dividend AchieversTM 50 Index (the “Index”). The Fund generally will invest at least 90% of its total assets in common stocks of companies that comprise the Index.
Strictly in accordance with its guidelines and mandated procedures, Nasdaq, Inc. (the “Index Provider”) includes common stocks in the Index that have a consistent record of dividend increases, principally on the basis of dividend yield and consistent growth in dividends. To qualify for inclusion in the Index, an issuer must have increased its annual regular cash dividend payments for each of its last ten or more calendar or fiscal years, and must have a minimum market capitalization of $1 billion.
The Fund generally invests in all of the securities comprising the Index in proportion to their weightings in the Index.
For the fiscal year ended April 30, 2019, on a market price basis, the Fund returned 10.86%. On a net asset value (“NAV”) basis, the Fund returned 10.79%. During the same time period, the Index returned 11.37%. During the fiscal year, the Fund fully replicated the components of the Index; therefore, the Fund’s performance, on a NAV basis, differed from the return of the Index primarily due to fees and operating expenses that the Fund incurred during the period, partially offset by income received from the security lending program in which the Fund participates.
During this same time period, the Dow Jones U.S. Select Dividend Index (the “Benchmark Index”) returned 9.04%. The Benchmark Index is an unmanaged index weighted by indicated dividend yield based on the average performance of approximately 100 securities. The Benchmark Index was selected for its recognition in the marketplace, and because its performance comparison is a useful measure for investors as a broad representation of the U.S. dividend-paying equity securities market.
The performance of the Fund differed from the Benchmark Index primarily because the selection methodology of the Index that the Fund tracks, which selects the top fifty highest yielding stocks that have increased their dividend every year for the past ten years, differs from the selection methodology of the Benchmark Index which uses several fundamental factors.
Relative to the Benchmark Index, the Fund was most overweight in the tobacco industry and most underweight in the electric utilities industry during the fiscal year ended April 30, 2019. The majority of the Fund’s outperformance relative to the Benchmark Index during that period can be attributed to the Fund’s stock selection in the diversified telecommunications services industry as well as the Fund’s overweight exposure and stock selection in the household products industry.
For the fiscal year ended April 30, 2019, the multi-utilities industry contributed most significantly to the Fund’s return, followed by the electric utilities industry and the insurance industry, respectively. The tobacco industry detracted most significantly from the Fund’s return, followed by the health care providers & services industry.
Positions that contributed most significantly to the Fund’s return, for the fiscal year ended April 30, 2019, included QUALCOMM, Inc., a semiconductors & semiconductor equipment company (portfolio average weight of 1.68%) and Procter & Gamble Co. (The), a household products company (no longer held at fiscalyear-end). Positions that detracted most significantly from the Fund’s return during this period included Vector Group Ltd., a tobacco company (portfolio average weight of 3.57%) and Owens & Minor, Inc., a health care company (no longer held at fiscalyear-end).
| | | | |
Industry Breakdown
(% of the Fund’s Net Assets)
as of April 30, 2019 | |
| Electric Utilities | | | 13.3 | |
| Tobacco | | | 10.0 | |
| Multi-Utilities | | | 9.3 | |
| Oil, Gas & Consumable Fuels | | | 8.3 | |
| Insurance | | | 8.2 | |
| Food Products | | | 7.5 | |
| Capital Markets | | | 7.1 | |
| Banks | | | 5.2 | |
| Diversified Telecommunication Services | | | 5.0 | |
| Semiconductors & Semiconductor Equipment | | | 4.4 | |
| Beverages | | | 3.6 | |
| Industry Types Each Less Than 3% | | | 18.0 | |
| Money Market Funds Plus Other Assets Less Liabilities | | | 0.1 | |
Invesco High Yield Equity Dividend AchieversTM ETF (PEY)(continued)
| | | | |
Top Ten Fund Holdings*
(% of the Fund’s Net Assets)
as of April 30, 2019 | |
| Security | | | | |
| Invesco Ltd. | | | 3.3 | |
| Vector Group Ltd. | | | 3.2 | |
| AT&T, Inc. | | | 3 | |
| Dominion Energy, Inc. | | | 2.9 | |
| Helmerich & Payne, Inc. | | | 2.7 | |
| QUALCOMM, Inc. | | | 2.6 | |
| Altria Group, Inc. | | | 2.6 | |
| ONEOK, Inc. | | | 2.6 | |
| Southern Co. (The) | | | 2.4 | |
| PPL Corp. | | | 2.3 | |
| Total | | | 27.6 | |
| * | Excluding money market fund holdings. |
Growth of a $10,000 Investment
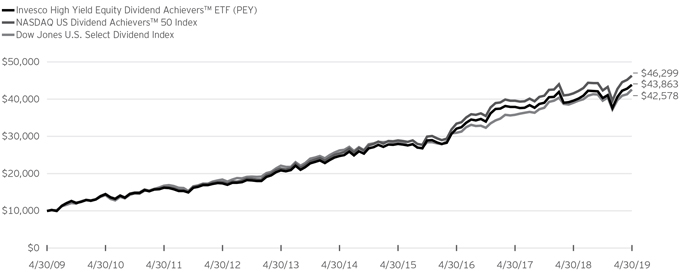
Fund Performance History as of April 30, 2019
| | | | | | | | | | | | | | | | | | | | | | | | | | | | | | | | | | | | | | | | |
| | | 1 Year | | | 3 Years Average
Annualized | | | 3 Years Cumulative | | | 5 Years Average
Annualized | | | 5 Years Cumulative | | | 10 Years Average
Annualized | | | 10 Years Cumulative | | | | | | Fund Inception | |
| Index | | | | | Average
Annualized | | | Cumulative | |
| NASDAQ US Dividend AchieversTM 50 Index | | | 11.37 | % | | | 11.49 | % | | | 38.57 | % | | | 12.68 | % | | | 81.68 | % | | | 16.56 | % | | | 362.99 | % | | | | | | | 6.09 | % | | | 134.14 | % |
| Dow Jones U.S. Select Dividend Index | | | 9.04 | | | | 11.20 | | | | 37.51 | | | | 10.17 | | | | 62.28 | | | | 15.59 | | | | 325.78 | | | | | | | | 8.05 | | | | 204.83 | |
| Fund | | | | | | | | | | | | | | | | | | | | | | | | | | | | | | | | | | | | | | | | |
| NAV Return | | | 10.79 | | | | 10.94 | | | | 36.54 | | | | 12.12 | | | | 77.15 | | | | 15.93 | | | | 338.63 | | | | | | | | 5.61 | | | | 119.36 | |
| Market Price Return | | | 10.86 | | | | 10.94 | | | | 36.53 | | | | 12.13 | | | | 77.24 | | | | 15.94 | | | | 338.83 | | | | | | | | 5.62 | | | | 119.62 | |
Invesco High Yield Equity Dividend AchieversTM ETF (PEY)(continued)
Fund Inception: December 9, 2004
Performance quoted above represents past performance. Past performance is not a guarantee of future results and current performance may be higher or lower than performance quoted. Investment returns and principal value will fluctuate, and shares of the Fund (“Fund Shares”), when redeemed or sold, may be worth more or less than their original cost. Fund performance reflects any applicable fee waivers and/or expense reimbursements. Had the adviser not waived fees and/or reimbursed expenses currently or in the past, returns would have been lower. See current prospectus for more information. According to the Fund’s current prospectus, the total annual operating expense ratio was indicated as 0.54%. The Financial Highlights section of the Shareholder Report presents the expense ratios based on expenses incurred during the period covered by this report. NAV and Market Price returns assume that dividends and capital gain distributions have been reinvested in the Fund at NAV and Market Price, respectively. The returns shown in the table above do not reflect the deduction of taxes that a shareholder would pay on Fund distributions or the redemption or
sale of Fund Shares. See invesco.com/ETFs to find the most recentmonth-end performance numbers.
Index and Benchmark Index performance results are based upon a hypothetical investment in their respective constituent securities. Index and Benchmark Index returns do not represent Fund returns. An investor cannot invest directly in an index. The Index and Benchmark Index do not charge management fees or brokerage expenses, and no such fees or expenses were deducted from the hypothetical performance shown. In addition, the results actual investors might have achieved would have differed from those shown because of differences in the timing, amounts of their investments, and fees and expenses associated with an investment in the Fund.
Notes Regarding Indexes and Fund Performance History:
| - | Average Annualized and Cumulative Inception returns for the Fund, Index and Benchmark Index are based on the inception date of the Fund. |
| | |
| PID | | Manager’s Analysis |
| | Invesco International Dividend AchieversTM ETF (PID) |
As an index fund, the Invesco International Dividend AchieversTMETF (the “Fund”) is passively managed and seeks to track the returns of an underlying index. The Fund seeks to track the investment results (before fees and expenses) of the NASDAQ International Dividend Achievers™ Index (the “Index”). The Fund generally will invest at least 90% of its total assets in dividend-paying common stocks and other securities that comprise the Index. The Index is composed of Global Depositary Receipts (“GDRs”) and American Depository Receipts (“ADRs”) that are listed on the London Stock Exchange or the London International Exchange, in addition to ADRs andnon-U.S. common or ordinary stocks traded on the New York Stock Exchange, The NASDAQ Stock Market LLC or NYSE American.
Strictly in accordance with its guidelines and mandated procedures, Nasdaq, Inc. (the “Index Provider”) includes stock in the Index pursuant to a proprietary selection methodology that identifies companies that have increased their aggregate annual regular cash dividend payments consistently for at least each of the last five consecutive years. The Fund generally invests in all of the securities comprising the Index in proportion to their weightings in the Index.
For the fiscal year ended April 30, 2019, on a market price basis, the Fund returned 7.13%. On a net asset value (“NAV”) basis, the Fund returned 7.06%. During the same time period, the Index returned 7.23%. During the fiscal year, the Fund fully replicated the components of the Index; therefore, the Fund’s performance, on a NAV basis, differed from the return of the Index primarily due to fees and operating expenses that the Fund incurred during the period, partially offset by income received from the securities lending program in which the Fund participates.
During this same time period, the MSCI EAFE® Index (Net) (the “Benchmark Index”) returned (3.22)%. The Benchmark Index is an unmanaged index weighted by market capitalization based on the average performance of approximately 920 securities. The Benchmark Index also was selected for its recognition in the marketplace, and because its performance comparison is a useful measure for investors as a broad representation of the overall international developed equity market.
The performance of the Fund differed from the Benchmark Index primarily because the Fund seeks to track an Index that employs a dividend yield weighting and stock selection methodology, whereas the Benchmark Index selects and weights stocks based primarily on market capitalization.
Relative to the Benchmark Index, the Fund was most overweight in the energy sector and most underweight in the consumer discretionary sector during the fiscal year ended April 30, 2019. The majority of the Fund’s outperformance relative to the Benchmark Index during that period can be attributed to the Fund’s overweight exposure to and stock selection in the energy sector as well as the underweight exposure to and stock selection in the financials sector.
For the fiscal year ended April 30, 2019, the energy sector contributed most significantly to the Fund’s return, followed by the financials and health care sectors, respectively. The communication services sector most significantly detracted from the Fund’s return followed by the consumer discretionary sector.
Positions that contributed most significantly to the Fund’s return, for the fiscal year ended April 30, 2019, included Enbridge, Inc., an energy company (portfolio average weight of 3.26%) and Micro Focus International PLC, ADR, an information technology company (portfolio average weight of 1.89%). Positions that detracted most significantly from the Fund’s return during this period included Vodafone Group PLC, ADR, a communication services company (portfolio average weight of 3.51%) and Hon Hai Precision Industry Co., Ltd. GDR, an information technology company (no longer held at fiscalyear-end).
| | | | |
Sector Breakdown
(% of the Fund’s Net Assets)
as of April 30, 2019 | |
| Financials | | | 18.4 | |
| Communication Services | | | 13.5 | |
| Industrials | | | 13.2 | |
| Energy | | | 11.7 | |
| Materials | | | 10.9 | |
| Information Technology | | | 9.8 | |
| Utilities | | | 8.8 | |
| Health Care | | | 4.3 | |
| Real Estate | | | 3.2 | |
| Consumer Staples | | | 3.0 | |
| Consumer Discretionary | | | 2.8 | |
| Money Market Funds Plus Other Assets Less Liabilities | | | 0.4 | |
|
Top Ten Fund Holdings*
(% of the Fund’s Net Assets)
as of April 30, 2019 | |
| Security | | | | |
| Novolipetsk Steel PJSC, GDR, REGS | | | 4.3 | |
| Severstal PJSC, GDR, REGS | | | 4 | |
| Vodafone Group PLC, ADR | | | 4 | |
| WPP PLC, ADR | | | 3.8 | |
| Brookfield Property Partners L.P. | | | 3.3 | |
| Grupo Aeroportuario del Pacifico S.A.B. de C.V., ADR | | | 2.8 | |
| Enbridge, Inc. | | | 2.7 | |
| National Grid PLC, ADR | | | 2.5 | |
| BCE, Inc. | | | 2.5 | |
| Nielsen Holdings PLC | | | 2.4 | |
| Total | | | 32.3 | |
| * | Excluding money market fund holdings. |
Invesco International Dividend AchieversTM ETF (PID)(continued)
Growth of a $10,000 Investment
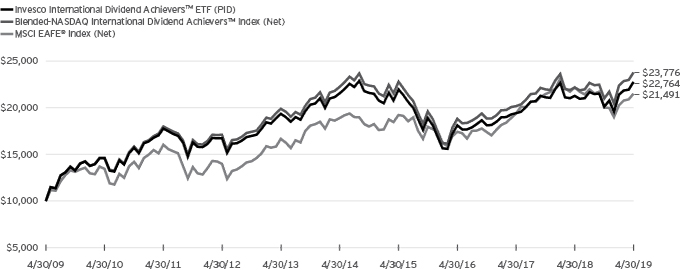
Fund Performance History as of April 30, 2019
| | | | | | | | | | | | | | | | | | | | | | | | | | | | | | | | | | | | | | | | |
| | | 1 Year | | | 3 Years Average
Annualized | | | 3 Years Cumulative | | | 5 Years Average
Annualized | | | 5 Years Cumulative | | | 10 Years Average
Annualized | | | 10 Years Cumulative | | | | | �� | Fund Inception | |
| Index | | | | | Average
Annualized | | | Cumulative | |
| Blended-NASDAQ International Dividend AchieversTM Index (Net) | | | 7.23 | % | | | 8.11 | % | | | 26.36 | % | | | 1.33 | % | | | 6.81 | % | | | 9.05 | % | | | 137.76 | % | | | | | | | 4.60 | % | | | 84.46 | % |
| MSCI EAFE® Index (Net) | | | (3.22 | ) | | | 7.24 | | | | 23.34 | | | | 2.60 | | | | 13.70 | | | | 7.95 | | | | 114.91 | | | | | | | | 4.21 | | | | 75.43 | |
| Fund | | | | | | | | | | | | | | | | | | | | | | | | | | | | | | | | | | | | | | | | |
| NAV Return | | | 7.06 | | | | 7.91 | | | | 25.66 | | | | 1.08 | | | | 5.52 | | | | 8.57 | | | | 127.64 | | | | | | | | 4.05 | | | | 71.67 | |
| Market Price Return | | | 7.13 | | | | 7.94 | | | | 25.75 | | | | 1.06 | | | | 5.42 | | | | 8.56 | | | | 127.36 | | | | | | | | 4.05 | | | | 71.65 | |
Fund Inception: September 15, 2005
Performance quoted above represents past performance. Past performance is not a guarantee of future results and current performance may be higher or lower than performance quoted. Investment returns and principal value will fluctuate, and shares of the Fund (“Fund Shares”), when redeemed or sold, may be worth more or less than their original cost. Fund performance reflects any applicable fee waivers and/or expense reimbursements. Had the adviser not waived fees and/or reimbursed expenses currently or in the past, returns would have been lower. See current prospectus for more information. According to the Fund’s current prospectus, the total annual operating expense ratio was indicated as 0.55%. The Financial Highlights section of the Shareholder Report presents the expense ratios based on expenses incurred during the period covered by this report. NAV and Market Price returns assume that dividends and capital gain distributions have been reinvested in the Fund at NAV and Market Price, respectively. The returns shown in the table above do not reflect the deduction of taxes that a shareholder would pay on Fund distributions or the redemption or sale of Fund Shares. See invesco.com/ETFs to find the most recentmonth-end performance numbers.
Blended-Index and Benchmark Index performance results are based upon a hypothetical investment in their respective constituent securities. Blended-Index and Benchmark Index returns do not represent Fund returns. An investor cannot invest directly in an index. The Blended-Index and Benchmark Index do not charge management fees or brokerage expenses, and no such fees or expenses were deducted from the hypothetical performance shown. In addition, the results actual investors might have achieved would have differed from those shown because of differences in the timing, amounts of their investments, and fees and expenses associated with an investment in the Fund.
Notes Regarding Indexes and Fund Performance History:
| - | The Blended-NASDAQ International Dividend AchieversTM Index (Net) is comprised of gross total returns of the Index from Fund inception through the conversion date, March 9, 2015, and net returns of the Index starting at the conversion date through April 30, 2019. |
| - | Net returns reflect invested dividends net of withholding taxes. |
| - | Average Annualized and Cumulative Inception returns for the Fund, Blended-Index and Benchmark Index are based on the inception date of the Fund. |
Schedule of Investments(a)
Invesco BuyBack AchieversTM ETF (PKW)
April 30, 2019
| | | | | | | | |
Number
of Shares | | | | | Value | |
| | | | Common Stocks & Other Equity Interests—100.0% | |
| | | | Communication Services—3.9% | |
| | 25,061 | | | AMC Entertainment Holdings, Inc.(b) | | $ | 379,925 | |
| | 21,860 | | | AMC Networks, Inc., Class A(c) | | | 1,276,843 | |
| | 169,606 | | | CBS Corp., Class B | | | 8,695,700 | |
| | 109,750 | | | Charter Communications, Inc., Class A(c) | | | 40,738,102 | |
| | | | | | | | |
| | | | | | | 51,090,570 | |
| | | | | | | | |
| | | | Consumer Discretionary—18.7% | |
| | 3,280 | | | America’s Car-Mart, Inc.(c) | | | 324,884 | |
| | 9,485 | | | Asbury Automotive Group, Inc.(c) | | | 760,507 | |
| | 12,145 | | | AutoZone, Inc.(c) | | | 12,488,825 | |
| | 38,515 | | | BBX Capital Corp. | | | 213,373 | |
| | 130,433 | | | Best Buy Co., Inc. | | | 9,705,520 | |
| | 21,950 | | | Booking Holdings, Inc.(c) | | | 40,717,030 | |
| | 18,635 | | | Brinker International, Inc. | | | 797,019 | |
| | 7,264 | | | Build-A-Bear Workshop, Inc.(c) | | | 40,678 | |
| | 7,836 | | | Children’s Place, Inc. (The) | | | 884,057 | |
| | 19,763 | | | Churchill Downs, Inc. | | | 1,993,099 | |
| | 6,252 | | | Citi Trends, Inc. | | | 115,725 | |
| | 18,731 | | | Dave & Buster’s Entertainment, Inc. | | | 1,064,670 | |
| | 14,088 | | | Deckers Outdoor Corp.(c) | | | 2,228,862 | |
| | 35,726 | | | Dick’s Sporting Goods, Inc. | | | 1,321,862 | |
| | 10,933 | | | Dillard’s, Inc., Class A(b) | | | 748,364 | |
| | 40,028 | | | Dunkin’ Brands Group, Inc. | | | 2,987,290 | |
| | 446,287 | | | eBay, Inc. | | | 17,293,621 | |
| | 33,128 | | | Express, Inc.(c) | | | 121,911 | |
| | 54,724 | | | Foot Locker, Inc. | | | 3,130,760 | |
| | 126,968 | | | Gentex Corp. | | | 2,924,073 | |
| | 112,971 | | | Goodyear Tire & Rubber Co. (The) | | | 2,170,173 | |
| | 9,267 | | | Group 1 Automotive, Inc. | | | 725,699 | |
| | 142,569 | | | Hilton Worldwide Holdings, Inc. | | | 12,402,077 | |
| | 19,194 | | | Hyatt Hotels Corp., Class A | | | 1,472,756 | |
| | 12,452 | | | Jack in the Box, Inc. | | | 960,049 | |
| | 7,219 | | | Kirkland’s, Inc.(c) | | | 42,448 | |
| | 30,456 | | | Lear Corp. | | | 4,355,208 | |
| | 10,892 | | | Lithia Motors, Inc., Class A | | | 1,236,460 | |
| | 164,248 | | | Marriott International, Inc., Class A | | | 22,406,712 | |
| | 261,896 | | | MGM Resorts International | | | 6,974,290 | |
| | 76,449 | | | Michaels Cos., Inc. (The) | | | 859,287 | |
| | 15,671 | | | Murphy USA, Inc.(c) | | | 1,339,400 | |
| | 38,253 | | | O’Reilly Automotive, Inc.(c) | | | 14,481,438 | |
| | 15,297 | | | Papa John’s International, Inc.(b) | | | 782,595 | |
| | 58,420 | | | Sally Beauty Holdings, Inc.(c) | | | 1,034,034 | |
| | 7,466 | | | Shoe Carnival, Inc.(b) | | | 266,238 | |
| | 25,138 | | | Signet Jewelers Ltd. | | | 582,699 | |
| | 16,018 | | | Sleep Number Corp.(c) | | | 557,426 | |
| | 22,460 | | | Sotheby’s(b)(c) | | | 947,363 | |
| | 606,619 | | | Starbucks Corp. | | | 47,122,164 | |
| | 70,553 | | | Toll Brothers, Inc. | | | 2,688,069 | |
| | 68,900 | | | TRI Pointe Group, Inc.(c) | | | 899,145 | |
| | 14,012 | | | Visteon Corp. | | | 925,072 | |
| | 30,929 | | | Whirlpool Corp. | | | 4,293,564 | |
| | 149,469 | | | Yum! Brands, Inc. | | | 15,603,069 | |
| | 13,153 | | | Zovio Inc.(c) | | | 79,181 | |
| | | | | | | | |
| | | | | | | 245,068,746 | |
| | | | | | | | |
| | | | | | | | |
Number
of Shares | | | | | Value | |
| | | | Common Stocks & Other Equity Interests
(continued) | |
| | | | Consumer Staples—1.1% | |
| | 75,581 | | | Herbalife Nutrition Ltd.(c) | | $ | 3,994,456 | |
| | 389,418 | | | Kroger Co. (The) | | | 10,039,196 | |
| | | | | | | | |
| | | | | | | 14,033,652 | |
| | | | | | | | |
| | | | Energy—4.9% | |
| | 244,525 | | | Anadarko Petroleum Corp. | | | 17,813,646 | |
| | 9,057 | | | Arch Coal, Inc., Class A | | | 878,348 | |
| | 206,512 | | | Cabot Oil & Gas Corp. | | | 5,346,596 | |
| | 98,383 | | | CNX Resources Corp.(c) | | | 881,512 | |
| | 213,810 | | | Devon Energy Corp. | | | 6,871,853 | |
| | 17,373 | | | Dril-Quip, Inc.(c) | | | 756,768 | |
| | 83,470 | | | Gulfport Energy Corp.(c) | | | 546,729 | |
| | 147,820 | | | Hess Corp. | | | 9,478,218 | |
| | 51,126 | | | Keane Group, Inc.(c) | | | 536,312 | |
| | 221,642 | | | Phillips 66 | | | 20,894,191 | |
| | | | | | | | |
| | | | | | | 64,004,173 | |
| | | | | | | | |
| | | | Financials—17.5% | |
| | 25,504 | | | Affiliated Managers Group, Inc. | | | 2,828,904 | |
| | 195,646 | | | Ally Financial, Inc. | | | 5,812,643 | |
| | 66,054 | | | Ameriprise Financial, Inc. | | | 9,694,745 | |
| | 51,149 | | | Assured Guaranty Ltd. | | | 2,439,807 | |
| | 8,187 | | | BankFinancial Corp. | | | 122,887 | |
| | 43,804 | | | Capstead Mortgage Corp. | | | 376,276 | |
| | 49,769 | | | CIT Group, Inc. | | | 2,651,195 | |
| | 990,853 | | | Citigroup, Inc. | | | 70,053,307 | |
| | 77,048 | | | Comerica, Inc. | | | 6,055,202 | |
| | 14,135 | | | Cowen, Inc., Class A(c) | | | 236,761 | |
| | 159,122 | | | Discover Financial Services | | | 12,966,852 | |
| | 119,594 | | | E*TRADE Financial Corp. | | | 6,058,632 | |
| | 6,106 | | | Ellington Residential Mortgage REIT | | | 72,173 | |
| | 378,223 | | | Fifth Third Bancorp | | | 10,900,387 | |
| | 21,200 | | | FirstCash, Inc. | | | 2,070,816 | |
| | 248,404 | | | Franklin Resources, Inc. | | | 8,592,294 | |
| | 9,922 | | | Greenhill & Co., Inc. | | | 205,485 | |
| | 4,406 | | | HCI Group, Inc. | | | 187,784 | |
| | 147,452 | | | Jefferies Financial Group, Inc. | | | 3,033,088 | |
| | 41,433 | | | Legg Mason, Inc. | | | 1,385,934 | |
| | 152,279 | | | Loews Corp. | | | 7,810,390 | |
| | 67,558 | | | M&T Bank Corp. | | | 11,489,589 | |
| | 466,961 | | | MetLife, Inc. | | | 21,540,911 | |
| | 9,339 | | | Och-Ziff Capital Management Group LLC, Class A(b) | | | 137,096 | |
| | 23,448 | | | Oxford Square Capital Corp.(b) | | | 151,239 | |
| | 59,002 | | | PacWest Bancorp | | | 2,333,529 | |
| | 33,050 | | | PennyMac Mortgage Investment Trust | | | 694,050 | |
| | 496,437 | | | Regions Financial Corp. | | | 7,709,667 | |
| | 216,233 | | | SunTrust Banks, Inc. | | | 14,158,937 | |
| | 346,246 | | | Synchrony Financial | | | 12,004,349 | |
| | 45,611 | | | Third Point Reinsurance Ltd. (Bermuda)(c) | | | 529,544 | |
| | 72,031 | | | Voya Financial, Inc. | | | 3,953,781 | |
| | 37,841 | | | Waddell & Reed Financial, Inc., Class A(b) | | | 708,762 | |
| | 1,545 | | | White Mountains Insurance Group Ltd. | | | 1,450,817 | |
| | | | | | | | |
| | | | | | | 230,417,833 | |
| | | | | | | | |
| | | | Health Care—10.5% | |
| | 721,035 | | | AbbVie, Inc. | | | 57,242,969 | |
| | 15,460 | | | Amedisys, Inc.(c) | | | 1,976,097 | |
See accompanying Notes to Financial Statements which are an integral part of the financial statements.
Invesco BuyBack AchieversTM ETF (PKW)(continued)
April 30, 2019
| | | | | | | | |
Number
of Shares | | | | | Value | |
| | | | Common Stocks & Other Equity Interests
(continued) | |
| | | | Health Care (continued) | |
| | 303,540 | | | Amgen, Inc. | | $ | 54,430,793 | |
| | 144,540 | | | Cardinal Health, Inc. | | | 7,040,543 | |
| | 80,588 | | | DaVita, Inc.(c) | | | 4,451,681 | |
| | 48,937 | | | Innoviva, Inc.(c) | | | 686,586 | |
| | 93,587 | | | McKesson Corp. | | | 11,160,250 | |
| | 17,294 | | | Medpace Holdings, Inc.(c) | | | 971,404 | |
| | 50,145 | | | PDL BioPharma, Inc.(c) | | | 163,974 | |
| | | | | | | | |
| | | | | | | 138,124,297 | |
| | | | | | | | |
| | | | | |
| | | | Industrials—13.3% | | | |
| | 61,101 | | | Allison Transmission Holdings, Inc. | | | 2,863,193 | |
| | 24,010 | | | Armstrong World Industries, Inc. | | | 2,080,947 | |
| | 22,800 | | | Atkore International Group, Inc.(c) | | | 564,528 | |
| | 37,425 | | | Avis Budget Group, Inc.(c) | | | 1,330,459 | |
| | 396,426 | | | CSX Corp. | | | 31,567,402 | |
| | 70,915 | | | Dover Corp. | | | 6,952,506 | |
| | 68,532 | | | Fortune Brands Home & Security, Inc. | | | 3,617,119 | |
| | 27,438 | | | Genesee & Wyoming, Inc., Class A(c) | | | 2,432,379 | |
| | 23,884 | | | Hawaiian Holdings, Inc. | | | 673,767 | |
| | 20,312 | | | Huntington Ingalls Industries, Inc. | | | 4,521,045 | |
| | 25,118 | | | InnerWorkings, Inc.(c) | | | 84,899 | |
| | 29,871 | | | ManpowerGroup, Inc. | | | 2,868,811 | |
| | 20,547 | | | Navigant Consulting, Inc. | | | 469,088 | |
| | 10,258 | | | PICO Holdings, Inc.(c) | | | 117,249 | |
| | 68,954 | | | Quanta Services, Inc. | | | 2,799,532 | |
| | 58,332 | | | Rockwell Automation, Inc. | | | 10,541,176 | |
| | 269,603 | | | Southwest Airlines Co. | | | 14,620,571 | |
| | 51,387 | | | Spirit AeroSystems Holdings, Inc., Class A | | | 4,465,530 | |
| | 35,630 | | | Terex Corp. | | | 1,187,548 | |
| | 114,060 | | | Textron, Inc. | | | 6,045,180 | |
| | 7,467 | | | UniFirst Corp. | | | 1,180,757 | |
| | 352,619 | | | Union Pacific Corp. | | | 62,427,668 | |
| | 130,105 | | | United Continental Holdings, Inc.(c) | | | 11,561,130 | |
| | | | | | | | |
| | | | | | | 174,972,484 | |
| | | | | | | | |
| | | | Information Technology—26.9% | |
| | 324,574 | | | Apple, Inc. | | | 65,132,265 | |
| | 463,089 | | | Applied Materials, Inc. | | | 20,408,332 | |
| | 53,805 | | | Avnet, Inc. | | | 2,615,461 | |
| | 21,030 | | | Benchmark Electronics, Inc. | | | 568,441 | |
| | 60,821 | | | CDK Global, Inc. | | | 3,668,723 | |
| | 29,035 | | | Cirrus Logic, Inc.(c) | | | 1,381,485 | |
| | 1,141,908 | | | Cisco Systems, Inc. | | | 63,889,753 | |
| | 64,271 | | | Citrix Systems, Inc. | | | 6,488,800 | |
| | 383,003 | | | Corning, Inc. | | | 12,198,645 | |
| | 668,432 | | | Hewlett Packard Enterprise Co. | | | 10,567,910 | |
| | 748,014 | | | HP, Inc. | | | 14,922,879 | |
| | 76,496 | | | Jabil, Inc. | | | 2,310,944 | |
| | 170,114 | | | Juniper Networks, Inc. | | | 4,724,066 | |
| | 31,623 | | | Manhattan Associates, Inc.(c) | | | 2,132,971 | |
| | 11,747 | | | Nanometrics, Inc.(c) | | | 349,943 | |
| | 120,483 | | | NetApp, Inc. | | | 8,777,187 | |
| | 37,652 | | | NetScout Systems, Inc.(c) | | | 1,106,969 | |
| | 1,147,844 | | | Oracle Corp. | | | 63,510,208 | |
| | 15,165 | | | Plexus Corp.(c) | | | 912,630 | |
| | 39,915 | | | Presidio, Inc. | | | 599,523 | |
| | 21,751 | | | Progress Software Corp. | | | 992,063 | |
| | 590,353 | | | QUALCOMM, Inc. | | | 50,847,104 | |
| | | | | | | | |
Number
of Shares | | | | | Value | |
| | | | Common Stocks & Other Equity Interests
(continued) | |
| | | | Information Technology (continued) | |
| | 33,085 | | | Sanmina Corp.(c) | | $ | 1,122,243 | |
| | 20,573 | | | Synchronoss Technologies, Inc.(c) | | | 110,683 | |
| | 85,515 | | | Teradyne, Inc. | | | 4,190,235 | |
| | 34,340 | | | Ubiquiti Networks, Inc. | | | 5,853,253 | |
| | 112,816 | | | Xerox Corp. | | | 3,763,542 | |
| | | | | | | | |
| | | | | | | 353,146,258 | |
| | | | | | | | |
| | | | Materials—1.7% | |
| | 9,021 | | | Advanced Emissions Solutions, Inc. | | | 101,937 | |
| | 81,095 | | | Chemours Co. (The) | | | 2,920,231 | |
| | 115,173 | | | PPG Industries, Inc. | | | 13,532,827 | |
| | 76,045 | | | Sealed Air Corp. | | | 3,545,218 | |
| | 91,261 | | | Valvoline, Inc. | | | 1,688,329 | |
| | 27,960 | | | Worthington Industries, Inc. | | | 1,122,035 | |
| | | | | | | | |
| | | | | | | 22,910,577 | |
| | | | | | | | |
| | | | Real Estate—1.1% | |
| | 237,594 | | | Colony Capital, Inc. | | | 1,221,233 | |
| | 19,074 | | | Hersha Hospitality Trust | | | 354,204 | |
| | 24,138 | | | NorthStar Realty Europe Corp. | | | 430,381 | |
| | 97,625 | | | Park Hotels & Resorts, Inc. | | | 3,131,810 | |
| | 62,097 | | | Piedmont Office Realty Trust, Inc., Class A | | | 1,292,860 | |
| | 57,062 | | | Realogy Holdings Corp.(b) | | | 742,947 | |
| | 104,391 | | | Retail Properties of America, Inc., Class A | | | 1,282,965 | |
| | 41,312 | | | SL Green Realty Corp. | | | 3,649,502 | |
| | 41,587 | | | Spirit Realty Capital, Inc. | | | 1,682,610 | |
| | 29,370 | | | St. Joe Co. (The)(c) | | | 500,465 | |
| | | | | | | | |
| | | | | | | 14,288,977 | |
| | | | | | | | |
| | | | Utilities—0.4% | |
| | 136,061 | | | NRG Energy, Inc. | | | 5,601,631 | |
| | 25,507 | | | Star Group L.P. | | | 242,062 | |
| | | | | | | | |
| | | | | | | 5,843,693 | |
| | | | | | | | |
| | | | Total Common Stocks & Other Equity Interests
(Cost $1,216,380,478) | | | 1,313,901,260 | |
| | | | | | | | |
| | |
| | | | | | | | |
| | | | Money Market Funds—0.1% | |
| | 1,523,148 | | | Invesco Premier U.S. Government Money Portfolio—Institutional Class, 2.32%(d)
(Cost $1,523,148) | | | 1,523,148 | |
| | | | | | | | |
| | |
| | | | Total Investments in Securities
(excluding investments purchased with cash collateral from securities on loan)
(Cost $1,217,903,626)—100.1% | | | 1,315,424,408 | |
| | | | | | | | |
| | |
| | | | | | | | |
| | | | Investments Purchased with Cash Collateral from
Securities on Loan | |
| | |
| | | | | | | | |
| | | | Money Market Funds—0.3% | |
| | 2,413,794 | | | Invesco Government & Agency
Portfolio—Institutional Class,
2.34%(d)(e) | | | 2,413,794 | |
See accompanying Notes to Financial Statements which are an integral part of the financial statements.
Invesco BuyBack AchieversTM ETF (PKW)(continued)
April 30, 2019
| | | | | | | | |
Number
of Shares | | | | | Value | |
| | | | Money Market Funds (continued) | |
| | 804,361 | | | Invesco Liquid Assets Portfolio—Institutional Class,
2.48%(d)(e) | | $ | 804,602 | |
| | | | | | | | |
| | |
| | | | | | | | |
| | | | Total Money Market Funds
(Cost $3,218,396) | | | 3,218,396 | |
| | | | | | | | |
| | |
| | | | Total Investments in Securities
(Cost $1,221,122,022)—100.4% | | | 1,318,642,804 | |
| | |
| | | | Other assets less liabilities—(0.4)% | | | (5,239,252 | ) |
| | | | | | | | |
| | |
| | | | Net Assets—100.0% | | $ | 1,313,403,552 | |
| | | | | | | | |
Abbreviations:
REIT—Real Estate Investment Trust
Notes to Schedule of Investments:
| (a) | Industry and/or sector classifications used in this report are generally according to the Global Industry Classification Standard, which was developed by and is the exclusive property and a service mark of MSCI Inc. and Standard & Poor’s. |
| (b) | All or a portion of this security was out on loan at April 30, 2019. |
| (c) | Non-income producing security. |
| (d) | The security and the Fund are advised by wholly-owned subsidiaries of Invesco Ltd. and are therefore considered to be affiliated. The rate shown is the 7-day SEC standardized yield as of April 30, 2019. |
| (e) | The security has been segregated to satisfy the commitment to return the cash collateral received in securities lending transactions upon the borrower’s return of the securities loaned. See Note 2J. |
See accompanying Notes to Financial Statements which are an integral part of the financial statements.
Schedule of Investments(a)
Invesco Dividend AchieversTM ETF (PFM)
April 30, 2019
| | | | | | | | |
Number
of Shares | | | | | Value | |
| | | | Common Stocks & Other Equity Interests—100.0% | |
| | | | Communication Services—7.6% | |
| | 248,902 | | | AT&T, Inc. | | $ | 7,706,006 | |
| | 154,340 | | | Comcast Corp., Class A | | | 6,718,420 | |
| | 1,636 | | | John Wiley & Sons, Inc., Class A | | | 75,551 | |
| | 1,371 | | | Meredith Corp. | | | 80,889 | |
| | 3,640 | | | Telephone & Data Systems, Inc. | | | 116,043 | |
| | 141,178 | | | Verizon Communications, Inc. | | | 8,073,970 | |
| | | | | | | | |
| | | | | | | 22,770,879 | |
| | | | | | | | |
| | | | Consumer Discretionary—7.2% | |
| | 2,289 | | | Aaron’s, Inc. | | | 127,474 | |
| | 9,175 | | | Best Buy Co., Inc. | | | 682,712 | |
| | 2,327 | | | Columbia Sportswear Co. | | | 232,630 | |
| | 817 | | | Cracker Barrel Old Country Store, Inc. | | | 137,861 | |
| | 4,968 | | | Genuine Parts Co. | | | 509,419 | |
| | 4,301 | | | Hasbro, Inc. | | | 438,100 | |
| | 816 | | | International Speedway Corp., Class A | | | 36,002 | |
| | 4,476 | | | Leggett & Platt, Inc. | | | 176,175 | |
| | 27,387 | | | Lowe’s Cos., Inc. | | | 3,098,565 | |
| | 26,165 | | | McDonald’s Corp. | | | 5,169,419 | |
| | 1,138 | | | Monro, Inc. | | | 95,398 | |
| | 42,925 | | | NIKE, Inc., Class B | | | 3,770,103 | |
| | 2,076 | | | Polaris Industries, Inc. | | | 200,126 | |
| | 12,645 | | | Ross Stores, Inc. | | | 1,234,911 | |
| | 17,793 | | | Target Corp. | | | 1,377,534 | |
| | 4,150 | | | Tiffany & Co. | | | 447,453 | |
| | 42,198 | | | TJX Cos., Inc. (The) | | | 2,315,826 | |
| | 13,493 | | | VF Corp. | | | 1,273,874 | |
| | 2,733 | | | Williams-Sonoma, Inc.(b) | | | 156,246 | |
| | | | | | | | |
| | | | | | | 21,479,828 | |
| | | | | | | | |
| | | | Consumer Staples—19.7% | |
| | 64,093 | | | Altria Group, Inc. | | | 3,482,173 | |
| | 1,115 | | | Andersons, Inc. (The) | | | 36,460 | |
| | 19,093 | | | Archer-Daniels-Midland Co. | | | 851,548 | |
| | 10,499 | | | Brown-Forman Corp., Class B | | | 559,492 | |
| | 4,809 | | | Bunge Ltd. | | | 252,040 | |
| | 1,246 | | | Casey’s General Stores, Inc. | | | 164,908 | |
| | 8,386 | | | Church & Dwight Co., Inc. | | | 628,531 | |
| | 4,364 | | | Clorox Co. (The) | | | 697,062 | |
| | 146,077 | | | Coca-Cola Co. (The) | | | 7,166,538 | |
| | 29,374 | | | Colgate-Palmolive Co. | | | 2,138,133 | |
| | 15,066 | | | Costco Wholesale Corp. | | | 3,699,155 | |
| | 7,196 | | | Flowers Foods, Inc. | | | 156,441 | |
| | 20,341 | | | General Mills, Inc. | | | 1,046,951 | |
| | 18,220 | | | Hormel Foods Corp. | | | 727,707 | |
| | 642 | | | J & J Snack Foods Corp. | | | 100,910 | |
| | 3,885 | | | JM Smucker Co. (The) | | | 476,418 | |
| | 11,720 | | | Kellogg Co. | | | 706,716 | |
| | 11,746 | | | Kimberly-Clark Corp. | | | 1,507,951 | |
| | 27,189 | | | Kroger Co. (The) | | | 700,932 | |
| | 945 | | | Lancaster Colony Corp. | | | 140,531 | |
| | 4,177 | | | McCormick & Co., Inc. | | | 643,133 | |
| | 1,887 | | | Nu Skin Enterprises, Inc., Class A | | | 95,992 | |
| | 48,009 | | | PepsiCo, Inc. | | | 6,147,552 | |
| | 53,162 | | | Philip Morris International, Inc. | | | 4,601,703 | |
| | 85,457 | | | Procter & Gamble Co. (The) | | | 9,099,461 | |
| | 17,514 | | | Sysco Corp. | | | 1,232,460 | |
| | 1,364 | | | Tootsie Roll Industries, Inc. | | | 52,964 | |
| | | | | | | | |
Number
of Shares | | | | | Value | |
| | | | Common Stocks & Other Equity Interests
(continued) | |
| | | | Consumer Staples (continued) | |
| | 853 | | | Universal Corp. | | $ | 45,943 | |
| | 4,801 | | | Vector Group Ltd. | | | 45,753 | |
| | 32,169 | | | Walgreens Boots Alliance, Inc. | | | 1,723,293 | |
| | 99,253 | | | Walmart, Inc. | | | 10,207,178 | |
| | | | | | | | |
| | | | | | | 59,136,029 | |
| | | | | | | | |
| | | | Energy—8.7% | |
| | 64,911 | | | Chevron Corp. | | | 7,793,215 | |
| | 89,308 | | | Energy Transfer L.P. | | | 1,350,337 | |
| | 74,428 | | | Enterprise Products Partners L.P. | | | 2,130,874 | |
| | 144,129 | | | Exxon Mobil Corp. | | | 11,570,676 | |
| | 3,724 | | | Helmerich & Payne, Inc. | | | 217,928 | |
| | 3,598 | | | Holly Energy Partners L.P. | | | 97,830 | |
| | 7,789 | | | Magellan Midstream Partners, L.P. | | | 482,996 | |
| | 25,546 | | | Occidental Petroleum Corp. | | | 1,504,148 | |
| | 14,038 | | | ONEOK, Inc. | | | 953,601 | |
| | | | | | | | |
| | | | | | | 26,101,605 | |
| | | | | | | | |
| | | | Financials—6.0% | |
| | 885 | | | 1st Source Corp. | | | 41,445 | |
| | 25,583 | | | Aflac, Inc. | | | 1,288,872 | |
| | 3,077 | | | American Equity Investment Life Holding Co. | | | 90,495 | |
| | 3,037 | | | American Financial Group, Inc. | | | 314,421 | |
| | 4,619 | | | Ameriprise Financial, Inc. | | | 677,931 | |
| | 2,104 | | | Assurant, Inc. | | | 199,880 | |
| | 2,846 | | | Axis Capital Holdings Ltd. | | | 161,795 | |
| | 1,120 | | | BancFirst Corp. | | | 63,168 | |
| | 482 | | | Bank of Marin Bancorp | | | 20,413 | |
| | 4,394 | | | Bank OZK | | | 143,464 | |
| | 2,221 | | | BOK Financial Corp. | | | 193,538 | |
| | 9,546 | | | Brown & Brown, Inc. | | | 303,085 | |
| | 15,638 | | | Chubb Ltd. | | | 2,270,638 | |
| | 5,564 | | | Cincinnati Financial Corp. | | | 535,145 | |
| | 3,789 | | | Commerce Bancshares, Inc. | | | 228,969 | |
| | 1,753 | | | Community Bank System, Inc. | | | 116,504 | |
| | 603 | | | Community Trust Bancorp, Inc. | | | 25,477 | |
| | 2,153 | | | Cullen/Frost Bankers, Inc. | | | 218,939 | |
| | 3,971 | | | Eaton Vance Corp. | | | 165,074 | |
| | 1,568 | | | Erie Indemnity Co., Class A | | | 296,854 | |
| | 1,389 | | | Evercore, Inc., Class A | | | 135,330 | |
| | 1,309 | | | FactSet Research Systems, Inc. | | | 361,114 | |
| | 872 | | | First of Long Island Corp. (The) | | | 20,291 | |
| | 17,363 | | | Franklin Resources, Inc. | | | 600,586 | |
| | 1,376 | | | Hanover Insurance Group, Inc. (The) | | | 165,959 | |
| | 13,544 | | | Invesco Ltd.(c) | | | 297,562 | |
| | 3,747 | | | Lazard Ltd., Class A | | | 145,683 | |
| | 1,886 | | | Mercury General Corp. | | | 101,429 | |
| | 10,326 | | | Old Republic International Corp. | | | 230,889 | |
| | 12,878 | | | People’s United Financial, Inc. | | | 222,661 | |
| | 9,493 | | | Principal Financial Group, Inc. | | | 542,620 | |
| | 2,390 | | | Prosperity Bancshares, Inc. | | | 176,000 | |
| | 13,954 | | | Prudential Financial, Inc. | | | 1,475,077 | |
| | 1,437 | | | RenaissanceRe Holdings Ltd. (Bermuda) | | | 223,252 | |
| | 1,523 | | | RLI Corp. | | | 123,866 | |
| | 8,488 | | | S&P Global, Inc. | | | 1,872,962 | |
| | 5,238 | | | SEI Investments Co. | | | 285,209 | |
| | 1,156 | | | Southside Bancshares, Inc. | | | 40,610 | |
| | 8,064 | | | T. Rowe Price Group, Inc. | | | 866,880 | |
See accompanying Notes to Financial Statements which are an integral part of the financial statements.
Invesco Dividend AchieversTM ETF (PFM)(continued)
April 30, 2019
| | | | | | | | |
Number
of Shares | | | | | Value | |
| | | | Common Stocks & Other Equity Interests
(continued) | |
| | | | Financials (continued) | |
| | 528 | | | Tompkins Financial Corp. | | $ | 42,594 | |
| | 3,805 | | | Torchmark Corp. | | | 333,546 | |
| | 8,978 | | | Travelers Cos., Inc. (The) | | | 1,290,587 | |
| | 1,703 | | | UMB Financial Corp. | | | 118,972 | |
| | 3,511 | | | United Bankshares, Inc. | | | 137,772 | |
| | 7,313 | | | Unum Group | | | 269,996 | |
| | 6,238 | | | W.R. Berkley Corp. | | | 382,389 | |
| | 926 | | | Westamerica Bancorp | | | 59,468 | |
| | 315 | | | Westwood Holdings Group, Inc. | | | 9,856 | |
| | | | | | | | |
| | | | | | | 17,889,267 | |
| | | | | | | | |
| | | | Health Care—9.3% | |
| | 60,064 | | | Abbott Laboratories | | | 4,778,692 | |
| | 7,204 | | | AmerisourceBergen Corp. | | | 538,571 | |
| | 76 | | | Atrion Corp. | | | 66,880 | |
| | 9,209 | | | Becton, Dickinson and Co. | | | 2,216,975 | |
| | 10,170 | | | Cardinal Health, Inc. | | | 495,381 | |
| | 534 | | | Chemed Corp. | | | 174,500 | |
| | 1,791 | | | Ensign Group, Inc. (The) | | | 92,272 | |
| | 83,369 | | | Johnson & Johnson | | | 11,771,703 | |
| | 6,543 | | | McKesson Corp. | | | 780,253 | |
| | 45,908 | | | Medtronic PLC | | | 4,077,089 | |
| | 528 | | | National HealthCare Corp. | | | 39,827 | |
| | 4,634 | | | Perrigo Co. PLC | | | 222,061 | |
| | 12,700 | | | Stryker Corp. | | | 2,399,157 | |
| | 2,530 | | | West Pharmaceutical Services, Inc. | | | 313,189 | |
| | | | | | | | |
| | | | | | | 27,966,550 | |
| | | | | | | | |
| | | | Industrials—14.9% | |
| | 19,642 | | | 3M Co. | | | 3,722,355 | |
| | 4,835 | | | A.O. Smith Corp. | | | 254,176 | |
| | 2,251 | | | ABM Industries, Inc. | | | 85,471 | |
| | 1,678 | | | Brady Corp., Class A | | | 81,870 | |
| | 4,671 | | | C.H. Robinson Worldwide, Inc. | | | 378,351 | |
| | 1,964 | | | Carlisle Cos., Inc. | | | 277,749 | |
| | 19,633 | | | Caterpillar, Inc. | | | 2,737,233 | |
| | 3,568 | | | Cintas Corp. | | | 774,756 | |
| | 27,824 | | | CSX Corp. | | | 2,215,625 | |
| | 5,361 | | | Cummins, Inc. | | | 891,481 | |
| | 4,354 | | | Donaldson Co., Inc. | | | 233,113 | |
| | 4,939 | | | Dover Corp. | | | 484,220 | |
| | 20,948 | | | Emerson Electric Co. | | | 1,487,099 | |
| | 5,850 | | | Expeditors International of Washington, Inc. | | | 464,607 | |
| | 9,767 | | | Fastenal Co. | | | 689,062 | |
| | 8,909 | | | FedEx Corp. | | | 1,687,899 | |
| | 1,570 | | | Franklin Electric Co., Inc. | | | 76,710 | |
| | 9,821 | | | General Dynamics Corp. | | | 1,755,209 | |
| | 897 | | | Gorman-Rupp Co. (The) | | | 29,870 | |
| | 5,631 | | | Graco, Inc. | | | 288,589 | |
| | 4,025 | | | Harris Corp. | | | 678,213 | |
| | 2,515 | | | Healthcare Services Group, Inc.(b) | | | 85,133 | |
| | 1,813 | | | HEICO Corp. | | | 191,326 | |
| | 2,136 | | | Hillenbrand, Inc. | | | 91,891 | |
| | 1,858 | | | Hubbell, Inc. | | | 237,081 | |
| | 11,199 | | | Illinois Tool Works, Inc. | | | 1,742,900 | |
| | 2,989 | | | ITT, Inc. | | | 180,984 | |
| | 3,698 | | | J.B. Hunt Transport Services, Inc. | | | 349,387 | |
| | 2,163 | | | Lincoln Electric Holdings, Inc. | | | 188,765 | |
| | | | | | | | |
Number
of Shares | | | | | Value | |
| | | | Common Stocks & Other Equity Interests
(continued) | |
| | | | Industrials (continued) | |
| | 361 | | | Lindsay Corp. | | $ | 30,685 | |
| | 9,662 | | | Lockheed Martin Corp. | | | 3,220,634 | |
| | 1,091 | | | Matthews International Corp., Class A | | | 43,705 | |
| | 826 | | | McGrath RentCorp. | | | 51,212 | |
| | 1,320 | | | MSA Safety, Inc. | | | 145,081 | |
| | 1,548 | | | MSC Industrial Direct Co., Inc., Class A | | | 129,490 | |
| | 1,973 | | | Nordson Corp. | | | 287,959 | |
| | 5,821 | | | Northrop Grumman Corp. | | | 1,687,566 | |
| | 9,618 | | | Raytheon Co. | | | 1,708,061 | |
| | 1,464 | | | Regal Beloit Corp. | | | 124,557 | |
| | 10,971 | | | Republic Services, Inc. | | | 908,618 | |
| | 4,077 | | | Robert Half International, Inc. | | | 253,141 | |
| | 11,163 | | | Rollins, Inc. | | | 431,673 | |
| | 3,538 | | | Roper Technologies, Inc. | | | 1,272,619 | |
| | 1,801 | | | Ryder System, Inc. | | | 113,463 | |
| | 5,149 | | | Stanley Black & Decker, Inc. | | | 754,843 | |
| | 616 | | | Tennant Co. | | | 40,890 | |
| | 3,627 | | | Toro Co. (The) | | | 265,315 | |
| | 24,659 | | | Union Pacific Corp. | | | 4,365,629 | |
| | 29,471 | | | United Technologies Corp. | | | 4,202,859 | |
| | 1,899 | | | W.W. Grainger, Inc. | | | 535,518 | |
| | 14,447 | | | Waste Management, Inc. | | | 1,550,741 | |
| | | | | | | | |
| | | | | | | 44,485,384 | |
| | | | | | | | |
| | | | Information Technology—15.3% | |
| | 21,742 | | | Accenture PLC, Class A | | | 3,971,611 | |
| | 12,561 | | | Analog Devices, Inc. | | | 1,460,091 | |
| | 14,846 | | | Automatic Data Processing, Inc. | | | 2,440,534 | |
| | 994 | | | Badger Meter, Inc. | | | 55,147 | |
| | 3,938 | | | Broadridge Financial Solutions, Inc. | | | 465,196 | |
| | 513 | | | Cass Information Systems, Inc. | | | 25,306 | |
| | 30,417 | | | International Business Machines Corp. | | | 4,266,593 | |
| | 2,624 | | | Jack Henry & Associates, Inc. | | | 391,133 | |
| | 9,331 | | | Maxim Integrated Products, Inc. | | | 559,860 | |
| | 8,086 | | | Microchip Technology, Inc. | | | 807,711 | |
| | 101,672 | | | Microsoft Corp. | | | 13,278,363 | |
| | 41,270 | | | QUALCOMM, Inc. | | | 3,554,585 | |
| | 32,013 | | | Texas Instruments, Inc. | | | 3,772,092 | |
| | 59,783 | | | Visa, Inc., Class A. | | | 9,830,119 | |
| | 8,636 | | | Xilinx, Inc. | | | 1,037,529 | |
| | | | | | | | |
| | | | | | | 45,915,870 | |
| | | | | | | | |
| | | | Materials—3.0% | |
| | 7,482 | | | Air Products and Chemicals, Inc. | | | 1,539,721 | |
| | 3,610 | | | Albemarle Corp.(b) | | | 270,967 | |
| | 2,151 | | | AptarGroup, Inc. | | | 239,277 | |
| | 1,107 | | | Balchem Corp. | | | 112,372 | |
| | 9,848 | | | Ecolab, Inc. | | | 1,812,820 | |
| | 1,740 | | | H.B. Fuller Co. | | | 85,208 | |
| | 357 | | | Hawkins, Inc. | | | 13,177 | |
| | 3,643 | | | International Flavors & Fragrances, Inc. | | | 501,969 | |
| | 10,400 | | | Nucor Corp. | | | 593,528 | |
| | 8,050 | | | PPG Industries, Inc. | | | 945,875 | |
| | 459 | | | Quaker Chemical Corp. | | | 102,733 | |
| | 2,226 | | | Royal Gold, Inc. | | | 193,795 | |
| | 4,498 | | | RPM International, Inc. | | | 272,804 | |
| | 1,438 | | | Sensient Technologies Corp. | | | 100,832 | |
| | 3,171 | | | Sherwin-Williams Co. (The) | | | 1,442,266 | |
See accompanying Notes to Financial Statements which are an integral part of the financial statements.
Invesco Dividend AchieversTM ETF (PFM)(continued)
April 30, 2019
| | | | | | | | |
Number
of Shares | | | | | Value | |
| | | | Common Stocks & Other Equity Interests
(continued) | |
| | | | Materials (continued) | |
| | 3,763 | | | Silgan Holdings, Inc. | | $ | 112,664 | |
| | 3,415 | | | Sonoco Products Co. | | | 215,350 | |
| | 769 | | | Stepan Co. | | | 71,163 | |
| | 4,376 | | | Westlake Chemical Corp. | | | 305,226 | |
| | | | | | | | |
| | | | | | | 8,931,747 | |
| | | | | | | | |
| | | | Real Estate—1.4% | |
| | 7,078 | | | Digital Realty Trust, Inc. | | | 833,151 | |
| | 3,066 | | | Equity LifeStyle Properties, Inc. | | | 357,802 | |
| | 2,239 | | | Essex Property Trust, Inc. | | | 632,517 | |
| | 2,537 | | | Federal Realty Investment Trust | | | 339,577 | |
| | 1,465 | | | National Health Investors, Inc. | | | 110,505 | |
| | 5,523 | | | National Retail Properties, Inc. | | | 290,620 | |
| | 6,967 | | | Omega Healthcare Investors, Inc.(b) | | | 246,562 | |
| | 10,373 | | | Realty Income Corp. | | | 726,214 | |
| | 3,209 | | | Tanger Factory Outlet Centers, Inc.(b) | | | 57,955 | |
| | 476 | | | Universal Health Realty Income Trust | | | 38,566 | |
| | 1,016 | | | Urstadt Biddle Properties, Inc., Class A | | | 22,281 | |
| | 5,671 | | | WP Carey, Inc. | | | 449,824 | |
| | | | | | | | |
| | | | | | | 4,105,574 | |
| | | | | | | | |
| | | | Utilities—6.9% | |
| | 8,067 | | | Alliant Energy Corp. | | | 381,004 | |
| | 1,253 | | | American States Water Co. | | | 89,176 | |
| | 6,171 | | | American Water Works Co., Inc. | | | 667,640 | |
| | 3,173 | | | AmeriGas Partners L.P. | | | 115,053 | |
| | 6,077 | | | Aqua America, Inc. | | | 237,368 | |
| | 3,986 | | | Atmos Energy Corp. | | | 407,927 | |
| | 2,043 | | | Black Hills Corp. | | | 148,649 | |
| | 9,456 | | | Brookfield Infrastructure Partners L.P. | | | | |
| | | | (Canada) | | | 391,289 | |
| | 1,640 | | | California Water Service Group | | | 82,640 | |
| | 17,101 | | | CenterPoint Energy, Inc. | | | 530,131 | |
| | 551 | | | Chesapeake Utilities Corp. | | | 51,045 | |
| | 9,668 | | | CMS Energy Corp. | | | 537,057 | |
| | 10,952 | | | Consolidated Edison, Inc. | | | 943,624 | |
| | 27,244 | | | Dominion Energy, Inc. | | | 2,121,490 | |
| | 24,789 | | | Duke Energy Corp. | | | 2,258,774 | |
| | 11,105 | | | Edison International | | | 708,166 | |
| | 8,690 | | | Evergy, Inc. | | | 502,456 | |
| | 10,822 | | | Eversource Energy | | | 775,504 | |
| | 6,681 | | | MDU Resources Group, Inc. | | | 174,708 | |
| | 1,172 | | | MGE Energy, Inc. | | | 79,450 | |
| | 550 | | | Middlesex Water Co. | | | 31,894 | |
| | 2,942 | | | National Fuel Gas Co. | | | 174,196 | |
| | 3,037 | | | New Jersey Resources Corp. | | | 152,093 | |
| | 16,360 | | | NextEra Energy, Inc. | | | 3,181,038 | |
| | 975 | | | Northwest Natural Holding Co. | | | 65,218 | |
| | 1,725 | | | NorthWestern Corp. | | | 120,491 | |
| | 6,821 | | | OGE Energy Corp. | | | 288,801 | |
| | 3,038 | | | Portland General Electric Co. | | | 158,918 | |
| | 24,580 | | | PPL Corp. | | | 767,142 | |
| | 959 | | | SJW Group | | | 59,516 | |
| | 3,147 | | | South Jersey Industries, Inc. | | | 101,082 | |
| | 35,270 | | | Southern Co. (The) | | | 1,877,069 | |
| | 1,809 | | | Southwest Gas Holdings, Inc. | | | 150,491 | |
| | 1,740 | | | Spire, Inc. | | | 146,491 | |
| | 5,933 | | | UGI Corp. | | | 323,408 | |
| | | | | | | | |
Number
of Shares | | | | | Value | |
| | | | Common Stocks & Other Equity Interests
(continued) | |
| | | | Utilities (continued) | |
| | 10,761 | | | WEC Energy Group, Inc. | | $ | 843,985 | |
| | 17,528 | | | Xcel Energy, Inc. | | | 990,332 | |
| | | | | | | | |
| | | | | | | 20,635,316 | |
| | | | | | | | |
| | | | Total Common Stocks & Other Equity Interests
(Cost $220,461,325) | | | 299,418,049 | |
| | | | | | | | |
| | |
| | | | | | | | |
| | | | Money Market Funds—0.0% | |
| | 6,176 | | | Invesco Premier U.S. Government Money Portfolio—Institutional Class, 2.32%(d)
(Cost $6,176) | | | 6,176 | |
| | | | | | | | |
| | |
| | | | Total Investments in Securities (excluding investments purchased with cash collateral from securities on loan)
(Cost $220,467,501)—100.0% | | | 299,424,225 | |
| | | | | | | | |
| | |
| | | | | | | | |
| | | | Investments Purchased with Cash Collateral from
Securities on Loan | |
| | |
| | | | | | | | |
| | | | Money Market Funds—0.2% | |
| | 506,680 | | | Invesco Government & Agency Portfolio—Institutional Class, 2.34%(d)(e) | | | 506,680 | |
| | 168,843 | | | Invesco Liquid Assets Portfolio—Institutional Class, 2.48%(d)(e) | | | 168,893 | |
| | | | | | | | |
| | |
| | | | | | | | |
| | |
| | | | Total Money Market Funds
(Cost $675,573) | | | 675,573 | |
| | | | | | | | |
| | |
| | | | Total Investments in Securities
(Cost $221,143,074)—100.2% | | | 300,099,798 | |
| | |
| | | | Other assets less liabilities—(0.2)% | | | (624,800 | ) |
| | | | | | | | |
| | |
| | | | Net Assets—100.0% | | $ | 299,474,998 | |
| | | | | | | | |
Notes to Schedule of Investments:
| (a) | Industry and/or sector classifications used in this report are generally according to the Global Industry Classification Standard, which was developed by and is the exclusive property and a service mark of MSCI Inc. and Standard & Poor’s. |
| (b) | All or a portion of this security was out on loan at April 30, 2019. |
| (c) | Affiliated company. See Note 4. |
| (d) | The security and the Fund are advised by wholly-owned subsidiaries of Invesco Ltd. and are therefore considered to be affiliated. The rate shown is the 7-day SEC standardized yield as of April 30, 2019. |
| (e) | The security has been segregated to satisfy the commitment to return the cash collateral received in securities lending transactions upon the borrower’s return of the securities loaned. See Note 2J. |
See accompanying Notes to Financial Statements which are an integral part of the financial statements.
Schedule of Investments(a)
Invesco Dow Jones Industrial Average Dividend ETF (DJD)
April 30, 2019
| | | | | | | | |
Number
of Shares | | | | | Value | |
| | | | Common Stocks & Other Equity Interests—99.8% | |
| | | | Communication Services—8.0% | |
| | 72,184 | | | Verizon Communications, Inc. | | $ | 4,128,203 | |
| | 13,207 | | | Walt Disney Co. (The) | | | 1,808,963 | |
| | | | | | | | |
| | | | | | | 5,937,166 | |
| | | | | | | | |
| | | | Consumer Discretionary—9.3% | |
| | 15,627 | | | Home Depot, Inc. (The) | | | 3,183,220 | |
| | 13,552 | | | McDonald’s Corp. | | | 2,677,469 | |
| | 11,667 | | | NIKE, Inc., Class B | | | 1,024,712 | |
| | | | | | | | |
| | | | | | | 6,885,401 | |
| | | | | | | | |
| | | | Consumer Staples—14.9% | |
| | 75,845 | | | Coca-Cola Co. (The) | | | 3,720,956 | |
| | 28,509 | | | Procter & Gamble Co. (The) | | | 3,035,638 | |
| | 39,774 | | | Walgreens Boots Alliance, Inc. | | | 2,130,693 | |
| | 21,150 | | | Walmart, Inc. | | | 2,175,066 | |
| | | | | | | | |
| | | | | | | 11,062,353 | |
| | | | | | | | |
| | | | Energy—10.6% | |
| | 31,544 | | | Chevron Corp. | | | 3,787,173 | |
| | 50,625 | | | Exxon Mobil Corp. | | | 4,064,175 | |
| | | | | | | | |
| | | | | | | 7,851,348 | |
| | | | | | | | |
| | | | Financials—12.1% | |
| | 12,923 | | | American Express Co. | | | 1,514,963 | |
| | 8,031 | | | Goldman Sachs Group, Inc. (The) | | | 1,653,744 | |
| | 28,687 | | | JPMorgan Chase & Co. | | | 3,329,126 | |
| | 17,045 | | | Travelers Cos., Inc. (The) | | | 2,450,219 | |
| | | | | | | | |
| | | | | | | 8,948,052 | |
| | | | | | | | |
| | | | Health Care—13.2% | |
| | 18,392 | | | Johnson & Johnson | | | 2,596,950 | |
| | 32,684 | | | Merck & Co., Inc. | | | 2,572,558 | |
| | 78,290 | | | Pfizer, Inc. | | | 3,179,357 | |
| | 6,037 | | | UnitedHealth Group, Inc. | | | 1,407,043 | |
| | | | | | | | |
| | | | | | | 9,755,908 | |
| | | | | | | | |
| | | | Industrials—12.6% | |
| | 13,323 | | | 3M Co. | | | 2,524,842 | |
| | 4,263 | | | Boeing Co. (The) | | | 1,610,092 | |
| | 18,376 | | | Caterpillar, Inc. | | | 2,561,982 | |
| | 18,177 | | | United Technologies Corp. | | | 2,592,222 | |
| | | | | | | | |
| | | | | | | 9,289,138 | |
| | | | | | | | |
| | | | Information Technology—19.1% | |
| | 9,399 | | | Apple, Inc. | | | 1,886,097 | |
| | 51,032 | | | Cisco Systems, Inc. | | | 2,855,240 | |
| | 43,689 | | | Intel Corp. | | | 2,229,887 | |
| | 32,435 | | | International Business Machines Corp. | | | 4,549,658 | |
| | 14,323 | | | Microsoft Corp. | | | 1,870,584 | |
| | 4,414 | | | Visa, Inc., Class A | | | 725,794 | |
| | | | | | | | |
| | | | | | | 14,117,260 | |
| | | | | | | | |
| | | | Total Common Stocks & Other Equity Interests
(Cost $71,465,472) | | | 73,846,626 | |
| | | | | | | | |
| | |
| | | | | | | | |
| | | | | | | | |
Number
of Shares | | | | | Value | |
| | | | Money Market Funds—0.1% | |
| | 40,519 | | | Invesco Premier U.S. Government Money Portfolio—Institutional Class, 2.32%(b)
(Cost $40,519) | | $ | 40,519 | |
| | | | | | | | |
| | | | | | | | |
| | |
| | | | Total Investments in Securities
(Cost $71,505,991)—99.9% | | | 73,887,145 | |
| | |
| | | | Other assets less liabilities—0.1% | | | 80,334 | |
| | | | | | | | |
| | |
| | | | Net Assets—100.0% | | $ | 73,967,479 | |
| | | | | | | | |
Notes to Schedule of Investments:
| (a) | Industry and/or sector classifications used in this report are generally according to the Global Industry Classification Standard, which was developed by and is the exclusive property and a service mark of MSCI Inc. and Standard & Poor’s. |
| (b) | The security and the Fund are advised by wholly-owned subsidiaries of Invesco Ltd. and are therefore considered to be affiliated. The rate shown is the 7-day SEC standardized yield as of April 30, 2019. |
See accompanying Notes to Financial Statements which are an integral part of the financial statements.
Schedule of Investments(a)
Invesco Financial Preferred ETF (PGF)
April 30, 2019
| | | | | | | | |
Number
of Shares | | | | | Value | |
| | | | Preferred Stocks—100.3% | |
| | | | Banks—63.1% | |
| | 835,142 | | | Bank of America Corp., 5.88%, Series HH, Pfd. | | $ | 21,914,126 | |
| | 686,125 | | | Bank of America Corp., 6.00%, Series EE, Pfd.(b) | | | 18,010,781 | |
| | 1,061,204 | | | Bank of America Corp., 6.00%, Series GG, Pfd.(b) | | | 28,312,923 | |
| | 891,122 | | | Bank of America Corp., 6.20%, Series CC, Pfd. | | | 23,418,686 | |
| | 853,807 | | | Bank of America Corp., 6.50%, Series Y, Pfd. | | | 21,959,916 | |
| | 862,596 | | | Bank of America Corp., 6.63%, Series W, Pfd. | | | 22,185,969 | |
| | 59,138 | | | BB&T Corp., 5.20%, Series G, Pfd.(b) | | | 1,467,214 | |
| | 1,660,813 | | | BB&T Corp., 5.63%, Series E, Pfd. | | | 42,350,732 | |
| | 399,157 | | | BB&T Corp., 5.63%, Series H, Pfd.(b) | | | 10,390,057 | |
| | 428,232 | | | BB&T Corp., 5.85%, Series D, Pfd. | | | 10,898,504 | |
| | 674,421 | | | Citigroup, Inc., 6.30%, Series S, Pfd.(b) | | | 17,710,295 | |
| | 943,999 | | | Citigroup, Inc., 6.88%, Series K, Pfd.(b) | | | 26,167,652 | |
| | 612,758 | | | Citigroup, Inc., 7.13%, Series J, Pfd.(b) | | | 16,979,524 | |
| | 248,959 | | | Citizens Financial Group, Inc., 6.35%, Series D, Pfd. | | | 6,570,028 | |
| | 402,939 | | | Fifth Third Bancorp, 6.63%, Series I, Pfd. | | | 11,576,437 | |
| | 254,748 | | | First Republic Bank, 5.50%, Series I, Pfd. | | | 6,450,219 | |
| | 77,003 | | | HSBC Holdings PLC, 6.20%, Series A, Pfd. (United Kingdom) | | | 1,994,378 | |
| | 526,683 | | | Huntington Bancshares, Inc., 6.25%, Series D, Pfd.(b) | | | 13,704,292 | |
| | 578,024 | | | ING Groep N.V., 6.13%, Pfd. (Netherlands)(b) | | | 14,774,293 | |
| | 881,050 | | | ING Groep N.V., 6.38%, Pfd. (Netherlands) | | | 22,281,755 | |
| | 774,583 | | | JPMorgan Chase & Co., 5.45%, Series P, Pfd. | | | 19,984,241 | |
| | 1,577,863 | | | JPMorgan Chase & Co., 5.75%, Series DD, Pfd.(b) | | | 41,829,148 | |
| | 1,184,603 | | | JPMorgan Chase & Co., 6.00%, Series EE, Pfd. | | | 31,652,592 | |
| | 1,171,166 | | | JPMorgan Chase & Co., 6.10%, Series AA, Pfd. | | | 30,719,684 | |
| | 1,217,817 | | | JPMorgan Chase & Co., 6.13%, Series Y, Pfd.(b) | | | 31,565,817 | |
| | 1,389,127 | | | JPMorgan Chase & Co., 6.15%, Series BB, Pfd.(b) | | | 36,631,279 | |
| | 150,921 | | | JPMorgan Chase & Co., 6.30%, Series W, Pfd. | | | 3,907,345 | |
| | 73,000 | | | KeyCorp, 5.63%, Series G, Pfd. | | | 1,825,000 | |
| | 350,114 | | | KeyCorp, 5.65%, Series F, Pfd. | | | 8,801,866 | |
| | 434,758 | | | KeyCorp, 6.13%, Series E, Pfd. | | | 11,864,546 | |
| | 207,864 | | | People’s United Financial, Inc., 5.63%, Series A, Pfd.(b) | | | 5,362,891 | |
| | 139,473 | | | PNC Financial Services Group, Inc. (The), 5.38%, Series Q, Pfd. | | | 3,506,351 | |
| | 1,525,880 | | | PNC Financial Services Group, Inc. (The), 6.13%, Series P, Pfd.(b) | | | 40,603,667 | |
| | 190,000 | | | Regions Financial Corp., 5.70%, Series C, Pfd. | | | 4,826,000 | |
| | 398,647 | | | Regions Financial Corp., 6.38%, Series A, Pfd. | | | 10,213,336 | |
| | | | | | | | |
Number
of Shares | | | | | Value | |
| | | | Preferred Stocks (continued) | |
| | | | Banks (continued) | |
| | 444,529 | | | Regions Financial Corp., 6.38%, Series B, Pfd.(b) | | $ | 12,349,016 | |
| | 427,796 | | | US Bancorp, 5.15%, Pfd.(b) | | | 10,801,849 | |
| | 575,721 | | | US Bancorp, 5.50%, Series K, Pfd.(b) | | | 14,945,717 | |
| | 875,233 | | | US Bancorp, 6.50%, Series F, Pfd. | | | 23,412,483 | |
| | 877,101 | | | Wells Fargo & Co., 5.20%, Pfd.(b) | | | 21,901,212 | |
| | 428,225 | | | Wells Fargo & Co., 5.25%, Series P, Pfd.(b) | | | 10,735,601 | |
| | 1,049,435 | | | Wells Fargo & Co., 5.50%, Series X, Pfd. | | | 26,855,042 | |
| | 605,552 | | | Wells Fargo & Co., 5.63%, Series Y, Pfd. | | | 15,514,242 | |
| | 861,771 | | | Wells Fargo & Co., 5.70%, Series W, Pfd. | | | 22,199,221 | |
| | 1,526,726 | | | Wells Fargo & Co., 5.85%, Series Q, Pfd. | | | 40,152,894 | |
| | 514,956 | | | Wells Fargo & Co., 6.00%, Series T, Pfd. | | | 13,254,967 | |
| | 785,139 | | | Wells Fargo & Co., 6.00%, Series V, Pfd.(b) | | | 20,680,561 | |
| | 667,772 | | | Wells Fargo & Co., 6.63%, Series R, Pfd.(b) | | | 18,610,806 | |
| | | | | | | | |
| | | | | | | 873,825,155 | |
| | | | | | | | |
| | | | Capital Markets—18.1% | | | |
| | 512,538 | | | Bank of New York Mellon Corp. (The), 5.20%, Pfd.(b) | | | 12,839,077 | |
| | 657,957 | | | Charles Schwab Corp. (The), 5.95%, Series D, Pfd. | | | 17,185,837 | |
| | 519,483 | | | Charles Schwab Corp. (The), 6.00%, Series C, Pfd. | | | 13,626,039 | |
| | 914,811 | | | Goldman Sachs Group, Inc. (The), 5.50%, Series J, Pfd. | | | 23,785,086 | |
| | 485,491 | | | Goldman Sachs Group, Inc. (The), 6.30%, Series N, Pfd.(b) | | | 12,676,170 | |
| | 618,440 | | | Goldman Sachs Group, Inc. (The), 6.38%, Series K, Pfd.(b) | | | 16,679,327 | |
| | 825,465 | | | Morgan Stanley, 5.85%, Series K, Pfd. | | | 21,676,711 | |
| | 793,974 | | | Morgan Stanley, 6.38%, Series I, Pfd. | | | 21,492,876 | |
| | 354,729 | | | Morgan Stanley, 6.63%, Series G, Pfd. | | | 9,034,948 | |
| | 678,703 | | | Morgan Stanley, 6.88%, Series F, Pfd. | | | 18,705,055 | |
| | 706,168 | | | Morgan Stanley, 7.13%, Series E,
Pfd.(b) | | | 19,596,162 | |
| | 330,782 | | | Northern Trust Corp., 5.85%, Series C,
Pfd.(b) | | | 8,418,402 | |
| | 489,425 | | | State Street Corp., 5.25%, Series C, Pfd. | | | 12,206,259 | |
| | 357,206 | | | State Street Corp., 5.35%, Series G, Pfd. | | | 9,187,338 | |
| | 769,749 | | | State Street Corp., 5.90%, Series D, Pfd. | | | 20,259,794 | |
| | 496,982 | | | State Street Corp., 6.00%, Series E, Pfd. | | | 12,752,558 | |
| | | | | | | | |
| | | | | | | 250,121,639 | |
| | | | | | | | |
| | | | Insurance—13.6% | |
| | 783,427 | | | Aegon N.V., 6.38%, Pfd.
(Netherlands)(b) | | | 20,094,903 | |
| | 308,261 | | | Aegon N.V., 6.50%, Pfd. (Netherlands) | | | 7,805,168 | |
| | 303,389 | | | Allstate Corp. (The), 5.63%, Series A, Pfd. | | | 7,812,267 | |
| | 483,681 | | | Allstate Corp. (The), 5.63%, Series G, Pfd. | | | 12,406,418 | |
| | 124,270 | | | Allstate Corp. (The), 6.25%, Series F, Pfd.(b) | | | 3,216,108 | |
| | 677,755 | | | Allstate Corp. (The), 6.63%, Series E, Pfd. | | | 17,214,977 | |
| | 369,473 | | | American International Group, Inc., 5.85%, Series A, Pfd. | | | 9,606,298 | |
| | 379,979 | | | Arch Capital Group Ltd., 5.25%, Series E, Pfd.(b) | | | 8,899,108 | |
| | 259,084 | | | Arch Capital Group Ltd., 5.45%, Series F, Pfd.(b) | | | 6,337,195 | |
| | 217,873 | | | Aspen Insurance Holdings Ltd., 5.63%, Pfd. (Bermuda)(b) | | | 5,422,859 | |
See accompanying Notes to Financial Statements which are an integral part of the financial statements.
Invesco Financial Preferred ETF (PGF)(continued)
April 30, 2019
| | | | | | | | |
Number
of Shares | | | | | Value | |
| | | | Preferred Stocks (continued) | |
| | | | Insurance (continued) | |
| | 231,181 | | | Aspen Insurance Holdings Ltd., 5.95%, Pfd. (Bermuda)(b) | | $ | 6,098,555 | |
| | 451,865 | | | AXIS Capital Holdings Ltd., 5.50%, Series E, Pfd.(b) | | | 11,084,248 | |
| | 235,047 | | | Brighthouse Financial, Inc., 6.60%, Series A, Pfd. | | | 6,207,591 | |
| | 331,502 | | | Enstar Group Ltd., 7.00%, Series D, Pfd. (Bermuda) | | | 8,569,327 | |
| | 282,511 | | | Hartford Financial Services Group, Inc. (The), 6.00%, Series G, Pfd.(b) | | | 7,421,564 | |
| | 687,140 | | | MetLife, Inc., 5.63%, Series E, Pfd. | | | 17,948,097 | |
| | 280,591 | | | PartnerRe Ltd., 7.25%, Series H, Pfd. (Bermuda) | | | 7,497,391 | |
| | 324,750 | | | Prudential PLC, 6.50%, Pfd. (United Kingdom) | | | 8,547,420 | |
| | 185,246 | | | Prudential PLC, 6.75%, Pfd. (United Kingdom) | | | 4,844,183 | |
| | 265,368 | | | RenaissanceRe Holdings Ltd., 5.38%, Series E, Pfd. (Bermuda) | | | 6,591,741 | |
| | 190,675 | | | RenaissanceRe Holdings Ltd., 5.75%, Series F, Pfd. (Bermuda) | | | 4,833,611 | |
| | | | | | | | |
| | | | | | | 188,459,029 | |
| | | | | | | | |
| | | | Consumer Finance—4.6% | |
| | 426,662 | | | Capital One Financial Corp., 5.20%, Series G, Pfd.(b) | | | 10,628,150 | |
| | 654,007 | | | Capital One Financial Corp., 6.00%, Series B, Pfd. | | | 16,598,698 | |
| | 353,542 | | | Capital One Financial Corp., 6.00%, Series H, Pfd.(b) | | | 9,223,911 | |
| | 421,763 | | | Capital One Financial Corp., 6.20%, Series F, Pfd. | | | 10,978,491 | |
| | 379,018 | | | Capital One Financial Corp., 6.25%, Series C, Pfd. | | | 9,672,539 | |
| | 269,560 | | | Capital One Financial Corp., 6.70%, Series D, Pfd. | | | 6,957,344 | |
| | | | | | | | |
| | | | | | | 64,059,133 | |
| | | | | | | | |
| | | | Thrifts & Mortgage Finance—0.8% | |
| | 442,010 | | | New York Community Bancorp, Inc., 6.38%, Series A, Pfd. | | | 11,735,365 | |
| | | | | | | | |
| |
| | | | Trading Companies & Distributors—0.1% | |
| | 59,840 | | | Air Lease Corp., 6.15%, Series A, Pfd. | | | 1,570,800 | |
| | | | | | | | |
| | |
| | | | Total Investments in Securities
(excluding investments purchased with cash collateral from securities on loan)
(Cost $1,372,895,644)—100.3% | | | 1,389,771,121 | |
| | | | | | | | |
| | |
| | | | | | | | |
| | | | Investments Purchased with Cash Collateral from
Securities on Loan | |
| | |
| | | | | | | | |
| | | | Money Market Funds—0.6% | |
| | 6,870,852 | | | Invesco Government & Agency Portfolio—Institutional Class, 2.34%(c)(d) | | | 6,870,852 | |
| | | | | | | | |
Number
of Shares | | | | | Value | |
| | | | Money Market Funds (continued) | |
| | 2,289,601 | | | Invesco Liquid Assets Portfolio—Institutional Class,
2.48%(c)(d) | | $ | 2,290,288 | |
| | | | | | | | |
| | |
| | | | | | | | |
| | | | Total Money Market Funds
(Cost $9,161,140) | | | 9,161,140 | |
| | | | | | | | |
| | |
| | | | Total Investments in Securities
(Cost $1,382,056,784)—100.9% | | | 1,398,932,261 | |
| | |
| | | | Other assets less liabilities—(0.9)% | | | (13,158,786 | ) |
| | | | | | | | |
| | |
| | | | Net Assets—100.0% | | $ | 1,385,773,475 | |
| | | | | | | | |
Abbreviations:
Pfd.—Preferred
Notes to Schedule of Investments:
| (a) | Industry and/or sector classifications used in this report are generally according to the Global Industry Classification Standard, which was developed by and is the exclusive property and a service mark of MSCI Inc. and Standard & Poor’s. |
| (b) | All or a portion of this security was out on loan at April 30, 2019. |
| (c) | The security and the Fund are advised by wholly-owned subsidiaries of Invesco Ltd. and are therefore considered to be affiliated. The rate shown is the7-day SEC standardized yield as of April 30, 2019. |
| (d) | The security has been segregated to satisfy the commitment to return the cash collateral received in securities lending transactions upon the borrower’s return of the securities loaned. See Note 2J. |
See accompanying Notes to Financial Statements which are an integral part of the financial statements.
Schedule of Investments(a)
Invesco High Yield Equity Dividend AchieversTM ETF (PEY)
April 30, 2019
| | | | | | | | |
Number
of Shares | | | | | Value | |
| | | | Common Stocks & Other Equity Interests—99.9% | |
| | | | Banks—5.2% | |
| | 872,831 | | | People’s United Financial, Inc. | | $ | 15,091,248 | |
| | 391,506 | | | Southside Bancshares, Inc. | | | 13,753,606 | |
| | 362,928 | | | United Bankshares, Inc. | | | 14,241,294 | |
| | | | | | | | |
| | | | | | | 43,086,148 | |
| | | | | | | | |
| | | | Beverages—3.6% | |
| | 281,405 | | | Coca-Cola Co. (The) | | | 13,805,729 | |
| | 125,202 | | | PepsiCo, Inc. | | | 16,032,116 | |
| | | | | | | | |
| | | | | | | 29,837,845 | |
| | | | | | | | |
| | | | Capital Markets—7.1% | |
| | 296,414 | | | Eaton Vance Corp. | | | 12,321,930 | |
| | 1,260,483 | | | Invesco Ltd.(b) | | | 27,692,812 | |
| | 494,074 | | | Lazard Ltd., Class A | | | 19,209,597 | |
| | | | | | | | |
| | | | | | | 59,224,339 | |
| | | | | | | | |
| | | | Diversified Telecommunication Services—5.0% | |
| | 816,271 | | | AT&T, Inc. | | | 25,271,750 | |
| | 289,520 | | | Verizon Communications, Inc. | | | 16,557,649 | |
| | | | | | | | |
| | | | | | | 41,829,399 | |
| | | | | | | | |
| | | | Electric Utilities—13.3% | |
| | 254,213 | | | Alliant Energy Corp. | | | 12,006,480 | |
| | 179,674 | | | Duke Energy Corp. | | | 16,371,895 | |
| | 266,175 | | | Edison International | | | 16,973,980 | |
| | 218,293 | | | Evergy, Inc. | | | 12,621,701 | |
| | 303,463 | | | OGE Energy Corp. | | | 12,848,623 | |
| | 623,247 | | | PPL Corp. | | | 19,451,539 | |
| | 382,287 | | | Southern Co. (The) | | | 20,345,314 | |
| | | | | | | | |
| | | | | | | 110,619,532 | |
| | | | | | | | |
| | | | Energy Equipment & Services—2.6% | |
| | 378,885 | | | Helmerich & Payne, Inc. | | | 22,172,350 | |
| | | | | | | | |
| |
| | | | Food Products—7.5% | |
| | 257,966 | | | Bunge Ltd. | | | 13,519,998 | |
| | 787,634 | | | Flowers Foods, Inc. | | | 17,123,163 | |
| | 327,213 | | | General Mills, Inc. | | | 16,841,653 | |
| | 257,746 | | | Kellogg Co. | | | 15,542,084 | |
| | | | | | | | |
| | | | | | | 63,026,898 | |
| | | | | | | | |
| | | | Gas Utilities—2.0% | |
| | 529,100 | | | South Jersey Industries, Inc. | | | 16,994,692 | |
| | | | | | | | |
| |
| | | | Health Care Providers & Services—1.5% | |
| | 251,908 | | | Cardinal Health, Inc. | | | 12,270,439 | |
| | | | | | | | |
| |
| | | | Hotels, Restaurants & Leisure—1.5% | |
| | 74,190 | | | Cracker Barrel Old Country Store, Inc.(c) | | | 12,518,821 | |
| | | | | | | | |
| |
| | | | Household Durables—1.3% | |
| | 269,629 | | | Leggett & Platt, Inc. | | | 10,612,597 | |
| | | | | | | | |
| |
| | | | Household Products—1.7% | |
| | 108,673 | | | Kimberly-Clark Corp. | | | 13,951,440 | |
| | | | | | | | |
| |
| | | | Insurance—8.2% | |
| | 350,779 | | | Mercury General Corp. | | | 18,864,895 | |
| | 704,990 | | | Old Republic International Corp. | | | 15,763,576 | |
| | 298,061 | | | Principal Financial Group, Inc. | | | 17,037,167 | |
| | 158,392 | | | Prudential Financial, Inc. | | | 16,743,618 | |
| | | | | | | | |
| | | | | | | 68,409,256 | |
| | | | | | | | |
| | | | | | | | |
Number
of Shares | | | | | Value | |
| | | | Common Stocks & Other Equity Interests
(continued) | |
| | | | IT Services—2.2% | |
| | 129,451 | | | International Business Machines Corp. | | $ | 18,158,092 | |
| | | | | | | | |
| |
| | | | Media—1.9% | |
| | 265,006 | | | Meredith Corp. | | | 15,635,354 | |
| | | | | | | | |
| |
| | | | Multiline Retail—1.7% | |
| | 189,321 | | | Target Corp. | | | 14,657,232 | |
| | | | | | | | |
| |
| | | | Multi-Utilities—9.3% | |
| | 484,899 | | | CenterPoint Energy, Inc. | | | 15,031,869 | |
| | 166,912 | | | Consolidated Edison, Inc. | | | 14,381,138 | |
| | 305,039 | | | Dominion Energy, Inc. | | | 23,753,387 | |
| | 447,939 | | | MDU Resources Group, Inc. | | | 11,713,605 | |
| | 184,186 | | | NorthWestern Corp. | | | 12,865,392 | |
| | | | | | | | |
| | | | | | | 77,745,391 | |
| | | | | | | | |
| | | | Oil, Gas & Consumable Fuels—8.3% | |
| | 125,145 | | | Chevron Corp. | | | 15,024,909 | |
| | 206,542 | | | Exxon Mobil Corp. | | | 16,581,192 | |
| | 278,625 | | | Occidental Petroleum Corp. | | | 16,405,440 | |
| | 317,640 | | | ONEOK, Inc. | | | 21,577,285 | |
| | | | | | | | |
| | | | | | | 69,588,826 | |
| | | | | | | | |
| | | | Road & Rail—1.6% | |
| | 217,825 | | | Ryder System, Inc. | | | 13,722,975 | |
| | | | | | | | |
| |
| | | | Semiconductors & Semiconductor Equipment—4.4% | |
| | 238,952 | | | Maxim Integrated Products, Inc. | | | 14,337,120 | |
| | 256,633 | | | QUALCOMM, Inc. | | | 22,103,800 | |
| | | | | | | | |
| | | | | | | 36,440,920 | |
| | | | | | | | |
| | | | Tobacco—10.0% | |
| | 405,006 | | | Altria Group, Inc. | | | 22,003,976 | |
| | 220,281 | | | Philip Morris International, Inc. | | | 19,067,523 | |
| | 294,873 | | | Universal Corp. | | | 15,881,860 | |
| | 2,759,520 | | | Vector Group Ltd. | | | 26,298,226 | |
| | | | | | | | |
| | | | | | | 83,251,585 | |
| | | | | | | | |
| | |
| | | | Total Investments in Securities
(excluding investments purchased with cash collateral from securities on loan)
(Cost $800,103,817)—99.9% | | | 833,754,131 | |
| | | | | | | | |
| | |
| | | | | | | | |
| | | | Investments Purchased with Cash Collateral from
Securities on Loan | |
| | |
| | | | | | | | |
| | | | Money Market Funds—1.0% | |
| | 6,067,476 | | | Invesco Government & Agency Portfolio—Institutional Class, 2.34%(d)(e) | | | 6,067,476 | |
| | 2,021,887 | | | Invesco Liquid Assets Portfolio—Institutional Class, 2.48%(d)(e) | | | 2,022,494 | |
| | | | | | | | |
| | |
| | | | Total Money Market Funds
(Cost $8,089,970) | | | 8,089,970 | |
| | | | | | | | |
| | |
| | | | Total Investments in Securities
(Cost $808,193,787)—100.9% | | | 841,844,101 | |
| | |
| | | | Other assets less liabilities—(0.9)% | | | (7,620,463 | ) |
| | | | | | | | |
| | |
| | | | Net Assets—100.0% | | $ | 834,223,638 | |
| | | | | | | | |
See accompanying Notes to Financial Statements which are an integral part of the financial statements.
Invesco High Yield Equity Dividend AchieversTM ETF (PEY)(continued)
April 30, 2019
Notes to Schedule of Investments:
| (a) | Industry and/or sector classifications used in this report are generally according to the Global Industry Classification Standard, which was developed by and is the exclusive property and a service mark of MSCI Inc. and Standard & Poor’s. |
| (b) | Affiliated company. See Note 4. |
| (c) | All or a portion of this security was out on loan at April 30, 2019. |
| (d) | The security and the Fund are advised by wholly-owned subsidiaries of Invesco Ltd. and are therefore considered to be affiliated. The rate shown is the7-day SEC standardized yield as of April 30, 2019. |
| (e) | The security has been segregated to satisfy the commitment to return the cash collateral received in securities lending transactions upon the borrower’s return of the securities loaned. See Note 2J. |
See accompanying Notes to Financial Statements which are an integral part of the financial statements.
Schedule of Investments
Invesco International Dividend AchieversTM ETF (PID)
April 30, 2019
| | | | | | | | |
Number
of Shares | | | | | Value | |
| | | | Common Stocks & Other Equity Interests—99.6% | |
| | | | Argentina—0.4% | |
| | 139,012 | | | Grupo Financiero Galicia S.A., ADR | | $ | 3,027,681 | |
| | | | | | | | |
| |
| | | | Brazil—1.1% | |
| | 978,078 | | | Banco Bradesco S.A., ADR | | | 8,861,387 | |
| | | | | | | | |
| |
| | | | Canada—42.6% | |
| | 1,463,185 | | | Algonquin Power & Utilities Corp.(a) | | | 16,680,309 | |
| | 174,707 | | | Bank of Montreal(a) | | | 13,796,612 | |
| | 295,720 | | | Bank of Nova Scotia (The)(a) | | | 16,282,343 | |
| | 418,518 | | | BCE, Inc. | | | 18,724,495 | |
| | 107,366 | | | Brookfield Asset Management, Inc., Class A | | | 5,173,967 | |
| | 428,830 | | | Brookfield Infrastructure Partners
L.P.(a) | | | 17,744,985 | |
| | 233,921 | | | CAE, Inc. | | | 5,448,020 | |
| | 203,153 | | | Canadian Imperial Bank of
Commerce(a) | | | 17,109,546 | |
| | 67,452 | | | Canadian National Railway Co. | | | 6,258,197 | |
| | 455,472 | | | Canadian Natural Resources Ltd.(a) | | | 13,655,050 | |
| | 551,082 | | | Enbridge, Inc. | | | 20,356,969 | |
| | 369,382 | | | Fortis Inc. | | | 13,667,134 | |
| | 60,025 | | | Franco-Nevada Corp.(a) | | | 4,302,592 | |
| | 126,447 | | | Gildan Activewear, Inc. | | | 4,662,101 | |
| | 274,085 | | | Imperial Oil Ltd.(a) | | | 7,970,392 | |
| | 170,489 | | | Magna International, Inc. | | | 9,486,008 | |
| | 907,254 | | | Manulife Financial Corp. | | | 16,702,546 | |
| | 149,023 | | | Methanex Corp. | | | 8,184,343 | |
| | 184,613 | | | Open Text Corp. | | | 7,098,370 | |
| | 460,446 | | | Pembina Pipeline Corp.(a) | | | 16,465,549 | |
| | 181,315 | | | Ritchie Bros. Auctioneers, Inc. | | | 6,307,949 | |
| | 172,511 | | | Royal Bank of Canada(a) | | | 13,747,402 | |
| | 333,930 | | | Suncor Energy, Inc. | | | 11,019,690 | |
| | 435,796 | | | Telus Corp. | | | 16,054,725 | |
| | 138,956 | | | Thomson Reuters Corp.(a) | | | 8,593,039 | |
| | 224,762 | | | Toronto-Dominion Bank (The) | | | 12,804,691 | |
| | 375,267 | | | TransCanada Corp. | | | 17,922,752 | |
| | | | | | | | |
| | | | | | | 326,219,776 | |
| | | | | | | | |
| | | | Colombia—1.4% | |
| | 207,102 | | | Bancolombia S.A., ADR | | | 10,504,213 | |
| | | | | | | | |
| |
| | | | France—2.1% | |
| | 371,583 | | | Sanofi, ADR | | | 16,249,325 | |
| | | | | | | | |
| |
| | | | Germany—1.7% | |
| | 145,824 | | | Fresenius Medical Care AG& Co. KGaA, ADR(a) | | | 6,150,856 | |
| | 51,773 | | | SAP S.E., ADR | | | 6,671,469 | |
| | | | | | | | |
| | | | | | | 12,822,325 | |
| | | | | | | | |
| | | | India—2.3% | |
| | 19,898 | | | HDFC Bank Ltd., ADR | | | 2,281,306 | |
| | 765,437 | | | Infosys Ltd., ADR | | | 8,236,102 | |
| | 249,223 | | | Larsen & Toubro Ltd., GDR, REGS(a)(b) | | | 4,795,051 | |
| | 52,290 | | | Reliance Industries Ltd., GDR(b) | | | 2,094,214 | |
| | | | | | | | |
| | | | | | | 17,406,673 | |
| | | | | | | | |
| | | | Mexico—4.8% | |
| | 568,190 | | | America Movil S.A.B. de C.V., Class L, ADR | | | 8,392,166 | |
| | | | | | | | |
Number
of Shares | | | | | Value | |
| | | | Common Stocks & Other Equity Interests
(continued) | |
| | | | Mexico—(continued) | |
| | 211,183 | | | Grupo Aeroportuario del Pacifico S.A.B. de C.V., ADR | | $ | 21,407,621 | |
| | 41,187 | | | Grupo Aeroportuario del Sureste S.A.B. de C.V., ADR | | | 6,777,321 | |
| | | | | | | | |
| | | | | | | 36,577,108 | |
| | | | | | | | |
| | | | Netherlands—0.5% | |
| | 18,152 | | | ASML Holding N.V., New York Shares | | | 3,790,501 | |
| | | | | | | | |
| |
| | | | Russia—8.3% | |
| | 1,248,298 | | | Novolipetsk Steel PJSC, GDR, REGS(b) | | | 32,880,169 | |
| | 1,925,368 | | | Severstal PJSC, GDR, REGS(b) | | | 31,171,708 | |
| | | | | | | | |
| | | | | | | 64,051,877 | |
| | | | | | | | |
| | | | South Korea—1.1% | |
| | 8,617 | | | Samsung Electronics Co. Ltd., GDR, REGS(b) | | | 8,496,362 | |
| | | | | | | | |
| |
| | | | Switzerland—4.2% | |
| | 745,068 | | | ABB Ltd., ADR | | | 15,393,105 | |
| | 175,564 | | | Logitech International S.A.(a) | | | 6,797,838 | |
| | 126,703 | | | Novartis AG, ADR | | | 10,418,788 | |
| | | | | | | | |
| | | | | | | 32,609,731 | |
| | | | | | | | |
| | | | Taiwan—1.8% | |
| | 308,765 | | | Taiwan Semiconductor Manufacturing Co., Ltd., ADR | | | 13,530,082 | |
| | | | | | | | |
| |
| | | | United Kingdom—19.6% | |
| | 52,015 | | | Diageo PLC, ADR | | | 8,771,810 | |
| | 110,926 | | | InterContinental Hotels Group PLC,
ADR(a) | | | 7,333,318 | |
| | 39,487 | | | Linde PLC | | | 7,117,927 | |
| | 556,692 | | | Micro Focus International PLC, ADR | | | 13,967,402 | |
| | 351,238 | | | National Grid PLC, ADR | | | 19,219,743 | |
| | 258,599 | | | Prudential PLC, ADR(a) | | | 11,805,044 | |
| | 358,736 | | | RELX PLC, ADR | | | 8,229,404 | |
| | 224,665 | | | Unilever N.V., New York Shares | | | 13,594,479 | |
| | 1,666,495 | | | Vodafone Group PLC, ADR | | | 30,863,488 | |
| | 471,701 | | | WPP PLC, ADR(a) | | | 29,386,972 | |
| | | | | | | | |
| | | | | | | 150,289,587 | |
| | | | | | | | |
| | | | United States—7.7% | |
| | 116,294 | | | Amdocs Ltd. | | | 6,405,474 | |
| | 19,529 | | | Aon PLC | | | 3,517,954 | |
| | 1,191,889 | | | Brookfield Property Partners L.P.(a) | | | 24,874,723 | |
| | 727,194 | | | Nielsen Holdings PLC | | | 18,565,263 | |
| | 29,127 | | | Willis Towers Watson PLC | | | 5,369,271 | |
| | | | | | | | |
| | | | | | | 58,732,685 | |
| | | | | | | | |
| | |
| | | | Total Common Stocks & Other Equity Interests
(Cost $716,999,367) | | | 763,169,313 | |
| | | | | | | | |
| | |
| | | | | | | | |
| | | | Money Market Funds—0.1% | |
| | 349,120 | | | Invesco Premier U.S. Government Money Portfolio—Institutional Class, 2.32%(c)
(Cost $349,119) | | | 349,119 | |
| | | | | | | | |
| | |
| | | | Total Investments in Securities
(excluding investments purchased with cash collateral from securities on loan)
(Cost $717,348,486)—99.7% | | | 763,518,432 | |
| | | | | | | | |
See accompanying Notes to Financial Statements which are an integral part of the financial statements.
Invesco International Dividend AchieversTM ETF (PID)(continued)
April 30, 2019
| | | | | | | | |
Number
of Shares | | | | | Value | |
| | | | Investments Purchased with Cash
Collateral from
Securities on Loan | |
| | |
| | | | | | | | |
| | | | Money Market Funds—7.3% | |
| | 42,104,110 | | | Invesco Government & Agency Portfolio— Institutional Class,
2.34%(c)(d) | | $ | 42,104,110 | |
| | 14,030,503 | | | Invesco Liquid Assets Portfolio—Institutional Class,
2.48%(c)(d) | | | 14,034,712 | |
| | | | | | | | |
| | |
| | | | Total Money Market Funds
(Cost $56,138,822) | | | 56,138,822 | |
| | | | | | | | |
| | |
| | | | Total Investments in Securities
(Cost $773,487,308)—107.0% | | | 819,657,254 | |
| | |
| | | | Other assets less liabilities—(7.0)% | | | (53,374,180 | ) |
| | | | | | | | |
| | |
| | | | Net Assets—100.0% | | $ | 766,283,074 | |
| | | | | | | | |
Abbreviations:
ADR—American Depositary Receipt
GDR—Global Depositary Receipt
REGS—Regulation S
Notes to Schedule of Investments:
| (a) | All or a portion of this security was out on loan at April 30, 2019. |
| (b) | Security purchased or received in a transaction exempt from registration under the Securities Act of 1933, as amended (the “1933 Act”). The security may be resold pursuant to an exemption from registration under the 1933 Act, typically to qualified institutional buyers. The aggregate value of these securities at April 30, 2019 was $79,437,504, which represented 10.37% of the Fund’s Net Assets. |
| (c) | The security and the Fund are advised by wholly-owned subsidiaries of Invesco Ltd. and are therefore considered to be affiliated. The rate shown is the7-day SEC standardized yield as of April 30, 2019. |
| (d) | The security has been segregated to satisfy the commitment to return the cash collateral received in securities lending transactions upon the borrower’s return of the securities loaned. See Note 2J. |
See accompanying Notes to Financial Statements which are an integral part of the financial statements.
Statements of Assets and Liabilities
April 30, 2019
| | | | | | | | | | | | | | | | | | | | | | | | |
| | | Invesco
BuyBack
AchieversTM
ETF (PKW) | | | Invesco
Dividend
AchieversTM
ETF (PFM) | | | Invesco Dow Jones
Industrial Average
Dividend ETF
ETF (DJD) | | | Invesco
Financial
Preferred
ETF (PGF) | | | Invesco
High Yield
Equity Dividend
AchieversTM
ETF (PEY) | | | Invesco
International
Dividend
AchieversTM
ETF (PID) | |
| Assets: | | | | | | | | | | | | | | | | | | | | | | | | |
Unaffiliated investments in securities, at value(a) | | $ | 1,313,901,260 | | | $ | 299,120,487 | | | $ | 73,846,626 | | | $ | 1,389,771,121 | | | $ | 806,061,319 | | | $ | 763,169,313 | |
Affiliated investments in securities, at value | | | 4,741,544 | | | | 979,311 | | | | 40,519 | | | | 9,161,140 | | | | 35,782,782 | | | | 56,487,941 | |
Cash | | | 747 | | | | — | | | | — | | | | — | | | | — | | | | 278,520 | |
Foreign currencies, at value | | | — | | | | — | | | | — | | | | — | | | | — | | | | 205 | |
Receivable for: | | | | | | | | | | | | | | | | | | | | | | | | |
Dividends | | | 658,780 | | | | 470,353 | | | | 84,436 | | | | 1,849,489 | | | | 1,673,836 | | | | 3,644,791 | |
Securities lending | | | 1,950 | | | | 128 | | | | — | | | | 43,788 | | | | 847 | | | | 52,387 | |
Investments sold | | | 28,508,710 | | | | 34,973 | | | | — | | | | 1,687,351 | | | | — | | | | — | |
Fund shares sold | | | 124,026,365 | | | | — | | | | — | | | | — | | | | 1,825,434 | | | | — | |
Foreign tax reclaims | | | — | | | | — | | | | — | | | | — | | | | — | | | | 817,248 | |
| | | | | | | | | | | | | | | | | | | | | | | | |
Total assets | | | 1,471,839,356 | | | | 300,605,252 | | | | 73,971,581 | | | | 1,402,512,889 | | | | 845,344,218 | | | | 824,450,405 | |
| | | | | | | | | | | | | | | | | | | | | | | | |
| | | | | | |
| Liabilities: | | | | | | | | | | | | | | | | | | | | | | | | |
Due to custodian | | | — | | | | 303 | | | | — | | | | 2,401,969 | | | | 231,421 | | | | — | |
Payable for: | | | | | | | | | | | | | | | | | | | | | | | | |
Investments purchased | | | 137,687,096 | | | | — | | | | — | | | | 3,322,750 | | | | 1,824,808 | | | | 871,751 | |
Collateral upon return of securities loaned | | | 3,218,396 | | | | 675,573 | | | | — | | | | 9,161,140 | | | | 8,089,970 | | | | 56,138,822 | |
Fund shares repurchased | | | 15,900,816 | | | | — | | | | — | | | | — | | | | — | | | | — | |
Accrued unitary management fees | | | — | | | | — | | | | 4,102 | | | | — | | | | — | | | | — | |
Accrued advisory fees | | | 480,860 | | | | 97,247 | | | | — | | | | 571,062 | | | | 268,561 | | | | 250,169 | |
Accrued trustees’ and officer’s fees | | | 125,998 | | | | 54,258 | | | | — | | | | 177,800 | | | | 69,729 | | | | 111,023 | |
Accrued expenses | | | 1,022,638 | | | | 302,873 | | | | — | | | | 1,104,693 | | | | 636,091 | | | | 795,566 | |
| | | | | | | | | | | | | | | | | | | | | | | | |
Total liabilities | | | 158,435,804 | | | | 1,130,254 | | | | 4,102 | | | | 16,739,414 | | | | 11,120,580 | | | | 58,167,331 | |
| | | | | | | | | | | | | | | | | | | | | | | | |
| Net Assets | | $ | 1,313,403,552 | | | $ | 299,474,998 | | | $ | 73,967,479 | | | $ | 1,385,773,475 | | | $ | 834,223,638 | | | $ | 766,283,074 | |
| | | | | | | | | | | | | | | | | | | | | | | | |
| | | | | | |
| Net assets consist of: | | | | | | | | | | | | | | | | | | | | | | | | |
Shares of beneficial interest | | $ | 1,574,618,946 | | | $ | 226,232,842 | | | $ | 72,187,355 | | | $ | 1,389,449,370 | | | $ | 866,782,349 | | | $ | 1,054,208,489 | |
Distributable earnings | | | (261,215,394 | ) | | | 73,242,156 | | | | 1,780,124 | | | | (3,675,895 | ) | | | (32,558,711 | ) | | | (287,925,415 | ) |
| | | | | | | | | | | | | | | | | | | | | | | | |
| Net Assets | | $ | 1,313,403,552 | | | $ | 299,474,998 | | | $ | 73,967,479 | | | $ | 1,385,773,475 | | | $ | 834,223,638 | | | $ | 766,283,074 | |
| | | | | | | | | | | | | | | | | | | | | | | | |
Shares outstanding (unlimited amount authorized, $0.01 par value) | | | 20,650,000 | | | | 10,500,000 | | | | 2,000,000 | | | | 75,600,000 | | | | 45,700,000 | | | | 46,600,000 | |
Net asset value | | $ | 63.60 | | | $ | 28.52 | | | $ | 36.98 | | | $ | 18.33 | | | $ | 18.25 | | | $ | 16.44 | |
| | | | | | | | | | | | | | | | | | | | | | | | |
Market price | | $ | 63.62 | | | $ | 28.52 | | | $ | 37.02 | | | $ | 18.35 | | | $ | 18.26 | | | $ | 16.45 | |
| | | | | | | | | | | | | | | | | | | | | | | | |
Unaffiliated investments in securities, at cost | | $ | 1,216,380,478 | | | $ | 219,908,740 | | | $ | 71,465,472 | | | $ | 1,372,895,644 | | | $ | 769,825,548 | | | $ | 716,999,367 | |
| | | | | | | | | | | | | | | | | | | | | | | | |
Affiliated investments in securities, at cost | | $ | 4,741,544 | | | $ | 1,234,334 | | | $ | 40,519 | | | $ | 9,161,140 | | | $ | 38,368,239 | | | $ | 56,487,941 | |
| | | | | | | | | | | | | | | | | | | | | | | | |
Foreign currencies, at cost | | $ | — | | | $ | — | | | $ | — | | | $ | — | | | $ | — | | | $ | 206 | |
| | | | | | | | | | | | | | | | | | | | | | | | |
(a)Includes securities on loan with an aggregate value of | | $ | 3,098,171 | | | $ | 661,346 | | | $ | — | | | $ | 8,936,321 | | | $ | 7,795,788 | | | $ | 54,379,909 | |
| | | | | | | | | | | | | | | | | | | | | | | | |
See accompanying Notes to Financial Statements which are an integral part of the financial statements.
Statements of Operations
For the year ended April 30, 2019
| | | | | | | | | | | | | | | | | | | | | | | | |
| | | Invesco
BuyBack
AchieversTM
ETF (PKW) | | | Invesco
Dividend
AchieversTM
ETF (PFM) | | | Invesco Dow Jones
Industrial Average
Dividend ETF
ETF (DJD) | | | Invesco
Financial
Preferred
ETF (PGF) | | | Invesco
High Yield
Equity Dividend
AchieversTM
ETF (PEY) | | | Invesco
International
Dividend
AchieversTM
ETF (PID) | |
| Investment income: | | | | | | | | | | | | | | | | | | | | | | | | |
Unaffiliated dividend income | | $ | 23,543,043 | | | $ | 8,246,270 | | | $ | 1,092,100 | | | $ | 87,625,717 | | | $ | 30,088,375 | | | $ | 33,945,260 | |
Affiliated dividend income | | | 22,803 | | | | 25,481 | | | | 728 | | | | 128,192 | | | | 896,569 | | | | 12,520 | |
Securities lending income | | | 369,964 | | | | 11,939 | | | | — | | | | 571,654 | | | | 262,863 | | | | 1,563,306 | |
Foreign witholding tax | | | — | | | | — | | | | — | | | | — | | | | — | | | | (3,104,518 | ) |
| | | | | | | | | | | | | | | | | | | | | | | | |
Total investment income | | | 23,935,810 | | | | 8,283,690 | | | | 1,092,828 | | | | 88,325,563 | | | | 31,247,807 | | | | 32,416,568 | |
| | | | | | | | | | | | | | | | | | | | | | | | |
| | | | | | |
| Expenses: | | | | | | | | | | | | | | | | | | | | | | | | |
Unitary management fees | | | — | | | | — | | | | 41,367 | | | | — | | | | — | | | | — | |
Advisory fees | | | 6,378,251 | | | | 1,199,023 | | | | — | | | | 7,405,390 | | | | 3,043,464 | | | | 3,059,855 | |
Sub-licensing fees | | | 1,275,641 | | | | 299,753 | | | | — | | | | 1,399,600 | | | | 760,859 | | | | 764,957 | |
Accounting & administration fees | | | 116,305 | | | | 45,570 | | | | — | | | | 134,700 | | | | 78,546 | | | | 84,746 | |
Custodian & transfer agent fees | | | 25,388 | | | | 14,944 | | | | — | | | | 39,765 | | | | 9,169 | | | | 95,623 | |
Trustees’ and officer’s fees | | | 22,361 | | | | 10,281 | | | | — | | | | 27,342 | | | | 15,369 | | | | 17,364 | |
Other expenses | | | 118,453 | | | | 57,033 | | | | — | | | | 144,634 | | | | 95,353 | | | | 126,272 | |
| | | | | | | | | | | | | | | | | | | | | | | | |
Total expenses | | | 7,936,399 | | | | 1,626,604 | | | | 41,367 | | | | 9,151,431 | | | | 4,002,760 | | | | 4,148,817 | |
| | | | | | | | | | | | | | | | | | | | | | | | |
Less: Waivers | | | (2,143 | ) | | | (548 | ) | | | (3,250 | ) | | | (10,761 | ) | | | (1,114 | ) | | | (1,122 | ) |
| | | | | | | | | | | | | | | | | | | | | | | | |
Net expenses | | | 7,934,256 | | | | 1,626,056 | | | | 38,117 | | | | 9,140,670 | | | | 4,001,646 | | | | 4,147,695 | |
| | | | | | | | | | | | | | | | | | | | | | | | |
Net investment income | | | 16,001,554 | | | | 6,657,634 | | | | 1,054,711 | | | | 79,184,893 | | | | 27,246,161 | | | | 28,268,873 | |
| | | | | | | | | | | | | | | | | | | | | | | | |
| | | | | | |
| Realized and unrealized gain (loss) from: | | | | | | | | | | | | | | | | | | | | | | | | |
Net realized gain (loss) from: | | | | | | | | | | | | | | | | | | | | | | | | |
Unaffiliated investment securities | | | (88,721,400 | ) | | | (3,349,485 | ) | | | (725,160 | ) | | | (12,839,230 | ) | | | (32,775,509 | ) | | | (24,175,328 | ) |
Affiliated investment securities | | | — | | | | (60,122 | ) | | | — | | | | — | | | | (746,171 | ) | | | — | |
Unaffiliatedin-kind redemptions | | | 89,712,802 | | | | 29,114,520 | | | | 8,058,327 | | | | 7,637,157 | | | | 35,373,769 | | | | 44,164,628 | |
Affiliatedin-kind redemptions | | | — | | | | (6,095 | ) | | | — | | | | — | | | | (66,562 | ) | | | — | |
Foreign currencies | | | — | | | | — | | | | — | | | | — | | | | — | | | | (6,104 | ) |
| | | | | | | | | | | | | | | | | | | | | | | | |
Net realized gain (loss) | | | 991,402 | | | | 25,698,818 | | | | 7,333,167 | | | | (5,202,073 | ) | | | 1,785,527 | | | | 19,983,196 | |
| | | | | | | | | | | | | | | | | | | | | | | | |
Change in net unrealized appreciation (depreciation) of: | | | | | | | | | | | | | | | | | | | | | | | | |
Unaffiliated investment securities | | | 118,531,883 | | | | 11,221,422 | | | | 2,541,208 | | | | 6,995,137 | | | | 51,087,838 | | | | (308,311 | ) |
Affiliated investment securities | | | — | | | | (49,454 | ) | | | — | | | | — | | | | (1,666,544 | ) | | | — | |
Foreign currencies | | | — | | | | — | | | | — | | | | — | | | | — | | | | 79 | |
| | | | | | | | | | | | | | | | | | | | | | | | |
Change in unrealized appreciation (depreciation) | | | 118,531,883 | | | | 11,171,968 | | | | 2,541,208 | | | | 6,995,137 | | | | 49,421,294 | | | | (308,232 | ) |
| | | | | | | | | | | | | | | | | | | | | | | | |
Net realized and unrealized gain | | | 119,523,285 | | | | 36,870,786 | | | | 9,874,375 | | | | 1,793,064 | | | | 51,206,821 | | | | 19,674,964 | |
| | | | | | | | | | | | | | | | | | | | | | | | |
Net increase in net assets resulting from operations | | $ | 135,524,839 | | | $ | 43,528,420 | | | $ | 10,929,086 | | | $ | 80,977,957 | | | $ | 78,452,982 | | | $ | 47,943,837 | |
| | | | | | | | | | | | | | | | | | | | | | | | |
See accompanying Notes to Financial Statements which are an integral part of the financial statements.
(This Page Intentionally Left Blank)
Statements of Changes in Net Assets
For the years ended April 30, 2019 and 2018
| | | | | | | | | | | | | | | | |
| | | Invesco BuyBack
AchieversTMETF (PKW) | | | Invesco Dividend
AchieversTMETF (PFM) | |
| | | Year Ended
April 30, 2019 | | | Year Ended
April 30, 2018 | | | Year Ended
April 30, 2019 | | | Year Ended
April 30, 2018 | |
| Operations: | | | | | | | | | | | | | | | | |
Net investment income | | $ | 16,001,554 | | | $ | 13,267,600 | | | $ | 6,657,634 | | | $ | 6,685,551 | |
Net realized gain (loss) | | | 991,402 | | | | 249,704,569 | | | | 25,698,818 | | | | 21,153,016 | |
Change in net unrealized appreciation (depreciation) | | | 118,531,883 | | | | (139,578,006 | ) | | | 11,171,968 | | | | (4,876,150 | ) |
| | | | | | | | | | | | | | | | |
Net increase in net assets resulting from operations | | | 135,524,839 | | | | 123,394,163 | | | | 43,528,420 | | | | 22,962,417 | |
| | | | | | | | | | | | | | | | |
| | | | |
| Distributions to Shareholders from: | | | | | | | | | | | | | | | | |
Distributable earnings | | | (15,899,340 | ) | | | (10,919,625 | ) | | | (6,637,686 | ) | | | (6,412,491 | ) |
| | | | | | | | | | | | | | | | |
| | | | |
| Shareholder Transactions: | | | | | | | | | | | | | | | | |
Proceeds from shares sold | | | 1,084,354,865 | | | | 958,997,388 | | | | 52,293,807 | | | | 13,896,875 | |
Value of shares repurchased | | | (1,202,800,609 | ) | | | (1,121,628,783 | ) | | | (74,719,434 | ) | | | (59,331,995 | ) |
| | | | | | | | | | | | | | | | |
Net increase (decrease) in net assets resulting from share transactions | | | (118,445,744 | ) | | | (162,631,395 | ) | | | (22,425,627 | ) | | | (45,435,120 | ) |
| | | | | | | | | | | | | | | | |
Net increase (decrease) in net assets | | | 1,179,755 | | | | (50,156,857 | ) | | | 14,465,107 | | | | (28,885,194 | ) |
| | | | | | | | | | | | | | | | |
| | | | |
| Net assets: | | | | | | | | | | | | | | | | |
Beginning of period | | | 1,312,223,797 | | | | 1,362,380,654 | | | | 285,009,891 | | | | 313,895,085 | |
| | | | | | | | | | | | | | | | |
End of period | | $ | 1,313,403,552 | | | $ | 1,312,223,797 | | | $ | 299,474,998 | | | $ | 285,009,891 | |
| | | | | | | | | | | | | | | | |
| | | | |
| Changes in Shares Outstanding: | | | | | | | | | | | | | | | | |
Shares sold | | | 18,500,000 | | | | 15,550,000 | | | | 1,950,000 | | | | 550,000 | |
Shares repurchased | | | (20,900,000 | ) | | | (18,600,000 | ) | | | (2,750,000 | ) | | | (2,350,000 | ) |
Shares outstanding, beginning of period | | | 23,050,000 | | | | 26,100,000 | | | | 11,300,000 | | | | 13,100,000 | |
| | | | | | | | | | | | | | | | |
Shares outstanding, end of period | | | 20,650,000 | | | | 23,050,000 | | | | 10,500,000 | | | | 11,300,000 | |
| | | | | | | | | | | | | | | | |
| (a) | Effective April 30, 2018, Invesco Dow Jones Industrial Average Dividend ETF changed its fiscal year end to April 30. |
See accompanying Notes to Financial Statements which are an integral part of the financial statements.
| | | | | | | | | | | | | | | | | | | | | | | | | | |
| Invesco Dow Jones Industrial Average Dividend ETF (DJD) | | | Invesco Financial
Preferred ETF (PGF) | | | Invesco High Yield Equity Dividend
AchieversTMETF (PEY) | |
Year Ended
April 30, 2019 | | | Eight Months Ended
April 30, 2018(a) | | | Year Ended
August 31, 2017 | | | Year Ended
April 30, 2019 | | | Year Ended
April 30, 2018 | | | Year Ended
April 30, 2019 | | | Year Ended
April 30, 2018 | |
| | | | | | | | | | | | | | | | | | | | | | | | | | |
| $ | 1,054,711 | | | $ | 216,978 | | | $ | 216,986 | | | $ | 79,184,893 | | | $ | 86,951,689 | | | $ | 27,246,161 | | | $ | 32,035,935 | |
| | 7,333,167 | | | | 1,371,474 | | | | 742,195 | | | | (5,202,073 | ) | | | 11,224,994 | | | | 1,785,527 | | | | 71,633,983 | |
| | 2,541,208 | | | | (622,353 | ) | | | 314,764 | | | | 6,995,137 | | | | (58,826,997 | ) | | | 49,421,294 | | | | (62,327,335 | ) |
| | | | | | | | | | | | | | | | | | | | | | | | | | |
| | 10,929,086 | | | | 966,099 | | | | 1,273,945 | | | | 80,977,957 | | | | 39,349,686 | | | | 78,452,982 | | | | 41,342,583 | |
| | | | | | | | | | | | | | | | | | | | | | | | | | |
| | | | | | |
| | | | | | | | | | | | | | | | | | | | | | | | | | |
| | (954,129 | ) | | | (270,380 | ) | | | (179,295 | ) | | | (82,129,730 | ) | | | (88,485,717 | ) | | | (29,155,112 | ) | | | (32,704,666 | ) |
| | | | | | | | | | | | | | | | | | | | | | | | | | |
| | | | | | |
| | | | | | | | | | | | | | | | | | | | | | | | | | |
| | 160,409,817 | | | | 11,633,151 | | | | 17,361,187 | | | | 265,291,213 | | | | 119,697,181 | | | | 308,878,877 | | | | 325,187,706 | |
| | (111,411,587 | ) | | | (8,209,794 | ) | | | (10,335,307 | ) | | | (443,394,426 | ) | | | (178,444,080 | ) | | | (287,352,611 | ) | | | (555,151,325 | ) |
| | | | | | | | | | | | | | | | | | | | | | | | | | |
| | 48,998,230 | | | | 3,423,357 | | | | 7,025,880 | | | | (178,103,213 | ) | | | (58,746,899 | ) | | | 21,526,266 | | | | (229,963,619 | ) |
| | | | | | | | | | | | | | | | | | | | | | | | | | |
| | 58,973,187 | | | | 4,119,076 | | | | 8,120,530 | | | | (179,254,986 | ) | | | (107,882,930 | ) | | | 70,824,136 | | | | (221,325,702 | ) |
| | | | | | | | | | | | | | | | | | | | | | | | | | |
| | | | | | |
| | | | | | | | | | | | | | | | | | | | | | | | | | |
| | 14,994,292 | | | | 10,875,216 | | | | 2,754,686 | | | | 1,565,028,461 | | | | 1,672,911,391 | | | | 763,399,502 | | | | 984,725,204 | |
| | | | | | | | | | | | | | | | | | | | | | | | | | |
| $ | 73,967,479 | | | $ | 14,994,292 | | | $ | 10,875,216 | | | $ | 1,385,773,475 | | | $ | 1,565,028,461 | | | $ | 834,223,638 | | | $ | 763,399,502 | |
| | | | | | | | | | | | | | | | | | | | | | | | | | |
| | | | | | |
| | | | | | | | | | | | | | | | | | | | | | | | | | |
| | 4,750,000 | | | | 350,000 | | | | 600,000 | | | | 14,750,000 | | | | 6,350,000 | | | | 17,650,000 | | | | 18,800,000 | |
| | (3,200,000 | ) | | | (250,000 | ) | | | (350,000 | ) | | | (24,600,000 | ) | | | (9,550,000 | ) | | | (16,550,000 | ) | | | (32,100,000 | ) |
| | 450,000 | | | | 350,000 | | | | 100,000 | | | | 85,450,000 | | | | 88,650,000 | | | | 44,600,000 | | | | 57,900,000 | |
| | | | | | | | | | | | | | | | | | | | | | | | | | |
| | 2,000,000 | | | | 450,000 | | | | 350,000 | | | | 75,600,000 | | | | 85,450,000 | | | | 45,700,000 | | | | 44,600,000 | |
| | | | | | | | | | | | | | | | | | | | | | | | | | |
Statements of Changes in Net Assets(continued)
For the years ended April 30, 2019 and 2018
| | | | | | | | |
| | | Invesco International Dividend
AchieversTMETF (PID) | |
| | | Year Ended
April 30, 2019 | | | Year Ended
April 30, 2018 | |
| Operations: | | | | | | | | |
Net investment income | | $ | 28,268,873 | | | $ | 30,423,840 | |
Net realized gain | | | 19,983,196 | | | | 24,745,208 | |
Change in net unrealized appreciation (depreciation) | | | (308,232 | ) | | | 21,204,927 | |
| | | | | | | | |
Net increase in net assets resulting from operations | | | 47,943,837 | | | | 76,373,975 | |
| | | | | | | | |
| | |
| Distributions to Shareholders from: | | | | | | | | |
Distributable earnings | | | (26,698,616 | ) | | | (32,348,073 | ) |
| | | | | | | | |
| | |
| Shareholder Transactions: | | | | | | | | |
Proceeds from shares sold | | | 118,365,179 | | | | 215,195,308 | |
Value of shares repurchased | | | (236,205,371 | ) | | | (208,123,145 | ) |
| | | | | | | | |
Net increase (decrease) in net assets resulting from share transactions | | | (117,840,192 | ) | | | 7,072,163 | |
| | | | | | | | |
Net increase (decrease) in net assets | | | (96,594,971 | ) | | | 51,098,065 | |
| | | | | | | | |
| | |
| Net assets: | | | | | | | | |
Beginning of year | | | 862,878,045 | | | | 811,779,980 | |
| | | | | | | | |
End of year | | $ | 766,283,074 | | | $ | 862,878,045 | |
| | | | | | | | |
| | |
| Changes in Shares Outstanding: | | | | | | | | |
Shares sold | | | 7,500,000 | | | | 13,500,000 | |
Shares repurchased | | | (15,100,000 | ) | | | (13,100,000 | ) |
Shares outstanding, beginning of year | | | 54,200,000 | | | | 53,800,000 | |
| | | | | | | | |
Shares outstanding, end of year | | | 46,600,000 | | | | 54,200,000 | |
| | | | | | | | |
See accompanying Notes to Financial Statements which are an integral part of the financial statements.
Financial Highlights
Invesco BuyBack AchieversTMETF (PKW)
| | | | | | | | | | | | | | | | | | | | |
| | | Years Ended April 30, | |
| | | 2019 | | | 2018 | | | 2017 | | | 2016 | | | 2015 | |
| Per Share Operating Performance: | | | | | | | | | | | | | | | | | | | | |
Net asset value at beginning of year | | $ | 56.93 | | | $ | 52.20 | | | $ | 45.67 | | | $ | 48.78 | | | $ | 43.42 | |
Net investment income(a) | | | 0.73 | | | | 0.55 | | | | 0.51 | | | | 0.56 | | | | 0.51 | |
Net realized and unrealized gain (loss) on investments | | | 6.67 | | | | 4.64 | | | | 6.70 | | | | (3.08 | ) | | | 5.38 | |
Total from investment operations. | | | 7.40 | | | | 5.19 | | | | 7.21 | | | | (2.52 | ) | | | 5.89 | |
Distributions to shareholders from: | | | | | | | | | | | | | | | | | | | | |
Net investment income | | | (0.73 | ) | | | (0.46 | ) | | | (0.68 | ) | | | (0.59 | ) | | | (0.53 | ) |
Net asset value at end of year | | $ | 63.60 | | | $ | 56.93 | | | $ | 52.20 | | | $ | 45.67 | | | $ | 48.78 | |
Market price at end of year(b) | | $ | 63.62 | | | $ | 56.95 | | | $ | 52.19 | | | $ | 45.65 | | | $ | 48.77 | |
| Net Asset Value Total Return(c) | | | 13.16 | % | | | 9.95 | % | | | 15.92 | % | | | (5.18 | )% | | | 13.63 | % |
| Market Price Total Return(c) | | | 13.16 | % | | | 10.02 | % | | | 15.96 | % | | | (5.20 | )% | | | 13.61 | % |
| Ratios/Supplemental Data: | | | | | | | | | | | | | | | | | | | | |
Net assets at end of year (000’s omitted) | | $ | 1,313,404 | | | $ | 1,312,224 | | | $ | 1,362,381 | | | $ | 1,639,434 | | | $ | 2,970,924 | |
Ratio to average net assets of: | | | | | | | | | | | | | | | | | | | | |
Expenses | | | 0.62 | % | | | 0.63 | % | | | 0.63 | % | | | 0.63 | %(d) | | | 0.63 | %(d) |
Net investment income | | | 1.25 | % | | | 0.99 | % | | | 1.05 | % | | | 1.21 | % | | | 1.09 | % |
Portfolio turnover rate(e) | | | 76 | % | | | 66 | % | | | 57 | % | | | 53 | % | | | 68 | % |
| (a) | Based on average shares outstanding. |
| (b) | The mean between the last bid and ask prices. |
| (c) | Net asset value total return is calculated assuming an initial investment made at the net asset value at the beginning of the period, reinvestment of all dividends and distributions at net asset value during the period, and redemption on the last day of the period. Net asset value total return includes adjustments in accordance with accounting principles generally accepted in the United States of America and as such, the net asset value for financial reporting purposes and the returns based upon those net asset values may differ from the net asset value and returns for shareholder transactions. Market price total return is calculated assuming an initial investment made at the market price at the beginning of the period, reinvestment of all dividends and distributions at market price during the period, and sale at the market price on the last day of the period. Total investment returns calculated for a period of less than one year are not annualized. |
| (d) | In addition to the fees and expenses which the Fund bears directly, the Fund indirectly bears a pro rata share of the fees and expenses of the investment companies in which the Fund invests. Estimated investment companies’ expenses are not expenses that are incurred directly by the Fund. They are expenses that are incurred directly by the investment companies and are deducted from the value of the investment companies the Fund invests in. The effect of the estimated investment companies’ expenses that the Fund bears indirectly is included in the Fund’s total return. |
| (e) | Portfolio turnover rate is not annualized for periods less than one year, if applicable, and does not include securities received or delivered from processing creations or redemptions. |
Invesco Dividend AchieversTMETF (PFM)
| | | | | | | | | | | | | | | | | | | | |
| | | Years Ended April 30, | |
| | | 2019 | | | 2018 | | | 2017 | | | 2016 | | | 2015 | |
| Per Share Operating Performance: | | | | | | | | | | | | | | | | | | | | |
Net asset value at beginning of year | | $ | 25.22 | | | $ | 23.96 | | | $ | 21.75 | | | $ | 21.42 | | | $ | 20.50 | |
Net investment income(a) | | | 0.59 | | | | 0.54 | | | | 0.50 | | | | 0.49 | | | | 0.44 | |
Net realized and unrealized gain on investments | | | 3.29 | | | | 1.24 | | | | 2.25 | | | | 0.33 | | | | 0.90 | |
Total from investment operations | | | 3.88 | | | | 1.78 | | | | 2.75 | | | | 0.82 | | | | 1.34 | |
Distributions to shareholders from: | | | | | | | | | | | | | | | | | | | | |
Net investment income | | | (0.58 | ) | | | (0.52 | ) | | | (0.54 | ) | | | (0.49 | ) | | | (0.42 | ) |
Net asset value at end of year | | $ | 28.52 | | | $ | 25.22 | | | $ | 23.96 | | | $ | 21.75 | | | $ | 21.42 | |
Market price at end of year(b) | | $ | 28.52 | | | $ | 25.24 | | | $ | 23.99 | | | $ | 21.75 | | | $ | 21.40 | |
| Net Asset Value Total Return(c) | | | 15.63 | % | | | 7.42 | % | | | 12.80 | % | | | 3.98 | % | | | 6.54 | % |
| Market Price Total Return(c) | | | 15.53 | % | | | 7.37 | % | | | 12.94 | % | | | 4.08 | % | | | 6.44 | % |
| Ratios/Supplemental Data: | | | | | | | | | | | | | | | | | | | | |
Net assets at end of year (000’s omitted) | | $ | 299,475 | | | $ | 285,010 | | | $ | 313,895 | | | $ | 287,052 | | | $ | 343,819 | |
Ratio to average net assets of: | | | | | | | | | | | | | | | | | | | | |
Expenses | | | 0.54 | % | | | 0.55 | % | | | 0.55 | % | | | 0.55 | % | | | 0.55 | % |
Net investment income | | | 2.22 | % | | | 2.15 | % | | | 2.17 | % | | | 2.35 | % | | | 2.07 | % |
Portfolio turnover rate(d) | | | 13 | % | | | 5 | % | | | 6 | % | | | 7 | % | | | 20 | % |
| (a) | Based on average shares outstanding. |
| (b) | The mean between the last bid and ask prices. |
| (c) | Net asset value total return is calculated assuming an initial investment made at the net asset value at the beginning of the period, reinvestment of all dividends and distributions at net asset value during the period, and redemption on the last day of the period. Net asset value total return includes adjustments in accordance with accounting principles generally accepted in the United States of America and as such, the net asset value for financial reporting purposes and the returns based upon those net asset values may differ from the net asset value and returns for shareholder transactions. Market price total return is calculated assuming an initial investment made at the market price at the beginning of the period, reinvestment of all dividends and distributions at market price during the period, and sale at the market price on the last day of the period. Total investment returns calculated for a period of less than one year are not annualized. |
| (d) | Portfolio turnover rate is not annualized for periods less than one year, if applicable, and does not include securities received or delivered from processing creations or redemptions. |
See accompanying Notes to Financial Statements which are an integral part of the financial statements.
Financial Highlights(continued)
Invesco Dow Jones Industrial Average Dividend ETF (DJD)
| | | | | | | | | | | | | | | | |
| | | Year Ended
April 30, 2019 | | | Eight Months Ended
April 30, 2018 | | | Year Ended
August 31, 2017 | | | For the Period
December 16, 2016(a)
Through
August 31, 2016 | |
| Per Share Operating Performance: | | | | | | | | | | | | | | | | |
Net asset value at beginning of period | | $ | 33.32 | | | $ | 31.07 | | | $ | 27.55 | | | $ | 25.35 | |
Net investment income(b) | | | 0.91 | | | | 0.49 | | | | 0.83 | | | | 0.53 | |
Net realized and unrealized gain on investments | | | 3.74 | | | | 2.37 | | | | 3.55 | | | | 2.05 | |
Total from investment operations | | | 4.65 | | | | 2.86 | | | | 4.38 | | | | 2.58 | |
Distributions to shareholders from: | | | | | | | | | | | | | | | | |
Net investment income. | | | (0.99 | ) | | | (0.53 | ) | | | (0.86 | ) | | | (0.38 | ) |
Net realized gains | | | — | | | | (0.08 | ) | | | — | | | | — | |
Total distributions | | | (0.99 | ) | | | (0.61 | ) | | | (0.86 | ) | | | (0.38 | ) |
Net asset value at end of period | | $ | 36.98 | | | $ | 33.32 | | | $ | 31.07 | | | $ | 27.55 | |
Market price at end of period | | $ | 37.02 | (c) | | $ | 33.35 | (c) | | $ | 31.10 | | | $ | 27.52 | |
| Net Asset Value Total Return(d) | | | 14.24 | % | | | 9.23 | % | | | 16.13 | % | | | 10.27 | % |
| Market Price Total Return(d) | | | 14.25 | % | | | 9.22 | % | | | | | | | | |
| Ratios/Supplemental Data: | | | | | | | | | | | | | | | | |
Net assets at end of period (000’s omitted) | | $ | 73,967 | | | $ | 14,994 | | | $ | 10,875 | | | $ | 2,755 | |
Ratio to average net assets of: | | | | | | | | | | | | | | | | |
Expenses, after Waivers | | | 0.09 | % | | | 0.30 | %(e) | | | 0.30 | % | | | 0.30 | %(e) |
Expenses, prior to Waivers | | | 0.10 | % | | | 0.30 | %(e) | | | 0.30 | % | | | 0.30 | %(e) |
Net investment income, after Waivers | | | 2.62 | % | | | 2.25 | %(e) | | | 2.80 | % | | | 2.86 | %(e) |
Portfolio turnover rate(f) | | | 20 | % | | | 19 | % | | | 3 | % | | | 0 | % |
| (a) | Commencement of investment operations. |
| (b) | Based on average shares outstanding. |
| (c) | The mean between the last bid and ask prices. |
| (d) | Net asset value total return is calculated assuming an initial investment made at the net asset value at the beginning of the period, reinvestment of all dividends and distributions at net asset value during the period, and redemption on the last day of the period. Net asset value total return includes adjustments in accordance with accounting principles generally accepted in the United States of America and as such, the net asset value for financial reporting purposes and the returns based upon those net asset values may differ from the net asset value and returns for shareholder transactions. Market price total return is calculated assuming an initial investment made at the market price at the beginning of the period, reinvestment of all dividends and distributions at market price during the period, and sale at the market price on the last day of the period. Total investment returns calculated for a period of less than one year are not annualized. |
| (f) | Portfolio turnover rate is not annualized for periods less than one year, if applicable, and does not include securities received or delivered from processing creations or redemptions. |
See accompanying Notes to Financial Statements which are an integral part of the financial statements.
Financial Highlights(continued)
Invesco Financial Preferred ETF (PGF)
| | | | | | | | | | | | | | | | | | | | |
| | | Years Ended April 30, | |
| | | 2019 | | | 2018 | | | 2017 | | | 2016 | | | 2015 | |
| Per Share Operating Performance: | | | | | | | | | | | | | | | | | | | | |
Net asset value at beginning of year | | $ | 18.32 | | | $ | 18.87 | | | $ | 18.80 | | | $ | 18.45 | | | $ | 17.99 | |
Net investment income(a) | | | 0.97 | | | | 0.99 | | | | 1.03 | | | | 1.06 | | | | 1.07 | |
Net realized and unrealized gain (loss) on investments | | | 0.05 | | | | (0.53 | ) | | | 0.07 | | | | 0.36 | | | | 0.45 | |
Total from investment operations | | | 1.02 | | | | 0.46 | | | | 1.10 | | | | 1.42 | | | | 1.52 | |
Distributions to shareholders from: | | | | | | | | | | | | | | | | | | | | |
Net investment income | | | (1.01 | ) | | | (1.01 | ) | | | (1.03 | ) | | | (1.07 | ) | | | (1.06 | ) |
Net asset value at end of year | | $ | 18.33 | | | $ | 18.32 | | | $ | 18.87 | | | $ | 18.80 | | | $ | 18.45 | |
Market price at end of year(b) | | $ | 18.35 | | | $ | 18.31 | | | $ | 18.87 | | | $ | 18.83 | | | $ | 18.46 | |
| Net Asset Value Total Return(c) | | | 5.79 | % | | | 2.43 | % | | | 6.06 | % | | | 8.01 | % | | | 8.73 | % |
| Market Price Total Return(c) | | | 5.97 | % | | | 2.37 | % | | | 5.89 | % | | | 8.12 | % | | | 8.85 | % |
| Ratios/Supplemental Data: | | | | | | | | | | | | | | | | | | | | |
Net assets at end of year (000’s omitted) | | $ | 1,385,773 | | | $ | 1,565,028 | | | $ | 1,672,911 | | | $ | 1,636,378 | | | $ | 1,471,716 | |
Ratio to average net assets of: | | | | | | | | | | | | | | | | | | | | |
Expenses | | | 0.62 | % | | | 0.63 | % | | | 0.63 | % | | | 0.63 | % | | | 0.63 | % |
Net investment income | | | 5.35 | % | | | 5.26 | % | | | 5.48 | % | | | 5.76 | % | | | 5.87 | % |
Portfolio turnover rate(d) | | | 21 | % | | | 5 | % | | | 8 | % | | | 13 | % | | | 9 | % |
| (a) | Based on average shares outstanding. |
| (b) | The mean between the last bid and ask prices. |
| (c) | Net asset value total return is calculated assuming an initial investment made at the net asset value at the beginning of the period, reinvestment of all dividends and distributions at net asset value during the period, and redemption on the last day of the period. Net asset value total return includes adjustments in accordance with accounting principles generally accepted in the United States of America and as such, the net asset value for financial reporting purposes and the returns based upon those net asset values may differ from the net asset value and returns for shareholder transactions. Market price total return is calculated assuming an initial investment made at the market price at the beginning of the period, reinvestment of all dividends and distributions at market price during the period, and sale at the market price on the last day of the period. Total investment returns calculated for a period of less than one year are not annualized. |
| (d) | Portfolio turnover rate is not annualized for periods less than one year, if applicable, and does not include securities received or delivered from processing creations or redemptions. |
Invesco High Yield Equity Dividend AchieversTMETF (PEY)
| | | | | | | | | | | | | | | | | | | | |
| | | Years Ended April 30, | |
| | | 2019 | | | 2018 | | | 2017 | | | 2016 | | | 2015 | |
| Per Share Operating Performance: | | | | | | | | | | | | | | | | | | | | |
Net asset value at beginning of year | | $ | 17.12 | | | $ | 17.01 | | | $ | 14.90 | | | $ | 13.45 | | | $ | 12.32 | |
Net investment income(a) | | | 0.63 | | | | 0.62 | | | | 0.52 | | | | 0.48 | | | | 0.43 | |
Net realized and unrealized gain on investments | | | 1.17 | | | | 0.14 | | | | 2.12 | | | | 1.46 | | | | 1.13 | |
Total from investment operations | | | 1.80 | | | | 0.76 | | | | 2.64 | | | | 1.94 | | | | 1.56 | |
Distributions to shareholders from: | | | | | | | | | | | | | | | | | | | | |
Net investment income | | | (0.67 | ) | | | (0.65 | ) | | | (0.53 | ) | | | (0.49 | ) | | | (0.43 | ) |
Net asset value at end of year | | $ | 18.25 | | | $ | 17.12 | | | $ | 17.01 | | | $ | 14.90 | | | $ | 13.45 | |
Market price at end of year(b) | | $ | 18.26 | | | $ | 17.12 | | | $ | 17.02 | | | $ | 14.91 | | | $ | 13.45 | |
| Net Asset Value Total Return(c) | | | 10.79 | % | | | 4.48 | % | | | 17.95 | % | | | 14.92 | % | | | 12.89 | % |
| Market Price Total Return(c) | | | 10.86 | % | | | 4.42 | % | | | 17.94 | % | | | 14.99 | % | | | 12.89 | % |
| Ratios/Supplemental Data: | | | | | | | | | | | | | | | | | | | | |
Net assets at end of year (000’s omitted) | | $ | 834,224 | | | $ | 763,400 | | | $ | 984,725 | | | $ | 737,783 | | | $ | 537,324 | |
Ratio to average net assets of: | | | | | | | | | | | | | | | | | | | | |
Expenses | | | 0.53 | % | | | 0.54 | % | | | 0.54 | % | | | 0.54 | % | | | 0.54 | % |
Net investment income | | | 3.58 | % | | | 3.63 | % | | | 3.23 | % | | | 3.62 | % | | | 3.29 | % |
Portfolio turnover rate(d) | | | 50 | % | | | 38 | % | | | 49 | % | | | 59 | % | | | 45 | % |
| (a) | Based on average shares outstanding. |
| (b) | The mean between the last bid and ask prices. |
| (c) | Net asset value total return is calculated assuming an initial investment made at the net asset value at the beginning of the period, reinvestment of all dividends and distributions at net asset value during the period, and redemption on the last day of the period. Net asset value total return includes adjustments in accordance with accounting principles generally accepted in the United States of America and as such, the net asset value for financial reporting purposes and the returns based upon those net asset values may differ from the net asset value and returns for shareholder transactions. Market price total return is calculated assuming an initial investment made at the market price at the beginning of the period, reinvestment of all dividends and distributions at market price during the period, and sale at the market price on the last day of the period. Total investment returns calculated for a period of less than one year are not annualized. |
| (d) | Portfolio turnover rate is not annualized for periods less than one year, if applicable, and does not include securities received or delivered from processing creations or redemptions. |
See accompanying Notes to Financial Statements which are an integral part of the financial statements.
Financial Highlights(continued)
Invesco International Dividend AchieversTMETF (PID)
| | | | | | | | | | | | | | | | | | | | |
| | | Years Ended April 30, | |
| | | 2019 | | | 2018 | | | 2017 | | | 2016 | | | 2015 | |
| Per Share Operating Performance: | | | | | | | | | | | | | | | | | | | | |
Net asset value at beginning of year | | $ | 15.92 | | | $ | 15.09 | | | $ | 14.66 | | | $ | 18.42 | | | $ | 18.56 | |
Net investment income(a) | | | 0.58 | | | | 0.56 | | | | 0.44 | | | | 0.56 | | | | 0.51 | |
Net realized and unrealized gain (loss) on investments | | | 0.48 | | | | 0.87 | | | | 0.56 | | | | (3.78 | ) | | | (0.17 | ) |
Total from investment operations. | | | 1.06 | | | | 1.43 | | | | 1.00 | | | | (3.22 | ) | | | 0.34 | |
Distributions to shareholders from: | | | | | | | | | | | | | | | | | | | | |
Net investment income | | | (0.54 | ) | | | (0.60 | ) | | | (0.57 | ) | | | (0.54 | ) | | | (0.48 | ) |
Net asset value at end of year | | $ | 16.44 | | | $ | 15.92 | | | $ | 15.09 | | | $ | 14.66 | | | $ | 18.42 | |
Market price at end of year(b) | | $ | 16.45 | | | $ | 15.91 | | | $ | 15.09 | | | $ | 14.65 | | | $ | 18.43 | |
| Net Asset Value Total Return(c) | | | 6.99 | % | | | 9.57 | % | | | 7.12 | % | | | (17.53 | )% | | | 1.83 | % |
| Market Price Total Return(c) | | | 7.13 | % | | | 9.50 | % | | | 7.19 | % | | | (17.63 | )% | | | 1.77 | % |
| Ratios/Supplemental Data: | | | | | | | | | | | | | | | | | | | | |
Net assets at end of year (000’s omitted) | | $ | 766,283 | | | $ | 862,878 | | | $ | 811,780 | | | $ | 701,684 | | | $ | 1,571,846 | |
Ratio to average net assets of: | | | | | | | | | | | | | | | | | | | | |
Expenses | | | 0.54 | % | | | 0.55 | % | | | 0.56 | % | | | 0.58 | % | | | 0.55 | % |
Net investment income | | | 3.70 | % | | | 3.52 | % | | | 3.01 | % | | | 3.62 | % | | | 2.77 | % |
Portfolio turnover rate(d) | | | 47 | % | | | 55 | % | | | 61 | % | | | 61 | % | | | 66 | % |
| (a) | Based on average shares outstanding. |
| (b) | The mean between the last bid and ask prices. |
| (c) | Net asset value total return is calculated assuming an initial investment made at the net asset value at the beginning of the period, reinvestment of all dividends and distributions at net asset value during the period, and redemption on the last day of the period. Net asset value total return includes adjustments in accordance with accounting principles generally accepted in the United States of America and as such, the net asset value for financial reporting purposes and the returns based upon those net asset values may differ from the net asset value and returns for shareholder transactions. Market price total return is calculated assuming an initial investment made at the market price at the beginning of the period, reinvestment of all dividends and distributions at market price during the period, and sale at the market price on the last day of the period. Total investment returns calculated for a period of less than one year are not annualized. |
| (d) | Portfolio turnover rate is not annualized for periods less than one year, if applicable, and does not include securities received or delivered from processing creations or redemptions. |
See accompanying Notes to Financial Statements which are an integral part of the financial statements.
Notes to Financial Statements
Invesco Exchange-Traded Fund Trust
April 30, 2019
NOTE 1—Organization
Invesco Exchange-Traded Fund Trust (the “Trust”) was organized as a Massachusetts business trust on June 9, 2000 and is authorized to have multiple series of portfolios. The Trust is anopen-end management investment company registered under the Investment Company Act of 1940, as amended (the “1940 Act”). This report includes the following portfolios:
| | |
Full Name | | Short Name |
| Invesco BuyBack AchieversTMETF (PKW) | | “BuyBack AchieversTMETF” |
| Invesco Dividend AchieversTMETF (PFM) | | “Dividend AchieversTMETF” |
| Invesco Dow Jones Industrial Average Dividend ETF (DJD) | | “Dow Jones Industrial Average Dividend ETF” |
| Invesco Financial Preferred ETF (PGF) | | “Financial Preferred ETF” |
| Invesco High Yield Equity Dividend AchieversTMETF (PEY) | | “High Yield Equity Dividend AchieversTMETF” |
| Invesco International Dividend AchieversTMETF (PID) | | “International Dividend AchieversTMETF” |
Each portfolio (each, a “Fund”, and collectively, the “Funds”) represents a separate series of the Trust. The shares of the Funds are referred to herein as “Shares” or “Fund’s Shares.” Each Fund’s Shares are listed and traded on The Nasdaq Stock Market, except for Shares of Dow Jones Industrial Average Dividend ETF and Financial Preferred ETF, which are listed and traded on NYSE Arca, Inc.
The market price of each Share may differ to some degree from a Fund’s net asset value (“NAV”). Unlike conventional mutual funds, each Fund issues and redeems Shares on a continuous basis, at NAV, only in a large specified number of Shares, each called a “Creation Unit.” Creation Units are issued and redeemed principally in exchange for the deposit or delivery of a basket of securities (“Deposit Securities”). Except when aggregated in Creation Units by Authorized Participants, the Shares are not individually redeemable securities of the Funds.
The investment objective of each Fund is to seek to track the investment results (before fees and expenses) of its respective index listed below (each, an “Underlying Index”):
| | |
Fund | | Underlying Index |
| BuyBack AchieversTMETF | | NASDAQ US BuyBack AchieversTMIndex |
| Dividend AchieversTMETF | | NASDAQ US Broad Dividend AchieversTMIndex |
| Dow Jones Industrial Average Dividend ETF | | Dow Jones Industrial Average Yield Weighted |
| Financial Preferred ETF | | Wells Fargo®Hybrid and Preferred Securities Financial Index |
| High Yield Equity Dividend AchieversTMETF | | NASDAQ US Dividend AchieversTM50 Index |
| International Dividend AchieversTMETF | | NASDAQ International Dividend AchieversTMIndex |
NOTE 2—Significant Accounting Policies
The following is a summary of the significant accounting policies followed by the Funds in preparation of their financial statements.
Each Fund is an investment company and accordingly follows the investment company accounting and reporting guidance in accordance with Financial Accounting Standards Board Accounting Standards Codification Topic 946,Financial Services—Investment Companies.
| A. | Security Valuation — Securities, including restricted securities, are valued according to the following policies: |
A security listed or traded on an exchange (except convertible securities) is generally valued at its last sales price or official closing price as of the close of the customary trading session on the exchange where the security is principally traded or, lacking any sales or official closing price on a particular day, the security may be valued at the closing bid price on that day. Securities traded in theover-the-counter market are valued based on prices furnished by independent pricing services or market makers. When such securities are valued by an independent pricing service they may be considered fair valued. Futures contracts are valued at the final settlement price set by an exchange on which they are principally traded. Listed options are valued at the mean between the last bid and asked prices from the exchange on which they are principally traded, or at the final settlement price set by such exchange. Swaps and options not listed on an exchange are valued by an independent source. For purposes of determining NAV per Share, futures and option contracts generally are valued 15 minutes after the close of the customary trading session of the New York Stock Exchange (“NYSE”).
Investment companies are valued using such company’s NAV per share, unless the shares are exchange-traded, in which case they are valued at the last sales price or official closing price as of the close of the customary trading session on the exchange where the security is principally traded.
Debt obligations (including convertible securities) and unlisted equities are fair valued using an evaluated quote provided by an independent pricing service. Evaluated quotes provided by the pricing service may be determined without exclusive reliance on quoted prices, and may reflect appropriate factors such asinstitution-size trading in similar groups of securities, developments related to specific securities, dividend rate (for unlisted equities), yield (for debt obligations), quality, type of issue, coupon rate (for debt obligations), maturity (for debt obligations), individual trading characteristics and other market data. Securities with a demand feature exercisable within one to seven days are valued at par. Pricing services generally value debt obligations assuming orderly transactions of institutional round lot size, but a Fund may hold or transact in the same securities in smaller, odd lot sizes. Odd lots often trade at lower prices than institutional round lots. Debt obligations are subject to interest rate and credit risks. In addition, all debt obligations involve some risk of default with respect to interest and/or principal payments.
Foreign securities’ (including foreign exchange contracts’) prices are converted into U.S. dollar amounts using the applicable exchange rates as of the close of the London world markets. If market quotations are available and reliable for foreign exchange-traded equity securities, the securities will be valued at the market quotations. Because trading hours for certain foreign securities end before the close of the NYSE, closing market quotations may become unreliable. If between the time trading ends on a particular security and the close of the customary trading session on the NYSE, events occur that Invesco Capital Management LLC (the “Adviser”) determines are significant and make the closing price unreliable, a Fund may fair value the security. If the event is likely to have affected the closing price of the security, the security will be valued at fair value in good faith using procedures approved by the Board of Trustees. Adjustments to closing prices to reflect fair value may also be based on a screening process of an independent pricing service to indicate the degree of certainty, based on historical data, that the closing price in the principal market where a foreign security trades is not the current value as of the close of the NYSE. Foreign securities’ prices meeting the approved degree of certainty that the price is not reflective of current value will be priced at the indication of fair value from the independent pricing service. Multiple factors may be considered by the independent pricing service in determining adjustments to reflect fair value and may include information relating to sector indices, American Depositary Receipts and domestic and foreign index futures. Foreign securities may have additional risks including exchange rate changes, the potential for sharply devalued currencies and high inflation, political and economic upheaval, the relative lack of issuer information, relatively low market liquidity and the potential lack of strict financial and accounting controls and standards.
Securities for which market prices are not provided by any of the above methods may be valued based upon quotes furnished by independent sources. The last bid price may be used to value exchange-traded equity securities. The mean between the last bid and asked prices may be used to value debt obligations, including corporate loans, and unlisted equity securities.
Securities for which market quotations are not readily available or became unreliable are valued at fair value as determined in good faith following procedures approved by the Board of Trustees. Issuer-specific events, market trends, bid/asked quotes of brokers and information providers and other market data may be reviewed in the course of making a good faith determination of a security’s fair value.
Each Fund may invest in securities that are subject to interest rate risk, meaning the risk that the prices will generally fall as interest rates rise and, conversely, the prices will generally rise as interest rates fall. Specific securities differ in their sensitivity to changes in interest rates depending on their individual characteristics. Changes in interest rates may result in increased market volatility, which may affect the value and/or liquidity of certain Fund investments.
Valuations change in response to many factors, including the historical and prospective earnings of the issuer, the value of the issuer’s assets, general economic conditions, interest rates, investor perceptions and market liquidity. Because of the inherent uncertainties of valuation, the values reflected in the financial statements may materially differ from the value received upon actual sale of those investments.
Index Risk. Unlike many investment companies, the Funds do not utilize investing strategies that seek returns in excess of their Underlying Indexes. Therefore, a Fund would not necessarily buy or sell a security unless that security is added or removed, respectively, from its respective Underlying Index, even if that security generally is underperforming.
Authorized Participant Concentration Risk. Only Authorized Participants (“APs”) may engage in creation or redemption transactions directly with each Fund. Each Fund has a limited number of institutions that may act as APs, and such APs have no obligation to submit creation or redemption orders. Consequently, there is no assurance that those APs will establish or maintain an active trading market for the Shares. This risk may be heightened to the extent that securities underlying each Fund are traded outside a collateralized settlement system. In that case, APs may be required to post collateral on certain trades on an agency basis (i.e., on behalf of other market participants), which only a limited number of APs may be able to do. In addition, to the extent that APs exit the business or are unable to proceed with creation and/or redemption orders with respect to each Fund and no other AP is able to step forward to create or redeem Creation Units, this may result in a significantly diminished trading market for Fund Shares, which may be more likely to trade at a premium or discount to each
Fund’s NAV and possibly face trading halts and/or delisting. This risk may be heightened for Funds that invest innon-U.S. securities, which may have lower trading volumes.
Equity Risk. Equity risk is the risk that the value of equity securities, including common stocks, may fall due to both changes in general economic conditions that impact the market as a whole, as well as factors that directly relate to a specific company or its industry. Such general economic conditions include changes in interest rates, periods of market turbulence or instability, or general and prolonged periods of economic decline and cyclical change. It is possible that a drop in the stock market may depress the price of most or all of the common stocks that each Fund holds. In addition, equity risk includes the risk that investor sentiment toward particular industries will become negative. The value of a company’s common stock may fall solely because of factors, such as an increase in production costs, that negatively impact other companies in the same region, industry or sector of the market. A company’s common stock also may decline significantly in price over a short period of time due to factors specific to that company, including decisions made by its management or lower demand for the company’s products or services. For example, an adverse event, such as an unfavorable earnings report or the failure to make anticipated dividend payments, may depress the value of common stock.
Industry Concentration Risk. In following its methodology, each Fund’s Underlying Index from time to time may be concentrated to a significant degree in securities of issuers operating in a single industry or industry group. To the extent that each Underlying Index concentrates in the securities of issuers in a particular industry or industry group, the corresponding Fund will also concentrate its investments to approximately the same extent. By concentrating its investments in an industry or industry group, each Fund faces more risks than if it were diversified broadly over numerous industries or industry groups. Such industry-based risks, any of which may adversely affect the companies in which each Fund invests, may include, but are not limited to, legislative or regulatory changes, adverse market conditions and/or increased competition within the industry or industry group. In addition, at times, such industry or industry group may be out of favor and underperform other industries, industry groups or the market as a whole.
Non-Diversified Fund Risk. Dow Jones Industrial Average Dividend ETF and Financial Preferred ETF arenon-diversified and can invest a greater portion of their assets in securities of individual issuers than diversified funds. As a result, changes in the market value of a single investment could cause greater fluctuations in Share price than would occur in a diversified fund. This may increase a Fund’s volatility and cause the performance of a relatively small number of issuers to have a greater impact on a Fund’s performance.
Non-Correlation Risk. Each Fund’s return may not match the return of its Underlying Index for a number of reasons. For example, each Fund incurs operating expenses not applicable to its Underlying Index, and incurs costs in buying and selling securities, especially when rebalancing the Fund’s securities holdings to reflect changes in the composition of its Underlying Index. In addition, the performance of each Fund and its Underlying Index may vary due to asset valuation differences and differences between each Fund’s portfolio and its Underlying Index resulting from legal restrictions, costs or liquidity constraints.
Sampling Risk. Certain Funds’ use of a representative sampling approach may result in the Fund holding a smaller number of securities than are in its Underlying Index. As a result, an adverse development to an issuer of securities held by the Fund could result in a greater decline in NAV than would be the case if the Fund held all of the securities in its Underlying Index. To the extent the assets in the Fund are smaller, these risks may be greater.
Small- andMid-Capitalization Company Risk. For certain Funds, investing in securities of small- andmid-capitalization companies involves greater risk than customarily is associated with investing in larger, more established companies. These companies’ securities may be more volatile and less liquid than those of more established companies. These securities may have returns that vary, sometimes significantly, from the overall securities market. Often small- andmid-capitalization companies and the industries in which they focus are still evolving and, as a result, they may be more sensitive to changing market conditions.
Dividend Paying Security Risk. Certain Funds invest in securities that pay high dividends. As a group, these securities can fall out of favor with the market, causing such companies to underperform companies that do not pay high dividends. Also, changes in the dividend policies of the companies in an Underlying Index and the capital resources available for such companies’ dividend payments may affect a Fund.
Financial Sector Risk. The market value of securities of issuers in the financial sector can be affected by factors such as adverse regulatory or economic occurrences affecting the financial sector, availability of credit, fluctuations in asset values, unstable interest rates, increased competition, continuing consolidations and development of new products and structures. Furthermore, increased government involvement in financial institutions, including measures such as taking ownership positions in such institutions, could result in a dilution in the value of the shares held by shareholders in such institutions.
Foreign Securities Risk. Investments in foreign securities involve risks in addition to the risks associated with domestic securities. In general, foreign companies are not subject to the regulatory requirements of U.S. companies and, as such, there may be less publicly available information about these companies. Moreover, foreign companies often are subject to less stringent requirements regarding accounting, auditing, financial reporting and record-keeping than are U.S. companies. Therefore, not all material information regarding these companies will be available.
ADR and GDR Risk. Certain Funds may invest in American Depositary Receipts (“ADRs”) and Global Depositary Receipts (“GDRs”). ADRs are certificates that evidence ownership of shares of a foreign issuer and are alternatives to purchasing
directly the underlying foreign securities in their national markets and currencies. GDRs are certificates issued by an international bank that generally are traded and denominated in the currencies of countries other than the home country of the issuer of the underlying shares. ADRs and GDRs may be subject to certain of the risks associated with direct investments in the securities of foreign companies, such as currency, political, economic and market risks. Moreover, ADRs and GDRs may not track the price of the underlying foreign securities on which they are based, and their value may change materially at times when U.S. markets are not open for trading.
High Yield Securities Risk. High yield securities typically involve greater risk and are less liquid than higher grade issues. Changes in general economic conditions, changes in the financial condition of the issuers and changes in interest rates may adversely impact the ability of issuers of high yield securities to make timely payments of interest and principal.
Preferred Securities Risk. Certain Funds face special risks associated with investing in preferred securities. Preferred securities may include provisions that permit the issuer, in its discretion, to defer or omit distributions for a certain period of time. If the Fund owns a security that is deferring or omitting its distributions, the Fund may be required to report the distribution on its tax returns, even though it may not have received this income. Further, preferred securities may lose substantial value due to the omission or deferment of dividend payments. Preferred securities may be less liquid than many other securities, such as common stocks, and generally offer no voting rights with respect to the issuer. Preferred securities also may be subordinated to bonds or other debt instruments in an issuer’s capital structure, subjecting them to a greater risk ofnon-payment than more senior securities. In addition, in certain circumstances, an issuer of preferred securities may redeem the securities prior to a specified date, and this may negatively impact the return of the security.
| C. | Investment Transactions and Investment Income — Investment transactions are accounted for on a trade date basis. Realized gains and losses from the sale or disposition of securities are computed on the specific identified cost basis. Interest income is recorded on the accrual basis from settlement date.Pay-in-kind interest income andnon-cash dividend income received in the form of securitiesin-lieu of cash are recorded at the fair value of the securities received. Dividend income (net of withholding tax, if any) is recorded on theex-dividend date. Realized gains, dividends and interest received by a Fund may give rise to withholding and other taxes imposed by foreign countries. Tax conventions between certain countries and the United States may reduce or eliminate such taxes. |
The Funds may periodically participate in litigation related to each Fund’s investments. As such, the Funds may receive proceeds from litigation settlements. Any proceeds received are included in the Statements of Operations as realized gain (loss) for investments no longer held and as unrealized gain (loss) for investments still held.
Brokerage commissions and mark ups are considered transaction costs and are recorded as an increase to the cost basis of securities purchased and/or a reduction of proceeds on a sale of securities. Such transaction costs are included in the determination of net realized and unrealized gain (loss) from investment securities reported in the Statements of Operations and the Statements of Changes in Net Assets and the net realized and unrealized gains (losses) on securities per share in the Financial Highlights. Transaction costs are included in the calculation of each Fund’s NAV and, accordingly, they reduce each Fund’s total returns. These transaction costs are not considered operating expenses and are not reflected in net investment income reported in the Statements of Operations and the Statements of Changes in Net Assets, or the net investment income per share and the ratios of expenses and net investment income reported in the Financial Highlights, nor are they limited by any expense limitation arrangements between each Fund and the Adviser.
| D. | Country Determination — For the purposes of presentation in the Schedules of Investments, the Adviser may determine the country in which an issuer is located and/or credit risk exposure based on various factors. These factors include whether each Fund’s Underlying Index has made a country determination and may include the laws of the country under which the issuer is organized, where the issuer maintains a principal office, the country in which the issuer derives 50% or more of its total revenues and the country that has the primary market for the issuer’s securities, as well as other criteria. Among the other criteria that may be evaluated for making this determination are the country in which the issuer maintains 50% or more of its assets, the type of security, financial guarantees and enhancements, the nature of the collateral and the sponsor organization. Country of issuer and/or credit risk exposure has been determined to be the United States of America, unless otherwise noted. |
| E. | Dividends and Distributions to Shareholders — Each Fund (except for Financial Preferred ETF and High Yield Equity Dividend Achievers™ ETF, which declare and pay dividends from net investment income, if any, monthly) declares and pays dividends from net investment income, if any, to its shareholders quarterly and records such dividends onex-dividend date. Generally, each Fund distributes net realized taxable capital gains, if any, annually in cash and records them onex-dividend date. Such distributions on a tax basis are determined in conformity with federal income tax regulations, which may differ from accounting principles generally accepted in the United States of America (“GAAP”). Distributions in excess of tax basis earnings and profits, if any, are reported in such Fund’s financial statements as a tax return of capital at fiscalyear-end. |
| F. | Federal Income Taxes — Each Fund intends to comply with the provisions of the Internal Revenue Code of 1986, as amended (the “Internal Revenue Code”), applicable to regulated investment companies and to distribute substantially all of the Fund’s taxable earnings to its shareholders. As such, the Funds will not be subject to federal income taxes on otherwise taxable income (including net realized gains) that is distributed to the shareholders. Therefore, no provision for federal income taxes is recorded in the financial statements. |
Each Fund recognizes the tax benefits of uncertain tax positions only when the position is more likely than not to be sustained. Management has analyzed each Fund’s uncertain tax positions and concluded that no liability for unrecognized tax
benefits should be recorded related to uncertain tax positions. Management is not aware of any tax positions for which it is reasonably possible that the total amounts of unrecognized tax benefits will change materially in the next 12 months.
Income and capital gain distributions are determined in accordance with federal income tax regulations, which may differ from GAAP. These differences are primarily due to differing book and tax treatments forin-kind transactions, losses deferred due to wash sales, and passive foreign investment company adjustments, if any.
The Funds file U.S. federal tax returns and tax returns in certain other jurisdictions. Generally, a Fund is subject to examinations by such taxing authorities for up to three years after the filing of the return for the tax period.
| G. | Expenses — Expenses of the Trust that are directly identifiable to a specific Fund are applied to that Fund. Expenses of the Trust that are not readily identifiable to a specific Fund are allocated in such a manner as deemed equitable, taking into consideration the nature and type of expense and the relative net assets of each Fund. |
Each Fund (except for Dow Jones Industrial Average Dividend ETF) is responsible for all of its expenses, including the investment advisory fees, costs of transfer agency, custody, fund administration, legal, audit and other services, interest, taxes, brokerage commissions and other expenses connected with executions of portfolio transactions,sub-licensing fees related to its respective Underlying Index, any distribution fees or expenses, litigation expenses, fees payable to the Trust’s Board members who are not “interested persons” (as defined in the 1940 Act) of the Trust (the “Independent Trustees”), or the Adviser, expenses incurred in connection with the Board members’ services, including travel expenses and legal fees of counsel for the Independent Trustees, acquired fund fees and expenses, if any, and extraordinary expenses.
Dow Jones Industrial Average Dividend ETF has agreed to pay an annual unitary management fee to the Adviser. Out of the unitary management fee, the Adviser has agreed to pay for substantially all expenses of the Fund, including the costs of transfer agency, custody, fund administration, legal, audit and other services, except for advisory fees, distribution fees, if any, brokerage expenses, taxes, interest, acquired fund fees and expenses, if any, litigation expenses and other extraordinary expenses.
To the extent a Fund invests in other investment companies, the expenses shown in the accompanying financial statements reflect the expenses of the Fund and do not include any expenses of the investment companies in which it invests. The effects of such investment companies’ expenses are included in the realized and unrealized gain or loss on the investments in the investment companies.
| H. | Accounting Estimates — The preparation of the financial statements in accordance with GAAP requires management to make estimates and assumptions that affect the reported amounts and disclosures in the financial statements, including estimates and assumptions related to taxation. Actual results could differ from these estimates. In addition, the Funds monitor for material events or transactions that may occur or become known after theperiod-end date and before the date the financial statements are released to print. |
| I. | Indemnifications — Under the Trust’s organizational documents, its Officers and Trustees are indemnified against certain liabilities arising out of the performance of their duties to the Trust. Each Independent Trustee is also indemnified against certain liabilities arising out of the performance of his duties to the Trust pursuant to an Indemnification Agreement between such trustee and the Trust. Additionally, in the normal course of business, the Trust enters into contracts with service providers that contain general indemnification clauses. The Trust’s maximum exposure under these arrangements is unknown, as this would involve future claims that may be made against the Trust that have not yet occurred. However, based on experience, the Trust believes the risk of loss to be remote. |
| J. | Securities Lending — During the fiscal year ended April 30, 2019, each Fund (except for Dow Jones Industrial Average Dividend ETF) participated in securities lending. Each Fund loaned portfolio securities having a market value up toone-third of each Fund’s total assets. Such loans are secured by cash collateral equal to no less than 102% (105% for international securities) of the market value of the loaned securities determined daily by the securities lending provider. Cash collateral received in connection with these loans is generally invested in an affiliated money market fund and is shown as such on the Schedules of Investments. Each Fund bears the risk of loss with respect to the investment of collateral. It is the policy of these Funds to obtain additional collateral from or return excess collateral to the borrower by the end of the next business day, following the valuation date of the securities loaned. Therefore, the value of the collateral held may be temporarily less than the value of the securities on loan. When loaning securities, each Fund retains certain benefits of owning the securities, including the economic equivalent of dividends or interest generated by the security. Lending securities entails a risk of loss to each Fund if, and to the extent that, the market value of the securities loaned were to increase, and the borrower did not increase the collateral accordingly, and the borrower failed to return the securities. The securities loaned are subject to termination at the option of the borrower or each Fund. Upon termination, the borrower will return to each Fund the securities loaned and each Fund will return the collateral. Upon the failure of the borrower to return the securities, collateral may be liquidated and the securities may be purchased on the open market to replace the loaned securities. Each Fund could experience delays and costs in gaining access to the collateral and the securities may lose value during the delay which could result in potential losses to each Fund. Some of these losses may be indemnified by the lending agent. Each Fund bears the risk of any deficiency in the amount of the collateral available for return to the borrower due to any loss on the collateral invested. Dividends received on cash collateral investments for securities lending transactions, which are net of compensation to counterparties, are included inSecurities lending incomeon the Statements of Operations. The aggregate value of securities out on loan, if any, is shown on the Statements of Assets and Liabilities. |
| K. | Distributions from Distributable Earnings — In accordance with the Securities and Exchange Commission’s issuance of Disclosure Update and Simplification, the Funds have presented the total, rather than the components, of distributions to shareholders, except for tax return of capital distributions, if any, in the Statements of Changes in Net Assets. |
For the year ended April 30, 2018 (the eight months ended April 30, 2018, for the Dow Jones Industrial Average Dividend ETF) distributions from distributable earnings consisted of:
| | | | | | | | |
| | | Distributions to
Shareholders from net
investment income | | | Distributions to
Shareholders from net
realized gains | |
| BuyBack AchieversTMETF | | $ | 10,919,625 | | | $ | — | |
| Dividend AchieversTMETF | | | 6,412,491 | | | | — | |
| Dow Jones Industrial Average Dividend ETF* | | | 238,620 | | | | 31,760 | |
| Financial Preferred ETF | | | 88,485,717 | | | | — | |
| High Yield Equity Dividend AchieversTMETF | | | 32,704,666 | | | | — | |
| International Dividend AchieversTMETF | | | 32,348,073 | | | | — | |
| * | For the fiscal year ended August 31, 2017, distributions from distributable earnings consisted of distributions from net investment income. |
NOTE 3—Investment Advisory Agreement and Other Agreements
The Trust has entered into Investment Advisory Agreements with the Adviser on behalf of the Funds, pursuant to which the Adviser has overall responsibility for the selection and ongoing monitoring of the Funds’ investments, managing the Funds’ business affairs and providing certain clerical, bookkeeping and other administrative services. Pursuant to an Investment Advisory Agreement, each Fund (except Dow Jones Industrial Average Dividend ETF) accrues daily and pays monthly to the Adviser an annual fee of 0.40% of the Fund’s average daily net assets, except for BuyBack AchieversTM ETF and Financial Preferred ETF, each of which accrues daily and pays monthly to the Adviser an annual fee of 0.50% of the Fund’s average daily net assets.
Pursuant to another Investment Advisory Agreement, Dow Jones Industrial Average Dividend ETF accrues daily and pays monthly to the Adviser, as compensation for its services, an annual unitary management fee of 0.07% of the Fund’s average daily net assets. Prior to August 20, 2018, the Fund’s annual unitary management fee was 0.30%. For the period August 20, 2018 to September 24, 2018, the Adviser voluntarily agreed to permanently waive a portion of the Fund’s unitary management fee. After giving effect to such waiver, the net unitary management fee was 0.07%. Effective September 24, 2018, the Adviser contractually reduced the Fund’s unitary management fee from 0.30% to 0.07%. Out of the unitary management fee, the Adviser has agreed to pay for substantially all expenses of the Dow Jones Industrial Average Dividend ETF, including the cost of transfer agency, custody, fund administration, legal, audit and other services, except for advisory fees, distribution fees, if any, brokerage expenses, taxes, interest, acquired fund fees and expenses, if any, litigation expenses and other extraordinary expenses.
The Trust also has entered into an Amended and Restated Excess Expense Agreement (the “Expense Agreement”) with the Adviser on behalf of each Fund (except Dow Jones Industrial Average Dividend ETF), pursuant to which the Adviser has agreed to waive fees and/or pay Fund expenses to the extent necessary to prevent the operating expenses (excluding interest expenses, brokerage commissions and other trading expenses,sub-licensing fees, offering costs, taxes, acquired fund fees and expenses, if any, and extraordinary expenses) of each Fund (except for BuyBack Achievers™ ETF and Financial Preferred ETF) from exceeding 0.50% of the Fund’s average daily net assets per year (0.60% of the Fund’s average daily net assets per year for BuyBack Achievers™ ETF and Financial Preferred ETF) (the “Expense Cap”), through at least August 31, 2021. Unless the Adviser continues the Expense Agreement, it will terminate on August 31, 2021. During its term, the Expense Agreement cannot be terminated or amended to increase the Expense Cap without approval of the Board of Trustees. For each Fund (excluding the Dow Jones Industrial Average Dividend ETF), the Adviser did not waive fees and/or pay Fund expenses during the period under this Expense Cap.
Further, through August 31, 2021, the Adviser has contractually agreed to waive a portion of each Fund’s management fee in an amount equal to 100% of the net advisory fees an affiliate of the Adviser receives that are attributable to certain of the Fund’s investments in money market funds managed by that affiliate (excluding investments of cash collateral from securities lending). The Adviser cannot discontinue this waiver prior to its expiration. This agreement is not subject to recapture by the Adviser.
For the fiscal year ended April 30, 2019, the Adviser waived fees and/or paid Fund expenses for each Fund in the following amounts:
| | | | |
| BuyBack AchieversTMETF | | $ | 2,143 | |
| Dividend AchieversTMETF | | | 548 | |
| Dow Jones Industrial Average Dividend ETF | | | 3,250 | |
| Financial Preferred ETF | | | 10,761 | |
| High Yield Equity Dividend AchieversTMETF | | | 1,114 | |
| International Dividend AchieversTMETF | | | 1,122 | |
The fees waived and/or expenses borne by the Adviser, pursuant to the Expense Cap, are subject to recapture by the Adviser up to three years from the date the fees were waived or the expenses were incurred, but no recapture payment will be made by the Funds if it would result in the Funds exceeding (i) the Expense Cap or (ii) the expense cap in effect at the time the fees and/or expenses subject to recapture were waived and/or borne by the Adviser.
For the fiscal year ended April 30, 2019, there were no amounts available for potential recapture by the Adviser under the Expense Agreement.
The Trust has entered into a Distribution Agreement with Invesco Distributors, Inc. (the “Distributor”), which serves as the distributor of Creation Units for each Fund. The Distributor does not maintain a secondary market in the Shares. The Funds are not charged any fees pursuant to the Distribution Agreement. The Distributor is an affiliate of the Adviser.
The Adviser has entered into a licensing agreement for each Fund with the following entities (each, a “Licensor”):
| | |
Fund | | Licensor |
| BuyBack AchieversTMETF | | Nasdaq, Inc. |
| Dividend AchieversTMETF | | Nasdaq, Inc. |
| Dow Jones Industrial Average Dividend ETF | | S&P Dow Jones Indices LLC |
| Financial Preferred ETF | | Wells Fargo & Company |
| High Yield Equity Dividend AchieversTMETF | | Nasdaq, Inc. |
| International Dividend AchieversTMETF | | Nasdaq, Inc. |
Each Underlying Index name trademark is owned by its respective Licensor. These trademarks have been licensed to the Adviser for use by the Funds. Each Fund is entitled to use its Underlying Index pursuant to the Trust’ssub-licensing agreement with the Adviser. The Funds (except for Dow Jones Industrial Average Dividend ETF) are required to pay thesub-licensing fees that are shown on the Statements of Operations. The Funds are not sponsored, endorsed, sold or promoted by the Licensors, and the Licensors make no representation regarding the advisability of investing in any of the Funds.
The Trust has entered into service agreements whereby The Bank of New York Mellon, a wholly-owned subsidiary of The Bank of New York Mellon Corporation, serves as the administrator, custodian, fund accountant and transfer agent for each Fund.
NOTE 4—Investments in Affiliates
The Adviser is a wholly-owned subsidiary of Invesco Ltd. and therefore, Invesco Ltd. is considered to be affiliated with the Funds. The tables below show certain Funds’ transactions in, and earnings from, investments in affiliates (excluding affiliated money market funds) for the fiscal year ended April 30, 2019.
Dividend AchieversTM ETF
| | | | | | | | | | | | | | | | | | | | | | | | | | | | |
| | | Value
April 30, 2018 | | | Purchases
at Cost | | | Proceeds
from Sales | | | Change in
Unrealized
Appreciation
(Depreciation) | | | Realized
Gain
(Loss) | | | Value
April 30, 2019 | | | Dividend
Income | |
| Invesco Ltd. | | $ | 462,014 | | | $ | 64,434 | | | $ | (113,215 | ) | | $ | (49,454 | ) | | $ | (66,217 | ) | | $ | 297,562 | | | $ | 19,384 | |
High Yield Equity Dividend AchieversTMETF
| | | | | | | | | | | | | | | | | | | | | | | | | | | | |
| | | Value
April 30, 2018 | | | Purchases
at Cost | | | Proceeds
from Sales | | | Change in
Unrealized
Appreciation
(Depreciation) | | | Realized
Gain
(Loss) | | | Value
April 30, 2019 | | | Dividend
Income | |
| Invesco Ltd. | | $ | 12,024,665 | | | $ | 20,866,622 | | | $ | (2,719,198 | ) | | $ | (1,666,544 | ) | | $ | (812,733 | ) | | $ | 27,692,812 | | | $ | 883,335 | |
NOTE 5—Security Transactions with Affiliated Funds
Each Fund is permitted to purchase or sell securities from or to certain other affiliated funds under specified conditions outlined in procedures adopted by the Board of Trustees of the Trust. The procedures have been designed to ensure that any purchase or sale of securities by each Fund from or to another fund or portfolio that is or could be considered an affiliate by virtue of having a common investment adviser (or affiliated investment advisers), common Trustees and/or common officers complies with Rule17a-7 of the 1940 Act. Further, as defined under the procedures, each transaction is effected at the current market price. For the fiscal year ended April 30, 2019, the following Fund engaged in transactions with affiliates as listed below:
| | | | | | | | | | | | |
| | | Securities
Purchases | | | Securities
Sales | | | Net Realized
Gain (Loss) | |
| Financial Preferred ETF | | $ | 2,322,057 | | | $ | 11,332,750 | | | $ | (682,700 | ) |
NOTE 6—Additional Valuation Information
GAAP defines fair value as the price that would be received to sell an asset or paid to transfer a liability in an orderly transaction between market participants at the measurement date, under current market conditions. GAAP establishes a hierarchy that prioritizes the inputs to valuation methods, giving the highest priority to readily available unadjusted quoted prices in an active market for identical assets (Level 1) and the lowest priority to significant unobservable inputs (Level 3), generally when market prices are not readily available or are unreliable. Based on the valuation inputs, the securities or other investments are tiered into one of three levels. Changes in valuation methods may result in transfers in or out of an investment’s assigned level:
| | Level 1 — | Prices are determined using quoted prices in an active market for identical assets. |
| | Level 2 — | Prices are determined using other significant observable inputs. Observable inputs are inputs that other market participants may use in pricing a security. These may include quoted prices for similar securities, interest rates, prepayment speeds, credit risk, yield curves, loss severities, default rates, discount rates, volatilities and others. |
| | Level 3 — | Prices are determined using significant unobservable inputs. In situations where quoted prices or observable inputs are unavailable (for example, when there is little or no market activity for an investment at the end of the period), unobservable inputs may be used. Unobservable inputs reflect a Fund’s own assumptions about the factors market participants would use in determining fair value of the securities or instruments and would be based on the best available information. |
As of April 30, 2019, all of the securities in each Fund were valued based on Level 1 inputs (see the Schedules of Investments for security categories). The level assigned to the securities valuations may not be an indication of the risk or liquidity associated with investing in those securities. Because of the inherent uncertainties of valuation, the values reflected in the financial statements may materially differ from the value received upon actual sale of those investments.
NOTE 7—Distributions to Shareholders and Tax Components of Net Assets
Tax Character of Distributions to Shareholders Paid During the Years Ended April 30, 2019 and April 30, 2018 (for the eight months ended April 30, 2018 and the fiscal year ended August 31, 2017 for the Dow Jones Industrial Average Dividend ETF):
| | | | | | | | | | | | | | | | |
| | | 2019 | | | 2018 | | | 2017 | |
| | | Ordinary
Income | | | Ordinary
Income | | | Long-Term
Capital Gains | | | Ordinary
Income | |
| BuyBack AchieversTMETF | | $ | 15,899,340 | | | $ | 10,919,625 | | | $ | — | | | $ | — | |
| Dividend AchieversTMETF | | | 6,637,686 | | | | 6,412,491 | | | | — | | | | — | |
| Dow Jones Industrial Average Dividend ETF | | | 954,129 | | | | 269,203 | | | | 1,177 | | | | 179,295 | |
| Financial Preferred ETF | | | 82,129,730 | | | | 88,485,717 | | | | — | | | | — | |
| High Yield Equity Dividend AchieversTMETF | | | 29,155,112 | | | | 32,704,666 | | | | — | | | | — | |
| International Dividend AchieversTMETF | | | 26,698,616 | | | | 32,348,073 | | | | — | | | | — | |
Tax Components of Net Assets at FiscalYear-End:
| | | | | | | | | | | | | | | | | | | | | | | | | | | | |
| | | Undistributed
Ordinary
Income | | | Temporary
Book/Tax
Differences | | | Net
Unrealized
Appreciation—
Investments | | | Net Unrealized
Appreciation—
Other Investments | | | Capital Loss
Carryforwards | | | Shares of
Beneficial
Interest | | | Total Net
Assets | |
| BuyBack AchieversTM ETF | | $ | 2,521,655 | | | $ | (116,704 | ) | | $ | 74,946,966 | | | $ | — | | | $ | (338,567,311 | ) | | $ | 1,574,618,946 | | | $ | 1,313,403,552 | |
| Dividend AchieversTM ETF | | | 853,347 | | | | (50,835 | ) | | | 75,636,134 | | | | — | | | | (3,196,490 | ) | | | 226,232,842 | | | | 299,474,998 | |
| Dow Jones Industrial Average Dividend ETF | | | 121,536 | | | | — | | | | 2,194,532 | | | | — | | | | (535,944 | ) | | | 72,187,355 | | | | 73,967,479 | |
| Financial Preferred ETF | | | — | | | | (168,793 | ) | | | 14,068,469 | | | | — | | | | (17,575,571 | ) | | | 1,389,449,370 | | | | 1,385,773,475 | |
| High Yield Equity Dividend AchieversTMETF | | | — | | | | (65,063 | ) | | | 18,283,451 | | | | — | | | | (50,777,099 | ) | | | 866,782,349 | | | | 834,223,638 | |
| International Dividend AchieversTMETF | | | 6,501,617 | | | | (104,491 | ) | | | 36,087,118 | | | | 130 | | | | (330,409,789 | ) | | | 1,054,208,489 | | | | 766,283,074 | |
Capital loss carryforwards are calculated and reported as of a specific date. Results of transactions and other activity after that date may affect the amount of capital loss carryforwards actually available for the Funds to utilize. Capital losses generated in years beginning after December 22, 2010 can be carried forward for an unlimited period, whereas previous losses expire in eight tax years. Capital losses with an expiration period may not be used to offset capital gains until all net capital losses without an expiration date have been utilized. Capital loss carryforwards with no expiration date will retain their character as either short-term or long-term capital losses instead of as short-term capital losses as under prior law. The ability to utilize capital loss carryforwards in the future may be limited under the Internal Revenue Code and related regulations based on the results of future transactions.
The following table presents available capital loss carryforwards for each Fund as of April 30, 2019:
| | | | | | | | | | | | |
| | | Post-effective/no expiration | | | | |
| | | Short-Term | | | Long-Term | | | Total* | |
| BuyBack AchieversTMETF | | $ | 246,203,824 | | | $ | 92,363,487 | | | $ | 338,567,311 | |
| Dividend AchieversTMETF | | | 384,638 | | | | 2,811,852 | | | | 3,196,490 | |
| Dow Jones Industrial Average Dividend ETF | | | 229,761 | | | | 306,183 | | | | 535,944 | |
| Financial Preferred ETF | | | 3,095,153 | | | | 14,480,418 | | | | 17,575,571 | |
| High Yield Equity Dividend AchieversTMETF | | | — | | | | 50,777,099 | | | | 50,777,099 | |
| International Dividend AchieversTMETF | | | 145,230,681 | | | | 185,179,108 | | | | 330,409,789 | |
| * | Capital loss carryforward as of the date listed above is reduced for limitations, if any, to the extent required by the Internal Revenue Code and may be further limited depending upon a variety of factors, including the realization of net unrealized gains or losses as of the date of any reorganization. |
NOTE 8—Investment Transactions
For the fiscal year ended April 30, 2019, the cost of securities purchased and proceeds from sales of securities (other than short-term securities, U.S. Treasury obligations, money market funds andin-kind transactions, if any) were as follows:
| | | | | | | | |
| | | Purchases | | | Sales | |
| BuyBack AchieversTMETF | | $ | 1,006,396,527 | | | $ | 960,874,066 | |
| Dividend AchieversTMETF | | | 40,019,975 | | | | 38,776,203 | |
| Dow Jones Industrial Average Dividend ETF | | | 8,168,644 | | | | 9,147,177 | |
| Financial Preferred ETF | | | 304,259,554 | | | | 325,270,150 | |
| High Yield Equity Dividend AchieversTMETF | | | 380,245,147 | | | | 379,694,679 | |
| International Dividend AchieversTMETF | | | 362,015,182 | | | | 361,988,269 | |
For the fiscal year ended April 30, 2019,in-kind transactions associated with creations and redemptions were as follows:
| | | | | | | | |
| | | Cost of
Securities
Received | | | Value of
Securities
Delivered | |
| BuyBack AchieversTMETF | | $ | 949,817,649 | | | $ | 1,113,248,733 | |
| Dividend AchieversTMETF | | | 52,209,112 | | | | 75,243,894 | |
| Dow Jones Industrial Average Dividend ETF | | | 160,161,046 | | | | 110,197,945 | |
| Financial Preferred ETF | | | 249,129,675 | | | | 413,839,205 | |
| High Yield Equity Dividend AchieversTMETF | | | 308,021,253 | | | | 286,246,053 | |
| International Dividend AchieversTMETF | | | 118,338,553 | | | | 236,097,222 | |
Gains (losses) onin-kind transactions are generally not considered taxable gains (losses) for federal income tax purposes. At April 30, 2019, the aggregate cost of investments, including any derivatives, on a tax basis includes adjustments for financial reporting purposes as of the most recently completed federal income tax reportingperiod-end:
| | | | | | | | | | | | | | | | |
| | | Gross
Unrealized
Appreciation | | | Gross
Unrealized
(Depreciation) | | | Net
Unrealized
Appreciation
(Depreciation) | | | Cost | |
| BuyBack AchieversTMETF | | $ | 107,194,992 | | | $ | (32,248,026 | ) | | $ | 74,946,966 | | | $ | 1,243,695,838 | |
| Dividend AchieversTMETF | | | 80,651,873 | | | | (5,015,739 | ) | | | 75,636,134 | | | | 224,463,664 | |
| Dow Jones Industrial Average Dividend ETF | | | 4,097,604 | | | | (1,903,072 | ) | | | 2,194,532 | | | | 71,692,613 | |
| Financial Preferred ETF | | | 23,619,314 | | | | (9,550,845 | ) | | | 14,068,469 | | | | 1,384,863,792 | |
| High Yield Equity Dividend AchieversTMETF | | | 56,210,785 | | | | (37,927,334 | ) | | | 18,283,451 | | | | 823,560,650 | |
| International Dividend AchieversTMETF | | | 59,902,854 | | | | (23,815,736 | ) | | | 36,087,118 | | | | 783,570,136 | |
NOTE 9—Reclassification of Permanent Differences
Primarily as a result of differing book/tax treatment ofin-kind transactions and expired capital loss carryforwards, amounts were reclassified between undistributed net investment income (loss), undistributed net realized gain (loss) and Shares of beneficial interest. These reclassifications had no effect on the net assets of each Fund. For the fiscal year ended April 30, 2019, the reclassifications were as follows:
| | | | | | | | | | | | |
| | | Undistributed
Net Investment
Income (Loss) | | | Undistributed
Net Realized
Gain (Loss) | | | Shares of
Beneficial
Interest | |
| BuyBack AchieversTMETF | | $ | — | | | $ | (70,642,817 | ) | | $ | 70,642,817 | |
| Dividend AchieversTMETF | | | (119,194 | ) | | | (25,833,576 | ) | | | 25,952,770 | |
| Dow Jones Industrial Average Dividend ETF | | | — | | | | (8,003,236 | ) | | | 8,003,236 | |
| Financial Preferred ETF | | | 2,891,955 | | | | (6,613,337 | ) | | | 3,721,382 | |
| High Yield Equity Dividend AchieversTMETF | | | 1,887,452 | | | | (28,352,121 | ) | | | 26,464,669 | |
| International Dividend AchieversTMETF | | | 1,466,777 | | | | (30,117,675 | ) | | | 28,650,898 | |
NOTE 10—Trustees’ and Officer’s Fees
Trustees’ and Officer’s Fees include amounts accrued by the Funds to pay remuneration to the Independent Trustees and an Officer of the Trust. The Adviser, as a result of the unitary management fee, pays for such compensation for Dow Jones Industrial Average Dividend ETF. The Trustee who is an “interested person” of the Trust does not receive any Trustees’ fees.
The Trust has adopted a deferred compensation plan (the “Plan”). Under the Plan, each Independent Trustee who has executed a Deferred Fee Agreement (a “Participating Trustee”) may defer receipt of all or a portion of his compensation (“Deferral Fees”). Such Deferral Fees are deemed to be invested in select Invesco Funds. The Deferral Fees payable to the Participating Trustee are valued as of the date such Deferral Fees would have been paid to the Participating Trustee. The value increases with contributions or with increases in the value of the Shares selected, and the value decreases with distributions or with declines in the value of the Shares selected. Obligations under the Plan represent unsecured claims against the general assets of the Funds.
NOTE 11—Capital
Shares are created and redeemed by each Fund only in Creation Units of 50,000 Shares. Only Authorized Participants are permitted to purchase or redeem Creation Units from the Funds. Such transactions are principally permitted in exchange for Deposit Securities, with a balancing cash component to equate the transaction to the NAV per Share of a Fund of the Trust on the transaction date. However, for all Funds, cash in an amount equivalent to the value of certain securities may be substituted, generally when the securities are not available in sufficient quantity for delivery, not eligible for trading by the Authorized Participant or as a result of other market circumstances.
To the extent that the Funds permit transactions in exchange for Deposit Securities, each Fund may issue Shares in advance of receipt of Deposit Securities subject to various conditions, including a requirement to maintain on deposit with the Trust cash at least equal to 105% of the market value of the missing Deposit Securities. In accordance with the Trust’s Participant Agreement, Creation Units will be issued to an Authorized Participant, notwithstanding the fact that the corresponding Deposit Securities have not been received in part or in whole, in reliance on the undertaking of the Authorized Participant to deliver the missing Deposit Securities as soon as possible, which undertaking shall be secured by the Authorized Participant’s delivery and maintenance of collateral consisting of cash in the form of U.S. dollars in immediately available funds having a value(marked-to-market daily) at least equal to 105%, which the Adviser may change from time to time, of the value of the missing Deposit Securities.
Certain transaction fees may be charged by the Funds for creations and redemptions, which are treated as increases in capital. Transactions in each Fund’s Shares are disclosed in detail in the Statements of Changes in Net Assets.
Report of Independent Registered Public Accounting Firm
To the Board of Trustees of Invesco Exchange-Traded Fund Trust and Shareholders of Invesco BuyBack AchieversTM ETF, Invesco Dividend AchieversTM ETF, Invesco Dow Jones Industrial Average Dividend ETF, Invesco Financial Preferred ETF, Invesco High Yield Equity Dividend AchieversTM ETF and Invesco International Dividend AchieversTM ETF:
Opinions on the Financial Statements
We have audited the accompanying statements of assets and liabilities, including the schedules of investments, of Invesco BuyBack AchieversTM ETF, Invesco Dividend AchieversTM ETF, Invesco Dow Jones Industrial Average Dividend ETF, Invesco Financial Preferred ETF, Invesco High Yield Equity Dividend AchieversTM ETF and Invesco International Dividend AchieversTM ETF (six of the funds constituting Invesco Exchange-Traded Fund Trust, hereafter collectively referred to as the “Funds”) as of April 30, 2019, the related statements of operations for the year ended April 30, 2019, the statements of changes in net assets for each of the two years in the period ended April 30, 2019 (or for Invesco Dow Jones Industrial Average Dividend ETF, for the year ended April 30, 2019 and for the eight months ended April 30, 2018), including the related notes, and the financial highlights for each of the five years in the period ending April 30, 2019 (or for Invesco Dow Jones Industrial Average Dividend ETF, for the year ended April 30, 2019 and for the eight months ended April 30, 2018) (collectively referred to as the “financial statements”). In our opinion, the financial statements present fairly, in all material respects, the financial position of each of the Funds as of April 30, 2019, the results of each of their operations for the year then ended, the changes in each of their net assets for each of the two years in the period ended April 30, 2019 (or for Invesco Dow Jones Industrial Average Dividend ETF, for the year ended April 30, 2019 and for the eight months ended April 30, 2018), and each of the financial highlights for each of the five years in the period ended April 30, 2019 (or for Invesco Dow Jones Industrial Average Dividend ETF, for the year ended April 30, 2019 and for the eight months ended April 30, 2018), in conformity with accounting principles generally accepted in the United States of America.
The financial statements of Invesco Dow Jones Industrial Average Dividend ETF (Predecessor Fund Guggenheim Dow Jones Industrial Average Dividend ETF) as of and for the year ended August 31, 2017 and the financial highlights for each of the periods ended on or prior to August 31, 2017 (not presented herein, other than the statement of changes in net assets and the financial highlights) were audited by other auditors whose report dated October 30, 2017, expressed an unqualified opinion on those financial statements and financial highlights.
Basis for Opinions
These financial statements are the responsibility of the Funds’ management. Our responsibility is to express an opinion on the Funds’ financial statements based on our audits. We are a public accounting firm registered with the Public Company Accounting Oversight Board (United States) (“PCAOB”) and are required to be independent with respect to the Funds in accordance with the U.S. federal securities laws and the applicable rules and regulations of the Securities and Exchange Commission and the PCAOB.
We conducted our audits of these financial statements in accordance with the standards of the PCAOB. Those standards require that we plan and perform the audit to obtain reasonable assurance about whether the financial statements are free of material misstatement, whether due to error or fraud.
Our audits included performing procedures to assess the risks of material misstatement of the financial statements, whether due to error or fraud, and performing procedures that respond to those risks. Such procedures included examining, on a test basis, evidence regarding the amounts and disclosures in the financial statements. Our audits also included evaluating the accounting principles used and significant estimates made by management, as well as evaluating the overall presentation of the financial statements. Our procedures included confirmation of securities owned as of April 30, 2019 by correspondence with the custodian, transfer agent and brokers; when replies were not received from brokers, we performed other auditing procedures. We believe that our audits provide a reasonable basis for our opinions.
PricewaterhouseCoopers LLP
Chicago, Illinois
June 26, 2019
We have served as the auditor of one or more of the investment companies in the Invesco group of investment companies since at least 1995. We have not determined the specific year we began serving as auditor.
Calculating your ongoing Fund expenses
Example
As a shareholder of a Fund of the Invesco Exchange-Traded Fund Trust (excluding Dow Jones Industrial Average Dividend ETF), you incur advisory fees and other Fund expenses. As a shareholder of the Dow Jones Industrial Average Dividend ETF, you incur a unitary management fee. In addition to the unitary management fee, a shareholder may pay distribution fees, if any, brokerage expenses, taxes, interest, acquired fund fees and expenses, if any, litigation expenses and other extraordinary expenses. The expense examples below are intended to help you understand your ongoing costs (in dollars) of investing in the Funds and to compare these costs with the ongoing costs of investing in other funds.
The example is based on an investment of $1,000 invested at the beginning of the period and held through thesix-month period ended April 30, 2019.
Actual Expenses
The first line in the following table provides information about actual account values and actual expenses. You may use the information in this line, together with the amount you invested, to estimate the expenses that you paid over the period. Simply divide your account value by $1,000 (for example, an $8,600 account value divided by $1,000 = 8.6), then multiply the result by the number in the first line under the heading “Expenses Paid During theSix-Month Period” to estimate the expenses you paid on your account during this period.
Hypothetical Example for Comparison Purposes
The second line in the following table provides information about hypothetical account values and hypothetical expenses based on each Fund’s actual expense ratio and an assumed annualized rate of return of 5% per year before expenses, which is not the Fund’s actual return. The hypothetical account values and expenses may not be used to estimate the actual ending account balance or expenses you paid for the period. You may use this information to compare the ongoing costs of investing in the Funds and other funds. To do so, compare this 5% hypothetical example with the 5% hypothetical examples that appear in the shareholder reports of the other funds.
Please note that the expenses shown in the table are meant to highlight your ongoing costs only, and do not reflect any transactional costs, such as sales charges and brokerage commissions. Therefore, the second line in the table is useful in comparing ongoing costs only, and will not help you determine the relative total costs of owning different funds. In addition, expenses shown in the table do not include the expenses of the underlying funds, which are borne indirectly by a Fund. If transaction costs and indirect expenses were included, your costs would have been higher.
| | | | | | | | | | | | | | | | |
| | | Beginning
Account Value
November 1, 2018 | | | Ending
Account Value
April 30, 2019 | | | Annualized
Expense Ratio
Based on the
Six-Month Period | | | Expenses Paid
During the
Six-Month Period(1) | |
| Invesco BuyBack AchieversTMETF (PKW) | | | | | | | | | | | | | | | | |
Actual | | $ | 1,000.00 | | | $ | 1,105.90 | | | | 0.61 | % | | $ | 3.19 | |
Hypothetical (5% return before expenses) | | | 1,000.00 | | | | 1,021.77 | | | | 0.61 | | | | 3.06 | |
| Invesco Dividend AchieversTMETF (PFM) | | | | | | | | | | | | | | | | |
Actual | | | 1,000.00 | | | | 1,100.10 | | | | 0.54 | | | | 2.81 | |
Hypothetical (5% return before expenses) | | | 1,000.00 | | | | 1,022.12 | | | | 0.54 | | | | 2.71 | |
| Invesco Dow Jones Industrial Average Dividend ETF (DJD) | | | | | | | | | | | | | | | | |
Actual | | | 1,000.00 | | | | 1,079.40 | | | | 0.07 | | | | 0.36 | |
Hypothetical (5% return before expenses) | | | 1,000.00 | | | | 1,024.45 | | | | 0.07 | | | | 0.35 | |
| Invesco Financial Preferred ETF (PGF) | | | | | | | | | | | | | | | | |
Actual | | | 1,000.00 | | | | 1,056.20 | | | | 0.61 | | | | 3.11 | |
Hypothetical (5% return before expenses) | | | 1,000.00 | | | | 1,021.77 | | | | 0.61 | | | | 3.06 | |
| Invesco High Yield Equity Dividend AchieversTMETF (PEY) | | | | | | | | | | | | | | | | |
Actual | | | 1,000.00 | | | | 1,089.50 | | | | 0.51 | | | | 2.64 | |
Hypothetical (5% return before expenses) | | | 1,000.00 | | | | 1,022.27 | | | | 0.51 | | | | 2.56 | |
Calculating your ongoing Fund expenses (continued)
| | | | | | | | | | | | | | | | |
| | | Beginning
Account Value
November 1, 2018 | | | Ending
Account Value
April 30, 2019 | | | Annualized
Expense Ratio
Based on the
Six-Month Period | | | Expenses Paid
During the
Six-Month Period(1) | |
| Invesco International Dividend AchieversTMETF (PID) | | | | | | | | | | | | | | | | |
Actual | | $ | 1,000.00 | | | $ | 1,132.10 | | | | 0.53 | % | | $ | 2.80 | |
Hypothetical (5% return before expenses) | | | 1,000.00 | | | | 1,022.17 | | | | 0.53 | | | | 2.66 | |
| (1) | Expenses are calculated using the annualized expense ratio, which represents the ongoing expenses as a percentage of net assets for thesix-month period ended April 30, 2019. Expenses are calculated by multiplying the Fund’s annualized expense ratio by the average account value for the period, then multiplying the result by 181/365. Expense ratios for the most recentsix-month period may differ from expense ratios based on the annualized data in the Financial Highlights. |
Tax Information
Form1099-DIV, Form1042-S and other year–end tax information provide shareholders with actual calendar year amounts that should be included in their tax returns. Shareholders should consult their tax advisers.
The following distribution information is being provided as required by the Internal Revenue Code or to meet a specific state’s requirement.
Each Fund designates the following amounts or, if subsequently determined to be different, the maximum amount allowable for its fiscal year ended April 30, 2019:
| | | | | | | | | | |
| | | Qualified Dividend
Income* | | Dividends-Received
Deduction* |
| Invesco BuyBack AchieversTMETF | | | | 100 | % | | | | 100 | % |
| Invesco Dividend AchieversTMETF | | | | 100 | % | | | | 100 | % |
| Invesco Dow Jones Industrial Average Dividend ETF | | | | 87 | % | | | | 89 | % |
| Invesco Financial Preferred ETF | | | | 100 | % | | | | 91 | % |
| Invesco High Yield Equity Dividend AchieversTMETF | | | | 100 | % | | | | 100 | % |
| Invesco International Dividend AchieversTMETF | | | | 61 | % | | | | 0 | % |
| * | The above percentages are based on ordinary income dividends paid to shareholders during the fiscal year. |
The Funds intend to elect to pass through to shareholders the credit for taxes paid to foreign countries. The gross foreign source income and foreign taxes paid are as follows:
| | | | | | | | | | |
| | | Gross Foreign
Income | | Foreign Taxes
Paid |
| Invesco International Dividend AchieversTMETF | | | $ | 21,811,746 | | | | $ | 2,013,017 | |
Trustees and Officers
The Independent Trustees of the Trust, their term of office and length of time served, their principal business occupations during at least the past five years, the number of portfolios in the Fund Complex (as defined below) overseen by each Independent Trustee and the other directorships, if any, held by each Independent Trustee are shown below.
| | | | | | | | | | |
Name, Address and Year of
Birth of Independent Trustees | | Position(s)
Held
with Trust | | Term of
Office
and
Length of
Time
Served* | | Principal
Occupation(s) During
Past 5 Years | | Number of
Portfolios
in Fund
Complex**
Overseen by
Independent
Trustees | | Other
Directorships
Held by
Independent
Trustees During
the Past 5 Years |
Ronn R. Bagge—1958
c/o Invesco Capital Management LLC
3500 Lacey Road, Suite 700
Downers Grove, IL 60515 | | Vice Chairman of the Board; Chairman of the Nominating and Governance Committee and Trustee | | Vice Chairman since 2018; Chairman of the Nominating and Governance Committee and Trustee since 2003 | | Founder and Principal, YQA Capital Management LLC (1998-Present); formerly, Owner/CEO of Electronic Dynamic Balancing Co., Inc. (high-speed rotating equipment service provider). | | 241 | | Trustee and Investment Oversight Committee member, Mission Aviation Fellowship (2017-Present). |
| | | | | |
Todd J. Barre—1957
c/o Invesco Capital Management LLC
3500 Lacey Road, Suite 700
Downers Grove, IL 60515 | | Trustee | | Since 2010 | | Assistant Professor of Business, Trinity Christian College (2010-2016); formerly, Vice President and Senior Investment Strategist (2001-2008), Director of Open Architecture and Trading (2007-2008), Head of Fundamental Research (2004-2007), and Vice President and Senior Fixed Income Strategist (1994-2001), BMO Financial Group/Harris Private Bank. | | 241 | | None. |
| | | | | |
Marc M. Kole—1960
c/o Invesco Capital Management LLC
3500 Lacey Road, Suite 700
Downers Grove, IL 60515 | | Chairman of the Audit Committee and Trustee | | Chairman of the Audit Committee since 2008; Trustee since 2006 | | Senior Director of Finance, By The Hand Club For Kids (not-for-profit) (2015-Present); formerly, Chief Financial Officer, Hope Network (social services) (2008-2012); Assistant Vice President and Controller, Priority Health (health insurance) (2005-2008); Regional Chief Financial Officer, United Healthcare (2005); Chief Accounting Officer, Senior Vice President of Finance, Oxford Health Plans (2000-2004); Audit Partner, Arthur Andersen LLP (1996-2000). | | 241 | | Treasurer (2018-Present), Finance Committee Member (2015-Present) and Audit Committee Member (2015), Thornapple Evangelical Covenant Church; formerly, Board and Finance Committee Member (2009-2017) and Treasurer (2010-2015, 2017), NorthPointe Christian Schools. |
| * | This is the date the Independent Trustee began serving the Trust. Each Independent Trustee serves an indefinite term, until his successor is elected. |
| ** | Fund Complex includes all open- and closed-end funds (including all of their portfolios) advised by the Adviser and any affiliated person of the Adviser. |
Trustees and Officers(continued)
| | | | | | | | | | |
Name, Address and Year of
Birth of Independent Trustees | | Position(s)
Held
with Trust | | Term of
Office
and
Length of
Time
Served* | | Principal
Occupation(s) During
Past 5 Years | | Number of
Portfolios
in Fund
Complex**
Overseen by
Independent
Trustees | | Other
Directorships
Held by
Independent
Trustees During
the Past 5 Years |
Yung Bong Lim—1964
c/o Invesco Capital Management LLC
3500 Lacey Road, Suite 700
Downers Grove, IL 60515 | | Chairman of the Investment Oversight Committee and Trustee | | Chairman of the Investment Oversight Committee since 2014; Trustee since 2013 | | Managing Partner, RDG Funds LLC (real estate) (2008-Present); formerly, Managing Director, Citadel LLC (1999-2007). | | 241 | | Advisory Board Member, Performance Trust Capital Partners, LLC (2008-Present); Board Director, Beacon Power Services, Corp. (2019-Present). |
| | | | | |
Gary R. Wicker—1961
c/o Invesco Capital Management LLC
3500 Lacey Road, Suite 700
Downers Grove, IL 60515 | | Trustee | | Since 2013 | | Senior Vice President of Global Finance and Chief Financial Officer at RBC Ministries (publishing company) (2013-Present); formerly, Executive Vice President and Chief Financial Officer, Zondervan Publishing (a division of Harper Collins/NewsCorp) (2007-2012); Senior Vice President and Group Controller (2005-2006), Senior Vice President and Chief Financial Officer (2003-2004), Chief Financial Officer (2001-2003), Vice President, Finance and Controller (1999-2001) and Assistant Controller (1997-1999), divisions of The Thomson Corporation (information services provider); Senior Audit Manager (1994-1997), PricewaterhouseCoopers LLP. | | 241 | | Board Member and Treasurer, Our Daily Bread Ministries Canada (2015-Present); Board and Finance Committee Member, West Michigan Youth For Christ (2010-Present). |
| | | | | |
Donald H. Wilson—1959
c/o Invesco Capital Management LLC
3500 Lacey Road, Suite 700
Downers Grove, IL 60515 | | Chairman of the Board and Trustee | | Chairman since 2012; Trustee since 2006 | | Chairman, President and Chief Executive Officer, McHenry Bancorp Inc. and McHenry Savings Bank (subsidiary) (2018-Present); Chairman and Chief Executive Officer, Stone Pillar Advisors, Ltd. (advisory services to the financial sector) (2010-Present); formerly, President and Chief Executive Officer, Stone Pillar Investments, Ltd. (2016-2018); Chairman, President and Chief Executive Officer, Community Financial Shares, Inc. and Community Bank—Wheaton/Glen Ellyn (subsidiary) (2013-2015); Chief Operating Officer, AMCORE Financial, Inc. (bank holding company) (2007-2009); Executive Vice President and Chief Financial Officer, AMCORE Financial, Inc. (2006-2007); Senior Vice President and Treasurer, Marshall & Ilsley Corp. (bank holding company) (1995-2006). | | 241 | | Director, Penfield Children’s Center (2004-present); Board Chairman, Gracebridge Alliance, Inc. (2015-present). |
| * | This is the date the Independent Trustee began serving the Trust. Each Independent Trustee serves an indefinite term, until his successor is elected. |
| ** | Fund Complex includes all open- and closed-end funds (including all of their portfolios) advised by the Adviser and any affiliated person of the Adviser. |
Trustees and Officers(continued)
The Interested Trustee and the executive officers of the Trust, their term of office and length of time served, their principal business occupations during at least the past five years, the number of portfolios in the Fund Complex (as defined below) overseen by the Interested Trustee and the other directorships, if any, held by the Interested Trustee are shown below.
| | | | | | | | | | |
Name, Address and Year of
Birth of Interested Trustee | | Position(s)
Held
with Trust | | Term of
Office
and
Length of
Time
Served* | | Principal
Occupation(s) During
Past 5 Years | | Number of
Portfolios
in Fund
Complex**
Overseen by
Interested
Trustee | | Other
Directorships
Held by
Interested
Trustee During
the Past 5 Years |
Kevin M. Carome—1956
Invesco Ltd.
Two Peachtree Pointe,
1555 Peachtree St., N.E.,
Suite 1800
Atlanta, GA 30309 | | Trustee | | Since 2010 | | Senior Managing Director, Secretary and General Counsel, Invesco Ltd. (2007-Present); Director, Invesco Advisers, Inc. (2009-Present); Director (2006-Present) and Executive Vice President (2008–Present), Invesco North American Holdings, Inc.; Executive Vice President (2008–Present), Invesco Investments (Bermuda) Ltd.; Manager, Horizon Flight Works LLC, and Director, Invesco Finance PLC (2011- Present); Director and Secretary (2012–Present), Invesco Services (Bahamas) Private Limited; and Director and Executive Vice President (2014–Present), INVESCO Asset Management (Bermuda) Ltd.; formerly, Director and Executive Vice President, Invesco Finance, Inc. (2011-2018); Director (2006-2018) and Executive Vice President (2008–2018), Invesco Group Services, Inc., Invesco Holding Company (US), Inc.; Director, Invesco Holding Company Limited (2007-2018); Director and Chairman, INVESCO Funds Group, Inc., Senior Vice President, Secretary and General Counsel, Invesco Advisers, Inc. (2003-2006); Director, Invesco Investments (Bermuda) Ltd. (2008-2016); Senior Vice President and General Counsel, Liberty Financial Companies, Inc. (2000-2001); General Counsel of certain investment management subsidiaries of Liberty Financial Companies, Inc. (1998-2000); Associate General Counsel, Liberty Financial Companies, Inc. (1993-1998); Associate, Ropes & Gray LLP. | | 241 | | None |
| * | This is the date the Interested Trustee began serving the Trust. The Interested Trustee serves an indefinite term, until his successor is elected. |
| ** | Fund Complex includes all open- andclosed-end funds (including all of their portfolios) advised by the Adviser and any affiliated person of the Adviser. |
Trustees and Officers(continued)
| | | | | | |
Name, Address and Year of
Birth of Executive Officers | | Position(s)
Held
with Trust | | Length of
Time
Served* | | Principal Occupation(s) During Past 5 Years |
Daniel E. Draper—1968 Invesco Capital
Management LLC 3500 Lacey Road, Suite 700 Downers Grove, IL 60515 | | President and Principal Executive Officer | | Since 2015 | | Chief Executive Officer, Manager and Principal Executive Officer, Invesco Specialized Products, LLC (2018-Present); President and Principal Executive Officer, Invesco Exchange-Traded Fund Trust, Invesco Exchange-Traded Fund Trust II, Invesco India Exchange-Traded Fund Trust, Invesco Actively Managed Exchange-Traded Fund Trust and Invesco Actively Managed Exchange-Traded Commodity Fund Trust (2015-Present) and Invesco Exchange-Traded Self-Indexed Fund Trust (2016-Present); Chief Executive Officer and Principal Executive Officer (2016-Present) and Managing Director (2013-Present), Invesco Capital Management LLC; Senior Vice President, Invesco Distributors, Inc. (2014-Present); formerly, Vice President, Invesco Exchange-Traded Fund Trust, Invesco Exchange-Traded Fund Trust II, Invesco India Exchange-Traded Fund Trust, Invesco Actively Managed Exchange-Traded Fund Trust (2013-2015) and Invesco Actively Managed Exchange-Traded Commodity Fund Trust (2014-2015); Managing Director, Credit Suisse Asset Management (2010-2013) and Lyxor Asset Management/Societe Generale (2007-2010). |
| | | |
Kelli Gallegos—1970 Invesco Capital Management LLC 3500 Lacey Road, Suite 700 Downers Grove, IL 60515 | | Vice President
and Treasurer | | Since 2018 | | Assistant Treasurer, Invesco Specialized Products, LLC (2018-Present); Vice President and Treasurer, Invesco Exchange-Traded Fund Trust, Invesco Exchange-Traded Fund Trust II, Invesco India Exchange-Traded Fund Trust, Invesco Actively Managed Exchange-Traded Fund Trust, Invesco Actively Managed Exchange-Traded Commodity Fund Trust and Invesco Exchange-Traded Self-Indexed Fund Trust (2018-Present); Principal Financial and Accounting Officer-Pooled Investments, Invesco Capital Management LLC (2018-Present); Vice President, Principal Financial Officer (2016-Present) and Assistant Treasurer (2008-Present), The Invesco Funds; formerly, Assistant Treasurer Invesco Exchange-Traded Fund Trust, Invesco Exchange-Traded Fund Trust II, Invesco India Exchange-Traded Fund Trust and Invesco Actively Managed Exchange-Traded Fund Trust (2012-2018), Invesco Actively Managed Exchange-Traded Commodity Fund Trust (2014-2018) and Invesco Exchange-Traded Self-Indexed Fund Trust (2016-2018); Assistant Treasurer, Invesco Capital Management LLC (2013-2018); and Assistant Vice President, The Invesco Funds (2008-2016). |
| | | |
Peter Hubbard—1981 Invesco Capital Management LLC 3500 Lacey Road, Suite 700 Downers Grove, IL 60515 | | Vice President | | Since 2009 | | Vice President, Invesco Specialized Products, LLC (2018-Present); Vice President, Invesco Exchange-Traded Fund Trust, Invesco Exchange-Traded Fund Trust II, Invesco India Exchange-Traded Fund Trust, Invesco Actively Managed Exchange-Traded Fund Trust (2009-Present), Invesco Actively Managed Exchange-Traded Commodity Fund Trust (2014-Present) and Invesco Exchange-Traded Self-Indexed Fund Trust (2016-Present); Vice President and Director of Portfolio Management, Invesco Capital Management LLC (2010-Present); formerly, Vice President of Portfolio Management, Invesco Capital Management LLC (2008-2010); Portfolio Manager, Invesco Capital Management LLC (2007-2008); Research Analyst, Invesco Capital Management LLC (2005-2007); Research Analyst and Trader, Ritchie Capital, a hedge fund operator (2003-2005). |
| * | This is the date each Officer began serving the Trust. Each Officer serves an indefinite term, until his or her successor is elected. |
Trustees and Officers(continued)
| | | | | | |
Name, Address and Year of
Birth of Executive Officers | | Position(s)
Held
with Trust | | Length of
Time
Served* | | Principal Occupation(s) During Past 5 Years |
Sheri Morris—1964 Invesco Capital Management LLC 3500 Lacey Road, Suite 700 Downers Grove, IL 60515 | | Vice President | | Since 2012 | | President and Principal Executive Officer, The Invesco Funds (2016-Present); Treasurer, The Invesco Funds (2008-Present); Vice President, Invesco Advisers, Inc. (formerly known as Invesco Institutional (N.A.), Inc.) (registered investment adviser) (2009-Present) and Vice President, Invesco Exchange-Traded Fund Trust, Invesco Exchange-Traded Fund Trust II, Invesco India Exchange-Traded Fund Trust, Invesco Actively Managed Exchange-Traded Fund Trust (2012-Present), Invesco Actively Managed Exchange-Traded Commodity Fund Trust (2014-Present) and Invesco Exchange-Traded Self-Indexed Fund Trust (2016-Present); formerly, Vice President and Principal Financial Officer, The Invesco Funds (2008-2016); Treasurer, Invesco Exchange-Traded Fund Trust, Invesco Exchange-Traded Fund Trust II, Invesco India Exchange-Traded Fund Trust and Invesco Actively Managed Exchange-Traded Fund Trust (2011-2013); Vice President, Invesco Aim Advisers, Inc., Invesco Aim Capital Management, Inc. and Invesco Aim Private Asset Management, Inc.; Assistant Vice President and Assistant Treasurer, The Invesco Funds and Assistant Vice President, Invesco Advisers, Inc., Invesco Aim Capital Management, Inc. and Invesco Aim Private Asset Management, Inc. |
| | | |
Anna Paglia—1974 Invesco Capital Management LLC 3500 Lacey Road, Suite 700 Downers Grove, IL 60515 | | Secretary | | Since 2011 | | Secretary, Invesco Specialized Products, LLC (2018-Present); Secretary, Invesco Exchange-Traded Fund Trust, Invesco Exchange-Traded Fund Trust II, Invesco India Exchange-Traded Fund Trust, Invesco Actively Managed Exchange-Traded Fund Trust (2011-Present), Invesco Actively Managed Exchange-Traded Commodity Fund Trust (2014-Present) and Invesco Exchange-Traded Self-Indexed Fund Trust (2015-Present); Head of Legal (2010-Present) and Secretary (2015-Present), Invesco Capital Management LLC; Manager and Assistant Secretary, Invesco Indexing LLC (2017-Present); formerly, Partner, K&L Gates LLP (formerly, Bell Boyd & Lloyd LLP) (2007-2010); Associate Counsel at Barclays Global Investors Ltd. (2004-2006). |
| | | |
Rudolf E. Reitmann—1971 Invesco Capital Management LLC 3500 Lacey Road, Suite 700 Downers Grove, IL 60515 | | Vice President | | Since 2013 | | Head of Global Exchange Traded Funds Services, Invesco Specialized Products, LLC (2018-Present); Vice President, Invesco Exchange-Traded Fund Trust, Invesco Exchange-Traded Fund Trust II, Invesco India Exchange-Traded Fund Trust, Invesco Actively Managed Exchange-Traded Fund Trust (2013-Present), Invesco Actively Managed Exchange-Traded Commodity Fund Trust (2014-Present) and Invesco Exchange-Traded Self-Indexed Fund Trust (2016-Present); Head of Global Exchange Traded Funds Services, Invesco Capital Management LLC (2013-Present); Vice President, Invesco Capital Markets, Inc. (2018-Present). |
| * | This is the date each Officer began serving the Trust. Each Officer serves an indefinite term, until his or her successor is elected. |
Trustees and Officers(continued)
| | | | | | |
Name, Address and Year of
Birth of Executive Officers | | Position(s)
Held
with Trust | | Length of
Time
Served* | | Principal Occupation(s) During Past 5 Years |
David Warren—1957 Invesco Canada Ltd. 5140 Yonge Street, Suite 800 Toronto, Ontario M2N 6X7 | | Vice President | | Since 2009 | | Manager, Invesco Specialized Products, LLC (2018-Present); Vice President, Invesco Exchange-Traded Fund Trust, Invesco Exchange-Traded Fund Trust II, Invesco India Exchange-Traded Fund Trust, and Invesco Actively Managed Exchange-Traded Fund Trust (2009-Present), Invesco Actively Managed Exchange-Traded Commodity Fund Trust (2014-Present) and Invesco Exchange-Traded Self-Indexed Fund Trust (2016-Present); Managing Director—Chief Administrative Officer, Americas, Invesco Capital Management LLC; Senior Vice President, Invesco Advisers, Inc. (2009-Present); Director, Invesco Inc. (2009-Present); Director, Executive Vice President and Chief Financial Officer, Invesco Canada Ltd. (formerly, Invesco Trimark Ltd.) (2011-Present); Chief Administrative Officer, North American Retail, Invesco Ltd. (2007-Present); Director, Invesco Corporate Class Inc. (2014-Present); Director, Invesco Global Direct Real Estate Feeder GP Ltd. (2015-Present); Director, Invesco Canada Holdings Inc. (2002-Present); Director, Invesco Financial Services Ltd. / Services Financiers Invesco Ltée and Trimark Investments Ltd./Placements Trimark Ltée (2014-Present); Director, Invesco IP Holdings (Canada) Ltd. (2016-Present); Director, Invesco Global Direct Real Estate GP Ltd. (2015-Present); formerly, Senior Vice President, Invesco Management Group, Inc. (2007-2018); Executive Vice President and Chief Financial Officer, Invesco Inc. (2009-2015); Director, Executive Vice President and Chief Financial Officer, Invesco Canada Ltd. (formerly, Invesco Trimark Ltd.) (2000-2011). |
| | | |
Melanie Zimdars—1976 Invesco Capital
Management LLC 3500 Lacey Road, Suite 700 Downers Grove, IL 60515 | | Chief Compliance
Officer | | Since 2017 | | Chief Compliance Officer, Invesco Specialized Products, LLC (2018-Present); Chief Compliance Officer, Invesco Capital Management LLC (2017-Present); Chief Compliance Officer, Invesco Exchange-Traded Fund Trust, Invesco Exchange-Traded Fund Trust II, Invesco India Exchange-Traded Fund Trust, Invesco Actively Managed Exchange-Traded Fund Trust, Invesco Actively Managed Exchange-Traded Commodity Fund Trust and Invesco Exchange-Traded Self-Indexed Fund Trust (2017-Present); formerly, Vice President and Deputy Chief Compliance Officer at ALPS Holding, Inc. (2009-2017); Mutual Fund Treasurer/Chief Financial Officer at Wasatch Advisors, Inc. (2005-2008); Compliance Officer, U.S. Bancorp Fund Services, LLC (2001-2005). |
Availability of Additional Information About the Trustees
The Statement of Additional Information includes additional information about the Trustees and is available, without charge, upon request at (800)983-0903.
| * | This is the date each Officer began serving the Trust. Each Officer serves an indefinite term, until his or her successor is elected. |
Board Considerations Regarding Continuation of Investment Advisory Agreement
At a meeting held on April 11, 2019, the Board of Trustees of the Invesco Exchange-Traded Fund Trust (the “Trust”), including the Independent Trustees, approved the continuation of the Investment Advisory Agreement between Invesco Capital Management LLC (the “Adviser”) and the Trust for the following 53 series (each, a “Fund” and collectively, the “Funds”):
Invesco Aerospace & Defense ETF
Invesco BRIC ETF
Invesco BuyBack AchieversTM ETF
Invesco CleantechTM ETF
Invesco Dividend AchieversTM ETF
Invesco DWA Basic Materials Momentum ETF
Invesco DWA Consumer Cyclicals Momentum ETF
Invesco DWA Consumer Staples Momentum ETF
Invesco DWA Energy Momentum ETF
Invesco DWA Financial Momentum ETF
Invesco DWA Healthcare Momentum ETF
Invesco DWA Industrials Momentum ETF
Invesco DWA Momentum ETF
Invesco DWA NASDAQ Momentum ETF
Invesco DWA Technology Momentum ETF
Invesco DWA Utilities Momentum ETF
Invesco Dynamic Biotechnology & Genome ETF
Invesco Dynamic Building & Construction ETF
Invesco Dynamic Energy Exploration & Production ETF
Invesco Dynamic Food & Beverage ETF
Invesco Dynamic Large Cap Growth ETF
Invesco Dynamic Large Cap Value ETF
Invesco Dynamic Leisure and Entertainment ETF
Invesco Dynamic Market ETF
Invesco Dynamic Media ETF
Invesco Dynamic Networking ETF
Invesco Dynamic Oil & Gas Services ETF
Invesco Dynamic Pharmaceuticals ETF
Invesco Dynamic Retail ETF
Invesco Dynamic Semiconductors ETF
Invesco Dynamic Software ETF
Invesco Financial Preferred ETF
Invesco FTSE RAFI US 1000 ETF
Invesco FTSE RAFI US 1500Small-Mid ETF
Invesco Global Listed Private Equity ETF
Invesco Golden Dragon China ETF
Invesco High Yield Equity Dividend AchieversTM ETF
Invesco Insider Sentiment ETF
Invesco International Dividend AchieversTM ETF
Invesco Russell 2000 Pure Growth ETF
Invesco Russell 2000 Pure Value ETF
Invesco Russell Midcap Equal Weight ETF
Invesco Russell Midcap Pure Growth ETF
Invesco Russell Midcap Pure Value ETF
Invesco Russell Top 200 Equal Weight ETF
Invesco Russell Top 200 Pure Growth ETF
Invesco Russell Top 200 Pure Value ETF
Invesco S&P 500® Quality ETF
Invesco S&PSpin-Off ETF
Invesco Water Resources ETF
Invesco WilderHill Clean Energy ETF
Invesco ZacksMid-Cap ETF
Invesco Zacks Multi-Asset Income ETF
The Trustees reviewed information from the Adviser describing: (i) the nature, extent and quality of services provided, (ii) the investment performance of the Funds and the Adviser, (iii) the fees and expenses paid by the Funds and comparisons to amounts paid by other comparable registered investment companies, (iv) the costs of services provided and estimated profits realized by the Adviser, (v) the extent to which economies of scale may be realized as a Fund grows and whether fee levels reflect any possible economies of scale for the benefit of Fund shareholders, and (vi) any further benefits realized by the Adviser from its relationships with the Funds.
Nature, Extent and Quality of Services. In evaluating the nature, extent and quality of the Adviser’s services, the Trustees reviewed information concerning the functions performed by the Adviser for the Funds, information describing the Adviser’s current organization and staffing, including operational support provided by the Adviser’s parent organization, Invesco Ltd. (“Invesco”), and the background and experience of the persons responsible for theday-to-day management of the Funds. The Trustees reviewed matters related to the Adviser’s execution and/or oversight of execution of portfolio transactions on behalf of the Funds. The Trustees also reviewed information on the performance of the Funds and their underlying indexes for theone-year, three-year, five-year,ten-year and since-inception periods ended December 31, 2018, as applicable, including reports for each of those periods on the correlation and tracking error between each Fund’s performance and the performance of its underlying index, as well as the Adviser’s analysis of the tracking error between certain Funds and their underlying indexes. In reviewing the tracking error reports, the Trustees considered information provided by Invesco’s Global Performance Measurement and Risk Group, an independent organization within Invesco, with respect to
general expected tracking error ranges. The Trustees also considered that certain Funds were created in connection with the purchase by Invesco of the exchange-traded funds business of Guggenheim Capital LLC (the “Transaction”) and that such Funds’ performance
Board Considerations Regarding Continuation of Investment Advisory Agreement(continued)
prior to the closing of the Transaction on April 6, 2018 or May 18, 2018, as applicable, is that of their predecessor Guggenheim ETFs. The Trustees noted that, for each applicable period, the correlation and tracking error for each Fund was within the targeted range set forth in the Trust’s registration statement and concluded that each Fund was correlated to its underlying index and that the tracking error for each Fund was within an acceptable range given that Fund’s particular circumstances.
The Trustees also considered the services provided by the Adviser in its oversight of the Funds’ administrator, custodian and transfer agent. They noted the significant amount of time, effort and resources that had been devoted to this oversight function.
Based on their review, the Trustees concluded that the nature, extent and quality of services provided by the Adviser to the Funds under the Investment Advisory Agreement were appropriate and reasonable.
Fees, Expenses and Profitability. The Trustees reviewed and discussed the information provided by the Adviser on each Fund’s contractual advisory fee, net advisory fee, and gross and net expense ratios. The Trustees also compared each Fund’s contractual advisory fee and net expense ratio to information compiled by the Adviser from Lipper Inc. databases on the net advisory fees and net expense ratios of comparable exchange-traded funds (“ETFs”),open-end(non-ETF) index funds andopen-end(non-ETF) actively-managed funds, as applicable. The Trustees noted that the annual contractual advisory fee charged to each Fund is:
| | ● | | 0.50% of the Fund’s average daily net assets for each Fund other than Invesco Dividend AchieversTM ETF, Invesco FTSE RAFI US 1000 ETF, Invesco FTSE RAFI US 1500Small-Mid ETF, Invesco High Yield Equity Dividend AchieversTM ETF, Invesco International Dividend AchieversTM ETF, Invesco Russell 2000 Pure Growth ETF, Invesco Russell 2000 Pure Value ETF, Invesco Russell Midcap Equal Weight ETF, Invesco Russell Midcap Pure Growth ETF, Invesco Russell Midcap Pure Value ETF, Invesco Russell Top 200 Equal Weight ETF, Invesco Russell Top 200 Pure Growth ETF, Invesco Russell Top 200 Pure Value ETF and Invesco S&P 500® Quality ETF (The net advisory fee, after giving effect to the Expense Cap, as defined below, was-0.16% for Invesco Dynamic Retail ETF.); |
| | ● | | 0.40% of the Fund’s average daily net assets for each of Invesco Dividend AchieversTM ETF, Invesco High Yield Equity Dividend AchieversTM ETF and Invesco International Dividend AchieversTM ETF; |
| | ● | | 0.29% of the Fund’s average daily net assets for each of Invesco FTSE RAFI US 1000 ETF, Invesco FTSE RAFI US 1500Small-Mid ETF, Invesco Russell 2000 Pure Growth ETF, Invesco Russell 2000 Pure Value ETF, Invesco Russell Midcap Pure Growth ETF, Invesco Russell Midcap Pure Value ETF, Invesco Russell Top 200 Pure Growth ETF and Invesco Russell Top 200 Pure Value ETF; |
| | ● | | 0.25% of the Fund’s average daily net assets for each of Invesco Russell Midcap Equal Weight ETF and Invesco Russell Top 200 Equal Weight ETF (The net advisory fee, after giving effect to the Expense Cap, as defined below, was-0.17% for Invesco Russell Midcap Equal Weight ETF.); and |
| | ● | | 0.15% of the Fund’s average daily net assets for Invesco S&P 500® Quality ETF (The Trustees noted that, prior to September 24, 2018, the Fund’s advisory fee was 0.29%.). |
The Trustees also noted that the Adviser has agreed to waive a portion of its contractual advisory fee and/or pay expenses (an “Expense Cap”) to the extent necessary to prevent the annual operating expenses of each Fund from exceeding the percentage of that Fund’s average daily net assets, at least until August 31, 2021, as set forth below:
| | ● | | 0.60%, excluding interest expenses, brokerage commissions and other trading expenses, taxes, acquired fund fees and expenses, if applicable, and extraordinary expenses, for each of Invesco DWA NASDAQ Momentum ETF and Invesco Dynamic Market ETF; |
| | ● | | 0.60%, excluding interest expenses, offering costs, brokerage commissions and other trading expenses, taxes, acquired fund fees and expenses, if applicable, and extraordinary expenses, for each of Invesco DWA Basic Materials Momentum ETF, Invesco DWA Consumer Cyclicals Momentum ETF, Invesco DWA Consumer Staples Momentum ETF, Invesco DWA Energy Momentum ETF, Invesco DWA Financial Momentum ETF, Invesco DWA Healthcare Momentum ETF, Invesco DWA Industrials Momentum ETF, Invesco DWA Technology Momentum ETF and Invesco DWA Utilities Momentum ETF; |
| | ● | | 0.50%, excluding interest expenses,sub-licensing fees, offering costs, brokerage commissions and other trading expenses, taxes, acquired fund fees and expenses, if applicable, and extraordinary expenses, for each of Invesco Dividend AchieversTM ETF, Invesco High Yield Equity Dividend AchieversTM ETF and Invesco International Dividend AchieversTM ETF; |
| | ● | | 0.39%, excluding interest expenses, offering costs, brokerage commissions and other trading expenses, taxes, acquired fund fees and expenses, if applicable, and extraordinary expenses, for each of Invesco FTSE RAFI US 1000 ETF, Invesco FTSE RAFI US 1500Small-Mid ETF, Invesco Russell 2000 Pure Growth ETF, Invesco Russell 2000 Pure Value ETF, Invesco Russell Midcap Pure |
Board Considerations Regarding Continuation of Investment Advisory Agreement(continued)
| | Growth ETF, Invesco Russell Midcap Pure Value ETF, Invesco Russell Top 200 Pure Growth ETF and Invesco Russell Top 200 Pure Value ETF; |
| | ● | | 0.25%, excluding interest expenses, offering costs, brokerage commissions and other trading expenses, taxes, acquired fund fees and expenses, if applicable, and extraordinary expenses, for each of Invesco Russell Midcap Equal Weight ETF and Invesco Russell Top 200 Equal Weight ETF; |
| | ● | | 0.15%, excluding interest expenses, offering costs, brokerage commissions and other trading expenses, taxes, acquired fund fees and expenses, if applicable, and extraordinary expenses, for Invesco S&P 500 Quality ETF; and |
| | ● | | 0.60%, excluding interest expenses,sub-licensing fees, offering costs, brokerage commissions and other trading expenses, taxes, acquired fund fees and expenses, if applicable, and extraordinary expenses, for each other Fund. |
The Trustees noted that the Adviser represented that it does not serve as the investment adviser to any clients, other than other ETFs also overseen by the Trustees, with comparable investment strategies as the Funds, but that it providessub-advisory services to other clients. The Trustees further noted the Adviser’s explanation with respect to thesub-advisory fees it receives for such services in comparison to the advisory fees charged to the Funds. The Trustees noted that the contractual advisory fees for certain Funds were equal to or lower than the median net advisory fees of their ETF andopen-end index peer funds, as applicable, as illustrated in the table below. The Trustees also noted that the contractual advisory fees for all of the Funds were lower than the median net advisory fees of theiropen-end actively-managed peer funds.
| | | | | | |
Invesco Fund | | Equal to/Lower
than ETF Median | | Equal to/Lower
than Open-End
Index Fund
Median* | | Equal to/Lower
than Open-End
Active Fund
Median |
| Invesco Aerospace & Defense ETF | | | | | | X |
| Invesco BRIC ETF | | | | | | X |
| Invesco Buyback AchieversTM ETF | | | | | | X |
| Invesco CleantechTM ETF | | | | | | X |
| Invesco Dividend AchieversTM ETF | | | | | | X |
| Invesco DWA Basic Materials Momentum ETF | | | | | | X |
| Invesco DWA Consumer Cyclicals Momentum ETF | | | | | | X |
| Invesco DWA Consumer Staples Momentum ETF | | | | | | X |
| Invesco DWA Energy Momentum ETF | | | | | | X |
| Invesco DWA Financial Momentum ETF | | | | | | X |
| Invesco DWA Healthcare Momentum ETF | | | | | | X |
| Invesco DWA Industrials Momentum ETF | | | | | | X |
| Invesco DWA Momentum ETF | | X | | | | X |
| Invesco DWA NASDAQ Momentum ETF | | | | | | X |
| Invesco DWA Technology Momentum ETF | | | | | | X |
| Invesco DWA Utilities Momentum ETF | | | | | | X |
| Invesco Dynamic Biotechnology & Genome ETF | | | | | | X |
| Invesco Dynamic Building & Construction ETF | | | | | | X |
| Invesco Dynamic Energy Exploration & Production ETF | | | | | | X |
| Invesco Dynamic Food & Beverage ETF | | | | | | X |
| Invesco Dynamic Large Cap Growth ETF | | | | | | X |
| Invesco Dynamic Large Cap Value ETF | | | | | | X |
| Invesco Dynamic Leisure and Entertainment ETF | | | | | | X |
| Invesco Dynamic Market ETF | | | | | | X |
| Invesco Dynamic Media ETF | | | | | | X |
| Invesco Dynamic Networking ETF | | | | | | X |
| Invesco Dynamic Oil & Gas Services ETF | | | | N/A | | X |
| Invesco Dynamic Pharmaceuticals ETF | | | | | | X |
Board Considerations Regarding Continuation of Investment Advisory Agreement(continued)
| | | | | | |
Invesco Fund | | Equal to/Lower
than ETF Median | | Equal to/Lower
than Open-End
Index Fund
Median* | | Equal to/Lower
than Open-End
Active Fund
Median |
| Invesco Dynamic Retail ETF | | | | | | X |
| Invesco Dynamic Semiconductors ETF | | | | | | X |
| Invesco Dynamic Software ETF | | | | | | X |
| Invesco Financial Preferred ETF | | | | N/A | | X |
| Invesco FTSE RAFI US 1000 ETF | | | | | | X |
| Invesco FTSE RAFI US 1500Small-Mid ETF | | | | | | X |
| Invesco Global Listed Private Equity ETF | | | | N/A | | X |
| Invesco Golden Dragon China ETF | | X | | N/A | | X |
| Invesco High Yield Equity Dividend AchieversTM ETF | | | | | | X |
| Invesco Insider Sentiment ETF | | | | | | X |
| Invesco International Dividend AchieversTM ETF | | X | | | | X |
| Invesco Russell 2000 Pure Growth ETF | | | | X | | X |
| Invesco Russell 2000 Pure Value ETF | | | | X | | X |
| Invesco Russell Midcap Equal Weight ETF | | | | | | X |
| Invesco Russell Midcap Pure Growth ETF | | X | | | | X |
| Invesco Russell Midcap Pure Value ETF | | X | | | | X |
| Invesco Russell Top 200 Equal Weight ETF | | X | | | | X |
| Invesco Russell Top 200 Pure Growth ETF | | | | | | X |
| Invesco Russell Top 200 Pure Value ETF | | | | | | X |
| Invesco S&P 500® Quality ETF | | X | | | | X |
| Invesco S&PSpin-Off | | | | | | X |
| Invesco Water Resources ETF | | | | | | X |
| Invesco WilderHill Clean Energy ETF | | | | | | X |
| Invesco ZacksMid-Cap ETF | | | | | | X |
| Invesco Zacks Multi-Asset Income ETF | | | | | | X |
| * | The information provided by the Adviser indicated that certain Funds did not have open-end index fund peers. Those Funds have been designated with an “N/A” for not available. |
The Trustees determined that the contractual advisory fees were reasonable, noting the nature of the indexes, the distinguishing factors of the Funds, and the administrative, operational and management oversight costs for the Adviser. The Trustees noted that the net expense ratios for certain Funds were equal to or lower than the median net expense ratios of their ETF andopen-end index peer funds, as applicable, as illustrated in the table below. The Trustees also noted that the net expense ratios for all of the Funds were lower than the median net expense ratios of theiropen-end actively-managed peer funds.
| | | | | | |
Invesco Fund | | Equal to/Lower
than ETF Median | | Equal to/Lower
than Open-End
Index Fund
Median* | | Equal to/Lower
than Open-End
Active Fund
Median |
| Invesco Aerospace & Defense ETF | | | | | | X |
| Invesco BRIC ETF | | | | | | X |
| Invesco Buyback AchieversTM ETF | | | | | | X |
| Invesco CleantechTM ETF | | | | | | X |
| Invesco Dividend AchieversTM ETF | | | | X | | X |
| Invesco DWA Basic Materials Momentum ETF | | | | | | X |
| Invesco DWA Consumer Cyclicals Momentum ETF | | | | | | X |
| Invesco DWA Consumer Staples Momentum ETF | | | | | | X |
Board Considerations Regarding Continuation of Investment Advisory Agreement(continued)
| | | | | | |
Invesco Fund | | Equal to/Lower
than ETF Median | | Equal to/Lower
than Open-End
Index Fund
Median* | | Equal to/Lower
than Open-End
Active Fund
Median |
| Invesco DWA Energy Momentum ETF | | | | | | X |
| Invesco DWA Financial Momentum ETF | | | | | | X |
| Invesco DWA Healthcare Momentum ETF | | | | | | X |
| Invesco DWA Industrials Momentum ETF | | | | | | X |
| Invesco DWA Momentum ETF | | | | X | | X |
| Invesco DWA NASDAQ Momentum ETF | | | | | | X |
| Invesco DWA Technology Momentum ETF | | | | | | X |
| Invesco DWA Utilities Momentum ETF | | | | | | X |
| Invesco Dynamic Biotechnology & Genome ETF | | | | | | X |
| Invesco Dynamic Building & Construction ETF | | | | | | X |
| Invesco Dynamic Energy Exploration & Production ETF | | | | | | X |
| Invesco Dynamic Food & Beverage ETF | | | | | | X |
| Invesco Dynamic Large Cap Growth ETF | | | | | | X |
| Invesco Dynamic Large Cap Value ETF | | | | | | X |
| Invesco Dynamic Leisure and Entertainment ETF | | | | | | X |
| Invesco Dynamic Market ETF | | | | | | X |
| Invesco Dynamic Media ETF | | | | | | X |
| Invesco Dynamic Networking ETF | | | | | | X |
| Invesco Dynamic Oil & Gas Services ETF | | | | N/A | | X |
| Invesco Dynamic Pharmaceuticals ETF | | | | | | X |
| Invesco Dynamic Retail ETF | | | | | | X |
| Invesco Dynamic Semiconductors ETF | | | | | | X |
| Invesco Dynamic Software ETF | | | | | | X |
| Invesco Financial Preferred ETF | | | | N/A | | X |
| Invesco FTSE RAFI US 1000 ETF | | | | | | X |
| Invesco FTSE RAFI US 1500Small-Mid ETF | | | | | | X |
| Invesco Global Listed Private Equity ETF | | | | N/A | | X |
| Invesco Golden Dragon China ETF | | | | N/A | | X |
| Invesco High Yield Equity Dividend AchieversTM ETF | | | | X | | X |
| Invesco Insider Sentiment ETF | | | | | | X |
| Invesco International Dividend AchieversTM ETF | | | | | | X |
| Invesco Russell 2000 Pure Growth ETF | | | | X | | X |
| Invesco Russell 2000 Pure Value ETF | | | | X | | X |
| Invesco Russell Midcap Equal Weight ETF | | | | | | X |
| Invesco Russell Midcap Pure Growth ETF | | | | | | X |
| Invesco Russell Midcap Pure Value ETF | | | | | | X |
| Invesco Russell Top 200 Equal Weight ETF | | X | | | | X |
| Invesco Russell Top 200 Pure Growth ETF | | | | | | X |
| Invesco Russell Top 200 Pure Value ETF | | | | | | X |
| Invesco S&P 500® Quality ETF | | X | | | | X |
| Invesco S&PSpin-Off ETF | | | | | | X |
| Invesco Water Resources ETF | | | | | | X |
Board Considerations Regarding Continuation of Investment Advisory Agreement(continued)
| | | | | | |
Invesco Fund | | Equal to/Lower
than ETF Median | | Equal to/Lower
than Open-End
Index Fund
Median* | | Equal to/Lower
than Open-End
Active Fund
Median |
| Invesco WilderHill Clean Energy ETF | | | | | | X |
| Invesco ZacksMid-Cap ETF | | | | | | X |
| Invesco Zacks Multi-Asset Income ETF | | | | | | X |
| * | The information provided by the Adviser indicated that certain Funds did not have open-end index fund peers. Those Funds have been designated with an “N/A” for not available. |
In response to questions from the Independent Trustees, the Adviser provided supplemental information regarding each of Invesco Dynamic Energy Exploration & Production ETF, Invesco Dynamic Large Cap Growth ETF and Invesco WilderHill Clean Energy ETF’s advisory fees and total expenses and the Lipper peer data. The Adviser explained in detail its view that it believes that the advisory fees and total expenses for these Funds are competitive and generally in line with other comparable funds in the marketplace, noting, in particular, the unique underlying investment strategy and complexity of each Fund, the limited number of peers in the Lipper data, and/or the differing pricing philosophy of certain of the peers.
The Trustees noted that a significant component of thenon-advisory fee expenses was the license fees paid by the Funds, and noted those Funds for which license fees are included in the Funds’ Expense Caps. The Trustees also noted that the Adviser has agreed to reimburse certain Funds in the amount equal to the licensing fee paid that causes that Fund’s annual operating expenses (excluding interest expenses, offering costs, brokerage commissions and other trading expenses, taxes, acquired fund fees and expenses and extraordinary expenses) to exceed a percentage of that Fund’s average daily net assets through April 6, 2020 (May 18, 2020 for Invesco BRIC ETF) as set forth below:
| | | | |
| Invesco BRIC ETF | | | 0.64 | % |
| Invesco Insider Sentiment ETF | | | 0.60 | % |
| Invesco S&PSpin-Off ETF | | | 0.64 | % |
| Invesco ZacksMid-Cap ETF | | | 0.65 | % |
| Invesco Zacks Multi-Asset Income ETF | | | 0.65 | % |
The Board concluded that the advisory fee and expense ratio of each Fund (giving effect to the Fund’s Expense Cap) were reasonable and appropriate in light of the services provided.
In conjunction with their review of fees, the Trustees considered information provided by the Adviser on the revenues received by the Adviser under the Investment Advisory Agreement for the Funds, as well as the fees waived and expenses reimbursed by the Adviser for the Funds. The Trustees reviewed information provided by the Adviser on its overall profitability, as well as the estimated profitability to the Adviser from its relationship to each Fund. The Trustees concluded that the overall and estimated profitability to the Adviser was not unreasonable.
Economies of Scale and Whether Fee Levels Reflect These Economies of Scale. The Trustees reviewed the information provided by the Adviser as to the extent to which economies of scale may be realized as each Fund grows and whether fee levels reflect economies of scale for the benefit of shareholders. The Trustees reviewed each Fund’s asset size, advisory fee, expense ratio and Expense Cap agreed to by the Adviser. The Trustees also noted that the Amended and Restated Excess Expense Agreement with the Trust provides that the Adviser is entitled to be reimbursed by each Fund, other than Invesco Dynamic Market ETF and Invesco DWA NASDAQ Momentum ETF, for fees waived or expenses absorbed pursuant to the Expense Cap for a period of three years from the date the fee or expense was incurred, provided that no reimbursement would be made that would result in a Fund exceeding its Expense Cap then in effect or in effect at the time the fees and/or expenses subject to reimbursement were waived and/or borne by the Adviser. The Trustees considered whether the advisory fee rate for each Fund was reasonable in relation to the asset size of that Fund, and concluded that the flat advisory fee was reasonable and appropriate.
The Trustees noted that the Adviser had not identified any further benefits that it derived from its relationships with the Funds and had noted that it does not have any soft-dollar arrangements.
Based on all of the information considered and the conclusions reached, the Board, including the Independent Trustees, determined to approve the continuation of the Investment Advisory Agreement for each Fund. No single factor was determinative in the Board’s analysis.
Board Considerations Regarding Continuation of Investment Advisory Agreement(continued)
At a meeting held on April 11, 2019, the Board of Trustees of the Invesco Exchange-Traded Fund Trust (the “Trust”), including the Independent Trustees, approved the continuation of the Investment Advisory Agreement between Invesco Capital Management LLC (the “Adviser”) and the Trust for the following 24 series (each, a “Fund” and together, the “Funds”):
Invesco Dow Jones Industrial Average Dividend ETF
Invesco NASDAQ Internet ETF
Invesco Raymond JamesSB-1 Equity ETF
Invesco S&P 500 BuyWrite ETF
Invesco S&P 500®Equal Weight Consumer Discretionary ETF
Invesco S&P 500®Equal Weight Consumer Staples ETF
Invesco S&P 500®Equal Weight Energy ETF
Invesco S&P 500®Equal Weight ETF
Invesco S&P 500®Equal Weight Financials ETF
Invesco S&P 500®Equal Weight Health Care ETF
Invesco S&P 500®Equal Weight Industrials ETF
Invesco S&P 500®Equal Weight Materials ETF
Invesco S&P 500®Equal Weight Real Estate ETF
Invesco S&P 500®Equal Weight Technology ETF
Invesco S&P 500®Equal Weight Utilities ETF
Invesco S&P 500®Pure Growth ETF
Invesco S&P 500®Pure Value ETF
Invesco S&P 500®Top 50 ETF
Invesco S&P MidCap 400® Equal Weight ETF
Invesco S&P MidCap 400® Pure Growth ETF
Invesco S&P MidCap 400® Pure Value ETF
Invesco S&P SmallCap 600® Equal Weight ETF
Invesco S&P SmallCap 600® Pure Growth ETF
Invesco S&P SmallCap 600® Pure Value ETF
The Trustees reviewed information from the Adviser describing: (i) the nature, extent and quality of services provided, (ii) the investment performance of the Funds and the Adviser, (iii) the fees paid by the Funds and comparisons to amounts paid by other comparable registered investment companies, (iv) the costs of services provided and estimated profits realized by the Adviser, (v) the extent to which economies of scale may be realized as a Fund grows and whether fee levels reflect any possible economies of scale for the benefit of Fund shareholders, and (vi) any further benefits realized by the Adviser from its relationships with the Funds.
Nature, Extent and Quality of Services. In evaluating the nature, extent and quality of the Adviser’s services, the Trustees reviewed information concerning the functions performed by the Adviser for the Funds, information describing the Adviser’s current organization and staffing, including operational support provided by the Adviser’s parent organization, Invesco Ltd. (“Invesco”), and the background and experience of the persons responsible for theday-to-day management of the Funds. The Trustees reviewed matters related to the Adviser’s execution and/or oversight of execution of portfolio transactions on behalf of the Funds.
The Trustees also reviewed information on the performance of the Funds and their underlying indexes for theone-year, three-year, five-year,ten-year and since-inception periods ended December 31, 2018, as applicable, including reports for each of those periods on the correlation and tracking error between each Fund’s performance and the performance of its underlying index, as well as the Adviser’s analysis of the tracking error between the Funds and their underlying indexes. In reviewing the tracking error reports, the Trustees considered information provided by Invesco’s Global Performance Measurement and Risk Group, an independent organization within Invesco, with respect to general expected tracking error ranges. The Trustees also considered that certain Funds were created in connection with the purchase by Invesco of the exchange-traded funds business of Guggenheim Capital LLC (the “Transaction”) and that such Funds’ performance prior to the closing of the Transaction on April 6, 2018 is that of their predecessor Guggenheim ETFs. The Trustees noted that, for each applicable period, the correlation and tracking error for each Fund were within the targeted range set forth in the Trust’s registration statement and concluded that each Fund was correlated to its underlying index and that the tracking error for each Fund was within an acceptable range given that Fund’s particular circumstances.
The Trustees also considered the services provided by the Adviser in its oversight of the Funds’ administrator, custodian and transfer agent. They noted the significant amount of time, effort and resources that had been devoted to this oversight function.
Based on their review, the Trustees concluded that the nature, extent and quality of services provided by the Adviser to the Funds under the Investment Advisory Agreement were appropriate and reasonable.
Fees, Expenses and Profitability. The Trustees reviewed and discussed the information provided by the Adviser on each Fund’s net expense ratio and unitary advisory fee, as compared to information compiled by the Adviser from Lipper Inc. databases on the net expense ratios of comparable exchange-traded funds (“ETFs”),open-end(non-ETF) index funds andopen-end(non-ETF) actively-managed funds. The Trustees noted that the annual unitary advisory fee charged to each Fund is as follows, with the Adviser paying all
Board Considerations Regarding Continuation of Investment Advisory Agreement(continued)
other operating expenses of each Fund, except that each Fund pays its own distribution fees, if any, brokerage expenses, taxes, interest, litigation expenses, acquired fund fees and expenses, if any, and other extraordinary expenses:
| | ● | | 0.75% of the Fund’s average daily net assets for Invesco Raymond JamesSB-1 Equity ETF; |
| | ● | | 0.60% of the Fund’s average daily net assets for Invesco NASDAQ Internet ETF; |
| | ● | | 0.49% of the Fund’s average daily net assets for Invesco S&P 500 BuyWrite ETF (The Trustees noted that prior to July 1, 2018, the Fund’s annual unitary advisory fee was 0.75%.); |
| | ● | | 0.35% of the Fund’s average daily net assets for each of Invesco S&P 500® Pure Growth ETF, Invesco S&P 500® Pure Value ETF, Invesco S&P MidCap 400® Pure Growth ETF, Invesco S&P MidCap 400® Pure Value ETF, Invesco S&P SmallCap 600® Pure Growth ETF and Invesco S&P SmallCap 600® Pure Value ETF; |
| | ● | | 0.20% of the Fund’s average daily net assets for each of Invesco S&P 500® Equal Weight ETF and Invesco S&P 500® Top 50 ETF; |
| | ● | | 0.07% of the Fund’s average daily net assets for Invesco Dow Jones Industrial Average Dividend ETF (The Trustees noted that prior to September 24, 2018, the Fund’s annual unitary advisory fee was 0.30%.); and |
| | ● | | 0.40% of the Fund’s average daily net assets for each other Fund. |
The Trustees noted that the Adviser represented that it does not serve as the investment adviser to any clients, other than other ETFs also overseen by the Trustees, with comparable investment strategies as the Funds, but that it providessub-advisory services to other clients. The Trustees further noted the Adviser’s explanation with respect to thesub-advisory fees it receives for such services in comparison to the advisory fees charged to the Funds. The Trustees noted that the net expense ratios for certain Funds were equal to or lower than the median net expense ratios of their ETF andopen-end index peer funds as illustrated in the table below. The Trustees also noted that the net expense ratios for all of the Funds were lower than the median net expense ratios of theiropen-end actively-managed peer funds.
| | | | | | | | | | | | |
Invesco Fund | | Equal to/Lower
than ETF Median | | | Equal to/Lower
than Open-End
Index Fund
Median | | | Equal to/Lower
than Open-End
Active Fund
Median | |
| Invesco Dow Jones Industrial Average Dividend ETF | | | X | | | | X | | | | X | |
| Invesco NASDAQ Internet ETF | | | | | | | | | | | X | |
| Invesco Raymond JamesSB-1 Equity ETF | | | | | | | | | | | X | |
| Invesco S&P 500 BuyWrite ETF | | | X | | | | X | | | | X | |
| Invesco S&P 500®Equal Weight Consumer Discretionary ETF | | | X | | | | | | | | X | |
| Invesco S&P 500®Equal Weight Consumer Staples ETF | | | X | | | | | | | | X | |
| Invesco S&P 500®Equal Weight Energy ETF | | | X | | | | | | | | X | |
| Invesco S&P 500®Equal Weight ETF | | | X | | | | X | | | | X | |
| Invesco S&P 500®Equal Weight Financials ETF | | | X | | | | | | | | X | |
| Invesco S&P 500®Equal Weight Health Care ETF | | | X | | | | | | | | X | |
| Invesco S&P 500®Equal Weight Industrials ETF | | | X | | | | | | | | X | |
| Invesco S&P 500®Equal Weight Materials ETF | | | X | | | | | | | | X | |
| Invesco S&P 500®Equal Weight Real Estate ETF | | | X | | | | | | | | X | |
| Invesco S&P 500®Equal Weight Technology ETF | | | X | | | | | | | | X | |
| Invesco S&P 500®Equal Weight Utilities ETF | | | X | | | | X | | | | X | |
| Invesco S&P 500®Pure Growth ETF | | | X | | | | X | | | | X | |
| Invesco S&P 500®Pure Value ETF | | | | | | | | | | | X | |
| Invesco S&P 500®Top 50 ETF | | | X | | | | X | | | | X | |
| Invesco S&P MidCap 400® Equal Weight ETF | | | | | | | | | | | X | |
| Invesco S&P MidCap 400® Pure Growth ETF | | | | | | | X | | | | X | |
| Invesco S&P MidCap 400® Pure Value ETF | | | | | | | X | | | | X | |
| Invesco S&P SmallCap 600® Equal Weight ETF | | | | | | | | | | | X | |
Board Considerations Regarding Continuation of Investment Advisory Agreement(continued)
| | | | | | | | | | | | |
Invesco Fund | | Equal to/Lower
than ETF Median | | | Equal to/Lower
than Open-End
Index Fund
Median | | | Equal to/Lower
than Open-End
Active Fund
Median | |
| Invesco S&P SmallCap 600® Pure Growth ETF | | | | | | | X | | | | X | |
| Invesco S&P SmallCap 600® Pure Value ETF | | | | | | | X | | | | X | |
The Trustees determined that each Fund’s unitary advisory fee was reasonable, noting the nature of the indexes, the distinguishing factors of the Funds, and the administrative, operational and management oversight costs for the Adviser. The Trustees also noted that a portion of each Fund’s operating expenses was attributable to a license fee payable out of the unitary advisory fee charged to that Fund. The Board concluded that the unitary advisory fee charged to each Fund was reasonable and appropriate in light of the services provided.
In conjunction with their review of the unitary advisory fees, the Trustees considered information provided by the Adviser on the revenues received by the Adviser under the Investment Advisory Agreement for the Funds. The Trustees reviewed information provided by the Adviser on its overall profitability, as well as the estimated profitability to the Adviser from its relationship to each Fund. The Trustees concluded that the overall and estimated profitability to the Adviser was not unreasonable.
Economies of Scale and Whether Fee Levels Reflect These Economies of Scale. The Trustees reviewed the information provided by the Adviser as to the extent to which economies of scale may be realized as each Fund grows and whether fee levels reflect economies of scale for the benefit of shareholders. The Trustees reviewed each Fund’s asset size and unitary advisory fee. The Trustees noted that any reduction in fixed costs associated with the management of the Funds would be enjoyed by the Adviser, but a unitary advisory fee provides a level of certainty in expenses for the Funds. The Trustees considered whether the unitary advisory fee rate for each Fund was reasonable in relation to the asset size of that Fund, and concluded that the unitary advisory fee was reasonable and appropriate.
The Trustees noted that the Adviser had not identified any further benefits that it derived from its relationships with the Funds and had noted that it does not have any soft-dollar arrangements.
Based on all of the information considered and the conclusions reached, the Board, including the Independent Trustees, determined to approve the continuation of the Investment Advisory Agreement for each Fund. No single factor was determinative in the Board’s analysis.
Proxy Voting Policies and Procedures
A description of the Trust’s proxy voting policies and procedures that the Funds use to determine how to vote proxies relating to portfolio securities is available, without charge and upon request, by calling(800) 983-0903. This information is also available on the Securities and Exchange Commission’s (the “Commission”) website atwww.sec.gov.
Information regarding how each Fund voted proxies for portfolio securities, if applicable, during the most recent 12-month period ended June 30, is available, without charge and upon request, by (i) calling(800) 983-0903; or (ii) accessing the Trust’sForm N-PX on the Commission’s website atwww.sec.gov.
Quarterly Portfolios
The Trust files its complete schedule of portfolio holdings for the Funds with the Commission for the first and third quarters of each fiscal year onForm N-Q (or any successor Form). The Trust’sForms N-Q (or any successor Form) are available on the Commission’s website atwww.sec.gov.
Frequency Distribution of Discounts and Premiums
A table showing the number of days the market price of each Fund’s shares was greater than the Fund’s net asset value, and the number of days it was less than the Fund’s net asset value (i.e., premium or discount) for the most recently completed calendar year, and the calendar quarters since that year end (or the life of the Fund, if shorter) may be found at the Fund’s website atwww.invesco.com/ETFs.
| | | | | | |
©2019 Invesco Capital Management LLC 3500 Lacey Road, Suite 700 Downers Grove, IL 60515 | | P-PS-AR-1 | | invesco.com/ETFs |

Invesco Annual Report to Shareholders
April 30, 2019
| | |
| |
| PBE | | Invesco Dynamic Biotechnology & Genome ETF |
| |
| PKB | | Invesco Dynamic Building & Construction ETF |
| |
| PXE | | Invesco Dynamic Energy Exploration & Production ETF |
| |
| PBJ | | Invesco Dynamic Food & Beverage ETF |
| |
| PEJ | | Invesco Dynamic Leisure and Entertainment ETF |
| |
| PBS | | Invesco Dynamic Media ETF |
| |
| PXQ | | Invesco Dynamic Networking ETF |
| |
| PXJ | | Invesco Dynamic Oil & Gas Services ETF |
| |
| PJP | | Invesco Dynamic Pharmaceuticals ETF |
| |
| PMR | | Invesco Dynamic Retail ETF |
| |
| PSI | | Invesco Dynamic Semiconductors ETF |
| |
| PSJ | | Invesco Dynamic Software ETF |
Beginning on January 1, 2021, as permitted by regulations adopted by the Securities and Exchange Commission, paper copies of the Funds’ shareholder reports will no longer be sent by mail, unless you specifically request paper copies of the reports from your financial intermediary, such as a broker-dealer or bank. Instead, the reports will be made available on a website, and you will be notified by mail each time a report is posted and provided with a website link to access the report.
If you already elected to receive shareholder reports electronically, you will not be affected by this change and you need not take any action. If you hold accounts through a financial intermediary, you may contact your financial intermediary to enroll in electronic delivery. Please note that not all financial intermediaries may offer this service.
You may elect to receive all future reports in paper free of charge. If you hold accounts through a financial intermediary, you can follow the instructions included with this disclosure, if applicable, or contact your financial intermediary to request that you continue to receive paper copies of your shareholder reports. Please note that not all financial intermediaries may offer this service. Your election to receive reports in paper will apply to all funds held with your financial intermediary.
Table of Contents
The Market Environment
Domestic Equity
The fiscal year proved to be an increasingly volatile time for U.S. equities. Throughout the summer, U.S. equities moved higher as corporate profits surged amid the benefit of corporate tax cuts and improving global economic growth. Several U.S. equity indexes reached new highs despite potential headwinds, including trade tensions, tariff announcements and contagion concerns over a Turkish currency crisis. After a relatively quiet summer, market volatility noticeably rose in October 2018, as U.S. equity markets suffered a sharpsell-off throughyear-end 2018, amid ongoing trade concerns between the U.S. and China, fears of a global economic slowdown and lower oil prices from a supply glut, with oil prices plummeting from near $75 per barrel in early October 2018 to around $45 per barrel in late December 2018.1 In this environment, there was a flight to safety, as investors fled to defensive areas of the markets, such as health care, utilities and U.S. Treasuries.
Given signs of a strong economy, the U.S. Federal Reserve (the “Fed”) raised interest rates three times during the fiscal year: in June, September and December 2018. Following December’s Fed meeting, the Fed raised interest rates by 25 basis points to a targeted range of 2.25% to 2.50%, which signaled a slightly more dovish stance than expected.2 In contrast, the European Central Bank and central banks in several other countries maintained extraordinarily accommodative monetary policies.
Equity markets rebounded at the start of 2019, fueled by optimism about a potential U.S.-China trade deal and the Fed’s indication that there would be no interest rate hikes in 2019, a surprising shift in monetary policy. The Fed’s more accommodative stance provided a supportive environment for equities and fixed income, even as U.S. economic data were mixed and overseas growth appeared to be slowing. By the end of the fiscal year, the U.S. equity market generally recovered the losses from fourth quarter 2018, backed by improving investor sentiment, low unemployment and a growing economy.
| 2 | Source: U.S. Federal Reserve |
Global Equity
The fiscal year began with significant market and currency volatility. While most domestic equity indexes delivered positive performance at the beginning of the fiscal year, most major international indexes had negative results. Many international stocks struggled as investors worried that heightened global trade tensions would derail economic growth. Other concerns, such as geopolitical uncertainty and the potential impact of higher interest rates, also weakened investor sentiment. In this environment, developed markets held up better than emerging markets. After a relatively quiet summer, market volatility markedly rose again in October 2018. Global equity markets (particularly the U.S.) declined sharply in the fourth quarter of 2018 amid rising interest rates and concerns that higher inflation could result in a more restrictive monetary policy. Investors also had concerns over the Brexit negotiations, ongoing U.S.-China trade tensions, declining oil prices and fears of slowing economic growth, particularly in the eurozone.
Following the sharpsell-off in the later part of 2018, global equities rebounded in the beginning of 2019, fueled by accommodative central bank policy and the potential for a U.S.-China trade deal. Central bank policy provided a supportive environment for equities and fixed income, even as global economic growth appeared to be slowing. In January, China’s central bank initiated a stimulus program to counteract its slowing economy, while the European Central Bank and U.S. Federal Reserve later indicated they would not raise interest rates for the remainder of 2019. Lack of consensus on a deal for the U.K.’s withdrawal from the European Union prompted additional concerns for the U.K. and eurozone economies, though equity markets across the region posted gains. U.S. and Chinese equities also delivered robust gains. Both emerging and developed markets had positive returns for the first quarter of 2019.
Despite concerns over a decline in global growth for 20191, global equity indexes, in general, ended the fiscal year in positive territory, with developed markets outperforming emerging markets.
| 1 | Source: International Monetary Fund World |
| | |
| PBE | | Manager’s Analysis |
| | Invesco Dynamic Biotechnology & Genome ETF (PBE) |
As an index fund, the Invesco Dynamic Biotechnology & Genome ETF (the “Fund”) is passively managed and seeks to track the returns of an underlying index. The Fund seeks to track the investment results (before fees and expenses) of the Dynamic Biotech & Genome IntellidexSM Index (the “Index”). The Fund generally will invest at least 90% of its total assets in common stocks of biotechnology and genome companies that comprise the Index. These companies are engaged principally in the research, development, manufacture and marketing and distribution of various biotechnological products, services and processes, and are companies that benefit significantly from scientific and technological advances in biotechnology and genetic engineering and research. These companies may include, for example, companies involved in the research, development or production of pharmaceuticals, including veterinary drugs.
Strictly in accordance with its guidelines and mandated procedures, ICE Data Indices, LLC (the “Index Provider”) includes common stocks of biotechnology and genome companies in the Index principally on the basis of their capital appreciation potential, which the Index Provider identifies pursuant to a proprietary selection methodology. The Fund generally invests in all of the securities comprising the Index in proportion to their weightings in the Index.
For the fiscal year ended April 30, 2019, on a market price basis, the Fund returned 8.62%. On a net asset value (“NAV”) basis, the Fund returned 8.75%. During the same time period, the Index returned 9.08%. During the fiscal year, the Fund fully replicated the components of the Index; therefore, the Fund’s performance, on a NAV basis, differed from the return of the Index primarily due to fees and operating expenses that the Fund incurred during the period, partially offset by revenue generated through the Fund’s securities lending program.
During this same time period, the S&P Composite 1500® Biotech Index (the “Benchmark Index”) returned (2.17)%. The Benchmark Index is an unmanaged index weighted by market capitalization based on the average performance of approximately 25 securities. The Benchmark Index was selected for its recognition in the marketplace, and because its performance comparison is a useful measure for investors as a broad representation of the biotech industry. It is important to note, however, that the Index includes stocks from its proprietary “Biotechnology & Genome Group Universe” of which approximately 95% are considered pharmaceuticals, biotechnology and life sciences, while the remaining 5% of the Index contains stocks in other industry groups including materials, health care equipment & services, and technology hardware & equipment. The Benchmark Index contains 100% biotechnology companies. This Benchmark Index is relevant as a comparison, but the disparity compared to pure biotechnology exposure may produce potentially significant differences in performance when compared to the Fund.
Relative to the Benchmark Index, the Fund was most overweight in the life sciences tools & services sub-industry and most underweight in the biotechnology sub-industry during the fiscal year ended April 30, 2019. The majority of the Fund’s outperformance relative to the Benchmark Index during the period can be attributed to the Fund’s stock selection within the biotechnology sub-industry.
For the fiscal year ended April 30, 2019, the biotechnology sub-industry contributed most significantly to the Fund’s return, followed by the life sciences tools & services sub-industry. The pharmaceuticals sub-industry was the only detracting sub-industry.
Positions that contributed most significantly to the Fund’s return for the fiscal year ended April 30, 2019, included Spark Therapeutics, Inc., a biotechnology company (no longer held at fiscal year-end) and Genomic Health, Inc., a biotechnology company (portfolio average weight of 3.04%). Positions that detracted most significantly from the Fund’s return during this period included Nektar Therapeutics, a pharmaceuticals company (no longer held at fiscal year-end) and Neurocrine Biosciences, Inc., a biotechnology company (no longer held at fiscal year-end).
| | | | |
Sub-Industry Breakdown
(% of the Fund’s Net Assets)
as of April 30, 2019 | |
| Biotechnology | | | 80.9 | |
| Life Sciences Tools & Services | | | 13.4 | |
| Sub-Industry Types Each Less Than 3% | | | 5.8 | |
| Money Market Funds Plus Other Assets Less Liabilities | | | (0.1) | |
|
Top Ten Fund Holdings*
(% of the Fund’s Net Assets)
as of April 30, 2019 | |
| Security | | | | |
| Alnylam Pharmaceuticals, Inc. | | | 6.0 | |
| Celgene Corp. | | | 5.4 | |
| Illumina, Inc. | | | 5.4 | |
| QIAGEN NV | | | 5.1 | |
| Amgen, Inc. | | | 4.9 | |
| Vertex Pharmaceuticals, Inc. | | | 4.7 | |
| Regeneron Pharmaceuticals, Inc. | | | 4.2 | |
| Sangamo Therapeutics, Inc. | | | 3.8 | |
| Biogen, Inc. | | | 3.6 | |
| Veracyte, Inc. | | | 3.4 | |
| Total | | | 46.5 | |
| * | Excluding money market fund holdings. |
Invesco Dynamic Biotechnology & Genome ETF (PBE)(continued)
Growth of a $10,000 Investment
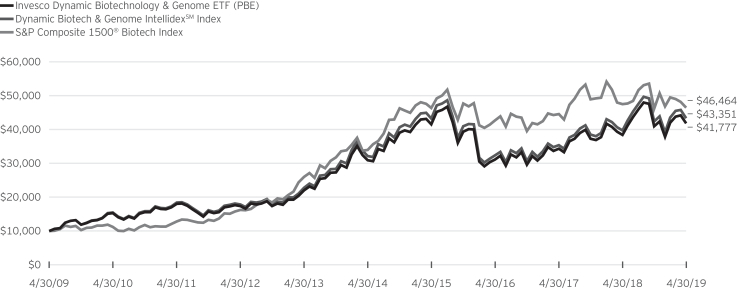
Fund Performance History as of April 30, 2019
| | | | | | | | | | | | | | | | | | | | | | | | | | | | | | | | | | | | | | | | |
| | | 1 Year | | | 3 Years Average Annualized | | | 3 Years Cumulative | | | 5 Years Average Annualized | | | 5 Years Cumulative | | | 10 Years Average Annualized | | | 10 Years Cumulative | | | | | | Fund Inception | |
| Index | | | | | Average Annualized | | | Cumulative | |
| Dynamic Biotech & Genome IntellidexSM Index | | | 9.08 | % | | | 10.30 | % | | | 34.21 | % | | | 6.16 | % | | | 34.82 | % | | | 15.80 | % | | | 333.51 | % | | | | | | | 10.16 | % | | | 282.15 | % |
| S&P Composite 1500® Biotech Index | | | (2.17 | ) | | | 2.85 | | | | 8.80 | | | | 6.48 | | | | 36.90 | | | | 16.60 | | | | 364.64 | | | | | | | | 12.81 | | | | 430.85 | |
| Fund | | | | | | | | | | | | | | | | | | | | | | | | | | | | | | | | | | | | | | | | |
| NAV Return | | | 8.75 | | | | 10.25 | | | | 34.02 | | | | 6.20 | | | | 35.08 | | | | 15.37 | | | | 317.77 | | | | | | | | 9.83 | | | | 266.36 | |
| Market Price Return | | | 8.62 | | | | 10.26 | | | | 34.03 | | | | 6.21 | | | | 35.18 | | | | 15.40 | | | | 318.74 | | | | | | | | 9.82 | | | | 266.12 | |
Fund Inception: June 23, 2005
Performance quoted above represents past performance. Past performance is not a guarantee of future results and current performance may be higher or lower than performance quoted. Investment returns and principal value will fluctuate, and shares of the Fund (“Fund Shares”), when redeemed or sold, may be worth more or less than their original cost. Fund performance reflects any applicable fee waivers and/or expense reimbursements. Had the adviser not waived fees and/or reimbursed expenses currently or in the past, returns would have been lower. See current prospectus for more information. According to the Fund’s current prospectus, the total annual operating expense ratio was indicated as 0.59%. The Financial Highlights section of the Shareholder Report presents the expense ratios based on expenses incurred during the period covered by this report. NAV and Market Price returns assume that dividends and capital gain distributions have been reinvested in the Fund at NAV and Market Price, respectively. The returns shown in the table above do not reflect the deduction of taxes that a shareholder would pay on Fund distributions or the redemption or
sale of Fund Shares. See invesco.com/ETFs to find the most recentmonth-end performance numbers.
Index and Benchmark Index performance results are based upon a hypothetical investment in their respective constituent securities. Index and Benchmark Index returns do not represent Fund returns. An investor cannot invest directly in an index. The Index and Benchmark Index do not charge management fees or brokerage expenses, and no such fees or expenses were deducted from the hypothetical performance shown. In addition, the results actual investors might have achieved would have differed from those shown because of differences in the timing, amounts of their investments, and fees and expenses associated with an investment in the Fund.
Notes Regarding Indexes and Fund Performance History:
| - | Average Annualized and Cumulative Inception returns for the Fund, Index and Benchmark Index are based on the inception date of the Fund. |
| | |
| PKB | | Manager’s Analysis |
| | Invesco Dynamic Building & Construction ETF (PKB) |
As an index fund, the Invesco Dynamic Building & Construction ETF (the “Fund”) is passively managed and seeks to track the returns of an underlying index. The Fund seeks to track the investment results (before fees and expenses) of the Dynamic Building & Construction IntellidexSM Index (the “Index”). The Fund generally will invest at least 90% of its total assets in common stocks of building and construction companies that comprise the Index. These companies are engaged primarily in providing construction and related engineering services for building and remodeling residential properties, commercial or industrial buildings, or working on large-scale infrastructure projects, such as highways, tunnels, bridges, dams, power lines and airports. These companies also may include manufacturers of building materials for home improvement and general construction projects and specialized machinery used for building and construction; companies that provide installation, maintenance or repair work; and land developers.
Strictly in accordance with its guidelines and mandated procedures, ICE Data Indices, LLC (the “Index Provider”) includes common stocks of building and construction companies in the Index principally on the basis of their capital appreciation potential, which the Index Provider identifies pursuant to a proprietary selection methodology. The Fund generally invests in all of the securities comprising the Index in proportion to their weightings in the Index.
For the fiscal year ended April 30, 2019, on a market price basis, the Fund returned (0.47)%. On a net asset value (“NAV”) basis, the Fund returned (0.47)%. During the same time period, the Index returned 0.22%. During the fiscal year, the Fund fully replicated the components of the Index; therefore, the Fund’s performance, on a NAV basis, differed from the return of the Index primarily due to fees and operating expenses that the Fund incurred during the period.
During this same time period, the S&P Composite 1500® Construction & Engineering Index (the “Benchmark Index”) returned 1.91%. The Benchmark Index is an unmanaged index weighted by market capitalization based on the average performance of approximately 15 securities. The Benchmark Index was selected for its recognition in the marketplace, and because its performance comparison is a useful measure for investors as a broad representation of the building & construction industry.
The performance of the Fund differed from the Benchmark Index in part because the Fund seeks to track an Index that employs a modified equal weighting and stock selection methodology, whereas the Benchmark Index selects and weights stocks based on market capitalization.
Relative to the Benchmark Index, the Fund was most overweight in the building productssub-industry and most underweight in the construction & engineeringsub-industry during the fiscal year ended April 30, 2019. The majority of the Fund’s
underperformance relative to the Benchmark Index during that period can be attributed to the Fund’s overweight allocation to the homebuilding and building productssub-industries.
For the fiscal year ended April 30, 2019, the construction & engineeringsub-industry contributed most significantly to the Fund’s return, followed by the specialty storessub-industry. The building productssub-industry detracted most significantly from the Fund’s return, followed by the homebuilding and office services & suppliessub-industries, respectively.
Positions that contributed most significantly to the Fund’s return for the fiscal year ended April 30, 2019, included Tractor Supply Co., a specialty stores company (portfolio average weight of 5.30%) and Jacobs Engineering Group, Inc., a construction & engineering company (portfolio average weight of 2.42%). Positions that detracted most significantly from the Fund’s return during this period included NCI Building Systems, Inc., a building products company (no longer held at fiscalyear-end) and Interface, Inc., an office services & supplies company (no longer held at fiscalyear-end).
| | | | |
Sub-Industry Breakdown
(% of the Fund’s Net Assets)
as of April 30, 2019 | |
| Building Products | | | 18.6 | |
| Construction & Engineering | | | 18.5 | |
| Homebuilding | | | 16.1 | |
| Construction Materials | | | 13.2 | |
| Home Improvement Retail | | | 9.9 | |
| Industrial Machinery | | | 8.0 | |
| Specialty Stores | | | 5.0 | |
| Sub-Industry Types Each Less Than 3% | | | 10.7 | |
| Money Market Funds Plus Other Assets Less Liabilities | | | 0.0 | |
|
Top Ten Fund Holdings*
(% of the Fund’s Net Assets)
as of April 30, 2019 | |
| Security | | | | |
| Martin Marietta Materials, Inc. | | | 5.4 | |
| Ingersoll-Rand PLC | | | 5.4 | |
| Vulcan Materials Co. | | | 5.2 | |
| Lennox International, Inc. | | | 5.1 | |
| Lowe’s Cos., Inc. | | | 5.0 | |
| Tractor Supply Co. | | | 5.0 | |
| Home Depot, Inc. (The) | | | 4.9 | |
| Jacobs Engineering Group, Inc. | | | 4.9 | |
| Armstrong World Industries, Inc. | | | 3.1 | |
| EMCOR Group, Inc. | | | 3.0 | |
| Total | | | 47.0 | |
| * | Excluding money market fund holdings. |
Invesco Dynamic Building & Construction ETF (PKB)(continued)
Growth of a $10,000 Investment
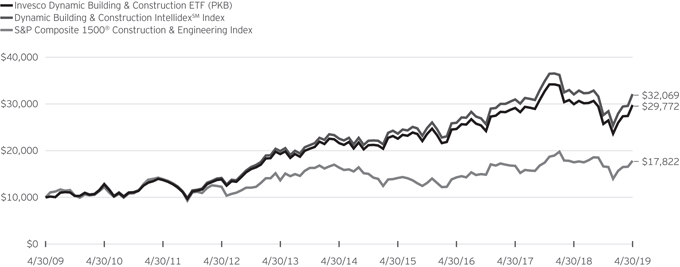
Fund Performance History as of April 30, 2019
| | | | | | | | | | | | | | | | | | | | | | | | | | | | | | | | | | | | | | | | |
| | | 1 Year | | | 3 Years Average Annualized | | | 3 Years Cumulative | | | 5 Years Average Annualized | | | 5 Years Cumulative | | | 10 Years Average Annualized | | | 10 Years Cumulative | | | | | | Fund Inception | |
| Index | | | | | Average
Annualized | | | Cumulative | |
| Dynamic Building & Construction IntellidexSM Index | | | 0.22 | % | | | 7.26 | % | | | 23.41 | % | | | 7.32 | % | | | 42.35 | % | | | 12.36 | % | | | 220.69 | % | | | | | | | 6.63 | % | | | 138.02 | % |
| S&P Composite 1500® Construction & Engineering Index | | | 1.91 | | | | 7.68 | | | | 24.86 | | | | 1.74 | | | | 9.02 | | | | 5.95 | | | | 78.22 | | | | | | | | 6.42 | | | | 131.81 | |
| Fund | | | | | | | | | | | | | | | | | | | | | | | | | | | | | | | | | | | | | | | | |
| NAV Return | | | (0.47 | ) | | | 6.56 | | | | 20.99 | | | | 6.60 | | | | 37.65 | | | | 11.53 | | | | 197.72 | | | | | | | | 5.78 | | | | 113.69 | |
| Market Price Return | | | (0.47 | ) | | | 6.57 | | | | 21.03 | | | | 6.60 | | | | 37.63 | | | | 11.51 | | | | 197.28 | | | | | | | | 5.78 | | | | 113.62 | |
Fund Inception: October 26, 2005
Performance quoted above represents past performance. Past performance is not a guarantee of future results and current performance may be higher or lower than performance quoted. Investment returns and principal value will fluctuate, and shares of the Fund (“Fund Shares”), when redeemed or sold, may be worth more or less than their original cost. Fund performance reflects any applicable fee waivers and/or expense reimbursements. Had the adviser not waived fees and/or reimbursed expenses currently or in the past, returns would have been lower. See current prospectus for more information. According to the Fund’s current prospectus, the total annual operating expense ratio was indicated as 0.58%. The Financial Highlights section of the Shareholder Report presents the expense ratios based on expenses incurred during the period covered by this report. NAV and Market Price returns assume that dividends and capital gain distributions have been reinvested in the Fund at NAV and Market Price, respectively. The returns shown in the table above do not reflect the deduction of taxes that a shareholder would pay on Fund distributions or the redemption or
sale of Fund Shares. See invesco.com/ETFs to find the most recentmonth-end performance numbers.
Index and Benchmark Index performance results are based upon a hypothetical investment in their respective constituent securities. Index and Benchmark Index returns do not represent Fund returns. An investor cannot invest directly in an index. The Index and Benchmark Index do not charge management fees or brokerage expenses, and no such fees or expenses were deducted from the hypothetical performance shown. In addition, the results actual investors might have achieved would have differed from those shown because of differences in the timing, amounts of their investments, and fees and expenses associated with an investment in the Fund.
Notes Regarding Indexes and Fund Performance History:
| - | Average Annualized and Cumulative Inception returns for the Fund, Index and Benchmark Index are based on the inception date of the Fund. |
| | |
| PXE | | Manager’s Analysis |
| | Invesco Dynamic Energy Exploration & Production ETF (PXE) |
As an index fund, the Invesco Dynamic Energy Exploration & Production ETF (the “Fund”) is passively managed and seeks to track the returns of an underlying index. The Fund seeks to track the investment results (before fees and expenses) of the Dynamic Energy Exploration & Production IntellidexSM Index (the “Index”). The Fund generally will invest at least 90% of its total assets in common stocks of companies engaged in energy exploration and production that comprise the Index. These companies are engaged principally in exploration, extraction and production of crude oil and natural gas from land-based or offshore wells. These companies include petroleum refineries that process the crude oil into finished products, such as gasoline and automotive lubricants, and companies involved in gathering and processing natural gas, and manufacturing natural gas liquid.
Strictly in accordance with its guidelines and mandated procedures, ICE Data Indices, LLC (the “Index Provider”) includes common stocks of energy exploration and production companies in the Index principally on the basis of their capital appreciation potential, which the Index Provider identifies pursuant to a proprietary selection methodology. The Fund generally invests in all of the securities comprising the Index in proportion to their weightings in the Index.
For the fiscal year ended April 30, 2019, on a market price basis, the Fund returned (17.96)%. On a net asset value (“NAV”) basis, the Fund returned (17.84)%. During the same time period, the Index returned (17.27)%. During the fiscal year, the Fund fully replicated the components of the Index; therefore, the Fund’s performance, on a NAV basis, differed from the return of the Index primarily due to fees and operating expenses that the Fund incurred during the period, partially offset by income received from the securities lending program in which the Fund participates.
During this same time period, the S&P Composite 1500® Oil & Gas Exploration & Production Index (the “Benchmark Index”) returned (12.83)%. The Benchmark Index is an unmanaged index weighted by market capitalization based on the average performance of approximately 64 securities. The Benchmark Index was selected for its recognition in the marketplace and because its performance comparison is a useful measure for investors as a broad representation of the oil & gas exploration & productionsub-industry.
The performance of the Fund differed from the Benchmark Index in part because the Fund seeks to track an Index that employs a modified equal weighting and stock selection methodology, whereas the Benchmark Index selects and weights stocks based on market capitalization.
Relative to the Benchmark Index, the Fund was most overweight in the oil & gas refining & marketingsub-industry and most underweight in the oil & gas exploration & productionsub-industry
during the fiscal year ended April 30, 2019. The majority of the Fund’s underperformance relative to the Benchmark Index during that period can be attributed to the Fund’s stock selection in the oil & gas exploration & productionsub-industry.
For the fiscal year ended April 30, 2019, the gas utilitiessub-industry contributed most significantly to the Fund’s return. The oil & gas exploration & productionsub-industry detracted most significantly from the Fund’s return, followed by the oil & gas refining & marketingsub-industry.
Positions that contributed most significantly to the Fund’s return for the fiscal year ended April 30, 2019, included Anadarko Petroleum Corp., an oil & gas exploration & production company (portfolio average weight of 2.07%) and California Resources Corp., an oil & gas exploration & production company (no longer held at fiscal year-end). Positions that detracted most significantly from the Fund’s return during this period included Laredo Petroleum, Inc., an oil & gas exploration & production company (portfolio average weight of 2.47%) and Antero Resources Corp., an oil & gas exploration & production company (portfolio average weight of 2.57%).
| | | | |
Sub-Industry Breakdown
(% of the Fund’s Net Assets)
as of April 30, 2019 | |
| Oil & Gas Exploration & Production | | | 67.9 | |
| Oil & Gas Refining & Marketing | | | 25.6 | |
| Integrated Oil & Gas | | | 6.6 | |
| Money Market Funds Plus Other Assets Less Liabilities | | | (0.1) | |
|
Top Ten Fund Holdings*
(% of the Fund’s Net Assets)
as of April 30, 2019 | |
| Security | | | | |
| Anadarko Petroleum Corp. | | | 8.3 | |
| Hess Corp. | | | 5.5 | |
| Valero Energy Corp. | | | 5.3 | |
| EOG Resources, Inc. | | | 5.0 | |
| Phillips 66 | | | 4.8 | |
| Marathon Petroleum Corp. | | | 4.7 | |
| ConocoPhillips | | | 4.5 | |
| Occidental Petroleum Corp. | | | 4.4 | |
| SRC Energy, Inc. | | | 3.5 | |
| Chesapeake Energy Corp. | | | 3.0 | |
| Total | | | 49.0 | |
| * | Excluding money market fund holdings. |
Invesco Dynamic Energy Exploration & Production ETF (PXE)(continued)
Growth of a $10,000 Investment
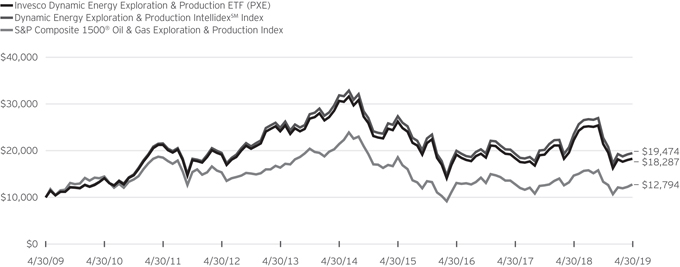
Fund Performance History as of April 30, 2019
| | | | | | | | | | | | | | | | | | | | | | | | | | | | | | | | | | | | | | | | |
| | | 1 Year | | | 3 Years
Average
Annualized | | | 3 Years
Cumulative | | | 5 Years
Average
Annualized | | | 5 Years
Cumulative | | | 10 Years
Average
Annualized | | | 10 Years
Cumulative | | | | | | Fund Inception | |
| Index | | | | | Average
Annualized | | | Cumulative | |
| Dynamic Energy Exploration & Production IntellidexSM Index | | | (17.27 | )% | | | (0.89 | )% | | | (2.66 | )% | | | (9.36 | )% | | | (38.83 | )% | | | 6.89 | % | | | 94.74 | % | | | | | | | 3.76 | % | | | 64.77 | % |
| S&P Composite 1500® Oil & Gas Exploration & Production Index | | | (12.83 | ) | | | (0.75 | ) | | | (2.23 | ) | | | (9.83 | ) | | | (40.40 | ) | | | 2.49 | | | | 27.94 | | | | | | | | 1.96 | | | | 30.05 | |
| Fund | | | | | | | | | | | | | | | | | | | | | | | | | | | | | | | | | | | | | | | | |
| NAV Return | | | (17.84 | ) | | | (1.53 | ) | | | (4.52 | ) | | | (9.82 | ) | | | (40.35 | ) | | | 6.22 | | | | 82.87 | | | | | | | | 3.15 | | | | 52.02 | |
| Market Price Return | | | (17.96 | ) | | | (1.49 | ) | | | (4.42 | ) | | | (9.80 | ) | | | (40.29 | ) | | | 6.25 | | | | 83.35 | | | | | | | | 3.15 | | | | 52.00 | |
Fund Inception: October 26, 2005
Performance quoted above represents past performance. Past performance is not a guarantee of future results and current performance may be higher or lower than performance quoted. Investment returns and principal value will fluctuate, and shares of the Fund (“Fund Shares”), when redeemed or sold, may be worth more or less than their original cost. Fund performance reflects any applicable fee waivers and/or expense reimbursements. Had the adviser not waived fees and/or reimbursed expenses currently or in the past, returns would have been lower. See current prospectus for more information. The adviser has contractually agreed to waive fees and/or pay certain Fund expenses through August 31, 2021. According to the Fund’s current prospectus, the total gross annual operating expense ratio was indicated as 0.77% and the net annual operating expense ratio was indicated as 0.65%. The Financial Highlights section of the Shareholder Report presents the expense ratios based on expenses incurred during the period covered by this report. NAV and Market Price returns assume that dividends and capital gain distributions have been reinvested in the Fund at NAV and Market Price, respectively. The returns shown in the table
above do not reflect the deduction of taxes that a shareholder would pay on Fund distributions or the redemption or sale of Fund Shares. See invesco.com/ETFs to find the most recentmonth-end performance numbers.
Index and Benchmark Index performance results are based upon a hypothetical investment in their respective constituent securities. Index and Benchmark Index returns do not represent Fund returns. An investor cannot invest directly in an index. The Index and Benchmark Index do not charge management fees or brokerage expenses, and no such fees or expenses were deducted from the hypothetical performance shown. In addition, the results actual investors might have achieved would have differed from those shown because of differences in the timing, amounts of their investments, and fees and expenses associated with an investment in the Fund.
Notes Regarding Indexes and Fund Performance History:
| - | Average Annualized and Cumulative Inception returns for the Fund, Index and Benchmark Index are based on the inception date of the Fund. |
| | |
| PBJ | | Manager’s Analysis |
| | Invesco Dynamic Food & Beverage ETF (PBJ) |
As an index fund, the Invesco Dynamic Food & Beverage ETF (the “Fund”) is passively managed and seeks to track the returns of an underlying index. The Fund seeks to track the investment results (before fees and expenses) of the Dynamic Food & Beverage IntellidexSM Index (the “Index”). The Fund generally will invest at least 90% of its total assets in common stocks of food and beverage companies that comprise the Index. These companies are engaged principally in the manufacture, sale or distribution of food and beverage products, agricultural products and products related to the development of new food technologies. These companies may include consumer manufacturing of agricultural inputs like livestock and crops, as well as processed food and beverage products; food and beverage stores such as grocery stores, supermarkets, wholesale distributors of grocery items; and food and beverage services like restaurants, bars, snack bars, coffeehouses and other establishments providing food and refreshment. Companies with focused operations as tobacco growers and manufacturers, or pet supplies stores are specifically excluded from this universe.
Strictly in accordance with its guidelines and mandated procedures, ICE Data Indices, LLC (the “Index Provider”) includes common stocks of food and beverage companies in the Index principally on the basis of their capital appreciation potential, which the Index Provider identifies pursuant to a proprietary selection methodology. The Fund generally invests in all of the securities comprising the Index in proportion to their weightings in the Index.
For the fiscal year ended April 30, 2019, on a market price basis, the Fund returned 5.47%. On a net asset value (“NAV”) basis, the Fund returned 5.37%. During the same time period, the Index returned 5.84%. During the fiscal year, the Fund fully replicated the components of the Index; therefore, the Fund’s performance, on a NAV basis, differed from the return of the Index primarily due to fees and operating expenses, as well as trading costs around the rebalances that the Fund incurred during the period.
During this same time period, the S&P Composite 1500® Food Beverage & Tobacco Index (the “Benchmark Index”) returned 12.76%. The Benchmark Index is an unmanaged index weighted by market capitalization based on the average performance of approximately 40 securities. The Benchmark Index was selected for its recognition in the marketplace, and because its performance comparison is a useful measure for investors as a broad representation of the food & beverage industry.
The performance of the Fund differed from the Benchmark Index in part because the Fund seeks to track an Index that employs a modified equal weighting and stock selection methodology, whereas the Benchmark Index selects and weights stocks based on market capitalization.
Relative to the Benchmark Index, the Fund was most overweight in the packaged foods & meatssub-industry and most underweight in the tobaccosub-industry during the fiscal year ended April 30, 2019. The majority of the Fund’s
underperformance relative to the Benchmark Index during the period can be attributed to the Fund’s underweight allocation to the soft drinkssub-industry.
For the fiscal year ended April 30, 2019, the soft drinkssub-industry contributed most significantly to the Fund’s return, followed by the packaged foods & meats and restaurantssub-industries, respectively. The distillers & vintnerssub-industry detracted most significantly from the Fund’s return, followed by the food distributorssub-industry.
Positions that contributed most significantly to the Fund’s return for the fiscal year ended April 30, 2019, included Mondelez International, Inc., Class A, a packaged foods & meats company (portfolio average weight of 5.09%) and Keurig Dr Pepper, Inc., a soft drinks company (portfolio average weight of 3.35%). Positions that detracted most significantly from the Fund’s return during this period included United Natural Foods, Inc., a food distributors company (no longer held at fiscalyear-end) and Constellation Brands, Inc., Class A, a distillers & vintners company (no longer held at fiscalyear-end).
| | | | |
Sub-Industry Breakdown
(% of the Fund’s Net Assets)
as of April 30, 2019 | |
| Packaged Foods & Meats | | | 40.1 | |
| Soft Drinks | | | 16.8 | |
| Restaurants | | | 16.3 | |
| Food Distributors | | | 10.2 | |
| Food Retail | | | 8.9 | |
| Agricultural Products | | | 7.6 | |
| Money Market Funds Plus Other Assets Less Liabilities | | | 0.1 | |
|
Top Ten Fund Holdings*
(% of the Fund’s Net Assets)
as of April 30, 2019 | |
| Security | | | | |
| Yum! Brands, Inc. | | | 5.3 | |
| Starbucks Corp. | | | 5.3 | |
| Coca-Cola Co. (The) | | | 5.1 | |
| Mondelez International, Inc., Class A | | | 5.0 | |
| Archer-Daniels-Midland Co. | | | 5.0 | |
| Keurig Dr Pepper, Inc. | | | 5.0 | |
| Hormel Foods Corp. | | | 4.6 | |
| Kroger Co. (The) | | | 4.4 | |
| Coca-Cola Bottling Co. Consolidated, Inc. | | | 3.7 | |
| McCormick & Co, Inc. | | | 3.0 | |
| Total | | | 46.4 | |
| * | Excluding money market fund holdings. |
Invesco Dynamic Food & Beverage ETF (PBJ)(continued)
Growth of a $10,000 Investment
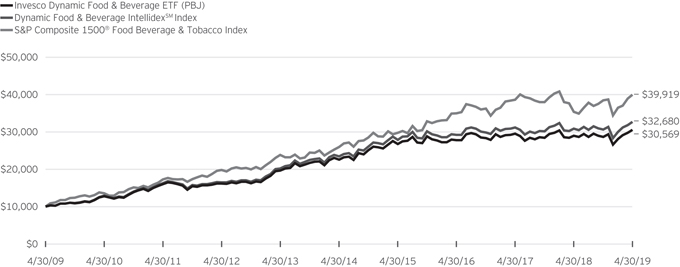
Fund Performance History as of April 30, 2019
| | | | | | | | | | | | | | | | | | | | | | | | | | | | | | | | | | | | | | | | |
| | | 1 Year | | | 3 Years Average
Annualized | | | 3 Years Cumulative | | | 5 Years Average
Annualized | | | 5 Years Cumulative | | | 10 Years Average
Annualized | | | 10 Years Cumulative | | | | | | Fund Inception | |
| Index | | | | | Average
Annualized | | | Cumulative | |
| Dynamic Food & Beverage IntellidexSM Index | | | 5.84 | % | | | 3.79 | % | | | 11.81 | % | | | 6.86 | % | | | 39.33 | % | | | 12.57 | % | | | 226.80 | % | | | | | | | 8.38 | % | | | 204.94 | % |
| S&P Composite 1500® Food Beverage & Tobacco Index | | | 12.76 | | | | 4.52 | | | | 14.17 | | | | 8.95 | | | | 53.50 | | | | 14.85 | | | | 299.19 | | | | | | | | 11.34 | | | | 342.72 | |
| Fund | | | | | | | | | | | | | | | | | | | | | | | | | | | | | | | | | | | | | | | | |
| NAV Return | | | 5.37 | | | | 3.17 | | | | 9.82 | | | | 6.21 | | | | 35.14 | | | | 11.82 | | | | 205.69 | | | | | | | | 7.68 | | | | 178.64 | |
| Market Price Return | | | 5.47 | | | | 3.16 | | | | 9.79 | | | | 6.19 | | | | 35.02 | | | | 11.81 | | | | 205.27 | | | | | | | | 7.67 | | | | 178.47 | |
Fund Inception: June 23, 2005
Performance quoted above represents past performance. Past performance is not a guarantee of future results and current performance may be higher or lower than performance quoted. Investment returns and principal value will fluctuate, and shares of the Fund (“Fund Shares”), when redeemed or sold, may be worth more or less than their original cost. Fund performance reflects any applicable fee waivers and/or expense reimbursements. Had the adviser not waived fees and/or reimbursed expenses currently or in the past, returns would have been lower. See current prospectus for more information. The adviser has contractually agreed to waive fees and/or pay certain Fund expenses through August 31, 2021. According to the Fund’s current prospectus, the total gross annual operating expense ratio was indicated as 0.65% and the net annual operating expense ratio was indicated as 0.63%. The Financial Highlights section of the Shareholder Report presents the expense ratios based on expenses incurred during the period covered by this report. NAV and Market Price returns assume that dividends and capital gain distributions have been reinvested in the Fund at NAV and Market Price, respectively. The returns shown in the table
above do not reflect the deduction of taxes that a shareholder would pay on Fund distributions or the redemption or sale of Fund Shares. See invesco.com/ETFs to find the most recentmonth-end performance numbers.
Index and Benchmark Index performance results are based upon a hypothetical investment in their respective constituent securities. Index and Benchmark Index returns do not represent Fund returns. An investor cannot invest directly in an index. The Index and Benchmark Index do not charge management fees or brokerage expenses, and no such fees or expenses were deducted from the hypothetical performance shown. In addition, the results actual investors might have achieved would have differed from those shown because of differences in the timing, amounts of their investments, and fees and expenses associated with an investment in the Fund.
Notes Regarding Indexes and Fund Performance History:
| - | Average Annualized and Cumulative Inception returns for the Fund, Index and Benchmark Index are based on the inception date of the Fund. |
| | |
| PEJ | | Manager’s Analysis |
| | Invesco Dynamic Leisure and Entertainment ETF (PEJ) |
As an index fund, the Invesco Dynamic Leisure and Entertainment ETF (the “Fund”) is passively managed and seeks to track the returns of an underlying index. The Fund seeks to track the investment results (before fees and expenses) of the Dynamic Leisure & Entertainment IntellidexSM Index (the “Index”). The Fund generally will invest at least 90% of its total assets in common stocks of leisure and entertainment companies that comprise the Index. These companies are engaged principally in the design, production or distribution of goods or services in the leisure and entertainment industries. These companies may include hospitality industry companies such as hotels, restaurants and bars, cruise lines, casinos, and all other recreation and amusement businesses, as well as entertainment programming companies engaged in the production of motion pictures, music by recording artists, programming for radio and television, related post-production and movie theaters.
Strictly in accordance with its guidelines and mandated procedures, ICE Data Indices, LLC (the “Index Provider”) includes common stocks of leisure companies and entertainment companies in the Index principally on the basis of their capital appreciation potential, which the Index Provider identifies pursuant to a proprietary selection methodology. The Fund generally invests in all of the securities comprising the Index in proportion to their weightings in the Index.
For the fiscal year ended April 30, 2019, on a market price basis, the Fund returned 0.12%. On a net asset value (“NAV”) basis, the Fund returned 0.33%. During the same time period, the Index returned 0.87%. During the fiscal year, the Fund fully replicated the components of the Index; therefore, the Fund’s performance, on a NAV basis, differed from the return of the Index primarily due to fees and operating expenses that the Fund incurred during the period.
During this same time period, the S&P Composite 1500® Hotels Restaurants & Leisure Index (the “Benchmark Index”) returned 14.45%. The Benchmark Index is an unmanaged index weighted by market capitalization based on the average performance of approximately 45 securities. The Benchmark Index was selected for its recognition in the marketplace, and because its performance comparison is a useful measure for investors as a broad representation of the leisure & entertainment industry.
The performance of the Fund differed from the Benchmark Index in part because the Fund seeks to track an Index that employs a modified equal weighting and stock selection methodology, whereas the Benchmark Index selects and weights stocks based on market capitalization.
Relative to the Benchmark Index, the Fund was most overweight in the movies & entertainmentsub-industry and most underweight in the restaurantssub-industry during the fiscal year ended April 30, 2019. The majority of the Fund’s underperformance
relative to the Benchmark Index during that period can be attributed to the Fund’s relative underweight allocation to the restaurantssub-industry.
For the fiscal year ended April 30, 2019, the movies & entertainmentsub-industry contributed most significantly to the Fund’s return, followed by the restaurantssub-industry. The casinos & gaming and internet & direct marketing retailsub-industries were the greatest detractors, respectively.
Positions that contributed most significantly to the Fund’s return for the fiscal year ended April 30, 2019, included World Wrestling Entertainment, Inc., Class A, a movies & entertainment company (portfolio average weight of 3.13%) and Walt Disney Co. (The), a movies & entertainment company (portfolio average weight of 3.62%). Positions that detracted most significantly from the Fund’s return during this period included Manchester United PLC, Class A, a movies & entertainment company (portfolio average weight of 1.11%) and Wynn Resorts, Ltd., a casinos & gaming company (no longer held at fiscalyear-end).
| | | | |
Sub-Industry Breakdown
(% of the Fund’s Net Assets)
as of April 30, 2019 | |
| Movies & Entertainment | | | 31.3 | |
| Restaurants | | | 30.6 | |
| Airlines | | | 17.8 | |
| Broadcasting | | | 6.9 | |
| Internet & Direct Marketing Retail | | | 5.1 | |
| Sub-Industry Types Each Less Than 3% | | | 8.3 | |
| Money Market Funds Plus Other Assets Less Liabilities | | | 0.0 | |
|
Top Ten Fund Holdings*
(% of the Fund’s Net Assets)
as of April 30, 2019 | |
| Security | | | | |
| Walt Disney Co. (The) | | | 8.3 | |
| Chipotle Mexican Grill, Inc. | | | 5.8 | |
| Yum! Brands, Inc. | | | 5.6 | |
| Starbucks Corp. | | | 5.5 | |
| Expedia Group, Inc. | | | 5.1 | |
| United Continental Holdings, Inc. | | | 5.1 | |
| Southwest Airlines Co. | | | 5.0 | |
| Live Nation Entertainment, Inc. | | | 3.2 | |
| Cinemark Holdings, Inc. | | | 3.2 | |
| Central European Media Enterprises Ltd., Class A | | | 3.1 | |
| Total | | | 49.9 | |
| * | Excluding money market fund holdings. |
Invesco Dynamic Leisure and Entertainment ETF (PEJ) (continued)
Growth of a $10,000 Investment
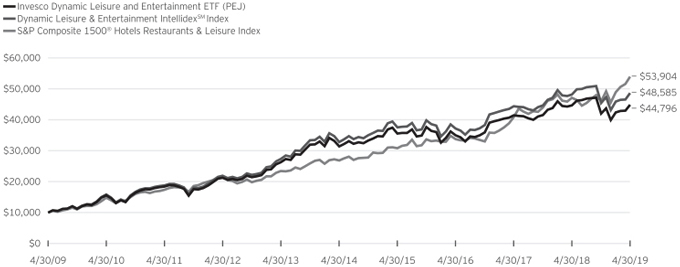
Fund Performance History as of April 30, 2019
| | | | | | | | | | | | | | | | | | | | | | | | | | | | | | | | | | | | | | | | |
| | | | | | 3 Years Average
Annualized | | | 3 Years Cumulative | | | 5 Years Average
Annualized | | | 5 Years Cumulative | | | 10 Years Average
Annualized | | | 10 Years Cumulative | | | | | | Fund Inception | |
| Index | | 1 Year | | | | | | Average
Annualized | | | Cumulative | |
| Dynamic Leisure & Entertainment IntellidexSM Index | | | 0.87 | % | | | 9.38 | % | | | 30.88 | % | | | 8.17 | % | | | 48.08 | % | | | 17.13 | % | | | 385.85 | % | | | | | | | 9.91 | % | | | 270.23 | % |
| S&P Composite 1500® Hotels Restaurants & Leisure Index | | | 14.45 | | | | 16.95 | | | | 59.97 | | | | 15.00 | | | | 101.16 | | | | 18.35 | | | | 439.04 | | | | | | | | 12.68 | | | | 422.89 | |
| Fund | | | | | | | | | | | | | | | | | | | | | | | | | | | | | | | | | | | | | | | | |
| NAV Return | | | 0.33 | | | | 8.64 | | | | 28.21 | | | | 7.41 | | | | 42.97 | | | | 16.18 | | | | 347.96 | | | | | | | | 9.22 | | | | 239.46 | |
| Market Price Return | | | 0.12 | | | | 8.63 | | | | 28.19 | | | | 7.41 | | | | 42.95 | | | | 16.19 | | | | 348.61 | | | | | | | | 9.22 | | | | 239.40 | |
Fund Inception: June 23, 2005
Performance quoted above represents past performance. Past performance is not a guarantee of future results and current performance may be higher or lower than performance quoted. Investment returns and principal value will fluctuate, and shares of the Fund (“Fund Shares”), when redeemed or sold, may be worth more or less than their original cost. Fund performance reflects any applicable fee waivers and/or expense reimbursements. Had the adviser not waived fees and/or reimbursed expenses currently or in the past, returns would have been lower. See current prospectus for more information. The adviser has contractually agreed to waive fees and/or pay certain Fund expenses through August 31, 2021. According to the Fund’s current prospectus, the total gross annual operating expense ratio was indicated as 0.65% and the net annual operating expense ratio was indicated as 0.63%. The Financial Highlights section of the Shareholder Report presents the expense ratios based on expenses incurred during the period covered by this report. NAV and Market Price returns assume that dividends and capital gain distributions have been reinvested in the Fund at NAV and Market Price, respectively. The returns shown in the table
above do not reflect the deduction of taxes that a shareholder would pay on Fund distributions or the redemption or sale of Fund Shares. See invesco.com/ETFs to find the most recentmonth-end performance numbers.
Index and Benchmark Index performance results are based upon a hypothetical investment in their respective constituent securities. Index and Benchmark Index returns do not represent Fund returns. An investor cannot invest directly in an index. The Index and Benchmark Index do not charge management fees or brokerage expenses, and no such fees or expenses were deducted from the hypothetical performance shown. In addition, the results actual investors might have achieved would have differed from those shown because of differences in the timing, amounts of their investments, and fees and expenses associated with an investment in the Fund.
Notes Regarding Indexes and Fund Performance History:
| - | Average Annualized and Cumulative Inception returns for the Fund, Index and Benchmark Index are based on the inception date of the Fund. |
| | |
| PBS | | Manager’s Analysis |
| | Invesco Dynamic Media ETF (PBS) |
As an index fund, the Invesco Dynamic Media ETF (the “Fund”) is passively managed and seeks to track the returns of an underlying index. The Fund seeks to track the investment results (before fees and expenses) of the Dynamic Media IntellidexSM Index (the “Index”). The Fund generally will invest at least 90% of its total assets in common stocks of media companies that comprise the Index. These companies are engaged principally in the development, production, sale and distribution of goods or services used in the media industry. These companies produce and distribute information and entertainment content and may include television and radio stations, broadcast and cable networks, motion picture companies, music producers, print publishers, and providers of content delivered via the internet, as well as direct to home satellite services, traditional cable services, and advertising and related services.
Strictly in accordance with its guidelines and mandated procedures, ICE Data Indices, LLC (the “Index Provider”) includes common stocks of media companies in the Index principally on the basis of their capital appreciation potential, which the Index Provider identifies pursuant to a proprietary selection methodology. The Fund generally invests in all of the securities comprising the Index in proportion to their weightings in the Index.
For the fiscal year ended April 30, 2019, on a market price basis, the Fund returned 19.73%. On a net asset value (“NAV”) basis, the Fund returned 19.81%. During the same time period, the Index returned 20.35%. During the fiscal year, the Fund fully replicated the components of the Index; therefore, the Fund’s performance, on a NAV basis, differed from the return of the Index primarily due to fees and operating expenses that the Fund incurred during the period.
During this same time period, the S&P Composite 1500® Media Index (the “Benchmark Index”) returned 28.73%. The Benchmark Index is an unmanaged index weighted by market capitalization based on the average performance of approximately 30 securities. The Benchmark Index was selected for its recognition in the marketplace, and because its performance comparison is a useful measure for investors as a broad representation of the media industry.
The performance of the Fund differed from the Benchmark Index in part because the Fund seeks to track an Index that employs a modified equal weighting and stock selection methodology, whereas the Benchmark Index selects and weights stocks based on market capitalization.
Relative to the Benchmark Index, the Fund was most overweight in the interactive media & servicessub-industry and most underweight in the cable & satellitesub-industry during the fiscal year ended April 30, 2019. The majority of the Fund’s underperformance relative to the Benchmark Index during that
period can be attributed to the Fund’s relative underweight allocation to the cable & satellitesub-industry.
For the fiscal year ended April 30, 2019, the interactive media & services sub-industry contributed most significantly to the Fund’s return, followed by the movies & entertainment and broadcasting sub-industries, respectively. The publishing sub-industry detracted most significantly from the Fund’s return, followed by the internet & direct marketing retail and advertising sub-industries, respectively.
Positions that contributed most significantly to the Fund’s return for the fiscal year ended April 30, 2019, included World Wrestling Entertainment, Inc., Class A, a movies & entertainment company (portfolio average weight of 3.05%) and Walt Disney Co. (The), a movies & entertainment company (portfolio average weight of 5.36%). Positions that detracted most significantly from the Fund’s return during this period included Care.com, Inc., an interactive media & services company (portfolio average weight of 0.36%) and Emerald Expositions Events, Inc., an advertising company (no longer held at fiscalyear-end).
| | | | |
Sub-Industry Breakdown
(% of the Fund’s Net Assets)
as of April 30, 2019 | |
| Broadcasting | | | 30.5 | |
| Interactive Media & Services | | | 27.0 | |
| Movies & Entertainment | | | 22.9 | |
| Publishing | | | 9.9 | |
| Advertising | | | 5.3 | |
| Cable & Satellite | | | 4.5 | |
| Money Market Funds Plus Other Assets Less Liabilities | | | (0.1) | |
|
Top Ten Fund Holdings*
(% of the Fund’s Net Assets)
as of April 30, 2019 | |
| Security | | | | |
| Walt Disney Co. (The) | | | 7.8 | |
| Twitter, Inc. | | | 6.2 | |
| Facebook, Inc., Class A | | | 5.7 | |
| Alphabet, Inc., Class A | | | 5.2 | |
| CBS Corp., Class B | | | 4.8 | |
| Sirius XM Holdings, Inc. | | | 4.5 | |
| Spotify Technology S.A. | | | 4.3 | |
| Sinclair Broadcast Group, Inc., Class A | | | 3.6 | |
| Gray Television, Inc. | | | 3.4 | |
| TEGNA, Inc. | | | 3.3 | |
| Total | | | 48.8 | |
| * | Excluding money market fund holdings. |
Invesco Dynamic Media ETF (PBS)(continued)
Growth of a $10,000 Investment
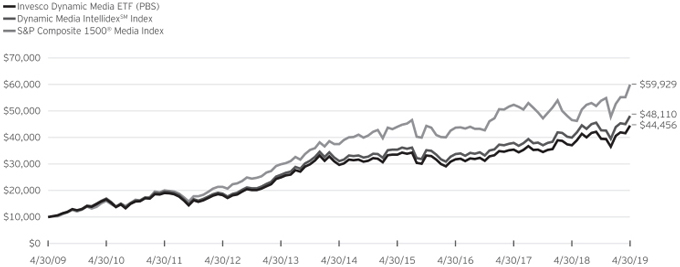
Fund Performance History as of April 30, 2019
| | | | | | | | | | | | | | | | | | | | | | | | | | | | | | | | | | | | | | | | |
| | | 1 Year | | | 3 Years Average
Annualized | | | 3 Years Cumulative | | | 5 Years Average
Annualized | | | 5 Years Cumulative | | | 10 Years Average
Annualized | | | 10 Years Cumulative | | | | | | Fund Inception | |
| Index | | | | | Average
Annualized | | | Cumulative | |
| Dynamic Media IntellidexSM Index | | | 20.35 | % | | | 12.52 | % | | | 42.46 | % | | | 9.13 | % | | | 54.76 | % | | | 17.01 | % | | | 381.10 | % | | | | | | | 7.57 | % | | | 174.66 | % |
| S&P Composite 1500® Media Index | | | 28.73 | | | | 11.13 | | | | 37.24 | | | | 9.82 | | | | 59.72 | | | | 19.61 | | | | 499.29 | | | | | | | | 10.18 | | | | 282.94 | |
| Fund | | | | | | | | | | | | | | | | | | | | | | | | | | | | | | | | | | | | | | | | |
| NAV Return | | | 19.81 | | | | 11.81 | | | | 39.77 | | | | 8.42 | | | | 49.81 | | | | 16.09 | | | | 344.56 | | | | | | | | 6.92 | | | | 152.60 | |
| Market Price Return | | | 19.73 | | | | 11.82 | | | | 39.83 | | | | 8.44 | | | | 49.93 | | | | 16.08 | | | | 344.02 | | | | | | | | 6.92 | | | | 152.60 | |
Fund Inception: June 23, 2005
Performance quoted above represents past performance. Past performance is not a guarantee of future results and current performance may be higher or lower than performance quoted. Investment returns and principal value will fluctuate, and shares of the Fund (“Fund Shares”), when redeemed or sold, may be worth more or less than their original cost. Fund performance reflects any applicable fee waivers and/or expense reimbursements. Had the adviser not waived fees and/or reimbursed expenses currently or in the past, returns would have been lower. See current prospectus for more information. The adviser has contractually agreed to waive fees and/or pay certain Fund expenses through August 31, 2021. According to the Fund’s current prospectus, the total gross annual operating expense ratio was indicated as 0.68% and the net annual operating expense ratio was indicated as 0.63%. The Financial Highlights section of the Shareholder Report presents the expense ratios based on expenses incurred during the period covered by this report. NAV and Market Price returns assume that dividends and capital gain distributions have been reinvested in the Fund at NAV and Market Price, respectively. The returns shown in the table
above do not reflect the deduction of taxes that a shareholder would pay on Fund distributions or the redemption or sale of Fund Shares. See invesco.com/ETFs com to find the most recentmonth-end performance numbers.
Index and Benchmark Index performance results are based upon a hypothetical investment in their respective constituent securities. Index and Benchmark Index returns do not represent Fund returns. An investor cannot invest directly in an index. The Index and Benchmark Index do not charge management fees or brokerage expenses, and no such fees or expenses were deducted from the hypothetical performance shown. In addition, the results actual investors might have achieved would have differed from those shown because of differences in the timing, amounts of their investments, and fees and expenses associated with an investment in the Fund.
Notes Regarding Indexes and Fund Performance History:
| - | Average Annualized and Cumulative Inception returns for the Fund, Index and Benchmark Index are based on the inception date of the Fund. |
| | |
| PXQ | | Manager’s Analysis |
| | Invesco Dynamic Networking ETF (PXQ) |
As an index fund, the Invesco Dynamic Networking ETF (the “Fund”) is passively managed and seeks to track the returns of an underlying index. The Fund seeks to track the investment results (before fees and expenses) of the Dynamic Networking IntellidexSM Index (the “Index”). The Fund generally will invest at least 90% of its total assets in common stocks of networking companies that comprise the Index. These companies are engaged principally in the development, manufacture, sale or distribution of products, services or technologies that support the flow of electronic information, including voice, data, images and commercial transactions. These companies may include communications equipment companies that offer a broad range of access, transport, and connectivity equipment and devices which span across a diverse set of markets including enterprise networking, home networking, satellite, wireless (terrestrial), wireline wide area networking, and cable (CATV). Such companies also may provide integrated circuits specialized to facilitate communications within a network; software that enables, manages, supports, and secures enterprise networks; and equipment used to build storage networks, which are specialized, high speed networks dedicated to accessing storage data.
Strictly in accordance with its guidelines and mandated procedures, ICE Data Indices, LLC (the “Index Provider”) includes common stocks of networking companies in the Index principally on the basis of their capital appreciation potential, which the Index Provider identifies pursuant to a proprietary selection methodology. The Fund generally invests in all of the securities comprising the Index in proportion to their weightings in the Index.
For the fiscal year ended April 30, 2019, on a market price basis, the Fund returned 27.81%. On a net asset value (“NAV”) basis, the Fund returned 27.90%. During the same time period, the Index returned 28.42%. During the fiscal year, the Fund fully replicated the components of the Index; therefore, the Fund’s performance, on a NAV basis, differed from the return of the Index primarily due to fees and operating expenses that the Fund incurred during the period, partially offset by income received from the securities lending program in which the Fund participates.
During this same time period, the S&P Composite 1500® Communications Equipment Index (the “Benchmark Index”) returned 26.27%. The Benchmark Index is an unmanaged index weighted by market capitalization based on the average performance of approximately 20 securities. The Benchmark Index was selected for its recognition in the marketplace, and because its performance comparison is a useful measure for investors as a broad representation of the communications equipment industry.
The performance of the Fund differed from the Benchmark Index in part because the Fund seeks to track an Index that employs a modified equal weighting and stock selection methodology, whereas the Benchmark Index selects and weights stocks based on market capitalization.
Relative to the Benchmark Index, the Fund was most overweight in the systems softwaresub-industry and most underweight in the
communications equipmentsub-industry during the fiscal year ended April 30, 2019. The majority of the Fund’s outperformance relative to the Benchmark Index during that period can be attributed to the Fund’s relative overweight allocations to the systems software and semiconductorssub-industries.
For the fiscal year ended April 30, 2019, the systems softwaresub-industry contributed most significantly to the Fund’s return followed by the communications equipment and semiconductorssub-industries, respectively. The electronic equipment & instrumentssub-industry detracted most significantly from the Fund’s return, followed by the semiconductor equipmentsub-industry.
Positions that contributed most significantly to the Fund’s return for the fiscal year ended April 30, 2019, included VMware, Inc., Class A, a systems software company (portfolio average weight of 5.35%) and QUALCOMM, Inc., a semiconductor company (portfolio average weight of 5.06%). Positions that detracted most significantly from the Fund’s return during this period included nLIGHT, Inc., an electronic equipment & instruments company (no longer held at fiscalyear-end) and Varonis Systems, Inc., a systems software company (no longer held at fiscalyear-end).
| | | | |
Sub-Industry Breakdown
(% of the Fund’s Net Assets)
as of April 30, 2019 | |
| Systems Software | | | 43.1 | |
| Communications Equipment | | | 35.8 | |
| Semiconductors | | | 7.6 | |
| Application Software | | | 5.0 | |
| Internet Services & Infrastructure | | | 3.2 | |
| Sub-Industry Types Each Less Than 3% | | | 5.3 | |
| Money Market Funds Plus Other Assets Less Liabilities | | | 0.0 | |
|
Top Ten Fund Holdings*
(% of the Fund’s Net Assets)
as of April 30, 2019 | |
| Security | | | | |
| QUALCOMM, Inc. | | | 7.6 | |
| VMware, Inc., Class A | | | 5.5 | |
| Arista Networks, Inc. | | | 5.3 | |
| Cisco Systems, Inc. | | | 5.2 | |
| Palo Alto Networks, Inc. | | | 5.1 | |
| Symantec Corp. | | | 5.0 | |
| Motorola Solutions, Inc. | | | 4.8 | |
| Check Point Software Technologies Ltd. | | | 4.6 | |
| Zscaler, Inc. | | | 3.5 | |
| Okta, Inc. | | | 3.2 | |
| Total | | | 49.8 | |
| * | Excluding money market fund holdings. |
Invesco Dynamic Networking ETF (PXQ)(continued)
Growth of a $10,000 Investment
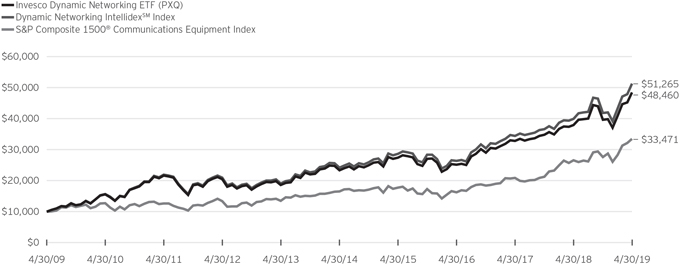
Fund Performance History as of April 30, 2019
| | | | | | | | | | | | | | | | | | | | | | | | | | | | | | | | | | | | | | | | |
| | | 1 Year | | | 3 Years Average
Annualized | | | 3 Years Cumulative | | | 5 Years Average
Annualized | | | 5 Years Cumulative | | | 10 Years Average
Annualized | | | 10 Years Cumulative | | | | | | Fund Inception | |
| Index | | | | | Average
Annualized | | | Cumulative | |
| Dynamic Networking IntellidexSM Index | | | 28.42 | % | | | 24.85 | % | | | 94.62 | % | | | 16.22 | % | | | 112.06 | % | | | 17.76 | % | | | 412.65 | % | | | | | | | 11.91 | % | | | 375.25 | % |
| S&P Composite 1500® Communications Equipment Index | | | 26.27 | | | | 27.26 | | | | 106.10 | | | | 15.20 | | | | 102.91 | | | | 12.84 | | | | 234.71 | | | | | | | | 8.31 | | | | 202.29 | |
| Fund | | | | | | | | | | | | | | | | | | | | | | | | | | | | | | | | | | | | | | | | |
| NAV Return | | | 27.90 | | | | 24.43 | | | | 92.66 | | | | 15.75 | | | | 107.79 | | | | 17.10 | | | | 384.60 | | | | | | | | 11.27 | | | | 339.27 | |
| Market Price Return | | | 27.81 | | | | 24.42 | | | | 92.60 | | | | 15.75 | | | | 107.79 | | | | 17.07 | | | | 383.73 | | | | | | | | 11.27 | | | | 339.12 | |
Fund Inception: June 23, 2005
Performance quoted above represents past performance. Past performance is not a guarantee of future results and current performance may be higher or lower than performance quoted. Investment returns and principal value will fluctuate, and shares of the Fund (“Fund Shares”), when redeemed or sold, may be worth more or less than their original cost. Fund performance reflects any applicable fee waivers and/or expense reimbursements. Had the adviser not waived fees and/or reimbursed expenses currently or in the past, returns would have been lower. See current prospectus for more information. The adviser has contractually agreed to waive fees and/or pay certain Fund expenses through August 31, 2021. According to the Fund’s current prospectus, the total gross annual operating expense ratio was indicated as 0.83% and the net annual operating expense ratio was indicated as 0.63%. The Financial Highlights section of the Shareholder Report presents the expense ratios based on expenses incurred during the period covered by this report. NAV and Market Price returns assume that dividends and capital gain distributions have been reinvested in the Fund at NAV and Market Price, respectively. The returns shown in the table
above do not reflect the deduction of taxes that a shareholder would pay on Fund distributions or the redemption or sale of Fund Shares. See invesco.com/ETFs to find the most recentmonth-end performance numbers.
Index and Benchmark Index performance results are based upon a hypothetical investment in their respective constituent securities. Index and Benchmark Index returns do not represent Fund returns. An investor cannot invest directly in an index. The Index and Benchmark Index do not charge management fees or brokerage expenses, and no such fees or expenses were deducted from the hypothetical performance shown. In addition, the results actual investors might have achieved would have differed from those shown because of differences in the timing, amounts of their investments, and fees and expenses associated with an investment in the Fund.
Notes Regarding Indexes and Fund Performance History:
| - | Average Annualized and Cumulative Inception returns for the Fund, Index and Benchmark Index are based on the inception date of the Fund. |
| | |
| PXJ | | Manager’s Analysis |
| | Invesco Dynamic Oil & Gas Services ETF (PXJ) |
As an index fund, the Invesco Dynamic Oil & Gas Services ETF (the “Fund”) is passively managed and seeks to track the returns of an underlying index. The Fund seeks to track the investment results (before fees and expenses) of the Dynamic Oil Services IntellidexSM Index (the “Index”). The Fund generally will invest at least 90% of its total assets in common stocks of companies that assist in the production, processing and distribution of oil and gas that comprise the Index. The Index may include companies engaged in the drilling of oil and gas wells; manufacturing oil and gas field machinery and equipment; or providing services to the oil and gas industry, such as well analysis, platform and pipeline engineering and construction, logistics and transportation services, oil and gas well emergency management and geophysical data acquisition and processing.
Strictly in accordance with its guidelines and mandated procedures, ICE Data Indices, LLC (the “Index Provider”) includes common stocks of oil and gas services companies in the Index principally on the basis of their capital appreciation potential, which the Index Provider identifies pursuant to a proprietary selection methodology. The Fund generally invests in all of the securities comprising the Index in proportion to their weightings in the Index.
For the fiscal year ended April 30, 2019, on a market price basis, the Fund returned (28.69)%. On a net asset value (“NAV”) basis, the Fund returned (28.69)%. During the same time period, the Index returned (28.27)%. During the fiscal year, the Fund fully replicated the components of the Index; therefore, the Fund’s performance, on a NAV basis, differed from the return of the Index primarily due to fees and operating expenses that the Fund incurred during the period, partially offset by income received from the securities lending program in which the Fund participates.
During this same time period, the S&P Composite 1500® Energy Equipment & Services Index (the “Benchmark Index”) returned (35.21)%. The Benchmark Index is an unmanaged index weighted by market capitalization based on the average performance of approximately 40 securities. The Benchmark Index was selected for its recognition in the marketplace, and because its performance comparison is a useful measure for investors as a broad representation of the oil & gas services industry.
The performance of the Fund differed from the Benchmark Index in part because the Fund seeks to track an Index that employs a modified equal weighting and stock selection methodology, whereas the Benchmark Index selects and weights stocks based on market capitalization.
Relative to the Benchmark Index, the Fund was most overweight in the oil & gas drillingsub-industry and most underweight in the oil & gas equipment & servicessub-industry during the fiscal year ended April 30, 2019. The majority of the Fund’s outperformance relative to the Benchmark Index during that period can be
attributed to the Fund’s relative overweight allocation to the oil & gas storage & transportationsub-industry, as well as stock selection in the oil & gas equipment & servicessub-industry. For the fiscal year ended April 30, 2019, there were no contributingsub-industries. The oil & gas equipment & servicessub-industry detracted most significantly from the Fund’s return, followed by the oil & gas drillingsub-industry.
Positions that contributed most significantly to the Fund’s return for the fiscal year ended April 30, 2019, included Cactus, Inc., Class A, an oil & gas equipment & services company (portfolio average weight of 2.21%) and ProPetro Holding Corp., an oil & gas equipment & services company (portfolio average weight of 2.68%). Positions that detracted most significantly from the Fund’s return during this period included Core Laboratories NV, an oil & gas equipment & services company (no longer held at fiscalyear-end) and Transocean Ltd., an oil & gas drilling company (fiscalyear-end weight 4.81%).
| | | | |
Sub-Industry Breakdown
(% of the Fund’s Net Assets)
as of April 30, 2019 | |
| Oil & Gas Equipment & Services | | | 75.1 | |
| Oil & Gas Drilling | | | 25.0 | |
| Money Market Funds Plus Other Assets Less Liabilities | | | (0.1) | |
|
Top Ten Fund Holdings*
(% of the Fund’s Net Assets)
as of April 30, 2019 | |
| Security | | | | |
| TechnipFMC PLC | | | 5.7 | |
| Helmerich & Payne, Inc. | | | 5.5 | |
| Patterson-UTI Energy, Inc. | | | 5.1 | |
| Schlumberger Ltd. | | | 5.0 | |
| Transocean Ltd. | | | 4.9 | |
| Baker Hughes, a GE Co., Class A | | | 4.8 | |
| National Oilwell Varco, Inc. | | | 4.8 | |
| Halliburton Co. | | | 4.7 | |
| Ensco Rowan PLC, Class A | | | 4.4 | |
| ProPetro Holding Corp. | | | 3.5 | |
| Total | | | 48.4 | |
| * | Excluding money market fund holdings. |
Invesco Dynamic Oil & Gas Services ETF (PXJ)(continued)
Growth of a $10,000 Investment
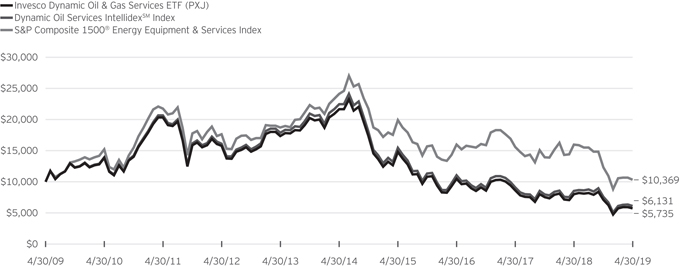
Fund Performance History as of April 30, 2019
| | | | | | | | | | | | | | | | | | | | | | | | | | | | | | | | | | | | | | | | |
| | | 1 Year | | | 3 Years Average
Annualized | | | 3 Years Cumulative | | | 5 Years Average
Annualized | | | 5 Years Cumulative | | | 10 Years Average
Annualized | | | 10 Years Cumulative | | | | | | Fund Inception | |
| Index | | | | | Average
Annualized | | | Cumulative | |
| Dynamic Oil Services IntellidexSM Index | | | (28.27 | )% | | | (17.82 | )% | | | (44.50 | )% | | | (22.89 | )% | | | (72.74 | )% | | | (4.78 | )% | | | (38.69 | )% | | | | | | | (5.04 | )% | | | (50.27 | )% |
| S&P Composite 1500® Energy Equipment & Services Index | | | (35.21 | ) | | | (13.41 | ) | | | (35.07 | ) | | | (15.55 | ) | | | (57.05 | ) | | | 0.36 | | | | 3.69 | | | | | | | | (0.86 | ) | | | (11.03 | ) |
| Fund | | | | | | | | | | | | | | | | | | | | | | | | | | | | | | | | | | | | | | | | |
| NAV Return | | | (28.69 | ) | | | (18.29 | ) | | | (45.44 | ) | | | (23.36 | ) | | | (73.56 | ) | | | (5.41 | ) | | | (42.65 | ) | | | | | | | (5.60 | ) | | | (54.12 | ) |
| Market Price Return | | | (28.69 | ) | | | (18.27 | ) | | | (45.40 | ) | | | (23.35 | ) | | | (73.55 | ) | | | (5.42 | ) | | | (42.74 | ) | | | | | | | (5.60 | ) | | | (54.13 | ) |
Fund Inception: October 26, 2005
Performance quoted above represents past performance. Past performance is not a guarantee of future results and current performance may be higher or lower than performance quoted. Investment returns and principal value will fluctuate, and shares of the Fund (“Fund Shares”), when redeemed or sold, may be worth more or less than their original cost. Fund performance reflects any applicable fee waivers and/or expense reimbursements. Had the adviser not waived fees and/or reimbursed expenses currently or in the past, returns would have been lower. See current prospectus for more information. The adviser has contractually agreed to waive fees and/or pay certain Fund expenses through August 31, 2021. According to the Fund’s current prospectus, the total gross annual operating expense ratio was indicated as 0.86% and the net annual operating expense ratio was indicated as 0.63%. The Financial Highlights section of the Shareholder Report presents the expense ratios based on expenses incurred during the period covered by this report. NAV and Market Price returns assume that dividends and capital gain distributions have been reinvested in the Fund at NAV and Market Price, respectively. The returns shown in the table
above do not reflect the deduction of taxes that a shareholder would pay on Fund distributions or the redemption or sale of Fund Shares. See invesco.com/ETFs to find the most recentmonth-end performance numbers.
Index and Benchmark Index performance results are based upon a hypothetical investment in their respective constituent securities. Index and Benchmark Index returns do not represent Fund returns. An investor cannot invest directly in an index. The Index and Benchmark Index do not charge management fees or brokerage expenses, and no such fees or expenses were deducted from the hypothetical performance shown. In addition, the results actual investors might have achieved would have differed from those shown because of differences in the timing, amounts of their investments, and fees and expenses associated with an investment in the Fund.
Notes Regarding Indexes and Fund Performance History:
| - | Average Annualized and Cumulative Inception returns for the Fund, Index and Benchmark Index are based on the inception date of the Fund. |
| | |
| PJP | | Manager’s Analysis |
| | Invesco Dynamic Pharmaceuticals ETF (PJP) |
As an index fund, the Invesco Dynamic Pharmaceuticals ETF (the “Fund”) is passively managed and seeks to track the returns of an underlying index. The Fund seeks to track the investment results (before fees and expenses) of the Dynamic Pharmaceutical IntellidexSM Index (the “Index”). The Fund generally will invest at least 90% of its total assets in common stocks of pharmaceutical companies that comprise the Index. These companies are engaged principally in the research, development, manufacture, sale or distribution of pharmaceuticals and drugs of all types. These companies may include, for example, pharmaceutical companies and other companies involved in the research, development, manufacture, sale or distribution of drugs, including companies that facilitate the testing or regulatory approval of drugs.
Strictly in accordance with its guidelines and mandated procedures, ICE Data Indices, LLC (the “Index Provider”) includes common stocks of pharmaceutical companies in the Index principally on the basis of their capital appreciation potential, which the Index Provider identifies pursuant to a proprietary selection methodology. The Fund generally invests in all of the securities comprising the Index in proportion to their weightings in the Index.
For the fiscal year ended April 30, 2019, on a market price basis, the Fund returned 2.94%. On a net asset value (“NAV”) basis, the Fund returned 3.02%. During the same time period, the Index returned 3.68%. During the fiscal year, the Fund fully replicated the components of the Index; therefore, the Fund’s performance, on a NAV basis, differed from the return of the Index primarily due to the fees and operating expenses that the Fund incurred during the period.
During this same time period, the S&P Composite 1500® Pharmaceuticals Index (the “Benchmark Index”) returned 15.51%. The Benchmark Index is an unmanaged index weighted by market capitalization based on the average performance of approximately 25 securities. The Benchmark Index was selected for its recognition in the marketplace, and because its performance comparison is a useful measure for investors as a broad representation of the pharmaceuticals industry.
The performance of the Fund differed from the Benchmark Index in part because the Fund seeks to track an Index that employs a modified equal weighting and stock selection methodology, whereas the Benchmark Index selects and weights stocks based on market capitalization.
Relative to the Benchmark Index, the Fund was most overweight in the biotechnologysub-industry and most underweight in the pharmaceuticalssub-industry during the fiscal year ended April 30, 2019. The majority of the Fund’s underperformance relative to the Benchmark Index during that period can be attributed to the Fund’s relative underweight allocation to the pharmaceuticalssub-industry.
For the fiscal year ended April 30, 2019, pharmaceuticals was the primary contributingsub-industry. The biotechnologysub-industry detracted most significantly from the Fund’s return.
Positions that contributed most significantly to the Fund’s return for the fiscal year ended April 30, 2019, included Endo International PLC, a pharmaceuticals company (portfolio average weight of 3.03%) and Eli Lilly and Co., a pharmaceuticals company (portfolio average weight of 5.30%). Positions that detracted most significantly from the Fund’s return during this period included Akorn, Inc., a pharmaceuticals company (no longer held at fiscalyear-end) and Acorda Therapeutics, Inc., a biotechnology company (no longer held at fiscalyear-end).
| | | | |
Sub-Industry Breakdown
(% of the Fund’s Net Assets)
as of April 30, 2019 | |
| Pharmaceuticals | | | 67.5 | |
| Biotechnology | | | 27.0 | |
| Health Care Equipment | | | 5.5 | |
| Money Market Funds Plus Other Assets Less Liabilities | | | 0.0 | |
|
Top Ten Fund Holdings*
(% of the Fund’s Net Assets)
as of April 30, 2019 | |
| Security | | | | |
| Abbott Laboratories | | | 5.5 | |
| Johnson & Johnson | | | 5.5 | |
| Merck & Co., Inc. | | | 5.2 | |
| Amgen, Inc. | | | 5.1 | |
| Pfizer, Inc. | | | 5.0 | |
| Eli Lilly and Co. | | | 5.0 | |
| Bristol-Myers Squibb Co. | | | 4.9 | |
| Biogen, Inc. | | | 3.7 | |
| Horizon Pharma PLC | | | 3.4 | |
| Corcept Therapeutics, Inc. | | | 3.2 | |
| Total | | | 46.5 | |
| * | Excluding money market fund holdings. |
Invesco Dynamic Pharmaceuticals ETF (PJP)(continued)
Growth of a $10,000 Investment
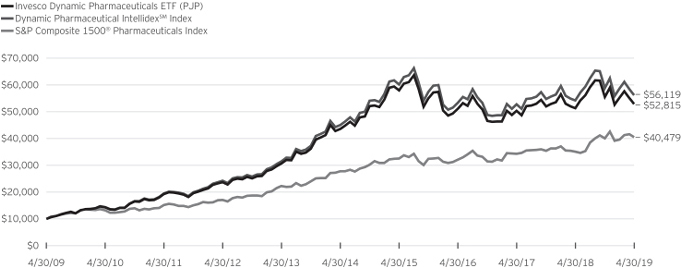
Fund Performance History as of April 30, 2019
| | | | | | | | | | | | | | | | | | | | | | | | | | | | | | | | | | | | | | | | |
| | | 1 Year | | | 3 Years Average
Annualized | | | 3 Years Cumulative | | | 5 Years Average
Annualized | | | 5 Years Cumulative | | | 10 Years Average
Annualized | | | 10 Years Cumulative | | | | | | Fund Inception | |
| Index | | | | | Average
Annualized | | | Cumulative | |
| Dynamic Pharmaceutical IntellidexSM Index | | | 3.68 | % | | | 1.71 | % | | | 5.22 | % | | | 4.51 | % | | | 24.69 | % | | | 18.83 | % | | | 461.19 | % | | | | | | | 13.07 | % | | | 447.99 | % |
| S&P Composite 1500® Pharmaceuticals Index | | | 15.51 | | | | 8.11 | | | | 26.35 | | | | 7.82 | | | | 45.74 | | | | 15.01 | | | | 304.79 | | | | | | | | 9.01 | | | | 230.25 | |
| Fund | | | | | | | | | | | | | | | | | | | | | | | | | | | | | | | | | | | | | | | | |
| NAV Return | | | 3.02 | | | | 1.16 | | | | 3.52 | | | | 3.94 | | | | 21.33 | | | | 18.11 | | | | 428.15 | | | | | | | | 12.39 | | | | 404.46 | |
| Market Price Return | | | 2.94 | | | | 1.17 | | | | 3.54 | | | | 3.96 | | | | 21.41 | | | | 18.10 | | | | 427.64 | | | | | | | | 12.40 | | | | 404.69 | |
Fund Inception: June 23, 2005
Performance quoted above represents past performance. Past performance is not a guarantee of future results and current performance may be higher or lower than performance quoted. Investment returns and principal value will fluctuate, and shares of the Fund (“Fund Shares”), when redeemed or sold, may be worth more or less than their original cost. Fund performance reflects any applicable fee waivers and/or expense reimbursements. Had the adviser not waived fees and/or reimbursed expenses currently or in the past, returns would have been lower. See current prospectus for more information. According to the Fund’s current prospectus, the total annual operating expense ratio was indicated as 0.57%. The Financial Highlights section of the Shareholder Report presents the expense ratios based on expenses incurred during the period covered by this report. NAV and Market Price returns assume that dividends and capital gain distributions have been reinvested in the Fund at NAV and Market Price, respectively. The returns shown in the table above do not reflect the deduction of taxes that a shareholder would pay on Fund distributions or the redemption or
sale of Fund Shares. See invesco.com/ETFs to find the most recentmonth-end performance numbers.
Index and Benchmark Index performance results are based upon a hypothetical investment in their respective constituent securities. Index and Benchmark Index returns do not represent Fund returns. An investor cannot invest directly in an index. The Index and Benchmark Index do not charge management fees or brokerage expenses, and no such fees or expenses were deducted from the hypothetical performance shown. In addition, the results actual investors might have achieved would have differed from those shown because of differences in the timing, amounts of their investments, and fees and expenses associated with an investment in the Fund.
Notes Regarding Indexes and Fund Performance History:
| - | Average Annualized and Cumulative Inception returns for the Fund, Index and Benchmark Index are based on the inception date of the Fund. |
| | |
| PMR | | Manager’s Analysis |
| | Invesco Dynamic Retail ETF (PMR) |
As an index fund, the Invesco Dynamic Retail ETF (the “Fund”) is passively managed and seeks to track the returns of an underlying index. The Fund seeks to track the investment results (before fees and expenses) of the Dynamic Retail IntellidexSM Index (the “Index”). The Fund generally will invest at least 90% of its total assets in common stocks of retail companies that comprise the Index. These companies are engaged principally in operating general merchandise stores such as department stores, discount stores, warehouse clubs and superstores; specialty stores, including apparel, electronics, accessories and footwear stores; and home improvement and home furnishings stores. Dealers of motor vehicles and parts, auction houses or rental companies also may be included.
Strictly in accordance with its guidelines and mandated procedures, ICE Data Indices, LLC (the “Index Provider”) includes common stocks of retail companies in the Index principally on the basis of their capital appreciation potential, which the Index Provider identifies pursuant to a proprietary selection methodology. The Fund generally invests in all of the securities comprising the Index in proportion to their weightings in the Index.
For the fiscal year ended April 30, 2019, on a market price basis, the Fund returned 5.95%. On a net asset value (“NAV”) basis, the Fund returned 6.09%. During the same time period, the Index returned 6.85%. During the fiscal year, the Fund fully replicated the components of the Index; therefore, the Fund’s performance, on a NAV basis, differed from the return of the Index primarily due to the fees and operating expenses that the Fund incurred during the period.
During this same time period, the S&P Composite 1500® Retailing Index (the “Benchmark Index”) returned 18.59%. The Benchmark Index is an unmanaged index weighted by market capitalization based on the average performance of approximately 90 securities. The Benchmark Index was selected for its recognition in the marketplace, and because its performance comparison is a useful measure for investors as a broad representation of the retail industry.
The performance of the Fund differed from the Benchmark Index in part because the Fund seeks to track an Index that employs a modified equal weighting and stock selection methodology, whereas the Benchmark Index selects and weights stocks based on market capitalization.
Relative to the Benchmark Index, the Fund was most overweight in the hypermarkets & super centerssub-industry and most underweight in the internet & direct marketing retailsub-industry during the fiscal year ended April 30, 2019. The majority of the Fund’s underperformance relative to the Benchmark Index during that period can be attributed to the Fund’s relative underweight allocation to the internet & direct marketing retailsub-industry.
For the fiscal year ended April 30, 2019, the automotive retailsub-industry contributed most significantly to the Fund’s return,
followed by the apparel, accessories & luxury goods and general merchandise storessub-industries, respectively. The trading companies & distributorssub-industry detracted most significantly from the Fund’s return, followed by the forest productssub-industry.
Positions that contributed most significantly to the Fund’s return for the fiscal year ended April 30, 2019, included lululemon athletica, Inc., an apparel, accessories & luxury goods company (portfolio average weight of 1.73%) and Etsy, Inc., an internet & direct marketing retail company (portfolio average weight of 2.19%). Positions that detracted most significantly from the Fund’s return during this period included Tailored Brands, Inc., an apparel retail company (no longer held at fiscalyear-end) and Stitch Fix, Inc., Class A, an internet & direct marketing retail company (no longer held at fiscalyear-end).
| | | | |
Sub-Industry Breakdown
(% of the Fund’s Net Assets)
as of April 30, 2019 | |
| Apparel Retail | | | 21.5 | |
| Automotive Retail | | | 13.2 | |
| Hypermarkets & Super Centers | | | 10.4 | |
| Specialty Stores | | | 10.2 | |
| Food Retail | | | 8.9 | |
| Internet & Direct Marketing Retail | | | 6.5 | |
| Apparel, Accessories & Luxury Goods | | | 5.7 | |
| General Merchandise Stores | | | 5.1 | |
| Home Improvement Retail | | | 5.1 | |
| Homefurnishing Retail | | | 4.6 | |
| Computer & Electronics Retail | | | 3.6 | |
| Sub-Industry Types Each Less Than 3% | | | 5.3 | |
| Money Market Funds Plus Other Assets Less Liabilities | | | (0.1) | |
|
Top Ten Fund Holdings*
(% of the Fund’s Net Assets)
as of April 30, 2019 | |
| Security | | | | |
| lululemon athletica, Inc. | | | 5.7 | |
| AutoZone, Inc. | | | 5.4 | |
| Dollar General Corp. | | | 5.1 | |
| Home Depot, Inc. (The) | | | 5.1 | |
| Ross Stores, Inc. | | | 5.0 | |
| Walmart, Inc. | | | 5.0 | |
| O’Reilly Automotive, Inc. | | | 4.8 | |
| Kroger Co. (The) | | | 4.4 | |
| Abercrombie & Fitch Co., Class A | | | 3.9 | |
| Rent-A-Center, Inc. | | | 3.6 | |
| Total | | | 48.0 | |
| * | Excluding money market fund holdings. |
Invesco Dynamic Retail ETF (PMR)(continued)
Growth of a $10,000 Investment
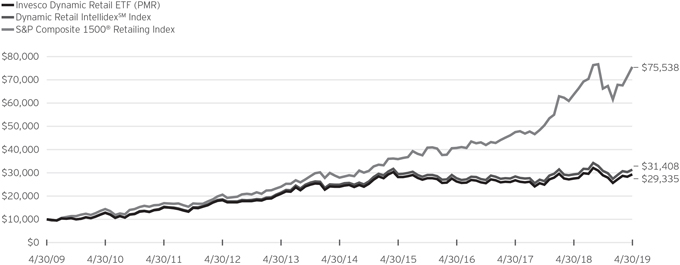
Fund Performance History as of April 30, 2019
| | | | | | | | | | | | | | | | | | | | | | | | | | | | | | | | | | | | | | | | |
| | | 1 Year | | | 3 Years Average
Annualized | | | 3 Years Cumulative | | | 5 Years Average
Annualized | | | 5 Years Cumulative | | | 10 Years Average
Annualized | | | 10 Years Cumulative | | | | | | Fund Inception | |
| Index | | | | | Average
Annualized | | | Cumulative | |
| Dynamic Retail IntellidexSM Index | | | 6.85 | % | | | 4.25 | % | | | 13.29 | % | | | 4.67 | % | | | 25.65 | % | | | 12.13 | % | | | 214.08 | % | | | | | | | 8.85 | % | | | 214.56 | % |
| S&P Composite 1500® Retailing Index | | | 18.59 | | | | 22.80 | | | | 85.18 | | | | 22.03 | | | | 170.56 | | | | 22.41 | | | | 655.38 | | | | | | | | 14.49 | | | | 522.61 | |
| Fund | | | | | | | | | | | | | | | | | | | | | | | | | | | | | | | | | | | | | | | | |
| NAV Return | | | 6.09 | | | | 3.63 | | | | 11.30 | | | | 4.03 | | | | 21.85 | | | | 11.36 | | | | 193.35 | | | | | | | | 8.15 | | | | 188.36 | |
| Market Price Return | | | 5.95 | | | | 3.62 | | | | 11.27 | | | | 4.03 | | | | 21.85 | | | | 11.36 | | | | 193.29 | | | | | | | | 8.14 | | | | 188.10 | |
Fund Inception: October 26, 2005
Performance quoted above represents past performance. Past performance is not a guarantee of future results and current performance may be higher or lower than performance quoted. Investment returns and principal value will fluctuate, and shares of the Fund (“Fund Shares”), when redeemed or sold, may be worth more or less than their original cost. Fund performance reflects any applicable fee waivers and/or expense reimbursements. Had the adviser not waived fees and/or reimbursed expenses currently or in the past, returns would have been lower. See current prospectus for more information. The adviser has contractually agreed to waive fees and/or pay certain Fund expenses through August 31, 2021. According to the Fund’s current prospectus, the total gross annual operating expense ratio was indicated as 1.27% and the net annual operating expense ratio was indicated as 0.63%. The Financial Highlights section of the Shareholder Report presents the expense ratios based on expenses incurred during the period covered by this report. NAV and Market Price returns assume that dividends and capital gain distributions have been reinvested in the Fund at NAV and Market Price, respectively. The returns shown in the table
above do not reflect the deduction of taxes that a shareholder would pay on Fund distributions or the redemption or sale of Fund Shares. See invesco.com/ETFs to find the most recentmonth-end performance numbers.
Index and Benchmark Index performance results are based upon a hypothetical investment in their respective constituent securities. Index and Benchmark Index returns do not represent Fund returns. An investor cannot invest directly in an index. The Index and Benchmark Index do not charge management fees or brokerage expenses, and no such fees or expenses were deducted from the hypothetical performance shown. In addition, the results actual investors might have achieved would have differed from those shown because of differences in the timing, amounts of their investments, and fees and expenses associated with an investment in the Fund.
Notes Regarding Indexes and Fund Performance History:
| - | Average Annualized and Cumulative Inception returns for the Fund, Index and Benchmark Index are based on the inception date of the Fund. |
| | |
| PSI | | Manager’s Analysis |
| | Invesco Dynamic Semiconductors ETF (PSI) |
As an index fund, the Invesco Dynamic Semiconductors ETF (the “Fund”) is passively managed and seeks to track the returns of an underlying index. The Fund seeks to track the investment results (before fees and expenses) of the Dynamic Semiconductor IntellidexSM Index (the “Index”). The Fund generally will invest at least 90% of its total assets in common stocks of semiconductor companies that comprise the Index. These companies are principally engaged in the manufacture of semiconductors. These companies manufacture semiconductors that serve as the core electronic components of virtually all electronic equipment; make or test chips for third parties; and provide equipment or services used in the production of semiconductors and other thin film products like flat panel displays and thin film heads.
Strictly in accordance with its guidelines and mandated procedures, ICE Data Indices, LLC (the “Index Provider”) includes common stocks of semiconductor companies in the Index principally on the basis of their capital appreciation potential, which the Index Provider identifies pursuant to a proprietary selection methodology. The Fund generally invests in all of the securities comprising the Index in proportion to their weightings in the Index.
For the fiscal year ended April 30, 2019, on a market price basis, the Fund returned 19.53%. On a net asset value (“NAV”) basis, the Fund returned 19.71%. During the same time period, the Index returned 20.49%. During the fiscal year, the Fund fully replicated the components of the Index; therefore, the Fund’s performance, on a NAV basis, differed from the return of the Index primarily due to fees and operating expenses that the Fund incurred during the period, as well as slippage associated with the portfolio’s quarterly rebalances.
During this same time period, the S&P Composite 1500® Semiconductor Index (the “Benchmark Index”) returned 16.77%. The Benchmark Index is an unmanaged index weighted by market capitalization based on the average performance of approximately 50 securities. The Benchmark Index was selected for its recognition in the marketplace, and because its performance comparison is a useful measure for investors as a broad representation of the semiconductors industry.
The performance of the Fund differed from the Benchmark Index in part because the Fund seeks to track an Index that employs a modified equal weighting and stock selection methodology, whereas the Benchmark Index selects and weights stocks based on market capitalization.
Relative to the Benchmark Index, the Fund was most overweight in the semiconductor equipmentsub-industry and most underweight in the semiconductorssub-industry during the fiscal year ended April 30, 2019. The majority of the Fund’s outperformance relative to the Benchmark Index during that period can be attributed to the Fund’s relative overweight
allocation to the semiconductor equipmentsub-industry and stock selection in the semiconductorssub-industry.
For the fiscal year ended April 30, 2019, the semiconductorssub-industry contributed most significantly to the Fund’s return, followed by the semiconductor equipment and electric componentssub-industries, respectively. There were no detractingsub-industries.
Positions that contributed most significantly to the Fund’s return for the fiscal year ended April 30, 2019, included Xilinx, Inc., a semiconductors company (portfolio average weight of 4.34%) and QUALCOMM, Inc., a semiconductor company (portfolio average weight of 5.16%). Positions that detracted most significantly from the Fund’s return during this period included NVIDIA Corp., a semiconductors company (no longer held at fiscalyear-end) and Nanometrics Inc., a semiconductor equipment company (no longer held at fiscalyear-end).
| | | | |
Sub-Industry Breakdown
(% of the Fund’s Net Assets)
as of April 30, 2019 | |
| Semiconductors | | | 71.1 | |
| Semiconductor Equipment | | | 23.7 | |
| Electronic Components | | | 5.2 | |
| Money Market Funds Plus Other Assets Less Liabilities | | | 0.0 | |
|
Top Ten Fund Holdings*
(% of the Fund’s Net Assets)
as of April 30, 2019 | |
| Security | | | | |
| QUALCOMM, Inc. | | | 7.7 | |
| Lam Research Corp. | | | 5.4 | |
| Broadcom, Inc. | | | 5.3 | |
| Texas Instruments, Inc. | | | 5.2 | |
| Analog Devices, Inc. | | | 5.2 | |
| Micron Technology, Inc. | | | 4.7 | |
| Xilinx, Inc. | | | 4.7 | |
| Intel Corp. | | | 4.7 | |
| Cree, Inc. | | | 3.3 | |
| Ambarella, Inc. | | | 3.2 | |
| Total | | | 49.4 | |
| * | Excluding money market fund holdings. |
Invesco Dynamic Semiconductors ETF (PSI)(continued)
Growth of a $10,000 Investment
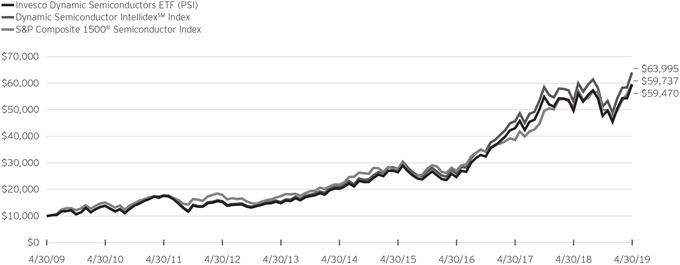
Fund Performance History as of April 30, 2019
| | | | | | | | | | | | | | | | | | | | | | | | | | | | | | | | | | | | | | | | |
| | | 1 Year | | | 3 Years Average
Annualized | | | 3 Years Cumulative | | | 5 Years Average
Annualized | | | 5 Years Cumulative | | | 10 Years Average
Annualized | | | 10 Years Cumulative | | | | | | Fund Inception | |
| Index | | Average
Annualized | | | Cumulative | |
| Dynamic Semiconductor IntellidexSM Index | | | 20.49 | % | | | 35.03 | % | | | 146.21 | % | | | 24.85 | % | | | 203.39 | % | | | 20.40 | % | | | 539.95 | % | | | | | | | 11.64 | % | | | 359.70 | % |
| S&P Composite 1500® Semiconductor Index | | | 16.77 | | | | 30.26 | | | | 121.01 | | | | 22.28 | | | | 173.33 | | | | 19.57 | | | | 497.37 | | | | | | | | 10.34 | | | | 290.67 | |
| Fund | | | | | | | | | | | | | | | | | | | | | | | | | | | | | | | | | | | | | | | | |
| NAV Return | | | 19.71 | | | | 34.13 | | | | 141.31 | | | | 23.94 | | | | 192.50 | | | | 19.52 | | | | 494.70 | | | | | | | | 10.84 | | | | 315.95 | |
| Market Price Return | | | 19.53 | | | | 34.13 | | | | 141.30 | | | | 23.92 | | | | 192.24 | | | | 19.51 | | | | 494.18 | | | | | | | | 10.83 | | | | 315.32 | |
Fund Inception: June 23, 2005
Performance quoted above represents past performance. Past performance is not a guarantee of future results and current performance may be higher or lower than performance quoted. Investment returns and principal value will fluctuate, and shares of the Fund (“Fund Shares”), when redeemed or sold, may be worth more or less than their original cost. Fund performance reflects any applicable fee waivers and/or expense reimbursements. Had the adviser not waived fees and/or reimbursed expenses currently or in the past, returns would have been lower. See current prospectus for more information. According to the Fund’s current prospectus, the total annual operating expense ratio was indicated as 0.61%. The Financial Highlights section of the Shareholder Report presents the expense ratios based on expenses incurred during the period covered by this report. NAV and Market Price returns assume that dividends and capital gain distributions have been reinvested in the Fund at NAV and Market Price, respectively. The returns shown in the table above do not reflect the deduction of taxes that a shareholder would pay on Fund distributions or the redemption or
sale of Fund Shares. See invesco.com/ETFs to find the most recentmonth-end performance numbers.
Index and Benchmark Index performance results are based upon a hypothetical investment in their respective constituent securities. Index and Benchmark Index returns do not represent Fund returns. An investor cannot invest directly in an index. The Index and Benchmark Index do not charge management fees or brokerage expenses, and no such fees or expenses were deducted from the hypothetical performance shown. In addition, the results actual investors might have achieved would have differed from those shown because of differences in the timing, amounts of their investments, and fees and expenses associated with an investment in the Fund.
Notes Regarding Indexes and Fund Performance History:
| - | Average Annualized and Cumulative Inception returns for the Fund, Index and Benchmark Index are based on the inception date of the Fund. |
| | |
| PSJ | | Manager’s Analysis |
| | Invesco Dynamic Software ETF (PSJ) |
As an index fund, the Invesco Dynamic Software ETF (the “Fund”) is passively managed and seeks to track the returns of an underlying index. The Fund seeks to track the investment results (before fees and expenses) of the Dynamic Software IntellidexSM Index (the “Index”). The Fund generally will invest at least 90% of its total assets in common stocks of software companies that comprise the Index. These are companies that are principally engaged in the research, design, production or distribution of products or processes that relate to software applications and systems and information-based services. These companies may include companies that design and market computer applications targeted toward various end user markets, including home/office, design/engineering, and IT infrastructure; as well as distributors of third-party software applications, primarily to resellers, retailers, and corporations.
Strictly in accordance with its guidelines and mandated procedures, ICE Data Indices, LLC (the “Index Provider”) includes common stocks of software companies in the Index principally on the basis of their capital appreciation potential, which the Index Provider identifies pursuant to a proprietary selection methodology. The Fund generally invests in all of the securities comprising the Index in proportion to their weightings in the Index.
For the fiscal year ended April 30, 2019, on a market price basis, the Fund returned 35.58%. On a net asset value (“NAV”) basis, the Fund returned 35.71%. During the same time period, the Index returned 36.62%. During the fiscal year, the Fund fully replicated the components of the Index; therefore, the Fund’s performance, on a NAV basis, differed from the return of the Index primarily due to fees and operating expenses that the Fund incurred during the period, as well as slippage associated with the portfolio’s quarterly rebalances.
During this same time period, the S&P Composite 1500® Software & Services Index (the “Benchmark Index”) returned 26.44%. The Benchmark Index is an unmanaged index weighted by market capitalization based on the average performance of approximately 100 securities. The Benchmark Index was selected for its recognition in the marketplace, and because its performance comparison is a useful measure for investors as a broad representation of the software industry.
The performance of the Fund differed from the Benchmark Index in part because the Fund seeks to track an Index that employs a modified equal weighting and stock selection methodology, whereas the Benchmark Index selects and weights stocks based on market capitalization.
Relative to the Benchmark Index, the Fund was most overweight in the application softwaresub-industry and most underweight in the data processing & outsourced servicessub-industry during the fiscal year ended April 30, 2019. The majority of the Fund’s outperformance relative to the Benchmark Index during that
period can be attributed to the Fund’s overweight allocation to the application softwaresub-industry.
For the fiscal year ended April 30, 2019, the application softwaresub-industry contributed most significantly to the Fund’s return, followed by the interactive home entertainment and systems softwaresub-industries, respectively. The communications equipmentsub-industry was the only detractingsub-industry.
Positions that contributed most significantly to the Fund’s return for the fiscal year ended April 30, 2019, included CyberArk Software Ltd., a systems software company (portfolio average weight of 1.89%) and HubSpot, Inc., an application software company (portfolio average weight of 2.81%). Positions that detracted most significantly from the Fund’s return during this period included Benefitfocus, Inc. an application software company (portfolio average weight of 0.35%) and Blucora, Inc., a management & custody banks company (no longer held at fiscalyear-end).
| | | | |
Sub-Industry Breakdown
(% of the Fund’s Net Assets)
as of April 30, 2019 | |
| Application Software | | | 47.8 | |
| Systems Software | | | 22.3 | |
| Interactive Home Entertainment | | | 13.6 | |
| Health Care Technology | | | 10.0 | |
| Alternative Carriers | | | 3.5 | |
| IT Consulting & Other Services | | | 2.8 | |
| Money Market Funds Plus Other Assets Less Liabilities | | | 0.0 | |
|
Top Ten Fund Holdings*
(% of the Fund’s Net Assets)
as of April 30, 2019 | |
| Security | | | | |
| Cadence Design Systems, Inc. | | | 5.6 | |
| VMware, Inc., Class A | | | 5.4 | |
| Cerner Corp. | | | 5.2 | |
| Activision Blizzard, Inc. | | | 5.2 | |
| Atlassian Corp. PLC, Class A | | | 4.8 | |
| Intuit, Inc. | | | 4.8 | |
| Oracle Corp. | | | 4.8 | |
| Red Hat, Inc. | | | 4.5 | |
| Trade Desk, Inc. (The), Class A | | | 3.6 | |
| Bandwidth, Inc., Class A | | | 3.5 | |
| Total | | | 47.4 | |
| * | Excluding money market fund holdings. |
Invesco Dynamic Software ETF (PSJ)(continued)
Growth of a $10,000 Investment
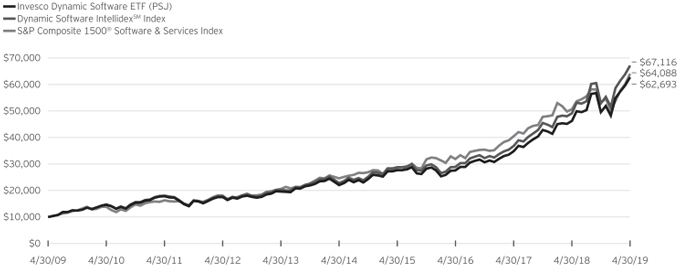
Fund Performance History as of April 30, 2019
| | | | | | | | | | | | | | | | | | | | | | | | | | | | | | | | | | | | | | | | |
| | | 1 Year | | | 3 Years Average
Annualized | | | 3 Years Cumulative | | | 5 Years Average
Annualized | | | 5 Years Cumulative | | | 10 Years Average
Annualized | | | 10 Years Cumulative | | | | | | Fund Inception | |
| Index | | Average
Annualized | | | Cumulative | |
| Dynamic Software IntellidexSM Index | | | 36.62 | % | | | 32.50 | % | | | 132.62 | % | | | 24.06 | % | | | 193.87 | % | | | 20.97 | % | | | 571.16 | % | | | | | | | 15.12 | % | | | 603.17 | % |
| S&P Composite 1500® Software & Services Index | | | 26.44 | | | | 26.24 | | | | 101.17 | | | | 21.13 | | | | 160.82 | | | | 20.41 | | | | 540.88 | | | | | | | | 13.33 | | | | 465.81 | |
| Fund | | | | | | | | | | | | | | | | | | | | | | | | | | | | | | | | | | | | | | | | |
| NAV Return | | | 35.71 | | | | 31.58 | | | | 127.80 | | | | 23.19 | | | | 183.74 | | | | 20.15 | | | | 526.93 | | | | | | | | 14.38 | | | | 543.25 | |
| Market Price Return | | | 35.58 | | | | 31.58 | | | | 127.81 | | | | 23.22 | | | | 184.07 | | | | 20.15 | | | | 527.12 | | | | | | | | 14.38 | | | | 543.02 | |
Fund Inception: June 23, 2005
Performance quoted above represents past performance. Past performance is not a guarantee of future results and current performance may be higher or lower than performance quoted. Investment returns and principal value will fluctuate, and shares of the Fund (“Fund Shares”), when redeemed or sold, may be worth more or less than their original cost. Fund performance reflects any applicable fee waivers and/or expense reimbursements. Had the adviser not waived fees and/or reimbursed expenses currently or in the past, returns would have been lower. See current prospectus for more information. The adviser has contractually agreed to waive fees and/or pay certain Fund expenses through August 31, 2021. According to the Fund’s current prospectus, the total annual operating expense ratio was indicated as 0.63%. The Financial Highlights section of the Shareholder Report presents the expense ratios based on expenses incurred during the period covered by this report. NAV and Market Price returns assume that dividends and capital gain distributions have been reinvested in the Fund at NAV and Market Price, respectively. The returns shown in the table above do not reflect the deduction of taxes that a shareholder
would pay on Fund distributions or the redemption or sale of Fund Shares. See invesco.com/ETFs to find the most recentmonth-end performance numbers.
Index and Benchmark Index performance results are based upon a hypothetical investment in their respective constituent securities. Index and Benchmark Index returns do not represent Fund returns. An investor cannot invest directly in an index. The Index and Benchmark Index do not charge management fees or brokerage expenses, and no such fees or expenses were deducted from the hypothetical performance shown. In addition, the results actual investors might have achieved would have differed from those shown because of differences in the timing, amounts of their investments, and fees and expenses associated with an investment in the Fund.
Notes Regarding Indexes and Fund Performance History:
| - | Average Annualized and Cumulative Inception returns for the Fund, Index and Benchmark Index are based on the inception date of the Fund. |
Schedule of Investments(a)
Invesco Dynamic Biotechnology & Genome ETF (PBE)
April 30, 2019
| | | | | | | | |
Number
of Shares | | | | | Value | |
| | | | Common Stocks & Other Equity Interests—100.1% | |
| | | | Biotechnology—80.9% | |
| | 1,062,904 | | | Akebia Therapeutics, Inc.(b) | | $ | 6,419,940 | |
| | 211,800 | | | Alkermes PLC(b) | | | 6,421,776 | |
| | 165,945 | | | Alnylam Pharmaceuticals, Inc.(b) | | | 14,825,526 | |
| | 68,174 | | | Amgen, Inc. | | | 12,224,962 | |
| | 303,756 | | | Array BioPharma, Inc.(b) | | | 6,867,923 | |
| | 382,807 | | | Arrowhead Pharmaceuticals, Inc.(b)(c) | | | 6,882,870 | |
| | 39,378 | | | Biogen, Inc.(b) | | | 9,027,013 | |
| | 142,657 | | | Celgene Corp.(b) | | | 13,503,912 | |
| | 108,256 | | | Emergent BioSolutions, Inc.(b) | | | 5,594,670 | |
| | 70,374 | | | Enanta Pharmaceuticals, Inc.(b) | | | 6,135,909 | |
| | 325,081 | | | Exelixis, Inc.(b) | | | 6,391,092 | |
| | 123,427 | | | FibroGen, Inc.(b) | | | 5,767,744 | |
| | 88,042 | | | Genomic Health, Inc.(b) | | | 5,663,742 | |
| | 415,303 | | | Halozyme Therapeutics, Inc.(b) | | | 6,698,837 | |
| | 217,607 | | | Myriad Genetics, Inc.(b) | | | 6,850,268 | |
| | 2,517,602 | | | OPKO Health, Inc.(b)(c) | | | 6,017,069 | |
| | 219,897 | | | PTC Therapeutics, Inc.(b) | | | 8,228,546 | |
| | 30,211 | | | Regeneron Pharmaceuticals, Inc.(b) | | | 10,366,602 | |
| | 151,009 | | | REGENXBIO, Inc.(b) | | | 7,610,854 | |
| | 118,832 | | | Repligen Corp.(b) | | | 8,006,900 | |
| | 807,753 | | | Sangamo Therapeutics, Inc.(b) | | | 9,442,633 | |
| | 58,946 | | | United Therapeutics Corp.(b) | | | 6,046,091 | |
| | 344,396 | | | Vanda Pharmaceuticals, Inc.(b) | | | 5,610,211 | |
| | 366,930 | | | Veracyte, Inc.(b) | | | 8,391,689 | |
| | 69,087 | | | Vertex Pharmaceuticals, Inc.(b) | | | 11,674,321 | |
| | | | | | | | |
| | | | | | 200,671,100 | |
| | | | | | | | |
| | | | Health Care Equipment—2.9% | |
| | 198,739 | | | Cardiovascular Systems, Inc.(b) | | | 7,063,184 | |
| | | | | | | | |
| | | | Life Sciences Tools & Services—13.4% | |
| | 35,568 | | | Bio—Techne Corp. | | | 7,276,857 | |
| | 42,602 | | | Illumina, Inc.(b) | | | 13,291,824 | |
| | 326,114 | | | QIAGEN NV(b) | | | 12,705,401 | |
| | | | | | | | |
| | | | | | | 33,274,082 | |
| | | | | | | | |
| | | | Pharmaceuticals—2.9% | |
| | 162,158 | | | Catalent, Inc.(b) | | | 7,267,922 | |
| | | | | | | | |
| | | | Total Common Stocks & Other Equity Interests
(Cost $243,689,553) 248,276,288 | | | | |
| | |
| | | | | | | | |
| | | | Money Market Funds—0.0% | |
| | 69,857 | | | Invesco Premier U.S. Government Money Portfolio—Institutional Class, 2.32%(d)
(Cost $69,857) | | | 69,857 | |
| | | | | | | | |
| | |
| | | | Total Investments in Securities
(excluding investments purchased with cash collateral from securities on loan)
(Cost $243,759,410)—100.1% | | | 248,346,145 | |
| | | | | | | | |
| | |
| | | | | | | | |
| | | | Investments Purchased with Cash Collateral from
Securities on Loan | |
| | |
| | | | | | | | |
| | | | Money Market Funds—3.0% | |
| | 5,455,325 | | | Invesco Government & Agency Portfolio— Institutional Class, 2.34%(d)(e) | | | 5,455,325 | |
| | | | | | | | |
Number
of Shares | | | | | Value | |
| | | | Money Market Funds (continued) | |
| | 1,817,897 | | | Invesco Liquid Assets Portfolio—Institutional Class,
2.48%(d)(e) | | $ | 1,818,442 | |
| | | | | | | | |
| | | | Total Money Market Funds
(Cost $7,273,767) | | | 7,273,767 | |
| | | | | | | | |
| | |
| | | | Total Investments in Securities
(Cost $251,033,177)—103.1% | | | 255,619,912 | |
| | |
| | | | Other assets less liabilities—(3.1)% | | | (7,592,821 | ) |
| | | | | | | | |
| | |
| | | | Net Assets—100.0% | | $ | 248,027,091 | |
| | | | | | | | |
Notes to Schedule of Investments:
| (a) | Industry and/or sector classifications used in this report are generally according to the Global Industry Classification Standard, which was developed by and is the exclusive property and a service mark of MSCI Inc. and Standard & Poor’s. |
| (b) | Non-income producing security. |
| (c) | All or a portion of this security was out on loan at April 30, 2019. |
| (d) | The security and the Fund are advised by wholly-owned subsidiaries of Invesco Ltd. and are therefore considered to be affiliated. The rate shown is the 7-day SEC standardized yield as of April 30, 2019. |
| (e) | The security has been segregated to satisfy the commitment to return the cash collateral received in securities lending transactions upon the borrower’s return of the securities loaned. See Note 2J. |
See accompanying Notes to Financial Statements which are an integral part of the financial statements.
Schedule of Investments(a)
Invesco Dynamic Building & Construction ETF (PKB)
April 30, 2019
| | | | | | | | |
Number
of Shares | | | | | Value | |
| | | | Common Stocks & Other Equity Interests—100.0% | |
| | | | Building Products—18.6% | |
| | 81,229 | | | Apogee Enterprises, Inc. | | $ | 3,273,529 | |
| | 42,226 | | | Armstrong World Industries, Inc. | | | 3,659,727 | |
| | 109,664 | | | Continental Building Products, Inc.(b) | | | 2,812,882 | |
| | 72,178 | | | Gibraltar Industries, Inc.(b) | | | 2,863,301 | |
| | 22,194 | | | Lennox International, Inc. | | | 6,024,561 | |
| | 92,699 | | | Universal Forest Products, Inc. | | | 3,425,228 | |
| | | | | | | | |
| | | | | | | 22,059,228 | |
| | | | | | | | |
| | | | Construction & Engineering—18.5% | |
| | 97,495 | | | AECOM(b) | | | 3,305,080 | |
| | 42,694 | | | EMCOR Group, Inc. | | | 3,592,273 | |
| | 74,904 | | | Jacobs Engineering Group, Inc. | | | 5,838,018 | |
| | 38,062 | | | NV5 Global, Inc.(b) | | | 2,410,847 | |
| | 83,296 | | | Quanta Services, Inc. | | | 3,381,818 | |
| | 168,163 | | | Tutor Perini Corp.(b) | | | 3,358,215 | |
| | | | | | | | |
| | | | | | | 21,886,251 | |
| | | | | | | | |
| | | | Construction Machinery & Heavy Trucks—2.6% | |
| | 37,986 | | | Oshkosh Corp. | | | 3,137,264 | |
| | | | | | | | |
| | | | Construction Materials—13.2% | |
| | 29,023 | | | Martin Marietta Materials, Inc. | | | 6,440,204 | |
| | 171,517 | | | Summit Materials, Inc., Class A(b) | | | 3,004,978 | |
| | 48,896 | | | Vulcan Materials Co. | | | 6,166,274 | |
| | | | | | | | |
| | | | | | | 15,611,456 | |
| | | | | | | | |
| | | | Environmental & Facilities Services—2.8% | |
| | 50,908 | | | Tetra Tech, Inc. | | | 3,294,766 | |
| | | | | | | | |
| | | | Forest Products—2.4% | |
| | 113,636 | | | Louisiana—Pacific Corp. | | | 2,846,582 | |
| | | | | | | | |
| | | | Home Improvement Retail—9.9% | |
| | 28,798 | | | Home Depot, Inc. (The) | | | 5,866,152 | |
| | 52,356 | | | Lowe’s Cos., Inc. | | | 5,923,558 | |
| | | | | | | | |
| | | | | | | 11,789,710 | |
| | | | | | | | |
| | | | Homebuilding—16.1% | |
| | 48,994 | | | LGI Homes, Inc.(b) | | | 3,395,774 | |
| | 102,742 | | | MDC Holdings, Inc. | | | 3,139,796 | |
| | 66,235 | | | Meritage Homes Corp.(b) | | | 3,387,920 | |
| | 145,867 | | | Skyline Champion Corp. | | | 3,079,252 | |
| | 80,789 | | | Toll Brothers, Inc. | | | 3,078,061 | |
| | 227,954 | | | TRI Pointe Group, Inc.(b) | | | 2,974,800 | |
| | | | | | | | |
| | | | | | | 19,055,603 | |
| | | | | | | | |
| | | | Industrial Conglomerates—2.9% | |
| | 24,671 | | | Carlisle Cos., Inc. | | | 3,488,973 | |
| | | | | | | | |
| | | | Industrial Machinery—8.0% | |
| | 79,386 | | | Columbus McKinnon Corp. | | | 3,124,633 | |
| | 52,339 | | | Ingersoll—Rand PLC | | | 6,417,285 | |
| | | | | | | | |
| | | | | | | 9,541,918 | |
| | | | | | | | |
| | | | Specialty Stores—5.0% | |
| | 56,950 | | | Tractor Supply Co. | | | 5,894,325 | |
| | | | | | | | |
| | | | Total Common Stocks & Other Equity Interests
(Cost $109,005,237) | | | 118,606,076 | |
| | | | | | | | |
| | | | | | | | |
Number
of Shares | | | | | Value | |
| | | | Money Market Funds—0.2% | |
| | 255,728 | | | Invesco Premier U.S. Government Money Portfolio—Institutional Class, 2.32%(c)
(Cost $255,728) | | $ | 255,728 | |
| | | | | | | | |
| | |
| | | | Total Investments in Securities
(Cost $109,260,965)—100.2% | | | 118,861,804 | |
| | |
| | | | Other assets less liabilities—(0.2)% | | | (222,599 | ) |
| | | | | | | | |
| | |
| | | | Net Assets—100.0% | | $ | 118,639,205 | |
| | | | | | | | |
Notes to Schedule of Investments:
| (a) | Industry and/or sector classifications used in this report are generally according to the Global Industry Classification Standard, which was developed by and is the exclusive property and a service mark of MSCI Inc. and Standard & Poor’s. |
| (b) | Non-income producing security. |
| (c) | The security and the Fund are advised by wholly-owned subsidiaries of Invesco Ltd. and are therefore considered to be affiliated. The rate shown is the 7-day SEC standardized yield as of April 30, 2019. |
See accompanying Notes to Financial Statements which are an integral part of the financial statements.
Schedule of Investments(a)
Invesco Dynamic Energy Exploration & Production ETF (PXE)
April 30, 2019
| | | | | | | | |
Number
of Shares | | | | | Value | |
| | | | Common Stocks & Other Equity Interests—100.1% | |
| | | | Integrated Oil & Gas—6.6% | |
| | 29,847 | | | Occidental Petroleum Corp. | | $ | 1,757,391 | |
| | 66,187 | | | Unit Corp.(b) | | | 897,496 | |
| | | | | | | | |
| | | | | | | 2,654,887 | |
| | | | | | | | |
| | | | Oil & Gas Exploration & Production—67.9% | |
| | 45,347 | | | Anadarko Petroleum Corp. | | | 3,303,529 | |
| | 111,760 | | | Antero Resources Corp.(b) | | | 810,260 | |
| | 32,464 | | | Apache Corp. | | | 1,068,390 | |
| | 91,169 | | | Carrizo Oil & Gas, Inc.(b) | | | 1,168,787 | |
| | 416,877 | | | Chesapeake Energy Corp.(b)(c) | | | 1,213,112 | |
| | 14,830 | | | Cimarex Energy Co. | | | 1,018,228 | |
| | 103,566 | | | CNX Resources Corp.(b) | | | 927,951 | |
| | 28,300 | | | ConocoPhillips. | | | 1,786,296 | |
| | 508,144 | | | Denbury Resources, Inc.(b) | | | 1,133,161 | |
| | 36,288 | | | Devon Energy Corp. | | | 1,166,296 | |
| | 20,848 | | | EOG Resources, Inc. | | | 2,002,450 | |
| | 56,925 | | | EQT Corp. | | | 1,164,116 | |
| | 55,930 | | | Geopark Ltd. (Colombia)(b) | | | 878,101 | |
| | 473,080 | | | Gran Tierra Energy, Inc. (Canada)(b) | | | 1,130,661 | |
| | 136,785 | | | Gulfport Energy Corp.(b) | | | 895,942 | |
| | 34,462 | | | Hess Corp. | | | 2,209,704 | |
| | 302,905 | | | Laredo Petroleum, Inc.(b) | | | 914,773 | |
| | 179,149 | | | Oasis Petroleum, Inc.(b) | | | 1,092,809 | |
| | 100,012 | | | Range Resources Corp. | | | 904,109 | |
| | 253,244 | | | Southwestern Energy Co.(b) | | | 1,000,314 | |
| | 227,131 | | | SRC Energy, Inc.(b) | | | 1,396,856 | |
| | | | | | | | |
| | | | | | | 27,185,845 | |
| | | | | | | | |
| | | | Oil & Gas Refining & Marketing—25.6% | |
| | 26,160 | | | CVR Energy, Inc. | | | 1,193,158 | |
| | 29,958 | | | Delek US Holdings, Inc. | | | 1,110,243 | |
| | 19,682 | | | HollyFrontier Corp. | | | 939,422 | |
| | 30,742 | | | Marathon Petroleum Corp. | | | 1,871,265 | |
| | 31,976 | | | PBF Energy, Inc., Class A | | | 1,073,754 | |
| | 20,533 | | | Phillips 66 | | | 1,935,646 | |
| | 23,530 | | | Valero Energy Corp. | | | 2,133,230 | |
| | | | | | | | |
| | | | | | | 10,256,718 | |
| | | | | | | | |
| | | | Total Common Stocks & Other Equity Interests
(Cost $49,929,102) | | | 40,097,450 | |
| | | | | | | | |
| |
| | | | | |
| | | | Money Market Funds—0.2% | |
| | 96,102 | | | Invesco Premier U.S. Government Money Portfolio—Institutional Class, 2.32%(d)
(Cost $96,102) | | | 96,102 | |
| | | | | | | | |
| | |
| | | | Total Investments in Securities
(excluding investments purchased with cash collateral from securities on loan)
(Cost $50,025,204)—100.3% | | | 40,193,552 | |
| | | | | | | | |
| | | | Investments Purchased with Cash Collateral from
Securities on Loan | |
| |
| | | | | |
| | | | Money Market Funds—0.3% | |
| | 90,736 | | | Invesco Government & Agency Portfolio—Institutional Class, 2.34%(d)(e) | | | 90,736 | |
| | | | | | | | |
Number
of Shares | | | | | Value | |
| | | | Money Market Funds (continued) | |
| | 30,236 | | | Invesco Liquid Assets Portfolio—Institutional Class, 2.48%(d)(e) | | $ | 30,245 | |
| | | | | | | | |
| | | | Total Money Market Funds
(Cost $120,981) | | | 120,981 | |
| | | | | | | | |
| | |
| | | | Total Investments in Securities
(Cost $50,146,185)—100.6% | | | 40,314,533 | |
| | | | Other assets less liabilities—(0.6)% | | | (236,278 | ) |
| | | | | | | | |
| | |
| | | | Net Assets—100.0% | | $ | 40,078,255 | |
| | | | | | | | |
Notes to Schedule of Investments:
| (a) | Industry and/or sector classifications used in this report are generally according to the Global Industry Classification Standard, which was developed by and is the exclusive property and a service mark of MSCI Inc. and Standard & Poor’s. |
| (b) | Non-income producing security. |
| (c) | All or a portion of this security was out on loan at April 30, 2019. |
| (d) | The security and the Fund are advised by wholly-owned subsidiaries of Invesco Ltd. and are therefore considered to be affiliated. The rate shown is the 7-day SEC standardized yield as of April 30, 2019. |
| (e) | The security has been segregated to satisfy the commitment to return the cash collateral received in securities lending transactions upon the borrower’s return of the securities loaned. See Note 2J. |
See accompanying Notes to Financial Statements which are an integral part of the financial statements.
Schedule of Investments(a)
Invesco Dynamic Food & Beverage ETF (PBJ)
April 30, 2019
| | | | | | | | |
Number
of Shares | | | | | Value | |
| | | | Common Stocks & Other Equity Interests—99.9% | |
| | | | Agricultural Products—7.6% | |
| | 80,977 | | | Archer—Daniels—Midland Co. | | $ | 3,611,574 | |
| | 85,545 | | | Darling Ingredients, Inc.(b) | | | 1,865,737 | |
| | | | | | | | |
| | | | | | | 5,477,311 | |
| | | | | | | | |
| | | | Food Distributors—10.2% | |
| | 50,984 | | | Andersons, Inc. (The) | | | 1,667,177 | |
| | 58,759 | | | Chefs’ Warehouse, Inc. (The)(b) | | | 1,920,244 | |
| | 48,336 | | | Performance Food Group Co.(b) | | | 1,979,359 | |
| | 107,877 | | | SpartanNash Co. | | | 1,744,371 | |
| | | | | | | | |
| | | | | | | 7,311,151 | |
| | | | | | | | |
| | | | Food Retail—8.9% | |
| | 120,616 | | | Kroger Co. (The) | | | 3,109,480 | |
| | 80,734 | | | Sprouts Farmers Market, Inc.(b) | | | 1,729,322 | |
| | 36,132 | | | Weis Markets, Inc. | | | 1,519,351 | |
| | | | | | | | |
| | | | | | | 6,358,153 | |
| | | | | | | | |
| | | | Packaged Foods & Meats—40.1% | |
| | 69,231 | | | B&G Foods, Inc.(c) | | | 1,800,006 | |
| | 89,538 | | | Flowers Foods, Inc. | | | 1,946,556 | |
| | 47,542 | | | Freshpet, Inc.(b) | | | 2,123,226 | |
| | 16,909 | | | Hershey Co. (The) | | | 2,111,089 | |
| | 82,096 | | | Hormel Foods Corp. | | | 3,278,914 | |
| | 26,490 | | | Lamb Weston Holdings, Inc. | | | 1,855,624 | |
| | 11,683 | | | Lancaster Colony Corp. | | | 1,737,379 | |
| | 14,057 | | | McCormick & Co., Inc. | | | 2,164,356 | |
| | 71,209 | | | Mondelez International, Inc., Class A | | | 3,620,978 | |
| | 18,333 | | | Post Holdings, Inc.(b) | | | 2,067,596 | |
| | 91,946 | | | Simply Good Foods Co. (The)(b) | | | 2,065,107 | |
| | 51,317 | | | Tootsie Roll Industries, Inc. | | | 1,992,639 | |
| | 30,911 | | | TreeHouse Foods, Inc.(b) | | | 2,070,419 | |
| | | | | | | | |
| | | | | | | 28,833,889 | |
| | | | | | | | |
| | | | Restaurants—16.3% | |
| | 3,128 | | | Chipotle Mexican Grill, Inc.(b) | | | 2,152,189 | |
| | 48,758 | | | Starbucks Corp. | | | 3,787,521 | |
| | 105,813 | | | Wendy’s Co. (The) | | | 1,969,180 | |
| | 36,332 | | | Yum! Brands, Inc. | | | 3,792,698 | |
| | | | | | | | |
| | | | | | | 11,701,588 | |
| | | | | | | | |
| | | | Soft Drinks—16.8% | |
| | 8,292 | | | Coca—Cola Bottling Co. Consolidated, Inc. | | | 2,695,149 | |
| | 75,168 | | | Coca—Cola Co. (The) | | | 3,687,742 | |
| | 40,315 | | | Coca—Cola European Partners PLC (United Kingdom) | | | 2,160,481 | |
| | 122,371 | | | Keurig Dr Pepper, Inc.(c) | | | 3,557,325 | |
| | | | | | | | |
| | | | | | | 12,100,697 | |
| | | | | | | | |
| | | | Total Common Stocks & Other Equity Interests
(Cost $65,042,645) | | | 71,782,789 | |
| | | | | | | | |
| | | | | | | | |
Number
of Shares | | | | | Value | |
| | | | Money Market Funds—0.3% | |
| | 186,032 | | | Invesco Premier U.S. Government Money Portfolio—Institutional Class, 2.32%(d)
(Cost $186,032) | | $ | 186,032 | |
| | | | | | | | |
| | |
| | | | Total Investments in Securities
(excluding investments purchased with cash collateral from securities on loan)
(Cost $65,228,677)—100.2% | | | 71,968,821 | |
| | | | | | | | |
| | |
| | | | | | | | |
| | | | Investments Purchased with Cash Collateral from
Securities on Loan | |
| | |
| | | | | | | | |
| | | | Money Market Funds—6.1% | |
| | 3,313,533 | | | Invesco Government & Agency Portfolio— Institutional Class, 2.34%(d)(e) | | | 3,313,533 | |
| | 1,104,180 | | | Invesco Liquid Assets Portfolio—Institutional Class, 2.48%(d)(e) | | | 1,104,511 | |
| | | | | | | | |
| | | | Total Money Market Funds
(Cost $4,418,044) | | | 4,418,044 | |
| | | | | | | | |
| | |
| | | | Total Investments in Securities
(Cost $69,646,721)—106.3% | | | 76,386,865 | |
| | |
| | | | Other assets less liabilities—(6.3)% | | | (4,555,967 | ) |
| | | | | | | | |
| | |
| | | | Net Assets—100.0% | | $ | 71,830,898 | |
| | | | | | | | |
Notes to Schedule of Investments:
| (a) | Industry and/or sector classifications used in this report are generally according to the Global Industry Classification Standard, which was developed by and is the exclusive property and a service mark of MSCI Inc. and Standard & Poor’s. |
| (b) | Non-income producing security. |
| (c) | All or a portion of this security was out on loan at April 30, 2019. |
| (d) | The security and the Fund are advised by wholly-owned subsidiaries of Invesco Ltd. and are therefore considered to be affiliated. The rate shown is the 7-day SEC standardized yield as of April 30, 2019. |
| (e) | The security has been segregated to satisfy the commitment to return the cash collateral received in securities lending transactions upon the borrower’s return of the securities loaned. See Note 2J. |
See accompanying Notes to Financial Statements which are an integral part of the financial statements.
Schedule of Investments(a)
Invesco Dynamic Leisure and Entertainment ETF (PEJ)
April 30, 2019
| | | | | | | | |
Number
of Shares | | | | | Value | |
| | | | Common Stocks & Other Equity Interests–100.0% | |
| | | | Airlines—17.8% | |
| | 29,466 | | | Alaska Air Group, Inc. | | $ | 1,823,945 | |
| | 58,429 | | | Hawaiian Holdings, Inc. | | | 1,648,282 | |
| | 62,524 | | | Southwest Airlines Co. | | | 3,390,677 | |
| | 31,088 | | | Spirit Airlines, Inc.(b) | | | 1,690,565 | |
| | 38,223 | | | United Continental Holdings, Inc.(b) | | | 3,396,496 | |
| | | | | | | | |
| | | | | | | 11,949,965 | |
| | | | | | | | |
| | | | Broadcasting—6.9% | |
| | 29,059 | | | AMC Networks, Inc., Class A(b) | | | 1,697,336 | |
| | 523,221 | | | Central European Media Enterprises Ltd., Class A (Czech Republic)(b) | | | 2,071,955 | |
| | 22,317 | | | Fox Corp., Class A(b) | | | 870,140 | |
| | | | | | | | |
| | | | | | | 4,639,431 | |
| | | | | | | | |
| | | | Food Distributors—2.9% | |
| | 47,614 | | | Performance Food Group Co.(b) | | | 1,949,793 | |
| | | | | | | | |
| | | | Interactive Media & Services—2.5% | |
| | 116,564 | | | Liberty TripAdvisor Holdings, Inc., Series A(b) | | | 1,718,153 | |
| | | | | | | | |
| | | | Internet & Direct Marketing Retail—5.1% | |
| | 26,508 | | | Expedia Group, Inc. | | | 3,441,799 | |
| | | | | | | | |
| | | | Leisure Facilities—2.9% | |
| | 35,750 | | | Cedar Fair, L.P. | | | 1,929,428 | |
| | | | | | | | |
| | | | Movies & Entertainment—31.3% | |
| | 135,197 | | | AMC Entertainment Holdings, Inc.(c) | | | 2,049,587 | |
| | 50,195 | | | Cinemark Holdings, Inc. | | | 2,110,700 | |
| | 33,152 | | | Live Nation Entertainment, Inc.(b) | | | 2,166,152 | |
| | 6,278 | | | Madison Square Garden Co. (The), Class A(b) | | | 1,961,498 | |
| | 92,564 | | | Manchester United PLC, Class A (United Kingdom)(c) | | | 1,824,437 | |
| | 44,739 | | | Marcus Corp. (The) | | | 1,683,081 | |
| | 63,453 | | | Viacom, Inc., Class B | | | 1,834,426 | |
| | 40,865 | | | Walt Disney Co. (The) | | | 5,597,279 | |
| | 21,418 | | | World Wrestling Entertainment, Inc., Class A | | | 1,795,899 | |
| | | | | | | | |
| | | | | | | 21,023,059 | |
| | | | | | | | |
| | | | Restaurants—30.6% | |
| | 84,306 | | | Bloomin’ Brands, Inc. | | | 1,685,277 | |
| | 42,191 | | | Brinker International, Inc. | | | 1,804,509 | |
| | 5,648 | | | Chipotle Mexican Grill, Inc.(b) | | | 3,886,050 | |
| | 10,787 | | | Cracker Barrel Old Country Store, Inc. | | | 1,820,198 | |
| | 16,671 | | | Darden Restaurants, Inc. | | | 1,960,510 | |
| | 48,030 | | | Starbucks Corp. | | | 3,730,970 | |
| | 104,232 | | | Wendy’s Co. (The) | | | 1,939,758 | |
| | 35,790 | | | Yum! Brands, Inc. | | | 3,736,118 | |
| | | | | | | | |
| | | | | | | 20,563,390 | |
| | | | | | | | |
| | | | Total Common Stocks & Other Equity Interests
(Cost $64,017,398) | | | 67,215,018 | |
| | | | | | | | |
| | | | | | | | |
Number
of Shares | | | | | Value | |
| | | | Money Market Funds—0.2% | |
| | 124,448 | | | Invesco Premier U.S. Government Money Portfolio—Institutional Class, 2.32%(d)
(Cost $124,448) | | $ | 124,448 | |
| | | | | | | | |
| | |
| | | | | | | | |
| | |
| | | | Total Investments in Securities
(excluding investments purchased with cash collateral from securities on loan)
(Cost $64,141,846)—100.2% | | | 67,339,466 | |
| | | | | | | | |
| | |
| | | | | | | | |
| | | | Investments Purchased with Cash Collateral from
Securities on Loan | |
| | |
| | | | | | | | |
| | | | Money Market Funds—2.0% | |
| | 1,004,340 | | | Invesco Government & Agency Portfolio— Institutional Class, 2.34%(d)(e) | | | 1,004,340 | |
| | 334,679 | | | Invesco Liquid Assets Portfolio—Institutional Class, 2.48%(d)(e) | | | 334,780 | |
| | | | | | | | |
| | |
| | | | | | | | |
| | | | Total Money Market Funds
(Cost $1,339,120) | | | 1,339,120 | |
| | | | | | | | |
| | |
| | | | Total Investments in Securities
(Cost $65,480,966)—102.2% | | | 68,678,586 | |
| | |
| | | | Other assets less liabilities—(2.2)% | | | (1,477,512 | ) |
| | | | | | | | |
| | |
| | | | Net Assets—100.0% | | $ | 67,201,074 | |
| | | | | | | | |
Notes to Schedule of Investments:
| (a) | Industry and/or sector classifications used in this report are generally according to the Global Industry Classification Standard, which was developed by and is the exclusive property and a service mark of MSCI Inc. and Standard & Poor’s. |
| (b) | Non-income producing security. |
| (c) | All or a portion of this security was out on loan at April 30, 2019. |
| (d) | The security and the Fund are advised by wholly-owned subsidiaries of Invesco Ltd. and are therefore considered to be affiliated. The rate shown is the7-day SEC standardized yield as of April 30, 2019. |
| (e) | The security has been segregated to satisfy the commitment to return the cash collateral received in securities lending transactions upon the borrower’s return of the securities loaned. See Note 2J. |
See accompanying Notes to Financial Statements which are an integral part of the financial statements.
Schedule of Investments(a)
Invesco Dynamic Media ETF (PBS)
April 30, 2019
| | | | | | | | |
Number
of Shares | | | | | Value | |
| | | | Common Stocks & Other Equity Interests—100.1% | |
| | | | Advertising—5.3% | |
| | 97,718 | | | Interpublic Group of Cos., Inc. (The) | | $ | 2,247,514 | |
| | 30,540 | | | Omnicom Group, Inc. | | | 2,444,116 | |
| | | | | | | | |
| | | | | | | 4,691,630 | |
| | | | | | | | |
| | | | Broadcasting—30.5% | |
| | 35,892 | | | AMC Networks, Inc., Class A(b) | | | 2,096,452 | |
| | 82,364 | | | CBS Corp., Class B | | | 4,222,802 | |
| | 646,215 | | | Central European Media Enterprises Ltd., Class A (Czech Republic)(b) | | | 2,559,011 | |
| | 115,827 | | | E.W. Scripps Co. (The), Class A | | | 2,639,697 | |
| | 27,558 | | | Fox Corp., Class A(b) | | | 1,074,486 | |
| | 126,736 | | | Gray Television, Inc.(b) | | | 2,969,425 | |
| | 25,185 | | | Nexstar Media Group, Inc., Class A | | | 2,947,904 | |
| | 69,528 | | | Sinclair Broadcast Group, Inc., Class A | | | 3,183,687 | |
| | 185,231 | | | TEGNA, Inc. | | | 2,948,878 | |
| | 49,269 | | | Tribune Media Co., Class A | | | 2,276,228 | |
| | | | | | | | |
| | | | | | | 26,918,570 | |
| | | | | | | | |
| | | | Cable & Satellite—4.5% | |
| | 689,788 | | | Sirius XM Holdings, Inc.(c) | | | 4,007,668 | |
| | | | | | | | |
| | | | Interactive Media & Services—27.0% | |
| | 3,805 | | | Alphabet, Inc., Class A(b) | | | 4,562,043 | |
| | 141,032 | | | ANGI Homeservices, Inc., Class A(b) | | | 2,451,136 | |
| | 92,465 | | | Care.com, Inc.(b) | | | 1,548,789 | |
| | 26,207 | | | Facebook, Inc., Class A(b) | | | 5,068,434 | |
| | 10,544 | | | IAC/InterActiveCorp.(b) | | | 2,370,713 | |
| | 40,327 | | | Match Group, Inc. | | | 2,435,751 | |
| | 136,340 | | | Twitter, Inc.(b) | | | 5,441,329 | |
| | | | | | | | |
| | | | | | | 23,878,195 | |
| | | | | | | | |
| | | | Movies & Entertainment—22.9% | |
| | 74,299 | | | Liberty Media Corp.—Liberty Formula One, Class A(b) | | | 2,805,530 | |
| | 149,028 | | | Lions Gate Entertainment Corp., Class A | | | 2,174,319 | |
| | 28,241 | | | Spotify Technology S.A.(b) | | | 3,834,281 | |
| | 78,373 | | | Viacom, Inc., Class B | | | 2,265,763 | |
| | 50,530 | | | Walt Disney Co. (The) | | | 6,921,094 | |
| | 26,455 | | | World Wrestling Entertainment, Inc., Class A | | | 2,218,252 | |
| | | | | | | | |
| | | | | | | 20,219,239 | |
| | | | | | | | |
| | | | Publishing—9.9% | |
| | 214,599 | | | Gannett Co., Inc. | | | 2,002,208 | |
| | 71,198 | | | New York Times Co. (The), Class A | | | 2,360,214 | |
| | 178,716 | | | News Corp., Class A | | | 2,219,653 | |
| | 53,650 | | | Scholastic Corp. | | | 2,139,562 | |
| | | | | | | | |
| | | | | | | 8,721,637 | |
| | | | | | | | |
| | | | Total Common Stocks & Other Equity Interests
(Cost $82,250,116) | | | 88,436,939 | |
| | | | | | | | |
| | | | | | | | |
Number
of Shares | | | | | Value | |
| | | | Money Market Funds—0.1% | |
| | 57,302 | | | Invesco Premier U.S. Government Money Portfolio—Institutional Class, 2.32%(d)
(Cost $57,302) | | $ | 57,302 | |
| | | | | | | | |
| | |
| | | | | | | | |
| | |
| | | | Total Investments in Securities
(excluding investments purchased with cash collateral from securities on loan)
(Cost $82,307,418)—100.2% | | | 88,494,241 | |
| | | | | | | | |
| | |
| | | | | | | | |
| | | | Investments Purchased with Cash Collateral from
Securities on Loan | |
| | |
| | | | | | | | |
| | | | Money Market Funds—1.3% | |
| | 860,884 | | | Invesco Government & Agency Portfolio— Institutional Class, 2.34%(d)(e) | | | 860,884 | |
| | 286,875 | | | Invesco Liquid Assets Portfolio—Institutional Class, 2.48%(d)(e) | | | 286,961 | |
| | | | | | | | |
| | |
| | | | Total Money Market Funds
(Cost $1,147,845) | | | 1,147,845 | |
| | | | | | | | |
| | |
| | | | Total Investments in Securities
(Cost $83,455,263)—101.5% | | | 89,642,086 | |
| | |
| | | | Other assets less liabilities—(1.5)% | | | (1,293,866 | ) |
| | | | | | | | |
| | |
| | | | Net Assets—100.0% | | $ | 88,348,220 | |
| | | | | | | | |
Notes to Schedule of Investments:
| (a) | Industry and/or sector classifications used in this report are generally according to the Global Industry Classification Standard, which was developed by and is the exclusive property and a service mark of MSCI Inc. and Standard & Poor’s. |
| (b) | Non-income producing security. |
| (c) | All or a portion of this security was out on loan at April 30, 2019. |
| (d) | The security and the Fund are advised by wholly-owned subsidiaries of Invesco Ltd. and are therefore considered to be affiliated. The rate shown is the7-day SEC standardized yield as of April 30, 2019. |
| (e) | The security has been segregated to satisfy the commitment to return the cash collateral received in securities lending transactions upon the borrower’s return of the securities loaned. See Note 2J. |
See accompanying Notes to Financial Statements which are an integral part of the financial statements.
Schedule of Investments(a)
Invesco Dynamic Networking ETF (PXQ)
April 30, 2019
| | | | | | | | |
Number
of Shares | | | | | Value | |
| | | | Common Stocks & Other Equity Interests—100.0% | |
| | | | Application Software—5.0% | |
| | 24,245 | | | Citrix Systems, Inc. | | $ | 2,447,775 | |
| | 24,790 | | | New Relic, Inc.(b) | | | 2,608,900 | |
| | | | | | | | |
| | | | | | | 5,056,675 | |
| | | | | | | | |
| | | | Communications Equipment—35.8% | |
| | 17,251 | | | Arista Networks, Inc.(b) | | | 5,387,315 | |
| | 60,102 | | | Ciena Corp.(b) | | | 2,305,513 | |
| | 94,442 | | | Cisco Systems, Inc. | | | 5,284,030 | |
| | 14,987 | | | F5 Networks, Inc.(b) | | | 2,351,460 | |
| | 106,366 | | | Finisar Corp.(b) | | | 2,564,484 | |
| | 36,366 | | | InterDigital, Inc. | | | 2,377,973 | |
| | 93,441 | | | Juniper Networks, Inc. | | | 2,594,856 | |
| | 33,720 | | | Motorola Solutions, Inc. | | | 4,886,365 | |
| | 91,990 | | | NetScout Systems, Inc.(b) | | | 2,704,506 | |
| | 103,765 | | | Radware Ltd. (Israel)(b) | | | 2,707,229 | |
| | 17,867 | | | Ubiquiti Networks, Inc. | | | 3,045,430 | |
| | | | | | | | |
| | | | | | | 36,209,161 | |
| | | | | | | | |
| | | | Consumer Electronics—2.6% | |
| | 30,882 | | | Garmin Ltd. | | | 2,647,823 | |
| | | | | | | | |
| | | | Internet Services & Infrastructure—3.2% | |
| | 31,013 | | | Okta, Inc.(b) | | | 3,226,282 | |
| | | | | | | | |
| | | | Semiconductor Equipment—2.7% | |
| | 108,588 | | | Xperi Corp. | | | 2,698,412 | |
| | | | | | | | |
| | | | Semiconductors—7.6% | |
| | 89,140 | | | QUALCOMM, Inc. | | | 7,677,628 | |
| | | | | | | | |
| | | | Systems Software—43.1% | |
| | 38,507 | | | Check Point Software Technologies Ltd. (Israel)(b) | | | 4,650,105 | |
| | 24,453 | | | CyberArk Software Ltd. (Israel)(b) | | | 3,152,725 | |
| | 30,124 | | | Fortinet, Inc.(b) | | | 2,814,184 | |
| | 20,632 | | | Palo Alto Networks, Inc.(b) | | | 5,133,861 | |
| | 30,179 | | | Qualys, Inc.(b) | | | 2,723,957 | |
| | 55,684 | | | Rapid7, Inc.(b) | | | 3,025,869 | |
| | 83,509 | | | SailPoint Technologies Holding, Inc.(b) | | | 2,359,964 | |
| | 124,101 | | | SecureWorks Corp., Class A(b)(c) | | | 2,410,041 | |
| | 208,884 | | | Symantec Corp. | | | 5,057,082 | |
| | 87,319 | | | Tenable Holdings, Inc.(b) | | | 3,134,752 | |
| | 27,323 | | | VMware, Inc., Class A | | | 5,577,444 | |
| | 51,244 | | | Zscaler, Inc.(b) | | | 3,500,478 | |
| | | | | | | | |
| | | | | | | 43,540,462 | |
| | | | | | | | |
| | | | Total Common Stocks & Other Equity Interests
(Cost $85,189,067) | | | 101,056,443 | |
| | | | | | | | |
| | |
| | | | | | | | |
| | | | Money Market Funds—0.1% | |
| | 149,027 | | | Invesco Premier U.S. Government Money Portfolio—Institutional Class, 2.32%(d)
(Cost $149,027) | | | 149,027 | |
| | | | | | | | |
| | |
| | | | Total Investments in Securities
(excluding investments purchased with cash collateral from securities on loan)
(Cost $85,338,094)—100.1% | | | 101,205,470 | |
| | | | | | | | |
| | | | | | | | |
Number
of Shares | | | | | Value | |
| | | | Investments Purchased with Cash Collateral from
Securities on Loan | |
| | |
| | | | | | | | |
| | | | Money Market Funds—1.7% | |
| | 1,275,053 | | | Invesco Government & Agency Portfolio— Institutional Class, 2.34%(d)(e) | | $ | 1,275,053 | |
| | 424,891 | | | Invesco Liquid Assets Portfolio—Institutional Class, 2.48%(d)(e) | | | 425,018 | |
| | | | | | | | |
| | |
| | | | | | | | |
| | |
| | | | Total Money Market Funds
(Cost $1,700,071) | | | 1,700,071 | |
| | | | | | | | |
| | |
| | | | Total Investments in Securities
(Cost $87,038,165)—101.8% | | | 102,905,541 | |
| | |
| | | | Other assets less liabilities—(1.8)% | | | (1,854,955 | ) |
| | | | | | | | |
| | |
| | | | Net Assets—100.0% | | $ | 101,050,586 | |
| | | | | | | | |
Notes to Schedule of Investments:
| (a) | Industry and/or sector classifications used in this report are generally according to the Global Industry Classification Standard, which was developed by and is the exclusive property and a service mark of MSCI Inc. and Standard & Poor’s. |
| (b) | Non-income producing security. |
| (c) | All or a portion of this security was out on loan at April 30, 2019. |
| (d) | The security and the Fund are advised by wholly-owned subsidiaries of Invesco Ltd. and are therefore considered to be affiliated. The rate shown is the7-day SEC standardized yield as of April 30, 2019. |
| (e) | The security has been segregated to satisfy the commitment to return the cash collateral received in securities lending transactions upon the borrower’s return of the securities loaned. See Note 2J. |
This Fund has holdings greater than 10% of net assets in the following country:
See accompanying Notes to Financial Statements which are an integral part of the financial statements.
Schedule of Investments(a)
Invesco Dynamic Oil & Gas Services ETF (PXJ)
April 30, 2019
| | | | | | | | |
Number
of Shares | | | | | Value | |
| | | | Common Stocks & Other Equity Interests—100.1% | |
| | | | Oil & Gas Drilling—25.0% | |
| | 48,042 | | | Diamond Offshore Drilling, Inc.(b)(c) | | $ | 466,488 | |
| | 55,031 | | | Ensco Rowan PLC, Class A | | | 768,783 | |
| | 16,518 | | | Helmerich & Payne, Inc. | | | 966,633 | |
| | 159,934 | | | Noble Corp. PLC(b) | | | 420,626 | |
| | 66,072 | | | Patterson-UTI Energy, Inc. | | | 897,919 | |
| | 107,972 | | | Transocean Ltd.(b) | | | 848,660 | |
| | | | | | | | |
| | | | | | | 4,369,109 | |
| | | | | | | | |
| | | | Oil & Gas Equipment & Services—75.1% | |
| | 12,446 | | | Apergy Corp. | | | 493,982 | |
| | 48,838 | | | Archrock, Inc. | | | 493,752 | |
| | 34,936 | | | Baker Hughes, a GE Co., Class A | | | 839,163 | |
| | 28,281 | | | C&J Energy Services, Inc.(b) | | | 397,348 | |
| | 13,791 | | | Cactus, Inc., Class A(b) | | | 500,613 | |
| | 13,406 | | | Dril-Quip, Inc.(b) | | | 583,965 | |
| | 47,182 | | | FTS International, Inc.(b) | | | 488,334 | |
| | 29,247 | | | Halliburton Co. | | | 828,568 | |
| | 69,142 | | | Helix Energy Solutions Group, Inc.(b) | | | 540,690 | |
| | 45,344 | | | Keane Group, Inc.(b) | | | 475,659 | |
| | 29,639 | | | Liberty Oilfield Services, Inc., Class A(c) | | | 441,917 | |
| | 21,420 | | | Mammoth Energy Services, Inc. | | | 333,938 | |
| | 65,955 | | | McDermott International, Inc.(b) | | | 533,576 | |
| | 31,910 | | | National Oilwell Varco, Inc. | | | 834,127 | |
| | 53,828 | | | Newpark Resources, Inc.(b) | | | 392,944 | |
| | 19,740 | | | Nine Energy Service, Inc.(b) | | | 397,366 | |
| | 28,250 | | | Oil States International, Inc.(b) | | | 545,790 | |
| | 27,340 | | | ProPetro Holding Corp.(b) | | | 605,034 | |
| | 46,481 | | | RPC, Inc.(c) | | | 478,290 | |
| | 20,523 | | | Schlumberger Ltd. | | | 875,922 | |
| | 51,983 | | | Select Energy Services, Inc., Class A(b) | | | 598,844 | |
| | 40,520 | | | TechnipFMC PLC (United Kingdom) | | | 996,387 | |
| | 21,634 | | | Tidewater, Inc.(b) | | | 486,765 | |
| | | | | | | | |
| | | | | | | 13,162,974 | |
| | | | | | | | |
| | | | Total Common Stocks & Other Equity Interests
(Cost $23,076,105) | | | 17,532,083 | |
| | | | | | | | |
| | |
| | | | | | | | |
| | | | Money Market Funds—0.7% | |
| | 112,339 | | | Invesco Premier U.S. Government Money Portfolio—Institutional Class, 2.32%(d)
(Cost $112,339) | | | 112,339 | |
| | | | | | | | |
| | | | Total Investments in Securities
(excluding investments purchased with cash collateral from securities on loan)
(Cost $23,188,444)—100.8% | | | 17,644,422 | |
| | | | | | | | |
| | |
| | | | | | | | |
| | | | Investments Purchased with Cash Collateral from
Securities on Loan | |
| | |
| | | | | | | | |
| | | | Money Market Funds—5.4% | |
| | 714,857 | | | Invesco Government & Agency Portfolio— Institutional
Class, 2.34%(d)(e) | | | 714,857 | |
| | | | | | | | |
Number
of Shares | | | | | Value | |
| | | | Money Market Funds (continued) | |
| | 238,214 | | | Invesco Liquid Assets Portfolio—Institutional Class, 2.48%(d)(e) | | $ | 238,286 | |
| | | | | | | | |
| | |
| | | | Total Money Market Funds
(Cost $953,143) | | | 953,143 | |
| | | | | | | | |
| | |
| | | | Total Investments in Securities
(Cost $24,141,587)—106.2% | | | 18,597,565 | |
| | |
| | | | Other assets less liabilities—(6.2)% | | | (1,078,557 | ) |
| | | | | | | | |
| | |
| | | | Net Assets—100.0% | | $ | 17,519,008 | |
| | | | | | | | |
Notes to Schedule of Investments:
| (a) | Industry and/or sector classifications used in this report are generally according to the Global Industry Classification Standard, which was developed by and is the exclusive property and a service mark of MSCI Inc. and Standard & Poor’s. |
| (b) | Non-income producing security. |
| (c) | All or a portion of this security was out on loan at April 30, 2019. |
| (d) | The security and the Fund are advised by wholly-owned subsidiaries of Invesco Ltd. and are therefore considered to be affiliated. The rate shown is the7-day SEC standardized yield as of April 30, 2019. |
| (e) | The security has been segregated to satisfy the commitment to return the cash collateral received in securities lending transactions upon the borrower’s return of the securities loaned. See Note 2J. |
See accompanying Notes to Financial Statements which are an integral part of the financial statements.
Schedule of Investments(a)
Invesco Dynamic Pharmaceuticals ETF (PJP)
April 30, 2019
| | | | | | | | |
Number
of Shares | | | | | Value | |
| | | | Common Stocks & Other Equity
Interests—100.0% | |
| | | | Biotechnology—27.0% | | | |
| | 93,470 | | | Alexion Pharmaceuticals, Inc.(b) | | $ | 12,724,071 | |
| | 117,831 | | | Amgen, Inc. | | | 21,129,455 | |
| | 68,055 | | | Biogen, Inc.(b) | | | 15,600,928 | |
| | 134,489 | | | Celgene Corp.(b) | | | 12,730,729 | |
| | 187,105 | | | Emergent BioSolutions, Inc.(b) | | | 9,669,587 | |
| | 121,630 | | | Enanta Pharmaceuticals, Inc.(b) | | | 10,604,920 | |
| | 28,481 | | | Regeneron Pharmaceuticals, Inc.(b) | | | 9,772,970 | |
| | 101,883 | | | United Therapeutics Corp.(b) | | | 10,450,139 | |
| | 595,227 | | | Vanda Pharmaceuticals, Inc.(b) | | | 9,696,248 | |
| | | | | | | | |
| | | | | | | 112,379,047 | |
| | | | | | | | |
| | | | Health Care Equipment—5.5% | | | |
| | 290,893 | | | Abbott Laboratories | | | 23,143,447 | |
| | | | | | | | |
| | | | Pharmaceuticals—67.5% | | | |
| | 87,280 | | | Allergan PLC | | | 12,830,160 | |
| | 492,861 | | | Amphastar Pharmaceuticals, Inc.(b) | | | 10,640,869 | |
| | 507,117 | | | Bausch Health Cos. Inc.(b) | | | 11,709,332 | |
| | 436,022 | | | Bristol-Myers Squibb Co. | | | 20,244,500 | |
| | 1,075,054 | | | Corcept Therapeutics, Inc.(b)(c) | | | 13,309,169 | |
| | 178,110 | | | Eli Lilly and Co. | | | 20,845,994 | |
| | 1,153,035 | | | Endo International PLC(b) | | | 8,647,762 | |
| | 561,318 | | | Horizon Pharma PLC(b) | | | 14,330,449 | |
| | 800,696 | | | Innoviva, Inc.(b) | | | 11,233,765 | |
| | 95,218 | | | Jazz Pharmaceuticals PLC(b) | | | 12,356,440 | |
| | 161,405 | | | Johnson & Johnson | | | 22,790,386 | |
| | 581,010 | | | Mallinckrodt PLC(b) | | | 8,982,415 | |
| | 273,801 | | | Merck & Co., Inc. | | | 21,550,877 | |
| | 383,849 | | | Mylan N.V.(b) | | | 10,360,084 | |
| | 300,995 | | | Pacira BioSciences, Inc.(b) | | | 11,985,621 | |
| | 246,739 | | | Perrigo Co. PLC | | | 11,823,733 | |
| | 518,691 | | | Pfizer, Inc. | | | 21,064,041 | |
| | 411,828 | | | Prestige Consumer Healthcare, Inc.(b) | | | 12,115,980 | |
| | 325,482 | | | Supernus Pharmaceuticals, Inc.(b) | | | 11,954,954 | |
| | 116,113 | | | Taro Pharmaceutical Industries Ltd. | | | 12,471,697 | |
| | | | | | | | |
| | | | | | | 281,248,228 | |
| | | | | | | | |
| | | | Total Common Stocks & Other Equity Interests
(Cost $405,273,840) | | | 416,770,722 | |
| | | | | | | | |
| |
| | | | | |
| | | | Money Market Funds—0.0% | |
| | 59,262 | | | Invesco Premier U.S. Government Money Portfolio—Institutional Class, 2.32%(d)(Cost $59,262) | | | 59,262 | |
| | | | | | | | |
| | |
| | | | Total Investments in Securities
(excluding investments purchased with cash collateral from securities on loan) (Cost $405,333,102)—100.0% | | | 416,829,984 | |
| | | | | | | | |
| |
| | | | | |
| | | | Investments Purchased with Cash Collateral from
Securities on Loan | |
| |
| | | | | |
| | | | Money Market Funds—0.2% | |
| | 564,992 | | | Invesco Government & Agency Portfolio—Institutional Class, 2.34%(d)(e) | | | 564,992 | |
| | | | | | | | |
Number
of Shares | | | | | Value | |
| | | | Money Market Funds (continued) | |
| | 188,274 | | | Invesco Liquid Assets Portfolio—Institutional Class, 2.48%(d)(e) | | $ | 188,331 | |
| | | | | | | | |
| | |
| | | | Total Money Market Funds
(Cost $753,323) | | | 753,323 | |
| | | | | | | | |
| | |
| | | | Total Investments in Securities
(Cost $406,086,425)—100.2% | | | 417,583,307 | |
| | |
| | | | Other assets less liabilities—(0.2)% | | | (992,711 | ) |
| | | | | | | | |
| | |
| | | | Net Assets—100.0% | | $ | 416,590,596 | |
| | | | | | | | |
Notes to Schedule of Investments:
| (a) | Industry and/or sector classifications used in this report are generally according to the Global Industry Classification Standard, which was developed by and is the exclusive property and a service mark of MSCI Inc. and Standard & Poor’s. |
| (b) | Non-income producing security. |
| (c) | All or a portion of this security was out on loan at April 30, 2019. |
| (d) | The security and the Fund are advised by wholly-owned subsidiaries of Invesco Ltd. and are therefore considered to be affiliated. The rate shown is the7-day SEC standardized yield as of April 30, 2019. |
| (e) | The security has been segregated to satisfy the commitment to return the cash collateral received in securities lending transactions upon the borrower’s return of the securities loaned. See Note 2J. |
See accompanying Notes to Financial Statements which are an integral part of the financial statements.
Schedule of Investments(a)
Invesco Dynamic Retail ETF (PMR)
April 30, 2019
| | | | | | | | |
Number
of Shares | | | | | Value | |
| | | | Common Stocks & Other Equity
Interests—100.1% | |
| | | | Apparel Retail—21.5% | |
| | 10,053 | | | Abercrombie & Fitch Co., Class A | | $ | 300,484 | |
| | 7,288 | | | Boot Barn Holdings, Inc.(b) | | | 209,822 | |
| | 1,235 | | | Burlington Stores, Inc.(b) | | | 208,604 | |
| | 7,206 | | | Designer Brands Inc., Class A | | | 160,333 | |
| | 3,356 | | | Foot Locker, Inc. | | | 191,997 | |
| | 4,394 | | | Genesco, Inc.(b) | | | 196,895 | |
| | 3,947 | | | Ross Stores, Inc. | | | 385,464 | |
| | | | | | | | |
| | | | | | | 1,653,599 | |
| | | | | | | | |
| | | | Apparel, Accessories & Luxury Goods—5.7% | |
| | 2,493 | | | lululemon athletica, Inc.(b) | | | 439,641 | |
| | | | | | | | |
| | | | Automotive Retail—13.2% | |
| | 2,836 | | | Asbury Automotive Group, Inc.(b) | | | 227,391 | |
| | 407 | | | AutoZone, Inc.(b) | | | 418,522 | |
| | 971 | | | O’Reilly Automotive, Inc.(b) | | | 367,591 | |
| | | | | | | | |
| | | | | | | 1,013,504 | |
| | | | | | | | |
| | | | Computer & Electronics Retail—3.6% | |
| | 11,174 | | | Rent-A-Center, Inc.(b) | | | 278,568 | |
| | | | | | | | |
| | | | Department Stores—2.9% | | | |
| | 3,087 | | | Kohl’s Corp. | | | 219,486 | |
| | | | | | | | |
| | | | Distributors—2.4% | | | |
| | 1,833 | | | Genuine Parts Co. | | | 187,956 | |
| | | | | | | | |
| | | | Food Retail—8.9% | | | |
| | 12,915 | | | Kroger Co. (The) | | | 332,949 | |
| | 8,646 | | | Sprouts Farmers Market, Inc.(b) | | | 185,197 | |
| | 3,870 | | | Weis Markets, Inc. | | | 162,733 | |
| | | | | | | | |
| | | | | | | 680,879 | |
| | | | | | | | |
| | | | General Merchandise Stores—5.1% | |
| | 3,117 | | | Dollar General Corp. | | | 393,022 | |
| | | | Home Improvement Retail—5.1% | | | |
| | 1,924 | | | Home Depot, Inc. (The) | | | 391,919 | |
| | | | Homefurnishing Retail—4.6% | | | |
| | 3,716 | | | Aaron’s, Inc. | | | 206,944 | |
| | 1,402 | | | RH(b)(c) | | | 149,607 | |
| | | | | | | | |
| | | | | | | 356,551 | |
| | | | | | | | |
| | | | Hypermarkets & Super Centers—10.4% | |
| | 7,899 | | | BJs Wholesale Club Holdings, Inc.(b) | | | 223,937 | |
| | 3,229 | | | PriceSmart, Inc. | | | 193,126 | |
| | 3,714 | | | Walmart, Inc. | | | 381,948 | |
| | | | | | | | |
| | | | | | | 799,011 | |
| | | | | | | | |
| | | | Internet & Direct Marketing Retail—6.5% | |
| | 11,525 | | | 1-800-Flowers.com, Inc., Class A(b) | | | 245,367 | |
| | 3,798 | | | Etsy, Inc.(b) | | | 256,517 | |
| | | | | | | | |
| | | | | | | 501,884 | |
| | | | | | | | |
| | | | Specialty Stores—10.2% | | | |
| | 5,316 | | | Dick’s Sporting Goods, Inc. | | | 196,692 | |
| | 1,553 | | | Five Below, Inc.(b) | | | 227,344 | |
| | 59,750 | | | Office Depot, Inc. | | | 143,400 | |
| | 2,076 | | | Tractor Supply Co. | | | 214,866 | |
| | | | | | | | |
| | | | | | | 782,302 | |
| | | | | | | | |
| | | | Total Common Stocks & Other Equity Interests
(Cost $7,005,994) | | | 7,698,322 | |
| | | | | | | | |
| | | | | | | | |
Number
of Shares | | | | | Value | |
| | | | Money Market Funds—1.2% | | | |
| | 94,221 | | | Invesco Premier U.S. Government Money Portfolio—Institutional Class, 2.32%(d)
(Cost $94,221) | | $ | 94,221 | |
| | | | | | | | |
| | |
| | | | Total Investments in Securities
(excluding investments purchased with cash collateral from securities on loan)
(Cost $7,100,215)—101.3% | | | 7,792,543 | |
| | | | | | | | |
| | |
| | | | | | | | |
| | | | Investments Purchased with Cash Collateral from
Securities on Loan | |
| | |
| | | | | | | | |
| | | | Money Market Funds—1.8% | |
| | 103,639 | | | Invesco Government & Agency Portfolio—Institutional Class, 2.34%(d)(e) | | | 103,639 | |
| | 34,746 | | | Invesco Liquid Assets Portfolio—Institutional Class, 2.48%(d)(e) | | | 34,757 | |
| | | | | | | | |
| | | | Total Money Market Funds
(Cost $138,396) | | | 138,396 | |
| | | | | | | | |
| | | | Total Investments in Securities
(Cost $7,238,611)—103.1% | | | 7,930,939 | |
| | |
| | | | Other assets less liabilities—(3.1)% | | | (234,946 | ) |
| | | | | | | | |
| | |
| | | | Net Assets—100.0% | | $ | 7,695,993 | |
| | | | | | | | |
Notes to Schedule of Investments:
| (a) | Industry and/or sector classifications used in this report are generally according to the Global Industry Classification Standard, which was developed by and is the exclusive property and a service mark of MSCI Inc. and Standard & Poor’s. |
| (b) | Non-income producing security. |
| (c) | All or a portion of this security was out on loan at April 30, 2019. |
| (d) | The security and the Fund are advised by wholly-owned subsidiaries of Invesco Ltd. and are therefore considered to be affiliated. The rate shown is the7-day SEC standardized yield as of April 30, 2019. |
| (e) | The security has been segregated to satisfy the commitment to return the cash collateral received in securities lending transactions upon the borrower’s return of the securities loaned. See Note 2J. |
See accompanying Notes to Financial Statements which are an integral part of the financial statements.
Schedule of Investments(a)
Invesco Dynamic Semiconductors ETF (PSI)
April 30, 2019
| | | | | | | | |
Number
of Shares | | | | | Value | |
| | | | Common Stocks & Other Equity Interests—100.0% | |
| | | | Electronic Components—5.2% | | | |
| | 315,038 | | | Knowles Corp.(b) | | $ | 5,947,917 | |
| | 230,471 | | | Vishay Intertechnology, Inc. | | | 4,565,631 | |
| | | | | | | | |
| | | | | | | 10,513,548 | |
| | | | | | | | |
| | | | Semiconductor Equipment—23.7% | |
| | 548,787 | | | Amkor Technology, Inc.(b) | | | 4,972,010 | |
| | 276,317 | | | Cohu, Inc. | | | 4,097,781 | |
| | 318,959 | | | FormFactor, Inc.(b) | | | 6,044,273 | |
| | 45,364 | | | KLA-Tencor Corp. | | | 5,783,003 | |
| | 219,514 | | | Kulicke & Soffa Industries, Inc. (Singapore) | | | 5,108,091 | |
| | 52,551 | | | Lam Research Corp. | | | 10,900,654 | |
| | 488,625 | | | Photronics, Inc.(b) | | | 4,563,757 | |
| | 124,712 | | | Teradyne, Inc. | | | 6,110,888 | |
| | | | | | | | |
| | | | | | | 47,580,457 | |
| | | | | | | | |
| | | | Semiconductors—71.1% | |
| | 214,285 | | | Advanced Micro Devices, Inc.(b) | | | 5,920,695 | |
| | 129,110 | | | Ambarella, Inc.(b) | | | 6,470,993 | |
| | 89,258 | | | Analog Devices, Inc. | | | 10,375,350 | |
| | 33,449 | | | Broadcom, Inc. | | | 10,650,162 | |
| | 130,392 | | | Cirrus Logic, Inc.(b) | | | 6,204,051 | |
| | 98,990 | | | Cree, Inc.(b) | | | 6,542,249 | |
| | 124,895 | | | Diodes, Inc.(b) | | | 4,548,676 | |
| | 119,535 | | | Inphi Corp.(b) | | | 5,457,968 | |
| | 182,787 | | | Intel Corp. | | | 9,329,449 | |
| | 432,911 | | | Lattice Semiconductor Corp.(b) | | | 5,606,197 | |
| | 92,756 | | | Maxim Integrated Products, Inc. | | | 5,565,360 | |
| | 221,603 | | | MaxLinear, Inc.(b) | | | 5,963,337 | |
| | 226,271 | | | Micron Technology, Inc.(b) | | | 9,516,958 | |
| | 228,213 | | | ON Semiconductor Corp.(b) | | | 5,262,592 | |
| | 179,505 | | | QUALCOMM, Inc. | | | 15,460,766 | |
| | 93,705 | | | Semtech Corp.(b) | | | 5,047,888 | |
| | 124,621 | | | Synaptics, Inc.(b) | | | 4,694,473 | |
| | 88,119 | | | Texas Instruments, Inc. | | | 10,383,062 | |
| | 78,795 | | | Xilinx, Inc. | | | 9,466,431 | |
| | | | | | | | |
| | | | | | | 142,466,657 | |
| | | | | | | | |
| | |
| | | | Total Common Stocks & Other Equity Interests
(Cost $171,277,138) | | | 200,560,662 | |
| | | | | | | | |
| | |
| | | | | | | | |
| | | | Money Market Funds—0.1% | |
| | 155,934 | | | Invesco Premier U.S. Government Money Portfolio—Institutional Class, 2.32%(c)
(Cost $155,934) | | | 155,934 | |
| | | | | | | | |
| | |
| | | | Total Investments in Securities
(Cost $171,433,072)—100.1% | | | 200,716,596 | |
| | |
| | | | Other assets less liabilities—(0.1)% | | | (293,613 | ) |
| | | | | | | | |
| | |
| | | | Net Assets—100.0% | | $ | 200,422,983 | |
| | | | | | | | |
Notes to Schedule of Investments:
| (a) | Industry and/or sector classifications used in this report are generally according to the Global Industry Classification Standard, which was developed by and is the exclusive property and a service mark of MSCI Inc. and Standard & Poor’s. |
| (b) | Non-income producing security. |
| (c) | The security and the Fund are advised by wholly-owned subsidiaries of Invesco Ltd. and are therefore considered to be affiliated. The rate shown is the7-day SEC standardized yield as of April 30, 2019. |
See accompanying Notes to Financial Statements which are an integral part of the financial statements.
Schedule of Investments(a)
Invesco Dynamic Software ETF (PSJ)
April 30, 2019
| | | | | | | | |
Number
of Shares | | | | | Value | |
| | | | Common Stocks & Other Equity
Interests—100.0% | | | |
| | | | Alternative Carriers—3.5% | | | |
| | 204,849 | | | Bandwidth, Inc., Class A(b) | | $ | 15,449,712 | |
| | | | | | | | |
| | | | Application Software—47.8% | | | |
| | 341,631 | | | ACI Worldwide, Inc.(b) | | | 12,134,733 | |
| | 166,617 | | | Alarm.com Holdings, Inc.(b) | | | 11,809,813 | |
| | 148,783 | | | Alteryx, Inc., Class A(b)(c) | | | 13,188,125 | |
| | 190,443 | | | Atlassian Corp. PLC, Class A(b) | | | 20,977,296 | |
| | 183,813 | | | Benefitfocus, Inc.(b) | | | 7,486,703 | |
| | 354,200 | | | Cadence Design Systems, Inc.(b) | | | 24,574,396 | |
| | 101,944 | | | Citrix Systems, Inc. | | | 10,292,266 | |
| | 115,994 | | | Coupa Software, Inc.(b) | | | 11,985,660 | |
| | 43,602 | | | Fair Isaac Corp.(b) | | | 12,197,660 | |
| | 64,767 | | | HubSpot, Inc.(b) | | | 11,948,864 | |
| | 83,485 | | | Intuit, Inc. | | | 20,959,744 | |
| | 198,070 | | | Manhattan Associates, Inc.(b) | | | 13,359,822 | |
| | 98,407 | | | SPS Commerce, Inc.(b) | | | 10,208,742 | |
| | 71,129 | | | Trade Desk, Inc. (The), Class A(b) | | | 15,753,651 | |
| | 203,723 | | | Verint Systems, Inc.(b) | | | 12,302,832 | |
| | | | | | | | |
| | | | | | | 209,180,307 | |
| | | | | | | | |
| | | | Health Care Technology—10.0% | |
| | 342,879 | | | Cerner Corp.(b) | | | 22,784,310 | |
| | 387,105 | | | HealthStream, Inc.(b) | | | 10,134,409 | |
| | 580,450 | | | NextGen Healthcare, Inc.(b) | | | 10,906,655 | |
| | | | | | | | |
| | | | | | | 43,825,374 | |
| | | | | | | | |
| | | | Interactive Home Entertainment—13.6% | |
| | 468,321 | | | Activision Blizzard, Inc. | | | 22,577,756 | |
| | 1,176,195 | | | Glu Mobile, Inc.(b) | | | 12,867,573 | |
| | 122,201 | | | Take-Two Interactive Software, Inc.(b) | | | 11,832,723 | |
| | 2,157,947 | | | Zynga, Inc., Class A(b) | | | 12,213,980 | |
| | | | | | | | |
| | | | | | | 59,492,032 | |
| | | | | | | | |
| | | | IT Consulting & Other Services—2.8% | |
| | 206,993 | | | LiveRamp Holdings, Inc.(b) | | | 12,073,902 | |
| | | | | | | | |
| | | | Systems Software—22.3% | | | |
| | 102,828 | | | CyberArk Software Ltd. (Israel)(b) | | | 13,257,614 | |
| | 376,565 | | | Oracle Corp. | | | 20,835,341 | |
| | 107,287 | | | Red Hat, Inc.(b) | | | 19,583,096 | |
| | 521,865 | | | SecureWorks Corp., Class A(b)(c) | | | 10,134,618 | |
| | 82,081 | | | Tableau Software, Inc., Class A(b) | | | 9,998,287 | |
| | 114,900 | | | VMware, Inc., Class A | | | 23,454,537 | |
| | | | | | | | |
| | | | | | | 97,263,493 | |
| | | | | | | | |
| | |
| | | | Total Common Stocks & Other Equity Interests
(Cost $376,821,720) | | | 437,284,820 | |
| | | | | | | | |
| | | | | | | | |
Number
of Shares | | | | | Value | |
| | | | Money Market Funds—0.0% | |
| | 143,208 | | | Invesco Premier U.S. Government Money Portfolio—Institutional Class, 2.32%(d)
(Cost $143,208) | | $ | 143,208 | |
| | | | | | | | |
| | |
| | | | Total Investments in Securities
(excluding investments purchased with cash collateral from securities on loan) (Cost $376,964,928)–100.0% | | | 437,428,028 | |
| | | | | | | | |
| | |
| | | | | | | | |
| | | | Investments Purchased with Cash Collateral from
Securities on Loan | |
| | |
| | | | | | | | |
| | | | Money Market Funds—3.3% | |
| | 10,756,766 | | | Invesco Government & Agency Portfolio—Institutional Class, 2.34%(d)(e) | | | 10,756,766 | |
| | 3,584,513 | | | Invesco Liquid Assets Portfolio—Institutional Class, 2.48%(d)(e) | | | 3,585,589 | |
| | | | | | | | |
| | |
| | | | Total Money Market Funds
(Cost $14,342,355) | | | 14,342,355 | |
| | | | | | | | |
| | |
| | | | Total Investments in Securities
(Cost $391,307,283)—103.3% | | | 451,770,383 | |
| | |
| | | | Other assets less liabilities—(3.3)% | | | (14,527,454 | ) |
| | | | | | | | |
| | |
| | | | Net Assets—100.0% | | $ | 437,242,929 | |
| | | | | | | | |
Notes to Schedule of Investments:
| (a) | Industry and/or sector classifications used in this report are generally according to the Global Industry Classification Standard, which was developed by and is the exclusive property and a service mark of MSCI Inc. and Standard & Poor’s. |
| (b) | Non-income producing security. |
| (c) | All or a portion of this security was out on loan at April 30, 2019. |
| (d) | The security and the Fund are advised by wholly-owned subsidiaries of Invesco Ltd. and are therefore considered to be affiliated. The rate shown is the7-day SEC standardized yield as of April 30, 2019. |
| (e) | The security has been segregated to satisfy the commitment to return the cash collateral received in securities lending transactions upon the borrower’s return of the securities loaned. See Note 2J. |
See accompanying Notes to Financial Statements which are an integral part of the financial statements.
Statements of Assets and Liabilities
April 30, 2019
| | | | | | | | | | | | | | | | |
| | | Invesco
Dynamic
Biotechnology &
Genome
ETF (PBE) | | | Invesco
Dynamic Building &
Construction
ETF (PKB) | | | Invesco
Dynamic Energy
Exploration &
Production
ETF (PXE) | | | Invesco
Dynamic Food &
Beverage
ETF (PBJ) | |
| Assets: | | | | | | | | | | | | | | | | |
Unaffiliated investments in securities, at value(a) | | $ | 248,276,288 | | | $ | 118,606,076 | | | $ | 40,097,450 | | | $ | 71,782,789 | |
Affiliated investments in securities, at value | | | 7,343,624 | | | | 255,728 | | | | 217,083 | | | | 4,604,076 | |
Receivable for: | | | | | | | | | | | | | | | | |
Dividends | | | 255 | | | | 25,944 | | | | 8,480 | | | | 19,572 | |
Securities lending | | | 936 | | | | 33 | | | | 72 | | | | 3,336 | |
Investments sold | | | — | | | | 1,485,694 | | | | — | | | | — | |
Expenses absorbed | | | — | | | | — | | | | — | | | | — | |
| | | | | | | | | | | | | | | | |
Total assets | | | 255,621,103 | | | | 120,373,475 | | | | 40,323,085 | | | | 76,409,773 | |
| | | | | | | | | | | | | | | | |
| | | | |
| Liabilities: | | | | | | | | | | | | | | | | |
Payable for: | | | | | | | | | | | | | | | | |
Collateral upon return of securities loaned | | | 7,273,767 | | | | — | | | | 120,981 | | | | 4,418,044 | |
Fund shares repurchased | | | — | | | | 1,486,085 | | | | — | | | | — | |
Expenses recaptured | | | — | | | | — | | | | — | | | | — | |
Accrued advisory fees | | | 111,491 | | | | 48,132 | | | | 15,022 | | | | 28,941 | |
Accrued trustees’ and officer’s fees | | | 56,825 | | | | 38,581 | | | | 39,873 | | | | 46,761 | |
Accrued expenses | | | 151,929 | | | | 161,472 | | | | 68,954 | | | | 85,129 | |
| | | | | | | | | | | | | | | | |
Total liabilities | | | 7,594,012 | | | | 1,734,270 | | | | 244,830 | | | | 4,578,875 | |
| | | | | | | | | | | | | | | | |
| Net Assets | | $ | 248,027,091 | | | $ | 118,639,205 | | | $ | 40,078,255 | | | $ | 71,830,898 | |
| | | | | | | | | | | | | | | | |
| | | | |
| Net assets consist of: | | | | | | | | | | | | | | | | |
Shares of beneficial interest | | $ | 434,481,876 | | | $ | 178,096,052 | | | $ | 154,278,084 | | | $ | 142,158,667 | |
Distributable earnings | | | (186,454,785 | ) | | | (59,456,847 | ) | | | (114,199,829 | ) | | | (70,327,769 | ) |
| | | | | | | | | | | | | | | | |
| Net Assets | | $ | 248,027,091 | | | $ | 118,639,205 | | | $ | 40,078,255 | | | $ | 71,830,898 | |
| | | | | | | | | | | | | | | | |
Shares outstanding (unlimited amount authorized, $0.01 par value) | | | 4,750,000 | | | | 3,950,000 | | | | 2,050,000 | | | | 2,100,000 | |
Net asset value | | $ | 52.22 | | | $ | 30.04 | | | $ | 19.55 | | | $ | 34.21 | |
| | | | | | | | | | | | | | | | |
Market price | | $ | 52.22 | | | $ | 30.05 | | | $ | 19.57 | | | $ | 34.19 | |
| | | | | | | | | | | | | | | | |
Unaffiliated investments in securities, at cost | | $ | 243,689,553 | | | $ | 109,005,237 | | | $ | 49,929,102 | | | $ | 65,042,645 | |
| | | | | | | | | | | | | | | | |
Affiliated investments in securities, at cost | | $ | 7,343,624 | | | $ | 255,728 | | | $ | 217,083 | | | $ | 4,604,076 | |
| | | | | | | | | | | | | | | | |
(a)Includes securities on loan with an aggregate value of | | $ | 6,965,669 | | | $ | — | | | $ | 108,272 | | | $ | 4,386,865 | |
| | | | | | | | | | | | | | | | |
See accompanying Notes to Financial Statements which are an integral part of the financial statements.
| | | | | | | | | | | | | | | | | | | | | | | | | | | | | | |
Invesco
Dynamic Leisure
and
Entertainment
ETF (PEJ) | | | Invesco
Dynamic Media
ETF (PBS) | | | Invesco
Dynamic
Networking
ETF (PXQ) | | | Invesco
Dynamic Oil &
Gas Services
ETF (PXJ) | | | Invesco
Dynamic
Pharmaceuticals
ETF (PJP) | | | Invesco
Dynamic Retail
ETF (PMR) | | | Invesco
Dynamic
Semiconductors
ETF (PSI) | | | Invesco
Dynamic
Software
ETF (PSJ) | |
| | | | | | | | | | | | | | | | | | | | | | | | | | | | | | |
| $ | 67,215,018 | | | $ | 88,436,939 | | | $ | 101,056,443 | | | $ | 17,532,083 | | | $ | 416,770,722 | | | $ | 7,698,322 | | | $ | 200,560,662 | | | $ | 437,284,820 | |
| | 1,463,568 | | | | 1,205,147 | | | | 1,849,098 | | | | 1,065,482 | | | | 812,585 | | | | 232,617 | | | | 155,934 | | | | 14,485,563 | |
| | | | | | | | | | | | | | | | | | | | | | | | | | | | | | |
| | 34,798 | | | | 8,197 | | | | 667 | | | | 203 | | | | 278,245 | | | | 1,444 | | | | 644 | | | | 160,261 | |
| | 333 | | | | 97 | | | | 1,843 | | | | 253 | | | | 148 | | | | 35 | | | | 5 | | | | 5,504 | |
| | — | | | | — | | | | — | | | | — | | | | — | | | | — | | | | — | | | | — | |
| | — | | | | — | | | | — | | | | — | | | | — | | | | 1,037 | | | | — | | | | — | |
| | | | | | | | | | | | | | | | | | | | | | | | | | | | | | |
| | 68,713,717 | | | | 89,650,380 | | | | 102,908,051 | | | | 18,598,021 | | | | 417,861,700 | | | | 7,933,455 | | | | 200,717,245 | | | | 451,936,148 | |
| | | | | | | | | | | | | | | | | | | | | | | | | | | | | | |
| | | | | | | |
| | | | | | | | | | | | | | | | | | | | | | | | | | | | | | |
| | | | | | | | | | | | | | | | | | | | | | | | | | | | | | |
| | 1,339,120 | | | | 1,147,845 | | | | 1,700,071 | | | | 953,143 | | | | 753,323 | | | | 138,396 | | | | — | | | | 14,342,355 | |
| | — | | | | — | | | | — | | | | — | | | | — | | | | — | | | | — | | | | — | |
| | 2,825 | | | | — | | | | — | | | | — | | | | — | | | | — | | | | — | | | | — | |
| | 27,251 | | | | 30,512 | | | | 39,203 | | | | 3,883 | | | | 176,296 | | | | — | | | | 80,039 | | | | 167,293 | |
| | 39,276 | | | | 41,075 | | | | 34,293 | | | | 47,690 | | | | 89,363 | | | | 32,659 | | | | 36,958 | | | | 37,367 | |
| | 104,171 | | | | 82,728 | | | | 83,898 | | | | 74,297 | | | | 252,122 | | | | 66,407 | | | | 177,265 | | | | 146,204 | |
| | | | | | | | | | | | | | | | | | | | | | | | | | | | | | |
| | 1,512,643 | | | | 1,302,160 | | | | 1,857,465 | | | | 1,079,013 | | | | 1,271,104 | | | | 237,462 | | | | 294,262 | | | | 14,693,219 | |
| | | | | | | | | | | | | | | | | | | | | | | | | | | | | | |
| $ | 67,201,074 | | | $ | 88,348,220 | | | $ | 101,050,586 | | | $ | 17,519,008 | | | $ | 416,590,596 | | | $ | 7,695,993 | | | $ | 200,422,983 | | | $ | 437,242,929 | |
| | | | | | | | | | | | | | | | | | | | | | | | | | | | | | |
| | | | | | | |
| | | | | | | | | | | | | | | | | | | | | | | | | | | | | | |
| $ | 131,681,432 | | | $ | 159,722,849 | | | $ | 124,222,874 | | | $ | 117,636,570 | | | $ | 780,661,769 | | | $ | 28,294,260 | | | $ | 210,621,302 | | | $ | 403,517,628 | |
| | (64,480,358 | ) | | | (71,374,629 | ) | | | (23,172,288 | ) | | | (100,117,562 | ) | | | (364,071,173 | ) | | | (20,598,267 | ) | | | (10,198,319 | ) | | | 33,725,301 | |
| | | | | | | | | | | | | | | | | | | | | | | | | | | | | | |
| $ | 67,201,074 | | | $ | 88,348,220 | | | $ | 101,050,586 | | | $ | 17,519,008 | | | $ | 416,590,596 | | | $ | 7,695,993 | | | $ | 200,422,983 | | | $ | 437,242,929 | |
| | | | | | | | | | | | | | | | | | | | | | | | | | | | | | |
| | 1,500,000 | | | | 2,550,000 | | | | 1,600,000 | | | | 2,550,000 | | | | 6,650,000 | | | | 200,000 | | | | 3,450,000 | | | | 4,550,000 | |
| $ | 44.80 | | | $ | 34.65 | | | $ | 63.16 | | | $ | 6.87 | | | $ | 62.65 | | | $ | 38.48 | | | $ | 58.09 | | | $ | 96.10 | |
| | | | | | | | | | | | | | | | | | | | | | | | | | | | | | |
| $ | 44.78 | | | $ | 34.65 | | | $ | 63.14 | | | $ | 6.87 | | | $ | 62.64 | | | $ | 38.47 | | | $ | 58.04 | | | $ | 96.13 | |
| | | | | | | | | | | | | | | | | | | | | | | | | | | | | | |
| $ | 64,017,398 | | | $ | 82,250,116 | | | $ | 85,189,067 | | | $ | 23,076,105 | | | $ | 405,273,840 | | | $ | 7,005,994 | | | $ | 171,277,138 | | | $ | 376,821,720 | |
| | | | | | | | | | | | | | | | | | | | | | | | | | | | | | |
| $ | 1,463,568 | | | $ | 1,205,147 | | | $ | 1,849,098 | | | $ | 1,065,482 | | | $ | 812,585 | | | $ | 232,617 | | | $ | 155,934 | | | $ | 14,485,563 | |
| | | | | | | | | | | | | | | | | | | | | | | | | | | | | | |
| $ | 1,269,952 | | | $ | 1,111,488 | | | $ | 1,700,395 | | | $ | 869,901 | | | $ | 731,461 | | | $ | 134,561 | | | $ | — | | | $ | 14,170,899 | |
| | | | | | | | | | | | | | | | | | | | | | | | | | | | | | |
Statements of Operations
For the year ended April 30, 2019
| | | | | | | | | | | | | | | | |
| | | Invesco
Dynamic
Biotechnology &
Genome
ETF (PBE) | | | Invesco
Dynamic Building &
Construction
ETF (PKB) | | | Invesco
Dynamic Energy
Exploration &
Production
ETF (PXE) | | | Invesco
Dynamic Food &
Beverage
ETF (PBJ) | |
| Investment income: | | | | | | | | | | | | | | | | |
Unaffiliated dividend income | | $ | 668,374 | | | $ | 1,825,286 | | | $ | 1,083,359 | | �� | $ | 1,221,638 | |
Affiliated dividend income | | | 5,031 | | | | 4,198 | | | | 1,766 | | | | 2,673 | |
Securities lending income | | | 88,089 | | | | 2,307 | | | | 28,229 | | | | 10,307 | |
Foreign witholding tax | | | — | | | | — | | | | — | | | | — | |
| | | | | | | | | | | | | | | | |
Total investment income | | | 761,494 | | | | 1,831,791 | | | | 1,113,354 | | | | 1,234,618 | |
| | | | | | | | | | | | | | | | |
| | | | |
| Expenses: | | | | | | | | | | | | | | | | |
Advisory fees | | | 1,372,674 | | | | 878,742 | | | | 383,290 | | | | 367,527 | |
Sub-licensing fees | | | 82,359 | | | | 52,724 | | | | 23,061 | | | | 22,051 | |
Accounting & administration fees | | | 41,481 | | | | 46,047 | | | | 28,280 | | | | 30,397 | |
Professional fees | | | 24,476 | | | | 24,775 | | | | 24,131 | | | | 23,394 | |
Custodian & transfer agent fees | | | 7,145 | | | | 4,260 | | | | 4,226 | | | | 4,688 | |
Trustees’ and officer’s fees | | | 10,075 | | | | 8,951 | | | | 7,521 | | | | 7,801 | |
Listing fee and expenses | | | 9,000 | | | | 7,000 | | | | 7,000 | | | | 9,000 | |
Recapture (Note 3) | | | — | | | | — | | | | — | | | | — | |
Other expenses | | | 24,476 | | | | 30,416 | | | | 12,521 | | | | 14,249 | |
| | | | | | | | | | | | | | | | |
Total expenses | | | 1,571,686 | | | | 1,052,915 | | | | 490,030 | | | | 479,107 | |
| | | | | | | | | | | | | | | | |
Less: Waivers | | | (452 | ) | | | (380 | ) | | | (7,210 | ) | | | (16,236 | ) |
| | | | | | | | | | | | | | | | |
Net expenses | | | 1,571,234 | | | | 1,052,535 | | | | 482,820 | | | | 462,871 | |
| | | | | | | | | | | | | | | | |
Net investment income (loss) | | | (809,740 | ) | | | 779,256 | | | | 630,534 | | | | 771,747 | |
| | | | | | | | | | | | | | | | |
| | | |
| Realized and unrealized gain (loss) from: | | | | | | | | | | | | | |
Net realized gain (loss) from: | | | | | | | | | | | | | | | | |
Investment securities | | | (14,154,814 | ) | | | (29,290,969 | ) | | | (11,534,964 | ) | | | (7,415,923 | ) |
In-kind redemptions | | | 35,596,712 | | | | 17,920,626 | | | | 6,156,137 | | | | 5,995,794 | |
| | | | | | | | | | | | | | | | |
Net realized gain (loss) | | | 21,441,898 | | | | (11,370,343 | ) | | | (5,378,827 | ) | | | (1,420,129 | ) |
| | | | | | | | | | | | | | | | |
Change in unrealized appreciation (depreciation) on investment securities | | | (6,492,275 | ) | | | 2,686,239 | | | | (18,782,093 | ) | | | 3,677,368 | |
| | | | | | | | | | | | | | | | |
Net realized and unrealized gain (loss) | | | 14,949,623 | | | | (8,684,104 | ) | | | (24,160,920 | ) | | | 2,257,239 | |
| | | | | | | | | | | | | | | | |
Net increase (decrease) in net assets resulting from operations | | $ | 14,139,883 | | | $ | (7,904,848 | ) | | $ | (23,530,386 | ) | | $ | 3,028,986 | |
| | | | | | | | | | | | | | | | |
See accompanying Notes to Financial Statements which are an integral part of the financial statements.
| | | | | | | | | | | | | | | | | | | | | | | | | | | | | | |
Invesco
Dynamic Leisure
and
Entertainment
ETF (PEJ) | | | Invesco
Dynamic Media
ETF (PBS) | | | Invesco
Dynamic
Networking
ETF (PXQ) | | | Invesco
Dynamic Oil &
Gas Services
ETF (PXJ) | | | Invesco
Dynamic
Pharmaceuticals
ETF (PJP) | | | Invesco
Dynamic Retail
ETF (PMR) | | | Invesco
Dynamic
Semiconductors
ETF (PSI) | | | Invesco
Dynamic
Software
ETF (PSJ) | |
| | | | | | | | | | | | | | | | | | | | | | | | | | | | | | |
| $ | 1,233,348 | | | $ | 634,910 | | | $ | 1,120,865 | | | $ | 261,968 | | | $ | 8,435,613 | | | $ | 166,857 | | | $ | 3,186,947 | | | $ | 832,655 | |
| | 3,558 | | | | 1,924 | | | | 3,102 | | | | 1,953 | | | | 6,685 | | | | 1,551 | | | | 5,850 | | | | 2,810 | |
| | 1,253 | | | | 29,842 | | | | 132,331 | | | | 40,535 | | | | 92,755 | | | | 4,532 | | | | 38 | | | | 17,277 | |
| | — | | | | (937 | ) | | | — | | | | (2,849 | ) | | | (305,086 | ) | | | — | | | | (4,086 | ) | | | — | |
| | | | | | | | | | | | | | | | | | | | | | | | | | | | | | |
| | 1,238,159 | | | | 665,739 | | | | 1,256,298 | | | | 301,607 | | | | 8,229,967 | | | | 172,940 | | | | 3,188,749 | | | | 852,742 | |
| | | | | | | | | | | | | | | | | | | | | | | | | | | | | | |
| | | | | | | |
| | | | | | | | | | | | | | | | | | | | | | | | | | | | | | |
| | 590,580 | | | | 297,365 | | | | 341,513 | | | | 135,932 | | | | 2,589,176 | | | | 50,353 | | | | 1,210,781 | | | | 1,370,219 | |
| | 35,434 | | | | 17,841 | | | | 20,548 | | | | 8,179 | | | | 155,348 | | | | 3,030 | | | | 72,646 | | | | 82,212 | |
| | 32,134 | | | | 28,707 | | | | 29,005 | | | | 26,887 | | | | 63,684 | | | | 25,445 | | | | 49,012 | | | | 34,898 | |
| | 24,464 | | | | 24,287 | | | | 23,412 | | | | 24,244 | | | | 27,623 | | | | 23,020 | | | | 26,950 | | | | 25,714 | |
| | 3,214 | | | | 3,448 | | | | 2,703 | | | | 3,972 | | | | 6,811 | | | | 2,279 | | | | 5,209 | | | | 4,224 | |
| | 7,994 | | | | 7,424 | | | | 7,244 | | | | 7,444 | | | | 14,153 | | | | 6,623 | | | | 9,502 | | | | 8,837 | |
| | 8,000 | | | | 9,001 | | | | 7,000 | | | | 7,001 | | | | 7,001 | | | | 7,000 | | | | 7,000 | | | | 7,000 | |
| | 17,051 | | | | — | | | | — | | | | — | | | | — | | | | — | | | | — | | | | 30,484 | |
| | 24,035 | | | | 11,201 | | | | 8,989 | | | | 11,163 | | | | 55,002 | | | | 6,812 | | | | 32,366 | | | | 18,150 | |
| | | | | | | | | | | | | | | | | | | | | | | | | | | | | | |
| | 742,906 | | | | 399,274 | | | | 440,414 | | | | 224,822 | | | | 2,918,798 | | | | 124,562 | | | | 1,413,466 | | | | 1,581,738 | |
| | | | | | | | | | | | | | | | | | | | | | | | | | | | | | |
| | (275 | ) | | | (24,788 | ) | | | (10,342 | ) | | | (53,706 | ) | | | (574 | ) | | | (61,246 | ) | | | (545 | ) | | | (234 | ) |
| | | | | | | | | | | | | | | | | | | | | | | | | | | | | | |
| | 742,631 | | | | 374,486 | | | | 430,072 | | | | 171,116 | | | | 2,918,224 | | | | 63,316 | | | | 1,412,921 | | | | 1,581,504 | |
| | | | | | | | | | | | | | | | | | | | | | | | | | | | | | |
| | 495,528 | | | | 291,253 | | | | 826,226 | | | | 130,491 | | | | 5,311,743 | | | | 109,624 | | | | 1,775,828 | | | | (728,762 | ) |
| | | | | | | | | | | | | | | | | | | | | | | | | | | | | | |
| | | | | | | |
| | | | | | | | | | | | | | | | | | | | | | | | | | | | | | |
| | (18,549,397 | ) | | | (4,067,487 | ) | | | (3,870,037 | ) | | | (4,012,536 | ) | | | (43,459,102 | ) | | | (998,240 | ) | | | (19,029,682 | ) | | | (8,071,162 | ) |
| | 14,624,403 | | | | 7,088,277 | | | | 6,389,256 | | | | 1,740,735 | | | | 57,113,782 | | | | 1,659,543 | | | | 46,459,188 | | | | 40,227,087 | |
| | | | | | | | | | | | | | | | | | | | | | | | | | | | | | |
| | (3,924,994 | ) | | | 3,020,790 | | | | 2,519,219 | | | | (2,271,801 | ) | | | 13,654,680 | | | | 661,303 | | | | 27,429,506 | | | | 32,155,925 | |
| | | | | | | | | | | | | | | | | | | | | | | | | | | | | | |
| | | | | | | |
| | | | | | | | | | | | | | | | | | | | | | | | | | | | | | |
| | (1,778,186 | ) | | | 5,886,119 | | | | 11,758,442 | | | | (6,350,850 | ) | | | 710,432 | | | | (121,819 | ) | | | 8,851,111 | | | | 44,624,284 | |
| | | | | | | | | | | | | | | | | | | | | | | | | | | | | | |
| | (5,703,180 | ) | | | 8,906,909 | | | | 14,277,661 | | | | (8,622,651 | ) | | | 14,365,112 | | | | 539,484 | | | | 36,280,617 | | | | 76,780,209 | |
| | | | | | | | | | | | | | | | | | | | | | | | | | | | | | |
| $ | (5,207,652 | ) | | $ | 9,198,162 | | | $ | 15,103,887 | | | $ | (8,492,160 | ) | | $ | 19,676,855 | | | $ | 649,108 | | | $ | 38,056,445 | | | $ | 76,051,447 | |
| | | | | | | | | | | | | | | | | | | | | | | | | | | | | | |
Statements of Changes in Net Assets
For the years ended April 30, 2019 and 2018
| | | | | | | | | | | | | | | | |
| | | Invesco Dynamic
Biotechnology & Genome
ETF (PBE) | | | Invesco Dynamic
Building & Construction
ETF (PKB) | |
| | | 2019 | | | 2018 | | | 2019 | | | 2018 | |
| Operations: | | | | | | | | | | | | | | | | |
Net investment income (loss) | | $ | (809,740 | ) | | $ | 24,053 | | | $ | 779,256 | | | $ | 807,257 | |
Net realized gain (loss) | | | 21,441,898 | | | | 26,250,205 | | | | (11,370,343 | ) | | | 18,908,111 | |
Change in net unrealized appreciation (depreciation) | | | (6,492,275 | ) | | | 107,003 | | | | 2,686,239 | | | | (11,339,416 | ) |
| | | | | | | | | | | | | | | | |
Net increase (decrease) in net assets resulting from operations | | | 14,139,883 | | | | 26,381,261 | | | | (7,904,848 | ) | | | 8,375,952 | |
| | | | | | | | | | | | | | | | |
| | | | |
| Distributions to Shareholders from: | | | | | | | | | | | | | | | | |
Distributable earnings | | | (11,178 | ) | | | (1,130,430 | ) | | | (854,627 | ) | | | (648,374 | ) |
| | | | | | | | | | | | | | | | |
| | | | |
| Shareholder Transactions: | | | | | | | | | | | | | | | | |
Proceeds from shares sold | | | 182,767,340 | | | | 226,021,644 | | | | 124,857,662 | | | | 266,345,013 | |
Value of shares repurchased | | | (181,778,588 | ) | | | (248,993,669 | ) | | | (277,968,568 | ) | | | (311,558,068 | ) |
| | | | | | | | | | | | | | | | |
Net increase (decrease) in net assets resulting from share transactions | | | 988,752 | | | | (22,972,025 | ) | | | (153,110,906 | ) | | | (45,213,055 | ) |
| | | | | | | | | | | | | | | | |
Net increase (decrease) in net assets | | | 15,117,457 | | | | 2,278,806 | | | | (161,870,381 | ) | | | (37,485,477 | ) |
| | | | | | | | | | | | | | | | |
| | | | |
| Net assets: | | | | | | | | | | | | | | | | |
Beginning of year | | | 232,909,634 | | | | 230,630,828 | | | | 280,509,586 | | | | 317,995,063 | |
| | | | | | | | | | | | | | | | |
End of year | | $ | 248,027,091 | | | $ | 232,909,634 | | | $ | 118,639,205 | | | $ | 280,509,586 | |
| | | | | | | | | | | | | | | | |
| | | | |
| Changes in Shares Outstanding: | | | | | | | | | | | | | | | | |
Shares sold | | | 3,250,000 | | | | 4,850,000 | | | | 4,100,000 | | | | 8,600,000 | |
Shares repurchased | | | (3,350,000 | ) | | | (5,350,000 | ) | | | (9,400,000 | ) | | | (10,100,000 | ) |
Shares outstanding, beginning of year | | | 4,850,000 | | | | 5,350,000 | | | | 9,250,000 | | | | 10,750,000 | |
| | | | | | | | | | | | | | | | |
Shares outstanding, end of year | | | 4,750,000 | | | | 4,850,000 | | | | 3,950,000 | | | | 9,250,000 | |
| | | | | | | | | | | | | | | | |
See accompanying Notes to Financial Statements which are an integral part of the financial statements.
| | | | | | | | | | | | | | | | | | | | | | | | | | | | | | |
Invesco Dynamic Energy
Exploration & Production
ETF (PXE) | | | Invesco Dynamic Food &
Beverage ETF (PBJ) | | | Invesco Dynamic Leisure
and Entertainment
ETF (PEJ) | | | Invesco Dynamic Media
ETF (PBS) | |
| 2019 | | | 2018 | | | 2019 | | | 2018 | | | 2019 | | | 2018 | | | 2019 | | | 2018 | |
| | | | | | | | | | | | | | | | | | | | | | | | | | | | | | |
| $ | 630,534 | | | $ | 686,824 | | | $ | 771,747 | | | $ | 1,305,092 | | | $ | 495,528 | | | $ | 1,094,495 | | | $ | 291,253 | | | $ | 415,409 | |
| | (5,378,827 | ) | | | (641,209 | ) | | | (1,420,129 | ) | | | 2,502,856 | | | | (3,924,994 | ) | | | 10,028,747 | | | | 3,020,790 | | | | 10,279,831 | |
| | (18,782,093 | ) | | | 8,853,996 | | | | 3,677,368 | | | | (7,627,941 | ) | | | (1,778,186 | ) | | | (3,728,215 | ) | | | 5,886,119 | | | | (10,563,667 | ) |
| | | | | | | | | | | | | | | | | | | | | | | | | | | | | | |
| | (23,530,386 | ) | | | 8,899,611 | | | | 3,028,986 | | | | (3,819,993 | ) | | | (5,207,652 | ) | | | 7,395,027 | | | | 9,198,162 | | | | 131,573 | |
| | | | | | | | | | | | | | | | | | | | | | | | | | | | | | |
| | | | | | | |
| | | | | | | | | | | | | | | | | | | | | | | | | | | | | | |
| | (706,116 | ) | | | (989,971 | ) | | | (759,871 | ) | | | (1,168,900 | ) | | | (634,213 | ) | | | (1,074,686 | ) | | | (415,501 | ) | | | (441,052 | ) |
| | | | | | | | | | | | | | | | | | | | | | | | | | | | | | |
| | | | | | | |
| | | | | | | | | | | | | | | | | | | | | | | | | | | | | | |
| | 101,184,657 | | | | 11,685,116 | | | | 40,972,298 | | | | 67,548,108 | | | | 150,611,248 | | | | 160,291,665 | | | | 84,195,471 | | | | 77,802,968 | |
| | (86,194,334 | ) | | | (26,030,817 | ) | | | (50,142,813 | ) | | | (130,647,859 | ) | | | (194,292,631 | ) | | | (194,789,227 | ) | | | (52,710,381 | ) | | | (177,643,376 | ) |
| | | | | | | | | | | | | | | | | | | | | | | | | | | | | | |
| | 14,990,323 | | | | (14,345,701 | ) | | | (9,170,515 | ) | | | (63,099,751 | ) | | | (43,681,383 | ) | | | (34,497,562 | ) | | | 31,485,090 | | | | (99,840,408 | ) |
| | | | | | | | | | | | | | | | | | | | | | | | | | | | | | |
| | (9,246,179 | ) | | | (6,436,061 | ) | | | (6,901,400 | ) | | | (68,088,644 | ) | | | (49,523,248 | ) | | | (28,177,221 | ) | | | 40,267,751 | | | | (100,149,887 | ) |
| | | | | | | | | | | | | | | | | | | | | | | | | | | | | | |
| | | | | | | |
| | | | | | | | | | | | | | | | | | | | | | | | | | | | | | |
| | 49,324,434 | | | | 55,760,495 | | | | 78,732,298 | | | | 146,820,942 | | | | 116,724,322 | | | | 144,901,543 | | | | 48,080,469 | | | | 148,230,356 | |
| | | | | | | | | | | | | | | | | | | | | | | | | | | | | | |
| $ | 40,078,255 | | | $ | 49,324,434 | | | $ | 71,830,898 | | | $ | 78,732,298 | | | $ | 67,201,074 | | | $ | 116,724,322 | | | $ | 88,348,220 | | | $ | 48,080,469 | |
| | | | | | | | | | | | | | | | | | | | | | | | | | | | | | |
| | | | | | | |
| | | | | | | | | | | | | | | | | | | | | | | | | | | | | | |
| | 3,800,000 | | | | 550,000 | | | | 1,250,000 | | | | 2,050,000 | | | | 3,250,000 | | | | 3,700,000 | | | | 2,600,000 | | | | 2,750,000 | |
| | (3,800,000 | ) | | | (1,250,000 | ) | | | (1,550,000 | ) | | | (4,000,000 | ) | | | (4,350,000 | ) | | | (4,550,000 | ) | | | (1,700,000 | ) | | | (6,400,000 | ) |
| | 2,050,000 | | | | 2,750,000 | | | | 2,400,000 | | | | 4,350,000 | | | | 2,600,000 | | | | 3,450,000 | | | | 1,650,000 | | | | 5,300,000 | |
| | | | | | | | | | | | | | | | | | | | | | | | | | | | | | |
| | 2,050,000 | | | | 2,050,000 | | | | 2,100,000 | | | | 2,400,000 | | | | 1,500,000 | | | | 2,600,000 | | | | 2,550,000 | | | | 1,650,000 | |
| | | | | | | | | | | | | | | | | | | | | | | | | | | | | | |
Statements of Changes in Net Assets(continued)
For the years ended April 30, 2019 and 2018
| | | | | | | | | | | | | | | | |
| | | Invesco Dynamic
Networking ETF (PXQ) | | | Invesco Dynamic Oil & Gas
Services ETF (PXJ) | |
| | | 2019 | | | 2018 | | | 2019 | | | 2018 | |
| Operations: | | | | | | | | | | | | | | | | |
Net investment income (loss) | | $ | 826,226 | | | $ | 129,605 | | | $ | 130,491 | | | $ | 947,139 | |
Net realized gain (loss) | | | 2,519,219 | | | | 3,519,092 | | | | (2,271,801 | ) | | | (9,243,310 | ) |
Change in net unrealized appreciation (depreciation) | | | 11,758,442 | | | | 915,872 | | | | (6,350,850 | ) | | | 5,874,538 | |
| | | | | | | | | | | | | | | | |
Net increase (decrease) in net assets resulting from operations | | | 15,103,887 | | | | 4,564,569 | | | | (8,492,160 | ) | | | (2,421,633 | ) |
| | | | | | | | | | | | | | | | |
| | | | |
| Distributions to Shareholders from: | | | | | | | | | | | | | | | | |
Distributable earnings | | | (851,255 | ) | | | (178,729 | ) | | | (193,273 | ) | | | (971,048 | ) |
| | | | | | | | | | | | | | | | |
| | | | |
| Shareholder Transactions: | | | | | | | | | | | | | | | | |
Proceeds from shares sold | | | 66,219,472 | | | | 57,932,538 | | | | 12,414,658 | | | | 23,165,781 | |
Value of shares repurchased | | | (39,512,641 | ) | | | (28,372,339 | ) | | | (24,037,714 | ) | | | (15,119,177 | ) |
| | | | | | | | | | | | | | | | |
Net increase (decrease) in net assets resulting from share transactions | | | 26,706,831 | | | | 29,560,199 | | | | (11,623,056 | ) | | | 8,046,604 | |
| | | | | | | | | | | | | | | | |
Net increase (decrease) in net assets | | | 40,959,463 | | | | 33,946,039 | | | | (20,308,489 | ) | | | 4,653,923 | |
| | | | | | | | | | | | | | | | |
| | | | |
| Net assets: | | | | | | | | | | | | | | | | |
Beginning of year | | | 60,091,123 | | | | 26,145,084 | | | | 37,827,497 | | | | 33,173,574 | |
| | | | | | | | | | | | | | | | |
End of year | | $ | 101,050,586 | | | $ | 60,091,123 | | | $ | 17,519,008 | | | $ | 37,827,497 | |
| | | | | | | | | | | | | | | | |
| | | | |
| Changes in Shares Outstanding: | | | | | | | | | | | | | | | | |
Shares sold. | | | 1,150,000 | | | | 1,200,000 | | | | 1,300,000 | | | | 2,500,000 | |
Shares repurchased | | | (750,000 | ) | | | (600,000 | ) | | | (2,650,000 | ) | | | (1,700,000 | ) |
Shares outstanding, beginning of year | | | 1,200,000 | | | | 600,000 | | | | 3,900,000 | | | | 3,100,000 | |
| | | | | | | | | | | | | | | | |
Shares outstanding, end of year | | | 1,600,000 | | | | 1,200,000 | | | | 2,550,000 | | | | 3,900,000 | |
| | | | | | | | | | | | | | | | |
See accompanying Notes to Financial Statements which are an integral part of the financial statements.
| | | | | | | | | | | | | | | | | | | | | | | | | | | | | | |
Invesco Dynamic
Pharmaceuticals ETF (PJP) | | | Invesco Dynamic Retail
ETF (PMR) | | | Invesco Dynamic
Semiconductors ETF (PSI) | | | Invesco Dynamic Software
ETF (PSJ) | |
| 2019 | | | 2018 | | | 2019 | | | 2018 | | | 2019 | | | 2018 | | | 2019 | | | 2018 | |
| | | | | | | | | | | | | | | | | | | | | | | | | | | | | | |
| $ | 5,311,743 | | | $ | 4,529,100 | | | $ | 109,624 | | | $ | 167,515 | | | $ | 1,775,828 | | | $ | 961,439 | | | $ | (728,762 | ) | | $ | (547,930 | ) |
| | 13,654,680 | | | | (47,449,544 | ) | | | 661,303 | | | | 431,983 | | | | 27,429,506 | | | | 56,923,121 | | | | 32,155,925 | | | | 30,941,413 | |
| | 710,432 | | | | 66,592,972 | | | | (121,819 | ) | | | (64,005 | ) | | | 8,851,111 | | | | (24,043,339 | ) | | | 44,624,284 | | | | 3,615,758 | |
| | | | | | | | | | | | | | | | | | | | | | | | | | | | | | |
| | 19,676,855 | | | | 23,672,528 | | | | 649,108 | | | | 535,493 | | | | 38,056,445 | | | | 33,841,221 | | | | 76,051,447 | | | | 34,009,241 | |
| | | | | | | | | | | | | | | | | | | | | | | | | | | | | | |
| | | | | | | |
| | | | | | | | | | | | | | | | | | | | | | | | | | | | | | |
| | (5,380,286 | ) | | | (4,756,214 | ) | | | (122,169 | ) | | | (163,669 | ) | | | (1,907,533 | ) | | | (720,638 | ) | | | — | | | | — | |
| | | | | | | | | | | | | | | | | | | | | | | | | | | | | | |
| | | | | | | |
| | | | | | | | | | | | | | | | | | | | | | | | | | | | | | |
| | 148,549,343 | | | | 204,490,601 | | | | 9,735,292 | | | | 7,190,746 | | | | 157,705,240 | | | | 306,036,772 | | | | 555,545,576 | | | | 193,692,019 | |
| | (272,009,569 | ) | | | (462,561,133 | ) | | | (13,565,783 | ) | | | (10,991,661 | ) | | | (308,886,292 | ) | | | (259,401,020 | ) | | | (350,138,139 | ) | | | (173,462,585 | ) |
| | | | | | | | | | | | | | | | | | | | | | | | | | | | | | |
| | (123,460,226 | ) | | | (258,070,532 | ) | | | (3,830,491 | ) | | | (3,800,915 | ) | | | (151,181,052 | ) | | | 46,635,752 | | | | 205,407,437 | | | | 20,229,434 | |
| | | | | | | | | | | | | | | | | | | | | | | | | | | | | | |
| | (109,163,657 | ) | | | (239,154,218 | ) | | | (3,303,552 | ) | | | (3,429,091 | ) | | | (115,032,140 | ) | | | 79,756,335 | | | | 281,458,884 | | | | 54,238,675 | |
| | | | | | | | | | | | | | | | | | | | | | | | | | | | | | |
| | | | | | | |
| | | | | | | | | | | | | | | | | | | | | | | | | | | | | | |
| | 525,754,253 | | | | 764,908,471 | | | | 10,999,545 | | | | 14,428,636 | | | | 315,455,123 | | | | 235,698,788 | | | | 155,784,045 | | | | 101,545,370 | |
| | | | | | | | | | | | | | | | | | | | | | | | | | | | | | |
| $ | 416,590,596 | | | $ | 525,754,253 | | | $ | 7,695,993 | | | $ | 10,999,545 | | | $ | 200,422,983 | | | $ | 315,455,123 | | | $ | 437,242,929 | | | $ | 155,784,045 | |
| | | | | | | | | | | | | | | | | | | | | | | | | | | | | | |
| | | | | | | |
| | | | | | | | | | | | | | | | | | | | | | | | | | | | | | |
| | 2,100,000 | | | | 3,350,000 | | | | 250,000 | | | | 200,000 | | | | 2,900,000 | | | | 6,200,000 | | | | 6,700,000 | | | | 3,050,000 | |
| | (4,000,000 | ) | | | (7,400,000 | ) | | | (350,000 | ) | | | (300,000 | ) | | | (5,900,000 | ) | | | (5,300,000 | ) | | | (4,350,000 | ) | | | (2,750,000 | ) |
| | 8,550,000 | | | | 12,600,000 | | | | 300,000 | | | | 400,000 | | | | 6,450,000 | | | | 5,550,000 | | | | 2,200,000 | | | | 1,900,000 | |
| | | | | | | | | | | | | | | | | | | | | | | | | | | | | | |
| | 6,650,000 | | | | 8,550,000 | | | | 200,000 | | | | 300,000 | | | | 3,450,000 | | | | 6,450,000 | | | | 4,550,000 | | | | 2,200,000 | |
| | | | | | | | | | | | | | | | | | | | | | | | | | | | | | |
Financial Highlights
Invesco Dynamic Biotechnology & Genome ETF (PBE)
| | | | | | | | | | | | | | | | | | | | |
| | | Years Ended April 30, | |
| | | 2019 | | | 2018 | | | 2017 | | | 2016 | | | 2015 | |
| Per Share Operating Performance: | | | | | | | | | | | | | | | | | | | | |
Net asset value at beginning of year | | $ | 48.02 | | | $ | 43.11 | | | $ | 39.35 | | | $ | 52.98 | | | $ | 39.71 | |
Net investment income (loss)(a) | | | (0.16 | ) | | | 0.00 | (b) | | | 0.33 | | | | 0.50 | | | | 0.34 | |
Net realized and unrealized gain (loss) on investments | | | 4.36 | | | | 5.13 | | | | 3.63 | | | | (13.56 | ) | | | 13.21 | |
Total from investment operations | | | 4.20 | | | | 5.13 | | | | 3.96 | | | | (13.06 | ) | | | 13.55 | |
Distributions to shareholders from: | | | | | | | | | | | | | | | | | | | | |
Net investment income | | | (0.00 | )(c) | | | (0.22 | ) | | | (0.20 | ) | | | (0.57 | ) | | | (0.28 | ) |
Net asset value at end of year | | $ | 52.22 | | | $ | 48.02 | | | $ | 43.11 | | | $ | 39.35 | | | $ | 52.98 | |
Market price at end of year(d) | | $ | 52.22 | | | $ | 48.08 | | | $ | 43.13 | | | $ | 39.35 | | | $ | 52.95 | |
| Net Asset Value Total Return(e) | | | 8.75 | % | | | 11.94 | % | | | 10.09 | % | | | (24.92 | )% | | | 34.25 | % |
| Market Price Total Return(e) | | | 8.62 | % | | | 12.04 | % | | | 10.15 | % | | | (24.88 | )% | | | 34.28 | % |
| Ratios/Supplemental Data: | | | | | | | | | | | | | | | | | | | | |
Net assets at end of year (000’s omitted) | | $ | 248,027 | | | $ | 232,910 | | | $ | 230,631 | | | $ | 267,584 | | | $ | 511,262 | |
Ratio to average net assets of: | | | | | | | | | | | | | | | | | | | | |
Expenses, after Waivers | | | 0.57 | % | | | 0.59 | % | | | 0.58 | % | | | 0.58 | % | | | 0.57 | % |
Expenses, prior to Waivers | | | 0.57 | % | | | 0.59 | % | | | 0.58 | % | | | 0.58 | % | | | 0.57 | % |
Net investment income (loss), after Waivers | | | (0.29 | )% | | | 0.01 | % | | | 0.81 | % | | | 1.00 | % | | | 0.69 | % |
Portfolio turnover rate(f) | | | 117 | % | | | 141 | % | | | 69 | % | | | 74 | % | | | 95 | % |
| (a) | Based on average shares outstanding. |
| (b) | Amount represents less than $0.005. |
| (c) | Amount represents less than $(0.005). |
| (d) | The mean between the last bid and ask prices. |
| (e) | Net asset value total return is calculated assuming an initial investment made at the net asset value at the beginning of the period, reinvestment of all dividends and distributions at net asset value during the period, and redemption on the last day of the period. Net asset value total return includes adjustments in accordance with accounting principles generally accepted in the United States of America and as such, the net asset value for financial reporting purposes and the returns based upon those net asset values may differ from the net asset value and returns for shareholder transactions. Market price total return is calculated assuming an initial investment made at the market price at the beginning of the period, reinvestment of all dividends and distributions at market price during the period, and sale at the market price on the last day of the period. Total investment returns calculated for a period of less than one year are not annualized. |
| (f) | Portfolio turnover rate is not annualized for periods less than one year, if applicable, and does not include securities received or delivered from processing creations or redemptions. |
Invesco Dynamic Building & Construction ETF (PKB)
| | | | | | | | | | | | | | | | | | | | |
| | | Years Ended April 30, | |
| | | 2019 | | | 2018 | | | 2017 | | | 2016 | | | 2015 | |
| Per Share Operating Performance: | | | | | | | | | | | | | | | | | | | | |
Net asset value at beginning of year | | $ | 30.33 | | | $ | 29.58 | | | $ | 25.08 | | | $ | 22.99 | | | $ | 22.09 | |
Net investment income(a) | | | 0.13 | | | | 0.08 | | | | 0.07 | | | | 0.04 | | | | 0.03 | |
Net realized and unrealized gain (loss) on investments | | | (0.29 | ) | | | 0.73 | | | | 4.52 | | | | 2.08 | | | | 0.89 | |
Total from investment operations | | | (0.16 | ) | | | 0.81 | | | | 4.59 | | | | 2.12 | | | | 0.92 | |
Distributions to shareholders from: | | | | | | | | | | | | | | | | | | | | |
Net investment income | | | (0.13 | ) | | | (0.06 | ) | | | (0.09 | ) | | | (0.03 | ) | | | (0.02 | ) |
Net asset value at end of year | | $ | 30.04 | | | $ | 30.33 | | | $ | 29.58 | | | $ | 25.08 | | | $ | 22.99 | |
Market price at end of year(b) | | $ | 30.05 | | | $ | 30.34 | | | $ | 29.60 | | | $ | 25.08 | | | $ | 22.98 | |
| Net Asset Value Total Return(c) | | | (0.47 | )% | | | 2.73 | % | | | 18.33 | % | | | 9.21 | % | | | 4.17 | % |
| Market Price Total Return(c) | | | (0.47 | )% | | | 2.70 | % | | | 18.41 | % | | | 9.26 | % | | | 4.08 | % |
| Ratios/Supplemental Data: | | | | | | | | | | | | | | | | | | | | |
Net assets at end of year (000’s omitted) | | $ | 118,639 | | | $ | 280,510 | | | $ | 317,995 | | | $ | 60,201 | | | $ | 55,177 | |
Ratio to average net assets of: | | | | | | | | | | | | | | | | | | | | |
Expenses, after Waivers | | | 0.60 | % | | | 0.58 | % | | | 0.63 | % | | | 0.63 | % | | | 0.63 | % |
Expenses, prior to Waivers | | | 0.60 | % | | | 0.58 | % | | | 0.63 | % | | | 0.68 | % | | | 0.65 | % |
Net investment income, after Waivers | | | 0.44 | % | | | 0.24 | % | | | 0.24 | % | | | 0.18 | % | | | 0.15 | % |
Portfolio turnover rate(d) | | | 148 | % | | | 143 | % | | | 129 | % | | | 90 | % | | | 96 | % |
| (a) | Based on average shares outstanding. |
| (b) | The mean between the last bid and ask prices. |
| (c) | Net asset value total return is calculated assuming an initial investment made at the net asset value at the beginning of the period, reinvestment of all dividends and distributions at net asset value during the period, and redemption on the last day of the period. Net asset value total return includes adjustments in accordance with accounting principles generally accepted in the United States of America and as such, the net asset value for financial reporting purposes and the returns based upon those net asset values may differ from the net asset value and returns for shareholder transactions. Market price total return is calculated assuming an initial investment made at the market price at the beginning of the period, reinvestment of all dividends and distributions at market price during the period, and sale at the market price on the last day of the period. Total investment returns calculated for a period of less than one year are not annualized. |
| (d) | Portfolio turnover rate is not annualized for periods less than one year, if applicable, and does not include securities received or delivered from processing creations or redemptions. |
See accompanying Notes to Financial Statements which are an integral part of the financial statements.
Financial Highlights(continued)
Invesco Dynamic Energy Exploration & Production ETF (PXE)
| | | | | | | | | | | | | | | | | | | | |
| | | Years Ended April 30, | |
| | | 2019 | | | 2018 | | | 2017 | | | 2016 | | | 2015 | |
| Per Share Operating Performance: | | | | | | | | | | | | | | | | | | | | |
Net asset value at beginning of year | | $ | 24.06 | | | $ | 20.28 | | | $ | 22.63 | | | $ | 31.78 | | | $ | 37.76 | |
Net investment income(a) | | | 0.20 | | | | 0.28 | | | | 0.24 | | | | 0.51 | | | | 0.39 | |
Net realized and unrealized gain (loss) on investments | | | (4.48 | ) | | | 3.89 | | | | (1.15 | ) | | | (9.04 | ) | | | (5.84 | ) |
Total from investment operations | | | (4.28 | ) | | | 4.17 | | | | (0.91 | ) | | | (8.53 | ) | | | (5.45 | ) |
Distributions to shareholders from: | | | | | | | | | | | | | | | | | | | | |
Net investment income | | | (0.23 | ) | | | (0.39 | ) | | | (1.44 | ) | | | (0.62 | ) | | | (0.53 | ) |
Net asset value at end of year | | $ | 19.55 | | | $ | 24.06 | | | $ | 20.28 | | | $ | 22.63 | | | $ | 31.78 | |
Market price at end of year(b) | | $ | 19.57 | | | $ | 24.12 | | | $ | 20.28 | | | $ | 22.63 | | | $ | 31.77 | |
| Net Asset Value Total Return(c) | | | (17.84 | )% | | | 21.00 | % | | | (3.96 | )% | | | (26.93 | )% | | | (14.51 | )% |
| Market Price Total Return(c) | | | (17.96 | )% | | | 21.31 | % | | | (3.96 | )% | | | (26.91 | )% | | | (14.54 | )% |
| Ratios/Supplemental Data: | | | | | | | | | | | | | | | | | | | | |
Net assets at end of year (000’s omitted) | | $ | 40,078 | | | $ | 49,324 | | | $ | 55,760 | | | $ | 74,682 | | | $ | 117,593 | |
Ratio to average net assets of: | | | | | | | | | | | | | | | | | | | | |
Expenses, after Waivers | | | 0.63 | % | | | 0.65 | % | | | 0.80 | %(d) | | | 0.65 | % | | | 0.64 | % |
Expenses, prior to Waivers | | | 0.64 | % | | | 0.77 | % | | | 0.88 | %(d) | | | 0.67 | % | | | 0.64 | % |
Net investment income, after Waivers | | | 0.82 | % | | | 1.37 | % | | | 1.13 | % | | | 2.09 | % | | | 1.20 | % |
Portfolio turnover rate(e) | | | 110 | % | | | 87 | % | | | 91 | % | | | 134 | % | | | 140 | % |
| (a) | Based on average shares outstanding. |
| (b) | The mean between the last bid and ask prices. |
| (c) | Net asset value total return is calculated assuming an initial investment made at the net asset value at the beginning of the period, reinvestment of all dividends and distributions at net asset value during the period, and redemption on the last day of the period. Net asset value total return includes adjustments in accordance with accounting principles generally accepted in the United States of America and as such, the net asset value for financial reporting purposes and the returns based upon those net asset values may differ from the net asset value and returns for shareholder transactions. Market price total return is calculated assuming an initial investment made at the market price at the beginning of the period, reinvestment of all dividends and distributions at market price during the period, and sale at the market price on the last day of the period. Total investment returns calculated for a period of less than one year are not annualized. |
| (d) | Expenses, after Waivers and Expenses, prior to Waivers include state income taxes paid during the fiscal year ended April 30, 2017. Expenses, after Waivers and Expenses, prior to Waivers excluding the taxes paid are 0.63% and 0.71%, respectively. |
| (e) | Portfolio turnover rate is not annualized for periods less than one year, if applicable, and does not include securities received or delivered from processing creations or redemptions. |
Invesco Dynamic Food & Beverage ETF (PBJ)
| | | | | | | | | | | | | | | | | | | | |
| | | Years Ended April 30, | |
| | | 2019 | | | 2018 | | | 2017 | | | 2016 | | | 2015 | |
| Per Share Operating Performance: | | | | | | | | | | | | | | | | | | | | |
Net asset value at beginning of year | | $ | 32.81 | | | $ | 33.75 | | | $ | 32.31 | | | $ | 31.45 | | | $ | 26.98 | |
Net investment income(a) | | | 0.34 | | | | 0.41 | | | | 0.33 | | | | 0.39 | | | | 0.31 | |
Net realized and unrealized gain (loss) on investments | | | 1.39 | | | | (0.99 | ) | | | 1.61 | | | | 0.88 | | | | 4.58 | |
Total from investment operations | | | 1.73 | | | | (0.58 | ) | | | 1.94 | | | | 1.27 | | | | 4.89 | |
Distributions to shareholders from: | | | | | | | | | | | | | | | | | | | | |
Net investment income | | | (0.33 | ) | | | (0.36 | ) | | | (0.50 | ) | | | (0.41 | ) | | | (0.42 | ) |
Net asset value at end of year | | $ | 34.21 | | | $ | 32.81 | | | $ | 33.75 | | | $ | 32.31 | | | $ | 31.45 | |
Market price at end of year(b) | | $ | 34.19 | | | $ | 32.76 | | | $ | 33.74 | | | $ | 32.30 | | | $ | 31.43 | |
| Net Asset Value Total Return(c) | | | 5.37 | % | | | (1.70 | )% | | | 6.03 | % | | | 4.06 | % | | | 18.25 | % |
| Market Price Total Return(c) | | | 5.47 | % | | | (1.82 | )% | | | 6.03 | % | | | 4.10 | % | | | 18.13 | % |
| Ratios/Supplemental Data: | | | | | | | | | | | | | | | | | | | | |
Net assets at end of year (000’s omitted) | | $ | 71,831 | | | $ | 78,732 | | | $ | 146,821 | | | $ | 300,455 | | | $ | 265,721 | |
Ratio to average net assets of: | | | | | | | | | | | | | | | | | | | | |
Expenses, after Waivers | | | 0.63 | % | | | 0.63 | % | | | 0.59 | % | | | 0.58 | % | | | 0.58 | % |
Expenses, prior to Waivers. | | | 0.65 | % | | | 0.65 | % | | | 0.59 | % | | | 0.58 | % | | | 0.58 | % |
Net investment income, after Waivers | | | 1.05 | % | | | 1.25 | % | | | 0.99 | % | | | 1.21 | % | | | 1.05 | % |
Portfolio turnover rate(d) | | | 122 | % | | | 147 | % | | | 145 | % | | | 109 | % | | | 124 | % |
| (a) | Based on average shares outstanding. |
| (b) | The mean between the last bid and ask prices. |
| (c) | Net asset value total return is calculated assuming an initial investment made at the net asset value at the beginning of the period, reinvestment of all dividends and distributions at net asset value during the period, and redemption on the last day of the period. Net asset value total return includes adjustments in accordance with accounting principles generally accepted in the United States of America and as such, the net asset value for financial reporting purposes and the returns based upon those net asset values may differ from the net asset value and returns for shareholder transactions. Market price total return is calculated assuming an initial investment made at the market price at the beginning of the period, reinvestment of all dividends and distributions at market price during the period, and sale at the market price on the last day of the period. Total investment returns calculated for a period of less than one year are not annualized. |
| (d) | Portfolio turnover rate is not annualized for periods less than one year, if applicable, and does not include securities received or delivered from processing creations or redemptions. |
See accompanying Notes to Financial Statements which are an integral part of the financial statements.
Financial Highlights(continued)
Invesco Dynamic Leisure and Entertainment ETF (PEJ)
| | | | | | | | | | | | | | | | | | | | |
| | | Years Ended April 30, | |
| | | 2019 | | | 2018 | | | 2017 | | | 2016 | | | 2015 | |
| Per Share Operating Performance: | | | | | | | | | | | | | | | | | | | | |
Net asset value at beginning of year | | $ | 44.89 | | | $ | 42.00 | | | $ | 35.69 | | | $ | 36.40 | | | $ | 32.35 | |
Net investment income(a) | | | 0.19 | | | | 0.41 | | | | 0.31 | | | | 0.11 | | | | 0.31 | |
Net realized and unrealized gain (loss) on investments | | | (0.05 | ) | | | 2.86 | | | | 6.26 | | | | (0.74 | ) | | | 4.04 | |
Total from investment operations | | | 0.14 | | | | 3.27 | | | | 6.57 | | | | (0.63 | ) | | | 4.35 | |
Distributions to shareholders from: | | | | | | | | | | | | | | | | | | | | |
Net investment income | | | (0.23 | ) | | | (0.38 | ) | | | (0.26 | ) | | | (0.08 | ) | | | (0.30 | ) |
Net asset value at end of year | | $ | 44.80 | | | $ | 44.89 | | | $ | 42.00 | | | $ | 35.69 | | | $ | 36.40 | |
Market price at end of year(b) | | $ | 44.78 | | | $ | 44.96 | | | $ | 42.00 | | | $ | 35.68 | | | $ | 36.39 | |
| Net Asset Value Total Return(c) | | | 0.33 | % | | | 7.84 | % | | | 18.52 | % | | | (1.73 | )% | | | 13.47 | % |
| Market Price Total Return(c) | | | 0.12 | % | | | 8.01 | % | | | 18.55 | % | | | (1.73 | )% | | | 13.47 | % |
| Ratios/Supplemental Data: | | | | | | | | | | | | | | | | | | | | |
Net assets at end of year (000’s omitted) | | $ | 67,201 | | | $ | 116,724 | | | $ | 144,902 | | | $ | 142,754 | | | $ | 192,940 | |
Ratio to average net assets of: | | | | | | | | | | | | | | | | | | | | |
Expenses, after Waivers | | | 0.63 | % | | | 0.63 | % | | | 0.61 | % | | | 0.61 | % | | | 0.63 | % |
Expenses, prior to Waivers | | | 0.63 | % | | | 0.65 | % | | | 0.61 | % | | | 0.61 | % | | | 0.63 | % |
Net investment income, after Waivers | | | 0.42 | % | | | 0.97 | % | | | 0.83 | % | | | 0.29 | % | | | 0.88 | % |
Portfolio turnover rate(d) | | | 207 | % | | | 177 | % | | | 183 | % | | | 136 | % | | | 187 | % |
| (a) | Based on average shares outstanding. |
| (b) | The mean between the last bid and ask prices. |
| (c) | Net asset value total return is calculated assuming an initial investment made at the net asset value at the beginning of the period, reinvestment of all dividends and distributions at net asset value during the period, and redemption on the last day of the period. Net asset value total return includes adjustments in accordance with accounting principles generally accepted in the United States of America and as such, the net asset value for financial reporting purposes and the returns based upon those net asset values may differ from the net asset value and returns for shareholder transactions. Market price total return is calculated assuming an initial investment made at the market price at the beginning of the period, reinvestment of all dividends and distributions at market price during the period, and sale at the market price on the last day of the period. Total investment returns calculated for a period of less than one year are not annualized. |
| (d) | Portfolio turnover rate is not annualized for periods less than one year, if applicable, and does not include securities received or delivered from processing creations or redemptions. |
Invesco Dynamic Media ETF (PBS)
| | | | | | | | | | | | | | | | | | | | |
| | | Years Ended April 30, | |
| | | 2019 | | | 2018 | | | 2017 | | | 2016 | | | 2015 | |
| Per Share Operating Performance: | | | | | | | | | | | | | | | | | | | | |
Net asset value at beginning of year | | $ | 29.14 | | | $ | 27.97 | | | $ | 25.13 | | | $ | 26.73 | | | $ | 23.81 | |
Net investment income(a) | | | 0.16 | | | | 0.15 | | | | 0.06 | | | | 0.07 | | | | 0.21 | |
Net realized and unrealized gain (loss) on investments | | | 5.58 | | | | 1.14 | | | | 2.82 | | | | (1.45 | ) | | | 2.89 | |
Total from investment operations | | | 5.74 | | | | 1.29 | | | | 2.88 | | | | (1.38 | ) | | | 3.10 | |
Distributions to shareholders from: | | | | | | | | | | | | | | | | | | | | |
Net investment income. | | | (0.23 | ) | | | (0.12 | ) | | | (0.04 | ) | | | (0.22 | ) | | | (0.18 | ) |
Net asset value at end of year | | $ | 34.65 | | | $ | 29.14 | | | $ | 27.97 | | | $ | 25.13 | | | $ | 26.73 | |
Market price at end of year(b) | | $ | 34.65 | | | $ | 29.16 | | | $ | 27.98 | | | $ | 25.12 | | | $ | 26.72 | |
| Net Asset Value Total Return(c) | | | 19.81 | % | | | 4.64 | % | | | 11.49 | % | | | (5.18 | )% | | | 13.04 | % |
| Market Price Total Return(c) | | | 19.73 | % | | | 4.67 | % | | | 11.57 | % | | | (5.18 | )% | | | 13.09 | % |
| Ratios/Supplemental Data: | | | | | | | | | | | | | | | | | | | | |
Net assets at end of year (000’s omitted) | | $ | 88,348 | | | $ | 48,080 | | | $ | 148,230 | | | $ | 90,461 | | | $ | 145,668 | |
Ratio to average net assets of: | | | | | | | | | | | | | | | | | | | | |
Expenses, after Waivers | | | 0.63 | % | | | 0.63 | % | | | 0.63 | % | | | 0.61 | % | | | 0.59 | % |
Expenses, prior to Waivers | | | 0.67 | % | | | 0.68 | % | | | 0.63 | % | | | 0.61 | % | | | 0.59 | % |
Net investment income, after Waivers | | | 0.49 | % | | | 0.53 | % | | | 0.21 | % | | | 0.26 | % | | | 0.84 | % |
Portfolio turnover rate(d) | | | 103 | % | | | 150 | % | | | 103 | % | | | 124 | % | | | 131 | % |
| (a) | Based on average shares outstanding. |
| (b) | The mean between the last bid and ask prices. |
| (c) | Net asset value total return is calculated assuming an initial investment made at the net asset value at the beginning of the period, reinvestment of all dividends and distributions at net asset value during the period, and redemption on the last day of the period. Net asset value total return includes adjustments in accordance with accounting principles generally accepted in the United States of America and as such, the net asset value for financial reporting purposes and the returns based upon those net asset values may differ from the net asset value and returns for shareholder transactions. Market price total return is calculated assuming an initial investment made at the market price at the beginning of the period, reinvestment of all dividends and distributions at market price during the period, and sale at the market price on the last day of the period. Total investment returns calculated for a period of less than one year are not annualized. |
| (d) | Portfolio turnover rate is not annualized for periods less than one year, if applicable, and does not include securities received or delivered from processing creations or redemptions. |
See accompanying Notes to Financial Statements which are an integral part of the financial statements.
Financial Highlights(continued)
Invesco Dynamic Networking ETF (PXQ)
| | | | | | | | | | | | | | | | | | | | |
| | | Years Ended April 30, | |
| | | 2019 | | | 2018 | | | 2017 | | | 2016 | | | 2015 | |
| Per Share Operating Performance: | | | | | | | | | | | | | | | | | | | | |
Net asset value at beginning of year | | $ | 50.08 | | | $ | 43.58 | | | $ | 33.65 | | | $ | 36.65 | | | $ | 31.20 | |
Net investment income (loss)(a) | | | 0.66 | | | | 0.18 | | | | 0.21 | | | | 0.15 | | | | (0.01 | ) |
Net realized and unrealized gain (loss) on investments | | | 13.13 | | | | 6.62 | | | | 9.90 | | | | (3.15 | ) | | | 5.46 | |
Total from investment operations | | | 13.79 | | | | 6.80 | | | | 10.11 | | | | (3.00 | ) | | | 5.45 | |
Distributions to shareholders from: | | | | | | | | | | | | | | | | | | | | |
Net investment income | | | (0.71 | ) | | | (0.30 | ) | | | (0.18 | ) | | | — | | | | — | |
Net asset value at end of year | | $ | 63.16 | | | $ | 50.08 | | | $ | 43.58 | | | $ | 33.65 | | | $ | 36.65 | |
Market price at end of year(b) | | $ | 63.14 | | | $ | 50.10 | | | $ | 43.59 | | | $ | 33.65 | | | $ | 36.64 | |
| Net Asset Value Total Return(c) | | | 27.90 | % | | | 15.70 | % | | | 30.19 | % | | | (8.19 | )% | | | 17.47 | % |
| Market Price Total Return(c) | | | 27.81 | % | | | 15.73 | % | | | 30.22 | % | | | (8.16 | )% | | | 17.48 | % |
| Ratios/Supplemental Data: | | | | | | | | | | | | | | | | | | | | |
Net assets at end of year (000’s omitted) | | $ | 101,051 | | | $ | 60,091 | | | $ | 26,145 | | | $ | 20,189 | | | $ | 27,485 | |
Ratio to average net assets of: | | | | | | | | | | | | | | | | | | | | |
Expenses, after Waivers | | | 0.63 | % | | | 0.63 | % | | | 0.63 | % | | | 0.63 | % | | | 0.63 | % |
Expenses, prior to Waivers | | | 0.64 | % | | | 0.83 | % | | | 0.89 | % | | | 0.88 | % | | | 0.85 | % |
Net investment income (loss), after Waivers | | | 1.21 | % | | | 0.39 | % | | | 0.55 | % | | | 0.42 | % | | | (0.02 | )% |
Portfolio turnover rate(d) | | | 98 | % | | | 79 | % | | | 97 | % | | | 87 | % | | | 74 | % |
| (a) | Based on average shares outstanding. |
| (b) | The mean between the last bid and ask prices. |
| (c) | Net asset value total return is calculated assuming an initial investment made at the net asset value at the beginning of the period, reinvestment of all dividends and distributions at net asset value during the period, and redemption on the last day of the period. Net asset value total return includes adjustments in accordance with accounting principles generally accepted in the United States of America and as such, the net asset value for financial reporting purposes and the returns based upon those net asset values may differ from the net asset value and returns for shareholder transactions. Market price total return is calculated assuming an initial investment made at the market price at the beginning of the period, reinvestment of all dividends and distributions at market price during the period, and sale at the market price on the last day of the period. Total investment returns calculated for a period of less than one year are not annualized. |
| (d) | Portfolio turnover rate is not annualized for periods less than one year, if applicable, and does not include securities received or delivered from processing creations or redemptions. |
See accompanying Notes to Financial Statements which are an integral part of the financial statements.
Financial Highlights(continued)
Invesco Dynamic Oil & Gas Services ETF (PXJ)
| | | | | | | | | | | | | | | | | | | | |
| | | Years Ended April 30, | |
| | | 2019 | | | 2018 | | | 2017 | | | 2016 | | | 2015 | |
| Per Share Operating Performance: | | | | | | | | | | | | | | | | | | | | |
Net asset value at beginning of year | | $ | 9.70 | | | $ | 10.70 | | | $ | 13.20 | | | $ | 18.91 | | | $ | 28.01 | |
Net investment income(a) | | | 0.04 | | | | 0.27 | (b) | | | 0.06 | | | | 0.20 | | | | 0.22 | |
Net realized and unrealized gain (loss) on investments | | | (2.81 | ) | | | (1.01 | ) | | | (2.41 | ) | | | (5.69 | ) | | | (9.07 | ) |
Total from investment operations | | | (2.77 | ) | | | (0.74 | ) | | | (2.35 | ) | | | (5.49 | ) | | | (8.85 | ) |
Distributions to shareholders from: | | | | | | | | | | | | | | | | | | | | |
Net investment income | | | (0.06 | ) | | | (0.26 | ) | | | (0.08 | ) | | | (0.22 | ) | | | (0.25 | ) |
Return of capital | | | — | | | | — | | | | (0.07 | ) | | | — | | | | — | |
Total distributions | | | (0.06 | ) | | | (0.26 | ) | | | (0.15 | ) | | | (0.22 | ) | | | (0.25 | ) |
Net asset value at end of year | | $ | 6.87 | | | $ | 9.70 | | | $ | 10.70 | | | $ | 13.20 | | | $ | 18.91 | |
Market price at end of year(c) | | $ | 6.87 | | | $ | 9.70 | | | $ | 10.70 | | | $ | 13.19 | | | $ | 18.92 | |
| Net Asset Value Total Return(d) | | | (28.69 | )% | | | (6.71 | )% | | | (17.99 | )% | | | (29.06 | )% | | | (31.67 | )% |
| Market Price Total Return(d) | | | (28.69 | )% | | | (6.72 | )% | | | (17.92 | )% | | | (29.15 | )% | | | (31.61 | )% |
| Ratios/Supplemental Data: | | | | | | | | | | | | | | | | | | | | |
Net assets at end of year (000’s omitted) | | $ | 17,519 | | | $ | 37,827 | | | $ | 33,174 | | | $ | 45,534 | | | $ | 72,786 | |
Ratio to average net assets of: | | | | | | | | | | | | | | | | | | | | |
Expenses, after Waivers | | | 0.63 | % | | | 0.63 | % | | | 0.63 | % | | | 0.63 | % | | | 0.63 | % |
Expenses, prior to Waivers | | | 0.83 | % | | | 0.86 | % | | | 0.75 | % | | | 0.72 | % | | | 0.64 | % |
Net investment income, after Waivers | | | 0.48 | % | | | 2.90 | %(b) | | | 0.47 | % | | | 1.46 | % | | | 0.96 | % |
Portfolio turnover rate(e) | | | 81 | % | | | 91 | % | | | 90 | % | | | 89 | % | | | 79 | % |
| (a) | Based on average shares outstanding. |
| (b) | Net investment income per share and the ratio of net investment income to average net assets include a significant dividend received during the period. Net investment income per share and the ratio of net investment income to average net assets excluding the significant dividend are $0.06 and 0.61%, respectively. |
| (c) | The mean between the last bid and ask prices. |
| (d) | Net asset value total return is calculated assuming an initial investment made at the net asset value at the beginning of the period, reinvestment of all dividends and distributions at net asset value during the period, and redemption on the last day of the period. Net asset value total return includes adjustments in accordance with accounting principles generally accepted in the United States of America and as such, the net asset value for financial reporting purposes and the returns based upon those net asset values may differ from the net asset value and returns for shareholder transactions. Market price total return is calculated assuming an initial investment made at the market price at the beginning of the period, reinvestment of all dividends and distributions at market price during the period, and sale at the market price on the last day of the period. Total investment returns calculated for a period of less than one year are not annualized. |
| (e) | Portfolio turnover rate is not annualized for periods less than one year, if applicable, and does not include securities received or delivered from processing creations or redemptions. |
See accompanying Notes to Financial Statements which are an integral part of the financial statements.
Financial Highlights(continued)
Invesco Dynamic Pharmaceuticals ETF (PJP)
| | | | | | | | | | | | | | | | | | | | |
| | | Years Ended April 30, | |
| | | 2019 | | | 2018 | | | 2017 | | | 2016 | | | 2015 | |
| Per Share Operating Performance: | | | | | | | | | | | | | | | | | | | | |
Net asset value at beginning of year | | $ | 61.49 | | | $ | 60.71 | | | $ | 62.16 | | | $ | 74.40 | | | $ | 57.65 | |
Net investment income(a) | | | 0.69 | | | | 0.43 | | | | 0.48 | | | | 0.41 | | | | 0.32 | |
Net realized and unrealized gain (loss) on investments | | | 1.17 | | | | 0.79 | | | | (1.40 | ) | | | (8.81 | ) | | | 18.42 | |
Total from investment operations | | | 1.86 | | | | 1.22 | | | | (0.92 | ) | | | (8.40 | ) | | | 18.74 | |
Distributions to shareholders from: | | | | | | | | | | | | | | | | | | | | |
Net investment income | | | (0.70 | ) | | | (0.44 | ) | | | (0.53 | ) | | | (0.39 | ) | | | (0.34 | ) |
Net realized gains | | | — | | | | — | | | | — | | | | (3.45 | ) | | | (1.65 | ) |
Total distributions | | | (0.70 | ) | | | (0.44 | ) | | | (0.53 | ) | | | (3.84 | ) | | | (1.99 | ) |
Net asset value at end of year | | $ | 62.65 | | | $ | 61.49 | | | $ | 60.71 | | | $ | 62.16 | | | $ | 74.40 | |
Market price at end of year(b) | | $ | 62.64 | | | $ | 61.53 | | | $ | 60.71 | | | $ | 62.14 | | | $ | 74.35 | |
| Net Asset Value Total Return(c) | | | 3.02 | % | | | 1.99 | % | | | (1.47 | )% | | | (11.86 | )% | | | 32.95 | % |
| Market Price Total Return(c) | | | 2.94 | % | | | 2.05 | % | | | (1.44 | )% | | | (11.83 | )% | | | 32.97 | % |
| Ratios/Supplemental Data: | | | | | | | | | | | | | | | | | | | | |
Net assets at end of year (000’s omitted) | | $ | 416,591 | | | $ | 525,754 | | | $ | 764,908 | | | $ | 1,168,526 | | | $ | 1,926,934 | |
Ratio to average net assets of: | | | | | | | | | | | | | | | | | | | | |
Expenses, after Waivers | | | 0.56 | % | | | 0.57 | % | | | 0.56 | % | | | 0.57 | % | | | 0.56 | % |
Expenses, prior to Waivers | | | 0.56 | % | | | 0.57 | % | | | 0.56 | % | | | 0.57 | % | | | 0.56 | % |
Net investment income, after Waivers | | | 1.03 | % | | | 0.68 | % | | | 0.79 | % | | | 0.58 | % | | | 0.48 | % |
Portfolio turnover rate(d) | | | 81 | % | | | 98 | % | | | 26 | % | | | 26 | % | | | 47 | % |
| (a) | Based on average shares outstanding. |
| (b) | The mean between the last bid and ask prices. |
| (c) | Net asset value total return is calculated assuming an initial investment made at the net asset value at the beginning of the period, reinvestment of all dividends and distributions at net asset value during the period, and redemption on the last day of the period. Net asset value total return includes adjustments in accordance with accounting principles generally accepted in the United States of America and as such, the net asset value for financial reporting purposes and the returns based upon those net asset values may differ from the net asset value and returns for shareholder transactions. Market price total return is calculated assuming an initial investment made at the market price at the beginning of the period, reinvestment of all dividends and distributions at market price during the period, and sale at the market price on the last day of the period. Total investment returns calculated for a period of less than one year are not annualized. |
| (d) | Portfolio turnover rate is not annualized for periods less than one year, if applicable, and does not include securities received or delivered from processing creations or redemptions. |
Invesco Dynamic Retail ETF (PMR)
| | | | | | | | | | | | | | | | | | | | |
| | | Years Ended April 30, | |
| | | 2019 | | | 2018 | | | 2017 | | | 2016 | | | 2015 | |
| Per Share Operating Performance: | | | | | | | | | | | | | | | | | | | | |
Net asset value at beginning of year | | $ | 36.67 | | | $ | 36.07 | | | $ | 35.69 | | | $ | 38.41 | | | $ | 33.15 | |
Net investment income(a) | | | 0.42 | | | | 0.45 | | | | 0.27 | | | | 0.25 | | | | 0.22 | |
Net realized and unrealized gain (loss) on investments | | | 1.80 | | | | 0.57 | | | | 0.43 | | | | (2.70 | ) | | | 5.38 | |
Total from investment operations | | | 2.22 | | | | 1.02 | | | | 0.70 | | | | (2.45 | ) | | | 5.60 | |
Distributions to shareholders from: | | | | | | | | | | | | | | | | | | | | |
Net investment income | | | (0.41 | ) | | | (0.42 | ) | | | (0.32 | ) | | | (0.27 | ) | | | (0.34 | ) |
Net asset value at end of year | | $ | 38.48 | | | $ | 36.67 | | | $ | 36.07 | | | $ | 35.69 | | | $ | 38.41 | |
Market price at end of year(b) | | $ | 38.47 | | | $ | 36.71 | | | $ | 36.05 | | | $ | 35.69 | | | $ | 38.42 | |
| Net Asset Value Total Return(c) | | | 6.09 | % | | | 2.87 | % | | | 1.98 | % | | | (6.40 | )% | | | 16.97 | % |
| Market Price Total Return(c) | | | 5.95 | % | | | 3.03 | % | | | 1.92 | % | | | (6.42 | )% | | | 17.04 | % |
| Ratios/Supplemental Data: | | | | | | | | | | | | | | | | | | | | |
Net assets at end of year (000’s omitted) | | $ | 7,696 | | | $ | 11,000 | | | $ | 14,429 | | | $ | 21,416 | | | $ | 38,410 | |
Ratio to average net assets of: | | | | | | | | | | | | | | | | | | | | |
Expenses, after Waivers. | | | 0.63 | % | | | 0.63 | % | | | 0.63 | % | | | 0.63 | % | | | 0.63 | % |
Expenses, prior to Waivers | | | 1.24 | % | | | 1.27 | % | | | 0.99 | % | | | 0.88 | % | | | 0.91 | % |
Net investment income, after Waivers | | | 1.09 | % | | | 1.27 | % | | | 0.76 | % | | | 0.67 | % | | | 0.61 | % |
Portfolio turnover rate(d) | | | 148 | % | | | 131 | % | | | 152 | % | | | 129 | % | | | 111 | % |
| (a) | Based on average shares outstanding. |
| (b) | The mean between the last bid and ask prices. |
| (c) | Net asset value total return is calculated assuming an initial investment made at the net asset value at the beginning of the period, reinvestment of all dividends and distributions at net asset value during the period, and redemption on the last day of the period. Net asset value total return includes adjustments in accordance with accounting principles generally accepted in the United States of America and as such, the net asset value for financial reporting purposes and the returns based upon those net asset values may differ from the net asset value and returns for shareholder transactions. Market price total return is calculated assuming an initial investment made at the market price at the beginning of the period, reinvestment of all dividends and distributions at market price during the period, and sale at the market price on the last day of the period. Total investment returns calculated for a period of less than one year are not annualized. |
| (d) | Portfolio turnover rate is not annualized for periods less than one year, if applicable, and does not include securities received or delivered from processing creations or redemptions. |
See accompanying Notes to Financial Statements which are an integral part of the financial statements.
Financial Highlights(continued)
Invesco Dynamic Semiconductors ETF (PSI)
| | | | | | | | | | | | | | | | | | | | |
| | | Years Ended April 30, | |
| | | 2019 | | | 2018 | | | 2017 | | | 2016 | | | 2015 | |
| Per Share Operating Performance: | | | | | | | | | | | | | | | | | | | | |
Net asset value at beginning of year | | $ | 48.91 | | | $ | 42.47 | | | $ | 24.50 | | | $ | 26.30 | | | $ | 20.62 | |
Net investment income(a) | | | 0.38 | | | | 0.14 | | | | 0.19 | | | | 0.10 | | | | 0.25 | (b) |
Net realized and unrealized gain (loss) on investments | | | 9.19 | | | | 6.41 | | | | 18.02 | | | | (1.86 | ) | | | 5.88 | |
Total from investment operations | | | 9.57 | | | | 6.55 | | | | 18.21 | | | | (1.76 | ) | | | 6.13 | |
Distributions to shareholders from: | | | | | | | | | | | | | | | | | | | | |
Net investment income | | | (0.39 | ) | | | (0.11 | ) | | | (0.24 | ) | | | (0.04 | ) | | | (0.33 | ) |
Return of capital | | | — | | | | — | | | | — | | | | — | | | | (0.12 | ) |
Total distributions | | | (0.39 | ) | | | (0.11 | ) | | | (0.24 | ) | | | (0.04 | ) | | | (0.45 | ) |
Net asset value at end of year | | $ | 58.09 | | | $ | 48.91 | | | $ | 42.47 | | | $ | 24.50 | | | $ | 26.30 | |
Market price at end of year(c) | | $ | 58.04 | | | $ | 48.94 | | | $ | 42.51 | | | $ | 24.48 | | | $ | 26.31 | |
| Net Asset Value Total Return(d) | | | 19.71 | % | | | 15.42 | % | | | 74.65 | % | | | (6.69 | )% | | | 29.90 | % |
| Market Price Total Return(d) | | | 19.53 | % | | | 15.38 | % | | | 74.96 | % | | | (6.80 | )% | | | 29.95 | % |
| Ratios/Supplemental Data: | | | | | | | | | | | | | | | | | | | | |
Net assets at end of year (000’s omitted) | | $ | 200,423 | | | $ | 315,455 | | | $ | 235,699 | | | $ | 48,999 | | | $ | 78,911 | |
Ratio to average net assets of: | | | | | | | | | | | | | | | | | | | | |
Expenses, after Waivers | | | 0.58 | % | | | 0.61 | % | | | 0.63 | % | | | 0.63 | % | | | 0.63 | % |
Expenses, prior to Waivers | | | 0.58 | % | | | 0.61 | % | | | 0.63 | % | | | 0.68 | % | | | 0.78 | % |
Net investment income, after Waivers | | | 0.73 | % | | | 0.29 | % | | | 0.55 | % | | | 0.38 | % | | | 1.03 | %(b) |
Portfolio turnover rate(e) | | | 98 | % | | | 65 | % | | | 62 | % | | | 104 | % | | | 103 | % |
| (a) | Based on average shares outstanding. |
| (b) | Net investment income per share and the ratio of net investment income to average net assets include a significant dividend received of $16.50 per share owned ofKLA-Tencor Corp. on November 26, 2014. Net investment income per share and the ratio of net investment income to average net assets excluding the significant dividend are $0.05 and 0.22%, respectively. |
| (c) | The mean between the last bid and ask prices. |
| (d) | Net asset value total return is calculated assuming an initial investment made at the net asset value at the beginning of the period, reinvestment of all dividends and distributions at net asset value during the period, and redemption on the last day of the period. Net asset value total return includes adjustments in accordance with accounting principles generally accepted in the United States of America and as such, the net asset value for financial reporting purposes and the returns based upon those net asset values may differ from the net asset value and returns for shareholder transactions. Market price total return is calculated assuming an initial investment made at the market price at the beginning of the period, reinvestment of all dividends and distributions at market price during the period, and sale at the market price on the last day of the period. Total investment returns calculated for a period of less than one year are not annualized. |
| (e) | Portfolio turnover rate is not annualized for periods less than one year, if applicable, and does not include securities received or delivered from processing creations or redemptions. |
See accompanying Notes to Financial Statements which are an integral part of the financial statements.
Financial Highlights(continued)
Invesco Dynamic Software ETF (PSJ)
| | | | | | | | | | | | | | | | | | | | |
| | | Years Ended April 30, | |
| | | 2019 | | | 2018 | | | 2017 | | | 2016 | | | 2015 | |
| Per Share Operating Performance: | | | | | | | | | | | | | | | | | | | | |
Net asset value at beginning of year | | $ | 70.81 | | | $ | 53.44 | | | $ | 42.20 | | | $ | 42.47 | | | $ | 33.96 | |
Net investment income (loss)(a) | | | (0.22 | ) | | | (0.27 | ) | | | (0.05 | ) | | | (0.08 | ) | | | 0.11 | |
Net realized and unrealized gain (loss) on investments | | | 25.51 | | | | 17.64 | | | | 11.30 | | | | (0.13 | ) | | | 8.44 | |
Total from investment operations | | | 25.29 | | | | 17.37 | | | | 11.25 | | | | (0.21 | ) | | | 8.55 | |
Distributions to shareholders from: | | | | | | | | | | | | | | | | | | | | |
Net investment income | | | — | | | | — | | | | (0.01 | ) | | | (0.06 | ) | | | (0.04 | ) |
Net asset value at end of year | | $ | 96.10 | | | $ | 70.81 | | | $ | 53.44 | | | $ | 42.20 | | | $ | 42.47 | |
Market price at end of year(b) | | $ | 96.13 | | | $ | 70.90 | | | $ | 53.39 | | | $ | 42.21 | | | $ | 42.48 | |
| Net Asset Value Total Return(c) | | | 35.71 | % | | | 32.51 | % | | | 26.67 | % | | | (0.50 | )% | | | 25.18 | % |
| Market Price Total Return(c) | | | 35.58 | % | | | 32.80 | % | | | 26.52 | % | | | (0.50 | )% | | | 25.32 | % |
| Ratios/Supplemental Data: | | | | | | | | | | | | | | | | | | | | |
Net assets at end of year (000’s omitted) | | $ | 437,243 | | | $ | 155,784 | | | $ | 101,545 | | | $ | 73,847 | | | $ | 57,329 | |
Ratio to average net assets of: | | | | | | | | | | | | | | | | | | | | |
Expenses, after Waivers | | | 0.58 | % | | | 0.63 | % | | | 0.63 | % | | | 0.63 | % | | | 0.63 | % |
Expenses, prior to Waivers | | | 0.58 | % | | | 0.63 | % | | | 0.64 | % | | | 0.66 | % | | | 0.71 | % |
Net investment income (loss), after Waivers | | | (0.27 | )% | | | (0.42 | )% | | | (0.11 | )% | | | (0.19 | )% | | | 0.29 | % |
Portfolio turnover rate(d) | | | 157 | % | | | 145 | % | | | 154 | % | | | 154 | % | | | 132 | % |
| (a) | Based on average shares outstanding. |
| (b) | The mean between the last bid and ask prices. |
| (c) | Net asset value total return is calculated assuming an initial investment made at the net asset value at the beginning of the period, reinvestment of all dividends and distributions at net asset value during the period, and redemption on the last day of the period. Net asset value total return includes adjustments in accordance with accounting principles generally accepted in the United States of America and as such, the net asset value for financial reporting purposes and the returns based upon those net asset values may differ from the net asset value and returns for shareholder transactions. Market price total return is calculated assuming an initial investment made at the market price at the beginning of the period, reinvestment of all dividends and distributions at market price during the period, and sale at the market price on the last day of the period. Total investment returns calculated for a period of less than one year are not annualized. |
| (d) | Portfolio turnover rate is not annualized for periods less than one year, if applicable, and does not include securities received or delivered from processing creations or redemptions. |
See accompanying Notes to Financial Statements which are an integral part of the financial statements.
Notes to Financial Statements
Invesco Exchange-Traded Fund Trust
April 30, 2019
NOTE 1—Organization
Invesco Exchange-Traded Fund Trust (the “Trust”) was organized as a Massachusetts business trust on June 9, 2000 and is authorized to have multiple series of portfolios. The Trust is anopen-end management investment company registered under the Investment Company Act of 1940, as amended (the “1940 Act”). This report includes the following portfolios:
| | |
Full Name | | Short Name |
| Invesco Dynamic Biotechnology & Genome ETF (PBE) | | “Dynamic Biotechnology & Genome ETF” |
| Invesco Dynamic Building & Construction ETF (PKB) | | “Dynamic Building & Construction ETF” |
| Invesco Dynamic Energy Exploration & Production ETF (PXE) | | “Dynamic Energy Exploration & Production ETF” |
| Invesco Dynamic Food & Beverage ETF (PBJ) | | “Dynamic Food & Beverage ETF” |
| Invesco Dynamic Leisure and Entertainment ETF (PEJ) | | “Dynamic Leisure and Entertainment ETF” |
| Invesco Dynamic Media ETF (PBS) | | “Dynamic Media ETF” |
| Invesco Dynamic Networking ETF (PXQ) | | “Dynamic Networking ETF” |
| Invesco Dynamic Oil & Gas Services ETF (PXJ) | | “Dynamic Oil & Gas Services ETF” |
| Invesco Dynamic Pharmaceuticals ETF (PJP) | | “Dynamic Pharmaceuticals ETF” |
| Invesco Dynamic Retail ETF (PMR) | | “Dynamic Retail ETF” |
| Invesco Dynamic Semiconductors ETF (PSI) | | “Dynamic Semiconductors ETF” |
| Invesco Dynamic Software ETF (PSJ) | | “Dynamic Software ETF” |
Each portfolio (each, a “Fund”, and collectively, the “Funds”) represents a separate series of the Trust. The shares of the Funds are referred to herein as “Shares” or “Fund’s Shares.” Each Fund’s Shares are listed and traded on NYSE Arca, Inc.
The market price of each Share may differ to some degree from a Fund’s net asset value (“NAV”). Unlike conventional mutual funds, each Fund issues and redeems Shares on a continuous basis, at NAV, only in a large specified number of Shares, each called a “Creation Unit.” Creation Units are issued and redeemed principally in exchange for the deposit or delivery of a basket of securities (“Deposit Securities”). Except when aggregated in Creation Units by Authorized Participants, the Shares are not individually redeemable securities of the Funds.
The investment objective of each Fund is to seek to track the investment results (before fees and expenses) of its respective index listed below (each, an “Underlying Index”):
| | |
Fund | | Underlying Index |
| Dynamic Biotechnology & Genome ETF | | Dynamic Biotech & Genome IntellidexSMIndex |
| Dynamic Building & Construction ETF | | Dynamic Building & Construction IntellidexSMIndex |
| Dynamic Energy Exploration & Production ETF | | Dynamic Energy Exploration & Production IntellidexSMIndex |
| Dynamic Food & Beverage ETF | | Dynamic Food & Beverage IntellidexSMIndex |
| Dynamic Leisure and Entertainment ETF | | Dynamic Leisure & Entertainment IntellidexSMIndex |
| Dynamic Media ETF | | Dynamic Media IntellidexSMIndex |
| Dynamic Networking ETF | | Dynamic Networking IntellidexSMIndex |
| Dynamic Oil & Gas Services ETF | | Dynamic Oil Services IntellidexSMIndex |
| Dynamic Pharmaceuticals ETF | | Dynamic Pharmaceutical IntellidexSMIndex |
| Dynamic Retail ETF | | Dynamic Retail IntellidexSMIndex |
| Dynamic Semiconductors ETF | | Dynamic Semiconductor IntellidexSMIndex |
| Dynamic Software ETF | | Dynamic Software IntellidexSMIndex |
NOTE 2—Significant Accounting Policies
The following is a summary of the significant accounting policies followed by the Funds in preparation of their financial statements.
Each Fund is an investment company and accordingly follows the investment company accounting and reporting guidance in accordance with Financial Accounting Standards Board Accounting Standards Codification Topic 946,Financial Services—Investment Companies.
| A. | Security Valuation- Securities, including restricted securities, are valued according to the following policies: |
A security listed or traded on an exchange (except convertible securities) is generally valued at its last sales price or official closing price as of the close of the customary trading session on the exchange where the security is principally traded or, lacking any sales or official closing price on a particular day, the security may be valued at the closing bid price on that day. Securities traded in theover-the-counter market are valued based on prices furnished by independent pricing services or market makers. When such securities are valued by an independent pricing service they may be considered fair valued. Futures contracts are valued at the final settlement price set by an exchange on which they are principally traded. Listed options are valued at the mean between the last bid and asked prices from the exchange on which they are principally traded, or at the final settlement price set by such exchange. Swaps and options not listed on an exchange are valued by an independent source. For purposes of determining NAV per Share, futures and option contracts generally are valued 15 minutes after the close of the customary trading session of the New York Stock Exchange (“NYSE”).
Investment companies are valued using such company’s NAV per share, unless the shares are exchange-traded, in which case they are valued at the last sales price or official closing price as of the close of the customary trading session on the exchange where the security is principally traded.
Debt obligations (including convertible securities) and unlisted equities are fair valued using an evaluated quote provided by an independent pricing service. Evaluated quotes provided by the pricing service may be determined without exclusive reliance on quoted prices, and may reflect appropriate factors such asinstitution-size trading in similar groups of securities, developments related to specific securities, dividend rate (for unlisted equities), yield (for debt obligations), quality, type of issue, coupon rate (for debt obligations), maturity (for debt obligations), individual trading characteristics and other market data. Securities with a demand feature exercisable within one to seven days are valued at par. Pricing services generally value debt obligations assuming orderly transactions of institutional round lot size, but a Fund may hold or transact in the same securities in smaller, odd lot sizes. Odd lots often trade at lower prices than institutional round lots. Debt obligations are subject to interest rate and credit risks. In addition, all debt obligations involve some risk of default with respect to interest and/or principal payments.
Foreign securities’ (including foreign exchange contracts’) prices are converted into U.S. dollar amounts using the applicable exchange rates as of the close of the London world markets. If market quotations are available and reliable for foreign exchange-traded equity securities, the securities will be valued at the market quotations. Because trading hours for certain foreign securities end before the close of the NYSE, closing market quotations may become unreliable. If between the time trading ends on a particular security and the close of the customary trading session on the NYSE, events occur that Invesco Capital Management LLC (the “Adviser”) determines are significant and make the closing price unreliable, a Fund may fair value the security. If the event is likely to have affected the closing price of the security, the security will be valued at fair value in good faith using procedures approved by the Board of Trustees. Adjustments to closing prices to reflect fair value may also be based on a screening process of an independent pricing service to indicate the degree of certainty, based on historical data, that the closing price in the principal market where a foreign security trades is not the current value as of the close of the NYSE. Foreign securities’ prices meeting the approved degree of certainty that the price is not reflective of current value will be priced at the indication of fair value from the independent pricing service. Multiple factors may be considered by the independent pricing service in determining adjustments to reflect fair value and may include information relating to sector indices, American Depositary Receipts and domestic and foreign index futures. Foreign securities may have additional risks including exchange rate changes, the potential for sharply devalued currencies and high inflation, political and economic upheaval, the relative lack of issuer information, relatively low market liquidity and the potential lack of strict financial and accounting controls and standards.
Securities for which market prices are not provided by any of the above methods may be valued based upon quotes furnished by independent sources. The last bid price may be used to value exchange-traded equity securities. The mean between the last bid and asked prices may be used to value debt obligations, including corporate loans, and unlisted equity securities.
Securities for which market quotations are not readily available or became unreliable are valued at fair value as determined in good faith following procedures approved by the Board of Trustees. Issuer-specific events, market trends, bid/asked quotes of brokers and information providers and other market data may be reviewed in the course of making a good faith determination of a security’s fair value.
Each Fund may invest in securities that are subject to interest rate risk, meaning the risk that the prices will generally fall as interest rates rise and, conversely, the prices will generally rise as interest rates fall. Specific securities differ in their sensitivity to changes in interest rates depending on their individual characteristics. Changes in interest rates may result in increased market volatility, which may affect the value and/or liquidity of certain Fund investments.
Valuations change in response to many factors, including the historical and prospective earnings of the issuer, the value of the issuer’s assets, general economic conditions, interest rates, investor perceptions and market liquidity. Because of the inherent uncertainties of valuation, the values reflected in the financial statements may materially differ from the value received upon actual sale of those investments.
Index Risk. Unlike many investment companies, the Funds do not utilize investing strategies that seek returns in excess of their Underlying Indexes. Therefore, a Fund would not necessarily buy or sell a security unless that security is added or removed, respectively, from its respective Underlying Index, even if that security generally is underperforming.
Authorized Participant Concentration Risk. Only Authorized Participants (“APs”) may engage in creation or redemption transactions directly with each Fund. Each Fund has a limited number of institutions that may act as APs, and such APs have no obligation to submit creation or redemption orders. Consequently, there is no assurance that those APs will establish or maintain an active trading market for the Shares. This risk may be heightened to the extent that securities underlying each Fund are traded outside a collateralized settlement system. In that case, APs may be required to post collateral on certain trades on an agency basis (i.e., on behalf of other market participants), which only a limited number of APs may be able to do. In addition, to the extent that APs exit the business or are unable to proceed with creation and/or redemption orders with respect to each Fund and no other AP is able to step forward to create or redeem Creation Units, this may result in a significantly diminished trading market for Fund Shares, which may be more likely to trade at a premium or discount to each Fund’s NAV and possibly face trading halts and/or delisting. This risk may be heightened for Funds that invest innon-U.S. securities, which may have lower trading volumes.
Equity Risk. Equity risk is the risk that the value of equity securities, including common stocks, may fall due to both changes in general economic conditions that impact the market as a whole, as well as factors that directly relate to a specific company or its industry. Such general economic conditions include changes in interest rates, periods of market turbulence or instability, or general and prolonged periods of economic decline and cyclical change. It is possible that a drop in the stock market may depress the price of most or all of the common stocks that each Fund holds. In addition, equity risk includes the risk that investor sentiment toward particular industries will become negative. The value of a company’s common stock may fall solely because of factors, such as an increase in production costs, that negatively impact other companies in the same region, industry or sector of the market. A company’s common stock also may decline significantly in price over a short period of time due to factors specific to that company, including decisions made by its management or lower demand for the company’s products or services. For example, an adverse event, such as an unfavorable earnings report or the failure to make anticipated dividend payments, may depress the value of common stock.
Industry Concentration Risk. In following its methodology, each Fund’s Underlying Index from time to time may be concentrated to a significant degree in securities of issuers operating in a single industry or industry group. To the extent that each Underlying Index concentrates in the securities of issuers in a particular industry or industry group, the corresponding Fund will also concentrate its investments to approximately the same extent. By concentrating its investments in an industry or industry group, each Fund faces more risks than if it were diversified broadly over numerous industries or industry groups. Such industry-based risks, any of which may adversely affect the companies in which each Fund invests, may include, but are not limited to, legislative or regulatory changes, adverse market conditions and/or increased competition within the industry or industry group. In addition, at times, such industry or industry group may be out of favor and underperform other industries, industry groups or the market as a whole.
Non-Diversified Fund Risk. Each Fund isnon-diversified and can invest a greater portion of its assets in securities of individual issuers than diversified funds. As a result, changes in the market value of a single investment could cause greater fluctuations in Share price than would occur in a diversified fund. This may increase a Fund’s volatility and cause the performance of a relatively small number of issuers to have a greater impact on a Fund’s performance.
Non-Correlation Risk. Each Fund’s return may not match the return of its Underlying Index for a number of reasons. For example, each Fund incurs operating expenses not applicable to its Underlying Index, and incurs costs in buying and selling securities, especially when rebalancing the Fund’s securities holdings to reflect changes in the composition of its Underlying Index. In addition, the performance of each Fund and its Underlying Index may vary due to asset valuation differences and differences between each Fund’s portfolio and its Underlying Index resulting from legal restrictions, costs or liquidity constraints.
Small- andMid-Capitalization Company Risk. For certain Funds, investing in securities of small- andmid-capitalization companies involves greater risk than customarily is associated with investing in larger, more established companies. These companies’ securities may be more volatile and less liquid than those of more established companies. These securities may have returns that vary, sometimes significantly, from the overall securities market. Often small- andmid-capitalization companies and the industries in which they focus are still evolving and, as a result, they may be more sensitive to changing market conditions.
Portfolio Turnover Risk. Certain Funds may engage in frequent trading of their portfolio securities in connection with the rebalancing or adjustment of their respective Underlying Index. A portfolio turnover rate of 200%, for example, is equivalent to a Fund buying and selling all of its securities two times during the course of a year. A high portfolio turnover rate (such as 100% or more) could result in high brokerage costs for a Fund. While a high portfolio turnover rate can result in an increase in taxable capital gain distributions to a Fund’s shareholders, each Fund will seek to utilize anin-kind creation and redemption mechanism to minimize realization of capital gains to the extent possible.
| C. | Investment Transactions and Investment Income— Investment transactions are accounted for on a trade date basis. Realized gains and losses from the sale or disposition of securities are computed on the specific identified cost basis. Interest |
| | income is recorded on the accrual basis from settlement date.Pay-in-kind interest income andnon-cash dividend income received in the form of securitiesin-lieu of cash are recorded at the fair value of the securities received. Dividend income (net of withholding tax, if any) is recorded on theex-dividend date. Realized gains, dividends and interest received by a Fund may give rise to withholding and other taxes imposed by foreign countries. Tax conventions between certain countries and the United States may reduce or eliminate such taxes. |
The Funds may periodically participate in litigation related to each Fund’s investments. As such, the Funds may receive proceeds from litigation settlements. Any proceeds received are included in the Statements of Operations as realized gain (loss) for investments no longer held and as unrealized gain (loss) for investments still held.
Brokerage commissions and mark ups are considered transaction costs and are recorded as an increase to the cost basis of securities purchased and/or a reduction of proceeds on a sale of securities. Such transaction costs are included in the determination of net realized and unrealized gain (loss) from investment securities reported in the Statements of Operations and the Statements of Changes in Net Assets and the net realized and unrealized gains (losses) on securities per share in the Financial Highlights. Transaction costs are included in the calculation of each Fund’s NAV and, accordingly, they reduce each Fund’s total returns. These transaction costs are not considered operating expenses and are not reflected in net investment income reported in the Statements of Operations and the Statements of Changes in Net Assets, or the net investment income per share and the ratios of expenses and net investment income reported in the Financial Highlights, nor are they limited by any expense limitation arrangements between each Fund and the Adviser.
| D. | Country Determination— For the purposes of presentation in the Schedules of Investments, the Adviser may determine the country in which an issuer is located and/or credit risk exposure based on various factors. These factors include whether each Fund’s Underlying Index has made a country determination and may include the laws of the country under which the issuer is organized, where the issuer maintains a principal office, the country in which the issuer derives 50% or more of its total revenues and the country that has the primary market for the issuer’s securities, as well as other criteria. Among the other criteria that may be evaluated for making this determination are the country in which the issuer maintains 50% or more of its assets, the type of security, financial guarantees and enhancements, the nature of the collateral and the sponsor organization. Country of issuer and/or credit risk exposure has been determined to be the United States of America, unless otherwise noted. |
| E. | Dividends and Distributions to Shareholders— Each Fund declares and pays dividends from net investment income, if any, to its shareholders quarterly and records such dividends onex-dividend date. Generally, each Fund distributes net realized taxable capital gains, if any, annually in cash and records them onex-dividend date. Such distributions on a tax basis are determined in conformity with federal income tax regulations, which may differ from accounting principles generally accepted in the United States of America (“GAAP”). Distributions in excess of tax basis earnings and profits, if any, are reported in such Fund’s financial statements as a tax return of capital at fiscalyear-end. |
| F. | Federal Income Taxes— Each Fund intends to comply with the provisions of the Internal Revenue Code of 1986, as amended (the “Internal Revenue Code”), applicable to regulated investment companies and to distribute substantially all of the Fund’s taxable earnings to its shareholders. As such, the Funds will not be subject to federal income taxes on otherwise taxable income (including net realized gains) that is distributed to the shareholders. Therefore, no provision for federal income taxes is recorded in the financial statements. |
Each Fund recognizes the tax benefits of uncertain tax positions only when the position is more likely than not to be sustained. Management has analyzed each Fund’s uncertain tax positions and concluded that no liability for unrecognized tax benefits should be recorded related to uncertain tax positions. Management is not aware of any tax positions for which it is reasonably possible that the total amounts of unrecognized tax benefits will change materially in the next 12 months.
Income and capital gain distributions are determined in accordance with federal income tax regulations, which may differ from GAAP. These differences are primarily due to differing book and tax treatments forin-kind transactions, losses deferred due to wash sales, and passive foreign investment company adjustments, if any.
The Funds file U.S. federal tax returns and tax returns in certain other jurisdictions. Generally, a Fund is subject to examinations by such taxing authorities for up to three years after the filing of the return for the tax period.
| G. | Expenses— Expenses of the Trust that are directly identifiable to a specific Fund are applied to that Fund. Expenses of the Trust that are not readily identifiable to a specific Fund are allocated in such a manner as deemed equitable, taking into consideration the nature and type of expense and the relative net assets of each Fund. |
Each Fund is responsible for all of its expenses, including the investment advisory fees, costs of transfer agency, custody, fund administration, legal, audit and other services, interest, taxes, brokerage commissions and other expenses connected with executions of portfolio transactions,sub-licensing fees related to its respective Underlying Index, any distribution fees or expenses, litigation expenses, fees payable to the Trust’s Board members who are not “interested persons” (as defined in the 1940 Act) of the Trust (the “Independent Trustees”) or the Adviser, expenses incurred in connection with the Board members’ services, including travel expenses and legal fees of counsel for the Independent Trustees, acquired fund fees and expenses, if any, and extraordinary expenses.
To the extent a Fund invests in other investment companies, the expenses shown in the accompanying financial statements reflect the expenses of the Fund and do not include any expenses of the investment companies in which it invests. The effects of such investment companies’ expenses are included in the realized and unrealized gain or loss on the investments in the investment companies.
| H. | Accounting Estimates— The preparation of the financial statements in accordance with GAAP requires management to make estimates and assumptions that affect the reported amounts and disclosures in the financial statements, including estimates and assumptions related to taxation. Actual results could differ from these estimates. In addition, the Funds monitor for material events or transactions that may occur or become known after theperiod-end date and before the date the financial statements are released to print. |
| I. | Indemnifications— Under the Trust’s organizational documents, its Officers and Trustees are indemnified against certain liabilities arising out of the performance of their duties to the Trust. Each Independent Trustee is also indemnified against certain liabilities arising out of the performance of his duties to the Trust pursuant to an Indemnification Agreement between such trustee and the Trust. Additionally, in the normal course of business, the Trust enters into contracts with service providers that contain general indemnification clauses. The Trust’s maximum exposure under these arrangements is unknown, as this would involve future claims that may be made against the Trust that have not yet occurred. However, based on experience, the Trust believes the risk of loss to be remote. |
| J. | Securities Lending— During the fiscal year ended April 30, 2019, each Fund participated in securities lending. Each Fund loaned portfolio securities having a market value up toone-third of each Fund’s total assets. Such loans are secured by cash collateral equal to no less than 102% (105% for international securities) of the market value of the loaned securities determined daily by the securities lending provider. Cash collateral received in connection with these loans is generally invested in an affiliated money market fund and is shown as such on the Schedules of Investments. Each Fund bears the risk of loss with respect to the investment of collateral. It is the policy of these Funds to obtain additional collateral from or return excess collateral to the borrower by the end of the next business day, following the valuation date of the securities loaned. Therefore, the value of the collateral held may be temporarily less than the value of the securities on loan. When loaning securities, each Fund retains certain benefits of owning the securities, including the economic equivalent of dividends or interest generated by the security. Lending securities entails a risk of loss to each Fund if, and to the extent that, the market value of the securities loaned were to increase, and the borrower did not increase the collateral accordingly, and the borrower failed to return the securities. The securities loaned are subject to termination at the option of the borrower or each Fund. Upon termination, the borrower will return to each Fund the securities loaned and each Fund will return the collateral. Upon the failure of the borrower to return the securities, collateral may be liquidated and the securities may be purchased on the open market to replace the loaned securities. Each Fund could experience delays and costs in gaining access to the collateral and the securities may lose value during the delay which could result in potential losses to each Fund. Some of these losses may be indemnified by the lending agent. Each Fund bears the risk of any deficiency in the amount of the collateral available for return to the borrower due to any loss on the collateral invested. Dividends received on cash collateral investments for securities lending transactions, which are net of compensation to counterparties, are included inSecurities lending incomeon the Statements of Operations. The aggregate value of securities out on loan, if any, is shown on the Statements of Assets and Liabilities. |
| K. | Distributions from Distributable Earnings— In accordance with the Securities and Exchange Commission’s issuance of Disclosure Update and Simplification, the Funds have presented the total, rather than the components, of distributions to shareholders, except for tax return of capital distributions, if any, in the Statements of Changes in Net Assets. |
For the year ended April 30, 2018, distributions from distributable earnings consisted of distributions from net investment income.
NOTE 3—Investment Advisory Agreement and Other Agreements
The Trust has entered into an Investment Advisory Agreement with the Adviser on behalf of each Fund, pursuant to which the Adviser has overall responsibility for the selection and ongoing monitoring of the Funds’ investments, managing the Funds’ business affairs and providing certain clerical, bookkeeping and other administrative services. Pursuant to that Investment Advisory Agreement, each Fund accrues daily and pays monthly to the Adviser an annual fee of 0.50% of the Fund’s average daily net assets.
The Trust also has entered into an Amended and Restated Excess Expense Agreement (the “Expense Agreement”) with the Adviser on behalf of each Fund, pursuant to which the Adviser has agreed to waive fees and/or pay Fund expenses to the extent necessary to prevent the operating expenses (excluding interest expenses, brokerage commissions and other trading expenses,sub-licensing fees, offering costs, taxes, acquired fund fees and expenses, if any, and extraordinary expenses) of each Fund from exceeding 0.60% of the Fund’s average daily net assets per year (the “Expense Cap”), through at least August 31, 2021. Unless the Adviser continues the Expense Agreement, it will terminate on August 31, 2021. During its term, the Expense Agreement cannot be terminated or amended to increase the Expense Cap without approval of the Board of Trustees. The Adviser did not waive fees and/or pay Fund expenses during the period under this Expense Cap for Dynamic Biotechnology & Genome ETF, Dynamic Building & Construction ETF, Dynamic Leisure and Entertainment ETF, Dynamic Pharmaceuticals ETF, Dynamic Semiconductors ETF and Dynamic Software ETF.
Further, through August 31, 2021, the Adviser has contractually agreed to waive a portion of each Fund’s management fee in an amount equal to 100% of the net advisory fees an affiliate of the Adviser receives that are attributable to certain of the Fund’s
investments in money market funds managed by that affiliate (excluding investments of cash collateral from securities lending). The Adviser cannot discontinue this waiver prior to its expiration. This agreement is not subject to recapture by the Adviser.
For the fiscal year ended April 30, 2019, the Adviser waived fees and/or paid Fund expenses for each Fund in the following amounts:
| | | | |
| Dynamic Biotechnology & Genome ETF | | $ | 452 | |
| Dynamic Building & Construction ETF | | | 380 | |
| Dynamic Energy Exploration & Production ETF | | | 7,210 | |
| Dynamic Food & Beverage ETF | | | 16,236 | |
| Dynamic Leisure and Entertainment ETF | | | 275 | |
| Dynamic Media ETF | | | 24,788 | |
| Dynamic Networking ETF | | | 10,342 | |
| Dynamic Oil & Gas Services ETF | | | 53,706 | |
| Dynamic Pharmaceuticals ETF | | | 574 | |
| Dynamic Retail ETF | | | 61,246 | |
| Dynamic Semiconductors ETF | | | 545 | |
| Dynamic Software ETF | | | 234 | |
The fees waived and/or expenses borne by the Adviser are subject to recapture by the Adviser up to three years from the date the fees were waived or the expenses were incurred, but no recapture payment will be made by the Funds if it would result in the Funds exceeding (i) the Expense Cap or (ii) the expense cap in effect at the time the fees and/or expenses subject to recapture were waived and/or borne by the Adviser.
For the following Funds, the amounts available for potential future recapture by the Adviser under the Expense Agreement and the expiration schedule at April 30, 2019 are as follows:
| | | | | | | | | | | | | | | | |
| | | Total
Potential
Recapture
Amounts | | | Potential Recapture Amounts
Expiring | |
| | | 4/30/20 | | | 4/30/21 | | | 4/30/22 | |
| Dynamic Energy Exploration & Production ETF | | $ | 113,476 | | | $ | 48,725 | | | $ | 57,701 | | | $ | 7,050 | |
| Dynamic Food & Beverage ETF | | | 37,384 | | | | — | | | | 21,375 | | | | 16,009 | |
| Dynamic Media ETF | | | 61,734 | | | | 144 | | | | 36,982 | | | | 24,608 | |
| Dynamic Networking ETF | | | 141,583 | | | | 65,931 | | | | 65,560 | | | | 10,092 | |
| Dynamic Oil & Gas Services ETF | | | 184,220 | | | | 54,195 | | | | 76,492 | | | | 53,533 | |
| Dynamic Retail ETF | | | 216,749 | | | | 70,612 | | | | 85,026 | | | | 61,111 | |
The Trust has entered into a Distribution Agreement with Invesco Distributors, Inc. (the “Distributor”), which serves as the distributor of Creation Units for each Fund. The Distributor does not maintain a secondary market in the Shares. The Funds are not charged any fees pursuant to the Distribution Agreement. The Distributor is an affiliate of the Adviser.
The Adviser has entered into a licensing agreement for each Fund with ICE Data Indices, LLC (the “Licensor”). Each Underlying Index name trademark is owned by the Licensor. These trademarks have been licensed to the Adviser for use by the Funds. Each Fund is entitled to use its Underlying Index pursuant to the Trust’ssub-licensing agreement with the Adviser. The Funds are required to pay thesub-licensing fees that are shown on the Statements of Operations. The Funds are not sponsored, endorsed, sold or promoted by the Licensor, and the Licensor makes no representation regarding the advisability of investing in any of the Funds.
The Trust has entered into service agreements whereby The Bank of New York Mellon, a wholly-owned subsidiary of The Bank of New York Mellon Corporation, serves as the administrator, custodian, fund accountant and transfer agent for each Fund.
NOTE 4—Additional Valuation Information
GAAP defines fair value as the price that would be received to sell an asset or paid to transfer a liability in an orderly transaction between market participants at the measurement date, under current market conditions. GAAP establishes a hierarchy that prioritizes the inputs to valuation methods, giving the highest priority to readily available unadjusted quoted prices in an active market for identical assets (Level 1) and the lowest priority to significant unobservable inputs (Level 3), generally when market prices are not readily available or are unreliable. Based on the valuation inputs, the securities or other investments are tiered into one of three levels. Changes in valuation methods may result in transfers in or out of an investment’s assigned level:
| | Level 1 — | Prices are determined using quoted prices in an active market for identical assets. |
| | Level 2 — | Prices are determined using other significant observable inputs. Observable inputs are inputs that other market participants may use in pricing a security. These may include quoted prices for similar securities, interest rates, prepayment speeds, credit risk, yield curves, loss severities, default rates, discount rates, volatilities and others. |
| | Level 3 — | Prices are determined using significant unobservable inputs. In situations where quoted prices or observable inputs are unavailable (for example, when there is little or no market activity for an investment at the end of the period), unobservable inputs may be used. Unobservable inputs reflect a Fund’s own assumptions about the factors market participants would use in determining fair value of the securities or instruments and would be based on the best available information. |
As of April 30, 2019, all of the securities in each Fund were valued based on Level 1 inputs (see the Schedules of Investments for security categories). The level assigned to the securities valuations may not be an indication of the risk or liquidity associated with investing in those securities. Because of the inherent uncertainties of valuation, the values reflected in the financial statements may materially differ from the value received upon actual sale of those investments.
NOTE 5—Distributions to Shareholders and Tax Components of Net Assets
Tax Character of Distributions to Shareholders Paid During the Fiscal Years Ended April 30, 2019 and 2018:
| | | | | | | | |
| | | 2019 | | | 2018 | |
| | | Ordinary
Income | | | Ordinary
Income | |
| Dynamic Biotechnology & Genome ETF | | $ | 11,178 | | | $ | 1,130,430 | |
| Dynamic Building & Construction ETF | | | 854,627 | | | | 648,374 | |
| Dynamic Energy Exploration & Production ETF | | | 706,116 | | | | 989,971 | |
| Dynamic Food & Beverage ETF | | | 759,871 | | | | 1,168,900 | |
| Dynamic Leisure and Entertainment ETF | | | 634,213 | | | | 1,074,686 | |
| Dynamic Media ETF | | | 415,501 | | | | 441,052 | |
| Dynamic Networking ETF | | | 851,255 | | | | 178,729 | |
| Dynamic Oil & Gas Services ETF | | | 193,273 | | | | 971,048 | |
| Dynamic Pharmaceuticals ETF | | | 5,380,286 | | | | 4,756,214 | |
| Dynamic Retail ETF | | | 122,169 | | | | 163,669 | |
| Dynamic Semiconductors ETF | | | 1,907,533 | | | | 720,638 | |
| Dynamic Software ETF | | | — | | | | — | |
Tax Components of Net Assets at FiscalYear-End:
| | | | | | | | | | | | | | | | | | | | | | | | | | | | |
| | | Undistributed
Ordinary
Income | | | Temporary
Book/Tax
Differences | | | Net
Unrealized
Appreciation
(Depreciation)-
Investments | | | Capital Loss
Carryforwards | | | Late-Year
Ordinary
Loss
Deferral | | | Shares of
Beneficial
Interest | | | Total
Net Assets | |
| Dynamic Biotechnology & Genome ETF | | $ | — | | | $ | (53,631 | ) | | $ | 1,718,443 | | | $ | (187,731,260 | ) | | $ | (388,337 | ) | | $ | 434,481,876 | | | $ | 248,027,091 | |
| Dynamic Building & Construction ETF | | | 101,133 | | | | (35,423 | ) | | | 9,141,906 | | | | (68,664,463 | ) | | | — | | | | 178,096,052 | | | | 118,639,205 | |
| Dynamic Energy Exploration & Production ETF | | | 59,771 | | | | (37,255 | ) | | | (10,455,592 | ) | | | (103,766,753 | ) | | | — | | | | 154,278,084 | | | | 40,078,255 | |
| Dynamic Food & Beverage ETF | | | 167,792 | | | | (43,875 | ) | | | 6,398,237 | | | | (76,849,923 | ) | | | — | | | | 142,158,667 | | | | 71,830,898 | |
| Dynamic Leisure and Entertainment ETF | | | — | | | | (36,701 | ) | | | 3,081,774 | | | | (67,519,853 | ) | | | (5,578 | ) | | | 131,681,432 | | | | 67,201,074 | |
| Dynamic Media ETF | | | — | | | | (38,614 | ) | | | 5,495,434 | | | | (76,831,449 | ) | | | — | | | | 159,722,849 | | | | 88,348,220 | |
| Dynamic Networking ETF | | | 78,827 | | | | (31,785 | ) | | | 15,636,764 | | | | (38,856,094 | ) | | | — | | | | 124,222,874 | | | | 101,050,586 | |
| Dynamic Oil & Gas Services ETF | | | — | | | | (45,175 | ) | | | (7,144,571 | ) | | | (92,814,672 | ) | | | (113,144 | ) | | | 117,636,570 | | | | 17,519,008 | |
| Dynamic Pharmaceuticals ETF | | | 536,554 | | | | (85,196 | ) | | | 8,840,270 | | | | (373,362,801 | ) | | | — | | | | 780,661,769 | | | | 416,590,596 | |
| Dynamic Retail ETF | | | 12,212 | | | | (30,392 | ) | | | 643,006 | | | | (21,223,093 | ) | | | — | | | | 28,294,260 | | | | 7,695,993 | |
| Dynamic Semiconductors ETF | | | 174,323 | | | | (34,023 | ) | | | 27,780,329 | | | | (38,118,948 | ) | | | — | | | | 210,621,302 | | | | 200,422,983 | |
| Dynamic Software ETF | | | — | | | | (34,428 | ) | | | 57,515,355 | | | | (23,589,524 | ) | | | (166,102 | ) | | | 403,517,628 | | | | 437,242,929 | |
Capital loss carryforwards are calculated and reported as of a specific date. Results of transactions and other activity after that date may affect the amount of capital loss carryforwards actually available for the Funds to utilize. Capital losses generated in years beginning after December 22, 2010 can be carried forward for an unlimited period, whereas previous losses expire in eight tax years. Capital losses with an expiration period may not be used to offset capital gains until all net capital losses without an expiration date have been utilized. Capital loss carryforwards with no expiration date will retain their character as either short-term
or long-term capital losses instead of as short-term capital losses as under prior law. The ability to utilize capital loss carryforwards in the future may be limited under the Internal Revenue Code and related regulations based on the results of future transactions.
The following table presents available capital loss carryforwards for each Fund as of April 30, 2019:
| | | | | | | | | | | | |
| | | Post-effective/no expiration | | | | |
| | | Short-Term | | | Long-Term | | | Total* | |
| Dynamic Biotechnology & Genome ETF | | $ | 167,680,588 | | | $ | 20,050,672 | | | $ | 187,731,260 | |
| Dynamic Building & Construction ETF | | | 62,299,799 | | | | 6,364,664 | | | | 68,664,463 | |
| Dynamic Energy Exploration & Production ETF | | | 82,207,341 | | | | 21,559,412 | | | | 103,766,753 | |
| Dynamic Food & Beverage ETF | | | 67,538,029 | | | | 9,311,894 | | | | 76,849,923 | |
| Dynamic Leisure and Entertainment ETF | | | 65,951,386 | | | | 1,568,467 | | | | 67,519,853 | |
| Dynamic Media ETF | | | 74,715,626 | | | | 2,115,823 | | | | 76,831,449 | |
| Dynamic Networking ETF | | | 29,507,856 | | | | 9,348,238 | | | | 38,856,094 | |
| Dynamic Oil & Gas Services ETF | | | 54,542,820 | | | | 38,271,852 | | | | 92,814,672 | |
| Dynamic Pharmaceuticals ETF | | | 144,123,467 | | | | 229,239,334 | | | | 373,362,801 | |
| Dynamic Retail ETF | | | 19,666,912 | | | | 1,556,181 | | | | 21,223,093 | |
| Dynamic Semiconductors ETF | | | 35,527,628 | | | | 2,591,320 | | | | 38,118,948 | |
| Dynamic Software ETF | | | 23,589,524 | | | | — | | | | 23,589,524 | |
| * | Capital loss carryforward as of the date listed above is reduced for limitations, if any, to the extent required by the Internal Revenue Code and may be further limited depending upon a variety of factors, including the realization of net unrealized gains or losses as of the date of any reorganization. |
NOTE 6—Investment Transactions
For the fiscal year ended April 30, 2019, the cost of securities purchased and proceeds from sales of securities (other than short-term securities, U.S. Treasury obligations, money market funds andin-kind transactions, if any) were as follows:
| | | | | | | | |
| | | Purchases | | | Sales | |
| Dynamic Biotechnology & Genome ETF | | $ | 318,458,363 | | | $ | 318,612,960 | |
| Dynamic Building & Construction ETF | | | 261,309,485 | | | | 260,305,017 | |
| Dynamic Energy Exploration & Production ETF | | | 82,528,263 | | | | 82,931,982 | |
| Dynamic Food & Beverage ETF | | | 90,952,448 | | | | 89,634,988 | |
| Dynamic Leisure and Entertainment ETF | | | 241,340,155 | | | | 241,173,475 | |
| Dynamic Media ETF | | | 63,896,940 | | | | 62,597,912 | |
| Dynamic Networking ETF | | | 68,908,404 | | | | 68,084,504 | |
| Dynamic Oil & Gas Services ETF | | | 21,767,410 | | | | 21,610,181 | |
| Dynamic Pharmaceuticals ETF | | | 416,716,194 | | | | 414,947,976 | |
| Dynamic Retail ETF | | | 14,679,438 | | | | 15,723,972 | |
| Dynamic Semiconductors ETF | | | 236,735,800 | | | | 239,450,073 | |
| Dynamic Software ETF | | | 439,211,267 | | | | 432,012,551 | |
For the fiscal year ended April 30, 2019,in-kind transactions associated with creations and redemptions were as follows:
| | | | | | | | |
| | | Cost of
Securities
Received | | | Value of
Securities
Delivered | |
| Dynamic Biotechnology & Genome ETF | | $ | 182,392,891 | | | $ | 182,043,811 | |
| Dynamic Building & Construction ETF | | | 124,801,106 | | | | 278,934,134 | |
| Dynamic Energy Exploration & Production ETF | | | 101,139,143 | | | | 85,635,508 | |
| Dynamic Food & Beverage ETF | | | 40,945,289 | | | | 51,232,111 | |
| Dynamic Leisure and Entertainment ETF | | | 150,625,517 | | | | 194,491,833 | |
| Dynamic Media ETF | | | 84,253,360 | | | | 53,985,840 | |
| Dynamic Networking ETF | | | 66,215,799 | | | | 40,307,490 | |
| Dynamic Oil & Gas Services ETF | | | 12,408,204 | | | | 24,158,914 | |
| Dynamic Pharmaceuticals ETF | | | 148,529,562 | | | | 273,426,963 | |
| Dynamic Retail ETF | | | 9,733,917 | | | | 12,525,643 | |
| Dynamic Semiconductors ETF | | | 157,733,109 | | | | 306,260,453 | |
| Dynamic Software ETF | | | 547,782,797 | | | | 350,345,818 | |
Gains (losses) onin-kind transactions are generally not considered taxable gains (losses) for federal income tax purposes. At April 30, 2019, the aggregate cost of investments, including any derivatives, on a tax basis includes adjustments for financial reporting purposes as of the most recently completed federal income tax reportingperiod-end:
| | | | | | | | | | | | | | | | |
| | | Gross
Unrealized
Appreciation | | | Gross
Unrealized
(Depreciation) | | | Net
Unrealized
Appreciation
(Depreciation) | | | Cost | |
| Dynamic Biotechnology & Genome ETF | | $ | 25,404,336 | | | $ | (23,685,893 | ) | | $ | 1,718,443 | | | $ | 253,901,469 | |
| Dynamic Building & Construction ETF | | | 12,204,307 | | | | (3,062,401 | ) | | | 9,141,906 | | | | 109,719,898 | |
| Dynamic Energy Exploration & Production ETF | | | 1,949,333 | | | | (12,404,925 | ) | | | (10,455,592 | ) | | | 50,770,125 | |
| Dynamic Food & Beverage ETF | | | 8,388,561 | | | | (1,990,324 | ) | | | 6,398,237 | | | | 69,988,628 | |
| Dynamic Leisure and Entertainment ETF | | | 4,686,160 | | | | (1,604,386 | ) | | | 3,081,774 | | | | 65,596,812 | |
| Dynamic Media ETF | | | 7,791,727 | | | | (2,296,293 | ) | | | 5,495,434 | | | | 84,146,652 | |
| Dynamic Networking ETF | | | 16,041,542 | | | | (404,778 | ) | | | 15,636,764 | | | | 87,268,777 | |
| Dynamic Oil & Gas Services ETF | | | 343,993 | | | | (7,488,564 | ) | | | (7,144,571 | ) | | | 25,742,136 | |
| Dynamic Pharmaceuticals ETF | | | 48,922,684 | | | | (40,082,414 | ) | | | 8,840,270 | | | | 408,743,037 | |
| Dynamic Retail ETF | | | 1,045,887 | | | | (402,881 | ) | | | 643,006 | | | | 7,287,933 | |
| Dynamic Semiconductors ETF | | | 31,318,625 | | | | (3,538,296 | ) | | | 27,780,329 | | | | 172,936,267 | |
| Dynamic Software ETF | | | 63,060,888 | | | | (5,545,533 | ) | | | 57,515,355 | | | | 394,255,028 | |
NOTE 7—Reclassification of Permanent Differences
Primarily as a result of differing book/tax treatment ofin-kind transactions and expired capital loss carryforwards, amounts were reclassified between undistributed net investment income (loss), undistributed net realized gain (loss) and Shares of beneficial interest. These reclassifications had no effect on the net assets of each Fund. For the fiscal year ended April 30, 2019, the reclassifications were as follows:
| | | | | | | | | | | | |
| | | Undistributed
Net Investment
Income (Loss) | | | Undistributed
Net Realized
Gain (Loss) | | | Shares of
Beneficial
Interest | |
| Dynamic Biotechnology & Genome ETF | | $ | 646,075 | | | $ | (20,963,146 | ) | | $ | 20,317,071 | |
| Dynamic Building & Construction ETF | | | — | | | | (9,286,559 | ) | | | 9,286,559 | |
| Dynamic Energy Exploration & Production ETF | | | 16,050 | | | | (3,384,964 | ) | | | 3,368,914 | |
| Dynamic Food & Beverage ETF | | | — | | | | (5,515,845 | ) | | | 5,515,845 | |
| Dynamic Leisure and Entertainment ETF | | | 209 | | | | (11,399,923 | ) | | | 11,399,714 | |
| Dynamic Media ETF | | | 51,037 | | | | (495,722 | ) | | | 444,685 | |
| Dynamic Networking ETF | | | — | | | | (5,519,052 | ) | | | 5,519,052 | |
| Dynamic Oil & Gas Services ETF | | | (119,234 | ) | | | 34,799,810 | | | | (34,680,576 | ) |
| Dynamic Pharmaceuticals ETF | | | — | | | | (54,685,553 | ) | | | 54,685,553 | |
| Dynamic Retail ETF | | | — | | | | 667,434 | | | | (667,434 | ) |
| Dynamic Semiconductors ETF | | | — | | | | (42,298,746 | ) | | | 42,298,746 | |
| Dynamic Software ETF | | | 729,822 | | | | (34,648,245 | ) | | | 33,918,423 | |
NOTE 8—Trustees’ and Officer’s Fees
Trustees’ and Officer’s Fees include amounts accrued by the Funds to pay remuneration to the Independent Trustees and an Officer of the Trust. The Trustee who is an “interested person” of the Trust does not receive any Trustees’ fees.
The Trust has adopted a deferred compensation plan (the “Plan”). Under the Plan, each Independent Trustee who has executed a Deferred Fee Agreement (a “Participating Trustee”) may defer receipt of all or a portion of his compensation (“Deferral Fees”). Such Deferral Fees are deemed to be invested in select Invesco Funds. The Deferral Fees payable to the Participating Trustee are valued as of the date such Deferral Fees would have been paid to the Participating Trustee. The value increases with contributions or with increases in the value of the Shares selected, and the value decreases with distributions or with declines in the value of the Shares selected. Obligations under the Plan represent unsecured claims against the general assets of the Funds.
NOTE 9—Capital
Shares are created and redeemed by each Fund only in Creation Units of 50,000 Shares. Only Authorized Participants are permitted to purchase or redeem Creation Units from the Funds. Such transactions are principally permitted in exchange for Deposit Securities, with a balancing cash component to equate the transaction to the NAV per Share of a Fund of the Trust on the transaction date. However, for all Funds, cash in an amount equivalent to the value of certain securities may be substituted,
generally when the securities are not available in sufficient quantity for delivery, not eligible for trading by the Authorized Participant or as a result of other market circumstances.
To the extent that the Funds permit transactions in exchange for Deposit Securities, each Fund may issue Shares in advance of receipt of Deposit Securities subject to various conditions, including a requirement to maintain on deposit with the Trust cash at least equal to 105% of the market value of the missing Deposit Securities. In accordance with the Trust’s Participant Agreement, Creation Units will be issued to an Authorized Participant, notwithstanding the fact that the corresponding Deposit Securities have not been received in part or in whole, in reliance on the undertaking of the Authorized Participant to deliver the missing Deposit Securities as soon as possible, which undertaking shall be secured by the Authorized Participant’s delivery and maintenance of collateral consisting of cash in the form of U.S. dollars in immediately available funds having a value(marked-to-market daily) at least equal to 105%, which the Adviser may change from time to time, of the value of the missing Deposit Securities.
Certain transaction fees may be charged by the Funds for creations and redemptions, which are treated as increases in capital. Transactions in each Fund’s Shares are disclosed in detail in the Statements of Changes in Net Assets.
Report of Independent Registered Public Accounting Firm
To the Board of Trustees of Invesco Exchange-Traded Fund Trust and Shareholders of Invesco Dynamic Biotechnology & Genome ETF, Invesco Dynamic Building & Construction ETF, Invesco Dynamic Energy Exploration & Production ETF, Invesco Dynamic Food & Beverage ETF, Invesco Dynamic Leisure and Entertainment ETF, Invesco Dynamic Media ETF, Invesco Dynamic Networking ETF, Invesco Dynamic Oil & Gas Services ETF, Invesco Dynamic Pharmaceuticals ETF, Invesco Dynamic Retail ETF, Invesco Dynamic Semiconductors ETF and Invesco Dynamic Software ETF
Opinions on the Financial Statements
We have audited the accompanying statements of assets and liabilities, including the schedules of investments, of Invesco Dynamic Biotechnology & Genome ETF, Invesco Dynamic Building & Construction ETF, Invesco Dynamic Energy Exploration & Production ETF, Invesco Dynamic Food & Beverage ETF, Invesco Dynamic Leisure and Entertainment ETF, Invesco Dynamic Media ETF, Invesco Dynamic Networking ETF, Invesco Dynamic Oil & Gas Services ETF, Invesco Dynamic Pharmaceuticals ETF, Invesco Dynamic Retail ETF, Invesco Dynamic Semiconductors ETF and Invesco Dynamic Software ETF (twelve of the funds constituting Invesco Exchange-Traded Fund Trust, hereafter collectively referred to as the “Funds”) as of April 30, 2019, the related statements of operations for the year ended April 30, 2019, the statements of changes in net assets for each of the two years in the period ended April 30, 2019, including the related notes, and the financial highlights for each of the five years in the period ended April 30, 2019 (collectively referred to as the “financial statements”). In our opinion, the financial statements present fairly, in all material respects, the financial position of each of the Funds as of April 30, 2019, the results of each of their operations for the year then ended, the changes in each of their net assets for each of the two years in the period ended April 30, 2019, and each of the financial highlights for each of the five years in the period ended April 30, 2019 in conformity with accounting principles generally accepted in the United States of America.
Basis for Opinions
These financial statements are the responsibility of the Funds’ management. Our responsibility is to express an opinion on the Funds’ financial statements based on our audits. We are a public accounting firm registered with the Public Company Accounting Oversight Board (United States) (“PCAOB”) and are required to be independent with respect to the Funds in accordance with the U.S. federal securities laws and the applicable rules and regulations of the Securities and Exchange Commission and the PCAOB.
We conducted our audits of these financial statements in accordance with the standards of the PCAOB. Those standards require that we plan and perform the audit to obtain reasonable assurance about whether the financial statements are free of material misstatement, whether due to error or fraud.
Our audits included performing procedures to assess the risks of material misstatement of the financial statements, whether due to error or fraud, and performing procedures that respond to those risks. Such procedures included examining, on a test basis, evidence regarding the amounts and disclosures in the financial statements. Our audits also included evaluating the accounting principles used and significant estimates made by management, as well as evaluating the overall presentation of the financial statements. Our procedures included confirmation of securities owned as of April 30, 2019 by correspondence with the custodian and transfer agent. We believe that our audits provide a reasonable basis for our opinions.
PricewaterhouseCoopers LLP
Chicago, Illinois
June 26, 2019
We have served as the auditor of one or more of the investment companies in the Invesco group of investment companies since at least 1995. We have not determined the specific year we began serving as auditor.
Calculating your ongoing Fund expenses
Example
As a shareholder of a Fund of the Invesco Exchange-Traded Fund Trust, you incur advisory fees and other Fund expenses. The expense examples below are intended to help you understand your ongoing costs (in dollars) of investing in the Funds and to compare these costs with the ongoing costs of investing in other funds.
The example is based on an investment of $1,000 invested at the beginning of the period and held through thesix-month period ended April 30, 2019.
Actual Expenses
The first line in the following table provides information about actual account values and actual expenses. You may use the information in this line, together with the amount you invested, to estimate the expenses that you paid over the period. Simply divide your account value by $1,000 (for example, an $8,600 account value divided by $1,000 = 8.6), then multiply the result by the number in the first line under the heading “Expenses Paid During theSix-Month Period” to estimate the expenses you paid on your account during this period.
Hypothetical Example for Comparison Purposes
The second line in the following table provides information about hypothetical account values and hypothetical expenses based on each Fund’s actual expense ratio and an assumed annualized rate of return of 5% per year before expenses, which is not the Fund’s actual return. The hypothetical account values and expenses may not be used to estimate the actual ending account balance or expenses you paid for the period. You may use this information to compare the ongoing costs of investing in the Funds and other funds. To do so, compare this 5% hypothetical example with the 5% hypothetical examples that appear in the shareholder reports of the other funds.
Please note that the expenses shown in the table are meant to highlight your ongoing costs only, and do not reflect any transactional costs such as sales charges and brokerage commissions. Therefore the second line in the table is useful in comparing ongoing costs only, and will not help you determine the relative total costs of owning different funds. In addition, if these transactional costs were included, your costs would have been higher.
| | | | | | | | | | | | | | | | |
| | | Beginning
Account Value
November 1, 2018 | | | Ending
Account Value
April 30, 2019 | | | Annualized
Expense Ratio
Based on the
Six-Month Period | | | Expenses Paid
During the
Six-Month Period(1) | |
| Invesco Dynamic Biotechnology & Genome ETF (PBE) | | | | | | | | | | | | | | | | |
Actual | | | $1,000.00 | | | | $1,020.30 | | | | 0.57% | | | | $2.86 | |
Hypothetical (5% return before expenses) | | | 1,000.00 | | | | 1,021.97 | | | | 0.57 | | | | 2.86 | |
| Invesco Dynamic Building & Construction ETF (PKB) | | | | | | | | | | | | | | | | |
Actual | | | 1,000.00 | | | | 1,158.40 | | | | 0.61 | | | | 3.26 | |
Hypothetical (5% return before expenses) | | | 1,000.00 | | | | 1,021.77 | | | | 0.61 | | | | 3.06 | |
| Invesco Dynamic Energy Exploration & Production ETF (PXE) | | | | | | | | | | | | | | | | |
Actual | | | 1,000.00 | | | | 852.10 | | | | 0.63 | | | | 2.89 | |
Hypothetical (5% return before expenses) | | | 1,000.00 | | | | 1,021.67 | | | | 0.63 | | | | 3.16 | |
| Invesco Dynamic Food & Beverage ETF (PBJ) | | | | | | | | | | | | | | | | |
Actual | | | 1,000.00 | | | | 1,065.70 | | | | 0.63 | | | | 3.23 | |
Hypothetical (5% return before expenses) | | | 1,000.00 | | | | 1,021.67 | | | | 0.63 | | | | 3.16 | |
| Invesco Dynamic Leisure and Entertainment ETF (PEJ) | | | | | | | | | | | | | | | | |
Actual | | | 1,000.00 | | | | 1,066.50 | | | | 0.63 | | | | 3.23 | |
Hypothetical (5% return before expenses) | | | 1,000.00 | | | | 1,021.67 | | | | 0.63 | | | | 3.16 | |
| Invesco Dynamic Media ETF (PBS) | | | | | | | | | | | | | | | | |
Actual | | | 1,000.00 | | | | 1,125.00 | | | | 0.63 | | | | 3.32 | |
Hypothetical (5% return before expenses) | | | 1,000.00 | | | | 1,021.67 | | | | 0.63 | | | | 3.16 | |
Calculating your ongoing Fund expenses(continued)
| | | | | | | | |
| | | Beginning
Account Value
November 1, 2018 | | Ending
Account Value
April 30, 2019 | | Annualized
Expense Ratio
Based on the
Six-Month Period | | Expenses Paid
During the
Six-Month Period(1) |
| Invesco Dynamic Networking ETF (PXQ) | | | | | | | | |
Actual | | $1,000.00 | | $1,223.60 | | 0.63% | | $3.47 |
Hypothetical (5% return before expenses) | | 1,000.00 | | 1,021.67 | | 0.63 | | 3.16 |
| Invesco Dynamic Oil & Gas Services ETF (PXJ) | | | | | | | | |
Actual | | 1,000.00 | | 806.30 | | 0.63 | | 2.82 |
Hypothetical (5% return before expenses) | | 1,000.00 | | 1,021.67 | | 0.63 | | 3.16 |
| Invesco Dynamic Pharmaceuticals ETF (PJP) | | | | | | | | |
Actual | | 1,000.00 | | 951.40 | | 0.55 | | 2.66 |
Hypothetical (5% return before expenses) | | 1,000.00 | | 1,022.07 | | 0.55 | | 2.76 |
| Invesco Dynamic Retail ETF (PMR) | | | | | | | | |
Actual | | 1,000.00 | | 1,013.80 | | 0.63 | | 3.15 |
Hypothetical (5% return before expenses) | | 1,000.00 | | 1,021.67 | | 0.63 | | 3.16 |
| Invesco Dynamic Semiconductors ETF (PSI) | | | | | | | | |
Actual | | 1,000.00 | | 1,246.40 | | 0.59 | | 3.29 |
Hypothetical (5% return before expenses) | | 1,000.00 | | 1,021.87 | | 0.59 | | 2.96 |
| Invesco Dynamic Software ETF (PSJ) | | | | | | | | |
Actual | | 1,000.00 | | 1,263.60 | | 0.57 | | 3.20 |
Hypothetical (5% return before expenses) | | 1,000.00 | | 1,021.97 | | 0.57 | | 2.86 |
| (1) | Expenses are calculated using the annualized expense ratio, which represents the ongoing expenses as a percentage of net assets for thesix-month period ended April 30, 2019. Expenses are calculated by multiplying the Fund’s annualized expense ratio by the average account value for the period, then multiplying the result by 181/365. Expense ratios for the most recentsix-month period may differ from expense ratios based on the annualized data in the Financial Highlights. |
Tax Information
Form 1099-DIV, Form 1042-S and other year–end tax information provide shareholders with actual calendar year amounts that should be included in their tax returns. Shareholders should consult their tax advisers.
The following distribution information is being provided as required by the Internal Revenue Code or to meet a specific state’s requirement.
Each Fund designates the following amounts or, if subsequently determined to be different, the maximum amount allowable for its fiscal year ended April 30, 2019:
| | | | | | | | | | |
| | | Qualified Dividend
Income* | | Dividends-Received
Deduction* |
| Invesco Dynamic Biotechnology & Genome ETF | | | | 0 | % | | | | 0 | % |
| Invesco Dynamic Building & Construction ETF | | | | 100 | % | | | | 100 | % |
| Invesco Dynamic Energy Exploration & Production ETF | | | | 100 | % | | | | 100 | % |
| Invesco Dynamic Food & Beverage ETF | | | | 100 | % | | | | 100 | % |
| Invesco Dynamic Leisure and Entertainment ETF | | | | 100 | % | | | | 100 | % |
| Invesco Dynamic Media ETF | | | | 100 | % | | | | 100 | % |
| Invesco Dynamic Networking ETF | | | | 84 | % | | | | 78 | % |
| Invesco Dynamic Oil & Gas Services ETF | | | | 100 | % | | | | 94 | % |
| Invesco Dynamic Pharmaceuticals ETF | | | | 100 | % | | | | 100 | % |
| Invesco Dynamic Retail ETF | | | | 100 | % | | | | 100 | % |
| Invesco Dynamic Semiconductors ETF | | | | 100 | % | | | | 100 | % |
| Invesco Dynamic Software ETF | | | | 0 | % | | | | 0 | % |
* The above percentages are based on ordinary income dividends paid to shareholders during the fiscal year.
Trustees and Officers
The Independent Trustees of the Trust, their term of office and length of time served, their principal business occupations during at least the past five years, the number of portfolios in the Fund Complex (as defined below) overseen by each Independent Trustee and the other directorships, if any, held by each Independent Trustee are shown below.
| | | | | | | | | | |
Name, Address and Year of
Birth of Independent Trustees | | Position(s)
Held
with Trust | | Term of
Office
and
Length of
Time
Served* | | Principal
Occupation(s) During
Past 5 Years | | Number of
Portfolios
in Fund
Complex**
Overseen by
Independent
Trustees | | Other
Directorships
Held by
Independent
Trustees During
the Past 5 Years |
Ronn R. Bagge—1958
c/o Invesco Capital Management LLC
3500 Lacey Road, Suite 700
Downers Grove, IL 60515 | | Vice Chairman of the Board; Chairman of the Nominating and Governance Committee and Trustee | | Vice Chairman since 2018; Chairman of the Nominating and Governance Committee and Trustee since 2003 | | Founder and Principal, YQA Capital Management LLC (1998-Present); formerly, Owner/CEO of Electronic Dynamic Balancing Co., Inc. (high-speed rotating equipment service provider). | | 241 | | Trustee and Investment Oversight Committee member, Mission Aviation Fellowship (2017-Present). |
| | | | | |
Todd J. Barre—1957
c/o Invesco Capital Management LLC
3500 Lacey Road, Suite 700
Downers Grove, IL 60515 | | Trustee | | Since 2010 | | Assistant Professor of Business, Trinity Christian College (2010-2016); formerly, Vice President and Senior Investment Strategist (2001-2008), Director of Open Architecture and Trading (2007-2008), Head of Fundamental Research (2004-2007), and Vice President and Senior Fixed Income Strategist (1994-2001), BMO Financial Group/Harris Private Bank. | | 241 | | None. |
| | | | | |
Marc M. Kole—1960
c/o Invesco Capital Management LLC
3500 Lacey Road, Suite 700
Downers Grove, IL 60515 | | Chairman of the Audit Committee and Trustee | | Chairman of the Audit Committee since 2008; Trustee since 2006 | | Senior Director of Finance, By The Hand Club For Kids (not-for-profit) (2015-Present); formerly, Chief Financial Officer, Hope Network (social services) (2008-2012); Assistant Vice President and Controller, Priority Health (health insurance) (2005-2008); Regional Chief Financial Officer, United Healthcare (2005); Chief Accounting Officer, Senior Vice President of Finance, Oxford Health Plans (2000-2004); Audit Partner, Arthur Andersen LLP (1996-2000). | | 241 | | Treasurer (2018-Present), Finance Committee Member (2015-Present) and Audit Committee Member (2015), Thornapple Evangelical Covenant Church; formerly, Board and Finance Committee Member (2009-2017) and Treasurer (2010-2015, 2017), NorthPointe Christian Schools. |
| * | This is the date the Independent Trustee began serving the Trust. Each Independent Trustee serves an indefinite term, until his successor is elected. |
| ** | Fund Complex includes all open- and closed-end funds (including all of their portfolios) advised by the Adviser and any affiliated person of the Adviser. |
Trustees and Officers(continued)
| | | | | | | | | | |
Name, Address and Year of
Birth of Independent Trustees | | Position(s)
Held
with Trust | | Term of
Office
and
Length of
Time
Served* | | Principal
Occupation(s) During
Past 5 Years | | Number of
Portfolios
in Fund
Complex**
Overseen by
Independent
Trustees | | Other
Directorships
Held by
Independent
Trustees During
the Past 5 Years |
Yung Bong Lim—1964
c/o Invesco Capital Management LLC
3500 Lacey Road, Suite 700
Downers Grove, IL 60515 | | Chairman of the Investment Oversight Committee and Trustee | | Chairman of the Investment Oversight Committee since 2014; Trustee since 2013 | | Managing Partner, RDG Funds LLC (real estate) (2008-Present); formerly, Managing Director, Citadel LLC (1999-2007). | | 241 | | Advisory Board Member, Performance Trust Capital Partners, LLC (2008-Present); Board Director, Beacon Power Services, Corp. (2019-Present). |
| | | | | |
Gary R. Wicker—1961
c/o Invesco Capital Management LLC
3500 Lacey Road, Suite 700
Downers Grove, IL 60515 | | Trustee | | Since 2013 | | Senior Vice President of Global Finance and Chief Financial Officer at RBC Ministries (publishing company) (2013-Present); formerly, Executive Vice President and Chief Financial Officer, Zondervan Publishing (a division of Harper Collins/NewsCorp) (2007-2012); Senior Vice President and Group Controller (2005-2006), Senior Vice President and Chief Financial Officer (2003-2004), Chief Financial Officer (2001-2003), Vice President, Finance and Controller (1999-2001) and Assistant Controller (1997-1999), divisions of The Thomson Corporation (information services provider); Senior Audit Manager (1994-1997), PricewaterhouseCoopers LLP. | | 241 | | Board Member and Treasurer, Our Daily Bread Ministries Canada (2015-Present); Board and Finance Committee Member, West Michigan Youth For Christ (2010-Present). |
| | | | | |
Donald H. Wilson—1959
c/o Invesco Capital Management LLC
3500 Lacey Road, Suite 700
Downers Grove, IL 60515 | | Chairman of the Board and Trustee | | Chairman since 2012; Trustee since 2006 | | Chairman, President and Chief Executive Officer, McHenry Bancorp Inc. and McHenry Savings Bank (subsidiary) (2018-Present); Chairman and Chief Executive Officer, Stone Pillar Advisors, Ltd. (advisory services to the financial sector) (2010-Present); formerly, President and Chief Executive Officer, Stone Pillar Investments, Ltd. (2016-2018); Chairman, President and Chief Executive Officer, Community Financial Shares, Inc. and Community Bank—Wheaton/Glen Ellyn (subsidiary) (2013-2015); Chief Operating Officer, AMCORE Financial, Inc. (bank holding company) (2007-2009); Executive Vice President and Chief Financial Officer, AMCORE Financial, Inc. (2006-2007); Senior Vice President and Treasurer, Marshall & Ilsley Corp. (bank holding company) (1995-2006). | | 241 | | Director, Penfield Children’s Center (2004-present); Board Chairman, Gracebridge Alliance, Inc. (2015-present). |
| * | This is the date the Independent Trustee began serving the Trust. Each Independent Trustee serves an indefinite term, until his successor is elected. |
| ** | Fund Complex includes all open- and closed-end funds (including all of their portfolios) advised by the Adviser and any affiliated person of the Adviser. |
Trustees and Officers(continued)
The Interested Trustee and the executive officers of the Trust, their term of office and length of time served, their principal business occupations during at least the past five years, the number of portfolios in the Fund Complex (as defined below) overseen by the Interested Trustee and the other directorships, if any, held by the Interested Trustee are shown below.
| | | | | | | | | | |
Name, Address and Year of
Birth of Interested Trustee | | Position(s)
Held
with Trust | | Term of
Office
and
Length of
Time
Served* | | Principal
Occupation(s) During
Past 5 Years | | Number of
Portfolios
in Fund
Complex**
Overseen by
Interested
Trustee | | Other
Directorships
Held by
Interested
Trustee During
the Past 5 Years |
Kevin M. Carome—1956
Invesco Ltd.
Two Peachtree Pointe,
1555 Peachtree St., N.E.,
Suite 1800
Atlanta, GA 30309 | | Trustee | | Since 2010 | | Senior Managing Director, Secretary and General Counsel, Invesco Ltd. (2007-Present); Director, Invesco Advisers, Inc. (2009-Present); Director (2006-Present) and Executive Vice President (2008–Present), Invesco North American Holdings, Inc.; Executive Vice President (2008–Present), Invesco Investments (Bermuda) Ltd.; Manager, Horizon Flight Works LLC, and Director, Invesco Finance PLC (2011- Present); Director and Secretary (2012–Present), Invesco Services (Bahamas) Private Limited; and Director and Executive Vice President (2014–Present), INVESCO Asset Management (Bermuda) Ltd.; formerly, Director and Executive Vice President, Invesco Finance, Inc. (2011-2018); Director (2006-2018) and Executive Vice President (2008–2018), Invesco Group Services, Inc., Invesco Holding Company (US), Inc.; Director, Invesco Holding Company Limited (2007-2018); Director and Chairman, INVESCO Funds Group, Inc., Senior Vice President, Secretary and General Counsel, Invesco Advisers, Inc. (2003-2006); Director, Invesco Investments (Bermuda) Ltd. (2008-2016); Senior Vice President and General Counsel, Liberty Financial Companies, Inc. (2000-2001); General Counsel of certain investment management subsidiaries of Liberty Financial Companies, Inc. (1998-2000); Associate General Counsel, Liberty Financial Companies, Inc. (1993-1998); Associate, Ropes & Gray LLP. | | 241 | | None |
| * | This is the date the Interested Trustee began serving the Trust. The Interested Trustee serves an indefinite term, until his successor is elected. |
| ** | Fund Complex includes all open- andclosed-end funds (including all of their portfolios) advised by the Adviser and any affiliated person of the Adviser. |
Trustees and Officers(continued)
| | | | | | |
Name, Address and Year of
Birth of Executive Officers | | Position(s)
Held
with Trust | | Length of
Time
Served* | | Principal Occupation(s) During Past 5 Years |
Daniel E. Draper—1968 Invesco Capital
Management LLC 3500 Lacey Road, Suite 700 Downers Grove, IL 60515 | | President and Principal Executive Officer | | Since 2015 | | Chief Executive Officer, Manager and Principal Executive Officer, Invesco Specialized Products, LLC (2018-Present); President and Principal Executive Officer, Invesco Exchange-Traded Fund Trust, Invesco Exchange-Traded Fund Trust II, Invesco India Exchange-Traded Fund Trust, Invesco Actively Managed Exchange-Traded Fund Trust and Invesco Actively Managed Exchange-Traded Commodity Fund Trust (2015-Present) and Invesco Exchange-Traded Self-Indexed Fund Trust (2016-Present); Chief Executive Officer and Principal Executive Officer (2016-Present) and Managing Director (2013-Present), Invesco Capital Management LLC; Senior Vice President, Invesco Distributors, Inc. (2014-Present); formerly, Vice President, Invesco Exchange-Traded Fund Trust, Invesco Exchange-Traded Fund Trust II, Invesco India Exchange-Traded Fund Trust, Invesco Actively Managed Exchange-Traded Fund Trust (2013-2015) and Invesco Actively Managed Exchange-Traded Commodity Fund Trust (2014-2015); Managing Director, Credit Suisse Asset Management (2010-2013) and Lyxor Asset Management/Societe Generale (2007-2010). |
| | | |
Kelli Gallegos—1970 Invesco Capital Management LLC 3500 Lacey Road, Suite 700 Downers Grove, IL 60515 | | Vice President
and Treasurer | | Since 2018 | | Assistant Treasurer, Invesco Specialized Products, LLC (2018-Present); Vice President and Treasurer, Invesco Exchange-Traded Fund Trust, Invesco Exchange-Traded Fund Trust II, Invesco India Exchange-Traded Fund Trust, Invesco Actively Managed Exchange-Traded Fund Trust, Invesco Actively Managed Exchange-Traded Commodity Fund Trust and Invesco Exchange-Traded Self-Indexed Fund Trust (2018-Present); Principal Financial and Accounting Officer-Pooled Investments, Invesco Capital Management LLC (2018-Present); Vice President, Principal Financial Officer (2016-Present) and Assistant Treasurer (2008-Present), The Invesco Funds; formerly, Assistant Treasurer Invesco Exchange-Traded Fund Trust, Invesco Exchange-Traded Fund Trust II, Invesco India Exchange-Traded Fund Trust and Invesco Actively Managed Exchange-Traded Fund Trust (2012-2018), Invesco Actively Managed Exchange-Traded Commodity Fund Trust (2014-2018) and Invesco Exchange-Traded Self-Indexed Fund Trust (2016-2018); Assistant Treasurer, Invesco Capital Management LLC (2013-2018); and Assistant Vice President, The Invesco Funds (2008-2016). |
| | | |
Peter Hubbard—1981 Invesco Capital Management LLC 3500 Lacey Road, Suite 700 Downers Grove, IL 60515 | | Vice President | | Since 2009 | | Vice President, Invesco Specialized Products, LLC (2018-Present); Vice President, Invesco Exchange-Traded Fund Trust, Invesco Exchange-Traded Fund Trust II, Invesco India Exchange-Traded Fund Trust, Invesco Actively Managed Exchange-Traded Fund Trust (2009-Present), Invesco Actively Managed Exchange-Traded Commodity Fund Trust (2014-Present) and Invesco Exchange-Traded Self-Indexed Fund Trust (2016-Present); Vice President and Director of Portfolio Management, Invesco Capital Management LLC (2010-Present); formerly, Vice President of Portfolio Management, Invesco Capital Management LLC (2008-2010); Portfolio Manager, Invesco Capital Management LLC (2007-2008); Research Analyst, Invesco Capital Management LLC (2005-2007); Research Analyst and Trader, Ritchie Capital, a hedge fund operator (2003-2005). |
| * | This is the date each Officer began serving the Trust. Each Officer serves an indefinite term, until his or her successor is elected. |
Trustees and Officers(continued)
| | | | | | |
Name, Address and Year of
Birth of Executive Officers | | Position(s)
Held
with Trust | | Length of
Time
Served* | | Principal Occupation(s) During Past 5 Years |
Sheri Morris—1964 Invesco Capital Management LLC 3500 Lacey Road, Suite 700 Downers Grove, IL 60515 | | Vice President | | Since 2012 | | President and Principal Executive Officer, The Invesco Funds (2016-Present); Treasurer, The Invesco Funds (2008-Present); Vice President, Invesco Advisers, Inc. (formerly known as Invesco Institutional (N.A.), Inc.) (registered investment adviser) (2009-Present) and Vice President, Invesco Exchange-Traded Fund Trust, Invesco Exchange-Traded Fund Trust II, Invesco India Exchange-Traded Fund Trust, Invesco Actively Managed Exchange-Traded Fund Trust (2012-Present), Invesco Actively Managed Exchange-Traded Commodity Fund Trust (2014-Present) and Invesco Exchange-Traded Self-Indexed Fund Trust (2016-Present); formerly, Vice President and Principal Financial Officer, The Invesco Funds (2008-2016); Treasurer, Invesco Exchange-Traded Fund Trust, Invesco Exchange-Traded Fund Trust II, Invesco India Exchange-Traded Fund Trust and Invesco Actively Managed Exchange-Traded Fund Trust (2011-2013); Vice President, Invesco Aim Advisers, Inc., Invesco Aim Capital Management, Inc. and Invesco Aim Private Asset Management, Inc.; Assistant Vice President and Assistant Treasurer, The Invesco Funds and Assistant Vice President, Invesco Advisers, Inc., Invesco Aim Capital Management, Inc. and Invesco Aim Private Asset Management, Inc. |
| | | |
Anna Paglia—1974 Invesco Capital Management LLC 3500 Lacey Road, Suite 700 Downers Grove, IL 60515 | | Secretary | | Since 2011 | | Secretary, Invesco Specialized Products, LLC (2018-Present); Secretary, Invesco Exchange-Traded Fund Trust, Invesco Exchange-Traded Fund Trust II, Invesco India Exchange-Traded Fund Trust, Invesco Actively Managed Exchange-Traded Fund Trust (2011-Present), Invesco Actively Managed Exchange-Traded Commodity Fund Trust (2014-Present) and Invesco Exchange-Traded Self-Indexed Fund Trust (2015-Present); Head of Legal (2010-Present) and Secretary (2015-Present), Invesco Capital Management LLC; Manager and Assistant Secretary, Invesco Indexing LLC (2017-Present); formerly, Partner, K&L Gates LLP (formerly, Bell Boyd & Lloyd LLP) (2007-2010); Associate Counsel at Barclays Global Investors Ltd. (2004-2006). |
| | | |
Rudolf E. Reitmann—1971 Invesco Capital Management LLC 3500 Lacey Road, Suite 700 Downers Grove, IL 60515 | | Vice President | | Since 2013 | | Head of Global Exchange Traded Funds Services, Invesco Specialized Products, LLC (2018-Present); Vice President, Invesco Exchange-Traded Fund Trust, Invesco Exchange-Traded Fund Trust II, Invesco India Exchange-Traded Fund Trust, Invesco Actively Managed Exchange-Traded Fund Trust (2013-Present), Invesco Actively Managed Exchange-Traded Commodity Fund Trust (2014-Present) and Invesco Exchange-Traded Self-Indexed Fund Trust (2016-Present); Head of Global Exchange Traded Funds Services, Invesco Capital Management LLC (2013-Present); Vice President, Invesco Capital Markets, Inc. (2018-Present). |
| * | This is the date each Officer began serving the Trust. Each Officer serves an indefinite term, until his or her successor is elected. |
Trustees and Officers(continued)
| | | | | | |
Name, Address and Year of
Birth of Executive Officers | | Position(s)
Held
with Trust | | Length of
Time
Served* | | Principal Occupation(s) During Past 5 Years |
David Warren—1957 Invesco Canada Ltd. 5140 Yonge Street, Suite 800 Toronto, Ontario M2N 6X7 | | Vice President | | Since 2009 | | Manager, Invesco Specialized Products, LLC (2018-Present); Vice President, Invesco Exchange-Traded Fund Trust, Invesco Exchange-Traded Fund Trust II, Invesco India Exchange-Traded Fund Trust, and Invesco Actively Managed Exchange-Traded Fund Trust (2009-Present), Invesco Actively Managed Exchange-Traded Commodity Fund Trust (2014-Present) and Invesco Exchange-Traded Self-Indexed Fund Trust (2016-Present); Managing Director—Chief Administrative Officer, Americas, Invesco Capital Management LLC; Senior Vice President, Invesco Advisers, Inc. (2009-Present); Director, Invesco Inc. (2009-Present); Director, Executive Vice President and Chief Financial Officer, Invesco Canada Ltd. (formerly, Invesco Trimark Ltd.) (2011-Present); Chief Administrative Officer, North American Retail, Invesco Ltd. (2007-Present); Director, Invesco Corporate Class Inc. (2014-Present); Director, Invesco Global Direct Real Estate Feeder GP Ltd. (2015-Present); Director, Invesco Canada Holdings Inc. (2002-Present); Director, Invesco Financial Services Ltd. / Services Financiers Invesco Ltée and Trimark Investments Ltd./Placements Trimark Ltée (2014-Present); Director, Invesco IP Holdings (Canada) Ltd. (2016-Present); Director, Invesco Global Direct Real Estate GP Ltd. (2015-Present); formerly, Senior Vice President, Invesco Management Group, Inc. (2007-2018); Executive Vice President and Chief Financial Officer, Invesco Inc. (2009-2015); Director, Executive Vice President and Chief Financial Officer, Invesco Canada Ltd. (formerly, Invesco Trimark Ltd.) (2000-2011). |
| | | |
Melanie Zimdars—1976 Invesco Capital
Management LLC 3500 Lacey Road, Suite 700 Downers Grove, IL 60515 | | Chief Compliance
Officer | | Since 2017 | | Chief Compliance Officer, Invesco Specialized Products, LLC (2018-Present); Chief Compliance Officer, Invesco Capital Management LLC (2017-Present); Chief Compliance Officer, Invesco Exchange-Traded Fund Trust, Invesco Exchange-Traded Fund Trust II, Invesco India Exchange-Traded Fund Trust, Invesco Actively Managed Exchange-Traded Fund Trust, Invesco Actively Managed Exchange-Traded Commodity Fund Trust and Invesco Exchange-Traded Self-Indexed Fund Trust (2017-Present); formerly, Vice President and Deputy Chief Compliance Officer at ALPS Holding, Inc. (2009-2017); Mutual Fund Treasurer/Chief Financial Officer at Wasatch Advisors, Inc. (2005-2008); Compliance Officer, U.S. Bancorp Fund Services, LLC (2001-2005). |
Availability of Additional Information About the Trustees
The Statement of Additional Information includes additional information about the Trustees and is available, without charge, upon request at (800)983-0903.
| * | This is the date each Officer began serving the Trust. Each Officer serves an indefinite term, until his or her successor is elected. |
Board Considerations Regarding Continuation of Investment Advisory Agreement
At a meeting held on April 11, 2019, the Board of Trustees of the Invesco Exchange-Traded Fund Trust (the “Trust”), including the Independent Trustees, approved the continuation of the Investment Advisory Agreement between Invesco Capital Management LLC (the “Adviser”) and the Trust for the following 53 series (each, a “Fund” and collectively, the “Funds”):
Invesco Aerospace & Defense ETF
Invesco BRIC ETF
Invesco BuyBack AchieversTM ETF
Invesco CleantechTM ETF
Invesco Dividend AchieversTM ETF
Invesco DWA Basic Materials Momentum ETF
Invesco DWA Consumer Cyclicals Momentum ETF
Invesco DWA Consumer Staples Momentum ETF
Invesco DWA Energy Momentum ETF
Invesco DWA Financial Momentum ETF
Invesco DWA Healthcare Momentum ETF
Invesco DWA Industrials Momentum ETF
Invesco DWA Momentum ETF
Invesco DWA NASDAQ Momentum ETF
Invesco DWA Technology Momentum ETF
Invesco DWA Utilities Momentum ETF
Invesco Dynamic Biotechnology & Genome ETF
Invesco Dynamic Building & Construction ETF
Invesco Dynamic Energy Exploration & Production ETF
Invesco Dynamic Food & Beverage ETF
Invesco Dynamic Large Cap Growth ETF
Invesco Dynamic Large Cap Value ETF
Invesco Dynamic Leisure and Entertainment ETF
Invesco Dynamic Market ETF
Invesco Dynamic Media ETF
Invesco Dynamic Networking ETF
Invesco Dynamic Oil & Gas Services ETF
Invesco Dynamic Pharmaceuticals ETF
Invesco Dynamic Retail ETF
Invesco Dynamic Semiconductors ETF
Invesco Dynamic Software ETF
Invesco Financial Preferred ETF
Invesco FTSE RAFI US 1000 ETF
Invesco FTSE RAFI US 1500Small-Mid ETF
Invesco Global Listed Private Equity ETF
Invesco Golden Dragon China ETF
Invesco High Yield Equity Dividend AchieversTM ETF
Invesco Insider Sentiment ETF
Invesco International Dividend AchieversTM ETF
Invesco Russell 2000 Pure Growth ETF
Invesco Russell 2000 Pure Value ETF
Invesco Russell Midcap Equal Weight ETF
Invesco Russell Midcap Pure Growth ETF
Invesco Russell Midcap Pure Value ETF
Invesco Russell Top 200 Equal Weight ETF
Invesco Russell Top 200 Pure Growth ETF
Invesco Russell Top 200 Pure Value ETF
Invesco S&P 500® Quality ETF
Invesco S&PSpin-Off ETF
Invesco Water Resources ETF
Invesco WilderHill Clean Energy ETF
Invesco ZacksMid-Cap ETF
Invesco Zacks Multi-Asset Income ETF
The Trustees reviewed information from the Adviser describing: (i) the nature, extent and quality of services provided, (ii) the investment performance of the Funds and the Adviser, (iii) the fees and expenses paid by the Funds and comparisons to amounts paid by other comparable registered investment companies, (iv) the costs of services provided and estimated profits realized by the Adviser, (v) the extent to which economies of scale may be realized as a Fund grows and whether fee levels reflect any possible economies of scale for the benefit of Fund shareholders, and (vi) any further benefits realized by the Adviser from its relationships with the Funds.
Nature, Extent and Quality of Services. In evaluating the nature, extent and quality of the Adviser’s services, the Trustees reviewed information concerning the functions performed by the Adviser for the Funds, information describing the Adviser’s current organization and staffing, including operational support provided by the Adviser’s parent organization, Invesco Ltd. (“Invesco”), and the background and experience of the persons responsible for theday-to-day management of the Funds. The Trustees reviewed matters related to the Adviser’s execution and/or oversight of execution of portfolio transactions on behalf of the Funds. The Trustees also reviewed information on the performance of the Funds and their underlying indexes for theone-year, three-year, five-year,ten-year and since-inception periods ended December 31, 2018, as applicable, including reports for each of those periods on the correlation and tracking error between each Fund’s performance and the performance of its underlying index, as well as the Adviser’s analysis of the tracking error between certain Funds and their underlying indexes. In reviewing the tracking error reports, the Trustees considered information provided by Invesco’s Global Performance Measurement and Risk Group, an independent organization within Invesco, with respect to general expected tracking error ranges. The Trustees also considered that certain Funds were created in connection with the purchase
Board Considerations Regarding Continuation of Investment Advisory Agreement(continued)
by Invesco of the exchange-traded funds business of Guggenheim Capital LLC (the “Transaction”) and that such Funds’ performance prior to the closing of the Transaction on April 6, 2018 or May 18, 2018, as applicable, is that of their predecessor Guggenheim ETFs. The Trustees noted that, for each applicable period, the correlation and tracking error for each Fund was within the targeted range set forth in the Trust’s registration statement and concluded that each Fund was correlated to its underlying index and that the tracking error for each Fund was within an acceptable range given that Fund’s particular circumstances.
The Trustees also considered the services provided by the Adviser in its oversight of the Funds’ administrator, custodian and transfer agent. They noted the significant amount of time, effort and resources that had been devoted to this oversight function.
Based on their review, the Trustees concluded that the nature, extent and quality of services provided by the Adviser to the Funds under the Investment Advisory Agreement were appropriate and reasonable.
Fees, Expenses and Profitability. The Trustees reviewed and discussed the information provided by the Adviser on each Fund’s contractual advisory fee, net advisory fee, and gross and net expense ratios. The Trustees also compared each Fund’s contractual advisory fee and net expense ratio to information compiled by the Adviser from Lipper Inc. databases on the net advisory fees and net expense ratios of comparable exchange-traded funds (“ETFs”),open-end(non-ETF) index funds andopen-end(non-ETF) actively-managed funds, as applicable. The Trustees noted that the annual contractual advisory fee charged to each Fund is:
| | ● | | 0.50% of the Fund’s average daily net assets for each Fund other than Invesco Dividend AchieversTM ETF, Invesco FTSE RAFI US 1000 ETF, Invesco FTSE RAFI US 1500Small-Mid ETF, Invesco High Yield Equity Dividend AchieversTM ETF, Invesco International Dividend AchieversTM ETF, Invesco Russell 2000 Pure Growth ETF, Invesco Russell 2000 Pure Value ETF, Invesco Russell Midcap Equal Weight ETF, Invesco Russell Midcap Pure Growth ETF, Invesco Russell Midcap Pure Value ETF, Invesco Russell Top 200 Equal Weight ETF, Invesco Russell Top 200 Pure Growth ETF, Invesco Russell Top 200 Pure Value ETF and Invesco S&P 500® Quality ETF (The net advisory fee, after giving effect to the Expense Cap, as defined below, was-0.16% for Invesco Dynamic Retail ETF.); |
| | ● | | 0.40% of the Fund’s average daily net assets for each of Invesco Dividend AchieversTM ETF, Invesco High Yield Equity Dividend AchieversTM ETF and Invesco International Dividend AchieversTM ETF; |
| | ● | | 0.29% of the Fund’s average daily net assets for each of Invesco FTSE RAFI US 1000 ETF, Invesco FTSE RAFI US 1500Small-Mid ETF, Invesco Russell 2000 Pure Growth ETF, Invesco Russell 2000 Pure Value ETF, Invesco Russell Midcap Pure Growth ETF, Invesco Russell Midcap Pure Value ETF, Invesco Russell Top 200 Pure Growth ETF and Invesco Russell Top 200 Pure Value ETF; |
| | ● | | 0.25% of the Fund’s average daily net assets for each of Invesco Russell Midcap Equal Weight ETF and Invesco Russell Top 200 Equal Weight ETF (The net advisory fee, after giving effect to the Expense Cap, as defined below, was-0.17% for Invesco Russell Midcap Equal Weight ETF.); and |
| | ● | | 0.15% of the Fund’s average daily net assets for Invesco S&P 500® Quality ETF (The Trustees noted that, prior to September 24, 2018, the Fund’s advisory fee was 0.29%.). |
The Trustees also noted that the Adviser has agreed to waive a portion of its contractual advisory fee and/or pay expenses (an “Expense Cap”) to the extent necessary to prevent the annual operating expenses of each Fund from exceeding the percentage of that Fund’s average daily net assets, at least until August 31, 2021, as set forth below:
| | ● | | 0.60%, excluding interest expenses, brokerage commissions and other trading expenses, taxes, acquired fund fees and expenses, if applicable, and extraordinary expenses, for each of Invesco DWA NASDAQ Momentum ETF and Invesco Dynamic Market ETF; |
| | ● | | 0.60%, excluding interest expenses, offering costs, brokerage commissions and other trading expenses, taxes, acquired fund fees and expenses, if applicable, and extraordinary expenses, for each of Invesco DWA Basic Materials Momentum ETF, Invesco DWA Consumer Cyclicals Momentum ETF, Invesco DWA Consumer Staples Momentum ETF, Invesco DWA Energy Momentum ETF, Invesco DWA Financial Momentum ETF, Invesco DWA Healthcare Momentum ETF, Invesco DWA Industrials Momentum ETF, Invesco DWA Technology Momentum ETF and Invesco DWA Utilities Momentum ETF; |
| | ● | | 0.50%, excluding interest expenses,sub-licensing fees, offering costs, brokerage commissions and other trading expenses, taxes, acquired fund fees and expenses, if applicable, and extraordinary expenses, for each of Invesco Dividend AchieversTM ETF, Invesco High Yield Equity Dividend AchieversTM ETF and Invesco International Dividend AchieversTM ETF; |
| | ● | | 0.39%, excluding interest expenses, offering costs, brokerage commissions and other trading expenses, taxes, acquired fund fees and expenses, if applicable, and extraordinary expenses, for each of Invesco FTSE RAFI US 1000 ETF, Invesco FTSE RAFI US |
Board Considerations Regarding Continuation of Investment Advisory Agreement(continued)
| | 1500Small-Mid ETF, Invesco Russell 2000 Pure Growth ETF, Invesco Russell 2000 Pure Value ETF, Invesco Russell Midcap Pure Growth ETF, Invesco Russell Midcap Pure Value ETF, Invesco Russell Top 200 Pure Growth ETF and Invesco Russell Top 200 Pure Value ETF; |
| | ● | | 0.25%, excluding interest expenses, offering costs, brokerage commissions and other trading expenses, taxes, acquired fund fees and expenses, if applicable, and extraordinary expenses, for each of Invesco Russell Midcap Equal Weight ETF and Invesco Russell Top 200 Equal Weight ETF; |
| | ● | | 0.15%, excluding interest expenses, offering costs, brokerage commissions and other trading expenses, taxes, acquired fund fees and expenses, if applicable, and extraordinary expenses, for Invesco S&P 500 Quality ETF; and |
| | ● | | 0.60%, excluding interest expenses,sub-licensing fees, offering costs, brokerage commissions and other trading expenses, taxes, acquired fund fees and expenses, if applicable, and extraordinary expenses, for each other Fund. |
The Trustees noted that the Adviser represented that it does not serve as the investment adviser to any clients, other than other ETFs also overseen by the Trustees, with comparable investment strategies as the Funds, but that it providessub-advisory services to other clients. The Trustees further noted the Adviser’s explanation with respect to thesub-advisory fees it receives for such services in comparison to the advisory fees charged to the Funds. The Trustees noted that the contractual advisory fees for certain Funds were equal to or lower than the median net advisory fees of their ETF andopen-end index peer funds, as applicable, as illustrated in the table below. The Trustees also noted that the contractual advisory fees for all of the Funds were lower than the median net advisory fees of theiropen-end actively-managed peer funds.
| | | | | | |
Invesco Fund | | Equal to/Lower
than ETF Median | | Equal to/Lower
than Open-End
Index Fund
Median* | | Equal to/Lower
thanOpen-End
Active Fund
Median |
| Invesco Aerospace & Defense ETF | | | | | | X |
| Invesco BRIC ETF | | | | | | X |
| Invesco Buyback AchieversTM ETF | | | | | | X |
| Invesco CleantechTM ETF | | | | | | X |
| Invesco Dividend AchieversTM ETF | | | | | | X |
| Invesco DWA Basic Materials Momentum ETF | | | | | | X |
| Invesco DWA Consumer Cyclicals Momentum ETF | | | | | | X |
| Invesco DWA Consumer Staples Momentum ETF | | | | | | X |
| Invesco DWA Energy Momentum ETF | | | | | | X |
| Invesco DWA Financial Momentum ETF | | | | | | X |
| Invesco DWA Healthcare Momentum ETF | | | | | | X |
| Invesco DWA Industrials Momentum ETF | | | | | | X |
| Invesco DWA Momentum ETF | | X | | | | X |
| Invesco DWA NASDAQ Momentum ETF | | | | | | X |
| Invesco DWA Technology Momentum ETF | | | | | | X |
| Invesco DWA Utilities Momentum ETF | | | | | | X |
| Invesco Dynamic Biotechnology & Genome ETF | | | | | | X |
| Invesco Dynamic Building & Construction ETF | | | | | | X |
| Invesco Dynamic Energy Exploration & Production ETF | | | | | | X |
| Invesco Dynamic Food & Beverage ETF | | | | | | X |
| Invesco Dynamic Large Cap Growth ETF | | | | | | X |
| Invesco Dynamic Large Cap Value ETF | | | | | | X |
| Invesco Dynamic Leisure and Entertainment ETF | | | | | | X |
| Invesco Dynamic Market ETF | | | | | | X |
| Invesco Dynamic Media ETF | | | | | | X |
| Invesco Dynamic Networking ETF | | | | | | X |
Board Considerations Regarding Continuation of Investment Advisory Agreement(continued)
| | | | | | |
Invesco Fund | | Equal to/Lower
than ETF Median | | Equal to/Lower
than Open-End
Index Fund
Median* | | Equal to/Lower
thanOpen-End
Active Fund
Median |
| Invesco Dynamic Oil & Gas Services ETF | | | | N/A | | X |
| Invesco Dynamic Pharmaceuticals ETF | | | | | | X |
| Invesco Dynamic Retail ETF | | | | | | X |
| Invesco Dynamic Semiconductors ETF | | | | | | X |
| Invesco Dynamic Software ETF | | | | | | X |
| Invesco Financial Preferred ETF | | | | N/A | | X |
| Invesco FTSE RAFI US 1000 ETF | | | | | | X |
| Invesco FTSE RAFI US 1500Small-Mid ETF | | | | | | X |
| Invesco Global Listed Private Equity ETF | | | | N/A | | X |
| Invesco Golden Dragon China ETF | | X | | N/A | | X |
| Invesco High Yield Equity Dividend AchieversTM ETF | | | | | | X |
| Invesco Insider Sentiment ETF | | | | | | X |
| Invesco International Dividend AchieversTM ETF | | X | | | | X |
| Invesco Russell 2000 Pure Growth ETF | | | | X | | X |
| Invesco Russell 2000 Pure Value ETF | | | | X | | X |
| Invesco Russell Midcap Equal Weight ETF | | | | | | X |
| Invesco Russell Midcap Pure Growth ETF | | X | | | | X |
| Invesco Russell Midcap Pure Value ETF | | X | | | | X |
| Invesco Russell Top 200 Equal Weight ETF | | X | | | | X |
| Invesco Russell Top 200 Pure Growth ETF | | | | | | X |
| Invesco Russell Top 200 Pure Value ETF | | | | | | X |
| Invesco S&P 500® Quality ETF | | X | | | | X |
| Invesco S&PSpin-Off | | | | | | X |
| Invesco Water Resources ETF | | | | | | X |
| Invesco WilderHill Clean Energy ETF | | | | | | X |
| Invesco ZacksMid-Cap ETF | | | | | | X |
| Invesco Zacks Multi-Asset Income ETF | | | | | | X |
| * | The information provided by the Adviser indicated that certain Funds did not have open-end index fund peers. Those Funds have been designated with an “N/A” for not available. |
The Trustees determined that the contractual advisory fees were reasonable, noting the nature of the indexes, the distinguishing factors of the Funds, and the administrative, operational and management oversight costs for the Adviser. The Trustees noted that the net expense ratios for certain Funds were equal to or lower than the median net expense ratios of their ETF andopen-end index peer funds, as applicable, as illustrated in the table below. The Trustees also noted that the net expense ratios for all of the Funds were lower than the median net expense ratios of theiropen-end actively-managed peer funds.
| | | | | | |
Invesco Fund | | Equal to/Lower
than ETF Median | | Equal to/Lower
thanOpen-End
Index Fund
Median* | | Equal to/Lower
thanOpen-End
Active Fund
Median |
| Invesco Aerospace & Defense ETF | | | | | | X |
| Invesco BRIC ETF | | | | | | X |
| Invesco Buyback AchieversTM ETF | | | | | | X |
| Invesco CleantechTM ETF | | | | | | X |
| Invesco Dividend AchieversTM ETF | | | | X | | X |
| Invesco DWA Basic Materials Momentum ETF | | | | | | X |
Board Considerations Regarding Continuation of Investment Advisory Agreement(continued)
| | | | | | |
Invesco Fund | | Equal to/Lower
than ETF Median | | Equal to/Lower
thanOpen-End
Index Fund
Median* | | Equal to/Lower
thanOpen-End
Active Fund
Median |
| Invesco DWA Consumer Cyclicals Momentum ETF | | | | | | X |
| Invesco DWA Consumer Staples Momentum ETF | | | | | | X |
| Invesco DWA Energy Momentum ETF | | | | | | X |
| Invesco DWA Financial Momentum ETF | | | | | | X |
| Invesco DWA Healthcare Momentum ETF | | | | | | X |
| Invesco DWA Industrials Momentum ETF | | | | | | X |
| Invesco DWA Momentum ETF | | | | X | | X |
| Invesco DWA NASDAQ Momentum ETF | | | | | | X |
| Invesco DWA Technology Momentum ETF | | | | | | X |
| Invesco DWA Utilities Momentum ETF | | | | | | X |
| Invesco Dynamic Biotechnology & Genome ETF | | | | | | X |
| Invesco Dynamic Building & Construction ETF | | | | | | X |
| Invesco Dynamic Energy Exploration & Production ETF | | | | | | X |
| Invesco Dynamic Food & Beverage ETF | | | | | | X |
| Invesco Dynamic Large Cap Growth ETF | | | | | | X |
| Invesco Dynamic Large Cap Value ETF | | | | | | X |
| Invesco Dynamic Leisure and Entertainment ETF | | | | | | X |
| Invesco Dynamic Market ETF | | | | | | X |
| Invesco Dynamic Media ETF | | | | | | X |
| Invesco Dynamic Networking ETF | | | | | | X |
| Invesco Dynamic Oil & Gas Services ETF | | | | N/A | | X |
| Invesco Dynamic Pharmaceuticals ETF | | | | | | X |
| Invesco Dynamic Retail ETF | | | | | | X |
| Invesco Dynamic Semiconductors ETF | | | | | | X |
| Invesco Dynamic Software ETF | | | | | | X |
| Invesco Financial Preferred ETF | | | | N/A | | X |
| Invesco FTSE RAFI US 1000 ETF | | | | | | X |
| Invesco FTSE RAFI US 1500Small-Mid ETF | | | | | | X |
| Invesco Global Listed Private Equity ETF | | | | N/A | | X |
| Invesco Golden Dragon China ETF | | | | N/A | | X |
| Invesco High Yield Equity Dividend AchieversTM ETF | | | | X | | X |
| Invesco Insider Sentiment ETF | | | | | | X |
| Invesco International Dividend AchieversTM ETF | | | | | | X |
| Invesco Russell 2000 Pure Growth ETF | | | | X | | X |
| Invesco Russell 2000 Pure Value ETF | | | | X | | X |
| Invesco Russell Midcap Equal Weight ETF | | | | | | X |
| Invesco Russell Midcap Pure Growth ETF | | | | | | X |
| Invesco Russell Midcap Pure Value ETF | | | | | | X |
| Invesco Russell Top 200 Equal Weight ETF | | X | | | | X |
| Invesco Russell Top 200 Pure Growth ETF | | | | | | X |
| Invesco Russell Top 200 Pure Value ETF | | | | | | X |
| Invesco S&P 500® Quality ETF | | X | | | | X |
| Invesco S&PSpin-Off ETF | | | | | | X |
| Invesco Water Resources ETF | | | | | | X |
Board Considerations Regarding Continuation of Investment Advisory Agreement(continued)
| | | | | | |
Invesco Fund | | Equal to/Lower
than ETF Median | | Equal to/Lower
thanOpen-End
Index Fund
Median* | | Equal to/Lower
thanOpen-End
Active Fund
Median |
| Invesco WilderHill Clean Energy ETF | | | | | | X |
| Invesco ZacksMid-Cap ETF | | | | | | X |
| Invesco Zacks Multi-Asset Income ETF | | | | | | X |
| * | The information provided by the Adviser indicated that certain Funds did not have open-end index fund peers. Those Funds have been designated with an “N/A” for not available. |
In response to questions from the Independent Trustees, the Adviser provided supplemental information regarding each of Invesco Dynamic Energy Exploration & Production ETF, Invesco Dynamic Large Cap Growth ETF and Invesco WilderHill Clean Energy ETF’s advisory fees and total expenses and the Lipper peer data. The Adviser explained in detail its view that it believes that the advisory fees and total expenses for these Funds are competitive and generally in line with other comparable funds in the marketplace, noting, in particular, the unique underlying investment strategy and complexity of each Fund, the limited number of peers in the Lipper data, and/or the differing pricing philosophy of certain of the peers.
The Trustees noted that a significant component of thenon-advisory fee expenses was the license fees paid by the Funds, and noted those Funds for which license fees are included in the Funds’ Expense Caps. The Trustees also noted that the Adviser has agreed to reimburse certain Funds in the amount equal to the licensing fee paid that causes that Fund’s annual operating expenses (excluding interest expenses, offering costs, brokerage commissions and other trading expenses, taxes, acquired fund fees and expenses and extraordinary expenses) to exceed a percentage of that Fund’s average daily net assets through April 6, 2020 (May 18, 2020 for Invesco BRIC ETF) as set forth below:
| | | | |
| Invesco BRIC ETF | | | 0.64 | % |
| Invesco Insider Sentiment ETF | | | 0.60 | % |
| Invesco S&PSpin-Off ETF | | | 0.64 | % |
| Invesco ZacksMid-Cap ETF | | | 0.65 | % |
| Invesco Zacks Multi-Asset Income ETF | | | 0.65 | % |
The Board concluded that the advisory fee and expense ratio of each Fund (giving effect to the Fund’s Expense Cap) were reasonable and appropriate in light of the services provided.
In conjunction with their review of fees, the Trustees considered information provided by the Adviser on the revenues received by the Adviser under the Investment Advisory Agreement for the Funds, as well as the fees waived and expenses reimbursed by the Adviser for the Funds. The Trustees reviewed information provided by the Adviser on its overall profitability, as well as the estimated profitability to the Adviser from its relationship to each Fund. The Trustees concluded that the overall and estimated profitability to the Adviser was not unreasonable.
Economies of Scale and Whether Fee Levels Reflect These Economies of Scale. The Trustees reviewed the information provided by the Adviser as to the extent to which economies of scale may be realized as each Fund grows and whether fee levels reflect economies of scale for the benefit of shareholders. The Trustees reviewed each Fund’s asset size, advisory fee, expense ratio and Expense Cap agreed to by the Adviser. The Trustees also noted that the Amended and Restated Excess Expense Agreement with the Trust provides that the Adviser is entitled to be reimbursed by each Fund, other than Invesco Dynamic Market ETF and Invesco DWA NASDAQ Momentum ETF, for fees waived or expenses absorbed pursuant to the Expense Cap for a period of three years from the date the fee or expense was incurred, provided that no reimbursement would be made that would result in a Fund exceeding its Expense Cap then in effect or in effect at the time the fees and/or expenses subject to reimbursement were waived and/or borne by the Adviser. The Trustees considered whether the advisory fee rate for each Fund was reasonable in relation to the asset size of that Fund, and concluded that the flat advisory fee was reasonable and appropriate.
The Trustees noted that the Adviser had not identified any further benefits that it derived from its relationships with the Funds and had noted that it does not have any soft-dollar arrangements.
Based on all of the information considered and the conclusions reached, the Board, including the Independent Trustees, determined to approve the continuation of the Investment Advisory Agreement for each Fund. No single factor was determinative in the Board’s analysis.
Proxy Voting Policies and Procedures
A description of the Trust’s proxy voting policies and procedures that the Funds use to determine how to vote proxies relating to portfolio securities is available, without charge and upon request, by calling(800) 983-0903. This information is also available on the Securities and Exchange Commission’s (the “Commission”) website atwww.sec.gov.
Information regarding how each Fund voted proxies for portfolio securities, if applicable, during the most recent 12-month period ended June 30, is available, without charge and upon request, by (i) calling(800) 983-0903; or (ii) accessing the Trust’sForm N-PX on the Commission’s website atwww.sec.gov.
Quarterly Portfolios
The Trust files its complete schedule of portfolio holdings for the Funds with the Commission for the first and third quarters of each fiscal year onForm N-Q (or any successor Form). The Trust’sForms N-Q (or any successor Form) are available on the Commission’s website atwww.sec.gov.
Frequency Distribution of Discounts and Premiums
A table showing the number of days the market price of each Fund’s shares was greater than the Fund’s net asset value, and the number of days it was less than the Fund’s net asset value (i.e., premium or discount) for the most recently completed calendar year, and the calendar quarters since that year end (or the life of the Fund, if shorter) may be found at the Fund’s website atwww.invesco.com/ETFs.
| | | | |
©2019 Invesco Capital Management LLC 3500 Lacey Road, Suite 700 Downers Grove, IL 60515 | | P-PS-AR-7 | | invesco.com/ETFs |

Invesco Annual Report to Shareholders
April 30, 2019
| | |
| |
| PYZ | | Invesco DWA Basic Materials Momentum ETF |
| |
| PEZ | | Invesco DWA Consumer Cyclicals Momentum ETF |
| |
| PSL | | Invesco DWA Consumer Staples Momentum ETF |
| |
| PXI | | Invesco DWA Energy Momentum ETF |
| |
| PFI | | Invesco DWA Financial Momentum ETF |
| |
| PTH | | Invesco DWA Healthcare Momentum ETF |
| |
| PRN | | Invesco DWA Industrials Momentum ETF |
| |
| PTF | | Invesco DWA Technology Momentum ETF |
| |
| PUI | | Invesco DWA Utilities Momentum ETF |
| |
| PNQI | | Invesco NASDAQ Internet ETF |
Beginning on January 1, 2021, as permitted by regulations adopted by the Securities and Exchange Commission, paper copies of the Funds’ shareholder reports will no longer be sent by mail, unless you specifically request paper copies of the reports from your financial intermediary, such as a broker-dealer or bank. Instead, the reports will be made available on a website, and you will be notified by mail each time a report is posted and provided with a website link to access the report.
If you already elected to receive shareholder reports electronically, you will not be affected by this change and you need not take any action. If you hold accounts through a financial intermediary, you may contact your financial intermediary to enroll in electronic delivery. Please note that not all financial intermediaries may offer this service.
You may elect to receive all future reports in paper free of charge. If you hold accounts through a financial intermediary, you can follow the instructions included with this disclosure, if applicable, or contact your financial intermediary to request that you continue to receive paper copies of your shareholder reports. Please note that not all financial intermediaries may offer this service. Your election to receive reports in paper will apply to all funds held with your financial intermediary.
Table of Contents
The Market Environment
Domestic Equity
The fiscal year proved to be an increasingly volatile time for U.S. equities. Throughout the summer, U.S. equities moved higher as corporate profits surged amid the benefit of corporate tax cuts and improving global economic growth. Several U.S. equity indexes reached new highs despite potential headwinds, including trade tensions, tariff announcements and contagion concerns over a Turkish currency crisis. After a relatively quiet summer, market volatility noticeably rose in October 2018, as U.S. equity markets suffered a sharpsell-off throughyear-end 2018, amid ongoing trade concerns between the U.S. and China, fears of a global economic slowdown and lower oil prices from a supply glut, with oil prices plummeting from near $75 per barrel in early October 2018 to around $45 per barrel in late December 2018.1 In this environment, there was a flight to safety, as investors fled to defensive areas of the markets, such as health care, utilities and U.S. Treasuries.
Given signs of a strong economy, the U.S. Federal Reserve (the “Fed”) raised interest rates three times during the fiscal year: in June, September and December 2018. Following December’s Fed meeting, the Fed raised interest rates by 25 basis points to a targeted range of 2.25% to 2.50%, which signaled a slightly more dovish stance than expected.2 In contrast, the European Central Bank and central banks in several other countries maintained extraordinarily accommodative monetary policies.
Equity markets rebounded at the start of 2019, fueled by optimism about a potential U.S.-China trade deal and the Fed’s indication that there would be no interest rate hikes in 2019, a surprising shift in monetary policy. The Fed’s more accommodative stance provided a supportive environment for equities and fixed income, even as U.S. economic data were mixed and overseas growth appeared to be slowing. By the end of the fiscal year, the U.S. equity market generally recovered the losses from fourth quarter 2018, backed by improving investor sentiment, low unemployment and a growing economy.
| 2 | Source: U.S. Federal Reserve |
Global Equity
The fiscal year began with significant market and currency volatility. While most domestic equity indexes delivered positive performance at the beginning of the fiscal year, most major international indexes had negative results. Many international stocks struggled as investors worried that heightened global trade tensions would derail economic growth. Other concerns, such as geopolitical uncertainty and the potential impact of higher interest rates, also weakened investor sentiment. In this environment, developed markets held up better than emerging markets. After a relatively quiet summer, market volatility markedly rose again in October 2018. Global equity markets (particularly the U.S.) declined sharply in the fourth quarter of 2018 amid rising interest rates and concerns that higher inflation could result in a more restrictive monetary policy. Investors also had concerns over the Brexit negotiations, ongoing U.S.-China trade tensions, declining oil prices and fears of slowing economic growth, particularly in the eurozone.
Following the sharpsell-off in the later part of 2018, global equities rebounded in the beginning of 2019, fueled by accommodative central bank policy and the potential for a U.S.-China trade deal. Central bank policy provided a supportive environment for equities and fixed income, even as global economic growth appeared to be slowing. In January, China’s central bank initiated a stimulus program to counteract its slowing economy, while the European Central Bank and U.S. Federal Reserve later indicated they would not raise interest rates for the remainder of 2019. Lack of consensus on a deal for the U.K.’s withdrawal from the European Union prompted additional concerns for the U.K. and eurozone economies, though equity markets across the region posted gains. U.S. and Chinese equities also delivered robust gains. Both emerging and developed markets had positive returns for the first quarter of 2019.
Despite concerns over a decline in global growth for 20191, global equity indexes, in general, ended the fiscal year in positive territory, with developed markets outperforming emerging markets.
| 1 | Source: International Monetary Fund World |
| | |
| PYZ | | Manager’s Analysis |
| | Invesco DWA Basic Materials Momentum ETF (PYZ) |
As an index fund, the Invesco DWA Basic Materials Momentum ETF (the “Fund”) is passively managed and seeks to track the returns of an underlying index. The Fund seeks to track the investment results (before fees and expenses) of the Dorsey Wright® Basic Materials Technical Leaders Index (the “Index”). The Fund generally will invest at least 90% of its total assets in securities of companies that comprise the Index. The Index is composed of at least 30 securities of companies in the basic materials sector that have powerful relative strength or “momentum” characteristics. Dorsey, Wright & Associates, LLC (the “Index Provider”) selects these securities from approximately 2,000 of the largest constituents by market capitalization within the NASDAQ US Benchmark Index. “Relative strength” is an investing technique that seeks to determine the strongest performing securities by measuring certain factors, such as a security’s relative performance against the overall market or a security’s relative strength value, which is derived by comparing the rate of increase of the security’s price over a set period as compared to that of a benchmark index.
Strictly in accordance with its guidelines and mandated procedures, the Index Provider uses a proprietary methodology to analyze the relative strength of each security within the universe of eligible securities and determine a “momentum” score. In general, momentum is the tendency of an investment to exhibit persistence in its relative performance; a “momentum” style of investing emphasizes investing in securities that have had better recent performance compared to other securities. The momentum score for each security included in the Index is based on intermediate and long-term upward price movements of the security as compared to a representative benchmark and other eligible securities within the universe.
After giving each eligible security a momentum score, the Index Provider selects at least 30 securities with the highest momentum scores from the basic materials sector for inclusion in the Index. Companies in the basic materials sector are principally engaged in the business of producing raw materials, including paper or wood products, chemicals, construction materials, and mining and metals.
The total number of securities in the Index may vary depending on the capitalization characteristics of the securities that qualify for inclusion in the Index. The Index Provider weights each security by its momentum score, with higher scoring securities representing a greater weight in the Index. The Fund generally invests in all of the securities comprising the Index in proportion to their weightings in the Index.
For the fiscal year ended April 30, 2019, on a market price basis, the Fund returned (8.46)%. On a net asset value (“NAV”) basis, the Fund returned (8.36)%. During the same time period, the Index returned (7.80)%. During the fiscal year, the Fund fully replicated the components of the Index; therefore, the Fund’s performance, on a NAV basis, differed from the return of the
Index primarily due to fees and operating expenses that the Fund incurred during the period, as well as trading costs around the rebalances during the period.
During this same time period, the S&P 500® Materials Index (the “Benchmark Index”) returned 3.04%. The Benchmark Index is an unmanaged index weighted by market capitalization based on the average performance of approximately 25 securities. The Benchmark Index was selected for its recognition in the marketplace, and because its performance comparison is a useful measure for investors as a broad representation of the materials sector.
The performance of the Fund differed from the Benchmark Index in part because the Fund seeks to track an Index that employs a proprietary stock selection and weighting methodology, whereas the Benchmark Index selects and weights stocks based primarily on market capitalization.
Relative to the Benchmark Index, the Fund was most overweight in the specialty chemicals and steelsub-industries and most underweight in the diversified chemicals and industrial gasessub-industries during the fiscal year ended April 30, 2019. The majority of the Fund’s underperformance relative to the Benchmark Index during the period can be attributed to the Fund being overweight in the steelsub-industry.
For the fiscal year ended April 30, 2019, the specialty chemicalssub-industry contributed most significantly to the Fund’s return, followed by the industrial gases and diversified metals & miningsub-industries, respectively. The diversified chemicalssub-industry detracted most significantly from the Fund’s return, followed by the steelsub-industry.
Positions that contributed most significantly to the Fund’s return for the fiscal year ended April 30, 2019, included Ingevity Corp., a specialty chemicals company (portfolio average weight of 2.65%), and Air Products and Chemicals, Inc., an industrial gases company (portfolio average weight of 3.59%). Positions that detracted most significantly from the Fund’s return during this period included Chemours Co. (The), a diversified chemicals company (portfolio average weight of 2.62%) and United States Steel Corp., a steel company (no longer held at fiscalyear-end).
Invesco DWA Basic Materials Momentum ETF (PYZ)(continued)
| | | | |
Sub-Industry Breakdown
(% of the Fund’s Net Assets)
as of April 30, 2019 | |
| Specialty Chemicals | | | 42.0 | |
| Steel | | | 10.3 | |
| Commodity Chemicals | | | 8.6 | |
| Fertilizers & Agricultural Chemicals | | | 8.4 | |
| Diversified Chemicals | | | 6.7 | |
| Paper Products | | | 5.6 | |
| Industrial Gases | | | 4.6 | |
| Paper Packaging | | | 4.0 | |
| Gold | | | 3.5 | |
| Sub-Industry Types Each Less Than 3% | | | 6.3 | |
| Money Market Funds Plus Other Assets Less Liabilities | | | 0.0 | |
|
Top Ten Fund Holdings*
(% of the Fund’s Net Assets)
as of April 30, 2019 | |
| Security | | | | |
| Ashland Global Holdings, Inc. | | | 4.7 | |
| Air Products and Chemicals, Inc. | | | 4.6 | |
| FMC Corp. | | | 4.5 | |
| Ecolab, Inc. | | | 4.1 | |
| Avery Dennison Corp. | | | 4.0 | |
| Celanese Corp., Series A | | | 3.8 | |
| LyondellBassell Industries N.V., Class A | | | 3.8 | |
| PPG Industries, Inc. | | | 3.0 | |
| International Flavors & Fragrances, Inc. | | | 2.9 | |
| Quaker Chemical Corp. | | | 2.8 | |
| Total | | | 38.2 | |
| * | Excluding money market fund holdings. |
Invesco DWA Basic Materials Momentum ETF (PYZ)(continued)
Growth of a $10,000 Investment
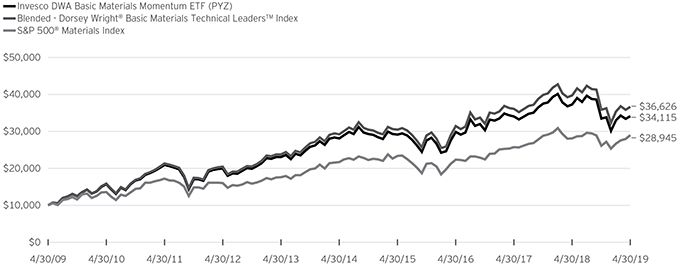
Fund Performance History as of April 30, 2019
| | | | | | | | | | | | | | | | | | | | | | | | | | | | | | | | | | | | | | | | |
| | | 1 Year | | | 3 Years Average
Annualized | | | 3 Years Cumulative | | | 5 Years Average
Annualized | | | 5 Years Cumulative | | | 10 Years Average
Annualized | | | 10 Years Cumulative | | | | | | Fund Inception | |
| Index | | | | | Average
Annualized | | | Cumulative | |
| Blended-Dorsey Wright® Basic Materials Technical LeadersTM Index | | | (7.80 | )% | | | 5.25 | % | | | 16.61 | % | | | 4.65 | % | | | 25.52 | % | | | 13.86 | % | | | 266.26 | % | | | | | | | 9.32 | % | | | 205.83 | % |
| S&P 500® Materials Index | | | 3.04 | | | | 9.02 | | | | 29.58 | | | | 5.88 | | | | 33.06 | | | | 11.21 | | | | 189.45 | | | | | | | | 7.09 | | | | 136.30 | |
| Fund | | | | | | | | | | | | | | | | | | | | | | | | | | | | | | | | | | | | | | | | |
| NAV Return | | | (8.36 | ) | | | 4.56 | | | | 14.31 | | | | 3.96 | | | | 21.45 | | | | 13.06 | | | | 241.15 | | | | | | | | 8.45 | | | | 176.86 | |
| Market Price Return | | | (8.46 | ) | | | 4.54 | | | | 14.23 | | | | 3.97 | | | | 21.47 | | | | 13.05 | | | | 240.93 | | | | | | | | 8.45 | | | | 176.93 | |
Fund Inception: October 12, 2006
Performance quoted above represents past performance. Past performance is not a guarantee of future results and current performance may be higher or lower than performance quoted. Investment returns and principal value will fluctuate, and shares of the Fund (“Fund Shares”), when redeemed or sold, may be worth more or less than their original cost. Fund performance reflects any applicable fee waivers and/or expense reimbursements. Had the adviser not waived fees and/or reimbursed expenses currently or in the past, returns would have been lower. See current prospectus for more information. The adviser has contractually agreed to waive fees and/or pay certain Fund expenses through August 31, 2021. According to the Fund’s current prospectus, the total gross annual operating expense ratio was indicated as 0.76% and the net annual operating expense ratio was indicated as 0.60%. The Financial Highlights section of the Shareholder Report presents the expense ratios based on expenses incurred during the period covered by this report. NAV and Market Price returns assume that dividends and capital gain distributions have been reinvested in the Fund at NAV and Market Price, respectively. The returns shown in the table above do not reflect the deduction of taxes that a shareholder would pay on Fund distributions or the redemption or sale of Fund Shares. See invesco.com/ETFs to find the most recentmonth-end performance numbers.
Blended-Index and Benchmark Index performance results are based upon a hypothetical investment in their respective constituent securities. Blended-Index and Benchmark Index returns do not represent Fund returns. An investor cannot invest directly in an index. The Blended-Index and Benchmark Index do not charge management fees or brokerage expenses, and no such fees or expenses were deducted from the hypothetical performance shown. In addition, the results actual investors might have achieved would have differed from those shown because of differences in the timing, amounts of their investments, and fees and expenses associated with an investment in the Fund.
Notes Regarding Indexes and Fund Performance History:
| - | The Blended-Dorsey Wright® Basic Materials Technical Leaders Index performance is comprised of the performance of the Dynamic Basic Materials Sector IntellidexSM Index, the Fund’s previous underlying index, from Fund inception through the conversion date, February 19, 2014, followed by the performance of the Index, starting from the conversion date through April 30, 2019. |
| - | Average Annualized and Cumulative Inception returns for the Fund, Blended-Index and Benchmark Index are based on the inception date of the Fund. |
| | |
| PEZ | | Manager’s Analysis |
| | Invesco DWA Consumer Cyclicals Momentum ETF (PEZ) |
As an index fund, the Invesco DWA Consumer Cyclicals Momentum ETF (the “Fund”) is passively managed and seeks to track the returns of an underlying index. The Fund seeks to track the investment results (before fees and expenses) of the Dorsey Wright® Consumer Cyclicals Technical Leaders Index (the “Index”). The Fund generally will invest at least 90% of its total assets in securities of companies that comprise the Index. The Index is composed of at least 30 securities of companies in the consumer discretionary (or cyclicals) sector that have powerful relative strength or “momentum” characteristics. Dorsey, Wright & Associates, LLC (the “Index Provider”) selects these securities from approximately 2,000 of the largest constituents by market capitalization within the NASDAQ US Benchmark Index. “Relative strength” is an investing technique that seeks to determine the strongest performing securities by measuring certain factors, such as a security’s relative performance against the overall market or a security’s relative strength value, which is derived by comparing the rate of increase of the security’s price over a set period as compared to that of a benchmark index.
Strictly in accordance with its guidelines and mandated procedures, the Index Provider uses a proprietary methodology to analyze the relative strength of each security within the universe of eligible securities and determine a “momentum” score. In general, momentum is the tendency of an investment to exhibit persistence in its relative performance; a “momentum” style of investing emphasizes investing in securities that have had better recent performance compared to other securities. The momentum score for each security included in the Index is based on intermediate and long-term upward price movements of the security as compared to a representative benchmark and other eligible securities within the universe.
After giving each eligible security a momentum score, the Index Provider selects at least 30 securities with the highest momentum scores from the consumer discretionary sector for inclusion in the Index. Companies in the consumer discretionary sector are principally engaged in the businesses of providing consumer goods and services that are cyclical in nature, including retail, automotive, leisure and recreation, media and home construction and furnishing.
The total number of securities in the Index may vary depending on the capitalization characteristics of the securities that qualify for inclusion in the Index. The Index Provider weights each security by its momentum score, with higher scoring securities representing a greater weight in the Index. The Fund generally invests in all of the securities comprising the Index in proportion to their weightings in the Index.
For the fiscal year ended April 30, 2019, on a market price basis, the Fund returned 13.03%. On a net asset value (“NAV”) basis, the Fund returned 13.15%. During the same time period, the Index returned 13.76%. During the fiscal year, the Fund fully replicated the components of the Index; therefore, the Fund’s
performance, on a NAV basis, differed from the return of the Index primarily due to fees and operating expenses that the Fund incurred during the period, partially offset by income received from the securities lending program in which the Fund participates.
During this same time period, the S&P 500® Consumer Discretionary Index (the “Benchmark Index”) returned 16.89%. The Benchmark Index is an unmanaged index weighted by market capitalization based on the average performance of approximately 80 securities. The Benchmark Index was selected for its recognition in the marketplace, and because its performance comparison is a useful measure for investors as a broad representation of the consumer discretionary sector.
The performance of the Fund differed from the Benchmark Index in part because the Fund seeks to track the Index, which employs a proprietary stock selection and weighting methodology, whereas the Benchmark Index selects and weights stocks based primarily on market capitalization. More broadly, for the fiscal year, the Index weighting included small-,mid- and large-capitalization companies while the Benchmark Index was predominantly weighted to large-capitalization companies.
Relative to the Benchmark Index, the Fund was most overweight in the leisure facilitiessub-industry and most underweight in the internet & direct marketing retailsub-industry during the fiscal year ended April 30, 2019. The majority of the Fund’s underperformance relative to the Benchmark Index during the period can be attributed to the Fund being underweight in the internet & direct marketing retailsub-industry.
For the fiscal year ended April 30, 2019, the application softwaresub-industry contributed most significantly to the Fund’s return followed by the movies & entertainment software and footwearsub-industries, respectively. The computers & electronics retailsub-industry detracted most significantly from the Fund’s return, followed by the home entertainment software and leisure productssub-industries, respectively.
Positions that contributed most significantly to the Fund’s return for the fiscal year ended April 30, 2019, included Trade Desk, Inc., (The) Class A, an application software company (portfolio average weight of 3.36%) and World Wrestling Entertainment, Inc., Class A, a movies & entertainment company (portfolio average weight of 3.37%). Positions that detracted most significantly from the Fund’s return during this period included Stitch Fix, Inc., Class A, an internet & direct marketing retail company (no longer held at fiscalyear-end) and Conn’s, Inc. a computer & electronics retail company (no longer held at fiscalyear-end).
Invesco DWA Consumer Cyclicals Momentum ETF (PEZ)(continued)
| | | | |
Sub-Industry Breakdown
(% of the Fund’s Net Assets)
as of April 30, 2019 | |
| Movies & Entertainment | | | 10.8 | |
| Automotive Retail | | | 10.3 | |
| Internet & Direct Marketing Retail | | | 7.7 | |
| Specialty Stores | | | 6.7 | |
| Footwear | | | 6.5 | |
| Restaurants | | | 6.4 | |
| Homefurnishing Retail | | | 5.7 | |
| Home Improvement Retail | | | 5.5 | |
| Cable & Satellite | | | 4.9 | |
| Broadcasting | | | 4.2 | |
| Casinos & Gaming | | | 4.1 | |
| Application Software | | | 4.0 | |
| Leisure Facilities | | | 3.9 | |
| Interactive Media & Services | | | 3.5 | |
| Sub-Industry Types Each Less Than 3% | | | 15.8 | |
| Money Market Funds Plus Other Assets Less Liabilities | | | 0.0 | |
|
Top Ten Fund Holdings*
(% of the Fund’s Net Assets)
as of April 30, 2019 | |
| Security | | | | |
| Carvana Co. | | | 4.7 | |
| Trade Desk, Inc. (The), Class A | | | 4.0 | |
| Five Below, Inc. | | | 3.9 | |
| O’Reilly Automotive, Inc. | | | 3.9 | |
| Planet Fitness, Inc., Class A | | | 3.9 | |
| IAC/InterActiveCorp. | | | 3.5 | |
| Etsy, Inc. | | | 3.5 | |
| NIKE, Inc., Class B | | | 3.5 | |
| Live Nation Entertainment, Inc. | | | 3.3 | |
| Netflix, Inc. | | | 3.2 | |
| Total | | | 37.4 | |
| * | Excluding money market fund holdings. |
Invesco DWA Consumer Cyclicals Momentum ETF (PEZ) (continued)
Growth of a $10,000 Investment
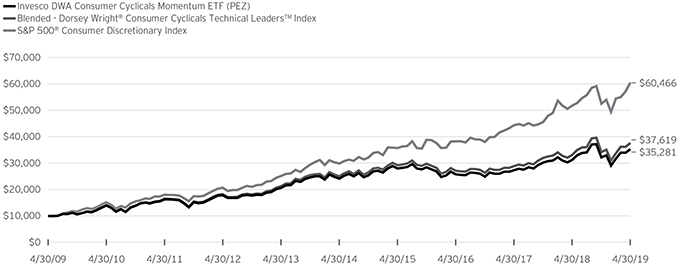
Fund Performance History as of April 30, 2019
| | | | | | | | | | | | | | | | | | | | | | | | | | | | | | | | | | | | | | | | |
| | | 1 Year | | | 3 Years Average
Annualized | | | 3 Years Cumulative | | | 5 Years Average
Annualized | | | 5 Years Cumulative | | | 10 Years Average
Annualized | | | 10 Years Cumulative | | | | | | Fund Inception | |
| Index | | | | | Average
Annualized | | | Cumulative | |
| Blended-Dorsey Wright® Consumer Cyclicals Technical LeadersTM Index | | | 13.76 | % | | | 11.54 | % | | | 38.78 | % | | | 8.51 | % | | | 50.40 | % | | | 14.17 | % | | | 276.19 | % | | | | | | | 7.92 | % | | | 160.19 | % |
| S&P 500® Consumer Discretionary Index | | | 16.89 | | | | 16.49 | | | | 58.09 | | | | 15.17 | | | | 102.59 | | | | 19.72 | | | | 504.66 | | | | | | | | 11.66 | | | | 299.34 | |
| Fund | | | | | | | | | | | | | | | | | | | | | | | | | | | | | | | | | | | | | | | | |
| NAV Return | | | 13.15 | | | | 11.00 | | | | 36.76 | | | | 7.90 | | | | 46.26 | | | | 13.44 | | | | 252.81 | | | | | | | | 7.29 | | | | 141.86 | |
| Market Price Return | | | 13.03 | | | | 11.01 | | | | 36.82 | | | | 7.93 | | | | 46.48 | | | | 13.44 | | | | 252.86 | | | | | | | | 7.29 | | | | 141.99 | |
Fund Inception: October 12, 2006
Performance quoted above represents past performance. Past performance is not a guarantee of future results and current performance may be higher or lower than performance quoted. Investment returns and principal value will fluctuate, and shares of the Fund (“Fund Shares”), when redeemed or sold, may be worth more or less than their original cost. Fund performance reflects any applicable fee waivers and/or expense reimbursements. Had the adviser not waived fees and/or reimbursed expenses currently or in the past, returns would have been lower. See current prospectus for more information. The adviser has contractually agreed to waive fees and/or pay certain Fund expenses through August 31, 2021. According to the Fund’s current prospectus, the total gross annual operating expense ratio was indicated as 0.90% and the net annual operating expense ratio was indicated as 0.60%. The Financial Highlights section of the Shareholder Report presents the expense ratios based on expenses incurred during the period covered by this report. NAV and Market Price returns assume that dividends and capital gain distributions have been reinvested in the Fund at NAV and Market Price, respectively. The returns shown in the table above do not reflect the deduction of taxes that a shareholder would pay on Fund distributions or the redemption or sale of Fund Shares. See invesco.com/ETFs to find the most recentmonth-end performance numbers.
Blended-Index and Benchmark Index performance results are based upon a hypothetical investment in their respective constituent securities. Blended-Index and Benchmark Index returns do not represent Fund returns. An investor cannot invest directly in an index. The Blended-Index and Benchmark Index do not charge management fees or brokerage expenses, and no such fees or expenses were deducted from the hypothetical performance shown. In addition, the results actual investors might have achieved would have differed from those shown because of differences in the timing, amounts of their investments, and fees and expenses associated with an investment in the Fund.
Notes Regarding Indexes and Fund Performance History:
| - | The Blended-Dorsey Wright® Consumer Cyclicals Technical Leaders Index performance is comprised of the performance of the Dynamic Consumer Discretionary Sector IntellidexSM Index, the Fund’s previous underlying index, from Fund inception through the conversion date, February 19, 2014, followed by the performance of the Index, starting from the conversion date through April 30, 2019. |
| - | Average Annualized and Cumulative Inception returns for the Fund, Blended-Index and Benchmark Index are based on the inception date of the Fund. |
| | |
| PSL | | Manager’s Analysis |
| | Invesco DWA Consumer Staples Momentum ETF (PSL) |
As an index fund, the Invesco DWA Consumer Staples Momentum ETF (the “Fund”) is passively managed and seeks to track the returns of an underlying index. The Fund seeks to track the investment results (before fees and expenses) of the Dorsey Wright® Consumer Staples Technical Leaders Index (the “Index”). The Fund generally will invest at least 90% of its total assets in securities of companies that comprise the Index. The Index is composed of at least 30 securities of companies in the consumer staples sector that have powerful relative strength or “momentum” characteristics. Dorsey Wright & Associates, LLC (the “Index Provider”) selects these securities from approximately 2,000 of the largest constituents by market capitalization within the NASDAQ US Benchmark Index. “Relative strength” is an investing technique that seeks to determine the strongest performing securities by measuring certain factors, such as a security’s relative performance against the overall market or a security’s relative strength value, which is derived by comparing the rate of increase of the security’s price over a set period as compared to that of a benchmark index.
Strictly in accordance with its guidelines and mandated procedures, the Index Provider uses a proprietary methodology to analyze the relative strength of each security within the universe of eligible securities and determine a “momentum” score. In general, momentum is the tendency of an investment to exhibit persistence in its relative performance; a “momentum” style of investing emphasizes investing in securities that have had better recent performance compared to other securities. The momentum score for each security included in the Index is based on intermediate and long-term upward price movements of the security as compared to a representative benchmark and other eligible securities within the universe.
After giving each eligible security a momentum score, the Index Provider selects at least 30 securities with the highest momentum scores from the consumer staples sector for inclusion in the Index. Companies in the consumer staples sector are principally engaged in the businesses of providing consumer goods and services that havenon-cyclical characteristics, including tobacco, textiles, food and beverages, andnon-discretionary retail goods and services.
The total number of securities in the Index may vary depending on the capitalization characteristics of the securities that qualify for inclusion in the Index. The Index Provider weights each security by its momentum score, with higher scoring securities representing a greater weight in the Index. The Fund generally invests in all of the securities comprising the Index in proportion to their weightings in the Index.
For the fiscal year ended April 30, 2019, on a market price basis, the Fund returned 8.12%. On a net asset value (“NAV”) basis, the Fund returned 8.50%. During the same time period, the Index returned 9.14%. During the fiscal year, the Fund fully replicated the components of the Index; therefore, the Fund’s performance,
on a NAV basis, differed from the return of the Index primarily due to fees and operating expenses that the Fund incurred during the period.
During this same time period, the S&P 500® Consumer Staples Index (the “Benchmark Index”) returned 18.38%. The Benchmark Index is an unmanaged index weighted by market capitalization based on the average performance of approximately 33 securities. The Benchmark Index was selected for its recognition in the marketplace, and because its performance comparison is a useful measure for investors as a broad representation of the consumer staples sector.
The performance of the Fund differed from the Benchmark Index in part because the Fund seeks to track an Index that employs a proprietary stock selection and weighting methodology, whereas the Benchmark Index selects and weights stocks based primarily on market capitalization.
Relative to the Benchmark Index, the Fund was most overweight in the education servicessub-industry and most underweight in the soft drinkssub-industry during the fiscal year ended April 30, 2019. The majority of the Fund’s underperformance relative to the Benchmark Index during the period can be attributed to the Fund being underweight in the household products and the soft drinks sub-industries.
For the fiscal year ended April 30, 2019, the household productssub-industry contributed most significantly to the Fund’s return, followed by the package foods & meats and education servicessub-industries, respectively. The food retailsub-industry detracted most significantly from the Fund’s return, followed by the distillers & vintners and the household appliancessub-industries, respectively.
Positions that contributed most significantly to the Fund’s return for the fiscal year ended April 30, 2019, included Church & Dwight Co., Inc., a household products company (portfolio average weight of 5.34%) and Chegg, Inc., an education services company (portfolio average weight of 4.25%). Positions that detracted most significantly from the Fund’s return during this period included Weight Watchers International, Inc., a specialized consumer services company (no longer held at fiscalyear-end) and National Beverage Corp., a soft drinks company (no longer held at fiscalyear-end).
Invesco DWA Consumer Staples Momentum ETF (PSL)(continued)
| | | | |
Sub-Industry Breakdown
(% of the Fund’s Net Assets)
as of April 30, 2019 | |
| Packaged Foods & Meats | | | 24.2 | |
| Education Services | | | 15.6 | |
| Household Products | | | 12.9 | |
| Personal Products | | | 9.5 | |
| Food Distributors | | | 6.9 | |
| Specialized Consumer Services | | | 5.7 | |
| Environmental & Facilities Services | | | 4.9 | |
| Soft Drinks | | | 4.6 | |
| Trading Companies & Distributors | | | 3.6 | |
| Industrial Machinery | | | 3.2 | |
| Sub-Industry Types Each Less Than 3% | | | 8.9 | |
| Money Market Funds Plus Other Assets Less Liabilities | | | (0.0) | |
|
Top Ten Fund Holdings*
(% of the Fund’s Net Assets)
as of April 30, 2019 | |
| Security | | | | |
| Church & Dwight Co., Inc. | | | 5.3 | |
| Rollins, Inc. | | | 4.9 | |
| McCormick & Co, Inc. | | | 4.6 | |
| Estee Lauder Cos., Inc. (The), Class A | | | 4.3 | |
| Chegg, Inc. | | | 4.3 | |
| United Rentals, Inc. | | | 3.6 | |
| Herbalife Nutrition Ltd. | | | 3.5 | |
| Sanderson Farms, Inc. | | | 3.5 | |
| Post Holdings, Inc. | | | 3.4 | |
| Service Corp. International | | | 3.2 | |
| Total | | | 40.6 | |
| * | Excluding money market fund holdings. |
Invesco DWA Consumer Staples Momentum ETF (PSL) (continued)
Growth of a $10,000 Investment
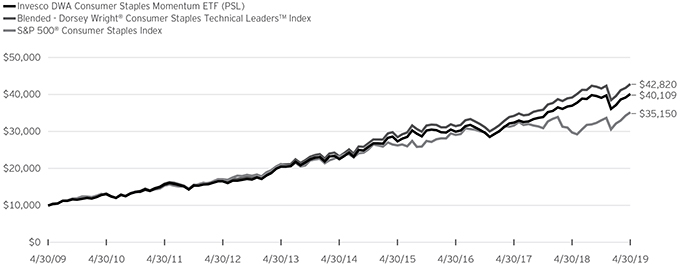
Fund Performance History as of April 30, 2019
| | | | | | | | | | | | | | | | | | | | | | | | | | | | | | | | | | | | | | | | |
| | | 1 Year | | | 3 Years Average
Annualized | | | 3 Years Cumulative | | | 5 Years Average
Annualized | | | 5 Years Cumulative | | | 10 Years Average
Annualized | | | 10 Years Cumulative | | | | | | Fund Inception | |
| Index | | | | | Average
Annualized | | | Cumulative | |
| Blended-Dorsey Wright® Consumer Staples Technical LeadersTM Index | | | 9.14 | % | | | 10.87 | % | | | 36.28 | % | | | 12.91 | % | | | 83.50 | % | | | 15.65 | % | | | 328.20 | % | | | | | | | 11.05 | % | | | 272.55 | % |
| S&P 500® Consumer Staples Index | | | 18.38 | | | | 6.48 | | | | 20.72 | | | | 8.50 | | | | 50.37 | | | | 13.39 | | | | 251.50 | | | | | | | | 9.85 | | | | 224.99 | |
| Fund | | | | | | | | | | | | | | | | | | | | | | | | | | | | | | | | | | | | | | | | |
| NAV Return | | | 8.50 | | | | 10.18 | | | | 33.77 | | | | 12.21 | | | | 77.91 | | | | 14.90 | | | | 301.09 | | | | | | | | 10.32 | | | | 242.93 | |
| Market Price Return | | | 8.12 | | | | 10.17 | | | | 33.73 | | | | 12.21 | | | | 77.91 | | | | 14.91 | | | | 301.40 | | | | | | | | 10.31 | | | | 242.76 | |
Fund Inception: October 12, 2006
Performance quoted above represents past performance. Past performance is not a guarantee of future results and current performance may be higher or lower than performance quoted. Investment returns and principal value will fluctuate, and shares of the Fund (“Fund Shares”), when redeemed or sold, may be worth more or less than their original cost. Fund performance reflects any applicable fee waivers and/or expense reimbursements. Had the adviser not waived fees and/or reimbursed expenses currently or in the past, returns would have been lower. See current prospectus for more information. The adviser has contractually agreed to waive fees and/or pay certain Fund expenses through August 31, 2021. According to the Fund’s current prospectus, the total gross annual operating expense ratio was indicated as 0.79% and the net annual operating expense ratio was indicated as 0.60%. The Financial Highlights section of the Shareholder Report presents the expense ratios based on expenses incurred during the period covered by this report. NAV and Market Price returns assume that dividends and capital gain distributions have been reinvested in the Fund at NAV and Market Price, respectively. The returns shown in the table above do not reflect the deduction of taxes that a shareholder would pay on Fund distributions or the redemption or sale of Fund Shares. See invesco.com/ETFs to find the most recentmonth-end performance numbers.
Blended-Index and Benchmark Index performance results are based upon a hypothetical investment in their respective constituent securities. Blended-Index and Benchmark Index returns do not represent Fund returns. An investor cannot invest directly in an index. The Blended-Index and Benchmark Index do not charge management fees or brokerage expenses, and no such fees or expenses were deducted from the hypothetical performance shown. In addition, the results actual investors might have achieved would have differed from those shown because of differences in the timing, amounts of their investments, and fees and expenses associated with an investment in the Fund.
Notes Regarding Indexes and Fund Performance History:
| - | The Blended-Dorsey Wright® Consumer Staples Technical Leaders Index performance is comprised of the performance of the Dynamic Consumer Staples Sector IntellidexSM Index, the Fund’s previous underlying index, from Fund inception through the conversion date, February 19, 2014, followed by the performance of the Index, starting from the conversion date through April 30, 2019. |
| - | Average Annualized and Cumulative Inception returns for the Fund, Blended-Index and Benchmark Index are based on the inception date of the Fund. |
| | |
| PXI | | Manager’s Analysis |
| | Invesco DWA Energy Momentum ETF (PXI) |
As an index fund, the Invesco DWA Energy Momentum ETF (the “Fund”) is passively managed and seeks to track the returns of an underlying index. The Fund seeks to track the investment results (before fees and expenses) of the Dorsey Wright® Energy Technical Leaders Index (the “Index”). The Fund generally will invest at least 90% of its total assets in securities of companies that comprise the Index. The Index is composed of at least 30 securities of companies in the energy sector that have powerful relative strength or “momentum” characteristics. Dorsey, Wright & Associates, LLC (the “Index Provider”) selects these securities from approximately 2,000 of the largest constituents by market capitalization within the NASDAQ US Benchmark Index. “Relative strength” is an investing technique that seeks to determine the strongest performing securities by measuring certain factors, such as a security’s relative performance against the overall market or a security’s relative strength value, which is derived by comparing the rate of increase of the security’s price over a set period as compared to that of a benchmark index.
Strictly in accordance with its guidelines and mandated procedures, the Index Provider uses a proprietary methodology to analyze the relative strength of each security within the universe of eligible securities and determine a “momentum” score. In general, momentum is the tendency of an investment to exhibit persistence in its relative performance; a “momentum” style of investing emphasizes investing in securities that have had better recent performance compared to other securities. The momentum score for each security included in the Index is based on intermediate and long-term upward price movements of the security as compared to a representative benchmark and other eligible securities within the universe.
After giving each eligible security a momentum score, the Index Provider selects at least 30 securities with the highest momentum scores from the energy sector for inclusion in the Index. Companies in the energy sector are principally engaged in the business of producing, distributing or servicing energy-related products, including oil and gas exploration and production, refining, oil services, pipeline, and solar, wind and othernon-oil based energy.
The total number of securities in the Index may vary depending on the capitalization characteristics of the securities that qualify for inclusion in the Index. The Index Provider weights each security by its momentum score, with higher scoring securities representing a greater weight in the Index. The Fund generally invests in all of the securities comprising the Index in proportion to their weightings in the Index.
For the fiscal year ended April 30, 2019, on a market price basis, the Fund returned (23.74)%. On a net asset value (“NAV”) basis, the Fund returned (23.63)%. During the same time period, the Index returned (23.11)%. During the fiscal year, the Fund fully replicated the components of the Index; therefore, the Fund’s performance, on a NAV basis, differed from the return of the
Index primarily due to fees and operating expenses that the Fund incurred during the period, partially offset by income received from the securities lending program in which the Fund participates.
During this same time period, the S&P 500® Energy Index (the “Benchmark Index”) returned (7.29%). The Benchmark Index is an unmanaged index weighted by market capitalization based on the average performance of approximately 29 securities. The Benchmark Index was selected for its recognition in the marketplace, and because its performance comparison is a useful measure for investors as a broad representation of the energy sector.
The performance of the Fund differed from the Benchmark Index in part because the Fund seeks to track an Index that employs a proprietary stock selection and weighting methodology, whereas the Benchmark Index selects and weights stocks based primarily on market capitalization.
Relative to the Benchmark Index, the Fund was most overweight in the oil & gas exploration & productionsub-industry and most underweight in the integrated oil & gassub-industry during the fiscal year ended April 30, 2019. The majority of the Fund’s underperformance relative to the Benchmark Index during the period can be attributed to the Fund being overweight in the oil & gas exploration & productionsub-industry.
For the fiscal year ended April 30, 2019, the steelsub-industry contributed most significantly to the Fund’s return, followed by the oil & gas storage & transportationsub-industry. The oil & gas exploration & productionsub-industry detracted most significantly from the Fund’s return, followed by the oil & gas equipment & servicessub-industry.
Positions that contributed most significantly to the Fund’s return for the fiscal year ended April 30, 2019, included Hess Corp., an oil & gas exploration & production company (portfolio average weight of 0.78%) and CVR Energy, Inc., an oil & gas refining & marketing company (portfolio average weight of 2.45%). Positions that detracted most significantly from the Fund’s return during this period included Denbury Resources Inc., an oil & gas exploration & production company (no longer held at fiscalyear-end) and California Resources Corp., an oil & gas exploration & production company (portfolio average weight of 1.44%).
Invesco DWA Energy Momentum ETF (PXI)(continued)
| | | | |
Sub-Industry Breakdown
(% of the Fund’s Net Assets)
as of April 30, 2019 | |
| Oil & Gas Exploration & Production | | | 40.8 | |
| Oil & Gas Refining & Marketing | | | 21.1 | |
| Oil & Gas Equipment & Services | | | 12.8 | |
| Oil & Gas Storage & Transportation | | | 11.8 | |
| Integrated Oil & Gas | | | 6.1 | |
| Coal & Consumable Fuels | | | 4.5 | |
| Steel | | | 2.9 | |
| Money Market Funds Plus Other Assets Less Liabilities | | | (0.0) | |
|
Top Ten Fund Holdings*
(% of the Fund’s Net Assets)
as of April 30, 2019 | |
| Security | | | | |
| Pioneer Natural Resources Co. | | | 3.6 | |
| Cheniere Energy, Inc. | | | 3.4 | |
| Valero Energy Corp. | | | 3.4 | |
| Phillips 66 | | | 3.2 | |
| Delek US Holdings, Inc. | | | 3.2 | |
| Williams Cos., Inc. (The) | | | 3.2 | |
| Diamondback Energy, Inc. | | | 3.2 | |
| Occidental Petroleum Corp. | | | 3.1 | |
| Marathon Petroleum Corp. | | | 3.1 | |
| ConocoPhillips | | | 3.0 | |
| Total | | | 32.4 | |
| * | Excluding money market fund holdings. |
Invesco DWA Energy Momentum ETF (PXI) (continued)
Growth of a $10,000 Investment
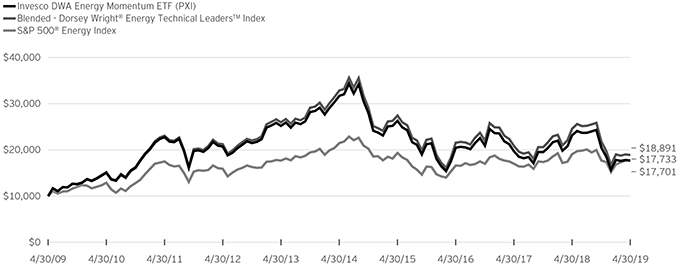
Fund Performance History as of April 30, 2019
| | | | | | | | | | | | | | | | | | | | | | | | | | | | | | | | | | | | | | | | |
| | | 1 Year | | | 3 Years Average
Annualized | | | 3 Years Cumulative | | | 5 Years Average
Annualized | | | 5 Years Cumulative | | | 10 Years Average
Annualized | | | 10 Years Cumulative | | | | | | Fund Inception | |
| Index | | | | | Average
Annualized | | | Cumulative | |
| Blended-Dorsey Wright® Energy Technical LeadersTM Index | | | (23.11 | )% | | | (4.28 | )% | | | (12.29 | )% | | | (10.48 | )% | | | (42.51 | )% | | | 6.57 | % | | | 88.91 | % | | | | | | | 3.19 | % | | | 48.39 | % |
| S&P 500® Energy Index | | | (7.29 | ) | | | 2.09 | | | | 6.40 | | | | (3.76 | ) | | | (17.42 | ) | | | 5.90 | | | | 77.33 | | | | | | | | 3.87 | | | | 60.98 | |
| Fund | | | | | | | | | | | | | | | | | | | | | | | | | | | | | | | | | | | | | | | | |
| NAV Return | | | (23.63 | ) | | | (4.78 | ) | | | (13.66 | ) | | | (11.00 | ) | | | (44.17 | ) | | | 5.88 | | | | 77.01 | | | | | | | | 2.57 | | | | 37.53 | |
| Market Price Return | | | (23.74 | ) | | | (4.77 | ) | | | (13.63 | ) | | | (10.99 | ) | | | (44.13 | ) | | | 5.87 | | | | 76.92 | | | | | | | | 2.58 | | | | 37.64 | |
Fund Inception: October 12, 2006
Performance quoted above represents past performance. Past performance is not a guarantee of future results and current performance may be higher or lower than performance quoted. Investment returns and principal value will fluctuate, and shares of the Fund (“Fund Shares”), when redeemed or sold, may be worth more or less than their original cost. Fund performance reflects any applicable fee waivers and/or expense reimbursements. Had the adviser not waived fees and/or reimbursed expenses currently or in the past, returns would have been lower. See current prospectus for more information. The adviser has contractually agreed to waive fees and/or pay certain Fund expenses through August 31, 2021. According to the Fund’s current prospectus, the total gross annual operating expense ratio was indicated as 0.78% and the net annual operating expense ratio was indicated as 0.60%. The Financial Highlights section of the Shareholder Report presents the expense ratios based on expenses incurred during the period covered by this report. NAV and Market Price returns assume that dividends and capital gain distributions have been reinvested in the Fund at NAV and Market Price, respectively. The returns shown in the table above do not reflect the deduction of taxes that a shareholder would pay on Fund distributions or the redemption or sale of Fund Shares. See invesco.com/ETFs to find the most recentmonth-end performance numbers.
Blended-Index and Benchmark Index performance results are based upon a hypothetical investment in their respective constituent securities. Blended-Index and Benchmark Index returns do not represent Fund returns. An investor cannot invest directly in an index. The Blended-Index and Benchmark Index do not charge management fees or brokerage expenses, and no such fees or expenses were deducted from the hypothetical performance shown. In addition, the results actual investors might have achieved would have differed from those shown because of differences in the timing, amounts of their investments, and fees and expenses associated with an investment in the Fund.
Notes Regarding Indexes and Fund Performance History:
| - | The Blended-Dorsey Wright® Energy Technical Leaders Index performance is comprised of the performance of the Dynamic Energy Sector IntellidexSM Index, the Fund’s previous underlying index, from Fund inception through the conversion date, February 19, 2014, followed by the performance of the Index, starting from the conversion date through April 30, 2019. |
| - | Average Annualized and Cumulative Inception returns for the Fund, Blended-Index and Benchmark Index are based on the inception date of the Fund. |
| | |
| PFI | | Manager’s Analysis |
| | Invesco DWA Financial Momentum ETF (PFI) |
As an index fund, the Invesco DWA Financial Momentum ETF (the “Fund”) is passively managed and seeks to track the returns of an underlying index. The Fund seeks to track the investment results (before fees and expenses) of the Dorsey Wright® Financials Technical Leaders Index (the “Index”). The Fund generally will invest at least 90% of its total assets in securities of companies that comprise the Index. The Index is composed of at least 30 securities of companies in the financials sector that have powerful relative strength or “momentum” characteristics. Dorsey, Wright & Associates, LLC (the “Index Provider”) selects these securities from approximately 2,000 of the largest constituents by market capitalization within the NASDAQ US Benchmark Index. “Relative strength” is an investing technique that seeks to determine the strongest performing securities by measuring certain factors, such as a security’s relative performance against the overall market or a security’s relative strength value, which is derived by comparing the rate of increase of the security’s price over a set period as compared to that of a benchmark index.
Strictly in accordance with its guidelines and mandated procedures, the Index Provider uses a proprietary methodology to analyze the relative strength of each security within the universe of eligible securities and determine a “momentum” score. In general, momentum is the tendency of an investment to exhibit persistence in its relative performance; a “momentum” style of investing emphasizes investing in securities that have had better recent performance compared to other securities. The momentum score for each security included in the Index is based on intermediate and long-term upward price movements of the security as compared to a representative benchmark and other eligible securities within the universe.
After giving each eligible security a momentum score, the Index Provider selects at least 30 securities with the highest momentum scores from the financials sector for inclusion in the Index. Companies in the financials sector are principally engaged in the business of providing financial services and products, including banking, investment services, insurance and real estate finance services.
The total number of securities in the Index may vary depending on the capitalization characteristics of the securities that qualify for inclusion in the Index. The Index Provider weights each security by its momentum score, with higher scoring securities representing a greater weight in the Index. The Fund generally invests in all of the securities comprising the Index in proportion to their weightings in the Index.
For the fiscal year ended April 30, 2019, on a market price basis, the Fund returned 2.18%. On a net asset value (“NAV”) basis, the Fund returned 2.44%. During the same time period, the Index returned 3.05%. During the fiscal year, the Fund fully replicated the components of the Index; therefore, the Fund’s performance, on a NAV basis, differed from the return of the Index primarily
due to fees and operating expenses that the Fund incurred during the period, as well as trading costs around the rebalances during the period.
During this same time period, the S&P 500® Financials Index (the “Benchmark Index”) returned 4.29%. The Benchmark Index is an unmanaged index weighted by market capitalization based on the average performance of approximately 70 securities. The Benchmark Index was selected for its recognition in the marketplace, and because its performance comparison is a useful measure for investors as a broad representation of the financials sector.
The performance of the Fund differed from the Benchmark Index in part because the Fund seeks to track an Index that employs a proprietary stock selection and weighting methodology, whereas the Benchmark Index selects and weights stocks based primarily on market capitalization. More broadly, for the fiscal year, the Index weighting included small-,mid- and large-capitalization companies while the Benchmark Index was predominantly weighted to large-capitalization companies.
Relative to the Benchmark Index, the Fund was most overweight in the regional bankssub-industry and most underweight in the diversified bankssub-industry during the fiscal year ended April 30, 2019. The majority of the Fund’s underperformance relative to the Benchmark Index during that period can be attributed to the Fund being overweight the regional bankssub-industry and underweight in the investment banking & broker and diversified bankssub-industries.
For the fiscal year ended April 30, 2019, the industrial REITssub-industry contributed most significantly to the Fund’s return, followed by the data processing & outsourced services and financial exchanges & datasub-industries, respectively. The regional bankssub-industry detracted most significantly from the Fund’s return, followed by the investment banking & brokeragesub-industry.
Positions that contributed most significantly to the Fund’s return for the fiscal year ended April 30, 2019, included Mastercard Inc., Class A, a data processing & outsourced services company (portfolio average weight of 6.37%) and LendingTree Inc., a thrifts & mortgage finance company (portfolio average weight of 1.33%). Positions that detracted most significantly from the Fund’s return during this period included SVB Financial Group, a regional banks company (no longer held at fiscalyear-end) and Western Alliance Bancorp, Inc. a regional banks company (no longer held at fiscalyear-end).
Invesco DWA Financial Momentum ETF (PFI) (continued)
| | | | |
Sub-Industry Breakdown
(% of the Fund’s Net Assets)
as of April 30, 2019 | |
| Financial Exchanges & Data | | | 19.5 | |
| Specialized REITs | | | 15.0 | |
| Property & Casualty Insurance | | | 8.1 | |
| Industrial REITs | | | 8.0 | |
| Data Processing & Outsourced Services | | | 7.7 | |
| Regional Banks | | | 7.0 | |
| Consumer Finance | | | 6.0 | |
| Thrifts & Mortgage Finance | | | 4.4 | |
| Life & Health Insurance | | | 4.1 | |
| Insurance Brokers | | | 4.1 | |
| Investment Banking & Brokerage | | | 4.0 | |
| Sub-Industry Types Each Less Than 3% | | | 12.2 | |
| Money Market Funds Plus Other Assets Less Liabilities | | | (0.1) | |
|
Top Ten Fund Holdings*
(% of the Fund’s Net Assets)
as of April 30, 2019 | |
| Security | | | | |
| MarketAxess Holdings, Inc. | | | 5.2 | |
| Mastercard, Inc., Class A | | | 5.1 | |
| American Tower Corp. | | | 5.1 | |
| Crown Castle International Corp. | | | 4.8 | |
| Extra Space Storage, Inc. | | | 3.0 | |
| JPMorgan Chase & Co. | | | 2.7 | |
| Moody’s Corp. | | | 2.7 | |
| MSCI, Inc. | | | 2.7 | |
| LendingTree, Inc. | | | 2.6 | |
| Visa, Inc., Class A | | | 2.6 | |
| Total | | | 36.5 | |
| * | Excluding money market fund holdings. |
Invesco DWA Financial Momentum ETF (PFI)(continued)
Growth of a $10,000 Investment
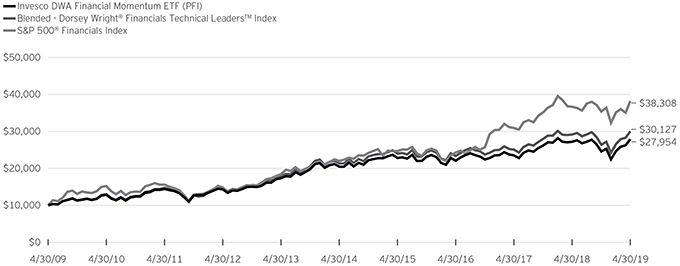
Fund Performance History as of April 30, 2019
| | | | | | | | | | | | | | | | | | | | | | | | | | | | | | | | | | | | | | | | |
| | | 1 Year | | | 3 Years Average
Annualized | | | 3 Years Cumulative | | | 5 Years Average
Annualized | | | 5 Years Cumulative | | | 10 Years Average
Annualized | | | 10 Years Cumulative | | | | | | Fund Inception | |
| Index | | | | | Average
Annualized | | | Cumulative | |
| Blended-Dorsey Wright® Financials Technical LeadersTM Index | | | 3.05 | % | | | 8.77 | % | | | 28.67 | % | | | 7.15 | % | | | 41.25 | % | | | 11.66 | % | | | 201.27 | % | | | | | | | 4.91 | % | | | 82.54 | % |
| S&P 500® Financials Index | | | 4.29 | | | | 16.30 | | | | 57.29 | | | | 11.63 | | | | 73.38 | | | | 14.37 | | | | 283.08 | | | | | | | | 1.93 | | | | 27.17 | |
| Fund | | | | | | | | | | | | | | | | | | | | | | | | | | | | | | | | | | | | | | | | |
| NAV Return | | | 2.44 | | | | 8.06 | | | | 26.17 | | | | 6.45 | | | | 36.71 | | | | 10.83 | | | | 179.54 | | | | | | | | 4.14 | | | | 66.35 | |
| Market Price Return | | | 2.18 | | | | 8.01 | | | | 26.02 | | | | 6.46 | | | | 36.74 | | | | 10.84 | | | | 179.86 | | | | | | | | 4.13 | | | | 66.27 | |
Fund Inception: October 12, 2006
Performance quoted above represents past performance. Past performance is not a guarantee of future results and current performance may be higher or lower than performance quoted. Investment returns and principal value will fluctuate, and shares of the Fund (“Fund Shares”), when redeemed or sold, may be worth more or less than their original cost. Fund performance reflects any applicable fee waivers and/or expense reimbursements. Had the adviser not waived fees and/or reimbursed expenses currently or in the past, returns would have been lower. See current prospectus for more information. The adviser has contractually agreed to waive fees and/or pay certain Fund expenses through August 31, 2021. According to the Fund’s current prospectus, the total gross annual operating expense ratio was indicated as 0.75% and the net annual operating expense ratio was indicated as 0.60%. The Financial Highlights section of the Shareholder Report presents the expense ratios based on expenses incurred during the period covered by this report. NAV and Market Price returns assume that dividends and capital gain distributions have been reinvested in the Fund at NAV and Market Price, respectively. The returns shown in the table above do not reflect the deduction of taxes that a shareholder would pay on Fund distributions or the redemption or sale of Fund Shares. See invesco.com/ETFs to find the most recentmonth-end performance numbers.
Blended-Index and Benchmark Index performance results are based upon a hypothetical investment in their respective constituent securities. Blended-Index and Benchmark Index returns do not represent Fund returns. An investor cannot invest directly in an index. The Blended-Index and Benchmark Index do not charge management fees or brokerage expenses, and no such fees or expenses were deducted from the hypothetical performance shown. In addition, the results actual investors might have achieved would have differed from those shown because of differences in the timing, amounts of their investments, and fees and expenses associated with an investment in the Fund.
Notes Regarding Indexes and Fund Performance History:
| - | The Blended-Dorsey Wright® Financials Technical Leaders Index performance is comprised of the performance of the Dynamic Financial Sector IntellidexSM Index, the Fund’s previous underlying index, from Fund inception through the conversion date, February 19, 2014, followed by the performance of the Index, starting from the conversion date through April 30, 2019. |
| - | Average Annualized and Cumulative Inception returns for the Fund, Blended-Index and Benchmark Index are based on the inception date of the Fund. |
| | |
| PTH | | Manager’s Analysis |
| | Invesco DWA Healthcare Momentum ETF (PTH) |
As an index fund, the Invesco DWA Healthcare Momentum ETF (the “Fund”) is passively managed and seeks to track the returns of an underlying index. The Fund seeks to track the investment results (before fees and expenses) of the Dorsey Wright® Healthcare Technical Leaders Index (the “Index”). The Fund generally will invest at least 90% of its total assets in securities of companies that comprise the Index. The Index is composed of at least 30 securities of companies in the health care sector that have powerful relative strength or “momentum” characteristics. Dorsey Wright & Associates, LLC (the “Index Provider”) selects these securities from approximately 2,000 of the largest constituents by market capitalization within the NASDAQ US Benchmark Index. “Relative strength” is an investing technique that seeks to determine the strongest performing securities by measuring certain factors, such as a security’s relative performance against the overall market or a security’s relative strength value, which is derived by comparing the rate of increase of the security’s price over a set period as compared to that of a benchmark index.
Strictly in accordance with its guidelines and mandated procedures, the Index Provider uses a proprietary methodology to analyze the relative strength of each security within the universe of eligible securities and determine a “momentum” score. In general, momentum is the tendency of an investment to exhibit persistence in its relative performance; a “momentum” style of investing emphasizes investing in securities that have had better recent performance compared to other securities. The momentum score for each security included in the Index is based on intermediate and long-term upward price movements of the security as compared to a representative benchmark and other eligible securities within the universe.
After giving each eligible security a momentum score, the Index Provider selects at least 30 securities with the highest momentum scores from the health care sector for inclusion in the Index. Companies in the health care sector are principally engaged in the business of providing health care-related products and services, including biotechnology, pharmaceuticals, medical technology and supplies, and facilities.
The total number of securities in the Index may vary depending on the capitalization characteristics of the securities that qualify for inclusion in the Index. The Index Provider weights each security by its momentum score, with higher scoring securities representing a greater weight in the Index. The Fund generally invests in all of the securities comprising the Index in proportion to their weightings in the Index.
For the fiscal year ended April 30, 2019, on a market price basis, the Fund returned (0.15)%. On a net asset value (“NAV”) basis, the Fund returned 0.18%. During the same time period, the Index returned 0.76%. During the fiscal year, the Fund fully replicated the components of the Index; therefore, the Fund’s performance,
on a NAV basis, differed from the return of the Index primarily due to fees and operating expenses that the Fund incurred during the period, partially offset by income received from the securities lending program in which the Fund participates.
During this same time period, the S&P 500® Health Care Index (the “Benchmark Index”) returned 10.52%. The Benchmark Index is an unmanaged index weighted by market capitalization based on the average performance of approximately 60 securities. The Benchmark Index was selected for its recognition in the marketplace, and because its performance comparison is a useful measure for investors as a broad representation of the health care sector.
The performance of the Fund differed from the Benchmark Index in part because the Fund seeks to track an Index that employs a proprietary stock selection and weighting methodology, whereas the Benchmark Index selects and weights stocks based primarily on market capitalization.
Relative to the Benchmark Index, the Fund was most overweight in the biotechnologysub-industry and most underweight in the pharmaceuticalssub-industry during the fiscal year ended April 30, 2019. The majority of the Fund’s underperformance relative to the Benchmark Index during the period can be attributed to the Fund being underweight in the pharmaceuticalssub-industry and the security selection in the health care equipmentsub-industry.
For the fiscal year ended April 30, 2019, the health care services sub-industry contributed most significantly to the Fund’s return, followed by the life sciences tools & services and health care equipmentsub-industries, respectively. The pharmaceuticalssub-industry detracted most significantly from the Fund’s return, followed by the managed health caresub-industry.
Positions that contributed most significantly to the Fund’s return for the fiscal year ended April 30, 2019, included Exact Sciences Corp., a biotechnology company (portfolio average weight of 5.17%) and Endocyte, Inc., a pharmaceuticals company no longer held at fiscal year-end. Positions that detracted most significantly from the Fund’s return during this period included Nektar Therapeutics, Inc., a pharmaceuticals company (no longer held at fiscalyear-end) and Vikings Therapeutics, Inc., a biotechnology company (no longer held at fiscalyear-end).
Invesco DWA Healthcare Momentum ETF (PTH) (continued)
| | | | |
Sub-Industry Breakdown
(% of the Fund’s Net Assets)
as of April 30, 2019 | |
| Health Care Equipment | | | 26.8 | |
| Biotechnology | | | 22.8 | |
| Health Care Supplies | | | 11.1 | |
| Health Care Services | | | 10.8 | |
| Life Sciences Tools & Services | | | 8.7 | |
| Pharmaceuticals | | | 6.9 | |
| Managed Health Care | | | 4.9 | |
| Health Care Technology | | | 4.6 | |
| Sub-Industry Types Each Less Than 3% | | | 3.4 | |
| Money Market Funds Plus Other Assets Less Liabilities | | | (0.0) | |
|
Top Ten Fund Holdings*
(% of the Fund’s Net Assets)
as of April 30, 2019 | |
| Security | | | | |
| Exact Sciences Corp. | | | 6.4 | |
| Align Technology, Inc. | | | 5.2 | |
| Mirati Therapeutics, Inc. | | | 5.0 | |
| Amedisys, Inc. | | | 4.4 | |
| Axsome Therapeutics, Inc. | | | 3.4 | |
| Thermo Fisher Scientific, Inc. | | | 3.4 | |
| Teladoc Health, Inc. | | | 3.3 | |
| Masimo Corp. | | | 3.2 | |
| West Pharmaceutical Services, Inc. | | | 2.9 | |
| UnitedHealth Group, Inc. | | | 2.8 | |
| Total | | | 40.0 | |
| * | Excluding money market fund holdings. |
Invesco DWA Healthcare Momentum ETF (PTH)(continued)
Growth of a $10,000 Investment
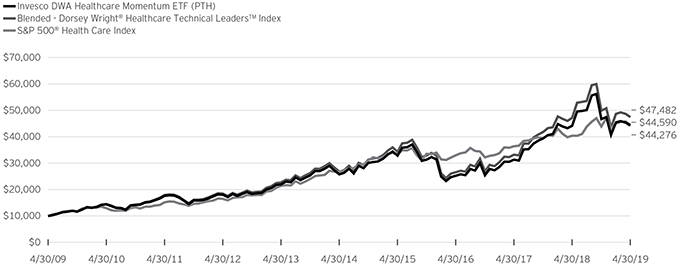
Fund Performance History as of April 30, 2019
| | | | | | | | | | | | | | | | | | | | | | | | | | | | | | | | | | | | | | | | |
| | | 1 Year | | | 3 Years Average
Annualized | | | 3 Years Cumulative | | | 5 Years Average
Annualized | | | 5 Years Cumulative | | | 10 Years Average
Annualized | | | 10 Years Cumulative | | | | | | Fund Inception | |
| Index | | | | | Average
Annualized | | | Cumulative | |
| Blended-Dorsey Wright® Healthcare Technical LeadersTM Index | | | 0.76 | % | | | 21.34 | % | | | 78.65 | % | | | 12.12 | % | | | 77.20 | % | | | 16.86 | % | | | 374.82 | % | | | | | | | 10.39 | % | | | 245.78 | % |
| S&P 500® Health Care Index | | | 10.52 | | | | 10.51 | | | | 34.95 | | | | 10.81 | | | | 67.03 | | | | 16.12 | | | | 345.90 | | | | | | | | 10.26 | | | | 240.85 | |
| Fund | | | | | | | | | | | | | | | | | | | | | | | | | | | | | | | | | | | | | | | | |
| NAV Return | | | 0.18 | | | | 20.63 | | | | 75.56 | | | | 11.40 | | | | 71.57 | | | | 16.04 | | | | 342.76 | | | | | | | | 9.62 | | | | 216.71 | |
| Market Price Return | | | (0.15 | ) | | | 20.61 | | | | 75.46 | | | | 11.37 | | | | 71.35 | | | | 16.05 | | | | 342.93 | | | | | | | | 9.61 | | | | 216.30 | |
Fund Inception: October 12, 2006
Performance quoted above represents past performance. Past performance is not a guarantee of future results and current performance may be higher or lower than performance quoted. Investment returns and principal value will fluctuate, and shares of the Fund (“Fund Shares”), when redeemed or sold, may be worth more or less than their original cost. Fund performance reflects any applicable fee waivers and/or expense reimbursements. Had the adviser not waived fees and/or reimbursed expenses currently or in the past, returns would have been lower. See current prospectus for more information. The adviser has contractually agreed to waive fees and/or pay certain Fund expenses through August 31, 2021. According to the Fund’s current prospectus, the total gross annual operating expense ratio was indicated as 0.73% and the net annual operating expense ratio was indicated as 0.60%. The Financial Highlights section of the Shareholder Report presents the expense ratios based on expenses incurred during the period covered by this report. NAV and Market Price returns assume that dividends and capital gain distributions have been reinvested in the Fund at NAV and Market Price, respectively. The returns shown in the table above do not reflect the deduction of taxes that a shareholder would pay on Fund distributions or the redemption or sale of Fund Shares. See invesco.com/ETFs to find the most recentmonth-end performance numbers.
Blended-Index and Benchmark Index performance results are based upon a hypothetical investment in their respective constituent securities. Blended-Index and Benchmark Index returns do not represent Fund returns. An investor cannot invest directly in an index. The Blended-Index and Benchmark Index do not charge management fees or brokerage expenses, and no such fees or expenses were deducted from the hypothetical performance shown. In addition, the results actual investors might have achieved would have differed from those shown because of differences in the timing, amounts of their investments, and fees and expenses associated with an investment in the Fund.
Notes Regarding Indexes and Fund Performance History:
| - | The Blended-Dorsey Wright® Healthcare Technical Leaders Index performance is comprised of the performance of the Dynamic Healthcare Sector IntellidexSM Index, the Fund’s previous underlying index, from Fund inception through the conversion date, February 19, 2014, followed by the performance of the Index, starting from the conversion date through April 30, 2019. |
| - | Average Annualized and Cumulative Inception returns for the Fund, Blended-Index and Benchmark Index are based on the inception date of the Fund. |
| | |
| PRN | | Manager’s Analysis |
| | Invesco DWA Industrials Momentum ETF (PRN) |
As an index fund, the Invesco DWA Industrials Momentum ETF (the “Fund”) is passively managed and seeks to track the returns of an underlying index. The Fund seeks to track the investment results (before fees and expenses) of the Dorsey Wright® Industrials Technical Leaders Index (the “Index”). The Fund generally will invest at least 90% of its total assets in securities of companies that comprise the Index. The Index is composed of at least 30 securities of companies in the industrials sector that have powerful relative strength or “momentum” characteristics. Dorsey Wright & Associates, LLC (the “Index Provider”) selects these securities from approximately 2,000 of the largest constituents by market capitalization within the NASDAQ US Benchmark Index. “Relative strength” is an investing technique that seeks to determine the strongest performing securities by measuring certain factors, such as a security’s relative performance against the overall market or a security’s relative strength value, which is derived by comparing the rate of increase of the security’s price over a set period as compared to that of a benchmark index.
Strictly in accordance with its guidelines and mandated procedures, the Index Provider uses a proprietary methodology to analyze the relative strength of each security within the universe of eligible securities and determine a “momentum” score. In general, momentum is the tendency of an investment to exhibit persistence in its relative performance; a “momentum” style of investing emphasizes investing in securities that have had better recent performance compared to other securities. The momentum score for each security included in the Index is based on intermediate and long-term upward price movements of the security as compared to a representative benchmark and other eligible securities within the universe.
After giving each eligible security a momentum score, the Index Provider selects at least 30 securities with the highest momentum scores from the industrials sector for inclusion in the Index. Companies in the industrials sector are principally engaged in the business of providing industrial products and services, including engineering, heavy machinery, construction, electrical equipment, aerospace and defense and general manufacturing products and services.
The total number of securities in the Index may vary depending on the capitalization characteristics of the securities that qualify for inclusion in the Index. The Index Provider weights each security by its momentum score, with higher scoring securities representing a greater weight in the Index. The Fund generally invests in all of the securities comprising the Index in proportion to their weightings in the Index.
For the fiscal year ended April 30, 2019, on a market price basis, the Fund returned 10.19%. On a net asset value (“NAV”) basis, the Fund returned 10.28%. During the same time period, the Index returned 10.98%. During the fiscal year, the Fund fully replicated the components of the Index; therefore, the Fund’s
performance, on a NAV basis, differed from the return of the Index primarily due to fees and operating expenses that the Fund incurred during the period.
During this same time period, the S&P 500® Industrials Index (the “Benchmark Index”) returned 10.56%. The Benchmark Index is an unmanaged index weighted by market capitalization based on the average performance of approximately 70 securities. The Benchmark Index was selected for its recognition in the marketplace, and because its performance comparison is a useful measure for investors as a broad representation of the industrials sector.
The performance of the Fund differed from the Benchmark Index in part because the Fund seeks to track an Index that employs a proprietary stock selection and weighting methodology, of which market capitalization is one component, whereas the Benchmark Index selects and weights stocks based primarily on market capitalization.
Relative to the Benchmark Index, the Fund was most overweight in the data processing & outsourced servicessub-industry and most underweight in the industrial conglomeratessub-industry during the fiscal year ended April 30, 2019. The majority of the Fund’s underperformance relative to the Benchmark Index during the period can be attributed the Fund being overweight in the railroadssub-industry as well as stock selection in the industrial machinerysub-industry.
For the fiscal year ended April 30, 2019, the data processing & outsourced servicessub-industry contributed most significantly to the Fund’s return, followed by the railroads and electrical component & equipment sub-industries, respectively. The trucking sub-industry detracted most significantly from the Fund’s return, followed by the electronic equipment & instruments and the commodity chemicalssub-industries, respectively.
Positions that contributed most significantly to the Fund’s return for the fiscal year ended April 30, 2019, included TransDigm Group, Inc., an aerospace & defense company (portfolio average weight of 3.61%) and Fair Isaac Corp., an application software company (portfolio average weight of 2.77%). Positions that detracted most significantly from the Fund’s return during this period included John Bean Technologies Corp., an industrial machinery company (no longer held at fiscalyear-end) and Control4 Corp., an electronic equipment & instruments company (no longer held at fiscalyear-end).
Invesco DWA Industrials Momentum ETF (PRN) (continued)
| | | | |
Sub-Industry Breakdown
(% of the Fund’s Net Assets)
as of April 30, 2019 | |
| Aerospace & Defense | | | 15.9 | |
| IT Consulting & Other Services | | | 7.6 | |
| Data Processing & Outsourced Services | | | 7.4 | |
| Building Products | | | 6.8 | |
| Industrial Machinery | | | 6.6 | |
| Electrical Components & Equipment | | | 5.9 | |
| Health Care Equipment | | | 5.6 | |
| Specialty Chemicals | | | 4.4 | |
| Railroads | | | 4.2 | |
| Industrial Conglomerates | | | 4.2 | |
| Application Software | | | 3.6 | |
| Semiconductors | | | 3.3 | |
| Human Resource & Employment Services | | | 3.2 | |
| Diversified Support Services | | | 3.0 | |
| Sub-Industry Types Each Less Than 3% | | | 18.3 | |
| Money Market Funds Plus Other Assets Less Liabilities | | | 0.0 | |
|
Top Ten Fund Holdings*
(% of the Fund’s Net Assets)
as of April 30, 2019 | |
| Security | | | | |
| TransDigm Group, Inc. | | | 4.8 | |
| Sherwin-Williams Co. (The) | | | 4.4 | |
| AMETEK, Inc. | | | 4.4 | |
| Union Pacific Corp. | | | 4.2 | |
| Roper Technologies, Inc. | | | 4.2 | |
| Gartner, Inc. | | | 4.1 | |
| Fair Isaac Corp. | | | 3.6 | |
| Danaher Corp. | | | 3.6 | |
| Accenture PLC, Class A | | | 3.5 | |
| Boeing Co. (The) | | | 3.4 | |
| Total | | | 40.2 | |
| * | Excluding money market fund holdings. |
Invesco DWA Industrials Momentum ETF (PRN) (continued)
Growth of a $10,000 Investment
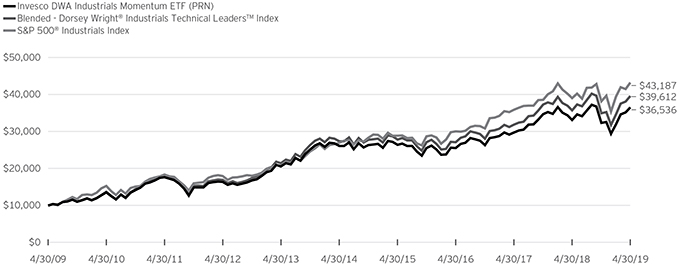
Fund Performance History as of April 30, 2019
| | | | | | | | | | | | | | | | | | | | | | | | | | | | | | | | | | | | | | | | |
| | | | | | 3 Years Average
Annualized | | | 3 Years Cumulative | | | 5 Years Average
Annualized | | | 5 Years Cumulative | | | 10 Years Average
Annualized | | | 10 Years Cumulative | | | | | | Fund Inception | |
| Index | | 1 Year | | | | | | Average
Annualized | | | Cumulative | |
| Blended-Dorsey Wright® Industrials Technical LeadersTM Index | | | 10.98 | % | | | 13.44 | % | | | 45.99 | % | | | 7.68 | % | | | 44.75 | % | | | 14.76 | % | | | 296.12 | % | | | | | | | 9.15 | % | | | 199.97 | % |
| S&P 500® Industrials Index | | | 10.56 | | | | 12.84 | | | | 43.69 | | | | 9.88 | | | | 60.21 | | | | 15.75 | | | | 331.87 | | | | | | | | 8.46 | | | | 177.00 | |
| Fund | | | | | | | | | | | | | | | | | | | | | | | | | | | | | | | | | | | | | | | | |
| NAV Return | | | 10.28 | | | | 12.71 | | | | 43.17 | | | | 6.98 | | | | 40.09 | | | | 13.83 | | | | 265.36 | | | | | | | | 8.28 | | | | 171.53 | |
| Market Price Return | | | 10.19 | | | | 12.70 | | | | 43.15 | | | | 6.99 | | | | 40.19 | | | | 13.85 | | | | 265.90 | | | | | | | | 8.29 | | | | 171.62 | |
Fund Inception: October 12, 2006
Performance quoted above represents past performance. Past performance is not a guarantee of future results and current performance may be higher or lower than performance quoted. Investment returns and principal value will fluctuate, and shares of the Fund (“Fund Shares”), when redeemed or sold, may be worth more or less than their original cost. Fund performance reflects any applicable fee waivers and/or expense reimbursements. Had the adviser not waived fees and/or reimbursed expenses currently or in the past, returns would have been lower. See current prospectus for more information. The adviser has contractually agreed to waive fees and/or pay certain Fund expenses through August 31, 2021. According to the Fund’s current prospectus, the total gross annual operating expense ratio was indicated as 0.64% and the net annual operating expense ratio was indicated as 0.60%. The Financial Highlights section of the Shareholder Report presents the expense ratios based on expenses incurred during the period covered by this report. NAV and Market Price returns assume that dividends and capital gain distributions have been reinvested in the Fund at NAV and Market Price, respectively. The returns shown in the table above do not reflect the deduction of taxes that a shareholder would pay on Fund distributions or the redemption or sale of Fund Shares. See invesco.com/ETFs to find the most recent month-end performance numbers.
Blended-Index and Benchmark Index performance results are based upon a hypothetical investment in their respective constituent securities. Blended-Index and Benchmark Index returns do not represent Fund returns. An investor cannot invest directly in an index. The Blended-Index and Benchmark Index do not charge management fees or brokerage expenses, and no such fees or expenses were deducted from the hypothetical performance shown. In addition, the results actual investors might have achieved would have differed from those shown because of differences in the timing, amounts of their investments, and fees and expenses associated with an investment in the Fund.
Notes Regarding Indexes and Fund Performance History:
| - | The Blended-Dorsey Wright® Industrials Technical Leaders Index performance is comprised of the performance of the Dynamic Industrials Sector IntellidexSM Index, the Fund’s previous underlying index, from Fund inception through the conversion date, February 19, 2014, followed by the performance of the Index, starting from the conversion date through April 30, 2019. |
| - | Average Annualized and Cumulative Inception returns for the Fund, Blended-Index and Benchmark Index are based on the inception date of the Fund. |
| | |
| PTF | | Manager’s Analysis |
| | Invesco DWA Technology Momentum ETF (PTF) |
As an index fund, the Invesco DWA Technology Momentum ETF (the “Fund”) is passively managed and seeks to track the returns of an underlying index. The Fund seeks to track the investment results (before fees and expenses) of the Dorsey Wright® Technology Technical Leaders Index (the “Index”). The Fund generally will invest at least 90% of its total assets in securities of companies that comprise the Index. The Index is composed of at least 30 securities of companies in the technology sector that have powerful relative strength or “momentum” characteristics. Dorsey Wright & Associates, LLC (the “Index Provider”) selects these securities from approximately 2,000 of the largest constituents by market capitalization within the NASDAQ US Benchmark Index. “Relative strength” is an investing technique that seeks to determine the strongest performing securities by measuring certain factors, such as a security’s relative performance against the overall market or a security’s relative strength value, which is derived by comparing the rate of increase of the security’s price over a set period as compared to that of a benchmark index.
Strictly in accordance with its guidelines and mandated procedures, the Index Provider uses a proprietary methodology to analyze the relative strength of each security within the universe of eligible securities and determine a “momentum” score. In general, momentum is the tendency of an investment to exhibit persistence in its relative performance; a “momentum” style of investing emphasizes investing in securities that have had better recent performance compared to other securities. The momentum score for each security included in the Index is based on intermediate and long-term upward price movements of the security as compared to a representative benchmark and other eligible securities within the universe.
After giving each eligible security a momentum score, the Index Provider selects at least 30 securities with the highest momentum scores from the technology sector for inclusion in the Index. Companies in the technology sector are principally engaged in the business of providing technology-related products and services, including computer hardware and software, internet, electronics and semiconductors, and wireless communication technologies.
The total number of securities in the Index may vary depending on the capitalization characteristics of the securities that qualify for inclusion in the Index. The Index Provider weights each security by its momentum score, with higher scoring securities representing a greater weight in the Index. The Fund generally invests in all of the securities comprising the Index in proportion to their weightings in the Index.
For the fiscal year ended April 30, 2019, on a market price basis, the Fund returned 28.01%. On a net asset value (“NAV”) basis, the Fund returned 27.90%. During the same time period, the Index returned 28.82%. During the fiscal year, the Fund fully replicated the components of the Index; therefore, the Fund’s
performance, on a NAV basis, differed from the return of the Index primarily due to fees and operating expenses that the Fund incurred, as well as trading costs around rebalances during the period, partially offset by income received from the securities lending program in which the Fund participates.
During this same time period, the S&P 500® Information Technology Index (the “Benchmark Index”) returned 22.76%. The Benchmark Index is an unmanaged index weighted by market capitalization based on the average performance of approximately 70 securities. The Benchmark Index was selected for its recognition in the marketplace, and because its performance comparison is a useful measure for investors as a broad representation of the technology sector.
The performance of the Fund differed from the Benchmark Index in part because the Fund seeks to track an Index that employs a proprietary stock selection and weighting methodology, whereas the Benchmark Index selects and weights stocks based primarily on market capitalization.
Relative to the Benchmark Index, the Fund was most overweight in the application softwaresub-industry and most underweight in the technology hardware storage & peripheralssub-industry during the fiscal year ended April 30, 2019. The majority of the Fund’s outperformance relative to the Benchmark Index during the period can be attributed to the Fund being overweight in the application softwaresub-industry.
For the fiscal year ended April 30, 2019, the application softwaresub-industry contributed most significantly to the Fund’s return, followed by the internet services & infrastructure and semiconductor equipmentsub-industries, respectively. The semiconductorssub-industry detracted most significantly from the Fund’s return, followed by the wireless telecommunication servicessub-industry.
Positions that contributed most significantly to the Fund’s return for the fiscal year ended April 30, 2019, included Twilio, Inc., Class A, an internet services & infrastructure company (portfolio average weight of 2.79%) and Veeva Systems, Inc., Class A, a health care technology company (portfolio average weight of 2.74%). Positions that detracted most significantly from the Fund’s return during this period included NIVIDIA, Inc., a semiconductors company (no longer held at fiscalyear-end) and GTT Communications, Inc., an internet services & infrastructure company (no longer held at fiscalyear-end).
Invesco DWA Technology Momentum ETF (PTF) (continued)
| | | | |
Sub-Industry Breakdown
(% of the Fund’s Net Assets)
as of April 30, 2019 | |
| Application Software | | | 50.4 | |
| Internet Services & Infrastructure | | | 14.1 | |
| Data Processing & Outsourced Services | | | 6.4 | |
| Systems Software | | | 5.9 | |
| Semiconductors | | | 5.7 | |
| Communications Equipment | | | 4.2 | |
| Interactive Media & Services | | | 3.2 | |
| Health Care Technology | | | 3.1 | |
| Sub-Industry Types Each Less Than 3% | | | 7.0 | |
| Money Market Funds Plus Other Assets Less Liabilities | | | (0.0) | |
| | | | |
Top Ten Fund Holdings*
(% of the Fund’s Net Assets)
as of April 30, 2019 | |
| Security | | | | |
| Paycom Software, Inc. | | | 6.8 | |
| RingCentral, Inc., Class A | | | 4.8 | |
| Twilio, Inc., Class A | | | 4.4 | |
| MongoDB, Inc. | | | 4.2 | |
| Cadence Design Systems, Inc. | | | 4.2 | |
| Square, Inc., Class A | | | 4.1 | |
| Broadcom, Inc. | | | 3.7 | |
| Alteryx, Inc., Class A | | | 3.7 | |
| Match Group, Inc. | | | 3.2 | |
| Adobe, Inc. | | | 3.2 | |
| Total | | | 42.3 | |
| * | Excluding money market fund holdings. |
Invesco DWA Technology Momentum ETF (PTF)(continued)
Growth of a $10,000 Investment
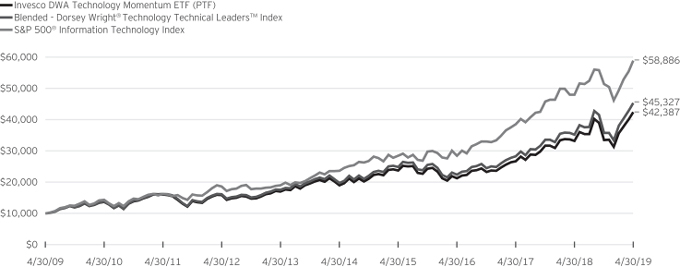
Fund Performance History as of April 30, 2019
| | | | | | | | | | | | | | | | | | | | | | | | | | | | | | | | | | | | | | | | |
| | | 1 Year | | | 3 Years Average
Annualized | | | 3 Years Cumulative | | | 5 Years Average
Annualized | | | 5 Years Cumulative | | | 10 Years Average
Annualized | | | 10 Years Cumulative | | | | | | Fund Inception | |
| Index | | | | | Average
Annualized | | | Cumulative | |
| Blended-Dorsey Wright® Technology Technical LeadersTM Index | | | 28.82 | % | | | 26.51 | % | | | 102.46 | % | | | 18.16 | % | | | 130.33 | % | | | 16.31 | % | | | 353.27 | % | | | | | | | 9.49 | % | | | 211.96 | % |
| S&P 500® Information Technology Index | | | 22.76 | | | | 27.47 | | | | 107.12 | | | | 20.05 | | | | 149.39 | | | | 19.40 | | | | 488.86 | | | | | | | | 13.07 | | | | 367.30 | |
| Fund | | | | | | | | | | | | | | | | | | | | | | | | | | | | | | | | | | | | | | | | |
| NAV Return | | | 27.90 | | | | 25.85 | | | | 99.34 | | | | 17.47 | | | | 123.71 | | | | 15.54 | | | | 323.87 | | | | | | | | 8.76 | | | | 186.95 | |
| Market Price Return | | | 28.01 | | | | 25.91 | | | | 99.59 | | | | 17.49 | | | | 123.92 | | | | 15.55 | | | | 324.41 | | | | | | | | 8.77 | | | | 187.32 | |
Fund Inception: October 12, 2006
Performance quoted above represents past performance. Past performance is not a guarantee of future results and current performance may be higher or lower than performance quoted. Investment returns and principal value will fluctuate, and shares of the Fund (“Fund Shares”), when redeemed or sold, may be worth more or less than their original cost. Fund performance reflects any applicable fee waivers and/or expense reimbursements. Had the adviser not waived fees and/or reimbursed expenses currently or in the past, returns would have been lower. See current prospectus for more information. The adviser has contractually agreed to waive fees and/or pay certain Fund expenses through August 31, 2021. According to the Fund’s current prospectus, the total gross annual operating expense ratio was indicated as 0.74% and the net annual operating expense ratio was indicated as 0.60%. The Financial Highlights section of the Shareholder Report presents the expense ratios based on expenses incurred during the period covered by this report. NAV and Market Price returns assume that dividends and capital gain distributions have been reinvested in the Fund at NAV and Market Price, respectively. The returns shown in the table above do not reflect the deduction of taxes that a shareholder would pay on Fund distributions or the redemption or sale of Fund Shares. See invesco.com/ETFs to find the most recent month-end performance numbers.
Blended-Index and Benchmark Index performance results are based upon a hypothetical investment in their respective constituent securities. Blended-Index and Benchmark Index returns do not represent Fund returns. An investor cannot invest directly in an index. The Blended-Index and Benchmark Index do not charge management fees or brokerage expenses, and no such fees or expenses were deducted from the hypothetical performance shown. In addition, the results actual investors might have achieved would have differed from those shown because of differences in the timing, amounts of their investments, and fees and expenses associated with an investment in the Fund.
Notes Regarding Indexes and Fund Performance History:
| - | The Blended-Dorsey Wright® Technology Technical Leaders Index performance is comprised of the performance of the Dynamic Technology Sector IntellidexSM Index, the Fund’s previous underlying index, from Fund inception through the conversion date, February 19, 2014, followed by the performance of the Index, starting from the conversion date through April 30, 2019. |
| - | Average Annualized and Cumulative Inception returns for the Fund, Blended-Index and Benchmark Index are based on the inception date of the Fund. |
| | |
| PUI | | Manager’s Analysis |
| | Invesco DWA Utilities Momentum ETF (PUI) |
As an index fund, the Invesco DWA Utilities Momentum ETF (the “Fund”) is passively managed and seeks to track the returns of an underlying index. The Fund seeks to track the investment results (before fees and expenses) of the Dorsey Wright® Utilities Technical Leaders Index (the “Index”). The Fund generally will invest at least 90% of its total assets in securities of companies that comprise the Index. The Index is composed of at least 30 securities of companies in the utilities sector that have powerful relative strength or “momentum” characteristics. Dorsey Wright & Associates, LLC (the “Index Provider”) selects these securities from approximately 2,000 of the largest constituents by market capitalization within the NASDAQ US Benchmark Index. “Relative strength” is an investing technique that seeks to determine the strongest performing securities by measuring certain factors, such as a security’s relative performance against the overall market or a security’s relative strength value, which is derived by comparing the rate of increase of the security’s price over a set period as compared to that of a benchmark index.
Strictly in accordance with its guidelines and mandated procedures, the Index Provider uses a proprietary methodology to analyze the relative strength of each security within the universe of eligible securities and determine a “momentum” score. In general, momentum is the tendency of an investment to exhibit persistence in its relative performance; a “momentum” style of investing emphasizes investing in securities that have had better recent performance compared to other securities. The momentum score for each security included in the Index is based on intermediate and long-term upward price movements of the security as compared to a representative benchmark and other eligible securities within the universe.
After giving each eligible security a momentum score, the Index Provider selects at least 30 securities with the highest momentum scores from the utilities sector for inclusion in the Index. Companies in the utilities sector are principally engaged in providing energy, water, natural gas or telecommunications services. These companies may include companies that generate and supply electricity, including electricity wholesalers; distribute natural gas to customers; provide water to customers, as well as deal with associated wastewater; and provide land line telephone services.
The total number of securities in the Index may vary depending on the capitalization characteristics of the securities that qualify for inclusion in the Index. The Index Provider weights each security by its momentum score, with higher scoring securities representing a greater weight in the Index. The Fund generally invests in all of the securities comprising the Index in proportion to their weightings in the Index.
For the fiscal year ended April 30, 2019, on a market price basis, the Fund returned 20.89%. On a net asset value (“NAV”) basis, the Fund returned 20.98%. During the same time period, the
Index returned 21.69%. During the fiscal year, the Fund fully replicated the components of the Index; therefore, the Fund’s performance, on a NAV basis, differed from the return of the Index primarily due to fees and operating expenses that the Fund incurred during the period.
During this same time period, the S&P 500® Utilities Index (the “Benchmark Index”) returned 17.96%. The Benchmark Index is an unmanaged index weighted by market capitalization based on the average performance of approximately 28 securities. The Benchmark Index was selected for its recognition in the marketplace, and because its performance comparison is a useful measure for investors as a broad representation of the utilities sector.
The performance of the Fund differed from the Benchmark Index in part because the Fund seeks to track an Index that employs a proprietary stock selection and weighting methodology, whereas the Benchmark Index selects and weights stocks based primarily on market capitalization.
Relative to the Benchmark Index, the Fund was most overweight in the gas utilitiessub-industry and most underweight in the electric utilitiessub-industry during the fiscal year ended April 30, 2019. The majority of the Fund’s outperformance relative to the Benchmark Index during the period can be attributed to the Fund being underweight and the Fund’s stock selection in the electric utilitiessub-industry, as well as the Fund being overweight in the oil & gas exploration & productionsub-industry.
For the fiscal year ended April 30, 2019, the electric utilities sub-industry contributed most significantly to the Fund’s return, followed by the multi-utilitiessub-industry. The wireless telecommunication services sub-industry detracted most significantly from the Fund’s return.
Positions that contributed most significantly to the Fund’s return for the fiscal year ended April 30, 2019, included NRG Energy, Inc., an independent power producers & energy traders company (portfolio average weight of 3.69%) and AES Corp. (The), an independent power producers & energy traders company (portfolio average weight of 2.62%). Positions that detracted most significantly from the Fund’s return during this period included South Jersey Industries, Inc., a gas utilities company (no longer held at fiscalyear-end) and ONEOK, Inc., an oil & gas storage & transportation company (portfolio average weight of 2.66%).
Invesco DWA Utilities Momentum ETF (PUI) (continued)
| | | | |
Sub-Industry Breakdown
(% of the Fund’s Net Assets)
as of April 30, 2019 | |
| Electric Utilities | | | 37.3 | |
| Multi-Utilities | | | 24.9 | |
| Gas Utilities | | | 16.1 | |
| Water Utilities | | | 8.7 | |
| Independent Power Producers & Energy Traders | | | 6.7 | |
| Oil & Gas Storage & Transportation | | | 3.6 | |
| Wireless Telecommunication Services | | | 2.7 | |
| Money Market Funds Plus Other Assets Less Liabilities | | | (0.0) | |
| | | | |
Top Ten Fund Holdings*
(% of the Fund’s Net Assets)
as of April 30, 2019 | |
| Security | | | | |
| American Water Works Co., Inc. | | | 3.9 | |
| DTE Energy Co. | | | 3.8 | |
| CenterPoint Energy, Inc. | | | 3.8 | |
| Alliant Energy Corp. | | | 3.7 | |
| Pinnacle West Capital Corp. | | | 3.7 | |
| NextEra Energy, Inc. | | | 3.6 | |
| NRG Energy, Inc. | | | 3.6 | |
| Duke Energy Corp. | | | 3.6 | |
| CMS Energy Corp. | | | 3.6 | |
| Eversource Energy | | | 3.6 | |
| Total | | | 36.9 | |
| * | Excluding money market fund holdings. |
Invesco DWA Utilities Momentum ETF (PUI)(continued)
Growth of a $10,000 Investment
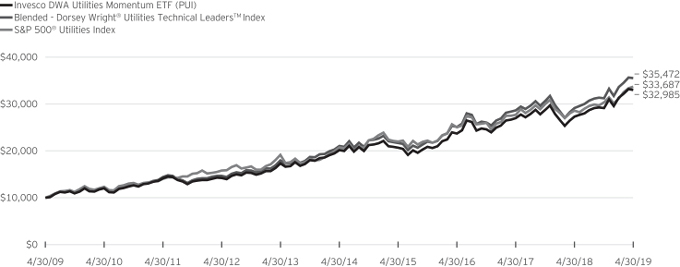
Fund Performance History as of April 30, 2019
| | | | | | | | | | | | | | | | | | | | | | | | | | | | | | | | | | | | | | | | |
| | | 1 Year | | | 3 Years Average
Annualized | | | 3 Years Cumulative | | | 5 Years Average
Annualized | | | 5 Years Cumulative | | | 10 Years Average
Annualized | | | 10 Years Cumulative | | | | | | Fund Inception | |
| Index | | | | | Average
Annualized | | | Cumulative | |
| Blended-Dorsey Wright® Utilities Technical LeadersTM Index | | | 21.69 | % | | | 12.28 | % | | | 41.53 | % | | | 11.02 | % | | | 68.68 | % | | | 13.50 | % | | | 254.72 | % | | | | | | | 9.42 | % | | | 237.72 | % |
| S&P 500® Utilities Index | | | 17.96 | | | | 10.42 | | | | 34.63 | | | | 10.18 | | | | 62.36 | | | | 12.91 | | | | 236.87 | | | | | | | | 8.99 | | | | 220.00 | |
| Fund | | | | | | | | | | | | | | | | | | | | | | | | | | | | | | | | | | | | | | | | |
| NAV Return | | | 20.98 | | | | 11.62 | | | | 39.08 | | | | 10.36 | | | | 63.70 | | | | 12.68 | | | | 229.85 | | | | | | | | 8.66 | | | | 207.12 | |
| Market Price Return | | | 20.89 | | | | 11.65 | | | | 39.19 | | | | 10.38 | | | | 63.86 | | | | 12.69 | | | | 230.35 | | | | | | | | 8.67 | | | | 207.52 | |
Fund Inception: October 26, 2005
Performance quoted above represents past performance. Past performance is not a guarantee of future results and current performance may be higher or lower than performance quoted. Investment returns and principal value will fluctuate, and shares of the Fund (“Fund Shares”), when redeemed or sold, may be worth more or less than their original cost. Fund performance reflects any applicable fee waivers and/or expense reimbursements. Had the adviser not waived fees and/or reimbursed expenses currently or in the past, returns would have been lower. See current prospectus for more information. The adviser has contractually agreed to waive fees and/or pay certain Fund expenses through August 31, 2021. According to the Fund’s current prospectus, the total gross annual operating expense ratio was indicated as 0.83% and the net annual operating expense ratio was indicated as 0.60%. The Financial Highlights section of the Shareholder Report presents the expense ratios based on expenses incurred during the period covered by this report. NAV and Market Price returns assume that dividends and capital gain distributions have been reinvested in the Fund at NAV and Market Price, respectively. The returns shown in the table above do not reflect the deduction of taxes that a shareholder would pay on Fund distributions or the redemption or sale of Fund Shares. See invesco.com/ETFs to find the most recentmonth-end performance numbers.
Blended-Index and Benchmark Index performance results are based upon a hypothetical investment in their respective constituent securities. Blended-Index and Benchmark Index returns do not represent Fund returns. An investor cannot invest directly in an index. The Blended-Index and Benchmark Index do not charge management fees or brokerage expenses, and no such fees or expenses were deducted from the hypothetical performance shown. In addition, the results actual investors might have achieved would have differed from those shown because of differences in the timing, amounts of their investments, and fees and expenses associated with an investment in the Fund.
Notes Regarding Indexes and Fund Performance History:
| - | The Blended-Dorsey Wright® Utilities Technical Leaders Index performance is comprised of the performance of the Dynamic Utilities IntellidexSMIndex, the Fund’s previous underlying index, from Fund inception through the conversion date, February 19, 2014, followed by the performance of the Index, starting from the conversion date through April 30, 2019. |
| - | Average Annualized and Cumulative Inception returns for the Fund, Blended-Index and Benchmark Index are based on the inception date of the Fund. |
| | |
| PNQI | | Manager’s Analysis |
| | Invesco NASDAQ Internet ETF (PNQI) |
As an index fund, the Invesco NASDAQ Internet ETF (the “Fund”) is passively managed and seeks to track the returns of an underlying index. The Fund seeks to track the investment results (before fees and expenses) of the NASDAQ Internet IndexSM (the “Index”). The Fund generally will invest at least 90% of its total assets in securities of internet companies that comprise the Index.
Nasdaq, Inc. (the “Index Provider”) compiles the Index strictly in accordance with its guidelines and mandated procedures. The Index is designed to track the performance of the largest and most liquid U.S.-listed companies engaged in internet-related businesses that are listed on one of the three major U.S. stock exchanges. Companies in the Index include internet software and services companies involved in internet-related services, including internet access providers, internet search engines, web hosting, website design, ande-commerce. The Fund generally invests in all of the securities comprising the Index in proportion to their weightings in the Index.
For the fiscal year ended April 30, 2019, on a market price basis, the Fund returned 10.15%. On a net asset value (“NAV”) basis, the Fund returned 10.29%. During the same time period, the Index returned 10.89%. During the fiscal year, the Fund fully replicated the components of the Index; therefore, the Fund’s performance, on a NAV basis, differed from the return of the Index primarily due to fees and operating expenses that the Fund incurred during the period.
During this same time period, theNASDAQ-100® Index (the “Benchmark Index”) returned 19.10%. The Benchmark Index is an unmanaged, modified market-capitalization weighted index based on the average performance of approximately 100 securities. The Benchmark Index was selected for its recognition in the marketplace, and because its performance comparison is a useful measure for investors as a broad representation of the overall U.S. stock market.
The performance of the Fund differed from the Benchmark Index in part because the Fund seeks to track an Index that consists of companies engaged in internet-related businesses, whereas the Benchmark Index consists of approximately 100 of the largestnon-financial companies listed on the NASDAQ Stock Market, which may include companies that are not engaged in internet-related businesses.
Relative to the Benchmark Index, the Fund was most overweight in the internet & direct marketing retailsub-industry and most underweight in the technology hardware storage & peripheralssub-industry during the fiscal year ended April 30, 2019. The majority of the Fund’s underperformance relative to the Benchmark Index during the period can be attributed to the Fund being underweight in the system softwaresub-industry.
For the fiscal year ended April 30, 2019, the internet services & infrastructuresub-industry contributed most significantly to the Fund’s return, followed by the internet & direct marketing retail and research & consulting servicessub-industries, respectively. The application softwaresub-industry detracted most significantly from the Fund’s return, followed by the commercial printingsub-industry.
Positions that contributed most significantly to the Fund’s return for the fiscal year ended April 30, 2019, included Netflix, Inc., a movies & entertainment company (portfolio average weight of 8.31%) and Amazon.com, Inc., an internet & direct marketing retail company (portfolio average weight of 8.15%). Positions that detracted most significantly from the Fund’s return during this period included Baidu, Inc., ADR (China), an interactive media & services company (portfolio average weight of 3.8%) and Booking Holdings, Inc., an internet & direct marketing retail company (portfolio average weight of 2.81%).
| | | | |
Sub-Industry Breakdown
(% of the Fund’s Net Assets)
as of April 30, 2019 | |
| Internet & Direct Marketing Retail | | | 38.2 | |
| Interactive Media & Services | | | 32.5 | |
| Movies & Entertainment | | | 7.6 | |
| Internet Services & Infrastructure | | | 7.5 | |
| Application Software | | | 5.9 | |
| Sub-Industry Types Each Less Than 3% | | | 8.3 | |
| Money Market Funds Plus Other Assets Less Liabilities | | | (0.0) | |
|
Top Ten Fund Holdings*
(% of the Fund’s Net Assets)
as of April 30, 2019 | |
| Security | | | | |
| Facebook, Inc., Class A | | | 8.8 | |
| Amazon.com, Inc. | | | 8.6 | |
| Alphabet, Inc., Class C | | | 7.8 | |
| Netflix, Inc. | | | 7.6 | |
| Alibaba Group Holding Ltd., ADR (China) | | | 7.5 | |
| Booking Holdings, Inc. | | | 4.0 | |
| eBay, Inc. | | | 3.8 | |
| Baidu, Inc., ADR (China) | | | 3.8 | |
| Twitter, Inc. | | | 3.3 | |
| JD.com, Inc., ADR (China) | | | 3.0 | |
| Total | | | 58.2 | |
| * | Excluding money market fund holdings. |
Invesco NASDAQ Internet ETF (PNQI)(continued)
Growth of a $10,000 Investment
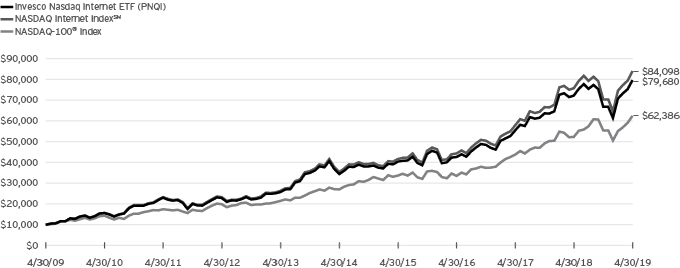
Fund Performance History as of April 30, 2019
| | | | | | | | | | | | | | | | | | | | | | | | | | | | | | | | | | | | | | | | |
| | | 1 Year | | | 3 Years Average
Annualized | | | 3 Years Cumulative | | | 5 Years Average
Annualized | | | 5 Years Cumulative | | | 10 Years Average
Annualized | | | 10 Years Cumulative | | | | | | Fund Inception | |
| Index | | | | | Average
Annualized | | | Cumulative | |
| NASDAQ Internet IndexSM | | | 10.89 | % | | | 23.71 | % | | | 89.35 | % | | | 18.90 | % | | | 137.60 | % | | | 23.73 | % | | | 740.98 | % | | | | | | | 18.43 | % | | | 530.27 | % |
| NASDAQ100® Index | | | 19.10 | | | | 22.87 | | | | 85.48 | | | | 18.17 | | | | 130.45 | | | | 20.09 | | | | 523.86 | | | | | | | | 14.93 | | | | 354.51 | |
| Fund | | | | | | | | | | | | | | | | | | | | | | | | | | | | | | | | | | | | | | | | |
| NAV Return | | | 10.29 | | | | 23.04 | | | | 86.28 | | | | 18.25 | | | | 131.21 | | | | 23.07 | | | | 696.80 | | | | | | | | 17.81 | | | | 494.99 | |
| Market Price Return | | | 10.15 | | | | 23.06 | | | | 86.34 | | | | 18.29 | | | | 131.59 | | | | 23.07 | | | | 697.07 | | | | | | | | 17.63 | | | | 485.58 | |
Fund Inception: June 12, 2008
Performance quoted above represents past performance. Past performance is not a guarantee of future results and current performance may be higher or lower than performance quoted. Investment returns and principal value will fluctuate, and shares of the Fund (“Fund Shares”), when redeemed or sold, may be worth more or less than their original cost. Fund performance reflects any applicable fee waivers and/or expense reimbursements. Had the adviser not waived fees and/or reimbursed expenses currently or in the past, returns would have been lower. See current prospectus for more information. According to the Fund’s current prospectus, the Fund’s expense ratio of 0.60% is expressed as a unitary management fee to cover operating expenses and expenses incurred in connection with managing the portfolio. NAV and Market Price returns assume that dividends and capital gain distributions have been reinvested in the Fund at NAV and Market Price, respectively. The returns shown in the table above do not reflect the deduction of taxes that a shareholder would pay on Fund distributions or the redemption or sale of Fund Shares. See invesco.com/ETFs to find the most recentmonth-end performance numbers.
Index and Benchmark Index performance results are based upon a hypothetical investment in their respective constituent securities. Index and Benchmark Index returns do not represent Fund returns. An investor cannot invest directly in an index. The Index and Benchmark Index do not charge management fees or brokerage expenses, and no such fees or expenses were deducted from the hypothetical performance shown. In addition, the results actual investors might have achieved would have differed from those shown because of differences in the timing, amounts of their investments, and fees and expenses associated with an investment in the Fund.
Notes Regarding Indexes and Fund Performance History:
| - | Average Annualized and Cumulative Inception returns for the Fund, Index and Benchmark Index are based on the inception date of the Fund. |
Schedule of Investments(a)
Invesco DWA Basic Materials Momentum ETF (PYZ)
April 30, 2019
| | | | | | | | |
Number
of Shares | | | | | Value | |
| | | | Common Stocks & Other Equity Interests—100.0% | |
| | | | Aluminum—2.0% | | | |
| | 13,209 | | | Kaiser Aluminum Corp. | | $ | 1,299,766 | |
| | | | | | | | |
| |
| | | | Commodity Chemicals—8.6% | |
| | 65,558 | | | Kronos Worldwide, Inc. | | | 891,589 | |
| | 27,010 | | | LyondellBasell Industries N.V., Class A | | | 2,383,092 | |
| | 48,112 | | | Olin Corp. | | | 1,043,549 | |
| | 16,320 | | | Westlake Chemical Corp. | | | 1,138,320 | |
| | | | | | | | |
| | | | | | | 5,456,550 | |
| | | | | | | | |
| | | | Diversified Chemicals—6.7% | |
| | 29,550 | | | Chemours Co. (The) | | | 1,064,095 | |
| | 22,744 | | | Eastman Chemical Co. | | | 1,794,047 | |
| | 64,172 | | | Huntsman Corp. | | | 1,427,185 | |
| | | | | | | | |
| | | | | | | 4,285,327 | |
| | | | | | | | |
| | | | Diversified Metals & Mining—1.4% | |
| | 15,655 | | | Materion Corp. | | | 908,460 | |
| | | | | | | | |
| |
| | | | Fertilizers & Agricultural Chemicals—8.4% | |
| | 31,558 | | | CF Industries Holdings, Inc. | | | 1,413,167 | |
| | 36,144 | | | FMC Corp. | | | 2,857,545 | |
| | 41,060 | | | Mosaic Co. (The) | | | 1,072,076 | |
| | | | | | | | |
| | | | | | | 5,342,788 | |
| | | | | | | | |
| | | | Forest Products—1.7% | |
| | 42,336 | | | Louisiana-Pacific Corp. | | | 1,060,517 | |
| | | | | | | | |
| |
| | | | Gold—3.5% | |
| | 36,775 | | | Newmont Goldcorp Corp. | | | 1,142,232 | |
| | 12,056 | | | Royal Gold, Inc. | | | 1,049,595 | |
| | | | | | | | |
| | | | | | | 2,191,827 | |
| | | | | | | | |
| | | | Industrial Gases—4.6% | |
| | 14,183 | | | Air Products and Chemicals, Inc. | | | 2,918,720 | |
| | | | | | | | |
| |
| | | | Oil & Gas Equipment & Services—1.2% | |
| | 49,904 | | | US Silica Holdings, Inc. | | | 789,481 | |
| | | | | | | | |
| |
| | | | Paper Packaging—4.0% | |
| | 22,808 | | | Avery Dennison Corp. | | | 2,523,705 | |
| | | | | | | | |
| |
| | | | Paper Products—5.6% | |
| | 22,610 | | | Domtar Corp. | | | 1,105,629 | |
| | 12,006 | | | Neenah, Inc. | | | 814,607 | |
| | 16,896 | | | Schweitzer-Mauduit International, Inc., Class A | | | 600,991 | |
| | 46,260 | | | Verso Corp., Class A(b) | | | 1,032,523 | |
| | | | | | | | |
| | | | | | | 3,553,750 | |
| | | | | | | | |
| | | | Specialty Chemicals—42.0% | |
| | 36,668 | | | Ashland Global Holdings, Inc. | | | 2,952,874 | |
| | 6,701 | | | Balchem Corp. | | | 680,219 | |
| | 22,512 | | | Celanese Corp., Series A | | | 2,428,820 | |
| | 36,236 | | | DowDuPont, Inc. | | | 1,393,274 | |
| | 14,313 | | | Ecolab, Inc. | | | 2,634,737 | |
| | 104,409 | | | Element Solutions, Inc.(b) | | | 1,133,882 | |
| | 32,336 | | | Ferro Corp.(b) | | | 577,844 | |
| | 16,820 | | | H.B. Fuller Co. | | | 823,675 | |
| | 14,878 | | | Ingevity Corp.(b) | | | 1,711,119 | |
| | 11,931 | | | Innospec, Inc. | | | 1,011,987 | |
| | 13,348 | | | International Flavors & Fragrances, Inc.(c) | | | 1,839,221 | |
| | 19,752 | | | Kraton Corp.(b) | | | 648,261 | |
| | 1,805 | | | NewMarket Corp. | | | 757,342 | |
| | 16,477 | | | PPG Industries, Inc. | | | 1,936,048 | |
| | | | | | | | |
Number
of Shares | | | | | Value | |
| | | | Common Stocks & Other Equity Interests
(continued) | |
| | | | Specialty Chemicals (continued) | |
| | 8,042 | | | Quaker Chemical Corp. | | $ | 1,799,960 | |
| | 26,134 | | | RPM International, Inc. | | | 1,585,027 | |
| | 15,062 | | | Sensient Technologies Corp. | | | 1,056,147 | |
| | 10,152 | | | Stepan Co. | | | 939,466 | |
| | 10,020 | | | W.R. Grace & Co. | | | 757,312 | |
| | | | | | | | |
| | | | | | | 26,667,215 | |
| | | | | | | | |
| | | | Steel—10.3% | |
| | 55,968 | | | Allegheny Technologies, Inc.(b) | | | 1,394,722 | |
| | 16,919 | | | Carpenter Technology Corp. | | | 840,367 | |
| | 129,539 | | | Cleveland-Cliffs, Inc.(c) | | | 1,294,095 | |
| | 9,473 | | | Reliance Steel & Aluminum Co. | | | 871,137 | |
| | 42,923 | | | Steel Dynamics, Inc. | | | 1,359,801 | |
| | 18,853 | | | Worthington Industries, Inc. | | | 756,571 | |
| | | | | | | | |
| | | | | | | 6,516,693 | |
| | | | | | | | |
| | | | Total Common Stocks & Other Equity Interests
(Cost $61,197,963) | | | 63,514,799 | |
| | | | | | | | |
| | |
| | | | | | | | |
| | | | Money Market Funds—0.4% | |
| | 236,202 | | | Invesco Premier U.S. Government Money Portfolio—Institutional Class, 2.32%(d)
(Cost $236,202) | | | 236,202 | |
| | | | | | | | |
| | |
| | | | Total Investments in Securities
(excluding investments purchased with cash collateral from securities on loan)
(Cost $61,434,165)—100.4% | | | 63,751,001 | |
| | | | | | | | |
| | |
| | | | | | | | |
| | | | Investments Purchased with Cash
Collateral from Securities on Loan | |
| | |
| | | | | | | | |
| | | | Money Market Funds—4.5% | |
| | 2,155,286 | | | Invesco Government & Agency Portfolio—Institutional Class, 2.34%(d)(e) | | | 2,155,286 | |
| | 718,213 | | | Invesco Liquid Assets Portfolio—Institutional
Class, 2.48%(d)(e) | | | 718,429 | |
| | | | | | | | |
| | |
| | | | Total Money Market Funds
(Cost $2,873,715) | | | 2,873,715 | |
| | | | | | | | |
| | |
| | | | Total Investments in Securities
(Cost $64,307,880)—104.9% | | | 66,624,716 | |
| | |
| | | | Other assets less liabilities—(4.9)% | | | (3,107,143 | ) |
| | | | | | | | |
| | |
| | | | Net Assets—100.0% | | $ | 63,517,573 | |
| | | | | | | | |
See accompanying Notes to Financial Statements which are an integral part of the financial statements.
Invesco DWA Basic Materials Momentum ETF (PYZ)(continued)
April 30, 2019
Notes to Schedule of Investments:
| (a) | Industry and/or sector classifications used in this report are generally according to the Global Industry Classification Standard, which was developed by and is the exclusive property and a service mark of MSCI Inc. and Standard & Poor’s. |
| (b) | Non-income producing security. |
| (c) | All or a portion of this security was out on loan at April 30, 2019. |
| (d) | The security and the Fund are advised by wholly-owned subsidiaries of Invesco Ltd. and are therefore considered to be affiliated. The rate shown is the 7-day SEC standardized yield as of April 30, 2019. |
| (e) | The security has been segregated to satisfy the commitment to return the cash collateral received in securities lending transactions upon the borrower’s return of the securities loaned. See Note 2J. |
See accompanying Notes to Financial Statements which are an integral part of the financial statements.
Schedule of Investments(a)
Invesco DWA Consumer Cyclicals Momentum ETF (PEZ)
April 30, 2019
| | | | | | | | |
Number
of Shares | | | | | Value | |
| | | | Common Stocks & Other Equity Interests—100.0% | |
| | | | Apparel Retail—2.2% | | | |
| | 11,777 | | | Foot Locker, Inc. | | $ | 673,762 | |
| | | | | | | | |
| |
| | | | Apparel, Accessories & Luxury Goods—1.6% | |
| | 5,112 | | | Columbia Sportswear Co. | | | 511,047 | |
| | | | | | | | |
| |
| | | | Application Software—4.0% | |
| | 5,672 | | | Trade Desk, Inc. (The), Class A(b) | | | 1,256,235 | |
| | | | | | | | |
| |
| | | | Auto Parts & Equipment—1.6% | |
| | 15,622 | | | Stoneridge, Inc.(b) | | | 491,000 | |
| | | | | | | | |
| |
| | | | Automotive Retail—10.3% | |
| | 5,366 | | | America’s Car-Mart, Inc.(b) | | | 531,502 | |
| | 20,258 | | | Carvana Co.(b)(c) | | | 1,449,662 | |
| | 3,238 | | | O’Reilly Automotive, Inc.(b) | | | 1,225,810 | |
| | | | | | | | |
| | | | | | | 3,206,974 | |
| | | | | | | | |
| | | | Broadcasting—4.2% | |
| | 24,149 | | | Gray Television, Inc.(b) | | | 565,811 | |
| | 6,435 | | | Nexstar Media Group, Inc., Class A | | | 753,217 | |
| | | | | | | | |
| | | | | | | 1,319,028 | |
| | | | | | | | |
| | | | Cable & Satellite—4.9% | |
| | 535 | | | Cable One, Inc. | | | 567,384 | |
| | 2,607 | | | Charter Communications, Inc., Class A(b) | | | 967,692 | |
| | | | | | | | |
| | | | | | | 1,535,076 | |
| | | | | | | | |
| | | | Casinos & Gaming—4.1% | |
| | 18,198 | | | Boyd Gaming Corp. | | | 523,738 | |
| | 15,475 | | | Eldorado Resorts, Inc.(b) | | | 764,001 | |
| | | | | | | | |
| | | | | | | 1,287,739 | |
| | | | | | | | |
| | | | Consumer Electronics—2.5% | |
| | 9,119 | | | Garmin Ltd. | | | 781,863 | |
| | | | | | | | |
| |
| | | | Distributors—1.5% | |
| | 22,980 | | | Funko, Inc., Class A(b)(c) | | | 455,693 | |
| | | | | | | | |
| |
| | | | Footwear—6.5% | |
| | 5,875 | | | Deckers Outdoor Corp.(b) | | | 929,484 | |
| | 12,456 | | | NIKE, Inc., Class B | | | 1,094,010 | |
| | | | | | | | |
| | | | | | | 2,023,494 | |
| | | | | | | | |
| |
| | | | Home Improvement Retail—5.5% | |
| | 4,564 | | | Home Depot, Inc. (The) | | | 929,687 | |
| | 6,960 | | | Lowe’s Cos., Inc. | | | 787,454 | |
| | | | | | | | |
| | | | | | | 1,717,141 | |
| | | | | | | | |
| |
| | | | Homebuilding—2.5% | |
| | 245 | | | NVR, Inc.(b) | | | 772,358 | |
| | | | | | | | |
| |
| | | | Homefurnishing Retail—5.7% | |
| | 9,810 | | | Aaron’s, Inc. | | | 546,319 | |
| | 7,843 | | | RH(b)(c) | | | 836,927 | |
| | 11,128 | | | Sleep Number Corp.(b) | | | 387,254 | |
| | | | | | | | |
| | | | | | | 1,770,500 | |
| | | | | | | | |
| | | | Interactive Media & Services—3.5% | |
| | 4,918 | | | IAC/InterActiveCorp.(b) | | | 1,105,763 | |
| | | | | | | | |
| |
| | | | Internet & Direct Marketing Retail—7.7% | |
| | 22,608 | | | 1-800-Flowers.com, Inc., Class A(b) | | | 481,324 | |
| | 16,297 | | | Etsy, Inc.(b) | | | 1,100,700 | |
| | 5,099 | | | Wayfair, Inc., Class A(b)(c) | | | 826,803 | |
| | | | | | | | |
| | | | | | | 2,408,827 | |
| | | | | | | | |
| | | | | | | | |
Number
of Shares | | | | | Value | |
| | | | Common Stocks & Other Equity Interests
(continued) | |
| | | | Leisure Facilities—3.9% | |
| | 16,186 | | | Planet Fitness, Inc., Class A(b) | | $ | 1,225,280 | |
| | | | | | | | |
| |
| | | | Movies & Entertainment—10.8% | |
| | 15,789 | | | Live Nation Entertainment, Inc.(b) | | | 1,031,653 | |
| | 10,438 | | | Marcus Corp. (The) | | | 392,678 | |
| | 2,692 | | | Netflix, Inc.(b) | | | 997,494 | |
| | 11,543 | | | World Wrestling Entertainment, Inc., Class A | | | 967,880 | |
| | | | | | | | |
| | | | | | | 3,389,705 | |
| | | | | | | | |
| | | | Publishing—2.5% | |
| | 23,281 | | | New York Times Co. (The), Class A | | | 771,765 | |
| | | | | | | | |
| |
| | | | Restaurants—6.4% | |
| | 6,579 | | | Darden Restaurants, Inc. | | | 773,690 | |
| | 6,277 | | | Dine Brands Global, Inc. | | | 556,519 | |
| | 9,133 | | | Wingstop, Inc. | | | 687,441 | |
| | | | | | | | |
| | | | | | | 2,017,650 | |
| | | | | | | | |
| | | | Specialty Stores—6.7% | |
| | 8,458 | | | Five Below, Inc.(b) | | | 1,238,167 | |
| | 2,481 | | | Ulta Beauty, Inc.(b) | | | 865,819 | |
| | | | | | | | |
| | | | | | | 2,103,986 | |
| | | | | | | | |
| | | | Technology Distributors—1.4% | |
| | 16,134 | | | PCM, Inc.(b) | | | 445,137 | |
| | | | | | | | |
| | | | Total Common Stocks & Other Equity Interests
(Cost $26,958,677) | | | 31,270,023 | |
| | | | | | | | |
| | |
| | | | | | | | |
| | | | Money Market Funds—0.6% | |
| | 173,843 | | | Invesco Premier U.S. Government Money Portfolio—Institutional Class, 2.32%(d)
(Cost $173,843) | | | 173,843 | |
| | | | | | | | |
| | | | Total Investments in Securities
(excluding investments purchased with cash collateral from securities on loan)
(Cost $27,132,520)—100.6% | | | 31,443,866 | |
| | | | | | | | |
| | |
| | | | | | | | |
| | | | Investments Purchased with Cash
Collateral from Securities on Loan | |
| | |
| | | | | | | | |
| | | | Money Market Funds—10.0% | |
| | 2,356,522 | | | Invesco Government & Agency Portfolio—Institutional Class, 2.34%(d)(e) | | | 2,356,522 | |
| | 785,277 | | | Invesco Liquid Assets Portfolio—Institutional Class, 2.48%(d)(e) | | | 785,512 | |
| | | | | | | | |
| | | | Total Money Market Funds
(Cost $3,142,034) | | | 3,142,034 | |
| | | | | | | | |
| | |
| | | | Total Investments in Securities
(Cost $30,274,554)—110.6% | | | 34,585,900 | |
| | |
| | | | Other assets less liabilities—(10.6)% | | | (3,315,261 | ) |
| | | | | | | | |
| | |
| | | | Net Assets—100.0% | | $ | 31,270,639 | |
| | | | | | | | |
See accompanying Notes to Financial Statements which are an integral part of the financial statements.
Invesco DWA Consumer Cyclicals Momentum ETF (PEZ)(continued)
April 30, 2019
Notes to Schedule of Investments:
| (a) | Industry and/or sector classifications used in this report are generally according to the Global Industry Classification Standard, which was developed by and is the exclusive property and a service mark of MSCI Inc. and Standard & Poor’s. |
| (b) | Non-income producing security. |
| (c) | All or a portion of this security was out on loan at April 30, 2019. |
| (d) | The security and the Fund are advised by wholly-owned subsidiaries of Invesco Ltd. and are therefore considered to be affiliated. The rate shown is the 7-day SEC standardized yield as of April 30, 2019. |
| (e) | The security has been segregated to satisfy the commitment to return the cash collateral received in securities lending transactions upon the borrower’s return of the securities loaned. See Note 2J. |
See accompanying Notes to Financial Statements which are an integral part of the financial statements.
Schedule of Investments(a)
Invesco DWA Consumer Staples Momentum ETF (PSL)
April 30, 2019
| | | | | | | | |
Number
of Shares | | | | | Value | |
| | | | Common Stocks & Other Equity Interests—100.0% | |
| | | | Agricultural Products—2.1% | | | |
| | 170,066 | | | Darling Ingredients, Inc.(b) | | $ | 3,709,139 | |
| | | | | | | | |
| |
| | | | Brewers—2.1% | |
| | 11,907 | | | Boston Beer Co., Inc. (The), Class A(b) | | | 3,691,289 | |
| | | | | | | | |
| |
| | | | Distillers & Vintners—2.7% | |
| | 54,364 | | | MGP Ingredients, Inc.(c) | | | 4,776,965 | |
| | | | | | | | |
| |
| | | | Education Services—15.6% | |
| | 84,283 | | | Adtalem Global Education, Inc.(b) | | | 4,156,837 | |
| | 31,444 | | | Bright Horizons Family Solutions, Inc.(b) | | | 4,029,549 | |
| | 208,333 | | | Chegg, Inc.(b) | | | 7,427,071 | |
| | 36,292 | | | Grand Canyon Education, Inc.(b) | | | 4,205,880 | |
| | 99,459 | | | K12, Inc.(b) | | | 2,995,705 | |
| | 30,325 | | | Strategic Education, Inc. | | | 4,347,089 | |
| | | | | | | | |
| | | | | | | 27,162,131 | |
| | | | | | | | |
| | | | Environmental & Facilities Services—4.9% | |
| | 219,060 | | | Rollins, Inc. | | | 8,471,050 | |
| | | | | | | | |
| |
| | | | Food Distributors—6.9% | |
| | 82,654 | | | Performance Food Group Co.(b) | | | 3,384,681 | |
| | 65,522 | | | Sysco Corp. | | | 4,610,783 | |
| | 112,058 | | | US Foods Holding Corp.(b) | | | 4,095,720 | |
| | | | | | | | |
| | | | | | | 12,091,184 | |
| | | | | | | | |
| | | | Household Products—12.9% | |
| | 124,416 | | | Church & Dwight Co., Inc. | | | 9,324,979 | |
| | 26,378 | | | Clorox Co. (The) | | | 4,213,358 | |
| | 45,265 | | | Procter & Gamble Co. (The) | | | 4,819,817 | |
| | 24,407 | | | WD-40 Co. | | | 4,106,478 | |
| | | | | | | | |
| | | | | | | 22,464,632 | |
| | | | | | | | |
| | | | Industrial Machinery—3.2% | |
| | 37,821 | | | Stanley Black & Decker, Inc. | | | 5,544,559 | |
| | | | | | | | |
| |
| | | | Packaged Foods & Meats—24.2% | |
| | 93,655 | | | Freshpet, Inc.(b) | | | 4,182,632 | |
| | 138,299 | | | Hormel Foods Corp. | | | 5,523,662 | |
| | 26,531 | | | J & J Snack Foods Corp. | | | 4,170,143 | |
| | 71,339 | | | Lamb Weston Holdings, Inc. | | | 4,997,297 | |
| | 52,087 | | | McCormick & Co., Inc. | | | 8,019,835 | |
| | 52,283 | | | Post Holdings, Inc.(b) | | | 5,896,477 | |
| | 40,094 | | | Sanderson Farms, Inc. | | | 6,079,453 | |
| | 50,977 | | | TreeHouse Foods, Inc.(b) | | | 3,414,440 | |
| | | | | | | | |
| | | | | | | 42,283,939 | |
| | | | | | | | |
| | | | Personal Products—9.5% | |
| | 43,691 | | | Estee Lauder Cos., Inc. (The), Class A | | | 7,506,551 | |
| | 116,457 | | | Herbalife Nutrition Ltd.(b) | | | 6,154,752 | |
| | 40,214 | | | Inter Parfums, Inc. | | | 2,915,113 | |
| | | | | | | | |
| | | | | | | 16,576,416 | |
| | | | | | | | |
| | | | Soft Drinks—4.6% | |
| | 11,962 | | | Coca-Cola Bottling Co. Consolidated, Inc. | | | 3,888,009 | |
| | 67,968 | | | Monster Beverage Corp.(b) | | | 4,050,893 | |
| | | | | | | | |
| | | | | | | 7,938,902 | |
| | | | | | | | |
| | | | Specialized Consumer Services—5.7% | |
| | 136,017 | | | Service Corp. International | | | 5,659,667 | |
| | 87,225 | | | ServiceMaster Global Holdings, Inc.(b) | | | 4,276,642 | |
| | | | | | | | |
| | | | | | | 9,936,309 | |
| | | | | | | | |
| | | | | | | | |
Number
of Shares | | | | | Value | |
| | | | Common Stocks & Other Equity Interests
(continued) | |
| | | | Tobacco—2.0% | |
| | 81,133 | | | Turning Point Brands, Inc. | | $ | 3,470,058 | |
| | | | | | | | |
| |
| | | | Trading Companies & Distributors—3.6% | |
| | 44,628 | | | United Rentals, Inc.(b) | | | 6,288,978 | |
| | | | | | | | |
| | | | Total Common Stocks & Other Equity Interests
(Cost $156,095,614) | | | 174,405,551 | |
| | | | | | | | |
| | |
| | | | | | | | |
| | | | Money Market Funds—0.1% | |
| | 281,289 | | | Invesco Premier U.S. Government Money Portfolio—Institutional Class, 2.32%(d)
(Cost $281,289) | | | 281,289 | |
| | | | | | | | |
| | |
| | | | Total Investments in Securities
(excluding investments purchased with cash collateral from securities on loan)
(Cost $156,376,903)—100.1% | | | 174,686,840 | |
| | | | | | | | |
| | |
| | | | | | | | |
| | | | Investments Purchased with Cash
Collateral from Securities on Loan | |
| | |
| | | | | | | | |
| | | | Money Market Funds—2.5% | |
| | 3,238,341 | | | Invesco Government & Agency Portfolio—Institutional Class, 2.34%(d)(e) | | | 3,238,341 | |
| | 1,079,123 | | | Invesco Liquid Assets Portfolio—Institutional Class, 2.48%(d)(e) | | | 1,079,447 | |
| | | | | | | | |
| | |
| | | | Total Money Market Funds
(Cost $4,317,788) | | | 4,317,788 | |
| | | | | | | | |
| | |
| | | | Total Investments in Securities
(Cost $160,694,691)—102.6% | | | 179,004,628 | |
| | |
| | | | Other assets less liabilities—(2.6)% | | | (4,603,980 | ) |
| | | | | | | | |
| | |
| | | | Net Assets—100.0% | | $ | 174,400,648 | |
| | | | | | | | |
Notes to Schedule of Investments:
| (a) | Industry and/or sector classifications used in this report are generally according to the Global Industry Classification Standard, which was developed by and is the exclusive property and a service mark of MSCI Inc. and Standard & Poor’s. |
| (b) | Non-income producing security. |
| (c) | All or a portion of this security was out on loan at April 30, 2019. |
| (d) | The security and the Fund are advised by wholly-owned subsidiaries of Invesco Ltd. and are therefore considered to be affiliated. The rate shown is the 7-day SEC standardized yield as of April 30, 2019. |
| (e) | The security has been segregated to satisfy the commitment to return the cash collateral received in securities lending transactions upon the borrower’s return of the securities loaned. See Note 2J. |
See accompanying Notes to Financial Statements which are an integral part of the financial statements.
Schedule of Investments(a)
Invesco DWA Energy Momentum ETF (PXI)
April 30, 2019
| | | | | | | | |
Number
of Shares | | | | | Value | |
| | | | Common Stocks & Other Equity Interests—100.0% | |
| | | | Coal & Consumable Fuels—4.5% | |
| | 13,977 | | | Arch Coal, Inc., Class A | | $ | 1,355,490 | |
| | 27,390 | | | CONSOL Energy, Inc.(b) | | | 928,521 | |
| | | | | | | | |
| | | | | | | 2,284,011 | |
| | | | | | | | |
| | | | Integrated Oil & Gas—6.1% | |
| | 12,872 | | | Chevron Corp. | | | 1,545,412 | |
| | 27,016 | | | Occidental Petroleum Corp. | | | 1,590,702 | |
| | | | | | | | |
| | | | | | | 3,136,114 | |
| | | | | | | | |
| | | | Oil & Gas Equipment & Services—12.8% | |
| | 28,171 | | | Apergy Corp.(b) | | | 1,118,107 | |
| | 35,955 | | | Cactus, Inc., Class A(b) | | | 1,305,167 | |
| | 134,978 | | | Helix Energy Solutions Group, Inc.(b) | | | 1,055,528 | |
| | 59,657 | | | ProPetro Holding Corp.(b) | | | 1,320,209 | |
| | 85,494 | | | Select Energy Services, Inc., Class A(b) | | | 984,891 | |
| | 215,864 | | | Superior Energy Services, Inc.(b) | | | 774,952 | |
| | | | | | | | |
| | | | | | | 6,558,854 | |
| | | | | | | | |
| | | | Oil & Gas Exploration & Production—40.8% | |
| | 92,914 | | | Berry Petroleum Corp. | | | 1,055,503 | |
| | 59,943 | | | Cabot Oil & Gas Corp. | | | 1,551,924 | |
| | 46,358 | | | California Resources Corp.(b)(c) | | | 977,227 | |
| | 24,690 | | | ConocoPhillips | | | 1,558,433 | |
| | 30,609 | | | Continental Resources, Inc.(b) | | | 1,407,708 | |
| | 15,231 | | | Diamondback Energy, Inc. | | | 1,620,426 | |
| | 14,137 | | | EOG Resources, Inc. | | | 1,357,859 | |
| | 20,443 | | | Hess Corp. | | | 1,310,805 | |
| | 176,439 | | | Kosmos Energy Ltd. (Ghana) | | | 1,180,377 | |
| | 77,152 | | | Marathon Oil Corp. | | | 1,314,670 | |
| | 41,566 | | | Murphy Oil Corp. | | | 1,132,258 | |
| | 27,220 | | | PDC Energy, Inc.(b) | | | 1,183,798 | |
| | 11,103 | | | Pioneer Natural Resources Co. | | | 1,848,205 | |
| | 107,622 | | | Tellurian, Inc.(b)(c) | | | 1,022,409 | |
| | 163,522 | | | W&T Offshore, Inc.(b) | | | 1,043,271 | |
| | 46,760 | | | Whiting Petroleum Corp.(b) | | | 1,280,756 | |
| | | | | | | | |
| | | | | | | 20,845,629 | |
| | | | | | | | |
| | | | Oil & Gas Refining & Marketing—21.1% | |
| | 34,052 | | | CVR Energy, Inc. | | | 1,553,112 | |
| | 44,020 | | | Delek US Holdings, Inc. | | | 1,631,381 | |
| | 27,586 | | | HollyFrontier Corp. | | | 1,316,680 | |
| | 25,767 | | | Marathon Petroleum Corp. | | | 1,568,437 | |
| | 39,523 | | | PBF Energy, Inc., Class A | | | 1,327,182 | |
| | 17,323 | | | Phillips 66 | | | 1,633,039 | |
| | 19,239 | | | Valero Energy Corp. | | | 1,744,208 | |
| | | | | | | | |
| | | | | | | 10,774,039 | |
| | | | | | | | |
| | | | Oil & Gas Storage & Transportation—11.8% | |
| | 27,646 | | | Cheniere Energy, Inc.(b) | | | 1,779,020 | |
| | 61,653 | | | Kinder Morgan, Inc. | | | 1,225,045 | |
| | 35,451 | | | Targa Resources Corp. | | | 1,423,358 | |
| | 57,429 | | | Williams Cos., Inc. (The) | | | 1,626,963 | |
| | | | | | | | |
| | | | | | | 6,054,386 | |
| | | | | | | | |
| | | | Steel—2.9% | |
| | 48,187 | | | Warrior Met Coal, Inc. | | | 1,493,797 | |
| | | | | | | | |
| | | | Total Common Stocks & Other Equity Interests
(Cost $55,277,093) | | | 51,146,830 | |
| | | | | | | | |
| | | | | | | | |
Number
of Shares | | | | | Value | |
| | | | Money Market Funds—0.4% | |
| | 173,555 | | | Invesco Premier U.S. Government Money Portfolio—Institutional Class, 2.32%(d)
(Cost $173,555) | | $ | 173,555 | |
| | | | | | | | |
| | |
| | | | Total Investments in Securities
(excluding investments purchased with cash collateral from securities on loan)
(Cost $55,450,648)—100.4% | | | 51,320,385 | |
| | | | | | | | |
| | |
| | | | | | | | |
| | | | Investments Purchased with Cash
Collateral from Securities on Loan | |
| | |
| | | | | | | | |
| | | | Money Market Funds—3.6% | |
| | 1,381,049 | | | Invesco Government & Agency Portfolio—Institutional Class, 2.34%(d)(e) | | | 1,381,049 | |
| | 460,212 | | | Invesco Liquid Assets Portfolio—Institutional Class, 2.48%(d)(e) | | | 460,350 | |
| | | | | | | | |
| | |
| | | | Total Money Market Funds
(Cost $1,841,399) | | | 1,841,399 | |
| | | | | | | | |
| | |
| | | | Total Investments in Securities
(Cost $57,292,047)—104.0% | | | 53,161,784 | |
| | |
| | | | Other assets less liabilities—(4.0)% | | | (2,035,095 | ) |
| | | | | | | | |
| | |
| | | | Net Assets—100.0% | | $ | 51,126,689 | |
| | | | | | | | |
Notes to Schedule of Investments:
| (a) | Industry and/or sector classifications used in this report are generally according to the Global Industry Classification Standard, which was developed by and is the exclusive property and a service mark of MSCI Inc. and Standard & Poor’s. |
| (b) | Non-income producing security. |
| (c) | All or a portion of this security was out on loan at April 30, 2019. |
| (d) | The security and the Fund are advised by wholly-owned subsidiaries of Invesco Ltd. and are therefore considered to be affiliated. The rate shown is the 7-day SEC standardized yield as of April 30, 2019. |
| (e) | The security has been segregated to satisfy the commitment to return the cash collateral received in securities lending transactions upon the borrower’s return of the securities loaned. See Note 2J. |
See accompanying Notes to Financial Statements which are an integral part of the financial statements.
Schedule of Investments(a)
Invesco DWA Financial Momentum ETF (PFI)
April 30, 2019
| | | | | | | | |
Number
of Shares | | | | | Value | |
| | | | Common Stocks & Other Equity Interests—100.1% | |
| | | | Application Software—1.9% | |
| | 6,558 | | | Envestnet, Inc.(b) | | $ | 465,552 | |
| | | | | | | | |
| |
| | | | Consumer Finance—6.0% | |
| | 4,830 | | | American Express Co. | | | 566,221 | |
| | 962 | | | Credit Acceptance Corp.(b) | | | 477,364 | |
| | 3,549 | | | World Acceptance Corp.(b) | | | 461,334 | |
| | | | | | | | |
| | | | | | | 1,504,919 | |
| | | | | | | | |
| | | | Data Processing & Outsourced Services—7.7% | |
| | 5,000 | | | Mastercard, Inc., Class A | | | 1,271,200 | |
| | 3,899 | | | Visa, Inc., Class A | | | 641,113 | |
| | | | | | | | |
| | | | | | | 1,912,313 | |
| | | | | | | | |
| | | | Diversified Banks—2.7% | |
| | 5,859 | | | JPMorgan Chase & Co. | | | 679,937 | |
| | | | | | | | |
| |
| | | | Financial Exchanges & Data—19.5% | |
| | 5,138 | | | Cboe Global Markets, Inc. | | | 522,072 | |
| | 2,901 | | | CME Group, Inc., Class A | | | 518,989 | |
| | 4,667 | | | MarketAxess Holdings, Inc. | | | 1,298,966 | |
| | 3,403 | | | Moody’s Corp. | | | 669,098 | |
| | 2,951 | | | MSCI, Inc. | | | 665,096 | |
| | 5,748 | | | Nasdaq, Inc. | | | 529,966 | |
| | 2,883 | | | S&P Global, Inc. | | | 636,163 | |
| | | | | | | | |
| | | | | | | 4,840,350 | |
| | | | | | | | |
| | | | Health Care REITs—1.8% | |
| | 18,221 | | | CareTrust REIT, Inc. | | | 441,859 | |
| | | | | | | | |
| |
| | | | Industrial REITs—8.0% | |
| | 16,213 | | | Americold Realty Trust | | | 518,978 | |
| | 5,417 | | | Innovative Industrial Properties, Inc.(c) | | | 461,203 | |
| | 7,132 | | | Prologis, Inc. | | | 546,811 | |
| | 12,026 | | | Rexford Industrial Realty, Inc. | | | 455,665 | |
| | | | | | | | |
| | | | | | | 1,982,657 | |
| | | | | | | | |
| | | | Insurance Brokers—4.1% | |
| | 6,150 | | | Arthur J. Gallagher & Co. | | | 514,263 | |
| | 5,244 | | | Marsh & McLennan Cos., Inc. | | | 494,457 | |
| | | | | | | | |
| | | | | | | 1,008,720 | |
| | | | | | | | |
| | | | Investment Banking & Brokerage—4.0% | |
| | 4,636 | | | Evercore, Inc., Class A | | | 451,685 | |
| | 7,197 | | | LPL Financial Holdings, Inc. | | | 533,226 | |
| | | | | | | | |
| | | | | | | 984,911 | |
| | | | | | | | |
| | | | Life & Health Insurance—4.1% | |
| | 3,717 | | | Primerica, Inc. | | | 484,288 | |
| | 6,100 | | | Torchmark Corp. | | | 534,726 | |
| | | | | | | | |
| | | | | | | 1,019,014 | |
| | | | | | | | |
| | | | Mortgage REITs—1.7% | |
| | 31,197 | | | Arbor Realty Trust, Inc.(c) | | | 426,151 | |
| | | | | | | | |
| |
| | | | Multi—line Insurance—1.9% | |
| | 4,527 | | | American Financial Group, Inc. | | | 468,680 | |
| | | | | | | | |
| |
| | | | Property & Casualty Insurance—8.1% | |
| | 2,694 | | | Erie Indemnity Co., Class A | | | 510,028 | |
| | 5,769 | | | Kemper Corp. | | | 518,518 | |
| | | | | | | | |
Number
of Shares | | | | | Value | |
| | | | Common Stocks & Other Equity Interests
(continued) | |
| | | | Property & Casualty Insurance (continued) | |
| | 6,936 | | | Progressive Corp. (The) | | $ | 542,049 | |
| | 6,346 | | | Selective Insurance Group, Inc. | | | 452,533 | |
| | | | | | | | |
| | | | | | | 2,023,128 | |
| | | | | | | | |
| | | | Regional Banks—7.0% | |
| | 7,714 | | | Eagle Bancorp, Inc.(b) | | | 426,276 | |
| | 41,601 | | | First BanCorp | | | 470,091 | |
| | 5,236 | | | Independent Bank Corp. | | | 420,084 | |
| | 20,772 | | | OFG Bancorp | | | 419,179 | |
| | | | | | | | |
| | | | | | | 1,735,630 | |
| | | | | | | | |
| | | | Residential REITs—2.2% | |
| | 10,847 | | | Apartment Investment & Management Co., Class A | | | 535,408 | |
| | | | | | | | |
| |
| | | | Specialized REITs—15.0% | |
| | 6,478 | | | American Tower Corp. | | | 1,265,154 | |
| | 9,495 | | | Crown Castle International Corp. | | | 1,194,281 | |
| | 16,085 | | | CubeSmart | | | 513,272 | |
| | 7,339 | | | Extra Space Storage, Inc. | | | 760,981 | |
| | | | | | | | |
| | | | | | | 3,733,688 | |
| | | | | | | | |
| | | | Thrifts & Mortgage Finance—4.4% | |
| | 1,684 | | | LendingTree, Inc.(b) | | | 648,037 | |
| | 16,241 | | | NMI Holdings, Inc., Class A(b) | | | 456,047 | |
| | | | | | | | |
| | | | | | | 1,104,084 | |
| | | | | | | | |
| | | | Total Common Stocks & Other Equity Interests
(Cost $21,251,134) | | | 24,867,001 | |
| | | | | | | | |
| | |
| | | | | | | | |
| | | | Money Market Funds—0.5% | |
| | 126,694 | | | Invesco Premier U.S. Government Money Portfolio—Institutional Class, 2.32%(d)
(Cost $126,694) | | | 126,694 | |
| | | | | | | | |
| | | | Total Investments in Securities
(excluding investments purchased with cash collateral from securities on loan)
(Cost $21,377,828)—100.6% | | | 24,993,695 | |
| | | | | | | | |
| | |
| | | | | | | | |
| | | | Investments Purchased with Cash
Collateral from Securities on Loan | |
| | |
| | | | | | | | |
| | | | Money Market Funds—3.3% | |
| | 619,301 | | | Invesco Government & Agency Portfolio—Institutional Class, 2.34%(d)(e) | | | 619,301 | |
| | 206,372 | | | Invesco Liquid Assets Portfolio—Institutional Class, 2.48%(d)(e) | | | 206,434 | |
| | | | | | | | |
| | | | Total Money Market Funds
(Cost $825,735) | | | 825,735 | |
| | | | | | | | |
| | |
| | | | Total Investments in Securities
(Cost $22,203,563)—103.9% | | | 25,819,430 | |
| | |
| | | | Other assets less liabilities—(3.9)% | | | (958,201 | ) |
| | | | | | | | |
| | |
| | | | Net Assets—100.0% | | $ | 24,861,229 | |
| | | | | | | | |
Abbreviations:
REIT—Real Estate Investment Trust
See accompanying Notes to Financial Statements which are an integral part of the financial statements.
Invesco DWA Financial Momentum ETF (PFI)(continued)
April 30, 2019
Notes to Schedule of Investments:
| (a) | Industry and/or sector classifications used in this report are generally according to the Global Industry Classification Standard, which was developed by and is the exclusive property and a service mark of MSCI Inc. and Standard & Poor’s. |
| (b) | Non-income producing security. |
| (c) | All or a portion of this security was out on loan at April 30, 2019. |
| (d) | The security and the Fund are advised by wholly-owned subsidiaries of Invesco Ltd. and are therefore considered to be affiliated. The rate shown is the 7-day SEC standardized yield as of April 30, 2019. |
| (e) | The security has been segregated to satisfy the commitment to return the cash collateral received in securities lending transactions upon the borrower’s return of the securities loaned. See Note 2J. |
See accompanying Notes to Financial Statements which are an integral part of the financial statements.
Schedule of Investments(a)
Invesco DWA Healthcare Momentum ETF (PTH)
April 30, 2019
| | | | | | | | |
Number
of Shares | | | | | Value | |
| | | | Common Stocks & Other Equity Interests—100.0% | |
| | | | Biotechnology—22.8% | |
| | 42,460 | | | Biohaven Pharmaceutical Holding Co., Ltd.(b). | | $ | 2,541,231 | |
| | 121,170 | | | CareDx, Inc.(b) | | | 3,297,036 | |
| | 28,584 | | | Enanta Pharmaceuticals, Inc.(b) | | | 2,492,239 | |
| | 106,091 | | | Exact Sciences Corp.(b) | | | 10,470,121 | |
| | 130,102 | | | Invitae Corp.(b) | | | 3,073,009 | |
| | 138,270 | | | Mirati Therapeutics, Inc.(b) | | | 8,225,682 | |
| | 72,932 | | | Ra Pharmaceuticals, Inc.(b) | | | 1,619,091 | |
| | 35,259 | | | uniQure N.V. (Netherlands)(b) | | | 1,981,203 | |
| | 79,002 | | | Veracyte, Inc.(b) | | | 1,806,776 | |
| | 107,867 | | | Vericel Corp.(b) | | | 1,832,660 | |
| | | | | | | | |
| | | | | | | 37,339,048 | |
| | | | | | | | |
| | | | Health Care Equipment—26.8% | | | |
| | 18,122 | | | Becton, Dickinson and Co. | | | 4,362,690 | |
| | 107,642 | | | Boston Scientific Corp.(b) | | | 3,995,671 | |
| | 69,367 | | | Cardiovascular Systems, Inc.(b) | | | 2,465,303 | |
| | 27,120 | | | DexCom, Inc.(b) | | | 3,283,418 | |
| | 23,317 | | | Edwards Lifesciences Corp.(b) | | | 4,105,424 | |
| | 34,902 | | | Glaukos Corp.(b) | | | 2,517,481 | |
| | 37,356 | | | Hill-Rom Holdings, Inc. | | | 3,788,646 | |
| | 31,041 | | | Integer Holdings Corp.(b) | | | 2,144,623 | |
| | 6,825 | | | Intuitive Surgical, Inc.(b) | | | 3,485,050 | |
| | 25,585 | | | iRhythm Technologies, Inc.(b) | | | 1,952,391 | |
| | 39,606 | | | Masimo Corp.(b) | | | 5,154,721 | |
| | 79,167 | | | Novocure Ltd.(b) | | | 3,488,890 | |
| | 49,329 | | | Tandem Diabetes Care, Inc.(b) | | | 3,029,294 | |
| | | | | | | | |
| | | | | | | 43,773,602 | |
| | | | | | | | |
| | | | Health Care Facilities—1.0% | | | |
| | 13,699 | | | US Physical Therapy, Inc. | | | 1,595,796 | |
| | | | | | | | |
| | |
| | | | Health Care Services—10.8% | | | |
| | 55,499 | | | Amedisys, Inc.(b) | | | 7,093,882 | |
| | 63,352 | | | BioTelemetry, Inc.(b) | | | 3,446,349 | |
| | 44,913 | | | Guardant Health, Inc.(b) | | | 2,942,251 | |
| | 19,458 | | | LHC Group, Inc.(b) | | | 2,161,978 | |
| | 192,750 | | | R1 RCM, Inc.(b) | | | 2,018,092 | |
| | | | | | | | |
| | | | | | | 17,662,552 | |
| | | | | | | | |
| | | | Health Care Supplies—11.1% | | | |
| | 26,041 | | | Align Technology, Inc.(b) | | | 8,454,992 | |
| | 43,100 | | | Merit Medical Systems, Inc.(b) | | | 2,421,358 | |
| | 38,073 | | | Quidel Corp.(b) | | | 2,434,388 | |
| | 39,183 | | | West Pharmaceutical Services, Inc. | | | 4,850,463 | |
| | | | | | | | |
| | | | | | | 18,161,201 | |
| | | | | | | | |
| | | | Health Care Technology—4.6% | | | |
| | 26,532 | | | Omnicell, Inc.(b) | | | 2,132,112 | |
| | 94,074 | | | Teladoc Health, Inc.(b) | | | 5,350,929 | |
| | | | | | | | |
| | | | | | | 7,483,041 | |
| | | | | | | | |
| | | | Insurance Brokers—2.4% | | | |
| | 64,178 | | | eHealth, Inc.(b) | | | 3,898,172 | |
| | | | | | | | |
| |
| | | | Life Sciences Tools & Services—8.7% | |
| | 97,730 | | | Codexis, Inc.(b) | | | 1,925,281 | |
| | 130,964 | | | Fluidigm Corp.(b) | | | 1,799,446 | |
| | 108,593 | | | NeoGenomics, Inc.(b) | | | 2,261,992 | |
| | | | | | | | |
Number
of Shares | | | | | Value | |
| | | | Common Stocks & Other Equity Interests
(continued) | |
| | | | Life Sciences Tools & Services (continued) | |
| | 27,766 | | | PRA Health Sciences, Inc.(b) | | $ | 2,688,304 | |
| | 19,829 | | | Thermo Fisher Scientific, Inc. | | | 5,501,556 | |
| | | | | | | | |
| | | | | | | 14,176,579 | |
| | | | | | | | |
| | | | Managed Health Care—4.9% | | | |
| | 25,939 | | | Molina Healthcare, Inc.(b) | | | 3,362,472 | |
| | 20,013 | | | UnitedHealth Group, Inc. | | | 4,664,430 | |
| | | | | | | | |
| | | | | | | 8,026,902 | |
| | | | | | | | |
| | | | Pharmaceuticals—6.9% | | | |
| | 316,523 | | | Axsome Therapeutics, Inc.(b)(c) | | | 5,611,953 | |
| | 120,888 | | | Horizon Pharma PLC(b) | | | 3,086,271 | |
| | 66,950 | | | Zogenix, Inc.(b)(c) | | | 2,610,380 | |
| | | | | | | | |
| | | | | | | 11,308,604 | |
| | | | | | | | |
| | | | Total Common Stocks & Other Equity Interests
(Cost $152,050,328) | | | 163,425,497 | |
| | | | | | | | |
| | |
| | | | | | | | |
| | | | Money Market Funds—0.3% | | | |
| | 416,454 | | | Invesco Premier U.S. Government Money Portfolio—Institutional Class, 2.32%(d)
(Cost $416,454) | | | 416,454 | |
| | | | | | | | |
| | |
| | | | Total Investments in Securities
(excluding investments purchased with cash collateral from securities on loan)
(Cost $152,466,782)—100.3% | | | 163,841,951 | |
| | | | | | | | |
| | |
| | | | | | | | |
| | | | Investments Purchased with Cash
Collateral from Securities on Loan | |
| | |
| | | | | | | | |
| | | | Money Market Funds—3.5% | | | |
| | 4,233,037 | | | Invesco Government & Agency Portfolio—Institutional Class, 2.34%(d)(e) | | | 4,233,037 | |
| | 1,410,594 | | | Invesco Liquid Assets Portfolio—Institutional Class, 2.48%(d)(e) | | | 1,411,017 | |
| | | | | | | | |
| | |
| | | | Total Money Market Funds
(Cost $5,644,054) | | | 5,644,054 | |
| | | | | | | | |
| | | | Total Investments in Securities
(Cost $158,110,836)—103.8% | | | 169,486,005 | |
| | |
| | | | Other assets less liabilities—(3.8)% | | | (6,134,821 | ) |
| | | | | | | | |
| | |
| | | | Net Assets—100.0% | | $ | 163,351,184 | |
| | | | | | | | |
Notes to Schedule of Investments:
| (a) | Industry and/or sector classifications used in this report are generally according to the Global Industry Classification Standard, which was developed by and is the exclusive property and a service mark of MSCI Inc. and Standard & Poor’s. |
| (b) | Non-income producing security. |
| (c) | All or a portion of this security was out on loan at April 30, 2019. |
| (d) | The security and the Fund are advised by wholly-owned subsidiaries of Invesco Ltd. and are therefore considered to be affiliated. The rate shown is the 7-day SEC standardized yield as of April 30, 2019. |
| (e) | The security has been segregated to satisfy the commitment to return the cash collateral received in securities lending transactions upon the borrower’s return of the securities loaned. See Note 2J. |
See accompanying Notes to Financial Statements which are an integral part of the financial statements.
Schedule of Investments(a)
Invesco DWA Industrials Momentum ETF (PRN)
April 30, 2019
| | | | | | | | |
Number
of Shares | | | | | Value | |
| | | | Common Stocks & Other Equity Interests—100.0% | |
| | | | Aerospace & Defense—15.9% | |
| | 9,099 | | | Boeing Co. (The) | | $ | 3,436,601 | |
| | 25,289 | | | HEICO Corp. | | | 2,668,748 | |
| | 20,804 | | | Hexcel Corp. | | | 1,471,051 | |
| | 102,578 | | | Kratos Defense & Security Solutions, Inc.(b) | | | 1,628,939 | |
| | 24,872 | | | Spirit AeroSystems Holdings, Inc., Class A | | | 2,161,377 | |
| | 10,046 | | | TransDigm Group, Inc.(b) | | | 4,847,396 | |
| | | | | | | | |
| | | | | | | 16,214,112 | |
| | | | | | | | |
| | | | Agricultural & Farm Machinery—1.8% | | | |
| | 25,138 | | | Toro Co. (The) | | | 1,838,845 | |
| | | | | | | | |
| | |
| | | | Alternative Carriers—1.2% | | | |
| | 16,339 | | | Bandwidth, Inc., Class A(b) | | | 1,232,287 | |
| | | | | | | | |
| | |
| | | | Application Software—3.6% | | | |
| | 13,225 | | | Fair Isaac Corp.(b) | | | 3,699,694 | |
| | | | | | | | |
| | |
| | | | Building Products—6.8% | | | |
| | 11,432 | | | Lennox International, Inc. | | | 3,103,216 | |
| | 54,658 | | | Masco Corp. | | | 2,134,942 | |
| | 24,559 | | | Trex Co., Inc.(b) | | | 1,701,202 | |
| | | | | | | | |
| | | | | | | 6,939,360 | |
| | | | | | | | |
| | | | Construction & Engineering—1.1% | | | |
| | 20,198 | | | Comfort Systems USA, Inc. | | | 1,092,712 | |
| | | | | | | | |
| |
| | | | Data Processing & Outsourced Services—7.4% | |
| | 13,678 | | | Automatic Data Processing, Inc. | | | 2,248,527 | |
| | 29,233 | | | Fiserv, Inc.(b) | | | 2,550,287 | |
| | 18,691 | | | Global Payments, Inc. | | | 2,730,194 | |
| | | | | | | | |
| | | | | | | 7,529,008 | |
| | | | | | | | |
| | | | Distributors—2.0% | | | |
| | 11,021 | | | Pool Corp. | | | 2,024,998 | |
| | | | | | | | |
| | |
| | | | Diversified Support Services—3.0% | | | |
| | 13,916 | | | Cintas Corp. | | | 3,021,720 | |
| | | | | | | | |
| |
| | | | Electrical Components & Equipment—5.9% | |
| | 50,645 | | | AMETEK, Inc. | | | 4,465,370 | |
| | 98,664 | | | Sunrun, Inc.(b) | | | 1,500,679 | |
| | | | | | | | |
| | | | | | | 5,966,049 | |
| | | | | | | | |
| | | | Electronic Components—1.4% | | | |
| | 8,591 | | | Rogers Corp.(b) | | | 1,439,164 | |
| | | | | | | | |
| |
| | | | Electronic Equipment & Instruments—2.2% | |
| | 25,286 | | | Keysight Technologies, Inc.(b) | | | 2,200,641 | |
| | | | | | | | |
| |
| | | | Electronic Manufacturing Services—1.5% | |
| | 25,131 | | | Fabrinet (Thailand)(b) | | | 1,520,928 | |
| | | | | | | | |
| |
| | | | Environmental & Facilities Services—1.5% | |
| | 40,948 | | | Casella Waste Systems, Inc., Class A(b) | | | 1,528,179 | |
| | | | | | | | |
| | |
| | | | Health Care Equipment—5.6% | | | |
| | 27,915 | | | Danaher Corp. | | | 3,697,062 | |
| | 7,194 | | | Teleflex, Inc. | | | 2,058,779 | |
| | | | | | | | |
| | | | | | | 5,755,841 | |
| | | | | | | | |
| | | | | | | | |
Number
of Shares | | | | | Value | |
| | | | Common Stocks & Other Equity Interests
(continued) | |
| | | | Human Resource & Employment Services—3.2% | |
| | 13,057 | | | Insperity, Inc. | | $ | 1,561,095 | |
| | 27,194 | | | TriNet Group, Inc.(b) | | | 1,695,274 | |
| | | | | | | | |
| | | | | | | 3,256,369 | |
| | | | | | | | |
| | | | Industrial Conglomerates—4.2% | |
| | 11,849 | | | Roper Technologies, Inc. | | | 4,262,085 | |
| | | | | | | | |
| | |
| | | | Industrial Machinery—6.6% | | | |
| | 19,974 | | | Chart Industries, Inc.(b) | | | 1,763,105 | |
| | 14,449 | | | IDEX Corp. | | | 2,263,580 | |
| | 21,859 | | | Ingersoll-Rand PLC | | | 2,680,132 | |
| | | | | | | | |
| | | | | | | 6,706,817 | |
| | | | | | | | |
| | | | IT Consulting & Other Services—7.6% | |
| | 19,602 | | | Accenture PLC, Class A | | | 3,580,697 | |
| | 25,950 | | | Gartner, Inc.(b) | | | 4,125,272 | |
| | | | | | | | |
| | | | | | | 7,705,969 | |
| | | | | | | | |
| | | | Life Sciences Tools & Services—2.5% | |
| | 3,435 | | | Mettler-Toledo International, Inc.(b) | | | 2,559,968 | |
| | | | | | | | |
| | |
| | | | Railroads—4.2% | | | |
| | 24,275 | | | Union Pacific Corp. | | | 4,297,646 | |
| | | | | | | | |
| | |
| | | | Semiconductors—3.3% | | | |
| | 20,881 | | | Universal Display Corp.(c) | | | 3,332,608 | |
| | | | | | | | |
| | |
| | | | Specialty Chemicals—4.4% | | | |
| | 9,973 | | | Sherwin-Williams Co. (The) | | | 4,536,020 | |
| | | | | | | | |
| |
| | | | Technology Hardware, Storage & Peripherals—1.6% | |
| | 162,689 | | | Diebold Nixdorf, Inc.(b) | | | 1,641,532 | |
| | | | | | | | |
| |
| | | | Trading Companies & Distributors—1.5% | |
| | 46,632 | | | Triton International Ltd. (Bermuda) | | | 1,536,524 | |
| | | | | | | | |
| | | | Total Common Stocks & Other Equity Interests
(Cost $84,209,243) | | | 101,839,076 | |
| | | | | | | | |
| | |
| | | | | | | | |
| | | | Money Market Funds—0.2% | | | |
| | 172,752 | | | Invesco Premier U.S. Government Money Portfolio—Institutional Class, 2.32%(d)
(Cost $172,752) | | | 172,752 | |
| | | | | | | | |
| | | | Total Investments in Securities
(excluding investments purchased with cash collateral from securities on loan)
(Cost $84,381,995)—100.2% | | | 102,011,828 | |
| | | | | | | | |
| | |
| | | | | | | | |
| | | | Investments Purchased with Cash
Collateral from Securities on Loan | |
| | |
| | | | | | | | |
| | | | Money Market Funds—2.9% | | | |
| | 2,208,499 | | | Invesco Government & Agency Portfolio—Institutional Class, 2.34%(d)(e) | | | 2,208,499 | |
See accompanying Notes to Financial Statements which are an integral part of the financial statements.
Invesco DWA Industrials Momentum ETF (PRN)(continued)
April 30, 2019
| | | | | | | | |
Number
of Shares | | | | | Value | |
| | | | Money Market Funds (continued) | |
| | 735,946 | | | Invesco Liquid Assets Portfolio—Institutional Class, 2.48%(d)(e) | | $ | 736,166 | |
| | | | | | | | |
| | | | Total Money Market Funds
(Cost $2,944,665) | | | 2,944,665 | |
| | | | | | | | |
| | |
| | | | Total Investments in Securities
(Cost $87,326,660)—103.1% | | | 104,956,493 | |
| | |
| | | | Other assets less liabilities—(3.1)% | | | (3,117,370 | ) |
| | | | | | | | |
| | |
| | | | Net Assets—100.0% | | $ | 101,839,123 | |
| | | | | | | | |
Notes to Schedule of Investments:
| (a) | Industry and/or sector classifications used in this report are generally according to the Global Industry Classification Standard, which was developed by and is the exclusive property and a service mark of MSCI Inc. and Standard & Poor’s. |
| (b) | Non-income producing security. |
| (c) | All or a portion of this security was out on loan at April 30, 2019. |
| (d) | The security and the Fund are advised by wholly-owned subsidiaries of Invesco Ltd. and are therefore considered to be affiliated. The rate shown is the 7-day SEC standardized yield as of April 30, 2019. |
| (e) | The security has been segregated to satisfy the commitment to return the cash collateral received in securities lending transactions upon the borrower’s return of the securities loaned. See Note 2J. |
See accompanying Notes to Financial Statements which are an integral part of the financial statements.
Schedule of Investments(a)
Invesco DWA Technology Momentum ETF (PTF)
April 30, 2019
| | | | | | | | |
Number
of Shares | | | | | Value | |
| | | | Common Stocks & Other Equity Interests—100.0% | |
| | | | Aerospace & Defense—1.8% | | | |
| | 42,564 | | | Mercury Systems, Inc.(b) | | $ | 3,108,023 | |
| | | | | | | | |
| | |
| | | | Application Software—50.4% | | | |
| | 19,471 | | | Adobe, Inc.(b) | | | 5,631,987 | |
| | 37,072 | | | Alarm.com Holdings, Inc.(b) | | | 2,627,663 | |
| | 72,759 | | | Alteryx, Inc., Class A(b) | | | 6,449,358 | |
| | 20,888 | | | AppFolio, Inc., Class A(b) | | | 2,028,434 | |
| | 105,872 | | | Cadence Design Systems, Inc.(b) | | | 7,345,399 | |
| | 47,132 | | | Coupa Software, Inc.(b) | | | 4,870,150 | |
| | 45,992 | | | Domo, Inc., Class B(b) | | | 1,761,954 | |
| | 34,201 | | | Everbridge, Inc.(b) | | | 2,527,112 | |
| | 58,429 | | | Five9, Inc.(b) | | | 3,100,827 | |
| | 26,725 | | | HubSpot, Inc.(b) | | | 4,930,495 | |
| | 20,677 | | | Intuit, Inc. | | | 5,191,168 | |
| | 96,304 | | | LivePerson, Inc.(b) | | | 2,824,596 | |
| | 63,522 | | | Mimecast Ltd.(b) | | | 3,272,018 | |
| | 58,804 | | | Paycom Software, Inc.(b) | | | 11,909,574 | |
| | 34,722 | | | Q2 Holdings, Inc.(b) | | | 2,618,733 | |
| | 72,244 | | | RingCentral, Inc., Class A(b) | | | 8,407,034 | |
| | 68,875 | | | SS&C Technologies Holdings, Inc. | | | 4,660,082 | |
| | 39,135 | | | Upland Software, Inc.(b) | | | 1,819,386 | |
| | 38,914 | | | Workiva, Inc.(b) | | | 2,067,890 | |
| | 53,564 | | | Zendesk, Inc.(b) | | | 4,701,848 | |
| | | | | | | | |
| | | | | | | 88,745,708 | |
| | | | | | | | |
| | | | Communications Equipment—4.2% | | | |
| | 15,195 | | | Arista Networks, Inc.(b) | | | 4,745,247 | |
| | 15,278 | | | Ubiquiti Networks, Inc. | | | 2,604,135 | |
| | | | | | | | |
| | | | | | | 7,349,382 | |
| | | | | | | | |
| | | | Data Processing & Outsourced Services—6.4% | |
| | 27,704 | | | Jack Henry & Associates, Inc. | | | 4,129,558 | |
| | 99,076 | | | Square, Inc., Class A(b) | | | 7,214,714 | |
| | | | | | | | |
| | | | | | | 11,344,272 | |
| | | | | | | | |
| | | | Health Care Technology—3.1% | | | |
| | 38,987 | | | Veeva Systems, Inc., Class A(b) | | | 5,453,112 | |
| | | | | | | | |
| |
| | | | Integrated Telecommunication Services—0.7% | |
| | 249,796 | | | Pareteum Corp.(b)(c) | | | 1,139,070 | |
| | | | | | | | |
| |
| | | | Interactive Media & Services—3.2% | |
| | 93,787 | | | Match Group, Inc. | | | 5,664,735 | |
| | | | | | | | |
| |
| | | | Internet Services & Infrastructure—14.1% | |
| | 52,759 | | | MongoDB, Inc.(b) | | | 7,434,798 | |
| | 48,070 | | | Okta, Inc.(b) | | | 5,000,722 | |
| | 56,234 | | | Twilio, Inc., Class A(b) | | | 7,711,931 | |
| | 23,609 | | | VeriSign, Inc.(b) | | | 4,661,597 | |
| | | | | | | | |
| | | | | | | 24,809,048 | |
| | | | | | | | |
| | | | IT Consulting & Other Services—1.8% | | | |
| | 54,922 | | | LiveRamp Holdings, Inc.(b) | | | 3,203,600 | |
| | | | | | | | |
| | | | Semiconductors—5.7% | | | |
| | 20,633 | | | Broadcom, Inc. | | | 6,569,547 | |
| | 21,897 | | | Monolithic Power Systems, Inc. | | | 3,409,582 | |
| | | | | | | | |
| | | | | | | 9,979,129 | |
| | | | | | | | |
| | | | Specialized REITs—2.7% | | | |
| | 23,612 | | | SBA Communications Corp., Class A(b) | | | 4,810,473 | |
| | | | | | | | |
| | | | | | | | |
Number
of Shares | | | | | Value | |
| | | | Common Stocks & Other Equity Interests
(continued) | |
| | | | Systems Software—5.9% | | | |
| | 41,256 | | | Rapid7, Inc.(b) | | $ | 2,241,851 | |
| | 16,885 | | | ServiceNow, Inc.(b) | | | 4,584,447 | |
| | 52,788 | | | Zscaler, Inc.(b) | | | 3,605,948 | |
| | | | | | | | |
| | | | | | | 10,432,246 | |
| | | | | | | | |
| | | | Total Common Stocks & Other Equity Interests
(Cost $140,477,064) | | | 176,038,798 | |
| | | | | | | | |
| | |
| | | | | | | | |
| | | | Money Market Funds—0.2% | | | |
| | 266,670 | | | Invesco Premier U.S. Government Money Portfolio—Institutional Class, 2.32%(d)
(Cost $266,670) | | | 266,670 | |
| | | | | | | | |
| | |
| | | | Total Investments in Securities
(excluding investments purchased with cash collateral from securities on loan)
(Cost $140,743,734)—100.2% | | | 176,305,468 | |
| | | | | | | | |
| | |
| | | | | | | | |
| | | | Investments Purchased with Cash
Collateral from Securities on Loan | |
| | |
| | | | | | | | |
| | | | Money Market Funds—0.5% | | | |
| | 727,805 | | | Invesco Government & Agency Portfolio—Institutional Class, 2.34%(d)(e) | | | 727,805 | |
| | 242,535 | | | Invesco Liquid Assets Portfolio—Institutional Class, 2.48%(d)(e) | | | 242,608 | |
| | | | | | | | |
| | | | Total Money Market Funds
(Cost $970,413) | | | 970,413 | |
| | | | | | | | |
| | |
| | | | Total Investments in Securities
(Cost $141,714,147)—100.7% | | | 177,275,881 | |
| | |
| | | | Other assets less liabilities—(0.7)% | | | (1,310,298 | ) |
| | | | | | | | |
| | |
| | | | Net Assets—100.0% | | $ | 175,965,583 | |
| | | | | | | | |
Notes to Schedule of Investments:
| (a) | Industry and/or sector classifications used in this report are generally according to the Global Industry Classification Standard, which was developed by and is the exclusive property and a service mark of MSCI Inc. and Standard & Poor’s. |
| (b) | Non-income producing security. |
| (c) | All or a portion of this security was out on loan at April 30, 2019. |
| (d) | The security and the Fund are advised by wholly-owned subsidiaries of Invesco Ltd. and are therefore considered to be affiliated. The rate shown is the 7-day SEC standardized yield as of April 30, 2019. |
| (e) | The security has been segregated to satisfy the commitment to return the cash collateral received in securities lending transactions upon the borrower’s return of the securities loaned. See Note 2J. |
See accompanying Notes to Financial Statements which are an integral part of the financial statements.
Schedule of Investments(a)
Invesco DWA Utilities Momentum ETF (PUI)
April 30, 2019
| | | | | | | | |
Number
of Shares | | | | | Value | |
| | | | Common Stocks & Other Equity Interests—100.0% | |
| | | | Electric Utilities—37.3% | | | |
| | 175,838 | | | Alliant Energy Corp. | | $ | 8,304,829 | |
| | 87,991 | | | American Electric Power Co., Inc. | | | 7,527,630 | |
| | 89,162 | | | Duke Energy Corp. | | | 8,124,441 | |
| | 112,309 | | | Eversource Energy | | | 8,048,063 | |
| | 65,856 | | | IDACORP, Inc. | | | 6,521,061 | |
| | 41,932 | | | NextEra Energy, Inc. | | | 8,153,258 | |
| | 177,650 | | | OGE Energy Corp. | | | 7,521,701 | |
| | 87,084 | | | Pinnacle West Capital Corp. | | | 8,296,493 | |
| | 152,956 | | | PNM Resources, Inc. | | | 7,103,277 | |
| | 117,173 | | | Portland General Electric Co. | | | 6,129,320 | |
| | 137,293 | | | Xcel Energy, Inc. | | | 7,757,054 | |
| | | | | | | | |
| | | | | | | 83,487,127 | |
| | | | | | | | |
| | | | Gas Utilities—16.1% | | | |
| | 78,595 | | | Atmos Energy Corp. | | | 8,043,412 | |
| | 147,395 | | | New Jersey Resources Corp. | | | 7,381,542 | |
| | 69,225 | | | ONE Gas, Inc. | | | 6,127,797 | |
| | 77,723 | | | Spire, Inc. | | | 6,543,500 | |
| | 144,632 | | | UGI Corp. | | | 7,883,890 | |
| | | | | | | | |
| | | | | | | 35,980,141 | |
| | | | | | | | |
| | | | Independent Power Producers & Energy Traders —6.7% | |
| | 403,989 | | | AES Corp. (The) | | | 6,916,291 | |
| | 197,522 | | | NRG Energy, Inc. | | | 8,131,981 | |
| | | | | | | | |
| | | | | | | 15,048,272 | |
| | | | | | | | |
| | | | Multi-Utilities—24.9% | | | |
| | 98,456 | | | Ameren Corp. | | | 7,164,643 | |
| | 271,746 | | | CenterPoint Energy, Inc. | | | 8,424,126 | |
| | 145,314 | | | CMS Energy Corp. | | | 8,072,193 | |
| | 89,297 | | | Consolidated Edison, Inc. | | | 7,693,829 | |
| | 67,522 | | | DTE Energy Co. | | | 8,488,191 | |
| | 281,621 | | | NiSource, Inc. | | | 7,823,431 | |
| | 101,916 | | | WEC Energy Group, Inc. | | | 7,993,272 | |
| | | | | | | | |
| | | | | | | 55,659,685 | |
| | | | | | | | |
| | | | Oil & Gas Storage & Transportation—3.6% | |
| | 117,454 | | | ONEOK, Inc. | | | 7,978,650 | |
| | | | | | | | |
| | |
| | | | Water Utilities—8.7% | | | |
| | 79,176 | | | American States Water Co. | | | 5,634,956 | |
| | 80,936 | | | American Water Works Co., Inc. | | | 8,756,466 | |
| | 101,416 | | | California Water Service Group | | | 5,110,352 | |
| | | | | | | | |
| | | | | | | 19,501,774 | |
| | | | | | | | |
| | | | Wireless Telecommunication Services—2.7% | |
| | 144,857 | | | Shenandoah Telecommunications Co. | | | 5,986,940 | |
| | | | | | | | |
| | | | Total Common Stocks & Other Equity Interests
(Cost $211,979,443) | | | 223,642,589 | |
| | | | | | | | |
| | | | | | | | |
Number
of Shares | | | | | Value | |
| | | | Money Market Funds—0.2% | |
| | 348,733 | | | Invesco Premier U.S. Government Money Portfolio—Institutional Class, 2.32%(b)
(Cost $ 348,733) | | $ | 348,733 | |
| | | | | | | | |
| | |
| | | | Total Investments in Securities
(Cost $ 212,328,176)—100.2% | | | 223,991,322 | |
| | |
| | | | Other assets less liabilities—(0.2)% | | | (354,528 | ) |
| | | | | | | | |
| | |
| | | | Net Assets—100.0% | | $ | 223,636,794 | |
| | | | | | | | |
Notes to Schedule of Investments:
| (a) | Industry and/or sector classifications used in this report are generally according to the Global Industry Classification Standard, which was developed by and is the exclusive property and a service mark of MSCI Inc. and Standard & Poor’s. |
| (b) | The security and the Fund are advised by wholly-owned subsidiaries of Invesco Ltd. and are therefore considered to be affiliated. The rate shown is the 7-day SEC standardized yield as of April 30, 2019. |
See accompanying Notes to Financial Statements which are an integral part of the financial statements.
Schedule of Investments(a)
Invesco NASDAQ Internet ETF (PNQI)
April 30, 2019
| | | | | | | | |
Number
of Shares | | | | | Value | |
| | | | Common Stocks & Other Equity Interests—100.0% | |
| | | | Advertising—0.2% | |
| | 40,434 | | | Criteo S.A., ADR (France)(b) | | $ | 799,784 | |
| | 17,972 | | | TechTarget, Inc.(b) | | | 299,953 | |
| | | | | | | | |
| | | | | | | 1,099,737 | |
| | | | | | | | |
| | | | Alternative Carriers—0.3% | |
| | 29,746 | | | Cogent Communications Holdings, Inc. | | | 1,642,872 | |
| | | | | | | | |
| |
| | | | Application Software—5.9% | |
| | 37,317 | | | 2U, Inc.(b) | | | 2,257,678 | |
| | 30,809 | | | Alarm.com Holdings, Inc.(b) | | | 2,183,742 | |
| | 80,204 | | | Anaplan, Inc.(b)(c) | | | 3,157,631 | |
| | 10,162 | | | AppFolio, Inc., Class A(b) | | | 986,832 | |
| | 20,816 | | | Benefitfocus, Inc.(b) | | | 847,836 | |
| | 37,932 | | | Cornerstone OnDemand, Inc.(b) | | | 2,072,984 | |
| | 38,153 | | | Coupa Software, Inc.(b) | | | 3,942,349 | |
| | 17,908 | | | eGain Corp.(b) | | | 178,901 | |
| | 29,346 | | | Envestnet, Inc.(b) | | | 2,083,273 | |
| | 38,029 | | | Five9, Inc.(b) | | | 2,018,199 | |
| | 31,635 | | | j2 Global, Inc. | | | 2,771,859 | |
| | 41,036 | | | LivePerson, Inc.(b) | | | 1,203,586 | |
| | 32,630 | | | LogMeIn, Inc. | | | 2,688,712 | |
| | 36,809 | | | New Relic, Inc.(b) | | | 3,873,779 | |
| | 93,661 | | | Nutanix, Inc., Class A(b) | | | 4,045,219 | |
| | 11,398 | | | SPS Commerce, Inc.(b) | | | 1,182,428 | |
| | | | | | | | |
| | | | | | | 35,495,008 | |
| | | | | | | | |
| | | | Asset Management & Custody Banks—0.2% | |
| | 30,789 | | | Blucora, Inc.(b) | | | 1,077,615 | |
| | | | | | | | |
| |
| | | | Commercial Printing—0.3% | |
| | 19,796 | | | Cimpress N.V. (Netherlands)(b) | | | 1,789,559 | |
| | | | | | | | |
| |
| | | | Communications Equipment—2.5% | |
| | 48,492 | | | Arista Networks, Inc.(b) | | | 15,143,567 | |
| | | | | | | | |
| |
| | | | Data Processing & Outsourced Services—0.1% | |
| | 42,766 | | | NIC, Inc. | | | 738,141 | |
| | | | | | | | |
| |
| | | | Interactive Home Entertainment—2.6% | |
| | 46,865 | | | NetEase, Inc., ADR (China) | | | 13,334,498 | |
| | 84,510 | | | Sea Ltd., ADR (Thailand)(b) | | | 2,103,454 | |
| | | | | | | | |
| | | | | | | 15,437,952 | |
| | | | | | | | |
| | | | Interactive Media & Services—32.5% | |
| | 39,263 | | | Alphabet, Inc., Class C(b) | | | 46,663,290 | |
| | 36,159 | | | Autohome, Inc., ADR (China)(b) | | | 4,176,003 | |
| | 135,297 | | | Baidu, Inc., ADR (China)(b) | | | 22,490,420 | |
| | 22,862 | | | Eventbrite, Inc., Class A(b) | | | 571,550 | |
| | 272,357 | | | Facebook, Inc., Class A(b) | | | 52,673,844 | |
| | 49,728 | | | IAC/InterActiveCorp.(b) | | | 11,180,844 | |
| | 43,984 | | | Match Group, Inc. | | | 2,656,634 | |
| | 47,457 | | | Meet Group, Inc. (The)(b) | | | 263,861 | |
| | 100,665 | | | Momo, Inc., ADR (China) | | | 3,530,322 | |
| | 31,968 | | | QuinStreet, Inc.(b) | | | 456,183 | |
| | 45,871 | | | SINA Corp. (China)(b) | | | 2,887,121 | |
| | 668,353 | | | Snap, Inc., Class A(b)(c) | | | 7,445,452 | |
| | 58,686 | | | Sogou, Inc., ADR (China)(b)(c) | | | 333,923 | |
| | 25,373 | | | Sohu.com Ltd., ADR (China)(b) | | | 524,460 | |
| | 80,443 | | | TripAdvisor, Inc.(b) | | | 4,281,981 | |
| | 66,753 | | | TrueCar, Inc.(b) | | | 429,889 | |
| | | | | | | | |
Number
of Shares | | | | | Value | |
| | | | Common Stocks & Other Equity Interests
(continued) | |
| | | | Interactive Media & Services (continued) | |
| | 491,037 | | | Twitter, Inc.(b) | | $ | 19,597,287 | |
| | 47,871 | | | Weibo Corp., ADR (China)(b) | | | 3,279,164 | |
| | 183,215 | | | Yandex N.V., Class A (Russia)(b) | | | 6,857,737 | |
| | 31,778 | | | YY, Inc., ADR (China)(b) | | | 2,688,737 | |
| | 37,297 | | | Zillow Group, Inc., Class A(b) | | | 1,238,633 | |
| | | | | | | | |
| | | | | | | 194,227,335 | |
| | | | | | | | |
| | | | Internet & Direct Marketing Retail—38.2% | |
| | 22,859 | | | 1-800-Flowers.com, Inc., Class A(b) | | | 486,668 | |
| | 240,352 | | | Alibaba Group Holding Ltd., ADR
(China)(b) | | | 44,602,121 | |
| | 26,815 | | | Amazon.com, Inc.(b) | | | 51,659,634 | |
| | 27,807 | | | Baozun, Inc., ADR (China)(b)(c) | | | 1,348,640 | |
| | 12,956 | | | Booking Holdings, Inc.(b) | | | 24,033,250 | |
| | 311,598 | | | Ctrip.com International, Ltd., ADR
(China)(b) | | | 13,725,892 | |
| | 585,970 | | | eBay, Inc. | | | 22,706,337 | |
| | 76,740 | | | Etsy, Inc.(b) | | | 5,183,020 | |
| | 85,982 | | | Expedia Group, Inc. | | | 11,163,903 | |
| | 366,039 | | | Groupon, Inc.(b) | | | 1,288,457 | |
| | 58,405 | | | GrubHub, Inc.(b) | | | 3,900,870 | |
| | 591,918 | | | JD.com, Inc., ADR (China)(b) | | | 17,917,358 | |
| | 20,674 | | | Lands’ End, Inc.(b) | | | 362,002 | |
| | 34,977 | | | Liberty Expedia Holdings, Inc., Series A(b) | | | 1,623,632 | |
| | 21,378 | | | Liquidity Services, Inc.(b) | | | 145,157 | |
| | 38,088 | | | MakeMyTrip Ltd. (India)(b) | | | 960,198 | |
| | 28,930 | | | MercadoLibre, Inc. (Argentina)(b) | | | 14,006,170 | |
| | 20,631 | | | Overstock.com, Inc.(b)(c) | | | 271,917 | |
| | 13,269 | | | PetMed Express, Inc.(c) | | | 289,928 | |
| | 21,568 | | | Shutterfly, Inc.(b) | | | 945,325 | |
| | 22,516 | | | Shutterstock, Inc. | | | 910,772 | |
| | 11,618 | | | Stamps.com, Inc.(b) | | | 996,824 | |
| | 26,947 | | | Stitch Fix, Inc., Class A(b)(c) | | | 718,138 | |
| | 299,513 | | | Vipshop Holdings Ltd., ADR (China)(b) | | | 2,578,807 | |
| | 40,456 | | | Wayfair, Inc., Class A(b) | | | 6,559,940 | |
| | | | | | | | |
| | | | | | | 228,384,960 | |
| | | | | | | | |
| | | | Internet Services & Infrastructure—7.5% | |
| | 39,971 | | | 21Vianet Group, Inc., ADR (China)(b) | | | 314,172 | |
| | 104,374 | | | Akamai Technologies, Inc.(b) | | | 8,356,182 | |
| | 23,520 | | | Brightcove, Inc.(b) | | | 235,906 | |
| | 22,056 | | | Carbonite, Inc.(b) | | | 541,034 | |
| | 92,413 | | | Endurance International Group Holdings, Inc.(b) | | | 511,044 | |
| | 110,961 | | | GoDaddy, Inc., Class A(b) | | | 9,043,321 | |
| | 63,049 | | | Okta, Inc.(b) | | | 6,558,987 | |
| | 76,633 | | | VeriSign, Inc.(b) | | | 15,131,186 | |
| | 30,818 | | | Wix.com Ltd. (Israel)(b) | | | 4,134,543 | |
| | | | | | | | |
| | | | | | | 44,826,375 | |
| | | | | | | | |
| | | | IT Consulting & Other Services—0.1% | |
| | 33,428 | | | Switch, Inc., Class A(c) | | | 363,362 | |
| | | | | | | | |
| |
| | | | Movies & Entertainment—7.6% | |
| | 122,852 | | | Netflix, Inc.(b) | | | 45,521,580 | |
| | | | | | | | |
| |
| | | | Research & Consulting Services—1.9% | |
| | 23,325 | | | CoStar Group, Inc.(b) | | | 11,575,031 | |
| | | | | | | | |
See accompanying Notes to Financial Statements which are an integral part of the financial statements.
Invesco NASDAQ Internet ETF (PNQI)(continued)
April 30, 2019
| | | | | | | | |
Number
of Shares | | | | | Value | |
| | | | Common Stocks & Other Equity Interests
(continued) | |
| | | | Wireless Telecommunication Services—0.1% | |
| | 27,284 | | | Boingo Wireless, Inc.(b) | | $ | 620,438 | |
| | 56,198 | | | Gogo, Inc.(b)(c) | | | 295,602 | |
| | | | | | | | |
| | | | | | | 916,040 | |
| | | | | | | | |
| | | | Total Common Stocks & Other Equity Interests
(Cost $502,985,270) | | | 598,239,134 | |
| | | | | | | | |
| | |
| | | | | | | | |
| | | | Money Market Funds—0.0% | |
| | 44,687 | | | Invesco Premier U.S. Government Money Portfolio—Institutional Class, 2.32%(d)
(Cost $44,687) | | | 44,687 | |
| | | | | | | | |
| | |
| | | | Total Investments in Securities
(excluding investments purchased with cash collateral from securities on loan)
(Cost $503,029,957)—100.0% | | | 598,283,821 | |
| | | | | | | | |
| | |
| | | | | | | | |
| | | | Investments Purchased with Cash
Collateral from Securities on Loan | |
| | |
| | | | | | | | |
| | | | Money Market Funds—1.2% | |
| | 5,209,761 | | | Invesco Government & Agency Portfolio—Institutional Class,
2.34%(d)(e) | | | 5,209,761 | |
| | 1,736,067 | | | Invesco Liquid Assets Portfolio—Institutional Class, 2.48%(d)(e) | | | 1,736,588 | |
| | | | | | | | |
| | |
| | | | Total Money Market Funds
(Cost $6,946,349) | | | 6,946,349 | |
| | | | | | | | |
| | |
| | | | Total Investments in Securities
(Cost $509,976,306)—101.2% | | | 605,230,170 | |
| | |
| | | | Other assets less liabilities—(1.2)% | | | (6,998,596 | ) |
| | | | | | | | |
| | |
| | | | Net Assets—100.0% | | $ | 598,231,574 | |
| | | | | | | | |
Abbreviations:
ADR—American Depositary Receipt
Notes to Schedule of Investments:
| (a) | Industry and/or sector classifications used in this report are generally according to the Global Industry Classification Standard, which was developed by and is the exclusive property and a service mark of MSCI Inc. and Standard & Poor’s. |
| (b) | Non-income producing security. |
| (c) | All or a portion of this security was out on loan at April 30, 2019. |
| (d) | The security and the Fund are advised by wholly-owned subsidiaries of Invesco Ltd. and are therefore considered to be affiliated. The rate shown is the 7-day SEC standardized yield as of April 30, 2019. |
| (e) | The security has been segregated to satisfy the commitment to return the cash collateral received in securities lending transactions upon the borrower’s return of the securities loaned. See Note 2J. |
This Fund has holdings greater than 10% of net assets in the following country:
See accompanying Notes to Financial Statements which are an integral part of the financial statements.
Statements of Assets and Liabilities
April 30, 2019
| | | | | | | | | | | | | | | | |
| | | Invesco DWA
Basic Materials
Momentum
ETF (PYZ) | | | Invesco DWA
Consumer Cyclicals
Momentum
ETF (PEZ) | | | Invesco DWA
Consumer Staples
Momentum
ETF (PSL) | | | Invesco DWA
Energy
Momentum
ETF (PXI) | |
| Assets: | | | | | | | | | | | | | | | | |
Unaffiliated investments in securities, at value(a) | | $ | 63,514,799 | | | $ | 31,270,023 | | | $ | 174,405,551 | | | $ | 51,146,830 | |
Affiliated investments in securities, at value | | | 3,109,917 | | | | 3,315,877 | | | | 4,599,077 | | | | 2,014,954 | |
Cash | | | — | | | | — | | | | — | | | | — | |
Receivable for: | | | | | | | | | | | | | | | | |
Dividends | | | 82,320 | | | | 13,086 | | | | 91,592 | | | | 47,991 | |
Securities lending | | | 292 | | | | 1,253 | | | | 320 | | | | 3,384 | |
Investments sold | | | — | | | | — | | | | — | | | | — | |
Fund shares sold | | | — | | | | — | | | | — | | | | — | |
Foreign tax reclaims | | | — | | | | — | | | | — | | | | — | |
| | | | | | | | | | | | | | | | |
Total assets | | | 66,707,328 | | | | 34,600,239 | | | | 179,096,540 | | | | 53,213,159 | |
| | | | | | | | | | | | | | | | |
| | | | |
| Liabilities: | | | | | | | | | | | | | | | | |
Payable for: | | | | | | | | | | | | | | | | |
Investments purchased | | | 69,730 | | | | — | | | | — | | | | — | |
Collateral upon return of securities loaned | | | 2,873,715 | | | | 3,142,034 | | | | 4,317,788 | | | | 1,841,399 | |
Fund shares repurchased | | | — | | | | — | | | | — | | | | — | |
Accrued unitary management fees | | | — | | | | — | | | | — | | | | — | |
Accrued advisory fees | | | 15,478 | | | | 3,570 | | | | 55,061 | | | | 11,276 | |
Accrued trustees’ and officer’s fees | | | 36,944 | | | | 34,807 | | | | 37,709 | | | | 41,418 | |
Accrued expenses | | | 193,888 | | | | 149,189 | | | | 285,334 | | | | 192,377 | |
| | | | | | | | | | | | | | | | |
Total liabilities | | | 3,189,755 | | | | 3,329,600 | | | | 4,695,892 | | | | 2,086,470 | |
| | | | | | | | | | | | | | | | |
| Net Assets | | $ | 63,517,573 | | | $ | 31,270,639 | | | $ | 174,400,648 | | | $ | 51,126,689 | |
| | | | | | | | | | | | | | | | |
| | | | |
| Net assets consist of: | | | | | | | | | | | | | | | | |
Shares of beneficial interest | | $ | 102,865,373 | | | $ | 83,146,692 | | | $ | 213,852,374 | | | $ | 218,575,092 | |
Distributable earnings | | | (39,347,800 | ) | | | (51,876,053 | ) | | | (39,451,726 | ) | | | (167,448,403 | ) |
| | | | | | | | | | | | | | | | |
| Net Assets | | $ | 63,517,573 | | | $ | 31,270,639 | | | $ | 174,400,648 | | | $ | 51,126,689 | |
| | | | | | | | | | | | | | | | |
Shares outstanding (unlimited amount authorized, $0.01 par value) | | | 1,050,000 | | | | 550,000 | | | | 2,400,000 | | | | 1,600,000 | |
Net asset value | | $ | 60.49 | | | $ | 56.86 | | | $ | 72.67 | | | $ | 31.95 | |
| | | | | | | | | | | | | | | | |
Market price | | $ | 60.48 | | | $ | 56.87 | | | $ | 72.65 | | | $ | 31.95 | |
| | | | | | | | | | | | | | | | |
Unaffiliated investments in securities, at cost | | $ | 61,197,963 | | | $ | 26,958,677 | | | $ | 156,095,614 | | | $ | 55,277,093 | |
| | | | | | | | | | | | | | | | |
Affiliated investments in securities, at cost | | $ | 3,109,917 | | | $ | 3,315,877 | | | $ | 4,599,077 | | | $ | 2,014,954 | |
| | | | | | | | | | | | | | | | |
(a)Includes securities on loan with an aggregate value of | | $ | 2,813,961 | | | $ | 3,089,486 | | | $ | 4,299,215 | | | $ | 1,799,661 | |
| | | | | | | | | | | | | | | | |
See accompanying Notes to Financial Statements which are an integral part of the financial statements.
| | | | | | | | | | | | | | | | | | | | | | |
Invesco DWA
Financial
Momentum
ETF (PFI) | | | Invesco DWA
Healthcare
Momentum
ETF (PTH) | | | Invesco DWA
Industrials
Momentum
ETF (PRN) | | | Invesco DWA
Technology
Momentum
ETF (PTF) | | | Invesco DWA
Utilities
Momentum
ETF (PUI) | | | Invesco
NASDAQ
Internet
ETF (PNQI) | |
| | | | | | | | | | | | | | | | | | | | | | |
| $ | 24,867,001 | | | $ | 163,425,497 | | | $ | 101,839,076 | | | $ | 176,038,798 | | | $ | 223,642,589 | | | $ | 598,239,134 | |
| | 952,429 | | | | 6,060,508 | | | | 3,117,417 | | | | 1,237,083 | | | | 348,733 | | | | 6,991,036 | |
| | 634 | | | | — | | | | 1,200 | | | | — | | | | — | | | | — | |
| | | | | | | | | | | | | | | | | | | | | | |
| | 6,929 | | | | 7,647 | | | | 34,416 | | | | 544 | | | | 347,965 | | | | 195 | |
| | 962 | | | | 3,975 | | | | 228 | | | | 2,796 | | | | — | | | | 9,769 | |
| | — | | | | — | | | | — | | | | — | | | | 1,606,411 | | | | 613,325 | |
| | — | | | | — | | | | — | | | | 7,161,367 | | | | — | | | | — | |
| | — | | | | — | | | | — | | | | 10,778 | | | | — | | | | — | |
| | | | | | | | | | | | | | | | | | | | | | |
| | 25,827,955 | | | | 169,497,627 | | | | 104,992,337 | | | | 184,451,366 | | | | 225,945,698 | | | | 605,853,459 | |
| | | | | | | | | | | | | | | | | | | | | | |
| | | | | |
| | | | | | | | | | | | | | | | | | | | | | |
| | | | | | | | | | | | | | | | | | | | | | |
| | — | | | | — | | | | — | | | | 7,164,484 | | | | 349,780 | | | | 386,884 | |
| | 825,735 | | | | 5,644,054 | | | | 2,944,665 | | | | 970,413 | | | | — | | | | 6,946,349 | |
| | — | | | | — | | | | — | | | | — | | | | 1,608,878 | | | | — | |
| | — | | | | — | | | | — | | | | — | | | | — | | | | 288,652 | |
| | 3,015 | | | | 57,831 | | | | 32,206 | | | | 47,128 | | | | 78,433 | | | | — | |
| | 32,848 | | | | 41,345 | | | | 37,690 | | | | 37,053 | | | | 34,969 | | | | — | |
| | 105,128 | | | | 403,213 | | | | 138,653 | | | | 266,705 | | | | 236,844 | | | | — | |
| | | | | | | | | | | | | | | | | | | | | | |
| | 966,726 | | | | 6,146,443 | | | | 3,153,214 | | | | 8,485,783 | | | | 2,308,904 | | | | 7,621,885 | |
| | | | | | | | | | | | | | | | | | | | | | |
| $ | 24,861,229 | | | $ | 163,351,184 | | | $ | 101,839,123 | | | $ | 175,965,583 | | | $ | 223,636,794 | | | $ | 598,231,574 | |
| | | | | | | | | | | | | | | | | | | | | | |
| | | | | |
| | | | | | | | | | | �� | | | | | | | | | | | |
| $ | 36,754,598 | | | $ | 298,419,025 | | | $ | 138,000,091 | | | $ | 216,344,528 | | | $ | 225,260,629 | | | $ | 545,676,449 | |
| | (11,893,369 | ) | | | (135,067,841 | ) | | | (36,160,968 | ) | | | (40,378,945 | ) | | | (1,623,835 | ) | | | 52,555,125 | |
| | | | | | | | | | | | | | | | | | | | | | |
| $ | 24,861,229 | | | $ | 163,351,184 | | | $ | 101,839,123 | | | $ | 175,965,583 | | | $ | 223,636,794 | | | $ | 598,231,574 | |
| | | | | | | | | | | | | | | | | | | | | | |
|
700,000 |
| | | 2,100,000 | | | | 1,600,000 | | | | 2,450,000 | | | | 6,950,000 | | | | 4,200,000 | |
| $ | 35.52 | | | $ | 77.79 | | | $ | 63.65 | | | $ | 71.82 | | | $ | 32.18 | | | $ | 142.44 | |
| | | | | | | | | | | | | | | | | | | | | | |
| $ | 35.49 | | | $ | 77.69 | | | $ | 63.64 | | | $ | 71.91 | | | $ | 32.18 | | | $ | 142.41 | |
| | | | | | | | | | | | | | | | | | | | | | |
| $ | 21,251,134 | | | $ | 152,050,328 | | | $ | 84,209,243 | | | $ | 140,477,064 | | | $ | 211,979,443 | | | $ | 502,985,270 | |
| | | | | | | | | | | | | | | | | | | | | | |
| $ | 952,429 | | | $ | 6,060,508 | | | $ | 3,117,417 | | | $ | 1,237,083 | | | $ | 348,733 | | | $ | 6,991,036 | |
| | | | | | | | | | | | | | | | | | | | | | |
| $ | 798,590 | | | $ | 5,417,252 | | | $ | 2,905,518 | | | $ | 983,319 | | | $ | — | | | $ | 6,762,512 | |
| | | | | | | | | | | | | | | | | | | | | | |
Statements of Operations
For the year ended April 30, 2019
| | | | | | | | | | | | | | | | |
| | | Invesco DWA
Basic Materials
Momentum
ETF (PYZ) | | | Invesco DWA
Consumer Cyclicals
Momentum
ETF (PEZ) | | | Invesco DWA
Consumer Staples
Momentum
ETF (PSL) | | | Invesco DWA
Energy
Momentum
ETF (PXI) | |
| Investment income: | | | | | | | | | | | | | | | | |
Unaffiliated dividend income | | $ | 1,458,585 | | | $ | 365,804 | | | $ | 1,848,668 | | | $ | 1,084,720 | |
Affiliated dividend income | | | 3,630 | | | | 2,551 | | | | 4,447 | | | | 3,748 | |
Securities lending income | | | 727 | | | | 28,660 | | | | 3,714 | | | | 54,460 | |
Foreign witholding tax | | | — | | | | — | | | | — | | | | — | |
| | | | | | | | | | | | | | | | |
Total investment income | | | 1,462,942 | | | | 397,015 | | | | 1,856,829 | | | | 1,142,928 | |
| | | | | | | | | | | | | | | | |
| | | | |
| Expenses: | | | | | | | | | | | | | | | | |
Unitary management fees | | | — | | | | — | | | | — | | | | — | |
Advisory fees | | | 425,449 | | | | 263,879 | | | | 747,592 | | | | 431,622 | |
Sub-licensing fees | | | 127,635 | | | | 79,164 | | | | 224,279 | | | | 129,487 | |
Accounting & administration fees | | | 32,620 | | | | 28,980 | | | | 31,591 | | | | 31,172 | |
Professional fees | | | 24,944 | | | | 24,421 | | | | 24,987 | | | | 24,775 | |
Custodian & transfer agent fees | | | 3,818 | | | | 4,571 | | | | 2,538 | | | | 4,344 | |
Trustees’ and officer’s fees | | | 7,594 | | | | 7,139 | | | | 8,027 | | | | 7,772 | |
Other expenses | | | 20,963 | | | | 16,036 | | | | 19,030 | | | | 21,235 | |
| | | | | | | | | | | | | | | | |
Total expenses | | | 643,023 | | | | 424,190 | | | | 1,058,044 | | | | 650,407 | |
| | | | | | | | | | | | | | | | |
Less: Waivers | | | (132,810 | ) | | | (107,760 | ) | | | (161,293 | ) | | | (132,817 | ) |
| | | | | | | | | | | | | | | | |
Net expenses | | | 510,213 | | | | 316,430 | | | | 896,751 | | | | 517,590 | |
| | | | | | | | | | | | | | | | |
Net investment income (loss) | | | 952,729 | | | | 80,585 | | | | 960,078 | | | | 625,338 | |
| | | | | | | | | | | | | | | | |
| | | | |
| Realized and unrealized gain (loss) from: | | | | | | | | | | | | | | | | |
Net realized gain (loss) from: | | | | | | | | | | | | | | | | |
Investment securities | | | (8,671,190 | ) | | | (7,956,362 | ) | | | (16,835,831 | ) | | | (19,680,358 | ) |
In-kind redemptions | | | 6,045,613 | | | | 9,368,085 | | | | 16,781,685 | | | | 15,330,393 | |
| | | | | | | | | | | | | | | | |
Net realized gain (loss) | | | (2,625,577 | ) | | | 1,411,723 | | | | (54,146 | ) | | | (4,349,965 | ) |
| | | | | | | | | | | | | | | | |
Change in unrealized appreciation (depreciation) on investment securities | | | (7,328,753 | ) | | | 341,267 | | | | 7,172,036 | | | | (18,412,376 | ) |
| | | | | | | | | | | | | | | | |
Net realized and unrealized gain (loss) | | | (9,954,330 | ) | | | 1,752,990 | | | | 7,117,890 | | | | (22,762,341 | ) |
| | | | | | | | | | | | | | | | |
Net increase (decrease) in net assets resulting from operations | | $ | (9,001,601 | ) | | $ | 1,833,575 | | | $ | 8,077,968 | | | $ | (22,137,003 | ) |
| | | | | | | | | | | | | | | | |
See accompanying Notes to Financial Statements which are an integral part of the financial statements.
| | | | | | | | | | | | | | | | | | | | | | |
Invesco DWA
Financial
Momentum
ETF (PFI) | | | Invesco DWA
Healthcare
Momentum
ETF (PTH) | | | Invesco DWA
Industrials
Momentum
ETF (PRN) | | | Invesco DWA
Technology
Momentum
ETF (PTF) | | | Invesco DWA
Utilities
Momentum
ETF (PUI) | | | Invesco
NASDAQ
Internet
ETF (PNQI) | |
| | | | | | | | | | | | | | | | | | | | | | |
| $ | 701,534 | | | $ | 290,954 | | | $ | 934,141 | | | $ | 555,990 | | | $ | 2,775,314 | | | $ | 1,219,504 | |
| | 2,538 | | | | 4,841 | | | | 3,408 | | | | 5,408 | | | | 2,813 | | | | 3,174 | |
| | 1,424 | | | | 196,825 | | | | 514 | | | | 48,382 | | | | — | | | | 327,206 | |
| | (425 | ) | | | — | | | | (5,973 | ) | | | — | | | | (13 | ) | | | — | |
| | | | | | | | | | | | | | | | | | | | | | |
| | 705,071 | | | | 492,620 | | | | 932,090 | | | | 609,780 | | | | 2,778,114 | | | | 1,549,884 | |
| | | | | | | | | | | | | | | | | | | | | | |
| | | | | |
| | | | | | | | | | | | | | | | | | | | | | |
| | — | | | | — | | | | — | | | | — | | | | — | | | | 3,581,189 | |
| | 194,242 | | | | 1,190,901 | | | | 525,421 | | | | 680,207 | | | | 517,909 | | | | — | |
| | 30,276 | | | | 357,988 | | | | 53,738 | | | | 204,442 | | | | 155,369 | | | | — | |
| | 30,692 | | | | 37,678 | | | | 33,740 | | | | 35,692 | | | | 28,015 | | | | — | |
| | 24,549 | | | | 25,617 | | | | 24,134 | | | | 24,449 | | | | 22,812 | | | | — | |
| | 3,575 | | | | 5,968 | | | | 5,891 | | | | 4,466 | | | | 9,383 | | | | — | |
| | 7,064 | | | | 9,285 | | | | 7,869 | | | | 8,056 | | | | 7,199 | | | | — | |
| | 18,179 | | | | 25,974 | | | | 19,139 | | | | 20,238 | | | | 16,487 | | | | — | |
| | | | | | | | | | | | | | | | | | | | | | |
| | 308,577 | | | | 1,653,411 | | | | 669,932 | | | | 977,550 | | | | 757,174 | | | | 3,581,189 | |
| | | | | | | | | | | | | | | | | | | | | | |
| | (75,711 | ) | | | (224,675 | ) | | | (39,696 | ) | | | (161,738 | ) | | | (135,984 | ) | | | (292 | ) |
| | | | | | | | | | | | | | | | | | | | | | |
| | 232,866 | | | | 1,428,736 | | | | 630,236 | | | | 815,812 | | | | 621,190 | | | | 3,580,897 | |
| | | | | | | | | | | | | | | | | | | | | | |
| | 472,205 | | | | (936,116 | ) | | | 301,854 | | | | (206,032 | ) | | | 2,156,924 | | | | (2,031,013 | ) |
| | | | | | | | | | | | | | | | | | | | | | |
| | | | | |
|
|
| | | | | | | | | | | | | | | | | | | | |
| | | | | | | | | | | | | | | | | | | | | | |
| | (4,790,462 | ) | | | (66,117,239 | ) | | | (10,759,291 | ) | | | (8,959,394 | ) | | | (1,277,550 | ) | | | (17,246,071 | ) |
| | 7,033,416 | | | | 54,956,798 | | | | 11,054,922 | | | | 25,248,558 | | | | 7,767,846 | | | | 75,868,440 | |
| | | | | | | | | | | | | | | | | | | | | | |
| | 2,242,954 | | | | (11,160,441 | ) | | | 295,631 | | | | 16,289,164 | | | | 6,490,296 | | | | 58,622,369 | |
| | | | | | | | | | | | | | | | | | | | | | |
|
(3,476,945 |
) | | | (10,003,951 | ) | | | 7,878,282 | | | | 15,847,728 | | | | 10,841,628 | | | | (8,326,753 | ) |
| | | | | | | | | | | | | | | | | | | | | | |
| | (1,233,991 | ) | | | (21,164,392 | ) | | | 8,173,913 | | | | 32,136,892 | | | | 17,331,924 | | | | 50,295,616 | |
| | | | | | | | | | | | | | | | | | | | | | |
$ |
(761,786 |
) | | $ | (22,100,508 | ) | | $ | 8,475,767 | | | $ | 31,930,860 | | | $ | 19,488,848 | | | $ | 48,264,603 | |
| | | | | | | | | | | | | | | | | | | | | | |
Statements of Changes in Net Assets
For the years ended April 30, 2019 and 2018
| | | | | | | | | | | | | | | | |
| | | Invesco DWA Basic Materials
Momentum ETF (PYZ) | | | Invesco DWA Consumer Cyclicals
Momentum ETF (PEZ) | |
| | | 2019 | | | 2018 | | | 2019 | | | 2018 | |
| Operations: | | | | | | | | | | | | | | | | |
Net investment income (loss) | | $ | 952,729 | | | $ | 753,674 | | | $ | 80,585 | | | $ | 207,733 | |
Net realized gain (loss) | | | (2,625,577 | ) | | | 6,406,896 | | | | 1,411,723 | | | | 2,465,265 | |
Change in net unrealized appreciation (depreciation) | | | (7,328,753 | ) | | | 1,802,654 | | | | 341,267 | | | | 443,726 | |
| | | | | | | | | | | | | | | | |
Net increase (decrease) in net assets resulting from operations | | | (9,001,601 | ) | | | 8,963,224 | | | | 1,833,575 | | | | 3,116,724 | |
| | | | | | | | | | | | | | | | |
| | | | |
| Distributions to Shareholders from: | | | | | | | | | | | | | | | | |
Distributable earnings | | | (888,902 | ) | | | (618,978 | ) | | | (158,244 | ) | | | (174,078 | ) |
| | | | | | | | | | | | | | | | |
| | | | |
| Shareholder Transactions: | | | | | | | | | | | | | | | | |
Proceeds from shares sold | | | 27,240,965 | | | | 63,257,342 | | | | 52,623,503 | | | | 93,230,455 | |
Value of shares repurchased | | | (53,946,537 | ) | | | (72,756,787 | ) | | | (78,491,892 | ) | | | (69,545,904 | ) |
| | | | | | | | | | | | | | | | |
Net increase (decrease) in net assets resulting from share transactions | | | (26,705,572 | ) | | | (9,499,445 | ) | | | (25,868,389 | ) | | | 23,684,551 | |
| | | | | | | | | | | | | | | | |
Net increase (decrease) in net assets | | | (36,596,075 | ) | | | (1,155,199 | ) | | | (24,193,058 | ) | | | 26,627,197 | |
| | | | | | | | | | | | | | | | |
| | | | |
| Net assets: | | | | | | | | | | | | | | | | |
Beginning of year | | | 100,113,648 | | | | 101,268,847 | | | | 55,463,697 | | | | 28,836,500 | |
| | | | | | | | | | | | | | | | |
End of year | | $ | 63,517,573 | | | $ | 100,113,648 | | | $ | 31,270,639 | | | $ | 55,463,697 | |
| | | | | | | | | | | | | | | | |
| | | | |
| Changes in Shares Outstanding: | | | | | | | | | | | | | | | | |
Shares sold | | | 400,000 | | | | 950,000 | | | | 950,000 | | | | 1,950,000 | |
Shares repurchased | | | (850,000 | ) | | | (1,100,000 | ) | | | (1,500,000 | ) | | | (1,500,000 | ) |
Shares outstanding, beginning of year | | | 1,500,000 | | | | 1,650,000 | | | | 1,100,000 | | | | 650,000 | |
| | | | | | | | | | | | | | | | |
Shares outstanding, end of year | | | 1,050,000 | | | | 1,500,000 | | | | 550,000 | | | | 1,100,000 | |
| | | | | | | | | | | | | | | | |
See accompanying Notes to Financial Statements which are an integral part of the financial statements.
| | | | | | | | | | | | | | | | | | | | | | | | | | | | | | |
Invesco DWA Consumer Staples
Momentum ETF (PSL) | | | Invesco DWA Energy
Momentum ETF (PXI) | | | Invesco DWA Financial
Momentum ETF (PFI) | | | Invesco DWA Healthcare
Momentum ETF (PTH) | |
| 2019 | | | 2018 | | | 2019 | | | 2018 | | | 2019 | | | 2018 | | | 2019 | | | 2018 | |
| | | | | | | | | | | | | | | | | | | | | | | | | | | | | | |
| $ | 960,078 | | | $ | 483,488 | | | $ | 625,338 | | | $ | 1,048,595 | | | $ | 472,205 | | | $ | 776,514 | | | $ | (936,116 | ) | | $ | (400,484 | ) |
| | (54,146 | ) | | | 5,073,454 | | | | (4,349,965 | ) | | | (10,879,545 | ) | | | 2,242,954 | | | | 3,584,062 | | | | (11,160,441 | ) | | | 25,406,736 | |
| | 7,172,036 | | | | 4,488,372 | | | | (18,412,376 | ) | | | 21,908,276 | | | | (3,476,945 | ) | | | 6,536,625 | | | | (10,003,951 | ) | | | 12,271,288 | |
| | | | | | | | | | | | | | | | | | | | | | | | | | | | | | |
| | 8,077,968 | | | | 10,045,314 | | | | (22,137,003 | ) | | | 12,077,326 | | | | (761,786 | ) | | | 10,897,201 | | | | (22,100,508 | ) | | | 37,277,540 | |
| | | | | | | | | | | | | | | | | | | | | | | | | | | | | | |
| | | | | | | |
| | | | | | | | | | | | | | | | | | | | | | | | | | | | | | |
| | (896,392 | ) | | | (351,231 | ) | | | (813,322 | ) | | | (808,060 | ) | | | (535,745 | ) | | | (612,178 | ) | | | — | | | | — | |
| | | | | | | | | | | | | | | | | | | | | | | | | | | | | | |
| | | | | | | |
| | | | | | | | | | | | | | | | | | | | | | | | | | | | | | |
| | 184,250,972 | | | | 55,005,066 | | | | 109,650,071 | | | | 21,017,579 | | | | 17,180,080 | | | | 61,429,140 | | | | 366,642,626 | | | | 234,947,048 | |
| | (108,009,337 | ) | | | (50,913,125 | ) | | | (124,310,912 | ) | | | (56,280,030 | ) | | | (61,351,116 | ) | | | (87,240,976 | ) | | | (336,483,387 | ) | | | (180,211,073 | ) |
| | | | | | | | | | | | | | | | | | | | | | | | | | | | | | |
|
76,241,635 |
| | | 4,091,941 | | | | (14,660,841 | ) | | | (35,262,451 | ) | | | (44,171,036 | ) | | | (25,811,836 | ) | | | 30,159,239 | | | | 54,735,975 | |
| | | | | | | | | | | | | | | | | | | | | | | | | | | | | | |
| | 83,423,211 | | | | 13,786,024 | | | | (37,611,166 | ) | | | (23,993,185 | ) | | | (45,468,567 | ) | | | (15,526,813 | ) | | | 8,058,731 | | | | 92,013,515 | |
| | | | | | | | | | | | | | | | | | | | | | | | | | | | | | |
| | | | | | | |
| | | | | | | | | | | | | | | | | | | | | | | | | | | | | | |
| | 90,977,437 | | | | 77,191,413 | | | | 88,737,855 | | | | 112,731,040 | | | | 70,329,796 | | | | 85,856,609 | | | | 155,292,453 | | | | 63,278,938 | |
| | | | | | | | | | | | | | | | | | | | | | | | | | | | | | |
| $ | 174,400,648 | | | $ | 90,977,437 | | | $ | 51,126,689 | | | $ | 88,737,855 | | | $ | 24,861,229 | | | $ | 70,329,796 | | | $ | 163,351,184 | | | $ | 155,292,453 | |
| | | | | | | | | | | | | | | | | | | | | | | | | | | | | | |
| | | | | | | |
| | | | | | | | | | | | | | | | | | | | | | | | | | | | | | |
| | 2,600,000 | | | | 850,000 | | | | 2,550,000 | | | | 550,000 | | | | 500,000 | | | | 1,850,000 | | | | 4,100,000 | | | | 3,450,000 | |
| | (1,550,000 | ) | | | (800,000 | ) | | | (3,050,000 | ) | | | (1,550,000 | ) | | | (1,800,000 | ) | | | (2,650,000 | ) | | | (4,000,000 | ) | | | (2,600,000 | ) |
| | 1,350,000 | | | | 1,300,000 | | | | 2,100,000 | | | | 3,100,000 | | | | 2,000,000 | | | | 2,800,000 | | | | 2,000,000 | | | | 1,150,000 | |
| | | | | | | | | | | | | | | | | | | | | | | | | | | | | | |
| | 2,400,000 | | | | 1,350,000 | | | | 1,600,000 | | | | 2,100,000 | | | | 700,000 | | | | 2,000,000 | | | | 2,100,000 | | | | 2,000,000 | |
| | | | | | | | | | | | | | | | | | | | | | | | | | | | | | |
Statements of Changes in Net Assets(continued)
For the years ended April 30, 2019 and 2018
| | | | | | | | | | | | | | | | |
| | | Invesco DWA Industrials
Momentum ETF (PRN) | | | Invesco DWA Technology
Momentum ETF (PTF) | |
| | | 2019 | | | 2018 | | | 2019 | | | 2018 | |
| Operations: | | | | | | | | | | | | | | | | |
Net investment income (loss) | | $ | 301,854 | | | $ | 475,892 | | | $ | (206,032 | ) | | $ | 95,831 | |
Net realized gain | | | 295,631 | | | | 14,254,002 | | | | 16,289,164 | | | | 24,828,738 | |
Change in net unrealized appreciation (depreciation) | | | 7,878,282 | | | | (501,925 | ) | | | 15,847,728 | | | | 2,069,284 | |
| | | | | | | | | | | | | | | | |
Net increase in net assets resulting from operations | | | 8,475,767 | | | | 14,227,969 | | | | 31,930,860 | | | | 26,993,853 | |
| | | | | | | | | | | | | | | | |
| | | | |
| Distributions to Shareholders from: | | | | | | | | | | | | | | | | |
Distributable earnings | | | (271,559 | ) | | | (510,083 | ) | | | (94,036 | ) | | | (51,408 | ) |
Return of capital | | | — | | | | (271,174 | ) | | | — | | | | — | |
| | | | | | | | | | | | | | | | |
Total distributions to shareholders | | | (271,559 | ) | | | (781,257 | ) | | | (94,036 | ) | | | (51,408 | ) |
| | | | | | | | | | | | | | | | |
| | | | |
| Shareholder Transactions: | | | | | | | | | | | | | | | | |
Proceeds from shares sold | | | 70,906,996 | | | | 90,162,488 | | | | 155,387,556 | | | | 99,710,756 | |
Value of shares repurchased | | | (84,325,128 | ) | | | (127,225,474 | ) | | | (129,255,146 | ) | | | (139,873,509 | ) |
| | | | | | | | | | | | | | | | |
Net increase (decrease) in net assets resulting from share transactions | | | (13,418,132 | ) | | | (37,062,986 | ) | | | 26,132,410 | | | | (40,162,753 | ) |
| | | | | | | | | | | | | | | | |
Net increase (decrease) in net assets | | | (5,213,924 | ) | | | (23,616,274 | ) | | | 57,969,234 | | | | (13,220,308 | ) |
| | | | | | | | | | | | | | | | |
| | | | |
| Net assets: | | | | | | | | | | | | | | | | |
Beginning of year | | | 107,053,047 | | | | 130,669,321 | | | | 117,996,349 | | | | 131,216,657 | |
| | | | | | | | | | | | | | | | |
End of year | | $ | 101,839,123 | | | $ | 107,053,047 | | | $ | 175,965,583 | | | $ | 117,996,349 | |
| | | | | | | | | | | | | | | | |
| | | | |
| Changes in Shares Outstanding: | | | | | | | | | | | | | | | | |
Shares sold | | | 1,150,000 | | | | 1,550,000 | | | | 2,400,000 | | | | 1,950,000 | |
Shares repurchased | | | (1,400,000 | ) | | | (2,200,000 | ) | | | (2,050,000 | ) | | | (2,750,000 | ) |
Shares outstanding, beginning of year | | | 1,850,000 | | | | 2,500,000 | | | | 2,100,000 | | | | 2,900,000 | |
| | | | | | | | | | | | | | | | |
Shares outstanding, end of year | | | 1,600,000 | | | | 1,850,000 | | | | 2,450,000 | | | | 2,100,000 | |
| | | | | | | | | | | | | | | | |
See accompanying Notes to Financial Statements which are an integral part of the financial statements.
| | | | | | | | | | | | | | |
Invesco DWA Utilities
Momentum ETF (PUI) | | | Invesco NASDAQ
Internet ETF (PNQI) | |
| 2019 | | | 2018 | | | 2019 | | | 2018 | |
| | | | | | | | | | | | | | |
| $ | 2,156,924 | | | $ | 1,435,638 | | | $ | (2,031,013 | ) | | $ | (1,479,291 | ) |
| | 6,490,296 | | | | 2,264,535 | | | | 58,622,369 | | | | 75,580,692 | |
| | 10,841,628 | | | | (1,822,585 | ) | | | (8,326,753 | ) | | | 41,807,534 | |
| | | | | | | | | | | | | | |
| | 19,488,848 | | | | 1,877,588 | | | | 48,264,603 | | | | 115,908,935 | |
| | | | | | | | | | | | | | |
| | | |
| | | | | | | | | | | | | | |
| | (1,488,891 | ) | | | (1,607,003 | ) | | | — | | | | (109,107 | ) |
| | — | | | | — | | | | — | | | | — | |
| | | | | | | | | | | | | | |
| | (1,488,891 | ) | | | (1,607,003 | ) | | | — | | | | (109,107 | ) |
| | | | | | | | | | | | | | |
| | | |
| | | | | | | | | | | | | | |
| | 224,199,894 | | | | 9,942,147 | | | | 148,587,172 | | | | 322,305,601 | |
| | (63,293,016 | ) | | | (102,958,355 | ) | | | (199,155,415 | ) | | | (189,509,351 | ) |
| | | | | | | | | | | | | | |
|
160,906,878 |
| | | (93,016,208 | ) | | | (50,568,243 | ) | | | 132,796,250 | |
| | | | | | | | | | | | | | |
| | 178,906,835 | | | | (92,745,623 | ) | | | (2,303,640 | ) | | | 248,596,078 | |
| | | | | | | | | | | | | | |
| | | |
| | | | | | | | | | | | | | |
| | 44,729,959 | | | | 137,475,582 | | | | 600,535,214 | | | | 351,939,136 | |
| | | | | | | | | | | | | | |
| $ | 223,636,794 | | | $ | 44,729,959 | | | $ | 598,231,574 | | | $ | 600,535,214 | |
| | | | | | | | | | | | | | |
| | | |
| | | | | | | | | | | | | | |
| | 7,350,000 | | | | 350,000 | | | | 1,100,000 | | | | 2,700,000 | |
| | (2,050,000 | ) | | | (3,700,000 | ) | | | (1,550,000 | ) | | | (1,600,000 | ) |
| | 1,650,000 | | | | 5,000,000 | | | | 4,650,000 | | | | 3,550,000 | |
| | | | | | | | | | | | | | |
| | 6,950,000 | | | | 1,650,000 | | | | 4,200,000 | | | | 4,650,000 | |
| | | | | | | | | | | | | | |
Financial Highlights
Invesco DWA Basic Materials Momentum ETF (PYZ)
| | | | | | | | | | | | | | | | | | | | |
| | | Years Ended April 30, | |
| | | 2019 | | | 2018 | | | 2017 | | | 2016 | | | 2015 | |
| Per Share Operating Performance: | | | | | | | | | | | | | | | | | | | | |
Net asset value at beginning of year | | $ | 66.74 | | | $ | 61.38 | | | $ | 54.35 | | | $ | 53.85 | | | $ | 52.33 | |
Net investment income(a) | | | 0.72 | | | | 0.49 | | | | 0.46 | | | | 0.58 | | | | 0.43 | |
Net realized and unrealized gain (loss) on investments | | | (6.30 | ) | | | 5.27 | | | | 7.14 | | | | 0.59 | | | | 1.57 | |
Total from investment operations | | | (5.58 | ) | | | 5.76 | | | | 7.60 | | | | 1.17 | | | | 2.00 | |
Distributions to shareholders from: | | | | | | | | | | | | | | | | | | | | |
Net investment income | | | (0.67 | ) | | | (0.40 | ) | | | (0.57 | ) | | | (0.67 | ) | | | (0.48 | ) |
Net asset value at end of year | | $ | 60.49 | | | $ | 66.74 | | | $ | 61.38 | | | $ | 54.35 | | | $ | 53.85 | |
Market price at end of year(b) | | $ | 60.48 | | | $ | 66.79 | | | $ | 61.38 | | | $ | 54.38 | | | $ | 53.80 | |
| Net Asset Value Total Return(c) | | | (8.36 | )% | | | 9.40 | % | | | 14.04 | % | | | 2.32 | % | | | 3.82 | % |
| Market Price Total Return(c) | | | (8.46 | )% | | | 9.48 | % | | | 13.98 | % | | | 2.47 | % | | | 3.77 | % |
| Ratios/Supplemental Data: | | | | | | | | | | | | | | | | | | | | |
Net assets at end of year (000’s omitted) | | $ | 63,518 | | | $ | 100,114 | | | $ | 101,269 | | | $ | 168,497 | | | $ | 78,082 | |
Ratio to average net assets of: | | | | | | | | | | | | | | | | | | | | |
Expenses, after Waivers | | | 0.60 | % | | | 0.60 | % | | | 0.60 | % | | | 0.60 | % | | | 0.60 | % |
Expenses, prior to Waivers | | | 0.76 | % | | | 0.76 | % | | | 0.69 | % | | | 0.69 | % | | | 0.69 | % |
Net investment income, after Waivers | | | 1.12 | % | | | 0.75 | % | | | 0.79 | % | | | 1.17 | % | | | 0.79 | % |
Portfolio turnover rate(d) | | | 89 | % | | | 75 | % | | | 132 | % | | | 96 | % | | | 80 | % |
| (a) | Based on average shares outstanding. |
| (b) | The mean between the last bid and ask prices. |
| (c) | Net asset value total return is calculated assuming an initial investment made at the net asset value at the beginning of the period, reinvestment of all dividends and distributions at net asset value during the period, and redemption on the last day of the period. Net asset value total return includes adjustments in accordance with accounting principles generally accepted in the United States of America and as such, the net asset value for financial reporting purposes and the returns based upon those net asset values may differ from the net asset value and returns for shareholder transactions. Market price total return is calculated assuming an initial investment made at the market price at the beginning of the period, reinvestment of all dividends and distributions at market price during the period, and sale at the market price on the last day of the period. Total investment returns calculated for a period of less than one year are not annualized. |
| (d) | Portfolio turnover rate is not annualized for periods less than one year, if applicable, and does not include securities received or delivered from processing creations or redemptions. |
Invesco DWA Consumer Cyclicals Momentum ETF (PEZ)
| | | | | | | | | | | | | | | | | | | | |
| | | Years Ended April 30, | |
| | | 2019 | | | 2018 | | | 2017 | | | 2016 | | | 2015 | |
| Per Share Operating Performance: | | | | | | | | | | | | | | | | | | | | |
Net asset value at beginning of year | | $ | 50.42 | | | $ | 44.36 | | | $ | 42.26 | | | $ | 45.93 | | | $ | 39.79 | |
Net investment income(a) | | | 0.08 | | | | 0.25 | | | | 0.15 | | | | 0.17 | | | | 0.27 | |
Net realized and unrealized gain (loss) on investments | | | 6.53 | | | | 6.03 | | | | 2.30 | | | | (3.71 | ) | | | 6.06 | |
Total from investment operations | | | 6.61 | | | | 6.28 | | | | 2.45 | | | | (3.54 | ) | | | 6.33 | |
Distributions to shareholders from: | | | | | | | | | | | | | | | | | | | | |
Net investment income | | | (0.17 | ) | | | (0.22 | ) | | | (0.35 | ) | | | (0.13 | ) | | | (0.19 | ) |
Net asset value at end of year | | $ | 56.86 | | | $ | 50.42 | | | $ | 44.36 | | | $ | 42.26 | | | $ | 45.93 | |
Market price at end of year(b) | | $ | 56.87 | | | $ | 50.48 | | | $ | 44.37 | | | $ | 42.25 | | | $ | 45.93 | |
| Net Asset Value Total Return(c) | | | 13.15 | % | | | 14.20 | % | | | 5.85 | % | | | (7.73 | )% | | | 15.91 | % |
| Market Price Total Return(c) | | | 13.03 | % | | | 14.31 | % | | | 5.90 | % | | | (7.76 | )% | | | 16.06 | % |
| Ratios/Supplemental Data: | | | | | | | | | | | | | | | | | | | | |
Net assets at end of year (000’s omitted) | | $ | 31,271 | | | $ | 55,464 | | | $ | 28,837 | | | $ | 92,964 | | | $ | 96,463 | |
Ratio to average net assets of: | | | | | | | | | | | | | | | | | | | | |
Expenses, after Waivers | | | 0.60 | % | | | 0.60 | % | | | 0.60 | % | | | 0.60 | % | | | 0.60 | % |
Expenses, prior to Waivers | | | 0.80 | % | | | 0.90 | % | | | 0.86 | % | | | 0.71 | % | | | 0.81 | % |
Net investment income, after Waivers | | | 0.15 | % | | | 0.52 | % | | | 0.35 | % | | | 0.39 | % | | | 0.63 | % |
Portfolio turnover rate(d) | | | 136 | % | | | 185 | % | | | 117 | % | | | 139 | % | | | 114 | % |
| (a) | Based on average shares outstanding. |
| (b) | The mean between the last bid and ask prices. |
| (c) | Net asset value total return is calculated assuming an initial investment made at the net asset value at the beginning of the period, reinvestment of all dividends and distributions at net asset value during the period, and redemption on the last day of the period. Net asset value total return includes adjustments in accordance with accounting principles generally accepted in the United States of America and as such, the net asset value for financial reporting purposes and the returns based upon those net asset values may differ from the net asset value and returns for shareholder transactions. Market price total return is calculated assuming an initial investment made at the market price at the beginning of the period, reinvestment of all dividends and distributions at market price during the period, and sale at the market price on the last day of the period. Total investment returns calculated for a period of less than one year are not annualized. |
| (d) | Portfolio turnover rate is not annualized for periods less than one year, if applicable, and does not include securities received or delivered from processing creations or redemptions. |
See accompanying Notes to Financial Statements which are an integral part of the financial statements.
Financial Highlights(continued)
Invesco DWA Consumer Staples Momentum ETF (PSL)
| | | | | | | | | | | | | | | | | | | | |
| | | Years Ended April 30, | |
| | | 2019 | | | 2018 | | | 2017 | | | 2016 | | | 2015 | |
| Per Share Operating Performance: | | | | | | | | | | | | | | | | | | | | |
Net asset value at beginning of year | | $ | 67.39 | | | $ | 59.38 | | | $ | 56.05 | | | $ | 51.43 | | | $ | 43.04 | |
Net investment income(a) | | | 0.45 | | | | 0.41 | | | | 0.76 | | | | 0.43 | | | | 0.76 | (b) |
Net realized and unrealized gain on investments | | | 5.25 | | | | 7.90 | | | | 3.69 | | | | 4.54 | | | | 8.37 | |
Total from investment operations | | | 5.70 | | | | 8.31 | | | | 4.45 | | | | 4.97 | | | | 9.13 | |
Distributions to shareholders from: | | | | | | | | | | | | | | | | | | | | |
Net investment income | | | (0.42 | ) | | | (0.30 | ) | | | (1.12 | ) | | | (0.35 | ) | | | (0.74 | ) |
Net asset value at end of year | | $ | 72.67 | | | $ | 67.39 | | | $ | 59.38 | | | $ | 56.05 | | | $ | 51.43 | |
Market price at end of year(c) | | $ | 72.65 | | | $ | 67.61 | | | $ | 59.38 | | | $ | 56.05 | | | $ | 51.43 | |
| Net Asset Value Total Return(d) | | | 8.50 | % | | | 14.03 | % | | | 8.12 | % | | | 9.67 | % | | | 21.28 | % |
| Market Price Total Return(d) | | | 8.12 | % | | | 14.40 | % | | | 8.12 | % | | | 9.67 | % | | | 21.31 | % |
| Ratios/Supplemental Data: | | | | | | | | | | | | | | | | | | | | |
Net assets at end of year (000’s omitted) | | $ | 174,401 | | | $ | 90,977 | | | $ | 77,191 | | | $ | 297,070 | | | $ | 97,713 | |
Ratio to average net assets of: | | | | | | | | | | | | | | | | | | | | |
Expenses, after Waivers | | | 0.60 | % | | | 0.60 | % | | | 0.60 | % | | | 0.60 | % | | | 0.60 | % |
Expenses, prior to Waivers | | | 0.71 | % | | | 0.79 | % | | | 0.71 | % | | | 0.69 | % | | | 0.78 | % |
Net investment income, after Waivers | | | 0.64 | % | | | 0.65 | % | | | 1.33 | % | | | 0.76 | % | | | 1.54 | %(b) |
Portfolio turnover rate(e) | | | 118 | % | | | 80 | % | | | 106 | % | | | 113 | % | | | 83 | % |
| (a) | Based on average shares outstanding. |
| (b) | Net investment income per share and the ratio of net investment income to average net assets include a significant dividend received of $5.77 per share owned of Pilgrim’s Pride Corp. on January 28, 2015. Net investment income per share and the ratio of net investment income to average net assets excluding the significant dividend are $0.28 and 0.55%, respectively. |
| (c) | The mean between the last bid and ask prices. |
| (d) | Net asset value total return is calculated assuming an initial investment made at the net asset value at the beginning of the period, reinvestment of all dividends and distributions at net asset value during the period, and redemption on the last day of the period. Net asset value total return includes adjustments in accordance with accounting principles generally accepted in the United States of America and as such, the net asset value for financial reporting purposes and the returns based upon those net asset values may differ from the net asset value and returns for shareholder transactions. Market price total return is calculated assuming an initial investment made at the market price at the beginning of the period, reinvestment of all dividends and distributions at market price during the period, and sale at the market price on the last day of the period. Total investment returns calculated for a period of less than one year are not annualized. |
| (e) | Portfolio turnover rate is not annualized for periods less than one year, if applicable, and does not include securities received or delivered from processing creations or redemptions. |
See accompanying Notes to Financial Statements which are an integral part of the financial statements.
Financial Highlights(continued)
Invesco DWA Energy Momentum ETF (PXI)
| | | | | | | | | | | | | | | | | | | | |
| | | Years Ended April 30, | |
| | | 2019 | | | 2018 | | | 2017 | | | 2016 | | | 2015 | |
| Per Share Operating Performance: | | | | | | | | | | | | | | | | | | | | |
Net asset value at beginning of year | | $ | 42.26 | | | $ | 36.36 | | | $ | 37.97 | | | $ | 49.51 | | | $ | 60.41 | |
Net investment income(a) | | | 0.28 | | | | 0.41 | | | | 0.14 | | | | 0.51 | | | | 0.53 | |
Net realized and unrealized gain (loss) on investments | | | (10.24 | ) | | | 5.80 | | | | (1.50 | ) | | | (11.39 | ) | | | (10.82 | ) |
Total from investment operations | | | (9.96 | ) | | | 6.21 | | | | (1.36 | ) | | | (10.88 | ) | | | (10.29 | ) |
Distributions to shareholders from: | | | | | | | | | | | | | | | | | | | | |
Net investment income | | | (0.35 | ) | | | (0.31 | ) | | | (0.19 | ) | | | (0.66 | ) | | | (0.61 | ) |
Return of capital | | | — | | | | — | | | | (0.06 | ) | | | — | | | | — | |
Total distributions | | | (0.35 | ) | | | (0.31 | ) | | | (0.25 | ) | | | (0.66 | ) | | | (0.61 | ) |
Net asset value at end of year | | $ | 31.95 | | | $ | 42.26 | | | $ | 36.36 | | | $ | 37.97 | | | $ | 49.51 | |
Market price at end of year(b) | | $ | 31.95 | | | $ | 42.32 | | | $ | 36.35 | | | $ | 37.95 | | | $ | 49.51 | |
| Net Asset Value Total Return(c) | | | (23.63 | )% | | | 17.28 | % | | | (3.62 | )% | | | (22.01 | )% | | | (17.08 | )% |
| Market Price Total Return(c) | | | (23.74 | )% | | | 17.47 | % | | | (3.60 | )% | | | (22.05 | )% | | | (17.02 | )% |
| Ratios/Supplemental Data: | | | | | | | | | | | | | | | | | | | | |
Net assets at end of year (000’s omitted) | | $ | 51,127 | | | $ | 88,738 | | | $ | 112,731 | | | $ | 125,286 | | | $ | 183,178 | |
Ratio to average net assets of: | | | | | | | | | | | | | | | | | | | | |
Expenses, after Waivers | | | 0.60 | % | | | 0.60 | % | | | 0.60 | % | | | 0.60 | % | | | 0.60 | % |
Expenses, prior to Waivers | | | 0.75 | % | | | 0.78 | % | | | 0.72 | % | | | 0.76 | % | | | 0.74 | % |
Net investment income, after Waivers | | | 0.72 | % | | | 1.15 | % | | | 0.34 | % | | | 1.32 | % | | | 0.97 | % |
Portfolio turnover rate(d) | | | 113 | % | | | 95 | % | | | 116 | % | | | 119 | % | | | 109 | % |
| (a) | Based on average shares outstanding. |
| (b) | The mean between the last bid and ask prices. |
| (c) | Net asset value total return is calculated assuming an initial investment made at the net asset value at the beginning of the period, reinvestment of all dividends and distributions at net asset value during the period, and redemption on the last day of the period. Net asset value total return includes adjustments in accordance with accounting principles generally accepted in the United States of America and as such, the net asset value for financial reporting purposes and the returns based upon those net asset values may differ from the net asset value and returns for shareholder transactions. Market price total return is calculated assuming an initial investment made at the market price at the beginning of the period, reinvestment of all dividends and distributions at market price during the period, and sale at the market price on the last day of the period. Total investment returns calculated for a period of less than one year are not annualized. |
| (d) | Portfolio turnover rate is not annualized for periods less than one year, if applicable, and does not include securities received or delivered from processing creations or redemptions. |
See accompanying Notes to Financial Statements which are an integral part of the financial statements.
Financial Highlights(continued)
Invesco DWA Financial Momentum ETF (PFI)
| | | | | | | | | | | | | | | | | | | | |
| | | Years Ended April 30, | |
| | | 2019 | | | 2018 | | | 2017 | | | 2016 | | | 2015 | |
| Per Share Operating Performance: | | | | | | | | | | | | | | | | | | | | |
Net asset value at beginning of year | | $ | 35.16 | | | $ | 30.66 | | | $ | 29.42 | | | $ | 30.76 | | | $ | 27.82 | |
Net investment income(a) | | | 0.41 | | | | 0.35 | | | | 0.47 | | | | 0.42 | | | | 0.37 | |
Net realized and unrealized gain (loss) on investments | | | 0.39 | | | | 4.44 | | | | 1.43 | | | | (1.37 | ) | | | 2.92 | |
Total from investment operations | | | 0.80 | | | | 4.79 | | | | 1.90 | | | | (0.95 | ) | | | 3.29 | |
Distributions to shareholders from: | | | | | | | | | | | | | | | | | | | | |
Net investment income | | | (0.44 | ) | | | (0.29 | ) | | | (0.66 | ) | | | (0.39 | ) | | | (0.35 | ) |
Net asset value at end of year | | $ | 35.52 | | | $ | 35.16 | | | $ | 30.66 | | | $ | 29.42 | | | $ | 30.76 | |
Market price at end of year(b) | | $ | 35.49 | | | $ | 35.22 | | | $ | 30.64 | | | $ | 29.43 | | | $ | 30.76 | |
| Net Asset Value Total Return(c) | | | 2.44 | % | | | 15.64 | % | | | 6.51 | % | | | (3.11 | )% | | | 11.84 | % |
| Market Price Total Return(c) | | | 2.18 | % | | | 15.91 | % | | | 6.41 | % | | | (3.08 | )% | | | 11.96 | % |
| Ratios/Supplemental Data: | | | | | | | | | | | | | | | | | | | | |
Net assets at end of year (000’s omitted) | | $ | 24,861 | | | $ | 70,330 | | | $ | 85,857 | | | $ | 29,418 | | | $ | 38,447 | |
Ratio to average net assets of: | | | | | | | | | | | | | | | | | | | | |
Expenses, after Waivers | | | 0.60 | % | | | 0.60 | % | | | 0.60 | % | | | 0.60 | % | | | 0.60 | %(d) |
Expenses, prior to Waivers | | | 0.79 | % | | | 0.75 | % | | | 0.77 | % | | | 0.84 | % | | | 0.85 | %(d) |
Net investment income, after Waivers | | | 1.22 | % | | | 1.04 | % | | | 1.53 | % | | | 1.38 | % | | | 1.24 | % |
Portfolio turnover rate(e) | | | 132 | % | | | 105 | % | | | 204 | % | | | 119 | % | | | 115 | % |
| (a) | Based on average shares outstanding. |
| (b) | The mean between the last bid and ask prices. |
| (c) | Net asset value total return is calculated assuming an initial investment made at the net asset value at the beginning of the period, reinvestment of all dividends and distributions at net asset value during the period, and redemption on the last day of the period. Net asset value total return includes adjustments in accordance with accounting principles generally accepted in the United States of America and as such, the net asset value for financial reporting purposes and the returns based upon those net asset values may differ from the net asset value and returns for shareholder transactions. Market price total return is calculated assuming an initial investment made at the market price at the beginning of the period, reinvestment of all dividends and distributions at market price during the period, and sale at the market price on the last day of the period. Total investment returns calculated for a period of less than one year are not annualized. |
| (d) | In addition to the fees and expenses which the Fund bears directly, the Fund indirectly bears a pro rata share of the fees and expenses of the investment companies in which the Fund invests. Estimated investment companies’ expenses are not expenses that are incurred directly by the Fund. They are expenses that are incurred directly by the investment companies and are deducted from the value of the investment companies the Fund invests in. The effect of the estimated investment companies’ expenses that the Fund bears indirectly is included in the Fund’s total return. |
| (e) | Portfolio turnover rate is not annualized for periods less than one year, if applicable, and does not include securities received or delivered from processing creations or redemptions. |
Invesco DWA Healthcare Momentum ETF (PTH)
| | | | | | | | | | | | | | | | | | | | |
| | | Years Ended April 30, | |
| | | 2019 | | | 2018 | | | 2017 | | | 2016 | | | 2015 | |
| Per Share Operating Performance: | | | | | | | | | | | | | | | | | | | | |
Net asset value at beginning of year | | $ | 77.65 | | | $ | 55.03 | | | $ | 44.31 | | | $ | 57.68 | | | $ | 45.34 | |
Net investment income (loss)(a) | | | (0.33 | ) | | | (0.21 | ) | | | (0.19 | ) | | | (0.27 | ) | | | (0.20 | ) |
Net realized and unrealized gain (loss) on investments | | | 0.47 | | | | 22.83 | | | | 10.91 | | | | (13.10 | ) | | | 12.54 | |
Total from investment operations | | | 0.14 | | | | 22.62 | | | | 10.72 | | | | (13.37 | ) | | | 12.34 | |
Net asset value at end of year | | $ | 77.79 | | | $ | 77.65 | | | $ | 55.03 | | | $ | 44.31 | | | $ | 57.68 | |
Market price at end of year(b) | | $ | 77.69 | | | $ | 77.80 | | | $ | 55.02 | | | $ | 44.28 | | | $ | 57.64 | |
| Net Asset Value Total Return(c) | | | 0.18 | % | | | 41.11 | % | | | 24.19 | % | | | (23.18 | )% | | | 27.22 | % |
| Market Price Total Return(c) | | | (0.15 | )% | | | 41.40 | % | | | 24.26 | % | | | (23.18 | )% | | | 27.13 | % |
| Ratios/Supplemental Data: | | | | | | | | | | | | | | | | | | | | |
Net assets at end of year (000’s omitted) | | $ | 163,351 | | | $ | 155,292 | | | $ | 63,279 | | | $ | 75,332 | | | $ | 178,802 | |
Ratio to average net assets of: | | | | | | | | | | | | | | | | | | | | |
Expenses, after Waivers | | | 0.60 | % | | | 0.60 | % | | | 0.60 | % | | | 0.60 | % | | | 0.60 | % |
Expenses, prior to Waivers | | | 0.69 | % | | | 0.73 | % | | | 0.78 | % | | | 0.70 | % | | | 0.68 | % |
Net investment income (loss), after Waivers | | | (0.39 | )% | | | (0.31 | )% | | | (0.39 | )% | | | (0.48 | )% | | | (0.38 | )% |
Portfolio turnover rate(d) | | | 166 | % | | | 130 | % | | | 175 | % | | | 200 | % | | | 151 | % |
| (a) | Based on average shares outstanding. |
| (b) | The mean between the last bid and ask prices. |
| (c) | Net asset value total return is calculated assuming an initial investment made at the net asset value at the beginning of the period, reinvestment of all dividends and distributions at net asset value during the period, and redemption on the last day of the period. Net asset value total return includes adjustments in accordance with accounting principles generally accepted in the United States of America and as such, the net asset value for financial reporting purposes and the returns based upon those net asset values may differ from the net asset value and returns for shareholder transactions. Market price total return is calculated assuming an initial investment made at the market price at the beginning of the period, reinvestment of all dividends and distributions at market price during the period, and sale at the market price on the last day of the period. Total investment returns calculated for a period of less than one year are not annualized. |
| (d) | Portfolio turnover rate is not annualized for periods less than one year, if applicable, and does not include securities received or delivered from processing creations or redemptions. |
See accompanying Notes to Financial Statements which are an integral part of the financial statements.
Financial Highlights(continued)
Invesco DWA Industrials Momentum ETF (PRN)
| | | | | | | | | | | | | | | | | | | | |
| | | Years Ended April 30, | |
| | | 2019 | | | 2018 | | | 2017 | | | 2016 | | | 2015 | |
| Per Share Operating Performance: | | | | | | | | | | | | | | | | | | | | |
Net asset value at beginning of year | | $ | 57.87 | | | $ | 52.27 | | | $ | 45.13 | | | $ | 46.84 | | | $ | 46.47 | |
Net investment income(a) | | | 0.17 | | | | 0.23 | | | | 0.29 | | | | 0.22 | | | | 0.17 | |
Net realized and unrealized gain (loss) on investments | | | 5.76 | | | | 5.73 | | | | 7.14 | | | | (1.73 | ) | | | 0.35 | |
Total from investment operations | | | 5.93 | | | | 5.96 | | | | 7.43 | | | | (1.51 | ) | | | 0.52 | |
Distributions to shareholders from: | | | | | | | | | | | | | | | | | | | | |
Net investment income | | | (0.15 | ) | | | (0.23 | ) | | | (0.29 | ) | | | (0.20 | ) | | | (0.15 | ) |
Return of capital | | | — | | | | (0.13 | ) | | | — | | | | — | | | | — | |
Total distributions | | | (0.15 | ) | | | (0.36 | ) | | | (0.29 | ) | | | (0.20 | ) | | | (0.15 | ) |
Net asset value at end of year | | $ | 63.65 | | | $ | 57.87 | | | $ | 52.27 | | | $ | 45.13 | | | $ | 46.84 | |
Market price at end of year(b) | | $ | 63.64 | | | $ | 57.91 | | | $ | 52.26 | | | $ | 45.13 | | | $ | 46.85 | |
| Net Asset Value Total Return(c) | | | 10.28 | % | | | 11.43 | % | | | 16.50 | % | | | (3.24 | )% | | | 1.12 | % |
| Market Price Total Return(c) | | | 10.19 | % | | | 11.53 | % | | | 16.48 | % | | | (3.26 | )% | | | 1.23 | % |
| Ratios/Supplemental Data: | | | | | | | | | | | | | | | | | | | | |
Net assets at end of year (000’s omitted) | | $ | 101,839 | | | $ | 107,053 | | | $ | 130,669 | | | $ | 42,876 | | | $ | 112,414 | |
Ratio to average net assets of: | | | | | | | | | | | | | | | | | | | | |
Expenses, after Waivers | | | 0.60 | % | | | 0.60 | % | | | 0.60 | % | | | 0.60 | % | | | 0.60 | % |
Expenses, prior to Waivers | | | 0.64 | % | | | 0.64 | % | | | 0.65 | % | | | 0.65 | % | | | 0.64 | % |
Net investment income, after Waivers | | | 0.29 | % | | | 0.39 | % | | | 0.59 | % | | | 0.48 | % | | | 0.36 | % |
Portfolio turnover rate(d) | | | 104 | % | | | 106 | % | | | 122 | % | | | 122 | % | | | 121 | % |
| (a) | Based on average shares outstanding. |
| (b) | The mean between the last bid and ask prices. |
| (c) | Net asset value total return is calculated assuming an initial investment made at the net asset value at the beginning of the period, reinvestment of all dividends and distributions at net asset value during the period, and redemption on the last day of the period. Net asset value total return includes adjustments in accordance with accounting principles generally accepted in the United States of America and as such, the net asset value for financial reporting purposes and the returns based upon those net asset values may differ from the net asset value and returns for shareholder transactions. Market price total return is calculated assuming an initial investment made at the market price at the beginning of the period, reinvestment of all dividends and distributions at market price during the period, and sale at the market price on the last day of the period. Total investment returns calculated for a period of less than one year are not annualized. |
| (d) | Portfolio turnover rate is not annualized for periods less than one year, if applicable, and does not include securities received or delivered from processing creations or redemptions. |
See accompanying Notes to Financial Statements which are an integral part of the financial statements.
Financial Highlights(continued)
Invesco DWA Technology Momentum ETF (PTF)
| | | | | | | | | | | | | | | | | | | | |
| | | Years Ended April 30, | |
| | | 2019 | | | 2018 | | | 2017 | | | 2016 | | | 2015 | |
| Per Share Operating Performance: | | | | | | | | | | | | | | | | | | | | |
Net asset value at beginning of year | | $ | 56.19 | | | $ | 45.25 | | | $ | 36.16 | | | $ | 40.37 | | | $ | 32.44 | |
Net investment income (loss)(a) | | | (0.09 | ) | | | 0.04 | | | | 0.07 | | | | (0.01 | ) | | | 0.17 | |
Net realized and unrealized gain (loss) on investments | | | 15.76 | | | | 10.92 | | | | 9.12 | | | | (4.20 | ) | | | 8.02 | |
Total from investment operations | | | 15.67 | | | | 10.96 | | | | 9.19 | | | | (4.21 | ) | | | 8.19 | |
Distributions to shareholders from: | | | | | | | | | | | | | | | | | | | | |
Net investment income | | | (0.04 | ) | | | (0.02 | ) | | | (0.05 | ) | | | — | | | | (0.26 | ) |
Return of capital | | | — | | | | — | | | | (0.05 | ) | | | — | | | | — | |
Total distributions | | | (0.04 | ) | | | (0.02 | ) | | | (0.10 | ) | | | — | | | | (0.26 | ) |
Net asset value at end of year | | $ | 71.82 | | | $ | 56.19 | | | $ | 45.25 | | | $ | 36.16 | | | $ | 40.37 | |
Market price at end of year(b) | | $ | 71.91 | | | $ | 56.21 | | | $ | 45.22 | | | $ | 36.16 | | | $ | 40.36 | |
| Net Asset Value Total Return(c) | | | 27.90 | % | | | 24.22 | % | | | 25.46 | % | | | (10.43 | )% | | | 25.29 | % |
| Market Price Total Return(c) | | | 28.01 | % | | | 24.35 | % | | | 25.38 | % | | | (10.41 | )% | | | 25.22 | % |
| Ratios/Supplemental Data: | | | | | | | | | | | | | | | | | | | | |
Net assets at end of year (000’s omitted) | | $ | 175,966 | | | $ | 117,996 | | | $ | 131,217 | | | $ | 182,623 | | | $ | 64,588 | |
Ratio to average net assets of: | | | | | | | | | | | | | | | | | | | | |
Expenses, after Waivers | | | 0.60 | % | | | 0.60 | % | | | 0.60 | % | | | 0.60 | % | | | 0.60 | % |
Expenses, prior to Waivers | | | 0.72 | % | | | 0.74 | % | | | 0.72 | % | | | 0.70 | % | | | 0.77 | % |
Net investment income (loss), after Waivers | | | (0.15 | )% | | | 0.08 | % | | | 0.17 | % | | | (0.03 | )% | | | 0.46 | % |
Portfolio turnover rate(d) | | | 133 | % | | | 107 | % | | | 147 | % | | | 159 | % | | | 157 | % |
| (a) | Based on average shares outstanding. |
| (b) | The mean between the last bid and ask prices. |
| (c) | Net asset value total return is calculated assuming an initial investment made at the net asset value at the beginning of the period, reinvestment of all dividends and distributions at net asset value during the period, and redemption on the last day of the period. Net asset value total return includes adjustments in accordance with accounting principles generally accepted in the United States of America and as such, the net asset value for financial reporting purposes and the returns based upon those net asset values may differ from the net asset value and returns for shareholder transactions. Market price total return is calculated assuming an initial investment made at the market price at the beginning of the period, reinvestment of all dividends and distributions at market price during the period, and sale at the market price on the last day of the period. Total investment returns calculated for a period of less than one year are not annualized. |
| (d) | Portfolio turnover rate is not annualized for periods less than one year, if applicable, and does not include securities received or delivered from processing creations or redemptions. |
Invesco DWA Utilities Momentum ETF (PUI)
| | | | | | | | | | | | | | | | | | | | |
| | | Years Ended April 30, | |
| | | 2019 | | | 2018 | | | 2017 | | | 2016 | | | 2015 | |
| Per Share Operating Performance: | | | | | | | | | | | | | | | | | | | | |
Net asset value at beginning of year | | $ | 27.11 | | | $ | 27.50 | | | $ | 25.12 | | | $ | 22.51 | | | $ | 22.49 | |
Net investment income(a) | | | 0.63 | | | | 0.65 | | | | 0.65 | | | | 0.64 | | | | 0.57 | |
Net realized and unrealized gain (loss) on investments | | | 4.98 | | | | (0.31 | ) | | | 2.71 | | | | 2.60 | | | | (0.01 | ) |
Total from investment operations | | | 5.61 | | | | 0.34 | | | | 3.36 | | | | 3.24 | | | | 0.56 | |
Distributions to shareholders from: | | | | | | | | | | | | | | | | | | | | |
Net investment income | | | (0.54 | ) | | | (0.73 | ) | | | (0.98 | ) | | | (0.63 | ) | | | (0.54 | ) |
Net asset value at end of year | | $ | 32.18 | | | $ | 27.11 | | | $ | 27.50 | | | $ | 25.12 | | | $ | 22.51 | |
Market price at end of year(b) | | $ | 32.18 | | | $ | 27.13 | | | $ | 27.51 | | | $ | 25.10 | | | $ | 22.50 | |
| Net Asset Value Total Return(c) | | | 20.98 | % | | | 1.16 | % | | | 13.65 | % | | | 14.86 | % | | | 2.48 | % |
| Market Price Total Return(c) | | | 20.89 | % | | | 1.19 | % | | | 13.78 | % | | | 14.81 | % | | | 2.53 | % |
| Ratios/Supplemental Data: | | | | | | | | | | | | | | | | | | | | |
Net assets at end of year (000’s omitted) | | $ | 223,637 | | | $ | 44,730 | | | $ | 137,476 | | | $ | 200,953 | | | $ | 34,893 | |
Ratio to average net assets of: | | | | | | | | | | | | | | | | | | | | |
Expenses, after Waivers | | | 0.60 | % | | | 0.60 | % | | | 0.60 | % | | | 0.60 | % | | | 0.60 | % |
Expenses, prior to Waivers | | | 0.73 | % | | | 0.83 | % | | | 0.71 | % | | | 0.74 | % | | | 0.80 | % |
Net investment income, after Waivers | | | 2.08 | % | | | 2.35 | % | | | 2.46 | % | | | 2.74 | % | | | 2.49 | % |
Portfolio turnover rate(d) | | | 49 | % | | | 41 | % | | | 54 | % | | | 91 | % | | | 47 | % |
| (a) | Based on average shares outstanding. |
| (b) | The mean between the last bid and ask prices. |
| (c) | Net asset value total return is calculated assuming an initial investment made at the net asset value at the beginning of the period, reinvestment of all dividends and distributions at net asset value during the period, and redemption on the last day of the period. Net asset value total return includes adjustments in accordance with accounting principles generally accepted in the United States of America and as such, the net asset value for financial reporting purposes and the returns based upon those net asset values may differ from the net asset value and returns for shareholder transactions. Market price total return is calculated assuming an initial investment made at the market price at the beginning of the period, reinvestment of all dividends and distributions at market price during the period, and sale at the market price on the last day of the period. Total investment returns calculated for a period of less than one year are not annualized. |
| (d) | Portfolio turnover rate is not annualized for periods less than one year, if applicable, and does not include securities received or delivered from processing creations or redemptions. |
See accompanying Notes to Financial Statements which are an integral part of the financial statements.
Financial Highlights(continued)
Invesco NASDAQ Internet ETF (PNQI)
| | | | | | | | | | | | | | | | | | | | |
| | | Years Ended April 30, | |
| | | 2019 | | | 2018 | | | 2017 | | | 2016 | | | 2015 | |
| Per Share Operating Performance: | | | | | | | | | | | | | | | | | | | | |
Net asset value at beginning of year | | $ | 129.15 | | | $ | 99.14 | | | $ | 76.48 | | | $ | 72.28 | | | $ | 61.62 | |
Net investment income (loss)(a) | | | (0.44 | ) | | | (0.36 | ) | | | (0.22 | ) | | | (0.16 | ) | | | (0.21 | ) |
Net realized and unrealized gain on investments | | | 13.73 | | | | 30.40 | | | | 22.88 | | | | 4.36 | | | | 10.87 | |
Total from investment operations | | | 13.29 | | | | 30.04 | | | | 22.66 | | | | 4.20 | | | | 10.66 | |
Distributions to shareholders from: | | | | | | | | | | | | | | | | | | | | |
Net investment income | | | — | | | | (0.03 | ) | | | — | | | | — | | | | — | |
Net asset value at end of year | | $ | 142.44 | | | $ | 129.15 | | | $ | 99.14 | | | $ | 76.48 | | | $ | 72.28 | |
Market price at end of year(b) | | $ | 142.41 | | | $ | 129.29 | | | $ | 99.17 | | | $ | 76.44 | | | $ | 72.26 | |
| Net Asset Value Total Return(c) | | | 10.29 | % | | | 30.30 | % | | | 29.63 | % | | | 5.81 | % | | | 17.30 | % |
| Market Price Total Return(c) | | | 10.15 | % | | | 30.40 | % | | | 29.73 | % | | | 5.79 | % | | | 17.48 | % |
| Ratios/Supplemental Data: | | | | | | | | | | | | | | | | | | | | |
Net assets at end of year (000’s omitted) | | $ | 598,232 | | | $ | 600,535 | | | $ | 351,939 | | | $ | 279,152 | | | $ | 216,851 | |
Ratio to average net assets of: | | | | | | | | | | | | | | | | | | | | |
Expenses | | | 0.60 | % | | | 0.60 | % | | | 0.60 | % | | | 0.60 | % | | | 0.60 | % |
Net investment income (loss) | | | (0.34 | )% | | | (0.31 | )% | | | (0.26 | )% | | | (0.21 | )% | | | (0.31 | )% |
Portfolio turnover rate(d) | | | 20 | % | | | 20 | % | | | 14 | % | | | 27 | % | | | 31 | % |
| (a) | Based on average shares outstanding. |
| (b) | The mean between the last bid and ask prices. |
| (c) | Net asset value total return is calculated assuming an initial investment made at the net asset value at the beginning of the period, reinvestment of all dividends and distributions at net asset value during the period, and redemption on the last day of the period. Net asset value total return includes adjustments in accordance with accounting principles generally accepted in the United States of America and as such, the net asset value for financial reporting purposes and the returns based upon those net asset values may differ from the net asset value and returns for shareholder transactions. Market price total return is calculated assuming an initial investment made at the market price at the beginning of the period, reinvestment of all dividends and distributions at market price during the period, and sale at the market price on the last day of the period. Total investment returns calculated for a period of less than one year are not annualized. |
| (d) | Portfolio turnover rate is not annualized for periods less than one year, if applicable, and does not include securities received or delivered from processing creations or redemptions. |
See accompanying Notes to Financial Statements which are an integral part of the financial statements.
Notes to Financial Statements
Invesco Exchange-Traded Fund Trust
April 30, 2019
NOTE 1—Organization
Invesco Exchange-Traded Fund Trust (the “Trust”) was organized as a Massachusetts business trust on June 9, 2000 and is authorized to have multiple series of portfolios. The Trust is an open-end management investment company registered under the Investment Company Act of 1940, as amended (the “1940 Act”). This report includes the following portfolios:
| | |
Full Name | | Short Name |
| Invesco DWA Basic Materials Momentum ETF (PYZ) | | “DWA Basic Materials Momentum ETF” |
| Invesco DWA Consumer Cyclicals Momentum ETF (PEZ) | | “DWA Consumer Cyclicals Momentum ETF” |
| Invesco DWA Consumer Staples Momentum ETF (PSL) | | “DWA Consumer Staples Momentum ETF” |
| Invesco DWA Energy Momentum ETF (PXI) | | “DWA Energy Momentum ETF” |
| Invesco DWA Financial Momentum ETF (PFI) | | “DWA Financial Momentum ETF” |
| Invesco DWA Healthcare Momentum ETF (PTH) | | “DWA Healthcare Momentum ETF” |
| Invesco DWA Industrials Momentum ETF (PRN) | | “DWA Industrials Momentum ETF” |
| Invesco DWA Technology Momentum ETF (PTF) | | “DWA Technology Momentum ETF” |
| Invesco DWA Utilities Momentum ETF (PUI) | | “DWA Utilities Momentum ETF” |
| Invesco NASDAQ Internet ETF (PNQI) | | “NASDAQ Internet ETF” |
Each portfolio (each, a “Fund”, and collectively, the “Funds”) represents a separate series of the Trust. The shares of the Funds are referred to herein as “Shares” or “Fund’s Shares.” Each Fund’s Shares are listed and traded on The NASDAQ Stock Market LLC.
The market price of each Share may differ to some degree from a Fund’s net asset value (“NAV”). Unlike conventional mutual funds, each Fund issues and redeems Shares on a continuous basis, at NAV, only in a large specified number of Shares, each called a “Creation Unit.” Creation Units are issued and redeemed principally in exchange for the deposit or delivery of a basket of securities (“Deposit Securities”). Except when aggregated in Creation Units by Authorized Participants, the Shares are not individually redeemable securities of the Funds.
The investment objective of each Fund is to seek to track the investment results (before fees and expenses) of its respective index listed below (each, an “Underlying Index”):
| | |
Fund | | Underlying Index |
| DWA Basic Materials Momentum ETF | | Dorsey Wright® Basic Materials Technical Leaders Index |
| DWA Consumer Cyclicals Momentum ETF | | Dorsey Wright® Consumer Cyclicals Technical Leaders Index |
| DWA Consumer Staples Momentum ETF | | Dorsey Wright® Consumer Staples Technical Leaders Index |
| DWA Energy Momentum ETF | | Dorsey Wright® Energy Technical Leaders Index |
| DWA Financial Momentum ETF | | Dorsey Wright® Financials Technical Leaders Index |
| DWA Healthcare Momentum ETF | | Dorsey Wright® Healthcare Technical Leaders Index |
| DWA Industrials Momentum ETF | | Dorsey Wright® Industrials Technical Leaders Index |
| DWA Technology Momentum ETF | | Dorsey Wright® Technology Technical Leaders Index |
| DWA Utilities Momentum ETF | | Dorsey Wright® Utilities Technical Leaders Index |
| NASDAQ Internet ETF | | NASDAQ Internet IndexSM |
NOTE 2—Significant Accounting Policies
The following is a summary of the significant accounting policies followed by the Funds in preparation of their financial statements.
Each Fund is an investment company and accordingly follows the investment company accounting and reporting guidance in accordance with Financial Accounting Standards Board Accounting Standards Codification Topic 946,Financial Services—Investment Companies.
| A. | Security Valuation— Securities, including restricted securities, are valued according to the following policies: |
A security listed or traded on an exchange (except convertible securities) is generally valued at its last sales price or official closing price as of the close of the customary trading session on the exchange where the security is principally traded or, lacking any sales or official closing price on a particular day, the security may be valued at the closing bid price on that day. Securities traded in the over-the-counter market are valued based on prices furnished by independent pricing services or market makers. When such securities are valued by an independent pricing service they may be considered fair valued.
Futures contracts are valued at the final settlement price set by an exchange on which they are principally traded. Listed options are valued at the mean between the last bid and asked prices from the exchange on which they are principally traded, or at the final settlement price set by such exchange. Swaps and options not listed on an exchange are valued by an independent source. For purposes of determining NAV per Share, futures and option contracts generally are valued 15 minutes after the close of the customary trading session of the New York Stock Exchange (“NYSE”).
Investment companies are valued using such company’s NAV per share, unless the shares are exchange-traded, in which case they are valued at the last sales price or official closing price as of the close of the customary trading session on the exchange where the security is principally traded.
Debt obligations (including convertible securities) and unlisted equities are fair valued using an evaluated quote provided by an independent pricing service. Evaluated quotes provided by the pricing service may be determined without exclusive reliance on quoted prices, and may reflect appropriate factors such as institution-size trading in similar groups of securities, developments related to specific securities, dividend rate (for unlisted equities), yield (for debt obligations), quality, type of issue, coupon rate (for debt obligations), maturity (for debt obligations), individual trading characteristics and other market data. Securities with a demand feature exercisable within one to seven days are valued at par. Pricing services generally value debt obligations assuming orderly transactions of institutional round lot size, but a Fund may hold or transact in the same securities in smaller, odd lot sizes. Odd lots often trade at lower prices than institutional round lots. Debt obligations are subject to interest rate and credit risks. In addition, all debt obligations involve some risk of default with respect to interest and/or principal payments.
Foreign securities’ (including foreign exchange contracts’) prices are converted into U.S. dollar amounts using the applicable exchange rates as of the close of the London world markets. If market quotations are available and reliable for foreign exchange-traded equity securities, the securities will be valued at the market quotations. Because trading hours for certain foreign securities end before the close of the NYSE, closing market quotations may become unreliable. If between the time trading ends on a particular security and the close of the customary trading session on the NYSE, events occur that Invesco Capital Management LLC (the “Adviser”) determines are significant and make the closing price unreliable, a Fund may fair value the security. If the event is likely to have affected the closing price of the security, the security will be valued at fair value in good faith using procedures approved by the Board of Trustees. Adjustments to closing prices to reflect fair value may also be based on a screening process of an independent pricing service to indicate the degree of certainty, based on historical data, that the closing price in the principal market where a foreign security trades is not the current value as of the close of the NYSE. Foreign securities’ prices meeting the approved degree of certainty that the price is not reflective of current value will be priced at the indication of fair value from the independent pricing service. Multiple factors may be considered by the independent pricing service in determining adjustments to reflect fair value and may include information relating to sector indices, American Depositary Receipts and domestic and foreign index futures. Foreign securities may have additional risks including exchange rate changes, the potential for sharply devalued currencies and high inflation, political and economic upheaval, the relative lack of issuer information, relatively low market liquidity and the potential lack of strict financial and accounting controls and standards.
Securities for which market prices are not provided by any of the above methods may be valued based upon quotes furnished by independent sources. The last bid price may be used to value exchange-traded equity securities. The mean between the last bid and asked prices may be used to value debt obligations, including corporate loans, and unlisted equity securities.
Securities for which market quotations are not readily available or became unreliable are valued at fair value as determined in good faith following procedures approved by the Board of Trustees. Issuer-specific events, market trends, bid/asked quotes of brokers and information providers and other market data may be reviewed in the course of making a good faith determination of a security’s fair value.
Each Fund may invest in securities that are subject to interest rate risk, meaning the risk that the prices will generally fall as interest rates rise and, conversely, the prices will generally rise as interest rates fall. Specific securities differ in their sensitivity to changes in interest rates depending on their individual characteristics. Changes in interest rates may result in increased market volatility, which may affect the value and/or liquidity of certain Fund investments.
Valuations change in response to many factors, including the historical and prospective earnings of the issuer, the value of the issuer’s assets, general economic conditions, interest rates, investor perceptions and market liquidity. Because of the inherent uncertainties of valuation, the values reflected in the financial statements may materially differ from the value received upon actual sale of those investments.
Index Risk.Unlike many investment companies, the Funds do not utilize investing strategies that seek returns in excess of their Underlying Indexes. Therefore, a Fund would not necessarily buy or sell a security unless that security is added or removed, respectively, from its respective Underlying Index, even if that security generally is underperforming.
Authorized Participant Concentration Risk.Only Authorized Participants (“APs”) may engage in creation or redemption transactions directly with each Fund. Each Fund has a limited number of institutions that may act as APs, and such APs have no obligation to submit creation or redemption orders. Consequently, there is no assurance that those APs will establish or maintain an active trading market for the Shares. This risk may be heightened to the extent that securities underlying each
Fund are traded outside a collateralized settlement system. In that case, APs may be required to post collateral on certain trades on an agency basis (i.e., on behalf of other market participants), which only a limited number of APs may be able to do. In addition, to the extent that APs exit the business or are unable to proceed with creation and/or redemption orders with respect to each Fund and no other AP is able to step forward to create or redeem Creation Units, this may result in a significantly diminished trading market for Fund Shares, which may be more likely to trade at a premium or discount to each Fund’s NAV and possibly face trading halts and/or delisting. This risk may be heightened for Funds that invest in non-U.S. securities, which may have lower trading volumes.
Equity Risk.Equity risk is the risk that the value of equity securities, including common stocks, may fall due to both changes in general economic conditions that impact the market as a whole, as well as factors that directly relate to a specific company or its industry. Such general economic conditions include changes in interest rates, periods of market turbulence or instability, or general and prolonged periods of economic decline and cyclical change. It is possible that a drop in the stock market may depress the price of most or all of the common stocks that each Fund holds. In addition, equity risk includes the risk that investor sentiment toward particular industries will become negative. The value of a company’s common stock may fall solely because of factors, such as an increase in production costs, that negatively impact other companies in the same region, industry or sector of the market. A company’s common stock also may decline significantly in price over a short period of time due to factors specific to that company, including decisions made by its management or lower demand for the company’s products or services. For example, an adverse event, such as an unfavorable earnings report or the failure to make anticipated dividend payments, may depress the value of common stock.
Industry Concentration Risk.In following its methodology, each Fund’s Underlying Index from time to time may be concentrated to a significant degree in securities of issuers operating in a single industry or industry group. To the extent that each Underlying Index concentrates in the securities of issuers in a particular industry or industry group, the corresponding Fund will also concentrate its investments to approximately the same extent. By concentrating its investments in an industry or industry group, each Fund faces more risks than if it were diversified broadly over numerous industries or industry groups. Such industry-based risks, any of which may adversely affect the companies in which each Fund invests, may include, but are not limited to, legislative or regulatory changes, adverse market conditions and/or increased competition within the industry or industry group. In addition, at times, such industry or industry group may be out of favor and underperform other industries, industry groups or the market as a whole.
Non-Diversified Fund Risk.NASDAQ Internet ETF is non-diversified and can invest a greater portion of its assets in securities of individual issuers than diversified funds. As a result, changes in the market value of a single investment could cause greater fluctuations in Share price than would occur in a diversified fund. This may increase the Fund’s volatility and cause the performance of a relatively small number of issuers to have a greater impact on the Fund’s performance.
Non-Correlation Risk.Each Fund’s return may not match the return of its Underlying Index for a number of reasons. For example, each Fund incurs operating expenses not applicable to its Underlying Index, and incurs costs in buying and selling securities, especially when rebalancing the Fund’s securities holdings to reflect changes in the composition of its Underlying Index. In addition, the performance of each Fund and its Underlying Index may vary due to asset valuation differences and differences between each Fund’s portfolio and its Underlying Index resulting from legal restrictions, costs or liquidity constraints.
Momentum Investing Risk.Certain Funds employ a “momentum” style of investing that is subject to the risk that the securities may be more volatile than the market as a whole, or that the returns on securities that have previously exhibited price momentum are less than returns on other styles of investing. Momentum can turn quickly, and stocks that previously have exhibited high momentum may not experience continued positive momentum. In addition, there may be periods when the momentum style of investing is out of favor and therefore, the investment performance of the Fund may suffer.
Small- and Mid-Capitalization Company Risk.For certain Funds, investing in securities of small- and mid-capitalization companies involves greater risk than customarily is associated with investing in larger, more established companies. These companies’ securities may be more volatile and less liquid than those of more established companies. These securities may have returns that vary, sometimes significantly, from the overall securities market. Often small- and mid-capitalization companies and the industries in which they focus are still evolving and, as a result, they may be more sensitive to changing market conditions.
Portfolio Turnover Risk.Certain Funds may engage in frequent trading of their portfolio securities in connection with the rebalancing or adjustment of their respective Underlying Index. A portfolio turnover rate of 200%, for example, is equivalent to a Fund buying and selling all of its securities two times during the course of a year. A high portfolio turnover rate (such as 100% or more) could result in high brokerage costs for a Fund. While a high portfolio turnover rate can result in an increase in taxable capital gain distributions to a Fund’s shareholders, each Fund will seek to utilize an in-kind creation and redemption mechanism to minimize realization of capital gains to the extent possible.
| C. | Investment Transactions and Investment Income— Investment transactions are accounted for on a trade date basis. Realized gains and losses from the sale or disposition of securities are computed on the specific identified cost basis. Interest income is recorded on the accrual basis from settlement date. Pay-in-kind interest income and non-cash dividend income received in the form of securities in-lieu of cash are recorded at the fair value of the securities received. Dividend income (net |
| | of withholding tax, if any) is recorded on the ex-dividend date. Realized gains, dividends and interest received by a Fund may give rise to withholding and other taxes imposed by foreign countries. Tax conventions between certain countries and the United States may reduce or eliminate such taxes. |
The Funds may periodically participate in litigation related to each Fund’s investments. As such, the Funds may receive proceeds from litigation settlements. Any proceeds received are included in the Statements of Operations as realized gain (loss) for investments no longer held and as unrealized gain (loss) for investments still held.
Brokerage commissions and mark ups are considered transaction costs and are recorded as an increase to the cost basis of securities purchased and/or a reduction of proceeds on a sale of securities. Such transaction costs are included in the determination of net realized and unrealized gain (loss) from investment securities reported in the Statements of Operations and the Statements of Changes in Net Assets and the net realized and unrealized gains (losses) on securities per share in the Financial Highlights. Transaction costs are included in the calculation of each Fund’s NAV and, accordingly, they reduce each Fund’s total returns. These transaction costs are not considered operating expenses and are not reflected in net investment income reported in the Statements of Operations and the Statements of Changes in Net Assets, or the net investment income per share and the ratios of expenses and net investment income reported in the Financial Highlights, nor are they limited by any expense limitation arrangements between each Fund and the Adviser.
| D. | Country Determination— For the purposes of presentation in the Schedules of Investments, the Adviser may determine the country in which an issuer is located and/or credit risk exposure based on various factors. These factors include whether each Fund’s Underlying Index has made a country determination and may include the laws of the country under which the issuer is organized, where the issuer maintains a principal office, the country in which the issuer derives 50% or more of its total revenues and the country that has the primary market for the issuer’s securities, as well as other criteria. Among the other criteria that may be evaluated for making this determination are the country in which the issuer maintains 50% or more of its assets, the type of security, financial guarantees and enhancements, the nature of the collateral and the sponsor organization. Country of issuer and/or credit risk exposure has been determined to be the United States of America, unless otherwise noted. |
| E. | Dividends and Distributions to Shareholders— Each Fund declares and pays dividends from net investment income, if any, to its shareholders quarterly and records such dividends on ex-dividend date. Generally, each Fund distributes net realized taxable capital gains, if any, annually in cash and records them on ex-dividend date. Such distributions on a tax basis are determined in conformity with federal income tax regulations, which may differ from accounting principles generally accepted in the United States of America (“GAAP”). Distributions in excess of tax basis earnings and profits, if any, are reported in such Fund’s financial statements as a tax return of capital at fiscal year-end. |
| F. | Federal Income Taxes— Each Fund intends to comply with the provisions of the Internal Revenue Code of 1986, as amended (the “Internal Revenue Code”), applicable to regulated investment companies and to distribute substantially all of the Fund’s taxable earnings to its shareholders. As such, the Funds will not be subject to federal income taxes on otherwise taxable income (including net realized gains) that is distributed to the shareholders. Therefore, no provision for federal income taxes is recorded in the financial statements. |
Each Fund recognizes the tax benefits of uncertain tax positions only when the position is more likely than not to be sustained. Management has analyzed each Fund’s uncertain tax positions and concluded that no liability for unrecognized tax benefits should be recorded related to uncertain tax positions. Management is not aware of any tax positions for which it is reasonably possible that the total amounts of unrecognized tax benefits will change materially in the next 12 months.
Income and capital gain distributions are determined in accordance with federal income tax regulations, which may differ from GAAP. These differences are primarily due to differing book and tax treatments for in-kind transactions, losses deferred due to wash sales, and passive foreign investment company adjustments, if any.
The Funds file U.S. federal tax returns and tax returns in certain other jurisdictions. Generally, a Fund is subject to examinations by such taxing authorities for up to three years after the filing of the return for the tax period.
| G. | Expenses— Expenses of the Trust that are directly identifiable to a specific Fund are applied to that Fund. Expenses of the Trust that are not readily identifiable to a specific Fund are allocated in such a manner as deemed equitable, taking into consideration the nature and type of expense and the relative net assets of each Fund. |
Each Fund (except for NASDAQ Internet ETF) is responsible for all of its expenses, including the investment advisory fees, costs of transfer agency, custody, fund administration, legal, audit and other services, interest, taxes, brokerage commissions and other expenses connected with executions of portfolio transactions, sub-licensing fees related to its respective Underlying Index, any distribution fees or expenses, litigation expenses, fees payable to the Trust’s Board members who are not “interested persons” (as defined in the 1940 Act) of the Trust (the “Independent Trustees”) or the Adviser, expenses incurred in connection with the Board members’ services, including travel expenses and legal fees of counsel for the Independent Trustees, acquired fund fees and expenses, if any, and extraordinary expenses.
NASDAQ Internet ETF has agreed to pay an annual unitary management fee to the Adviser. Out of the unitary management fee, the Adviser has agreed to pay for substantially all expenses of the Fund, including the costs of transfer agency, custody, fund administration, legal, audit and other services, except for advisory fees, distribution fees, if any, brokerage expenses, taxes, interest, acquired fund fees and expenses, if any, litigation expenses and other extraordinary expenses.
To the extent a Fund invests in other investment companies, the expenses shown in the accompanying financial statements reflect the expenses of the Fund and do not include any expenses of the investment companies in which it invests. The effects
of such investment companies’ expenses are included in the realized and unrealized gain or loss on the investments in the investment companies.
| H. | Accounting Estimates— The preparation of the financial statements in accordance with GAAP requires management to make estimates and assumptions that affect the reported amounts and disclosures in the financial statements, including estimates and assumptions related to taxation. Actual results could differ from these estimates. In addition, the Funds monitor for material events or transactions that may occur or become known after the period-end date and before the date the financial statements are released to print. |
| I. | Indemnifications— Under the Trust’s organizational documents, its Officers and Trustees are indemnified against certain liabilities arising out of the performance of their duties to the Trust. Each Independent Trustee is also indemnified against certain liabilities arising out of the performance of his duties to the Trust pursuant to an Indemnification Agreement between such trustee and the Trust. Additionally, in the normal course of business, the Trust enters into contracts with service providers that contain general indemnification clauses. The Trust’s maximum exposure under these arrangements is unknown, as this would involve future claims that may be made against the Trust that have not yet occurred. However, based on experience, the Trust believes the risk of loss to be remote. |
| J. | Securities Lending— During the fiscal year ended April 30, 2019, DWA Basic Materials Momentum ETF, DWA Consumer Cyclicals Momentum ETF, DWA Consumer Staples Momentum ETF, DWA Energy Momentum ETF, DWA Financial Momentum ETF, DWA Healthcare Momentum ETF, DWA Industrials Momentum ETF, DWA Technology Momentum ETF and NASDAQ Internet ETF participated in securities lending. Each Fund loaned portfolio securities having a market value up to one-third of each Fund’s total assets. Such loans are secured by cash collateral equal to no less than 102% (105% for international securities) of the market value of the loaned securities determined daily by the securities lending provider. Cash collateral received in connection with these loans is generally invested in an affiliated money market fund and is shown as such on the Schedules of Investments. Each Fund bears the risk of loss with respect to the investment of collateral. It is the policy of these Funds to obtain additional collateral from or return excess collateral to the borrower by the end of the next business day, following the valuation date of the securities loaned. Therefore, the value of the collateral held may be temporarily less than the value of the securities on loan. When loaning securities, each Fund retains certain benefits of owning the securities, including the economic equivalent of dividends or interest generated by the security. Lending securities entails a risk of loss to each Fund if, and to the extent that, the market value of the securities loaned were to increase, and the borrower did not increase the collateral accordingly, and the borrower failed to return the securities. The securities loaned are subject to termination at the option of the borrower or each Fund. Upon termination, the borrower will return to each Fund the securities loaned and each Fund will return the collateral. Upon the failure of the borrower to return the securities, collateral may be liquidated and the securities may be purchased on the open market to replace the loaned securities. Each Fund could experience delays and costs in gaining access to the collateral and the securities may lose value during the delay which could result in potential losses to each Fund. Some of these losses may be indemnified by the lending agent. Each Fund bears the risk of any deficiency in the amount of the collateral available for return to the borrower due to any loss on the collateral invested. Dividends received on cash collateral investments for securities lending transactions, which are net of compensation to counterparties, are included inSecurities lending incomeon the Statements of Operations. The aggregate value of securities out on loan, if any, is shown on the Statements of Assets and Liabilities. |
| K. | Distributions from Distributable Earnings— In accordance with the Securities and Exchange Commission’s issuance of Disclosure Update and Simplification, the Funds have presented the total, rather than the components, of distributions to shareholders, except for tax return of capital distributions, if any, in the Statements of Changes in Net Assets. |
For the year ended April 30, 2018, distributions from distributable earnings consisted of distributions from net investment income.
NOTE 3—Investment Advisory Agreement and Other Agreements
The Trust has entered into Investment Advisory Agreements with the Adviser on behalf of the Funds, pursuant to which the Adviser has overall responsibility for the selection and ongoing monitoring of the Funds’ investments, managing the Funds’ business affairs and providing certain clerical, bookkeeping and other administrative services. Pursuant to an Investment Advisory Agreement, each Fund (except for NASDAQ Internet ETF) accrues daily and pays monthly to the Adviser an annual fee of 0.50% of the Fund’s average daily net assets.
Pursuant to another Investment Advisory Agreement, NASDAQ Internet ETF accrues daily and pays monthly to the Adviser, as compensation for its services, an annual unitary management fee of 0.60% of the Fund’s average daily net assets. Out of the unitary management fee, the Adviser has agreed to pay for substantially all expenses of NASDAQ Internet ETF, including the cost of transfer agency, custody, fund administration, legal, audit and other services, except for advisory fees, distribution fees, if any, brokerage expenses, taxes, interest, acquired fund fees and expenses, if any, litigation expenses and other extraordinary expenses.
The Trust also has entered into an Amended and Restated Excess Expense Agreement (the “Expense Agreement”) with the Adviser on behalf of each Fund (except NASDAQ Internet ETF), pursuant to which the Adviser has agreed to waive fees and/or pay Fund expenses to the extent necessary to prevent the operating expenses (excluding interest expenses, brokerage commissions and other trading expenses, offering costs, taxes, acquired fund fees and expenses, if any, and extraordinary
expenses) of each Fund (except NASDAQ Internet ETF) from exceeding 0.60% of the Fund’s average daily net assets per year (the “Expense Cap”), through at least August 31, 2021. Unless the Adviser continues the Expense Agreement, it will terminate on August 31, 2021. During its term, the Expense Agreement cannot be terminated or amended to increase the Expense Cap without approval of the Board of Trustees.
Further, through August 31, 2021, the Adviser has contractually agreed to waive a portion of each Fund’s management fee in an amount equal to 100% of the net advisory fees an affiliate of the Adviser receives that are attributable to certain of the Fund’s investments in money market funds managed by that affiliate (excluding investments of cash collateral from securities lending). The Adviser cannot discontinue this waiver prior to its expiration. This agreement is not subject to recapture by the Adviser.
For the fiscal year ended April 30, 2019, the Adviser waived fees and/or paid Fund expenses for each Fund in the following amounts:
| | | | |
| DWA Basic Materials Momentum ETF | | $ | 132,810 | |
| DWA Consumer Cyclicals Momentum ETF | | | 107,760 | |
| DWA Consumer Staples Momentum ETF | | | 161,293 | |
| DWA Energy Momentum ETF | | | 132,817 | |
| DWA Financial Momentum ETF | | | 75,711 | |
| DWA Healthcare Momentum ETF | | | 224,675 | |
| DWA Industrials Momentum ETF | | | 39,696 | |
| DWA Technology Momentum ETF | | | 161,738 | |
| DWA Utilities Momentum ETF | | | 135,984 | |
| NASDAQ Internet ETF | | | 292 | |
Except for NASDAQ Internet ETF, the fees waived and/or expenses borne by the Adviser are subject to recapture by the Adviser up to three years from the date the fees were waived or the expenses were incurred, but no recapture payment will be made by the Funds if it would result in the Funds exceeding (i) the Expense Cap or (ii) the expense cap in effect at the time the fees and/or expenses subject to recapture were waived and/or borne by the Adviser.
For the following Funds, the amounts available for potential future recapture by the Adviser under the Expense Agreement and the expiration schedule at April 30, 2019 are as follows:
| | | | | | | | | | | | | | | | |
| | | Total
Potential
Recapture | | | Potential Recapture Amounts
Expiring | |
| | | Amounts | | | 4/30/20 | | | 4/30/21 | | | 4/30/22 | |
| DWA Basic Materials Momentum ETF | | $ | 417,340 | | | $ | 125,307 | | | $ | 159,542 | | | $ | 132,491 | |
| DWA Consumer Cyclicals Momentum ETF | | | 342,384 | | | | 115,120 | | | | 119,724 | | | | 107,540 | |
| DWA Consumer Staples Momentum ETF | | | 515,744 | | | | 214,731 | | | | 140,107 | | | | 160,906 | |
| DWA Energy Momentum ETF | | | 477,796 | | | | 184,582 | | | | 160,735 | | | | 132,479 | |
| DWA Financial Momentum ETF | | | 280,277 | | | | 91,999 | | | | 112,796 | | | | 75,482 | |
| DWA Healthcare Momentum ETF | | | 523,722 | | | | 124,797 | | | | 174,653 | | | | 224,272 | |
| DWA Industrials Momentum ETF | | | 138,096 | | | | 47,109 | | | | 51,599 | | | | 39,388 | |
| DWA Technology Momentum ETF | | | 515,135 | | | | 180,774 | | | | 173,020 | | | | 161,341 | |
| DWA Utilities Momentum ETF | | | 442,218 | | | | 165,742 | | | | 140,725 | | | | 135,751 | |
The Trust has entered into a Distribution Agreement with Invesco Distributors, Inc. (the “Distributor”), which serves as the distributor of Creation Units for each Fund. The Distributor does not maintain a secondary market in the Shares. The Funds are not charged any fees pursuant to the Distribution Agreement. The Distributor is an affiliate of the Adviser.
The Adviser has entered into a licensing agreement for each Fund with the following entities (each, a “Licensor”):
| | |
Fund | | Licensor |
| DWA Basic Materials Momentum ETF | | Dorsey Wright & Associates, LLC |
| DWA Consumer Cyclicals Momentum ETF | | Dorsey Wright & Associates, LLC |
| DWA Consumer Staples Momentum ETF | | Dorsey Wright & Associates, LLC |
| DWA Energy Momentum ETF | | Dorsey Wright & Associates, LLC |
| DWA Financial Momentum ETF | | Dorsey Wright & Associates, LLC |
| DWA Healthcare Momentum ETF | | Dorsey Wright & Associates, LLC |
| DWA Industrials Momentum ETF | | Dorsey Wright & Associates, LLC |
| DWA Technology Momentum ETF | | Dorsey Wright & Associates, LLC |
| DWA Utilities Momentum ETF | | Dorsey Wright & Associates, LLC |
| NASDAQ Internet ETF | | Nasdaq, Inc. |
Each Underlying Index name trademark is owned by its respective Licensor. These trademarks have been licensed to the Adviser for use by the Funds. Each Fund is entitled to use its Underlying Index pursuant to the Trust’s sub-licensing agreement with the Adviser. The Funds (except for NASDAQ Internet ETF) are required to pay the sub-licensing fees that are shown on the Statements of Operations. The Funds are not sponsored, endorsed, sold or promoted by the Licensors, and the Licensors make no representation regarding the advisability of investing in any of the Funds.
The Trust has entered into service agreements whereby The Bank of New York Mellon, a wholly-owned subsidiary of The Bank of New York Mellon Corporation, serves as the administrator, custodian, fund accountant and transfer agent for each Fund.
NOTE 4—Additional Valuation Information
GAAP defines fair value as the price that would be received to sell an asset or paid to transfer a liability in an orderly transaction between market participants at the measurement date, under current market conditions. GAAP establishes a hierarchy that prioritizes the inputs to valuation methods, giving the highest priority to readily available unadjusted quoted prices in an active market for identical assets (Level 1) and the lowest priority to significant unobservable inputs (Level 3), generally when market prices are not readily available or are unreliable. Based on the valuation inputs, the securities or other investments are tiered into one of three levels. Changes in valuation methods may result in transfers in or out of an investment’s assigned level:
| | Level 1 — | Prices are determined using quoted prices in an active market for identical assets. |
| | Level 2 — | Prices are determined using other significant observable inputs. Observable inputs are inputs that other market participants may use in pricing a security. These may include quoted prices for similar securities, interest rates, prepayment speeds, credit risk, yield curves, loss severities, default rates, discount rates, volatilities and others. |
| | Level 3 — | Prices are determined using significant unobservable inputs. In situations where quoted prices or observable inputs are unavailable (for example, when there is little or no market activity for an investment at the end of the period), unobservable inputs may be used. Unobservable inputs reflect a Fund’s own assumptions about the factors market participants would use in determining fair value of the securities or instruments and would be based on the best available information. |
As of April 30, 2019, all of the securities in each Fund were valued based on Level 1 inputs (see the Schedules of Investments for security categories). The level assigned to the securities valuations may not be an indication of the risk or liquidity associated with investing in those securities. Because of the inherent uncertainties of valuation, the values reflected in the financial statements may materially differ from the value received upon actual sale of those investments.
NOTE 5—Distributions to Shareholders and Tax Components of Net Assets
Tax Character of Distributions to Shareholders Paid During the Fiscal Years Ended April 30, 2019 and 2018:
| | | | | | | | | | | | | | | | |
| | | 2019 | | | 2018 | |
| | | Ordinary
Income | | | Return of
Capital | | | Ordinary
Income | | | Return of
Capital | |
| DWA Basic Materials Momentum ETF | | $ | 888,902 | | | $ | — | | | $ | 618,978 | | | $ | — | |
| DWA Consumer Cyclicals Momentum ETF | | | 158,244 | | | | — | | | | 174,078 | | | | — | |
| DWA Consumer Staples Momentum ETF | | | 896,392 | | | | — | | | | 351,231 | | | | — | |
| DWA Energy Momentum ETF | | | 813,322 | | | | — | | | | 808,060 | | | | — | |
| DWA Financial Momentum ETF | | | 535,745 | | | | — | | | | 612,178 | | | | — | |
| DWA Healthcare Momentum ETF | | | — | | | | — | | | | — | | | | — | |
| DWA Industrials Momentum ETF | | | 271,559 | | | | — | | | | 510,083 | | | | 271,174 | |
| DWA Technology Momentum ETF | | | 94,036 | | | | — | | | | 51,408 | | | | — | |
| DWA Utilities Momentum ETF | | | 1,488,891 | | | | — | | | | 1,607,003 | | | | — | |
| NASDAQ Internet ETF | | | — | | | | — | | | | 109,107 | | | | — | |
Tax Components of Net Assets at Fiscal Year-End:
| | | | | | | | | | | | | | | | | | | | | | | | | | | | |
| | | Undistributed
Ordinary
Income | | | Temporary
Book/Tax
Differences | | | Net
Unrealized
Appreciation
(Depreciation)—
Investments | | | Capital Loss
Carryforwards | | | Late-Year
Ordinary
Loss
Deferral | | | Shares of
Beneficial
Interest | | | Total
Net Assets | |
| DWA Basic Materials Momentum ETF | | $ | 223,431 | | | $ | (34,274 | ) | | $ | 2,089,271 | | | $ | (41,626,228 | ) | | $ | — | | | $ | 102,865,373 | | | $ | 63,517,573 | |
| DWA Consumer Cyclicals Momentum ETF | | | — | | | | (32,334 | ) | | | 4,306,994 | | | | (56,150,713 | ) | | | — | | | | 83,146,692 | | | | 31,270,639 | |
| DWA Consumer Staples Momentum ETF | | | 213,061 | | | | (35,031 | ) | | | 17,959,254 | | | | (57,589,010 | ) | | | — | | | | 213,852,374 | | | | 174,400,648 | |
| DWA Energy Momentum ETF | | | 70,563 | | | | (38,554 | ) | | | (4,762,092 | ) | | | (162,718,320 | ) | | | — | | | | 218,575,092 | | | | 51,126,689 | |
| DWA Financial Momentum ETF | | | 115,527 | | | | (30,405 | ) | | | 3,589,089 | | | | (15,567,580 | ) | | | — | | | | 36,754,598 | | | | 24,861,229 | |
| | | | | | | | | | | | | | | | | | | | | | | | | | | | |
| | | Undistributed
Ordinary
Income | | | Temporary
Book/Tax
Differences | | | Net
Unrealized
Appreciation
(Depreciation)—
Investments | | | Capital Loss
Carryforwards | | | Late-Year
Ordinary
Loss
Deferral | | | Shares of
Beneficial
Interest | | | Total
Net Assets | |
| DWA Healthcare Momentum ETF | | $ | — | | | $ | (38,772 | ) | | $ | 11,011,358 | | | $ | (145,792,956 | ) | | $ | (247,471 | ) | | $ | 298,419,025 | | | $ | 163,351,184 | |
| DWA Industrials Momentum ETF | | | 33,665 | | | | (34,987 | ) | | �� | 17,547,730 | | | | (53,707,376 | ) | | | — | | | | 138,000,091 | | | | 101,839,123 | |
| DWA Technology Momentum ETF | | | — | | | | (34,366 | ) | | | 35,325,183 | | | | (75,543,958 | ) | | | (125,804 | ) | | | 216,344,528 | | | | 175,965,583 | |
| DWA Utilities Momentum ETF | | | 831,585 | | | | (32,411 | ) | | | 11,153,033 | | | | (13,576,042 | ) | | | — | | | | 225,260,629 | | | | 223,636,794 | |
| NASDAQ Internet ETF | | | — | | | | — | | | | 79,828,399 | | | | (26,608,455 | ) | | | (664,819 | ) | | | 545,676,449 | | | | 598,231,574 | |
Capital loss carryforwards are calculated and reported as of a specific date. Results of transactions and other activity after that date may affect the amount of capital loss carryforwards actually available for the Funds to utilize. Capital losses generated in years beginning after December 22, 2010 can be carried forward for an unlimited period, whereas previous losses expire in eight tax years. Capital losses with an expiration period may not be used to offset capital gains until all net capital losses without an expiration date have been utilized. Capital loss carryforwards with no expiration date will retain their character as either short-term or long-term capital losses instead of as short-term capital losses as under prior law. The ability to utilize capital loss carryforwards in the future may be limited under the Internal Revenue Code and related regulations based on the results of future transactions.
The following table presents available capital loss carryforwards for each Fund as of April 30, 2019:
| | | | | | | | | | | | |
| | | Post-effective/no expiration | | | | |
| | | Short-Term | | | Long-Term | | | Total* | |
| DWA Basic Materials Momentum ETF | | $ | 35,085,639 | | | $ | 6,540,589 | | | $ | 41,626,228 | |
| DWA Consumer Cyclicals Momentum ETF | | | 55,705,628 | | | | 445,085 | | | | 56,150,713 | |
| DWA Consumer Staples Momentum ETF | | | 56,144,781 | | | | 1,444,229 | | | | 57,589,010 | |
| DWA Energy Momentum ETF | | | 145,159,073 | | | | 17,559,247 | | | | 162,718,320 | |
| DWA Financial Momentum ETF | | | 15,154,985 | | | | 412,595 | | | | 15,567,580 | |
| DWA Healthcare Momentum ETF | | | 145,792,956 | | | | — | | | | 145,792,956 | |
| DWA Industrials Momentum ETF | | | 53,664,003 | | | | 43,373 | | | | 53,707,376 | |
| DWA Technology Momentum ETF | | | 75,543,958 | | | | — | | | | 75,543,958 | |
| DWA Utilities Momentum ETF | | | 11,687,042 | | | | 1,889,000 | | | | 13,576,042 | |
| NASDAQ Internet ETF | | | 11,100,138 | | | | 15,508,317 | | | | 26,608,455 | �� |
| * | Capital loss carryforward as of the date listed above is reduced for limitations, if any, to the extent required by the Internal Revenue Code and may be further limited depending upon a variety of factors, including the realization of net unrealized gains or losses as of the date of any reorganization. |
NOTE 6—Investment Transactions
For the fiscal year ended April 30, 2019, the cost of securities purchased and proceeds from sales of securities (other than short-term securities, U.S. Treasury obligations, money market funds and in-kind transactions, if any) were as follows:
| | | | | | | | |
| | | Purchases | | | Sales | |
| DWA Basic Materials Momentum ETF | | $ | 77,048,222 | | | $ | 77,001,426 | |
| DWA Consumer Cyclicals Momentum ETF | | | 71,973,662 | | | | 71,779,289 | |
| DWA Consumer Staples Momentum ETF | | | 180,565,248 | | | | 179,585,897 | |
| DWA Energy Momentum ETF | | | 100,341,517 | | | | 99,764,170 | |
| DWA Financial Momentum ETF | | | 55,788,910 | | | | 53,771,843 | |
| DWA Healthcare Momentum ETF | | | 409,983,874 | | | | 408,208,512 | |
| DWA Industrials Momentum ETF | | | 115,336,227 | | | | 112,850,477 | |
| DWA Technology Momentum ETF | | | 199,078,164 | | | | 191,837,498 | |
| DWA Utilities Momentum ETF | | | 53,654,612 | | | | 52,775,955 | |
| NASDAQ Internet ETF | | | 119,361,000 | | | | 118,476,852 | |
For the fiscal year ended April 30, 2019, in-kind transactions associated with creations and redemptions were as follows:
| | | | | | | | |
| | | Cost of
Securities
Received | | | Value of
Securities
Delivered | |
| DWA Basic Materials Momentum ETF | | $ | 27,239,617 | | | $ | 53,902,852 | |
| DWA Consumer Cyclicals Momentum ETF | | | 52,649,023 | | | | 78,738,974 | |
| DWA Consumer Staples Momentum ETF | | | 183,484,989 | | | | 108,078,861 | |
| DWA Energy Momentum ETF | | | 109,658,784 | | | | 124,900,104 | |
| DWA Financial Momentum ETF | | | 15,017,336 | | | | 61,221,956 | |
| DWA Healthcare Momentum ETF | | | 366,753,019 | | | | 339,217,135 | |
| DWA Industrials Momentum ETF | | | 70,896,379 | | | | 86,744,263 | |
| DWA Technology Momentum ETF | | | 147,752,864 | | | | 129,127,279 | |
| DWA Utilities Momentum ETF | | | 224,074,468 | | | | 63,315,366 | |
| NASDAQ Internet ETF | | | 148,385,334 | | | | 201,976,696 | |
Gains (losses) on in-kind transactions are generally not considered taxable gains (losses) for federal income tax purposes.
At April 30, 2019, the aggregate cost of investments, including any derivatives, on a tax basis includes adjustments for financial reporting purposes as of the most recently completed federal income tax reporting period-end:
| | | | | | | | | | | | | | | | |
| | | Gross
Unrealized
Appreciation | | | Gross
Unrealized
(Depreciation) | | | Net
Unrealized
Appreciation
(Depreciation) | | | Cost | |
| DWA Basic Materials Momentum ETF | | $ | 5,916,354 | | | $ | (3,827,083 | ) | | $ | 2,089,271 | | | $ | 64,535,445 | |
| DWA Consumer Cyclicals Momentum ETF | | | 4,778,565 | | | | (471,571 | ) | | | 4,306,994 | | | | 30,278,906 | |
| DWA Consumer Staples Momentum ETF | | | 18,653,104 | | | | (693,850 | ) | | | 17,959,254 | | | | 161,045,374 | |
| DWA Energy Momentum ETF | | | 2,406,538 | | | | (7,168,630 | ) | | | (4,762,092 | ) | | | 57,923,876 | |
| DWA Financial Momentum ETF | | | 3,604,788 | | | | (15,699 | ) | | | 3,589,089 | | | | 22,230,341 | |
| DWA Healthcare Momentum ETF | | | 16,510,854 | | | | (5,499,496 | ) | | | 11,011,358 | | | | 158,474,647 | |
| DWA Industrials Momentum ETF | | | 17,889,169 | | | | (341,439 | ) | | | 17,547,730 | | | | 87,408,763 | |
| DWA Technology Momentum ETF | | | 35,627,295 | | | | (302,112 | ) | | | 35,325,183 | | | | 141,950,698 | |
| DWA Utilities Momentum ETF | | | 12,539,113 | | | | (1,386,080 | ) | | | 11,153,033 | | | | 212,838,289 | |
| NASDAQ Internet ETF | | | 111,265,060 | | | | (31,436,661 | ) | | | 79,828,399 | | | | 525,401,771 | |
NOTE 7—Reclassification of Permanent Differences
Primarily as a result of differing book/tax treatment of in-kind transactions and expired capital loss carryforwards, amounts were reclassified between undistributed net investment income (loss), undistributed net realized gain (loss) and Shares of beneficial interest. These reclassifications had no effect on the net assets of each Fund. For the fiscal year ended April 30, 2019, the reclassifications were as follows:
| | | | | | | | | | | | |
| | | Undistributed
Net Investment
Income (Loss) | | | Undistributed
Net Realized
Gain (Loss) | | | Shares of
Beneficial
Interest | |
| DWA Basic Materials Momentum ETF | | $ | — | | | $ | (3,274,992 | ) | | $ | 3,274,992 | |
| DWA Consumer Cyclicals Momentum ETF | | | 28,306 | | | | (7,177,185 | ) | | | 7,148,879 | |
| DWA Consumer Staples Momentum ETF | | | — | | | | (15,156,431 | ) | | | 15,156,431 | |
| DWA Energy Momentum ETF | | | — | | | | (12,737,097 | ) | | | 12,737,097 | |
| DWA Financial Momentum ETF | | | — | | | | (4,981,376 | ) | | | 4,981,376 | |
| DWA Healthcare Momentum ETF | | | 918,015 | | | | (50,554,673 | ) | | | 49,636,658 | |
| DWA Industrials Momentum ETF | | | (8,023 | ) | | | (8,159,754 | ) | | | 8,167,777 | |
| DWA Technology Momentum ETF | | | 112,915 | | | | (22,018,746 | ) | | | 21,905,831 | |
| DWA Utilities Momentum ETF | | | — | | | | (6,810,818 | ) | | | 6,810,818 | |
| NASDAQ Internet ETF | | | 3,257,980 | | | | (70,889,640 | ) | | | 67,631,660 | |
NOTE 8—Trustees’ and Officer’s Fees
Trustees’ and Officer’s Fees include amounts accrued by the Funds to pay remuneration to the Independent Trustees and an Officer of the Trust. The Adviser, as a result of the unitary management fee, pays for such compensation for NASDAQ Internet ETF. The Trustee who is an “interested person” of the Trust does not receive any Trustees’ fees.
The Trust has adopted a deferred compensation plan (the “Plan”). Under the Plan, each Independent Trustee who has executed a Deferred Fee Agreement (a “Participating Trustee”) may defer receipt of all or a portion of his compensation (“Deferral Fees”). Such Deferral Fees are deemed to be invested in select Invesco Funds. The Deferral Fees payable to the Participating Trustee are valued as of the date such Deferral Fees would have been paid to the Participating Trustee. The value increases with contributions or with increases in the value of the Shares selected, and the value decreases with distributions or with declines in the value of the Shares selected.
Obligations under the Plan represent unsecured claims against the general assets of the Funds.
NOTE 9—Capital
Shares are created and redeemed by each Fund only in Creation Units of 50,000 Shares. Only Authorized Participants are permitted to purchase or redeem Creation Units from the Funds. Such transactions are principally permitted in exchange for Deposit Securities, with a balancing cash component to equate the transaction to the NAV per Share of a Fund of the Trust on the transaction date. However, for all Funds, cash in an amount equivalent to the value of certain securities may be substituted, generally when the securities are not available in sufficient quantity for delivery, not eligible for trading by the Authorized Participant or as a result of other market circumstances.
To the extent that the Funds permit transactions in exchange for Deposit Securities, each Fund may issue Shares in advance of receipt of Deposit Securities subject to various conditions, including a requirement to maintain on deposit with the Trust cash at least equal to 105% of the market value of the missing Deposit Securities. In accordance with the Trust’s Participant Agreement, Creation Units will be issued to an Authorized Participant, notwithstanding the fact that the corresponding Deposit Securities have not been received in part or in whole, in reliance on the undertaking of the Authorized Participant to deliver the missing Deposit Securities as soon as possible, which undertaking shall be secured by the Authorized Participant’s delivery and maintenance of collateral consisting of cash in the form of U.S. dollars in immediately available funds having a value (marked-to-market daily) at least equal to 105%, which the Adviser may change from time to time, of the value of the missing Deposit Securities.
Certain transaction fees may be charged by the Funds for creations and redemptions, which are treated as increases in capital.
Transactions in each Fund’s Shares are disclosed in detail in the Statements of Changes in Net Assets.
Report of Independent Registered Public Accounting Firm
To the Board of Trustees of Invesco Exchange-Traded Fund Trust and Shareholders of Invesco DWA Basic Materials Momentum ETF, Invesco DWA Consumer Cyclicals Momentum ETF, Invesco DWA Consumer Staples Momentum ETF, Invesco DWA Energy Momentum ETF, Invesco DWA Financial Momentum ETF, Invesco DWA Healthcare Momentum ETF, Invesco DWA Industrials Momentum ETF, Invesco DWA Technology Momentum ETF, Invesco DWA Utilities Momentum ETF and Invesco NASDAQ Internet ETF
Opinions on the Financial Statements
We have audited the accompanying statements of assets and liabilities, including the schedules of investments, of Invesco DWA Basic Materials Momentum ETF, Invesco DWA Consumer Cyclicals Momentum ETF, Invesco DWA Consumer Staples Momentum ETF, Invesco DWA Energy Momentum ETF, Invesco DWA Financial Momentum ETF, Invesco DWA Healthcare Momentum ETF, Invesco DWA Industrials Momentum ETF, Invesco DWA Technology Momentum ETF, Invesco DWA Utilities Momentum ETF and Invesco NASDAQ Internet ETF (ten of the funds constituting Invesco Exchange-Traded Fund Trust, hereafter collectively referred to as the “Funds”) as of April 30, 2019, the related statements of operations for the year ended April 30, 2019, the statements of changes in net assets for each of the two years in the period ended April 30, 2019, including the related notes, and the financial highlights for each of the five years in the period ended April 30, 2019 (collectively referred to as the “financial statements”). In our opinion, the financial statements present fairly, in all material respects, the financial position of each of the Funds as of April 30, 2019, the results of each of their operations for the year then ended, the changes in each of their net assets for each of the two years in the period ended April 30, 2019, and each of the financial highlights for each of the five years in the period ended April 30, 2019 in conformity with accounting principles generally accepted in the United States of America.
Basis for Opinions
These financial statements are the responsibility of the Funds’ management. Our responsibility is to express an opinion on the Funds’ financial statements based on our audits. We are a public accounting firm registered with the Public Company Accounting Oversight Board (United States) (“PCAOB”) and are required to be independent with respect to the Funds in accordance with the U.S. federal securities laws and the applicable rules and regulations of the Securities and Exchange Commission and the PCAOB.
We conducted our audits of these financial statements in accordance with the standards of the PCAOB. Those standards require that we plan and perform the audit to obtain reasonable assurance about whether the financial statements are free of material misstatement, whether due to error or fraud.
Our audits included performing procedures to assess the risks of material misstatement of the financial statements, whether due to error or fraud, and performing procedures that respond to those risks. Such procedures included examining, on a test basis, evidence regarding the amounts and disclosures in the financial statements. Our audits also included evaluating the accounting principles used and significant estimates made by management, as well as evaluating the overall presentation of the financial statements. Our procedures included confirmation of securities owned as of April 30, 2019 by correspondence with the custodian, transfer agent and brokers; when replies were not received from brokers, we performed other auditing procedures. We believe that our audits provide a reasonable basis for our opinions.
PricewaterhouseCoopers LLP
Chicago, Illinois
June 26, 2019
We have served as the auditor of one or more of the investment companies in the Invesco group of investment companies since at least 1995. We have not determined the specific year we began serving as auditor.
Calculating your ongoing Fund expenses
Example
As a shareholder of a Fund of the Invesco Exchange-Traded Fund Trust (excluding Invesco NASDAQ Internet ETF), you incur advisory fees and other Fund expenses. As a shareholder of the Invesco NASDAQ Internet ETF, you incur a unitary management fee. In addition to the unitary management fee, a shareholder may pay distribution fees, if any, brokerage expenses, taxes, interest, acquired fund fees and expenses, if any, litigation expenses and other extraordinary expenses. The expense examples below are intended to help you understand your ongoing costs (in dollars) of investing in the Funds and to compare these costs with the ongoing costs of investing in other funds.
The example is based on an investment of $1,000 invested at the beginning of the period and held through the six-month period ended April 30, 2019.
Actual Expenses
The first line in the following table provides information about actual account values and actual expenses. You may use the information in this line, together with the amount you invested, to estimate the expenses that you paid over the period. Simply divide your account value by $1,000 (for example, an $8,600 account value divided by $1,000 = 8.6), then multiply the result by the number in the first line under the heading “Expenses Paid During the Six-Month Period” to estimate the expenses you paid on your account during this period.
Hypothetical Example for Comparison Purposes
The second line in the following table provides information about hypothetical account values and hypothetical expenses based on each Fund’s actual expense ratio and an assumed annualized rate of return of 5% per year before expenses, which is not the Fund’s actual return. The hypothetical account values and expenses may not be used to estimate the actual ending account balance or expenses you paid for the period. You may use this information to compare the ongoing costs of investing in the Funds and other funds. To do so, compare this 5% hypothetical example with the 5% hypothetical examples that appear in the shareholder reports of the other funds.
Please note that the expenses shown in the table are meant to highlight your ongoing costs only, and do not reflect any transactional costs, such as sales charges and brokerage commissions. Therefore, the second line in the table is useful in comparing ongoing costs only, and will not help you determine the relative total costs of owning different funds. In addition, expenses shown in the table do not include the expenses of the underlying funds, which are borne indirectly by a Fund. If transaction costs and indirect expenses were included, your costs would have been higher.
| | | | | | | | | | | | | | | | |
| | | Beginning Account Value November 1, 2018 | | | Ending Account Value April 30, 2019 | | | Annualized Expense Ratio Based on the Six-Month Period | | | Expenses Paid During the Six-Month Period(1) | |
| Invesco DWA Basic Materials Momentum ETF (PYZ) | | | | | | | | | | | | | | | | |
Actual | | $ | 1,000.00 | | | $ | 1,018.70 | | | | 0.60 | % | | $ | 3.00 | |
Hypothetical (5% return before expenses) | | | 1,000.00 | | | | 1,021.82 | | | | 0.60 | | | | 3.01 | |
| Invesco DWA Consumer Cyclicals Momentum ETF (PEZ) | | | | | | | | | | | | | | | | |
Actual | | | 1,000.00 | | | | 1,097.90 | | | | 0.60 | | | | 3.12 | |
Hypothetical (5% return before expenses) | | | 1,000.00 | | | | 1,021.82 | | | | 0.60 | | | | 3.01 | |
| Invesco DWA Consumer Staples Momentum ETF (PSL) | | | | | | | | | | | | | | | | |
Actual | | | 1,000.00 | | | | 1,024.90 | | | | 0.60 | | | | 3.01 | |
Hypothetical (5% return before expenses) | | | 1,000.00 | | | | 1,021.82 | | | | 0.60 | | | | 3.01 | |
| Invesco DWA Energy Momentum ETF (PXI) | | | | | | | | | | | | | | | | |
Actual | | | 1,000.00 | | | | 863.70 | | | | 0.60 | | | | 2.77 | |
Hypothetical (5% return before expenses) | | | 1,000.00 | | | | 1,021.82 | | | | 0.60 | | | | 3.01 | |
| Invesco DWA Financial Momentum ETF (PFI) | | | | | | | | | | | | | | | | |
Actual | | | 1,000.00 | | | | 1,133.70 | | | | 0.60 | | | | 3.17 | |
Hypothetical (5% return before expenses) | | | 1,000.00 | | | | 1,021.82 | | | | 0.60 | | | | 3.01 | |
Calculating your ongoing Fund expenses(continued)
| | | | | | | | | | | | | | | | |
| | | Beginning Account Value November 1, 2018 | | | Ending Account Value April 30, 2019 | | | Annualized Expense Ratio Based on the Six-Month Period | | | Expenses Paid During the Six-Month Period(1) | |
| Invesco DWA Healthcare Momentum ETF (PTH) | | | | | | | | | | | | | | | | |
Actual | | $ | 1,000.00 | | | $ | 948.20 | | | | 0.60 | % | | $ | 2.90 | |
Hypothetical (5% return before expenses) | | | 1,000.00 | | | | 1,021.82 | | | | 0.60 | | | | 3.01 | |
| Invesco DWA Industrials Momentum ETF (PRN) | | | | | | | | | | | | | | | | |
Actual | | | 1,000.00 | | | | 1,130.00 | | | | 0.60 | | | | 3.17 | |
Hypothetical (5% return before expenses) | | | 1,000.00 | | | | 1,021.82 | | | | 0.60 | | | | 3.01 | |
| Invesco DWA Technology Momentum ETF (PTF) | | | | | | | | | | | | | | | | |
Actual | | | 1,000.00 | | | | 1,266.00 | | | | 0.60 | | | | 3.37 | |
Hypothetical (5% return before expenses) | | | 1,000.00 | | | | 1,021.82 | | | | 0.60 | | | | 3.01 | |
| Invesco DWA Utilities Momentum ETF (PUI) | | | | | | | | | | | | | | | | |
Actual | | | 1,000.00 | | | | 1,132.40 | | | | 0.60 | | | | 3.17 | |
Hypothetical (5% return before expenses) | | | 1,000.00 | | | | 1,021.82 | | | | 0.60 | | | | 3.01 | |
| Invesco NASDAQ Internet ETF (PNQI) | | | | | | | | | | | | | | | | |
Actual | | | 1,000.00 | | | | 1,192.20 | | | | 0.60 | | | | 3.26 | |
Hypothetical (5% return before expenses) | | | 1,000.00 | | | | 1,021.82 | | | | 0.60 | | | | 3.01 | |
| (1) | Expenses are calculated using the annualized expense ratio, which represents the ongoing expenses as a percentage of net assets for the six-month period ended April 30, 2019. Expenses are calculated by multiplying the Fund’s annualized expense ratio by the average account value for the period, then multiplying the result by 181/365. Expense ratios for the most recent six-month period may differ from expense ratios based on the annualized data in the Financial Highlights. |
Tax Information
Form 1099-DIV, Form 1042-S and other year-end tax information provide shareholders with actual calendar year amounts that should be included in their tax returns. Shareholders should consult their tax advisers.
The following distribution information is being provided as required by the Internal Revenue Code or to meet a specific state’s requirement.
Each Fund designates the following amounts or, if subsequently determined to be different, the maximum amount allowable for its fiscal year ended April 30, 2019:
| | | | | | | | | | | | | | | |
| | | Qualified Business
Income* | | Qualified Dividend
Income* | | Dividends-Received
Deduction* |
| Invesco DWA Basic Materials Momentum ETF | | | | 0 | % | | | | 100 | % | | | | 100 | % |
| Invesco DWA Consumer Cyclicals Momentum ETF | | | | 0 | % | | | | 100 | % | | | | 100 | % |
| Invesco DWA Consumer Staples Momentum ETF | | | | 0 | % | | | | 100 | % | | | | 100 | % |
| Invesco DWA Energy Momentum ETF | | | | 0 | % | | | | 89 | % | | | | 89 | % |
| Invesco DWA Financial Momentum ETF | | | | 25 | % | | | | 100 | % | | | | 100 | % |
| Invesco DWA Healthcare Momentum ETF | | | | 0 | % | | | | 0 | % | | | | 0 | % |
| Invesco DWA Industrials Momentum ETF | | | | 0 | % | | | | 100 | % | | | | 100 | % |
| Invesco DWA Technology Momentum ETF | | | | 0 | % | | | | 100 | % | | | | 100 | % |
| Invesco DWA Utilities Momentum ETF | | | | 0 | % | | | | 100 | % | | | | 100 | % |
| Invesco NASDAQ Internet ETF | | | | 0 | % | | | | 0 | % | | | | 0 | % |
| * | The above percentages are based on ordinary income dividends paid to shareholders during the fiscal year. |
Trustees and Officers
The Independent Trustees of the Trust, their term of office and length of time served, their principal business occupations during at least the past five years, the number of portfolios in the Fund Complex (as defined below) overseen by each Independent Trustee and the other directorships, if any, held by each Independent Trustee are shown below.
| | | | | | | | | | |
Name, Address and Year of
Birth of Independent Trustees | | Position(s)
Held
with Trust | | Term of
Office
and
Length of
Time
Served* | | Principal
Occupation(s) During
Past 5 Years | | Number of
Portfolios
in Fund
Complex**
Overseen by
Independent
Trustees | | Other
Directorships
Held by
Independent
Trustees During
the Past 5 Years |
Ronn R. Bagge—1958
c/o Invesco Capital Management LLC
3500 Lacey Road, Suite 700
Downers Grove, IL 60515 | | Vice Chairman of the Board; Chairman of the Nominating and Governance Committee and Trustee | | Vice Chairman since 2018; Chairman of the Nominating and Governance Committee and Trustee since 2003 | | Founder and Principal, YQA Capital Management LLC (1998-Present); formerly, Owner/CEO of Electronic Dynamic Balancing Co., Inc. (high-speed rotating equipment service provider). | | 241 | | Trustee and Investment Oversight Committee member, Mission Aviation Fellowship (2017-Present). |
| | | | | |
Todd J. Barre—1957
c/o Invesco Capital Management LLC
3500 Lacey Road, Suite 700
Downers Grove, IL 60515 | | Trustee | | Since 2010 | | Assistant Professor of Business, Trinity Christian College (2010-2016); formerly, Vice President and Senior Investment Strategist (2001-2008), Director of Open Architecture and Trading (2007-2008), Head of Fundamental Research (2004-2007), and Vice President and Senior Fixed Income Strategist (1994-2001), BMO Financial Group/Harris Private Bank. | | 241 | | None. |
| | | | | |
Marc M. Kole—1960
c/o Invesco Capital Management LLC
3500 Lacey Road, Suite 700
Downers Grove, IL 60515 | | Chairman of the Audit Committee and Trustee | | Chairman of the Audit Committee since 2008; Trustee since 2006 | | Senior Director of Finance, By The Hand Club For Kids (not-for-profit) (2015-Present); formerly, Chief Financial Officer, Hope Network (social services) (2008-2012); Assistant Vice President and Controller, Priority Health (health insurance) (2005-2008); Regional Chief Financial Officer, United Healthcare (2005); Chief Accounting Officer, Senior Vice President of Finance, Oxford Health Plans (2000-2004); Audit Partner, Arthur Andersen LLP (1996-2000). | | 241 | | Treasurer (2018-Present), Finance Committee Member (2015-Present) and Audit Committee Member (2015), Thornapple Evangelical Covenant Church; formerly, Board and Finance Committee Member (2009-2017) and Treasurer (2010-2015, 2017), NorthPointe Christian Schools. |
| * | This is the date the Independent Trustee began serving the Trust. Each Independent Trustee serves an indefinite term, until his successor is elected. |
| ** | Fund Complex includes all open- and closed-end funds (including all of their portfolios) advised by the Adviser and any affiliated person of the Adviser. |
Trustees and Officers(continued)
| | | | | | | | | | |
Name, Address and Year of
Birth of Independent Trustees | | Position(s)
Held
with Trust | | Term of
Office
and
Length of
Time
Served* | | Principal
Occupation(s) During
Past 5 Years | | Number of
Portfolios
in Fund
Complex**
Overseen by
Independent
Trustees | | Other
Directorships
Held by
Independent
Trustees During
the Past 5 Years |
Yung Bong Lim—1964
c/o Invesco Capital Management LLC
3500 Lacey Road, Suite 700
Downers Grove, IL 60515 | | Chairman of the Investment Oversight Committee and Trustee | | Chairman of the Investment Oversight Committee since 2014; Trustee since 2013 | | Managing Partner, RDG Funds LLC (real estate) (2008-Present); formerly, Managing Director, Citadel LLC (1999-2007). | | 241 | | Advisory Board Member, Performance Trust Capital Partners, LLC (2008-Present); Board Director, Beacon Power Services, Corp. (2019-Present). |
| | | | | |
Gary R. Wicker—1961
c/o Invesco Capital Management LLC
3500 Lacey Road, Suite 700
Downers Grove, IL 60515 | | Trustee | | Since 2013 | | Senior Vice President of Global Finance and Chief Financial Officer at RBC Ministries (publishing company) (2013-Present); formerly, Executive Vice President and Chief Financial Officer, Zondervan Publishing (a division of Harper Collins/NewsCorp) (2007-2012); Senior Vice President and Group Controller (2005-2006), Senior Vice President and Chief Financial Officer (2003-2004), Chief Financial Officer (2001-2003), Vice President, Finance and Controller (1999-2001) and Assistant Controller (1997-1999), divisions of The Thomson Corporation (information services provider); Senior Audit Manager (1994-1997), PricewaterhouseCoopers LLP. | | 241 | | Board Member and Treasurer, Our Daily Bread Ministries Canada (2015-Present); Board and Finance Committee Member, West Michigan Youth For Christ (2010-Present). |
| | | | | |
Donald H. Wilson—1959
c/o Invesco Capital Management LLC
3500 Lacey Road, Suite 700
Downers Grove, IL 60515 | | Chairman of the Board and Trustee | | Chairman since 2012; Trustee since 2006 | | Chairman, President and Chief Executive Officer, McHenry Bancorp Inc. and McHenry Savings Bank (subsidiary) (2018-Present); Chairman and Chief Executive Officer, Stone Pillar Advisors, Ltd. (advisory services to the financial sector) (2010-Present); formerly, President and Chief Executive Officer, Stone Pillar Investments, Ltd. (2016-2018); Chairman, President and Chief Executive Officer, Community Financial Shares, Inc. and Community Bank—Wheaton/Glen Ellyn (subsidiary) (2013-2015); Chief Operating Officer, AMCORE Financial, Inc. (bank holding company) (2007-2009); Executive Vice President and Chief Financial Officer, AMCORE Financial, Inc. (2006-2007); Senior Vice President and Treasurer, Marshall & Ilsley Corp. (bank holding company) (1995-2006). | | 241 | | Director, Penfield Children’s Center (2004-present); Board Chairman, Gracebridge Alliance, Inc. (2015-present). |
| * | This is the date the Independent Trustee began serving the Trust. Each Independent Trustee serves an indefinite term, until his successor is elected. |
| ** | Fund Complex includes all open- and closed-end funds (including all of their portfolios) advised by the Adviser and any affiliated person of the Adviser. |
Trustees and Officers(continued)
The Interested Trustee and the executive officers of the Trust, their term of office and length of time served, their principal business occupations during at least the past five years, the number of portfolios in the Fund Complex (as defined below) overseen by the Interested Trustee and the other directorships, if any, held by the Interested Trustee are shown below.
| | | | | | | | | | |
Name, Address and Year of
Birth of Interested Trustee | | Position(s)
Held
with Trust | | Term of
Office
and
Length of
Time
Served* | | Principal
Occupation(s) During
Past 5 Years | | Number of
Portfolios
in Fund
Complex**
Overseen by
Interested
Trustee | | Other
Directorships
Held by
Interested
Trustee During
the Past 5 Years |
Kevin M. Carome—1956
Invesco Ltd.
Two Peachtree Pointe,
1555 Peachtree St., N.E.,
Suite 1800
Atlanta, GA 30309 | | Trustee | | Since 2010 | | Senior Managing Director, Secretary and General Counsel, Invesco Ltd. (2007-Present); Director, Invesco Advisers, Inc. (2009-Present); Director (2006-Present) and Executive Vice President (2008–Present), Invesco North American Holdings, Inc.; Executive Vice President (2008–Present), Invesco Investments (Bermuda) Ltd.; Manager, Horizon Flight Works LLC, and Director, Invesco Finance PLC (2011- Present); Director and Secretary (2012–Present), Invesco Services (Bahamas) Private Limited; and Director and Executive Vice President (2014–Present), INVESCO Asset Management (Bermuda) Ltd.; formerly, Director and Executive Vice President, Invesco Finance, Inc. (2011-2018); Director (2006-2018) and Executive Vice President (2008–2018), Invesco Group Services, Inc., Invesco Holding Company (US), Inc.; Director, Invesco Holding Company Limited (2007-2018); Director and Chairman, INVESCO Funds Group, Inc., Senior Vice President, Secretary and General Counsel, Invesco Advisers, Inc. (2003-2006); Director, Invesco Investments (Bermuda) Ltd. (2008-2016); Senior Vice President and General Counsel, Liberty Financial Companies, Inc. (2000-2001); General Counsel of certain investment management subsidiaries of Liberty Financial Companies, Inc. (1998-2000); Associate General Counsel, Liberty Financial Companies, Inc. (1993-1998); Associate, Ropes & Gray LLP. | | 241 | | None |
| * | This is the date the Interested Trustee began serving the Trust. The Interested Trustee serves an indefinite term, until his successor is elected. |
| ** | Fund Complex includes all open- andclosed-end funds (including all of their portfolios) advised by the Adviser and any affiliated person of the Adviser. |
Trustees and Officers(continued)
| | | | | | |
Name, Address and Year of
Birth of Executive Officers | | Position(s)
Held
with Trust | | Length of
Time
Served* | | Principal Occupation(s) During Past 5 Years |
Daniel E. Draper—1968 Invesco Capital
Management LLC 3500 Lacey Road, Suite 700 Downers Grove, IL 60515 | | President and Principal Executive Officer | | Since 2015 | | Chief Executive Officer, Manager and Principal Executive Officer, Invesco Specialized Products, LLC (2018-Present); President and Principal Executive Officer, Invesco Exchange-Traded Fund Trust, Invesco Exchange-Traded Fund Trust II, Invesco India Exchange-Traded Fund Trust, Invesco Actively Managed Exchange-Traded Fund Trust and Invesco Actively Managed Exchange-Traded Commodity Fund Trust (2015-Present) and Invesco Exchange-Traded Self-Indexed Fund Trust (2016-Present); Chief Executive Officer and Principal Executive Officer (2016-Present) and Managing Director (2013-Present), Invesco Capital Management LLC; Senior Vice President, Invesco Distributors, Inc. (2014-Present); formerly, Vice President, Invesco Exchange-Traded Fund Trust, Invesco Exchange-Traded Fund Trust II, Invesco India Exchange-Traded Fund Trust, Invesco Actively Managed Exchange-Traded Fund Trust (2013-2015) and Invesco Actively Managed Exchange-Traded Commodity Fund Trust (2014-2015); Managing Director, Credit Suisse Asset Management (2010-2013) and Lyxor Asset Management/Societe Generale (2007-2010). |
| | | |
Kelli Gallegos—1970 Invesco Capital Management LLC 3500 Lacey Road, Suite 700 Downers Grove, IL 60515 | | Vice President
and Treasurer | | Since 2018 | | Assistant Treasurer, Invesco Specialized Products, LLC (2018-Present); Vice President and Treasurer, Invesco Exchange-Traded Fund Trust, Invesco Exchange-Traded Fund Trust II, Invesco India Exchange-Traded Fund Trust, Invesco Actively Managed Exchange-Traded Fund Trust, Invesco Actively Managed Exchange-Traded Commodity Fund Trust and Invesco Exchange-Traded Self-Indexed Fund Trust (2018-Present); Principal Financial and Accounting Officer-Pooled Investments, Invesco Capital Management LLC (2018-Present); Vice President, Principal Financial Officer (2016-Present) and Assistant Treasurer (2008-Present), The Invesco Funds; formerly, Assistant Treasurer Invesco Exchange-Traded Fund Trust, Invesco Exchange-Traded Fund Trust II, Invesco India Exchange-Traded Fund Trust and Invesco Actively Managed Exchange-Traded Fund Trust (2012-2018), Invesco Actively Managed Exchange-Traded Commodity Fund Trust (2014-2018) and Invesco Exchange-Traded Self-Indexed Fund Trust (2016-2018); Assistant Treasurer, Invesco Capital Management LLC (2013-2018); and Assistant Vice President, The Invesco Funds (2008-2016). |
| | | |
Peter Hubbard—1981 Invesco Capital Management LLC 3500 Lacey Road, Suite 700 Downers Grove, IL 60515 | | Vice President | | Since 2009 | | Vice President, Invesco Specialized Products, LLC (2018-Present); Vice President, Invesco Exchange-Traded Fund Trust, Invesco Exchange-Traded Fund Trust II, Invesco India Exchange-Traded Fund Trust, Invesco Actively Managed Exchange-Traded Fund Trust (2009-Present), Invesco Actively Managed Exchange-Traded Commodity Fund Trust (2014-Present) and Invesco Exchange-Traded Self-Indexed Fund Trust (2016-Present); Vice President and Director of Portfolio Management, Invesco Capital Management LLC (2010-Present); formerly, Vice President of Portfolio Management, Invesco Capital Management LLC (2008-2010); Portfolio Manager, Invesco Capital Management LLC (2007-2008); Research Analyst, Invesco Capital Management LLC (2005-2007); Research Analyst and Trader, Ritchie Capital, a hedge fund operator (2003-2005). |
| * | This is the date each Officer began serving the Trust. Each Officer serves an indefinite term, until his or her successor is elected. |
Trustees and Officers(continued)
| | | | | | |
Name, Address and Year of
Birth of Executive Officers | | Position(s)
Held
with Trust | | Length of
Time
Served* | | Principal Occupation(s) During Past 5 Years |
Sheri Morris—1964 Invesco Capital Management LLC 3500 Lacey Road, Suite 700 Downers Grove, IL 60515 | | Vice President | | Since 2012 | | President and Principal Executive Officer, The Invesco Funds (2016-Present); Treasurer, The Invesco Funds (2008-Present); Vice President, Invesco Advisers, Inc. (formerly known as Invesco Institutional (N.A.), Inc.) (registered investment adviser) (2009-Present) and Vice President, Invesco Exchange-Traded Fund Trust, Invesco Exchange-Traded Fund Trust II, Invesco India Exchange-Traded Fund Trust, Invesco Actively Managed Exchange-Traded Fund Trust (2012-Present), Invesco Actively Managed Exchange-Traded Commodity Fund Trust (2014-Present) and Invesco Exchange-Traded Self-Indexed Fund Trust (2016-Present); formerly, Vice President and Principal Financial Officer, The Invesco Funds (2008-2016); Treasurer, Invesco Exchange-Traded Fund Trust, Invesco Exchange-Traded Fund Trust II, Invesco India Exchange-Traded Fund Trust and Invesco Actively Managed Exchange-Traded Fund Trust (2011-2013); Vice President, Invesco Aim Advisers, Inc., Invesco Aim Capital Management, Inc. and Invesco Aim Private Asset Management, Inc.; Assistant Vice President and Assistant Treasurer, The Invesco Funds and Assistant Vice President, Invesco Advisers, Inc., Invesco Aim Capital Management, Inc. and Invesco Aim Private Asset Management, Inc. |
| | | |
Anna Paglia—1974 Invesco Capital Management LLC 3500 Lacey Road, Suite 700 Downers Grove, IL 60515 | | Secretary | | Since 2011 | | Secretary, Invesco Specialized Products, LLC (2018-Present); Secretary, Invesco Exchange-Traded Fund Trust, Invesco Exchange-Traded Fund Trust II, Invesco India Exchange-Traded Fund Trust, Invesco Actively Managed Exchange-Traded Fund Trust (2011-Present), Invesco Actively Managed Exchange-Traded Commodity Fund Trust (2014-Present) and Invesco Exchange-Traded Self-Indexed Fund Trust (2015-Present); Head of Legal (2010-Present) and Secretary (2015-Present), Invesco Capital Management LLC; Manager and Assistant Secretary, Invesco Indexing LLC (2017-Present); formerly, Partner, K&L Gates LLP (formerly, Bell Boyd & Lloyd LLP) (2007-2010); Associate Counsel at Barclays Global Investors Ltd. (2004-2006). |
| | | |
Rudolf E. Reitmann—1971 Invesco Capital Management LLC 3500 Lacey Road, Suite 700 Downers Grove, IL 60515 | | Vice President | | Since 2013 | | Head of Global Exchange Traded Funds Services, Invesco Specialized Products, LLC (2018-Present); Vice President, Invesco Exchange-Traded Fund Trust, Invesco Exchange-Traded Fund Trust II, Invesco India Exchange-Traded Fund Trust, Invesco Actively Managed Exchange-Traded Fund Trust (2013-Present), Invesco Actively Managed Exchange-Traded Commodity Fund Trust (2014-Present) and Invesco Exchange-Traded Self-Indexed Fund Trust (2016-Present); Head of Global Exchange Traded Funds Services, Invesco Capital Management LLC (2013-Present); Vice President, Invesco Capital Markets, Inc. (2018-Present). |
| * | This is the date each Officer began serving the Trust. Each Officer serves an indefinite term, until his or her successor is elected. |
Trustees and Officers(continued)
| | | | | | |
Name, Address and Year of
Birth of Executive Officers | | Position(s)
Held
with Trust | | Length of
Time
Served* | | Principal Occupation(s) During Past 5 Years |
David Warren—1957 Invesco Canada Ltd. 5140 Yonge Street, Suite 800 Toronto, Ontario M2N 6X7 | | Vice President | | Since 2009 | | Manager, Invesco Specialized Products, LLC (2018-Present); Vice President, Invesco Exchange-Traded Fund Trust, Invesco Exchange-Traded Fund Trust II, Invesco India Exchange-Traded Fund Trust, and Invesco Actively Managed Exchange-Traded Fund Trust (2009-Present), Invesco Actively Managed Exchange-Traded Commodity Fund Trust (2014-Present) and Invesco Exchange-Traded Self-Indexed Fund Trust (2016-Present); Managing Director—Chief Administrative Officer, Americas, Invesco Capital Management LLC; Senior Vice President, Invesco Advisers, Inc. (2009-Present); Director, Invesco Inc. (2009-Present); Director, Executive Vice President and Chief Financial Officer, Invesco Canada Ltd. (formerly, Invesco Trimark Ltd.) (2011-Present); Chief Administrative Officer, North American Retail, Invesco Ltd. (2007-Present); Director, Invesco Corporate Class Inc. (2014-Present); Director, Invesco Global Direct Real Estate Feeder GP Ltd. (2015-Present); Director, Invesco Canada Holdings Inc. (2002-Present); Director, Invesco Financial Services Ltd. / Services Financiers Invesco Ltée and Trimark Investments Ltd./Placements Trimark Ltée (2014-Present); Director, Invesco IP Holdings (Canada) Ltd. (2016-Present); Director, Invesco Global Direct Real Estate GP Ltd. (2015-Present); formerly, Senior Vice President, Invesco Management Group, Inc. (2007-2018); Executive Vice President and Chief Financial Officer, Invesco Inc. (2009-2015); Director, Executive Vice President and Chief Financial Officer, Invesco Canada Ltd. (formerly, Invesco Trimark Ltd.) (2000-2011). |
| | | |
Melanie Zimdars—1976 Invesco Capital
Management LLC 3500 Lacey Road, Suite 700 Downers Grove, IL 60515 | | Chief Compliance
Officer | | Since 2017 | | Chief Compliance Officer, Invesco Specialized Products, LLC (2018-Present); Chief Compliance Officer, Invesco Capital Management LLC (2017-Present); Chief Compliance Officer, Invesco Exchange-Traded Fund Trust, Invesco Exchange-Traded Fund Trust II, Invesco India Exchange-Traded Fund Trust, Invesco Actively Managed Exchange-Traded Fund Trust, Invesco Actively Managed Exchange-Traded Commodity Fund Trust and Invesco Exchange-Traded Self-Indexed Fund Trust (2017-Present); formerly, Vice President and Deputy Chief Compliance Officer at ALPS Holding, Inc. (2009-2017); Mutual Fund Treasurer/Chief Financial Officer at Wasatch Advisors, Inc. (2005-2008); Compliance Officer, U.S. Bancorp Fund Services, LLC (2001-2005). |
Availability of Additional Information About the Trustees
The Statement of Additional Information includes additional information about the Trustees and is available, without charge, upon request at (800)983-0903.
| * | This is the date each Officer began serving the Trust. Each Officer serves an indefinite term, until his or her successor is elected. |
Board Considerations Regarding Continuation of Investment Advisory Agreement
At a meeting held on April 11, 2019, the Board of Trustees of the Invesco Exchange-Traded Fund Trust (the “Trust”), including the Independent Trustees, approved the continuation of the Investment Advisory Agreement between Invesco Capital Management LLC (the “Adviser”) and the Trust for the following 53 series (each, a “Fund” and collectively, the “Funds”):
Invesco Aerospace & Defense ETF
Invesco BRIC ETF
Invesco BuyBack AchieversTM ETF
Invesco CleantechTM ETF
Invesco Dividend AchieversTM ETF
Invesco DWA Basic Materials Momentum ETF
Invesco DWA Consumer Cyclicals Momentum ETF
Invesco DWA Consumer Staples Momentum ETF
Invesco DWA Energy Momentum ETF
Invesco DWA Financial Momentum ETF
Invesco DWA Healthcare Momentum ETF
Invesco DWA Industrials Momentum ETF
Invesco DWA Momentum ETF
Invesco DWA NASDAQ Momentum ETF
Invesco DWA Technology Momentum ETF
Invesco DWA Utilities Momentum ETF
Invesco Dynamic Biotechnology & Genome ETF
Invesco Dynamic Building & Construction ETF
Invesco Dynamic Energy Exploration & Production ETF
Invesco Dynamic Food & Beverage ETF
Invesco Dynamic Large Cap Growth ETF
Invesco Dynamic Large Cap Value ETF
Invesco Dynamic Leisure and Entertainment ETF
Invesco Dynamic Market ETF
Invesco Dynamic Media ETF
Invesco Dynamic Networking ETF
Invesco Dynamic Oil & Gas Services ETF
Invesco Dynamic Pharmaceuticals ETF
Invesco Dynamic Retail ETF
Invesco Dynamic Semiconductors ETF
Invesco Dynamic Software ETF
Invesco Financial Preferred ETF
Invesco FTSE RAFI US 1000 ETF
Invesco FTSE RAFI US 1500Small-Mid ETF
Invesco Global Listed Private Equity ETF
Invesco Golden Dragon China ETF
Invesco High Yield Equity Dividend AchieversTM ETF
Invesco Insider Sentiment ETF
Invesco International Dividend AchieversTM ETF
Invesco Russell 2000 Pure Growth ETF
Invesco Russell 2000 Pure Value ETF
Invesco Russell Midcap Equal Weight ETF
Invesco Russell Midcap Pure Growth ETF
Invesco Russell Midcap Pure Value ETF
Invesco Russell Top 200 Equal Weight ETF
Invesco Russell Top 200 Pure Growth ETF
Invesco Russell Top 200 Pure Value ETF
Invesco S&P 500® Quality ETF
Invesco S&PSpin-Off ETF
Invesco Water Resources ETF
Invesco WilderHill Clean Energy ETF
Invesco ZacksMid-Cap ETF
Invesco Zacks Multi-Asset Income ETF
The Trustees reviewed information from the Adviser describing: (i) the nature, extent and quality of services provided, (ii) the investment performance of the Funds and the Adviser, (iii) the fees and expenses paid by the Funds and comparisons to amounts paid by other comparable registered investment companies, (iv) the costs of services provided and estimated profits realized by the Adviser, (v) the extent to which economies of scale may be realized as a Fund grows and whether fee levels reflect any possible economies of scale for the benefit of Fund shareholders, and (vi) any further benefits realized by the Adviser from its relationships with the Funds.
Nature, Extent and Quality of Services. In evaluating the nature, extent and quality of the Adviser’s services, the Trustees reviewed information concerning the functions performed by the Adviser for the Funds, information describing the Adviser’s current organization and staffing, including operational support provided by the Adviser’s parent organization, Invesco Ltd. (“Invesco”), and the background and experience of the persons responsible for theday-to-day management of the Funds. The Trustees reviewed matters related to the Adviser’s execution and/or oversight of execution of portfolio transactions on behalf of the Funds. The Trustees also reviewed information on the performance of the Funds and their underlying indexes for theone-year, three-year, five-year,ten-year and since-inception periods ended December 31, 2018, as applicable, including reports for each of those periods on the correlation and tracking error between each Fund’s performance and the performance of its underlying index, as well as the Adviser’s analysis of the tracking error between certain Funds and their underlying indexes. In reviewing the tracking error reports, the Trustees considered information provided by Invesco’s Global Performance Measurement and Risk Group, an independent organization within Invesco, with respect to general expected tracking error ranges. The Trustees also considered that certain Funds were created in connection with the purchase
Board Considerations Regarding Continuation of Investment Advisory Agreement(continued)
by Invesco of the exchange-traded funds business of Guggenheim Capital LLC (the “Transaction”) and that such Funds’ performance prior to the closing of the Transaction on April 6, 2018 or May 18, 2018, as applicable, is that of their predecessor Guggenheim ETFs. The Trustees noted that, for each applicable period, the correlation and tracking error for each Fund was within the targeted range set forth in the Trust’s registration statement and concluded that each Fund was correlated to its underlying index and that the tracking error for each Fund was within an acceptable range given that Fund’s particular circumstances.
The Trustees also considered the services provided by the Adviser in its oversight of the Funds’ administrator, custodian and transfer agent. They noted the significant amount of time, effort and resources that had been devoted to this oversight function.
Based on their review, the Trustees concluded that the nature, extent and quality of services provided by the Adviser to the Funds under the Investment Advisory Agreement were appropriate and reasonable.
Fees, Expenses and Profitability. The Trustees reviewed and discussed the information provided by the Adviser on each Fund’s contractual advisory fee, net advisory fee, and gross and net expense ratios. The Trustees also compared each Fund’s contractual advisory fee and net expense ratio to information compiled by the Adviser from Lipper Inc. databases on the net advisory fees and net expense ratios of comparable exchange-traded funds (“ETFs”),open-end(non-ETF) index funds andopen-end(non-ETF) actively-managed funds, as applicable. The Trustees noted that the annual contractual advisory fee charged to each Fund is:
| | ● | | 0.50% of the Fund’s average daily net assets for each Fund other than Invesco Dividend AchieversTM ETF, Invesco FTSE RAFI US 1000 ETF, Invesco FTSE RAFI US 1500Small-Mid ETF, Invesco High Yield Equity Dividend AchieversTM ETF, Invesco International Dividend AchieversTM ETF, Invesco Russell 2000 Pure Growth ETF, Invesco Russell 2000 Pure Value ETF, Invesco Russell Midcap Equal Weight ETF, Invesco Russell Midcap Pure Growth ETF, Invesco Russell Midcap Pure Value ETF, Invesco Russell Top 200 Equal Weight ETF, Invesco Russell Top 200 Pure Growth ETF, Invesco Russell Top 200 Pure Value ETF and Invesco S&P 500® Quality ETF (The net advisory fee, after giving effect to the Expense Cap, as defined below, was-0.16% for Invesco Dynamic Retail ETF.); |
| | ● | | 0.40% of the Fund’s average daily net assets for each of Invesco Dividend AchieversTM ETF, Invesco High Yield Equity Dividend AchieversTM ETF and Invesco International Dividend AchieversTM ETF; |
| | ● | | 0.29% of the Fund’s average daily net assets for each of Invesco FTSE RAFI US 1000 ETF, Invesco FTSE RAFI US 1500Small-Mid ETF, Invesco Russell 2000 Pure Growth ETF, Invesco Russell 2000 Pure Value ETF, Invesco Russell Midcap Pure Growth ETF, Invesco Russell Midcap Pure Value ETF, Invesco Russell Top 200 Pure Growth ETF and Invesco Russell Top 200 Pure Value ETF; |
| | ● | | 0.25% of the Fund’s average daily net assets for each of Invesco Russell Midcap Equal Weight ETF and Invesco Russell Top 200 Equal Weight ETF (The net advisory fee, after giving effect to the Expense Cap, as defined below, was-0.17% for Invesco Russell Midcap Equal Weight ETF.); and |
| | ● | | 0.15% of the Fund’s average daily net assets for Invesco S&P 500® Quality ETF (The Trustees noted that, prior to September 24, 2018, the Fund’s advisory fee was 0.29%.). |
The Trustees also noted that the Adviser has agreed to waive a portion of its contractual advisory fee and/or pay expenses (an “Expense Cap”) to the extent necessary to prevent the annual operating expenses of each Fund from exceeding the percentage of that Fund’s average daily net assets, at least until August 31, 2021, as set forth below:
| | ● | | 0.60%, excluding interest expenses, brokerage commissions and other trading expenses, taxes, acquired fund fees and expenses, if applicable, and extraordinary expenses, for each of Invesco DWA NASDAQ Momentum ETF and Invesco Dynamic Market ETF; |
| | ● | | 0.60%, excluding interest expenses, offering costs, brokerage commissions and other trading expenses, taxes, acquired fund fees and expenses, if applicable, and extraordinary expenses, for each of Invesco DWA Basic Materials Momentum ETF, Invesco DWA Consumer Cyclicals Momentum ETF, Invesco DWA Consumer Staples Momentum ETF, Invesco DWA Energy Momentum ETF, Invesco DWA Financial Momentum ETF, Invesco DWA Healthcare Momentum ETF, Invesco DWA Industrials Momentum ETF, Invesco DWA Technology Momentum ETF and Invesco DWA Utilities Momentum ETF; |
| | ● | | 0.50%, excluding interest expenses,sub-licensing fees, offering costs, brokerage commissions and other trading expenses, taxes, acquired fund fees and expenses, if applicable, and extraordinary expenses, for each of Invesco Dividend AchieversTM ETF, Invesco High Yield Equity Dividend AchieversTM ETF and Invesco International Dividend AchieversTM ETF; |
| | ● | | 0.39%, excluding interest expenses, offering costs, brokerage commissions and other trading expenses, taxes, acquired fund fees and expenses, if applicable, and extraordinary expenses, for each of Invesco FTSE RAFI US 1000 ETF, Invesco FTSE RAFI US |
Board Considerations Regarding Continuation of Investment Advisory Agreement(continued)
| | 1500Small-Mid ETF, Invesco Russell 2000 Pure Growth ETF, Invesco Russell 2000 Pure Value ETF, Invesco Russell Midcap Pure Growth ETF, Invesco Russell Midcap Pure Value ETF, Invesco Russell Top 200 Pure Growth ETF and Invesco Russell Top 200 Pure Value ETF; |
| | ● | | 0.25%, excluding interest expenses, offering costs, brokerage commissions and other trading expenses, taxes, acquired fund fees and expenses, if applicable, and extraordinary expenses, for each of Invesco Russell Midcap Equal Weight ETF and Invesco Russell Top 200 Equal Weight ETF; |
| | ● | | 0.15%, excluding interest expenses, offering costs, brokerage commissions and other trading expenses, taxes, acquired fund fees and expenses, if applicable, and extraordinary expenses, for Invesco S&P 500 Quality ETF; and |
| | ● | | 0.60%, excluding interest expenses,sub-licensing fees, offering costs, brokerage commissions and other trading expenses, taxes, acquired fund fees and expenses, if applicable, and extraordinary expenses, for each other Fund. |
The Trustees noted that the Adviser represented that it does not serve as the investment adviser to any clients, other than other ETFs also overseen by the Trustees, with comparable investment strategies as the Funds, but that it providessub-advisory services to other clients. The Trustees further noted the Adviser’s explanation with respect to thesub-advisory fees it receives for such services in comparison to the advisory fees charged to the Funds. The Trustees noted that the contractual advisory fees for certain Funds were equal to or lower than the median net advisory fees of their ETF andopen-end index peer funds, as applicable, as illustrated in the table below. The Trustees also noted that the contractual advisory fees for all of the Funds were lower than the median net advisory fees of theiropen-end actively-managed peer funds.
| | | | | | | | | | | | |
Invesco Fund | | Equal to/Lower
than ETF Median | | | Equal to/Lower
thanOpen-End
Index Fund
Median* | | | Equal to/Lower
thanOpen-End
Active Fund
Median | |
| Invesco Aerospace & Defense ETF | | | | | | | | | | | X | |
| Invesco BRIC ETF | | | | | | | | | | | X | |
| Invesco Buyback AchieversTM ETF | | | | | | | | | | | X | |
| Invesco CleantechTM ETF | | | | | | | | | | | X | |
| Invesco Dividend AchieversTM ETF | | | | | | | | | | | X | |
| Invesco DWA Basic Materials Momentum ETF | | | | | | | | | | | X | |
| Invesco DWA Consumer Cyclicals Momentum ETF | | | | | | | | | | | X | |
| Invesco DWA Consumer Staples Momentum ETF | | | | | | | | | | | X | |
| Invesco DWA Energy Momentum ETF | | | | | | | | | | | X | |
| Invesco DWA Financial Momentum ETF | | | | | | | | | | | X | |
| Invesco DWA Healthcare Momentum ETF | | | | | | | | | | | X | |
| Invesco DWA Industrials Momentum ETF | | | | | | | | | | | X | |
| Invesco DWA Momentum ETF | | | X | | | | | | | | X | |
| Invesco DWA NASDAQ Momentum ETF | | | | | | | | | | | X | |
| Invesco DWA Technology Momentum ETF | | | | | | | | | | | X | |
| Invesco DWA Utilities Momentum ETF | | | | | | | | | | | X | |
| Invesco Dynamic Biotechnology & Genome ETF | | | | | | | | | | | X | |
| Invesco Dynamic Building & Construction ETF | | | | | | | | | | | X | |
| Invesco Dynamic Energy Exploration & Production ETF | | | | | | | | | | | X | |
| Invesco Dynamic Food & Beverage ETF | | | | | | | | | | | X | |
| Invesco Dynamic Large Cap Growth ETF | | | | | | | | | | | X | |
| Invesco Dynamic Large Cap Value ETF | | | | | | | | | | | X | |
| Invesco Dynamic Leisure and Entertainment ETF | | | | | | | | | | | X | |
| Invesco Dynamic Market ETF | | | | | | | | | | | X | |
| Invesco Dynamic Media ETF | | | | | | | | | | | X | |
| Invesco Dynamic Networking ETF | | | | | | | | | | | X | |
Board Considerations Regarding Continuation of Investment Advisory Agreement(continued)
| | | | | | | | | | | | |
Invesco Fund | | Equal to/Lower
than ETF Median | | | Equal to/Lower
thanOpen-End
Index Fund
Median* | | | Equal to/Lower
thanOpen-End
Active Fund
Median | |
| Invesco Dynamic Oil & Gas Services ETF | | | | | | | N/A | | | | X | |
| Invesco Dynamic Pharmaceuticals ETF | | | | | | | | | | | X | |
| Invesco Dynamic Retail ETF | | | | | | | | | | | X | |
| Invesco Dynamic Semiconductors ETF | | | | | | | | | | | X | |
| Invesco Dynamic Software ETF | | | | | | | | | | | X | |
| Invesco Financial Preferred ETF | | | | | | | N/A | | | | X | |
| Invesco FTSE RAFI US 1000 ETF | | | | | | | | | | | X | |
| Invesco FTSE RAFI US 1500Small-Mid ETF | | | | | | | | | | | X | |
| Invesco Global Listed Private Equity ETF | | | | | | | N/A | | | | X | |
| Invesco Golden Dragon China ETF | | | X | | | | N/A | | | | X | |
| Invesco High Yield Equity Dividend AchieversTM ETF | | | | | | | | | | | X | |
| Invesco Insider Sentiment ETF | | | | | | | | | | | X | |
| Invesco International Dividend AchieversTM ETF | | | X | | | | | | | | X | |
| Invesco Russell 2000 Pure Growth ETF | | | | | | | X | | | | X | |
| Invesco Russell 2000 Pure Value ETF | | | | | | | X | | | | X | |
| Invesco Russell Midcap Equal Weight ETF | | | | | | | | | | | X | |
| Invesco Russell Midcap Pure Growth ETF | | | X | | | | | | | | X | |
| Invesco Russell Midcap Pure Value ETF | | | X | | | | | | | | X | |
| Invesco Russell Top 200 Equal Weight ETF | | | X | | | | | | | | X | |
| Invesco Russell Top 200 Pure Growth ETF | | | | | | | | | | | X | |
| Invesco Russell Top 200 Pure Value ETF | | | | | | | | | | | X | |
| Invesco S&P 500® Quality ETF | | | X | | | | | | | | X | |
| Invesco S&PSpin-Off | | | | | | | | | | | X | |
| Invesco Water Resources ETF | | | | | | | | | | | X | |
| Invesco WilderHill Clean Energy ETF | | | | | | | | | | | X | |
| Invesco ZacksMid-Cap ETF | | | | | | | | | | | X | |
| Invesco Zacks Multi-Asset Income ETF | | | | | | | | | | | X | |
| * | The information provided by the Adviser indicated that certain Funds did not haveopen-end index fund peers. Those Funds have been designated with an “N/A” for not available. |
The Trustees determined that the contractual advisory fees were reasonable, noting the nature of the indexes, the distinguishing factors of the Funds, and the administrative, operational and management oversight costs for the Adviser. The Trustees noted that the net expense ratios for certain Funds were equal to or lower than the median net expense ratios of their ETF andopen-end index peer funds, as applicable, as illustrated in the table below. The Trustees also noted that the net expense ratios for all of the Funds were lower than the median net expense ratios of theiropen-end actively-managed peer funds.
| | | | | | | | | | | | |
Invesco Fund | | Equal to/Lower
than ETF Median | | | Equal to/Lower
thanOpen-End
Index Fund
Median* | | | Equal to/Lower
thanOpen-End
Active Fund
Median | |
| Invesco Aerospace & Defense ETF | | | | | | | | | | | X | |
| Invesco BRIC ETF | | | | | | | | | | | X | |
| Invesco Buyback AchieversTM ETF | | | | | | | | | | | X | |
| Invesco CleantechTM ETF | | | | | | | | | | | X | |
Board Considerations Regarding Continuation of Investment Advisory Agreement(continued)
| | | | | | | | | | |
Invesco Fund | | Equal to/Lower
than ETF Median | | | Equal to/Lower
thanOpen-End
Index Fund
Median* | | Equal to/Lower
thanOpen-End
Active Fund
Median | |
| Invesco Dividend AchieversTM ETF | | | | | | X | | | X | |
| Invesco DWA Basic Materials Momentum ETF | | | | | | | | | X | |
| Invesco DWA Consumer Cyclicals Momentum ETF | | | | | | | | | X | |
| Invesco DWA Consumer Staples Momentum ETF | | | | | | | | | X | |
| Invesco DWA Energy Momentum ETF | | | | | | | | | X | |
| Invesco DWA Financial Momentum ETF | | | | | | | | | X | |
| Invesco DWA Healthcare Momentum ETF | | | | | | | | | X | |
| Invesco DWA Industrials Momentum ETF | | | | | | | | | X | |
| Invesco DWA Momentum ETF | | | | | | X | | | X | |
| Invesco DWA NASDAQ Momentum ETF | | | | | | | | | X | |
| Invesco DWA Technology Momentum ETF | | | | | | | | | X | |
| Invesco DWA Utilities Momentum ETF | | | | | | | | | X | |
| Invesco Dynamic Biotechnology & Genome ETF | | | | | | | | | X | |
| Invesco Dynamic Building & Construction ETF | | | | | | | | | X | |
| Invesco Dynamic Energy Exploration & Production ETF | | | | | | | | | X | |
| Invesco Dynamic Food & Beverage ETF | | | | | | | | | X | |
| Invesco Dynamic Large Cap Growth ETF | | | | | | | | | X | |
| Invesco Dynamic Large Cap Value ETF | | | | | | | | | X | |
| Invesco Dynamic Leisure and Entertainment ETF | | | | | | | | | X | |
| Invesco Dynamic Market ETF | | | | | | | | | X | |
| Invesco Dynamic Media ETF | | | | | | | | | X | |
| Invesco Dynamic Networking ETF | | | | | | | | | X | |
| Invesco Dynamic Oil & Gas Services ETF | | | | | | N/A | | | X | |
| Invesco Dynamic Pharmaceuticals ETF | | | | | | | | | X | |
| Invesco Dynamic Retail ETF | | | | | | | | | X | |
| Invesco Dynamic Semiconductors ETF | | | | | | | | | X | |
| Invesco Dynamic Software ETF | | | | | | | | | X | |
| Invesco Financial Preferred ETF | | | | | | N/A | | | X | |
| Invesco FTSE RAFI US 1000 ETF | | | | | | | | | X | |
| Invesco FTSE RAFI US 1500Small-Mid ETF | | | | | | | | | X | |
| Invesco Global Listed Private Equity ETF | | | | | | N/A | | | X | |
| Invesco Golden Dragon China ETF | | | | | | N/A | | | X | |
| Invesco High Yield Equity Dividend AchieversTM ETF | | | | | | X | | | X | |
| Invesco Insider Sentiment ETF | | | | | | | | | X | |
| Invesco International Dividend AchieversTM ETF | | | | | | | | | X | |
| Invesco Russell 2000 Pure Growth ETF | | | | | | X | | | X | |
| Invesco Russell 2000 Pure Value ETF | | | | | | X | | | X | |
| Invesco Russell Midcap Equal Weight ETF | | | | | | | | | X | |
| Invesco Russell Midcap Pure Growth ETF | | | | | | | | | X | |
| Invesco Russell Midcap Pure Value ETF | | | | | | | | | X | |
| Invesco Russell Top 200 Equal Weight ETF | | | X | | | | | | X | |
| Invesco Russell Top 200 Pure Growth ETF | | | | | | | | | X | |
Board Considerations Regarding Continuation of Investment Advisory Agreement(continued)
| | | | | | | | | | | | |
Invesco Fund | | Equal to/Lower
than ETF Median | | | Equal to/Lower
thanOpen-End
Index Fund
Median* | | | Equal to/Lower
thanOpen-End
Active Fund
Median | |
| Invesco Russell Top 200 Pure Value ETF | | | | | | | | | | | X | |
| Invesco S&P 500® Quality ETF | | | X | | | | | | | | X | |
| Invesco S&PSpin-Off ETF | | | | | | | | | | | X | |
| Invesco Water Resources ETF | | | | | | | | | | | X | |
| Invesco WilderHill Clean Energy ETF | | | | | | | | | | | X | |
| Invesco ZacksMid-Cap ETF | | | | | | | | | | | X | |
| Invesco Zacks Multi-Asset Income ETF | | | | | | | | | | | X | |
| * | The information provided by the Adviser indicated that certain Funds did not haveopen-end index fund peers. Those Funds have been designated with an “N/A” for not available. |
In response to questions from the Independent Trustees, the Adviser provided supplemental information regarding each of Invesco Dynamic Energy Exploration & Production ETF, Invesco Dynamic Large Cap Growth ETF and Invesco WilderHill Clean Energy ETF’s advisory fees and total expenses and the Lipper peer data. The Adviser explained in detail its view that it believes that the advisory fees and total expenses for these Funds are competitive and generally in line with other comparable funds in the marketplace, noting, in particular, the unique underlying investment strategy and complexity of each Fund, the limited number of peers in the Lipper data, and/or the differing pricing philosophy of certain of the peers.
The Trustees noted that a significant component of thenon-advisory fee expenses was the license fees paid by the Funds, and noted those Funds for which license fees are included in the Funds’ Expense Caps. The Trustees also noted that the Adviser has agreed to reimburse certain Funds in the amount equal to the licensing fee paid that causes that Fund’s annual operating expenses (excluding interest expenses, offering costs, brokerage commissions and other trading expenses, taxes, acquired fund fees and expenses and extraordinary expenses) to exceed a percentage of that Fund’s average daily net assets through April 6, 2020 (May 18, 2020 for Invesco BRIC ETF) as set forth below:
| | | | |
| Invesco BRIC ETF | | | 0.64 | % |
| Invesco Insider Sentiment ETF | | | 0.60 | % |
| Invesco S&PSpin-Off ETF | | | 0.64 | % |
| Invesco ZacksMid-Cap ETF | | | 0.65 | % |
| Invesco Zacks Multi-Asset Income ETF | | | 0.65 | % |
The Board concluded that the advisory fee and expense ratio of each Fund (giving effect to the Fund’s Expense Cap) were reasonable and appropriate in light of the services provided.
In conjunction with their review of fees, the Trustees considered information provided by the Adviser on the revenues received by the Adviser under the Investment Advisory Agreement for the Funds, as well as the fees waived and expenses reimbursed by the Adviser for the Funds. The Trustees reviewed information provided by the Adviser on its overall profitability, as well as the estimated profitability to the Adviser from its relationship to each Fund. The Trustees concluded that the overall and estimated profitability to the Adviser was not unreasonable.
Economies of Scale and Whether Fee Levels Reflect These Economies of Scale. The Trustees reviewed the information provided by the Adviser as to the extent to which economies of scale may be realized as each Fund grows and whether fee levels reflect economies of scale for the benefit of shareholders. The Trustees reviewed each Fund’s asset size, advisory fee, expense ratio and Expense Cap agreed to by the Adviser. The Trustees also noted that the Amended and Restated Excess Expense Agreement with the Trust provides that the Adviser is entitled to be reimbursed by each Fund, other than Invesco Dynamic Market ETF and Invesco DWA NASDAQ Momentum ETF, for fees waived or expenses absorbed pursuant to the Expense Cap for a period of three years from the date the fee or expense was incurred, provided that no reimbursement would be made that would result in a Fund exceeding its Expense Cap then in effect or in effect at the time the fees and/or expenses subject to reimbursement were waived and/or borne by the Adviser. The Trustees considered whether the advisory fee rate for each Fund was reasonable in relation to the asset size of that Fund, and concluded that the flat advisory fee was reasonable and appropriate.
Board Considerations Regarding Continuation of Investment Advisory Agreement(continued)
The Trustees noted that the Adviser had not identified any further benefits that it derived from its relationships with the Funds and had noted that it does not have any soft-dollar arrangements.
Based on all of the information considered and the conclusions reached, the Board, including the Independent Trustees, determined to approve the continuation of the Investment Advisory Agreement for each Fund. No single factor was determinative in the Board’s analysis.
Board Considerations Regarding Continuation of Investment Advisory Agreement(continued)
At a meeting held on April 11, 2019, the Board of Trustees of the Invesco Exchange-Traded Fund Trust (the “Trust”), including the Independent Trustees, approved the continuation of the Investment Advisory Agreement between Invesco Capital Management LLC (the “Adviser”) and the Trust for the following 24 series (each, a “Fund” and together, the “Funds”):
Invesco Dow Jones Industrial Average Dividend ETF
Invesco NASDAQ Internet ETF
Invesco Raymond JamesSB-1 Equity ETF
Invesco S&P 500 BuyWrite ETF
Invesco S&P 500®Equal Weight Consumer Discretionary ETF
Invesco S&P 500®Equal Weight Consumer Staples ETF
Invesco S&P 500®Equal Weight Energy ETF
Invesco S&P 500®Equal Weight ETF
Invesco S&P 500®Equal Weight Financials ETF
Invesco S&P 500®Equal Weight Health Care ETF
Invesco S&P 500®Equal Weight Industrials ETF
Invesco S&P 500®Equal Weight Materials ETF
Invesco S&P 500®Equal Weight Real Estate ETF
Invesco S&P 500®Equal Weight Technology ETF
Invesco S&P 500®Equal Weight Utilities ETF
Invesco S&P 500®Pure Growth ETF
Invesco S&P 500®Pure Value ETF
Invesco S&P 500®Top 50 ETF
Invesco S&P MidCap 400® Equal Weight ETF
Invesco S&P MidCap 400® Pure Growth ETF
Invesco S&P MidCap 400® Pure Value ETF
Invesco S&P SmallCap 600® Equal Weight ETF
Invesco S&P SmallCap 600® Pure Growth ETF
Invesco S&P SmallCap 600® Pure Value ETF
The Trustees reviewed information from the Adviser describing: (i) the nature, extent and quality of services provided, (ii) the investment performance of the Funds and the Adviser, (iii) the fees paid by the Funds and comparisons to amounts paid by other comparable registered investment companies, (iv) the costs of services provided and estimated profits realized by the Adviser, (v) the extent to which economies of scale may be realized as a Fund grows and whether fee levels reflect any possible economies of scale for the benefit of Fund shareholders, and (vi) any further benefits realized by the Adviser from its relationships with the Funds.
Nature, Extent and Quality of Services. In evaluating the nature, extent and quality of the Adviser’s services, the Trustees reviewed information concerning the functions performed by the Adviser for the Funds, information describing the Adviser’s current organization and staffing, including operational support provided by the Adviser’s parent organization, Invesco Ltd. (“Invesco”), and the background and experience of the persons responsible for theday-to-day management of the Funds. The Trustees reviewed matters related to the Adviser’s execution and/or oversight of execution of portfolio transactions on behalf of the Funds.
The Trustees also reviewed information on the performance of the Funds and their underlying indexes for theone-year, three-year,five-year,ten-year and since-inception periods ended December 31, 2018, as applicable, including reports for each of those periods on the correlation and tracking error between each Fund’s performance and the performance of its underlying index, as well as the Adviser’s analysis of the tracking error between the Funds and their underlying indexes. In reviewing the tracking error reports, the Trustees considered information provided by Invesco’s Global Performance Measurement and Risk Group, an independent organization within Invesco, with respect to general expected tracking error ranges. The Trustees also considered that certain Funds were created in connection with the purchase by Invesco of the exchange-traded funds business of Guggenheim Capital LLC (the “Transaction”) and that such Funds’ performance prior to the closing of the Transaction on April 6, 2018 is that of their predecessor Guggenheim ETFs. The Trustees noted that, for each applicable period, the correlation and tracking error for each Fund were within the targeted range set forth in the Trust’s registration statement and concluded that each Fund was correlated to its underlying index and that the tracking error for each Fund was within an acceptable range given that Fund’s particular circumstances.
The Trustees also considered the services provided by the Adviser in its oversight of the Funds’ administrator, custodian and transfer agent. They noted the significant amount of time, effort and resources that had been devoted to this oversight function.
Based on their review, the Trustees concluded that the nature, extent and quality of services provided by the Adviser to the Funds under the Investment Advisory Agreement were appropriate and reasonable.
Fees, Expenses and Profitability. The Trustees reviewed and discussed the information provided by the Adviser on each Fund’s net expense ratio and unitary advisory fee, as compared to information compiled by the Adviser from Lipper Inc. databases on the net expense ratios of comparable exchange-traded funds (“ETFs”),open-end(non-ETF) index funds andopen-end(non-ETF) actively-managed funds. The Trustees noted that the annual unitary advisory fee charged to each Fund is as follows, with the Adviser paying all
Board Considerations Regarding Continuation of Investment Advisory Agreement(continued)
other operating expenses of each Fund, except that each Fund pays its own distribution fees, if any, brokerage expenses, taxes, interest, litigation expenses, acquired fund fees and expenses, if any, and other extraordinary expenses:
| | ● | | 0.75% of the Fund’s average daily net assets for Invesco Raymond JamesSB-1 Equity ETF; |
| | ● | | 0.60% of the Fund’s average daily net assets for Invesco NASDAQ Internet ETF; |
| | ● | | 0.49% of the Fund’s average daily net assets for Invesco S&P 500 BuyWrite ETF (The Trustees noted that prior to July 1, 2018, the Fund’s annual unitary advisory fee was 0.75%.); |
| | ● | | 0.35% of the Fund’s average daily net assets for each of Invesco S&P 500® Pure Growth ETF, Invesco S&P 500® Pure Value ETF, Invesco S&P MidCap 400® Pure Growth ETF, Invesco S&P MidCap 400® Pure Value ETF, Invesco S&P SmallCap 600® Pure Growth ETF and Invesco S&P SmallCap 600® Pure Value ETF; |
| | ● | | 0.20% of the Fund’s average daily net assets for each of Invesco S&P 500® Equal Weight ETF and Invesco S&P 500® Top 50 ETF; |
| | ● | | 0.07% of the Fund’s average daily net assets for Invesco Dow Jones Industrial Average Dividend ETF (The Trustees noted that prior to September 24, 2018, the Fund’s annual unitary advisory fee was 0.30%.); and |
| | ● | | 0.40% of the Fund’s average daily net assets for each other Fund. |
The Trustees noted that the Adviser represented that it does not serve as the investment adviser to any clients, other than other ETFs also overseen by the Trustees, with comparable investment strategies as the Funds, but that it providessub-advisory services to other clients. The Trustees further noted the Adviser’s explanation with respect to thesub-advisory fees it receives for such services in comparison to the advisory fees charged to the Funds. The Trustees noted that the net expense ratios for certain Funds were equal to or lower than the median net expense ratios of their ETF andopen-end index peer funds as illustrated in the table below. The Trustees also noted that the net expense ratios for all of the Funds were lower than the median net expense ratios of theiropen-end actively-managed peer funds.
| | | | | | | | | | | | |
Invesco Fund | | Equal to/Lower
than ETF Median | | | Equal to/Lower
thanOpen-End
Index Fund
Median | | | Equal to/Lower
thanOpen-End
Active Fund
Median | |
| Invesco Dow Jones Industrial Average Dividend ETF | | | X | | | | X | | | | X | |
| Invesco NASDAQ Internet ETF | | | | | | | | | | | X | |
| Invesco Raymond JamesSB-1 Equity ETF | | | | | | | | | | | X | |
| Invesco S&P 500 BuyWrite ETF | | | X | | | | X | | | | X | |
| Invesco S&P 500®Equal Weight Consumer Discretionary ETF | | | X | | | | | | | | X | |
| Invesco S&P 500®Equal Weight Consumer Staples ETF | | | X | | | | | | | | X | |
| Invesco S&P 500®Equal Weight Energy ETF | | | X | | | | | | | | X | |
| Invesco S&P 500®Equal Weight ETF | | | X | | | | X | | | | X | |
| Invesco S&P 500®Equal Weight Financials ETF | | | X | | | | | | | | X | |
| Invesco S&P 500®Equal Weight Health Care ETF | | | X | | | | | | | | X | |
| Invesco S&P 500®Equal Weight Industrials ETF | | | X | | | | | | | | X | |
| Invesco S&P 500®Equal Weight Materials ETF | | | X | | | | | | | | X | |
| Invesco S&P 500®Equal Weight Real Estate ETF | | | X | | | | | | | | X | |
| Invesco S&P 500®Equal Weight Technology ETF | | | X | | | | | | | | X | |
| Invesco S&P 500®Equal Weight Utilities ETF | | | X | | | | X | | | | X | |
| Invesco S&P 500®Pure Growth ETF | | | X | | | | X | | | | X | |
| Invesco S&P 500®Pure Value ETF | | | | | | | | | | | X | |
| Invesco S&P 500®Top 50 ETF | | | X | | | | X | | | | X | |
| Invesco S&P MidCap 400® Equal Weight ETF | | | | | | | | | | | X | |
| Invesco S&P MidCap 400® Pure Growth ETF | | | | | | | X | | | | X | |
| Invesco S&P MidCap 400® Pure Value ETF | | | | | | | X | | | | X | |
| Invesco S&P SmallCap 600® Equal Weight ETF | | | | | | | | | | | X | |
Board Considerations Regarding Continuation of Investment Advisory Agreement(continued)
| | | | | | | | | | | | |
Invesco Fund | | Equal to/Lower
than ETF Median | | | Equal to/Lower
thanOpen-End
Index Fund
Median | | | Equal to/Lower
thanOpen-End
Active Fund
Median | |
| Invesco S&P SmallCap 600® Pure Growth ETF | | | | | | | X | | | | X | |
| Invesco S&P SmallCap 600® Pure Value ETF | | | | | | | X | | | | X | |
The Trustees determined that each Fund’s unitary advisory fee was reasonable, noting the nature of the indexes, the distinguishing factors of the Funds, and the administrative, operational and management oversight costs for the Adviser. The Trustees also noted that a portion of each Fund’s operating expenses was attributable to a license fee payable out of the unitary advisory fee charged to that Fund. The Board concluded that the unitary advisory fee charged to each Fund was reasonable and appropriate in light of the services provided.
In conjunction with their review of the unitary advisory fees, the Trustees considered information provided by the Adviser on the revenues received by the Adviser under the Investment Advisory Agreement for the Funds. The Trustees reviewed information provided by the Adviser on its overall profitability, as well as the estimated profitability to the Adviser from its relationship to each Fund. The Trustees concluded that the overall and estimated profitability to the Adviser was not unreasonable.
Economies of Scale and Whether Fee Levels Reflect These Economies of Scale. The Trustees reviewed the information provided by the Adviser as to the extent to which economies of scale may be realized as each Fund grows and whether fee levels reflect economies of scale for the benefit of shareholders. The Trustees reviewed each Fund’s asset size and unitary advisory fee. The Trustees noted that any reduction in fixed costs associated with the management of the Funds would be enjoyed by the Adviser, but a unitary advisory fee provides a level of certainty in expenses for the Funds. The Trustees considered whether the unitary advisory fee rate for each Fund was reasonable in relation to the asset size of that Fund, and concluded that the unitary advisory fee was reasonable and appropriate.
The Trustees noted that the Adviser had not identified any further benefits that it derived from its relationships with the Funds and had noted that it does not have any soft-dollar arrangements.
Based on all of the information considered and the conclusions reached, the Board, including the Independent Trustees, determined to approve the continuation of the Investment Advisory Agreement for each Fund. No single factor was determinative in the Board’s analysis.
Proxy Voting Policies and Procedures
A description of the Trust’s proxy voting policies and procedures that the Funds use to determine how to vote proxies relating to portfolio securities is available, without charge and upon request, by calling(800) 983-0903. This information is also available on the Securities and Exchange Commission’s (the “Commission”) website atwww.sec.gov.
Information regarding how each Fund voted proxies for portfolio securities, if applicable, during the most recent 12-month period ended June 30, is available, without charge and upon request, by (i) calling(800) 983-0903; or (ii) accessing the Trust’sForm N-PX on the Commission’s website atwww.sec.gov.
Quarterly Portfolios
The Trust files its complete schedule of portfolio holdings for the Funds with the Commission for the first and third quarters of each fiscal year onForm N-Q (or any successor Form). The Trust’sForms N-Q (or any successor Form) are available on the Commission’s website atwww.sec.gov.
Frequency Distribution of Discounts and Premiums
A table showing the number of days the market price of each Fund’s shares was greater than the Fund’s net asset value, and the number of days it was less than the Fund’s net asset value (i.e., premium or discount) for the most recently completed calendar year, and the calendar quarters since that year end (or the life of the Fund, if shorter) may be found at the Fund’s website atwww.invesco.com/ETFs.
| | | | |
©2019 Invesco Capital Management LLC 3500 Lacey Road, Suite 700 Downers Grove, IL 60515 | | P-PS-AR-3 | | invesco.com/ETFs |

Invesco Annual Report to Shareholders
April 30, 2019
| | |
| |
| RSP | | Invesco S&P 500® Equal Weight ETF |
| |
| EWCO | | Invesco S&P 500® Equal Weight Communication Services ETF |
| |
| RCD | | Invesco S&P 500® Equal Weight Consumer Discretionary ETF |
| |
| RHS | | Invesco S&P 500® Equal Weight Consumer Staples ETF |
| |
| RYE | | Invesco S&P 500® Equal Weight Energy ETF |
| |
| RYF | | Invesco S&P 500® Equal Weight Financials ETF |
| |
| RYH | | Invesco S&P 500® Equal Weight Health Care ETF |
| |
| RGI | | Invesco S&P 500® Equal Weight Industrials ETF |
| |
| RTM | | Invesco S&P 500® Equal Weight Materials ETF |
| |
| EWRE | | Invesco S&P 500® Equal Weight Real Estate ETF |
| |
| RYT | | Invesco S&P 500® Equal Weight Technology ETF |
| |
| RYU | | Invesco S&P 500® Equal Weight Utilities ETF |
| |
| EWMC | | Invesco S&P MidCap 400® Equal Weight ETF |
| |
| EWSC | | Invesco S&P SmallCap 600® Equal Weight ETF |
Beginning on January 1, 2021, as permitted by regulations adopted by the Securities and Exchange Commission, paper copies of the Funds’ shareholder reports will no longer be sent by mail, unless you specifically request paper copies of the reports from your financial intermediary, such as a broker-dealer or bank. Instead, the reports will be made available on a website, and you will be notified by mail each time a report is posted and provided with a website link to access the report.
If you already elected to receive shareholder reports electronically, you will not be affected by this change and you need not take any action. If you hold accounts through a financial intermediary, you may contact your financial intermediary to enroll in electronic delivery. Please note that not all financial intermediaries may offer this service.
You may elect to receive all future reports in paper free of charge. If you hold accounts through a financial intermediary, you can follow the instructions included with this disclosure, if applicable, or contact your financial intermediary to request that you continue to receive paper copies of your shareholder reports. Please note that not all financial intermediaries may offer this service. Your election to receive reports in paper will apply to all funds held with your financial intermediary.
Table of Contents
The Market Environment
Domestic Equity
The fiscal year proved to be an increasingly volatile time for U.S. equities. Throughout the summer, U.S. equities moved higher as corporate profits surged amid the benefit of corporate tax cuts and improving global economic growth. Several U.S. equity indexes reached new highs despite potential headwinds, including trade tensions, tariff announcements and contagion concerns over a Turkish currency crisis. After a relatively quiet summer, market volatility noticeably rose in October 2018, as U.S. equity markets suffered a sharpsell-off throughyear-end 2018, amid ongoing trade concerns between the U.S. and China, fears of a global economic slowdown and lower oil prices from a supply glut, with oil prices plummeting from near $75 per barrel in early October 2018 to around $45 per barrel in late December 2018.1 In this environment, there was a flight to safety, as investors fled to defensive areas of the markets, such as health care, utilities and U.S. Treasuries.
Given signs of a strong economy, the U.S. Federal Reserve (the “Fed”) raised interest rates three times during the fiscal year: in June, September and December 2018. Following December’s Fed meeting, the Fed raised interest rates by 25 basis points to a targeted range of 2.25% to 2.50%, which signaled a slightly more dovish stance than expected.2 In contrast, the European Central Bank and central banks in several other countries maintained extraordinarily accommodative monetary policies.
Equity markets rebounded at the start of 2019, fueled by optimism about a potential U.S.-China trade deal and the Fed’s indication that there would be no interest rate hikes in 2019, a surprising shift in monetary policy. The Fed’s more accommodative stance provided a supportive environment for equities and fixed income, even as U.S. economic data were mixed and overseas growth appeared to be slowing. By the end of the fiscal year, the U.S. equity market generally recovered the losses from fourth quarter 2018, backed by improving investor sentiment, low unemployment and a growing economy.
| 2 | Source: U.S. Federal Reserve |
| | |
| RSP | | Manager’s Analysis |
| | Invesco S&P 500® Equal Weight ETF (RSP) |
As an index fund, the Invesco S&P 500® Equal Weight ETF (the “Fund”) is passively managed and seeks to track the returns of an underlying index. The Fund seeks to track the investment results (before fees and expenses) of the S&P 500® Equal Weight Index (the “Index”). The Fund will generally invest at least 90% of its total assets in the securities that comprise the Index.
Strictly in accordance with its guidelines and mandated procedures, S&P Dow Jones Indices LLC (“S&P DJI” or the “Index Provider”) compiles, maintains and calculates the Index, which is an equal-weighted version of the S&P 500® Index. Unlike the S&P 500® Index, which employs a market capitalization weighted methodology, the Index is equal weighted, meaning that the Index Provider assigns each component security the same weight in the Index. The Fund generally invests in all of the securities comprising the Index in proportion to their weightings in the Index.
For the fiscal year ended April 30, 2019, on a market price basis, the Fund returned 10.43%. On a net asset value (“NAV”) basis, the Fund returned 10.45%. During the same time period, the Index returned 10.62%. During the fiscal year, the Fund fully replicated the components of the Index; therefore, the Fund’s performance, on a NAV basis, differed from the return of the Index primarily due to fees and operating expenses that the Fund incurred during the period.
During this same time period, the S&P 500® Index (the “Benchmark Index”) returned 13.49%. The Benchmark Index is an unmanaged index weighted by market capitalization based on the average performance of approximately 505 equity securities. The Benchmark Index was selected for its recognition in the marketplace, and its performance comparison is a useful measure for investors as a broad representation of the U.S. equity market.
The performance of the Fund differed from the Benchmark Index in part because the Fund seeks to track an Index that employs an equal weighted methodology, whereas the Benchmark Index weights stocks based primarily on market capitalization.
Relative to the Benchmark Index, the Fund was most overweight in the industrials sector and most underweight in the information technology sector during the fiscal year ended April 30, 2019. The majority of the Fund’s underperformance relative to the Benchmark Index during that period can be attributed to the Fund being underweight in the information technology sector.
For the fiscal year ended April 30, 2019, the information technology sector contributed most significantly to the Fund’s return, followed by the consumer discretionary and industrials sectors, respectively. The energy and communications services sectors were the only detracting sectors from the Fund’s return.
Positions that contributed most significantly to the Fund’s return for the fiscal year ended April 30, 2019, included Advanced Micro Devices, Inc., an information technology company (portfolio
average weight of 0.22%) and Xilinx, Inc., an information technology company (portfolio average weight of 0.21%). Positions that detracted most significantly from the Fund’s return during this period included PG&E Corp., a utilities company (no longer held at fiscalyear-end) and Nektar Therapeutics, a health care company (portfolio average weight of 0.18%).
| | | | |
Sector Breakdown
(% of the Fund’s Net Assets)
as of April 30, 2019 | |
| Information Technology | | | 14.2 | |
| Industrials | | | 14.1 | |
| Financials | | | 13.6 | |
| Consumer Discretionary | | | 12.6 | |
| Health Care | | | 11.8 | |
| Consumer Staples | | | 6.7 | |
| Real Estate | | | 6.1 | |
| Energy | | | 5.9 | |
| Utilities | | | 5.4 | |
| Materials | | | 5.1 | |
| Communication Services | | | 4.4 | |
| Money Market Funds Plus Other Assets Less Liabilities | | | 0.1 | |
|
Top Ten Fund Holdings*
(% of the Fund’s Net Assets)
as of April 30, 2019 | |
| Security | | | | |
| Anadarko Petroleum Corp. | | | 0.3 | |
| QUALCOMM, Inc. | | | 0.3 | |
| Align Technology, Inc. | | | 0.3 | |
| Conagra Brands, Inc. | | | 0.3 | |
| CarMax, Inc. | | | 0.3 | |
| Twitter, Inc. | | | 0.3 | |
| Pioneer Natural Resources Co. | | | 0.2 | |
| Constellation Brands, Inc., Class A | | | 0.2 | |
| Noble Energy, Inc. | | | 0.2 | |
| Advanced Micro Devices, Inc. | | | 0.2 | |
| Total | | | 2.6 | |
| * | Excluding money market fund holdings. |
Invesco S&P 500® Equal Weight ETF (RSP)(continued)
Growth of a $10,000 Investment
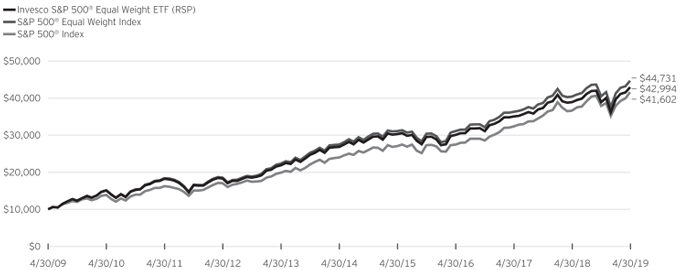
Fund Performance History as of April 30, 2019
| | | | | | | | | | | | | | | | | | | | | | | | | | | | | | | | | | | | | | | | |
| | | 1 Year | �� | | 3 Years
Average
Annualized | | | 3 Years
Cumulative | | | 5 Years
Average
Annualized | | | 5 Years
Cumulative | | | 10 Years
Average
Annualized | | | 10 Years
Cumulative | | | | | | Fund Inception | |
Index | | | | | Average
Annualized | | | Cumulative | |
| S&P 500® Equal Weight Index | | | 10.62 | % | | | 12.90 | % | | | 43.89 | % | | | 10.22 | % | | | 62.66 | % | | | 16.16 | % | | | 347.31 | % | | | | | | | 11.62 | % | | | 481.77 | % |
| S&P 500® Index | | | 13.49 | | | | 14.87 | | | | 51.58 | | | | 11.63 | | | | 73.32 | | | | 15.32 | | | | 316.02 | | | | | | | | 9.82 | | | | 348.63 | |
| Fund | | | | | | | | | | | | | | | | | | | | | | | | | | | | | | | | | | | | | | | | |
| NAV Return | | | 10.45 | | | | 12.59 | | | | 42.74 | | | | 9.86 | | | | 60.05 | | | | 15.70 | | | | 329.94 | | | | | | | | 11.10 | | | | 439.70 | |
| Market Price Return | | | 10.43 | | | | 12.58 | | | | 42.68 | | | | 9.86 | | | | 59.99 | | | | 15.69 | | | | 329.63 | | | | | | | | 11.10 | | | | 439.80 | |
Guggenheim S&P 500® Equal Weight ETF (the “Predecessor Fund”) Inception: April 24, 2003
Performance quoted above represents past performance. Past performance is not a guarantee of future results and current performance may be higher or lower than performance quoted. Investment returns and principal value will fluctuate, and shares of the Fund (“Fund Shares”), when redeemed or sold, may be worth more or less than their original cost. Fund performance reflects any applicable fee waivers and/or expense reimbursements. Had the adviser not waived fees and/or reimbursed expenses currently or in the past, returns would have been lower. See current prospectus for more information. According to the Fund’s current prospectus, the total annual operating expense ratio was indicated as 0.20%. The Financial Highlights section of the Shareholder Report presents the expense ratios based on expenses incurred during the period covered by this report. NAV and Market Price returns assume that dividends and capital gain distributions have been reinvested in the Fund at NAV and Market Price, respectively. The returns shown in the table above do not reflect the deduction of taxes that a shareholder would pay on Fund distributions or the redemption or sale of Fund Shares. See invesco.com/ETFs to find the most recentmonth-end performance numbers.
Index and Benchmark Index performance results are based upon a hypothetical investment in their respective constituent securities. Index and Benchmark Index returns do not represent Fund returns. An investor cannot invest directly in an index. The Index and Benchmark Index do not charge management fees or brokerage expenses, and no such fees or expenses were deducted from the hypothetical performance shown. In addition, the results actual investors might have achieved would have differed from those shown because of differences in the timing, amounts of their investments, and fees and expenses associated with an investment in the Fund.
Notes Regarding Indexes and Fund Performance History:
| - | Average Annualized and Cumulative Inception returns for the Fund, Index and Benchmark Index are based on the inception date of the Predecessor Fund. |
| - | Effective after the close of business on April 6, 2018, the Predecessor Fund was reorganized into the Fund. Returns shown are blended returns of the Predecessor Fund and the Fund. |
| | |
| EWCO | | Manager’s Analysis |
| | Invesco S&P 500® Equal Weight Communication Services ETF (EWCO) |
As an index fund, the Invesco S&P 500® Equal Weight Communication Services ETF (the “Fund”) is passively managed and seeks to track the returns of an underlying index. The Fund seeks to track the investment results (before fees and expenses) of the S&P 500® Equal Weight Communication Services Plus Index (the “Index”). The Fund generally will invest at least 90% of its total assets in the securities that comprise the Index.
Strictly in accordance with its guidelines and mandated procedures, S&P Dow Jones Indices LLC (“S&P DJI” or the “Index Provider”) compiles, maintains and calculates the Index, which is comprised of common stocks of companies in the communication services sector. The Index Provider defines sectors according to the Global Industry Classification Standard (“GICS”). The communication services sector includes companies that facilitate communication or offer related content and information through various types of media and is comprised of companies from the following industries: diversified telecommunications services; wireless telecommunication services; media; entertainment; and interactive media & services. In the event there are fewer than 22 securities eligible for inclusion in the Index at the quarterly rebalance, the Index will be supplemented with the largest communication services companies in the S&P MidCap 400 Index based on float-adjusted market capitalization until the 22 security minimum is reached. Any supplementary companies that are added to the Index will remain in the Index until the next quarterly rebalance.
Unlike the S&P 500® Communication Services Index, which employs a market capitalization weighted methodology, the Index is equally weighted, meaning that the Index Provider assigns each component security the same weight in the Index. The Fund employs a “full replication” methodology in seeking to track the Index, meaning that the Fund generally invests in all of the securities comprising the Index in proportion to their weightings in the Index.
During the fiscal period from the Fund’s inception (November 7, 2018) through April 30, 2019, on a market price basis, the Fund returned 0.04%. On a net asset value (“NAV”) basis, the Fund returned 0.08%. During the same time period, the Index returned 0.24%. During the fiscal period, the Fund fully replicated the components of the Index; therefore, the Fund’s performance, on a NAV basis, differed from the return of the Index primarily due to fees and operating expenses that the Fund incurred during the period.
During this same time period, the S&P 500® Index (the “Benchmark Index”) returned 5.76%. The Benchmark Index is an unmanaged index weighted by market capitalization based on the average performance of approximately 505 equity securities. The Benchmark Index was selected for its recognition in the marketplace, and its performance comparison is a useful measure for investors as a broad representation of the U.S. equity market.
The performance of the Fund differed from the Benchmark Index in part because the Fund seeks to track an Index that employs an equal weighted methodology, whereas the Benchmark Index weights stocks based primarily on market capitalization.
Relative to the Benchmark Index, the Fund was most overweight in the mediasub-industry and most underweight in the pharmaceuticalssub-industry during the fiscal year ended April 30, 2019. The majority of the Fund’s underperformance relative to the Benchmark Index during that period can be attributed to the Fund having an overweight allocation to diversified telecommunication services and entertainmentsub-industries.
For the fiscal year ended April 30, 2019, the interactive media & servicessub-industry contributed most significantly to the Fund’s return, followed by the mediasub-industry. The diversified telecommunicationsub-industry is the onlysub-industry that detracted from the Fund’s return.
Positions that contributed most significantly to the Fund’s return for the fiscal year ended April 30, 2019, included Netflix, Inc., a movies & entertainment company (portfolio average weight of 4.85%) and Facebook, Inc., Class A, an interactive media & services company (portfolio average weight of 4.57%). Positions that detracted most significantly from the Fund’s return during this period included CenturyLink, Inc., an alternative carriers company (portfolio average weight of 3.96%) andTake-Two Interactive Software, Inc., an interactive home entertainment company (portfolio average weight of 4.30%).
| | | | |
Industry Breakdown
(% of the Fund’s Net Assets)
as of April 30, 2019 | |
| Media | | | 40.3 | |
| Entertainment | | | 27.5 | |
| Interactive Media & Services | | | 19.4 | |
| Diversified Telecommunication Services | | | 12.6 | |
| Money Market Funds Plus Other Assets Less Liabilities | | | 0.2 | |
Invesco S&P 500® Equal Weight Communication Services ETF (EWCO)(continued)
| | | | |
Top Ten Fund Holdings*
(% of the Fund’s Net Assets)
as of April 30, 2019 | |
| Security | | | | |
| Twitter, Inc. | | | 5.7 | |
| Walt Disney Co. (The) | | | 5.1 | |
| Activision Blizzard, Inc. | | | 4.9 | |
| Comcast Corp., Class A | | | 4.8 | |
| Facebook, Inc., Class A | | | 4.8 | |
| Take-Two Interactive Software, Inc. | | | 4.7 | |
| DISH Network Corp., Class A | | | 4.7 | |
| Charter Communications, Inc., Class A | | | 4.7 | |
| Omnicom Group, Inc. | | | 4.6 | |
| Netflix, Inc. | | | 4.5 | |
| Total | | | 48.5 | |
| * | Excluding money market fund holdings. |
Growth of a $10,000 Investment Since Inception

Fund Performance History as of April 30, 2019
| | | | |
| | | Fund Inception | |
Index | | Cumulative | |
| S&P 500® Equal Weight Communication Services Plus Index | | | 0.24 | % |
| S&P 500® Index | | | 5.76 | |
| Fund | | | | |
| NAV Return | | | 0.08 | |
| Market Price Return | | | 0.04 | |
Invesco S&P 500® Equal Weight Communication Services ETF (EWCO)(continued)
Fund Inception: November 7, 2018
Investment returns and principal value will fluctuate, and shares of the Fund (“Fund Shares”), when redeemed or sold, may be worth more or less than their original cost. Fund performance reflects any applicable fee waivers and/or expense reimbursements. Had the adviser not waived fees and/or reimbursed expenses currently or in the past, returns would have been lower. See current prospectus for more information. According to the Fund’s current prospectus, the total annual operating expense ratio was indicated as 0.40%. The Financial Highlights section of the Shareholder Report presents the expense ratios based on expenses incurred during the period covered by this report. NAV and Market Price returns assume that dividends and capital gain distributions have been reinvested in the Fund at NAV and Market Price, respectively. The returns shown in the table above do not reflect the deduction of taxes that a shareholder would pay on Fund distributions or the redemption or sale of Fund Shares. See invesco.com/ETFs to find the most recentmonth-end performance numbers.
Index and Benchmark Index performance results are based upon a hypothetical investment in their respective constituent securities. Index and Benchmark Index returns do not represent Fund returns. An investor cannot invest directly in an index. The Index and Benchmark Index do not charge management fees or brokerage expenses, and no such fees or expenses were deducted from the hypothetical performance shown. In addition, the results actual investors might have achieved would have differed from those shown because of differences in the timing, amounts of their investments, and fees and expenses associated with an investment in the Fund.
Notes Regarding Indexes and Fund Performance History:
| - | Cumulative Inception returns for the Fund, Index and Benchmark Index are based on the inception date of the Fund. |
| | |
| RCD | | Manager’s Analysis |
| | Invesco S&P 500® Equal Weight Consumer Discretionary ETF (RCD) |
As an index fund, the Invesco S&P 500® Equal Weight Consumer Discretionary ETF (the “Fund”) is passively managed and seeks to track the returns of an underlying index. The Fund seeks to track the investment results (before fees and expenses) of the S&P 500® Equal Weight Consumer Discretionary Index (the “Index”). The Fund generally will invest at least 90% of its total assets in the securities that comprise the Index.
Strictly in accordance with its guidelines and mandated procedures, S&P Dow Jones Indices LLC (“S&P DJI” or the “Index Provider”) compiles, maintains and calculates the Index, which is comprised of common stocks of companies in the consumer discretionary sector of the S&P 500® Index. The Index Provider defines sectors according to the Global Industry Classification Standard (“GICS”). The manufacturing segment of the consumer discretionary sector includes automotive, household durable goods, leisure equipment, and textiles and apparel, and the services segment of the consumer discretionary sector includes hotels, restaurants and other leisure facilities, media production and services, and consumer retailing and services.
Unlike the S&P 500® Consumer Discretionary Index, which employs a market capitalization weighted methodology, the Index is equal weighted, meaning that the Index Provider assigns each component security the same weight in the Index. The Fund generally invests in all of the securities comprising the Index in proportion to their weightings in the Index.
For the fiscal year ended April 30, 2019, on a market price basis, the Fund returned 10.61%. On a net asset value (“NAV”) basis, the Fund returned 10.58%. During the same time period, the Index returned 10.98%. During the fiscal year, the Fund fully replicated the components of the Index; therefore, the Fund’s performance, on a NAV basis, differed from the return of the Index primarily due to fees and operating expenses that the Fund incurred during the period.
During this same time period, the S&P 500® Index (the “Benchmark Index”) returned 13.49%. The Benchmark Index is an unmanaged index weighted by market capitalization based on the average performance of approximately 505 equity securities. The Benchmark Index was selected for its recognition in the marketplace, and its performance comparison is a useful measure for investors as a broad representation of the U.S. equity market.
The performance of the Fund differed from the Benchmark Index in part because the Fund seeks to track an Index that employs an equal weighted methodology, whereas the Benchmark Index weights stocks based primarily on market capitalization.
Relative to the Benchmark Index, the Fund was most overweight in the apparel, accessories & luxury goodssub-industry and most underweight in the pharmaceuticalssub-industry during the fiscal year ended April 30, 2019. The majority of the Fund’s underperformance relative to the Benchmark Index during that
period can be attributed to the Fund being overweight in the systems softwaresub-industry.
For the fiscal year ended April 30, 2019, the restaurantssub-industry contributed most significantly to the Fund’s return, followed by the automotive retail and specialty storessub-industries, respectively. The housewares & specialtiessub-industry detracted most significantly from the Fund’s return, followed by the home furnishingssub-industry.
Positions that contributed most significantly to the Fund’s return for the fiscal year ended April 30, 2019, included Chipotle Mexican Grill, Inc., a restaurants company (portfolio average weight of 1.60%) and AutoZone, Inc., an automotive retail company (portfolio average weight of 1.54%). Positions that detracted most significantly from the Fund’s return during this period included Newell Brands Inc., a housewares & specialties company (portfolio average weight of 1.37%) and Tapestry, Inc., an apparel, accessories & luxury goods company (portfolio average weight of 1.39%).
| | | | |
Industry Breakdown
(% of the Fund’s Net Assets)
as of April 30, 2019 | |
| Specialty Retail | | | 24.5 | |
| Hotels, Restaurants & Leisure | | | 19.3 | |
| Textiles, Apparel & Luxury Goods | | | 12.5 | |
| Household Durables | | | 12.2 | |
| Multiline Retail | | | 9.2 | |
| Internet & Direct Marketing Retail | | | 6.6 | |
| Automobiles | | | 4.8 | |
| Auto Components | | | 3.2 | |
| Distributors | | | 3.1 | |
| Leisure Products | | | 3.0 | |
| Diversified Consumer Services | | | 1.6 | |
Money Market Funds Plus Other Assets Less Liabilities | | | 0.0 | |
Invesco S&P 500® Equal Weight Consumer Discretionary ETF (RCD)(continued)
| | | | |
Top Ten Fund Holdings*
(% of the Fund’s Net Assets)
as of April 30, 2019 | |
| Security | | | | |
| CarMax, Inc. | | | 2.0 | |
| Ford Motor Co. | | | 1.8 | |
| Wynn Resorts, Ltd. | | | 1.8 | |
| Amazon.com, Inc. | | | 1.8 | |
| Hasbro, Inc. | | | 1.7 | |
| PVH Corp. | | | 1.7 | |
| Tractor Supply Co. | | | 1.7 | |
| Tiffany & Co. | | | 1.7 | |
| PulteGroup, Inc. | | | 1.7 | |
| Lowe’s Cos., Inc. | | | 1.7 | |
| Total | | | 17.6 | |
| * | Excluding money market fund holdings. |
Growth of a $10,000 Investment
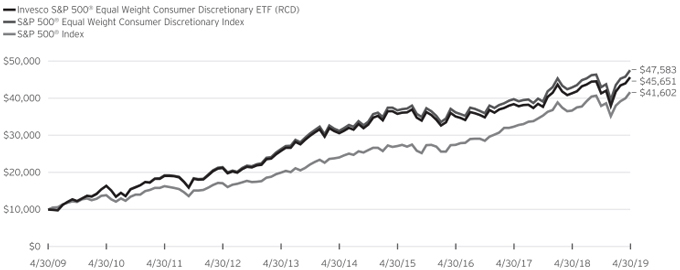
Fund Performance History as of April 30, 2019
| | | | | | | | | | | | | | | | | | | | | | | | | | | | | | | | | | | | | | | | |
| | | 1 Year | | | 3 Years
Average
Annualized | | | 3 Years
Cumulative | | | 5 Years
Average
Annualized | | | 5 Years
Cumulative | | | 10 Years
Average
Annualized | | | 10 Years
Cumulative | | | | | | Fund Inception | |
| Index | | | | | Average
Annualized | | | Cumulative | |
| S&P 500® Equal Weight Consumer Discretionary Index | | | 10.98 | % | | | 9.56 | % | | | 31.52 | % | | | 8.78 | % | | | 52.32 | % | | | 16.88 | % | | | 375.83 | % | | | | | | | 9.11 | % | | | 197.41 | % |
| S&P 500® Index | | | 13.49 | | | | 14.87 | | | | 51.58 | | | | 11.63 | | | | 73.32 | | | | 15.32 | | | | 316.02 | | | | | | | | 8.61 | | | | 180.61 | |
| Fund | | | | | | | | | | | | | | | | | | | | | | | | | | | | | | | | | | | | | | | | |
| NAV Return | | | 10.58 | | | | 9.16 | | | | 30.08 | | | | 8.37 | | | | 49.46 | | | | 16.40 | | | | 356.51 | | | | | | | | 8.64 | | | | 181.56 | |
| Market Price Return | | | 10.61 | | | | 9.19 | | | | 30.17 | | | | 8.39 | | | | 49.59 | | | | 16.40 | | | | 356.55 | | | | | | | | 8.64 | | | | 181.60 | |
Invesco S&P 500® Equal Weight Consumer Discretionary ETF (RCD)(continued)
Guggenheim S&P 500® Equal Weight Consumer Discretionary ETF (the “Predecessor Fund”) Inception: November 1, 2006
Performance quoted above represents past performance. Past performance is not a guarantee of future results and current performance may be higher or lower than performance quoted. Investment returns and principal value will fluctuate, and shares of the Fund (“Fund Shares”), when redeemed or sold, may be worth more or less than their original cost. Fund performance reflects any applicable fee waivers and/or expense reimbursements. Had the adviser not waived fees and/or reimbursed expenses currently or in the past, returns would have been lower. See current prospectus for more information. According to the Fund’s current prospectus, the total annual operating expense ratio was indicated as 0.40%. The Financial Highlights section of the Shareholder Report presents the expense ratios based on expenses incurred during the period covered by this report. NAV and Market Price returns assume that dividends and capital gain distributions have been reinvested in the Fund at NAV and Market Price, respectively. The returns shown in the table above do not reflect the deduction of taxes that a shareholder would pay on Fund distributions or the redemption or sale of Fund Shares. See invesco.com/ETFs to find the most recentmonth-end performance numbers.
Index and Benchmark Indexes performance results are based upon a hypothetical investment in their respective constituent securities. Index and Benchmark Indexes returns do not represent Fund returns. An investor cannot invest directly in an index. The Index and Benchmark Indexes do not charge management fees or brokerage expenses, and no such fees or expenses were deducted from the hypothetical performance shown. In addition, the results actual investors might have achieved would have differed from those shown because of differences in the timing, amounts of their investments, and fees and expenses associated with an investment in the Fund.
Notes Regarding Indexes and Fund Performance History:
| - | Average Annualized and Cumulative Inception returns for the Fund, Index and Benchmark Index are based on the inception date of the Predecessor Fund. |
| - | Effective after the close of business on April 6, 2018, the Predecessor Fund was reorganized into the Fund. Returns shown are blended returns of the Predecessor Fund and the Fund. |
| | |
| RHS | | Manager’s Analysis |
| | Invesco S&P 500® Equal Weight Consumer Staples ETF (RHS) |
As an index fund, the Invesco S&P 500® Equal Weight Consumer Staples ETF (the “Fund”) is passively managed and seeks to track the returns of an underlying index. The Fund seeks to track the investment results (before fees and expenses) of the S&P 500® Equal Weight Consumer Staples Index (the “Index”). The Fund generally will invest at least 90% of its total assets in the securities that comprise the Index.
Strictly in accordance with its guidelines and mandated procedures, S&P Dow Jones Indices LLC (“S&P DJI” or the “Index Provider”) compiles, maintains and calculates the Index, which is comprised of common stocks of companies in the consumer staples sector of the S&P 500® Index. The Index Provider defines sectors according to the Global Industry Classification Standard (“GICS”). The consumer staples sector includes manufacturers and distributors of food, beverages and tobacco, producers ofnon-durable household goods and personal products, food and drug retailing companies and consumer super centers.
Unlike the S&P 500® Consumer Staples Index, which employs a market capitalization weighted methodology, the Index is equal weighted, meaning that the Index Provider assigns each component security the same weight in the Index. The Fund generally invests in all of the securities comprising the Index in proportion to their weightings in the Index.
For the fiscal year ended April 30, 2019, on a market price basis, the Fund returned 12.67%. On a net asset value (“NAV”) basis, the Fund returned 12.63%. During the same time period, the Index returned 13.05%. During the fiscal year, the Fund fully replicated the components of the Index; therefore, the Fund’s performance, on a NAV basis, differed from the return of the Index primarily due to fees and operating expenses that the Fund incurred during the period.
During this same time period, the S&P 500® Index (the “Benchmark Index”) returned 13.49%. The Benchmark Index is an unmanaged index weighted by market capitalization based on the average performance of approximately 505 equity securities. The Benchmark Index was selected for its recognition in the marketplace, and its performance comparison is a useful measure for investors as a broad representation of the U.S. equity market.
The performance of the Fund differed from the Benchmark Index in part because the Fund seeks to track an Index that employs an equal weighted methodology, whereas the Benchmark Index weights stocks based primarily on market capitalization.
Relative to the Benchmark Index, the Fund was most overweight in the packaged foods & meatssub-industry and most underweight in the interactive media & servicessub-industry during the fiscal year ended April 30, 2019. The majority of the Fund’s underperformance relative to the Benchmark Index during that period can be attributed to the Fund being underweight in the systems softwaresub-industry.
For the fiscal year ended April 30, 2019, the household productssub-industry contributed most significantly to the Fund’s return, followed by the packaged foods & meats and soft drinkssub-industries, respectively. The drug retailsub-industry detracted most significantly from the Fund’s return, followed by the distillers & vintnerssub-industry.
Positions that contributed most significantly to the Fund’s return for the fiscal year ended April 30, 2019, included Church & Dwight Co., Inc., a household products company (portfolio average weight of 3.21%) and Procter & Gamble Co., a household products company (portfolio average weight of 3.14%). Positions that detracted most significantly from the Fund’s return during this period included Kraft Heinz Co. (The), a food products company (portfolio average weight of 2.90%) and Walgreens Boots Alliance, Inc., a drug retail company (portfolio average weight of 3.07%).
| | | | |
Industry Breakdown
(% of the Fund’s Net Assets)
as of April 30, 2019 | |
| Food Products | | | 40.3 | |
| Beverages | | | 18.5 | |
| Household Products | | | 15.3 | |
| Food & Staples Retailing | | | 14.4 | |
| Personal Products | | | 5.8 | |
| Tobacco | | | 5.5 | |
| Money Market Funds Plus Other Assets Less Liabilities | | | 0.2 | |
|
Top Ten Fund Holdings*
(% of the Fund’s Net Assets)
as of April 30, 2019 | |
| Security | | | | |
| Conagra Brands, Inc. | | | 3.8 | |
| Constellation Brands, Inc., Class A | | | 3.6 | |
| JM Smucker Co. (The) | | | 3.4 | |
| Tyson Foods, Inc., Class A | | | 3.4 | |
| Church & Dwight Co., Inc. | | | 3.2 | |
| McCormick & Co, Inc. | | | 3.1 | |
| Hershey Co. (The) | | | 3.1 | |
| Colgate-Palmolive Co. | | | 3.1 | |
| PepsiCo, Inc. | | | 3.1 | |
| Kimberly-Clark Corp. | | | 3.1 | |
| Total | | | 32.9 | |
| * | Excluding money market fund holdings. |
Invesco S&P 500® Equal Weight Consumer Staples ETF (RHS)(continued)
Growth of a $10,000 Investment
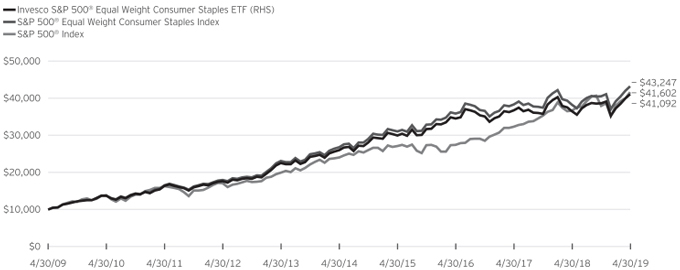
Fund Performance History as of April 30, 2019
| | | | | | | | | | | | | | | | | | | | | | | | | | | | | | | | | | | | | | | | |
| | | 1 Year | | | 3 Years Average
Annualized | | | 3 Years Cumulative | | | 5 Years Average
Annualized | | | 5 Years Cumulative | | | 10 Years Average
Annualized | | | 10 Years Cumulative | | | | | | Fund Inception | |
| Index | | | | | Average
Annualized | | | Cumulative | |
| S&P 500® Equal Weight Consumer Staples Index | | | 13.05 | % | | | 6.41 | % | | | 20.48 | % | | | 10.01 | % | | | 61.16 | % | | | 15.77 | % | | | 332.47 | % | | | | | | | 11.38 | % | | | 284.53 | % |
| S&P 500® Index | | | 13.49 | | | | 14.87 | | | | 51.58 | | | | 11.63 | | | | 73.32 | | | | 15.32 | | | | 316.02 | | | | | | | | 8.61 | | | | 180.61 | |
| Fund | | | | | | | | | | | | | | | | | | | | | | | | | | | | | | | | | | | | | | | | |
| NAV Return | | | 12.63 | | | | 5.98 | | | | 19.04 | | | | 9.55 | | | | 57.77 | | | | 15.18 | | | | 310.92 | | | | | | | | 10.81 | | | | 260.86 | |
| Market Price Return | | | 12.67 | | | | 5.98 | | | | 19.03 | | | | 9.54 | | | | 57.73 | | | | 15.20 | | | | 311.47 | | | | | | | | 10.82 | | | | 261.00 | |
Guggenheim S&P 500® Equal Weight Consumer Staples ETF (the “Predecessor Fund”) Inception: November 1, 2006
Performance quoted above represents past performance. Past performance is not a guarantee of future results and current performance may be higher or lower than performance quoted. Investment returns and principal value will fluctuate, and shares of the Fund (“Fund Shares”), when redeemed or sold, may be worth more or less than their original cost. Fund performance reflects any applicable fee waivers and/or expense reimbursements. Had the adviser not waived fees and/or reimbursed expenses currently or in the past, returns would have been lower. See current prospectus for more information. According to the Fund’s current prospectus, the total annual operating expense ratio was indicated as 0.40%. The Financial Highlights section of the Shareholder Report presents the expense ratios based on expenses incurred during the period covered by this report. NAV and Market Price returns assume that dividends and capital gain distributions have been reinvested in the Fund at NAV and Market Price, respectively. The returns shown in the table above do not reflect the deduction of taxes that a shareholder would pay on Fund distributions or the redemption or sale of Fund Shares. See invesco.com/ETFs to find the most recentmonth-end performance numbers.
Index and Benchmark Indexes performance results are based upon a hypothetical investment in their respective constituent securities. Index and Benchmark Indexes returns do not represent Fund returns. An investor cannot invest directly in an index. The Index and Benchmark Indexes do not charge management fees or brokerage expenses, and no such fees or expenses were deducted from the hypothetical performance shown. In addition, the results actual investors might have achieved would have differed from those shown because of differences in the timing, amounts of their investments, and fees and expenses associated with an investment in the Fund.
Notes Regarding Indexes and Fund Performance History:
| - | Average Annualized and Cumulative Inception returns for the Fund, Index and Benchmark Index are based on the inception date of the Predecessor Fund. |
| - | Effective after the close of business on April 6, 2018, the Predecessor Fund was reorganized into the Fund. Returns shown are blended returns of the Predecessor Fund and the Fund. |
| | |
| RYE | | Manager’s Analysis |
| | Invesco S&P 500® Equal Weight Energy ETF (RYE) |
As an index fund, the Invesco S&P 500® Equal Weight Energy ETF (the “Fund”) is passively managed and seeks to track the returns of an underlying index. The Fund seeks to track the investment results (before fees and expenses) of the S&P 500® Equal Weight Energy Index (the “Index”). The Fund generally will invest at least 90% of its total assets in the securities that comprise the Index.
Strictly in accordance with its guidelines and mandated procedures, S&P Dow Jones Indices LLC (“S&P DJI” or the “Index Provider”) compiles, maintains and calculates the Index, which is comprised of common stocks of companies in the energy sector of the S&P 500® Index. The Index Provider defines sectors according to the Global Industry Classification Standard (“GICS”). The energy sector includes companies operating in the exploration and production, refining and marketing, and storage and transportation of oil and gas and coal and consumable fuels, as well as companies that offer oil and gas equipment and services.
Unlike the S&P 500® Energy Index, which employs a market capitalization weighted methodology, the Index is equal weighted, meaning that the Index Provider assigns each component security the same weight in the Index. The Fund generally invests in all of the securities comprising the Index in proportion to their weightings in the Index.
For the fiscal year ended April 30, 2019, on a market price basis, the Fund returned (12.65)%. On a net asset value (“NAV”) basis, the Fund returned (12.46)%. During the same time period, the Index returned (12.15)%. During the fiscal year, the Fund fully replicated the components of the Index; therefore, the Fund’s performance, on a NAV basis, differed from the return of the Index primarily due to fees and operating expenses that the Fund incurred during the period.
During this same time period, the S&P 500® Index (the “Benchmark Index”) returned 13.49%. The Benchmark Index is an unmanaged index weighted by market capitalization based on the average performance of approximately 505 equity securities. The Benchmark Index was selected for its recognition in the marketplace, and its performance comparison is a useful measure for investors as a broad representation of the U.S. equity market.
The performance of the Fund differed from the Benchmark Index in part because the Fund seeks to track an Index that employs an equal weighted methodology, whereas the Benchmark Index weights stocks based primarily on market capitalization.
Relative to the Benchmark Index, the Fund was most overweight in the oil & gas exploration & productionsub-industry and most underweight in the interactive media & servicessub-industry during the fiscal year ended April 30, 2019. The majority of the Fund’s underperformance relative to the Benchmark Index during that period can be attributed to the Fund being overweight in the oil & gas exploration & production and oil & gas equipment & servicessub-industries.
For the fiscal year ended April 30, 2019, the oil & gas storage & transportationsub-industry contributed most significantly to the Fund’s return. The oil & gas equipment & servicessub-industry detracted most significantly from the Fund’s return.
Positions that contributed most significantly to the Fund’s return for the fiscal year ended April 30, 2019, included Kinder Morgan Inc., an oil, gas & consumable fuels company (portfolio average weight of 3.26%) and Andeavor, an oil & gas storage & transportation company (no longer held at fiscal year-end). Positions that detracted most significantly from the Fund’s return during this period included Halliburton Co., an oil & gas equipment & services company (portfolio average weight of 3.20%) and HollyFrontier Corp., an oil & gas refining & marketing company (portfolio average weight of 3.20%).
| | | | |
Industry Breakdown
(% of the Fund’s Net Assets)
as of April 30, 2019 | |
| Oil, Gas & Consumable Fuels | | | 80.0 | |
| Energy Equipment & Services | | | 19.9 | |
| Money Market Funds Plus Other Assets Less Liabilities | | | 0.1 | |
|
Top Ten Fund Holdings*
(% of the Fund’s Net Assets)
as of April 30, 2019 | |
| Security | | | | |
| Anadarko Petroleum Corp. | | | 5.5 | |
| Pioneer Natural Resources Co. | | | 4.0 | |
| Noble Energy, Inc. | | | 4.0 | |
| Devon Energy Corp. | | | 3.8 | |
| TechnipFMC PLC | | | 3.7 | |
| Hess Corp. | | | 3.7 | |
| Concho Resources, Inc. | | | 3.7 | |
| Valero Energy Corp. | | | 3.6 | |
| Diamondback Energy, Inc. | | | 3.5 | |
| EOG Resources, Inc. | | | 3.5 | |
| Total | | | 39.0 | |
| * | Excluding money market fund holdings. |
Invesco S&P 500® Equal Weight Energy ETF (RYE)(continued)
Growth of a $10,000 Investment
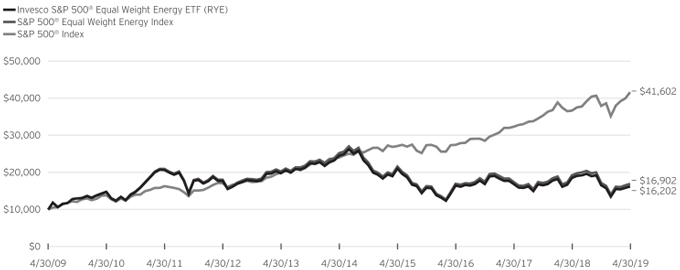
Fund Performance History as of April 30, 2019
| | | | | | | | | | | | | | | | | | | | | | | | | | | | | | | | | | | | | | | | |
| | | 1 Year | | | 3 Years Average
Annualized | | | 3 Years Cumulative | | | 5 Years Average
Annualized | | | 5 Years Cumulative | | | 10 Years Average
Annualized | | | 10 Years Cumulative | | | | | | Fund Inception | |
| Index | | | | | Average
Annualized | | | Cumulative | |
| S&P 500® Equal Weight Energy Index | | | (12.15 | )% | | | (0.08 | )% | | | (0.24 | )% | | | (7.69 | )% | | | (32.97 | )% | | | 5.39 | % | | | 69.02 | % | | | | | | | 2.55 | % | | | 36.94 | % |
| S&P 500® Index | | | 13.49 | | | | 14.87 | | | | 51.58 | | | | 11.63 | | | | 73.32 | | | | 15.32 | | | | 316.02 | | | | | | | | 8.61 | | | | 180.61 | |
| Fund | | | | | | | | | | | | | | | | | | | | | | | | | | | | | | | | | | | | | | | | |
| NAV Return | | | (12.46 | ) | | | (0.44 | ) | | | (1.32 | ) | | | (7.95 | ) | | | (33.92 | ) | | | 4.94 | | | | 62.02 | | | | | | | | 2.07 | | | | 29.24 | |
| Market Price Return | | | (12.65 | ) | | | (0.44 | ) | | | (1.31 | ) | | | (7.98 | ) | | | (34.02 | ) | | | 4.95 | | | | 62.05 | | | | | | | | 2.08 | | | | 29.26 | |
Guggenheim S&P 500® Equal Weight Energy ETF (the “Predecessor Fund”) Inception: November 1, 2006
Performance quoted above represents past performance. Past performance is not a guarantee of future results and current performance may be higher or lower than performance quoted. Investment returns and principal value will fluctuate, and shares of the Fund (“Fund Shares”), when redeemed or sold, may be worth more or less than their original cost. Fund performance reflects any applicable fee waivers and/or expense reimbursements. Had the adviser not waived fees and/or reimbursed expenses currently or in the past, returns would have been lower. See current prospectus for more information. According to the Fund’s current prospectus, the total annual operating expense ratio was indicated as 0.40%. The Financial Highlights section of the Shareholder Report presents the expense ratios based on expenses incurred during the period covered by this report. NAV and Market Price returns assume that dividends and capital gain distributions have been reinvested in the Fund at NAV and Market Price, respectively. The returns shown in the table above do not reflect the deduction of taxes that a shareholder would pay on Fund distributions or the redemption or
sale of Fund Shares. See invesco.com/ETFs to find the most recentmonth-end performance numbers.
Index and Benchmark Indexes performance results are based upon a hypothetical investment in their respective constituent securities. Index and Benchmark Indexes returns do not represent Fund returns. An investor cannot invest directly in an index. The Index and Benchmark Indexes do not charge management fees or brokerage expenses, and no such fees or expenses were deducted from the hypothetical performance shown. In addition, the results actual investors might have achieved would have differed from those shown because of differences in the timing, amounts of their investments, and fees and expenses associated with an investment in the Fund.
Notes Regarding Indexes and Fund Performance History:
| - | Average Annualized and Cumulative Inception returns for the Fund, Index and Benchmark Index are based on the inception date of the Predecessor Fund. |
| - | Effective after the close of business on April 6, 2018, the Predecessor Fund was reorganized into the Fund. Returns shown are blended returns of the Predecessor Fund and the Fund. |
| | |
| RYF | | Manager’s Analysis |
| | Invesco S&P 500® Equal Weight Financials ETF (RYF) |
As an index fund, the Invesco S&P 500® Equal Weight Financials ETF (the “Fund”) is passively managed and seeks to track the returns of an underlying index. The Fund seeks to track the investment results (before fees and expenses) of the S&P 500® Equal Weight Financials Index (the “Index”). The Fund generally will invest at least 90% of its total assets in the securities that comprise the Index.
Strictly in accordance with its guidelines and mandated procedures, S&P Dow Jones Indices LLC (“S&P DJI” or the “Index Provider”) compiles, maintains and calculates the Index, which is comprised of common stocks of companies in the financials sector of the S&P 500® Index. The Index Provider defines sectors according to the Global Industry Classification Standard (“GICS”). The financials sector includes companies involved in banking, thrifts and mortgage finance, specialized finance, consumer finance, asset management and custody banks, investment banking and brokerage and insurance, as well as financial exchanges and data and mortgage real estate investment trusts.
Unlike the S&P 500® Financials Index, which employs a market capitalization weighted methodology, the Index is equal weighted, meaning that the Index Provider assigns each component security the same weight in the Index. The Fund generally invests in all of the securities comprising the Index in proportion to their weightings in the Index.
For the fiscal year ended April 30, 2019, on a market price basis, the Fund returned 1.91%. On a net asset value (“NAV”) basis, the Fund returned 1.98%. During the same time period, the Index returned 2.38%. During the fiscal year, the Fund fully replicated the components of the Index; therefore, the Fund’s performance, on a NAV basis, differed from the return of the Index primarily due to fees and operating expenses that the Fund incurred as well as trading costs associated with portfolio rebalances during the period.
During this same time period, the S&P 500® Index (the “Benchmark Index”) returned 13.49%. The Benchmark Index is an unmanaged index weighted by market capitalization based on the average performance of approximately 505 equity securities. The Benchmark Index was selected for its recognition in the marketplace, and its performance comparison is a useful measure for investors as a broad representation of the U.S. equity market.
The performance of the Fund differed from the Benchmark Index in part because the Fund seeks to track an Index that employs an equal weighted methodology, whereas the Benchmark Index weights stocks based primarily on market capitalization.
Relative to the Benchmark Index, the Fund was most overweight in the regional bankssub-industry and most underweight the interactive media & servicessub-industry during the fiscal year ended April 30, 2019. The majority of the Fund’s
underperformance relative to the Benchmark Index during that period can be attributed to the Fund being underweight in the systems softwaresub-industry.
For the fiscal year ended April 30, 2019, the financial exchanges & datasub-industry contributed most significantly to the Fund’s return, followed by the property & casualty insurance and insurance brokerssub-industries, respectively. The asset management & custody bankssub-industry detracted most significantly from the Fund’s return followed by the regional bankssub-industry.
Positions that contributed most significantly to the Fund’s return for the fiscal year ended April 30, 2019, included MSCI Inc., a financial exchanges & data company (portfolio average weight of 1.52%) and Cincinnati Financial Corp., a property & casualty insurance company (portfolio average weight of 1.51%). Positions that detracted most significantly from the Fund’s return during this period included State Street Corp., an asset manager & custody banks company (portfolio average weight of 1.40%) and Affiliated Managers Group, Inc., an asset manager & custody banks company (portfolio average weight of 1.39%).
| | | | |
Industry Breakdown
(% of the Fund’s Net Assets)
as of April 30, 2019 | |
| Capital Markets | | | 32.1 | |
| Insurance | | | 31.4 | |
| Banks | | | 27.3 | |
| Consumer Finance | | | 6.2 | |
| Diversified Financial Services | | | 3.0 | |
| Other Assets Less Liabilities | | | 0.0 | |
|
Top Ten Fund Holdings
(% of the Fund’s Net Assets)
as of April 30, 2019 | |
| Security | | | | |
| MSCI, Inc. | | | 1.7 | |
| Ameriprise Financial, Inc. | | | 1.6 | |
| Invesco Ltd. | | | 1.6 | |
| Morgan Stanley | | | 1.6 | |
| Discover Financial Services | | | 1.6 | |
| Moody’s Corp. | | | 1.6 | |
| BlackRock, Inc. | | | 1.6 | |
| Principal Financial Group, Inc. | | | 1.6 | |
| Capital One Financial Corp. | | | 1.6 | |
| Raymond James Financial, Inc. | | | 1.6 | |
| Total | | | 16.1 | |
Invesco S&P 500® Equal Weight Financials ETF (RYF)(continued)
Growth of a $10,000 Investment
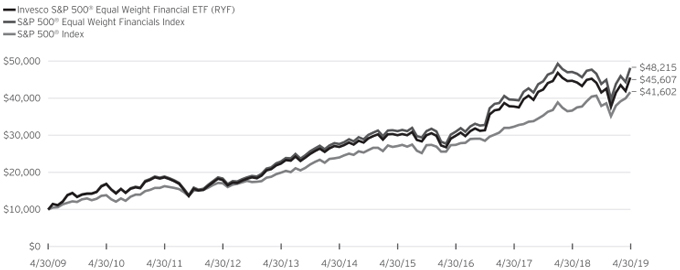
Fund Performance History as of April 30, 2019
| | | | | | | | | | | | | | | | | | | | | | | | | | | | | | | | | | | | | | | | |
| | | 1 Year | | | 3 Years Average Annualized | | | 3 Years Cumulative | | | 5 Years Average Annualized | | | 5 Years Cumulative | | | 10 Years Average Annualized | | | 10 Years Cumulative | | | | | | Fund Inception | |
| Index | | | | | Average Annualized | | | Cumulative | |
| S&P 500® Equal Weight Financials Index | | | 2.38 | % | | | 15.88 | % | | | 55.62 | % | | | 11.73 | % | | | 74.09 | % | | | 17.04 | % | | | 382.15 | % | | | | | | | 4.68 | % | | | 77.13 | % |
| S&P 500® Index | | | 13.49 | | | | 14.87 | | | | 51.58 | | | | 11.63 | | | | 73.32 | | | | 15.32 | | | | 316.02 | | | | | | | | 8.61 | | | | 180.61 | |
| Fund | | | | | | | | | | | | | | | | | | | | | | | | | | | | | | | | | | | | | | | | |
NAV Return | | | 1.98 | | | | 15.19 | | | | 52.84 | | | | 11.15 | | | | 69.65 | | | | 16.39 | | | | 356.07 | | | | | | | | 3.93 | | | | 61.83 | |
| Market Price Return | | | 1.91 | | | | 15.22 | | | | 52.96 | | | | 11.20 | | | | 69.99 | | | | 16.41 | | | | 357.13 | | | | | | | | 3.93 | | | | 61.82 | |
Guggenheim S&P 500® Equal Weight Financials ETF (the “Predecessor Fund”) Inception: November 1, 2006
Performance quoted above represents past performance. Past performance is not a guarantee of future results and current performance may be higher or lower than performance quoted. Investment returns and principal value will fluctuate, and shares of the Fund (“Fund Shares”), when redeemed or sold, may be worth more or less than their original cost. Fund performance reflects any applicable fee waivers and/or expense reimbursements. Had the adviser not waived fees and/or reimbursed expenses currently or in the past, returns would have been lower. See current prospectus for more information. According to the Fund’s current prospectus, the total annual operating expense ratio was indicated as 0.40%. The Financial Highlights section of the Shareholder Report presents the expense ratios based on expenses incurred during the period covered by this report. NAV and Market Price returns assume that dividends and capital gain distributions have been reinvested in the Fund at NAV and Market Price, respectively. The returns shown in the table above do not reflect the deduction of taxes that a shareholder would pay on Fund distributions or the redemption or sale of Fund Shares. See invesco.com/ETFs to find the most recentmonth-end performance numbers.
Index and Benchmark Indexes performance results are based upon a hypothetical investment in their respective constituent securities. Index and Benchmark Indexes returns do not represent Fund returns. An investor cannot invest directly in an index. The Index and Benchmark Indexes do not charge management fees or brokerage expenses, and no such fees or expenses were deducted from the hypothetical performance shown. In addition, the results actual investors might have achieved would have differed from those shown because of differences in the timing, amounts of their investments, and fees and expenses associated with an investment in the Fund.
Notes Regarding Indexes and Fund Performance History:
| - | Average Annualized and Cumulative Inception returns for the Fund, Index and Benchmark Index are based on the inception date of the Predecessor Fund. |
| - | Effective after the close of business on April 6, 2018, the Predecessor Fund was reorganized into the Fund. Returns shown are blended returns of the Predecessor Fund and the Fund. |
| | |
| RYH | | Manager’s Analysis |
| | Invesco S&P 500® Equal Weight Health Care ETF (RYH) |
As an index fund, the Invesco S&P 500® Equal Weight Health Care ETF (the “Fund”) is passively managed and seeks to track the returns of an underlying index. The Fund seeks to track the investment results (before fees and expenses) of the S&P 500® Equal Weight Health Care Index (the “Index”). The Fund generally will invest at least 90% of its total assets in the securities that comprise the Index.
Strictly in accordance with its guidelines and mandated procedures, S&P Dow Jones Indices LLC (“S&P DJI” or the “Index Provider”) compiles, maintains and calculates the Index, which is comprised of common stocks of companies in the health care sector of the S&P 500® Index. The Index Provider defines sectors according to the Global Industry Classification Standard (“GICS”). The health care sector includes health care providers and services, companies that manufacture and distribute health care equipment and supplies, health care technology companies and companies involved in the research, development, production and marketing of pharmaceuticals and biotechnology products.
Unlike the S&P 500® Health Care Index, which employs a market capitalization weighted methodology, the Index is equal weighted, meaning that the Index Provider assigns each component security the same weight in the Index. The Fund generally invests in all of the securities comprising the Index in proportion to their weightings in the Index.
For the fiscal year ended April 30, 2019, on a market price basis, the Fund returned 8.82%. On a net asset value (“NAV”) basis, the Fund returned 8.91%. During the same time period, the Index returned 9.36%. During the fiscal year, the Fund fully replicated the components of the Index; therefore, the Fund’s performance, on a NAV basis, differed from the return of the Index primarily due to fees and operating expenses that the Fund incurred during the period.
During this same time period, the S&P 500® Index (the “Benchmark Index”) returned 13.49%. The Benchmark Index is an unmanaged index weighted by market capitalization based on the average performance of approximately 505 equity securities. The Benchmark Index was selected for its recognition in the marketplace, and its performance comparison is a useful measure for investors as a broad representation of the U.S. equity market.
The performance of the Fund differed from the Benchmark Index in part because the Fund seeks to track an Index that employs an equal weighted methodology, whereas the Benchmark Index weights stocks based primarily on market capitalization.
Relative to the Benchmark Index, the Fund was most overweight in the health care equipmentsub-industry and most underweight in the interactive media & servicessub-industry during the fiscal year ended April 30, 2019. The majority of the Fund’s underperformance relative to the Benchmark Index during that
period can be attributed to the Fund being underweight in the systems softwaresub-industry.
For the fiscal year ended April 30, 2019, the health care equipmentsub-industry contributed most significantly to the Fund’s return, followed by the life sciences tools & services and health care suppliessub-industries, respectively. The health care distributorssub-industry detracted most significantly from the Fund’s return, followed by the pharmaceuticalssub-industry.
Positions that contributed most significantly to the Fund’s return for the fiscal year ended April 30, 2019, included Align Technology, Inc., a health care supplies company (portfolio average weight of 1.58%) and Eli Lilly and Co., a pharmaceuticals company (portfolio average weight of 1.70%). Positions that detracted most significantly from the Fund’s return during this period included Nektar Therapeutics, a pharmaceuticals company (portfolio average weight of 1.45%) and Perrigo Co. PLC, a pharmaceuticals company (portfolio average weight of 1.48%).
| | | | |
Industry Breakdown
(% of the Fund’s Net Assets)
as of April 30, 2019 | |
| Health Care Equipment & Supplies | | | 31.1 | |
| Health Care Providers & Services | | | 25.9 | |
| Pharmaceuticals | | | 15.7 | |
| Biotechnology | | | 13.9 | |
| Life Sciences Tools & Services | | | 11.5 | |
| Health Care Technology | | | 1.9 | |
| Money Market Funds Plus Other Assets Less Liabilities | | | 0.0 | |
|
Top Ten Fund Holdings*
(% of the Fund’s Net Assets)
as of April 30, 2019 | |
| Security | | | | |
| Align Technology, Inc. | | | 2.2 | |
| Cerner Corp. | | | 1.9 | |
| IDEXX Laboratories, Inc. | | | 1.8 | |
| Quest Diagnostics, Inc. | | | 1.8 | |
| Celgene Corp. | | | 1.8 | |
| Thermo Fisher Scientific, Inc. | | | 1.8 | |
| DaVita, Inc. | | | 1.8 | |
| Zoetis, Inc. | | | 1.8 | |
| Mettler-Toledo International, Inc. | | | 1.7 | |
| Henry Schein, Inc. | | | 1.7 | |
| Total | | | 18.3 | |
| * | Excluding money market fund holdings. |
Invesco S&P 500® Equal Weight Health Care ETF (RYH)(continued)
Growth of a $10,000 Investment
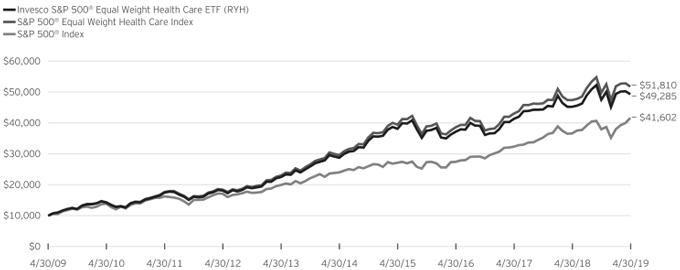
Fund Performance History as of April 30, 2019
| | | | | | | | | | | | | | | | | | | | | | | | | | | | | | | | | | | | | | | | |
| | | 1 Year | | | 3 Years Average Annualized | | | 3 Years Cumulative | | | 5 Years Average Annualized | | | 5 Years Cumulative | | | 10 Years Average Annualized | | | 10 Years Cumulative | | | | | | Fund Inception | |
| Index | | | | | Average Annualized | | | Cumulative | |
| S&P 500® Equal Weight Health Care Index | | | 9.36 | % | | | 10.31 | % | | | 34.21 | % | | | 11.86 | % | | | 75.17 | % | | | 17.88 | % | | | 418.10 | % | | | | | | | 12.83 | % | | | 352.12 | % |
| S&P 500® Index | | | 13.49 | | | | 14.87 | | | | 51.58 | | | | 11.63 | | | | 73.32 | | | | 15.32 | | | | 316.02 | | | | | | | | 8.61 | | | | 180.61 | |
| Fund | | | | | | | | | | | | | | | | | | | | | | | | | | | | | | | | | | | | | | | | |
NAV Return | | | 8.91 | | | | 9.87 | | | | 32.62 | | | | 11.39 | | | | 71.51 | | | | 17.29 | | | | 392.85 | | | | | | | | 12.13 | | | | 318.34 | |
| Market Price Return | | | 8.82 | | | | 9.87 | | | | 32.63 | | | | 11.42 | | | | 71.71 | | | | 17.29 | | | | 392.52 | | | | | | | | 12.13 | | | | 318.35 | |
Guggenheim S&P 500® Equal Weight Health Care ETF (the “Predecessor Fund”) Inception: November 1, 2006
Performance quoted above represents past performance. Past performance is not a guarantee of future results and current performance may be higher or lower than performance quoted. Investment returns and principal value will fluctuate, and shares of the Fund (“Fund Shares”), when redeemed or sold, may be worth more or less than their original cost. Fund performance reflects any applicable fee waivers and/or expense reimbursements. Had the adviser not waived fees and/or reimbursed expenses currently or in the past, returns would have been lower. See current prospectus for more information. According to the Fund’s current prospectus, the total annual operating expense ratio was indicated as 0.40%. The Financial Highlights section of the Shareholder Report presents the expense ratios based on expenses incurred during the period covered by this report. NAV and Market Price returns assume that dividends and capital gain distributions have been reinvested in the Fund at NAV and Market Price, respectively. The returns shown in the table above do not reflect the deduction of taxes that a shareholder would pay on Fund distributions or the redemption or sale of Fund Shares. See invesco.com/ETFs to find the most recentmonth-end performance numbers.
Index and Benchmark Indexes performance results are based upon a hypothetical investment in their respective constituent securities. Index and Benchmark Indexes returns do not represent Fund returns. An investor cannot invest directly in an index. The Index and Benchmark Indexes do not charge management fees or brokerage expenses, and no such fees or expenses were deducted from the hypothetical performance shown. In addition, the results actual investors might have achieved would have differed from those shown because of differences in the timing, amounts of their investments, and fees and expenses associated with an investment in the Fund.
Notes Regarding Indexes and Fund Performance History:
| - | Average Annualized and Cumulative Inception returns for the Fund, Index and Benchmark Index are based on the inception date of the Predecessor Fund. |
| - | Effective after the close of business on April 6, 2018, the Predecessor Fund was reorganized into the Fund. Returns shown are blended returns of the Predecessor Fund and the Fund. |
| | |
| RGI | | Manager’s Analysis |
| | Invesco S&P 500® Equal Weight Industrials ETF (RGI) |
As an index fund, the Invesco S&P 500® Equal Weight Industrials ETF (the “Fund”) is passively managed and seeks to track the returns of an underlying index. The Fund seeks to track the investment results (before fees and expenses) of the S&P 500® Equal Weight Industrials Index (the “Index”). The Fund generally will invest at least 90% of its total assets in the securities that comprise the Index.
Strictly in accordance with its guidelines and mandated procedures, S&P Dow Jones Indices LLC (“S&P DJI” or the “Index Provider”) compiles, maintains and calculates the Index, which is comprised of common stocks of companies in the industrials sector of the S&P 500® Index. The Index Provider defines sectors according to the Global Industry Classification Standard (“GICS”). The industrials sector includes manufacturers and distributors of capital goods such as aerospace and defense, building projects, electrical equipment and machinery, companies that offer construction and engineering services, providers of commercial and professional services including printing, environmental and facilities services, office services and supplies, security and alarm services, human resource and employment services, research and consulting services and providers of transportation services.
Unlike the S&P 500® Industrials Index, which employs a market capitalization weighted methodology, the Index is equal weighted, meaning that the Index Provider assigns each component security the same weight in the Index. The Fund generally invests in all of the securities comprising the Index in proportion to their weightings in the Index.
For the fiscal year ended April 30, 2019, on a market price basis, the Fund returned 11.17%. On a net asset value (“NAV”) basis, the Fund returned 11.21%. During the same time period, the Index returned 11.67%. During the fiscal year, the Fund fully replicated the components of the Index; therefore, the Fund’s performance, on a NAV basis, differed from the return of the Index primarily due to fees and operating expenses that the Fund incurred during the period.
During this same time period, the S&P 500® Index (the “Benchmark Index”) returned 13.49%. The Benchmark Index is an unmanaged index weighted by market capitalization based on the average performance of approximately 505 equity securities. The Benchmark Index was selected for its recognition in the marketplace, and its performance comparison is a useful measure for investors as a broad representation of the U.S. equity market.
The performance of the Fund differed from the Benchmark Index in part because the Fund seeks to track an Index that employs an equal weighted methodology, whereas the Benchmark Index weights stocks based primarily on market capitalization.
Relative to the Benchmark Index, the Fund was most overweight in the aerospace & defensesub-industry and most underweight in
the interactive media & servicessub-industry during the fiscal year ended April 30, 2019. The majority of the Fund’s underperformance relative to the Benchmark Index during that period can be attributed to the Fund being overweight in the aerospace & defensesub-industry.
For the fiscal year ended April 30, 2019, the industrial machinerysub-industry contributed most significantly to the Fund’s return, followed by the railroads and electrical components & equipmentsub-industries, respectively. The truckingsub-industry detracted most significantly from the Fund’s return, followed by the air freight & logisticssub-industry.
Positions that contributed most significantly to the Fund’s return for the fiscal year ended April 30, 2019, included TransDigm Group, Inc., an aerospace & defense company (portfolio average weight of 1.51%) and Norfolk Southern Corp., a railroads company (portfolio average weight of 1.51%). Positions that detracted most significantly from the Fund’s return during this period included Fluor Corp., a construction & engineering company (portfolio average weight of 1.40%) and FedEx Corp., an air freight & logistics company (portfolio average weight of 1.37%).
| | | | |
Industry Breakdown
(% of the Fund’s Net Assets)
as of April 30, 2019 | |
| Machinery | | | 21.6 | |
| Aerospace & Defense | | | 17.0 | |
| Airlines | | | 7.3 | |
| Road & Rail | | | 7.2 | |
| Commercial Services & Supplies | | | 7.1 | |
| Building Products | | | 7.1 | |
| Professional Services | | | 7.1 | |
| Industrial Conglomerates | | | 5.7 | |
| Electrical Equipment | | | 5.7 | |
| Air Freight & Logistics | | | 5.5 | |
| Construction & Engineering | | | 4.4 | |
| Trading Companies & Distributors | | | 4.3 | |
| Money Market Funds Plus Other Assets Less Liabilities | | | 0.0 | |
Invesco S&P 500® Equal Weight Industrials ETF (RGI)(continued)
| | | | |
Top Ten Fund Holdings*
(% of the Fund’s Net Assets)
as of April 30, 2019 | |
| Security | | | | |
| Ingersoll-Rand PLC | | | 1.6 | |
| Delta Air Lines, Inc. | | | 1.6 | |
| Arconic, Inc. | | | 1.6 | |
| Equifax, Inc. | | | 1.6 | |
| Copart, Inc. | | | 1.5 | |
| Norfolk Southern Corp. | | | 1.5 | |
| Quanta Services, Inc. | | | 1.5 | |
| United Technologies Corp. | | | 1.5 | |
| Fastenal Co. | | | 1.5 | |
| Honeywell International, Inc. | | | 1.5 | |
| Total | | | 15.4 | |
| * | Excluding money market fund holdings. |
Growth of a $10,000 Investment
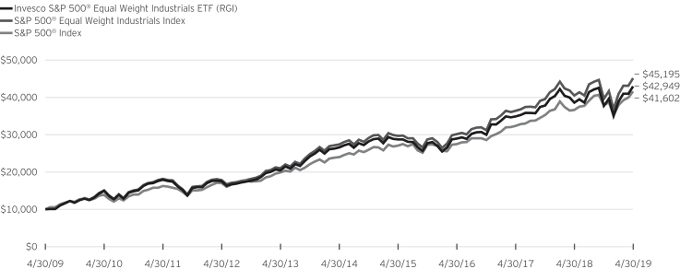
Fund Performance History as of April 30, 2019
| | | | | | | | | | | | | | | | | | | | | | | | | | | | | | | | | | | | | | | | |
| | | 1 Year | | | 3 Years Average
Annualized | | | 3 Years Cumulative | | | 5 Years Average
Annualized | | | 5 Years Cumulative | | | 10 Years Average
Annualized | | | 10 Years Cumulative | | | | | | Fund Inception | |
Index | | | | | Average
Annualized | | | Cumulative | |
| S&P 500® Equal Weight Industrials Index | | | 11.67 | % | | | 14.44 | % | | | 49.89 | % | | | 10.50 | % | | | 64.77 | % | | | 16.28 | % | | | 351.95 | % | | | | | | | 10.25 | % | | | 238.37 | % |
| S&P 500® Index | | | 13.49 | | | | 14.87 | | | | 51.58 | | | | 11.63 | | | | 73.32 | | | | 15.32 | | | | 316.02 | | | | | | | | 8.61 | | | | 180.61 | |
| Fund | | | | | | | | | | | | | | | | | | | | | | | | | | | | | | | | | | | | | | | | |
| NAV Return | | | 11.21 | | | | 13.97 | | | | 48.05 | | | | 10.05 | | | | 61.39 | | | | 15.69 | | | | 329.49 | | | | | | | | 9.70 | | | | 218.15 | |
| Market Price Return | | | 11.17 | | | | 13.96 | | | | 47.99 | | | | 10.00 | | | | 61.08 | | | | 15.64 | | | | 327.51 | | | | | | | | 9.70 | | | | 218.04 | |
Invesco S&P 500® Equal Weight Industrials ETF (RGI)(continued)
Guggenheim S&P 500® Equal Weight Industrials ETF (the “Predecessor Fund”) Inception: November 1, 2006
Performance quoted above represents past performance. Past performance is not a guarantee of future results and current performance may be higher or lower than performance quoted. Investment returns and principal value will fluctuate, and shares of the Fund (“Fund Shares”), when redeemed or sold, may be worth more or less than their original cost. Fund performance reflects any applicable fee waivers and/or expense reimbursements. Had the adviser not waived fees and/or reimbursed expenses currently or in the past, returns would have been lower. See current prospectus for more information. According to the Fund’s current prospectus, the total annual operating expense ratio was indicated as 0.40%. The Financial Highlights section of the Shareholder Report presents the expense ratios based on expenses incurred during the period covered by this report. NAV and Market Price returns assume that dividends and capital gain distributions have been reinvested in the Fund at NAV and Market Price, respectively. The returns shown in the table above do not reflect the deduction of taxes that a shareholder would pay on Fund distributions or the redemption or sale of Fund Shares. See invesco.com/ETFs to find the most recentmonth-end performance numbers.
Index and Benchmark Indexes performance results are based upon a hypothetical investment in their respective constituent securities. Index and Benchmark Indexes returns do not represent Fund returns. An investor cannot invest directly in an index. The Index and Benchmark Indexes do not charge management fees or brokerage expenses, and no such fees or expenses were deducted from the hypothetical performance shown. In addition, the results actual investors might have achieved would have differed from those shown because of differences in the timing, amounts of their investments, and fees and expenses associated with an investment in the Fund.
Notes Regarding Indexes and Fund Performance History:
| - | Average Annualized and Cumulative Inception returns for the Fund, Index and Benchmark Index are based on the inception date of the Predecessor Fund. |
| - | Effective after the close of business on April 6, 2018, the Predecessor Fund was reorganized into the Fund. Returns shown are blended returns of the Predecessor Fund and the Fund. |
| | |
| RTM | | Manager’s Analysis |
| | Invesco S&P 500® Equal Weight Materials ETF (RTM) |
As an index fund, the Invesco S&P 500® Equal Weight Materials ETF (the “Fund”) is passively managed and seeks to track the returns of an underlying index. The Fund seeks to track the investment results (before fees and expenses) of the S&P 500® Equal Weight Materials Index (the “Index”). The Fund generally will invest at least 90% of its total assets in the securities that comprise the Index.
Strictly in accordance with its guidelines and mandated procedures, S&P Dow Jones Indices LLC (“S&P DJI” or the “Index Provider”) compiles, maintains and calculates the Index, which is comprised of common stocks of companies in the materials sector of the S&P 500® Index. The Index Provider defines sectors according to the Global Industry Classification Standard (“GICS”). The materials sector includes companies that manufacture chemicals, construction materials, glass, paper, forest products and related packaging products, and metals, minerals and mining companies, including producers of steel.
Unlike the S&P 500® Materials Index, which employs a market capitalization weighted methodology, the Index is equal weighted, meaning that the Index Provider assigns each component security the same weight in the Index. The Fund generally invests in all of the securities comprising the Index in proportion to their weightings in the Index.
For the fiscal year ended April 30, 2019, on a market price basis, the Fund returned 3.70%. On a net asset value (“NAV”) basis, the Fund returned 3.67%. During the same time period, the Index returned 4.08%. During the fiscal year, the Fund fully replicated the components of the Index; therefore, the Fund’s performance, on a NAV basis, differed from the return of the Index primarily due to fees and operating expenses that the Fund incurred during the period.
During this same time period, the S&P 500® Index (the “Benchmark Index”) returned 13.49%. The Benchmark Index is an unmanaged index weighted by market capitalization based on the average performance of approximately 505 equity securities. The Benchmark Index was selected for its recognition in the marketplace, and its performance comparison is a useful measure for investors as a broad representation of the U.S. equity market.
The performance of the Fund differed from the Benchmark Index in part because the Fund seeks to track an Index that employs an equal weighted methodology, whereas the Benchmark Index weights stocks based primarily on market capitalization.
Relative to the Benchmark Index, the Fund was most overweight in the specialty chemicalssub-industry and most underweight in the interactive media & servicessub-industry during the fiscal year ended April 30, 2019. The majority of the Fund’s underperformance relative to the Benchmark Index during that period can be attributed to the Fund being overweight in the paper packagingsub-industry.
For the fiscal year ended April 30, 2019, the specialty chemicalssub-industry contributed most significantly to the Fund’s return, followed by the industrial gases and metal & glass containerssub-industries, respectively. The paper packagingsub-industry detracted most significantly from the Fund’s return.
Positions that contributed most significantly to the Fund’s return for the fiscal year ended April 30, 2019, included Ball Corp., a metals & glass containers company (portfolio average weight of 4.31%) and Air Products and Chemicals, Inc., an industrial gases company (portfolio average weight of 4.12%). Positions that detracted most significantly from the Fund’s return during this period included WestRock Co., a paper packaging (portfolio average weight of 3.71%) and Albemarle Corp., a specialty chemicals (portfolio average weight of 4.04%).
| | | | |
Industry Breakdown
(% of the Fund’s Net Assets)
as of April 30, 2019 | |
| Chemicals | | | 57.9 | |
| Containers & Packaging | | | 23.0 | |
| Metals & Mining | | | 10.8 | |
| Construction Materials | | | 8.3 | |
| Money Market Funds Plus Other Assets Less Liabilities | | | 0.0 | |
|
Top Ten Fund Holdings*
(% of the Fund’s Net Assets)
as of April 30, 2019 | |
| Security | | | | |
| Air Products and Chemicals, Inc. | | | 4.2 | |
| Martin Marietta Materials, Inc. | | | 4.2 | |
| CF Industries Holdings, Inc. | | | 4.1 | |
| Vulcan Materials Co. | | | 4.1 | |
| International Flavors & Fragrances, Inc. | | | 4.1 | |
| Sherwin-Williams Co. (The) | | | 4.0 | |
| Ball Corp. | | | 4.0 | |
| Ecolab, Inc. | | | 4.0 | |
| Celanese Corp., Series A | | | 4.0 | |
| PPG Industries, Inc. | | | 4.0 | |
| Total | | | 40.7 | |
| * | Excluding money market fund holdings. |
Invesco S&P 500® Equal Weight Materials ETF (RTM)(continued)
Growth of a $10,000 Investment
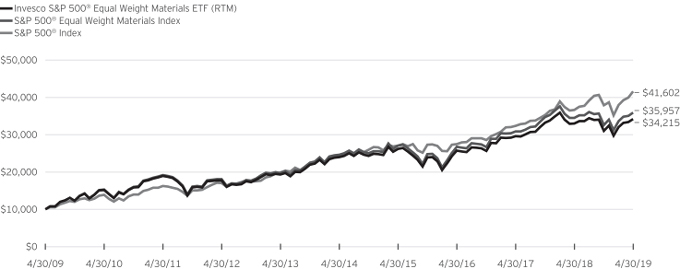
Fund Performance History as of April 30, 2019
| | | | | | | | | | | | | | | | | | | | | | | | | | | | | | | | | | | | | | | | |
| | | 1 Year | | | 3 Years Average
Annualized | | | 3 Years Cumulative | | | 5 Years Average
Annualized | | | 5 Years Cumulative | | | 10 Years Average
Annualized | | | 10 Years Cumulative | | | | | | Fund Inception | |
Index | | | | | Average
Annualized | | | Cumulative | |
| S&P 500® Equal Weight Materials Index | | | 4.08 | % | | | 10.35 | % | | | 34.38 | % | | | 7.82 | % | | | 45.73 | % | | | 13.65 | % | | | 259.57 | % | | | | | | | 9.16 | % | | | 198.91 | % |
| S&P 500® Index | | | 13.49 | | | | 14.87 | | | | 51.58 | | | | 11.63 | | | | 73.32 | | | | 15.32 | | | | 316.02 | | | | | | | | 8.61 | | | | 180.61 | |
| Fund | | | | | | | | | | | | | | | | | | | | | | | | | | | | | | | | | | | | | | | | |
| NAV Return | | | 3.67 | | | | 9.90 | | | | 32.73 | | | | 7.34 | | | | 42.52 | | | | 13.09 | | | | 242.15 | | | | | | | | 8.51 | | | | 177.42 | |
| Market Price Return | | | 3.70 | | | | 9.99 | | | | 33.05 | | | | 7.31 | | | | 42.28 | | | | 13.08 | | | | 241.83 | | | | | | | | 8.51 | | | | 177.47 | |
Guggenheim S&P 500® Equal Weight Materials ETF (the “Predecessor Fund”) Inception: November 1, 2006
Performance quoted above represents past performance. Past performance is not a guarantee of future results and current performance may be higher or lower than performance quoted. Investment returns and principal value will fluctuate, and shares of the Fund (“Fund Shares”), when redeemed or sold, may be worth more or less than their original cost. Fund performance reflects any applicable fee waivers and/or expense reimbursements. Had the adviser not waived fees and/or reimbursed expenses currently or in the past, returns would have been lower. See current prospectus for more information. According to the Fund’s current prospectus, the total annual operating expense ratio was indicated as 0.40%. The Financial Highlights section of the Shareholder Report presents the expense ratios based on expenses incurred during the period covered by this report. NAV and Market Price returns assume that dividends and capital gain distributions have been reinvested in the Fund at NAV and Market Price, respectively. The returns shown in the table above do not reflect the deduction of taxes that a shareholder would pay on Fund distributions or the redemption or sale of Fund Shares. See invesco.com/ETFs to find the most recentmonth-end performance numbers.
Index and Benchmark Indexes performance results are based upon a hypothetical investment in their respective constituent securities. Index and Benchmark Indexes returns do not represent Fund returns. An investor cannot invest directly in an index. The Index and Benchmark Indexes do not charge management fees or brokerage expenses, and no such fees or expenses were deducted from the hypothetical performance shown. In addition, the results actual investors might have achieved would have differed from those shown because of differences in the timing, amounts of their investments, and fees and expenses associated with an investment in the Fund.
Notes Regarding Indexes and Fund Performance History:
| - | Average Annualized and Cumulative Inception returns for the Fund, Index and Benchmark Index are based on the inception date of the Predecessor Fund. |
| - | Effective after the close of business on April 6, 2018, the Predecessor Fund was reorganized into the Fund. Returns shown are blended returns of the Predecessor Fund and the Fund. |
| | |
| EWRE | | Manager’s Analysis |
| | Invesco S&P 500® Equal Weight Real Estate ETF (EWRE) |
As an index fund, the Invesco S&P 500® Equal Weight Real Estate ETF (the “Fund”) is passively managed and seeks to track the returns of an underlying index. The Fund seeks to track the investment results (before fees and expenses) of the S&P 500® Equal Weight Real Estate Index (the “Index”). The Fund generally will invest at least 90% of its total assets in the securities that comprise the Index.
Strictly in accordance with its guidelines and mandated procedures, S&P Dow Jones Indices LLC (“S&P DJI” or the “Index Provider”) compiles, maintains and calculates the Index, which is comprised of common stocks of companies in the real estate sector of the S&P 500® Index. The Index Provider defines sectors according to the Global Industry Classification Standard (“GICS”). The real estate sector includes companies operating in real estate development and operation, offering real estate related services and equity real estate investment trusts.
Unlike the S&P 500® Real Estate Index, which employs a market capitalization weighted methodology, the Index is equal weighted, meaning that the Index Provider assigns each component security the same weight in the Index. The Fund generally invests in all of the securities comprising the Index in proportion to their weightings in the Index.
For the fiscal year ended April 30, 2019, on a market price basis, the Fund returned 18.51%. On a net asset value (“NAV”) basis, the Fund returned 18.35%. During the same time period, the Index returned 18.78%. During the fiscal year, the Fund fully replicated the components of the Index; therefore, the Fund’s performance, on a NAV basis, differed from the return of the Index primarily due to fees and operating expenses that the Fund incurred during the period.
During this same time period, the S&P 500® Index (the “Benchmark Index”) returned 13.49%. The Benchmark Index is an unmanaged index weighted by market capitalization based on the average performance of approximately 505 equity securities. The Benchmark Index was selected for its recognition in the marketplace, and its performance comparison is a useful measure for investors as a broad representation of the U.S. equity market.
The performance of the Fund differed from the Benchmark Index in part because the Fund seeks to track an Index that employs an equal weighted methodology, whereas the Benchmark Index weights stocks based primarily on market capitalization.
Relative to the Benchmark Index, the Fund was most overweight in the specialized REITsub-industry and most underweight in the interactive media & servicessub-industry during the fiscal year ended April 30, 2019. The majority of the Fund’s outperformance relative to the Benchmark Index during that period can be attributed to the Fund being overweight in the residential REIT and specialized REITssub-industries.
For the fiscal year ended April 30, 2019, the residential REITssub-industry contributed most significantly to the Fund’s return, followed by the specialized REIT and retail REITsub-industries, respectively. There were nosub-industries that detracted from performance. All were positive for the year.
Positions that contributed most significantly to the Fund’s return for the fiscal year ended April 30, 2019, included Welltower, Inc., a health care REITs company (portfolio average weight of 3.20%) and American Tower Corp., a specialized REITs company (portfolio average weight of 3.18%). Positions that detracted most significantly from the Fund’s return during this period included Macerich Co. (The), a retail REITs company (portfolio average weight of 2.94%) and Weyerhaeuser Co., a specialized REITs company (portfolio average weight of 2.92%).
| | | | |
Industry Breakdown
(% of the Fund’s Net Assets)
as of April 30, 2019 | |
| Equity Real Estate Investment Trusts (REITs) | | | 96.8 | |
| Real Estate Management & Development | | | 3.1 | |
| Money Market Funds Plus Other Assets Less Liabilities | | | 0.1 | |
|
Top Ten Fund Holdings*
(% of the Fund’s Net Assets)
as of April 30, 2019 | |
| Security | | | | |
| SBA Communications Corp., Class A | | | 3.4 | |
| Prologis, Inc. | | | 3.3 | |
| Weyerhaeuser Co. | | | 3.3 | |
| American Tower Corp. | | | 3.3 | |
| Extra Space Storage, Inc. | | | 3.3 | |
| Equinix, Inc. | | | 3.2 | |
| Regency Centers Corp. | | | 3.2 | |
| Digital Realty Trust, Inc. | | | 3.2 | |
| Duke Realty Corp. | | | 3.2 | |
| Crown Castle International Corp. | | | 3.2 | |
| Total | | | 32.6 | |
| * | Excluding money market fund holdings. |
Invesco S&P 500® Equal Weight Real Estate ETF (EWRE)(continued)
Growth of a $10,000 Investment Since Inception

Fund Performance History as of April 30, 2019
| | | | | | | | | | | | | | | | | | | | | | | | |
| | | 1 Year | | | 3 Years
Average
Annualized | | | 3 Years
Cumulative | | | | | | Fund Inception | |
| Index | | | | | Average
Annualized | | | Cumulative | |
S&P 500® Equal Weight Real Estate Index | | | 18.78 | % | | | 7.80 | % | | | 25.27 | % | | | | | | | 7.60 | % | | | 31.27 | % |
| S&P 500® Index | | | 13.49 | | | | 14.87 | | | | 51.58 | | | | | | | | 12.04 | | | | 52.57 | |
| Fund | | | | | | | | | | | | | | | | | | | | | | | | |
| NAV Return | | | 18.35 | | | | 7.37 | | | | 23.79 | | | | | | | | 7.21 | | | | 29.54 | |
| Market Price Return | | | 18.51 | | | | 7.43 | | | | 24.00 | | | | | | | | 7.37 | | | | 30.23 | |
Guggenheim S&P 500® Equal Weight Real Estate ETF (the “Predecessor Fund”) Inception: August 13, 2015
Performance quoted above represents past performance. Past performance is not a guarantee of future results and current performance may be higher or lower than performance quoted. Investment returns and principal value will fluctuate, and shares of the Fund (“Fund Shares”), when redeemed or sold, may be worth more or less than their original cost. Fund performance reflects any applicable fee waivers and/or expense reimbursements. Had the adviser not waived fees and/or reimbursed expenses currently or in the past, returns would have been lower. See current prospectus for more information. According to the Fund’s current prospectus, the total annual operating expense ratio was indicated as 0.40%. The Financial Highlights section of the Shareholder Report presents the expense ratios based on expenses incurred during the period covered by this report. NAV and Market Price returns assume that dividends and capital gain distributions have been reinvested in the Fund at NAV and Market Price, respectively. The returns shown in the table above do not reflect the deduction of taxes that a shareholder would pay on Fund distributions or the redemption or sale of Fund Shares. See invesco.com/ETFs to find the most recentmonth-end performance numbers.
Index and Benchmark Indexes performance results are based upon a hypothetical investment in their respective constituent securities. Index and Benchmark Indexes returns do not represent Fund returns. An investor cannot invest directly in an index. The Index and Benchmark Indexes do not charge management fees or brokerage expenses, and no such fees or expenses were deducted from the hypothetical performance shown. In addition, the results actual investors might have achieved would have differed from those shown because of differences in the timing, amounts of their investments, and fees and expenses associated with an investment in the Fund.
Notes Regarding Indexes and Fund Performance History:
| - | Average Annualized and Cumulative Inception returns for the Fund, Index and Benchmark Index are based on the inception date of the Predecessor Fund. |
| - | Effective after the close of business on April 6, 2018, the Predecessor Fund was reorganized into the Fund. Returns shown are blended returns of the Predecessor Fund and the Fund. |
| | |
| RYT | | Manager’s Analysis |
| | Invesco S&P 500® Equal Weight Technology ETF (RYT) |
As an index fund, the Invesco S&P 500® Equal Weight Technology ETF (the “Fund”) is passively managed and seeks to track the returns of an underlying index. The Fund seeks to track the investment results (before fees and expenses) of the S&P 500® Equal Weight Information Technology Index (the “Index”). The Fund generally will invest at least 90% of its total assets in the securities that comprise the Index.
Strictly in accordance with its guidelines and mandated procedures, S&P Dow Jones Indices LLC (“S&P DJI” or the “Index Provider”) compiles, maintains and calculates the Index, which is comprised of common stocks of companies in the information technology sector of the S&P 500® Index. The Index Provider defines sectors according to the Global Industry Classification Standard (“GICS”). The information technology sector includes companies that offer software and information technology services, manufacturers and distributors of technology hardware and equipment such as communications equipment, cellular phones, computers and peripherals, electronic equipment and related instruments and semiconductors.
Unlike the S&P 500® Information Technology Index, which employs a market capitalization weighted methodology, the Index is equal weighted, meaning that the Index Provider assigns each component security the same weight in the Index. The Fund generally invests in all of the securities comprising the Index in proportion to their weightings in the Index.
For the fiscal year ended April 30, 2019, on a market price basis, the Fund returned 20.77%. On a net asset value (“NAV”) basis, the Fund returned 20.92%. During the same time period, the Index returned 21.43%. During the fiscal year, the Fund fully replicated the components of the Index; therefore, the Fund’s performance, on a NAV basis, differed from the return of the Index primarily due to fees and operating expenses that the Fund incurred as well as trading costs associated with portfolio rebalances during the period.
During this same time period, the S&P 500® Index (the “Benchmark Index”) returned 13.49%. The Benchmark Index is an unmanaged index weighted by market capitalization based on the average performance of approximately 505 equity securities. The Benchmark Index was selected for its recognition in the marketplace, and its performance comparison is a useful measure for investors as a broad representation of the U.S. equity market.
The performance of the Fund differed from the Benchmark Index in part because the Fund seeks to track an Index that employs an equal weighted methodology, whereas the Benchmark Index weights stocks based primarily on market capitalization.
Relative to the Benchmark Index, the Fund was most overweight in the data processing & outsourced servicessub-industry and most underweight in the pharmaceuticalssub-industry during the fiscal year ended April 30, 2019. The majority of the Fund’s
outperformance relative to the Benchmark Index during that period can be attributed to the Fund being overweight in the semiconductorssub-industry.
For the fiscal year ended April 30, 2019, the semiconductorssub-industry contributed most significantly to the Fund’s return, followed by the data processing & outsourced services and application softwaresub-industries, respectively. The technology hardware, storage & peripheralssub-industry was the greatest detractor from Fund performance.
Positions that contributed most significantly to the Fund’s return for the fiscal year ended April 30, 2019, included Advanced Micro Devices, Inc., a semiconductors company (portfolio average weight of 1.56%) and Xilinx, Inc., a semiconductors company (portfolio average weight of 1.56%). Positions that detracted most significantly from the Fund’s return during this period included Western Digital Corp., a technology hardware, storage & peripherals company (portfolio average weight of 1.37%) and Twitter, Inc., an interactive media & services company (no longer held as of fiscalyear-end).
| | | | |
Industry Breakdown
(% of the Fund’s Net Assets)
as of April 30, 2019 | |
| IT Services | | | 30.6 | |
| Semiconductors & Semiconductor Equipment | | | 24.6 | |
| Software | | | 19.0 | |
| Technology Hardware, Storage & Peripherals | | | 10.1 | |
| Electronic Equipment, Instruments & Components | | | 8.5 | |
| Communications Equipment | | | 7.1 | |
| Money Market Funds Plus Other Assets Less Liabilities | | | 0.1 | |
Invesco S&P 500® Equal Weight Technology ETF (RYT)(continued)
| | | | |
Top Ten Fund Holdings*
(% of the Fund’s Net Assets)
as of April 30, 2019 | |
| Security | | | | |
| QUALCOMM, Inc. | | | 2.1 | |
| Advanced Micro Devices, Inc. | | | 1.7 | |
| Lam Research Corp. | | | 1.6 | |
| Broadcom, Inc. | | | 1.6 | |
| NVIDIA Corp. | | | 1.6 | |
| Broadridge Financial Solutions, Inc. | | | 1.6 | |
| Microsoft Corp. | | | 1.6 | |
| IPG Photonics Corp. | | | 1.6 | |
| PayPal Holdings, Inc. | | | 1.5 | |
| TE Connectivity Ltd. | | | 1.5 | |
| Total | | | 16.4 | |
| * | Excluding money market fund holdings. |
Growth of a $10,000 Investment
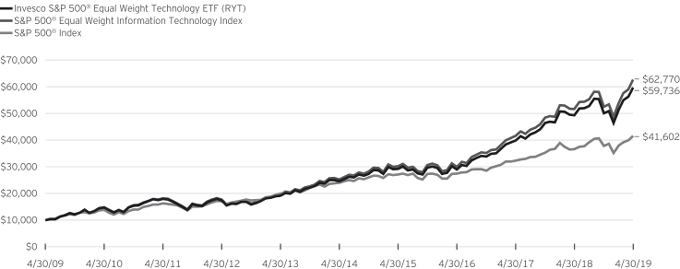
Fund Performance History as of April 30, 2019
| | | | | | | | | | | | | | | | | | | | | | | | | | | | | | | | | | | | | | | | |
| | | 1 Year | | | 3 Years
Average
Annualized | | | 3 Years
Cumulative | | | 5 Years
Average
Annualized | | | 5 Years
Cumulative | | | 10 Years
Average
Annualized | | | 10 Years
Cumulative | | | | | | Fund Inception | |
| Index | | | | | Average
Annualized | | | Cumulative | |
| S&P 500® Equal Weight Information Technology Index | | | 21.43 | % | | | 27.84 | % | | | 108.94 | % | | | 19.95 | % | | | 148.32 | % | | | 20.16 | % | | | 527.70 | % | | | | | | | 12.59 | % | | | 340.08 | % |
| S&P 500® Index | | | 13.49 | | | | 14.87 | | | | 51.58 | | | | 11.63 | | | | 73.32 | | | | 15.32 | | | | 316.02 | | | | | | | | 8.61 | | | | 180.61 | |
| Fund | | | | | | | | | | | | | | | | | | | | | | | | | | | | | | | | | | | | | | | | |
| NAV Return | | | 20.92 | | | | 27.30 | | | | 106.31 | | | | 19.43 | | | | 143.03 | | | | 19.57 | | | | 497.36 | | | | | | | | 12.04 | | | | 313.98 | |
| Market Price Return | | | 20.77 | | | | 27.33 | | | | 106.42 | | | | 19.46 | | | | 143.31 | | | | 19.56 | | | | 496.61 | | | | | | | | 12.04 | | | | 313.89 | |
Invesco S&P 500® Equal Weight Technology ETF (RYT)(continued)
Guggenheim S&P 500® Equal Weight Technology ETF (the “Predecessor Fund”) Inception: November 1, 2006
Performance quoted above represents past performance. Past performance is not a guarantee of future results and current performance may be higher or lower than performance quoted. Investment returns and principal value will fluctuate, and shares of the Fund (“Fund Shares”), when redeemed or sold, may be worth more or less than their original cost. Fund performance reflects any applicable fee waivers and/or expense reimbursements. Had the adviser not waived fees and/or reimbursed expenses currently or in the past, returns would have been lower. See current prospectus for more information. According to the Fund’s current prospectus, the total annual operating expense ratio was indicated as 0.40%. The Financial Highlights section of the Shareholder Report presents the expense ratios based on expenses incurred during the period covered by this report. NAV and Market Price returns assume that dividends and capital gain distributions have been reinvested in the Fund at NAV and Market Price, respectively. The returns shown in the table above do not reflect the deduction of taxes that a shareholder would pay on Fund distributions or the redemption or sale of Fund Shares. See invesco.com/ETFs to find the most recentmonth-end performance numbers.
Index and Benchmark Indexes performance results are based upon a hypothetical investment in their respective constituent securities. Index and Benchmark Indexes returns do not represent Fund returns. An investor cannot invest directly in an index. The Index and Benchmark Indexes do not charge management fees or brokerage expenses, and no such fees or expenses were deducted from the hypothetical performance shown. In addition, the results actual investors might have achieved would have differed from those shown because of differences in the timing, amounts of their investments, and fees and expenses associated with an investment in the Fund.
Notes Regarding Indexes and Fund Performance History:
| - | Average Annualized and Cumulative Inception returns for the Fund, Index and Benchmark Index are based on the inception date of the Predecessor Fund. |
| - | Effective after the close of business on April 6, 2018, the Predecessor Fund was reorganized into the Fund. Returns shown are blended returns of the Predecessor Fund and the Fund. |
| | |
| RYU | | Manager’s Analysis |
| | Invesco S&P 500® Equal Weight Utilities ETF (RYU) |
As an index fund, the Invesco S&P 500® Equal Weight Utilities ETF (the “Fund”) is passively managed and seeks to track the returns of an underlying index. The Fund seeks to track the investment results (before fees and expenses) of the S&P 500® Equal Weight Utilities Plus Index (the “Index”). The Fund generally will invest at least 90% of its total assets in the securities that comprise the Index.
Strictly in accordance with its guidelines and mandated procedures, S&P Dow Jones Indices LLC (“S&P DJI” or the “Index Provider”) compiles, maintains and calculates the Index, which is comprised of common stocks of companies in the utilities sector of the S&P 500® Index. The Index Provider defines sectors according to the Global Industry Classification Standard (“GICS”). The utilities sector includes utility companies such as electric, gas and water utilities, independent power producers and energy traders and companies that engage in generation and distribution of electricity using renewable sources. In the event there are fewer than 22 securities of utilities companies eligible for inclusion in the Index at the quarterly rebalance, the Index will be supplemented with the largest utilities companies in the S&P MidCap 400 Index based on float-adjusted market capitalization until the 22 security minimum is reached. Any supplementary companies that are added to the Index will remain in the Index until at least the next quarterly rebalance.
Unlike the S&P 500® Utilities Index, which employs a market capitalization weighted methodology, the Index is equal weighted, meaning that the Index Provider assigns each component security the same weight in the Index. The Fund generally invests in all of the securities comprising the Index in proportion to their weightings in the Index.
For the fiscal year ended April 30, 2019, on a market price basis, the Fund returned 18.60%. On a net asset value (“NAV”) basis, the Fund returned 18.54%. During the same time period, the Index returned 19.00%. During the fiscal year, the Fund fully replicated the components of the Index; therefore, the Fund’s performance, on a NAV basis, differed from the return of the Index primarily due to fees and operating expenses that the Fund incurred as well as trading costs associated with portfolio rebalances during the period.
During this same time period, the S&P 500® Index (the “Benchmark Index”) returned 13.49%. The Benchmark Index is an unmanaged index weighted by market capitalization based on the average performance of approximately 505 equity securities. The Benchmark Index was selected for its recognition in the marketplace, and its performance comparison is a useful measure for investors as a broad representation of the U.S. equity market.
The performance of the Fund differed from the Benchmark Index in part because the Fund seeks to track an Index that employs an
equal weighted methodology, whereas the Benchmark Index weights stocks based primarily on market capitalization.
Relative to the Benchmark Index, the Fund was most overweight in the electric utilitiessub-industry and most underweight in the interactive media & servicessub-industry during the fiscal year ended April 30, 2019. The majority of the Fund’s outperformance relative to the Benchmark Index during that period can be attributed to the Fund being overweight in as well as security selection in the multi-utilitiessub-industry and being overweight in the independent power producers & energy traderssub-industry.
For the fiscal year ended April 30, 2019, the multi-utilitiessub-industry contributed most significantly to the Fund’s return, followed by the electric utilities and independent power producers & energy traderssub-industries, respectively. Nosub-industry detracted from the Fund’s return over the fiscal year.
Positions that contributed most significantly to the Fund’s return for the fiscal year ended April 30, 2019, included AES Corp. (The), an independent power producers & energy traders company (portfolio average weight of 3.51%) and SCANA Corp., a multi-utilities company (no longer held at fiscal year-end). Positions that detracted most significantly from the Fund’s return during this period included PG&E Corp., an electric utilities company (no longer held at fiscal year-end).
| | | | |
Industry Breakdown
(% of the Fund’s Net Assets)
as of April 30, 2019 | |
| Electric Utilities | | | 50.1 | |
| Multi-Utilities | | | 35.7 | |
| Independent Power and Renewable Electricity Producers | | | 6.8 | |
| Water Utilities | | | 3.7 | |
| Gas Utilities | | | 3.6 | |
| Money Market Funds Plus Other Assets Less Liabilities | | | 0.1 | |
Invesco S&P 500® Equal Weight Utilities ETF (RYU)(continued)
| | | | |
Top Ten Fund Holdings*
(% of the Fund’s Net Assets)
as of April 30, 2019 | |
| Security | | | | |
| American Water Works Co., Inc. | | | 3.7 | |
| Entergy Corp. | | | 3.7 | |
| Sempra Energy | | | 3.7 | |
| Southern Co. (The) | | | 3.6 | |
| Exelon Corp. | | | 3.6 | |
| American Electric Power Co., Inc. | | | 3.6 | |
| Evergy, Inc. | | | 3.6 | |
| CenterPoint Energy, Inc. | | | 3.6 | |
| NextEra Energy, Inc. | | | 3.6 | |
| Eversource Energy | | | 3.6 | |
| Total | | | 36.3 | |
| * | Excluding money market fund holdings. |
Growth of a $10,000 Investment
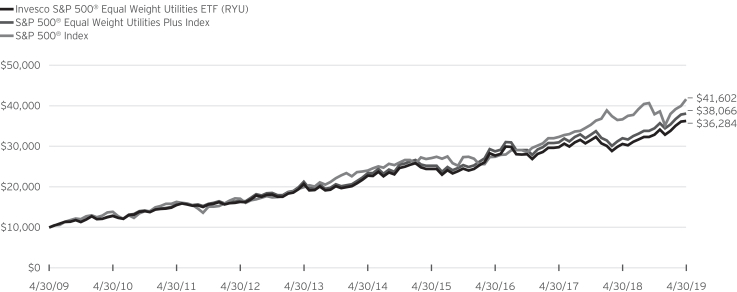
Fund Performance History as of April 30, 2019
| | | | | | | | | | | | | | | | | | | | | | | | | | | | | | | | | | | | | | | | |
| | | 1 Year | | | 3 Years
Average
Annualized | | | 3 Years
Cumulative | | | 5 Years
Average
Annualized | | | 5 Years
Cumulative | | | 10 Years
Average
Annualized | | | 10 Years
Cumulative | | | | | | Fund Inception | |
| Index | | | | | Average
Annualized | | | Cumulative | |
| S&P 500® Equal Weight Utilities Plus Index | | | 19.00 | % | | | 9.78 | % | | | 32.31 | % | | | 10.22 | % | | | 62.65 | % | | | 14.30 | % | | | 280.66 | % | | | | | | | 8.89 | % | | | 189.94 | % |
| S&P 500® Index | | | 13.49 | | | | 14.87 | | | | 51.58 | | | | 11.63 | | | | 73.32 | | | | 15.32 | | | | 316.02 | | | | | | | | 8.61 | | | | 180.61 | |
| Fund | | | | | | | | | | | | | | | | | | | | | | | | | | | | | | | | | | | | | | | | |
| NAV Return | | | 18.54 | | | | 9.33 | | | | 30.67 | | | | 9.76 | | | | 59.33 | | | | 13.76 | | | | 262.84 | | | | | | | | 8.36 | | | | 172.78 | |
| Market Price Return | | | 18.60 | | | | 9.28 | | | | 30.49 | | | | 9.72 | | | | 59.00 | | | | 13.80 | | | | 264.39 | | | | | | | | 8.36 | | | | 172.64 | |
Invesco S&P 500® Equal Weight Utilities ETF (RYU)(continued)
Guggenheim S&P 500® Equal Weight Utilities ETF (the “Predecessor Fund”) Inception: November 1, 2006
Performance quoted above represents past performance. Past performance is not a guarantee of future results and current performance may be higher or lower than performance quoted. Investment returns and principal value will fluctuate, and shares of the Fund (“Fund Shares”), when redeemed or sold, may be worth more or less than their original cost. Fund performance reflects any applicable fee waivers and/or expense reimbursements. Had the adviser not waived fees and/or reimbursed expenses currently or in the past, returns would have been lower. See current prospectus for more information. According to the Fund’s current prospectus, the total annual operating expense ratio was indicated as 0.40%. The Financial Highlights section of the Shareholder Report presents the expense ratios based on expenses incurred during the period covered by this report. NAV and Market Price returns assume that dividends and capital gain distributions have been reinvested in the Fund at NAV and Market Price, respectively. The returns shown in the table above do not reflect the deduction of taxes that a shareholder would pay on Fund distributions or the redemption or sale of Fund Shares. See invesco.com/ETFs to find the most recentmonth-end performance numbers.
Index and Benchmark Indexes performance results are based upon a hypothetical investment in their respective constituent securities. Index and Benchmark Indexes returns do not represent Fund returns. An investor cannot invest directly in an index. The Index and Benchmark Indexes do not charge management fees or brokerage expenses, and no such fees or expenses were deducted from the hypothetical performance shown. In addition, the results actual investors might have achieved would have differed from those shown because of differences in the timing, amounts of their investments, and fees and expenses associated with an investment in the Fund.
Notes Regarding Indexes and Fund Performance History:
| - | Average Annualized and Cumulative Inception returns for the Fund, Index and Benchmark Index are based on the inception date of the Predecessor Fund. |
| - | Effective after the close of business on April 6, 2018, the Predecessor Fund was reorganized into the Fund. Returns shown are blended returns of the Predecessor Fund and the Fund. |
| | |
| EWMC | | Manager’s Analysis |
| | Invesco S&P MidCap 400® Equal Weight ETF (EWMC) |
As an index fund, the Invesco S&P MidCap 400® Equal Weight ETF (the “Fund”) is passively managed and seeks to track the returns of an underlying index. The Fund seeks to track the investment results (before fees and expenses) of the S&P MidCap 400® Equal Weight Index (the “Index”). The Fund generally will invest at least 90% of its total assets in the securities that comprise the Index.
Strictly in accordance with its guidelines and mandated procedures, S&P Dow Jones Indices LLC (“S&P DJI” or the “Index Provider”) compiles, maintains and calculates the Index, which consists of U.S. common equities listed on the New York Stock Exchanges (including NYSE Arca and NYSE American) and The Nasdaq Stock Market (“NASDAQ”), and also may include equity interests in real estate investment trusts (“REITs”) and business development companies (“BDCs”).
Unlike the S&P MidCap 400® Index, which employs a market capitalization weighted methodology, the Index is equally weighted, meaning that the Index Provider assigns each component security the same weight in the Index. The Fund generally invests in all of the securities comprising the Index in proportion to their weightings in the Index.
For the fiscal year ended April 30, 2019, on a market price basis, the Fund returned 5.99%. On a net asset value (“NAV”) basis, the Fund returned 5.96%. During the same time period, the Index returned 6.39%. During the fiscal year, the Fund fully replicated the components of the Index; therefore, the Fund’s performance, on a NAV basis, differed from the return of the Index primarily due to fees and operating expenses that the Fund incurred during the period.
During this same time period, the S&P MidCap 400® Index (the “Benchmark Index”) returned 6.99%. The Benchmark Index is an unmanaged index weighted by market capitalization based on the average performance of approximately 400 equity securities. The Benchmark Index was selected for its recognition in the marketplace, and its performance comparison is a useful measure for investors as a broad representation of themid-cap segment of the U.S. equity universe.
The performance of the Fund differed from the Benchmark Index in part because the Fund seeks to track an Index that employs an equal weighted methodology, whereas the Benchmark Index weights stocks based primarily on market capitalization.
Relative to the Benchmark Index, the Fund was most overweight in the consumer discretionary sector and most underweight in the information technology sector during the fiscal year ended April 30, 2019. The majority of the Fund’s underperformance relative to the Benchmark Index during that period can be attributed to the Fund being underweight in the information technology sector.
For the fiscal year ended April 30, 2019, the information technology sector contributed most significantly to the Fund’s return, followed by the industrials and real estate sectors, respectively. The energy sector detracted most significantly from the Fund’s return, followed by the materials sector.
Positions that contributed most significantly to the Fund’s return for the fiscal year ended April 30, 2019, included LiveRamp Holdings, Inc., an information technology company (portfolio average weight of 0.27%) and Five Below, Inc., a consumer discretionary company (portfolio average weight of 0.26%). Positions that detracted most significantly from the Fund’s return during this period included Weight Watchers International, Inc., a consumer discretionary company (portfolio average weight of 0.12%) and Nabors Industries Ltd., an energy company (no longer held at fiscalyear-end).
| | | | |
Sector Breakdown
(% of the Fund’s Net Assets)
as of April 30, 2019 | |
| Financials | | | 15.6 | |
| Consumer Discretionary | | | 14.9 | |
| Industrials | | | 14.9 | |
| Information Technology | | | 14.0 | |
| Real Estate | | | 9.3 | |
| Health Care | | | 8.5 | |
| Materials | | | 7.3 | |
| Energy | | | 5.5 | |
| Utilities | | | 3.6 | |
| Consumer Staples | | | 3.4 | |
| Communication Services | | | 3.0 | |
| Money Market Funds Plus Other Assets Less Liabilities | | | 0.0 | |
|
Top Ten Fund Holdings*
(% of the Fund’s Net Assets)
as of April 30, 2019 | |
| Security | | | | |
| Adient PLC | | | 0.4 | |
| XPO Logistics, Inc. | | | 0.4 | |
| Silicon Laboratories, Inc. | | | 0.3 | |
| Oceaneering International, Inc. | | | 0.3 | |
| Lumentum Holdings, Inc. | | | 0.3 | |
| Uniti Group, Inc. | | | 0.3 | |
| Helen of Troy Ltd. | | | 0.3 | |
| Five Below, Inc. | | | 0.3 | |
| Cree, Inc. | | | 0.3 | |
| Manhattan Associates, Inc. | | | 0.3 | |
| Total | | | 3.2 | |
| * | Excluding money market fund holdings. |
Invesco S&P MidCap 400® Equal Weight ETF (EWMC)(continued)
Growth of a $10,000 Investment Since Inception
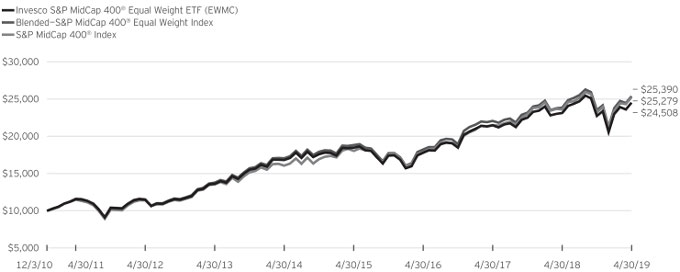
Fund Performance History as of April 30, 2019
| | | | | | | | | | | | | | | | | | | | | | | | | | | | | | | | |
| | | 1 Year | | | 3 Years Average
Annualized | | | 3 Years Cumulative | | | 5 Years Average
Annualized | | | 5 Years Cumulative | | | | | | Fund Inception | |
| Index | | | | | Average
Annualized | | | Cumulative | |
| Blended—S&P MidCap 400® Equal Weight Index | | | 6.39 | % | | | 11.65 | % | | | 39.18 | % | | | 8.28 | % | | | 48.88 | % | | | | | | | 11.72 | % | | | 153.90 | % |
| S&P MidCap 400® Index | | | 6.99 | | | | 12.26 | | | | 41.47 | | | | 9.49 | | | | 57.35 | | | | | | | | 11.66 | | | | 152.79 | |
| Fund | | | | | | | | | | | | | | | | | | | | | | | | | | | | | | | | |
| NAV Return | | | 5.96 | | | | 11.22 | | | | 37.58 | | | | 7.83 | | | | 45.77 | | | | | | | | 11.25 | | | | 145.08 | |
| Market Price Return | | | 5.99 | | | | 11.27 | | | | 37.77 | | | | 7.88 | | | | 46.09 | | | | | | | | 11.25 | | | | 145.13 | |
Guggenheim S&P MidCap 400® Equal Weight ETF (the “Predecessor Fund”) Inception: December 3, 2010
Performance quoted above represents past performance. Past performance is not a guarantee of future results and current performance may be higher or lower than performance quoted. Investment returns and principal value will fluctuate, and shares of the Fund (“Fund Shares”), when redeemed or sold, may be worth more or less than their original cost. Fund performance reflects any applicable fee waivers and/or expense reimbursements. Had the adviser not waived fees and/or reimbursed expenses currently or in the past, returns would have been lower. See current prospectus for more information. According to the Fund’s current prospectus, the total annual operating expense ratio was indicated as 0.40%. The Financial Highlights section of the Shareholder Report presents the expense ratios based on expenses incurred during the period covered by this report. NAV and Market Price returns assume that dividends and capital gain distributions have been reinvested in the Fund at NAV and Market Price, respectively. The returns shown in the table above do not reflect the deduction of taxes that a shareholder would pay on Fund distributions or the redemption or sale of Fund Shares. See invesco.com/ETFs to find the most recentmonth-end performance numbers.
Blended Index and Benchmark Indexes performance results are based upon a hypothetical investment in their respective constituent securities.
Blended Index and Benchmark Indexes returns do not represent Fund returns. An investor cannot invest directly in an index. The Blended Index and Benchmark Indexes do not charge management fees or brokerage expenses, and no such fees or expenses were deducted from the hypothetical performance shown. In addition, the results actual investors might have achieved would have differed from those shown because of differences in the timing, amounts of their investments, and fees and expenses associated with an investment in the Fund.
Notes Regarding Indexes and Fund Performance History:
| - | The Blended—S&P MidCap 400® Equal Weight Index performance is comprised of the performance of the Russell MidCap Equal Weight Index, the Fund’s previous underlying index, prior to the conversion date, January 26, 2016, followed by the performance of the Index, starting from the conversion date through April 30, 2019. |
| - | Average Annualized and Cumulative Inception returns for the Fund, Blended Index and Benchmark Index are based on the inception date of the Predecessor Fund. |
| - | Effective after the close of business on April 6, 2018, the Predecessor Fund was reorganized into the Fund. Returns shown are blended returns of the Predecessor Fund and the Fund. |
| | |
| EWSC | | Manager’s Analysis |
| | Invesco S&P SmallCap 600® Equal Weight ETF (EWSC) |
As an index fund, the Invesco S&P SmallCap 600® Equal Weight ETF (the “Fund”) is passively managed and seeks to track the returns of an underlying index. The Fund seeks to track the investment results (before fees and expenses) of the S&P SmallCap 600® Equal Weight Index (the “Index”). The Fund will generally invest at least 90% of its total assets in the securities that comprise the Index.
S&P Dow Jones Indices LLC (“S&P DJI” or the “Index Provider”) compiles, maintains and calculates the Index, which consists of U.S. common equities listed on the New York Stock Exchanges (including NYSE Arca and NYSE American and NASDAQ), and also may include equity interests in real estate investment trusts (“REITs”) and business development companies (“BDCs”).
Unlike the S&P SmallCap 600® Index, which employs a market capitalization weighted methodology, the Index is equally weighted, meaning that the Index Provider assigns each component security the same weight in the Index. The Fund generally invests in all of the securities comprising the Index in proportion to their weightings in the Index.
For the fiscal year ended April 30, 2019, on a market price basis, the Fund returned 2.00%. On a net asset value (“NAV”) basis, the Fund returned 2.55%. During the same time period, the Index returned 2.95%. During the fiscal year, the Fund fully replicated the components of the Index; therefore, the Fund’s performance, on a NAV basis, differed from the return of the Index primarily due to fees and operating expenses that the Fund incurred during the period.
During this same time period, the S&P SmallCap 600® Index (the “Benchmark Index”) returned 4.42%. The Benchmark Index is an unmanaged index weighted by market capitalization based on the average performance of approximately 600 equity securities. The Benchmark Index was selected for its recognition in the marketplace, and its performance comparison is a useful measure for investors as a broad representation of thesmall-cap segment of the U.S. equity universe.
The performance of the Fund differed from the Benchmark Index in part because the Fund seeks to track an Index that employs an equal weighted methodology, whereas the Benchmark Index weights stocks based primarily on market capitalization.
Relative to the Benchmark Index, the Fund was most overweight in the consumer discretionary sector and most underweight in the industrials sector during the fiscal year ended April 30, 2019. The majority of the Fund’s underperformance relative to the Benchmark Index during that period can be attributed to the fees and operating expenses that the Fund incurred as well as the Fund being underweight in and security selection in the health care sector.
For the fiscal year ended April 30, 2019, the information technology sector contributed most significantly to the Fund’s return, followed by the industrials and consumer discretionary sectors, respectively. The energy sector detracted most significantly from the Fund’s return, followed by the materials and health care sectors, respectively.
Positions that contributed most significantly to the Fund’s return for the fiscal year ended April 30, 2019, included Diebold Nixdorf, Inc., an information technology company (portfolio average weight of 0.18%) and eHealth, Inc., a financials company (portfolio average weight of 0.21%). Positions that detracted most significantly from the Fund’s return during this period included Cloud Peak Energy Inc., an industrials company (no longer held at fiscalyear-end) and Bristow Group Inc., an energy company (no longer held at fiscalyear-end).
| | | | |
Sector Breakdown
(% of the Fund’s Net Assets)
as of April 30, 2019 | |
| Industrials | | | 16.6 | |
| Financials | | | 15.9 | |
| Consumer Discretionary | | | 15.8 | |
| Information Technology | | | 15.1 | |
| Health Care | | | 11.0 | |
| Real Estate | | | 6.8 | |
| Energy | | | 6.7 | |
| Materials | | | 5.3 | |
| Consumer Staples | | | 3.2 | |
| Sector Types Each Less Than 3% | | | 3.5 | |
| Money Market Funds Plus Other Assets Less Liabilities | | | 0.1 | |
|
Top Ten Fund Holdings*
(% of the Fund’s Net Assets)
as of April 30, 2019 | |
| Security | | | | |
| WageWorks, Inc. | | | 0.3 | |
| Titan International, Inc. | | | 0.3 | |
| Sonic Automotive, Inc., Class A | | | 0.3 | |
| Cytokinetics, Inc. | | | 0.2 | |
| Electronics For Imaging, Inc. | | | 0.2 | |
| Denbury Resources, Inc. | | | 0.2 | |
| Axon Enterprise, Inc. | | | 0.2 | |
| SRC Energy, Inc. | | | 0.2 | |
| Ichor Holdings Ltd. | | | 0.2 | |
| Coca-Cola Bottling Co. Consolidated | | | 0.2 | |
| Total | | | 2.3 | |
| * | Excluding money market fund holdings. |
Invesco S&P SmallCap 600® Equal Weight ETF (EWSC)(continued)
Growth of a $10,000 Investment Since Inception
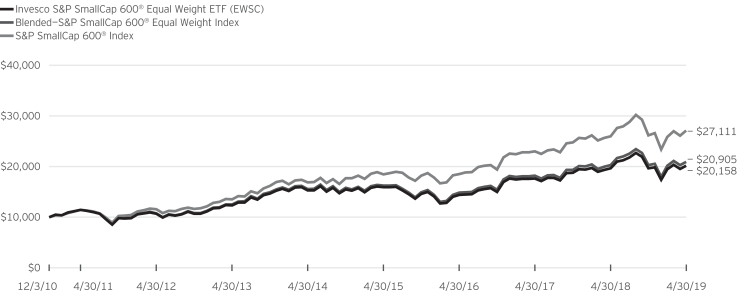
Fund Performance History as of April 30, 2019
| | | | | | | | | | | | | | | | | | | | | | | | | | | | | | | | |
| | | 1 Year | | | 3 Years Average
Annualized | | | 3 Years Cumulative | | | 5 Years Average
Annualized | | | 5 Years Cumulative | | | | | | Fund Inception | |
| Index | | | | | Average
Annualized | | | Cumulative | |
| Blended—S&P SmallCap 600® Equal Weight Index | | | 2.95 | % | | | 12.10 | % | | | 40.86 | % | | | 6.05 | % | | | 34.13 | % | | | | | | | 9.17 | % | | | 109.05 | % |
| S&P SmallCap 600® Index | | | 4.42 | | | | 13.54 | | | | 46.39 | | | | 9.90 | | | | 60.34 | | | | | | | | 12.59 | | | | 171.11 | |
| Fund | | | | | | | | | | | | | | | | | | | | | | | | | | | | | | | | |
| NAV Return | | | 2.55 | | | | 11.77 | | | | 39.65 | | | | 5.66 | | | | 31.72 | | | | | | | | 8.69 | | | | 101.58 | |
| Market Price Return | | | 2.00 | | | | 11.85 | | | | 39.94 | | | | 5.61 | | | | 31.38 | | | | | | | | 8.65 | | | | 100.88 | |
Guggenheim S&P SmallCap 600® Equal Weight ETF (the “Predecessor Fund”) Inception: December 3, 2010
Performance quoted above represents past performance. Past performance is not a guarantee of future results and current performance may be higher or lower than performance quoted. Investment returns and principal value will fluctuate, and shares of the Fund (“Fund Shares”), when redeemed or sold, may be worth more or less than their original cost. Fund performance reflects any applicable fee waivers and/or expense reimbursements. Had the adviser not waived fees and/or reimbursed expenses currently or in the past, returns would have been lower. See current prospectus for more information. According to the Fund’s current prospectus, the total annual operating expense ratio was indicated as 0.40%. The Financial Highlights section of the Shareholder Report presents the expense ratios based on expenses incurred during the period covered by this report. NAV and Market Price returns assume that dividends and capital gain distributions have been reinvested in the Fund at NAV and Market Price, respectively. The returns shown in the table above do not reflect the deduction of taxes that a shareholder would pay on Fund distributions or the redemption or sale of Fund Shares. See invesco.com/ETFs to find the most recentmonth-end performance numbers.
Blended Index and Benchmark Indexes performance results are based upon a hypothetical investment in their respective constituent securities.
Blended Index and Benchmark Indexes returns do not represent Fund returns. An investor cannot invest directly in an index. The Blended Index and Benchmark Indexes do not charge management fees or brokerage expenses, and no such fees or expenses were deducted from the hypothetical performance shown. In addition, the results actual investors might have achieved would have differed from those shown because of differences in the timing, amounts of their investments, and fees and expenses associated with an investment in the Fund.
Notes Regarding Indexes and Fund Performance History:
| - | The Blended—S&P SmallCap 600® Equal Weight Index performance is comprised of the performance of the Russell 2000® Equal Weight Index, the Fund’s previous underlying index, prior to the conversion date, January 26, 2016, followed by the performance of the Index, starting from the conversion date through April 30, 2019. |
| - | Average Annualized and Cumulative Inception returns for the Fund, Blended Index and Benchmark Index are based on the inception date of the Predecessor Fund. |
| - | Effective after the close of business on April 6, 2018, the Predecessor Fund was reorganized into the Fund. Returns shown are blended returns of the Predecessor Fund and the Fund. |
Schedule of Investments(a)
Invesco S&P 500® Equal Weight ETF (RSP)
April 30, 2019
| | | | | | | | |
Number
of Shares | | | | | Value | |
| | | | Common Stocks & Other Equity Interests—99.9% | |
| | | | Communication Services—4.4% | |
| | 720,292 | | | Activision Blizzard, Inc. | | $ | 34,725,277 | |
| | 13,014 | | | Alphabet, Inc., Class A(b) | | | 15,603,265 | |
| | 13,390 | | | Alphabet, Inc., Class C(b) | | | 15,913,747 | |
| | 1,010,488 | | | AT&T, Inc. | | | 31,284,708 | |
| | 617,712 | | | CBS Corp., Class B | | | 31,670,094 | |
| | 2,461,310 | | | CenturyLink, Inc. | | | 28,108,160 | |
| | 89,731 | | | Charter Communications, Inc., Class A(b) | | | 33,307,250 | |
| | 793,648 | | | Comcast Corp., Class A | | | 34,547,497 | |
| | 334,698 | | | Discovery, Inc., Class A(b) | | | 10,342,168 | |
| | 761,240 | | | Discovery, Inc., Class C(b) | | | 21,893,262 | |
| | 953,521 | | | DISH Network Corp., Class A(b) | | | 33,487,658 | |
| | 307,787 | | | Electronic Arts, Inc.(b) | | | 29,132,040 | |
| | 178,505 | | | Facebook, Inc., Class A(b) | | | 34,522,867 | |
| | 521,989 | | | Fox Corp., Class A(b) | | | 20,352,351 | |
| | 247,265 | | | Fox Corp., Class B(b) | | | 9,519,703 | |
| | 1,360,633 | | | Interpublic Group of Cos., Inc. (The) | | | 31,294,559 | |
| | 86,622 | | | Netflix, Inc.(b) | | | 32,096,916 | |
| | 1,772,238 | | | News Corp., Class A | | | 22,011,196 | |
| | 572,199 | | | News Corp., Class B | | | 7,146,766 | |
| | 409,218 | | | Omnicom Group, Inc. | | | 32,749,717 | |
| | 347,824 | | | Take-Two Interactive Software, Inc.(b) | | | 33,679,798 | |
| | 594,655 | | | TripAdvisor, Inc.(b) | | | 31,653,486 | |
| | 1,007,796 | | | Twitter, Inc.(b) | | | 40,221,138 | |
| | 535,534 | | | Verizon Communications, Inc. | | | 30,627,189 | |
| | 1,049,004 | | | Viacom, Inc., Class B | | | 30,326,706 | |
| | 266,906 | | | Walt Disney Co. (The) | | | 36,558,115 | |
| | | | | | | | |
| | | | | | | 712,775,633 | |
| | | | | | | | |
| | | | Consumer Discretionary—12.6% | |
| | 199,475 | | | Advance Auto Parts, Inc. | | | 33,176,682 | |
| | 18,675 | | | Amazon.com, Inc.(b) | | | 35,977,761 | |
| | 370,144 | | | Aptiv PLC | | | 31,721,341 | |
| | 32,390 | | | AutoZone, Inc.(b) | | | 33,306,961 | |
| | 449,376 | | | Best Buy Co., Inc. | | | 33,438,068 | |
| | 17,645 | | | Booking Holdings, Inc.(b) | | | 32,731,299 | |
| | 794,384 | | | BorgWarner, Inc. | | | 33,181,420 | |
| | 694,681 | | | Capri Holdings Ltd.(b) | | | 30,621,538 | |
| | 518,572 | | | CarMax, Inc.(b) | | | 40,376,016 | |
| | 550,744 | | | Carnival Corp. | | | 30,213,816 | |
| | 49,116 | | | Chipotle Mexican Grill, Inc.(b) | | | 33,793,773 | |
| | 749,357 | | | D.R. Horton, Inc. | | | 33,204,009 | |
| | 279,437 | | | Darden Restaurants, Inc. | | | 32,861,791 | |
| | 255,020 | | | Dollar General Corp. | | | 32,155,472 | |
| | 295,692 | | | Dollar Tree, Inc.(b) | | | 32,904,606 | |
| | 843,528 | | | eBay, Inc. | | | 32,686,710 | |
| | 249,462 | | | Expedia Group, Inc. | | | 32,390,146 | |
| | 503,908 | | | Foot Locker, Inc. | | | 28,828,577 | |
| | 3,595,498 | | | Ford Motor Co. | | | 37,572,954 | |
| | 1,167,528 | | | Gap, Inc. (The) | | | 30,449,130 | |
| | 366,191 | | | Garmin Ltd. | | | 31,397,216 | |
| | 796,895 | | | General Motors Co. | | | 31,039,060 | |
| | 285,769 | | | Genuine Parts Co. | | | 29,302,753 | |
| | 1,213,395 | | | H&R Block, Inc. | | | 33,016,478 | |
| | 1,655,230 | | | Hanesbrands, Inc. | | | 29,910,006 | |
| | 803,874 | | | Harley-Davidson, Inc. | | | 29,928,229 | |
| | 347,784 | | | Hasbro, Inc. | | | 35,425,278 | |
| | 367,214 | | | Hilton Worldwide Holdings, Inc. | | | 31,943,946 | |
| | | | | | | | |
Number
of Shares | | | | | Value | |
| | | | Common Stocks & Other Equity Interests
(continued) | |
| | | | Consumer Discretionary (continued) | |
| | 167,360 | | | Home Depot, Inc. (The) | | $ | 34,091,232 | |
| | 446,722 | | | Kohl’s Corp. | | | 31,761,934 | |
| | 1,169,337 | | | L Brands, Inc. | | | 29,981,801 | |
| | 682,927 | | | Leggett & Platt, Inc. | | | 26,880,007 | |
| | 634,284 | | | Lennar Corp., Class A | | | 33,001,797 | |
| | 1,106,914 | | | LKQ Corp.(b) | | | 33,318,111 | |
| | 304,781 | | | Lowe’s Cos., Inc. | | | 34,482,922 | |
| | 1,311,129 | | | Macy’s, Inc. | | | 30,863,977 | |
| | 250,820 | | | Marriott International, Inc., Class A | | | 34,216,864 | |
| | 2,089,307 | | | Mattel, Inc.(b)(c) | | | 25,468,652 | |
| | 168,664 | | | McDonald’s Corp. | | | 33,322,947 | |
| | 1,142,420 | | | MGM Resorts International | | | 30,422,645 | |
| | 229,213 | | | Mohawk Industries, Inc.(b) | | | 31,230,271 | |
| | 1,960,756 | | | Newell Brands, Inc. | | | 28,195,671 | |
| | 357,025 | | | NIKE, Inc., Class B | | | 31,357,506 | |
| | 689,926 | | | Nordstrom, Inc. | | | 28,300,765 | |
| | 550,332 | | | Norwegian Cruise Line Holdings Ltd.(b) | | | 31,033,221 | |
| | 82,804 | | | O’Reilly Automotive, Inc.(b) | | | 31,347,110 | |
| | 1,097,685 | | | PulteGroup, Inc. | | | 34,533,170 | |
| | 274,520 | | | PVH Corp. | | | 35,410,335 | |
| | 248,025 | | | Ralph Lauren Corp. | | | 32,635,130 | |
| | 339,930 | | | Ross Stores, Inc. | | | 33,197,564 | |
| | 259,773 | | | Royal Caribbean Cruises Ltd. | | | 31,416,947 | |
| | 441,517 | | | Starbucks Corp. | | | 34,297,041 | |
| | 902,620 | | | Tapestry, Inc. | | | 29,127,547 | |
| | 399,344 | | | Target Corp. | | | 30,917,212 | |
| | 320,944 | | | Tiffany & Co. | | | 34,604,182 | |
| | 596,886 | | | TJX Cos., Inc. (The) | | | 32,757,104 | |
| | 334,924 | | | Tractor Supply Co. | | | 34,664,634 | |
| | 98,839 | | | Ulta Beauty, Inc.(b) | | | 34,492,834 | |
| | 749,523 | | | Under Armour, Inc., Class A(b) | | | 17,306,486 | |
| | 755,885 | | | Under Armour, Inc., Class C(b) | | | 15,661,937 | |
| | 359,501 | | | VF Corp. | | | 33,940,489 | |
| | 220,098 | | | Whirlpool Corp. | | | 30,554,004 | |
| | 253,151 | | | Wynn Resorts, Ltd. | | | 36,567,662 | |
| | 314,559 | | | Yum! Brands, Inc. | | | 32,836,814 | |
| | | | | | | | |
| | | | | | | 2,037,753,561 | |
| | | | | | | | |
| | | | Consumer Staples—6.7% | |
| | 546,757 | | | Altria Group, Inc. | | | 29,705,308 | |
| | 722,187 | | | Archer-Daniels-Midland Co. | | | 32,209,540 | |
| | 612,813 | | | Brown-Forman Corp., Class B | | | 32,656,805 | |
| | 840,484 | | | Campbell Soup Co. | | | 32,518,326 | |
| | 461,150 | | | Church & Dwight Co., Inc. | | | 34,563,193 | |
| | 191,811 | | | Clorox Co. (The) | | | 30,637,971 | |
| | 675,155 | | | Coca-Cola Co. (The) | | | 33,123,104 | |
| | 463,257 | | | Colgate-Palmolive Co. | | | 33,720,477 | |
| | 1,347,318 | | | Conagra Brands, Inc. | | | 41,470,448 | |
| | 182,165 | | | Constellation Brands, Inc., Class A | | | 38,558,866 | |
| | 132,892 | | | Costco Wholesale Corp. | | | 32,628,973 | |
| | 2,745,714 | | | Coty, Inc., Class A(c) | | | 29,708,625 | |
| | 194,029 | | | Estee Lauder Cos., Inc. (The), Class A | | | 33,336,123 | |
| | 650,218 | | | General Mills, Inc. | | | 33,466,720 | |
| | 272,148 | | | Hershey Co. (The) | | | 33,977,678 | |
| | 704,212 | | | Hormel Foods Corp. | | | 28,126,227 | |
| | 295,386 | | | JM Smucker Co. (The) | | | 36,223,185 | |
| | 554,878 | | | Kellogg Co. | | | 33,459,143 | |
See accompanying Notes to Financial Statements which are an integral part of the financial statements.
Invesco S&P 500® Equal Weight ETF (RSP)(continued)
April 30, 2019
| | | | | | | | |
Number
of Shares | | | | | Value | |
| | | | Common Stocks & Other Equity Interests
(continued) | |
| | | | Consumer Staples (continued) | | | |
| | 261,260 | | | Kimberly-Clark Corp. | | $ | 33,540,559 | |
| | 943,117 | | | Kraft Heinz Co. (The) | | | 31,349,209 | |
| | 1,237,197 | | | Kroger Co. (The) | | | 31,894,939 | |
| | 432,426 | | | Lamb Weston Holdings, Inc. | | | 30,291,441 | |
| | 220,898 | | | McCormick & Co., Inc. | | | 34,011,665 | |
| | 509,241 | | | Molson Coors Brewing Co., Class B | | | 32,688,180 | |
| | 649,940 | | | Mondelez International, Inc., Class A | | | 33,049,449 | |
| | 499,507 | | | Monster Beverage Corp.(b) | | | 29,770,617 | |
| | 262,727 | | | PepsiCo, Inc. | | | 33,642,192 | |
| | 349,534 | | | Philip Morris International, Inc. | | | 30,255,663 | |
| | 307,631 | | | Procter & Gamble Co. (The) | | | 32,756,549 | |
| | 460,229 | | | Sysco Corp. | | | 32,386,315 | |
| | 482,230 | | | Tyson Foods, Inc., Class A | | | 36,172,072 | |
| | 505,406 | | | Walgreens Boots Alliance, Inc. | | | 27,074,599 | |
| | 314,044 | | | Walmart, Inc. | | | 32,296,285 | |
| | | | | | | | |
| | | | | | | 1,081,270,446 | |
| | | | | | | | |
| | | | Energy—5.9% | | | |
| | 719,610 | | | Anadarko Petroleum Corp. | | | 52,423,589 | |
| | 953,629 | | | Apache Corp. | | | 31,383,930 | |
| | 1,176,603 | | | Baker Hughes, a GE Co., Class A | | | 28,262,004 | |
| | 1,227,159 | | | Cabot Oil & Gas Corp. | | | 31,771,147 | |
| | 248,918 | | | Chevron Corp. | | | 29,885,095 | |
| | 443,322 | | | Cimarex Energy Co. | | | 30,438,489 | |
| | 301,893 | | | Concho Resources, Inc. | | | 34,832,414 | |
| | 462,694 | | | ConocoPhillips | | | 29,205,245 | |
| | 1,133,439 | | | Devon Energy Corp. | | | 36,428,729 | |
| | 313,532 | | | Diamondback Energy, Inc. | | | 33,356,670 | |
| | 350,228 | | | EOG Resources, Inc. | | | 33,639,399 | |
| | 381,599 | | | Exxon Mobil Corp. | | | 30,634,768 | |
| | 1,102,074 | | | Halliburton Co. | | | 31,221,756 | |
| | 573,263 | | | Helmerich & Payne, Inc. | | | 33,547,351 | |
| | 550,432 | | | Hess Corp. | | | 35,293,700 | |
| | 620,372 | | | HollyFrontier Corp. | | | 29,610,356 | |
| | 1,534,416 | | | Kinder Morgan, Inc. | | | 30,488,846 | |
| | 1,860,736 | | | Marathon Oil Corp. | | | 31,706,941 | |
| | 526,500 | | | Marathon Petroleum Corp. | | | 32,048,055 | |
| | 1,170,237 | | | National Oilwell Varco, Inc. | | | 30,589,995 | |
| | 1,413,361 | | | Noble Energy, Inc. | | | 38,245,549 | |
| | 482,766 | | | Occidental Petroleum Corp. | | | 28,425,262 | |
| | 461,640 | | | ONEOK, Inc. | | | 31,359,205 | |
| | 321,012 | | | Phillips 66 | | | 30,261,801 | |
| | 232,237 | | | Pioneer Natural Resources Co. | | | 38,658,171 | |
| | 737,553 | | | Schlumberger Ltd. | | | 31,478,762 | |
| | 1,443,613 | | | TechnipFMC PLC (United Kingdom) | | | 35,498,444 | |
| | 379,610 | | | Valero Energy Corp. | | | 34,415,443 | |
| | 1,124,180 | | | Williams Cos., Inc. (The) | | | 31,848,019 | |
| | | | | | | | |
| | | | | | | 956,959,135 | |
| | | | | | | | |
| | | | Financials—13.6% | |
| | 291,577 | | | Affiliated Managers Group, Inc. | | | 32,341,721 | |
| | 623,566 | | | Aflac, Inc. | | | 31,415,255 | |
| | 324,484 | | | Allstate Corp. (The) | | | 32,143,385 | |
| | 280,368 | | | American Express Co. | | | 32,867,541 | |
| | 717,390 | | | American International Group, Inc. | | | 34,126,242 | |
| | 243,464 | | | Ameriprise Financial, Inc. | | | 35,733,211 | |
| | 187,504 | | | Aon PLC | | | 33,776,971 | |
| | 388,782 | | | Arthur J. Gallagher & Co. | | | 32,509,951 | |
| | | | | | | | |
Number
of Shares | | | | | Value | |
| | | | Common Stocks & Other Equity
Interests (continued) | | | |
| | | | Financials (continued) | |
| | 302,856 | | | Assurant, Inc. | | $ | 28,771,320 | |
| | 1,056,686 | | | Bank of America Corp. | | | 32,313,458 | |
| | 592,505 | | | Bank of New York Mellon Corp. (The) | | | 29,423,798 | |
| | 610,371 | | | BB&T Corp. | | | 31,250,995 | |
| | 152,360 | | | Berkshire Hathaway, Inc., Class B(b) | | | 33,017,936 | |
| | 71,856 | | | BlackRock, Inc. | | | 34,867,405 | |
| | 372,059 | | | Capital One Financial Corp. | | | 34,538,237 | |
| | 327,892 | | | Cboe Global Markets, Inc. | | | 33,317,106 | |
| | 696,750 | | | Charles Schwab Corp. (The) | | | 31,897,215 | |
| | 228,730 | | | Chubb Ltd. | | | 33,211,596 | |
| | 358,315 | | | Cincinnati Financial Corp. | | | 34,462,737 | |
| | 487,813 | | | Citigroup, Inc. | | | 34,488,379 | |
| | 870,948 | | | Citizens Financial Group, Inc. | | | 31,528,318 | |
| | 176,482 | | | CME Group, Inc., Class A | | | 31,572,630 | |
| | 362,700 | | | Comerica, Inc. | | | 28,504,593 | |
| | 433,227 | | | Discover Financial Services | | | 35,303,668 | |
| | 646,060 | | | E*TRADE Financial Corp. | | | 32,729,400 | |
| | 139,656 | | | Everest Re Group, Ltd. | | | 32,888,988 | |
| | 1,135,131 | | | Fifth Third Bancorp | | | 32,714,475 | |
| | 297,635 | | | First Republic Bank | | | 31,436,209 | |
| | 966,299 | | | Franklin Resources, Inc. | | | 33,424,282 | |
| | 154,697 | | | Goldman Sachs Group, Inc. (The) | | | 31,855,206 | |
| | 629,270 | | | Hartford Financial Services Group, Inc. (The) | | | 32,917,114 | |
| | 2,200,148 | | | Huntington Bancshares, Inc. | | | 30,626,060 | |
| | 417,574 | | | Intercontinental Exchange, Inc. | | | 33,969,645 | |
| | 1,624,143 | | | Invesco Ltd.(d) | | | 35,682,422 | |
| | 1,597,572 | | | Jefferies Financial Group, Inc. | | | 32,862,056 | |
| | 293,888 | | | JPMorgan Chase & Co. | | | 34,105,702 | |
| | 1,805,253 | | | KeyCorp | | | 31,682,190 | |
| | 503,148 | | | Lincoln National Corp. | | | 33,570,035 | |
| | 639,881 | | | Loews Corp. | | | 32,819,496 | |
| | 180,369 | | | M&T Bank Corp. | | | 30,675,356 | |
| | 337,953 | | | Marsh & McLennan Cos., Inc. | | | 31,865,588 | |
| | 685,558 | | | MetLife, Inc. | | | 31,624,791 | |
| | 178,150 | | | Moody’s Corp. | | | 35,027,853 | |
| | 731,961 | | | Morgan Stanley | | | 35,317,118 | |
| | 165,974 | | | MSCI, Inc. | | | 37,407,220 | |
| | 362,830 | | | Nasdaq, Inc. | | | 33,452,926 | |
| | 338,140 | | | Northern Trust Corp. | | | 33,323,697 | |
| | 1,764,221 | | | People’s United Financial, Inc. | | | 30,503,381 | |
| | 238,942 | | | PNC Financial Services Group, Inc. (The) | | | 32,718,328 | |
| | 606,570 | | | Principal Financial Group, Inc. | | | 34,671,541 | |
| | 418,921 | | | Progressive Corp. (The) | | | 32,738,676 | |
| | 324,484 | | | Prudential Financial, Inc. | | | 34,301,204 | |
| | 376,774 | | | Raymond James Financial, Inc. | | | 34,501,195 | |
| | 1,956,957 | | | Regions Financial Corp. | | | 30,391,542 | |
| | 154,204 | | | S&P Global, Inc. | | | 34,026,655 | |
| | 444,554 | | | State Street Corp. | | | 30,078,524 | |
| | 476,835 | | | SunTrust Banks, Inc. | | | 31,223,156 | |
| | 126,301 | | | SVB Financial Group(b) | | | 31,792,488 | |
| | 959,868 | | | Synchrony Financial | | | 33,278,624 | |
| | 313,523 | | | T. Rowe Price Group, Inc. | | | 33,703,722 | |
| | 373,821 | | | Torchmark Corp. | | | 32,769,149 | |
| | 231,059 | | | Travelers Cos., Inc. (The) | | | 33,214,731 | |
| | 591,641 | | | U.S. Bancorp | | | 31,546,298 | |
| | 840,252 | | | Unum Group | | | 31,022,104 | |
See accompanying Notes to Financial Statements which are an integral part of the financial statements.
Invesco S&P 500® Equal Weight ETF (RSP)(continued)
April 30, 2109
| | | | | | | | |
Number
of Shares | | | | | Value | |
| | | | Common Stocks & Other Equity Interests
(continued) | |
| | | | Financials (continued) | |
| | 607,917 | | | Wells Fargo & Co. | | $ | 29,429,262 | |
| | 178,904 | | | Willis Towers Watson PLC | | | 32,979,163 | |
| | 621,640 | | | Zions Bancorp. N.A | | | 30,665,501 | |
| | | | | | | | |
| | | | | | | 2,190,916,741 | |
| | | | | | | | |
| | | | Health Care—11.8% | |
| | 395,063 | | | Abbott Laboratories | | | 31,431,212 | |
| | 390,233 | | | AbbVie, Inc. | | | 30,980,598 | |
| | 96,346 | | | ABIOMED, Inc.(b) | | | 26,727,344 | |
| | 388,269 | | | Agilent Technologies, Inc. | | | 30,479,116 | |
| | 235,292 | | | Alexion Pharmaceuticals, Inc.(b) | | | 32,030,300 | |
| | 131,148 | | | Align Technology, Inc.(b) | | | 42,581,133 | |
| | 208,701 | | | Allergan PLC | | | 30,679,047 | |
| | 396,209 | | | AmerisourceBergen Corp. | | | 29,620,585 | |
| | 167,379 | | | Amgen, Inc. | | | 30,014,402 | |
| | 102,605 | | | Anthem, Inc. | | | 26,988,193 | |
| | 408,439 | | | Baxter International, Inc. | | | 31,163,896 | |
| | 122,705 | | | Becton, Dickinson and Co. | | | 29,540,002 | |
| | 98,316 | | | Biogen, Inc.(b) | | | 22,537,960 | |
| | 766,241 | | | Boston Scientific Corp.(b) | | | 28,442,866 | |
| | 589,099 | | | Bristol-Myers Squibb Co. | | | 27,351,867 | |
| | 634,681 | | | Cardinal Health, Inc. | | | 30,915,312 | |
| | 358,441 | | | Celgene Corp.(b) | | | 33,930,025 | |
| | 535,251 | | | Centene Corp.(b) | | | 27,597,542 | |
| | 545,971 | | | Cerner Corp.(b) | | | 36,279,773 | |
| | 185,569 | | | Cigna Corp. | | | 29,475,780 | |
| | 105,106 | | | Cooper Cos., Inc. (The) | | | 30,472,332 | |
| | 571,969 | | | CVS Health Corp. | | | 31,103,674 | |
| | 242,152 | | | Danaher Corp. | | | 32,070,611 | |
| | 606,086 | | | DaVita, Inc.(b) | | | 33,480,191 | |
| | 623,438 | | | DENTSPLY SIRONA, Inc. | | | 31,876,385 | |
| | 180,088 | | | Edwards Lifesciences Corp.(b) | | | 31,708,094 | |
| | 238,945 | | | Eli Lilly and Co. | | | 27,966,123 | |
| | 478,787 | | | Gilead Sciences, Inc. | | | 31,140,306 | |
| | 242,693 | | | HCA Healthcare, Inc. | | | 30,877,830 | |
| | 516,884 | | | Henry Schein, Inc.(b) | | | 33,111,589 | |
| | 649,526 | | | Hologic, Inc.(b) | | | 30,125,016 | |
| | 112,852 | | | Humana, Inc. | | | 28,823,529 | |
| | 151,579 | | | IDEXX Laboratories, Inc.(b) | | | 35,166,328 | |
| | 102,782 | | | Illumina, Inc.(b) | | | 32,067,984 | |
| | 368,663 | | | Incyte Corp.(b) | | | 28,313,318 | |
| | 56,718 | | | Intuitive Surgical, Inc.(b) | | | 28,961,912 | |
| | 220,338 | | | IQVIA Holdings, Inc.(b) | | | 30,604,948 | |
| | 216,778 | | | Johnson & Johnson | | | 30,609,054 | |
| | 206,632 | | | Laboratory Corp. of America Holdings(b) | | | 33,044,589 | |
| | 270,647 | | | McKesson Corp. | | | 32,274,655 | |
| | 334,445 | | | Medtronic PLC | | | 29,702,060 | |
| | 377,074 | | | Merck & Co., Inc. | | | 29,679,495 | |
| | 44,472 | | | Mettler-Toledo International, Inc.(b) | | | 33,143,203 | |
| | 1,137,692 | | | Mylan N.V.(b) | | | 30,706,307 | |
| | 861,776 | | | Nektar Therapeutics(b) | | | 27,594,068 | |
| | 329,526 | | | PerkinElmer, Inc. | | | 31,581,772 | |
| | 651,053 | | | Perrigo Co. PLC | | | 31,198,460 | |
| | 740,377 | | | Pfizer, Inc. | | | 30,066,710 | |
| | 358,822 | | | Quest Diagnostics, Inc. | | | 34,583,264 | |
| | 75,663 | | | Regeneron Pharmaceuticals, Inc.(b) | | | 25,963,002 | |
| | 299,738 | | | ResMed, Inc. | | | 31,325,618 | |
| | | | | | | | |
Number
of Shares | | | | | Value | |
| | | | Common Stocks & Other Equity Interests
(continued) | |
| | | | Health Care (continued) | |
| | 161,740 | | | Stryker Corp. | | $ | 30,554,303 | |
| | 105,520 | | | Teleflex, Inc. | | | 30,197,714 | |
| | 121,174 | | | Thermo Fisher Scientific, Inc. | | | 33,619,726 | |
| | 127,586 | | | UnitedHealth Group, Inc. | | | 29,736,469 | |
| | 234,344 | | | Universal Health Services, Inc., Class B | | | 29,731,223 | |
| | 226,787 | | | Varian Medical Systems, Inc.(b) | | | 30,881,586 | |
| | 170,958 | | | Vertex Pharmaceuticals, Inc.(b) | | | 28,888,483 | |
| | 126,923 | | | Waters Corp.(b) | | | 27,103,137 | |
| | 126,290 | | | WellCare Health Plans, Inc.(b) | | | 32,627,021 | |
| | 248,939 | | | Zimmer Biomet Holdings, Inc. | | | 30,659,327 | |
| | 325,986 | | | Zoetis, Inc. | | | 33,198,414 | |
| | | | | | | | |
| | | | | | | 1,905,306,783 | |
| | | | | | | | |
| | | | Industrials—14.1% | | | |
| | 150,706 | | | 3M Co. | | | 28,560,294 | |
| | 595,121 | | | A.O. Smith Corp. | | | 31,285,511 | |
| | 544,297 | | | Alaska Air Group, Inc. | | | 33,691,984 | |
| | 344,098 | | | Allegion PLC | | | 34,144,845 | |
| | 948,734 | | | American Airlines Group, Inc. | | | 32,427,728 | |
| | 384,996 | | | AMETEK, Inc. | | | 33,945,097 | |
| | 1,637,326 | | | Arconic, Inc. | | | 35,169,762 | |
| | 71,669 | | | Boeing Co. (The) | | | 27,068,665 | |
| | 344,354 | | | C.H. Robinson Worldwide, Inc. | | | 27,892,674 | |
| | 230,481 | | | Caterpillar, Inc. | | | 32,133,661 | |
| | 150,373 | | | Cintas Corp. | | | 32,651,993 | |
| | 519,842 | | | Copart, Inc.(b) | | | 34,995,763 | |
| | 421,816 | | | CSX Corp. | | | 33,589,208 | |
| | 195,865 | | | Cummins, Inc. | | | 32,570,391 | |
| | 190,394 | | | Deere & Co. | | | 31,534,958 | |
| | 610,493 | | | Delta Air Lines, Inc. | | | 35,585,637 | |
| | 339,167 | | | Dover Corp. | | | 33,251,933 | |
| | 381,384 | | | Eaton Corp. PLC | | | 31,586,223 | |
| | 454,562 | | | Emerson Electric Co. | | | 32,269,356 | |
| | 278,940 | | | Equifax, Inc. | | | 35,132,493 | |
| | 409,194 | | | Expeditors International of Washington, Inc. | | | 32,498,187 | |
| | 492,843 | | | Fastenal Co. | | | 34,770,074 | |
| | 176,237 | | | FedEx Corp. | | | 33,389,862 | |
| | 704,865 | | | Flowserve Corp. | | | 34,559,531 | |
| | 828,975 | | | Fluor Corp. | | | 32,935,177 | |
| | 376,541 | | | Fortive Corp. | | | 32,510,550 | |
| | 655,147 | | | Fortune Brands Home & Security, Inc. | | | 34,578,659 | |
| | 182,219 | | | General Dynamics Corp. | | | 32,566,180 | |
| | 3,160,134 | | | General Electric Co. | | | 32,138,563 | |
| | 187,135 | | | Harris Corp. | | | 31,532,248 | |
| | 199,711 | | | Honeywell International, Inc. | | | 34,675,821 | |
| | 151,284 | | | Huntington Ingalls Industries, Inc. | | | 33,672,793 | |
| | 576,209 | | | IHS Markit Ltd.(b) | | | 32,993,727 | |
| | 215,242 | | | Illinois Tool Works, Inc. | | | 33,498,112 | |
| | 290,256 | | | Ingersoll-Rand PLC | | | 35,588,288 | |
| | 297,450 | | | J.B. Hunt Transport Services, Inc. | | | 28,103,076 | |
| | 421,103 | | | Jacobs Engineering Group, Inc. | | | 32,820,768 | |
| | 843,763 | | | Johnson Controls International PLC | | | 31,641,112 | |
| | 272,002 | | | Kansas City Southern | | | 33,494,326 | |
| | 145,370 | | | L3 Technologies, Inc. | | | 31,774,975 | |
| | 100,312 | | | Lockheed Martin Corp. | | | 33,436,999 | |
| | 771,517 | | | Masco Corp. | | | 30,135,454 | |
See accompanying Notes to Financial Statements which are an integral part of the financial statements.
Invesco S&P 500® Equal Weight ETF (RSP)(continued)
April 30, 2019
| | | | | | | | |
Number
of Shares | | | | | Value | |
| | | | Common Stocks & Other Equity Interests
(continued) | |
| | | | Industrials (continued) | |
| | 1,163,049 | | | Nielsen Holdings PLC | | $ | 29,692,641 | |
| | 171,265 | | | Norfolk Southern Corp. | | | 34,941,485 | |
| | 111,028 | | | Northrop Grumman Corp. | | | 32,188,127 | |
| | 449,775 | | | PACCAR, Inc. | | | 32,235,374 | |
| | 179,105 | | | Parker-Hannifin Corp. | | | 32,432,333 | |
| | 727,048 | | | Pentair PLC | | | 28,347,602 | |
| | 860,328 | | | Quanta Services, Inc. | | | 34,929,317 | |
| | 167,481 | | | Raytheon Co. | | | 29,742,951 | |
| | 387,645 | | | Republic Services, Inc. | | | 32,104,759 | |
| | 468,061 | | | Robert Half International, Inc. | | | 29,061,907 | |
| | 173,459 | | | Rockwell Automation, Inc. | | | 31,345,776 | |
| | 754,777 | | | Rollins, Inc. | | | 29,187,227 | |
| | 95,304 | | | Roper Technologies, Inc. | | | 34,280,849 | |
| | 192,077 | | | Snap-on, Inc. | | | 32,322,718 | |
| | 584,781 | | | Southwest Airlines Co. | | | 31,712,674 | |
| | 234,204 | | | Stanley Black & Decker, Inc. | | | 34,334,306 | |
| | 592,454 | | | Textron, Inc. | | | 31,400,062 | |
| | 70,796 | | | TransDigm Group, Inc.(b) | | | 34,160,486 | |
| | 184,264 | | | Union Pacific Corp. | | | 32,622,099 | |
| | 367,402 | | | United Continental Holdings, Inc.(b) | | | 32,647,342 | |
| | 283,783 | | | United Parcel Service, Inc., Class B | | | 30,143,430 | |
| | 245,647 | | | United Rentals, Inc.(b) | | | 34,616,575 | |
| | 243,330 | | | United Technologies Corp. | | | 34,701,291 | |
| | 240,279 | | | Verisk Analytics, Inc., Class A | | | 33,912,978 | |
| | 102,566 | | | W.W. Grainger, Inc. | | | 28,923,612 | |
| | 431,751 | | | Wabtec Corp. | | | 31,979,797 | |
| | 305,959 | | | Waste Management, Inc. | | | 32,841,639 | |
| | 403,223 | | | Xylem, Inc. | | | 33,628,798 | |
| | | | | | | | |
| | | | | | | 2,273,240,813 | |
| | | | | | | | |
| | | | Information Technology—14.2% | |
| | 185,404 | | | Accenture PLC, Class A | | | 33,867,749 | |
| | 118,890 | | | Adobe, Inc.(b) | | | 34,388,933 | |
| | 1,375,470 | | | Advanced Micro Devices, Inc.(b) | | | 38,004,236 | |
| | 430,637 | | | Akamai Technologies, Inc.(b) | | | 34,476,798 | |
| | 181,990 | | | Alliance Data Systems Corp. | | | 29,136,599 | |
| | 326,015 | | | Amphenol Corp., Class A | | | 32,458,053 | |
| | 287,238 | | | Analog Devices, Inc. | | | 33,388,545 | |
| | 170,668 | | | ANSYS, Inc.(b) | | | 33,416,794 | |
| | 174,211 | | | Apple, Inc. | | | 34,958,921 | |
| | 802,177 | | | Applied Materials, Inc. | | | 35,351,940 | |
| | 110,269 | | | Arista Networks, Inc.(b) | | | 34,435,906 | |
| | 198,697 | | | Autodesk, Inc.(b) | | | 35,409,792 | |
| | 202,876 | | | Automatic Data Processing, Inc. | | | 33,350,786 | |
| | 114,486 | | | Broadcom, Inc. | | | 36,452,342 | |
| | 305,990 | | | Broadridge Financial Solutions, Inc. | | | 36,146,599 | |
| | 511,784 | | | Cadence Design Systems, Inc.(b) | | | 35,507,574 | |
| | 592,806 | | | Cisco Systems, Inc. | | | 33,167,496 | |
| | 302,795 | | | Citrix Systems, Inc. | | | 30,570,183 | |
| | 425,515 | | | Cognizant Technology Solutions Corp., Class A | | | 31,045,574 | |
| | 895,681 | | | Corning, Inc. | | | 28,527,440 | |
| | 471,632 | | | DXC Technology Co. | | | 31,005,088 | |
| | 191,617 | | | F5 Networks, Inc.(b) | | | 30,064,707 | |
| | 286,388 | | | Fidelity National Information Services, Inc. | | | 33,200,961 | |
| | 356,694 | | | Fiserv, Inc.(b) | | | 31,117,985 | |
| | | | | | | | |
Number
of Shares | | | | | Value | |
| | | | Common Stocks & Other Equity Interests
(continued) | |
| | | | Information Technology (continued) | |
| | 132,936 | | | FleetCor Technologies, Inc.(b) | | $ | 34,689,649 | |
| | 611,475 | | | FLIR Systems, Inc. | | | 32,371,487 | |
| | 375,289 | | | Fortinet, Inc.(b) | | | 35,059,498 | |
| | 214,332 | | | Gartner, Inc.(b) | | | 34,072,358 | |
| | 232,332 | | | Global Payments, Inc. | | | 33,936,735 | |
| | 1,939,404 | | | Hewlett Packard Enterprise Co. | | | 30,661,977 | |
| | 1,615,475 | | | HP, Inc. | | | 32,228,726 | |
| | 576,865 | | | Intel Corp. | | | 29,443,190 | |
| | 224,102 | | | International Business Machines Corp. | | | 31,434,788 | |
| | 123,140 | | | Intuit, Inc. | | | 30,915,528 | |
| | 204,437 | | | IPG Photonics Corp.(b) | | | 35,721,277 | |
| | 230,516 | | | Jack Henry & Associates, Inc. | | | 34,360,715 | |
| | 1,178,440 | | | Juniper Networks, Inc. | | | 32,725,279 | |
| | 360,455 | | | Keysight Technologies, Inc.(b) | | | 31,370,399 | |
| | 265,723 | | | KLA-Tencor Corp. | | | 33,874,368 | |
| | 179,316 | | | Lam Research Corp. | | | 37,195,518 | |
| | 136,472 | | | Mastercard, Inc., Class A | | | 34,696,641 | |
| | 582,751 | | | Maxim Integrated Products, Inc. | | | 34,965,060 | |
| | 355,953 | | | Microchip Technology, Inc. | | | 35,556,145 | |
| | 783,282 | | | Micron Technology, Inc.(b) | | | 32,944,841 | |
| | 272,110 | | | Microsoft Corp. | | | 35,537,566 | |
| | 218,034 | | | Motorola Solutions, Inc. | | | 31,595,307 | |
| | 479,102 | | | NetApp, Inc. | | | 34,902,581 | |
| | 200,965 | | | NVIDIA Corp. | | | 36,374,665 | |
| | 573,722 | | | Oracle Corp. | | | 31,744,038 | |
| | 396,602 | | | Paychex, Inc. | | | 33,437,515 | |
| | 316,413 | | | PayPal Holdings, Inc.(b) | | | 35,681,894 | |
| | 441,443 | | | Qorvo, Inc.(b) | | | 33,377,505 | |
| | 565,560 | | | QUALCOMM, Inc. | | | 48,711,683 | |
| | 167,527 | | | Red Hat, Inc.(b) | | | 30,578,703 | |
| | 195,236 | | | salesforce.com, inc.(b) | | | 32,282,273 | |
| | 654,991 | | | Seagate Technology PLC | | | 31,649,165 | |
| | 377,817 | | | Skyworks Solutions, Inc. | | | 33,315,903 | |
| | 1,379,227 | | | Symantec Corp. | | | 33,391,086 | |
| | 293,351 | | | Synopsys, Inc.(b) | | | 35,518,939 | |
| | 372,880 | | | TE Connectivity Ltd. | | | 35,665,972 | |
| | 288,713 | | | Texas Instruments, Inc. | | | 34,019,053 | |
| | 325,248 | | | Total System Services, Inc. | | | 33,253,356 | |
| | 170,361 | | | VeriSign, Inc.(b) | | | 33,637,780 | |
| | 205,494 | | | Visa, Inc., Class A | | | 33,789,378 | |
| | 637,622 | | | Western Digital Corp. | | | 32,595,237 | |
| | 1,688,462 | | | Western Union Co. (The) | | | 32,823,701 | |
| | 999,176 | | | Xerox Corp. | | | 33,332,511 | |
| | 255,224 | | | Xilinx, Inc. | | | 30,662,611 | |
| | | | | | | | |
| | | | | | | 2,285,553,602 | |
| | | | | | | | |
| | | | Materials—5.1% | | | |
| | 166,936 | | | Air Products and Chemicals, Inc. | | | 34,353,759 | |
| | 364,876 | | | Albemarle Corp. | | | 27,387,593 | |
| | 279,319 | | | Avery Dennison Corp. | | | 30,906,647 | |
| | 550,379 | | | Ball Corp. | | | 32,989,717 | |
| | 303,421 | | | Celanese Corp., Series A | | | 32,736,092 | |
| | 751,407 | | | CF Industries Holdings, Inc. | | | 33,648,005 | |
| | 551,544 | | | Dow, Inc.(b) | | | 31,289,091 | |
| | 832,379 | | | DowDuPont, Inc. | | | 32,004,973 | |
| | 383,307 | | | Eastman Chemical Co. | | | 30,235,256 | |
| | 178,557 | | | Ecolab, Inc. | | | 32,868,773 | |
See accompanying Notes to Financial Statements which are an integral part of the financial statements.
Invesco S&P 500® Equal Weight ETF (RSP)(continued)
April 30, 2019
| | | | | | | | |
Number
of Shares | | | | | Value | |
| | | | Common Stocks & Other Equity Interests
(continued) | |
| | | | Materials (continued) | |
| | 390,484 | | | FMC Corp. | | $ | 30,871,665 | |
| | 2,504,058 | | | Freeport-McMoRan, Inc. | | | 30,824,954 | |
| | 241,421 | | | International Flavors & Fragrances, Inc. | | | 33,265,400 | |
| | 663,901 | | | International Paper Co. | | | 31,077,206 | |
| | 178,652 | | | Linde PLC (United Kingdom) | | | 32,203,810 | |
| | 350,182 | | | LyondellBasell Industries N.V., Class A | | | 30,896,558 | |
| | 154,126 | | | Martin Marietta Materials, Inc. | | | 34,200,559 | |
| | 1,080,445 | | | Mosaic Co. (The) | | | 28,210,419 | |
| | 898,075 | | | Newmont Goldcorp Corp. | | | 27,894,209 | |
| | 523,870 | | | Nucor Corp. | | | 29,897,261 | |
| | 308,669 | | | Packaging Corp. of America | | | 30,607,618 | |
| | 276,154 | | | PPG Industries, Inc. | | | 32,448,095 | |
| | 674,556 | | | Sealed Air Corp. | | | 31,447,801 | |
| | 72,601 | | | Sherwin-Williams Co. (The) | | | 33,021,113 | |
| | 266,657 | | | Vulcan Materials Co. | | | 33,628,114 | |
| | 803,025 | | | WestRock Co. | | | 30,820,099 | |
| | | | | | | | |
| | | | | | | 819,734,787 | |
| | | | | | | | |
| | | | Real Estate—6.1% | |
| | 220,061 | | | Alexandria Real Estate Equities, Inc. | | | 31,334,486 | |
| | 166,736 | | | American Tower Corp. | | | 32,563,541 | |
| | 630,876 | | | Apartment Investment & Management | | | | |
| | | | Co., Class A | | | 31,140,039 | |
| | 154,376 | | | AvalonBay Communities, Inc. | | | 31,018,770 | |
| | 229,409 | | | Boston Properties, Inc. | | | 31,571,267 | |
| | 604,404 | | | CBRE Group, Inc., Class A(b) | | | 31,471,316 | |
| | 251,771 | | | Crown Castle International Corp. | | | 31,667,756 | |
| | 270,334 | | | Digital Realty Trust, Inc. | | | 31,821,015 | |
| | 1,012,844 | | | Duke Realty Corp. | | | 31,519,705 | |
| | 70,391 | | | Equinix, Inc. | | | 32,006,788 | |
| | 412,428 | | | Equity Residential | | | 31,517,748 | |
| | 106,790 | | | Essex Property Trust, Inc. | | | 30,168,175 | |
| | 311,917 | | | Extra Space Storage, Inc. | | | 32,342,674 | |
| | 229,645 | | | Federal Realty Investment Trust | | | 30,737,983 | |
| | 996,121 | | | HCP, Inc. | | | 29,664,483 | |
| | 1,569,419 | | | Host Hotels & Resorts, Inc. | | | 30,195,622 | |
| | 870,449 | | | Iron Mountain, Inc. | | | 28,272,184 | |
| | 1,753,157 | | | Kimco Realty Corp. | | | 30,487,400 | |
| | 720,817 | | | Macerich Co. (The) | | | 28,933,594 | |
| | 284,492 | | | Mid-America Apartment Communities, Inc. | | | 31,126,270 | |
| | 432,857 | | | Prologis, Inc. | | | 33,187,146 | |
| | 141,780 | | | Public Storage | | | 31,358,900 | |
| | 434,714 | | | Realty Income Corp. | | | 30,434,327 | |
| | 468,980 | | | Regency Centers Corp. | | | 31,501,387 | |
| | 165,005 | | | SBA Communications Corp., Class A(b) | | | 33,616,469 | |
| | 173,766 | | | Simon Property Group, Inc. | | | 30,183,154 | |
| | 335,035 | | | SL Green Realty Corp. | | | 29,596,992 | |
| | 674,406 | | | UDR, Inc. | | | 30,314,550 | |
| | 488,375 | | | Ventas, Inc. | | | 29,844,596 | |
| | 447,577 | | | Vornado Realty Trust | | | 30,945,474 | |
| | 403,812 | | | Welltower, Inc. | | | 30,096,108 | |
| | 1,227,654 | | | Weyerhaeuser Co. | | | 32,901,127 | |
| | | | | | | | |
| | | | | | | 993,541,046 | |
| | | | | | | | |
| | | | Utilities—5.4% | |
| | 1,710,406 | | | AES Corp. (The) | | | 29,282,151 | |
| | 654,570 | | | Alliant Energy Corp. | | | 30,915,341 | |
| | | | | | | | |
Number
of Shares | | | | | Value | |
| | | | Common Stocks & Other Equity Interests
(continued) | |
| | | | Utilities (continued) | |
| | 422,226 | | | Ameren Corp. | | $ | 30,725,386 | |
| | 369,424 | | | American Electric Power Co., Inc. | | | 31,604,223 | |
| | 296,959 | | | American Water Works Co., Inc. | | | 32,127,994 | |
| | 302,301 | | | Atmos Energy Corp. | | | 30,937,484 | |
| | 1,008,130 | | | CenterPoint Energy, Inc. | | | 31,252,030 | |
| | 554,069 | | | CMS Energy Corp. | | | 30,778,533 | |
| | 361,179 | | | Consolidated Edison, Inc. | | | 31,119,183 | |
| | 399,764 | | | Dominion Energy, Inc. | | | 31,129,623 | |
| | 243,986 | | | DTE Energy Co. | | | 30,671,480 | |
| | 335,627 | | | Duke Energy Corp. | | | 30,582,332 | |
| | 483,498 | | | Edison International | | | 30,832,667 | |
| | 327,327 | | | Entergy Corp. | | | 31,717,986 | |
| | 542,936 | | | Evergy, Inc. | | | 31,392,559 | |
| | 434,478 | | | Eversource Energy | | | 31,134,693 | |
| | 612,867 | | | Exelon Corp. | | | 31,225,574 | |
| | 737,201 | | | FirstEnergy Corp. | | | 30,984,558 | |
| | 159,108 | | | NextEra Energy, Inc. | | | 30,936,960 | |
| | 1,104,088 | | | NiSource, Inc. | | | 30,671,565 | |
| | 730,204 | | | NRG Energy, Inc. | | | 30,062,499 | |
| | 324,970 | | | Pinnacle West Capital Corp. | | | 30,959,892 | |
| | 942,793 | | | PPL Corp. | | | 29,424,570 | |
| | 517,969 | | | Public Service Enterprise Group, Inc. | | | 30,896,851 | |
| | 247,540 | | | Sempra Energy | | | 31,672,743 | |
| | 594,772 | | | Southern Co. (The) | | | 31,653,766 | |
| | 393,173 | | | WEC Energy Group, Inc. | | | 30,836,558 | |
| | 542,754 | | | Xcel Energy, Inc. | | | 30,665,601 | |
| | | | | | | | |
| | | | | | | 866,194,802 | |
| | | | | | | | |
| | | | Total Common Stocks & Other Equity Interests
(Cost $13,390,717,918) | | | 16,123,247,349 | |
| | | | | | | | |
| | |
| | | | | | | | |
| | | | Money Market Funds—0.1% | |
| | 10,882,317 | | | Invesco Premier U.S. Government Money Portfolio—Institutional Class, 2.32%(e)
(Cost $10,882,317) | | | 10,882,317 | |
| | | | | | | | |
| | |
| | | | Total Investments in Securities
(excluding investments purchased with cash collateral from securities on loan)
(Cost $13,401,600,235)—100.0% | | | 16,134,129,666 | |
| | | | | | | | |
| | |
| | | | | | | | |
| | | | Investments Purchased with Cash Collateral from
Securities on Loan | |
| | |
| | | | | | | | |
| | | | Money Market Funds—0.2% | |
| | 31,848,243 | | | Invesco Government & Agency Portfolio—Institutional Class, 2.34%(e)(f) | | | 31,848,243 | |
See accompanying Notes to Financial Statements which are an integral part of the financial statements.
Invesco S&P 500® Equal Weight ETF (RSP)(continued)
April 30, 2019
| | | | | | | | |
Number
of Shares | | | | | Value | |
| | | | Money Market Funds (continued) | |
| | 10,612,915 | | | Invesco Liquid Assets Portfolio—Institutional Class, 2.48%(e)(f) | | $ | 10,616,099 | |
| | | | | | | | |
| | | | Total Money Market Funds
(Cost $42,464,342) | | | 42,464,342 | |
| | | | | | | | |
| | |
| | | | Total Investments in Securities
(Cost $13,444,064,577)—100.2% | | | 16,176,594,008 | |
| | |
| | | | Other assets less liabilities—(0.2)% | | | (32,633,488 | ) |
| | | | | | | | |
| | |
| | | | Net Assets—100.0% | | $ | 16,143,960,520 | |
| | | | | | | | |
Notes to Schedule of Investments:
| (a) | Industry and/or sector classifications used in this report are generally according to the Global Industry Classification Standard, which was developed by and is the exclusive property and a service mark of MSCI Inc. and Standard & Poor’s. |
| (b) | Non-income producing security. |
| (c) | All or a portion of this security was out on loan at April 30, 2019. |
| (d) | Affiliated company. See Note 4. |
| (e) | The security and the Fund are advised by wholly-owned subsidiaries of Invesco Ltd. and are therefore considered to be affiliated. The rate shown is the7-day SEC standardized yield as of April 30, 2019. |
| (f) | The security has been segregated to satisfy the commitment to return the cash collateral received in securities lending transactions upon the borrower’s return of the securities loaned. See Note 2J. |
See accompanying Notes to Financial Statements which are an integral part of the financial statements.
Schedule of Investments(a)
Invesco S&P 500® Equal Weight Communication Services ETF (EWCO)
April 30, 2019
| | | | | | | | |
Number
of Shares | | | | | Value | |
| | | | Common Stocks & Other Equity Interests—99.8% | |
| | | | Diversified Telecommunication Services—12.6% | |
| | 32,397 | | | AT&T, Inc. | | $ | 1,003,011 | |
| | 78,897 | | | CenturyLink, Inc. | | | 901,004 | |
| | 17,171 | | | Verizon Communications, Inc. | | | 982,009 | |
| | | | | | | | |
| | | | | | | 2,886,024 | |
| | | | | | | | |
| | | | Entertainment—27.5% | |
| | 23,109 | | | Activision Blizzard, Inc. | | | 1,114,085 | |
| | 9,868 | | | Electronic Arts, Inc.(b) | | | 934,006 | |
| | 2,774 | | | Netflix, Inc.(b) | | | 1,027,878 | |
| | 11,146 | | | Take-Two Interactive Software, Inc.(b) | | | 1,079,267 | |
| | 33,625 | | | Viacom, Inc., Class B | | | 972,099 | |
| | 8,534 | | | Walt Disney Co. (The) | | | 1,168,902 | |
| | | | | | | | |
| | | | | | | 6,296,237 | |
| | | | | | | | |
| | | | Interactive Media & Services—19.4% | |
| | 416 | | | Alphabet, Inc., Class A(b) | | | 498,767 | |
| | 431 | | | Alphabet, Inc., Class C(b) | | | 512,235 | |
| | 5,724 | | | Facebook, Inc., Class A(b) | | | 1,107,022 | |
| | 19,063 | | | TripAdvisor, Inc.(b) | | | 1,014,724 | |
| | 32,330 | | | Twitter, Inc.(b) | | | 1,290,290 | |
| | | | | | | | |
| | | | | | | 4,423,038 | |
| | | | | | | | |
| | | | Media—40.3% | |
| | 19,802 | | | CBS Corp., Class B | | | 1,015,249 | |
| | 2,878 | | | Charter Communications, Inc., Class A(b) | | | 1,068,285 | |
| | 25,433 | | | Comcast Corp., Class A | | | 1,107,098 | |
| | 10,587 | | | Discovery, Inc., Class A(b) | | | 327,138 | |
| | 24,337 | | | Discovery, Inc., Class C(b) | | | 699,932 | |
| | 30,565 | | | DISH Network Corp., Class A(b) | | | 1,073,443 | |
| | 16,348 | | | Fox Corp., Class A(b) | | | 637,408 | |
| | 7,525 | | | Fox Corp., Class B(b) | | | 289,712 | |
| | 43,616 | | | Interpublic Group of Cos., Inc. (The) | | | 1,003,168 | |
| | 57,114 | | | News Corp., Class A | | | 709,356 | |
| | 18,357 | | | News Corp., Class B | | | 229,279 | |
| | 13,121 | | | Omnicom Group, Inc. | | | 1,050,074 | |
| | | | | | | | |
| | | | | | | 9,210,142 | |
| | | | | | | | |
| | | | Total Common Stocks & Other Equity Interests
(Cost $22,162,288) | | | 22,815,441 | |
| | | | | | | | |
| | |
| | | | | | | | |
| | | | Money Market Funds—0.1% | | | |
| | 19,831 | | | Invesco Premier U.S. Government Money Portfolio—Institutional Class, 2.32(c)
(Cost $19,831) | | | 19,831 | |
| | | | | | | | |
| | |
| | | | Total Investments in Securities
(Cost $22,182,119)—99.9% | | | 22,835,272 | |
| | |
| | | | Other assets less liabilities—0.1% | | | 15,455 | |
| | | | | | | | |
| | |
| | | | Net Assets—100.0% | | $ | 22,850,727 | |
| | | | | | | | |
Notes to Schedule of Investments:
| (a) | Industry and/or sector classifications used in this report are generally according to the Global Industry Classification Standard, which was developed by and is the exclusive property and a service mark of MSCI Inc. and Standard & Poor’s. |
| (b) | Non-income producing security. |
| (c) | The security and the Fund are advised by wholly-owned subsidiaries of Invesco Ltd. and are therefore considered to be affiliated. The rate shown is the7-day SEC standardized yield as of April 30, 2019. |
See accompanying Notes to Financial Statements which are an integral part of the financial statements.
Schedule of Investments(a)
Invesco S&P 500® Equal Weight Consumer Discretionary ETF (RCD)
April 30, 2019
| | | | | | | | |
Number
of Shares | | | | | Value | |
| | | | Common Stocks & Other Equity Interests—100.0% | |
| | | | Auto Components—3.2% | |
| | 20,568 | | | Aptiv PLC | | $ | 1,762,678 | |
| | 44,142 | | | BorgWarner, Inc. | | | 1,843,811 | |
| | | | | | | | |
| | | | | | | 3,606,489 | |
| | | | | | | | |
| | | | Automobiles—4.8% | |
| | 199,792 | | | Ford Motor Co. | | | 2,087,826 | |
| | 44,281 | | | General Motors Co. | | | 1,724,745 | |
| | 44,669 | | | Harley-Davidson, Inc. | | | 1,663,027 | |
| | | | | | | | |
| | | | | | | 5,475,598 | |
| | | | | | | | |
| | | | Distributors—3.1% | |
| | 15,879 | | | Genuine Parts Co. | | | 1,628,233 | |
| | 61,508 | | | LKQ Corp.(b) | | | 1,851,391 | |
| | | | | | | | |
| | | | | | | 3,479,624 | |
| | | | | | | | |
| | | | Diversified Consumer Services—1.6% | |
| | 67,425 | | | H&R Block, Inc. | | | 1,834,634 | |
| | | | | | | | |
| | | | Hotels, Restaurants & Leisure—19.3% | |
| | 30,603 | | | Carnival Corp. | | | 1,678,880 | |
| | 2,729 | | | Chipotle Mexican Grill, Inc.(b) | | | 1,877,661 | |
| | 15,628 | | | Darden Restaurants, Inc. | | | 1,837,853 | |
| | 20,403 | | | Hilton Worldwide Holdings, Inc. | | | 1,774,857 | |
| | 13,937 | | | Marriott International, Inc., Class A | | | 1,901,285 | |
| | 9,372 | | | McDonald’s Corp. | | | 1,851,626 | |
| | 63,481 | | | MGM Resorts International | | | 1,690,499 | |
| | 30,581 | | | Norwegian Cruise Line Holdings Ltd.(b) | | | 1,724,463 | |
| | 14,433 | | | Royal Caribbean Cruises Ltd. | | | 1,745,527 | |
| | 24,254 | | | Starbucks Corp. | | | 1,884,051 | |
| | 14,067 | | | Wynn Resorts, Ltd. | | | 2,031,978 | |
| | 17,402 | | | Yum! Brands, Inc. | | | 1,816,595 | |
| | | | | | | | |
| | | | | | | 21,815,275 | |
| | | | | | | | |
| | | | Household Durables—12.2% | |
| | 41,640 | | | D.R. Horton, Inc. | | | 1,845,068 | |
| | 20,347 | | | Garmin Ltd. | | | 1,744,552 | |
| | 37,949 | | | Leggett & Platt, Inc. | | | 1,493,673 | |
| | 35,245 | | | Lennar Corp., Class A | | | 1,833,797 | |
| | 12,737 | | | Mohawk Industries, Inc.(b) | | | 1,735,416 | |
| | 108,954 | | | Newell Brands, Inc. | | | 1,566,758 | |
| | 60,995 | | | PulteGroup, Inc. | | | 1,918,903 | |
| | 12,230 | | | Whirlpool Corp. | | | 1,697,769 | |
| | | | | | | | |
| | | | | | | 13,835,936 | |
| | | | | | | | |
| | | | Internet & Direct Marketing Retail—6.6% | |
| | 1,038 | | | Amazon.com, Inc.(b) | | | 1,999,728 | |
| | 980 | | | Booking Holdings, Inc.(b) | | | 1,817,890 | |
| | 46,872 | | | eBay, Inc. | | | 1,816,290 | |
| | 13,861 | | | Expedia Group, Inc. | | | 1,799,712 | |
| | | | | | | | |
| | | | | | | 7,433,620 | |
| | | | | | | | |
| | | | Leisure Products—3.0% | |
| | 19,325 | | | Hasbro, Inc. | | | 1,968,445 | |
| | 116,097 | | | Mattel, Inc.(b)(c) | | | 1,415,222 | |
| | | | | | | | |
| | | | | | | 3,383,667 | |
| | | | | | | | |
| | | | Multiline Retail—9.2% | |
| | 14,172 | | | Dollar General Corp. | | | 1,786,947 | |
| | 16,429 | | | Dollar Tree, Inc.(b) | | | 1,828,219 | |
| | 24,823 | | | Kohl’s Corp. | | | 1,764,915 | |
| | | | | | | | |
Number
of Shares | | | | | Value | |
| | | | Common Stocks & Other Equity Interests
(continued) | |
| | | | Multiline Retail (continued) | |
| | 72,857 | | | Macy’s, Inc. | | $ | 1,715,054 | |
| | 38,337 | | | Nordstrom, Inc. | | | 1,572,584 | |
| | 22,190 | | | Target Corp. | | | 1,717,950 | |
| | | | | | | | |
| | | | | | | 10,385,669 | |
| | | | | | | | |
| | | | Specialty Retail—24.5% | |
| | 11,084 | | | Advance Auto Parts, Inc. | | | 1,843,491 | |
| | 1,799 | | | AutoZone, Inc.(b) | | | 1,849,930 | |
| | 24,970 | | | Best Buy Co., Inc. | | | 1,858,018 | |
| | 28,816 | | | CarMax, Inc.(b)(c) | | | 2,243,614 | |
| | 28,000 | | | Foot Locker, Inc. | | | 1,601,880 | |
| | 64,877 | | | Gap, Inc. (The) | | | 1,691,992 | |
| | 9,283 | | | Home Depot, Inc. (The) | | | 1,890,947 | |
| | 64,977 | | | L Brands, Inc. | | | 1,666,010 | |
| | 16,936 | | | Lowe’s Cos., Inc. | | | 1,916,139 | |
| | 4,620 | | | O’Reilly Automotive, Inc.(b) | | | 1,748,993 | |
| | 18,889 | | | Ross Stores, Inc. | | | 1,844,700 | |
| | 17,833 | | | Tiffany & Co. | | | 1,922,754 | |
| | 33,167 | | | TJX Cos., Inc. (The) | | | 1,820,205 | |
| | 18,611 | | | Tractor Supply Co. | | | 1,926,239 | |
| | 5,490 | | | Ulta Beauty, Inc.(b) | | | 1,915,900 | |
| | | | | | | | |
| | | | | | | 27,740,812 | |
| | | | | | | | |
| | | | Textiles, Apparel & Luxury Goods—12.5% | |
| | 38,602 | | | Capri Holdings Ltd.(b) | | | 1,701,576 | |
| | 91,977 | | | Hanesbrands, Inc. | | | 1,662,024 | |
| | 19,838 | | | NIKE, Inc., Class B | | | 1,742,372 | |
| | 15,254 | | | PVH Corp. | | | 1,967,613 | |
| | 13,782 | | | Ralph Lauren Corp. | | | 1,813,436 | |
| | 50,156 | | | Tapestry, Inc. | | | 1,618,534 | |
| | 40,967 | | | Under Armour, Inc., Class A(b) | | | 945,928 | |
| | 42,003 | | | Under Armour, Inc., Class C(b) | | | 870,302 | |
| | 19,977 | | | VF Corp. | | | 1,886,029 | |
| | | | | | | | |
| | | | | | | 14,207,814 | |
| | | | | | | | |
| | |
| | | | Total Investments in Securities
(excluding investments purchased with cash collateral from securities on loan)
(Cost $113,142,746)—100.0% | | | 113,199,138 | |
| | | | | | | | |
| | |
| | | | | | | | |
| | | | Investments Purchased with Cash Collateral from
Securities on Loan | |
| |
| | | | | |
| | | | Money Market Funds—2.8% | |
| | 2,380,703 | | | Invesco Government & Agency Portfolio— Institutional Class, 2.34%(d)(e) | | | 2,380,703 | |
| | 793,330 | | | Invesco Liquid Assets Portfolio—Institutional Class, 2.48%(d)(e) | | | 793,568 | |
| | | | | | | | |
| | |
| | | | Total Money Market Funds
(Cost $3,174,271) | | | 3,174,271 | |
| | | | | | | | |
| | |
| | | | Total Investments in Securities
(Cost $116,317,017)—102.8% | | | 116,373,409 | |
| | |
| | | | Other assets less liabilities—(2.8)% | | | (3,133,968 | ) |
| | | | | | | | |
| | |
| | | | Net Assets—100.0% | | $ | 113,239,441 | |
| | | | | | | | |
See accompanying Notes to Financial Statements which are an integral part of the financial statements.
Invesco S&P 500® Equal Weight Consumer Discretionary ETF (RCD)(continued)
April 30, 2019
Notes to Schedule of Investments:
| (a) | Industry and/or sector classifications used in this report are generally according to the Global Industry Classification Standard, which was developed by and is the exclusive property and a service mark of MSCI Inc. and Standard & Poor’s. |
| (b) | Non-income producing security. |
| (c) | All or a portion of this security was out on loan at April 30, 2019. |
| (d) | The security and the Fund are advised by wholly-owned subsidiaries of Invesco Ltd. and are therefore considered to be affiliated. The rate shown is the7-day SEC standardized yield as of April 30, 2019. |
| (e) | The security has been segregated to satisfy the commitment to return the cash collateral received in securities lending transactions upon the borrower’s return of the securities loaned. See Note 2J. |
See accompanying Notes to Financial Statements which are an integral part of the financial statements.
Schedule of Investments(a)
Invesco S&P 500® Equal Weight Consumer Staples ETF (RHS)
April 30, 2019
| | | | | | | | |
Number
of Shares | | | | | Value | |
| | | | Common Stocks & Other Equity Interests—99.8% | |
| | | | Beverages—18.5% | |
| | 241,921 | | | Brown-Forman Corp., Class B | | $ | 12,891,970 | |
| | 269,328 | | | Coca-Cola Co. (The) | | | 13,213,232 | |
| | 72,668 | | | Constellation Brands, Inc., Class A | | | 15,381,636 | |
| | 203,140 | | | Molson Coors Brewing Co., Class B | | | 13,039,557 | |
| | 199,252 | | | Monster Beverage Corp.(b) | | | 11,875,419 | |
| | 104,806 | | | PepsiCo, Inc. | | | 13,420,408 | |
| | | | | | | | |
| | | | | | | 79,822,222 | |
| | | | | | | | |
| |
| | | | Food & Staples Retailing—14.4% | |
| | 53,010 | | | Costco Wholesale Corp. | | | 13,015,545 | |
| | 493,530 | | | Kroger Co. (The) | | | 12,723,203 | |
| | 183,593 | | | Sysco Corp. | | | 12,919,440 | |
| | 201,614 | | | Walgreens Boots Alliance, Inc. | | | 10,800,462 | |
| | 123,750 | | | Walmart, Inc. | | | 12,726,450 | |
| | | | | | | | |
| | | | | | | 62,185,100 | |
| | | | | | | | |
| |
| | | | Food Products—40.3% | |
| | 288,089 | | | Archer-Daniels-Midland Co. | | | 12,848,769 | |
| | 335,278 | | | Campbell Soup Co. | | | 12,971,906 | |
| | 537,459 | | | Conagra Brands, Inc. | | | 16,542,988 | |
| | 259,380 | | | General Mills, Inc. | | | 13,350,289 | |
| | 108,564 | | | Hershey Co. (The) | | | 13,554,215 | |
| | 280,918 | | | Hormel Foods Corp. | | | 11,219,865 | |
| | 117,833 | | | JM Smucker Co. (The) | | | 14,449,861 | |
| | 221,348 | | | Kellogg Co. | | | 13,347,284 | |
| | 376,221 | | | Kraft Heinz Co. (The) | | | 12,505,586 | |
| | 172,499 | | | Lamb Weston Holdings, Inc. | | | 12,083,555 | |
| | 88,119 | | | McCormick & Co., Inc. | | | 13,567,682 | |
| | 259,268 | | | Mondelez International, Inc., Class A | | | 13,183,778 | |
| | 192,366 | | | Tyson Foods, Inc., Class A | | | 14,429,374 | |
| | | | | | | | |
| | | | | | | 174,055,152 | |
| | | | | | | | |
| |
| | | | Household Products—15.3% | |
| | 183,956 | | | Church & Dwight Co., Inc. | | | 13,787,502 | |
| | 76,518 | | | Clorox Co. (The) | | | 12,222,220 | |
| | 184,801 | | | Colgate-Palmolive Co. | | | 13,451,665 | |
| | 104,217 | | | Kimberly-Clark Corp. | | | 13,379,378 | |
| | 122,718 | | | Procter & Gamble Co. (The) | | | 13,067,013 | |
| | | | | | | | |
| | | | | | | 65,907,778 | |
| | | | | | | | |
| |
| | | | Personal Products—5.8% | |
| | 1,097,881 | | | Coty, Inc., Class A(c) | | | 11,879,072 | |
| | 77,395 | | | Estee Lauder Cos., Inc. (The), Class A | | | 13,297,235 | |
| | | | | | | | |
| | | | | | | 25,176,307 | |
| | | | | | | | |
| |
| | | | Tobacco—5.5% | |
| | 218,109 | | | Altria Group, Inc. | | | 11,849,862 | |
| | 138,099 | | | Philip Morris International, Inc. | | | 11,953,850 | |
| | | | | | | | |
| | | | | | | 23,803,712 | |
| | | | | | | | |
| | | | Total Common Stocks & Other Equity Interests (Cost $433,706,091) | | | 430,950,271 | |
| | | | | | | | |
| | | | | | | | |
Number
of Shares | | | | | Value | |
| | | | Money Market Funds—0.1% | |
| | 475,895 | | | Invesco Premier U.S. Government Money Portfolio—Institutional Class, 2.32(d)
(Cost $475,895) | | $ | 475,895 | |
| | | | | | | | |
| | | | Total Investments in Securities
(excluding investments purchased with cash collateral from securities on loan)
(Cost $434,181,986)—99.9% | | | 431,426,166 | |
| | | | | | | | |
| | |
| | | | | | | | |
| | | | Investments Purchased with Cash Collateral from
Securities on Loan | |
| | |
| | | | | | | | |
| | | | Money Market Funds—2.6% | |
| | 8,320,524 | | | Invesco Government & Agency Portfolio—Institutional Class, 2.34%(d)(e) | | | 8,320,524 | |
| | 2,772,676 | | | Invesco Liquid Assets Portfolio—Institutional Class, 2.48%(d)(e) | | | 2,773,508 | |
| | | | | | | | |
| | | | Total Money Market Funds
(Cost $11,094,032) | | | 11,094,032 | |
| | | | | | | | |
| | |
| | | | Total Investments in Securities
(Cost $445,276,018)—102.5% | | | 442,520,198 | |
| | |
| | | | Other assets less liabilities—(2.5)% | | | (10,683,691 | ) |
| | | | | | | | |
| | |
| | | | Net Assets—100.0% | | $ | 431,836,507 | |
| | | | | | | | |
Notes to Schedule of Investments:
| (a) | Industry and/or sector classifications used in this report are generally according to the Global Industry Classification Standard, which was developed by and is the exclusive property and a service mark of MSCI Inc. and Standard & Poor’s. |
| (b) | Non-income producing security. |
| (c) | All or a portion of this security was out on loan at April 30, 2019. |
| (d) | The security and the Fund are advised by wholly-owned subsidiaries of Invesco Ltd. and are therefore considered to be affiliated. The rate shown is the7-day SEC standardized yield as of April 30, 2019. |
| (e) | The security has been segregated to satisfy the commitment to return the cash collateral received in securities lending transactions upon the borrower’s return of the securities loaned. See Note 2J. |
See accompanying Notes to Financial Statements which are an integral part of the financial statements.
Schedule of Investments(a)
Invesco S&P 500® Equal Weight Energy ETF (RYE)
April 30, 2019
| | | | | | | | |
Number
of Shares | | | | | Value | |
| | | | Common Stocks & Other Equity Interests—99.9% | |
| | | | Energy Equipment & Services—19.9% | |
| | 257,766 | | | Baker Hughes, a GE Co., Class A | | $ | 6,191,539 | |
| | 241,440 | | | Halliburton Co. | | | 6,839,995 | |
| | 125,588 | | | Helmerich & Payne, Inc. | | | 7,349,410 | |
| | 256,372 | | | National Oilwell Varco, Inc. | | | 6,701,564 | |
| | 160,628 | | | Schlumberger Ltd. | | | 6,855,603 | |
| | 316,126 | | | TechnipFMC PLC (United Kingdom) | | | 7,773,539 | |
| | | | | | | | |
| | | | | | | 41,711,650 | |
| | | | | | | | |
| |
| | | | Oil, Gas & Consumable Fuels—80.0% | |
| | 157,649 | | | Anadarko Petroleum Corp. | | | 11,484,730 | |
| | 207,585 | | | Apache Corp. | | | 6,831,622 | |
| | 268,842 | | | Cabot Oil & Gas Corp. | | | 6,960,319 | |
| | 54,533 | | | Chevron Corp. | | | 6,547,232 | |
| | 97,121 | | | Cimarex Energy Co. | | | 6,668,328 | |
| | 66,139 | | | Concho Resources, Inc. | | | 7,631,118 | |
| | 101,365 | | | ConocoPhillips | | | 6,398,159 | |
| | 248,309 | | | Devon Energy Corp. | | | 7,980,651 | |
| | 69,448 | | | Diamondback Energy, Inc. | | | 7,388,573 | |
| | 76,728 | | | EOG Resources, Inc. | | | 7,369,724 | |
| | 83,943 | | | Exxon Mobil Corp. | | | 6,738,944 | |
| | 120,588 | | | Hess Corp. | | | 7,732,102 | |
| | 135,908 | | | HollyFrontier Corp. | | | 6,486,889 | |
| | 336,154 | | | Kinder Morgan, Inc. | | | 6,679,380 | |
| | 407,642 | | | Marathon Oil Corp. | | | 6,946,220 | |
| | 115,345 | | | Marathon Petroleum Corp. | | | 7,021,050 | |
| | 309,633 | | | Noble Energy, Inc. | | | 8,378,669 | |
| | 105,762 | | | Occidental Petroleum Corp. | | | 6,227,267 | |
| | 101,133 | | | ONEOK, Inc. | | | 6,869,965 | |
| | 70,325 | | | Phillips 66 | | | 6,629,538 | |
| | 50,877 | | | Pioneer Natural Resources Co. | | | 8,468,985 | |
| | 83,164 | | | Valero Energy Corp. | | | 7,539,648 | |
| | 246,282 | | | Williams Cos., Inc. (The) | | | 6,977,169 | |
| | | | | | | | |
| | | | | | | 167,956,282 | |
| | | | | | | | |
| | | | Total Common Stocks & Other Equity Interests
(Cost $ 247,051,914) | | | 209,667,932 | |
| | | | | | | | |
| | |
| | | | | | | | |
| | | | Money Market Funds—0.0% | |
| | 268 | | | Invesco Premier U.S. Government Money Portfolio—Institutional Class, 2.32(b)(Cost $268) | | | 268 | |
| | | | | | | | |
| | |
| | | | Total Investments in Securities
(Cost $247,052,182)—99.9% | | | 209,668,200 | |
| | |
| | | | Other assets less liabilities—0.1% | | | 154,689 | |
| | | | | | | | |
| | |
| | | | Net Assets—100.0% | | $ | 209,822,889 | |
| | | | | | | | |
Notes to Schedule of Investments:
| (a) | Industry and/or sector classifications used in this report are generally according to the Global Industry Classification Standard, which was developed by and is the exclusive property and a service mark of MSCI Inc. and Standard & Poor’s. |
| (b) | The security and the Fund are advised by wholly-owned subsidiaries of Invesco Ltd. and are therefore considered to be affiliated. The rate shown is the7-day SEC standardized yield as of April 30, 2019. |
See accompanying Notes to Financial Statements which are an integral part of the financial statements.
Schedule of Investments(a)
Invesco S&P 500® Equal Weight Financials ETF (RYF)
April 30, 2019
| | | | | | | | |
Number
of Shares | | | | | Value | |
| | | | Common Stocks & Other Equity Interests—100.0% | |
| | | | Banks—27.3% | |
| | 140,375 | | | Bank of America Corp. | | $ | 4,292,667 | |
| | 81,083 | | | BB&T Corp. | | | 4,151,450 | |
| | 64,804 | | | Citigroup, Inc. | | | 4,581,643 | |
| | 115,700 | | | Citizens Financial Group, Inc. | | | 4,188,340 | |
| | 48,182 | | | Comerica, Inc. | | | 3,786,623 | |
| | 150,796 | | | Fifth Third Bancorp | | | 4,345,941 | |
| | 39,538 | | | First Republic Bank | | | 4,176,003 | |
| | 292,276 | | | Huntington Bancshares, Inc. | | | 4,068,482 | |
| | 39,042 | | | JPMorgan Chase & Co. | | | 4,530,824 | |
| | 239,817 | | | KeyCorp | | | 4,208,788 | |
| | 23,962 | | | M&T Bank Corp. | | | 4,075,217 | |
| | 234,367 | | | People’s United Financial, Inc. | | | 4,052,205 | |
| | 31,742 | | | PNC Financial Services Group, Inc. (The) | | | 4,346,432 | |
| | 259,969 | | | Regions Financial Corp. | | | 4,037,319 | |
| | 63,345 | | | SunTrust Banks, Inc. | | | 4,147,831 | |
| | 16,779 | | | SVB Financial Group(b) | | | 4,223,610 | |
| | 79,059 | | | U.S. Bancorp | | | 4,215,426 | |
| | 80,758 | | | Wells Fargo & Co. | | | 3,909,495 | |
| | 82,582 | | | Zions Bancorp. N.A. | | | 4,073,770 | |
| | | | | | | | |
| | | | | | | 79,412,066 | |
| | | | | | | | |
| |
| | | | Capital Markets—32.1% | |
| | 38,734 | | | Affiliated Managers Group, Inc. | | | 4,296,375 | |
| | 32,342 | | | Ameriprise Financial, Inc. | | | 4,746,835 | |
| | 78,123 | | | Bank of New York Mellon Corp. (The) | | | 3,879,588 | |
| | 9,546 | | | BlackRock, Inc. | | | 4,632,101 | |
| | 43,558 | | | Cboe Global Markets, Inc. | | | 4,425,928 | |
| | 92,560 | | | Charles Schwab Corp. (The) | | | 4,237,397 | |
| | 23,445 | | | CME Group, Inc., Class A | | | 4,194,311 | |
| | 85,825 | | | E*TRADE Financial Corp. | | | 4,347,895 | |
| | 128,367 | | | Franklin Resources, Inc. | | | 4,440,215 | |
| | 20,599 | | | Goldman Sachs Group, Inc. (The) | | | 4,241,746 | |
| | 55,472 | | | Intercontinental Exchange, Inc. | | | 4,512,647 | |
| | 215,758 | | | Invesco Ltd.(c) | | | 4,740,203 | |
| | 23,666 | | | Moody’s Corp. | | | 4,653,209 | |
| | 97,237 | | | Morgan Stanley | | | 4,691,685 | |
| | 22,044 | | | MSCI, Inc. | | | 4,968,277 | |
| | 48,199 | | | Nasdaq, Inc. | | | 4,443,948 | |
| | 44,920 | | | Northern Trust Corp. | | | 4,426,866 | |
| | 50,053 | | | Raymond James Financial, Inc. | | | 4,583,353 | |
| | 20,485 | | | S&P Global, Inc. | | | 4,520,220 | |
| | 59,056 | | | State Street Corp. | | | 3,995,729 | |
| | 41,530 | | | T. Rowe Price Group, Inc. | | | 4,464,475 | |
| | | | | | | | |
| | | | | | | 93,443,003 | |
| | | | | | | | |
| |
| | | | Consumer Finance—6.2% | |
| | 37,245 | | | American Express Co. | | | 4,366,231 | |
| | 49,425 | | | Capital One Financial Corp. | | | 4,588,123 | |
| | 57,552 | | | Discover Financial Services | | | 4,689,913 | |
| | 127,512 | | | Synchrony Financial | | | 4,420,841 | |
| | | | | | | | |
| | | | | | | 18,065,108 | |
| | | | | | | | |
| |
| | | | Diversified Financial Services—3.0% | |
| | 20,240 | | | Berkshire Hathaway, Inc., Class B(b) | | | 4,386,210 | |
| | 212,228 | | | Jefferies Financial Group, Inc. | | | 4,365,530 | |
| | | | | | | | |
| | | | | | | 8,751,740 | |
| | | | | | | | |
| | | | | | | | |
Number
of Shares | | | | | Value | |
| | | | Common Stocks & Other Equity Interests
(continued) | |
| | | | Insurance—31.4% | |
| | 82,837 | | | Aflac, Inc. | | $ | 4,173,328 | |
| | 43,105 | | | Allstate Corp. (The) | | | 4,269,981 | |
| | 95,301 | | | American International Group, Inc. | | | 4,533,469 | |
| | 24,819 | | | Aon PLC | | | 4,470,895 | |
| | 51,620 | | | Arthur J. Gallagher & Co. | | | 4,316,464 | |
| | 40,233 | | | Assurant, Inc. | | | 3,822,135 | |
| | 30,385 | | | Chubb Ltd. | | | 4,411,902 | |
| | 47,600 | | | Cincinnati Financial Corp. | | | 4,578,168 | |
| | 18,553 | | | Everest Re Group, Ltd. | | | 4,369,232 | |
| | 83,594 | | | Hartford Financial Services Group, Inc. (The) | | | 4,372,802 | |
| | 66,839 | | | Lincoln National Corp. | | | 4,459,498 | |
| | 85,788 | | | Loews Corp. | | | 4,400,067 | |
| | 44,895 | | | Marsh & McLennan Cos., Inc. | | | 4,233,150 | |
| | 91,072 | | | MetLife, Inc. | | | 4,201,151 | |
| | 80,579 | | | Principal Financial Group, Inc. | | | 4,605,896 | |
| | 55,649 | | | Progressive Corp. (The) | | | 4,348,969 | |
| | 43,105 | | | Prudential Financial, Inc. | | | 4,556,630 | |
| | 49,559 | | | Torchmark Corp. | | | 4,344,342 | |
| | 30,695 | | | Travelers Cos., Inc. (The) | | | 4,412,406 | |
| | 111,622 | | | Unum Group | | | 4,121,084 | |
| | 23,766 | | | Willis Towers Watson PLC | | | 4,381,024 | |
| | | | | | | | |
| | | | | | | 91,382,593 | |
| | | | | | | | |
| | |
| | | | Total Investments in Securities
(Cost $290,373,627)—100.0% | | | 291,054,510 | |
| | |
| | | | Other assets less liabilities—0.0% | | | 90,004 | |
| | | | | | | | |
| | |
| | | | Net Assets—100.0% | | $ | 291,144,514 | |
| | | | | | | | |
Notes to Schedule of Investments:
| (a) | Industry and/or sector classifications used in this report are generally according to the Global Industry Classification Standard, which was developed by and is the exclusive property and a service mark of MSCI Inc. and Standard & Poor’s. |
| (b) | Non-income producing security. |
| (c) | Affiliated company. See Note 4. |
See accompanying Notes to Financial Statements which are an integral part of the financial statements.
Schedule of Investments(a)
Invesco S&P 500® Equal Weight Health Care ETF (RYH)
April 30, 2019
| | | | | | | | |
Number
of Shares | | | | | Value | |
| | | | Common Stocks & Other Equity Interests—100.0% | |
| | | | Biotechnology—13.9% | |
| | 144,700 | | | AbbVie, Inc. | | $ | 11,487,733 | |
| | 87,238 | | | Alexion Pharmaceuticals, Inc.(b) | | | 11,875,709 | |
| | 62,066 | | | Amgen, Inc. | | | 11,129,675 | |
| | 36,457 | | | Biogen, Inc.(b) | | | 8,357,403 | |
| | 132,912 | | | Celgene Corp.(b) | | | 12,581,450 | |
| | 177,539 | | | Gilead Sciences, Inc. | | | 11,547,137 | |
| | 136,699 | | | Incyte Corp.(b) | | | 10,498,483 | |
| | 27,880 | | | Regeneron Pharmaceuticals, Inc.(b) | | | 9,566,743 | |
| | 63,328 | | | Vertex Pharmaceuticals, Inc.(b) | | | 10,701,165 | |
| | | | | | | | |
| | | | | | | 97,745,498 | |
| | | | | | | | |
| |
| | | | Health Care Equipment & Supplies—31.1% | |
| | 146,493 | | | Abbott Laboratories | | | 11,654,983 | |
| | 35,728 | | | ABIOMED, Inc.(b) | | | 9,911,304 | |
| | 48,631 | | | Align Technology, Inc.(b) | | | 15,789,513 | |
| | 151,435 | | | Baxter International, Inc. | | | 11,554,491 | |
| | 45,501 | | | Becton, Dickinson and Co. | | | 10,953,911 | |
| | 284,126 | | | Boston Scientific Corp.(b) | | | 10,546,757 | |
| | 38,964 | | | Cooper Cos., Inc. (The) | | | 11,296,443 | |
| | 89,777 | | | Danaher Corp. | | | 11,890,066 | |
| | 231,173 | | | DENTSPLY SIRONA, Inc. | | | 11,819,876 | |
| | 66,321 | | | Edwards Lifesciences Corp.(b) | | | 11,677,138 | |
| | 240,846 | | | Hologic, Inc.(b) | | | 11,170,438 | |
| | 55,646 | | | IDEXX Laboratories, Inc.(b) | | | 12,909,872 | |
| | 21,032 | | | Intuitive Surgical, Inc.(b) | | | 10,739,570 | |
| | 124,014 | | | Medtronic PLC | | | 11,013,683 | |
| | 111,145 | | | ResMed, Inc. | | | 11,615,764 | |
| | 59,958 | | | Stryker Corp. | | | 11,326,666 | |
| | 39,129 | | | Teleflex, Inc. | | | 11,197,937 | |
| | 84,081 | | | Varian Medical Systems, Inc.(b) | | | 11,449,310 | |
| | 92,308 | | | Zimmer Biomet Holdings, Inc. | | | 11,368,653 | |
| | | | | | | | |
| | | | | | | 219,886,375 | |
| | | | | | | | |
| |
| | | | Health Care Providers & Services—25.9% | |
| | 146,914 | | | AmerisourceBergen Corp. | | | 10,983,291 | |
| | 38,049 | | | Anthem, Inc. | | | 10,008,029 | |
| | 235,341 | | | Cardinal Health, Inc. | | | 11,463,460 | |
| | 198,475 | | | Centene Corp.(b) | | | 10,233,371 | |
| | 68,810 | | | Cigna Corp. | | | 10,929,780 | |
| | 212,088 | | | CVS Health Corp. | | | 11,533,345 | |
| | 224,739 | | | DaVita, Inc.(b) | | | 12,414,582 | |
| | 89,993 | | | HCA Healthcare, Inc. | | | 11,449,809 | |
| | 191,663 | | | Henry Schein, Inc.(b) | | | 12,277,932 | |
| | 41,846 | | | Humana, Inc. | | | 10,687,887 | |
| | 76,620 | | | Laboratory Corp. of America Holdings(b) | | | 12,253,070 | |
| | 100,355 | | | McKesson Corp. | | | 11,967,334 | |
| | 133,053 | | | Quest Diagnostics, Inc. | | | 12,823,648 | |
| | 47,308 | | | UnitedHealth Group, Inc. | | | 11,026,076 | |
| | 86,895 | | | Universal Health Services, Inc., Class B | | | 11,024,369 | |
| | 46,829 | | | WellCare Health Plans, Inc.(b) | | | 12,098,272 | |
| | | | | | | | |
| | | | | | | 183,174,255 | |
| | | | | | | | |
| | | | Health Care Technology—1.9% | |
| | 202,450 | | | Cerner Corp.(b) | | | 13,452,803 | |
| | | | | | | | |
| |
| | | | Life Sciences Tools & Services—11.5% | |
| | 143,957 | | | Agilent Technologies, Inc. | | | 11,300,625 | |
| | 38,115 | | | Illumina, Inc.(b) | | | 11,891,880 | |
| | 81,684 | | | IQVIA Holdings, Inc.(b) | | | 11,345,908 | |
| | | | | | | | |
Number
of Shares | | | | | Value | |
| | | | Common Stocks & Other Equity
Interests (continued) | |
| | | | Life Sciences Tools & Services (continued) | |
| | 16,485 | | | Mettler-Toledo International, Inc.(b) | | $ | 12,285,611 | |
| | 122,192 | | | PerkinElmer, Inc. | | | 11,710,881 | |
| | 44,932 | | | Thermo Fisher Scientific, Inc. | | | 12,466,383 | |
| | 47,049 | | | Waters Corp.(b) | | | 10,046,843 | |
| | | | | | | | |
| | | | | | | 81,048,131 | |
| | | | | | | | |
| |
| | | | Pharmaceuticals—15.7% | |
| | 77,387 | | | Allergan PLC | | | 11,375,889 | |
| | 218,444 | | | Bristol-Myers Squibb Co. | | | 10,142,355 | |
| | 88,600 | | | Eli Lilly and Co. | | | 10,369,744 | |
| | 81,310 | | | Johnson & Johnson | | | 11,480,972 | |
| | 140,674 | | | Merck & Co., Inc. | | | 11,072,451 | |
| | 421,863 | | | Mylan N.V.(b) | | | 11,386,082 | |
| | 319,551 | | | Nektar Therapeutics(b) | | | 10,232,023 | |
| | 241,415 | | | Perrigo Co. PLC | | | 11,568,607 | |
| | 274,536 | | | Pfizer, Inc. | | | 11,148,907 | |
| | 121,478 | | | Zoetis, Inc. | | | 12,371,319 | |
| | | | | | | | |
| | | | | | | 111,148,349 | |
| | | | | | | | |
| | | | Total Common Stocks & Other Equity Interests
(Cost $667,145,275) | | | 706,455,411 | |
| | | | | | | | |
| | |
| | | | | | | | |
| | | | Money Market Funds—0.0% | |
| | 190,371 | | | Invesco Premier U.S. Government Money Portfolio—Institutional Class, 2.32(c)
(Cost $190,371) | | | 190,371 | |
| | | | | | | | |
| | | | Total Investments in Securities
(Cost $667,335,646)—100.0% | | | 706,645,782 | |
| | |
| | | | Other assets less liabilities—0.0% | | | 199,216 | |
| | | | | | | | |
| | |
| | | | Net Assets—100.0% | | $ | 706,844,998 | |
| | | | | | | | |
Notes to Schedule of Investments:
| (a) | Industry and/or sector classifications used in this report are generally according to the Global Industry Classification Standard, which was developed by and is the exclusive property and a service mark of MSCI Inc. and Standard & Poor’s. |
| (b) | Non-income producing security. |
| (c) | The security and the Fund are advised by wholly-owned subsidiaries of Invesco Ltd. and are therefore considered to be affiliated. The rate shown is the7-day SEC standardized yield as of April 30, 2019. |
See accompanying Notes to Financial Statements which are an integral part of the financial statements.
Schedule of Investments(a)
Invesco S&P 500® Equal Weight Industrials ETF (RGI)
April 30, 2019
| | | | | | | | |
Number
of Shares | | | | | Value | |
| | | | Common Stocks & Other Equity
Interests—100.0% | |
| | | | Aerospace & Defense—17.0% | |
| | 176,987 | | | Arconic, Inc. | | $ | 3,801,681 | |
| | 7,749 | | | Boeing Co. (The) | | | 2,926,720 | |
| | 19,697 | | | General Dynamics Corp. | | | 3,520,248 | |
| | 20,231 | | | Harris Corp. | | | 3,408,923 | |
| | 16,350 | | | Huntington Ingalls Industries, Inc. | | | 3,639,183 | |
| | 15,714 | | | L3 Technologies, Inc. | | | 3,434,766 | |
| | 10,875 | | | Lockheed Martin Corp. | | | 3,624,964 | |
| | 11,858 | | | Northrop Grumman Corp. | | | 3,437,753 | |
| | 18,103 | | | Raytheon Co. | | | 3,214,912 | |
| | 64,040 | | | Textron, Inc. | | | 3,394,120 | |
| | 7,650 | | | TransDigm Group, Inc.(b) | | | 3,691,278 | |
| | 26,391 | | | United Technologies Corp. | | | 3,763,620 | |
| | | | | | | | |
| | | | | | | 41,858,168 | |
| | | | | | | | |
| | |
| | | | Air Freight & Logistics—5.5% | | | |
| | 37,429 | | | C.H. Robinson Worldwide, Inc. | | | 3,031,749 | |
| | 43,919 | | | Expeditors International of Washington, Inc. | | | 3,488,047 | |
| | 19,046 | | | FedEx Corp. | | | 3,608,455 | |
| | 30,680 | | | United Parcel Service, Inc., Class B | | | 3,258,830 | |
| | | | | | | | |
| | | | | | | 13,387,081 | |
| | | | | | | | |
| | |
| | | | Airlines—7.3% | | | |
| | 58,840 | | | Alaska Air Group, Inc. | | | 3,642,196 | |
| | 102,558 | | | American Airlines Group, Inc. | | | 3,505,433 | |
| | 65,991 | | | Delta Air Lines, Inc. | | | 3,846,615 | |
| | 63,214 | | | Southwest Airlines Co. | | | 3,428,095 | |
| | 39,712 | | | United Continental Holdings, Inc.(b) | | | 3,528,808 | |
| | | | | | | | |
| | | | | | | 17,951,147 | |
| | | | | | | | |
| | |
| | | | Building Products—7.1% | | | |
| | 64,335 | | | A.O. Smith Corp. | | | 3,382,091 | |
| | 37,198 | | | Allegion PLC | | | 3,691,157 | |
| | 70,820 | | | Fortune Brands Home & Security, Inc. | | | 3,737,880 | |
| | 91,210 | | | Johnson Controls International PLC | | | 3,420,375 | |
| | 83,393 | | | Masco Corp. | | | 3,257,331 | |
| | | | | | | | |
| | | | | | | 17,488,834 | |
| | | | | | | | |
| | |
| | | | Commercial Services & Supplies—7.1% | | | |
| | 16,257 | | | Cintas Corp. | | | 3,530,045 | |
| | 56,193 | | | Copart, Inc.(b) | | | 3,782,913 | |
| | 42,007 | | | Republic Services, Inc. | | | 3,479,020 | |
| | 81,589 | | | Rollins, Inc. | | | 3,155,046 | |
| | 33,073 | | | Waste Management, Inc. | | | 3,550,056 | |
| | | | | | | | |
| | | | | | | 17,497,080 | |
| | | | | | | | |
| | |
| | | | Construction & Engineering—4.4% | | | |
| | 89,611 | | | Fluor Corp. | | | 3,560,245 | |
| | 45,515 | | | Jacobs Engineering Group, Inc. | | | 3,547,439 | |
| | 93,000 | | | Quanta Services, Inc. | | | 3,775,800 | |
| | | | | | | | |
| | | | | | | 10,883,484 | |
| | | | | | | | |
| | |
| | | | Electrical Equipment—5.7% | | | |
| | 41,613 | | | AMETEK, Inc. | | | 3,669,018 | |
| | 41,225 | | | Eaton Corp. PLC | | | 3,414,254 | |
| | 49,138 | | | Emerson Electric Co. | | | 3,488,307 | |
| | 18,753 | | | Rockwell Automation, Inc. | | | 3,388,855 | |
| | | | | | | | |
| | | | | | | 13,960,434 | |
| | | | | | | | |
| | |
| | | | Industrial Conglomerates—5.7% | | | |
| | 16,293 | | | 3M Co. | | | 3,087,686 | |
| | | | | | | | |
Number
of Shares | | | | | Value | |
| | | | Common Stocks & Other Equity Interests
(continued) | |
| | | | Industrial Conglomerates (continued) | |
| | 341,598 | | | General Electric Co. | | $ | 3,474,052 | |
| | 21,592 | | | Honeywell International, Inc. | | | 3,749,019 | |
| | 10,300 | | | Roper Technologies, Inc. | | | 3,704,910 | |
| | | | | | | | |
| | | | | | | 14,015,667 | |
| | | | | | | | |
| |
| | | | Machinery—21.6% | |
| | 24,916 | | | Caterpillar, Inc. | | | 3,473,789 | |
| | 21,173 | | | Cummins, Inc. | | | 3,520,858 | |
| | 20,583 | | | Deere & Co. | | | 3,409,162 | |
| | 36,659 | | | Dover Corp. | | | 3,594,048 | |
| | 76,196 | | | Flowserve Corp. | | | 3,735,890 | |
| | 40,706 | | | Fortive Corp. | | | 3,514,556 | |
| | 23,270 | | | Illinois Tool Works, Inc. | | | 3,621,510 | |
| | 31,380 | | | Ingersoll-Rand PLC | | | 3,847,502 | |
| | 48,622 | | | PACCAR, Inc. | | | 3,484,739 | |
| | 19,357 | | | Parker-Hannifin Corp. | | | 3,505,166 | |
| | 78,589 | | | Pentair PLC | | | 3,064,185 | |
| | 20,759 | | | Snap-on, Inc. | | | 3,493,324 | |
| | 25,316 | | | Stanley Black & Decker, Inc. | | | 3,711,326 | |
| | 46,674 | | | Wabtec Corp.(c) | | | 3,457,143 | |
| | 43,590 | | | Xylem, Inc. | | | 3,635,406 | |
| | | | | | | | |
| | | | | | | 53,068,604 | |
| | | | | | | | |
| |
| | | | Professional Services—7.1% | |
| | 30,152 | | | Equifax, Inc. | | | 3,797,644 | |
| | 62,285 | | | IHS Markit Ltd.(b) | | | 3,566,439 | |
| | 125,724 | | | Nielsen Holdings PLC | | | 3,209,734 | |
| | 50,593 | | | Robert Half International, Inc. | | | 3,141,319 | |
| | 25,971 | | | Verisk Analytics, Inc., Class A | | | 3,665,547 | |
| | | | | | | | |
| | | | | | | 17,380,683 | |
| | | | | | | | |
| |
| | | | Road & Rail—7.2% | |
| | 45,596 | | | CSX Corp. | | | 3,630,809 | |
| | 32,150 | | | J.B. Hunt Transport Services, Inc. | | | 3,037,532 | |
| | 29,404 | | | Kansas City Southern | | | 3,620,809 | |
| | 18,514 | | | Norfolk Southern Corp. | | | 3,777,226 | |
| | 19,921 | | | Union Pacific Corp. | | | 3,526,814 | |
| | | | | | | | |
| | | | | | | 17,593,190 | |
| | | | | | | | |
| |
| | | | Trading Companies & Distributors—4.3% | |
| | 53,273 | | | Fastenal Co. | | | 3,758,410 | |
| | 26,555 | | | United Rentals, Inc.(b) | | | 3,742,131 | |
| | 11,154 | | | W.W. Grainger, Inc. | | | 3,145,428 | |
| | | | | | | | |
| | | | | | | 10,645,969 | |
| | | | | | | | |
| | |
| | | | Total Investments in Securities
(excluding investments purchased with cash collateral from securities on loan)
(Cost $238,946,445)—100.0% | | | 245,730,341 | |
| | | | | | | | |
| | | | Investments Purchased with Cash
Collateral from Securities on Loan | | | |
| | |
| | | | Money Market Funds—0.8% | | | | |
| | 1,567,775 | | | Invesco Government & Agency Portfolio—Institutional Class, 2.34%(d)(e) | | | 1,567,775 | |
See accompanying Notes to Financial Statements which are an integral part of the financial statements.
Invesco S&P 500® Equal Weight Industrials ETF (RGI)(continued)
April 30, 2019
| | | | | | | | |
Number
of Shares | | | | | Value | |
| | | | Money Market Funds (continued) | | | |
| | 522,436 | | | Invesco Liquid Assets Portfolio—Institutional Class, 2.48%(d)(e) | | $ | 522,593 | |
| | | | | | | | |
| | | | Total Money Market Funds
(Cost $2,090,368) | | | 2,090,368 | |
| | | | | | | | |
| | | | Total Investments in Securities
(Cost $241,036,813)—100.8% | | | 247,820,709 | |
| | |
| | | | Other assets less liabilities—(0.8)% | | | (2,070,439 | ) |
| | | | | | | | |
| | |
| | | | Net Assets—100.0% | | $ | 245,750,270 | |
| | | | | | | | |
Notes to Schedule of Investments:
| (a) | Industry and/or sector classifications used in this report are generally according to the Global Industry Classification Standard, which was developed by and is the exclusive property and a service mark of MSCI Inc. and Standard & Poor’s. |
| (b) | Non-income producing security. |
| (c) | All or a portion of this security was out on loan at April 30, 2019. |
| (d) | The security and the Fund are advised by wholly-owned subsidiaries of Invesco Ltd. and are therefore considered to be affiliated. The rate shown is the7-day SEC standardized yield as of April 30, 2019. |
| (e) | The security has been segregated to satisfy the commitment to return the cash collateral received in securities lending transactions upon the borrower’s return of the securities loaned. See Note 2J. |
See accompanying Notes to Financial Statements which are an integral part of the financial statements.
Schedule of Investments(a)
Invesco S&P 500® Equal Weight Materials ETF (RTM)
April 30, 2019
| | | | | | | | |
Number
of Shares | | | | | Value | |
| | | | Common Stocks & Other Equity
Interests—100.0% | |
| | | | Chemicals—57.9% | | | |
| | 26,444 | | | Air Products and Chemicals, Inc. | | $ | 5,441,911 | |
| | 57,804 | | | Albemarle Corp.(b) | | | 4,338,768 | |
| | 48,065 | | | Celanese Corp., Series A | | | 5,185,733 | |
| | 119,036 | | | CF Industries Holdings, Inc. | | | 5,330,432 | |
| | 84,017 | | | Dow, Inc.(c) | | | 4,766,284 | |
| | 132,761 | | | DowDuPont, Inc. | | | 5,104,660 | |
| | 60,724 | | | Eastman Chemical Co. | | | 4,789,909 | |
| | 28,283 | | | Ecolab, Inc. | | | 5,206,335 | |
| | 61,860 | | | FMC Corp. | | | 4,890,652 | |
| | 38,245 | | | International Flavors & Fragrances,
Inc.(b) | | | 5,269,779 | |
| | 28,301 | | | Linde PLC (United Kingdom) | | | 5,101,538 | |
| | 55,038 | | | LyondellBasell Industries N.V., Class A | | | 4,856,003 | |
| | 171,163 | | | Mosaic Co. (The) | | | 4,469,066 | |
| | 43,747 | | | PPG Industries, Inc. | | | 5,140,272 | |
| | 11,502 | | | Sherwin-Williams Co. (The) | | | 5,231,455 | |
| | | | | | | | |
| | | | | | | 75,122,797 | |
| | | | | | | | |
| | | | Construction Materials—8.3% | | | |
| | 24,416 | | | Martin Marietta Materials, Inc. | | | 5,417,910 | |
| | 42,244 | | | Vulcan Materials Co. | | | 5,327,391 | |
| | | | | | | | |
| | | | | | | 10,745,301 | |
| | | | | | | | |
| | | | Containers & Packaging—23.0% | | | |
| | 44,244 | | | Avery Dennison Corp. | | | 4,895,599 | |
| | 87,184 | | | Ball Corp. | | | 5,225,809 | |
| | 104,784 | | | International Paper Co. | | | 4,904,939 | |
| | 49,240 | | | Packaging Corp. of America | | | 4,882,638 | |
| | 106,863 | | | Sealed Air Corp. | | | 4,981,953 | |
| | 127,214 | | | WestRock Co. | | | 4,882,473 | |
| | | | | | | | |
| | | | | | | 29,773,411 | |
| | | | | | | | |
| | | | Metals & Mining—10.8% | | | |
| | 396,689 | | | Freeport-McMoRan, Inc. | | | 4,883,242 | |
| | 142,271 | | | Newmont Goldcorp Corp. | | | 4,418,937 | |
| | 82,989 | | | Nucor Corp. | | | 4,736,182 | |
| | | | | | | | |
| | | | | | | 14,038,361 | |
| | | | | | | | |
| | | | Total Investments in Securities | | | |
| | | | (excluding investments purchased with cash collateral from securities on loan)
(Cost $138,778,948)—100.0% | | | 129,679,870 | |
| | | | | | | | |
| | | | Investments Purchased with Cash
Collateral from Securities on Loan | |
| | | | Money Market Funds—6.8% | | | |
| | 6,634,636 | | | Invesco Government & Agency Portfolio— Institutional Class, 2.34%(d)(e) | | | 6,634,636 | |
| | 2,210,882 | | | Invesco Liquid Assets Portfolio—Institutional Class, 2.48%(d)(e) | | | 2,211,545 | |
| | | | | | | | |
| | | | Total Money Market Funds
(Cost $8,846,181) | | | 8,846,181 | |
| | | | | | | | |
| | | | Total Investments in Securities
(Cost $147,625,129)—106.8% | | 138,526,051 | |
| | |
| | | | Other assets less liabilities—(6.8)% | | | (8,798,482 | ) |
| | | | | | | | |
| | |
| | | | Net Assets—100.0% | | $ | 129,727,569 | |
| | | | | | | | |
Notes to Schedule of Investments:
| (a) | Industry and/or sector classifications used in this report are generally according to the Global Industry Classification Standard, which was developed by and is the exclusive property and a service mark of MSCI Inc. and Standard & Poor’s. |
| (b) | All or a portion of this security was out on loan at April 30, 2019. |
| (c) | Non-income producing security. |
| (d) | The security and the Fund are advised by wholly-owned subsidiaries of Invesco Ltd. and are therefore considered to be affiliated. The rate shown is the7-day SEC standardized yield as of April 30, 2019. |
| (e) | The security has been segregated to satisfy the commitment to return the cash collateral received in securities lending transactions upon the borrower’s return of the securities loaned. See Note 2J. |
See accompanying Notes to Financial Statements which are an integral part of the financial statements.
Schedule of Investments(a)
Invesco S&P 500® Equal Weight Real Estate ETF (EWRE)
April 30, 2019
| | | | | | | | |
Number
of Shares | | | | | Value | |
| | | | Common Stocks & Other Equity
Interests—99.9% | | | |
| | | | Equity Real Estate Investment Trusts (REITs) —96.8% | |
| | 8,229 | | | Alexandria Real Estate Equities, Inc. | | $ | 1,171,727 | |
| | 6,234 | | | American Tower Corp. | | | 1,217,500 | |
| | 22,914 | | | Apartment Investment & Management Co., Class A | | | 1,131,035 | |
| | 5,765 | | | AvalonBay Communities, Inc. | | | 1,158,361 | |
| | 8,550 | | | Boston Properties, Inc. | | | 1,176,651 | |
| | 9,360 | | | Crown Castle International Corp. | | | 1,177,301 | |
| | 10,110 | | | Digital Realty Trust, Inc. | | | 1,190,048 | |
| | 37,883 | | | Duke Realty Corp. | | | 1,178,919 | |
| | 2,631 | | | Equinix, Inc. | | | 1,196,316 | |
| | 15,377 | | | Equity Residential | | | 1,175,110 | |
| | 3,995 | | | Essex Property Trust, Inc. | | | 1,128,588 | |
| | 11,667 | | | Extra Space Storage, Inc. | | | 1,209,751 | |
| | 8,590 | | | Federal Realty Investment Trust | | | 1,149,772 | |
| | 37,284 | | | HCP, Inc. | | | 1,110,318 | |
| | 58,701 | | | Host Hotels & Resorts, Inc. | | | 1,129,407 | |
| | 32,557 | | | Iron Mountain, Inc. | | | 1,057,451 | |
| | 65,377 | | | Kimco Realty Corp. | | | 1,136,906 | |
| | 26,960 | | | Macerich Co. (The) | | | 1,082,174 | |
| | 10,742 | | | Mid-America Apartment Communities, Inc. | | | 1,175,282 | |
| | 16,191 | | | Prologis, Inc. | | | 1,241,364 | |
| | 5,283 | | | Public Storage | | | 1,168,494 | |
| | 16,233 | | | Realty Income Corp. | | | 1,136,472 | |
| | 17,756 | | | Regency Centers Corp. | | | 1,192,671 | |
| | 6,172 | | | SBA Communications Corp., Class A(b) | | | 1,257,422 | |
| | 6,500 | | | Simon Property Group, Inc. | | | 1,129,050 | |
| | 12,531 | | | SL Green Realty Corp. | | | 1,106,989 | |
| | 25,225 | | | UDR, Inc. | | | 1,133,864 | |
| | 18,267 | | | Ventas, Inc. | | | 1,116,296 | |
| | 16,741 | | | Vornado Realty Trust | | | 1,157,473 | |
| | 15,104 | | | Welltower, Inc. | | | 1,125,701 | |
| | 45,919 | | | Weyerhaeuser Co. | | | 1,230,629 | |
| | | | | | | | |
| | | | | | | 35,949,042 | |
| | | | | | | | |
| | | | Real Estate Management & Development—3.1% | | | | |
| | 22,606 | | | CBRE Group, Inc., Class A(b) | | | 1,177,094 | |
| | | | | | | | |
| | |
| | | | Total Common Stocks & Other Equity Interests
(Cost $36,526,404) | | | 37,126,136 | |
| | | | | | | | |
| | |
| | | | | | | | |
| | | | Money Market Funds—0.1% | | | |
| | 25,673 | | | Invesco Premier U.S. Government Money Portfolio—Institutional Class, 2.32(c)
(Cost $25,673) | | | 25,673 | |
| | | | | | | | |
| | |
| | | | Total Investments in Securities
(Cost $36,552,077)—100.0% | | | 37,151,809 | |
| | |
| | | | Other assets less liabilities-(0.0)% | | | (8,756 | ) |
| | | | | | | | |
| | |
| | | | NetAssets-100.0% | | $ | 37,143,053 | |
| | | | | | | | |
Notes to Schedule of Investments:
| (a) | Industry and/or sector classifications used in this report are generally according to the Global Industry Classification Standard, which was developed by and is the exclusive property and a service mark of MSCI Inc. and Standard & Poor’s. |
| (b) | Non-income producing security. |
| (c) | The security and the Fund are advised by wholly-owned subsidiaries of Invesco Ltd. and are therefore considered to be affiliated. The rate shown is the7-day SEC standardized yield as of April 30, 2019. |
See accompanying Notes to Financial Statements which are an integral part of the financial statements.
Schedule of Investments(a)
Invesco S&P 500® Equal Weight Technology ETF (RYT)
April 30, 2019
| | | | | | | | |
Number
of Shares | | | | | Value | |
| | | | Common Stocks & Other Equity
Interests—99.9% | | | |
| | | | Communications Equipment—7.1% | | | |
| | 86,215 | | | Arista Networks, Inc.(b) | | $ | 26,924,082 | |
| | 463,500 | | | Cisco Systems, Inc. | | | 25,932,825 | |
| | 149,827 | | | F5 Networks, Inc.(b) | | | 23,507,856 | |
| | 921,409 | | | Juniper Networks, Inc. | | | 25,587,528 | |
| | 170,479 | | | Motorola Solutions, Inc. | | | 24,704,112 | |
| | | | | | | | |
| | | | | | | 126,656,403 | |
| | | | | | | | |
| | | | Electronic Equipment, Instruments &
Components—8.5% | | | |
| | 254,908 | | | Amphenol Corp., Class A | | | 25,378,641 | |
| | 700,324 | | | Corning, Inc. | | | 22,305,319 | |
| | 478,106 | | | FLIR Systems, Inc. | | | 25,310,932 | |
| | 159,841 | | | IPG Photonics Corp.(b) | | | 27,929,018 | |
| | 281,829 | | | Keysight Technologies, Inc.(b) | | | 24,527,578 | |
| | 291,548 | | | TE Connectivity Ltd. | | | 27,886,566 | |
| | | | | | | | |
| | | | | | | 153,338,054 | |
| | | | | | | | |
| | | | IT Services—30.6% | | | |
| | 146,396 | | | Accenture PLC, Class A | | | 26,742,157 | |
| | 336,715 | | | Akamai Technologies, Inc.(b) | | | 26,957,403 | |
| | 142,297 | | | Alliance Data Systems Corp. | | | 22,781,750 | |
| | 158,610 | | | Automatic Data Processing, Inc. | | | 26,073,898 | |
| | 239,244 | | | Broadridge Financial Solutions, Inc. | | | 28,261,894 | |
| | 332,690 | | | Cognizant Technology Solutions Corp., Class A | | | 24,273,062 | |
| | 368,762 | | | DXC Technology Co. | | | 24,242,414 | |
| | 223,924 | | | Fidelity National Information Services, Inc. | | | 25,959,509 | |
| | 278,874 | | | Fiserv, Inc.(b) | | | 24,328,968 | |
| | 103,904 | | | FleetCor Technologies, Inc.(b) | | | 27,113,749 | |
| | 167,580 | | | Gartner, Inc.(b) | | | 26,640,193 | |
| | 181,639 | | | Global Payments, Inc. | | | 26,532,009 | |
| | 175,224 | | | International Business Machines Corp. | | | 24,578,670 | |
| | 180,239 | | | Jack Henry & Associates, Inc. | | | 26,866,425 | |
| | 106,690 | | | Mastercard, Inc., Class A | | | 27,124,866 | |
| | 310,075 | | | Paychex, Inc. | | | 26,142,423 | |
| | 247,370 | | | PayPal Holdings, Inc.(b) | | | 27,895,915 | |
| | 254,306 | | | Total System Services, Inc. | | | 26,000,245 | |
| | 133,187 | | | VeriSign, Inc.(b) | | | 26,297,773 | |
| | 160,643 | | | Visa, Inc., Class A | | | 26,414,528 | |
| | 1,320,188 | | | Western Union Co. (The) | | | 25,664,455 | |
| | | | | | | | |
| | | | | | | 546,892,306 | |
| | | | | | | | |
| | | | Semiconductors & Semiconductor Equipment—24.6% | |
| | 1,075,465 | | | Advanced Micro Devices, Inc.(b) | | | 29,715,098 | |
| | 224,561 | | | Analog Devices, Inc. | | | 26,102,971 | |
| | 627,212 | | | Applied Materials, Inc. | | | 27,641,233 | |
| | 89,600 | | | Broadcom, Inc. | | | 28,528,640 | |
| | 451,047 | | | Intel Corp. | | | 23,021,439 | |
| | 207,734 | | | KLA-Tencor Corp. | | | 26,481,930 | |
| | 140,205 | | | Lam Research Corp. | | | 29,082,723 | |
| | 455,648 | | | Maxim Integrated Products, Inc. | | | 27,338,880 | |
| | 278,319 | | | Microchip Technology, Inc. | | | 27,801,285 | |
| | 612,443 | | | Micron Technology, Inc.(b) | | | 25,759,352 | |
| | 157,137 | | | NVIDIA Corp. | | | 28,441,797 | |
| | 345,157 | | | Qorvo, Inc.(b) | | | 26,097,321 | |
| | 442,198 | | | QUALCOMM, Inc. | | | 38,086,514 | |
| | 295,407 | | | Skyworks Solutions, Inc. | | | 26,048,989 | |
| | | | | | | | |
Number
of Shares | | | | | Value | |
| | | | Common Stocks & Other Equity
Interests (continued) | | | |
| | | | Semiconductors & Semiconductor
Equipment (continued) | | | |
| | 225,738 | | | Texas Instruments, Inc. | | $ | 26,598,708 | |
| | 199,541 | | | Xilinx, Inc. | | | 23,972,856 | |
| | | | | | | | |
| | | | | | | 440,719,736 | |
| | | | | | | | |
| | | | Software—19.0% | | | |
| | 92,921 | | | Adobe, Inc.(b) | | | 26,877,399 | |
| | 133,411 | | | ANSYS, Inc.(b) | | | 26,121,874 | |
| | 155,353 | | | Autodesk, Inc.(b) | | | 27,685,458 | |
| | 400,121 | | | Cadence Design Systems, Inc.(b) | | | 27,760,395 | |
| | 236,758 | | | Citrix Systems, Inc. | | | 23,903,088 | |
| | 293,430 | | | Fortinet, Inc.(b) | | | 27,412,231 | |
| | 96,270 | | | Intuit, Inc. | | | 24,169,546 | |
| | 214,198 | | | Microsoft Corp. | | | 27,974,259 | |
| | 448,566 | | | Oracle Corp. | | | 24,819,157 | |
| | 130,990 | | | Red Hat, Inc.(b) | | | 23,909,605 | |
| | 152,657 | | | salesforce.com, inc.(b) | | | 25,241,835 | |
| | 1,078,401 | | | Symantec Corp. | | | 26,108,088 | |
| | 229,368 | | | Synopsys, Inc.(b) | | | 27,771,877 | |
| | | | | | | | |
| | | | | | | 339,754,812 | |
| | | | | | | | |
| | | | Technology Hardware, Storage &
Peripherals—10.1% | | | |
| | 136,896 | | | Apple, Inc. | | | 27,470,920 | |
| | 1,516,398 | | | Hewlett Packard Enterprise Co. | | | 23,974,252 | |
| | 1,263,123 | | | HP, Inc. | | | 25,199,304 | |
| | 374,600 | | | NetApp, Inc. | | | 27,289,610 | |
| | 512,138 | | | Seagate Technology PLC | | | 24,746,508 | |
| | 498,546 | | | Western Digital Corp. | | | 25,485,672 | |
| | 781,222 | | | Xerox Corp. | | | 26,061,567 | |
| | | | | | | | |
| | | | | | | 180,227,833 | |
| | | | | | | | |
| | | | Total Common Stocks & Other Equity Interests
(Cost $1,453,842,809) | | | 1,787,589,144 | |
| | | | | | | | |
| | |
| | | | | | | | |
| | | | Money Market Funds—0.1% | | | |
| | 1,581,815 | | | Invesco Premier U.S. Government Money Portfolio—Institutional Class, 2.32(c)(Cost $1,581,815) | | | 1,581,815 | |
| | | | | | | | |
| | |
| | | | Total Investments in Securities
(Cost$1,455,424,624)—100.0% | | | 1,789,170,959 | |
| | |
| | | | Other assets less liabilities—(0.0)% | | | (324,762 | ) |
| | | | | | | | |
| | |
| | | | Net Assets—100.0% | | $ | 1,788,846,197 | |
| | | | | | | | |
Notes to Schedule of Investments:
| (a) | Industry and/or sector classifications used in this report are generally according to the Global Industry Classification Standard, which was developed by and is the exclusive property and a service mark of MSCI Inc. and Standard & Poor’s. |
| (b) | Non-income producing security. |
| (c) | The security and the Fund are advised by wholly-owned subsidiaries of Invesco Ltd. and are therefore considered to be affiliated. The rate shown is the7-day SEC standardized yield as of April 30, 2019. |
See accompanying Notes to Financial Statements which are an integral part of the financial statements.
Schedule of Investments(a)
Invesco S&P 500® Equal Weight Utilities ETF (RYU)
April 30, 2019
| | | | | | | | |
Number
of Shares | | | | | Value | |
| | | | Common Stocks & Other Equity Interests—99.9% | |
| | | | Electric Utilities—50.1% | | | |
| | 252,989 | | | Alliant Energy Corp. | | $ | 11,948,671 | |
| | 142,779 | | | American Electric Power Co., Inc. | | | 12,214,743 | |
| | 129,720 | | | Duke Energy Corp. | | | 11,820,086 | |
| | 188,569 | | | Edison International | | | 12,025,045 | |
| | 126,508 | | | Entergy Corp. | | | 12,258,625 | |
| | 209,841 | | | Evergy, Inc. | | | 12,133,007 | |
| | 167,921 | | | Eversource Energy. | | | 12,033,219 | |
| | 239,867 | | | Exelon Corp. | | | 12,221,224 | |
| | 286,151 | | | FirstEnergy Corp. | | | 12,026,927 | |
| | 62,007 | | | NextEra Energy, Inc. | | | 12,056,641 | |
| | 125,598 | | | Pinnacle West Capital Corp. | | | 11,965,721 | |
| | 365,877 | | | PPL Corp. | | | 11,419,021 | |
| | 229,877 | | | Southern Co. (The) | | | 12,234,054 | |
| | 210,180 | | | Xcel Energy, Inc. | | | 11,875,170 | |
| | | | | | | | |
| | | | | | | 168,232,154 | |
| | | | | | | | |
| | | | Gas Utilities—3.6% | | | |
| | 116,820 | | | Atmos Energy Corp. | | | 11,955,359 | |
| | | | | | | | |
| | | | Independent Power and Renewable Electricity Producers—6.8% | |
| | 661,058 | | | AES Corp. (The) | | | 11,317,313 | |
| | 282,217 | | | NRG Energy, Inc. | | | 11,618,874 | |
| | | | | | | | |
| | | | | | | 22,936,187 | |
| | | | | | | | |
| | | | Multi-Utilities—35.7% | | | |
| | 163,190 | | | Ameren Corp. | | | 11,875,336 | |
| | 389,635 | | | CenterPoint Energy, Inc. | | | 12,078,685 | |
| | 214,142 | | | CMS Energy Corp. | | | 11,895,588 | |
| | 139,594 | | | Consolidated Edison, Inc. | | | 12,027,419 | |
| | 154,506 | | | Dominion Energy, Inc. | | | 12,031,382 | |
| | 94,973 | | | DTE Energy Co. | | | 11,939,056 | |
| | 426,723 | | | NiSource, Inc. | | | 11,854,365 | |
| | 198,722 | | | Public Service Enterprise Group, Inc. | | | 11,853,767 | |
| | 95,672 | | | Sempra Energy. | | | 12,241,233 | |
| | 151,958 | | | WEC Energy Group, Inc. | | | 11,918,066 | |
| | | | | | | | |
| | | | | | | 119,714,897 | |
| | | | | | | | |
| | | | Water Utilities—3.7% | | | |
| | 114,120 | | | American Water Works Co., Inc. | | | 12,346,643 | |
| | | | | | | | |
| | | | Total Common Stocks & Other Equity Interests
(Cost $ 301,431,586) | | | 335,185,240 | |
| | | | | | | | |
| | |
| | | | | | | | |
| | | | Money Market Funds—0.0% | |
| | 55,729 | | | Invesco Premier U.S. Government Money Portfolio—Institutional Class, 2.32(b)
(Cost $ 55,729) | | | 55,729 | |
| | | | | | | | |
| | |
| | | | Total Investments in Securities(Cost $ 301,487,315)-99.9% | | | 335,240,969 | |
| | |
| | | | Other assets less liabilities—0.1% | | | 257,750 | |
| | | | | | | | |
| | |
| | | | Net Assets—100.0% | | $ | 335,498,719 | |
| | | | | | | | |
Notes to Schedule of Investments:
| (a) | Industry and/or sector classifications used in this report are generally according to the Global Industry Classification Standard, which was developed by and is the exclusive property and a service mark of MSCI Inc. and Standard & Poor’s. |
| (b) | The security and the Fund are advised by wholly-owned subsidiaries of Invesco Ltd. and are therefore considered to be affiliated. The rate shown is the7-day SEC standardized yield as of April 30, 2019. |
See accompanying Notes to Financial Statements which are an integral part of the financial statements.
Schedule of Investments(a)
Invesco S&P MidCap 400® Equal Weight ETF (EWMC)
April 30, 2019
| | | | | | | | |
Number
of Shares | | | | | Value | |
| | | | Common Stocks & Other Equity
Interests—100.0% | |
| | | | Communication Services—3.0% | | | |
| | 4,014 | | | AMC Networks, Inc., Class A(b) | | $ | 234,458 | |
| | 273 | | | Cable One, Inc. | | | 289,525 | |
| | 11,010 | | | Cars.com, Inc.(b) | | | 229,118 | |
| | 6,436 | | | Cinemark Holdings, Inc. | | | 270,634 | |
| | 5,608 | | | John Wiley & Sons, Inc., Class A | | | 258,977 | |
| | 4,121 | | | Live Nation Entertainment, Inc.(b) | | | 269,266 | |
| | 4,397 | | | Meredith Corp. | | | 259,423 | |
| | 7,513 | | | New York Times Co. (The), Class A | | | 249,056 | |
| | 17,578 | | | TEGNA, Inc. | | | 279,842 | |
| | 8,067 | | | Telephone & Data Systems, Inc. | | | 257,176 | |
| | 2,984 | | | World Wrestling Entertainment, Inc., Class A(c) | | | 250,208 | |
| | 7,210 | | | Yelp, Inc.(b) | | | 288,833 | |
| | | | | | | | |
| | | | | | | 3,136,516 | |
| | | | | | | | |
| | | | ConsumerDiscretionary-14.9% | | | |
| | 4,746 | | | Aaron’s, Inc. | | | 264,305 | |
| | 16,522 | | | Adient PLC | | | 381,658 | |
| | 5,284 | | | Adtalem Global Education, Inc.(b) | | | 260,607 | |
| | 12,413 | | | American Eagle Outfitters, Inc. | | | 295,181 | |
| | 7,453 | | | AutoNation, Inc.(b) | | | 312,504 | |
| | 16,743 | | | Bed Bath & Beyond, Inc. | | | 279,775 | |
| | 8,655 | | | Boyd Gaming Corp. | | | 249,091 | |
| | 5,828 | | | Brinker International, Inc. | | | 249,263 | |
| | 4,833 | | | Brunswick Corp. | | | 247,498 | |
| | 29,643 | | | Caesars Entertainment Corp.(b) | | | 277,458 | |
| | 2,696 | | | Carter’s, Inc. | | | 285,533 | |
| | 5,430 | | | Cheesecake Factory, Inc. (The) | | | 269,436 | |
| | 2,867 | | | Churchill Downs, Inc. | | | 289,137 | |
| | 1,586 | | | Cracker Barrel Old Country Store, Inc.(c) | | | 267,622 | |
| | 13,562 | | | Dana, Inc. | | | 264,459 | |
| | 1,777 | | | Deckers Outdoor Corp.(b) | | | 281,139 | |
| | 12,370 | | | Delphi Technologies PLC | | | 273,748 | |
| | 6,618 | | | Dick’s Sporting Goods, Inc. | | | 244,866 | |
| | 3,562 | | | Dillard’s, Inc., Class A(c) | | | 243,819 | |
| | 1,000 | | | Domino’s Pizza, Inc. | | | 270,580 | |
| | 3,541 | | | Dunkin’ Brands Group, Inc. | | | 264,265 | |
| | 5,472 | | | Eldorado Resorts, Inc.(b) | | | 270,153 | |
| | 2,180 | | | Five Below, Inc.(b) | | | 319,130 | |
| | 12,231 | | | Gentex Corp. | | | 281,680 | |
| | 14,208 | | | Goodyear Tire & Rubber Co. (The) | | | 272,936 | |
| | 370 | | | Graham Holdings Co., Class B | | | 275,069 | |
| | 2,267 | | | Helen of Troy Ltd.(b) | | | 326,448 | |
| | 5,748 | | | International Speedway Corp., Class A | | | 253,602 | |
| | 3,259 | | | Jack in the Box, Inc. | | | 251,269 | |
| | 10,682 | | | KB Home | | | 276,771 | |
| | 2,590 | | | Marriott Vacations Worldwide Corp. | | | 273,582 | |
| | 19,833 | | | Michaels Cos., Inc. (The)(b) | | | 222,923 | |
| | 3,222 | | | Murphy USA, Inc.(b) | | | 275,384 | |
| | 93 | | | NVR, Inc.(b) | | | 293,181 | |
| | 3,133 | | | Ollie’s Bargain Outlet Holdings, Inc.(b) | | | 299,640 | |
| | 5,602 | | | Papa John’s International, Inc.(c) | | | 286,598 | |
| | 11,001 | | | Penn National Gaming, Inc.(b) | | | 238,392 | |
| | 2,943 | | | Polaris Industries, Inc. | | | 283,705 | |
| | 1,628 | | | Pool Corp. | | | 299,129 | |
| | 14,289 | | | Sally Beauty Holdings, Inc.(b) | | | 252,915 | |
| | 10,162 | | | Scientific Games Corp.(b) | | | 235,047 | |
| | | | | | | | |
Number
of Shares | | | | | Value | |
| | | | Common Stocks & Other Equity
Interests (continued) | |
| | | | Consumer Discretionary (continued) | | | |
| | 6,281 | | | Service Corp. International | | $ | 261,352 | |
| | 9,561 | | | Signet Jewelers Ltd. | | | 221,624 | |
| | 4,986 | | | Six Flags Entertainment Corp. | | | 264,707 | |
| | 7,717 | | | Skechers U.S.A., Inc., Class A(b) | | | 244,320 | |
| | 6,281 | | | Sotheby’s(b)(c) | | | 264,932 | |
| | 4,370 | | | Tempur Sealy International, Inc.(b)(c) | | | 268,318 | |
| | 4,188 | | | Texas Roadhouse, Inc. | | | 226,194 | |
| | 3,941 | | | Thor Industries, Inc. | | | 259,594 | |
| | 7,038 | | | Toll Brothers, Inc. | | | 268,148 | |
| | 19,478 | | | TRI Pointe Group, Inc.(b) | | | 254,188 | |
| | 9,222 | | | Tupperware Brands Corp. | | | 219,484 | |
| | 8,596 | | | Urban Outfitters, Inc.(b) | | | 255,559 | |
| | 3,202 | | | Visteon Corp.(b) | | | 211,396 | |
| | 12,885 | | | Weight Watchers International, Inc.(b) | | | 263,112 | |
| | 14,752 | | | Wendy’s Co. (The) | | | 274,535 | |
| | 4,392 | | | Williams-Sonoma, Inc.(c) | | | 251,091 | |
| | 5,623 | | | Wyndham Destinations, Inc. | | | 244,938 | |
| | 4,817 | | | Wyndham Hotels & Resorts, Inc. | | | 268,403 | |
| | | | | | | | |
| | | | | | | 15,781,393 | |
| | | | | | | | |
| | | | Consumer Staples—3.4% | | | |
| | 798 | | | Boston Beer Co., Inc. (The), Class A(b) | | | 247,388 | |
| | 1,938 | | | Casey’s General Stores, Inc. | | | 256,494 | |
| | 5,780 | | | Edgewell Personal Care Co.(b) | | | 238,309 | |
| | 5,545 | | | Energizer Holdings, Inc. | | | 265,550 | |
| | 12,315 | | | Flowers Foods, Inc. | | | 267,728 | |
| | 11,650 | | | Hain Celestial Group, Inc. (The)(b) | | | 254,203 | |
| | 2,747 | | | Ingredion, Inc. | | | 260,278 | |
| | 1,657 | | | Lancaster Colony Corp. | | | 246,413 | |
| | 4,276 | | | Nu Skin Enterprises, Inc., Class A | | | 217,520 | |
| | 2,513 | | | Post Holdings, Inc.(b) | | | 283,416 | |
| | 2,051 | | | Sanderson Farms, Inc. | | | 310,993 | |
| | 11,329 | | | Sprouts Farmers Market, Inc.(b) | | | 242,667 | |
| | 6,830 | | | Tootsie Roll Industries, Inc.(c) | | | 265,209 | |
| | 4,227 | | | TreeHouse Foods, Inc.(b) | | | 283,125 | |
| | | | | | | | |
| | | | | | | 3,639,293 | |
| | | | | | | | |
| | | | Energy—5.5% | | | |
| | 6,364 | | | Apergy Corp.(b) | | | 252,587 | |
| | 36,567 | | | Callon Petroleum Co.(b) | | | 274,618 | |
| | 91,753 | | | Chesapeake Energy Corp.(b)(c) | | | 267,001 | |
| | 24,776 | | | CNX Resources Corp.(b) | | | 221,993 | |
| | 3,830 | | | Core Laboratories N.V. | | | 242,784 | |
| | 15,655 | | | Ensco Rowan PLC, Class A | | | 218,700 | |
| | 13,643 | | | EQT Corp. | | | 278,999 | |
| | 13,402 | | | Equitrans Midstream Corp. | | | 279,164 | |
| | 14,999 | | | Matador Resources Co.(b) | | | 295,330 | |
| | 31,747 | | | McDermott International, Inc.(b) | | | 256,833 | |
| | 8,638 | | | Murphy Oil Corp. | | | 235,299 | |
| | 49,405 | | | Oasis Petroleum, Inc.(b) | | | 301,371 | |
| | 17,802 | | | Oceaneering International, Inc.(b) | | | 341,798 | |
| | 19,630 | | | Patterson-UTI Energy, Inc. | | | 266,772 | |
| | 8,626 | | | PBF Energy, Inc., Class A | | | 289,661 | |
| | 34,693 | | | QEP Resources, Inc.(b) | | | 260,891 | |
| | 25,586 | | | Range Resources Corp. | | | 231,298 | |
| | 16,621 | | | SM Energy Co. | | | 264,773 | |
| | 58,661 | | | Southwestern Energy Co.(b) | | | 231,711 | |
| | 30,924 | | | Transocean Ltd.(b) | | | 243,063 | |
See accompanying Notes to Financial Statements which are an integral part of the financial statements.
Invesco S&P MidCap 400® Equal Weight ETF (EWMC)(continued)
April 30, 2019
| | | | | | | | |
Number
of Shares | | | | | Value | |
| | | | Common Stocks & Other Equity
Interests (continued) | |
| | | | Energy (continued) | | | |
| | 8,844 | | | World Fuel Services Corp. | | $ | 272,837 | |
| | 21,953 | | | WPX Energy, Inc.(b) | | | 304,927 | |
| | | | | | | | |
| | | | | | | 5,832,410 | |
| | | | | | | | |
| | | | Financials—15.6% | | | |
| | 407 | | | Alleghany Corp.(b) | | | 267,350 | |
| | 2,604 | | | American Financial Group, Inc. | | | 269,592 | |
| | 11,098 | | | Associated Banc-Corp. | | | 251,814 | |
| | 8,383 | | | BancorpSouth Bank | | | 255,514 | |
| | 3,072 | | | Bank of Hawaii Corp. | | | 253,071 | |
| | 8,093 | | | Bank OZK | | | 264,236 | |
| | 6,940 | | | Brighthouse Financial, Inc.(b) | | | 290,023 | |
| | 8,676 | | | Brown & Brown, Inc. | | | 275,463 | |
| | 6,829 | | | Cathay General Bancorp | | | 251,239 | |
| | 5,838 | | | Chemical Financial Corp. | | | 256,463 | |
| | 15,301 | | | CNO Financial Group, Inc. | | | 253,232 | |
| | 4,155 | | | Commerce Bancshares, Inc. | | | 251,087 | |
| | 2,475 | | | Cullen/Frost Bankers, Inc. | | | 251,683 | |
| | 4,798 | | | East West Bancorp, Inc. | | | 247,001 | |
| | 6,297 | | | Eaton Vance Corp. | | | 261,766 | |
| | 2,844 | | | Evercore, Inc., Class A | | | 277,091 | |
| | 21,612 | | | F.N.B. Corp. | | | 262,154 | |
| | 1,084 | | | FactSet Research Systems, Inc.(c) | | | 299,043 | |
| | 8,554 | | | Federated Investors, Inc., Class B | | | 262,864 | |
| | 4,985 | | | First American Financial Corp. | | | 284,444 | |
| | 4,431 | | | First Financial Bankshares, Inc. | | | 272,595 | |
| | 16,891 | | | First Horizon National Corp. | | | 254,885 | |
| | 15,349 | | | Fulton Financial Corp. | | | 264,770 | |
| | 69,004 | | | Genworth Financial, Inc., Class A(b) | | | 261,525 | |
| | 4,371 | | | Green Dot Corp., Class A(b) | | | 278,739 | |
| | 6,027 | | | Hancock Whitney Corp. | | | 263,621 | |
| | 2,136 | | | Hanover Insurance Group, Inc. (The) | | | 257,623 | |
| | 13,460 | | | Home BancShares, Inc. | | | 258,297 | |
| | 4,817 | | | Interactive Brokers Group, Inc., Class A | | | 261,274 | |
| | 6,324 | | | International Bancshares Corp. | | | 262,256 | |
| | 10,610 | | | Janus Henderson Group PLC (United Kingdom) | | | 265,993 | |
| | 3,168 | | | Kemper Corp. | | | 284,740 | |
| | 9,043 | | | Legg Mason, Inc. | | | 302,488 | |
| | 806 | | | LendingTree, Inc.(b) | | | 310,165 | |
| | 1,110 | | | MarketAxess Holdings, Inc. | | | 308,946 | |
| | 4,918 | | | Mercury General Corp. | | | 264,490 | |
| | 21,354 | | | Navient Corp. | | | 288,493 | |
| | 20,498 | | | New York Community Bancorp, Inc. | | | 238,392 | |
| | 12,130 | | | Old Republic International Corp. | | | 271,227 | |
| | 6,400 | | | PacWest Bancorp | | | 253,120 | |
| | 4,396 | | | Pinnacle Financial Partners, Inc. | | | 255,276 | |
| | 2,118 | | | Primerica, Inc. | | | 275,954 | |
| | 3,453 | | | Prosperity Bancshares, Inc. | | | 254,279 | |
| | 1,752 | | | Reinsurance Group of America, Inc. | | | 265,445 | |
| | 1,756 | | | RenaissanceRe Holdings Ltd. (Bermuda) | | | 272,812 | |
| | 4,998 | | | SEI Investments Co. | | | 272,141 | |
| | 1,878 | | | Signature Bank | | | 248,027 | |
| | 23,833 | | | SLM Corp. | | | 242,143 | |
| | 13,128 | | | Sterling Bancorp | | | 281,202 | |
| | 4,707 | | | Stifel Financial Corp. | | | 280,867 | |
| | 6,610 | | | Synovus Financial Corp. | | | 243,645 | |
| | | | | | | | |
Number
of Shares | | | | | Value | |
| | | | Common Stocks & Other Equity
Interests (continued) | |
| | | | Financials (continued) | | | |
| | 11,661 | | | TCF Financial Corp. | | $ | 258,058 | |
| | 4,237 | | | Texas Capital Bancshares, Inc.(b) | | | 274,261 | |
| | 7,159 | | | Trustmark Corp. | | | 257,438 | |
| | 3,826 | | | UMB Financial Corp. | | | 267,284 | |
| | 14,144 | | | Umpqua Holdings Corp. | | | 245,540 | |
| | 6,745 | | | United Bankshares, Inc. | | | 264,674 | |
| | 24,085 | | | Valley National Bancorp | | | 252,411 | |
| | 4,539 | | | W.R. Berkley Corp. | | | 278,241 | |
| | 8,363 | | | Washington Federal, Inc. | | | 277,150 | |
| | 4,548 | | | Webster Financial Corp. | | | 241,635 | |
| | 3,591 | | | Wintrust Financial Corp. | | | 273,634 | |
| | | | | | | | |
| | | | | | | 16,490,886 | |
| | | | | | | | |
| | | | Health Care—8.5% | | | |
| | 8,643 | | | Acadia Healthcare Co., Inc.(b)(c) | | | 276,749 | |
| | 24,438 | | | Allscripts Healthcare Solutions, Inc.(b) | | | 241,203 | |
| | 2,118 | | | Amedisys, Inc.(b) | | | 270,723 | |
| | 5,815 | | | Avanos Medical, Inc.(b) | | | 243,939 | |
| | 825 | | | Bio-Rad Laboratories, Inc., Class A(b) | | | 248,267 | |
| | 1,322 | | | Bio-Techne Corp. | | | 270,468 | |
| | 3,835 | | | Cantel Medical Corp. | | | 264,385 | |
| | 5,932 | | | Catalent, Inc.(b) | | | 265,872 | |
| | 1,816 | | | Charles River Laboratories International, Inc.(b) | | | 255,094 | |
| | 787 | | | Chemed Corp. | | | 257,176 | |
| | 7,497 | | | Covetrus, Inc.(b) | | | 246,426 | |
| | 4,242 | | | Encompass Health Corp. | | | 273,397 | |
| | 10,872 | | | Exelixis, Inc.(b) | | | 213,744 | |
| | 5,417 | | | Globus Medical, Inc., Class A(b) | | | 244,253 | |
| | 2,916 | | | Haemonetics Corp.(b) | | | 254,509 | |
| | 3,347 | | | HealthEquity, Inc.(b) | | | 226,759 | |
| | 2,429 | | | Hill-Rom Holdings, Inc. | | | 246,349 | |
| | 1,074 | | | ICU Medical, Inc.(b) | | | 244,335 | |
| | 2,666 | | | Inogen, Inc.(b) | | | 232,742 | |
| | 4,565 | | | Integra LifeSciences Holdings Corp.(b) | | | 238,247 | |
| | 2,365 | | | Ligand Pharmaceuticals, Inc.(b) | | | 297,635 | |
| | 2,724 | | | LivaNova PLC(b) | | | 187,656 | |
| | 11,827 | | | Mallinckrodt PLC(b) | | | 182,845 | |
| | 1,947 | | | Masimo Corp.(b) | | | 253,402 | |
| | 3,464 | | | Medidata Solutions, Inc.(b) | | | 312,938 | |
| | 8,370 | | | MEDNAX, Inc.(b) | | | 234,109 | |
| | 1,890 | | | Molina Healthcare, Inc.(b) | | | 245,001 | |
| | 4,314 | | | NuVasive, Inc.(b) | | | 261,428 | |
| | 11,596 | | | Patterson Cos., Inc. | | | 253,257 | |
| | 2,459 | | | PRA Health Sciences, Inc.(b) | | | 238,080 | |
| | 9,226 | | | Prestige Consumer Healthcare, Inc.(b) | | | 271,429 | |
| | 2,102 | | | STERIS PLC | | | 275,320 | |
| | 6,046 | | | Syneos Health, Inc.(b) | | | 283,739 | |
| | 9,219 | | | Tenet Healthcare Corp.(b) | | | 201,896 | |
| | 2,265 | | | United Therapeutics Corp.(b) | | | 232,321 | |
| | 2,466 | | | West Pharmaceutical Services, Inc. | | | 305,266 | |
| | | | | | | | |
| | | | | | | 9,050,959 | |
| | | | | | | | |
| | | | Industrials—14.9% | | | |
| | 1,943 | | | Acuity Brands, Inc. | | | 284,319 | |
| | 8,314 | | | AECOM(b) | | | 281,845 | |
| | 3,797 | | | AGCO Corp. | | | 268,752 | |
| | 4,154 | | | ASGN, Inc.(b) | | | 261,868 | |
See accompanying Notes to Financial Statements which are an integral part of the financial statements.
Invesco S&P MidCap 400® Equal Weight ETF (EWMC)(continued)
April 30, 2019
| | | | | | | | |
Number
of Shares | | | | | Value | |
| | | | Common Stocks & Other Equity
Interests (continued) | |
| | | | Industrials (continued) | | | |
| | 7,307 | | | Avis Budget Group, Inc.(b) | | $ | 259,764 | |
| | 3,446 | | | Brink’s Co. (The) | | | 275,439 | |
| | 2,062 | | | Carlisle Cos., Inc. | | | 291,608 | |
| | 3,705 | | | Clean Harbors, Inc.(b) | | | 281,580 | |
| | 9,571 | | | Colfax Corp.(b) | | | 288,757 | |
| | 3,066 | | | Crane Co. | | | 260,763 | |
| | 2,186 | | | Curtiss-Wright Corp. | | | 249,073 | |
| | 5,943 | | | Deluxe Corp. | | | 265,771 | |
| | 5,189 | | | Donaldson Co., Inc. | | | 277,819 | |
| | 5,307 | | | Dycom Industries, Inc.(b) | | | 263,174 | |
| | 3,557 | | | EMCOR Group, Inc. | | | 299,286 | |
| | 3,643 | | | EnerSys | | | 252,059 | |
| | 3,331 | | | GATX Corp. | | | 256,920 | |
| | 3,121 | | | Genesee & Wyoming, Inc., Class A(b) | | | 276,677 | |
| | 5,307 | | | Graco, Inc. | | | 271,984 | |
| | 5,344 | | | Granite Construction, Inc. | | | 239,892 | |
| | 7,570 | | | Healthcare Services Group, Inc. | | | 256,244 | |
| | 6,997 | | | Herman Miller, Inc. | | | 271,624 | |
| | 6,777 | | | HNI Corp. | | | 248,784 | |
| | 2,126 | | | Hubbell, Inc. | | | 271,278 | |
| | 1,752 | | | IDEX Corp. | | | 274,468 | |
| | 2,060 | | | Insperity, Inc. | | | 246,294 | |
| | 4,409 | | | ITT, Inc. | | | 266,965 | |
| | 15,578 | | | JetBlue Airways Corp.(b) | | | 288,972 | |
| | 6,989 | | | Kennametal, Inc. | | | 284,452 | |
| | 3,518 | | | Kirby Corp.(b) | | | 287,491 | |
| | 7,717 | | | Knight-Swift Transportation Holdings, Inc. | | | 257,362 | |
| | 2,361 | | | Landstar System, Inc. | | | 257,255 | |
| | 1,026 | | | Lennox International, Inc. | | | 278,508 | |
| | 2,969 | | | Lincoln Electric Holdings, Inc. | | | 259,105 | |
| | 3,122 | | | ManpowerGroup, Inc. | | | 299,837 | |
| | 5,443 | | | MasTec, Inc.(b) | | | 275,688 | |
| | 2,450 | | | MSA Safety, Inc. | | | 269,279 | |
| | 3,023 | | | MSC Industrial Direct Co., Inc., Class A | | | 252,874 | |
| | 1,898 | | | Nordson Corp. | | | 277,013 | |
| | 18,270 | | | NOW, Inc.(b) | | | 267,107 | |
| | 9,374 | | | nVent Electric PLC | | | 262,003 | |
| | 1,755 | | | Old Dominion Freight Line, Inc. | | | 261,986 | |
| | 3,226 | | | Oshkosh Corp. | | | 266,435 | |
| | 3,130 | | | Regal Beloit Corp. | | | 266,300 | |
| | 12,664 | | | Resideo Technologies, Inc.(b) | | | 287,473 | |
| | 4,243 | | | Ryder System, Inc. | | | 267,309 | |
| | 5,225 | | | Stericycle, Inc.(b) | | | 305,088 | |
| | 1,092 | | | Teledyne Technologies, Inc.(b) | | | 271,373 | |
| | 7,455 | | | Terex Corp. | | | 248,475 | |
| | 5,874 | | | Timken Co. (The) | | | 281,658 | |
| | 3,731 | | | Toro Co. (The) | | | 272,923 | |
| | 4,174 | | | Trex Co., Inc.(b) | | | 289,133 | |
| | 11,083 | | | Trinity Industries, Inc. | | | 238,949 | |
| | 1,860 | | | Valmont Industries, Inc. | | | 250,802 | |
| | 1,784 | | | Watsco, Inc. | | | 282,710 | |
| | 7,375 | | | Werner Enterprises, Inc. | | | 247,063 | |
| | 2,668 | | | Woodward, Inc. | | | 290,545 | |
| | 5,494 | | | XPO Logistics, Inc.(b)(c) | | | 374,032 | |
| | | | | | | | |
| | | | | | | 15,762,207 | |
| | | | | | | | |
| | | | | | | | |
Number
of Shares | | | | | Value | |
| | | | Common Stocks & Other Equity
Interests (continued) | |
| | | | InformationTechnology-14.0% | | | |
| | 7,842 | | | ACI Worldwide, Inc.(b) | | $ | 278,548 | |
| | 3,246 | | | Arrow Electronics, Inc.(b) | | | 274,319 | |
| | 5,935 | | | Avnet, Inc. | | | 288,500 | |
| | 4,352 | | | Belden, Inc. | | | 241,754 | |
| | 3,291 | | | Blackbaud, Inc. | | | 260,943 | |
| | 1,397 | | | CACI International, Inc., Class A(b) | | | 272,331 | |
| | 4,356 | | | CDK Global, Inc. | | | 262,754 | |
| | 6,421 | | | Ciena Corp.(b) | | | 246,310 | |
| | 6,251 | | | Cirrus Logic, Inc.(b) | | | 297,423 | |
| | 4,865 | | | Cognex Corp. | | | 245,342 | |
| | 1,871 | | | Coherent, Inc.(b) | | | 276,927 | |
| | 3,901 | | | CommVault Systems, Inc.(b) | | | 205,193 | |
| | 6,755 | | | CoreLogic, Inc.(b) | | | 274,320 | |
| | 4,810 | | | Cree, Inc.(b) | | | 317,893 | |
| | 16,914 | | | Cypress Semiconductor Corp | | | 290,582 | |
| | 1,020 | | | Fair Isaac Corp.(b) | | | 285,345 | |
| | 4,896 | | | First Solar, Inc.(b) | | | 301,251 | |
| | 3,793 | | | InterDigital, Inc. | | | 248,024 | |
| | 2,973 | | | j2 Global, Inc. | | | 260,494 | |
| | 9,271 | | | Jabil, Inc. | | | 280,077 | |
| | 13,162 | | | KBR, Inc. | | | 292,460 | |
| | 4,011 | | | Leidos Holdings, Inc. | | | 294,728 | |
| | 1,349 | | | Littelfuse, Inc. | | | 271,216 | |
| | 4,270 | | | LiveRamp Holdings, Inc.(b) | | | 249,069 | |
| | 3,131 | | | LogMeIn, Inc. | | | 257,994 | |
| | 5,345 | | | Lumentum Holdings, Inc.(b) | | | 331,230 | |
| | 4,702 | | | Manhattan Associates, Inc.(b) | | | 317,150 | |
| | 3,596 | | | MAXIMUS, Inc. | | | 264,845 | |
| | 3,193 | | | MKS Instruments, Inc. | | | 290,595 | |
| | 1,865 | | | Monolithic Power Systems, Inc. | | | 290,399 | |
| | 5,618 | | | National Instruments Corp. | | | 264,608 | |
| | 9,350 | | | NCR Corp.(b) | | | 270,682 | |
| | 9,333 | | | NetScout Systems, Inc.(b) | | | 274,390 | |
| | 12,296 | | | Perspecta, Inc. | | | 283,792 | |
| | 5,235 | | | Plantronics, Inc. | | | 269,498 | |
| | 2,873 | | | PTC, Inc.(b) | | | 259,920 | |
| | 11,889 | | | Sabre Corp. | | | 246,816 | |
| | 3,489 | | | Science Applications International Corp. | | | 261,501 | |
| | 4,952 | | | Semtech Corp.(b) | | | 266,764 | |
| | 3,177 | | | Silicon Laboratories, Inc.(b) | | | 342,036 | |
| | 5,998 | | | Synaptics, Inc.(b) | | | 225,945 | |
| | 2,715 | | | SYNNEX Corp. | | | 292,894 | |
| | 2,592 | | | Tech Data Corp.(b) | | | 276,333 | |
| | 5,278 | | | Teradata Corp.(b) | | | 239,991 | |
| | 6,464 | | | Teradyne, Inc. | | | 316,736 | |
| | 6,567 | | | Trimble, Inc.(b) | | | 268,065 | |
| | 1,276 | | | Tyler Technologies, Inc.(b) | | | 295,917 | |
| | 763 | | | Ultimate Software Group, Inc. (The)(b) | | | 252,286 | |
| | 1,723 | | | Universal Display Corp.(c) | | | 274,991 | |
| | 5,132 | | | Versum Materials, Inc. | | | 267,788 | |
| | 3,360 | | | ViaSat, Inc.(b)(c) | | | 305,155 | |
| | 12,575 | | | Vishay Intertechnology, Inc. | | | 249,111 | |
| | 1,466 | | | WEX, Inc.(b) | | | 308,300 | |
| | 1,241 | | | Zebra Technologies Corp., Class A(b) | | | 262,025 | |
| | | | | | | | |
| | | | | | | 14,843,560 | |
| | | | | | | | |
See accompanying Notes to Financial Statements which are an integral part of the financial statements.
Invesco S&P MidCap 400® Equal Weight ETF (EWMC)(continued)
April 30, 2019
| | | | | | | | |
Number
of Shares | | | | | Value | |
| | | | Common Stocks & Other Equity
Interests (continued) | |
| | | | Materials—7.3% | |
| | 9,742 | | | Allegheny Technologies, Inc.(b) | | $ | 242,771 | |
| | 2,493 | | | AptarGroup, Inc. | | | 277,321 | |
| | 3,235 | | | Ashland Global Holdings, Inc. | | | 260,514 | |
| | 4,723 | | | Bemis Co., Inc. | | | 271,195 | |
| | 5,729 | | | Cabot Corp. | | | 259,982 | |
| | 5,587 | | | Carpenter Technology Corp. | | | 277,506 | |
| | 6,587 | | | Chemours Co. (The) | | | 237,198 | |
| | 16,005 | | | Commercial Metals Co. | | | 276,726 | |
| | 4,973 | | | Compass Minerals International, Inc. | | | 285,400 | |
| | 5,019 | | | Domtar Corp. | | | 245,429 | |
| | 3,169 | | | Eagle Materials, Inc. | | | 288,094 | |
| | 6,221 | | | Greif, Inc., Class A | | | 245,854 | |
| | 2,269 | | | Ingevity Corp.(b) | | | 260,958 | |
| | 9,916 | | | Louisiana-Pacific Corp. | | | 248,396 | |
| | 4,214 | | | Minerals Technologies, Inc. | | | 264,513 | |
| | 564 | | | NewMarket Corp. | | | 236,643 | |
| | 10,450 | | | Olin Corp. | | | 226,660 | |
| | 12,793 | | | Owens-Illinois, Inc. | | | 252,790 | |
| | 8,031 | | | PolyOne Corp. | | | 221,977 | |
| | 2,904 | | | Reliance Steel & Aluminum Co. | | | 267,052 | |
| | 2,807 | | | Royal Gold, Inc. | | | 244,377 | |
| | 4,395 | | | RPM International, Inc. | | | 266,557 | |
| | 3,048 | | | ScottsMiracle-Gro Co. (The)(c) | | | 259,141 | |
| | 3,924 | | | Sensient Technologies Corp. | | | 275,151 | |
| | 8,807 | | | Silgan Holdings, Inc. | | | 263,682 | |
| | 4,296 | | | Sonoco Products Co. | | | 270,906 | |
| | 7,227 | | | Steel Dynamics, Inc. | | | 228,951 | |
| | 13,013 | | | United States Steel Corp. | | | 203,003 | |
| | 13,409 | | | Valvoline, Inc. | | | 248,066 | |
| | 6,944 | | | Worthington Industries, Inc. | | | 278,663 | |
| | | | | | | | |
| | | | | | | 7,685,476 | |
| | | | | | | | |
| | | | RealEstate-9.3% | |
| | 11,188 | | | Alexander & Baldwin, Inc. REIT | | | 264,261 | |
| | 5,493 | | | American Campus Communities, Inc. | | | 259,270 | |
| | 14,674 | | | Brixmor Property Group, Inc. | | | 262,371 | |
| | 2,527 | | | Camden Property Trust | | | 254,342 | |
| | 12,859 | | | CoreCivic, Inc. | | | 267,596 | |
| | 2,475 | | | CoreSite Realty Corp. | | | 270,790 | |
| | 9,587 | | | Corporate Office Properties Trust | | | 267,286 | |
| | 25,877 | | | Cousins Properties, Inc. | | | 247,643 | |
| | 5,019 | | | CyrusOne, Inc. | | | 279,508 | |
| | 6,373 | | | Douglas Emmett, Inc. | | | 262,504 | |
| | 3,382 | | | EPR Properties | | | 266,704 | |
| | 7,373 | | | First Industrial Realty Trust, Inc. | | | 260,046 | |
| | 12,309 | | | GEO Group, Inc. (The) | | | 246,426 | |
| | 8,005 | | | Healthcare Realty Trust, Inc. | | | 247,194 | |
| | 5,600 | | | Highwoods Properties, Inc. | | | 249,648 | |
| | 9,587 | | | Hospitality Properties Trust | | | 249,262 | |
| | 6,194 | | | JBG SMITH Properties | | | 263,555 | |
| | 1,558 | | | Jones Lang LaSalle, Inc. | | | 240,820 | |
| | 3,387 | | | Kilroy Realty Corp. | | | 260,494 | |
| | 3,234 | | | Lamar Advertising Co., Class A | | | 267,355 | |
| | 5,204 | | | Liberty Property Trust | | | 258,327 | |
| | 2,680 | | | Life Storage, Inc. | | | 255,377 | |
| | 12,025 | | | Mack-Cali Realty Corp. | | | 279,942 | |
| | 13,885 | | | Medical Properties Trust, Inc. | | | 242,432 | |
| | | | | | | | |
Number
of Shares | | | | | Value | |
| | | | Common Stocks & Other Equity
Interests (continued) | |
| | | | Real Estate (continued) | |
| | 4,803 | | | National Retail Properties, Inc. | | $ | 252,734 | |
| | 7,007 | | | Omega Healthcare Investors, Inc.(c) | | | 247,978 | |
| | 7,922 | | | Pebblebrook Hotel Trust | | | 257,940 | |
| | 7,102 | | | PotlatchDeltic Corp. | | | 274,563 | |
| | 1,724 | | | PS Business Parks, Inc. | | | 264,841 | |
| | 8,698 | | | Rayonier, Inc. | | | 276,509 | |
| | 20,414 | | | Realogy Holdings Corp.(c) | | | 265,790 | |
| | 14,346 | | | Sabra Health Care REIT, Inc. | | | 280,608 | |
| | 20,788 | | | Senior Housing Properties Trust | | | 166,928 | |
| | 12,236 | | | Tanger Factory Outlet Centers, Inc.(c) | | | 220,982 | |
| | 4,891 | | | Taubman Centers, Inc. | | | 241,126 | |
| | 30,107 | | | Uniti Group, Inc. | | | 330,876 | |
| | 13,374 | | | Urban Edge Properties | | | 248,355 | |
| | 9,298 | | | Weingarten Realty Investors | | | 269,084 | |
| | | | | | | | |
| | | | | | | 9,821,467 | |
| | | | | | | | |
| | | | Utilities—3.6% | |
| | 3,036 | | | ALLETE, Inc. | | | 247,282 | |
| | 7,042 | | | Aqua America, Inc. | | | 275,061 | |
| | 3,441 | | | Black Hills Corp. | | | 250,367 | |
| | 6,356 | | | Hawaiian Electric Industries, Inc. | | | 263,647 | |
| | 2,496 | | | IDACORP, Inc. | | | 247,154 | |
| | 9,634 | | | MDU Resources Group, Inc. | | | 251,929 | |
| | 4,182 | | | National Fuel Gas Co. | | | 247,616 | |
| | 5,065 | | | New Jersey Resources Corp. | | | 253,655 | |
| | 3,570 | | | NorthWestern Corp. | | | 249,364 | |
| | 5,912 | | | OGE Energy Corp. | | | 250,314 | |
| | 2,855 | | | ONE Gas, Inc. | | | 252,725 | |
| | 5,462 | | | PNM Resources, Inc. | | | 253,655 | |
| | 3,036 | | | Southwest Gas Holdings, Inc. | | | 252,565 | |
| | 3,163 | | | Spire, Inc. | | | 266,293 | |
| | 4,588 | | | UGI Corp. | | | 250,092 | |
| | | | | | | | |
| | | | | | | 3,811,719 | |
| | | | | | | | |
| | |
| | | | Total Common Stocks & Other Equity Interests
(Cost $ 100,097,368) | | | 105,855,886 | |
| | | | | | | | |
| | |
| | | | | | | | |
| | | | Money MarketFunds-0.0% | |
| | 26,749 | | | Invesco Premier U.S. Government Money Portfolio—Institutional Class, 2.32%(d)
(Cost $ 26,749) | | | 26,749 | |
| | | | | | | | |
| | |
| | | | Total Investments in Securities
(excluding investments purchased with cash collateral from securities on loan)
(Cost $100,124,117)-100.0% | | | 105,882,635 | |
| | | | | | | | |
| | |
| | | | | | | | |
| |
| | | | Investments Purchased with Cash Collateral from
Securities on Loan | |
| |
| | | | | |
| | | | Money MarketFunds-3.9% | | | |
| | 3,119,837 | | | Invesco Government & Agency Portfolio— Institutional Class,
2.34%(d)(e) | | | 3,119,837 | |
See accompanying Notes to Financial Statements which are an integral part of the financial statements.
Invesco S&P MidCap 400® Equal Weight ETF (EWMC)(continued)
April 30, 2019
| | | | | | | | |
Number
of Shares | | | | | Value | |
| | | | Money Market Funds (continued) | |
| | 1,017,703 | | | Invesco Liquid Assets Portfolio—Institutional Class, 2.48%(d)(e) | | $ | 1,018,008 | |
| | | | | | | | |
| | |
| | | | Total Money Market Funds
(Cost $4,137,845) | | | 4,137,845 | |
| | | | | | | | |
| | |
| | | | Total Investments in Securities
(Cost$104,261,962)-103.9% | | | 110,020,480 | |
| | |
| | | | Other assets less liabilities-(3.9)% | | | (4,127,529 | ) |
| | | | | | | | |
| | |
| | | | Net Assets—100.0% | | $ | 105,892,951 | |
| | | | | | | | |
Abbreviations:
REIT—Real Estate Investment Trust
Notes to Schedule of Investments:
| (a) | Industry and/or sector classifications used in this report are generally according to the Global Industry Classification Standard, which was developed by and is the exclusive property and a service mark of MSCI Inc. and Standard & Poor’s. |
| (b) | Non-income producing security. |
| (c) | All or a portion of this security was out on loan at April 30, 2019. |
| (d) | The security and the Fund are advised by wholly-owned subsidiaries of Invesco Ltd. and are therefore considered to be affiliated. The rate shown is the7-day SEC standardized yield as of April 30, 2019. |
| (e) | The security has been segregated to satisfy the commitment to return the cash collateral received in securities lending transactions upon the borrower’s return of the securities loaned. See Note 2J. |
See accompanying Notes to Financial Statements which are an integral part of the financial statements.
Schedule of Investments(a)
Invesco S&P SmallCap 600® Equal Weight ETF (EWSC)
April 30, 2019
| | | | | | | | |
Number
of Shares | | | | | Value | |
| | | | Common Stocks & Other EquityInterests-99.9% | |
| | | | Communication Services—2.5% | |
| | 1,058 | | | ATN International, Inc. | | $ | 64,591 | |
| | 2,494 | | | Care.com, Inc.(b) | | | 41,775 | |
| | 6,559 | | | Cincinnati Bell, Inc.(b) | | | 58,375 | |
| | 1,197 | | | Cogent Communications Holdings, Inc. | | | 66,110 | |
| | 5,994 | | | Consolidated Communications Holdings, Inc.(c). | | | 30,929 | |
| | 2,606 | | | E.W. Scripps Co. (The), Class A | | | 59,391 | |
| | 21,702 | | | Frontier Communications Corp.(b)(c) | | | 61,851 | |
| | 5,436 | | | Gannett Co., Inc. | | | 50,718 | |
| | 2,584 | | | Iridium Communications, Inc.(b) | | | 70,957 | |
| | 1,407 | | | Marcus Corp. (The) | | | 52,931 | |
| | 4,809 | | | New Media Investment Group, Inc. | | | 51,408 | |
| | 4,564 | | | QuinStreet, Inc.(b) | | | 65,128 | |
| | 1,433 | | | Scholastic Corp. | | | 57,148 | |
| | 4,255 | | | Spok Holdings, Inc. | | | 58,932 | |
| | 3,672 | | | TechTarget, Inc.(b) | | | 61,286 | |
| | 5,909 | | | Vonage Holdings Corp.(b) | | | 57,435 | |
| | | | | | | | |
| | | | | | | 908,965 | |
| | | | | | | | |
| | | | Consumer Discretionary—15.8% | |
| | 2,278 | | | Abercrombie & Fitch Co., Class A | | | 68,089 | |
| | 4,029 | | | American Axle & Manufacturing Holdings, Inc.(b) | | | 59,428 | |
| | 1,815 | | | American Public Education, Inc.(b) | | | 58,080 | |
| | 871 | | | Asbury Automotive Group, Inc.(b) | | | 69,837 | |
| | 32,075 | | | Ascena Retail Group, Inc.(b) | | | 38,169 | |
| | 13,801 | | | Barnes & Noble Education, Inc.(b) | | | 59,344 | |
| | 10,973 | | | Barnes & Noble, Inc. | | | 55,194 | |
| | 1,614 | | | Big Lots, Inc. | | | 59,976 | |
| | 1,225 | | | BJ’s Restaurants, Inc. | | | 61,140 | |
| | 1,876 | | | Boot Barn Holdings, Inc.(b) | | | 54,010 | |
| | 3,162 | | | Buckle, Inc. (The)(c) | | | 58,434 | |
| | 2,124 | | | Caleres, Inc. | | | 55,713 | |
| | 3,469 | | | Callaway Golf Co. | | | 60,916 | |
| | 3,606 | | | Career Education Corp.(b) | | | 65,449 | |
| | 4,423 | | | Cato Corp. (The), Class A | | | 67,053 | |
| | 469 | | | Cavco Industries, Inc.(b) | | | 58,517 | |
| | 2,222 | | | Century Communities, Inc.(b) | | | 56,505 | |
| | 11,699 | | | Chico’s FAS, Inc. | | | 40,947 | |
| | 654 | | | Children’s Place, Inc. (The) | | | 73,784 | |
| | 2,734 | | | Chuy’s Holdings, Inc.(b) | | | 54,379 | |
| | 2,516 | | | Conn’s, Inc.(b) | | | 65,089 | |
| | 2,019 | | | Cooper Tire & Rubber Co. | | | 60,287 | |
| | 1,039 | | | Cooper-Standard Holdings, Inc.(b) | | | 52,646 | |
| | 1,529 | | | Core-Mark Holding Co., Inc. | | | 55,579 | |
| | 2,318 | | | Crocs, Inc.(b) | | | 64,556 | |
| | 1,278 | | | Dave & Buster’s Entertainment, Inc. | | | 72,642 | |
| | 2,170 | | | Designer Brands Inc., Class A | | | 48,283 | |
| | 635 | | | Dine Brands Global, Inc. | | | 56,299 | |
| | 704 | | | Dorman Products, Inc.(b) | | | 61,720 | |
| | 4,678 | | | El Pollo Loco Holdings, Inc.(b) | | | 59,785 | |
| | 3,014 | | | Ethan Allen Interiors, Inc. | | | 66,609 | |
| | 11,938 | | | Express, Inc.(b) | | | 43,932 | |
| | 4,206 | | | Fiesta Restaurant Group, Inc.(b) | | | 53,248 | |
| | 3,977 | | | Fossil Group, Inc.(b) | | | 51,979 | |
| | 918 | | | Fox Factory Holding Corp.(b) | | | 71,237 | |
| | 5,322 | | | GameStop Corp., Class A(c) | | | 46,035 | |
| | 3,838 | | | Garrett Motion, Inc. (Switzerland)(b) | | | 72,154 | |
| | | | | | | | |
Number
of Shares | | | | | Value | |
| | | | Common Stocks & Other Equity Interests
(continued) | |
| | | | Consumer Discretionary (continued) | |
| | 1,304 | | | Genesco, Inc.(b) | | $ | 58,432 | |
| | 1,519 | | | Gentherm, Inc.(b) | | | 64,345 | |
| | 1,667 | | | G-III Apparel Group Ltd.(b) | | | 71,931 | |
| | 964 | | | Group 1 Automotive, Inc. | | | 75,491 | |
| | 2,650 | | | Guess?, Inc. | | | 53,981 | |
| | 2,444 | | | Haverty Furniture Cos., Inc. | | | 58,216 | |
| | 3,208 | | | Hibbett Sports, Inc.(b) | | | 66,406 | |
| | 1,258 | | | Installed Building Products, Inc.(b) | | | 60,422 | |
| | 478 | | | iRobot Corp.(b)(c) | | | 49,492 | |
| | 35,596 | | | J.C. Penney Co., Inc.(b)(c) | | | 48,767 | |
| | 5,945 | | | Kirkland’s, Inc.(b) | | | 34,957 | |
| | 1,748 | | | La-Z-Boy, Inc. | | | 57,334 | |
| | 742 | | | LCI Industries | | | 65,185 | |
| | 1,006 | | | LGI Homes, Inc.(b) | | | 69,726 | |
| | 8,585 | | | Liquidity Services, Inc.(b) | | | 58,292 | |
| | 671 | | | Lithia Motors, Inc., Class A | | | 76,172 | |
| | 5,212 | | | Lumber Liquidators Holdings, Inc.(b)(c) | | | 68,903 | |
| | 2,241 | | | M/I Homes, Inc.(b) | | | 63,129 | |
| | 3,156 | | | MarineMax, Inc.(b) | | | 54,567 | |
| | 2,038 | | | MDC Holdings, Inc. | | | 62,281 | |
| | 1,349 | | | Meritage Homes Corp.(b) | | | 69,001 | |
| | 1,344 | | | Monarch Casino & Resort, Inc.(b) | | | 57,375 | |
| | 749 | | | Monro, Inc. | | | 62,789 | |
| | 2,959 | | | Motorcar Parts of America, Inc.(b) | | | 61,133 | |
| | 1,703 | | | Movado Group, Inc. | | | 60,712 | |
| | 9,697 | | | Nautilus, Inc.(b) | | | 51,879 | |
| | 17,531 | | | Office Depot, Inc. | | | 42,074 | |
| | 769 | | | Oxford Industries, Inc. | | | 63,873 | |
| | 2,801 | | | PetMed Express, Inc.(c) | | | 61,202 | |
| | 2,114 | | | Red Robin Gourmet Burgers, Inc.(b) | | | 67,711 | |
| | 3,223 | | | Regis Corp.(b) | | | 60,335 | |
| | 2,850 | | | Rent-A-Center, Inc.(b) | | | 71,050 | |
| | 416 | | | RH(b)(c) | | | 44,391 | |
| | 2,324 | | | Ruth’s Hospitality Group, Inc. | | | 60,378 | |
| | 1,117 | | | Shake Shack, Inc., Class A(b) | | | 68,472 | |
| | 1,712 | | | Shoe Carnival, Inc.(c) | | | 61,050 | |
| | 1,415 | | | Shutterfly, Inc.(b) | | | 62,019 | |
| | 1,293 | | | Shutterstock, Inc. | | | 52,302 | |
| | 1,272 | | | Sleep Number Corp.(b) | | | 44,266 | |
| | 4,191 | | | Sonic Automotive, Inc., Class A | | | 84,784 | |
| | 670 | | | Stamps.com, Inc.(b) | | | 57,486 | |
| | 1,223 | | | Standard Motor Products, Inc. | | | 61,113 | |
| | 1,817 | | | Steven Madden Ltd. | | | 66,048 | |
| | 436 | | | Strategic Education, Inc. | | | 62,501 | |
| | 1,142 | | | Sturm Ruger & Co., Inc. | | | 63,941 | |
| | 10,731 | | | Superior Industries International, Inc. | | | 53,118 | |
| | 4,964 | | | Tailored Brands, Inc.(c) | | | 40,457 | |
| | 9,633 | | | Tile Shop Holdings, Inc. | | | 46,816 | |
| | 916 | | | TopBuild Corp.(b) | | | 65,247 | |
| | 2,695 | | | Unifi, Inc.(b) | | | 54,439 | |
| | 1,830 | | | Universal Electronics, Inc.(b) | | | 69,631 | |
| | 5,786 | | | Vera Bradley, Inc.(b) | | | 71,052 | |
| | 6,718 | | | Vista Outdoor, Inc.(b)(c) | | | 57,976 | |
| | 8,522 | | | Vitamin Shoppe, Inc.(b) | | | 53,518 | |
| | 4,018 | | | William Lyon Homes, Class A(b) | | | 67,743 | |
| | 876 | | | Wingstop, Inc. | | | 65,937 | |
| | 1,846 | | | Winnebago Industries, Inc. | | | 65,293 | |
See accompanying Notes to Financial Statements which are an integral part of the financial statements.
Invesco S&P SmallCap 600® Equal Weight ETF (EWSC) (continued)
April 30, 2019
| | | | | | | | |
Number
of Shares | | | | | Value | |
| | | | Common Stocks & Other Equity Interests
(continued) | |
| | | | Consumer Discretionary (continued) | |
| | 1,671 | | | Wolverine World Wide, Inc. | | $ | 61,510 | |
| | 2,372 | | | Zumiez, Inc.(b) | | | 63,166 | |
| | | | | | | | |
| | | | | | | 5,748,861 | |
| | | | | | | | |
| | | | Consumer Staples—3.2% | |
| | 1,685 | | | Andersons, Inc. (The) | | | 55,100 | |
| | 21,783 | | | Avon Products, Inc. (United Kingdom)(b) | | | 69,270 | |
| | 2,433 | | | B&G Foods, Inc.(c) | | | 63,258 | |
| | 706 | | | Calavo Growers, Inc.(c) | | | 67,642 | |
| | 1,337 | | | Cal-Maine Foods, Inc. | | | 54,964 | |
| | 426 | | | Central Garden & Pet Co.(b) | | | 11,493 | |
| | 1,690 | | | Central Garden & Pet Co., Class A(b) | | | 41,371 | |
| | 1,919 | | | Chefs’ Warehouse, Inc. (The)(b) | | | 62,713 | |
| | 235 | | | Coca-Cola Bottling Co. Consolidated, Inc. | | | 76,382 | |
| | 2,783 | | | Darling Ingredients, Inc.(b) | | | 60,697 | |
| | 20,270 | | | Dean Foods Co. | | | 34,459 | |
| | 746 | | | Inter Parfums, Inc. | | | 54,078 | |
| | 385 | | | J & J Snack Foods Corp. | | | 60,514 | |
| | 859 | | | John B. Sanfilippo & Son, Inc. | | | 61,943 | |
| | 444 | | | Medifast, Inc. | | | 65,130 | |
| | 728 | | | MGP Ingredients, Inc.(c) | | | 63,969 | |
| | 2,028 | | | Seneca Foods Corp., Class A(b) | | | 50,193 | |
| | 3,347 | | | SpartanNash Co. | | | 54,121 | |
| | 4,126 | | | United Natural Foods, Inc.(b) | | | 53,308 | |
| | 987 | | | Universal Corp. | | | 53,160 | |
| | 331 | | | WD-40 Co. | | | 55,691 | |
| | | | | | | | |
| | | | | | | 1,169,456 | |
| | | | | | | | |
| | | | Energy—6.7% | |
| | 6,230 | | | Archrock, Inc. | | | 62,985 | |
| | 2,771 | | | Bonanza Creek Energy, Inc.(b) | | | 66,698 | |
| | 3,831 | | | C&J Energy Services, Inc.(b) | | | 53,826 | |
| | 5,735 | | | Carrizo Oil & Gas, Inc.(b) | | | 73,523 | |
| | 1,734 | | | CONSOL Energy, Inc.(b) | | | 58,783 | |
| | 36,715 | | | Denbury Resources, Inc.(b) | | | 81,874 | |
| | 6,197 | | | Diamond Offshore Drilling, Inc.(b)(c) | | | 60,173 | |
| | 849 | | | DMC Global, Inc. | | | 58,836 | |
| | 1,492 | | | Dril-Quip, Inc.(b) | | | 64,992 | |
| | 5,723 | | | Era Group, Inc.(b) | | | 55,170 | |
| | 3,529 | | | Exterran Corp.(b) | | | 50,182 | |
| | 3,871 | | | Geospace Technologies Corp.(b) | | | 52,065 | |
| | 3,833 | | | Green Plains, Inc. | | | 66,579 | |
| | 6,178 | | | Gulf Island Fabrication, Inc.(b) | | | 53,131 | |
| | 8,019 | | | Gulfport Energy Corp.(b) | | | 52,524 | |
| | 8,019 | | | Helix Energy Solutions Group, Inc.(b) | | | 62,709 | |
| | 25,946 | | | HighPoint Resources Corp.(b)(c) | | | 71,092 | |
| | 2,484 | | | KLX Energy Services Holdings, Inc.(b) | | | 69,676 | |
| | 19,722 | | | Laredo Petroleum, Inc.(b) | | | 59,560 | |
| | 2,936 | | | Matrix Service Co.(b) | | | 57,575 | |
| | 18,243 | | | Nabors Industries Ltd. | | | 63,851 | |
| | 7,288 | | | Newpark Resources, Inc.(b) | | | 53,202 | |
| | 22,113 | | | Noble Corp. PLC(b) | | | 58,157 | |
| | 3,910 | | | Oil States International, Inc.(b) | | | 75,541 | |
| | 3,557 | | | Par Pacific Holdings, Inc.(b) | | | 69,504 | |
| | 1,574 | | | PDC Energy, Inc.(b) | | | 68,453 | |
| | 1,101 | | | Penn Virginia Corp.(b) | | | 49,435 | |
| | 38,661 | | | Pioneer Energy Services Corp.(b) | | | 67,270 | |
| | 3,033 | | | ProPetro Holding Corp.(b) | | | 67,120 | |
| | | | | | | | |
Number
of Shares | | | | | Value | |
| | | | Common Stocks & Other Equity Interests
(continued) | |
| |
| | | | Energy (continued) | |
| | 2,528 | | | Renewable Energy Group, Inc.(b) | | $ | 60,975 | |
| | 756 | | | REX American Resources Corp.(b) | | | 63,890 | |
| | 9,811 | | | Ring Energy, Inc.(b)(c) | | | 50,821 | |
| | 1,466 | | | SEACOR Holdings, Inc.(b) | | | 65,296 | |
| | 12,774 | | | SRC Energy, Inc.(b) | | | 78,560 | |
| | 14,273 | | | Superior Energy Services, Inc.(b) | | | 51,240 | |
| | 25,946 | | | TETRA Technologies, Inc.(b) | | | 61,752 | |
| | 4,173 | | | Unit Corp.(b) | | | 56,586 | |
| | 4,337 | | | US Silica Holdings, Inc.(c) | | | 68,611 | |
| | 2,590 | | | Whiting Petroleum Corp.(b) | | | 70,940 | |
| | | | | | | | |
| | | | | | | 2,433,157 | |
| | | | | | | | |
| | | | Financials—15.9% | |
| | 2,994 | | | Ambac Financial Group, Inc.(b) | | | 55,988 | |
| | 1,949 | | | American Equity Investment Life Holding Co. | | | 57,320 | |
| | 1,535 | | | Ameris Bancorp | | | 55,966 | |
| | 960 | | | AMERISAFE, Inc. | | | 56,851 | |
| | 3,247 | | | Apollo Commercial Real Estate Finance, Inc. | | | 60,849 | |
| | 3,006 | | | ARMOUR Residential REIT, Inc. | | | 57,354 | |
| | 1,943 | | | Axos Financial, Inc.(b) | | | 63,575 | |
| | 3,876 | | | Banc of California, Inc. | | | 56,241 | |
| | 1,018 | | | Banner Corp. | | | 53,974 | |
| | 1,928 | | | Berkshire Hills Bancorp, Inc. | | | 57,821 | |
| | 2,149 | | | Blucora, Inc.(b) | | | 75,215 | |
| | 5,231 | | | Boston Private Financial Holdings, Inc. | | | 59,895 | |
| | 3,876 | | | Brookline Bancorp, Inc. | | | 58,334 | |
| | 7,128 | | | Capstead Mortgage Corp. | | | 61,230 | |
| | 2,042 | | | Central Pacific Financial Corp. | | | 61,280 | |
| | 766 | | | City Holding Co. | | | 60,805 | |
| | 1,645 | | | Columbia Banking System, Inc. | | | 61,753 | |
| | 960 | | | Community Bank System, Inc. | | | 63,802 | |
| | 3,025 | | | Customers Bancorp, Inc.(b) | | | 68,516 | |
| | 2,723 | | | CVB Financial Corp. | | | 59,089 | |
| | 2,959 | | | Dime Community Bancshares, Inc. | | | 59,624 | |
| | 4,158 | | | Donnelley Financial Solutions, Inc.(b) | | | 63,659 | |
| | 1,047 | | | Eagle Bancorp, Inc.(b) | | | 57,857 | |
| | 1,034 | | | eHealth, Inc.(b) | | | 62,805 | |
| | 1,444 | | | Employers Holdings, Inc. | | | 61,976 | |
| | 1,830 | | | Encore Capital Group, Inc.(b)(c) | | | 51,716 | |
| | 2,411 | | | Enova International, Inc.(b) | | | 66,134 | |
| | 6,037 | | | EZCORP, Inc., Class A(b) | | | 65,622 | |
| | 1,917 | | | Fidelity Southern Corp. | | | 55,804 | |
| | 5,331 | | | First BanCorp | | | 60,240 | |
| | 4,370 | | | First Commonwealth Financial Corp. | | | 59,476 | |
| | 2,297 | | | First Financial Bancorp | | | 57,655 | |
| | 2,699 | | | First Midwest Bancorp, Inc. | | | 57,948 | |
| | 681 | | | FirstCash, Inc. | | | 66,520 | |
| | 1,800 | | | Flagstar Bancorp, Inc. | | | 64,350 | |
| | 1,876 | | | Franklin Financial Network, Inc. | | | 51,871 | |
| | 1,429 | | | Glacier Bancorp, Inc. | | | 60,861 | |
| | 3,156 | | | Granite Point Mortgage Trust, Inc. | | | 60,690 | |
| | 1,673 | | | Great Western Bancorp, Inc. | | | 58,839 | |
| | 2,632 | | | Greenhill & Co., Inc. | | | 54,509 | |
| | 2,719 | | | Hanmi Financial Corp. | | | 64,495 | |
| | 1,531 | | | HCI Group, Inc. | | | 65,251 | |
| | 1,899 | | | Heritage Financial Corp. | | | 57,483 | |
| | 2,186 | | | HomeStreet, Inc.(b) | | | 61,514 | |
See accompanying Notes to Financial Statements which are an integral part of the financial statements.
Invesco S&P SmallCap 600® Equal Weight ETF (EWSC)(continued)
April 30, 2019
| | | | | | | | |
Number
of Shares | | | | | Value | |
| | | | Common Stocks & Other Equity
Interests (continued) | |
| | | | Financials (continued) | |
| | 4,277 | | | Hope Bancorp, Inc. | | $ | 60,135 | |
| | 1,554 | | | Horace Mann Educators Corp. | | | 59,953 | |
| | 725 | | | Independent Bank Corp. | | | 58,167 | |
| | 1,436 | | | INTL. FCStone, Inc.(b) | | | 58,244 | |
| | 3,699 | | | Invesco Mortgage Capital, Inc.(d) | | | 60,368 | |
| | 1,464 | | | James River Group Holdings Ltd. | | | 61,810 | |
| | 1,487 | | | LegacyTexas Financial Group, Inc. | | | 59,599 | |
| | 2,960 | | | Meta Financial Group, Inc. | | | 76,250 | |
| | 1,722 | | | National Bank Holdings Corp., Class A | | | 65,849 | |
| | 836 | | | Navigators Group, Inc. (The) | | | 58,470 | |
| | 1,579 | | | NBT Bancorp, Inc. | | | 60,034 | |
| | 9,828 | | | New York Mortgage Trust, Inc. | | | 61,916 | |
| | 2,360 | | | NMI Holdings, Inc., Class A(b) | | | 66,269 | |
| | 4,077 | | | Northfield Bancorp, Inc. | | | 61,155 | |
| | 3,321 | | | Northwest Bancshares, Inc. | | | 57,885 | |
| | 2,994 | | | OFG Bancorp | | | 60,419 | |
| | 3,450 | | | Old National Bancorp | | | 58,926 | |
| | 2,767 | | | Opus Bank | | | 60,514 | |
| | 3,357 | | | Oritani Financial Corp. | | | 58,244 | |
| | 2,111 | | | Pacific Premier Bancorp, Inc. | | | 61,367 | |
| | 2,856 | | | PennyMac Mortgage Investment Trust | | | 59,976 | |
| | 854 | | | Piper Jaffray Cos | | | 68,832 | |
| | 2,089 | | | PRA Group, Inc.(b) | | | 58,743 | |
| | 1,211 | | | Preferred Bank | | | 59,569 | |
| | 1,530 | | | ProAssurance Corp. | | | 57,421 | |
| | 2,191 | | | Provident Financial Services, Inc. | | | 58,105 | |
| | 3,728 | | | Redwood Trust, Inc. | | | 60,990 | |
| | 844 | | | RLI Corp. | | | 68,643 | |
| | 1,481 | | | S&T Bancorp, Inc. | | | 59,358 | |
| | 688 | | | Safety Insurance Group, Inc. | | | 63,929 | |
| | 2,066 | | | Seacoast Banking Corp. of Florida(b) | | | 58,592 | |
| | 920 | | | Selective Insurance Group, Inc. | | | 65,605 | |
| | 1,733 | | | ServisFirst Bancshares, Inc. | | | 58,818 | |
| | 2,319 | | | Simmons First National Corp., Class A | | | 58,879 | |
| | 1,724 | | | Southside Bancshares, Inc. | | | 60,564 | |
| | 1,367 | | | Stewart Information Services Corp. | | | 58,111 | |
| | 5,441 | | | Third Point Reinsurance Ltd. (Bermuda)(b) | | | 63,170 | |
| | 746 | | | Tompkins Financial Corp. | | | 60,180 | |
| | 1,899 | | | Triumph Bancorp, Inc.(b) | | | 58,888 | |
| | 7,207 | | | TrustCo Bank Corp. NY | | | 57,656 | |
| | 2,255 | | | United Community Banks, Inc. | | | 63,320 | |
| | 1,261 | | | United Fire Group, Inc. | | | 54,992 | |
| | 3,695 | | | United Insurance Holdings Corp. | | | 56,607 | |
| | 1,863 | | | Universal Insurance Holdings, Inc. | | | 55,499 | |
| | 2,221 | | | Veritex Holdings, Inc. | | | 58,879 | |
| | 595 | | | Virtus Investment Partners, Inc. | | | 72,953 | |
| | 3,319 | | | Waddell & Reed Financial, Inc., Class A(c) | | | 62,165 | |
| | 1,103 | | | Walker & Dunlop, Inc. | | | 60,610 | |
| | 955 | | | Westamerica Bancorp.(c) | | | 61,330 | |
| | 8,041 | | | WisdomTree Investments, Inc. | | | 57,895 | |
| | 519 | | | World Acceptance Corp.(b) | | | 67,465 | |
| | | | | | | | |
| | | | | | | 5,766,075 | |
| | | | | | | | |
| | | | Health Care—11.0% | |
| | 4,321 | | | Acorda Therapeutics, Inc.(b) | | | 45,154 | |
| | 953 | | | Addus HomeCare Corp.(b) | | | 64,709 | |
| | 15,485 | | | Akorn, Inc.(b) | | | 41,809 | |
| | | | | | | | |
Number
of Shares | | | | | Value | |
| | | | Common Stocks & Other Equity
Interests (continued) | |
| | | | Health Care (continued) | |
| | 5,171 | | | AMAG Pharmaceuticals, Inc.(b) | | $ | 57,708 | |
| | 1,262 | | | AMN Healthcare Services, Inc.(b) | | | 65,700 | |
| | 2,452 | | | Amphastar Pharmaceuticals, Inc.(b) | | | 52,939 | |
| | 2,705 | | | AngioDynamics, Inc.(b) | | | 55,561 | |
| | 915 | | | ANI Pharmaceuticals, Inc.(b) | | | 64,947 | |
| | 1,904 | | | Anika Therapeutics, Inc.(b) | | | 60,642 | |
| | 14,558 | | | Assertio Therapeutics, Inc.(b) | | | 60,707 | |
| | 883 | | | BioTelemetry, Inc.(b) | | | 48,035 | |
| | 1,517 | | | Cambrex Corp.(b) | | | 65,261 | |
| | 1,450 | | | Cardiovascular Systems, Inc.(b) | | | 51,533 | |
| | 12,581 | | | Community Health Systems, Inc.(b)(c) | | | 43,279 | |
| | 1,876 | | | Computer Programs & Systems, Inc. | | | 57,012 | |
| | 754 | | | CONMED Corp. | | | 60,343 | |
| | 4,829 | | | Corcept Therapeutics, Inc.(b)(c) | | | 59,783 | |
| | 924 | | | CorVel Corp.(b) | | | 66,343 | |
| | 7,712 | | | Cross Country Healthcare, Inc.(b) | | | 54,370 | |
| | 1,999 | | | CryoLife, Inc.(b) | | | 61,289 | |
| | 3,555 | | | Cutera, Inc.(b) | | | 63,066 | |
| | 9,340 | | | Cytokinetics, Inc.(b) | | | 82,379 | |
| | 9,894 | | | Diplomat Pharmacy, Inc.(b)(c) | | | 55,208 | |
| | 1,225 | | | Eagle Pharmaceuticals, Inc.(b) | | | 62,977 | |
| | 1,025 | | | Emergent BioSolutions, Inc.(b) | | | 52,972 | |
| | 588 | | | Enanta Pharmaceuticals, Inc.(b) | | | 51,268 | |
| | 6,749 | | | Endo International PLC(b) | | | 50,617 | |
| | 1,204 | | | Ensign Group, Inc. (The) | | | 62,030 | |
| | 2,221 | | | HealthStream, Inc.(b) | | | 58,146 | |
| | 753 | | | Heska Corp.(b) | | | 58,478 | |
| | 1,886 | | | HMS Holdings Corp.(b) | | | 57,391 | |
| | 4,167 | | | Innoviva, Inc.(b) | | | 58,463 | |
| | 705 | | | Integer Holdings Corp.(b) | | | 48,708 | |
| | 6,204 | | | Invacare Corp. | | | 45,910 | |
| | 7,427 | | | Lannett Co., Inc.(b)(c) | | | 57,114 | |
| | 2,489 | | | Lantheus Holdings, Inc.(b) | | | 60,134 | |
| | 1,962 | | | LeMaitre Vascular, Inc. | | | 56,663 | |
| | 540 | | | LHC Group, Inc.(b) | | | 59,999 | |
| | 2,434 | | | Luminex Corp. | | | 55,520 | |
| | 909 | | | Magellan Health, Inc.(b) | | | 63,630 | |
| | 2,319 | | | Medicines Co. (The)(b)(c) | | | 74,092 | |
| | 1,128 | | | Medpace Holdings, Inc.(b) | | | 63,360 | |
| | 3,551 | | | Meridian Bioscience, Inc. | | | 40,872 | |
| | 1,020 | | | Merit Medical Systems, Inc.(b) | | | 57,304 | |
| | 4,426 | | | Momenta Pharmaceuticals, Inc.(b) | | | 61,920 | |
| | 2,001 | | | Myriad Genetics, Inc.(b) | | | 62,991 | |
| | 2,216 | | | Natus Medical, Inc.(b) | | | 59,300 | |
| | 994 | | | Neogen Corp.(b) | | | 60,296 | |
| | 3,112 | | | NeoGenomics, Inc.(b) | | | 64,823 | |
| | 3,494 | | | NextGen Healthcare, Inc.(b) | | | 65,652 | |
| | 700 | | | Omnicell, Inc.(b) | | | 56,252 | |
| | 5,302 | | | OraSure Technologies, Inc.(b) | | | 50,157 | |
| | 1,062 | | | Orthofix Medical, Inc.(b) | | | 58,187 | |
| | 13,148 | | | Owens & Minor, Inc. | | | 44,835 | |
| | 2,023 | | | Phibro Animal Health Corp., Class A | | | 70,218 | |
| | 14,522 | | | Progenics Pharmaceuticals, Inc.(b) | | | 74,643 | |
| | 941 | | | Providence Service Corp. (The)(b) | | | 62,416 | |
| | 1,083 | | | REGENXBIO, Inc.(b) | | | 54,583 | |
| | 1,029 | | | Repligen Corp.(b) | | | 69,334 | |
| | 4,236 | | | Select Medical Holdings Corp.(b) | | | 60,871 | |
See accompanying Notes to Financial Statements which are an integral part of the financial statements.
Invesco S&P SmallCap 600® Equal Weight ETF (EWSC)(continued)
April 30, 2019
| | | | | | | | |
Number
of Shares | | | | | Value | |
| | | | Common Stocks & Other Equity Interests
(continued) | |
| | | | Health Care (continued) | |
| | 5,832 | | | Spectrum Pharmaceuticals, Inc.(b) | | $ | 54,646 | |
| | 1,552 | | | Supernus Pharmaceuticals, Inc.(b) | | | 57,005 | |
| | 1,116 | | | SurModics, Inc.(b) | | | 48,479 | |
| | 1,001 | | | Tabula Rasa HealthCare, Inc.(b)(c) | | | 53,313 | |
| | 810 | | | Tactile Systems Technology, Inc.(b) | | | 40,306 | |
| | 3,006 | | | Tivity Health, Inc.(b) | | | 64,990 | |
| | 537 | | | US Physical Therapy, Inc. | | | 62,555 | |
| | 3,142 | | | Vanda Pharmaceuticals, Inc.(b) | | | 51,183 | |
| | 1,806 | | | Varex Imaging Corp.(b) | | | 59,309 | |
| | | | | | | | |
| | | | | | | 4,001,689 | |
| | | | | | | | |
| | | | Industrials—16.6% | |
| | 1,404 | | | AAON, Inc. | | | 70,495 | |
| | 1,733 | | | AAR Corp. | | | 58,523 | |
| | 1,786 | | | ABM Industries, Inc. | | | 67,814 | |
| | 2,466 | | | Actuant Corp., Class A | | | 63,080 | |
| | 3,489 | | | Aegion Corp.(b) | | | 69,466 | |
| | 1,771 | | | Aerojet Rocketdyne Holdings, Inc.(b) | | | 59,966 | |
| | 742 | | | Aerovironment, Inc.(b) | | | 50,872 | |
| | 592 | | | Alamo Group, Inc. | | | 61,355 | |
| | 775 | | | Albany International Corp., Class A | | | 57,327 | |
| | 460 | | | Allegiant Travel Co. | | | 67,565 | |
| | 731 | | | American Woodmark Corp.(b) | | | 65,739 | |
| | 1,666 | | | Apogee Enterprises, Inc. | | | 67,140 | |
| | 1,023 | | | Applied Industrial Technologies, Inc. | | | 61,319 | |
| | 1,731 | | | ArcBest Corp. | | | 52,899 | |
| | 1,731 | | | Arcosa, Inc. | | | 53,886 | |
| | 1,504 | | | Astec Industries, Inc. | | | 50,700 | |
| | 1,193 | | | Atlas Air Worldwide Holdings, Inc.(b) | | | 57,610 | |
| | 1,246 | | | Axon Enterprise, Inc.(b) | | | 79,121 | |
| | 1,333 | | | AZZ, Inc. | | | 63,304 | |
| | 1,048 | | | Barnes Group, Inc. | | | 58,290 | |
| | 1,271 | | | Brady Corp., Class A | | | 62,012 | |
| | 4,633 | | | Briggs & Stratton Corp. | | | 56,523 | |
| | 673 | | | Chart Industries, Inc.(b) | | | 59,406 | |
| | 1,923 | | | CIRCOR International, Inc.(b) | | | 64,844 | |
| | 1,122 | | | Comfort Systems USA, Inc. | | | 60,700 | |
| | 1,051 | | | Cubic Corp. | | | 59,676 | |
| | 1,384 | | | DXP Enterprises, Inc.(b) | | | 59,360 | |
| | 2,497 | | | Echo Global Logistics, Inc.(b) | | | 57,281 | |
| | 1,004 | | | Encore Wire Corp. | | | 59,527 | |
| | 875 | | | EnPro Industries, Inc. | | | 65,030 | |
| | 867 | | | ESCO Technologies, Inc. | | | 65,025 | |
| | 1,044 | | | Exponent, Inc. | | | 59,111 | |
| | 2,432 | | | Federal Signal Corp. | | | 69,969 | |
| | 1,211 | | | Forrester Research, Inc. | | | 61,591 | |
| | 942 | | | Forward Air Corp. | | | 59,647 | |
| | 1,118 | | | Franklin Electric Co., Inc. | | | 54,625 | |
| | 791 | | | FTI Consulting, Inc.(b) | | | 67,219 | |
| | 1,489 | | | Gibraltar Industries, Inc.(b) | | | 59,069 | |
| | 1,500 | | | Greenbrier Cos., Inc. (The) | | | 53,295 | |
| | 3,374 | | | Griffon Corp. | | | 66,198 | |
| | 2,640 | | | Harsco Corp.(b) | | | 59,770 | |
| | 2,279 | | | Hawaiian Holdings, Inc. | | | 64,291 | |
| | 2,945 | | | Heartland Express, Inc.(c) | | | 57,958 | |
| | 1,432 | | | Heidrick & Struggles International, Inc. | | | 51,237 | |
| | 1,354 | | | Hillenbrand, Inc. | | | 58,249 | |
| | | | | | | | |
Number
of Shares | | | | | Value | |
| | | | Common Stocks & Other Equity Interests
(continued) | |
| | | | Industrials (continued) | |
| | 1,392 | | | Hub Group, Inc., Class A(b) | | $ | 57,865 | |
| | 2,811 | | | Insteel Industries, Inc. | | | 58,862 | |
| | 3,523 | | | Interface, Inc. | | | 56,509 | |
| | 655 | | | John Bean Technologies Corp. | | | 71,912 | |
| | 1,002 | | | Kaman Corp. | | | 62,034 | |
| | 2,613 | | | Kelly Services, Inc., Class A | | | 58,165 | |
| | 1,305 | | | Korn Ferry. | | | 61,361 | |
| | 632 | | | Lindsay Corp. | | | 53,720 | |
| | 8,153 | | | LSC Communications, Inc.(c) | | | 56,989 | |
| | 2,379 | | | Lydall, Inc.(b) | | | 58,547 | |
| | 3,240 | | | Marten Transport Ltd. | | | 64,087 | |
| | 1,661 | | | Matson, Inc. | | | 65,792 | |
| | 1,491 | | | Matthews International Corp., Class A | | | 59,729 | |
| | 980 | | | Mercury Systems, Inc.(b) | | | 71,560 | |
| | 1,650 | | | Mobile Mini, Inc. | | | 59,433 | |
| | 662 | | | Moog, Inc., Class A. | | | 61,990 | |
| | 1,801 | | | Mueller Industries, Inc. | | | 52,535 | |
| | 1,165 | | | Multi-Color Corp. | | | 58,134 | |
| | 1,650 | | | MYR Group, Inc.(b) | | | 59,648 | |
| | 554 | | | National Presto Industries, Inc. | | | 59,001 | |
| | 2,978 | | | Navigant Consulting, Inc. | | | 67,988 | |
| | 15,322 | | | Orion Group Holdings, Inc.(b) | | | 39,684 | |
| | 1,294 | | | Patrick Industries, Inc.(b) | | | 64,532 | |
| | 4,123 | | | PGT Innovations, Inc.(b) | | | 60,443 | |
| | 8,020 | | | Pitney Bowes, Inc. | | | 57,022 | |
| | 1,915 | | | Powell Industries, Inc. | | | 56,014 | |
| | 552 | | | Proto Labs, Inc.(b) | | | 60,604 | |
| | 3,974 | | | Quanex Building Products Corp. | | | 66,445 | |
| | 1,557 | | | Raven Industries, Inc. | | | 60,583 | |
| | 3,428 | | | Resources Connection, Inc. | | | 55,054 | |
| | 11,817 | | | RR Donnelley & Sons Co. | | | 54,595 | |
| | 957 | | | Saia, Inc.(b) | | | 61,621 | |
| | 973 | | | Simpson Manufacturing Co., Inc. | | | 61,961 | |
| | 1,167 | | | SkyWest, Inc. | | | 71,876 | |
| | 1,655 | | | SPX Corp.(b) | | | 60,407 | |
| | 1,777 | | | SPX FLOW, Inc.(b) | | | 63,865 | |
| | 772 | | | Standex International Corp. | | | 51,006 | |
| | 3,628 | | | Team, Inc.(b) | | | 61,313 | |
| | 953 | | | Tennant Co. | | | 63,260 | |
| | 1,018 | | | Tetra Tech, Inc. | | | 65,885 | |
| | 13,119 | | | Titan International, Inc. | | | 90,915 | |
| | 2,748 | | | Triumph Group, Inc. | | | 65,210 | |
| | 2,708 | | | TrueBlue, Inc.(b) | | | 65,425 | |
| | 431 | | | UniFirst Corp. | | | 68,154 | |
| | 1,957 | | | Universal Forest Products, Inc. | | | 72,311 | |
| | 1,017 | | | US Ecology, Inc. | | | 62,047 | |
| | 2,305 | | | Veritiv Corp.(b) | | | 64,286 | |
| | 1,085 | | | Viad Corp. | | | 66,521 | |
| | 1,923 | | | Vicor Corp.(b) | | | 72,132 | |
| | 4,255 | | | Wabash National Corp. | | | 64,165 | |
| | 1,966 | | | WageWorks, Inc.(b) | | | 95,921 | |
| | 747 | | | Watts Water Technologies, Inc., Class A | | | 63,936 | |
| | | | | | | | |
| | | | | | | 6,011,138 | |
| | | | | | | | |
| | | | Information Technology—15.1% | |
| | 5,341 | | | 3D Systems Corp.(b)(c) | | | 56,828 | |
| | 3,097 | | | 8x8, Inc.(b) | | | 74,080 | |
See accompanying Notes to Financial Statements which are an integral part of the financial statements.
Invesco S&P SmallCap 600® Equal Weight ETF (EWSC)(continued)
April 30, 2109
| | | | | | | | |
Number
of Shares | | | | | Value | |
| | | | Common Stocks & Other Equity Interests
(continued) | |
| | | | Information Technology (continued) | |
| | 3,958 | | | ADTRAN, Inc. | | $ | 67,840 | |
| | 1,249 | | | Advanced Energy Industries, Inc.(b) | | | 72,142 | |
| | 2,916 | | | Agilysys, Inc.(b) | | | 55,783 | |
| | 1,004 | | | Alarm.com Holdings, Inc.(b) | | | 71,164 | |
| | 1,053 | | | Anixter International, Inc.(b) | | | 66,202 | |
| | 4,532 | | | Applied Optoelectronics, Inc.(b)(c) | | | 56,741 | |
| | 13,389 | | | Arlo Technologies, Inc.(b) | | | 53,154 | |
| | 2,983 | | | Axcelis Technologies, Inc.(b) | | | 63,508 | |
| | 1,020 | | | Badger Meter, Inc. | | | 56,590 | |
| | 2,376 | | | Bel Fuse, Inc., Class B | | | 56,311 | |
| | 2,231 | | | Benchmark Electronics, Inc. | | | 60,304 | |
| | 1,224 | | | Bottomline Technologies (DE), Inc.(b) | | | 61,898 | |
| | 1,913 | | | Brooks Automation, Inc. | | | 71,757 | |
| | 535 | | | Cabot Microelectronics Corp. | | | 67,544 | |
| | 4,484 | | | CalAmp Corp.(b) | | | 65,511 | |
| | 1,989 | | | Cardtronics PLC, Class A(b) | | | 71,127 | |
| | 2,116 | | | CEVA, Inc.(b) | | | 53,302 | |
| | 3,414 | | | Cohu, Inc. | | | 50,630 | |
| | 2,467 | | | Comtech Telecommunications Corp. | | | 58,049 | |
| | 3,454 | | | Control4 Corp.(b) | | | 60,134 | |
| | 2,385 | | | Cray, Inc.(b) | | | 62,630 | |
| | 1,419 | | | CSG Systems International, Inc. | | | 63,358 | |
| | 1,932 | | | CTS Corp. | | | 57,863 | |
| | 7,484 | | | Daktronics, Inc. | | | 56,729 | |
| | 6,270 | | | Diebold Nixdorf, Inc.(b) | | | 63,264 | |
| | 4,637 | | | Digi International, Inc.(b) | | | 59,678 | |
| | 1,573 | | | Diodes, Inc.(b) | | | 57,289 | |
| | 4,393 | | | DSP Group, Inc.(b) | | | 62,776 | |
| | 1,162 | | | Ebix, Inc.(c) | | | 58,658 | |
| | 2,205 | | | Electronics For Imaging, Inc.(b) | | | 82,004 | |
| | 664 | | | ePlus, Inc.(b) | | | 62,609 | |
| | 2,109 | | | EVERTEC, Inc. | | | 66,033 | |
| | 995 | | | ExlService Holdings, Inc.(b) | | | 59,103 | |
| | 7,732 | | | Extreme Networks, Inc.(b) | | | 61,856 | |
| | 1,076 | | | Fabrinet (Thailand)(b) | | | 65,120 | |
| | 1,313 | | | FARO Technologies, Inc.(b) | | | 73,856 | |
| | 2,492 | | | Finisar Corp.(b) | | | 60,082 | |
| | 3,871 | | | FormFactor, Inc.(b) | | | 73,355 | |
| | 10,406 | | | Harmonic, Inc.(b)(c) | | | 58,898 | |
| | 3,040 | | | Ichor Holdings Ltd.(b) | | | 76,547 | |
| | 1,522 | | | II-VI, Inc.(b)(c) | | | 60,636 | |
| | 1,061 | | | Insight Enterprises, Inc.(b) | | | 60,031 | |
| | 1,192 | | | Itron, Inc.(b) | | | 63,963 | |
| | 3,349 | | | KEMET Corp. | | | 59,847 | |
| | 3,690 | | | Knowles Corp.(b) | | | 69,667 | |
| | 34,748 | | | Kopin Corp.(b)(c) | | | 43,435 | |
| | 2,572 | | | Kulicke & Soffa Industries, Inc. (Singapore) | | | 59,850 | |
| | 2,067 | | | LivePerson, Inc.(b) | | | 60,625 | |
| | 1,083 | | | ManTech International Corp., Class A | | | 67,135 | |
| | 2,387 | | | MaxLinear, Inc.(b) | | | 64,234 | |
| | 1,970 | | | Methode Electronics, Inc. | | | 58,135 | |
| | 423 | | | MicroStrategy, Inc., Class A(b) | | | 63,323 | |
| | 2,971 | | | Monotype Imaging Holdings, Inc. | | | 51,220 | |
| | 1,120 | | | MTS Systems Corp. | | | 61,578 | |
| | 2,063 | | | Nanometrics, Inc.(b) | | | 61,457 | |
| | 1,656 | | | NETGEAR, Inc.(b) | | | 51,386 | |
| | 3,496 | | | NIC, Inc. | | | 60,341 | |
| | | | | | | | |
Number
of Shares | | | | | Value | |
| | | | Common Stocks & Other Equity Interests
(continued) | |
| | | | Information Technology (continued) | |
| | 2,975 | | | OneSpan, Inc.(b) | | $ | 55,156 | |
| | 689 | | | OSI Systems, Inc.(b) | | | 62,100 | |
| | 3,483 | | | Park Electrochemical Corp. | | | 57,295 | |
| | 4,939 | | | PDF Solutions, Inc.(b)(c) | | | 64,108 | |
| | 2,092 | | | Perficient, Inc.(b) | | | 61,588 | |
| | 6,087 | | | Photronics, Inc.(b) | | | 56,853 | |
| | 977 | | | Plexus Corp.(b) | | | 58,796 | |
| | 834 | | | Power Integrations, Inc. | | | 65,903 | |
| | 1,605 | | | Progress Software Corp. | | | 73,204 | |
| | 705 | | | Qualys, Inc.(b) | | | 63,633 | |
| | 5,879 | | | Rambus, Inc.(b) | | | 67,373 | |
| | 394 | | | Rogers Corp.(b) | | | 66,003 | |
| | 2,657 | | | Rudolph Technologies, Inc.(b) | | | 64,273 | |
| | 1,971 | | | Sanmina Corp.(b) | | | 66,856 | |
| | 1,578 | | | ScanSource, Inc.(b) | | | 59,412 | |
| | 2,491 | | | SMART Global Holdings, Inc.(b) | | | 54,154 | |
| | 1,486 | | | SolarEdge Technologies, Inc.(b) | | | 65,830 | |
| | 550 | | | SPS Commerce, Inc.(b) | | | 57,057 | |
| | 2,056 | | | Sykes Enterprises, Inc.(b) | | | 57,054 | |
| | 6,031 | | | TiVo Corp. | | | 56,510 | |
| | 3,714 | | | Travelport Worldwide Ltd. | | | 58,236 | |
| | 1,711 | | | TTEC Holdings, Inc. | | | 62,383 | |
| | 5,085 | | | TTM Technologies, Inc.(b) | | | 67,325 | |
| | 6,056 | | | Ultra Clean Holdings, Inc.(b) | | | 72,490 | |
| | 4,615 | | | Unisys Corp.(b) | | | 51,734 | |
| | 5,581 | | | Veeco Instruments, Inc.(b) | | | 67,977 | |
| | 4,727 | | | Viavi Solutions, Inc.(b) | | | 62,869 | |
| | 1,169 | | | Virtusa Corp.(b) | | | 64,938 | |
| | 2,508 | | | Xperi Corp. | | | 62,324 | |
| | | | | | | | |
| | | | | | | 5,472,604 | |
| | | | | | | | |
| | | | Materials—5.3% | |
| | 1,595 | | | A. Schulman, Inc., CVR(b)(e) | | | 834 | |
| | 1,848 | | | AdvanSix, Inc.(b) | | | 55,865 | |
| | 22,367 | | | AK Steel Holding Corp.(b)(c) | | | 54,128 | |
| | 3,169 | | | American Vanguard Corp. | | | 49,880 | |
| | 640 | | | Balchem Corp. | | | 64,966 | |
| | 2,164 | | | Boise Cascade Co. | | | 59,921 | |
| | 7,641 | | | Century Aluminum Co.(b) | | | 64,261 | |
| | 2,195 | | | Clearwater Paper Corp.(b) | | | 44,273 | |
| | 2,655 | | | Ferro Corp.(b) | | | 47,445 | |
| | 3,328 | | | FutureFuel Corp. | | | 48,888 | |
| | 1,194 | | | H.B. Fuller Co. | | | 58,470 | |
| | 1,462 | | | Hawkins, Inc. | | | 53,963 | |
| | 1,853 | | | Haynes International, Inc. | | | 59,871 | |
| | 1,912 | | | Innophos Holdings, Inc. | | | 61,547 | |
| | 705 | | | Innospec, Inc. | | | 59,798 | |
| | 566 | | | Kaiser Aluminum Corp. | | | 55,694 | |
| | 2,269 | | | Koppers Holdings, Inc.(b) | | | 60,673 | |
| | 1,692 | | | Kraton Corp.(b) | | | 55,532 | |
| | 4,571 | | | Livent Corp.(b) | | | 49,275 | |
| | 8,954 | | | LSB Industries, Inc.(b)(c) | | | 52,381 | |
| | 1,030 | | | Materion Corp. | | | 59,771 | |
| | 4,347 | | | Mercer International, Inc. (Canada) | | | 61,554 | |
| | 3,174 | | | Myers Industries, Inc. | | | 56,783 | |
| | 915 | | | Neenah, Inc. | | | 62,083 | |
| | 3,547 | | | Olympic Steel, Inc. | | | 57,532 | |
See accompanying Notes to Financial Statements which are an integral part of the financial statements.
Invesco S&P SmallCap 600® Equal Weight ETF (EWSC)(continued)
April 30, 2109
| | | | | | | | |
Number
of Shares | | | | | Value | |
| | | | Common Stocks & Other Equity Interests
(continued) | |
| | | | Materials (continued) | |
| | 4,508 | | | PH Glatfelter Co. | | $ | 71,136 | |
| | 299 | | | Quaker Chemical Corp. | | | 66,922 | |
| | 4,626 | | | Rayonier Advanced Materials, Inc.(c) | | | 68,650 | |
| | 1,547 | | | Schweitzer-Mauduit International, Inc., Class A | | | 55,027 | |
| | 652 | | | Stepan Co. | | | 60,336 | |
| | 6,619 | | | SunCoke Energy, Inc.(b) | | | 56,990 | |
| | 5,436 | | | TimkenSteel Corp.(b) | | | 55,121 | |
| | 3,487 | | | Tredegar Corp. | | | 62,836 | |
| | 1,415 | | | US Concrete, Inc.(b)(c) | | | 66,689 | |
| | | | | | | | |
| | | | | | | 1,919,095 | |
| | | | | | | | |
| | | | Real Estate—6.8% | |
| | 2,121 | | | Acadia Realty Trust | | | 59,897 | |
| | 881 | | | Agree Realty Corp. | | | 57,679 | |
| | 1,289 | | | American Assets Trust, Inc. | | | 59,539 | |
| | 3,848 | | | Armada Hoffler Properties, Inc. | | | 62,145 | |
| | 2,514 | | | CareTrust REIT, Inc. | | | 60,965 | |
| | 30,888 | | | CBL & Associates Properties, Inc.(c) | | | 31,197 | |
| | 17,962 | | | Cedar Realty Trust, Inc. | | | 55,143 | |
| | 3,110 | | | Chatham Lodging Trust | | | 61,236 | |
| | 2,024 | | | Chesapeake Lodging Trust | | | 57,684 | |
| | 1,777 | | | Community Healthcare Trust, Inc. | | | 64,825 | |
| | 5,497 | | | DiamondRock Hospitality Co. | | | 59,697 | |
| | 3,280 | | | Easterly Government Properties, Inc. | | | 59,040 | |
| | 546 | | | EastGroup Properties, Inc. | | | 62,424 | |
| | 2,070 | | | Four Corners Property Trust, Inc. | | | 58,871 | |
| | 8,328 | | | Franklin Street Properties Corp. | | | 65,458 | |
| | 1,791 | | | Getty Realty Corp. | | | 58,082 | |
| | 3,278 | | | Global NET Lease, Inc. | | | 62,512 | |
| | 3,285 | | | Hersha Hospitality Trust | | | 61,002 | |
| | 1,302 | | | HFF, Inc., Class A | | | 61,962 | |
| | 5,668 | | | Independence Realty Trust, Inc. | | | 60,024 | |
| | 843 | | | Innovative Industrial Properties, Inc. | | | 71,773 | |
| | 6,958 | | | iStar, Inc.(c) | | | 60,326 | |
| | 3,861 | | | Kite Realty Group Trust | | | 60,965 | |
| | 6,626 | | | Lexington Realty Trust | | | 60,098 | |
| | 1,335 | | | LTC Properties, Inc. | | | 60,155 | |
| | 1,528 | | | Marcus & Millichap, Inc.(b) | | | 65,857 | |
| | 2,106 | | | National Storage Affiliates Trust | | | 61,622 | |
| | 3,267 | | | NorthStar Realty Europe Corp. | | | 58,251 | |
| | 2,216 | | | Office Properties Income Trust | | | 60,142 | |
| | 10,170 | | | Pennsylvania Real Estate Investment Trust(c) | | | 61,223 | |
| | 1,487 | | | RE/MAX Holdings, Inc., Class A | | | 64,432 | |
| | 3,462 | | | Retail Opportunity Investments Corp. | | | 60,758 | |
| | 5,112 | | | RPT Realty | | | 62,009 | |
| | 1,101 | | | Saul Centers, Inc. | | | 58,738 | |
| | 5,171 | | | Summit Hotel Properties, Inc. | | | 60,035 | |
| | 808 | | | Universal Health Realty Income Trust | | | 65,464 | |
| | 2,835 | | | Urstadt Biddle Properties, Inc., Class A | | | 62,172 | |
| | 11,292 | | | Washington Prime Group, Inc.(c) | | | 50,249 | |
| | 2,142 | | | Washington REIT | | | 60,490 | |
| | 5,033 | | | Whitestone REIT | | | 64,573 | |
| | 2,381 | | | Xenia Hotels & Resorts, Inc. | | | 51,549 | |
| | | | | | | | |
| | | | | | | 2,460,263 | |
| | | | | | | | |
| | | | Utilities—1.0% | |
| | 830 | | | American States Water Co. | | | 59,071 | |
| | | | | | | | |
Number
of Shares | | | | | Value | |
| | | | Common Stocks & Other Equity Interests
(continued) | |
| | | | Utilities (continued) | |
| | 1,421 | | | Avista Corp. | | $ | 61,302 | |
| | 1,111 | | | California Water Service Group | | | 55,983 | |
| | 999 | | | El Paso Electric Co. | | | 61,049 | |
| | 909 | | | Northwest Natural Holding Co. | | | 60,803 | |
| | 1,906 | | | South Jersey Industries, Inc. | | | 61,221 | |
| | | | | | | | |
| | | | | | | 359,429 | |
| | | | | | | | |
| | | | Total Common Stocks & Other Equity Interests
(Cost $36,342,275) | | | 36,250,732 | |
| | | | | | | | |
| | |
| | | | | | | | |
| | | | Money MarketFunds-0.1% | |
| | 32,687 | | | Invesco Premier U.S. Government Money Portfolio—Institutional Class, 2.32%(f)
(Cost $32,687) | | | 32,687 | |
| | | | | | | | |
| | |
| | | | Total Investments in Securities
(excluding investments purchased with cash collateral from securities on loan)
(Cost $36,374,962)—100.0% | | | 36,283,419 | |
| | | | | | | | |
| | |
| | | | | | | | |
| | | | Investments Purchased with Cash Collateral from
Securities on Loan | |
| | |
| | | | | | | | |
| | | | Money Market Funds—5.7% | |
| | 1,567,320 | | | Invesco Government & Agency Portfolio— Institutional Class, 2.34%(f)(g) | | | 1,567,320 | |
| | 522,284 | | | Invesco Liquid Assets Portfolio—Institutional Class, 2.48%(f)(g) | | | 522,440 | |
| | | | | | | | |
| | | | Total Money Market Funds
(Cost $2,089,760) | | | 2,089,760 | |
| | | | | | | | |
| | |
| | | | Total Investments in Securities
(Cost $38,464,722)—105.7% | | | 38,373,179 | |
| | |
| | | | Other assets less liabilities—(5.7)% | | | (2,085,879 | ) |
| | | | | | | | |
| | |
| | | | Net Assets—100.0% | | $ | 36,287,300 | |
| | | | | | | | |
Abbreviations:
REIT—Real Estate Investment Trust
CVR—Contingent Value Rights
Notes to Schedule of Investments:
| (a) | Industry and/or sector classifications used in this report are generally according to the Global Industry Classification Standard, which was developed by and is the exclusive property and a service mark of MSCI Inc. and Standard & Poor’s. |
| (b) | Non-income producing security. |
| (c) | All or a portion of this security was out on loan at April 30, 2019. |
| (d) | Affiliated company. See Note 4. |
| (e) | Security valued using significant unobservable inputs (Level 3). See Note 5. |
| (f) | The security and the Fund are advised by wholly-owned subsidiaries of Invesco Ltd. and are therefore considered to be affiliated. The rate shown is the7-day SEC standardized yield as of April 30, 2019. |
| (g) | The security has been segregated to satisfy the commitment to return the cash collateral received in securities lending transactions upon the borrower’s return of the securities loaned. See Note 2J. |
See accompanying Notes to Financial Statements which are an integral part of the financial statements.
(This Page Intentionally Left Blank)
Statements of Assets and Liabilities
April 30, 2019
| | | | | | | | | | | | | | | | |
| | | Invesco S&P 500®
Equal Weight
ETF (RSP) | | | Invesco S&P 500®
Equal Weight
Communication Services
ETF (EWCO) | | | Invesco S&P 500®
Equal Weight
Consumer Discretionary
ETF (RCD) | | | Invesco S&P 500®
Equal Weight
Consumer Staples
ETF (RHS) | |
| Assets: | | | | | | | | | | | | | | | | |
Unaffiliated investments in securities, at value(a) | | $ | 16,087,564,927 | | | $ | 22,815,441 | | | $ | 113,199,138 | | | $ | 430,950,271 | |
Affiliated investments in securities, at value | | | 89,029,081 | | | | 19,831 | | | | 3,174,271 | | | | 11,569,927 | |
Receivable for: | | | | | | | | | | | | | | | | |
Dividends | | | 12,441,311 | | | | 20,227 | | | | 90,751 | | | | 545,006 | |
Securities lending | | | 8,155 | | | | — | | | | 475 | | | | 3,291 | |
| | | | | | | | | | | | | | | | |
Total assets | | | 16,189,043,474 | | | | 22,855,499 | | | | 116,464,635 | | | | 443,068,495 | |
| | | | | | | | | | | | | | | | |
| | | | |
| Liabilities: | | | | | | | | | | | | | | | | |
Due to custodian | | | 526 | | | | 96 | | | | 13,163 | | | | — | |
Payable for: | | | | | | | | | | | | | | | | |
Collateral upon return of securities loaned | | | 42,464,342 | | | | — | | | | 3,174,271 | | | | 11,094,032 | |
Accrued unitary management fees | | | 2,615,588 | | | | 4,676 | | | | 37,142 | | | | 137,956 | |
Accrued expenses | | | 2,498 | | | | — | | | | 618 | | | | — | |
| | | | | | | | | | | | | | | | |
Total liabilities. | | | 45,082,954 | | | | 4,772 | | | | 3,225,194 | | | | 11,231,988 | |
| | | | | | | | | | | | | | | | |
| Net Assets | | $ | 16,143,960,520 | | | $ | 22,850,727 | | | $ | 113,239,441 | | | $ | 431,836,507 | |
| | | | | | | | | | | | | | | | |
| | | | |
| Net assets consist of: | | | | | | | | | | | | | | | | |
Shares of beneficial interest | | $ | 14,274,182,443 | | | $ | 22,165,734 | | | $ | 130,308,351 | | | $ | 466,233,374 | |
Distributable earnings | | | 1,869,778,077 | | | | 684,993 | | | | (17,068,910 | ) | | | (34,396,867 | ) |
| | | | | | | | | | | | | | | | |
| Net Assets | | $ | 16,143,960,520 | | | $ | 22,850,727 | | | $ | 113,239,441 | | | $ | 431,836,507 | |
| | | | | | | | | | | | | | | | |
Shares outstanding (unlimited amount authorized, $0.01 par value) | | | 149,202,663 | | | | 900,001 | | | | 1,050,000 | | | | 3,200,000 | |
Net asset value | | $ | 108.20 | | | $ | 25.39 | | | $ | 107.85 | | | $ | 134.95 | |
| | | | | | | | | | | | | | | | |
Market price | | $ | 108.22 | | | $ | 25.41 | | | $ | 107.86 | | | $ | 134.97 | |
| | | | | | | | | | | | | | | | |
Unaffiliated investments in securities, at cost | | $ | 13,346,938,065 | | | $ | 22,162,288 | | | $ | 113,142,746 | | | $ | 433,706,091 | |
| | | | | | | | | | | | | | | | |
Affiliated investments in securities, at cost | | $ | 97,126,512 | | | $ | 19,831 | | | $ | 3,174,271 | | | $ | 11,569,927 | |
| | | | | | | | | | | | | | | | |
(a)Includes securities on loan with an aggregate value of | | $ | 40,740,032 | | | $ | — | | | $ | 3,073,586 | | | $ | 10,691,156 | |
| | | | | | | | | | | | | | | | |
See accompanying Notes to Financial Statements which are an integral part of the financial statements.
| | | | | | | | | | | | | | | | | | | | | | | | | | |
Invesco S&P 500®
Equal Weight
Energy
ETF (RYE) | | | Invesco S&P 500®
Equal Weight
Financials
ETF (RYF) | | | Invesco S&P 500®
Equal Weight
Health Care
ETF (RYH) | | | Invesco S&P 500®
Equal Weight
Industrials
ETF (RGI) | | | Invesco S&P 500®
Equal Weight
Materials
ETF (RTM) | | | Invesco S&P 500®
Equal Weight
Real Estate
ETF (EWRE) | | | Invesco S&P 500®
Equal Weight
Technology
ETF (RYT) | |
| | | | | | | | | | | | | | | | | | | | | | | | | | |
| $ | 209,667,932 | | | $ | 286,314,307 | | | $ | 706,455,411 | | | $ | 245,730,341 | | | $ | 129,679,870 | | | $ | 37,126,136 | | | $ | 1,787,589,144 | |
| | 268 | | | | 4,740,203 | | | | 190,371 | | | | 2,090,368 | | | | 8,846,181 | | | | 25,673 | | | | 1,581,815 | |
| | | | | | |
| | | | | | | | | | | | | | | | | | | | | | | | | | |
| | 223,438 | | | | 274,442 | | | | 437,669 | | | | 131,835 | | | | 241,024 | | | | 3,672 | | | | 251,074 | |
| | — | | | | 15 | | | | — | | | | 79 | | | | 801 | | | | — | | | | 271 | |
| | | | | | | | | | | | | | | | | | | | | | |
| | 209,891,638 | | | | 291,328,967 | | | | 707,083,451 | | | | 247,952,623 | | | | 138,767,876 | | | | 37,155,481 | | | | 1,789,422,304 | |
| | | | | | | | | | | | | | | | | | | | | | | | | | |
| | | | | | |
| | | | | | | | | | | | | | | | | | | | | | | | | | |
| | — | | | | 91,535 | | | | — | | | | 33,278 | | | | 151,428 | | | | — | | | | — | |
| | | | | | |
| | | | | | | | | | | | | | | | | | | | | | | | | | |
| | — | | | | — | | | | — | | | | 2,090,368 | | | | 8,846,181 | | | | — | | | | — | |
| | 68,749 | | | | 92,918 | | | | 238,453 | | | | 78,707 | | | | 42,698 | | | | 12,428 | | | | 576,107 | |
| | — | | | | — | | | | — | | | | — | | | | — | | | | — | | | | — | |
| | | | | | | | | | | | | | | | | | | | | | | | | | |
| | 68,749 | | | | 184,453 | | | | 238,453 | | | | 2,202,353 | | | | 9,040,307 | | | | 12,428 | | | | 576,107 | |
| | | | | | | | | | | | | | | | | | | | | | | | | | |
| $ | 209,822,889 | | | $ | 291,144,514 | | | $ | 706,844,998 | | | $ | 245,750,270 | | | $ | 129,727,569 | | | $ | 37,143,053 | | | $ | 1,788,846,197 | |
| | | | | | | | | | | | | | | | | | | | | | | | | | |
| $ | 350,651,557 | | | $ | 305,218,830 | | | $ | 714,082,341 | | | $ | 254,725,026 | | | $ | 152,861,347 | | | $ | 36,674,749 | | | $ | 1,522,279,797 | |
| | (140,828,668 | ) | | | (14,074,316 | ) | | | (7,237,343 | ) | | | (8,974,756 | ) | | | (23,133,778 | ) | | | 468,304 | | | | 266,566,400 | |
| | | | | | | | | | | | | | | | | | | | | | | | | | |
| $ | 209,822,889 | | | $ | 291,144,514 | | | $ | 706,844,998 | | | $ | 245,750,270 | | | $ | 129,727,569 | | | $ | 37,143,053 | | | $ | 1,788,846,197 | |
| | | | | | | | | | | | | | | | | | | | | | | | | | |
| | | | | | |
| | | | | | | | | | | | | | | | | | | | | | | | | | |
| | 4,050,005 | | | | 6,650,000 | | | | 3,650,000 | | | | 1,950,000 | | | | 1,200,000 | | | | 1,250,000 | | | | 9,900,000 | |
| $ | 51.81 | | | $ | 43.78 | | | $ | 193.66 | | | $ | 126.03 | | | $ | 108.11 | | | $ | 29.71 | | | $ | 180.69 | |
| | | | | | | | | | | | | | | | | | | | | | | | | | |
| $ | 51.82 | | | $ | 43.79 | | | $ | 193.67 | | | $ | 126.01 | | | $ | 108.16 | | | $ | 29.75 | | | $ | 180.66 | |
| | | | | | | | | | | | | | | | | | | | | | | | | | |
| $ | 247,051,914 | | | $ | 283,271,596 | | | $ | 667,145,275 | | | $ | 238,946,445 | | | $ | 138,778,948 | | | $ | 36,526,404 | | | $ | 1,453,842,809 | |
| | | | | | | | | | | | | | | | | | | | | | | | | | |
| $ | 268 | | | $ | 7,102,031 | | | $ | 190,371 | | | $ | 2,090,368 | | | $ | 8,846,181 | | | $ | 25,673 | | | $ | 1,581,815 | |
| | | | | | | | | | | | | | | | | | | | | | | | | | |
| | | | | | |
| | | | | | | | | | | | | | | | | | | | | | | | | | |
| $ | — | | | $ | — | | | $ | — | | | $ | 2,050,776 | | | $ | 8,647,578 | | | $ | — | | | $ | — | |
| | | | | | | | | | | | | | | | | | | | | | | | | | |
Statements of Assets and Liabilities(continued)
April 30, 2019
| | | | | | | | | | | | |
| | | Invesco S&P 500®
Equal Weight
Utilities
ETF (RYU) | | | Invesco S&P
MidCap 400®
Equal Weight
ETF (EWMC) | | | Invesco S&P
SmallCap 600®
Equal Weight
ETF (EWSC) | |
| Assets: | | | | | | | | | | | | |
Unaffiliated investments in securities, at value(a) | | $ | 335,185,240 | | | $ | 105,855,886 | | | $ | 36,190,364 | |
Affiliated investments in securities, at value | | | 55,729 | | | | 4,164,594 | | | | 2,182,815 | |
Receivable for: | | | | | | | | | | | | |
Dividends | | | 366,489 | | | | 43,551 | | | | 14,302 | |
Securities lending | | | 86 | | | | 1,281 | | | | 1,434 | |
| | | | | | | | | | | | |
Total assets | | | 335,607,544 | | | | 110,065,312 | | | | 38,388,915 | |
| | | | | | | | | | | | |
| | | |
| Liabilities: | | | | | | | | | | | | |
Due to custodian. | | | — | | | | 4 | | | | — | |
Payable for: | | | | | | | | | | | | |
Collateral upon return of securities loaned | | | — | | | | 4,137,845 | | | | 2,089,760 | |
Accrued unitary management fees | | | 108,825 | | | | 34,512 | | | | 11,855 | |
| | | | | | | | | | | | |
Total liabilities | | | 108,825 | | | | 4,172,361 | | | | 2,101,615 | |
| | | | | | | | | | | | |
| Net Assets | | $ | 335,498,719 | | | $ | 105,892,951 | | | $ | 36,287,300 | |
| | | | | | | | | | | | |
| | | |
| Net assets consist of: | | | | | | | | | | | | |
Shares of beneficial interest | | $ | 326,213,546 | | | $ | 118,398,990 | | | $ | 51,605,276 | |
Distributable earnings. | | | 9,285,173 | | | | (12,506,039 | ) | | | (15,317,976 | ) |
| | | | | | | | | | | | |
| Net Assets | | $ | 335,498,719 | | | $ | 105,892,951 | | | $ | 36,287,300 | |
| | | | | | | | | | | | |
Shares outstanding (unlimited amount authorized, $0.01 par value) | | | 3,450,000 | | | | 1,600,000 | | | | 650,000 | |
Net asset value | | $ | 97.25 | | | $ | 66.18 | | | $ | 55.83 | |
| | | | | | | | | | | | |
Market price | | $ | 97.23 | | | $ | 66.19 | | | $ | 55.63 | |
| | | | | | | | | | | | |
Unaffiliated investments in securities, at cost | | $ | 301,431,586 | | | $ | 100,097,368 | | | $ | 36,278,550 | |
| | | | | | | | | | | | |
Affiliated investments in securities, at cost | | $ | 55,729 | | | $ | 4,164,594 | | | $ | 2,186,172 | |
| | | | | | | | | | | | |
(a)Includes securities on loan with an aggregate value of. | | $ | — | | | $ | 4,027,159 | | | $ | 2,002,751 | |
| | | | | | | | | | | | |
See accompanying Notes to Financial Statements which are an integral part of the financial statements.
(This Page Intentionally Left Blank)
Statements of Operations
For the year ended April 30, 2019
| | | | | | | | | | | | | | | | |
| | | Invesco S&P 500®
Equal Weight
ETF (RSP) | | | Invesco S&P 500®
Equal Weight
Communication Services
ETF (EWCO)(a) | | | Invesco S&P 500®
Equal Weight
Consumer Discretionary
ETF (RCD) | | | Invesco S&P 500®
Equal Weight
Consumer Staples
ETF (RHS) | |
| Investment income: | | | | | | | | | | | | | | | | |
Unaffiliated dividend income | | $ | 291,042,845 | | | $ | 79,438 | | | $ | 1,857,077 | | | $ | 12,235,722 | |
Affiliated dividend income | | | 1,730,890 | | | | 175 | | | | 1,480 | | | | 8,905 | |
Securities lending income | | | 254,718 | | | | 4 | | | | 1,773 | | | | 13,900 | |
Foreign witholding tax | | | (681 | ) | | | — | | | | — | | | | — | |
| | | | | | | | | | | | | | | | |
Total investment income | | | 293,027,772 | | | | 79,617 | | | | 1,860,330 | | | | 12,258,527 | |
| | | | | | | | | | | | | | | | |
| | | | |
| Expenses: | | | | | | | | | | | | | | | | |
Unitary management fees | | | 30,141,548 | | | | 17,367 | | | | 401,110 | | | | 1,836,074 | |
Other expenses | | | 2,583 | | | | — | | | | 640 | | | | — | |
| | | | | | | | | | | | | | | | |
Total expenses | | | 30,144,131 | | | | 17,367 | | | | 401,750 | | | | 1,836,074 | |
| | | | | | | | | | | | | | | | |
Less: Waivers | | | (21,448 | ) | | | (15 | ) | | | (131 | ) | | | (688 | ) |
| | | | | | | | | | | | | | | | |
Net expenses | | | 30,122,683 | | | | 17,352 | | | | 401,619 | | | | 1,835,386 | |
| | | | | | | | | | | | | | | | |
Net investment income | | | 262,905,089 | | | | 62,265 | | | | 1,458,711 | | | | 10,423,141 | |
| | | | | | | | | | | | | | | | |
| | | | |
| Realized and unrealized gain (loss) from: | | | | | | | | | | | | | | | | |
Net realized gain (loss) from: | | | | | | | | | | | | | | | | |
Unaffiliated investment securities | | | (376,581,886 | ) | | | (25,573 | ) | | | (5,049,781 | ) | | | (18,204,936 | ) |
Affiliated investment securities | | | (1,265,573 | ) | | | — | | | | — | | | | — | |
Unaffiliatedin-kind redemptions | | | 1,262,019,541 | | | | 934,671 | | | | 9,008,978 | | | | 33,162,152 | |
Affiliatedin-kind redemptions | | | (97,405 | ) | | | — | | | | — | | | | — | |
| | | | | | | | | | | | | | | | |
Net realized gain (loss) | | | 884,074,677 | | | | 909,098 | | | | 3,959,197 | | | | 14,957,216 | |
| | | | | | | | | | | | | | | | |
Change in net unrealized appreciation (depreciation) of: | | | | | | | | | | | | | | | | |
Unaffiliated investment securities | | | 304,460,363 | | | | 653,153 | | | | 2,541,435 | | | | 18,516,498 | |
Affiliated investment securities | | | (4,803,680 | ) | | | — | | | | — | | | | — | |
| | | | | | | | | | | | | | | | |
Change in unrealized appreciation (depreciation) | | | 299,656,683 | | | | 653,153 | | | | 2,541,435 | | | | 18,516,498 | |
| | | | | | | | | | | | | | | | |
Net realized and unrealized gain (loss) | | | 1,183,731,360 | | | | 1,562,251 | | | | 6,500,632 | | | | 33,473,714 | |
| | | | | | | | | | | | | | | | |
Net increase (decrease) in net assets resulting from operations | | $ | 1,446,636,449 | | | $ | 1,624,516 | | | $ | 7,959,343 | | | $ | 43,896,855 | |
| | | | | | | | | | | | | | | | |
| (a) | For the period November 5, 2018 (commencement of investment operations) through April 30, 2019. |
See accompanying Notes to Financial Statements which are an integral part of the financial statements.
| | | | | | | | | | | | | | | | | | | | | | | | | | |
Invesco S&P 500®
Equal Weight
Energy
ETF (RYE) | | | Invesco S&P 500®
Equal Weight
Financials
ETF (RYF) | | | Invesco S&P 500®
Equal Weight
Health Care
ETF (RYH) | | | Invesco S&P 500®
Equal Weight
Industrials
ETF (RGI) | | | Invesco S&P 500®
Equal Weight
Materials
ETF (RTM) | | | Invesco S&P 500®
Equal Weight
Real Estate
ETF (EWRE) | | | Invesco S&P 500®
Equal Weight
Technology
ETF (RYT) | |
| | | | | | | | | | | | | | | | | | | | | | | | | | |
| $ | 4,662,203 | | | $ | 7,784,986 | | | $ | 6,429,215 | | | $ | 4,036,133 | | | $ | 3,066,973 | | | $ | 603,231 | | | $ | 22,832,871 | |
| | 3,289 | | | | 270,950 | | | | 8,221 | | | | 3,242 | | | | 2,945 | | | | 447 | | | | 17,873 | |
| | 55 | | | | 707 | | | | 48,817 | | | | 282 | | | | 1,156 | | | | — | | | | 2,529 | |
| | — | | | | — | | | | — | | | | — | | | | — | | | | — | | | | (1,065 | ) |
| | | | | | | | | | | | | | | | | | | | | | | | | | |
| | 4,665,547 | | | | 8,056,643 | | | | 6,486,253 | | | | 4,039,657 | | | | 3,071,074 | | | | 603,678 | | | | 22,852,208 | |
| | | | | | | | | | | | | | | | | | | | | | | | | | |
| | | | | | |
| | | | | | | | | | | | | | | | | | | | | | | | | | |
| | 1,003,847 | | | | 1,424,975 | | | | 2,736,345 | | | | 957,516 | | | | 586,922 | | | | 84,354 | | | | 6,642,171 | |
| | — | | | | — | | | | — | | | | — | | | | — | | | | — | | | | — | |
| | | | | | | | | | | | | | | | | | | | | | | | | | |
| | 1,003,847 | | | | 1,424,975 | | | | 2,736,345 | | | | 957,516 | | | | 586,922 | | | | 84,354 | | | | 6,642,171 | |
| | | | | | | | | | | | | | | | | | | | | | | | | | |
| | (289 | ) | | | (595 | ) | | | (656 | ) | | | (290 | ) | | | (228 | ) | | | (34 | ) | | | (1,574 | ) |
| | | | | | | | | | | | | | | | | | | | | | | | | | |
| | 1,003,558 | | | | 1,424,380 | | | | 2,735,689 | | | | 957,226 | | | | 586,694 | | | | 84,320 | | | | 6,640,597 | |
| | | | | | | | | | | | | | | | | | | | | | | | | | |
| | 3,661,989 | | | | 6,632,263 | | | | 3,750,564 | | | | 3,082,431 | | | | 2,484,380 | | | | 519,358 | | | | 16,211,611 | |
| | | | | | | | | | | | | | | | | | | | | | | | | | |
| | | | | | |
| | | | | | | | | | | | | | | | | | | | | | | | | | |
| | | | | | | | | | | | | | | | | | | | | | | | | | |
| | (26,541,761 | ) | | | (6,459,574 | ) | | | (6,466,878 | ) | | | (9,666,799 | ) | | | (2,937,764 | ) | | | (135,603 | ) | | | (30,755,113 | ) |
| | — | | | | (86,833 | ) | | | — | | | | — | | | | — | | | | — | | | | — | |
| | 17,792,790 | | | | 21,884,255 | | | | 56,611,702 | | | | 14,914,940 | | | | (786,089 | ) | | | 854,438 | | | | 252,746,356 | |
| | — | | | | (185,206 | ) | | | — | | | | — | | | | — | | | | — | | | | — | |
| | | | | | | | | | | | | | | | | | | | | | | | | | |
| | (8,748,971 | ) | | | 15,152,642 | | | | 50,144,824 | | | | 5,248,141 | | | | (3,723,853 | ) | | | 718,835 | | | | 221,991,243 | |
| | | | | | | | | | | | | | | | | | | | | | | | | | |
| | | | | | | | | | | | | | | | | | | | | | | | | | |
| | (35,709,100 | ) | | | (27,761,395 | ) | | | (6,705,939 | ) | | | 9,169,704 | | | | 3,621,001 | | | | 2,242,570 | | | | 67,176,950 | |
| | — | | | | (1,355,937 | ) | | | — | | | | — | | | | — | | | | — | | | | — | |
| | | | | | | | | | | | | | | | | | | | | | | | | | |
| | (35,709,100 | ) | | | (29,117,332 | ) | | | (6,705,939 | ) | | | 9,169,704 | | | | 3,621,001 | | | | 2,242,570 | | | | 67,176,950 | |
| | | | | | | | | | | | | | | | | | | | | | | | | | |
| | (44,458,071 | ) | | | (13,964,690 | ) | | | 43,438,885 | | | | 14,417,845 | | | | (102,852 | ) | | | 2,961,405 | | | | 289,168,193 | |
| | | | | | | | | | | | | | | | | | | | | | | | | | |
| $ | (40,796,082 | ) | | $ | (7,332,427 | ) | | $ | 47,189,449 | | | $ | 17,500,276 | | | $ | 2,381,528 | | | $ | 3,480,763 | | | $ | 305,379,804 | |
| | | | | | | | | | | | | | | | | | | | | | | | | | |
Statements of Operations(continued)
For the year ended April 30, 2019
| | | | | | | | | | | | |
| | | Invesco S&P 500®
Equal Weight
Utilities
ETF (RYU) | | | Invesco S&P
MidCap 400®
Equal Weight
ETF (EWMC) | | | Invesco S&P
SmallCap 600®
Equal Weight
ETF (EWSC) | |
| Investment income: | | | | | | | | | | | | |
Unaffiliated dividend income | | $ | 7,275,872 | | | $ | 1,617,251 | | | $ | 512,034 | |
Affiliated dividend income | | | 3,867 | | | | 1,346 | | | | 6,769 | |
Securities lending income | | | 738 | | | | 5,342 | | | | 18,008 | |
Foreign witholding tax | | | — | | | | (969 | ) | | | (137 | ) |
| | | | | | | | | | | | |
Total investment income | | | 7,280,477 | | | | 1,622,970 | | | | 536,674 | |
| | | | | | | | | | | | |
| | | |
| Expenses: | | | | | | | | | | | | |
Unitary management fees | | | 866,815 | | | | 407,610 | | | | 148,410 | |
| | | | | | | | | | | | |
Less: Waivers | | | (333 | ) | | | (118 | ) | | | (32 | ) |
| | | | | | | | | | | | |
Net expenses | | | 866,482 | | | | 407,492 | | | | 148,378 | |
| | | | | | | | | | | | |
Net investment income | | | 6,413,995 | | | | 1,215,478 | | | | 388,296 | |
| | | | | | | | | | | | |
| | | |
| Realized and unrealized gain (loss) from: | | | | | | | | | | | | |
Net realized gain (loss) from: | | | | | | | | | | | | |
Unaffiliated investment securities | | | (15,085,794 | ) | | | (2,600,607 | ) | | | (1,111,459 | ) |
Affiliated investment securities | | | — | | | | — | | | | (2,551 | ) |
Unaffiliatedin-kind redemptions | | | 9,859,547 | | | | 5,445,925 | | | | 860,306 | |
Affiliatedin-kind redemptions | | | — | | | | — | | | | (492 | ) |
| | | | | | | | | | | | |
Net realized gain (loss) | | | (5,226,247 | ) | | | 2,845,318 | | | | (254,196 | ) |
| | | | | | | | | | | | |
Change in net unrealized appreciation (depreciation) of: | | | | | | | | | | | | |
Unaffiliated investment securities | | | 38,279,021 | | | | 2,191,849 | | | | (427,961 | ) |
Affiliated investment securities | | | — | | | | — | | | | 1,826 | |
| | | | | | | | | | | | |
Change in unrealized appreciation (depreciation) | | | 38,279,021 | | | | 2,191,849 | | | | (426,135 | ) |
| | | | | | | | | | | | |
Net realized and unrealized gain (loss) | | | 33,052,774 | | | | 5,037,167 | | | | (680,331 | ) |
| | | | | | | | | | | | |
Net increase (decrease) in net assets resulting from operations | | $ | 39,466,769 | | | $ | 6,252,645 | | | $ | (292,035 | ) |
| | | | | | | | | | | | |
See accompanying Notes to Financial Statements which are an integral part of the financial statements.
(This Page Intentionally Left Blank)
Statements of Changes in Net Assets
For the year ended April 30, 2019 and period November 1, 2017 through April 30, 2018 and the year ended October 31, 2017
| | | | | | | | | | | | |
| | | Invesco S&P 500®Equal Weight
ETF (RSP) | |
| | | Year Ended
April 30, 2019 | | | Six Months Ended
April 30, 2018 | | | Year Ended
October 31, 2017 | |
| Operations: | | | | | | | | | | | | |
Net investment income | | $ | 262,905,089 | | | $ | 124,625,608 | | | $ | 196,447,136 | |
Net realized gain (loss) | | | 884,074,677 | | | | 366,229,700 | | | | 509,941,400 | |
Change in net unrealized appreciation | | | 299,656,683 | | | | 130,889,396 | | | | 1,513,147,427 | |
| | | | | | | | | | | | |
Net increase in net assets resulting from operations | | | 1,446,636,449 | | | | 621,744,704 | | | | 2,219,535,963 | |
| | | | | | | | | | | | |
| | | |
| Distributions to Shareholders from: | | | | | | | | | | | | |
Distributable earnings | | | (281,738,317 | ) | | | (132,095,127 | ) | | | (179,124,293 | ) |
| | | | | | | | | | | | |
| | | |
| Shareholder Transactions: | | | | | | | | | | | | |
Proceeds from shares sold | | | 3,919,384,246 | | | | 756,582,872 | | | | 3,882,548,954 | |
Value of shares repurchased | | | (3,556,378,815 | ) | | | (856,800,328 | ) | | | (1,656,006,406 | ) |
| | | | | | | | | | | | |
Net increase (decrease) in net assets resulting from share transactions | | | 363,005,431 | | | | (100,217,456 | ) | | | 2,226,542,548 | |
| | | | | | | | | | | | |
Net increase in net assets | | | 1,527,903,563 | | | | 389,432,121 | | | | 4,266,954,218 | |
| | | | | | | | | | | | |
| | | |
| Net assets: | | | | | | | | | | | | |
Beginning of period | | | 14,616,056,957 | | | | 14,226,624,836 | | | | 9,959,670,618 | |
| | | | | | | | | | | | |
End of period | | $ | 16,143,960,520 | | | $ | 14,616,056,957 | | | $ | 14,226,624,836 | |
| | | | | | | | | | | | |
| | | |
| Changes in Shares Outstanding: | | | | | | | | | | | | |
Shares sold | | | 38,250,000 | | | | 7,500,000 | | | | 43,350,000 | |
Shares repurchased | | | (35,400,000 | ) | | | (8,450,000 | ) | | | (18,150,000 | ) |
Shares outstanding, beginning of period | | | 146,352,663 | | | | 147,302,663 | | | | 122,102,663 | |
| | | | | | | | | | | | |
Shares outstanding, end of period | | | 149,202,663 | | | | 146,352,663 | | | | 147,302,663 | |
| | | | | | | | | | | | |
| (a) | For the period November 5, 2018 (commencement of investment operations) through April 30, 2019. |
See accompanying Notes to Financial Statements which are an integral part of the financial statements.
| | | | | | | | | | | | | | |
Invesco S&P 500® Equal Weight
Communication Services ETF (EWCO) | | | Invesco S&P 500®Equal Weight
Consumer Discretionary ETF (RCD) | |
Period Ended
April 30, 2019(a) | | | Year Ended
April 30, 2019 | | | Six Months Ended
April 30, 2018 | | | Year Ended
October 31, 2017 | |
| | | | | | | | | | | | | | |
| $ | 62,265 | | | $ | 1,458,711 | | | $ | 569,462 | | | $ | 1,135,473 | |
| | 909,098 | | | | 3,959,197 | | | | 1,845,837 | | | | (1,620,433 | ) |
| | 653,153 | | | | 2,541,435 | | | | 2,973,752 | | | | 6,533,651 | |
| | | | | | | | | | | | | | |
| | 1,624,516 | | | | 7,959,343 | | | | 5,389,051 | | | | 6,048,691 | |
| | | | | | | | | | | | | | |
| | | |
| | | | | | | | | | | | | | |
| | (28,476 | ) | | | (1,507,788 | ) | | | (601,330 | ) | | | (1,160,323 | ) |
| | | | | | | | | | | | | | |
| | | |
| | | | | | | | | | | | | | |
| | 34,174,882 | | | | 103,317,979 | | | | 31,018,111 | | | | 27,144,099 | |
| | (12,920,195 | ) | | | (80,808,929 | ) | | | (24,492,220 | ) | | | (27,390,480 | ) |
| | | | | | | | | | | | | | |
| | 21,254,687 | | | | 22,509,050 | | | | 6,525,891 | | | | (246,381 | ) |
| | | | | | | | | | | | | | |
| | 22,850,727 | | | | 28,960,605 | | | | 11,313,612 | | | | 4,641,987 | |
| | | | | | | | | | | | | | |
| | | |
| | | | | | | | | | | | | | |
| | — | | | | 84,278,836 | | | | 72,965,224 | | | | 68,323,237 | |
| | | | | | | | | | | | | | |
| $ | 22,850,727 | | | $ | 113,239,441 | | | $ | 84,278,836 | | | $ | 72,965,224 | |
| | | | | | | | | | | | | | |
| | | |
| | | | | | | | | | | | | | |
| | 1,450,001 | | | | 1,000,000 | | | | 300,000 | | | | 300,000 | |
| | (550,000 | ) | | | (800,000 | ) | | | (250,000 | ) | | | (300,000 | ) |
| | — | | | | 850,000 | | | | 800,000 | | | | 800,000 | |
| | | | | | | | | | | | | | |
| | 900,001 | | | | 1,050,000 | | | | 850,000 | | | | 800,000 | |
| | | | | | | | | | | | | | |
Statements of Changes in Net Assets(continued)
For the year ended April 30, 2019 and period November 1, 2017 through April 30, 2018 and the year ended October 31, 2017
| | | | | | | | | | | | |
| | | Invesco S&P 500®Equal Weight
Consumer Staples ETF (RHS) | |
| | | Year Ended
April 30, 2019 | | | Six Months Ended
April 30, 2018 | | | Year Ended
October 31, 2017 | |
| Operations: | | | | | | | | | | | | |
Net investment income | | $ | 10,423,141 | | | $ | 4,718,708 | | | $ | 9,533,859 | |
Net realized gain (loss) | | | 14,957,216 | | | | 5,003,557 | | | | 20,301,445 | |
Change in net unrealized appreciation (depreciation) | | | 18,516,498 | | | | (919,528 | ) | | | (22,537,500 | ) |
| | | | | | | | | | | | |
Net increase (decrease) in net assets resulting from operations | | | 43,896,855 | | | | 8,802,737 | | | | 7,297,804 | |
| | | | | | | | | | | | |
| | | |
| Distributions to Shareholders from: | | | | | | | | | | | | |
Distributable earnings | | | (11,042,415 | ) | | | (4,600,825 | ) | | | (9,494,388 | ) |
| | | | | | | | | | | | |
| | | |
| Shareholder Transactions: | | | | | | | | | | | | |
Proceeds from shares sold | | | 279,942,417 | | | | 66,157,576 | | | | 149,237,362 | |
Value of shares repurchased | | | (298,713,392 | ) | | | (96,698,320 | ) | | | (316,609,508 | ) |
| | | | | | | | | | | | |
Net increase (decrease) in net assets resulting from share transactions | | | (18,770,975 | ) | | | (30,540,744 | ) | | | (167,372,146 | ) |
| | | | | | | | | | | | |
Net increase (decrease) in net assets | | | 14,083,465 | | | | (26,338,832 | ) | | | (169,568,730 | ) |
| | | | | | | | | | | | |
| | | |
| Net assets: | | | | | | | | | | | | |
Beginning of period | | | 417,753,042 | | | | 444,091,874 | | | | 613,660,604 | |
| | | | | | | | | | | | |
End of period | | $ | 431,836,507 | | | $ | 417,753,042 | | | $ | 444,091,874 | |
| | | | | | | | | | | | |
| | | |
| Changes in Shares Outstanding: | | | | | | | | | | | | |
Shares sold | | | 2,200,000 | | | | 500,000 | | | | 1,200,000 | |
Shares repurchased | | | (2,400,000 | ) | | | (750,000 | ) | | | (2,600,000 | ) |
Shares outstanding, beginning of period | | | 3,400,000 | | | | 3,650,000 | | | | 5,050,000 | |
| | | | | | | | | | | | |
Shares outstanding, end of period | | | 3,200,000 | | | | 3,400,000 | | | | 3,650,000 | |
| | | | | | | | | | | | |
See accompanying Notes to Financial Statements which are an integral part of the financial statements.
| | | | | | | | | | | | | | | | | | | | | | |
Invesco S&P 500®Equal Weight
Energy ETF (RYE) | | | Invesco S&P 500®Equal Weight
Financials ETF (RYF) | |
Year Ended
April 30, 2019 | | | Six Months Ended
April 30, 2018 | | | Year Ended
October 31, 2017 | | | Year Ended
April 30, 2019 | | | Six Months Ended
April 30, 2018 | | | Year Ended
October 31, 2017 | |
| | | | | | | | | | | | | | | | | | | | | | |
| $ | 3,661,989 | | | $ | 2,177,027 | | | $ | 5,177,069 | | | $ | 6,632,263 | | | $ | 3,692,009 | | | $ | 4,649,290 | |
| | (8,748,971 | ) | | | 350,972 | | | | 1,826,342 | | | | 15,152,642 | | | | 15,706,492 | | | | 29,673,559 | |
| | (35,709,100 | ) | | | 23,727,402 | | | | (18,258,580 | ) | | | (29,117,332 | ) | | | (2,059,908 | ) | | | 34,101,728 | |
| | | | | | | | | | | | | | | | | | | | | | |
| | (40,796,082 | ) | | | 26,255,401 | | | | (11,255,169 | ) | | | (7,332,427 | ) | | | 17,338,593 | | | | 68,424,577 | |
| | | | | | | | | | | | | | | | | | | | | | |
| | | | | |
| | | | | | | | | | | | | | | | | | | | | | |
| | (4,181,660 | ) | | | (2,040,302 | ) | | | (5,194,156 | ) | | | (7,699,405 | ) | | | (3,026,800 | ) | | | (4,369,545 | ) |
| | | | | | | | | | | | | | | | | | | | | | |
| | | | | |
| | | | | | | | | | | | | | | | | | | | | | |
| | 276,270,674 | | | | 56,131,454 | | | | 166,387,004 | | | | 84,986,669 | | | | 146,094,808 | | | | 396,942,732 | |
| | (274,672,264 | ) | | | (57,891,483 | ) | | | (118,354,186 | ) | | | (220,368,652 | ) | | | (77,344,020 | ) | | | (217,151,515 | ) |
| | | | | | | | | | | | | | | | | | | | | | |
| | 1,598,410 | | | | (1,760,029 | ) | | | 48,032,818 | | | | (135,381,983 | ) | | | 68,750,788 | | | | 179,791,217 | |
| | | | | | | | | | | | | | | | | | | | | | |
| | (43,379,332 | ) | | | 22,455,070 | | | | 31,583,493 | | | | (150,413,815 | ) | | | 83,062,581 | | | | 243,846,249 | |
| | | | | | | | | | | | | | | | | | | | | | |
| | | | | |
| | | | | | | | | | | | | | | | | | | | | | |
| | 253,202,221 | | | | 230,747,151 | | | | 199,163,658 | | | | 441,558,329 | | | | 358,495,748 | | | | 114,649,499 | |
| | | | | | | | | | | | | | | | | | | | | | |
| $ | 209,822,889 | | | $ | 253,202,221 | | | $ | 230,747,151 | | | $ | 291,144,514 | | | $ | 441,558,329 | | | $ | 358,495,748 | |
| | | | | | | | | | | | | | | | | | | | | | |
| | | | | |
| | | | | | | | | | | | | | | | | | | | | | |
| | 4,700,000 | | | | 950,000 | | | | 2,800,000 | | | | 2,000,000 | | | | 3,250,000 | | | | 10,650,000 | |
| | (4,850,000 | ) | | | (1,000,000 | ) | | | (2,050,000 | ) | | | (5,400,000 | ) | | | (1,750,000 | ) | | | (5,750,000 | ) |
| | 4,200,005 | | | | 4,250,005 | | | | 3,500,005 | | | | 10,050,000 | | | | 8,550,000 | | | | 3,650,000 | |
| | | | | | | | | | | | | | | | | | | | | | |
| | 4,050,005 | | | | 4,200,005 | | | | 4,250,005 | | | | 6,650,000 | | | | 10,050,000 | | | | 8,550,000 | |
| | | | | | | | | | | | | | | | | | | | | | |
Statements of Changes in Net Assets(continued)
For the year ended April 30, 2019 and period November 1, 2017 through April 30, 2018 and the year ended October 31, 2017
| | | | | | | | | | | | |
| | | Invesco S&P 500®Equal Weight
Health Care ETF (RYH) | |
| | | Year Ended
April 30, 2019 | | | Six Months Ended
April 30, 2018 | | | Year Ended
October 31, 2017 | |
| Operations: | | | | | | | | | | | | |
Net investment income | | $ | 3,750,564 | | | $ | 1,611,353 | | | $ | 2,763,505 | |
Net realized gain (loss) | | | 50,144,824 | | | | 23,620,380 | | | | 14,435,025 | |
Change in net unrealized appreciation (depreciation) | | | (6,705,939 | ) | | | (10,570,420 | ) | | | 94,082,455 | |
| | | | | | | | | | | | |
Net increase (decrease) in net assets resulting from operations | | | 47,189,449 | | | | 14,661,313 | | | | 111,280,985 | |
| | | | | | | | | | | | |
| | | |
| Distributions to Shareholders from: | | | | | | | | | | | | |
Distributable earnings | | | (3,834,753 | ) | | | (1,620,790 | ) | | | (2,631,245 | ) |
| | | | | | | | | | | | |
| | | |
| Shareholder Transactions: | | | | | | | | | | | | |
Proceeds from shares sold | | | 261,569,215 | | | | 54,560,345 | | | | 216,349,448 | |
Value of shares repurchased | | | (196,990,256 | ) | | | (119,306,978 | ) | | | (148,875,500 | ) |
| | | | | | | | | | | | |
Net increase (decrease) in net assets resulting from share transactions | | | 64,578,959 | | | | (64,746,633 | ) | | | 67,473,948 | |
| | | | | | | | | | | | |
Net increase (decrease) in net assets | | | 107,933,655 | | | | (51,706,110 | ) | | | 176,123,688 | |
| | | | | | | | | | | | |
| | | |
| Net assets: | | | | | | | | | | | | |
Beginning of period | | | 598,911,343 | | | | 650,617,453 | | | | 474,493,765 | |
| | | | | | | | | | | | |
End of period | | $ | 706,844,998 | | | $ | 598,911,343 | | | $ | 650,617,453 | |
| | | | | | | | | | | | |
| | | |
| Changes in Shares Outstanding: | | | | | | | | | | | | |
Shares sold | | | 1,350,000 | | | | 300,000 | | | | 1,300,000 | |
Shares repurchased | | | (1,050,000 | ) | | | (650,000 | ) | | | (900,000 | ) |
Shares outstanding, beginning of period | | | 3,350,000 | | | | 3,700,000 | | | | 3,300,000 | |
| | | | | | | | | | | | |
Shares outstanding, end of period | | | 3,650,000 | | | | 3,350,000 | | | | 3,700,000 | |
| | | | | | | | | | | | |
See accompanying Notes to Financial Statements which are an integral part of the financial statements.
| | | | | | | | | | | | | | | | | | | | | | |
Invesco S&P 500®Equal Weight
Industrials ETF (RGI) | | | Invesco S&P 500®Equal Weight
Materials ETF (RTM) | |
Year Ended
April 30, 2019 | | | Six Months Ended
April 30, 2018 | | | Year Ended
October 31, 2017 | | | Year Ended
April 30, 2019 | | | Six Months Ended
April 30, 2018 | | | Year Ended
October 31, 2017 | |
| | | | | | | | | | | | | | | | | | | | | | |
| $ | 3,082,431 | | | $ | 1,421,619 | | | $ | 2,255,750 | | | $ | 2,484,380 | | | $ | 1,514,808 | | | $ | 2,191,919 | |
| | 5,248,141 | | | | 19,761,417 | | | | 15,306,071 | | | | (3,723,853 | ) | | | 21,887,445 | | | | 9,700,540 | |
| | 9,169,704 | | | | (19,293,244 | ) | | | 19,430,465 | | | | 3,621,001 | | | | (28,704,634 | ) | | | 21,833,761 | |
| | | | | | | | | | | | | | | | | | | | | | |
| | 17,500,276 | | | | 1,889,792 | | | | 36,992,286 | | | | 2,381,528 | | | | (5,302,381 | ) | | | 33,726,220 | |
| | | | | | | | | | | | | | | | | | | | | | |
| | | | | |
| | | | | | | | | | | | | | | | | | | | | | |
| | (3,156,072 | ) | | | (1,408,275 | ) | | | (2,570,293 | ) | | | (2,650,226 | ) | | | (1,376,220 | ) | | | (2,126,922 | ) |
| | | | | | | | | | | | | | | | | | | | | | |
| | | | | |
| | | | | | | | | | | | | | | | | | | | | | |
| | 132,418,296 | | | | 145,766,213 | | | | 172,708,806 | | | | 48,609,682 | | | | 170,322,861 | | | | 174,633,878 | |
| | (182,774,836 | ) | | | (91,069,129 | ) | | | (107,834,685 | ) | | | (99,339,316 | ) | | | (176,938,428 | ) | | | (96,676,433 | ) |
| | | | | | | | | | | | | | | | | | | | | | |
| | (50,356,540 | ) | | | 54,697,084 | | | | 64,874,121 | | | | (50,729,634 | ) | | | (6,615,567 | ) | | | 77,957,445 | |
| | | | | | | | | | | | | | | | | | | | | | |
| | (36,012,336 | ) | | | 55,178,601 | | | | 99,296,114 | | | | (50,998,332 | ) | | | (13,294,168 | ) | | | 109,556,743 | |
| | | | | | | | | | | | | | | | | | | | | | |
| | | | | |
| | | | | | | | | | | | | | | | | | | | | | |
| | 281,762,606 | | | | 226,584,005 | | | | 127,287,891 | | | | 180,725,901 | | | | 194,020,069 | | | | 84,463,326 | |
| | | | | | | | | | | | | | | | | | | | | | |
| $ | 245,750,270 | | | $ | 281,762,606 | | | $ | 226,584,005 | | | $ | 129,727,569 | | | $ | 180,725,901 | | | $ | 194,020,069 | |
| | | | | | | | | | | | | | | | | | | | | | |
| | | | | |
| | | | | | | | | | | | | | | | | | | | | | |
| | 1,100,000 | | | | 1,200,000 | | | | 1,650,000 | | | | 450,000 | | | | 1,500,000 | | | | 1,800,000 | |
| | (1,600,000 | ) | | | (750,000 | ) | | | (1,050,000 | ) | | | (950,000 | ) | | | (1,600,000 | ) | | | (1,000,000 | ) |
| | 2,450,000 | | | | 2,000,000 | | | | 1,400,000 | | | | 1,700,000 | | | | 1,800,000 | | | | 1,000,000 | |
| | | | | | | | | | | | | | | | | | | | | | |
| | 1,950,000 | | | | 2,450,000 | | | | 2,000,000 | | | | 1,200,000 | | | | 1,700,000 | | | | 1,800,000 | |
| | | | | | | | | | | | | | | | | | | | | | |
Statements of Changes in Net Assets(continued)
For the year ended April 30, 2019 and period November 1, 2017 through April 30, 2018 and the year ended October 31, 2017
| | | | | | | | | | | | |
| | | Invesco S&P 500®Equal Weight
Real Estate ETF (EWRE) | |
| | | Year Ended
April 30, 2019 | | | Six Months Ended
April 30, 2018 | | | Year Ended
October 31, 2017 | |
| Operations: | | | | | | | | | | | | |
Net investment income | | $ | 519,358 | | | $ | 330,349 | | | $ | 567,825 | |
Net realized gain (loss) | | | 718,835 | | | | 453,682 | | | | 431,120 | |
Change in net unrealized appreciation (depreciation) | | | 2,242,570 | | | | (1,204,302 | ) | | | 1,214,032 | |
| | | | | | | | | | | | |
Net increase (decrease) in net assets resulting from operations | | | 3,480,763 | | | | (420,271 | ) | | | 2,212,977 | |
| | | | | | | | | | | | |
| | | |
| Distributions to Shareholders from: | | | | | | | | | | | | |
Distributable earnings | | | (702,345 | ) | | | (512,165 | ) | | | (723,609 | ) |
| | | | | | | | | | | | |
| | | |
| Shareholder Transactions: | | | | | | | | | | | | |
Proceeds from shares sold | | | 24,629,150 | | | | 2,719,647 | | | | 8,142,625 | |
Value of shares repurchased | | | (7,137,070 | ) | | | (9,475,945 | ) | | | (21,205,756 | ) |
| | | | | | | | | | | | |
Net increase (decrease) in net assets resulting from share transactions | | | 17,492,080 | | | | (6,756,298 | ) | | | (13,063,131 | ) |
| | | | | | | | | | | | |
Net increase (decrease) in net assets | | | 20,270,498 | | | | (7,688,734 | ) | | | (11,573,763 | ) |
| | | | | | | | | | | | |
| | | |
| Net assets: | | | | | | | | | | | | |
Beginning of period | | | 16,872,555 | | | | 24,561,289 | | | | 36,135,052 | |
| | | | | | | | | | | | |
End of period. | | $ | 37,143,053 | | | $ | 16,872,555 | | | $ | 24,561,289 | |
| | | | | | | | | | | | |
| | | |
| Changes in Shares Outstanding: | | | | | | | | | | | | |
Shares sold | | | 850,000 | | | | 100,000 | | | | 300,000 | |
Shares repurchased | | | (250,000 | ) | | | (350,000 | ) | | | (800,000 | ) |
Shares outstanding, beginning of period | | | 650,000 | | | | 900,000 | | | | 1,400,000 | |
| | | | | | | | | | | | |
Shares outstanding, end of period | | | 1,250,000 | | | | 650,000 | | | | 900,000 | |
| | | | | | | | | | | | |
See accompanying Notes to Financial Statements which are an integral part of the financial statements.
| | | | | | | | | | | | | | | | | | | | | | |
Invesco S&P 500®Equal Weight
Technology ETF (RYT) | | | Invesco S&P 500®Equal Weight
Utilities ETF (RYU) | |
Year Ended
April 30, 2019 | | | Six Months Ended
April 30, 2018 | | | Year Ended
October 31, 2017 | | | Year Ended
April 30, 2019 | | | Six Months Ended
April 30, 2018 | | | Year Ended
October 31, 2017 | |
| | | | | | | | | | | | | | | | | | | | | | |
| $ | 16,211,611 | | | $ | 5,950,610 | | | $ | 11,461,755 | | | $ | 6,413,995 | | | $ | 2,475,589 | | | $ | 5,596,410 | |
| | 221,991,243 | | | | 104,901,237 | | | | 126,729,919 | | | | (5,226,247 | ) | | | 1,266,209 | | | | 3,229,596 | |
| | 67,176,950 | | | | (21,563,864 | ) | | | 241,071,754 | | | | 38,279,021 | | | | (9,685,599 | ) | | | 10,680,671 | |
| | | | | | | | | | | | | | | | | | | | | | |
| | 305,379,804 | | | | 89,287,983 | | | | 379,263,428 | | | | 39,466,769 | | | | (5,943,801 | ) | | | 19,506,677 | |
| | | | | | | | | | | | | | | | | | | | | | |
| | | | | |
| | | | | | | | | | | | | | | | | | | | | | |
| | (16,781,040 | ) | | | (6,972,945 | ) | | | (10,382,861 | ) | | | (6,335,821 | ) | | | (2,707,230 | ) | | | (5,692,156 | ) |
| | | | | | | | | | | | | | | | | | | | | | |
| | | | | |
| | | | | | | | | | | | | | | | | | | | | | |
| | 784,103,342 | | | | 328,539,770 | | | | 720,005,127 | | | | 234,753,812 | | | | 22,134,653 | | | | 55,463,449 | |
| | (898,921,413 | ) | | | (305,622,050 | ) | | | (494,931,647 | ) | | | (71,819,651 | ) | | | (42,230,142 | ) | | | (111,962,567 | ) |
| | | | | | | | | | | | | | | | | | | | | | |
| | (114,818,071 | ) | | | 22,917,720 | | | | 225,073,480 | | | | 162,934,161 | | | | (20,095,489 | ) | | | (56,499,118 | ) |
| | | | | | | | | | | | | | | | | | | | | | |
| | 173,780,693 | | | | 105,232,758 | | | | 593,954,047 | | | | 196,065,109 | | | | (28,746,520 | ) | | | (42,684,597 | ) |
| | | | | | | | | | | | | | | | | | | | | | |
| | | | | |
| | | | | | | | | | | | | | | | | | | | | | |
| | 1,615,065,504 | | | | 1,509,832,746 | | | | 915,878,699 | | | | 139,433,610 | | | | 168,180,130 | | | | 210,864,727 | |
| | | | | | | | | | | | | | | | | | | | | | |
| $ | 1,788,846,197 | | | $ | 1,615,065,504 | | | $ | 1,509,832,746 | | | $ | 335,498,719 | | | $ | 139,433,610 | | | $ | 168,180,130 | |
| | | | | | | | | | | | | | | | | | | | | | |
| | | | | |
| | | | | | | | | | | | | | | | | | | | | | |
| | 4,800,000 | | | | 2,150,000 | | | | 5,950,000 | | | | 2,600,000 | | | | 250,000 | | | | 650,000 | |
| | (5,600,000 | ) | | | (2,050,000 | ) | | | (4,100,000 | ) | | | (800,000 | ) | | | (500,000 | ) | | | (1,350,000 | ) |
| | 10,700,000 | | | | 10,600,000 | | | | 8,750,000 | | | | 1,650,000 | | | | 1,900,000 | | | | 2,600,000 | |
| | | | | | | | | | | | | | | | | | | | | | |
| | 9,900,000 | | | | 10,700,000 | | | | 10,600,000 | | | | 3,450,000 | | | | 1,650,000 | | | | 1,900,000 | |
| | | | | | | | | | | | | | | | | | | | | | |
Statements of Changes in Net Assets(continued)
For the year ended April 30, 2019 and period November 1, 2017 through April 30, 2018 and the year ended October 31, 2017
| | | | | | | | | | | | |
| | | Invesco S&P MidCap 400®Equal Weight
ETF (EWMC) | |
| | | Year Ended
April 30, 2019 | | | Six Months Ended
April 30, 2018 | | | Year Ended
October 31, 2017 | |
| Operations: | | | | | | | | | | | | |
Net investment income | | $ | 1,215,478 | | | $ | 751,728 | | | $ | 1,189,109 | |
Net realized gain (loss) | | | 2,845,318 | | | | 9,731,230 | | | | 15,490,139 | |
Change in net unrealized appreciation (depreciation) | | | 2,191,849 | | | | (7,149,508 | ) | | | 3,665,557 | |
| | | | | | | | | | | | |
Net increase (decrease) in net assets resulting from operations | | | 6,252,645 | | | | 3,333,450 | | | | 20,344,805 | |
| | | | | | | | | | | | |
| | | |
| Distributions to Shareholders from: | | | | | | | | | | | | |
Distributable earnings. | | | (1,331,829 | ) | | | (818,160 | ) | | | (1,246,531 | ) |
| | | | | | | | | | | | |
| | | |
| Shareholder Transactions: | | | | | | | | | | | | |
Proceeds from shares sold | | | 13,112,375 | | | | 19,196,734 | | | | 55,894,493 | |
Value of shares repurchased. | | | (16,577,948 | ) | | | (31,966,258 | ) | | | (50,244,574 | ) |
| | | | | | | | | | | | |
Net increase (decrease) in net assets resulting from share transactions | | | (3,465,573 | ) | | | (12,769,524 | ) | | | 5,649,919 | |
| | | | | | | | | | | | |
Net increase (decrease) in net assets. | | | 1,455,243 | | | | (10,254,234 | ) | | | 24,748,193 | |
| | | | | | | | | | | | |
| | | |
| Net assets: | | | | | | | | | | | | |
Beginning of period | | | 104,437,708 | | | | 114,691,942 | | | | 89,943,749 | |
| | | | | | | | | | | | |
End of period. | | $ | 105,892,951 | | | $ | 104,437,708 | | | $ | 114,691,942 | |
| | | | | | | | | | | | |
| | | |
| Changes in Shares Outstanding: | | | | | | | | | | | | |
Shares sold | | | 200,000 | | | | 300,000 | | | | 950,000 | |
Shares repurchased | | | (250,000 | ) | | | (500,000 | ) | | | (850,000 | ) |
Shares outstanding, beginning of period | | | 1,650,000 | | | | 1,850,000 | | | | 1,750,000 | |
| | | | | | | | | | | | |
Shares outstanding, end of period | | | 1,600,000 | | | | 1,650,000 | | | | 1,850,000 | |
| | | | | | | | | | | | |
See accompanying Notes to Financial Statements which are an integral part of the financial statements.
| | | | | | | | | | |
Invesco S&P SmallCap 600®Equal Weight
ETF (EWSC) | |
Year Ended
April 30, 2019 | | | Six Months Ended
April 30, 2018 | | | Year Ended
October 31, 2017 | |
| | | | | | | | | | |
| $ | 388,296 | | | $ | 171,294 | | | $ | 321,015 | |
| | (254,196 | ) | | | 4,402,467 | | | | 6,705,770 | |
| | (426,135 | ) | | | (3,048,315 | ) | | | 908,558 | |
| | | | | | | | | | |
| | (292,035 | ) | | | 1,525,446 | | | | 7,935,343 | |
| | | | | | | | | | |
| | |
| | | | | | | | | | |
| | (314,960 | ) | | | (197,020 | ) | | | (296,001 | ) |
| | | | | | | | | | |
| | | | | | | | | | |
| | 12,080,100 | | | | 10,987,337 | | | | 12,419,932 | |
| | (5,393,393 | ) | | | (13,773,725 | ) | | | (22,371,710 | ) |
| | | | | | | | | | |
| | 6,686,707 | | | | (2,786,388 | ) | | | (9,951,778 | ) |
| | | | | | | | | | |
| | 6,079,712 | | | | (1,457,962 | ) | | | (2,312,436 | ) |
| | | | | | | | | | |
| | |
| | | | | | | | | | |
| | 30,207,588 | | | | 31,665,550 | | | | 33,977,986 | |
| | | | | | | | | | |
| $ | 36,287,300 | | | $ | 30,207,588 | | | $ | 31,665,550 | |
| | | | | | | | | | |
| | |
| | | | | | | | | | |
| | 200,000 | | | | 200,000 | | | | 250,000 | |
| | (100,000 | ) | | | (250,000 | ) | | | (450,000 | ) |
| | 550,000 | | | | 600,000 | | | | 800,000 | |
| | | | | | | | | | |
| | 650,000 | | | | 550,000 | | | | 600,000 | |
| | | | | | | | | | |
Financial Highlights
Invesco S&P 500®Equal Weight ETF (RSP)
| | | | | | | | | | | | | | | | | | | | | | | | |
| | | Year Ended
April 30, 2019 | | | Six Months Ended
April 30, 2018 | | | Years Ended October 31, | |
| | | 2017 | | | 2016 | | | 2015 | | | 2014 | |
| Per Share Operating Performance: | | | | | | | | | | | | | | | | | | | | | | | | |
Net asset value at beginning of period | | $ | 99.87 | | | $ | 96.58 | | | $ | 81.57 | | | $ | 78.71 | | | $ | 78.08 | | | $ | 67.94 | |
Net investment income(a) | | | 1.78 | | | | 0.85 | | | | 1.39 | | | | 1.31 | | | | 1.22 | | | | 1.09 | |
Net realized and unrealized gain on investments | | | 8.45 | | | | 3.33 | | | | 14.85 | | | | 2.78 | | | | 0.71 | | | | 10.13 | |
Total from investment operations | | | 10.23 | | | | 4.18 | | | | 16.24 | | | | 4.09 | | | | 1.93 | | | | 11.22 | |
Distributions to shareholders from: | | | | | | | | | | | | | | | | | | | | | | | | |
Net investment income | | | (1.90 | ) | | | (0.89 | ) | | | (1.23 | ) | | | (1.23 | ) | | | (1.30 | ) | | | (1.08 | ) |
Net asset value at end of period | | $ | 108.20 | | | $ | 99.87 | | | $ | 96.58 | | | $ | 81.57 | | | $ | 78.71 | | | $ | 78.08 | |
Market price at end of period(b) | | $ | 108.22 | | | $ | 99.92 | | | | | | | | | | | | | | | | | |
| Net Asset Value Total Return(c) | | | 10.45 | % | | | 4.30 | % | | | 19.98 | % | | | 5.24 | % | | | 2.49 | % | | | 16.60 | % |
| Market Price Total Return(c) | | | 10.43 | % | | | 4.36 | % | | | | | | | | | | | | | | | | |
| Ratios/Supplemental Data: | | | | | | | | | | | | | | | | | | | | | | | | |
Net assets at end of period (000’s omitted) | | $ | 16,143,961 | | | $ | 14,616,057 | | | $ | 14,226,625 | | | $ | 9,959,671 | | | $ | 9,799,542 | | | $ | 8,976,197 | |
Ratio to average net assets of: | | | | | | | | | | | | | | | | | | | | | | | | |
Expenses, after Waivers | | | 0.20 | % | | | 0.20 | %(d) | | | 0.33 | % | | | 0.40 | % | | | 0.40 | % | | | 0.40 | % |
Expenses, prior to Waivers | | | 0.20 | % | | | 0.20 | %(d) | | | 0.36 | % | | | 0.40 | % | | | 0.40 | % | | | 0.40 | % |
Net investment income, after Waivers | | | 1.74 | % | | | 1.69 | %(d) | | | 1.52 | % | | | 1.66 | % | | | 1.53 | % | | | 1.48 | % |
Portfolio turnover rate(e) | | | 19 | % | | | 9 | % | | | 21 | % | | | 22 | % | | | 22 | % | | | 18 | % |
| (a) | Based on average shares outstanding. |
| (b) | The mean between the last bid and ask prices. |
| (c) | Net asset value total return is calculated assuming an initial investment made at the net asset value at the beginning of the period, reinvestment of all dividends and distributions at net asset value during the period, and redemption on the last day of the period. Net asset value total return includes adjustments in accordance with accounting principles generally accepted in the United States of America and as such, the net asset value for financial reporting purposes and the returns based upon those net asset values may differ from the net asset value and returns for shareholder transactions. Market price total return is calculated assuming an initial investment made at the market price at the beginning of the period, reinvestment of all dividends and distributions at market price during the period, and sale at the market price on the last day of the period. Total investment returns calculated for a period of less than one year are not annualized. |
| (e) | Portfolio turnover rate is not annualized for periods less than one year, if applicable, and does not include securities received or delivered from processing creations or redemptions. |
See accompanying Notes to Financial Statements which are an integral part of the financial statements.
Financial Highlights(continued)
Invesco S&P 500®Equal Weight Communication Services ETF (EWCO)
| | | | |
| | | For the Period
November 5, 2018(a)
Through
April 30, 2019 | |
| Per Share Operating Performance: | | | | |
Net asset value at beginning of period | | $ | 25.00 | |
Net investment income(b) | | | 0.16 | |
Net realized and unrealized gain on investments | | | 0.33 | |
Total from investment operations | | | 0.49 | |
Distributions to shareholders from: | | | | |
Net investment income | | | (0.10 | ) |
Net asset value at end of period | | $ | 25.39 | |
Market price at end of period(c) | | $ | 25.41 | |
| Net Asset Value Total Return(d) | | | 2.04 | %(e) |
| Market Price Total Return(d) | | | 2.12 | %(e) |
| Ratios/Supplemental Data: | | | | |
Net assets at end of period (000’s omitted) | | $ | 22,851 | |
Ratio to average net assets of: | | | | |
Expenses | | | 0.40 | %(f) |
Net investment income | | | 1.42 | %(f) |
Portfolio turnover rate(g) | | | 10 | % |
| (a) | Commencement of investment operations. |
| (b) | Based on average shares outstanding. |
| (c) | The mean between the last bid and ask prices. |
| (d) | Net asset value total return is calculated assuming an initial investment made at the net asset value at the beginning of the period, reinvestment of all dividends and distributions at net asset value during the period, and redemption on the last day of the period. Net asset value total return includes adjustments in accordance with accounting principles generally accepted in the United States of America and as such, the net asset value for financial reporting purposes and the returns based upon those net asset values may differ from the net asset value and returns for shareholder transactions. Market price total return is calculated assuming an initial investment made at the market price at the beginning of the period, reinvestment of all dividends and distributions at market price during the period, and sale at the market price on the last day of the period. Total investment returns calculated for a period of less than one year are not annualized. |
| (e) | The net asset value total return from Fund Inception (November 7, 2018, the first day of trading on the exchange) to April 30, 2019 was 0.08%. The market price total return from Fund Inception to April 30, 2019 was 0.04%. |
| (g) | Portfolio turnover rate is not annualized for periods less than one year, if applicable, and does not include securities received or delivered from processing creations or redemptions. |
Invesco S&P 500® Equal Weight Consumer Discretionary ETF (RCD)
| | | | | | | | | | | | | | | | | | | | | | | | |
| | | Year Ended
April 30, 2019 | | | Six Months Ended
April 30, 2018 | | | Years Ended October 31, | |
| | | 2017 | | | 2016 | | | 2015 | | | 2014 | |
| Per Share Operating Performance: | | | | | | | | | | | | | | | | | | | | | | | | |
Net asset value at beginning of period | | $ | 99.15 | | | $ | 91.21 | | | $ | 85.40 | | | $ | 90.26 | | | $ | 82.76 | | | $ | 76.06 | |
Net investment income(a) | | | 1.49 | | | | 0.68 | | | | 1.27 | | | | 1.29 | | | | 1.15 | | | | 0.95 | |
Net realized and unrealized gain (loss) on investments. | | | 8.80 | | | | 7.98 | | | | 5.84 | | | | (4.96 | ) | | | 7.39 | | | | 6.67 | |
Total from investment operations | | | 10.29 | | | | 8.66 | | | | 7.11 | | | | (3.67 | ) | | | 8.54 | | | | 7.62 | |
Distributions to shareholders from: | | | | | | | | | | | | | | | | | | | | | | | | |
Net investment income | | | (1.59 | ) | | | (0.72 | ) | | | (1.30 | ) | | | (1.19 | ) | | | (1.04 | ) | | | (0.92 | ) |
Net asset value at end of period | | $ | 107.85 | | | $ | 99.15 | | | $ | 91.21 | | | $ | 85.40 | | | $ | 90.26 | | | $ | 82.76 | |
Market price at end of period(b) | | $ | 107.86 | | | $ | 99.13 | | | | | | | | | | | | | | | | | |
| Net Asset Value Total Return(c) | | | 10.58 | % | | | 9.49 | % | | | 8.32 | % | | | (4.07 | )% | | | 10.35 | % | | | 10.07 | % |
| Market Price Total Return(c) | | | 10.61 | % | | | 9.48 | % | | | | | | | | | | | | | | | | |
| Ratios/Supplemental Data: | | | | | | | | | | | | | | | | | | | | | | | | |
Net assets at end of period (000’s omitted) | | $ | 113,239 | | | $ | 84,279 | | | $ | 72,965 | | | $ | 68,323 | | | $ | 176,001 | | | $ | 86,897 | |
Ratio to average net assets of: | | | | | | | | | | | | | | | | | | | | | | | | |
Expenses | | | 0.40 | % | | | 0.40 | %(d) | | | 0.40 | % | | | 0.40 | % | | | 0.40 | % | | | 0.40 | % |
Net investment income | | | 1.45 | % | | | 1.38 | %(d) | | | 1.39 | % | | | 1.49 | % | | | 1.29 | % | | | 1.20 | % |
Portfolio turnover rate(e) | | | 30 | % | | | 13 | % | | | 29 | % | | | 30 | % | | | 23 | % | | | 22 | % |
| (a) | Based on average shares outstanding. |
| (b) | The mean between the last bid and ask prices. |
| (c) | Net asset value total return is calculated assuming an initial investment made at the net asset value at the beginning of the period, reinvestment of all dividends and distributions at net asset value during the period, and redemption on the last day of the period. Net asset value total return includes adjustments in accordance with accounting principles generally accepted in the United States of America and as such, the net asset value for financial reporting purposes and the returns based upon those net asset values may differ from the net asset value and returns for shareholder transactions. Market price total return is calculated assuming an initial investment made at the market price at the beginning of the period, reinvestment of all dividends and distributions at market price during the period, and sale at the market price on the last day of the period. Total investment returns calculated for a period of less than one year are not annualized. |
| (e) | Portfolio turnover rate is not annualized for periods less than one year, if applicable, and does not include securities received or delivered from processing creations or redemptions. |
See accompanying Notes to Financial Statements which are an integral part of the financial statements.
Financial Highlights(continued)
Invesco S&P 500® Equal Weight Consumer Staples ETF (RHS)
| | | | | | | | | | | | | | | | | | | | | | | | |
| | | Year Ended
April 30, 2019 | | | Six Months Ended
April 30, 2018 | | | Years Ended October 31, | |
| | | 2017 | | | 2016 | | | 2015 | | | 2014 | |
| Per Share Operating Performance: | | | | | | | | | | | | | | | | | | | | | | | | |
Net asset value at beginning of period | | $ | 122.87 | | | $ | 121.67 | | | $ | 121.52 | | | $ | 111.76 | | | $ | 100.75 | | | $ | 88.48 | |
Net investment income(a) | | | 2.87 | | | | 1.32 | | | | 2.30 | | | | 2.19 | | | | 2.08 | | | | 2.04 | |
Net realized and unrealized gain on investments | | | 12.30 | | | | 1.14 | | | | 0.13 | | | | 9.69 | | | | 10.86 | | | | 12.03 | |
Total from investment operations | | | 15.17 | | | | 2.46 | | | | 2.43 | | | | 11.88 | | | | 12.94 | | | | 14.07 | |
Distributions to shareholders from: | | | | | | | | | | | | | | | | | | | | | | | | |
Net investment income | | | (3.09 | ) | | | (1.26 | ) | | | (2.28 | ) | | | (2.12 | ) | | | (1.93 | ) | | | (1.80 | ) |
Net asset value at end of period | | $ | 134.95 | | | $ | 122.87 | | | $ | 121.67 | | | $ | 121.52 | | | $ | 111.76 | | | $ | 100.75 | |
Market price at end of period(b) | | $ | 134.97 | | | $ | 122.84 | | | | | | | | | | | | | | | | | |
| Net Asset Value Total Return(c) | | | 12.63 | % | | | 1.96 | % | | | 1.99 | % | | | 10.63 | % | | | 12.95 | % | | | 16.04 | % |
| Market Price Total Return(c) | | | 12.67 | % | | | 1.97 | % | | | | | | | | | | | | | | | | |
| Ratios/Supplemental Data: | | | | | | | | | | | | | | | | | | | | | | | | |
Net assets at end of period (000’s omitted) | | $ | 431,837 | | | $ | 417,753 | | | $ | 444,092 | | | $ | 613,661 | | | $ | 530,872 | | | $ | 186,382 | |
Ratio to average net assets of: | | | | | | | | | | | | | | | | | | | | | | | | |
Expenses | | | 0.40 | % | | | 0.40 | %(d) | | | 0.40 | % | | | 0.40 | % | | | 0.40 | % | | | 0.40 | % |
Net investment income | | | 2.27 | % | | | 2.06 | %(d) | | | 1.86 | % | | | 1.81 | % | | | 1.94 | % | | | 2.18 | % |
Portfolio turnover rate(e) | | | 19 | % | | | 9 | % | | | 20 | % | | | 17 | % | | | 16 | % | | | 20 | % |
| (a) | Based on average shares outstanding. |
| (b) | The mean between the last bid and ask prices. |
| (c) | Net asset value total return is calculated assuming an initial investment made at the net asset value at the beginning of the period, reinvestment of all dividends and distributions at net asset value during the period, and redemption on the last day of the period. Net asset value total return includes adjustments in accordance with accounting principles generally accepted in the United States of America and as such, the net asset value for financial reporting purposes and the returns based upon those net asset values may differ from the net asset value and returns for shareholder transactions. Market price total return is calculated assuming an initial investment made at the market price at the beginning of the period, reinvestment of all dividends and distributions at market price during the period, and sale at the market price on the last day of the period. Total investment returns calculated for a period of less than one year are not annualized. |
| (e) | Portfolio turnover rate is not annualized for periods less than one year, if applicable, and does not include securities received or delivered from processing creations or redemptions. |
Invesco S&P 500® Equal Weight Energy ETF (RYE)
| | | | | | | | | | | | | | | | | | | | | | | | |
| | | Year Ended
April 30, 2019 | | | Six Months Ended
April 30, 2018 | | | Years Ended October 31, | |
| | | 2017 | | | 2016 | | | 2015 | | | 2014 | |
| Per Share Operating Performance: | | | | | | | | | | | | | | | | | | | | | | | | |
Net asset value at beginning of period | | $ | 60.29 | | | $ | 54.29 | | | $ | 56.90 | | | $ | 54.39 | | | $ | 77.16 | | | $ | 79.86 | |
Net investment income(a) | | | 0.82 | | | | 0.47 | | | | 1.28 | | | | 0.90 | | | | 1.35 | | | | 1.40 | |
Net realized and unrealized gain (loss) on investments | | | (8.34 | ) | | | 5.98 | | | | (2.50 | ) | | | 2.53 | | | | (22.73 | ) | | | (2.91 | ) |
Total from investment operations | | | (7.52 | ) | | | 6.45 | | | | (1.22 | ) | | | 3.43 | | | | (21.38 | ) | | | (1.51 | ) |
Distributions to shareholders from: | | | | | | | | | | | | | | | | | | | | | | | | |
Net investment income | | | (0.96 | ) | | | (0.45 | ) | | | (1.39 | ) | | | (0.92 | ) | | | (1.39 | ) | | | (1.19 | ) |
Net asset value at end of period | | $ | 51.81 | | | $ | 60.29 | | | $ | 54.29 | | | $ | 56.90 | | | $ | 54.39 | | | $ | 77.16 | |
Market price at end of period(b) | | $ | 51.82 | | | $ | 60.43 | | | | | | | | | | | | | | | | | |
| Net Asset Value Total Return(c) | | | (12.46 | )% | | | 11.97 | % | | | (2.20 | )% | | | 6.50 | % | | | (27.93 | )% | | | (2.02 | )% |
| Market Price Total Return(c) | | | (12.65 | )% | | | 12.31 | % | | | | | | | | | | | | | | | | |
| Ratios/Supplemental Data: | | | | | | | | | | | | | | | | | | | | | | | | |
Net assets at end of period (000’s omitted) | | $ | 209,823 | | | $ | 253,202 | | | $ | 230,747 | | | $ | 199,164 | | | $ | 176,773 | | | $ | 100,307 | |
Ratio to average net assets of: | | | | | | | | | | | | | | | | | | | | | | | | |
Expenses | | | 0.40 | % | | | 0.40 | %(d) | | | 0.40 | % | | | 0.40 | % | | | 0.40 | % | | | 0.40 | % |
Net investment income | | | 1.46 | % | | | 1.69 | %(d) | | | 2.22 | % | | | 1.72 | % | | | 2.16 | % | | | 1.64 | % |
Portfolio turnover rate(e) | | | 31 | % | | | 10 | % | | | 34 | % | | | 41 | % | | | 34 | % | | | 25 | % |
| (a) | Based on average shares outstanding. |
| (b) | The mean between the last bid and ask prices. |
| (c) | Net asset value total return is calculated assuming an initial investment made at the net asset value at the beginning of the period, reinvestment of all dividends and distributions at net asset value during the period, and redemption on the last day of the period. Net asset value total return includes adjustments in accordance with accounting principles generally accepted in the United States of America and as such, the net asset value for financial reporting purposes and the returns based upon those net asset values may differ from the net asset value and returns for shareholder transactions. Market price total return is calculated assuming an initial investment made at the market price at the beginning of the period, reinvestment of all dividends and distributions at market price during the period, and sale at the market price on the last day of the period. Total investment returns calculated for a period of less than one year are not annualized. |
| (e) | Portfolio turnover rate is not annualized for periods less than one year, if applicable, and does not include securities received or delivered from processing creations or redemptions. |
See accompanying Notes to Financial Statements which are an integral part of the financial statements.
Financial Highlights(continued)
Invesco S&P 500®Equal Weight Financials ETF (RYF)
| | | | | | | | | | | | | | | | | | | | | | | | |
| | | Year Ended
April 30, 2019 | | | Six Months Ended
April 30, 2018 | | | Years Ended October 31, | |
| | | 2017 | | | 2016 | | | 2015 | | | 2014 | |
| Per Share Operating Performance: | | | | | | | | | | | | | | | | | | | | | | | | |
Net asset value at beginning of period | | $ | 43.94 | | | $ | 41.93 | | | $ | 31.41 | | | $ | 43.72 | | | $ | 43.27 | | | $ | 37.64 | |
Net investment income(a) | | | 0.78 | | | | 0.40 | | | | 0.55 | | | | 0.81 | | | | 0.72 | | | | 0.53 | |
Net realized and unrealized gain on investments | | | — | | | | 1.91 | | | | 10.45 | | | | 1.03 | | | | 0.58 | | | | 5.76 | |
Total from investment operations | | | 0.78 | | | | 2.31 | | | | 11.00 | | | | 1.84 | | | | 1.30 | | | | 6.29 | |
Distributions to shareholders from: | | | | | | | | | | | | | | | | | | | | | | | | |
Net investment income | | | (0.94 | ) | | | (0.30 | ) | | | (0.48 | ) | | | (0.78 | ) | | | (0.80 | ) | | | (0.66 | ) |
Return of capital | | | — | | | | — | | | | — | | | | (13.37 | )(b) | | | (0.05 | ) | | | — | |
Total distributions | | | (0.94 | ) | | | (0.30 | ) | | | (0.48 | ) | | | (14.15 | ) | | | (0.85 | ) | | | (0.66 | ) |
Net asset value at end of period | | $ | 43.78 | | | $ | 43.94 | | | $ | 41.93 | | | $ | 31.41 | | | $ | 43.72 | | | $ | 43.27 | |
Market price at end of period(c) | | $ | 43.79 | | | $ | 43.98 | | | | | | | | | | | | | | | | | |
| Net Asset Value Total Return(d) | | | 1.98 | % | | | 5.50 | % | | | 35.15 | % | | | 4.33 | % | | | 3.04 | % | | | 16.84 | % |
| Market Price Total Return(d) | | | 1.91 | % | | | 5.47 | % | | | | | | | | | | | | | | | | |
| Ratios/Supplemental Data: | | | | | | | | | | | | | | | | | | | | | | | | |
Net assets at end of period (000’s omitted) | | $ | 291,145 | | | $ | 441,558 | | | $ | 358,496 | | | $ | 114,649 | | | $ | 183,620 | | | $ | 136,316 | |
Ratio to average net assets of: | | | | | | | | | | | | | | | | | | | | | | | | |
Expenses | | | 0.40 | % | | | 0.40 | %(e) | | | 0.40 | % | | | 0.40 | % | | | 0.40 | % | | | 0.40 | % |
Net investment income | | | 1.86 | % | | | 1.81 | %(e) | | | 1.44 | % | | | 1.96 | % | | | 1.64 | % | | | 1.30 | % |
Portfolio turnover rate(f) | | | 17 | % | | | 7 | % | | | 15 | % | | | 53 | % | | | 13 | % | | | 19 | % |
| (a) | Based on average shares outstanding. |
| (b) | Special distribution. |
| (c) | The mean between the last bid and ask prices. |
| (d) | Net asset value total return is calculated assuming an initial investment made at the net asset value at the beginning of the period, reinvestment of all dividends and distributions at net asset value during the period, and redemption on the last day of the period. Net asset value total return includes adjustments in accordance with accounting principles generally accepted in the United States of America and as such, the net asset value for financial reporting purposes and the returns based upon those net asset values may differ from the net asset value and returns for shareholder transactions. Market price total return is calculated assuming an initial investment made at the market price at the beginning of the period, reinvestment of all dividends and distributions at market price during the period, and sale at the market price on the last day of the period. Total investment returns calculated for a period of less than one year are not annualized. |
| (f) | Portfolio turnover rate is not annualized for periods less than one year, if applicable, and does not include securities received or delivered from processing creations or redemptions. |
Invesco S&P 500® Equal Weight Health Care ETF (RYH)
| | | | | | | | | | | | | | | | | | | | | | | | |
| | | Year Ended
April 30, 2019 | | | Six Months Ended
April 30, 2018 | | | Years Ended October 31, | |
| | | 2017 | | | 2016 | | | 2015 | | | 2014 | |
| Per Share Operating Performance: | | | | | | | | | | | | | | | | | | | | | | | | |
Net asset value at beginning of period | | $ | 178.78 | | | $ | 175.84 | | | $ | 143.79 | | | $ | 149.97 | | | $ | 137.44 | | | $ | 104.50 | |
Net investment income(a) | | | 1.05 | | | | 0.44 | | | | 0.78 | | | | 0.78 | | | | 0.75 | | | | 0.66 | |
Net realized and unrealized gain (loss) on investments | | | 14.87 | | | | 2.93 | | | | 32.02 | | | | (6.22 | ) | | | 12.46 | | | | 32.89 | |
Total from investment operations | | | 15.92 | | | | 3.37 | | | | 32.80 | | | | (5.44 | ) | | | 13.21 | | | | 33.55 | |
Distributions to shareholders from: | | | | | | | | | | | | | | | | | | | | | | | | |
Net investment income | | | (1.04 | ) | | | (0.43 | ) | | | (0.75 | ) | | | (0.74 | ) | | | (0.68 | ) | | | (0.61 | ) |
Net asset value at end of period | | $ | 193.66 | | | $ | 178.78 | | | $ | 175.84 | | | $ | 143.79 | | | $ | 149.97 | | | $ | 137.44 | |
Market price at end of period(b) | | $ | 193.67 | | | $ | 178.95 | | | | | | | | | | | | | | | | | |
| Net Asset Value Total Return(c) | | | 8.91 | % | | | 1.92 | % | | | 22.85 | % | | | (3.65 | )% | | | 9.61 | % | | | 32.20 | % |
| Market Price Total Return(c) | | | 8.82 | % | | | 2.06 | % | | | | | | | | | | | | | | | | |
| Ratios/Supplemental Data: | | | | | | | | | | | | | | | | | | | | | | | | |
Net assets at end of period (000’s omitted) | | $ | 706,845 | | | $ | 598,911 | | | $ | 650,617 | | | $ | 474,494 | | | $ | 569,893 | | | $ | 391,714 | |
Ratio to average net assets of: | | | | | | | | | | | | | | | | | | | | | | | | |
Expenses | | | 0.40 | % | | | 0.40 | %(d) | | | 0.40 | % | | | 0.40 | % | | | 0.40 | % | | | 0.40 | % |
Net investment income | | | 0.55 | % | | | 0.49 | %(d) | | | 0.48 | % | | | 0.52 | % | | | 0.49 | % | | | 0.55 | % |
Portfolio turnover rate(e) | | | 23 | % | | | 12 | % | | | 24 | % | | | 28 | % | | | 22 | % | | | 23 | % |
| (a) | Based on average shares outstanding. |
| (b) | The mean between the last bid and ask prices. |
| (c) | Net asset value total return is calculated assuming an initial investment made at the net asset value at the beginning of the period, reinvestment of all dividends and distributions at net asset value during the period, and redemption on the last day of the period. Net asset value total return includes adjustments in accordance with accounting principles generally accepted in the United States of America and as such, the net asset value for financial reporting purposes and the returns based upon those net asset values may differ from the net asset value and returns for shareholder transactions. Market price total return is calculated assuming an initial investment made at the market price at the beginning of the period, reinvestment of all dividends and distributions at market price during the period, and sale at the market price on the last day of the period. Total investment returns calculated for a period of less than one year are not annualized. |
| (e) | Portfolio turnover rate is not annualized for periods less than one year, if applicable, and does not include securities received or delivered from processing creations or redemptions. |
See accompanying Notes to Financial Statements which are an integral part of the financial statements.
Financial Highlights(continued)
Invesco S&P 500®Equal Weight Industrials ETF (RGI)
| | | | | | | | | | | | | | | | | | | | | | | | |
| | | Year Ended
April 30, 2019 | | | Six Months Ended
April 30, 2018 | | | Years Ended October 31, | |
| | | 2017 | | | 2016 | | | 2015 | | | 2014 | |
| Per Share Operating Performance: | | | | | | | | | | | | | | | | | | | | | | | | |
Net asset value at beginning of period | | $ | 115.01 | | | $ | 113.29 | | | $ | 90.92 | | | $ | 85.30 | | | $ | 88.18 | | | $ | 76.33 | |
Net investment income(a) | | | 1.53 | | | | 0.62 | | | | 1.24 | | | | 1.40 | | | | 1.13 | | | | 1.22 | |
Net realized and unrealized gain (loss) on investments | | | 11.15 | | | | 1.73 | | | | 22.50 | | | | 5.57 | | | | (2.69 | ) | | | 11.59 | |
Total from investment operations | | | 12.68 | | | | 2.35 | | | | 23.74 | | | | 6.97 | | | | (1.56 | ) | | | 12.81 | |
Distributions to shareholders from: | | | | | | | | | | | | | | | | | | | | | | | | |
Net investment income | | | (1.66 | ) | | | (0.63 | ) | | | (1.37 | ) | | | (1.35 | ) | | | (1.29 | ) | | | (0.96 | ) |
Return of capital | | | — | | | | — | | | | — | | | | — | | | | (0.03 | ) | | | — | |
Total distributions | | | (1.66 | ) | | | (0.63 | ) | | | (1.37 | ) | | | (1.35 | ) | | | (1.32 | ) | | | (0.96 | ) |
Net asset value at end of period | | $ | 126.03 | | | $ | 115.01 | | | $ | 113.29 | | | $ | 90.92 | | | $ | 85.30 | | | $ | 88.18 | |
Market price at end of period(b) | | $ | 126.01 | | | $ | 115.03 | | | | | | | | | | | | | | | | | |
| Net Asset Value Total Return(c) | | | 11.21 | % | | | 2.05 | % | | | 26.21 | % | | | 8.25 | % | | | (1.78 | )% | | | 16.85 | % |
| Market Price Total Return(c) | | | 11.17 | % | | | 2.00 | % | | | | | | | | | | | | | | | | |
| Ratios/Supplemental Data: | | | | | | | | | | | | | | | | | | | | | | | | |
Net assets at end of period (000’s omitted) | | $ | 245,750 | | | $ | 281,763 | | | $ | 226,584 | | | $ | 127,288 | | | $ | 93,831 | | | $ | 123,447 | |
Ratio to average net assets of: | | | | | | | | | | | | | | | | | | | | | | | | |
Expenses | | | 0.40 | % | | | 0.40 | %(d) | | | 0.40 | % | | | 0.40 | % | | | 0.40 | % | | | 0.40 | % |
Net investment income | | | 1.29 | % | | | 1.05 | %(d) | | | 1.18 | % | | | 1.60 | % | | | 1.29 | % | | | 1.47 | % |
Portfolio turnover rate(e) | | | 28 | % | | | 7 | % | | | 18 | % | | | 23 | % | | | 22 | % | | | 15 | % |
| (a) | Based on average shares outstanding. |
| (b) | The mean between the last bid and ask prices. |
| (c) | Net asset value total return is calculated assuming an initial investment made at the net asset value at the beginning of the period, reinvestment of all dividends and distributions at net asset value during the period, and redemption on the last day of the period. Net asset value total return includes adjustments in accordance with accounting principles generally accepted in the United States of America and as such, the net asset value for financial reporting purposes and the returns based upon those net asset values may differ from the net asset value and returns for shareholder transactions. Market price total return is calculated assuming an initial investment made at the market price at the beginning of the period, reinvestment of all dividends and distributions at market price during the period, and sale at the market price on the last day of the period. Total investment returns calculated for a period of less than one year are not annualized. |
| (e) | Portfolio turnover rate is not annualized for periods less than one year, if applicable, and does not include securities received or delivered from processing creations or redemptions. |
Invesco S&P 500®Equal Weight Materials ETF (RTM)
| | | | | | | | | | | | | | | | | | | | | | | | |
| | | Year Ended
April 30, 2019 | | | Six Months Ended
April 30, 2018 | | | Years Ended October 31, | |
| | | 2017 | | | 2016 | | | 2015 | | | 2014 | |
| Per Share Operating Performance: | | | | | | | | | | | | | | | | | | | | | | | | |
Net asset value at beginning of period | | $ | 106.31 | | | $ | 107.79 | | | $ | 84.46 | | | $ | 79.97 | | | $ | 82.38 | | | $ | 75.49 | |
Net investment income(a) | | | 1.79 | | | | 0.70 | | | | 1.49 | | | | 1.29 | | | | 1.23 | | | | 1.21 | |
Net realized and unrealized gain (loss) on investments | | | 1.97 | | | | (1.50 | ) | | | 23.28 | | | | 4.49 | | | | (2.41 | ) | | | 6.85 | |
Total from investment operations | | | 3.76 | | | | (0.80 | ) | | | 24.77 | | | | 5.78 | | | | (1.18 | ) | | | 8.06 | |
Distributions to shareholders from: | | | | | | | | | | | | | | | | | | | | | | | | |
Net investment income | | | (1.96 | ) | | | (0.68 | ) | | | (1.44 | ) | | | (1.29 | ) | | | (1.23 | ) | | | (1.17 | ) |
Net asset value at end of period | | $ | 108.11 | | | $ | 106.31 | | | $ | 107.79 | | | $ | 84.46 | | | $ | 79.97 | | | $ | 82.38 | |
Market price at end of period(b) | | $ | 108.16 | | | $ | 106.31 | | | | | | | | | | | | | | | | | |
| Net Asset Value Total Return(c) | | | 3.67 | % | | | (0.77 | )% | | | 29.52 | % | | | 7.29 | % | | | (1.44 | )% | | | 10.68 | % |
| Market Price Total Return(c) | | | 3.70 | % | | | (0.91 | )% | | | | | | | | | | | | | | | | |
| Ratios/Supplemental Data: | | | | | | | | | | | | | | | | | | | | | | | | |
Net assets at end of period (000’s omitted) | | $ | 129,728 | | | $ | 180,726 | | | $ | 194,020 | | | $ | 84,463 | | | $ | 55,982 | | | $ | 74,138 | |
Ratio to average net assets of: | | | | | | | | | | | | | | | | | | | | | | | | |
Expenses | | | 0.40 | % | | | 0.40 | %(d) | | | 0.40 | % | | | 0.40 | % | | | 0.40 | % | | | 0.40 | % |
Net investment income | | | 1.69 | % | | | 1.28 | %(d) | | | 1.54 | % | | | 1.57 | % | | | 1.46 | % | | | 1.48 | % |
Portfolio turnover rate(e) | | | 23 | % | | | 6 | % | | | 22 | % | | | 25 | % | | | 27 | % | | | 22 | % |
| (a) | Based on average shares outstanding. |
| (b) | The mean between the last bid and ask prices. |
| (c) | Net asset value total return is calculated assuming an initial investment made at the net asset value at the beginning of the period, reinvestment of all dividends and distributions at net asset value during the period, and redemption on the last day of the period. Net asset value total return includes adjustments in accordance with accounting principles generally accepted in the United States of America and as such, the net asset value for financial reporting purposes and the returns based upon those net asset values may differ from the net asset value and returns for shareholder transactions. Market price total return is calculated assuming an initial investment made at the market price at the beginning of the period, reinvestment of all dividends and distributions at market price during the period, and sale at the market price on the last day of the period. Total investment returns calculated for a period of less than one year are not annualized. |
| (e) | Portfolio turnover rate is not annualized for periods less than one year, if applicable, and does not include securities received or delivered from processing creations or redemptions. |
See accompanying Notes to Financial Statements which are an integral part of the financial statements.
Financial Highlights(continued)
Invesco S&P 500® Equal Weight Real Estate ETF (EWRE)
| | | | | | | | | | | | | | | | | | | | |
| | | Year Ended
April 30, 2019 | | | Six Months Ended
April 30, 2018 | | | Years Ended October 31, | | | For the Period
August 13, 2015(a)
Through
October 31, 2015 | |
| | | 2017 | | | 2016 | |
| Per Share Operating Performance: | | | | | | | | | | | | | | | | | | | | |
Net asset value at beginning of period | | $ | 25.96 | | | $ | 27.29 | | | $ | 25.81 | | | $ | 25.63 | | | $ | 25.31 | |
Net investment income(b) | | | 0.69 | | | | 0.44 | | | | 0.54 | | | | 0.70 | | | | 0.13 | |
Net realized and unrealized gain (loss) on investments | | | 3.97 | | | | (1.20 | ) | | | 1.59 | | | | (0.08 | ) | | | 0.27 | |
Total from investment operations | | | 4.66 | | | | (0.76 | ) | | | 2.13 | | | | 0.62 | | | | 0.40 | |
Distributions to shareholders from: | | | | | | | | | | | | | | | | | | | | |
Net investment income | | | (0.85 | ) | | | (0.35 | ) | | | (0.65 | ) | | | (0.44 | ) | | | (0.08 | ) |
Net realized gains | | | (0.06 | ) | | | (0.22 | ) | | | — | | | | — | | | | — | |
Total distributions | | | (0.91 | ) | | | (0.57 | ) | | | (0.65 | ) | | | (0.44 | ) | | | (0.08 | ) |
Net asset value at end of period | | $ | 29.71 | | | $ | 25.96 | | | $ | 27.29 | | | $ | 25.81 | | | $ | 25.63 | |
Market price at end of period(c) | | $ | 29.75 | | | $ | 25.96 | | | | | | | | | | | | | |
| Net Asset Value Total Return(d) | | | 18.35 | % | | | (2.93 | )% | | | 8.33 | % | | | 2.39 | % | | | 1.61 | % |
| Market Price Total Return(d) | | | 18.51 | % | | | (2.35 | )% | | | | | | | | | | | | |
| Ratios/Supplemental Data: | | | | | | | | | | | | | | | | | | | | |
Net assets at end of period (000’s omitted) | | $ | 37,143 | | | $ | 16,873 | | | $ | 24,561 | | | $ | 36,135 | | | $ | 2,563 | |
Ratio to average net assets of: | | | | | | | | | | | | | | | | | | | | |
Expenses | | | 0.40 | % | | | 0.41 | %(e) | | | 0.41 | % | | | 0.37 | % | | | 0.40 | %(e) |
Net investment income | | | 2.46 | % | | | 3.28 | %(e) | | | 2.00 | % | | | 2.70 | % | | | 2.49 | %(e) |
Portfolio turnover rate(f) | | | 14 | % | | | 2 | % | | | 24 | % | | | 10 | % | | | 5 | % |
| (a) | Commencement of investment operations. |
| (b) | Based on average shares outstanding. |
| (c) | The mean between the last bid and ask prices. |
| (d) | Net asset value total return is calculated assuming an initial investment made at the net asset value at the beginning of the period, reinvestment of all dividends and distributions at net asset value during the period, and redemption on the last day of the period. Net asset value total return includes adjustments in accordance with accounting principles generally accepted in the United States of America and as such, the net asset value for financial reporting purposes and the returns based upon those net asset values may differ from the net asset value and returns for shareholder transactions. Market price total return is calculated assuming an initial investment made at the market price at the beginning of the period, reinvestment of all dividends and distributions at market price during the period, and sale at the market price on the last day of the period. Total investment returns calculated for a period of less than one year are not annualized. |
| (f) | Portfolio turnover rate is not annualized for periods less than one year, if applicable, and does not include securities received or delivered from processing creations or redemptions. |
See accompanying Notes to Financial Statements which are an integral part of the financial statements.
Financial Highlights(continued)
Invesco S&P 500®Equal Weight Technology ETF (RYT)
| | | | | | | | | | | | | | | | | | | | | | | | |
| | | Year Ended
April 30, 2019 | | | Six Months Ended
April 30, 2018 | | | Years Ended October 31, | |
| | | 2017 | | | 2016 | | | 2015 | | | 2014 | |
| Per Share Operating Performance: | | | | | | | | | | | | | | | | | | | | | |
Net asset value at beginning of period | | $ | 150.94 | | | $ | 142.44 | | | $ | 104.67 | | | $ | 93.16 | | | $ | 87.17 | | | $ | 70.98 | |
Net investment income(a) | | | 1.57 | | | | 0.56 | | | | 1.16 | | | | 1.47 | | | | 1.09 | | | | 0.78 | |
Net realized and unrealized gain on investments | | | 29.78 | | | | 8.56 | | | | 37.61 | | | | 11.48 | | | | 6.09 | | | | 16.15 | |
Total from investment operations | | | 31.35 | | | | 9.12 | | | | 38.77 | | | | 12.95 | | | | 7.18 | | | | 16.93 | |
Distributions to shareholders from: | | | | | | | | | | | | | | | | | | | | | | | | |
Net investment income | | | (1.60 | ) | | | (0.62 | ) | | | (1.00 | ) | | | (1.44 | ) | | | (1.12 | ) | | | (0.74 | ) |
Return of capital | | | — | | | | — | | | | — | | | | — | | | | (0.07 | ) | | | — | |
Total distributions | | | (1.60 | ) | | | (0.62 | ) | | | (1.00 | ) | | | (1.44 | ) | | | (1.19 | ) | | | (0.74 | ) |
Net asset value at end of period | | $ | 180.69 | | | $ | 150.94 | | | $ | 142.44 | | | $ | 104.67 | | | $ | 93.16 | | | $ | 87.17 | |
Market price at end of period(b) | | $ | 180.66 | | | $ | 151.10 | | | | | | | | | | | | | | | | | |
| Net Asset Value Total Return(c) | | | 20.92 | % | | | 6.40 | % | | | 37.19 | % | | | 14.06 | % | | | 8.30 | % | | | 23.92 | % |
| Market Price Total Return(c) | | | 20.77 | % | | | 6.48 | % | | | | | | | | | | | | | | | | |
| Ratios/Supplemental Data: | | | | | | | | | | | | | | | | | | | | | | | | |
Net assets at end of period (000’s omitted) | | $ | 1,788,846 | | | $ | 1,615,066 | | | $ | 1,509,833 | | | $ | 915,879 | | | $ | 740,629 | | | $ | 671,221 | |
Ratio to average net assets of: | | | | | | | | | | | | | | | | | | | | | | | | |
Expenses | | | 0.40 | % | | | 0.40 | %(d) | | | 0.40 | % | | | 0.40 | % | | | 0.40 | % | | | 0.40 | % |
Net investment income | | | 0.98 | % | | | 0.76 | %(d) | | | 0.95 | % | | | 1.55 | % | | | 1.20 | % | | | 0.97 | % |
Portfolio turnover rate(e) | | | 27 | % | | | 10 | % | | | 19 | % | | | 24 | % | | | 21 | % | | | 22 | % |
| (a) | Based on average shares outstanding. |
| (b) | The mean between the last bid and ask prices. |
| (c) | Net asset value total return is calculated assuming an initial investment made at the net asset value at the beginning of the period, reinvestment of all dividends and distributions at net asset value during the period, and redemption on the last day of the period. Net asset value total return includes adjustments in accordance with accounting principles generally accepted in the United States of America and as such, the net asset value for financial reporting purposes and the returns based upon those net asset values may differ from the net asset value and returns for shareholder transactions. Market price total return is calculated assuming an initial investment made at the market price at the beginning of the period, reinvestment of all dividends and distributions at market price during the period, and sale at the market price on the last day of the period. Total investment returns calculated for a period of less than one year are not annualized. |
| (e) | Portfolio turnover rate is not annualized for periods less than one year, if applicable, and does not include securities received or delivered from processing creations or redemptions. |
See accompanying Notes to Financial Statements which are an integral part of the financial statements.
Financial Highlights(continued)
Invesco S&P 500®Equal Weight Utilities ETF (RYU)
| | | | | | | | | | | | | | | | | | | | | | | | |
| | | Year Ended
April 30, 2019 | | | Six Months Ended
April 30, 2018 | | | Years Ended October 31, | |
| | | 2017 | | | 2016 | | | 2015 | | | 2014 | |
| Per Share Operating Performance: | | | | | | | | | | | | | | | | | | | | | | | | |
Net asset value at beginning of period | | $ | 84.51 | | | $ | 88.52 | | | $ | 81.10 | | | $ | 73.29 | | | $ | 76.69 | | | $ | 64.67 | |
Net investment income(a) | | | 2.67 | | | | 1.38 | | | | 2.54 | | | | 2.49 | | | | 2.48 | | | | 2.59 | |
Net realized and unrealized gain (loss) on investments | | | 12.69 | | | | (3.92 | ) | | | 7.44 | | | | 7.81 | | | | (2.97 | ) | | | 11.75 | |
Total from investment operations | | | 15.36 | | | | (2.54 | ) | | | 9.98 | | | | 10.30 | | | | (0.49 | ) | | | 14.34 | |
Distributions to shareholders from: | | | | | | | | | | | | | | | | | | | | | | | | |
Net investment income | | | (2.62 | ) | | | (1.47 | ) | | | (2.56 | ) | | | (2.49 | ) | | | (2.91 | ) | | | (2.32 | ) |
Net asset value at end of period | | $ | 97.25 | | | $ | 84.51 | | | $ | 88.52 | | | $ | 81.10 | | | $ | 73.29 | | | $ | 76.69 | |
Market price at end of period(b) | | $ | 97.23 | | | $ | 84.45 | | | | | | | | | | | | | | | | | |
| Net Asset Value Total Return(c) | | | 18.54 | % | | | (2.88 | )% | | | 12.51 | % | | | 14.13 | % | | | (0.56 | )% | | | 22.61 | % |
| Market Price Total Return(c) | | | 18.60 | % | | | (2.92 | )% | | | | | | | | | | | | | | | | |
| Ratios/Supplemental Data: | | | | | | | | | | | | | | | | | | | | | | | | |
Net assets at end of period (000’s omitted) | | $ | 335,499 | | | $ | 139,434 | | | $ | 168,180 | | | $ | 210,865 | | | $ | 128,258 | | | $ | 141,875 | |
Ratio to average net assets of: | | | | | | | | | | | | | | | | | | | | | | | | |
Expenses | | | 0.40 | % | | | 0.40 | %(d) | | | 0.40 | % | | | 0.40 | % | | | 0.40 | % | | | 0.40 | % |
Net investment income | | | 2.96 | % | | | 3.29 | %(d) | | | 3.01 | % | | | 3.09 | % | | | 3.30 | % | | | 3.72 | % |
Portfolio turnover rate(e) | | | 27 | % | | | 7 | % | | | 11 | % | | | 22 | % | | | 20 | % | | | 31 | % |
| (a) | Based on average shares outstanding. |
| (b) | The mean between the last bid and ask prices. |
| (c) | Net asset value total return is calculated assuming an initial investment made at the net asset value at the beginning of the period, reinvestment of all dividends and distributions at net asset value during the period, and redemption on the last day of the period. Net asset value total return includes adjustments in accordance with accounting principles generally accepted in the United States of America and as such, the net asset value for financial reporting purposes and the returns based upon those net asset values may differ from the net asset value and returns for shareholder transactions. Market price total return is calculated assuming an initial investment made at the market price at the beginning of the period, reinvestment of all dividends and distributions at market price during the period, and sale at the market price on the last day of the period. Total investment returns calculated for a period of less than one year are not annualized. |
| (e) | Portfolio turnover rate is not annualized for periods less than one year, if applicable, and does not include securities received or delivered from processing creations or redemptions. |
See accompanying Notes to Financial Statements which are an integral part of the financial statements.
Financial Highlights(continued)
Invesco S&P MidCap 400®Equal Weight ETF (EWMC)
| | | | | | | | | | | | | | | | | | | | | | | | |
| | | Year Ended
April 30, 2019 | | | Six Months Ended
April 30, 2018 | | | Years Ended October 31, | |
| | | 2017 | | | 2016 | | | 2015 | | | 2014 | |
| Per Share Operating Performance: | | | | | | | | | | | | | | | | | | | | | |
Net asset value at beginning of period | | $ | 63.30 | | | $ | 62.00 | | | $ | 51.40 | | | $ | 49.09 | | | $ | 50.39 | | | $ | 45.24 | |
Net investment income(a) | | | 0.77 | | | | 0.42 | | | | 0.60 | | | | 0.66 | | | | 0.62 | | | | 0.62 | |
Net realized and unrealized gain (loss) on investments | | | 2.96 | | | | 1.30 | | | | 10.59 | | | | 2.30 | | | | (1.21 | ) | | | 5.48 | |
Total from investment operations | | | 3.73 | | | | 1.72 | | | | 11.19 | | | | 2.96 | | | | (0.59 | ) | | | 6.10 | |
Distributions to shareholders from: | | | | | | | | | | | | | | | | | | | | | | | | |
Net investment income | | | (0.85 | ) | | | (0.42 | ) | | | (0.59 | ) | | | (0.65 | ) | | | (0.67 | ) | | | (0.59 | ) |
Capital gains | | | — | | | | — | | | | — | | | | — | | | | — | | | | (0.36 | ) |
Return of capital | | | — | | | | — | | | | — | | | | — | | | | (0.04 | ) | | | — | |
Total distributions | | | (0.85 | ) | | | (0.42 | ) | | | (0.59 | ) | | | (0.65 | ) | | | (0.71 | ) | | | (0.95 | ) |
Net asset value at end of period | | $ | 66.18 | | | $ | 63.30 | | | $ | 62.00 | | | $ | 51.40 | | | $ | 49.09 | | | $ | 50.39 | |
Market price at end of period(b) | | $ | 66.19 | | | $ | 63.29 | | | | | | | | | | | | | | | | | |
| Net Asset Value Total Return(c) | | | 5.96 | % | | | 2.76 | % | | | 21.82 | % | | | 6.08 | % | | | (1.19 | )% | | | 13.61 | % |
| Market Price Total Return(c) | | | 5.99 | % | | | 2.74 | % | | | | | | | | | | | | | | | | |
| Ratios/Supplemental Data: | | | | | | | | | | | | | | | | | | | | | | | | |
Net assets at end of period (000’s omitted) | | $ | 105,893 | | | $ | 104,438 | | | $ | 114,692 | | | $ | 89,944 | | | $ | 132,532 | | | $ | 146,125 | |
Ratio to average net assets of: | | | | | | | | | | | | | | | | | | | | | | | | |
Expenses | | | 0.40 | % | | | 0.40 | %(d) | | | 0.41 | % | | | 0.41 | % | | | 0.41 | % | | | 0.41 | % |
Net investment income | | | 1.19 | % | | | 1.33 | %(d) | | | 1.02 | % | | | 1.35 | % | | | 1.22 | % | | | 1.27 | % |
Portfolio turnover rate(e) | | | 30 | % | | | 9 | % | | | 26 | % | | | 101 | % | | | 31 | % | | | 29 | % |
| (a) | Based on average shares outstanding. |
| (b) | The mean between the last bid and ask prices. |
| (c) | Net asset value total return is calculated assuming an initial investment made at the net asset value at the beginning of the period, reinvestment of all dividends and distributions at net asset value during the period, and redemption on the last day of the period. Net asset value total return includes adjustments in accordance with accounting principles generally accepted in the United States of America and as such, the net asset value for financial reporting purposes and the returns based upon those net asset values may differ from the net asset value and returns for shareholder transactions. Market price total return is calculated assuming an initial investment made at the market price at the beginning of the period, reinvestment of all dividends and distributions at market price during the period, and sale at the market price on the last day of the period. Total investment returns calculated for a period of less than one year are not annualized. |
| (e) | Portfolio turnover rate is not annualized for periods less than one year, if applicable, and does not include securities received or delivered from processing creations or redemptions. |
See accompanying Notes to Financial Statements which are an integral part of the financial statements.
Financial Highlights(continued)
Invesco S&P SmallCap 600®Equal Weight ETF (EWSC)
| | | | | | | | | | | | | | | | | | | | | | | | |
| | | Year Ended
April 30, 2019 | | | Six Months Ended
April 30, 2018 | | | Years Ended October 31, | |
| | | 2017 | | | 2016 | | | 2015 | | | 2014 | |
| Per Share Operating Performance: | | | | | | | | | | | | | | | | | | | | | |
Net asset value at beginning of period | | $ | 54.92 | | | $ | 52.78 | | | $ | 42.47 | | | $ | 41.84 | | | $ | 44.87 | | | $ | 42.89 | |
Net investment income(a) | | | 0.59 | | | | 0.29 | | | | 0.47 | | | | 0.32 | | | | 0.49 | | | | 0.43 | |
Net realized and unrealized gain (loss) on investments | | | 0.80 | | | | 2.15 | | | | 10.27 | | | | 0.67 | | | | (2.97 | ) | | | 1.97 | |
Total from investment operations | | | 1.39 | | | | 2.44 | | | | 10.74 | | | | 0.99 | | | | (2.48 | ) | | | 2.40 | |
Distributions to shareholders from: | | | | | | | | | | | | | | | | | | | | | | | | |
Net investment income | | | (0.48 | ) | | | (0.30 | ) | | | (0.43 | ) | | | (0.36 | ) | | | (0.52 | ) | | | (0.42 | ) |
Return of capital | | | — | | | | — | | | | — | | | | — | | | | (0.03 | ) | | | — | |
Total distributions | | | (0.48 | ) | | | (0.30 | ) | | | (0.43 | ) | | | (0.36 | ) | | | (0.55 | ) | | | (0.42 | ) |
Net asset value at end of period | | $ | 55.83 | | | $ | 54.92 | | | $ | 52.78 | | | $ | 42.47 | | | $ | 41.84 | | | $ | 44.87 | |
Market price at end of period(b) | | $ | 55.63 | | | $ | 55.02 | | | | | | | | | | | | | | | | | |
| Net Asset Value Total Return(c) | | | 2.55 | % | | | 4.62 | % | | | 25.32 | % | | | 2.39 | % | | | (5.59 | )% | | | 5.58 | % |
| Market Price Total Return(c) | | | 2.00 | % | | | 4.55 | % | | | | | | | | | | | | | | | | |
| Ratios/Supplemental Data: | | | | | | | | | | | | | | | | | | | | | | | | |
Net assets at end of period (000’s omitted) | | $ | 36,287 | | | $ | 30,208 | | | $ | 31,666 | | | $ | 33,978 | | | $ | 43,930 | | | $ | 40,380 | |
Ratio to average net assets of: | | | | | | | | | | | | | | | | | | | | | | | | |
Expenses | | | 0.40 | % | | | 0.40 | %(d) | | | 0.41 | % | | | 0.41 | % | | | 0.41 | % | | | 0.42 | % |
Net investment income | | | 1.05 | % | | | 1.10 | %(d) | | | 0.96 | % | | | 0.80 | % | | | 1.11 | % | | | 0.96 | % |
Portfolio turnover rate(e) | | | 34 | % | | | 10 | % | | | 24 | % | | | 96 | % | | | 47 | % | | | 43 | % |
| (a) | Based on average shares outstanding. |
| (b) | The mean between the last bid and ask prices. |
| (c) | Net asset value total return is calculated assuming an initial investment made at the net asset value at the beginning of the period, reinvestment of all dividends and distributions at net asset value during the period, and redemption on the last day of the period. Net asset value total return includes adjustments in accordance with accounting principles generally accepted in the United States of America and as such, the net asset value for financial reporting purposes and the returns based upon those net asset values may differ from the net asset value and returns for shareholder transactions. Market price total return is calculated assuming an initial investment made at the market price at the beginning of the period, reinvestment of all dividends and distributions at market price during the period, and sale at the market price on the last day of the period. Total investment returns calculated for a period of less than one year are not annualized. |
| (e) | Portfolio turnover rate is not annualized for periods less than one year, if applicable, and does not include securities received or delivered from processing creations or redemptions. |
See accompanying Notes to Financial Statements which are an integral part of the financial statements.
Notes to Financial Statements
Invesco Exchange-Traded Fund Trust
April 30, 2019
NOTE 1—Organization
Invesco Exchange-Traded Fund Trust (the “Trust”) was organized as a Massachusetts business trust on June 9, 2000 and is authorized to have multiple series of portfolios. The Trust is anopen-end management investment company registered under the Investment Company Act of 1940, as amended (the “1940 Act”). This report includes the following portfolios:
| | |
Full Name | | Short Name |
| Invesco S&P 500®Equal Weight ETF (RSP) | | “S&P 500®Equal Weight ETF” |
| Invesco S&P 500®Equal Weight Communication Services ETF (EWCO) | | “S&P 500®Equal Weight Communication Services ETF” |
| Invesco S&P 500®Equal Weight Consumer Discretionary ETF (RCD) | | “S&P 500®Equal Weight Consumer Discretionary ETF” |
| Invesco S&P 500®Equal Weight Consumer Staples ETF (RHS) | | “S&P 500®Equal Weight Consumer Staples ETF” |
| Invesco S&P 500®Equal Weight Energy ETF (RYE) | | “S&P 500®Equal Weight Energy ETF” |
| Invesco S&P 500®Equal Weight Financials ETF (RYF) | | “S&P 500®Equal Weight Financials ETF” |
| Invesco S&P 500®Equal Weight Health Care ETF (RYH) | | “S&P 500®Equal Weight Health Care ETF” |
| Invesco S&P 500®Equal Weight Industrials ETF (RGI) | | “S&P 500®Equal Weight Industrials ETF” |
| Invesco S&P 500®Equal Weight Materials ETF (RTM) | | “S&P 500®Equal Weight Materials ETF” |
| Invesco S&P 500®Equal Weight Real Estate ETF (EWRE) | | “S&P 500®Equal Weight Real Estate ETF” |
| Invesco S&P 500®Equal Weight Technology ETF (RYT) | | “S&P 500®Equal Weight Technology ETF” |
| Invesco S&P 500®Equal Weight Utilities ETF (RYU) | | “S&P 500®Equal Weight Utilities ETF” |
| Invesco S&P MidCap 400®Equal Weight ETF (EWMC) | | “S&P MidCap 400®Equal Weight ETF” |
| Invesco S&P SmallCap 600®Equal Weight ETF (EWSC) | | “S&P SmallCap 600®Equal Weight ETF” |
Each portfolio (each, a “Fund”, and collectively, the “Funds”) represents a separate series of the Trust. The shares of the Funds are referred to herein as “Shares” or “Fund’s Shares.” Each Fund’s shares are listed and traded on NYSE Arca, Inc.
The market price of each Share may differ to some degree from a Fund’s net asset value (“NAV”). Unlike conventional mutual funds, each Fund issues and redeems Shares on a continuous basis, at NAV, only in a large specified number of Shares, each called a “Creation Unit.” Creation Units are issued and redeemed principally in exchange for the deposit or delivery of a basket of securities (“Deposit Securities”). Except when aggregated in Creation Units by Authorized Participants, the Shares are not individually redeemable securities of the Funds.
The investment objective of each of the Funds is to replicate as closely as possible, before fees and expenses, the daily performance of its respective index listed below (each, an “Underlying Index”):
| | |
Fund | | Underlying Index |
| S&P 500®Equal Weight ETF | | S&P 500®Equal Weight Index |
| S&P 500®Equal Weight Communication Services ETF | | S&P 500®Equal Weight Communication Services Plus Index |
| S&P 500®Equal Weight Consumer Discretionary ETF | | S&P 500®Equal Weight Consumer Discretionary Index |
| S&P 500®Equal Weight Consumer Staples ETF | | S&P 500®Equal Weight Consumer Staples Index |
| S&P 500®Equal Weight Energy ETF | | S&P 500®Equal Weight Energy Index |
| S&P 500®Equal Weight Financials ETF | | S&P 500®Equal Weight Financials Index |
| S&P 500®Equal Weight Health Care ETF | | S&P 500®Equal Weight Health Care Index |
| S&P 500®Equal Weight Industrials ETF | | S&P 500®Equal Weight Industrials Index |
| S&P 500®Equal Weight Materials ETF | | S&P 500®Equal Weight Materials Index |
| S&P 500®Equal Weight Real Estate ETF | | S&P 500®Equal Weight Real Estate Index |
| S&P 500®Equal Weight Technology ETF | | S&P 500®Equal Weight Information Technology Index |
| S&P 500®Equal Weight Utilities ETF | | S&P 500®Equal Weight Telecommunication Services & Utilities Index |
| S&P MidCap 400®Equal Weight ETF | | S&P MidCap 400®Equal Weight Index |
| S&P SmallCap 600®Equal Weight ETF | | S&P SmallCap 600®Equal Weight Index |
NOTE 2—Significant Accounting Policies
The following is a summary of the significant accounting policies followed by the Funds in preparation of their financial statements.
Each Fund is an investment company and accordingly follows the investment company accounting and reporting guidance in accordance with Financial Accounting Standards Board Accounting Standards Codification Topic 946,Financial Services—Investment Companies.
| A. | Security Valuation— Securities, including restricted securities, are valued according to the following policies: |
A security listed or traded on an exchange (except convertible securities) is generally valued at its last sales price or official closing price as of the close of the customary trading session on the exchange where the security is principally traded or, lacking any sales or official closing price on a particular day, the security may be valued at the closing bid price on that day. Securities traded in theover-the-counter market are valued based on prices furnished by independent pricing services or market makers. When such securities are valued by an independent pricing service they may be considered fair valued. Futures contracts are valued at the final settlement price set by an exchange on which they are principally traded. Listed options are valued at the mean between the last bid and asked prices from the exchange on which they are principally traded, or at the final settlement price set by such exchange. Swaps and options not listed on an exchange are valued by an independent source. For purposes of determining NAV per Share, futures and option contracts generally are valued 15 minutes after the close of the customary trading session of the New York Stock Exchange (“NYSE”).
Investment companies are valued using such company’s NAV per share, unless the shares are exchange-traded, in which case they are valued at the last sales price or official closing price as of the close of the customary trading session on the exchange where the security is principally traded.
Debt obligations (including convertible securities) and unlisted equities are fair valued using an evaluated quote provided by an independent pricing service. Evaluated quotes provided by the pricing service may be determined without exclusive reliance on quoted prices, and may reflect appropriate factors such asinstitution-size trading in similar groups of securities, developments related to specific securities, dividend rate (for unlisted equities), yield (for debt obligations), quality, type of issue, coupon rate (for debt obligations), maturity (for debt obligations), individual trading characteristics and other market data. Securities with a demand feature exercisable within one to seven days are valued at par. Pricing services generally value debt obligations assuming orderly transactions of institutional round lot size, but a Fund may hold or transact in the same securities in smaller, odd lot sizes. Odd lots often trade at lower prices than institutional round lots. Debt obligations are subject to interest rate and credit risks. In addition, all debt obligations involve some risk of default with respect to interest and/or principal payments.
Foreign securities’ (including foreign exchange contracts’) prices are converted into U.S. dollar amounts using the applicable exchange rates as of the close of the London world markets. If market quotations are available and reliable for foreign exchange-traded equity securities, the securities will be valued at the market quotations. Because trading hours for certain foreign securities end before the close of the NYSE, closing market quotations may become unreliable. If between the time trading ends on a particular security and the close of the customary trading session on the NYSE, events occur that Invesco Capital Management LLC (the “Adviser”) determines are significant and make the closing price unreliable, a Fund may fair value the security. If the event is likely to have affected the closing price of the security, the security will be valued at fair value in good faith using procedures approved by the Board of Trustees. Adjustments to closing prices to reflect fair value may also be based on a screening process of an independent pricing service to indicate the degree of certainty, based on historical data, that the closing price in the principal market where a foreign security trades is not the current value as of the close of the NYSE. Foreign securities’ prices meeting the approved degree of certainty that the price is not reflective of current value will be priced at the indication of fair value from the independent pricing service. Multiple factors may be considered by the independent pricing service in determining adjustments to reflect fair value and may include information relating to sector indices, American Depositary Receipts and domestic and foreign index futures. Foreign securities may have additional risks including exchange rate changes, the potential for sharply devalued currencies and high inflation, political and economic upheaval, the relative lack of issuer information, relatively low market liquidity and the potential lack of strict financial and accounting controls and standards.
Securities for which market prices are not provided by any of the above methods may be valued based upon quotes furnished by independent sources. The last bid price may be used to value exchange-traded equity securities. The mean between the last bid and asked prices may be used to value debt obligations, including corporate loans, and unlisted equity securities.
Securities for which market quotations are not readily available or became unreliable are valued at fair value as determined in good faith following procedures approved by the Board of Trustees. Issuer-specific events, market trends, bid/asked quotes of brokers and information providers and other market data may be reviewed in the course of making a good faith determination of a security’s fair value.
Each Fund may invest in securities that are subject to interest rate risk, meaning the risk that the prices will generally fall as interest rates rise and, conversely, the prices will generally rise as interest rates fall. Specific securities differ in their sensitivity to changes in interest rates depending on their individual characteristics. Changes in interest rates may result in increased market volatility, which may affect the value and/or liquidity of certain Fund investments.
Valuations change in response to many factors, including the historical and prospective earnings of the issuer, the value of the issuer’s assets, general economic conditions, interest rates, investor perceptions and market liquidity. Because of the
inherent uncertainties of valuation, the values reflected in the financial statements may materially differ from the value received upon actual sale of those investments.
Authorized Participant Concentration Risk. Only Authorized Participants (“APs”) may engage in creation or redemption transactions directly with each Fund. Each Fund has a limited number of institutions that may act as APs, and such APs have no obligation to submit creation or redemption orders. Consequently, there is no assurance that those APs will establish or maintain an active trading market for the Shares. This risk may be heightened to the extent that securities underlying each Fund are traded outside a collateralized settlement system. In that case, APs may be required to post collateral on certain trades on an agency basis (i.e., on behalf of other market participants), which only a limited number of APs may be able to do. In addition, to the extent that APs exit the business or are unable to proceed with creation and/or redemption orders with respect to each Fund and no other AP is able to step forward to create or redeem Creation Units, this may result in a significantly diminished trading market for Fund Shares, which may be more likely to trade at a premium or discount to each Fund’s NAV and possibly face trading halts and/or delisting. This risk may be heightened for Funds that invest innon-U.S. securities, which may have lower trading volumes.
Equity Risk. Equity risk is the risk that the value of equity securities, including common stocks, may fall due to both changes in general economic conditions that impact the market as a whole, as well as factors that directly relate to a specific company or its industry. Such general economic conditions include changes in interest rates, periods of market turbulence or instability, or general and prolonged periods of economic decline and cyclical change. It is possible that a drop in the stock market may depress the price of most or all of the common stocks that each Fund holds. In addition, equity risk includes the risk that investor sentiment toward particular industries will become negative. The value of a company’s common stock may fall solely because of factors, such as an increase in production costs, that negatively impact other companies in the same region, industry or sector of the market. A company’s common stock also may decline significantly in price over a short period of time due to factors specific to that company, including decisions made by its management or lower demand for the company’s products or services. For example, an adverse event, such as an unfavorable earnings report or the failure to make anticipated dividend payments, may depress the value of common stock.
Industry Concentration Risk. In following its methodology, each Fund’s Underlying Index from time to time may be concentrated to a significant degree in securities of issuers operating in a single industry or industry group. To the extent that each Underlying Index concentrates in the securities of issuers in a particular industry or industry group, the corresponding Fund will also concentrate its investments to approximately the same extent. By concentrating its investments in an industry or industry group, each Fund faces more risks than if it were diversified broadly over numerous industries or industry groups. Such industry-based risks, any of which may adversely affect the companies in which each Fund invests, may include, but are not limited to, legislative or regulatory changes, adverse market conditions and/or increased competition within the industry or industry group. In addition, at times, such industry or industry group may be out of favor and underperform other industries, industry groups or the market as a whole.
Non-Correlation Risk. Each Fund’s return may not match the return of its Underlying Index for a number of reasons. For example, each Fund incurs operating expenses not applicable to its Underlying Index, and incurs costs in buying and selling securities, especially when rebalancing the Fund’s securities holdings to reflect changes in the composition of its Underlying Index. In addition, the performance of each Fund and its Underlying Index may vary due to asset valuation differences and differences between each Fund’s portfolio and its Underlying Index resulting from legal restrictions, costs or liquidity constraints.
Non-Diversified Fund Risk. Each Fund is considerednon-diversified and can invest a greater portion of its assets in securities of individual issuers than a diversified fund. As a result, changes in the market value of a single issuer’s securities could cause greater fluctuations in the value of the Shares than would occur in a diversified fund. This may increase the Fund’s volatility and cause the performance of a relativley small number of issuers to have a greater impact on the Fund’s performance.
Index Risk. Unlike many investment companies, the Funds do not utilize investing strategies that seek returns in excess of their Underlying Indexes. Therefore, a Fund would not necessarily buy or sell a security unless that security is added or removed, respectively, from its respective Underlying Index, even if that security generally is underperforming.
REIT Risk. For certain Funds, in addition to the risks pertaining to real estate investments more generally, REITs are subject to additional risks. The value of a REIT can depend on the structure of and cash flow generated by the REIT. REITs whose investments are concentrated in a limited number or type of properties, investments or narrow geographic area are subject to the risks affecting those properties or areas to a greater extent than a REIT with less concentrated investments. REITs are also subject to certain requirements under federal tax law. In addition, REITs may have expenses, including advisory and administration expenses, and each Fund and its shareholders will incur its pro rata share of the underlying expenses.
Small- andMid-Capitalization Company Risk. For certain Funds, investing in securities of small- andmid-capitalization companies involves greater risk than customarily is associated with investing in larger, more established companies. These companies’ securities may be more volatile and less liquid than those of more established companies. These securities may have returns that vary, sometimes significantly, from the overall securities market. Often small- andmid-capitalization companies and the industries in which they focus are still evolving and, as a result, they may be more sensitive to changing market conditions.
| C. | Investment Transactions and Investment Income— Security transactions are recorded on the trade date for financial reporting purposes. Realized gains and losses from securities transactions are recorded using the identified cost basis. Dividend income is recorded on theex-dividend date, net of applicable taxes withheld by foreign countries. Taxablenon-cash dividends are recorded as dividend income. Interest income, including amortization of premiums and accretion of discounts, is accrued on a daily basis. Dividend income from REITs is recorded based on the income included in the distributions received from the REIT investments using published REIT classifications, including some management estimates when actual amounts are not available. Distributions received in excess of this estimated amount are recorded as a reduction of the cost of investments or reclassified to capital gains. The actual amounts of income, return of capital, and capital gains are only determined by each REIT after its fiscalyear-end, and may differ from the estimated amounts. |
The Funds may periodically participate in litigation related to each Fund’s investments. As such, the Funds may receive proceeds from litigation settlements. Any proceeds received are included in the Statements of Operations as realized gain (loss) for investments no longer held and as unrealized gain (loss) for investments still held.
Brokerage commissions and mark ups are considered transaction costs and are recorded as an increase to the cost basis of securities purchased and/or a reduction of proceeds on a sale of securities. Such transaction costs are included in the determination of net realized and unrealized gain (loss) from investment securities reported in the Statements of Operations and the Statements of Changes in Net Assets and the net realized and unrealized gains (losses) on securities per share in the Financial Highlights. Transaction costs are included in the calculation of each Fund’s NAV and, accordingly, they reduce each Fund’s total returns. These transaction costs are not considered operating expenses and are not reflected in net investment income reported in the Statements of Operations and the Statements of Changes in Net Assets, or the net investment income per share and the ratios of expenses and net investment income reported in the Financial Highlights, nor are they limited by any expense limitation arrangements between each Fund and the Adviser.
| D. | Country Determination— For the purposes of presentation in the Schedules of Investments, the Adviser may determine the country in which an issuer is located and/or credit risk exposure based on various factors. These factors include whether each Fund’s Underlying Index has made a country determination and may include the laws of the country under which the issuer is organized, where the issuer maintains a principal office, the country in which the issuer derives 50% or more of its total revenues and the country that has the primary market for the issuer’s securities, as well as other criteria. Among the other criteria that may be evaluated for making this determination are the country in which the issuer maintains 50% or more of its assets, the type of security, financial guarantees and enhancements, the nature of the collateral and the sponsor organization. Country of issuer and/or credit risk exposure has been determined to be the United States of America, unless otherwise noted. |
| E. | Dividends and Distributions to Shareholders— Each Fund declares and pays dividends from net investment income, if any, to its shareholders quarterly and records such dividends onex-dividend date. Generally, each Fund distributes net realized taxable capital gains, if any, annually in cash and records them onex-dividend date. Such distributions on a tax basis are determined in conformity with federal income tax regulations, which may differ from accounting principles generally accepted in the United States of America (“GAAP”). Distributions in excess of tax basis earnings and profits, if any, are reported in such Fund’s financial statements as a tax return of capital at fiscalyear-end. |
| F. | Federal Income Taxes— Each Fund intends to comply with the requirements of Subchapter M of the Internal Revenue Code of 1986, as amended (the “Internal Revenue Code”), necessary to qualify as a regulated investment company and to distribute substantially all of the Fund’s taxable earnings to shareholders. As such, the Funds will not be subject to federal income taxes on otherwise taxable income (including net realized capital gain) that is distributed to shareholders. Therefore, no provision for federal income taxes is recorded in the financial statements. |
Each Fund recognizes the tax benefits of uncertain tax positions only when the position is more likely than not to be sustained. Management has analyzed each Fund’s uncertain tax positions and concluded that no liability for unrecognized tax benefits should be recorded related to uncertain tax positions. Management is not aware of any tax positions for which it is reasonably possible that the total amounts of unrecognized tax benefits will change materially in the next 12 months.
Income and capital gain distributions are determined in accordance with federal income tax regulations, which may differ from GAAP. These differences are primarily due to differing book and tax treatments forin-kind transactions, losses deferred due to wash sales, and passive foreign investment company adjustments, if any.
The Funds file U.S. federal tax returns and tax returns in certain other jurisdictions. Generally, a Fund is subject to examinations by such taxing authorities for up to three years after the filing of the return for the tax period.
| G. | Expenses— Expenses of the Trust that are directly identifiable to a specific Fund are applied to that Fund. Expenses of the Trust that are not readily identifiable to a specific Fund are allocated in such a manner as deemed equitable, taking into consideration the nature and type of expense and the relative net assets of each Fund. |
Each Fund has agreed to pay an annual unitary management fee to the Adviser. Out of the unitary management fee, the Adviser has agreed to pay for substantially all expenses of the Funds, including the costs of transfer agency, custody, fund administration, legal, audit and other services, except for advisory fees, distribution fees, if any, brokerage expenses, taxes, interest, acquired fund fees and expenses, if any, litigation expenses and other extraordinary expenses.
To the extent a Fund invests in other investment companies, the expenses shown in the accompanying financial statements reflect the expenses of the Fund and do not include any expenses of the investment companies in which it invests. The effects
of such investment companies’ expenses are included in the realized and unrealized gain or loss on the investments in the investment companies.
| H. | Accounting Estimates— The preparation of the financial statements in accordance with GAAP requires management to make estimates and assumptions that affect the reported amounts and disclosures in the financial statements, including estimates and assumptions related to taxation. Actual results could differ from these estimates. In addition, the Funds monitor for material events or transactions that may occur or become known after theperiod-end date and before the date the financial statements are released to print. |
| I. | Indemnifications— Under the Trust’s organizational documents, its Officers and Trustees are indemnified against certain liabilities arising out of the performance of their duties to the Trust. Each Board member who is not an “interested person” (as defined in the 1940 Act) of the Trust (each, an “Independent Trustee”) is also indemnified against certain liabilities arising out of the performance of his duties to the Trust pursuant to an Indemnification Agreement between such trustee and the Trust. Additionally, in the normal course of business, the Trust enters into contracts with service providers that contain general indemnification clauses. The Trust’s maximum exposure under these arrangements is unknown, as this would involve future claims that may be made against the Trust that have not yet occurred. However, based on experience, the Trust believes the risk of loss to be remote. |
| J. | Securities Lending— During the fiscal year ended April 30, 2019, S&P 500® Equal Weight ETF, S&P 500® Equal Weight Communication Services ETF, S&P 500® Equal Weight Consumer Discretionary ETF, S&P 500® Equal Weight Consumer Staples ETF, S&P 500® Equal Weight Energy ETF, S&P 500® Equal Weight Financials ETF, S&P 500® Equal Weight Health Care ETF, S&P 500® Equal Weight Industrials ETF, S&P 500® Equal Weight Materials ETF, S&P 500® Equal Weight Technology ETF, S&P 500® Equal Weight Utilities ETF, S&P MidCap 400® Equal Weight ETF and S&P SmallCap 600® Equal Weight ETF participated in securities lending. Each Fund loaned portfolio securities having a market value up toone-third of each Fund’s total assets. Such loans are secured by cash collateral equal to no less than 102% (105% for international securities) of the market value of the loaned securities determined daily by the securities lending provider. Cash collateral received in connection with these loans is generally invested in an affiliated money market fund and is shown as such on the Schedules of Investments. Each Fund bears the risk of loss with respect to the investment of collateral. It is the policy of these Funds to obtain additional collateral from or return excess collateral to the borrower by the end of the next business day, following the valuation date of the securities loaned. Therefore, the value of the collateral held may be temporarily less than the value of the securities on loan. When loaning securities, each Fund retains certain benefits of owning the securities, including the economic equivalent of dividends or interest generated by the security. Lending securities entails a risk of loss to each Fund if, and to the extent that, the market value of the securities loaned were to increase, and the borrower did not increase the collateral accordingly, and the borrower failed to return the securities. The securities loaned are subject to termination at the option of the borrower or each Fund. Upon termination, the borrower will return to each Fund the securities loaned and each Fund will return the collateral. Upon the failure of the borrower to return the securities, collateral may be liquidated and the securities may be purchased on the open market to replace the loaned securities. Each Fund could experience delays and costs in gaining access to the collateral and the securities may lose value during the delay which could result in potential losses to each Fund. Some of these losses may be indemnified by the lending agent. Each Fund bears the risk of any deficiency in the amount of the collateral available for return to the borrower due to any loss on the collateral invested. Dividends received on cash collateral investments for securities lending transactions, which are net of compensation to counterparties, are included inSecurities lending incomeon the Statements of Operations. The aggregate value of securities out on loan, if any, is shown on the Statements of Assets and Liabilities. |
| K. | Distributions from Distributable Earnings— In accordance with the Securities and Exchange Commission’s issuance of Disclosure Update and Simplification, the Funds have presented the total, rather than the components, of distributions to shareholders, except for tax return of capital distributions, if any, in the Statements of Changes in Net Assets. |
For the fiscal year ended October 31, 2017, distributions from distributable earnings consisted of distributions from net investment income. For the period November 1, 2017 through April 30, 2018, distributions from distributable earnings consisted of:
| | | | | | | | |
| | | Distributions to
Shareholders from net
investment income | | | Distributions to
Shareholders from net
realized gains | |
| S&P 500®Equal Weight ETF | | $ | 132,095,127 | | | $ | — | |
| S&P 500®Equal Weight Consumer Discretionary ETF | | | 601,330 | | | | — | |
| S&P 500®Equal Weight Consumer Staples ETF | | | 4,600,825 | | | | — | |
| S&P 500®Equal Weight Energy ETF | | | 2,040,302 | | | | — | |
| S&P 500®Equal Weight Financials ETF | | | 3,026,800 | | | | — | |
| S&P 500®Equal Weight Health Care ETF | | | 1,620,790 | | | | — | |
| S&P 500®Equal Weight Industrials ETF | | | 1,408,275 | | | | — | |
| S&P 500®Equal Weight Materials ETF | | | 1,376,220 | | | | — | |
| S&P 500®Equal Weight Real Estate ETF | | | 307,630 | | | | 204,535 | |
| S&P 500®Equal Weight Technology ETF | | | 6,972,945 | | | | — | |
| S&P 500®Equal Weight Utilities ETF | | | 2,707,230 | | | | — | |
| S&P MidCap 400®Equal Weight ETF | | | 818,160 | | | | — | |
| S&P SmallCap 600®Equal Weight ETF | | | 197,020 | | | | — | |
NOTE 3—Investment Advisory Agreement and Other Agreements
The Trust has entered into an Investment Advisory Agreement with the Adviser on behalf of each Fund, pursuant to which the Adviser has overall responsibility for the selection and ongoing monitoring of each Fund’s investments, managing each Fund’s business affairs and providing certain clerical, bookkeeping and other administrative services. Pursuant to the Investment Advisory Agreement, each Fund accrues daily and pays monthly to the Adviser an annual unitary management fee equal to a percentage of its average daily net assets as follows:
| | | | |
| | | Unitary Management Fees
(as a % of Net Assets) | |
| S&P 500®Equal Weight ETF | | | 0.20 | % |
| S&P 500®Equal Weight Communication Services ETF | | | 0.40 | % |
| S&P 500®Equal Weight Consumer Discretionary ETF | | | 0.40 | % |
| S&P 500®Equal Weight Consumer Staples ETF | | | 0.40 | % |
| S&P 500®Equal Weight Energy ETF | | | 0.40 | % |
| S&P 500®Equal Weight Financials ETF | | | 0.40 | % |
| S&P 500®Equal Weight Health Care ETF | | | 0.40 | % |
| S&P 500®Equal Weight Industrials ETF | | | 0.40 | % |
| S&P 500®Equal Weight Materials ETF | | | 0.40 | % |
| S&P 500®Equal Weight Real Estate ETF | | | 0.40 | % |
| S&P 500®Equal Weight Technology ETF | | | 0.40 | % |
| S&P 500®Equal Weight Utilities ETF | | | 0.40 | % |
| S&P MidCap 400®Equal Weight ETF | | | 0.40 | % |
| S&P SmallCap 600®Equal Weight ETF | | | 0.40 | % |
Out of the unitary management fee, the Adviser has agreed to pay for substantially all expenses of the Funds, including the cost of transfer agency, custody, fund administration, legal, audit and other services, except for advisory fees, distribution fees, if any, brokerage expenses, taxes, interest, acquired fund fees and expenses, if any, litigation expenses and other extraordinary expenses.
The Adviser has agreed to waive fees and/or pay Fund expenses to the extent necessary to prevent the operating expenses of each Fund (except S&P 500® Equal Weight Communication Services ETF) (excluding interest expenses, brokerage commissions and other trading expenses, taxes, acquired fund fees and expenses, if applicable, and litigation expenses and extraordinary expenses) from exceeding a percentage of the Fund’s average daily net assets per year (the “Expense Cap”) through at least
April 6, 2020, and neither the Adviser nor the Fund can discontinue the agreement prior to its expiration. For each Fund, the Adviser did not waive fees and/or pay Fund expenses during the period under this Expense Cap. The limits are listed below:
| | | | | | | | |
| | | Expense Caps | | | Contract End Date | |
| S&P 500®Equal Weight ETF | | | 0.20 | % | | | 04/06/20 | |
| S&P 500®Equal Weight Consumer Discretionary ETF | | | 0.40 | % | | | 04/06/20 | |
| S&P 500®Equal Weight Consumer Staples ETF | | | 0.40 | % | | | 04/06/20 | |
| S&P 500®Equal Weight Energy ETF | | | 0.40 | % | | | 04/06/20 | |
| S&P 500®Equal Weight Financials ETF | | | 0.40 | % | | | 04/06/20 | |
| S&P 500®Equal Weight Health Care ETF | | | 0.40 | % | | | 04/06/20 | |
| S&P 500®Equal Weight Industrials ETF | | | 0.40 | % | | | 04/06/20 | |
| S&P 500®Equal Weight Materials ETF | | | 0.40 | % | | | 04/06/20 | |
| S&P 500®Equal Weight Real Estate ETF | | | 0.40 | % | | | 04/06/20 | |
| S&P 500®Equal Weight Technology ETF | | | 0.40 | % | | | 04/06/20 | |
| S&P 500®Equal Weight Utilities ETF | | | 0.40 | % | | | 04/06/20 | |
| S&P MidCap 400®Equal Weight ETF | | | 0.40 | % | | | 04/06/20 | |
| S&P SmallCap 600®Equal Weight ETF | | | 0.40 | % | | | 04/06/20 | |
Additionally, through at least August 31, 2021, the Adviser has contractually agreed to waive a portion of each Fund’s management fee in an amount equal to 100% of the net advisory fees an affiliate of the Adviser receives that are attributable to certain of the Fund’s investment in money market funds managed by that affiliate (excluding investment of cash collateral from securities lending). There is no guarantee that the Adviser will extend the waiver of these fees past that date.
For the fiscal year ended April 30, 2019, the Adviser waived fees and/or paid Fund expenses for each Fund in the following amounts:
| | | | |
| S&P 500®Equal Weight ETF | | $ | 21,448 | |
| S&P 500®Equal Weight Communication Services ETF | | | 15 | |
| S&P 500®Equal Weight Consumer Discretionary ETF | | | 131 | |
| S&P 500®Equal Weight Consumer Staples ETF | | | 688 | |
| S&P 500®Equal Weight Energy ETF | | | 289 | |
| S&P 500®Equal Weight Financials ETF | | | 595 | |
| S&P 500®Equal Weight Health Care ETF | | | 656 | |
| S&P 500®Equal Weight Industrials ETF | | | 290 | |
| S&P 500®Equal Weight Materials ETF | | | 228 | |
| S&P 500®Equal Weight Real Estate ETF | | | 34 | |
| S&P 500®Equal Weight Technology ETF | | | 1,574 | |
| S&P 500®Equal Weight Utilities ETF | | | 333 | |
| S&P MidCap 400®Equal Weight ETF | | | 118 | |
| S&P SmallCap 600®Equal Weight ETF | | | 32 | |
The Trust has entered into a Distribution Agreement with Invesco Distributors, Inc. (the “Distributor”), which serves as the distributor of Creation Units for each Fund. The Distributor does not maintain a secondary market in the Shares. The Funds are not charged any fees pursuant to the Distribution Agreement. The Distributor is an affiliate of the Adviser.
The Trust has entered into service agreements whereby The Bank of New York Mellon, a wholly-owned subsidiary of The Bank of New York Mellon Corporation, serves as the administrator, custodian, fund accountant and transfer agent for each Fund.
The Adviser has entered into licensing agreements on behalf of each Fund with S&P Dow Jones Indices LLC (the “Licensor”).
Each Underlying Index name trademark is owned by the Licensor. These trademarks have been licensed to the Adviser for use by the Funds. Each Fund is entitled to use its Underlying Index pursuant to the Trust’ssub-licensing agreement with the Adviser. The Funds are not sponsored, endorsed, sold or promoted by the Licensor, and the Licensor makes no representation regarding the advisability of investing in any of the Funds.
NOTE 4—Investments in Affiliates
The Adviser and Invesco Mortgage Capital, Inc. are wholly-owned subsidiaries of Invesco Ltd. and therefore, Invesco Ltd. and Invesco Mortgage Capital, Inc. are considered to be affiliated with the Funds. The tables below show certain Funds’ transactions in, and earnings from, investments in affiliates (excluding affiliated money market funds) for the fiscal year ended April 30, 2019.
S&P 500® Equal Weight ETF
| | | | | | | | | | | | | | | | | | | | | | | | | | | | |
| | | Value
April 30, 2018 | | | Purchases
at Cost | | | Proceeds
from Sales | | | Change in
Unrealized
Appreciation
(Depreciation) | | | Realized
Gain (Loss) | | | Value
April 30, 2019 | | | Dividend
Income | |
| Invesco Ltd. | | $ | 25,443,974 | | | $ | 21,185,014 | | | $ | (4,779,908 | ) | | $ | (4,803,680 | ) | | $ | (1,362,978 | ) | | $ | 35,682,422 | | | $ | 1,482,258 | |
| S&P 500®Equal Weight Financials ETF | | | | | | | | | | | | | | | | | | | | | | | | | | | | |
| | | Value
April 30, 2018 | | | Purchases
at Cost | | | Proceeds
from Sales | | | Change in
Unrealized
Appreciation
(Depreciation) | | | Realized
Gain (Loss) | | | Value
April 30, 2019 | | | Dividend
Income | |
| Invesco Ltd. | | $ | 5,711,233 | | | $ | 3,643,713 | | | $ | (2,986,766 | ) | | $ | (1,355,937 | ) | | $ | (272,040 | ) | | $ | 4,740,203 | | | $ | 264,498 | |
| S&P SmallCap 600®Equal Weight ETF | | | | | | | | | | | | | | | | | | | | | | | | | | | | |
| | | Value
April 30, 2018 | | | Purchases
at Cost | | | Proceeds
from Sales | | | Change in
Unrealized
Appreciation | | | Realized
Gain (Loss) | | | Value
April 30, 2019 | | | Dividend
Income | |
| Invesco Mortgage Capital, Inc. | | $ | 51,482 | | | $ | 26,025 | | | $ | (15,922 | ) | | $ | 1,826 | | | $ | (3,043 | ) | | $ | 60,368 | | | $ | 6,399 | |
NOTE 5—Additional Valuation Information
GAAP defines fair value as the price that would be received to sell an asset or paid to transfer a liability in an orderly transaction between market participants at the measurement date, under current market conditions. GAAP establishes a hierarchy that prioritizes the inputs to valuation methods, giving the highest priority to readily available unadjusted quoted prices in an active market for identical assets (Level 1) and the lowest priority to significant unobservable inputs (Level 3), generally when market prices are not readily available or are unreliable. Based on the valuation inputs, the securities or other investments are tiered into one of three levels. Changes in valuation methods may result in transfers in or out of an investment’s assigned level:
| | Level 1 — | Prices are determined using quoted prices in an active market for identical assets. |
| | Level 2 — | Prices are determined using other significant observable inputs. Observable inputs are inputs that other market participants may use in pricing a security. These may include quoted prices for similar securities, interest rates, prepayment speeds, credit risk, yield curves, loss severities, default rates, discount rates, volatilities and others. |
| | Level 3 — | Prices are determined using significant unobservable inputs. In situations where quoted prices or observable inputs are unavailable (for example, when there is little or no market activity for an investment at the end of the period), unobservable inputs may be used. Unobservable inputs reflect the Fund’s own assumptions about the factors market participants would use in determining fair value of the securities or instruments and would be based on the best available information. |
Except for the Fund listed below, as of April 30, 2019, all of the securities in each Fund were valued based on Level 1 inputs (see the Schedules of Investments for security categories). The level assigned to the securities valuations may not be an indication of the risk or liquidity associated with investing in those securities. Because of the inherent uncertainties of valuation, the values reflected in the financial statements may materially differ from the value received upon actual sale of those investments.
| | | | | | | | | | | | | | | | |
| | | Level 1 | | | Level 2 | | | Level 3 | | | Total | |
| S&P SmallCap 600®Equal Weight ETF | | | | | | | | | | | | | | | | |
| Investments in Securities | | | | | | | | | | | | | | | | |
Common Stocks & Other Equity Interests | | $ | 36,249,898 | | | $ | — | | | $ | 834 | | | $ | 36,250,732 | |
Money Market Funds | | | 2,122,447 | | | | — | | | | — | | | | 2,122,447 | |
| | | | | | | | | | | | | | | | |
Total Investments | | $ | 38,372,345 | | | $ | — | | | $ | 834 | | | $ | 38,373,179 | |
| | | | | | | | | | | | | | | | |
NOTE 6—Distributions to Shareholders and Tax Components of Net Assets
Tax Character of Distributions to Shareholder Paid During the Year Ended April 30, 2019, Period November 1, 2017 to April 30, 2018 and Year Ended October 31, 2017:
| | | | | | | | | | | | | | | | | | | | |
| | | 2019 | | | 2018 | | | 2017 | |
| | | Ordinary
Income | | | Long-Term
Capital Gains | | | Ordinary
Income | | | Long-Term
Capital Gains | | | Ordinary
Income | |
| S&P 500®Equal Weight ETF | | $ | 281,738,317 | | | $ | — | | | $ | 132,095,127 | | | $ | — | | | $ | 179,124,293 | |
| S&P 500® Equal Weight Communication Services ETF | | | 28,476 | | | | — | | | | — | | | | — | | | | — | |
| S&P 500®Equal Weight Consumer Discretionary ETF | | | 1,507,788 | | | | — | | | | 601,330 | | | | — | | | | 1,160,323 | |
| S&P 500®Equal Weight Consumer Staples ETF | | | 11,042,415 | | | | — | | | | 4,600,825 | | | | — | | | | 9,494,388 | |
| S&P 500®Equal Weight Energy ETF | | | 4,181,660 | | | | — | | | | 2,040,302 | | | | — | | | | 5,194,156 | |
| S&P 500®Equal Weight Financials ETF | | | 7,699,405 | | | | — | | | | 3,026,800 | | | | — | | | | 4,369,545 | |
| S&P 500®Equal Weight Health Care ETF | | | 3,834,753 | | | | — | | | | 1,620,790 | | | | — | | | | 2,631,245 | |
| S&P 500®Equal Weight Industrials ETF | | | 3,156,072 | | | | — | | | | 1,408,275 | | | | — | | | | 2,570,293 | |
| S&P 500®Equal Weight Materials ETF | | | 2,650,226 | | | | — | | | | 1,376,220 | | | | — | | | | 2,126,922 | |
| S&P 500®Equal Weight Real Estate ETF | | | 659,417 | | | | 42,928 | | | | 307,630 | | | | 204,535 | | | | 723,609 | |
| S&P 500®Equal Weight Technology ETF | | | 16,781,040 | | | | — | | | | 6,972,945 | | | | — | | | | 10,382,861 | |
| S&P 500®Equal Weight Utilities ETF | | | 6,335,821 | | | | — | | | | 2,707,230 | | | | — | | | | 5,692,156 | |
| S&P MidCap 400®Equal Weight ETF | | | 1,331,830 | | | | — | | | | 818,160 | | | | — | | | | 1,246,531 | |
| S&P SmallCap 600®Equal Weight ETF | | | 314,960 | | | | — | | | | 197,020 | | | | — | | | | 296,001 | |
Tax Components of Net Assets at FiscalYear-End:
| | | | | | | | | | | | | | | | | | | | |
| | | Undistributed
Ordinary
Income | | | Net
Unrealized
Appreciation
(Depreciation)-
Investments | | | Capital Loss
Carryforwards | | | Shares of
Beneficial
Interest | | | Total
Net Assets | |
| S&P 500®Equal Weight ETF | | $ | 7,236,334 | | | $ | 2,708,656,241 | | | $ | (846,114,498 | ) | | $ | 14,274,182,443 | | | $ | 16,143,960,520 | |
| S&P 500®Equal Weight Communication Services ETF | | | 48,285 | | | | 636,708 | | | | — | | | | 22,165,734 | | | | 22,850,727 | |
| S&P 500®Equal Weight Consumer Discretionary ETF | | | 53,629 | | | | (366,956 | ) | | | (16,755,583 | ) | | | 130,308,351 | | | | 113,239,441 | |
| S&P 500®Equal Weight Consumer Staples ETF | | | 661,832 | | | | (3,973,172 | ) | | | (31,085,527 | ) | | | 466,233,374 | | | | 431,836,507 | |
| S&P 500®Equal Weight Energy ETF | | | — | | | | (39,695,377 | ) | | | (101,133,291 | ) | | | 350,651,557 | | | | 209,822,889 | |
| S&P 500®Equal Weight Financials ETF | | | 79,419 | | | | (224,307 | ) | | | (13,929,428 | ) | | | 305,218,830 | | | | 291,144,514 | |
| S&P 500®Equal Weight Health Care ETF | | | 333,629 | | | | 34,940,063 | | | | (42,511,035 | ) | | | 714,082,341 | | | | 706,844,998 | |
| S&P 500®Equal Weight Industrials ETF | | | 12,540 | | | | 5,290,809 | | | | (14,278,105 | ) | | | 254,725,026 | | | | 245,750,270 | |
| S&P 500®Equal Weight Materials ETF | | | 142,233 | | | | (9,800,269 | ) | | | (13,475,742 | ) | | | 152,861,347 | | | | 129,727,569 | |
| S&P 500®Equal Weight Real Estate ETF | | | — | | | | 484,839 | | | | (16,535 | ) | | | 36,674,749 | | | | 37,143,053 | |
| S&P 500®Equal Weight Technology ETF | | | 135,019 | | | | 327,663,954 | | | | (61,232,573 | ) | | | 1,522,279,797 | | | | 1,788,846,197 | |
| S&P 500®Equal Weight Utilities ETF | | | 279,416 | | | | 33,151,123 | | | | (24,145,366 | ) | | | 326,213,546 | | | | 335,498,719 | |
| S&P MidCap 400®Equal Weight ETF | | | — | | | | 5,672,182 | | | | (18,178,221 | ) | | | 118,398,990 | | | | 105,892,951 | |
| S&P SmallCap 600®Equal Weight ETF | | | 94,710 | | | | (105,874 | ) | | | (15,306,812 | ) | | | 51,605,276 | | | | 36,287,300 | |
Capital loss carryforwards are calculated and reported as of a specific date. Results of transactions and other activity after that date may affect the amount of capital loss carryforwards actually available for the Funds to utilize. Capital losses generated in years beginning after December 22, 2010 can be carried forward for an unlimited period, whereas previous losses expire in eight tax years. Capital losses with an expiration period may not be used to offset capital gains until all net capital losses without an expiration date have been utilized. Capital loss carryforwards with no expiration date will retain their character as either short-term or long-term capital losses instead of as short-term capital losses as under prior law. The ability to utilize capital loss carryforwards in the future may be limited under the Internal Revenue Code and related regulations based on the results of future transactions.
The following table presents available capital loss carryforwards for each Fund as of April 30, 2019:
| | | | | | | | | | | | |
| | | Post-effective/no expiration | | | | |
| | | Short-Term | | | Long-Term | | | Total* | |
| S&P 500®Equal Weight ETF | | $ | 125,032,648 | | | $ | 721,081,850 | | | $ | 846,114,498 | |
| S&P 500®Equal Weight Communication Services ETF | | | — | | | | — | | | | — | |
| | | | | | | | | | | | |
| | | Post-effective/no expiration | | | | |
| | | Short-Term | | | Long-Term | | | Total* | |
| S&P 500®Equal Weight Consumer Discretionary ETF | | $ | 1,979,498 | | | $ | 14,776,085 | | | $ | 16,755,583 | |
| S&P 500®Equal Weight Consumer Staples ETF | | | 4,543,897 | | | | 26,541,630 | | | | 31,085,527 | |
| S&P 500®Equal Weight Energy ETF | | | 26,053,807 | | | | 75,079,484 | | | | 101,133,291 | |
| S&P 500®Equal Weight Financials ETF | | | 4,221,047 | | | | 9,708,381 | | | | 13,929,428 | |
| S&P 500®Equal Weight Health Care ETF | | | 5,369,955 | | | | 37,141,080 | | | | 42,511,035 | |
| S&P 500®Equal Weight Industrials ETF | | | 4,096,116 | | | | 10,181,989 | | | | 14,278,105 | |
| S&P 500®Equal Weight Materials ETF | | | 2,634,884 | | | | 10,840,858 | | | | 13,475,742 | |
| S&P 500®Equal Weight Real Estate ETF | | | — | | | | 16,535 | | | | 16,535 | |
| S&P 500®Equal Weight Technology ETF | | | 27,996,715 | | | | 33,235,858 | | | | 61,232,573 | |
| S&P 500®Equal Weight Utilities ETF | | | 9,062,824 | | | | 15,082,542 | | | | 24,145,366 | |
| S&P MidCap 400®Equal Weight ETF | | | 8,137,255 | | | | 10,040,966 | | | | 18,178,221 | |
| S&P SmallCap 600®Equal Weight ETF | | | 7,688,814 | | | | 7,617,998 | | | | 15,306,812 | |
| * | Capital loss carryforward as of the date listed above is reduced for limitations, if any, to the extent required by the Internal Revenue Code and may be further limited depending upon a variety of factors, including the realization of net unrealized gains or losses as of the date of any reorganization. |
NOTE 7—Investment Transactions
For the fiscal year ended April 30, 2019, the cost of securities purchased and proceeds from sales of securities (other than short-term securities, U.S. Treasury obligations, money market funds andin-kind transactions, if any) were as follows:
| | | | | | | | |
| | | Purchases | | | Sales | |
| S&P 500®Equal Weight ETF | | $ | 2,851,474,405 | | | $ | 2,860,455,076 | |
| S&P 500®Equal Weight Communication Services ETF | | | 3,617,336 | | | | 1,112,764 | |
| S&P 500®Equal Weight Consumer Discretionary ETF | | | 32,958,814 | | | | 30,278,668 | |
| S&P 500®Equal Weight Consumer Staples ETF | | | 91,183,757 | | | | 87,657,838 | |
| S&P 500®Equal Weight Energy ETF | | | 74,972,841 | | | | 74,861,953 | |
| S&P 500®Equal Weight Financials ETF | | | 60,951,971 | | | | 62,299,720 | |
| S&P 500®Equal Weight Health Care ETF | | | 166,172,708 | | | | 159,778,348 | |
| S&P 500®Equal Weight Industrials ETF | | | 67,456,569 | | | | 68,590,549 | |
| S&P 500®Equal Weight Materials ETF | | | 36,950,095 | | | | 34,428,298 | |
| S&P 500®Equal Weight Real Estate ETF | | | 2,952,176 | | | | 2,932,814 | |
| S&P 500®Equal Weight Technology ETF | | | 452,875,235 | | | | 462,080,066 | |
| S&P 500®Equal Weight Utilities ETF | | | 59,879,084 | | | | 62,350,168 | |
| S&P MidCap 400®Equal Weight ETF | | | 32,552,243 | | | | 30,327,492 | |
| S&P SmallCap 600®Equal Weight ETF | | | 12,451,567 | | | | 13,563,700 | |
For the fiscal year ended April 30, 2019,in-kind transactions associated with creations and redemptions were as follows:
| | | | | | | | |
| | | Cost of
Securities
Received | | | Value of
Securities
Delivered | |
| S&P 500®Equal Weight ETF | | $ | 3,909,062,629 | | | $ | 3,558,589,990 | |
| S&P 500®Equal Weight Communication Services ETF | | | 31,653,461 | | | | 12,904,663 | |
| S&P 500®Equal Weight Consumer Discretionary ETF | | | 102,646,193 | | | | 82,882,684 | |
| S&P 500®Equal Weight Consumer Staples ETF | | | 279,696,614 | | | | 303,280,497 | |
| S&P 500®Equal Weight Energy ETF | | | 276,128,878 | | | | 274,321,473 | |
| S&P 500®Equal Weight Financials ETF | | | 84,861,731 | | | | 219,982,210 | |
| S&P 500®Equal Weight Health Care ETF | | | 260,025,342 | | | | 202,381,806 | |
| S&P 500®Equal Weight Industrials ETF | | | 132,362,349 | | | | 181,248,751 | |
| S&P 500®Equal Weight Materials ETF | | | 48,540,299 | | | | 102,046,998 | |
| S&P 500®Equal Weight Real Estate ETF | | | 24,580,029 | | | | 7,116,900 | |
| S&P 500®Equal Weight Technology ETF | | | 781,628,023 | | | | 889,318,913 | |
| S&P 500®Equal Weight Utilities ETF | | | 234,446,145 | | | | 69,137,984 | |
| S&P MidCap 400®Equal Weight ETF | | | 13,104,820 | | | | 18,756,717 | |
| S&P SmallCap 600®Equal Weight ETF | | | 12,059,782 | | | | 4,139,188 | |
Gains (losses) onin-kind transactions are generally not considered taxable gains (losses) for federal income tax purposes. At April 30, 2019, the aggregate cost of investments, including any derivatives, on a tax basis includes adjustments for financial reporting purposes as of the most recently completed federal income tax reportingperiod-end:
| | | | | | | | | | | | | | | | |
| | | Gross
Unrealized
Appreciation | | | Gross
Unrealized
(Depreciation) | | | Net
Unrealized
Appreciation
(Depreciation) | | | Cost | |
| S&P 500®Equal Weight ETF | | $ | 3,361,627,740 | | | $ | (652,971,499 | ) | | $ | 2,708,656,241 | | | $ | 13,467,937,767 | |
| S&P 500®Equal Weight Communication Services ETF | | | 845,490 | | | | (208,782 | ) | | | 636,708 | | | | 22,198,564 | |
| S&P 500®Equal Weight Consumer Discretionary ETF | | | 8,228,104 | | | | (8,595,060 | ) | | | (366,956 | ) | | | 116,740,365 | |
| S&P 500®Equal Weight Consumer Staples ETF | | | 36,073,398 | | | | (40,046,570 | ) | | | (3,973,172 | ) | | | 446,493,370 | |
| S&P 500®Equal Weight Energy ETF | | | 5,400,501 | | | | (45,095,878 | ) | | | (39,695,377 | ) | | | 249,363,577 | |
| S&P 500®Equal Weight Financials ETF | | | 19,572,675 | | | | (19,796,982 | ) | | | (224,307 | ) | | | 291,278,817 | |
| S&P 500®Equal Weight Health Care ETF | | | 105,298,629 | | | | (70,358,566 | ) | | | 34,940,063 | | | | 671,705,719 | |
| S&P 500®Equal Weight Industrials ETF | | | 19,393,394 | | | | (14,102,585 | ) | | | 5,290,809 | | | | 242,529,900 | |
| S&P 500®Equal Weight Materials ETF | | | 6,539,047 | | | | (16,339,316 | ) | | | (9,800,269 | ) | | | 148,326,320 | |
| S&P 500®Equal Weight Real Estate ETF | | | 2,111,004 | | | | (1,626,165 | ) | | | 484,839 | | | | 36,666,970 | |
| S&P 500®Equal Weight Technology ETF | | | 368,444,307 | | | | (40,780,353 | ) | | | 327,663,954 | | | | 1,461,507,005 | |
| S&P 500®Equal Weight Utilities ETF | | | 35,341,791 | | | | (2,190,668 | ) | | | 33,151,123 | | | | 302,089,846 | |
| S&P MidCap 400®Equal Weight ETF | | | 13,998,165 | | | | (8,325,983 | ) | | | 5,672,182 | | | | 104,348,298 | |
| S&P SmallCap 600®Equal Weight ETF | | | 4,688,312 | | | | (4,794,186 | ) | | | (105,874 | ) | | | 38,479,053 | |
NOTE 8—Reclassification of Permanent Differences
Primarily as a result of differing book/tax treatment ofin-kind transactions and expired capital loss carryforwards, amounts were reclassified between undistributed net investment income, undistributed net realized gain (loss) and Shares of beneficial interest. These reclassifications had no effect on the net assets of each Fund. For the fiscal year ended April 30, 2019, the reclassifications were as follows:
| | | | | | | | | | | | |
| | | Undistributed
Net Investment
Income | | | Undistributed
Net Realized
Gain (Loss) | | | Shares of
Beneficial
Interest | |
| S&P 500®Equal Weight ETF | | $ | — | | | $ | (1,236,401,793 | ) | | $ | 1,236,401,793 | |
| S&P 500®Equal Weight Communication Services ETF | | | — | | | | (911,047 | ) | | | 911,047 | |
| S&P 500®Equal Weight Consumer Discretionary ETF | | | — | | | | (8,686,266 | ) | | | 8,686,266 | |
| S&P 500®Equal Weight Consumer Staples ETF | | | — | | | | (30,214,549 | ) | | | 30,214,549 | |
| S&P 500®Equal Weight Energy ETF | | | 267,892 | | | | (13,880,940 | ) | | | 13,613,048 | |
| S&P 500®Equal Weight Financials ETF | | | — | | | | (20,518,152 | ) | | | 20,518,152 | |
| S&P 500®Equal Weight Health Care ETF | | | — | | | | (55,105,090 | ) | | | 55,105,090 | |
| S&P 500®Equal Weight Industrials ETF | | | — | | | | (13,528,477 | ) | | | 13,528,477 | |
| S&P 500®Equal Weight Materials ETF | | | — | | | | 864,997 | | | | (864,997 | ) |
| S&P 500®Equal Weight Real Estate ETF | | | 79,413 | | | | (778,759 | ) | | | 699,346 | |
| S&P 500®Equal Weight Technology ETF | | | — | | | | (248,227,441 | ) | | | 248,227,441 | |
| S&P 500®Equal Weight Utilities ETF | | | — | | | | (9,300,076 | ) | | | 9,300,076 | |
| S&P MidCap 400®Equal Weight ETF | | | 30,617 | | | | (5,432,443 | ) | | | 5,401,826 | |
| S&P SmallCap 600®Equal Weight ETF | | | — | | | | (599,799 | ) | | | 599,799 | |
NOTE 9—Trustees’ and Officer’s Fees
Trustees’ and Officer’s Fees include amounts accrued by the Funds to pay remuneration to the Independent Trustees and an Officer of the Trust. The Adviser, as a result of the unitary management fee, pays for such compensation for the Funds. The Trustee who is an “interested person” of the Trust does not receive any Trustees’ Fees.
The Trust has adopted a deferred compensation plan (the “Plan”). Under the Plan, each Independent Trustee who has executed a Deferred Fee Agreement (a “Participating Trustee”) may defer receipt of all or a portion of his compensation (“Deferral Fees”). Such Deferral Fees are deemed to be invested in select Invesco Funds. The Deferral Fees payable to the Participating Trustee are valued as of the date such Deferral Fees would have been paid to the Participating Trustee. The value increases with contributions or with increases in the value of the Shares selected, and the value decreases with distributions or with declines in the value of the Shares selected.
Obligations under the Plan represent unsecured claims against the general assets of the Funds.
NOTE 10—Capital
Shares are issued and redeemed by the Funds only in creation unit size aggregations of 50,000 Shares. Transactions are permitted on anin-kind basis, with a separate cash payment, which is balancing each component to equate the transaction to the net asset value per share of the Fund on the transaction date.
To the extent that the Funds permit transactions in exchange for Deposit Securities, each Fund may issue Shares in advance of receipt of Deposit Securities subject to various conditions, including a requirement to maintain on deposit with the Trust cash at least equal to 105% of the market value of the missing Deposit Securities. In accordance with the Trust’s Participant Agreement, Creation Units will be issued to an Authorized Participant, notwithstanding the fact that the corresponding Deposit Securities have not been received in part or in whole, in reliance on the undertaking of the Authorized Participant to deliver the missing Deposit Securities as soon as possible, which undertaking shall be secured by the Authorized Participant’s delivery and maintenance of collateral consisting of cash in the form of U.S. dollars in immediately available funds having a value(marked-to-market daily) at least equal to 105%, which the Adviser may change from time to time, of the value of the missing Deposit Securities.
Certain transaction fees may be charged by the Funds for creations and redemptions, which are treated as increases in capital. Transactions in each Fund’s Shares are disclosed in detail in the Statements of Changes in Net Assets.
Report of Independent Registered Public Accounting Firm
To the Board of Trustees of Invesco Exchange-Traded Fund Trust and Shareholders of Invesco S&P 500® Equal Weight ETF, Invesco S&P 500® Equal Weight Communication Services ETF, Invesco S&P 500® Equal Weight Consumer Discretionary ETF, Invesco S&P 500® Equal Weight Consumer Staples ETF, Invesco S&P 500® Equal Weight Energy ETF, Invesco S&P 500® Equal Weight Financials ETF, Invesco S&P 500® Equal Weight Health Care ETF, Invesco S&P 500® Equal Weight Industrials ETF, Invesco S&P 500® Equal Weight Materials ETF, Invesco S&P 500® Equal Weight Real Estate ETF, Invesco S&P 500® Equal Weight Technology ETF, Invesco S&P 500® Equal Weight Utilities ETF, Invesco S&P MidCap 400® Equal Weight ETF and Invesco S&P SmallCap 600® Equal Weight ETF
Opinions on the Financial Statements
We have audited the accompanying statements of assets and liabilities, including the schedules of investments, of each of the funds listed in the table below (fourteen of the funds constituting Invesco Exchange-Traded Fund Trust, hereafter collectively referred to as the “Funds”) as of April 30, 2019, the related statements of operations for the year ended April 30, 2019 (or for Invesco S&P 500® Equal Weight Communication Services ETF, for the period November 5, 2018 (commencement of investment operations) through April 30, 2019) and the statements of changes in net assets and the financial highlights for the year ended April 30, 2019 and for the six months ended April 30, 2018 (or for Invesco S&P 500® Equal Weight Communication Services ETF, for the period November 5, 2018 (commencement of investment operations) through April 30, 2019), including the related notes (collectively referred to as the “financial statements”). In our opinion, the financial statements present fairly, in all material respects, the financial position of each of the Funds as of April 30, 2019, the results of each of their operations for the year then ended (or for Invesco S&P 500® Equal Weight Communication Services ETF, for the period November 5, 2018 (commencement of investment operations) through April 30, 2019) and the changes in each of their net assets and the financial highlights for the year ended April 30, 2019 and for the six months ended April 30, 2018 (or for Invesco S&P 500® Equal Weight Communication Services ETF, for the period November 5, 2018 (commencement of investment operations) through April 30, 2019) in conformity with accounting principles generally accepted in the United States of America.
| | |
Fund Name | | Predecessor Fund |
| Invesco S&P 500®Equal Weight ETF | | Guggenheim S&P 500®Equal Weight ETF |
| Invesco S&P 500®Equal Weight Communication Services ETF | | — |
| Invesco S&P 500®Equal Weight Consumer Discretionary ETF | | Guggenheim S&P 500®Equal Weight Consumer Discretionary ETF |
| Invesco S&P 500®Equal Weight Consumer Staples ETF | | Guggenheim S&P 500®Equal Weight Consumer Staples ETF |
| Invesco S&P 500®Equal Weight Energy ETF | | Guggenheim S&P 500®Equal Weight Energy ETF |
| Invesco S&P 500®Equal Weight Financials ETF | | Guggenheim S&P 500®Equal Weight Financials ETF |
| Invesco S&P 500®Equal Weight Health Care ETF | | Guggenheim S&P 500®Equal Weight Health Care ETF |
| Invesco S&P 500®Equal Weight Industrials ETF | | Guggenheim S&P 500®Equal Weight Industrials ETF |
| Invesco S&P 500®Equal Weight Materials ETF | | Guggenheim S&P 500®Equal Weight Materials ETF |
| Invesco S&P 500®Equal Weight Real Estate ETF | | Guggenheim S&P 500®Equal Weight Real Estate ETF |
| Invesco S&P 500®Equal Weight Technology ETF | | Guggenheim S&P 500®Equal Weight Technology ETF |
| Invesco S&P 500®Equal Weight Utilities ETF | | Guggenheim S&P 500®Equal Weight Utilities ETF |
| Invesco S&P MidCap 400®Equal Weight ETF | | Guggenheim S&P MidCap 400®Equal Weight ETF |
| Invesco S&P SmallCap 600®Equal Weight ETF | | Guggenheim S&P SmallCap 600®Equal Weight ETF |
The financial statements of the Predecessor Funds listed in the table above as of and for the year ended October 31, 2017 and the financial highlights for each of the periods ended on or prior to October 31, 2017 (not presented herein, other than the statements of changes in net assets and the financial highlights) were audited by other auditors whose report, dated December 21, 2017, expressed an unqualified opinion on those financial statements and financial highlights.
Basis for Opinions
These financial statements are the responsibility of the Funds’ management. Our responsibility is to express an opinion on the Funds’ financial statements based on our audits. We are a public accounting firm registered with the Public Company Accounting Oversight Board (United States) (PCAOB) and are required to be independent with respect to the Funds in accordance with the U.S. federal securities laws and the applicable rules and regulations of the Securities and Exchange Commission and the PCAOB.
Report of Independent Registered Public Accounting Firm(continued)
We conducted our audits of these financial statements in accordance with the standards of the PCAOB. Those standards require that we plan and perform the audit to obtain reasonable assurance about whether the financial statements are free of material misstatement, whether due to error or fraud.
Our audits included performing procedures to assess the risks of material misstatement of the financial statements, whether due to error or fraud, and performing procedures that respond to those risks. Such procedures included examining, on a test basis, evidence regarding the amounts and disclosures in the financial statements. Our audits also included evaluating the accounting principles used and significant estimates made by management, as well as evaluating the overall presentation of the financial statements. Our procedures included confirmation of securities owned as of April 30, 2019 by correspondence with the custodian, transfer agent and brokers; when replies were not received from brokers, we performed other auditing procedures. We believe that our audits provide a reasonable basis for our opinions.
PricewaterhouseCoopers LLP
Chicago, Illinois
June 26, 2019
We have served as the auditor of one or more of the investment companies in the Invesco group of investment companies since at least 1995. We have not determined the specific year we began serving as auditor.
Calculating your ongoing Fund expenses
Example
As a shareholder of a Fund of the Invesco Exchange-Traded Fund Trust, you incur a unitary management fee. In addition to the unitary management fee, a shareholder may pay distribution fees, if any, brokerage expenses, taxes, interest, acquired fund fees and expenses, if any, litigation expenses and other extraordinary expenses. The expense examples below are intended to help you understand your ongoing costs (in dollars) of investing in the Funds and to compare these costs with the ongoing costs of investing in other funds.
The example is based on an investment of $1,000 invested at the beginning of the period and held through thesix-month period ended April 30, 2019.
Actual Expenses
The first line in the following table provides information about actual account values and actual expenses. You may use the information in this line, together with the amount you invested, to estimate the expenses that you paid over the period. Simply divide your account value by $1,000 (for example, an $8,600 account value divided by $1,000 = 8.6), then multiply the result by the number in the first line under the heading “Expenses Paid During theSix-Month Period” to estimate the expenses you paid on your account during this period.
Hypothetical Example for Comparison Purposes
The second line in the following table provides information about hypothetical account values and hypothetical expenses based on each Fund’s actual expense ratio and an assumed annualized rate of return of 5% per year before expenses, which is not the Fund’s actual return. The hypothetical account values and expenses may not be used to estimate the actual ending account balance or expenses you paid for the period. You may use this information to compare the ongoing costs of investing in the Funds and other funds. To do so, compare this 5% hypothetical example with the 5% hypothetical examples that appear in the shareholder reports of the other funds.
Please note that the expenses shown in the table are meant to highlight your ongoing costs only, and do not reflect any transactional costs such as sales charges and brokerage commissions. Therefore the second line in the table is useful in comparing ongoing costs only, and will not help you determine the relative total costs of owning different funds. In addition, if these transactional costs were included, your costs would have been higher.
| | | | | | | | | | | | | | | | |
| | | Beginning Account Value November 1, 2018 | | | Ending Account Value April 30, 2019 | | | Annualized Expense Ratio Based on the Six-Month Period | | | Expenses Paid During the Six-Month Period(1) | |
| Invesco S&P 500®Equal Weight ETF (RSP) | | | | | | | | | | | | | | | | |
Actual | | $ | 1,000.00 | | | $ | 1,104.10 | | | | 0.20 | % | | $ | 1.04 | |
Hypothetical (5% return before expenses) | | | 1,000.00 | | | | 1,023.80 | | | | 0.20 | | | | 1.00 | |
| Invesco S&P 500®Equal Weight Communication Services ETF (EWCO) | | | | | | | | | | | | | | | | |
Actual | | | 1,000.00 | | | | 1,000.80 | | | | 0.40 | (2) | | | 1.94 | (3) |
Hypothetical (5% return before expenses) | | | 1,000.00 | | | | 1,022.81 | | | | 0.40 | (2) | | | 2.01 | (3) |
| Invesco S&P 500®Equal Weight Consumer Discretionary ETF (RCD) | | | | | | | | | | | | | | | | |
Actual | | | 1,000.00 | | | | 1,106.10 | | | | 0.40 | | | | 2.09 | |
Hypothetical (5% return before expenses) | | | 1,000.00 | | | | 1,022.81 | | | | 0.40 | | | | 2.01 | |
| Invesco S&P 500®Equal Weight Consumer Staples ETF (RHS) | | | | | | | | | | | | | | | | |
Actual | | | 1,000.00 | | | | 1,064.90 | | | | 0.40 | | | | 2.05 | |
Hypothetical (5% return before expenses) | | | 1,000.00 | | | | 1,022.81 | | | | 0.40 | | | | 2.01 | |
| Invesco S&P 500®Equal Weight Energy ETF (RYE) | | | | | | | | | | | | | | | | |
Actual | | | 1,000.00 | | | | 981.10 | | | | 0.40 | | | | 1.96 | |
Hypothetical (5% return before expenses) | | | 1,000.00 | | | | 1,022.81 | | | | 0.40 | | | | 2.01 | |
| Invesco S&P 500®Equal Weight Financials ETF (RYF) | | | | | | | | | | | | | | | | |
Actual | | | 1,000.00 | | | | 1,097.30 | | | | 0.40 | | | | 2.08 | |
Hypothetical (5% return before expenses) | | | 1,000.00 | | | | 1,022.81 | | | | 0.40 | | | | 2.01 | |
Calculating your ongoing Fund expenses(continued)
| | | | | | | | | | | | | | | | |
| | | Beginning Account Value November 1, 2018 | | | Ending Account Value April 30, 2019 | | | Annualized Expense Ratio Based on the Six-Month Period | | | Expenses Paid During the Six-Month Period(1) | |
| Invesco S&P 500®Equal Weight Health Care ETF (RYH) | | | | | | | | | | | | | | | | |
Actual | | $ | 1,000.00 | | | $ | 1,038.40 | | | | 0.40 | % | | $ | 2.02 | |
Hypothetical (5% return before expenses) | | | 1,000.00 | | | | 1,022.81 | | | | 0.40 | | | | 2.01 | |
| Invesco S&P 500®Equal Weight Industrials ETF (RGI) | | | | | | | | | | | | | | | | |
Actual | | | 1,000.00 | | | | 1,138.20 | | | | 0.40 | | | | 2.12 | |
Hypothetical (5% return before expenses) | | | 1,000.00 | | | | 1,022.81 | | | | 0.40 | | | | 2.01 | |
| Invesco S&P 500®Equal Weight Materials ETF (RTM) | | | | | | | | | | | | | | | | |
Actual | | | 1,000.00 | | | | 1,101.00 | | | | 0.40 | | | | 2.08 | |
Hypothetical (5% return before expenses) | | | 1,000.00 | | | | 1,022.81 | | | | 0.40 | | | | 2.01 | |
| Invesco S&P 500®Equal Weight Real Estate ETF (EWRE) | | | | | | | | | | | | | | | | |
Actual | | | 1,000.00 | | | | 1,128.70 | | | | 0.40 | | | | 2.11 | |
Hypothetical (5% return before expenses) | | | 1,000.00 | | | | 1,022.81 | | | | 0.40 | | | | 2.01 | |
| Invesco S&P 500®Equal Weight Technology ETF (RYT) | | | | | | | | | | | | | | | | |
Actual | | | 1,000.00 | | | | 1,192.00 | | | | 0.40 | | | | 2.17 | |
Hypothetical (5% return before expenses) | | | 1,000.00 | | | | 1,022.81 | | | | 0.40 | | | | 2.01 | |
| Invesco S&P 500®Equal Weight Utilities ETF (RYU) | | | | | | | | | | | | | | | | |
Actual | | | 1,000.00 | | | | 1,102.30 | | | | 0.40 | | | | 2.09 | |
Hypothetical (5% return before expenses) | | | 1,000.00 | | | | 1,022.81 | | | | 0.40 | | | | 2.01 | |
| Invesco S&P MidCap 400®Equal Weight ETF (EWMC) | | | | | | | | | | | | | | | | |
Actual | | | 1,000.00 | | | | 1,077.50 | | | | 0.40 | | | | 2.06 | |
Hypothetical (5% return before expenses) | | | 1,000.00 | | | | 1,022.81 | | | | 0.40 | | | | 2.01 | |
| Invesco S&P SmallCap 600®Equal Weight ETF (EWSC) | | | | | | | | | | | | | | | | |
Actual | | | 1,000.00 | | | | 1,025.90 | | | | 0.40 | | | | 2.01 | |
Hypothetical (5% return before expenses) | | | 1,000.00 | | | | 1,022.81 | | | | 0.40 | | | | 2.01 | |
| (1) | Expenses are calculated using the annualized expense ratio, which represents the ongoing expenses as a percentage of net assets for thesix-month period ended April 30, 2019. Expenses are calculated by multiplying the Fund’s annualized expense ratio by the average account value for the period, then multiplying the result by 181/365. Expense ratios for the most recentsix-month period may differ from expense ratios based on the annualized data in the Financial Highlights. |
| (2) | The actual ending account value is based on the actual total return of the Fund for the period November 5, 2018 (commencement of investment operations) through April 30, 2019, after actual expenses and will differ from the hypothetical ending account value which is based on the Fund’s expense ratio and a hypothetical annual return of 5% before expenses. |
| (3) | Expenses are calculated using the annualized expense ratio, which represents the ongoing expenses as a percentage of net assets for the period November 5, 2018 (commencement of investment operations) to April 30, 2019. Expenses are calculated by multiplying the Fund’s annualized expense ratio by the average account value for the period, then multiplying the result by 177/365. Hypothetical expenses are calculated by multiplying the Fund’s annualized expense ratio by the average account value for the period, then multiplying the result by 181/365. |
Tax Information
Form1099-DIV, Form1042-S and other year-end tax information provide shareholders with actual calendar year amounts that should be included in their tax returns. Shareholders should consult their tax advisers.
The following distribution information is being provided as required by the Internal Revenue Code or to meet a specific state’s requirement.
Each Fund designates the following amounts or, if subsequently determined to be different, the maximum amount allowable for its fiscal year ended April 30, 2019:
| | | | | | | | | | | | | | | | | | | | |
| | | Qualified Business
Income* | | Qualified Dividend
Income* | | Corporate Dividends
Received Deduction* | | Long Term
Capital Gains |
| Invesco S&P 500®Equal Weight ETF | | | | 0 | % | | | | 100 | % | | | | 99 | % | | | | — | |
| Invesco S&P 500®Equal Weight Communication Services ETF | | | | 0 | % | | | | 78 | % | | | | 78 | % | | | | — | |
| Invesco S&P 500®Equal Weight Consumer Discretionary ETF | | | | 0 | % | | | | 100 | % | | | | 100 | % | | | | — | |
| Invesco S&P 500®Equal Weight Consumer Staples ETF | | | | 0 | % | | | | 100 | % | | | | 100 | % | | | | — | |
| Invesco S&P 500®Equal Weight Energy ETF | | | | 0 | % | | | | 100 | % | | | | 100 | % | | | | — | |
| Invesco S&P 500®Equal Weight Financials ETF | | | | 0 | % | | | | 100 | % | | | | 100 | % | | | | — | |
| Invesco S&P 500®Equal Weight Health Care ETF | | | | 0 | % | | | | 100 | % | | | | 100 | % | | | | — | |
| Invesco S&P 500®Equal Weight Industrials ETF | | | | 0 | % | | | | 100 | % | | | | 100 | % | | | | — | |
| Invesco S&P 500®Equal Weight Materials ETF | | | | 0 | % | | | | 100 | % | | | | 100 | % | | | | — | |
| Invesco S&P 500®Equal Weight Real Estate ETF | | | | 70 | % | | | | 9 | % | | | | 0 | % | | | | 441,054 | |
| Invesco S&P 500®Equal Weight Technology ETF | | | | 0 | % | | | | 100 | % | | | | 100 | % | | | | — | |
| Invesco S&P 500®Equal Weight Utilities ETF | | | | 0 | % | | | | 100 | % | | | | 100 | % | | | | — | |
| Invesco S&P MidCap 400®Equal Weight ETF | | | | 0 | % | | | | 99 | % | | | | 99 | % | | | | — | |
| Invesco S&P SmallCap 600®Equal Weight ETF | | | | 0 | % | | | | 100 | % | | | | 99 | % | | | | — | |
| * | The above percentages are based on ordinary income dividends paid to shareholders during the fiscal year. |
Trustees and Officers
The Independent Trustees of the Trust, their term of office and length of time served, their principal business occupations during at least the past five years, the number of portfolios in the Fund Complex (as defined below) overseen by each Independent Trustee and the other directorships, if any, held by each Independent Trustee are shown below.
| | | | | | | | | | |
Name, Address and Year of
Birth of Independent Trustees | | Position(s)
Held
with Trust | | Term of
Office and
Length of
Time
Served* | | Principal
Occupation(s) During
Past 5 Years | | Number of
Portfolios
in Fund
Complex**
Overseen by
Independent
Trustees | | Other
Directorships
Held by
Independent
Trustees During
the Past 5 Years |
Ronn R. Bagge—1958
c/o Invesco Capital Management LLC
3500 Lacey Road, Suite 700
Downers Grove, IL 60515 | | Vice Chairman of the Board; Chairman of the Nominating and Governance Committee and Trustee | | Vice Chairman since 2018; Chairman of the Nominating and Governance Committee and Trustee since 2003 | | Founder and Principal, YQA Capital Management LLC (1998-Present); formerly, Owner/CEO of Electronic Dynamic Balancing Co., Inc. (high-speed rotating equipment service provider). | | 241 | | Trustee and Investment Oversight Committee member, Mission Aviation Fellowship (2017-Present). |
| | | | | |
Todd J. Barre—1957
c/o Invesco Capital Management LLC
3500 Lacey Road, Suite 700
Downers Grove, IL 60515 | | Trustee | | Since 2010 | | Assistant Professor of Business, Trinity Christian College (2010-2016); formerly, Vice President and Senior Investment Strategist (2001-2008), Director of Open Architecture and Trading (2007-2008), Head of Fundamental Research (2004-2007), and Vice President and Senior Fixed Income Strategist (1994-2001), BMO Financial Group/Harris Private Bank. | | 241 | | None. |
| | | | | |
Marc M. Kole—1960
c/o Invesco Capital Management LLC
3500 Lacey Road, Suite 700
Downers Grove, IL 60515 | | Chairman of the Audit Committee and Trustee | | Chairman of the Audit Committee since 2008; Trustee since 2006 | | Senior Director of Finance, By The Hand Club For Kids (not-for-profit) (2015-Present); formerly, Chief Financial Officer, Hope Network (social services) (2008-2012); Assistant Vice President and Controller, Priority Health (health insurance) (2005-2008); Regional Chief Financial Officer, United Healthcare (2005); Chief Accounting Officer, Senior Vice President of Finance, Oxford Health Plans (2000-2004); Audit Partner, Arthur Andersen LLP (1996-2000). | | 241 | | Treasurer (2018-Present), Finance Committee Member (2015-Present) and Audit Committee Member (2015), Thornapple Evangelical Covenant Church; formerly, Board and Finance Committee Member (2009-2017) and Treasurer (2010-2015, 2017), NorthPointe Christian Schools. |
| * | This is the date the Independent Trustee began serving the Trust. Each Independent Trustee serves an indefinite term, until his successor is elected. |
| ** | Fund Complex includes all open- and closed-end funds (including all of their portfolios) advised by the Adviser and any affiliated person of the Adviser. |
Trustees and Officers(continued)
| | | | | | | | | | |
Name, Address and Year of
Birth of Independent Trustees | | Position(s)
Held
with Trust | | Term of
Office and
Length of
Time
Served* | | Principal
Occupation(s) During
Past 5 Years | | Number of
Portfolios
in Fund
Complex**
Overseen by
Independent
Trustees | | Other
Directorships
Held by
Independent
Trustees During
the Past 5 Years |
Yung Bong Lim—1964
c/o Invesco Capital Management LLC
3500 Lacey Road, Suite 700
Downers Grove, IL 60515 | | Chairman of the Investment Oversight Committee and Trustee | | Chairman of the Investment Oversight Committee since 2014; Trustee since 2013 | | Managing Partner, RDG Funds LLC (real estate) (2008-Present); formerly, Managing Director, Citadel LLC (1999-2007). | | 241 | | Advisory Board Member, Performance Trust Capital Partners, LLC (2008-Present); Board Director, Beacon Power Services, Corp. (2019-Present). |
| | | | | |
Gary R. Wicker—1961
c/o Invesco Capital Management LLC
3500 Lacey Road, Suite 700
Downers Grove, IL 60515 | | Trustee | | Since 2013 | | Senior Vice President of Global Finance and Chief Financial Officer at RBC Ministries (publishing company) (2013-Present); formerly, Executive Vice President and Chief Financial Officer, Zondervan Publishing (a division of Harper Collins/NewsCorp) (2007-2012); Senior Vice President and Group Controller (2005-2006), Senior Vice President and Chief Financial Officer (2003-2004), Chief Financial Officer (2001-2003), Vice President, Finance and Controller (1999-2001) and Assistant Controller (1997-1999), divisions of The Thomson Corporation (information services provider); Senior Audit Manager (1994-1997), PricewaterhouseCoopers LLP. | | 241 | | Board Member and Treasurer, Our Daily Bread Ministries Canada (2015-Present); Board and Finance Committee Member, West Michigan Youth For Christ (2010-Present). |
| | | | | |
Donald H. Wilson—1959
c/o Invesco Capital Management LLC
3500 Lacey Road, Suite 700
Downers Grove, IL 60515 | | Chairman of the Board and Trustee | | Chairman since 2012; Trustee since 2006 | | Chairman, President and Chief Executive Officer, McHenry Bancorp Inc. and McHenry Savings Bank (subsidiary) (2018-Present); Chairman and Chief Executive Officer, Stone Pillar Advisors, Ltd. (advisory services to the financial sector) (2010-Present); formerly, President and Chief Executive Officer, Stone Pillar Investments, Ltd. (2016-2018); Chairman, President and Chief Executive Officer, Community Financial Shares, Inc. and Community Bank—Wheaton/Glen Ellyn (subsidiary) (2013-2015); Chief Operating Officer, AMCORE Financial, Inc. (bank holding company) (2007-2009); Executive Vice President and Chief Financial Officer, AMCORE Financial, Inc. (2006-2007); Senior Vice President and Treasurer, Marshall & Ilsley Corp. (bank holding company) (1995-2006). | | 241 | | Director, Penfield Children’s Center (2004-present); Board Chairman, Gracebridge Alliance, Inc. (2015-present). |
| * | This is the date the Independent Trustee began serving the Trust. Each Independent Trustee serves an indefinite term, until his successor is elected. |
| ** | Fund Complex includes all open- and closed-end funds (including all of their portfolios) advised by the Adviser and any affiliated person of the Adviser. |
Trustees and Officers(continued)
The Interested Trustee and the executive officers of the Trust, their term of office and length of time served, their principal business occupations during at least the past five years, the number of portfolios in the Fund Complex (as defined below) overseen by the Interested Trustee and the other directorships, if any, held by the Interested Trustee are shown below.
| | | | | | | | | | |
Name, Address and Year of
Birth of Interested Trustee | | Position(s)
Held
with Trust | | Term of
Office
and
Length of
Time
Served* | | Principal
Occupation(s) During
Past 5 Years | | Number of
Portfolios
in Fund
Complex**
Overseen by
Interested
Trustee | | Other
Directorships
Held by
Interested
Trustee During
the Past 5 Years |
Kevin M. Carome—1956
Invesco Ltd.
Two Peachtree Pointe,
1555 Peachtree St., N.E.,
Suite 1800
Atlanta, GA 30309 | | Trustee | | Since 2010 | | Senior Managing Director, Secretary and General Counsel, Invesco Ltd. (2007-Present); Director, Invesco Advisers, Inc. (2009-Present); Director (2006-Present) and Executive Vice President (2008–Present), Invesco North American Holdings, Inc.; Executive Vice President (2008–Present), Invesco Investments (Bermuda) Ltd.; Manager, Horizon Flight Works LLC, and Director, Invesco Finance PLC (2011- Present); Director and Secretary (2012–Present), Invesco Services (Bahamas) Private Limited; and Director and Executive Vice President (2014–Present), INVESCO Asset Management (Bermuda) Ltd.; formerly, Director and Executive Vice President, Invesco Finance, Inc. (2011-2018); Director (2006-2018) and Executive Vice President (2008–2018), Invesco Group Services, Inc., Invesco Holding Company (US), Inc.; Director, Invesco Holding Company Limited (2007-2018); Director and Chairman, INVESCO Funds Group, Inc., Senior Vice President, Secretary and General Counsel, Invesco Advisers, Inc. (2003-2006); Director, Invesco Investments (Bermuda) Ltd. (2008-2016); Senior Vice President and General Counsel, Liberty Financial Companies, Inc. (2000-2001); General Counsel of certain investment management subsidiaries of Liberty Financial Companies, Inc. (1998-2000); Associate General Counsel, Liberty Financial Companies, Inc. (1993-1998); Associate, Ropes & Gray LLP. | | 241 | | None |
| * | This is the date the Interested Trustee began serving the Trust. The Interested Trustee serves an indefinite term, until his successor is elected. |
| ** | Fund Complex includes all open- andclosed-end funds (including all of their portfolios) advised by the Adviser and any affiliated person of the Adviser. |
Trustees and Officers(continued)
| | | | | | |
Name, Address and Year of
Birth of Executive Officers | | Position(s)
Held
with Trust | | Length of
Time
Served* | | Principal Occupation(s) During Past 5 Years |
Daniel E. Draper—1968 Invesco Capital
Management LLC 3500 Lacey Road, Suite 700 Downers Grove, IL 60515 | | President and Principal Executive Officer | | Since 2015 | | Chief Executive Officer, Manager and Principal Executive Officer, Invesco Specialized Products, LLC (2018-Present); President and Principal Executive Officer, Invesco Exchange-Traded Fund Trust, Invesco Exchange-Traded Fund Trust II, Invesco India Exchange-Traded Fund Trust, Invesco Actively Managed Exchange-Traded Fund Trust and Invesco Actively Managed Exchange-Traded Commodity Fund Trust (2015-Present) and Invesco Exchange-Traded Self-Indexed Fund Trust (2016-Present); Chief Executive Officer and Principal Executive Officer (2016-Present) and Managing Director (2013-Present), Invesco Capital Management LLC; Senior Vice President, Invesco Distributors, Inc. (2014-Present); formerly, Vice President, Invesco Exchange-Traded Fund Trust, Invesco Exchange-Traded Fund Trust II, Invesco India Exchange-Traded Fund Trust, Invesco Actively Managed Exchange-Traded Fund Trust (2013-2015) and Invesco Actively Managed Exchange-Traded Commodity Fund Trust (2014-2015); Managing Director, Credit Suisse Asset Management (2010-2013) and Lyxor Asset Management/Societe Generale (2007-2010). |
| | | |
Kelli Gallegos—1970 Invesco Capital Management LLC 3500 Lacey Road, Suite 700 Downers Grove, IL 60515 | | Vice President
and Treasurer | | Since 2018 | | Assistant Treasurer, Invesco Specialized Products, LLC (2018-Present); Vice President and Treasurer, Invesco Exchange-Traded Fund Trust, Invesco Exchange-Traded Fund Trust II, Invesco India Exchange-Traded Fund Trust, Invesco Actively Managed Exchange-Traded Fund Trust, Invesco Actively Managed Exchange-Traded Commodity Fund Trust and Invesco Exchange-Traded Self-Indexed Fund Trust (2018-Present); Principal Financial and Accounting Officer-Pooled Investments, Invesco Capital Management LLC (2018-Present); Vice President, Principal Financial Officer (2016-Present) and Assistant Treasurer (2008-Present), The Invesco Funds; formerly, Assistant Treasurer Invesco Exchange-Traded Fund Trust, Invesco Exchange-Traded Fund Trust II, Invesco India Exchange-Traded Fund Trust and Invesco Actively Managed Exchange-Traded Fund Trust (2012-2018), Invesco Actively Managed Exchange-Traded Commodity Fund Trust (2014-2018) and Invesco Exchange-Traded Self-Indexed Fund Trust (2016-2018); Assistant Treasurer, Invesco Capital Management LLC (2013-2018); and Assistant Vice President, The Invesco Funds (2008-2016). |
| | | |
Peter Hubbard—1981 Invesco Capital Management LLC 3500 Lacey Road, Suite 700 Downers Grove, IL 60515 | | Vice President | | Since 2009 | | Vice President, Invesco Specialized Products, LLC (2018-Present); Vice President, Invesco Exchange-Traded Fund Trust, Invesco Exchange-Traded Fund Trust II, Invesco India Exchange-Traded Fund Trust, Invesco Actively Managed Exchange-Traded Fund Trust (2009-Present), Invesco Actively Managed Exchange-Traded Commodity Fund Trust (2014-Present) and Invesco Exchange-Traded Self-Indexed Fund Trust (2016-Present); Vice President and Director of Portfolio Management, Invesco Capital Management LLC (2010-Present); formerly, Vice President of Portfolio Management, Invesco Capital Management LLC (2008-2010); Portfolio Manager, Invesco Capital Management LLC (2007-2008); Research Analyst, Invesco Capital Management LLC (2005-2007); Research Analyst and Trader, Ritchie Capital, a hedge fund operator (2003-2005). |
| * | This is the date each Officer began serving the Trust. Each Officer serves an indefinite term, until his or her successor is elected. |
Trustees and Officers(continued)
| | | | | | |
Name, Address and Year of
Birth of Executive Officers | | Position(s)
Held
with Trust | | Length of
Time
Served* | | Principal Occupation(s) During Past 5 Years |
Sheri Morris—1964 Invesco Capital Management LLC 3500 Lacey Road, Suite 700 Downers Grove, IL 60515 | | Vice President | | Since 2012 | | President and Principal Executive Officer, The Invesco Funds (2016-Present); Treasurer, The Invesco Funds (2008-Present); Vice President, Invesco Advisers, Inc. (formerly known as Invesco Institutional (N.A.), Inc.) (registered investment adviser) (2009-Present) and Vice President, Invesco Exchange-Traded Fund Trust, Invesco Exchange-Traded Fund Trust II, Invesco India Exchange-Traded Fund Trust, Invesco Actively Managed Exchange-Traded Fund Trust (2012-Present), Invesco Actively Managed Exchange-Traded Commodity Fund Trust (2014-Present) and Invesco Exchange-Traded Self-Indexed Fund Trust (2016-Present); formerly, Vice President and Principal Financial Officer, The Invesco Funds (2008-2016); Treasurer, Invesco Exchange-Traded Fund Trust, Invesco Exchange-Traded Fund Trust II, Invesco India Exchange-Traded Fund Trust and Invesco Actively Managed Exchange-Traded Fund Trust (2011-2013); Vice President, Invesco Aim Advisers, Inc., Invesco Aim Capital Management, Inc. and Invesco Aim Private Asset Management, Inc.; Assistant Vice President and Assistant Treasurer, The Invesco Funds and Assistant Vice President, Invesco Advisers, Inc., Invesco Aim Capital Management, Inc. and Invesco Aim Private Asset Management, Inc. |
| | | |
Anna Paglia—1974 Invesco Capital Management LLC 3500 Lacey Road, Suite 700 Downers Grove, IL 60515 | | Secretary | | Since 2011 | | Secretary, Invesco Specialized Products, LLC (2018-Present); Secretary, Invesco Exchange-Traded Fund Trust, Invesco Exchange-Traded Fund Trust II, Invesco India Exchange-Traded Fund Trust, Invesco Actively Managed Exchange-Traded Fund Trust (2011-Present), Invesco Actively Managed Exchange-Traded Commodity Fund Trust (2014-Present) and Invesco Exchange-Traded Self-Indexed Fund Trust (2015-Present); Head of Legal (2010-Present) and Secretary (2015-Present), Invesco Capital Management LLC; Manager and Assistant Secretary, Invesco Indexing LLC (2017-Present); formerly, Partner, K&L Gates LLP (formerly, Bell Boyd & Lloyd LLP) (2007-2010); Associate Counsel at Barclays Global Investors Ltd. (2004-2006). |
| | | |
Rudolf E. Reitmann—1971 Invesco Capital Management LLC 3500 Lacey Road, Suite 700 Downers Grove, IL 60515 | | Vice President | | Since 2013 | | Head of Global Exchange Traded Funds Services, Invesco Specialized Products, LLC (2018-Present); Vice President, Invesco Exchange-Traded Fund Trust, Invesco Exchange-Traded Fund Trust II, Invesco India Exchange-Traded Fund Trust, Invesco Actively Managed Exchange-Traded Fund Trust (2013-Present), Invesco Actively Managed Exchange-Traded Commodity Fund Trust (2014-Present) and Invesco Exchange-Traded Self-Indexed Fund Trust (2016-Present); Head of Global Exchange Traded Funds Services, Invesco Capital Management LLC (2013-Present); Vice President, Invesco Capital Markets, Inc. (2018-Present). |
| * | This is the date each Officer began serving the Trust. Each Officer serves an indefinite term, until his or her successor is elected. |
Trustees and Officers(continued)
| | | | | | |
Name, Address and Year of
Birth of Executive Officers | | Position(s)
Held
with Trust | | Length of
Time
Served* | | Principal Occupation(s) During Past 5 Years |
David Warren—1957 Invesco Canada Ltd. 5140 Yonge Street, Suite 800 Toronto, Ontario M2N 6X7 | | Vice President | | Since 2009 | | Manager, Invesco Specialized Products, LLC (2018-Present); Vice President, Invesco Exchange-Traded Fund Trust, Invesco Exchange-Traded Fund Trust II, Invesco India Exchange-Traded Fund Trust, and Invesco Actively Managed Exchange-Traded Fund Trust (2009-Present), Invesco Actively Managed Exchange-Traded Commodity Fund Trust (2014-Present) and Invesco Exchange-Traded Self-Indexed Fund Trust (2016-Present); Managing Director—Chief Administrative Officer, Americas, Invesco Capital Management LLC; Senior Vice President, Invesco Advisers, Inc. (2009-Present); Director, Invesco Inc. (2009-Present); Director, Executive Vice President and Chief Financial Officer, Invesco Canada Ltd. (formerly, Invesco Trimark Ltd.) (2011-Present); Chief Administrative Officer, North American Retail, Invesco Ltd. (2007-Present); Director, Invesco Corporate Class Inc. (2014-Present); Director, Invesco Global Direct Real Estate Feeder GP Ltd. (2015-Present); Director, Invesco Canada Holdings Inc. (2002-Present); Director, Invesco Financial Services Ltd. / Services Financiers Invesco Ltée and Trimark Investments Ltd./Placements Trimark Ltée (2014-Present); Director, Invesco IP Holdings (Canada) Ltd. (2016-Present); Director, Invesco Global Direct Real Estate GP Ltd. (2015-Present); formerly, Senior Vice President, Invesco Management Group, Inc. (2007-2018); Executive Vice President and Chief Financial Officer, Invesco Inc. (2009-2015); Director, Executive Vice President and Chief Financial Officer, Invesco Canada Ltd. (formerly, Invesco Trimark Ltd.) (2000-2011). |
| | | |
Melanie Zimdars—1976 Invesco Capital
Management LLC 3500 Lacey Road, Suite 700 Downers Grove, IL 60515 | | Chief Compliance
Officer | | Since 2017 | | Chief Compliance Officer, Invesco Specialized Products, LLC (2018-Present); Chief Compliance Officer, Invesco Capital Management LLC (2017-Present); Chief Compliance Officer, Invesco Exchange-Traded Fund Trust, Invesco Exchange-Traded Fund Trust II, Invesco India Exchange-Traded Fund Trust, Invesco Actively Managed Exchange-Traded Fund Trust, Invesco Actively Managed Exchange-Traded Commodity Fund Trust and Invesco Exchange-Traded Self-Indexed Fund Trust (2017-Present); formerly, Vice President and Deputy Chief Compliance Officer at ALPS Holding, Inc. (2009-2017); Mutual Fund Treasurer/Chief Financial Officer at Wasatch Advisors, Inc. (2005-2008); Compliance Officer, U.S. Bancorp Fund Services, LLC (2001-2005). |
Availability of Additional Information About the Trustees
The Statement of Additional Information includes additional information about the Trustees and is available, without charge, upon request at (800)983-0903.
| * | This is the date each Officer began serving the Trust. Each Officer serves an indefinite term, until his or her successor is elected. |
Board Considerations Regarding Continuation of Investment Advisory Agreement
At a meeting held on April 11, 2019, the Board of Trustees of the Invesco Exchange-Traded Fund Trust (the “Trust”), including the Independent Trustees, approved the continuation of the Investment Advisory Agreement between Invesco Capital Management LLC (the “Adviser”) and the Trust for the following 24 series (each, a “Fund” and together, the “Funds”):
Invesco Dow Jones Industrial Average Dividend ETF
Invesco NASDAQ Internet ETF
Invesco Raymond JamesSB-1 Equity ETF
Invesco S&P 500 BuyWrite ETF
Invesco S&P 500®Equal Weight Consumer Discretionary ETF
Invesco S&P 500®Equal Weight Consumer Staples ETF
Invesco S&P 500®Equal Weight Energy ETF
Invesco S&P 500®Equal Weight ETF
Invesco S&P 500®Equal Weight Financials ETF
Invesco S&P 500®Equal Weight Health Care ETF
Invesco S&P 500®Equal Weight Industrials ETF
Invesco S&P 500®Equal Weight Materials ETF
Invesco S&P 500®Equal Weight Real Estate ETF
Invesco S&P 500®Equal Weight Technology ETF
Invesco S&P 500®Equal Weight Utilities ETF
Invesco S&P 500®Pure Growth ETF
Invesco S&P 500®Pure Value ETF
Invesco S&P 500®Top 50 ETF
Invesco S&P MidCap 400® Equal Weight ETF
Invesco S&P MidCap 400® Pure Growth ETF
Invesco S&P MidCap 400® Pure Value ETF
Invesco S&P SmallCap 600® Equal Weight ETF
Invesco S&P SmallCap 600® Pure Growth ETF
Invesco S&P SmallCap 600® Pure Value ETF
The Trustees reviewed information from the Adviser describing: (i) the nature, extent and quality of services provided, (ii) the investment performance of the Funds and the Adviser, (iii) the fees paid by the Funds and comparisons to amounts paid by other comparable registered investment companies, (iv) the costs of services provided and estimated profits realized by the Adviser, (v) the extent to which economies of scale may be realized as a Fund grows and whether fee levels reflect any possible economies of scale for the benefit of Fund shareholders, and (vi) any further benefits realized by the Adviser from its relationships with the Funds.
Nature, Extent and Quality of Services. In evaluating the nature, extent and quality of the Adviser’s services, the Trustees reviewed information concerning the functions performed by the Adviser for the Funds, information describing the Adviser’s current organization and staffing, including operational support provided by the Adviser’s parent organization, Invesco Ltd. (“Invesco”), and the background and experience of the persons responsible for theday-to-day management of the Funds. The Trustees reviewed matters related to the Adviser’s execution and/or oversight of execution of portfolio transactions on behalf of the Funds.
The Trustees also reviewed information on the performance of the Funds and their underlying indexes for theone-year, three-year, five-year,ten-year and since-inception periods ended December 31, 2018, as applicable, including reports for each of those periods on the correlation and tracking error between each Fund’s performance and the performance of its underlying index, as well as the Adviser’s analysis of the tracking error between the Funds and their underlying indexes. In reviewing the tracking error reports, the Trustees considered information provided by Invesco’s Global Performance Measurement and Risk Group, an independent organization within Invesco, with respect to general expected tracking error ranges. The Trustees also considered that certain Funds were created in connection with the purchase by Invesco of the exchange-traded funds business of Guggenheim Capital LLC (the “Transaction”) and that such Funds’ performance prior to the closing of the Transaction on April 6, 2018 is that of their predecessor Guggenheim ETFs. The Trustees noted that, for each applicable period, the correlation and tracking error for each Fund were within the targeted range set forth in the Trust’s registration statement and concluded that each Fund was correlated to its underlying index and that the tracking error for each Fund was within an acceptable range given that Fund’s particular circumstances.
The Trustees also considered the services provided by the Adviser in its oversight of the Funds’ administrator, custodian and transfer agent. They noted the significant amount of time, effort and resources that had been devoted to this oversight function.
Based on their review, the Trustees concluded that the nature, extent and quality of services provided by the Adviser to the Funds under the Investment Advisory Agreement were appropriate and reasonable.
Fees, Expenses and Profitability. The Trustees reviewed and discussed the information provided by the Adviser on each Fund’s net expense ratio and unitary advisory fee, as compared to information compiled by the Adviser from Lipper Inc. databases on the net expense ratios of comparable exchange-traded funds (“ETFs”),open-end(non-ETF) index funds andopen-end(non-ETF) actively-
Board Considerations Regarding Continuation of Investment Advisory Agreement(continued)
managed funds. The Trustees noted that the annual unitary advisory fee charged to each Fund is as follows, with the Adviser paying all other operating expenses of each Fund, except that each Fund pays its own distribution fees, if any, brokerage expenses, taxes, interest, litigation expenses, acquired fund fees and expenses, if any, and other extraordinary expenses:
| | ● | | 0.75% of the Fund’s average daily net assets for Invesco Raymond JamesSB-1 Equity ETF; |
| | ● | | 0.60% of the Fund’s average daily net assets for Invesco NASDAQ Internet ETF; |
| | ● | | 0.49% of the Fund’s average daily net assets for Invesco S&P 500 BuyWrite ETF (The Trustees noted that prior to July 1, 2018, the Fund’s annual unitary advisory fee was 0.75%.); |
| | ● | | 0.35% of the Fund’s average daily net assets for each of Invesco S&P 500® Pure Growth ETF, Invesco S&P 500® Pure Value ETF, Invesco S&P MidCap 400® Pure Growth ETF, Invesco S&P MidCap 400® Pure Value ETF, Invesco S&P SmallCap 600® Pure Growth ETF and Invesco S&P SmallCap 600® Pure Value ETF; |
| | ● | | 0.20% of the Fund’s average daily net assets for each of Invesco S&P 500® Equal Weight ETF and Invesco S&P 500® Top 50 ETF; |
| | ● | | 0.07% of the Fund’s average daily net assets for Invesco Dow Jones Industrial Average Dividend ETF (The Trustees noted that prior to September 24, 2018, the Fund’s annual unitary advisory fee was 0.30%.); and |
| | ● | | 0.40% of the Fund’s average daily net assets for each other Fund. |
The Trustees noted that the Adviser represented that it does not serve as the investment adviser to any clients, other than other ETFs also overseen by the Trustees, with comparable investment strategies as the Funds, but that it providessub-advisory services to other clients. The Trustees further noted the Adviser’s explanation with respect to thesub-advisory fees it receives for such services in comparison to the advisory fees charged to the Funds. The Trustees noted that the net expense ratios for certain Funds were equal to or lower than the median net expense ratios of their ETF andopen-end index peer funds as illustrated in the table below. The Trustees also noted that the net expense ratios for all of the Funds were lower than the median net expense ratios of theiropen-end actively-managed peer funds.
| | | | | | | | | | | | |
Invesco Fund | | Equal to/Lower
than ETF Median | | | Equal to/Lower
than Open-End
Index Fund
Median | | | Equal to/Lower
than Open-End
Active Fund
Median | |
| Invesco Dow Jones Industrial Average Dividend ETF | | | X | | | | X | | | | X | |
| Invesco NASDAQ Internet ETF | | | | | | | | | | | X | |
| Invesco Raymond JamesSB-1 Equity ETF | | | | | | | | | | | X | |
| Invesco S&P 500 BuyWrite ETF | | | X | | | | X | | | | X | |
| Invesco S&P 500®Equal Weight Consumer Discretionary ETF | | | X | | | | | | | | X | |
| Invesco S&P 500®Equal Weight Consumer Staples ETF | | | X | | | | | | | | X | |
| Invesco S&P 500®Equal Weight Energy ETF | | | X | | | | | | | | X | |
| Invesco S&P 500®Equal Weight ETF | | | X | | | | X | | | | X | |
| Invesco S&P 500®Equal Weight Financials ETF | | | X | | | | | | | | X | |
| Invesco S&P 500®Equal Weight Health Care ETF | | | X | | | | | | | | X | |
| Invesco S&P 500®Equal Weight Industrials ETF | | | X | | | | | | | | X | |
| Invesco S&P 500®Equal Weight Materials ETF | | | X | | | | | | | | X | |
| Invesco S&P 500®Equal Weight Real Estate ETF | | | X | | | | | | | | X | |
| Invesco S&P 500®Equal Weight Technology ETF | | | X | | | | | | | | X | |
| Invesco S&P 500®Equal Weight Utilities ETF | | | X | | | | X | | | | X | |
| Invesco S&P 500®Pure Growth ETF | | | X | | | | X | | | | X | |
| Invesco S&P 500®Pure Value ETF | | | | | | | | | | | X | |
| Invesco S&P 500®Top 50 ETF | | | X | | | | X | | | | X | |
| Invesco S&P MidCap 400® Equal Weight ETF | | | | | | | | | | | X | |
| Invesco S&P MidCap 400® Pure Growth ETF | | | | | | | X | | | | X | |
Board Considerations Regarding Continuation of Investment Advisory Agreement(continued)
| | | | | | | | | | | | |
Invesco Fund | | Equal to/Lower
than ETF Median | | | Equal to/Lower
than Open-End
Index Fund
Median | | | Equal to/Lower
than Open-End
Active Fund
Median | |
| Invesco S&P MidCap 400® Pure Value ETF | | | | | | | X | | | | X | |
| Invesco S&P SmallCap 600® Equal Weight ETF | | | | | | | | | | | X | |
| Invesco S&P SmallCap 600® Pure Growth ETF | | | | | | | X | | | | X | |
| Invesco S&P SmallCap 600® Pure Value ETF | | | | | | | X | | | | X | |
The Trustees determined that each Fund’s unitary advisory fee was reasonable, noting the nature of the indexes, the distinguishing factors of the Funds, and the administrative, operational and management oversight costs for the Adviser. The Trustees also noted that a portion of each Fund’s operating expenses was attributable to a license fee payable out of the unitary advisory fee charged to that Fund. The Board concluded that the unitary advisory fee charged to each Fund was reasonable and appropriate in light of the services provided.
In conjunction with their review of the unitary advisory fees, the Trustees considered information provided by the Adviser on the revenues received by the Adviser under the Investment Advisory Agreement for the Funds. The Trustees reviewed information provided by the Adviser on its overall profitability, as well as the estimated profitability to the Adviser from its relationship to each Fund. The Trustees concluded that the overall and estimated profitability to the Adviser was not unreasonable.
Economies of Scale and Whether Fee Levels Reflect These Economies of Scale. The Trustees reviewed the information provided by the Adviser as to the extent to which economies of scale may be realized as each Fund grows and whether fee levels reflect economies of scale for the benefit of shareholders. The Trustees reviewed each Fund’s asset size and unitary advisory fee. The Trustees noted that any reduction in fixed costs associated with the management of the Funds would be enjoyed by the Adviser, but a unitary advisory fee provides a level of certainty in expenses for the Funds. The Trustees considered whether the unitary advisory fee rate for each Fund was reasonable in relation to the asset size of that Fund, and concluded that the unitary advisory fee was reasonable and appropriate.
The Trustees noted that the Adviser had not identified any further benefits that it derived from its relationships with the Funds and had noted that it does not have any soft-dollar arrangements.
Based on all of the information considered and the conclusions reached, the Board, including the Independent Trustees, determined to approve the continuation of the Investment Advisory Agreement for each Fund. No single factor was determinative in the Board’s analysis.
Proxy Voting Policies and Procedures
A description of the Trust’s proxy voting policies and procedures that the Funds use to determine how to vote proxies relating to portfolio securities is available, without charge and upon request, by calling(800) 983-0903. This information is also available on the Securities and Exchange Commission’s (the “Commission”) website atwww.sec.gov.
Information regarding how each Fund voted proxies for portfolio securities, if applicable, during the most recent 12-month period ended June 30, is available, without charge and upon request, by (i) calling(800) 983-0903; or (ii) accessing the Trust’sForm N-PX on the Commission’s website atwww.sec.gov.
Quarterly Portfolios
The Trust files its complete schedule of portfolio holdings for the Funds with the Commission for the first and third quarters of each fiscal year onForm N-Q (or any successor Form). The Trust’sForms N-Q (or any successor Form) are available on the Commission’s website atwww.sec.gov.
Frequency Distribution of Discounts and Premiums
A table showing the number of days the market price of each Fund’s shares was greater than the Fund’s net asset value, and the number of days it was less than the Fund’s net asset value (i.e., premium or discount) for the most recently completed calendar year, and the calendar quarters since that year end (or the life of the Fund, if shorter) may be found at the Fund’s website atwww.invesco.com/ETFs.
| | | | |
©2019 Invesco Capital Management LLC 3500 Lacey Road, Suite 700 Downers Grove, IL 60515 | | P-TRST1-AR-2 | | invesco.com/ETFs |

Invesco Annual Report to Shareholders
April 30, 2019
| | |
| |
| RPG | | Invesco S&P 500® Pure Growth ETF |
| |
| RPV | | Invesco S&P 500® Pure Value ETF |
| |
| XLG | | Invesco S&P 500® Top 50 ETF |
| |
| RFG | | Invesco S&P MidCap 400® Pure Growth ETF |
| |
| RFV | | Invesco S&P MidCap 400® Pure Value ETF |
| |
| RZG | | Invesco S&P SmallCap 600® Pure Growth ETF |
| |
| RZV | | Invesco S&P SmallCap 600® Pure Value ETF |
Beginning on January 1, 2021, as permitted by regulations adopted by the Securities and Exchange Commission, paper copies of the Funds’ shareholder reports will no longer be sent by mail, unless you specifically request paper copies of the reports from your financial intermediary, such as a broker-dealer or bank. Instead, the reports will be made available on a website, and you will be notified by mail each time a report is posted and provided with a website link to access the report.
If you already elected to receive shareholder reports electronically, you will not be affected by this change and you need not take any action. If you hold accounts through a financial intermediary, you may contact your financial intermediary to enroll in electronic delivery. Please note that not all financial intermediaries may offer this service.
You may elect to receive all future reports in paper free of charge. If you hold accounts through a financial intermediary, you can follow the instructions included with this disclosure, if applicable, or contact your financial intermediary to request that you continue to receive paper copies of your shareholder reports. Please note that not all financial intermediaries may offer this service. Your election to receive reports in paper will apply to all funds held with your financial intermediary.
Table of Contents
The Market Environment
Domestic Equity
The fiscal year proved to be an increasingly volatile time for U.S. equities. Throughout the summer, U.S. equities moved higher as corporate profits surged amid the benefit of corporate tax cuts and improving global economic growth. Several U.S. equity indexes reached new highs despite potential headwinds, including trade tensions, tariff announcements and contagion concerns over a Turkish currency crisis. After a relatively quiet summer, market volatility noticeably rose in October 2018, as U.S. equity markets suffered a sharpsell-off throughyear-end 2018, amid ongoing trade concerns between the U.S. and China, fears of a global economic slowdown and lower oil prices from a supply glut, with oil prices plummeting from near $75 per barrel in early October 2018 to around $45 per barrel in late December 2018.1 In this environment, there was a flight to safety, as investors fled to defensive areas of the markets, such as health care, utilities and U.S. Treasuries.
Given signs of a strong economy, the U.S. Federal Reserve (the “Fed”) raised interest rates three times during the fiscal year: in June, September and December 2018. Following December’s Fed meeting, the Fed raised interest rates by 25 basis points to a targeted range of 2.25% to 2.50%, which signaled a slightly more dovish stance than expected.2 In contrast, the European Central Bank and central banks in several other countries maintained extraordinarily accommodative monetary policies.
Equity markets rebounded at the start of 2019, fueled by optimism about a potential U.S.-China trade deal and the Fed’s indication that there would be no interest rate hikes in 2019, a surprising shift in monetary policy. The Fed’s more accommodative stance provided a supportive environment for equities and fixed income, even as U.S. economic data were mixed and overseas growth appeared to be slowing. By the end of the fiscal year, the U.S. equity market generally recovered the losses from fourth quarter 2018, backed by improving investor sentiment, low unemployment and a growing economy.
| 2 | Source: U.S. Federal Reserve |
| | |
| RPG | | Manager’s Analysis |
| | Invesco S&P 500® Pure Growth ETF (RPG) |
As an index fund, the Invesco S&P 500® Pure Growth ETF (the “Fund”) is passively managed and seeks to track the returns of an underlying index. The Fund seeks to track the investment results (before fees and expenses) of the S&P 500® Pure Growth Index (the “Index”). The Fund generally will invest at least 90% of its total assets in the securities that comprise the Index.
S&P Dow Jones Indices LLC (“S&P DJI” or the “Index Provider”) compiles, maintains and calculates the Index, which is composed of a subset of securities from the S&P 500® Index. The Index includes securities that exhibit the strongest growth characteristics as measured using three factors: three-year sales per share growth, three-year ratio of earnings per share change to price per share, and momentum(12-month percentage price change) as selected by S&P DJI strictly in accordance with its guidelines and mandated procedures. The Fund generally invests in all of the securities comprising the Index in proportion to their weightings in the Index.
For the fiscal year ended April 30, 2019, on a market price basis, the Fund returned 9.71%. On a net asset value (“NAV”) basis, the Fund returned 9.79%. During the same time period, the Index returned 10.22%. During the fiscal year, the Fund fully replicated the components of the Index; therefore, the Fund’s performance, on a NAV basis, differed from the return of the Index primarily due to fees and operating expenses that the Fund incurred, as well as trading costs associated with portfolio rebalances during the period.
During this same time period, the S&P 500® Growth Index (the “Benchmark Index”) returned 16.94%. The Benchmark Index is an unmanaged index weighted by market capitalization based on the average performance of approximately 295 equity securities. The Benchmark Index was selected for its recognition in the marketplace, and its performance comparison is a useful measure for investors as a broad representation of growth style of the U.S. equity universe.
The performance of the Fund differed from the Benchmark Index because the Fund seeks to track an Index that employs a proprietary stock selection and weighting methodology, whereas the Benchmark Index selects and weights stocks based primarily on market capitalization.
Relative to the Benchmark Index, the Fund was most overweight in the health care sector and most underweight in the information technology sector during the fiscal year ended April 30, 2019. The majority of the Fund’s underperformance relative to the Benchmark Index during that period can be attributed to the Fund’s underweight exposure to and stock selection in the information technology and consumer discretionary sectors.
For the fiscal year ended April 30, 2019, the industrials sector contributed most significantly to the Fund’s return, followed by the energy and information technology sectors, respectively. The
financials sector was the only detracting sector from the Fund’s return.
Positions that contributed most significantly to the Fund’s return for the fiscal year ended April 30, 2019 included Keysight Technologies Inc., an information technology company (portfolio average weight of 0.76%) and Ulta Beauty Inc., a consumer discretionary company (portfolio average weight of 0.74%). Positions that detracted most significantly from the Fund’s return during this period included NVIDIA Corp., an information technology company (no longer held at fiscalyear-end) and IPG Photonics Corp., an information technology company (no longer held at fiscalyear-end).
| | | | |
Sector Breakdown
(% of the Fund’s Net Assets)
as of April 30, 2019 | |
| Information Technology | | | 23.5 | |
| Health Care | | | 14.6 | |
| Industrials | | | 13.2 | |
| Consumer Discretionary | | | 10.7 | |
| Energy | | | 10.1 | |
| Consumer Staples | | | 7.6 | |
| Communication Services | | | 6.7 | |
| Financials | | | 5.5 | |
| Utilities | | | 3.7 | |
| Sector Types Each Less Than 3% | | | 4.4 | |
| Money Market Funds Plus Other Assets Less Liabilities | | | 0.0 | |
|
Top Ten Fund Holdings*
(% of the Fund’s Net Assets)
as of April 30, 2019 | |
| Security | | | | |
| Keysight Technologies, Inc. | | | 2.3 | |
| Ulta Beauty, Inc. | | | 2.3 | |
| Devon Energy Corp. | | | 2.1 | |
| CSX Corp. | | | 2.0 | |
| Netflix, Inc. | | | 2.0 | |
| Autodesk, Inc. | | | 2.0 | |
| salesforce.com, inc. | | | 1.8 | |
| Thermo Fisher Scientific, Inc. | | | 1.7 | |
| Vertex Pharmaceuticals, Inc. | | | 1.5 | |
| SVB Financial Group | | | 1.5 | |
| Total | | | 19.2 | |
| * | Excluding money market fund holdings. |
Invesco S&P 500® Pure Growth ETF (RPG)(continued)
Growth of a $10,000 Investment
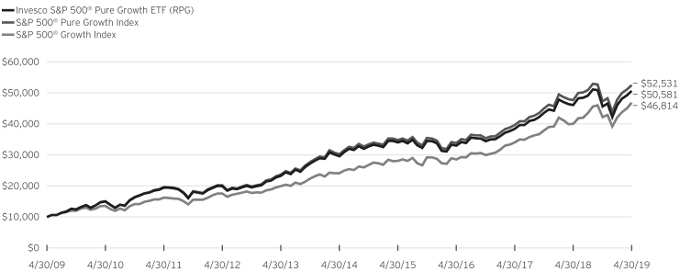
Fund Performance History as of April 30, 2019
| | | | | | | | | | | | | | | | | | | | | | | | | | | | | | | | | | | | | | | | |
| | | 1 Year | | | 3 Years Average Annualized | | | 3 Years Cumulative | | | 5 Years Average Annualized | | | 5 Years Cumulative | | | 10 Years Average Annualized | | | 10 Years Cumulative | | | | | | Fund Inception | |
| Index | | | | | Average Annualized | | | Cumulative | |
| S&P 500® Pure Growth Index | | | 10.22 | % | | | 15.77 | % | | | 55.15 | % | | | 11.71 | % | | | 73.96 | % | | | 18.04 | % | | | 425.31 | % | | | | | | | 10.93 | % | | | 291.81 | % |
| S&P 500® Growth Index | | | 16.94 | | | | 17.93 | | | | 64.03 | | | | 14.18 | | | | 94.09 | | | | 16.69 | | | | 368.14 | | | | | | | | 10.35 | | | | 265.60 | |
| Fund | | | | | | | | | | | | | | | | | | | | | | | | | | | | | | | | | | | | | | | | |
NAV Return | | | 9.79 | | | | 15.34 | | | | 53.44 | | | | 11.31 | | | | 70.84 | | | | 17.60 | | | | 405.81 | | | | | | | | 10.53 | | | | 273.75 | |
| Market Price Return | | | 9.71 | | | | 15.37 | | | | 53.56 | | | | 11.33 | | | | 70.99 | | | | 17.59 | | | | 405.51 | | | | | | | | 10.54 | | | | 273.82 | |
Guggenheim S&P 500® Pure Growth ETF (the “Predecessor Fund”) Inception: March 1, 2006
Performance quoted above represents past performance. Past performance is not a guarantee of future results and current performance may be higher or lower than performance quoted. Investment returns and principal value will fluctuate, and shares of the Fund (“Fund Shares”), when redeemed or sold, may be worth more or less than their original cost. Fund performance reflects any applicable fee waivers and/or expense reimbursements. Had the adviser not waived fees and/or reimbursed expenses currently or in the past, returns would have been lower. See current prospectus for more information. According to the Fund’s current prospectus, the total annual operating expense ratio was indicated as 0.35%. The Financial Highlights section of the Shareholder Report presents the expense ratios based on expenses incurred during the period covered by this report. NAV and Market Price returns assume that dividends and capital gain distributions have been reinvested in the Fund at NAV and Market Price, respectively. The returns shown in the table above do not reflect the deduction of taxes that a shareholder would pay on Fund distributions or the redemption or sale of Fund Shares. See invesco.com/ETFs to find the most recentmonth-end performance numbers.
Index and Benchmark Indexes performance results are based upon a hypothetical investment in their respective constituent securities. Index and Benchmark Indexes returns do not represent Fund returns. An investor cannot invest directly in an index. The Index and Benchmark Indexes do not charge management fees or brokerage expenses, and no such fees or expenses were deducted from the hypothetical performance shown. In addition, the results actual investors might have achieved would have differed from those shown because of differences in the timing, amounts of their investments, and fees and expenses associated with an investment in the Fund.
Notes Regarding Indexes and Fund Performance History:
| - | Average Annualized and Cumulative Inception returns for the Fund, Index and Benchmark Index are based on the inception date of the Predecessor Fund. |
| - | Effective after the close of business on April 6, 2018, the Predecessor Fund was reorganized into the Fund. Returns shown are blended returns of the Predecessor Fund and the Fund. |
| | |
| RPV | | Manager’s Analysis |
| | Invesco S&P 500® Pure Value ETF (RPV) |
As an index fund, the Invesco S&P 500® Pure Value ETF (the “Fund”) is passively managed and seeks to track the returns of an underlying index. The Fund seeks to track the investment results (before fees and expenses) of the S&P 500® Pure Value Index (the “Index”). The Fund generally will invest at least 90% of its total assets in the securities that comprise the Index.
S&P Dow Jones Indices LLC (“S&P & DJI” or the “Index Provider”) compiles, maintains and calculates the Index, which is composed of a subset of securities from the S&P 500® Index. The Index includes securities that exhibit the strongest value characteristics as measured using three factors: book to value price ratio, earnings to price ratio, and sales to price ratio, as selected by S&P DJI strictly in accordance with its guidelines and mandated procedures. The Fund generally invests in all of the securities comprising the Index in proportion to their weightings in the Index.
For the fiscal year ended April 30, 2019, on a market price basis, the Fund returned 2.33%. On a net asset value (“NAV”) basis, the Fund returned 2.37%. During the same time period, the Index returned 2.70%. During the fiscal year, the Fund fully replicated the components of the Index; therefore, the Fund’s performance, on a NAV basis, differed from the return of the Index primarily due to fees and operating expenses that the Fund incurred during the period, partially offset by income from the securities lending program in which the Fund participates.
During this same time period, the S&P 500® Value Index (the “Benchmark Index”) returned 9.75%. The Benchmark Index is an unmanaged index weighted by market capitalization based on the average performance of approximately 380 equity securities. The Benchmark Index was selected for its recognition in the marketplace, and its performance comparison is a useful measure for investors as a broad representation of value style of the U.S. equity universe.
The performance of the Fund differed from the Benchmark Index because the Fund seeks to track an Index that employs a proprietary stock selection and weighting methodology, whereas the Benchmark Index selects and weights stocks based primarily on market capitalization.
Relative to the Benchmark Index, the Fund was most overweight in the consumer discretionary sector and most underweight in the information technology sector during the fiscal year ended April 30, 2019. The majority of the Fund’s underperformance relative to the Benchmark Index during that period can be attributed to the Fund’s underweight exposure to and stock selection in the information technology sector as well as stock selection in the consumer discretionary sector.
For the fiscal year ended April 30, 2019, the financials sector contributed most significantly to the Fund’s return, followed by the consumer discretionary and information technology sectors, respectively. The energy sector detracted most significantly to the
Fund’s return, followed by the communication services and health care sectors, respectively.
Positions that contributed most significantly to the Fund’s return for the fiscal year ended April 30, 2019, included Envision Healthcare Corp., a health care company (no longer held at fiscalyear-end) and Coty Inc., Class A., a consumer staples company (portfolio average weight of 0.74%). Positions that detracted most significantly from the Fund’s return during this period included PG&E Corp., a utilities company (no longer held at fiscalyear-end) and CenturyLink, Inc., a communication services company (portfolio average weight of 2.33%).
| | | | |
Sector Breakdown
(% of the Fund’s Net Assets)
as of April 30, 2019 | |
| Financials | | | 33.9 | |
| Consumer Discretionary | | | 16.6 | |
| Energy | | | 11.0 | |
| Consumer Staples | | | 8.8 | |
| Industrials | | | 7.9 | |
| Health Care | | | 6.1 | |
| Information Technology | | | 5.9 | |
| Communication Services | | | 3.6 | |
| Materials | | | 3.2 | |
| Sector Types Each Less Than 3% | | | 2.9 | |
| Money Market Funds Plus Other Assets Less Liabilities | | | 0.1 | |
|
Top Ten Fund Holdings*
(% of the Fund’s Net Assets)
as of April 30, 2019 | |
| Security | | | | |
| Ford Motor Co. | | | 2.4 | |
| Prudential Financial, Inc. | | | 2.1 | |
| Valero Energy Corp. | | | 2.0 | |
| Baker Hughes, a GE Co., Class A | | | 1.9 | |
| MetLife, Inc. | | | 1.8 | |
| Lennar Corp., Class A | | | 1.7 | |
| Coty, Inc., Class A | | | 1.7 | |
| Unum Group | | | 1.7 | |
| Lincoln National Corp. | | | 1.6 | |
| Jefferies Financial Group, Inc. | | | 1.5 | |
| Total | | | 18.4 | |
| * | Excluding money market fund holdings. |
Invesco S&P 500® Pure Value ETF (RPV)(continued)
Growth of a $10,000 Investment
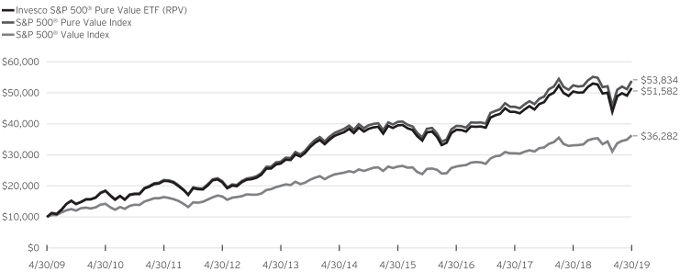
Fund Performance History as of April 30, 2019
| | | | | | | | | | | | | | | | | | | | | | | | | | | | | | | | | | | | | | | | |
| | | 1 Year | | | 3 Years Average Annualized | | | 3 Years Cumulative | | | 5 Years Average Annualized | | | 5 Years Cumulative | | | 10 Years Average Annualized | | | 10 Years Cumulative | | | | | | Fund Inception | |
| Index | | | | | Average Annualized | | | Cumulative | |
| S&P 500® Pure Value Index | | | 2.70 | % | | | 11.06 | % | | | 36.99 | % | | | 7.38 | % | | | 42.79 | % | | | 18.33 | % | | | 438.34 | % | | | | | | | 8.91 | % | | | 207.40 | % |
| S&P 500® Value Index | | | 9.75 | | | | 11.34 | | | | 38.04 | | | | 8.66 | | | | 51.48 | | | | 13.75 | | | | 262.82 | | | | | | | | 6.91 | | | | 140.88 | |
| Fund | | | | | | | | | | | | | | | | | | | | | | | | | | | | | | | | | | | | | | | | |
NAV Return | | | 2.37 | | | | 10.68 | | | | 35.57 | | | | 7.03 | | | | 40.44 | | | | 17.83 | | | | 415.82 | | | | | | | | 8.45 | | | | 190.95 | |
| Market Price Return | | | 2.33 | | | | 10.70 | | | | 35.65 | | | | 7.02 | | | | 40.42 | | | | 17.66 | | | | 408.66 | | | | | | | | 8.45 | | | | 191.09 | |
Guggenheim S&P 500® Pure Value ETF (the “Predecessor Fund”) Inception: March 1, 2006
Performance quoted above represents past performance. Past performance is not a guarantee of future results and current performance may be higher or lower than performance quoted. Investment returns and principal value will fluctuate, and shares of the Fund (“Fund Shares”), when redeemed or sold, may be worth more or less than their original cost. Fund performance reflects any applicable fee waivers and/or expense reimbursements. Had the adviser not waived fees and/or reimbursed expenses currently or in the past, returns would have been lower. See current prospectus for more information. According to the Fund’s current prospectus, the total annual operating expense ratio was indicated as 0.35%. The Financial Highlights section of the Shareholder Report presents the expense ratios based on expenses incurred during the period covered by this report. NAV and Market Price returns assume that dividends and capital gain distributions have been reinvested in the Fund at NAV and Market Price, respectively. The returns shown in the table above do not reflect the deduction of taxes that a shareholder would pay on Fund distributions or the redemption or sale of Fund Shares. See invesco.com/ETFs to find the most recentmonth-end performance numbers.
Index and Benchmark Indexes performance results are based upon a hypothetical investment in their respective constituent securities. Index and Benchmark Indexes returns do not represent Fund returns. An investor cannot invest directly in an index. The Index and Benchmark Indexes do not charge management fees or brokerage expenses, and no such fees or expenses were deducted from the hypothetical performance shown. In addition, the results actual investors might have achieved would have differed from those shown because of differences in the timing, amounts of their investments, and fees and expenses associated with an investment in the Fund.
Notes Regarding Indexes and Fund Performance History:
| - | Average Annualized and Cumulative Inception returns for the Fund, Index and Benchmark Index are based on the inception date of the Predecessor Fund. |
| - | Effective after the close of business on April 6, 2018, the Predecessor Fund was reorganized into the Fund. Returns shown are blended returns of the Predecessor Fund and the Fund. |
| | |
| XLG | | Manager’s Analysis |
| | Invesco S&P 500® Top 50 ETF (XLG) |
As an index fund, the Invesco S&P 500® Top 50 ETF (the “Fund”) is passively managed and seeks to track the returns of an underlying index. The Fund seeks to track the investment results (before fees and expenses) of the S&P 500® Top 50 Index (the “Index”). The Fund generally will invest at least 90% of its total assets in the securities that comprise the Index.
S&P Dow Jones Indices LLC (“S&P DJI” or the “Index Provider”) compiles, maintains and calculates the Index, which includes 50 of the largest capitalization members of the S&P 500® Index. The Index’s components are weighted by float-adjusted market capitalization. The Fund generally invests in all of the securities comprising the Index in proportion to their weightings in the Index.
For the fiscal year ended April 30, 2019, on a market price basis, the Fund returned 15.50%. On a net asset value (“NAV”) basis, the Fund returned 15.64%. During the same time period, the Index returned 15.85%. During the fiscal year, the Fund fully replicated the components of the Index; therefore, the Fund’s performance, on a NAV basis, differed from the return of the Index primarily due to fees and operating expenses that the Fund incurred.
During this same time period, the S&P 100® Index (the “Benchmark Index”) returned 14.85%. The Benchmark Index is an unmanaged index weighted by market capitalization based on the average performance of approximately 100 equity securities. The Benchmark Index was selected for its recognition in the marketplace, and its performance comparison is a useful measure for investors as a representation of major blue chip companies.
The performance of the Fund differed from the Benchmark Index because the Fund seeks to track an index that employs a different stock universe selection process.
Relative to the Benchmark Index, the Fund was most overweight in the information technology sector and most underweight in the utilities sector during the fiscal year ended April 30, 2019. The majority of the Fund’s outperformance relative to the Benchmark Index during that period can be attributed to the Fund’s underweight exposure to and stock selection in the industrials sector as well as the stock selection in the consumer staples sector.
For the fiscal year ended April 30, 2019, the information technology sector contributed most significantly to the Fund’s return, followed by the consumer discretionary and consumer staples sectors, respectively. The materials sector detracted most significantly from the Fund’s return, followed by the energy sector.
Positions that contributed most significantly to the Fund’s return for the fiscal year ended April 30, 2019 included Microsoft Corp., an information technology company (portfolio average weight of 7.11%) and Apple Inc., an information technology company
(portfolio average weight of 7.72%). Positions that detracted most significantly from the Fund’s return during this period included NVIDIA Corp., an information technology company (portfolio average weight of 0.91%) and Schlumberger NV, an energy company (portfolio average weight of 0.65%).
| | | | |
Sector Breakdown
(% of the Fund’s Net Assets)
as of April 30, 2019 | |
| Information Technology | | | 28.5 | |
| Communication Services | | | 18.1 | |
| Financials | | | 11.6 | |
| Health Care | | | 11.1 | |
| Consumer Discretionary | | | 10.1 | |
| Consumer Staples | | | 8.2 | |
| Industrials | | | 6.2 | |
| Energy | | | 5.1 | |
| Materials | | | 1.0 | |
| Money Market Funds Plus Other Assets Less Liabilities | | | 0.1 | |
|
Top Ten Fund Holdings*
(% of the Fund’s Net Assets)
as of April 30, 2019 | |
| Security | | | | |
| Microsoft Corp. | | | 8.1 | |
| Apple, Inc. | | | 7.2 | |
| Amazon.com, Inc. | | | 6.4 | |
| Facebook, Inc., Class A | | | 3.7 | |
| Berkshire Hathaway, Inc., Class B | | | 3.4 | |
| JPMorgan Chase & Co. | | | 3.1 | |
| Johnson & Johnson | | | 3.0 | |
| Alphabet, Inc., Class C | | | 2.9 | |
| Alphabet, Inc., Class A | | | 2.9 | |
| Exxon Mobil Corp. | | | 2.7 | |
| Total | | | 43.4 | |
| * | Excluding money market fund holdings. |
Invesco S&P 500® Top 50 ETF (XLG)(continued)
Growth of a $10,000 Investment
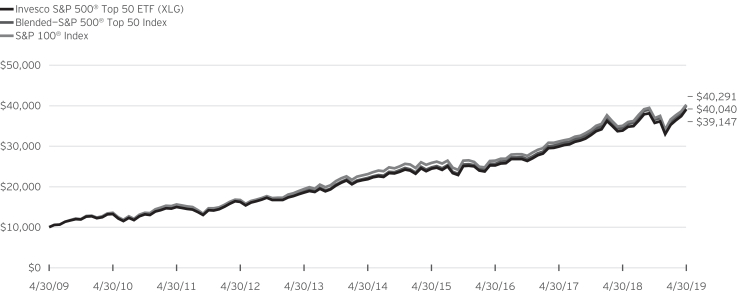
Fund Performance History as of April 30, 2019
| | | | | | | | | | | | | | | | | | | | | | | | | | | | | | | | | | | | | | | | |
| | | 1 Year | | | 3 Years
Average
Annualized | | | 3 Years
Cumulative | | | 5 Years
Average
Annualized | | | 5 Years
Cumulative | | | 10 Years
Average
Annualized | | | 10 Years
Cumulative | | | | | | Fund Inception | |
| Index | | | | | Average
Annualized | | | Cumulative | |
| Blended—S&P 500® Top 50 Index | | | 15.85 | % | | | 15.98 | % | | | 55.99 | % | | | 12.54 | % | | | 80.52 | % | | | 14.88 | % | | | 300.40 | % | | | | | | | 8.65 | % | | | 219.12 | % |
| S&P 100® Index | | | 14.85 | | | | 15.05 | | | | 52.29 | | | | 11.77 | | | | 74.41 | | | | 14.95 | | | | 302.91 | | | | | | | | 8.70 | | | | 221.13 | |
| Fund | | | | | | | | | | | | | | | | | | | | | | | | | | | | | | | | | | | | | | | | |
| NAV Return | | | 15.64 | | | | 15.74 | | | | 55.03 | | | | 12.32 | | | | 78.77 | | | | 14.62 | | | | 291.47 | | | | | | | | 8.44 | | | | 210.55 | |
| Market Price Return | | | 15.50 | | | | 15.74 | | | | 55.04 | | | | 12.32 | | | | 78.79 | | | | 14.63 | | | | 291.60 | | | | | | | | 8.44 | | | | 210.60 | |
Guggenheim S&P 500® Top 50 ETF (the “Predecessor Fund”) Inception: May 4, 2005
Performance quoted above represents past performance. Past performance is not a guarantee of future results and current performance may be higher or lower than performance quoted. Investment returns and principal value will fluctuate, and shares of the Fund (“Fund Shares”), when redeemed or sold, may be worth more or less than their original cost. Fund performance reflects any applicable fee waivers and/or expense reimbursements. Had the adviser not waived fees and/or reimbursed expenses currently or in the past, returns would have been lower. See current prospectus for more information. According to the Fund’s current prospectus, the total annual operating expense ratio was indicated as 0.20%. The Financial Highlights section of the Shareholder Report presents the expense ratios based on expenses incurred during the period covered by this report. NAV and Market Price returns assume that dividends and capital gain distributions have been reinvested in the Fund at NAV and Market Price, respectively. The returns shown in the table above do not reflect the deduction of taxes that a shareholder would pay on Fund distributions or the redemption or sale of Fund Shares. See invesco.com/ETFs to find the most recentmonth-end performance numbers.
Blended-Index and Benchmark Index performance results are based upon a hypothetical investment in their respective constituent securities.
Blended-Index and Benchmark Index returns do not represent Fund returns. An investor cannot invest directly in an index. The Blended-Index and Benchmark Index do not charge management fees or brokerage expenses, and no such fees or expenses were deducted from the hypothetical performance shown. In addition, the results actual investors might have achieved would have differed from those shown because of differences in the timing, amounts of their investments, and fees and expenses associated with an investment in the Fund.
Notes Regarding Indexes and Fund Performance History:
| - | The Blended—S&P 500® Top 50 Index performance is comprised of the performance of the Russell Top 50® Mega Cap Index, the Fund’s previous underlying index, prior to the conversion date, January 26, 2016, followed by the performance of the Index, starting from the conversion date through April 30, 2019. |
| - | Average Annualized and Cumulative Inception returns for the Fund, Blended-Index and Benchmark Index are based on the inception date of the Predecessor Fund. |
| - | Effective after the close of business on April 6, 2018, the Predecessor Fund was reorganized into the Fund. Returns shown are blended returns of the Predecessor Fund and the Fund. |
| | |
| RFG | | Manager’s Analysis |
| | Invesco S&P MidCap 400® Pure Growth ETF (RFG) |
As an index fund, the Invesco S&P MidCap 400® Pure Growth ETF (the “Fund”) is passively managed and seeks to track the returns of an underlying index. The Fund seeks to track the investment results (before fees and expenses) of the S&P MidCap 400® Pure Growth Index (the “Index”). The Fund generally will invest at least 90% of its total assets in the securities that comprise the Index.
S&P Dow Jones Indices LLC (“S&P DJI” or the “Index Provider”) compiles, maintains and calculates the Index. The Index is comprised only of those S&P MidCap 400® companies with strong growth characteristics as measured using three factors: three-year sales per share growth, three-year ratio of earnings per share change to price per share, and momentum(12-month percentage price change) as selected by S&P DJI strictly in accordance with its guidelines and mandated procedures. The Fund generally invests in all of the securities comprising the Index in proportion to their weightings in the Index.
For the fiscal year ended April 30, 2019, on a market price basis, the Fund returned (1.07)%. On a net asset value (“NAV”) basis, the Fund returned (1.05)%. During the same time period, the Index returned (0.73)%. During the fiscal year, the Fund fully replicated the components of the Index; therefore, the Fund’s performance, on a NAV basis, differed from the return of the Index primarily due to fees and operating expenses that the Fund incurred during the period, partially offset by income from the securities lending program in which the Fund participates.
During this same time period, the S&P MidCap 400® Growth Index (the “Benchmark Index”) returned 6.25%. The Benchmark Index is an unmanaged index weighted by market capitalization based on the average performance of approximately 240 equity securities. The Benchmark Index was selected for its recognition in the marketplace, and its performance comparison is a useful measure for investors as a representation of growth style of themid-cap segment of the U.S. equity universe.
The performance of the Fund differed from the Benchmark Index because the Fund seeks to track an Index that employs a proprietary stock selection and weighting methodology, whereas the Benchmark Index selects and weights stocks based primarily on market capitalization.
Relative to the Benchmark Index, the Fund was most overweight in the consumer discretionary sector and most underweight in the real estate sector during the fiscal year ended April 30, 2019. The majority of the Fund’s underperformance relative to the Benchmark Index during that period can be attributed to the Fund’s overweight exposure to and stock selection in the consumer discretionary sector as well stock selection in the health care sector.
For the fiscal year ended April 30, 2019, the information technology sector contributed most significantly to the Fund’s
return, followed by the energy and industrials sectors, respectively. The consumer discretionary sector detracted most significantly from the Fund’s return, followed by the health care and financials sectors, respectively.
Positions that contributed most significantly to the Fund’s return for the fiscal year ended April 30, 2019, included Eldorado Resorts Inc., a consumer discretionary company (portfolio average weight of 1.39%) and ABIOMED, Inc,. a health care company (no longer held at fiscalyear-end). Positions that detracted most significantly from the Fund’s return during this period included Dycom Industries, Inc., an industrials company (no longer held at fiscalyear-end) and MKS Instruments, Inc., a consumer staples company (no longer held at fiscalyear-end).
| | | | |
Sector Breakdown
(% of the Fund’s Net Assets)
as of April 30, 2019 | |
| Information Technology | | | 18.1 | |
| Consumer Discretionary | | | 17.3 | |
| Health Care | | | 16.8 | |
| Financials | | | 9.5 | |
| Energy | | | 9.1 | |
| Industrials | | | 8.2 | |
| Real Estate | | | 6.5 | |
| Communication Services | | | 5.4 | |
| Materials | | | 4.3 | |
| Sector Types Each Less Than 3% | | | 4.7 | |
| Money Market Funds Plus Other Assets Less Liabilities | | | 0.1 | |
|
Top Ten Fund Holdings*
(% of the Fund’s Net Assets)
as of April 30, 2019 | |
| Security | | | | |
| Eldorado Resorts, Inc. | | | 3.0 | |
| Amedisys, Inc. | | | 2.2 | |
| Primerica, Inc. | | | 2.1 | |
| Churchill Downs, Inc. | | | 2.0 | |
| Allegheny Technologies, Inc. | | | 2.0 | |
| Globus Medical, Inc., Class A | | | 1.8 | |
| Murphy Oil Corp. | | | 1.8 | |
| Deckers Outdoor Corp. | | | 1.8 | |
| World Wrestling Entertainment, Inc., Class A | | | 1.7 | |
| LiveRamp Holdings, Inc. | | | 1.7 | |
| Total | | | 20.1 | |
| * | Excluding money market fund holdings. |
Invesco S&P MidCap 400® Pure Growth ETF (RFG)(continued)
Growth of a $10,000 Investment
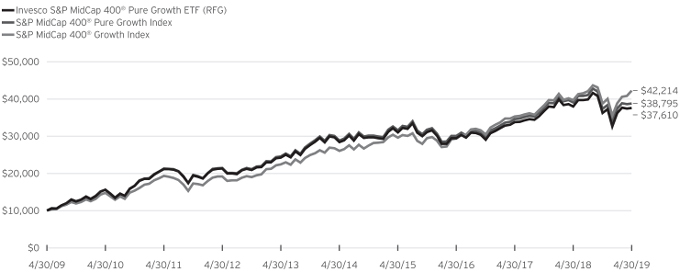
Fund Performance History as of April 30, 2019
| | | | | | | | | | | | | | | | | | | | | | | | | | | | | | | | | | | | | | | | |
| | | 1 Year | | | 3 Years
Average
Annualized | | | 3 Years
Cumulative | | | 5 Years
Average
Annualized | | | 5 Years
Cumulative | | | 10 Years
Average
Annualized | | | 10 Years
Cumulative | | | | | | Fund Inception | |
| Index | | | | | Average
Annualized | | | Cumulative | |
| S&P MidCap 400 Pure Growth Index | | | (0.73 | )% | | | 8.86 | % | | | 29.02 | % | | | 6.12 | % | | | 34.58 | % | | | 14.52 | % | | | 287.95 | % | | | | | | | 9.22 | % | | | 219.14 | % |
| S&P MidCap 400® Growth Index | | | 6.25 | | | | 12.87 | | | | 43.78 | | | | 10.14 | | | | 62.06 | | | | 15.49 | | | | 322.14 | | | | | | | | 9.36 | | | | 224.69 | |
| Fund | | | | | | | | | | | | | | | | | | | | | | | | | | | | | | | | | | | | | | | | |
| NAV Return | | | (1.05 | ) | | | 8.49 | | | | 27.68 | | | | 5.77 | | | | 32.41 | | | | 14.16 | | | | 276.10 | | | | | | | | 8.86 | | | | 205.77 | |
| Market Price Return | | | (1.07 | ) | | | 8.55 | | | | 27.90 | | | | 5.82 | | | | 32.69 | | | | 14.18 | | | | 276.63 | | | | | | | | 8.87 | | | | 206.01 | |
Guggenheim S&P MidCap 400® Pure Growth ETF (the “Predecessor Fund”) Inception: March 1, 2006
Performance quoted above represents past performance. Past performance is not a guarantee of future results and current performance may be higher or lower than performance quoted. Investment returns and principal value will fluctuate, and shares of the Fund (“Fund Shares”), when redeemed or sold, may be worth more or less than their original cost. Fund performance reflects any applicable fee waivers and/or expense reimbursements. Had the adviser not waived fees and/or reimbursed expenses currently or in the past, returns would have been lower. See current prospectus for more information. According to the Fund’s current prospectus, the total annual operating expense ratio was indicated as 0.35%. The Financial Highlights section of the Shareholder Report presents the expense ratios based on expenses incurred during the period covered by this report. NAV and Market Price returns assume that dividends and capital gain distributions have been reinvested in the Fund at NAV and Market Price, respectively. The returns shown in the table above do not reflect the deduction of taxes that a shareholder would pay on Fund distributions or the redemption or sale of Fund Shares. See invesco.com/ETFs to find the most recentmonth-end performance numbers.
Index and Benchmark Indexes performance results are based upon a hypothetical investment in their respective constituent securities. Index and Benchmark Indexes returns do not represent Fund returns. An investor cannot invest directly in an index. The Index and Benchmark Indexes do not charge management fees or brokerage expenses, and no such fees or expenses were deducted from the hypothetical performance shown. In addition, the results actual investors might have achieved would have differed from those shown because of differences in the timing, amounts of their investments, and fees and expenses associated with an investment in the Fund.
| Notes | Regarding Indexes and Fund Performance History: |
| - | Average Annualized and Cumulative Inception returns for the Fund, Index and Benchmark Index are based on the inception date of the Predecessor Fund. |
| - | Effective after the close of business on April 6, 2018, the Predecessor Fund was reorganized into the Fund. Returns shown are blended returns of the Predecessor Fund and the Fund. |
| | |
| RFV | | Manager’s Analysis |
| | Invesco S&P MidCap 400® Pure Value ETF (RFV) |
As an index fund, the Invesco S&P MidCap 400® Pure Value ETF (the “Fund”) is passively managed and seeks to track the returns of an underlying index. The Fund seeks to track the investment results (before fees and expenses) of the S&P MidCap 400® Pure Value Index (the “Index”). The Fund generally will invest at least 90% of its total assets in the securities that comprise the Index.
S&P Dow Jones Indices LLC (“S&P DJI” or the “Index Provider”) compiles, maintains and calculates the Index. The Index is comprised only of those S&P MidCap 400® companies with strong value characteristics as measured using three factors: book to value price ratio, earnings to price ratio, and sales to price ratio as selected by S&P DJI, strictly in accordance with its guidelines and mandated procedures. The Fund generally invests in all of the securities comprising the Index in proportion to their weightings in the Index.
For the fiscal year ended April 30, 2019, on a market price basis, the Fund returned 7.25%. On a net asset value (“NAV”) basis, the Fund returned 7.25%. During the same time period, the Index returned 7.62%. During the fiscal year, the Fund fully replicated the components of the Index; therefore, the Fund’s performance, on a NAV basis, differed from the return of the Index primarily due to fees and operating expenses that the Fund incurred, as well as trading costs associated with portfolio rebalances during the period.
During this same time period, the S&P MidCap 400® Value Index (the “Benchmark Index”) returned 7.83%. The Benchmark Index is an unmanaged index weighted by market capitalization based on the average performance of approximately 290 equity securities. The Benchmark Index was selected for its recognition in the marketplace, and its performance comparison is a useful measure for investors as a representation of value style of themid-cap segment of the U.S. equity universe.
The performance of the Fund differed from the Benchmark Index because the Fund seeks to track an Index that employs a proprietary stock selection and weighting methodology, whereas the Benchmark Index selects and weights stocks based primarily on market capitalization.
Relative to the Benchmark Index, the Fund was most overweight in the consumer discretionary sector and most underweight in the real estate sector during the fiscal year ended April 30, 2019. The majority of the Fund’s underperformance relative to the Benchmark Index during that period can be attributed to the Fund’s overweight exposure to the energy sector, as well as the underweight exposure to and stock selection in the real estate sector.
For the fiscal year ended April 30, 2019, the industrials sector contributed most significantly to the Fund’s return, followed by the information technology and consumer staples sectors,
respectively. The energy sector detracted most significantly from the Fund’s return, followed by the materials sector.
Positions that contributed most significantly to the Fund’s return for the fiscal year ended April 30, 2019 included Genworth Financial, Inc., Class A, a financials company (no longer held at fiscalyear-end) and LifePoint Health, Inc., a health care company (no longer held at fiscalyear-end). Positions that detracted most significantly from the Fund’s return during this period included United States Steel Corp., a materials company (position average weight of 1.71%) and QEP Resources, Inc., an energy company (no longer held at fiscalyear-end).
| | | | |
Sector Breakdown
(% of the Fund’s Net Assets)
as of April 30, 2019 | |
| Consumer Discretionary | | | 25.0 | |
| Industrials | | | 18.3 | |
| Financials | | | 16.4 | |
| Information Technology | | | 11.2 | |
| Materials | | | 10.3 | |
| Energy | | | 9.1 | |
| Real Estate | | | 3.6 | |
| Sector Types Each Less Than 3% | | | 6.1 | |
| Money Market Funds Plus Other Assets Less Liabilities | | | 0.0 | |
|
Top Ten Fund Holdings*
(% of the Fund’s Net Assets)
as of April 30, 2019 | |
| Security | | | | |
| Bed Bath & Beyond, Inc. | | | 3.0 | |
| KB Home | | | 2.4 | |
| Ryder System, Inc. | | | 2.3 | |
| Goodyear Tire & Rubber Co. (The) | | | 2.2 | |
| McDermott International, Inc. | | | 2.2 | |
| AutoNation, Inc. | | | 2.1 | |
| Dana, Inc. | | | 2.1 | |
| SYNNEX Corp. | | | 2.1 | |
| Tech Data Corp. | | | 2.1 | |
| World Fuel Services Corp. | | | 2.0 | |
| Total | | | 22.5 | |
| * | Excluding money market fund holdings. |
Invesco S&P MidCap 400® Pure Value ETF (RFV)(continued)
Growth of a $10,000 Investment
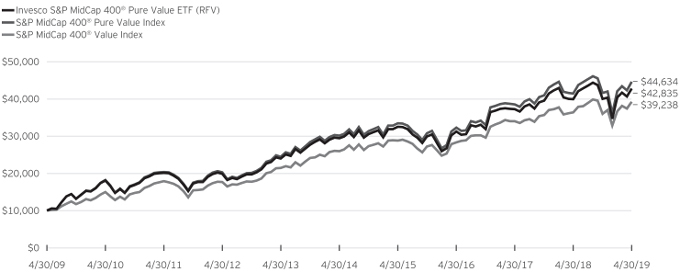
Fund Performance History as of April 30, 2019
| | | | | | | | | | | | | | | | | | | | | | | | | | | | | | | | | | | | | | | | |
| | | 1 Year | | | 3 Years Average
Annualized | | | 3 Years Cumulative | | | 5 Years Average
Annualized | | | 5 Years Cumulative | | | 10 Years Average
Annualized | | | 10 Years Cumulative | | | | | | Fund Inception | |
Index | | | | | Average
Annualized | | | Cumulative | |
| S&P MidCap 400® Pure Value Index | | | 7.62 | % | | | 11.40 | % | | | 38.25 | % | | | 8.16 | % | | | 47.99 | % | | | 16.14 | % | | | 346.34 | % | | | | | | | 8.36 | % | | | 187.80 | % |
| S&P MidCap 400® Value Index | | | 7.83 | | | | 11.41 | | | | 38.28 | | | | 8.58 | | | | 50.91 | | | | 14.65 | | | | 292.38 | | | | | | | | 8.25 | | | | 183.92 | |
| Fund | | | | | | | | | | | | | | | | | | | | | | | | | | | | | | | | | | | | | | | | |
| NAV Return | | | 7.25 | | | | 11.06 | | | | 37.00 | | | | 7.81 | | | | 45.62 | | | | 15.66 | | | | 328.35 | | | | | | | | 7.95 | | | | 173.73 | |
| Market Price Return | | | 7.25 | | | | 11.26 | | | | 37.72 | | | | 7.86 | | | | 46.01 | | | | 15.65 | | | | 327.92 | | | | | | | | 7.96 | | | | 173.98 | |
Guggenheim S&P MidCap 400® Pure Value ETF (the “Predecessor Fund”) Inception: March 1, 2006
Performance quoted above represents past performance. Past performance is not a guarantee of future results and current performance may be higher or lower than performance quoted. Investment returns and principal value will fluctuate, and shares of the Fund (“Fund Shares”), when redeemed or sold, may be worth more or less than their original cost. Fund performance reflects any applicable fee waivers and/or expense reimbursements. Had the adviser not waived fees and/or reimbursed expenses currently or in the past, returns would have been lower. See current prospectus for more information. According to the Fund’s current prospectus, the total annual operating expense ratio was indicated as 0.35%. The Financial Highlights section of the Shareholder Report presents the expense ratios based on expenses incurred during the period covered by this report. NAV and Market Price returns assume that dividends and capital gain distributions have been reinvested in the Fund at NAV and Market Price, respectively. The returns shown in the table above do not reflect the deduction of taxes that a shareholder would pay on Fund distributions or the redemption or sale of Fund Shares. See invesco.com/ETFs to find the most recentmonth-end performance numbers.
Index and Benchmark Indexes performance results are based upon a hypothetical investment in their respective constituent securities. Index and Benchmark Indexes returns do not represent Fund returns. An investor cannot invest directly in an index. The Index and Benchmark Indexes do not charge management fees or brokerage expenses, and no such fees or expenses were deducted from the hypothetical performance shown. In addition, the results actual investors might have achieved would have differed from those shown because of differences in the timing, amounts of their investments, and fees and expenses associated with an investment in the Fund.
Notes Regarding Indexes and Fund Performance History:
| - | Average Annualized and Cumulative Inception returns for the Fund, Index and Benchmark Index are based on the inception date of the Predecessor Fund. |
| - | Effective after the close of business on April 6, 2018, the Predecessor Fund was reorganized into the Fund. Returns shown are blended returns of the Predecessor Fund and the Fund. |
| | |
| RZG | | Manager’s Analysis |
| | Invesco S&P SmallCap 600® Pure Growth ETF (RZG) |
As an index fund, the Invesco S&P SmallCap 600® Pure Growth ETF (the “Fund”) is passively managed and seeks to track the returns of an underlying index. The Fund seeks to track the investment results (before fees and expenses) of the S&P SmallCap 600® Pure Growth Index (the “Index”). The Fund generally will invest at least 90% of its total assets in the securities that comprise the Index.
Strictly in accordance with its guidelines and mandated procedures, S&P Dow Jones Indices LLC (“S&P DJI” or the “Index Providers”), compiles, maintains and calculates the Index, which is comprised of those S&P SmallCap 600® companies with strong growth characteristics selected by S&P DJI. The Fund generally invests in all of the securities comprising the Index in proportion to their weightings in the Index.
For the fiscal year ended April 30, 2019, on a market price basis, the Fund returned 1.26%. On a net asset value (“NAV”) basis, the Fund returned 1.43%. During the same time period, the Index returned 1.84%. During the fiscal year, the Fund fully replicated the components of the Index; therefore, the Fund’s performance, on a NAV basis, differed from the return of the Index primarily due to fees and operating expenses that the Fund incurred, as well as trading costs associated with portfolio rebalances during the period.
During this same time period, the S&P SmallCap 600® Growth Index (the “Benchmark Index”) returned 7.00%. The Benchmark Index is an unmanaged index weighted by market capitalization based on the average performance of approximately 335 equity securities. The Benchmark Index was selected for its recognition in the marketplace, and its performance comparison is a useful measure for investors as a broad representation of growth style of thesmall-cap segment of the U.S. equity universe.
The performance of the Fund differed from the Benchmark Index because the Fund seeks to track an Index that employs a proprietary stock selection and weighting methodology, whereas the Benchmark Index selects and weights stocks based primarily on market capitalization.
Relative to the Benchmark Index, the Fund was most overweight in the health care sector and most underweight in the industrials sector during the fiscal year ended April 30, 2019. The majority of the Fund’s underperformance relative to the Benchmark Index during that period can be attributed to the Fund’s overweight exposure to and stock selection in the information technology sector as well as stock selection in the health care sector.
For the fiscal year ended April 30, 2019, the energy sector contributed most significantly to the Fund’s return, followed by the consumer discretionary and real estate sectors, respectively. The health care sector detracted most significantly from the Fund’s return, followed by the information technology and financials sectors, respectively.
Positions that contributed most significantly to the Fund’s return for the fiscal year ended April 30, 2019 included Avon Products, Inc., a consumer staples company (portfolio average weight of 0.55%) and World Wrestling Entertainment, Inc., Class A, a communication services company (no longer held at fiscalyear-end). Positions that detracted most significantly from the Fund’s return during this period included Cutera, Inc., a health care company (no longer held at fiscalyear-end) and Ascena Retail Group, Inc., a consumer discretionary company (portfolio average weight of 0.39%).
| | | | |
Sector Breakdown
(% of the Fund’s Net Assets)
as of April 30, 2019 | |
| Health Care | | | 20.1 | |
| Consumer Discretionary | | | 16.6 | |
| Information Technology | | | 12.0 | |
| Industrials | | | 12.0 | |
| Financials | | | 10.6 | |
| Energy | | | 10.1 | |
| Real Estate | | | 6.3 | |
| Consumer Staples | | | 4.8 | |
| Communication Services | | | 4.0 | |
| Materials | | | 3.5 | |
| Money Market Funds Plus Other Assets Less Liabilities | | | 0.0 | |
|
Top Ten Fund Holdings*
(% of the Fund’s Net Assets)
as of April 30, 2019 | |
| Security | | | | |
| Avon Products, Inc. | | | 2.0 | |
| NeoGenomics, Inc. | | | 1.7 | |
| Renewable Energy Group, Inc. | | | 1.6 | |
| Shake Shack, Inc., Class A | | | 1.5 | |
| Innovative Industrial Properties, Inc. | | | 1.3 | |
| KEMET Corp. | | | 1.3 | |
| ProPetro Holding Corp. | | | 1.3 | |
| Medifast, Inc. | | | 1.3 | |
| Perficient, Inc. | | | 1.2 | |
| Iridium Communications, Inc. | | | 1.2 | |
| Total | | | 14.4 | |
| * | Excluding money market fund holdings. |
Invesco S&P SmallCap 600® Pure Growth ETF (RZG)(continued)
Growth of a $10,000 Investment
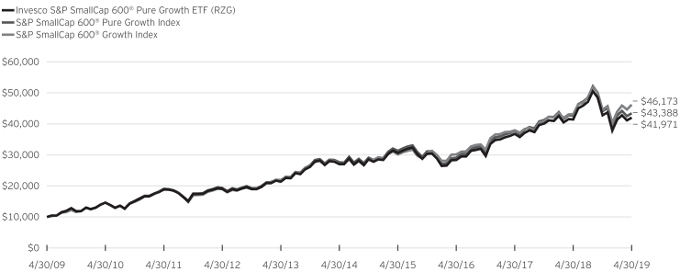
Fund Performance History as of April 30, 2019
| | | | | | | | | | | | | | | | | | | | | | | | | | | | | | | | | | | | | | | | |
| | | 1 Year | | | 3 Years Average
Annualized | | | 3 Years Cumulative | | | 5 Years Average
Annualized | | | 5 Years Cumulative | | | 10 Years Average
Annualized | | | 10 Years Cumulative | | | | | | Fund Inception | |
Index | | | | | Average
Annualized | | | Cumulative | |
| S&P SmallCap 600® Pure Growth Index | | | 1.84 | % | | | 14.30 | % | | | 49.35 | % | | | 9.51 | % | | | 57.47 | % | | | 15.81 | % | | | 333.88 | % | | | | | | | 9.27 | % | | | 221.43 | % |
| S&P SmallCap 600® Growth Index | | | 7.00 | | | | 15.28 | | | | 53.21 | | | | 11.24 | | | | 70.32 | | | | 16.53 | | | | 361.73 | | | | | | | | 9.58 | | | | 233.52 | |
| Fund | | | | | | | | | | | | | | | | | | | | | | | | | | | | | | | | | | | | | | | | |
| NAV Return | | | 1.43 | | | | 13.99 | | | | 48.13 | | | | 9.20 | | | | 55.25 | | | | 15.42 | | | | 319.71 | | | | | | | | 8.99 | | | | 210.65 | |
| Market Price Return | | | 1.26 | | | | 14.02 | | | | 48.24 | | | | 9.28 | | | | 55.86 | | | | 15.42 | | | | 319.68 | | | | | | | | 8.99 | | | | 210.63 | |
Guggenheim S&P SmallCap 600® Pure Growth ETF (the “Predecessor Fund”) Inception: March 1, 2006
Performance quoted above represents past performance. Past performance is not a guarantee of future results and current performance may be higher or lower than performance quoted. Investment returns and principal value will fluctuate, and shares of the Fund (“Fund Shares”), when redeemed or sold, may be worth more or less than their original cost. Fund performance reflects any applicable fee waivers and/or expense reimbursements. Had the adviser not waived fees and/or reimbursed expenses currently or in the past, returns would have been lower. See current prospectus for more information. According to the Fund’s current prospectus, the total annual operating expense ratio was indicated as 0.35%. The Financial Highlights section of the Shareholder Report presents the expense ratios based on expenses incurred during the period covered by this report. NAV and Market Price returns assume that dividends and capital gain distributions have been reinvested in the Fund at NAV and Market Price, respectively. The returns shown in the table above do not reflect the deduction of taxes that a shareholder would pay on Fund distributions or the redemption or sale of Fund Shares. See invesco.com/ETFs to find the most recentmonth-end performance numbers.
Index and Benchmark Indexes performance results are based upon a hypothetical investment in their respective constituent securities. Index and Benchmark Indexes returns do not represent Fund returns. An investor cannot invest directly in an index. The Index and Benchmark Indexes do not charge management fees or brokerage expenses, and no such fees or expenses were deducted from the hypothetical performance shown. In addition, the results actual investors might have achieved would have differed from those shown because of differences in the timing, amounts of their investments, and fees and expenses associated with an investment in the Fund.
Notes Regarding Indexes and Fund Performance History:
| - | Average Annualized and Cumulative Inception returns for the Fund, Index and Benchmark Index are based on the inception date of the Predecessor Fund. |
| - | Effective after the close of business on April 6, 2018, the Predecessor Fund was reorganized into the Fund. Returns shown are blended returns of the Predecessor Fund and the Fund. |
| | |
| RZV | | Manager’s Analysis |
| | Invesco S&P SmallCap 600® Pure Value ETF (RZV) |
As an index fund, the Invesco S&P SmallCap 600® Pure Value ETF (the “Fund”) is passively managed and seeks to track the returns of an underlying index. The Fund seeks to track the investment results (before fees and expenses) of the S&P SmallCap 600® Pure Value Index (the “Index”). The Fund generally will invest at least 90% of its total assets in the securities that comprise the Index.
Strictly in accordance with its guidelines and mandated procedures, S&P Dow Jones Indices LLC (“S&P DJI”) or the Index Providers”), compiles, maintains and calculates the Index, which is comprised of those S&P SmallCap 600® companies with strong value characteristics selected by S&P DJI. The Fund generally invests in all of the securities comprising the Index in proportion to their weightings in the Index.
For the fiscal year ended April 30, 2019, on a market price basis, the Fund returned (4.28)%. On a net asset value (“NAV”) basis, the Fund returned (4.27)%. During the same time period, the Index returned (3.98)%. During the fiscal year, the Fund fully replicated the components of the Index; therefore, the Fund’s performance, on a NAV basis, differed from the return of the Index primarily due to fees and operating expenses that the Fund incurred, partially offset by income from the securities lending program in which the Fund participates.
During this same time period, the S&P SmallCap 600® Value Index (the “Benchmark Index”) returned 2.16%. The Benchmark Index is an unmanaged index weighted by market capitalization based on the average performance of approximately 450 equity securities. The Benchmark Index was selected for its recognition in the marketplace, and its performance comparison is a useful measure for investors as a broad representation of value style of thesmall-cap segment of the U.S. equity universe.
The performance of the Fund differed from the Benchmark Index because the Fund seeks to track an Index that employs a proprietary stock selection and weighting methodology, whereas the Benchmark Index selects and weights stocks based primarily on market capitalization.
Relative to the Benchmark Index, the Fund was most overweight in the consumer discretionary sector and most underweight in the financials sector during the fiscal year ended April 30, 2019. The majority of the Fund’s underperformance relative to the Benchmark Index during that period can be attributed to the Fund’s stock selection in the consumer discretionary sector as well as stock selection in the consumer staples sector.
For the fiscal year ended April 30, 2019, the information technology sector contributed most significantly to the Fund’s return, followed by the materials and industrials sectors, respectively. The energy sector detracted most significantly from the Fund’s return, followed by the health care and consumer discretionary sectors, respectively.
Positions that contributed most significantly to the Fund’s return for the fiscal year ended April 30, 2019 included Griffon Corp., an industrials company (portfolio average weight of 0.52%) and Ultra Clean Holdings, Inc., an information technology company (portfolio average weight of 0.51%). Positions that detracted most significantly from the Fund’s return during this period included Cloud Peak Energy Inc., an energy company (no longer held at fiscalyear-end) and Owens & Minor, Inc., a health care company (portfolio average weight of 0.78%).
| | | | |
Sector Breakdown
(% of the Fund’s Net Assets)
as of April 30, 2019 | |
| Consumer Discretionary | | | 33.9 | |
| Industrials | | | 19.7 | |
| Materials | | | 10.8 | |
| Information Technology | | | 9.1 | |
| Energy | | | 8.1 | |
| Financials | | | 7.0 | |
| Consumer Staples | | | 4.5 | |
| Health Care | | | 3.7 | |
| Sector Types Each Less Than 3% | | | 3.2 | |
| Money Market Funds Plus Other Assets Less Liabilities | | | 0.0 | |
|
Top Ten Fund Holdings*
(% of the Fund’s Net Assets)
as of April 30, 2019 | |
| Security | | | | |
| Griffon Corp. | | | 1.7 | |
| Group 1 Automotive, Inc. | | | 1.7 | |
| Sonic Automotive, Inc., Class A | | | 1.6 | |
| William Lyon Homes, Class A | | | 1.6 | |
| Hibbett Sports, Inc. | | | 1.6 | |
| Ultra Clean Holdings, Inc. | | | 1.6 | |
| American Axle & Manufacturing Holdings, Inc. | | | 1.4 | |
| Century Communities, Inc. | | | 1.4 | |
| M/I Homes, Inc. | | | 1.4 | |
| PH Glatfelter Co. | | | 1.3 | |
| Total | | | 15.3 | |
| * | Excluding money market fund holdings. |
Invesco S&P SmallCap 600® Pure Value ETF (RZV)(continued)
Growth of a $10,000 Investment
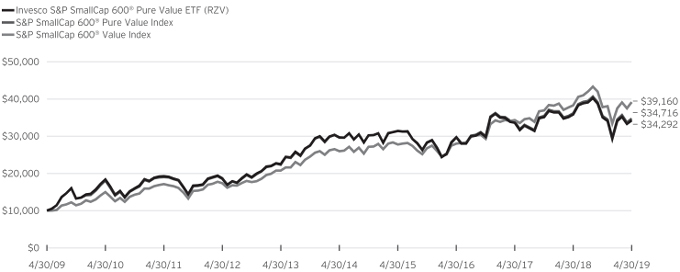
Fund Performance History as of April 30, 2019
| | | | | | | | | | | | | | | | | | | | | | | | | | | | | | | | | | | | | | | | |
| | | 1 Year | | | 3 Years Average
Annualized | | | 3 Years Cumulative | | | 5 Years Average
Annualized | | | 5 Years Cumulative | | | 10 Years Average
Annualized | | | 10 Years Cumulative | | | | | | Fund Inception | |
Index | | | | | Average
Annualized | | | Cumulative | |
| S&P SmallCap 600® Pure Value Index | | | (3.98 | )% | | | 5.22 | % | | | 16.48 | % | | | 3.24 | % | | | 17.26 | % | | | 13.25 | % | | | 247.16 | % | | | | | | | 5.81 | % | | | 110.24 | % |
| S&P SmallCap 600® Value Index | | | 2.16 | | | | 11.80 | | | | 39.76 | | | | 8.57 | | | | 50.85 | | | | 14.63 | | | | 291.60 | | | | | | | | 7.87 | | | | 171.20 | |
| Fund | | | | | | | | | | | | | | | | | | | | | | | | | | | | | | | | | | | | | | | | |
| NAV Return | | | (4.27 | ) | | | 4.96 | | | | 15.64 | | | | 2.94 | | | | 15.58 | | | | 13.11 | | | | 242.92 | | | | | | | | 5.56 | | | | 103.99 | |
| Market Price Return | | | (4.28 | ) | | | 4.99 | | | | 15.73 | | | | 2.98 | | | | 15.83 | | | | 13.13 | | | | 243.40 | | | | | | | | 5.57 | | | | 104.20 | |
Guggenheim S&P SmallCap 600® Pure Value ETF (the “Predecessor Fund”) Inception: March 1, 2006
Performance quoted above represents past performance. Past performance is not a guarantee of future results and current performance may be higher or lower than performance quoted. Investment returns and principal value will fluctuate, and shares of the Fund (“Fund Shares”), when redeemed or sold, may be worth more or less than their original cost. Fund performance reflects any applicable fee waivers and/or expense reimbursements. Had the adviser not waived fees and/or reimbursed expenses currently or in the past, returns would have been lower. See current prospectus for more information. According to the Fund’s current prospectus, the total annual operating expense ratio was indicated as 0.35%. The Financial Highlights section of the Shareholder Report presents the expense ratios based on expenses incurred during the period covered by this report. NAV and Market Price returns assume that dividends and capital gain distributions have been reinvested in the Fund at NAV and Market Price, respectively. The returns shown in the table above do not reflect the deduction of taxes that a shareholder would pay on Fund distributions or the redemption or sale of Fund Shares. See invesco.com/ETFs to find the most recentmonth-end performance numbers.
Index and Benchmark Indexes performance results are based upon a hypothetical investment in their respective constituent securities. Index and Benchmark Indexes returns do not represent Fund returns. An investor cannot invest directly in an index. The Index and Benchmark Indexes do not charge management fees or brokerage expenses, and no such fees or expenses were deducted from the hypothetical performance shown. In addition, the results actual investors might have achieved would have differed from those shown because of differences in the timing, amounts of their investments, and fees and expenses associated with an investment in the Fund.
Notes Regarding Indexes and Fund Performance History:
| - | Average Annualized and Cumulative Inception returns for the Fund, Index and Benchmark Index are based on the inception date of the Predecessor Fund. |
| - | Effective after the close of business on April 6, 2018, the Predecessor Fund was reorganized into the Fund. Returns shown are blended returns of the Predecessor Fund and the Fund. |
Schedule of Investments(a)
Invesco S&P 500® Pure Growth ETF (RPG)
April 30, 2019
| | | | | | | | |
Number
of Shares | | | | | Value | |
| | | | Common Stocks & Other Equity
Interests—100.0% | |
| | | | Communication Services—6.7% | |
| | 13,344 | | | Alphabet, Inc., Class A(b) | | $ | 15,998,922 | |
| | 13,746 | | | Alphabet, Inc., Class C(b) | | | 16,336,846 | |
| | 117,220 | | | Facebook, Inc., Class A(b) | | | 22,670,348 | |
| | 150,828 | | | Netflix, Inc.(b) | | | 55,887,807 | |
| | 289,440 | | | Take-Two Interactive Software, Inc.(b) | | | 28,026,475 | |
| | 638,296 | | | Twitter, Inc.(b) | | | 25,474,394 | |
| | 448,747 | | | Verizon Communications, Inc. | | | 25,663,841 | |
| | | | | | | | |
| | | | | | | 190,058,633 | |
| | | | | | | | |
| | | | Consumer Discretionary—10.7% | |
| | 9,684 | | | Amazon.com, Inc.(b) | | | 18,656,420 | |
| | 15,391 | | | AutoZone, Inc.(b) | | | 15,826,719 | |
| | 33,045 | | | Chipotle Mexican Grill, Inc.(b) | | | 22,736,282 | |
| | 194,672 | | | Dollar General Corp. | | | 24,546,192 | |
| | 215,082 | | | Hilton Worldwide Holdings, Inc. | | | 18,709,983 | |
| | 95,087 | | | O’Reilly Automotive, Inc.(b) | | | 35,997,086 | |
| | 416,590 | | | TJX Cos., Inc. (The) | | | 22,862,459 | |
| | 277,996 | | | Tractor Supply Co. | | | 28,772,586 | |
| | 183,819 | | | Ulta Beauty, Inc.(b) | | | 64,149,155 | |
| | 269,533 | | | VF Corp. | | | 25,446,610 | |
| | 242,515 | | | Yum! Brands, Inc. | | | 25,316,141 | |
| | | | | | | | |
| | | | | | | 303,019,633 | |
| | | | | | | | |
| | | | Consumer Staples—7.6% | |
| | 492,692 | | | Church & Dwight Co., Inc. | | | 36,927,266 | |
| | 94,086 | | | Clorox Co. (The) | | | 15,028,357 | |
| | 149,683 | | | Constellation Brands, Inc., Class A | | | 31,683,401 | |
| | 646,629 | | | Hormel Foods Corp. | | | 25,826,362 | |
| | 525,327 | | | Kellogg Co. | | | 31,677,218 | |
| | 314,737 | | | Lamb Weston Holdings, Inc. | | | 22,047,327 | |
| | 178,761 | | | McCormick & Co., Inc. | | | 27,523,831 | |
| | 438,294 | | | Monster Beverage Corp.(b) | | | 26,122,322 | |
| | | | | | | | |
| | | | | | | 216,836,084 | |
| | | | | | | | |
| | | | Energy—10.1% | |
| | 449,193 | | | Anadarko Petroleum Corp. | | | 32,723,710 | |
| | 867,227 | | | Apache Corp. | | | 28,540,441 | |
| | 645,377 | | | ConocoPhillips | | | 40,736,196 | |
| | 1,890,215 | | | Devon Energy Corp. | | | 60,751,510 | |
| | 387,390 | | | Diamondback Energy, Inc. | | | 41,214,422 | |
| | 625,804 | | | HollyFrontier Corp. | | | 29,869,625 | |
| | 1,792,248 | | | Marathon Oil Corp. | | | 30,539,906 | |
| | 393,450 | | | Occidental Petroleum Corp. | | | 23,166,336 | |
| | | | | | | | |
| | | | | | | 287,542,146 | |
| | | | | | | | |
| | | | Financials—5.5% | |
| | 211,148 | | | Cboe Global Markets, Inc. | | | 21,454,748 | |
| | 190,247 | | | First Republic Bank | | | 20,093,888 | |
| | 397,680 | | | Intercontinental Exchange, Inc. | | | 32,351,268 | |
| | 68,222 | | | S&P Global, Inc. | | | 15,053,867 | |
| | 164,549 | | | SVB Financial Group(b) | | | 41,420,274 | |
| | 484,932 | | | U.S. Bancorp | | | 25,856,574 | |
| | | | | | | | |
| | | | | | | 156,230,619 | |
| | | | | | | | |
| | | | Health Care—14.6% | |
| | 298,994 | | | Abbott Laboratories | | | 23,787,963 | |
| | 666,984 | | | Boston Scientific Corp.(b) | | | 24,758,446 | |
| | 333,446 | | | Cerner Corp.(b) | | | 22,157,487 | |
| | 534,396 | | | DaVita, Inc.(b) | | | 29,520,035 | |
| | | | | | | | |
Number
of Shares | | | | | Value | |
| | | | Common Stocks & Other Equity
Interests (continued) | |
| | | | Health Care (continued) | |
| | 158,216 | | | Edwards Lifesciences Corp.(b) | | $ | 27,857,091 | |
| | 216,071 | | | Eli Lilly and Co. | | | 25,288,950 | |
| | 141,702 | | | HCA Healthcare, Inc. | | | 18,028,745 | |
| | 78,398 | | | Humana, Inc. | | | 20,023,633 | |
| | 38,956 | | | Illumina, Inc.(b) | | | 12,154,272 | |
| | 43,057 | | | Intuitive Surgical, Inc.(b) | | | 21,986,196 | |
| | 161,867 | | | Medtronic PLC | | | 14,375,408 | |
| | 194,535 | | | Merck & Co., Inc. | | | 15,311,850 | |
| | 419,196 | | | Pfizer, Inc. | | | 17,023,549 | |
| | 176,688 | | | Thermo Fisher Scientific, Inc. | | | 49,022,086 | |
| | 245,694 | | | Vertex Pharmaceuticals, Inc.(b) | | | 41,517,372 | |
| | 112,891 | | | WellCare Health Plans, Inc.(b) | | | 29,165,390 | |
| | 192,161 | | | Zimmer Biomet Holdings, Inc. | | | 23,666,549 | |
| | | | | | | | |
| | | | | | | 415,645,022 | |
| | | | | | | | |
| | | | Industrials—13.2% | |
| | 162,608 | | | AMETEK, Inc. | | | 14,337,147 | |
| | 39,064 | | | Boeing Co. (The) | | | 14,754,082 | |
| | 142,710 | | | Cintas Corp. | | | 30,988,050 | |
| | 717,817 | | | CSX Corp. | | | 57,159,768 | |
| | 241,079 | | | Expeditors International of Washington, Inc. | | | 19,146,494 | |
| | 339,064 | | | Fastenal Co. | | | 23,920,965 | |
| | 436,107 | | | IHS Markit Ltd.(b) | | | 24,971,487 | |
| | 196,152 | | | Ingersoll-Rand PLC | | | 24,050,197 | |
| | 42,745 | | | Roper Technologies, Inc. | | | 15,375,377 | |
| | 78,303 | | | TransDigm Group, Inc.(b) | | | 37,782,764 | |
| | 113,634 | | | Union Pacific Corp. | | | 20,117,763 | |
| | 121,143 | | | W.W. Grainger, Inc. | | | 34,162,326 | |
| | 366,754 | | | Waste Management, Inc. | | | 39,367,374 | |
| | 226,541 | | | Xylem, Inc. | | | 18,893,519 | |
| | | | | | | | |
| | | | | | | 375,027,313 | |
| | | | | | | | |
| | | | Information Technology—23.5% | |
| | 90,690 | | | Adobe, Inc.(b) | | | 26,232,083 | |
| | 1,320,299 | | | Advanced Micro Devices, Inc.(b) | | | 36,479,861 | |
| | 259,321 | | | Akamai Technologies, Inc.(b) | | | 20,761,239 | |
| | 106,394 | | | Alliance Data Systems Corp. | | | 17,033,679 | |
| | 130,412 | | | ANSYS, Inc.(b) | | | 25,534,670 | |
| | 312,262 | | | Autodesk, Inc.(b) | | | 55,648,211 | |
| | 96,309 | | | Automatic Data Processing, Inc. | | | 15,832,237 | |
| | 63,981 | | | Broadcom, Inc. | | | 20,371,550 | |
| | 134,702 | | | Broadridge Financial Solutions, Inc. | | | 15,912,347 | |
| | 451,603 | | | Cisco Systems, Inc. | | | 25,267,188 | |
| | 182,183 | | | Fidelity National Information Services, Inc. | | | 21,120,475 | |
| | 322,296 | | | Fortinet, Inc.(b) | | | 30,108,892 | |
| | 172,253 | | | Gartner, Inc.(b) | | | 27,383,059 | |
| | 156,073 | | | Global Payments, Inc. | | | 22,797,583 | |
| | 125,812 | | | Intuit, Inc. | | | 31,586,361 | |
| | 737,647 | | | Keysight Technologies, Inc.(b) | | | 64,197,418 | |
| | 84,249 | | | Mastercard, Inc., Class A | | | 21,419,466 | |
| | 221,662 | | | Motorola Solutions, Inc. | | | 32,121,040 | |
| | 192,162 | | | NetApp, Inc. | | | 13,999,002 | |
| | 229,020 | | | PayPal Holdings, Inc.(b) | | | 25,826,585 | |
| | 133,445 | | | Red Hat, Inc.(b) | | | 24,357,716 | |
| | 313,070 | | | salesforce.com, inc.(b) | | | 51,766,125 | |
See accompanying Notes to Financial Statements which are an integral part of the financial statements.
Invesco S&P 500® Pure Growth ETF (RPG)(continued)
April 30, 2019
| | | | | | | | |
Number
of Shares | | | | | Value | |
| | | | Common Stocks & Other Equity
Interests (continued) | |
| | | | Information Technology (continued) | |
| | 91,141 | | | VeriSign, Inc.(b) | | $ | 17,995,791 | |
| | 206,872 | | | Xilinx, Inc. | | | 24,853,602 | |
| | | | | | | | |
| | | | | | | 668,606,180 | |
| | | | | | | | |
| | | | Materials—2.0% | |
| | 150,557 | | | Air Products and Chemicals, Inc. | | | 30,983,125 | |
| | 138,405 | | | Ecolab, Inc. | | | 25,477,592 | |
| | | | | | | | |
| | | | | | | 56,460,717 | |
| | | | | | | | |
| | | | Real Estate—2.4% | |
| | 457,576 | | | Apartment Investment & Management Co., | | | | |
| | | | Class A | | | 22,585,952 | |
| | 479,095 | | | HCP, Inc. | | | 14,267,449 | |
| | 396,902 | | | Welltower, Inc. | | | 29,581,106 | |
| | | | | | | | |
| | | | | | | 66,434,507 | |
| | | | | | | | |
| | | | Utilities—3.7% | |
| | 409,436 | | | Ameren Corp. | | | 29,794,658 | |
| | 102,956 | | | NextEra Energy, Inc. | | | 20,018,765 | |
| | 728,934 | | | NRG Energy, Inc. | | | 30,010,213 | |
| | 260,598 | | | Pinnacle West Capital Corp. | | | 24,827,171 | |
| | | | | | | | |
| | | | | | | 104,650,807 | |
| | | | | | | | |
| | | | Total Common Stocks & Other Equity Interests
(Cost $2,325,596,627) | | | 2,840,511,661 | |
| | | | | | | | |
| | |
| | | | | | | | |
| | | | Money Market Funds—0.0% | |
| | 950,966 | | | Invesco Premier U.S. Government Money Portfolio—Institutional Class, 2.32%(c)
(Cost $950,966) | | | 950,966 | |
| | | | | | | | |
| | |
| | | | Total Investments in Securities
(Cost $2,326,547,593)—100.0% | | | 2,841,462,627 | |
| | |
| | | | Other assets less liabilities—0.0% | | | 696,061 | |
| | | | | | | | |
| | |
| | | | Net Assets—100.0% | | $ | 2,842,158,688 | |
| | | | | | | | |
Notes to Schedule of Investments:
| (a) | Industry and/or sector classifications used in this report are generally according to the Global Industry Classification Standard, which was developed by and is the exclusive property and a service mark of MSCI Inc. and Standard & Poor’s. |
| (b) | Non-income producing security. |
| (c) | The security and the Fund are advised by wholly-owned subsidiaries of Invesco Ltd. and are therefore considered to be affiliated. The rate shown is the 7-day SEC standardized yield as of April 30, 2019. |
See accompanying Notes to Financial Statements which are an integral part of the financial statements.
Schedule of Investments(a)
Invesco S&P 500® Pure Value ETF (RPV)
April 30, 2019
| | | | | | | | |
Number
of Shares | | | | | Value | |
| | | | Common Stocks & Other
Equity Interests—99.9% | |
| | | | Communication Services—3.6% | |
| | 257,683 | | | AT&T, Inc. | | $ | 7,977,866 | |
| | 726,260 | | | CenturyLink, Inc. | | | 8,293,889 | |
| | 161,930 | | | DISH Network Corp., Class A(b) | | | 5,686,982 | |
| | 342,057 | | | News Corp., Class A | | | 4,248,348 | |
| | 109,603 | | | News Corp., Class B | | | 1,368,941 | |
| | 218,079 | | | Viacom, Inc., Class B | | | 6,304,664 | |
| | | | | | | | |
| | | | | | | 33,880,690 | |
| | | | | | | | |
| | | | Consumer Discretionary—16.6% | |
| | 110,333 | | | Best Buy Co., Inc. | | | 8,209,879 | |
| | 153,346 | | | BorgWarner, Inc. | | | 6,405,262 | |
| | 52,232 | | | Carnival Corp. | | | 2,865,448 | |
| | 205,456 | | | D.R. Horton, Inc. | | | 9,103,755 | |
| | 47,085 | | | Dollar Tree, Inc.(b) | | | 5,239,619 | |
| | 2,148,746 | | | Ford Motor Co. | | | 22,454,396 | |
| | 199,889 | | | Gap, Inc. (The) | | | 5,213,105 | |
| | 360,956 | | | General Motors Co. | | | 14,059,236 | |
| | 125,813 | | | Kohl’s Corp. | | | 8,945,304 | |
| | 302,380 | | | Lennar Corp., Class A | | | 15,732,831 | |
| | 234,283 | | | LKQ Corp.(b) | | | 7,051,918 | |
| | 139,640 | | | MGM Resorts International | | | 3,718,613 | |
| | 69,253 | | | Mohawk Industries, Inc.(b) | | | 9,435,721 | |
| | 61,799 | | | Norwegian Cruise Line Holdings Ltd.(b) | | | 3,484,846 | |
| | 305,964 | | | PulteGroup, Inc. | | | 9,625,628 | |
| | 72,892 | | | PVH Corp. | | | 9,402,339 | |
| | 99,288 | | | Target Corp. | | | 7,686,877 | |
| | 38,688 | | | Whirlpool Corp. | | | 5,370,668 | |
| | | | | | | | |
| | | | | | | 154,005,445 | |
| | | | | | | | |
| | | | Consumer Staples—8.8% | |
| | 304,889 | | | Archer-Daniels-Midland Co. | | | 13,598,049 | |
| | 1,434,277 | | | Coty, Inc., Class A(c) | | | 15,518,877 | |
| | 54,906 | | | JM Smucker Co. (The) | | | 6,733,123 | |
| | 180,512 | | | Kraft Heinz Co. (The) | | | 6,000,219 | |
| | 384,348 | | | Kroger Co. (The) | | | 9,908,492 | |
| | 149,300 | | | Molson Coors Brewing Co., Class B | | | 9,583,567 | |
| | 178,578 | | | Tyson Foods, Inc., Class A | | | 13,395,136 | |
| | 55,814 | | | Walgreens Boots Alliance, Inc. | | | 2,989,956 | |
| | 39,473 | | | Walmart, Inc. | | | 4,059,403 | |
| | | | | | | | |
| | | | | | | 81,786,822 | |
| | | | | | | | |
| | | | Energy—11.0% | |
| | 739,317 | | | Baker Hughes, a GE Co., Class A | | | 17,758,394 | |
| | 40,621 | | | Chevron Corp. | | | 4,876,957 | |
| | 57,461 | | | Helmerich & Payne, Inc. | | | 3,362,618 | |
| | 248,025 | | | Kinder Morgan, Inc. | | | 4,928,257 | |
| | 194,295 | | | Marathon Petroleum Corp. | | | 11,826,737 | |
| | 275,149 | | | National Oilwell Varco, Inc. | | | 7,192,395 | |
| | 311,517 | | | Noble Energy, Inc. | | | 8,429,650 | |
| | 131,490 | | | Phillips 66 | | | 12,395,562 | |
| | 523,719 | | | TechnipFMC PLC (United Kingdom) | | | 12,878,250 | |
| | 203,131 | | | Valero Energy Corp. | | | 18,415,857 | |
| | | | | | | | |
| | | | | | | 102,064,677 | |
| | | | | | | | |
| | | | Financials—33.9% | |
| | 38,558 | | | Affiliated Managers Group, Inc. | | | 4,276,853 | |
| | 126,153 | | | Aflac, Inc. | | | 6,355,588 | |
| | 102,417 | | | Allstate Corp. (The) | | | 10,145,428 | |
| | | | | | | | |
Number
of Shares | | | | | Value | |
| | | | Common Stocks & Other
Equity Interests (continued) | |
| | | | Financials (continued) | |
| | 177,735 | | | American International Group, Inc. | | $ | 8,454,854 | |
| | 114,598 | | | Assurant, Inc. | | | 10,886,810 | |
| | 217,058 | | | Bank of America Corp. | | | 6,637,634 | |
| | 92,713 | | | Bank of New York Mellon Corp. (The) | | | 4,604,128 | |
| | 70,771 | | | BB&T Corp. | | | 3,623,475 | |
| | 108,129 | | | Capital One Financial Corp. | | | 10,037,615 | |
| | 48,289 | | | Chubb Ltd. | | | 7,011,563 | |
| | 102,491 | | | Citigroup, Inc. | | | 7,246,114 | |
| | 294,688 | | | Citizens Financial Group, Inc. | | | 10,667,706 | |
| | 41,186 | | | Everest Re Group, Ltd. | | | 9,699,303 | |
| | 219,659 | | | Fifth Third Bancorp | | | 6,330,572 | |
| | 45,392 | | | Goldman Sachs Group, Inc. (The) | | | 9,347,121 | |
| | 188,693 | | | Hartford Financial Services Group, Inc. (The) | | | 9,870,531 | |
| | 243,133 | | | Huntington Bancshares, Inc. | | | 3,384,411 | |
| | 563,610 | | | Invesco Ltd.(d) | | | 12,382,512 | |
| | 693,931 | | | Jefferies Financial Group, Inc. | | | 14,274,161 | |
| | 255,357 | | | KeyCorp | | | 4,481,515 | |
| | 226,145 | | | Lincoln National Corp. | | | 15,088,394 | |
| | 256,168 | | | Loews Corp. | | | 13,138,857 | |
| | 367,974 | | | MetLife, Inc. | | | 16,974,641 | |
| | 184,821 | | | Morgan Stanley | | | 8,917,613 | |
| | 420,669 | | | People’s United Financial, Inc. | | | 7,273,367 | |
| | 30,395 | | | PNC Financial Services Group, Inc. (The) | | | 4,161,987 | |
| | 204,234 | | | Principal Financial Group, Inc. | | | 11,674,015 | |
| | 180,467 | | | Prudential Financial, Inc. | | | 19,077,167 | |
| | 46,606 | | | Raymond James Financial, Inc. | | | 4,267,711 | |
| | 345,744 | | | Regions Financial Corp. | | | 5,369,404 | |
| | 80,809 | | | State Street Corp. | | | 5,467,537 | |
| | 88,736 | | | SunTrust Banks, Inc. | | | 5,810,433 | |
| | 214,754 | | | Synchrony Financial | | | 7,445,521 | |
| | 43,688 | | | Travelers Cos., Inc. (The) | | | 6,280,150 | |
| | 416,513 | | | Unum Group | | | 15,377,660 | |
| | 78,717 | | | Wells Fargo & Co. | | | 3,810,690 | |
| | 96,063 | | | Zions Bancorp. N.A. | | | 4,738,788 | |
| | | | | | | | |
| | | | | | | 314,591,829 | |
| | | | | | | | |
| | | | Health Care—6.1% | |
| | 52,894 | | | Allergan PLC | | | 7,775,418 | |
| | 110,003 | | | AmerisourceBergen Corp. | | | 8,223,824 | |
| | 13,832 | | | Anthem, Inc. | | | 3,638,231 | |
| | 191,315 | | | Cardinal Health, Inc. | | | 9,318,954 | |
| | 91,474 | | | Centene Corp.(b) | | | 4,716,399 | |
| | 115,058 | | | CVS Health Corp. | | | 6,256,854 | |
| | 27,806 | | | Laboratory Corp. of America Holdings(b) | | | 4,446,736 | |
| | 77,323 | | | McKesson Corp. | | | 9,220,768 | |
| | 130,002 | | | Mylan N.V.(b) | | | 3,508,754 | |
| | | | | | | | |
| | | | | | | 57,105,938 | |
| | | | | | | | |
| | | | Industrials—7.9% | |
| | 57,646 | | | Alaska Air Group, Inc. | | | 3,568,287 | |
| | 149,934 | | | American Airlines Group, Inc. | | | 5,124,744 | |
| | 164,070 | | | Arconic, Inc. | | | 3,524,224 | |
| | 53,638 | | | Delta Air Lines, Inc. | | | 3,126,559 | |
| | 353,425 | | | Fluor Corp. | | | 14,041,575 | |
| | 118,622 | | | Jacobs Engineering Group, Inc. | | | 9,245,399 | |
| | 180,561 | | | Johnson Controls International PLC | | | 6,771,037 | |
| | 76,144 | | | PACCAR, Inc. | | | 5,457,240 | |
See accompanying Notes to Financial Statements which are an integral part of the financial statements.
Invesco S&P 500® Pure Value ETF (RPV)(continued)
April 30, 2019
| | | | | | | | |
Number
of Shares | | | | | Value | |
| | | | Common Stocks & Other
Equity Interests (continued) | |
| | | | Industrials (continued) | |
| | 342,731 | | | Quanta Services, Inc. | | $ | 13,914,879 | |
| | 59,788 | | | Textron, Inc. | | | 3,168,764 | |
| | 58,265 | | | United Continental Holdings, Inc.(b) | | | 5,177,428 | |
| | | | | | | | |
| | | | | | | 73,120,136 | |
| | | | | | | | |
| | | | Information Technology—5.9% | |
| | 143,369 | | | DXC Technology Co. | | | 9,425,078 | |
| | 797,555 | | | Hewlett Packard Enterprise Co. | | | 12,609,344 | |
| | 133,485 | | | HP, Inc. | | | 2,663,026 | |
| | 174,030 | | | Micron Technology, Inc.(b) | | | 7,319,702 | |
| | 238,097 | | | Western Digital Corp. | | | 12,171,519 | |
| | 306,829 | | | Xerox Corp. | | | 10,235,815 | |
| | | | | | | | |
| | | | | | | 54,424,484 | |
| | | | | | | | |
| | | | Materials—3.2% | |
| | 24,964 | | | Dow, Inc.(b) | | | 1,416,208 | |
| | 73,848 | | | DowDuPont, Inc. | | | 2,839,455 | |
| | 108,268 | | | International Paper Co. | | | 5,068,025 | |
| | 40,199 | | | LyondellBasell Industries N.V., Class A | | | 3,546,758 | |
| | 114,348 | | | Nucor Corp. | | | 6,525,840 | |
| | 267,502 | | | WestRock Co. | | | 10,266,727 | |
| | | | | | | | |
| | | | | | | 29,663,013 | |
| | | | | | | | |
| | | | Real Estate—0.4% | |
| | 224,758 | | | Kimco Realty Corp. | | | 3,908,542 | |
| | | | | | | | |
| |
| | | | Utilities—2.5% | |
| | 116,186 | | | CenterPoint Energy, Inc. | | | 3,601,766 | |
| | 41,897 | | | Consolidated Edison, Inc. | | | 3,609,845 | |
| | 34,036 | | | Duke Energy Corp. | | | 3,101,360 | |
| | 64,288 | | | Edison International | | | 4,099,646 | |
| | 49,180 | | | Evergy, Inc. | | | 2,843,588 | |
| | 125,316 | | | Exelon Corp. | | | 6,384,850 | |
| | | | | | | | |
| | | | | | | 23,641,055 | |
| | | | | | | | |
| | |
| | | | Total Investments in Securities
(excluding investments purchased with cash collateral from securities on loan)
(Cost $870,418,991)—99.9% | | | 928,192,631 | |
| | | | | | | | |
| | |
| | | | | | | | |
| | | | Investments Purchased with Cash Collateral from
Securities on Loan | |
| | |
| | | | | | | | |
| | | | Money Market Funds—1.6% | |
| | 10,870,812 | | | Invesco Government & Agency Portfolio—Institutional Class, 2.34%(e)(f) | | | 10,870,812 | |
| | 3,622,519 | | | Invesco Liquid Assets Portfolio—Institutional
Class, 2.48%(e)(f) | | | 3,623,606 | |
| | | | | | | | |
| | | | Total Money Market Funds
(Cost $14,494,418) | | | 14,494,418 | |
| | | | | | | | |
| | |
| | | | Total Investments in Securities
(Cost $884,913,409)—101.5% | | | 942,687,049 | |
| | |
| | | | Other assets less liabilities—(1.5)% | | | (13,803,581 | ) |
| | | | | | | | |
| | |
| | | | Net Assets—100.0% | | $ | 928,883,468 | |
| | | | | | | | |
Notes to Schedule of Investments:
| (a) | Industry and/or sector classifications used in this report are generally according to the Global Industry Classification Standard, which was developed by and is the exclusive property and a service mark of MSCI Inc. and Standard & Poor’s. |
| (b) | Non-income producing security. |
| (c) | All or a portion of this security was out on loan at April 30, 2019. |
| (d) | Affiliated company. See Note 4. |
| (e) | The security and the Fund are advised by wholly-owned subsidiaries of Invesco Ltd. and are therefore considered to be affiliated. The rate shown is the 7-day SEC standardized yield as of April 30, 2019. |
| (f) | The security has been segregated to satisfy the commitment to return the cash collateral received in securities lending transactions upon the borrower’s return of the securities loaned. See Note 2J. |
See accompanying Notes to Financial Statements which are an integral part of the financial statements.
Schedule of Investments(a)
Invesco S&P 500® Top 50 ETF (XLG)
April 30, 2019
| | | | | | | | |
Number
of Shares | | | | | Value | |
| | | | Common Stocks & Other Equity
Interests—99.9% | |
| | | | Communication Services—18.1% | |
| | 20,227 | | | Alphabet, Inc., Class A(b) | | $ | 24,251,364 | |
| | 20,764 | | | Alphabet, Inc., Class C(b) | | | 24,677,599 | |
| | 492,049 | | | AT&T, Inc. | | | 15,233,838 | |
| | 305,050 | | | Comcast Corp., Class A | | | 13,278,827 | |
| | 161,180 | | | Facebook, Inc., Class A(b) | | | 31,172,212 | |
| | 29,496 | | | Netflix, Inc.(b) | | | 10,929,448 | |
| | 279,207 | | | Verizon Communications, Inc. | | | 15,967,848 | |
| | 117,955 | | | Walt Disney Co. (The) | | | 16,156,296 | |
| | | | | | | | |
| | | | | | | 151,667,432 | |
| | | | | | | | |
| | | | Consumer Discretionary—10.1% | |
| | 27,872 | | | Amazon.com, Inc.(b) | | | 53,695,965 | |
| | 3,049 | | | Booking Holdings, Inc.(b) | | | 5,655,865 | |
| | 76,317 | | | Home Depot, Inc. (The) | | | 15,545,773 | |
| | 51,725 | | | McDonald’s Corp. | | | 10,219,308 | |
| | | | | | | | |
| | | | | | | 85,116,911 | |
| | | | | | | | |
| | | | Consumer Staples—8.2% | |
| | 126,956 | | | Altria Group, Inc. | | | 6,897,520 | |
| | 259,948 | | | Coca-Cola Co. (The) | | | 12,753,049 | |
| | 94,865 | | | PepsiCo, Inc. | | | 12,147,463 | |
| | 105,050 | | | Philip Morris International, Inc. | | | 9,093,128 | |
| | 168,996 | | | Procter & Gamble Co. (The) | | | 17,994,694 | |
| | 96,205 | | | Walmart, Inc. | | | 9,893,722 | |
| | | | | | | | |
| | | | | | | 68,779,576 | |
| | | | | | | | |
| | | | Energy—5.1% | |
| | 128,353 | | | Chevron Corp. | | | 15,410,061 | |
| | 286,236 | | | Exxon Mobil Corp. | | | 22,979,026 | |
| | 93,873 | | | Schlumberger Ltd. | | | 4,006,500 | |
| | | | | | | | |
| | | | | | | 42,395,587 | |
| | | | | | | | |
| | | | Financials—11.6% | |
| | 606,950 | | | Bank of America Corp. | | | 18,560,531 | |
| | 131,365 | | | Berkshire Hathaway, Inc., Class B(b) | | | 28,468,109 | |
| | 158,854 | | | Citigroup, Inc. | | | 11,230,978 | |
| | 221,179 | | | JPMorgan Chase & Co. | | | 25,667,823 | |
| | 276,617 | | | Wells Fargo & Co. | | | 13,391,029 | |
| | | | | | | | |
| | | | | | | 97,318,470 | |
| | | | | | | | |
| | | | Health Care—11.1% | |
| | 99,908 | | | AbbVie, Inc. | | | 7,931,696 | |
| | 42,147 | | | Amgen, Inc. | | | 7,557,800 | |
| | 179,920 | | | Johnson & Johnson | | | 25,404,704 | |
| | 90,837 | | | Medtronic PLC | | | 8,067,234 | |
| | 174,390 | | | Merck & Co., Inc. | | | 13,726,237 | |
| | 375,102 | | | Pfizer, Inc. | | | 15,232,892 | |
| | 64,826 | | | UnitedHealth Group, Inc. | | | 15,108,996 | |
| | | | | | | | |
| | | | | | | 93,029,559 | |
| | | | | | | | |
| | | | Industrials—6.2% | |
| | 39,000 | | | 3M Co. | | | 7,390,890 | |
| | 35,488 | | | Boeing Co. (The) | | | 13,403,463 | |
| | 589,599 | | | General Electric Co. | | | 5,996,222 | |
| | 49,381 | | | Honeywell International, Inc. | | | 8,574,023 | |
| | 48,961 | | | Union Pacific Corp. | | | 8,668,055 | |
| | 54,902 | | | United Technologies Corp. | | | 7,829,574 | |
| | | | | | | | |
| | | | | | | 51,862,227 | |
| | | | | | | | |
| | | | | | | | |
Number
of Shares | | | | | Value | |
| | | | Common Stocks & Other Equity
Interests (continued) | |
| | | | Information Technology—28.5% | |
| | 33,034 | | | Adobe, Inc.(b) | | $ | 9,555,084 | |
| | 302,610 | | | Apple, Inc. | | | 60,724,748 | |
| | 26,829 | | | Broadcom, Inc. | | | 8,542,354 | |
| | 297,419 | | | Cisco Systems, Inc. | | | 16,640,593 | |
| | 303,766 | | | Intel Corp. | | | 15,504,217 | |
| | 60,271 | | | International Business Machines Corp. | | | 8,454,213 | |
| | 60,981 | | | Mastercard, Inc., Class A | | | 15,503,809 | |
| | 518,301 | | | Microsoft Corp. | | | 67,690,111 | |
| | 41,044 | | | NVIDIA Corp. | | | 7,428,964 | |
| | 172,586 | | | Oracle Corp. | | | 9,549,183 | |
| | 118,251 | | | Visa, Inc., Class A | | | 19,444,012 | |
| | | | | | | | |
| | | | | | | 239,037,288 | |
| | | | | | | | |
| | | | Materials—1.0% | |
| | 50,904 | | | Dow, Inc.(b) | | | 2,887,784 | |
| | 152,716 | | | DowDuPont, Inc. | | | 5,871,930 | |
| | | | | | | | |
| | | | | | | 8,759,714 | |
| | | | | | | | |
| | | | Total Common Stocks & Other Equity Interests
(Cost $634,401,007) | | | 837,966,764 | |
| | | | | | | | |
| | |
| | | | | | | | |
| | | | Money Market Funds—0.0% | |
| | 393,949 | | | Invesco Premier U.S. Government Money Portfolio—Institutional Class, 2.32%(c)
(Cost $393,949) | | | 393,949 | |
| | | | | | | | |
| | |
| | | | Total Investments in Securities
(Cost $634,794,956)—99.9% | | | 838,360,713 | |
| | |
| | | | Other assets less liabilities—0.1% | | | 543,216 | |
| | | | | | | | |
| | |
| | | | Net Assets—100.0% | | $ | 838,903,929 | |
| | | | | | | | |
Notes to Schedule of Investments:
| (a) | Industry and/or sector classifications used in this report are generally according to the Global Industry Classification Standard, which was developed by and is the exclusive property and a service mark of MSCI Inc. and Standard & Poor’s. |
| (b) | Non-income producing security. |
| (c) | The security and the Fund are advised by wholly-owned subsidiaries of Invesco Ltd. and are therefore considered to be affiliated. The rate shown is the 7-day SEC standardized yield as of April 30, 2019. |
See accompanying Notes to Financial Statements which are an integral part of the financial statements.
Schedule of Investments(a)
Invesco S&P Midcap 400® Pure Growth ETF (RFG)
April 30, 2019
| | | | | | | | |
Number
of Shares | | | | | Value | |
| | | | Common Stocks & Other Equity
Interests—99.9% | |
| | | | Communication Services—5.4% | |
| | 86,323 | | | Live Nation Entertainment, Inc.(b) | | $ | 5,640,345 | |
| | 229,727 | | | New York Times Co. (The), Class A | | | 7,615,450 | |
| | 102,507 | | | World Wrestling Entertainment, Inc., Class A(c) | | | 8,595,212 | |
| | 119,052 | | | Yelp, Inc.(b) | | | 4,769,223 | |
| | | | | | | | |
| | | | | | | 26,620,230 | |
| | | | | | | | |
| | | | Consumer Discretionary—17.3% | |
| | 63,409 | | | Adtalem Global Education, Inc.(b) | | | 3,127,332 | |
| | 103,691 | | | Brinker International, Inc. | | | 4,434,864 | |
| | 97,750 | | | Churchill Downs, Inc. | | | 9,858,087 | |
| | 54,620 | | | Deckers Outdoor Corp.(b) | | | 8,641,430 | |
| | 20,621 | | | Domino’s Pizza, Inc. | | | 5,579,630 | |
| | 303,093 | | | Eldorado Resorts, Inc.(b) | | | 14,963,701 | |
| | 42,524 | | | Helen of Troy Ltd.(b) | | | 6,123,456 | |
| | 18,331 | | | Pool Corp. | | | 3,368,138 | |
| | 307,751 | | | Scientific Games Corp.(b) | | | 7,118,281 | |
| | 118,360 | | | Service Corp. International | | | 4,924,960 | |
| | 237,342 | | | Urban Outfitters, Inc.(b) | | | 7,056,178 | |
| | 51,722 | | | Weight Watchers International, Inc.(b) | | | 1,056,163 | |
| | 284,362 | | | Wendy’s Co. (The) | | | 5,291,977 | |
| | 72,267 | | | Wyndham Hotels & Resorts, Inc. | | | 4,026,717 | |
| | | | | | | | |
| | | | | | | 85,570,914 | |
| | | | | | | | |
| | | | Consumer Staples—2.2% | |
| | 11,966 | | | Boston Beer Co., Inc. (The), Class A(b) | | | 3,709,579 | |
| | 14,128 | | | Lancaster Colony Corp. | | | 2,100,975 | |
| | 47,446 | | | Post Holdings, Inc.(b) | | | 5,350,960 | |
| | | | | | | | |
| | | | | | | 11,161,514 | |
| | | | | | | | |
| | | | Energy—9.1% | |
| | 954,540 | | | Callon Petroleum Co.(b) | | | 7,168,595 | |
| | 806,621 | | | CNX Resources Corp.(b) | | | 7,227,324 | |
| | 444,983 | | | Ensco Rowan PLC, Class A | | | 6,216,413 | |
| | 357,808 | | | Equitrans Midstream Corp. | | | 7,453,141 | |
| | 321,471 | | | Murphy Oil Corp. | | | 8,756,870 | |
| | 1,070,312 | | | QEP Resources, Inc.(b) | | | 8,048,746 | |
| | | | | | | | |
| | | | | | | 44,871,089 | |
| | | | | | | | |
| | | | Financials—9.5% | |
| | 139,493 | | | Brown & Brown, Inc. | | | 4,428,903 | |
| | 15,524 | | | FactSet Research Systems, Inc.(c) | | | 4,282,606 | |
| | 70,904 | | | First Financial Bankshares, Inc. | | | 4,362,014 | |
| | 65,112 | | | Green Dot Corp., Class A(b) | | | 4,152,192 | |
| | 19,552 | | | LendingTree, Inc.(b) | | | 7,524,001 | |
| | 81,204 | | | Primerica, Inc. | | | 10,580,069 | |
| | 573,279 | | | SLM Corp. | | | 5,824,515 | |
| | 84,678 | | | UMB Financial Corp. | | | 5,915,605 | |
| | | | | | | | |
| | | | | | | 47,069,905 | |
| | | | | | | | |
| | | | Health Care—16.8% | |
| | 84,368 | | | Amedisys, Inc.(b) | | | 10,783,918 | |
| | 167,574 | | | Avanos Medical, Inc.(b) | | | 7,029,729 | |
| | 14,732 | | | Bio-Rad Laboratories, Inc., Class A(b) | | | 4,433,301 | |
| | 9,658 | | | Chemed Corp. | | | 3,156,041 | |
| | 72,221 | | | Encompass Health Corp. | | | 4,654,643 | |
| | 196,102 | | | Globus Medical, Inc., Class A(b) | | | 8,842,239 | |
| | 23,967 | | | Haemonetics Corp.(b) | | | 2,091,840 | |
| | 77,866 | | | Integra LifeSciences Holdings Corp.(b) | | | 4,063,827 | |
| | | | | | | | |
Number
of Shares | | | | | Value | |
| | | | Common Stocks & Other Equity
Interests (continued) | |
| | | | Health Care (continued) | |
| | 22,467 | | | Ligand Pharmaceuticals, Inc.(b) | | $ | 2,827,472 | |
| | 53,909 | | | LivaNova PLC(b) | | | 3,713,791 | |
| | 530,336 | | | Mallinckrodt PLC(b) | | | 8,198,995 | |
| | 22,641 | | | Masimo Corp.(b) | | | 2,946,726 | |
| | 51,179 | | | Molina Healthcare, Inc.(b) | | | 6,634,334 | |
| | 87,309 | | | PRA Health Sciences, Inc.(b) | | | 8,453,257 | |
| | 37,531 | | | STERIS PLC | | | 4,915,810 | |
| | | | | | | | |
| | | | | | | 82,745,923 | |
| | | | | | | | |
| | | | Industrials—8.2% | |
| | 93,399 | | | ASGN, Inc.(b) | | | 5,887,873 | |
| | 30,198 | | | Curtiss-Wright Corp. | | | 3,440,760 | |
| | 19,187 | | | IDEX Corp. | | | 3,005,835 | |
| | 46,948 | | | Insperity, Inc. | | | 5,613,103 | |
| | 111,729 | | | ITT, Inc. | | | 6,765,191 | |
| | 101,574 | | | Kennametal, Inc. | | | 4,134,062 | |
| | 16,775 | | | Lennox International, Inc. | | | 4,553,574 | |
| | 24,786 | | | MSA Safety, Inc. | | | 2,724,229 | |
| | 39,260 | | | Woodward, Inc. | | | 4,275,414 | |
| | | | | | | | |
| | | | | | | 40,400,041 | |
| | | | | | | | |
| | | | Information Technology—18.1% | |
| | 88,727 | | | ACI Worldwide, Inc.(b) | | | 3,151,583 | |
| | 189,698 | | | Ciena Corp.(b) | | | 7,276,815 | |
| | 108,011 | | | CommVault Systems, Inc.(b) | | | 5,681,379 | |
| | 295,939 | | | Cypress Semiconductor Corp. | | | 5,084,232 | |
| | 23,921 | | | Fair Isaac Corp.(b) | | | 6,691,900 | |
| | 71,286 | | | j2 Global, Inc. | | | 6,246,079 | |
| | 62,109 | | | Leidos Holdings, Inc. | | | 4,563,769 | |
| | 146,072 | | | LiveRamp Holdings, Inc.(b) | | | 8,520,380 | |
| | 91,707 | | | MAXIMUS, Inc. | | | 6,754,221 | |
| | 52,283 | | | PTC, Inc.(b) | | | 4,730,043 | |
| | 198,504 | | | Sabre Corp. | | | 4,120,943 | |
| | 136,803 | | | Semtech Corp.(b) | | | 7,369,578 | |
| | 30,486 | | | Silicon Laboratories, Inc.(b) | | | 3,282,123 | |
| | 76,784 | | | Trimble, Inc.(b) | | | 3,134,323 | |
| | 10,999 | | | Ultimate Software Group, Inc. (The)(b) | | | 3,636,819 | |
| | 17,871 | | | WEX, Inc.(b) | | | 3,758,271 | |
| | 24,361 | | | Zebra Technologies Corp., Class A(b) | | | 5,143,581 | |
| | | | | | | | |
| | | | | | | 89,146,039 | |
| | | | | | | | |
| | | | Materials—4.3% | |
| | 394,238 | | | Allegheny Technologies, Inc.(b) | | | 9,824,411 | |
| | 206,123 | | | Chemours Co. (The) | | | 7,422,489 | |
| | 66,598 | | | RPM International, Inc. | | | 4,039,169 | |
| | | | | | | | |
| | | | | | | 21,286,069 | |
| | | | | | | | |
| | | | Real Estate—6.5% | |
| | 139,465 | | | American Campus Communities, Inc. | | | 6,582,748 | |
| | 96,625 | | | CyrusOne, Inc. | | | 5,381,046 | |
| | 30,596 | | | Life Storage, Inc. | | | 2,915,493 | |
| | 436,429 | | | Medical Properties Trust, Inc. | | | 7,620,051 | |
| | 87,113 | | | National Retail Properties, Inc. | | | 4,583,886 | |
| | 141,698 | | | Omega Healthcare Investors, Inc.(c) | | | 5,014,692 | |
| | | | | | | | |
| | | | | | | 32,097,916 | |
| | | | | | | | |
| | | | Utilities—2.5% | |
| | 69,310 | | | Black Hills Corp. | | | 5,042,996 | |
See accompanying Notes to Financial Statements which are an integral part of the financial statements.
Invesco S&P Midcap 400® Pure Growth ETF (RFG)(continued)
April 30, 2019
| | | | | | | | |
Number
of Shares | | | | | Value | |
| | | | Common Stocks & Other Equity
Interests (continued) | |
| | | | Utilities (continued) | |
| | 68,599 | | | National Fuel Gas Co. | | $ | 4,061,747 | |
| | 57,209 | | | UGI Corp. | | | 3,118,462 | |
| | | | | | | | |
| | | | | | | 12,223,205 | |
| | | | | | | | |
| | | | Total Common Stocks & Other Equity Interests
(Cost $421,393,303) | | | 493,192,845 | |
| | | | | | | | |
| | |
| | | | | | | | |
| | | | Money Market Funds—0.1% | |
| | 374,156 | | | Invesco Premier U.S. Government Money Portfolio—Institutional Class, 2.32%(d)
(Cost $374,156) | | | 374,156 | |
| | | | | | | | |
| | |
| | | | Total Investments in Securities
(excluding investments purchased with cash collateral from securities on loan)
(Cost $421,767,459)—100.0% | | | 493,567,001 | |
| | | | | | | | |
| | |
| | | | | | | | |
| | | | Investments Purchased with Cash
Collateral from Securities on Loan | |
| | |
| | | | | | | | |
| | | | Money Market Funds—2.0% | |
| | 7,839,559 | | | Invesco Government & Agency Portfolio—Institutional Class, 2.34%(d)(e) | | | 7,839,559 | |
| | 2,111,013 | | | Invesco Liquid Assets Portfolio—Institutional Class, 2.48%(d)(e) | | | 2,111,646 | |
| | | | | | | | |
| | | | Total Money Market Funds
(Cost $9,951,205) | | | 9,951,205 | |
| | | | | | | | |
| | |
| | | | Total Investments in Securities
(Cost $431,718,664)—102.0% | | | 503,518,206 | |
| | |
| | | | Other assets less liabilities—(2.0)% | | | (9,955,401 | ) |
| | | | | | | | |
| | |
| | | | Net Assets—100.0% | | $ | 493,562,805 | |
| | | | | | | | |
Notes to Schedule of Investments:
| (a) | Industry and/or sector classifications used in this report are generally according to the Global Industry Classification Standard, which was developed by and is the exclusive property and a service mark of MSCI Inc. and Standard & Poor’s. |
| (b) | Non-income producing security. |
| (c) | All or a portion of this security was out on loan at April 30, 2019. |
| (d) | The security and the Fund are advised by wholly-owned subsidiaries of Invesco Ltd. and are therefore considered to be affiliated. The rate shown is the 7-day SEC standardized yield as of April 30, 2019. |
| (e) | The security has been segregated to satisfy the commitment to return the cash collateral received in securities lending transactions upon the borrower’s return of the securities loaned. See Note 2J. |
See accompanying Notes to Financial Statements which are an integral part of the financial statements.
Schedule of Investments(a)
Invesco S&P Midcap 400® Pure Value ETF (RFV)
April 30, 2019
| | | | | | | | |
Number
of Shares | | | | | Value | |
| | | | Common Stocks & Other Equity
Interests—100.0% | |
| | | | Communication Services—1.2% | |
| | 53,098 | | | Telephone & Data Systems, Inc. | | $ | 1,692,764 | |
| | | | | | | | |
| | | | Consumer Discretionary—25.0% | |
| | 45,662 | | | Adient PLC | | | 1,054,792 | |
| | 71,717 | | | AutoNation, Inc.(b) | | | 3,007,094 | |
| | 254,266 | | | Bed Bath & Beyond, Inc.(c) | | | 4,248,785 | |
| | 120,281 | | | Caesars Entertainment Corp.(b) | | | 1,125,830 | |
| | 152,467 | | | Dana, Inc. | | | 2,973,107 | |
| | 81,803 | | | Delphi Technologies PLC(b) | | | 1,810,300 | |
| | 44,651 | | | Dick’s Sporting Goods, Inc. | | | 1,652,087 | |
| | 40,589 | | | Dillard’s, Inc., Class A(c) | | | 2,778,317 | |
| | 167,020 | | | Goodyear Tire & Rubber Co. (The) | | | 3,208,454 | |
| | 1,531 | | | Graham Holdings Co., Class B | | | 1,138,191 | |
| | 130,028 | | | KB Home | | | 3,369,026 | |
| | 10,989 | | | Marriott Vacations Worldwide Corp. | | | 1,160,768 | |
| | 19,530 | | | Murphy USA, Inc.(b) | | | 1,669,229 | |
| | 18,376 | | | Signet Jewelers Ltd. | | | 425,956 | |
| | 25,397 | | | Thor Industries, Inc. | | | 1,672,900 | |
| | 52,486 | | | Toll Brothers, Inc. | | | 1,999,717 | |
| | 186,859 | | | TRI Pointe Group, Inc.(b) | | | 2,438,510 | |
| | | | | | | | |
| | | | | | | 35,733,063 | |
| | | | | | | | |
| | | | Consumer Staples—2.5% | |
| | 4,103 | | | Casey’s General Stores, Inc. | | | 543,032 | |
| | 41,504 | | | Hain Celestial Group, Inc. (The)(b) | | | 905,617 | |
| | 7,887 | | | Sanderson Farms, Inc. | | | 1,195,906 | |
| | 14,078 | | | TreeHouse Foods, Inc.(b) | | | 942,945 | |
| | | | | | | | |
| | | | | | | 3,587,500 | |
| | | | | | | | |
| | | | Energy—9.1% | |
| | 49,670 | | | EQT Corp. | | | 1,015,752 | |
| | 395,984 | | | McDermott International, Inc.(b) | | | 3,203,511 | |
| | 145,804 | | | Oasis Petroleum, Inc.(b) | | | 889,404 | |
| | 66,611 | | | Oceaneering International, Inc.(b) | | | 1,278,931 | |
| | 112,653 | | | Patterson-UTI Energy, Inc. | | | 1,530,954 | |
| | 114,233 | | | Range Resources Corp. | | | 1,032,666 | |
| | 71,275 | | | SM Energy Co. | | | 1,135,411 | |
| | 94,182 | | | World Fuel Services Corp. | | | 2,905,515 | |
| | | | | | | | |
| | | | | | | 12,992,144 | |
| | | | | | | | |
| | | | Financials—16.4% | |
| | 1,785 | | | Alleghany Corp.(b) | | | 1,172,531 | |
| | 32,273 | | | Associated Banc-Corp. | | | 732,274 | |
| | 44,395 | | | Bank OZK | | | 1,449,497 | |
| | 59,790 | | | Brighthouse Financial, Inc.(b) | | | 2,498,624 | |
| | 68,452 | | | CNO Financial Group, Inc. | | | 1,132,881 | |
| | 20,361 | | | First American Financial Corp. | | | 1,161,799 | |
| | 38,426 | | | First Horizon National Corp. | | | 579,848 | |
| | 16,357 | | | Hancock Whitney Corp. | | | 715,455 | |
| | 60,853 | | | Janus Henderson Group PLC (United Kingdom) | | | 1,525,585 | |
| | 72,986 | | | Legg Mason, Inc. | | | 2,441,382 | |
| | 131,879 | | | Navient Corp. | | | 1,781,685 | |
| | 111,655 | | | New York Community Bancorp, Inc. | | | 1,298,548 | |
| | 49,121 | | | Old Republic International Corp. | | | 1,098,345 | |
| | 21,718 | | | PacWest Bancorp | | | 858,947 | |
| | 9,821 | | | Pinnacle Financial Partners, Inc. | | | 570,305 | |
| | 11,033 | | | Reinsurance Group of America, Inc. | | | 1,671,610 | |
| | 22,074 | | | Stifel Financial Corp. | | | 1,317,155 | |
| | | | | | | | |
Number
of Shares | | | | | Value | |
| | | | Common Stocks & Other Equity
Interests (continued) | |
| | | | Financials (continued) | |
| | 40,039 | | | Umpqua Holdings Corp. | | $ | 695,077 | |
| | 18,841 | | | Washington Federal, Inc. | | | 624,391 | |
| | | | | | | | |
| | | | | | | 23,325,939 | |
| | | | | | | | |
| | | | Health Care—2.4% | |
| | 37,671 | | | Acadia Healthcare Co., Inc.(b)(c) | | | 1,206,226 | |
| | 28,221 | | | MEDNAX, Inc.(b) | | | 789,341 | |
| | 68,061 | | | Patterson Cos., Inc. | | | 1,486,452 | |
| | | | | | | | |
| | | | | | | 3,482,019 | |
| | | | | | | | |
| | | | Industrials—18.3% | |
| | 75,201 | | | AECOM(b) | | | 2,549,314 | |
| | 22,147 | | | AGCO Corp. | | | 1,567,565 | |
| | 55,487 | | | Avis Budget Group, Inc.(b) | | | 1,972,563 | |
| | 55,074 | | | Colfax Corp.(b) | | | 1,661,582 | |
| | 12,813 | | | EMCOR Group, Inc. | | | 1,078,086 | |
| | 17,676 | | | Granite Construction, Inc. | | | 793,476 | |
| | 64,738 | | | JetBlue Airways Corp.(b) | | | 1,200,890 | |
| | 40,600 | | | Knight-Swift Transportation Holdings, Inc. | | | 1,354,010 | |
| | 27,452 | | | ManpowerGroup, Inc. | | | 2,636,490 | |
| | 24,974 | | | MasTec, Inc.(b) | | | 1,264,933 | |
| | 12,373 | | | Oshkosh Corp. | | | 1,021,886 | |
| | 77,152 | | | Resideo Technologies, Inc.(b) | | | 1,751,350 | |
| | 52,198 | | | Ryder System, Inc. | | | 3,288,474 | |
| | 27,278 | | | Terex Corp. | | | 909,176 | |
| | 15,082 | | | Timken Co. (The) | | | 723,182 | |
| | 81,020 | | | Trinity Industries, Inc. | | | 1,746,791 | |
| | 17,618 | | | Werner Enterprises, Inc. | | | 590,203 | |
| | | | | | | | |
| | | | | | | 26,109,971 | |
| | | | | | | | |
| | | | Information Technology—11.2% | |
| | 32,445 | | | Arrow Electronics, Inc.(b) | | | 2,741,927 | |
| | 53,466 | | | Avnet, Inc. | | | 2,598,982 | |
| | 13,206 | | | Belden, Inc. | | | 733,594 | |
| | 3,746 | | | CACI International, Inc., Class A(b) | | | 730,245 | |
| | 65,925 | | | Jabil, Inc. | | | 1,991,594 | |
| | 21,760 | | | NetScout Systems, Inc.(b) | | | 639,744 | |
| | 27,277 | | | Perspecta, Inc. | | | 629,553 | |
| | 27,437 | | | SYNNEX Corp. | | | 2,959,904 | |
| | 27,513 | | | Tech Data Corp. | | | 2,933,161 | |
| | | | | | | | |
| | | | | | | 15,958,704 | |
| | | | | | | | |
| | | | Materials—10.3% | |
| | 25,886 | | | Carpenter Technology Corp. | | | 1,285,758 | |
| | 79,566 | | | Commercial Metals Co. | | | 1,375,696 | |
| | 32,420 | | | Domtar Corp. | | | 1,585,338 | |
| | 14,868 | | | Minerals Technologies, Inc. | | | 933,264 | |
| | 85,680 | | | Olin Corp. | | | 1,858,399 | |
| | 55,440 | | | Owens-Illinois, Inc. | | | 1,095,494 | |
| | 24,976 | | | Reliance Steel & Aluminum Co. | | | 2,296,793 | |
| | 24,269 | | | Silgan Holdings, Inc. | | | 726,614 | |
| | 24,768 | | | Steel Dynamics, Inc. | | | 784,650 | |
| | 133,826 | | | United States Steel Corp. | | | 2,087,686 | |
| | 15,945 | | | Worthington Industries, Inc. | | | 639,873 | |
| | | | | | | | |
| | | | | | | 14,669,565 | |
| | | | | | | | |
| | | | Real Estate—3.6% | |
| | 42,546 | | | Alexander & Baldwin, Inc. REIT | | | 1,004,936 | |
| | 4,920 | | | Jones Lang LaSalle, Inc. | | | 760,484 | |
See accompanying Notes to Financial Statements which are an integral part of the financial statements.
Invesco S&P Midcap 400® Pure Value ETF (RFV)(continued)
April 30, 2019
| | | | | | | | |
Number
of Shares | | | | | Value | |
| | | | Common Stocks & Other Equity
Interests (continued) | |
| | | | Real Estate (continued) | |
| | 148,242 | | | Realogy Holdings Corp.(c) | | $ | 1,930,111 | |
| | 44,567 | | | Sabra Health Care REIT, Inc. | | | 871,731 | |
| | 73,236 | | | Senior Housing Properties Trust | | | 588,085 | |
| | | | | | | | |
| | | | | | | 5,155,347 | |
| | | | | | | | |
| | | | Total Common Stocks & Other Equity Interests
(Cost $124,091,519) | | | 142,707,016 | |
| | | | | | | | |
| | |
| | | | | | | | |
| | | | Money Market Funds—0.1% | |
| | 153,691 | | | Invesco Premier U.S. Government Money Portfolio—Institutional Class, 2.32%(d)
(Cost $153,691) | | | 153,691 | |
| | | | | | | | |
| | | | Total Investments in Securities
(excluding investments purchased with cash collateral from securities on loan)
(Cost $124,245,210)—100.1% | | | 142,860,707 | |
| | | | | | | | |
| | |
| | | | | | | | |
| | | | Investments Purchased with Cash
Collateral from Securities on Loan | |
| | |
| | | | | | | | |
| | | | Money Market Funds—5.5% | |
| | 5,715,019 | | | Invesco Government & Agency Portfolio—Institutional Class, 2.34%(d)(e) | | | 5,715,019 | |
| | 2,205,880 | | | Invesco Liquid Assets Portfolio—Institutional Class, 2.48%(d)(e) | | | 2,206,542 | |
| | | | | | | | |
| | | | Total Money Market Funds
(Cost $7,921,561) | | | 7,921,561 | |
| | | | | | | | |
| | |
| | | | Total Investments in Securities
(Cost $132,166,771)—105.6% | | | 150,782,268 | |
| | |
| | | | Other assets less liabilities—(5.6)% | | | (8,045,463 | ) |
| | | | | | | | |
| | |
| | | | Net Assets—100.0% | | $ | 142,736,805 | |
| | | | | | | | |
Abbreviations:
REIT—Real Estate Investment Trust
Notes to Schedule of Investments:
| (a) | Industry and/or sector classifications used in this report are generally according to the Global Industry Classification Standard, which was developed by and is the exclusive property and a service mark of MSCI Inc. and Standard & Poor’s. |
| (b) | Non-income producing security. |
| (c) | All or a portion of this security was out on loan at April 30, 2019. |
| (d) | The security and the Fund are advised by wholly-owned subsidiaries of Invesco Ltd. and are therefore considered to be affiliated. The rate shown is the 7-day SEC standardized yield as of April 30, 2019. |
| (e) | The security has been segregated to satisfy the commitment to return the cash collateral received in securities lending transactions upon the borrower’s return of the securities loaned. See Note 2J. |
See accompanying Notes to Financial Statements which are an integral part of the financial statements.
Schedule of Investments(a)
Invesco S&P SmallCap 600® Pure Growth ETF (RZG)
April 30, 2019
| | | | | | | | |
Number
of Shares | | | | | Value | |
| | | | Common Stocks & Other Equity
Interests—100.0% | |
| | | | Communication Services—4.0% | |
| | 14,265 | | | ATN International, Inc. | | $ | 870,878 | |
| | 97,867 | | | Care.com, Inc.(b) | | | 1,639,272 | |
| | 71,495 | | | E.W. Scripps Co. (The), Class A | | | 1,629,371 | |
| | 104,407 | | | Iridium Communications, Inc.(b) | | | 2,867,016 | |
| | 42,015 | | | Marcus Corp. (The) | | | 1,580,605 | |
| | 69,555 | | | QuinStreet, Inc.(b) | | | 992,550 | |
| | | | | | | | |
| | | | | | | 9,579,692 | |
| | | | | | | | |
| | | | Consumer Discretionary—16.6% | |
| | 35,117 | | | American Public Education, Inc.(b) | | | 1,123,744 | |
| | 1,296,772 | | | Ascena Retail Group, Inc.(b) | | | 1,543,159 | |
| | 41,948 | | | BJ’s Restaurants, Inc. | | | 2,093,625 | |
| | 123,057 | | | Career Education Corp.(b) | | | 2,233,484 | |
| | 8,761 | | | Cavco Industries, Inc.(b) | | | 1,093,110 | |
| | 15,116 | | | Children’s Place, Inc. (The) | | | 1,705,387 | |
| | 43,114 | | | Crocs, Inc.(b) | | | 1,200,725 | |
| | 20,982 | | | Dave & Buster’s Entertainment, Inc. | | | 1,192,617 | |
| | 10,204 | | | Dine Brands Global, Inc. | | | 904,687 | |
| | 15,022 | | | Dorman Products, Inc.(b) | | | 1,316,979 | |
| | 78,782 | | | El Pollo Loco Holdings, Inc.(b) | | | 1,006,834 | |
| | 111,748 | | | Guess?, Inc. | | | 2,276,307 | |
| | 26,617 | | | iRobot Corp.(b)(c) | | | 2,755,924 | |
| | 206,582 | | | Liquidity Services, Inc.(b) | | | 1,402,692 | |
| | 14,449 | | | Monro, Inc. | | | 1,211,260 | |
| | 102,750 | | | Regis Corp.(b) | | | 1,923,480 | |
| | 54,389 | | | Ruth’s Hospitality Group, Inc. | | | 1,413,026 | |
| | 56,384 | | | Shake Shack, Inc., Class A(b) | | | 3,456,339 | |
| | 62,773 | | | Shoe Carnival, Inc.(c) | | | 2,238,485 | |
| | 48,330 | | | Sleep Number Corp.(b) | | | 1,681,884 | |
| | 11,331 | | | Stamps.com, Inc.(b) | | | 972,200 | |
| | 6,050 | | | Strategic Education, Inc. | | | 867,267 | |
| | 152,748 | | | Tailored Brands, Inc.(c) | | | 1,244,896 | |
| | 33,269 | | | Wingstop, Inc. | | | 2,504,157 | |
| | | | | | | | |
| | | | | | | 39,362,268 | |
| | | | | | | | |
| | | | Consumer Staples—4.8% | |
| | 1,479,695 | | | Avon Products, Inc. (United Kingdom)(b) | | | 4,705,430 | |
| | 27,168 | | | Inter Parfums, Inc. | | | 1,969,408 | |
| | 20,615 | | | Medifast, Inc. | | | 3,024,015 | |
| | 10,187 | | | WD-40 Co. | | | 1,713,963 | |
| | | | | | | | |
| | | | | | | 11,412,816 | |
| | | | | | | | |
| | | | Energy—10.1% | |
| | 150,240 | | | Archrock, Inc. | | | 1,518,925 | |
| | 95,692 | | | Carrizo Oil & Gas, Inc.(b) | | | 1,226,771 | |
| | 1,212,606 | | | Denbury Resources, Inc.(b) | | | 2,704,111 | |
| | 38,689 | | | DMC Global, Inc. | | | 2,681,148 | |
| | 847,407 | | | HighPoint Resources Corp.(b) | | | 2,321,895 | |
| | 89,851 | | | KLX Energy Services Holdings, Inc.(b) | | | 2,520,321 | |
| | 47,730 | | | Penn Virginia Corp.(b) | | | 2,143,077 | |
| | 1,127,651 | | | Pioneer Energy Services Corp.(b) | | | 1,962,113 | |
| | 137,646 | | | ProPetro Holding Corp.(b) | | | 3,046,106 | |
| | 159,882 | | | Renewable Energy Group, Inc.(b) | | | 3,856,354 | |
| | | | | | | | |
| | | | | | | 23,980,821 | |
| | | | | | | | |
| | | | Financials—10.6% | |
| | 67,020 | | | Blucora, Inc.(b) | | | 2,345,700 | |
| | 13,277 | | | City Holding Co. | | | 1,053,928 | |
| | | | | | | | |
Number
of Shares | | | | | Value | |
| | | | Common Stocks & Other Equity
Interests (continued) | |
| | | | Financials (continued) | |
| | 18,383 | | | Community Bank System, Inc. | | $ | 1,221,734 | |
| | 24,927 | | | eHealth, Inc.(b) | | | 1,514,066 | |
| | 14,504 | | | FirstCash, Inc. | | | 1,416,751 | |
| | 18,081 | | | Glacier Bancorp, Inc. | | | 770,070 | |
| | 32,337 | | | HCI Group, Inc. | | | 1,378,203 | |
| | 18,133 | | | Independent Bank Corp. | | | 1,454,811 | |
| | 31,227 | | | LegacyTexas Financial Group, Inc. | | | 1,251,578 | |
| | 28,368 | | | Navigators Group, Inc. (The) | | | 1,984,058 | |
| | 89,574 | | | Old National Bancorp. | | | 1,529,924 | |
| | 106,244 | | | Redwood Trust, Inc. | | | 1,738,152 | |
| | 22,450 | | | RLI Corp. | | | 1,825,858 | |
| | 33,405 | | | Seacoast Banking Corp. of Florida(b) | | | 947,366 | |
| | 48,043 | | | Triumph Bancorp, Inc.(b) | | | 1,489,813 | |
| | 33,205 | | | United Fire Group, Inc. | | | 1,448,070 | |
| | 36,936 | | | Universal Insurance Holdings, Inc. | | | 1,100,323 | |
| | 11,077 | | | Westamerica Bancorp | | | 711,365 | |
| | | | | | | | |
| | | | | | | 25,181,770 | |
| | | | | | | | |
| | | | Health Care—20.1% | |
| | 10,568 | | | Addus HomeCare Corp.(b) | | | 717,567 | |
| | 14,430 | | | AMN Healthcare Services, Inc.(b) | | | 751,226 | |
| | 39,929 | | | Amphastar Pharmaceuticals, Inc.(b) | | | 862,067 | |
| | 92,886 | | | AngioDynamics, Inc.(b) | | | 1,907,878 | |
| | 10,282 | | | BioTelemetry, Inc.(b) | | | 559,341 | |
| | 64,279 | | | Cardiovascular Systems, Inc.(b) | | | 2,284,476 | |
| | 35,337 | | | CONMED Corp. | | | 2,828,020 | |
| | 80,636 | | | Corcept Therapeutics, Inc.(b) | | | 998,274 | |
| | 13,271 | | | CorVel Corp.(b) | | | 952,858 | |
| | 23,754 | | | CryoLife, Inc.(b) | | | 728,298 | |
| | 30,553 | | | Eagle Pharmaceuticals, Inc.(b) | | | 1,570,730 | |
| | 137,075 | | | Endo International PLC(b) | | | 1,028,063 | |
| | 24,620 | | | Ensign Group, Inc. (The) | | | 1,268,422 | |
| | 15,075 | | | Heska Corp.(b) | | | 1,170,725 | |
| | 37,655 | | | HMS Holdings Corp.(b) | | | 1,145,842 | |
| | 127,443 | | | Innoviva, Inc.(b) | | | 1,788,025 | |
| | 17,559 | | | Integer Holdings Corp.(b) | | | 1,213,151 | |
| | 91,505 | | | Luminex Corp. | | | 2,087,229 | |
| | 51,004 | | | Medpace Holdings, Inc.(b) | | | 2,864,895 | |
| | 37,554 | | | Meridian Bioscience, Inc. | | | 432,247 | |
| | 14,523 | | | Merit Medical Systems, Inc.(b) | | | 815,902 | |
| | 25,481 | | | Neogen Corp.(b) | | | 1,545,677 | |
| | 190,676 | | | NeoGenomics, Inc.(b) | | | 3,971,781 | |
| | 41,539 | | | NextGen Healthcare, Inc.(b) | | | 780,518 | |
| | 17,156 | | | Omnicell, Inc.(b) | | | 1,378,656 | |
| | 17,388 | | | REGENXBIO, Inc.(b) | | | 876,355 | |
| | 23,815 | | | Repligen Corp.(b) | | | 1,604,655 | |
| | 53,233 | | | Spectrum Pharmaceuticals, Inc.(b) | | | 498,793 | |
| | 65,549 | | | Supernus Pharmaceuticals, Inc.(b) | | | 2,407,615 | |
| | 15,917 | | | SurModics, Inc.(b) | | | 691,434 | |
| | 40,340 | | | Tabula Rasa HealthCare, Inc.(b)(c) | | | 2,148,508 | |
| | 51,679 | | | Tactile Systems Technology, Inc.(b) | | | 2,571,547 | |
| | 26,783 | | | Tivity Health, Inc.(b) | | | 579,048 | |
| | 31,487 | | | Vanda Pharmaceuticals, Inc.(b) | | | 512,923 | |
| | | | | | | | |
| | | | | | | 47,542,746 | |
| | | | | | | | |
| | | | Industrials—12.0% | |
| | 18,471 | | | Aerojet Rocketdyne Holdings, Inc.(b)(c) | | | 625,428 | |
| | 23,309 | | | Aerovironment, Inc.(b) | | | 1,598,065 | |
See accompanying Notes to Financial Statements which are an integral part of the financial statements.
Invesco S&P SmallCap 600® Pure Growth ETF (RZG)(continued)
April 30, 2019
| | | | | | | | |
Number
of Shares | | | | | Value | |
| | | | Common Stocks & Other Equity
Interests (continued) | |
| | | | Industrials (continued) | |
| | 13,163 | | | Albany International Corp., Class A | | $ | 973,667 | |
| | 10,352 | | | Allegiant Travel Co. | | | 1,520,502 | |
| | 36,777 | | | Axon Enterprise, Inc.(b) | | | 2,335,339 | |
| | 58,200 | | | DXP Enterprises, Inc.(b) | | | 2,496,198 | |
| | 15,081 | | | ESCO Technologies, Inc. | | | 1,131,075 | |
| | 19,741 | | | Exponent, Inc. | | | 1,117,735 | |
| | 14,849 | | | Forrester Research, Inc. | | | 755,220 | |
| | 33,252 | | | Franklin Electric Co., Inc. | | | 1,624,693 | |
| | 66,020 | | | Harsco Corp.(b) | | | 1,494,693 | |
| | 51,452 | | | Matson, Inc. | | | 2,038,014 | |
| | 33,493 | | | Mobile Mini, Inc. | | | 1,206,418 | |
| | 8,168 | | | National Presto Industries, Inc. | | | 869,892 | |
| | 12,030 | | | Proto Labs, Inc.(b) | | | 1,320,774 | |
| | 21,662 | | | Raven Industries, Inc. | | | 842,868 | |
| | 61,196 | | | SPX Corp.(b) | | | 2,233,654 | |
| | 6,375 | | | UniFirst Corp. | | | 1,008,079 | |
| | 12,026 | | | US Ecology, Inc. | | | 733,706 | |
| | 64,096 | | | Vicor Corp.(b) | | | 2,404,241 | |
| | | | | | | | |
| | | | | | | 28,330,261 | |
| | | | | | | | |
| | | | Information Technology—12.0% | |
| | 107,240 | | | 3D Systems Corp.(b)(c) | | | 1,141,036 | |
| | 45,670 | | | 8x8, Inc.(b) | | | 1,092,426 | |
| | 52,186 | | | Agilysys, Inc.(b) | | | 998,318 | |
| | 43,888 | | | Bottomline Technologies (DE), Inc.(b) | | | 2,219,416 | |
| | 33,384 | | | Brooks Automation, Inc. | | | 1,252,234 | |
| | 14,432 | | | Cabot Microelectronics Corp. | | | 1,822,040 | |
| | 46,685 | | | Cardtronics PLC, Class A(b) | | | 1,669,455 | |
| | 41,812 | | | CTS Corp. | | | 1,252,269 | |
| | 179,327 | | | Harmonic, Inc.(b)(c) | | | 1,014,991 | |
| | 171,233 | | | KEMET Corp. | | | 3,059,934 | |
| | 91,435 | | | Nanometrics, Inc.(b) | | | 2,723,849 | |
| | 100,539 | | | Perficient, Inc.(b) | | | 2,959,868 | |
| | 24,759 | | | SPS Commerce, Inc.(b) | | | 2,568,499 | |
| | 205,889 | | | Unisys Corp.(b) | | | 2,308,016 | |
| | 65,057 | | | Viavi Solutions, Inc.(b) | | | 865,258 | |
| | 28,023 | | | Virtusa Corp.(b) | | | 1,556,678 | |
| | | | | | | | |
| | | | | | | 28,504,287 | |
| | | | | | | | |
| | | | Materials—3.5% | |
| | 33,263 | | | Hawkins, Inc. | | | 1,227,737 | |
| | 20,754 | | | Innospec, Inc. | | | 1,760,354 | |
| | 23,558 | | | Kaiser Aluminum Corp. | | | 2,318,107 | |
| | 3,398 | | | Quaker Chemical Corp. | | | 760,541 | |
| | 246,888 | | | SunCoke Energy, Inc.(b) | | | 2,125,706 | |
| | | | | | | | |
| | | | | | | 8,192,445 | |
| | | | | | | | |
| | | | Real Estate—6.3% | |
| | 34,274 | | | Agree Realty Corp. | | | 2,243,919 | |
| | 89,931 | | | Armada Hoffler Properties, Inc. | | | 1,452,386 | |
| | 20,469 | | | Community Healthcare Trust, Inc. | | | 746,709 | |
| | 62,297 | | | Easterly Government Properties, Inc. | | | 1,121,346 | |
| | 71,723 | | | Four Corners Property Trust, Inc. | | | 2,039,802 | |
| | 37,445 | | | Innovative Industrial Properties, Inc.(c) | | | 3,188,067 | |
| | 29,226 | | | Marcus & Millichap, Inc.(b) | | | 1,259,641 | |
| | 23,812 | | | National Storage Affiliates Trust | | | 696,739 | |
| | | | | | | | |
Number
of Shares | | | | | Value | |
| | | | Common Stocks & Other Equity
Interests (continued) | |
| | | | Real Estate (continued) | |
| | 48,809 | | | Urstadt Biddle Properties, Inc., Class A | | $ | 1,070,381 | |
| | 232,932 | | | Washington Prime Group, Inc.(c) | | | 1,036,547 | |
| | | | | | | | |
| | | | | | | 14,855,537 | |
| | | | | | | | |
| | | | Total Common Stocks & Other Equity Interests
(Cost $215,459,713) | | | 236,942,643 | |
| | | | | | | | |
| | |
| | | | | | | | |
| | | | Money Market Funds—0.0% | |
| | 42,372 | | | Invesco Premier U.S. Government Money Portfolio—Institutional Class, 2.32%(d)
(Cost $42,372) | | | 42,372 | |
| | | | | | | | |
| | | | Total Investments in Securities
(excluding investments purchased with cash collateral from securities on loan)
(Cost $215,502,085)—100.0% | | | 236,985,015 | |
| | | | | | | | |
| | |
| | | | | | | | |
| | | | Investments Purchased with Cash
Collateral from Securities on Loan | |
| | |
| | | | | | | | |
| | | | Money Market Funds—4.7% | |
| | 8,258,249 | | | Invesco Government & Agency Portfolio—Institutional Class, 2.34%(d)(e) | | | 8,258,249 | |
| | 2,751,926 | | | Invesco Liquid Assets Portfolio—Institutional Class, 2.48%(d)(e) | | | 2,752,752 | |
| | | | | | | | |
| | | | Total Money Market Funds
(Cost $11,011,001) | | | 11,011,001 | |
| | | | | | | | |
| | |
| | | | Total Investments in Securities
(Cost $226,513,086)—104.7% | | | 247,996,016 | |
| | |
| | | | Other assets less liabilities—(4.7)% | | | (11,042,508 | ) |
| | | | | | | | |
| | |
| | | | Net Assets—100.0% | | $ | 236,953,508 | |
| | | | | | | | |
Notes to Schedule of Investments:
| (a) | Industry and/or sector classifications used in this report are generally according to the Global Industry Classification Standard, which was developed by and is the exclusive property and a service mark of MSCI Inc. and Standard & Poor’s. |
| (b) | Non-income producing security. |
| (c) | All or a portion of this security was out on loan at April 30, 2019. |
| (d) | The security and the Fund are advised by wholly-owned subsidiaries of Invesco Ltd. and are therefore considered to be affiliated. The rate shown is the 7-day SEC standardized yield as of April 30, 2019. |
| (e) | The security has been segregated to satisfy the commitment to return the cash collateral received in securities lending transactions upon the borrower’s return of the securities loaned. See Note 2J. |
See accompanying Notes to Financial Statements which are an integral part of the financial statements.
Schedule of Investments(a)
Invesco S&P SmallCap 600® Pure Value ETF (RZV)
April 30, 2019
| | | | | | | | |
Number
of Shares | | | | | Value | |
| | | | Common Stocks & Other Equity
Interests—100.0% | |
| | | | Communication Services—1.5% | |
| | 207,033 | | | Frontier Communications Corp.(b)(c) | | $ | 590,044 | |
| | 140,620 | | | Gannett Co., Inc. | | | 1,311,985 | |
| | 92,567 | | | New Media Investment Group, Inc. | | | 989,541 | |
| | | | | | | | |
| | | | | | | 2,891,570 | |
| | | | | | | | |
| | | | Consumer Discretionary—33.9% | |
| | 67,087 | | | Abercrombie & Fitch Co., Class A | | | 2,005,230 | |
| | 187,654 | | | American Axle & Manufacturing Holdings, Inc.(b) | | | 2,767,896 | |
| | 126,470 | | | Barnes & Noble Education, Inc.(b) | | | 543,821 | |
| | 74,693 | | | Barnes & Noble, Inc. | | | 375,706 | |
| | 33,564 | | | Big Lots, Inc. | | | 1,247,238 | |
| | 31,043 | | | Caleres, Inc. | | | 814,258 | |
| | 93,163 | | | Cato Corp. (The), Class A | | | 1,412,351 | |
| | 107,426 | | | Century Communities, Inc.(b) | | | 2,731,843 | |
| | 324,677 | | | Chico’s FAS, Inc. | | | 1,136,370 | |
| | 53,573 | | | Conn’s, Inc.(b) | | | 1,385,934 | |
| | 17,690 | | | Cooper Tire & Rubber Co. | | | 528,223 | |
| | 22,047 | | | Cooper-Standard Holdings, Inc.(b) | | | 1,117,121 | |
| | 38,743 | | | Core-Mark Holding Co., Inc. | | | 1,408,308 | |
| | 31,055 | | | Ethan Allen Interiors, Inc. | | | 686,316 | |
| | 359,688 | | | Express, Inc.(b) | | | 1,323,652 | |
| | 30,130 | | | Fossil Group, Inc.(b) | | | 393,799 | |
| | 39,450 | | | GameStop Corp., Class A(c) | | | 341,243 | |
| | 43,306 | | | Genesco, Inc.(b) | | | 1,940,542 | |
| | 16,842 | | | G-III Apparel Group Ltd.(b) | | | 726,732 | |
| | 40,521 | | | Group 1 Automotive, Inc. | | | 3,173,200 | |
| | 42,507 | | | Haverty Furniture Cos., Inc. | | | 1,012,517 | |
| | 147,441 | | | Hibbett Sports, Inc.(b) | | | 3,052,029 | |
| | 876,515 | | | J.C. Penney Co., Inc.(b)(c) | | | 1,200,826 | |
| | 122,018 | | | Kirkland’s, Inc.(b) | | | 717,466 | |
| | 14,218 | | | LGI Homes, Inc.(b) | | | 985,450 | |
| | 19,971 | | | Lithia Motors, Inc., Class A | | | 2,267,108 | |
| | 103,596 | | | Lumber Liquidators Holdings, Inc.(b)(c) | | | 1,369,539 | |
| | 93,665 | | | M/I Homes, Inc.(b) | | | 2,638,543 | |
| | 65,075 | | | MarineMax, Inc.(b) | | | 1,125,147 | |
| | 46,807 | | | MDC Holdings, Inc. | | | 1,430,422 | |
| | 46,856 | | | Meritage Homes Corp.(b) | | | 2,396,684 | |
| | 27,634 | | | Motorcar Parts of America, Inc.(b) | | | 570,918 | |
| | 660,991 | | | Office Depot, Inc. | | | 1,586,378 | |
| | 45,958 | | | Red Robin Gourmet Burgers, Inc.(b) | | | 1,472,035 | |
| | 62,545 | | | Rent-A-Center, Inc.(b) | | | 1,559,247 | |
| | 154,522 | | | Sonic Automotive, Inc., Class A | | | 3,125,980 | |
| | 246,877 | | | Superior Industries International, Inc. | | | 1,222,041 | |
| | 11,124 | | | TopBuild Corp.(b) | | | 792,363 | |
| | 25,641 | | | Unifi, Inc.(b) | | | 517,948 | |
| | 50,408 | | | Vera Bradley, Inc.(b) | | | 619,010 | |
| | 149,750 | | | Vista Outdoor, Inc.(b)(c) | | | 1,292,342 | |
| | 246,903 | | | Vitamin Shoppe, Inc.(b) | | | 1,550,551 | |
| | 182,426 | | | William Lyon Homes, Class A(b) | | | 3,075,702 | |
| | 62,278 | | | Winnebago Industries, Inc. | | | 2,202,773 | |
| | 53,021 | | | Zumiez, Inc.(b) | | | 1,411,949 | |
| | | | | | | | |
| | | | | | | 65,254,751 | |
| | | | | | | | |
| | | | Consumer Staples—4.5% | |
| | 55,099 | | | Andersons, Inc. (The) | | | 1,801,737 | |
| | 2,573 | | | Central Garden & Pet Co.(b) | | | 69,420 | |
| | 10,191 | | | Central Garden & Pet Co., Class A(b) | | | 249,476 | |
| | | | | | | | |
Number
of Shares | | | | | Value | |
| | | | Common Stocks & Other Equity
Interests (continued) | |
| | | | Consumer Staples (continued) | |
| | 361,595 | | | Dean Foods Co. | | $ | 614,712 | |
| | 48,475 | | | Seneca Foods Corp., Class A(b) | | | 1,199,756 | |
| | 113,444 | | | SpartanNash Co. | | | 1,834,389 | |
| | 169,152 | | | United Natural Foods, Inc.(b) | | | 2,185,444 | |
| | 12,672 | | | Universal Corp. | | | 682,514 | |
| | | | | | | | |
| | | | | | | 8,637,448 | |
| | | | | | | | |
| | | | Energy—8.1% | |
| | 52,369 | | | C&J Energy Services, Inc.(b) | | | 735,784 | |
| | 62,125 | | | Diamond Offshore Drilling, Inc.(b)(c) | | | 603,234 | |
| | 27,293 | | | Exterran Corp.(b) | | | 388,106 | |
| | 118,454 | | | Green Plains, Inc.(c) | | | 2,057,546 | |
| | 114,721 | | | Gulfport Energy Corp.(b) | | | 751,423 | |
| | 120,731 | | | Helix Energy Solutions Group, Inc.(b) | | | 944,116 | |
| | 233,619 | | | Laredo Petroleum, Inc.(b) | | | 705,529 | |
| | 27,511 | | | Matrix Service Co.(b) | | | 539,491 | |
| | 91,109 | | | Newpark Resources, Inc.(b) | | | 665,096 | |
| | 26,474 | | | Oil States International, Inc.(b) | | | 511,478 | |
| | 78,194 | | | Par Pacific Holdings, Inc.(b) | | | 1,527,911 | |
| | 12,246 | | | REX American Resources Corp.(b) | | | 1,034,909 | |
| | 64,320 | | | Ring Energy, Inc.(b) | | | 333,178 | |
| | 20,742 | | | SEACOR Holdings, Inc.(b) | | | 923,849 | |
| | 139,050 | | | SRC Energy, Inc.(b) | | | 855,157 | |
| | 316,119 | | | Superior Energy Services, Inc.(b) | | | 1,134,867 | |
| | 113,708 | | | US Silica Holdings, Inc.(c) | | | 1,798,861 | |
| | | | | | | | |
| | | | | | | 15,510,535 | |
| | | | | | | | |
| | | | Financials—7.0% | |
| | 64,064 | | | Ambac Financial Group, Inc.(b) | | | 1,197,997 | |
| | 19,697 | | | Apollo Commercial Real Estate Finance, Inc. | | | 369,122 | |
| | 70,669 | | | Capstead Mortgage Corp. | | | 607,047 | |
| | 47,254 | | | Customers Bancorp, Inc.(b) | | | 1,070,303 | |
| | 30,494 | | | Donnelley Financial Solutions, Inc.(b) | | | 466,863 | |
| | 51,402 | | | Encore Capital Group, Inc.(b)(c) | | | 1,452,620 | |
| | 151,549 | | | EZCORP, Inc., Class A(b) | | | 1,647,338 | |
| | 30,430 | | | Hope Bancorp, Inc. | | | 427,846 | |
| | 12,308 | | | Horace Mann Educators Corp. | | | 474,843 | |
| | 36,303 | | | INTL. FCStone, Inc.(b) | | | 1,472,450 | |
| | 38,047 | | | Invesco Mortgage Capital, Inc.(d) | | | 620,927 | |
| | 29,645 | | | Opus Bank | | | 648,336 | |
| | 14,137 | | | Pacific Premier Bancorp, Inc. | | | 410,962 | |
| | 24,205 | | | PennyMac Mortgage Investment Trust | | | 508,305 | |
| | 16,843 | | | PRA Group, Inc.(b) | | | 473,625 | |
| | 20,288 | | | Stewart Information Services Corp. | | | 862,443 | |
| | 68,230 | | | Third Point Reinsurance Ltd. (Bermuda)(b) | | | 792,150 | |
| | | | | | | | |
| | | | | | | 13,503,177 | |
| | | | | | | | |
| | | | Health Care—3.7% | |
| | 146,621 | | | Assertio Therapeutics, Inc.(b) | | | 611,410 | |
| | 171,723 | | | Cross Country Healthcare, Inc.(b) | | | 1,210,647 | |
| | 77,454 | | | Diplomat Pharmacy, Inc.(b)(c) | | | 432,193 | |
| | 144,472 | | | Invacare Corp. | | | 1,069,093 | |
| | 110,391 | | | Lannett Co., Inc.(b)(c) | | | 848,907 | |
| | 31,942 | | | Magellan Health, Inc.(b) | | | 2,235,940 | |
| | 109,247 | | | Owens & Minor, Inc. | | | 372,532 | |
| | 22,177 | | | Select Medical Holdings Corp.(b) | | | 318,683 | |
| | | | | | | | |
| | | | | | | 7,099,405 | |
| | | | | | | | |
See accompanying Notes to Financial Statements which are an integral part of the financial statements.
Invesco S&P SmallCap 600® Pure Value ETF (RZV)(continued)
April 30, 2019
| | | | | | | | |
Number
of Shares | | | | | Value | |
| | | | Common Stocks & Other Equity
Interests (continued) | |
| | | | Industrials—19.7% | |
| | 48,633 | | | ABM Industries, Inc. | | $ | 1,846,595 | |
| | 48,099 | | | Aegion Corp.(b) | | | 957,651 | |
| | 12,046 | | | Apogee Enterprises, Inc. | | | 485,454 | |
| | 39,694 | | | ArcBest Corp. | | | 1,213,049 | |
| | 35,604 | | | Arcosa, Inc. | | | 1,108,352 | |
| | 16,458 | | | Astec Industries, Inc. | | | 554,799 | |
| | 33,233 | | | Atlas Air Worldwide Holdings, Inc.(b) | | | 1,604,822 | |
| | 86,938 | | | Briggs & Stratton Corp. | | | 1,060,644 | |
| | 22,973 | | | CIRCOR International, Inc.(b) | | | 774,650 | |
| | 53,462 | | | Echo Global Logistics, Inc.(b) | | | 1,226,418 | |
| | 10,485 | | | Encore Wire Corp. | | | 621,656 | |
| | 23,110 | | | Greenbrier Cos., Inc. (The) | | | 821,098 | |
| | 169,665 | | | Griffon Corp. | | | 3,328,827 | |
| | 98,662 | | | Kelly Services, Inc., Class A | | | 2,196,216 | |
| | 63,882 | | | LSC Communications, Inc.(c) | | | 446,535 | |
| | 69,478 | | | Lydall, Inc.(b) | | | 1,709,854 | |
| | 11,272 | | | Matthews International Corp., Class A | | | 451,556 | |
| | 17,994 | | | Mueller Industries, Inc. | | | 524,885 | |
| | 28,496 | | | Multi-Color Corp. | | | 1,421,950 | |
| | 43,114 | | | MYR Group, Inc.(b) | | | 1,558,571 | |
| | 502,700 | | | Orion Group Holdings, Inc.(b) | | | 1,301,993 | |
| | 26,159 | | | Patrick Industries, Inc.(b) | | | 1,304,549 | |
| | 121,493 | | | Pitney Bowes, Inc. | | | 863,815 | |
| | 18,480 | | | Powell Industries, Inc. | | | 540,540 | |
| | 51,266 | | | Quanex Building Products Corp. | | | 857,168 | |
| | 9,879 | | | SkyWest, Inc. | | | 608,448 | |
| | 13,600 | | | SPX FLOW, Inc.(b) | | | 488,784 | |
| | 46,850 | | | Team, Inc.(b) | | | 791,765 | |
| | 210,367 | | | Titan International, Inc. | | | 1,457,843 | |
| | 41,908 | | | TrueBlue, Inc.(b) | | | 1,012,497 | |
| | 47,447 | | | Universal Forest Products, Inc. | | | 1,753,167 | |
| | 59,712 | | | Veritiv Corp.(b) | | | 1,665,368 | |
| | 80,349 | | | Wabash National Corp. | | | 1,211,663 | |
| | | | | | | | |
| | | | | | | 37,771,182 | |
| | | | | | | | |
| | | | Information Technology—9.1% | |
| | 23,811 | | | Anixter International, Inc.(b) | | | 1,496,998 | |
| | 27,015 | | | Bel Fuse, Inc., Class B | | | 640,256 | |
| | 53,015 | | | Benchmark Electronics, Inc. | | | 1,432,995 | |
| | 20,741 | | | Comtech Telecommunications Corp. | | | 488,036 | |
| | 40,582 | | | Digi International, Inc.(b) | | | 522,290 | |
| | 43,806 | | | Ichor Holdings Ltd.(b) | | | 1,103,035 | |
| | 30,792 | | | Insight Enterprises, Inc.(b) | | | 1,742,211 | |
| | 88,812 | | | Photronics, Inc.(b) | | | 829,504 | |
| | 45,787 | | | Sanmina Corp.(b) | | | 1,553,095 | |
| | 43,003 | | | ScanSource, Inc.(b) | | | 1,619,063 | |
| | 16,424 | | | Sykes Enterprises, Inc.(b) | | | 455,766 | |
| | 45,678 | | | TiVo Corp. | | | 428,003 | |
| | 155,324 | | | TTM Technologies, Inc.(b) | | | 2,056,490 | |
| | 254,625 | | | Ultra Clean Holdings, Inc.(b) | | | 3,047,861 | |
| | | | | | | | |
| | | | | | | 17,415,603 | |
| | | | | | | | |
| | | | Materials—10.8% | |
| | 10,718 | | | A. Schulman, Inc., CVR(b)(e) | | | 5,606 | |
| | 22,867 | | | AdvanSix, Inc.(b) | | | 691,269 | |
| | 65,155 | | | Boise Cascade Co. | | | 1,804,142 | |
| | 179,153 | | | Century Aluminum Co.(b) | | | 1,506,677 | |
| | 77,206 | | | Clearwater Paper Corp.(b) | | | 1,557,245 | |
| | | | | | | | |
Number
of Shares | | | | | Value | |
| | | | Common Stocks & Other Equity
Interests (continued) | |
| | | | Materials (continued) | |
| | 18,581 | | | Innophos Holdings, Inc. | | $ | 598,122 | |
| | 32,127 | | | Koppers Holdings, Inc.(b) | | | 859,076 | |
| | 62,411 | | | Kraton Corp.(b) | | | 2,048,329 | |
| | 104,030 | | | Mercer International, Inc. (Canada) | | | 1,473,065 | |
| | 120,032 | | | Olympic Steel, Inc. | | | 1,946,919 | |
| | 153,058 | | | PH Glatfelter Co. | | | 2,415,255 | |
| | 156,632 | | | Rayonier Advanced Materials, Inc.(c) | | | 2,324,419 | |
| | 16,181 | | | Schweitzer-Mauduit International, Inc., Class A | | | 575,558 | |
| | 162,358 | | | TimkenSteel Corp.(b) | | | 1,646,310 | |
| | 24,694 | | | Tredegar Corp. | | | 444,986 | |
| | 19,493 | | | US Concrete, Inc.(b) | | | 918,705 | |
| | | | | | | | |
| | | | | | | 20,815,683 | |
| | | | | | | | |
| | | | Real Estate—1.7% | |
| | 434,758 | | | CBL & Associates Properties, Inc.(c) | | | 439,105 | |
| | 124,058 | | | Cedar Realty Trust, Inc. | | | 380,858 | |
| | 27,688 | | | Hersha Hospitality Trust | | | 514,166 | |
| | 100,483 | | | iStar, Inc.(c) | | | 871,188 | |
| | 54,392 | | | Summit Hotel Properties, Inc. | | | 631,491 | |
| | 20,586 | | | Xenia Hotels & Resorts, Inc. | | | 445,687 | |
| | | | | | | | |
| | | | | | | 3,282,495 | |
| | | | | | | | |
| | | | Total Common Stocks & Other Equity Interests
(Cost $183,342,616) | | | 192,181,849 | |
| | | | | | | | |
| | |
| | | | | | | | |
| | | | Money Market Funds—0.0% | |
| | 71,455 | | | Invesco Premier U.S. Government Money Portfolio—Institutional Class, 2.32%(f)
(Cost $71,455) | | | 71,455 | |
| | | | | | | | |
| | | | Total Investments in Securities
(excluding investments purchased with cash collateral from securities on loan)
(Cost $183,414,071)-100.0% | | | 192,253,304 | |
| | | | | | | | |
| | |
| | | | | | | | |
| | | | Investments Purchased with Cash
Collateral from Securities on Loan | |
| | |
| | | | | | | | |
| | | | Money Market Funds—4.4% | |
| | 6,366,137 | | | Invesco Government & Agency Portfolio—Institutional Class, 2.34%(f)(g) | | | 6,366,137 | |
| | 2,121,411 | | | Invesco Liquid Assets Portfolio—Institutional Class, 2.48%(f)(g) | | | 2,122,047 | |
| | | | | | | | |
| | | | Total Money Market Funds
(Cost $8,488,184) | | | 8,488,184 | |
| | | | | | | | |
| | | | Total Investments in Securities
(Cost $191,902,255)—104.4% | | | 200,741,488 | |
| | |
| | | | Other assets less liabilities—(4.4)% | | | (8,462,904 | ) |
| | | | | | | | |
| | | | Net Assets—100.0% | | $ | 192,278,584 | |
| | | | | | | | |
Abbreviations:
CVR—Contingent Value Rights
See accompanying Notes to Financial Statements which are an integral part of the financial statements.
Invesco S&P SmallCap 600® Pure Value ETF (RZV)(continued)
April 30, 2019
Notes to Schedule of Investments:
| (a) | Industry and/or sector classifications used in this report are generally according to the Global Industry Classification Standard, which was developed by and is the exclusive property and a service mark of MSCI Inc. and Standard & Poor’s. |
| (b) | Non-income producing security. |
| (c) | All or a portion of this security was out on loan at April 30, 2019. |
| (d) | Affiliated company. See Note 4. |
| (e) | Security valued using significant unobservable inputs (Level 3). See Note 5. |
| (f) | The security and the Fund are advised by wholly-owned subsidiaries of Invesco Ltd. and are therefore considered to be affiliated. The rate shown is the 7-day SEC standardized yield as of April 30, 2019. |
| (g) | The security has been segregated to satisfy the commitment to return the cash collateral received in securities lending transactions upon the borrower’s return of the securities loaned. See Note 2J. |
See accompanying Notes to Financial Statements which are an integral part of the financial statements.
Statements of Assets and Liabilities
April 30, 2019
| | | | | | | | | | | | |
| | |
Invesco S&P 500®
Pure Growth ETF
(RPG) | | | Invesco S&P 500®
Pure Value ETF
(RPV) | | | Invesco S&P 500®
Top 50 ETF (XLG) | |
| Assets: | | | | | | | | | | | | |
Unaffiliated investments in securities, at value(a) | | $ | 2,840,511,661 | | | $ | 915,810,119 | | | $ | 837,966,764 | |
Affiliated investments in securities, at value | | | 950,966 | | | | 26,876,930 | | | | 393,949 | |
Receivable for: | | | | | | | | | | | | |
Dividends | | | 1,292,241 | | | | 1,150,450 | | | | 655,317 | |
Securities lending | | | — | | | | 5,284 | | | | — | |
Investments sold | | | — | | | | — | | | | — | |
Fund shares sold | | | 196,624,866 | | | | — | | | | 21,233,854 | |
Foreign tax reclaims | | | — | | | | — | | | | — | |
| | | | | | | | | | | | |
Total assets | | | 3,039,379,734 | | | | 943,842,783 | | | | 860,249,884 | |
| | | | | | | | | | | | |
| | | |
| Liabilities: | | | | | | | | | | | | |
Due to custodian | | | — | | | | 200,913 | | | | — | |
Payable for: | | | | | | | | | | | | |
Investments purchased | | | 196,480,781 | | | | — | | | | 21,213,936 | |
Collateral upon return of securities loaned | | | — | | | | 14,494,418 | | | | — | |
Fund shares repurchased | | | — | | | | — | | | | — | |
Accrued unitary management fees | | | 740,265 | | | | 263,388 | | | | 132,019 | |
Accrued expenses | | | — | | | | 596 | | | | — | |
| | | | | | | | | | | | |
Total liabilities | | | 197,221,046 | | | | 14,959,315 | | | | 21,345,955 | |
| | | | | | | | | | | | |
| Net Assets | | $ | 2,842,158,688 | | | $ | 928,883,468 | | | $ | 838,903,929 | |
| | | | | | | | | | | | |
| | | |
| Net assets consist of: | | | | | | | | | | | | |
Shares of beneficial interest | | $ | 2,735,595,754 | | | $ | 1,101,966,713 | | | $ | 652,689,618 | |
Distributable earnings | | | 106,562,934 | | | | (173,083,245 | ) | | | 186,214,311 | |
| | | | | | | | | | | | |
| Net Assets | | $ | 2,842,158,688 | | | $ | 928,883,468 | | | $ | 838,903,929 | |
| | | | | | | | | | | | |
Shares outstanding (unlimited amount authorized, $0.01 par value) | | | 23,850,299 | | | | 14,002,836 | | | | 3,950,785 | |
Net asset value | | $ | 119.17 | | | $ | 66.34 | | | $ | 212.34 | |
| | | | | | | | | | | | |
Market price | | $ | 119.19 | | | $ | 66.36 | | | $ | 212.32 | |
| | | | | | | | | | | | |
Unaffiliated investments in securities, at cost | | $ | 2,325,596,627 | | | $ | 859,911,733 | | | $ | 634,401,007 | |
| | | | | | | | | | | | |
Affiliated investments in securities, at cost | | $ | 950,966 | | | $ | 25,001,676 | | | $ | 393,949 | |
| | | | | | | | | | | | |
(a)Includes securities on loan with an aggregate value of | | $ | — | | | $ | 13,966,986 | | | $ | — | |
| | | | | | | | | | | | |
See accompanying Notes to Financial Statements which are an integral part of the financial statements.
| | | | | | | | | | | | | | |
Invesco S&P
Midcap 400® Pure
Growth ETF (RFG) | | | Invesco S&P
MidCap 400® Pure
Value ETF (RFV) | | | Invesco S&P
SmallCap 600®
Pure Growth ETF
(RZG) | | | Invesco S&P
SmallCap 600®
Pure Value ETF
(RZV) | |
| | | | | | | | | | | | | | |
| $ | 493,192,845 | | | $ | 142,707,016 | | | $ | 236,942,643 | | | $ | 191,560,922 | |
| | 10,325,361 | | | | 8,075,252 | | | | 11,053,373 | | | | 9,180,566 | |
| | | | | | | | | | | | | | |
| | 137,562 | | | | 55,520 | | | | 31,451 | | | | 67,838 | |
| | 968 | | | | 1,819 | | | | 8,632 | | | | 11,550 | |
| | — | | | | — | | | | 11,558,023 | | | | — | |
| | — | | | | — | | | | — | | | | — | |
| | — | | | | — | | | | — | | | | 1,306 | |
| | | | | | | | | | | | | | |
| | 503,656,736 | | | | 150,839,607 | | | | 259,594,122 | | | | 200,822,182 | |
| | | | | | | | | | | | | | |
| | | |
| | | | | | | | | | | | | | |
| | — | | | | 16 | | | | — | | | | — | |
| | | | | | | | | | | | | | |
| | — | | | | 140,365 | | | | — | | | | — | |
| | 9,951,205 | | | | 7,921,561 | | | | 11,011,001 | | | | 8,488,184 | |
| | — | | | | — | | | | 11,558,686 | | | | — | |
| | 142,726 | | | | 40,860 | | | | 70,927 | | | | 55,414 | |
| | — | | | | — | | | | — | | | | — | |
| | | | | | | | | | | | | | |
| | 10,093,931 | | | | 8,102,802 | | | | 22,640,614 | | | | 8,543,598 | |
| | | | | | | | | | | | | | |
| $ | 493,562,805 | | | $ | 142,736,805 | | | $ | 236,953,508 | | | $ | 192,278,584 | |
| | | | | | | | | | | | | | |
| | | |
| | | | | | | | | | | | | | |
| $ | 607,873,653 | | | $ | 164,066,613 | | | $ | 309,111,912 | | | $ | 279,915,782 | |
| | (114,310,848 | ) | | | (21,329,808 | ) | | | (72,158,404 | ) | | | (87,637,198 | ) |
| | | | | | | | | | | | | | |
| $ | 493,562,805 | | | $ | 142,736,805 | | | $ | 236,953,508 | | | $ | 192,278,584 | |
| | | | | | | | | | | | | | |
| | 3,250,021 | | | | 2,050,499 | | | | 2,050,004 | | | | 2,850,040 | |
| $ | 151.86 | | | $ | 69.61 | | | $ | 115.59 | | | $ | 67.47 | |
| | | | | | | | | | | | | | |
| $ | 151.97 | | | $ | 69.69 | | | $ | 115.58 | | | $ | 67.53 | |
| | | | | | | | | | | | | | |
| $ | 421,393,303 | | | $ | 124,091,519 | | | $ | 215,459,713 | | | $ | 182,719,162 | |
| | | | | | | | | | | | | | |
| $ | 10,325,361 | | | $ | 8,075,252 | | | $ | 11,053,373 | | | $ | 9,183,093 | |
| | | | | | | | | | | | | | |
| $ | 9,864,873 | | | $ | 7,569,936 | | | $ | 10,611,097 | | | $ | 8,022,995 | |
| | | | | | | | | | | | | | |
Statements of Operations
For the year ended April 30, 2019
| | | | | | | | | | | | |
| | | Invesco S&P 500®
Pure Growth ETF
(RPG) | | | Invesco S&P 500®
Pure Value ETF
(RPV) | | | Invesco S&P 500®
Top 50 ETF (XLG) | |
| Investment income: | | | | | | | | | | | | |
Unaffiliated dividend income | | $ | 21,126,625 | | | $ | 23,890,086 | | | $ | 15,322,380 | |
Affiliated dividend income | | | 19,159 | | | | 268,130 | | | | 9,924 | |
Non-cash dividend income | | | — | | | | — | | | | 230,493 | |
Securities lending income | | | 88,010 | | | | 28,065 | | | | — | |
Foreign witholding tax | | | — | | | | — | | | | — | |
| | | | | | | | | | | | |
Total investment income | | | 21,233,794 | | | | 24,186,281 | | | | 15,562,797 | |
| | | | | | | | | | | | |
| | | |
| Expenses: | | | | | | | | | | | | |
Unitary management fees | | | 8,398,311 | | | | 3,202,836 | | | | 1,492,502 | |
Other expenses | | | — | | | | 617 | | | | — | |
| | | | | | | | | | | | |
Total expenses | | | 8,398,311 | | | | 3,203,453 | | | | 1,492,502 | |
| | | | | | | | | | | | |
Less: Waivers | | | (1,608 | ) | | | (1,606 | ) | | | (862 | ) |
| | | | | | | | | | | | |
Net expenses | | | 8,396,703 | | | | 3,201,847 | | | | 1,491,640 | |
| | | | | | | | | | | | |
Net investment income | | | 12,837,091 | | | | 20,984,434 | | | | 14,071,157 | |
| | | | | | | | | | | | |
| | | |
| Realized and unrealized gain (loss) from: | | | | | | | | | | | | |
Net realized gain (loss) from: | | | | | | | | | | | | |
Unaffiliated investment securities | | | (190,370,527 | ) | | | (74,568,314 | ) | | | (7,447,710 | ) |
Affiliated investment securities | | | — | | | | (66,903 | ) | | | — | |
Unaffiliated in-kind redemptions | | | 245,113,429 | | | | 44,935,074 | | | | 60,349,529 | |
Affiliated in-kind redemptions | | | — | | | | 107,768 | | | | — | |
| | | | | | | | | | | | |
Net realized gain (loss) | | | 54,742,902 | | | | (29,592,375 | ) | | | 52,901,819 | |
| | | | | | | | | | | | |
Change in net unrealized appreciation (depreciation) of: | | | | | | | | | | | | |
Unaffiliated investment securities | | | 106,676,629 | | | | 17,822,295 | | | | 35,383,349 | |
Affiliated investment securities | | | — | | | | 2,122,123 | | | | — | |
| | | | | | | | | | | | |
Change in unrealized appreciation (depreciation) | | | 106,676,629 | | | | 19,944,418 | | | | 35,383,349 | |
| | | | | | | | | | | | |
Net realized and unrealized gain (loss) | | | 161,419,531 | | | | (9,647,957 | ) | | | 88,285,168 | |
| | | | | | | | | | | | |
Net increase (decrease) in net assets resulting from operations | | $ | 174,256,622 | | | $ | 11,336,477 | | | $ | 102,356,325 | |
| | | | | | | | | | | | |
See accompanying Notes to Financial Statements which are an integral part of the financial statements.
| | | | | | | | | | | | | | |
Invesco S&P
Midcap 400® Pure
Growth ETF (RFG) | | | Invesco S&P
MidCap 400® Pure
Value ETF (RFV) | | | Invesco S&P
SmallCap 600®
Pure Growth ETF
(RZG) | | | Invesco S&P
SmallCap 600®
Pure Value ETF
(RZV) | |
| | | | | | | | | | | | | | |
| $ | 4,462,705 | | | $ | 1,762,297 | | | $ | 1,675,796 | | | $ | 2,913,963 | |
| | 8,444 | | | | 10,257 | | | | 2,299 | | | | 71,606 | |
| | 1,454,296 | | | | — | | | | — | | | | — | |
| | 10,410 | | | | 33,073 | | | | 133,157 | | | | 154,681 | |
| | — | | | | — | | | | — | | | | (1,900 | ) |
| | | | | | | | | | | | | | |
| | 5,935,855 | | | | 1,805,627 | | | | 1,811,252 | | | | 3,138,350 | |
| | | | | | | | | | | | | | |
| | | |
| | | | | | | | | | | | | | |
| | 1,990,495 | | | | 407,005 | | | | 1,032,676 | | | | 633,238 | |
| | — | | | | — | | | | — | | | | — | |
| | | | | | | | | | | | | | |
| | 1,990,495 | | | | 407,005 | | | | 1,032,676 | | | | 633,238 | |
| | | | | | | | | | | | | | |
| | (705 | ) | | | (693 | ) | | | (208 | ) | | | (256 | ) |
| | | | | | | | | | | | | | |
| | 1,989,790 | | | | 406,312 | | | | 1,032,468 | | | | 632,982 | |
| | | | | | | | | | | | | | |
| | 3,946,065 | | | | 1,399,315 | | | | 778,784 | | | | 2,505,368 | |
| | | | | | | | | | | | | | |
| | | |
| | | | | | | | | | | | | | |
| | | | | | | | | | | | | | |
| | (114,122,598 | ) | | | (14,767,948 | ) | | | (57,755,085 | ) | | | (37,345,534 | ) |
| | — | | | | — | | | | — | | | | (88,275 | ) |
| | 65,513,957 | | | | 4,822,346 | | | | 53,684,541 | | | | 8,976,735 | |
| | — | | | | — | | | | — | | | | (919 | ) |
| | | | | | | | | | | | | | |
| | (48,608,641 | ) | | | (9,945,602 | ) | | | (4,070,544 | ) | | | (28,457,993 | ) |
| | | | | | | | | | | | | | |
| | | | | | | | | | | | | | |
| | 28,123,582 | | | | 20,989,667 | | | | (4,396,199 | ) | | | 21,188,133 | |
| | — | | | | — | | | | — | | | | 77,636 | |
| | | | | | | | | | | | | | |
| | 28,123,582 | | | | 20,989,667 | | | | (4,396,199 | ) | | | 21,265,769 | |
| | | | | | | | | | | | | | |
| | (20,485,059 | ) | | | 11,044,065 | | | | (8,466,743 | ) | | | (7,192,224 | ) |
| | | | | | | | | | | | | | |
| $ | (16,538,994 | ) | | $ | 12,443,380 | | | $ | (7,687,959 | ) | | $ | (4,686,856 | ) |
| | | | | | | | | | | | | | |
Statements of Changes in Net Assets
For the year ended April 30, 2019, the period November 1, 2017 through April 30, 2018 and the year ended October 31, 2017
| | | | | | | | | | | | | | | | | | | | | | | | |
| | | Invesco S&P 500® Pure Growth ETF (RPG) | | | Invesco S&P 500® Pure Value ETF (RPV) | |
| | | Year Ended
April 30, 2019 | | | Six Months Ended
April 30, 2018 | | | Year Ended
October 31, 2017 | | | Year Ended
April 30, 2019 | | | Six Months Ended
April 30, 2018 | | | Year Ended
October 31, 2017 | |
| Operations: | | | | | | | | | | | | | | | | | | | | | | | | |
Net investment income | | $ | 12,837,091 | | | $ | 5,471,220 | | | $ | 10,168,511 | | | $ | 20,984,434 | | | $ | 8,567,969 | | | $ | 16,965,268 | |
Net realized gain (loss) | | | 54,742,902 | | | | 246,611,044 | | | | 88,028,423 | | | | (29,592,375 | ) | | | 80,151,491 | | | | 44,548,648 | |
Change in net unrealized appreciation (depreciation) | | | 106,676,629 | | | | (119,773,928 | ) | | | 371,208,577 | | | | 19,944,418 | | | | (28,786,043 | ) | | | 91,626,516 | |
| | | | | | | | | | | | | | | | | | | | | | | | |
Net increase (decrease) in net assets resulting from operations | | | 174,256,622 | | | | 132,308,336 | | | | 469,405,511 | | | | 11,336,477 | | | | 59,933,417 | | | | 153,140,432 | |
| | | | | | | | | | | | | | | | | | | | | | | | |
| | | | | | |
| Distributions to Shareholders from: | | | | | | | | | | | | | | | | | | | | | | | | |
Distributable earnings | | | (11,700,928 | ) | | | (5,229,876 | ) | | | (13,278,946 | ) | | | (20,818,512 | ) | | | (8,749,124 | ) | | | (16,800,045 | ) |
| | | | | | | | | | | | | | | | | | | | | | | | |
| | | | | | |
| Shareholder Transactions: | | | | | | | | | | | | | | | | | | | | | | | | |
Proceeds from shares sold | | | 1,493,867,737 | | | | 1,044,825,329 | | | | 501,015,089 | | | | 457,558,632 | | | | 373,377,228 | | | | 545,805,294 | |
Value of shares repurchased | | | (1,160,011,393 | ) | | | (1,041,113,616 | ) | | | (511,770,658 | ) | | | (401,585,419 | ) | | | (372,675,931 | ) | | | (571,302,183 | ) |
| | | | | | | | | | | | | | | | | | | | | | | | |
Net increase (decrease) in net assets resulting from share transactions | | | 333,856,344 | | | | 3,711,713 | | | | (10,755,569 | ) | | | 55,973,213 | | | | 701,297 | | | | (25,496,889 | ) |
| | | | | | | | | | | | | | | | | | | | | | | | |
Net increase (decrease) in net assets | | | 496,412,038 | | | | 130,790,173 | | | | 445,370,996 | | | | 46,491,178 | | | | 51,885,590 | | | | 110,843,498 | |
| | | | | | | | | | | | | | | | | | | | | | | | |
| | | | | | |
| Net assets: | | | | | | | | | | | | | | | | | | | | | | | | |
Beginning of period | | | 2,345,746,650 | | | | 2,214,956,477 | | | | 1,769,585,481 | | | | 882,392,290 | | | | 830,506,700 | | | | 719,663,202 | |
| | | | | | | | | | | | | | | | | | | | | | | | |
End of period | | $ | 2,842,158,688 | | | $ | 2,345,746,650 | | | $ | 2,214,956,477 | | | $ | 928,883,468 | | | $ | 882,392,290 | | | $ | 830,506,700 | |
| | | | | | | | | | | | | | | | | | | | | | | | |
| | | | | | |
| Changes in Shares Outstanding: | | | | | | | | | | | | | | | | | | | | | | | | |
Shares sold | | | 13,900,000 | | | | 9,950,000 | | | | 5,750,000 | | | | 7,450,000 | | | | 5,700,000 | | | | 9,350,000 | |
Shares repurchased | | | (11,550,000 | ) | | | (9,850,000 | ) | | | (5,900,000 | ) | | | (6,750,000 | ) | | | (5,700,000 | ) | | | (9,800,000 | ) |
Shares outstanding, beginning of period | | | 21,500,299 | | | | 21,400,299 | | | | 21,550,299 | | | | 13,302,836 | | | | 13,302,836 | | | | 13,752,836 | |
| | | | | | | | | | | | | | | | | | | | | | | | |
Shares outstanding, end of period | | | 23,850,299 | | | | 21,500,299 | | | | 21,400,299 | | | | 14,002,836 | | | | 13,302,836 | | | | 13,302,836 | |
| | | | | | | | | | | | | | | | | | | | | | | | |
See accompanying Notes to Financial Statements which are an integral part of the financial statements.
| | | | | | | | | | | | | | | | | | | | | | |
| Invesco S&P 500® Top 50 ETF (XLG) | | | Invesco S&P Midcap 400® Pure Growth ETF (RFG) | |
Year Ended
April 30, 2019 | | | Six Months Ended
April 30, 2018 | | | Year Ended
October 31, 2017 | | | Year Ended
April 30, 2019 | | | Six Months Ended
April 30, 2018 | | | Year Ended
October 31, 2017 | |
| | | | | | | | | | | | | | | | | | | | | | |
| $ | 14,071,157 | | | $ | 6,512,498 | | | $ | 12,772,295 | | | $ | 3,946,065 | | | $ | 859,901 | | | $ | 3,616,681 | |
| | 52,901,819 | | | | 19,258,602 | | | | 18,737,200 | | | | (48,608,641 | ) | | | 56,197,782 | | | | 35,666,592 | |
|
35,383,349 |
| | | (5,269,131 | ) | | | 107,309,944 | | | | 28,123,582 | | | | (36,008,957 | ) | | | 88,865,358 | |
| | | | | | | | | | | | | | | | | | | | | | |
| | | | | |
| | 102,356,325 | | | | 20,501,969 | | | | 138,819,439 | | | | (16,538,994 | ) | | | 21,048,726 | | | | 128,148,631 | |
| | | | | | | | | | | | | | | | | | | | | | |
| | | | | |
| | | | | | | | | | | | | | | | | | | | | | |
| | (14,318,678 | ) | | | (6,688,046 | ) | | | (12,471,172 | ) | | | (4,283,416 | ) | | | (1,653,088 | ) | | | (3,297,427 | ) |
| | | | | | | | | | | | | | | | | | | | | | |
| | | | | |
| | | | | | | | | | | | | | | | | | | | | | |
| | 211,912,221 | | | | 29,024,718 | | | | 41,498,147 | | | | 201,430,427 | | | | 168,230,814 | | | | 207,728,198 | |
| | (144,537,082 | ) | | | (46,058,616 | ) | | | (58,937,433 | ) | | | (282,457,176 | ) | | | (177,384,374 | ) | | | (266,029,211 | ) |
| | | | | | | | | | | | | | | | | | | | | | |
| | | | | |
| | 67,375,139 | | | | (17,033,898 | ) | | | (17,439,286 | ) | | | (81,026,749 | ) | | | (9,153,560 | ) | | | (58,301,013 | ) |
| | | | | | | | | | | | | | | | | | | | | | |
| | 155,412,786 | | | | (3,219,975 | ) | | | 108,908,981 | | | | (101,849,159 | ) | | | 10,242,078 | | | | 66,550,191 | |
| | | | | | | | | | | | | | | | | | | | | | |
| | | | | |
| | | | | | | | | | | | | | | | | | | | | | |
| | 683,491,143 | | | | 686,711,118 | | | | 577,802,137 | | | | 595,411,964 | | | | 585,169,886 | | | | 518,619,695 | |
| | | | | | | | | | | | | | | | | | | | | | |
| $ | 838,903,929 | | | $ | 683,491,143 | | | $ | 686,711,118 | | | $ | 493,562,805 | | | $ | 595,411,964 | | | $ | 585,169,886 | |
| | | | | | | | | | | | | | | | | | | | | | |
| | | | | |
| | | | | | | | | | | | | | | | | | | | | | |
| | 1,050,000 | | | | 150,000 | | | | 250,000 | | | | 1,400,000 | | | | 1,100,000 | | | | 1,550,000 | |
| | (750,000 | ) | | | (250,000 | ) | | | (350,000 | ) | | | (2,000,000 | ) | | | (1,150,000 | ) | | | (2,000,000 | ) |
| | 3,650,785 | | | | 3,750,785 | | | | 3,850,785 | | | | 3,850,021 | | | | 3,900,021 | | | | 4,350,021 | |
| | | | | | | | | | | | | | | | | | | | | | |
| | 3,950,785 | | | | 3,650,785 | | | | 3,750,785 | | | | 3,250,021 | | | | 3,850,021 | | | | 3,900,021 | |
| | | | | | | | | | | | | | | | | | | | | | |
Statements of Changes in Net Assets(continued)
For the year ended April 30, 2019, the period November 1, 2017 through April 30, 2018 and the year ended October 31, 2017
| | | | | | | | | | | | | | | | | | | | | | | | |
| | | Invesco S&P MidCap 400® Pure Value ETF (RFV) | | | Invesco S&P SmallCap 600® Pure Growth ETF (RZG) | |
| | | Year Ended
April 30, 2019 | | | Six Months Ended
April 30, 2018 | | | Year Ended
October 31, 2017 | | | Year Ended
April 30, 2019 | | | Six Months Ended
April 30, 2018 | | | Year Ended
October 31, 2017 | |
| Operations: | | | | | | | | | | | | | | | | | | | | | | | | |
Net investment income | | $ | 1,399,315 | | | $ | 818,825 | | | $ | 2,066,448 | | | $ | 778,784 | | | $ | 780,509 | | | $ | 849,033 | |
Net realized gain (loss) | | | (9,945,602 | ) | | | 10,884,099 | | | | 32,729,206 | | | | (4,070,544 | ) | | | 13,524,865 | | | | 18,296,851 | |
Change in net unrealized appreciation (depreciation) | | | 20,989,667 | | | | (9,879,123 | ) | | | (1,639,552 | ) | | | (4,396,199 | ) | | | (6,428,921 | ) | | | 33,649,878 | |
| | | | | | | | | | | | | | | | | | | | | | | | |
Net increase (decrease) in net assets resulting from operations | | | 12,443,380 | | | | 1,823,801 | | | | 33,156,102 | | | | (7,687,959 | ) | | | 7,876,453 | | | | 52,795,762 | |
| | | | | | | | | | | | | | | | | | | | | | | | |
| | | | | | |
| Distributions to Shareholders from: | | | | | | | | | | | | | | | | | | | | | | | | |
Distributable earnings | | | (1,390,448 | ) | | | (873,890 | ) | | | (1,979,370 | ) | | | (1,100,625 | ) | | | (831,382 | ) | | | (850,483 | ) |
| | | | | | | | | | | | | | | | | | | | | | | | |
| | | | | | |
| Shareholder Transactions: | | | | | | | | | | | | | | | | | | | | | | | | |
Proceeds from shares sold | | | 61,713,395 | | | | 50,825,161 | | | | 116,728,819 | | | | 241,193,771 | | | | 68,655,989 | | | | 135,684,810 | |
Value of shares repurchased | | | (31,919,256 | ) | | | (57,900,402 | ) | | | (205,643,868 | ) | | | (258,630,704 | ) | | | (51,425,729 | ) | | | (101,636,207 | ) |
| | | | | | | | | | | | | | | | | | | | | | | | |
Net increase (decrease) in net assets resulting from share transactions | | | 29,794,139 | | | | (7,075,241 | ) | | | (88,915,049 | ) | | | (17,436,933 | ) | | | 17,230,260 | | | | 34,048,603 | |
| | | | | | | | | | | | | | | | | | | | | | | | |
Net increase (decrease) in net assets | | | 40,847,071 | | | | (6,125,330 | ) | | | (57,738,317 | ) | | | (26,225,517 | ) | | | 24,275,331 | | | | 85,993,882 | |
| | | | | | | | | | | | | | | | | | | | | | | | |
| | | | | | |
| Net assets: | | | | | | | | | | | | | | | | | | | | | | | | |
Beginning of period | | | 101,889,734 | | | | 108,015,064 | | | | 165,753,381 | | | | 263,179,025 | | | | 238,903,694 | | | | 152,909,812 | |
| | | | | | | | | | | | | | | | | | | | | | | | |
End of period | | $ | 142,736,805 | | | $ | 101,889,734 | | | $ | 108,015,064 | | | $ | 236,953,508 | | | $ | 263,179,025 | | | $ | 238,903,694 | |
| | | | | | | | | | | | | | | | | | | | | | | | |
| | | | | | |
| Changes in Shares Outstanding: | | | | | | | | | | | | | | | | | | | | | | | | |
Shares sold | | | 1,050,000 | | | | 750,000 | | | | 1,850,000 | | | | 2,050,000 | | | | 600,000 | | | | 1,350,000 | |
Shares repurchased | | | (550,000 | ) | | | (850,000 | ) | | | (3,300,000 | ) | | | (2,300,000 | ) | | | (450,000 | ) | | | (1,050,000 | ) |
Shares outstanding, beginning of period | | | 1,550,499 | | | | 1,650,499 | | | | 3,100,499 | | | | 2,300,004 | | | | 2,150,004 | | | | 1,850,004 | |
| | | | | | | | | | | | | | | | | | | | | | | | |
Shares outstanding, end of period | | | 2,050,499 | | | | 1,550,499 | | | | 1,650,499 | | | | 2,050,004 | | | | 2,300,004 | | | | 2,150,004 | |
| | | | | | | | | | | | | | | | | | | | | | | | |
See accompanying Notes to Financial Statements which are an integral part of the financial statements.
| | | | | | | | | | |
| Invesco S&P SmallCap 600® Pure Value ETF (RZV) | |
Year Ended
April 30, 2019 | | | Six Months Ended
April 30, 2018 | | | Year Ended
October 31, 2017 | |
| | | | | | | | | | |
| $ | 2,505,368 | | | $ | 1,157,018 | | | $ | 2,039,640 | |
| | (28,457,993 | ) | | | 22,889,624 | | | | 24,663,508 | |
| | |
| | 21,265,769 | | | | (20,216,552 | ) | | | 795,078 | |
| | | | | | | | | | |
| | |
| | (4,686,856 | ) | | | 3,830,090 | | | | 27,498,226 | |
| | | | | | | | | | |
| | |
| | | | | | | | | | |
| | (2,712,991 | ) | | | (1,184,577 | ) | | | (1,947,059 | ) |
| | | | | | | | | | |
| | |
| | | | | | | | | | |
| | 98,052,973 | | | | 60,654,896 | | | | 239,701,459 | |
| | (62,999,201 | ) | | | (135,470,342 | ) | | | (222,122,975 | ) |
| | | | | | | | | | |
| | |
| | 35,053,772 | | | | (74,815,446 | ) | | | 17,578,484 | |
| | | | | | | | | | |
| | 27,653,925 | | | | (72,169,933 | ) | | | 43,129,651 | |
| | | | | | | | | | |
| | |
| | | | | | | | | | |
| | 164,624,659 | | | | 236,794,592 | | | | 193,664,941 | |
| | | | | | | | | | |
| $ | 192,278,584 | | | $ | 164,624,659 | | | $ | 236,794,592 | |
| | | | | | | | | | |
| | |
| | | | | | | | | | |
| | 1,550,000 | | | | 850,000 | | | | 3,300,000 | |
| | (1,000,000 | ) | | | (1,900,000 | ) | | | (3,150,000 | ) |
| | 2,300,040 | | | | 3,350,040 | | | | 3,200,040 | |
| | | | | | | | | | |
| | 2,850,040 | | | | 2,300,040 | | | | 3,350,040 | |
| | | | | | | | | | |
Financial Highlights
Invesco S&P 500® Pure Growth ETF (RPG)
| | | | | | | | | | | | | | | | | | | | | | | | |
| | | Year Ended
April 30, 2019 | | | Six Months Ended
April 30, 2018 | | | Years Ended October 31, | |
| | | 2017 | | | 2016 | | | 2015 | | | 2014 | |
| Per Share Operating Performance: | | | | | | | | | | | | | | | | | | | | | | | | |
Net asset value at beginning of period | | $ | 109.10 | | | $ | 103.50 | | | $ | 82.11 | | | $ | 82.93 | | | $ | 78.96 | | | $ | 66.12 | |
Net investment income(a) | | | 0.60 | | | | 0.25 | | | | 0.47 | | | | 0.59 | | | | 0.52 | | | | 0.55 | |
Net realized and unrealized gain (loss) on investments | | | 10.04 | | | | 5.55 | | | | 21.52 | | | | (0.95 | ) | | | 3.93 | | | | 12.81 | |
Total from investment operations | | | 10.64 | | | | 5.80 | | | | 21.99 | | | | (0.36 | ) | | | 4.45 | | | | 13.36 | |
Distributions to shareholders from: | | | | | | | | | | | | | | | | | | | | | | | | |
Net investment income | | | (0.57 | ) | | | (0.20 | ) | | | (0.60 | ) | | | (0.46 | ) | | | (0.48 | ) | | | (0.52 | ) |
Net asset value at end of period | | $ | 119.17 | | | $ | 109.10 | | | $ | 103.50 | | | $ | 82.11 | | | $ | 82.93 | | | $ | 78.96 | |
Market price at end of period(b) | | $ | 119.19 | | | $ | 109.20 | | | | | | | | | | | | | | | | | |
| Net Asset Value Total Return(c) | | | 9.79 | % | | | 5.61 | % | | | 26.87 | % | | | (0.42 | )% | | | 5.65 | % | | | 20.24 | % |
| Market Price Total Return(c) | | | 9.71 | % | | | 5.71 | % | | | | | | | | | | | | | | | | |
| Ratios/Supplemental Data: | | | | | | | | | | | | | | | | | | | | | | | | |
Net assets at end of period (000’s omitted) | | $ | 2,842,159 | | | $ | 2,345,747 | | | $ | 2,214,956 | | | $ | 1,769,585 | | | $ | 2,338,586 | | | $ | 1,792,516 | |
Ratio to average net assets of: | | | | | | | | | | | | | | | | | | | | | | | | |
Expenses | | | 0.35 | % | | | 0.35 | %(d) | | | 0.35 | % | | | 0.35 | % | | | 0.35 | % | | | 0.35 | % |
Net investment income | | | 0.53 | % | | | 0.47 | %(d) | | | 0.52 | % | | | 0.74 | % | | | 0.64 | % | | | 0.74 | % |
Portfolio turnover rate(e) | | | 64 | % | | | 52 | % | | | 58 | % | | | 67 | % | | | 62 | % | | | 46 | % |
| (a) | Based on average shares outstanding. |
| (b) | The mean between the last bid and ask prices. |
| (c) | Net asset value total return is calculated assuming an initial investment made at the net asset value at the beginning of the period, reinvestment of all dividends and distributions at net asset value during the period, and redemption on the last day of the period. Net asset value total return includes adjustments in accordance with accounting principles generally accepted in the United States of America and as such, the net asset value for financial reporting purposes and the returns based upon those net asset values may differ from the net asset value and returns for shareholder transactions. Market price total return is calculated assuming an initial investment made at the market price at the beginning of the period, reinvestment of all dividends and distributions at market price during the period, and sale at the market price on the last day of the period. Total investment returns calculated for a period of less than one year are not annualized. |
| (e) | Portfolio turnover rate is not annualized for periods less than one year, if applicable, and does not include securities received or delivered from processing creations or redemptions. |
See accompanying Notes to Financial Statements which are an integral part of the financial statements.
Financial Highlights(continued)
Invesco S&P 500® Pure Value ETF (RPV)
| | | | | | | | | | | | | | | | | | | | | | | | |
| | | Year Ended
April 30, 2019 | | | Six Months Ended
April 30, 2018 | | | Years Ended October 31, | |
| | | 2017 | | | 2016 | | | 2015 | | | 2014 | |
| Per Share Operating Performance: | | | | | | | | | | | | | | | | | | | | | | | | |
Net asset value at beginning of period | | $ | 66.33 | | | $ | 62.43 | | | $ | 52.33 | | | $ | 51.45 | | | $ | 54.14 | | | $ | 46.51 | |
Net investment income(a) | | | 1.49 | | | | 0.63 | | | | 1.11 | | | | 1.17 | | | | 1.12 | | | | 0.90 | |
Net realized and unrealized gain (loss) on investments | | | (0.01 | ) | | | 3.84 | | | | 10.05 | | | | 0.81 | | | | (2.70 | ) | | | 7.50 | |
Total from investment operations | | | 1.48 | | | | 4.47 | | | | 11.16 | | | | 1.98 | | | | (1.58 | ) | | | 8.40 | |
Distributions to shareholders from: | | | | | | | | | | | | | | | | | | | | | | | | |
Net investment income | | | (1.47 | ) | | | (0.57 | ) | | | (1.06 | ) | | | (1.10 | ) | | | (1.11 | ) | | | (0.77 | ) |
Net asset value at end of period | | $ | 66.34 | | | $ | 66.33 | | | $ | 62.43 | | | $ | 52.33 | | | $ | 51.45 | | | $ | 54.14 | |
Market price at end of period(b) | | $ | 66.36 | | | $ | 66.38 | | | | | | | | | | | | | | | | | |
| Net Asset Value Total Return(c) | | | 2.37 | % | | | 7.17 | % | | | 21.44 | % | | | 3.94 | % | | | (2.94 | )% | | | 18.13 | % |
| Market Price Total Return(c) | | | 2.33 | % | | | 7.25 | % | | | | | | | | | | | | | | | | |
| Ratios/Supplemental Data: | | | | | | | | | | | | | | | | | | | | | | | | |
Net assets at end of period (000’s omitted) | | $ | 928,883 | | | $ | 882,392 | | | $ | 830,507 | | | $ | 719,663 | | | $ | 813,029 | | | $ | 1,275,062 | |
Ratio to average net assets of: | | | | | | | | | | | | | | | | | | | | | | | | |
Expenses | | | 0.35 | % | | | 0.35 | %(d) | | | 0.35 | % | | | 0.35 | % | | | 0.35 | % | | | 0.35 | % |
Net investment income | | | 2.29 | % | | | 1.94 | %(d) | | | 1.89 | % | | | 2.32 | % | | | 2.09 | % | | | 1.74 | % |
Portfolio turnover rate(e) | | | 37 | % | | | 35 | % | | | 46 | % | | | 44 | % | | | 54 | % | | | 25 | % |
| (a) | Based on average shares outstanding. |
| (b) | The mean between the last bid and ask prices. |
| (c) | Net asset value total return is calculated assuming an initial investment made at the net asset value at the beginning of the period, reinvestment of all dividends and distributions at net asset value during the period, and redemption on the last day of the period. Net asset value total return includes adjustments in accordance with accounting principles generally accepted in the United States of America and as such, the net asset value for financial reporting purposes and the returns based upon those net asset values may differ from the net asset value and returns for shareholder transactions. Market price total return is calculated assuming an initial investment made at the market price at the beginning of the period, reinvestment of all dividends and distributions at market price during the period, and sale at the market price on the last day of the period. Total investment returns calculated for a period of less than one year are not annualized. |
| (e) | Portfolio turnover rate is not annualized for periods less than one year, if applicable, and does not include securities received or delivered from processing creations or redemptions. |
Invesco S&P 500® Top 50 ETF (XLG)
| | | | | | | | | | | | | | | | | | | | | | | | |
| | | Year Ended
April 30, 2019 | | | Six Months Ended
April 30, 2018 | | | Years Ended October 31, | |
| | | 2017 | | | 2016 | | | 2015 | | | 2014 | |
| Per Share Operating Performance: | | | | | | | | | | | | | | | | | | | | | | | | |
Net asset value at beginning of period | | $ | 187.22 | | | $ | 183.08 | | | $ | 150.05 | | | $ | 145.93 | | | $ | 140.87 | | | $ | 123.06 | |
Net investment income(a) | | | 3.72 | | | | 1.71 | | | | 3.35 | | | | 3.12 | | | | 3.00 | | | | 2.74 | |
Net realized and unrealized gain on investments | | | 25.18 | | | | 4.18 | | | | 32.95 | | | | 4.09 | | | | 5.09 | | | | 17.82 | |
Total from investment operations | | | 28.90 | | | | 5.89 | | | | 36.30 | | | | 7.21 | | | | 8.09 | | | | 20.56 | |
Distributions to shareholders from: | | | | | | | | | | | | | | | | | | | | | | | | |
Net investment income | | | (3.78 | ) | | | (1.75 | ) | | | (3.27 | ) | | | (3.09 | ) | | | (3.03 | ) | | | (2.75 | ) |
Net asset value at end of period | | $ | 212.34 | | | $ | 187.22 | | | $ | 183.08 | | | $ | 150.05 | | | $ | 145.93 | | | $ | 140.87 | |
Market price at end of period(b) | | $ | 212.32 | | | $ | 187.43 | | | | | | | | | | | | | | | | | |
| Net Asset Value Total Return(c) | | | 15.64 | % | | | 3.20 | % | | | 24.40 | % | | | 4.99 | % | | | 5.87 | % | | | 16.86 | % |
| Market Price Total Return(c) | | | 15.50 | % | | | 3.20 | % | | | | | | | | | | | | | | | | |
| Ratios/Supplemental Data: | | | | | | | | | | | | | | | | | | | | | | | | |
Net assets at end of period (000’s omitted) | | $ | 838,904 | | | $ | 683,491 | | | $ | 686,711 | | | $ | 577,802 | | | $ | 496,264 | | | $ | 598,797 | |
Ratio to average net assets of: | | | | | | | | | | | | | | | | | | | | | | | | |
Expenses | | | 0.20 | % | | | 0.20 | %(d) | | | 0.20 | % | | | 0.20 | % | | | 0.20 | % | | | 0.20 | % |
Net investment income | | | 1.89 | % | | | 1.81 | %(d) | | | 2.00 | % | | | 2.13 | % | | | 2.11 | % | | | 2.08 | % |
Portfolio turnover rate(e) | | | 8 | % | | | 1 | % | | | 4 | % | | | 7 | % | | | 8 | % | | | 6 | % |
| (a) | Based on average shares outstanding. |
| (b) | The mean between the last bid and ask prices. |
| (c) | Net asset value total return is calculated assuming an initial investment made at the net asset value at the beginning of the period, reinvestment of all dividends and distributions at net asset value during the period, and redemption on the last day of the period. Net asset value total return includes adjustments in accordance with accounting principles generally accepted in the United States of America and as such, the net asset value for financial reporting purposes and the returns based upon those net asset values may differ from the net asset value and returns for shareholder transactions. Market price total return is calculated assuming an initial investment made at the market price at the beginning of the period, reinvestment of all dividends and distributions at market price during the period, and sale at the market price on the last day of the period. Total investment returns calculated for a period of less than one year are not annualized. |
| (e) | Portfolio turnover rate is not annualized for periods less than one year, if applicable, and does not include securities received or delivered from processing creations or redemptions. |
See accompanying Notes to Financial Statements which are an integral part of the financial statements.
Financial Highlights(continued)
Invesco S&P Midcap 400® Pure Growth ETF (RFG)
| | | | | | | | | | | | | | | | | | | | | | | | |
| | | Year Ended
April 30, 2019 | | | Six Months Ended
April 30, 2018 | | | Years Ended October 31, | |
| | | 2017 | | | 2016 | | | 2015 | | | 2014 | |
| Per Share Operating Performance: | | | | | | | | | | | | | | | | | | | | | | | | |
Net asset value at beginning of period | | $ | 154.65 | | | $ | 150.04 | | | $ | 119.22 | | | $ | 128.31 | | | $ | 123.30 | | | $ | 115.31 | |
Net investment income(a) | | | 1.07 | | | | 0.22 | | | | 0.90 | | | | 0.59 | | | | 0.70 | | | | 0.75 | |
Net realized and unrealized gain (loss) on investments | | | (2.69 | ) | | | 4.77 | | | | 30.73 | | | | (9.10 | ) | | | 5.10 | | | | 7.93 | |
Total from investment operations | | | (1.62 | ) | | | 4.99 | | | | 31.63 | | | | (8.51 | ) | | | 5.80 | | | | 8.68 | |
Distributions to shareholders from: | | | | | | | | | | | | | | | | | | | | | | | | |
Net investment income | | | (1.17 | ) | | | (0.38 | ) | | | (0.81 | ) | | | (0.58 | ) | | | (0.71 | ) | | | (0.69 | ) |
Return of capital | | | — | | | | — | | | | — | | | | — | | | | (0.08 | ) | | | — | |
Total distributions | | | (1.17 | ) | | | (0.38 | ) | | | (0.81 | ) | | | (0.58 | ) | | | (0.79 | ) | | | (0.69 | ) |
Net asset value at end of period | | $ | 151.86 | | | $ | 154.65 | | | $ | 150.04 | | | $ | 119.22 | | | $ | 128.31 | | | $ | 123.30 | |
Market price at end of period(b) | | $ | 151.97 | | | $ | 154.80 | | | | | | | | | | | | | | | | | |
| Net Asset Value Total Return(c) | | | (1.05 | )% | | | 3.32 | % | | | 26.59 | % | | | (6.65 | )% | | | 4.71 | % | | | 7.53 | % |
| Market Price Total Return(c) | | | (1.07 | )% | | | 3.45 | % | | | | | | | | | | | | | | | | |
| Ratios/Supplemental Data: | | | | | | | | | | | | | | | | | | | | | | | | |
Net assets at end of period (000’s omitted) | | $ | 493,563 | | | $ | 595,412 | | | $ | 585,170 | | | $ | 518,620 | | | $ | 769,872 | | | $ | 745,942 | |
Ratio to average net assets of: | | | | | | | | | | | | | | | | | | | | | | | | |
Expenses | | | 0.35 | % | | | 0.35 | %(d) | | | 0.35 | % | | | 0.35 | % | | | 0.35 | % | | | 0.35 | % |
Net investment income | | | 0.69 | % | | | 0.29 | %(d) | | | 0.66 | % | | | 0.48 | % | | | 0.54 | % | | | 0.62 | % |
Portfolio turnover rate(e) | | | 86 | % | | | 70 | % | | | 81 | % | | | 78 | % | | | 102 | % | | | 75 | % |
| (a) | Based on average shares outstanding. |
| (b) | The mean between the last bid and ask prices. |
| (c) | Net asset value total return is calculated assuming an initial investment made at the net asset value at the beginning of the period, reinvestment of all dividends and distributions at net asset value during the period, and redemption on the last day of the period. Net asset value total return includes adjustments in accordance with accounting principles generally accepted in the United States of America and as such, the net asset value for financial reporting purposes and the returns based upon those net asset values may differ from the net asset value and returns for shareholder transactions. Market price total return is calculated assuming an initial investment made at the market price at the beginning of the period, reinvestment of all dividends and distributions at market price during the period, and sale at the market price on the last day of the period. Total investment returns calculated for a period of less than one year are not annualized. |
| (e) | Portfolio turnover rate is not annualized for periods less than one year, if applicable, and does not include securities received or delivered from processing creations or redemptions. |
See accompanying Notes to Financial Statements which are an integral part of the financial statements.
Financial Highlights(continued)
Invesco S&P Midcap 400® Pure Value ETF (RFV)
| | | | | | | | | | | | | | | | | | | | | | | | |
| | | Year Ended
April 30, 2019 | | | Six Months Ended
April 30, 2018 | | | Years Ended October 31, | |
| | | 2017 | | | 2016 | | | 2015 | | | 2014 | |
| Per Share Operating Performance: | | | | | | | | | | | | | | | | | | | | | | | | |
Net asset value at beginning of period | | $ | 65.71 | | | $ | 65.44 | | | $ | 53.46 | | | $ | 50.79 | | | $ | 52.71 | | | $ | 48.42 | |
Net investment income(a) | | | 0.81 | | | | 0.49 | | | | 0.75 | | | | 0.69 | | | | 0.86 | | | | 0.71 | |
Net realized and unrealized gain (loss) on investments | | | 3.90 | | | | 0.21 | | | | 12.01 | | | | 2.65 | | | | (1.96 | ) | | | 4.18 | |
Total from investment operations | | | 4.71 | | | | 0.70 | | | | 12.76 | | | | 3.34 | | | | (1.10 | ) | | | 4.89 | |
Distributions to shareholders from: | | | | | | | | | | | | | | | | | | | | | | | | |
Net investment income | | | (0.81 | ) | | | (0.43 | ) | | | (0.78 | ) | | | (0.67 | ) | | | (0.82 | ) | | | (0.60 | ) |
Net asset value at end of period | | $ | 69.61 | | | $ | 65.71 | | | $ | 65.44 | | | $ | 53.46 | | | $ | 50.79 | | | $ | 52.71 | |
Market price at end of period(b) | | $ | 69.69 | | | $ | 65.78 | | | | | | | | | | | | | | | | | |
| Net Asset Value Total Return(c) | | | 7.25 | % | | | 1.05 | % | | | 23.93 | % | | | 6.65 | % | | | (2.12 | )% | | | 10.14 | % |
| Market Price Total Return(c) | | | 7.25 | % | | | 1.19 | % | | | | | | | | | | | | | | | | |
| Ratios/Supplemental Data: | | | | | | | | | | | | | | | | | | | | | | | | |
Net assets at end of period (000’s omitted) | | $ | 142,737 | | | $ | 101,890 | | | $ | 108,015 | | | $ | 165,753 | | | $ | 104,142 | | | $ | 118,631 | |
Ratio to average net assets of: | | | | | | | | | | | | | | | | | | | | | | | | |
Expenses | | | 0.35 | % | | | 0.35 | %(d) | | | 0.35 | % | | | 0.35 | % | | | 0.35 | % | | | 0.35 | % |
Net investment income | | | 1.20 | % | | | 1.47 | %(d) | | | 1.21 | % | | | 1.36 | % | | | 1.62 | % | | | 1.38 | % |
Portfolio turnover rate(e) | | | 57 | % | | | 44 | % | | | 76 | % | | | 47 | % | | | 59 | % | | | 40 | % |
| (a) | Based on average shares outstanding. |
| (b) | The mean between the last bid and ask prices. |
| (c) | Net asset value total return is calculated assuming an initial investment made at the net asset value at the beginning of the period, reinvestment of all dividends and distributions at net asset value during the period, and redemption on the last day of the period. Net asset value total return includes adjustments in accordance with accounting principles generally accepted in the United States of America and as such, the net asset value for financial reporting purposes and the returns based upon those net asset values may differ from the net asset value and returns for shareholder transactions. Market price total return is calculated assuming an initial investment made at the market price at the beginning of the period, reinvestment of all dividends and distributions at market price during the period, and sale at the market price on the last day of the period. Total investment returns calculated for a period of less than one year are not annualized. |
| (e) | Portfolio turnover rate is not annualized for periods less than one year, if applicable, and does not include securities received or delivered from processing creations or redemptions. |
Invesco S&P SmallCap 600® Pure Growth ETF (RZG)
| | | | | | | | | | | | | | | | | | | | | | | | |
| | | Year Ended
April 30, 2019 | | | Six Months Ended
April 30, 2018 | | | Years Ended October 31, | |
| | | 2017 | | | 2016 | | | 2015 | | | 2014 | |
| Per Share Operating Performance: | | | | | | | | | | | | | | | | | | | | | | | | |
Net asset value at beginning of period | | $ | 114.43 | | | $ | 111.12 | | | $ | 82.65 | | | $ | 85.26 | | | $ | 80.56 | | | $ | 74.23 | |
Net investment income(a) | | | 0.32 | | | | 0.36 | | | | 0.46 | | | | 0.79 | | | | 0.47 | | | | 0.31 | |
Net realized and unrealized gain (loss) on investments | | | 1.32 | | | | 3.33 | | | | 28.43 | | | | (2.69 | ) | | | 4.70 | | | | 6.33 | |
Total from investment operations | | | 1.64 | | | | 3.69 | | | | 28.89 | | | | (1.90 | ) | | | 5.17 | | | | 6.64 | |
Distributions to shareholders from: | | | | | | | | | | | | | | | | | | | | | | | | |
Net investment income | | | (0.48 | ) | | | (0.38 | ) | | | (0.42 | ) | | | (0.71 | ) | | | (0.47 | ) | | | (0.31 | ) |
Net asset value at end of period | | $ | 115.59 | | | $ | 114.43 | | | $ | 111.12 | | | $ | 82.65 | | | $ | 85.26 | | | $ | 80.56 | |
Market price at end of period(b) | | $ | 115.58 | | | $ | 114.61 | | | | | | | | | | | | | | | | | |
| Net Asset Value Total Return(c) | | | 1.43 | % | | | 3.32 | % | | | 35.01 | % | | | (2.20 | )% | | | 6.42 | % | | | 8.96 | % |
| Market Price Total Return(c) | | | 1.26 | % | | | 3.36 | % | | | | | | | | | | | | | | | | |
| Ratios/Supplemental Data: | | | | | | | | | | | | | | | | | | | | | | | | |
Net assets at end of period (000’s omitted) | | $ | 236,954 | | | $ | 263,179 | | | $ | 238,904 | | | $ | 152,910 | | | $ | 225,933 | | | $ | 104,723 | |
Ratio to average net assets of: | | | | | | | | | | | | | | | | | | | | | | | | |
Expenses | | | 0.35 | % | | | 0.35 | %(d) | | | 0.35 | % | | | 0.35 | % | | | 0.35 | % | | | 0.35 | % |
Net investment income | | | 0.26 | % | | | 0.64 | %(d) | | | 0.45 | % | | | 0.97 | % | | | 0.55 | % | | | 0.39 | % |
Portfolio turnover rate(e) | | | 71 | % | | | 56 | % | | | 70 | % | | | 92 | % | | | 62 | % | | | 78 | % |
| (a) | Based on average shares outstanding. |
| (b) | The mean between the last bid and ask prices. |
| (c) | Net asset value total return is calculated assuming an initial investment made at the net asset value at the beginning of the period, reinvestment of all dividends and distributions at net asset value during the period, and redemption on the last day of the period. Net asset value total return includes adjustments in accordance with accounting principles generally accepted in the United States of America and as such, the net asset value for financial reporting purposes and the returns based upon those net asset values may differ from the net asset value and returns for shareholder transactions. Market price total return is calculated assuming an initial investment made at the market price at the beginning of the period, reinvestment of all dividends and distributions at market price during the period, and sale at the market price on the last day of the period. Total investment returns calculated for a period of less than one year are not annualized. |
| (e) | Portfolio turnover rate is not annualized for periods less than one year, if applicable, and does not include securities received or delivered from processing creations or redemptions. |
See accompanying Notes to Financial Statements which are an integral part of the financial statements.
Financial Highlights(continued)
Invesco S&P SmallCap 600® Pure Value ETF (RZV)
| | | | | | | | | | | | | | | | | | | | | | | | |
| | | Year Ended
April 30, 2019 | | | Six Months Ended
April 30, 2018 | | | Years Ended October 31, | |
| | | 2017 | | | 2016 | | | 2015 | | | 2014 | |
| Per Share Operating Performance: | | | | | | | | | | | | | | | | | | | | | | | | |
Net asset value at beginning of period | | $ | 71.57 | | | $ | 70.68 | | | $ | 60.52 | | | $ | 57.76 | | | $ | 62.54 | | | $ | 57.37 | |
Net investment income(a) | | | 0.99 | | | | 0.46 | | | | 0.62 | | | | 0.47 | | | | 0.71 | | | | 0.44 | |
Net realized and unrealized gain (loss) on investments | | | (4.02 | ) | | | 0.86 | | | | 10.18 | | | | 2.69 | | | | (4.79 | ) | | | 5.14 | |
Total from investment operations | | | (3.03 | ) | | | 1.32 | | | | 10.80 | | | | 3.16 | | | | (4.08 | ) | | | 5.58 | |
Distributions to shareholders from: | | | | | | | | | | | | | | | | | | | | | | | | |
Net investment income | | | (1.07 | ) | | | (0.43 | ) | | | (0.64 | ) | | | (0.40 | ) | | | (0.70 | ) | | | (0.41 | ) |
Net asset value at end of period | | $ | 67.47 | | | $ | 71.57 | | | $ | 70.68 | | | $ | 60.52 | | | $ | 57.76 | | | $ | 62.54 | |
Market price at end of period(b) | | $ | 67.53 | | | $ | 71.64 | | | | | | | | | | | | | | | | | |
| Net Asset Value Total Return(c) | | | (4.27 | )% | | | 1.87 | % | | | 17.88 | % | | | 5.50 | % | | | (6.60 | )% | | | 9.73 | % |
| Market Price Total Return(c) | | | (4.28 | )% | | | 1.76 | % | | | | | | | | | | | | | | | | |
| Ratios/Supplemental Data: | | | | | | | | | | | | | | | | | | | | | | | | |
Net assets at end of period (000’s omitted) | | $ | 192,279 | | | $ | 164,625 | | | $ | 236,795 | | | $ | 193,665 | | | $ | 150,190 | | | $ | 171,990 | |
Ratio to average net assets of: | | | | | | | | | | | | | | | | | | | | | | | | |
Expenses | | | 0.35 | % | | | 0.35 | %(d) | | | 0.35 | % | | | 0.35 | % | | | 0.35 | % | | | 0.35 | % |
Net investment income | | | 1.38 | % | | | 1.28 | %(d) | | | 0.91 | % | | | 0.83 | % | | | 1.15 | % | | | 0.73 | % |
Portfolio turnover rate(e) | | | 52 | % | | | 48 | % | | | 68 | % | | | 51 | % | | | 52 | % | | | 51 | % |
| (a) | Based on average shares outstanding. |
| (b) | The mean between the last bid and ask prices. |
| (c) | Net asset value total return is calculated assuming an initial investment made at the net asset value at the beginning of the period, reinvestment of all dividends and distributions at net asset value during the period, and redemption on the last day of the period. Net asset value total return includes adjustments in accordance with accounting principles generally accepted in the United States of America and as such, the net asset value for financial reporting purposes and the returns based upon those net asset values may differ from the net asset value and returns for shareholder transactions. Market price total return is calculated assuming an initial investment made at the market price at the beginning of the period, reinvestment of all dividends and distributions at market price during the period, and sale at the market price on the last day of the period. Total investment returns calculated for a period of less than one year are not annualized. |
| (e) | Portfolio turnover rate is not annualized for periods less than one year, if applicable, and does not include securities received or delivered from processing creations or redemptions. |
See accompanying Notes to Financial Statements which are an integral part of the financial statements.
Notes to Financial Statements
Invesco Exchange-Traded Fund Trust
April 30, 2019
NOTE 1—Organization
Invesco Exchange-Traded Fund Trust (the “Trust”) was organized as a Massachusetts business trust on June 9, 2000 and is authorized to have multiple series of portfolios. The Trust is an open-end management investment company registered under the Investment Company Act of 1940, as amended (the “1940 Act”). This report includes the following portfolios:
| | |
Full Name | | Short Name |
| Invesco S&P 500® Pure Growth ETF (RPG) | | “S&P 500® Pure Growth ETF” |
| Invesco S&P 500® Pure Value ETF (RPV) | | “S&P 500® Pure Value ETF” |
| Invesco S&P 500® Top 50 ETF (XLG) | | “S&P 500® Top 50 ETF” |
| Invesco S&P Midcap 400® Pure Growth ETF (RFG) | | “S&P Midcap 400® Pure Growth ETF” |
| Invesco S&P Midcap 400® Pure Value ETF (RFV) | | “S&P Midcap 400® Pure Value ETF” |
| Invesco S&P SmallCap 600® Pure Growth ETF (RZG) | | “S&P SmallCap 600® Pure Growth ETF” |
| Invesco S&P SmallCap 600® Pure Value ETF (RZV) | | “S&P SmallCap 600® Pure Value ETF” |
Each portfolio (each, a “Fund”, and collectively, the “Funds”) represents a separate series of the Trust. The shares of the Funds are referred to herein as “Shares” or “Fund’s Shares.” Each Fund’s shares are listed and traded on NYSE Arca, Inc.
The market price of each Share may differ to some degree from the Fund’s net asset value (“NAV”). Unlike conventional mutual funds, each Fund issues and redeems Shares on a continuous basis, at NAV, only in a large specified number of Shares, each called a “Creation Unit.” Creation Units are issued and redeemed principally in exchange for the deposit or delivery of a basket of securities (“Deposit Securities”). Except when aggregated in Creation Units by Authorized Participants, the Shares are not individually redeemable securities of the Funds.
The investment objective of each of the Funds is to replicate as closely as possible, before fees and expenses, the daily performance of its respective index listed below (each, an Underlying Index):
| | |
Fund | | Underlying Index |
| S&P 500® Pure Growth ETF | | S&P 500® Pure Growth Index |
| S&P 500® Pure Value ETF | | S&P 500® Pure Value Index |
| S&P 500® Top 50 ETF | | S&P 500® Top 50 Index |
| S&P Midcap 400® Pure Growth ETF | | S&P MidCap 400® Pure Growth Index |
| S&P Midcap 400® Pure Value ETF | | S&P MidCap 400® Pure Value Index |
| S&P SmallCap 600® Pure Growth ETF | | S&P SmallCap 600® Pure Growth Index |
| S&P SmallCap 600® Pure Value ETF | | S&P SmallCap 600® Pure Value Index |
NOTE 2—Significant Accounting Policies
The following is a summary of the significant accounting policies followed by the Funds in preparation of their financial statements.
Each Fund is an investment company and accordingly follows the investment company accounting and reporting guidance in accordance with Financial Accounting Standards Board Accounting Standards Codification Topic 946,Financial Services—Investment Companies.
| A. | Security Valuation— Securities, including restricted securities, are valued according to the following policies: |
A security listed or traded on an exchange (except convertible securities) is generally valued at its last sales price or official closing price as of the close of the customary trading session on the exchange where the security is principally traded or, lacking any sales or official closing price on a particular day, the security may be valued at the closing bid price on that day. Securities traded in the over-the-counter market are valued based on prices furnished by independent pricing services or market makers. When such securities are valued by an independent pricing service they may be considered fair valued. Futures contracts are valued at the final settlement price set by an exchange on which they are principally traded. Listed options are valued at the mean between the last bid and asked prices from the exchange on which they are principally traded, or at the final settlement price set by such exchange. Swaps and options not listed on an exchange are valued by an independent source. For purposes of determining NAV per Share, futures and option contracts generally are valued 15 minutes after the close of the customary trading session of the New York Stock Exchange (“NYSE”).
Investment companies are valued using such company’s NAV per share, unless the shares are exchange-traded, in which case they are valued at the last sales price or official closing price as of the close of the customary trading session on the exchange where the security is principally traded.
Debt obligations (including convertible securities) and unlisted equities are fair valued using an evaluated quote provided by an independent pricing service. Evaluated quotes provided by the pricing service may be determined without exclusive reliance on quoted prices, and may reflect appropriate factors such as institution-size trading in similar groups of securities, developments related to specific securities, dividend rate (for unlisted equities), yield (for debt obligations), quality, type of issue, coupon rate (for debt obligations), maturity (for debt obligations), individual trading characteristics and other market data. Securities with a demand feature exercisable within one to seven days are valued at par. Pricing services generally value debt obligations assuming orderly transactions of institutional round lot size, but a Fund may hold or transact in the same securities in smaller, odd lot sizes. Odd lots often trade at lower prices than institutional round lots. Debt obligations are subject to interest rate and credit risks. In addition, all debt obligations involve some risk of default with respect to interest and/or principal payments.
Foreign securities’ (including foreign exchange contracts’) prices are converted into U.S. dollar amounts using the applicable exchange rates as of the close of the London world markets. If market quotations are available and reliable for foreign exchange-traded equity securities, the securities will be valued at the market quotations. Because trading hours for certain foreign securities end before the close of the NYSE, closing market quotations may become unreliable. If between the time trading ends on a particular security and the close of the customary trading session on the NYSE, events occur that Invesco Capital Management LLC (the “Adviser”) determines are significant and make the closing price unreliable, a Fund may fair value the security. If the event is likely to have affected the closing price of the security, the security will be valued at fair value in good faith using procedures approved by the Board of Trustees. Adjustments to closing prices to reflect fair value may also be based on a screening process of an independent pricing service to indicate the degree of certainty, based on historical data, that the closing price in the principal market where a foreign security trades is not the current value as of the close of the NYSE. Foreign securities’ prices meeting the approved degree of certainty that the price is not reflective of current value will be priced at the indication of fair value from the independent pricing service. Multiple factors may be considered by the independent pricing service in determining adjustments to reflect fair value and may include information relating to sector indices, American Depositary Receipts and domestic and foreign index futures. Foreign securities may have additional risks including exchange rate changes, the potential for sharply devalued currencies and high inflation, political and economic upheaval, the relative lack of issuer information, relatively low market liquidity and the potential lack of strict financial and accounting controls and standards.
Securities for which market prices are not provided by any of the above methods may be valued based upon quotes furnished by independent sources. The last bid price may be used to value exchange-traded equity securities. The mean between the last bid and asked prices may be used to value debt obligations, including corporate loans, and unlisted equity securities.
Securities for which market quotations are not readily available or became unreliable are valued at fair value as determined in good faith following procedures approved by the Board of Trustees. Issuer-specific events, market trends, bid/asked quotes of brokers and information providers and other market data may be reviewed in the course of making a good faith determination of a security’s fair value.
Each Fund may invest in securities that are subject to interest rate risk, meaning the risk that the prices will generally fall as interest rates rise and, conversely, the prices will generally rise as interest rates fall. Specific securities differ in their sensitivity to changes in interest rates depending on their individual characteristics. Changes in interest rates may result in increased market volatility, which may affect the value and/or liquidity of certain Fund investments.
Valuations change in response to many factors, including the historical and prospective earnings of the issuer, the value of the issuer’s assets, general economic conditions, interest rates, investor perceptions and market liquidity. Because of the inherent uncertainties of valuation, the values reflected in the financial statements may materially differ from the value received upon actual sale of those investments.
Authorized Participant Concentration Risk.Only Authorized Participants (“APs”) may engage in creation or redemption transactions directly with each Fund. Each Fund has a limited number of institutions that may act as APs, and such APs have no obligation to submit creation or redemption orders. Consequently, there is no assurance that those APs will establish or maintain an active trading market for the Shares. This risk may be heightened to the extent that securities underlying each Fund are traded outside a collateralized settlement system. In that case, APs may be required to post collateral on certain trades on an agency basis (i.e., on behalf of other market participants), which only a limited number of APs may be able to do. In addition, to the extent that APs exit the business or are unable to proceed with creation and/or redemption orders with respect to each Fund and no other AP is able to step forward to create or redeem Creation Units, this may result in a significantly diminished trading market for Fund Shares, which may be more likely to trade at a premium or discount to each Fund’s NAV and possibly face trading halts and/or delisting. This risk may be heightened for Funds that invest in non-U.S. securities, which may have lower trading volumes.
Equity Risk.Equity risk is the risk that the value of equity securities, including common stocks, may fall due to both changes in general economic conditions that impact the market as a whole, as well as factors that directly relate to a specific company or its industry. Such general economic conditions include changes in interest rates, periods of market turbulence or instability, or general and prolonged periods of economic decline and cyclical change. It is possible that a drop in the stock market may depress the price of most or all of the common stocks that each Fund holds. In addition, equity risk includes the risk that investor sentiment toward particular industries will become negative. The value of a company’s common stock may fall solely because of factors, such as an increase in production costs, that negatively impact other companies in the same region, industry or sector of the market. A company’s common stock also may decline significantly in price over a short period of time due to factors specific to that company, including decisions made by its management or lower demand for the company’s products or services. For example, an adverse event, such as an unfavorable earnings report or the failure to make anticipated dividend payments, may depress the value of common stock.
Industry Concentration Risk.In following its methodology, each Fund’s Underlying Index from time to time may be concentrated to a significant degree in securities of issuers operating in a single industry or industry group. To the extent that each Underlying Index concentrates in the securities of issuers in a particular industry or industry group, the corresponding Fund will also concentrate its investments to approximately the same extent. By concentrating its investments in an industry or industry group, each Fund faces more risks than if it were diversified broadly over numerous industries or industry groups. Such industry-based risks, any of which may adversely affect the companies in which each Fund invests, may include, but are not limited to, legislative or regulatory changes, adverse market conditions and/or increased competition within the industry or industry group. In addition, at times, such industry or industry group may be out of favor and underperform other industries, industry groups or the market as a whole.
Non-Correlation Risk.Each Fund’s return may not match the return of its Underlying Index for a number of reasons. For example, each Fund incurs operating expenses not applicable to its Underlying Index, and incurs costs in buying and selling securities, especially when rebalancing the Fund’s securities holdings to reflect changes in the composition of its Underlying Index. In addition, the performance of each Fund and its Underlying Index may vary due to asset valuation differences and differences between each Fund’s portfolio and its Underlying Index resulting from legal restrictions, costs or liquidity constraints.
Non-Diversified Fund Risk.Each Fund is non-diversified and can invest a greater portion of its assets in securities of individual issuers than a diversified fund. As a result, changes in the market value of a single issuer’s securities could cause greater fluctuations in the value of the Shares than would occur in a diversified fund. This may increase a Fund’s volatility and cause the performance of a relatively small number of issuers to have a greater impact on a Fund’s performance.
Index Risk.Unlike many investment companies, the Funds do not utilize investing strategies that seek returns in excess of their Underlying Indexes. Therefore, a Fund would not necessarily buy or sell a security unless that security is added or removed, respectively, from its respective Underlying Index, even if that security generally is underperforming.
Small-and Mid-Capitalization Company Risk.For certain Funds, investing in securities of small- and mid-capitalization companies involves greater risk than customarily is associated with investing in larger, more established companies. These companies’ securities may be more volatile and less liquid than those of more established companies. These securities may have returns that vary, sometimes significantly, from the overall securities market. Often small- and mid-capitalization companies and the industries in which they focus are still evolving and, as a result, they may be more sensitive to changing market conditions.
| C. | Investment Transactions and Investment Income— Investment transactions are accounted for on a trade date basis. Realized gains and losses from the sale or disposition of securities are computed on the specific identified cost basis. Interest income is recorded on the accrual basis from settlement date. Pay-in-kind interest income and non-cash dividend income received in the form of securities in-lieu of cash are recorded at the fair value of the securities received. Dividend income (net of withholding tax, if any) is recorded on the ex-dividend date. Realized gains, dividends and interest received by a Fund may give rise to withholding and other taxes imposed by foreign countries. Tax conventions between certain countries and the United States may reduce or eliminate such taxes. |
The Funds may periodically participate in litigation related to each Fund’s investments. As such, the Funds may receive proceeds from litigation settlements. Any proceeds received are included in the Statements of Operations as realized gain (loss) for investments no longer held and as unrealized gain (loss) for investments still held.
Brokerage commissions and mark ups are considered transaction costs and are recorded as an increase to the cost basis of securities purchased and/or a reduction of proceeds on a sale of securities. Such transaction costs are included in the determination of net realized and unrealized gain (loss) from investment securities reported in the Statements of Operations and the Statements of Changes in Net Assets and the net realized and unrealized gains (losses) on securities per share in the Financial Highlights. Transaction costs are included in the calculation of each Fund’s NAV and, accordingly, they reduce each Fund’s total returns. These transaction costs are not considered operating expenses and are not reflected in net investment income reported in the Statements of Operations and the Statements of Changes in Net Assets, or the net investment income per share and the ratios of expenses and net investment income reported in the Financial Highlights, nor are they limited by any expense limitation arrangements between each Fund and the Adviser.
| D. | Country Determination— For the purposes of presentation in the Schedules of Investments, the Adviser may determine the country in which an issuer is located and/or credit risk exposure based on various factors. These factors include whether each Fund’s Underlying Index has made a country determination and may include the laws of the country under which the issuer is organized, where the issuer maintains a principal office, the country in which the issuer derives 50% or more of its total revenues and the country that has the primary market for the issuer’s securities, as well as other criteria. Among the other criteria that may be evaluated for making this determination are the country in which the issuer maintains 50% or more of its assets, the type of security, financial guarantees and enhancements, the nature of the collateral and the sponsor organization. Country of issuer and/or credit risk exposure has been determined to be the United States of America, unless otherwise noted. |
| E. | Dividends and Distributions to Shareholders— Each Fund declares and pays dividends from net investment income, if any, to its shareholders quarterly and records such dividends on ex-dividend date. Generally, each Fund distributes net realized taxable capital gains, if any, annually in cash and records them on ex-dividend date. Such distributions on a tax basis are determined in conformity with federal income tax regulations, which may differ from accounting principles generally accepted in the United States of America (“GAAP”). Distributions in excess of tax basis earnings and profits, if any, are reported in such Fund’s financial statements as a tax return of capital at fiscal year-end. |
| F. | Federal Income Taxes— Each Fund intends to comply with the provisions of the Internal Revenue Code of 1986, as amended (the “Internal Revenue Code”), applicable to regulated investment companies and to distribute substantially all of the Fund’s taxable earnings to its shareholders. As such, the Funds will not be subject to federal income taxes on otherwise taxable income (including net realized gains) that is distributed to the shareholders. Therefore, no provision for federal income taxes is recorded in the financial statements. |
Each Fund recognizes the tax benefits of uncertain tax positions only when the position is more likely than not to be sustained. Management has analyzed each Fund’s uncertain tax positions and concluded that no liability for unrecognized tax benefits should be recorded related to uncertain tax positions. Management is not aware of any tax positions for which it is reasonably possible that the total amounts of unrecognized tax benefits will change materially in the next 12 months.
Income and capital gain distributions are determined in accordance with federal income tax regulations, which may differ from GAAP. These differences are primarily due to differing book and tax treatments for in-kind transactions, losses deferred due to wash sales, and passive foreign investment company adjustments, if any.
The Funds file U.S. federal tax returns and tax returns in certain other jurisdictions. Generally, a Fund is subject to examinations by such taxing authorities for up to three years after the filing of the return for the tax period.
| G. | Expenses— Expenses of the Trust that are directly identifiable to a specific Fund are applied to that Fund. Expenses of the Trust that are not readily identifiable to a specific Fund are allocated in such a manner as deemed equitable, taking into consideration the nature and type of expense and the relative net assets of each Fund. |
Each Fund has agreed to pay an annual unitary management fee to the Adviser. Out of the unitary management fee, the Adviser has agreed to pay for substantially all expenses of the Funds, including the costs of transfer agency, custody, fund administration, legal, audit and other services, except for advisory fees, distribution fees, if any, brokerage expenses, taxes, interest, acquired fund fees and expenses, if any, litigation expenses and other extraordinary expenses.
To the extent a Fund invests in other investment companies, the expenses shown in the accompanying financial statements reflect the expenses of the Fund and do not include any expenses of the investment companies in which it invests. The effects of such investment companies’ expenses are included in the realized and unrealized gain or loss on the investments in the investment companies.
| H. | Accounting Estimates— The preparation of the financial statements in accordance with GAAP requires management to make estimates and assumptions that affect the reported amounts and disclosures in the financial statements, including estimates and assumptions related to taxation. Actual results could differ from these estimates. In addition, the Funds monitor for material events or transactions that may occur or become known after the period-end date and before the date the financial statements are released to print. |
| I. | Indemnifications— Under the Trust’s organizational documents, its Officers and Trustees are indemnified against certain liabilities arising out of the performance of their duties to the Trust. Each Board member who is not an “interested person” (as defined in the 1940 Act) of the Trust (each, an “Independent Trustee”) is also indemnified against certain liabilities arising out of the performance of his duties to the Trust pursuant to an Indemnification Agreement between such trustee and the Trust. Additionally, in the normal course of business, the Trust enters into contracts with service providers that contain general indemnification clauses. The Trust’s maximum exposure under these arrangements is unknown, as this would involve future claims that may be made against the Trust that have not yet occurred. However, based on experience, the Trust believes the risk of loss to be remote. |
| J. | Securities Lending— During the fiscal year ended April 30, 2019, Invesco S&P 500® Pure Growth ETF, Invesco S&P 500® Pure Value ETF, Invesco S&P MidCap 400® Pure Growth ETF, Invesco S&P MidCap 400® Pure Value ETF, Invesco S&P SmallCap 600® Pure Growth ETF and Invesco S&P SmallCap 600® Pure Value ETF participated in securities lending. Each Fund loaned portfolio securities having a market value up to one-third of each Fund’s total assets. Such loans are secured by cash collateral equal to no less than 102% (105% for international securities) of the market value of the loaned securities determined daily by the securities lending provider. Cash collateral received in connection with these loans is generally invested in an affiliated money market fund and is shown as such on the Schedules of Investments. Each Fund bears the risk |
of loss with respect to the investment of collateral. It is the policy of these Funds to obtain additional collateral from or return excess collateral to the borrower by the end of the next business day, following the valuation date of the securities loaned. Therefore, the value of the collateral held may be temporarily less than the value of the securities on loan. When loaning securities, each Fund retains certain benefits of owning the securities, including the economic equivalent of dividends or interest generated by the security. Lending securities entails a risk of loss to each Fund if, and to the extent that, the market value of the securities loaned were to increase, and the borrower did not increase the collateral accordingly, and the borrower failed to return the securities. The securities loaned are subject to termination at the option of the borrower or each Fund. Upon termination, the borrower will return to each Fund the securities loaned and each Fund will return the collateral. Upon the failure of the borrower to return the securities, collateral may be liquidated and the securities may be purchased on the open market to replace the loaned securities. Each Fund could experience delays and costs in gaining access to the collateral and the securities may lose value during the delay which could result in potential losses to each Fund. Some of these losses may be indemnified by the lending agent. Each Fund bears the risk of any deficiency in the amount of the collateral available for return to the borrower due to any loss on the collateral invested. Dividends received on cash collateral investments for securities lending transactions, which are net of compensation to counterparties, are included inSecurities lending incomeon the Statements of Operations. The aggregate value of securities out on loan, if any, is shown on the Statements of Assets and Liabilities.
| K. | Distributions from Distributable Earnings— In accordance with the Securities and Exchange Commission’s issuance of Disclosure Update and Simplification, the Funds have presented the total, rather than the components, of distributions to shareholders, except for tax return of capital distributions, if any, in the Statements of Changes in Net Assets. |
For the period November 1, 2017 through April 30, 2018 and the fiscal year ended October 31, 2017, distributions from distributable earnings consisted of distributions from net investment income.
NOTE 3—Investment Advisory Agreement and Other Agreements
The Trust has entered into an Investment Advisory Agreement with the Adviser on behalf of each Fund, pursuant to which the Adviser has overall responsibility for the selection and ongoing monitoring of each Fund’s investments, managing each Fund’s business affairs and providing certain clerical, bookkeeping and other administrative services. Pursuant to the Investment Advisory Agreement, each Fund accrues daily and pays monthly to the Adviser an annual unitary management fee equal to a percentage of its average daily net assets as follows:
| | |
| | | Unitary Management Fees
(as a % of Net Assets) |
| S&P 500® Pure Growth ETF | | 0.35% |
| S&P 500® Pure Value ETF | | 0.35% |
| S&P 500® Top 50 ETF | | 0.20% |
| S&P Midcap 400® Pure Growth ETF | | 0.35% |
| S&P Midcap 400® Pure Value ETF | | 0.35% |
| S&P SmallCap 600® Pure Growth ETF | | 0.35% |
| S&P SmallCap 600® Pure Value ETF | | 0.35% |
Out of the unitary management fee, the Adviser has agreed to pay for substantially all expenses of the Funds, including the cost of transfer agency, custody, fund administration, legal, audit and other services, except for advisory fees, distribution fees, if any, brokerage expenses, taxes, interest, acquired fund fees and expenses, if any, litigation expenses and other extraordinary expenses.
The Adviser has agreed to waive fees and/or pay Fund expenses to the extent necessary to prevent the operating expense of the Fund (excluding interest expenses, brokerage commissions and other trading expenses, taxes and litigation expenses, acquired fund fees and expenses, if applicable, and extraordinary expenses) from exceeding a percentage of the Fund’s average daily net assets per year (the “Expense Cap’’) through at least April 6, 2020, and neither the Adviser nor the Fund can discontinue the agreement prior to its expiration. For each Fund, the Adviser did not waive fees and/or pay Fund expenses during the period under this Expense Cap. The limits are listed below:
| | | | |
| | | Expense Caps | | Contract End Date |
| S&P 500® Pure Growth ETF | | 0.35% | | 04/06/20 |
| S&P 500® Pure Value ETF | | 0.35% | | 04/06/20 |
| S&P 500® Top 50 ETF | | 0.20% | | 04/06/20 |
| S&P Midcap 400® Pure Growth ETF | | 0.35% | | 04/06/20 |
| S&P Midcap 400® Pure Value ETF | | 0.35% | | 04/06/20 |
| S&P SmallCap 600® Pure Growth ETF | | 0.35% | | 04/06/20 |
| S&P SmallCap 600® Pure Value ETF | | 0.35% | | 04/06/20 |
Additionally, through at least August 31, 2021, the Adviser has contractually agreed to waive a portion of each Fund’s management fee in an amount equal to 100% of the net advisory fees an affiliate of the Adviser receives that are attributable to certain of the Fund’s investment in money market funds managed by that affiliate (excluding investment of cash collateral from securities lending). There is no guarantee that the Adviser will extend the waiver of these fees past that date.
For the year ended April 30, 2019, the Adviser waived fees and/or paid Fund expenses for each Fund in the following amounts:
| | | | |
| S&P 500® Pure Growth ETF | | $ | 1,608 | |
| S&P 500® Pure Value ETF | | | 1,606 | |
| S&P 500® Top 50 ETF | | | 862 | |
| S&P Midcap 400® Pure Growth ETF | | | 705 | |
| S&P Midcap 400® Pure Value ETF | | | 693 | |
| S&P SmallCap 600® Pure Growth ETF | | | 208 | |
| S&P SmallCap 600® Pure Value ETF | | | 256 | |
The Trust has entered in a Distribution Agreement with Invesco Distributors, Inc. (the “Distributor”), which serves as the distributor of Creation Units for each Fund. The Distributor does not maintain a secondary market in the Shares. The Funds are not charged any fees pursuant to the Distribution Agreement. The Distributor is an affiliate of the Adviser.
The Trust has entered into service agreements whereby The Bank of New York Mellon, a wholly-owned subsidiary of The Bank of New York Mellon Corporation, serves as the administrator, custodian, fund accountant and transfer agent for each Fund.
The Adviser has entered into licensing agreements on behalf of each Fund with S&P Dow Jones Indices LLC (the “Licensor”).
Each Underlying Index name trademark is owned by the Licensor. These trademarks have been licensed to the Adviser for use by the Funds. Each Fund is entitled to use its Underlying Index pursuant to the Trust’s sub-licensing agreement with the Adviser. The Funds are not sponsored, endorsed, sold or promoted by the Licensor, and the Licensor makes no representation regarding the advisability of investing in any of the Funds.
NOTE 4—Investments in Affiliates
The Adviser and Invesco Mortgage Capital, Inc. are wholly-owned subsidiaries of Invesco Ltd. and therefore, Invesco Ltd. and Invesco Mortgage Capital, Inc. are considered to be affiliated with the Funds. The tables below show certain Funds’ transactions in, and earnings from, investments in affiliates (excluding affiliated money market funds) for the fiscal year ended April 30, 2019.
S&P 500® Pure Value ETF
| | | | | | | | | | | | | | | | | | | | | | | | | | | | |
| | | Value
April 30, 2018 | | | Purchases
at Cost | | | Proceeds
from Sales | | | Change in
Unrealized
Appreciation | | | Realized
Gain
(Loss) | | | Value
April 30, 2019 | | | Dividend
Income | |
| Invesco Ltd. | | $ | 2,388,779 | | | $ | 9,161,425 | | | $ | (1,330,680 | ) | | $ | 2,122,123 | | | $ | 40,865 | | | $ | 12,382,512 | | | $ | 247,148 | |
S&P SmallCap 600® Pure Value ETF
| | | | | | | | | | | | | | | | | | | | | | | | | | | | |
| | | Value
April 30, 2018 | | | Purchases
at Cost | | | Proceeds
from Sales | | | Change in
Unrealized
Appreciation | | | Realized
Gain
(Loss) | | | Value
April 30, 2019 | | | Dividend
Income | |
| Invesco Mortgage Capital, Inc. | | $ | 682,894 | | | $ | 454,910 | | | $ | (505,319 | ) | | $ | 77,636 | | | $ | (89,194 | ) | | $ | 620,927 | | | $ | 68,751 | |
NOTE 5—Additional Valuation Information
GAAP defines fair value as the price that would be received to sell an asset or paid to transfer a liability in an orderly transaction between market participants at the measurement date, under current market conditions. GAAP establishes a hierarchy that prioritizes the inputs to valuation methods, giving the highest priority to readily available unadjusted quoted prices in an active market for identical assets (Level 1) and the lowest priority to significant unobservable inputs (Level 3), generally when market prices are not readily available or are unreliable. Based on the valuation inputs, the securities or other investments are tiered into one of three levels. Changes in valuation methods may result in transfers in or out of an investment’s assigned level:
| | Level 1 — | Prices are determined using quoted prices in an active market for identical assets. |
| | Level 2 — | Prices are determined using other significant observable inputs. Observable inputs are inputs that other market participants may use in pricing a security. These may include quoted prices for similar securities, interest rates, prepayment speeds, credit risk, yield curves, loss severities, default rates, discount rates, volatilities and others. |
| | Level 3 — | Prices are determined using significant unobservable inputs. In situations where quoted prices or observable inputs are unavailable (for example, when there is little or no market activity for an investment at the end of the period), unobservable inputs may be used. Unobservable inputs reflect a Fund’s own assumptions about the factors market participants would use in determining fair value of the securities or instruments and would be based on the best available information. |
Except for the Fund listed below, as of April 30, 2019, all of the securities in each Fund were valued based on Level 1 inputs (see the Schedules of Investments for security categories). The level assigned to the securities valuations may not be an indication of the risk or liquidity associated with investing in those securities. Because of the inherent uncertainties of valuation, the values reflected in the financial statements may materially differ from the value received upon actual sale of those investments.
| | | | | | | | | | | | | | | | |
| | | Level 1 | | | Level 2 | | | Level 3 | | | Total | |
| S&P SmallCap 600® Pure Value ETF | | | | | | | | | | | | | | | | |
| Investments in Securities | | | | | | | | | | | | | | | | |
Common Stocks & Other Equity Interests | | $ | 192,176,243 | | | $ | — | | | $ | 5,606 | | | $ | 192,181,849 | |
Money Market Funds | | | 8,559,639 | | | | — | | | | — | | | | 8,559,639 | |
| | | | | | | | | | | | | | | | |
Total Investments | | $ | 200,735,882 | | | $ | — | | | $ | 5,606 | | | $ | 200,741,488 | |
| | | | | | | | | | | | | | | | |
NOTE 6—Distributions to Shareholders and Tax Components of Net Assets
Tax Character of Distributions to Shareholder Paid During the Year Ended April 30, 2019, Period November 1, 2017 to April 30, 2018 and Year Ended October 31, 2017:
| | | | | | | | | | | | |
| | | 2019 | | | 2018 | | | 2017 | |
| | | Ordinary
Income | | | Ordinary
Income | | | Ordinary
Income | |
| S&P 500® Pure Growth ETF | | $ | 11,700,928 | | | $ | 5,229,876 | | | $ | 13,278,946 | |
| S&P 500® Pure Value ETF | | | 20,818,512 | | | | 8,749,124 | | | | 16,800,045 | |
| S&P 500® Top 50 ETF | | | 14,318,678 | | | | 6,688,046 | | | | 12,471,172 | |
| S&P Midcap 400® Pure Growth ETF | | | 4,283,416 | | | | 1,653,088 | | | | 3,297,427 | |
| S&P Midcap 400® Pure Value ETF | | | 1,390,448 | | | | 873,890 | | | | 1,979,370 | |
| S&P SmallCap 600® Pure Growth ETF | | | 1,100,625 | | | | 831,382 | | | | 850,483 | |
| S&P SmallCap 600® Pure Value ETF | | | 2,712,991 | | | | 1,184,577 | | | | 1,947,059 | |
Tax Components of Net Assets at Fiscal Year-End:
| | | | | | | | | | | | | | | | | | | | |
| | | Undistributed
Ordinary
Income | | | Net
Unrealized
Appreciation-
Investments | | | Capital Loss
Carryforwards | | | Shares of
Beneficial
Interest | | | Total
Net Assets | |
| S&P 500® Pure Growth ETF | | $ | 1,898,173 | | | $ | 514,572,553 | | | $ | (409,907,792 | ) | | $ | 2,735,595,754 | | | $ | 2,842,158,688 | |
| S&P 500® Pure Value ETF | | | 1,085,557 | | | | 54,800,782 | | | | (228,969,584 | ) | | | 1,101,966,713 | | | | 928,883,468 | |
| S&P 500® Top 50 ETF | | | 907,375 | | | | 202,510,911 | | | | (17,203,975 | ) | | | 652,689,618 | | | | 838,903,929 | |
| S&P Midcap 400® Pure Growth ETF | | | — | | | | 71,216,680 | | | | (185,527,528 | ) | | | 607,873,653 | | | | 493,562,805 | |
| S&P Midcap 400® Pure Value ETF | | | 57,822 | | | | 18,098,654 | | | | (39,486,284 | ) | | | 164,066,613 | | | | 142,736,805 | |
| S&P SmallCap 600® Pure Growth ETF | | | — | | | | 20,603,819 | | | | (92,762,223 | ) | | | 309,111,912 | | | | 236,953,508 | |
| S&P SmallCap 600® Pure Value ETF | | | — | | | | 7,266,769 | | | | (94,903,967 | ) | | | 279,915,782 | | | | 192,278,584 | |
Capital loss carryforwards are calculated and reported as of a specific date. Results of transactions and other activity after that date may affect the amount of capital loss carryforwards actually available for the Funds to utilize. Capital losses generated in years beginning after December 22, 2010 can be carried forward for an unlimited period, whereas previous losses expire in eight tax years. Capital losses with an expiration period may not be used to offset capital gains until all net capital losses without an expiration date have been utilized. Capital loss carryforwards with no expiration date will retain their character as either short-term or long-term capital losses instead of as short-term capital losses as under prior law. The ability to utilize capital loss carryforwards in the future may be limited under the Internal Revenue Code and related regulations based on the results of future transactions.
The following table presents available capital loss carryforwards for each Fund as of April 30, 2019:
| | | | | | | | | | | | |
| | | Post-effective/no expiration | | | | |
| | | Short-Term | | | Long-Term | | | Total* | |
| S&P 500® Pure Growth ETF | | $ | 236,025,344 | | | $ | 173,882,448 | | | $ | 409,907,792 | |
| S&P 500® Pure Value ETF | | | 80,546,163 | | | | 148,423,421 | | | | 228,969,584 | |
| S&P 500® Top 50 ETF | | | 5,036,434 | | | | 12,167,541 | | | | 17,203,975 | |
| S&P Midcap 400® Pure Growth ETF | | | 108,921,726 | | | | 76,605,802 | | | | 185,527,528 | |
| S&P Midcap 400® Pure Value ETF | | | 19,599,251 | | | | 19,887,033 | | | | 39,486,284 | |
| S&P SmallCap 600® Pure Growth ETF | | | 63,771,012 | | | | 28,991,211 | | | | 92,762,223 | |
| S&P SmallCap 600® Pure Value ETF | | | 44,033,267 | | | | 50,870,700 | | | | 94,903,967 | |
| * | Capital loss carryforward as of the date listed above is reduced for limitations, if any, to the extent required by the Internal Revenue Code and may be further limited depending upon a variety of factors, including the realization of net unrealized gains or losses as of the date of any reorganization. |
NOTE 7—Investment Transactions
For the fiscal year ended April 30, 2019, the cost of securities purchased and proceeds from sales of securities (other than short-term securities, U.S. Treasury obligations, money market funds and in-kind transactions, if any) were as follows:
| | | | | | | | |
| | | Purchases | | | Sales | |
| S&P 500® Pure Growth ETF | | $ | 1,555,463,907 | | | $ | 1,541,486,573 | |
| S&P 500® Pure Value ETF | | | 341,718,252 | | | | 334,554,244 | |
| S&P 500® Top 50 ETF | | | 58,732,813 | | | | 62,953,358 | |
| S&P Midcap 400® Pure Growth ETF | | | 485,283,340 | | | | 489,983,610 | |
| S&P Midcap 400® Pure Value ETF | | | 66,576,555 | | | | 67,405,388 | |
| S&P SmallCap 600® Pure Growth ETF | | | 208,562,310 | | | | 216,629,851 | |
| S&P SmallCap 600® Pure Value ETF | | | 93,395,527 | | | | 93,322,287 | |
For the fiscal year ended April 30, 2019, in-kind transactions associated with creations and redemptions were as follows:
| | | | | | | | |
| | | Cost of
Securities
Received | | | Value of
Securities
Delivered | |
| S&P 500® Pure Growth ETF | | $ | 1,493,462,719 | | | $ | 1,171,531,118 | |
| S&P 500® Pure Value ETF | | | 456,427,870 | | | | 407,397,924 | |
| S&P 500® Top 50 ETF | | | 211,716,263 | | | | 141,200,222 | |
| S&P Midcap 400® Pure Growth ETF | | | 200,812,031 | | | | 277,013,385 | |
| S&P Midcap 400® Pure Value ETF | | | 60,853,011 | | | | 30,248,965 | |
| S&P SmallCap 600® Pure Growth ETF | | | 240,513,402 | | | | 249,890,266 | |
| S&P SmallCap 600® Pure Value ETF | | | 97,970,361 | | | | 62,921,507 | |
Gains (losses) on in-kind transactions are generally not considered taxable gains (losses) for federal income tax purposes.
At April 30, 2019, the aggregate cost of investments, including any derivatives, on a tax basis includes adjustments for financial reporting purposes as of the most recently completed federal income tax reporting period-end:
| | | | | | | | | | | | | | | | |
| | | Gross
Unrealized
Appreciation | | | Gross
Unrealized
(Depreciation) | | | Net
Unrealized
Appreciation
(Depreciation) | | | Cost | |
| S&P 500® Pure Growth ETF | | $ | 531,636,371 | | | $ | (17,063,818 | ) | | $ | 514,572,553 | | | $ | 2,326,890,074 | |
| S&P 500® Pure Value ETF | | | 106,651,751 | | | | (51,850,969 | ) | | | 54,800,782 | | | | 887,886,267 | |
| S&P 500® Top 50 ETF | | | 240,783,929 | | | | (38,273,018 | ) | | | 202,510,911 | | | | 635,849,802 | |
| S&P Midcap 400® Pure Growth ETF | | | 84,189,873 | | | | (12,973,193 | ) | | | 71,216,680 | | | | 432,301,526 | |
| S&P Midcap 400® Pure Value ETF | | | 24,213,007 | | | | (6,114,353 | ) | | | 18,098,654 | | | | 132,683,614 | |
| S&P SmallCap 600® Pure Growth ETF | | | 31,561,193 | | | | (10,957,374 | ) | | | 20,603,819 | | | | 227,392,197 | |
| S&P SmallCap 600® Pure Value ETF | | | 31,133,981 | | | | (23,867,212 | ) | | | 7,266,769 | | | | 193,474,719 | |
NOTE 8—Reclassification of Permanent Differences
Primarily as a result of differing book/tax treatment of in-kind transactions and expired capital loss carryforwards, amounts were reclassified between undistributed net investment income (loss), undistributed net realized gain (loss) and Shares of beneficial interest. These reclassifications had no effect on the net assets of each Fund. For the fiscal year ended April 30, 2019, the reclassifications were as follows:
| | | | | | | | | | | | |
| | | Undistributed
Net Investment
Income | | | Undistributed
Net Realized
Gain (Loss) | | | Shares of
Beneficial
Interest | |
| S&P 500® Pure Growth ETF | | $ | — | | | $ | (244,871,808 | ) | | $ | 244,871,808 | |
| S&P 500® Pure Value ETF | | | — | | | | (43,850,547 | ) | | | 43,850,547 | |
| S&P 500® Top 50 ETF | | | — | | | | (56,433,282 | ) | | | 56,433,282 | |
| S&P Midcap 400® Pure Growth ETF | | | 337,351 | | | | (64,632,059 | ) | | | 64,294,708 | |
| S&P Midcap 400® Pure Value ETF | | | — | | | | (4,544,613 | ) | | | 4,544,613 | |
| S&P SmallCap 600® Pure Growth ETF | | | 284,028 | | | | (52,397,974 | ) | | | 52,113,946 | |
| S&P SmallCap 600® Pure Value ETF | | | 86,637 | | | | (8,455,285 | ) | | | 8,368,648 | |
NOTE 9—Trustees’ and Officer’s Fees
Trustees’ and Officer’s Fees include amounts accrued by the Funds to pay remuneration to the Independent Trustees and an Officer of the Trust. The Adviser, as a result of the unitary management fee, pays for such compensation for the Funds. The Trustee who is an “interested person” of the Trust does not receive any Trustees’ Fees.
The Trust has adopted a deferred compensation plan (the “Plan”). Under the Plan, each Independent Trustee who has executed a Deferred Fee Agreement (a “Participating Trustee”) may defer receipt of all or a portion of his compensation (“Deferral Fees”). Such Deferral Fees are deemed to be invested in select Invesco Funds. The Deferral Fees payable to the Participating Trustee are valued as of the date such Deferral Fees would have been paid to the Participating Trustee. The value increases with contributions or with increases in the value of the Shares selected, and the value decreases with distributions or with declines in the value of the Shares selected. Obligations under the Plan represent unsecured claims against the general assets of the Funds.
NOTE 10—Capital
Shares are issued and redeemed by the Funds only in creation unit size aggregations of 50,000 to 100,000 Shares. Transactions are permitted on an in-kind basis, with a separate cash payment, which is balancing each component to equate the transaction to the net asset value per share of the Fund on the transaction date.
To the extent that the Funds permit transactions in exchange for Deposit Securities, each Fund may issue Shares in advance of receipt of Deposit Securities subject to various conditions, including a requirement to maintain on deposit with the Trust cash at least equal to 105% of the market value of the missing Deposit Securities. In accordance with the Trust’s Participant Agreement, Creation Units will be issued to an Authorized Participant, notwithstanding the fact that the corresponding Deposit Securities have not been received in part or in whole, in reliance on the undertaking of the Authorized Participant to deliver the missing Deposit Securities as soon as possible, which undertaking shall be secured by the Authorized Participant’s delivery and maintenance of collateral consisting of cash in the form of U.S. dollars in immediately available funds having a value (marked-to-market daily) at least equal to 105%, which the Adviser may change from time to time, of the value of the missing Deposit Securities.
Certain transaction fees may be charged by the Funds for creations and redemptions, which are treated as increases in capital. Transactions in each Fund’s Shares are disclosed in detail in the Statements of Changes in Net Assets.
Report of Independent Registered Public Accounting Firm
To the Board of Trustees of Invesco Exchange-Traded Fund Trust and Shareholders of Invesco S&P 500® Pure Growth ETF, Invesco S&P 500® Pure Value ETF, Invesco S&P 500® Top 50 ETF, Invesco S&P MidCap 400® Pure Growth ETF, Invesco S&P MidCap 400® Pure Value ETF, Invesco S&P SmallCap 600® Pure Growth ETF and Invesco S&P SmallCap 600® Pure Value ETF
Opinions on the Financial Statements
We have audited the accompanying statements of assets and liabilities, including the schedules of investments, of each of the funds listed in the table below (seven of the funds constituting Invesco Exchange-Traded Fund Trust, hereafter collectively referred to as the “Funds”) as of April 30, 2019, the related statements of operations for the year ended April 30, 2019, the statements of changes in net assets and the financial highlights for the year ended April 30, 2019 and for the six months ended April 30, 2018, including the related notes (collectively referred to as the “financial statements”). In our opinion, the financial statements present fairly, in all material respects, the financial position of each of the Funds as of April 30, 2019, the results of each of their operations for the year ended April 30, 2019, the changes in each of their net assets and the financial highlights for the year ended April 30, 2019 and for the six months ended April 30, 2018, in conformity with accounting principles generally accepted in the United States of America.
| | |
Fund Name | | Predecessor Fund |
| Invesco S&P 500® Pure Growth ETF | | Guggenheim S&P 500® Pure Growth ETF |
| Invesco S&P 500® Pure Value ETF | | Guggenheim S&P 500® Pure Value ETF |
| Invesco S&P 500® Top 50 ETF | | Guggenheim S&P 500® Top 50 ETF |
| Invesco S&P MidCap 400® Pure Growth ETF | | Guggenheim S&P MidCap 400® Pure Growth ETF |
| Invesco S&P MidCap 400® Pure Value ETF | | Guggenheim S&P MidCap 400® Pure Value ETF |
| Invesco S&P SmallCap 600® Pure Growth ETF | | Guggenheim S&P SmallCap 600® Pure Growth ETF |
| Invesco S&P SmallCap 600® Pure Value ETF | | Guggenheim S&P SmallCap 600® Pure Value ETF |
The financial statements of the Predecessor Funds listed in the table above as of and for the year ended October 31, 2017 and the financial highlights for each of the years ended on or prior to October 31, 2017 (not presented herein, other than the statements of changes in net assets and the financial highlights) were audited by other auditors whose report dated December 21, 2017 expressed an unqualified opinion on those financial statements and financial highlights.
Basis for Opinions
These financial statements are the responsibility of the Funds’ management. Our responsibility is to express an opinion on the Funds’ financial statements based on our audits. We are a public accounting firm registered with the Public Company Accounting Oversight Board (United States) (“PCAOB”) and are required to be independent with respect to the Funds in accordance with the U.S. federal securities laws and the applicable rules and regulations of the Securities and Exchange Commission and the PCAOB.
We conducted our audits of these financial statements in accordance with the standards of the PCAOB. Those standards require that we plan and perform the audit to obtain reasonable assurance about whether the financial statements are free of material misstatement, whether due to error or fraud.
Our audits included performing procedures to assess the risks of material misstatement of the financial statements, whether due to error or fraud, and performing procedures that respond to those risks. Such procedures included examining, on a test basis, evidence regarding the amounts and disclosures in the financial statements. Our audits also included evaluating the accounting principles used and significant estimates made by management, as well as evaluating the overall presentation of the financial statements. Our procedures included confirmation of securities owned as of April 30, 2019 by correspondence with the custodian, transfer agent and brokers; when replies were not received from brokers, we performed other auditing procedures. We believe that our audits provide a reasonable basis for our opinions.
PricewaterhouseCoopers LLP
Chicago, Illinois
June 26, 2019
Report of Independent Registered Public Accounting Firm(continued)
We have served as the auditor of one or more of the investment companies in the Invesco group of investment companies since at least 1995. We have not determined the specific year we began serving as auditor.
Calculating your ongoing Fund expenses
Example
As a shareholder of a Fund of the Invesco Exchange-Traded Fund Trust, you incur a unitary management fee. In addition to the unitary management fee, a shareholder may pay distribution fees, if any, brokerage expenses, taxes, interest, acquired fund fees and expenses, if any, litigation expenses and other extraordinary expenses. The expense examples below are intended to help you understand your ongoing costs (in dollars) of investing in the Funds and to compare these costs with the ongoing costs of investing in other funds.
The example is based on an investment of $1,000 invested at the beginning of the period and held through the six-month period ended April 30, 2019.
Actual Expenses
The first line in the following table provides information about actual account values and actual expenses. You may use the information in this line, together with the amount you invested, to estimate the expenses that you paid over the period. Simply divide your account value by $1,000 (for example, an $8,600 account value divided by $1,000 = 8.6), then multiply the result by the number in the first line under the heading “Expenses Paid During the Six-Month Period” to estimate the expenses you paid on your account during this period.
Hypothetical Example for Comparison Purposes
The second line in the following table provides information about hypothetical account values and hypothetical expenses based on each Fund’s actual expense ratio and an assumed annualized rate of return of 5% per year before expenses, which is not the Fund’s actual return. The hypothetical account values and expenses may not be used to estimate the actual ending account balance or expenses you paid for the period. You may use this information to compare the ongoing costs of investing in the Funds and other funds. To do so, compare this 5% hypothetical example with the 5% hypothetical examples that appear in the shareholder reports of the other funds.
Please note that the expenses shown in the table are meant to highlight your ongoing costs only, and do not reflect any transactional costs such as sales charges and brokerage commissions. Therefore the second line in the table is useful in comparing ongoing costs only, and will not help you determine the relative total costs of owning different funds. In addition, if these transactional costs were included, your costs would have been higher.
| | | | | | | | | | | | | | | | |
| | | Beginning
Account Value
November 1, 2018 | | | Ending
Account Value
April 30, 2019 | | | Annualized
Expense Ratio
Based on the
Six-Month Period | | | Expenses Paid During the Six-Month Period(1) | |
| Invesco S&P 500® Pure Growth ETF (RPG) | | | | | | | | | | | | | | | | |
Actual | | $ | 1,000.00 | | | $ | 1,108.90 | | | | 0.35 | % | | $ | 1.83 | |
Hypothetical (5% return before expenses) | | | 1,000.00 | | | | 1,023.06 | | | | 0.35 | | | | 1.76 | |
| Invesco S&P 500® Pure Value ETF (RPV) | | | | | | | | | | | | | | | | |
Actual | | | 1,000.00 | | | | 1,037.70 | | | | 0.35 | | | | 1.77 | |
Hypothetical (5% return before expenses) | | | 1,000.00 | | | | 1,023.06 | | | | 0.35 | | | | 1.76 | |
| Invesco S&P 500® Top 50 ETF (XLG) | | | | | | | | | | | | | | | | |
Actual | | | 1,000.00 | | | | 1,094.60 | | | | 0.20 | | | | 1.04 | |
Hypothetical (5% return before expenses) | | | 1,000.00 | | | | 1,023.80 | | | | 0.20 | | | | 1.00 | |
| Invesco S&P Midcap 400® Pure Growth ETF (RFG) | | | | | | | | | | | | | | | | |
Actual | | | 1,000.00 | | | | 1,038.00 | | | | 0.35 | | | | 1.77 | |
Hypothetical (5% return before expenses) | | | 1,000.00 | | | | 1,023.06 | | | | 0.35 | | | | 1.76 | |
| Invesco S&P Midcap 400® Pure Value ETF (RFV) | | | | | | | | | | | | | | | | |
Actual | | | 1,000.00 | | | | 1,070.30 | | | | 0.35 | | | | 1.80 | |
Hypothetical (5% return before expenses) | | | 1,000.00 | | | | 1,023.06 | | | | 0.35 | | | | 1.76 | |
| Invesco S&P SmallCap 600® Pure Growth ETF (RZG) | | | | | | | | | | | | | | | | |
Actual | | | 1,000.00 | | | | 982.20 | | | | 0.35 | | | | 1.72 | |
Hypothetical (5% return before expenses) | | | 1,000.00 | | | | 1,023.06 | | | | 0.35 | | | | 1.76 | |
Calculating your ongoing Fund expenses(continued)
| | | | | | | | | | | | | | | | |
| | | Beginning
Account Value
November 1, 2018 | | | Ending
Account Value
April 30, 2019 | | | Annualized
Expense Ratio
Based on the
Six-Month Period | | | Expenses Paid During the Six-Month Period(1) | |
| Invesco S&P SmallCap 600® Pure Value ETF (RZV) | | | | | | | | | | | | | | | | |
Actual | | $ | 1,000.00 | | | $ | 977.60 | | | | 0.35 | % | | $ | 1.72 | |
Hypothetical (5% return before expenses) | | | 1,000.00 | | | | 1,023.06 | | | | 0.35 | | | | 1.76 | |
| (1) | Expenses are calculated using the annualized expense ratio, which represents the ongoing expenses as a percentage of net assets for the six-month period ended April 30, 2019. Expenses are calculated by multiplying the Fund’s annualized expense ratio by the average account value for the period, then multiplying the result by 181/365. Expense ratios for the most recent six-month period may differ from expense ratios based on the annualized data in the Financial Highlights. |
Tax Information
Form 1099-DIV, Form 1042-S and other year–end tax information provide shareholders with actual calendar year amounts that should be included in their tax returns. Shareholders should consult their tax advisers.
The following distribution information is being provided as required by the Internal Revenue Code or to meet a specific state’s requirement.
Each Fund designates the following amounts or, if subsequently determined to be different, the maximum amount allowable for its fiscal year ended April 30, 2019:
| | | | | | | | | | |
| | | Qualified Dividend
Income* | | Corporate Dividends
Received Deduction* |
| Invesco S&P 500® Pure Growth ETF | | | | 100 | % | | | | 100 | % |
| Invesco S&P 500® Pure Value ETF | | | | 100 | % | | | | 100 | % |
| Invesco S&P 500® Top 50 ETF | | | | 100 | % | | | | 99 | % |
| Invesco S&P MidCap 400® Pure Growth ETF | | | | 93 | % | | | | 93 | % |
| Invesco S&P MidCap 400® Pure Value ETF | | | | 100 | % | | | | 100 | % |
| Invesco S&P SmallCap 600® Pure Growth ETF | | | | 100 | % | | | | 100 | % |
| Invesco S&P SmallCap 600® Pure Value ETF | | | | 100 | % | | | | 100 | % |
| * | The above percentages are based on ordinary income dividends paid to shareholders during the fiscal year. |
Trustees and Officers
The Independent Trustees of the Trust, their term of office and length of time served, their principal business occupations during at least the past five years, the number of portfolios in the Fund Complex (as defined below) overseen by each Independent Trustee and the other directorships, if any, held by each Independent Trustee are shown below.
| | | | | | | | | | |
Name, Address and Year of
Birth of Independent Trustees | | Position(s)
Held
with Trust | | Term of
Office and
Length of
Time
Served* | | Principal
Occupation(s) During
Past 5 Years | | Number of
Portfolios
in Fund
Complex**
Overseen by
Independent
Trustees | | Other
Directorships
Held by
Independent
Trustees During
the Past 5 Years |
Ronn R. Bagge—1958
c/o Invesco Capital Management LLC
3500 Lacey Road, Suite 700
Downers Grove, IL 60515 | | Vice Chairman of the Board; Chairman of the Nominating and Governance Committee and Trustee | | Vice Chairman since 2018; Chairman of the Nominating and Governance Committee and Trustee since 2003 | | Founder and Principal, YQA Capital Management LLC (1998-Present); formerly, Owner/CEO of Electronic Dynamic Balancing Co., Inc. (high-speed rotating equipment service provider). | | 241 | | Trustee and Investment Oversight Committee member, Mission Aviation Fellowship (2017-Present). |
| | | | | |
Todd J. Barre—1957
c/o Invesco Capital Management LLC
3500 Lacey Road, Suite 700
Downers Grove, IL 60515 | | Trustee | | Since 2010 | | Assistant Professor of Business, Trinity Christian College (2010-2016); formerly, Vice President and Senior Investment Strategist (2001-2008), Director of Open Architecture and Trading (2007-2008), Head of Fundamental Research (2004-2007), and Vice President and Senior Fixed Income Strategist (1994-2001), BMO Financial Group/Harris Private Bank. | | 241 | | None. |
| | | | | |
Marc M. Kole—1960
c/o Invesco Capital Management LLC
3500 Lacey Road, Suite 700
Downers Grove, IL 60515 | | Chairman of the Audit Committee and Trustee | | Chairman of the Audit Committee since 2008; Trustee since 2006 | | Senior Director of Finance, By The Hand Club For Kids (not-for-profit) (2015-Present); formerly, Chief Financial Officer, Hope Network (social services) (2008-2012); Assistant Vice President and Controller, Priority Health (health insurance) (2005-2008); Regional Chief Financial Officer, United Healthcare (2005); Chief Accounting Officer, Senior Vice President of Finance, Oxford Health Plans (2000-2004); Audit Partner, Arthur Andersen LLP (1996-2000). | | 241 | | Treasurer (2018-Present), Finance Committee Member (2015-Present) and Audit Committee Member (2015), Thornapple Evangelical Covenant Church; formerly, Board and Finance Committee Member (2009-2017) and Treasurer (2010-2015, 2017), NorthPointe Christian Schools. |
| * | This is the date the Independent Trustee began serving the Trust. Each Independent Trustee serves an indefinite term, until his successor is elected. |
| ** | Fund Complex includes all open- and closed-end funds (including all of their portfolios) advised by the Adviser and any affiliated person of the Adviser. |
Trustees and Officers(continued)
| | | | | | | | | | |
Name, Address and Year of
Birth of Independent Trustees | | Position(s)
Held
with Trust | | Term of
Office and
Length of
Time
Served* | | Principal
Occupation(s) During
Past 5 Years | | Number of
Portfolios
in Fund
Complex**
Overseen by
Independent
Trustees | | Other
Directorships
Held by
Independent
Trustees During
the Past 5 Years |
Yung Bong Lim—1964
c/o Invesco Capital Management LLC
3500 Lacey Road, Suite 700
Downers Grove, IL 60515 | | Chairman of the Investment Oversight Committee and Trustee | | Chairman of the Investment Oversight Committee since 2014; Trustee since 2013 | | Managing Partner, RDG Funds LLC (real estate) (2008-Present); formerly, Managing Director, Citadel LLC (1999-2007). | | 241 | | Advisory Board Member, Performance Trust Capital Partners, LLC (2008-Present); Board Director, Beacon Power Services, Corp. (2019-Present). |
| | | | | |
Gary R. Wicker—1961
c/o Invesco Capital Management LLC
3500 Lacey Road, Suite 700
Downers Grove, IL 60515 | | Trustee | | Since 2013 | | Senior Vice President of Global Finance and Chief Financial Officer at RBC Ministries (publishing company) (2013-Present); formerly, Executive Vice President and Chief Financial Officer, Zondervan Publishing (a division of Harper Collins/NewsCorp) (2007-2012); Senior Vice President and Group Controller (2005-2006), Senior Vice President and Chief Financial Officer (2003-2004), Chief Financial Officer (2001-2003), Vice President, Finance and Controller (1999-2001) and Assistant Controller (1997-1999), divisions of The Thomson Corporation (information services provider); Senior Audit Manager (1994-1997), PricewaterhouseCoopers LLP. | | 241 | | Board Member and Treasurer, Our Daily Bread Ministries Canada (2015-Present); Board and Finance Committee Member, West Michigan Youth For Christ (2010-Present). |
| | | | | |
Donald H. Wilson—1959
c/o Invesco Capital Management LLC
3500 Lacey Road, Suite 700
Downers Grove, IL 60515 | | Chairman of the Board and Trustee | | Chairman since 2012; Trustee since 2006 | | Chairman, President and Chief Executive Officer, McHenry Bancorp Inc. and McHenry Savings Bank (subsidiary) (2018-Present); Chairman and Chief Executive Officer, Stone Pillar Advisors, Ltd. (advisory services to the financial sector) (2010-Present); formerly, President and Chief Executive Officer, Stone Pillar Investments, Ltd. (2016-2018); Chairman, President and Chief Executive Officer, Community Financial Shares, Inc. and Community Bank—Wheaton/Glen Ellyn (subsidiary) (2013-2015); Chief Operating Officer, AMCORE Financial, Inc. (bank holding company) (2007-2009); Executive Vice President and Chief Financial Officer, AMCORE Financial, Inc. (2006-2007); Senior Vice President and Treasurer, Marshall & Ilsley Corp. (bank holding company) (1995-2006). | | 241 | | Director, Penfield Children’s Center (2004-present); Board Chairman, Gracebridge Alliance, Inc. (2015-present). |
| * | This is the date the Independent Trustee began serving the Trust. Each Independent Trustee serves an indefinite term, until his successor is elected. |
| ** | Fund Complex includes all open- and closed-end funds (including all of their portfolios) advised by the Adviser and any affiliated person of the Adviser. |
Trustees and Officers(continued)
The Interested Trustee and the executive officers of the Trust, their term of office and length of time served, their principal business occupations during at least the past five years, the number of portfolios in the Fund Complex (as defined below) overseen by the Interested Trustee and the other directorships, if any, held by the Interested Trustee are shown below.
| | | | | | | | | | |
Name, Address and Year of
Birth of Interested Trustee | | Position(s)
Held
with Trust | | Term of
Office
and
Length of
Time
Served* | | Principal
Occupation(s) During
Past 5 Years | | Number of
Portfolios
in Fund
Complex**
Overseen by
Interested
Trustee | | Other
Directorships
Held by
Interested
Trustee During
the Past 5 Years |
Kevin M. Carome—1956
Invesco Ltd.
Two Peachtree Pointe,
1555 Peachtree St., N.E.,
Suite 1800
Atlanta, GA 30309 | | Trustee | | Since 2010 | | Senior Managing Director, Secretary and General Counsel, Invesco Ltd. (2007-Present); Director, Invesco Advisers, Inc. (2009-Present); Director (2006-Present) and Executive Vice President (2008–Present), Invesco North American Holdings, Inc.; Executive Vice President (2008–Present), Invesco Investments (Bermuda) Ltd.; Manager, Horizon Flight Works LLC, and Director, Invesco Finance PLC (2011- Present); Director and Secretary (2012–Present), Invesco Services (Bahamas) Private Limited; and Director and Executive Vice President (2014–Present), INVESCO Asset Management (Bermuda) Ltd.; formerly, Director and Executive Vice President, Invesco Finance, Inc. (2011-2018); Director (2006-2018) and Executive Vice President (2008–2018), Invesco Group Services, Inc., Invesco Holding Company (US), Inc.; Director, Invesco Holding Company Limited (2007-2018); Director and Chairman, INVESCO Funds Group, Inc., Senior Vice President, Secretary and General Counsel, Invesco Advisers, Inc. (2003-2006); Director, Invesco Investments (Bermuda) Ltd. (2008-2016); Senior Vice President and General Counsel, Liberty Financial Companies, Inc. (2000-2001); General Counsel of certain investment management subsidiaries of Liberty Financial Companies, Inc. (1998-2000); Associate General Counsel, Liberty Financial Companies, Inc. (1993-1998); Associate, Ropes & Gray LLP. | | 241 | | None |
| * | This is the date the Interested Trustee began serving the Trust. The Interested Trustee serves an indefinite term, until his successor is elected. |
| ** | Fund Complex includes all open- andclosed-end funds (including all of their portfolios) advised by the Adviser and any affiliated person of the Adviser. |
Trustees and Officers(continued)
| | | | | | |
Name, Address and Year of
Birth of Executive Officers | | Position(s)
Held
with Trust | | Length of
Time
Served* | | Principal Occupation(s) During Past 5 Years |
Daniel E. Draper—1968 Invesco Capital
Management LLC 3500 Lacey Road, Suite 700 Downers Grove, IL 60515 | | President and Principal Executive Officer | | Since 2015 | | Chief Executive Officer, Manager and Principal Executive Officer, Invesco Specialized Products, LLC (2018-Present); President and Principal Executive Officer, Invesco Exchange-Traded Fund Trust, Invesco Exchange-Traded Fund Trust II, Invesco India Exchange-Traded Fund Trust, Invesco Actively Managed Exchange-Traded Fund Trust and Invesco Actively Managed Exchange-Traded Commodity Fund Trust (2015-Present) and Invesco Exchange-Traded Self-Indexed Fund Trust (2016-Present); Chief Executive Officer and Principal Executive Officer (2016-Present) and Managing Director (2013-Present), Invesco Capital Management LLC; Senior Vice President, Invesco Distributors, Inc. (2014-Present); formerly, Vice President, Invesco Exchange-Traded Fund Trust, Invesco Exchange-Traded Fund Trust II, Invesco India Exchange-Traded Fund Trust, Invesco Actively Managed Exchange-Traded Fund Trust (2013-2015) and Invesco Actively Managed Exchange-Traded Commodity Fund Trust (2014-2015); Managing Director, Credit Suisse Asset Management (2010-2013) and Lyxor Asset Management/Societe Generale (2007-2010). |
| | | |
Kelli Gallegos—1970 Invesco Capital Management LLC 3500 Lacey Road, Suite 700 Downers Grove, IL 60515 | | Vice President
and Treasurer | | Since 2018 | | Assistant Treasurer, Invesco Specialized Products, LLC (2018-Present); Vice President and Treasurer, Invesco Exchange-Traded Fund Trust, Invesco Exchange-Traded Fund Trust II, Invesco India Exchange-Traded Fund Trust, Invesco Actively Managed Exchange-Traded Fund Trust, Invesco Actively Managed Exchange-Traded Commodity Fund Trust and Invesco Exchange-Traded Self-Indexed Fund Trust (2018-Present); Principal Financial and Accounting Officer-Pooled Investments, Invesco Capital Management LLC (2018-Present); Vice President, Principal Financial Officer (2016-Present) and Assistant Treasurer (2008-Present), The Invesco Funds; formerly, Assistant Treasurer Invesco Exchange-Traded Fund Trust, Invesco Exchange-Traded Fund Trust II, Invesco India Exchange-Traded Fund Trust and Invesco Actively Managed Exchange-Traded Fund Trust (2012-2018), Invesco Actively Managed Exchange-Traded Commodity Fund Trust (2014-2018) and Invesco Exchange-Traded Self-Indexed Fund Trust (2016-2018); Assistant Treasurer, Invesco Capital Management LLC (2013-2018); and Assistant Vice President, The Invesco Funds (2008-2016). |
| | | |
Peter Hubbard—1981 Invesco Capital Management LLC 3500 Lacey Road, Suite 700 Downers Grove, IL 60515 | | Vice President | | Since 2009 | | Vice President, Invesco Specialized Products, LLC (2018-Present); Vice President, Invesco Exchange-Traded Fund Trust, Invesco Exchange-Traded Fund Trust II, Invesco India Exchange-Traded Fund Trust, Invesco Actively Managed Exchange-Traded Fund Trust (2009-Present), Invesco Actively Managed Exchange-Traded Commodity Fund Trust (2014-Present) and Invesco Exchange-Traded Self-Indexed Fund Trust (2016-Present); Vice President and Director of Portfolio Management, Invesco Capital Management LLC (2010-Present); formerly, Vice President of Portfolio Management, Invesco Capital Management LLC (2008-2010); Portfolio Manager, Invesco Capital Management LLC (2007-2008); Research Analyst, Invesco Capital Management LLC (2005-2007); Research Analyst and Trader, Ritchie Capital, a hedge fund operator (2003-2005). |
| * | This is the date each Officer began serving the Trust. Each Officer serves an indefinite term, until his or her successor is elected. |
Trustees and Officers(continued)
| | | | | | |
Name, Address and Year of
Birth of Executive Officers | | Position(s)
Held
with Trust | | Length of
Time
Served* | | Principal Occupation(s) During Past 5 Years |
Sheri Morris—1964 Invesco Capital Management LLC 3500 Lacey Road, Suite 700 Downers Grove, IL 60515 | | Vice President | | Since 2012 | | President and Principal Executive Officer, The Invesco Funds (2016-Present); Treasurer, The Invesco Funds (2008-Present); Vice President, Invesco Advisers, Inc. (formerly known as Invesco Institutional (N.A.), Inc.) (registered investment adviser) (2009-Present) and Vice President, Invesco Exchange-Traded Fund Trust, Invesco Exchange-Traded Fund Trust II, Invesco India Exchange-Traded Fund Trust, Invesco Actively Managed Exchange-Traded Fund Trust (2012-Present), Invesco Actively Managed Exchange-Traded Commodity Fund Trust (2014-Present) and Invesco Exchange-Traded Self-Indexed Fund Trust (2016-Present); formerly, Vice President and Principal Financial Officer, The Invesco Funds (2008-2016); Treasurer, Invesco Exchange-Traded Fund Trust, Invesco Exchange-Traded Fund Trust II, Invesco India Exchange-Traded Fund Trust and Invesco Actively Managed Exchange-Traded Fund Trust (2011-2013); Vice President, Invesco Aim Advisers, Inc., Invesco Aim Capital Management, Inc. and Invesco Aim Private Asset Management, Inc.; Assistant Vice President and Assistant Treasurer, The Invesco Funds and Assistant Vice President, Invesco Advisers, Inc., Invesco Aim Capital Management, Inc. and Invesco Aim Private Asset Management, Inc. |
| | | |
Anna Paglia—1974 Invesco Capital Management LLC 3500 Lacey Road, Suite 700 Downers Grove, IL 60515 | | Secretary | | Since 2011 | | Secretary, Invesco Specialized Products, LLC (2018-Present); Secretary, Invesco Exchange-Traded Fund Trust, Invesco Exchange-Traded Fund Trust II, Invesco India Exchange-Traded Fund Trust, Invesco Actively Managed Exchange-Traded Fund Trust (2011-Present), Invesco Actively Managed Exchange-Traded Commodity Fund Trust (2014-Present) and Invesco Exchange-Traded Self-Indexed Fund Trust (2015-Present); Head of Legal (2010-Present) and Secretary (2015-Present), Invesco Capital Management LLC; Manager and Assistant Secretary, Invesco Indexing LLC (2017-Present); formerly, Partner, K&L Gates LLP (formerly, Bell Boyd & Lloyd LLP) (2007-2010); Associate Counsel at Barclays Global Investors Ltd. (2004-2006). |
| | | |
Rudolf E. Reitmann—1971 Invesco Capital Management LLC 3500 Lacey Road, Suite 700 Downers Grove, IL 60515 | | Vice President | | Since 2013 | | Head of Global Exchange Traded Funds Services, Invesco Specialized Products, LLC (2018-Present); Vice President, Invesco Exchange-Traded Fund Trust, Invesco Exchange-Traded Fund Trust II, Invesco India Exchange-Traded Fund Trust, Invesco Actively Managed Exchange-Traded Fund Trust (2013-Present), Invesco Actively Managed Exchange-Traded Commodity Fund Trust (2014-Present) and Invesco Exchange-Traded Self-Indexed Fund Trust (2016-Present); Head of Global Exchange Traded Funds Services, Invesco Capital Management LLC (2013-Present); Vice President, Invesco Capital Markets, Inc. (2018-Present). |
| * | This is the date each Officer began serving the Trust. Each Officer serves an indefinite term, until his or her successor is elected. |
Trustees and Officers(continued)
| | | | | | |
Name, Address and Year of
Birth of Executive Officers | | Position(s)
Held
with Trust | | Length of
Time
Served* | | Principal Occupation(s) During Past 5 Years |
David Warren—1957 Invesco Canada Ltd. 5140 Yonge Street, Suite 800 Toronto, Ontario M2N 6X7 | | Vice President | | Since 2009 | | Manager, Invesco Specialized Products, LLC (2018-Present); Vice President, Invesco Exchange-Traded Fund Trust, Invesco Exchange-Traded Fund Trust II, Invesco India Exchange-Traded Fund Trust, and Invesco Actively Managed Exchange-Traded Fund Trust (2009-Present), Invesco Actively Managed Exchange-Traded Commodity Fund Trust (2014-Present) and Invesco Exchange-Traded Self-Indexed Fund Trust (2016-Present); Managing Director—Chief Administrative Officer, Americas, Invesco Capital Management LLC; Senior Vice President, Invesco Advisers, Inc. (2009-Present); Director, Invesco Inc. (2009-Present); Director, Executive Vice President and Chief Financial Officer, Invesco Canada Ltd. (formerly, Invesco Trimark Ltd.) (2011-Present); Chief Administrative Officer, North American Retail, Invesco Ltd. (2007-Present); Director, Invesco Corporate Class Inc. (2014-Present); Director, Invesco Global Direct Real Estate Feeder GP Ltd. (2015-Present); Director, Invesco Canada Holdings Inc. (2002-Present); Director, Invesco Financial Services Ltd. / Services Financiers Invesco Ltée and Trimark Investments Ltd./Placements Trimark Ltée (2014-Present); Director, Invesco IP Holdings (Canada) Ltd. (2016-Present); Director, Invesco Global Direct Real Estate GP Ltd. (2015-Present); formerly, Senior Vice President, Invesco Management Group, Inc. (2007-2018); Executive Vice President and Chief Financial Officer, Invesco Inc. (2009-2015); Director, Executive Vice President and Chief Financial Officer, Invesco Canada Ltd. (formerly, Invesco Trimark Ltd.) (2000-2011). |
| | | |
Melanie Zimdars—1976 Invesco Capital
Management LLC 3500 Lacey Road, Suite 700 Downers Grove, IL 60515 | | Chief Compliance
Officer | | Since 2017 | | Chief Compliance Officer, Invesco Specialized Products, LLC (2018-Present); Chief Compliance Officer, Invesco Capital Management LLC (2017-Present); Chief Compliance Officer, Invesco Exchange-Traded Fund Trust, Invesco Exchange-Traded Fund Trust II, Invesco India Exchange-Traded Fund Trust, Invesco Actively Managed Exchange-Traded Fund Trust, Invesco Actively Managed Exchange-Traded Commodity Fund Trust and Invesco Exchange-Traded Self-Indexed Fund Trust (2017-Present); formerly, Vice President and Deputy Chief Compliance Officer at ALPS Holding, Inc. (2009-2017); Mutual Fund Treasurer/Chief Financial Officer at Wasatch Advisors, Inc. (2005-2008); Compliance Officer, U.S. Bancorp Fund Services, LLC (2001-2005). |
Availability of Additional Information About the Trustees
The Statement of Additional Information includes additional information about the Trustees and is available, without charge, upon request at (800)983-0903.
| * | This is the date each Officer began serving the Trust. Each Officer serves an indefinite term, until his or her successor is elected. |
Board Considerations Regarding Continuation of Investment Advisory Agreement
At a meeting held on April 11, 2019, the Board of Trustees of the Invesco Exchange-Traded Fund Trust (the “Trust”), including the Independent Trustees, approved the continuation of the Investment Advisory Agreement between Invesco Capital Management LLC (the “Adviser”) and the Trust for the following 24 series (each, a “Fund” and together, the “Funds”):
Invesco Dow Jones Industrial Average Dividend ETF
Invesco NASDAQ Internet ETF
Invesco Raymond JamesSB-1 Equity ETF
Invesco S&P 500 BuyWrite ETF
Invesco S&P 500®Equal Weight Consumer Discretionary ETF
Invesco S&P 500®Equal Weight Consumer Staples ETF
Invesco S&P 500®Equal Weight Energy ETF
Invesco S&P 500®Equal Weight ETF
Invesco S&P 500®Equal Weight Financials ETF
Invesco S&P 500®Equal Weight Health Care ETF
Invesco S&P 500®Equal Weight Industrials ETF
Invesco S&P 500®Equal Weight Materials ETF
Invesco S&P 500®Equal Weight Real Estate ETF
Invesco S&P 500®Equal Weight Technology ETF
Invesco S&P 500®Equal Weight Utilities ETF
Invesco S&P 500®Pure Growth ETF
Invesco S&P 500®Pure Value ETF
Invesco S&P 500®Top 50 ETF
Invesco S&P MidCap 400® Equal Weight ETF
Invesco S&P MidCap 400® Pure Growth ETF
Invesco S&P MidCap 400® Pure Value ETF
Invesco S&P SmallCap 600® Equal Weight ETF
Invesco S&P SmallCap 600® Pure Growth ETF
Invesco S&P SmallCap 600® Pure Value ETF
The Trustees reviewed information from the Adviser describing: (i) the nature, extent and quality of services provided, (ii) the investment performance of the Funds and the Adviser, (iii) the fees paid by the Funds and comparisons to amounts paid by other comparable registered investment companies, (iv) the costs of services provided and estimated profits realized by the Adviser, (v) the extent to which economies of scale may be realized as a Fund grows and whether fee levels reflect any possible economies of scale for the benefit of Fund shareholders, and (vi) any further benefits realized by the Adviser from its relationships with the Funds.
Nature, Extent and Quality of Services. In evaluating the nature, extent and quality of the Adviser’s services, the Trustees reviewed information concerning the functions performed by the Adviser for the Funds, information describing the Adviser’s current organization and staffing, including operational support provided by the Adviser’s parent organization, Invesco Ltd. (“Invesco”), and the background and experience of the persons responsible for theday-to-day management of the Funds. The Trustees reviewed matters related to the Adviser’s execution and/or oversight of execution of portfolio transactions on behalf of the Funds.
The Trustees also reviewed information on the performance of the Funds and their underlying indexes for theone-year, three-year, five-year,ten-year and since-inception periods ended December 31, 2018, as applicable, including reports for each of those periods on the correlation and tracking error between each Fund’s performance and the performance of its underlying index, as well as the Adviser’s analysis of the tracking error between the Funds and their underlying indexes. In reviewing the tracking error reports, the Trustees considered information provided by Invesco’s Global Performance Measurement and Risk Group, an independent organization within Invesco, with respect to general expected tracking error ranges. The Trustees also considered that certain Funds were created in connection with the purchase by Invesco of the exchange-traded funds business of Guggenheim Capital LLC (the “Transaction”) and that such Funds’ performance prior to the closing of the Transaction on April 6, 2018 is that of their predecessor Guggenheim ETFs. The Trustees noted that, for each applicable period, the correlation and tracking error for each Fund were within the targeted range set forth in the Trust’s registration statement and concluded that each Fund was correlated to its underlying index and that the tracking error for each Fund was within an acceptable range given that Fund’s particular circumstances.
The Trustees also considered the services provided by the Adviser in its oversight of the Funds’ administrator, custodian and transfer agent. They noted the significant amount of time, effort and resources that had been devoted to this oversight function.
Based on their review, the Trustees concluded that the nature, extent and quality of services provided by the Adviser to the Funds under the Investment Advisory Agreement were appropriate and reasonable.
Fees, Expenses and Profitability. The Trustees reviewed and discussed the information provided by the Adviser on each Fund’s net expense ratio and unitary advisory fee, as compared to information compiled by the Adviser from Lipper Inc. databases on the net expense ratios of comparable exchange-traded funds (“ETFs”),open-end(non-ETF) index funds andopen-end(non-ETF) actively-managed funds. The Trustees noted that the annual unitary advisory fee charged to each Fund is as follows, with the Adviser paying all
Board Considerations Regarding Continuation of Investment Advisory Agreement(continued)
other operating expenses of each Fund, except that each Fund pays its own distribution fees, if any, brokerage expenses, taxes, interest, litigation expenses, acquired fund fees and expenses, if any, and other extraordinary expenses:
| | ● | | 0.75% of the Fund’s average daily net assets for Invesco Raymond JamesSB-1 Equity ETF; |
| | ● | | 0.60% of the Fund’s average daily net assets for Invesco NASDAQ Internet ETF; |
| | ● | | 0.49% of the Fund’s average daily net assets for Invesco S&P 500 BuyWrite ETF (The Trustees noted that prior to July 1, 2018, the Fund’s annual unitary advisory fee was 0.75%.); |
| | ● | | 0.35% of the Fund’s average daily net assets for each of Invesco S&P 500® Pure Growth ETF, Invesco S&P 500® Pure Value ETF, Invesco S&P MidCap 400® Pure Growth ETF, Invesco S&P MidCap 400® Pure Value ETF, Invesco S&P SmallCap 600® Pure Growth ETF and Invesco S&P SmallCap 600® Pure Value ETF; |
| | ● | | 0.20% of the Fund’s average daily net assets for each of Invesco S&P 500® Equal Weight ETF and Invesco S&P 500® Top 50 ETF; |
| | ● | | 0.07% of the Fund’s average daily net assets for Invesco Dow Jones Industrial Average Dividend ETF (The Trustees noted that prior to September 24, 2018, the Fund’s annual unitary advisory fee was 0.30%.); and |
| | ● | | 0.40% of the Fund’s average daily net assets for each other Fund. |
The Trustees noted that the Adviser represented that it does not serve as the investment adviser to any clients, other than other ETFs also overseen by the Trustees, with comparable investment strategies as the Funds, but that it providessub-advisory services to other clients. The Trustees further noted the Adviser’s explanation with respect to thesub-advisory fees it receives for such services in comparison to the advisory fees charged to the Funds. The Trustees noted that the net expense ratios for certain Funds were equal to or lower than the median net expense ratios of their ETF andopen-end index peer funds as illustrated in the table below. The Trustees also noted that the net expense ratios for all of the Funds were lower than the median net expense ratios of theiropen-end actively-managed peer funds.
| | | | | | |
Invesco Fund | | Equal to/Lower
than ETF Median | | Equal to/Lower
than Open-End
Index Fund
Median | | Equal to/Lower
than Open-End
Active Fund
Median |
| Invesco Dow Jones Industrial Average Dividend ETF | | X | | X | | X |
| Invesco NASDAQ Internet ETF | | | | | | X |
| Invesco Raymond JamesSB-1 Equity ETF | | | | | | X |
| Invesco S&P 500 BuyWrite ETF | | X | | X | | X |
| Invesco S&P 500®Equal Weight Consumer Discretionary ETF | | X | | | | X |
| Invesco S&P 500®Equal Weight Consumer Staples ETF | | X | | | | X |
| Invesco S&P 500®Equal Weight Energy ETF | | X | | | | X |
| Invesco S&P 500®Equal Weight ETF | | X | | X | | X |
| Invesco S&P 500®Equal Weight Financials ETF | | X | | | | X |
| Invesco S&P 500®Equal Weight Health Care ETF | | X | | | | X |
| Invesco S&P 500®Equal Weight Industrials ETF | | X | | | | X |
| Invesco S&P 500®Equal Weight Materials ETF | | X | | | | X |
| Invesco S&P 500®Equal Weight Real Estate ETF | | X | | | | X |
| Invesco S&P 500®Equal Weight Technology ETF | | X | | | | X |
| Invesco S&P 500®Equal Weight Utilities ETF | | X | | X | | X |
| Invesco S&P 500®Pure Growth ETF | | X | | X | | X |
| Invesco S&P 500®Pure Value ETF | | | | | | X |
| Invesco S&P 500®Top 50 ETF | | X | | X | | X |
| Invesco S&P MidCap 400® Equal Weight ETF | | | | | | X |
| Invesco S&P MidCap 400® Pure Growth ETF | | | | X | | X |
Board Considerations Regarding Continuation of Investment Advisory Agreement(continued)
| | | | | | |
Invesco Fund | | Equal to/Lower
than ETF Median | | Equal to/Lower
than Open-End
Index Fund
Median | | Equal to/Lower
than Open-End
Active Fund
Median |
| Invesco S&P MidCap 400® Pure Value ETF | | | | X | | X |
| Invesco S&P SmallCap 600® Equal Weight ETF | | | | | | X |
| Invesco S&P SmallCap 600® Pure Growth ETF | | | | X | | X |
| Invesco S&P SmallCap 600® Pure Value ETF | | | | X | | X |
The Trustees determined that each Fund’s unitary advisory fee was reasonable, noting the nature of the indexes, the distinguishing factors of the Funds, and the administrative, operational and management oversight costs for the Adviser. The Trustees also noted that a portion of each Fund’s operating expenses was attributable to a license fee payable out of the unitary advisory fee charged to that Fund. The Board concluded that the unitary advisory fee charged to each Fund was reasonable and appropriate in light of the services provided.
In conjunction with their review of the unitary advisory fees, the Trustees considered information provided by the Adviser on the revenues received by the Adviser under the Investment Advisory Agreement for the Funds. The Trustees reviewed information provided by the Adviser on its overall profitability, as well as the estimated profitability to the Adviser from its relationship to each Fund. The Trustees concluded that the overall and estimated profitability to the Adviser was not unreasonable.
Economies of Scale and Whether Fee Levels Reflect These Economies of Scale. The Trustees reviewed the information provided by the Adviser as to the extent to which economies of scale may be realized as each Fund grows and whether fee levels reflect economies of scale for the benefit of shareholders. The Trustees reviewed each Fund’s asset size and unitary advisory fee. The Trustees noted that any reduction in fixed costs associated with the management of the Funds would be enjoyed by the Adviser, but a unitary advisory fee provides a level of certainty in expenses for the Funds. The Trustees considered whether the unitary advisory fee rate for each Fund was reasonable in relation to the asset size of that Fund, and concluded that the unitary advisory fee was reasonable and appropriate.
The Trustees noted that the Adviser had not identified any further benefits that it derived from its relationships with the Funds and had noted that it does not have any soft-dollar arrangements.
Based on all of the information considered and the conclusions reached, the Board, including the Independent Trustees, determined to approve the continuation of the Investment Advisory Agreement for each Fund. No single factor was determinative in the Board’s analysis.
Proxy Voting Policies and Procedures
A description of the Trust’s proxy voting policies and procedures that the Funds use to determine how to vote proxies relating to portfolio securities is available, without charge and upon request, by calling(800) 983-0903. This information is also available on the Securities and Exchange Commission’s (the “Commission”) website atwww.sec.gov.
Information regarding how each Fund voted proxies for portfolio securities, if applicable, during the most recent 12-month period ended June 30, is available, without charge and upon request, by (i) calling(800) 983-0903; or (ii) accessing the Trust’sForm N-PX on the Commission’s website atwww.sec.gov.
Quarterly Portfolios
The Trust files its complete schedule of portfolio holdings for the Funds with the Commission for the first and third quarters of each fiscal year onForm N-Q (or any successor Form). The Trust’sForms N-Q (or any successor Form) are available on the Commission’s website atwww.sec.gov.
Frequency Distribution of Discounts and Premiums
A table showing the number of days the market price of each Fund’s shares was greater than the Fund’s net asset value, and the number of days it was less than the Fund’s net asset value (i.e., premium or discount) for the most recently completed calendar year, and the calendar quarters since that year end (or the life of the Fund, if shorter) may be found at the Fund’s website atwww.invesco.com/ETFs.
| | | | |
©2019 Invesco Capital Management LLC 3500 Lacey Road, Suite 700 Downers Grove, IL 60515 | | P-TRST1-AR-3 | | invesco.com/ETFs |
Item 2. Code of Ethics.
The Registrant has adopted a Code of Ethics that applies to the Registrant’s principal executive officer and principal financial officer. This Code is filed as an exhibit to this report on FormN-CSR under Item 12(a)(1). No substantive amendments to this Code were made during the reporting period. There were no waivers for the fiscal year ended April 30, 2019.
Item 3. Audit Committee Financial Expert.
The Registrant’s Board of Trustees (the “Board”) has determined that the Registrant has three “audit committee financial experts” serving on its audit committee (the “Audit Committee”) : Mr. Marc M. Kole, Mr. Gary R. Wicker and Mr. Donald H. Wilson. Each of these Audit Committee members is “independent,” meaning that he is not an “interested person” of the Registrant (as that term is defined in Section 2(a)(19) of the Investment Company Act of 1940, as amended) and he does not accept any consulting, advisory, or other compensatory fee from the Registrant (except in his capacity as a Board or committee member).
An “audit committee financial expert” is not an “expert” for any purpose, including for purposes of Section 11 of the Securities Act of 1933, as a result of being designated as an “audit committee financial expert.” Further, the designation of a person as an “audit committee financial expert” does not mean that person has any greater duties, obligations, or liability than those imposed on a person without the “audit committee financial expert” designation. Similarly, the designation of a person as an “audit committee financial expert” does not affect the duties, obligations, or liability of any other member of the Audit Committee or the Board .
Item 4. Principal Accountant Fees and Services.
(a) to (d)
Fees Billed by PwC to the Registrant
PricewaterhouseCoopers LLP (“PwC”), the Registrant’s independent registered public accounting firm, billed the Registrant aggregate fees for services rendered to the Registrant for the last two fiscal years as shown in the following table. The Audit Committeepre-approved all audit andnon-audit services provided to the Registrant.
| | | | |
| | | Fees Billed by PwC for
Services Rendered to the
Registrant for fiscal year end 2019 | | Fees Billed by PwC for
Services Rendered to the
Registrant for fiscal year end
2018 |
| | |
Audit Fees | | $ 962,030 | | $ 988,040 |
Audit-Related Fees | | $ 0 | | $ 0 |
Tax Fees(1) | | $ 472,745 | | $ 429,980 |
All Other Fees | | $ 0 | | $ 0 |
Total Fees | | $ 1,434,775 | | $ 1,418,020 |
(1) Tax Fees for the fiscal year ended April 30, 2019 include fees billed for reviewing tax returns, 2018 excise tax returns and excise tax distributions calculations and reviewing the final tax returns for the three 2019 liquidated funds. Tax Fees for the fiscal year ended April 30, 2018 included fees billed for reviewing tax returns, 2017 excise tax returns and excise tax distribution calculations.
Fees Billed by PwC Related to Invesco and Invesco Affiliates
PwC billed Invesco Capital Management LLC (“Invesco” or “Adviser”), the Registrant’s investment adviser, and any entity controlling, controlled by or under common control with Invesco that provides ongoing services to the Registrant (“Affiliates”), aggregate fees forpre-approvednon-audit services rendered to Invesco and Affiliates for the last two fiscal years as shown in the following table. The Audit Committeepre-approved allnon-audit services provided to Invesco and Affiliates that were required to bepre-approved.
| | | | |
| | | Fees Billed for Non-Audit
Services Rendered to
Invesco and Affiliates for
fiscal year end 2019 That
Were Required to be Pre-Approved by the Registrant’s Audit Committee | | Fees Billed for Non-Audit
Services Rendered to Invesco
and Affiliates for fiscal year
end 2018 That Were
Required to be Pre-Approved by the Registrant’s Audit Committee |
Audit-Related Fees(1) | | $ 690,000 | | $ 662,000 |
Tax Fees | | $ 0 | | $ 0 |
All Other Fees(2) | | $ 0 | | $ 526,000 |
Total Fees | | $ 690,000 | | $ 1,188,000 |
| (1) | Audit-Related Fees for the year end 2019 include fees billed related to reviewing controls at a service organization. Audit-Related Fees for the year end 2018 included fees billed related to reviewing controls at a service organization. |
| (2) | All Other Fees for the fiscal year end 2018 included fees billed related to assessments of the company’s current state analysis against regulatory requirements. |
(e) (1)Audit Committee Pre Approval Policies and Procedures
Pre-Approval of Audit andNon-Audit Services Policies and Procedures
As Adopted by the Audit Committee of the Invesco ETFs
| | |
| Applicable to | | Invesco Exchange-Traded Fund Trust, Invesco Exchange-Traded Fund Trust II, Invesco India Exchange-Traded Fund Trust, Invesco Actively Managed Exchange-Traded Fund Trust, Invesco Actively Managed Exchange-Traded Commodity Fund Trust and Invesco Exchange-Traded Self-Indexed Fund Trust (collectively the “Funds”) |
| Risk Addressed by Policy | | Approval of Audit andNon-Audit Services |
| Relevant Law and Other Sources | | Sarbanes-Oxley Act of 2002; RegulationS-X. |
| Last Reviewed by Compliance for Accuracy | | June 15, 2018 |
| Approved/Adopted Date | | June 2009 |
Statement of Principles
Under the Sarbanes-Oxley Act of 2002 and rules adopted by the Securities and Exchange Commission (“SEC”) (“Rules”), the Audit Committee of the Funds’ (the “Audit Committee”) Board of Trustees (the “Board”) is responsible for the appointment, compensation and oversight of the work of independent accountants (an “Auditor”). As part of this responsibility and to assure that the Auditor’s independence is not impaired, the Audit Committeepre-approves the audit andnon-audit services provided to the Funds by each Auditor, as well as allnon-audit services provided by the Auditor to the Funds’ investment adviser and to affiliates of the adviser that provide ongoing services to the Funds (“Service Affiliates”) if the services directly impact the Funds’ operations or financial reporting. The SEC Rules also specify the types of services that an Auditor may not provide to its audit client. The following policies and procedures comply with the requirements forpre-approval and provide a mechanism by which management of the Funds may request and securepre-approval of audit andnon-audit services in an orderly manner with minimal disruption to normal business operations.
Proposed services either may bepre-approved without consideration of specificcase-by-case services by the Audit Committee (“generalpre-approval”) or require the specificpre-approval of the Audit Committee (“specificpre-approval”). As set forth in these policies and procedures, unless a type of service has received generalpre-approval, it will require specificpre-approval by the Audit Committee. Additionally, any fees exceeding 110% of estimatedpre-approved fee levels provided at the time the service waspre-approved will also require specific approval by the Audit Committee before payment is made. The Audit Committee will also consider the impact of additional fees on the Auditor’s independence when determining whether to approve any additional fees for previouslypre-approved services.
The Audit Committee will annually review and generallypre-approve the services that may be provided by each Auditor without obtaining specificpre-approval from the Audit Committee. The term of any generalpre-approval runs from the date of suchpre-approval through June 30th of the following year, unless the Audit Committee considers a different period and states otherwise. The Audit Committee will add to or subtract from the list of generalpre-approved services from time to time, based on subsequent determinations.
The purpose of these policies and procedures is to set forth the guidelines to assist the Audit Committee in fulfilling its responsibilities.
Delegation
The Chairman of the Audit Committee (or, in his or her absence, any member of the Audit Committee) may grant specificpre-approval fornon-prohibited services. All such delegatedpre-approvals shall be presented to the Audit Committee no later than the next Audit Committee meeting.
Audit Services
The annual Audit services engagement terms will be subject to specificpre-approval of the Audit Committee. Audit services include the annual financial statement audit and other procedures such as tax provision work that is required to be performed by the independent auditor to be able to form an opinion on the Funds’ financial statements. The Audit Committee will obtain, review and consider sufficient information concerning the proposed Auditor to make a reasonable evaluation of the Auditor’s qualifications and independence.
In addition to the annual Audit services engagement, the Audit Committee may grant either general or specificpre-approval of other Audit services, which are those services that only the independent auditor reasonably can provide. Other Audit services may include services such as issuing consents for the inclusion of audited financial statements with SEC registration statements, periodic reports and other documents filed with the SEC or other documents issued in connection with securities offerings.
Non-Audit Services
The Audit Committee may provide either general or specificpre-approval of anynon-audit services to the Funds and its Service Affiliates if the Audit Committee believes that the provision of the service will not impair the independence of the Auditor, is consistent with the SEC’s Rules on auditor independence, and otherwise conforms to the Audit Committee’s general principles and policies as set forth herein.
Audit-Related Services
“Audit-related services” are assurance and related services that are reasonably related to the performance of the audit or review of the Funds’ financial statements or that are traditionally performed by the independent auditor. Audit-related services include, among others, accounting consultations related to accounting, financial reporting or disclosure matters not classified as “Audit services”; and assistance with understanding and implementing new accounting and financial reporting guidance from rulemaking authorities.
Tax Services
“Tax services” include, but are not limited to, the review and signing of the Funds’ federal tax returns, the review of required distributions by the Funds and consultations regarding tax matters such as the tax treatment of new investments or the impact of new regulations. The Audit Committee will scrutinize carefully the retention of the Auditor in connection with a transaction initially recommended by the Auditor, the major business purpose of which may be tax avoidance or the tax treatment of which may not be supported in the Internal Revenue Code and related regulations. The Audit Committee will consult with the Funds’ Treasurer (or his or her designee) and may consult with outside counsel or advisors as necessary to ensure the consistency of Tax services rendered by the Auditor with the foregoing policy.
No Auditor shall represent any Fund or any Service Affiliate before a tax court, district court or federal court of claims.
Under rules adopted by the Public Company Accounting Oversight Board and approved by the SEC, in connection with seeking Audit Committeepre-approval of permissible Tax services, the Auditor shall:
| | |
1. | | Describe in writing to the Audit Committee, which writing may be in the form of the proposed engagement letter: |
| |
a. | | The scope of the service, the fee structure for the engagement, and any side letter or amendment to the engagement letter, or any other agreement between the Auditor and the Fund, relating to the service; and |
| |
b. | | Any compensation arrangement or other agreement, such as a referral agreement, a referral fee orfee-sharing arrangement, between the Auditor and any person (other than the Fund) with respect to the promoting, marketing, or recommending of a transaction covered by the service; |
|
2. Discuss with the Audit Committee the potential effects of the services on the independence of the Auditor; and |
|
3. Document the substance of its discussion with the Audit Committee. |
All Other Auditor Services
The Audit Committee maypre-approvenon-audit services classified as “All other services” that are not categorically prohibited by the SEC, as listed in Exhibit 1 to this policy.
Pre-Approval Fee Levels or Established Amounts
Pre-approval of estimated fees or established amounts for services to be provided by the Auditor under general or specificpre-approval policies will be set periodically by the Audit Committee. Any proposed fees exceeding 110% of the maximum estimatedpre-approved fees or established amounts forpre-approved audit andnon-audit services will be reported to the Audit Committee at the quarterly Audit Committee meeting and will require specific approval by the Audit Committee before payment is made. The Audit Committee will always factor in the overall relationship of fees for audit andnon-audit services in determining whether topre-approve any such services and in determining whether to approve any additional fees exceeding 110% of the maximumpre-approved fees or established amounts for previouslypre-approved services.
Procedures
On an annual basis, the Auditor will submit to the Audit Committee for generalpre-approval, a list ofnon-audit services that the Funds or Service Affiliates of the Funds may request from the Auditor. The list will describe thenon-audit services in reasonable detail and will include an estimated range of fees and such other information as the Audit Committee may request.
Each request for services to be provided by the Auditor under the generalpre-approval of the Audit Committee will be submitted to the Funds’ Treasurer (or his or her designee) and must include a detailed description of the services to be rendered. The Treasurer or his or her designee will ensure that such services are included within the list of services that have received the generalpre-approval of the Audit Committee.
Each request to provide services that require specific approval by the Audit Committee shall be submitted to the Audit Committee jointly by the Funds’ Treasurer or his or her designee and the Auditor, and must include a joint statement that, in their view, such request is consistent with thepre-approval policies and procedures and the SEC Rules.
Each request to provide Tax services under either the general or specificpre-approval of the Audit Committee will describe in writing: (i) the scope of the service, the fee structure for the engagement, and any side letter or amendment to the engagement letter, or any other agreement between the Auditor and the audit client, relating to the service; and (ii) any compensation arrangement or other agreement between the Auditor and any person (other than
the audit client) with respect to the promoting, marketing, or recommending of a transaction covered by the service. The Auditor will discuss with the Audit Committee the potential effects of the services on the Auditor’s independence and will document the substance of the discussion.
Non-audit services pursuant to the de minimis exception provided by the SEC Rules will be promptly brought to the attention of the Audit Committee for approval, including documentation that each of the conditions for this exception, as set forth in the SEC Rules, has been satisfied.
On at least an annual basis, the Auditor will prepare a summary of all the services provided to any entity in the investment company complex as defined in section2-01(f)(14) of RegulationS-X in sufficient detail as to the nature of the engagement and the fees associated with those services.
The Audit Committee has designated the Funds’ Treasurer to monitor the performance of all services provided by the Auditor and to ensure such services are in compliance with these policies and procedures. The Funds’ Treasurer will report to the Audit Committee on a periodic basis as to the results of such monitoring. Both the Funds’ Treasurer and management will immediately report to the Chairman of the Audit Committee any breach of these policies and procedures that comes to the attention of the Funds’ Treasurer or senior management.
Adopted: June 26, 2009
Amended: June 15, 2018
Exhibit 1 toPre-Approval of Audit andNon-Audit Services Policies and Procedures
Conditionally ProhibitedNon-Audit Services (not prohibited if the Fund can reasonably conclude that the results of the service would not be subject to audit procedures in connection with the audit of the Fund’s financial statements)
| | • | | Bookkeeping or other services related to the accounting records or financial statements of the audit client |
| | • | | Financial information systems design and implementation |
| | • | | Appraisal or valuation services, fairness opinions, orcontribution-in-kind reports |
| | • | | Internal audit outsourcing services |
Categorically ProhibitedNon-Audit Services
| | • | | Broker-dealer, investment adviser, or investment banking services |
| | • | | Expert services unrelated to the audit |
| | • | | Any service or product provided for a contingent fee or a commission |
| | • | | Services related to marketing, planning, or opining in favor of the tax treatment of confidential transactions or aggressive tax position transactions, a significant purpose of which is tax avoidance |
| | • | | Tax services for persons in financial reporting oversight roles at the Fund |
| | • | | Any other service that the Public Company Oversight Board determines by regulation is impermissible. |
| | (e)(2) | There were no amounts that werepre-approved by the Audit Committee pursuant to the de minimus exception under Rule2-01 of RegulationS-X. |
| | (g) | In addition to the amounts shown in the tables above, PwC billed Invesco and Affiliates aggregate fees of $2,123,000 for the fiscal year ended April 30, 2019 and $2,004,000 for |
| | the fiscal year ended April 30, 2018 fornon-audit services not required to bepre-approved by the Registrant’s Audit Committee. In total, PwC billed the Registrant, Invesco and Affiliates aggregatenon-audit fees of $3,285,745 for the fiscal year ended 2019, and $3,707,000 for the fiscal year ended 2018. |
| (h) | With respect to thenon-audit services above billed to Invesco and Affiliates that were not required to bepre-approved by the Registrant’s Audit Committee, the Audit Committee received information from PwC about such services, including by way of comparison, that PwC provided audit services to entities within the Investment Company Complex, as defined by Rule2-01(f)(14) of RegulationS-X, of approximately $29 million andnon-audit services of approximately $17 million for the fiscal year ended 2019. The Audit Committee considered this information in evaluating PwC’s independence. |
PwC informed the Audit Committee that it has identified an issue related to its independence under Rule2-01(c)(1)(ii)(A) of RegulationS-X (referred to as the “Loan Rule”). The Loan Rule prohibits accounting firms, such as PwC, from being deemed independent if they have certain financial relationships with their audit clients or certain affiliates of those clients. The Registrant is required under various securities laws to have its financial statements audited by an independent accounting firm.
The Loan Rule specifically provides that an accounting firm would not be independent if it receives a loan from a lender that is a record or beneficial owner of more than ten percent of an audit client’s equity securities. For purposes of the Loan Rule, audit clients include the Registrant as well as all registered investment companies advised by the Adviser and its affiliates, including other subsidiaries of the Adviser’s parent company, Invesco Ltd. (collectively, the “Invesco Fund Complex”). PwC informed the Audit Committee it has relationships with lenders who hold, as record owner, more than ten percent of the shares of certain funds within the Invesco Fund Complex. These relationships call into question PwC’s independence under the Loan Rule with respect to those funds, as well as all other funds in the Invesco Fund Complex.
On June 20, 2016, the SEC Staff issued a“no-action” letter to another mutual fund complex (see Fidelity Management & Research Company et al.,No-Action Letter) related to the audit independence issue described above. In that letter, the SEC confirmed that it would not recommend enforcement action against a fund that relied on audit services performed by an audit firm that was not in compliance with the Loan Rule in certain specified circumstances. On June 18, 2019, the SEC adopted amendments to the Loan Rule (the “Amendments”) addressing many of the issues that led to the issuance of theno-action letter. The Amendments will become effective and supersede theno-action letter 90 days after publication in the Federal Register.
In an August 18, 2016 letter, and in subsequent communications, PwC affirmed to the Audit Committee that, as of the date of the letter and the subsequent communications, respectively, PwC is an independent accountant with respect to the Registrant within the meaning of PCAOB Rule 3520. In its letter and in its subsequent communications, PwC also informed the Audit Committee that, after evaluating the facts and circumstances and the applicable independence
rules, PwC has concluded that with regard to its compliance with the independence criteria set forth in the rules and regulations of the SEC related to the Loan Rule, it believes that it remains objective and impartial despite matters that may ultimately be determined to be inconsistent with these criteria and therefore it can continue to serve as the Registrant’s registered public accounting firm. PwC has advised the Audit Committee that this conclusion is based in part on the following considerations: (1) the lenders to PwC have no influence over any fund, or other entity within the Invesco Fund Complex, or its Adviser; (2) none of the officers or trustees of the Invesco Fund Complex whose shares are owned by PwC lenders are associated with those lenders; (3) PwC understands that the shares held by PwC lenders are held for the benefit of and on behalf of its policy owners/end investors; (4) investments in funds such as the Invesco Fund Complex funds are passive; (5) the PwC lenders are part of various syndicates of unrelated lenders; (6) there have been no changes to the loans in question since the origination of each respective note; (7) the debts are in good standing and no lender has the right to take action against PwC, as borrower, in connection with the financings; (8) the debt balances with each lender are immaterial to PwC and to each lender; and (9) the PwC audit engagement team has no involvement in PwC’s treasury function and PwC’s treasury function has no oversight of or ability to influence the PwC audit engagement team. In addition, PwC has communicated that the lending relationships appear to be consistent with the lending relationships described in theno-action letter and that they are not aware of other relationships that would be implicated by the Loan Rule. In addition to relying on PwC’s August 18, 2016 letter and subsequent communications regarding its independence, the Registrant intends to rely upon theno-action letter.
If in the future the independence of PwC is called into question under the Loan Rule by circumstances that are not addressed in the SEC’sno-action letter, the Registrant may need to take other action in order for the Registrant’s filings with the SEC containing financial statements to be deemed compliant with applicable securities laws. Such additional actions could result in additional costs, impair the ability of the Registrant to issue new shares or have other material adverse effects on the Registrant. The SECno-action relief was initially set to expire 18 months from issuance, but has been extended by the SEC without an expiration date, except that theno-action letter will be withdrawn upon the effectiveness of the Amendments.
During the reporting period, PwC advised the Registrant’s Audit Committee of the following matters for consideration under the SEC auditor independence rules. PwC advised the Audit Committee that a PwC Manager, a PwC Senior Manager and a PwC Partner each held financial interests either directly or, in the case of the PwC Partner, indirectly through her spouse’s equivalent brokerage account, in investment companies within the Invesco Fund Complex that were inconsistent with the requirements ofRule 2-01(c)(1) of RegulationS-X. PwC noted, among other things, that during the time of its audit, the engagement team was not aware of the investments, the individuals were not in the chain of command of the audit or the audit partners of Invesco or the affiliates of the Registrant, the services each individual provided were not relied upon by the audit engagement team with respect to the audit of the Registrant or its affiliates or, in the case of the PwC Partner, the individual did not provide any services to the Registrant or its affiliates, and the investments were not material to the net worth of each individual or their respective immediate family members which they considered in reaching their conclusion. PwC advised the Audit Committee that it believes its objectivity and
impartiality has not been adversely affected by these matters as they relate to the audit of the Registrant
Item 5. Audit Committee of Listed Registrants.
| | (a) | The Registrant has a separately designated Audit Committee established in accordance with Section 3(a)(58)(A) of the Securities Exchange Act of 1934, as amended, which consists solely of independent trustees. The Audit Committee members are: Marc M. Kole, Gary R. Wicker, and Donald H. Wilson. |
Item 6. Schedule of Investments.
| | (a) | The Schedules of Investments are included as a part of the report to shareholders filed under Item 1 of this FormN-CSR. |
Item 7. Disclosure of Proxy Voting Policies and Procedures forClosed-End Management Investment Companies.
Not applicable.
Item 8. Portfolio Managers ofClosed-End Management Investment Companies.
Not applicable.
Item 9. Purchases of Equity Securities byClosed-End Management Investment Company and Affiliated Purchasers.
Not applicable.
Item 10. Submission of Matters to a Vote of Security Holders.
There have been no material changes to the procedures by which shareholders may recommend nominees to the Board that would require disclosure herein.
Item 11. Controls and Procedures.
| | (a) | Based on their evaluation of the Registrant’s disclosure controls and procedures (as defined in Rule30a-3(c) under the Investment Company Act of 1940) as of a date within 90 days of the filing date of this report, the Registrant’s President (principal executive |
| | officer) and Treasurer (principal financial officer) have concluded that such disclosure controls and procedures are effective. |
| | (b) | There were no changes in the Registrant’s internal control over financial reporting (as defined in Rule30a-3(d) under the Investment Company Act of 1940) that occurred during the last fiscal quarter that has materially affected, or is reasonably likely to materially affect, the Registrant’s internal control over financial reporting. |
| Item 12. | Disclosure of Securities Lending Activities forClosed-End Management Investment Companies. |
Not applicable.
Item 13. Exhibits.
| | (a)(1) | Code of Ethics is attached as Exhibit 99.CODEETH. |
| | (a)(2) | Certifications of the Registrant’s President and Treasurer pursuant to Rule30a-2(a) under the Investment Company Act of 1940 and Section 302 of the Sarbanes-Oxley Act of 2002 are attached as Exhibit 99.CERT. |
| | (b) | Certifications of the Registrant’s President and Treasurer pursuant to Rule30a-2(b) under the Investment Company Act of 1940 and Section 906 of the Sarbanes-Oxley Act of 2002 are attached as Exhibit 99.906CERT. |
SIGNATURES
Pursuant to the requirements of the Securities Exchange Act of 1934 and the Investment Company Act of 1940, the Registrant has duly caused this report to be signed on its behalf by the undersigned, thereunto duly authorized.
(Registrant) Invesco Exchange-Traded Fund Trust
By: /s/ Daniel E. Draper
Name: Daniel E. Draper
Title: President
Date: July 8, 2019
Pursuant to the requirements of the Securities Exchange Act of 1934 and the Investment Company Act of 1940, this report has been signed below by the following persons on behalf of the Registrant and in the capacities and on the dates indicated.
By: /s/ Daniel E. Draper
Name: Daniel E. Draper
Title: President
Date: July 8, 2019
By:/s/ Kelli Gallegos
Name: Kelli Gallegos
Title: Treasurer
Date: July 8, 2019