UNITED STATES
SECURITIES AND EXCHANGE COMMISSION
Washington, D.C. 20549
FORM N-CSR
CERTIFIED SHAREHOLDER REPORT OF REGISTERED MANAGEMENT
INVESTMENT COMPANIES
Investment Company Act file number 811-21265
Invesco Exchange-Traded Fund Trust
(Exact name of registrant as specified in charter)
3500 Lacey Road
Downers Grove, IL 60515
(Address of principal executive offices) (Zip code)
Anna Paglia
President
3500 Lacey Road
Downers Grove, IL 60515
(Name and address of agent for service)
Registrant’s telephone number, including area code: 800-983-0903
Date of fiscal year end: April 30
Date of reporting period: April 30, 2021
Form N-CSR is to be used by management investment companies to file reports with the Commission not later than 10 days after the transmission to stockholders of any report that is required to be transmitted to stockholders under Rule 30e-1 under the Investment Company Act of 1940 (17 CFR 270.30e-1). The Commission may use the information provided on Form N-CSR in its regulatory, disclosure review, inspection, and policymaking roles.
A registrant is required to disclose the information specified by Form N-CSR, and the Commission will make this information public. A registrant is not required to respond to the collection of information contained in Form N-CSR unless the Form displays a currently valid Office of Management and Budget (“OMB”) control number. Please direct comments concerning the accuracy of the information collection burden estimate and any suggestions for reducing the burden to Secretary, Securities and Exchange Commission, 450 Fifth Street, NW, Washington, DC 20549-0609. The OMB has reviewed this collection of information under the clearance requirements of 44 U.S.C. § 3507.
Item 1. Reports to Stockholders.
| (a) | The Registrant’s annual report transmitted to shareholders pursuant to Rule 30e-1 under the Investment Company Act of 1940 is as follows: |

Invesco Annual Report to Shareholders
April 30, 2021
| | |
| |
| PKW | | Invesco BuyBack AchieversTM ETF |
| |
| PFM | | Invesco Dividend AchieversTM ETF |
| |
| DJD | | Invesco Dow Jones Industrial Average Dividend ETF |
| |
| PGF | | Invesco Financial Preferred ETF |
| |
| PEY | | Invesco High Yield Equity Dividend AchieversTM ETF |
| |
| PID | | Invesco International Dividend AchieversTM ETF |

Table of Contents
The Market Environment
Domestic Equity
As many businesses began to shut down in April 2020 due to coronavirus (COVID-19), US unemployment numbers continued to climb, as the economy ground to a halt. However, during the second and into the third quarter of 2020, US stocks largely shrugged off economic uncertainty, social unrest and a resurgence in COVID-19 infections to rally from the market bottom. Investor sentiment improved in response to trillions of dollars in economic stimulus, progress on a COVID-19 vaccine and re-openings in many US regions. In July, the US Federal Reserve (the Fed) extended its emergency stimulus programs, originally scheduled to end in September, to year-end, which provided support to equities. In late August, second-quarter gross domestic product (GDP) fell by 31.4%,1 a record decline. Despite the extreme drop in the economy, the S&P 500 Index not only erased all its losses from the first quarter but made record highs.
Despite a September selloff, US equity markets posted gains in the third quarter as the Fed extended its emergency stimulus programs and changed its inflation target policy, both of which supported equities. Data for both manufacturing and services indicated expansion, a reversal from significant declines earlier in the year. Corporate earnings were also better than anticipated and a gradual decline in new COVID-19 infections in many regions, combined with optimism about progress on a COVID-19 vaccine, further boosted stocks. October saw increased volatility as COVID-19 infection rates rose to record highs in the US and in Europe. Investors also became concerned about delayed results from the US presidential election and the real possibility of a contested election, further delaying a clear winner.
US equity markets posted gains in the fourth quarter, as positive news on COVID-19 vaccines and strong corporate earnings outweighed investor concerns about the political disagreement over a fiscal stimulus package and sharply rising COVID-19 infections nationwide. Cyclical sectors like energy and financials led the way, while real estate and consumer staples lagged. Market leadership also shifted during the quarter with value stocks outperforming growth for the first time since the fourth quarter of 2016. While the US economy rebounded significantly since COVID-19 began, the recovery appeared to slow in the fourth quarter with employment gains and GDP growth down from the third quarter. However, stocks were buoyed by the Fed’s pledge to maintain its accommodative stance and asset purchases, “until substantial further progress has been made” toward employment and inflation targets.
US political unrest and rising COVID-19 infection rates marked the start of the first quarter. Additionally, retail investors bid up select stocks like GameStop and AMC Theaters, ultimately causing a sharp selloff in late January. Corporate earnings generally beat expectations, but market volatility rose during the quarter as investors worried about rising bond yields and inflation. Despite
the Fed’s commitment to an accommodative policy, the 10-year US Treasury yield rose from 0.92% at year-end to 1.63%2 at the fiscal year-end. Approval of a third COVID-19 vaccine boosted investors’ optimism for faster economic recovery. Although March saw increased volatility with consecutive down days in the US stock market, stocks continued to hit all-time highs through April. US stocks had strong returns for the fiscal year, with the S&P 500 Index returning 45.98% for the year.3
| 1 | Source: US Bureau of Economic Analysis |
Global Equity
Despite the continuing global spread of COVID-19 at the beginning of the fiscal year, many countries achieved some success in controlling the spread and were able to slowly re-open their economies. Global equity markets benefited from government policy responses to the crisis, which were swift and encouraging. Many economies received fiscal stimulus and very significant monetary stimulus. The massive monetary policy responses created an environment in which investors embraced risk, and stocks rose globally after a deep rout.
Building on progress made in the latter part of the second quarter, many countries were able to continue reducing COVID-19-related stringency protocols. As a result, the “green shoots” we saw at the end of the second quarter grew and flourished into the third quarter, as many countries experienced a strong economic rebound.
At the end of 2020, global equity markets again posted gains as good news about COVID-19 vaccines outweighed concerns about sharply rising infection rates and tightening social restrictions. In most global regions, equity market leadership shifted as value stocks outperformed growth stocks. Sectors that had been severely affected by COVID-19, including energy and financials, were among the fourth quarter’s top performers. Emerging market equities posted robust gains amplified by US dollar weakness.
Global equity markets ended the first quarter in positive territory amid concerns about rising bond yields and inflation. The value-led equity rally continued in most regions, with value stocks outperforming growth stocks. The successful rollout of COVID-19 vaccinations in the US and UK benefited equity markets. However, even regions facing slower rollouts, including the Eurozone and Japan, performed well, driven by a rebound in global demand for goods.
At the end of the fiscal year, global equity markets were mixed with more cyclical markets lagging. We saw a pause in the value-lead equity rally; growth stocks outperformed value stocks in April. Overall, developed market equities and emerging market equities had strong returns for the fiscal year.
| | |
| PKW | | Management’s Discussion of Fund Performance |
| | Invesco BuyBack AchieversTM ETF (PKW) |
As an index fund, the Invesco BuyBack AchieversTM ETF (the ”Fund”) is passively managed and seeks to track the investment results (before fees and expenses) of the NASDAQ US BuyBack AchieversTM Index (the “Index”). The Fund generally will invest at least 90% of its total assets in the securities that comprise the Index.
Strictly in accordance with its guidelines and mandated procedures, Nasdaq, Inc. (the “Index Provider”) includes common stocks in the Index pursuant to a proprietary selection methodology that identifies a universe of “BuyBack AchieversTM”. To qualify for the universe of “BuyBack AchieversTM,” an issuer must have effected a net reduction in shares outstanding of 5% or more in the past 12 months.
The Fund generally invests in all of the securities comprising the Index in proportion to their weightings in the Index.
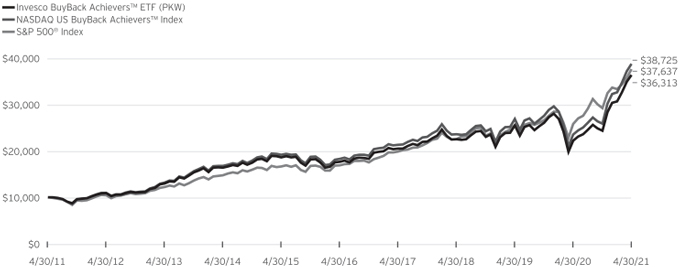
For the fiscal year ended April 30, 2021, on a market price basis, the Fund returned 63.58%. On a net asset value (“NAV”) basis, the Fund returned 63.52%. During the same time period, the Index returned 64.65%. During the fiscal year, the Fund fully replicated the components of the Index; therefore, the Fund’s performance, on a NAV basis, differed from the return of the Index primarily due to the fees and expenses that the Fund incurred during the period, the effect of which was compounded during a time period of high returns. During this same time period, the S&P 500® Index returned 45.98%.
For the fiscal year ended April 30, 2021, the financials sector contributed most significantly to the Fund’s return, followed by the information technology and industrials sectors, respectively. No sector detracted from the Fund’s performance during this period.
Positions that contributed most significantly to the Fund’s return for the fiscal year ended April 30, 2021, included Apple Inc., an information technology company (no longer held at fiscal year-end) and Qualcomm Inc., an information technology company (no longer held at fiscal year-end). Positions that detracted most significantly from the Fund’s return during this period included Biogen Inc., a health care company (portfolio average weight of 2.23%) and Citrix Systems, Inc., an information technology company (portfolio average weight of 0.56%).
| | | | |
Sector Breakdown
(% of the Fund’s Net Assets)
as of April 30, 2021 | |
| Financials | | | 28.14 | |
| Information Technology | | | 24.25 | |
| Health Care | | | 12.90 | |
| Industrials | | | 11.47 | |
| Consumer Discretionary | | | 9.75 | |
| Communication Services | | | 7.77 | |
| Sector Types Each Less Than 3% | | | 5.71 | |
| Money Market Funds Plus Other Assets Less Liabilities | | | 0.01 | |
|
Top Ten Fund Holdings*
(% of the Fund’s Net Assets)
as of April 30, 2021 | |
| Security | | | | |
| Charter Communications, Inc., Class A | | | 5.23 | |
| Oracle Corp. | | | 5.18 | |
| HP, Inc. | | | 5.15 | |
| Allstate Corp. (The) | | | 4.72 | |
| Biogen, Inc. | | | 4.58 | |
| eBay, Inc. | | | 4.37 | |
| Intel Corp. | | | 4.31 | |
| Fortinet, Inc. | | | 4.13 | |
| Ameriprise Financial, Inc. | | | 3.74 | |
| McKesson Corp. | | | 3.70 | |
| Total | | | 45.11 | |
| * | Excluding money market fund holdings. |
Invesco BuyBack AchieversTM ETF (PKW) (continued)
Growth of a $10,000 Investment
Fund Performance History as of April 30, 2021
| | | | | | | | | | | | | | | | | | | | | | | | | | | | | | | | | | | | | | | | |
| | | 1 Year | | | 3 Years
Average
Annualized | | | 3 Years
Cumulative | | | 5 Years
Average
Annualized | | | 5 Years
Cumulative | | | 10 Years
Average
Annualized | | | 10 Years
Cumulative | | | | | | Fund Inception | |
Index | | | | | Average
Annualized | | | Cumulative | |
| NASDAQ US BuyBack Achievers™ Index | | | 64.65 | % | | | 17.99 | % | | | 64.25 | % | | | 16.22 | % | | | 112.03 | % | | | 14.50 | % | | | 287.25 | % | | | | | | | 11.07 | % | | | 352.00 | % |
| S&P 500® Index | | | 45.98 | | | | 18.67 | | | | 67.11 | | | | 17.42 | | | | 123.20 | | | | 14.17 | | | | 276.37 | | | | | | | | 10.05 | | | | 295.77 | |
| Fund | | | | | | | | | | | | | | | | | | | | | | | | | | | | | | | | | | | | | | | | |
| NAV Return | | | 63.52 | | | | 17.29 | | | | 61.34 | | | | 15.51 | | | | 105.65 | | | | 13.76 | | | | 263.13 | | | | | | | | 10.32 | | | | 309.95 | |
| Market Price Return | | | 63.58 | | | | 17.31 | | | | 61.43 | | | | 15.54 | | | | 105.93 | | | | 13.77 | | | | 263.47 | | | | | | | | 10.32 | | | | 309.71 | |
Fund Inception: December 20, 2006
Performance quoted above represents past performance. Past performance is not a guarantee of future results and current performance may be higher or lower than performance quoted. Investment returns and principal value will fluctuate, and shares of the Fund (“Fund Shares”), when redeemed or sold, may be worth more or less than their original cost. Fund performance reflects any applicable fee waivers and/or expense reimbursements. Had the adviser not waived fees and/or reimbursed expenses currently or in the past, returns would have been lower. See current prospectus for more information. According to the Fund’s current prospectus, the total annual operating expense ratio was indicated as 0.62%. The Financial Highlights section of the Shareholder Report presents the expense ratios based on expenses incurred during the period covered by this report. NAV and Market Price returns assume that dividends and capital gain distributions have been reinvested in the Fund at NAV and Market Price, respectively. The returns shown in the table above do not reflect the deduction of taxes that a shareholder would pay on Fund distributions or the redemption or sale of Fund Shares. See invesco.com/ETFs to find the most recent month-end performance numbers.
Performance results for the indexes stated above are based upon a hypothetical investment in their respective constituent securities. The returns of an index do not represent Fund returns. An investor cannot invest directly in an index. The indexes do not charge management fees or brokerage expenses, and no such fees or expenses were deducted from the hypothetical performance shown. In addition, the results actual investors might have achieved would have differed from those shown because of differences in the timing, amounts of their investments, and fees and expenses associated with an investment in the Fund.
Notes Regarding Indexes and Fund Performance History:
| - | Average Annualized and Cumulative Inception returns for the Fund and the indexes are based on the inception date of the Fund. |
| - | Effective June 26, 2020, the Fund changed its designated broad-based securities market benchmark index from the S&P 500® Index to the Index, as the Index more closely reflects the performance of the types of securities in which the Fund invests. |
| | |
| PFM | | Management’s Discussion of Fund Performance |
| | Invesco Dividend AchieversTM ETF (PFM) |
As an index fund, the Invesco Dividend AchieversTM ETF (the “Fund”) is passively managed and seeks to track the investment results (before fees and expenses) of the NASDAQ US Broad Dividend AchieversTM Index (the “Index”). The Fund generally will invest at least 90% of its total assets in the securities that comprise the Index.
Strictly in accordance with its guidelines and mandated procedures, Nasdaq, Inc. (the “Index Provider”) includes common stocks in the Index pursuant to a proprietary selection methodology that identifies a universe of “Dividend AchieversTM.” To qualify for the universe of “Dividend AchieversTM,” an issuer must have increased its annual regular cash dividend payments for at least each of its last ten or more calendar or fiscal years.
The Fund generally invests in all of the securities comprising the Index in proportion to their weightings in the Index.
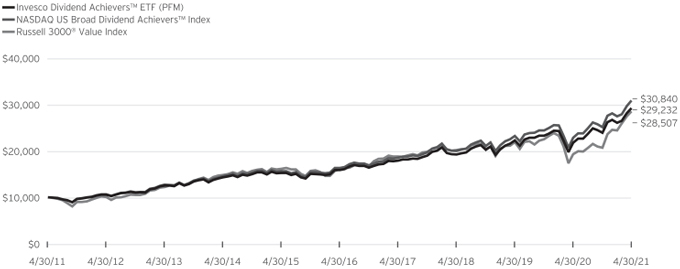
For the fiscal year ended April 30, 2021, on a market price basis, the Fund returned 34.02%. On a net asset value (“NAV”) basis, the Fund returned 34.21%. During the same time period, the Index returned 34.94%. During the fiscal year, the Fund fully replicated the components of the Index; therefore, the Fund’s performance, on a NAV basis, differed from the return of the Index primarily due to the fees and expenses that the Fund incurred during the period, the effect of which was compounded during a time period of high returns. During this same time period, the Russell 3000® Value Index returned 47.78%.
For the fiscal year ended April 30, 2021, the information technology sector contributed most significantly to the Fund’s return, followed by the industrials and consumer discretionary sectors, respectively. No sector detracted from the Fund’s performance during this period.
Positions that contributed most significantly to the Fund’s return for the fiscal year ended April 30, 2021, included Microsoft Corp., an information technology company (portfolio average weight of 4.16%) and Home Depot, Inc. (The), a consumer discretionary company (portfolio average weight of 2.67%). Positions that detracted most significantly from the Fund’s return during this period included Merck & Co., Inc., a health care company (portfolio average weight of 0.15%) and Broadcom, Inc., an information technology company (portfolio average weight of 0.15%).
| | | | |
Sector Breakdown
(% of the Fund’s Net Assets)
as of April 30, 2021 | |
| Information Technology | | | 16.57 | |
| Financials | | | 13.87 | |
| Health Care | | | 13.85 | |
| Consumer Staples | | | 13.74 | |
| Industrials | | | 13.57 | |
| Consumer Discretionary | | | 8.81 | |
| Communication Services | | | 5.37 | |
| Utilities | | | 5.21 | |
| Energy | | | 3.75 | |
| Materials | | | 3.47 | |
| Real Estate | | | 1.70 | |
| Money Market Funds Plus Other Assets Less Liabilities | | | 0.09 | |
|
Top Ten Fund Holdings*
(% of the Fund’s Net Assets)
as of April 30, 2021 | |
| Security | | | | |
| Microsoft Corp. | | | 3.94 | |
| JPMorgan Chase & Co. | | | 3.18 | |
| Johnson & Johnson | | | 2.89 | |
| Walmart, Inc. | | | 2.68 | |
| Visa, Inc., Class A | | | 2.68 | |
| UnitedHealth Group, Inc. | | | 2.55 | |
| Home Depot, Inc. (The) | | | 2.36 | |
| Procter & Gamble Co. (The) | | | 2.22 | |
| Comcast Corp., Class A | | | 1.73 | |
| Exxon Mobil Corp. | | | 1.64 | |
| Total | | | 25.87 | |
| * | Excluding money market fund holdings. |
Invesco Dividend AchieversTM ETF (PFM) (continued)
Growth of a $10,000 Investment
Fund Performance History as of April 30, 2021
| | | | | | | | | | | | | | | | | | | | | | | | | | | | | | | | | | | | | | | | |
| | | 1 Year | | | 3 Years Average
Annualized | | | 3 Years Cumulative | | | 5 Years Average
Annualized | | | 5 Years Cumulative | | | 10 Years Average
Annualized | | | 10 Years Cumulative | | | | | | Fund Inception | |
| Index | | | | | Average
Annualized | | | Cumulative | |
NASDAQ US Broad Dividend Achievers™ Index | | | 34.94 | % | | | 15.54 | % | | | 54.23 | % | | | 13.58 | % | | | 89.02 | % | | | 11.92 | % | | | 208.40 | % | | | | | | | 8.77 | % | | | 271.66 | % |
| Russell 3000® Value Index | | | 47.78 | | | | 12.24 | | | | 41.38 | | | | 12.25 | | | | 78.20 | | | | 11.04 | | | | 185.07 | | | | | | | | 8.14 | | | | 239.49 | |
Fund | | | | | | | | | | | | | | | | | | | | | | | | | | | | | | | | | | | | | | | | |
NAV Return | | | 34.21 | | | | 14.98 | | | | 52.03 | | | | 13.00 | | | | 84.21 | | | | 11.32 | | | | 192.32 | | | | | | | | 8.14 | | | | 239.72 | |
| Market Price Return | | | 34.02 | | | | 14.95 | | | | 51.91 | | | | 13.00 | | | | 84.22 | | | | 11.32 | | | | 192.33 | | | | | | | | 8.14 | | | | 239.71 | |
Fund Inception: September 15, 2005
Performance quoted above represents past performance. Past performance is not a guarantee of future results and current performance may be higher or lower than performance quoted. Investment returns and principal value will fluctuate, and shares of the Fund (“Fund Shares”), when redeemed or sold, may be worth more or less than their original cost. Fund performance reflects any applicable fee waivers and/or expense reimbursements. Had the adviser not waived fees and/or reimbursed expenses currently or in the past, returns would have been lower. See current prospectus for more information. According to the Fund’s current prospectus, the total annual operating expense ratio was indicated as 0.53%. The Financial Highlights section of the Shareholder Report presents the expense ratios based on expenses incurred during the period covered by this report. NAV and Market Price returns assume that dividends and capital gain distributions have been reinvested in the Fund at NAV and Market Price, respectively. The returns shown in the table above do not reflect the deduction of taxes that a shareholder would pay on Fund distributions or the redemption or
sale of Fund Shares. See invesco.com/ETFs to find the most recent month-end performance numbers.
Performance results for the indexes stated above are based upon a hypothetical investment in their respective constituent securities. The returns of an index do not represent Fund returns. An investor cannot invest directly in an index. The indexes do not charge management fees or brokerage expenses, and no such fees or expenses were deducted from the hypothetical performance shown. In addition, the results actual investors might have achieved would have differed from those shown because of differences in the timing, amounts of their investments, and fees and expenses associated with an investment in the Fund.
Notes Regarding Indexes and Fund Performance History:
| - | Average Annualized and Cumulative Inception returns for the Fund and the indexes are based on the inception date of the Fund. |
| - | Effective June 26, 2020, the Fund changed its designated broad-based securities market benchmark index from the Russell 3000® Value Index to the Index, as the Index more closely reflects the performance of the types of securities in which the Fund invests. |
| | |
| DJD | | Management’s Discussion of Fund Performance |
| | Invesco Dow Jones Industrial Average Dividend ETF (DJD) |
As an index fund, the Invesco Dow Jones Industrial Average Dividend ETF (the “Fund”) is passively managed and seeks to track the investment results (before fees and expenses) of the Dow Jones Industrial Average Yield Weighted (the “Index”). The Fund generally will invest at least 90% of its total assets in the securities that comprise the Index.
The Index is designed to provide exposure to dividend-paying equity securities of companies included in the Dow Jones Industrial AverageTM (the “Benchmark Index”), which is a price- weighted index of 30 U.S. companies that meet certain size, listing and liquidity requirements. The Index includes all constituents of the Benchmark Index that pay dividends. The Index is calculated using a yield-weighted methodology that weights all dividend- paying constituents of the Benchmark Index by their twelve-month dividend yield over the prior twelve months.
The Fund generally will invest in all of the securities comprising the Index in proportion to their weightings in the Index.
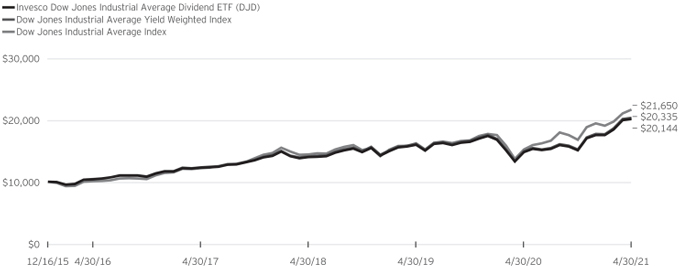
For the fiscal year ended April 30, 2021, on a market price basis, the Fund returned 36.03%. On a net asset value (“NAV”) basis, the Fund returned 36.03%. During the same time period, the Index returned 36.21%. During the fiscal year, the Fund fully replicated the components of the Index; therefore, the Fund’s performance, on a NAV basis, differed from the return of the Index primarily due fees and operating expenses that the Fund incurred during the period.
During this same time period, the Benchmark Index returned 42.12%. The Benchmark Index was selected for its recognition in the marketplace, and because its performance comparison is a useful measure for investors as a broad representation of the U.S. equity market.
The performance of the Fund differed from the Benchmark Index in part because the Fund seeks to track an Index that employs a proprietary stock selection and weighting methodology, whereas the Benchmark Index selects and weights stocks based on market capitalization.
Relative to the Benchmark Index, the Fund was most overweight in the consumer staples sector and most underweight in the consumer discretionary sector during the fiscal year ended April 30, 2021. The majority of the Fund’s underperformance relative to the Benchmark Index during that period can be attributed to the Fund’s overweight allocation in the energy sector, as well as the Fund’s underweight allocation to and security selection in the information technology sector.
For the fiscal year ended April 30, 2021, the financials sector contributed most significantly to the Fund’s return, followed by the industrials and materials sectors, respectively. No sector detracted from the Fund’s performance during this period.
Positions that contributed most significantly to the Fund’s return for the fiscal year ended April 30, 2021, included Dow, Inc., a
materials company (portfolio average weight of 8.01%) and Caterpillar, Inc., an industrials company (portfolio average weight of 4.03%). Positions that detracted most significantly from the Fund’s return during this period included Exxon Mobil Corp., an energy company (no longer held at fiscal year-end) and Amgen, Inc., a health care company (portfolio average weight of 2.01%).
| | | | |
Sector Breakdown
(% of the Fund’s Net Assets)
as of April 30, 2021 | |
| Information Technology | | | 19.24 | |
| Consumer Staples | | | 16.48 | |
| Health Care | | | 15.27 | |
| Financials | | | 10.43 | |
| Industrials | | | 10.19 | |
| Consumer Discretionary | | | 9.04 | |
| Energy | | | 6.54 | |
| Communication Services | | | 6.47 | |
| Materials | | | 6.29 | |
| Money Market Funds Plus Other Assets Less Liabilities | | | 0.05 | |
|
Top Ten Fund Holdings*
(% of the Fund’s Net Assets)
as of April 30, 2021 | |
| Security | | | | |
| International Business Machines Corp. | | | 8.36 | |
| Chevron Corp. | | | 6.54 | |
| Verizon Communications, Inc. | | | 6.47 | |
| Dow, Inc. | | | 6.29 | |
| Walgreens Boots Alliance, Inc. | | | 5.34 | |
| Coca-Cola Co. (The) | | | 5.04 | |
| 3M Co. | | | 4.95 | |
| Merck & Co., Inc. | | | 4.90 | |
| Cisco Systems, Inc. | | | 4.72 | |
| Amgen, Inc. | | | 4.47 | |
| Total | | | 57.08 | |
| * | Excluding money market fund holdings. |
Invesco Dow Jones Industrial Average Dividend ETF (DJD) (continued)
Growth of a $10,000 Investment Since Inception
Fund Performance History as of April 30, 2021
| | | | | | | | | | | | | | | | | | | | | | | | | | | | | | | | |
| | | | | | 3 Years Average
Annualized | | | 3 Years Cumulative | | | 5 Years Average
Annualized | | | 5 Years Cumulative | | | | | | Fund Inception | |
Index | | 1 Year | | | Average
Annualized | | | Cumulative | |
Dow Jones Industrial Average Yield Weighted Index | | | 36.21 | % | | | 12.96 | % | | | 44.12 | % | | | 14.28 | % | | | 94.94 | % | | | | | | | 14.12 | % | | | 103.35 | % |
| Dow Jones Industrial Average Index | | | 42.12 | | | | 14.52 | | | | 50.20 | | | | 16.48 | | | | 114.44 | | | | | | | | 15.46 | | | | 116.50 | |
Fund | | | | | | | | | | | | | | | | | | | | | | | | | | | | | | | | |
NAV Return | | | 36.03 | | | | 12.93 | | | | 44.01 | | | | 14.10 | | | | 93.40 | | | | | | | | 13.92 | | | | 101.44 | |
| Market Price Return | | | 36.03 | | | | 12.94 | | | | 44.04 | | | | 13.79 | | | | 90.76 | | | | | | | | 13.94 | | | | 101.65 | |
Guggenheim Dow Jones Industrial Average Dividend ETF (Predecessor Fund) Inception: December 16, 2015
Performance quoted above represents past performance. Past performance is not a guarantee of future results and current performance may be higher or lower than performance quoted. Investment returns and principal value will fluctuate, and shares of the Fund (“Fund Shares”), when redeemed or sold, may be worth more or less than their original cost. Fund performance reflects any applicable fee waivers and/or expense reimbursements. Had the adviser not waived fees and/or reimbursed expenses currently or in the past, returns would have been lower. See current prospectus for more information. According to the Fund’s current prospectus, the Fund’s expense ratio of 0.07% is expressed as a unitary management fee to cover operating expenses and expenses incurred in connection with managing the portfolio. The Financial Highlights section of the Shareholder Report presents the expense ratios based on expenses incurred during the period covered by this report. NAV and Market Price returns assume that dividends and capital gain distributions have been reinvested in the Fund at NAV and Market Price, respectively. The returns shown in the table above do not reflect the deduction of taxes that a shareholder would pay
on Fund distributions or the redemption or sale of Fund Shares. See invesco.com/ETFs to find the most recent month-end performance numbers.
Index and Benchmark Index performance results are based upon a hypothetical investment in their respective constituent securities. Index and Benchmark Index returns do not represent Fund returns. An investor cannot invest directly in an index. The Index and Benchmark Index do not charge management fees or brokerage expenses, and no such fees or expenses were deducted from the hypothetical performance shown. In addition, the results actual investors might have achieved would have differed from those shown because of differences in the timing, amounts of their investments, and fees and expenses associated with an investment in the Fund.
Notes Regarding Indexes and Fund Performance History:
| - | Average Annualized and Cumulative Inception returns for the Fund, Index and Benchmark Index are based on the inception date of the Predecessor Fund. |
| - | Effective after the close of business on April 6, 2018, the Predecessor Fund was reorganized into the Fund. Returns shown are blended returns of the Predecessor Fund and the Fund. |
| | |
| PGF | | Management’s Discussion of Fund Performance |
| | Invesco Financial Preferred ETF (PGF) |
As an index fund, the Invesco Financial Preferred ETF (the “Fund”) is passively managed and seeks to track the investment results (before fees and expenses) of the Wells Fargo® Hybrid and Preferred Securities Financial Index (the “Index”). The Fund generally will invest at least 90% of its total assets in the securities that comprise the Index.
Strictly in accordance with its guidelines and mandated procedures, Wells Fargo Securities, LLC (together with Wells Fargo & Company, the “Index Provider”) uses a proprietary methodology to select securities for the Index, which is a market capitalization weighted index designed to track the performance of preferred securities and securities that the Index Provider believes are functionally equivalent to preferred securities, including, but not limited to, depositary preferred securities, perpetual subordinated debt and certain capital securities. The Index is composed of preferred and equivalent securities with either fixed or fixed to floating rate dividends or coupons, issued by the financial institutions that have received an industry sector classification of “financial” from the Bloomberg Professional Service® and that are traded in the U.S. market.
In general, preferred stock is a class of equity security that pays distributions to preferred stockholders. Preferred stockholders have priority over common stockholders in the payment of specified dividends, such that preferred stockholders receive dividends before any dividends are paid to common stockholders. In addition, preferred stock takes precedence over common stock in receiving proceeds from an issuer in the event of the issuer’s liquidation, but is generally junior to debt, including senior and subordinated debt.
The Index may include fixed or variable rate securities, meaning that dividends and coupons (as applicable) may be paid either on a fixed rate or a floating rate percentage of the fixed par value at which the preferred stock or other securities are issued. Floating rate preferred securities are securities that pay interest at rates that adjust whenever a specified benchmark interest rate (e.g., the LIBOR or a T-Bill rate) changes, float at a fixed margin above a generally recognized base lending rate, or are reset or re-determined on specified dates (such as the last day of a month or calendar quarter). Preferred stocks often have a liquidation value that equals the original purchase price of the stock at the time of issuance.
The Fund does not purchase all of the securities in the Index; instead, the Fund utilizes a “sampling” methodology to seek to achieve its investment objective.
For the fiscal year ended April 30, 2021, on a market price basis, the Fund returned 10.22%. On a net asset value (“NAV”) basis, the Fund returned 9.94%. During the same time period, the Index returned 10.39%. The Fund’s performance, on a NAV basis, differed from the return of the Index due to the fees and operating expenses incurred by the Fund during the period, which were partially offset by the positive effect from the Fund’s
sampling methodology, as well as income received from the securities lending program in which the Fund participates.
During this same time period, the S&P U.S. Preferred Stock Index (the “Benchmark Index”) returned 17.15%. The Benchmark Index is an unmanaged index weighted by modified market capitalization based on the average performance of approximately 305 securities. The Benchmark Index was selected for its recognition in the marketplace, and because its performance comparison is a useful measure for investors as a broad representation of the U.S. preferred stock market.
The performance of the Fund differed from the Benchmark Index primarily because the Fund seeks to track an Index that employs a methodology that focuses on financials sector preferred securities, whereas the Benchmark Index includes preferred stocks from across the U.S. preferred stock market, including convertible preferred stocks. As such, the Fund was overweight to the financials sector compared to the Benchmark Index.
Relative to the Benchmark Index, the majority of the Fund’s underperformance during the period can be primarily attributed to its overweight allocation to preferred securities in the banks and diversified financial services preferred industries.
For the fiscal year ended April 30, 2021, the banks industry contributed most significantly to the Fund’s return, followed by the insurance and capital markets industries, respectively. No industry detracted from the Fund’s performance during this period.
Positions that contributed most significantly to the Fund’s return for the fiscal year ended April 30, 2021, included Wells Fargo & Co., 4.75%, Series Z, a banks company (portfolio average weight of 2.70%), Wells Fargo & Co., 5.85%, Series Q, a banks company (portfolio average weight of 2.40%), and Synchrony Financial, 5.63%, Series A, a consumer finance company (portfolio average weight of 1.00%). Positions that detracted most significantly from the Fund’s return during this period included US Bancorp, 3.75%, Series L, a banks company (portfolio average weight of 0.60%), Regions Financial Corp., 4.45%, Series E, a banks company (portfolio average weight of 0.40%), and Equitable Holdings, Inc., 4.30%, Series C, a diversified financial services company (portfolio average weight of 0.40%).
| | | | |
Industry Breakdown
(% of the Fund’s Net Assets)
as of April 30, 2021 | |
| Banks | | | 58.55 | |
| Insurance | | | 17.62 | |
| Capital Markets | | | 14.33 | |
| Consumer Finance | | | 5.68 | |
| Industry Types Each Less Than 3% | | | 3.72 | |
| Money Market Funds Plus Other Assets Less Liabilities | | | 0.10 | |
Invesco Financial Preferred ETF (PGF) (continued)
| | | | |
Top Ten Fund Holdings*
(% of the Fund’s Net Assets)
as of April 30, 2021 | |
| Security | | | | |
| Wells Fargo & Co., Series Z, Pfd., 4.75%, | | | 2.75 | |
| JPMorgan Chase & Co., Series EE, Pfd., 6.00%, | | | 2.57 | |
| Wells Fargo & Co., Series Q, Pfd., 5.85%, | | | 2.43 | |
| JPMorgan Chase & Co., Series DD, Pfd., 5.75%, | | | 2.31 | |
| Citigroup, Inc., Series K, Pfd., 6.88%, | | | 2.16 | |
| Bank of America Corp., Series KK, Pfd., 5.38%, | | | 2.03 | |
| PNC Financial Services Group, Inc. (The), Series P, Pfd., 6.13%, | | | 1.99 | |
| JPMorgan Chase & Co., Series JJ, Pfd., 4.55%, | | | 1.95 | |
| Bank of America Corp., Series GG, Pfd., 6.00%, | | | 1.88 | |
| Bank of America Corp., Series LL, Pfd., 5.00%, | | | 1.78 | |
| Total | | | 21.85 | |
| * | Excluding money market fund holdings. |
Growth of a $10,000 Investment
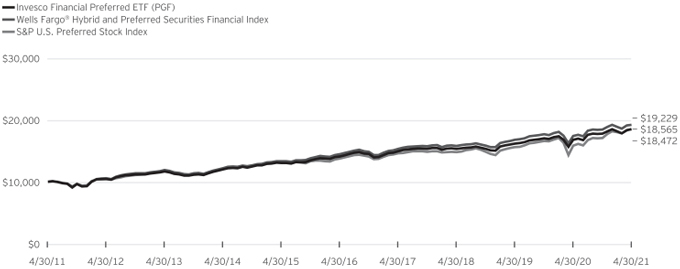
Fund Performance History as of April 30, 2021
| | | | | | | | | | | | | | | | | | | | | | | | | | | | | | | | | | | | | | | | |
| | | 1 Year | | | 3 Years Average
Annualized | | | 3 Years Cumulative | | | 5 Years Average
Annualized | | | 5 Years Cumulative | | | 10 Years Average
Annualized | | | 10 Years Cumulative | | | | | | Fund Inception | |
Index | | | | | Average
Annualized | | | Cumulative | |
Wells Fargo® Hybrid and Preferred Securities Financial Index | | | 10.39 | % | | | 6.81 | % | | | 21.86 | % | | | 5.89 | % | | | 33.12 | % | | | 6.76 | % | | | 92.29 | % | | | | | | | 5.42 | % | | | 113.88 | % |
| S&P U.S. Preferred Stock Index | | | 17.15 | | | | 7.89 | | | | 25.58 | | | | 6.21 | | | | 35.14 | | | | 6.38 | | | | 85.65 | | | | | | | | 5.38 | | | | 112.87 | |
| Fund | | | | | | | | | | | | | | | | | | | | | | | | | | | | | | | | | | | | | | | | |
NAV Return | | | 9.94 | | | | 6.47 | | | | 20.70 | | | | 5.57 | | | | 31.12 | | | | 6.33 | | | | 84.72 | | | | | | | | 4.67 | | | | 93.15 | |
| Market Price Return | | | 10.22 | | | | 6.62 | | | | 21.21 | | | | 5.61 | | | | 31.39 | | | | 6.36 | | | | 85.21 | | | | | | | | 4.64 | | | | 92.38 | |
Invesco Financial Preferred ETF (PGF) (continued)
Fund Inception: December 1, 2006
Performance quoted above represents past performance. Past performance is not a guarantee of future results and current performance may be higher or lower than performance quoted. Investment returns and principal value will fluctuate, and shares of the Fund (“Fund Shares”), when redeemed or sold, may be worth more or less than their original cost. Fund performance reflects any applicable fee waivers and/or expense reimbursements. Had the adviser not waived fees and/or reimbursed expenses currently or in the past, returns would have been lower. See current prospectus for more information. According to the Fund’s current prospectus, the total annual operating expense ratio was indicated as 0.61%. The Financial Highlights section of the Shareholder Report presents the expense ratios based on expenses incurred during the period covered by this report. NAV and Market Price returns assume that dividends and capital gain distributions have been reinvested in the Fund at NAV and Market Price, respectively. The returns shown in the table above do not reflect the deduction of taxes
that a shareholder would pay on Fund distributions or the redemption or
sale of Fund Shares. See invesco.com/ETFs to find the most recent month-end performance numbers.
Index and Benchmark Index performance results are based upon a hypothetical investment in their respective constituent securities. Index and Benchmark Index returns do not represent Fund returns. An investor cannot invest directly in an index. The Index and Benchmark Index do not charge management fees or brokerage expenses, and no such fees or expenses were deducted from the hypothetical performance shown. In addition, the results actual investors might have achieved would have differed from those shown because of differences in the timing, amounts of their investments, and fees and expenses associated with an investment in the Fund.
Notes Regarding Indexes and Fund Performance History:
| - | Average Annualized and Cumulative Inception returns for the Fund, Index and Benchmark Index are based on the inception date of the Fund. |
| | |
| PEY | | Management’s Discussion of Fund Performance |
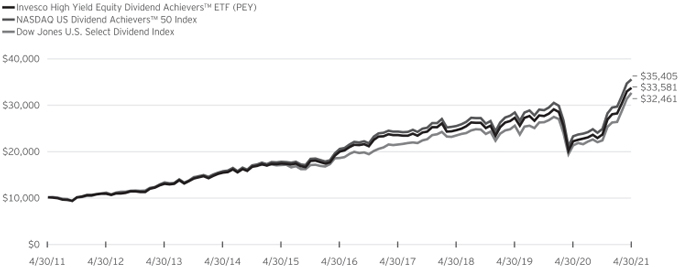
| | Invesco High Yield Equity Dividend AchieversTM ETF (PEY) |
As an index fund, the Invesco High Yield Equity Dividend AchieversTM ETF (the “Fund”) is passively managed and seeks to track the investment results (before fees and expenses) of the NASDAQ US Dividend AchieversTM 50 Index (the “Index”). The Fund generally will invest at least 90% of its total assets in the securities that comprise the Index.
Strictly in accordance with its guidelines and mandated procedures, Nasdaq, Inc. (the “Index Provider”) includes common stocks in the Index that have a consistent record of dividend increases, principally on the basis of dividend yield and consistent growth in dividends. The Underlying Index is composed of the 50 issuers with the highest modified dividend yield chosen from the NASDAQ US Broad Dividend AchieversTM Index. To qualify for inclusion in the Index, an issuer must have increased its annual regular cash dividend payments for each of its last ten or more calendar or fiscal years, and must have a minimum market capitalization of $1 billion.
The Fund generally invests in all of the securities comprising the Index in proportion to their weightings in the Index.
For the fiscal year ended April 30, 2021, on a market price basis, the Fund returned 51.80%. On a net asset value (“NAV”) basis, the Fund returned 52.12%. During the same time period, the Index returned 53.11%. During the fiscal year, the Fund fully replicated the components of the Index; therefore, the Fund’s performance, on a NAV basis, differed from the return of the Index primarily due to the fees and expenses that the Fund incurred during the period, the effect of which was compounded during a time period of high returns. During this same time period, the Dow Jones U.S. Select Dividend Index returned 53.35%.
For the fiscal year ended April 30, 2021, the insurance industry contributed most significantly to the Fund’s return, followed by the banks and oil, gas & consumable fuels industries, respectively. The energy equipment & services industry was the only industry to detract from the Fund’s return during this period.
Positions that contributed most significantly to the Fund’s return for the fiscal year ended April 30, 2021, included ONEOK, Inc. an oil, gas & consumable fuels company (portfolio average weight of 3.50%) and Travel + Leisure Co., a hotel, restaurants & leisure company (no longer held at fiscal year-end). Positions that detracted most significantly from the Fund’s return during this period included Meredith Corp., a media company (no longer held at fiscal year-end) and Invesco Ltd., a capital markets company (no longer held at fiscal year-end).
| | | | |
Industry Breakdown
(% of the Fund’s Net Assets)
as of April 30, 2021 | |
| Electric Utilities | | | 13.22 | |
| Oil, Gas & Consumable Fuels | | | 10.60 | |
| Insurance | | | 9.90 | |
| Tobacco | | | 8.51 | |
| Banks | | | 6.62 | |
| Multi-Utilities | | | 5.89 | |
| Gas Utilities | | | 5.28 | |
| Diversified Telecommunication Services | | | 5.16 | |
| Food Products | | | 4.75 | |
| Capital Markets | | | 4.11 | |
| Pharmaceuticals | | | 3.38 | |
| Industry Types Each Less Than 3% | | | 22.50 | |
| Money Market Funds Plus Other Assets Less Liabilities | | | 0.08 | |
Top Ten Fund Holdings*
(% of the Fund’s Net Assets)
as of April 30, 2021 | |
| Security | | | | |
| ONEOK, Inc. | | | 3.93 | |
| Altria Group, Inc. | | | 3.36 | |
| AT&T, Inc. | | | 3.31 | |
| PPL Corp. | | | 2.78 | |
| Exxon Mobil Corp. | | | 2.65 | |
| Universal Corp. | | | 2.63 | |
| International Business Machines Corp. | | | 2.57 | |
| Philip Morris International, Inc. | | | 2.51 | |
| OGE Energy Corp. | | | 2.44 | |
| Prudential Financial, Inc. | | | 2.34 | |
| Total | | | 28.52 | |
| * | Excluding money market fund holdings. |
Invesco High Yield Equity Dividend AchieversTM ETF (PEY) (continued)
Growth of a $10,000 Investment
Fund Performance History as of April 30, 2021
| | | | | | | | | | | | | | | | | | | | | | | | | | | | | | | | | | | | | | | | |
| | | 1 Year | | | 3 Years Average
Annualized | | | 3 Years Cumulative | | | 5 Years Average
Annualized | | | 5 Years Cumulative | | | 10 Years Average
Annualized | | | 10 Years Cumulative | | | | | | Fund Inception | |
| Index | | | | | Average
Annualized | | | Cumulative | |
NASDAQ US Dividend Achievers™ 50 Index | | | 53.11 | % | | | 11.73 | % | | | 39.48 | % | | | 11.66 | % | | | 73.55 | % | | | 13.48 | % | | | 254.05 | % | | | | | | | 6.78 | % | | | 193.25 | % |
| Dow Jones U.S. Select Dividend Index | | | 53.35 | | | | 11.68 | | | | 39.31 | | | | 11.93 | | | | 75.68 | | | | 12.50 | | | | 224.61 | | | | | | | | 8.65 | | | | 289.46 | |
| Fund | | | | | | | | | | | | | | | | | | | | | | | | | | | | | | | | | | | | | | | | |
NAV Return | | | 52.12 | | | | 11.13 | | | | 37.25 | | | | 11.09 | | | | 69.15 | | | | 12.88 | | | | 235.81 | | | | | | | | 6.29 | | | | 171.74 | |
| Market Price Return | | | 51.80 | | | | 11.13 | | | | 37.25 | | | | 11.07 | | | | 69.03 | | | | 12.88 | | | | 235.79 | | | | | | | | 6.29 | | | | 171.92 | |
Fund Inception: December 9, 2004
Performance quoted above represents past performance. Past performance is not a guarantee of future results and current performance may be higher or lower than performance quoted. Investment returns and principal value will fluctuate, and shares of the Fund (“Fund Shares”), when redeemed or sold, may be worth more or less than their original cost. Fund performance reflects any applicable fee waivers and/or expense reimbursements. Had the adviser not waived fees and/or reimbursed expenses currently or in the past, returns would have been lower. See current prospectus for more information. According to the Fund’s current prospectus, the total annual operating expense ratio was indicated as 0.52%. The Financial Highlights section of the Shareholder Report presents the expense ratios based on expenses incurred during the period covered by this report. NAV and Market Price returns assume that dividends and capital gain distributions have been reinvested in the Fund at NAV and Market Price, respectively. The returns shown in the table above do not reflect the deduction of taxes that a shareholder would pay on Fund distributions or the redemption or sale of Fund Shares. See invesco.com/ETFs to find the most recent month-end performance numbers.
Performance results for the indexes stated above are based upon a hypothetical investment in their respective constituent securities. The returns of an index do not represent Fund returns. An investor cannot invest directly in an index. The indexes do not charge management fees or brokerage expenses, and no such fees or expenses were deducted from the hypothetical performance shown. In addition, the results actual investors might have achieved would have differed from those shown because of differences in the timing, amounts of their investments, and fees and expenses associated with an investment in the Fund.
Notes Regarding Indexes and Fund Performance History:
| - | Average Annualized and Cumulative Inception returns for the Fund and the indexes are based on the inception date of the Fund. |
| - | Effective June 26, 2020, the Fund changed its designated broad-based securities market benchmark index from the Dow Jones U.S. Select Dividend Index to the Index, as the Index more closely reflects the performance of the types of securities in which the Fund invests. |
| | |
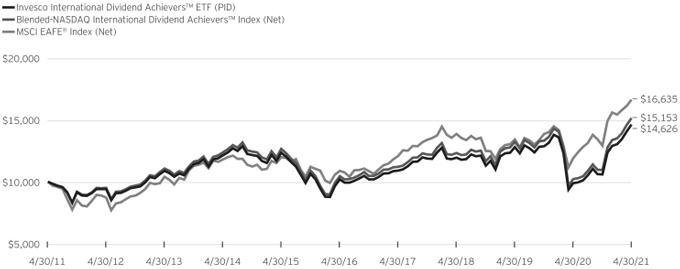
| PID | | Management’s Discussion of Fund Performance |
| | Invesco International Dividend AchieversTM ETF (PID) |
As an index fund, the Invesco International Dividend AchieversTM ETF (the “Fund”) is passively managed and seeks to track the investment results (before fees and expenses) of the NASDAQ International Dividend AchieversTM Index (the “Index”). The Fund generally will invest at least 90% of its total assets in the securities that comprise the Index.
Strictly in accordance with its guidelines and mandated procedures, Nasdaq, Inc. (the “Index Provider”) includes dividend- paying common stocks and other securities in the Index pursuant to a proprietary selection methodology that identifies companies that have increased their aggregate annual regular cash dividend payments consistently for at least each of the last five consecutive years. The Index is composed of Global Depositary Receipts (“GDRs”) that are listed on the London Stock Exchange or the London International Exchange, and American Depository Receipts (“ADRs”) and non-U.S. common or ordinary stocks traded on the New York Stock Exchange, The Nasdaq Stock Market, Cboe Exchange or NYSE American.
The Fund generally invests in all of the securities comprising the Index in proportion to their weightings in the Index.
For the fiscal year ended April 30, 2021, on a market price basis, the Fund returned 48.23%. On a net asset value (“NAV”) basis, the Fund returned 47.87%. During the same time period, the Index returned 48.24%. During the fiscal year, the Fund fully replicated the components of the Index; therefore, the Fund’s performance, on a NAV basis, differed from the return of the Index primarily due to fees and operating expenses that the Fund incurred during the period, partially offset by income received from the securities lending program in which the Fund participates. During this same time period, the MSCI EAFE® Index (Net) returned 39.88%.
For the fiscal year ended April 30, 2021, the financials sector contributed most significantly to the Fund’s return, followed by the materials sector. No sector detracted from the Fund’s performance during this period.
Positions that contributed most significantly to the Fund’s return, for the fiscal year ended April 30, 2021, included Methanex Corp., a materials company (no longer held at fiscal year-end) and Brookfield Property Partners L.P., a real estate company (portfolio average weight of 4.03%). Positions that detracted most significantly from the Fund’s return during this period included GasLog Partners LP, an energy company (no longer held at fiscal year-end) and Credicorp Ltd., a financials company (portfolio average weight of 2.64%).
| | | | |
Sector Breakdown
(% of the Fund’s Net Assets)
as of April 30, 2021 | |
| Financials | | | 23.30 | |
| Energy | | | 17.86 | |
| Utilities | | | 15.73 | |
| Communication Services | | | 8.11 | |
| Information Technology | | | 6.05 | |
| Health Care | | | 5.86 | |
| Industrials | | | 5.59 | |
| Consumer Staples | | | 5.31 | |
| Materials | | | 4.35 | |
| Real Estate | | | 4.12 | |
| Consumer Discretionary | | | 3.50 | |
| Money Market Funds Plus Other Assets Less Liabilities | | | 0.22 | |
|
Top Ten Fund Holdings*
(% of the Fund’s Net Assets)
as of April 30, 2021 | |
| Security | | | | |
| Pembina Pipeline Corp. | | | 4.43 | |
| Enbridge, Inc. | | | 4.15 | |
| TC Energy Corp. | | | 3.88 | |
| Brookfield Property Partners L.P. | | | 3.84 | |
| BCE, Inc. | | | 3.70 | |
| National Grid PLC, ADR | | | 3.64 | |
| Cia Paranaense de Energia, ADR | | | 3.35 | |
| Canadian Imperial Bank of Commerce | | | 3.04 | |
| Canadian Natural Resources Ltd. | | | 2.95 | |
| Bank of Nova Scotia (The) | | | 2.89 | |
| Total | | | 35.87 | |
| * | Excluding money market fund holdings. |
Invesco International Dividend AchieversTM ETF (PID) (continued)
Growth of a $10,000 Investment
Fund Performance History as of April 30, 2021
| | | | | | | | | | | | | | | | | | | | | | | | | | | | | | | | | | | | | | | | |
| | | 1 Year | | | 3 Years Average
Annualized | | | 3 Years Cumulative | | | 5 Years Average
Annualized | | | 5 Years Cumulative | | | 10 Years Average
Annualized | | | 10 Years Cumulative | | | | | | Fund Inception | |
| Index | | | | | Average
Annualized | | | Cumulative | |
Blended - NASDAQ International Dividend Achievers™ Index (Net) | | | 48.24 | % | | | 7.12 | % | | | 22.90 | % | | | 7.69 | % | | | 44.83 | % | | | 4.24 | % | | | 51.53 | % | | | | | | | 4.91 | % | | | 111.42 | % |
| MSCI EAFE® Index (Net) | | | 39.88 | | | | 6.27 | | | | 20.03 | | | | 8.87 | | | | 52.96 | | | | 5.22 | | | | 66.35 | | | | | | | | 5.10 | | | | 117.57 | |
| Fund | | | | | | | | | | | | | | | | | | | | | | | | | | | | | | | | | | | | | | | | |
NAV Return | | | 47.87 | | | | 6.94 | | | | 22.28 | | | | 7.49 | | | | 43.53 | | | | 3.88 | | | | 46.26 | | | | | | | | 4.40 | | | | 96.09 | |
| Market Price Return | | | 48.23 | | | | 6.90 | | | | 22.16 | | | | 7.47 | | | | 43.39 | | | | 3.83 | | | | 45.67 | | | | | | | | 4.39 | | | | 95.73 | |
Fund Inception: September 15, 2005
Performance quoted above represents past performance. Past performance is not a guarantee of future results and current performance may be higher or lower than performance quoted. Investment returns and principal value will fluctuate, and shares of the Fund (“Fund Shares”), when redeemed or sold, may be worth more or less than their original cost. Fund performance reflects any applicable fee waivers and/or expense reimbursements. Had the adviser not waived fees and/or reimbursed expenses currently or in the past, returns would have been lower. See current prospectus for more information. According to the Fund’s current prospectus, the total annual operating expense ratio was indicated as 0.53%. The Financial Highlights section of the Shareholder Report presents the expense ratios based on expenses incurred during the period covered by this report. NAV and Market Price returns assume that dividends and capital gain distributions have been reinvested in the Fund at NAV and Market Price, respectively. The returns shown in the table above do not reflect the deduction of taxes that a shareholder would pay on Fund distributions or the redemption or sale of Fund Shares. See invesco.com/ETFs to find the most recent month-end performance numbers.
Performance results for the indexes stated above are based upon a hypothetical investment in their respective constituent securities. The
returns of an index do not represent Fund returns. An investor cannot invest directly in an index. The indexes do not charge management fees or brokerage expenses, and no such fees or expenses were deducted from the hypothetical performance shown. In addition, the results actual investors might have achieved would have differed from those shown because of differences in the timing, amounts of their investments, and fees and expenses associated with an investment in the Fund.
Notes Regarding Indexes and Fund Performance History:
| - | The Blended-NASDAQ International Dividend AchieversTM Index (Net) is comprised of gross total returns of the Index from Fund inception through the conversion date, March 9, 2015, and net returns of the Index starting at the conversion date through April 30, 2021. |
| - | Net returns reflect invested dividends net of withholding taxes. |
| - | Average Annualized and Cumulative Inception returns for the Fund and the indexes are based on the inception date of the Fund. |
| - | Effective June 26, 2020, the Fund changed its designated broad-based securities market benchmark index from the MSCI EAFE® Index (Net) to the Index, as the Index more closely reflects the performance of the types of securities in which the Fund invests. |
Liquidity Risk Management Program
In compliance with Rule 22e-4 under the Investment Company Act of 1940, as amended (the “Liquidity Rule”), the Funds have adopted and implemented a liquidity risk management program (the “Program”). The Program is reasonably designed to assess and manage the Funds’ liquidity risk, which is the risk that the Funds could not meet redemption requests without significant dilution of remaining investors’ interests in the Funds. The Board of Trustees of the Funds (the “Board”) has appointed Invesco Capital Management LLC (“Invesco”), the Funds’ investment adviser, as the Program’s administrator, and Invesco has delegated oversight of the Program to the Liquidity Risk Management Committee (the “Committee”), which is composed of senior representatives from relevant business groups at Invesco and its affiliates.
As required by the Liquidity Rule, the Program includes policies and procedures providing for an assessment, no less frequently than annually, of the Funds’ liquidity risk that takes into account, as relevant to the Funds’ liquidity risk: (1) each Fund’s investment strategy and liquidity of portfolio investments during both normal and reasonably foreseeable stressed conditions; (2) short-term and long-term cash flow projections for the Funds during both normal and reasonably foreseeable stressed conditions; (3) each Fund’s holdings of cash and cash equivalents and any borrowing arrangements; (4) the relationship between the Funds’ portfolio liquidity and the way in which, and the prices and spreads at which, Fund shares trade, including the efficiency of the arbitrage function and the level of active participation by market participants, including authorized participants; and (5) the effect of the composition of baskets on the overall liquidity of each Fund’s portfolio. The Liquidity Rule also requires the classification of each Fund’s investments into categories that reflect the assessment of their relative liquidity under current market conditions. Each Fund classifies its investments into one of four categories defined in the Liquidity Rule: “Highly Liquid,” “Moderately Liquid,” “Less Liquid,” and “Illiquid.” Funds that are not invested primarily in “Highly Liquid Investments” that are assets (cash or investments that are reasonably expected to be convertible into cash within three business days without significantly changing the market value of the investment) are required to establish a “Highly Liquid Investment Minimum” (“HLIM”), which is the minimum percentage of net assets that must be invested in Highly Liquid Investments. Funds with HLIMs have procedures for addressing HLIM shortfalls, including reporting to the Board and the SEC (on a non-public basis) as required by the Program and the Liquidity Rule. In addition, a Fund may not acquire an investment if, immediately after the acquisition, over 15% of such Fund’s net assets would consist of “Illiquid Investments” that are assets (an investment that cannot reasonably be expected to be sold or disposed of in current market conditions in seven calendar days or less without the sale or disposition significantly changing the market value of the investment). The Liquidity Rule and the Program also require reporting to the Board and the SEC (on a non-public basis) if a Fund’s holdings of Illiquid Investments exceed 15% of such Fund’s assets.
At a meeting held on March 12, 2021, the Committee presented a report to the Board that addressed the operation of the Program and assessed the Program’s adequacy and effectiveness of implementation (the “Report”). The Report covered the period from January 1, 2020 through December 31, 2020 (the “Program Reporting Period”). The Report discussed notable events affecting liquidity over the Program Reporting Period, including the impact of the coronavirus pandemic on the Funds and the overall market. The Report noted that there were no material changes to the Program during the Program Reporting Period.
The Report stated, in relevant part, that during the Program Reporting Period:
| | ● | | The Program, as adopted and implemented, remained reasonably designed to assess and manage the Funds’ liquidity risk and was operated effectively to achieve that goal; |
| | ● | | Each Fund’s investment strategy remained appropriate for an open-end fund; |
| | ● | | Each Fund was able to meet requests for redemption without significant dilution of remaining investors’ interests in the Fund; |
| | ● | | The Funds did not breach the 15% limit on Illiquid Investments; and |
| | ● | | The Funds primarily held Highly Liquid Investments and therefore have not adopted an HLIM. |
Invesco BuyBack AchieversTM ETF (PKW)
April 30, 2021
Schedule of Investments(a)
| | | | | | | | |
| | | Shares | | | Value | |
| Common Stocks & Other Equity Interests-99.99% | | | | | |
| Communication Services-7.77% | | | | | | | | |
Altice USA, Inc., Class A(b) | | | 664,380 | | | $ | 24,123,638 | |
AMC Networks, Inc., Class A(b)(c) | | | 68,537 | | | | 3,446,040 | |
Charter Communications, Inc., Class A(b)(c) | | | 143,208 | | | | 96,443,427 | |
Discovery, Inc., Class A(b)(c) | | | 371,526 | | | | 13,991,669 | |
MSG Networks, Inc., Class A(b)(c) | | | 99,369 | | | | 1,576,986 | |
Sinclair Broadcast Group, Inc., Class A(c) | | | 112,793 | | | | 3,662,389 | |
| | | | | | | | |
| | | | | | | 143,244,149 | |
| | | | | | | | |
| Consumer Discretionary-9.75% | | | | | | | | |
Bally’s Corp.(b) | | | 70,710 | | | | 4,098,352 | |
Caleres, Inc. | | | 87,622 | | | | 2,042,469 | |
Cato Corp. (The), Class A(b) | | | 47,649 | | | | 638,497 | |
Citi Trends, Inc.(b) | | | 21,534 | | | | 2,252,456 | |
Dillard’s, Inc., Class A(c) | | | 40,896 | | | | 4,045,023 | |
eBay, Inc. | | | 1,442,881 | | | | 80,498,331 | |
Ethan Allen Interiors, Inc. | | | 57,557 | | | | 1,652,462 | |
Fiesta Restaurant Group, Inc.(b) | | | 60,093 | | | | 885,771 | |
Flexsteel Industries, Inc. | | | 16,145 | | | | 702,792 | |
Graham Holdings Co., Class B | | | 9,232 | | | | 5,867,952 | |
H&R Block, Inc. | | | 414,832 | | | | 9,234,160 | |
Haverty Furniture Cos., Inc., (Acquired 01/31/2020 - 04/30/2021;
Cost $1,304,160)(d) | | | 38,632 | | | | 1,795,229 | |
Murphy USA, Inc. | | | 61,698 | | | | 8,600,701 | |
Service Corp. International | | | 387,260 | | | | 20,695,174 | |
Toll Brothers, Inc. | | | 281,516 | | | | 17,651,053 | |
Travel + Leisure Co. | | | 197,053 | | | | 12,715,830 | |
Tri Pointe Homes, Inc.(b) | | | 272,921 | | | | 6,500,978 | |
| | | | | | | | |
| | | | | | | 179,877,230 | |
| | | | | | | | |
| Consumer Staples-2.38% | | | | | | | | |
Herbalife Nutrition Ltd.(b)(c) | | | 270,200 | | | | 12,367,054 | |
Nu Skin Enterprises, Inc., Class A | | | 116,253 | | | | 6,145,134 | |
Post Holdings, Inc.(b) | | | 147,173 | | | | 16,745,344 | |
Spectrum Brands Holdings, Inc. | | | 97,453 | | | | 8,589,507 | |
| | | | | | | | |
| | | | | | | 43,847,039 | |
| | | | | | | | |
| Energy-0.92% | | | | | | | | |
Antero Midstream Corp. | | | 1,090,421 | | | | 9,421,238 | |
Antero Resources Corp.(b)(c) | | | 688,653 | | | | 6,211,650 | |
Dorian LPG Ltd.(b) | | | 94,846 | | | | 1,260,503 | |
| | | | | | | | |
| | | | | | | 16,893,391 | |
| | | | | | | | |
| Financials-28.14% | | | | | | | | |
Affiliated Managers Group, Inc.(c) | | | 97,454 | | | | 15,706,661 | |
Allstate Corp. (The) | | | 686,714 | | | | 87,075,335 | |
Ameriprise Financial, Inc. | | | 266,598 | | | | 68,888,923 | |
Apollo Commercial Real Estate Finance, Inc. | | | 319,757 | | | | 4,863,504 | |
Assured Guaranty Ltd. | | | 174,547 | | | | 8,875,715 | |
Atlantic Capital Bancshares, Inc.(b) | | | 46,557 | | | | 1,245,400 | |
B. Riley Financial, Inc. | | | 62,171 | | | | 4,432,171 | |
Brighthouse Financial, Inc.(b) | | | 199,787 | | | | 9,348,034 | |
Brightsphere Investment Group, Inc. | | | 181,543 | | | | 4,086,533 | |
Carver Bancorp, Inc.(b)(c) | | | 6,750 | | | | 59,198 | |
CNO Financial Group, Inc. | | | 305,491 | | | | 7,799,185 | |
Cowen, Inc., Class A(c) | | | 60,987 | | | | 2,408,377 | |
| | | | | | | | |
| | | Shares | | | Value | |
| Financials-(continued) | | | | | | | | |
Credit Acceptance Corp.(b)(c) | | | 38,456 | | | $ | 15,182,044 | |
Diamond Hill Investment Group, Inc. | | | 7,225 | | | | 1,235,475 | |
Elevate Credit, Inc.(b)(c) | | | 81,523 | | | | 273,917 | |
Employers Holdings, Inc. | | | 65,114 | | | | 2,635,815 | |
Equitable Holdings, Inc.(c) | | | 979,134 | | | | 33,515,757 | |
First Citizens BancShares, Inc., Class A(c) | | | 20,146 | | | | 17,475,849 | |
Flagstar Bancorp, Inc. | | | 120,473 | | | | 5,606,813 | |
Hanover Insurance Group, Inc. (The) | | | 83,182 | | | | 11,504,902 | |
HomeStreet, Inc. | | | 49,187 | | | | 2,008,797 | |
Jefferies Financial Group, Inc. | | | 564,689 | | | | 18,358,039 | |
LendingClub Corp.(b) | | | 213,897 | | | | 3,291,875 | |
Loews Corp. | | | 610,772 | | | | 34,050,539 | |
MBIA, Inc.(b)(c) | | | 124,265 | | | | 1,245,135 | |
Meta Financial Group, Inc. | | | 73,735 | | | | 3,632,186 | |
Midland States Bancorp, Inc. | | | 51,508 | | | | 1,451,495 | |
Navient Corp. | | | 415,758 | | | | 6,997,207 | |
PCSB Financial Corp. | | | 36,668 | | | | 641,323 | |
PennyMac Financial Services, Inc. | | | 158,323 | | | | 9,532,628 | |
Popular, Inc. | | | 192,927 | | | | 14,268,881 | |
Santander Consumer USA Holdings, Inc. | | | 699,929 | | | | 23,755,590 | |
SLM Corp. | | | 831,514 | | | | 16,347,565 | |
Synchrony Financial | | | 1,329,644 | | | | 58,158,629 | |
Universal Insurance Holdings, Inc. | | | 71,189 | | | | 993,087 | |
Voya Financial, Inc. | | | 277,091 | | | | 18,792,312 | |
Waterstone Financial, Inc. | | | 57,688 | | | | 1,136,454 | |
World Acceptance Corp.(b)(c) | | | 15,559 | | | | 2,034,184 | |
| | | | | | | | |
| | | | | | | 518,915,534 | |
| | | | | | | | |
| Health Care-12.90% | | | | | | | | |
Biogen, Inc.(b) | | | 315,861 | | | | 84,439,121 | |
DaVita, Inc.(b) | | | 250,137 | | | | 29,148,465 | |
Halozyme Therapeutics, Inc.(b) | | | 327,651 | | | | 16,366,167 | |
Ligand Pharmaceuticals, Inc.(b)(c) | | | 37,983 | | | | 5,541,340 | |
McKesson Corp. | | | 363,927 | | | | 68,258,148 | |
Molina Healthcare, Inc.(b) | | | 133,486 | | | | 34,052,279 | |
| | | | | | | | |
| | | | | | | 237,805,520 | |
| | | | | | | | |
| Industrials-11.47% | | | | | | | | |
Acuity Brands, Inc.(c) | | | 81,638 | | | | 15,145,482 | |
Allison Transmission Holdings, Inc. | | | 254,063 | | | | 10,535,993 | |
Avis Budget Group, Inc.(b) | | | 159,728 | | | | 14,313,226 | |
Carlisle Cos., Inc. | | | 120,449 | | | | 23,084,051 | |
Covenant Logistics Group, Inc., Class A(b) | | | 33,039 | | | | 710,669 | |
FTI Consulting, Inc.(b)(c) | | | 78,290 | | | | 10,870,566 | |
GrafTech International Ltd. | | | 611,018 | | | | 7,772,149 | |
Kansas City Southern | | | 207,921 | | | | 60,756,595 | |
Masco Corp. | | | 580,537 | | | | 37,084,703 | |
Meritor, Inc.(b) | | | 165,848 | | | | 4,482,871 | |
Moog, Inc., Class A | | | 67,128 | | | | 5,809,928 | |
Primoris Services Corp. | | | 122,836 | | | | 4,011,824 | |
Trinity Industries, Inc. | | | 253,134 | | | | 6,996,624 | |
Triton International Ltd. (Bermuda) | | | 154,042 | | | | 7,728,287 | |
TrueBlue, Inc.(b) | | | 81,112 | | | | 2,295,470 | |
| | | | | | | | |
| | | | | | | 211,598,438 | |
| | | | | | | | |
| Information Technology-24.25% | | | | | | | | |
Arrow Electronics, Inc.(b) | | | 169,374 | | | | 19,320,492 | |
Avaya Holdings Corp.(b) | | | 191,840 | | | | 5,519,237 | |
Citrix Systems, Inc. | | | 281,150 | | | | 34,820,428 | |
See accompanying Notes to Financial Statements which are an integral part of the financial statements.
Invesco BuyBack AchieversTM ETF (PKW)–(continued)
April 30, 2021
| | | | | | | | |
| | | Shares | | | Value | |
| Information Technology-(continued) | | | | | | | | |
Fortinet, Inc.(b) | | | 373,127 | | | $ | 76,203,727 | |
HP, Inc. | | | 2,783,057 | | | | 94,930,074 | |
Immersion Corp.(b) | | | 70,576 | | | | 604,836 | |
Intel Corp. | | | 1,380,657 | | | | 79,429,197 | |
j2 Global, Inc.(b)(c) | | | 103,232 | | | | 12,491,072 | |
MicroStrategy, Inc., Class A(b)(c) | | | 17,792 | | | | 11,692,191 | |
Oracle Corp. | | | 1,259,257 | | | | 95,439,088 | |
Sanmina Corp.(b) | | | 148,451 | | | | 6,062,739 | |
Xerox Holdings Corp. | | | 445,756 | | | | 10,760,550 | |
| | | | | | | | |
| | | | | | | 447,273,631 | |
| | | | | | | | |
| Materials-1.66% | | | | | | | | |
Graphic Packaging Holding Co. | | | 649,811 | | | | 12,053,994 | |
Louisiana-Pacific Corp. | | | 243,611 | | | | 16,049,093 | |
Resolute Forest Products, Inc.(b) | | | 182,529 | | | | 2,467,792 | |
| | | | | | | | |
| | | | | | | 30,570,879 | |
| | | | | | | | |
| Real Estate-0.70% | | | | | | | | |
City Office REIT, Inc. | | | 99,225 | | | | 1,084,529 | |
SL Green Realty Corp. | | | 158,567 | | | | 11,735,544 | |
| | | | | | | | |
| | | | | | | 12,820,073 | |
| | | | | | | | |
| Utilities-0.05% | | | | | | | | |
Star Group L.P. | | | 92,161 | | | | 975,985 | |
| | | | | | | | |
Total Common Stocks & Other Equity
Interests
(Cost $1,591,580,630) | | | | 1,843,821,869 | |
| | | | | | | | |
| | | | | | | | |
| | | Shares | | | Value | |
| Money Market Funds-0.08% | | | | | | | | |
Invesco Government & Agency Portfolio, Institutional Class,
0.03%(e)(f)
(Cost $1,541,414) | | | 1,541,414 | | | $ | 1,541,414 | |
| | | | | | | | |
TOTAL INVESTMENTS IN SECURITIES
(excluding investments purchased with cash collateral from securities on loan)-100.07%
(Cost $1,593,122,044) | | | | | | | 1,845,363,283 | |
| | | | | | | | |
|
| Investments Purchased with Cash Collateral from Securities on Loan | |
| | |
| Money Market Funds-12.21% | | | | | | | | |
Invesco Private Government Fund, 0.01%(e)(f)(g) | | | 90,071,112 | | | | 90,071,112 | |
Invesco Private Prime Fund,
0.11%(e)(f)(g) | | | 135,052,647 | | | | 135,106,669 | |
| | | | | | | | |
Total Investments Purchased with Cash Collateral from Securities on Loan
(Cost $225,177,780) | | | | 225,177,781 | |
| | | | | | | | |
TOTAL INVESTMENTS IN SECURITIES-112.28%
(Cost $1,818,299,824) | | | | 2,070,541,064 | |
OTHER ASSETS LESS LIABILITIES-(12.28)% | | | | (226,421,642 | ) |
| | | | | | | | |
NET ASSETS-100.00% | | | $ | 1,844,119,422 | |
| | | | | | | | |
Investment Abbreviations:
REIT-Real Estate Investment Trust
Notes to Schedule of Investments:
| (a) | Industry and/or sector classifications used in this report are generally according to the Global Industry Classification Standard, which was developed by and is the exclusive property and a service mark of MSCI Inc. and Standard & Poor’s. |
| (b) | Non-income producing security. |
| (c) | All or a portion of this security was out on loan at April 30, 2021. |
| (d) | Restricted security. The value of this security at April 30, 2021 represented less than 1% of the Fund’s Net Assets. |
| (e) | Affiliated issuer. The issuer and/or the Fund is a wholly-owned subsidiary of Invesco Ltd., or is affiliated by having an investment adviser that is under common control of Invesco Ltd. The table below shows the Fund’s transactions in, and earnings from, its investments in affiliates for the fiscal year ended April 30, 2021. |
| | | | | | | | | | | | | | | | | | | | | | | | | | | | | | | | | | | |
| | | Value
April 30, 2020 | | Purchases at
Cost | | Proceeds from
Sales | | Change in
Unrealized
Appreciation | | Realized
Gain | | Value
April 30, 2021 | | Dividend
Income |
| Investments in Affiliated Money Market Funds: | | | | | | | | | | | | | | | | | | | | | | | | | | | | | | | | | | | |
| Invesco Government & Agency Portfolio, Institutional Class | | | $ | - | | | | $ | 19,709,916 | | | | $ | (18,168,502 | ) | | | $ | - | | | | $ | - | | | | $ | 1,541,414 | | | | $ | 158 | |
| Invesco Premier U.S. Government Money Portfolio, Institutional Class | | | | 1,204,318 | | | | | 11,384,578 | | | | | (12,588,896 | ) | | | | - | | | | | - | | | | | - | | | | | 287 | |
| Investments Purchased with Cash Collateral from Securities on Loan: | | | | | | | | | | | | | | | | | | | | | | | | | | | | | | | | | | | |
| Invesco Private Government Fund | | | | 7,343,615 | | | | | 177,354,201 | | | | | (94,626,704 | ) | | | | - | | | | | - | | | | | 90,071,112 | | | | | 1,644 | * |
Invesco Private Prime Fund | | | | - | | | | | 230,444,040 | | | | | (95,337,946 | ) | | | | 1 | | | | | 574 | | | | | 135,106,669 | | | | | 11,523 | * |
| | | | | | | | | | | | | | | | | | | | | | | | | | | | | | | | | | | |
Total | | | $ | 8,547,933 | | | | $ | 438,892,735 | | | | $ | (220,722,048 | ) | | | $ | 1 | | | | $ | 574 | | | | $ | 226,719,195 | | | | $ | 13,612 | |
| | | | | | | | | | | | | | | | | | | | | | | | | | | | | | | | | | | |
| * | Represents the income earned on the investment of cash collateral, which is included in securities lending income on the Statements of Operations. Does not include rebates and fees paid to lending agent or premiums received from borrowers, if any. |
See accompanying Notes to Financial Statements which are an integral part of the financial statements.
Invesco BuyBack AchieversTM ETF (PKW)–(continued)
April 30, 2021
| (f) | The rate shown is the 7-day SEC standardized yield as of April 30, 2021. |
| (g) | The security has been segregated to satisfy the commitment to return the cash collateral received in securities lending transactions upon the borrower’s return of the securities loaned. See Note 2J. |
See accompanying Notes to Financial Statements which are an integral part of the financial statements.
Invesco Dividend AchieversTM ETF (PFM)
April 30, 2021
Schedule of Investments(a)
| | | | | | | | |
| | | Shares | | | Value | |
| Common Stocks & Other Equity Interests-99.91% | |
| Communication Services-5.37% | | | | | | | | |
Activision Blizzard, Inc. | | | 32,149 | | | $ | 2,931,667 | |
AT&T, Inc. | | | 295,779 | | | | 9,290,418 | |
Comcast Corp., Class A | | | 189,659 | | | | 10,649,353 | |
John Wiley & Sons, Inc., Class A | | | 1,935 | | | | 110,179 | |
Telephone & Data Systems, Inc. | | | 4,475 | | | | 102,836 | |
Verizon Communications, Inc. | | | 171,591 | | | | 9,916,244 | |
| | | | | | | | |
| | | | | | | 33,000,697 | |
| | | | | | | | |
| Consumer Discretionary-8.81% | | | | | | | | |
Best Buy Co., Inc. | | | 10,715 | | | | 1,245,833 | |
Churchill Downs, Inc. | | | 1,516 | | | | 320,634 | |
Dillard’s, Inc., Class A(b) | | | 709 | | | | 70,127 | |
Gentex Corp. | | | 10,113 | | | | 355,775 | |
Genuine Parts Co. | | | 6,133 | | | | 766,441 | |
Hasbro, Inc. | | | 5,668 | | | | 563,683 | |
Home Depot, Inc. (The) | | | 44,773 | | | | 14,491,677 | |
Leggett & Platt, Inc. | | | 5,496 | | | | 272,986 | |
Lithia Motors, Inc., Class A | | | 1,150 | | | | 442,037 | |
Lowe’s Cos., Inc. | | | 30,460 | | | | 5,977,775 | |
McDonald’s Corp. | | | 30,961 | | | | 7,309,273 | |
Monro, Inc. | | | 1,317 | | | | 92,967 | |
NIKE, Inc., Class B | | | 52,871 | | | | 7,011,752 | |
PetMed Express, Inc.(b) | | | 799 | | | | 23,511 | |
Polaris, Inc. | | | 2,642 | | | | 369,959 | |
Pool Corp. | | | 1,744 | | | | 736,875 | |
Service Corp. International | | | 7,017 | | | | 374,988 | |
Starbucks Corp | | | 48,770 | | | | 5,583,677 | |
Target Corp. | | | 20,756 | | | | 4,301,889 | |
Thor Industries, Inc. | | | 2,267 | | | | 320,985 | |
Tractor Supply Co. | | | 4,839 | | | | 912,635 | |
VF Corp. | | | 16,203 | | | | 1,420,355 | |
Whirlpool Corp. | | | 2,652 | | | | 627,065 | |
Williams-Sonoma, Inc. | | | 3,301 | | | | 563,646 | |
| | | | | | | | |
| | | | | | | 54,156,545 | |
| | | | | | | | |
| Consumer Staples-13.74% | | | | | | | | |
Altria Group, Inc. | | | 77,099 | | | | 3,681,477 | |
Andersons, Inc. (The) | | | 1,308 | | | | 37,566 | |
Archer-Daniels-Midland Co. | | | 23,330 | | | | 1,472,823 | |
Brown-Forman Corp., Class B | | | 12,792 | | | | 975,774 | |
Casey’s General Stores, Inc. | | | 1,456 | | | | 323,509 | |
Church & Dwight Co., Inc | | | 10,169 | | | | 871,890 | |
Clorox Co. (The) | | | 5,213 | | | | 951,372 | |
Coca-Cola Co. (The) | | | 178,677 | | | | 9,644,984 | |
Colgate-Palmolive Co. | | | 35,228 | | | | 2,842,900 | |
Costco Wholesale Corp. | | | 18,393 | | | | 6,843,851 | |
Flowers Foods, Inc. | | | 8,768 | | | | 210,081 | |
Hershey Co. (The) | | | 6,116 | | | | 1,004,859 | |
Hormel Foods Corp. | | | 22,384 | | | | 1,034,141 | |
Ingredion, Inc. | | | 2,815 | | | | 262,949 | |
J&J Snack Foods Corp. | | | 748 | | | | 123,128 | |
JM Smucker Co. (The) | | | 4,574 | | | | 599,148 | |
Kellogg Co. | | | 14,236 | | | | 888,611 | |
Kimberly-Clark Corp. | | | 14,015 | | | | 1,868,480 | |
Kroger Co. (The) | | | 31,639 | | | | 1,156,089 | |
Lancaster Colony Corp. | | | 1,086 | | | | 200,595 | |
McCormick & Co., Inc. | | | 10,321 | | | | 932,606 | |
Nu Skin Enterprises, Inc., Class A | | | 2,089 | | | | 110,425 | |
| | | | | | | | |
| | | Shares | | | Value | |
| Consumer Staples-(continued) | | | | | | | | |
PepsiCo, Inc. | | | 57,178 | | | $ | 8,242,780 | |
Philip Morris International, Inc. | | | 64,612 | | | | 6,138,140 | |
Procter & Gamble Co. (The) | | | 102,456 | | | | 13,669,680 | |
SpartanNash Co. | | | 1,413 | | | | 27,370 | |
Sysco Corp. | | | 21,178 | | | | 1,794,412 | |
Tootsie Roll Industries, Inc. | | | 1,597 | | | | 50,417 | |
Universal Corp. | | | 966 | | | | 54,318 | |
Walgreens Boots Alliance, Inc. | | | 35,838 | | | | 1,902,998 | |
Walmart, Inc. | | | 117,746 | | | | 16,473,843 | |
WD-40 Co.(b) | | | 539 | | | | 134,071 | |
| | | | | | | | |
| | | | | | | 84,525,287 | |
| | | | | | | | |
| Energy-3.75% | | | | | | | | |
Chevron Corp. | | | 79,917 | | | | 8,237,045 | |
Enterprise Products Partners L.P | | | 90,598 | | | | 2,084,660 | |
Exxon Mobil Corp. | | | 176,269 | | | | 10,089,638 | |
Magellan Midstream Partners L.P. | | | 9,225 | | | | 431,453 | |
ONEOK, Inc. | | | 18,490 | | | | 967,767 | |
Valero Energy Corp. | | | 16,952 | | | | 1,253,770 | |
| | | | | | | | |
| | | | | | | 23,064,333 | |
| | | | | | | | |
| Financials-13.87% | | | | | | | | |
1st Source Corp. | | | 997 | | | | 47,447 | |
Aflac, Inc. | | | 28,592 | | | | 1,536,248 | |
Allstate Corp. (The) | | | 12,532 | | | | 1,589,058 | |
American Equity Investment Life Holding Co. | | | 3,797 | | | | 117,631 | |
American Financial Group, Inc. | | | 3,744 | | | | 459,988 | |
Ameriprise Financial, Inc. | | | 5,018 | | | | 1,296,651 | |
Arthur J. Gallagher & Co. | | | 8,061 | | | | 1,168,442 | |
Assurant, Inc. | | | 2,367 | | | | 368,305 | |
Atlantic Union Bankshares Corp. | | | 3,276 | | | | 126,683 | |
AXIS Capital Holdings Ltd. | | | 3,497 | | | | 195,133 | |
BancFirst Corp. | | | 1,291 | | | | 89,737 | |
Bank of New York Mellon Corp. (The) | | | 36,417 | | | | 1,816,480 | |
Bank OZK | | | 5,443 | | | | 223,109 | |
BlackRock, Inc. | | | 6,384 | | | | 5,230,411 | |
BOK Financial Corp.(b) | | | 2,996 | | | | 263,468 | |
Brown & Brown, Inc. | | | 11,713 | | | | 622,897 | |
Bryn Mawr Bank Corp. | | | 787 | | | | 36,170 | |
Cambridge Bancorp | | | 273 | | | | 23,901 | |
Cboe Global Markets, Inc. | | | 4,480 | | | | 467,578 | |
Chubb Ltd. | | | 18,836 | | | | 3,232,069 | |
Cincinnati Financial Corp. | | | 6,699 | | | | 754,843 | |
CME Group, Inc., Class A | | | 14,914 | | | | 3,012,479 | |
Cohen & Steers, Inc.(b) | | | 1,986 | | | | 135,088 | |
Comerica, Inc. | | | 5,837 | | | | 438,709 | |
Commerce Bancshares, Inc. | | | 4,869 | | | | 378,857 | |
Community Bank System, Inc. | | | 2,195 | | | | 170,398 | |
Community Trust Bancorp, Inc. | | | 703 | | | | 31,326 | |
Cullen/Frost Bankers, Inc. | | | 2,689 | | | | 322,841 | |
Discover Financial Services | | | 12,682 | | | | 1,445,748 | |
Erie Indemnity Co., Class A(b) | | | 1,905 | | | | 407,708 | |
Evercore, Inc., Class A | | | 1,805 | | | | 252,935 | |
FactSet Research Systems, Inc. | | | 1,644 | | | | 552,746 | |
Fifth Third Bancorp | | | 29,376 | | | | 1,190,903 | |
Financial Institutions, Inc. | | | 632 | | | | 20,180 | |
First American Financial Corp. | | | 4,584 | | | | 295,668 | |
First Financial Bankshares, Inc.(b) | | | 5,861 | | | | 287,658 | |
First Financial Corp. | | | 541 | | | | 23,934 | |
See accompanying Notes to Financial Statements which are an integral part of the financial statements.
Invesco Dividend AchieversTM ETF (PFM)–(continued)
April 30, 2021
| | | | | | | | |
| | | Shares | | | Value | |
| Financials-(continued) | | | | | | | | |
First of Long Island Corp. (The) | | | 941 | | | $ | 20,034 | |
Franklin Resources, Inc. | | | 20,939 | | | | 628,170 | |
Globe Life, Inc. | | | 4,854 | | | | 497,486 | |
Hanover Insurance Group, Inc. (The) | | | 1,434 | | | | 198,337 | |
Hingham Institution for Savings (The) | | | 84 | | | | 25,548 | |
Home BancShares, Inc. | | | 6,859 | | | | 190,886 | |
Horace Mann Educators Corp. | | | 1,718 | | | | 68,892 | |
Horizon Bancorp, Inc. | | | 1,816 | | | | 33,305 | |
Huntington Bancshares, Inc. | | | 42,216 | | | | 646,749 | |
Independent Bank Corp. | | | 1,301 | | | | 106,552 | |
International Bancshares Corp. | | | 2,665 | | | | 126,294 | |
JPMorgan Chase & Co. | | | 126,947 | | | | 19,525,718 | |
KeyCorp | | | 40,138 | | | | 873,403 | |
Lakeland Bancorp, Inc. | | | 2,074 | | | | 37,602 | |
Lazard Ltd., Class A | | | 4,366 | | | | 196,426 | |
Lincoln National Corp. | | | 7,990 | | | | 512,399 | |
MarketAxess Holdings, Inc. | | | 1,617 | | | | 789,840 | |
Marsh & McLennan Cos., Inc. | | | 21,181 | | | | 2,874,262 | |
Mercury General Corp. | | | 2,267 | | | | 141,166 | |
Moody’s Corp. | | | 7,811 | | | | 2,551,932 | |
Morningstar, Inc. | | | 1,776 | | | | 470,658 | |
Northwest Bancshares, Inc. | | | 5,258 | | | | 73,822 | |
Old Republic International Corp. | | | 12,704 | | | | 312,772 | |
PNC Financial Services Group, Inc. (The) | | | 17,561 | | | | 3,283,029 | |
Primerica, Inc. | | | 1,551 | | | | 247,803 | |
Principal Financial Group, Inc. | | | 11,445 | | | | 730,992 | |
Prosperity Bancshares, Inc. | | | 3,973 | | | | 291,459 | |
Prudential Financial, Inc. | | | 16,496 | | | | 1,655,539 | |
Raymond James Financial, Inc. | | | 5,747 | | | | 751,593 | |
Reinsurance Group of America, Inc. | | | 2,849 | | | | 371,880 | |
RenaissanceRe Holdings Ltd. (Bermuda) | | | 2,084 | | | | 351,800 | |
RLI Corp. | | | 1,864 | | | | 207,761 | |
S&P Global, Inc. | | | 10,005 | | | | 3,905,852 | |
Sandy Spring Bancorp, Inc. | | | 1,941 | | | | 88,044 | |
SEI Investments Co. | | | 5,911 | | | | 363,172 | |
Southside Bancshares, Inc. | | | 1,291 | | | | 51,834 | |
State Street Corp. | | | 14,629 | | | | 1,228,105 | |
Stock Yards Bancorp, Inc. | | | 896 | | | | 45,839 | |
T. Rowe Price Group, Inc. | | | 9,679 | | | | 1,734,477 | |
Tompkins Financial Corp. | | | 588 | | | | 45,952 | |
Travelers Cos., Inc. (The) | | | 10,628 | | | | 1,643,726 | |
Truist Financial Corp. | | | 55,900 | | | | 3,315,429 | |
U.S. Bancorp | | | 62,262 | | | | 3,695,250 | |
UMB Financial Corp. | | | 1,978 | | | | 191,925 | |
United Bankshares, Inc. | | | 5,369 | | | | 210,841 | |
Unum Group | | | 8,454 | | | | 238,910 | |
W.R. Berkley Corp. | | | 7,407 | | | | 590,486 | |
Washington Federal, Inc. | | | 3,161 | | | | 102,891 | |
Washington Trust Bancorp, Inc. | | | 680 | | | | 34,714 | |
Webster Financial Corp. | | | 3,728 | | | | 197,248 | |
WesBanco, Inc. | | | 2,821 | | | | 102,374 | |
Westamerica Bancorporation | | | 1,056 | | | | 66,950 | |
| | | | | | | | |
| | | | | | | 85,281,555 | |
| | | | | | | | |
| Health Care-13.85% | | | | | | | | |
Abbott Laboratories | | | 73,521 | | | | 8,828,402 | |
AmerisourceBergen Corp. | | | 8,493 | | | | 1,025,954 | |
Atrion Corp. | | | 72 | | | | 45,979 | |
Becton, Dickinson and Co. | | | 12,046 | | | | 2,997,165 | |
Bristol-Myers Squibb Co. | | | 92,891 | | | | 5,798,256 | |
| | | | | | | | |
| | | Shares | | | Value | |
| Health Care-(continued) | | | | | | | | |
Cardinal Health, Inc. | | | 12,272 | | | $ | 740,492 | |
Chemed Corp. | | | 632 | | | | 301,218 | |
Ensign Group, Inc. (The) | | | 2,241 | | | | 192,390 | |
Hill-Rom Holdings, Inc. | | | 2,785 | | | | 306,963 | |
Johnson & Johnson | | | 109,208 | | | | 17,771,418 | |
McKesson Corp. | | | 6,694 | | | | 1,255,527 | |
Medtronic PLC | | | 55,923 | | | | 7,321,439 | |
Merck & Co., Inc. | | | 104,909 | | | | 7,815,720 | |
National HealthCare Corp. | | | 606 | | | | 42,608 | |
Perrigo Co. PLC | | | 5,634 | | | | 234,543 | |
Pfizer, Inc. | | | 231,298 | | | | 8,939,668 | |
STERIS PLC | | | 3,534 | | | | 745,745 | |
Stryker Corp. | | | 15,592 | | | | 4,094,927 | |
UnitedHealth Group, Inc. | | | 39,385 | | | | 15,706,738 | |
West Pharmaceutical Services, Inc. | | | 3,091 | | | | 1,015,455 | |
| | | | | | | | |
| | | | | | | 85,180,607 | |
| | | | | | | | |
| Industrials-13.57% | | | | | | | | |
3M Co. | | | 24,110 | | | | 4,753,045 | |
A.O. Smith Corp. | | | 5,689 | | | | 385,430 | |
ABM Industries, Inc. | | | 2,814 | | | | 144,668 | |
Applied Industrial Technologies, Inc. | | | 1,530 | | | | 146,360 | |
Brady Corp., Class A | | | 1,996 | | | | 108,922 | |
C.H. Robinson Worldwide, Inc. | | | 5,529 | | | | 536,755 | |
Carlisle Cos., Inc. | | | 2,215 | | | | 424,505 | |
Caterpillar, Inc. | | | 22,738 | | | | 5,186,765 | |
Cintas Corp. | | | 4,394 | | | | 1,516,545 | |
CSX Corp. | | | 31,780 | | | | 3,201,835 | |
Cummins, Inc. | | | 6,228 | | | | 1,569,705 | |
Donaldson Co., Inc. | | | 5,230 | | | | 328,862 | |
Douglas Dynamics, Inc. | | | 901 | | | | 40,302 | |
Dover Corp. | | | 6,128 | | | | 914,236 | |
Eaton Corp. PLC | | | 16,660 | | | | 2,381,214 | |
Emerson Electric Co. | | | 25,036 | | | | 2,265,508 | |
Expeditors International of Washington, Inc. | | | 7,039 | | | | 773,305 | |
Fastenal Co. | | | 23,826 | | | | 1,245,623 | |
Franklin Electric Co., Inc. | | | 1,907 | | | | 154,982 | |
GATX Corp.(b) | | | 1,383 | | | | 135,133 | |
General Dynamics Corp. | | | 11,968 | | | | 2,276,673 | |
Gorman-Rupp Co. (The) | | | 1,029 | | | | 35,521 | |
Graco, Inc. | | | 6,991 | | | | 536,909 | |
Healthcare Services Group, Inc. | | | 3,115 | | | | 93,294 | |
HEICO Corp. | | | 2,221 | | | | 312,717 | |
Hillenbrand, Inc. | | | 3,128 | | | | 153,554 | |
HNI Corp. | | | 1,768 | | | | 74,857 | |
Honeywell International, Inc. | | | 28,856 | | | | 6,436,042 | |
Hubbell, Inc. | | | 2,255 | | | | 432,983 | |
IDEX Corp. | | | 3,161 | | | | 708,696 | |
Illinois Tool Works, Inc. | | | 13,282 | | | | 3,060,970 | |
Insperity, Inc. | | | 1,506 | | | | 131,835 | |
ITT, Inc. | | | 3,723 | | | | 351,116 | |
J.B. Hunt Transport Services, Inc. | | | 4,591 | | | | 783,730 | |
L3Harris Technologies, Inc. | | | 8,706 | | | | 1,821,556 | |
Lennox International, Inc. | | | 1,638 | | | | 549,287 | |
Lincoln Electric Holdings, Inc. | | | 2,436 | | | | 311,930 | |
Lindsay Corp. | | | 428 | | | | 70,954 | |
Lockheed Martin Corp. | | | 11,634 | | | | 4,427,435 | |
ManpowerGroup, Inc. | | | 2,252 | | | | 272,244 | |
Matthews International Corp., Class A | | | 1,248 | | | | 51,642 | |
McGrath RentCorp | | | 951 | | | | 77,963 | |
See accompanying Notes to Financial Statements which are an integral part of the financial statements.
Invesco Dividend AchieversTM ETF (PFM)–(continued)
April 30, 2021
| | | | | | | | |
| | | Shares | | | Value | |
| Industrials-(continued) | | | | | | | | |
MSA Safety, Inc. | | | 1,541 | | | $ | 247,731 | |
MSC Industrial Direct Co., Inc., Class A | | | 1,926 | | | | 173,648 | |
Nordson Corp. | | | 2,375 | | | | 502,099 | |
Northrop Grumman Corp. | | | 6,911 | | | | 2,449,535 | |
Raytheon Technologies Corp. | | | 63,193 | | | | 5,260,185 | |
Regal Beloit Corp. | | | 1,810 | | | | 261,418 | |
Republic Services, Inc. | | | 13,248 | | | | 1,408,262 | |
Resources Connection, Inc. | | | 1,281 | | | | 18,075 | |
Robert Half International, Inc. | | | 4,745 | | | | 415,709 | |
Rockwell Automation, Inc. | | | 4,946 | | | | 1,307,030 | |
Roper Technologies, Inc. | | | 4,391 | | | | 1,960,318 | |
Ryder System, Inc. | | | 2,201 | | | | 175,728 | |
Snap-on, Inc. | | | 2,254 | | | | 535,550 | |
Standex International Corp. | | | 487 | | | | 46,177 | |
Stanley Black & Decker, Inc. | | | 6,856 | | | | 1,417,615 | |
Tennant Co. | | | 730 | | | | 57,604 | |
Toro Co. (The) | | | 4,653 | | | | 533,234 | |
Trane Technologies PLC | | | 9,907 | | | | 1,722,134 | |
Trinity Industries, Inc. | | | 4,629 | | | | 127,946 | |
Union Pacific Corp. | | | 27,912 | | | | 6,198,976 | |
United Parcel Service, Inc., Class B | | | 29,802 | | | | 6,075,436 | |
W.W. Grainger, Inc. | | | 2,149 | | | | 931,678 | |
Waste Management, Inc. | | | 17,527 | | | | 2,418,200 | |
| | | | | | | | |
| | | | | | | 83,429,896 | |
| | | | | | | | |
| Information Technology-16.57% | | | | | | | | |
Accenture PLC, Class A | | | 27,505 | | | | 7,975,625 | |
Analog Devices, Inc. | | | 15,321 | | | | 2,346,564 | |
Automatic Data Processing, Inc. | | | 17,868 | | | | 3,341,137 | |
Badger Meter, Inc. | | | 1,149 | | | | 107,305 | |
Broadcom, Inc. | | | 16,939 | | | | 7,727,572 | |
Broadridge Financial Solutions, Inc. | | | 4,819 | | | | 764,438 | |
Cass Information Systems, Inc. | | | 567 | | | | 26,020 | |
Corning, Inc. | | | 31,898 | | | | 1,410,211 | |
HP, Inc. | | | 51,680 | | | | 1,762,805 | |
International Business Machines Corp. | | | 37,088 | | | | 5,262,045 | |
Jack Henry & Associates, Inc. | | | 3,168 | | | | 515,845 | |
KLA Corp. | | | 6,461 | | | | 2,037,476 | |
Littelfuse, Inc. | | | 967 | | | | 256,487 | |
Microchip Technology, Inc. | | | 11,371 | | | | 1,708,948 | |
Microsoft Corp. | | | 95,959 | | | | 24,198,941 | |
Oracle Corp. | | | 122,123 | | | | 9,255,702 | |
Paychex, Inc. | | | 14,978 | | | | 1,460,205 | |
QUALCOMM, Inc. | | | 47,058 | | | | 6,531,650 | |
TE Connectivity Ltd. | | | 13,721 | | | | 1,845,063 | |
Texas Instruments, Inc. | | | 38,214 | | | | 6,898,009 | |
Visa, Inc., Class A | | | 70,510 | | | | 16,468,316 | |
| | | | | | | | |
| | | | | | | 101,900,364 | |
| | | | | | | | |
| Materials-3.47% | | | | | | | | |
Air Products and Chemicals, Inc. | | | 9,146 | | | | 2,638,438 | |
Albemarle Corp. | | | 4,852 | | | | 815,961 | |
AptarGroup, Inc. | | | 2,738 | | | | 412,918 | |
Ashland Global Holdings, Inc. | | | 2,476 | | | | 213,456 | |
Avery Dennison Corp. | | | 3,443 | | | | 737,387 | |
Balchem Corp. | | | 1,277 | | | | 162,422 | |
Celanese Corp. | | | 4,873 | | | | 763,355 | |
Eastman Chemical Co. | | | 5,691 | | | | 656,684 | |
Ecolab, Inc. | | | 11,861 | | | | 2,658,287 | |
H.B. Fuller Co. | | | 2,138 | | | | 142,861 | |
Hawkins, Inc. | | | 836 | | | | 27,880 | |
| | | | | | | | |
| | | Shares | | | Value | |
| Materials-(continued) | | | | | | | | |
International Flavors & Fragrances, Inc. | | | 10,313 | | | $ | 1,466,199 | |
International Paper Co. | | | 16,355 | | | | 948,590 | |
Neenah, Inc. | | | 664 | | | | 35,305 | |
Nucor Corp. | | | 12,449 | | | | 1,024,055 | |
Packaging Corp. of America | | | 3,907 | | | | 576,868 | |
PPG Industries, Inc. | | | 9,842 | | | | 1,685,344 | |
Quaker Chemical Corp. | | | 703 | | | | 170,372 | |
Reliance Steel & Aluminum Co. | | | 2,677 | | | | 429,150 | |
Royal Gold, Inc. | | | 2,756 | | | | 308,286 | |
RPM International, Inc. | | | 5,383 | | | | 510,524 | |
Scotts Miracle-Gro Co. (The) | | | 2,317 | | | | 535,598 | |
Sensient Technologies Corp. | | | 1,757 | | | | 144,496 | |
Sherwin-Williams Co. (The) | | | 11,103 | | | | 3,040,779 | |
Silgan Holdings, Inc. | | | 4,593 | | | | 193,687 | |
Sonoco Products Co. | | | 4,130 | | | | 270,350 | |
Stepan Co. | | | 886 | | | | 115,765 | |
Westlake Chemical Corp. | | | 5,376 | | | | 504,753 | |
Worthington Industries, Inc. | | | 2,142 | | | | 139,787 | |
| | | | | | | | |
| | | | | | | 21,329,557 | |
| | | | | | | | |
| Real Estate-1.70% | | | | | | | | |
Alexandria Real Estate Equities, Inc. | | | 5,642 | | | | 1,021,766 | |
Apartment Investment & Management Co. | | | 6,195 | | | | 42,993 | |
CoreSite Realty Corp. | | | 1,771 | | | | 215,159 | |
CubeSmart | | | 8,295 | | | | 351,210 | |
Digital Realty Trust, Inc. | | | 11,637 | | | | 1,795,706 | |
Douglas Emmett, Inc. | | | 7,255 | | | | 243,333 | |
Equity LifeStyle Properties, Inc. | | | 7,775 | | | | 539,585 | |
Essex Property Trust, Inc. | | | 2,787 | | | | 809,679 | |
Extra Space Storage, Inc. | | | 5,459 | | | | 811,699 | |
Federal Realty Investment Trust | | | 3,195 | | | | 360,524 | |
Iron Mountain, Inc.(b) | | | 11,962 | | | | 479,915 | |
Mid-America Apartment Communities, Inc. | | | 4,763 | | | | 749,363 | |
National Health Investors, Inc. | | | 1,866 | | | | 136,983 | |
National Retail Properties, Inc. | | | 7,248 | | | | 336,452 | |
Omega Healthcare Investors, Inc. | | | 9,645 | | | | 366,510 | |
Realty Income Corp. | | | 15,481 | | | | 1,070,511 | |
UDR, Inc. | | | 12,305 | | | | 571,567 | |
Universal Health Realty Income Trust | | | 543 | | | | 36,354 | |
WP Carey, Inc. | | | 7,253 | | | | 543,177 | |
| | | | | | | | |
| | | | | | | 10,482,486 | |
| | | | | | | | |
| Utilities-5.21% | | | | | | | | |
ALLETE, Inc. | | | 2,139 | | | | 150,500 | |
Alliant Energy Corp. | | | 10,358 | | | | 581,809 | |
American Electric Power Co., Inc. | | | 20,592 | | | | 1,826,716 | |
American States Water Co. | | | 1,454 | | | | 115,142 | |
American Water Works Co., Inc. | | | 7,491 | | | | 1,168,521 | |
Atmos Energy Corp. | | | 5,306 | | | | 549,649 | |
Avista Corp. | | | 2,900 | | | | 133,458 | |
Black Hills Corp | | | 2,645 | | | | 182,452 | |
Brookfield Infrastructure Partners L.P. (Canada) | | | 12,238 | | | | 658,037 | |
California Water Service Group | | | 2,069 | | | | 121,554 | |
Chesapeake Utilities Corp. | | | 689 | | | | 81,660 | |
CMS Energy Corp. | | | 11,983 | | | | 771,585 | |
Consolidated Edison, Inc. | | | 14,175 | | | | 1,097,287 | |
DTE Energy Co. | | | 8,062 | | | | 1,128,841 | |
Duke Energy Corp. | | | 31,909 | | | | 3,212,917 | |
Edison International | | | 15,713 | | | | 934,138 | |
Essential Utilities, Inc. | | | 10,177 | | | | 479,642 | |
See accompanying Notes to Financial Statements which are an integral part of the financial statements.
Invesco Dividend AchieversTM ETF (PFM)–(continued)
April 30, 2021
| | | | | | | | |
| | | Shares | | | Value | |
| Utilities-(continued) | | | | | | | | |
Evergy, Inc. | | | 9,369 | | | $ | 599,335 | |
Eversource Energy | | | 14,198 | | | | 1,224,152 | |
MDU Resources Group, Inc. | | | 8,472 | | | | 283,473 | |
MGE Energy, Inc. | | | 1,425 | | | | 106,604 | |
Middlesex Water Co. | | | 689 | | | | 56,512 | |
National Fuel Gas Co. | | | 3,763 | | | | 186,871 | |
New Jersey Resources Corp.(b) | | | 3,963 | | | | 166,248 | |
NextEra Energy, Inc. | | | 81,237 | | | | 6,296,680 | |
Northwest Natural Holding Co. | | | 1,206 | | | | 65,028 | |
NorthWestern Corp. | | | 2,080 | | | | 141,502 | |
OGE Energy Corp. | | | 8,308 | | | | 278,816 | |
Portland General Electric Co. | | | 3,699 | | | | 188,131 | |
PPL Corp. | | | 31,922 | | | | 929,888 | |
Sempra Energy | | | 11,964 | | | | 1,645,887 | |
SJW Group | | | 1,125 | | | | 73,744 | |
South Jersey Industries, Inc. | | | 4,135 | | | | 102,341 | |
Southern Co. (The) | | | 43,853 | | | | 2,901,753 | |
Southwest Gas Holdings, Inc. | | | 2,340 | | | | 163,145 | |
Spire, Inc. | | | 2,121 | | | | 159,796 | |
UGI Corp. | | | 8,644 | | | | 377,829 | |
WEC Energy Group, Inc. | | | 13,112 | | | | 1,274,093 | |
Xcel Energy, Inc. | | | 22,295 | | | | 1,589,634 | |
York Water Co. (The) | | | 514 | | | | 26,543 | |
| | | | | | | | |
| | | | | | | 32,031,913 | |
| | | | | | | | |
Total Common Stocks & Other Equity Interests
(Cost $479,559,341) | | | | 614,383,240 | |
| | | | | | | | |
| | | | | | | | |
| | | Shares | | | Value | |
| Money Market Funds-0.08% | | | | | | | | |
Invesco Government & Agency Portfolio, Institutional Class,
0.03%(c)(d)
(Cost $504,143) | | | 504,143 | | | $ | 504,143 | |
| | | | | | | | |
TOTAL INVESTMENTS IN SECURITIES
(excluding investments purchased with cash collateral from securities on loan)-99.99%
(Cost $480,063,484) | | | | | | | 614,887,383 | |
| | | | | | | | |
|
| Investments Purchased with Cash Collateral from Securities on Loan | |
| | |
| Money Market Funds-0.30% | | | | | | | | |
Invesco Private Government Fund, 0.01%(c)(d)(e) | | | 698,686 | | | | 698,686 | |
Invesco Private Prime Fund,
0.11%(c)(d)(e) | | | 1,124,416 | | | | 1,124,866 | |
| | | | | | | | |
Total Investments Purchased with Cash Collateral from Securities on Loan
(Cost $1,823,552) | | | | 1,823,552 | |
| | | | | | | | |
TOTAL INVESTMENTS IN SECURITIES-100.29%
(Cost $481,887,036) | | | | 616,710,935 | |
OTHER ASSETS LESS LIABILITIES-(0.29)% | | | | (1,756,397 | ) |
| | | | | | | | |
NET ASSETS-100.00% | | | | | | $ | 614,954,538 | |
| | | | | | | | |
Notes to Schedule of Investments:
| (a) | Industry and/or sector classifications used in this report are generally according to the Global Industry Classification Standard, which was developed by and is the exclusive property and a service mark of MSCI Inc. and Standard & Poor’s. |
| (b) | All or a portion of this security was out on loan at April 30, 2021. |
| (c) | Affiliated issuer. The issuer and/or the Fund is a wholly-owned subsidiary of Invesco Ltd., or is affiliated by having an investment adviser that is under common control of Invesco Ltd. The table below shows the Fund’s transactions in, and earnings from, its investments in affiliates for the fiscal year ended April 30, 2021. |
| | | | | | | | | | | | | | | | | | | | | | | | | | | | |
| | | | | | | | | | | | Change in | | | Realized | | | | | | | |
| | | Value | | | Purchases | | | Proceeds | | | Unrealized | | | Gain | | | Value | | | Dividend | |
| | | April 30, 2020 | | | at Cost | | | from Sales | | | Appreciation | | | (Loss) | | | April 30, 2021 | | | Income | |
| Invesco Ltd. | | $ | 121,585 | | | $ | 1,378 | | | $ | (95,611 | ) | | $ | 292,422 | | | $ | (319,774 | ) | | $ | - | | | $ | 2,196 | |
| Investments in Affiliated Money Market Funds: | | | | | | | | | | | | | | | | | | | | | | | | | | | | |
| Invesco Government & Agency Portfolio, Institutional Class | | | - | | | | 10,573,133 | | | | (10,068,990 | ) | | | - | | | | - | | | | 504,143 | | | | 61 | |
| Invesco Premier U.S. Government Money Portfolio, Institutional Class | | | - | | | | 6,159,556 | | | | (6,159,556 | ) | | | - | | | | - | | | | - | | | | 90 | |
| Investments Purchased with Cash Collateral from Securities on Loan: | | | | | | | | | | | | | | | | | | | | | | | | | | | | |
Invesco Private Government Fund | | | 1,967,874 | | | | 6,716,354 | | | | (7,985,542 | ) | | | - | | | | - | | | | 698,686 | | | | 124 | * |
| Invesco Private Prime Fund | | | - | | | | 4,813,343 | | | | (3,688,529 | ) | | | - | | | | 52 | | | | 1,124,866 | | | | 283 | * |
| | | | | | | | | | | | | | | | | | | | | | | | | | | | |
Total | | $ | 2,089,459 | | | $ | 28,263,764 | | | $ | (27,998,228 | ) | | $ | 292,422 | | | $ | (319,722 | ) | | $ | 2,327,695 | | | $ | 2,754 | |
| | | | | | | | | | | | | | | | | | | | | | | | | | | | |
| * | Represents the income earned on the investment of cash collateral, which is included in securities lending income on the Statements of Operations. Does not include rebates and fees paid to lending agent or premiums received from borrowers, if any. |
| (d) | The rate shown is the 7-day SEC standardized yield as of April 30, 2021. |
| (e) | The security has been segregated to satisfy the commitment to return the cash collateral received in securities lending transactions upon the borrower’s return of the securities loaned. See Note 2J. |
See accompanying Notes to Financial Statements which are an integral part of the financial statements.
Invesco Dow Jones Industrial Average Dividend ETF (DJD)
April 30, 2021
Schedule of Investments(a)
| | | | | | | | |
| | | Shares | | | Value | |
| Common Stocks & Other Equity Interests-99.95% | |
| Communication Services-6.47% | | | | | | | | |
Verizon Communications, Inc. | | | 173,265 | | | $ | 10,012,984 | |
| | | | | | | | |
| Consumer Discretionary-9.04% | | | | | | | | |
Home Depot, Inc. (The) | | | 19,894 | | | | 6,439,091 | |
McDonald’s Corp. | | | 25,069 | | | | 5,918,289 | |
NIKE, Inc., Class B | | | 12,361 | | | | 1,639,316 | |
| | | | | | | | |
| | | | | | | 13,996,696 | |
| | | | | | | | |
| Consumer Staples-16.48% | | | | | | | | |
Coca-Cola Co. (The) | | | 144,576 | | | | 7,804,213 | |
Procter & Gamble Co. (The) | | | 42,495 | | | | 5,669,683 | |
Walgreens Boots Alliance, Inc. | | | 155,664 | | | | 8,265,758 | |
Walmart, Inc. | | | 26,857 | | | | 3,757,563 | |
| | | | | | | | |
| | | | | | | 25,497,217 | |
| | | | | | | | |
| Energy-6.54% | | | | | | | | |
Chevron Corp. | | | 98,217 | | | | 10,123,226 | |
| | | | | | | | |
| Financials-10.43% | | | | | | | | |
American Express Co. | | | 18,214 | | | | 2,793,117 | |
Goldman Sachs Group, Inc. (The) | | | 9,567 | | | | 3,333,621 | |
JPMorgan Chase & Co. | | | 33,320 | | | | 5,124,949 | |
Travelers Cos., Inc. (The) | | | 31,602 | | | | 4,887,566 | |
| | | | | | | | |
| | | | | | | 16,139,253 | |
| | | | | | | | |
| Health Care-15.27% | | | | | | | | |
Amgen, Inc. | | | 28,883 | | | | 6,921,522 | |
Johnson & Johnson | | | 33,975 | | | | 5,528,752 | |
Merck & Co., Inc. | | | 101,886 | | | | 7,590,507 | |
UnitedHealth Group, Inc. | | | 8,991 | | | | 3,585,611 | |
| | | | | | | | |
| | | | | | | 23,626,392 | |
| | | | | | | | |
| | | | | | | | |
| | | Shares | | | Value | |
| Industrials-10.19% | | | | | | | | |
3M Co. | | | 38,824 | | | $ | 7,653,763 | |
Caterpillar, Inc. | | | 17,722 | | | | 4,042,565 | |
Honeywell International, Inc. | | | 18,238 | | | | 4,067,804 | |
| | | | | | | | |
| | | | | | | 15,764,132 | |
| | | | | | | | |
| Information Technology-19.24% | | | | | | | | |
Apple, Inc. | | | 11,886 | | | | 1,562,534 | |
Cisco Systems, Inc. | | | 143,457 | | | | 7,303,396 | |
Intel Corp. | | | 77,334 | | | | 4,449,025 | |
International Business Machines Corp. | | | 91,202 | | | | 12,939,740 | |
Microsoft Corp. | | | 8,696 | | | | 2,192,957 | |
Visa, Inc., Class A | | | 5,720 | | | | 1,335,963 | |
| | | | | | | | |
| | | | | | | 29,783,615 | |
| | | | | | | | |
| Materials-6.29% | | | | | | | | |
Dow, Inc. | | | 155,822 | | | | 9,738,875 | |
| | | | | | | | |
Total Common Stocks & Other Equity Interests
(Cost $145,083,100) | | | | | | | 154,682,390 | |
| | | | | | | | |
| | |
| Money Market Funds-0.02% | | | | | | | | |
Invesco Government & Agency Portfolio, Institutional Class,
0.03%(b)(c)
(Cost $36,023) | | | 36,023 | | | | 36,023 | |
| | | | | | | | |
TOTAL INVESTMENTS IN SECURITIES-99.97%
(Cost $145,119,123) | | | | 154,718,413 | |
OTHER ASSETS LESS LIABILITIES-0.03% | | | | 39,833 | |
| | | | | | | | |
NET ASSETS-100.00% | | | | | | $ | 154,758,246 | |
| | | | | | | | |
Notes to Schedule of Investments:
| (a) | Industry and/or sector classifications used in this report are generally according to the Global Industry Classification Standard, which was developed by and is the exclusive property and a service mark of MSCI Inc. and Standard & Poor’s. |
| (b) | Affiliated issuer. The issuer and/or the Fund is a wholly-owned subsidiary of Invesco Ltd., or is affiliated by having an investment adviser that is under common control of Invesco Ltd. The table below shows the Fund’s transactions in, and earnings from, its investments in affiliates for the fiscal year ended April 30, 2021. |
| | | | | | | | | | | | | | | | | | | | | | | | | | | | | | | | | | | |
| | | Value
April 30, 2020 | | Purchases
at Cost | | Proceeds
from Sales | | Change in
Unrealized
Appreciation | | Realized
Gain | | Value
April 30, 2021 | | Dividend
Income |
| Investments in Affiliated Money Market Funds: | | | | | | | | | | | | | | | | | | | | | | | | | | | | | | | | | | | |
| Invesco Government & Agency Portfolio, Institutional Class | | | $ | - | | | | $ | 3,267,724 | | | | $ | (3,231,701 | ) | | | $ | - | | | | $ | - | | | | $ | 36,023 | | | | $ | 25 | |
| Invesco Premier U.S. Government Money Portfolio,Institutional Class | | | | 106,166 | | | | | 2,334,214 | | | | | (2,440,380 | ) | | | | - | | | | | - | | | | | - | | | | | 53 | |
| | | | | | | | | | | | | | | | | | | | | | | | | | | | | | | | | | | |
Total | | | $ | 106,166 | | | | $ | 5,601,938 | | | | $ | (5,672,081 | ) | | | $ | - | | | | $ | - | | | | $ | 36,023 | | | | $ | 78 | |
| | | | | | | | | | | | | | | | | | | | | | | | | | | | | | | | | | | |
| (c) | The rate shown is the 7-day SEC standardized yield as of April 30, 2021. |
See accompanying Notes to Financial Statements which are an integral part of the financial statements.
Invesco Financial Preferred ETF (PGF)
April 30, 2021
Schedule of Investments(a)
| | | | | | | | |
| | | Shares | | | Value | |
| Preferred Stocks-99.90% | | | | | | | | |
| Banks-58.55% | | | | | | | | |
Bank of America Corp. | | | | | | | | |
Series PP, Pfd., 4.13%(b) | | | 854,540 | | | $ | 21,602,771 | |
Series NN, Pfd., 4.38%(b) | | | 1,016,654 | | | | 25,812,845 | |
Series LL, Pfd., 5.00% | | | 1,192,974 | | | | 32,520,471 | |
Series KK, Pfd., 5.38% | | | 1,336,976 | | | | 37,074,344 | |
Series HH, Pfd., 5.88%(b) | | | 787,844 | | | | 21,571,169 | |
Series GG, Pfd., 6.00%(b) | | | 1,246,386 | | | | 34,313,007 | |
Citigroup, Inc. | | | | | | | | |
Series K, Pfd., 6.88%(c) | | | 1,389,755 | | | | 39,538,530 | |
Series J, Pfd., 7.13%(c) | | | 872,586 | | | | 24,606,925 | |
Citizens Financial Group, Inc. | | | | | | | | |
Series E, Pfd., 5.00%(b) | | | 420,788 | | | | 10,919,449 | |
Series D, Pfd., 6.35%(c) | | | 280,897 | | | | 7,870,734 | |
Fifth Third Bancorp | | | | | | | | |
Series K, Pfd., 4.95%(b) | | | 241,779 | | | | 6,520,780 | |
Series I, Pfd., 6.63%(c) | | | 420,772 | | | | 11,891,017 | |
First Citizens BancShares, Inc.,
Series A, Pfd., 5.38%(b) | | | 280,133 | | | | 7,527,174 | |
First Republic Bank | | | | | | | | |
Series K, Pfd., 4.13%(b) | | | 459,214 | | | | 11,457,389 | |
Series L, Pfd., 4.25%(b) | | | 757,445 | | | | 19,466,336 | |
Series J, Pfd., 4.70%(b) | | | 372,568 | | | | 9,649,511 | |
Series I, Pfd., 5.50%(b) | | | 281,612 | | | | 7,662,663 | |
Huntington Bancshares, Inc. | | | | | | | | |
Series H, Pfd., 4.50% | | | 443,588 | | | | 11,156,238 | |
Series D, Pfd., 6.25% | | | 556,862 | | | | 14,116,452 | |
JPMorgan Chase & Co. | | | | | | | | |
Series JJ, Pfd., 4.55%(b) | | | 1,368,970 | | | | 35,593,220 | |
Series GG, Pfd., 4.75%(b) | | | 830,980 | | | | 21,788,296 | |
Series DD, Pfd., 5.75%(b) | | | 1,549,961 | | | | 42,127,940 | |
Series EE, Pfd., 6.00%(b) | | | 1,699,972 | | | | 46,902,227 | |
Series AA, Pfd., 6.10%(b) | | | 1,146,264 | | | | 29,000,479 | |
Series BB, Pfd., 6.15%(b) | | | 898,692 | | | | 22,754,881 | |
KeyCorp | | | | | | | | |
Series G, Pfd., 5.63% | | | 417,265 | | | | 11,512,341 | |
Series F, Pfd., 5.65%(b) | | | 395,958 | | | | 10,734,421 | |
Series E, Pfd., 6.13%(c) | | | 463,836 | | | | 13,915,080 | |
People’s United Financial, Inc.,
Series A, Pfd., 5.63%(c) | | | 237,167 | | | | 6,522,093 | |
PNC Financial Services Group, Inc. (The), Series P, Pfd., 6.13%(c) | | | 1,387,912 | | | | 36,391,053 | |
Regions Financial Corp. | | | | | | | | |
Series E, Pfd., 4.45% | | | 265,000 | | | | 6,545,500 | |
Series C, Pfd., 5.70%(b)(c) | | | 471,090 | | | | 12,969,108 | |
Series A, Pfd., 6.38%(b) | | | 463,565 | | | | 11,760,644 | |
Series B, Pfd., 6.38%(c) | | | 458,052 | | | | 13,049,901 | |
Signature Bank, Series A, Pfd.,
5.00%(b) | | | 676,070 | | | | 17,341,195 | |
SVB Financial Group, Series A, Pfd., 5.25%(b) | | | 331,578 | | | | 8,856,448 | |
Synovus Financial Corp., Series E, Pfd., 5.88%(b)(c) | | | 328,839 | | | | 8,773,425 | |
Texas Capital Bancshares, Inc.,
Series B, Pfd., 5.75% | | | 268,639 | | | | 6,952,377 | |
Truist Financial Corp. | | | | | | | | |
Series R, Pfd., 4.75% | | | 856,700 | | | | 22,719,684 | |
Series O, Pfd., 5.25%(b) | | | 533,816 | | | | 14,872,114 | |
Series H, Pfd., 5.63% | | | 433,910 | | | | 10,986,601 | |
| | | | | | | | |
| | | Shares | | | Value | |
| Banks-(continued) | | | | | | | | |
U.S. Bancorp | | | | | | | | |
Series L, Pfd., 3.75%(b) | | | 465,907 | | | $ | 11,265,631 | |
Series M, Pfd., 4.00%(b) | | | 690,739 | | | | 17,227,031 | |
Series K, Pfd., 5.50% | | | 533,330 | | | | 14,874,574 | |
Series F, Pfd., 6.50%(c) | | | 1,021,141 | | | | 26,570,089 | |
Wells Fargo & Co. | | | | | | | | |
Series CC, Pfd., 4.38%(b) | | | 934,754 | | | | 23,387,545 | |
Series AA, Pfd., 4.70% | | | 1,078,975 | | | | 27,513,862 | |
Series Z, Pfd., 4.75%(b) | | | 1,952,072 | | | | 50,226,813 | |
Series O, Pfd., 5.13%(b) | | | 146,495 | | | | 3,797,150 | |
Pfd., 5.20%(b) | | | 454,119 | | | | 11,725,353 | |
Series X, Pfd., 5.50% | | | 1,132,672 | | | | 29,200,284 | |
Series Y, Pfd., 5.63% | | | 680,086 | | | | 17,947,470 | |
Series Q, Pfd., 5.85%(c) | | | 1,644,464 | | | | 44,351,194 | |
Series R, Pfd., 6.63%(c) | | | 838,991 | | | | 24,322,349 | |
| | | | | | | | |
| | | | | | | 1,069,756,178 | |
| | | | | | | | |
| Capital Markets-14.33% | | | | | | | | |
Charles Schwab Corp. (The) | | | | | | | | |
Series J, Pfd., 4.45% | | | 569,141 | | | | 14,484,638 | |
Series D, Pfd., 5.95% | | | 691,279 | | | | 17,648,353 | |
Series C, Pfd., 6.00% | | | 374,073 | | | | 9,482,751 | |
Goldman Sachs Group, Inc. (The) | | | | | | | | |
Series J, Pfd., 5.50%(b)(c) | | | 933,214 | | | | 25,290,099 | |
Series N, Pfd., 6.30%(b) | | | 627,628 | | | | 15,696,976 | |
Series K, Pfd., 6.38%(b)(c) | | | 656,873 | | | | 18,536,956 | |
KKR & Co., Inc., Series A, Pfd., 6.75% | | | 322,747 | | | | 8,265,551 | |
Morgan Stanley | | | | | | | | |
Series L, Pfd., 4.88% | | | 460,203 | | | | 12,186,175 | |
Series K, Pfd., 5.85%(c) | | | 919,006 | | | | 26,283,572 | |
Series I, Pfd., 6.38%(b)(c) | | | 919,449 | | | | 26,066,379 | |
Series F, Pfd., 6.88%(c) | | | 774,332 | | | | 21,634,836 | |
Series E, Pfd., 7.13%(c) | | | 796,045 | | | | 22,918,136 | |
Northern Trust Corp., Series E, Pfd., 4.70% | | | 373,908 | | | | 10,136,646 | |
State Street Corp. | | | | | | | | |
Series G, Pfd., 5.35%(b)(c) | | | 467,021 | | | | 13,646,354 | |
Series D, Pfd., 5.90%(c) | | | 695,326 | | | | 19,636,006 | |
| | | | | | | | |
| | | | | | | 261,913,428 | |
| | | | | | | | |
| Consumer Finance-5.68% | | | | | | | | |
Capital One Financial Corp. | | | | | | | | |
Series L, Pfd., 4.38% | | | 130,500 | | | | 3,211,605 | |
Series J, Pfd., 4.80%(b) | | | 1,048,111 | | | | 26,674,425 | |
Series I, Pfd., 5.00%(b) | | | 1,236,004 | | | | 32,136,104 | |
Series G, Pfd., 5.20% | | | 494,262 | | | | 12,623,452 | |
Series H, Pfd., 6.00% | | | 412,507 | | | | 10,655,056 | |
Synchrony Financial, Series A, Pfd., 5.63%(b) | | | 699,320 | | | | 18,476,034 | |
| | | | | | | | |
| | | | | | | 103,776,676 | |
| | | | | | | | |
| Diversified Financial Services-2.25% | | | | | | | | |
Equitable Holdings, Inc. | | | | | | | | |
Series C, Pfd., 4.30%(b) | | | 269,836 | | | | 6,662,250 | |
Series A, Pfd., 5.25%(b) | | | 749,136 | | | | 19,537,467 | |
See accompanying Notes to Financial Statements which are an integral part of the financial statements.
Invesco Financial Preferred ETF (PGF)–(continued)
April 30, 2021
| | | | | | | | |
| | | Shares | | | Value | |
| Diversified Financial Services-(continued) | |
PartnerRe Ltd., Series H, Pfd., 7.25% (Bermuda) | | | 274,743 | | | $ | 6,950,998 | |
Voya Financial, Inc., Series B, Pfd., 5.35%(c) | | | 279,200 | | | | 7,923,696 | |
| | | | | | | | |
| | | | | | | 41,074,411 | |
| | | | | | | | |
| Insurance-17.62% | | | | | | | | |
Allstate Corp. (The) | | | | | | | | |
Series I, Pfd., 4.75% | | | 282,976 | | | | 7,524,332 | |
Series H, Pfd., 5.10% | | | 1,066,689 | | | | 29,131,277 | |
Series G, Pfd., 5.63%(b) | | | 534,789 | | | | 14,851,091 | |
American Equity Investment Life Holding Co. | | | | | | | | |
Series A, Pfd., 5.95%(c) | | | 374,342 | | | | 10,309,379 | |
Series B, Pfd., 6.63%(c) | | | 278,706 | | | | 7,820,490 | |
American International Group, Inc., Series A, Pfd., 5.85%(b) | | | 463,985 | | | | 12,866,304 | |
Arch Capital Group Ltd. | | | | | | | | |
Series E, Pfd., 5.25% | | | 420,727 | | | | 10,682,259 | |
Series F, Pfd., 5.45%(b) | | | 309,038 | | | | 8,062,801 | |
Aspen Insurance Holdings Ltd. | | | | | | | | |
Pfd., 5.63% (Bermuda) | | | 234,280 | | | | 6,196,706 | |
Pfd., 5.63% (Bermuda) | | | 237,538 | | | | 6,178,363 | |
Pfd., 5.95% (Bermuda)(c) | | | 259,832 | | | | 7,028,456 | |
Athene Holding Ltd. | | | | | | | | |
Series D, Pfd., 4.88% | | | 535,089 | | | | 13,484,243 | |
Series B, Pfd., 5.63% | | | 313,955 | | | | 8,260,156 | |
Series A, Pfd., 6.35%(c) | | | 810,782 | | | | 23,131,610 | |
Series C, Pfd., 6.38%(b)(c) | | | 572,729 | | | | 16,128,049 | |
AXIS Capital Holdings Ltd., Series E, Pfd., 5.50% | | | 511,025 | | | | 13,005,586 | |
Brighthouse Financial, Inc. | | | | | | | | |
Series C, Pfd., 5.38% | | | 491,944 | | | | 12,903,691 | |
Series A, Pfd., 6.60% | | | 434,662 | | | | 11,709,794 | |
Series B, Pfd., 6.75% | | | 371,787 | | | | 10,436,061 | |
Enstar Group Ltd., Series D, Pfd., 7.00%(c) | | | 374,055 | | | | 10,776,525 | |
Hartford Financial Services Group, Inc. (The), Series G, Pfd., 6.00%(b) | | | 323,081 | | | | 9,036,576 | |
MetLife, Inc. | | | | | | | | |
Series F, Pfd., 4.75% | | | 923,738 | | | | 24,331,259 | |
Series E, Pfd., 5.63%(b) | | | 753,972 | | | | 20,802,087 | |
Prudential PLC | | | | | | | | |
Pfd., 6.50% (United Kingdom) | | | 282,173 | | | | 7,759,757 | |
Pfd., 6.75% (United Kingdom)(b) | | | 232,758 | | | | 6,417,138 | |
| | | | | | | | |
| | | Shares | | | Value | |
| Insurance-(continued) | | | | | | | | |
RenaissanceRe Holdings Ltd. | | | | | | | | |
Series E, Pfd., 5.38% (Bermuda) | | | 258,059 | | | $ | 6,557,279 | |
Series F, Pfd., 5.75% (Bermuda) | | | 237,374 | | | | 6,584,755 | |
| | | | | | | | |
| | | | | | | 321,976,024 | |
| | | | | | | | |
| Thrifts & Mortgage Finance-1.12% | |
New York Community Bancorp, Inc.,
Series A, Pfd., 6.38%(c) | | | 478,051 | | | | 13,275,476 | |
Washington Federal, Inc., Series A, Pfd., 4.88%(b) | | | 278,809 | | | | 7,176,544 | |
| | | | | | | | |
| | | | | | | 20,452,020 | |
| | | | | | | | |
| Trading Companies & Distributors-0.35% | |
Air Lease Corp., Series A, Pfd., 6.15%(c) | | | 236,137 | | | | 6,342,639 | |
| | | | | | | | |
Total Preferred Stocks
(Cost $1,774,257,068) | | | | | | | 1,825,291,376 | |
| | | | | | | | |
| Money Market Funds-0.63% | | | | | | | | |
Invesco Government & Agency Portfolio, Institutional Class, 0.03%(d)(e)
(Cost $11,481,962) | | | 11,481,962 | | | | 11,481,962 | |
| | | | | | | | |
TOTAL INVESTMENTS IN SECURITIES
(excluding investments purchased with cash collateral from securities on loan)-100.53%
(Cost $1,785,739,030) | | | | 1,836,773,338 | |
| | | | | | | | |
|
| Investments Purchased with Cash Collateral from Securities on Loan | |
| | |
| Money Market Funds-3.79% | | | | | | | | |
Invesco Private Government Fund,
0.01%(d)(e)(f) | | | 27,670,665 | | | | 27,670,665 | |
Invesco Private Prime Fund,
0.11%(d)(e)(f) | | | 41,493,750 | | | | 41,510,348 | |
| | | | | | | | |
Total Investments Purchased with Cash Collateral from Securities on Loan
(Cost $69,181,013) | | | | 69,181,013 | |
| | | | | | | | |
TOTAL INVESTMENTS IN SECURITIES-104.32% (Cost $1,854,920,043) | | | | 1,905,954,351 | |
OTHER ASSETS LESS LIABILITIES-(4.32)% | | | | (78,867,180 | ) |
| | | | | | | | |
NET ASSETS-100.00% | | | | | | $ | 1,827,087,171 | |
| | | | | | | | |
Investment Abbreviations:
Pfd. -Preferred
See accompanying Notes to Financial Statements which are an integral part of the financial statements.
Invesco Financial Preferred ETF (PGF)–(continued)
April 30, 2021
Notes to Schedule of Investments:
| (a) | Industry and/or sector classifications used in this report are generally according to the Global Industry Classification Standard, which was developed by and is the exclusive property and a service mark of MSCI Inc. and Standard & Poor’s. |
| (b) | All or a portion of this security was out on loan at April 30, 2021. |
| (c) | Security issued at a fixed rate for a specific period of time, after which it will convert to a variable rate. |
| (d) | Affiliated issuer. The issuer and/or the Fund is a wholly-owned subsidiary of Invesco Ltd., or is affiliated by having an investment adviser that is under common control of Invesco Ltd. The table below shows the Fund’s transactions in, and earnings from, its investments in affiliates for the fiscal year ended April 30, 2021. |
| | | | | | | | | | | | | | | | | | | | | | | | | | | | | | | | | | | |
| | | Value
April 30, 2020 | | Purchases at
Cost | | Proceeds from
Sales | | Change in
Unrealized
Appreciation | | Realized
Gain | | Value
April 30, 2021 | | Dividend
Income |
| Investments in Affiliated Money Market Funds: | | | | | | | | | | | | | | | | | | | | | | | | | | | | | | | | | | | |
| Invesco Government & Agency Portfolio, Institutional Class | | | $ | - | | | | $ | 198,604,290 | | | | $ | (187,122,328 | ) | | | $ | - | | | | $ | - | | | | $ | 11,481,962 | | | | $ | 1,055 | |
| Invesco Premier U.S. Government Money Portfolio, Institutional Class | | | | 11,370,877 | | | | | 56,260,781 | | | | | (67,631,658 | ) | | | | - | | | | | - | | | | | - | | | | | 2,719 | |
| Investments Purchased with Cash Collateral from Securities on Loan: | | | | | | | | | | | | | | | | | | | | | | | | | | | | | | | | | | | |
Invesco Private Government Fund | | | | 15,115,317 | | | | | 205,966,020 | | | | | (193,410,672 | ) | | | | - | | | | | - | | | | | 27,670,665 | | | | | 3,536 | * |
Invesco Private Prime Fund | | | | - | | | | | 179,580,099 | | | | | (138,071,228 | ) | | | | - | | | | | 1,477 | | | | | 41,510,348 | | | | | 14,824 | * |
| | | | | | | | | | | | | | | | | | | | | | | | | | | | | | | | | | | |
Total | | | $ | 26,486,194 | | | | $ | 640,411,190 | | | | $ | (586,235,886 | ) | | | $ | - | | | | $ | 1,477 | | | | $ | 80,662,975 | | | | $ | 22,134 | |
| | | | | | | | | | | | | | | | | | | | | | | | | | | | | | | | | | | |
| * | Represents the income earned on the investment of cash collateral, which is included in securities lending income on the Statements of Operations. Does not include rebates and fees paid to lending agent or premiums received from borrowers, if any. |
| (e) | The rate shown is the 7-day SEC standardized yield as of April 30, 2021. |
| (f) | The security has been segregated to satisfy the commitment to return the cash collateral received in securities lending transactions upon the borrower’s return of the securities loaned. See Note 2J. |
See accompanying Notes to Financial Statements which are an integral part of the financial statements.
Invesco High Yield Equity Dividend AchieversTM ETF (PEY)
April 30, 2021
Schedule of Investments(a)
| | | | | | | | |
| | | Shares | | | Value | |
| Common Stocks & Other Equity Interests-99.92% | |
| Banks-6.62% | | | | | | | | |
Comerica, Inc. | | | 214,932 | | | $ | 16,154,289 | |
Huntington Bancshares, Inc. | | | 934,289 | | | | 14,313,308 | |
United Bankshares, Inc.(b) | | | 375,644 | | | | 14,751,540 | |
WesBanco, Inc. | | | 449,677 | | | | 16,318,778 | |
| | | | | | | | |
| | | | | | | 61,537,915 | |
| | | | | | | | |
| Beverages-1.45% | | | | | | | | |
Coca-Cola Co. (The) | | | 250,423 | | | | 13,517,834 | |
| | | | | | | | |
| Capital Markets-4.11% | | | | | | | | |
Franklin Resources, Inc.(b) | | | 582,662 | | | | 17,479,860 | |
Lazard Ltd., Class A | | | 459,698 | | | | 20,681,813 | |
| | | | | | | | |
| | | | | | | 38,161,673 | |
| | | | | | | | |
| Commercial Services & Supplies-1.61% | |
HNI Corp. | | | 352,848 | | | | 14,939,584 | |
| | | | | | | | |
| Containers & Packaging-1.90% | | | | | | | | |
International Paper Co. | | | 304,493 | | | | 17,660,594 | |
| | | | | | | | |
| Diversified Telecommunication Services-5.16% | |
AT&T, Inc. | | | 978,786 | | | | 30,743,668 | |
Verizon Communications, Inc. | | | 297,499 | | | | 17,192,467 | |
| | | | | | | | |
| | | | | | | 47,936,135 | |
| | | | | | | | |
| Electric Utilities-13.22% | | | | | | | | |
ALLETE, Inc. | | | 235,496 | | | | 16,569,498 | |
Duke Energy Corp. | | | 191,890 | | | | 19,321,404 | |
Edison International | | | 323,375 | | | | 19,224,644 | |
OGE Energy Corp.(b) | | | 675,123 | | | | 22,657,128 | |
PPL Corp. | | | 885,878 | | | | 25,805,626 | |
Southern Co. (The) | | | 291,404 | | | | 19,282,203 | |
| | | | | | | | |
| | | | | | | 122,860,503 | |
| | | | | | | | |
| Food & Staples Retailing-1.69% | | | | | | | | |
Walgreens Boots Alliance, Inc. | | | 296,387 | | | | 15,738,150 | |
| | | | | | | | |
| Food Products-4.75% | | | | | | | | |
Flowers Foods, Inc. | | | 619,663 | | | | 14,847,126 | |
JM Smucker Co. (The) | | | 104,536 | | | | 13,693,171 | |
Kellogg Co.(b) | | | 250,632 | | | | 15,644,449 | |
| | | | | | | | |
| | | | | | | 44,184,746 | |
| | | | | | | | |
| Gas Utilities-5.28% | | | | | | | | |
National Fuel Gas Co. | | | 313,830 | | | | 15,584,798 | |
Northwest Natural Holding Co. | | | 304,451 | | | | 16,415,998 | |
South Jersey Industries, Inc.(b) | | | 689,464 | | | | 17,064,234 | |
| | | | | | | | |
| | | | | | | 49,065,030 | |
| | | | | | | | |
| Health Care Providers & Services-1.74% | |
Cardinal Health, Inc. | | | 267,377 | | | | 16,133,528 | |
| | | | | | | | |
| Household Durables-1.67% | | | | | | | | |
Leggett & Platt, Inc. | | | 313,169 | | | | 15,555,104 | |
| | | | | | | | |
| Household Products-1.37% | | | | | | | | |
Kimberly-Clark Corp. | | | 95,201 | | | | 12,692,197 | |
| | | | | | | | |
| Industrial Conglomerates-1.49% | | | | | | | | |
3M Co. | | | 70,470 | | | | 13,892,456 | |
| | | | | | | | |
| Insurance-9.90% | | | | | | | | |
Mercury General Corp.(b) | | | 270,754 | | | | 16,859,852 | |
Old Republic International Corp. | | | 823,229 | | | | 20,267,898 | |
Principal Financial Group, Inc. | | | 256,161 | | | | 16,361,003 | |
| | | | | | | | |
| | | Shares | | | Value | |
| Insurance-(continued) | | | | | | | | |
Prudential Financial, Inc. | | | 216,598 | | | $ | 21,737,775 | |
Unum Group | | | 595,165 | | | | 16,819,363 | |
| | | | | | | | |
| | | | | | | 92,045,891 | |
| | | | | | | | |
| IT Services-2.57% | | | | | | | | |
International Business Machines Corp. | | | 168,691 | | | | 23,933,879 | |
| | | | | | | | |
| Multi-Utilities-5.89% | | | | | | | | |
Avista Corp.(b) | | | 370,664 | | | | 17,057,957 | |
Consolidated Edison, Inc. | | | 260,748 | | | | 20,184,503 | |
NorthWestern Corp.(b) | | | 256,909 | | | | 17,477,519 | |
| | | | | | | | |
| | | | | | | 54,719,979 | |
| | | | | | | | |
| Oil, Gas & Consumable Fuels-10.60% | | | | | | | | |
Chevron Corp. | | | 188,862 | | | | 19,466,006 | |
Exxon Mobil Corp. | | | 430,915 | | | | 24,665,575 | |
ONEOK, Inc. | | | 697,809 | | | | 36,523,323 | |
Valero Energy Corp. | | | 242,209 | | | | 17,913,778 | |
| | | | | | | | |
| | | | | | | 98,568,682 | |
| | | | | | | | |
| Pharmaceuticals-3.38% | | | | | | | | |
Merck & Co., Inc. | | | 172,264 | | | | 12,833,668 | |
Pfizer, Inc. | | | 480,106 | | | | 18,556,097 | |
| | | | | | | | |
| | | | | | | 31,389,765 | |
| | | | | | | | |
| Road & Rail-1.54% | | | | | | | | |
Ryder System, Inc. | | | 178,743 | | | | 14,270,841 | |
| | | | | | | | |
| Thrifts & Mortgage Finance-2.11% | | | | | | | | |
Northwest Bancshares, Inc. | | | 1,395,274 | | | | 19,589,647 | |
| | | | | | | | |
| Tobacco-8.51% | | | | | | | | |
Altria Group, Inc. | | | 654,616 | | | | 31,257,914 | |
Philip Morris International, Inc. | | | 245,861 | | | | 23,356,795 | |
Universal Corp. | | | 435,126 | | | | 24,467,135 | |
| | | | | | | | |
| | | | | | | 79,081,844 | |
| | | | | | | | |
| Trading Companies & Distributors-1.44% | | | | | | | | |
MSC Industrial Direct Co., Inc., Class A(b) | | | 148,183 | | | | 13,360,179 | |
| | | | | | | | |
| Wireless Telecommunication Services-1.92% | | | | | | | | |
Telephone & Data Systems, Inc. | | | 777,647 | | | | 17,870,328 | |
| | | | | | | | |
TOTAL INVESTMENTS IN SECURITIES (excluding investments purchased with cash collateral from securities on loan)-99.92%
(Cost $812,083,908) | | | | | | | 928,706,484 | |
| | | | | | | | |
|
| Investments Purchased with Cash Collateral from Securities on Loan | |
| |
| Money Market Funds-2.09% | | | | | |
Invesco Private Government Fund, 0.01%(c)(d)(e) | | | 7,776,139 | | | | 7,776,139 | |
Invesco Private Prime Fund, 0.11%(c)(d)(e) | | | 11,659,545 | | | | 11,664,209 | |
| | | | | | | | |
Total Investments Purchased with Cash Collateral from Securities on Loan
(Cost $19,440,348) | | | | 19,440,348 | |
| | | | | | | | |
TOTAL INVESTMENTS IN SECURITIES-102.01%
(Cost $831,524,256) | | | | 948,146,832 | |
OTHER ASSETS LESS LIABILITIES-(2.01)% | | | | | | | (18,667,763 | ) |
| | | | | | | | |
NET ASSETS-100.00% | | | | | | $ | 929,479,069 | |
| | | | | | | | |
See accompanying Notes to Financial Statements which are an integral part of the financial statements.
Invesco High Yield Equity Dividend AchieversTM ETF (PEY)–(continued)
April 30, 2021
Notes to Schedule of Investments:
| (a) | Industry and/or sector classifications used in this report are generally according to the Global Industry Classification Standard, which was developed by and is the exclusive property and a service mark of MSCI Inc. and Standard & Poor’s. |
| (b) | All or a portion of this security was out on loan at April 30, 2021. |
| (c) | Affiliated issuer. The issuer and/or the Fund is a wholly-owned subsidiary of Invesco Ltd., or is affiliated by having an investment adviser that is under common control of Invesco Ltd. The table below shows the Fund’s transactions in, and earnings from, its investments in affiliates for the fiscal year ended April 30, 2021. |
| | | | | | | | | | | | | | | | | | | | | | | | | | | | | | | | | | | |
| | | Value
April 30, 2020 | | Purchases
at Cost | | Proceeds
from Sales | | Change in
Unrealized
Appreciation | | Realized
Gain (Loss) | | Value
April 30, 2021 | | Dividend
Income |
| Invesco Ltd. | | | $ | 14,366,075 | | | | $ | - | | | | $ | (11,153,997 | ) | | | $ | 14,797,760 | | | | $ | (18,009,838 | ) | | | $ | - | | | | $ | 258,323 | |
| Investments in Affiliated Money Market Funds: | | | | | | | | | | | | | | | | | | | | | | | | | | | | | | | | | | | |
| Invesco Government & Agency Portfolio, Institutional Class | | | | - | | | | | 19,524,470 | | | | | (19,524,470 | ) | | | | - | | | | | - | | | | | - | | | | | 111 | |
| Invesco Premier U.S. Government Money Portfolio, Institutional Class | | | | 40,130 | | | | | 15,995,016 | | | | | (16,035,146 | ) | | | | - | | | | | - | | | | | - | | | | | 229 | |
| Investments Purchased with Cash Collateral from Securities on Loan: | | | | | | | | | | | | | | | | | | | | | | | | | | | | | | | | | | | |
| Invesco Private Government Fund | | | | 14,705,063 | | | | | 55,257,837 | | | | | (62,186,761 | ) | | | | - | | | | | - | | | | | 7,776,139 | | | | | 189 | * |
| Invesco Private Prime Fund | | | | - | | | | | 65,541,020 | | | | | (53,876,811 | ) | | | | - | | | | | - | | | | | 11,664,209 | | | | | 927 | * |
| | | | | | | | | | | | | | | | | | | | | | | | | | | | | | | | | | | |
Total | | | $ | 29,111,268 | | | | $ | 156,318,343 | | | | $ | (162,777,185 | ) | | | $ | 14,797,760 | | | | $ | (18,009,838 | ) | | | $ | 19,440,348 | | | | $ | 259,779 | |
| | | | | | | | | | | | | | | | | | | | | | | | | | | | | | | | | | | |
| * | Represents the income earned on the investment of cash collateral, which is included in securities lending income on the Statements of Operations. Does not include rebates and fees paid to lending agent or premiums received from borrowers, if any. |
| (d) | The rate shown is the 7-day SEC standardized yield as of April 30, 2021. |
| (e) | The security has been segregated to satisfy the commitment to return the cash collateral received in securities lending transactions upon the borrower’s return of the securities loaned. See Note 2J. |
See accompanying Notes to Financial Statements which are an integral part of the financial statements.
Invesco International Dividend AchieversTM ETF (PID)
April 30, 2021
Schedule of Investments
| | | | | | | | |
| | | Shares | | | Value | |
| Common Stocks & Other Equity Interests-99.78% | | | | | |
| Brazil-3.35% | | | | | | | | |
Cia Paranaense de Energia, ADR(a) | | | 3,572,592 | | | $ | 19,434,901 | |
| | | | | | | | |
| Canada-62.83% | | | | | | | | |
Agnico Eagle Mines Ltd. | | | 117,301 | | | | 7,324,274 | |
Algonquin Power & Utilities Corp. | | | 844,498 | | | | 13,630,198 | |
Bank of Montreal(a) | | | 159,146 | | | | 15,013,834 | |
Bank of Nova Scotia (The) | | | 262,973 | | | | 16,748,750 | |
BCE, Inc. | | | 453,377 | | | | 21,422,063 | |
Brookfield Asset Management, Inc., Class A | | | 99,975 | | | | 4,556,860 | |
Brookfield Infrastructure Partners L.P. | | | 251,768 | | | | 13,537,565 | |
Brookfield Renewable Partners L.P. | | | 218,628 | | | | 8,589,894 | |
Canadian Imperial Bank of Commerce | | | 169,586 | | | | 17,630,161 | |
Canadian National Railway Co. | | | 48,472 | | | | 5,218,011 | |
Canadian Natural Resources Ltd.(a) | | | 563,436 | | | | 17,117,186 | |
Canadian Pacific Railway Ltd. | | | 6,937 | | | | 2,588,403 | |
Enbridge, Inc.(a) | | | 624,208 | | | | 24,075,703 | |
FirstService Corp. | | | 9,564 | | | | 1,551,759 | |
Fortis, Inc. | | | 333,315 | | | | 14,865,849 | |
Franco-Nevada Corp. | | | 29,848 | | | | 4,156,036 | |
Imperial Oil Ltd. | | | 459,008 | | | | 13,288,282 | |
Magna International, Inc. | | | 75,120 | | | | 7,092,830 | |
Manulife Financial Corp.(a) | | | 710,525 | | | | 15,524,971 | |
Open Text Corp. | | | 125,574 | | | | 5,914,535 | |
Pembina Pipeline Corp.(a) | | | 831,140 | | | | 25,648,980 | |
Restaurant Brands International,
Inc.(a) | | | 192,669 | | | | 13,219,020 | |
Ritchie Bros. Auctioneers, Inc. | | | 96,812 | | | | 6,157,243 | |
Royal Bank of Canada | | | 148,853 | | | | 14,200,576 | |
Stantec, Inc.(a) | | | 98,549 | | | | 4,615,050 | |
Sun Life Financial, Inc. | | | 240,906 | | | | 12,994,470 | |
TC Energy Corp. | | | 454,744 | | | | 22,496,186 | |
TELUS Corp.(a) | | | 740,559 | | | | 15,366,599 | |
TFI International, Inc. | | | 54,115 | | | | 4,743,180 | |
Toronto-Dominion Bank (The) | | | 215,802 | | | | 14,836,387 | |
| | | | | | | | |
| | | | | | | 364,124,855 | |
| | | | | | | | |
| Colombia-1.70% | | | | | | | | |
Bancolombia S.A., ADR | | | 329,883 | | | | 9,873,398 | |
| | | | | | | | |
| France-2.43% | | | | | | | | |
Sanofi, ADR | | | 268,663 | | | | 14,069,881 | |
| | | | | | | | |
| Germany-2.29% | | | | | | | | |
Fresenius Medical Care AG & Co. KGaA, ADR | | | 200,178 | | | | 7,985,100 | |
SAP SE, ADR | | | 37,835 | | | | 5,294,630 | |
| | | | | | | | |
| | | | | | | 13,279,730 | |
| | | | | | | | |
| India-1.18% | | | | | | | | |
Infosys Ltd., ADR | | | 325,841 | | | | 5,891,206 | |
Reliance Industries Ltd., GDR(b) | | | 17,461 | | | | 944,640 | |
| | | | | | | | |
| | | | | | | 6,835,846 | |
| | | | | | | | |
| Ireland-1.31% | | | | | | | | |
CRH PLC, ADR | | | 160,730 | | | | 7,597,707 | |
| | | | | | | | |
| | | | | | | | |
| | | Shares | | | Value | |
| Mexico-3.15% | | | | | | | | |
America Movil S.A.B. de C.V., Class L, ADR | | | 731,532 | | | $ | 10,197,556 | |
Fomento Economico Mexicano, S.A.B. de C.V., ADR | | | 103,783 | | | | 8,043,182 | |
| | | | | | | | |
| | | | | | | 18,240,738 | |
| | | | | | | | |
| Peru-2.36% | | | | | | | | |
Credicorp Ltd. | | | 114,453 | | | | 13,665,688 | |
| | | | | | | | |
| Switzerland-2.52% | | | | | | | | |
Logitech International S.A.(a) | | | 24,794 | | | | 2,749,159 | |
Novartis AG, ADR | | | 139,105 | | | | 11,857,310 | |
| | | | | | | | |
| | | | | | | 14,606,469 | |
| | | | | | | | |
| Taiwan-1.63% | | | | | | | | |
Silicon Motion Technology Corp., ADR | | | 131,713 | | | | 9,459,628 | |
| | | | | | | | |
| United Kingdom-10.18% | | | | | | | | |
Diageo PLC, ADR | | | 49,863 | | | | 8,942,929 | |
Linde PLC | | | 21,489 | | | | 6,142,416 | |
National Grid PLC, ADR | | | 334,723 | | | | 21,080,854 | |
RELX PLC, ADR | | | 347,492 | | | | 9,062,591 | |
Unilever PLC, ADR | | | 234,655 | | | | 13,778,942 | |
| | | | | | | | |
| | | | | | | 59,007,732 | |
| | | | | | | | |
| United States-4.85% | | | | | | | | |
Amdocs Ltd. | | | 75,733 | | | | 5,811,751 | |
Brookfield Property Partners L.P. | | | 1,238,367 | | | | 22,278,222 | |
| | | | | | | | |
| | | | | | | 28,089,973 | |
| | | | | | | | |
TOTAL INVESTMENTS IN SECURITIES
(excluding investments purchased with cash collateral from securities on loan)-99.78%
(Cost $497,132,411) | | | | 578,286,546 | |
| | | | | | | | |
|
| Investments Purchased with Cash Collateral from Securities on Loan | |
| |
| Money Market Funds-9.13% | | | | | |
Invesco Private Government Fund, 0.01%(c)(d)(e) | | | 21,104,517 | | | | 21,104,517 | |
Invesco Private Prime Fund, 0.11%(c)(d)(e) | | | 31,777,565 | | | | 31,790,276 | |
| | | | | | | | |
Total Investments Purchased with Cash Collateral from Securities on Loan
(Cost $52,894,793) | | | | 52,894,793 | |
| | | | | | | | |
TOTAL INVESTMENTS IN SECURITIES-108.91%
(Cost $550,027,204) | | | | 631,181,339 | |
OTHER ASSETS LESS LIABILITIES-(8.91)% | | | | (51,611,165 | ) |
| | | | | | | | |
NET ASSETS-100.00% | | | | | | $ | 579,570,174 | |
| | | | | | | | |
Investment Abbreviations:
ADR-American Depositary Receipt
GDR-Global Depositary Receipt
See accompanying Notes to Financial Statements which are an integral part of the financial statements.
Invesco International Dividend AchieversTM ETF (PID)–(continued)
April 30, 2021
Notes to Schedule of Investments:
| (a) | All or a portion of this security was out on loan at April 30, 2021. |
| (b) | Security purchased or received in a transaction exempt from registration under the Securities Act of 1933, as amended (the “1933 Act”). The security may be resold pursuant to an exemption from registration under the 1933 Act, typically to qualified institutional buyers. The value of this security at April 30, 2021 represented less than 1% of the Fund’s Net Assets. |
| (c) | Affiliated issuer. The issuer is affiliated by having an investment adviser that is under common control of Invesco Ltd. and/or the Investment Company Act of 1940, as amended (the “1940 Act”), defines “affiliated person” to include an issuer of which a fund holds 5% or more of the outstanding voting securities. The Fund has not owned enough of the outstanding voting securities of the issuer to have control (as defined in the 1940 Act) of that issuer. The table below shows the Fund’s transactions in, and earnings from, its investments in affiliates for the fiscal year ended April 30, 2021. |
| | | | | | | | | | | | | | | | | | | | | | | | | | | | | | | | | | | |
| | | Value
April 30, 2020 | | Purchases at
Cost | | Proceeds
from Sales | | Change in
Unrealized
Appreciation | | Realized
Gain
(Loss) | | Value
April 30, 2021 | | Dividend
Income |
| Investments in Affiliated Money Market Funds: | | | | | | | | | | | | | | | | | | | | | | | | | | | | | | | | | | | |
| Invesco Government & Agency Portfolio, Institutional Class | | | $ | - | | | | $ | 17,072,549 | | | | $ | (17,072,549 | ) | | | $ | - | | | | $ | - | | | | $ | - | | | | $ | 46 | |
| Invesco Premier U.S. Government Money Portfolio, Institutional Class | | | | 311,171 | | | | | 12,893,632 | | | | | (13,204,803 | ) | | | | - | | | | | - | | | | | - | | | | | 104 | |
| Investments Purchased with Cash Collateral from Securities on Loan: | | | | | | | | | | | | | | | | | | | | | | | | | | | | | | | | | | | |
| Invesco Private Government Fund | | | | 49,685,697 | | | | | 523,959,184 | | | | | (552,540,364 | ) | | | | - | | | | | - | | | | | 21,104,517 | | | | | 8,444 | * |
| Invesco Private Prime Fund | | | | - | | | | | 399,644,831 | | | | | (367,858,360 | ) | | | | - | | | | | 3,805 | | | | | 31,790,276 | | | | | 23,083 | * |
| Investments in Other Affiliates: | | | | | | | | | | | | | | | | | | | | | | | | | | | | | | | | | | | |
| GasLog Partners L.P. | | | | 41,528,579 | | | | | 13,916,158 | | | | | (36,570,108 | ) | | | | 7,066,067 | | | | | (25,940,696 | ) | | | | - | | | | | - | |
| Hoegh LNG Partners L.P. | | | | 23,976,524 | | | | | 7,023,752 | | | | | (39,222,343 | ) | | | | 3,550,999 | | | | | 4,671,068 | | | | | - | | | | | 1,696,445 | |
| | | | | | | | | | | | | | | | | | | | | | | | | | | | | | | | | | | |
Total | | | $ | 115,501,971 | | | | $ | 974,510,106 | | | | $ | (1,026,468,527 | ) | | | $ | 10,617,066 | | | | $ | (21,265,823 | ) | | | $ | 52,894,793 | | | | $ | 1,728,122 | |
| | | | | | | | | | | | | | | | | | | | | | | | | | | | | | | | | | | |
| * | Represents the income earned on the investment of cash collateral, which is included in securities lending income on the Statements of Operations. Does not include rebates and fees paid to lending agent or premiums received from borrowers, if any. |
| (d) | The rate shown is the 7-day SEC standardized yield as of April 30, 2021. |
| (e) | The security has been segregated to satisfy the commitment to return the cash collateral received in securities lending transactions upon the borrower’s return of the securities loaned. See Note 2J. |
See accompanying Notes to Financial Statements which are an integral part of the financial statements.
(This Page Intentionally Left Blank)
Statements of Assets and Liabilities
April 30, 2021
| | | | | | | | | | | | | | | | |
| | | Invesco
BuyBack
AchieversTM
ETF (PKW) | | | Invesco
Dividend
AchieversTM
ETF (PFM) | | | Invesco Dow Jones
Industrial Average
Dividend ETF
ETF (DJD) | | | Invesco
Financial
Preferred
ETF (PGF) | |
| Assets: | | | | | | | | | | | | | | | | |
Unaffiliated investments in securities, at value(a) | | $ | 1,843,821,869 | | | $ | 614,383,240 | | | $ | 154,682,390 | | | $ | 1,825,291,376 | |
Affiliated investments in securities, at value | | | 226,719,195 | | | | 2,327,695 | | | | 36,023 | | | | 80,662,975 | |
Cash | | | 45 | | | | 143 | | | | — | | | | — | |
Foreign currencies, at value | | | — | | | | — | | | | — | | | | — | |
Receivable for: | | | | | | | | | | | | | | | | |
Dividends | | | 636,350 | | | | 722,594 | | | | 162,034 | | | | 5,511,252 | |
Securities lending | | | 11,416 | | | | 160 | | | | — | | | | 104,386 | |
Investments sold | | | 18,332 | | | | 40,769 | | | | — | | | | — | |
Investments sold - affiliated broker | | | 32,174,858 | | | | — | | | | — | | | | — | |
Fund shares sold | | | — | | | | — | | | | 3,485,839 | | | | 944,708 | |
Foreign tax reclaims | | | — | | | | — | | | | — | | | | — | |
| | | | | | | | | | | | | | | | |
Total assets | | | 2,103,382,065 | | | | 617,474,601 | | | | 158,366,286 | | | | 1,912,514,697 | |
| | | | | | | | | | | | | | | | |
| | | | |
| Liabilities: | | | | | | | | | | | | | | | | |
Due to custodian | | | — | | | | — | | | | — | | | | 170 | |
Payable for: | | | | | | | | | | | | | | | | |
Investments purchased | | | 253,206 | | | | — | | | | 3,589,406 | | | | 13,551,939 | |
Investments purchased - affiliated broker | | | 32,049,985 | | | | — | | | | 10,311 | | | | — | |
Collateral upon return of securities loaned | | | 225,177,780 | | | | 1,823,552 | | | | — | | | | 69,181,013 | |
Accrued unitary management fees | | | — | | | | — | | | | 8,323 | | | | — | |
Accrued advisory fees | | | 728,383 | | | | 196,392 | | | | — | | | | 752,388 | |
Accrued trustees’ and officer’s fees | | | 184,171 | | | | 82,223 | | | | — | | | | 260,559 | |
Accrued expenses | | | 869,118 | | | | 417,896 | | | | — | | | | 1,681,457 | |
| | | | | | | | | | | | | | | | |
Total liabilities | | | 259,262,643 | | | | 2,520,063 | | | | 3,608,040 | | | | 85,427,526 | |
| | | | | | | | | | | | | | | | |
| Net Assets | | $ | 1,844,119,422 | | | $ | 614,954,538 | | | $ | 154,758,246 | | | $ | 1,827,087,171 | |
| | | | | | | | | | | | | | | | |
| | | | |
| Net assets consist of: | | | | | | | | | | | | | | | | |
Shares of beneficial interest | | $ | 1,985,103,127 | | | $ | 497,832,039 | | | $ | 151,628,648 | | | $ | 1,815,334,596 | |
Distributable earnings (loss) | | | (140,983,705 | ) | | | 117,122,499 | | | | 3,129,598 | | | | 11,752,575 | |
| | | | | | | | | | | | | | | | |
| Net Assets | | $ | 1,844,119,422 | | | $ | 614,954,538 | | | $ | 154,758,246 | | | $ | 1,827,087,171 | |
| | | | | | | | | | | | | | | | |
Shares outstanding (unlimited amount authorized, $0.01 par value) | | | 21,040,000 | | | | 17,130,000 | | | | 3,560,000 | | | | 96,700,000 | |
Net asset value | | $ | 87.65 | | | $ | 35.90 | | | $ | 43.47 | | | $ | 18.89 | |
| | | | | | | | | | | | | | | | |
Market price | | $ | 87.72 | | | $ | 35.90 | | | $ | 43.52 | | | $ | 18.96 | |
| | | | | | | | | | | | | | | | |
Unaffiliated investments in securities, at cost | | $ | 1,591,580,630 | | | $ | 479,559,341 | | | $ | 145,083,100 | | | $ | 1,774,257,068 | |
| | | | | | | | | | | | | | | | |
Affiliated investments in securities, at cost | | $ | 226,719,194 | | | $ | 2,327,695 | | | $ | 36,023 | | | $ | 80,662,975 | |
| | | | | | | | | | | | | | | | |
Foreign currencies, at cost | | $ | — | | | $ | — | | | $ | — | | | $ | — | |
| | | | | | | | | | | | | | | | |
(a) Includes securities on loan with an aggregate value of: | | $ | 219,829,449 | | | $ | 1,764,607 | | | $ | — | | | $ | 67,454,262 | |
| | | | | | | | | | | | | | | | |
See accompanying Notes to Financial Statements which are an integral part of the financial statements.
| | | | | | | | |
Invesco
High Yield
Equity Dividend
AchieversTM
ETF (PEY) | | | Invesco
International
Dividend
AchieversTM
ETF (PID) | | | |
| | | | | | | |
| $ | 928,706,484 | | | $ | 578,286,546 | |
| | 19,440,348 | | | | 52,894,793 | |
| | - | | | | - | |
| | - | | | | 269,670 | |
| | 1,986,620 | | | | 2,350,974 | |
| | 1,138 | | | | 28,717 | |
| | - | | | | - | |
| | - | | | | - | |
| | - | | | | - | |
| | - | | | | 467,535 | |
| | | | | | |
| | 950,134,590 | | | | 634,298,235 | |
| | | | | | |
| | | | | | | |
| | 159,382 | | | | 912,718 | |
| | - | | | | - | |
| | - | | | | - | |
| | 19,440,348 | | | | 52,894,793 | |
| | - | | | | - | |
| | 299,707 | | | | 206,966 | |
| | 108,848 | | | | 161,461 | |
| | 647,236 | | | | 552,123 | |
| | | | | | |
| | 20,655,521 | | | | 54,728,061 | |
| | | | | | |
| $ | 929,479,069 | | | $ | 579,570,174 | |
| | | | | | |
| | | | | | | |
| $ | 993,531,249 | | | $ | 934,204,153 | |
| | (64,052,180 | ) | | | (354,633,979 | ) |
| | | | | | |
| $ | 929,479,069 | | | $ | 579,570,174 | |
| | | | | | |
| | 45,000,000 | | | | 33,540,000 | |
| $ | 20.66 | | | $ | 17.28 | |
| | | | | | |
| $ | 20.65 | | | $ | 17.25 | |
| | | | | | |
| $ | 812,083,908 | | | $ | 497,132,411 | |
| | | | | | |
| $ | 19,440,348 | | | $ | 52,894,793 | |
| | | | | | |
| $ | - | | | $ | 269,225 | |
| | | | | | |
| $ | 18,880,142 | | | $ | 51,265,194 | |
| | | | | | |
Statements of Operations
For the year ended April 30, 2021
| | | | | | | | | | | | | | | | | | | | | | | | |
| | | Invesco
BuyBack
AchieversTM
ETF (PKW) | | | Invesco
Dividend
AchieversTM
ETF (PFM) | | | Invesco Dow Jones
Industrial Average
Dividend ETF
ETF (DJD) | | | Invesco
Financial
Preferred
ETF (PGF) | | | Invesco
High Yield
Equity Dividend
AchieversTM
ETF (PEY) | | | Invesco
International
Dividend
AchieversTM
ETF (PID) | |
| Investment income: | | | | | | | | | | | | | | | | | | | | | | | | |
Unaffiliated dividend income | | $ | 17,331,378 | | | $ | 11,197,020 | | | $ | 3,707,210 | | | $ | 92,970,271 | | | $ | 33,477,129 | | | $ | 19,525,467 | |
Affiliated dividend income | | | 445 | | | | 2,347 | | | | 78 | | | | 3,774 | | | | 258,663 | | | | 1,696,595 | |
Securities lending income | | | 95,080 | | | | 8,120 | | | | - | | | | 782,742 | | | | 2,152 | | | | 451,477 | |
Foreign withholding tax | | | (6,580 | ) | | | (11 | ) | | | - | | | | - | | | | - | | | | (2,275,556 | ) |
| | | | | | | | | | | | | | | | | | | | | | | | |
Total investment income | | | 17,420,323 | | | | 11,207,476 | | | | 3,707,288 | | | | 93,756,787 | | | | 33,737,944 | | | | 19,397,983 | |
| | | | | | | | | | | | | | | | | | | | | | | | |
| | | | | | |
| Expenses: | | | | | | | | | | | | | | | | | | | | | | | | |
Unitary management fees | | | - | | | | - | | | | 74,094 | | | | - | | | | - | | | | - | |
Advisory fees | | | 4,576,061 | | | | 1,792,518 | | | | - | | | | 8,314,208 | | | | 2,854,332 | | | | 2,073,816 | |
Sub-licensing fees | | | 915,205 | | | | 448,133 | | | | - | | | | 1,571,364 | | | | 713,576 | | | | 518,457 | |
Accounting & administration fees | | | 68,235 | | | | 33,418 | | | | - | | | | 112,106 | | | | 59,048 | | | | 50,676 | |
Custodian & transfer agent fees | | | 16,118 | | | | 16,414 | | | | - | | | | 12,144 | | | | 16,383 | | | | 74,540 | |
Trustees’ and officer’s fees | | | 85,235 | | | | 42,958 | | | | - | | | | 125,453 | | | | 56,253 | | | | 74,208 | |
Other expenses | | | 164,052 | | | | 57,486 | | | | - | | | | 132,183 | | | | 88,800 | | | | 113,525 | |
| | | | | | | | | | | | | | | | | | | | | | | | |
Total expenses | | | 5,824,906 | | | | 2,390,927 | | | | 74,094 | | | | 10,267,458 | | | | 3,788,392 | | | | 2,905,222 | |
| | | | | | | | | | | | | | | | | | | | | | | | |
Less: Waivers | | | (1,187 | ) | | | (466 | ) | | | (199 | ) | | | (8,720 | ) | | | (1,142 | ) | | | (466 | ) |
| | | | | | | | | | | | | | | | | | | | | | | | |
Net expenses | | | 5,823,719 | | | | 2,390,461 | | | | 73,895 | | | | 10,258,738 | | | | 3,787,250 | | | | 2,904,756 | |
| | | | | | | | | | | | | | | | | | | | | | | | |
Net investment income | | | 11,596,604 | | | | 8,817,015 | | | | 3,633,393 | | | | 83,498,049 | | | | 29,950,694 | | | | 16,493,227 | |
| | | | | | | | | | | | | | | | | | | | | | | | |
| | | | | | |
| Realized and unrealized gain (loss) from: | | | | | | | | | | | | | | | | | | | | | | | | |
Net realized gain (loss) from: | | | | | | | | | | | | | | | | | | | | | | | | |
Unaffiliated investment securities | | | (13,175,717 | ) | | | (5,453,525 | ) | | | (6,470,322 | ) | | | (11,046,350 | ) | | | (67,357,757 | ) | | | (3,809,111 | ) |
Affiliated investment securities | | | 574 | | | | (319,722 | ) | | | - | | | | 1,477 | | | | (18,005,277 | ) | | | (21,265,823 | ) |
Unaffiliated in-kind redemptions | | | 77,559,651 | | | | 45,358,568 | | | | 18,448,867 | | | | 15,336,459 | | | | 85,746,740 | | | | 40,968,898 | |
Affiliated in-kind redemptions | | | - | | | | - | | | | - | | | | - | | | | (4,561 | ) | | | - | |
Foreign currencies | | | - | | | | - | | | | - | | | | - | | | | - | | | | 21,373 | |
| | | | | | | | | | | | | | | | | | | | | | | | |
Net realized gain | | | 64,384,508 | | | | 39,585,321 | | | | 11,978,545 | | | | 4,291,586 | | | | 379,145 | | | | 15,915,337 | |
| | | | | | | | | | | | | | | | | | | | | | | | |
Change in net unrealized appreciation of: | | | | | | | | | | | | | | | | | | | | | | | | |
Unaffiliated investment securities | | | 385,148,179 | | | | 81,813,314 | | | | 16,731,202 | | | | 62,606,987 | | | | 259,132,128 | | | | 158,429,444 | |
Affiliated investment securities | | | 1 | | | | 292,422 | | | | - | | | | - | | | | 14,797,760 | | | | 10,617,066 | |
Foreign currencies | | | - | | | | - | | | | - | | | | - | | | | - | | | | 1,555 | |
| | | | | | | | | | | | | | | | | | | | | | | | |
Change in net unrealized appreciation | | | 385,148,180 | | | | 82,105,736 | | | | 16,731,202 | | | | 62,606,987 | | | | 273,929,888 | | | | 169,048,065 | |
| | | | | | | | | | | | | | | | | | | | | | | | |
Net realized and unrealized gain | | | 449,532,688 | | | | 121,691,057 | | | | 28,709,747 | | | | 66,898,573 | | | | 274,309,033 | | | | 184,963,402 | |
| | | | | | | | | | | | | | | | | | | | | | | | |
Net increase in net assets resulting from operations | | $ | 461,129,292 | | | $ | 130,508,072 | | | $ | 32,343,140 | | | $ | 150,396,622 | | | $ | 304,259,727 | | | $ | 201,456,629 | |
| | | | | | | | | | | | | | | | | | | | | | | | |
See accompanying Notes to Financial Statements which are an integral part of the financial statements.
(This Page Intentionally Left Blank)
Statements of Changes in Net Assets
For the years ended April 30, 2021 and 2020
| | | | | | | | | | | | | | | | |
| | | Invesco BuyBack
AchieversTM ETF (PKW) | | | Invesco Dividend
AchieversTM ETF (PFM) | |
| | | 2021 | | | 2020 | | | 2021 | | | 2020 | |
| Operations: | | | | | | | | | | | | | | | | |
Net investment income | | $ | 11,596,604 | | | $ | 18,412,965 | | | $ | 8,817,015 | | | $ | 6,432,979 | |
Net realized gain (loss) | | | 64,384,508 | | | | 35,681,111 | | | | 39,585,321 | | | | 16,772,909 | |
Change in net unrealized appreciation (depreciation) | | | 385,148,180 | | | | (230,427,722 | ) | | | 82,105,736 | | | | (26,238,561 | ) |
| | | | | | | | | | | | | | | | |
Net increase (decrease) in net assets resulting from operations | | | 461,129,292 | | | | (176,333,646 | ) | | | 130,508,072 | | | | (3,032,673 | ) |
| | | | | | | | | | | | | | | | |
| | | | |
| Distributions to Shareholders from: | | | | | | | | | | | | | | | | |
Distributable earnings | | | (12,637,498 | ) | | | (19,077,680 | ) | | | (8,438,801 | ) | | | (6,842,429 | ) |
| | | | | | | | | | | | | | | | |
| | | | |
| Shareholder Transactions: | | | | | | | | | | | | | | | | |
Proceeds from shares sold | | | 1,106,271,086 | | | | 701,919,893 | | | | 294,790,443 | | | | 68,172,876 | |
Value of shares repurchased | | | (428,974,237 | ) | | | (1,101,581,340 | ) | | | (108,684,883 | ) | | | (50,993,065 | ) |
| | | | | | | | | | | | | | | | |
Net increase (decrease) in net assets resulting from share transactions | | | 677,296,849 | | | | (399,661,447 | ) | | | 186,105,560 | | | | 17,179,811 | |
| | | | | | | | | | | | | | | | |
Net increase (decrease) in net assets | | | 1,125,788,643 | | | | (595,072,773 | ) | | | 308,174,831 | | | | 7,304,709 | |
| | | | | | | | | | | | | | | | |
| | | | |
| Net assets: | | | | | | | | | | | | | | | | |
Beginning of year | | | 718,330,779 | | | | 1,313,403,552 | | | | 306,779,707 | | | | 299,474,998 | |
| | | | | | | | | | | | | | | | |
End of year | | $ | 1,844,119,422 | | | $ | 718,330,779 | | | $ | 614,954,538 | | | $ | 306,779,707 | |
| | | | | | | | | | | | | | | | |
| | | | |
| Changes in Shares Outstanding: | | | | | | | | | | | | | | | | |
Shares sold | | | 14,260,000 | | | | 10,500,000 | | | | 9,080,000 | | | | 2,550,000 | |
Shares repurchased | | | (6,420,000 | ) | | | (17,950,000 | ) | | | (3,200,000 | ) | | | (1,800,000 | ) |
Shares outstanding, beginning of year | | | 13,200,000 | | | | 20,650,000 | | | | 11,250,000 | | | | 10,500,000 | |
| | | | | | | | | | | | | | | | |
Shares outstanding, end of year | | | 21,040,000 | | | | 13,200,000 | | | | 17,130,000 | | | | 11,250,000 | |
| | | | | | | | | | | | | | | | |
See accompanying Notes to Financial Statements which are an integral part of the financial statements.
| | | | | | | | | | | | | | | | | | | | | | | | | | | | | | |
Invesco Dow Jones
Industrial Average
Dividend ETF (DJD) | | | Invesco Financial
Preferred ETF (PGF) | | | Invesco High Yield Equity Dividend
AchieversTM ETF (PEY) | | | Invesco International Dividend
AchieversTM ETF (PID) | |
| 2021 | | | 2020 | | | 2021 | | | 2020 | | | 2021 | | | 2020 | | | 2021 | | | 2020 | |
| | | | | | | | | | | | | | | | | | | | | | | | | | | | | | | |
| $ | 3,633,393 | | | $ | 2,387,528 | | | $ | 83,498,049 | | | $ | 77,096,509 | | | $ | 29,950,694 | | | $ | 36,322,730 | | | $ | 16,493,227 | | | $ | 27,727,993 | |
| | 11,978,545 | | | | 1,024,704 | | | | 4,291,586 | | | | (11,377,401 | ) | | | 379,145 | | | | (16,535,218 | ) | | | 15,915,337 | | | | (58,077,642 | ) |
| | 16,731,202 | | | | (9,513,066 | ) | | | 62,606,987 | | | | (28,448,156 | ) | | | 273,929,888 | | | | (190,957,626 | ) | | | 169,048,065 | | | | (134,061,829 | ) |
| | | | | | | | | | | | | | | | | | | | | | | | | | | | | | |
| | 32,343,140 | | | | (6,100,834 | ) | | | 150,396,622 | | | | 37,270,952 | | | | 304,259,727 | | | | (171,170,114 | ) | | | 201,456,629 | | | | (164,411,478 | ) |
| | | | | | | | | | | | | | | | | | | | | | | | | | | | | | |
| | | | | | | |
| | | | | | | | | | | | | | | | | | | | | | | | | | | | | | | |
| | (3,862,239 | ) | | | (2,239,884 | ) | | | (82,544,541 | ) | | | (78,034,495 | ) | | | (32,331,907 | ) | | | (36,486,586 | ) | | | (18,541,664 | ) | | | (32,779,007 | ) |
| | | | | | | | | | | | | | | | | | | | | | | | | | | | | | |
| | | | | | | |
| | | | | | | | | | | | | | | | | | | | | | | | | | | | | | | |
| | 152,412,394 | | | | 93,984,096 | | | | 502,248,151 | | | | 349,431,093 | | | | 347,215,806 | | | | 237,468,388 | | | | 76,561,774 | | | | 98,426,346 | |
| | (142,243,228 | ) | | | (43,502,678 | ) | | | (205,602,674 | ) | | | (231,851,412 | ) | | | (320,602,135 | ) | | | (233,097,748 | ) | | | (190,158,904 | ) | | | (157,266,596 | ) |
| | | | | | | | | | | | | | | | | | | | | | | | | | | | | | |
| | 10,169,166 | | | | 50,481,418 | | | | 296,645,477 | | | | 117,579,681 | | | | 26,613,671 | | | | 4,370,640 | | | | (113,597,130 | ) | | | (58,840,250 | ) |
| | | | | | | | | | | | | | | | | | | | | | | | | | | | | | |
| | 38,650,067 | | | | 42,140,700 | | | | 364,497,558 | | | | 76,816,138 | | | | 298,541,491 | | | | (203,286,060 | ) | | | 69,317,835 | | | | (256,030,735 | ) |
| | | | | | | | | | | | | | | | | | | | | | | | | | | | | | |
| | | | | | | |
| | | | | | | | | | | | | | | | | | | | | | | | | | | | | | | |
| | 116,108,179 | | | | 73,967,479 | | | | 1,462,589,613 | | | | 1,385,773,475 | | | | 630,937,578 | | | | 834,223,638 | | | | 510,252,339 | | | | 766,283,074 | |
| | | | | | | | | | | | | | | | | | | | | | | | | | | | | | |
| $ | 154,758,246 | | | $ | 116,108,179 | | | $ | 1,827,087,171 | | | $ | 1,462,589,613 | | | $ | 929,479,069 | | | $ | 630,937,578 | | | $ | 579,570,174 | | | $ | 510,252,339 | |
| | | | | | | | | | | | | | | | | | | | | | | | | | | | | | |
| | | | | | | |
| | | | | | | | | | | | | | | | | | | | | | | | | | | | | | | |
| | 3,920,000 | | | | 2,750,000 | | | | 26,550,000 | | | | 18,850,000 | | | | 17,700,000 | | | | 12,950,000 | | | | 4,560,000 | | | | 5,900,000 | |
| | (3,860,000 | ) | | | (1,250,000 | ) | | | (10,900,000 | ) | | | (13,400,000 | ) | | | (17,100,000 | ) | | | (14,250,000 | ) | | | (13,120,000 | ) | | | (10,400,000 | ) |
| | 3,500,000 | | | | 2,000,000 | | | | 81,050,000 | | | | 75,600,000 | | | | 44,400,000 | | | | 45,700,000 | | | | 42,100,000 | | | | 46,600,000 | |
| | | | | | | | | | | | | | | | | | | | | | | | | | | | | | |
| | 3,560,000 | | | | 3,500,000 | | | | 96,700,000 | | | | 81,050,000 | | | | 45,000,000 | | | | 44,400,000 | | | | 33,540,000 | | | | 42,100,000 | |
| | | | | | | | | | | | | | | | | | | | | | | | | | | | | | |
Financial Highlights
Invesco BuyBack AchieversTM ETF (PKW)
| | | | | | | | | | | | | | | | | | | | |
| | | Years Ended April 30, | |
| | | 2021 | | | 2020 | | | 2019 | | | 2018 | | | 2017 | |
| Per Share Operating Performance: | | | | | | | | | | | | | | | | | | | | |
Net asset value at beginning of year | | $ | 54.42 | | | $ | 63.60 | | | $ | 56.93 | | | $ | 52.20 | | | $ | 45.67 | |
| | | | | | | | | | | | | | | | | | | | |
Net investment income(a) | | | 0.88 | | | | 1.01 | | | | 0.73 | | | | 0.55 | | | | 0.51 | |
Net realized and unrealized gain (loss) on investments | | | 33.35 | | | | (9.13 | ) | | | 6.67 | | | | 4.64 | | | | 6.70 | |
| | | | | | | | | | | | | | | | | | | | |
Total from investment operations | | | 34.23 | | | | (8.12 | ) | | | 7.40 | | | | 5.19 | | | | 7.21 | |
| | | | | | | | | | | | | | | | | | | | |
Distributions to shareholders from: | | | | | | | | | | | | | | | | | | | | |
Net investment income | | | (1.00 | ) | | | (1.06 | ) | | | (0.73 | ) | | | (0.46 | ) | | | (0.68 | ) |
| | | | | | | | | | | | | | | | | | | | |
Net asset value at end of year | | $ | 87.65 | | | $ | 54.42 | | | $ | 63.60 | | | $ | 56.93 | | | $ | 52.20 | |
| | | | | | | | | | | | | | | | | | | | |
Market price at end of year(b) | | $ | 87.72 | | | $ | 54.45 | | | $ | 63.62 | | | $ | 56.95 | | | $ | 52.19 | |
| | | | | | | | | | | | | | | | | | | | |
| Net Asset Value Total Return(c) | | | 63.54 | % | | | (12.81 | )% | | | 13.16 | % | | | 9.95 | % | | | 15.92 | % |
| Market Price Total Return(c) | | | 63.58 | % | | | (12.79 | )% | | | 13.16 | % | | | 10.02 | % | | | 15.96 | % |
| Ratios/Supplemental Data: | | | | | | | | | | | | | | | | | | | | |
Net assets at end of year (000’s omitted) | | $ | 1,844,119 | | | $ | 718,331 | | | $ | 1,313,404 | | | $ | 1,312,224 | | | $ | 1,362,381 | |
Ratio to average net assets of: | | | | | | | | | | | | | | | | | | | | |
Expenses | | | 0.64 | % | | | 0.62 | % | | | 0.62 | % | | | 0.63 | % | | | 0.63 | % |
Net investment income | | | 1.27 | % | | | 1.60 | % | | | 1.25 | % | | | 0.99 | % | | | 1.05 | % |
Portfolio turnover rate(d) | | | 93 | % | | | 56 | % | | | 76 | % | | | 66 | % | | | 57 | % |
| (a) | Based on average shares outstanding. |
| (b) | The mean between the last bid and ask prices. |
| (c) | Net asset value total return is calculated assuming an initial investment made at the net asset value at the beginning of the period, reinvestment of all dividends and distributions at net asset value during the period, and redemption at net asset value on the last day of the period. Net asset value total return includes adjustments in accordance with accounting principles generally accepted in the United States of America and as such, the net asset value for financial reporting purposes and the returns based upon those net asset values may differ from the net asset value and returns for shareholder transactions. Market price total return is calculated assuming an initial investment made at the market price at the beginning of the period, reinvestment of all dividends and distributions at market price during the period, and sale at the market price on the last day of the period. Total investment returns calculated for a period of less than one year are not annualized. |
| (d) | Portfolio turnover rate is not annualized for periods less than one year, if applicable, and does not include securities received or delivered from processing creations or redemptions. |
Invesco Dividend AchieversTM ETF (PFM)
| | | | | | | | | | | | | | | | | | | | |
| | | Years Ended April 30, | |
| | | 2021 | | | 2020 | | | 2019 | | | 2018 | | | 2017 | |
| Per Share Operating Performance: | | | | | | | | | | | | | | | | | | | | |
Net asset value at beginning of year | | $ | 27.27 | | | $ | 28.52 | | | $ | 25.22 | | | $ | 23.96 | | | $ | 21.75 | |
Net investment income(a) | | | 0.62 | | | | 0.61 | | | | 0.59 | | | | 0.54 | | | | 0.50 | |
Net realized and unrealized gain (loss) on investments | | | 8.61 | | | | (1.20 | ) | | | 3.29 | | | | 1.24 | | | | 2.25 | |
| | | | | | | | | | | | | | | | | | | | |
Total from investment operations | | | 9.23 | | | | (0.59 | ) | | | 3.88 | | | | 1.78 | | | | 2.75 | |
| | | | | | | | | | | | | | | | | | | | |
Distributions to shareholders from: | | | | | | | | | | | | | | | | | | | | |
Net investment income | | | (0.60 | ) | | | (0.66 | ) | | | (0.58 | ) | | | (0.52 | ) | | | (0.54 | ) |
| | | | | | | | | | | | | | | | | | | | |
Net asset value at end of year | | $ | 35.90 | | | $ | 27.27 | | | $ | 28.52 | | | $ | 25.22 | | | $ | 23.96 | |
| | | | | | | | | | | | | | | | | | | | |
Market price at end of year(b) | | $ | 35.90 | | | $ | 27.31 | | | $ | 28.52 | | | $ | 25.24 | | | $ | 23.99 | |
| | | | | | | | | | | | | | | | | | | | |
| Net Asset Value Total Return(c) | | | 34.21 | % | | | (2.04 | )% | | | 15.63 | % | | | 7.42 | % | | | 12.80 | % |
| Market Price Total Return(c) | | | 34.02 | % | | | (1.89 | )% | | | 15.53 | % | | | 7.37 | % | | | 12.94 | % |
| Ratios/Supplemental Data: | | | | | | | | | | | | | | | | | | | | |
Net assets at end of year (000’s omitted) | | $ | 614,955 | | | $ | 306,780 | | | $ | 299,475 | | | $ | 285,010 | | | $ | 313,895 | |
Ratio to average net assets of: | | | | | | | | | | | | | | | | | | | | |
Expenses | | | 0.53 | % | | | 0.53 | % | | | 0.54 | % | | | 0.55 | % | | | 0.55 | % |
Net investment income | | | 1.97 | % | | | 2.13 | % | | | 2.22 | % | | | 2.15 | % | | | 2.17 | % |
Portfolio turnover rate(d) | | | 28 | % | | | 20 | % | | | 13 | % | | | 5 | % | | | 6 | % |
| (a) | Based on average shares outstanding. |
| (b) | The mean between the last bid and ask prices. |
| (c) | Net asset value total return is calculated assuming an initial investment made at the net asset value at the beginning of the period, reinvestment of all dividends and distributions at net asset value during the period, and redemption at net asset value on the last day of the period. Net asset value total return includes adjustments in accordance with accounting principles generally accepted in the United States of America and as such, the net asset value for financial reporting purposes and the returns based upon those net asset values may differ from the net asset value and returns for shareholder transactions. Market price total return is calculated assuming an initial investment made at the market price at the beginning of the period, reinvestment of all dividends and distributions at market price during the period, and sale at the market price on the last day of the period. Total investment returns calculated for a period of less than one year are not annualized. |
| (d) | Portfolio turnover rate is not annualized for periods less than one year, if applicable, and does not include securities received or delivered from processing creations or redemptions. |
See accompanying Notes to Financial Statements which are an integral part of the financial statements.
Financial Highlights–(continued)
Invesco Dow Jones Industrial Average Dividend ETF (DJD)
| | | | | | | | | | | | | | | | | | | | | | | | | | | | | | |
| | | Years Ended April 30, | | Eight Months Ended
April 30, | | Year Ended
August 31, | | For the Period
December 16, 2015(a)
Through August 31, |
| | | 2021 | | 2020 | | 2019 | | 2018 | | 2017 | | 2016 |
| Per Share Operating Performance: | | | | | | | | | | | | | | | | | | | | | | | | | | | | | | |
Net asset value at beginning of period | | | $ | 33.17 | | | | $ | 36.98 | | | | $ | 33.32 | | | | $ | 31.07 | | | | $ | 27.55 | | | | $ | 25.35 | |
| | | | | | | | | | | | | | | | | | | | | | | | | | | | | | |
Net investment income(b) | | | | 1.27 | | | | | 1.10 | | | | | 0.91 | | | | | 0.49 | | | | | 0.83 | | | | | 0.53 | |
Net realized and unrealized gain (loss) on investments | | | | 10.40 | | | | | (3.80 | ) | | | | 3.74 | | | | | 2.37 | | | | | 3.55 | | | | | 2.05 | |
| | | | | | | | | | | | | | | | | | | | | | | | | | | | | | |
Total from investment operations | | | | 11.67 | | | | | (2.70 | ) | | | | 4.65 | | | | | 2.86 | | | | | 4.38 | | | | | 2.58 | |
| | | | | | | | | | | | | | | | | | | | | | | | | | | | | | |
Distributions to shareholders from: | | | | | | | | | | | | | | | | | | | | | | | | | | | | | | |
Net investment income | | | | (1.37 | ) | | | | (1.11 | ) | | | | (0.99 | ) | | | | (0.53 | ) | | | | (0.86 | ) | | | | (0.38 | ) |
Net realized gains | | | | — | | | | | — | | | | | — | | | | | (0.08 | ) | | | | — | | | | | — | |
| | | | | | | | | | | | | | | | | | | | | | | | | | | | | | |
Total distributions | | | | (1.37 | ) | | | | (1.11 | ) | | | | (0.99 | ) | | | | (0.61 | ) | | | | (0.86 | ) | | | | (0.38 | ) |
| | | | | | | | | | | | | | | | | | | | | | | | | | | | | | |
Net asset value at end of period | | | $ | 43.47 | | | | $ | 33.17 | | | | $ | 36.98 | | | | $ | 33.32 | | | | $ | 31.07 | | | | $ | 27.55 | |
| | | | | | | | | | | | | | | | | | | | | | | | | | | | | | |
Market price at end of period | | | $ | 43.52 | (c) | | | $ | 33.21 | (c) | | | $ | 37.02 | (c) | | | $ | 33.35 | (c) | | | $ | 31.10 | | | | $ | 27.52 | |
| | | | | | | | | | | | | | | | | | | | | | | | | | | | | | |
| Net Asset Value Total Return(d) | | | | 36.03 | % | | | | (7.33 | )% | | | | 14.24 | % | | | | 9.23 | % | | | | 16.13 | % | | | | 10.27 | % |
| Market Price Total Return(d) | | | | 36.03 | % | | | | (7.32 | )% | | | | 14.25 | % | | | | 9.22 | % | | | | | | | | | | |
| Ratios/Supplemental Data: | | | | | | | | | | | | | | | | | | | | | | | | | | | | | | |
Net assets at end of period (000’s omitted) | | | $ | 154,758 | | | | $ | 116,108 | | | | $ | 73,967 | | | | $ | 14,994 | | | | $ | 10,875 | | | | $ | 2,755 | |
Ratio to average net assets of: | | | | | | | | | | | | | | | | | | | | | | | | | | | | | | |
Expenses, after Waivers | | | | 0.07 | % | | | | 0.08 | %(e) | | | | 0.09 | % | | | | 0.30 | %(f) | | | | 0.30 | % | | | | 0.30 | %(f) |
Expenses, prior to Waivers | | | | 0.07 | % | | | | 0.08 | %(e) | | | | 0.10 | % | | | | 0.30 | %(f) | | | | 0.30 | % | | | | 0.30 | %(f) |
Net investment income | | | | 3.43 | % | | | | 3.04 | %(e) | | | | 2.62 | % | | | | 2.25 | %(f) | | | | 2.80 | % | | | | 2.86 | %(f) |
Portfolio turnover rate(g) | | | | 50 | % | | | | 14 | % | | | | 20 | % | | | | 19 | % | | | | 3 | % | | | | 0 | % |
| (a) | Commencement of investment operations. |
| (b) | Based on average shares outstanding. |
| (c) | The mean between the last bid and ask prices. |
| (d) | Net asset value total return is calculated assuming an initial investment made at the net asset value at the beginning of the period, reinvestment of all dividends and distributions at net asset value during the period, and redemption at net asset value on the last day of the period. Net asset value total return includes adjustments in accordance with accounting principles generally accepted in the United States of America and as such, the net asset value for financial reporting purposes and the returns based upon those net asset values may differ from the net asset value and returns for shareholder transactions. Market price total return is calculated assuming an initial investment made at the market price at the beginning of the period, reinvestment of all dividends and distributions at market price during the period, and sale at the market price on the last day of the period. Total investment returns calculated for a period of less than one year are not annualized. |
| (e) | Ratios include non-recurring costs associated with a proxy statement of 0.01%. |
| (g) | Portfolio turnover rate is not annualized for periods less than one year, if applicable, and does not include securities received or delivered from processing creations or redemptions. |
See accompanying Notes to Financial Statements which are an integral part of the financial statements.
Financial Highlights–(continued)
Invesco Financial Preferred ETF (PGF)
| | | | | | | | | | | | | | | | | | | | |
| | | Years Ended April 30, | |
| | | 2021 | | | 2020 | | | 2019 | | | 2018 | | | 2017 | |
| Per Share Operating Performance: | | | | | | | | | | | | | | | | | | | | |
Net asset value at beginning of year | | $ | 18.05 | | | $ | 18.33 | | | $ | 18.32 | | | $ | 18.87 | | | $ | 18.80 | |
| | | | | | | | | | | | | | | | | | | | |
Net investment income(a) | | | 0.94 | | | | 0.94 | | | | 0.97 | | | | 0.99 | | | | 1.03 | |
Net realized and unrealized gain (loss) on investments | | | 0.82 | | | | (0.27 | ) | | | 0.05 | | | | (0.53 | ) | | | 0.07 | |
| | | | | | | | | | | | | | | | | | | | |
Total from investment operations | | | 1.76 | | | | 0.67 | | | | 1.02 | | | | 0.46 | | | | 1.10 | |
| | | | | | | | | | | | | | | | | | | | |
Distributions to shareholders from: | | | | | | | | | | | | | | | | | | | | |
Net investment income | | | (0.92 | ) | | | (0.95 | ) | | | (1.01 | ) | | | (1.01 | ) | | | (1.03 | ) |
| | | | | | | | | | | | | | | | | | | | |
Net asset value at end of year | | $ | 18.89 | | | $ | 18.05 | | | $ | 18.33 | | | $ | 18.32 | | | $ | 18.87 | |
| | | | | | | | | | | | | | | | | | | | |
Market price at end of year(b) | | $ | 18.96 | | | $ | 18.07 | | | $ | 18.35 | | | $ | 18.31 | | | $ | 18.87 | |
| | | | | | | | | | | | | | | | | | | | |
| Net Asset Value Total Return(c) | | | 9.94 | % | | | 3.78 | % | | | 5.79 | % | | | 2.43 | % | | | 6.06 | % |
| Market Price Total Return(c) | | | 10.22 | % | | | 3.77 | % | | | 5.97 | % | | | 2.37 | % | | | 5.89 | % |
| Ratios/Supplemental Data: | | | | | | | | | | | | | | | | | | | | |
Net assets at end of year (000’s omitted) | | $ | 1,827,087 | | | $ | 1,462,590 | | | $ | 1,385,773 | | | $ | 1,565,028 | | | $ | 1,672,911 | |
Ratio to average net assets of: | | | | | | | | | | | | | | | | | | | | |
Expenses | | | 0.62 | % | | | 0.61 | % | | | 0.62 | % | | | 0.63 | % | | | 0.63 | % |
Net investment income | | | 5.02 | % | | | 5.10 | % | | | 5.35 | % | | | 5.26 | % | | | 5.48 | % |
Portfolio turnover rate(d) | | | 23 | % | | | 31 | % | | | 21 | % | | | 5 | % | | | 8 | % |
| (a) | Based on average shares outstanding. |
| (b) | The mean between the last bid and ask prices. |
| (c) | Net asset value total return is calculated assuming an initial investment made at the net asset value at the beginning of the period, reinvestment of all dividends and distributions at net asset value during the period, and redemption at net asset value on the last day of the period. Net asset value total return includes adjustments in accordance with accounting principles generally accepted in the United States of America and as such, the net asset value for financial reporting purposes and the returns based upon those net asset values may differ from the net asset value and returns for shareholder transactions. Market price total return is calculated assuming an initial investment made at the market price at the beginning of the period, reinvestment of all dividends and distributions at market price during the period, and sale at the market price on the last day of the period. Total investment returns calculated for a period of less than one year are not annualized. |
| (d) | Portfolio turnover rate is not annualized for periods less than one year, if applicable, and does not include securities received or delivered from processing creations or redemptions. |
Invesco High Yield Equity Dividend AchieversTM ETF (PEY)
| | | | | | | | | | | | | | | | | | | | |
| | | Years Ended April 30, | |
| | | 2021 | | | 2020 | | | 2019 | | | 2018 | | | 2017 | |
| Per Share Operating Performance: | | | | | | | | | | | | | | | | | | | | |
Net asset value at beginning of year | | $ | 14.21 | | | $ | 18.25 | | | $ | 17.12 | | | $ | 17.01 | | | $ | 14.90 | |
| | | | | | | | | | | | | | | | | | | | |
Net investment income(a) | | | 0.69 | | | | 0.75 | | | | 0.63 | | | | 0.62 | | | | 0.52 | |
Net realized and unrealized gain (loss) on investments | | | 6.51 | | | | (4.03 | ) | | | 1.17 | | | | 0.14 | | | | 2.12 | |
| | | | | | | | | | | | | | | | | | | | |
Total from investment operations | | | 7.20 | | | | (3.28 | ) | | | 1.80 | | | | 0.76 | | | | 2.64 | |
| | | | | | | | | | | | | | | | | | | | |
Distributions to shareholders from: | | | | | | | | | | | | | | | | | | | | |
Net investment income | | | (0.75 | ) | | | (0.76 | ) | | | (0.67 | ) | | | (0.65 | ) | | | (0.53 | ) |
| | | | | | | | | | | | | | | | | | | | |
Net asset value at end of year | | $ | 20.66 | | | $ | 14.21 | | | $ | 18.25 | | | $ | 17.12 | | | $ | 17.01 | |
| | | | | | | | | | | | | | | | | | | | |
Market price at end of year(b) | | $ | 20.65 | | | $ | 14.24 | | | $ | 18.26 | | | $ | 17.12 | | | $ | 17.02 | |
| | | | | | | | | | | | | | | | | | | | |
| Net Asset Value Total Return(c) | | | 52.20 | % | | | (18.57 | )% | | | 10.79 | % | | | 4.48 | % | | | 17.95 | % |
| Market Price Total Return(c) | | | 51.80 | % | | | (18.44 | )% | | | 10.86 | % | | | 4.42 | % | | | 17.94 | % |
| Ratios/Supplemental Data: | | | | | | | | | | | | | | | | | | | | |
Net assets at end of year (000’s omitted) | | $ | 929,479 | | | $ | 630,938 | | | $ | 834,224 | | | $ | 763,400 | | | $ | 984,725 | |
Ratio to average net assets of: | | | | | | | | | | | | | | | | | | | | |
Expenses | | | 0.53 | % | | | 0.52 | % | | | 0.53 | % | | | 0.54 | % | | | 0.54 | % |
Net investment income | | | 4.20 | % | | | 4.30 | % | | | 3.58 | % | | | 3.63 | % | | | 3.23 | % |
Portfolio turnover rate(d) | | | 74 | % | | | 51 | % | | | 50 | % | | | 38 | % | | | 49 | % |
| (a) | Based on average shares outstanding. |
| (b) | The mean between the last bid and ask prices. |
| (c) | Net asset value total return is calculated assuming an initial investment made at the net asset value at the beginning of the period, reinvestment of all dividends and distributions at net asset value during the period, and redemption at net asset value on the last day of the period. Net asset value total return includes adjustments in accordance with accounting principles generally accepted in the United States of America and as such, the net asset value for financial reporting purposes and the returns based upon those net asset values may differ from the net asset value and returns for shareholder transactions. Market price total return is calculated assuming an initial investment made at the market price at the beginning of the period, reinvestment of all dividends and distributions at market price during the period, and sale at the market price on the last day of the period. Total investment returns calculated for a period of less than one year are not annualized. |
| (d) | Portfolio turnover rate is not annualized for periods less than one year, if applicable, and does not include securities received or delivered from processing creations or redemptions. |
See accompanying Notes to Financial Statements which are an integral part of the financial statements.
Financial Highlights–(continued)
Invesco International Dividend AchieversTM ETF (PID)
| | | | | | | | | | | | | | | | | | | | |
| | | Years Ended April 30, | |
| | | 2021 | | | 2020 | | | 2019 | | | 2018 | | | 2017 | |
| Per Share Operating Performance: | | | | | | | | | | | | | | | | | | | | |
Net asset value at beginning of year | | $ | 12.12 | | | $ | 16.44 | | | $ | 15.92 | | | $ | 15.09 | | | $ | 14.66 | |
| | | | | | | | | | | | | | | | | | | | |
Net investment income(a) | | | 0.45 | | | | 0.61 | | | | 0.58 | | | | 0.56 | | | | 0.44 | |
Net realized and unrealized gain (loss) on investments | | | 5.21 | | | | (4.20 | ) | | | 0.48 | | | | 0.87 | | | | 0.56 | |
| | | | | | | | | | | | | | | | | | | | |
Total from investment operations | | | 5.66 | | | | (3.59 | ) | | | 1.06 | | | | 1.43 | | | | 1.00 | |
| | | | | | | | | | | | | | | | | | | | |
Distributions to shareholders from: | | | | | | | | | | | | | | | | | | | | |
Net investment income | | | (0.50 | ) | | | (0.73 | ) | | | (0.54 | ) | | | (0.60 | ) | | | (0.57 | ) |
| | | | | | | | | | | | | | | | | | | | |
Net asset value at end of year | | $ | 17.28 | | | $ | 12.12 | | | $ | 16.44 | | | $ | 15.92 | | | $ | 15.09 | |
| | | | | | | | | | | | | | | | | | | | |
Market price at end of year(b) | | $ | 17.25 | | | $ | 12.07 | | | $ | 16.45 | | | $ | 15.91 | | | $ | 15.09 | |
| | | | | | | | | | | | | | | | | | | | |
| Net Asset Value Total Return(c) | | | 47.87 | % | | | (22.71 | )% | | | 6.99 | % | | | 9.57 | % | | | 7.12 | % |
| Market Price Total Return(c) | | | 48.23 | % | | | (23.07 | )% | | | 7.13 | % | | | 9.50 | % | | | 7.19 | % |
| Ratios/Supplemental Data: | | | | | | | | | | | | | | | | | | | | |
Net assets at end of year (000’s omitted) | | $ | 579,570 | | | $ | 510,252 | | | $ | 766,283 | | | $ | 862,878 | | | $ | 811,780 | |
Ratio to average net assets of: | | | | | | | | | | | | | | | | | | | | |
Expenses | | | 0.56 | % | | | 0.53 | % | | | 0.54 | % | | | 0.55 | % | | | 0.56 | % |
Net investment income | | | 3.18 | % | | | 3.92 | % | | | 3.70 | % | | | 3.52 | % | | | 3.01 | % |
Portfolio turnover rate(d) | | | 69 | % | | | 45 | % | | | 47 | % | | | 55 | % | | | 61 | % |
| (a) | Based on average shares outstanding. |
| (b) | The mean between the last bid and ask prices. |
| (c) | Net asset value total return is calculated assuming an initial investment made at the net asset value at the beginning of the period, reinvestment of all dividends and distributions at net asset value during the period, and redemption at net asset value on the last day of the period. Net asset value total return includes adjustments in accordance with accounting principles generally accepted in the United States of America and as such, the net asset value for financial reporting purposes and the returns based upon those net asset values may differ from the net asset value and returns for shareholder transactions. Market price total return is calculated assuming an initial investment made at the market price at the beginning of the period, reinvestment of all dividends and distributions at market price during the period, and sale at the market price on the last day of the period. Total investment returns calculated for a period of less than one year are not annualized. |
| (d) | Portfolio turnover rate is not annualized for periods less than one year, if applicable, and does not include securities received or delivered from processing creations or redemptions. |
See accompanying Notes to Financial Statements which are an integral part of the financial statements.
Notes to Financial Statements
Invesco Exchange-Traded Fund Trust
April 30, 2021
NOTE 1–Organization
Invesco Exchange-Traded Fund Trust (the “Trust”) was organized as a Massachusetts business trust and is authorized to have multiple series of portfolios. The Trust is an open-end management investment company registered under the Investment Company Act of 1940, as amended (the “1940 Act”). This report includes the following portfolios:
| | |
| Full Name | | Short Name |
Invesco BuyBack AchieversTM ETF (PKW) | | “BuyBack AchieversTM ETF” |
Invesco Dividend AchieversTM ETF (PFM) | | “Dividend AchieversTM ETF” |
Invesco Dow Jones Industrial Average Dividend ETF (DJD) | | “Dow Jones Industrial Average Dividend ETF” |
Invesco Financial Preferred ETF (PGF) | | “Financial Preferred ETF” |
Invesco High Yield Equity Dividend AchieversTM ETF (PEY) | | “High Yield Equity Dividend AchieversTM ETF” |
Invesco International Dividend AchieversTM ETF (PID) | | “International Dividend AchieversTM ETF” |
Each portfolio (each, a “Fund”, and collectively, the “Funds”) represents a separate series of the Trust. The shares of the Funds are referred to herein as “Shares” or “Fund’s Shares.” Each Fund’s Shares are listed and traded on The Nasdaq Stock Market, except for Shares of Dow Jones Industrial Average Dividend ETF and Financial Preferred ETF, which are listed and traded on NYSE Arca, Inc.
The market price of each Share may differ to some degree from a Fund’s net asset value (“NAV”). Unlike conventional mutual funds, each Fund issues and redeems Shares on a continuous basis, at NAV, only in a large specified number of Shares, each called a “Creation Unit.” Creation Units are issued and redeemed principally in exchange for the deposit or delivery of a basket of securities (“Deposit Securities”). Except when aggregated in Creation Units by Authorized Participants, the Shares are not individually redeemable securities of the Funds.
The investment objective of each Fund is to seek to track the investment results (before fees and expenses) of its respective index listed below (each, an “Underlying Index”):
| | |
| Fund | | Underlying Index |
BuyBack AchieversTM ETF | | NASDAQ US BuyBack AchieversTM Index |
Dividend AchieversTM ETF | | NASDAQ US Broad Dividend AchieversTM Index |
Dow Jones Industrial Average Dividend ETF | | Dow Jones Industrial Average Yield Weighted |
Financial Preferred ETF | | Wells Fargo® Hybrid and Preferred Securities Financial Index |
High Yield Equity Dividend AchieversTM ETF | | NASDAQ US Dividend AchieversTM 50 Index |
International Dividend AchieversTM ETF | | NASDAQ International Dividend AchieversTM Index |
NOTE 2–Significant Accounting Policies
The following is a summary of the significant accounting policies followed by the Funds in preparation of their financial statements.
Each Fund is an investment company and accordingly follows the investment company accounting and reporting guidance in accordance with Financial Accounting Standards Board Accounting Standards Codification Topic 946, Financial Services–Investment Companies.
| A. | Security Valuation - Securities, including restricted securities, are valued according to the following policies: |
A security listed or traded on an exchange (except convertible securities) is generally valued at its last sales price or official closing price as of the close of the customary trading session on the exchange where the security is principally traded or, lacking any sales or official closing price on a particular day, the security may be valued at the closing bid price on that day. Securities traded in the over-the-counter (“OTC”) market are valued based on prices furnished by independent pricing services or market makers. When such securities are valued by an independent pricing service they may be considered fair valued. Futures contracts are valued at the final settlement price set by an exchange on which they are principally traded. Listed options are valued at the mean between the last bid and asked prices from the exchange on which they are principally traded, or at the final settlement price set by such exchange. Swaps and options not listed on an exchange are valued by an independent source. For purposes of determining NAV per Share, futures and option contracts generally are valued 15 minutes after the close of the customary trading session of the New York Stock Exchange (“NYSE”).
Investment companies are valued using such company’s NAV per share, unless the shares are exchange-traded, in which case they are valued at the last sales price or official closing price as of the close of the customary trading session on the exchange where the security is principally traded.
Debt obligations (including convertible securities) and unlisted equities are fair valued using an evaluated quote provided by an independent pricing service. Evaluated quotes provided by the pricing service may be determined without exclusive reliance on quoted prices, and may reflect appropriate factors such as institution-size trading in similar groups of securities, developments related to specific securities, dividend rate (for unlisted equities), yield (for debt obligations), quality, type of issue, coupon rate (for debt obligations), maturity (for debt obligations), individual trading characteristics and other market data. Securities with a demand feature exercisable within one to seven days are valued at par. Pricing services generally value debt obligations assuming orderly transactions of institutional round lot size, but a Fund may hold or transact in the same securities in smaller, odd lot sizes. Odd lots often trade at lower prices than institutional round lots. Debt obligations are subject to interest rate and credit risks. In addition, all debt obligations involve some risk of default with respect to interest and/or principal payments.
Foreign securities’ (including foreign exchange contracts’) prices are converted into U.S. dollar amounts using the applicable exchange rates as of the close of the London world markets. If market quotations are available and reliable for foreign exchange-traded equity securities, the securities will be valued at the market quotations. Because trading hours for certain foreign securities end before the close of the NYSE, closing market quotations may become unreliable. If between the time trading ends on a particular security and the close of the customary trading session on the NYSE, events occur that Invesco Capital Management LLC (the “Adviser”) determines are significant and make the closing price unreliable, a Fund may fair value the security. If the event is likely to have affected the closing price of the security, the security will be valued at fair value in good faith using procedures approved by the Board of Trustees. Adjustments to closing prices to reflect fair value may also be based on a screening process of an independent pricing service to indicate the degree of certainty, based on historical data, that the closing price in the principal market where a foreign security trades is not the current value as of the close of the NYSE. Foreign securities’ prices meeting the approved degree of certainty that the price is not reflective of current value will be priced at the indication of fair value from the independent pricing service. Multiple factors may be considered by the independent pricing service in determining adjustments to reflect fair value and may include information relating to sector indices, American Depositary Receipts and domestic and foreign index futures. Foreign securities may have additional risks including exchange rate changes, the potential for sharply devalued currencies and high inflation, political and economic upheaval, the relative lack of issuer information, relatively low market liquidity and the potential lack of strict financial and accounting controls and standards.
Securities for which market prices are not provided by any of the above methods may be valued based upon quotes furnished by independent sources. The last bid price may be used to value exchange-traded equity securities. The mean between the last bid and asked prices may be used to value debt obligations, including corporate loans, and unlisted equity securities.
Securities for which market quotations are not readily available or became unreliable are valued at fair value as determined in good faith following procedures approved by the Board of Trustees. Issuer-specific events, market trends, bid/asked quotes of brokers and information providers and other market data may be reviewed in the course of making a good faith determination of a security’s fair value.
Each Fund may invest in securities that are subject to interest rate risk, meaning the risk that the prices will generally fall as interest rates rise and, conversely, the prices will generally rise as interest rates fall. Specific securities differ in their sensitivity to changes in interest rates depending on their individual characteristics. Changes in interest rates may result in increased market volatility, which may affect the value and/or liquidity of certain Fund investments.
| Valuations | change in response to many factors, including the historical and prospective earnings of the issuer, the value of the issuer’s assets, general market conditions which are not specifically related to the particular issuer, such as real or perceived adverse economic conditions, changes in the general outlook for revenues or corporate earnings, changes in interest or currency rates, regional or global instability, natural or environmental disasters, widespread disease or other public health issues, war, acts of terrorism or adverse investor sentiment generally and market liquidity. Because of the inherent uncertainties of valuation, the values reflected in the financial statements may materially differ from the value received upon actual sale of those investments. |
ADR and GDR Risk. Certain Funds may invest in American Depositary Receipts (“ADRs”) and Global Depositary Receipts (“GDRs”). ADRs are certificates that evidence ownership of shares of a foreign issuer and are alternatives to purchasing the underlying foreign securities directly in their national markets and currencies. GDRs are certificates issued by an international bank that generally are traded and denominated in the currencies of countries other than the home country of the issuer of the underlying shares. ADRs and GDRs may be subject to certain of the risks associated with direct investments in the securities of foreign companies, such as currency, political, economic and market risks, because their values depend on the performance of the non-dollar denominated underlying foreign securities. Moreover, ADRs and GDRs may not track the price of the underlying foreign securities on which they are based, and their value may change materially at times when U.S. markets are not open for trading.
Authorized Participant Concentration Risk. Only authorized participants (“APs”) may engage in creation or redemption transactions directly with each Fund. Each Fund has a limited number of institutions that may act as APs, and such APs have no obligation to submit creation or redemption orders. Consequently, there is no assurance that APs will establish or maintain an active trading market for the Shares. This risk may be heightened to the extent that securities held by each Fund are traded outside a collateralized settlement system. In that case, APs may be required to post collateral on certain trades on an agency basis (i.e., on behalf of other market participants), which only a limited number of APs may be able to do. In addition, to the extent that APs exit the business or are unable to proceed with creation and/or redemption orders with respect to each Fund and no other AP is able to step forward to create or redeem Creation Units, this may result in a significantly diminished trading market for Fund Shares, and Shares may be more likely to trade at a premium or discount to a Fund’s NAV and to face trading halts and/or delisting. Investments in non-U.S. securities, which may have lower trading volumes, may increase this risk.
COVID-19 Risk. The COVID-19 strain of coronavirus has resulted in instances of market closures and dislocations, extreme volatility, liquidity constraints and increased trading costs. Efforts to contain its spread have resulted in travel restrictions, disruptions of healthcare systems, business operations and supply chains, layoffs, lower consumer demand, and defaults, among other significant economic impacts that have disrupted global economic activity across many industries. Such economic impacts may exacerbate other pre-existing political, social and economic risks locally or globally.
The ongoing effects of COVID-19 are unpredictable and may result in significant and prolonged effects on the Funds’ performance.
Dividend Paying Security Risk. Certain Funds invest in securities that pay high dividends. As a group, these securities can fall out of favor with the market, causing such companies to underperform companies that do not pay high dividends. Also, changes in the dividend policies of the companies in an Underlying Index and the capital resources available for such companies’ dividend payments may affect a Fund.
Equity Risk. Equity risk is the risk that the value of equity securities, including common stocks, may fall due to both changes in general economic conditions that impact the market as a whole, as well as factors that directly relate to a specific company or its industry. Such general economic conditions include changes in interest rates, periods of market turbulence or instability, or general and prolonged periods of economic decline and cyclical change. It is possible that a drop in the stock market may depress the price of most or all of the common stocks that each Fund holds. In addition, equity risk includes the risk that investor sentiment toward one or more industries will become negative, resulting in those investors exiting their investments in those industries, which could cause a reduction in the value of companies in those industries more broadly. The value of a company’s common stock may fall solely because of factors, such as an increase in production costs that negatively impact other companies in the same region, industry or sector of the market. A company’s common stock also may decline significantly in price over a short period of time due to factors specific to that company, including decisions made by its management or lower demand for the company’s products or services. For example, an adverse event, such as an unfavorable earnings report or the failure to make anticipated dividend payments, may depress the value of common stock.
Financial Sector Risk. The market value of securities of issuers in the financial sector can be affected by factors such as adverse regulatory or economic occurrences affecting the financial sector, availability of credit, fluctuations in asset values, unstable interest rates, increased competition, continuing consolidations and development of new products and structures. Furthermore, increased government involvement in financial institutions, including measures such as taking ownership positions in such institutions, could result in a dilution in the value of the shares held by shareholders in such institutions.
Foreign Investment Risk. Investments in the securities of non-U.S. issuers involve risks beyond those associated with investments in U.S. securities. Foreign securities may have relatively low market liquidity, greater market volatility, decreased publicly available information and less reliable financial information about issuers. Foreign securities also are subject to the risks of expropriation, nationalization, political instability, and inconsistent and potentially less stringent accounting, auditing and financial reporting requirements and standards of practice comparable to those applicable to domestic issuers or other adverse political or economic developments and the difficulty of enforcing obligations in other countries. Investments in foreign securities also may be subject to dividend withholding or confiscatory taxes, currency blockage and/or transfer restrictions and higher transactional costs. If a Fund invests in securities denominated in foreign currencies, fluctuations in the value of the U.S. dollar relative to the values of other currencies may adversely affect investments in foreign securities and may negatively impact the Fund’s returns.
Index Risk. Unlike many investment companies, each Fund does not utilize an investing strategy that seeks returns in excess of its Underlying Index. Therefore, a Fund would not necessarily buy or sell a security unless that security is added or removed, respectively, from its Underlying Index, even if that security generally is underperforming. Additionally, each Fund rebalances its portfolio in accordance with its Underlying Index, and, therefore, any changes to the Underlying Index’s rebalance schedule will result in corresponding changes to each Fund’s rebalance schedule.
Industry Concentration Risk. In following its methodology, each Fund’s Underlying Index from time to time may be concentrated to a significant degree in securities of issuers located in a single industry or industry group. To the extent that each Underlying Index concentrates in the securities of issuers in a particular industry or industry group, the corresponding Fund will also concentrate its investments to approximately the same extent. By concentrating its investments in an industry or industry group, each Fund may face more risks than if it were diversified broadly over numerous industries or industry
groups. Such industry-based risks, any of which may adversely affect the companies in which each Fund invests, may include, but are not limited to, the following: general economic conditions or cyclical market patterns that could negatively affect supply and demand in a particular industry; competition for resources, adverse labor relations, political or world events; obsolescence of technologies; and increased competition or new product introductions that may affect the profitability or viability of companies in an industry. In addition, at times, such industry or industry group may be out of favor and underperform other industries or the market as a whole.
Market Risk. Securities in the Underlying Index are subject to market fluctuations. You should anticipate that the value of the Shares will decline, more or less, in correlation with any decline in value of the securities in the Underlying Index. Additionally, natural or environmental disasters, widespread disease or other public health issues, war, acts of terrorism or other events could result in increased premiums or discounts to each Fund’s NAV.
Non-Correlation Risk. Each Fund’s return may not match the return of its corresponding Underlying Index for a number of reasons. For example, each Fund incurs operating expenses not applicable to the Underlying Index, and incurs costs in buying and selling securities, especially when rebalancing the Fund’s securities holdings to reflect changes in the composition of its corresponding Underlying Index. In addition, the performance of each Fund and its corresponding Underlying Index may vary due to asset valuation differences and differences between each Fund’s portfolio and its corresponding Underlying Index resulting from legal restrictions, costs or liquidity constraints.
Non-Diversified Fund Risk. Because Dow Jones Industrial Average Dividend ETF and Financial Preferred ETF are non-diversified, and to the extent certain Funds become non-diversified and can invest a greater portion of their assets in securities of individual issuers than a diversified fund, changes in the market value of a single investment could cause greater fluctuations in Share price than would occur in a diversified fund. This may increase a Fund’s volatility and cause the performance of a relatively small number of issuers to have a greater impact on a Fund’s performance.
Preferred Securities Risk. There are special risks associated with investing in preferred securities. Preferred securities may include provisions that permit the issuer, in its discretion, to defer or omit distributions for a certain period of time. If a Fund owns a security that is deferring or omitting its distributions, the Fund may be required to report the distribution on its tax returns, even though it may not have received any income. Further, preferred securities may lose substantial value due to the omission or deferment of dividend payments. Preferred securities may be less liquid than many other securities, such as common stocks, and generally offer no voting rights with respect to the issuer. Preferred securities also may be subordinated to bonds or other debt instruments in an issuer’s capital structure, subjecting them to a greater risk of non-payment than more senior securities.
Sampling Risk. Certain Funds’ use of a representative sampling approach may result in the Fund holding a smaller number of securities than are in its respective Underlying Index. As a result, an adverse development with respect to an issuer of securities held by the Fund could result in a greater decline in NAV than would be the case if the Fund held all of the securities in its Underlying Index. To the extent the assets in the Fund are smaller, these risks will be greater.
Small- and Mid-Capitalization Company Risk. Investing in securities of small- and mid-capitalization companies involves greater risk than customarily is associated with investing in larger, more established companies. These companies’ securities may be more volatile and less liquid than those of more established companies. These securities may have returns that vary, sometimes significantly, from the overall securities market. Often small- and mid-capitalization companies and the industries in which they focus are still evolving and, as a result, they may be more sensitive to changing market conditions.
| C. | Investment Transactions and Investment Income - Investment transactions are accounted for on a trade date basis. Realized gains and losses from the sale or disposition of securities are computed on the specific identified cost basis. Interest income is recorded on an accrual basis from settlement date and includes coupon interest and amortization of premium and accretion of discount on debt securities as applicable. Pay-in-kind interest income and non-cash dividend income received in the form of securities in-lieu of cash are recorded at the fair value of the securities received. Dividend income (net of withholding tax, if any) is recorded on the ex-dividend date. Realized gains, dividends and interest received by a Fund may give rise to withholding and other taxes imposed by foreign countries. Tax conventions between certain countries and the United States may reduce or eliminate such taxes. |
The Funds may periodically participate in litigation related to a Fund’s investments. As such, the Funds may receive proceeds from litigation settlements. Any proceeds received are included in the Statements of Operations as realized gain (loss) for investments no longer held and as unrealized gain (loss) for investments still held.
Brokerage commissions and mark ups are considered transaction costs and are recorded as an increase to the cost basis of securities purchased and/or a reduction of proceeds on a sale of securities. Such transaction costs are included in the determination of net realized and unrealized gain (loss) from investment securities reported in the Statements of Operations and the Statements of Changes in Net Assets and the net realized and unrealized gains (losses) on securities per share in the Financial Highlights. Transaction costs are included in the calculation of a Fund’s NAV and, accordingly, they reduce a Fund’s total returns. These transaction costs are not considered operating expenses and are not reflected in net investment income reported in the Statements of Operations and the Statements of Changes in Net Assets, or the net investment income per share and the ratios of expenses and net investment income reported in the Financial Highlights, nor are they limited by any expense limitation arrangements between each Fund and the Adviser.
| D. | Country Determination - For the purposes of presentation in the Schedules of Investments, the Adviser may determine the country in which an issuer is located and/or credit risk exposure based on various factors. These factors include whether each Fund’s Underlying Index has made a country determination and may include the laws of the country under which the issuer is organized, where the issuer maintains a principal office, the country in which the issuer derives 50% or more of its total revenues and the country that has the primary market for the issuer’s securities, as well as other criteria. Among the other criteria that may be evaluated for making this determination are the country in which the issuer maintains 50% or more of its assets, the type of security, financial guarantees and enhancements, the nature of the collateral and the sponsor organization. Country of issuer and/or credit risk exposure has been determined to be the United States of America, unless otherwise noted. |
| E. | Dividends and Distributions to Shareholders - Each Fund (except for Financial Preferred ETF and High Yield Equity Dividend Achievers™ ETF, which declare and pay dividends from net investment income, if any, monthly) declares and pays dividends from net investment income, if any, to its shareholders quarterly and records such dividends on the ex-dividend date. Generally, each Fund distributes net realized taxable capital gains, if any, annually in cash and records them on the ex-dividend date. Such distributions on a tax basis are determined in conformity with federal income tax regulations, which may differ from accounting principles generally accepted in the United States of America (“GAAP”). Distributions in excess of tax basis earnings and profits, if any, are reported in such Fund’s financial statements as a tax return of capital at fiscal year-end. |
| F. | Federal Income Taxes - Each Fund intends to comply with the provisions of the Internal Revenue Code of 1986, as amended (the “Internal Revenue Code”), applicable to regulated investment companies and to distribute substantially all of the Fund’s taxable earnings to its shareholders. As such, the Funds will not be subject to federal income taxes on otherwise taxable income (including net realized gains) that is distributed to the shareholders. Therefore, no provision for federal income taxes is recorded in the financial statements. |
Each Fund recognizes the tax benefits of uncertain tax positions only when the position is more likely than not to be sustained. Management has analyzed each Fund’s uncertain tax positions and concluded that no liability for unrecognized tax benefits should be recorded related to uncertain tax positions. Management is not aware of any tax positions for which it is reasonably possible that the total amounts of unrecognized tax benefits will change materially in the next 12 months.
Income and capital gain distributions are determined in accordance with federal income tax regulations, which may differ from GAAP. These differences are primarily due to differing book and tax treatments for in-kind transactions, losses deferred due to wash sales, and passive foreign investment company adjustments, if any.
The Funds file U.S. federal tax returns and tax returns in certain other jurisdictions. Generally, a Fund is subject to examinations by such taxing authorities for up to three years after the filing of the return for the tax period.
| G. | Expenses - Each Fund (except for Dow Jones Industrial Average Dividend ETF) is responsible for all of its expenses, including, but not limited to, the investment advisory fees, costs of transfer agency, custody, fund administration, legal, audit and other services, interest, taxes, acquired fund fees and expenses, if any, brokerage commissions and other expenses connected with executions of portfolio transactions, sub-licensing fees related to its respective Underlying Index, any distribution fees or expenses, litigation expenses, fees payable to the Trust’s Board members who are not “interested persons” (as defined in the 1940 Act) of the Trust (the “Independent Trustees”), or the Adviser, expenses incurred in connection with the Board members’ services, including travel expenses and legal fees of counsel for the Independent Trustees, and extraordinary expenses, including proxy expenses (except for such proxies related to: (i) changes to the Investment Advisory Agreement, (ii) the election of any Board member who is an “interested person” of the Trust, or (iii) any other matters that directly benefit the Adviser). |
Dow Jones Industrial Average Dividend ETF has agreed to pay an annual unitary management fee to the Adviser. Out of the unitary management fee, the Adviser has agreed to pay for substantially all expenses of the Fund, including the costs of transfer agency, custody, fund administration, legal, audit and other services, except for distribution fees, if any, brokerage expenses, taxes, interest, litigation expenses, acquired fund fees and expenses, if any, and other extraordinary expenses, including proxy expenses (except for such proxies related to: (i) changes to the Investment Advisory Agreement, (ii) the election of any Board member who is an “interested person” of the Trust, or (iii) any other matters that directly benefit the Adviser).
Expenses of the Trust that are excluded from a Fund’s unitary management fee (if applicable) and are directly identifiable to a specific Fund are applied to that Fund. Expenses of the Trust that are excluded from a Fund’s unitary management fee (if applicable) and are not readily identifiable to a specific Fund are allocated in such a manner as deemed equitable, taking into consideration the nature and type of expense and the relative net assets of each Fund.
To the extent a Fund invests in other investment companies, the expenses shown in the accompanying financial statements reflect the expenses of the Fund and do not include any expenses of the investment companies in which it invests. The effects of such investment companies’ expenses are included in the realized and unrealized gain or loss on the investments in the investment companies.
| H. | Accounting Estimates - The preparation of the financial statements in accordance with GAAP requires management to make estimates and assumptions that affect the reported amounts and disclosures in the financial statements, including estimates and assumptions related to taxation. Actual results could differ from these estimates. In addition, the Funds monitor for material events or transactions that may occur or become known after the period-end date and before the date the financial statements are released to print. |
| I. | Indemnifications - Under the Trust’s organizational documents, its Officers and Trustees are indemnified against certain liabilities arising out of the performance of their duties to the Trust. Each Independent Trustee is also indemnified against certain liabilities arising out of the performance of their duties to the Trust pursuant to an Indemnification Agreement between such trustee and the Trust. Additionally, in the normal course of business, the Trust enters into contracts with service providers that contain general indemnification clauses. The Trust’s maximum exposure under these arrangements is unknown, as this would involve future claims that may be made against the Trust that have not yet occurred. The risk of material loss as a result of such indemnification claims is considered remote. |
| J. | Securities Lending - Each Fund may participate in securities lending and may loan portfolio securities having a market value up to one-third of the Fund’s total assets. Such loans are secured by cash collateral equal to no less than 102% (105% for international securities) of the market value of the loaned securities determined daily by the securities lending provider. Cash collateral received in connection with these loans is generally invested in an affiliated money market fund and is shown as such on the Schedules of Investments. Each Fund bears the risk of loss with respect to the investment of collateral. It is the policy of these Funds to obtain additional collateral from or return excess collateral to the borrower by the end of the next business day, following the valuation date of the securities loaned. Therefore, the value of the collateral held may be temporarily less than the value of the securities on loan. When loaning securities, each Fund retains certain benefits of owning the securities, including the economic equivalent of dividends or interest generated by the security. Lending securities entails a risk of loss to each Fund if, and to the extent that, the market value of the securities loaned were to increase, and the borrower did not increase the collateral accordingly, and the borrower failed to return the securities. The securities loaned are subject to termination at the option of the borrower or each Fund. Upon termination, the borrower will return to each Fund the securities loaned and each Fund will return the collateral. Upon the failure of the borrower to return the securities, collateral may be liquidated and the securities may be purchased on the open market to replace the loaned securities. Each Fund could experience delays and costs in gaining access to the collateral and the securities may lose value during the delay which could result in potential losses to each Fund. Some of these losses may be indemnified by the lending agent. Each Fund bears the risk of any deficiency in the amount of the collateral available for return to the borrower due to any loss on the collateral invested. For Funds that participated in securities lending, dividends received on cash collateral investments for securities lending transactions, which are net of compensation to counterparties, are included in Securities lending income on the Statements of Operations. The aggregate value of securities out on loan, if any, is shown on the Statements of Assets and Liabilities. |
NOTE 3–Investment Advisory Agreement and Other Agreements
The Trust has entered into Investment Advisory Agreements with the Adviser on behalf of the Funds, pursuant to which the Adviser has overall responsibility for the selection and ongoing monitoring of the Funds’ investments, managing the Funds’ business affairs and providing certain clerical, bookkeeping and other administrative services. Pursuant to an Investment Advisory Agreement, each Fund (except Dow Jones Industrial Average Dividend ETF) accrues daily and pays monthly to the Adviser an annual fee of 0.40% of the Fund’s average daily net assets, except for BuyBack AchieversTM ETF and Financial Preferred ETF, each of which accrues daily and pays monthly to the Adviser an annual fee of 0.50% of the Fund’s average daily net assets.
Pursuant to another Investment Advisory Agreement, Dow Jones Industrial Average Dividend ETF accrues daily and pays monthly to the Adviser, as compensation for its services, an annual unitary management fee of 0.07% of the Fund’s average daily net assets. Out of the unitary management fee, the Adviser has agreed to pay for substantially all expenses of the Dow Jones Industrial Average Dividend ETF, including the cost of transfer agency, custody, fund administration, legal, audit and other services, except for distribution fees, if any, brokerage expenses, taxes, interest, litigation expenses, acquired fund fees and expenses, if any, and other extraordinary expenses, including proxy expenses (except for such proxies related to: (i) changes to the Investment Advisory Agreement, (ii) the election of any Board member who is an “interested person” of the Trust, or (iii) any other matters that directly benefit the Adviser).
The Trust also has entered into an Amended and Restated Excess Expense Agreement (the “Expense Agreement”) with the Adviser on behalf of each Fund (except Dow Jones Industrial Average Dividend ETF), pursuant to which the Adviser has contractually agreed to waive fees and/or pay Fund expenses to the extent necessary to prevent the operating expenses (excluding interest expenses, sub-licensing fees, offering costs, brokerage commissions and other trading expenses, taxes, acquired fund fees and expenses, if any, and extraordinary expenses, including proxy expenses (except for such proxies related to: (i) changes to the Investment Advisory Agreement, (ii) the election of any Board member who is an “interested person” of the Trust, or (iii) any other matters that directly benefit the Adviser)) of each Fund (except for BuyBack Achievers™ ETF and Financial Preferred ETF) from exceeding 0.50% of the Fund’s average daily net assets per year (0.60% of the Fund’s average daily net assets per year for BuyBack Achievers™ ETF and Financial Preferred ETF) (the “Expense Cap”), through at least August 31, 2023. Unless the Adviser continues the Expense Agreement, it will terminate on August 31, 2023. During its term, the Expense Agreement cannot be terminated or amended to increase the Expense Cap without approval of the Board of Trustees. For each Fund (excluding the Dow Jones Industrial Average Dividend ETF), the Adviser did not waive fees and/or pay Fund expenses during the period under this Expense Cap.
Further, through at least August 31, 2023, the Adviser has contractually agreed to waive a portion of each Fund’s management fee in an amount equal to 100% of the net advisory fees an affiliate of the Adviser receives that are attributable to the Fund’s investments of otherwise uninvested cash in money market funds managed by that affiliate (excluding investments of cash collateral from securities lending). There is no guarantee that the Adviser will extend the waiver of these fees past the due date. This agreement is not subject to recapture by the Adviser.
For the fiscal year ended April 30, 2021, the Adviser waived fees and/or paid Fund expenses for each Fund in the following amounts:
| | | | |
BuyBack AchieversTM ETF | | $ | 1,187 | |
Dividend AchieversTM ETF | | | 466 | |
Dow Jones Industrial Average Dividend ETF | | | 199 | |
Financial Preferred ETF | | | 8,720 | |
High Yield Equity Dividend AchieversTM ETF | | | 1,142 | |
International Dividend AchieversTM ETF | | | 466 | |
The fees waived and/or expenses borne by the Adviser pursuant to the Expense Cap are subject to recapture by the Adviser up to three years from the date the fees were waived or the expenses were incurred, but no recapture payment will be made by the Funds if it would result in the Funds exceeding (i) the Expense Cap or (ii) the expense cap in effect at the time the fees and/or expenses subject to recapture were waived and/or borne by the Adviser.
For the fiscal year ended April 30, 2021, there were no amounts available for potential recapture by the Adviser under the Expense Agreement.
The Trust has entered into a Distribution Agreement with Invesco Distributors, Inc. (the “Distributor”), which serves as the distributor of Creation Units for each Fund. The Distributor does not maintain a secondary market in the Shares. The Funds are not charged any fees pursuant to the Distribution Agreement. The Distributor is an affiliate of the Adviser.
The Adviser has entered into a licensing agreement for each Fund with the following entities (each, a “Licensor”):
| | |
| Fund | | Licensor |
BuyBack AchieversTM ETF | | Nasdaq, Inc. |
Dividend AchieversTM ETF | | Nasdaq, Inc. |
Dow Jones Industrial Average Dividend ETF | | S&P Dow Jones Indices LLC |
Financial Preferred ETF | | Wells Fargo & Company |
High Yield Equity Dividend AchieversTM ETF | | Nasdaq, Inc. |
International Dividend AchieversTM ETF | | Nasdaq, Inc. |
Each Underlying Index name trademark is owned by its respective Licensor. These trademarks have been licensed to the Adviser for use by the Funds. Each Fund is entitled to use its Underlying Index pursuant to the Trust’s sub-licensing agreement with the Adviser. The Funds (except for Dow Jones Industrial Average Dividend ETF) are required to pay the sub-licensing fees that are shown on the Statements of Operations. The Funds are not sponsored, endorsed, sold or promoted by the Licensors, and the Licensors make no representation regarding the advisability of investing in any of the Funds.
The Trust has entered into service agreements whereby The Bank of New York Mellon, a wholly-owned subsidiary of The Bank of New York Mellon Corporation, serves as the administrator, custodian, fund accountant and transfer agent for each Fund.
For the fiscal year ended April 30, 2021, the following Funds incurred brokerage commissions with Invesco Capital Markets, Inc. (“ICMI”), an affiliate of the Adviser and Distributor, for portfolio transactions executed on behalf of the Funds, as listed below:
| | | | |
BuyBack AchieversTM ETF | | $ | 52,261 | |
Dividend AchieversTM ETF | | | 2,983 | |
Dow Jones Industrial Average Dividend ETF | | | 5,924 | |
High Yield Equity Dividend AchieversTM ETF | | | 24,797 | |
International Dividend AchieversTM ETF | | | 12,588 | |
Portfolio transactions with ICMI that have not settled at period-end, if any, are shown in the Statements of Assets and Liabilities under the receivable caption Investments sold - affiliated broker and/or payable caption Investments purchased - affiliated broker.
NOTE 4–Security Transactions with Affiliated Funds
Each Fund is permitted to purchase or sell securities from or to certain other affiliated funds under specified conditions outlined in procedures adopted by the Board of Trustees of the Trust. The procedures have been designed to ensure that any purchase or sale of securities by each Fund from or to another fund or portfolio that is or could be considered an affiliate by virtue of having a common investment adviser (or affiliated investment advisers), common Trustees and/or common officers complies with Rule 17a-7 of the 1940 Act. Further, as defined under the procedures, each transaction is effected at the current market price.
For the fiscal year ended April 30, 2021, the following Fund engaged in transactions with affiliates as listed below:
| | | | | | | | | | | | | | | |
| | | Securities Purchases | | Securities Sales | | Net Realized Gains (Losses)* |
BuyBack AchieversTM ETF | | | $ | 958,271 | | | | $ | 45,387,149 | | | | $ | (3,427,148 | ) |
| * | Net realized gains (losses) from securities sold to affiliates are included in net realized gain (loss) from investment securities in the Statements of Operations. |
NOTE 5–Additional Valuation Information
GAAP defines fair value as the price that would be received to sell an asset or paid to transfer a liability in an orderly transaction between market participants at the measurement date, under current market conditions. GAAP establishes a hierarchy that prioritizes the inputs to valuation methods, giving the highest priority to readily available unadjusted quoted prices in an active market for identical assets (Level 1) and the lowest priority to significant unobservable inputs (Level 3), generally when market prices are not readily available or are unreliable. Based on the valuation inputs, the securities or other investments are tiered into one of three levels. Changes in valuation methods may result in transfers in or out of an investment’s assigned level:
| | Level 1 – | Prices are determined using quoted prices in an active market for identical assets. |
| | Level 2 – | Prices are determined using other significant observable inputs. Observable inputs are inputs that other market participants may use in pricing a security. These may include quoted prices for similar securities, interest rates, prepayment speeds, credit risk, yield curves, loss severities, default rates, discount rates, volatilities and others. |
| | Level 3 – | Prices are determined using significant unobservable inputs. In situations where quoted prices or observable inputs are unavailable (for example, when there is little or no market activity for an investment at the end of the period), unobservable inputs may be used. Unobservable inputs reflect a Fund’s own assumptions about the factors market participants would use in determining fair value of the securities or instruments and would be based on the best available information. |
The following is a summary of the tiered valuation input levels, as of April 30, 2021, for each Fund (except for Dow Jones Industrial Average Dividend ETF). As of April 30, 2021, all of the securities in Dow Jones Industrial Average Dividend ETF were valued based on Level 1 inputs (see the Schedules of Investments for security categories). The level assigned to the securities valuations may not be an indication of the risk or liquidity associated with investing in those securities. Because of the inherent uncertainties of valuation, the values reflected in the financial statements may materially differ from the value received upon actual sale of those investments.
| | | | | | | | | | | | | | | | | | | | |
| | | Level 1 | | Level 2 | | Level 3 | | Total |
| | | | |
| BuyBack AchieversTM ETF | | | | | | | | | | | | | | | | | | | | |
| | | | |
| Investments in Securities | | | | | | | | | | | | | | | | | | | | |
| | | | |
Common Stocks & Other Equity Interests | | | $ | 1,843,821,869 | | | | $ | — | | | | | $- | | | | $ | 1,843,821,869 | |
| | | | |
Money Market Funds | | | | 1,541,414 | | | | | 225,177,781 | | | | | - | | | | | 226,719,195 | |
| | | | | | | | | | | | | | | | | | | | |
| | | | |
Total Investments | | | $ | 1,845,363,283 | | | | $ | 225,177,781 | | | | | $- | | | | $ | 2,070,541,064 | |
| | | | | | | | | | | | | | | | | | | | |
| | | | |
| Dividend AchieversTM ETF | | | | | | | | | | | | | | | | | | | | |
| | | | |
| Investments in Securities | | | | | | | | | | | | | | | | | | | | |
| | | | |
Common Stocks & Other Equity Interests | | | $ | 614,383,240 | | | | $ | — | | | | | $- | | | | $ | 614,383,240 | |
| | | | |
Money Market Funds | | | | 504,143 | | | | | 1,823,552 | | | | | - | | | | | 2,327,695 | |
| | | | | | | | | | | | | | | | | | | | |
| | | | |
Total Investments | | | $ | 614,887,383 | | | | $ | 1,823,552 | | | | | $- | | | | $ | 616,710,935 | |
| | | | | | | | | | | | | | | | | | | | |
| | | | |
| Financial Preferred ETF | | | | | | | | | | | | | | | | | | | | |
| | | | |
| Investments in Securities | | | | | | | | | | | | | | | | | | | | |
| | | | |
Preferred Stocks | | | $ | 1,825,291,376 | | | | $ | — | | | | | $- | | | | $ | 1,825,291,376 | |
| | | | |
Money Market Funds | | | | 11,481,962 | | | | | 69,181,013 | | | | | - | | | | | 80,662,975 | |
| | | | | | | | | | | | | | | | | | | | |
| | | | |
Total Investments | | | $ | 1,836,773,338 | | | | $ | 69,181,013 | | | | | $- | | | | $ | 1,905,954,351 | |
| | | | | | | | | | | | | | | | | | | | |
| | | | |
| High Yield Equity Dividend AchieversTM ETF | | | | | | | | | | | | | | | | | | | | |
| | | | |
| Investments in Securities | | | | | | | | | | | | | | | | | | | | |
| | | | |
Common Stocks & Other Equity Interests | | | $ | 928,706,484 | | | | $ | — | | | | | $- | | | | $ | 928,706,484 | |
| | | | |
Money Market Funds | | | | — | | | | | 19,440,348 | | | | | - | | | | | 19,440,348 | |
| | | | | | | | | | | | | | | | | | | | |
| | | | |
Total Investments | | | $ | 928,706,484 | | | | $ | 19,440,348 | | | | | $- | | | | $ | 948,146,832 | |
| | | | | | | | | | | | | | | | | | | | |
| | | | |
| International Dividend AchieversTM ETF | | | | | | | | | | | | | | | | | | | | |
| | | | |
| Investments in Securities | | | | | | | | | | | | | | | | | | | | |
| | | | |
Common Stocks & Other Equity Interests | | | $ | 578,286,546 | | | | $ | — | | | | | $- | | | | $ | 578,286,546 | |
| | | | |
Money Market Funds | | | | — | | | | | 52,894,793 | | | | | — | | | | | 52,894,793 | |
| | | | | | | | | | | | | | | | | | | | |
| | | | |
Total Investments | | | $ | 578,286,546 | | | | $ | 52,894,793 | | | | | $- | | | | $ | 631,181,339 | |
| | | | | | | | | | | | | | | | | | | | |
NOTE 6–Distributions to Shareholders and Tax Components of Net Assets
Tax Character of Distributions to Shareholders Paid During the Fiscal Years Ended April 30, 2021 and 2020:
| | | | | | | | |
| | | 2021 | | | 2020 | |
| | | Ordinary
Income* | | | Ordinary
Income* | |
| | |
BuyBack AchieversTM ETF | | $ | 12,637,498 | | | $ | 19,077,680 | |
| | |
Dividend AchieversTM ETF | | | 8,438,801 | | | | 6,842,429 | |
| | |
Dow Jones Industrial Average Dividend ETF | | | 3,862,239 | | | | 2,239,884 | |
| | |
Financial Preferred ETF | | | 82,544,541 | | | | 78,034,495 | |
| | |
High Yield Equity Dividend AchieversTM ETF | | | 32,331,907 | | | | 36,486,586 | |
| | |
International Dividend AchieversTM ETF | | | 18,541,664 | | | | 32,779,007 | |
| * | Includes short-term capital gain distributions, if any. |
Tax Components of Net Assets at Fiscal Year-End:
| | | | | | | | | | | | | | | | | | | | | | | | | | |
| | | Undistributed
Ordinary
Income | | | Temporary
Book/Tax
Differences | | | Net
Unrealized
Appreciation-
Investments | | | Net
Unrealized
Appreciation -
Foreign
Currencies | | Capital Loss
Carryforwards | | | Shares of
Beneficial
Interest | | | Total
Net Assets | |
| | | | | | | |
BuyBack AchieversTM ETF | | $ | 880,858 | | | $ | (161,694 | ) | | $ | 246,329,646 | | | $ - | | $ | (388,032,515 | ) | | $ | 1,985,103,127 | | | $ | 1,844,119,422 | |
| | | | | | | |
Dividend AchieversTM ETF | | | 1,295,388 | | | | (71,707 | ) | | | 123,481,508 | | | - | | | (7,582,690 | ) | | | 497,832,039 | | | | 614,954,538 | |
| | | | | | | |
| Dow Jones Industrial Average Dividend ETF | | | 40,334 | | | | - | | | | 7,649,394 | | | - | | | (4,560,130 | ) | | | 151,628,648 | | | | 154,758,246 | |
| | | | | | | |
| Financial Preferred ETF | | | 1,046,707 | | | | (234,572 | ) | | | 44,928,716 | | | - | | | (33,988,276 | ) | | | 1,815,334,596 | | | | 1,827,087,171 | |
| | | | | | | |
| High Yield Equity Dividend AchieversTM ETF | | | - | | | | (92,375 | ) | | | 105,115,360 | | | - | | | (169,075,165 | ) | | | 993,531,249 | | | | 929,479,069 | |
| | | | | | | |
| International Dividend AchieversTM ETF | | | 4,659,371 | | | | (477,562 | ) | | | 71,800,412 | | | 2,177 | | | (430,618,377 | ) | | | 934,204,153 | | | | 579,570,174 | |
Capital loss carryforwards are calculated and reported as of a specific date. Results of transactions and other activity after that date may affect the amount of capital loss carryforwards actually available for the Funds to utilize. The ability to utilize capital loss carryforwards in the future may be limited under the Internal Revenue Code and related regulations based on the results of future transactions.
The following table presents available capital loss carryforwards for each Fund as of April 30, 2021:
| | | | | | | | | | | | |
| | | No expiration | | | | |
| | | Short-Term | | | Long-Term | | | Total* | |
BuyBack AchieversTM ETF | | $ | 270,034,055 | | | $ | 117,998,460 | | | $ | 388,032,515 | |
Dividend AchieversTM ETF | | | 1,292,960 | | | | 6,289,730 | | | | 7,582,690 | |
Dow Jones Industrial Average Dividend ETF | | | 952,623 | | | | 3,607,507 | | | | 4,560,130 | |
Financial Preferred ETF | | | 5,621,368 | | | | 28,366,908 | | | | 33,988,276 | |
High Yield Equity Dividend AchieversTM ETF | | | 30,478,043 | | | | 138,597,122 | | | | 169,075,165 | |
International Dividend AchieversTM ETF | | | 185,692,966 | | | | 244,925,411 | | | | 430,618,377 | |
| * | Capital loss carryforwards are reduced for limitations, if any, to the extent required by the Internal Revenue Code and may be further limited depending upon a variety of factors, including the realization of net unrealized gains or losses as of the date of any reorganization. |
NOTE 7–Investment Transactions
For the fiscal year ended April 30, 2021, the cost of securities purchased and the proceeds from sales of securities (other than short-term securities, U.S. Government obligations, money market funds and in-kind transactions, if any) were as follows:
| | | | | | | | |
| | | Purchases | | | Sales | |
BuyBack AchieversTM ETF | | $ | 888,719,530 | | | $ | 888,390,532 | |
Dividend AchieversTM ETF | | | 124,833,645 | | | | 124,241,852 | |
Dow Jones Industrial Average Dividend ETF | | | 52,578,964 | | | | 52,005,099 | |
Financial Preferred ETF | | | 390,733,766 | | | | 374,154,450 | |
High Yield Equity Dividend AchieversTM ETF | | | 526,605,546 | | | | 525,004,809 | |
International Dividend AchieversTM ETF | | | 355,678,612 | | | | 353,395,714 | |
For the fiscal year ended April 30, 2021, in-kind transactions associated with creations and redemptions were as follows:
| | | | | | | | |
| | | Cost of
Securities
Received | | | Value of
Securities
Delivered | |
BuyBack AchieversTM ETF | | $ | 1,104,319,280 | | | $ | 427,741,131 | |
Dividend AchieversTM ETF | | | 293,553,683 | | | | 107,635,582 | |
Dow Jones Industrial Average Dividend ETF | | | 152,044,635 | | | | 142,681,192 | |
Financial Preferred ETF | | | 494,213,858 | | | | 203,737,409 | |
High Yield Equity Dividend AchieversTM ETF | | | 346,741,872 | | | | 319,830,777 | |
International Dividend AchieversTM ETF | | | 74,167,342 | | | | 187,636,515 | |
Gains (losses) on in-kind transactions are generally not considered taxable gains (losses) for federal income tax purposes.
As of April 30, 2021, the aggregate cost of investments, including any derivatives, on a tax basis includes adjustments for financial reporting purposes as of the most recently completed federal income tax reporting period-end:
| | | | | | | | | | | | | | | | |
| | | Gross
Unrealized
Appreciation | | | Gross
Unrealized
(Depreciation) | | | Net
Unrealized
Appreciation | | | Cost | |
BuyBack AchieversTM ETF | | $ | 263,461,734 | | | $ | (17,132,088 | ) | | $ | 246,329,646 | | | $ | 1,824,211,418 | |
Dividend AchieversTM ETF | | | 136,022,964 | | | | (12,541,456 | ) | | | 123,481,508 | | | | 493,229,427 | |
Dow Jones Industrial Average Dividend ETF | | | 10,263,648 | | | | (2,614,254 | ) | | | 7,649,394 | | | | 147,069,019 | |
Financial Preferred ETF | | | 58,455,803 | | | | (13,527,087 | ) | | | 44,928,716 | | | | 1,861,025,635 | |
High Yield Equity Dividend AchieversTM ETF | | | 119,333,103 | | | | (14,217,743 | ) | | | 105,115,360 | | | | 843,031,472 | |
International Dividend AchieversTM ETF | | | 89,605,574 | | | | (17,805,162 | ) | | | 71,800,412 | | | | 559,380,927 | |
NOTE 8–Reclassification of Permanent Differences
Primarily as a result of differing book/tax treatment of in-kind transactions, amounts were reclassified between undistributed net investment income (loss), undistributed net realized gain (loss) and Shares of beneficial interest. These reclassifications had no effect on the net assets of each Fund. For the fiscal year ended April 30, 2021, the reclassifications were as follows:
| | | | | | | | | | | | | | | |
| | | Undistributed Net | | Undistributed Net | | Shares of |
| | | Investment Income | | Realized Gain (Loss) | | Beneficial Interest |
BuyBack AchieversTM ETF | | | $ | 19,683 | | | | $ | (72,159,421 | ) | | | $ | 72,139,738 | |
Dividend AchieversTM ETF | | | | 238,480 | | | | | (44,679,662 | ) | | | | 44,441,182 | |
Dow Jones Industrial Average Dividend ETF | | | | - | | | | | (17,362,519 | ) | | | | 17,362,519 | |
Financial Preferred ETF | | | | - | | | | | (14,462,354 | ) | | | | 14,462,354 | |
High Yield Equity Dividend AchieversTM ETF | | | | 2,254,088 | | | | | (82,824,545 | ) | | | | 80,570,457 | |
International Dividend AchieversTM ETF | | | | 2,826,289 | | | | | (36,689,059 | ) | | | | 33,862,770 | |
NOTE 9–Trustees’ and Officer’s Fees
Trustees’ and Officer’s Fees include amounts accrued by the Funds to pay remuneration to the Independent Trustees and an Officer of the Trust. The Adviser, as a result of the unitary management fee, pays for such compensation for Dow Jones Industrial Average Dividend ETF. The Trustee who is an “interested person” of the Trust does not receive any Trustees’ fees.
The Trust has adopted a deferred compensation plan (the “Plan”). Under the Plan, each Independent Trustee who has executed a Deferred Fee Agreement (a “Participating Trustee”) may defer receipt of all or a portion of their compensation (“Deferral Fees”). Such Deferral Fees are deemed to be invested in select Invesco ETFs. The Deferral Fees payable to a Participating Trustee are valued as of the date such Deferral Fees would have been paid to a Participating Trustee. The value increases with contributions or with increases in the value of the Shares selected, and the value decreases with distributions or with declines in the value of the Shares selected. Obligations under the Plan represent unsecured claims against the general assets of the Funds.
NOTE 10–Capital
Shares are issued and redeemed by each Fund only in Creation Units consisting of a specified number of Shares as set forth in each Fund’s prospectus. Only Authorized Participants are permitted to purchase or redeem Creation Units from the Funds. Such transactions are principally permitted in exchange for Deposit Securities, with a balancing cash component to equate the transaction to the NAV per Share of a Fund on the transaction date. However, for all Funds, cash in an amount equivalent to the value of certain securities may be substituted, generally when the securities are not available in sufficient quantity for delivery, not eligible for trading by the Authorized Participant or as a result of other market circumstances.
To the extent that the Funds permit transactions in exchange for Deposit Securities, each Fund may issue Shares in advance of receipt of Deposit Securities subject to various conditions, including a requirement to maintain on deposit with the Trust cash at least equal to 105% of the market value of the missing Deposit Securities. In accordance with the Trust’s Participant Agreement, Creation Units will be issued to an Authorized Participant, notwithstanding the fact that the corresponding Deposit Securities have not been received in part or in whole, in reliance on the undertaking of the Authorized Participant to deliver the missing Deposit Securities as soon as possible, which undertaking shall be secured by the Authorized Participant’s delivery and maintenance of collateral consisting of cash in the form of U.S. dollars in immediately available funds having a value (marked-to-market daily) at least equal to 105%, which the Adviser may change from time to time, of the value of the missing Deposit Securities.
Certain transaction fees may be charged by the Funds for creations and redemptions, which are treated as increases in capital.
Transactions in each Fund’s Shares are disclosed in detail in the Statements of Changes in Net Assets.
NOTE 11–Significant Event
On March 12, 2021, the Board of Trustees approved changes to Invesco Financial Preferred ETF’s underlying index, index provider, investment objective and principal investment strategy. The Fund’s underlying index will change to ICE Exchange-Listed Fixed Rate Financial Preferred Securities Index (the “New Underlying Index”), the index provider will change to ICE Data Indices, LLC, the investment objective will change to track the investment results (before fees and expenses) of the New Underlying Index, and the principal investment strategy will change to generally invest at least 90% of its total assets in the components of the New Underlying Index. Theses changes will be effective as of the close of markets on June 30, 2021.
Report of Independent Registered Public Accounting Firm
To the Board of Trustees of Invesco Exchange-Traded Fund Trust and Shareholders of Invesco BuyBack Achievers™ ETF, Invesco Dividend Achievers™ ETF, Invesco Dow Jones Industrial Average Dividend ETF, Invesco Financial Preferred ETF, Invesco High Yield Equity Dividend Achievers™ ETF and Invesco International Dividend Achievers™ ETF
Opinions on the Financial Statements
We have audited the accompanying statements of assets and liabilities, including the schedules of investments, of Invesco BuyBack Achievers™ ETF, Invesco Dividend Achievers™ ETF, Invesco Dow Jones Industrial Average Dividend ETF, Invesco Financial Preferred ETF, Invesco High Yield Equity Dividend Achievers™ ETF and Invesco International Dividend Achievers™ ETF (six of the funds constituting Invesco Exchange-Traded Fund Trust, hereafter collectively referred to as the “Funds”) as of April 30, 2021, the related statements of operations for the year ended April 30, 2021, the statements of changes in net assets for each of the two years in the period ended April 30, 2021, including the related notes, and the financial highlights for each of the five years in the period ended April 30, 2021 (or for Invesco Dow Jones Industrial Average Dividend ETF, for each of the three years in the period ended April 30, 2021 and for the eight months ended April 30, 2018) (collectively referred to as the “financial statements”). In our opinion, the financial statements present fairly, in all material respects, the financial position of each of the Funds as of April 30, 2021, the results of each of their operations for the year then ended, the changes in each of their net assets for each of the two years in the period ended April 30, 2021, and each of the financial highlights for each of the five years in the period ended April 30, 2021 (or for Invesco Dow Jones Industrial Average Dividend ETF, for each of the three years in the period ended April 30, 2021 and for the eight months ended April 30, 2018) in conformity with accounting principles generally accepted in the United States of America.
The financial statements of Invesco Dow Jones Industrial Average Dividend ETF (Predecessor Fund Guggenheim Dow Jones Industrial Average Dividend ETF) as of and for the year ended August 31, 2017 and the financial highlights for each of the periods ended on or prior to August 31, 2017 (not presented herein, other than the financial highlights) were audited by other auditors whose report dated October 30, 2017, expressed an unqualified opinion on those financial statements and financial highlights.
Basis for Opinions
These financial statements are the responsibility of the Funds’ management. Our responsibility is to express an opinion on the Funds’ financial statements based on our audits. We are a public accounting firm registered with the Public Company Accounting Oversight Board (United States) (PCAOB) and are required to be independent with respect to the Funds in accordance with the U.S. federal securities laws and the applicable rules and regulations of the Securities and Exchange Commission and the PCAOB.
We conducted our audits of these financial statements in accordance with the standards of the PCAOB. Those standards require that we plan and perform the audit to obtain reasonable assurance about whether the financial statements are free of material misstatement, whether due to error or fraud.
Our audits included performing procedures to assess the risks of material misstatement of the financial statements, whether due to error or fraud, and performing procedures that respond to those risks. Such procedures included examining, on a test basis, evidence regarding the amounts and disclosures in the financial statements. Our audits also included evaluating the accounting principles used and significant estimates made by management, as well as evaluating the overall presentation of the financial statements. Our procedures included confirmation of securities owned as of April 30, 2021 by correspondence with the custodian, transfer agent and brokers; when replies were not received from brokers, we performed other auditing procedures. We believe that our audits provide a reasonable basis for our opinions.
/s/ PricewaterhouseCoopers LLP
Chicago, Illinois
June 29, 2021
We have served as the auditor of one or more of the investment companies in the Invesco group of investment companies since at least 1995. We have not determined the specific year we began serving as auditor.
Calculating your ongoing Fund expenses
Example
As a shareholder of a Fund of the Invesco Exchange-Traded Fund Trust (excluding Dow Jones Industrial Average Dividend ETF), you incur advisory fees and other Fund expenses. As a shareholder of the Dow Jones Industrial Average Dividend ETF, you incur a unitary management fee. In addition to the unitary management fee, a shareholder may pay distribution fees, if any, brokerage expenses, taxes, interest, litigation expenses, acquired fund fees and expenses, if any, and other extraordinary expenses, including proxy expenses (except for such proxies related to: (i) changes to the Investment Advisory Agreement, (ii) the election of any Board member who is an “interested person” of the Trust, or (iii) any other matters that directly benefit the Adviser). The expense examples below are intended to help you understand your ongoing costs (in dollars) of investing in the Funds and to compare these costs with the ongoing costs of investing in other funds.
The example is based on an investment of $1,000 invested at the beginning of the period and held for the entire period November 1, 2020 through April 30, 2021.
Actual Expenses
The first line in the following table provides information about actual account values and actual expenses. You may use the information in this line, together with the amount you invested, to estimate the expenses that you paid over the period. Simply divide your account value by $1,000 (for example, an $8,600 account value divided by $1,000 = 8.6), then multiply the result by the number in the first line under the heading “Expenses Paid During the Six-Month Period” to estimate the expenses you paid on your account during this period.
Hypothetical Example for Comparison Purposes
The second line in the following table provides information about hypothetical account values and hypothetical expenses based on each Fund’s actual expense ratio and an assumed annualized rate of return of 5% per year before expenses, which is not the Fund’s actual return. The hypothetical account values and expenses may not be used to estimate the actual ending account balance or expenses you paid for the period. You may use this information to compare the ongoing costs of investing in the Funds and other funds. To do so, compare this 5% hypothetical example with the 5% hypothetical examples that appear in the shareholder reports of the other funds.
Please note that the expenses shown in the table are meant to highlight your ongoing costs only, and do not reflect any transactional costs, such as sales charges and brokerage commissions. Therefore, the second line in the table is useful in comparing ongoing costs only, and will not help you determine the relative total costs of owning different funds. In addition, expenses shown in the table do not include the expenses of the underlying funds, which are borne indirectly by a Fund. If transaction costs and indirect expenses were included, your costs would have been higher.
| | | | | | | | | | | | | | | | | | | | |
| | | | | | | Annualized | | |
| | | Beginning | | Ending | | Expense Ratio | | Expenses Paid |
| | | Account Value | | Account Value | | Based on the | | During the |
| | | November 1, 2020 | | April 30, 2021 | | Six-Month Period | | Six-Month Period(1) |
| | | | |
Invesco BuyBack AchieversTM ETF (PKW) | | | | | | | | | | | | | | | | | | | | |
| | | | |
Actual | | | $ | 1,000.00 | | | | $ | 1,492.80 | | | | | 0.63 | % | | | $ | 3.89 | |
| | | | |
Hypothetical (5% return before expenses) | | | | 1,000.00 | | | | | 1,021.67 | | | | | 0.63 | | | | | 3.16 | |
Invesco Dividend AchieversTM ETF (PFM) | | | | | | | | | | | | | | | | | | | | |
| | | | |
Actual | | | | 1,000.00 | | | | | 1,223.80 | | | | | 0.53 | | | | | 2.92 | |
| | | | |
Hypothetical (5% return before expenses) | | | | 1,000.00 | | | | | 1,022.17 | | | | | 0.53 | | | | | 2.66 | |
| | | | |
Invesco Dow Jones Industrial Average Dividend ETF (DJD) | | | | | | | | | | | | | | | | | | | | |
| | | | |
Actual | | | | 1,000.00 | | | | | 1,335.90 | | | | | 0.07 | | | | | 0.41 | |
| | | | |
Hypothetical (5% return before expenses) | | | | 1,000.00 | | | | | 1,024.45 | | | | | 0.07 | | | | | 0.35 | |
Invesco Financial Preferred ETF (PGF) | | | | | | | | | | | | | | | | | | | | |
| | | | |
Actual | | | | 1,000.00 | | | | | 1,039.30 | | | | | 0.62 | | | | | 3.13 | |
| | | | |
Hypothetical (5% return before expenses) | | | | 1,000.00 | | | | | 1,021.72 | | | | | 0.62 | | | | | 3.11 | |
Calculating your ongoing Fund expenses—(continued)
| | | | | | | | | | | | | | | | | | | | |
| | | | | | | Annualized | | |
| | | Beginning | | Ending | | Expense Ratio | | Expenses Paid |
| | | Account Value | | Account Value | | Based on the | | During the |
| | | November 1, 2020 | | April 30, 2021 | | Six-Month Period | | Six-Month Period(1) |
| | | | |
Invesco High Yield Equity Dividend AchieversTM ETF (PEY) | | | | | | | | | | | | | | | | | | | | |
| | | | |
Actual | | | $ | 1,000.00 | | | | $ | 1,426.50 | | | | | 0.53 | % | | | $ | 3.19 | |
| | | | |
Hypothetical (5% return before expenses) | | | | 1,000.00 | | | | | 1,022.17 | | | | | 0.53 | | | | | 2.66 | |
Invesco International Dividend AchieversTM ETF (PID) | | | | | | | | | | | | | | | | | | | | |
| | | | |
Actual | | | | 1,000.00 | | | | | 1,378.90 | | | | | 0.56 | | | | | 3.30 | |
| | | | |
Hypothetical (5% return before expenses) | | | | 1,000.00 | | | | | 1,022.02 | | | | | 0.56 | | | | | 2.81 | |
| (1) | Expenses are calculated using the annualized expense ratio, which represents the ongoing expenses as a percentage of net assets for the six-month period ended April 30, 2021. Expenses are calculated by multiplying the Fund’s annualized expense ratio by the average account value for the period, then multiplying the result by 181/365. Expense ratios for the most recent six-month period may differ from expense ratios based on the annualized data in the Financial Highlights. |
Tax Information
Form 1099-DIV, Form 1042-S and other year–end tax information provide shareholders with actual calendar year amounts that should be included in their tax returns. Shareholders should consult their tax advisers.
The following distribution information is being provided as required by the Internal Revenue Code or to meet a specific state’s requirement.
Each Fund designates the following amounts or, if subsequently determined to be different, the maximum amount allowable for its fiscal year ended April 30, 2021:
| | | | | | | | | | | | | | | | | | | | | | | | | |
| | | Qualified | | Qualified | | | | | | Business |
| | | Business | | Dividend | | Corporate Dividends | | U.S. Treasury | | Interest |
| | | Income* | | Income* | | Received Deduction* | | Obligations* | | Income* |
Invesco BuyBack AchieversTM ETF | | | | 0 | % | | | | 100 | % | | | | 100 | % | | | | 0 | % | | | | 0 | % |
Invesco Dividend AchieversTM ETF | | | | 0 | % | | | | 100 | % | | | | 100 | % | | | | 0 | % | | | | 0 | % |
Invesco Dow Jones Industrial Average Dividend ETF | | | | 0 | % | | | | 97 | % | | | | 98 | % | | | | 0 | % | | | | 0 | % |
Invesco Financial Preferred ETF | | | | 0 | % | | | | 99 | % | | | | 97 | % | | | | 0 | % | | | | 0 | % |
Invesco High Yield Equity Dividend AchieversTM ETF | | | | 0 | % | | | | 99 | % | | | | 100 | % | | | | 0 | % | | | | 0 | % |
Invesco International Dividend AchieversTM ETF | | | | 0 | % | | | | 55 | % | | | | 0 | % | | | | 0 | % | | | | 0 | % |
| * | The above percentages are based on ordinary income dividends paid to shareholders during the Fund’s fiscal year. |
The Funds intend to elect to pass through to shareholders the credit for taxes paid to foreign countries. The foreign source income and foreign taxes paid per share are as follows:
| | | | | | | | | | |
| | | Foreign Taxes | | Foreign Source |
| | | Per Share | | Income Per Share |
Invesco International Dividend AchieversTM ETF | | | $ | 0.0281 | | | | $ | 0.5795 | |
Trustees and Officers
The Independent Trustees of the Trust, their term of office and length of time served, their principal business occupations during at least the past five years, the number of portfolios in the Fund Complex (as defined below) overseen by each Independent Trustee and the other directorships, if any, held by each Independent Trustee are shown below.
As of April 30, 2021
| | | | | | | | | | |
Name, Address and Year of Birth of Independent Trustees | | Position(s)
Held with Trust | | Term of
Office and
Length of
Time
Served* | | Principal Occupation(s) During Past 5 Years | | Number of
Portfolios
in Fund
Complex**
Overseen by
Independent
Trustees | | Other Directorships Held by Independent Trustees During
the Past 5 Years |
Ronn R. Bagge–1958 c/o Invesco Capital Management LLC 3500 Lacey Road, Suite 700 Downers Grove, IL 60515 | | Vice Chairman of the Board; Chairman of the Nominating and Governance Committee and Trustee | | Vice Chairman since 2018; Chairman of the Nominating and Governance Committee and Trustee since 2003 | | Founder and Principal, YQA Capital Management LLC (1998-Present); formerly, Owner/CEO, Electronic Dynamic Balancing Co., Inc. (high-speed rotating equipment service provider). | | 220 | | Trustee and Investment Oversight Committee member, Mission Aviation Fellowship (2017-Present). |
| | | | | |
Todd J. Barre–1957 c/o Invesco Capital Management LLC 3500 Lacey Road, Suite 700 Downers Grove, IL 60515 | | Trustee | | Since 2010 | | Assistant Professor of Business, Trinity Christian College (2010-2016); formerly, Vice President and Senior Investment Strategist (2001-2008), Director of Open Architecture and Trading (2007-2008), Head of Fundamental Research (2004-2007) and Vice President and Senior Fixed Income Strategist (1994-2001), BMO Financial Group/Harris Private Bank. | | 220 | | None. |
| * | This is the date the Independent Trustee began serving the Trust. Each Independent Trustee serves an indefinite term, until his or her successor is elected. |
| ** | Fund Complex includes all open- and closed-end funds (including all of their portfolios) advised by the Adviser and any affiliated person of the Adviser. |
Trustees and Officers–(continued)
| | | | | | | | | | |
Name, Address and Year of Birth of Independent Trustees | | Position(s)
Held with Trust | | Term of
Office and
Length of
Time
Served* | | Principal Occupation(s) During Past 5 Years | | Number of
Portfolios
in Fund
Complex**
Overseen by
Independent
Trustees | | Other Directorships Held by Independent Trustees During
the Past 5 Years |
Edmund P. Giambastiani, Jr.–1948 c/o Invesco Capital Management LLC 3500 Lacey Road, Suite 700 Downers Grove, IL 60515 | | Trustee | | Since 2019 | | President, Giambastiani Group LLC (national security and energy consulting) (2007-Present); Director, The Boeing Company (2009-Present); Director, First Eagle Alternative Credit LLC (2020-Present); Advisory Board Member, Massachusetts Institute of Technology Lincoln Laboratory (federally-funded research development) (2010-Present); Defense Advisory Board Member, Lawrence Livermore National Laboratory (2013-Present); formerly, Trustee, MITRE Corporation (federally funded research development) (2008-2020); Director, THL Credit, Inc. (alternative credit investment manager) (2016-2020); Chairman (2015-2016), Lead Director (2011-2015) and Director (2008-2011), Monster Worldwide, Inc. (career services); United States Navy, career nuclear submarine officer (1970-2007); Seventh Vice Chairman of the Joint Chiefs of Staff (2005-2007); first NATO Supreme Allied Commander Transformation (2003-2005); Commander, U.S. Joint Forces Command (2002-2005). | | 220 | | Trustee, U.S. Naval Academy Foundation Athletic & Scholarship Program (2010-Present); formerly, Trustee, certain funds of the Oppenheimer Funds complex (2013- 2019); Advisory Board Member, Maxwell School of Citizenship and Public Affairs of Syracuse University (2012-2016). |
* This is the date the Independent Trustee began serving the Trust. Each Independent Trustee serves an indefinite term, until his or her successor is elected.
** Fund Complex includes all open- and closed-end funds (including all of their portfolios) advised by the Adviser and any affiliated person of the Adviser.
Trustees and Officers–(continued)
| | | | | | | | | | |
Name, Address and Year of Birth of Independent Trustees | | Position(s)
Held with Trust | | Term of
Office and
Length of
Time
Served* | | Principal Occupation(s) During Past 5 Years | | Number of
Portfolios
in Fund
Complex**
Overseen by
Independent
Trustees | | Other Directorships Held by Independent Trustees During
the Past 5 Years |
Victoria J. Herget–1951 c/o Invesco Capital Management LLC 3500 Lacey Road, Suite 700 Downers Grove, IL 60515 | | Trustee | | Since 2019 | | Formerly, Managing Director (1993-2001), Principal (1985-1993), Vice President (1978-1985) and Assistant Vice President (1973-1978), Zurich Scudder Investments (investment adviser) (and its predecessor firms). | | 220 | | Trustee (2000- Present) and Chair (2010-2017), Newberry Library; Trustee, Mather LifeWays (2001-Present); Trustee, Chikaming Open Lands (2014-Present); formerly, Trustee, certain funds in the Oppenheimer Funds complex (2012- 2019); Board Chair (2008-2015) and Director (2004- 2018), United Educators Insurance Company; Independent Director, First American Funds (2003-2011); Trustee (1992- 2007), Chair of the Board of Trustees (1999-2007), Investment Committee Chair (1994-1999) and Investment Committee member (2007-2010), Wellesley College; Trustee, BoardSource (2006-2009); Trustee, Chicago City Day School (1994-2005). |
| * | This is the date the Independent Trustee began serving the Trust. Each Independent Trustee serves an indefinite term, until his or her successor is elected. |
| ** | Fund Complex includes all open- and closed-end funds (including all of their portfolios) advised by the Adviser and any affiliated person of the Adviser. |
Trustees and Officers–(continued)
| | | | | | | | | | |
Name, Address and Year of Birth of Independent Trustees | | Position(s)
Held with Trust | | Term of
Office and
Length of
Time
Served* | | Principal Occupation(s) During Past 5 Years | | Number of
Portfolios
in Fund
Complex**
Overseen by
Independent
Trustees | | Other Directorships Held by Independent Trustees During
the Past 5 Years |
Marc M. Kole–1960 c/o Invesco Capital Management LLC 3500 Lacey Road, Suite 700 Downers Grove, IL 60515 | | Chairman of the Audit Committee and Trustee | | Chairman of the Audit Committee since 2008; Trustee since 2006 | | Managing Director of Finance (2020-Present) and Senior Director of Finance (2015-2020), By The Hand Club for Kids (not-for-profit); formerly, Chief Financial Officer, Hope Network (social services) (2008-2012); Assistant Vice President and Controller, Priority Health (health insurance) (2005-2008); Regional Chief Financial Officer, United Healthcare (2005); Chief Accounting Officer, Senior Vice President of Finance, Oxford Health Plans (2000-2004); Audit Partner, Arthur Andersen LLP (1996-2000). | | 220 | | Formerly, Treasurer (2018-2021), Finance Committee Member (2015- 2021) and Audit Committee Member (2015), Thornapple Evangelical Covenant Church; Board and Finance Committee Member (2009- 2017) and Treasurer (2010-2015, 2017), NorthPointe Christian Schools. |
| | | | | |
Yung Bong Lim–1964 c/o Invesco Capital Management LLC 3500 Lacey Road, Suite 700 Downers Grove, IL 60515 | | Chairman of the Investment Oversight Committee and Trustee | | Chairman of the Investment Oversight Committee since 2014; Trustee since 2013 | | Managing Partner, RDG Funds LLC (real estate) (2008-Present); formerly, Managing Director, Citadel LLC (1999-2007). | | 220 | | Board Director, Beacon Power Services, Corp. (2019-Present); formerly, Advisory Board Member, Performance Trust Capital Partners, LLC (2008-2020) |
| * | This is the date the Independent Trustee began serving the Trust. Each Independent Trustee serves an indefinite term, until his or her successor is elected. |
| ** | Fund Complex includes all open- and closed-end funds (including all of their portfolios) advised by the Adviser and any affiliated person of the Adviser. |
Trustees and Officers–(continued)
| | | | | | | | | | |
Name, Address and Year of Birth of Independent Trustees | | Position(s)
Held with Trust | | Term of
Office and
Length of
Time
Served* | | Principal Occupation(s) During Past 5 Years | | Number of
Portfolios
in Fund
Complex**
Overseen by
Independent
Trustees | | Other Directorships Held by Independent Trustees During
the Past 5 Years |
Joanne Pace–1958 c/o Invesco Capital Management LLC 3500 Lacey Road, Suite 700 Downers Grove, IL 60515 | | Trustee | | Since 2019 | | Formerly, Senior Advisor, SECOR Asset Management, LP (2010-2011); Managing Director and Chief Operating Officer, Morgan Stanley Investment Management (2006-2010); Partner and Chief Operating Officer, FrontPoint Partners, LLC (alternative investments) (2005-2006); Managing Director (2003-2005), Global Head of Human Resources and member of Executive Board and Operating Committee (2004-2005), Global Head of Operations and Product Control (2003-2004), Credit Suisse (investment banking); Managing Director (1997-2003), Controller and Principal Accounting Officer (1999-2003), Chief Financial Officer (temporary assignment) for the Oversight Committee, Long Term Capital Management (1998-1999), Morgan Stanley. | | 220 | | Board Director, Horizon Blue Cross Blue Shield of New Jersey (2012- Present); Advisory Board Director, The Alberleen Group LLC (2012-Present); Governing Council Member (2016- Present) and Chair of Education Committee (2017-Present), Independent Directors Council (IDC); Council Member, NewYork— Presbyterian Hospital’s Leadership Council on Children’s and Women’s Health (2012-Present); formerly, Board Member, 100 Women in Finance (2015-2020); Trustee, certain funds in the Oppenheimer Funds complex (2012-2019); Lead Independent Director and Chair of the Audit and Nominating Committee of The Global Chartist Fund, LLC, Oppenheimer Asset Management (2011-2012); Board Director, Managed Funds Association (2008-2010); Board Director (2007-2010) and Investment Committee Chair (2008-2010), Morgan Stanley Foundation. |
| * | This is the date the Independent Trustee began serving the Trust. Each Independent Trustee serves an indefinite term, until his or her successor is elected. |
| ** | Fund Complex includes all open- and closed-end funds (including all of their portfolios) advised by the Adviser and any affiliated person of the Adviser. |
Trustees and Officers–(continued)
| | | | | | | | | | |
Name, Address and Year of Birth of Independent Trustees | | Position(s)
Held with Trust | | Term of
Office and
Length of
Time
Served* | | Principal Occupation(s) During Past 5 Years | | Number of
Portfolios
in Fund
Complex**
Overseen by
Independent
Trustees | | Other Directorships Held by Independent Trustees During
the Past 5 Years |
Gary R. Wicker–1961 c/o Invesco Capital Management LLC 3500 Lacey Road, Suite 700 Downers Grove, IL 60515 | | Trustee | | Since 2013 | | Senior Vice President of Global Finance and Chief Financial Officer, RBC Ministries (publishing company) (2013-Present); formerly, Executive Vice President and Chief Financial Officer, Zondervan Publishing (a division of Harper Collins/NewsCorp) (2007-2012); Senior Vice President and Group Controller (2005- 2006), Senior Vice President and Chief Financial Officer (2003-2004), Chief Financial Officer (2001-2003), Vice President, Finance and Controller (1999-2001) and Assistant Controller (1997-1999), divisions of The Thomson Corporation (information services provider); Senior Audit Manager (1994-1997), PricewaterhouseCoopers LLP. | | 220 | | Board Member and Treasurer, Our Daily Bread Ministries Canada (2015- Present); Board and Finance Committee Member, West Michigan Youth For Christ (2010- Present). |
| | | | | |
Donald H. Wilson–1959 c/o Invesco Capital Management LLC 3500 Lacey Road, Suite 700 Downers Grove, IL 60515 | | Chairman of the Board and Trustee | | Chairman since 2012; Trustee since 2006 | | Chairman, President and Chief Executive Officer, McHenry Bancorp Inc. and McHenry Savings Bank (subsidiary) (2018-Present); formerly, Chairman and Chief Executive Officer, Stone Pillar Advisors, Ltd. (2010-2017); President and Chief Executive Officer, Stone Pillar Investments, Ltd. (advisory services to the financial sector) (2016- 2018); Chairman, President and Chief Executive Officer, Community Financial Shares, Inc. and Community Bank—Wheaton/Glen Ellyn (subsidiary) (2013-2015); Chief Operating Officer, AMCORE Financial, Inc. (bank holding company) (2007-2009); Executive Vice President and Chief Financial Officer, AMCORE Financial, Inc. (2006-2007); Senior Vice President and Treasurer, Marshall & Ilsley Corp. (bank holding company) (1995-2006). | | 220 | | Director, Penfield Children’s Center (2004-Present); Board Chairman, Gracebridge Alliance, Inc. (2015-Present). |
| * | This is the date the Independent Trustee began serving the Trust. Each Independent Trustee serves an indefinite term, until his or her successor is elected. |
| ** | Fund Complex includes all open- and closed-end funds (including all of their portfolios) advised by the Adviser and any affiliated person of the Adviser. |
Trustees and Officers–(continued)
The Interested Trustee and the executive officers of the Trust, their term of office and length of time served, their principal business occupations during at least the past five years, the number of portfolios in the Fund Complex (as defined below) overseen by the Interested Trustee and the other directorships, if any, held by the Interested Trustee are shown below.
| | | | | | | | | | |
Name, Address and Year of Birth of Interested Trustee | | Position(s)
Held with Trust | | Term of
Office and
Length of
Time
Served* | | Principal Occupation(s) During Past 5 Years | | Number of
Portfolios
in Fund
Complex**
Overseen by
Interested
Trustee | | Other Directorships Held by Interested Trustee During
the Past 5 Years |
Kevin M. Carome–1956 Invesco Ltd. Two Peachtree Pointe 1555 Peachtree St., N.E., Suite 1800 Atlanta, GA 30309 | | Trustee | | Since 2010 | | Senior Managing Director, Secretary and General Counsel, Invesco Ltd. (2007-Present); Director, Invesco Advisers, Inc. (2009-Present); Director (2006-Present) and Executive Vice President (2008-Present), Invesco North American Holdings, Inc.; Executive Vice President (2008-Present), Invesco Investments (Bermuda) Ltd.; Manager, Horizon Flight Works LLC; and Executive Vice President (2014-Present), INVESCO Asset Management (Bermuda) Ltd.; formerly, Director and Secretary (2012-2020), Invesco Services (Bahamas) Private Limited; Director, Invesco Finance PLC (2011-2019); Director, INVESCO Asset Management (Bermuda) Ltd. (2014-2019); Director and Executive Vice President, Invesco Finance, Inc. (2011-2018); Director (2006-2018) and Executive Vice President (2008-2018), Invesco Group Services, Inc., Invesco Holding Company (US), Inc.; Director, Invesco Holding Company Limited (2007- 2019); Director and Chairman, INVESCO Funds Group, Inc., Senior Vice President, Secretary and General Counsel, Invesco Advisers, Inc. (2003-2006); Director, Invesco Investments (Bermuda) Ltd. (2008-2016); Senior Vice President and General Counsel, Liberty Financial Companies, Inc. (2000-2001); General Counsel of certain investment management subsidiaries of Liberty Financial Companies, Inc. (1998-2000); Associate General Counsel, Liberty Financial Companies, Inc. (1993-1998); Associate, Ropes & Gray LLP. | | 220 | | None. |
| * | This is the date the Interested Trustee began serving the Trust. The Interested Trustee serves an indefinite term, until his successor is elected. |
| ** | Fund Complex includes all open- and closed-end funds (including all of their portfolios) advised by the Adviser and any affiliated person of the Adviser. |
Trustees and Officers–(continued)
| | | | | | |
Name, Address and Year of Birth of Executive Officers | | Position(s)
Held with Trust | | Length of
Time Served* | | Principal Occupation(s) During Past 5 Years |
Anna Paglia–1974 Invesco Capital Management LLC 3500 Lacey Road, Suite 700 Downers Grove, IL 60515 | | President and Principal Executive Officer | | Since 2020 | | President and Principal Executive Officer, Invesco Exchange-Traded Fund Trust, Invesco Exchange-Traded Fund Trust II, Invesco India Exchange-Traded Fund Trust, Invesco Actively Managed Exchange-Traded Fund Trust, Invesco Actively Managed Exchange-Traded Commodity Fund Trust and Invesco Exchange-Traded Self-Indexed Fund Trust (2020-Present); Managing Director and Global Head of ETFs and Indexed Strategies, Chief Executive Officer and Principal Executive Officer, Invesco Capital Management LLC (2020-Present); Chief Executive Officer, Manager and Principal Executive Officer, Invesco Specialized Products, LLC (2020-Present); Authorized Person, Accretive Asset Management LLC (2018-Present); Vice President, Invesco Indexing LLC (2020-Present); formerly, Secretary, Invesco Exchange-Traded Fund Trust, Invesco Exchange-Traded Fund Trust II, Invesco India Exchange-Traded Fund Trust and Invesco Actively Managed Exchange-Traded Fund Trust (2011-2020), Invesco Actively Managed Exchange-Traded Commodity Fund Trust (2014-2020) and Invesco Exchange-Traded Self-Indexed Fund Trust (2015-2020); Head of Legal (2010-2020) and Secretary (2015-2020), Invesco Capital Management LLC; Manager and Assistant Secretary, Invesco Indexing LLC (2017-2020); Head of Legal and Secretary, Invesco Specialized Products, LLC (2018-2020); Partner, K&L Gates LLP (formerly, Bell Boyd & Lloyd LLP) (2007-2010); and Associate Counsel at Barclays Global Investors Ltd. (2004-2006). |
| | | |
Adrien Deberghes–1967 Invesco Capital Management LLC, 11 Greenway Plaza Suite 1000 Houston, TX 77046 | | Vice President | | Since 2020 | | Vice President, Invesco Exchange-Traded Fund Trust, Invesco Exchange- Traded Fund Trust II, Invesco India Exchange-Traded Fund Trust, Invesco Actively Managed Exchange-Traded Fund Trust, Invesco Actively Managed Exchange-Traded Commodity Fund Trust and Invesco Exchange-Traded Self-Indexed Fund Trust (2020-Present); Head of the Fund Office of the CFO; Vice President and Fund Administration, Invesco Advisers, Inc. (2020- Present); Principal Financial Officer, Treasurer and Vice President, The Invesco Funds (2020-Present); Vice President, Invesco Advisers, Inc. (2020-Present); formerly, Senior Vice President and Treasurer, Fidelity Investments (2008-2020). |
| | | |
Kelli Gallegos–1970 Invesco Capital Management LLC, 11 Greenway Plaza Suite 1000 Houston, TX 77046 | | Vice President and Treasurer | | Since 2018 | | Vice President, Invesco Advisers, Inc. (2020-Present); Principal Financial and Accounting Officer- Pooled Investments, Invesco Specialized Products, LLC (2018-Present); Vice President and Treasurer, Invesco Exchange-Traded Fund Trust, Invesco Exchange-Traded Fund Trust II, Invesco India Exchange-Traded Fund Trust, Invesco Actively Managed Exchange-Traded Fund Trust, Invesco Actively Managed Exchange-Traded Commodity Fund Trust and Invesco Exchange-Traded Self-Indexed Fund Trust (2018-Present); Principal Financial and Accounting Officer-Pooled Investments, Invesco Capital Management LLC (2018-Present); Vice President (2016-Present) and Assistant Treasurer (2008-Present), The Invesco Funds; formerly, Assistant Treasurer, Invesco Specialized Products, LLC (2018); Assistant Treasurer, Invesco Exchange- Traded Fund Trust, Invesco Exchange-Traded Fund Trust II, Invesco India Exchange-Traded Fund Trust and Invesco Actively Managed Exchange-Traded Fund Trust (2012-2018), Invesco Actively Managed Exchange-Traded Commodity Fund Trust (2014-2018) and Invesco Exchange-Traded Self-Indexed Fund Trust (2016-2018); Assistant Treasurer, Invesco Capital Management LLC (2013-2018); and Principal Financial Officer (2016-2020) and Assistant Vice President (2008-2016), The Invesco Funds. |
| * | This is the date each Officer began serving the Trust. Each Officer serves an indefinite term, until his or her successor is elected. |
Trustees and Officers–(continued)
| | | | | | |
Name, Address and Year of Birth of Executive Officers | | Position(s)
Held with Trust | | Length of
Time Served* | | Principal Occupation(s) During Past 5 Years |
Adam Henkel – 1980 Invesco Capital Management LLC 3500 Lacey Road Suite 700 Downers Grove, IL 60515 | | Secretary | | Since 2020 | | Head of Legal and Secretary, Invesco Capital Management LLC and Invesco Specialized Products, LLC (2020-present); Secretary, Invesco Exchange- Traded Fund Trust, Invesco Exchange-Traded Fund Trust II, Invesco India Exchange-Traded Fund Trust, Invesco Actively Managed Exchange-Traded Fund Trust, Invesco Actively Managed Exchange-Traded Commodity Fund Trust and Invesco Exchange-Traded Self-Indexed Fund Trust (2020-Present); Assistant Secretary, Invesco Capital Markets, Inc. (2020-Present); Assistant Secretary, the Invesco Funds (2014-Present); Manager and Assistant Secretary, Invesco Indexing LLC (2020-Present); Assistant Secretary, Invesco Investment Advisers LLC (2020-Present); formerly, Assistant Secretary of Invesco Exchange-Traded Fund Trust, Invesco Exchange-Traded Fund Trust II, Invesco India Exchange-Traded Fund Trust, Invesco Actively Managed Exchange-Traded Fund Trust and Invesco Actively Managed Exchange-Traded Commodity Fund Trust (2014-2020); Chief Compliance Officer of Invesco Capital Management LLC (2017); Chief Compliance Officer of Invesco Exchange-Traded Fund Trust, Invesco Exchange-Traded Fund Trust II, Invesco India Exchange-Traded Fund Trust, Invesco Actively Managed Exchange- Traded Fund Trust and Invesco Actively Managed Exchange-Traded Commodity Fund Trust (2017); Senior Counsel, Invesco, Ltd. (2013-2020); Assistant Secretary, Invesco Specialized Products, LLC (2018-2020). |
| | | |
Peter Hubbard–1981 Invesco Capital Management LLC 3500 Lacey Road, Suite 700 Downers Grove, IL 60515 | | Vice President | | Since 2009 | | Vice President, Invesco Specialized Products, LLC (2018-Present); Vice President, Invesco Exchange-Traded Fund Trust, Invesco Exchange-Traded Fund Trust II, Invesco India Exchange-Traded Fund Trust, Invesco Actively Managed Exchange-Traded Fund Trust (2009-Present), Invesco Actively Managed Exchange-Traded Commodity Fund Trust (2014-Present) and Invesco Exchange-Traded Self-Indexed Fund Trust (2016-Present); Vice President and Director of Portfolio Management, Invesco Capital Management LLC (2010-Present); formerly, Vice President of Portfolio Management, Invesco Capital Management LLC (2008-2010); Portfolio Manager, Invesco Capital Management LLC (2007-2008); Research Analyst, Invesco Capital Management LLC (2005-2007); Research Analyst and Trader, Ritchie Capital, a hedge fund operator (2003-2005). |
| | | |
Michael McMaster – 1962 Invesco Capital Management LLC, 11 Greenway Plaza Suite 1000 Houston, TX 77046 | | Chief Tax Officer | | Since 2020 | | Vice President and Head of Global Fund Services Tax, Invesco Advisers, Inc. (2020-Present); Chief Tax Officer, Vice President and Assistant Treasurer, The Invesco Funds (2020-Present); Assistant Treasurer, Invesco Capital Management LLC (2020-Present); Chief Tax Officer and Assistant Treasurer, Invesco Exchange-Traded Fund Trust, Invesco Exchange-Traded Fund Trust II, Invesco India Exchange-Traded Fund Trust, Invesco Actively Managed Exchange-Traded Fund Trust Invesco Actively Managed Exchange-Traded Commodity Fund Trust and Invesco Exchange-Traded Self-Indexed Fund Trust (2020-Present); Assistant Treasurer, Invesco Specialized Products, LLC (2020-Present); formerly, Senior Vice President, Managing Director of Tax Services, U.S. Bank Global Fund Services (GFS) (2007-2020). |
| * | This is the date each Officer began serving the Trust. Each Officer serves an indefinite term, until his or her successor is elected. |
Trustees and Officers–(continued)
| | | | | | |
Name, Address and Year of Birth of Executive Officers | | Position(s)
Held with Trust | | Length of
Time Served* | | Principal Occupation(s) During Past 5 Years |
Sheri Morris–1964 Invesco Capital Management LLC, 11 Greenway Plaza Suite 1000 Houston, TX 77046 | | Vice President | | Since 2012 | | Head of Global Fund Services, Invesco Ltd. (2019-Present); Vice President, OppenheimerFunds, Inc. (2019-Present); President and Principal Executive Officer, The Invesco Funds (2016-Present); Senior Vice President, Invesco Advisers, Inc. (formerly known as Invesco Institutional (N.A.), Inc.) (registered investment adviser) (2020-Present) and Vice President, Invesco Exchange- Traded Fund Trust, Invesco Exchange-Traded Fund Trust II, Invesco India Exchange-Traded Fund Trust, Invesco Actively Managed Exchange-Traded Fund Trust (2012-Present), Invesco Actively Managed Exchange-Traded Commodity Fund Trust (2014-Present) and Invesco Exchange-Traded Self-Indexed Fund Trust (2016-Present); formerly, Treasurer (2008-2020), Vice President and Principal Financial Officer, The Invesco Funds (2008- 2016); Treasurer, Invesco Exchange-Traded Fund Trust, Invesco Exchange- Traded Fund Trust II, Invesco India Exchange-Traded Fund Trust and Invesco Actively Managed Exchange-Traded Fund Trust (2011-2013); Vice President, Invesco Aim Advisers, Inc., Invesco Aim Capital Management, Inc. and Invesco Aim Private Asset Management, Inc.; Treasurer, Assistant Vice President and Assistant Treasurer, The Invesco Funds and Assistant Vice President, Invesco Advisers, Inc., Invesco Aim Capital Management, Inc. and Invesco Aim Private Asset Management, Inc.; Vice President, Invesco Advisers, Inc. (2009-2020). |
| | | |
Rudolf E. Reitmann–1971 Invesco Capital Management LLC 3500 Lacey Road, Suite 700 Downers Grove, IL 60515 | | Vice President | | Since 2013 | | Head of Global Exchange Traded Funds Services, Invesco Specialized Products, LLC (2018-Present); Vice President, Invesco Exchange-Traded Fund Trust, Invesco Exchange-Traded Fund Trust II, Invesco India Exchange-Traded Fund Trust, Invesco Actively Managed Exchange-Traded Fund Trust (2013-Present), Invesco Actively Managed Exchange-Traded Commodity Fund Trust (2014-Present) and Invesco Exchange-Traded Self-Indexed Fund Trust (2016-Present); Head of Global Exchange Traded Funds Services, Invesco Capital Management LLC (2013-Present); Vice President, Invesco Capital Markets, Inc. (2018-Present). |
| | | |
Melanie Zimdars–1976 Invesco Capital Management LLC 3500 Lacey Road, Suite 700 Downers Grove, IL 60515 | | Chief Compliance Officer | | Since 2017 | | Chief Compliance Officer, Invesco Specialized Products, LLC (2018-Present); Chief Compliance Officer, Invesco Capital Management LLC (2017-Present); Chief Compliance Officer, Invesco Exchange-Traded Fund Trust, Invesco Exchange-Traded Fund Trust II, Invesco India Exchange-Traded Fund Trust, Invesco Actively Managed Exchange-Traded Fund Trust, Invesco Actively Managed Exchange-Traded Commodity Fund Trust and Invesco Exchange- Traded Self-Indexed Fund Trust (2017-Present); formerly, Vice President and Deputy Chief Compliance Officer, ALPS Holding, Inc. (2009-2017); Mutual Fund Treasurer/ Chief Financial Officer, Wasatch Advisors, Inc. (2005-2008); Compliance Officer, U.S. Bancorp Fund Services, LLC (2001-2005). |
| * | This is the date each Officer began serving the Trust. Each Officer serves an indefinite term, until his or her successor is elected. |
Approval of Investment Advisory Contracts
At a meeting held on April 15, 2021, the Board of Trustees of the Invesco Exchange-Traded Fund Trust (the “Trust”), including the Independent Trustees, approved the continuation of the Investment Advisory Agreement between Invesco Capital Management LLC (the “Adviser”) and the Trust for the following 25 series (each, a “Fund” and collectively, the “Funds”):
Invesco Dow Jones Industrial Average Dividend ETF
Invesco NASDAQ Internet ETF
Invesco Raymond James SB-1 Equity ETF
Invesco S&P 500 BuyWrite ETF
Invesco S&P 500® Equal Weight Communications Services ETF
Invesco S&P 500® Equal Weight Consumer Discretionary ETF
Invesco S&P 500® Equal Weight Consumer Staples ETF
Invesco S&P 500® Equal Weight Energy ETF
Invesco S&P 500® Equal Weight ETF
Invesco S&P 500® Equal Weight Financials ETF
Invesco S&P 500® Equal Weight Health Care ETF
Invesco S&P 500® Equal Weight Industrials ETF
Invesco S&P 500® Equal Weight Materials ETF
Invesco S&P 500® Equal Weight Real Estate ETF
Invesco S&P 500® Equal Weight Technology ETF
Invesco S&P 500® Equal Weight Utilities ETF
Invesco S&P 500® Pure Growth ETF
Invesco S&P 500® Pure Value ETF
Invesco S&P 500® Top 50 ETF
Invesco S&P MidCap 400® Equal Weight ETF
Invesco S&P MidCap 400® Pure Growth ETF
Invesco S&P MidCap 400® Pure Value ETF
Invesco S&P SmallCap 600® Equal Weight ETF
Invesco S&P SmallCap 600® Pure Growth ETF
Invesco S&P SmallCap 600® Pure Value ETF
The Trustees reviewed information from the Adviser describing: (i) the nature, extent and quality of services provided, (ii) the investment performance of the Funds and the Adviser, (iii) the fees paid by the Funds and comparisons to amounts paid by other comparable registered investment companies, (iv) the costs of services provided and estimated profits realized by the Adviser, (v) the extent to which economies of scale may be realized as a Fund grows and whether fee levels reflect any possible economies of scale for the benefit of Fund shareholders, and (vi) any further benefits realized by the Adviser or its affiliates from the Adviser’s relationship with the Funds.
Nature, Extent and Quality of Services. In evaluating the nature, extent and quality of the Adviser’s services, the Trustees reviewed information concerning the functions performed by the Adviser for the Funds, information describing the Adviser’s current organization and staffing, including operational support provided by the Adviser’s parent organization, Invesco Ltd. (“Invesco”), and the background and experience of the persons responsible for the day-to-day management of the Funds. The Trustees reviewed matters related to the Adviser’s oversight of execution of portfolio transactions on behalf of the Funds. The Trustees also reviewed information on the performance of the Funds and their underlying indexes for the one-year, three-year, five-year, ten-year and since-inception periods ended December 31, 2020, as applicable, including reports for each of those periods on the correlation and tracking error between each Fund’s performance and the performance of its underlying index, as well as the Adviser’s analysis of the tracking error between certain Funds and their underlying indexes. In reviewing the tracking error reports, the Trustees considered information provided by Invesco’s independent performance and risk management group with respect to general expected tracking error ranges. The Trustees also considered that certain Funds were created in connection with the purchase by Invesco of the exchange-traded funds business of Guggenheim Capital LLC (the “Transaction”) and that each such Fund’s performance prior to the closing of the Transaction on April 6, 2018 or May 18, 2018 is that of its predecessor Guggenheim ETF. The Trustees noted that, for each applicable period, the correlation and tracking error for each Fund were within the targeted range set forth in the Trust’s registration statement and concluded that each Fund was correlated to its underlying index and that the tracking error for each Fund was within an acceptable range given that Fund’s particular circumstances.
The Trustees considered the services provided by the Adviser in its oversight of the Funds’ administrator, custodian and transfer agent. They noted the significant amount of time, effort and resources that had been devoted to this oversight function.
Based on their review, the Trustees concluded that the nature, extent and quality of services provided by the Adviser to the Funds under the Investment Advisory Agreement were appropriate and reasonable.
Fees, Expenses and Profitability. The Trustees reviewed and discussed the information provided by the Adviser on each Fund’s net expense ratio and unitary advisory fee. The Trustees noted that the annual unitary advisory fee charged to each Fund is as follows, with the Adviser paying all other operating expenses of each Fund, except that each Fund pays its brokerage expenses, taxes, interest, acquired fund fees and expenses, if any, litigation expenses, costs incurred in connection with proxies (except certain proxies) and other extraordinary expenses:
Approval of Investment Advisory Contracts–(continued)
| | ● | | 0.75% of the Fund’s average daily net assets for Invesco Raymond James SB-1 Equity ETF; |
| | ● | | 0.60% of the Fund’s average daily net assets for Invesco NASDAQ Internet ETF; |
| | ● | | 0.49% of the Fund’s average daily net assets for Invesco S&P 500 BuyWrite ETF; |
| | ● | | 0.35% of the Fund’s average daily net assets for each of Invesco S&P 500® Pure Growth ETF, Invesco S&P 500® Pure Value ETF, Invesco S&P MidCap 400® Pure Growth ETF, Invesco S&P MidCap 400® Pure Value ETF, Invesco S&P SmallCap 600® Pure Growth ETF and Invesco S&P SmallCap 600® Pure Value ETF; |
| | ● | | 0.20% of the Fund’s average daily net assets for each of Invesco S&P 500® Equal Weight ETF and Invesco S&P 500® Top 50 ETF; |
| | ● | | 0.07% of the Fund’s average daily net assets for Invesco Dow Jones Industrial Average Dividend ETF; and |
| | ● | | 0.40% of the Fund’s average daily net assets for each other Fund. |
The Trustees compared each Fund’s net expense ratio to information compiled by the Adviser from Lipper Inc. (“Lipper”) databases on the net expense ratios of comparable exchange-traded funds (“ETFs”), open-end (non-ETF) index funds and open-end (non-ETF) actively-managed funds. The Trustees noted that the net expense ratios for certain Funds were equal to or lower than the median net expense ratios of their ETF and open-end index peer funds, as applicable, as illustrated in the table below. The Trustees also noted that the net expense ratios for all of the Funds were lower than the median net expense ratios of their open-end actively-managed peer funds. The Trustees noted that a portion of each Fund’s operating expenses was attributable to a sub-license fee payable out of the unitary advisory fee charged to that Fund.
| | | | | | | | | | | | | | | |
| | | Equal | | Equal to/Lower | | Lower than |
| | | to/Lower | | than Open-End | | Open-End |
| | | than ETF | | Index Fund | | Active Fund |
| Invesco Fund | | Peer Median | | Peer Median | | Peer Median |
Invesco Dow Jones Industrial Average Dividend ETF | | | | X | | | | | X | | | | | X | |
Invesco NASDAQ Internet ETF | | | | | | | | | | | | | | X | |
Invesco Raymond James SB-1 Equity ETF | | | | | | | | | | | | | | X | |
Invesco S&P 500 BuyWrite ETF | | | | X | | | | | X | | | | | X | |
Invesco S&P 500® Equal Weight Communication Services ETF | | | | | | | | | | | | | | X | |
Invesco S&P 500® Equal Weight Consumer Discretionary ETF | | | | X | | | | | | | | | | X | |
Invesco S&P 500® Equal Weight Consumer Staples ETF | | | | X | | | | | | | | | | X | |
Invesco S&P 500® Equal Weight Energy ETF | | | | X | | | | | | | | | | X | |
Invesco S&P 500® Equal Weight ETF | | | | X | | | | | X | | | | | X | |
Invesco S&P 500® Equal Weight Financials ETF | | | | X | | | | | | | | | | X | |
Invesco S&P 500® Equal Weight Health Care ETF | | | | X | | | | | | | | | | X | |
Invesco S&P 500® Equal Weight Industrials ETF | | | | X | | | | | | | | | | X | |
Invesco S&P 500® Equal Weight Materials ETF | | | | X | | | | | | | | | | X | |
Invesco S&P 500® Equal Weight Real Estate ETF | | | | X | | | | | | | | | | X | |
Invesco S&P 500® Equal Weight Technology ETF | | | | X | | | | | | | | | | X | |
Invesco S&P 500® Equal Weight Utilities ETF | | | | X | | | | | X | | | | | X | |
Invesco S&P 500® Pure Growth ETF | | | | X | | | | | X | | | | | X | |
Invesco S&P 500® Pure Value ETF | | | | | | | | | | | | | | X | |
Invesco S&P 500® Top 50 ETF | | | | X | | | | | | | | | | X | |
Invesco S&P MidCap 400® Equal Weight ETF | | | | | | | | | | | | | | X | |
Invesco S&P MidCap 400® Pure Growth ETF | | | | | | | | | | | | | | X | |
Invesco S&P MidCap 400® Pure Value ETF | | | | | | | | | X | | | | | X | |
Invesco S&P SmallCap 600® Equal Weight ETF | | | | | | | | | | | | | | X | |
Invesco S&P SmallCap 600® Pure Growth ETF | | | | | | | | | | | | | | X | |
Invesco S&P SmallCap 600® Pure Value ETF | | | | | | | | | X | | | | | X | |
Approval of Investment Advisory Contracts–(continued)
In response to questions from the Independent Trustees, the Adviser provided supplemental information regarding Invesco Raymond James SB-1 Equity ETF’s advisory fee and total expenses and the Lipper peer data. The Adviser explained its view that the advisory fees and total expenses for the Fund are competitive and generally in line with other comparable funds in the marketplace, particularly in light of the level and nature of services provided and the investment management style of the Adviser. The Trustees also considered the Adviser’s statements regarding its pricing philosophy and the differing pricing philosophy of certain of the peers.
The Trustees noted information, including fee information, provided by the Adviser regarding other investment products to which it provides investment advisory services, including products that have an investment strategy comparable to one of the Funds. The Trustees considered the Adviser’s explanation of the differences between the services provided to the Funds and to the other investment products it advises, noting the Adviser’s statement that the management and oversight of the Funds requires substantially more labor and expense.
Based on all of the information provided, the Board concluded that each Fund’s unitary advisory fee was reasonable and appropriate in light of the services provided, the nature of the indexes, the distinguishing factors of the Funds, and the administrative, operational and management oversight costs for the Adviser.
In conjunction with their review of the unitary advisory fees, the Trustees considered information provided by the Adviser on the revenues received by the Adviser under the Investment Advisory Agreement for the Funds. The Trustees reviewed information provided by the Adviser on its overall profitability, as well as the estimated profitability to the Adviser from its relationship to each Fund. The Trustees concluded that the overall and estimated profitability to the Adviser was not unreasonable.
Economies of Scale and Whether Fee Levels Reflect These Economies of Scale. The Trustees reviewed the information provided by the Adviser as to the extent to which economies of scale may be realized as each Fund grows and whether fee levels reflect economies of scale for the benefit of shareholders. The Trustees reviewed each Fund’s asset size and unitary advisory fee. The Trustees noted that any reduction in fixed costs associated with the management of the Funds would be enjoyed by the Adviser, but a unitary advisory fee provides a level of certainty in expenses for the Funds. The Trustees considered whether the unitary advisory fee rate for each Fund was reasonable in relation to the asset size of that Fund, and concluded that the unitary advisory fee was reasonable and appropriate.
Fall-out Benefits. The Trustees considered that the Adviser identified no additional benefits it receives from its relationship with the Funds, and noted that the Adviser does not have any soft-dollar arrangements. The Trustees also considered benefits received by affiliates of the Adviser that may be directly or indirectly attributed to the Adviser’s relationship with the Funds, including brokerage fees and advisory fees for money market cash management vehicles. The Board concluded that each Fund’s unitary advisory fee was reasonable, taking into account any ancillary benefits received by affiliates of the Adviser.
Based on all of the information considered and the conclusions reached, the Board, including the Independent Trustees, determined to approve the continuation of the Investment Advisory Agreement for each Fund. No single factor was determinative in the Board’s analysis.
Approval of Investment Advisory Contracts
At a meeting held on April 15, 2021, the Board of Trustees of the Invesco Exchange-Traded Fund Trust (the “Trust”), including the Independent Trustees, approved the continuation of the Investment Advisory Agreement between Invesco Capital Management LLC (the “Adviser”) and the Trust for the following 49 series (each, a “Fund” and collectively, the “Funds”):
| | |
| Invesco Aerospace & Defense ETF | | Invesco Dynamic Semiconductors ETF |
| Invesco BuyBack AchieversTM ETF | | Invesco Dynamic Software ETF |
| Invesco Dividend AchieversTM ETF | | Invesco Financial Preferred ETF |
| Invesco DWA Basic Materials Momentum ETF | | Invesco FTSE RAFI US 1000 ETF |
| Invesco DWA Consumer Cyclicals Momentum ETF | | Invesco FTSE RAFI US 1500 Small-Mid ETF |
| Invesco DWA Consumer Staples Momentum ETF | | Invesco Global Listed Private Equity ETF |
| Invesco DWA Energy Momentum ETF | | Invesco Golden Dragon China ETF |
| Invesco DWA Financial Momentum ETF | | Invesco High Yield Equity Dividend AchieversTM ETF |
| Invesco DWA Healthcare Momentum ETF | | Invesco International Dividend AchieversTM ETF |
| Invesco DWA Industrials Momentum ETF | | Invesco MSCI Sustainable Future ETF |
| Invesco DWA Momentum ETF | | Invesco S&P 100 Equal Weight ETF |
| Invesco DWA Technology Momentum ETF | | Invesco S&P 500 GARP ETF |
| Invesco DWA Utilities Momentum ETF | | Invesco S&P 500® Quality ETF |
| Invesco Dynamic Biotechnology & Genome ETF | | Invesco S&P 500 Value with Momentum ETF |
| Invesco Dynamic Building & Construction ETF | | Invesco S&P MidCap Momentum ETF |
| Invesco Dynamic Energy Exploration & Production ETF | | Invesco S&P MidCap Quality ETF |
| Invesco Dynamic Food & Beverage ETF | | Invesco S&P MidCap Value with Momentum ETF |
| Invesco Dynamic Large Cap Growth ETF | | Invesco S&P SmallCap Momentum ETF |
| Invesco Dynamic Large Cap Value ETF | | Invesco S&P SmallCap Value with Momentum ETF |
| Invesco Dynamic Leisure and Entertainment ETF | | Invesco S&P Spin-Off ETF |
| Invesco Dynamic Market ETF | | Invesco Water Resources ETF |
| Invesco Dynamic Media ETF | | Invesco WilderHill Clean Energy ETF |
| Invesco Dynamic Networking ETF | | Invesco Zacks Mid-Cap ETF |
| Invesco Dynamic Oil & Gas Services ETF | | Invesco Zacks Multi-Asset Income ETF |
| Invesco Dynamic Pharmaceuticals ETF | | |
The Trustees reviewed information from the Adviser describing: (i) the nature, extent and quality of services provided, (ii) the investment performance of the Funds and the Adviser, (iii) the fees and expenses paid by the Funds and comparisons to amounts paid by other comparable registered investment companies, (iv) the costs of services provided and estimated profits realized by the Adviser, (v) the extent to which economies of scale may be realized as a Fund grows and whether fee levels reflect any possible economies of scale for the benefit of Fund shareholders, and (vi) any further benefits realized by the Adviser or its affiliates from the Adviser’s relationship with the Funds.
Nature, Extent and Quality of Services. In evaluating the nature, extent and quality of the Adviser’s services, the Trustees reviewed information concerning the functions performed by the Adviser for the Funds, information describing the Adviser’s current organization and staffing, including operational support provided by the Adviser’s parent organization, Invesco Ltd. (“Invesco”), and the background and experience of the persons responsible for the day-to-day management of the Funds. The Trustees reviewed matters related to the Adviser’s execution and/or oversight of execution of portfolio transactions on behalf of the Funds. The Trustees also reviewed information on the performance of the Funds and their underlying indexes for the one-year, three-year, five-year, ten-year and since-inception periods ended December 31, 2020, as applicable, including reports for each of those periods on the correlation and tracking error between each Fund’s performance and the performance of its underlying index, as well as the Adviser’s analysis of the tracking error between certain Funds and their underlying indexes. In reviewing the tracking error reports, the Trustees considered information provided by Invesco’s independent performance and risk management group with respect to general expected tracking error ranges. The Trustees also considered that certain Funds were created in connection with the purchase by Invesco of the exchange-traded funds business of Guggenheim Capital LLC (the “Transaction”) and that each such Fund’s performance prior to the closing of the Transaction on April 6, 2018 or May 18, 2018, as applicable, is that of its predecessor Guggenheim ETF. The Trustees noted that, for each applicable period, the correlation and tracking error for each Fund were within the targeted range set forth in the Trust’s registration statement and concluded that each Fund was correlated to its underlying index and that the tracking error for each Fund was within an acceptable range given that Fund’s particular circumstances.
Approval of Investment Advisory Contracts–(continued)
The Trustees considered the services provided by the Adviser in its oversight of the Funds’ administrator, custodian and transfer agent. They noted the significant amount of time, effort and resources that had been devoted to this oversight function.
Based on their review, the Trustees concluded that the nature, extent and quality of services provided by the Adviser to the Funds under the Investment Advisory Agreement were appropriate and reasonable.
Fees, Expenses and Profitability. The Trustees reviewed and discussed the information provided by the Adviser on each Fund’s contractual advisory fee, net advisory fee, and gross and net expense ratios. The Trustees noted that the annual contractual advisory fee charged to each Fund is:
| | ● | | 0.50% of the Fund’s average daily net assets for each Fund other than Invesco Dividend Achievers™ ETF, Invesco High Yield Equity Dividend Achievers™ ETF, Invesco International Dividend Achievers™ ETF, Invesco FTSE RAFI US 1000 ETF, Invesco FTSE RAFI US 1500 Small-Mid ETF, Invesco S&P 500 GARP ETF, Invesco S&P 500 Value with Momentum ETF, Invesco S&P MidCap Momentum ETF, Invesco S&P MidCap Value with Momentum ETF, Invesco S&P SmallCap Momentum ETF, Invesco S&P SmallCap Value with Momentum ETF, Invesco S&P 100 Equal Weight ETF, Invesco S&P MidCap Quality ETF and Invesco S&P 500® Quality ETF; |
| | ● | | 0.40% of the Fund’s average daily net assets for each of Invesco Dividend Achievers™ ETF, Invesco High Yield Equity Dividend Achievers™ ETF and Invesco International Dividend Achievers™ ETF; |
| | ● | | 0.29% of the Fund’s average daily net assets for each of Invesco FTSE RAFI US 1000 ETF, Invesco FTSE RAFI US 1500 Small-Mid ETF, Invesco S&P 500 GARP ETF, Invesco S&P 500 Value with Momentum ETF, Invesco S&P MidCap Momentum ETF, Invesco S&P MidCap Value with Momentum ETF, Invesco S&P SmallCap Momentum ETF and Invesco S&P SmallCap Value with Momentum ETF; |
| | ● | | 0.25% of the Fund’s average daily net assets for each of Invesco S&P 100 Equal Weight ETF and Invesco S&P MidCap Quality ETF; and |
| | ● | | 0.15% of the Fund’s average daily net assets for Invesco S&P 500® Quality ETF. |
The Trustees noted that the Adviser has agreed to waive a portion of its contractual advisory fee and/or pay expenses (an “Expense Cap”) to the extent necessary to prevent the annual operating expenses of each Fund from exceeding the percentage of that Fund’s average daily net assets, at least until August 31, 2023, as set forth below:
| | ● | | 0.60%, excluding interest expenses, sub-licensing fees, offering costs, brokerage commissions and other trading expenses, taxes, acquired fund fees and expenses and extraordinary expenses, for Invesco Aerospace & Defense ETF, Invesco BuyBack AchieversTM ETF, Invesco DWA Momentum ETF, Invesco Dynamic Biotechnology & Genome ETF, Invesco Dynamic Building & Construction ETF, Invesco Dynamic Energy Exploration & Production ETF, Invesco Dynamic Food & Beverage ETF, Invesco Dynamic Large Cap Growth ETF, Invesco Dynamic Large Cap Value ETF, Invesco Dynamic Leisure and Entertainment ETF, Invesco Dynamic Media ETF, Invesco Dynamic Networking ETF, Invesco Dynamic Oil & Gas Services ETF, Invesco Dynamic Pharmaceuticals ETF, Invesco Dynamic Semiconductors ETF, Invesco Dynamic Software ETF, Invesco Financial Preferred ETF, Invesco Global Listed Private Equity ETF, Invesco Golden Dragon China ETF, Invesco MSCI Sustainable Future ETF, Invesco S&P Spin-Off ETF, Invesco Water Resources ETF, Invesco WilderHill Clean Energy ETF, Invesco Zacks Mid-Cap ETF and Invesco Zacks Multi-Asset Income ETF; |
| | ● | | 0.60%, excluding interest expenses, brokerage commissions and other trading expenses, taxes, acquired fund fees and expenses and extraordinary expenses, for Invesco Dynamic Market ETF; |
| | ● | | 0.60%, excluding interest expenses, offering costs, brokerage commissions and other trading expenses, taxes, acquired fund fees and expenses and extraordinary expenses, for Invesco DWA Basic Materials Momentum ETF, Invesco DWA Consumer Cyclicals Momentum ETF, Invesco DWA Consumer Staples Momentum ETF, Invesco DWA Energy Momentum ETF, Invesco DWA Financial Momentum ETF, Invesco DWA Healthcare Momentum ETF, Invesco DWA Industrials Momentum ETF, Invesco DWA Technology Momentum ETF and Invesco DWA Utilities Momentum ETF; |
| | ● | | 0.50%, excluding interest expenses, sub-licensing fees, offering costs, brokerage commissions and other trading expenses, taxes, acquired fund fees and expenses and extraordinary expenses, for Invesco Dividend AchieversTM ETF, Invesco High Yield Equity Dividend AchieversTM ETF and Invesco International Dividend AchieversTM ETF; |
| | ● | | 0.39%, excluding interest expenses, offering costs, brokerage commissions and other trading expenses, taxes, acquired fund fees and expenses and extraordinary expenses, for Invesco FTSE RAFI US 1000 ETF, Invesco FTSE RAFI US 1500 Small-Mid ETF, Invesco S&P 500 GARP ETF, Invesco S&P 500 Value with Momentum ETF, Invesco S&P MidCap Momentum ETF, |
Approval of Investment Advisory Contracts–(continued)
| | Invesco S&P MidCap Value with Momentum ETF, Invesco S&P SmallCap Momentum ETF and Invesco S&P SmallCap Value with Momentum ETF; |
| | ● | | 0.25%, excluding interest expenses, offering costs, brokerage commissions and other trading expenses, taxes, acquired fund fees and expenses and extraordinary expenses, for Invesco S&P 100 Equal Weight ETF and Invesco S&P MidCap Quality ETF; and |
| | ● | | 0.15%, excluding interest expenses, offering costs, brokerage commissions and other trading expenses, taxes, acquired fund fees and expenses and extraordinary expenses, for Invesco S&P 500® Quality ETF. |
The Trustees compared each Fund’s contractual advisory fee and net expense ratio to information compiled by the Adviser from Lipper Inc. databases on the net advisory fees and net expense ratios of comparable exchange-traded funds (“ETFs”), open-end (non-ETF) index funds and open-end (non-ETF) actively-managed funds, as applicable. The Trustees noted that the contractual advisory fees for certain Funds were equal to or lower than the median net advisory fees of their ETF and open-end index peer funds, as applicable, as illustrated in the table below. The Trustees also noted that the contractual advisory fees for all of the Funds, except Invesco WilderHill Clean Energy ETF, were lower than the median net advisory fees of their open-end actively-managed peer funds.
| | | | | | | | | | | | | | | |
| | | | | Equal to/Lower | | Lower than |
| | | Equal | | than Open-End | | Open-End |
| | | to/Lower | | Index Fund | | Active Fund |
| Invesco Fund | | than ETF Peer Median | | Peer Median* | | Peer Median |
Invesco Aerospace & Defense ETF | | | | | | | | | | | | | | X | |
Invesco Buyback AchieversTM ETF | | | | | | | | | | | | | | X | |
Invesco Dividend AchieversTM ETF | | | | | | | | | | | | | | X | |
Invesco DWA Basic Materials Momentum ETF | | | | | | | | | | | | | | X | |
Invesco DWA Consumer Cyclicals Momentum ETF | | | | | | | | | | | | | | X | |
Invesco DWA Consumer Staples Momentum ETF | | | | | | | | | | | | | | X | |
Invesco DWA Energy Momentum ETF | | | | | | | | | | | | | | X | |
Invesco DWA Financial Momentum ETF | | | | | | | | | | | | | | X | |
Invesco DWA Healthcare Momentum ETF | | | | | | | | | | | | | | X | |
Invesco DWA Industrials Momentum ETF | | | | | | | | | | | | | | X | |
Invesco DWA Momentum ETF | | | | | | | | | | | | | | X | |
Invesco DWA Technology Momentum ETF | | | | | | | | | | | | | | X | |
Invesco DWA Utilities Momentum ETF | | | | | | | | | | | | | | X | |
Invesco Dynamic Biotechnology & Genome ETF | | | | | | | | | | | | | | X | |
Invesco Dynamic Building & Construction ETF | | | | | | | | | | | | | | X | |
Invesco Dynamic Energy Exploration & Production ETF | | | | | | | | | | | | | | X | |
Invesco Dynamic Food & Beverage ETF | | | | | | | | | | | | | | X | |
Invesco Dynamic Large Cap Growth ETF | | | | | | | | | | | | | | X | |
Invesco Dynamic Large Cap Value ETF | | | | | | | | | | | | | | X | |
Invesco Dynamic Leisure and Entertainment ETF | | | | | | | | | | | | | | X | |
Invesco Dynamic Market ETF | | | | | | | | | | | | | | X | |
Invesco Dynamic Media ETF | | | | | | | | | | | | | | X | |
Invesco Dynamic Networking ETF | | | | | | | | | | | | | | X | |
Invesco Dynamic Oil & Gas Services ETF | | | | | | | | | N/A | | | | | X | |
Invesco Dynamic Pharmaceuticals ETF | | | | | | | | | | | | | | X | |
Invesco Dynamic Semiconductors ETF | | | | | | | | | | | | | | X | |
Invesco Dynamic Software ETF | | | | | | | | | | | | | | X | |
Invesco Financial Preferred ETF | | | | | | | | | | | | | | X | |
Invesco FTSE RAFI US 1000 ETF | | | | | | | | | | | | | | X | |
Invesco FTSE RAFI US 1500 Small-Mid ETF | | | | X | | | | | | | | | | X | |
Invesco Global Listed Private Equity ETF | | | | | | | | | N/A | | | | | X | |
Approval of Investment Advisory Contracts–(continued)
| | | | | | | | | | | | | | | |
| | | | | Equal to/Lower | | Lower than |
| | | Equal | | than Open-End | | Open-End |
| | | to/Lower | | Index Fund | | Active Fund |
| Invesco Fund | | than ETF Peer Median | | Peer Median* | | Peer Median |
Invesco Golden Dragon China ETF | | | | X | | | | | N/A | | | | | X | |
Invesco High Yield Equity Dividend AchieversTM ETF | | | | | | | | | | | | | | X | |
Invesco International Dividend AchieversTM ETF | | | | X | | | | | | | | | | X | |
Invesco MSCI Sustainable Future ETF | | | | | | | | | | | | | | X | |
Invesco S&P 100 Equal Weight ETF | | | | | | | | | X | | | | | X | |
Invesco S&P 500 GARP ETF | | | | X | | | | | X | | | | | X | |
Invesco S&P 500® Quality ETF | | | | X | | | | | | | | | | X | |
Invesco S&P 500 Value with Momentum ETF | | | | | | | | | | | | | | X | |
Invesco S&P MidCap Momentum ETF | | | | X | | | | | | | | | | X | |
Invesco S&P MidCap Quality ETF | | | | X | | | | | | | | | | X | |
Invesco S&P MidCap Value with Momentum ETF | | | | | | | | | X | | | | | X | |
Invesco S&P SmallCap Momentum ETF | | | | | | | | | | | | | | X | |
Invesco S&P SmallCap Value with Momentum ETF | | | | | | | | | X | | | | | X | |
Invesco S&P Spin-Off ETF | | | | | | | | | | | | | | X | |
Invesco Water Resources ETF | | | | X | | | | | X | | | | | X | |
Invesco WilderHill Clean Energy ETF | | | | | | | | | N/A | | | | | | |
Invesco Zacks Mid-Cap ETF | | | | | | | | | | | | | | X | |
Invesco Zacks Multi-Asset Income ETF | | | | | | | | | | | | | | X | |
| * | The information provided by the Adviser indicated that certain Funds did not have open-end index fund peers. Those Funds have been designated with an “N/A” for not available. |
The Trustees noted that the net expense ratios for certain Funds were equal to or lower than the median net expense ratios of their ETF and open-end index peer funds, as applicable, as illustrated in the table below. The Trustees also noted that the net expense ratios for all of the Funds were lower than the median net expense ratios of their open-end actively-managed peer funds. The Trustees noted that a significant component of the non-advisory fee expenses was the sub-licensing fees paid by the Funds, and noted those Funds for which sub-license fees are subject to the Funds’ Expense Caps.
| | | | | | | | | | | | | | | |
| | | Equal | | Equal | | |
| | | to/Lower | | to/Lower than | | Lower than |
| | | than ETF | | Open-End | | Open-End |
| | | Peer | | Index Fund | | Active Fund |
Invesco Fund | | Median | | Peer Median* | | Peer Median |
Invesco Aerospace & Defense ETF | | | | | | | | | | | | | | X | |
Invesco Buyback AchieversTM ETF | | | | | | | | | | | | | | X | |
Invesco Dividend AchieversTM ETF | | | | | | | | | X | | | | | X | |
Invesco DWA Basic Materials Momentum ETF | | | | | | | | | | | | | | X | |
Invesco DWA Consumer Cyclicals Momentum ETF | | | | | | | | | | | | | | X | |
Invesco DWA Consumer Staples Momentum ETF | | | | | | | | | | | | | | X | |
Invesco DWA Energy Momentum ETF | | | | | | | | | | | | | | X | |
Invesco DWA Financial Momentum ETF | | | | | | | | | | | | | | X | |
Invesco DWA Healthcare Momentum ETF | | | | | | | | | | | | | | X | |
Invesco DWA Industrials Momentum ETF | | | | | | | | | | | | | | X | |
Invesco DWA Momentum ETF | | | | | | | | | X | | | | | X | |
Invesco DWA Technology Momentum ETF | | | | | | | | | | | | | | X | |
Invesco DWA Utilities Momentum ETF | | | | | | | | | | | | | | X | |
Invesco Dynamic Biotechnology & Genome ETF | | | | | | | | | | | | | | X | |
Invesco Dynamic Building & Construction ETF | | | | | | | | | | | | | | X | |
Invesco Dynamic Energy Exploration & Production ETF | | | | | | | | | | | | | | X | |
Approval of Investment Advisory Contracts–(continued)
| | | | | | | | | | | | | | | |
| | | Equal | | Equal | | |
| | | to/Lower | | to/Lower than | | Lower than |
| | | than ETF | | Open-End | | Open-End |
| | | Peer | | Index Fund | | Active Fund |
| Invesco Fund | | Median | | Peer Median* | | Peer Median |
Invesco Dynamic Food & Beverage ETF | | | | | | | | | | | | | | X | |
Invesco Dynamic Large Cap Growth ETF | | | | | | | | | | | | | | X | |
Invesco Dynamic Large Cap Value ETF | | | | | | | | | | | | | | X | |
Invesco Dynamic Leisure and Entertainment ETF | | | | | | | | | | | | | | X | |
Invesco Dynamic Market ETF | | | | | | | | | | | | | | X | |
Invesco Dynamic Media ETF | | | | | | | | | | | | | | X | |
Invesco Dynamic Networking ETF | | | | | | | | | | | | | | X | |
Invesco Dynamic Oil & Gas Services ETF | | | | | | | | | N/A | | | | | X | |
Invesco Dynamic Pharmaceuticals ETF | | | | | | | | | | | | | | X | |
Invesco Dynamic Semiconductors ETF | | | | | | | | | | | | | | X | |
Invesco Dynamic Software ETF | | | | | | | | | | | | | | X | |
Invesco Financial Preferred ETF | | | | | | | | | | | | | | X | |
Invesco FTSE RAFI US 1000 ETF | | | | | | | | | | | | | | X | |
Invesco FTSE RAFI US 1500 Small-Mid ETF | | | | | | | | | | | | | | X | |
Invesco Global Listed Private Equity ETF | | | | | | | | | N/A | | | | | X | |
Invesco Golden Dragon China ETF | | | | | | | | | N/A | | | | | X | |
Invesco High Yield Equity Dividend AchieversTM ETF | | | | | | | | | X | | | | | X | |
Invesco International Dividend AchieversTM ETF | | | | | | | | | | | | | | X | |
Invesco MSCI Sustainable Future ETF | | | | | | | | | | | | | | X | |
Invesco S&P 100 Equal Weight ETF | | | | | | | | | X | | | | | X | |
Invesco S&P 500 GARP ETF | | | | X | | | | | X | | | | | X | |
Invesco S&P 500® Quality ETF | | | | X | | | | | | | | | | X | |
Invesco S&P 500 Value with Momentum ETF | | | | | | | | | | | | | | X | |
Invesco S&P MidCap Momentum ETF | | | | X | | | | | | | | | | X | |
Invesco S&P MidCap Quality ETF | | | | X | | | | | | | | | | X | |
Invesco S&P MidCap Value with Momentum ETF | | | | | | | | | X | | | | | X | |
Invesco S&P SmallCap Momentum ETF | | | | | | | | | | | | | | X | |
Invesco S&P SmallCap Value with Momentum ETF | | | | | | | | | X | | | | | X | |
Invesco S&P Spin-Off ETF | | | | | | | | | | | | | | X | |
Invesco Water Resources ETF | | | | | | | | | X | | | | | X | |
Invesco WilderHill Clean Energy ETF | | | | | | | | | N/A | | | | | X | |
Invesco Zacks Mid-Cap ETF | | | | | | | | | | | | | | X | |
Invesco Zacks Multi-Asset Income ETF | | | | | | | | | | | | | | X | |
| * | The information provided by the Adviser indicated that certain Funds did not have open-end index fund peers. Those Funds have been designated with an “N/A” for not available. |
In response to questions from the Independent Trustees, the Adviser provided supplemental information regarding each of Invesco Dynamic Large Cap Value ETF, Invesco Global Listed Private Equity ETF and Invesco Zacks Multi-Asset Income ETF’s advisory fees and total expenses and the Lipper peer data. The Adviser explained its view that the advisory fees and total expenses for these Funds are competitive and generally in line with other comparable funds in the marketplace, particularly in light of the level and nature of services provided and the investment management style of the Adviser. The Trustees also considered the Adviser’s statements regarding its pricing philosophy and the differing pricing philosophy of certain of the peers.
The Trustees noted information, including fee information, provided by the Adviser regarding other investment products to which it provides investment advisory services, including products that have investment strategies comparable to one of the Funds. The Trustees considered the Adviser’s explanation of the differences between the services provided to the Funds and to the other
Approval of Investment Advisory Contracts–(continued)
investment products it advises, noting the Adviser’s statement that the management and oversight of the Funds requires substantially more labor and expense.
Based on all of the information provided, the Trustees determined that the contractual advisory fee and net expense ratio of each Fund were reasonable and appropriate in light of the services provided, the nature of the indexes, the distinguishing factors of the Funds, and the administrative, operational and management oversight costs for the Adviser.
In conjunction with their review of fees, the Trustees considered information provided by the Adviser on the revenues received by the Adviser under the Investment Advisory Agreement for the Funds, as well as the fees waived and expenses reimbursed by the Adviser for the Funds. The Trustees reviewed information provided by the Adviser on its overall profitability, as well as the estimated profitability to the Adviser from its relationship to each Fund. The Trustees concluded that the overall and estimated profitability to the Adviser was not unreasonable.
Economies of Scale and Whether Fee Levels Reflect These Economies of Scale. The Trustees reviewed the information provided by the Adviser as to the extent to which economies of scale may be realized as each Fund grows and whether fee levels reflect economies of scale for the benefit of shareholders. The Trustees reviewed each Fund’s asset size, advisory fee, expense ratio and Expense Cap agreed to by the Adviser. The Trustees also noted that the Expense Cap agreement with the Trust provides that the Adviser is entitled to be reimbursed by each Fund, other than Invesco Dynamic Market ETF, for fees waived or expenses absorbed pursuant to the Expense Cap for a period of three years from the date the fee or expense was incurred, provided that no reimbursement would be made that would result in a Fund exceeding its Expense Cap then in effect or in effect at the time the fees and/or expenses subject to reimbursement were waived and/or borne by the Adviser. The Trustees considered whether the advisory fee rate for each Fund was reasonable in relation to the asset size of that Fund, and concluded that the flat advisory fee was reasonable and appropriate.
Fall-out Benefits. The Trustees considered that the Adviser identified no additional benefits it receives from its relationship with the Funds, and noted that the Adviser does not have any soft-dollar arrangements. The Trustees also considered benefits received by affiliates of the Adviser that may be directly or indirectly attributed to the Adviser’s relationship with the Funds, including brokerage fees and advisory fees for money market cash management vehicles. The Board concluded that each Fund’s advisory fee was reasonable, taking into account any ancillary benefits received by affiliates of the Adviser.
Based on all of the information considered and the conclusions reached, the Board, including the Independent Trustees, determined to approve the continuation of the Investment Advisory Agreement for each Fund. No single factor was determinative in the Board’s analysis.
Proxy Voting Policies and Procedures
A description of the Trust’s proxy voting policies and procedures that the Funds use to determine how to vote proxies relating to portfolio securities is available, without charge and upon request, by calling (800) 983-0903. This information is also available on the Securities and Exchange Commission’s (the “Commission”) website at www.sec.gov.
Information regarding how each Fund voted proxies for portfolio securities, if applicable, during the most recent 12-month period ended June 30, is available, without charge and upon request, by (i) calling (800) 983-0903; or (ii) accessing the Trust’s Form N-PX on the Commission’s website at www.sec.gov.
Quarterly Portfolios
The Trust files its complete schedule of portfolio holdings for the Funds with the Commission for the first and third quarters of each fiscal year as an exhibit to its reports on Form N-PORT. The Forms N-PORT are available on the Commission’s website at www.sec.gov.
Frequency Distribution of Discounts and Premiums
A table showing the number of days the market price of each Fund’s shares was greater than the Fund’s net asset value, and the number of days it was less than the Fund’s net asset value (i.e., premium or discount) for the most recently completed calendar year, and the calendar quarters since that year end (or the life of the Fund, if shorter) may be found at the Fund’s website at www.invesco.com/ETFs.
| | | | |
©2021 Invesco Capital Management LLC 3500 Lacey Road, Suite 700 | | | | |
| Downers Grove, IL 60515 | | P-PS-AR-1 | | invesco.com/ETFs |
Item 2. Code of Ethics.
The Registrant has adopted a Code of Ethics that applies to the Registrant’s principal executive officer and principal financial officer. This Code is filed as an exhibit to this report on Form N-CSR under Item 13(a)(1). No substantive amendments to this Code were made during the reporting period. There were no waivers for the fiscal year ended April 30, 2021.
Item 3. Audit Committee Financial Expert.
The Registrant’s Board of Trustees (the “Board”) has determined that the Registrant has four “audit committee financial experts” serving on its audit committee: Mr. Marc M. Kole, Ms. Joanne Pace, Mr. Gary R. Wicker and Mr. Donald H. Wilson. Each of these audit committee members is “independent,” meaning that he/she is not an “interested person” of the Registrant (as that term is defined in Section 2(a)(19) of the Investment Company Act of 1940, as amended) and he/she does not accept any consulting, advisory, or other compensatory fee from the Registrant (except in his/her capacity as a Board or committee member).
An “audit committee financial expert” is not an “expert” for any purpose, including for purposes of Section 11 of the Securities Act of 1933, as a result of being designated as an “audit committee financial expert.” Further, the designation of a person as an “audit committee financial expert” does not mean that a person has any greater duties, obligations, or liability than those imposed on a person without the “audit committee financial expert” designation. Similarly, the designation of a person as an “audit committee financial expert” does not affect the duties, obligations, or liability of any other member of the audit committee or Board.
Item 4. Principal Accountant Fees and Services.
(a) to (d)
Fees Billed by PwC to the Registrant
PricewaterhouseCoopers LLP (“PwC”), the Registrant’s independent registered public accounting firm, billed the Registrant aggregate fees for pre-approved services rendered to the Registrant for the last two fiscal years as shown in the following table. The Audit Committee pre-approved all audit and non-audit services provided to the Registrant.
| | | | |
| | | Fees Billed by PwC for Services Rendered
to the Registrant for Fiscal Year End 2021 | | Fees Billed by PwC for Services Rendered
to the Registrant for Fiscal Year End 2020 |
Audit Fees | | $ 914,600 | | $ 914,600 |
Audit-Related Fees | | $ 0 | | $ 0 |
Tax Fees(1) | | $ 995,966 | | $ 962,000 |
All Other Fees | | $ 0 | | $ 0 |
Total Fees | | $ 1,910,566 | | $ 1,876,600 |
| (1) | Tax Fees for the fiscal years ended April 30, 2021 and 2020 include fees billed for preparation of U.S. Tax Returns and Taxable Income calculations, including excise and year-to-date estimates for various book-to-tax differences. |
Fees Billed by PwC Related to Invesco and Invesco Affiliates
PwC billed Invesco Capital Management LLC (“Invesco” or “Adviser”), the Registrant’s investment adviser, and any entity controlling, controlled by or under common control with Invesco that provides ongoing services to the Registrant (“Affiliates”), aggregate fees for pre-approved non-audit services rendered to Invesco and Affiliates for the last two fiscal years as shown in the following table. The Audit Committee pre-approved all non-audit services provided to Invesco and Affiliates that were required to be pre-approved.
| | | | |
| | | Fees Billed for Non-
Audit Services
Rendered to
Invesco and
Affiliates for Fiscal
Year End 2021 That
Were Required
to be Pre-Approved
by the Registrant’s Audit Committee | | Fees Billed for Non-
Audit Services
Rendered to
Invesco and
Affiliates for Fiscal
Year End 2020 That
Were Required
to be Pre-Approved
by the Registrant’s Audit Committee |
Audit-Related Fees(1) | | $793,000 | | $701,000 |
Tax Fees | | $ 0 | | $ 0 |
All Other Fees | | $ 0 | | $ 0 |
Total Fees | | $793,000 | | $701,000 |
| | (1) | Audit-Related Fees for the fiscal years ended 2021 and 2020 include fees billed related to reviewing controls at a service organization. |
(e)(1) Audit Committee Pre-Approval Policies and Procedures
Pre-Approval of Audit and Non-Audit Services Policies and Procedures
As Adopted by the Audit Committee of the Invesco ETFs
| | |
Applicable to | | Invesco Exchange-Traded Fund Trust, Invesco Exchange-Traded Fund Trust II, Invesco India Exchange-Traded Fund Trust, Invesco Actively Managed Exchange-Traded Fund Trust, Invesco Actively Managed Exchange-Traded Commodity Fund Trust and Invesco Exchange-Traded Self-Indexed Fund Trust (collectively the “Funds”) |
Risk Addressed by Policy | | Approval of Audit and Non-Audit Services |
Relevant Law and Other Sources | | Sarbanes-Oxley Act of 2002; Regulation S-X. |
Effective date | | June 26, 2009 |
Amended Dates | | March 12, 2015 and June 15, 2018 |
Statement of Principles
Under the Sarbanes-Oxley Act of 2002 and rules adopted by the Securities and Exchange Commission (“SEC”) (“Rules”), the Audit Committee of the Funds’ (the “Audit Committee”) Board of Trustees (the “Board”) is responsible for the appointment, compensation and oversight of the work of independent accountants (an “Auditor”). As part of this responsibility and to assure that the Auditor’s independence is not impaired, the Audit Committee pre-approves the audit and non-audit services provided to the Funds by each Auditor, as well as all non-audit services provided by the Auditor to the Funds’ investment adviser and to affiliates of the adviser that provide ongoing services to the Funds (“Service Affiliates”) if the services directly impact the Funds’ operations or financial reporting. The SEC Rules also specify the types of services that an Auditor may not provide to its audit client. The following policies and procedures comply with the requirements for pre-approval and provide a mechanism by which management of the Funds may request and secure pre-approval of audit and non-audit services in an orderly manner with minimal disruption to normal business operations.
Proposed services either may be pre-approved without consideration of specific case-by-case services by the Audit Committee (“general pre-approval”) or require the specific pre-approval of the Audit Committee (“specific pre-approval”). As set forth in these policies and procedures, unless a type of service has received general pre-approval, it will require specific pre-approval by the Audit Committee. Additionally, any fees exceeding 110% of estimated pre-approved fee levels provided at the time the service was pre-approved will also require specific approval by the Audit Committee before payment is made. The Audit Committee will also consider the impact of additional fees on the Auditor’s independence when determining whether to approve any additional fees for previously pre-approved services.
The Audit Committee will annually review and generally pre-approve the services that may be provided by each Auditor without obtaining specific pre-approval from the Audit Committee. The term of any general pre-approval runs from the date of such pre-approval through June 30th of the following year, unless the Audit Committee considers a different period and states otherwise. The Audit Committee will add to or subtract from the list of general pre-approved services from time to time, based on subsequent determinations.
The purpose of these policies and procedures is to set forth the guidelines to assist the Audit Committee in fulfilling its responsibilities.
Delegation
The Chairman of the Audit Committee (or, in his or her absence, any member of the Audit Committee) may grant specific pre-approval for non-prohibited services. All such delegated pre-approvals shall be presented to the Audit Committee no later than the next Audit Committee meeting.
Audit Services
The annual Audit services engagement terms will be subject to specific pre-approval of the Audit Committee. Audit services include the annual financial statement audit and other procedures such as tax provision work that is required to be performed by the independent auditor to be able to form an opinion on the Funds’ financial statements. The Audit Committee will obtain, review and consider sufficient information concerning the proposed Auditor to make a reasonable evaluation of the Auditor’s qualifications and independence.
In addition to the annual Audit services engagement, the Audit Committee may grant either general or specific pre-approval of other Audit services, which are those services that only the independent auditor reasonably can provide. Other Audit services may include services such as issuing consents for the inclusion of audited financial statements with SEC registration statements, periodic reports and other documents filed with the SEC or other documents issued in connection with securities offerings.
Non-Audit Services
The Audit Committee may provide either general or specific pre-approval of any non-audit services to the Funds and its Service Affiliates if the Audit Committee believes that the provision of the service will not impair the independence of the Auditor, is consistent with the SEC’s Rules on auditor independence, and otherwise conforms to the Audit Committee’s general principles and policies as set forth herein.
Audit-Related Services
“Audit-related services” are assurance and related services that are reasonably related to the performance of the audit or review of the Funds’ financial statements or that are traditionally performed by the independent auditor. Audit-related services include, among others, accounting consultations related to accounting, financial reporting or disclosure matters not classified as “Audit services”; and assistance with understanding and implementing new accounting and financial reporting guidance from rulemaking authorities.
Tax Services
“Tax services” include, but are not limited to, the review and signing of the Funds’ federal tax returns, the review of required distributions by the Funds and consultations regarding tax matters such as the tax treatment of new investments or the impact of new regulations. The Audit Committee will scrutinize carefully the retention of the Auditor in connection with a transaction initially recommended by the Auditor, the major business purpose of which may be tax avoidance or the tax treatment of which may not be supported in the Internal Revenue Code and related regulations. The Audit Committee will consult with the Funds’ Treasurer (or his or her designee) and may consult with outside counsel or advisors as necessary to ensure the consistency of Tax services rendered by the Auditor with the foregoing policy.
No Auditor shall represent any Fund or any Service Affiliate before a tax court, district court or federal court of claims.
Under rules adopted by the Public Company Accounting Oversight Board and approved by the SEC, in connection with seeking Audit Committee pre-approval of permissible Tax services, the Auditor shall:
| | 1. | Describe in writing to the Audit Committee, which writing may be in the form of the proposed engagement letter: |
| | a. | The scope of the service, the fee structure for the engagement, and any side letter or amendment to the engagement letter, or any other agreement between the Auditor and the Fund, relating to the service; and |
| | b. | Any compensation arrangement or other agreement, such as a referral agreement, a referral fee or |
| | | fee-sharing arrangement, between the Auditor and any person (other than the Fund) with respect to the promoting, marketing, or recommending of a transaction covered by the service; |
| | 2. | Discuss with the Audit Committee the potential effects of the services on the independence of the Auditor; and |
| | 3. | Document the substance of its discussion with the Audit Committee. |
All Other Auditor Services
The Audit Committee may pre-approve non-audit services classified as “All other services” that are not categorically prohibited by the SEC, as listed in Exhibit 1 to this policy.
Pre-Approval Fee Levels or Established Amounts
Pre-approval of estimated fees or established amounts for services to be provided by the Auditor under general or specific pre-approval policies will be set periodically by the Audit Committee. Any proposed fees exceeding 110% of the maximum estimated pre-approved fees or established amounts for pre-approved audit and non-audit services will be reported to the Audit Committee at the quarterly Audit Committee meeting and will require specific approval by the Audit Committee before payment is made. The Audit Committee will always factor in the overall relationship of fees for audit and non-audit services in determining whether to pre-approve any such services and in determining whether to approve any additional fees exceeding 110% of the maximum pre-approved fees or established amounts for previously pre-approved services.
Procedures
On an annual basis, the Auditor will submit to the Audit Committee for general pre-approval, a list of non-audit services that the Funds or Service Affiliates of the Funds may request from the Auditor. The list will describe the non-audit services in reasonable detail and will include an estimated range of fees and such other information as the Audit Committee may request.
Each request for services to be provided by the Auditor under the general pre-approval of the Audit Committee will be submitted to the Funds’ Treasurer (or his or her designee) and must include a detailed description of the services to be rendered. The Treasurer or his or her designee will ensure that such services are included within the list of services that have received the general pre-approval of the Audit Committee.
Each request to provide services that require specific approval by the Audit Committee shall be submitted to the Audit Committee jointly by the Funds’ Treasurer or his or her designee and the Auditor, and must include a joint statement that, in their view, such request is consistent with the pre-approval policies and procedures and the SEC Rules.
Each request to provide Tax services under either the general or specific pre-approval of the Audit Committee will describe in writing: (i) the scope of the service, the fee structure for the engagement, and any side letter or amendment to the engagement letter, or any other agreement between the Auditor and the audit client, relating to the service; and (ii) any compensation arrangement or other agreement between the Auditor and any person (other than the audit client) with respect to the promoting, marketing, or recommending of a transaction covered by the service. The Auditor will discuss with the Audit Committee
the potential effects of the services on the Auditor’s independence and will document the substance of the discussion.
Non-audit services pursuant to the de minimis exception provided by the SEC Rules will be promptly brought to the attention of the Audit Committee for approval, including documentation that each of the conditions for this exception, as set forth in the SEC Rules, has been satisfied.
On at least an annual basis, the Auditor will prepare a summary of all the services provided to any entity in the investment company complex as defined in section 2-01(f)(14) of Regulation S-X in sufficient detail as to the nature of the engagement and the fees associated with those services.
The Audit Committee has designated the Funds’ Treasurer to monitor the performance of all services provided by the Auditor and to ensure such services are in compliance with these policies and procedures. The Funds’ Treasurer will report to the Audit Committee on a periodic basis as to the results of such monitoring. Both the Funds’ Treasurer and management will immediately report to the Chairman of the Audit Committee any breach of these policies and procedures that comes to the attention of the Funds’ Treasurer or senior management.
Exhibit 1 to Pre-Approval of Audit and Non-Audit Services Policies and Procedures
Conditionally Prohibited Non-Audit Services (not prohibited if the Fund can reasonably conclude that the results of the service would not be subject to audit procedures in connection with the audit of the Fund’s financial statements)
| | • | | Bookkeeping or other services related to the accounting records or financial statements of the audit client |
| | • | | Financial information systems design and implementation |
| | • | | Appraisal or valuation services, fairness opinions, or contribution-in-kind reports |
| | • | | Internal audit outsourcing services |
Categorically Prohibited Non-Audit Services
| | • | | Broker-dealer, investment adviser, or investment banking services |
| | • | | Expert services unrelated to the audit |
| | • | | Any service or product provided for a contingent fee or a commission |
| | • | | Services related to marketing, planning, or opining in favor of the tax treatment of confidential transactions or aggressive tax position transactions, a significant purpose of which is tax avoidance |
| | • | | Tax services for persons in financial reporting oversight roles at the Fund |
| | • | | Any other service that the Public Company Oversight Board determines by regulation is impermissible. |
| | (e)(2) | There were no amounts that were pre-approved by the Audit Committee pursuant to the de minimus exception under Rule 2-01 of Regulation S-X. |
| | (g) | In addition to the amounts shown in the tables above, PwC billed Invesco and Affiliates aggregate fees of $7,776,000 for the fiscal year ended April 30, 2021 and $6,727,000 for the fiscal year ended April 30, 2020 for non-audit services not required to be pre-approved by the Registrant’s Audit Committee. In total, PwC billed the Registrant, Invesco and Affiliates aggregate non-audit fees of $9,564,966 for the fiscal year ended April 30, 2021 and $8,390,000 for the fiscal year ended April 30, 2020. |
| | (h) | With respect to the non-audit services above billed to Invesco and Affiliates that were not required to be pre-approved by the Registrant’s Audit Committee, the Audit Committee received information from PwC about such services, including by way of comparison, that PwC provided audit services to entities within the Investment Company Complex, as defined by Rule 2-01(f)(14) of Regulation S-X, of approximately $32 million and non-audit services of approximately $21 million for the fiscal year ended 2021. The Audit Committee considered this information in evaluating PwC’s independence. |
Pursuant to PCAOB Rule 3526, PwC advised the Registrant’s Audit Committee of the following matters identified between May 1, 2020 to June 29, 2021 that may be reasonably thought to bear on PwC’s independence. PwC advised the Audit Committee that one PwC Manager and three PwC Associates each held financial interests in investment companies within the complex that includes the Funds as well as all registered investment companies advised by the Adviser and its affiliates, including other subsidiaries of the Adviser’s parent company, Invesco Ltd. (collectively, the “Invesco Fund Complex”) that were inconsistent with the requirements of Rule 2-01(c)(1) of Regulation S-X. In reporting the matters to the Audit Committee, PwC noted, among other things, that the impermissible holdings were disposed of by the individuals, the individuals were not in the chain of command of the audit or the audit partners of the Funds, the financial interests were not material to the net worth of each individual or their respective immediate family members and senior leadership of the Funds’ audit engagement team was unaware of the impermissible holdings until after the matters were confirmed to be independence exceptions or individuals ceased providing their non-audit services. In addition, PwC considered that audit work was performed by the PwC Associates, but such audit work was of a limited nature and/or was reviewed by other engagement team members. Based on the mitigating factors noted above, PwC advised the Audit Committee that it concluded that its objectivity and impartiality with respect to all issues encompassed within the audit engagement has not been impaired and it believes that a reasonable investor with knowledge of all relevant facts and circumstances for the violations would conclude that PwC is capable of exercising objective and impartial judgment on all issues encompassed within their audits of the financial statements of the Funds in the Registrant for the impacted periods.
Item 5. Audit Committee of Listed Registrants.
| | (a) | The Registrant has a separately designated Audit Committee established in accordance with Section 3(a)(58)(A) of the Securities Exchange Act of 1934, as amended, which consists solely of independent trustees. The Audit Committee members are Marc M. Kole, Joanne Pace, Gary R. Wicker, and Donald H. Wilson. |
Item 6. Schedule of Investments.
| (a) | The Schedules of Investments are included as a part of the report to shareholders filed under Item 1 of this Form N-CSR. |
Item 7. Disclosure of Proxy Voting Policies and Procedures for Closed-End Management Investment Companies.
Not applicable.
Item 8. Portfolio Managers of Closed-End Management Investment Companies.
Not applicable.
Item 9. Purchases of Equity Securities by Closed-End Management Investment Company and Affiliated Purchasers.
Not applicable.
Item 10. Submission of Matters to a Vote of Security Holders.
There have been no material changes to the procedures by which shareholders may recommend nominees to the Board that would require disclosure herein.
Item 11. Controls and Procedures.
| | (a) | Based on their evaluation of the Registrant’s disclosure controls and procedures (as defined in Rule 30a-3(c) under the Investment Company Act of 1940) as of a date within 90 days of the filing date of this report, the Registrant’s President (principal executive officer) and Treasurer (principal financial officer) have concluded that such disclosure controls and procedures are effective. |
| | (b) | There were no changes in the Registrant’s internal control over financial reporting (as defined in Rule 30a-3(d) under the Investment Company Act of 1940) that occurred during the period covered by this report that has materially affected, or is reasonably likely to materially affect, the Registrant’s internal control over financial reporting. |
Item 12. Disclosure of Securities Lending Activities for Closed-End Management Investment Companies.
Not applicable.
Item 13. Exhibits.
SIGNATURES
Pursuant to the requirements of the Securities Exchange Act of 1934 and the Investment Company Act of 1940, the Registrant has duly caused this report to be signed on its behalf by the undersigned, thereunto duly authorized.
| | |
| (Registrant) Invesco Exchange-Traded Fund Trust |
| | |
By: /s/ Anna Paglia |
|
Name: Anna Paglia |
Title: President |
|
Date: June 29, 2021 |
Pursuant to the requirements of the Securities Exchange Act of 1934 and the Investment Company Act of 1940, this report has been signed below by the following persons on behalf of the Registrant and in the capacities and on the dates indicated.
|
By: /s/ Anna Paglia |
|
Name: Anna Paglia |
Title: President |
|
Date: June 29, 2021 |
|
By: /s/ Kelli Gallegos |
|
Name: Kelli Gallegos |
Title: Treasurer |
|
Date: June 29, 2021 |