
UNITED STATES
SECURITIES AND EXCHANGE COMMISSION
Washington, D.C. 20549
FORM N-CSRS
CERTIFIED SHAREHOLDER REPORT OF REGISTERED
MANAGEMENT INVESTMENT COMPANIES
Investment Company Act file number: 811-21269
Wells Fargo Income Opportunities Fund
(Exact name of registrant as specified in charter)
525 Market St., San Francisco, CA 94105
(Address of principal executive offices) (Zip code)
Catherine Kennedy
Wells Fargo Funds Management, LLC
525 Market St., San Francisco, CA 94105
(Name and address of agent for service)
Registrant’s telephone number, including area code: 800-222-8222
Date of fiscal year end: April 30
Date of reporting period: October 31, 2020
ITEM 1. REPORT TO STOCKHOLDERS
Semi-Annual Report
October 31, 2020
Wells Fargo
Income Opportunities Fund (EAD)
Beginning on January 1, 2021, as permitted by new regulations adopted by the Securities and Exchange Commission, paper copies of the Wells Fargo Funds’ annual and semi-annual shareholder reports issued after this date will no longer be sent by mail, unless you specifically request paper copies of the reports. Instead, the reports will be made available on the Funds’ website, and you will be notified by mail each time a report is posted and provided with a website address to access the report.
If you already elected to receive shareholder reports electronically, you will not be affected by this change and you need not take any action. You may elect to receive shareholder reports and other communications from the Fund electronically at any time by contacting your financial intermediary (such as a broker-dealer or bank) or, if you are a direct investor, by calling 1-800-730-6001.
You may elect to receive all future reports in paper free of charge. If you invest through a financial intermediary, you can contact your financial intermediary to request that you continue to receive paper copies of your shareholder reports; if you invest directly with the Fund, you can call 1-800-730-6001. Your election to receive reports in paper will apply to all Wells Fargo Funds held in your account with your financial intermediary or, if you are a direct investor, to all Wells Fargo Funds that you hold.
|
|
|
Reduce clutter.
Save trees.
|
Sign up for
electronic delivery
of prospectuses
and shareholder
reports at
wellsfargo.com/
advantagedelivery |
The views expressed and any forward-looking statements are as of October 31, 2020, unless otherwise noted, and are those of the Fund’s portfolio managers and/or Wells Fargo Asset Management. Discussions of individual securities, or the markets generally, or any Wells Fargo Fund are not intended as individual recommendations. Future events or results may vary significantly from those expressed in any forward-looking statements. The views expressed are subject to change at any time in response to changing circumstances in the market. Wells Fargo Asset Management and the Fund disclaim any obligation to publicly update or revise any views expressed or forward-looking statements.
INVESTMENT PRODUCTS: NOT FDIC INSURED ◾ NO BANK GUARANTEE ◾ MAY LOSE VALUE
Wells Fargo Income Opportunities Fund | 1
Letter to shareholders (unaudited)

Andrew Owen
President
Wells Fargo Funds
“The global equity market continued to rebound from earlier volatility in May, with widespread advances.”
Dear Shareholder:
We are pleased to offer you this semi-annual report for the Wells Fargo Income Opportunities Fund for the six-month period that ended October 31, 2020. Global stock markets rallied strongly, driven by aggressive stimulus measures introduced by central banks and governments in response to challenges presented by the COVID-19 pandemic. Emerging market equities had particularly robust results during the six-month period. Among bonds, high-yield issues led the way while U.S. bonds generally had more modest returns than their international counterparts.
For the period, U.S. stocks, based on the S&P 500 Index,1 returned 13.29% and international stocks, as measured by the MSCI ACWI ex USA Index (Net),2 gained 12.22%. The MSCI EM Index (Net)3 rallied 20.96%. Among bond investments, the Bloomberg Barclays U.S. Aggregate Bond Index4 returned a modest 1.27%, the Bloomberg Barclays Global Aggregate ex-USD Index5 gained 5.99%, the Bloomberg Barclays Municipal Bond Index6 had a 4.99% return, and the ICE BofA U.S. High Yield Index7 gained 11.08%.
Equities enjoyed a strong tailwind from monetary and fiscal stimulus.
The global equity market continued to rebound from earlier volatility in May, with widespread advances. Investors regained confidence on reports of early signs of success in human trials of a COVID-19 vaccine. Growth stocks continued to lead value stocks while returns on global government bonds were generally flat. In the U.S., a gap grew between the stock market rebound and economic data. Manufacturing and services Purchasing Managers’ Indices, a monthly survey of purchasing managers, reflected widespread weakening activity in May. U.S. corporate earnings reports understandably indicated a 14% year-over-year contraction in earnings from the first quarter of 2019. However, high demand for technology, driven by remote activity, supported robust information technology sector earnings, which helped drive major technology stocks higher.
Financial markets posted widely positive returns in June despite ongoing economic weakness and high levels of uncertainty on the containment of COVID-19 and the timing of an effective vaccine. As economies reopened, optimism rose. Vitally important to market sentiment was the ongoing global central bank commitment to do everything possible to provide economic support through liquidity and low borrowing costs. U.S. economic activity was boosted by one-time $1,200 stimulus checks and $600 weekly bonus unemployment benefits that carried tens of millions of
| 1 | The S&P 500 Index consists of 500 stocks chosen for market size, liquidity, and industry group representation. It is a market-value-weighted index with each stock’s weight in the index proportionate to its market value. You cannot invest directly in an index. |
| 2 | The Morgan Stanley Capital International (MSCI) All Country World Index (ACWI) ex USA Index (Net) is a free-float-adjusted market-capitalization-weighted index that is designed to measure the equity market performance of developed and emerging markets, excluding the United States. Source: MSCI. MSCI makes no express or implied warranties or representations and shall have no liability whatsoever with respect to any MSCI data contained herein. The MSCI data may not be further redistributed or used as a basis for other indices or any securities or financial products. This report is not approved, reviewed, or produced by MSCI. You cannot invest directly in an index. |
| 3 | The MSCI Emerging Markets (EM) Index (Net) is a free-float-adjusted market-capitalization-weighted index that is designed to measure equity market performance of emerging markets. You cannot invest directly in an index. |
| 4 | The Bloomberg Barclays U.S. Aggregate Bond Index is a broad-based benchmark that measures the investment-grade, U.S. dollar-denominated, fixed-rate taxable bond market, including Treasuries, government-related and corporate securities, mortgage-backed securities (agency fixed-rate and hybrid adjustable-rate mortgage pass-throughs), asset-backed securities, and commercial mortgage-backed securities. You cannot invest directly in an index. |
| 5 | The Bloomberg Barclays Global Aggregate ex-USD Index is an unmanaged index that provides a broad-based measure of the global investment-grade fixed-income markets excluding the U.S. dollar-denominated debt market. You cannot invest directly in an index. |
| 6 | The Bloomberg Barclays Municipal Bond Index is an unmanaged index composed of long-term tax-exempt bonds with a minimum credit rating of Baa. You cannot invest directly in an index. |
| 7 | The ICE BofA U.S. High Yield Index is a market-capitalization-weighted index of domestic and Yankee high-yield bonds. The index tracks the performance of high-yield securities traded in the U.S. bond market. You cannot invest directly in an index. Copyright 2020. ICE Data Indices, LLC. All rights reserved. |
2 | Wells Fargo Income Opportunities Fund
Letter to shareholders (unaudited)
Americans through the end of July. However, unemployment remained historically high, easing somewhat from 14.7% in April to 11.1% in June. However, by late June, numerous states reported increases of COVID-19 cases. China’s economic recovery picked up momentum in June, though it remained far from a full recovery.
July was broadly positive for both global equities and fixed income. However, economic data and a resurgence of COVID-19 cases pointed to the vulnerability of the global economy and the ongoing imperative to regain control of the pandemic. Second-quarter gross domestic product (GDP) shrank from the previous quarter by 9.5% and 12.1% in the U.S. and the eurozone, respectively. In contrast, China reported a 3.2% year-over-year expansion in its second-quarter GDP. U.S. unemployment remained high despite adding 1.8 million jobs in July, with a double-digit jobless rate persisting. However, manufacturing activity grew in both the U.S. and the eurozone. In Asia, while China’s manufacturing sector continued to expand, activity in Japan and South Korea contracted. A rising concern was the rapid and broad reemergence of COVID-19 infections.
The stock market continued to rally in August despite concerns over widespread increases in the number of COVID-19 cases in the United States and Europe, as well as the July expiration of the U.S. $600 weekly bonus unemployment benefit. U.S. stocks had strong monthly gains, surpassing broadly positive overall global equity performance, while fixed-income market monthly returns were broadly flat. Generally stronger-than-expected second-quarter earnings boosted investor sentiment along with the Federal Reserve’s announcement of a policy shift that will likely lead to longer-term low interest rates and supportive monetary policy. U.S. indices measuring manufacturing and services activities beat expectations while the U.S. housing market maintained strength. In Europe, retail sales expanded and consumer confidence was steady. China’s economy continued to expand.
Stocks grew more volatile in September on mixed economic data. U.S. economic activity continued to grow. However, six months after the bottom fell out of the labor market in early spring, only half of the 22 million jobs lost had returned. The U.S. unemployment rate fell to 7.9% in September, reflecting steady improvement but far higher than the 3.5% pre-COVID-19 rate. Only 661,000 jobs were added for the month, down from 1.5 million in August. Meanwhile, a reported 2.3 million people have given up looking for work. With U.S. Congress failing to pass further fiscal relief and uncertainties surrounding a possible vaccine, doubts crept back into the financial markets. In the U.K., a lack of progress in Brexit talks with the European Union weighed on markets. China’s economy picked up steam, however, with growth fueled by increased global demand, and China’s services sector rallied.
In October, capital markets took a step back from their six-month rally. Market volatility rose in advance of the U.S. election and amid a global increase in COVID-19 infections. Europe responded with a new round of restrictions affecting economic activity. Meanwhile, Brexit remained unresolved as the European Union and the U.K. failed to strike a deal by a mid-October deadline. U.S. markets looked favorably at a possible Democratic sweep and control of the federal purse strings as that could lead to the passage of long-awaited additional fiscal stimulus, which could boost economic activity. Meanwhile, China continued to stand apart, reporting 4.9% third-quarter GDP growth year on year.
“In October, capital markets took a step back from their six-month rally. Market volatility rose in advance of the U.S. election and amid a global increase in COVID-19 infections.”
Wells Fargo Income Opportunities Fund | 3
Letter to shareholders (unaudited)
|
|
|
For further information about your Fund, contact your investment professional, visit our website at wfam.com, or call us directly at 1-800-222-8222. |
Don’t let short-term uncertainty derail long-term investment goals.
Periods of investment uncertainty can present challenges, but experience has taught us that maintaining long-term investment goals can be an effective way to plan for the future. Although diversification cannot guarantee an investment profit or prevent losses, we believe it can be an effective way to manage investment risk and potentially smooth out overall portfolio performance. We encourage investors to know their investments and to understand that appropriate levels of risk-taking may unlock opportunities.
Thank you for choosing to invest with Wells Fargo Funds. We appreciate your confidence in us and remain committed to helping you meet your financial needs.
Sincerely,

Andrew Owen
President
Wells Fargo Funds
Notice to Shareholders
| | ∎ | | On November 17, 2020, the Fund announced a renewal of its open-market share repurchase program (the “Buyback Program”). Under the renewed Buyback Program, the Fund may repurchase up to 10% of its outstanding shares in open market transactions during the period beginning on January 1, 2021 and ending on December 31, 2021. The Fund’s Board of Trustees has delegated to Wells Fargo Funds Management, LLC, the Fund’s adviser, discretion to administer the Buyback Program, including the determination of the amount and timing of repurchases in accordance with the best interests of the Fund and subject to applicable legal limitations. |
| | ∎ | | The Fund’s managed distribution plan provides for the declaration of monthly distributions to common shareholders of the Fund at an annual minimum fixed rate of 8% based on the Fund’s average monthly net asset value per share over the prior 12 months. Under the managed distribution plan, quarterly distributions may be sourced from income, paid-in capital, and/or capital gains, if any. To the extent that sufficient investment income is not available on a quarterly basis, the Fund may distribute paid-in capital and/or capital gains, if any, in order to maintain its managed distribution level. You should not draw any conclusions about the Fund’s investment performance from the amount of the Fund’s distributions or from the terms of the managed distribution plan. Shareholders may elect to reinvest distributions received pursuant to the managed distribution plan in the Fund under the existing dividend reinvestment plan, which is described later in this report. |
4 | Wells Fargo Income Opportunities Fund
Letter to shareholders (unaudited)
Notice to Shareholders
Preparing for LIBOR Transition
The global financial industry is preparing to transition away from the London Interbank Offered Rate (LIBOR), a key benchmark interest rate, to new alternative rates. LIBOR underpins more than $350 trillion of financial contracts. It is the benchmark rate for a wide spectrum of products ranging from residential mortgages to corporate bonds to derivatives. Regulators have called for a market-wide transition away from LIBOR to successor reference rates by the end of 2021, which requires proactive steps be taken by issuers, counterparties, and asset managers to identify impacted products and adopt new reference rates.
The Fund holds at least one security that uses LIBOR as a floating reference rate and has a maturity date after 12-31-2021.
Although the transition process away from LIBOR has become increasingly well-defined in advance of the anticipated discontinuation date, there remains uncertainty regarding the nature of successor reference rates, and any potential effects of the transition away from LIBOR on investment instruments that use it as a benchmark rate. The transition process may result in, among other things, increased volatility or illiquidity in markets for instruments that currently rely on LIBOR and could negatively impact the value of certain instruments held by the Fund.
Wells Fargo Asset Management is monitoring LIBOR exposure closely and has put resources and controls in place to manage this transition effectively. The Fund’s portfolio management team is evaluating LIBOR holdings to understand what happens to those securities when LIBOR ceases to exist, including examining security documentation to identify the presence or absence of fallback language identifying a replacement rate to LIBOR.
While the pace of transition away from LIBOR will differ by asset class and investment strategy, the portfolio management team will monitor market conditions for those holdings to identify and mitigate deterioration or volatility in pricing and liquidity and ensure appropriate actions are taken in a timely manner.
Wells Fargo Income Opportunities Fund | 5
Performance highlights (unaudited)
Investment objective
The Fund seeks a high level of current income. Capital appreciation is a secondary objective.
Strategy summary
Under normal market conditions, the Fund invests at least 80% of its total assets in below-investment-grade (high yield) debt securities, loans and preferred stocks. These securities are rated Ba or lower by Moody’s or BB or lower by S&P, or are unrated securities of comparable quality as determined by the subadvisor.
Adviser
Wells Fargo Funds Management, LLC
Subadviser
Wells Capital Management Incorporated
Portfolio managers
Chris Lee, CFA®‡*
Michael J. Schueller, CFA®‡*
Average annual total returns (%) as of October 31, 20201
| | | | | | | | | | | | | | |
| | | | |
| | | 6 months | | 1 year | | | 5 year | | | 10 year | |
| | | | | |
| Based on market value | | 10.62 | | | (3.62 | ) | | | 7.52 | | | | 5.85 | |
| | | | | |
| Based on net asset value (NAV) | | 15.98 | | | 3.14 | | | | 8.07 | | | | 7.91 | |
| | | | | |
| ICE BofA U.S. High Yield Constrained Index2 | | 10.98 | | | 2.44 | | | | 6.12 | | | | 6.06 | |
Figures quoted represent past performance, which is no guarantee of future results, and do not reflect taxes that a shareholder may pay on an investment in a fund. Investment return and principal value of an investment will fluctuate so that an investor’s shares, when sold, may be worth more or less than their original cost. Current performance may be lower or higher than the performance data quoted, which assumes the reinvestment of dividends and capital gains. Performance figures of the Fund do not reflect brokerage commissions that a shareholder would pay on the purchase and sale of shares. If taxes and such brokerage commissions had been reflected, performance would have been lower. To obtain performance information current to the most recent month-end, please call 1-800-222-8222.
The Fund’s annualized expense ratio for the six months ended October 31, 2020 was 1.32%, which includes 0.37% of interest expense.
|
|
| Comparison of NAV vs. market value3 |
|
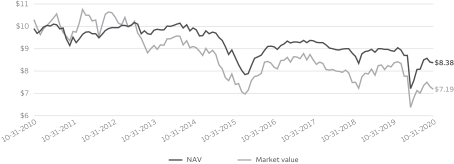 |
Risk summary
This closed-end fund is no longer available as an initial public offering and is only offered through broker-dealers on the secondary market. A closed-end fund is not required to buy its shares back from investors upon request. Shares of the Fund may trade at either a premium or discount relative to the Fund’s net asset value, and there can be no assurance that any discount will decrease. The Fund is leveraged through a revolving credit facility and also may incur leverage by issuing preferred shares in the future. The use of leverage results in certain risks including, among others, the likelihood of greater volatility of the net asset value and the market value of common shares. Derivatives involve additional risks including interest rate risk, credit risk, the risk of improper valuation, and the risk of non-correlation to the relevant instruments that they are designed to hedge or closely track. Bond values fluctuate in response to the financial condition of individual issuers, general market and economic conditions, and changes in interest rates. Changes in market conditions and government policies may lead to periods of heightened volatility in the bond market and reduced liquidity for certain bonds held by the Fund. In general, when interest rates rise, bond values fall and investors may lose principal value. Interest rate changes and their impact on the Fund and its share price can be sudden and unpredictable. High-yield securities have a greater risk of default and tend to be more volatile than higher rated debt securities.
Please see footnotes on page 8.
6 | Wells Fargo Income Opportunities Fund
Performance highlights (unaudited)
MANAGER’S DISCUSSION
The Fund’s return based on market value was 10.62% for the 6-month period that ended October 31, 2020. During the same period, the Fund’s return based on its net asset value (NAV) was 15.98%. Based on its NAV return, the Fund outperformed the ICE BofA U.S. High Yield Constrained Index, which returned 10.98% for the 6-month period that ended October 31, 2020.
Market overview
A combination of ongoing monetary support from the Federal Reserve (Fed) and the lagged impact of $2.5 trillion in fiscal stimulus helped reverse the economic contraction. Recent data suggests the U.S. economy continued to recover, but at a decelerating pace as an uptick in COVID-19 cases weighed on the economy and Congress failed to provide additional stimulus.
| | | | |
| |
| Ten largest holdings (%) as of October 31, 20204 | | | |
| | |
KAR Auction Services Incorporated, 5.13%, 6-1-2025 | | | 2.19 | |
| | |
Dell International LLC, 7.13%, 6-15-2024 | | | 2.08 | |
| | |
Service Corporation International, 7.50%, 4-1-2027 | | | 2.07 | |
| | |
Delta Air Lines Incorporated, 4.75%, 10-20-2028 | | | 1.96 | |
| | |
Occidental Petroleum Corporation, 6.45%, 9-15-2036 | | | 1.81 | |
| | |
Bristow Group Incorporated | | | 1.71 | |
| | |
CCM Merger Incorporated, 6.00%, 3-15-2022 | | | 1.70 | |
| | |
Allison Transmission Incorporated, 5.00%, 10-1-2024 | | | 1.69 | |
| | |
Ritchie Brothers Auctioneers Incorporated, 5.38%, 1-15-2025 | | | 1.60 | |
| | |
Cheniere Energy Partners LP, 5.25%, 10-1-2025 | | | 1.58 | |
|
|
| Credit quality as of October 31, 20205 |
|
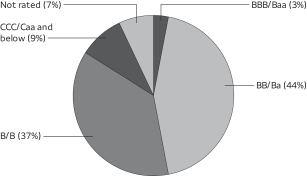 |
Main detractors
While overall allocation was positive, selection within consumer cyclical services and retailers hurt performance, as did holding cash. The net impact from ratings allocation was slightly negative. An underweight to the lowest-quality CCC-rated and below market segment hurt relative performance as those credits led the broader market. The impact from maturity positioning was largely immaterial even across the yield curve.
Top contributors
Both sector allocation and security selection were positive over the period. Overweights to and strong credit selection in energy, in particular the midstream, exploration and production, and oil-field services subsectors were the biggest drivers. An overweight to the automotive sector and outperformance within transportation services was also additive.
|
|
| Effective maturity distribution as of October 31, 20206 |
|
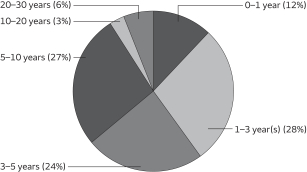 |
Outlook
While the speed of the U.S. economic recovery may be threatened by efforts to contain COVID-19 and political gridlock, the credit quality and liquidity of the portfolio has been built to withstand a wide range of outcomes. We continue to closely monitor the potential impact of COVID-19, trade wars, Fed policy, and Brexit. We expect the default rate to continue to improve from recent peak levels. Looking forward, we’ll continue to add yield opportunistically in a risk-neutral framework, and exploit potential mispricing presented by volatility in the credit markets.
Please see footnotes on page 8.
Wells Fargo Income Opportunities Fund | 7
Performance highlights (unaudited)
| ‡ | CFA® and Chartered Financial Analyst® are trademarks owned by CFA Institute. |
| * | Mr. Lee and Mr. Schueller became a portfolio managers of the Fund on August 6, 2020. |
| 1 | Total returns based on market value are calculated assuming a purchase of common stock on the first day and a sale on the last day of the period reported. Total returns based on NAV are calculated based on the NAV at the beginning of the period and at the end of period. Dividends and distributions, if any, are assumed for the purposes of these calculations to be reinvested at prices obtained under the Fund’s Automatic Dividend Reinvestment Plan. |
| 2 | The ICE BofA U.S. High Yield Constrained Index is a market-value-weighted index of all domestic and Yankee high-yield bonds, including deferred interest bonds and payment-in-kind securities. Issues included in the index have maturities of one year or more and have a credit rating lower than BBB-/Baa3 but are not in default. The ICE BofA U.S. High Yield Constrained Index limits any individual issuer to a maximum of 2% benchmark exposure. Effective October 15, 2019, the Fund changed its primary index from ICE BofA U.S. High Yield Index to ICE BofA U.S. High Yield Constrained Index in order to better align with the Fund’s principal investment strategy. You cannot invest directly in an index. Copyright 2020. ICE Data Indices, LLC. All rights reserved. |
| 3 | This chart does not reflect any brokerage commissions charged on the purchase and sale of the Fund’s common stock. Dividends and distributions paid by the Fund are included in the Fund’s average annual total returns but have the effect of reducing the Fund’s NAV. |
| 4 | The ten largest holdings, excluding cash, cash equivalents and any money market funds, are calculated based on the value of the investments divided by total net assets of the Fund. Holdings are subject to change and may have changed since the date specified. |
| 5 | The credit quality distribution of portfolio holdings reflected in the chart is based on ratings from Standard & Poor’s, Moody’s Investors Service, and/ or Fitch Ratings Ltd. Credit quality ratings apply to the underlying holdings of the Fund and not to the Fund itself. The percentages of the Fund’s portfolio with the ratings depicted in the chart are calculated based on the total market value of fixed income securities held by the Fund. If a security was rated by all three rating agencies, the middle rating was utilized. If rated by two of three rating agencies, the lower rating was utilized, and if rated by one of the rating agencies, that rating was utilized. Standard & Poor’s rates the creditworthiness of bonds, ranging from AAA (highest) to D (lowest). Ratings from A to CCC may be modified by the addition of a plus (+) or minus (-) sign to show relative standing within the rating categories. Standard & Poor’s rates the creditworthiness of short-term notes from SP-1 (highest) to SP-3 (lowest). Moody’s rates the creditworthiness of bonds, ranging from Aaa (highest) to C (lowest). Ratings Aa to B may be modified by the addition of a number 1 (highest) to 3 (lowest) to show relative standing within the ratings categories. Moody’s rates the creditworthiness of short-term U.S. tax-exempt municipal securities from MIG 1/VMIG 1 (highest) to SG (lowest). Fitch rates the creditworthiness of bonds, ranging from AAA (highest) to D (lowest). Credit quality distribution is subject to change and may have changed since the date specified. |
| 6 | Amounts are calculated based on the fixed-income securities of the Fund. These amounts are subject to change and may have changed since the date specified. |
8 | Wells Fargo Income Opportunities Fund
Portfolio of investments—October 31, 2020 (unaudited)
| | | | | | | | | | | | | | | | |
| | | | Shares | | | Value | |
| Common Stocks: 2.66% | |
|
Energy: 2.66% | |
|
| Energy Equipment & Services: 1.71% | |
Bristow Group Incorporated † | | | | 416,564 | | | $ | 8,656,200 | |
| | | | | | | | | |
|
| Oil, Gas & Consumable Fuels: 0.95% | |
Denbury Incorporated † | | | | 236,737 | | | | 3,927,467 | |
Whiting Petroleum Corporation † | | | | 61,847 | | | | 902,966 | |
| |
| | | | 4,830,433 | |
| | | | | |
|
| Materials: 0.00% | |
|
| Chemicals: 0.00% | |
LyondellBasell Industries NV Class A | | | | 7 | | | | 479 | |
| | | | | | | | | |
| |
Total Common Stocks (Cost $16,745,069) | | | | 13,487,112 | |
| | | | | |
| | | | |
| | | | | | | | | | | | | | | | |
| | | Interest
rate | | | Maturity
date | | | Principal | | | | |
| Corporate Bonds and Notes: 112.43% | |
|
| Communication Services: 18.49% | |
|
| Diversified Telecommunication Services: 2.08% | |
Cablevision Lightpath LLC 144A | | | 3.88 | % | | | 9-15-2027 | | | $ | 480,000 | | | | 476,400 | |
Cablevision Lightpath LLC 144A | | | 5.63 | | | | 9-15-2028 | | | | 1,665,000 | | | | 1,681,650 | |
Consolidated Communications Incorporated 144A | | | 6.50 | | | | 10-1-2028 | | | | 1,615,000 | | | | 1,659,413 | |
Frontier Communications Corporation 144A | | | 5.88 | | | | 10-15-2027 | | | | 510,000 | | | | 519,563 | |
Level 3 Financing Incorporated 144A | | | 3.63 | | | | 1-15-2029 | | | | 2,405,000 | | | | 2,326,838 | |
Level 3 Financing Incorporated 144A | | | 4.25 | | | | 7-1-2028 | | | | 1,250,000 | | | | 1,256,250 | |
Level 3 Financing Incorporated | | | 5.38 | | | | 1-15-2024 | | | | 1,125,000 | | | | 1,133,111 | |
Windstream Corporation 144A | | | 7.75 | | | | 8-15-2028 | | | | 1,560,000 | | | | 1,507,350 | |
| |
| | | | 10,560,575 | |
| | | | | |
|
| Entertainment: 0.40% | |
Live Nation Entertainment Incorporated 144A | | | 6.50 | | | | 5-15-2027 | | | | 1,875,000 | | | | 2,006,250 | |
| | | | | | | | | | | | | | | | |
|
| Media: 14.10% | |
Block Communications Incorporated 144A | | | 4.88 | | | | 3-1-2028 | | | | 400,000 | | | | 410,000 | |
CCO Holdings LLC 144A | | | 4.00 | | | | 3-1-2023 | | | | 175,000 | | | | 176,750 | |
CCO Holdings LLC 144A | | | 4.50 | | | | 8-15-2030 | | | | 7,150,000 | | | | 7,427,063 | |
CCO Holdings LLC 144A | | | 4.50 | | | | 5-1-2032 | | | | 850,000 | | | | 877,625 | |
CCO Holdings LLC 144A | | | 5.00 | | | | 2-1-2028 | | | | 375,000 | | | | 394,875 | |
CCO Holdings LLC 144A | | | 5.13 | | | | 5-1-2027 | | | | 750,000 | | | | 787,500 | |
CCO Holdings LLC 144A | | | 5.50 | | | | 5-1-2026 | | | | 325,000 | | | | 338,000 | |
CCO Holdings LLC 144A | | | 5.75 | | | | 2-15-2026 | | | | 3,675,000 | | | | 3,809,726 | |
Cinemark Incorporated | | | 4.88 | | | | 6-1-2023 | | | | 4,950,000 | | | | 4,150,031 | |
Cinemark Incorporated | | | 5.13 | | | | 12-15-2022 | | | | 1,800,000 | | | | 1,561,500 | |
Cinemark Incorporated 144A | | | 8.75 | | | | 5-1-2025 | | | | 200,000 | | | | 206,500 | |
CSC Holdings LLC 144A | | | 4.13 | | | | 12-1-2030 | | | | 825,000 | | | | 838,844 | |
CSC Holdings LLC 144A | | | 4.63 | | | | 12-1-2030 | | | | 2,400,000 | | | | 2,399,352 | |
CSC Holdings LLC 144A | | | 5.38 | | | | 2-1-2028 | | | | 1,125,000 | | | | 1,195,313 | |
CSC Holdings LLC 144A | | | 5.50 | | | | 5-15-2026 | | | | 2,425,000 | | | | 2,518,969 | |
CSC Holdings LLC 144A | | | 7.50 | | | | 4-1-2028 | | | | 2,150,000 | | | | 2,353,960 | |
Diamond Sports Group LLC 144A | | | 5.38 | | | | 8-15-2026 | | | | 1,525,000 | | | | 888,313 | |
Diamond Sports Group LLC 144A | | | 6.63 | | | | 8-15-2027 | | | | 3,950,000 | | | | 1,639,250 | |
DISH Network Corporation | | | 3.38 | | | | 8-15-2026 | | | | 3,125,000 | | | | 2,762,218 | |
Gray Television Incorporated 144A | | | 4.75 | | | | 10-15-2030 | | | | 1,750,000 | | | | 1,723,750 | |
The accompanying notes are an integral part of these financial statements.
Wells Fargo Income Opportunities Fund | 9
Portfolio of investments—October 31, 2020 (unaudited)
| | | | | | | | | | | | | | | | |
| | | Interest
rate | | | Maturity
date | | | Principal | | | Value | |
|
| Media (continued) | |
Gray Television Incorporated 144A | | | 5.88 | % | | | 7-15-2026 | | | $ | 2,425,000 | | | $ | 2,524,037 | |
Gray Television Incorporated 144A | | | 7.00 | | | | 5-15-2027 | | | | 675,000 | | | | 728,156 | |
Lamar Media Corp Company Guar | | | 3.75 | | | | 2-15-2028 | | | | 1,025,000 | | | | 1,017,953 | |
Lamar Media Corporation | | | 4.00 | | | | 2-15-2030 | | | | 2,175,000 | | | | 2,194,031 | |
Lamar Media Corporation | | | 5.75 | | | | 2-1-2026 | | | | 200,000 | | | | 206,940 | |
Nexstar Broadcasting Incorporated 144A | | | 5.63 | | | | 7-15-2027 | | | | 3,900,000 | | | | 4,065,750 | |
Nexstar Broadcasting Incorporated 144A | | | 4.75 | | | | 11-1-2028 | | | | 2,460,000 | | | | 2,478,450 | |
Nielsen Finance LLC 144A | | | 5.63 | | | | 10-1-2028 | | | | 1,330,000 | | | | 1,376,550 | |
Nielsen Finance LLC 144A | | | 5.88 | | | | 10-1-2030 | | | | 5,350,000 | | | | 5,624,188 | |
Outfront Media Capital Corporation 144A | | | 4.63 | | | | 3-15-2030 | | | | 1,600,000 | | | | 1,470,000 | |
Outfront Media Capital Corporation 144A | | | 5.00 | | | | 8-15-2027 | | | | 55,000 | | | | 52,113 | |
Outfront Media Capital Corporation | | | 5.63 | | | | 2-15-2024 | | | | 960,000 | | | | 967,200 | |
QVC Incorporated | | | 4.75 | | | | 2-15-2027 | | | | 400,000 | | | | 408,126 | |
Salem Media Group Incorporated 144A | | | 6.75 | | | | 6-1-2024 | | | | 6,525,000 | | | | 5,676,750 | |
Scripps Escrow Incorporated 144A | | | 5.88 | | | | 7-15-2027 | | | | 400,000 | | | | 389,000 | |
The E.W. Scripps Company 144A | | | 5.13 | | | | 5-15-2025 | | | | 6,194,000 | | | | 5,907,528 | |
| |
| | | | 71,546,311 | |
| | | | | |
|
| Wireless Telecommunication Services: 1.91% | |
Connect U.S. Finco LLC 144A | | | 6.75 | | | | 10-1-2026 | | | | 1,325,000 | | | | 1,334,540 | |
Sprint Capital Corporation | | | 6.88 | | | | 11-15-2028 | | | | 375,000 | | | | 473,906 | |
Sprint Capital Corporation | | | 8.75 | | | | 3-15-2032 | | | | 1,975,000 | | | | 2,955,509 | |
T-Mobile USA Incorporated | | | 4.50 | | | | 2-1-2026 | | | | 475,000 | | | | 486,875 | |
T-Mobile USA Incorporated | | | 4.75 | | | | 2-1-2028 | | | | 900,000 | | | | 964,257 | |
T-Mobile USA Incorporated | | | 5.13 | | | | 4-15-2025 | | | | 775,000 | | | | 794,375 | |
T-Mobile USA Incorporated | | | 5.38 | | | | 4-15-2027 | | | | 2,250,000 | | | | 2,401,875 | |
T-Mobile USA Incorporated | | | 6.00 | | | | 4-15-2024 | | | | 275,000 | | | | 279,868 | |
| |
| | | | 9,691,205 | |
| | | | | |
|
| Consumer Discretionary: 17.79% | |
|
| Auto Components: 3.50% | |
Allison Transmission Incorporated 144A | | | 4.75 | | | | 10-1-2027 | | | | 1,695,000 | | | | 1,745,850 | |
Allison Transmission Incorporated 144A | | | 5.00 | | | | 10-1-2024 | | | | 8,475,000 | | | | 8,550,851 | |
Allison Transmission Incorporated 144A | | | 5.88 | | | | 6-1-2029 | | | | 1,050,000 | | | | 1,146,474 | |
Clarios Global LP 144A | | | 6.25 | | | | 5-15-2026 | | | | 325,000 | | | | 339,625 | |
Cooper Tire & Rubber Company | | | 7.63 | | | | 3-15-2027 | | | | 5,190,000 | | | | 6,007,425 | |
| |
| | | | 17,790,225 | |
| | | | | |
|
| Automobiles: 0.93% | |
Ford Motor Company | | | 4.75 | | | | 1-15-2043 | | | | 3,925,000 | | | | 3,635,531 | |
Ford Motor Company | | | 9.00 | | | | 4-22-2025 | | | | 425,000 | | | | 499,906 | |
Ford Motor Company | | | 9.63 | | | | 4-22-2030 | | | | 425,000 | | | | 570,563 | |
| |
| | | | 4,706,000 | |
| | | | | |
|
| Diversified Consumer Services: 4.19% | |
Carriage Services Incorporated 144A | | | 6.63 | | | | 6-1-2026 | | | | 5,380,000 | | | | 5,654,703 | |
Prime Security Service Borrower LLC 144A | | | 3.38 | | | | 8-31-2027 | | | | 3,500,000 | | | | 3,377,500 | |
Service Corporation International | | | 7.50 | | | | 4-1-2027 | | | | 8,700,000 | | | | 10,527,000 | |
Service Corporation International | | | 8.00 | | | | 11-15-2021 | | | | 1,635,000 | | | | 1,733,100 | |
| |
| | | | 21,292,303 | |
| | | | | |
|
| Hotels, Restaurants & Leisure: 5.25% | |
Carnival Corporation 144A | | | 11.50 | | | | 4-1-2023 | | | | 3,225,000 | | | | 3,563,625 | |
CCM Merger Incorporated 144A | | | 6.00 | | | | 3-15-2022 | | | | 8,475,000 | | | | 8,614,838 | |
The accompanying notes are an integral part of these financial statements.
10 | Wells Fargo Income Opportunities Fund
Portfolio of investments—October 31, 2020 (unaudited)
| | | | | | | | | | | | | | | | |
| | | Interest
rate | | | Maturity
date | | | Principal | | | Value | |
|
| Hotels, Restaurants & Leisure (continued) | |
CCM Merger Incorporated 144A%% | | | 6.38 | % | | | 5-1-2026 | | | $ | 2,950,000 | | | $ | 3,020,063 | |
Hilton Domestic Operating Company | | | 4.88 | | | | 1-15-2030 | | | | 375,000 | | | | 385,781 | |
NCL Corporation Limited 144A | | | 12.25 | | | | 5-15-2024 | | | | 2,300,000 | | | | 2,553,000 | |
Royal Caribbean Cruises Limited 144A | | | 9.13 | | | | 6-15-2023 | | | | 3,825,000 | | | | 3,982,781 | |
Wyndham Hotels & Resorts Company 144A | | | 5.38 | | | | 4-15-2026 | | | | 4,025,000 | | | | 4,075,313 | |
Yum! Brands Incorporated 144A | | | 7.75 | | | | 4-1-2025 | | | | 400,000 | | | | 439,380 | |
| |
| | | | 26,634,781 | |
| | | | | |
|
| Specialty Retail: 3.58% | |
Asbury Automotive Group Incorporated 144A | | | 4.50 | | | | 3-1-2028 | | | | 1,162,000 | | | | 1,182,335 | |
Asbury Automotive Group Incorporated 144A | | | 4.75 | | | | 3-1-2030 | | | | 1,069,000 | | | | 1,103,743 | |
Group 1 Automotive Incorporated 144A | | | 4.00 | | | | 8-15-2028 | | | | 1,525,000 | | | | 1,526,906 | |
Lithia Motors Incorporated 144A | | | 5.25 | | | | 8-1-2025 | | | | 4,200,000 | | | | 4,347,000 | |
Lithia Motors Incorporated 144A | | | 4.38 | | | | 1-15-2031 | | | | 520,000 | | | | 536,900 | |
Lithia Motors Incorporated 144A | | | 4.63 | | | | 12-15-2027 | | | | 400,000 | | | | 421,040 | |
Michaels Stores Incorporated 144A | | | 4.75 | | | | 10-1-2027 | | | | 490,000 | | | | 478,975 | |
Penske Auto Group Incorporated | | | 3.50 | | | | 9-1-2025 | | | | 250,000 | | | | 252,188 | |
Penske Auto Group Incorporated | | | 5.38 | | | | 12-1-2024 | | | | 5,400,000 | | | | 5,514,750 | |
Sonic Automotive Incorporated | | | 6.13 | | | | 3-15-2027 | | | | 2,699,000 | | | | 2,785,017 | |
| |
| | | | 18,148,854 | |
| | | | | |
|
| Textiles, Apparel & Luxury Goods: 0.34% | |
Levi Strauss & Company | | | 5.00 | | | | 5-1-2025 | | | | 200,000 | | | | 205,000 | |
The William Carter Company 144A | | | 5.50 | | | | 5-15-2025 | | | | 400,000 | | | | 420,000 | |
The William Carter Company 144A | | | 5.63 | | | | 3-15-2027 | | | | 1,050,000 | | | | 1,101,844 | |
| |
| | | | 1,726,844 | |
| | | | | |
|
| Consumer Staples: 1.23% | |
|
| Beverages: 0.23% | |
Cott Beverages Incorporated 144A | | | 5.50 | | | | 4-1-2025 | | | | 1,125,000 | | | | 1,161,563 | |
| | | | | | | | | | | | | | | | |
|
| Food & Staples Retailing: 0.19% | |
Albertsons Companies Incorporated 144A | | | 4.63 | | | | 1-15-2027 | | | | 450,000 | | | | 466,875 | |
Albertsons Companies Incorporated 144A | | | 4.88 | | | | 2-15-2030 | | | | 450,000 | | | | 477,945 | |
| |
| | | | 944,820 | |
| | | | | |
|
| Food Products: 0.81% | |
Darling Ingredients Incorporated 144A | | | 5.25 | | | | 4-15-2027 | | | | 975,000 | | | | 1,033,500 | |
Pilgrim’s Pride Corporation 144A | | | 5.75 | | | | 3-15-2025 | | | | 2,360,000 | | | | 2,416,050 | |
Prestige Brands Incorporated 144A | | | 6.38 | | | | 3-1-2024 | | | | 660,000 | | | | 674,850 | |
| |
| | | | 4,124,400 | |
| | | | | |
|
| Energy: 21.95% | |
|
| Energy Equipment & Services: 4.97% | |
Bristow Group Incorporated †(a) | | | 6.25 | | | | 10-15-2022 | | | | 9,325,000 | | | | 0 | |
Bristow Group Incorporated | | | 7.75 | | | | 12-15-2022 | | | | 4,820,000 | | | | 4,765,775 | |
Hilcorp Energy Company 144A | | | 5.00 | | | | 12-1-2024 | | | | 3,100,000 | | | | 2,867,500 | |
Hilcorp Energy Company 144A | | | 5.75 | | | | 10-1-2025 | | | | 4,195,000 | | | | 3,877,774 | |
Hilcorp Energy Company 144A | | | 6.25 | | | | 11-1-2028 | | | | 1,450,000 | | | | 1,328,287 | |
Oceaneering International Incorporated | | | 6.00 | | | | 2-1-2028 | | | | 4,350,000 | | | | 3,219,000 | |
Pattern Energy Operations LP 144A | | | 4.50 | | | | 8-15-2028 | | | | 6,750,000 | | | | 7,037,753 | |
USA Compression Partners LP | | | 6.88 | | | | 4-1-2026 | | | | 2,150,000 | | | | 2,131,962 | |
| |
| | | | 25,228,051 | |
| | | | | |
The accompanying notes are an integral part of these financial statements.
Wells Fargo Income Opportunities Fund | 11
Portfolio of investments—October 31, 2020 (unaudited)
| | | | | | | | | | | | | | | | |
| | | Interest
rate | | | Maturity
date | | | Principal | | | Value | |
| Oil, Gas & Consumable Fuels: 16.98% | |
Antero Midstream Partners LP 144A | | | 5.75 | % | | | 1-15-2028 | | | $ | 5,225,000 | | | $ | 4,650,250 | |
Apache Corporation | | | 4.25 | | | | 1-15-2030 | | | | 75,000 | | | | 66,281 | |
Apache Corporation | | | 4.75 | | | | 4-15-2043 | | | | 2,191,000 | | | | 1,939,035 | |
Apache Corporation | | | 4.88 | | | | 11-15-2027 | | | | 225,000 | | | | 211,163 | |
Archrock Partners LP 144A | | | 6.25 | | | | 4-1-2028 | | | | 425,000 | | | | 410,125 | |
Archrock Partners LP 144A | | | 6.88 | | | | 4-1-2027 | | | | 1,375,000 | | | | 1,347,500 | |
Buckeye Partners LP | | | 5.85 | | | | 11-15-2043 | | | | 2,375,000 | | | | 2,101,875 | |
Callon Petroleum Company | | | 8.25 | | | | 7-15-2025 | | | | 3,046,000 | | | | 837,650 | |
Cheniere Energy Partners LP | | | 4.50 | | | | 10-1-2029 | | | | 1,075,000 | | | | 1,095,984 | |
Cheniere Energy Partners LP | | | 5.25 | | | | 10-1-2025 | | | | 7,875,000 | | | | 8,016,750 | |
Cheniere Energy Partners LP | | | 5.63 | | | | 10-1-2026 | | | | 1,325,000 | | | | 1,358,125 | |
EnLink Midstream LLC | | | 5.38 | | | | 6-1-2029 | | | | 4,725,000 | | | | 4,045,191 | |
EnLink Midstream Partners LP | | | 4.15 | | | | 6-1-2025 | | | | 30,000 | | | | 25,806 | |
EnLink Midstream Partners LP | | | 4.40 | | | | 4-1-2024 | | | | 900,000 | | | | 815,769 | |
EnLink Midstream Partners LP | | | 5.05 | | | | 4-1-2045 | | | | 3,350,000 | | | | 2,110,500 | |
EnLink Midstream Partners LP | | | 5.45 | | | | 6-1-2047 | | | | 3,350,000 | | | | 2,151,672 | |
EnLink Midstream Partners LP | | | 5.60 | | | | 4-1-2044 | | | | 2,196,000 | | | | 1,356,030 | |
Enviva Partners LP 144A | | | 6.50 | | | | 1-15-2026 | | | | 6,275,000 | | | | 6,620,125 | |
EQM Midstream Partners LP 144A | | | 6.00 | | | | 7-1-2025 | | | | 200,000 | | | | 205,000 | |
EQM Midstream Partners LP 144A | | | 6.50 | | | | 7-1-2027 | | | | 400,000 | | | | 419,518 | |
EQM Midstream Partners LP | | | 6.50 | | | | 7-15-2048 | | | | 1,000,000 | | | | 946,130 | |
Harvest Midstream LP 144A | | | 7.50 | | | | 9-1-2028 | | | | 1,005,000 | | | | 997,463 | |
Indigo Natural Resources LLC 144A | | | 6.88 | | | | 2-15-2026 | | | | 1,650,000 | | | | 1,621,125 | |
Kinder Morgan Incorporated | | | 7.42 | | | | 2-15-2037 | | | | 1,820,000 | | | | 2,273,148 | |
Murphy Oil Corporation | | | 5.75 | | | | 8-15-2025 | | | | 360,000 | | | | 295,700 | |
Murphy Oil Corporation | | | 5.88 | | | | 12-1-2027 | | | | 400,000 | | | | 315,632 | |
Murphy Oil USA incorporated | | | 4.75 | | | | 9-15-2029 | | | | 200,000 | | | | 209,500 | |
New Fortress Energy Incorporated 144A | | | 6.75 | | | | 9-15-2025 | | | | 840,000 | | | | 866,183 | |
Occidental Petroleum Corporation | | | 4.63 | | | | 6-15-2045 | | | | 4,550,000 | | | | 3,071,250 | |
Occidental Petroleum Corporation | | | 6.20 | | | | 3-15-2040 | | | | 1,425,000 | | | | 1,156,815 | |
Occidental Petroleum Corporation | | | 6.45 | | | | 9-15-2036 | | | | 11,330,000 | | | | 9,177,300 | |
Occidental Petroleum Corporation | | | 6.60 | | | | 3-15-2046 | | | | 1,215,000 | | | | 1,005,917 | |
Rockies Express Pipeline LLC 144A | | | 6.88 | | | | 4-15-2040 | | | | 3,600,000 | | | | 3,690,000 | |
Rockies Express Pipeline LLC 144A | | | 7.50 | | | | 7-15-2038 | | | | 1,150,000 | | | | 1,207,500 | |
Southwestern Energy Company | | | 7.50 | | | | 4-1-2026 | | | | 750,000 | | | | 763,350 | |
Southwestern Energy Company | | | 7.75 | | | | 10-1-2027 | | | | 2,650,000 | | | | 2,736,095 | |
Southwestern Energy Company | | | 8.38 | | | | 9-15-2028 | | | | 1,510,000 | | | | 1,577,950 | |
Tallgrass Energy Partners LP 144A | | | 5.50 | | | | 9-15-2024 | | | | 7,925,000 | | | | 7,615,767 | |
Tallgrass Energy Partners LP 144A | | | 7.50 | | | | 10-1-2025 | | | | 2,335,000 | | | | 2,358,350 | |
Western Midstream Operating LP | | | 5.05 | | | | 2-1-2030 | | | | 1,860,000 | | | | 1,764,517 | |
Western Midstream Operating LP | | | 5.30 | | | | 3-1-2048 | | | | 3,181,000 | | | | 2,560,705 | |
Western Midstream Operating LP | | | 6.25 | | | | 2-1-2050 | | | | 150,000 | | | | 137,783 | |
Whiting Petroleum Corporation †(a) | | | 1.25 | | | | 4-1-2021 | | | | 4,150,000 | | | | 0 | |
| |
| | | | 86,132,529 | |
| | | | | |
|
| Financials: 9.95% | |
|
| Capital Markets: 0.65% | |
Oppenheimer Holdings Incorporated 144A | | | 5.50 | | | | 10-1-2025 | | | | 3,320,000 | | | | 3,320,000 | |
| | | | | | | | | | | | | | | | |
|
| Consumer Finance: 3.75% | |
FirstCash Incorporated 144A | | | 4.63 | | | | 9-1-2028 | | | | 1,230,000 | | | | 1,248,450 | |
Ford Motor Credit Company LLC | | | 4.39 | | | | 1-8-2026 | | | | 4,200,000 | | | | 4,231,500 | |
Ford Motor Credit Company LLC | | | 5.11 | | | | 5-3-2029 | | | | 5,825,000 | | | | 6,050,719 | |
Ford Motor Credit Company LLC | | | 5.13 | | | | 6-16-2025 | | | | 850,000 | | | | 885,947 | |
OneMain Finance Corporation | | | 5.38 | | | | 11-15-2029 | | | | 1,975,000 | | | | 2,029,313 | |
The accompanying notes are an integral part of these financial statements.
12 | Wells Fargo Income Opportunities Fund
Portfolio of investments—October 31, 2020 (unaudited)
| | | | | | | | | | | | | | | | |
| | | Interest
rate | | | Maturity
date | | | Principal | | | Value | |
|
| Consumer Finance (continued) | |
OneMain Finance Corporation | | | 6.63 | % | | | 1-15-2028 | | | $ | 350,000 | | | $ | 382,764 | |
OneMain Finance Corporation | | | 7.13 | | | | 3-15-2026 | | | | 2,450,000 | | | | 2,716,707 | |
OneMain Finance Corporation | | | 8.25 | | | | 10-1-2023 | | | | 1,342,000 | | | | 1,479,555 | |
| |
| | | | 19,024,955 | |
| | | | | |
|
| Diversified Financial Services: 2.27% | |
LPL Holdings Incorporated 144A | | | 4.63 | | | | 11-15-2027 | | | | 575,000 | | | | 589,375 | |
LPL Holdings Incorporated 144A | | | 5.75 | | | | 9-15-2025 | | | | 7,650,000 | | | | 7,898,625 | |
United Shore Financial Services LLC 144A%% | | | 5.50 | | | | 11-15-2025 | | | | 2,975,000 | | | | 3,011,295 | |
| |
| | | | 11,499,295 | |
| | | | | |
|
| Insurance: 1.34% | |
AmWINS Group Incorporated 144A | | | 7.75 | | | | 7-1-2026 | | | | 3,675,000 | | | | 3,923,063 | |
HUB International Limited 144A | | | 7.00 | | | | 5-1-2026 | | | | 1,475,000 | | | | 1,511,875 | |
USI Incorporated 144A | | | 6.88 | | | | 5-1-2025 | | | | 1,325,000 | | | | 1,348,188 | |
| |
| | | | 6,783,126 | |
| | | | | |
|
| Mortgage REITs: 1.04% | |
Starwood Property Trust Incorporated | | | 5.00 | | | | 12-15-2021 | | | | 3,300,000 | | | | 3,283,500 | |
Starwood Property Trust Incorporated 144A%% | | | 5.50 | | | | 11-1-2023 | | | | 2,035,000 | | | | 2,016,766 | |
| |
| | | | 5,300,266 | |
| | | | | |
|
| Thrifts & Mortgage Finance: 0.90% | |
Ladder Capital Finance Holdings LP 144A | | | 5.25 | | | | 3-15-2022 | | | | 625,000 | | | | 606,250 | |
Ladder Capital Finance Holdings LP 144A | | | 4.25 | | | | 2-1-2027 | | | | 575,000 | | | | 497,375 | |
Ladder Capital Finance Holdings LP 144A | | | 5.25 | | | | 10-1-2025 | | | | 3,800,000 | | | | 3,472,250 | |
| |
| | | | 4,575,875 | |
| | | | | |
|
| Health Care: 9.63% | |
|
| Health Care Equipment & Supplies: 1.12% | |
Hill-Rom Holdings Incorporated 144A | | | 4.38 | | | | 9-15-2027 | | | | 753,000 | | | | 778,414 | |
Hill-Rom Holdings Incorporated 144A | | | 5.00 | | | | 2-15-2025 | | | | 975,000 | | | | 998,156 | |
Hologic Incorporated 144A | | | 3.25 | | | | 2-15-2029 | | | | 2,215,000 | | | | 2,226,075 | |
Surgery Center Holdings Incorporated 144A | | | 6.75 | | | | 7-1-2025 | | | | 1,675,000 | | | | 1,649,875 | |
| |
| | | | 5,652,520 | |
| | | | | |
|
| Health Care Providers & Services: 6.53% | |
Centene Corporation 144A | | | 5.38 | | | | 8-15-2026 | | | | 350,000 | | | | 370,125 | |
Community Health Systems Incorporated | | | 6.25 | | | | 3-31-2023 | | | | 2,750,000 | | | | 2,725,938 | |
Community Health Systems Incorporated 144A | | | 6.63 | | | | 2-15-2025 | | | | 4,525,000 | | | | 4,412,780 | |
Davita Incorporated 144A | | | 3.75 | | | | 2-15-2031 | | | | 900,000 | | | | 865,125 | |
Davita Incorporated 144A | | | 4.63 | | | | 6-1-2030 | | | | 1,625,000 | | | | 1,652,861 | |
Encompass Health Corporation | | | 4.50 | | | | 2-1-2028 | | | | 600,000 | | | | 614,472 | |
Encompass Health Corporation | | | 4.63 | | | | 4-1-2031 | | | | 520,000 | | | | 535,600 | |
Encompass Health Corporation | | | 4.75 | | | | 2-1-2030 | | | | 550,000 | | | | 572,891 | |
Encompass Health Corporation | | | 5.75 | | | | 9-15-2025 | | | | 1,725,000 | | | | 1,781,063 | |
MPH Acquisition Holdings LLC 144A | | | 5.75 | | | | 11-1-2028 | | | | 3,235,000 | | | | 3,170,300 | |
MPT Operating Partnership LP | | | 4.63 | | | | 8-1-2029 | | | | 875,000 | | | | 916,125 | |
MPT Operating Partnership LP | | | 5.00 | | | | 10-15-2027 | | | | 2,275,000 | | | | 2,380,674 | |
MPT Operating Partnership LP | | | 5.25 | | | | 8-1-2026 | | | | 3,200,000 | | | | 3,320,000 | |
MPT Operating Partnership LP | | | 6.38 | | | | 3-1-2024 | | | | 515,000 | | | | 527,206 | |
Select Medical Corporation 144A | | | 6.25 | | | | 8-15-2026 | | | | 2,625,000 | | | | 2,769,375 | |
Tenet Healthcare Corporation 144A | | | 4.63 | | | | 6-15-2028 | | | | 425,000 | | | | 431,109 | |
The accompanying notes are an integral part of these financial statements.
Wells Fargo Income Opportunities Fund | 13
Portfolio of investments—October 31, 2020 (unaudited)
| | | | | | | | | | | | | | | | |
| | | Interest
rate | | | Maturity
date | | | Principal | | | Value | |
|
| Health Care Providers & Services (continued) | |
Tenet Healthcare Corporation 144A | | | 4.88 | % | | | 1-1-2026 | | | $ | 2,950,000 | | | $ | 2,992,570 | |
Tenet Healthcare Corporation 144A | | | 5.13 | | | | 11-1-2027 | | | | 650,000 | | | | 669,305 | |
Tenet Healthcare Corporation 144A | | | 6.25 | | | | 2-1-2027 | | | | 625,000 | | | | 648,941 | |
Tenet Healthcare Corporation | | | 7.00 | | | | 8-1-2025 | | | | 950,000 | | | | 971,375 | |
Tenet Healthcare Corporation 144A | | | 7.50 | | | | 4-1-2025 | | | | 400,000 | | | | 430,884 | |
Vizient Incorporated 144A | | | 6.25 | | | | 5-15-2027 | | | | 375,000 | | | | 396,563 | |
| |
| | | | 33,155,282 | |
| | | | | |
|
| Health Care Technology: 1.52% | |
Change Healthcare Holdings Incorporated 144A | | | 5.75 | | | | 3-1-2025 | | | | 6,550,000 | | | | 6,547,184 | |
IQVIA Incorporated 144A | | | 5.00 | | | | 10-15-2026 | | | | 375,000 | | | | 388,648 | |
IQVIA Incorporated 144A | | | 5.00 | | | | 5-15-2027 | | | | 725,000 | | | | 759,438 | |
| |
| | | | 7,695,270 | |
| | | | | |
|
| Life Sciences Tools & Services: 0.26% | |
Charles River Laboratories Incorporated 144A | | | 5.50 | | | | 4-1-2026 | | | | 575,000 | | | | 600,875 | |
Charles River Laboratories Incorporated 144A | | | 4.25 | | | | 5-1-2028 | | | | 250,000 | | | | 261,250 | |
Ortho-Clinical Diagnostics Incorporated 144A | | | 7.25 | | | | 2-1-2028 | | | | 450,000 | | | | 470,250 | |
| |
| | | | 1,332,375 | |
| | | | | |
|
| Pharmaceuticals: 0.20% | |
Bausch Health Companies Incorporated 144A | | | 8.50 | | | | 1-31-2027 | | | | 925,000 | | | | 1,011,414 | |
| | | | | | | | | | | | | | | | |
|
| Industrials: 13.61% | |
|
| Aerospace & Defense: 1.41% | |
RBS Global & Rexnord LLC 144A | | | 4.88 | | | | 12-15-2025 | | | | 1,175,000 | | | | 1,195,563 | |
Signature Aviation US Holdings Incorporated 144A | | | 4.00 | | | | 3-1-2028 | | | | 1,625,000 | | | | 1,571,473 | |
Signature Aviation US Holdings Incorporated 144A | | | 5.38 | | | | 5-1-2026 | | | | 4,350,000 | | | | 4,393,500 | |
| |
| | | | 7,160,536 | |
| | | | | |
|
| Airlines: 4.19% | |
Delta Air Lines Incorporated 144A | | | 4.75 | | | | 10-20-2028 | | | | 9,760,000 | | | | 9,968,242 | |
Mileage Plus Holdings LLC 144A | | | 6.50 | | | | 6-20-2027 | | | | 6,400,000 | | | | 6,664,000 | |
United Airlines Pass-Through Trust Certificates Series 2020-1 Class A | | | 5.88 | | | | 4-15-2029 | | | | 4,600,000 | | | | 4,609,817 | |
| |
| | | | 21,242,059 | |
| | | | | |
|
| Commercial Services & Supplies: 5.26% | |
Advanced Disposal Services Incorporated 144A | | | 5.63 | | | | 11-15-2024 | | | | 6,150,000 | | | | 6,292,742 | |
Covanta Holding Corporation | | | 5.00 | | | | 9-1-2030 | | | | 240,000 | | | | 245,400 | |
Covanta Holding Corporation | | | 5.88 | | | | 7-1-2025 | | | | 1,500,000 | | | | 1,550,940 | |
Covanta Holding Corporation | | | 6.00 | | | | 1-1-2027 | | | | 375,000 | | | | 390,540 | |
IAA Spinco Incorporated 144A | | | 5.50 | | | | 6-15-2027 | | | | 3,650,000 | | | | 3,837,063 | |
KAR Auction Services Incorporated 144A | | | 5.13 | | | | 6-1-2025 | | | | 11,050,000 | | | | 11,132,875 | |
Plastipak Holdings Incorporated 144A | | | 6.25 | | | | 10-15-2025 | | | | 3,225,000 | | | | 3,229,031 | |
| |
| | | | 26,678,591 | |
| | | | | |
|
| Construction & Engineering: 0.08% | |
Pike Corporation 144A | | | 5.50 | | | | 9-1-2028 | | | | 420,000 | | | | 429,538 | |
| | | | | | | | | | | | | | | | |
|
| Machinery: 1.59% | |
Stevens Holding Company Incorporated 144A | | | 6.13 | | | | 10-1-2026 | | | | 3,600,000 | | | | 3,847,500 | |
Trimas Corporation 144A | | | 4.88 | | | | 10-15-2025 | | | | 4,175,000 | | | | 4,237,625 | |
| |
| | | | 8,085,125 | |
| | | | | |
The accompanying notes are an integral part of these financial statements.
14 | Wells Fargo Income Opportunities Fund
Portfolio of investments—October 31, 2020 (unaudited)
| | | | | | | | | | | | | | | | |
| | | Interest
rate | | | Maturity
date | | | Principal | | | Value | |
| Trading Companies & Distributors: 1.08% | |
Fortress Transportation & Infrastructure Investors LLC 144A | | | 6.50 | % | | | 10-1-2025 | | | $ | 5,125,000 | | | $ | 5,049,201 | |
Fortress Transportation & Infrastructure Investors LLC 144A | | | 9.75 | | | | 8-1-2027 | | | | 395,000 | | | | 420,181 | |
| |
| | | | 5,469,382 | |
| | | | | |
|
| Information Technology: 6.59% | |
|
| Communications Equipment: 0.93% | |
CommScope Technologies Finance LLC 144A | | | 8.25 | | | | 3-1-2027 | | | | 3,220,000 | | | | 3,332,684 | |
CommScope Technologies Finance LLC 144A | | | 6.00 | | | | 6-15-2025 | | | | 1,388,000 | | | | 1,376,035 | |
| |
| | | | 4,708,719 | |
| | | | | |
|
| IT Services: 1.33% | |
Cardtronics Incorporated 144A | | | 5.50 | | | | 5-1-2025 | | | | 6,450,000 | | | | 6,506,438 | |
Tempo Acquisition LLC 144A | | | 5.75 | | | | 6-1-2025 | | | | 225,000 | | | | 235,688 | |
| |
| | | | 6,742,126 | |
| | | | | |
|
| Software: 1.52% | |
CDK Global Incorporated 144A | | | 5.25 | | | | 5-15-2029 | | | | 350,000 | | | | 375,445 | |
Fair Isaac Corporation 144A | | | 5.25 | | | | 5-15-2026 | | | | 2,450,000 | | | | 2,719,500 | |
Logan Merger Sub Incorporated 144A | | | 5.50 | | | | 9-1-2027 | | | | 1,705,000 | | | | 1,728,444 | |
NortonLifeLock Incorporated 144A | | | 5.00 | | | | 4-15-2025 | | | | 1,150,000 | | | | 1,171,229 | |
SS&C Technologies Incorporated 144A | | | 5.50 | | | | 9-30-2027 | | | | 1,625,000 | | | | 1,727,099 | |
| |
| | | | 7,721,717 | |
| | | | | |
|
| Technology Hardware, Storage & Peripherals: 2.81% | |
Dell International LLC 144A | | | 5.88 | | | | 6-15-2021 | | | | 1,390,000 | | | | 1,393,350 | |
Dell International LLC 144A | | | 7.13 | | | | 6-15-2024 | | | | 10,175,000 | | | | 10,544,149 | |
NCR Corporation 144A | | | 6.13 | | | | 9-1-2029 | | | | 1,825,000 | | | | 1,911,688 | |
NCR Corporation 144A | | | 8.13 | | | | 4-15-2025 | | | | 400,000 | | | | 440,000 | |
| |
| | | | 14,289,187 | |
| | | | | |
|
| Materials: 5.60% | |
|
| Chemicals: 0.16% | |
Valvoline Incorporated 144A | | | 4.25 | | | | 2-15-2030 | | | | 775,000 | | | | 790,500 | |
| | | | | | | | | | | | | | | | |
|
| Containers & Packaging: 3.58% | |
Berry Global Incorporated 144A | | | 4.88 | | | | 7-15-2026 | | | | 1,000,000 | | | | 1,047,500 | |
Berry Global Incorporated | | | 5.13 | | | | 7-15-2023 | | | | 300,000 | | | | 303,675 | |
Berry Global Incorporated 144A | | | 5.63 | | | | 7-15-2027 | | | | 350,000 | | | | 366,151 | |
Crown Americas Capital Corporation VI | | | 4.75 | | | | 2-1-2026 | | | | 1,700,000 | | | | 1,763,750 | |
Crown Cork & Seal Company Incorporated | | | 7.38 | | | | 12-15-2026 | | | | 3,475,000 | | | | 4,163,432 | |
Flex Acquisition Company Incorporated 144A | | | 6.88 | | | | 1-15-2025 | | | | 2,700,000 | | | | 2,656,125 | |
Flex Acquisition Company Incorporated 144A | | | 7.88 | | | | 7-15-2026 | | | | 950,000 | | | | 959,880 | |
Owens-Brockway Packaging Incorporated 144A | | | 5.88 | | | | 8-15-2023 | | | | 1,300,000 | | | | 1,367,763 | |
Owens-Brockway Packaging Incorporated 144A | | | 6.38 | | | | 8-15-2025 | | | | 750,000 | | | | 823,125 | |
Reynolds Group Holding Limited 144A | | | 5.13 | | | | 7-15-2023 | | | | 55,000 | | | | 55,688 | |
Sealed Air Corporation 144A | | | 5.13 | | | | 12-1-2024 | | | | 2,350,000 | | | | 2,564,438 | |
Silgan Holdings Incorporated | | | 4.13 | | | | 2-1-2028 | | | | 2,025,000 | | | | 2,103,368 | |
| |
| | | | 18,174,895 | |
| | | | | |
|
| Metals & Mining: 0.80% | |
Cleveland-Cliffs Incorporated 144A | | | 9.88 | | | | 10-17-2025 | | | | 1,565,000 | | | | 1,789,969 | |
Indalex Holdings Corporation †(a) | | | 11.50 | | | | 2-1-2021 | | | | 5,646,283 | | | | 0 | |
Kaiser Aluminum Corporation 144A | | | 4.63 | | | | 3-1-2028 | | | | 800,000 | | | | 788,000 | |
The accompanying notes are an integral part of these financial statements.
Wells Fargo Income Opportunities Fund | 15
Portfolio of investments—October 31, 2020 (unaudited)
| | | | | | | | | | | | | | | | |
| | | Interest
rate | | | Maturity
date | | | Principal | | | Value | |
|
| Metals & Mining (continued) | |
Kaiser Aluminum Corporation 144A | | | 6.50 | % | | | 5-1-2025 | | | $ | 550,000 | | | $ | 583,000 | |
Novelis Corporation 144A | | | 5.88 | | | | 9-30-2026 | | | | 850,000 | | | | 877,098 | |
| |
| | | | 4,038,067 | |
| | | | | |
|
| Paper & Forest Products: 1.06% | |
Clearwater Paper Corporation 144A | | | 4.75 | | | | 8-15-2028 | | | | 665,000 | | | | 668,325 | |
Clearwater Paper Corporation 144A | | | 5.38 | | | | 2-1-2025 | | | | 798,000 | | | | 838,898 | �� |
Vertical U.S. Newco Incorporated 144A | | | 5.25 | | | | 7-15-2027 | | | | 3,775,000 | | | | 3,885,230 | |
| |
| | | | 5,392,453 | |
| | | | | |
|
| Real Estate: 3.22% | |
|
| Equity REITs: 3.22% | |
CoreCivic Incorporated | | | 4.63 | | | | 5-1-2023 | | | | 800,000 | | | | 732,000 | |
CoreCivic Incorporated | | | 5.00 | | | | 10-15-2022 | | | | 2,325,000 | | | | 2,226,188 | |
SBA Communications Corporation 144A | | | 3.88 | | | | 2-15-2027 | | | | 875,000 | | | | 889,219 | |
SBA Communications Corporation | | | 4.00 | | | | 10-1-2022 | | | | 300,000 | | | | 302,625 | |
Service Properties Trust Company | | | 3.95 | | | | 1-15-2028 | | | | 1,860,000 | | | | 1,460,100 | |
Service Properties Trust Company | | | 4.38 | | | | 2-15-2030 | | | | 1,425,000 | | | | 1,162,266 | |
Service Properties Trust Company | | | 4.75 | | | | 10-1-2026 | | | | 675,000 | | | | 577,125 | |
Service Properties Trust Company | | | 4.95 | | | | 2-15-2027 | | | | 1,850,000 | | | | 1,554,000 | |
Service Properties Trust Company | | | 5.25 | | | | 2-15-2026 | | | | 1,050,000 | | | | 913,500 | |
Service Properties Trust Company | | | 7.50 | | | | 9-15-2025 | | | | 550,000 | | | | 576,437 | |
The Geo Group Incorporated | | | 5.13 | | | | 4-1-2023 | | | | 1,224,000 | | | | 985,320 | |
The Geo Group Incorporated | | | 5.88 | | | | 1-15-2022 | | | | 2,595,000 | | | | 2,400,375 | |
The Geo Group Incorporated | | | 5.88 | | | | 10-15-2024 | | | | 2,050,000 | | | | 1,419,810 | |
The Geo Group Incorporated | | | 6.00 | | | | 4-15-2026 | | | | 1,760,000 | | | | 1,143,472 | |
| |
| | | | 16,342,437 | |
| | | | | |
|
| Utilities: 4.37% | |
|
| Electric Utilities: 1.44% | |
NextEra Energy Operating Partners LP 144A | | | 4.25 | | | | 7-15-2024 | | | | 2,150,000 | | | | 2,246,750 | |
NextEra Energy Operating Partners LP 144A | | | 4.25 | | | | 9-15-2024 | | | | 350,000 | | | | 366,625 | |
NextEra Energy Operating Partners LP 144A | | | 4.50 | | | | 9-15-2027 | | | | 3,450,000 | | | | 3,769,125 | |
PG&E Corporation | | | 5.00 | | | | 7-1-2028 | | | | 475,000 | | | | 476,199 | |
PG&E Corporation | | | 5.25 | | | | 7-1-2030 | | | | 475,000 | | | | 475,000 | |
| |
| | | | 7,333,699 | |
| | | | | |
|
| Gas Utilities: 0.04% | |
AmeriGas Partners LP | | | 5.63 | | | | 5-20-2024 | | | | 200,000 | | | | 212,500 | |
| | | | | | | | | | | | | | | | |
|
| Independent Power & Renewable Electricity Producers: 2.89% | |
NSG Holdings LLC 144A | | | 7.75 | | | | 12-15-2025 | | | | 5,460,908 | | | | 5,788,563 | |
TerraForm Power Operating LLC 144A | | | 4.25 | | | | 1-31-2023 | | | | 5,225,000 | | | | 5,316,438 | |
TerraForm Power Operating LLC 144A | | | 4.75 | | | | 1-15-2030 | | | | 1,000,000 | | | | 1,072,990 | |
TerraForm Power Operating LLC 144A | | | 5.00 | | | | 1-31-2028 | | | | 2,250,000 | | | | 2,470,106 | |
| |
| | | | 14,648,097 | |
| | | | | |
| |
Total Corporate Bonds and Notes (Cost $558,628,722) | | | | 570,504,717 | |
| | | | | |
|
| Loans: 7.32% | |
|
| Communication Services: 2.11% | |
|
| Diversified Telecommunication Services: 0.00% | |
Intelsat Jackson Holdings SA 2020 Dip Term Loan (3 Month LIBOR +5.50%) ± | | | 5.05 | | | | 7-13-2022 | | | | 10,085 | | | | 10,237 | |
| | | | | | | | | | | | | | | | |
The accompanying notes are an integral part of these financial statements.
16 | Wells Fargo Income Opportunities Fund
Portfolio of investments—October 31, 2020 (unaudited)
| | | | | | | | | | | | | | | | |
| | | Interest
rate | | | Maturity
date | | | Principal | | | Value | |
| Media: 2.11% | |
Ancestry.com Incorporated (1 Month LIBOR +4.25%) ± | | | 4.40 | % | | | 8-27-2026 | | | $ | 6,709,294 | | | $ | 6,685,342 | |
Hubbard Radio LLC (6 Month LIBOR +4.25%) ± | | | 5.25 | | | | 3-28-2025 | | | | 1,280,085 | | | | 1,217,143 | |
Montreign Operating Company LLC (1 Month LIBOR +2.75%) ± | | | 2.90 | | | | 3-22-2021 | | | | 2,942,956 | | | | 2,790,893 | |
| |
| | | | 10,693,378 | |
| | | | | |
|
| Consumer Discretionary: 0.23% | |
|
| Hotels, Restaurants & Leisure: 0.23% | |
Carnival Corporation (1 Month LIBOR +7.50%) ± | | | 8.50 | | | | 6-30-2025 | | | | 548,625 | | | | 551,917 | |
CCM Merger Incorporated (PRIME +1.25%) ±‡ | | | 4.50 | | | | 8-8-2021 | | | | 596,725 | | | | 591,319 | |
| |
| | | | 1,143,236 | |
| | | | | |
|
| Energy: 1.11% | |
|
| Oil, Gas & Consumable Fuels: 1.11% | |
Crestwood Holdings LLC (1 Month LIBOR +7.50%) ± | | | 7.66 | | | | 3-6-2023 | | | | 2,503,199 | | | | 1,549,380 | |
Encino Acquisition Partners Holdings LLC (1 Month LIBOR +6.75%) ± | | | 7.75 | | | | 10-29-2025 | | | | 1,225,000 | | | | 1,009,094 | |
EPIC Crude Services LP (3 Month LIBOR +5.00%) ± | | | 5.26 | | | | 3-2-2026 | | | | 4,400,000 | | | | 3,049,200 | |
| |
| | | | 5,607,674 | |
| | | | | |
|
| Financials: 2.73% | |
|
| Capital Markets: 1.08% | |
Nexus Buyer LLC (1 Month LIBOR +3.75%) ± | | | 3.90 | | | | 11-9-2026 | | | | 1,414,313 | | | | 1,385,319 | |
VFH Parent LLC (1 Month LIBOR +3.00%) ± | | | 3.15 | | | | 3-1-2026 | | | | 1,477,564 | | | | 1,460,025 | |
Victory Capital Management Incorporated (3 Month LIBOR +2.50%) ± | | | 2.73 | | | | 7-1-2026 | | | | 2,731,845 | | | | 2,672,646 | |
| |
| | | | 5,517,990 | |
| | | | | |
|
| Diversified Financial Services: 1.28% | |
Astro AB Borrower Incorporated (3 Month LIBOR +7.50%) ±‡ | | | 8.50 | | | | 4-30-2023 | | | | 2,110,000 | | | | 2,015,050 | |
Resolute Investment Managers Incorporated (3 Month LIBOR +7.50%) ±‡< | | | 8.50 | | | | 4-30-2023 | | | | 2,110,000 | | | | 2,099,450 | |
Stonepeak Lonestar Holdings LLC (3 Month LIBOR +4.50%) ± | | | 4.72 | | | | 10-19-2026 | | | | 2,398,439 | | | | 2,371,456 | |
| |
| | | | 6,485,956 | |
| | | | | |
|
| Insurance: 0.37% | |
HUB International Limited (3 Month LIBOR +4.00%) ± | | | 5.00 | | | | 4-25-2025 | | | | 1,439,125 | | | | 1,429,958 | |
USI Incorporated (3 Month LIBOR +4.00%) ± | | | 4.22 | | | | 12-2-2026 | | | | 446,625 | | | | 439,090 | |
| |
| | | | 1,869,048 | |
| | | | | |
|
| Information Technology: 1.00% | |
|
| IT Services: 0.60% | |
Fiserv Investment Solutions Incorporated (3 Month LIBOR +4.75%) ±< | | | 5.02 | | | | 2-18-2027 | | | | 723,500 | | | | 716,569 | |
Flexential Intermediate Corporation (3 Month LIBOR +3.50%) ± | | | 3.72 | | | | 8-1-2024 | | | | 497,436 | | | | 430,282 | |
Flexential Intermediate Corporation (3 Month LIBOR +7.25%) ± | | | 7.50 | | | | 8-1-2025 | | | | 3,125,000 | | | | 1,877,219 | |
| |
| | | | 3,024,070 | |
| | | | | |
|
| Software: 0.40% | |
Emerald Topco Incorporated (3 Month LIBOR +3.50%) ± | | | 3.71 | | | | 7-24-2026 | | | | 2,128,500 | | | | 2,048,681 | |
| | | | | | | | | | | | | | | | |
|
| Materials: 0.14% | |
|
| Containers & Packaging: 0.09% | |
Reynolds Group Holdings Incorporated (1 Month LIBOR +2.75%) ± | | | 2.90 | | | | 2-5-2023 | | | | 446,261 | | | | 437,398 | |
| | | | | | | | | | | | | | | | |
The accompanying notes are an integral part of these financial statements.
Wells Fargo Income Opportunities Fund | 17
Portfolio of investments—October 31, 2020 (unaudited)
| | | | | | | | | | | | | | | | |
| | | Interest
rate | | | Maturity
date | | | Principal | | | Value | |
| Paper & Forest Products: 0.05% | | | | | | | | | | | | | | | | |
Clearwater Paper Corporation (1 Month LIBOR +3.00%) ±‡ | | | 3.24 | % | | | 7-26-2026 | | | $ | 283,812 | | | $ | 281,684 | |
| | | | | | | | | | | | | | | | |
| | | | |
Total Loans (Cost $38,570,440) | | | | | | | | | | | | | | | 37,119,352 | |
| | | | | | | | | | | | | | | | |
| | | | |
| | | | | | | | | | | | | | | | |
| | | | | | Expiration
date | | | Shares | | | | |
| | | | |
| Rights: 0.12% | | | | | | | | | | | | |
| | | | |
| Utilities: 0.12% | | | | | | | | | | | | |
| | | | |
| Independent Power & Renewable Electricity Producers: 0.12% | | | | | | | | | | | | |
Vistra Energy Corporation † | | | | | | | 12-31-2046 | | | | 559,650 | | | | 597,147 | |
| | | | | | | | | | | | | | | | |
| | | | |
Total Rights (Cost $580,356) | | | | | | | | | | | | | | | 597,147 | |
| | | | | | | | | | | | | | | | |
| | | | |
| Warrants: 0.00% | | | | | | | | | | | | |
| | | | |
| Energy: 0.00% | | | | | | | | | | | | |
| | | | |
| Oil, Gas & Consumable Fuels: 0.00% | | | | | | | | | | | | |
Denbury Incorporated † | | | | | | | 9-18-2025 | | | | 19,979 | | | | 19,979 | |
| | | | | | | | | | | | | | | | |
| | | | |
Total Warrants (Cost $314,574) | | | | | | | | | | | | | | | 19,979 | |
| | | | | | | | | | | | | | | | |
| | | | |
| | | | | | | | | | | | | | | | |
| | | | | | Maturity
date | | | Principal | | | | |
| | | | |
| Yankee Corporate Bonds and Notes: 11.12% | | | | | | | | | | | | |
| | | | |
| Communication Services: 1.24% | | | | | | | | | | | | |
| | | | |
| Diversified Telecommunication Services: 0.27% | | | | | | | | | | | | |
Intelsat Connect Finance Company 144A† | | | 9.50 | | | | 2-15-2023 | | | $ | 825,000 | | | | 222,750 | |
Intelsat Luxembourg SA † | | | 8.13 | | | | 6-1-2023 | | | | 2,175,000 | | | | 70,688 | |
Telesat Canada Incorporated 144A | | | 6.50 | | | | 10-15-2027 | | | | 1,075,000 | | | | 1,069,625 | |
| | | | |
| | | | | | | | | | | | | | | 1,363,063 | |
| | | | | | | | | | | | | | | | |
| | | | |
| Media: 0.97% | | | | | | | | | | | | |
Nielsen Holding and Finance BV 144A | | | 5.00 | | | | 2-1-2025 | | | | 4,000,000 | | | | 4,108,800 | |
Nielsen Holding and Finance BV 144A | | | 5.50 | | | | 10-1-2021 | | | | 204,000 | | | | 204,255 | |
Virgin Media Finance plc 144A | | | 5.00 | | | | 7-15-2030 | | | | 625,000 | | | | 621,875 | |
| | | | |
| | | | | | | | | | | | | | | 4,934,930 | |
| | | | | | | | | | | | | | | | |
| | | | |
| Consumer Discretionary: 0.04% | | | | | | | | | | | | |
| | | | |
| Automobiles: 0.04% | | | | | | | | | | | | |
Clarios Global LP 144A | | | 6.75 | | | | 5-15-2025 | | | | 200,000 | | | | 211,520 | |
| | | | | | | | | | | | | | | | |
| | | | |
| Energy: 1.01% | | | | | | | | | | | | |
| | | | |
| Oil, Gas & Consumable Fuels: 1.01% | | | | | | | | | | | | |
Baytex Energy Corporation 144A | | | 5.63 | | | | 6-1-2024 | | | | 3,700,000 | | | | 2,044,250 | |
Baytex Energy Corporation 144A | | | 8.75 | | | | 4-1-2027 | | | | 6,475,000 | | | | 2,849,000 | |
Cenovus Energy Incorporated | | | 5.38 | | | | 7-15-2025 | | | | 240,000 | | | | 252,900 | |
Griffin Coal Mining Company Limited †(a) | | | 9.50 | | | | 12-1-2016 | | | | 191,090 | | | | 0 | |
Griffin Coal Mining Company Limited 144A†(a) | | | 9.50 | | | | 12-1-2016 | | | | 1,396,100 | | | | 0 | |
| | | | |
| | | | | | | | | | | | | | | 5,146,150 | |
| | | | | | | | | | | | | | | | |
The accompanying notes are an integral part of these financial statements.
18 | Wells Fargo Income Opportunities Fund
Portfolio of investments—October 31, 2020 (unaudited)
| | | | | | | | | | | | | | | | |
| | | Interest
rate | | | Maturity
date | | | Principal | | | Value | |
| Financials: 1.80% | | | | | | | | | | | | |
| | | | |
| Diversified Financial Services: 1.80% | | | | | | | | | | | | |
Intelsat Jackson Holdings SA † | | | 5.50 | % | | | 8-1-2023 | | | $ | 9,440,000 | | | $ | 5,534,200 | |
Intelsat Jackson Holdings SA 144A | | | 8.00 | | | | 2-15-2024 | | | | 225,000 | | | | 228,375 | |
Intelsat Jackson Holdings SA 144A† | | | 8.50 | | | | 10-15-2024 | | | | 3,400,000 | | | | 2,099,840 | |
Sensata Technologies UK Financing Company plc 144A | | | 6.25 | | | | 2-15-2026 | | | | 1,225,000 | | | | 1,267,875 | |
| |
| | | | 9,130,290 | |
| | | | | |
|
| Health Care: 3.51% | |
|
| Pharmaceuticals: 3.51% | |
Bausch Health Companies Incorporated 144A | | | 5.00 | | | | 1-30-2028 | | | | 750,000 | | | | 741,285 | |
Bausch Health Companies Incorporated 144A | | | 5.25 | | | | 1-30-2030 | | | | 750,000 | | | | 736,875 | |
Bausch Health Companies Incorporated 144A | | | 5.50 | | | | 3-1-2023 | | | | 1,226,000 | | | | 1,222,935 | |
Bausch Health Companies Incorporated 144A | | | 5.50 | | | | 11-1-2025 | | | | 925,000 | | | | 950,253 | |
Bausch Health Companies Incorporated 144A | | | 5.75 | | | | 8-15-2027 | | | | 175,000 | | | | 187,688 | |
Bausch Health Companies Incorporated 144A | | | 5.88 | | | | 5-15-2023 | | | | 241,000 | | | | 240,398 | |
Bausch Health Companies Incorporated 144A | | | 6.13 | | | | 4-15-2025 | | | | 3,875,000 | | | | 3,983,500 | |
Bausch Health Companies Incorporated 144A | | | 6.25 | | | | 2-15-2029 | | | | 1,300,000 | | | | 1,339,728 | |
Bausch Health Companies Incorporated 144A | | | 7.00 | | | | 3-15-2024 | | | | 1,100,000 | | | | 1,139,875 | |
Bausch Health Companies Incorporated 144A | | | 7.00 | | | | 1-15-2028 | | | | 350,000 | | | | 371,000 | |
Bausch Health Companies Incorporated 144A | | | 7.25 | | | | 5-30-2029 | | | | 175,000 | | | | 188,410 | |
Teva Pharmaceutical Finance Netherlands III BV | | | 4.10 | | | | 10-1-2046 | | | | 1,750,000 | | | | 1,454,635 | |
Teva Pharmaceutical Finance Netherlands III BV | | | 6.75 | | | | 3-1-2028 | | | | 4,975,000 | | | | 5,225,616 | |
| |
| | | | 17,782,198 | |
| | | | | |
|
| Industrials: 3.23% | |
|
| Airlines: 0.64% | |
Air Canada Company 144A | | | 7.75 | | | | 4-15-2021 | | | | 3,225,000 | | | | 3,249,188 | |
| | | | | | | | | | | | | | | | |
|
| Commercial Services & Supplies: 2.32% | |
NorthRiver Midstream Finance LP 144A | | | 5.63 | | | | 2-15-2026 | | | | 3,735,000 | | | | 3,699,518 | |
Ritchie Brothers Auctioneers Incorporated 144A | | | 5.38 | | | | 1-15-2025 | | | | 7,875,000 | | | | 8,101,406 | |
| |
| | | | 11,800,924 | |
| | | | | |
|
| Electrical Equipment: 0.17% | |
Sensata Technologies BV 144A | | | 5.00 | | | | 10-1-2025 | | | | 770,000 | | | | 840,567 | |
| | | | | | | | | | | | | | | | |
|
| Machinery: 0.10% | |
Vertical Holdco GmbH 144A | | | 7.63 | | | | 7-15-2028 | | | | 500,000 | | | | 518,750 | |
| | | | | | | | | | | | | | | | |
|
| Materials: 0.29% | |
|
| Containers & Packaging: 0.29% | |
Ardagh Packaging Finance plc 144A | | | 5.25 | | | | 4-30-2025 | | | | 375,000 | | | | 392,374 | |
OI European Group BV 144A | | | 4.00 | | | | 3-15-2023 | | | | 1,075,000 | | | | 1,080,375 | |
| |
| | | | 1,472,749 | |
| | | | | |
| |
Total Yankee Corporate Bonds and Notes (Cost $67,801,383) | | | | 56,450,329 | |
| | | | | |
| | | | |
| | | | | | | | | | | | | | | | |
The accompanying notes are an integral part of these financial statements.
Wells Fargo Income Opportunities Fund | 19
Portfolio of investments—October 31, 2020 (unaudited)
| | | | | | | | | | | | | | | | |
| | | Yield | | | | | | Shares | | | Value | |
| Short-Term Investments: 5.24% | |
|
| Investment Companies: 5.24% | |
Wells Fargo Government Money Market Fund Select Class (l)(u)## | | | 0.03 | % | | | | | | | 26,604,030 | | | $ | 26,604,030 | |
| | | | | | | | | | | | | | | | |
| |
Total Short-Term Investments (Cost $26,604,030) | | | | 26,604,030 | |
| | | | | |
| | | | | | | | |
| Total investments in securities (Cost $709,244,574) | | | 138.89 | % | | | 704,782,666 | |
| | |
Other assets and liabilities, net | | | (38.89 | ) | | | (197,338,110 | ) |
| | | | | | | | |
| Total net assets | | | 100.00 | % | | $ | 507,444,556 | |
| | | | | | | | |
| † | Non-income-earning security |
| 144A | The security may be resold in transactions exempt from registration, normally to qualified institutional buyers, pursuant to Rule 144A under the Securities Act of 1933. |
| %% | The security is purchased on a when-issued basis. |
| (a) | The security is fair valued in accordance with procedures approved by the Board of Trustees. |
| ± | Variable rate investment. The rate shown is the rate in effect at period end. |
| ‡ | Security is valued using significant unobservable inputs. |
| < | All or a portion of the position represents an unfunded loan commitment. The rate represents current interest rate if the loan is partially funded. |
| (l) | The issuer of the security is an affiliated person of the Fund as defined in the Investment Company Act of 1940. |
| (u) | The rate represents the 7-day annualized yield at period end. |
| ## | All or a portion of this security is segregated for when-issued and/or unfunded loans. |
Abbreviations:
| LIBOR | London Interbank Offered Rate |
| REIT | Real Estate Investment Trust |
Investments in Affiliates
An affiliated investment is an investment in which the Fund owns at least 5% of the outstanding voting shares of the issuer or as a result of other relationships, such as the Fund and the issuer having the same investment manager. Transactions with issuers that were either affiliated persons of the Fund at the beginning of the period or the end of the period were as follows:
| | | | | | | | | | | | | | | | | | | | | | | | | | | | | | | | | | | | |
| | | Value, beginning of period | | | Purchases | | | Sales proceeds | | | Net realized gains (losses) | | | Net change in unrealized gains (losses) | | | Value, end of
period | | | % of net assets | | | Shares,
end of
period | | | Income
from
affiliated
securities | |
| | | | | | | | | |
| Short-Term Investments | | | | | | | | | | | | | | | | | | | | | | | | | | | |
Investment Companies | | | | | | | | | | | | | | | | | | | | | | | | | | | | | | | | | | | | |
Wells Fargo Government Money Market Fund Select Class | | $ | 10,523,431 | | | $ | 133,536,526 | | | $ | (117,455,927 | ) | | $ | 0 | | | $ | 0 | | | $ | 26,604,030 | | | | 5.24 | % | | | 26,604,030 | | | $ | 5,176 | |
The accompanying notes are an integral part of these financial statements.
20 | Wells Fargo Income Opportunities Fund
Statement of assets and liabilities—October 31, 2020 (unaudited)
| | | | |
| | | | |
| |
Assets | | | | |
Investments in unaffiliated securities, at value (cost $682,640,544) | | $ | 678,178,636 | |
Investments in affiliated securities, at value (cost $26,604,030) | | | 26,604,030 | |
Cash | | | 11,047 | |
Receivable for investments sold | | | 2,064,588 | |
Receivable for interest | | | 8,661,387 | |
Prepaid expenses and other assets | | | 17,995 | |
| | | | |
Total assets | | | 715,537,683 | |
| | | | |
| |
Liabilities | | | | |
Secured borrowing payable | | | 194,000,000 | |
Payable for investments purchased | | | 10,213,650 | |
Advisory fee payable | | | 371,061 | |
Dividends payable | | | 3,434,764 | |
Administration fee payable | | | 30,922 | |
Accrued expenses and other liabilities | | | 42,730 | |
| | | | |
Total liabilities | | | 208,093,127 | |
| | | | |
Total net assets | | $ | 507,444,556 | |
| | | | |
| |
Net assets consist of | | | | |
Paid-in capital | | $ | 586,021,177 | |
Total distributable loss | | | (78,576,621 | ) |
| | | | |
Total net assets | | $ | 507,444,556 | |
| | | | |
| |
Net asset value per share | | | | |
Based on $507,444,556 divided by 60,586,214 shares issued and outstanding (100,000,000 shares authorized) | | $ | 8.38 | |
| | | | |
The accompanying notes are an integral part of these financial statements.
Wells Fargo Income Opportunities Fund | 21
Statement of operations—six months ended October 31, 2020 (unaudited)
| | | | |
| | | | |
| |
Investment income | | | | |
Interest | | $ | 19,324,007 | |
Income from affiliated securities | | | 5,176 | |
Dividends | | | 15 | |
| | | | |
Total investment income | | | 19,329,198 | |
| | | | |
| |
Expenses | | | | |
Advisory fee | | | 2,055,946 | |
Administration fee | | | 171,329 | |
Custody and accounting fees | | | 20,981 | |
Professional fees | | | 42,578 | |
Shareholder report expenses | | | 76,387 | |
Trustees’ fees and expenses | | | 9,883 | |
Transfer agent fees | | | 24,977 | |
Interest expense | | | 935,718 | |
Other fees and expenses | | | 34,186 | |
| | | | |
Total expenses | | | 3,371,985 | |
| | | | |
Net investment income | | | 15,957,213 | |
| | | | |
| |
Realized and unrealized gains (losses) on investments | | | | |
Net realized losses on investments | | | (24,381,961 | ) |
Net change in unrealized gains (losses) on investments | | | 78,489,273 | |
| | | | |
Net realized and unrealized gains (losses) on investments | | | 54,107,312 | |
| | | | |
Net increase in net assets resulting from operations | | $ | 70,064,525 | |
| | | | |
The accompanying notes are an integral part of these financial statements.
22 | Wells Fargo Income Opportunities Fund
Statement of changes in net assets
| | | | | | | | |
| | | Six months ended October 31, 2020
(unaudited) | | | Year ended April 30, 2020 | |
|
Operations | |
Net investment income | | $ | 15,957,213 | | | $ | 33,287,459 | |
Net realized gains (losses) on investments | | | (24,381,961 | ) | | | 909,328 | |
Net change in unrealized gains (losses) on investments | | | 78,489,273 | | | | (78,429,052 | ) |
| | | | |
Net increase (decrease) in net assets resulting from operations | | | 70,064,525 | | | | (44,232,265 | ) |
| | | | |
| | |
Distributions to shareholders from | | | | | | | | |
Net investment income and net realized gains | | | (20,904,610 | ) | | | (34,858,334 | ) |
Tax basis return of capital | | | 0 | | | | (8,760,619 | ) |
| | | | |
Total distributions to shareholders | | | (20,904,610 | ) | | | (43,618,953 | ) |
| | | | |
| | |
Capital share transactions | | | | | | | | |
Cost of shares repurchased | | | (270,774 | ) | | | (19,928,530 | ) |
| | | | |
Total increase (decrease) in net assets | | | 48,889,141 | | | | (107,779,748 | ) |
| | | | |
| | |
Net assets | | | | | | | | |
Beginning of period | | | 458,555,415 | | | | 566,335,163 | |
| | | | |
End of period | | $ | 507,444,556 | | | $ | 458,555,415 | |
| | | | |
The accompanying notes are an integral part of these financial statements.
Wells Fargo Income Opportunities Fund | 23
Statement of cash flows—six months ended October 31, 2020
| | | | |
| | | | |
| |
Cash flows from operating activities: | | | | |
Net increase in net assets resulting from operations | | $ | 70,064,525 | |
| |
Adjustments to reconcile net increase in net assets from operations to net cash used by operating activities: | | | | |
Purchase of long-term securities | | | (204,843,802 | ) |
Proceeds from sales of long-term securities | | | 188,383,538 | |
Amortization | | | (880,916 | ) |
Purchases and sales of short-term securities, net | | | (16,080,599 | ) |
Decrease in receivable for investments sold | | | 1,926,438 | |
Decrease in receivable for interest | | | 574,312 | |
Increase in prepaid expenses and other assets | | | (44,721 | ) |
Increase in payable for investments purchased | | | 6,171,737 | |
Increase in advisory fee payable | | | 87,106 | |
Increase in administration fee payable | | | 7,259 | |
Decrease in trustee’s fee and expenses payable | | | (5,441 | ) |
Decrease in accrued expenses and other liabilities | | | (743,080 | ) |
Net realized losses on investments | | | 24,381,961 | |
Net change in unrealized gains (losses) on investments | | | (78,489,273 | ) |
| | | | |
Net cash used in operating activities | | | (9,490,956 | ) |
| | | | |
| |
Cash flows from financing activities: | | | | |
Increase in secured borrowing payable | | | 30,600,000 | |
Payment for shares repurchased | | | (270,774 | ) |
Cash distributions paid | | | (20,827,223 | ) |
| | | | |
Net cash provided by financing activities | | | 9,502,003 | |
| | | | |
Net increase in cash | | | 11,047 | |
| | | | |
| |
Cash: | | | | |
Beginning of period | | | 0 | |
| | | | |
End of period | | $ | 11,047 | |
| | | | |
| |
Supplemental cash disclosure | | | | |
Cash paid for interest | | $ | 1,599,622 | |
| | | | |
The accompanying notes are an integral part of these financial statements.
24 | Wells Fargo Income Opportunities Fund
Financial highlights
(For a share outstanding throughout each period)
| | | | | | | | | | | | | | | | | | | | | | | | |
| | | Six months ended
October 31, 2020
(unaudited) | | | Year ended April 30 | |
| | | 2020 | | | 2019 | | | 2018 | | | 2017 | | | 2016 | |
Net asset value, beginning of period | | | $7.56 | | | | $8.98 | | | | $9.00 | | | | $9.31 | | | | $8.56 | | | | $9.75 | |
Net investment income | | | 0.26 | | | | 0.54 | 1 | | | 0.57 | 1 | | | 0.60 | 1 | | | 0.74 | 1 | | | 0.77 | 1 |
Net realized and unrealized gains (losses) on investments | | | 0.90 | | | | (1.28 | ) | | | (0.02 | ) | | | (0.23 | ) | | | 0.81 | | | | (1.14 | ) |
| | | | | | | | | | | | | | | | | | | | | | | | |
Total from investment operations | | | 1.16 | | | | (0.74 | ) | | | 0.55 | | | | 0.37 | | | | 1.55 | | | | (0.37 | ) |
Distributions to shareholders from | | | | | | | | | | | | | | | | | | | | | | | | |
Net investment income | | | (0.34 | ) | | | (0.57 | ) | | | (0.59 | ) | | | (0.62 | ) | | | (0.79 | ) | | | (0.82 | ) |
Tax basis return of capital | | | 0.00 | | | | (0.14 | ) | | | (0.09 | ) | | | (0.06 | ) | | | (0.01 | ) | | | 0.00 | |
| | | | | | | | | | | | | | | | | | | | | | | | |
Total distributions to shareholders | | | (0.34 | ) | | | (0.71 | ) | | | (0.68 | ) | | | (0.68 | ) | | | (0.80 | ) | | | (0.82 | ) |
Anti-dilutive effect of shares repurchased | | | 0.00 | 2 | | | 0.03 | | | | 0.11 | | | | 0.00 | 2 | | | 0.00 | 2 | | | 0.00 | |
Net asset value, end of period | | | $8.38 | | | | $7.56 | | | | $8.98 | | | | $9.00 | | | | $9.31 | | | | $8.56 | |
Market value, end of period | | | $7.19 | | | | $6.81 | | | | $8.09 | | | | $8.07 | | | | $8.64 | | | | $7.76 | |
Total return based on market value3 | | | 10.62 | % | | | (7.91 | )% | | | 9.29 | % | | | 1.24 | % | | | 22.55 | % | | | (3.47 | )% |
Ratios to average net assets (annualized) | | | | | | | | | | | | | | | | | | | | | | | | |
Gross expenses4 | | | 1.32 | % | | | 2.16 | % | | | 2.15 | % | | | 1.68 | % | | | 1.40 | % | | | 1.30 | % |
Net expenses4 | | | 1.32 | % | | | 2.16 | % | | | 2.12 | % | | | 1.63 | % | | | 1.23 | % | | | 1.10 | % |
Net investment income | | | 6.33 | % | | | 6.21 | % | | | 6.38 | % | | | 6.53 | % | | | 8.15 | % | | | 8.76 | % |
Supplemental data | | | | | | | | | | | | | | | | | | | | | | | | |
Portfolio turnover rate | | | 25 | % | | | 30 | % | | | 16 | % | | | 33 | % | | | 43 | % | | | 25 | % |
Net assets, end of period (000s omitted) | | | $507,445 | | | | $458,555 | | | | $566,335 | | | | $620,863 | | | | $656,517 | | | | $607,437 | |
Borrowings outstanding, end of period (000s omitted) | | | $194,000 | | | | $163,400 | | | | $231,027 | | | | $230,000 | | | | $230,000 | | | | $230,000 | |
Asset coverage per $1,000 of borrowing, end of period | | | $3,822 | | | | $3,806 | | | | $3,451 | | | | $3,699 | | | | $3,854 | | | | $3,641 | |
| 1 | Calculated based upon average shares outstanding |
| 2 | Amount is less than $0.005. |
| 3 | Total return is calculated assuming a purchase of common stock on the first day and sale on the last day of the period reported. Dividends and distributions, if any, are assumed for the purposes of these calculations to be reinvested at prices obtained under the Fund’s Automatic Dividend Reinvestment Plan. Total return does not reflect brokerage commissions or sales charges. |
| 4 | Ratios include interest expense relating to interest associated with borrowings and/or leverage transactions as follows: |
| | | | |
Six months ended October 31, 2020 (unaudited) | | | 0.37 | % |
Year ended April 30, 2020 | | | 1.17 | % |
Year ended April 30, 2019 | | | 1.19 | % |
Year ended April 30, 2018 | | | 0.74 | % |
Year ended April 30, 2017 | | | 0.48 | % |
Year ended April 30, 2016 | | | 0.37 | % |
The accompanying notes are an integral part of these financial statements.
Wells Fargo Income Opportunities Fund | 25
Notes to financial statements (unaudited)
1. ORGANIZATION
Wells Fargo Income Opportunities Fund (the “Fund”) was organized as a statutory trust under the laws of the state of Delaware on December 3, 2002 and is registered as a diversified closed-end management investment company under the Investment Company Act of 1940, as amended (the “1940 Act”). As an investment company, the Fund follows the accounting and reporting guidance in Financial Accounting Standards Board (“FASB”) Accounting Standards Codification (“ASC”) Topic 946, Financial Services – Investment Companies.
2. SIGNIFICANT ACCOUNTING POLICIES
The following significant accounting policies, which are consistently followed in the preparation of the financial statements of the Fund, are in conformity with U.S. generally accepted accounting principles which require management to make estimates and assumptions that affect the reported amounts of assets and liabilities, disclosure of contingent assets and liabilities at the date of the financial statements, and the reported amounts of revenues and expenses during the reporting period. Actual results could differ from those estimates.
Securities valuation
All investments are valued each business day as of the close of regular trading on the New York Stock Exchange (generally 4 p.m. Eastern Time), although the Fund may deviate from this calculation time under unusual or unexpected circumstances.
Debt securities are valued at the evaluated bid price provided by an independent pricing service (e.g. taking into account various factors, including yields, maturities, or credit ratings) or, if a reliable price is not available, the quoted bid price from an independent broker-dealer
Equity securities that are listed on a foreign or domestic exchange or market are valued at the official closing price or, if none, the last sales price. If no sale occurs on the principal exchange or market that day, a fair value price will be determined in accordance with the Fund’s Valuation Procedures.
Investments in registered open-end investment companies are valued at net asset value.
Investments which are not valued using any of the methods discussed above are valued at their fair value, as determined in good faith by the Board of Trustees of the Fund. The Board of Trustees has established a Valuation Committee comprised of the Trustees and has delegated to it the authority to take any actions regarding the valuation of portfolio securities that the Valuation Committee deems necessary or appropriate, including determining the fair value of portfolio securities, unless the determination has been delegated to the Wells Fargo Asset Management Pricing Committee at Wells Fargo Funds Management, LLC (“Funds Management”). The Board of Trustees retains the authority to make or ratify any valuation decisions or approve any changes to the Valuation Procedures as it deems appropriate. On a quarterly basis, the Board of Trustees receives reports on any valuation actions taken by the Valuation Committee or the Wells Fargo Asset Management Pricing Committee which may include items for ratification.
When-issued transactions
The Fund may purchase securities on a forward commitment or when-issued basis. The Fund records a when-issued transaction on the trade date and will segregate assets in an amount at least equal in value to the Fund’s commitment to purchase when-issued securities. Securities purchased on a when-issued basis are marked-to-market daily and the Fund begins earning interest on the settlement date. Losses may arise due to changes in the market value of the underlying securities or if the counterparty does not perform under the contract.
Loans
The Fund may invest in direct debt instruments which are interests in amounts owed to lenders by corporate or other borrowers. The loans pay interest at rates which are periodically reset by reference to a base lending rate plus a spread. Investments in loans may be in the form of participations in loans or assignments of all or a portion of loans from third parties. When the Fund purchases participations, it generally has no rights to enforce compliance with the terms of the loan agreement with the borrower. As a result, the Fund assumes the credit risk of both the borrower and the lender that is selling the participation. When the Fund purchases assignments from lenders, it acquires direct rights against the borrower on the loan and may enforce compliance by the borrower with the terms of the loan agreement. Loans may include fully funded term loans or unfunded loan commitments, which are contractual obligations for future funding.
Security transactions and income recognition
Securities transactions are recorded on a trade date basis. Realized gains or losses are recorded on the basis of identified cost.
26 | Wells Fargo Income Opportunities Fund
Notes to financial statements (unaudited)
Interest income is accrued daily and bond discounts are accreted and premiums are amortized daily. To the extent debt obligations are placed on non-accrual status, any related interest income may be reduced by writing off interest receivables when the collection of all or a portion of interest has been determined to be doubtful based on consistently applied procedures and the fair value has decreased. If the issuer subsequently resumes interest payments or when the collectability of interest is reasonably assured, the debt obligation is removed from non-accrual status.
Dividend income is recognized on the ex-dividend date.
Distributions to shareholders
Under a managed distribution plan, the Fund pays monthly distributions to shareholders at an annual minimum fixed rate of 8% based on the Fund’s average monthly net asset value per share over the prior 12 months. The monthly distributions may be sourced from income, paid-in capital, and/or capital gains, if any. To the extent that sufficient investment income is not available on a monthly basis, the Fund may distribute paid-in capital and/ or capital gains, if any, in order to maintain its managed distribution level.
Distributions to shareholders from net investment income and net realized gains, if any, are recorded on the ex-dividend date. Such distributions are determined in accordance with income tax regulations and may differ from U.S. generally accepted accounting principles. Dividend sources are estimated at the time of declaration. The tax character of distributions is determined as of the Fund’s fiscal year end. Therefore, a portion of the Fund’s distributions made prior to the Fund’s fiscal year end may be categorized as a tax return of capital at year end.
Federal and other taxes
The Fund intends to continue to qualify as a regulated investment company by distributing substantially all of its investment company taxable income and any net realized capital gains (after reduction for capital loss carryforwards) sufficient to relieve it from all, or substantially all, federal income taxes. Accordingly, no provision for federal income taxes was required.
The Fund’s income and federal excise tax returns and all financial records supporting those returns for the prior three fiscal years are subject to examination by the federal and Delaware revenue authorities. Management has analyzed the Fund’s tax positions taken on federal, state, and foreign tax returns for all open tax years and does not believe that there are any uncertain tax positions that require recognition of a tax liability.
As of October 31, 2020, the aggregate cost of all investments for federal income tax purposes was $796,192,633 and the unrealized gains (losses) consisted of:
| | | | |
| |
Gross unrealized gains | | $ | 47,911,960 | |
| |
Gross unrealized losses | | | (139,321,927 | ) |
| |
Net unrealized losses | | $ | (91,409,967 | ) |
As of April 30, 2020, the Fund had capital loss carryforwards which consist of $23,810,916 in short-term capital losses and $14,138,769 in long-term capital losses.
3. FAIR VALUATION MEASUREMENTS
Fair value measurements of investments are determined within a framework that has established a fair value hierarchy based upon the various data inputs utilized in determining the value of the Fund’s investments. The three-level hierarchy gives the highest priority to unadjusted quoted prices in active markets for identical assets or liabilities (Level 1) and the lowest priority to unobservable inputs (Level 3). The Fund’s investments are classified within the fair value hierarchy based on the lowest level of input that is significant to the fair value measurement. The inputs are summarized into three broad levels as follows:
| ∎ | | Level 1 – quoted prices in active markets for identical securities |
| ∎ | | Level 2 – other significant observable inputs (including quoted prices for similar securities, interest rates, prepayment speeds, credit risk, etc.) |
| ∎ | | Level 3 – significant unobservable inputs (including the Fund’s own assumptions in determining the fair value of investments) |
The inputs or methodologies used for valuing investments in securities are not necessarily an indication of the risk associated with investing in those securities.
Wells Fargo Income Opportunities Fund | 27
Notes to financial statements (unaudited)
The following is a summary of the inputs used in valuing the Fund’s assets and liabilities as of October 31, 2020:
| | | | | | | | | | | | | | | | |
| | | | |
| | | Quoted prices
(Level 1) | | | Other significant
observable inputs
(Level 2) | | | Significant
unobservable inputs (Level 3) | | | Total | |
| | | | |
Assets | | | | | | | | | | | | | | | | |
Investments in: | | | | | | | | | | | | | | | | |
| | | | |
Common stocks | | | | | | | | | | | | | | | | |
| | | | |
Energy | | $ | 13,486,633 | | | $ | 0 | | | $ | 0 | | | $ | 13,486,633 | |
| | | | |
Materials | | | 479 | | | | 0 | | | | 0 | | | | 479 | |
| | | | |
Corporate bonds and notes | | | 0 | | | | 570,504,717 | | | | 0 | | | | 570,504,717 | |
| | | | |
Loans | | | 0 | | | | 34,822,618 | | | | 2,296,734 | | | | 37,119,352 | |
| | | | |
Rights | | | | | | | | | | | | | | | | |
| | | | |
Utilities | | | 0 | | | | 597,147 | | | | 0 | | | | 597,147 | |
| | | | |
Warrants | | | | | | | | | | | | | | | | |
| | | | |
Energy | | | 0 | | | | 19,979 | | | | 0 | | | | 19,979 | |
| | | | |
Yankee corporate bonds and notes | | | 0 | | | | 56,450,329 | | | | 0 | | | | 56,450,329 | |
| | | | |
Short-term investments | | | | | | | | | | | | | | | | |
| | | | |
Investment companies | | | 26,604,030 | | | | 0 | | | | 0 | | | | 26,604,030 | |
| | | | |
Total assets | | $ | 40,091,142 | | | $ | 662,394,790 | | | $ | 2,296,734 | | | $ | 704,782,666 | |
Additional sector, industry or geographic detail is included in the Portfolio of Investments.
For the six months ended October 31, 2020, the Fund had no material transfers into/out of Level 3.
4. TRANSACTIONS WITH AFFILIATES
Advisory fee
Funds Management, an indirect wholly owned subsidiary of Wells Fargo & Company (“Wells Fargo”), is the adviser to the Fund and is entitled to receive a fee at an annual rate of 0.60% of the Fund’s average daily total assets. Total assets consist of the net assets of the Fund plus borrowings or other leverage for investment purposes to the extent excluded in calculating net assets.
Funds Management has retained the services of a subadviser to provide daily portfolio management to the Fund. The fee for subadvisory services is borne by Funds Management. Wells Capital Management Incorporated, an affiliate of Funds Management and an indirect wholly owned subsidiary of Wells Fargo, is the subadviser to the Fund and is entitled to receive a fee from Funds Management at an annual rate of 0.40% of the Fund’s average daily total assets.
Administration fee
Funds Management also serves as the administrator to the Fund, providing the Fund with a wide range of administrative services necessary to the operation of the Fund. Funds Management is entitled to receive an annual administration fee from the Fund equal to 0.05% of the Fund’s average daily total assets.
Interfund transactions
The Fund may purchase or sell portfolio investment securities to certain other Wells Fargo affiliates pursuant to Rule 17a-7 under the 1940 Act and under procedures adopted by the Board of Trustees. The procedures have been designed to ensure that these interfund transactions, which do not incur broker commissions, are effected at current market prices.
5. CAPITAL SHARE TRANSACTIONS
The Fund has authorized capital of 100,000,000 shares with no par value. For the six months ended October 31, 2020 and ended April 30, 2020, the Fund did not issue any shares.
On November 22, 2019, the Fund announced an extension of its open-market share repurchase program (the “Buyback Program”). Under the Buyback Program, the Fund is authorized to repurchase up to 10% of its outstanding shares in open market transactions during the period beginning on January 1, 2020 and ending on December 31, 2020. The Fund’s Board of Trustees has delegated to Funds Management full discretion to administer the Buyback Program including the determination of the amount and timing of repurchases in accordance with the best interests of the Fund and subject to applicable legal limitations. During the six months ended October 31, 2020, the Fund purchased 36,730 of its shares on the open market at a total cost of $270,774 (weighted average price per share of $7.36). The weighted average discount of these repurchased shares was 13.11%.
28 ��| Wells Fargo Income Opportunities Fund
Notes to financial statements (unaudited)
6. BORROWINGS
The Fund has borrowed $194,000,000 through a revolving line of credit administered by a major financial institution (the “Facility”). The Facility, which was effective October 27, 2020, has a commitment amount of up to $194,000,000. The Fund is charged interest at the 30 day London Interbank Offered Rate (LIBOR) plus 0.70% or the 1 Month LIBOR plus 0.70% and a commitment fee of 0.15% per annum of the unutilized amount of the commitment amount. The financial institution holds a security interest in all the assets of the Fund as collateral for the borrowing. Based on the nature of the terms of the Facility and comparative market rates, the carrying amount of the borrowings at October 31, 2020 approximates its fair value. If measured at fair value, the borrowings would be categorized as a Level 2 under the fair value hierarchy. Prior to October 27, 2020, the Fund had a commitment amount of $230,000,000 with interest charged at the London Interbank Offered Rate (LIBOR) plus 0.65% and a commitment fee of 0.30% of the average daily unutilized amount of the commitment which was waived if the amount drawn on the Facility was over 75% of the committed amount.
During the six months ended October 31, 2020, the Fund had average borrowings outstanding of $167,557,609 (on an annualized basis) at an average interest rate of 1.10% and paid interest in the amount of $935,718, which represents 0.37% of its average daily net assets (on an annualized basis).
7. INVESTMENT PORTFOLIO TRANSACTIONS
Purchases and sales of investments, excluding U.S. government obligations (if any) and short-term securities, for the six months ended October 31, 2020 were $184,087,791 and $165,577,098, respectively.
As of October 31, 2020, the Fund had unfunded term loan commitments of $2,224,294.
8. INDEMNIFICATION
Under the Fund’s organizational documents, the officers and Trustees have been granted certain indemnification rights against certain liabilities that may arise out of performance of their duties to the Fund. The Fund has entered into a separate agreement with each Trustee that converts indemnification rights currently existing under the Fund’s organizational documents into contractual rights that cannot be changed in the future without the consent of the Trustee. Additionally, in the normal course of business, the Fund may enter into contracts with service providers that contain a variety of indemnification clauses. The Fund’s maximum exposure under these arrangements is dependent on future claims that may be made against the Fund and, therefore, cannot be estimated.
9. NEW ACCOUNTING PRONOUNCEMENT
In August 2018, FASB issued Accounting Standards Update (“ASU”) No. 2018-13, Fair Value Measurement (Topic 820) Disclosure Framework—Changes to the Disclosure Requirements for Fair Value Measurement. ASU 2018-13 updates the disclosure requirements on fair value measurements in Topic 820, Fair Value Measurements. The amendments are effective for fiscal years, and interim periods within those fiscal years, beginning after December 15, 2019. Management has adopted this guidance which did not have a material impact on the financial statements.
10. CORONAVIRUS (COVID-19) PANDEMIC
On March 11, 2020, the World Health Organization announced that it had made the assessment that coronavirus disease 2019 (“COVID-19”) is a pandemic. The impacts of COVID-19 are adversely affecting the entire global economy, individual companies and investment products, and the market in general. There is significant uncertainty around the extent and duration of business disruptions related to COVID-19 and the impacts may be short term or may last for an extended period of time. The risk of further spreading of COVID-19 has led to significant uncertainty and volatility in the financial markets.
11. SUBSEQUENT DISTRIBUTIONS
Under the managed distribution plan, the Fund declared the following distributions to common shareholders:
| | | | | | |
| Declaration date | | Record date | | Payable date | | Per share amount |
| | | |
| October 30, 2020 | | November 13, 2020 | | December 1, 2020 | | $0.05620 |
| | | |
| November 20, 2020 | | December 14, 2020 | | January 4, 2021 | | 0.05594 |
These distributions are not reflected in the accompanying financial statements.
12. SUBSEQUENT EVENT
On November 17, 2020, the Fund announced a renewal of its Buyback Program. Under the renewed Buyback Program, the Fund may repurchase up to 10% of its outstanding shares in open market transactions during the period beginning on January 1, 2021 and ending on December 31, 2021. Funds Management, as the Fund’s adviser, will continue to administer the Buyback Program, including the determination of the amount and timing of repurchases in accordance with the best interests of the Fund and subject to applicable legal limitations.
Wells Fargo Income Opportunities Fund | 29
Other information (unaudited)
PROXY VOTING INFORMATION
A description of the policies and procedures used to determine how to vote proxies relating to portfolio securities is available, upon request, by calling 1-800-222-8222, visiting our website at wfam.com, or visiting the SEC website at sec.gov. Information regarding how the proxies related to portfolio securities were voted during the most recent 12-month period ended June 30 is available on the website at wfam.com or by visiting the SEC website at sec.gov.
ANNUAL MEETING OF SHAREHOLDERS
On August 10, 2020, an Annual Meeting of Shareholders for the Fund was held to consider the following proposal. The results of the proposal are indicated below.
Proposal 1 – Election of trustees:
| | | | | | |
| Shares voted “For” | | Isaiah Harris, Jr. | | | 41,111,567 | |
| | |
| Shares voted “Withhold” | | | | | 11,140,737 | |
| | |
| Shares voted “For” | | David F. Larcker | | | 41,069,496 | |
| | |
| Shares voted “Withhold” | | | | | 11,182,808 | |
| | |
| Shares voted “For” | | Olivia S. Mitchell | | | 41,245,270 | |
| Shares voted “Withhold” | | | | | 11,007,034 | |
QUARTERLY PORTFOLIO HOLDINGS INFORMATION
The Fund files its complete schedule of portfolio holdings with the SEC for the first and third quarters of each fiscal year as an exhibit to its reports on Form N-PORT. Shareholders may view the filed Form N-PORT by visiting the SEC website at sec.gov.
30 | Wells Fargo Income Opportunities Fund
Other information (unaudited)
BOARD OF TRUSTEES AND OFFICERS
The following table provides basic information about the Board of Trustees (the “Trustees”) and Officers of the Fund. Each of the Trustees and Officers1 listed below acts in identical capacities for each fund in the Wells Fargo family of funds, which consists of 144 mutual funds comprising the Wells Fargo Funds Trust, Wells Fargo Variable Trust, Wells Fargo Master Trust, and four closed-end funds, including the Fund (collectively the “Fund Complex”). The mailing address of each Trustee and Officer is 525 Market Street, 12th Floor, San Francisco, CA 94105. The Board of Trustees is classified into three classes of which one is elected annually. Each Trustee serves a three-year term concurrent with the class from which the Trustee is elected. Each Officer serves an indefinite term.
Independent Trustees
| | | | | | |
Name and year of birth | | Position held and
length of service | | Principal occupations during past five years or longer | | Current other
public company or
investment
company
directorships |
|
| Class I - Non-Interested Trustees to serve until 2023 Annual Meeting of Shareholders |
| | | |
| Isaiah Harris, Jr. (Born 1952) | | Trustee, since 2010; Audit Committee Chair, since 2019 | | Retired. Chairman of the Board of CIGNA Corporation since 2009, and Director since 2005. From 2003 to 2011, Director of Deluxe Corporation. Prior thereto, President and CEO of BellSouth Advertising and Publishing Corp. from 2005 to 2007, President and CEO of BellSouth Enterprises from 2004 to 2005 and President of BellSouth Consumer Services from 2000 to 2003. Emeritus member of the Iowa State University Foundation Board of Governors. Emeritus Member of the Advisory Board of Iowa State University School of Business. Advisory Board Member, Palm Harbor Academy (private school). Mr. Harris is a certified public accountant (inactive status). | | CIGNA Corporation |
| | | |
| David F. Larcker (Born 1950) | | Trustee, since 2010 | | James Irvin Miller Professor of Accounting at the Graduate School of Business (Emeritus), Stanford University, Director of the Corporate Governance Research Initiative and Senior Faculty of The Rock Center for Corporate Governance since 2006. From 2005 to 2008, Professor of Accounting at the Graduate School of Business, Stanford University. Prior thereto, Ernst & Young Professor of Accounting at The Wharton School, University of Pennsylvania from 1985 to 2005. | | N/A |
| | | |
| Olivia S. Mitchell (Born 1953) | | Trustee, since 2010; Nominating and Governance Committee Chairman, since 2018 | | International Foundation of Employee Benefit Plans Professor, Wharton School of the University of Pennsylvania since 1993. Director of Wharton’s Pension Research Council and Boettner Center on Pensions & Retirement Research, and Research Associate at the National Bureau of Economic Research. Previously, Cornell University Professor from 1978 to 1993. | | N/A |
|
| Class II - Non-Interested Trustees to serve until 2021 Annual Meeting of Shareholders |
| | | |
| William R. Ebsworth (Born 1957) | | Trustee, since 2015 | | Retired. From 1984 to 2013, equities analyst, portfolio manager, research director and chief investment officer at Fidelity Management and Research Company in Boston, Tokyo, and Hong Kong, and retired in 2013 as Chief Investment Officer of Fidelity Strategic Advisers, Inc. where he led a team of investment professionals managing client assets. Prior thereto, Board member of Hong Kong Securities Clearing Co., Hong Kong Options Clearing Corp., the Thailand International Fund, Ltd., Fidelity Investments Life Insurance Company, and Empire Fidelity Investments Life Insurance Company. Audit Committee Chair and Investment Committee Chair of the Vincent Memorial Hospital Endowment (non-profit organization). Mr. Ebsworth is a CFA® charterholder. | | N/A |
Wells Fargo Income Opportunities Fund | 31
Other information (unaudited)
| | | | | | |
Name and year of birth | | Position held and
length of service | | Principal occupations during past five years or longer | | Current other
public company or
investment
company
directorships |
| | | |
| Jane A. Freeman (Born 1953) | | Trustee, since 2015; Chair Liaison, since 2018 | | Retired. From 2012 to 2014 and 1999 to 2008, Chief Financial Officer of Scientific Learning Corporation. From 2008 to 2012, Ms. Freeman provided consulting services related to strategic business projects. Prior to 1999, Portfolio Manager at Rockefeller & Co. and Scudder, Stevens & Clark. Board member of the Harding Loevner Funds from 1996 to 2014, serving as both Lead Independent Director and chair of the Audit Committee. Board member of the Russell Exchange Traded Funds Trust from 2011 to 2012 and the chair of the Audit Committee. Ms. Freeman is also an inactive Chartered Financial Analyst. | | N/A |
| | | |
| Judith M. Johnson (Born 1949) | | Trustee, since 2010 | | Retired. Prior thereto, Chief Executive Officer and Chief Investment Officer of Minneapolis Employees Retirement Fund from 1996 to 2008. Ms. Johnson is an attorney, certified public accountant and a certified managerial accountant. | | N/A |
|
| Class III - Non-Interested Trustees to serve until 2022 Annual Meeting of Shareholders |
| | | |
| Timothy J. Penny (Born 1951) | | Trustee, since 2010; Chair, since 2018 | | President and Chief Executive Officer of Southern Minnesota Initiative Foundation, a non-profit organization, since 2007. Member of the Board of Trustees of NorthStar Education Finance, Inc., a non-profit organization, since 2007. | | N/A |
| | | |
| James G. Polisson (Born 1959) | | Trustee, since 2018 | | Retired. Chief Marketing Officer, Source (ETF) UK Services, Ltd, from 2015 to 2017. From 2012 to 2015, Principal of The Polisson Group, LLC, a management consulting, corporate advisory and principal investing company. Chief Executive Officer and Managing Director at Russell Investments, Global Exchange Traded Funds from 2010 to 2012. Managing Director of Barclays Global Investors from 1998 to 2010 and Global Chief Marketing Officer for iShares and Barclays Global Investors from 2000 to 2010. Trustee of the San Francisco Mechanics’ Institute, a non-profit organization, from 2013 to 2015. Board member of the Russell Exchange Traded Fund Trust from 2011 to 2012. Director of Barclays Global Investors Holdings Deutschland GmbH from 2006 to 2009. Mr. Polisson is an attorney and has a retired status with the Massachusetts and District of Columbia Bar Associations. | | N/A |
| | | |
| Pamela Wheelock (Born 1959) | | Trustee, since January 2020; previously Trustee from January 2018 to July 2019 | | Board member of the Destination Medical Center Economic Development Agency, Rochester, Minnesota since 2019. Interim President of the McKnight Foundation from January to September 2020. Acting Commissioner, Minnesota Department of Human Services, July 2019 through September 2019. Human Services Manager (part-time), Minnesota Department of Human Services, October 2019 through December 2019. Chief Operating Officer, Twin Cities Habitat for Humanity from 2017 to 2019. Vice President of University Services, University of Minnesota from 2012 to 2016. Prior thereto, on the Board of Directors, Governance Committee and Finance Committee for the Minnesota Philanthropy Partners (Saint Paul Foundation) from 2012 to 2018, Interim Chief Executive Officer of Blue Cross Blue Shield of Minnesota from 2011 to 2012, Chairman of the Board from 2009 to 2012 and Board Director from 2003 to 2015. Vice President, Leadership and Community Engagement, Bush Foundation, Saint Paul, Minnesota (a private foundation) from 2009 to 2011. Executive Vice President and Chief Financial Officer, Minnesota Sports and Entertainment from 2004 to 2009 and Senior Vice President from 2002 to 2004. Executive Vice President of the Minnesota Wild Foundation from 2004 to 2008. Commissioner of Finance, State of Minnesota, from 1999 to 2002. Currently Board Chair of the Minnesota Wild Foundation since 2010. | | N/A |
32 | Wells Fargo Income Opportunities Fund
Other information (unaudited)
Officers
| | | | |
Name and year of birth | | Position held and
length of service | | Principal occupations during past five years or longer |
| | |
| Andrew Owen (Born 1960) | | President, since 2017 | | Executive Vice President of Wells Fargo & Company and Head of Affiliated Managers, Wells Fargo Asset Management, since 2014. In addition, Mr. Owen is currently President, Chief Executive Officer and Director of Wells Fargo Funds Management, LLC since 2017. Prior thereto, Executive Vice President responsible for marketing, investments and product development for Wells Fargo Funds Management, LLC, from 2009 to 2014. |
| | |
| Jeremy DePalma1 (Born 1974) | | Treasurer, since 2012 | | Senior Vice President of Wells Fargo Funds Management, LLC since 2009. Senior Vice President of Evergreen Investment Management Company, LLC from 2008 to 2010 and head of the Fund Reporting and Control Team within Fund Administration from 2005 to 2010. |
| | |
| Michelle Rhee (Born 1966) | | Chief Legal Officer, since 2019 | | Secretary of Wells Fargo Funds Management, LLC and Chief Legal Counsel of Wells Fargo Asset Management since 2018. Deputy General Counsel of Wells Fargo Bank, N.A. since 2020 and Assistant General Counsel of Wells Fargo Bank, N.A. from 2018 to 2020. Associate General Counsel and Managing Director of Bank of America Corporation from 2004 to 2018. |
| | |
| Catherine Kennedy (Born 1969) | | Secretary, since 2019 | | Vice President of Wells Fargo Funds Management, LLC and Senior Counsel of the Wells Fargo Legal Department since 2010. Vice President and Senior Counsel of Evergreen Investment Management Company, LLC from 1998 to 2010. |
| | |
| Michael H. Whitaker (Born 1967) | | Chief Compliance Officer, since 2016 | | Chief Compliance Officer of Wells Fargo Asset Management since 2016. Senior Vice President and Chief Compliance Officer for Fidelity Investments from 2007 to 2016. |
| 1 | Jeremy DePalma acts as Treasurer of 77 funds in the Fund Complex. |
Wells Fargo Income Opportunities Fund | 33
Other information (unaudited)
BOARD CONSIDERATION OF INVESTMENT ADVISORY AND SUB-ADVISORY AGREEMENTS:
Wells Fargo Income Opportunities Fund
Under the Investment Company Act of 1940 (the “1940 Act”), the Board of Trustees (the “Board”) of Wells Fargo Income Opportunities Fund (the “Fund”) must determine whether to approve the continuation of the Fund’s investment advisory and sub-advisory agreements. In this regard, at a Board meeting held on May 26, 2020 and May 28, 2020 (collectively, the “Meeting”), the Board, all the members of which have no direct or indirect interest in the investment advisory and sub-advisory agreements and are not “interested persons” of the Fund, as defined in the 1940 Act (the “Independent Trustees”), reviewed and approved: (i) an investment advisory agreement with Wells Fargo Funds Management, LLC (“Funds Management”); and (ii) an investment sub-advisory agreement with Wells Capital Management Incorporated (the “Sub-Adviser”), an affiliate of Funds Management. The investment advisory agreement with Funds Management and the investment sub-advisory agreement with the Sub-Adviser are collectively referred to as the “Advisory Agreements.”
At the Meeting, the Board considered the factors and reached the conclusions described below relating to the selection of Funds Management and the Sub-Adviser and the continuation of the Advisory Agreements. Prior to the Meeting, including at a Board meeting held in April 2020, the Trustees conferred extensively among themselves and with representatives of Funds Management about these matters. Also, the Board has adopted a team-based approach, with each team consisting of a sub-set of Trustees, to assist the full Board in the discharge of its duties in reviewing investment performance and other matters throughout the year. The Independent Trustees were assisted in their evaluation of the Advisory Agreements by independent legal counsel, from whom they received separate legal advice and with whom they met separately.
In providing information to the Board, Funds Management and the Sub-Adviser were guided by a detailed set of requests for information submitted to them by independent legal counsel on behalf of the Independent Trustees at the start of the Board’s annual contract renewal process earlier in 2020. In considering and approving the Advisory Agreements, the Trustees considered the information they believed relevant, including but not limited to the information discussed below. The Board considered not only the specific information presented in connection with the Meeting, but also the knowledge gained over time through interaction with Funds Management and the Sub-Adviser about various topics. In this regard, the Board reviewed reports of Funds Management at each of its quarterly meetings, which included, among other things, portfolio reviews and investment performance reports. In addition, the Board and the teams mentioned above confer with portfolio managers at various times throughout the year. The Board did not identify any particular information or consideration that was all-important or controlling, and each individual Trustee may have attributed different weights to various factors.
After its deliberations, the Board unanimously approved the continuation of the Advisory Agreements and determined that the compensation payable to Funds Management and the Sub-Adviser is reasonable. The Board considered the continuation of the Advisory Agreements for the Fund as part of its consideration of agreements for funds across the complex, but its approvals were made on a fund-by-fund basis. The following summarizes a number of important, but not necessarily all, factors considered by the Board in support of its approvals.
Nature, extent and quality of services
The Board received and considered various information regarding the nature, extent and quality of services provided to the Fund by Funds Management and the Sub-Adviser under the Advisory Agreements. This information included, among other things, a summary of the background and experience of senior management of Wells Fargo Asset Management (“WFAM”), of which Funds Management and the Sub-Adviser are a part, and a summary of investments made in the business of WFAM. The Board also received a description of Funds Management’s and the Sub-Adviser’s business continuity plans and of their approaches to data privacy and cybersecurity, including related testing.
The Board considered the additional services provided to the Fund due to the fact that the Fund is a closed-end fund, including, but not limited to, leverage management and monitoring, evaluating, and, where appropriate, making recommendations with respect to the Fund’s trading discount, share repurchase program, managed distribution program, and distribution rates, as well as shareholder relations activities. The Board also considered the qualifications, background, tenure and responsibilities of each of the portfolio managers primarily responsible for the day-to-day portfolio management of the Fund.
The Board evaluated the ability of Funds Management and the Sub-Adviser to attract and retain qualified investment professionals, including research, advisory and supervisory personnel. The Board further considered the compliance programs and compliance records of Funds Management and the Sub-Adviser. In addition, the Board took into account the full range of services provided to the Fund by Funds Management and its affiliates.
34 | Wells Fargo Income Opportunities Fund
Other information (unaudited)
Fund investment performance and expenses
The Board considered the investment performance results for the Fund over various time periods ended December 31, 2019. The Board also considered more current results for various time periods ended March 31, 2020. The Board considered these results in comparison to the investment performance of funds in a Universe that was determined by Broadridge Inc. (“Broadridge”) to be similar to the Fund (the “Universe”), and in comparison to the Fund’s benchmark index and to other comparative data. The Board received a description of the methodology used by Broadridge to select the funds in the performance Universe. The Board noted that the investment performance of the Fund was higher than the average investment performance of the Universe for the one-, three-, five- and ten-year period ended December 31, 2019. The Board noted that the investment performance of the Fund was higher than the average investment performance of the Universe for all periods ended March 31, 2020. The Board also noted that the performance of the Fund was higher than its benchmark, the ICE BofA U.S. High Yield Index, for all periods ended December 31, 2019. The Board also noted that the performance of the Fund was lower than its benchmark, the ICE BofA U.S. High Yield Index, for the one- and three-year periods ended March 31, 2020, and higher than the benchmark index for the five- and ten-year periods ended March 31, 2020.
The Board also received and considered information regarding the Fund’s net operating expense ratio and its various components, including actual management fees, and custodian and other non-management fees. The Board considered this ratio in comparison to the median ratio of funds in an expense group that was determined by Broadridge to be similar to the Fund (the “Group”). Broadridge is an independent provider of investment company data. The Board received a description of the methodology used by Broadridge to select the funds in the expense Group and an explanation of how funds comprising expense groups and their expense ratios may vary from year-to-year. Based on the Broadridge reports, the Board noted that the net operating expense ratio of the Fund was lower than the median net operating expense ratio of the expense Group.
The Board took into account the Fund’s investment performance and expense information provided to it among the factors considered in deciding to re-approve the Advisory Agreements.
Investment advisory and sub-advisory fee rates
The Board reviewed and considered the contractual investment advisory fee rate that is payable by the Fund to Funds Management for investment advisory services (the “Advisory Agreement Rate”), both on a stand-alone basis and on a combined basis with the Fund’s contractual administration fee rate (the “Management Rate”). The Board also reviewed and considered the contractual investment sub-advisory fee rate that is payable by Funds Management to the Sub-Adviser for investment sub-advisory services (the “Sub-Advisory Agreement Rate”).
Among other information reviewed by the Board was a comparison of the Management Rate of the Fund with those of other funds in the expense Group at a common asset level. The Board noted that the Management Rate of the Fund was lower than the average rate for the Fund’s expense Group.
The Board also received and considered information about the portion of the total advisory fee that was retained by Funds Management after payment of the fee to the Sub-Adviser for sub-advisory services. In assessing the reasonableness of this amount, the Board received and evaluated information about the nature and extent of responsibilities retained and risks assumed by Funds Management and not delegated to or assumed by the Sub-Adviser, and about Funds Management’s on-going oversight services. Given the affiliation between Funds Management and the Sub-Adviser, the Board ascribed limited relevance to the allocation of the advisory fee between them.
Based on its consideration of the factors and information it deemed relevant, including those described here, the Board determined that the Advisory Agreement Rate and the Sub-Advisory Agreement Rate were reasonable.
Profitability
The Board received and considered information concerning the profitability of Funds Management, as well as the profitability of both WFAM and Wells Fargo & Co. (“Wells Fargo”) from providing services to the fund family as a whole. The Board noted that the Sub-Adviser’s profitability information with respect to providing services to the Fund and other funds in the family was subsumed in the WFAM and Wells Fargo profitability analysis.
Funds Management reported on the methodologies and estimates used in calculating profitability, including a description of the methodology used to allocate certain expenses. Among other things, the Board noted that the levels of profitability reported on a fund-by-fund basis varied widely, depending on factors such as the size, type and age of fund. Based on its review, the Board did not deem the profits reported by Funds Management, WFAM or Wells Fargo from services provided to the Fund to be at a level that would prevent it from approving the continuation of the Advisory Agreements.
Wells Fargo Income Opportunities Fund | 35
Other information (unaudited)
Economies of scale
The Board received and considered information about the potential for Funds Management to experience economies of scale in the provision of management services, the difficulties of calculating economies of scale on an individual fund level, and the extent to which potential scale benefits are shared with shareholders. The Board noted that the Fund is not engaged in a continuous offering that could help its assets grow, and that, as is typical of closed-end funds, there are no breakpoints in the Management Rate. Although the Fund would not share in any potential economies of scale through contractual breakpoints, the Board noted that Funds Management shares potential economies of scale from its management business in a variety of ways, including through fee waiver and expense reimbursement arrangements, services that benefit shareholders, competitive management fee rates set at the outset without regard to breakpoints, and investments in the business intended to enhance services available to shareholders.
The Board concluded that Funds Management’s arrangements with respect to the Fund constituted a reasonable approach to sharing potential economies of scale with the Fund and its shareholders. The Board also noted that it would have opportunities to revisit the Management Rate as part of future contract reviews.
Other benefits to Funds Management and the Sub-Adviser
The Board received and considered information regarding potential “fall-out” or ancillary benefits received by Funds Management and its affiliates, including the Sub-Adviser, as a result of their relationships with the Fund. Ancillary benefits could include, among others, benefits directly attributable to other relationships with the Fund and benefits potentially derived from an increase in Funds Management’s and the Sub-Adviser’s business as a result of their relationships with the Fund. The Board also reviewed information about soft dollar credits earned and utilized by the Sub-Adviser and commissions earned by affiliated brokers from portfolio transactions.
Based on its consideration of the factors and information it deemed relevant, including those described here, the Board did not find that any ancillary benefits received by Funds Management and its affiliates, including the Sub-Adviser, were unreasonable.
Conclusion
At the Meeting, after considering the above-described factors and based on its deliberations and its evaluation of the information described above, the Board unanimously approved the continuation of the Advisory Agreements for an additional one-year period and determined that the compensation payable to Funds Management and the Sub-Adviser is reasonable.
36 | Wells Fargo Income Opportunities Fund
Automatic dividend reinvestment plan
AUTOMATIC DIVIDEND REINVESTMENT PLAN
All common shareholders are eligible to participate in the Automatic Dividend Reinvestment Plan (“the Plan”). Pursuant to the Plan, unless a common shareholder is ineligible or elects otherwise, all cash dividends and capital gains distributions are automatically reinvested by Computershare Trust Company, N.A., as agent for shareholders in administering the Plan (“Plan Agent”), in additional common shares of the Fund. Whenever the Fund declares an ordinary income dividend or a capital gain dividend (collectively referred to as “dividends”) payable either in shares or in cash, nonparticipants in the Plan will receive cash, and participants in the Plan will receive the equivalent in common shares. The shares are acquired by the Plan Agent for the participant’s account, depending upon the circumstances described below, either (i) through receipt of additional unissued but authorized common shares from the Fund (“newly issued common shares”) or (ii) by purchase of outstanding common shares on the open-market (open-market purchases) on the NYSE Amex or elsewhere. If, on the payment date for any dividend or distribution, the net asset value per share of the common shares is equal to or less than the market price per common share plus estimated brokerage commissions (“market premium”), the Plan Agent will invest the amount of such dividend or distribution in newly issued shares on behalf of the participant. The number of newly issued common shares to be credited to the participant’s account will be determined by dividing the dollar amount of the dividend by the net asset value per share on the date the shares are issued, provided that the maximum discount from the then current market price per share on the date of issuance may not exceed 5%. If on the dividend payment date the net asset value per share is greater than the market value (“market discount”), the Plan Agent will invest the dividend amount in shares acquired on behalf of the participant in open market purchases. There will be no brokerage charges with respect to shares issued directly by the Fund as a result of dividends or capital gains distributions payable either in shares or in cash. However, each participant will pay a pro rata share of brokerage commissions incurred with respect to the Plan Agent’s open-market purchases in connection with the reinvestment of dividends. The automatic reinvestment of dividends and distributions will not relieve participants of any federal, state or local income tax that may be payable (or required to be withheld) on such dividends. All correspondence concerning the Plan should be directed to the Plan Agent at P.O. Box 505000, Louisville, Kentucky 40233 or by calling 1-800-730-6001.
Wells Fargo Income Opportunities Fund | 37
This page is intentionally left blank.
This page is intentionally left blank.
This page is intentionally left blank.

Transfer Agent, Registrar, Shareholder Servicing
Agent & Dividend Disbursing Agent
Computershare Trust Company, N.A.
P.O. Box 505000
Louisville, Kentucky 40233
1-800-730-6001
Website: wfam.com

Wells Fargo Asset Management (WFAM) is the trade name for certain investment advisory/management firms owned by Wells Fargo & Company. These firms include but are not limited to Wells Capital Management Incorporated and Wells Fargo Funds Management, LLC. Certain products managed by WFAM entities are distributed by Wells Fargo Funds Distributor, LLC (a broker-dealer and Member FINRA).
This material is for general informational and educational purposes only and is NOT intended to provide investment advice or a recommendation of any kind—including a recommendation for any specific investment, strategy, or plan.
INVESTMENT PRODUCTS: NOT FDIC INSURED ◾ NO BANK GUARANTEE ◾ MAY LOSE VALUE
© 2020 Wells Fargo & Company. All rights reserved.
PAR-1120-00564 12-20
SIO/SAR148 10-20
ITEM 2. CODE OF ETHICS
Not applicable.
ITEM 3. AUDIT COMMITTEE FINANCIAL EXPERT
Not applicable.
ITEM 4. PRINCIPAL ACCOUNTANT FEES AND SERVICES
Not applicable.
ITEM 5. AUDIT COMMITTEE OF LISTED REGISTRANTS
Not applicable.
ITEM 6. INVESTMENTS
A Portfolio of Investments for Wells Fargo Income Opportunities Fund is included as part of the report to shareholders filed under Item 1 of this Form.
ITEM 7. DISCLOSURE OF PROXY VOTING POLICIES AND PROCEDURES FOR CLOSED-END MANAGEMENT
INVESTMENT COMPANIES
Not applicable.
ITEM 8. PORTFOLIO MANAGERS OF CLOSED-END MANAGEMENT INVESTMENT COMPANIES
Not applicable.
ITEM 9. PURCHASES OF EQUITY SECURITIES BY CLOSED-END MANAGEMEENT INVESTMENT COMPANY AND AFFILIATED PURCHASERS
| | | | | | | | | | | | | | | | |
Period | | (a)
Total Number
of Shares
Purchased | | | (b)
Average
Price Paid
per Share | | | (c)
Total Number of Shares
Purchased as
Part of Publicly Announced
Plans or Programs | | | (d)
Maximum
Number of Shares
that May Yet Be Purchased
Under the Plans
or Programs | |
5/1/2020-5/31/2020 | | | 0 | | | | 0.00 | | | | 0 | | | | 6,017,847 | |
6/1/2020-6/30/2020 | | | 0 | | | | 0.00 | | | | 0 | | | | 6,017,847 | |
7/1/2020-7/31/2020 | | | 0 | | | | 0.00 | | | | 0 | | | | 6,017,847 | |
8/1/2020-8/31/2020 | | | 0 | | | | 0.00 | | | | 0 | | | | 6,017,847 | |
9/1/2020-9/30/2020 | | | 0 | | | | 0.00 | | | | 0 | | | | 6,017,847 | |
10/1/2020-10/31/2020 | | | 36,730 | | | | 7.36 | | | | 36,730 | | | | 5,981,117 | |
Total | | | 36,730 | | | | 7.36 | | | | 36,730 | | | | 5,981,117 | |
On November 22, 2019, the Fund announced an extension of its open-market share repurchase program (the “Buyback Program”). Under the extended Buyback Program, the Fund may repurchase up to 10% of its outstanding shares during the period in open market transactions beginning on January 1, 2020 and ending on December 31, 2020.
ITEM 10. SUBMISSION OF MATTERS TO A VOTE OF SECURITY HOLDERS
There have been no material changes to the procedures by which shareholders may recommend nominees to the registrant’s Board of Trustees that have been implemented since the registrant’s last provided disclosure in response to the requirements of this Item.
ITEM 11. CONTROLS AND PROCEDURES
(a) The President and Treasurer have concluded that the Wells Fargo Income Opportunities Fund disclosure controls and procedures (as defined in Rule 30a-3(c) under the Investment Company Act of 1940) provide reasonable assurances that material information relating to the registrant is made known to them by the appropriate persons, based on their evaluation of these controls and procedures as of a date within 90 days of the filing of this report.
(b) There were no significant changes in the registrant’s internal controls over financial reporting (as defined in Rule 30a-3(d) under the Investment Company Act of 1940) that occurred during the most recent fiscal half-year of the period covered by this report that materially affected, or is reasonably likely to materially affect, the registrant’s internal control over financial reporting.
SIGNATURES
Pursuant to the requirements of the Securities Exchange Act of 1934 and the Investment Company Act of 1940, the registrant has duly caused this report to be signed on its behalf by the undersigned, thereunto duly authorized.
| | |
| Wells Fargo Income Opportunities Fund |
| |
By: | | |
| | /s/ Andrew Owen |
| | Andrew Owen |
| | President |
|
Date: December 22, 2020 |
Pursuant to the requirements of the Securities Exchange Act of 1934 and the Investment Company Act of 1940, this report has been signed below by the following persons on behalf of the registrant and in the capacities and on the date indicated.
| | |
| Wells Fargo Income Opportunities Fund |
| |
By: | | |
| | /s/ Andrew Owen |
| | Andrew Owen |
| | President |
|
Date: December 22, 2020 |
| | |
By: | | |
| | /s/ Jeremy DePalma |
| | Jeremy DePalma |
| | Treasurer |
|
| Date: December 22, 2020 |