EXHIBIT 99.3

Group annual results
Provisional results for the year ended March 31, 2007
Telkom SA Limited
Building for a converged future.
13 June 2007

Cautionary statement on forward
looking statements
All of the statements included in this presentation, as well as oral statements that may be made by us or by officers, directors or employees acting on behalf of us, that are not statements of historical facts constitute or are based on forward-looking statements within the meaning of the US Private Securities Litigation Reform Act of 1995, specifically Section 27A of the US Securities Act of 1933, as amended, and Section 21E of the US Securities Exchange Act of 1934, as amended. These forward-looking statements involve a number of known and unknown risks, uncertainties and other factors that could cause our actual results and outcomes to be materially different from historical results or from any future results expressed or implied by such forward-looking statements. Among the factors that could cause our actual results or outcomes to differ materially from our expectations are those risks identified in Item 3. “Key Information-Risk Factors,” of Telkom’s most recent Annual Report on Form 20-F filed with the US Securities and Exchange Commission (SEC) and its other filings and submissions with the SEC which are available on Telkom’s website at www.telkom.co.za/ir, including, but not limited to, increased competition in the South African telecommunications markets; developments in the regulatory environment; continued mobile growth and reductions in Vodacom’s and Telkom’s net interconnect margins; Vodacom’s and Telkom’s ability to expand their operations and make investments and acquisitions in other African countries and the general economic, political, social and legal conditions in South Africa and in other countries where Vodacom and Telkom invest; our ability to attract and retain key personnel; our inability to appoint a majority of Vodacom’s directors and the consensus approval rights at Vodacom that may limit our flexibility and ability to implement our preferred strategies; Vodacom’s continued payment of dividends or distributions to us; our ability to improve and maintain our management information and other systems; our negative working capital; changes in technology and delays in the implementation of new technologies; our ability to reduce theft, vandalism, network and payphone fraud and lost revenue to non-licensed operators; our ability to improve our internal control over financial reporting; health risks related to mobile handsets, base stations and associated equipment; risks related to our control by the Government of the Republic of South Africa and major shareholders and the South African Government’s other positions in the telecommunications industry; the outcome of regulatory, legal and arbitration proceedings, including tariff approvals, and the outcome of Telkom’s proceedings with Telcordia Technologies Incorporated and others and its hearing before the Competition Commission related to the VANs litigation; our ability to negotiate favourable terms, rates and conditions for the provision of interconnection services and facilities leasing services; our ability to implement and recover the substantial capital and operational costs associated with carrier pre-selection, Number Portability and the monitoring, interception and customer registration requirements contained in the South African Regulation of Interception of Communication and Provision of Communication – Related Information Act; Telkom’s ability to comply with the South African Public Finance Management Act and South African Public Audit Act and the impact of the Municipal Property Rates Act; fluctuations in the value of the Rand; the impact of unemployment, poverty, crime and HIV infection, labour laws and exchange control restrictions in South Africa; and other matters not yet known to us or not currently considered material by us.
We caution you not to place undue reliance on these forward-looking statements. All written and oral forward-looking statements attributable to us, or persons acting on our behalf, are qualified in their entirety by these cautionary statements. Moreover, unless we are required by law to update these statements, we will not necessarily update any of these statements after the date hereof, either to conform them to actual results or to changes in our expectation.

Group highlights
Reuben September
Group overview

Financial summary
8.4% growth in Group operating revenue
to R51.6bn
38.3% Group EBITDA margin
39.6% Fixed-line EBITDA margin
excluding Telcordia
1.4% decrease in Group operating profit
to R14.5bn
20.9% growth in mobile revenue to
R41.1bn1
22.4% growth in mobile operating profit
to R10.9bn1
Headline earnings per share decrease
1.0% to 1,710.7 cents per share
Total dividend
1,100 cents per share
up 22%
Telcordia provision US$70m (R527m)
12,089,371
shares bought back
for R1.6bn
1. 100% Vodacom (50% consolidated)
Board approved
R2.4bn for share
buy-backs in
2007/2008
Operational highlights
Annuity revenue
13.5%
R5,137.1m
to
VPN & MPN services
27.2%
R340.9m
to
Managed data sites
29.6%
21,879
to
ADSL services
78.1%
255,633
to
Mobile leased lines
29.3%
60,000
to
Bundled packages
149.5%
R634.6m
to
Total mobile customers
28.2%
30.2m
to
Defensive strategies delivering results
Corporate market responding well to value added data services
Mobile growth remains strong

Operational highlights (continued)
82% of network with ADSL and WiMAX coverage
60% of local loop under 2.5km
250% growth on sales of ‘term and volume’ contracts
288,881 Closer Plan subscriptions – 18% penetration of consumer lines
88.7% increase in fibre optic network from 6.7m to 12.7m loop km
Acquisitions – Africa Online & Multi-Links
Swiftnet BEE transaction concluded – awaiting ICASA approval
Consumer demand remains strong
Telkom driving hard to build out network, products and services

Growth profile
Data
Mobile
Geographic
Employee engagement
Customer centricity
NGN deployment
Stakeholder management
Cost management
Acquisition growth
Capitalising on convergence
& mobility
Roll-out of key enablers progressing well
Strategic pillars - key enablers
for revenue growth and
retention

Group growth initiatives
Accelerating data growth – ADSL, VPN, MPN & Mobile leased lines
IT – Managed hosting environments
Driving Broadband penetration
Convergence – expanding into the application layer by integrating
fixed-line and mobile
Establish and grow Telkom Media – key convergence enabler
Increasing capacity and speed on the network
Evolving into a Pan-African service provider
Aggressively expanding Africa Online and Multi-Links
Pricing for volume, penetration and loyalty
Defending traditional and aggressively building for the new

Mobile strategy
Reviewing mobile partnership to achieve a
fixed-mobile service provider model across
the fixed and mobile value chain
Maximise services into the growing
converged solutions market
Integrate capabilities into the managed
hosting environment
Offer Swiftnet services into the fixed-mobile
service provider model
Speed of action is imperative

Cost initiatives
Renegotiate service and equipment contracts
Focussed move to automate assurance and fulfilment
Equipment sourced directly from original equipment manufacturers
Pursue turnkey capital programmes
Improve maintenance support and licensing models
The move to NGN creates operational cost saving opportunities
Cost management remains a key focus area

Mobile business – highlights
Operating revenue1
20.9%
R41,146m
to
Total customers
20.1%
23.0m
to
ARPU2
10.7%
R125
to
EBITDA margin
0.1%
34.6%
to
Data revenue1
64.0%
R3,342m
to
Remains market leader in South Africa
Churn2
33.8%
17.7%
from
1. 100% Vodacom (50% consolidated) 2. South Africa

Group highlights
Kaushik Patel
Financial overview
Group income statement
(3.7)
19,785
20,553
EBITDA
(5.1)
8,849
9,328
Net profit
4.6
(4,731)
(4,523)
Taxation
(3.7)
1,681.0
1,746.1
Basic earnings per
share (cents)
(8.0)
(1,125)
(1,223)
Finance charges
(40.8)
235
397
Investment income
(1.4)
14,470
14,677
Operating profit
(20.0)
384
480
Other income
12.3
(37,533)
(33,428)
Operating expenses
8.4
51,619
47,625
Operating revenue
%
2007
2006
ZAR million
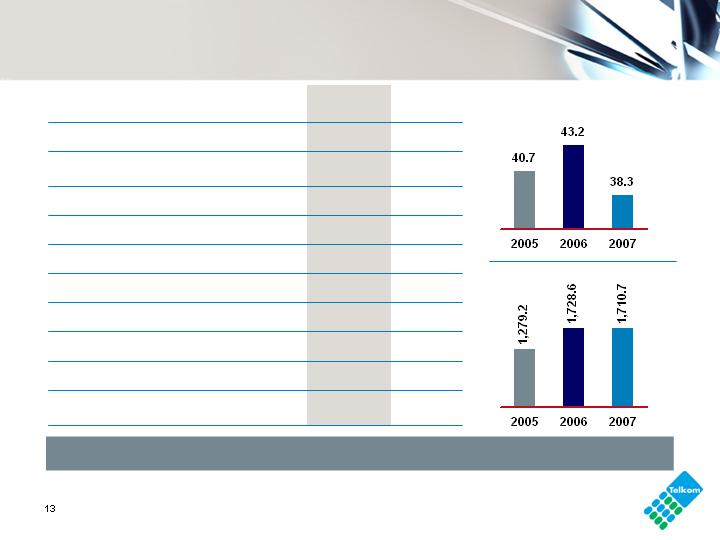
EBITDA margin
%
HEPS
Cents
Building the foundation for the future
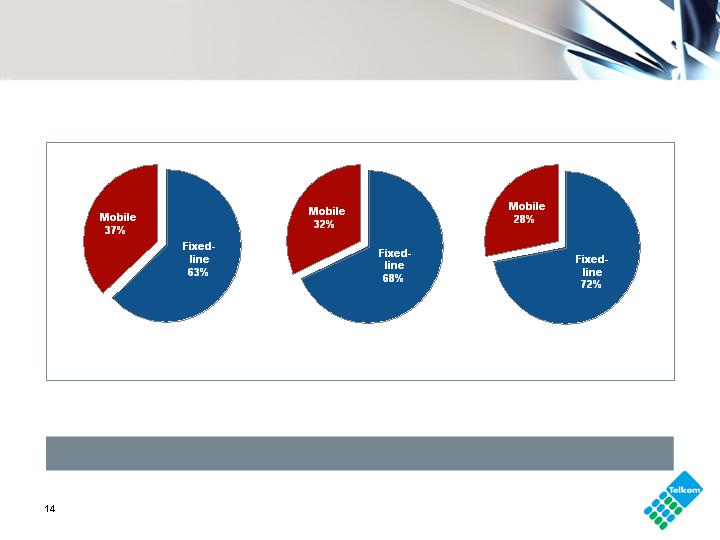
Segmental contribution
after inter-segmental eliminations
Operating revenue
Operating profit
Profit attributable to
equity holders
Fixed-line business remains the major contributor to the Group

Fixed-line revenue
Steady growth of annuity revenue and data services
ZAR million
2006
2007
(1.0%)
(4.7%)
8.3%
1.7%
6.4%
12.6%

Fixed-line traffic
Traffic revenue
Traffic volumes
ZAR millions
Millions of minutes
0.0%
(6.4%)
(13.9%)
(1.3%)
(8.8%)
8.3%
1.0%
(4.4%)
Tariff reduction, ADSL rollout and cannibalisation by bundled
products contribute to a decrease-in-traffic revenue
Fixed-line revenue (continued)
(1.0)
1,638
1,654
Interconnection revenue
(7.9)
823
894
International
7.2
815
760
Mobile
%
2007
2006
ZAR millions
21.7
1,664
1,367
Mobile leased facilities
10.2
5,820
5,282
Leased lines
%
2007
2006
ZAR millions
Interconnection
Data
Strong growth in mobile data
Regulatory changes may be beneficial to fixed-line margin
Total millions of minutes
Total
(Rm)
2.4%
12.6%

Fixed-line operating expenses
7.2%
(17.7)
3,623
4,404
Depreciation, amortisation,
impairment and write-offs
1.3
787
777
Operating leases
7.9
2,212
2,050
Services rendered
37.5
4,244
3,086
SG&A
5.1
6,463
6,150
Payments to other operators
12.3
7,268
6,470
Employee expenses
%
2007
2006
ZAR millions
Focus on service delivery, network reliability and new products and services
to satisfy and anticipate the needs of our customers
Total
(Rm)

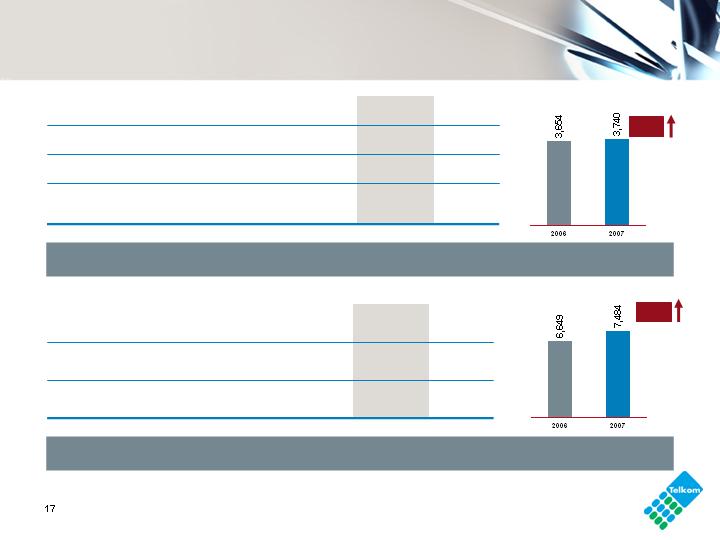
Employee expenses
12.3
(696)
(620)
Labour capitalised
(72.7)
24
88
Workforce reduction
12.7
2,715
2,410
Benefits
13.8
5,225
4,592
Salaries and wages
%
2007
2006
ZAR millions
Employee expenses: building skills and meeting sophisticated
and time dependent customer demands
12.3%
Total
(Rm)

Selling, general and administrative expenses
55.4
642
413
Marketing
(24.6)
141
187
Bad debts
78.7
1,553
869
Other (including Telcordia
provision)
18.0
1,908
1,617
Materials & Maintenance
%
2007
2006
ZAR millions
Maintaining competitive edge and marketing for competition
37.5%
Total
(Rm)

Group balance sheet
45.0
9,901
6,828
Net debt
2.8
59,146
57,544
Total equity & liabilities
18.5
18,584
15,687
Current liabilities
(31.0)
8,554
12,391
Non-current liabilities
8.6
32,008
29,466
Capital & reserves
(18.5)
10,376
12,731
Current assets
2.8
59,146
57,544
Total assets
8.8
48,770
44,813
Non-current assets
%
2007
2006
ZAR million
31% net debt to equity
23% return on assets
(%)
(%)

Majority spent on baseline expansion
Capex program frontloaded where possible
Capex/revenue ratio 20.0%
Fixed-line capex
22.1
43
36
Other
(30.2)
416
596
Sustainment
(57.5)
159
374
Revenue generation
33.2
501
376
Support
34.6
6,641
4,935
Total
1,153.3
188
15
Regulatory
5.6
1,141
1,080
Efficiencies & improvements
137.6
784
330
Network evolution
60.2
3,409
2,128
Baseline expansion
%
2007
2006
ZAR millions
Group cash flow
(302.7)
(3,976)
1,962
Net increase/(decrease) in cash
(92.8)
308
4,255
Cash at the end of the year
42.9
(10,412)
(7,286)
Investing activities
(47.5)
3,728
7,104
Free cash flow
1,031.8
(2,920)
(258)
Financing activities
(1.6)
9,356
9,506
Cash generated from operating activities
(2.1)
(4,784)
(4,884)
Dividend paid
4.0
20,520
19,724
Cash generated from operations
%
2007
2006
ZAR millions
Cash utilised to repay debt, tax and fund dividends and capex

Mobile financial highlights
Profit from operations increased by 22.5% to R10.9 billion
ZAR million
ZAR million
ZAR million
ZAR million
20.9%
25.0%
40.3%
22.5%
100% Vodacom (50% consolidated)
1. Including intangibles

Leading the South African mobile market
South African market continues to grow strongly
Thousands
Thousands
ZAR
%
20.1%
18.8%
91.0%
10.7%
1. Blended ARPU
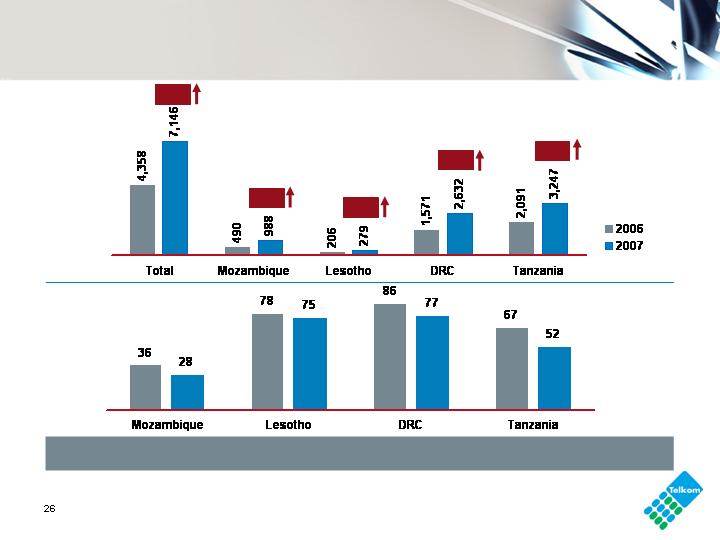
Performance in other African countries
Customers
Thousands
ARPU1
ZAR
Impressive performance from the African portfolio
64%
102%
55%
68%
35%
1. Blended ARPU

Guidance for 2007/2008
EBITDA margin between 37% and 40%
Net debt to equity of 50% to 70%
Capex/revenue 18% – 22%
Fixed-line
Group

Reuben September
Fixed-line business

Pricing strategy
Extend value
and savings
Broadband price
reduction
Rebalance
tariffs
Aligning tariffs with cost
Reduce broadband prices to remain competitive – drive
volumes and leverage our growing economies of scale
Improving the value offered by our calling plans and
bundles, especially on the entry level packages
Rebalance to
reduce arbitrage
risk
Further rebalancing to reduce arbitrage risks include
reduction in long distance and international usage fees
Reduce prices
of data services
To reduce the prices of data services – our data portfolio
pricing will decrease
Pricing for volume, penetration, loyalty and up-scaling

Pricing
% Difference between Basket Tariff change and CPI
Telkom will file an overall
price decrease of 1.2%
against an allowable basket
increase of 8.7%1 including
the carry-over
The productivity offset figure
(X-factor) is 3.5%
Telkom has reduced prices 13% effectively
1. Allowable increase = 3.5%, carry-over = 5.2%

Strong data growth
Telkom continues to offer premium data service
29.6%
7.1%
11.2%
78.1% growth in ADSL subscribers to 255,633
14.3% growth in 64 kbit/sec equivalent circuits 19,247
22.2% growth in Internet satellite subscribers to 2,420
1. Includes dialup, ADSL and satellite internet users

DSL performance
ADSL year-on-year growth
Creating niches for best in class prices
ADSL service initiatives
Introduction of ADSL Self Install Option
to improve Average-Time-To-Install
40% of new orders now done through
Self Install
Reduced ADSL Average-Time-To-Install
from 31 to 23 days on average, where
infrastructure is available
Broadband Demand Register to capture
and identify areas of growth for future build
Pre-provisioning of the network will
drastically shorten installation days

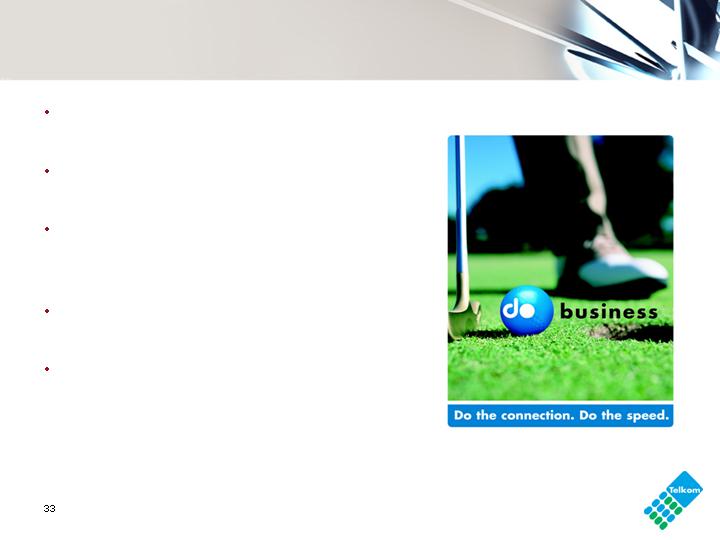
do Broadband – premium quality
Differentiating on content, quality and speed
Moving into the converged future
March 31, 2008 target – 420,000 subscribers
Bundles
2008 Target: 530,000 up 84%
Closer 1
Designed to suit your pocket at only
R120 per month
Closer 2
Unlimited calls anywhere in SA during
Callmore time limited to 1 hour per call
for R145
Closer 3
For R300 per month get all the benefits
plus cellular savings with pure per
second billing
Closer 4
For R499 per month receive all plan 3
benefits plus DSL up to 384kbps
Closer 5
For R699 per month you get all the
benefits of plan 3 bundles with DSL up to
1024kbps
2,997
0
Closer 5
288,881 base end March 2007
43,196
8,514
Internet
add on
18,973
0
Closer 4
157,957
49,950
Closer 3
105,885
11,863
Closer 2
3,069
990
Closer 1
2007
2006
Key NGN achievements
National IP Network (IPNet)
Bandwidth increased from 18.9 Gbit/s to 28.9 Gbit/s
Growth of 53%
International IP Network (IPNet)
Bandwidth increased from 1.5 Gbit/s to 2.4 Gbit/s
Growth of 60%
National Transport Network
Bandwidth increased from 1.0 Tbit/s to 1.2 Tbit/s
Growth of 20%
Local Transport Network
Bandwidth increased from 5.1 Tbit/s to 5.7 Tbit/s
Growth of 12%
Aggressively expanding capacity to cater for converged services
Key NGN achievements (continued)
Diginet and Diginet Plus Services
Bandwidth increased from 17.3 Gbit/s to 20.8 Gbit/s
Growth of 20%
ATM Network
Bandwidth increased from 80 Gbit/s to 104 Gbit/s
Growth of 30%
SAT-3/WASC was upgraded from 40 Gbit/s to 120 Gbit/s
SAFE was upgraded from 30 Gbit/s to 90 Gbit/s
International connectivity and speed is key for data growth and
the Pan African strategy
Moving legacy voice and leased line services to NGN platform
Key NGN developments
Development in progress for Voice over IP portfolio
NG Voice on IMAX
Voice over Broadband
Voice over WiMAX
Development of New Generation Diginet capability
NGD Frame based on ATM
NGD LAN based on Metro Ethernet
The PSTN is connected to NGN core via Media gateways (softswitch
operational for Voice Interconnect)

WiMAX – complementing ADSL sweet spots
Holistic wire-line and wireless approach to broadband
14 base stations commissioned
Target of 57 base stations to
be built
Internet WiMAX products
launched
Voice service planned to be
launched in the last quarter of
the 2007/2008 financial year

Telkom Media
To be Africa’s Digital Media Provider of Choice
Diversifying revenue
streams for Telkom
Becoming the
partner of choice for
the media industry
Delivering excellent
customer service
and a high quality
customer experience
Providing an
integrated, multi-
platform approach
Open access to
unaddressed pay-TV
market in emerging
middle class
Developing South
Africa’s media
economy through
content, service and
technology innovation

Telkom Media
Digital services via Internet, satellite and IPTV
TV content, video-on-demand and interactive services (portals,
music, games)
Planned basic bouquet of channels estimated to cost no more than
R100 per month
Peak funding of R7bn over 8 years
Breakeven anticipated 2013
Video On
Demand
User Generated
Content
Portal Services
Interactive
Services
Converged Services
Internet Services and Value Added Service
Portal Services (Blogging, Podcasting, Messaging)
Premium Portal (WebTV, Radio Streaming, Event Streaming, etc.)
High Speed Broadband Access

Pan-Africa strategy
Lead the expansion in Africa through
a Service Provider Strategy
Aggressively expand Africa Online
footprint into the continent
Aligned with domestic Fixed/Mobile
Service Provider Strategy
Acquisitions focussed on key
regional hubs
Fixed and Mobile voice for Africa
Global connectivity for Africa
Internet and Data services for Africa
Pay TV for Africa

Multi-Links
Acquired for USD280m in April 2007
USD1bn Capex planned over 5 years
Cashflow positive by 2010
Fixed, mobile, data subscribers:
816,000
1,500km of fibre optic cable
Management team established
Multi-Links is a PTO in Nigeria with a Unified Access License allowing
fixed, mobile, international and data services
Established key regional footprint on West Coast of Africa

Multi-Links – focus for the future
Increase revenue of fixed wireless and mobile customer through national
brand awareness and promotion campaign
To provide easy-to-understand high-value bundles, differentiated on
voice quality and service
Introduce Broadband Internet with ISP services to offer high-value bundles
Launch high quality IP NGN services to Government, Corporate and
Business customers
Deploy Metro Ethernet services in Lagos to attract high-end Corporate users
Introduce a Carrier Class wholesale product and service offering by
establishing an earth station to provide international connectivity

Africa Online
Africa Online is an Internet Service Provider based in Kenya, Tanzania,
Cote d’Ivoire, Ghana, Uganda, Namibia, Swaziland, and Zimbabwe
Key financial data
Acquired for R150m (GBP10.3m) in March 2007
Month of March 2007
Revenue R7.6m
Operating loss R394,586
Capex planned over 5 years USD10.8m
Cashflow positive by 2008/2009
Internet subscribers:160,000 at March 31, 2007
Aggressively expand ISP services in conjunction with
Telkom and Telkom Media

Africa Online – focus for the future
Investment approach focuses on
brand development
creation and development of
customer channels
market expansion
improvement of network systems
human resource development
Joint venture with Verizon in Kenya
Expanding wireless broadband (InfiNet)
in Kenya, Ghana and Tanzania
Large African footprint of ISP services provides multiple opportunities
Key regulatory issues
Impact on Telkom:
Licenses to be converted to network license and service license
Deadline July 2008
Uncertainty as to impacts of conversion
Electronics Communications Act
Telkom and Vodacom remain in consultation with the Office of Interception
Centres and DOC
RICA Act
Interconnection agreements with Neotel and major VANS concluded
Interconnection
Facilities leasing
Facilities leasing agreement concluded with Neotel
Telkom to provide shared access to the local loop to Neotel for the first 2 years
Awaiting clarity on facilities leasing to other licensees

Key regulatory issues (continued)
Unbundling of the local loop
Government expects it to be completed by 2011
Awaiting decision on:
Technical and functional regulations
Where the local loop is to be unbundled
Costing, dealing with access line deficit
Operational systems still to be developed
Outstanding matters
“Significant Market Power” analysis
Mobile termination investigations – likely to be margin enhancing for fixed-line
Possibility of asymmetrical cost based interconnection prices for
smaller operators
End of exclusivity on November 1, 2007
SAT-3

Key regulatory issues (continued)
VANS licensees may be authorised to provide services as well as
provide and operate facilities/networks
Attempt to have Infraco deemed as “holder of an individual
electronic communications network service license”
Frequency spectrum allocations
USAL licenses to merge and Provincial Under-Serviced Area
Network Operator licenses to be issued
SAT-3 monopoly to end, ICASA to prescribe all facilities connected
to cable as essential facilities
Reiterated announcement by President to provide special rate
for call centres
Minister of Communication’s budget speech 2007
Customer centricity
Sustainable profitable growth in
customer base requires creating and
strengthening capabilities focused
on managing customer relationships
and learning from acquired customer
information
Anticipating
customer needs
Revenue
Growth
Revenue
retention
Customer
satisfaction
through managing
customer
experience
Impacts
Protection of
customer base
Customer driven culture
Sense of mission,
motivation
High quality network,
innovative “solutions”
Improved Company
perception
Retention &
growth
Employee
engagement
NGN
Stakeholder
management

Roadmap for the journey
An intensive 2 year programme
Foundation 1
Foundation 2
Quick-wins and
momentum
programs
Enhancing 1 to 1
treatment
capabilities
Building the foundation of
customer centricity
Competitive
advantage
Time
36 initiatives from Phase
1 & 2 already kicked-off
Building 1 to 1 treatment capabilities
Oct 06 – Jul 07
Jan 07 – Mar 08
Aug 07 – Feb 09
Feb 08 – Mar 09

Thank you
Investor Relations:
Nicola White
Tel: +27 12 311 5720
Fax: +27 12 311 5721
E-Mail: whitenh@telkom.co.za
Building for a converged future.