EXHIBIT 99.5
Operational highlights
Alan Knott-Craig
Chief Executive Officer

Group highlights
For the year ended March 31, 2007 vs. prior year
Total customers (SIM cards)
30.2 million
28.2%
High gross connections: increase of 31.5% year on year to 15.6 million
Revenue
R41.1 billion
20.9%
Profit from operations
R10.9 billion
22.5%
EBITDA
R14.2 billion
20.5%
Net profit after tax
R6.6 billion
27.6%
Dividends
R5.4 billion
20.0%

South Africa
10.9 million
Gross connections
33.8%
Churn %
84%
Estimated mobile
penetration %
R10.3 billion
Profit from operations
23.0 million
Total customers
2007
20.1%
18.8%
13 pts
19.7%
16.1 pts
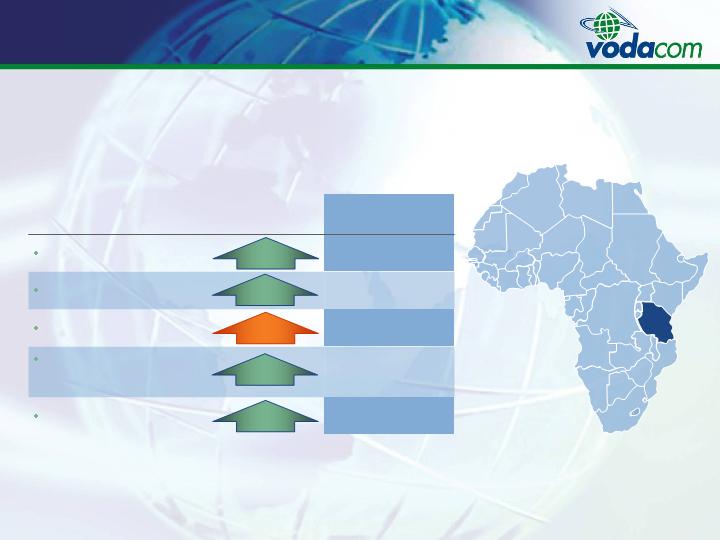
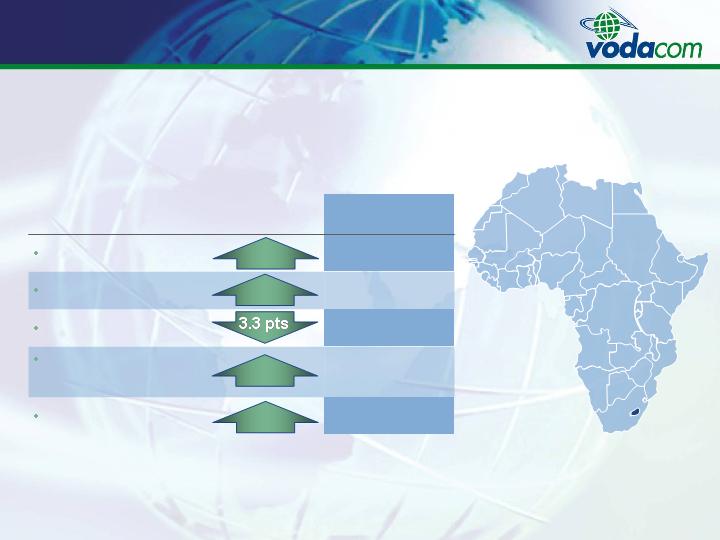
Tanzania
2.1 million
Gross connections
35.6%
Churn %
16%
Estimated mobile
penetration %
R346 million
Profit from operations
3.2 million
Total customers
2007
55.3%
54.6%
7 pts
31.6%
7.1 pts

Democratic Republic of Congo (DRC)
1.7 million
Gross connections
30.4%
Churn %
9%
Estimated mobile
penetration %
R277 million
Profit from operations
2.6 million
Total customers
2007
67.5%
89.2%
3 pts
136.8%
2.3 pts
Lesotho
119 thousand
Gross connections
19.0%
Churn %
17%
Estimated mobile
penetration %
R75 million
Profit from operations
279 thousand
Total customers
2007
35.4%
21.4%
4 pts
47.1%

Mozambique
R177 million
Loss from operations
797 thousand
Gross connections
41.7%
Churn %
14%
Estimated mobile
penetration %
R154 million
Loss from operations
(excluding impairment)
988 thousand
Total customers
2007
101.6%
133.0%
6 pts
9.5 pts
22.9%

Pillars for continued growth

Loyalty programmes
Prepaid:
Yebo Millionaires
Vodacom Talking Points
Contract:
Onyx/Platinum
Credit card
South Africa
VodaMail: Free e-mail service to contract
customers
Bazza uau!: prepaid tariff rewarding customers
for receiving calls
Bazza bonus: rewarding previous day’s spend
with free airtime
60+: free SMSs for long duration calls
Mozambique

Innovative non-voice products and tariffs
Access content through
commercial arrangement
22 TV channels
Enter broadcasting /
multimedia market
Over 33 thousand Mobile
TV users
Mobile TV / DVB-H
Digital Satellite Pay TV
Personal services and
telemetry
Business customer needs:
offering full service to
corporate customers
ISP services
WiMax
VPNs
Future offerings
Over 139 thousand
3G/HSDPA users
Offer fast reliable and low
priced wireless data
product
Over 899 thousand
Vodafone live! users
Vodafone live!,
3G/HSDPA
Data revenue
Data revenue as a % of service
revenue
Tanzania launched
3G/HSDPA during the year
64%
year on
year

Expansion of distribution and support channels
Community service containers
Strong relationships with the distribution channels
Informal channels
Dual service providers
Branded franchised store points
Vodaworld cellular mall – biggest contract
connection centre
Distribution channels
Vodacare stores
Walk-in customer care centres
Dedicated data stores
IT support
Support channels
Further improve level of customer care and quality of service

Brand leadership
Voted most popular telecommunications brand and second most recognised brand
after Coca-Cola (Markinor / Sunday Times Top Brands)

Black Economic Empowerment (BEE)
Vodacom is developing a BEE transaction which will be completed towards the end of the
year, enabling employees and BEE partners to share in the success of the business
May well be one of the largest BEE equity transactions in South Africa (capped at R7.5
billion)
Being aligned with the DTI Codes of Good Practice
Implementation of the ICT Sector Code projected for end of 2007
BEE

Regulation
Reduction in mobile termination rates
Pro-actively engaged with regulator
Customer registration legislation and MNP
Affects informal distribution channel
Remains threat to industry
Government re-evaluating introduction
Vodacom pro-active in commencing registration process
MNP had no major impact as less than 1% of Vodacom customers utilised it
Contract: 4,283 (net porting in)
Prepaid: (10,301) (net porting out)
New licence regime / ECA
Will bring new players into the market
Facilitates MVNO access to market
Vodacom will be converting its licences into an electronic communications network and an electronic
communications service licence
Converting licences to new framework may be lengthy and complex
Regulation

Acquisitions
Acquired a 10% stake in iBurst through the WBS acquisition, with a further option to acquire
15.5%
In order to ensure growth within our area of focus, Vodacom made investments in
companies such as:
G-Mobile Holdings Ltd (Wi-Fi business)
Gogga Tracking Solutions (Pty) Ltd (Wi-Fi business)
Effective September 13, 2006, Vodacom Service Provider Company (Pty) Ltd acquired the
contract customer base of approximately 160 thousand from Smartcom (Pty) Ltd
Increased equity of Smartphone SP (Pty) Ltd from 51% to 70% on August 30, 2006
Acquisitions
Way forward

Way forward (continued)
Continue to seek financially viable opportunities in Africa
Seek out new associated business opportunities in South Africa
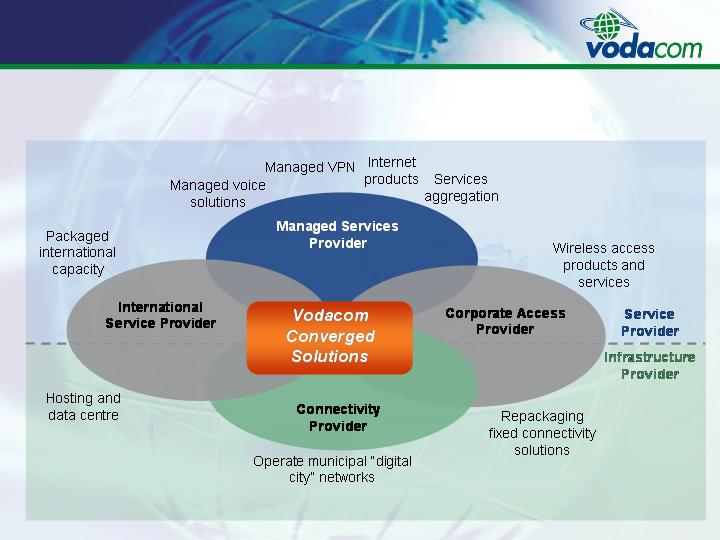
Gear up to provide total converged solutions to Corporates
Grow and consolidate current business
Focus on improving customer service and loyalty
Focus on data growth

Financial review
Leon Crouse
Chief Financial Officer

Group income statement
Extracts for the year ended March 31,
(147.9%)
(295)
(119)
(106)
Net finance (costs) / income
>200%
17
-
-
Profit on sale of investments
(143.4%)
(23)
53
(268)
Impairment
27.6%
6,560
5,143
3,888
Net profit
(24.4%)
(3,836)
(3,084)
(2,614)
Taxation
(21.1%)
(26,919)
(22,234)
(17,725)
Operating expenses excluding depreciation,
amortisation and impairment
20.5%
14,227
11,809
9,590
EBITDA
(12.2%)
(3,361)
(2,996)
(2,844)
Depreciation and amortisation
22.5%
10,860
8,866
6,478
Profit from operations
67.5%
(169)
(520)
130
IAS revaluations
26.4%
10,396
8,227
6,502
Profit before tax
20.9%
41,146
34,043
27,315
Revenue
2006
% change
2007
2005
R million
Effective tax rate 36.9% vs. 37.5% prior year

Group operational indicators
Gross connections up 31.5%
year on year to a record high of
15.6 million
Customers up 28.2% year on
year to 30.2 million
Total traffic in South Africa
increased by 19.4% year on
year to 20.4 billion minutes
Gross connections
Closing customers

ARPU by country
Declining ARPUs
SA decreased 10.1% to R125
DRC decreased 10.5% to R77
Lesotho decreased 3.8% to R75
Tanzania decreased 22.4% to R52
Mozambique decreased 22.2% to
R28
Vodacom Group consolidated
ARPU decreased 12.6% year on
year from R127 to R111
ARPU per month

South Africa ARPU
Contract ARPU decreased
9.6% year on year to R517
Prepaid ARPU decreased
8.7% year on year to R63
Total ARPU decreased
10.1% year on year to R125
Lower incoming revenue per customer
Lower average usage
Customer mix
South Africa ARPU per month

Group revenue
By country
43.5%
1,914
1,334
1,075
DRC
19.1%
37,007
31,069
25,041
South Africa, including holding companies
20.9%
41,146
34,043
27,315
70.3%
269
158
103
Mozambique
33.5%
227
170
137
Lesotho
31.8%
1,729
1,312
959
Tanzania
2006
%
change
2007
2005
R million
Revenue driven by strong customer growth
Non-South African operations contributing 10.1% (2006: 8.7%)

Group revenue
Revenue composition
34.5%
1,306
971
887
International airtime
17.9%
4,699
3,986
2,687
Equipment sales
17.0%
7,835
6,697
5,924
Interconnection
18.0%
23,708
20,085
16,191
Airtime, connection & access
20.9%
41,146
34,043
27,315
(3.8%)
256
266
286
Other sales and services
64.0%
3,342
2,038
1,340
Data
2006
%
change
2007
2005
R million
Revenue growth, excluding equipment sales was 21.3%

Group revenue (excluding equipment sales)
By revenue type
Revenue analysis – 2007
R36,447 million (excluding equipment sales)
Revenue analysis – 2006
R30,057 million (excluding equipment sales)
Airtime contribution down 1.8% points to 65.0%
Interconnect contribution down 0.8% points to 21.5%
Data contribution up 2.4% points to 9.2% (data revenue 9.4% of service revenue)

EBITDA and margin analysis
EBITDA margin by country
EBITDA performance
Increased 20.5% year on year to R14.2 billion
EBITDA margin decreased 0.1% points year on year to
34.6%
EBITDA margin 39.9%, when excluding cellular phone
and equipment sales
South Africa EBITDA
Increased 17.3% year on year to R13.0 billion
EBITDA margin decreased 0.6% points year on year to
35.0%
EBITDA for non-South African operations
Increased 56.6% year on year to R1.2 billion
Non-South African operations contributed 8.5% of total
vs. 6.6% for the same period in the previous financial
year
Mozambique EBITDA is negative R69 million
Tanzania EBITDA margin decreased: increase in
excise duty on airtime of 40%; drought; power
rationing; inflated fuel prices
20.5%
year on
year
EBITDA

Group profit from operations
By country
136.8%
277
117
50
DRC
>200%
46
(23)
56
Holding companies
31.6%
346
263
183
Tanzania
0.4% pts
26.4%
26.0%
23.7%
Profit from operations margin (%)
22.5%
10,860
8,866
6,478
(22.9%)
(177)
(144)
(454)
Mozambique
47.1%
75
51
25
Lesotho
19.7%
10,293
8,602
6,618
South Africa
2006
%
change
2007
2005
R million
Customer growth of 28.2% to 30.2 million
Revenue growth of 20.9% vs. operating expenses growth of 20.3%

Factors affecting trends and margins
South Africa traffic mix
Outgoing traffic increased 20.1% year on
year to 13.6 billion minutes:
Outgoing fixed increased by 2.6% to 1.2 billion
Outgoing mobile increased by 22.2% 12.4 billion
Incoming traffic increased 18.1% year on
year to 6.7 billion minutes:
Incoming fixed increased by 3.0% to 2.4 billion
Incoming mobile increased by 29.1% to 4.3 billion
Mobile to mobile traffic increased by 23.9%
to 16.7 billion minutes
Mobile/fixed traffic increased by 2.9% to 3.7
billion minutes
A 20% reduction in average mobile
termination rates will reduce profit
from operations by approximately
R430 million
South Africa net interconnect
Total South Africa traffic
19.4%
year on
year
10.0%
year on
year
Productivity measures
Consolidated customers
per employee
Increased 18.2% year on year to 5,093
based on 5,920 employees
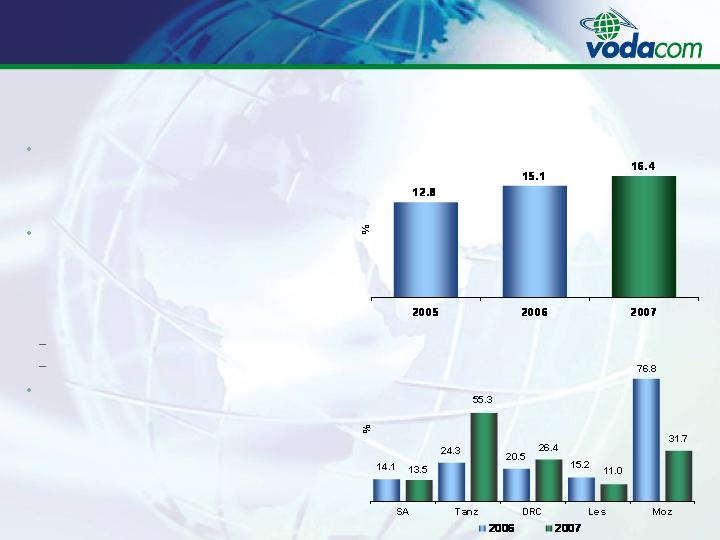
Consolidated gross capex
additions as a % of revenue
increased to 16.4% from 15.1%
for the same period in the
previous financial year
Investment in new technologies
Increased capacity for data and voice
Gross capex additions was R6.7
billion vs R5.1 billion in the
previous financial year
Gross capex additions as a % of revenue
Gross capex additions as a % of revenue

Capex additions and composition
Including software
Capex gross additions – 2007
R6,748 million
Capex gross additions – 2006
R5,138 million
South Africa capex gross additions increased by 13.9% to R5.0 billion
Non-South African capex additions increased by 113.1% to R1.6 billion

Cash generation
EBITDA increased by R2.4 billion
Cash generated from operations
increased 25.0% to R13.9 billion
Free cash flow increased
13.8% to R3.7 billion
Cash generated from operations
Free cash flow
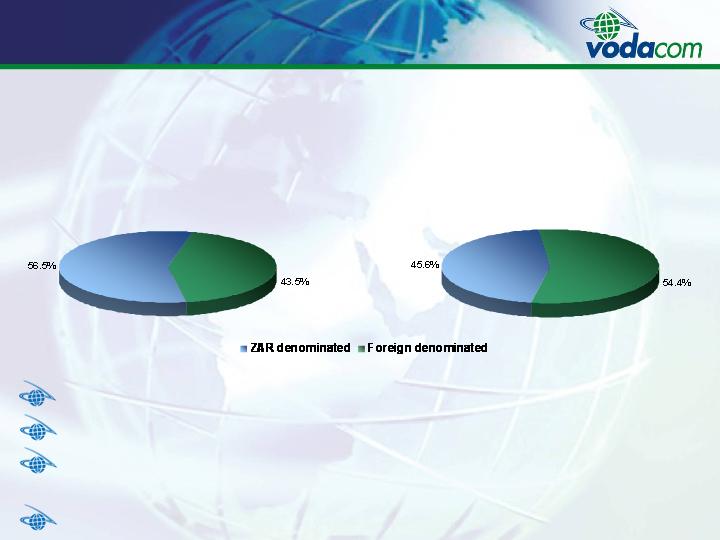
Debt composition
Gross debt composition
including bank overdrafts– 2007
R3,435 million
Gross debt composition
including bank overdrafts – 2006
R3,855 million
Net debt: R2,664 million (2006: R709 million)
Net debt to equity ratio 27.6% (2006: 8.2%)
Adjusting for dividends and STC on dividends payable: net debt to equity ratio of 72.8%
(2006: 50.5%)
Net debt to EBITDA ratio 18.7% (2006: 6.0%)
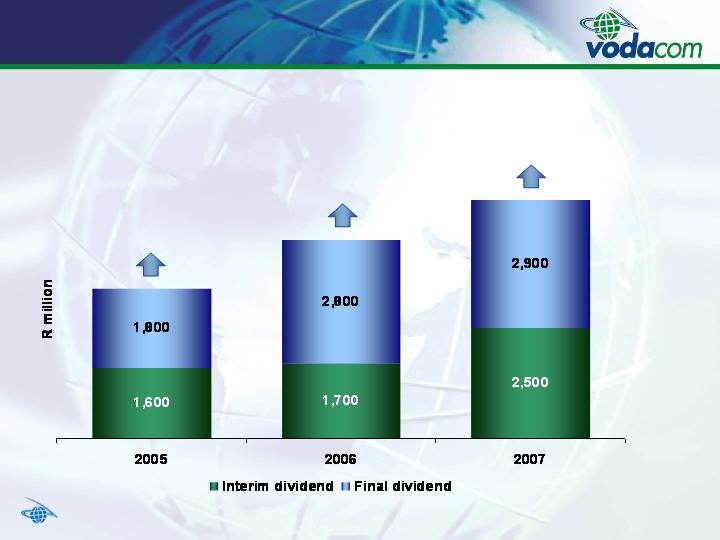
Group shareholder distributions
20.0%
year on
year
The level of future dividend payments is dependent on the extent of investment activities
32.4%
year on
year
61.9%
year on
year

Questions?

Group balance sheet
Extracts at March 31,
8.3%
15,011
13,860
11,474
Current liabilities
14.9%
28,470
24,768
22,595
Total equity and liabilities
70.5%
3,812
2,236
3,233
Non-current liabilities
11.2%
9,647
8,672
7,888
EQUITY AND LIABILITIES
Capital and reserves
14.9%
28,470
24,768
22,595
Total assets
(12.2%)
7,626
8,689
8,706
Current assets
29.6%
20,844
16,079
13,889
ASSETS
Non-current assets
2006
%
change
2007
2005
R million

Group cash flow statement
Extracts for the year ended March 31,
(106.1%)
(108)
1,760
2,173
Cash and cash equivalents at the
end of the year
>200%
58
(16)
(6)
Effect of foreign exchange rate changes
(19.0%)
1,760
2,173
1,598
Cash and cash equivalents at the
beginning of the year
(>200%)
(1,926)
(397)
581
Net increase in cash and cash
equivalents
(86.9%)
(200)
(107)
(195)
Net cash flows utilised in
financing activities
(37.4%)
(6,584)
(4,791)
(3,374)
Net cash flows utilised in investing
activities
7.9%
4,858
4,501
4,150
Net cash flows from operating activities
25.0%
13,866
11,090
10,012
Cash generated from operations
2006
%
change
2007
2005
R million

Disclaimer
This presentation has been prepared and published by Vodacom Group (Proprietary) Limited.
Vodacom Group (Proprietary) Limited is a private company and as such is not required by the
Companies Act 61 of 1973, as amended, to publish its results.
Vodacom Group (Proprietary) Limited makes no guarantee, assurance, representation and/or
warranty as to the accuracy of the information contained in this presentation and will not be
held liable for any reliance placed on the information contained in this presentation.
The information contained in this presentation is subject to change without notice and may be
incomplete or condensed. In addition, this presentation may not contain all material
information pertaining to Vodacom Group (Proprietary) Limited and its subsidiaries.
Without in any way derogating from the generality of the foregoing, it should be noted that:
Many of the statements included in this presentation are forward-looking statements that involve risks and/or uncertainties and caution must be exercised in placing any reliance on these statements. Moreover, Vodacom Group (Proprietary) Limited will not necessarily update any of these statements after the date of this presentation either to conform them to actual results or to changes in its expectations.
Insofar as the shareholders of Vodacom Group (Proprietary) Limited are listed and offer their shares publicly for sale on recognised stock exchanges locally and/or internationally, potential investors in the shares of Vodacom Group (Proprietary) Limited’s shareholders are cautioned not to place undue reliance on this presentation.

Thank you