Exhibit 99.3

Group interim results
for the six months ended September 30, 2007
Telkom SA Limited
Providing for the Bandwidth Explosion

Cautionary statement on forward looking statements
All of the statements included in this presentation, as well as oral statements that may be made by us or by officers, directors or employees acting on behalf of us, that are not statements of historical facts constitute or are based on forward-looking statements within the meaning of the US Private Securities Litigation Reform Act of 1995, specifically Section 27A of the US Securities Act of 1933, as amended, and Section 21E of the US Securities Exchange Act of 1934, as amended. These forward-looking statements involve a number of known and unknown risks, uncertainties and other factors that could cause our actual results and outcomes to be materially different from historical results or from any future results expressed or implied by such forward-looking statements. Among the factors that could cause our actual results or outcomes to differ materially from our expectations are those risks identified in Item 3. “Key Information-Risk Factors,” of Telkom’s most recent Annual Report on Form 20-F filed with the US Securities and Exchange Commission (SEC) and its other filings and submissions with the SEC which are available on Telkom’s website at www.telkom.co.za/ir, including, but not limited to, any changes to Telkom’s mobile strategy and its ability to successfully implement such strategy and organisational changes thereto; increased competition in the South African telecommunications markets; developments in the regulatory environment; continued mobile growth and reductions in Vodacom’s and Telkom’s net interconnect margins; Vodacom’s and Telkom’s ability to expand their operations and make investments and acquisitions in other African countries and the general economic, political, social and legal conditions in South Africa and in other countries where Vodacom and Telkom invest; our ability to attract and retain key personnel; our inability to appoint a majority of Vodacom’s directors and the consensus approval rights at Vodacom that may limit our flexibility and ability to implement our preferred strategies; Vodacom’s continued payment of dividends or distributions to us; our ability to improve and maintain our management information and other systems; our negative working capital; changes in technology and delays in the implementation of new technologies; our ability to reduce theft, vandalism, network and payphone fraud and lost revenue to non-licensed operators; our ability to improve our internal control over financial reporting; health risks related to mobile handsets, base stations and associated equipment; risks related to our control by the Government of the Republic of South Africa and major shareholders and the South African Government’s other positions in the telecommunications industry; the outcome of regulatory, legal and arbitration proceedings, including tariff approvals, and the outcome of Telkom’s proceedings with Telcordia Technologies Incorporated and others and its hearing before the Competition Commission related to the VANs litigation; our ability to negotiate favourable terms, rates and conditions for the provision of interconnection services and facilities leasing services; our ability to implement and recover the substantial capital and operational costs associated with carrier pre-selection, Number Portability and the monitoring, interception and customer registration requirements contained in the South African Regulation of Interception of Communication and Provision of Communication – Related Information Act; Telkom’s ability to comply with the South African Public Finance Management Act and South African Public Audit Act and the impact of the Municipal Property Rates Act; fluctuations in the value of the Rand; the impact of unemployment, poverty, crime and HIV infection, labour laws and exchange control restrictions in South Africa; and other matters not yet known to us or not currently considered material by us.
We caution you not to place undue reliance on these forward-looking statements. All written and oral forward-looking statements
attributable to us, or persons acting on our behalf, are qualified in their entirety by these cautionary statements. Moreover, unless we are
required by law to update these statements, we will not necessarily update any of these statements after the date hereof, either to
conform them to actual results or to changes in our expectation.

Reuben September
Group Overview

Strategy
Core Strategy -
Defend & Grow
Revenues
Defend Revenues
Increase annuity revenues
Drive to increase
subscription revenues
Long term contracts
Rebalance tariffs
To align with cost structures
to combat arbitrage
Build retention through
bundling
Offer attractive value
propositions
Grow Revenues
Fixed/ Mobile
Geographic
Data
Fixed/Mobile Platform:
Become an Integrated Service
Provider across the Fixed and
Mobile value chain
Position entity as a competitive
convergence solutions provider
Geographic Reach
Expand into Africa through the
Integrated Service Provider
Strategy
Converged Services (Voice, Data,
Video & Internet)
Expand aggressively into
managed voice, managed data
and applications

Enabling strategies
NGN deployment
Product innovation through convergence and mobility
Competitive pricing models
Cost management
Stakeholder engagement
Customer centricity
Employee engagement
Acquisitive growth
Effective organisational structures
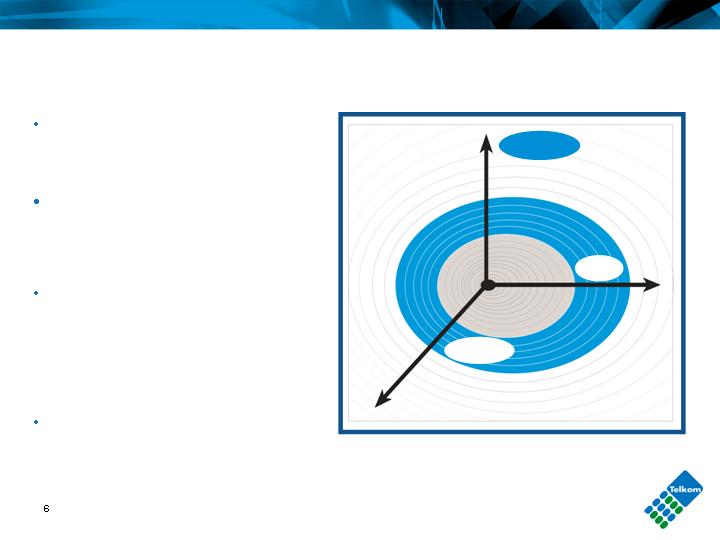
Protecting our EBITDA margin is vital

Fixed / Mobile growth
Improved
strength as an ICT
company
International
footprint for
enterprise
customers
Own the digital
home
Accelerated growth
Become an Integrated Service Provider across the fixed and
mobile value chain
Position entity as a competitive convergence solutions provider
Enable increased penetration in under serviced areas
Decrease cost of providing services in sparsely populated areas
Mobile strategy review in progress
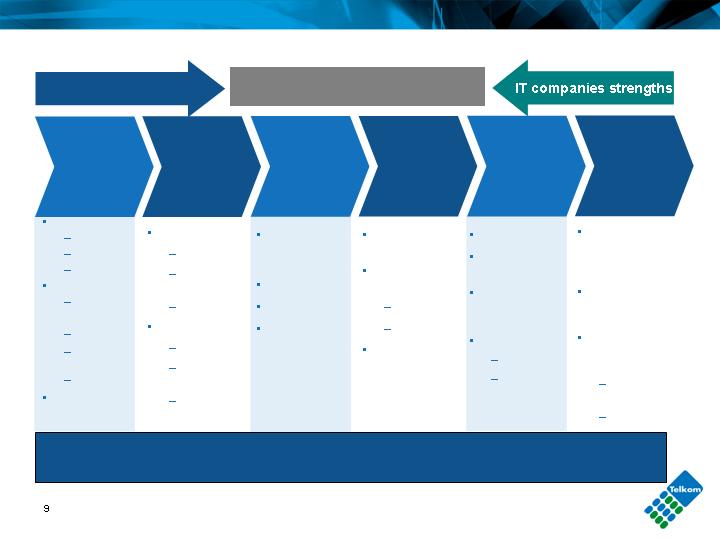
Converged Services and Data growth
Connectivity
Managed
networks
Data centre
outsourcing
Desktop
support
Application
Services
Business
process
services
Telcos strengths
Commoditising IT infrastructure
Access
Diginet
DSL
VSAT
Transport
Circuit-
switched
ATM
Frame
relay
IP
Internet
access
provisioning
WAN/VPN
installation
monitoring
& support
security
LAN
installation
monitoring
& support
security
Server &
applications
hosting
Web-hosting
Data storage
Disaster
recovery
Desktop
installation
Desktop
management
upgrades
repairs
End-user
support
IT consulting
Systems
integration
Custom
software
development
ASP
eComm
billing &
payments
Business
process
consulting &
engineering
Business
applications
development
Business
process
outsourcing
Transaction
processing
Call centres
Pursuing international IT capabilities

Geographic growth
Goal is to cover major cities in Africa
Expand international connectivity of major cities through hub and cluster
strategy
Focus on data connectivity
Dual fixed/ wireless licenses
Expansion of Africa Online ISP services from 9 to 15 Africa countries
Pan African service provider strategy
Global footprint for SA multi-nationals
Hosting and managed solutions
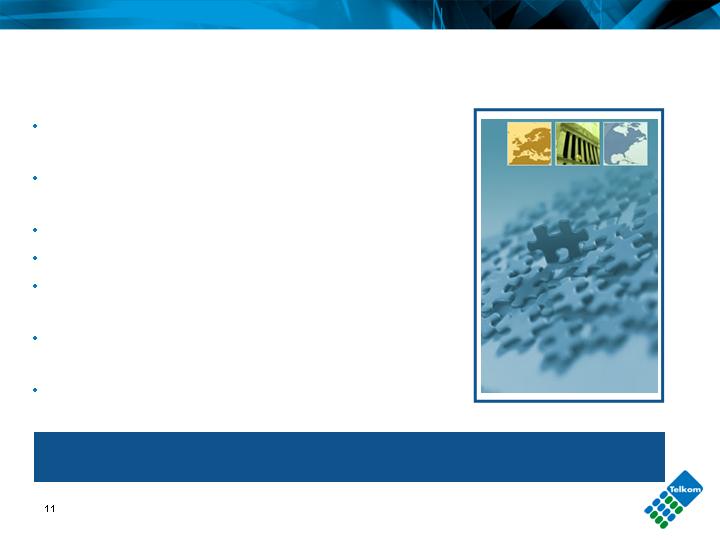
Key Criteria For Optimal Geographic Reach
Financial criteria
Core geographical
areas
Core business areas
Management restructuring
The new EXCO structure has been designed to:
Create specialised focus areas to service
customer segments
Ensure a coherent Group approach to marketing,
pricing and product and services development
Enhance effective and efficient resource utilisation
Increase the coherence and speed of deployment
Create a unified view of software and systems
technology
Allow smoother integration of resource deployment
to Telkom’s subsidiaries
Better serve multi-national and wholesale
customers
Enhancing effectiveness

Financial summary
8.3% growth in Group operating revenue to R27.2bn
37.5% Group EBITDA margin
4.8% decrease in Group operating profit to R7.3bn
15.1% decrease in Group headline earnings per share to
742.3 cents per share
38.2% f ixed-line EBITDA margin
33.3% mobile EBITDA margin
Aggressive retention and loyalty drive

Deon Fredericks
Financial overview

Group income statement
HEPS
Cents
EBITDA margin
%
(16.6)
724.3
868.1
Basis earnings per
share (cents)
(17.1)
3,793
4,574
Net profit
(5.8)
(2,678)
(2,844)
Taxation
122.4
(972)
(437)
Finance charges
(0.1)
10,214
10,225
EBITDA
(23.5)
130
170
Investment income
(4.8)
7,313
7,685
Operating profit
13.8
(20,118)
(17,675)
Operating expenses
(4.2)
204
213
Other income
8.3
27,227
25,147
Operating revenue
%
Sep 07
Sep 06
ZAR million
Six months ended
Building the foundation for the future
Group balance sheet
60% net debt to equity
9% return on assets
(%)
(%)
Balance sheet remains strong
50.9
17,732
11,751
Net debt
14.9
63,595
55,351
Total equity & liabilities
59.1
24,182
15,203
Current liabilities
(19.0)
9,838
12,148
Non-current liabilities
5.6
29,575
28,000
Capital & reserves
14.9
63,595
55,351
Total assets
9.7
11,311
10,309
Current assets
16.1
52,284
45,042
Non-current assets
%
Sep 07
Sep 06
ZAR million
Six months ended
Group cash flow
Six months ended
(56.0)
(1,825)
(4,147)
Net increase in cash
(1,096.7)
(1,525)
153
Cash at the end of period
71.3
(7,028)
(4,102)
Investing activities
(145.3)
(633)
1,396
Free cash flow
(653.2)
4,520
(817)
Financing activities
(11.5)
683
772
Cash generated from operating activities
20.9
(5,712)
(4,726)
Dividend paid
(8.1)
8,313
9,046
Cash generated from operations
%
Sep 07
Sep 06
ZAR millions
Capex, acquisitive growth and dividend payment reduce cash flow
Group Capital investment
Expenditure
ZAR millions
Capex to revenue
%
Fixed and mobile investment a priority for growth
6.0%

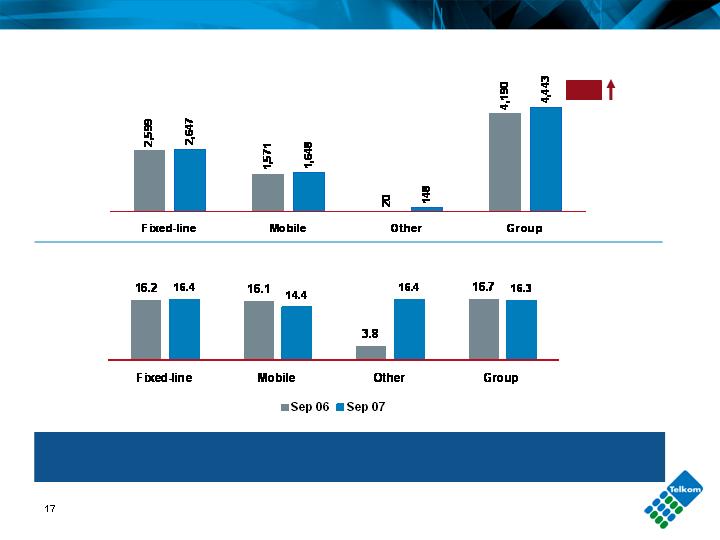
Fixed-line business remains the major contributor to the Group
Operating revenue
Operating profit
Profit attributable to
equity holders
Segmental contribution
before eliminations
Fixed-line
Mobile
Other

Fixed-line business
Deon Fredericks

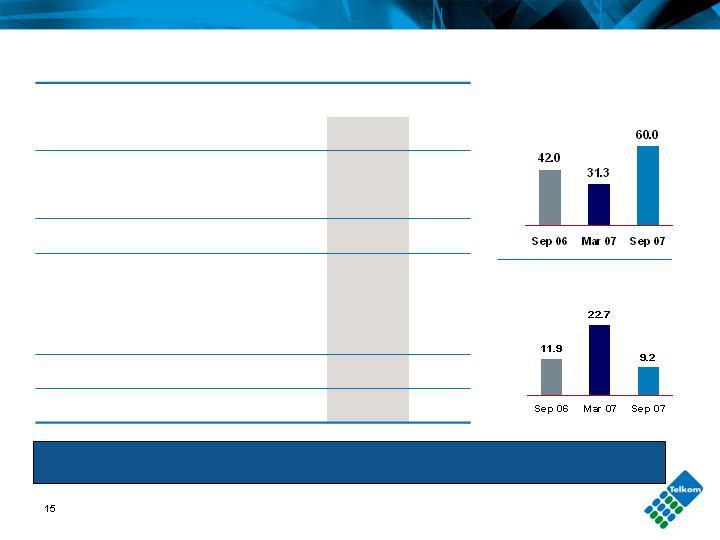
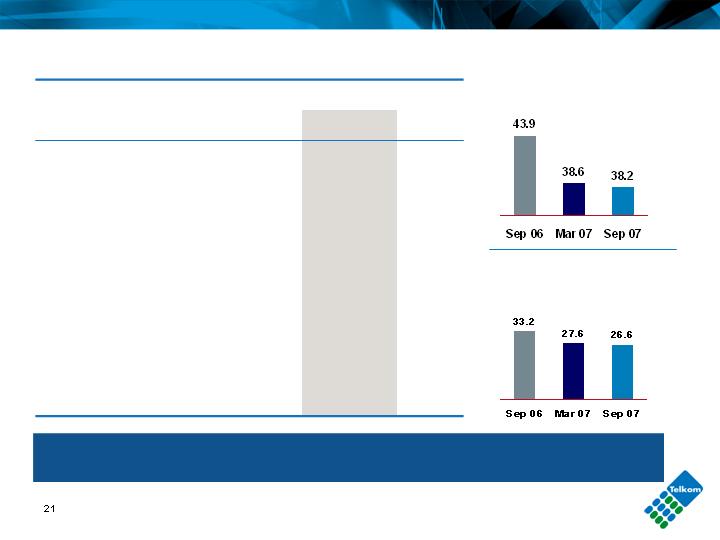
Fixed-line profitability
Six months ended
(12.5)
6,153
7,031
EBITDA
38.2
43.9
EBITDA margin (%)
26.6
33.2
Operating profit margin (%)
(19.4)
4,286
5,316
Operating profit
%
Sep 07
Sep 06
ZAR millions
EBITDA margin
%
Operating profit margin
%
(13.0%)
(19.9%)
Fixed-line income statement
Operating profit margin
%
Vodacom dividend declared after September 2007
EBITDA margin
%
(46.6)
2,623
4,909
Net profit
(1.8)
(1,798)
(1,831)
Taxation
65.3
(702)
(426)
Finance charges
(12.5)
6,153
7,031
EBITDA
(54.6)
839
1,850
Investment income
(19.4)
4,286
5,316
Operating profit
6.6
(12,011)
(11,272)
Operating expenses
(66.4)
189
563
Other income
0.5
16,108
16,025
Operating revenue
%
Sep 07
Sep 06
ZAR million
Six months ended

(R1,030 million)
Fixed-line operating profit drivers
ZAR million
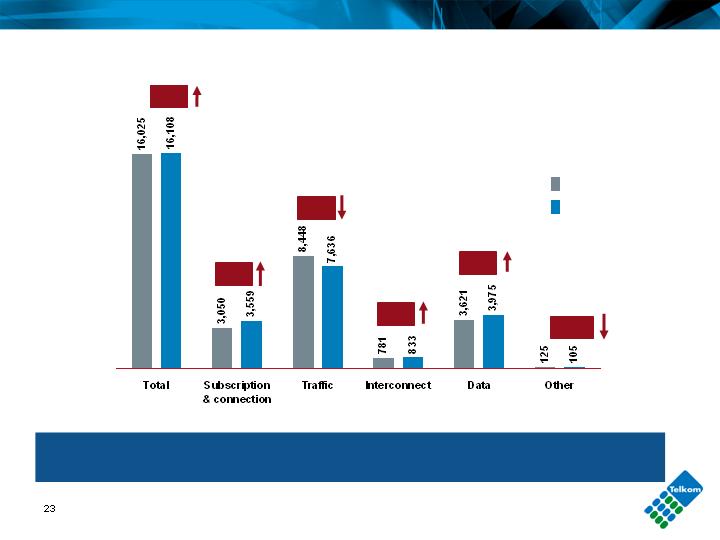
Fixed-line revenue
Competition and aggressive price reductions leading to revenue
pressure
ZAR million
Sep 06
Sep 07
6.7%
(9.6%)
16.7%
0.5%
(16.0%)
9.8%

Fixed-line traffic
Traffic revenue
Traffic volumes
ZAR millions
Millions of minutes
0.2%
(22.3%)
(14.9%)
1.0%
(17.8%)
15.1%
3.9%
Competition and term & volume discount plans affecting volume
& revenue
2.2%
Annuity revenue
9.1
12
11
International other
Six months ended
14.6
3,340
2,914
Total annuity revenue
7.8
165
153
Value added services
21.1
373
308
CPE rental
78.5
441
247
Calling Plans / packages
7.0
2,349
2,195
Line Rental
%
Sep 07
Sep 06
Annuity revenue
Annuity revenue includes all subscription revenue. It does not include usage or traffic
related revenue from calling plans/bundles, line installations, reconnection fees and
CPE sales
Recurring revenue continues to grow

Fixed-line operating expenses
6.6%
Six months ended
8.9
1,867
1,715
Depreciation, amortisation,
impairment and write-offs
(9.9)
337
374
Operating leases
10.9
1,186
1,069
Services rendered
23.7
1,845
1,491
SG&A
8.6
3,362
3,097
Payments to other operators
(3.2)
3,414
3,526
Employee expenses
%
Sep 07
Sep 06
ZAR millions
Focus on customer service and network reliability
Total
(Rm)

Fixed-line Employee expenses
(78.6)
3
14
Other
Six months ended
18.0
(381)
(323)
Labour capitalised
(25.7)
1,022
1,375
Benefits
12.6
2,770
2,460
Salaries and wages
%
Sep 07
Sep 06
ZAR millions
Skills mix drives growth in salary expenses
(3.2%)
Total
(Rm)
Fixed-line Selling, General and Administrative expenses
23.7%
Total
(Rm)
Ensuring service reliability and product positioning
56.9
441
281
Other
43.5
89
62
Bad debts
25.5
271
216
Marketing
12.0
1,044
932
Materials & Maintenance
%
Sep 07
Sep 06
ZAR million
Six months ended
Capex to revenue ratio up to 16.4% from 16.2%
Fixed-line capex
Six months ended
64.3
23
14
Other
(34.1)
114
173
Sustainment
(93.5)
6
93
Revenue generation
(27.0)
89
122
Support
1.8
2,647
2,599
Total
(96.2)
5
130
Regulatory
(15.6)
352
417
Efficiencies & improvements
(25.3)
204
273
Network evolution
34.6
1,854
1,377
Baseline expansion
%
Sep 07
Sep 06
ZAR millions

Mobile business
Deon Fredericks

Mobile financial highlights
Investing to maintain strong revenue growth
ZAR million
ZAR million
ZAR million
ZAR million
17.2%
26.1%
4.9%
15.1%
100% Vodacom (50% consolidated)
1. Including intangibles
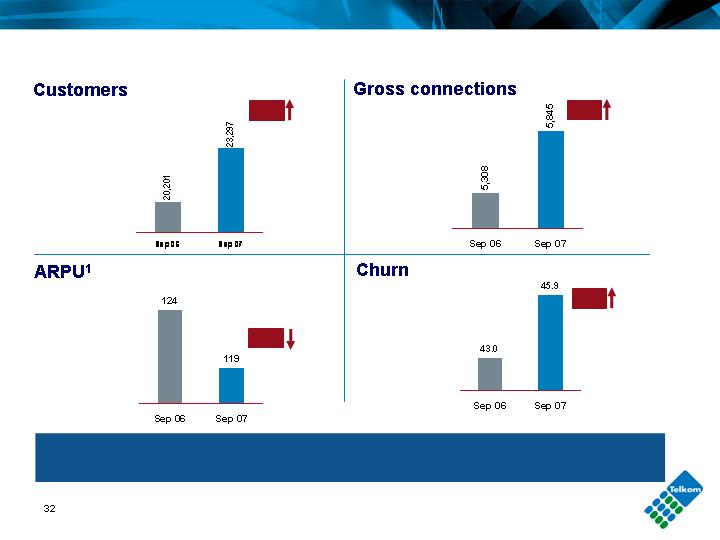
Leading the South African mobile market
New disconnection rules affect pre-paid churn
Thousands
Thousands
ZAR
%
15.3%
10.1%
(4.0%)
1. Blended ARPU
6.7%
Guidance for 2007/2008
EBITDA margin between 37% and 40%
Net debt to equity of 50% to 70%
Capex/revenue 18% – 22%
Fixed-line
Group

Reuben September
Operational Overview

2011 broadband plan
Up to 4Meg
Today
Legacy TDM network
Stand alone access, voice and Internet
value propositions
Limited content
Complex installation
Up to 10Meg
3rd Generation IP network
Integrated communication and
entertainment
Interactive IPTV and HDTV
“Better than” content strategy
Simplicity of use – plug and play
broadband in a box
2011
ADSL – 8.5% penetration of fixed
access lines
ADSL – 15-20% penetration of fixed
access lines
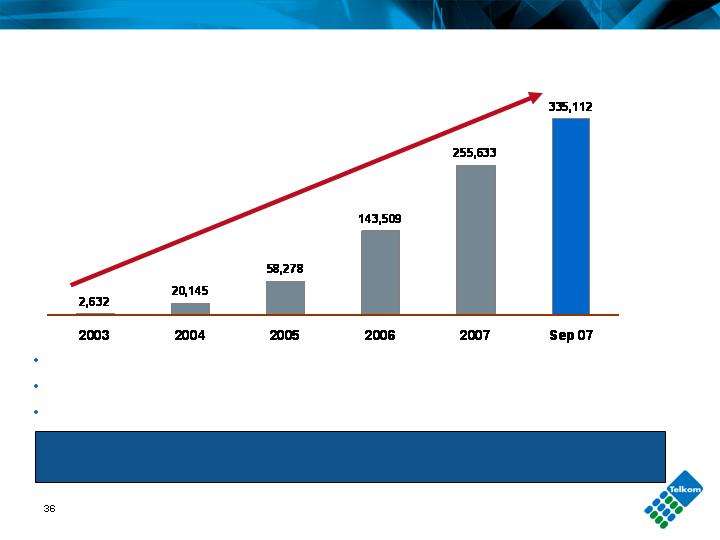
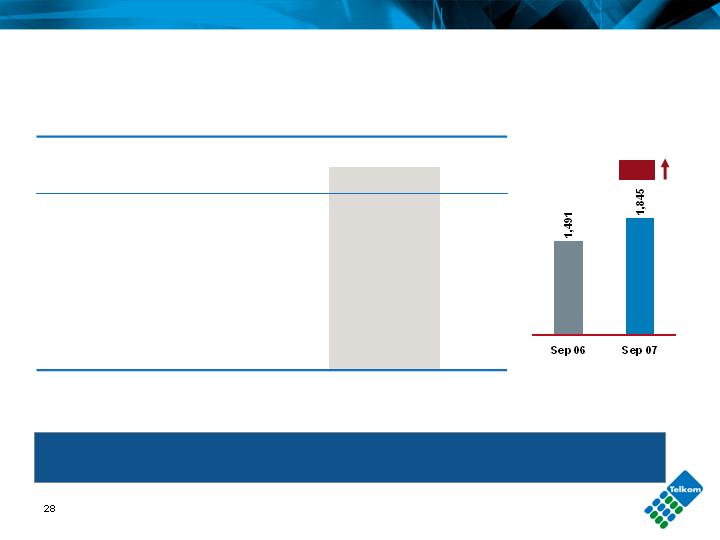
ADSL Year-On-Year Growth
Significant growth driven by Self Install Option and growth in capacity
Increased ADSL footprint to 2,501 DSLAMs
4.9% growth in 2MB services to 163,430 over six months
76.2% growth in ADSL from Sept 2006 to Sept 2007

Self install update
Self Install Option (SIO) is a key enabler of accelerated ADSL growth
The YTD performance of SIO is 59% of all installations and growth
On target to reach 420,000 by March 2008
Do Broadband
Launched May 2007
Bundled DSL access and Telkom Internet
3 bundled options
Entry level option R199 per month
Host of value added services through Do Broadband Portal
Multimedia portal – driver for ADSL growth
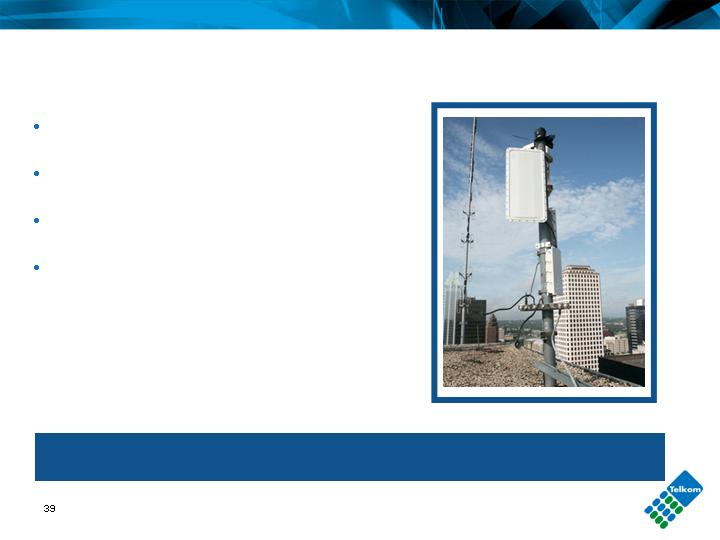
WiMAX – complementing ADSL sweet spots
Balanced approach of wire and wireless technology
Additional 71 base stations targeted
27 sites fully operational
Internet WiMAX products launched
Voice service planned to be launched
by March 2008
Data Services
(25.5)
35
47
Multimedia services
Six months ended
4.7
2,191
2,093
Data connectivity
27.0
537
423
Internet access and related services
12.0
899
803
Leased lines facilities
22.7
313
255
Managed data networks
(Satellite & VPN Services)
%
Sep 07
Sep 06
ZAR millions
Data growth remains strong
Telkom currently has 227,066 dial-up subscribers and is maintaining its 24%
market share

Bundled packages
78,780
-
Do Broadband
92.6
5,144
2,671
Closer 1
162.7
166,144
63,223
Closer 2
57.2
179,599
114,274
Closer 3
39,674
-
Closer 4
6,028
-
Closer 5
Six months ended
452.3
11,250
2,037
SupremeCall
120.1
396,589
180,168
Telkom Closer
%
Sep 07
Sep 06
Subscriber numbers
Attractive value propositions increase uptake

Capabilities of NGN
Improved customer service
experience
Self-service
Flexible billing and bandwidth usage
Diversified offerings bring
convenience, flexibility and cost
saving benefits
Improved service delivery
Automation of service delivery
Self-service tools will reduce
operational load
Converged services
Providing customers with a global
experience
Quick deployment of new products &
services
Key NGN achievements
National and Local Transport Network
Network increased by 167 nodes
Bandwidth potential to increase by 1.2 Tbit/s - 17%
93 being installed, 128 being planned for next 6 months
Bandwidth potential to increase by 2.2 Tbit/s – 47% for
the next 12 months
Diginet services bandwidth potential to increase by 86 Gbit/s
8000 2MB/s equivalent links provided to mobile operators in last
6 months
52 Metro Ethernet sites rolled out in Western Cape and Gauteng
– ready to carry traffic
Increasing bandwidth to service explosive demand
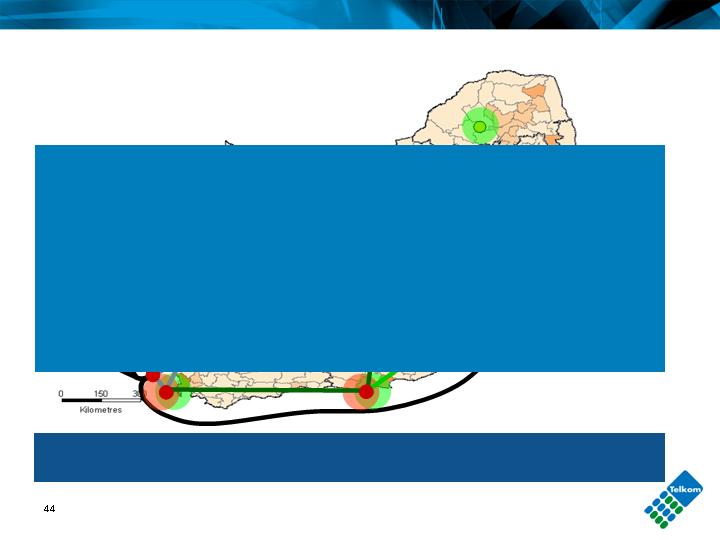
Port Elizabeth
Capetown
Polokwane
Matching core capacity to meet explosive demand
National Layer – core bandwidth
1000% increase in
bandwidth potential over
the next 2 years

Metro Layer – core bandwidth
Aligning capacity to Metro demand
1600% increase in bandwidth
potential over the next 2
years

New NGN products
Easy VPN available to wholesale customers over ADSL network
VPN Lite recently launched (retail VPN for SMMEs using Easy VPN
with advanced self help and online charging solution)
Telkom Mobility enhanced to allow access via 3G. Allows
corporate employees to access head office network by number of
technologies including ADSL, dial-up and 3G
Wholesale VoIP Interconnect – allows all operators to interconnect
to PSTN via VoIP
Network Interactive Voice Response System – advanced speech
services
Product innovation provides revenue opportunities
Customer centricity
Customer Centricity at the core
of the Corporate Strategy
Established a Customer
Centricity Office in May 2006
Overseeing this strategic
drive at enterprise level
Designing processes from a customer perspective
Formulation of a Customer Centricity Roadmap
67 initiatives aimed at building foundational customer centricity
capabilities
38 have already kicked off

Key elements of journey towards Customer Centricity
Competitive
Advantage
On target to meet our roadmap
Time
Call Center
Quick wins
1-to-1 Marketing
Call Center
Master Plan design
Customer
Profitability
Customer
Insight
Customer
Segmentation
Value and Needs Based
Customer
Data Management
Churn Analysis
Organizational
Change
Data Quality
Management
Campaign
Management
Differentiated
treatment plan for high value
Residential Customers
Customer Portfolio
Management for
Mass & Enterprise markets
Customer
Promise
Management
Customer
Strategy
Service Delivery
Dashboard
Design
Productivity
Improvement
Current position
Customer segmentation
Segment customers according to
value and needs
Understand customer equity and
break-even points
Differentiated value and service to
high-value customers
Anticipate customer needs
Easily identify value enhancers and
cross selling opportunities
Call centre master plan – designed
around customer value groups
making it easier to do business with
us
“Treat different customers differently”

Telkom Media
Granted a commercial satellite and cable subscription broadcast license
in September 2007
License to be issued after negotiations with ICASA
Targeting the under-served LSM 5 – 8 market: over 40% of SA
households
Offering element of choice and value for money
Package flexibility paving the way to greater affordability
Joining Telkom to offer full suite of converged services
Complementing Telkom’s converged services offering

Telkom Media (cont)
Funding required R7.5 billion
Telkom Board approved funding of R800 million (Capex & Opex)
Business plan and go-to-market strategy being aligned with current
market dynamics
License fees and operational expenditure to September 30, 2007
- R55 million
Commencement of service expected in 2009 financial year

Multi-Links
A private telecommunications operator in Nigeria with a Unified Access
License allowing fixed, mobile, fixed-wireless, international and data
services
Acquired in April 2007 for R1,985 million
Contribution for 5 months to September 30, 2007
Revenue - R310 million
Net profit - - R5 million
Current subscribers – 262,000
Target for March 2008 – 812,000
Current ARPU – R220 (USD 32)
Expected ARPU March 2008 below R206 (USD 30)
Centre for West African switched hubbing strategy

Multi-Links (cont.)
Aggressive roll-out of NGN infrastructure
Allows maximum efficiency and minimal network opex cost
Expected capex at March 2008 – R1.6 billion (USD 228 million)
Suite of IP Enterprise Solutions allows differentiation in Nigerian
market
Plans to launch carrier quality wholesale voice, data and internet
services through SAT3 cable

Africa Online
An Internet Services Provider with operations in Kenya, Tanzania, Cote
d’Ivoire, Ghana, Uganda, Namibia, Swaziland, Zambia and Zimbabwe
Acquired for R150m in February 2007
Contributed to September 30, 2007
Revenue - R46 million
Opex - R53 million
Net loss - R7 million
Expecting net profit by March 2009
Expected positive cash flow by March 2010
Centre for East African switched hubbing strategy

Africa Online (cont.)
Focusing on aggressive wireless broadband infrastructure roll-out
Expected capex at March 2008 – R80 million (USD 11.6 million)
Expected capex at March 2010 – R137 million (USD 20 million)
Intends to grow presence from 9 – 15 countries within 3 years
Capitalising on synergies with Telkom
Driving broadband VSAT services to corporates and multi-nationals
Has partnerships with 5 major carriers, signing up a further 10
affiliates

Providing for the
bandwidth
explosion
Conclusion

Investor Relations
Nicola White
Tel: +27 12 311 5720
Fax: +27 12 311 5721
E-Mail: whitenh@telkom.co.za