Exhibit 99.5

VODACOM GROUP (PROPRIETARY) LIMITED
INTERIM RESULTS
FOR THE SIX MONTHS ENDED SEPTEMBER 30, 2007

Operational highlights
Alan Knott-Craig
Chief Executive Officer
Group highlights
For the six months ended September 30, 2007 vs. prior year
Total customers
31.6 million
22.6%
High gross connections: increase of 19.4% year on year to 8.7 million
Revenue
R22.8 billion
17.2%
Profit from operations
R5.7 billion
15.1%
EBITDA
R7.6 billion
15.5%
Net profit after tax
R3.7 billion
17.5%
Interim dividend
(declared October 2007)
R2.75 billion
10.0%

Inactive customers – South Africa
Current rule
Call forwarding to voicemail is classified as a revenue generating activity
Disconnect inactive prepaid SIM cards after (6 + 1) months with no revenue generating activity on
the network
Supplementary rule
Disconnect inactive prepaid SIM cards after (12 + 1) months if only call forwarding to voicemail
and no other activity
Impact of supplementary rule
Disconnection of 2.9 million prepaid SIM cards in September 2007
Prepaid churn is expected to increase

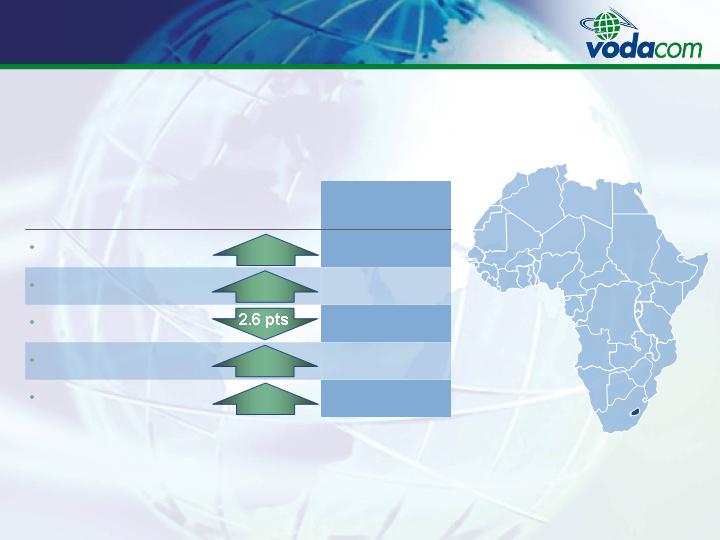
South Africa
For the six months ended September 30, 2007 vs. prior year
5.8 million
Gross connections
45.9%
Churn %
86.8%
Mobile penetration %
R5.4 billion
Profit from operations
23.3 million
Total customers
H1 2008
15.3%
10.1%
14.6 pts
13.6%
2.9 pts
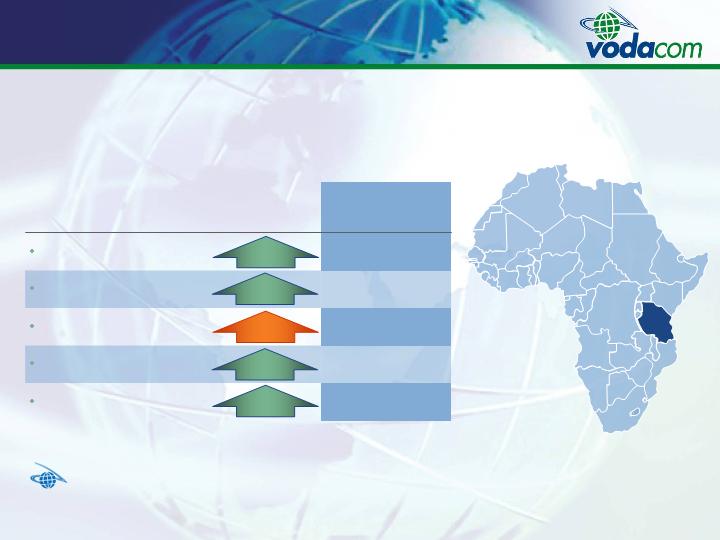
Tanzania
For the six months ended September 30, 2007 vs. prior year
1.2 million
Gross connections
46.8%
Churn %
17.3%
Mobile penetration %
R180 million
Profit from operations
3.7 million
Total customers
H1 2008
41.8%
36.6%
4.7 pts
34.3%
11.6 pts
3G has been launched in Dar es Salaam on March 1, 2007 (6,500 customers)

Democratic Republic of Congo (DRC)
For the six months ended September 30, 2007 vs. prior year
1.2 million
Gross connections
43.3%
Churn %
11.0%
Mobile penetration %
R172 million
Profit from operations
3.2 million
Total customers
H1 2008
56.8%
63.3%
4.4 pts
29.3%
13.3 pts
Lesotho
For the six months ended September 30, 2007 vs. prior year
80 thousand
Gross connections
17.9%
Churn %
22.1%
Mobile penetration %
R56 million
Profit from operations
332 thousand
Total customers
H1 2008
39.5%
45.5%
7.4 pts
64.7%

Mozambique
For the six months ended September 30, 2007 vs. prior year
R56 million
Loss from operations
391 thousand
Gross connections
57.3%
Churn %
13.7%
Mobile penetration %
R75 million
Loss from operations
(excluding impairment)
1.1 million
Total customers
H1 2008
55.5%
19.6%
3.0 pts
15.5 pts

Innovative non-voice products in South-Africa
Voted no 1 brand in telecommunication
Voted no 3 brand overall
Voted no 1 advertising company
Brand and marketing
More than 35 thousand unique Mobile TV users
26 TV channels
More than 4 thousand DSTV pay TV customers
Mobile TV / DVB-H
Changing media landscape: mobile
advertising and marketing
Mobile advertising launched on June 1, 2007
New products and services
Retail SMS 51.8% and bulk SMS 5.1% of data
revenue
Over 265 thousand data card and USB
modem users
Over 1.2 million Vodafone live! users
Vodafone live! / 3G / HSDPA
Group data revenue
Group data revenue as a % of
service revenue
45.3%
year on
year

Acquisitions of subsidiaries
On August 31, 2007 the Group increased its interest in the equity of Smartphone
SP (Proprietary) Limited from 70% to 100%
On September 1, 2007 the Group increased its interest in the equity of Smartcom
(Proprietary) Limited from 88% to 100%

Vodacom BEE equity transaction
Our envisaged BEE transaction has been impacted by pending shareholder
activity for the past four months
We are now pleased to announce that the Vodacom Group Board has given the
go ahead to proceed with the envisaged BEE equity transaction of R7.5 billion

Regulatory
Regulatory environment affecting the future potential earnings of the company:
Convergence Bill
Interconnect and wholesale rate regulations / mobile termination rates
Customer registrations (RICA)
EASSY cable delayed due to uncertainty as to landing rights

Current affairs
Vodacom Converged Solutions in place
Converged network services; managed hosting services; mobile and application services
Integrated into Vodacom South Africa
WiMax launch due early next year
Self provisioning of fiber rings underway. As at end October 2007, 15 km
completed and as at November 15, 2007, 23 km completed
Yebo radio launched on November 3, 2007. Destined for distribution channel, staff
and streaming to handsets
Earth station for international traffic completed in Midrand
Acquisitions for latest expansions underway

Financial review
Leon Crouse
Chief Financial Officer
Group income statement
For the six months ended September 30
n/a
(445)
4
(383)
Net finance (costs) / income
n/a
18
(38)
68
Impairment
17.5%
3,658
3,114
2,387
Net profit
13.2%
(1,611)
(1,855)
(1,455)
Taxation
(18.1%)
(15,215)
(12,888)
(10,612)
Operating expenses excluding depreciation,
amortisation and impairment
15.5%
7,600
6,578
5,563
EBITDA
(20.9%)
(1,904)
(1,575)
(1,406)
Depreciation and amortisation
15.1%
5,714
4,965
4,225
Profit from operations
6.0%
5,269
4,969
3,842
Profit before tax
17.2%
22,815
19,466
16,175
Revenue
H1 2007
%
change
H1 2008
H1 2006
R million
Effective tax rate 30.6% vs. 37.3% prior year, due to interim dividend declared in
October 2007

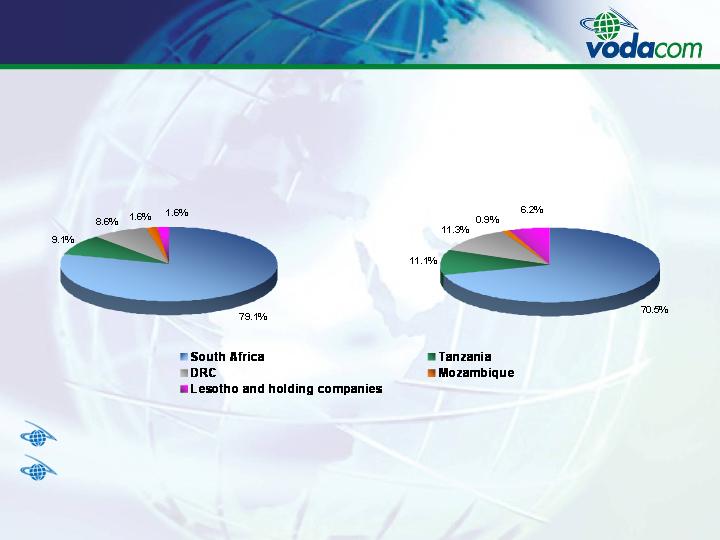
Group revenue
By country
23.4%
1,108
898
649
DRC
15.5%
20,299
17,580
14,764
South Africa, including holding companies
17.2%
22,815
19,466
16,175
69.4%
183
108
74
Mozambique
32.4%
139
105
77
Lesotho
40.1%
1,086
775
611
Tanzania
H1 2007
%
change
H1 2008
H1 2006
R million
Revenue driven by strong customer growth
Non-South African operations contributing 11.0% (H1 2007: 9.7%)
Group revenue
Composition
71.5%
952
555
485
International airtime
3.5%
2,393
2,312
1,910
Equipment sales
15.6%
4,304
3,723
3,186
Interconnection
14.4%
12,947
11,313
9,581
Airtime, connection & access
17.2%
22,815
19,466
16,175
2.5%
123
120
120
Other sales and services
45.3%
2,096
1,443
893
Data
H1 2007
%
change
H1 2008
H1 2006
R million
Revenue growth, excluding equipment sales was 19.1% (H1 2007: 20.3%)
Group revenue (excluding equipment sales)
By revenue type
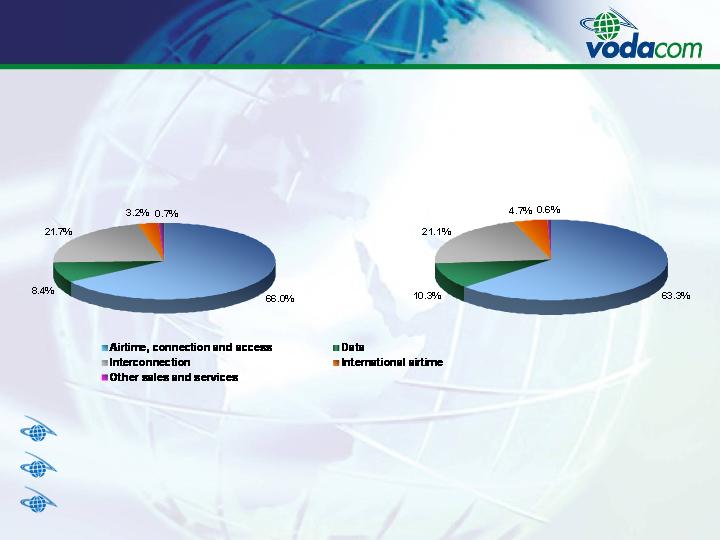
Revenue analysis – H1 2008
R20,422 million (excluding equipment sales)
Revenue analysis – H1 2007
R17,154 million (excluding equipment sales)
Airtime contribution down 2.7% points to 63.3%
Interconnect contribution down 0.6% points to 21.1%
Data contribution up 1.9% points to 10.3%

Group operational indicators
Gross connections up
19.4% year on year to a high of
8.7 million
Customers up 22.6% year on
year to 31.6 million
Total traffic in South Africa
increased by 14.0% year on
year to 11.0 billion minutes vs.
customer growth of 15.3%
Gross connections
Closing customers

Factors affecting trends and margins
South Africa traffic mix
Outgoing traffic increased 14.2% year on
year to 7.4 billion minutes:
Outgoing fixed increased by 3.8% to 624 million
Outgoing mobile increased by 15.3% to 6.8 billion
Incoming traffic increased 13.6% year on
year to 3.6 billion minutes:
Incoming fixed increased by 4.0% to 1.3 billion
Incoming mobile increased by 19.5% to 2.4 billion
Mobile to mobile traffic increased by 16.4%
to 9.1 billion minutes
Mobile/fixed traffic increased by 3.9% to 1.9
billion minutes
South Africa net interconnect
Total South Africa traffic
14.0%
year on
year
9.0%
year on
year

ARPU by country
Declining ARPUs
SA decreased 4.0% to R119
DRC decreased 22.9% to R64
Lesotho decreased 5.3% to R72
Tanzania decreased 9.4% to R48
Mozambique stable at R27
Vodacom Group consolidated
ARPU decreased 7.2% year on
year from R111 to R103
ARPU per month
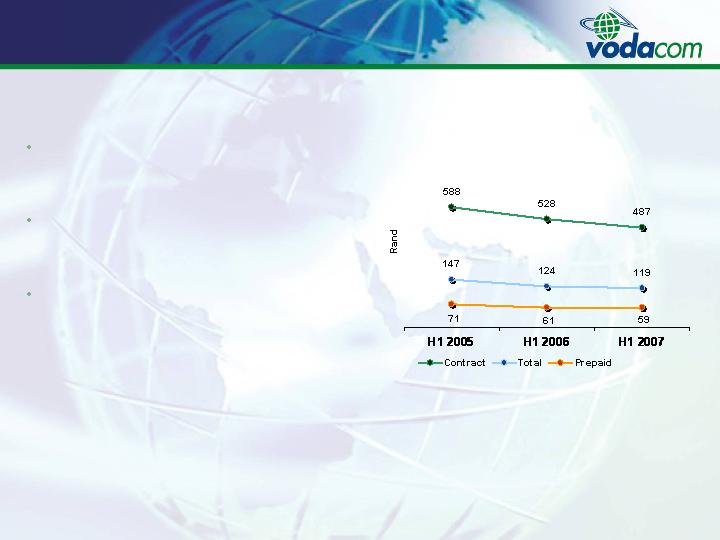
South Africa ARPU
Contract ARPU decreased
7.8% year on year to R487
Prepaid ARPU decreased
3.3% year on year to R59
Total ARPU decreased
4.0% year on year to R119
South Africa ARPU per month

EBITDA and margin analysis
EBITDA margin by country
EBITDA performance
Increased 15.5% year on year to R7.6 billion
EBITDA margin decreased 0.5% points year on year to
33.3%
EBITDA margin 38.3%, when excluding cellular phone
and equipment sales
South Africa EBITDA
Increased 14.9% year on year to R6.9 billion
EBITDA margin decreased 0.2% points year on year to
34.0%
EBITDA for non-South African operations
Increased 40.7% year on year to R719 million
Non-South African operations contributed 9.5% of total
vs. 7.8% for the same period in the previous financial
year
Tanzania EBITDA margin decreased: increase in excise
duty on airtime; inflated fuel prices; competition
15.5%
year on
year
EBITDA

Group profit from operations
By country
29.3%
172
133
47
DRC
(147.4%)
(27)
57
2
Holding companies
34.3%
180
134
115
Tanzania
(0.5% pts)
25.0%
25.5%
26.1%
Profit from operations margin (%)
15.1%
5,714
4,965
4,225
59.4%
(56)
(138)
(25)
Mozambique
64.7%
56
34
26
Lesotho
13.6%
5,389
4,745
4,060
South Africa
H1 2007
%
change
H1 2008
H1 2006
R million
Customer growth of 22.6% to 31.6 million
Revenue growth of 17.2%; operating expenses growth of 18.1%; depreciation, amortisation
and impairment growth of 16.9%

Productivity measures
Consolidated customers
per employee
Increased 8.0% year on year to 5,058 based
on 6,240 employees
Consolidated gross capex
additions as a % of revenue
decreased to 10.0% from 16.1%
for the same period in the
previous financial year
Gross capex additions at R2.3
billion vs. R3.1 billion for the same
period in the previous financial
year
Gross capex additions as a % of revenue
Gross capex additions as a % of revenue
Capex additions and composition
Including software
Capex gross additions – H1 2008
R2,289 million
Capex gross additions – H1 2007
R3,142 million
South Africa capex gross additions decreased by 35.1% to R1.6 billion
Non-South African capex additions decreased by 10.7% to R551 million

Cash generation
EBITDA increased by R1.0 billion
Cash generated from operations
increased by 26.1% to R6.9 billion
Free cash flow decreased from
R837 million to negative R582
million
Net investments increased by R948 million
Capex payments increased by R1.0 billion
or 39.9%
Cash generated from operations
Free cash flow
26.1%
year on
year
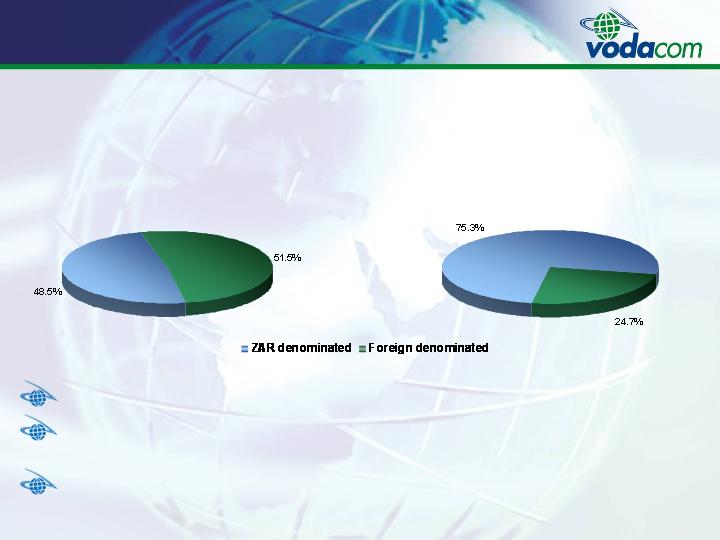
Debt composition
Gross debt composition
including bank overdrafts – H1 2008
R6,949 million
Gross debt composition
including bank overdrafts – H1 2007
R3,873 million
Net debt: R6,150 million (H1 2007: R3,006 million)
Net debt to adjusted equity ratio of 56.6% (H1 2007: 37.5%); 118.4% when including the
dividend declared in October (H1 2007: 72.6%)
Net debt to EBITDA ratio of 40.5% (H1 2007: 45.7%)
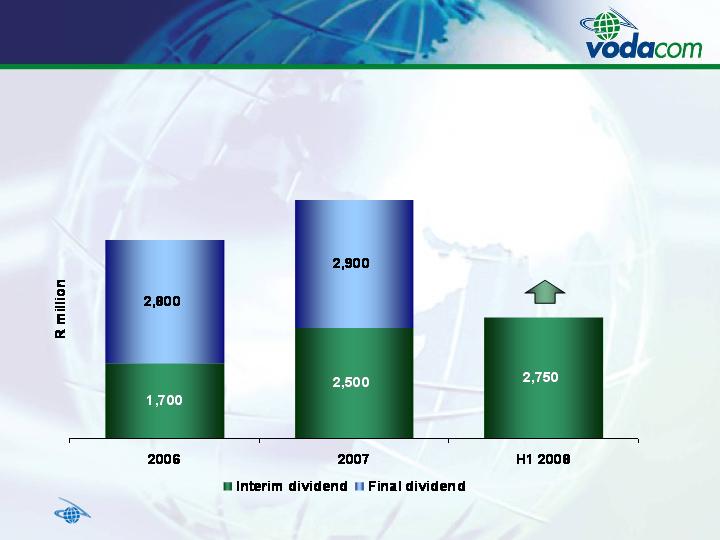
Group shareholder distributions
Interim dividend declared in October 2007
10.0%
year on
year

Questions?

Group balance sheet
Extracts as at
(5.7%)
14,155
15,011
13,513
Current liabilities
8.8%
30,984
28,470
26,586
Total equity and liabilities
(5.4%)
3,607
3,812
3,705
Non-current liabilities
37.1%
13,222
9,647
9,368
EQUITY AND LIABILITIES
Equity
8.8%
30,984
28,470
26,586
Total assets
19.7%
9,125
7,626
8,062
Current assets
4.9%
21,859
20,844
18,524
ASSETS
Non-current assets
March 2007
%
change
H1 2008
H1 2007
R million
Group cash flow statement
Extracts for the six months ended
n/a
763
(261)
1,372
Cash and cash equivalents at the
end of the year
(116.7%)
(15)
90
(12)
Effect of foreign exchange rate changes
(106.1%)
(108)
1,760
2,173
Cash and cash equivalents at the
beginning of the period
142.0%
886
(2,111)
(789)
Net increase in cash and cash
equivalents
n/a
4,458
(112)
(35)
Net cash flows utilised in
financing activities
(75.4%)
(4,641)
(2,646)
(2,231)
Net cash flows utilised in investing
activities
65.2%
1,069
647
1,477
Net cash flows from operating activities
26.1%
6,879
5,454
4,922
Cash generated from operations
H1 2007
%
change
H1 2008
H1 2006
R million

Disclaimer
This presentation has been prepared and published by Vodacom Group (Proprietary) Limited.
Vodacom Group (Proprietary) Limited is a private company and as such is not required by the Companies Act 61 of 1973, as amended, to publish its results.
Vodacom Group (Proprietary) Limited makes no guarantee, assurance, representation and/or warranty as to the accuracy of the information contained in this presentation and will not be held liable for any reliance placed on the information contained in this presentation.
The information contained in this presentation is subject to change without notice and may be incomplete or condensed. In addition, this presentation may not contain all material information pertaining to Vodacom Group (Proprietary) Limited and its subsidiaries.
Without in any way derogating from the generality of the foregoing, it should be noted that:
Many of the statements included in this presentation are forward-looking statements that involve risks and/or uncertainties and caution must be exercised in placing any reliance on these statements. Moreover, Vodacom Group (Proprietary) Limited will not necessarily update any of these statements after the date of this presentation either to conform them to actual results or to changes in its expectations.
Insofar as the shareholders of Vodacom Group (Proprietary) Limited are listed and offer their shares publicly for sale on recognised stock exchanges locally and/or internationally, potential investors in the shares of Vodacom Group (Proprietary) Limited’s shareholders are cautioned not to place undue reliance on this presentation.