UNITED STATES
SECURITIES AND EXCHANGE COMMISSION
Washington, D.C. 20549
FORM N-CSR
CERTIFIED SHAREHOLDER REPORT OF REGISTERED
MANAGEMENT INVESTMENT COMPANIES
Investment Company Act file number: 811-21284
AllianzGI Convertible & Income Fund
(Exact name of registrant as specified in charter)
| | |
| 1633 Broadway, New York, NY | | 10019 |
| (Address of principal executive offices) | | (Zip code) |
Lawrence G. Altadonna – 1633 Broadway, New York, New York 10019
(Name and address of agent for service)
Registrant’s telephone number, including area code: 212-739-3371
Date of fiscal year end: February 28, 2014
Date of reporting period: August 31, 2014
Item 1. Report to Shareholders
AllianzGI Convertible & Income Fund
AllianzGI Convertible & Income Fund II
Semi-Annual Report
August 31, 2014


Table of Contents
Letter from Chairman of the Board &
President

Hans W. Kertess
Chairman

Julian Sluyters
President & CEO
Dear Shareholder:
The US economy continued to expand during the fiscal six-month reporting period ended August 31, 2014, and both stocks and bonds posted strong returns.
Six Months in Review through August 31, 2014
| n | | AllianzGI Convertible & Income Fund returned 3.72% on net asset value (“NAV”) and 4.23% on market price. |
| n | | AllianzGI Convertible & Income Fund II returned 4.02% on NAV and 4.24% on market price. |
In comparison, the Standard & Poor’s (“S&P”) 500 Index, an unmanaged index generally representative of the US stock market, rose 8.84% and the BofA Merrill Lynch High Yield Master II Index, an unmanaged index generally representative of the high yield bond market, gained 2.97% during the six-month reporting period. Convertible securities, which share characteristics of both stocks and bonds, rose. The BofA Merrill Lynch All Convertibles Index, an unmanaged index generally representative of the convertible securities market, advanced 4.78% for the period.
After several years of positive growth, severe winter weather in parts of the country appeared to be a headwind for the US economy in early 2014. Looking back, gross domestic product (“GDP”), the value of goods and services produced in the country, the broadest measure of economic activity and the principal indicator of economic performance, contracted at an annual pace of 2.1% during the first quarter of 2014 but then expanded at a 4.6% annual pace during the second quarter of 2014.
The US Federal Reserve (the “Fed”) maintained an accommodative monetary policy during the reporting period. The reduction of the Fed’s monthly asset purchase program continued through the reporting period and markets continued to scrutinize Fed Statements related to when interest rates would begin to rise. In July, the Fed repeated it would not raise rates in the near future, saying that it “likely will be appropriate to maintain the current target range for the federal funds rate for a considerable time after the asset purchase program ends, especially if projected inflation continues to run below the Committee’s 2 percent longer-run goal, and provided that longer-term inflation expectations remain well anchored.”
| | | | |
| 2 | | Semi-Annual Report | | | August 31, 2014 |
Outlook
The US economy has been resilient and appears to have overcome the headwinds associated with severe winter weather. We continue to expect US economic growth will be above-trend in 2014 due, in part, to the fact that fiscal policy will be less of a drag than it was last year. While we wouldn’t be surprised if rate hikes begin a bit sooner than expected, we think the Fed’s tightening cycle will progress at a thoughtful pace. That
Receive this report electronically and eliminate paper mailings.
To enroll, visit:
us.allianzgi.com/edelivery.
pace will be dictated by macro conditions and, in our view, ultimately settle at a lower rate than the accustomed target set by the Fed in recent years.
For specific information on the Funds and their performance, please refer to the following pages. If you have any questions regarding the information provided, we encourage you to contact your financial advisor or call the Funds’ shareholder servicing agent at (800) 254-5197. In addition, a wide range of information and resources is available on our website, us.allianzgi.com/closedendfunds.
Together with Allianz Global Investors Fund Management LLC, the Funds’ investment manager, and Allianz Global Investors U.S. LLC, the Funds’ sub-adviser, we thank you for investing with us.
We remain dedicated to serving your investment needs.
Sincerely,
| | |
 | |  |
| Hans W. Kertess | | Julian Sluyters |
| Chairman of the Board of Trustees | | President & Chief Executive Officer |
| | | | | | |
| August 31, 2014 | | | Semi-Annual Report | | | 3 | |
Fund Insights
AllianzGI Convertible & Income Funds
August 31, 2014 (unaudited)
For the period of March 1, 2014, through August 31, 2014, as provided by Doug Forsyth, CFA, Portfolio Manager.
For the fiscal six-month period ended August 31, 2014, AllianzGI Convertible & Income Fund and AllianzGI Convertible & Income Fund II (the “Funds”) returned 3.72% and 4.02% on net asset value (“NAV”) and 4.23% and 4.24% on market price, respectively.
Market Environment
Convertible and high-yield bond markets moved higher over the reporting period. Both asset classes benefited from higher equity prices, credit spread tightening and overall credit market strength.
With credit risk continuing to be minimal, the external factors that had the greatest identifiable influence on the market’s psychology and direction during the period included economic data points and corporate profits, Treasury rates, geopolitical uncertainty and the Fed outlook.
The first external factor that influenced the markets was economic statistics and corporate profits. Most looked past the final GDP number for the first quarter and viewed the data as an anomaly. This was due to the upward trajectory of second quarter economic statistics. The improving data points were welcome, but also led to increased investor concern that the Fed may tighten up sooner than expected. With respect to corporate profits, the majority of companies continued to meet or exceed expectations.
The convertible and high-yield markets were influenced by a decline in Treasury yields. Historically, convertible bonds and high yield bonds have had a low or even negative
correlation with Treasury bonds. However, some parts of the convertible market (the bond-like or busted convertibles) are correlated with Treasuries. In addition, within the high-yield universe, BB rated issuers are far more correlated with Treasuries today compared with previous cycles. This combination of higher correlation and the unexpected decline in Treasury yields had a positive influence on these markets.
In terms of geopolitical uncertainty the focus shifted from Russia and Ukraine, to Iraq. The added day-to-day volatility did not help the markets, but the concerns added to a flight-to-quality bid for the Treasury market.
Finally, global central banks remained generally accommodative and Janet Yellen maintained a dovish stance. This position has aided not only the renewed interest in buying Treasury bonds, but also reduced market volatility. Credit markets responded positively to these observations.
Against this backdrop, share buyback and dividend announcements were prevalent, M&A activity was elevated and the IPO market was robust. These trends confirmed a healthy corporate earnings environment.
Portfolio Specifics
The Funds rallied with the market in the reporting period. The attribution for the period included several positive single-name performers from a variety of sectors. The majority of the Funds’ issuers exceeded earnings expectations, which helped contribute to performance.
In the convertibles sleeve, sector allocations which benefitted performance in the period relative to the convertibles universe were
| | | | |
| 4 | | Semi-Annual Report | | | August 31, 2014 |
Utilities, Energy and Financials. The Funds benefited from an overweight and stronger issue-specific performance in the Utilities and Energy sectors. In Financials, an overweight was a detractor, but relative outperformance more than offset the impact. Conversely, sector allocations that hindered relative performance in the reporting period were Technology, Materials and Telecom. An underweight and negative security selection in Technology and Telecom hampered returns. The Funds’ holdings in the Materials sector lagged their peers and adversely impacted performance.
In the high yield bond sleeve, industry allocations which benefitted performance in
the period relative to the high yield universe were Publishing/Printing, Metals/Mining and Steel. The Funds benefited from an overweight and stronger issue-specific performance in the Publishing/Printing and Steel industries. In Metals/Mining, an underweight and positive security selection was a source of strength. In contrast, industry allocations that hindered relative performance during the period were Gaming, Utilities and Energy. Negative security selection and a lower-than-benchmark weight in Energy held back the Funds. In Gaming, both an overweight to the lagging industry, and weaker issuer-specific returns negatively impacted relative performance. Having no exposure to Utilities was a detractor.
| | | | | | |
| August 31, 2014 | | | Semi-Annual Report | | | 5 | |
Performance & Statistics
AllianzGI Convertible & Income Fund
August 31, 2014 (unaudited)
| | | | | | | | |
| Total Return(1): | | Market Price | | | NAV | |
Six Month | | | 4.23% | | | | 3.72% | |
1 Year | | | 22.12% | | | | 16.22% | |
5 Year | | | 18.28% | | | | 17.37% | |
10 Year | | | 8.82% | | | | 8.46% | |
Commencement of Operations (3/31/03) to 8/31/14 | | | 9.62% | | | | 9.51% | |
| | |
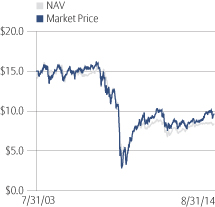
| Market Price/NAV Performance: | | |
Commencement of Operations (3/31/03) to 8/31/14

| | | | |
| Market Price/NAV: | | | |
Market Price | | | $10.06 | |
NAV | | | $9.29 | |
Premium to NAV | | | 8.29% | |
Market Price Yield(2) | | | 10.74% | |
Leverage(3) | | | 30.54% | |
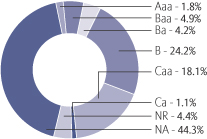
Moody’s Ratings*
(as a % of total investments)
| | | | |
| 6 | | Semi-Annual Report | | | August 31, 2014 |
Performance & Statistics
AllianzGI Convertible & Income Fund II
August 31, 2014 (unaudited)
| | | | | | | | |
| Total Return(1): | | Market Price | | | NAV | |
Six Month | | | 4.24% | | | | 4.02% | |
1 Year | | | 24.95% | | | | 16.03% | |
5 Year | | | 19.23% | | | | 17.48% | |
10 Year | | | 8.81% | | | | 7.85% | |
Commencement of Operations (7/31/03) to 8/31/14 | | | 8.82% | | | | 8.18% | |
| | |
| Market Price/NAV Performance: | | |
Commencement of Operations (7/31/03) to 8/31/14
| | | | |
| Market Price/NAV: | | | |
Market Price | | | $9.58 | |
NAV | | | $8.34 | |
Premium to NAV | | | 14.87% | |
Market Price Yield(2) | | | 10.65% | |
Leverage(3) | | | 30.80% | |
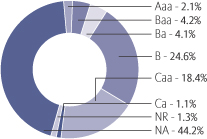
Moody’s Ratings*
(as a % of total investments)
| | | | | | |
| August 31, 2014 | | | Semi-Annual Report | | | 7 | |
Performance & Statistics
AllianzGI Convertible & Income Funds
August 31, 2014 (unaudited)
* Bond ratings apply to the underlying holdings of the Funds and not the Funds themselves and are divided into categories ranging from highest to lowest credit quality, determined for purposes of this presentation by using ratings provided by Moody’s Investors Service, Inc. (“Moody’s”). The Funds use ratings provided by Moody’s for this purpose, among other reasons, because of the access to background information and other materials provided by Moody’s, as well as the Funds’ consideration of industry practice. When a bond is not rated by Moody’s, it is designated in the chart above as “NR” for not rated. Credit quality ratings assigned by a rating agency are subjective opinions, not statements of fact, and are subject to change periodically, even as frequently as daily. Ratings assigned by Moody’s or another rating agency are not absolute standards of credit quality and do not evaluate market risk. Rating agencies may fail to make timely changes in credit ratings, and an issuer’s current financial condition may be better or worse than a rating indicates. In formulating investment decisions for the Funds, Allianz Global Investors U.S. LLC, the sub-adviser to the Funds, develops its own analysis of the credit quality and risks associated with individual debt instruments, rather than relying exclusively on rating agencies or third-party research.
(1) Past performance is no guarantee of future results. Total return is calculated by determining the percentage change in NAV or market price (as applicable) in the specified period. The calculation assumes that all dividends and distributions, if any, have been reinvested. Total return does not reflect broker commissions or sales charges in connection with the purchase or sale of Fund shares. Total return for a period of more than one year represents the average annual total return. Total return for a period of less than one year is not annualized.
Performance at market price will differ from results at NAV. Although market price returns typically reflect investment results over time, during shorter periods returns at market price can also be influenced by factors such as changing views about each Fund, market conditions, supply and demand for each Fund ‘s shares, or changes in each Fund’s dividends.
An investment in each Fund involves risk, including the loss of principal. Total return, market price, market price yield and NAV will fluctuate with changes in market conditions. This data is provided for information purposes only and is not intended for trading purposes. Closed-end funds, unlike open-end funds, are not continuously offered. There is a one time public offering and once issued, shares of closed-end funds are traded in the open market through a stock exchange. NAV is equal to total assets attributable to common shareholders less total liabilities divided by the number of common shares outstanding. Holdings are subject to change daily.
(2) Market Price Yield is determined by dividing the annualized current monthly dividend per common share (comprised of net investment income) by the market price per common share at August 31, 2014.
(3) Represents Preferred Shares (“Leverage”) outstanding, as a percentage of total managed assets. Total managed assets refer to total assets (including assets attributable to Leverage) minus liabilities (other than liabilities representing Leverage).
| | | | |
| 8 | | Semi-Annual Report | | | August 31, 2014 |
Schedule of Investments
AllianzGI Convertible & Income Fund
August 31, 2014 (unaudited)
| | | | | | | | | | |
Principal
Amount
(000s) | | | | | | | Value | |
| | Corporate Bonds & Notes – 41.4% | | | | | | |
| | | | Advertising – 0.5% | | | | | | |
| | $5,650 | | | Affinion Group, Inc., 7.875%, 12/15/18 | | | | | $5,190,937 | |
| | | | Aerospace & Defense – 0.5% | | | | | | |
| | 250 | | | Bombardier, Inc., 6.00%, 10/15/22 (a)(b) | | | | | 254,688 | |
| | 5,570 | | | Erickson, Inc., 8.25%, 5/1/20 | | | | | 5,556,075 | |
| | | | | | | | | | 5,810,763 | |
| | | | Auto Components – 0.9% | | | | | | |
| | 4,180 | | | Chassix, Inc., 9.25%, 8/1/18 (a)(b) | | | | | 4,347,200 | |
| | 5,280 | | | Goodyear Tire & Rubber Co., 8.25%, 8/15/20 | | | | | 5,768,400 | |
| | | | | | | | | | 10,115,600 | |
| | | | Auto Manufacturers – 0.7% | | | | | | |
| | 7,410 | | | Chrysler Group LLC, 8.25%, 6/15/21 | | | | | 8,317,725 | |
| | | | Commercial Services – 2.6% | | | | | | |
| | 4,000 | | | Avis Budget Car Rental LLC/Avis Budget Finance, Inc., 9.75%, 3/15/20 | | | | | 4,500,000 | |
| | 11,500 | | | Cenveo Corp., 11.50%, 5/15/17 | | | | | 12,103,750 | |
| | 5,705 | | | DynCorp International, Inc., 10.375%, 7/1/17 | | | | | 5,434,012 | |
| | 7,375 | | | Monitronics International, Inc., 9.125%, 4/1/20 | | | | | 7,928,125 | |
| | | | | | | | | | 29,965,887 | |
| | | | Commercial Services & Supplies – 0.5% | | | | | | |
| | 5,645 | | | United Rentals North America, Inc., 8.375%, 9/15/20 | | | | | 6,181,275 | |
| | | | Construction Materials – 0.6% | | | | | | |
| | 6,810 | | | US Concrete, Inc., 8.50%, 12/1/18 | | | | | 7,388,850 | |
| | | | Consumer Finance – 0.8% | | | | | | |
| | 3,210 | | | Navient LLC, 8.45%, 6/15/18 | | | | | 3,743,502 | |
| | 4,935 | | | Springleaf Finance Corp., 8.25%, 10/1/23 | | | | | 5,736,938 | |
| | | | | | | | | | 9,480,440 | |
| | | | Distribution/Wholesale – 0.8% | | | | | | |
| | 8,170 | | | HD Supply, Inc., 11.00%, 4/15/20 | | | | | 9,497,625 | |
| | | | Diversified Consumer Services – 0.6% | | | | | | |
| | 6,815 | | | Cambium Learning Group, Inc., 9.75%, 2/15/17 | | | | | 6,917,225 | |
| | | | Diversified Financial Services – 2.0% | | | | | | |
| | 8,395 | | | Affinion Investments LLC, 13.50%, 8/15/18 (a)(b) | | | | | 8,331,640 | |
| | | | Community Choice Financial, Inc., | | | | | | |
| | 10,085 | | | 10.75%, 5/1/19 | | | | | 8,320,125 | |
| | 7,130 | | | 12.75%, 5/1/20 (a)(b) | | | | | 6,007,025 | |
| | | | | | | | | | 22,658,790 | |
| | | | Diversified Telecommunications – 0.5% | | | | | | |
| | 4,923 | | | Cincinnati Bell, Inc., 8.75%, 3/15/18 | | | | | 5,162,996 | |
| | | | Electrical Components & Equipment – 1.2% | | | | | | |
| | 13,585 | | | WireCo WorldGroup, Inc., 9.50%, 5/15/17 | | | | | 13,958,588 | |
| | | | Electronic Equipment, Instruments & Components – 1.4% | | | | | | |
| | 7,725 | | | Kemet Corp., 10.50%, 5/1/18 | | | | | 8,149,875 | |
| | 7,500 | | | Viasystems, Inc., 7.875%, 5/1/19 (a)(b) | | | | | 7,800,000 | |
| | | | | | | | | | 15,949,875 | |
| | | | Energy Equipment & Services – 0.6% | | | | | | |
| | 2,830 | | | Hercules Offshore, Inc., 8.75%, 7/15/21 (a)(b) | | | | | 2,872,450 | |
| | 3,749 | | | Pioneer Drilling Co., 9.875%, 3/15/18 | | | | | 3,946,010 | |
| | | | | | | | | | 6,818,460 | |
| | | | | | |
| August 31, 2014 | | | Semi-Annual Report | | | 9 | |
Schedule of Investments
AllianzGI Convertible & Income Fund
August 31, 2014 (unaudited) (continued)
| | | | | | | | | | |
Principal
Amount
(000s) | | | | | | | Value | |
| | | | Food & Staples Retailing – 0.9% | | | | | | |
| | $5,000 | | | Rite Aid Corp., 10.25%, 10/15/19 | | | | | $5,306,250 | |
| | 5,000 | | | US Foods, Inc., 8.50%, 6/30/19 | | | | | 5,335,000 | |
| | | | | | | | | | 10,641,250 | |
| | | | Health Care Providers & Services – 0.8% | | | | | | |
| | 8,875 | | | ExamWorks Group, Inc., 9.00%, 7/15/19 | | | | | 9,629,375 | |
| | | | Healthcare-Products – 0.9% | | | | | | |
| | 8,885 | | | Kinetic Concepts, Inc./KCI USA, Inc., 10.50%, 11/1/18 | | | | | 9,940,094 | |
| | | | Hotels, Restaurants & Leisure – 1.8% | | | | | | |
| | 9,120 | | | DineEquity, Inc., 9.50%, 10/30/18 | | | | | 9,704,592 | |
| | 8,405 | | | MGM Resorts International, 11.375%, 3/1/18 | | | | | 10,653,338 | |
| | | | | | | | | | 20,357,930 | |
| | | | Household Durables – 1.1% | | | | | | |
| | | | Beazer Homes USA, Inc., | | | | | | |
| | 2,945 | | | 7.25%, 2/1/23 | | | | | 3,040,713 | |
| | 5,045 | | | 9.125%, 5/15/19 | | | | | 5,354,006 | |
| | 3,950 | | | Jarden Corp., 7.50%, 5/1/17 | | | | | 4,428,937 | |
| | | | | | | | | | 12,823,656 | |
| | | | Household Products/Wares – 0.7% | | | | | | |
| | 7,610 | | | Reynolds Group Issuer, Inc., 9.875%, 8/15/19 | | | | | 8,475,638 | |
| | | | Internet Software & Services – 1.2% | | | | | | |
| | | | EarthLink, Inc., | | | | | | |
| | 2,800 | | | 7.375%, 6/1/20 | | | | | 2,961,000 | |
| | 10,060 | | | 8.875%, 5/15/19 | | | | | 10,336,650 | |
| | | | | | | | | | 13,297,650 | |
| | | | Iron/Steel – 0.7% | | | | | | |
| | 7,305 | | | AK Steel Corp., 8.375%, 4/1/22 | | | | | 7,743,300 | |
| | | | Leisure Time – 0.8% | | | | | | |
| | 8,855 | | | Travelport LLC, 11.875%, 9/1/16 | | | | | 8,888,206 | |
| | | | Lodging – 0.3% | | | | | | |
| | 12,385 | | | Caesars Entertainment Operating Co., Inc., 12.75%, 4/15/18 | | | | | 3,529,725 | |
| | | | Machinery – 0.6% | | | | | | |
| | 6,755 | | | Navistar International Corp., 8.25%, 11/1/21 | | | | | 7,033,644 | |
| | | | Media – 2.8% | | | | | | |
| | 5,500 | | | AMC Entertainment, Inc., 9.75%, 12/1/20 | | | | | 6,201,250 | |
| | 8,355 | | | McClatchy Co., 9.00%, 12/15/22 | | | | | 9,441,150 | |
| | | | McGraw-Hill Global Education Holdings LLC / McGraw-Hill Global Education Finance, | | | | | | |
| | 8,220 | | | 9.75%, 4/1/21 | | | | | 9,329,700 | |
| | 3,745 | | | Mood Media Corp., 9.25%, 10/15/20 (a)(b) | | | | | 3,276,875 | |
| | 3,871 | | | SFX Entertainment, Inc., 9.625%, 2/1/19 (a)(b) | | | | | 3,967,775 | |
| | | | | | | | | | 32,216,750 | |
| | | | Metals & Mining – 1.7% | | | | | | |
| | 6,590 | | | ArcelorMittal, 10.35%, 6/1/19 | | | | | 8,328,112 | |
| | | | Thompson Creek Metals Co., Inc., | | | | | | |
| | 8,295 | | | 7.375%, 6/1/18 | | | | | 8,336,475 | |
| | 2,830 | | | 12.50%, 5/1/19 | | | | | 3,212,050 | |
| | | | | | | | | | 19,876,637 | |
| | | | |
| 10 | | Semi-Annual Report | | | August 31, 2014 |
Schedule of Investments
AllianzGI Convertible & Income Fund
August 31, 2014 (unaudited) (continued)
| | | | | | | | | | |
Principal
Amount
(000s) | | | | | | | Value | |
| | | | Miscellaneous Manufacturing – 0.5% | | | | | | |
| | $5,100 | | | Harland Clarke Holdings Corp., 9.25%, 3/1/21 (a)(b) | | | | | $5,310,375 | |
| | | | Oil & Gas – 1.4% | | | | | | |
| | 9,050 | | | Energy XXI Gulf Coast, Inc., 9.25%, 12/15/17 | | | | | 9,638,250 | |
| | 6,038 | | | United Refining Co., 10.50%, 2/28/18 | | | | | 6,551,230 | |
| | | | | | | | | | 16,189,480 | |
| | | | Oil, Gas & Consumable Fuels – 1.9% | | | | | | |
| | 2,840 | | | Arch Coal, Inc., 9.875%, 6/15/19 | | | | | 2,314,600 | |
| | 9,890 | | | Endeavour International Corp., 12.00%, 3/1/18 | | | | | 9,049,350 | |
| | 5,050 | | | EP Energy LLC/Everest Acquisition Finance, Inc., 9.375%, 5/1/20 | | | | | 5,719,125 | |
| | 4,500 | | | Laredo Petroleum, Inc., 9.50%, 2/15/19 | | | | | 4,860,000 | |
| | | | | | | | | | 21,943,075 | |
| | | | Packaging & Containers – 0.6% | | | | | | |
| | 6,692 | | | Tekni-Plex, Inc., 9.75%, 6/1/19 (a)(b) | | | | | 7,377,930 | |
| | | | Paper & Forest Products – 0.3% | | | | | | |
| | 3,000 | | | Louisiana-Pacific Corp., 7.50%, 6/1/20 | | | | | 3,285,000 | |
| | | | Retail – 1.4% | | | | | | |
| | 9,465 | | | Neiman Marcus Group LTD LLC, 8.00%, 10/15/21 (a)(b) | | | | | 10,257,694 | |
| | 6,110 | | | Toys “R” Us, Inc., 10.375%, 8/15/17 | | | | | 5,361,525 | |
| | | | | | | | | | 15,619,219 | |
| | | | Semiconductors & Semiconductor Equipment – 0.7% | | | | | | |
| | 7,160 | | | Freescale Semiconductor, Inc., 10.75%, 8/1/20 | | | | | 8,072,900 | |
| | | | Software – 1.7% | | | | | | |
| | | | First Data Corp., | | | | | | |
| | 5,645 | | | 8.25%, 1/15/21 (a)(b) | | | | | 6,181,275 | |
| | 1,834 | | | 10.625%, 6/15/21 | | | | | 2,136,610 | |
| | 9,045 | | | 12.625%, 1/15/21 | | | | | 11,080,125 | |
| | | | | | | | | | 19,398,010 | |
| | | | Specialty Retail – 1.1% | | | | | | |
| | 4,160 | | | Brown Shoe Co., Inc., 7.125%, 5/15/19 | | | | | 4,399,200 | |
| | 3,500 | | | Claire’s Stores, Inc., 9.00%, 3/15/19 (a)(b) | | | | | 3,666,250 | |
| | 5,000 | | | Conn’s, Inc., 7.25%, 7/15/22 (a)(b) | | | | | 4,850,000 | |
| | | | | | | | | | 12,915,450 | |
| | | | Telecommunications – 1.0% | | | | | | |
| | 7,415 | | | Consolidated Communications Finance Co., 10.875%, 6/1/20 | | | | | 8,592,131 | |
| | 4,520 | | | NII International Telecom SCA, 11.375%, 8/15/19 (a)(b) | | | | | 3,028,400 | |
| | | | | | | | | | 11,620,531 | |
| | | | Transportation – 1.5% | | | | | | |
| | 7,239 | | | Quality Distribution LLC, 9.875%, 11/1/18 | | | | | 7,709,535 | |
| | 8,610 | | | Swift Services Holdings, Inc., 10.00%, 11/15/18 | | | | | 9,212,700 | |
| | | | | | | | | | 16,922,235 | |
| | | | Wireless Telecommunication Services – 0.8% | | | | | | |
| | 7,205 | | | Sprint Communications, Inc., 11.50%, 11/15/21 | | | | | 9,438,550 | |
| | Total Corporate Bonds & Notes (cost-$468,264,750) | | | | | 475,961,646 | |
| | | | | | |
| August 31, 2014 | | | Semi-Annual Report | | | 11 | |
Schedule of Investments
AllianzGI Convertible & Income Fund
August 31, 2014 (unaudited) (continued)
| | | | | | | | | | |
| Shares | | | | | | | Value | |
| | Convertible Preferred Stock – 39.3% | | | | |
| | | | Aerospace & Defense – 1.3% | | | | | | |
| | 239,625 | | | United Technologies Corp., 7.50%, 8/1/15 | | | | | $14,391,878 | |
| | | | Airlines – 1.6% | | | | | | |
| | 361,355 | | | Continental Airlines Finance Trust II, 6.00%, 11/15/30 | | | | | 18,135,504 | |
| | | | Automobiles – 1.4% | | | | | | |
| | 495,375 | | | The Goldman Sachs Group, Inc., 8.50%, 12/16/14 (General Motors) (c) | | | | | 16,536,113 | |
| | | | Commercial Banks – 4.2% | | | | | | |
| | 9,695 | | | Huntington Bancshares, Inc., 8.50% (d) | | | | | 13,088,250 | |
| | 364,075 | | | The Goldman Sachs Group, Inc., 8.00%, 1/14/15 (Citigroup Inc.) (c) | | | | | 17,627,419 | |
| | 13,990 | | | Wells Fargo & Co., 7.50%, Ser. L (d) | | | | | 17,011,421 | |
| | | | | | | | | | 47,727,090 | |
| | | | Diversified Financial Services – 1.4% | | | | | | |
| | 13,790 | | | Bank of America Corp., 7.25%, Ser. L (d) | | | | | 16,148,090 | |
| | | | Diversified Telecommunication Services – 0.1% | | | | | | |
| | 25,335 | | | Intelsat SA, 5.75%, 5/1/16 | | | | | 1,214,813 | |
| | | | Electric Utilities – 1.8% | | | | | | |
| | 85,390 | | | Exelon Corp., 6.50%, 6/1/17 | | | | | 4,312,195 | |
| | 301,500 | | | NextEra Energy, Inc., 5.799%, 9/1/16 | | | | | 16,612,650 | |
| | | | | | | | | | 20,924,845 | |
| | | | Energy Equipment & Services – 1.7% | | | | | | |
| | 313,380 | | | Credit Suisse, 8.00%, 3/5/15 (Baker Hughes) (c) | | | | | 19,977,975 | |
| | | | Food Products – 0.2% | | | | | | |
| | 47,905 | | | Tyson Foods, Inc., 4.75%, 7/15/17 | | | | | 2,406,268 | |
| | | | Health Care Equipment & Supplies – 1.5% | | | | | | |
| | 273,890 | | | Credit Suisse AG, 8.00%, 6/23/15 (Medtronic, Inc.) (c) | | | | | 17,181,120 | |
| | | | Health Care Providers & Services – 1.8% | | | | | | |
| | 339,700 | | | JPMorgan Chase & Co., 8.00%, 5/5/15 (HCA Holdings, Inc.) (c) | | | | | 20,633,378 | |
| | | | Household Durables – 1.7% | | | | | | |
| | 171,185 | | | Stanley Black & Decker, Inc., 6.25%, 11/17/16 | | | | | 19,891,697 | |
| | | | Insurance – 0.5% | | | | | | |
| | 194,050 | | | MetLife, Inc., 5.00%, 10/8/14 | | | | | 6,087,348 | |
| | | | Metals & Mining – 2.2% | | | | | | |
| | 690,240 | | | ArcelorMittal, 6.00%, 1/15/16 | | | | | 15,659,820 | |
| | 662,000 | | | Cliffs Natural Resources, Inc., 7.00%, 2/1/16 | | | | | 9,910,140 | |
| | | | | | | | | | 25,569,960 | |
| | | | Multiline Retail – 1.6% | | | | | | |
| | 317,620 | | | The Goldman Sachs Group, Inc., 8.00%, 1/12/15 (Macy’s) (c) | | | | | 17,962,999 | |
| | | | Multi-Utilities – 1.6% | | | | | | |
| | 239,645 | | | AES Trust III, 6.75%, 10/15/29 | | | | | 12,217,102 | |
| | 128,500 | | | Dominion Resources, Inc., 6.375%, 7/1/17 | | | | | 6,531,655 | |
| | | | | | | | | | 18,748,757 | |
| | | | Oil, Gas & Consumable Fuels – 2.4% | | | | | | |
| | 191,170 | | | Credit Suisse, 8.00%, 3/5/15 (Occidental Petroleum Corp.) (c) | | | | | 18,551,137 | |
| | 14,100 | | | Energy XXI Bermuda Ltd., 5.625%, (d) | | | | | 3,309,094 | |
| | 124,235 | | | PetroQuest Energy, Inc., 6.875%, (d) | | | | | 5,683,751 | |
| | | | | | | | | | 27,543,982 | |
| | | | |
| 12 | | Semi-Annual Report | | | August 31, 2014 |
Schedule of Investments
AllianzGI Convertible & Income Fund
August 31, 2014 (unaudited) (continued)
| | | | | | | | | | |
| Shares | | | | | | | Value | |
| | | | Pharmaceuticals – 3.0% | | | | | | |
| | 143,430 | | | Bank of America Corp., 8.00%, 2/10/15 (Allergan, Inc.) (c) | | | | | $19,416,119 | |
| | 333,295 | | | JPMorgan Chase & Co., 8.00%, 4/30/15 (Mylan, Inc.) (c) | | | | | 15,314,905 | |
| | | | | | | | | | 34,731,024 | |
| | | | Real Estate Investment Trust – 4.2% | | | | | | |
| | 439,700 | | | Alexandria Real Estate Equities, Inc., 7.00%, (d) | | | | | 12,175,293 | |
| | 798,310 | | | FelCor Lodging Trust, Inc., 1.95%, Ser. A (d) | | | | | 20,157,327 | |
| | 208,680 | | | Health Care REIT, Inc., 6.50%, 4/20/18, Ser. I (d) | | | | | 12,712,786 | |
| | 56,930 | | | Weyerhaeuser Co., 6.375%, 7/1/16 | | | | | 3,288,277 | |
| | | | | | | | | | 48,333,683 | |
| | | | Semiconductors & Semiconductor Equipment – 1.5% | | | | | | |
| | 530,000 | | | Wells Fargo & Co., 8.00%, 6/18/15 (Micron Technology, Inc.) (c) | | | | | 16,859,300 | |
| | | | Specialty Retail – 2.0% | | | | | | |
| | 16,000 | | | Barnes & Noble, Inc., 7.75%, 8/18/21 (a) | | | | | 23,107,000 | |
| | | | Technology Hardware, Storage & Peripherals – 1.6% | | | | | | |
| | 27,900 | | | Bank of America Corp., 8.00%, 5/12/15 (Apple, Inc.) (c) | | | | | 18,434,367 | |
| | Total Convertible Preferred Stock (cost-$419,024,151) | | | | | 452,547,191 | |
| | | |
Principal
Amount
(000s) | | | | | | | | |
| | Convertible Bonds & Notes – 17.5% | | | | |
| | | | Biotechnology – 0.3% | | | | | | |
| | $5,385 | | | Dendreon Corp., 2.875%, 1/15/16 | | | | | 3,782,962 | |
| | | | Capital Markets – 2.6% | | | | | | |
| | 7,740 | | | Ares Capital Corp., 5.75%, 2/1/16 | | | | | 8,214,075 | |
| | 13,195 | | | BGC Partners, Inc., 4.50%, 7/15/16 | | | | | 13,994,947 | |
| | 8,460 | | | Walter Investment Management Corp., 4.50%, 11/1/19 | | | | | 7,603,425 | |
| | | | | | | | | | 29,812,447 | |
| | | | Commercial Services – 1.9% | | | | | | |
| | 20,305 | | | Cenveo Corp., 7.00%, 5/15/17 | | | | | 22,195,903 | |
| | | | Construction Materials – 0.8% | | | | | | |
| | 7,645 | | | Cemex S.A.B. de C.V., 4.875%, 3/15/15 | | | | | 9,341,234 | |
| | | | Hotels, Restaurants & Leisure – 1.9% | | | | | | |
| | 7,395 | | | MGM Resorts International, 4.25%, 4/15/15 | | | | | 10,029,469 | |
| | 11,940 | | | Morgans Hotel Group Co., 2.375%, 10/15/14 | | | | | 11,895,225 | |
| | | | | | | | | | 21,924,694 | |
| | | | Insurance – 0.3% | | | | | | |
| | 3,965 | | | HCI Group, Inc., 3.875%, 3/15/19 (a)(b) | | | | | 3,813,834 | |
| | | | Internet Software & Services – 0.1% | | | | | | |
| | 1,000 | | | Web.com Group, Inc., 1.00%, 8/15/18 | | | | | 907,500 | |
| | | | Life Sciences Tools & Services – 0.8% | | | | | | |
| | 8,125 | | | Sequenom, Inc., 5.00%, 10/1/17 | | | | | 8,759,766 | |
| | | | Machinery – 3.1% | | | | | | |
| | | | Meritor, Inc., | | | | | | |
| | 12,480 | | | 4.625%, 3/1/26 (e) | | | | | 13,915,200 | |
| | 5,655 | | | 7.875%, 3/1/26 | | | | | 9,373,163 | |
| | 11,335 | | | Navistar International Corp., 3.00%, 10/15/14 | | | | | 11,490,856 | |
| | 800 | | | Wabash National Corp., 3.375%, 5/1/18 | | | | | 1,114,500 | |
| | | | | | | | | | 35,893,719 | |
| | | | | | |
| August 31, 2014 | | | Semi-Annual Report | | | 13 | |
Schedule of Investments
AllianzGI Convertible & Income Fund
August 31, 2014 (unaudited) (continued)
| | | | | | | | | | |
Principal
Amount
(000s) | | | | | | | Value | |
| | | | Oil, Gas & Consumable Fuels – 0.4% | | | | | | |
| | $9,625 | | | Endeavour International Corp., 5.50%, 7/15/16 | | | | | $4,908,750 | |
| | | | Personal Products – 0.4% | | | | | | |
| | 5,385 | | | Herbalife Ltd., 2.00%, 8/15/19 (a)(b) | | | | | 4,223,886 | |
| | | | Real Estate Investment Trust – 0.6% | | | | | | |
| | 7,070 | | | IAS Operating Partnership LP, 5.00%, 3/15/18 (a)(b) | | | | | 6,933,019 | |
| | | | Software – 1.5% | | | | | | |
| | 6,335 | | | Nuance Communications, Inc., 2.75%, 8/15/27 | | | | | 6,346,878 | |
| | 10,320 | | | TeleCommunication Systems, Inc., 7.75%, 6/30/18 | | | | | 10,268,400 | |
| | | | | | | | | | 16,615,278 | |
| | | | Thrifts & Mortgage Finance – 0.6% | | | | | | |
| | 6,535 | | | MGIC Investment Corp., 5.00%, 5/1/17 | | | | | 7,315,116 | |
| | | | Tobacco – 2.1% | | | | | | |
| | | | Vector Group Ltd., (f) | | | | | | |
| | 5,665 | | | 1.75%, 4/15/20 | | | | | 6,397,909 | |
| | 11,865 | | | 2.50%, 1/15/19 | | | | | 17,307,001 | |
| | | | | | | | | | 23,704,910 | |
| | | | Trading Companies & Distribution – 0.1% | | | | | | |
| | 1,190 | | | Titan Machinery, Inc., 3.75%, 5/1/19 | | | | | 931,175 | |
| | Total Convertible Bonds & Notes (cost-$181,248,713) | | | | | 201,064,193 | |
| | Short-Term Investment – 1.8% | | | | | | |
| | | | Time Deposit – 1.8% | | | | | | |
| | 21,024 | | | Wells Fargo-Grand Cayman, 0.03%, 9/2/14 (cost-$21,023,575) | | | | | 21,023,575 | |
| | Total Investments (cost-$1,089,561,189) – 100.0% | | | | | $1,150,596,605 | |
Notes to Schedule of Investments:
| (a) | | Private Placement–Restricted as to resale and may not have a readily available market. Securities with an aggregate value of $115,607,316, representing 10.0% of total investments. | |
| (b) | | 144A–Exempt from registration under Rule 144A of the Securities Act of 1933. These securities may be resold in transactions exempt from registration, typically only to qualified institutional buyers. Unless otherwise indicated, these securities are not considered to be illiquid. | |
| (c) | | Securities exchangeable or convertible into securities of an entity different than the issuer or structured by the issuer to provide exposure to securities of an entity different than the issuer (synthetic convertible securities). Such entity is identified in the parenthetical. | |
| (d) | | Perpetual maturity. The date shown, if any, is the next call date. | |
| (e) | | Step Bond–Coupon is a fixed rate for an initial period then resets at a specific date and rate. | |
| (f) | | In addition to the coupon rate shown, the issuer is expected to pay additional interest based on the actual dividends paid on its common stock. | |
| | | | |
| 14 | | Semi-Annual Report | | | August 31, 2014 |
Schedule of Investments
AllianzGI Convertible & Income Fund
August 31, 2014 (unaudited) (continued)
| (g) | | Fair Value Measurements–See Note 1(b) in Notes to Financial Statements. | |
| | | | | | | | | | | | | | | | |
| | | Level 1 –
Quoted
Prices | | | Level 2 –
Other Significant
Observable
Inputs | | | Level 3 –
Significant
Unobservable
Inputs | | | Value at
8/31/14 | |
Investments in Securities – Assets | |
Corporate Bonds & Notes | | $ | – | | | $ | 475,961,646 | | | $ | – | | | $ | 475,961,646 | |
Convertible Preferred Stock: | | | | | | | | | | | | | | | | |
Airlines | | | – | | | | 18,135,504 | | | | – | | | | 18,135,504 | |
Automobiles | | | – | | | | – | | | | 16,536,113 | | | | 16,536,113 | |
Commercial Banks | | | 30,099,671 | | | | – | | | | 17,627,419 | | | | 47,727,090 | |
Diversified Telecommunication Services | | | – | | | | 1,214,813 | | | | – | | | | 1,214,813 | |
Energy Equipment & Services | | | – | | | | – | | | | 19,977,975 | | | | 19,977,975 | |
Health Care Equipment & Supplies | | | – | | | | – | | | | 17,181,120 | | | | 17,181,120 | |
Health Care Providers & Services | | | – | | | | – | | | | 20,633,378 | | | | 20,633,378 | |
Metals & Mining | | | 9,910,140 | | | | 15,659,820 | | | | – | | | | 25,569,960 | |
Multiline Retail | | | – | | | | – | | | | 17,962,999 | | | | 17,962,999 | |
Oil, Gas & Consumable Fuels | | | – | | | | 8,992,845 | | | | 18,551,137 | | | | 27,543,982 | |
Pharmaceuticals | | | – | | | | – | | | | 34,731,024 | | | | 34,731,024 | |
Semiconductors & Semiconductor Equipment | | | – | | | | – | | | | 16,859,300 | | | | 16,859,300 | |
Technology Hardware, Storage & Peripherals | | | – | | | | – | | | | 18,434,367 | | | | 18,434,367 | |
All Other | | | 170,039,566 | | | | – | | | | – | | | | 170,039,566 | |
Convertible Bonds & Notes | | | – | | | | 201,064,193 | | | | – | | | | 201,064,193 | |
Short-Term Investment | | | – | | | | 21,023,575 | | | | – | | | | 21,023,575 | |
Totals | | $ | 210,049,377 | | | $ | 742,052,396 | | | $ | 198,494,832 | | | $ | 1,150,596,605 | |
At August 31, 2014, there were no transfers between Levels 1 and 2.
| | | | | | |
| August 31, 2014 | | | Semi-Annual Report | | | 15 | |
Schedule of Investments
AllianzGI Convertible & Income Fund
August 31, 2014 (unaudited) (continued)
A roll forward of fair value measurements using significant unobservable inputs (Level 3) for the six months ended August 31, 2014, was as follows:
| | | | | | | | | | | | | | | | | | | | | | | | | | | | | | | | | | | | |
| | | Beginning
Balance
2/28/14 | | | Purchases | | | Sales | | | Accrued
Discounts
(Premiums) | | | Net
Realized
Gain
(Loss) | | | Net Change
in Unrealized
Appreciation/
Depreciation | | | Transfers
into
Level 3 | | | Transfers
out of
Level 3 | | | Ending
Balance
8/31/14 | |
Investments in Securities – Assets | | | | | | | | | | | | | | | | | | | | | | | | | |
Convertible Preferred Stock: | | | | | | | | | | | | | | | | | | | | | | | | | | | | | | | | | | | | |
Automobiles | | | $13,802,523 | | | | $4,474,514 | | | | $ – | | | | $ – | | | | $ – | | | | $(1,740,924 | ) | | | $ – | | | | $ – | | | | $16,536,113 | |
Commercial Banks | | | 15,935,338 | | | | 2,428,330 | | | | – | | | | – | | | | – | | | | (736,249 | ) | | | – | | | | – | | | | 17,627,419 | |
Computers & Peripherals | | | 12,985,586 | | | | – | | | | (13,019,681 | )† | | | – | | | | – | | | | 34,095 | | | | – | | | | – | | | | – | |
Energy Equipment & Services | | | 39,698,096 | | | | – | | | | (22,376,924 | ) | | | – | | | | 3,560,974 | | | | (904,171 | ) | | | – | | | | – | | | | 19,977,975 | |
Health Care Equipment & Supplies | | | – | | | | 17,767,244 | | | | – | | | | – | | | | – | | | | (586,124 | ) | | | – | | | | – | | | | 17,181,120 | |
Health Care Providers & Services | | | – | | | | 18,043,098 | | | | – | | | | – | | | | – | | | | 2,590,280 | | | | – | | | | – | | | | 20,633,378 | |
Household Durables | | | 14,324,200 | | | | – | | | | (13,840,543 | )† | | | – | | | | – | | | | (483,657 | ) | | | – | | | | – | | | | – | |
Insurance | | | 14,641,250 | | | | – | | | | (14,915,891 | ) | | | – | | | | 1,319,888 | | | | (1,045,247 | ) | | | – | | | | – | | | | – | |
Internet & Catalog Retail | | | 14,992,436 | | | | – | | | | (13,224,046 | ) | | | – | | | | 2,121,459 | | | | (3,889,849 | ) | | | – | | | | – | | | | – | |
Multiline Retail | | | 17,715,255 | | | | – | | | | – | | | | – | | | | – | | | | 247,744 | | | | – | | | | – | | | | 17,962,999 | |
Oil, Gas & Consumable Fuels | | | 18,189,826 | | | | – | | | | – | | | | – | | | | – | | | | 361,311 | | | | – | | | | – | | | | 18,551,137 | |
Pharmaceuticals | | | 17,363,636 | | | | 16,702,079 | | | | – | | | | – | | | | – | | | | 665,309 | | | | – | | | | – | | | | 34,731,024 | |
Semiconductors & Semiconductor Equipment | | | – | | | | 17,187,582 | | | | – | | | | – | | | | – | | | | (328,282 | ) | | | – | | | | – | | | | 16,859,300 | |
Technology Hardware, Storage & Peripherals | | | – | | | | 16,735,165 | | | | – | | | | – | | | | – | | | | 1,699,202 | | | | – | | | | – | | | | 18,434,367 | |
Totals | | | $179,648,146 | | | | $93,338,012 | | | | $(77,377,085 | ) | | | $ – | | | | $7,002,321 | | | | $(4,116,562 | ) | | | $ – | | | | $ – | | | | $198,494,832 | |
The following table presents additional information about valuation techniques and inputs used for investments that are measured at fair value and categorized within Level 3 at August 31, 2014:
| | | | | | | | | | |
| | | Ending Balance
at 8/31/14 | | | Valuation
Technique Used | | Unobservable
Inputs | | Input Values |
Investments in Securities – Assets | | |
Convertible Preferred Stock | | | $198,494,832 | | | Third-Party Pricing Vendor | | Single Broker Quote | | $31.81 – $660.73 |
The net change in unrealized appreciation/depreciation of Level 3 investments held at August 31, 2014 was $2,585,345. Net realized gain (loss) and net change in unrealized appreciation/depreciation are reflected on the Statement of Operations.
Glossary :
| | | | |
| REIT | | - | | Real Estate Investment Trust |
| | | | | | |
| 16 | | Semi-Annual Report | | | August 31, 2014 | | | See accompanying Notes to Financial Statements |
Schedule of Investments
AllianzGI Convertible & Income Fund II
August 31, 2014 (unaudited)
| | | | | | | | | | |
Principal
Amount
(000s) | | | | | | | Value | |
| | Corporate Bonds & Notes – 41.8% | | | | | | |
| | | | Advertising – 0.5% | | | | | | |
| | $4,350 | | | Affinion Group, Inc., 7.875%, 12/15/18 | | | | | $3,996,562 | |
| | | | Aerospace & Defense – 0.5% | | | | | | |
| | 250 | | | Bombardier, Inc., 6.00%, 10/15/22 (a)(b) | | | | | 254,688 | |
| | 4,430 | | | Erickson, Inc., 8.25%, 5/1/20 | | | | | 4,418,924 | |
| | | | | | | | | | 4,673,612 | |
| | | | Auto Components – 0.9% | | | | | | |
| | 3,320 | | | Chassix, Inc., 9.25%, 8/1/18 (a)(b) | | | | | 3,452,800 | |
| | 3,970 | | | Goodyear Tire & Rubber Co., 8.25%, 8/15/20 | | | | | 4,337,225 | |
| | | | | | | | | | 7,790,025 | |
| | | | Auto Manufacturers – 0.7% | | | | | | |
| | 5,590 | | | Chrysler Group LLC, 8.25%, 6/15/21 | | | | | 6,274,775 | |
| | | | Commercial Services – 2.6% | | | | | | |
| | 3,000 | | | Avis Budget Car Rental LLC/Avis Budget Finance, Inc., 9.75%, 3/15/20 | | | | | 3,375,000 | |
| | 8,535 | | | Cenveo Corp., 11.50%, 5/15/17 | | | | | 8,983,087 | |
| | 4,295 | | | DynCorp International, Inc., 10.375%, 7/1/17 | | | | | 4,090,988 | |
| | 5,925 | | | Monitronics International, Inc., 9.125%, 4/1/20 | | | | | 6,369,375 | |
| | | | | | | | | | 22,818,450 | |
| | | | Commercial Services & Supplies – 0.5% | | | | | | |
| | 4,355 | | | United Rentals North America, Inc., 8.375%, 9/15/20 | | | | | 4,768,725 | |
| | | | Construction Materials – 0.7% | | | | | | |
| | 5,690 | | | US Concrete, Inc., 8.50%, 12/1/18 | | | | | 6,173,650 | |
| | | | Consumer Finance – 0.9% | | | | | | |
| | 2,605 | | | Navient LLC, 8.45%, 6/15/18 | | | | | 3,037,951 | |
| | 3,865 | | | Springleaf Finance Corp., 8.25%, 10/1/23 | | | | | 4,493,062 | |
| | | | | | | | | | 7,531,013 | |
| | | | Distribution/Wholesale – 0.8% | | | | | | |
| | 6,430 | | | HD Supply, Inc., 11.00%, 4/15/20 | | | | | 7,474,875 | |
| | | | Diversified Consumer Services – 0.6% | | | | | | |
| | 5,270 | | | Cambium Learning Group, Inc., 9.75%, 2/15/17 | | | | | 5,349,050 | |
| | | | Diversified Financial Services – 1.9% | | | | | | |
| | 6,462 | | | Affinion Investments LLC, 13.50%, 8/15/18 (a)(b) | | | | | 6,413,237 | |
| | | | Community Choice Financial, Inc., | | | | | | |
| | 7,465 | | | 10.75%, 5/1/19 | | | | | 6,158,625 | |
| | 5,370 | | | 12.75%, 5/1/20 (a)(b) | | | | | 4,524,225 | |
| | | | | | | | | | 17,096,087 | |
| | | | Diversified Telecommunications – 0.4% | | | | | | |
| | 3,692 | | | Cincinnati Bell, Inc., 8.75%, 3/15/18 | | | | | 3,871,985 | |
| | | | Electrical Components & Equipment – 1.2% | | | | | | |
| | 10,275 | | | WireCo WorldGroup, Inc., 9.50%, 5/15/17 | | | | | 10,557,563 | |
| | | | Electronic Equipment, Instruments & Components – 1.3% | | | | | | |
| | 5,815 | | | Kemet Corp., 10.50%, 5/1/18 | | | | | 6,134,825 | |
| | 5,500 | | | Viasystems, Inc., 7.875%, 5/1/19 (a)(b) | | | | | 5,720,000 | |
| | | | | | | | | | 11,854,825 | |
| | | | Energy Equipment & Services – 0.6% | | | | | | |
| | 2,170 | | | Hercules Offshore, Inc., 8.75%, 7/15/21 (a)(b) | | | | | 2,202,550 | |
| | 3,103 | | | Pioneer Drilling Co., 9.875%, 3/15/18 | | | | | 3,266,063 | |
| | | | | | | | | | 5,468,613 | |
| | | | | | |
| August 31, 2014 | | | Semi-Annual Report | | | 17 | |
Schedule of Investments
AllianzGI Convertible & Income Fund II
August 31, 2014 (unaudited) (continued)
| | | | | | | | | | |
Principal
Amount
(000s) | | | | | | | Value | |
| | | | Food & Staples Retailing – 1.1% | | | | | | |
| | $4,000 | | | Rite Aid Corp., 10.25%, 10/15/19 | | | | | $4,245,000 | |
| | 5,000 | | | US Foods, Inc., 8.50%, 6/30/19 | | | | | 5,335,000 | |
| | | | | | | | | | 9,580,000 | |
| | | | Health Care Providers & Services – 0.8% | | | | | | |
| | 6,585 | | | ExamWorks Group, Inc., 9.00%, 7/15/19 | | | | | 7,144,725 | |
| | | | Healthcare-Products – 0.9% | | | | | | |
| | 6,785 | | | Kinetic Concepts, Inc./KCI USA, Inc., 10.50%, 11/1/18 | | | | | 7,590,719 | |
| | | | Hotels, Restaurants & Leisure – 1.8% | | | | | | |
| | 6,880 | | | DineEquity, Inc., 9.50%, 10/30/18 | | | | | 7,321,008 | |
| | 6,395 | | | MGM Resorts International, 11.375%, 3/1/18 | | | | | 8,105,662 | |
| | | | | | | | | | 15,426,670 | |
| | | | Household Durables – 0.9% | | | | | | |
| | | | Beazer Homes USA, Inc., | | | | | | |
| | 2,245 | | | 7.25%, 2/1/23 | | | | | 2,317,962 | |
| | 3,920 | | | 9.125%, 5/15/19 | | | | | 4,160,100 | |
| | 1,390 | | | Jarden Corp., 7.50%, 5/1/17 | | | | | 1,558,538 | |
| | | | | | | | | | 8,036,600 | |
| | | | Household Products/Wares – 0.7% | | | | | | |
| | 5,725 | | | Reynolds Group Issuer, Inc., 9.875%, 8/15/19 | | | | | 6,376,219 | |
| | | | Internet Software & Services – 1.2% | | | | | | |
| | | | EarthLink, Inc., | | | | | | |
| | 2,200 | | | 7.375%, 6/1/20 | | | | | 2,326,500 | |
| | 7,590 | | | 8.875%, 5/15/19 | | | | | 7,798,725 | |
| | | | | | | | | | 10,125,225 | |
| | | | Iron/Steel – 0.7% | | | | | | |
| | 5,600 | | | AK Steel Corp., 8.375%, 4/1/22 | | | | | 5,936,000 | |
| | | | Leisure Time – 0.9% | | | | | | |
| | 8,145 | | | Travelport LLC, 11.875%, 9/1/16 | | | | | 8,175,544 | |
| | | | Lodging – 0.3% | | | | | | |
| | 9,455 | | | Caesars Entertainment Operating Co., Inc., 12.75%, 4/15/18 | | | | | 2,694,675 | |
| | | | Machinery – 0.7% | | | | | | |
| | 5,495 | | | Navistar International Corp., 8.25%, 11/1/21 | | | | | 5,721,669 | |
| | | | Media – 3.0% | | | | | | |
| | 5,500 | | | AMC Entertainment, Inc., 9.75%, 12/1/20 | | | | | 6,201,250 | |
| | 6,645 | | | McClatchy Co., 9.00%, 12/15/22 | | | | | 7,508,850 | |
| | 6,280 | | | McGraw-Hill Global Education Holdings LLC / McGraw-Hill Global Education Finance, 9.75%, 4/1/21 | | | | | 7,127,800 | |
| | 2,850 | | | Mood Media Corp., 9.25%, 10/15/20 (a)(b) | | | | | 2,493,750 | |
| | 2,979 | | | SFX Entertainment, Inc., 9.625%, 2/1/19 (a)(b) | | | | | 3,053,475 | |
| | | | | | | | | | 26,385,125 | |
| | | | Metals & Mining – 1.7% | | | | | | |
| | 5,050 | | | ArcelorMittal, 10.35%, 6/1/19 | | | | | 6,381,937 | |
| | | | Thompson Creek Metals Co., Inc., | | | | | | |
| | 6,145 | | | 7.375%, 6/1/18 | | | | | 6,175,725 | |
| | 2,170 | | | 12.50%, 5/1/19 | | | | | 2,462,950 | |
| | | | | | | | | | 15,020,612 | |
| | | | |
| 18 | | Semi-Annual Report | | | August 31, 2014 |
Schedule of Investments
AllianzGI Convertible & Income Fund II
August 31, 2014 (unaudited) (continued)
| | | | | | | | | | |
Principal
Amount
(000s) | | | | | | | Value | |
| | | | Miscellaneous Manufacturing – 0.3% | | | | | | |
| | $2,900 | | | Harland Clarke Holdings Corp., 9.25%, 3/1/21 (a)(b) | | | | | $3,019,625 | |
| | | | Oil & Gas – 1.4% | | | | | | |
| | 7,000 | | | Energy XXI Gulf Coast, Inc., 9.25%, 12/15/17 | | | | | 7,455,000 | |
| | 4,306 | | | United Refining Co., 10.50%, 2/28/18 | | | | | 4,672,010 | |
| | | | | | | | | | 12,127,010 | |
| | | | Oil, Gas & Consumable Fuels – 2.1% | | | | | | |
| | 2,160 | | | Arch Coal, Inc., 9.875%, 6/15/19 | | | | | 1,760,400 | |
| | 7,510 | | | Endeavour International Corp., 12.00%, 3/1/18 | | | | | 6,871,650 | |
| | 4,550 | | | EP Energy LLC / Everest Acquisition Finance, Inc., 9.375%, 5/1/20 | | | | | 5,152,875 | |
| | 4,200 | | | Laredo Petroleum, Inc., 9.50%, 2/15/19 | | | | | 4,536,000 | |
| | | | | | | | | | 18,320,925 | |
| | | | Packaging & Containers – 0.7% | | | | | | |
| | 5,903 | | | Tekni-Plex, Inc., 9.75%, 6/1/19 (a)(b) | | | | | 6,508,058 | |
| | | | Paper & Forest Products – 0.3% | | | | | | |
| | 2,000 | | | Louisiana-Pacific Corp., 7.50%, 6/1/20 | | | | | 2,190,000 | |
| | | | Retail – 1.3% | | | | | | |
| | 5,785 | | | Neiman Marcus Group Ltd., Inc., 8.00%, 10/15/21 (a)(b) | | | | | 6,269,494 | |
| | 5,890 | | | Toys “R” Us, Inc., 10.375%, 8/15/17 | | | | | 5,168,475 | |
| | | | | | | | | | 11,437,969 | |
| | | | Semiconductors & Semiconductor Equipment – 0.7% | | | | | | |
| | 5,545 | | | Freescale Semiconductor, Inc., 10.75%, 8/1/20 | | | | | 6,251,987 | |
| | | | Software – 1.7% | | | | | | |
| | | | First Data Corp., | | | | | | |
| | 4,355 | | | 8.25%, 1/15/21 (a)(b) | | | | | 4,768,725 | |
| | 1,465 | | | 10.625%, 6/15/21 | | | | | 1,706,725 | |
| | 6,955 | | | 12.625%, 1/15/21 | | | | | 8,519,875 | |
| | | | | | | | | | 14,995,325 | |
| | | | Specialty Retail – 1.2% | | | | | | |
| | 3,140 | | | Brown Shoe Co., Inc., 7.125%, 5/15/19 | | | | | 3,320,550 | |
| | 4,500 | | | Claire’s Stores, Inc., 9.00%, 3/15/19 (a)(b) | | | | | 4,713,750 | |
| | 3,000 | | | Conn’s, Inc., 7.25%, 7/15/22 (a)(b) | | | | | 2,910,000 | |
| | | | | | | | | | 10,944,300 | |
| | | | Telecommunications – 1.1% | | | | | | |
| | 6,085 | | | Consolidated Communications Finance Co., 10.875%, 6/1/20 | | | | | 7,050,994 | |
| | 3,475 | | | NII International Telecom SCA, 11.375%, 8/15/19 (a)(b) | | | | | 2,328,250 | |
| | | | | | | | | | 9,379,244 | |
| | | | Transportation – 1.4% | | | | | | |
| | 5,340 | | | Quality Distribution LLC, 9.875%, 11/1/18 | | | | | 5,687,100 | |
| | 6,590 | | | Swift Services Holdings, Inc., 10.00%, 11/15/18 | | | | | 7,051,300 | |
| | | | | | | | | | 12,738,400 | |
| | | | Wireless Telecommunication Services – 0.8% | | | | | | |
| | 5,545 | | | Sprint Communications, Inc., 11.50%, 11/15/21 | | | | | 7,263,950 | |
| | Total Corporate Bonds & Notes (cost-$363,562,611) | | | | | 369,090,386 | |
| | | | | | |
| August 31, 2014 | | | Semi-Annual Report | | | 19 | |
Schedule of Investments
AllianzGI Convertible & Income Fund II
August 31, 2014 (unaudited) (continued)
| | | | | | | | | | |
| Shares | | | | | | | Value | |
| | Convertible Preferred Stock – 39.1% | | | | | | |
| | | | Aerospace & Defense – 1.2% | | | | | | |
| | 181,200 | | | United Technologies Corp., 7.50%, 8/1/15 | | | | | $10,882,872 | |
| | | | Airlines – 1.7% | | | | | | |
| | 296,875 | | | Continental Airlines Finance Trust II, 6.00%, 11/15/30 | | | | | 14,899,414 | |
| | | | Automobiles – 1.4% | | | | | | |
| | 378,190 | | | The Goldman Sachs Group, Inc., 8.50%, 12/16/14 (General Motors) (c) | | | | | 12,624,360 | |
| | | | Commercial Banks – 4.1% | | | | | | |
| | 7,455 | | | Huntington Bancshares, Inc., 8.50%, (d) | | | | | 10,064,250 | |
| | 283,055 | | | The Goldman Sachs Group, Inc., 8.00%, 1/14/15 (Citigroup Inc.) (c) | | | | | 13,704,674 | |
| | 9,900 | | | Wells Fargo & Co., 7.50%, Ser. L (d) | | | | | 12,038,103 | |
| | | | | | | | | | 35,807,027 | |
| | | | Diversified Financial Services – 1.4% | | | | | | |
| | 10,530 | | | Bank of America Corp., 7.25%, 4/30/14, Ser. L (d) | | | | | 12,330,630 | |
| | | | Diversified Telecommunication Services – 0.1% | | | | | | |
| | 19,665 | | | Intelsat SA, 5.75%, 5/1/16 | | | | | 942,937 | |
| | | | Electric Utilities – 2.5% | | | | | | |
| | 134,610 | | | Exelon Corp., 6.50%, 6/1/17 | | | | | 6,797,805 | |
| | 273,500 | | | NextEra Energy, Inc., 5.799%, 9/1/16 | | | | | 15,069,850 | |
| | | | | | | | | | 21,867,655 | |
| | | | Energy Equipment & Services – 1.8% | | | | | | |
| | 240,590 | | | Credit Suisse, 8.00%, 3/5/15 (Baker Hughes) (c) | | | | | 15,337,612 | |
| | | | Food Products – 0.2% | | | | | | |
| | 36,255 | | | Tyson Foods, Inc., 4.75%, 7/15/17 | | | | | 1,821,089 | |
| | | | Health Care Equipment & Supplies – 1.5% | | | | | | |
| | 210,000 | | | Credit Suisse AG, 8.00%, 6/23/15 (Medtronic, Inc.) (c) | | | | | 13,173,300 | |
| | | | Health Care Providers & Services – 1.8% | | | | | | |
| | 257,800 | | | JPMorgan Chase & Co., 8.00%, 5/5/15 (HCA Holdings, Inc.) (c) | | | | | 15,658,772 | |
| | | | Household Durables – 1.7% | | | | | | |
| | 128,815 | | | Stanley Black & Decker, Inc., 6.25%, 11/17/16 | | | | | 14,968,303 | |
| | | | Insurance – 0.5% | | | | | | |
| | 148,125 | | | MetLife, Inc., 5.00%, 10/8/14 | | | | | 4,646,681 | |
| | | | Metals & Mining – 2.2% | | | | | | |
| | 527,150 | | | ArcelorMittal, 6.00%, 1/15/16 | | | | | 11,959,716 | |
| | 513,000 | | | Cliffs Natural Resources, Inc., 7.00%, 2/1/16 | | | | | 7,679,610 | |
| | | | | | | | | | 19,639,326 | |
| | | | Multiline Retail – 1.6% | | | | | | |
| | 247,500 | | | The Goldman Sachs Group, Inc., 8.00%, 1/12/15 (Macy’s) (c) | | | | | 13,997,362 | |
| | | | Multi-Utilities – 1.1% | | | | | | |
| | 186,560 | | | AES Trust III, 6.75%, 10/15/29 | | | | | 9,510,829 | |
| | | | Oil, Gas & Consumable Fuels – 2.4% | | | | | | |
| | 146,765 | | | Credit Suisse, 8.00%, 3/5/15 (Occidental Petroleum Corp.) (c) | | | | | 14,242,075 | |
| | 10,900 | | | Energy XXI Bermuda Ltd., 5.625%, (d) | | | | | 2,558,094 | |
| | 94,905 | | | PetroQuest Energy, Inc., 6.875%, (d) | | | | | 4,341,904 | |
| | | | | | | | | | 21,142,073 | |
| | | | Pharmaceuticals – 3.0% | | | | | | |
| | 110,990 | | | Bank of America Corp., 8.00%, 2/10/15 (Allergan, Inc.) (c) | | | | | 15,024,717 | |
| | 253,015 | | | JPMorgan Chase & Co., 8.00%, 4/30/15 (Mylan, Inc.) (c) | | | | | 11,626,039 | |
| | | | | | | | | | 26,650,756 | |
| | | | |
| 20 | | Semi-Annual Report | | | August 31, 2014 |
Schedule of Investments
AllianzGI Convertible & Income Fund II
August 31, 2014 (unaudited) (continued)
| | | | | | | | | | |
| Shares | | | | | | | Value | |
| | | | Real Estate Investment Trust – 4.2% | | | | | | |
| | 335,200 | | | Alexandria Real Estate Equities, Inc., 7.00%, (d) | | | | | $9,281,688 | |
| | 610,095 | | | FelCor Lodging Trust, Inc., 1.95%, Ser. A (d) | | | | | 15,404,899 | |
| | 159,235 | | | Health Care REIT, Inc., 6.50%, 4/20/18, Ser. I (d) | | | | | 9,700,596 | |
| | 43,070 | | | Weyerhaeuser Co., 6.375%, 7/1/16 | | | | | 2,487,723 | |
| | | | | | | | | | 36,874,906 | |
| | | | Semiconductors & Semiconductor Equipment – 1.5% | | | | | | |
| | 420,000 | | | Wells Fargo & Co., 8.00%, 6/18/15 (Micron Technology, Inc.) (c) | | | | | 13,360,200 | |
| | | | Specialty Retail – 1.6% | | | | | | |
| | 10,000 | | | Barnes & Noble, Inc., 7.75%, 8/18/21 (a) | | | | | 14,441,875 | |
| | | | Technology Hardware, Storage & Peripherals – 1.6% | | | | | | |
| | 21,135 | | | Bank of America Corp., 8.00%, 5/12/15 (Apple, Inc.) (c) | | | | | 13,964,529 | |
| | Total Convertible Preferred Stock (cost-$317,130,944) | | | | | 344,542,508 | |
| | | |
Principal
Amount
(000s) | | | | | | | | |
| | Convertible Bonds & Notes – 17.0% | | | | | | |
| | | | Biotechnology – 0.3% | | | | | | |
| | $4,065 | | | Dendreon Corp., 2.875%, 1/15/16 | | | | | 2,855,662 | |
| | | | Capital Markets – 2.6% | | | | | | |
| | 5,880 | | | Ares Capital Corp., 5.75%, 2/1/16 | | | | | 6,240,150 | |
| | 10,075 | | | BGC Partners, Inc., 4.50%, 7/15/16 | | | | | 10,685,797 | |
| | 6,370 | | | Walter Investment Management Corp., 4.50%, 11/1/19 | | | | | 5,725,037 | |
| | | | | | | | | | 22,650,984 | |
| | | | Commercial Services – 1.9% | | | | | | |
| | 15,600 | | | Cenveo Corp., 7.00%, 5/15/17 | | | | | 17,052,750 | |
| | | | Construction Materials – 0.8% | | | | | | |
| | 5,850 | | | Cemex S.A.B. de C.V., 4.875%, 3/15/15 | | | | | 7,147,969 | |
| | | | Hotels, Restaurants & Leisure – 1.9% | | | | | | |
| | 5,615 | | | MGM Resorts International, 4.25%, 4/15/15 | | | | | 7,615,343 | |
| | 9,175 | | | Morgans Hotel Group Co., 2.375%, 10/15/14 | | | | | 9,140,594 | |
| | | | | | | | | | 16,755,937 | |
| | | | Insurance – 0.3% | | | | | | |
| | 3,035 | | | HCI Group, Inc., 3.875%, 3/15/19 (a)(b) | | | | | 2,919,291 | |
| | | | Life Sciences Tools & Services – 0.8% | | | | | | |
| | 6,265 | | | Sequenom, Inc., 5.00%, 10/1/17 | | | | | 6,754,453 | |
| | | | Machinery – 3.1% | | | | | | |
| | | | Meritor, Inc., | | | | | | |
| | 9,545 | | | 4.625%, 3/1/26 (e) | | | | | 10,642,675 | |
| | 4,325 | | | 7.875%, 3/1/26 | | | | | 7,168,687 | |
| | 8,665 | | | Navistar International Corp., 3.00%, 10/15/14 | | | | | 8,784,144 | |
| | 675 | | | Wabash National Corp., 3.375%, 5/1/18 | | | | | 940,359 | |
| | | | | | | | | | 27,535,865 | |
| | | | Oil, Gas & Consumable Fuels – 0.4% | | | | | | |
| | 7,135 | | | Endeavour International Corp., 5.50%, 7/15/16 | | | | | 3,638,850 | |
| | | | Personal Products – 0.4% | | | | | | |
| | 4,115 | | | Herbalife Ltd., 2.00%, 8/15/19 (a)(b) | | | | | 3,227,724 | |
| | | | | | |
| August 31, 2014 | | | Semi-Annual Report | | | 21 | |
Schedule of Investments
AllianzGI Convertible & Income Fund II
August 31, 2014 (unaudited) (continued)
| | | | | | | | | | |
Principal
Amount
(000s) | | | | | | | Value | |
| | | | Real Estate Investment Trust – 0.3% | | | | | | |
| | $2,430 | | | IAS Operating Partnership LP, 5.00%, 3/15/18 (a)(b) | | | | | $2,382,919 | |
| | | | Software – 1.4% | | | | | | |
| | 4,835 | | | Nuance Communications, Inc., 2.75%, 8/15/27 | | | | | 4,844,066 | |
| | 7,890 | | | TeleCommunication Systems, Inc., 7.75%, 6/30/18 | | | | | 7,850,550 | |
| | | | | | | | | | 12,694,616 | |
| | | | Thrifts & Mortgage Finance – 0.6% | | | | | | |
| | 4,965 | | | MGIC Investment Corp., 5.00%, 5/1/17 | | | | | 5,557,697 | |
| | | | Tobacco – 2.1% | | | | | | |
| | | | Vector Group Ltd., (f) | | | | | | |
| | 4,335 | | | 1.75%, 4/15/20 | | | | | 4,895,841 | |
| | 9,035 | | | 2.50%, 1/15/19 | | | | | 13,178,993 | |
| | | | | | | | | | 18,074,834 | |
| | | | Trading Companies & Distribution – 0.1% | | | | | | |
| | 910 | | | Titan Machinery, Inc., 3.75%, 5/1/19 | | | | | 712,075 | |
| | Total Convertible Bonds & Notes (cost-$134,716,615) | | | | | 149,961,626 | |
| | Short-Term Investment – 2.1% | | | | | | |
| | | | Time Deposit – 2.1% | | | | | | |
| | 18,405 | | | JP Morgan Chase & Co.-Nassau, 0.03%, 9/2/14 (cost-$18,405,183) | | | | | 18,405,183 | |
| | Total Investments (cost-$833,815,353) – 100.0% | | | | | $881,999,703 | |
Notes to Schedule of Investments:
| (a) | | Private Placement–Restricted as to resale and may not have a readily available market. Securities with an aggregate value of $81,604,436, representing 9.3% of total investments. | |
| (b) | | 144A–Exempt from registration under Rule 144A of the Securities Act of 1933. These securities may be resold in transactions exempt from registration, typically only to qualified institutional buyers. Unless otherwise indicated, these securities are not considered to be illiquid. | |
| (c) | | Securities exchangeable or convertible into securities of an entity different than the issuer or structured by the issuer to provide exposure to securities of an entity different than the issuer (synthetic convertible securities). Such entity is identified in the parenthetical. | |
| (d) | | Perpetual maturity. The date shown, if any, is the next call date. | |
| (e) | | Step Bond–Coupon is a fixed rate for an initial period then resets at a specific date and rate. | |
| (f) | | In addition to the coupon rate shown, the issuer is expected to pay additional interest based on the actual dividends paid on its common stock. | |
| | | | |
| 22 | | Semi-Annual Report | | | August 31, 2014 |
Schedule of Investments
AllianzGI Convertible & Income Fund II
August 31, 2014 (unaudited) (continued)
| (g) | | Fair Value Measurements–See Note 1(b) in Notes to Financial Statements. | |
| | | | | | | | | | | | | | | | |
| | | Level 1 –
Quoted
Prices | | | Level 2 –
Other Significant
Observable
Inputs | | | Level 3 –
Significant
Unobservable
Inputs | | | Value at
8/31/14 | |
Investments in Securities – Assets | | | | | | | | | | | | | | | | |
Corporate Bonds & Notes | | $ | – | | | $ | 369,090,386 | | | $ | – | | | $ | 369,090,386 | |
Convertible Preferred Stock: | | | | | | | | | | | | | | | | |
Airlines | | | – | | | | 14,899,414 | | | | – | | | | 14,899,414 | |
Automobiles | | | – | | | | – | | | | 12,624,360 | | | | 12,624,360 | |
Commercial Banks | | | 22,102,353 | | | | – | | | | 13,704,674 | | | | 35,807,027 | |
Diversified Telecommunication Services | | | – | | | | 942,937 | | | | – | | | | 942,937 | |
Energy Equipment & Services | | | – | | | | – | | | | 15,337,612 | | | | 15,337,612 | |
Health Care Equipment & Supplies | | | – | | | | – | | | | 13,173,300 | | | | 13,173,300 | |
Health Care Providers & Services | | | – | | | | – | | | | 15,658,772 | | | | 15,658,772 | |
Metals & Mining | | | 7,679,610 | | | | 11,959,716 | | | | – | | | | 19,639,326 | |
Multiline Retail | | | – | | | | – | | | | 13,997,362 | | | | 13,997,362 | |
Oil, Gas & Consumable Fuels | | | – | | | | 6,899,998 | | | | 14,242,075 | | | | 21,142,073 | |
Pharmaceuticals | | | – | | | | – | | | | 26,650,756 | | | | 26,650,756 | |
Semiconductors & Semiconductor Equipment | | | – | | | | – | | | | 13,360,200 | | | | 13,360,200 | |
Technology Hardware, Storage & Peripherals | | | – | | | | – | | | | 13,964,529 | | | | 13,964,529 | |
All Other | | | 127,344,840 | | | | – | | | | – | | | | 127,344,840 | |
Convertible Bonds & Notes | | | – | | | | 149,961,626 | | | | – | | | | 149,961,626 | |
Short-Term Investment | | | – | | | | 18,405,183 | | | | – | | | | 18,405,183 | |
Totals | | $ | 157,126,803 | | | $ | 572,159,260 | | | $ | 152,713,640 | | | $ | 881,999,703 | |
At August 31, 2014, there were no transfers between Levels 1 and 2.
| | | | | | |
| August 31, 2014 | | | Semi-Annual Report | | | 23 | |
Schedule of Investments
AllianzGI Convertible & Income Fund II
August 31, 2014 (unaudited) (continued)
A roll forward of fair value measurements using significant unobservable inputs (Level 3) for the six months ended August 31, 2014, was as follows:
| | | | | | | | | | | | | | | | | | | | | | | | | | | | | | | | | | | | |
| | | Beginning
Balance
2/28/14 | | | Purchases | | | Sales | | | Accrued
Discounts
(Premiums) | | | Net
Realized
Gain
(Loss) | | | Net Change
in Unrealized
Appreciation/
Depreciation | | | Transfers
into
Level 3 | | | Transfers
out of
Level 3 | | | Ending
Balance
8/31/14 | |
Investments in Securities – Assets | | | | | | | | | | | | | | | | | | | | | | | | | |
Convertible Preferred Stock: | | | | | | | | | | | | | | | | | | | | | | | | | | | | | | | | | | | | |
Automobiles | | $ | 10,665,088 | | | $ | 3,291,221 | | | $ | – | | | $ | – | | | $ | – | | | $ | (1,331,949 | ) | | $ | – | | | $ | – | | | $ | 12,624,360 | |
Commercial Banks | | | 12,419,982 | | | | 1,856,536 | | | | – | | | | – | | | | – | | | | (571,844 | ) | | | – | | | | – | | | | 13,704,674 | |
Computers & Peripherals | | | 9,953,184 | | | | – | | | | (9,979,317 | )† | | | – | | | | – | | | | 26,133 | | | | – | | | | – | | | | – | |
Energy Equipment & Services | | | 30,527,518 | | | | – | | | | (17,234,994 | ) | | | – | | | | 2,742,995 | | | | (697,907 | ) | | | – | | | | – | | | | 15,337,612 | |
Health Care Equipment & Supplies | | | – | | | | 13,622,700 | | | | – | | | | – | | | | – | | | | (449,400 | ) | | | – | | | | – | | | | 13,173,300 | |
Health Care Providers & Services | | | – | | | | 13,692,995 | | | | – | | | | – | | | | – | | | | 1,965,777 | | | | – | | | | – | | | | 15,658,772 | |
Household Durables | | | 11,014,697 | | | | – | | | | (10,642,786 | )† | | | – | | | | – | | | | (371,911 | ) | | | – | | | | – | | | | – | |
Insurance | | | 11,203,425 | | | | – | | | | (11,413,579 | ) | | | – | | | | 1,009,973 | | | | (799,819 | ) | | | – | | | | – | | | | – | |
Multiline Retail | | | 13,804,312 | | | | – | | | | – | | | | – | | | | – | | | | 193,050 | | | | – | | | | – | | | | 13,997,362 | |
Oil, Gas & Consumable Fuels | | | 13,964,690 | | | | – | | | | – | | | | – | | | | – | | | | 277,385 | | | | – | | | | – | | | | 14,242,075 | |
Pharmaceuticals | | | 13,436,449 | | | | 12,679,088 | | | | – | | | | – | | | | – | | | | 535,219 | | | | – | | | | – | | | | 26,650,756 | |
Semiconductors & Semiconductor Equipment | | | – | | | | 13,620,348 | | | | – | | | | – | | | | – | | | | (260,148 | ) | | | – | | | | – | | | | 13,360,200 | |
Technology Hardware, Storage & Peripherals | | | – | | | | 12,677,337 | | | | – | | | | – | | | | – | | | | 1,287,192 | | | | – | | | | – | | | | 13,964,529 | |
Totals | | $ | 126,989,345 | | | $ | 71,440,225 | | | $ | (49,270,676 | ) | | $ | – | | | $ | 3,752,968 | | | $ | (198,222 | ) | | $ | – | | | $ | – | | | $ | 152,713,640 | |
The following table presents additional information about valuation techniques and inputs used for investments that are measured at fair value and categorized within Level 3 at August 31, 2014:
| | | | | | | | | | |
| | | Ending Balance
at 8/31/14 | | | Valuation
Technique Used | | Unobservable
Inputs | | Input Values |
Investments in Securities – Assets | | |
Convertible Preferred Stock | | | $152,713,640 | | | Third-Party Pricing Vendor | | Single Broker Quote | | $31.81 – $660.73 |
The net change in unrealized appreciation/depreciation of Level 3 investments held at August 31, 2014 was $1,965,637. Net realized gain (loss) and net change in unrealized appreciation/depreciation are reflected on the Statement of Operations.
Glossary:
| | | | |
| REIT | | - | | Real Estate Investment Trust |
| | | | | | |
| 24 | | Semi-Annual Report | | | August 31, 2014 | | | See accompanying Notes to Financial Statements |
Statements of Assets and Liabilities
AllianzGI Convertible & Income Funds
August 31, 2014 (unaudited)
| | | | | | | | | | | | |
| | | | | Convertible &
Income | | | | | Convertible &
Income II | |
| Assets: | | | | | | | | | | | | |
| Investments, at value (cost-$1,089,561,189 and $833,815,353, respectively) | | | | | $1,150,596,605 | | | | | | $881,999,703 | |
| Dividends and interest receivable | | | | | 17,773,646 | | | | | | 13,763,307 | |
| Receivable for investments sold | | | | | 12,465,201 | | | | | | 9,433,345 | |
| Prepaid expenses | | | | | 93,368 | | | | | | 49,869 | |
Total Assets | | | | | 1,180,928,820 | | | | | | 905,246,224 | |
| | | | |
| Liabilities: | | | | | | | | | | | | |
| Dividends payable to common and preferred shareholders | | | | | 7,875,262 | | | | | | 6,273,394 | |
| Payable for investments purchased | | | | | 3,322,150 | | | | | | 8,805,599 | |
| Investment management fees payable | | | | | 689,760 | | | | | | 524,919 | |
| Accrued expenses | | | | | 158,511 | | | | | | 147,515 | |
Total Liabilities | | | | | 12,045,683 | | | | | | 15,751,427 | |
| Preferred Shares ($0.00001 par value; $25,000 liquidation preference per share applicable to an aggregate 14,280 and 10,960 shares issued and outstanding, respectively) | | | | | 357,000,000 | | | | | | 274,000,000 | |
| Net Assets Applicable to Common Shareholders | | | | | $811,883,137 | | | | | | $615,494,797 | |
| | | | |
| Composition of Net Assets Applicable to Common Shareholders: | | | | | | | | | | | | |
| Common Shares: | | | | | | | | | | | | |
Par value ($0.00001 per share) | | | | | $874 | | | | | | $738 | |
Paid-in-capital in excess of par | | | | | 1,170,619,181 | | | | | | 965,129,290 | |
| Undistributed (dividends in excess of) net investment income | | | | | 6,730,333 | | | | | | (281,088) | |
| Accumulated net realized loss | | | | | (426,502,667) | | | | | | (397,538,493) | |
| Net unrealized appreciation | | | | | 61,035,416 | | | | | | 48,184,350 | |
| Net Assets Applicable to Common Shareholders | | | | | $811,883,137 | | | | | | $615,494,797 | |
| Common Shares Issued and Outstanding | | | | | 87,427,482 | | | | | | 73,757,132 | |
| Net Asset Value Per Common Share | | | | | $9.29 | | | | | | $8.34 | |
| | | | | | | | |
| See accompanying Notes to Financial Statements | | | August 31, 2014 | | | Semi-Annual Report | | | 25 | |
Statements of Operations
AllianzGI Convertible & Income Funds
Six Months ended August 31, 2014 (unaudited)
| | | | | | | | | | | | |
| | | | | Convertible &
Income | | | | | Convertible &
Income II | |
| Investment Income: | | | | | | | | | | | | |
| Interest | | | | | $27,905,547 | | | | | | $21,489,487 | |
| Dividends | | | | | 18,835,663 | | | | | | 14,501,353 | |
| Miscellaneous | | | | | 113,550 | | | | | | 90,450 | |
Total Investment Income | | | | | 46,854,760 | | | | | | 36,081,290 | |
| | | | |
| Expenses: | | | | | | | | | | | | |
| Investment management | | | | | 4,130,601 | | | | | | 3,152,652 | |
| Auction agent | | | | | 283,031 | | | | | | 213,594 | |
| Custodian and accounting agent | | | | | 80,072 | | | | | | 75,606 | |
| New York Stock Exchange listing | | | | | 48,024 | | | | | | 40,876 | |
| Shareholder communications | | | | | 46,867 | | | | | | 38,943 | |
| Audit and tax services | | | | | 43,863 | | | | | | 46,863 | |
| Legal | | | | | 34,594 | | | | | | 19,276 | |
| Trustees | | | | | 33,092 | | | | | | 26,809 | |
| Insurance | | | | | 14,890 | | | | | | 12,056 | |
| Transfer agent | | | | | 12,963 | | | | | | 12,934 | |
| Miscellaneous | | | | | 8,429 | | | | | | 17,535 | |
Total Expenses | | | | | 4,736,426 | | | | | | 3,657,144 | |
| | | | |
| Net Investment Income | | | | | 42,118,334 | | | | | | 32,424,146 | |
| | | | |
| Realized and Change in Unrealized Gain (Loss): | | | | | | | | | | | | |
| Net realized gain on investments | | | | | 11,793,489 | | | | | | 8,547,875 | |
| Payments from affiliates (See Note 8) | | | | | 166,674 | | | | | | 120,146 | |
| Net change in unrealized appreciation/depreciation of investments | | | | | (25,469,599) | | | | | | (17,247,592) | |
| Net realized and change in unrealized loss | | | | | (13,509,436) | | | | | | (8,579,571) | |
| Net Increase in Net Assets Resulting from Investment Operations | | | | | 28,608,898 | | | | | | 23,844,575 | |
| Dividends on Preferred Shares from Net investment income | | | | | (204,030) | | | | | | (156,594) | |
| Net Increase in Net Assets Applicable to Common Shareholders Resulting from Investments Operations | | | | | $28,404,868 | | | | | | $23,687,981 | |
| | | | | | |
| 26 | | Semi-Annual Report | | | August 31, 2014 | | | See accompanying Notes to Financial Statements |
Statement of Changes in Net Assets Applicable to Common Shareholders
AllianzGI Convertible & Income Fund
August 31, 2014
| | | | | | | | | | | | |
| | | | | Six Months ended
August 31, 2014
(unaudited) | | | | | Year ended
February 28, 2014 | |
| Investments Operations: | | | | | | | | | | | | |
| Net investment income | | | | | $42,118,334 | | | | | | $82,352,257 | |
| Net realized gain | | | | | 11,960,163 | | | | | | 38,399,174 | |
| Net change in unrealized appreciation/depreciation | | | | | (25,469,599) | | | | | | 21,883,465 | |
| Net increase in net assets resulting from investment operations | | | | | 28,608,898 | | | | | | 142,634,896 | |
| | | | |
| Dividends on Preferred Shares from Net Investment Income | | | | | (204,030) | | | | | | (462,676) | |
| Net increase in net assets applicable to common shareholders resulting from investment operations | | | | | 28,404,868 | | | | | | 142,172,220 | |
| | | | |
| Dividends to Common Shareholders from Net Investment Income | | | | | (46,960,790) | | | | | | (87,527,246) | |
| | | | |
| Common Share Transactions: | | | | | | | | | | | | |
| Net proceeds from shares sold | | | | | 16,959,259 | | | | | | 72,694,937 | |
| Offering costs on sale of shares (See Note 7) | | | | | (16,983) | | | | | | (214,454) | |
| Reinvestment of dividends | | | | | 2,099,721 | | | | | | 4,249,654 | |
| Net increase in net assets from common share transactions | | | | | 19,041,997 | | | | | | 76,730,137 | |
| Total increase in net assets applicable to common shareholders | | | | | 486,075 | | | | | | 131,375,111 | |
| | | | |
| Net Assets Applicable to Common Shareholders: | | | | | | | | | | | | |
| Beginning of period | | | | | 811,397,062 | | | | | | 680,021,951 | |
| End of period* | | | | | $811,883,137 | | | | | | $811,397,062 | |
| *Including undistributed net investment income of: | | | | | $6,730,333 | | | | | | $11,776,819 | |
| | | | |
| Common Shares Issued: | | | | | | | | | | | | |
| Shares sold | | | | | 1,678,728 | | | | | | 7,635,105 | |
| Reinvestment of dividends | | | | | 215,494 | | | | | | 464,659 | |
| Total increase in shares outstanding | | | | | 1,894,222 | | | | | | 8,099,764 | |
| | | | | | | | |
| See accompanying Notes to Financial Statements | | | August 31, 2014 | | | Semi-Annual Report | | | 27 | |
Statement of Changes in Net Assets Applicable to Common Shareholders
AllianzGI Convertible & Income Fund II
August 31, 2014
| | | | | | | | | | | | |
| | | | | Six Months ended
August 31, 2014
(unaudited) | | | | | Year ended
February 28, 2014 | |
| Investments Operations: | | | | | | | | | | | | |
| Net investment income | | | | | $32,424,146 | | | | | | $66,319,859 | |
| Net realized gain | | | | | 8,668,021 | | | | | | 26,482,017 | |
| Net change in unrealized appreciation/depreciation | | | | | (17,247,592) | | | | | | 15,214,503 | |
| Net increase in net assets resulting from investment operations | | | | | 23,844,575 | | | | | | 108,016,379 | |
| | | | |
| Dividends on Preferred Shares from Net Investment Income | | | | | (156,594) | | | | | | (355,107) | |
| Net increase in net assets applicable to common shareholders resulting from investment operations | | | | | 23,687,981 | | | | | | 107,661,272 | |
| | | | |
| Dividends to Common Shareholders from Net Investment Income | | | | | (37,563,026) | | | | | | (71,177,580) | |
| | | | |
| Common Share Transactions: | | | | | | | | | | | | |
| Net proceeds from shares sold | | | | | – | | | | | | 67,744,043 | |
| Offering costs on sale of shares (See Note 7) | | | | | – | | | | | | (202,305) | |
| Reinvestment of dividends | | | | | 2,258,289 | | | | | | 4,809,455 | |
| Net increase in net assets from common share transactions | | | | | 2,258,289 | | | | | | 72,351,193 | |
| Total increase (decrease) in net assets applicable to common shareholders | | | | | (11,616,756) | | | | | | 108,834,885 | |
| | | | |
| Net Assets Applicable to Common Shareholders: | | | | | | | | | | | | |
| Beginning of period | | | | | 627,111,553 | | | | | | 518,276,668 | |
| End of period* | | | | | $615,494,797 | | | | | | $627,111,553 | |
| *Including undistributed (dividends in excess of) net investment income of: | | | | | $(281,088) | | | | | | $5,014,386 | |
| | | | |
| Common Shares Issued: | | | | | | | | | | | | |
| Shares sold | | | | | – | | | | | | 7,869,665 | |
| Reinvestment of dividends | | | | | 244,680 | | | | | | 574,843 | |
| Total increase in shares outstanding | | | | | 244,680 | | | | | | 8,444,508 | |
| | | | | | |
| 28 | | Semi-Annual Report | | | August 31, 2014 | | | See accompanying Notes to Financial Statements |
Notes to Financial Statements
AllianzGI Convertible & Income Funds
August 31, 2014 (unaudited)
1. Organization and Significant Accounting Policies
AllianzGI Convertible & Income Fund (“Convertible & Income”) and AllianzGI Convertible & Income Fund II (“Convertible & Income II”) (each a “Fund” and collectively the “Funds”), were organized as Massachusetts business trusts on January 17, 2003 and April 22, 2003, respectively. Prior to commencing operations on March 31, 2003, and July 31, 2003, respectively, the Funds had no operations other than matters relating to their organization and registration as diversified, closed-end management investment companies under the Investment Company Act of 1940, as amended, and the rules and regulations thereunder. Allianz Global Investors Fund Management LLC (the “Investment Manager”) and Allianz Global Investors U.S. LLC (the “Sub-Adviser”), serve as the Funds’ investment manager and sub-adviser, respectively, and are indirect, wholly-owned subsidiaries of Allianz Asset Management of America L.P. (“AAM”). AAM is an indirect, wholly-owned subsidiary of Allianz SE, a publicly traded European insurance and financial services company. Each Fund has authorized an unlimited amount of common shares with $0.00001 par value.
Each Fund’s investment objective is to provide total return through a combination of capital appreciation and high current income. The Funds attempt to achieve this objective by investing in a portfolio of convertible securities and non-convertible income-producing securities. There can be no assurance that the Funds will meet their stated objectives.
The preparation of the Funds’ financial statements in accordance with accounting principles generally accepted in the United States of America (“U.S. GAAP”) requires the Funds’ management to make estimates and
assumptions that affect the reported amounts and disclosures in each Fund’s financial statements. Actual results could differ from those estimates.
In the normal course of business, the Funds enter into contracts that contain a variety of representations that provide general indemnifications. The Funds’ maximum exposure under these arrangements is unknown as this would involve future claims that may be made against the Funds that have not yet occurred.
The following is a summary of significant accounting policies consistently followed by the Funds:
(a) Valuation of Investments
Portfolio securities and other financial instruments for which market quotations are readily available are stated at market value. Market value is generally determined on the basis of last reported sales prices, or if no sales are reported, on the basis of quotes obtained from a quotation reporting system, established market makers, or independent pricing services. The Funds’ investments are valued daily using prices supplied by an independent pricing service or dealer quotations, or by using the last sale price on the exchange that is the primary market for such securities, or the mean between the last quoted bid and ask price. Independent pricing services use information provided by market makers or estimates of market values obtained from yield data relating to investments or securities with similar characteristics.
The Board of Trustees (the “Board”) has adopted procedures for valuing portfolio securities and other financial instruments in circumstances where market quotes are not readily available, and has delegated the responsibility for applying the valuation
| | | | | | |
| August 31, 2014 | | | Semi-Annual Report | | | 29 | |
Notes to Financial Statements
AllianzGI Convertible & Income Funds
August 31, 2014 (unaudited)
1. Organization and Significant Accounting Policies (continued)
methods to the Investment Manager and Sub-Adviser. The Funds’ Valuation Committee was established by the Board to oversee the implementation of the Funds’ valuation methods and to make fair value determinations on behalf of the Board, as instructed by the Board. The Sub-Adviser monitors the continued appropriateness of methods applied and determines if adjustments should be made in light of market changes, events affecting the issuer or other factors. If the Sub-Adviser determines that a valuation method may no longer be appropriate, another valuation method may be selected, or the Valuation Committee will be convened to consider the matter and take any appropriate action in accordance with procedures set forth by the Board. The Board shall review the appropriateness of the valuation methods and these methods may be amended or supplemented from time to time by the Valuation Committee.
Synthetic convertible securities are valued based on quotations obtained from unaffiliated brokers who are the principal market-makers in such securities. Such valuations are derived by the brokers from proprietary models which are generally based on readily available market information including valuations of the common stock underlying the synthetic security.
Short-term securities maturing in 60 days or less are valued at amortized cost, if their original term to maturity was 60 days or less, or by amortizing their value on the 61st day prior to maturity, if the original term to maturity exceeded 60 days.
The prices used by the Funds to value investments may differ from the value that would be realized if the investments were sold,
and these differences could be material to the Funds’ financial statements. Each Fund’s net asset value (“NAV”) is normally determined as of the close of regular trading (normally, 4:00 p.m. Eastern time) on the New York Stock Exchange (“NYSE”) on each day the NYSE is open for business.
(b) Fair Value Measurements
Fair value is defined as the price that would be received to sell an asset or paid to transfer a liability (i.e. the “exit price”) in an orderly transaction between market participants. The three levels of the fair value hierarchy are described below:
| n | | Level 1 – quoted prices in active markets for identical investments that the Funds have the ability to access |
| n | | Level 2 – valuations based on other significant observable inputs, which may include, but are not limited to, quoted prices for similar assets or liabilities, interest rates, yield curves, volatilities, prepayment speeds, loss severities, credit risks and default rates or other market corroborated inputs |
| n | | Level 3 – valuations based on significant unobservable inputs (including the Sub-Adviser’s or Valuation Committee’s own assumptions and securities whose price was determined by using a single broker’s quote) |
The valuation techniques used by the Funds to measure fair value during the six months ended August 31, 2014 were intended to maximize the use of observable inputs and to minimize the use of unobservable inputs.
The Funds’ policy is to recognize transfers between levels at the end of the reporting period. An investment asset’s or liability’s level within the fair value hierarchy is based on the lowest level input, individually or in aggregate, that is significant to fair value measurement. The objective of fair value measurement
| | | | |
| 30 | | Semi-Annual Report | | | August 31, 2014 |
Notes to Financial Statements
AllianzGI Convertible & Income Funds
August 31, 2014 (unaudited)
1. Organization and Significant Accounting Policies (continued)
remains the same even when there is a significant decrease in the volume and level of activity for an asset or liability and regardless of the valuation techniques used. Assets categorized as Level 1 or 2 as of period end may have been transferred between Levels 1 and 2 since the prior period due to changes in the valuation method utilized in valuing the investments.
The inputs or methodology used for valuing securities are not necessarily an indication of the risk associated with investing in those securities. The following are certain inputs and techniques that the Funds generally use to evaluate how to classify each major category of assets and liabilities for Level 2 and Level 3, in accordance with U.S. GAAP.
Equity Securities (Common and Preferred Stock) – Equity securities traded in inactive markets are valued using inputs which include broker-dealer quotes, recently executed transactions adjusted for changes in the benchmark index, or evaluated price quotes received from independent pricing services that take into account the integrity of the market sector and issuer, the individual characteristics of the security, and information received from broker-dealers and other market sources pertaining to the issuer or security. To the extent that these inputs are observable, the values of equity securities are categorized as Level 2. To the extent that these inputs are unobservable the values are categorized as Level 3.
Convertible Bonds & Notes – Convertible bonds & notes are valued by independent pricing services using various inputs and techniques, which include broker-dealer quotations from relevant market makers and
recently executed transactions in securities of the issuer or comparable issuers. The broker-dealer quotations received are supported by credit analysis of the issuer that takes into consideration credit quality assessments, daily trading activity, and the activity of the underlying equities, listed bonds and sector-specific trends. To the extent that these inputs are observable, the values of convertible bonds & notes are categorized as Level 2. To the extent that these inputs are unobservable the values are categorized as Level 3.
Corporate Bonds & Notes – Corporate bonds & notes are generally comprised of two main categories: investment grade bonds and high yield bonds. Investment grade bonds are valued by independent pricing services using various inputs and techniques, which include broker-dealer quotations, live trading levels, recently executed transactions in securities of the issuer or comparable issuers, and option adjusted spread models that include base curve and spread curve inputs. Adjustments to individual bonds can be applied to recognize trading differences compared to other bonds issued by the same issuer. High yield bonds are valued by independent pricing services based primarily on broker-dealer quotations from relevant market makers and recently executed transactions in securities of the issuer or comparable issuers. The broker-dealer quotations received are supported by credit analysis of the issuer that takes into consideration credit quality assessments, daily trading activity, and the activity of the underlying equities, listed bonds and sector-specific trends. To the extent that these inputs are observable, the values of corporate bonds & notes are categorized as Level 2. To the extent that these inputs are unobservable the values are categorized as Level 3.
| | | | | | |
| August 31, 2014 | | | Semi-Annual Report | | | 31 | |
Notes to Financial Statements
AllianzGI Convertible & Income Funds
August 31, 2014 (unaudited)
1. Organization and Significant Accounting Policies (continued)
(c) Investment Transactions and Investment Income
Investment transactions are accounted for on the trade date. Realized gains and losses on investments are determined on the identified cost basis. Interest income adjusted for the accretion of discount and amortization of premiums is recorded on an accrual basis. Discounts or premiums on debt securities purchased are accreted or amortized, respectively, to interest income. Conversion premium is not amortized. Dividend income is recorded on the ex-dividend date. Payments received on synthetic convertible securities are generally included in dividends. Consent fees relating to corporate actions are recorded as miscellaneous income upon receipt. Payments received from certain investments may be comprised of dividends, realized gains and return of capital. These payments may initially be recorded as dividend income and may subsequently be reclassified as realized gains and/or return of capital upon receipt of information from the issuer.
(d) Federal Income Taxes
The Funds intend to distribute all of their taxable income and to comply with the other requirements of Subchapter M of the U.S. Internal Revenue Code of 1986, as amended, applicable to regulated investment companies. Accordingly, no provision for U.S. federal income taxes is required.
Accounting for uncertainty in income taxes establishes for all entities, including pass-through entities such as the Funds, a minimum threshold for financial statement recognition of the benefit of positions taken in filing tax returns (including whether an entity is taxable in a particular jurisdiction), and requires certain expanded tax disclosures. In accordance with
provisions set forth under U.S. GAAP, the Investment Manager has reviewed the Funds’ tax positions for all open tax years. As of August 31, 2014, the Funds have recorded no liability for net unrecognized tax benefits relating to uncertain income tax positions they have taken. The Funds’ federal tax returns for the prior three years remain subject to examination by the Internal Revenue Service.
(e) Dividends and Distributions – Common Shares
The Funds declare dividends from net investment income to common shareholders monthly. Distributions of net realized capital gains, if any, are paid at least annually. The Funds record dividends and distributions on the ex-dividend date. The amount of dividends from net investment income and distributions from net realized capital gains or return of capital is determined in accordance with federal income tax regulations, which may differ from U.S. GAAP. These “book-tax” differences are considered either temporary or permanent in nature. To the extent these differences are permanent in nature, such amounts are reclassified within the capital accounts based on their federal income tax treatment. Temporary differences do not require reclassification. To the extent dividends and/or distributions exceed current and accumulated earnings and profits for federal income tax purposes, they are reported as distributions to shareholders from return of capital.
(f) Convertible Securities
It is the Funds’ policy to invest a portion of their assets in convertible securities. Although convertible securities do derive part of their value from that of the securities into which they are convertible, they are not considered derivative financial instruments. However, certain of the Funds’ investments in convertible securities include features which render them
| | | | |
| 32 | | Semi-Annual Report | | | August 31, 2014 |
Notes to Financial Statements
AllianzGI Convertible & Income Funds
August 31, 2014 (unaudited)
1. Organization and Significant Accounting Policies (continued)
more sensitive to price changes in their underlying securities. The value of structured/synthetic convertible securities can be affected by interest rate changes and credit risks of the issuer. Such securities may be structured in ways that limit their potential for capital appreciation and the entire value of the security may be at risk of loss depending on the performance of the underlying equity security. Consequently, the Funds are exposed to greater downside risk than traditional convertible securities, but still less than that of the underlying stock.
2. Principal Risks
In the normal course of business, the Funds trade financial instruments and enter into financial transactions where risk of potential loss exists due to, among other things, changes in the market (market risk) or failure of the other party to a transaction to perform (counterparty risk). The Funds also are exposed to other risks such as, but not limited to, interest rate, credit and leverage risks.
Interest rate risk is the risk that fixed income securities will decline in value because of changes in interest rates. As nominal interest rates rise, the value of certain fixed income securities held by the Funds are likely to decrease. A nominal interest rate can be described as the sum of a real interest rate and an expected inflation rate. Fixed income securities with longer durations tend to be more sensitive to changes in interest rates, usually making them more volatile than securities with shorter durations. Duration is used primarily as a measure of the sensitivity of a fixed income security’s market price to interest rate (i.e. yield) movements. Interest rate changes can be sudden and unpredictable, and a Fund may lose money as a result of
movements in interest rates. A Fund may not be able to hedge against changes in interest rates or may choose not to do so for cost or other reasons. In addition, any hedges may not work as intended.
The Funds are exposed to credit risk, which is the risk of losing money if the issuer or guarantor of a fixed income security is unable or unwilling, or is perceived (whether by market participants, rating agencies, pricing services or otherwise) as unable or unwilling, to make timely principal and/or interest payments, or to otherwise honor its obligations. Securities are subject to varying degrees of credit risk, which are often reflected in credit ratings.
The market values of securities may decline due to general market conditions (market risk) which are not specifically related to a particular company, such as real or perceived adverse economic conditions, adverse changes in the general outlook for corporate earnings, changes in interest or currency rates, adverse changes to credit markets or adverse investor sentiment. They may also decline due to factors that affect a particular industry or industries, such as labor shortages or increased production costs and competitive conditions within an industry. Equity securities and equity-related investments generally have greater market price volatility than fixed income securities, although under certain market conditions fixed income securities may have comparable or greater price volatility. Credit ratings downgrades may also negatively affect securities held by a Fund. Even when markets perform well, there is no assurance that the investments held by a Fund will increase in value along with the broader market. In addition, market risk includes the risk that geopolitical events will disrupt the economy on a national or global level.
| | | | | | |
| August 31, 2014 | | | Semi-Annual Report | | | 33 | |
Notes to Financial Statements
AllianzGI Convertible & Income Funds
August 31, 2014 (unaudited)
2. Principal Risks (continued)
The Funds are exposed to counterparty risk, or the risk that an institution or other entity with which the Funds have unsettled or open transactions will default. The potential loss to the Funds could exceed the value of the financial assets recorded in the Funds’ financial statements. Financial assets, which potentially expose the Funds to counterparty risk, consist principally of cash due from counterparties and investments. The Sub-Adviser seeks to minimize the Funds’ counterparty risks by performing reviews of each counterparty and by minimizing concentration of counterparty risk by undertaking transactions with multiple customers and counterparties on recognized and reputable exchanges. Delivery of securities sold is only made once the Funds have received payment. Payment is made on a purchase once the securities have been delivered by the counterparty. The trade will fail if either party fails to meet its obligation.
The Funds are exposed to risks associated with leverage. Leverage may cause the value of the Funds’ shares to be more volatile than if the Funds did not use leverage. This is because leverage tends to exaggerate the effect of any increase or decrease in the value of the Funds’ portfolio securities. The Funds may engage in transactions or purchase instruments that give rise to forms of leverage. In addition, to the extent the Funds employ leverage, dividends and interest costs may not be recovered by any
appreciation of the securities purchased with the leverage proceeds and could exceed the Funds’ investment returns, resulting in greater losses.
3. Investment Manager/Sub-Adviser
Each Fund has an Investment Management Agreement (each an “Agreement”) with the Investment Manager. Subject to the supervision of each Fund’s Board, the Investment Manager is responsible for managing, either directly or through others selected by it, the Funds’ investment activities, business affairs and administrative matters. Pursuant to each Agreement, the Investment Manager receives an annual fee, payable monthly, at an annual rate of 0.70% of each Fund’s average daily total managed assets. Total managed assets refer to the total assets of each Fund (including assets attributable to any Preferred Shares or other forms of leverage that may be outstanding) minus accrued liabilities (other than liabilities representing leverage).
The Investment Manager has retained the Sub-Adviser to manage the Funds’ investments. Subject to the supervision of the Investment Manager, the Sub-Adviser is responsible for making all of the Funds’ investment decisions. The Investment Manager, not the Funds, pays a portion of the fees it receives as Investment Manager to the Sub-Adviser in return for its services.
4. Investment in Securities
For the six months ended August 31, 2014, purchases and sales of investments, other than short-term securities were:
| | | | | | | | |
| | | Purchases | | | Sales | |
Convertible & Income | | $ | 395,357,272 | | | $ | 378,700,093 | |
Convertible & Income II | | | 286,178,415 | | | | 287,521,419 | |
| | | | |
| 34 | | Semi-Annual Report | | | August 31, 2014 |
Notes to Financial Statements
AllianzGI Convertible & Income Funds
August 31, 2014 (unaudited)
5. Income Tax Information
At August 31, 2014, the aggregate cost basis and net unrealized appreciation of investments for federal income tax purposes were:
| | | | | | | | | | | | | | | | |
| | | Federal Tax Cost Basis | | | Unrealized
Appreciation | | | Unrealized Depreciation | | | Net
Unrealized Appreciation | |
Convertible & Income | | $ | 1,097,188,580 | | | $ | 91,634,791 | | | $ | (38,226,766 | ) | | $ | 53,408,025 | |
Convertible & Income II | | | 839,863,440 | | | | 71,453,414 | | | | (29,317,151 | ) | | | 42,136,263 | |
Differences between book and tax cost basis were attributable to wash sale loss deferrals and the differing treatment of bond premium amortization.
6. Auction-Rate Preferred Shares
Convertible & Income has 2,856 shares of Preferred Shares Series A, 2,856 shares of Preferred Shares Series B, 2,856 shares of Preferred Shares Series C, 2,856 shares of Preferred Shares Series D and 2,856 shares of Preferred Shares Series E outstanding, each with a liquidation preference of $25,000 per share plus any accumulated, unpaid dividends.
Convertible & Income II has 2,192 shares of Preferred Shares Series A, 2,192 shares of
Preferred Shares Series B, 2,192 shares of Preferred Shares Series C, 2,192 shares of Preferred Shares Series D and 2,192 shares of Preferred Shares Series E outstanding, each with a liquidation preference of $25,000 per share plus any accumulated, unpaid dividends.
Dividends are accumulated daily at an annual rate that is typically re-set every seven days. Distributions of net realized capital gains, if any, are paid annually.
For the six months ended August 31, 2014, the annualized dividend rates for the Funds ranged from:
| | | | | | | | | | | | |
| | | High | | | Low | | | At August 31, 2014 | |
Series A | | | 0.15% | | | | 0.06% | | | | 0.135% | |
| | | |
Series B | | | 0.22% | | | | 0.075% | | | | 0.105% | |
| | | |
Series C | | | 0.14% | | | | 0.06% | | | | 0.105% | |
| | | |
Series D | | | 0.14% | | | | 0.06% | | | | 0.105% | |
| | | |
Series E | | | 0.18% | | | | 0.08% | | | | 0.135% | |
The Funds are subject to certain limitations and restrictions while Preferred Shares are outstanding. Failure to comply with these limitations and restrictions could preclude the Funds from declaring or paying any dividends or distributions to common shareholders or repurchasing common shares and/or could trigger the mandatory redemption of Preferred Shares at their liquidation preference plus any accumulated, unpaid dividends.
Preferred shareholders, who are entitled to one vote per share, generally vote together with the common shareholders but vote separately as a class to elect two Trustees and on certain matters adversely affecting the rights of the Preferred Shares.
Since mid-February 2008, holders of auction-rate preferred shares (“ARPS”) issued by the Funds have been directly impacted by a lack of
| | | | | | |
| August 31, 2014 | | | Semi-Annual Report | | | 35 | |
Notes to Financial Statements
AllianzGI Convertible & Income Funds
August 31, 2014 (unaudited)
6. Auction-Rate Preferred Shares (continued)
liquidity, which has similarly affected ARPS holders in many of the nation’s closed-end funds. Since then, regularly scheduled auctions for ARPS issued by the Funds have consistently “failed” because of insufficient demand (bids to buy shares) to meet the supply (shares offered for sale) at each auction. In a failed auction, ARPS holders cannot sell all, and may not be able to sell any, of their shares tendered for sale. While repeated auction failures have affected the liquidity for ARPS, they do not constitute a default or automatically alter the credit quality of the ARPS, and ARPS holders have continued to receive dividends at the defined “maximum rate”, equal to the 7-day “AA” Composite Commercial Paper Rate multiplied by a minimum of 150%, depending on the credit rating of the ARPS. The maximum rate is a function of short-term interest rates and typically higher than the rate that would have otherwise been set through a successful auction. On May 29, 2014, Moody’s Investors Service upgraded each Fund’s ARPS ratings to Aa3 from A1. As a result, the applicable multiplier for calculating the maximum rate decreased from 200% to 150% beginning on that date. If the Funds’ ARPS auctions continue to fail and the “maximum rate” payable on the ARPS rises as a result of changes in short-term interest rates, returns for the Funds’ common shareholders could be adversely affected.
7. Common Shares Offering
On December 4, 2012, the Securities and Exchange Commission declared effective a registration statement filed using the “shelf” registration process for each Fund. Pursuant to their shelf registrations, Convertible & Income and Convertible & Income II offered, from time to time, in one or more offerings, up to 10,700,000 and 9,600,000 common shares, respectively. The aggregate sale proceeds for the sales of the Convertible & Income’s and Convertible & Income II’s common shares were
subject to aggregate caps of $135,000,000 and $100,000,000, respectively. The Funds could not sell any of their common shares at a price below the net asset values of such common shares at the time of each sale, exclusive of any distribution commission or discount. However, each Fund was able to instruct its sales agent not to sell its common shares if the sales could not be effected at or above a price designated by the Fund, which may be inclusive of any distribution commission or discount. Any proceeds from the Funds’ offerings of their common shares were invested in accordance with the Funds’ investment objectives and policies as set forth in their effective registration statements. The Funds are no longer offering shares under their “shelf” registrations.
During the six months ended August 31, 2014, Convertible & Income sold 1,678,728 common shares. Proceeds from the offerings by Convertible & Income during the six months ended August 31, 2014 (net of commissions and fees) totaled $16,959,259 and offering costs in connection with the sales of shares were $16,983. Convertible & Income II did not sell any common shares during the six months ended August 31, 2014. During the year ended February 28, 2014, Convertible & Income and Convertible & Income II sold 7,635,105 and 7,869,665 common shares, respectively. Proceeds from the offering during the year ended February 28, 2014 (net of commissions and fees) and offering costs in connection with the sales of shares aggregated $72,694,937 and $67,744,043, and $214,454 and $202,305, for Convertible & Income and Convertible & Income II, respectively.
8. Payment from Affiliates
During the six months ended August 31, 2014, the Sub-Adviser reimbursed AllianzGI Convertible & Income and AllianzGI Convertible & Income II $166,674 and $120,146, respectively, for realized losses resulting from trading errors.
| | | | |
| 36 | | Semi-Annual Report | | | August 31, 2014 |
Notes to Financial Statements
AllianzGI Convertible & Income Funds
August 31, 2014 (unaudited)
9. Subsequent Events
In preparing these financial statements, the Funds’ management has evaluated events and transactions for potential recognition or disclosure through the date the financial statements were issued.
On September 2, 2014 the following monthly dividends were declared to common shareholders, payable October 1, 2014 to shareholders of record on September 12, 2014:
| | |
| Convertible & Income | | $0.09 per common share |
| Convertible & Income II | | $0.085 per common share |
On October 1, 2014 the following monthly dividends were declared to common shareholders, payable November 3, 2014 to shareholders of record on October 14, 2014:
| | |
| Convertible & Income | | $0.09 per common share |
| Convertible & Income II | | $0.085 per common share |
There were no other subsequent events identified that require recognition or disclosure.
| | | | | | |
| August 31, 2014 | | | Semi-Annual Report | | | 37 | |
Financial Highlights
AllianzGI Convertible & Income Fund
For a common share outstanding throughout each period:
| | | | | | | | | | | | | | | | | | | | | | | | | | | | | | | | | | | | |
| | | | | Six Months
ended
August 31,
2014
(unaudited) | | | | | Year ended | |
| | | | | | | | February 28,
2014 | | | | | February 28,
2013 | | | | | February 29,
2012 | | | | | February 28,
2011 | | | | | February 28,
2010 | |
| Net asset value, beginning of period | | | | | $9.49 | | | | | | $8.78 | | | | | | $8.65 | | | | | | $9.76 | | | | | | $8.80 | | | | | | $4.80 | |
| Investment Operations: | | | | | | | | | | | | | | | | | | | | | | | | | | | | | | | | | | | | |
| Net investment income | | | | | 0.48 | | | | | | 1.02 | (1) | | | | | 1.02 | | | | | | 1.07 | | | | | | 1.20 | | | | | | 1.07 | |
| Net realized and change in unrealized gain (loss) | | | | | (0.15 | ) | | | | | 0.75 | | | | | | 0.20 | | | | | | (1.04 | ) | | | | | 1.02 | | | | | | 4.02 | |
| Total from investment operations | | | | | 0.33 | | | | | | 1.77 | | | | | | 1.22 | | | | | | 0.03 | | | | | | 2.22 | | | | | | 5.09 | |
| Dividends on Preferred Shares from Net Investment Income | | | | | (0.00 | )(2) | | | | | (0.01 | )(1) | | | | | (0.01 | ) | | | | | (0.01 | ) | | | | | (0.01 | ) | | | | | (0.01 | ) |
| Net increase in net assets applicable to common shareholders resulting from investment operations | | | | | 0.33 | | | | | | 1.76 | | | | | | 1.21 | | | | | | 0.02 | | | | | | 2.21 | | | | | | 5.08 | |
| Dividends to Common Shareholders from Net Investment Income | | | | | (0.54 | ) | | | | | (1.08 | ) | | | | | (1.08 | ) | | | | | (1.13 | ) | | | | | (1.25 | ) | | | | | (1.08 | ) |
| Common Share Transactions: | | | | | | | | | | | | | | | | | | | | | | | | | | | | | | | | | | | | |
| Accretion to net asset value, resulting from offerings | | | | | 0.01 | | | | | | 0.03 | | | | | | 0.00 | (3) | | | | | – | | | | | | – | | | | | | – | |
| Capital charge resulting from issuance of common shares and related offering costs | | | | | (0.00 | )(2) | | | | | (0.00 | )(2) | | | | | (0.00 | )(2) | | | | | – | | | | | | – | | | | | | – | |
| Total common share transactions | | | | | 0.01 | | | | | | 0.03 | | | | | | 0.00 | (3) | | | | | – | | | | | | – | | | | | | – | |
| Net asset value, end of period | | | | | $9.29 | (4) | | | | | $9.49 | | | | | | $8.78 | | | | | | $8.65 | | | | | | $9.76 | | | | | | $8.80 | |
| Market price, end of period | | | | | $10.06 | | | | | | $10.20 | | | | | | $9.18 | | | | | | $9.70 | | | | | | $11.00 | | | | | | $9.39 | |
| Total Investment Return (5) | | | | | 4.23 | % | | | | | 24.87 | % | | | | | 7.02 | % | | | | | (0.15 | )% | | | | | 33.53 | % | | | | | 166.37 | % |
| RATIOS/SUPPLEMENTAL DATA: | | | | | | | | | | | | | | | | | | | | | | | | | | | | | | | | | | | | |
| Net assets, applicable to common shareholders, end of period (000s) | | | | | $811,883 | | | | | | $811,397 | | | | | | $680,022 | | | | | | $653,381 | | | | | | $727,229 | | | | | | $644,408 | |
| Ratio of expenses to average net assets (6) | | | | | 1.15 | %(9) | | | | | 1.21 | %(7)(8) | | | | | 1.28 | % | | | | | 1.28 | % | | | | | 1.27 | % | | | | | 1.39 | % |
| Ratio of net investment income to average net assets (6) | | | | | 10.27 | %(9) | | | | | 11.13 | %(7)(8) | | | | | 12.12 | % | | | | | 12.32 | % | | | | | 13.25 | % | | | | | 14.21 | % |
| Preferred shares asset coverage per share | | | | | $81,853 | | | | | | $81,820 | | | | | | $72,619 | | | | | | $70,755 | | | | | | $75,925 | | | | | | $70,125 | |
| Portfolio turnover rate | | | | | 33 | % | | | | | 79 | % | | | | | 39 | % | | | | | 33 | % | | | | | 52 | % | | | | | 58 | % |
| (1) | | Calculated on average shares outstanding. | |
| (2) | | Less than $(0.005) per common share. | |
| (3) | | Less than $0.005 per common share. | |
| (4) | | Payment from affiliates increased the net asset value by less than $0.01. | |
| (5) | | Total investment return is calculated assuming a purchase of a common share at the market price on the first day and a sale of a common share at the market price on the last day of each period reported. Dividends and distributions, if any, are assumed, for purposes of this calculation, to be reinvested at prices obtained under the Fund’s dividend reinvestment plan. Total investment return does not reflect brokerage commissions or sales charges in connection with the purchase or sale of Fund shares. Total investment return for a period of less than one year is not annualized. | |
| (6) | | Calculated on the basis of income and expenses applicable to both common and preferred shares relative to the average net assets of common shareholders. | |
| (7) | | Inclusive of Reimbursement from Investment Manager of 0.01%. | |
| (8) | | Inclusive of excise tax expense of 0.04%. | |
| | | | | | |
| 38 | | Semi-Annual Report | | | August 31, 2014 | | | See accompanying Notes to Financial Statements |
Financial Highlights
AllianzGI Convertible & Income Fund II
For a common share outstanding throughout each period:
| | | | | | | | | | | | | | | | | | | | | | | | | | | | | | | | | | | | |
| | | | | Six Months
ended
August 31,
2014
(unaudited) | | | | | Year ended | |
| | | | | | | | February 28,
2014 | | | | | February 28,
2013 | | | | | February 29,
2012 | | | | | February 28,
2011 | | | | | February 28,
2010 | |
| Net asset value, beginning of period | | | | | $8.53 | | | | | | $7.97 | | | | | | $7.86 | | | | | | $8.89 | | | | | | $8.02 | | | | | | $4.39 | |
| Investment Operations: | | | | | | | | | | | | | | | | | | | | | | | | | | | | | | | | | | | | |
| Net investment income | | | | | 0.44 | | | | | | 0.95 | (1) | | | | | 0.93 | | | | | | 0.97 | | | | | | 1.09 | | | | | | 0.98 | |
| Net realized and change in unrealized gain (loss) | | | | | (0.12 | ) | | | | | 0.62 | | | | | | 0.20 | | | | | | (0.98 | ) | | | | | 0.95 | | | | | | 3.80 | |
| Total from investment operations | | | | | 0.32 | | | | | | 1.57 | | | | | | 1.13 | | | | | | (0.01 | ) | | | | | 2.04 | | | | | | 4.78 | |
| Dividends on Preferred Shares from Net Investment Income | | | | | (0.00 | )(2) | | | | | (0.01 | )(1) | | | | | (0.01 | ) | | | | | (0.00 | )(2) | | | | | (0.01 | ) | | | | | (0.01 | ) |
| Net increase (decrease) in net assets applicable to common shareholders resulting from investment operations | | | | | 0.32 | | | | | | 1.56 | | | | | | 1.12 | | | | | | (0.01 | ) | | | | | 2.03 | | | | | | 4.77 | |
| Dividends to Common Shareholders from Net Investment Income | | | | | (0.51 | ) | | | | | (1.02 | ) | | | | | (1.02 | ) | | | | | (1.02 | ) | | | | | (1.16 | ) | | | | | (1.14 | ) |
| Common Share Transactions: | | | | | | | | | | | | | | | | | | | | | | | | | | | | | | | | | | | | |
| Accretion to net asset value, resulting from offerings | | | | | – | | | | | | 0.02 | | | | | | 0.01 | | | | | | – | | | | | | – | | | | | | – | |
| Capital charge resulting from issuance of common shares and related offering costs | | | | | – | | | | | | (0.00 | )(2) | | | | | (0.00 | )(2) | | | | | – | | | | | | – | | | | | | – | |
| Total common share transactions | | | | | – | | | | | | 0.02 | | | | | | 0.01 | | | | | | – | | | | | | – | | | | | | – | |
| Net asset value, end of period | | | | | $8.34 | (3) | | | | | $8.53 | | | | | | $7.97 | | | | | | $7.86 | | | | | | $8.89 | | | | | | $8.02 | |
| Market price, end of period | | | | | $9.58 | | | | | | $9.71 | | | | | | $8.52 | | | | | | $8.84 | | | | | | $10.21 | | | | | | $8.76 | |
| Total Investment Return (4) | | | | | 4.24 | % | | | | | 28.50 | % | | | | | 9.35 | % | | | | | (2.27 | )% | | | | | 32.85 | % | | | | | 174.62 | % |
| RATIOS/SUPPLEMENTAL DATA: | | | | | | | | | | | | | | | | | | | | | | | | | | | | | | | | | | | | |
| Net assets, applicable to common shareholders, end of period (000s) | | | | | $615,495 | | | | | | $627,112 | | | | | | $518,277 | | | | | | $493,139 | | | | | | $549,130 | | | | | | $487,130 | |
| Ratio of expenses to average net assets (5) | | | | | 1.17 | %(7) | | | | | 1.18 | %(6) | | | | | 1.31 | % | | | | | 1.31 | % | | | | | 1.29 | % | | | | | 1.42 | % |
| Ratio of net investment income to average net assets (5) | | | | | 10.38 | %(7) | | | | | 11.50 | %(6) | | | | | 12.20 | % | | | | | 12.39 | % | | | | | 13.20 | % | | | | | 14.20 | % |
| Preferred shares asset coverage per share | | | | | $81,157 | | | | | | $82,218 | | | | | | $72,287 | | | | | | $69,994 | | | | | | $75,102 | | | | | | $69,445 | |
| Portfolio turnover rate | | | | | 33 | % | | | | | 93 | % | | | | | 41 | % | | | | | 32 | % | | | | | 54 | % | | | | | 58 | % |
| (1) | | Calculated on average shares outstanding. | |
| (2) | | Less than $(0.005) per common share. | |
| (3) | | Payment from affiliates increased the net asset value by less than $0.01. | |
| (4) | | Total investment return is calculated assuming a purchase of a common share at the market price on the first day and a sale of a common share at the market price on the last day of each period reported. Dividends and distributions, if any, are assumed, for purposes of this calculation, to be reinvested at prices obtained under the Fund’s dividend reinvestment plan. Total investment return does not reflect brokerage commissions or sales charges in connection with the purchase or sale of Fund shares. Total investment return for a period less than one year is not annualized. | |
| (5) | | Calculated on the basis of income and expenses applicable to both common and preferred shares relative to the average net assets of common shareholders. | |
| (6) | | Inclusive of Reimbursement from Investment Manager of 0.02%. | |
| | | | | | | | |
| See accompanying Notes to Financial Statements | | | August 31, 2014 | | | Semi-Annual Report | | | 39 | |
Annual Shareholder Meeting Results/Proxy Voting Policies & Procedures/Changes in Investment Policy (unaudited)
AllianzGI Convertible & Income Funds
Annual Shareholder Meeting Results:
The Funds held their joint annual meeting of shareholders on July 17, 2014. Common/Preferred shareholders voted as indicated below:
| | | | | | | | |
| Convertible & Income: | | Affirmative | | | Withheld
Authority | |
Re-election of Bradford K. Gallagher — Class II to serve until the
annual meeting for the 2017-2018 fiscal year | | | 72,880,749 | | | | 2,910,820 | |
| | |
Re-election of James A. Jacobson* — Class II to serve until the
annual meeting for the 2017-2018 fiscal year | | | 1,832 | | | | 694 | |
The other members of the Board at the time of the meeting, namely Ms. Deborah A. DeCotis and Messrs. Hans W. Kertess, William B. Ogden VI, Alan Rappaport* and John C. Maney† continue to serve as Trustees.
| | | | | | | | |
| Convertible & Income II: | | Affirmative | | | Withheld
Authority | |
Re-election of Bradford K. Gallagher — Class II to serve until the
annual meeting for the 2017-2018 fiscal year | | | 62,544,908 | | | | 2,411,441 | |
| | |
Re-election of Deborah A. DeCotis — Class II to serve until the
annual meeting for the 2017-2018 fiscal year | | | 62,528,357 | | | | 2,427,992 | |
| | |
Re-election of James A. Jacobson* — Class II to serve until the
annual meeting for the 2017-2018 fiscal year | | | 2,096 | | | | 657 | |
The other members of the Board at the time of the meeting, namely Messrs. Hans W. Kertess, William B. Ogden VI, Alan Rappaport* and John C. Maney† continue to serve as Trustees.
| * | | Preferred Shares Trustee | |
Proxy Voting Policies & Procedures:
A description of the policies and procedures that the Funds have adopted to determine how to vote proxies relating to portfolio securities and information about how the Funds voted proxies relating to portfolio securities held during the most recent twelve month period ended June 30 is available (i) without charge, upon request, by calling the Funds’ shareholder servicing agent at (800) 254-5197; (ii) on the Funds’ website at us.allianzgi.com/closedendfunds; and (iii) on the Securities and Exchange Commission’s website at www.sec.gov.
Changes in Investment Policy:
Effective March 11, 2014, the Funds rescinded their non-fundamental investment policy to maintain a weighted average maturity typically ranging from five to ten years with respect to the portion of their portfolio allocated to income-producing convertible securities.
| | | | |
| 40 | | Semi-Annual Report | | | August 31, 2014 |
Matters Relating to the Trustees’ Consideration of the Investment Management & Portfolio Management Agreements (unaudited)
AllianzGI Convertible & Income Funds
The Investment Company Act of 1940, as amended, requires that both the full Board of Trustees (the “Trustees”) and a majority of the non-interested Trustees (the “Independent Trustees”), voting separately, approve each Fund’s Investment Management Agreement with the Investment Manager (the “Advisory Agreements”) and Portfolio Management Agreement between the Investment Manager and the Sub-Adviser (the “Sub-Advisory Agreements,” and together with the Advisory Agreements, the “Agreements”). The Trustees met in person on June 23-24, 2014 (the “contract review meeting”) for the specific purpose of considering whether to approve the continuation of the Advisory Agreements and the Sub-Advisory Agreements. The Independent Trustees were assisted in their evaluation of the Agreements by independent legal counsel, from whom they received separate legal advice and with whom they met separately from Fund management during the contract review meeting.
In connection with their deliberations regarding the continuation of the Agreements, the Trustees, including the Independent Trustees, considered such information and factors as they believed, in light of the legal advice furnished to them and their own business judgment, to be relevant. As described below, the Trustees considered the nature, quality, and extent of the various investment management, administrative and other services performed by the Investment Manager or the Sub-Adviser under the applicable Agreement.
In connection with their contract review meeting, the Trustees received and relied upon materials provided by the Investment Manager which included, among other items: (i) information provided by Lipper Inc. (“Lipper”), an independent third party, on the total return investment performance (based on net assets) of the Funds for various time periods and the investment performance of a group of
funds with investment classifications/objectives comparable to those of the Funds identified by Lipper (the “Lipper performance universe”), (ii) information provided by Lipper on the Funds’ management fees and other expenses and the management fees and other expenses of comparable funds identified by Lipper, (iii) information regarding the investment performance and management fees for other funds and accounts managed by the Investment Manager and/or the Sub-Adviser with strategies that have similarities (but none of which are substantially similar) to those of the Funds, (iv) the estimated profitability to the Investment Manager from its relationship with the Funds for the one year period ended December 31, 2013, (v) descriptions of various functions performed by the Investment Manager and the Sub-Adviser for the Funds, such as portfolio management, compliance monitoring and portfolio trading practices, and (vi) information regarding the overall organization of the Investment Manager and the Sub-Adviser, including information regarding senior management, portfolio managers and other personnel providing investment management, administrative and other services to the Funds.
The Trustees’ conclusions as to the continuation of the Agreements were based on a comprehensive consideration of all information provided to the Trustees and were not the result of any single factor. Some of the factors that figured particularly in the Trustees’ deliberations are described below, although individual Trustees may have evaluated the information presented differently from one another, attributing different weights to various factors. The Trustees recognized that the fee arrangements for the Funds are in many cases the result of review and discussion in prior years between the Independent Trustees and the Investment Manager, that certain aspects of such arrangements may receive greater scrutiny in some years than in others, and that
| | | | | | |
| August 31, 2014 | | | Semi-Annual Report | | | 41 | |
Matters Relating to the Trustees’ Consideration of the Investment Management & Portfolio Management Agreements (unaudited) (continued)
AllianzGI Convertible & Income Funds
the Trustees’ conclusions may be based, in part, on their consideration of these same arrangements during the course of the year and in prior years.
Fund-specific performance results for the Funds reviewed by the Trustees are discussed below. The comparative performance information was prepared and provided by Lipper and was not independently verified by the Trustees. The Trustees reviewed, among other information, comparative information showing performance of each Fund against its respective Lipper performance universe for the one-year, three-year, five-year and ten-year periods ended March 31, 2014.
In addition, it was noted that the Trustees considered matters bearing on the Funds and their advisory arrangements at their meetings throughout the year, including a review of performance data at each regular meeting.
As part of their review, the Trustees examined the Investment Manager’s and the Sub-Adviser’s abilities to provide high-quality investment management and other services to the Funds. Among other information, the Trustees considered the investment philosophy and research and decision-making processes of the Sub-Adviser; the experience of key advisory personnel of the Sub-Adviser responsible for portfolio management of the Funds; the ability of the Investment Manager and the Sub-Adviser to attract and retain capable personnel; and the capability of the senior management and staff of the Investment Manager and the Sub-Adviser. In addition, the Trustees reviewed the quality of the Investment Manager’s and the Sub-Adviser’s services with respect to regulatory compliance and compliance with the investment policies of the Funds; the nature and quality of certain administrative services the Investment Manager is responsible for providing to the Funds; and conditions that might affect the Investment Manager’s or the Sub-Adviser’s ability to provide high quality
services to the Funds in the future under the Agreements, including each organization’s respective financial condition and operational stability. Based on the foregoing, the Trustees concluded that the Sub-Adviser’s investment process, research capabilities and philosophy were well suited to each of the Funds given their respective investment objectives and policies, and that the Investment Manager and the Sub-Adviser would be able to continue to meet any reasonably foreseeable obligations under the Agreements.
In assessing the reasonableness of each Fund’s fees under the Agreements, the Trustees considered, among other information, each Fund’s management fee and its total expense ratio as a percentage of average net assets attributable to common shares and as a percentage of total managed assets (including assets attributable to common shares and preferred shares outstanding combined), and the management fee and total expense ratios of peer expense groups of funds based on information provided by Lipper. The Fund-specific fee and expense results discussed below were prepared and provided by Lipper and were not independently verified by the Trustees.
The Trustees specifically took note of how each Fund compared to its Lipper peers as to performance and management fee and total net expenses. The Trustees noted that while the Funds are not charged a separate administration fee (recognizing that their management fee includes a component for administrative services), it was not clear in all cases whether the peer funds in the Lipper categories were separately charged such a fee by their investment managers, so that the total expense ratio (rather than any individual expense component) represented the most relevant comparison. It was noted that the total expense ratio comparisons reflect the effect of expense waivers/reimbursements (although none exist for the Funds).
| | | | |
| 42 | | Semi-Annual Report | | | August 31, 2014 |
Matters Relating to the Trustees’ Consideration of the Investment Management & Portfolio Management Agreements (unaudited) (continued)
AllianzGI Convertible & Income Funds
Convertible & Income
The Trustees noted that the expense group for the Fund provided by Lipper consisted of a total of five closed-end funds, including the Fund. The Trustees also noted that average net assets of the common shares of the five funds in the expense group ranged from $84.7 million to $860.3 million, and that one of the funds in the group was larger in asset size than the Fund. The Trustees noted that the Fund was ranked second out of five funds in the expense group both for total expense ratio based on common share assets and for total expense ratio based on common share and leveraged assets combined, third out of five funds in the expense group for actual management fees based on common share assets, and tied for second out of five funds in the expense group for actual management fees based on common and leveraged assets combined in each case, (with funds ranked first having the lowest fees/expenses and ranked fifth having the highest fees/expenses in the expense group).
With respect to the Fund’s total return performance relative to its Lipper performance universe (based on net asset value), the Trustees noted that the Fund had first quintile performance for the one-year, three-year and five-year periods ended March 31, 2014 and second quintile performance for the ten-year period ended March 31, 2014.
Convertible & Income II
The Trustees noted that the expense group for the Fund provided by Lipper consisted of a total of five closed-end funds, including the Fund. The Trustees also noted that average net assets of the common shares of the five funds in the expense group ranged from $84.7 million to $860.3 million, and that two of the funds in the group were larger in asset size than the Fund. The Trustees noted that the Fund was ranked first out of five funds in the expense group both for total expense ratio based on common share assets and for total expense ratio based on common share and leveraged assets combined, second out of five funds in the expense group
for actual management fees based on common share assets, and tied for second out of five funds in the expense group for actual management fees based on common and leveraged assets combined (with funds ranked first having the lowest fees/expenses and ranked fifth having the highest fees/expenses in the expense group).
With respect to the Fund’s total return performance relative to its Lipper performance universe (based on net asset value), the Trustees noted that the Fund had first quintile performance for the one-year, three-year and five-year periods ended March 31, 2014 and third quintile performance for the ten-year period ended March 31, 2014.
In addition to their review of Fund performance based on net asset value, the Trustees also considered the market value performance of each Fund’s common shares and related share price premium and/or discount information based on the materials provided by Lipper and management.
The Trustees were advised that the Investment Manager and the Sub-Adviser do not manage any funds or accounts, including institutional or separate accounts, with investment strategies and return profiles similar to those of the Funds. However, the Trustees considered the management fees charged by the Investment Manager and/or Sub-Adviser to other funds and accounts with strategies that have similarities (but none of which are substantially similar) to those of the Funds, including open-end funds and, in some cases, separate accounts, advised by the Sub-Adviser. The Trustees noted that the management fees paid by the Funds are generally higher than the fees paid by the Sub-Adviser’s separate account clients. However, the Trustees were advised by the Sub-Adviser that it generally provides broader and more extensive services to the Funds in comparison to separate accounts, and incurs additional expenses in connection with the more extensive regulatory regime to which the Funds are subject in
| | | | | | |
| August 31, 2014 | | | Semi-Annual Report | | | 43 | |
Matters Relating to the Trustees’ Consideration of the Investment Management & Portfolio Management Agreements (unaudited) (continued)
AllianzGI Convertible & Income Funds
comparison to separate accounts generally. The Trustees noted that the management fees paid by the Funds are generally higher than the fees paid by the open-end funds offered for comparison but were advised by the Investment Manager that there are additional portfolio management challenges in managing the Funds, such as those associated with the use of leverage and attempting to meet a regular dividend.
The Trustees also took into account that the Funds have preferred shares outstanding, which increases the amount of management fees payable by the Funds under the Agreements (because each Fund’s fees are calculated based on total managed assets, including assets attributable to preferred shares and other forms of leverage outstanding). In this regard, the Trustees took into account that the Investment Manager and the Sub-Adviser have a financial incentive for the Funds to continue to have preferred shares outstanding, which may create a conflict of interest between the Investment Manager and the Sub-Adviser, on one hand, and the Funds’ common shareholders, on the other. In this regard, the Trustees considered information provided by the Investment Manager and the Sub-Adviser and related presentations as to why the Funds’ use of leverage continues to be appropriate and in the best interests of the Funds under current market conditions. The Trustees also considered the Sub-Adviser’s representation that it will use leverage for the Funds solely as it determines to be in the best interests of the Funds from an investment perspective and without regard to the level of compensation the Investment Manager or the Sub-Adviser receive.
Based on a profitability analysis provided by the Investment Manager, the Trustees also considered the estimated profitability to the Investment Manager from its relationship with each Fund and determined that such profitability did not appear to be excessive.
The Trustees also took into account that, as a general matter, as closed-end investment companies, the assets of the Funds will grow (if at all) principally through the investment performance of each Fund. However, the Trustees noted that each Fund had recently concluded an offering of its common shares through an at-the-market offering program, thereby growing its assets. The Trustees considered that, as the assets of the Funds grow, certain economies of scale and other efficiencies may be realized through spreading certain fixed costs across a larger asset base, but also took into account that the at-the-market offerings had not substantially increased the overall assets of the Funds.
Additionally, the Trustees considered so-called “fall-out benefits” to the Investment Manager and the Sub-Adviser, such as reputational value derived from serving as Investment Manager and Sub-Adviser to the Funds.
After reviewing these and other factors described herein, the Trustees concluded with respect to each Fund, within the context of their overall conclusions regarding the Agreements and based on the information provided and related representations made by management, that they were satisfied with the Investment Manager’s and the Sub-Adviser’s responses and efforts relating to the investment performance of the Funds. The Trustees also concluded that the fees payable under each Agreement represent reasonable compensation in light of the nature, extent and quality of services provided by the Investment Manager or Sub-Adviser, as the case may be. Based on their evaluation of factors that they deemed to be material, including those factors described above, the Trustees, including the Independent Trustees, unanimously concluded that the continuation of the Agreements with respect to each Fund was in the interests of the Fund and its shareholders, and should be approved.
| | | | |
| 44 | | Semi-Annual Report | | | August 31, 2014 |
Trustees
Hans W. Kertess
Chairman of the Board of Trustees
Deborah A. DeCotis
Bradford K. Gallagher
James A. Jacobson
John C. Maney
William B. Ogden, IV
Alan Rappaport
Fund Officers
Julian Sluyters
President & Chief Executive Officer
Lawrence G. Altadonna
Treasurer, Principal Financial & Accounting Officer
Thomas J. Fuccillo
Vice President, Secretary & Chief Legal Officer
Scott Whisten
Assistant Treasurer
Richard J. Cochran
Assistant Treasurer
Orhan Dzemaili
Assistant Treasurer
Thomas L. Harter
Chief Compliance Officer
Lagan Srivastava
Assistant Secretary
Investment Manager
Allianz Global Investors Fund Management LLC
1633 Broadway
New York, NY 10019
Sub-Adviser
Allianz Global Investors U.S. LLC
1633 Broadway
New York, NY 10019
Custodian & Accounting Agent
Brown Brothers Harriman & Co.
50 Post Office Square
Boston, MA 02110
Transfer Agent, Dividend Paying Agent and Registrar
American Stock Transfer & Trust Company, LLC
6201 15th Avenue
Brooklyn, NY 11219
Independent Registered Public Accounting Firm
PricewaterhouseCoopers LLP
300 Madison Avenue
New York, NY 10017
Legal Counsel
Ropes & Gray LLP
Prudential Tower
800 Boylston Street
Boston, MA 02199
This report, including the financial information herein, is transmitted to the shareholders of AllianzGI Convertible & Income Fund and AllianzGI Convertible & Income Fund II for their information. It is not a prospectus, circular or representation intended for use in the purchase of shares of the Funds or any securities mentioned in this report.
The financial information included herein is taken from the records of the Funds without examination by an independent registered public accounting firm, who did not express an opinion herein.
Notice is hereby given in accordance with Section 23(c) of the Investment Company Act of 1940, as amended, that from time to time the Funds may purchase their common shares in the open market.
The Funds file their complete schedule of portfolio holdings with the Securities and Exchange Commission (“SEC”) for the first and third quarters of their fiscal year on Form N-Q. Each Fund’s Form N-Q is available on the SEC’s website at www.sec.gov and may be reviewed and copied at the SEC’s Public Reference Room in Washington D.C. Information on the operation of the Public Reference Room may be obtained by calling (800) SEC-0330. The information on Form N-Q is also available on the Funds’ website at us.allianzgi.com/closedendfunds.
Information on the Funds is available at us.allianzgi.com/closedendfunds or by calling the Funds’ shareholder servicing agent at (800) 254-5197.
us.allianzgi.com
Receive this report electronically and eliminate paper mailings.
To enroll, visit us.allianzgi.com/edelivery.
| | |
| ©2014 Allianz Global Investors Distributors U.S. LLC | | AZ603SA_083114 |
AGI-2014-10-13-10748
ITEM 2. CODE OF ETHICS
Not required in this filing.
ITEM 3. AUDIT COMMITTEE FINANCIAL EXPERT
Not required in this filing.
ITEM 4. PRINCIPAL ACCOUNTANT FEES AND SERVICES
Not required in this filing
ITEM 5. AUDIT COMMITTEE OF LISTED REGISTRANT
Not required in this filing
ITEM 6. INVESTMENTS
| | (a) | The registrant’s Schedule of Investments is included as part of the report to shareholders filed under Item 1 of this form. |
ITEM 7. DISCLOSURE OF PROXY VOTING POLICIES AND PROCEDURES FOR CLOSED-END MANAGEMENT INVESTMENT COMPANIES
Not required in this filing
ITEM 8. PORTFOLIO MANAGERS OF CLOSED-END MANAGEMENT INVESTMENT COMPANIES
Not required in this filing
ITEM 9. PURCHASES OF EQUITY SECURITIES BY CLOSED-END MANAGEMENT INVESTMENT COMPANY AND AFFILIATED COMPANIES
None
ITEM 10. SUBMISSION OF MATTERS TO A VOTE OF SECURITY HOLDERS
There have been no material changes to the procedures by which shareholders may recommend nominees to the Fund’s Board of Trustees since the Fund last provided disclosure in response to this item.
ITEM 11. CONTROLS AND PROCEDURES
(a) The registrant’s President & Chief Executive Officer and Treasurer, Principal Financial & Accounting Officer have concluded that the registrant’s disclosure controls and procedures (as defined in Rule 30a-3(c) under the Act (17 CFR 270.30a-3(c))) are effective based on their evaluation of these controls and procedures as of a date within 90 days of the filing date of this document.
(b) There were no significant changes in the registrant’s internal control over financial reporting (as defined in Rule 30a-3(d) under the Act (17 CFR 270.30a-3(d))) that occurred during the second fiscal quarter of the period covered by this report that has materially affected, or is reasonably likely to materially affect, the registrant’s internal control over financial reporting.
ITEM 12. EXHIBITS
(a) (1) Not required in this filing.
(a) (2) Exhibit 99.302 Cert. — Certification pursuant to Section 302 of the Sarbanes-Oxley Act of 2002
(a) (3) Not applicable
(b) Exhibit 99.906 Cert. — Certification pursuant to Section 906 of the Sarbanes-Oxley Act of 2002
Signature
Pursuant to the requirements of the Securities Exchange Act of 1934 and the Investment Company Act of 1940, the registrant has duly caused this report to be signed on its behalf by the undersigned, thereunto duly authorized.
| | |
| Registrant: AllianzGI Convertible & Income Fund |
| |
| By: | | /s/ Julian Sluyters |
| | Julian Sluyters, President & Chief Executive Officer |
|
| Date: October 30, 2014 |
| |
By: | | /s/ Lawrence G. Altadonna |
| | Lawrence G. Altadonna, Treasurer, Principal Financial & Accounting Officer |
|
| Date: October 30, 2014 |
Pursuant to the requirements of the Securities Exchange Act of 1934 and the Investment Company Act of 1940, this report has been signed below by the following persons on behalf of the registrant and in the capacities and on the dates indicated.
| | |
| By: | | /s/ Julian Sluyters |
| | Julian Sluyters, President & Chief Executive Officer |
|
| Date: October 30, 2014 |
| |
| By: | | /s/ Lawrence G. Altadonna |
| | Lawrence G. Altadonna, Treasurer, Principal Financial & Accounting Officer |
|
| Date: October 30, 2014 |