UNITED STATES
SECURITIES AND EXCHANGE COMMISSION
Washington, D.C. 20549
FORM N-CSR
CERTIFIED SHAREHOLDER REPORT OF REGISTERED
MANAGEMENT INVESTMENT COMPANIES
Investment Company Act file number: 811-21284
AllianzGI Convertible & Income Fund
(Exact name of registrant as specified in charter)
| | |
| 1633 Broadway, New York, NY | | 10019 |
| (Address of principal executive offices) | | (Zip code) |
Lawrence G. Altadonna – 1633 Broadway, New York, New York 10019
(Name and address of agent for service)
Registrant’s telephone number, including area code: 212-739-3371
Date of fiscal year end: February 28
Date of reporting period: August 31, 2017
Item 1. Report to Shareholders
AllianzGI Convertible & Income 2024 Target Term Fund
AllianzGI Convertible & Income Fund
AllianzGI Convertible & Income Fund II
Semi-Annual Report
August 31, 2017


Table of Contents
Letter from the President

Thomas J. Fuccillo
President & Chief Executive Officer
Dear Shareholder:
The US economy continued to expand during the six-month fiscal reporting period ended August 31, 2017, although the overall pace was fairly modest. Meanwhile, there were indications that economic activity overseas was improving. Against this backdrop, US and international equities generated strong results. Elsewhere, the US bond market posted a relatively modest return during the reporting period.
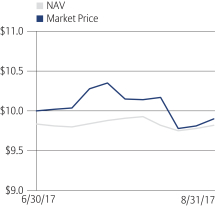
For the period since it’s inception on June 30, 2017 through August 31, 2017:
| ∎ | | AllianzGI Convertible & Income 2024 Target Term Fund returned 0.32% on net asset value (“NAV”) and -0.54% on market price. |
For the six-month reporting period ended August 31, 2017:
| ∎ | | AllianzGI Convertible & Income Fund returned 1.98% on net asset value (“NAV”) and 7.13% on market price. |
| ∎ | | AllianzGI Convertible & Income Fund II returned 2.29% on net asset value (“NAV”) and 7.05% on market price. |
During the six-month period ended August 31, 2017, the Standard & Poor’s (“S&P”) 500 Index, an unmanaged index generally representative of the US stock market, rose 5.65% and the BofA Merrill Lynch High Yield Master II Index, an unmanaged index generally representative of the high yield bond market, gained 3.08%. Convertible securities, which share characteristics of both stocks and bonds, also generated strong results. The BofA Merrill Lynch All Convertibles-All Qualities Index, an unmanaged index generally representative of the convertible securities market, returned 5.59%. The blended index 40% ML US Conv/45% ML US HY BB - B/15% CS Leveraged Loan, returned 1.57% since the AllianzGI Convertible & Income 2024 Target Term Fund was incepted on June 30, 2017, and returned 3.90% during the full reporting period.
Turning to the US economy, gross domestic product (“GDP”), the value of goods and services produced in the country, the broadest measure of economic activity and a principal indicator of economic performance, expanded at a 1.8% annualized pace during the fourth quarter of 2016. GDP then moderated to a 1.2% annual pace during the first quarter of 2017. The Commerce Department’s final reading showed that GDP — released after the reporting period had ended — grew at an annual pace of 3.1% for the second quarter of 2017.
The US Federal Reserve (the “Fed”) raised interest rates on two separate occasions during the reporting period: in March 2017 and June 2017. In both cases, the Fed’s movements were well telegraphed. With the rate hike in June, the federal funds rate moved to a range between 1.00% and 1.25%. In a statement following the July meeting, the Fed indicated that it planned to begin reducing its balance sheet, saying “The Committee expects to begin implementing its balance
| | | | |
| 2 | | Semi-Annual Report | | | August 31, 2017 |
sheet normalization program relatively soon, provided that the economy evolves broadly as anticipated.” Then, at its September meeting — after the reporting period ended — the Fed said, “In October, the Committee will initiate the balance sheet normalization program…”
Outlook
We believe the global economy has been in a cyclical “sweet spot” for more than a year. Meanwhile, geopolitical factors, including ongoing tensions with North Korea, continue to play on investor sentiment. In
Receive this report electronically and eliminate paper mailings.
To enroll, visit
us.allianzgi.com/edelivery.
our view, actively differentiating between regions and countries will become more important for investors.
Global growth has continued at around 3%, and we expect moderately higher core inflation over the medium term. While the global economic landscape remains solid, we expect it to become rocky over the months ahead, and believe that country-specific risk factors will become more important to asset-allocation strategies.
Central banks in the US, the eurozone and the UK have embarked on a path towards normalization – or are, at least, talking about it. Fading bond reinvestments by the Fed, proper tapering by the European Central Bank and an already visible slowdown in Japanese government bond purchases by the Bank of Japan is expected to culminate in a global central bank “peak liquidity” during the first half of 2018, in our view.
Apart from ambitious valuations in most asset classes, in our view, signs of market complacency have grown. While we remain risk-on for cyclical reasons for the time being, we are fully aware that the risks for a setback have increased. Our message remains: “If you take no risk, you will earn no return.” In today’s markets in particular, that means using active management to identify opportunities for income and capital gain, and to manage the periods of volatility that may arise.
For specific information on the Funds and their performance, please refer to the following pages. If you have any questions regarding the information provided, we encourage you to contact your financial advisor or call the Funds’ shareholder servicing agent at (800) 254-5197. In addition, a wide range of information and resources is available on our website, us.allianzgi.com/en-us/advisors/products-solutions/closed-end-funds.
On behalf of Allianz Global Investors U.S. LLC, the Funds’ investment manager, thank you for investing with us.
We remain dedicated to serving your investment needs.
Sincerely,
|
 |
| Thomas J. Fuccillo |
| President & Chief Executive Officer |
| | | | | | |
| August 31, 2017 | | | Semi-Annual Report | | | 3 | |
Fund Insights
AllianzGI Convertible & Income 2024 Target Term Fund / AllianzGI Convertible & Income Fund /AllianzGI Convertible & Income Fund II
August 31, 2017 (unaudited)
AllianzGI Convertible & Income 2024 Target Term Fund
For the period from inception on June 30, 2017 through August 31, 2017, as provided by Doug Forsyth, CFA, Portfolio Manager.
For the period since the Fund’s inception through August 31, 2017, the AllianzGI Convertible & Income 2024 Target Term Fund (the “Fund”) returned 0.32% on net asset value (“NAV”) and -0.54% on market price.
Market Environment
The convertible bond, high-yield bond and senior secured loan markets moved higher over the reporting period, despite a number of macro-related headwinds toward the end of the reporting period.
In general, convertibles benefited from the strength of the equity market, while high-yield bonds rallied alongside stocks, which touched record levels.
Several factors, in our view, influenced these asset classes throughout the reporting period, including corporate fundamentals, economic indicators and moves by the US Federal Reserve (“Fed”).
During the reporting period US companies continued to exhibit improving fundamentals as operating results for most issuers met or exceeded expectations and high-yield bond credit metrics showed further improvement. Second quarter earnings in 2017 finished stronger-than-expected and marked a second consecutive quarter of double-digit year-over-year earnings growth according to FactSet Research Systems Inc., a multinational financial
data and software company that provides financial information and analytic software for investment professionals. Concurrently, Bank of America Merrill Lynch reported that high-yield net leverage ticked lower and interest coverage rose during the period.
Certain economic statistics also factored into the market’s strength. The unemployment rate fell and housing prices continued their upward trend. Consumer and small business confidence remained at bullish levels and key manufacturing and service surveys ended within expansionary territory. Lastly, price indexes remained relatively benign.
As anticipated, the Fed increased interest rates for the second time this year, pushing the federal funds rate to a range of 1.00% to 1.25%. The market’s response to the Fed’s rate hike decision was muted. Additionally, the Fed noted that the process of balance sheet reduction is expected to begin later this year, reflecting their confidence in the US economy. Overall, the Fed did not deviate from its gradual approach toward policy adjustments, and along with continued accommodative economic policies outside the US, this lends support to the investment in risk assets.
Portfolio Review
The Fund provided a positive total return from inception to the end of the reporting period.
In the convertible bond sleeve, the sectors that contributed positively to relative performance were health care, industrials and telecommunications. On the other hand, the technology, financials and energy sectors pressured relative performance.
| | | | |
| 4 | | Semi-Annual Report | | | August 31, 2017 |
In the high-yield bond sleeve, industry exposure that helped relative performance included retail, basic industry & real estate and food & drug retailers. Conversely, the telecommunications, health care and support-services sectors hindered relative performance.
In the senior secured loan sleeve, top-contributing sectors included rail, health care and capital goods. In contrast, the media, personal & household products and automotive sectors negatively impacted performance.
Outlook
US stock markets are trading near all-time highs, equity volatility remains subdued and interest rates reside above the lows on an economic outlook that we believe is improving. Historically, these factors have been positive indicators for both economic and corporate earnings growth and supportive of investments in risk assets.
We expect the US economy to expand at a moderate pace in 2017 with the stock market’s strength and the Treasury’s yield curve confirming this notion, in our view. Moreover, positive tax reform, decreased regulation and increased fiscal spending could result in even stronger economic growth.
US monetary policy continues to be modestly accommodative and we expect the Fed to continue to take a gradual approach toward policy adjustments. Additional interest rate hikes and balance sheet reduction efforts could signal confidence in the US economy’s ability to grow. The purpose of these adjustments would be to achieve a normalized environment after an extended period of extreme accommodation. Outside of the US, global monetary policy continues to be constructive.
After bottoming in the second quarter of 2016, corporate profits have accelerated through the second quarter of 2017. Based on bottom-up estimates, we believe they are poised to trend higher throughout year.
AllianzGI Convertible & Income Fund /AllianzGI Convertible & Income Fund II
For the period of March 1, 2017 through August 31, 2017, as provided by Doug Forsyth, CFA, Portfolio Manager.
For the six-month period ended August 31, 2017, the AllianzGI Convertible & Income Fund returned 1.98% on net asset value and 7.13% on market price.
For the six-month reporting period ended August 31, 2017, the AllianzGI Convertible & Income Fund II returned 2.29% on net asset value (“NAV”) and 7.05% on market price.
Market Environment
The convertible bond and high-yield bond markets moved higher over the reporting period despite a number of macro-related headwinds toward the end of the reporting period.
In general, convertibles benefited from the strength of the equity market, while high-yield bonds rallied alongside stocks, which touched record levels.
Several factors, in our view, influenced these asset classes throughout the reporting period, including corporate fundamentals, economic indicators and moves made by the US Federal Reserve (“Fed”).
During the reporting period US companies continued to exhibit improving fundamentals, as operating results for most issuers met or exceeded expectations and high-yield bond credit metrics showed further improvement. Second quarter earnings in 2017 finished stronger-than-expected and marked a second consecutive quarter of double-digit year-over-year earnings growth according to FactSet Research Systems Inc., a multinational financial data and software company that provides financial information and analytic software for investment professionals. Concurrently, Bank of America Merrill Lynch reported that high-yield net leverage ticked lower and interest coverage rose during the period.
| | | | | | |
| August 31, 2017 | | | Semi-Annual Report | | | 5 | |
Certain economic statistics also factored into the market’s strength. The unemployment rate fell and housing prices continued their upward trend. Consumer and small business confidence remained at bullish levels and key manufacturing and service surveys ended within expansionary territory. Lastly, price indexes remained relatively benign.
As anticipated, the Fed increased interest rates for the second time this year, pushing the federal funds rate to a range of 1.00% to 1.25%. The market’s response to the Fed’s rate hike decision was muted. Additionally, the Fed noted that the process of balance sheet reduction is expected to begin later this year, reflecting their confidence in the US economy. Overall, the Fed did not deviate from its gradual approach toward policy adjustments, and along with continued accommodative economic policies outside the US, this lends support to the investment in risk assets.
Portfolio Review
In addition to providing a strong total return, the Funds also provided a high level of income over the reporting period.
In the convertible sleeve, the consumer discretionary sector had a positive contribution to relative performance. Additionally, issue selection was strongest in energy. On the other hand, the health care, telecommunications and technology sectors pressured relative performance.
In the high-yield sleeve, the theaters & entertainment, printing & publishing and steel producers/products sectors helped relative performance. Conversely, the telecommunications, support-services and energy industries hindered relative performance.
Outlook
US stock markets are trading near all-time highs, equity volatility remains subdued and interest rates reside above the lows on an economic outlook that we believe is improving. Historically, these factors have been positive indicators for both economic and corporate earnings growth and supportive of investments in risk assets.
We expect the US economy to expand at a moderate pace in 2017 with the stock market’s strength and the Treasury’s yield curve confirming this notion. Moreover, positive tax reform, decreased regulation and increased fiscal spending could result in even stronger economic growth.
US monetary policy continues to be modestly accommodative with and we expect the Fed to continue to take a gradual approach toward policy adjustments. Additional interest rate hikes and balance sheet reduction efforts could signal confidence in the US economy’s ability to grow. The purpose of these adjustments would be to achieve a normalized environment after an extended period of extreme accommodation. Outside of the US, global monetary policy continues to be constructive.
After bottoming in the second quarter of 2016, corporate profits have accelerated through the second quarter of 2017. Based on bottom-up estimates, we believe they are poised to trend higher throughout year.
| | | | |
| 6 | | Semi-Annual Report | | | August 31, 2017 |
Performance & Statistics
AllianzGI Convertible & Income 2024 Target Term Fund
August 31, 2017 (unaudited)
| | | | | | | | |
| Total Return(1): | | Market Price | | | NAV | |
Commencement of Operations (6/30/17) to 8/31/17 | | | -0.54% | | | | 0.32% | |
| | |
| Market Price/NAV Performance: | | |
Commencement of Operations (6/30/17) to 8/31/17
| | | | |
| Market Price/NAV: | | | |
Market Price | | | $9.90 | |
NAV(2) | | | $9.82 | |
Premium to NAV | | | 0.81% | |
Market Price Yield(3) | | | 5.58% | |
Leverage(4) | | | 27.99% | |
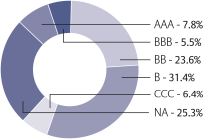
S&P Global Ratings*
(as a % of total investments)
See “Notes to Performance & Statistics” on page 10.
| | | | | | |
| August 31, 2017 | | | Semi-Annual Report | | | 7 | |
Performance & Statistics
AllianzGI Convertible & Income Fund
August 31, 2017 (unaudited)
| | | | | | | | |
| Total Return(1): | | Market Price | | | NAV | |
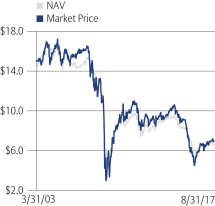
Six Month | | | 7.13% | | | | 1.98% | |
1 Year | | | 18.40% | | | | 11.33% | |
5 Year | | | 6.94% | | | | 8.01% | |
10 Year | | | 6.35% | | | | 5.53% | |
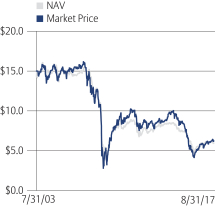
Commencement of Operations (3/31/03) to 8/31/17 | | | 7.65% | | | | 7.69% | |
| | |
| Market Price/NAV Performance: | | |
Commencement of Operations (3/31/03) to 8/31/17
| | | | |
| Market Price/NAV: | | | |
Market Price | | | $7.01 | |
NAV(2) | | | $6.61 | |
Premium to NAV | | | 6.05% | |
Market Price Yield(3) | | | 11.13% | |
Leverage(5) | | | 37.89% | |
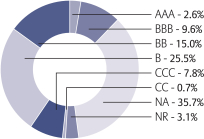
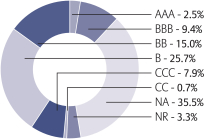
S&P Global Ratings*
(as a % of total investments)
See “Notes to Performance & Statistics” on page 10.
| | | | |
| 8 | | Semi-Annual Report | | | August 31, 2017 |
Performance & Statistics
AllianzGI Convertible & Income Fund II
August 31, 2017 (unaudited)
| | | | | | | | |
| Total Return(1): | | Market Price | | | NAV | |
Six Month | | | 7.05% | | | | 2.29% | |
1 Year | | | 21.37% | | | | 11.63% | |
5 Year | | | 6.05% | | | | 8.14% | |
10 Year | | | 5.49% | | | | 4.82% | |
Commencement of Operations (7/31/03) to 8/31/17 | | | 6.49% | | | | 6.64% | |
| | |
| Market Price/NAV Performance: | | |
Commencement of Operations (7/31/03) to 8/31/17
| | | | |
| Market Price/NAV: | | | |
Market Price | | | $6.24 | |
NAV(2) | | | $5.93 | |
Premium to NAV | | | 5.23% | |
Market Price Yield(3) | | | 10.24% | |
Leverage(5) | | | 38.22% | |
S&P Global Ratings*
(as a % of total investments)
See “Notes to Performance & Statistics” on page 10.
| | | | | | |
| August 31, 2017 | | | Semi-Annual Report | | | 9 | |
Performance & Statistics
AllianzGI Convertible & Income Funds
August 31, 2017 (unaudited)
Notes to Performance & Statistics:
* Credit ratings apply to the underlying holdings of the Funds and not the Funds themselves and are divided into categories ranging from highest to lowest credit quality, determined for purposes of presentations in this report by using ratings provided by S&P Global Ratings (“S&P”). Presentations of credit ratings information in this report use ratings provided by S&P for this purpose, among other reasons, because of the access to background information and other materials provided by S&P, as well as the Funds’ considerations of industry practice. Securities not rated by S&P, or bonds that do not have a rating available from S&P, or bonds that had a rating withdrawn by S&P are designated as “NR” or “NA”, respectively. Credit quality ratings assigned by a rating agency are subjective opinions, not statements of fact, and are subject to change periodically, even as frequently as daily. Ratings assigned by S&P or another rating agency are not absolute standards of credit quality and do not evaluate market risk. Rating agencies may fail to make timely changes in credit ratings, and an issuer’s current financial condition may be better or worse than a rating indicates. In formulating investment decisions for the Funds, Allianz Global Investors U.S. LLC develops its own analysis of the credit quality and risks associated with individual debt instruments, rather than relying exclusively on rating agencies or third-party research.
(1) Past performance is no guarantee of future results. Total return is calculated by determining the percentage change in NAV or market price (as applicable) in the specified period. The calculation assumes that all dividends and distributions, if any, have been reinvested. Total return does not reflect broker commissions or sales charges in connection with the purchase or sale of Fund shares. Total return for a period of more than one year represents the average annual total return. Total return for a period of less than one year is not annualized.
Performance at market price will differ from results at NAV. Although market price returns tend to reflect investment results over time, during shorter periods returns at market price can also be influenced by factors such as changing views about the Funds, market conditions, supply and demand for each Fund’s shares, or changes in each Fund’s dividends.
An investment in each Fund involves risk, including the loss of principal. Total return, market price, market price yield and NAV will fluctuate with changes in market conditions. This data is provided for information purposes only and is not intended for trading purposes. Closed-end funds, unlike open-end funds, are not continuously offered. There is a one time public offering and once issued, shares of closed-end funds are traded in the open market through a stock exchange. NAV is equal to total assets attributable to common shareholders less total liabilities divided by the number of common shares outstanding. Holdings are subject to change daily.
(2) The NAV disclosed in the Funds’ financial statements may differ from this NAV due to accounting principles generally accepted in the United States of America.
(3) Market Price Yield is determined by dividing the annualized current monthly dividend per common share (comprised of net investment income) by the market price per common share at August 31, 2017.
(4) Represents amounts drawn under the short-term margin loan facility (“Leverage”) outstanding, as a percentage of total managed assets. Total managed assets refer to total assets (including assets attributable to Leverage) minus liabilities (other than liabilities representing Leverage).
(5) Represents Preferred Shares (“Leverage”) outstanding, as a percentage of total managed assets. Total managed assets refer to total assets (including assets attributable to Leverage) minus liabilities (other than liabilities representing Leverage).
| | | | |
| 10 | | Semi-Annual Report | | | August 31, 2017 |
Schedule of Investments
AllianzGI Convertible & Income 2024 Target Term Fund
August 31, 2017 (unaudited)
| | | | | | | | | | | | |
Principal
Amount
(000s) | | | | | | | | Value | |
| | Corporate Bonds & Notes – 59.1% | |
| | | | Aerospace & Defense – 2.6% | | | | | | | | |
| | $1,500 | | | KLX, Inc., 5.875%, 12/1/22 (a)(c)(e) | | | | | | | $1,578,750 | |
| | 1,500 | | | Kratos Defense & Security Solutions, Inc., 7.00%, 5/15/19 (e) | | | | | | | 1,530,000 | |
| | 1,500 | | | TransDigm, Inc., 6.50%, 7/15/24 (e) | | | | | | | 1,561,875 | |
| | | | | | | | | | | | 4,670,625 | |
| | | | Auto Components – 0.9% | | | | | | | | |
| | 1,500 | | | American Axle & Manufacturing, Inc., 6.625%, 10/15/22 (e) | | | | | | | 1,554,375 | |
| | | | Auto Manufacturers – 0.9% | | | | | | | | |
| | 1,500 | | | Navistar International Corp., 8.25%, 11/1/21 (e) | | | | | | | 1,515,000 | |
| | | | Building Materials – 0.9% | | | | | | | | |
| | 1,500 | | | Builders FirstSource, Inc., 5.625%, 9/1/24 (a)(c)(e) | | | | | | | 1,573,125 | |
| | | | Chemicals – 3.5% | | | | | | | | |
| | 1,500 | | | Chemours Co., 6.625%, 5/15/23 (e) | | | | | | | 1,599,375 | |
| | 1,500 | | | Platform Specialty Products Corp., 6.50%, 2/1/22 (a)(c)(e) | | | | | | | 1,563,750 | |
| | 1,500 | | | Tronox Finance LLC, 7.50%, 3/15/22 (a)(c)(e) | | | | | | | 1,578,750 | |
| | 1,500 | | | Univar USA, Inc., 6.75%, 7/15/23 (a)(c)(e) | | | | | | | 1,567,500 | |
| | | | | | | | | | | | 6,309,375 | |
| | | | Computers – 1.9% | | | | | | | | |
| | 1,500 | | | Dell International LLC, 7.125%, 6/15/24 (a)(c)(e) | | | | | | | 1,662,346 | |
| | 1,500 | | | Western Digital Corp., 10.50%, 4/1/24 (e) | | | | | | | 1,783,125 | |
| | | | | | | | | | | | 3,445,471 | |
| | | | Diversified Financial Services – 3.4% | | | | | | | | |
| | 1,500 | | | Community Choice Financial, Inc., 10.75%, 5/1/19 (e) | | | | | | | 1,275,000 | |
| | 1,500 | | | Nationstar Mortgage LLC, 7.875%, 10/1/20 (e) | | | | | | | 1,535,625 | |
| | 1,500 | | | Navient Corp., 7.25%, 9/25/23 (e) | | | | | | | 1,634,400 | |
| | 1,500 | | | Springleaf Finance Corp., 8.25%, 10/1/23 (e) | | | | | | | 1,706,250 | |
| | | | | | | | | | | | 6,151,275 | |
| | | | Electric Utilities – 0.9% | | | | | | | | |
| | 1,500 | | | NRG Energy, Inc., 6.25%, 5/1/24 (e) | | | | | | | 1,560,000 | |
| | | | Engineering & Construction – 0.9% | | | | | | | | |
| | 1,500 | | | AECOM, 5.875%, 10/15/24 (e) | | | | | | | 1,648,125 | |
| | | | Entertainment – 0.9% | | | | | | | | |
| | 1,500 | | | Cedar Fair L.P., 5.375%, 6/1/24 (e) | | | | | | | 1,590,000 | |
| | | | Healthcare-Products – 0.9% | | | | | | | | |
| | 1,500 | | | Hologic, Inc., 5.25%, 7/15/22 (a)(c)(e) | | | | | | | 1,584,825 | |
| | | | Healthcare-Services – 5.3% | | | | | | | | |
| | 1,500 | | | Community Health Systems, Inc., 6.25%, 3/31/23 (e) | | | | | | | 1,516,875 | |
| | 1,500 | | | DaVita, Inc., 5.125%, 7/15/24 (e) | | | | | | | 1,533,750 | |
| | 1,500 | | | Envision Healthcare Corp., 6.25%, 12/1/24 (a)(c)(e) | | | | | | | 1,620,000 | |
| | 1,500 | | | HCA, Inc., 7.50%, 2/15/22 (e) | | | | | | | 1,732,500 | |
| | 1,500 | | | Kindred Healthcare, Inc., 8.75%, 1/15/23 (e) | | | | | | | 1,458,750 | |
| | 1,500 | | | Tenet Healthcare Corp., 8.125%, 4/1/22 (e) | | | | | | | 1,578,750 | |
| | | | | | | | | | | | 9,440,625 | |
| | | | Home Builders – 1.5% | | | | | | | | |
| | 1,000 | | | Beazer Homes USA, Inc., 8.75%, 3/15/22 (e) | | | | | | | 1,107,500 | |
| | 1,500 | | | CalAtlantic Group, Inc., 5.875%, 11/15/24 (e) | | | | | | | 1,633,125 | |
| | | | | | | | | | | | 2,740,625 | |
| | | | | | |
| August 31, 2017 | | | Semi-Annual Report | | | 11 | |
Schedule of Investments
AllianzGI Convertible & Income 2024 Target Term Fund
August 31, 2017 (unaudited) (continued)
| | | | | | | | | | | | |
Principal
Amount
(000s) | | | | | | | | Value | |
| | | | Internet & Catalog Retail – 0.9% | | | | | | | | |
| | $1,500 | | | Netflix, Inc., 5.875%, 2/15/25 | | | | | | | $1,627,500 | |
| | | | Iron/Steel – 1.8% | | | | | | | | |
| | 1,500 | | | AK Steel Corp., 7.50%, 7/15/23 (e) | | | | | | | 1,631,250 | |
| | 1,500 | | | United States Steel Corp., 8.375%, 7/1/21 (a)(c)(e) | | | | | | | 1,661,250 | |
| | | | | | | | | | | | 3,292,500 | |
| | | | Lodging – 0.9% | | | | | | | | |
| | 1,500 | | | Wynn Las Vegas LLC, 5.50%, 3/1/25 (a)(c)(e) | | | | | | | 1,567,500 | |
| | | | Machinery-Construction & Mining – 0.9% | | | | | | | | |
| | 1,500 | | | Terex Corp., 5.625%, 2/1/25 (a)(c)(e) | | | | | | | 1,578,750 | |
| | | | Media – 5.3% | | | | | | | | |
| | 1,500 | | | CCO Holdings LLC, 5.75%, 1/15/24 (e) | | | | | | | 1,577,325 | |
| | 1,500 | | | Clear Channel Worldwide Holdings, Inc., 6.50%, 11/15/22, Ser. B (e) | | | | | | | 1,548,750 | |
| | 1,500 | | | CSC Holdings LLC, 6.75%, 11/15/21 (e) | | | | | | | 1,661,700 | |
| | 1,500 | | | DISH DBS Corp., 5.875%, 7/15/22 (e) | | | | | | | 1,620,937 | |
| | 1,500 | | | McClatchy Co., 9.00%, 12/15/22 (e) | | | | | | | 1,565,625 | |
| | 1,500 | | | Nexstar Broadcasting, Inc., 5.625%, 8/1/24 (a)(c)(e) | | | | | | | 1,556,250 | |
| | | | | | | | | | | | 9,530,587 | |
| | | | Mining – 3.1% | | | | | | | | |
| | 1,500 | | | Alcoa Nederland Holding BV, 6.75%, 9/30/24 (a)(c)(e) | | | | | | | 1,653,750 | |
| | 2,000 | | | Hudbay Minerals, Inc., 7.625%, 1/15/25 (a)(c)(e) | | | | | | | 2,215,000 | |
| | 1,500 | | | Joseph T. Ryerson & Son, Inc., 11.00%, 5/15/22 (a)(c)(e) | | | | | | | 1,700,625 | |
| | | | | | | | | | | | 5,569,375 | |
| | | | Miscellaneous Manufacturing – 1.3% | | | | | | | | |
| | 1,500 | | | Koppers, Inc., 6.00%, 2/15/25 (a)(c)(e) | | | | | | | 1,593,750 | |
| | 750 | | | Trinseo Materials Operating SCA, 6.75%, 5/1/22 (a)(c)(e) | | | | | | | 800,063 | |
| | | | | | | | | | | | 2,393,813 | |
| | | | Oil, Gas & Consumable Fuels – 3.3% | | | | | | | | |
| | 1,500 | | | Calumet Specialty Products Partners L.P., 6.50%, 4/15/21 | | | | | | | 1,447,500 | |
| | 1,500 | | | Carrizo Oil & Gas, Inc., 6.25%, 4/15/23 (e) | | | | | | | 1,462,500 | |
| | 1,500 | | | Continental Resources, Inc., 5.00%, 9/15/22 (e) | | | | | | | 1,513,125 | |
| | 1,500 | | | Oasis Petroleum, Inc., 6.875%, 3/15/22 (e) | | | | | | | 1,470,000 | |
| | | | | | | | | | | | 5,893,125 | |
| | | | Pharmaceuticals – 0.8% | | | | | | | | |
| | 1,500 | | | Valeant Pharmaceuticals International, Inc., 7.50%, 7/15/21 (a)(c)(e) | | | | | | | 1,477,500 | |
| | | | Real Estate – 1.9% | | | | | | | | |
| | 1,500 | | | Kennedy-Wilson, Inc., 5.875%, 4/1/24 (e) | | | | | | | 1,546,875 | |
| | 1,950 | | | Uniti Group L.P., 8.25%, 10/15/23 (e) | | | | | | | 1,915,095 | |
| | | | | | | | | | | | 3,461,970 | |
| | | | Retail – 0.8% | | | | | | | | |
| | 1,500 | | | Conn’s, Inc., 7.25%, 7/15/22 (e) | | | | | | | 1,462,500 | |
| | | | Semiconductors – 0.9% | | | | | | | | |
| | 1,515 | | | Advanced Micro Devices, Inc., 7.00%, 7/1/24 | | | | | | | 1,619,156 | |
| | | | Semiconductors & Semiconductor Equipment – 0.8% | | | | | | | | |
| | 1,250 | | | Microsemi Corp., 9.125%, 4/15/23 (a)(c)(e) | | | | | | | 1,434,638 | |
| | | | Software – 2.8% | | | | | | | | |
| | 1,500 | | | Camelot Finance S.A., 7.875%, 10/15/24 (a)(c) | | | | | | | 1,631,250 | |
| | 1,500 | | | First Data Corp., 7.00%, 12/1/23 (a)(c)(e) | | | | | | | 1,620,000 | |
| | | | |
| 12 | | Semi-Annual Report | | | August 31, 2017 |
Schedule of Investments
AllianzGI Convertible & Income 2024 Target Term Fund
August 31, 2017 (unaudited) (continued)
| | | | | | | | | | | | |
Principal
Amount
(000s) | | | | | | | | Value | |
| | | | Software (continued) | | | | | | | | |
| | $185 | | | Rackspace Hosting, Inc., 8.625%, 11/15/24 (a)(c) | | | | | | | $196,794 | |
| | 1,500 | | | SS&C Technologies Holdings, Inc., 5.875%, 7/15/23 (e) | | | | | | | 1,582,500 | |
| | | | | | | | | | | | 5,030,544 | |
| | | | Telecommunications – 8.2% | | | | | | | | |
| | 2,000 | | | CenturyLink, Inc., 7.50%, 4/1/24, Ser. Y (e) | | | | | | | 2,100,000 | |
| | 1,500 | | | Cincinnati Bell, Inc., 7.00%, 7/15/24 (a)(c)(e) | | | | | | | 1,488,750 | |
| | 1,500 | | | Consolidated Communications, Inc., 6.50%, 10/1/22 (e) | | | | | | | 1,455,937 | |
| | 1,500 | | | Frontier Communications Corp., 10.50%, 9/15/22 (e) | | | | | | | 1,353,750 | |
| | 2,000 | | | GTT Communications, Inc., 7.875%, 12/31/24 (a)(c)(e) | | | | | | | 2,140,000 | |
| | 1,500 | | | Hughes Satellite Systems Corp., 7.625%, 6/15/21 (e) | | | | | | | 1,713,750 | |
| | 1,500 | | | Sprint Corp., 7.125%, 6/15/24 (e) | | | | | | | 1,651,875 | |
| | 1,500 | | | West Corp., 5.375%, 7/15/22 (a)(c)(e) | | | | | | | 1,520,625 | |
| | 1,500 | | | Windstream Services LLC, 7.50%, 6/1/22 (e) | | | | | | | 1,177,500 | |
| | | | | | | | | | | | 14,602,187 | |
| | | | Transportation – 0.9% | | | | | | | | |
| | 1,500 | | | XPO Logistics, Inc., 6.50%, 6/15/22 (a)(c)(e) | | | | | | | 1,580,625 | |
| | Total Corporate Bonds & Notes (cost-$106,183,701) | | | | | | | 105,905,716 | |
| | Convertible Bonds & Notes – 54.3% | | | | | | | | |
| | | | Apparel & Textiles – 1.8% | | | | | | | | |
| | 3,250 | | | Iconix Brand Group, Inc., 1.50%, 3/15/18 (e) | | | | | | | 3,227,656 | |
| | | | Auto Components – 1.6% | | | | | | | | |
| | 2,825 | | | Horizon Global Corp., 2.75%, 7/1/22 (e) | | | | | | | 2,925,641 | |
| | | | Auto Manufacturers – 1.4% | | | | | | | | |
| | 2,500 | | | Navistar International Corp., 4.75%, 4/15/19 (e) | | | | | | | 2,582,813 | |
| | | | Biotechnology – 4.0% | | | | | | | | |
| | 2,500 | | | Innoviva, Inc., 2.125%, 1/15/23 (e) | | | | | | | 2,415,625 | |
| | 3,000 | | | Intercept Pharmaceuticals, Inc., 3.25%, 7/1/23 (e) | | | | | | | 3,028,125 | |
| | 2,000 | | | PTC Therapeutics, Inc., 3.00%, 8/15/22 (e) | | | | | | | 1,691,250 | |
| | | | | | | | | | | | 7,135,000 | |
| | | | Capital Markets – 1.8% | | | | | | | | |
| | 3,000 | | | TPG Specialty Lending, Inc., 4.50%, 8/1/22 (a)(c)(e) | | | | | | | 3,123,750 | |
| | | | Computers – 1.0% | | | | | | | | |
| | 2,000 | | | KeyW Holding Corp., 2.50%, 7/15/19 (e) | | | | | | | 1,847,500 | |
| | | | Distribution/Wholesale – 1.7% | | | | | | | | |
| | 3,000 | | | Titan Machinery, Inc., 3.75%, 5/1/19 (e) | | | | | | | 2,955,000 | |
| | | | Diversified Financial Services – 3.2% | | | | | | | | |
| | 3,050 | | | Encore Capital Group, Inc., 2.875%, 3/15/21 (e) | | | | | | | 2,962,312 | |
| | 3,000 | | | PRA Group, Inc., 3.00%, 8/1/20 (e) | | | | | | | 2,756,250 | |
| | | | | | | | | | | | 5,718,562 | |
| | | | Electrical Equipment – 1.3% | | | | | | | | |
| | 2,715 | | | SunPower Corp., 4.00%, 1/15/23 (e) | | | | | | | 2,399,381 | |
| | | | Energy-Alternate Sources – 1.3% | | | | | | | | |
| | 2,500 | | | SolarCity Corp., 1.625%, 11/1/19 (e) | | | | | | | 2,387,500 | |
| | | | Engineering & Construction – 1.2% | | | | | | | | |
| | 2,200 | | | Layne Christensen Co., 4.25%, 11/15/18 (e) | | | | | | | 2,088,625 | |
| | | | Equity Real Estate Investment Trusts (REITs) – 7.1% | | | | | | | | |
| | 2,900 | | | IAS Operating Partnership L.P., 5.00%, 3/15/18 (a)(c)(e) | | | | | | | 2,936,250 | |
| | 3,000 | | | PennyMac Corp., 5.375%, 5/1/20 (e) | | | | | | | 2,992,500 | |
| | | | | | |
| August 31, 2017 | | | Semi-Annual Report | | | 13 | |
Schedule of Investments
AllianzGI Convertible & Income 2024 Target Term Fund
August 31, 2017 (unaudited) (continued)
| | | | | | | | | | | | |
Principal
Amount
(000s) | | | | | | | | Value | |
| | | | Equity Real Estate Investment Trusts (REITs) (continued) | | | | | | | | |
| | $1,000 | | | Redwood Trust, Inc., 4.75%, 8/15/23 | | | | | | | $1,004,375 | |
| | 2,850 | | | Starwood Property Trust, Inc., 4.375%, 4/1/23 (e) | | | | | | | 2,901,656 | |
| | 2,750 | | | Two Harbors Investment Corp., 6.25%, 1/15/22 (e) | | | | | | | 2,944,219 | |
| | | | | | | | | | | | 12,779,000 | |
| | | | Health Care/Health Care Distributors – 1.5% | | | | | | | | |
| | 3,100 | | | Aceto Corp., 2.00%, 11/1/20 (e) | | | | | | | 2,743,500 | |
| | | | Insurance – 1.4% | | | | | | | | |
| | 3,500 | | | AmTrust Financial Services, Inc., 2.75%, 12/15/44 (e) | | | | | | | 2,585,625 | |
| | | | Internet – 3.9% | | | | | | | | |
| | 3,000 | | | FireEye, Inc., 1.625%, 6/1/35, Ser. B (e) | | | | | | | 2,746,875 | |
| | 2,500 | | | Pandora Media, Inc., 1.75%, 12/1/20 (e) | | | | | | | 2,357,812 | |
| | 1,800 | | | WebMD Health Corp., 2.625%, 6/15/23 (e) | | | | | | | 1,801,125 | |
| | | | | | | | | | | | 6,905,812 | |
| | | | Investment Companies – 3.3% | | | | | | | | |
| | 2,900 | | | Goldman Sachs BDC, Inc., 4.50%, 4/1/22 (a)(c)(e) | | | | | | | 2,948,937 | |
| | 3,000 | | | Prospect Capital Corp., 4.95%, 7/15/22 (e) | | | | | | | 2,970,000 | |
| | | | | | | | | | | | 5,918,937 | |
| | | | Oil, Gas & Consumable Fuels – 6.2% | | | | | | | | |
| | 3,000 | | | Green Plains, Inc., 4.125%, 9/1/22 | | | | | | | 2,904,375 | |
| | 3,000 | | | Helix Energy Solutions Group, Inc., 4.25%, 5/1/22 (e) | | | | | | | 2,902,500 | |
| | 3,425 | | | Nabors Industries, Inc., 0.75%, 1/15/24 (a)(c)(e) | | | | | | | 2,491,688 | |
| | 3,150 | | | PDC Energy, Inc., 1.125%, 9/15/21 (e) | | | | | | | 2,854,687 | |
| | | | | | | | | | | | 11,153,250 | |
| | | | Pharmaceuticals – 4.1% | | | | | | | | |
| | 3,750 | | | Horizon Pharma Investment Ltd., 2.50%, 3/15/22 (e) | | | | | | | 3,421,875 | |
| | 3,250 | | | Impax Laboratories, Inc., 2.00%, 6/15/22 (e) | | | | | | | 2,894,531 | |
| | 1,000 | | | Sucampo Pharmaceuticals, Inc., 3.25%, 12/15/21 (a)(c) | | | | | | | 1,034,375 | |
| | | | | | | | | | | | 7,350,781 | |
| | | | Retail – 1.5% | | | | | | | | |
| | 3,500 | | | RH, zero coupon, 7/15/20 (a)(c)(e) | | | | | | | 2,751,875 | |
| | | | Semiconductors – 1.7% | | | | | | | | |
| | 3,300 | | | Veeco Instruments, Inc., 2.70%, 1/15/23 (e) | | | | | | | 3,046,313 | |
| | | | Telecommunications – 1.7% | | | | | | | | |
| | 3,100 | | | Gogo, Inc., 3.75%, 3/1/20 (e) | | | | | | | 2,985,688 | |
| | | | Transportation – 1.6% | | | | | | | | |
| | 3,000 | | | Echo Global Logistics, Inc., 2.50%, 5/1/20 (e) | | | | | | | 2,842,500 | |
| | Total Convertible Bonds & Notes (cost-$97,479,025) | | | | | | | 97,454,709 | |
| | Senior Loans (a)(b) – 19.3% | | | | | | | | |
| | | | Aerospace & Defense – 0.5% | | | | | | | | |
| | 983 | | | Engility Corp., 1 mo. LIBOR + 3.250%, 4.489%, 8/12/23, Term Loan B2 | | | | | | | 993,580 | |
| | | | Airlines – 0.6% | | | | | | | | |
| | 1,000 | | | Delta Air Lines, Inc., 1 mo. LIBOR + 2.500%, 3.729%, 10/18/18, 2018 Term Loan B1 | | | | | | | 1,007,969 | |
| | | | Automobiles – 0.6% | | | | | | | | |
| | | | Winnebago Industries, Inc., 11/8/23, Term Loan B | | | | | | | | |
| | 704 | | | 3 mo. LIBOR + 4.500%, 5.719% | | | | | | | 711,480 | |
| | 296 | | | 3 mo. LIBOR + 4.500%, 5.729% | | | | | | | 299,145 | |
| �� | | | | | | | | | | | 1,010,625 | |
| | | | |
| 14 | | Semi-Annual Report | | | August 31, 2017 |
Schedule of Investments
AllianzGI Convertible & Income 2024 Target Term Fund
August 31, 2017 (unaudited) (continued)
| | | | | | | | | | | | |
Principal
Amount
(000s) | | | | | | | | Value | |
| | | | Building Materials – 0.6% | | | | | | | | |
| | $1,000 | | | GYP Holdings III Corp., 3 mo. LIBOR + 3.000%, 4.311%, 4/1/23, 2017 Term Loan B | | | | | | | $1,004,375 | |
| | | | Chemicals – 1.1% | | | | | | | | |
| | 448 | | | Huntsman International LLC, 1 mo. LIBOR + 3.000%, 4.239%, 4/1/23, Term Loan B2 (d) | | | | | | | 451,059 | |
| | 587 | | | Kraton Polymers LLC, 1 mo. LIBOR + 3.000%, 4.239%, 1/6/22, 2017 USD Term Loan B (d) | | | | | | | 592,273 | |
| | 997 | | | Omnova Solutions, Inc., 1 mo. LIBOR + 4.250%, 5.489%, 8/28/23, 2016 Term Loan B | | | | | | | 1,007,456 | |
| | | | | | | | | | | | 2,050,788 | |
| | | | Commercial Services & Supplies – 0.6% | | | | | | | | |
| | 1,000 | | | Advanced Disposal Services, Inc., 1 Week LIBOR + 2.750%, 3.944%, 11/10/23, Term Loan B3 | | | | | | | 1,007,266 | |
| | | | Construction & Engineering – 0.6% | | | | | | | | |
| | 1,000 | | | Summit Materials Companies I LLC, 1 mo. LIBOR + 2.750%, 3.989%, 7/17/22, 2015 Term Loan B | | | | | | | 1,009,167 | |
| | | | Diversified Consumer Services – 0.6% | | | | | | | | |
| | 1,000 | | | Laureate Education, Inc., 1 mo. LIBOR + 4.500%, 5.739%, 4/26/24, 2017 Term Loan B | | | | | | | 1,005,469 | |
| | | | Electronic Equipment, Instruments & Components – 1.1% | | | | | | | | |
| | 1,000 | | | TTM Technologies, Inc., 1 mo. LIBOR + 4.250%, 5.489%, 5/31/21, 1st Lien Term Loan (d) | | | | | | | 1,014,375 | |
| | 1,000 | | | Zebra Technologies Corp., 3 mo. LIBOR + 2.000%, 3.314%, 10/27/21, 2017 Term Loan B | | | | | | | 1,001,569 | |
| | | | | | | | | | | | 2,015,944 | |
| | | | Electronics – 0.6% | | | | | | | | |
| | 1,000 | | | Kemet Electronic Corp., 1 mo. LIBOR + 6.000%, 7.239%, 4/26/24, Term Loan B | | | | | | | 1,006,250 | |
| | | | Food & Staples Retailing – 0.6% | | | | | | | | |
| | 1,000 | | | US Foods, Inc., 1 mo. LIBOR + 2.750%, 3.989%, 6/27/23, 2016 Term Loan B | | | | | | | 1,006,250 | |
| | | | Health Care Providers & Services – 1.1% | | | | | | | | |
| | 1,000 | | | Acadia Healthcare Company, Inc., 1 mo. LIBOR + 2.750%, 3.982%, 2/16/23, Term Loan B2 | | | | | | | 1,011,125 | |
| | | | Select Medical Corp., 3/6/24, 2017 Term Loan B | | | | | | | | |
| | 997 | | | 3 mo. LIBOR + 3.500%, 4.81% | | | | | | | 1,007,999 | |
| | 3 | | | 2 mo. LIBOR + 3.500%, 4.76% | | | | | | | 3,033 | |
| | – | * | | PRIME + 2.500%, 6.75% | | | | | | | 1 | |
| | | | | | | | | | | | 2,022,158 | |
| | | | Healthcare-Products – 0.5% | | | | | | | | |
| | 973 | | | Greatbatch Ltd., 1 mo. LIBOR + 3.500%, 4.73%, 10/27/22, 2017 Term Loan B | | | | | | | 976,517 | |
| | | | Hotels, Restaurants & Leisure – 2.2% | | | | | | | | |
| | 990 | | | Boyd Gaming Corp., 1 Week LIBOR + 2.500%, 3.697%, 9/15/23, Term Loan B (d) | | | | | | | 992,960 | |
| | 1,000 | | | Playa Resorts Holding B.V., 3 mo. LIBOR + 3.000%, 4.32%, 4/5/24, 2017 Term Loan B (d) | | | | | | | 1,004,000 | |
| | 1,000 | | | Scientific Games International, Inc., 3 mo. LIBOR + 3.250%, 4.512%, 8/14/24, 2017 Term Loan B4 (d) | | | | | | | 1,009,196 | |
| | 997 | | | Travelport Finance (Luxembourg) Sarl, 3 mo. LIBOR + 2.750%, 4.061%, 9/2/21, New 2017 Term Loan C (d) | | | | | | | 997,382 | |
| | | | | | | | | | | | 4,003,538 | |
| | | | Internet – 0.6% | | | | | | | | |
| | 1,000 | | | Everi Payments, Inc., 1 mo. LIBOR + 4.500%, 5.739%, 5/9/24, Term Loan B | | | | | | | 1,010,375 | |
| | | | | | |
| August 31, 2017 | | | Semi-Annual Report | | | 15 | |
Schedule of Investments
AllianzGI Convertible & Income 2024 Target Term Fund
August 31, 2017 (unaudited) (continued)
| | | | | | | | | | | | |
Principal
Amount
(000s) | | | | | | | | Value | |
| | | | Internet Software & Services – 0.8% | | | | | | | | |
| | $500 | | | Blucora, Inc., 3 mo. LIBOR + 3.750%, 5.037%, 5/22/24, Term Loan | | | | | | | $504,166 | |
| | 1,000 | | | Match Group, Inc., 3 mo. LIBOR + 2.500%, 3.809%, 11/16/22, 2017 Term Loan B (d) | | | | | | | 1,008,750 | |
| | | | | | | | | | | | 1,512,916 | |
| | | | IT Services – 1.1% | | | | | | | | |
| | 988 | | | First Data Corp., 1 mo. LIBOR + 2.500%, 3.736%, 4/26/24, 2017 Term Loan | | | | | | | 989,935 | |
| | 1,000 | | | Xerox Business Services LLC, 1 mo. LIBOR + 4.000%, 5.239%, 12/7/23, USD Term Loan B | | | | | | | 1,010,625 | |
| | | | | | | | | | | | 2,000,560 | |
| | | | Machinery – 1.1% | | | | | | | | |
| | 1,000 | | | Gardner Denver, Inc., 3 mo. LIBOR + 3.250%, 4.546%, 7/30/24, USD Term Loan B1 | | | | | | | 1,000,938 | |
| | 1,000 | | | Harsco Corp., 1 mo. LIBOR + 5.000%, 6.25%, 11/2/23, Term Loan B | | | | | | | 1,018,125 | |
| | | | | | | | | | | | 2,019,063 | |
| | | | Media – 1.1% | | | | | | | | |
| | 1,000 | | | Gray Television, Inc., 1 mo. LIBOR + 2.500%, 3.731%, 2/7/24, 2017 Term Loan B2 (d) | | | | | | | 1,006,250 | |
| | 1,000 | | | Lions Gate Entertainment Corp., 1 mo. LIBOR + 3.000%, 4.239%, 12/8/23, 2016 1st Lien Term Loan B (d) | | | | | | | 1,007,995 | |
| | | | | | | | | | | | 2,014,245 | |
| | | | Personal Products – 0.5% | | | | | | | | |
| | 985 | | | Prestige Brands, Inc., 1 mo. LIBOR + 2.750%, 3.989%, 1/26/24, Term Loan B4 (d) | | | | | | | 989,217 | |
| | | | Pharmaceuticals – 1.1% | | | | | | | | |
| | 1,000 | | | HLF Financing Sarl, 1 mo. LIBOR + 5.500%, 6.739%, 2/15/23, Term Loan B | | | | | | | 1,009,583 | |
| | 1,000 | | | Lannett Company, Inc., 1 mo. LIBOR + 5.375%, 6.614%, 11/25/22, Term Loan B | | | | | | | 996,667 | |
| | | | | | | | | | | | 2,006,250 | |
| | | | Road & Rail – 0.5% | | | | | | | | |
| | 945 | | | YRC Worldwide, Inc., 3 mo. LIBOR + 8.500%, 9.739%, 2/3/19, 2017 Term Loan (d) | | | | | | | 929,642 | |
| | | | Semiconductors & Semiconductor Equipment – 0.6% | | | | | | | | |
| | 1,000 | | | Cypress Semiconductor Corp., 1 mo. LIBOR + 2.750%, 3.98%, 7/5/21, 2016 Term Loan B (d) | | | | | | | 1,006,750 | |
| | | | Software – 0.6% | | | | | | | | |
| | 999 | | | Go Daddy Operating Co. LLC, 1 mo. LIBOR + 2.500%, 3.734%, 2/15/24, 2017 Term Loan B | | | | | | | 1,003,047 | |
| | Total Senior Loans (cost-$34,660,878) | | | | | | | 34,611,961 | |
| | | | Repurchase Agreements – 11.2% | | | | | | | | |
| | 20,014 | | | State Street Bank and Trust Co.,
dated 8/31/17, 0.12%, due 9/1/17, proceeds $20,014,067; collateralized by U.S. Treasury Inflation Indexed Notes, 0.625%, due 1/15/26, valued at $20,417,631 including accrued interest (cost-$20,014,000) | | | | | | | 20,014,000 | |
| | Total Investments (cost-$258,337,604) – 143.9% | | | | | | | 257,986,386 | |
| | Other liabilities in excess of other assets – (43.9)% | | | | | | | (78,688,071 | ) |
| | Net Assets – 100.0% | | | | | | | $179,298,315 | |
| | | | |
| 16 | | Semi-Annual Report | | | August 31, 2017 |
Schedule of Investments
AllianzGI Convertible & Income 2024 Target Term Fund
August 31, 2017 (unaudited) (continued)
Notes to Schedule of Investments:
| (a) | | Private Placement–Restricted as to resale and may not have a readily available market. Securities with an aggregate value of $90,045,002, representing 50.2% of net assets. | |
| (b) | | These securities generally pay interest at rates which are periodically pre-determined by reference to a base lending rate plus a premium. These base lending rates are generally either the lending rate offered by one or more major European banks, such as the “LIBOR” or the prime rate offered by one or more major United States banks, or the certificate of deposit rate. These securities are generally considered to be restricted as the Fund is ordinarily contractually obligated to receive approval from the Agent bank and/or borrower prior to disposition. Remaining maturities of senior loans may be less than the stated maturities shown as a result of contractual or optional payments by the borrower. Such prepayments cannot be predicted with certainty. The interest rate disclosed reflects the rate in effect on August 31, 2017. | |
| (c) | | 144A–Exempt from registration under Rule 144A of the Securities Act of 1933. These securities may be resold in transactions exempt from registration, typically only to qualified institutional buyers. Securities with an aggregate value of $55,433,041, representing 30.9% of net assets. | |
| (d) | | When-issued or delayed-delivery. To be settled/delivered after August 31, 2017. | |
| (e) | | All or partial amount segregated for the benefit of the counterparty as collateral for short-term loan financing. | |
| (f) | | Fair Value Measurements-See Note 1(b) in the Notes to Financial Statements. | |
| | | | | | | | | | | | | | | | |
| | | Level 1 –
Quoted
Prices | | | Level 2 –
Other Significant
Observable
Inputs | | | Level 3 –
Significant
Unobservable
Inputs | | | Value at
8/31/17 | |
Investments in Securities – Assets | | | | | | | | | | | | | | | | |
Corporate Bonds & Notes | | $ | – | | | | $105,905,716 | | | | $– | | | | $105,905,716 | |
Convertible Bonds & Notes | | | – | | | | 97,454,709 | | | | – | | | | 97,454,709 | |
Senior Loans | | | – | | | | 34,611,961 | | | | – | | | | 34,611,961 | |
Repurchase Agreements | | | – | | | | 20,014,000 | | | | – | | | | 20,014,000 | |
Totals | | $ | – | | | | $257,986,386 | | | | $– | | | | $257,986,386 | |
Glossary:
| | | | |
| LIBOR | | - | | London Inter-Bank Offered Rate |
| REIT | | - | | Real Estate Investment Trust |
| | | | | | | | |
| See accompanying Notes to Financial Statements | | | August 31, 2017 | | | Semi-Annual Report | | | 17 | |
Schedule of Investments
AllianzGI Convertible & Income Fund
August 31, 2017 (unaudited)
| | | | | | | | | | | | |
Principal
Amount
(000s) | | | | | | | | Value | |
| | Corporate Bonds & Notes – 40.1% | | | | | | | | |
| | | | Aerospace & Defense – 1.7% | | | | | | | | |
| | $6,636 | | | Kratos Defense & Security Solutions, Inc., 7.00%, 5/15/19 | | | | | | | $6,768,720 | |
| | 7,540 | | | TransDigm, Inc., 6.50%, 5/15/25 | | | | | | | 7,785,050 | |
| | 1,420 | | | Triumph Group, Inc., 7.75%, 8/15/25 (a)(b) | | | | | | | 1,464,730 | |
| | | | | | | | | | | | 16,018,500 | |
| | | | Auto Manufacturers – 0.7% | | | | | | | | |
| | 6,755 | | | Navistar International Corp., 8.25%, 11/1/21 | | | | | | | 6,822,550 | |
| | | | Building Materials – 0.7% | | | | | | | | |
| | 5,665 | | | U.S. Concrete, Inc., 6.375%, 6/1/24 | | | | | | | 6,146,525 | |
| | | | Chemicals – 2.8% | | | | | | | | |
| | 7,500 | | | Chemours Co., 6.625%, 5/15/23 | | | | | | | 7,996,875 | |
| | 4,790 | | | Kraton Polymers LLC, 7.00%, 4/15/25 (a)(b) | | | | | | | 5,173,200 | |
| | 5,670 | | | Platform Specialty Products Corp., 6.50%, 2/1/22 (a)(b) | | | | | | | 5,910,975 | |
| | 6,720 | | | Tronox Finance LLC, 7.50%, 3/15/22 (a)(b) | | | | | | | 7,072,800 | |
| | | | | | | | | | | | 26,153,850 | |
| | | | Commercial Services – 1.8% | | | | | | | | |
| | 8,050 | | | Cenveo Corp., 6.00%, 5/15/24 (a)(b) | | | | | | | 7,124,250 | |
| | 7,375 | | | Monitronics International, Inc., 9.125%, 4/1/20 | | | | | | | 6,241,094 | |
| | 3,500 | | | United Rentals North America, Inc., 5.50%, 7/15/25 | | | | | | | 3,758,125 | |
| | | | | | | | | | | | 17,123,469 | |
| | | | Computers – 1.9% | | | | | | | | |
| | 5,203 | | | DynCorp International, Inc., PIK 1.50%, 11.875%, 11/30/20 | | | | | | | 5,514,888 | |
| | 7,350 | | | Harland Clarke Holdings Corp., 9.25%, 3/1/21 (a)(b) | | | | | | | 7,515,375 | |
| | 3,935 | | | Western Digital Corp., 10.50%, 4/1/24 | | | | | | | 4,677,731 | |
| | | | | | | | | | | | 17,707,994 | |
| | | | Distribution/Wholesale – 0.5% | | | | | | | | |
| | | | H&E Equipment Services, Inc., | | | | | | | | |
| | 1,815 | | | 5.625%, 9/1/25 (a)(b) | | | | | | | 1,878,525 | |
| | 2,250 | | | 7.00%, 9/1/22 | | | | | | | 2,337,188 | |
| | | | | | | | | | | | 4,215,713 | |
| | | | Diversified Financial Services – 3.5% | | | | | | | | |
| | | | Community Choice Financial, Inc., | | | | | | | | |
| | 10,085 | | | 10.75%, 5/1/19 | | | | | | | 8,572,250 | |
| | 7,130 | | | 12.75%, 5/1/20 (a)(b) | | | | | | | 4,991,000 | |
| | | | Nationstar Mortgage LLC, | | | | | | | | |
| | 2,500 | | | 7.875%, 10/1/20 | | | | | | | 2,559,375 | |
| | 5,300 | | | 9.625%, 5/1/19 | | | | | | | 5,480,200 | |
| | | | Navient Corp., | | | | | | | | |
| | 1,575 | | | 7.25%, 9/25/23 | | | | | | | 1,716,120 | |
| | 3,210 | | | 8.45%, 6/15/18 | | | | | | | 3,374,513 | |
| | 4,935 | | | Springleaf Finance Corp., 8.25%, 10/1/23 | | | | | | | 5,613,562 | |
| | | | | | | | | | | | 32,307,020 | |
| | | | Electric Utilities – 0.6% | | | | | | | | |
| | 5,585 | | | NRG Energy, Inc., 6.25%, 5/1/24 | | | | | | | 5,808,400 | |
| | | | Engineering & Construction – 0.6% | | | | | | | | |
| | 5,100 | | | Tutor Perini Corp., 6.875%, 5/1/25 (a)(b) | | | | | | | 5,482,500 | |
| | | | |
| 18 | | Semi-Annual Report | | | August 31, 2017 |
Schedule of Investments
AllianzGI Convertible & Income Fund
August 31, 2017 (unaudited) (continued)
| | | | | | | | | | | | |
Principal
Amount
(000s) | | | | | | | | Value | |
| | | | Entertainment – 0.5% | | | | | | | | |
| | $4,000 | | | Cedar Fair L.P., 5.375%, 6/1/24 | | | | | | | $4,240,000 | |
| | | | Healthcare-Services – 3.0% | | | | | | | | |
| | 2,835 | | | Community Health Systems, Inc., 6.25%, 3/31/23 | | | | | | | 2,866,894 | |
| | 5,430 | | | DaVita, Inc., 5.125%, 7/15/24 | | | | | | | 5,552,175 | |
| | 3,860 | | | Envision Healthcare Corp., 6.25%, 12/1/24 (a)(b) | | | | | | | 4,168,800 | |
| | 3,800 | | | HCA, Inc., 7.50%, 2/15/22 | | | | | | | 4,389,000 | |
| | 7,955 | | | Kindred Healthcare, Inc., 8.75%, 1/15/23 | | | | | | | 7,736,237 | |
| | 3,500 | | | Tenet Healthcare Corp., 7.00%, 8/1/25 (a)(b) | | | | | | | 3,443,685 | |
| | | | | | | | | | | | 28,156,791 | |
| | | | Home Builders – 0.5% | | | | | | | | |
| | 4,395 | | | Beazer Homes USA, Inc., 8.75%, 3/15/22 | | | | | | | 4,867,463 | |
| | | | Internet & Catalog Retail – 0.3% | | | | | | | | |
| | 2,800 | | | Netflix, Inc., 5.875%, 2/15/25 | | | | | | | 3,038,000 | |
| | | | Iron/Steel – 1.7% | | | | | | | | |
| | | | AK Steel Corp., | | | | | | | | |
| | 1,315 | | | 7.50%, 7/15/23 | | | | | | | 1,430,063 | |
| | 7,305 | | | 8.375%, 4/1/22 | | | | | | | 7,609,984 | |
| | 5,975 | | | United States Steel Corp., 8.375%, 7/1/21 (a)(b) | | | | | | | 6,617,312 | |
| | | | | | | | | | | | 15,657,359 | |
| | | | Machinery-Construction & Mining ��� 0.5% | | | | | | | | |
| | 4,245 | | | Terex Corp., 5.625%, 2/1/25 (a)(b) | | | | | | | 4,467,863 | |
| | | | Media – 2.2% | | | | | | | | |
| | 7,370 | | | Cablevision Systems Corp., 8.00%, 4/15/20 | | | | | | | 8,171,487 | |
| | 3,740 | | | Gray Television, Inc., 5.875%, 7/15/26 (a)(b) | | | | | | | 3,861,550 | |
| | 4,671 | | | LiveStyle, Inc., 9.625%, 2/1/19
(acquisition cost-$4,879,905; purchased 5/7/14-2/26/15) (a)(b)(c)(h) | | | | | | | 29,194 | |
| | 8,355 | | | McClatchy Co., 9.00%, 12/15/22 | | | | | | | 8,720,531 | |
| | | | | | | | | | | | 20,782,762 | |
| | | | Metal Fabricate/Hardware – 0.4% | | | | | | | | |
| | 3,830 | | | Park-Ohio Industries, Inc., 6.625%, 4/15/27 | | | | | | | 4,066,981 | |
| | | | Mining – 1.1% | | | | | | | | |
| | 5,100 | | | Alcoa Nederland Holding BV, 7.00%, 9/30/26 (a)(b) | | | | | | | 5,724,750 | |
| | 3,950 | | | Joseph T. Ryerson & Son, Inc., 11.00%, 5/15/22 (a)(b) | | | | | | | 4,478,312 | |
| | | | | | | | | | | | 10,203,062 | |
| | | | Oil, Gas & Consumable Fuels – 4.4% | | | | | | | | |
| | 2,700 | | | Calumet Specialty Products Partners L.P., 6.50%, 4/15/21 | | | | | | | 2,605,500 | |
| | 1,900 | | | Carrizo Oil & Gas, Inc., 6.25%, 4/15/23 | | | | | | | 1,852,500 | |
| | 16,950 | | | Cobalt International Energy, Inc., 10.75%, 12/1/21 (a)(b) | | | | | | | 16,017,750 | |
| | 7,225 | | | EP Energy LLC, 9.375%, 5/1/20 | | | | | | | 5,355,531 | |
| | 2,835 | | | NGL Energy Partners L.P., 7.50%, 11/1/23 | | | | | | | 2,742,863 | |
| | 4,895 | | | Oasis Petroleum, Inc., 6.875%, 3/15/22 | | | | | | | 4,797,100 | |
| | 3,500 | | | Rice Energy, Inc., 6.25%, 5/1/22 | | | | | | | 3,644,375 | |
| | 4,530 | | | Sanchez Energy Corp., 6.125%, 1/15/23 | | | | | | | 3,476,775 | |
| | 820 | | | Weatherford International Ltd., 8.25%, 6/15/23 | | | | | | | 805,650 | |
| | | | | | | | | | | | 41,298,044 | |
| | | | Pharmaceuticals – 1.2% | | | | | | | | |
| | 2,290 | | | Endo Finance LLC, 5.375%, 1/15/23 (a)(b) | | | | | | | 1,929,325 | |
| | 5,865 | | | Horizon Pharma, Inc., 6.625%, 5/1/23 | | | | | | | 5,718,375 | |
| | 4,000 | | | Valeant Pharmaceuticals International, Inc., 7.50%, 7/15/21 (a)(b) | | | | | | | 3,940,000 | |
| | | | | | | | | | | | 11,587,700 | |
| | | | | | |
| August 31, 2017 | | | Semi-Annual Report | | | 19 | |
Schedule of Investments
AllianzGI Convertible & Income Fund
August 31, 2017 (unaudited) (continued)
| | | | | | | | | | | | |
Principal
Amount
(000s) | | | | | | | | Value | |
| | | | Pipelines – 0.4% | | | | | | | | |
| | $3,550 | | | Energy Transfer Equity L.P., 5.50%, 6/1/27 | | | | | | | $3,798,500 | |
| | | | Real Estate – 0.9% | | | | | | | | |
| | 3,085 | | | Kennedy-Wilson, Inc., 5.875%, 4/1/24 | | | | | | | 3,181,406 | |
| | 5,365 | | | Uniti Group L.P., 8.25%, 10/15/23 | | | | | | | 5,268,967 | |
| | | | | | | | | | | | 8,450,373 | |
| | | | Retail – 1.6% | | | | | | | | |
| | 3,500 | | | Claire’s Stores, Inc., 9.00%, 3/15/19 (a)(b) | | | | | | | 1,837,500 | |
| | 5,500 | | | Conn’s, Inc., 7.25%, 7/15/22 | | | | | | | 5,362,500 | |
| | 2,835 | | | Dollar Tree, Inc., 5.75%, 3/1/23 | | | | | | | 3,005,100 | |
| | 9,465 | | | Neiman Marcus Group Ltd. LLC, 8.00%, 10/15/21 (a)(b) | | | | | | | 4,898,137 | |
| | | | | | | | | | | | 15,103,237 | |
| | | | Semiconductors – 0.5% | | | | | | | | |
| | 4,645 | | | Amkor Technology, Inc., 6.375%, 10/1/22 | | | | | | | 4,813,381 | |
| | | | Software – 0.7% | | | | | | | | |
| | 5,035 | | | Camelot Finance S.A., 7.875%, 10/15/24 (a)(b) | | | | | | | 5,475,562 | |
| | 645 | | | Rackspace Hosting, Inc., 8.625%, 11/15/24 (a)(b) | | | | | | | 686,119 | |
| | | | | | | | | | | | 6,161,681 | |
| | | | Telecommunications – 4.9% | | | | | | | | |
| | 3,500 | | | Cincinnati Bell, Inc., 7.00%, 7/15/24 (a)(b) | | | | | | | 3,473,750 | |
| | 9,370 | | | Consolidated Communications, Inc., 6.50%, 10/1/22 | | | | | | | 9,094,756 | |
| | 5,290 | | | Frontier Communications Corp., 10.50%, 9/15/22 | | | | | | | 4,774,225 | |
| | 2,685 | | | GTT Communications, Inc., 7.875%, 12/31/24 (a)(b) | | | | | | | 2,872,950 | |
| | 4,250 | | | Hughes Satellite Systems Corp., 7.625%, 6/15/21 | | | | | | | 4,855,625 | |
| | 7,205 | | | Sprint Communications, Inc., 11.50%, 11/15/21 | | | | | | | 9,168,362 | |
| | 5,585 | | | West Corp., 5.375%, 7/15/22 (a)(b) | | | | | | | 5,661,794 | |
| | 7,655 | | | Windstream Services LLC, 7.50%, 4/1/23 | | | | | | | 5,951,763 | |
| | | | | | | | | | | | 45,853,225 | |
| | | | Transportation – 0.5% | | | | | | | | |
| | 4,830 | | | XPO Logistics, Inc., 6.50%, 6/15/22 (a)(b) | | | | | | | 5,089,612 | |
| | Total Corporate Bonds & Notes (cost-$387,826,828) | | | | | | | 375,422,555 | |
| | Convertible Bonds & Notes – 30.5% | | | | | | | | |
| | | | Apparel & Textiles – 1.6% | | | | | | | | |
| | 15,150 | | | Iconix Brand Group, Inc., 1.50%, 3/15/18 | | | | | | | 15,045,844 | |
| | | | Auto Components – 2.1% | | | | | | | | |
| | 6,155 | | | Horizon Global Corp., 2.75%, 7/1/22 | | | | | | | 6,374,272 | |
| | 6,975 | | | Meritor, Inc., 7.875%, 3/1/26 | | | | | | | 13,213,266 | |
| | | | | | | | | | | | 19,587,538 | |
| | | | Auto Manufacturers – 1.0% | | | | | | | | |
| | 6,225 | | | Navistar International Corp., 4.75%, 4/15/19 | | | | | | | 6,431,203 | |
| | 2,850 | | | Tesla, Inc., 1.25%, 3/1/21 | | | | | | | 3,295,313 | |
| | | | | | | | | | | | 9,726,516 | |
| | | | Building Materials – 0.5% | | | | | | | | |
| | 4,275 | | | Cemex S.A.B de C.V., 3.72%, 3/15/20 | | | | | | | 4,884,188 | |
| | | | Commercial Services – 1.5% | | | | | | | | |
| | 13,510 | | | Ascent Capital Group, Inc., 4.00%, 7/15/20 | | | | | | | 10,672,900 | |
| | 3,705 | | | ServiceSource International, Inc., 1.50%, 8/1/18 | | | | | | | 3,637,847 | |
| | | | | | | | | | | | 14,310,747 | |
| | | | |
| 20 | | Semi-Annual Report | | | August 31, 2017 |
Schedule of Investments
AllianzGI Convertible & Income Fund
August 31, 2017 (unaudited) (continued)
| | | | | | | | | | | | |
Principal
Amount
(000s) | | | | | | | | Value | |
| | | | Distribution/Wholesale – 0.7% | | | | | | | | |
| | $6,600 | | | Titan Machinery, Inc., 3.75%, 5/1/19 | | | | | | | $6,501,000 | |
| | | | Diversified Financial Services – 2.3% | | | | | | | | |
| | 9,320 | | | Encore Capital Group, Inc., 3.00%, 7/1/20 | | | | | | | 10,170,450 | |
| | 12,165 | | | PRA Group, Inc., 3.00%, 8/1/20 | | | | | | | 11,176,594 | |
| | | | | | | | | | | | 21,347,044 | |
| | | | Electric Utilities – 1.0% | | | | | | | | |
| | 9,230 | | | NRG Yield, Inc., 3.25%, 6/1/20 (a)(b) | | | | | | | 9,258,844 | |
| | | | Electrical Equipment – 1.2% | | | | | | | | |
| | | | SunPower Corp., | | | | | | | | |
| | 3,135 | | | 0.875%, 6/1/21 | | | | | | | 2,556,984 | |
| | 9,405 | | | 4.00%, 1/15/23 | | | | | | | 8,311,669 | |
| | | | | | | | | | | | 10,868,653 | |
| | | | Energy-Alternate Sources – 1.7% | | | | | | | | |
| | 16,800 | | | SolarCity Corp., 1.625%, 11/1/19 | | | | | | | 16,044,000 | |
| | | | Engineering & Construction – 0.3% | | | | | | | | |
| | 3,230 | | | Layne Christensen Co., 4.25%, 11/15/18 | | | | | | | 3,066,481 | |
| | | | Equity Real Estate Investment Trusts (REITs) – 0.6% | | | | | | | | |
| | 5,400 | | | Two Harbors Investment Corp., 6.25%, 1/15/22 | | | | | | | 5,781,375 | |
| | | | Health Care/Health Care Distributors – 1.1% | | | | | | | | |
| | 11,415 | | | Aceto Corp., 2.00%, 11/1/20 | | | | | | | 10,102,275 | |
| | | | Insurance – 1.0% | | | | | | | | |
| | 12,780 | | | AmTrust Financial Services, Inc., 2.75%, 12/15/44 | | | | | | | 9,441,225 | |
| | | | Iron/Steel – 0.1% | | | | | | | | |
| | 910 | | | AK Steel Corp., 5.00%, 11/15/19 | | | | | | | 1,231,344 | |
| | | | Oil, Gas & Consumable Fuels – 2.9% | | | | | | | | |
| | 18,235 | | | Helix Energy Solutions Group, Inc., 3.25%, 3/15/32 | | | | | | | 18,383,159 | |
| | 9,980 | | | Whiting Petroleum Corp., 1.25%, 4/1/20 | | | | | | | 8,520,425 | |
| | | | | | | | | | | | 26,903,584 | |
| | | | Pharmaceuticals – 2.8% | | | | | | | | |
| | 16,145 | | | Herbalife Ltd., 2.00%, 8/15/19 | | | | | | | 16,286,349 | |
| | 3,260 | | | Horizon Pharma Investment Ltd., 2.50%, 3/15/22 | | | | | | | 2,974,750 | |
| | 7,800 | | | Impax Laboratories, Inc., 2.00%, 6/15/22 | | | | | | | 6,946,875 | |
| | | | | | | | | | | | 26,207,974 | |
| | | | Pipelines – 1.0% | | | | | | | | |
| | 13,370 | | | Cheniere Energy, Inc., 4.25%, 3/15/45 | | | | | | | 9,250,369 | |
| | | | Retail – 1.3% | | | | | | | | |
| | | | RH (a)(b), | | | | | | | | |
| | 10,425 | | | zero coupon, 6/15/19 | | | | | | | 8,880,797 | |
| | 3,990 | | | zero coupon, 7/15/20 | | | | | | | 3,137,137 | |
| | | | | | | | | | | | 12,017,934 | |
| | | | Semiconductors – 0.9% | | | | | | | | |
| | 2,850 | | | Cypress Semiconductor Corp., 4.50%, 1/15/22 | | | | | | | 3,525,094 | |
| | 4,570 | | | Micron Technology, Inc., 3.00%, 11/15/43, Ser. G | | | | | | | 5,378,318 | |
| | | | | | | | | | | | 8,903,412 | |
| | | | Software – 1.3% | | | | | | | | |
| | 15,785 | | | Avid Technology, Inc., 2.00%, 6/15/20 | | | | | | | 11,582,244 | |
| | 570 | | | PROS Holdings, Inc., 2.00%, 12/1/19 | | | | | | | 597,431 | |
| | | | | | | | | | | | 12,179,675 | |
| | | | | | |
| August 31, 2017 | | | Semi-Annual Report | | | 21 | |
Schedule of Investments
AllianzGI Convertible & Income Fund
August 31, 2017 (unaudited) (continued)
| | | | | | | | | | | | |
Principal
Amount
(000s) | | | | | | | | Value | |
| | | | Telecommunications – 1.1% | | | | | | | | |
| | $11,065 | | | Gogo, Inc., 3.75%, 3/1/20 | | | | | | | $10,656,978 | |
| | | | Tobacco – 1.7% | | | | | | | | |
| | | | Vector Group Ltd. (g), | | | | | | | | |
| | 5,665 | | | 3 mo. Cash Dividends on Common Stock + 1.75%, 1.75%, 4/15/20 | | | | | | | 6,486,425 | |
| | 6,215 | | | 3 mo. Cash Dividends on Common Stock + 2.50%, 2.50%, 1/15/19 | | | | | | | 9,058,362 | |
| | | | | | | | | | | | 15,544,787 | |
| | | | Transportation – 0.8% | | | | | | | | |
| | 3,990 | | | Aegean Marine Petroleum Network, Inc., 4.25%, 12/15/21 (a)(b) | | | | | | | 3,019,931 | |
| | 4,560 | | | Echo Global Logistics, Inc., 2.50%, 5/1/20 | | | | | | | 4,320,600 | |
| | | | | | | | | | | | 7,340,531 | |
| | Total Convertible Bonds & Notes (cost-$260,285,341) | | | | | | | 286,202,318 | |
| | | |
| Shares | | | | | | | | | |
| | Convertible Preferred Stock – 25.6% | | | | | | | | |
| | | | Aerospace & Defense – 0.3% | | | | | | | | |
| | 78,975 | | | Arconic, Inc., 5.375%, 10/1/17 | | | | | | | 3,202,436 | |
| | | | Agriculture – 0.9% | | | | | | | | |
| | 82,645 | | | Bunge Ltd., 4.875% (e) | | | | | | | 8,765,535 | |
| | | | Banks – 4.6% | | | | | | | | |
| | 12,080 | | | Bank of America Corp., 7.25%, Ser. L (e) | | | | | | | 15,921,440 | |
| | 9,695 | | | Huntington Bancshares, Inc., 8.50%, Ser. A (e) | | | | | | | 13,946,258 | |
| | 9,880 | | | Wells Fargo & Co., 7.50%, Ser. L (e) | | | | | | | 13,150,280 | |
| | | | | | | | | | | | 43,017,978 | |
| | | | Chemicals – 0.8% | | | | | | | | |
| | 68,495 | | | Rayonier Advanced Materials, Inc., 8.00%, 8/15/19, Ser. A | | | | | | | 7,150,878 | |
| | | | Commercial Services & Supplies – 0.9% | | | | | | | | |
| | 145,890 | | | Stericycle, Inc., 5.25%, 9/15/18 | | | | | | | 8,671,702 | |
| | | | Computers – 0.3% | | | | | | | | |
| | 2,045 | | | NCR Corp., PIK 5.50%, 5.50%, Ser. A (e) | | | | | | | 2,932,660 | |
| | | | Diversified Financial Services – 0.5% | | | | | | | | |
| | 5,700 | | | Cowen, Inc., 5.625%, Ser. A (e) | | | | | | | 4,921,152 | |
| | | | Diversified Telecommunication Services – 0.4% | | | | | | | | |
| | 155,900 | | | Frontier Communications Corp., 11.125%, 6/29/18, Ser. A | | | | | | | 3,648,060 | |
| | | | Electric Utilities – 2.1% | | | | | | | | |
| | 302,350 | | | Dominion Energy, Inc., 6.75%, 8/15/19, Ser. A | | | | | | | 15,465,203 | |
| | 66,215 | | | NextEra Energy, Inc., 6.123%, 9/1/19 | | | | | | | 3,681,554 | |
| | | | | | | | | | | | 19,146,757 | |
| | | | Equity Real Estate Investment Trusts (REITs) – 4.6% | | | | | | | | |
| | 4,940 | | | Crown Castle International Corp., 6.875%, 8/1/20, Ser. A | | | | | | | 5,538,555 | |
| | 631,070 | | | FelCor Lodging Trust, Inc., 1.95%, Ser. A (e) | | | | | | | 17,669,960 | |
| | 410,065 | | | Sutherland Asset Management Corp., 7.00%, 8/15/23 | | | | | | | 10,427,953 | |
| | 141,135 | | | Welltower, Inc., 6.50%, Ser. I (e) | | | | | | | 9,336,080 | |
| | | | | | | | | | | | 42,972,548 | |
| | | | Hand/Machine Tools – 1.7% | | | | | | | | |
| | 139,055 | | | Stanley Black & Decker, Inc., 5.375%, 5/15/20 | | | | | | | 15,390,607 | |
| | | | Health Care Providers & Services – 2.2% | | | | | | | | |
| | 386,815 | | | Anthem, Inc., 5.25%, 5/1/18 | | | | | | | 20,300,051 | |
| | | | |
| 22 | | Semi-Annual Report | | | August 31, 2017 |
Schedule of Investments
AllianzGI Convertible & Income Fund
August 31, 2017 (unaudited) (continued)
| | | | | | | | | | | | |
| Shares | | | | | | | | Value | |
| | | | Healthcare-Products – 1.2% | | | | | | | | |
| | 199,155 | | | Becton Dickinson and Co., 6.125%, 5/1/20, Ser. A | | | | | | | $11,102,891 | |
| | | | Independent Power Producers & Energy Traders – 0.5% | | | | | | | | |
| | 156,435 | | | Dynegy, Inc., 5.375%, 11/1/17, Ser. A | | | | | | | 4,932,396 | |
| | | | Investment Companies – 1.3% | | | | | | | | |
| | 60,080 | | | Mandatory Exchangeable Trust, 5.75%, 6/3/19 (a)(b) | | | | | | | 11,733,924 | |
| | | | Oil, Gas & Consumable Fuels – 2.3% | | | | | | | | |
| | 159,375 | | | Anadarko Petroleum Corp., 7.50%, 6/7/18 | | | | | | | 5,896,875 | |
| | 173,410 | | | Kinder Morgan, Inc., 9.75%, 10/26/18, Ser. A | | | | | | | 7,312,700 | |
| | 230,425 | | | Sanchez Energy Corp., 6.50%, Ser. B (e) | | | | | | | 4,113,086 | |
| | 12,485 | | | Southwestern Energy Co., 6.25%, 1/15/18, Ser. B | | | | | | | 165,177 | |
| | 92,860 | | | WPX Energy, Inc., 6.25%, 7/31/18, Ser. A | | | | | | | 4,433,136 | |
| | | | | | | | | | | | 21,920,974 | |
| | | | Pharmaceuticals – 1.0% | | | | | | | | |
| | 4,275 | | | Allergan PLC, 5.50%, 3/1/18, Ser. A | | | | | | | 3,502,251 | |
| | 19,505 | | | Teva Pharmaceutical Industries Ltd., 7.00%, 12/15/18 | | | | | | | 6,211,367 | |
| | | | | | | | | | | | 9,713,618 | |
| | Total Convertible Preferred Stock (cost-$245,017,746) | | | | | | | 239,524,167 | |
| | Preferred Stock (a)(d)(f)(i) – 0.9% | | | | | | | | |
| | | | Media – 0.9% | | | | | | | | |
| | 8,339 | | | LiveStyle, Inc., Ser. A | | | | | | | 833,900 | |
| | 76,572 | | | LiveStyle, Inc., Ser. B | | | | | | | 7,657,200 | |
| | 6,750 | | | LiveStyle, Inc., Ser. B | | | | | | | 67 | |
| | Total Preferred Stock (cost-$15,074,564) | | | | | | | 8,491,167 | |
| | Common Stock (a)(d)(f)(i) – 0.2% | | | | | | | | |
| | | | Advertising – 0.2% | | | | | | | | |
| | 173,720 | | | Affinion Group Holdings, Inc., Class A | | | | | | | | |
| | | | | (acquisition cost-$3,080,312; purchased 11/9/15-11/12/15) (h) | | | | | | | 2,074,217 | |
| | | | Aerospace & Defense – 0.0% | | | | | | | | |
| | 8,295 | | | Erickson, Inc. | | | | | | | 231,679 | |
| | | | Media – 0.0% | | | | | | | | |
| | 90,407 | | | LiveStyle, Inc. | | | | | | | 9 | |
| | Total Common Stock (cost-$10,187,309) | | | | | | | 2,305,905 | |
| | | |
| Units | | | | | | | | | |
| | Warrants (a)(d)(f)(i) – 0.1% | | | | | | | | |
| | | | Commercial Services – 0.1% | | | | | | | | |
| | 2,062,338 | | | Cenveo Corp., strike price $12.00, expires 6/10/24 | | | | | | | 442,760 | |
| | | | Media – 0.0% | | | | | | | | |
| | 19,500 | | | LiveStyle, Inc., expires 11/30/21, Ser. C. | | | | | | | 2 | �� |
| | Total Warrants (cost-$246,984) | | | | | | | 442,762 | |
| | | |
Principal
Amount
(000s) | | | | | | | | | |
| | | | Repurchase Agreements – 2.6% | | | | | | | | |
| | $24,782 | | | State Street Bank and Trust Co.,
dated 8/31/17, 0.12%, due 9/1/17, proceeds $24,782,083; collateralized by U.S. Treasury Inflation Indexed Notes, 0.625%, due 1/15/26, valued at $25,278,721 including accrued interest (cost-$24,782,000) | | | | | | | 24,782,000 | |
| | Total Investments (cost-$943,420,772)-100.0% | | | | | | | $937,170,874 | |
| | | | | | |
| August 31, 2017 | | | Semi-Annual Report | | | 23 | |
Schedule of Investments
AllianzGI Convertible & Income Fund
August 31, 2017 (unaudited) (continued)
Notes to Schedule of Investments:
| (a) | | Private Placement–Restricted as to resale and may not have a readily available market. Securities with an aggregate value of $178,557,787, representing 19.1% of total investments. | |
| (b) | | 144A–Exempt from registration under Rule 144A of the Securities Act of 1933. These securities may be resold in transactions exempt from registration, typically only to qualified institutional buyers. Securities with an aggregate value of $167,317,953, representing 17.9% of total investments. | |
| (d) | | Fair-Valued–Securities with an aggregate value of $11,239,834, representing 1.2% of total investments. See Note 1(a) and Note 1(b) in the Notes to Financial Statements. | |
| (e) | | Perpetual maturity. The date shown, if any, is the next call date. | |
| (f) | | Level 3 security. See Note 1(b) in the Notes to Financial Statements. | |
| (g) | | In addition to the coupon rate shown, the issuer is expected to pay additional interest based on the actual dividends paid on its common stock. | |
| (h) | | Restricted. The aggregate acquisition cost of such securities is $7,960,217. The aggregate value is $2,103,411 representing 0.2% of total investments. | |
| (i) | | Non-income producing. | |
| (j) | | Fair Value Measurements-See Note 1(b) in the Notes to Financial Statements. | |
| | | | | | | | | | | | | | | | |
| | | Level 1 –
Quoted
Prices | | | Level 2 –
Other Significant
Observable
Inputs | | | Level 3 –
Significant
Unobservable
Inputs | | | Value at
8/31/17 | |
Investments in Securities – Assets | |
Corporate Bonds & Notes | | $ | – | | | | $375,422,555 | | | $ | – | | | | $375,422,555 | |
Convertible Bonds & Notes | | | – | | | | 286,202,318 | | | | – | | | | 286,202,318 | |
Convertible Preferred Stock: | |
Agriculture | | | – | | | | 8,765,535 | | | | – | | | | 8,765,535 | |
Computers | | | – | | | | 2,932,660 | | | | – | | | | 2,932,660 | |
Diversified Financial Services | | | – | | | | 4,921,152 | | | | – | | | | 4,921,152 | |
Healthcare-Products | | | – | | | | 11,102,891 | | | | – | | | | 11,102,891 | |
Investment Companies | | | – | | | | 11,733,924 | | | | – | | | | 11,733,924 | |
Oil, Gas & Consumable Fuels | | | 17,807,888 | | | | 4,113,086 | | | | – | | | | 21,920,974 | |
Pharmaceuticals | | | 3,502,251 | | | | 6,211,367 | | | | – | | | | 9,713,618 | |
All Other | | | 168,433,413 | | | | – | | | | – | | | | 168,433,413 | |
Preferred Stock | | | – | | | | – | | | | 8,491,167 | | | | 8,491,167 | |
Common Stock | | | – | | | | – | | | | 2,305,905 | | | | 2,305,905 | |
Warrants | | | – | | | | – | | | | 442,762 | | | | 442,762 | |
Repurchase Agreements | | | – | | | | 24,782,000 | | | | – | | | | 24,782,000 | |
Totals | | $ | 189,743,552 | | | | $736,187,488 | | | $ | 11,239,834 | | | | $937,170,874 | |
At August 31, 2017, a security valued at $7,150,878 was transferred from Level 2 to Level 1. The transfer was a result of the security having used an evaluated price from a third-party independent pricing vendor at February 28, 2017, and used an exchange-traded closing price on August 31, 2017.
| | | | |
| 24 | | Semi-Annual Report | | | August 31, 2017 |
Schedule of Investments
AllianzGI Convertible & Income Fund
August 31, 2017 (unaudited) (continued)
A roll forward of fair value measurements using significant unobservable inputs (Level 3) for the six months ended August 31, 2017, was as follows:
| | | | | | | | | | | | | | | | | | | | |
| | | Beginning
Balance
2/28/17 | | | Purchases | | | Sales | | | Accrued
Discount
(Premiums) | | | Net
Realized
Gain (Loss) | |
Investments in Securities – Assets | | | | | | | | | | | | | | | | | | | | |
Corporate Bonds & Notes: | | | | | | | | | | | | | | | | | | | | |
Commercial Services | | | $7,224,875 | | | $ | – | | | | $ – | | | | $(86,351 | ) | | | $ – | |
Preferred Stock | | | 7,759,048 | | | | – | | | | – | | | | – | | | | – | |
Common Stock: | | | | | | | | | | | | | | | | | | | | |
Advertising | | | 2,581,479 | | | | – | | | | – | | | | – | | | | – | |
Aerospace & Defense | | | – | | | | 7,106,997 | † | | | – | | | | – | | | | – | |
Media | | | 9 | | | | – | | | | – | | | | – | | | | – | |
Warrants: | | | | | | | | | | | | | | | | | | | | |
Commercial Services | | | 449,705 | | | | – | | | | – | | | | – | | | | – | |
Media | | | 2 | | | | – | | | | – | | | | – | | | | – | |
Totals | | | $18,015,118 | | | | $7,106,997 | | | | $ – | | | | $(86,351 | ) | | | $ – | |
| | | | | | | | | | | | | | | | |
| | | Net Change
in Unrealized
Appreciation/
Depreciation | | | Transfers
into
Level 3 | | | Transfers
out of
Level 3* | | | Ending
Balance
8/31/17 | |
Investments in Securities – Assets | | | | | | | | | | | | | | | | |
Corporate Bonds & Notes: | | | | | | | | | | | | | | | | |
Commercial Services | | | $(14,274 | ) | | $ | – | | | | $(7,124,250 | ) | | $ | – | |
Preferred Stock | | | 732,119 | | | | – | | | | – | | | | 8,491,167 | |
Common Stock: | | | | | | | | | | | | | | | | |
Advertising | | | (507,262 | ) | | | – | | | | – | | | | 2,074,217 | |
Aerospace & Defense | | | (6,875,318 | ) | | | – | | | | – | | | | 231,679 | |
Media | | | – | | | | – | | | | – | | | | 9 | |
Warrants: | | | | | | | | | | | | | | | | |
Commercial Services | | | (6,945 | ) | | | – | | | | – | | | | 442,760 | |
Media | | | – | | | | – | | | | – | | | | 2 | |
Totals | | $ | (6,671,680 | ) | | $ | – | | | | $(7,124,250 | ) | | $ | 11,239,834 | |
| † | | Issued via reorganization | |
| * | | Transferred out of Level 3 into Level 2 because an evaluated price from a third-party independent pricing vendor was used on August 31, 2017. | |
| | | | | | |
| August 31, 2017 | | | Semi-Annual Report | | | 25 | |
Schedule of Investments
AllianzGI Convertible & Income Fund
August 31, 2017 (unaudited) (continued)
The following tables present additional information about valuation techniques and inputs used for investments that are measured at fair value and categorized within Level 3 at August 31, 2017:
| | | | | | | | | | | | | | | | |
| | | Ending Balance
at 8/31/17 | | | Valuation
Technique Used | | | Unobservable
Inputs | | | Input Values | |
Investments in Securities – Assets | | | | | | | | | | | | | |
Preferred Stock | | | $8,491,100 | | | | Model Price | | |
| Proprietary Data
Used in Model |
| | | $100 | |
| | | $67 | | | | Liquidation Value | | | | Price of Stock | | | | $0.01* | |
Common Stock | | | $2,305,905 | | | | Model Price | | |
| Proprietary Data
Used in Model |
| | | $0.01 – $27.93 | |
Warrants | | | $442,760 | | |
| Fundamental
Analytical Data
Relating to the
Investment |
| | | Price of Warrant | | | | $0.214690 | |
| | | $2 | | | | Model Price | | |
| Proprietary Data
Used in Model |
| | | $0.0001 | |
| * | | Preferred stock trades are in lots of 1,000. | |
The net change in unrealized appreciation/depreciation of Level 3 investments held at August 31, 2017, was $(6,657,406). Net change in unrealized appreciation/depreciation is reflected on the Statements of Operations.
Glossary:
| | | | |
| PIK | | - | | Payment-in-Kind |
| REIT | | - | | Real Estate Investment Trust |
| | | | | | |
| 26 | | Semi-Annual Report | | | August 31, 2017 | | | See accompanying Notes to Financial Statements |
Schedule of Investments
AllianzGI Convertible & Income Fund II
August 31, 2017 (unaudited)
| | | | | | | | | | | | |
Principal
Amount
(000s) | | | | | | | | Value | |
| | Corporate Bonds & Notes – 40.4% | | | | | | | | |
| | | | Aerospace & Defense – 1.7% | | | | | | | | |
| | $5,071 | | | Kratos Defense & Security Solutions, Inc., 7.00%, 5/15/19 | | | | | | | $5,172,420 | |
| | 5,750 | | | TransDigm, Inc., 6.50%, 5/15/25 | | | | | | | 5,936,875 | |
| | 1,080 | | | Triumph Group, Inc., 7.75%, 8/15/25 (a)(b) | | | | | | | 1,114,020 | |
| | | | | | | | | | | | 12,223,315 | |
| | | | Auto Manufacturers – 0.8% | | | | | | | | |
| | 5,495 | | | Navistar International Corp., 8.25%, 11/1/21 | | | | | | | 5,549,950 | |
| | | | Building Materials – 0.7% | | | | | | | | |
| | 4,335 | | | U.S. Concrete, Inc., 6.375%, 6/1/24 | | | | | | | 4,703,475 | |
| | | | Chemicals – 2.8% | | | | | | | | |
| | 5,500 | | | Chemours Co., 6.625%, 5/15/23 | | | | | | | 5,864,375 | |
| | 3,640 | | | Kraton Polymers LLC, 7.00%, 4/15/25 (a)(b) | | | | | | | 3,931,200 | |
| | 4,330 | | | Platform Specialty Products Corp., 6.50%, 2/1/22 (a)(b) | | | | | | | 4,514,025 | |
| | 5,120 | | | Tronox Finance LLC, 7.50%, 3/15/22 (a)(b) | | | | | | | 5,388,800 | |
| | | | | | | | | | | | 19,698,400 | |
| | | | Commercial Services – 1.8% | | | | | | | | |
| | 5,974 | | | Cenveo Corp., 6.00%, 5/15/24 (a)(b) | | | | | | | 5,286,990 | |
| | 5,925 | | | Monitronics International, Inc., 9.125%, 4/1/20 | | | | | | | 5,014,031 | |
| | 2,500 | | | United Rentals North America, Inc., 5.50%, 7/15/25 | | | | | | | 2,684,375 | |
| | | | | | | | | | | | 12,985,396 | |
| | | | Computers – 1.9% | | | | | | | | |
| | 3,917 | | | DynCorp International, Inc., PIK 1.50%, 11.875%, 11/30/20 | | | | | | | 4,151,874 | |
| | 5,650 | | | Harland Clarke Holdings Corp., 9.25%, 3/1/21 (a)(b) | | | | | | | 5,777,125 | |
| | 3,155 | | | Western Digital Corp., 10.50%, 4/1/24 | | | | | | | 3,750,506 | |
| | | | | | | | | | | | 13,679,505 | |
| | | | Distribution/Wholesale – 0.5% | | | | | | | | |
| | | | H&E Equipment Services, Inc., | | | | | | | | |
| | 1,395 | | | 5.625%, 9/1/25 (a)(b) | | | | | | | 1,443,825 | |
| | 1,750 | | | 7.00%, 9/1/22 | | | | | | | 1,817,813 | |
| | | | | | | | | | | | 3,261,638 | |
| | | | Diversified Financial Services – 3.5% | | | | | | | | |
| | | | Community Choice Financial, Inc., | | | | | | | | |
| | 7,465 | | | 10.75%, 5/1/19 | | | | | | | 6,345,250 | |
| | 5,370 | | | 12.75%, 5/1/20 (a)(b) | | | | | | | 3,759,000 | |
| | | | Nationstar Mortgage LLC, | | | | | | | | |
| | 2,000 | | | 7.875%, 10/1/20 | | | | | | | 2,047,500 | |
| | 4,250 | | | 9.625%, 5/1/19 | | | | | | | 4,394,500 | |
| | | | Navient Corp., | | | | | | | | |
| | 1,200 | | | 7.25%, 9/25/23 | | | | | | | 1,307,520 | |
| | 2,605 | | | 8.45%, 6/15/18 | | | | | | | 2,738,506 | |
| | 3,865 | | | Springleaf Finance Corp., 8.25%, 10/1/23 | | | | | | | 4,396,438 | |
| | | | | | | | | | | | 24,988,714 | |
| | | | Electric Utilities – 0.6% | | | | | | | | |
| | 4,265 | | | NRG Energy, Inc., 6.25%, 5/1/24 | | | | | | | 4,435,600 | |
| | | | Engineering & Construction – 0.6% | | | | | | | | |
| | 3,900 | | | Tutor Perini Corp., 6.875%, 5/1/25 (a)(b) | | | | | | | 4,192,500 | |
| | | | Entertainment – 0.4% | | | | | | | | |
| | 3,045 | | | Cedar Fair L.P., 5.375%, 6/1/24 | | | | | | | 3,227,700 | |
| | | | | | |
| August 31, 2017 | | | Semi-Annual Report | | | 27 | |
Schedule of Investments
AllianzGI Convertible & Income Fund II
August 31, 2017 (unaudited) (continued)
| | | | | | | | | | | | |
Principal
Amount
(000s) | | | | | | | | Value | |
| | | | Healthcare-Services – 3.0% | | | | | | | | |
| | $2,165 | | | Community Health Systems, Inc., 6.25%, 3/31/23 | | | | | | | $2,189,356 | |
| | 4,125 | | | DaVita, Inc., 5.125%, 7/15/24 | | | | | | | 4,217,813 | |
| | 2,950 | | | Envision Healthcare Corp., 6.25%, 12/1/24 (a)(b) | | | | | | | 3,186,000 | |
| | 2,950 | | | HCA, Inc., 7.50%, 2/15/22 | | | | | | | 3,407,250 | |
| | 6,045 | | | Kindred Healthcare, Inc., 8.75%, 1/15/23 | | | | | | | 5,878,762 | |
| | 2,750 | | | Tenet Healthcare Corp., 7.00%, 8/1/25 (a)(b) | | | | | | | 2,705,753 | |
| | | | | | | | | | | | 21,584,934 | |
| | | | Home Builders – 0.5% | | | | | | | | |
| | 3,365 | | | Beazer Homes USA, Inc., 8.75%, 3/15/22 | | | | | | | 3,726,738 | |
| | | | Internet & Catalog Retail – 0.3% | | | | | | | | |
| | 2,200 | | | Netflix, Inc., 5.875%, 2/15/25 | | | | | | | 2,387,000 | |
| | | | Iron/Steel – 1.7% | | | | | | | | |
| | | | AK Steel Corp., | | | | | | | | |
| | 1,005 | | | 7.50%, 7/15/23 | | | | | | | 1,092,938 | |
| | 5,600 | | | 8.375%, 4/1/22 | | | | | | | 5,833,800 | |
| | 4,525 | | | United States Steel Corp., 8.375%, 7/1/21 (a)(b) | | | | | | | 5,011,437 | |
| | | | | | | | | | | | 11,938,175 | |
| | | | Machinery-Construction & Mining – 0.5% | | | | | | | | |
| | 3,235 | | | Terex Corp., 5.625%, 2/1/25 (a)(b) | | | | | | | 3,404,838 | |
| | | | Media – 2.3% | | | | | | | | |
| | 5,630 | | | Cablevision Systems Corp., 8.00%, 4/15/20 | | | | | | | 6,242,262 | |
| | 2,850 | | | Gray Television, Inc., 5.875%, 7/15/26 (a)(b) | | | | | | | 2,942,625 | |
| | 3,589 | | | LiveStyle, Inc., 9.625%, 2/1/19
(acquisition cost-$3,749,795; purchased 5/7/14-2/26/15) (a)(b)(c)(h) | | | | | | | 22,431 | |
| | 6,645 | | | McClatchy Co., 9.00%, 12/15/22 | | | | | | | 6,935,719 | |
| | | | | | | | | | | | 16,143,037 | |
| | | | Metal Fabricate/Hardware – 0.4% | | | | | | | | |
| | 2,920 | | | Park-Ohio Industries, Inc., 6.625%, 4/15/27 | | | | | | | 3,100,675 | |
| | | | Mining – 1.1% | | | | | | | | |
| | 3,900 | | | Alcoa Nederland Holding BV, 7.00%, 9/30/26 (a)(b) | | | | | | | 4,377,750 | |
| | 3,050 | | | Joseph T. Ryerson & Son, Inc., 11.00%, 5/15/22 (a)(b) | | | | | | | 3,457,938 | |
| | | | | | | | | | | | 7,835,688 | |
| | | | Oil, Gas & Consumable Fuels – 4.5% | | | | | | | | |
| | 2,300 | | | Calumet Specialty Products Partners L.P., 6.50%, 4/15/21 | | | | | | | 2,219,500 | |
| | 1,420 | | | Carrizo Oil & Gas, Inc., 6.25%, 4/15/23 | | | | | | | 1,384,500 | |
| | 12,800 | | | Cobalt International Energy, Inc., 10.75%, 12/1/21 (a)(b) | | | | | | | 12,096,000 | |
| | 6,180 | | | EP Energy LLC, 9.375%, 5/1/20 | | | | | | | 4,580,925 | |
| | 2,165 | | | NGL Energy Partners L.P., 7.50%, 11/1/23 | | | | | | | 2,094,637 | |
| | 3,745 | | | Oasis Petroleum, Inc., 6.875%, 3/15/22 | | | | | | | 3,670,100 | |
| | 2,500 | | | Rice Energy, Inc., 6.25%, 5/1/22 | | | | | | | 2,603,125 | |
| | 3,470 | | | Sanchez Energy Corp., 6.125%, 1/15/23 | | | | | | | 2,663,225 | |
| | 630 | | | Weatherford International Ltd., 8.25%, 6/15/23 | | | | | | | 618,975 | |
| | | | | | | | | | | | 31,930,987 | |
| | | | Pharmaceuticals – 1.2% | | | | | | | | |
| | 1,755 | | | Endo Finance LLC, 5.375%, 1/15/23 (a)(b) | | | | | | | 1,478,587 | |
| | 4,425 | | | Horizon Pharma, Inc., 6.625%, 5/1/23 | | | | | | | 4,314,375 | |
| | 3,000 | | | Valeant Pharmaceuticals International, Inc., 7.50%, 7/15/21 (a)(b) | | | | | | | 2,955,000 | |
| | | | | | | | | | | | 8,747,962 | |
| | | | |
| 28 | | Semi-Annual Report | | | August 31, 2017 |
Schedule of Investments
AllianzGI Convertible & Income Fund II
August 31, 2017 (unaudited) (continued)
| | | | | | | | | | | | |
Principal
Amount
(000s) | | | | | | | | Value | |
| | | | Pipelines – 0.4% | | | | | | | | |
| | $2,715 | | | Energy Transfer Equity L.P., 5.50%, 6/1/27 | | | | | | | $2,905,050 | |
| | | | Real Estate – 0.9% | | | | | | | | |
| | 2,345 | | | Kennedy-Wilson, Inc., 5.875%, 4/1/24 | | | | | | | 2,418,281 | |
| | 4,090 | | | Uniti Group L.P., 8.25%, 10/15/23 | | | | | | | 4,016,789 | |
| | | | | | | | | | | | 6,435,070 | |
| | | | Retail – 1.6% | | | | | | | | |
| | 4,500 | | | Claire’s Stores, Inc., 9.00%, 3/15/19 (a)(b) | | | | | | | 2,362,500 | |
| | 4,000 | | | Conn’s, Inc., 7.25%, 7/15/22 | | | | | | | 3,900,000 | |
| | 2,165 | | | Dollar Tree, Inc., 5.75%, 3/1/23 | | | | | | | 2,294,900 | |
| | 5,785 | | | Neiman Marcus Group Ltd. LLC, 8.00%, 10/15/21 (a)(b) | | | | | | | 2,993,737 | |
| | | | | | | | | | | | 11,551,137 | |
| | | | Semiconductors – 0.4% | | | | | | | | |
| | 2,875 | | | Amkor Technology, Inc., 6.375%, 10/1/22 | | | | | | | 2,979,219 | |
| | | | Software – 0.7% | | | | | | | | |
| | 3,850 | | | Camelot Finance S.A., 7.875%, 10/15/24 (a)(b) | | | | | | | 4,186,875 | |
| | 490 | | | Rackspace Hosting, Inc., 8.625%, 11/15/24 (a)(b) | | | | | | | 521,238 | |
| | | | | | | | | | | | 4,708,113 | |
| | | | Telecommunications – 5.0% | | | | | | | | |
| | 2,750 | | | Cincinnati Bell, Inc., 7.00%, 7/15/24 (a)(b) | | | | | | | 2,729,375 | |
| | 7,130 | | | Consolidated Communications, Inc., 6.50%, 10/1/22 | | | | | | | 6,920,556 | |
| | 4,045 | | | Frontier Communications Corp., 10.50%, 9/15/22 | | | | | | | 3,650,613 | |
| | 2,050 | | | GTT Communications, Inc., 7.875%, 12/31/24 (a)(b) | | | | | | | 2,193,500 | |
| | 3,500 | | | Hughes Satellite Systems Corp., 7.625%, 6/15/21 | | | | | | | 3,998,750 | |
| | 5,545 | | | Sprint Communications, Inc., 11.50%, 11/15/21 | | | | | | | 7,056,012 | |
| | 4,265 | | | West Corp., 5.375%, 7/15/22 (a)(b) | | | | | | | 4,323,644 | |
| | 5,845 | | | Windstream Services LLC, 7.50%, 4/1/23 | | | | | | | 4,544,487 | |
| | | | | | | | | | | | 35,416,937 | |
| | | | Transportation – 0.6% | | | | | | | | |
| | 3,920 | | | XPO Logistics, Inc., 6.50%, 6/15/22 (a)(b) | | | | | | | 4,130,700 | |
| | Total Corporate Bonds & Notes (cost-$297,384,525) | | | | | | | 287,872,453 | |
| | Convertible Bonds & Notes – 30.3% | | | | | | | | |
| | | | Apparel & Textiles – 1.6% | | | | | | | | |
| | 11,450 | | | Iconix Brand Group, Inc., 1.50%, 3/15/18 | | | | | | | 11,371,281 | |
| | | | Auto Components – 2.1% | | | | | | | | |
| | 4,645 | | | Horizon Global Corp., 2.75%, 7/1/22 | | | | | | | 4,810,478 | |
| | 5,255 | | | Meritor, Inc., 7.875%, 3/1/26 | | | | | | | 9,954,941 | |
| | | | | | | | | | | | 14,765,419 | |
| | | | Auto Manufacturers – 1.0% | | | | | | | | |
| | 4,675 | | | Navistar International Corp., 4.75%, 4/15/19 | | | | | | | 4,829,859 | |
| | 2,150 | | | Tesla, Inc., 1.25%, 3/1/21 | | | | | | | 2,485,938 | |
| | | | | | | | | | | | 7,315,797 | |
| | | | Building Materials – 0.5% | | | | | | | | |
| | 3,225 | | | Cemex S.A.B de C.V., 3.72%, 3/15/20 | | | | | | | 3,684,563 | |
| | | | Commercial Services – 1.5% | | | | | | | | |
| | 10,220 | | | Ascent Capital Group, Inc., 4.00%, 7/15/20 | | | | | | | 8,073,800 | |
| | 2,795 | | | ServiceSource International, Inc., 1.50%, 8/1/18 | | | | | | | 2,744,341 | |
| | | | | | | | | | | | 10,818,141 | |
| | | | Distribution/Wholesale – 0.7% | | | | | | | | |
| | 4,975 | | | Titan Machinery, Inc., 3.75%, 5/1/19 | | | | | | | 4,900,375 | |
| | | | | | |
| August 31, 2017 | | | Semi-Annual Report | | | 29 | |
Schedule of Investments
AllianzGI Convertible & Income Fund II
August 31, 2017 (unaudited) (continued)
| | | | | | | | | | | | |
Principal
Amount
(000s) | | | | | | | | Value | |
| | | | Diversified Financial Services – 2.3% | | | | | | | | |
| | $7,030 | | | Encore Capital Group, Inc., 3.00%, 7/1/20 | | | | | | | $7,671,487 | |
| | 9,160 | | | PRA Group, Inc., 3.00%, 8/1/20 | | | | | | | 8,415,750 | |
| | | | | | | | | | | | 16,087,237 | |
| | | | Electric Utilities – 1.0% | | | | | | | | |
| | 6,905 | | | NRG Yield, Inc., 3.25%, 6/1/20 (a)(b) | | | | | | | 6,926,578 | |
| | | | Electrical Equipment – 1.1% | | | | | | | | |
| | | | SunPower Corp., | | | | | | | | |
| | 2,365 | | | 0.875%, 6/1/21 | | | | | | �� | 1,928,953 | |
| | 7,095 | | | 4.00%, 1/15/23 | | | | | | | 6,270,206 | |
| | | | | | | | | | | | 8,199,159 | |
| | | | Energy-Alternate Sources – 1.7% | | | | | | | | |
| | 12,690 | | | SolarCity Corp., 1.625%, 11/1/19 | | | | | | | 12,118,950 | |
| | | | Engineering & Construction – 0.3% | | | | | | | | |
| | 2,445 | | | Layne Christensen Co., 4.25%, 11/15/18 | | | | | | | 2,321,222 | |
| | | | Equity Real Estate Investment Trusts (REITs) – 0.6% | | | | | | | | |
| | 4,100 | | | Two Harbors Investment Corp., 6.25%, 1/15/22 | | | | | | | 4,389,563 | |
| | | | Health Care/Health Care Distributors – 1.1% | | | | | | | | |
| | 8,615 | | | Aceto Corp., 2.00%, 11/1/20 | | | | | | | 7,624,275 | |
| | | | Insurance – 1.0% | | | | | | | | |
| | 9,690 | | | AmTrust Financial Services, Inc., 2.75%, 12/15/44 | | | | | | | 7,158,487 | |
| | | | Iron/Steel – 0.1% | | | | | | | | |
| | 690 | | | AK Steel Corp., 5.00%, 11/15/19 | | | | | | | 933,656 | |
| | | | Oil, Gas & Consumable Fuels – 2.8% | | | | | | | | |
| | 13,775 | | | Helix Energy Solutions Group, Inc., 3.25%, 3/15/32 | | | | | | | 13,886,922 | |
| | 7,525 | | | Whiting Petroleum Corp., 1.25%, 4/1/20 | | | | | | | 6,424,469 | |
| | | | | | | | | | | | 20,311,391 | |
| | | | Pharmaceuticals – 2.8% | | | | | | | | |
| | 12,175 | | | Herbalife Ltd., 2.00%, 8/15/19 | | | | | | | 12,281,592 | |
| | 2,460 | | | Horizon Pharma Investment Ltd., 2.50%, 3/15/22 | | | | | | | 2,244,750 | |
| | 5,885 | | | Impax Laboratories, Inc., 2.00%, 6/15/22 | | | | | | | 5,241,328 | |
| | | | | | | | | | | | 19,767,670 | |
| | | | Pipelines – 1.0% | | | | | | | | |
| | 10,095 | | | Cheniere Energy, Inc., 4.25%, 3/15/45 | | | | | | | 6,984,478 | |
| | | | Retail – 1.3% | | | | | | | | |
| | | | RH (a)(b), | | | | | | | | |
| | 7,860 | | | zero coupon, 6/15/19 | | | | | | | 6,695,737 | |
| | 3,010 | | | zero coupon, 7/15/20 | | | | | | | 2,366,613 | |
| | | | | | | | | | | | 9,062,350 | |
| | | | Semiconductors – 0.9% | | | | | | | | |
| | 2,150 | | | Cypress Semiconductor Corp., 4.50%, 1/15/22 | | | | | | | 2,659,281 | |
| | 3,430 | | | Micron Technology, Inc., 3.00%, 11/15/43, Ser. G | | | | | | | 4,036,682 | |
| | | | | | | | | | | | 6,695,963 | |
| | | | Software – 1.3% | | | | | | | | |
| | 11,915 | | | Avid Technology, Inc., 2.00%, 6/15/20 | | | | | | | 8,742,631 | |
| | 430 | | | PROS Holdings, Inc., 2.00%, 12/1/19 | | | | | | | 450,694 | |
| | | | | | | | | | | | 9,193,325 | |
| | | | Telecommunications – 1.1% | | | | | | | | |
| | 8,310 | | | Gogo, Inc., 3.75%, 3/1/20 | | | | | | | 8,003,569 | |
| | | | |
| 30 | | Semi-Annual Report | | | August 31, 2017 |
Schedule of Investments
AllianzGI Convertible & Income Fund II
August 31, 2017 (unaudited) (continued)
| | | | | | | | | | | | |
Principal
Amount
(000s) | | | | | | | | Value | |
| | | | Tobacco – 1.7% | | | | | | | | |
| | | | Vector Group Ltd. (g), | | | | | | | | |
| | $4,335 | | | 3 mo. Cash Dividends on Common Stock + 1.75%, 1.75%, 4/15/20 | | | | | | | $4,963,575 | |
| | 4,685 | | | 3 mo. Cash Dividends on Common Stock + 2.50%, 2.50%, 1/15/19 | | | | | | | 6,828,387 | |
| | | | | | | | | | | | 11,791,962 | |
| | | | Transportation – 0.8% | | | | | | | | |
| | 3,010 | | | Aegean Marine Petroleum Network, Inc., 4.25%, 12/15/21 (a)(b) | | | | | | | 2,278,194 | |
| | 3,440 | | | Echo Global Logistics, Inc., 2.50%, 5/1/20 | | | | | | | 3,259,400 | |
| | | | | | | | | | | | 5,537,594 | |
| | Total Convertible Bonds & Notes (cost-$196,412,213) | | | | | | | 215,963,005 | |
| | | |
| Shares | | | | | | | | | |
| | Convertible Preferred Stock – 25.4% | | | | | | | | |
| | | | Aerospace & Defense – 0.3% | | | | | | | | |
| | 59,615 | | | Arconic, Inc., 5.375%, 10/1/17 | | | | | | | 2,417,388 | |
| | | | Agriculture – 0.9% | | | | | | | | |
| | 62,355 | | | Bunge Ltd., 4.875% (e) | | | | | | | 6,613,527 | |
| | | | Banks – 4.6% | | | | | | | | |
| | 9,140 | | | Bank of America Corp., 7.25%, Ser. L (e) | | | | | | | 12,046,520 | |
| | 7,455 | | | Huntington Bancshares, Inc., 8.50%, Ser. A (e) | | | | | | | 10,724,018 | |
| | 7,435 | | | Wells Fargo & Co., 7.50%, Ser. L (e) | | | | | | | 9,895,985 | |
| | | | | | | | | | | | 32,666,523 | |
| | | | Chemicals – 0.8% | | | | | | | | |
| | 51,505 | | | Rayonier Advanced Materials, Inc., 8.00%, 8/15/19, Ser. A | | | | | | | 5,377,122 | |
| | | | Commercial Services & Supplies – 0.9% | | | | | | | | |
| | 110,120 | | | Stericycle, Inc., 5.25%, 9/15/18 | | | | | | | 6,545,533 | |
| | | | Computers – 0.3% | | | | | | | | |
| | 1,543 | | | NCR Corp., PIK 5.50%, 5.50%, Ser. A (e) | | | | | | | 2,212,944 | |
| | | | Diversified Financial Services – 0.5% | | | | | | | | |
| | 4,300 | | | Cowen, Inc., 5.625%, Ser. A (e) | | | | | | | 3,712,448 | |
| | | | Diversified Telecommunication Services – 0.4% | | | | | | | | |
| | 117,480 | | | Frontier Communications Corp., 11.125%, 6/29/18, Ser. A | | | | | | | 2,749,032 | |
| | | | Electric Utilities – 2.0% | | | | | | | | |
| | 228,650 | | | Dominion Energy, Inc., 6.75%, 8/15/19, Ser. A | | | | | | | 11,695,448 | |
| | 50,060 | | | NextEra Energy, Inc., 6.123%, 9/1/19 | | | | | | | 2,783,336 | |
| | | | | | | | | | | | 14,478,784 | |
| | | | Equity Real Estate Investment Trusts (REITs) – 4.6% | | | | | | | | |
| | 3,730 | | | Crown Castle International Corp., 6.875%, 8/1/20, Ser. A | | | | | | | 4,181,946 | |
| | 476,235 | | | FelCor Lodging Trust, Inc., 1.95%, Ser. A (e) | | | | | | | 13,334,580 | |
| | 309,935 | | | Sutherland Asset Management Corp., 7.00%, 8/15/23 | | | | | | | 7,881,647 | |
| | 106,440 | | | Welltower, Inc., 6.50%, Ser. I (e) | | | | | | | 7,041,006 | |
| | | | | | | | | | | | 32,439,179 | |
| | | | Hand/Machine Tools – 1.6% | | | | | | | | |
| | 104,940 | | | Stanley Black & Decker, Inc., 5.375%, 5/15/20 | | | | | | | 11,614,759 | |
| | | | Health Care Providers & Services – 2.2% | | | | | | | | |
| | 292,115 | | | Anthem, Inc., 5.25%, 5/1/18 | | | | | | | 15,330,195 | |
| | | | Healthcare-Products – 1.2% | | | | | | | | |
| | 150,440 | | | Becton Dickinson and Co., 6.125%, 5/1/20, Ser. A | | | | | | | 8,387,030 | |
| | | | | | |
| August 31, 2017 | | | Semi-Annual Report | | | 31 | |
Schedule of Investments
AllianzGI Convertible & Income Fund II
August 31, 2017 (unaudited) (continued)
| | | | | | | | | | | | |
| Shares | | | | | | | | Value | |
| | | | Independent Power Producers & Energy Traders – 0.5% | | | | | | | | |
| | 117,560 | | | Dynegy, Inc., 5.375%, 11/1/17, Ser. A | | | | | | | $3,706,667 | |
| | | | Investment Companies – 1.3% | | | | | | | | |
| | 45,390 | | | Mandatory Exchangeable Trust, 5.75%, 6/3/19 (a)(b) | | | | | | | 8,864,894 | |
| | | | Oil, Gas & Consumable Fuels – 2.3% | | | | | | | | |
| | 120,125 | | | Anadarko Petroleum Corp., 7.50%, 6/7/18 | | | | | | | 4,444,625 | |
| | 130,590 | | | Kinder Morgan, Inc., 9.75%, 10/26/18, Ser. A | | | | | | | 5,506,980 | |
| | 173,845 | | | Sanchez Energy Corp., 6.50%, Ser. B (e) | | | | | | | 3,103,133 | |
| | 8,585 | | | Southwestern Energy Co., 6.25%, 1/15/18, Ser. B | | | | | | | 113,580 | |
| | 70,105 | | | WPX Energy, Inc., 6.25%, 7/31/18, Ser. A | | | | | | | 3,346,813 | |
| | | | | | | | | | | | 16,515,131 | |
| | | | Pharmaceuticals – 1.0% | | | | | | | | |
| | 3,225 | | | Allergan PLC, 5.50%, 3/1/18, Ser. A | | | | | | | 2,642,049 | |
| | 14,705 | | | Teva Pharmaceutical Industries Ltd., 7.00%, 12/15/18 | | | | | | | 4,682,807 | |
| | | | | | | | | | | | 7,324,856 | |
| | Total Convertible Preferred Stock (cost-$183,981,632) | | | | | | | 180,956,012 | |
| | Preferred Stock (a)(d)(f)(i) – 1.2% | | | | | | | | |
| | | | Media – 1.2% | | | | | | | | |
| | 8,339 | | | LiveStyle, Inc., Ser. A | | | | | | | 833,900 | |
| | 76,572 | | | LiveStyle, Inc., Ser. B | | | | | | | 7,657,200 | |
| | 5,000 | | | LiveStyle, Inc., Ser. B | | | | | | | 50 | |
| | Total Preferred Stock (cost-$13,324,564) | | | | | | | 8,491,150 | |
| | Common Stock (a)(d)(f)(i) – 0.2% | | | | | | | | |
| | | | Advertising – 0.2% | | | | | | | | |
| | 133,715 | | | Affinion Group Holdings, Inc., Class A | | | | | | | | |
| | | | | (acquisition cost-$2,371,020; purchased 11/9/15-11/12/15) (h) | | | | | | | 1,596,557 | |
| | | | Aerospace & Defense – 0.0% | | | | | | | | |
| | 6,354 | | | Erickson, Inc. | | | | | | | 177,467 | |
| | | | Media – 0.0% | | | | | | | | |
| | 90,407 | | | LiveStyle, Inc. | | | | | | | 9 | |
| | Total Common Stock (cost-$7,842,203) | | | | | | | 1,774,033 | |
| | | |
| Units | | | | | | | | | |
| | Warrants (a)(d)(f)(i) – 0.0% | | | | | | | | |
| | | | Commercial Services – 0.0% | | | | | | | | |
| | 1,562,241 | | | Cenveo Corp. strike price $12.00, expires 6/10/24 | | | | | | | 335,394 | |
| | | | Media – 0.0% | | | | | | | | |
| | 19,500 | | | LiveStyle, Inc., expires 11/30/21, Ser. C | | | | | | | 2 | |
| | Total Warrants (cost-$183,305) | | | | | | | 335,396 | |
| | | |
Principal
Amount
(000s) | | | | | | | | | |
| | | | Repurchase Agreements – 2.5% | | | | | | | | |
| | $17,543 | | | State Street Bank and Trust Co.,
dated 8/31/17, 0.12%, due 9/1/17, proceeds $17,543,058; collateralized by U.S. Treasury Inflation Indexed Notes, 0.625%, due 1/15/26, valued at $17,897,650 including accrued interest (cost-$17,543,000) | | | | | | | 17,543,000 | |
| | Total Investments (cost-$716,671,442)-100.0% | �� | | | | | | $712,935,049 | |
| | | | |
| 32 | | Semi-Annual Report | | | August 31, 2017 |
Schedule of Investments
AllianzGI Convertible & Income Fund II
August 31, 2017 (unaudited) (continued)
Notes to Schedule of Investments:
| (a) | | Private Placement–Restricted as to resale and may not have a readily available market. Securities with an aggregate value of $138,220,008, representing 19.4% of total investments. | |
| (b) | | 144A–Exempt from registration under Rule 144A of the Securities Act of 1933. These securities may be resold in transactions exempt from registration, typically only to qualified institutional buyers. Securities with an aggregate value of $127,619,429, representing 17.9% of total investments. | |
| (d) | | Fair-Valued–Securities with an aggregate value of $10,600,579, representing 1.5% of total investments. See Note 1(a) and Note 1(b) in the Notes to Financial Statements. | |
| (e) | | Perpetual maturity. The date shown, if any, is the next call date. | |
| (f) | | Level 3 security. See Note 1(b) in the Notes to Financial Statements. | |
| (g) | | In addition to the coupon rate shown, the issuer is expected to pay additional interest based on the actual dividends paid on its common stock. | |
| (h) | | Restricted. The aggregate acquisition cost of such securities is $6,830,107. The aggregate value is $1,618,988, representing 0.2% of total investments. | |
| (i) | | Non-income producing. | |
| (j) | | Fair Value Measurements-See Note 1(b) in the Notes to Financial Statements. | |
| | | | | | | | | | | | | | | | |
| | | Level 1 –
Quoted
Prices | | | Level 2 –
Other Significant
Observable
Inputs | | | Level 3 –
Significant
Unobservable
Inputs | | | Value at
8/31/17 | |
Investments in Securities – Assets | | | | | | | | | | | | | | | | |
Corporate Bonds & Notes | | $ | – | | | | $287,872,453 | | | $ | – | | | | $287,872,453 | |
Convertible Bonds & Notes | | | – | | | | 215,963,005 | | | | – | | | | 215,963,005 | |
Convertible Preferred Stock: | | | | | | | | | | | | | | | | |
Agriculture | | | – | | | | 6,613,527 | | | | – | | | | 6,613,527 | |
Computers | | | – | | | | 2,212,944 | | | | – | | | | 2,212,944 | |
Diversified Financial Services | | | – | | | | 3,712,448 | | | | – | | | | 3,712,448 | |
Healthcare-Products | | | – | | | | 8,387,030 | | | | – | | | | 8,387,030 | |
Investment Companies | | | – | | | | 8,864,894 | | | | – | | | | 8,864,894 | |
Oil, Gas & Consumable Fuels | | | 13,411,998 | | | | 3,103,133 | | | | – | | | | 16,515,131 | |
Pharmaceuticals | | | 2,642,049 | | | | 4,682,807 | | | | – | | | | 7,324,856 | |
All Other | | | 127,325,182 | | | | – | | | | – | | | | 127,325,182 | |
Preferred Stock | | | – | | | | – | | | | 8,491,150 | | | | 8,491,150 | |
Common Stock | | | – | | | | – | | | | 1,774,033 | | | | 1,774,033 | |
Warrants | | | – | | | | – | | | | 335,396 | | | | 335,396 | |
Repurchase Agreements | | | – | | | | 17,543,000 | | | | – | | | | 17,543,000 | |
Totals | | $ | 143,379,229 | | | | $558,955,241 | | | $ | 10,600,579 | | | | $712,935,049 | |
At August 31, 2017, a security valued at $5,377,122 was transferred from Level 2 to Level 1. The transfer was a result of the security having used an evaluated price from a third-party independent pricing vendor at February 28, 2017, and used an exchange-traded closing price on August 31, 2017.
| | | | | | |
| August 31, 2017 | | | Semi-Annual Report | | | 33 | |
Schedule of Investments
AllianzGI Convertible & Income Fund II
August 31, 2017 (unaudited) (continued)
A roll forward of fair value measurements using significant unobservable inputs (Level 3) for the six months ended August 31, 2017, was as follows:
| | | | | | | | | | | | | | | | | | | | |
| | | Beginning
Balance
2/28/17 | | | Purchases | | | Sales | | | Accrued
Discounts
(Premiums) | | | Net
Realized
Gain (Loss) | |
Investments in Securities – Assets | |
Corporate Bonds & Notes: | | | | | | | | | | | | | | | | | | | | |
Commercial Services | | | $5,361,665 | | | | $ – | | | | $ – | | | | $(64,082 | ) | | | $ – | |
Preferred Stock | | | 7,759,031 | | | | – | | | | – | | | | – | | | | – | |
Common Stock: | | | | | | | | | | | | | | | | | | | | |
Advertising | | | 1,987,005 | | | | – | | | | – | | | | – | | | | – | |
Aerospace & Defense | | | – | | | | 5,471,183 | † | | | – | | | | – | | | | – | |
Media | | | 9 | | | | – | | | | – | | | | – | | | | – | |
Warrants: | | | | | | | | | | | | | | | | | | | | |
Commercial Services | | | 340,656 | | | | – | | | | – | | | | – | | | | – | |
Media | | | 2 | | | | – | | | | – | | | | – | | | | – | |
Totals | | | $15,448,368 | | | | $5,471,183 | | | | $ – | | | | $(64,082 | ) | | | $ – | |
| | | | | | | | | | | | | | | | |
| | | Net Change
in Unrealized
Appreciation/
Depreciation | | | Transfers
into
Level 3 | | | Transfers
out of
Level 3* | | | Ending
Balance
8/31/17 | |
Investments in Securities – Assets | | | | | | | | | | | | | | | | |
Corporate Bonds & Notes: | | | | | | | | | | | | | | | | |
Commercial Services | | | $(10,593 | ) | | | $ – | | | | $(5,286,990 | ) | | | $ – | |
Preferred Stock | | | 732,119 | | | | – | | | | – | | | | 8,491,150 | |
Common Stock: | | | | | | | | | | | | | | | | |
Advertising | | | (390,448 | ) | | | – | | | | – | | | | 1,596,557 | |
Aerospace & Defense | | | (5,293,716 | ) | | | – | | | | – | | | | 177,467 | |
Media | | | – | | | | – | | | | – | | | | 9 | |
Warrants: | | | | | | | | | | | | | | | | |
Commercial Services | | | (5,262 | ) | | | – | | | | – | | | | 335,394 | |
Media | | | – | | | | – | | | | – | | | | 2 | |
Totals | | | $(4,967,900 | ) | | | $ – | | | | $(5,286,990 | ) | | | $10,600,579 | |
| † | | Issued via reorganization | |
| * | | Transferred out of Level 3 into Level 2 because an evaluated price from a third-party independent pricing vendor was used on August 31, 2017. | |
The following tables present additional information about valuation techniques and inputs used for investments that are measured at fair value and categorized within Level 3 at August 31, 2017:
| | | | | | | | | | | | | | |
| | | Ending Balance
at 8/31/17 | | | Valuation
Technique Used | | Unobservable
Inputs | | | Input Values | |
Investments in Securities – Assets | | | | | | | | |
Preferred Stock | | | $8,491,100 | | | Model Price | |
| Proprietary Data
Used in Model |
| | | $100 | |
| | | $50 | | | Liquidation Value | | | Price of Stock | | | | $0.01* | |
Common Stock | | | $1,774,033 | | | Model Price | |
| Proprietary Data
Used in Model |
| | | $0.01 – $27.93 | |
Warrants | | | $335,394 | | | Fundamental Analytical Data
Relating to the Investment | |
| Price of
Warrant |
| | | $0.21469 | |
| | | $2 | | | Model Price | |
| Proprietary Data
Used in Model |
| | | $0.0001 | |
| * | | Preferred stock trades are in lots of 1,000. | |
The net change in unrealized appreciation/depreciation of Level 3 investments held at August 31, 2017, was $(4,957,307). Net change in unrealized appreciation/depreciation is reflected on the Statements of Operations.
Glossary:
| | | | |
| PIK | | - | | Payment-in-Kind |
| REIT | | - | | Real Estate Investment Trust |
| | | | | | |
| 34 | | Semi-Annual Report | | | August 31, 2017 | | | See accompanying Notes to Financial Statements |
Statements of Assets and Liabilities
AllianzGI Convertible & Income Funds
August 31, 2017 (unaudited)
| | | | | | | | | | | | | | | | | | | | | | | | |
| | | | | | Convertible &
Income 2024
Target Term | | | | | | Convertible &
Income | | | | | | Convertible &
Income II | |
| Assets: | | | | | | | | | | | | | | | | | | | | | | | | |
| Investments, at value (cost-$258,337,604, $943,420,772 and $716,671,442, respectively) | | | | | | | $257,986,386 | | | | | | | | $937,170,874 | | | | | | | | $712,935,049 | |
| Cash | | | | | | | 1,015,286 | | | | | | | | 265 | | | | | | | | 95 | |
| Receivable for investments sold | | | | | | | 3,755,579 | | | | | | | | – | | | | | | | | – | |
| Interest and dividends receivable | | | | | | | 3,027,358 | | | | | | | | 12,427,672 | | | | | | | | 9,529,179 | |
| Investments in Affiliated Funds - Trustees Deferred Compensation Plan (see Note 3) | | | | | | | – | | | | | | | | 60,872 | | | | | | | | 45,955 | |
| Tax reclaims receivable | | | | | | | – | | | | | | | | 11,756 | | | | | | | | 8,869 | |
| Prepaid expenses and other assets | | | | | | | 4,978 | | | | | | | | 80,036 | | | | | | | | 32,680 | |
Total Assets | | | | | | | 265,789,587 | | | | | | | | 949,751,475 | | | | | | | | 722,551,827 | |
| | | | | | |
| Liabilities: | | | | | | | | | | | | | | | | | | | | | | | | |
| Loan payable (See Note 7) | | | | | | | 69,700,000 | | | | | | | | – | | | | | | | | – | |
| Payable for investments purchased | | | | | | | 15,342,853 | | | | | | | | 837,314 | | | | | | | | 637,378 | |
| Dividends payable to common and preferred shareholders | | | | | | | 839,820 | | | | | | | | 5,809,716 | | | | | | | | 4,337,483 | |
| Due to Investment Manager | | | | | | | 364,936 | | | | | | | | – | | | | | | | | – | |
| Investment management fees payable | | | | | | | 154,680 | | | | | | | | 560,491 | | | | | | | | 426,428 | |
| Loan interest payable | | | | | | | 7,059 | | | | | | | | – | | | | | | | | – | |
| Trustees Deferred Compensation Plan payable (see Note 3) | | | | | | | – | | | | | | | | 60,872 | | | | | | | | 45,955 | |
| Accrued expenses | | | | | | | 81,924 | | | | | | | | 166,670 | | | | | | | | 149,872 | |
Total Liabilities | | | | | | | 86,491,272 | | | | | | | | 7,435,063 | | | | | | | | 5,597,116 | |
| Preferred Shares ($0.00001 par value and $25,000 liquidation preference per share applicable to an aggregate of 0, 14,280 and 10,960 shares issued and outstanding, respectively) | | | | | | | – | | | | | | | | 357,000,000 | | | | | | | | 274,000,000 | |
| Net Assets Applicable to Common Shareholders | | | | | | | $179,298,315 | | | | | | | | $585,316,412 | | | | | | | | $442,954,711 | |
| | | | | | |
| Composition of Net Assets Applicable to Common Shareholders: | | | | | | | | | | | | | | | | | | | | | | | | |
| Common Shares: | | | | | | | | | | | | | | | | | | | | | | | | |
Par value ($0.00001 per share) | | | | | | | $183 | | | | | | | | $885 | | | | | | | | $747 | |
Paid-in-capital in excess of par | | | | | | | 179,192,122 | | | | | | | | 1,047,115,752 | | | | | | | | 837,836,770 | |
| Undistributed (dividends in excess of) net investment income | | | | | | | 248,245 | | | | | | | | (10,236,685) | | | | | | | | (15,024,076) | |
| Accumulated net realized gain (loss) | | | | | | | 208,983 | | | | | | | | (445,313,642) | | | | | | | | (376,122,337) | |
| Net unrealized depreciation | | | | | | | (351,218) | | | | | | | | (6,249,898) | | | | | | | | (3,736,393) | |
| Net Assets Applicable to Common Shareholders | | | | | | | $179,298,315 | | | | | | | | $585,316,412 | | | | | | | | $442,954,711 | |
| Common Shares Issued and Outstanding | | | | | | | 18,256,964 | | | | | | | | 88,473,991 | | | | | | | | 74,660,994 | |
| Net Asset Value Per Common Share | | | | | | | $9.82 | | | | | | | | $6.62 | | | | | | | | $5.93 | |
| | | | | | | | |
| See accompanying Notes to Financial Statements | | | August 31, 2017 | | | Semi-Annual Report | | | 35 | |
Statements of Operations
AllianzGI Convertible & Income Funds
Period or Six Months ended August 31, 2017 (unaudited)
| | | | | | | | | | | | | | | | | | | | | | | | |
| | | | | | Convertible &
Income 2024
Target Term (1) | | | | | | Convertible &
Income | | | | | | Convertible &
Income II | |
| Investment Income: | | | | | | | | | | | | | | | | | | | | | | | | |
| Interest | | | | | | | $1,511,491 | | | | | | | | $26,716,039 | | | | | | | | $20,250,181 | |
| Dividends (net of foreign withholding taxes of $26,250, $187,736 and $141,536, respectively) | | | | | | | 100,750 | | | | | | | | 8,723,369 | | | | | | | | 6,504,099 | |
| Miscellaneous | | | | | | | 39,933 | | | | | | | | – | | | | | | | | – | |
Total Investment Income | | | | | | | 1,652,174 | | | | | | | | 35,439,408 | | | | | | | | 26,754,280 | |
| | | | | | |
| Expenses: | | | | | | | | | | | | | | | | | | | | | | | | |
| Investment management | | | | | | | 276,393 | | | | | | | | 3,349,114 | | | | | | | | 2,546,447 | |
| Loan interest | | | | | | | 203,921 | | | | | | | | – | | | | | | | | – | |
| Audit and tax services | | | | | | | 26,233 | | | | | | | | 50,126 | | | | | | | | 53,358 | |
| Custodian and accounting agent | | | | | | | 23,896 | | | | | | | | 69,766 | | | | | | | | 61,190 | |
| Legal | | | | | | | 13,176 | | | | | | | | 42,189 | | | | | | | | 38,270 | |
| Shareholder communications | | | | | | | 8,498 | | | | | | | | 48,923 | | | | | | | | 41,103 | |
| Transfer agent | | | | | | | 4,455 | | | | | | | | 12,623 | | | | | | | | 13,042 | |
| Trustees | | | | | | | 3,951 | | | | | | | | 27,187 | | | | | | | | 20,657 | |
| Insurance | | | | | | | 164 | | | | | | | | 9,405 | | | | | | | | 7,632 | |
| Auction agent and commissions | | | | | | | – | | | | | | | | 204,687 | | | | | | | | 167,506 | |
| New York Stock Exchange listing | | | | | | | – | | | | | | | | 26,324 | | | | | | | | 22,022 | |
| Miscellaneous | | | | | | | 3,422 | | | | | | | | 9,993 | | | | | | | | 28,252 | |
Total Expenses | | | | | | | 564,109 | | | | | | | | 3,850,337 | | | | | | | | 2,999,479 | |
| | | | | | |
| Net Investment Income | | | | | | | 1,088,065 | | | | | | | | 31,589,071 | | | | | | | | 23,754,801 | |
| | | | | | |
| Realized and Change in Unrealized Gain (Loss): | | | | | | | | | | | | | | | | | | | | | | | | |
| Net realized gain (loss) on investments | | | | | | | 208,983 | | | | | | | | (4,134,732) | | | | | | | | (1,285,741) | |
| Net change in unrealized appreciation/depreciation of investments | | | | | | | (351,218) | | | | | | | | (12,182,842) | | | | | | | | (10,140,905) | |
| Net realized and change in unrealized loss | | | | | | | (142,235) | | | | | | | | (16,317,574) | | | | | | | | (11,426,646) | |
| Net Increase in Net Assets Resulting from Investment Operations | | | | | | | 945,830 | | | | | | | | 15,271,497 | | | | | | | | 12,328,155 | |
| Dividends on Preferred Shares from Net Investment Income | | | | | | | – | | | | | | | | (2,649,788) | | | | | | | | (2,033,706) | |
| Net Increase in Net Assets Applicable to Common Shareholders Resulting from Investment Operations | | | | | | | $945,830 | | | | | | | | $12,621,709 | | | | | | | | $10,294,449 | |
(1) Commencement of operations was June 30, 2017. Information represents the period from June 30, 2017 through August 31, 2017.
| | | | | | |
| 36 | | Semi-Annual Report | | | August 31, 2017 | | | See accompanying Notes to Financial Statements |
Statements of Changes in Net Assets
AllianzGI Convertible & Income 2024 Target Term Fund
| | | | | | | | |
| | | | | | Period from
June 30, 2017**
through
August 31, 2017
(unaudited) | |
| Investment Operations: | | | | | | | | |
| Net investment income | | | | | | | $1,088,065 | |
| Net realized gain | | | | | | | 208,983 | |
| Net change in unrealized appreciation/depreciation | | | | | | | (351,218) | |
| Net increase in net assets resulting from investment operations | | | | | | | 945,830 | |
| | |
| Dividends to Common Shareholders from Net Investment Income | | | | | | | (839,820) | |
| | |
| Share Transactions: | | | | | | | | |
| Net proceeds from shares issued | | | | | | | 179,457,239 | |
| Offering costs charged to paid-in capital in excess of par (Note 9) | | | | | | | (364,936) | |
| Net increase in net assets from share transactions | | | | | | | 179,092,303 | |
| Total increase in net assets applicable to shareholders | | | | | | | 179,198,313 | |
| | |
| Net Assets Applicable | | | | | | | | |
| Beginning of period | | | | | | | 100,002 | |
| End of period* | | | | | | | $179,298,315 | |
| *Including undistributed net investment income of: | | | | | | | $248,245 | |
| | |
| Shares Activity: | | | | | | | | |
| Shares outstanding, beginning of period | | | | | | | 10,168 | |
| Shares issued | | | | | | | 18,246,796 | |
| Shares outstanding, end of period | | | | | | | 18,256,964 | |
** Commencement of operations.
| | | | | | | | |
| See accompanying Notes to Financial Statements | | | August 31, 2017 | | | Semi-Annual Report | | | 37 | |
Statement of Changes in Net Assets Applicable to Common Shareholders
AllianzGI Convertible & Income Fund
| | | | | | | | | | | | | | | | |
| | | | | | Six Months ended
August 31, 2017
(unaudited) | | | | | | Year ended
February 28, 2017 | |
| Investment Operations: | | | | | | | | | | | | | | | | |
| Net investment income | | | | | | | $31,589,071 | | | | | | | | $64,277,340 | |
| Net realized loss | | | | | | | (4,134,732) | | | | | | | | (49,853,202) | |
| Net change in unrealized appreciation/depreciation | | | | | | | (12,182,842) | | | | | | | | 176,239,359 | |
| Net increase in net assets resulting from investment operations | | | | | | | 15,271,497 | | | | | | | | 190,663,497 | |
| | | | |
| Dividends on Preferred Shares from Net Investment Income | | | | | | | (2,649,788) | | | | | | | | (2,357,962) | |
| Net increase in net assets applicable to common shareholders resulting from investment operations | | | | | | | 12,621,709 | | | | | | | | 188,305,535 | |
| | | | |
| Dividends to Common Shareholders from Net Investment Income | | | | | | | (34,459,248) | | | | | | | | (68,722,510) | |
| | | | |
| Common Share Transactions: | | | | | | | | | | | | | | | | |
| Reinvestment of dividends | | | | | | | 1,959,524 | | | | | | | | 1,099,679 | |
| Total increase (decrease) in net assets applicable to common shareholders | | | | | | | (19,878,015) | | | | | | | | 120,682,704 | |
| | | | |
| Net Assets Applicable to Common Shareholders: | | | | | | | | | | | | | | | | |
| Beginning of period | | | | | | | 605,194,427 | | | | | | | | 484,511,723 | |
| End of period* | | | | | | | $585,316,412 | | | | | | | | $605,194,427 | |
| *Including dividends in excess of net investment income of: | | | | | | | $(10,236,685) | | | | | | | | $(4,716,720) | |
| | | | |
| Common Shares Activity: | | | | | | | | | | | | | | | | |
| Common Shares outstanding, beginning of period | | | | | | | 88,185,843 | | | | | | | | 88,018,356 | |
| Common Shares issued | | | | | | | 288,148 | | | | | | | | 167,487 | |
| Common Shares outstanding, end of period | | | | | | | 88,473,991 | | | | | | | | 88,185,843 | |
| | | | | | |
| 38 | | Semi-Annual Report | | | August 31, 2017 | | | See accompanying Notes to Financial Statements |
Statement of Changes in Net Assets Applicable to Common Shareholders
AllianzGI Convertible & Income II Fund
| | | | | | | | | | | | | | | | |
| | | | | | Six Months ended
August 31, 2017
(unaudited) | | | | | | Year ended
February 28, 2017 | |
| Investment Operations: | | | | | | | | | | | | | | | | |
| Net investment income | | | | | | | $23,754,801 | | | | | | | | $49,013,543 | |
| Net realized loss | | | | | | | (1,285,741) | | | | | | | | (37,695,132) | |
| Net change in unrealized appreciation/depreciation | | | | | | | (10,140,905) | | | | | | | | 134,580,526 | |
| Net increase in net assets resulting from investment operations | | | | | | | 12,328,155 | | | | | | | | 145,898,937 | |
| | | | |
| Dividends on Preferred Shares from Net Investment Income | | | | | | | (2,033,706) | | | | | | | | (1,809,753) | |
| Net increase in net assets applicable to common shareholders resulting from investment operations | | | | | | | 10,294,449 | | | | | | | | 144,089,184 | |
| | | | |
| Dividends to Common Shareholders from Net Investment Income | | | | | | | (25,725,559) | | | | | | | | (51,344,679) | |
| | | | |
| Common Share Transactions: | | | | | | | | | | | | | | | | |
| Reinvestment of dividends | | | | | | | 1,401,043 | | | | | | | | 249,618 | |
| Total increase (decrease) in net assets applicable to common shareholders | | | | | | | (14,030,067) | | | | | | | | 92,994,123 | |
| | | | |
| Net Assets Applicable to Common Shareholders: | | | | | | | | | | | | | | | | |
| Beginning of period | | | | | | | 456,984,778 | | | | | | | | 363,990,655 | |
| End of period* | | | | | | | $442,954,711 | | | | | | | | $456,984,778 | |
| *Including dividends in excess of net investment income of: | | | | | | | $(15,024,076) | | | | | | | | $(11,019,612) | |
| | | | |
| Common Shares Activity: | | | | | | | | | | | | | | | | |
| Common Shares outstanding, beginning of period | | | | | | | 74,430,542 | | | | | | | | 74,387,429 | |
| Common Shares issued | | | | | | | 230,452 | | | | | | | | 43,113 | |
| Common Shares outstanding, end of period | | | | | | | 74,660,994 | | | | | | | | 74,430,542 | |
| | | | | | | | |
| See accompanying Notes to Financial Statements | | | August 31, 2017 | | | Semi-Annual Report | | | 39 | |
Statement of Cash Flows*
AllianzGI Convertible & Income 2024 Target Term Fund
Period from June 30, 2017** through August 31, 2017 (unaudited)
| | | | | | | | |
| Increase in Cash from: | | | | | | | | |
| | |
| Cash Flows Used for Operating Activities: | | | | | | | | |
Net increase in net assets resulting from investment operations | | | | | | | $945,830 | |
| | |
| Adjustments to Reconcile Net Increase in Net Assets Resulting from Investment Operations to Net Cash Used for Operating Activities: | | | | | | | | |
Purchases of long-term investments | | | | | | | (257,613,426) | |
Proceeds from sales of long-term investments | | | | | | | 25,720,066 | |
Purchases of short-term portfolio investments, net | | | | | | | (26,121,313) | |
Net change in unrealized appreciation/depreciation | | | | | | | 351,218 | |
Net amortization/accretion on investments | | | | | | | (113,948) | |
Net realized gain | | | | | | | (208,983) | |
Increase in payable for investments purchased | | | | | | | 15,342,853 | |
Increase in receivable for investments sold | | | | | | | (3,755,579) | |
Increase in interest and dividends receivable | | | | | | | (3,027,358) | |
Increase in prepaid expenses | | | | | | | (4,978) | |
Increase in investment management fees payable | | | | | | | 154,680 | |
Increase in due to Investment Manager | | | | | | | 364,936 | |
Increase in accrued expenses | | | | | | | 81,924 | |
Increase in loan interest payable | | | | | | | 7,059 | |
| Net cash used for operating activities | | | | | | | (247,877,019) | |
| | |
| Cash Flows Provided by Financing Activities: | | | | | | | | |
Proceeds from common shares issued | | | | | | | 179,457,239 | |
Increase in loan payable | | | | | | | 69,700,000 | |
Cash dividends paid | | | | | | | – | |
Offering costs | | | | | | | (364,936) | |
| Net cash provided by financing activities | | | | | | | 248,792,303 | |
| Net increase in cash | | | | | | | 915,284 | |
| | |
| Beginning of period | | | | | | | 100,002 | |
| End of period | | | | | | | $1,015,286 | |
| | |
| Supplemental Disclosure of Cash Flow Information: | | | | | | | | |
Interest expense paid on loan | | | | | | | $196,862 | |
* Statement of Cash Flows is not required for Convertible & Income and Convertible & Income II.
** Commencement of operations.
| | | | | | |
| 40 | | Semi-Annual Report | | | August 31, 2017 | | | See accompanying Notes to Financial Statements |
Financial Highlights
AllianzGI Convertible & Income 2024 Target Term Fund
For a common share outstanding throughout each period:
| | | | | | |
| | | | | Period from
June 30, 2017*
through August 31,
2017
(unaudited) | |
| Net asset value, beginning of period | | | | | $9.84 | ** |
| Investment Operations: | | | | | | |
| Net investment income | | | | | 0.06 | |
| Net realized and change in unrealized loss | | | | | (0.01 | ) |
| Total from investment operations | | | | | 0.05 | |
| Dividends to Shareholders from Net Investment Income | | | | | (0.05 | ) |
| Share Transactions: | | | | | | |
| Capital charge resulting from issuance of shares and related offering costs | | | | | (0.02 | ) |
| Net asset value, end of period | | | | | $9.82 | |
| Market price, end of period | | | | | $9.90 | |
| Total Investment Return (1) | | | | | (0.54 | )% |
| RATIOS/SUPPLEMENTAL DATA: | | | | | | |
| Net assets, end of period (000s) | | | | | $179,298 | |
| Ratio of expenses to average net assets, including interest expense (3) | | | | | 2.02 | %(2) |
| Ratio of expenses to average net assets, excluding interest expense (3) | | | | | 1.29 | %(2) |
| Ratio of net investment income to average net assets | | | | | 3.90 | %(2) |
| Portfolio turnover rate | | | | | 17 | % |
| * | | Commencement of operations. | |
| ** | | Initial public offering price of $10.00 per share less sales load of 1.65% of the offering price. | |
| (1) | | Total investment return is calculated assuming a purchase of a common share at the market price on the first day and a sale of a common share at the market price on the last day of each period reported. Dividends and distributions, if any, are assumed, for purposes of this calculation, to be reinvested at prices obtained under the Fund’s dividend reinvestment plan. Total investment return does not reflect brokerage commissions or sales charges in connection with the purchase or sale of Fund shares. Total investment return for a period of less than one year is not annualized. | |
| (3) | | Interest expense relates to participation in debt financing (See Note 7). | |
| | | | | | | | |
| See accompanying Notes to Financial Statements | | | August 31, 2017 | | | Semi-Annual Report | | | 41 | |
Financial Highlights
AllianzGI Convertible & Income Fund
For a common share outstanding throughout each period:
| | | | | | | | | | | | | | | | | | |
| | | | | Six Months
ended August 31,
2017
(unaudited) | | | Year ended | |
| | | | | | | | February 28,
2017 | | | | | February 29,
2016 | |
| Net asset value, beginning of period | | | | | $6.86 | | | | | | $5.50 | | | | | | $8.44 | |
| Investment Operations: | | | | | | | | | | | | | | | | | | |
| Net investment income | | | | | 0.36 | | | | | | 0.73 | | | | | | 0.83 | |
| Net realized and change in unrealized gain (loss) | | | | | (0.18 | ) | | | | | 1.44 | | | | | | (2.83 | ) |
| Total from investment operations | | | | | 0.18 | | | | | | 2.17 | | | | | | (2.00 | ) |
| Dividends on Preferred Shares from Net Investment Income | | | | | (0.03 | )(1) | | | | | (0.03 | )(1) | | | | | (0.01 | )(1) |
| Net increase (decrease) in net assets applicable to common shareholders resulting from investment operations | | | | | 0.15 | | | | | | 2.14 | | | | | | (2.01 | ) |
| Dividends to Common Shareholders from Net Investment Income | | | | | (0.39 | ) | | | | | (0.78 | ) | | | | | (0.93 | ) |
| Common Share Transactions: | | | | | | | | | | | | | | | | | | |
| Accretion to net asset value, resulting from offerings | | | | | – | | | | | | – | | | | | | – | |
| Capital charge resulting from issuance of common shares and related offering costs | | | | | – | | | | | | – | | | | | | – | |
| Total common share transactions | | | | | – | | | | | | – | | | | | | – | |
| Net asset value, end of period | | | | | $6.62 | | | | | | $6.86 | | | | | | $5.50 | |
| Market price, end of period | | | | | $7.01 | | | | | | $6.93 | | | | | | $4.92 | |
| Total Investment Return (5) | | | | | 7.13 | % | | | | | 59.15 | % | | | | | (38.23 | )% |
| RATIOS/SUPPLEMENTAL DATA: | | | | | | | | | | | | | | | | | | |
| Net assets, applicable to common shareholders, end of period (000s) | | | | | $585,316 | | | | | | $605,194 | | | | | | $484,512 | |
| Ratio of expenses to average net assets (6) | | | | | 1.29 | %(9) | | | | | 1.36 | %(8) | | | | | 1.26 | %(8) |
| Ratio of net investment income to average net assets (6) | | | | | 10.58 | %(9) | | | | | 11.33 | %(8) | | | | | 11.51 | %(8) |
| Preferred shares asset coverage per share | | | | | $65,982 | | | | | | $67,376 | | | | | | $58,927 | |
| Portfolio turnover rate | | | | | 22 | % | | | | | 28 | % | | | | | 51 | % |
| (1) | Calculated on average common shares outstanding. |
| (2) | Less than $(0.005) per common share. |
| (3) | Less than $0.005 per common share. |
| (4) | Payment from affiliate increased the net asset value by less than $0.01. |
| (5) | Total investment return is calculated assuming a purchase of a common share at the market price on the first day and a sale of a common share at the market price on the last day of each period reported. Dividends and distributions, if any, are assumed, for purposes of this calculation, to be reinvested at prices obtained under the Fund’s dividend reinvestment plan. Total investment return does not reflect brokerage commissions or sales charges in connection with the purchase or sale of Fund shares. Total investment return for a period of less than one year is not annualized. |
| (6) | Calculated on the basis of income and expenses applicable to both common and preferred shares relative to average net assets of common shareholders. |
| (7) | Inclusive of expense reimbursement from Investment Manager of 0.01%. |
| (8) | Inclusive of excise tax expense of 0.03%, less than 0.005%, 0.05% and 0.04% for the years ended February 28, 2017, February 29, 2016, February 28, 2015 and February 28, 2014, respectively. |
| | | | | | |
| 42 | | Semi-Annual Report | | | August 31, 2017 | | | See accompanying Notes to Financial Statements |
| | | | | | | | | | | | | | | | |
| |
| | | Year ended | |
| | | February 28,
2015 | | | | | February 28,
2014 | | | | | February 28,
2013 | |
| | | | $9.49 | | | | | | $8.78 | | | | | | $8.65 | |
| | | | | | | | | | | | | | | | |
| | | | 0.87 | | | | | | 1.02 | (1) | | | | | 1.02 | |
| | | | (0.85 | ) | | | | | 0.75 | | | | | | 0.20 | |
| | | | 0.02 | | | | | | 1.77 | | | | | | 1.22 | |
| | | | | |
| | | | (0.00 | )(1)(2) | | | | | (0.01 | )(1) | | | | | (0.01 | ) |
| | | | | |
| | | | 0.02 | | | | | | 1.76 | | | | | | 1.21 | |
| | | | | |
| | | | (1.08 | ) | | | | | (1.08 | ) | | | | | (1.08 | ) |
| | | | | | | | | | | | | | | | |
| | | | 0.01 | | | | | | 0.03 | | | | | | 0.00 | (3) |
| | | | | |
| | | | (0.00 | )(2) | | | | | (0.00 | )(2) | | | | | (0.00 | )(2) |
| | | | 0.01 | | | | | | 0.03 | | | | | | 0.00 | (3) |
| | | | $8.44 | (4) | | | | | $9.49 | | | | | | $8.78 | |
| | | | $9.12 | | | | | | $10.20 | | | | | | $9.18 | |
| | | | 0.37 | % | | | | | 24.87 | % | | | | | 7.02 | % |
| | | | | | | | | | | | | | | | |
| | | | | |
| | | | $739,983 | | | | | | $811,397 | | | | | | $680,022 | |
| | | | 1.23 | %(8) | | | | | 1.21 | %(7)(8) | | | | | 1.28 | % |
| | | | 9.73 | %(8) | | | | | 11.13 | %(7)(8) | | | | | 12.12 | % |
| | | | $76,819 | | | | | | $81,820 | | | | | | $72,619 | |
| | | | 56 | % | | | | | 79 | % | | | | | 39 | % |
| | | | | | | | |
| See accompanying Notes to Financial Statements | | | August 31, 2017 | | | Semi-Annual Report | | | 43 | |
Financial Highlights
AllianzGI Convertible & Income Fund II
For a common share outstanding throughout each period:
| | | | | | | | | | | | | | | | | | |
| | | | | Six Months
ended August 31,
2017
(unaudited) | | | | | Year ended | |
| | | | | | | | February 28,
2017 | | | | | February 29,
2016 | |
| Net asset value, beginning of period | | | | | $6.14 | | | | | | $4.89 | | | | | | $7.56 | |
| Investment Operations: | | | | | | | | | | | | | | | | | | |
| Net investment income | | | | | 0.32 | | | | | | 0.66 | | | | | | 0.75 | |
| Net realized and change in unrealized gain (loss) | | | | | (0.15 | ) | | | | | 1.30 | | | | | | (2.55 | ) |
| Total from investment operations | | | | | 0.17 | | | | | | 1.96 | | | | | | (1.80 | ) |
| Dividends on Preferred Shares from Net Investment Income | | | | | (0.03 | )(1) | | | | | (0.02 | )(1) | | | | | (0.01 | )(1) |
| Net increase (decrease) in net assets applicable to common shareholders resulting from investment operations | | | | | 0.14 | | | | | | 1.94 | | | | | | (1.81 | ) |
| Dividends to Common Shareholders from Net Investment Income | | | | | (0.35 | ) | | | | | (0.69 | ) | | | | | (0.86 | ) |
| Common Share Transactions: | | | | | | | | | | | | | | | | | | |
| Accretion to net asset value, resulting from offerings | | | | | – | | | | | | – | | | | | | – | |
| Capital charge resulting from issuance of common shares and related offering costs | | | | | – | | | | | | – | | | | | | – | |
| Total common share transactions | | | | | – | | | | | | – | | | | | | – | |
| Net asset value, end of period | | | | | $5.93 | | | | | | $6.14 | | | | | | $4.89 | |
| Market price, end of period | | | | | $6.24 | | | | | | $6.17 | | | | | | $4.46 | |
| Total Investment Return (4) | | | | | 7.05 | % | | | | | 56.31 | % | | | | | (40.34 | )% |
| RATIOS/SUPPLEMENTAL DATA: | | | | | | | | | | | | | | | | | | |
| Net assets, applicable to common shareholders, end of period (000s) | | | | | $442,955 | | | | | | $456,985 | | | | | | $363,991 | |
| Ratio of expenses to average net assets (5) | | | | | 1.33 | %(7) | | | | | 1.37 | % | | | | | 1.28 | % |
| Ratio of net investment income to average net assets (5) | | | | | 10.53 | %(7) | | | | | 11.46 | % | | | | | 11.58 | % |
| Preferred shares asset coverage per share | | | | | $65,409 | | | | | | $66,691 | | | | | | $58,208 | |
| Portfolio turnover rate | | | | | 22 | % | | | | | 28 | % | | | | | 51 | % |
| (1) | | Calculated on average common shares outstanding. | |
| (2) | | Less than $(0.005) per common share. | |
| (3) | | Payment from affiliate increased the net asset value by less than $0.01. | |
| (4) | | Total investment return is calculated assuming a purchase of a common share at the market price on the first day and a sale of a common share at the market price on the last day of each period reported. Dividends and distributions, if any, are assumed, for purposes of this calculation, to be reinvested at prices obtained under the Fund’s dividend reinvestment plan. Total investment return does not reflect brokerage commissions or sales charges in connection with the purchase or sale of Fund shares. Total investment return for a period of less than one year is not annualized. | |
| (5) | | Calculated on the basis of income and expenses applicable to both common and preferred shares relative to average net assets of common shareholders. | |
| (6) | | Inclusive of expense reimbursement from Investment Manager of 0.02%. | |
| | | | | | |
| 44 | | Semi-Annual Report | | | August 31, 2017 | | | See accompanying Notes to Financial Statements |
| | | | | | | | | | | | | | | | |
| |
| | | Year ended | |
| | | February 28,
2015 | | | | | February 28,
2014 | | | | | February 28,
2013 | |
| | | | $8.53 | | | | | | $7.97 | | | | | | $7.86 | |
| | | | | | | | | | | | | | | | |
| | | | 0.80 | | | | | | 0.95 | (1) | | | | | 0.93 | |
| | | | (0.75 | ) | | | | | 0.62 | | | | | | 0.20 | |
| | | | 0.05 | | | | | | 1.57 | | | | | | 1.13 | |
| | | | (0.00 | )(1)(2) | | | | | (0.01 | )(1) | | | | | (0.01 | ) |
| | | | | |
| | | | 0.05 | | | | | | 1.56 | | | | | | 1.12 | |
| | | | | |
| | | | (1.02 | ) | | | | | (1.02 | ) | | | | | (1.02 | ) |
| | | | | | | | | | | | | | | | |
| | | | – | | | | | | 0.02 | | | | | | 0.01 | |
| | | | | |
| | | | – | | | | | | (0.00 | )(2) | | | | | (0.00 | )(2) |
| | | | – | | | | | | 0.02 | | | | | | 0.01 | |
| | | | $7.56 | (3) | | | | | $8.53 | | | | | | $7.97 | |
| | | | $8.58 | | | | | | $9.71 | | | | | | $8.52 | |
| | | | (0.81 | )% | | | | | 28.50 | % | | | | | 9.35 | % |
| | | | | | | | | | | | | | | | |
| | | | | |
| | | | $559,342 | | | | | | $627,112 | | | | | | $518,277 | |
| | | | 1.19 | % | | | | | 1.18 | %(6) | | | | | 1.31 | % |
| | | | 9.87 | % | | | | | 11.50 | %(6) | | | | | 12.20 | % |
| | | | $76,034 | | | | | | $82,218 | | | | | | $72,287 | |
| | | | 57 | % | | | | | 93 | % | | | | | 41 | % |
| | | | | | | | |
| See accompanying Notes to Financial Statements | | | August 31, 2017 | | | Semi-Annual Report | | | 45 | |
Notes to Financial Statements
AllianzGI Convertible & Income 2024 Target Term Fund/AllianzGI Convertible & Income Fund/AllianzGI Convertible & Income Fund II
August 31, 2017 (unaudited)
1. Organization and Significant Accounting Policies
AllianzGI Convertible & Income 2024 Target Term Fund (“Convertible & Income 2024 Target Term”), AllianzGI Convertible & Income Fund (“Convertible & Income”) and AllianzGI Convertible & Income Fund II (“Convertible & Income II”) (each, a “Fund” and, collectively, the “Funds”), were organized as Massachusetts business trusts on March 21, 2017, January 17, 2003 and April 22, 2003, respectively, and accordingly follow the investment company accounting and reporting guidance of the Financial Accounting Standards Board (“FASB”) Accounting Standards Codification (“ASC”) Topic 946 Financial Services — Investment Companies. Prior to commencing operations on June 30, 2017, Convertible & Income 2024 Target Term had no operations other than matters relating to its organization and registration as a diversified, closed-end management investment company under the Investment Company Act of 1940, as amended (the “1940 Act”), and the rules and regulations thereunder, and the sale and issuance of 10,168 shares at an aggregate price of $100,002 (net of sales load) to Allianz Asset Management of America L.P. (“AAM”). Convertible & Income and Convertible & Income II are organized and registered as diversified, closed-end management investment companies registered under the 1940 Act, and the rules and regulations thereunder. Allianz Global Investors U.S. LLC (“AllianzGI U.S.” or the “Investment Manager”), serves as the Funds’ investment manager. AllianzGI U.S. is an indirect, wholly-owned subsidiary of AAM. AAM is an indirect, wholly-owned subsidiary of Allianz SE, a publicly-traded European insurance and financial services company. Each Fund has authorized an unlimited amount of common shares with $0.00001 par value.
Convertible & Income 2024 Target Term’s investment objectives are to provide a high level of income and to return at least $9.835 per common share (the original net asset value per common share of beneficial interest before
deducting offering costs of $0.02 per share) (the “Original NAV”) to holders of common shares on or about September 1, 2024 (the “Termination Date”). The objective to return Convertible & Income 2024 Target Term’s Original NAV is not an express or implied guarantee obligation of Convertible & Income 2024 Target Term, the Investment Manager or any other entity, and an investor may receive less than the Original NAV upon termination of Convertible & Income 2024 Target Term. Convertible & Income 2024 Target Term attempts to achieve its investment objectives by investing in a diversified portfolio of high yield securities, convertible securities and other income-producing debt instruments, including senior secured loans, primarily of U.S. issuers. The Fund intends, on or about the Termination Date, to cease its investment operations, liquidate its portfolio (to the extent possible), retire or redeem any outstanding leverage facilities and distribute all its liquidated assets to the then-record holders of common shares, unless such term is extended by the Trustees and absent Trustee and shareholder approval to amend the limited term.
Convertible & Income and Convertible & Income II’s investment objective is to provide total return through a combination of capital appreciation and high current income. Convertible & Income and Convertible & Income II attempt to achieve this objective by investing in a portfolio of domestic convertible securities and non-convertible income-producing securities.
There can be no assurance that the Funds will meet their stated objectives.
The preparation of the Funds’ financial statements in accordance with accounting principles generally accepted in the United States of America (“U.S. GAAP”) requires the Funds’ management to make estimates and assumptions that affect the reported amounts and disclosures in each Fund’s financial statements. Actual results could differ from those estimates.
| | | | |
| 46 | | Semi-Annual Report | | | August 31, 2017 |
Notes to Financial Statements
AllianzGI Convertible & Income 2024 Target Term Fund/AllianzGI Convertible & Income Fund/AllianzGI Convertible & Income Fund II
August 31, 2017 (unaudited)
1. Organization and Significant Accounting Policies (continued)
In the normal course of business, the Funds enter into contracts that contain a variety of representations that provide general indemnifications. The Funds’ maximum exposures under these arrangements are unknown as this would involve future claims that may be made against the Funds that have not yet occurred.
In August 2016, the FASB issued Accounting Standards Update (“ASU”) 2016-15 which amends ASC 230 to clarify guidance on the classification of certain cash receipts and cash payments in the statement of cash flows. The ASU 2016-15 is effective for annual periods beginning after December 15, 2017, and interim periods within those annual periods. At this time, management is evaluating the implications of these changes on the financial statements.
In October 2016, the U.S. Securities and Exchange Commission (“SEC”) adopted new rules and forms, and amendments to certain current rules and forms, to modernize reporting and disclosure of information by registered investment companies. The amendments to Regulation S-X require standardized, enhanced disclosure about derivatives in investment company financial statements, and also change the rules governing the form and content of such financial statements. The amendments to Regulation S-X took effect on August 1, 2017 and the financial statements have been modified accordingly, as applicable.
In November 2016, the FASB issued ASU 2016-18 which amends ASC 230 to provide guidance on the classification and presentation of changes in restricted cash and restricted cash equivalents on the statement of cash flows. The
ASU 2016-18 is effective for annual periods beginning after December 15, 2017, and interim periods within those annual periods. At this time, management is evaluating the implications of these changes on the financial statements.
The following is a summary of significant accounting policies consistently followed by the Funds:
(a) Valuation of Investments
Portfolio securities and other financial instruments for which market quotations are readily available are stated at market value. Market value is generally determined on the basis of official closing prices, last reported sales prices, or if no sales or closing prices are reported, on the basis of quotes obtained from a quotation reporting system, established market makers, or independent pricing services. The Funds’ investments are valued daily using prices supplied by an independent pricing service or broker/dealer quotations, or by using the last sale or settlement price on the exchange that is the primary market for such securities, or the mean between the last bid and ask quotations. Independent pricing services use information provided by market makers or estimates of market values obtained from yield data relating to investments or securities with similar characteristics.
The Board of Trustees of each fund (together, the “Board”) has adopted procedures for valuing portfolio securities and other financial instruments in circumstances where market quotations are not readily available (including in cases where available market quotations are deemed to be unreliable), and has delegated primary responsibility for applying the valuation methods to the Investment Manager. The Funds’ Valuation Committee was established by the Board to oversee the implementation of the
| | | | | | |
| August 31, 2017 | | | Semi-Annual Report | | | 47 | |
Notes to Financial Statements
AllianzGI Convertible & Income 2024 Target Term Fund/AllianzGI Convertible & Income Fund/AllianzGI Convertible & Income Fund II
August 31, 2017 (unaudited)
1. Organization and Significant Accounting Policies (continued)
Funds’ valuation methods and to make fair value determinations on behalf of the Board, as necessary. The Investment Manager monitors the continued appropriateness of methods applied and identifies circumstances and events that may require fair valuation. The Investment Manager determines if adjustments should be made in light of market changes, events affecting the issuer, or other factors. If the Investment Manager determines that a valuation method may no longer be appropriate, another valuation method previously approved by the Funds’ Valuation Committee may be selected or the Funds’ Valuation Committee will be convened to consider the matter and take any appropriate action in accordance with procedures adopted by the Board. The Board shall review and ratify the appropriateness of the valuation methods and these methods may be amended or supplemented from time to time by the Fund’s Valuation Committee.
Short-term debt instruments maturing in 60 days or less are valued at amortized cost, if their original term to maturity was 60 days or less, or by amortizing premiums or discounts based on their value on the 61st day prior to maturity, if the original term to maturity exceeded 60 days.
The prices used by the Funds to value investments may differ from the value that would be realized if the investments were sold, and these differences could be material to the Funds’ financial statements. Each Fund’s net asset value (“NAV”) is normally determined as of the close of regular trading (normally, 4:00 p.m. Eastern Time) on the New York Stock Exchange (“NYSE”) on each day the NYSE is open for business.
(b) Fair Value Measurements
Fair value is defined as the price that would be received to sell an asset or paid to transfer a liability (i.e., the “exit price”) in an orderly transaction between market participants. The three levels of the fair value hierarchy are described below:
| ∎ | | Level 1 – quoted prices in active markets for identical investments that the Funds have the ability to access |
| ∎ | | Level 2 – valuations based on other significant observable inputs, which may include, but are not limited to, quoted prices for similar assets or liabilities, interest rates, yield curves, volatilities, prepayment speeds, loss severities, credit risks and default rates or other market corroborated inputs |
| ∎ | | Level 3 – valuations based on significant unobservable inputs (including the Investment Manager’s or Valuation Committee’s own assumptions and securities whose price was determined by using a single broker’s quote) |
The valuation techniques used by the Funds to measure fair value during the six months ended August 31, 2017 were intended to maximize the use of observable inputs and to minimize the use of unobservable inputs.
The Funds’ policy is to recognize transfers between levels at the end of the reporting period. An investment asset’s or liability’s level within the fair value hierarchy is based on the lowest level input, individually or in aggregate, that is significant to the fair value measurement. The objective of fair value measurement remains the same even when there is a significant decrease in the volume and level of activity for an asset or liability and regardless of the valuation techniques used. Investments categorized as Level 1 or 2 as of period end may have been transferred between
| | | | |
| 48 | | Semi-Annual Report | | | August 31, 2017 |
Notes to Financial Statements
AllianzGI Convertible & Income 2024 Target Term Fund/AllianzGI Convertible & Income Fund/AllianzGI Convertible & Income Fund II
August 31, 2017 (unaudited)
1. Organization and Significant Accounting Policies (continued)
Levels 1 and 2 since the prior period due to changes in the valuation method utilized in valuing the investments.
The inputs or methodology used for valuing securities are not necessarily an indication of the risk associated with investing in those securities. The following are certain inputs and techniques that the Funds generally use to evaluate how to classify each major category of assets and liabilities within Level 2 and Level 3, in accordance with U.S. GAAP.
Equity Securities (Common and Preferred Stock and Warrants) – Equity securities traded in inactive markets are valued using inputs which include broker-dealer quotes, recently executed transactions adjusted for changes in the benchmark index, or evaluated price quotes received from independent pricing services that take into account the integrity of the market sector and issuer, the individual characteristics of the security, and information received from broker-dealers and other market sources pertaining to the issuer or security. To the extent that these inputs are observable, the values of equity securities are categorized as Level 2. To the extent that these inputs are unobservable, the values are categorized as Level 3.
Convertible Bonds & Notes – Convertible bonds & notes are valued by independent pricing services using various inputs and techniques, which include broker-dealer quotations from relevant market makers and recently executed transactions in securities of the issuer or comparable issuers. The broker-dealer quotations received are supported by credit analysis of the issuer that takes into consideration credit quality assessments, daily trading activity, and the activity of the
underlying equities, listed bonds and sector-specific trends. To the extent that these inputs are observable, the values of convertible bonds & notes are categorized as Level 2. To the extent that these inputs are unobservable the values are categorized as Level 3.
Corporate Bonds & Notes – Corporate bonds & notes are generally comprised of two main categories: investment grade bonds and high yield bonds. Investment grade bonds are valued by independent pricing services using various inputs and techniques, which include broker-dealer quotations, live trading levels, recently executed transactions in securities of the issuer or comparable issuers, and option adjusted spread models that include base curve and spread curve inputs. Adjustments to individual bonds can be applied to recognize trading differences compared to other bonds issued by the same issuer. High yield bonds are valued by independent pricing services based primarily on broker-dealer quotations from relevant market makers and recently executed transactions in securities of the issuer or comparable issuers. The broker-dealer quotations received are supported by credit analysis of the issuer that takes into consideration credit quality assessments, daily trading activity, and the activity of the underlying equities, listed bonds and sector-specific trends. To the extent that these inputs are observable, the values of corporate bonds & notes are categorized as Level 2. To the extent that these inputs are unobservable, the values are categorized as Level 3.
Senior Loans – Senior Loans generally are valued by independent pricing services based on the average of quoted prices received from multiple dealers or valued relative to other benchmark securities when broker-dealer quotes are unavailable. These quoted prices are based on interest rates, yield curves, option
| | | | | | |
| August 31, 2017 | | | Semi-Annual Report | | | 49 | |
Notes to Financial Statements
AllianzGI Convertible & Income 2024 Target Term Fund/AllianzGI Convertible & Income Fund/AllianzGI Convertible & Income Fund II
August 31, 2017 (unaudited)
1. Organization and Significant Accounting Policies (continued)
adjusted spreads, credit spreads and/or other criteria. To the extent that these inputs are observable, the values of Senior Loans are categorized as Level 2. To the extent that these inputs are unobservable, the values are categorized as Level 3.
(c) Investment Transactions and Investment Income
Investment transactions are accounted for on the trade date. Realized gains and losses on investments are determined on an identified cost basis. Interest income adjusted for the accretion of discounts and amortization of premiums is recorded on an accrual basis. Discounts or premiums on debt securities purchased are accreted or amortized, respectively, to interest income. Conversion premium is not amortized. Dividend income is recorded on the ex-dividend date, except for certain dividends from foreign securities where the ex-dividend date may have passed, and then are recorded as soon after the ex-dividend date as the Fund, using reasonable diligence, become aware of such dividends. Facility fees and other fees (such as origination fees) received on settlement date are amortized as income over the expected term of the senior loan. Consent fees relating to corporate actions and facility fees and other fees received after settlement date relating to senior loans and commitment fees received relating to unfunded purchase commitments are recorded as miscellaneous income upon receipt. Payments received from certain investments may be comprised of dividends, realized gains and return of capital. These payments may initially be recorded as dividend income and may subsequently be reclassified as realized gains and/or return of capital upon receipt of information from the issuer. Payments considered return of capital reduce the cost
basis of the respective security. Distributions, if any, in excess of the cost basis of a security are recognized as capital gains. Expenses are recorded on an accrual basis.
(d) Federal Income Taxes
The Funds intend to distribute all of their taxable income and to comply with the other requirements of Subchapter M of the U.S. Internal Revenue Code of 1986, as amended, applicable to regulated investment companies. Accordingly, no provision for U.S. federal income taxes is required. The Funds may be subject to excise tax based on distributions to shareholders.
Accounting for uncertainty in income taxes establishes for all entities, including pass-through entities such as the Funds, a minimum threshold for financial statement recognition of the benefit of positions taken in filing tax returns (including whether an entity is taxable in a particular jurisdiction), and requires certain expanded tax disclosures. In accordance with provisions set forth under U.S. GAAP, the Investment Manager has reviewed the Funds’ tax positions for all open tax years. As of August 31, 2017, the Funds have recorded no liability for net unrecognized tax benefits relating to uncertain income tax positions they have taken. The Funds’ federal income tax returns for the prior three years, as applicable, remain subject to examination by the Internal Revenue Service.
(e) Dividends and Distributions to Shareholders – Common Shares
The Funds declare dividends from net investment income to common shareholders monthly. Distributions of net realized capital gains, if any, are paid at least annually. The Funds record dividends and distributions on the ex-dividend date. The amount of dividends from net investment income and distributions
| | | | |
| 50 | | Semi-Annual Report | | | August 31, 2017 |
Notes to Financial Statements
AllianzGI Convertible & Income 2024 Target Term Fund/AllianzGI Convertible & Income Fund/AllianzGI Convertible & Income Fund II
August 31, 2017 (unaudited)
1. Organization and Significant Accounting Policies (continued)
from net realized capital gains or return of capital is determined in accordance with federal income tax regulations, which may differ from U.S. GAAP. These “book-tax” differences are considered either temporary or permanent in nature. To the extent these differences are permanent in nature, such amounts are reclassified within the capital accounts based on their federal income tax treatment. Temporary differences do not require reclassification. To the extent dividends and/or distributions exceed current and accumulated earnings and profits for federal income tax purposes, they are reported as dividends and/or distributions to shareholders from return of capital.
(f) Convertible Securities
Each of the Funds invests a portion of its assets in convertible securities. Although convertible securities derive part of their value from that of the securities into which they are convertible, they are not considered derivative financial instruments. However, certain of the Funds’ investments in convertible securities include features which render them sensitive to price changes in their underlying securities. The value of structured/synthetic convertible securities can be affected by interest rate changes and credit risks of the issuer. Such securities may be structured in ways that limit their potential for capital appreciation and the entire value of the security may be at risk of loss depending on the performance of the underlying equity security. Consequently, the Funds are exposed to greater downside risk than traditional convertible securities, but typically still less than that of the underlying stock.
(g) Senior Loans
The Funds may purchase assignments of, and participations in, Senior Loans originated, negotiated and structured by a U.S. or foreign commercial bank, insurance company, finance company or other financial institution for a lending syndicate of financial institutions (the “Lender”). When purchasing an assignment, the Funds succeed to all the rights and obligations under the loan agreement with the same rights and obligations as the assigning Lender. Assignments may, however, be arranged through private negotiations between potential assignees and potential assignors, and the rights and obligations acquired by the purchaser of an assignment may differ from, and be more limited than, those held by the assigning Lender. The Funds may also enter into lending arrangements involving unfunded loan commitments, which are contractual obligations for future funding. Unfunded loan commitments may include revolving credit facilities, which may obligate the Funds to supply additional cash to the borrower on demand. Unfunded loan commitments represent a future obligation, even though a percentage of the principal amounts may never be utilized by the borrower.
The Funds may purchase the securities of distressed companies (including assignments or direct investments), including companies engaged in restructurings or bankruptcy proceedings. Investments in distressed companies may include senior obligations of an issuer issued in connection with a restructuring under Chapter 11 of the U.S. Bankruptcy Code (commonly known as “debtor-in-possession” or “DIP” financings). Debtor-in-possession financings generally allow the issuer to continue its operations while reorganizing. Such financings constitute senior liens on unencumbered collateral (i.e., collateral not subject to other creditors’ claims). There is risk
| | | | | | |
| August 31, 2017 | | | Semi-Annual Report | | | 51 | |
Notes to Financial Statements
AllianzGI Convertible & Income 2024 Target Term Fund/AllianzGI Convertible & Income Fund/AllianzGI Convertible & Income Fund II
August 31, 2017 (unaudited)
1. Organization and Significant Accounting Policies (continued)
that the issuer under a debtor-in-possession financing will not emerge from Chapter 11 and be forced to liquidate its assets under Chapter 7 of the U.S. Bankruptcy Code. In the event of liquidation, the Funds’ only recourse would be against the collateral securing the debtor-in-possession financing.
(h) Payment In-Kind Securities
The Funds may invest in, payment in-kind securities, which are debt or preferred stock securities that require or permit payment of interest in the form of additional securities. Payment in-kind securities allow the issuer to avoid or delay the need to generate cash to meet current interest payments and, as a result, may involve greater risk than securities that pay interest currently or in cash.
(i) Warrants
The Funds may receive warrants. Warrants are securities that are usually issued together with a debt security or preferred stock and that give the holder the right to buy a proportionate amount of common stock at a specified price. Warrants may be freely transferable and are often traded on major exchanges. Warrants normally have a life that is measured in years and entitle the holder to buy common stock of a company at a price that is usually higher than the market price at the time the warrant is issued. Warrants may entail greater risks than certain other types of investments. Generally, warrants do not carry the right to receive dividends or exercise voting rights with respect to the underlying securities, and they do not represent any rights in the assets of the issuer. In addition, their value does not necessarily change with the value of the underlying securities, and they cease to have value if they are not exercised on or before their expiration date. If the market price of the underlying stock
does not exceed the exercise price during the life of the warrant, the warrant will expire worthless. Warrants may increase the potential profit or loss to be realized from the investment as compared with investing the same amount in the underlying securities. Similarly, the percentage increase or decrease in the value of an equity security warrant may be greater than the percentage increase or decrease in the value of the underlying common stock. Warrants may relate to the purchase of equity or debt securities. Debt obligations with warrants attached to purchase equity securities have many characteristics of convertible securities and their prices may, to some degree, reflect the performance of the underlying stock. Debt obligations also may be issued with warrants attached to purchase additional debt securities at the same coupon rate. A decline in interest rates would permit a Fund to sell such warrants at a profit. If interest rates rise, these warrants would generally expire with no value.
(j) Statement of Cash Flows
U.S. GAAP requires entities providing financial statements that report both financial position and results of operations to also provide a statement of cash flows for each period for which results of operations are provided, but exempts investment companies meeting certain conditions. One of the conditions is that the fund had little or no debt, based on the average debt outstanding during the period, in relation to average total assets. Convertible & Income 2024 Target Term indebtedness has been determined to be at a level requiring a statement of cash flows. The Statement of Cash Flows has been prepared using the indirect method which required net change in net assets resulting from operations to be adjusted to reconcile to net cash flows from operating activities. Convertible & Income and Convertible & Income II do not require a Statement of Cash Flows.
| | | | |
| 52 | | Semi-Annual Report | | | August 31, 2017 |
Notes to Financial Statements
AllianzGI Convertible & Income 2024 Target Term Fund/AllianzGI Convertible & Income Fund/AllianzGI Convertible & Income Fund II
August 31, 2017 (unaudited)
1. Organization and Significant Accounting Policies (continued)
(k) Loan Interest Expense
Loan interest expense relates to the Convertible & Income 2024 Target Term’s participation in debt financing transactions (See Note 7). Interest expense is recorded as it is incurred.
(l) Repurchase Agreements
The Funds are parties to Master Repurchase Agreements (“Master Repo Agreements”) with select counterparties. The Master Repo Agreements include provisions for initiation of repurchase transactions, income payments, events of default, and maintenance of collateral.
The Funds enter into transactions, under the Master Repo Agreements, with their custodian bank or securities brokerage firms whereby they purchase securities under agreements (i.e., repurchase agreements) to resell such securities at an agreed upon price and date. The Funds, through their custodian, take possession of securities collateralizing the repurchase agreement. Such agreements are carried at the contract amount in the financial statements, which is considered to represent fair value. The collateral that is pledged (i.e., the securities received by the Funds), which consists primarily of U.S. government obligations and asset-backed securities, is held by the custodian bank for the benefit of the Funds until maturity of the repurchase agreement. Provisions of the repurchase agreements and the procedures adopted by the Funds require that the market value of the collateral, including accrued interest thereon, be sufficient in the event of default by the counterparty. If the counterparty defaults under the Master Repo Agreements and the value of the collateral declines or if the counterparty enters an insolvency proceeding, realization of the collateral by the Fund may be delayed or limited. The gross values are
included in the Funds’ Schedules of Investments. As of August 31, 2017, the value of the related collateral exceeded the value of the repurchase agreements for each Fund.
(m) Restricted Securities
The Funds are permitted to invest in securities that are subject to legal or contractual restrictions on resale. These securities generally may be resold in transactions exempt from registration or to the public if the securities are registered. Disposal of these securities may involve time-consuming negotiations and expenses, and prompt sale at an acceptable price may be difficult.
2. Principal Risks
In the normal course of business, the Funds trade financial instruments and enter into financial transactions where risk of potential loss exists due to, among other things, changes in the market (market risk) or failure of the other party to a transaction to perform (counterparty risk). The Funds are also exposed to other risks such as, but not limited to, interest rate, credit and leverage risks. Additionally, Convertible & Income 2024 Target Term is exposed to limited term risk.
Interest rate risk is the risk that fixed income securities’ valuations will change because of changes in interest rates. During periods of rising nominal interest rates, the values of fixed income instruments are generally expected to decline. Conversely, during periods of declining nominal interest rates, the values of fixed income instruments are generally expected to rise. To the extent that a Fund effectively has short positions with respect to fixed income instruments, the values of such short positions would generally be expected to rise when nominal interest rates rise and to decline when nominal interest rates decline. A nominal interest rate can be described as the sum of a
| | | | | | |
| August 31, 2017 | | | Semi-Annual Report | | | 53 | |
Notes to Financial Statements
AllianzGI Convertible & Income 2024 Target Term Fund/AllianzGI Convertible & Income Fund/AllianzGI Convertible & Income Fund II
August 31, 2017 (unaudited)
2. Principal Risks (continued)
real interest rate and an expected inflation rate. Fixed income securities with longer durations tend to be more sensitive to changes in interest rates, usually making them more volatile than securities with shorter durations. Duration is used primarily as a measure of the sensitivity of a fixed income security’s market price to interest rate (i.e., yield) movements. Interest rate changes can be sudden and unpredictable, and the Funds may lose money as a result of movements in interest rates. The Funds may not be able to hedge against changes in interest rates or may choose not to do so for cost or other reasons. In addition, any hedges may not work as intended. The values of equity and other non-fixed income securities may decline due to fluctuations in interest rates.
The Funds are exposed to credit risk, which is the risk of losing money if the issuer or guarantor of a fixed income security is unable or unwilling, or is perceived (whether by market participants, rating agencies, pricing services or otherwise) as unable or unwilling, to make timely principal and/or interest payments, or to otherwise honor its obligations. Securities are subject to varying degrees of credit risk, which are often reflected in credit ratings.
The market values of securities may decline due to general market conditions (market risk) which are not specifically related to a particular company, such as real or perceived adverse economic conditions, changes in the general outlook for corporate earnings, changes in interest or currency rates, adverse changes to credit markets or adverse investor sentiment. They may also decline due to factors that affect a particular industry or industries, such as labor shortages or increased production costs and competitive conditions within an industry. Equity securities and equity-related investments generally have greater market price volatility than fixed income securities, although under
certain market conditions fixed income securities may have comparable or greater price volatility. Credit ratings downgrades may also negatively affect securities held by the Funds. Even when markets perform well, there is no assurance that the investments held by the Funds will increase in value along with the broader market. In addition, market risk includes the risk that geopolitical events will disrupt the economy on a national or global level.
The Funds are exposed to counterparty risk, or the risk that an institution or other entity with which the Funds have unsettled or open transactions will default. The potential loss to the Funds could exceed the value of the financial assets recorded in the Funds’ financial statements. Financial assets, which potentially expose the Funds to counterparty risk, consist principally of cash due from counterparties and investments. The Investment Manager seeks to minimize the Funds’ counterparty risk by performing reviews of each counterparty and by minimizing concentration of counterparty risk by undertaking transactions with multiple customers and counterparties on recognized and reputable exchanges. Delivery of securities sold is only made once the Funds have received payment. Payment is made on a purchase once the securities have been delivered by the counterparty. The trade will fail if either party fails to meet its obligation.
The Funds are exposed to risks associated with leverage. Leverage may cause the value of the Funds’ shares to be more volatile than if the Funds did not use leverage. This is because leverage tends to exaggerate the effect of any increase or decrease in the value of the Funds’ portfolio securities. The Funds may engage in transactions or purchase instruments that give rise to forms of leverage. In addition, to the extent the Funds employ leverage, dividend and
| | | | |
| 54 | | Semi-Annual Report | | | August 31, 2017 |
Notes to Financial Statements
AllianzGI Convertible & Income 2024 Target Term Fund/AllianzGI Convertible & Income Fund/AllianzGI Convertible & Income Fund II
August 31, 2017 (unaudited)
2. Principal Risks (continued)
interest costs may not be recovered by any appreciation of the securities purchased with the leverage proceeds and could exceed the Funds’ investment returns, resulting in greater losses. As discussed further in Note 6, Convertible & Income and Convertible & Income II have auction-rate preferred shares outstanding. As discussed further in Note 7, Convertible & Income 2024 Target Term has entered into margin loan financing.
Convertible & Income 2024 Target Term is exposed to limited term risk. The Fund has a limited term feature, pursuant to which it intends, on or about September 1, 2024, to cease its investment operations, liquidate its portfolio (to the extent possible), retire or redeem any outstanding leverage facilities and distribute all its liquidated assets to its then record shareholders, unless the term is extended by the Fund’s Board of Trustees (for up to six months) and absent Trustee and shareholder approval to amend the limited term. Because the assets of the Fund will be liquidated in connection with its termination, the Fund may be required to sell portfolio securities when it otherwise would not, including at times when market conditions are not favorable, or at a time when a particular security has entered into default or bankruptcy, or otherwise is in severe distress, which may cause the Fund to lose money. Although the Fund has an investment objective of returning the Original NAV to Common Shareholders on or about the Termination Date, this is not a guarantee and the Fund may not be successful in achieving this objective. There can be no assurance that the Fund will be able to return the Original NAV to Common Shareholders, and such return is not backed or otherwise guaranteed by the Fund, the Investment Manager or any other entity.
The Funds may hold defaulted securities that may involve special considerations including
bankruptcy proceedings, other regulatory and legal restrictions affecting the Funds’ ability to trade, and the availability of prices from independent pricing services or dealer quotations. Defaulted securities are often illiquid and may not be actively traded. Sale of securities in bankrupt companies at an acceptable price may be difficult and differences compared to the value of the securities used by the Funds could be material. A Fund may incur additional expenses to the extent it is required to seek recovery upon a portfolio security’s default in the payment of principal or interest. In any bankruptcy proceeding relating to a defaulted investment, a Fund may lose its entire investment or may be required to accept cash or securities with a value substantially less than its original investment.
Investments in senior loans and repurchase agreements also involve special risks. Although typically secured, senior loans may not be backed by sufficient collateral to satisfy their issuers’ obligations in the event of bankruptcy or similar scenarios. Senior loans may also be illiquid. Similarly, repurchase agreements may result in losses if the collateral associated with such positions is insufficient in the event of a bankruptcy or similar scenario. Repurchase agreement positions may be illiquid.
3. Investment Manager & Deferred Compensation
Investment Manager. Each Fund has an Investment Management Agreement (for the purpose of this section, each an “Agreement”) with the Investment Manager. Subject to the supervision of the Funds’ Board, the Investment Manager is responsible for managing, either directly or through others selected by it, the Funds’ investment activities, business affairs and administrative matters. Pursuant to its Agreement, Convertible & Income 2024 Target Term pays the Investment Manager an annual
| | | | | | |
| August 31, 2017 | | | Semi-Annual Report | | | 55 | |
Notes to Financial Statements
AllianzGI Convertible & Income 2024 Target Term Fund/AllianzGI Convertible & Income Fund/AllianzGI Convertible & Income Fund II
August 31, 2017 (unaudited)
3. Investment Manager & Deferred Compensation (continued)
fee, payable monthly, at a rate of 0.75% of its average daily total managed assets. Pursuant to their Agreements, Convertible & Income and Convertible & Income II, pay the Investment Manager an annual fee, payable monthly, at an annual rate of 0.70% of each Fund’s average daily total managed assets. Total managed assets for Convertible & Income 2024 Target Term refer to the total assets of the Fund (including assets attributable to any borrowings, issued debt securities or preferred shares that may be outstanding, reverse repurchase agreements and dollar rolls) minus accrued liabilities (other than liabilities representing borrowings, issued debt securities, reverse repurchase agreements and dollar rolls). Total managed assets for Convertible & Income and Convertible & Income II refer to the total assets of each Fund (including assets attributable to any Preferred Shares or other forms of leverage that may be outstanding) minus accrued liabilities (other than liabilities representing leverage).
Deferred Compensation. Trustees do not currently receive any pension or retirement benefits from the Funds. The Funds have adopted a deferred compensation plan (the “Plan”) for the Trustees, which permits the Trustees to defer their receipt of compensation from the Funds, at their election, in accordance with the terms of the Plan. Under the Plan, each Trustee may elect not to receive all or a portion of his or her fees from the Funds on a current basis but to receive in a subsequent period chosen by the Trustee an amount equal to the value of such compensation if such compensation had been invested in one or more series of Allianz Funds Multi-Strategy Trust or Allianz Funds selected by the Trustees from and after the normal payment dates for such compensation. The deferred compensation program is structured such that the Funds remain in substantially the same financial position whether Trustee fees are paid when earned or deferred.
“Due to Investment Manager” on the Statements of Asset and Liabilities represents the remaining payable for Convertible & Income 2024 Target Term’s offering costs that were paid by the Investment Manager.
4. Investments in Securities
For the period or six months ended August 31, 2017, purchases and sales of investments, other than short-term securities were:
| | | | | | | | |
| | | Purchases | | | Sales | |
Convertible & Income 2024 Target Term | | $ | 257,613,426 | | | $ | 25,720,066 | |
Convertible & Income | | | 204,232,634 | | | | 220,308,606 | |
Convertible & Income II | | | 154,256,701 | | | | 166,108,846 | |
5. Income Tax Information
At August 31, 2017, the aggregate cost basis and the net unrealized appreciation (depreciation) of investments for federal income tax purposes were:
| | | | | | | | | | | | | | | | |
| | | Federal Tax
Cost Basis(1) | | | Unrealized
Appreciation | | | Unrealized
Depreciation | | | Net Unrealized Depreciation | |
Convertible & Income 2024 Target Term | | $ | 258,454,930 | | | $ | 1,909,080 | | | $ | 2,377,624 | | | $ | (468,544 | ) |
Convertible & Income | | | 949,612,838 | | | | 79,879,208 | | | | 92,321,172 | | | | (12,441,964 | ) |
Convertible & Income II | | | 721,510,800 | | | | 61,731,006 | | | | 70,306,757 | | | | (8,575,751 | ) |
| (1) | | Differences between book and tax cost basis are primarily attributable to wash sale loss deferrals and differing treatment of bond premium amortization. | |
| | | | |
| 56 | | Semi-Annual Report | | | August 31, 2017 |
Notes to Financial Statements
AllianzGI Convertible & Income 2024 Target Term Fund/AllianzGI Convertible & Income Fund/AllianzGI Convertible & Income Fund II
August 31, 2017 (unaudited)
6. Auction-Rate Preferred Shares
Convertible & Income has 2,856 shares of Preferred Shares Series A, 2,856 shares of Preferred Shares Series B, 2,856 shares of Preferred Shares Series C, 2,856 shares of Preferred Shares Series D and 2,856 shares of Preferred Shares Series E outstanding, each with a liquidation preference of $25,000 per share plus any accumulated, unpaid dividends.
Convertible & Income II has 2,192 shares of Preferred Shares Series A, 2,192 shares of Preferred Shares Series B, 2,192 shares of
Preferred Shares Series C, 2,192 shares of Preferred Shares Series D and 2,192 shares of Preferred Shares Series E outstanding, each with a liquidation preference of $25,000 per share plus any accumulated, unpaid dividends.
Dividends are accumulated daily at an annual rate that is typically re-set every seven days. Distributions of net realized capital gains, if any, are paid annually.
For the six months ended August 31, 2017, the annualized dividend rates paid with respect to the Preferred shares of each Fund ranged from:
| | | | | | | | | | | | |
| | | High | | | Low | | | At August 31, 2017 | |
Series A | | | 1.757% | | | | 0.992% | | | | 1.742% | |
| | | |
Series B | | | 1.742% | | | | 0.977% | | | | 1.667% | |
| | | |
Series C | | | 1.772% | | | | 0.872% | | | | 1.757% | |
| | | |
Series D | | | 1.772% | | | | 1.007% | | | | 1.772% | |
| | | |
Series E | | | 1.772% | | | | 0.992% | | | | 1.712% | |
Convertible & Income and Convertible & Income II are subject to certain limitations and restrictions while Preferred Shares are outstanding. Failure to comply with these limitations and restrictions could preclude the Funds from declaring or paying any dividends or distributions to common shareholders or repurchasing common shares and/or could trigger the mandatory redemption of Preferred Shares at their liquidation preference plus any accumulated, unpaid dividends.
Preferred shareholders, who are entitled to one vote per shares, generally vote together with the common shareholders but vote separately as a class to elect two Trustees and on certain matters adversely affecting the rights of the Preferred Shares.
Since mid-February 2008, holders of auction-rate preferred shares (“ARPS”) issued by the Funds have been directly impacted by a lack of liquidity, which has similarly affected ARPS holders in many of the nation’s closed-end funds. Since then, regularly scheduled auctions for the Preferred shares (which are ARPS) issued by the Funds have consistently “failed” because of insufficient demand (bids to buy shares) to meet the supply (shares offered for sale) at each auction.
In a failed auction, ARPS holders cannot sell all, and may not be able to sell any, of their shares tendered for sale. While repeated auction failures have affected the liquidity for ARPS, they do not constitute a default or automatically alter the credit quality of the ARPS, and ARPS holders have continued to receive dividends at the defined “maximum rate”, which for the
| | | | | | |
| August 31, 2017 | | | Semi-Annual Report | | | 57 | |
Notes to Financial Statements
AllianzGI Convertible & Income 2024 Target Term Fund/AllianzGI Convertible & Income Fund/AllianzGI Convertible & Income Fund II
August 31, 2017 (unaudited)
6. Auction-Rate Preferred Shares (continued)
Funds is equal to the 7-day “AA” Composite Commercial Paper Rate multiplied by a minimum of 150%, depending on the credit rating of the ARPS. The maximum rate is a function of short-term interest rates and typically higher than the rate that would have otherwise been set through a successful auction.
On May 29, 2014, Moody’s Investors Service upgraded each Fund’s Preferred shares ratings to Aa3 from A1. As a result, the applicable multiplier for calculating the maximum rate decreased from 200% to 150% beginning on that date. If the Funds’ Preferred shares auctions continue to fail and the “maximum rate” payable on the Preferred shares rises as result of changes in short-term interest rates, returns for the Funds’ common shareholders could be adversely affected.
7. Margin Loan Financing
Convertible & Income 2024 Target Term has entered into a margin loan financing agreement with BNP Paribas Prime Brokerage International, Ltd. (“BNP”). The margin loan is offered at a daily rate equal to the U.S. 3-month LIBOR rate plus 0.90%. At August 31, 2017, the Fund had a borrowing outstanding under the margin agreement totaling $69,700,000. The interest rate charged at August 31, 2017, was 2.22%. During the period ended August 31, 2017, the weighted average daily balance outstanding was $64,280,769 at the weighted
average interest rate of 2.20%. In connection with the margin loan financing, loan interest expense of $203,921 is included in the Convertible & Income 2024 Target Term’s Statement of Operations.
The Fund is required to fully collateralize its outstanding loan balance as determined by BNP. Pledged assets are held in a segregated account and are denoted in the Schedule of Investments.
8. Related Party Transactions
The Investment Manager is a related party. Fees payable to this party are disclosed in Note 3 and the accrued related party fee amounts are disclosed on the Statements of Assets and Liabilities.
The Funds are permitted to purchase or sell securities from or to certain related affiliated funds under specified conditions outlined in procedures adopted by the Board. The procedures have been designed to ensure that any purchase or sale of securities by the Funds from or to another fund or portfolio that are, or could be, considered an affiliate by virtue of having a common investment adviser (or affiliated investment advisers), common Trustees and/or common officers comply with Rule 17a-7 of the 1940 Act. Further, as defined under the procedures, each transaction is effected at the current market price.
During the period or six months ended August 31, 2017, the following Funds engaged in purchases and sales of securities pursuant to Rule 17a-7 of the 1940 Act:
| | | | | | | | |
| | | Purchases | | | Sales | |
Convertible & Income 2024 Target Term | | $ | 12,200,084 | | | | – | |
Convertible & Income | | | – | | | $ | 2,802,416 | |
Convertible & Income II | | | – | | | | 2,112,527 | |
| | | | |
| 58 | | Semi-Annual Report | | | August 31, 2017 |
Notes to Financial Statements
AllianzGI Convertible & Income 2024 Target Term Fund/AllianzGI Convertible & Income Fund/AllianzGI Convertible & Income Fund II
August 31, 2017 (unaudited)
9. Common Shares Issued
During the fiscal period ended August 31, 2017, Convertible & Income 2024 Target Term issued 16,500,000 common shares in its initial public offering. An additional 1,746,796 shares were issued in connection with the exercise of the underwriters’ over-allotment option. These shares were all issued at $9.835 per share (public offering price of $10.00 per share less sales load of 1.65% of the offering price). Offering costs of $364,936 (representing $0.02
per share) were incurred by Convertible & Income 2024 Target Term for the shares issued in the initial offering and the exercise of the underwriter’s over-allotment option and were charged to paid-in capital in excess of par. The Investment Manager agreed to pay all offering costs associated with the public offering (other than the sales load) exceeding $0.02 per share, which came to approximately $1,170,064.
10. Subsequent Events
In preparing these financial statements, the Funds’ management has evaluated events and transactions for potential recognition or disclosure through the date the financial statements were issued.
On September 1, 2017 the following monthly dividends were declared to common shareholders, payable October 2, 2017 to common shareholders of record on September 11, 2017:
| | |
| Convertible & Income 2024 Target Term | | $0.046 per share |
| Convertible & Income | | $0.065 per common share |
| Convertible & Income II | | $0.0575 per common share |
On October 2, 2017 the following monthly dividends were declared to common shareholders, payable November 1, 2017 to common shareholders of record on October 12, 2017:
| | |
| Convertible & Income 2024 Target Term | | $0046 per share |
| Convertible & Income | | $0.065 per common share |
| Convertible & Income II | | $0.0575 per common share |
There were no other subsequent events identified that require recognition or disclosure.
| | | | | | |
| August 31, 2017 | | | Semi-Annual Report | | | 59 | |
Annual Shareholder Meeting Results (unaudited)
AllianzGI Convertible & Income Fund/AllianzGI Convertible & Income II Fund
Convertible & Income and Convertible & Income II held their meeting of shareholders on July 13, 2017. Shareholders voted as indicated below:
| | | | | | | | |
| Convertible & Income: | | Affirmative | | | Withheld
Authority | |
Re-election of James A. Jacobson* — Class II to serve until the annual meeting for the 2020-2021 fiscal year | | | 9,895 | | | | 578 | |
| | |
Re-election of Bradford K. Gallagher — Class II to serve until the annual meeting for the 2020-2021 fiscal year | | | 73,785,803 | | | | 1,692,906 | |
| | |
Re-election of Davey S. Scoon — Class II to serve until the annual meeting for the 2020-2021 fiscal year | | | 73,769,344 | | | | 1,709,365 | |
The other members of the Board of Trustees at the time of the meeting, namely, Ms. Barbara R. Claussen†, Ms. Deborah A. DeCotis and Messrs. F. Ford Drummond, A. Douglas Eu†, Hans W. Kertess, James S. MacLeod, William B. Ogden, IV and Alan Rappaport continued to serve as Trustees of the Fund.
| * | | Mr. Jacobson was elected by preferred shareholders voting as a separate class. All other trustees of Convertible & Income were elected by common and preferred shareholders voting together as a single class. | |
| | | | | | | | |
| Convertible & Income II: | | Affirmative | | | Withheld
Authority | |
Re-election of James A. Jacobson* – Class II to serve until the annual meeting for the 2020-2021 fiscal year | | | 7,293 | | | | 745 | |
| | |
Re-election of Deborah A. Decotis – Class II to serve until the annual meeting for the 2020-2021 fiscal year | | | 62,784,656 | | | | 2,978,029 | |
| | |
Re -election of Bradford K. Gallagher – Class II to serve until the annual meeting for the 2020-2021 fiscal year | | | 62,923,561 | | | | 2,839,124 | |
| | |
Re-election of Davey S. Scoon – Class II to serve until the annual meeting for the 2020-2021 fiscal year | | | 62,932,560 | | | | 2,830,125 | |
The other members of the Board of Trustees at the time of the meeting, namely, Ms. Barbara R. Claussen† and Messrs. F. Ford Drummond, A. Douglas Eu†, Hans W. Kertess, James S. MacLeod, William B. Ogden, IV and Alan Rappaport continued to serve as Trustees of the Fund.
| * | | Mr. Jacobson was elected by preferred shareholders voting as a separate class. All other trustees of Convertible & Income II were elected by common and preferred shareholders voting together as a single class. | |
| | | | |
| 60 | | Semi-Annual Report | | | August 31, 2017 |
Proxy Voting Policies & Procedures (unaudited)
AllianzGI Convertible & Income 2024 Target Term Fund/AllianzGI Convertible & Income Fund/AllianzGI Convertible & Income Fund II
Proxy Voting Policies & Procedures:
A description of the policies and procedures that the Funds have adopted to determine how to vote proxies relating to portfolio securities and information about how the Funds voted proxies relating to portfolio securities held during the most recent twelve month period ended June 30 is available (i) without charge, upon request, by calling the Funds’ shareholder servicing agent at (800) 254-5197; (ii) on the Funds’ website at us.allianzgi.com/en-us/advisors/products-solutions/closed-end-funds; and (iii) on the Securities and Exchange Commission website at www.sec.gov.
| | | | | | |
| August 31, 2017 | | | Semi-Annual Report | | | 61 | |
Matters Relating to the Trustees’ Consideration of the Investment
Management Agreements (unaudited)
AllianzGI Convertible & Income 2024 Target Term Fund/ AllianzGI Convertible & Income Fund/AllianzGI Convertible & Income Fund II
The Investment Company Act of 1940, as amended, requires that both the full Board of Trustees (the “Board” or the “Trustees”) and a majority of the non-interested Trustees (the “Independent Trustees”), voting separately, approve each Fund’s (as defined below) Investment Management Agreement (for purposes of this section, the “Advisory Agreements” or the “Agreements”) with Allianz Global Investors U.S. LLC (“AllianzGI U.S.” or the “Investment Manager”) with respect to AllianzGI Convertible & Income Fund (“NCV”) and AllianzGI Convertible & Income Fund II (“NCZ” and, together with NCV, for purposes of this section, the “Funds”). The Trustees met in person on June 6, 2017 for the specific purpose of considering whether to approve the continuation of the Advisory Agreements for an additional year. The Funds’ Contracts Committees, which are comprised of all of the Independent Trustees, met on May 22, 2017 and June 6, 2017 with independent counsel to discuss the materials provided by the Investment Manager in response to the Independent Trustees’ written request for information regarding the annual renewal. Representatives from fund management attended portions of those meetings to, among other topics, review the comparative fee and expense information and comparative performance information prepared and provided by Broadridge Financial Solutions, Inc. (“Broadridge”), an independent third party, for each Fund using its respective Broadridge peer groups for performance and expense comparisons.
In connection with their deliberations regarding the approval of the Agreements, the Trustees, including the Independent Trustees, considered such information and factors as they believed, in light of the legal advice furnished to them and their own business judgment, to be relevant. As described below, the Trustees considered the nature, quality and extent of the various
investment management, administrative and other services performed by the Investment Manager under the applicable Agreement.
It was noted that, on October 1, 2016, during the period under review, Allianz Global Investors Fund Management LLC (“AGIFM”), the former investment manager to the Funds, merged into AllianzGI U.S., the former sub-adviser to both Funds, after which AllianzGI U.S. assumed AGIFM’s roles as investment manager and administrator to the Funds and continued to provide the day-to-day portfolio management services it previously provided as sub-adviser in its new capacity as Investment Manager, and the applicable sub-advisory agreements with AllianzGI U.S. were terminated. It was noted that the merger was not expected to have any impact on the nature or quality of investment advisory or administrative services provided to the Funds.
In connection with their contract review meetings, the Trustees received and relied upon materials provided by the Investment Manager including, among other items: (i) information provided by Broadridge on the total return investment performance (based on net asset value and common share market price) of the Funds for various time periods, and the investment performance of a group of funds with investment classifications and/or objectives comparable to those of the Funds identified by Broadridge (the “Broadridge Performance Universe”); (ii) information provided by Broadridge on the Funds’ management fees and other expenses, and the fees and other expenses of comparable funds identified by Broadridge (the “Broadridge Expense Group” or “Expense Group”) (based both on common share and leveraged assets combined (if applicable), and on common share assets alone); (iii) information regarding the investment performance and fees for other funds and accounts managed by the
| | | | |
| 62 | | Semi-Annual Report | | | August 31, 2017 |
Matters Relating to the Trustees’ Consideration of the Investment
Management Agreements (unaudited) (continued)
AllianzGI Convertible & Income 2024 Target Term Fund/ AllianzGI Convertible & Income Fund/AllianzGI Convertible & Income Fund II
Investment Manager with strategies that have similarities (but none of which are substantially similar) to those of the Funds; (iv) an estimate of the profitability to the Investment Manager from its relationship with the Funds for the twelve months ended December 31, 2016; (v) descriptions of various functions performed by the Investment Manager for the Funds, such as portfolio management, compliance monitoring, portfolio trading practices and oversight of third party service providers; (vi) information regarding the overall organization and business functions of the Investment Manager, including, without limitation, information regarding senior management, portfolio managers and other personnel providing or proposed to provide investment management, administrative and other services, and corporate ownership and business operations unrelated to the Funds; (vii) fact cards for each Fund including, among other information, investment objective, total net assets, annual fund operating expenses, portfolio managers, performance based on net asset value and market value, related share price premium and/or discount information, performance (based on net asset value) relative to each Fund’s Broadridge Performance Universe, total expense ratio and management fee comparisons between each Fund and its Broadridge Expense Group and trends in profitability to the Investment Manager of its advisory relationship with each Fund; and (viii) summaries assigning a quadrant placement to each Fund based on an average of certain measures of performance and fees/expenses versus its Broadridge peer group medians.
The Trustees’ conclusions as to the approval of the Agreements were based on a comprehensive consideration of all information provided to the Trustees and were not the result of any single factor. Some of the factors that figured particularly in the Trustees’ deliberations are described below, although
individual Trustees may have evaluated the information presented differently from one another, attributing different weights to various factors. The Trustees recognized that the fee arrangements for the Funds are the result of review and discussion in the prior years between the Independent Trustees and the Investment Manager, that certain aspects of such arrangements may receive greater scrutiny in some years than in others and that the Trustees’ conclusions may be based, in part, on their consideration of these same arrangements during the course of the year and in prior years. The Trustees evaluated information available to them on a Fund-by-Fund basis, and their determinations were made separately in respect of each Fund. The Trustees also considered the risk profiles of the Funds.
Performance Information
Fund-specific performance results for the Funds reviewed by the Trustees are discussed below. The comparative performance information was prepared and provided by Broadridge and was not independently verified by the Trustees. Due to the passage of time, these performance results may differ from the performance results for more recent periods. The Trustees reviewed, among other information, comparative information showing performance of each Fund against its respective Broadridge Performance Universe (based on net asset value and market value) for the one-year, three-year, five-year and ten-year periods (to the extent each such Fund had been in existence), each ended March 31, 2017.
In addition, the Trustees considered matters bearing on the Funds and their advisory arrangements at their meetings throughout the year, including a review of performance data at each regular meeting (either by the full Board and/or the Performance Committee of the Board).
| | | | | | |
| August 31, 2017 | | | Semi-Annual Report | | | 63 | |
Matters Relating to the Trustees’ Consideration of the Investment
Management Agreements (unaudited) (continued)
AllianzGI Convertible & Income 2024 Target Term Fund/ AllianzGI Convertible & Income Fund/AllianzGI Convertible & Income Fund II
As part of their review, the Trustees examined the ability of the Investment Manager to provide high-quality investment management and other services to the Funds. Among other information, the Trustees considered the investment philosophy and research and decision-making processes of the Investment Manager, as well as the Investment Manager’s broker selection process and trading operations; the experience of key advisory personnel of the Investment Manager and its affiliates, responsible for portfolio management of the Funds; the ability of the Investment Manager to attract and retain capable personnel; the background and capabilities of the senior management and staff of the Investment Manager; employee compensation; and the operational infrastructure, including technology and systems, of the Investment Manager. In addition, the Trustees reviewed the extent and quality of the Investment Manager’s services with respect to regulatory compliance and ability to comply with the investment policies of the Funds; the compliance programs and risk controls of the Investment Manager; the specific contractual obligations of the Investment Manager pursuant to the Agreements; the nature, extent and quality of certain administrative services the Investment Manager is responsible for providing to the Funds; the Investment Manager’s risk management function; and conditions that might affect the ability of the Investment Manager to provide high quality services to the Funds in the future under the Agreements, including, but not limited to, each organization’s respective financial condition and operational stability. Based on the foregoing, the Trustees concluded that the Investment Manager’s investment process, research capabilities and philosophy were well-suited to the applicable Fund, given its respective investment objective and policies, that the Investment Manager would be able to
continue to meet any reasonably foreseeable obligations under the Agreements, and that the Investment Manager would otherwise be able to provide services to the Funds of sufficient extent and quality.
Fee and Expense Information
In assessing the reasonableness of each Fund’s fees under the Agreements, the Trustees considered, among other information, each Fund’s management fee and its total expense ratio as a percentage of average net assets attributable to common shares and as a percentage of average managed assets (including assets attributable to common shares and leverage outstanding combined) and the management fee and total expense ratios of such Fund’s Broadridge Expense Group. Specifically, the Trustees reviewed each Fund’s ranking within its Broadridge Expense Group for total expense ratio (including any interest and borrowing expenses) based on common share assets and total expense ratio (including any interest and borrowing expenses) based on common share and leveraged assets combined, as applicable. Each Fund’s ranking within its Broadridge Expense Group for both actual management fees based on common share assets and actual management fees based on common and leveraged assets combined were also considered, as applicable. The Fund-specific fee and expense results discussed below were prepared and provided by Broadridge and were not independently verified by the Trustees.
The Trustees specifically took note of how each Fund compared to its Broadridge peers as to performance, management fee and total expense ratio. The Trustees noted that while the Funds are not charged a separate administration fee (recognizing that their management fee includes a component for administrative services), it was not clear in all
| | | | |
| 64 | | Semi-Annual Report | | | August 31, 2017 |
Matters Relating to the Trustees’ Consideration of the Investment
Management Agreements (unaudited) (continued)
AllianzGI Convertible & Income 2024 Target Term Fund/ AllianzGI Convertible & Income Fund/AllianzGI Convertible & Income Fund II
cases whether the peer funds in the Broadridge categories were separately charged such a fee by their investment managers, so that the total expense ratio (rather than any individual expense component) represented the most relevant comparison. It was noted that the total expense ratio comparisons reflect the effect of any expense waivers/reimbursements (although none exist for the Funds).
Convertible & Income
The Trustees noted that the Broadridge Expense Group for the Fund consisted of a total of eight closed-end funds, including the Fund (but excluding Convertible & Income II). The Trustees also noted that average net assets of the common shares of the eight funds in the Broadridge Expense Group ranged from $267.3 million to $749.5 million, and that three funds in the Expense Group were larger in asset size than the Fund. The Trustees also noted that the Fund was ranked first out of eight funds in the Expense Group for total expense ratio (including any interest and borrowing expenses) based on common share assets, first based on total expense ratio (including any interest and borrowing expenses) based on common share and leveraged assets combined, seventh in the Expense Group for actual management fees based on common share assets and third in the Expense Group for actual management fees based on common and leveraged assets combined (with the fund ranked first having the lowest fees/expenses and the fund ranked eighth having the highest fees/expenses in the Expense Group).
With respect to total return performance relative to its Broadridge Performance Universe (based on net asset value), the Trustees noted that the Fund had first quintile performance for the one- and five-year periods, fifth quintile performance for the three-year period and third quintile performance for the ten-year period, each ended March 31, 2017.
Convertible & Income II
The Trustees noted that the Broadridge Expense Group for the Fund consisted of a total of eight closed-end funds, including the Fund (but excluding Convertible & Income). The Trustees also noted that average net assets of the common shares of the eight funds in the Broadridge Expense Group ranged from $267.3 million to $749.5 million, and that five funds in the group were larger in asset size than the Fund. The Trustees noted that the Fund was ranked first out of the eight funds in the Expense Group for total expense ratio (including any interest and borrowing expenses) based on common share assets, first based on total expense ratio (including any interest and borrowing expenses) based on common share and leveraged assets combined, seventh in the Expense Group for actual management fees based on common share assets and third in the Expense Group for actual management fees based on common and leveraged assets combined (with the fund ranked first having the lowest fees/expenses and the fund ranked eighth having the highest fees/expenses in the Expense Group).
With respect to total return performance relative to its Broadridge Performance Universe (based on net asset value), the Trustees noted that the Fund had first quintile performance for the one- and five-year periods and fourth quintile performance for the three- and ten-year periods, each ended March 31, 2017.
In addition to their review of Fund performance based on net asset value, the Trustees also considered the market value performance of each Fund’s common shares and related share price premium and/or discount information based on the materials provided by Broadridge and the Investment Manager.
The Trustees were advised that the Investment Manager does not manage any funds or
| | | | | | |
| August 31, 2017 | | | Semi-Annual Report | | | 65 | |
Matters Relating to the Trustees’ Consideration of the Investment
Management Agreements (unaudited) (continued)
AllianzGI Convertible & Income 2024 Target Term Fund/ AllianzGI Convertible & Income Fund/AllianzGI Convertible & Income Fund II
accounts, including institutional or separate accounts, with investment strategies and return profiles substantially similar to those of the Funds. However, the Trustees considered the management fees charged by the Investment Manager to other funds and accounts with strategies that have similarities (but none of which are substantially similar) to those of the Funds, including open-end funds and, in some cases, separate accounts, advised by the Investment Manager. The Trustees noted that the management fees paid by the Funds are generally higher than the fees paid by such separate account clients. However, the Trustees were advised that the Investment Manager generally provides broader and more extensive services to the Funds in comparison to separate accounts, and incurs additional expenses in connection with the more extensive regulatory regime to which the Funds are subject in comparison to separate accounts generally. The Trustees noted that the management fees paid by the Funds are generally higher than the fees paid by the open-end funds offered for comparison, but were advised by the Investment Manager that there are additional portfolio management challenges in managing closed-end funds such as the Funds, including, but not limited to, those associated with less liquid holdings, the use of leverage, issues relating to trading on a national exchange and attempting to meet a regular dividend, that do not apply to the management of open-end funds.
The Trustees also took into account that the Funds have preferred shares outstanding to provide leverage, which increase the amount of management fees payable by the Funds under the Agreements (because each Fund’s fees are calculated based on average daily managed assets, including assets attributable to preferred shares or other forms of leverage outstanding). The Trustees took into account that the Investment Manager has a financial incentive
for the Funds to continue to have preferred shares and/or other forms of leverage outstanding, which may create a conflict of interest between the Funds and the Investment Manager, on one hand, and each Fund’s common shareholders, on the other. In this regard, the Trustees considered information provided by the Investment Manager and related presentations as to why each Fund’s use of leverage continues to be appropriate and in the best interests of those Funds under current market conditions. The Trustees also considered the Investment Manager’s representation that it will use leverage for the Funds solely as it determines to be in the best interests of the Funds from an investment perspective and without regard to the level of compensation the Investment Manager receives.
Based on a profitability analysis provided by the Investment Manager, the Trustees also considered the estimated profitability to the Investment Manager from its relationship with each Fund and determined that such profitability did not appear to be excessive.
The Trustees also considered the extent to which the Investment Manager may realize economies of scale or other efficiencies in managing and supporting the Funds. The Trustees took into account that, as a general matter, as closed-end investment companies, the assets of the Funds will grow (if at all) principally through the investment performance of each Fund or through the use of additional leverage. The Trustees noted that the Funds had, in 2012 and 2013, concluded offerings of common shares through at-the-market offering programs, thereby growing their respective assets. The Trustees considered that, as the assets of the Funds grow over time, certain economies of scale and other efficiencies may be realized through spreading certain fixed costs across a larger asset base.
| | | | |
| 66 | | Semi-Annual Report | | | August 31, 2017 |
Matters Relating to the Trustees’ Consideration of the Investment
Management Agreements (unaudited) (continued)
AllianzGI Convertible & Income 2024 Target Term Fund/ AllianzGI Convertible & Income Fund/AllianzGI Convertible & Income Fund II
Additionally, the Trustees considered so-called “fall-out benefits” potentially available to the Investment Manager as a result of its advisory arrangements with the Funds, including research, statistical and quotation services from broker-dealers executing the Funds’ portfolio transactions on an agency basis, and enhanced visibility for marketing and distribution of other products managed by the Investment Manager. The Trustees also took into account the entrepreneurial, legal, regulatory and business risks the Investment Manager has undertaken as investment manager and sponsor of the Funds.
After reviewing these and other factors described herein, the Trustees concluded, within the context of their overall conclusions regarding the Agreements, that they were satisfied with the Investment Manager’s responses and ongoing efforts relating to the investment performance of the Funds. The Trustees also concluded that the fees payable under each Agreement represent reasonable compensation in light of the nature, extent and quality of services provided by the Investment Manager, and should be continued. Based on their evaluation of factors that they deemed to be material, including, but not limited to, those factors described above, the Independent Trustees unanimously concluded that the continuation of the Agreements with respect to each Fund was in the interests of the Fund and its shareholders, and determined to recommend that the continuance of the Agreements be approved by the full Board.
AllianzGI Convertible & Income 2024 Target Term Fund
The Investment Company Act of 1940, as amended, requires that both the full Board and a majority of the Independent Trustees, voting separately, approve the Investment Management Agreement with the Investment Manager (for
purposes of this section, the “Advisory Agreement” or the “Agreement”) for AllianzGI Convertible & Income 2024 Target Term Fund (for purposes of this section, the “Fund”). The Trustees met in person on May 17, 2017 for the specific purpose of considering whether to approve the Advisory Agreement for the Fund for an initial term of two-years commencing upon its execution in connection with the initial public offering of the Fund’s common shares. The Independent Trustees were assisted in their evaluation of the Agreement by independent counsel, from whom they received separate legal advice and with whom they met separately from Fund management during the meeting.
In connection with their deliberations regarding the approval of the Agreement, the Trustees, including the Independent Trustees, considered such information and factors as they believed, in light of the legal advice furnished to them and their own business judgment, to be relevant. As described below, the Trustees considered the nature, quality, and extent of the various investment management, administrative and other services to be performed by the Investment Manager under the Agreement.
In connection with their meeting, the Independent Trustees received and relied upon materials provided by the Investment Manager including, among other items: (i) descriptions of various functions proposed to be performed by the Investment Manager for the Fund, such as portfolio management, compliance monitoring and portfolio trading practices, administrative services and oversight of third party service providers; (ii) information regarding the overall organization and business functions of the Investment Manager, including, but not limited to, information regarding senior management, portfolio managers and other personnel proposed to provide investment management, administrative and other services
| | | | | | |
| August 31, 2017 | | | Semi-Annual Report | | | 67 | |
Matters Relating to the Trustees’ Consideration of the Investment
Management Agreements (unaudited) (continued)
AllianzGI Convertible & Income 2024 Target Term Fund/ AllianzGI Convertible & Income Fund/AllianzGI Convertible & Income Fund II
to the Fund, and corporate ownership and business operations unrelated to the Fund; (iii) the estimated costs to the Investment Manager of providing these services; (iv) the estimated profitability of the advisory arrangement to the Investment Manager; (v) information regarding potential economies of scale; (vi) information on potential “fall-out” benefits to the Investment Manager; (vii) information from Morningstar, Inc. (“Morningstar”) as compiled by the Investment Manager, on the total return investment performance for various time periods of a group of funds, including certain funds managed by the Investment Manager, with investment classifications/objectives comparable to those of the Fund (the “Morningstar Peer Group”) (the Trustees noted that the Fund was, at the time, newly organized and had no performance history of its own); (viii) information from Morningstar, as compiled by the Investment Manager, on the management fees and other expenses of comparable funds in the Morningstar Peer Group; and (ix) information regarding the fees for other open-end funds, closed-end funds and separately managed accounts managed by the Investment Manager with strategies that are similar (but in no case identical) to those of the Fund.
The Trustees’ conclusions as to the approval of the Agreement were based on a comprehensive consideration of all information provided to the Trustees and were not the result of any single factor. Some of the factors that figured particularly in the Trustees’ deliberations are described below, although individual Trustees may have evaluated the information presented differently from one another, attributing different weights to various factors.
Performance Information
As part of their review, the Trustees examined the ability of the Investment Manager to provide
high-quality investment management and other services to the Fund. Among other information, the Trustees considered the investment philosophy and research and decision-making processes to be employed by the Investment Manager in managing the Fund, as well as the Investment Manager’s broker selection process and trading operations; the experience of key advisory personnel of the Investment Manager and its affiliates, who would be responsible for portfolio management of the Fund; the ability of the Investment Manager to attract and retain capable personnel; the background and capabilities of the senior management and staff of the Investment Manager; employee compensation; and the operational infrastructure, including technology and systems, of the Investment Manager. In addition, the Trustees reviewed the extent and quality of the Investment Manager’s services to be provided with respect to regulatory compliance and ability to comply with the investment policies of the Fund; the compliance programs and risk controls of the Investment Manager; the specific contractual obligations of the Investment Manager pursuant to the Agreement; the nature, extent and quality of certain administrative services the Investment Manager is responsible for providing to the Fund; the Investment Manager’s risk management function; and conditions that might affect the ability of the Investment Manager to provide high quality services to the Fund in the future under the Agreement, including, but not limited to, AllianzGI U.S.’s financial condition, operational stability and ownership structure. Based on the foregoing, the Trustees concluded that the Investment Manager’s investment process, research capabilities and philosophy were well-suited to the Fund given its investment objective and policies, that the Investment Manager would be able to meet any reasonably foreseeable obligations under the Agreement, and that the
| | | | |
| 68 | | Semi-Annual Report | | | August 31, 2017 |
Matters Relating to the Trustees’ Consideration of the Investment
Management Agreements (unaudited) (continued)
AllianzGI Convertible & Income 2024 Target Term Fund/ AllianzGI Convertible & Income Fund/AllianzGI Convertible & Income Fund II
Investment Manager would otherwise be able to provide services to the Fund of sufficient extent and quality.
Fee and Expense Information
In assessing the reasonableness of the Fund’s proposed fees under the Agreement, the Trustees considered, among other information, the Fund’s management fee and projected total expense ratio and the management fees and total net expense ratios of funds in the Morningstar Peer Group. The Trustees, at the recommendation of the Investment Manager, specifically considered the estimated total expense ratio of the Fund compared to the total expenses of the peer funds, recognizing that fees for management and administrative services would be included within the total expense ratio. It was noted that the Fund’s proposed management fee was above the Peer Group average and median, the Fund’s total expense ratio (excluding interest expense) was below the Peer Group average and median, and the Fund’s estimated total expense ratio (including interest expense) was above the Peer Group average and median. It was noted that the total expense ratio comparisons reflected the effect of expense waivers/reimbursements (although none were proposed or reflected for the Fund). It was also noted that the total expense ratio comparison including interest expense assumed that the Fund obtained leverage in the form of long-term, fixed-rate financing, which is more expensive than the initial short-term borrowings that were contemplated, as discussed below. It was noted, further, that various information regarding the Fund’s estimated fees and expenses would depend upon the actual size of the assets raised by the Fund in its initial public offering, such as the level of “other expenses” to be borne by the Fund, as well as the amount and types of leverage actually used by the Fund.
The Trustees also considered the management fees charged by the Investment Manager to other funds and accounts with investment strategies that are similar (although in no case identical) to those of the Fund.
The Trustees also considered that the proposed fees to the Investment Manager under the Agreement will increase in absolute dollar terms to the extent that the Fund utilizes leverage, and that therefore the Investment Manager has a financial incentive to have leverage outstanding, which may create a conflict of interest between the Fund and the Investment Manager, on the one hand, and the Fund’s shareholders, on the other. In this regard, the Trustees considered information provided by the Investment Manager as to why the Fund’s proposed usage of leverage will be appropriate and in the best interests of the Fund under current market conditions. The Trustees further considered the Fund’s then current intention to initially engage in bank borrowings through the use of a short-term credit facility, and to subsequently replace a portion of its initial short-term borrowings with longer-term, fixed-rate financing by issuing preferred shares and/or through borrowings within the first year of the Fund’s operation. The Trustees also reviewed, as provided in the meeting materials, the total leverage ratios and total expense ratios based on net assets (with and without interest expense) for the funds within the Morningstar Peer Group. Additionally, the Trustees took into account the Investment Manager’s representation that it will use leverage for the Fund solely as it determines to be in the best interest of the Fund from an investment perspective and without regard to the level of compensation the Investment Manager will receive.
The Trustees considered the estimated profitability to the Investment Manager from its relationship with the Fund based on an
| | | | | | |
| August 31, 2017 | | | Semi-Annual Report | | | 69 | |
Matters Relating to the Trustees’ Consideration of the Investment
Management Agreements (unaudited) (continued)
AllianzGI Convertible & Income 2024 Target Term Fund/ AllianzGI Convertible & Income Fund/AllianzGI Convertible & Income Fund II
estimated initial offering size of the Fund of $250 million, and determined that such profitability was not excessive. The Trustees took into account that estimated profitability would increase or decrease, as applicable, if the Fund raised a higher or lower level of assets in its initial public offering, and they also took into account how estimated profitability would decrease significantly if the Investment Manager’s start-up costs, transaction fees and other offering expenses associated with the initial public offering of the Fund were factored in.
The Trustees considered the extent to which the Investment Manager may realize economies of scale or other efficiencies in managing and supporting the Funds. The Trustees took into account that, as a closed-end fund, the Fund was not expected to raise additional assets following its initial offering, so the net assets of the Fund were expected to grow (if at all) principally through the investment performance of the Fund or through the use of additional leverage. The Trustees also took into account the Investment Manager’s view that the proposed management fees for the Fund represent appropriate sharing of economies of scale under anticipated asset levels, while recognizing that the size of the initial public offering could not be predicted with accuracy.
Additionally, the Trustees considered so-called “fall-out benefits” potentially available to the Investment Manager as a result of its advisory arrangement, including research, statistical and quotation services from broker-dealers executing the Fund’s portfolio transactions on an agency basis, and enhanced visibility for marketing and distribution of other products managed by the Investment Manager. The Trustees also took into account the entrepreneurial, legal, regulatory and business risks the Investment Manager has undertaken as investment manager and sponsor of the Fund.
After reviewing these and other factors described herein, the Independent Trustees concluded, within the context of their overall conclusions regarding the Agreement, that the fees payable under the Agreement represent reasonable compensation in light of the nature, extent and quality of the services to be provided by the Investment Manager to the Fund. Based on their evaluation of factors that they deemed to be material, including those factors described above, the Trustees, including the Independent Trustees, unanimously concluded that the approval of the Agreement was in the interests of the Fund and its shareholders, and should be approved for an initial two-year period commencing upon its execution.
| | | | |
| 70 | | Semi-Annual Report | | | August 31, 2017 |
Privacy Policy (unaudited)
AllianzGI Convertible & Income 2024 Target Term Fund/AllianzGI Convertible & Income Fund/AllianzGI Convertible & Income Fund II
Privacy Policy
Please read this Policy carefully. It gives you important information about how Allianz Global Investors U.S. and its U.S. affiliates (“AllianzGI US,” “we” or “us”) handle non-public personal information (“Personal Information”) that we may receive about you. It applies to all of our past, present and future clients and shareholders of AllianzGI US and the funds and accounts it manages, advises, sub-advises, administers or distributes, and will continue to apply when you are no longer a client or shareholder. As used throughout this Policy, “AllianzGI US” means Allianz Global Investors U.S. LLC, Allianz Global Investors Distributors LLC, and the family of registered and unregistered funds managed by one or more of these firms. AllianzGI US is part of a global investment management group, and the privacy policies of other Allianz Global Investors entities outside of the United States may have provisions in their policies that differ from this Privacy Policy. Please refer to the website of the specific non-US Allianz Global Investors entity for its policy on privacy.
We Care about Your Privacy
We consider your privacy to be a fundamental aspect of our relationship with you, and we strive to maintain the confidentiality, integrity and security of your Personal Information. To ensure your privacy, we have developed policies that are designed to protect your Personal Information while allowing your needs to be served.
Information We May Collect
In the course of providing you with products and services, we may obtain Personal Information about you, which may come from sources such as account application and other forms, from other written, electronic, or verbal communications, from account transactions, from a brokerage or financial advisory firm, financial advisor or consultant, and/or from information you provide on our website.
You are not required to supply any of the Personal Information that we may request. However, failure to do so may result in us being unable to open and maintain your account, or to provide services to you.
How Your Information Is Shared
We do not disclose your Personal Information to anyone for marketing purposes. We disclose your Personal Information only to those service providers, affiliated and non-affiliated, who need the information for everyday business purposes, such as to respond to your inquiries, to perform services, and/or to service and maintain your account. This applies to all of the categories of Personal Information we collect about you. The affiliated and non-affiliated service providers who receive your Personal Information also may use it to process your transactions, provide you with materials (including preparing and mailing prospectuses and shareholder reports and gathering shareholder proxies), and provide you with account statements and other materials relating to your account. These service providers provide services at our direction, and under their agreements with us, are required to keep your Personal Information confidential and to use it only for providing the contractually required services. Our service providers may not use your Personal Information to market products and services to you except in conformance with applicable laws and regulations. We also may provide your Personal Information to your respective brokerage or financial advisory firm, custodian, and/or to your financial advisor or consultant.
In addition, we reserve the right to disclose or report Personal Information to non-affiliated third parties, in limited circumstances, where we believe in good faith that disclosure is required under law, to cooperate with regulators or law enforcement authorities or pursuant to other legal process, or to protect our rights or property, including to enforce our
| | | | | | |
| August 31, 2017 | | | Semi-Annual Report | | | 71 | |
Privacy Policy (unaudited) (continued)
AllianzGI Convertible & Income 2024 Target Term Fund/AllianzGI Convertible & Income Fund/AllianzGI Convertible & Income Fund II
Privacy Policy or other agreements with you. Personal Information collected by us may also be transferred as part of a corporate sale, restructuring, bankruptcy, or other transfer of assets.
Security of Your Information
We maintain your Personal Information for as long as necessary for legitimate business purposes or otherwise as required by law. In maintaining this information, we have implemented appropriate procedures that are designed to restrict access to your Personal Information only to those who need to know that information in order to provide products and/or services to you. In addition, we have implemented physical, electronic and procedural safeguards to help protect your Personal Information.
Privacy and the Internet
The Personal Information that you provide through our website, as applicable, is handled in the same way as the Personal Information that you provide by any other means, as described above. This section of the Policy gives you additional information about the way in which Personal Information that is obtained online is handled.
| ∎ | | Online Enrollment, Account Access and Transactions: When you visit our website, you can visit pages that are open to the general public, or, where available, log into protected pages to enroll online, access information about your account, or conduct certain transactions. Access to the secure pages of our website is permitted only after you have created a User ID and Password. The User ID and Password must be supplied each time you want to access your account information online. This information serves to verify your identity. When you enter Personal Information into our website to enroll or access your account online, you will |
| | | log into secure pages. By using our website, you consent to this Privacy Policy and to the use of your Personal Information in accordance with the practices described in this Policy. If you provide Personal Information to effect transactions, a record of the transactions you have performed while on the site is retained by us. For additional terms and conditions governing your use of our website, please refer to the Investor Mutual Fund Access – Disclaimer which is incorporated herein by reference and is available on our website. |
| ∎ | | Cookies and Similar Technologies: Cookies are small text files stored in your computer’s hard drive when you visit certain web pages. Clear GIFs (also known as Web Beacons) are typically transparent very small graphic images (usually 1 pixel x 1 pixel) that are placed on a website that may be included on our services provided via our website and typically work in conjunction with cookies to identify our users and user behavior. We may use cookies and automatically collected information to: (i) personalize our website and the services provided via our website, such as remembering your information so that you will not have to re-enter it during your use of, or the next time you use, our website and the services provided via our website; (ii) provide customized advertisements, content, and information; (iii) monitor and analyze the effectiveness of our website and the services provided via our website and third-party marketing activities; (iv) monitor aggregate site usage metrics such as total number of visitors and pages viewed; and (v) track your entries, submissions, and status in any promotions or other activities offered through our website and the services provided via our website. |
| | | | |
| 72 | | Semi-Annual Report | | | August 31, 2017 |
Privacy Policy (unaudited) (continued)
AllianzGI Convertible & Income 2024 Target Term Fund/AllianzGI Convertible & Income Fund/AllianzGI Convertible & Income Fund II
| | | Tracking technology also helps us manage and improve the usability of our website, (i) detecting whether there has been any contact between your computer and us in the past and (ii) to identify the most popular sections of our website. Because an industry-standard Do-Not-Track protocol is not yet established, our website will continue to operate as described in this Privacy Policy and will not be affected by any Do-Not-Track signals from any browser. |
| ∎ | | Use of Social Media Plugins Our website uses the following Social Media Plugins (“Plugins”): |
| | ∎ | | Facebook Share Button operated by Facebook Inc., 1601 S. California Ave, Palo Alto, CA 94304, USA |
| | ∎ | | Tweet Button operated by Twitter Inc., 795 Folsom St., Suite 600, San Francisco, CA 94107, USA |
| | ∎ | | LinkedIn Share Button operated by LinkedIn Corporation, 2029 Stierlin Court, Mountain View, CA 94043, USA |
All Plugins are marked with the brand of the respective operators Facebook, Twitter and LinkedIn (“Operators”). When you visit our website that contains a social plugin, your browser establishes a direct connection to the servers of the Operator. The Operator directly transfers the plugin content to your browser which embeds the latter into our website, enabling the Operator to receive information about you having accessed the respective page of our website. Thus, AllianzGI US has no influence on the data gathered by the plugin and we inform you according to our state of knowledge: The embedded plugins provide the Operator with the information that you have accessed the corresponding page of our website. If you do not wish to have such data
transferred to the Operators, you need to log out of your respective account before visiting our website. Please see the Operators’ data privacy statements in order to get further information about purpose and scope of the data collection and the processing and use:
| | ∎ | | Facebook: https://de-de.facebook.com/about/privacy/ |
| | ∎ | | Twitter: https://twitter.com/privacy |
| | ∎ | | LinkedIn: https://www.linkedin.com/legal/privacy-policy |
Changes to Our Privacy Policy
We may modify this Privacy Policy from time-to-time to reflect changes in related practices and procedures, or applicable laws and regulations. If we make changes, we will notify you on our website and the revised Policy will become effective immediately upon posting to our website. We also will provide account owners with a copy of our Privacy Policy annually if required. We encourage you to visit our website periodically to remain up to date on our Privacy Policy. You acknowledge that by using our website after we have posted changes to this Privacy Policy, you are agreeing to the terms of the Privacy Policy as modified.
Obtaining Additional Information
If you have any questions about this Privacy Policy or our privacy related practices in the United States, you may contact us via our dedicated email at PrivacyUS@allianzgi.com.
| | | | | | |
| August 31, 2017 | | | Semi-Annual Report | | | 73 | |
Trustees
Davey S. Scoon
Chairman of the Boards of Trustees
Barbara R. Claussen
Deborah A. DeCotis
F. Ford Drummond
A. Douglas Eu
Bradford K. Gallagher
James A. Jacobson
Hans W. Kertess
James S. MacLeod
William B. Ogden, IV
Alan Rappaport
Fund Officers
Thomas J. Fuccillo
President and Chief Executive Officer
Lawrence G. Altadonna
Treasurer, Principal Financial and Accounting Officer
Angela Borreggine
Chief Legal Officer and Secretary
Thomas L. Harter, CFA
Chief Compliance Officer
Scott Whisten
Assistant Treasurer
Orhan Dzemaili
Assistant Treasurer
Richard J. Cochran
Assistant Treasurer
Debra Rubano
Assistant Secretary
Investment Manager
Allianz Global Investors U.S. LLC
1633 Broadway
New York, NY 10019
Custodian & Accounting Agent*
State Street Bank & Trust Co.
801 Pennsylvania Avenue
Kansas City, MO 64105
Transfer Agent, Dividend Paying Agent and Registrar
American Stock Transfer & Trust Company, LLC
6201 15th Avenue
Brooklyn, NY 11219
Independent Registered Public Accounting Firm
PricewaterhouseCoopers LLP
300 Madison Avenue
New York, NY 10017
Legal Counsel
Ropes & Gray LLP
Prudential Tower
800 Boylston Street
Boston, MA 02199
| * | | Effective May 1, 2017, services related to custody and fund accounting for the AllianzGI Convertible & Income and AllianzGI Convertible & Income II Funds transitioned from Brown Brothers Harriman & Co. to State Street Bank and Trust Company. | |
This report, including the financial information herein, is transmitted to the shareholders of AllianzGI Convertible & Income 2024 Target Term, AllianzGI Convertible & Income and AllianzGI Convertible & Income II Funds for their information. It is not a prospectus, circular or representation intended for use in the purchase of shares of the Funds or any securities mentioned in this report.
The financial information included herein is taken from the records of the Funds without examination by an independent registered public accounting firm, who did not express an opinion herein.
Notice is hereby given in accordance with Section 23(c) of the Investment Company Act of 1940, as amended, that from time to time the Funds may purchase shares of their stock in the open market.
The Funds file their complete schedule of portfolio holdings with the Securities and Exchange Commission (“SEC”) for the first and third quarters of their fiscal year on Form N-Q. Each Fund’s Form N-Q is available on the SEC’s website at www.sec.gov and may be reviewed and copied at the SEC’s Public Reference Room in Washington D.C. Information on the operation of the Public Reference Room may be obtained by calling (800) SEC-0330. The information on Form N-Q is also available on the Funds’ website at us.allianzgi.com/en-us/advisors/products-solutions/closed-end-funds.
Information on the Funds is available at us.allianzgi.com/en-us/advisors/products-solutions/closed-end-funds or by calling the Funds’ shareholder servicing agent at (800) 254-5197.
Receive this report electronically and eliminate paper mailings.
To enroll, visit us.allianzgi.com/edelivery.
| | |
| Allianz Global Investors Distributors LLC | | AZ603SA_083117 |
253957
ITEM 2. CODE OF ETHICS
Not required in this filing.
ITEM 3. AUDIT COMMITTEE FINANCIAL EXPERT
Not required in this filing.
ITEM 4. PRINCIPAL ACCOUNTANT FEES AND SERVICES
Not required in this filing
ITEM 5. AUDIT COMMITTEE OF LISTED REGISTRANT
Not required in this filing
ITEM 6. INVESTMENTS
(a) The registrant’s Schedule of Investments is included as part of the report to shareholders filed under Item 1 of this form.
(b) Not applicable.
ITEM 7. DISCLOSURE OF PROXY VOTING POLICIES AND PROCEDURES FOR CLOSED-END MANAGEMENT INVESTMENT COMPANIES
Not required in this filing
ITEM 8. PORTFOLIO MANAGERS OF CLOSED-END MANAGEMENT INVESTMENT COMPANIES
Not required in this filing
ITEM 9. PURCHASES OF EQUITY SECURITIES BY CLOSED-END MANAGEMENT INVESTMENT COMPANY AND AFFILIATED COMPANIES
None
ITEM 10. SUBMISSION OF MATTERS TO A VOTE OF SECURITY HOLDERS
There have been no material changes to the procedures by which shareholders may recommend nominees to the Fund’s Board of Trustees since the Fund last provided disclosure in response to this item.
ITEM 11. CONTROLS AND PROCEDURES
(a) The registrant’s President and Chief Executive Officer and Treasurer, Principal Financial & Accounting Officer have concluded that the registrant’s disclosure controls and procedures (as defined in Rule 30a-3(c) under the Act (17 CFR 270.30a-3(c))) are effective based on their evaluation of these controls and procedures as of a date within 90 days of the filing date of this document.
(b) There were no significant changes in the registrant’s internal control over financial reporting (as defined in Rule 30a-3(d) under the Act (17 CFR 270.30a-3(d))) that occurred during the second fiscal quarter of the period covered by this report that has materially affected, or is reasonably likely to materially affect, the registrant’s internal control over financial reporting.
ITEM 12. EXHIBITS
(a) (1) Not required in this filing.
(a) (2) Exhibit 99.302 Cert. — Certification pursuant to Section 302 of the Sarbanes-Oxley Act of 2002
(a) (3) Not applicable
(b) Exhibit 99.906 Cert. — Certification pursuant to Section 906 of the Sarbanes-Oxley Act of 2002
Signature
Pursuant to the requirements of the Securities Exchange Act of 1934 and the Investment Company Act of 1940, the registrant has duly caused this report to be signed on its behalf by the undersigned, thereunto duly authorized.
Registrant: AllianzGI Convertible & Income Fund
| | |
| By: | | /s/ Thomas J. Fuccillo |
| | Thomas J. Fuccillo President & Chief Executive Officer |
|
| Date: October 27, 2017 |
| |
| By: | | /s/ Lawrence G. Altadonna |
| | Lawrence G. Altadonna Treasurer, Principal Financial & Accounting Officer |
|
| Date: October 27, 2017 |
Pursuant to the requirements of the Securities Exchange Act of 1934 and the Investment Company Act of 1940, this report has been signed below by the following persons on behalf of the registrant and in the capacities and on the dates indicated.
| | |
| By: | | /s/ Thomas J. Fuccillo |
| | Thomas J. Fuccillo President & Chief Executive Officer |
|
| Date: October 27, 2017 |
| |
| By: | | /s/ Lawrence G. Altadonna |
| | Lawrence G. Altadonna Treasurer, Principal Financial & Accounting Officer |
|
| Date: October 27, 2017 |