UNITED STATES
SECURITIES AND EXCHANGE COMMISSION
WASHINGTON, D.C. 20549 |
CERTIFIED SHAREHOLDER REPORT OF REGISTERED MANAGEMENT
INVESTMENT COMPANIES
| Investment Company Act file number 811-21289 |
Birmiwal Investment Trust
(Exact name of registrant as specified in charter)
24140 E. Greystone Lane, Woodway, WA 98020
(Address of principal executive offices) (Zip code)
Kailash Birmiwal
24140 E. Greystone Lane, Woodway, WA 98020
(Name and address of agent for service) |
Registrant's telephone number, including area code: (206) 542-7652
Date of fiscal year end: March 31
Date of reporting period: September 30, 2009
Form N-CSR is to be used by management investment companies to file reports with the Commission not later than 10 days after the transmission to stockholders of any report that is required to be transmitted to stockholders under Rule 30e-1 under the Investment Company Act of 1940 (17 CFR 270.30e -1). The Commission may use the information provided on Form N-CSR in its regulatory, disclosure review, inspection and policymaking roles.
A registrant is required to disclose the information specified by Form N-CSR, and the Commission will make this information public. A registrant is not required to respond to the collection of information contained in Form N-CSR unless the Form displays a currently valid Office of Management and Budget ("OMB") control number. Please direct comments concerning the accuracy of the information collection burden estimate and any suggestions for reducing the burden to Secretary, Securities and Exchange Commission, 450 Fifth Street, NW, Washington, DC 20549-0609. The OMB has reviewed this collection of information under the clearance requirements of 44 U.S.C. § 3507.
Item 1. Reports to Stockholders.
Birmiwal Oasis Fund
For Investors Seeking Capital Appreciation
SEMI-ANNUAL REPORT
September 30, 2009
__________________________________________________________________________________________
Birmiwal Investment Trust
www.birmiwal.com
1-800-417-5525 |
BIRMIWAL OASIS FUND (Unaudited)
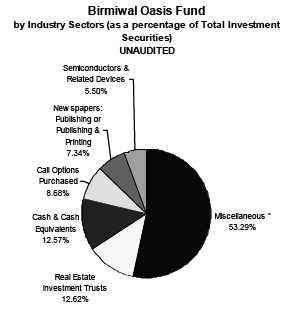
* Includes industry sectors that individually constitute no more than 4% of net assets.
See Schedule of Investments for additional information. |
PERFORMANCE INFORMATION
AVERAGE ANNUAL RATE OF RETURN (%) FOR THE PERIODS ENDED SEPTEMBER 30, 2009.
09/30/09 NAV $19.31
| | | | | | | | | Since |
| | | 1 Year(A) | | 3 Years(A) | | 5 Years(A) | | Inception(A) |
| Birmiwal Oasis Fund | | 10.65% | | (1.65)% | | 15.23% | | 24.56% |
| S&P 500 Index(B) | | (6.91)% | | (5.43)% | | 1.01% | | 5.52% |
(A)1 Year, 3 Year, 5 Year and Since Inception returns include change in share prices and in each case includes reinvestment of any dividends and capital gain distributions. The inception date of the Birmiwal Oasis Fund was April 1, 2003.
(B)The S&P 500 Index is a broad market-weighted average dominated by blue-chip stocks and is an unmanaged group of stocks whose composition is different from the Fund.
PAST PERFORMANCE DOES NOT GUARANTEE FUTURE RESULTS. INVESTMENT RETURN AND PRINCIPAL VALUE WILL FLUCTUATE SO THAT SHARES, WHEN REDEEMED, MAY BE WORTH MORE OR LESS THAN THEIR ORIGINAL COST. RETURNS DO NOT REFLECT THE DEDUCTION OF TAXES THAT A SHAREHOLDER WOULD PAY ON FUND DISTRIBUTIONS OR THE REDEMPTION OF FUND SHARES. CURRENT PERFORMANCE MAY BE LOWER OR HIGHER THAN THE PERFORMANCE DATA QUOTED. TO OBTAIN PERFORMANCE DATA CURRENT TO THE MOST RECENT MONTH END, PLEASE CALL 1-800-417-5525.
2009 Semi-Annual Report 1
Availability of Quarterly Schedule of Investments (Unaudited)
The Fund files its complete schedule of portfolio holdings with the Securities and Exchange Commission ("SEC") for the first and third quarters of each fiscal year on Form N-Q. The Fund’s Forms N-Q are available on the SEC's website at http://www.sec.gov. The Fund’s Forms N-Q may also be reviewed and copied at the SEC's Public Reference Room in Washington, DC. Information on the operation of the Public Reference Room may be obtained by calling 1-800-SEC-0330.
Proxy Voting Guidelines (Unaudited)
Birmiwal Asset Management, Inc., the Fund’s Adviser (“Adviser”), is responsible for exercising the voting rights associated with the securities held by the Fund. A description of the policies and procedures used by the Adviser in fulfilling this responsibility is available without charge on the Fund’s website at www.birmiwal.com. It is also included in the Fund’s Statement of Additional Information, which is available on the Securities and Exchange Commission’s website at http://www.sec.gov.
Information regarding how the Fund voted proxies, contained on Form N-PX, relating to portfolio securities during the most recent 12-month period ended June 30 is available without charge, upon request, by calling our toll free number (1-800-417-5525). This information is also available on the SEC’s website at http://www.sec.gov.
Disclosure of Expenses (Unaudited)
Shareholders of this Fund incur ongoing operating expenses consisting of a base management fee, a performance-based management fee and interest expense. The following example is intended to help you understand your ongoing costs of investing in the Fund and to compare these costs with similar costs of investing in other mutual funds. The example is based on an investment of $1,000 invested in the Fund on April 1, 2009 and held through September 30, 2009.
The first line of the table below provides information about actual account values and actual expenses. In order to estimate the expenses a shareholder paid during the period covered by this report, shareholders can divide their account value by $1,000 (for example, an $8,600 account value divided by $1,000 = 8.6) and then multiply the result by the number in the first line under the heading entitled "Expenses Paid During the Period."
The second line of the table below provides information about hypothetical account values and hypothetical expenses based on the Fund's actual expense ratio and an assumed rate of return of 5% per year before expenses, which is not the Fund’s actual return. The hypothetical account values and expenses may not be used to estimate the actual ending account balance or expenses paid by a shareholder for the period. Shareholders may use this information to compare the ongoing costs of investing in this Fund and other funds. To do so, compare this 5% hypothetical example with the 5% hypothetical examples that appear in other funds' shareholder reports.
| | | | | | | Expenses Paid |
| | | Beginning | | Ending | | During the Period* |
| | | Account Value | | Account Value | | April 1, 2009 to |
| | | April 1, 2009 | | September 30, 2009 | | September 30, 2009 |
| |
| Actual | | $1,000.00 | | $2,237.54 | | $9.74 |
| |
| Hypothetical | | $1,000.00 | | $1,019.05 | | $6.07 |
| (5% annual return | | | | | | |
| before expenses) | | | | | | |
* Expenses are equal to the Fund’s annualized expense ratio of 1.20%, multiplied
by the average account value over the period, multiplied by 183/365 (to reflect the
one-half year period). |
2009 Semi-Annual Report 2
| Birmiwal Oasis Fund |
| |
| | | | | Schedule of Investments |
| | | | | September 30, 2009 (Unaudited) |
| |
| Shares/Principal Amount | | Fair Value | | % of Net Assets |
| |
| COMMON STOCKS | | | | |
| Agricultural Chemicals | | | | |
| 508,178 | | Bodisen Biotech Inc. * | | $ 106,717 | | 0.71% |
| Agricultural Production - Crops | | | | |
| 75,000 | | Agria Corporation * ** | | 160,500 | | |
| 20,000 | | Origin Agritech Limited * (China) | | 97,400 | | |
| | | | | 257,900 | | 1.72% |
| Boardwoven Fabric Mills, Man Made Fiber & Silk | | | | |
| 180,000 | | Xerium Technologies Inc. * | | 234,000 | | 1.56% |
| Commercial Banks, NEC | | | | |
| 30,000 | | Doral Financial Corp. * | | 111,000 | | 0.74% |
| Communications Services | | | | |
| 50,000 | | TerreStar Corporation * | | 114,500 | | 0.76% |
| Computer Peripheral Equipment | | | | |
| 3,000 | | RadiSys Corp. * | | 26,070 | | 0.17% |
| Crude Petroleum & Natural Gas | | | | |
| 30,000 | | Callon Petroleum Co. | | 54,900 | | |
| 50,000 | | Delta Petroleum Corp. * | | 87,500 | | |
| 7,000 | | Dynegy Inc. * | | 17,850 | | |
| 29,215 | | Warren Resources Inc. * | | 86,476 | | |
| | | | | 246,726 | | 1.65% |
| Deep Sea Foreign Transportation of Freight | | | | |
| 20,000 | | Danaos Corporation * (Greece) | | 100,800 | | |
| 5,000 | | DryShips, Inc. (Greece) | | 33,150 | | |
| 9,000 | | FreeSeas Inc. * (Greece) | | 15,570 | | |
| | | | | 149,520 | | 1.00% |
| Drawing & Insulating Nonferrous Wire | | | | |
| 1,000 | | Fushi Copperweld, Inc. * (China) | | 8,460 | | 0.06% |
| Electrical Industrial Apparatus | | | | |
| 20,000 | | Ballard Power Systems Inc. * (Canada) | | 52,600 | | 0.35% |
| Fabricated Rubber Products | | | | |
| 10,000 | | OMNOVA Solutions Inc. * | | 64,800 | | 0.43% |
| Gold and Silver Ores | | | | |
| 10,000 | | GLG Partners, Inc. * | | 40,300 | | |
| 90,000 | | Northgate Minerals Corp. * | | 241,200 | | |
| | | | | 281,500 | | 1.88% |
| Guided Missiles & Space Vehicles & Parts | | | | |
| 10,000 | | Astrotech Corp. * | | 28,200 | | 0.19% |
| Hotels & Motels | | | | |
| 1,000 | | Melco PBL Entertainment (Macau) LTD. * ** | | 6,960 | | 0.05% |
| Industrial Organic Chemicals | | | | |
| 9,000 | | Gushan Environmental Energy Limited ** | | 16,380 | | 0.11% |
| In Vitro & In Vivo Diagnostic Substances | | | | |
| 10,000 | | Nymox Pharmaceutical Corporation * (Canada) | | 45,600 | | 0.30% |
| Investment Advise | | | | |
| 10,000 | | Fortress Investment Group LLC * | | 52,000 | | 0.35% |
| Meat Packing Plants | | | | |
| 1,000 | | Zhongpin, Inc. * (China) | | 14,720 | | 0.10% |
| Metal Mining | | | | | | |
| 55,000 | | Lundin Mining Corp. * (Canada) | | 185,639 | | 1.24% |
| Mining, Quarrying of Nonmetallic Minerals (No Fuels) | | | | |
| 4,000 | | Hecla Mining Co. * | | 17,560 | | 0.12% |
| Miscellaneous Chemical Products | | | | |
| 15,000 | | Shengdatech, Inc. * (China) | | 95,400 | | 0.64% |
| Motor Vehicle Parts & Accessories | | | | |
| 186,464 | | Quantum Fuel Systems Technologies Worldwide Inc. * | | 247,997 | | 1.66% |
| Motor Vehicles & Passenger Car Bodies | | | | |
| 1,000 | | Tata Motors Ltd. ** | | 12,960 | | 0.09% |
*Non-Income Producing Securities.
**ADR - American Depository Receipt.
The accompanying notes are an integral part of the financial
statements. |
2009 Semi-Annual Report 3
| Birmiwal Oasis Fund |
| |
| | | | | Schedule of Investments |
| | | | | September 30, 2009 (Unaudited) |
| |
| Shares/Principal Amount | | Fair Value | | % of Net Assets |
| |
| COMMON STOCKS | | | | |
| National Commercial Banks | | | | |
| 30,000 | | AMCORE Financial, Inc. * | | $ 48,000 | | |
| 20,000 | | Midwest Banc Holdings Inc. * | | 14,200 | | |
| | | | | 62,200 | | 0.42% |
| Newspapers: Publishing or Publishing & Printing | | | | |
| 481,500 | | The McClatchy Company * | | 1,232,640 | | 8.23% |
| Oil & Gas Field Exploration Services | | | | |
| 283,930 | | Energy XXI (Bermuda) Limited * | | 440,092 | | |
| 14,000 | | OMNI Energy Services Corp. * | | 21,700 | | |
| | | | | 461,792 | | 3.08% |
| Oil & Gas Field Services | | | | |
| 8,800 | | North American Energy Partners Inc. * | | 52,800 | | 0.35% |
| Operative Builders | | | | |
| 30,000 | | Hovnanian Enterprises Inc. * | | 115,200 | | 0.77% |
| Pharmaceutical Preparations | | | | |
| 50,000 | | KV Pharmaceuticals Co. * | | 153,500 | | 1.02% |
| Photographic Equipment & Supplies | | | | |
| 30,000 | | Eastman Kodak Co. * | | 143,400 | | 0.96% |
| Radio & TV Broadcasting & Communications Equipment | | | | |
| 1,000 | | Ceragon Networks Ltd. * (Israel) | | 8,460 | | |
| 4,000 | | Digital Ally Inc. * | | 10,000 | | |
| | | | | 18,460 | | 0.12% |
| Real Estate Agents & Managers (For Others) | | | | |
| 57,200 | | Grubb & Ellis Company * | | 96,668 | | 0.65% |
| Retail - Eating & Drinking Places | | | | |
| 1,000 | | Starbucks Corp. * | | 20,650 | | 0.14% |
| Savings Institutions, Federally Chartered | | | | |
| 50,000 | | Flagstar Bancorp Inc. * | | 51,500 | | 0.34% |
| Semiconductors & Related Devices | | | | |
| 194,307 | | Actions Semiconductor Co., Ltd. * ** | | 518,800 | | |
| 5,000 | | Anadigics, Inc. * | | 23,550 | | |
| 1,000 | | Applied Materials Inc. | | 13,380 | | |
| 9,369 | | Ascent Solar Technologies, Inc. * | | 20,893 | | |
| 60,000 | | JA Solar Holdings Co., Ltd. * ** | | 241,800 | | |
| 5,000 | | LSI Corporation * | | 27,450 | | |
| 50,000 | | Netlist Inc. * | | 34,500 | | |
| 2,000 | | OmniVision Technologies Inc. * | | 32,560 | | |
| 2,000 | | Solarfun Power Holdings Co. Ltd. * ** | | 11,480 | | |
| | | | | 924,413 | | 6.17% |
| Services - Advertising | | | | |
| 2,000 | | Focus Media Holding Ltd. * ** | | 22,080 | | |
| 1,000 | | VisionChina Media Inc. * ** | | 7,960 | | |
| | | | | 30,040 | | 0.20% |
| Services - Business Services | | | | |
| 1,000 | | The9 Limited ** | | 7,750 | | 0.05% |
| Services - Prepackaged Software | | | | |
| 1,300 | | China Digital TV Holding Co., Ltd. ** | | 9,360 | | |
| 1,000 | | Microsoft Corp. | | 25,720 | | |
| | | | | 35,080 | | 0.23% |
| Special Industry Machinery, NEC | | | | |
| 10,000 | | Amtech Systems Inc. * | | 53,000 | | |
| 1,000 | | Intevac Inc. * | | 13,440 | | |
| | | | | 66,440 | | 0.44% |
| Sporting Goods | | | | |
| 20,000 | | Nautilus Inc. * | | 34,000 | | 0.23% |
| State Commercial Banks | | | | |
| 40,000 | | Central Pacific Financial Corp. * | | 100,800 | | |
| 30,000 | | South Financial Group Inc. | | 44,100 | | |
| | | | | 144,900 | | 0.97% |
*Non-Income Producing Securities.
**ADR - American Depository Receipt.
The accompanying notes are an integral part of the financial
statements. |
2009 Semi-Annual Report 4
| Birmiwal Oasis Fund |
| |
| | | | | | | Schedule of Investments |
| | | | | | | September 30, 2009 (Unaudited) |
| |
| Shares/Principal Amount | | | | | | Fair Value | | % of Net Assets |
| |
| COMMON STOCKS | | | | | | | | |
| Steel Works, Blast Furnace & Rolling & Finishing Mills | | | | | | | | |
| 15,000 | | Sutor Technology Group, Ltd. * (China) | | | | | | $ 47,000 | | 0.32% |
| Surety Insurance | | | | | | | | |
| 100,000 | | Ambac Financial Group, Inc. * | | | | | | 168,000 | | 1.12% |
| Telephone & Telegraph Apparatus | | | | | | | | |
| 2,000 | | CIENA Corp. * | | | | | | 32,560 | | |
| 82,150 | | Qiao Xing Mobile Communication Co., Ltd. * (China) | | | | 237,414 | | |
| 129,084 | | Qiao Xing Universal Telephone Inc. * (China) | | | | 271,076 | | |
| | | | | | | | | 541,050 | | 3.60% |
| Television Broadcasting Stations | | | | | | | | |
| 20,000 | | Gray Television Inc. | | | | | | 46,400 | | 0.31% |
| Transportation Services | | | | | | | | |
| 20,000 | | Ambassadors International Inc. * | | | | | | 20,600 | | 0.14% |
| Trucking (No Local) | | | | | | | | |
| 40,000 | | YRC Worldwide Inc. * | | | | | | 178,000 | | 1.19% |
| Wholesale - Drugs, Proprietaries & Druggists' Sundries | | | | | | | | |
| 247,200 | | China Medicine Corporation * | | | | | | 474,624 | | 3.17% |
| Wholesale - Peroleum & Petroleum Products (No Bulk Stations) | | | | | | |
| 10,000 | | Crosstex Energy Inc. | | | | | | 52,800 | | 0.35% |
| Total for Common Stock (Cost $12,822,534) | | | | | | 7,557,516 | | 50.45% |
| CLOSED-END FUNDS | | | | | | | | |
| 120,000 | | American Capital, Ltd. * | | | | | | 387,600 | | |
| 2,000 | | India Fund, Inc. | | | | | | 58,100 | | |
| Total for Closed End Funds (Cost $493,043) | | | | | | 445,700 | | 2.98% |
| PUBLICALLY TRADED PARTNERSHIPS | | | | | | | | |
| 15,000 | | Atlas Pipeline Holdings LP | | | | | | 57,000 | | |
| Total for Publically Traded Partnerships (Cost $26,032) | | | | | | 57,000 | | 0.38% |
| REAL ESTATE INVESTMENT TRUSTS | | | | | | | | |
| 50,000 | | Alesco Financial Inc. * | | | | | | 62,500 | | |
| 45,300 | | Arbor Realty Trust Inc. * | | | | | | 128,652 | | |
| 50,000 | | Chimera Investment Corporation | | | | | | 191,000 | | |
| 84,100 | | Gramercy Capital Corp. | | | | | | 204,363 | | |
| 100,000 | | iStar Financial Inc. * | | | | | | 304,000 | | |
| 400,000 | | Maguire Properties Inc. * | | | | | | 840,000 | | |
| 150,000 | | Strategic Hotels & Resorts, Inc. * | | | | | | 388,500 | | |
| Total for Real Estate Investment Trusts (Cost $1,767,407) | | | | 2,119,015 | | 14.15% |
| WARRANTS | | | | | | | | | | |
| 130,000 | | Primoris Services Corporation * (expires 10-2-2010) | | | | 288,613 | | |
| | | exercise price @ 5.00 | | | | | | | | |
| Total for Warrants (Cost $259,987) | | | | | | 288,613 | | 1.93% |
| CALL OPTIONS | | Shares Subject | | | | |
| Expiration Date/Exercise Price | | to Call | | | | | | |
| AirTran Holdings Inc. * | | | | 20,000 | | - | | |
| October 2009 Calls @ 7.50 | | | | | | | | |
| Allied Irish Banks plc * ** | | | | 20,000 | | 48,000 | | |
| November 2009 Calls @ 7.50 | | | | | | | | |
| American Capital, Ltd. * | | | | 60,000 | | 63,000 | | |
| January 2010 Calls @ 2.50 | | | | | | | | |
| American International Group, Inc. * | | | | | | | | |
| November 2009 Calls @ 3.00 | | | | 50,000 | | 6,000 | | |
| November 2009 Calls @ 50.00 | | | | 10,000 | | 48,000 | | |
| | | | | | | | | 54,000 | | |
| Atlas Pipeline Holdings LP | | | | 20,000 | | 8,000 | | |
| November 2009 Calls @ 7.50 | | | | | | | | |
| A-Power Energy Generation Systems, Ltd. * | | | | 20,000 | | 44,000 | | |
| March 2010 Calls @ 10.00 | | | | | | | | |
*Non-Income Producing Securities.
**ADR - American Depository Receipt.
The accompanying notes are an integral part of the financial
statements. |
2009 Semi-Annual Report 5
| Birmiwal Oasis Fund |
| |
| | | | | Schedule of Investments |
| | | | | September 30, 2009 (Unaudited) |
| |
| Shares/Principal Amount | | | | Fair Value | | % of Net Assets |
| |
| CALL OPTIONS | | Shares Subject | | | | |
| Expiration Date/Exercise Price | | to Call | | | | |
| Citigroup, Inc. * | | | | | | |
| October 2009 Calls @ 5.00 | | 300,000 | | $ 51,000 | | |
| December 2009 Calls @ 5.00 | | 350,000 | | 161,000 | | |
| January 2011 Calls @ 5.00 | | 100,000 | | 131,000 | | |
| | | | | 343,000 | | |
| Direxion Daily Small Cap Bull 3X Shares | | 30,000 | | 147,000 | | |
| October 2009 Calls @ 41.00 | | | | | | |
| DryShips, Inc. (Greece) | | | | | | |
| December 2009 Calls @ 7.00 | | 20,000 | | 18,000 | | |
| December 2009 Calls @ 8.00 | | 10,000 | | 6,500 | | |
| January 2010 Calls @ 7.50 | | 30,000 | | 27,000 | | |
| | | | | 51,500 | | |
| Dynegy Inc. * | | | | | | |
| December 2009 Calls @ 2.50 | | 100,000 | | 45,000 | | |
| January 2010 Calls @ 2.50 | | 42,200 | | 23,210 | | |
| | | | | 68,210 | | |
| E*TRADE Financial Corporation * | | 72,100 | | 28,840 | | |
| April 2010 Calls @ 2.00 | | | | | | |
| Freddie Mac * | | 50,000 | | 12,500 | | |
| January 2010 Calls @ 2.50 | | | | | | |
| Georgia Gulf Corp. * | | 45,200 | | 2,260 | | |
| January 2010 Calls @ 2.50 | | | | | | |
| Intel Corporation | | 50,000 | | 85,000 | | |
| October 2009 Calls @ 18.00 | | | | | | |
| iStar Financial Inc. * | | 50,000 | | 45,000 | | |
| January 2010 Calls @ 2.50 | | | | | | |
| JA Solar Holdings Co., Ltd. * ** | | 50,000 | | 2,500 | | |
| October 2009 Calls @ 5.00 | | | | | | |
| Jackson Hewitt Tax Service Inc. * | | 20,000 | | 1,000 | | |
| October 2009 Calls @ 7.50 | | | | | | |
| Kulicke & Soffa Industries Inc. * | | 30,000 | | 40,500 | | |
| January 2010 Calls @ 5.00 | | | | | | |
| LDK Solar Co.Ltd. * ** | | 20,000 | | - | | |
| January 2010 Calls @ 80.00 | | | | | | |
| Lloyds Banking Group plc ** | | 20,000 | | 42,000 | | |
| January 2010 Calls @ 5.00 | | | | | | |
| Lions Gate Entertainment Corp. * | | | | | | |
| December 2009 Calls @ 7.50 | | 100,000 | | 30,000 | | |
| January 2010 Calls @ 7.50 | | 20,000 | | 7,000 | | |
| | | | | 37,000 | | |
| Motorola Inc. * | | 50,000 | | 25,500 | | |
| January 2010 Calls @ 10.00 | | | | | | |
| Novatel Wireless Inc. * | | 40,000 | | 76,000 | | |
| December 2009 Calls @ 10.00 | | | | | | |
| Paragon Shipping Inc. (Greece) | | 50,000 | | 17,500 | | |
| December 2009 Calls @ 5.00 | | | | | | |
| Qiao Xing Universal Telephone Inc. * (China) | | 100,000 | | 15,000 | | |
| January 2010 Calls @ 2.50 | | | | | | |
| Regions Financial Corp. | | | | | | |
| November 2009 Calls @ 7.50 | | 40,000 | | 10,000 | | |
| February 2010 Calls @ 6.00 | | 100,000 | | 115,000 | | |
| | | | | 125,000 | | |
| Ultra Real Estate ProShares | | 50,000 | | 70,000 | | |
| December 2009 Calls @ 5.00 | | | | | | |
| United States Natural Gas | | 10,000 | | 4,500 | | |
| January 2010 Calls @ 15.00 | | | | | | |
| Total (Premiums Paid - $1,863,140) | | | | 1,456,810 | | 9.73% |
*Non-Income Producing Securities.
**ADR - American Depository Receipt.
The accompanying notes are an integral part of the financial
statements. |
2009 Semi-Annual Report 6
| Birmiwal Oasis Fund |
| |
| | | Schedule of Investments |
| | | September 30, 2009 (Unaudited) |
| | |
| Shares/Principal Amount | | Fair Value | | % of Net Assets |
| Cash and Equivalents | | | | |
| 2,111,227 Fidelity Governmental Fund 57 0.19% *** | | 2,111,227 | | 14.09% |
| (Cost $2,111,227) | | | | |
| Total Investment Securities | | 14,035,881 | | 93.71% |
| (Cost $19,343,370) | | | | |
| Other Assets In Excess of Liabilities | | 942,735 | | 6.29% |
| Net Assets | | $ 14,978,616 | | 100.00% |
*Non-Income Producing Securities.
**ADR - American Depository Receipt.
***Variable Rate Security; The Yield Rate shown represents the
rate at September 30, 2009.
The accompanying notes are an integral part of the financial
statements. |
2009 Semi-Annual Report 7
| Birmiwal Oasis Fund |
| |
| | | Schedule of Securities Sold Short |
| | | September 30, 2009 (Unaudited) |
| | |
| Shares/Principal Amount | | Fair Value | | |
| COMMON STOCKS | | | | |
| Services - Computer Programming, Data Processing, Etc. | | | | |
| 700 Baidu, Inc. * ** | | $ 273,735 | | |
| Total for Securities Sold Short (Proceeds - $254,025) | | $ 273,735 | | 1.83% |
| Birmiwal Oasis Fund |
| |
| | | Schedule of Written Options |
| | | September 30, 2009 (Unaudited) |
| | | | | | |
| Underlying Security | | Shares Subject | | Market & | | |
| Expiration Date/Exercise Price | | to Call | | Fair Value | | |
| Direxion Daily Small Cap Bull 3X Shares | | 30,000 | | $ 135,000 | | |
| October 2009 Calls @ 43.00 | | | | | | |
| Total (Premiums Received - $72,240) | | | | $135,000 | | 0.90% |
*Non-Income Producing Securities.
**ADR - American Depository Receipt.
The accompanying notes are an integral part of the financial
statements. |
2009 Semi-Annual Report 8
| Birmiwal Oasis Fund |
| |
| Statement of Assets and Liabilities (Unaudited) | | |
| September 30, 2009 | | |
| |
| Assets: | | |
| Investment Securities at Fair Value | | $ 14,035,881 |
| (Identified Cost - $19,343,370) | | |
| Cash Held at Broker for Securities Sold Short | | 362,622 |
| Cash Held at Custodian | | 99,000 |
| Receivables: | | |
| Dividends and Interest | | 6,362 |
| Receivable for Securities Sold | | 2,378,658 |
| Total Assets | | 16,882,523 |
| Liabilities | | |
| Securities Sold Short, at Fair Value (Proceeds - $254,025) | | 273,735 |
| Call Options Written, at Fair Value (Premiums Received - $72,240) | | 135,000 |
| Payable for Securities Purchased | | 1,352,403 |
| Due to Broker | | 91,371 |
| Management Fees Payable | | |
| Base Management Fee Payable to Adviser | | 33,806 |
| Performance Adjustment Payable to Adviser | | 17,592 |
| Total Liabilities | | 1,903,907 |
| |
| Net Assets | | $ 14,978,616 |
| Net Assets Consist of: | | |
| Paid In Capital | | 23,481,556 |
| Accumulated Undistributed Net Investment Income/(Loss) | | (54,319) |
| Accumulated Realized Loss on Investments - Net | | (3,058,662) |
| Unrealized Depreciation in Value of Investments, Securities Sold Short, | | (5,389,959) |
| Options Written and Options Purchased Based on Identified Cost - Net | | |
| Net Assets, for 775,555 Shares Outstanding | | $ 14,978,616 |
| (Unlimited number of shares authorized without par value) | | |
| Net Asset Value, Offering and Redemption Price | | |
| Per Share ($14,978,616/775,555 shares) | | $ 19.31 |
| |
| Statement of Operations (Unaudited) | | |
| For the six months ended September 30, 2009 | | |
| |
| Investment Income: | | |
| Dividends (Net of foreign withholding tax and ADR fees of $1,505) | | $ 9,921 |
| Interest | | 2,534 |
| Total Investment Income | | 12,455 |
| Expenses: (Note 3) | | |
| Management Fees | | |
| Base Management Fees | | 161,304 |
| Less: Performance-Based Management Fee Paid to Fund - Net | | (94,852) |
| Net Management Fees | | 66,452 |
| Interest Expense | | 322 |
| Total Expenses | | 66,774 |
| |
| Net Investment Loss | | $ (54,319) |
| |
| Realized and Unrealized Gain (Loss) on Investments, Securities Sold Short, | | |
| Options Purchased & Options Written: | | |
| Net Realized Gain on Investments | | 2,550,021 |
| Net Realized Gain on Securities Sold Short | | 141,710 |
| Net Realized Gain on Options Purchased | | 786,266 |
| Net Realized Gain on Options Written | | 170,788 |
| Net Change In Unrealized Depreciation on Investments | | 5,067,805 |
| Net Change In Unrealized Depreciation on Securities Sold Short | | (10,152) |
| Net Change In Unrealized Depreciation on Options Purchased | | (294,146) |
| Net Change In Unrealized Depreciation on Options Written | | (62,760) |
| Net Realized and Unrealized Gain on Investments, Securities Sold Short, | | |
| Options Purchased & Options Written | | 8,349,532 |
| Net Increase in Net Assets from Operations | | $ 8,295,213 |
The accompanying notes are an integral part of the financial statements.
2009 Semi-Annual Report 9
| Birmiwal Oasis Fund |
| |
| Statements of Changes in Net Assets | | (Unaudited) | | |
| | | 4/1/2009 | | 4/1/2008 |
| | | to | | to |
| | | 9/30/2009 | | 3/31/2009 |
| From Operations: | | | | |
| Net Investment Loss | | $ (54,319) | | $ (260,702) |
| Net Realized Gain/(Loss) on Investments, Securities Sold Short, | | 3,648,785 | | (6,063,779) |
| Options Purchased and Options Written | | | | |
| Net Change In Unrealized Appreciation/(Depreciation) | | 4,700,747 | | (5,464,565) |
| Increase/(Decrease) in Net Assets from Operations | | 8,295,213 | | (11,789,046) |
| From Distributions to Shareholders: | | | | |
| Net Investment Income | | 0 | | 0 |
| Net Realized Loss from Security Transactions | | 0 | | (194,651) |
| Change in Net Assets from Distributions | | 0 | | (194,651) |
| From Capital Share Transactions: | | | | |
| Proceeds From Sale of Shares | | 29,175 | | 90,449 |
| Shares Issued on Reinvestment of Dividends | | 0 | | 194,318 |
| Cost of Shares Redeemed | | (60,677) | | (660,046) |
| Net Increase/(Decrease) from Shareholder Activity | | (31,502) | | (375,279) |
| Net Increase/(Decrease) in Net Assets | | 8,263,711 | | (12,358,976) |
| Net Assets at Beginning of Period | | 6,714,905 | | 19,073,881 |
| Net Assets at End of Period (including accumulated undistributed | | $ 14,978,616 | | $ 6,714,905 |
| net investment income/(loss) of ($54,319) and $0, respectively) | | | | |
| Share Transactions: | | | | |
| Issued | | 2,027 | | 4,874 |
| Reinvested | | - | | 17,943 |
| Redeemed | | (4,198) | | (67,313) |
| Net Increase/(Decrease) in Shares | | (2,171) | | (44,496) |
| Shares Outstanding Beginning of Period | | 777,726 | | 822,222 |
| Shares Outstanding End of Period | | 775,555 | | 777,726 |
| Financial Highlights | | (Unaudited) | | | | | | | | | | |
| Selected data for a share outstanding | | 4/1/2009 | | 4/1/2008 | | 4/1/2007 | | 4/1/2006 | | 4/1/2005 | | 4/1/2004 |
| throughout the period: | | to | | to | | to | | to | | to | | to |
| | | 9/30/2009 | | 3/31/2009 | | 3/31/2008 | | 3/31/2007 | | 3/31/2006 | | 3/31/2005 |
| Net Asset Value - | | | | | | | | | | | | |
| Beginning of Period | | $ 8.63 | | $ 23.20 | | $ 32.56 | | $ 37.19 | | $ 29.34 | | $ 35.65 |
| Net Investment Income/(Loss) (a) | | (0.07) | | (0.32) | | (0.80) | | (1.27) | | (1.18) | | (1.03) |
| Net Gains or Losses on Securities | | | | | | | | | | | | |
| (realized and unrealized) (b) | | 10.75 | | (14.01) | | 2.05 | | 9.26 | | 18.15 | | 2.86 |
| Total from Investment Operations | | 10.68 | | (14.33) | | 1.25 | | 7.99 | | 16.97 | | 1.83 |
| Distributions (From Net Investment Income) | | 0.00 | | 0.00 | | 0.00 | | 0.00 | | 0.00 | | 0.00 |
| Distributions (From Capital Gains) | | 0.00 | | (0.24) | | (10.61) | | (12.62) | | (9.12) | | (8.14) |
| Total Distributions | | 0.00 | | (0.24) | | (10.61) | | (12.62) | | (9.12) | | (8.14) |
| Net Asset Value - | | | | | | | | | | | | |
| End of Period | | $ 19.31 | | $ 8.63 | | $ 23.20 | | $ 32.56 | | $ 37.19 | | $ 29.34 |
| |
| Total Return (c) | | 123.75% | ** | (61.97)% | | (2.12)% | | 22.51% | | 63.83% | | 9.99% |
| Ratios/Supplemental Data | | | | | | | | | | | | |
| Net Assets - End of Period (Thousands) | | 14,979 | | 6,715 | | 19,074 | | 20,292 | | 16,326 | | 8,077 |
| Ratio of Expenses to Average Net Assets | | 1.20% | * | 2.57% | | 4.28% | | 4.85% | | 4.70% | | 4.26% |
| Ratio of Net Investment Loss to Average Net Assets | | -0.97% | * | -1.81% | | -2.58% | | -3.46% | | -3.50% | | -3.72% |
| Portfolio Turnover Rate | | 793.75% | ** | 998.97% | | 932.44% | | 688.12% | | 637.98% | | 1050.35% |
* Annualized. ** Not Annualized.
(a) Per share amounts were calculated using the average shares method.
(b) Realized and unrealized gains and losses per share in this caption are balancing amounts necessary to reconcile the
change in net asset value per share for the period, and may not reconcile with the aggregate gains and losses in the
Statement of Operations due to share transactions for the period.
(c) Total return in the above table represents the rate that the investor would have earned or lost on an investment in the
Fund assuming reinvestment of all Fund distributions. |
The accompanying notes are an integral part of these
financial statements. |
2009 Semi-Annual Report 10
NOTES TO THE FINANCIAL STATEMENTS
BIRMIWAL OASIS FUND
September 30, 2009
(Unaudited)
1.) ORGANIZATION
Birmiwal Oasis Fund (the "Fund") is a non-diversified series of the Birmiwal Investment Trust (the "Trust"), an open-end investment company that commenced operations on April 1, 2003. The Trust was organized in Ohio as a business trust on January 3, 2003. The Trust may offer shares of beneficial interest in a number of separate series, each series representing a distinct fund with its own investment objectives and policies. At present, there is only one series authorized by the Trust. Birmiwal Asset Management, Inc. is the adviser to the Fund (the "Adviser"). As of the close of business on January 30, 2006, the Fund closed to new investors and would not take additional purchases from existing investors, except shareholders of record on January 30, 2006 were able to continue to add to their existing accounts only through the reinvestment of dividends and/or capital gain distributions from shares owned, and trustees of the Fund, as well as directors, officers and employees of the Adv iser, were permitted to continue to open new accounts and make additional purchases in existing accounts. As of August 1, 2006, the Fund has revised its policies with respect to permitted investments in the Fund to reflect the following: The Fund remained closed to new investors except for non-profit organizations. Existing shareholders can purchase additional shares either by making new investments in their existing account(s) and/or by opening new account(s). The total of such new investments will be limited to a maximum of $25,000 per calendar year per taxpayer identification number/social security number. Existing shareholders may also continue to add to their existing accounts through the reinvestment of dividends and/or capital gain distributions from shares owned and may continue to participate in the Automatic Investment Plan (AIP). Non-profit organizations qualifying under Section 501(c)(3) of the Internal Revenue Code can open new accounts subject to a maximum investment limit of $25,000 per calend ar year per taxpayer identification number. Trustees of the Fund, as well as directors, officers and employees of the Adviser, may continue to open new accounts and make additional purchases in existing accounts. The Fund’s primary investment objective is to seek capital aprecia-tion. Significant accounting policies of the Fund are presented below: 2.) SIGNIFICANT ACCOUNTING POLICIES
SECURITY VALUATION: All investments in securities are recorded at their estimated fair value, as described in note 3.
SHORT SALES: The Fund may sell a security it does not own in anticipation of a decline in the fair value of that security. When the Fund sells a security short, it must borrow the security sold short and deliver it to the broker-dealer through which it made the short sale. A gain, limited to the price at which the Fund sold the security short, or a loss, unlimited in size, will be recognized upon the termination of a short sale.
As of September 30, 2009, all of the Cash Held at the Custodian and Broker valued at $461,622 is restricted because it represents collateral for securities sold short and amounts due to broker. OPTION WRITING: When the Fund writes an option, an amount equal to the premium received by the Fund is recorded as a liability and is subsequently adjusted to the current fair value of the option written. Premiums received from writing options that expire unexercised are treated by the Fund on the expiration date as realized gains from investments. The difference between the premium and the amount paid on effecting a closing purchase transaction, including brokerage commissions, is also treated as a realized gain, or, if the premium is less than the amount paid for the closing purchase transaction, as a realized loss. If a call option is exercised, the premium is added to the proceeds from the sale of the underlying security or currency in determining whether the Fund has realized a g ain or a loss. If a put option is exercised, the premium reduces the cost basis of the securities purchased by the Fund. The Fund as writer of an option bears the market risk of an unfavorable change in the price of the security underlying the written option.
FEDERAL INCOME TAXES: The Fund’s policy is to continue to comply with the requirements of the Internal Revenue Code that are applicable to regulated investment companies and to distribute all of its taxable income to shareholders. Therefore, no federal income tax provision is required. It is the Fund’s policy to distribute annually, prior to the end of the calendar year, dividends sufficient to satisfy excise tax requirements of the Internal Revenue Code. This Internal Revenue Code requirement may cause an excess of distributions over the book year-end accumulated income. In addition, it is the Fund’s policy to distribute annually, after the end of the fiscal year, any remaining net investment income and net realized capital gains.
The Fund recognizes the tax benefits of certain tax positions only where the position is “more likely than not” to be sustained assuming examination by tax authorities. Management has analyzed
2009 Semi-Annual Report 11
Notes to the Financial Statements (Unaudited) - continued
the Fund’s tax positions, and has concluded that no liability for unrecognized tax benefits should be recorded related to uncertain tax positions taken on returns filed for open tax years (2006 -2008), or expected to be taken on the Fund’s 2009 tax return. The Fund identifies its major tax jurisdictions as U.S. Federal and State tax authorities; however the Fund is not aware of any tax positions for which it is reasonably possible that the total amounts of unrecognized tax benefits will change materially in the next twelve months.
DISTRIBUTIONS TO SHAREHOLDERS: Distributions to shareholders, which are determined in accordance with income tax regulations, are recorded on the ex-dividend date.
USE OF ESTIMATES: The preparation of financial statements in conformity with accounting principles generally accepted in the United States of America requires management to make estimates and assumptions that affect the reported amounts of assets and liabilities and disclosure of contingent assets and liabilities at the date of the financial statements and the reported amounts of revenues and expenses during the reporting period. Actual results could differ from those estimates.
OTHER: The Fund records security transactions based on a trade date. Dividend income is recognized on the ex-dividend date, and interest income is recognized on an accrual basis. Discounts and premiums on securities purchased are amortized over the lives of the respective securities. Withholding taxes on foreign dividends have been provided for in accordance with the Fund’s understanding of the applicable country’s tax rules and rates.
SUBSEQUENT EVENTS: Management has evaluated subsequent events through November 30, 2009, the date the financial statements were issued.
3.) SECURITIES VALUATIONS
As described in note 2, the Fund utilizes various methods to measure the fair value of most of its investments on a recurring basis. GAAP establishes a hierarchy that prioritizes inputs to valuation methods. The three levels of inputs are: Level 1 - Unadjusted quoted prices in active markets for identical assets or liabilities that the Fund has the ability to access.
Level 2 - Observable inputs other than quoted prices included in level 1 that are observable for the asset or liability, either directly or indirectly. These inputs may include quoted prices for the identical instrument on an inactive market, prices for similar instruments, interest rates, prepayment speeds, credit risk, yield curves, default rates and similar data.
Level 3 - Unobservable inputs for the asset or liability, to the extent relevant observable inputs are not available, representing the Fund’s own assumptions about the assumptions a market participant would use in valuating the asset or liability, and would be based on the best information available.
The availability of observable inputs can vary from security to security and is affected by a wide variety of factors, including, for example, the type of security, whether the security is new and not yet established in the marketplace, the liquidity of markets, and other characteristics particular to the security. To the extent that valuation is based on models or inputs that are less observable or unobservable in the market, the determination of fair value requires more judgment. Accordingly, the degree of judgment exercised in determining fair value is greatest for instruments categorized in level 3.
The inputs used to measure fair value may fall into different levels of the fair value hierarchy. In such cases, for disclosure purposes, the level in the fair value hierarchy within which the fair value measurement falls in its entirety, is determined based on the lowest level input that is significant to the fair value measurement in its entirety.
FAIR VALUE MEASUREMENTS
A description of the valuation techniques applied to the Fund’s major categories of assets and liabilities measured at fair value on a recurring basis follows.
Equity securities (common stock, real estate investment trusts, closed-end funds, publically traded partnerships, warrants and securities sold short). Equity securities that are traded on any exchange or on the NASDAQ over-the-counter market are valued at the last quoted sale price. Lacking a last sale price, a security is valued at its last bid price except when, in the Adviser's opinion, the last bid price does not accurately reflect the current value of the security. All other securities for which over-the-counter market quotations are not readily available are valued at their last bid price. Generally, if the security is traded in an active market and is valued at the last sale price, the security is categorized as a level 1 security. When the security position is not con-
2009 Semi-Annual Report 12
Notes to the Financial Statements (Unaudited) - continued
sidered to be part of an active market or when the security is valued at the bid price, the position is generally categorized as a level 2. When market quotations are not readily available, when the Adviser determines the last bid price does not accurately reflect the current value or when restricted securities are being valued, such securities are valued as determined in good faith by the Adviser, in conformity with guidelines adopted by and subject to review of the Board of Trustees and are generally categorized in level 2 of the fair value hierarchy.
Money markets. Money Market securities are valued at a net asset value of $1.00 and are classified in level 1 of the fair value hierarchy.
Options. Option positions that are traded on any exchange or on the NASDAQ over-the-counter market are valued at the last quoted sale price. To the extent these option positions are actively traded and valuation adjustments are not applied, they are classified in level 1 of the fair value hierarchy. Lacking a last sale price, an option position, is valued at its last bid price except when, in the Adviser’s opinion, the last bid price does not accurately reflect the current value of the option position. When a bid price is used for valuation or when the security is not actively traded, those securities are valued at their last bid price and are generally categorized in level 2 of the fair value hierarchy.
Fixed income securities. Fixed income securities generally are valued by using market quotations, but may be valued on the basis of prices furnished by a pricing service when the Adviser believes such prices accurately reflect the fair market value of such securities. A pricing service utilizes electronic data processing techniques based on yield spreads relating to securities with similar characteristics to determine prices for normal institutional-size trading units of debt securities without regard to sale or bid prices. If the Adviser decides that a price provided by the pricing service does not accurately reflect the fair market value of the securities, when prices are not readily available from a pricing service or when restricted or illiquid securities are being valued, securities are valued at fair value as determined in good faith by the Adviser, in conformity with guidelines adopted by and subject to review of the Board of Trustees . Short term investments in fixed income securities with maturities of less than 60 days when acquired, or which subsequently are within 60 days of maturity, are valued by using the amortized cost method of valuation, which the Board of Trustees has determined will represent fair value.
In accordance with the Trust's good faith pricing guidelines, the Adviser is required to consider all appropriate factors relevant to the value of securities for which it has determined other pricing sources are not available or reliable as described above. There is no single standard for determining fair value controls, since fair value depends upon the circumstances of each individual case. As a general principle, the current fair value of an issue of securities being valued by the Adviser would appear to be the amount which the owner might reasonably expect to receive for them upon their current sale. Methods which are in accordance with this principle may, for example, be based on (i) a multiple of earnings; (ii) a discount from market of a similar freely traded security (including a derivative security or a basket of securities traded on other markets, exchanges or among dealers); or (iii) yield to maturity with respect to debt issues, or a combination of these and othe r methods.
The following table summarizes the inputs used to value the Fund’s assets and liabilities measured at fair value as of September 30, 2009:
| Valuation Inputs of Assets | | Level 1 | | Level 2 | | Level 3 | | Total |
| Common Stock | | $7,557,516 | | $0 | | $0 | | $7,557,516 |
| Closed-End Funds | | 445,700 | | 0 | | 0 | | 445,700 |
| Publically Traded Partnerships | | 57,000 | | 0 | | 0 | | 57,000 |
| Real Estate Investment Trusts | | 2,119,015 | | 0 | | 0 | | 2,119,015 |
| Warrants | | 288,613 | | 0 | | 0 | | 288,613 |
| Options Purchased | | 1,456,810 | | 0 | | 0 | | 1,456,810 |
| Money Market Fund | | 2,111,227 | | 0 | | 0 | | 2,111,227 |
| Total | | $14,035,881 | | $0 | | $0 | | $14,035,881 |
| Valuation Inputs of Liabilities | | Level 1 | | Level 2 | | Level 3 | | Total |
| Options Written | | $135,000 | | $0 | | $0 | | $135,000 |
| Securities Sold Short | | $273,735 | | $0 | | $0 | | $273,735 |
| Total | | $408,735 | | $0 | | $0 | | $408,735 |
Refer to the Fund’s Schedule of Investments for a listing of securities by industry. The Fund did not hold any Level 3 assets during the six month period ended September 30, 2009.
4.) INVESTMENT ADVISORY AGREEMENT
The Fund has entered into an Investment Advisory Agreement with Birmiwal Asset Management, Inc. Under the terms of the Investment Advisory Agreement, the Adviser manages the investment
2009 Semi-Annual Report 13
Notes to the Financial Statements (Unaudited) - continued
portfolio of the Fund, subject to policies adopted by the Trust’s Board of Trustees. Under the Investment Advisory Agreement, the Adviser, at its own expense and without reimbursement from the Trust, furnishes office space and all necessary office facilities, equipment and executive personnel necessary for managing the assets of the Fund. The Adviser also pays the salaries and fees of all of its officers and employees that serve as officers and trustees of the Trust. The Adviser pays all operating expenses of the Fund, with the exception of taxes, borrowing expenses (such as (i) interest and (ii) dividend expenses on securities sold short), brokerage commissions, indirect expenses (such as the expenses of other investment companies in which the Fund may invest) and extraordinary expenses.
For its services and its agreement to pay the Fund’s operating expenses, the Adviser receives an annual variable performance-based management fee comprised of a base rate of 2.90% of the Fund's average daily net assets and a performance adjustment, which is in accordance with a rate schedule. The performance adjustment increases or decreases the fee paid by the Fund to the Adviser based on the Fund's performance relative to the S&P 500 Index over the most recent 12-month period. If the Fund's return for the period is within 2.00% (two percentage points) of the return on the S&P 500 Index, no adjustment is made. If the difference between the performance of the Fund and the S&P 500 Index exceeds 2.00% (two percentage points), the performance adjustment is made at a rate that varies linearly with the difference between the Fund's performance and that of the S&P 500 Index. The resulting performance adjustment rate can be as high as 2.40% if the Fund outperfo rms the S&P 500 Index by 14% (fourteen percentage points) or more, and as low as -2.40% if the Fund underperforms the S&P 500 Index by 14% (fourteen percentage points) or more.
For the six months ended September 30, 2009, the Adviser earned base management fees totaling $161,304 and repaid the Fund performance-based management fees totaling $94,852. At September 30, 2009, the Fund owed the Adviser management fees in the amount of $51,398, which consisted of base management fees of $33,806 and performance-based management fees of $17,592.
5.) RELATED PARTY TRANSACTIONS
Kailash Birmiwal, Ph.D. is the control person of the Adviser and also serves as a trustee/officer of the Fund. This individual receives benefits from the Adviser resulting from management fees paid to the Adviser by the Fund.
The Trustees who are not interested persons of the Fund were paid a total of $0 in Trustee fees for the six months ended September 30, 2009. Pursuant to the Investment Advisery Agreement, these fees are paid by the Adviser.
6.) CAPITAL STOCK
The Trust is authorized to issue an unlimited number of shares without par value. Paid in capital at September 30, 2009 was $23,481,556 representing 775,555 shares outstanding.
7.) INVESTMENT TRANSACTIONS
For the six months ended September 30, 2009, purchases and sales of investment securities other than U.S. Government obligations and short-term investments aggregated $62,983,443 and $66,223,971, respectively. Purchases and sales of U.S. Government obligations aggregated $0 and $0, respectively.
For federal income tax purposes, the cost of total investment securities owned at September 30, 2009 was $19,343,370, proceeds from short positions amounted to $254,025, and premiums received from options written amounted to $72,240. At September 30, 2009, the composition of unrealized appreciation (the excess of value over tax cost) and depreciation (the excess of tax cost over value), was as follows:
| Appreciation | | (Depreciation) | | Net Appreciation (Depreciation) |
| $1,482,615 | | ($6,872,574) | | ($5,389,959) |
There were no differences between book basis and tax basis unrealized depreciation.
8.) CONTROL OWNERSHIP
The beneficial ownership, either directly or indirectly, of more than 25% of the voting securities of a fund creates a presumption of control of the fund, under Section 2(a)(9) of the Investment Company Act of 1940. As of September 30, 2009, Kailash Birmiwal, Ph.D., the control person of the Adviser, held, in aggregate, approximately 73% of the Fund.
2009 Semi-Annual Report 14
Notes to the Financial Statements (Unaudited) - continued
9.) DERIVATIVES
Transactions in written options during the six months ended September 30, 2009 were as follows:
| | | Number of | | Premiums |
| | | Contracts | | Received |
| Options outstanding at March 31, 2009 | | 0 | | $0 |
| Options written | | 3,080 | | $803,763 |
| Options terminated in closing purchase transactions | | (2,780) | | ($731,525) |
| Options expired | | 0 | | $0 |
| Options exercised | | 0 | | $0 |
| Options outstanding at September 30, 2009 | | 300 | | $72,238 |
Transactions in purchased options during the six months ended September 30, 2009 were as follows:
| | | Number of | | Premiums |
| | | Contracts | | Received |
| Options outstanding at March 31, 2009 | | 200 | | $112,184 |
| Options purchased | | 53,581 | | $6,098,020 |
| Options terminated in closing purchase transactions | | (24,002) | | ($3,696,515) |
| Options expired | | (8,084) | | ($628,819) |
| Options exercised | | (200) | | ($21,730) |
| Options outstanding at September 30, 2009 | | 21,495 | | $1,863,140 |
The locations on the statement of assets and liabilities of the Fund's derivative positions, which are not accounted for as hedging instruments under GAAP, is as follows:
| | | Asset | | | | Liability |
| | | Derivatives | | | | Derivatives |
| Call options purchased | | $1,456,810 | | Call options written | | $135,000 |
Realized and unrealized gains and losses on derivatives contracts entered into during the six month period ended September 30, 2009 by the Fund are recorded in the following locations in the Statement of Operations:
| | | | | Realized | | | | Unrealized |
| | | Location | | Gain/(Loss) | | Location | | Gain/(Loss) |
| Equity contracts | | Net Realized | | | | Change In Unrealized | | |
| | | Gain on Options | | $786,266 | | Appreciation/(Depreciation) | | ($294,150) |
| | | Purchased | | | | on Options Purchased | | |
| | | Net Realized | | | | Change In Unrealized | | |
| | | Gain on Options | | $170,788 | | Appreciation/(Depreciation) | | ($62,760) |
| | | Written | | | | on Options Written | | |
The Fund engages in option transactions involving individual securities and stock indexes. An option involves either: (a) the right or the obligation to buy or sell a specific instrument at a specific price until the expiration date of the option; or (b) the right to receive payments or the obligation to make payments representing the difference between the closing price of a stock index and the exercise price of the option expressed in dollars times a specified multiple until the expiration date of the option. Options are sold (written) on securities and stock indexes. The purchaser of an option on a security pays the seller (the writer) a premium for the right granted but is not obligated to buy or sell the underlying security. The purchaser of an option on a stock index pays the seller a premium for the right granted, and in return the seller of such an option is obligated to make the payment. A writer of an option may terminate the obligation prior to expiration of the o ption by making an offsetting purchase of an identical option. Options are traded on organized exchanges and in the over-the-counter market. To cover the potential obligations involved in writing options, a Fund will either: (a) own the underlying security, or in the case of an option on a market index, will hold a portfolio of stocks substantially replicating the movement of the index; or (b) the Fund will segregate with the custodian high grade liquid assets sufficient to purchase the underlying security or equal to the market value of the stock index option, marked to market daily.
The purchase and writing of options requires additional skills and techniques beyond normal portfolio management, and involves certain risks. The purchase of options limits a Fund's potential loss to the amount of the premium paid and can afford the Fund the opportunity to profit from favorable movements in the price of an underlying security to a greater extent than if transactions were effected in the security directly. However, the purchase of an option could result in the Fund losing a greater percentage of its investment than if the transaction were effected directly. When
2009 Semi-Annual Report 15
Notes to the Financial Statements (Unaudited) - continued
the Fund writes a call option, it will receive a premium, but it will give up the opportunity to profit from a price increase in the underlying security above the exercise price as long as its obligation as a writer continues, and it will retain the risk of loss should the price of the security decline. When the Fund writes a put option, it will assume the risk that the price of the underlying security or instrument will fall below the exercise price, in which case the Fund may be required to purchase the security or instrument at a higher price than the market price of the security or instrument. In addition, there can be no assurance that the Fund can effect a closing transaction on a particular option it has written. Further, the total premium paid for any option may be lost if the Fund does not exercise the option or, in the case of over-the-counter options, the writer does not perform its obligations.
10.) DISTRIBUTIONS TO SHAREHOLDERS
The tax character of distributions paid during the six months ended September 30, 2009 and fiscal year ended March 31, 2009 were as follows: Distributions paid from:
| | | Six Months ended | | Year ended |
| | | September, 2009 | | March 31, 2009 |
| Ordinary Income: | | $ 0 | | $ 0 |
| Short-term Capital Gain | | 0 | | 194,613 |
| Long-term Capital Gain | | 0 | | 38 |
| | | $ 0 | | $ 194,651 |
As of September 30, 2009 there were no differences between book and tax cost basis.
11.) AVERAGE BORROWINGS
Periodically, the Fund may seek to obtain loans from its brokers for the purpose of funding redemptions or purchasing securities up to the maximum amount that the Fund is permitted to borrow under the Investment Company Act of 1940 using the securities in its portfolio as collateral. Interest is computed on the settled margin balance in the account. The rate at which interest is charged on the settled margin balance may vary from the broker's base rate, depending on the amount of the settled debit balance in the account. During the six months ended September 30, 2009, the Fund had an average loan balance of $13,805 and paid an average interest rate of 4.59% . As of September 30, 2009 there was an outstanding loan balance due of $91,371.
12.) LOSS CARRYFORWARDS
At March 31, 2009, the Fund had available for federal tax purposes an unused capital loss carry-forward of $58,677 which expires in 2017. Capital loss carryforwards are available to offset future realized capital gains. To the extent that this carryforward is used to offset future capital gains, it is probable that the amount, which is offset, will not be distributed to shareholders.
2009 Semi-Annual Report 16
ADDITIONAL INFORMATION
(UNAUDITED) |
1.) APPROVAL OF INVESTMENT ADVISORY AGREEMENT
On May 16, 2009 the Trustees considered the renewal of the Management Agreement (the "Agreement") between the Advisor and the Trust, on behalf of the Fund. In approving the Agreement, the Trustees considered and evaluated the following factors: (i) the investment performance of the Fund and the Advisor; (ii) the nature, extent and quality of the services provided by the investment advisor to the Fund; (iii) the cost of the services to be provided and the profits to be realized by the Advisor and its affiliates from the relationship with the Fund; (iv) the extent to which economies of scale will be realized as the Fund grows; and (v) whether the fee levels reflect these economies of scale to the benefit of shareholders.
In determining whether to renew the Agreement, the Board met with the Adviser, to discuss the terms of the Agreement. They reviewed and discussed with the Adviser’s personal history, including background and investment management experience. They also discussed the Fund's performance for the last fiscal year, important factors relating to the Fund's performance, the Adviser's investment and research strategy, the Adviser's financial strength, and expected expenses and revenue from the Fund. The Adviser stated to the Board that the it had sufficient assets available to meet its obligations to the Fund.
The Board gave careful consideration to factors deemed relevant to the Trust and the Fund. As to the nature, extent and quality of the services to be provided by the Adviser, and the performance of the Fund since commencement of operations, the Board noted that the Fund underperformed its benchmark index, the S&P 500 Index, for the fiscal year ended March 31, 2009, by returning -61.97% compared to a return of -38.09% for the S&P 500 Index for the same period. The Board also reviewed comparative performance from the inception of the Fund through March 31, 2009, noting that the Fund outperformed its benchmark index with an average annualized return of 10.93% since inception compared to an average annualized return of 0.95% for the S&P 500 Index. The Board noted that although the Fund underperformed its index in fiscal 2009, the long-term performance provided strong evidence of the quality of the advisory services provided by the Adviser.
As to the costs of the services to be provided, the Board reviewed information regarding comparable fee structures and acknowledged that the Fund's base management fee rate (which includes paying substantially all operating expenses of the Fund) and total annual operating expenses were significantly higher than the management fees and expense ratio paid by 34 other funds of comparable size and with similar investment objectives. However, the Trustees acknowledged that the Adviser spends a substantial amount of time managing the Fund and noted that the Fund's superior performance over the long-term after deduction of the performance fee more than justified the higher fee expenses. In addition, the Trustees noted that the Adviser bears a risk of loss under the performance fee arrangement. Under the Agreement, poor Fund performance results in a reduction of the management fee. The Board concluded that this fee arrangement aligns the Adviser's interest with those of the sharehol ders. The Adviser noted that due to the poor short-term performance of the Fund in the last couple of months of the fiscal year he repaid the Fund performance-based management fees totaling $97,354. The Trustees therefore concluded that the fee structure under the current Agreement, including performance-based adjustments, was reasonable.
As to the profits to be realized by the Adviser under the Agreement, the extent to which economies of scale may be realized as the Fund grows, and whether the fee levels reflect these economies of scale for the benefit of the Fund investors, the Board noted that the Adviser has made a substantial investment in the Fund. The Trustees acknowledged that the fee under the current management agreement does not provide investors with an opportunity to realize the benefits of economies of scale as the Fund grows. However, the Trustees also noted that the management fee is structured so that investors pay a fee that varies directly with the performance of the Fund. Investors will pay a higher fee if the Fund outperforms its benchmark index and a lower fee if the Fund underperforms its benchmark index. Thus, Fund shareholders will receive the benefit of paying a fee that aligns their interests with the interests of the Adviser. In addition, given the small asset base of the Fund, the y did not think it necessary to consider adding break points at this time.
The independent Trustees then met in executive session with legal counsel to discuss the Agreement approval process.
The Trustees, after further consideration, then concluded that the Management Agreement was fair and reasonable, that the Advisor's fees are reasonable in light of the services provided to the Fund and the benefits received by the Advisor, and that renewal of the Management Agreement would be in the best interests of the Fund and its shareholders.
2009 Semi-Annual Report 17
Board of Trustees
Kailash Birmiwal, Ph. D.
Rajendra K. Bordia, Ph. D.
Hemant K. Gupta, Ph. D.
Veera S. Karukonda
Bal K. Sharma, Dr.
Investment Adviser
Birmiwal Asset Management, Inc.
24140 E. Greystone Lane
Woodway, WA 98020
Dividend Paying Agent,
Shareholders' Servicing Agent,
Transfer Agent
Mutual Shareholder Services, LLC
8000 Town Centre Dr., Ste 400
Broadview Hts, OH 44147
Custodian
U.S. Bank, NA
425 Walnut Street
P.O. Box 1118
Cincinnati, OH 45201
Fund Administrator
Premier Fund Solutions Inc.
480 N. Magnolia Avenue, Suite 103
El Cajon, CA 92020
Legal Counsel
Thompson Hine LLP
312 Walnut Street, 14th Floor
Cincinnati, OH 45202
Independent Registered Public
Accounting Firm
Cohen Fund Audit Services, Ltd.
800 Westpoint Pkwy., Ste 1100
Westlake, OH 44145-1594 |
This report is provided for the general information of the shareholders of the Birmiwal Oasis Fund. This report is not intended for distribution to prospective investors in the funds, unless preceded or accompanied by an effective prospectus.
Birmiwal Oasis Fund
24140 E. Greystone Lane
Woodway, WA 98020 |
Item 2. Code of Ethics. Not applicable.
Item 3. Audit Committee Financial Expert. Not applicable.
Item 4. Principal Accountant Fees and Services. Not applicable.
Item 5. Audit Committee of Listed Companies. Not applicable.
Item 6. Schedule of Investments. Not applicable. Schedule filed with Item 1.
Item 7. Disclosure of Proxy Voting Policies and Procedures for Closed-End Funds. Not applicable.
Item 8. Portfolio Managers of Closed End Funds. Not applicable.
Item 9. Purchases of Equity Securities by Closed-End Management Investment Companies and Affiliated Purchasers. Not applicable.
Item 10. Submission of Matters to a Vote of Security Holders.
The registrant has not adopted procedures by which shareholders may recommend nominees to the registrant’s board of trustees.
Item 11. Controls and Procedures.
(a) The Registrant’s president and chief financial officer concluded that the disclosure controls and procedures (as defined in Rule 30a-3(c) under the Investment Company Act of 1940 (the “Act”)) were effective as of a date within 90 days of the filing date of this report, based on the evaluation of these controls and procedures required by Rule 30a-3(b) under the Act.
(b) There were no changes in the registrant’s internal control over financial reporting (as defined in Rule 30a-3(d) under the Act) that occurred during the registrant’s second fiscal quarter of the period covered by this report that have materially affected, or are reasonably likely to materially affect, the registrant’s internal control over financial reporting.
Item 12. Exhibits.
(a)(1) Code of Ethics. Not applicable.
(a)(2) Certifications pursuant to Section 302 of the Sarbanes-Oxley Act of 2002. Filed herewith.
(b) Certification pursuant to Section 906 of the Sarbanes-Oxley Act of 2002. Filed herewith.
Pursuant to the requirements of the Securities Exchange Act of 1934 and the Investment Company Act of 1940, the registrant has duly caused this report to be signed on its behalf by the undersigned, thereunto duly authorized.
| | Birmiwal Investment Trust |
| | By: /s/ Kailash Birmiwal
Kailash Birmiwal
President |
Pursuant to the requirements of the Securities Exchange Act of 1934 and the Investment Company Act of 1940, this report has been signed below by the following persons on behalf of the registrant and in the capacities and on the dates indicated.
| | By: /s/ Kailash Birmiwal
Kailash Birmiwal
President |
| | By: /s/ Kailash Birmiwal
Kailash Birmiwal
Chief Financial Officer |