UNITED STATES
SECURITIES AND EXCHANGE COMMISSION
WASHINGTON, D.C. 20549
FORM N-CSR
CERTIFIED SHAREHOLDER REPORT OF REGISTERED MANAGEMENT
INVESTMENT COMPANIES
| Investment Company Act file number 811-21289 |
Birmiwal Investment Trust
(Exact name of registrant as specified in charter)
24140 E. Greystone Lane, Woodway, WA 98020
(Address of principal executive offices) (Zip code)
Kailash Birmiwal
24140 E. Greystone Lane, Woodway, WA 98020
(Name and address of agent for service)
Registrant's telephone number, including area code: (206) 542-7652
Date of fiscal year end: March 31
Date of reporting period: September 30, 2012
Form N-CSR is to be used by management investment companies to file reports with the Commission not later than 10 days after the transmission to stockholders of any report that is required to be transmitted to stockholders under Rule 30e-1 under the Investment Company Act of 1940 (17 CFR 270.30e -1). The Commission may use the information provided on Form N-CSR in its regulatory, disclosure review, inspection and policymaking roles.
A registrant is required to disclose the information specified by Form N-CSR, and the Commission will make this information public. A registrant is not required to respond to the collection of information contained in Form N-CSR unless the Form displays a currently valid Office of Management and Budget ("OMB") control number. Please direct comments concerning the accuracy of the information collection burden estimate and any suggestions for reducing the burden to Secretary, Securities and Exchange Commission, 450 Fifth Street, NW, Washington, DC 20549-0609. The OMB has reviewed this collection of information under the clearance requirements of 44 U.S.C. § 3507.
Item 1. Reports to Stockholders.
Birmiwal Oasis Fund
For Investors Seeking Capital Appreciation
SEMI-ANNUAL REPORT
September 30, 2012
Birmiwal Investment Trust
www.birmiwal.com
1-800-417-5525
BIRMIWAL OASIS FUND (Unaudited)
Birmiwal Oasis Fund
by Industry Sectors
(as a percentage of Total Investment Securities)
UNAUDITED
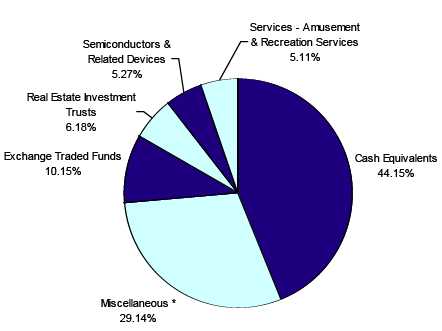
* Includes industry sectors that individually constitute no more than 4% of net assets.
See Schedule of Investments for additional information. |
PERFORMANCE INFORMATION
AVERAGE ANNUAL RATE OF RETURN (%) FOR THE PERIOD ENDED SEPTEMBER 30, 2012.
9/30/12 NAV $10.85
| | | | | | | | Since | |
| | 1 Year(A) | | 3 Years(A) | | 5 Years(A) | | Inception(A) | |
| Birmiwal Oasis Fund | -5.73% | | -16.90% | | -15.56% | | 9.61% | |
| S&P 500(B) | 30.20% | | 13.21% | | 1.05% | | 7.89% | |
(A)1 Year, 3 Years, 5 Years and Since Inception returns include change in share prices and in each case includes reinvestment of any dividends and capital gain distributions. The inception date of the Birmiwal Oasis Fund was April 1, 2003.
(B)The S&P 500 is a broad market-weighted average dominated by blue-chip stocks and is an unmanaged group of stocks whose composition is different from the Fund.
PAST PERFORMANCE DOES NOT GUARANTEE FUTURE RESULTS. INVESTMENT RETURN AND PRINCIPAL VALUE WILL FLUCTUATE SO THAT SHARES, WHEN REDEEMED, MAY BE WORTH MORE OR LESS THAN THEIR ORIGINAL COST. RETURNS DO NOT REFLECT THE DEDUCTION OF TAXES THAT A SHAREHOLDER WOULD PAY ON FUND DISTRIBUTIONS OR THE REDEMPTION OF FUND SHARES. CURRENT PERFORMANCE MAY BE LOWER OR HIGHER THAN THE PERFORMANCE DATA QUOTED. TO OBTAIN PERFORMANCE DATA CURRENT TO THE MOST RECENT MONTH END, PLEASE CALL 1-800-417-5525.
2012 Semi-Annual Report 1
Disclosure of Expenses
(Unaudited)
Shareholders of this Fund incur ongoing operating expenses consisting of a base management fee, a performance-based management fee, borrowing expenses and other expenses. The following example is intended to help you understand your ongoing costs of investing in the Fund and to compare these costs with similar costs of investing in other mutual funds. The example is based on an investment of $1,000 invested in the Fund on April 1, 2012 and held through September 30, 2012.
The first line of the table below provides information about actual account values and actual expenses. In order to estimate the expenses a shareholder paid during the period covered by this report, shareholders can divide their account value by $1,000 (for example, an $8,600 account value divided by $1,000 = 8.6) and then multiply the result by the number in the first line under the heading entitled "Expenses Paid During the Period."
The second line of the table below provides information about hypothetical account values and hypothetical expenses based on the Fund's actual expense ratio and an assumed rate of return of 5% per year before expenses, which is not the Fund’s actual return. The hypothetical account values and expenses may not be used to estimate the actual ending account balance or expenses paid by a shareholder for the period. Shareholders may use this information to compare the ongoing costs of investing in this Fund and other funds. To do so, compare this 5% hypothetical example with the 5% hypothetical examples that appear in other funds' shareholder reports.
| | | | | | | Expenses Paid |
| | | Beginning | | Ending | | During the Period* |
| | | Account Value | | Account Value | | April 1, 2012 to |
| | | April 1, 2012 | | September 30,2012 | | September 30,2012 |
| |
| Actual | | $1,000.00 | | $ 771.14 | | $1.02 |
| |
| Hypothetical | | $1,000.00 | | $1,023.92 | | $1.17 |
| (5% annual return | | | | | | |
| before expenses) | | | | | | |
* Expenses are equal to the Fund’s annualized expense ratio of 0.23%, multiplied by
the average account value over the period, multiplied by 183/365 (to reflect the one-
half year period). |
Availability of Quarterly Schedule of Investments
(Unaudited)
The Fund files its complete schedule of portfolio holdings with the Securities and Exchange Commission ("SEC") for the first and third quarters of each fiscal year on Form N-Q. The Fund’s Forms N-Q are available on the SEC's website at http://www.sec.gov. The Fund’s Forms N-Q may also be reviewed and copied at the SEC's Public Reference Room in Washington, DC. Information on the operation of the Public Reference Room may be obtained by calling 1-800-SEC-0330.
Proxy Voting Guideline
(Unaudited)
Birmiwal Asset Management, Inc., the Fund’s Adviser (“Adviser”), is responsible for exercising the voting rights associated with the securities held by the Fund. For existing shareholders, a description of the policies and procedures used by the Adviser in fulfilling this responsibility is available without charge on the Fund’s website at www.birmiwal.com. It is also included in the Fund’s Statement of Additional Information, which is available on the Securities and Exchange Commission’s website at http://www.sec.gov.
Information regarding how the Fund voted proxies, contained on Form N-PX, relating to portfolio securities during the most recent 12-month period ended June 30 is available without charge, upon request, by calling our toll free number (1-800-417-5525). This information is also available on the SEC’s website at http://www.sec.gov.
2012 Semi-Annual Report 2
| Birmiwal Oasis Fund |
| |
| | | | Schedule of Investments |
| | | | September 30, 2012 (Unaudited) |
| Shares/Principal Amount | | Fair Value | % of Net Assets |
| COMMON STOCKS | | | | |
| Agricultural Chemicals | | | | |
| 154,779 | Bodisen Biotech Inc. * (China) + | $ | 21,669 | 0.26 | % |
| Beverages | | | | | |
| 2,000 | The Coca-Cola Company | | 75,860 | 0.92 | % |
| Communications Services, NEC | | | | |
| 20,000 | Calix, Inc. * | | 128,000 | 1.55 | % |
| Converted Paper & Paperboard Products (No Containers/Boxes) | | | | |
| 50,000 | Orient Paper, Inc. * (China) | | 100,500 | 1.22 | % |
| Crude Petroleum & Natural Gas | | | | |
| 49,918 | Lone Pine Resources Inc. * (Canada) | | 77,872 | 0.94 | % |
| Engines & Turbines | | | | |
| 500 | Cummins Inc. | | 46,105 | 0.56 | % |
| Guided Missiles & Space Vehicles & Parts | | | | |
| 507 | Alliant Techsystems Inc. | | 25,406 | 0.31 | % |
| Miscellaneous Food Preparations & Kindred Products | | | | |
| 1,000 | Green Mountain Coffee Roasters Inc. * | | 23,740 | 0.29 | % |
| Motor Vehicles & Passenger Car Bodies | | | | |
| 2,000 | General Motors Company * | | 45,500 | | |
| 1,000 | Tata Motors Ltd. ** | | 25,680 | | |
| | | | 71,180 | 0.86 | % |
| Oil & Gas Field Services, NEC | | | | |
| 1,000 | Schlumberger Limited | | 72,330 | 0.88 | % |
| Radio & TV Broadcasting & Communications Equipment | | | | |
| 10,000 | Youku Tudou Inc. * ** | | 183,900 | 2.23 | % |
| Radiotelephone Communications | | | | |
| 20,000 | NII Holdings, Inc. * | | 156,600 | 1.89 | % |
| Retail - Catalog & Mail-Order Houses | | | | |
| 200 | Amazon.com Inc. * | | 50,864 | 0.62 | % |
| Retail - Department Stores | | | | |
| 2,000 | J. C. Penney Company, Inc. | | 48,580 | 0.59 | % |
| Retail - Jewelry Stores | | | | |
| 1,000 | Tiffany & Co. | | 61,880 | 0.75 | % |
| Retail - Radio, TV & Consumer Electronics Stores | | | | |
| 3,000 | Best Buy Co., Inc. | | 51,600 | 0.62 | % |
| Rubber & Plastics Footwear | | | | |
| 2,000 | Deckers Outdoor Corporation * | | 73,280 | 0.89 | % |
| Security Brokers, Dealers & Flotation Companies | | | | |
| 3,000 | Morgan Stanley | | 50,220 | 0.61 | % |
| Semiconductors & Related Devices | | | | |
| 164,307 | Actions Semiconductor Co., Ltd. * ** | | 264,534 | | |
| 20,000 | MEMC Electronic Materials, Inc. * | | 55,000 | | |
| 30,000 | Mindspeed Technologies, Inc. * | | 103,800 | | |
| | | | 423,334 | 5.12 | % |
| Services - Advertising | | | | |
| 522,868 | China MediaExpress Holdings, Inc. * (China) | | - | 0.00 | % |
| Services - Advertising Agencies | | | | |
| 2,000 | Groupon, Inc. * | | 9,530 | 0.12 | % |
| Services - Amusement & Recreation Services | | | | |
| 135,980 Asia Entertainment & Resources Ltd. (China) | | 410,660 | 4.97 | % |
| Services - Computer Processing & Data Preparation | | | | |
| 18,505 Renren Inc. * ** | | 74,575 | 0.90 | % |
| Services - Computer Programming, Data Processing, Etc. | | | | |
| 10,000 | Facebook, Inc. * | | 216,600 | 2.62 | % |
* Non-Income Producing Securities.
** ADR - American Depositary Receipt.
+ Level 2 Security; See Note 3.
The accompanying notes are an integral part of the financial
statements. |
2012 Semi-Annual Report 3
| Birmiwal Oasis Fund |
| |
| | | | | Schedule of Investments |
| | | | | September 30, 2012 (Unaudited) |
| Shares/Principal Amount | | | Fair Value | | % of Net Assets |
| COMMON STOCKS | | | | | | |
| Services - Educational Services | | | | | | |
| 99,463 | Corinthian Colleges Inc. * | | $ | 237,717 | | 2.88 | % |
| Services - Management Services | | | | | | |
| 10,000 | Accretive Health, Inc. * | | | 111,600 | | 1.35 | % |
| Services - Prepackaged Software | | | | | | |
| 1,000 | Microsoft Corp. | | | 29,760 | | 0.36 | % |
| Steel Works, Blast Furnaces & Rolling Mills (Coke Ovens) | | | | | | |
| 20,000 | Mechel OAO * ** | | | 140,800 | | 1.70 | % |
| Telephone & Telegraph Apparatus | | | | | | |
| 2,000 | CIENA Corp. * | | | 27,180 | | 0.32 | % |
| Telephone Communications (No Radiotelephone) | | | | | | |
| 20,000 | Sprint Nextel Corporation * | | | 55,200 | | 0.66 | % |
| Water, Sewer, Pipeline, Commercial & Power Line Construction | | | | | |
| 20,000 | The Goldfield Corporation * | | | 37,800 | | 0.45 | % |
| Total for Common Stock (Cost $8,294,216) | | | 3,094,342 | | 37.44 | % |
| REAL ESTATE INVESTMENT TRUSTS | | | | | | |
| 67,561 | Impac Mortgage Holdings, Inc. * | | $ | 496,573 | | 6.01 | % |
| Total for Real Estate Investment Trusts (Cost $347,227) | | | | | | |
| CONTINGENT VALUE RIGHTS | | | | | | |
| 40,000 | Sino Clean Energy Inc. * (China) ++ | | $ | - | | 0.00 | % |
| Total for Contingent Value Rights (Cost $0) | | | | | | |
| EXCHANGE TRADED FUNDS | | | | | | |
| 6,000 | Direxion Daily Small Cap Bear 3X Shares * | | | 89,280 | | | |
| 4,000 | iShares Barclays 1-3 Year Treasury Bond Fund | | | 338,000 | | | |
| 2,000 | iShares Silver Trust * | | | 66,960 | | | |
| 7,000 | SPDR® Barclays Capital 1-3 Month T-Bill ETF * | | | 320,670 | | | |
| Total for Exchange Traded Funds (Cost $886,296) | | | 814,910 | | 9.86 | % |
| CALL OPTIONS + | Shares Subject | | | | | |
| Expiration Date/Exercise Price | to Call | | | | | |
| Asia Entertainment & Resources Ltd. * (Hong Kong) | | | | | | |
| April 2013 Calls @ 5.00 | 20,000 | $ | - | | | |
| BP Prudhoe Bay Royalty Trust * | | | | | | |
| March 2013 Calls @ 90.00 | 10,000 | | 52,000 | | | |
| Hovnanian Enterprises, Inc. * | | | | | | |
| October 2012 Calls @ 3.50 | 100,000 | | 20,000 | | | |
| Qihoo 360 Technology Co. Ltd. * ** | | | | | | |
| October 2012 Calls @ 25.00 | 20,000 | | 8,000 | | | |
| Total (Premiums Paid - $162,876) | | | 80,000 | | 0.97 | % |
| Money Market Funds | | | | | | |
| 3,546,370 | Fidelity Governmental Fund 57 0.01% *** | | | 3,546,370 | | 42.90 | % |
| | (Cost $3,546,370) | | | | | | |
| | Total Investment Securities | | | 8,032,195 | | 97.18 | % |
| | (Cost $13,236,985) | | | | | | |
| | Other Assets In Excess of Liabilities | | | 232,665 | | 2.82 | % |
| | Net Assets | | $ | 8,264,860 | | 100.00 | % |
+ Level 2 Securities; See Note 3.
* Non-Income Producing Securities.
** ADR - American Depositary Receipt.
*** Variable Rate Security; The Yield Rate shown represents the rate at September 30, 2012.
++ Contingent Value Right, or CVR, issued by Sino Clean Energy Inc. provides owners the right to collect
90% of the proceeds received by the company resulting from a pending lawsuit. There is no market for these
rights, therefore these are considered to be illiquid and are valued according to fair value procedures
approved by the Trust; Level 3. |
The accompanying notes are an integral part of the financial
statements. |
2012 Semi-Annual Report 4
| Birmiwal Oasis Fund |
| |
| Statement of Assets and Liabilities (Unaudited) | | | |
| September 30, 2012 | | | |
| |
| Assets: | | | |
| Investment Securities at Fair Value | $ | 8,032,195 | |
| (Cost $13,236,985) | | | |
| Cash | | 65,473 | |
| Receivables: | | | |
| Dividends and Interest | | 2,263 | |
| Receivable for Securities Sold | | 259,752 | |
| Total Assets | | 8,359,683 | |
| Liabilities: | | | |
| Due to Broker | | 26,885 | |
| Payable for Securities Purchased | | 66,092 | |
| Management Fee Payable - Net | | 1,846 | |
| Total Liabilities | | 94,823 | |
| Net Assets | $ | 8,264,860 | |
| Net Assets Consist of: | | | |
| Paid In Capital | $ | 22,593,199 | |
| Accumulated Undistributed Net Investment Income | | 87,714 | |
| Accumulated Realized Loss on Investments - Net | | (9,211,263 | ) |
| Unrealized Depreciation in Value of Investments and Options | | | |
| Purchased Based on Identified Cost - Net | | (5,204,790 | ) |
| Net Assets, for 761,914 Shares Outstanding | $ | 8,264,860 | |
| (Unlimited number of shares authorized without par value) | | | |
| Net Asset Value, Offering and Redemption Price | | | |
| Per Share ($8,264,860/761,914 shares) | $ | 10.85 | |
| |
| Statement of Operations (Unaudited) | | | |
| For the six month period ended September 30, 2012 | | | |
| |
| Investment Income: | | | |
| Dividends | $ | 44,899 | |
| Interest | | 194 | |
| Total Investment Income | | 45,093 | |
| Expenses: (Note 4) | | | |
| Management Fees: | | | |
| Base Management Fees | | 126,487 | |
| Less: Performance Based Management Fee Adjustment – Net | | (119,459 | ) |
| Net Management Fees | | 7,028 | |
| Borrowing Expense on Securities Sold Short | | 380 | |
| ADR fees | | 2,690 | |
| Total Expenses | | 10,098 | |
| |
| Net Investment Income | | 34,995 | |
| |
| Realized and Unrealized Gain/(Loss) on Investments, Securities Sold Short | | | |
| Options Purchased and Options Written: | | | |
| Net Realized Loss on Investments | | (2,403,419 | ) |
| Net Realized Loss on Securities Sold Short | | (10,979 | ) |
| Net Realized Gain on Options Written | | 60,698 | |
| Net Realized Loss on Options Purchased | | (1,352,666 | ) |
| Net Change In Unrealized Depreciation on Investments | | 1,221,807 | |
| Net Change In Unrealized Depreciation on Options Purchased | | (19,611 | ) |
| Net Realized and Unrealized Gain/(Loss) on Investments, Securities Sold Short | | | |
| Options Purchased and Options Written | | (2,504,170 | ) |
| Net Decrease in Net Assets from Operations | $ | (2,469,175 | ) |
The accompanying notes are an integral part of the financial
statements. |
2012 Semi-Annual Report 5
| Birmiwal Oasis Fund |
| |
| Statements of Changes in Net Assets | | (Unaudited) | | | | | |
| | | 4/1/2012 | | | | 4/1/2011 | |
| | | to | | | | to | |
| | | 9/30/2012 | | | | 3/31/2012 | |
| From Operations: | | | | | | | |
| Net Investment Income/(Loss) | $ | 34,995 | | | $ | 52,719 | |
| Net Realized Gain/(Loss) on Investments, Securities Sold Short, | | (3,706,366 | ) | | | (2,413,454 | ) |
| Options Purchased and Options Written | | | | | | | |
| Net Change In Unrealized Appreciation/(Depreciation) | | 1,202,196 | | | | (2,095,742 | ) |
| Increase/(Decrease) in Net Assets from Operations | | (2,469,175 | ) | | | (4,456,477 | ) |
| From Distributions to Shareholders: | | | | | | | |
| Net Investment Income | | - | | | | - | |
| Net Realized Gain from Security Transactions | | - | | | | - | |
| Change in Net Assets from Distributions | | - | | | | - | |
| From Capital Share Transactions: | | | | | | | |
| Proceeds From Sale of Shares | | 500 | | | | 15,087 | |
| Shares Issued on Reinvestment of Dividends | | - | | | | 0 | |
| Cost of Shares Redeemed | | (50,442 | ) | | | (316,941 | ) |
| Net Increase/(Decrease) from Shareholder Activity | | (49,942 | ) | | | (301,854 | ) |
| Net Increase/(Decrease) in Net Assets | | (2,519,117 | ) | | | (4,758,331 | ) |
| Net Assets at Beginning of Period | | 10,783,977 | | | | 15,542,308 | |
| Net Assets at End of Period (including accumulated | $ | 8,264,860 | | | $ | 10,783,977 | |
| undistributed net investment income of $87,714 and $52,719, respectively) | | | | | | | |
| Share Transactions: | | | | | | | |
| Issued | | 44 | | | | 972 | |
| Reinvested | | - | | | | 0 | |
| Redeemed | | (4,598 | ) | | | (18,412 | ) |
| Net Increase/(Decrease) in Shares | | (4,554 | ) | | | (17,440 | ) |
| Shares Outstanding Beginning of Period | | 766,468 | | | | 783,908 | |
| Shares Outstanding End of Period | | 761,914 | | | | 766,468 | |
| Financial Highlights | | (Unaudited) | | | | | | | | | | | | | | | | |
| Selected data for a share outstanding | | 4/1/2012 | | | 4/1/2011 | | | 4/1/2010 | | | 4/1/2009 | | | 4/1/2008 | | | 4/1/2007 | |
| throughout the period: | | to | | | to | | | to | | | to | | | to | | | to | |
| | | 9/30/2012 | | | 3/31/2012 | | | 3/31/2011 | | | 3/31/2010 | | | 3/31/2009 | | | 3/31/2008 | |
| Net Asset Value - | | | | | | | | | | | | | | | | | | |
| Beginning of Period | $ | 14.07 | | $ | 19.83 | | $ | 25.59 | | $ | 8.63 | | $ | 23.20 | | $ | 32.56 | |
| Net Investment Income/(Loss) (a) | | 0.05 | | | 0.07 | | | (0.98 | ) | | (0.56 | ) | | (0.32 | ) | | (0.80 | ) |
| Net Gains or Losses on Securities | | | | | | | | | | | | | | | | | | |
| (realized and unrealized) (b) | | (3.27 | ) | | (5.83 | ) | | (4.26 | ) | | 17.52 | | | (14.01 | ) | | 2.05 | |
| Total from Investment Operations | | (3.22 | ) | | (5.76 | ) | | (5.24 | ) | | 16.96 | | | (14.33 | ) | | 1.25 | |
| Distributions (From Net Investment Income) | | 0.00 | | | 0.00 | | | 0.00 | | | 0.00 | | | 0.00 | | | 0.00 | |
| Distributions (From Capital Gains) | | 0.00 | | | 0.00 | | | (0.52 | ) | | 0.00 | | | (0.24 | ) | | (10.61 | ) |
| Total Distributions | | 0.00 | | | 0.00 | | | (0.52 | ) | | 0.00 | | | (0.24 | ) | | (10.61 | ) |
| Net Asset Value - | | | | | | | | | | | | | | | | | | |
| End of Period | $ | 10.85 | | $ | 14.07 | | $ | 19.83 | | $ | 25.59 | | $ | 8.63 | | $ | 23.20 | |
| |
| Total Return (c) | | (22.89)% | * | | (29.05)% | | | (20.91)% | | | 196.52% | | | (61.97)% | | | (2.12)% | |
| Ratios/Supplemental Data | | | | | | | | | | | | | | | | | | |
| Net Assets - End of Period (Thousands) | $ | 8,265 | | $ | 10,784 | | $ | 15,542 | | $ | 19,853 | | $ | 6,715 | | $ | 19,074 | |
| Ratio of Expenses to Average Net Assets | | 0.23% | ** | | -0.28% | | | 4.03% | | | 3.25% | | | 2.57% | | | 4.28% | |
| Ratio of Net Investment Income/(Loss) to Average Net Assets | | 0.80% | ** | | 0.48% | | | -4.00% | | | -3.08% | | | -1.81% | | | -2.58% | |
| Portfolio Turnover Rate | | 582.33% | * | | 1446.94% | | | 1383.38% | | | 1477.97% | | | 998.97% | | | 932.44% | |
* Not Annualized.
** Annualized.
(a) Per share amounts were calculated using the average shares method.
(b) Realized and unrealized gains and losses per share in this caption are balancing amounts necessary to reconcile the
change in net asset value per share for the period, and may not reconcile with the aggregate gains and losses in the
Statement of Operations due to share transactions for the period.
(c) Total return in the above table represents the rate that the investor would have earned or lost on an investment in the
Fund assuming reinvestment of all Fund distributions. |
The accompanying notes are an integral part of these
financial statements. |
2012 Semi-Annual Report 6
NOTES TO FINANCIAL STATEMENTS
BIRMIWAL OASIS FUND
September 30, 2012
(Unaudited)
1.) ORGANIZATION
Birmiwal Oasis Fund (the "Fund") is a non-diversified series of the Birmiwal Investment Trust (the "Trust"), an open-end investment company that commenced operations on April 1, 2003. The Trust was organized in Ohio as a business trust on January 3, 2003. The Trust may offer shares of beneficial interest in a number of separate series, each series representing a distinct fund with its own investment objectives and policies. At present, there is only one series authorized by the Trust. Birmiwal Asset Management, Inc. is the adviser to the Fund (the "Adviser"). As of August 1, 2006, the Fund revised its policies with respect to permitted investments in the Fund to reflect the following: The Fund remained closed to new investors except for non-profit organizations. Existing shareholders can purchase additional shares either by making new investments in their existing account(s) and/or by opening new account(s). The total of such new investments will be limited to a maximum of $25,000 per calendar year per taxpayer identification number/social security number. Existing shareholders may also continue to add to their existing accounts through the reinvestment of dividends and/or capital gain distributions from shares owned and may continue to participate in the Automatic Investment Plan (AIP). Non-profit organizations qualifying under Section 501(c)(3) of the Internal Revenue Code can open new accounts subject to a maximum investment limit of $25,000 per calendar year per taxpayer identification number. Trustees of the Fund, as well as directors, officers and employees of the Adviser, may continue to open new accounts and make additional purchases in existing accounts. The Fund’s primary investment objective is to seek capital apreciation. Significant accounting policies of the Fund are presented below:
2.) SIGNIFICANT ACCOUNTING POLICIES
SECURITY VALUATION: All investments in securities are recorded at their estimated fair value, as described in Note 3.
SHORT SALES: The Fund may sell a security it does not own in anticipation of a decline in the fair value of that security. When the Fund sells a security short, it must borrow the security sold short and deliver it to the broker-dealer through which it made the short sale. A gain, limited to the price at which the Fund sold the security short, or a loss, unlimited in size, will be recognized upon the termination of a short sale.
OPTION TRANSACTIONS: The purchase and writing of options requires additional skills and techniques beyond normal portfolio management, and involves certain risks. The purchase of options limits a Fund’s potential loss to the amount of the premium paid and can afford the Fund the opportunity to profit from favorable moments in the price of an underlying security to a greater extent than if transactions were effected in the security directly. However, the purchase of an option could result in the Fund losing a greater percentage of its investment than if the transaction were effected directly. When the Fund writes an option, an amount equal to the premium received by the Fund is recorded as a liability and is subsequently adjusted to the current fair value of the option written. Premiums received from writing options that expire unexercised are treated by the Fund on the expiration date as realized gains from investments. The difference between the premium and the amount paid on effecting a closing purchase transaction, including brokerage commissions, is also treated as a realized gain, or, if the premium is less than the amount paid for the closing purchase transaction, as a realized loss. If a written call option is exercised, the premium is added to the proceeds from the sale of the underlying security or currency in determining whether the Fund has realized a gain or a loss. If a written put option is exercised, the premium reduces the cost basis of the securities purchased by the Fund. The Fund as writer of an option bears the market risk of an unfavorable change in the price of the security underlying the written option. See Note 8 for additional information.
FEDERAL INCOME TAXES: The Fund’s policy is to continue to comply with the requirements of the Internal Revenue Code that are applicable to regulated investment companies and to distribute all of its taxable income to shareholders. Therefore, no federal income tax provision is required. It is the Fund’s policy to distribute annually, prior to the end of the calendar year, dividends sufficient to satisfy excise tax requirements of the Internal Revenue Code. This Internal Revenue Code requirement may cause an excess of distributions over the book year-end accumulated income. In addition, it is the Fund’s policy to distribute annually, after the end of the fiscal year, any remaining net investment income and net realized capital gains.
The Fund recognizes the tax benefits of certain tax positions only where the position is “more likely than not” to be sustained assuming examination by tax authorities. Management has analyzed the Fund’s tax positions, and has concluded that no liability for unrecognized tax benefits should be recorded related to uncertain tax positions taken on returns filed for open tax years (2009 -2011), or expected to be taken on the Fund’s 2012 tax return. The Fund identifies its major tax
2012 Semi-Annual Report 7
Notes to Financial Statements (Unaudited) - continued
jurisdictions as U.S. Federal tax authorities; however the Fund is not aware of any tax positions for which it is reasonably possible that the total amounts of unrecognized tax benefits will change materially in the next twelve months. The Fund recognizes interest and penalties, if any, related to unrecognized tax benefits as income tax expense on the Statement of Operations. During the period, the Fund did not incur any interest or penalties.
DISTRIBUTIONS TO SHAREHOLDERS: Distributions to shareholders, which are determined in accordance with income tax regulations, are recorded on the ex-dividend date. The treatment for financial reporting purposes of distributions made to shareholders during the year from net investment income or net realized capital gains may differ from their ultimate treatment for federal income tax purposes. These differences are caused primarily by differences in the timing of the recognition of certain components of income, expense, or realized capital gain for federal income tax purposes. Where such differences are permanent in nature, they are reclassified in the components of the net assets based on their ultimate characterization for federal income tax purposes. Any such reclassifications will have no effect on net assets, results of operations, or net asset values per share of the Fund.
USE OF ESTIMATES: The preparation of financial statements in conformity with accounting principles generally accepted in the United States of America (GAAP) requires management to make estimates and assumptions that affect the reported amounts of assets and liabilities and disclosure of contingent assets and liabilities at the date of the financial statements and the reported amounts of revenues and expenses during the reporting period. Actual results could differ from those estimates.
OTHER: The Fund records security transactions based on a trade date. Dividend income is recognized on the ex-dividend date, and interest income is recognized on an accrual basis. Discounts and premiums on securities purchased are amortized over the lives of the respective securities. Withholding taxes on foreign dividends have been provided for in accordance with the Fund’s understanding of the applicable country’s tax rules and rates.
3.) SECURITIES VALUATIONS
As described in Note 2, the Fund utilizes various methods to measure the fair value of most of its investments on a recurring basis. GAAP establishes a hierarchy that prioritizes inputs to valuation methods. The three levels of inputs are:
Level 1 - Unadjusted quoted prices in active markets for identical assets or liabilities that the Fund has the ability to access.
Level 2 - Observable inputs other than quoted prices included in level 1 that are observable for the asset or liability, either directly or indirectly. These inputs may include quoted prices for the identical instrument on an inactive market, prices for similar instruments, interest rates, prepayment speeds, credit risk, yield curves, default rates and similar data.
Level 3 - Unobservable inputs for the asset or liability, to the extent relevant observable inputs are not available, representing the Fund’s own assumptions about the assumptions a market participant would use in valuing the asset or liability, and would be based on the best information available.
The availability of observable inputs can vary from security to security and is affected by a wide variety of factors, including, for example, the type of security, whether the security is new and not yet established in the marketplace, the liquidity of markets, and other characteristics particular to the security. To the extent that valuation is based on models or inputs that are less observable or unobservable in the market, the determination of fair value requires more judgment. Accordingly, the degree of judgment exercised in determining fair value is greatest for instruments categorized in level 3.
The inputs used to measure fair value may fall into different levels of the fair value hierarchy. In such cases, for disclosure purposes, the level in the fair value hierarchy within which the fair value measurement falls in its entirety, is determined based on the lowest level input that is significant to the fair value measurement in its entirety.
FAIR VALUE MEASUREMENTS
A description of the valuation techniques applied to the Fund’s major categories of assets and liabilities measured at fair value on a recurring basis follows.
Equity securities (common stock, REITs, contingent value rights and exchange traded funds). Equity securities that are traded on any exchange or on the NASDAQ over-the-counter market are valued at the last quoted sale price. Lacking a last sale price, a security is valued at its last bid price except when, in the Adviser's opinion, the last bid price does not accurately reflect the current value of the security. All other securities for which over-the-counter market quotations are
2012 Semi-Annual Report 8
Notes to Financial Statements (Unaudited) - continued
not readily available are valued at their last bid price. Generally, if the security is traded in an active market and is valued at the last sale price, the security is categorized as a level 1 security. When the security position is not considered to be part of an active market or when the security is valued at the bid price, the position is generally categorized as a level 2. When market quotations are not readily available, when the Adviser determines the last bid price does not accurately reflect the current value or when restricted securities are being valued, such securities are valued as determined in good faith by the Adviser, in conformity with guidelines adopted by and subject to review of the Board of Trustees and are generally categorized in level 3 of the fair value hierarchy.
Money market funds. Shares of money market funds are valued at a net asset value of $1.00 and are classified in level 1 of the fair value hierarchy.
Options. Option positions that are traded on any exchange or on the NASDAQ over-the-counter market are valued at the last quoted sale price. To the extent these option positions are actively traded and valuation adjustments are not applied, they are classified in level 1 of the fair value hierarchy. Lacking a last sale price, an option position, is valued at its last bid price except when, in the Adviser’s opinion, the last bid price does not accurately reflect the current value of the option position. When a bid price is used for valuation or when the security is not actively traded, those securities are generally categorized in level 2 or level 3 of the fair value hierarchy.
In accordance with the Trust's good faith pricing guidelines, the Adviser is required to consider all appropriate factors relevant to the value of securities for which it has determined other pricing sources are not available or reliable as described above. There is no single standard for determining fair value procedures, since fair value depends upon the circumstances of each individual case. As a general principle, the current fair value of an issue of securities being valued by the Adviser would appear to be the amount which the owner might reasonably expect to receive for them upon their current sale. Methods which are in accordance with this principle may, for example, be based on (i) a multiple of earnings; (ii) a discount from market of a similar freely traded security (including a derivative security or a basket of securities traded on other markets, exchanges or among dealers); or (iii) yield to maturity with respect to debt issues, or a combination of these and other methods.
The following table summarizes the inputs used to value the Fund’s assets measured at fair value as of September 30, 2012:
| Valuation Inputs of Assets | | Level 1 | | Level 2 | | Level 3 | | Total |
| Common Stock | | $3,072,673 | | $21,669 | | $0 | | $3,094,342 |
| Real Estate Investment Trusts | | 496,573 | | 0 | | 0 | | 496,573 |
| Contingent Value Rights | | 0 | | 0 | | 0 | | 0 |
| Exchange Traded Funds | | 814,910 | | 0 | | 0 | | 814,910 |
| Options Purchased | | 0 | | 80,000 | | 0 | | 80,000 |
| Money Market Funds | | 3,546,370 | | 0 | | 0 | | 3,546,370 |
| Total | | $7,930,526 | | $101,669 | | $0 | | $8,032,195 |
Refer to the Fund's Schedule of Investments for a listing of securities by industry. It is the Fund’s policy to recognize transfers into or out of the levels as of the end of the reporting period.
The Fund's assets assigned to the level 3 input category are valued at fair value as determined in good faith under procedures established by and under the general supervision of the Board. To determine fair value, management will utilize the valuation technique that they deem the most appropriate in the circumstances. Contingent value rights held by the Fund were valued with consideration that no market exists for the rights and any future payment is not expected. As of September 30, 2012, the contingent value rights were valued at $0.
There were no transfers into or out of the levels during the six month period ended September 30, 2012. It is the Fund’s policy to consider transfers into or out of the levels as of the end of the reporting period.
4.) INVESTMENT ADVISORY AGREEMENT
The Fund has entered into an Investment Advisory Agreement with Birmiwal Asset Management, Inc. (the “Adviser”). Under the terms of the Investment Advisory Agreement, the Adviser manages the investment portfolio of the Fund, subject to policies adopted by the Trust’s Board of Trustees. Under the Investment Advisory Agreement, the Adviser, at its own expense and without reimbursement from the Trust, furnishes office space and all necessary office facilities, equipment and executive personnel necessary for managing the assets of the Fund. The Adviser also pays the salaries and fees of all of its officers and employees that serve as officers and trustees of the Trust. The Adviser pays all operating expenses of the Fund, with the exception of taxes, borrowing expenses (such as (i) interest and (ii) dividend expenses on securities sold short), brokerage
2012 Semi-Annual Report 9
Notes to Financial Statements (Unaudited) - continued
commissions, indirect expenses (such as the expenses of other investment companies in which the Fund may invest) and extraordinary expenses.
For its services and its agreement to pay the Fund’s operating expenses, the Adviser receives an annual variable performance-based management fee comprised of a base rate of 2.90% of the Fund's average daily net assets and a performance adjustment, which is in accordance with a rate schedule. The performance adjustment increases or decreases the fee paid by the Fund to the Adviser based on the Fund's performance relative to the S&P 500 Index over the most recent 12-month period. If the Fund's return for the period is within 2.00% (two percentage points) of the return on the S&P 500 Index, no adjustment is made. If the difference between the performance of the Fund and the S&P 500 Index exceeds 2.00% (two percentage points), the performance adjustment is made at a rate that varies linearly with the difference between the Fund's performance and that of the S&P 500 Index. The resulting performance adjustment rate can be as high as 2.40% if the Fund outperforms the S&P 500 Index by 14% (fourteen percentage points) or more, and as low as -2.40% if the Fund underperforms the S&P 500 Index by 14% (fourteen percentage points) or more. The performance adjustment is calculated on the average net assets of the Fund on a rolling 12-month basis.
For the six month period ended September 30, 2012, the Adviser earned base management fees totaling $126,487 and repaid the Fund performance-based management fees totaling $119,459. As a result, as of September 30, 2012, under the Investment Advisory Agreement, the Fund owed the Adviser $1,846.
5.) RELATED PARTY TRANSACTIONS
Kailash Birmiwal, Ph.D. is the control person of the Adviser and also serves as a trustee/officer of the Fund. This individual receives benefits from the Adviser resulting from management fees paid to the Adviser by the Fund.
The Trustees who are not interested persons of the Fund were paid a total of $0 in Trustee fees for the six month period ended September 30, 2012. Pursuant to the Investment Advisory Agreement, these fees, if any are paid by the Adviser.
6.) CAPITAL STOCK
The Trust is authorized to issue an unlimited number of shares without par value. Paid in capital at September 30, 2012 was $22,593,199 representing 761,914 shares outstanding.
7.) INVESTMENT TRANSACTIONS
For the six month period ended September 30, 2012, purchases and sales of investment securities other than U.S. Government obligations and short-term investments aggregated $27,600,086 and $27,816,071, respectively. Purchases and sales of U.S. Government obligations aggregated $0 and $0, respectively.
For federal income tax purposes, the cost of total investment securities owned at September 30, 2012 was $13,236,985. At September 30, 2012, the composition of unrealized appreciation (the excess of value over tax cost) and depreciation (the excess of tax cost over value), was as follows:
| | Appreciation | | (Depreciation) | | Net Appreciation (Depreciation) | |
| | $286,289 | | ($5,491,079) | | ($5,204,790) | |
8.) DERIVATIVES
Transactions in purchased options during the six month period ended September 30, 2012, were as follows:
| | Number of | | Premiums | |
| | Contracts | | Paid | |
| Options outstanding at March 31, 2012 | 7,900 | | $174,265 | |
| Options purchased | 208,881 | | $7,559,386 | |
| Options terminated in closing transactions | (110,200 | ) | ($4,777,425 | ) |
| Options expired | (98,506 | ) | ($2,705,445 | ) |
| Options exercised | (6,575 | ) | ($87,905 | ) |
| Options outstanding at September 30, 2012 | 1,500 | | $162,876 | |
Transactions in written options during the six month period ended September 30, 2012, were as follows:
2012 Semi-Annual Report 10
Notes to Financial Statements (Unaudited) - continued
| | | |
| | Number of | | Premiums | |
| | Contracts | | Received | |
| Options outstanding at March 31, 2012 | 0 | | $0 | |
| Options written | 2,800 | | $86,337 | |
| Options terminated in closing transactions | 0 | | $0 | |
| Options expired | (2,600 | ) | ($60,698 | ) |
| Options exercised | (200 | ) | ($25,639 | ) |
| Options outstanding at September 30, 2012 | 0 | | $0 | |
The locations on the Statement of Assets and Liabilities of the Fund's derivative positions, which are not accounted for as hedging instruments under GAAP, are as follows:
| | | Asset | | | Liability |
| | | Derivatives | | | Derivatives |
| Options purchased: | | | Written Options at | | |
| Included In Investments in | | $80,000 | Fair Value | | $0 |
| Securities at Fair Value | | | | | |
Realized and unrealized gains and losses on derivatives contracts entered into during the six month period ended September 30, 2012, by the Fund are recorded in the following locations in the Statement of Operations:
| | | | Realized | | | | Unrealized | |
| Equity Contracts | Location | | Gain/(Loss) | | Location | | Gain/(Loss) | |
| Options | Net Realized | | | | Change In Unrealized | | | |
| Purchased | Loss on Options | | ($1,352,666) | | Appreciation/(Depreciation) | | ($19,611) | |
| | Purchased | | | | on Options Purchased | | | |
| |
| Options | Net Realized | | | | Change In Unrealized | | | |
| Written | Gain on Options | | $60,698 | | Appreciation/(Depreciation) | | $0 | |
| | Written | | | | on Options Written | | | |
The Fund engages in option transactions involving individual securities and stock indexes. An option involves either: (a) the right or the obligation to buy or sell a specific instrument at a specific price until the expiration date of the option; or (b) the right to receive payments or the obligation to make payments representing the difference between the closing price of a stock index and the exercise price of the option expressed in dollars times a specified multiple until the expiration date of the option. The Fund may purchase and write options. Options are sold (written) on securities and stock indexes. The purchaser of an option on a security pays the seller (the writer) a premium for the right granted but is not obligated to buy or sell the underlying security. The purchaser of an option on a stock index pays the seller a premium for the right granted, and in return the seller of such an option is obligated to make the payment. A writer of an option may terminate the obligation prior to expiration of the option by making an offsetting purchase of an identical option. Options are traded on organized exchanges and in the over-the-counter market. To cover the potential obligations involved in writing options, a Fund will either: (a) own the underlying security, or in the case of an option on a market index, will hold a portfolio of stocks substantially replicating the movement of the index; or (b) the Fund will segregate with the custodian high grade liquid assets sufficient to purchase the underlying security or equal to the fair value of the stock index option, marked to market daily.
The purchase of options limits the Fund's potential loss to the amount of the premium paid and can afford the Fund the opportunity to profit from favorable movements in the price of an underlying security to a greater extent than if transactions were effected in the security directly. However, the purchase of an option could result in the Fund losing a greater percentage of its investment than if the transaction were effected directly. When the Fund writes a call option, it will receive a premium, but it will give up the opportunity to profit from a price increase in the underlying security above the exercise price as long as its obligation as a writer continues. When the Fund writes a put option, it will assume the risk that the price of the underlying security or instrument will fall below the exercise price, in which case the Fund may be required to purchase the security or instrument at a higher price than the market price of the security or instrument. In addition, there can be no assurance that the Fund can effect a closing transaction on a particular option it has written. Further, the total premium paid for any option may be lost if the Fund does not exercise the option.
The Fund engages in option transactions involving securities and stock indices in order to gain exposure to particular securities or markets, in connection with hedging transactions, or to try to enhance returns. Options require additional skills and techniques beyond normal portfolio management. The Fund's use of options involves risk that such instruments may not work as intended
2012 Semi-Annual Report 11
Notes to Financial Statements (Unaudited) - continued
due to unanticipated developments, especially in abnormal market conditions, or if the Adviser makes an error in judgment, or other causes. The use of options may magnify the increase or decrease in the performance of the Fund, and may also subject the Fund to higher price volatility.
The premiums paid for the options represent the cost of the investment and the options are valued daily at their closing price. The Fund recognizes a realized gain or loss when the option is sold or expired. Option holdings within the Fund, which may include put options and call options, are subject to loss of value with the passage of time, and may experience a total loss of value upon expiration. With options, there is minimal counterparty risk to the Fund since they are exchange traded.
9.) CONTROL OWNERSHIP
The beneficial ownership, either directly or indirectly, of more than 25% of the voting securities of a fund creates a presumption of control of the fund, under Section 2(a)(9) of the Investment Company Act of 1940. As of September 30, 2012, Kailash Birmiwal, Ph.D., the control person of the Adviser located at 24140 E. Greystone Lane, Woodway, Washington, held, in aggregate, approximately 76% of the Fund.
10.) DISTRIBUTIONS TO SHAREHOLDERS
The tax character of distributions paid during the six month period ended September 30, 2012 and fiscal year ended March 31, 2012 were as follows:
| Distributions paid from: | | | | |
| |
| | | Six Months ended | | Year ended |
| | | September 30, 2012 | | March 31, 2012 |
| Ordinary Income: | | $ 0 | | $ 0 |
| Short-term Capital Gain | | 0 | | 0 |
| Long-term Capital Gain | | 0 | | 0 |
| | | $ 0 | | $ 0 |
11.) LOSS CARRYFORWARDS
As of March 31, 2012, the Fund had available for federal purposes an unused capital loss carry-forward of $4,837,761, of which $1,913,108 expires in 2019; $1,603,227 is short-term with no expiration; and $1,321,426 is long-term with no expiration. Capital loss carryforwards are available to offset future realized capital gains. To the extent that these carryforwards are used to offset future capital gains, it is probable that the amount that is offset will not be distributed to shareholders.
Under the recently enacted Regulated Investment Company Modernization Act of 2010, funds will be permitted to carry forward capital losses incurred in taxable years beginning after December 22, 2010 for an unlimited period. However, any losses incurred during those future taxable years will be required to be utilized prior to the losses incurred in pre-enactment taxable years. As a result of this pre-enactment capital loss carryforwards may be more likely to expire unused. Additionally, post-enactment capital losses that are carried forward will retain their character as either short-term or long-term capital losses rather than being considered all short-term as under previous law.
12.)FOREIGN SECURITIES RISK
The Fund could be subject to greater risks because the Fund's performance may depend on issues other than the performance of a particular company. Changes in foreign economies and political climates are more likely to affect the Fund than a fund that invests exclusively in U.S. companies. The value of foreign securities also is affected by the value of the local currency relative to the U.S. dollar. There also may be less government supervision of foreign markets, resulting in non-uniform accounting practices and less publicly available information.
Investment in securities of issuers based in underdeveloped emerging markets entails all of the risks of investing in securities of foreign issuers outlined in this section to a heightened degree. These heightened risks include: (i) greater risks of expropriation, confiscatory taxation, nationalization, and less social, political and economic stability; (ii) the smaller size of the market for such securities and a low or nonexistent volume of trading, resulting in lack of liquidity and in price volatility; (iii) certain national policies which may restrict a Fund's investment opportunities; and (iv) in the case of Eastern Europe, China and other Asian countries, the absence of developed capital markets and legal structures governing private or foreign investment and private property, and the possibility that recent favorable economic and political developments could be slowed or reversed by unanticipated events. As of September 30, 2012, approximately 13% of the Fund’s investments were securities of issuers based in China.
2012 Semi-Annual Report 12
ADDITIONAL INFORMATION
September 30, 2012
(UNAUDITED)
1.) APPROVAL OF INVESTMENT ADVISORY AGREEMENT
On April 15, 2012 the Trustees considered the renewal of the Management Agreement (the "Agreement") between the Adviser and the Trust, on behalf of the Fund. In considering the renewal of the Agreement, the Board of Trustees (the “Trustees” or the “Board”) received materials from the Adviser addressing the following factors: (i) the investment performance of the Fund and the Adviser; (ii) the nature, extent and quality of the services provided by the Adviser to the Fund; (iii) the cost of the services to be provided and the profits to be realized by the Adviser and its affiliates from the relationship with the Fund; (iv) the extent to which economies of scale will be realized as the Fund grows; and (v) whether the fee levels reflect these economies of scale to the benefit of shareholders.
In determining whether to renew the Agreement, the Board met with the President of the Adviser, to discuss the terms of the Agreement. The Adviser reviewed and discussed with the Trustees his personal history, including background and investment management experience. The Adviser also discussed with the Board the Fund's performance for the 12-month period ended February 29, 2012, important factors relating to the Fund's performance, the Adviser's investment and research strategy, the Adviser's financial strength, and expected expenses and revenue from the Fund. During the discussion, he referred the Board to financial statements of the Adviser which had been provided to the Board prior to the meeting. The Adviser stated to the Board that it had sufficient assets available to meet its obligations to the Fund, but noted that as a result of the performance fee adjustment, the Adviser would not be profitable for the current year.
The Board gave careful consideration to factors deemed relevant to the Trust and the Fund. As to the nature, extent and quality of the services to be provided by the Adviser, and the performance of the Fund since commencement of operations, the Board noted that the Fund greatly underperformed its benchmark index, the S&P 500 Index, for the 12-month period ended February 29, 2012, by returning -41.87% compared to a return of 5.12% for the S&P 500 Index for the same period. The Board also reviewed comparative performance from the inception of the Fund through February 29, 2012, noting that the Fund outperformed its benchmark index, as well as the average performance of the selected peer group of 37 other funds of comparable size and with similar investment objectives. The Board noted that the Fund's performance provided strong evidence that the Fund had a bad short-term performance but overall since inception had outperformed its benchmark and was reflective of the quality of the advisory services provided by the Adviser.
As to the costs of the services to be provided, the Board reviewed information regarding comparable fee structures and acknowledged that the Fund's base management fee rate (which includes paying substantially all operating expenses of the Fund) and total annual operating expenses (as reported in the Prospectus dated August 1, 2011) were much higher than the management fees and expense ratio paid by the selected peer group of 37 other funds of comparable size and with similar investment objectives. However, the Trustees acknowledged that the Adviser spends a substantial amount of time managing the Fund and, in addition, noted that the Adviser bears a risk of loss under the performance fee arrangement. Under the Agreement, poor Fund performance results in a reduction of the management fee, as is the current case. The Adviser stated that for the fiscal year ended March 31, 2012, the performance fee adjustment exceeded the management fee and therefore, the Fund had a negative expense ratio. The Board noted that the performance fee arrangement compared the Fund's performance to that of the S&P 500 Index (the "benchmark index"). The Trustees discussed the appropriateness of the S&P 500 Index in the performance fee calculation and determined that the S&P 500 Index was an appropriate benchmark index. The Board concluded that the Fund's fee arrangement aligns the Adviser’s interest with those of the shareholders. The Trustees therefore concluded that the fee structure under the current Agreement, including performance-based adjustments, was reasonable.
As to the profits to be realized by the Adviser under the Agreement, the extent to which economies of scale may be realized as the Fund grows, and whether the fee levels reflect these economies of scale for the benefit of the Fund investors, the Board noted that the Adviser has made a substantial investment in the Fund. The Trustees acknowledged that the fee under the current management agreement does not provide investors with an opportunity to realize the benefits of economies of scale as the Fund grows. However, the Trustees also noted that the management fee is structured so that investors pay a fee that varies directly with the performance of the Fund. Investors will pay a higher fee if the Fund outperforms its benchmark index and a lower fee if the Fund underperforms its benchmark index. Thus, Fund shareholders will receive the benefit of paying a fee that aligns their interests with the interests of the Adviser. In addition, given
2012 Semi-Annual Report 13
Additional Information (Unaudited) - continued
the small asset base of the Fund, they did not think it necessary to consider adding break points at this time, but agreed they would review this annually and add break points when appropriate.
The independent Trustees then met in executive session with legal counsel to discuss the Agreement approval process.
Based upon the information provided, it was the Board's consensus (including a majority of the independent Trustees) that the fee to be paid to the Adviser pursuant to the Agreement was reasonable, that the overall arrangement provided under the terms of the Agreement was a reasonable business arrangement, and that the approval of the Agreement was in the best interest of the Fund's shareholders. Accordingly, the Board, including a majority of the independent Trustees, approved the continuance of the Agreement for an additional year.
2012 Semi-Annual Report 14
Board of Trustees
Kailash Birmiwal, Ph. D.
Rajendra K. Bordia, Ph. D.
Hemant K. Gupta, Ph. D.
Veera S. Karukonda
Bal K. Sharma, Dr.
Investment Adviser
Birmiwal Asset Management, Inc.
24140 E. Greystone Lane
Woodway, WA 98020
Dividend Paying Agent,
Shareholders' Servicing Agent,
Transfer Agent
Mutual Shareholder Services, LLC
8000 Town Centre Drive, Suite 400
Broadview Hts, OH 44147
Custodian
U.S. Bank, NA
425 Walnut Street
P.O. Box 1118
Cincinnati, OH 45201
Fund Administrator
Premier Fund Solutions Inc.
1939 Friendship Drive, Suite C
El Cajon, CA 92020
Legal Counsel
Thompson Hine LLP
312 Walnut Street, 14th Floor
Cincinnati, OH 45202
Independent Registered Public
Accounting Firm
Cohen Fund Audit Services, Ltd.
1350 Euclid Avenue, Suite 800
Cleveland, OH 44115 |
This report is provided for the general information of the shareholders of the Birmiwal Oasis
Fund. This report is not intended for distribution to prospective investors in the Fund, unless
preceded or accompanied by an effective prospectus. |
Birmiwal Oasis Fund
24140 E. Greystone Lane
Woodway, WA 98020 |
Item 2. Code of Ethics. Not applicable.
Item 3. Audit Committee Financial Expert. Not applicable.
Item 4. Principal Accountant Fees and Services. Not applicable.
Item 5. Audit Committee of Listed Companies. Not applicable.
Item 6. Schedule of Investments. Not applicable. Schedule filed with Item 1.
Item 7. Disclosure of Proxy Voting Policies and Procedures for Closed-End Funds. Not applicable.
Item 8. Portfolio Managers of Closed End Funds. Not applicable.
Item 9. Purchases of Equity Securities by Closed-End Management Investment Companies and Affiliated Purchasers. Not applicable.
Item 10. Submission of Matters to a Vote of Security Holders.
The registrant has not adopted procedures by which shareholders may recommend nominees to the registrant’s board of trustees.
Item 11. Controls and Procedures.
(a) The Registrant’s president and chief financial officer concluded that the disclosure controls and procedures (as defined in Rule 30a-3(c) under the Investment Company Act of 1940 (the “Act”)) were effective as of a date within 90 days of the filing date of this report, based on the evaluation of these controls and procedures required by Rule 30a-3(b) under the Act.
(b) There were no changes in the registrant’s internal control over financial reporting (as defined in Rule 30a-3(d) under the Act) that occurred during the registrant’s second fiscal quarter of the period covered by this report that have materially affected, or are reasonably likely to materially affect, the registrant’s internal control over financial reporting.
Item 12. Exhibits.
(a)(1) Code of Ethics. Not applicable.
(a)(2) Certifications pursuant to Section 302 of the Sarbanes-Oxley Act of 2002. Filed herewith.
(b) Certification pursuant to Section 906 of the Sarbanes-Oxley Act of 2002. Filed herewith.
SIGNATURES
Pursuant to the requirements of the Securities Exchange Act of 1934 and the Investment Company Act of 1940, the registrant has duly caused this report to be signed on its behalf by the undersigned, thereunto duly authorized.
| | Birmiwal Investment Trust |
| | By: /s/Kailash Birmiwal
Kailash Birmiwal
President |
Pursuant to the requirements of the Securities Exchange Act of 1934 and the Investment Company Act of 1940, this report has been signed below by the following persons on behalf of the registrant and in the capacities and on the dates indicated.
| | By: /s/Kailash Birmiwal
Kailash Birmiwal
President |
| | By: /s/Kailash Birmiwal
Kailash Birmiwal
Chief Financial Officer |