UNITED STATES
SECURITIES AND EXCHANGE COMMISSION
WASHINGTON, D.C. 20549 |
CERTIFIED SHAREHOLDER REPORT OF REGISTERED MANAGEMENT INVESTMENT COMPANIES
| Investment Company Act file number 811-21289 |
Birmiwal Investment Trust
(Exact name of registrant as specified in charter)
24140 E. Greystone Lane, Woodway, WA 98020
(Address of principal executive offices) (Zip code)
Kailash Birmiwal
24140 E. Greystone Lane, Woodway, WA 98020
(Name and address of agent for service) |
Registrant's telephone number, including area code: (206) 542-7652
Date of fiscal year end: March 31
Date of reporting period: March 31, 2010
Form N-CSR is to be used by management investment companies to file reports with the Commission not later than 10 days after the transmission to stockholders of any report that is required to be transmitted to stockholders under Rule 30e-1 under the Investment Company Act of 1940 (17 CFR 270.30e -1). The Commission may use the information provided on Form N-CSR in its regulatory, disclosure review, inspection and policymaking roles.
A registrant is required to disclose the information specified by Form N-CSR, and the Commission will make this information public. A registrant is not required to respond to the collection of information contained in Form N-CSR unless the Form displays a currently valid Office of Management and Budget ("OMB") control number. Please direct comments concerning the accuracy of the information collection burden estimate and any suggestions for reducing the burden to Secretary, Securities and Exchange Commission, 450 Fifth Street, NW, Washington, DC 20549-0609. The OMB has reviewed this collection of information under the clearance requirements of 44 U.S.C. § 3507.
Item 1. Reports to Stockholders.
Birmiwal Oasis Fund
For Investors Seeking Capital Appreciation
ANNUAL REPORT
March 31, 2010 |
Birmiwal Investment Trust
www.birmiwal.com
1-800-417-5525 |
Birmiwal Oasis Fund
Annual Report
May 31, 2010 |
Dear Fellow Shareholders,
I am pleased to report that after a very disappointing performance in 2008, your Fund did well in 2009 and regained the top percentile ranking in the small cap category (topped amongst all actively managed mutual funds, source: Bloomberg). Primary reason for this outperformance was the Fund's emphasis on the financial sector. Additional factors contributing to the outperformance were (a) a rebound in some of the Fund’s holdings from highly depressed levels and (b) short-term trading.
The Fund's net asset value (NAV) is highly volatile. It is desirable to have low volatility relative to the Fund's performance and I hope to make progress in this area.
I will briefly discuss some recent events which have affected many investors. They raise some fundamental questions: How much did firms like Goldman Sachs (GS) and JP Morgan (JPM) contribute to the recent crisis world over? And what was the role of the Federal Reserve (FED)? It should be obvious to everyone by this time that something is not right since even the Securities and Exchange Commission (SEC) is charging GS with fraud and the Justice Department has initiated its own criminal investigation of the firm. The Justice Department has also reportedly initiated an investigation of JPM for manipulating the silver market. This investigation was allegedly initiated after a trader in London recently informed the Commodity Futures Trading Commission (CFTC) about how the silver prices would be manipulated on a specific day and at a specific time; and the events happened to unfold just "as predicted".
As a side note, a large financial firm generally does not survive once indicted. And just a reminder, information presented in this letter is partly from sources on the web and hence the accuracy is not guaranteed.
Matt Taibbi wrote a detailed article a year ago about Goldman Sachs (Rolling Stone, July 9, 2009, entitled: "The Great American Bubble Machine - From tech stocks to high gas prices, Goldman Sachs has engineered every major market manipulation since the Great Depression - and they're about to do it again.") where he writes, "The world's most powerful investment bank is a great vampire squid wrapped around the face of humanity, relentlessly jamming its blood funnel into anything that smells like money." Since the publication of this article, much information has come to light about the firm which is very troubling and tends to confirm Taibbi's story. For example, it has been alleged that GS developed a security with the aid of a large hedge fund manager, stuffed the new security with junk, took large bets against this or similar securities (so that GS and the hedge fund manager can make bundle at the expense of average Joe's) and did not disclose crucial information to investo rs. When some investors specifically sought some important information about the security before investing, GS misled them. And the worst part is that GS even endorsed such behavior by later promoting people responsible.
It appears that GS considers its own clients as nothing but counterparties to financial transactions and hence it will not hesitate to act in its best interest, without any regard of the implications of its actions on the counterparty clients. In the process, GS may use any means necessary to achieve its goal. It remains a mystery how so many experts got duped by GS. How did GS convince rating agencies to give the highest rating to junk created by GS? How GS convinced AIG not to do any due diligence and bet the whole house on junk? How GS, through its agents convinced Congress to secretly transfer cash to GS through AIG without Congress even knowing where the money would really go. Furthermore, GS even used Societe Generale of France to magnify its bet so that AIG would not suspect anything fishy. And to facilitate the transfer of cash, GS quietly appointed its own man as head of AIG (chair of its audit committee who should know all details including how GS fooled AIG). It n ow appears that in comparison, convincing unsuspecting investors (aka "suckers") to buy the junk should not have been difficult for GS. This activity, if true, is simply disgusting. If accurate, GS has been very smart in fooling others.
GS makes many recommendations, advertises opinions about securities, etc. But when GS changed it outlook internally regarding the housing market, a deliberate decision was made not to share the opinion with the world and bet heavily against this market. The question then arises - when GS does advertise its opinion, how credible it is? Do the "buy" recommendations mean Goldman is looking for suckers?
Goldman Sachs is the hub of information. And they allegedly use it very aggressively without
2010 Annual Report 1
regard to laws, ethics, client relationship, etc. John Paulson, the hedge fund manager who helped GS stuff junk in the security mentioned above, was looking for a broker who could create a junk security so that he could short it. He sought Bear Sterns' help. Bear Stearns refused on ethical grounds. GS agreed as discussed above and also shorted Bear Sterns' stock. Now we know the history - Bear is gone and GS is making tons of money. What a world.
What about Greece? Looks like Goldman found creative ways to fool Europeans. In the quest to join Economic and Monetary Union (EMU) of the European Union, Greece needed to show certain financial characteristics and the maestro found creative ways to "help" Greece by giving cash, fabricating a new instrument and then using it to cook Greece's balance sheet. In return, Greece traded away the rights to airport fees, and lottery proceeds for years to come. What will happen if the people of Greece learn the details? Incidentally, GS was knocking on the doors in Athens in as late as November 2009 offering to provide additional services. Greeks refused this time. I am just wondering which other country has been helped by GS? On a related note, is it insider trading if Goldman buys Greece Credit Default Swaps (which would be a bet against Greece's ability to pay its debts) using the information that they learned by virtue of their previous relationship?
What about cities and towns in Europe, in US? Many of them have learned their lessons the hard way - what happens when you deal with bankers like GS or JPM and trust them with complex instruments like swaps? They may take you to the cleaners.
On May 6, 2010, around 2:40 pm Eastern, the U.S. markets plunged - sharpest drop ever (nearly 1000 points in the Dow Jones Industrial Average) and in a very short time (about 10 minutes). We still don't know why. It happened after 2:30 pm, the cutoff time after which circuit breaker of 1050 points drop was off. It should be obvious that it was not caused by small investors, instead by program trading. Notable events of that day were: (1) televised civil disturbances in Greece, (2) a vote in the U.S. Senate on the Brown/Kaufman Amendment regarding too-big-to-fail, and (3) discussion on the Sanders Amendment regarding audit of the FED. It is unlikely that the first item was the reason for the plunge since Greece was relatively quieter than the previous day and the market reaction could not have been swift on a massive scale by investors. The other two events were probably the most important financial issues to ever come before the Congress which could have altered the financia l landscape completely and they happen to come on the same day. How could these two events be linked to the market plunge? Maybe, just maybe someone wanted to send a clear signal to the Congress to remind them who is the boss. And if so, did it work? Yes. Later that day, the Senate voted 33-61 against too-big-too-fail and Sanders Amendment was significantly watered down. As a side note, using threats to get the job done is nothing new. Threat of martial law was used to get Congress to pass the $700 billion bailout bill and threat of market plunge was used to get support for re-confirmation for the FED's chairman Ben Bernanke.
The question then arises - is it possible to manipulate the market to this level? It appears that answer is yes. Nearly 2/3 of the trades on NYSE are done through program trading. And amongst all program traders, GS is by far the largest, beating its nearest competitor by nearly 100%. All GS had to do was temporarily reduce (or remove) their buy orders for a short time. The effect will be more pronounced if some other program traders join the strategy.
After the 2008 crash, New York Stock Exchange (NYSE) instituted a new program called Supplemental Liquidity Provider (SLP) to artificially boost trading volume on NYSE and GS is a SLP. During downturn, GS is required to provide liquidity (buy stock). Did GS provide liquidity when the market was plunging or did it do just the opposite? It appears that the exchange has taken huge risk of making the whole market highly vulnerable by giving a key for market manipulation to GS.
If markets can be easily manipulated, and actions of GS reveal that they can partner with hedge funds to make money for themselves even if it meant that the counterparty is destroyed, then did GS collaborate with some hedge funds to bring down the market over the last two years? In particular, did they bring down Bear Sterns, Lehman Brothers? The motive to do so is obvious - two competitors gone. Bear Sterns (BSC) chairman has repeatedly said that Bear was solvent and rumor brought it down. And we still don't know who spread the rumor. Incidentally, Lehman has recently initiated its own investigations in this area and is seeking information from GS and some hedge funds.
GS and JPM did not have a single day when they lost money trading in their own accounts in Q1'10. Should it be surprising to anyone?
The world should have been awakened by the size of the credit default swap (CDS) market -more than 600 trillion dollars, almost all of which is naked (without holding underlying assets).
2010 Annual Report 2
Instead of decreasing in size after the crash, the credit default market has grown significantly in the last two years. I just don't understand what purpose the naked CDS market serve except for converting the financial world into a gigantic casino. And it is a powerful tool to manipulate: short, buy CDS, spread rumor and destroy; or, invest in a company's bonds, get inside info, buy CDS, and then make sure that company files for bankruptcy by refusing to join in any creditor's deal - the idea being that gain in CDS will pay off handsomely and it will easily beat loss in long bonds. Simply put, CDS are financial nukes. Question then arises, if something goes wrong , such as the inability of a counterparty to pay, what will happen to the stability of the economic system, or to the livelihoods of the rest of the people who are not party to the private transactions? Does it sound familiar?
Haven't we learned a basic lesson that miscreants use CDS to create negative perception and such perception can destroy companies, can destroy economies, and now can destroy countries and currencies? Maybe, just like when GS was under attack and its stock was in a free fall, GS asked the SEC's help to stop the shorting of its stock (and SEC obliged), this time when US will be on the verge of a financial meltdown (whether true or not, but the rumor spreads and the world starts believing it), law makers in the US will take action against naked CDS. Until then, the mantra continues - we believe in free markets, anything goes as long as bankers can make money. Incidentally, the same GS was lobbying Congress in 2009 and seeking no restriction on counterfeiting. GS believes that counterfeiting is good - what's wrong with taking real cash for counterfeit securities? Isn't it a good business? Who cares about some unsophisticated chap on the other side who doesn't even know that he/s he is being robbed?
Ultimate responsibility of the current state of affairs rests with the Congress. I will cite just one example to show for whom the Congress really works. In the late 1990s, a large hedge fund, Long Term Capital Management (LTCM) blew up because of very high leverage and excessive use of derivatives. Regulators then were concerned about systematic risk it posed because of its size (off-balance sheet derivative positions with a notional value of 1.25 trillion dollars, assets of $130 billion, but with equity of just under $5 billion). Congress held hearings. But how they really acted is shocking. After LTCM debacle and after being aware of the major system wide risk LTCM posed (and negative consequence to the US economy), and after a very strong opposing voice of Brooksley Born who simply wanted to make OTC derivatives transparent and regulated to minimize risk to the US economy, Congress went ahead and passed a law which prohibited any agency from regulating OTC derivatives. ( These OTC derivatives including credit default swaps are the main cause of the current worldwide financial problems). Congress listened to Alan Greenspan (who is now working for John Paulson), Bob Rubin (who played a key role in destroying Citicorp), Larry Summers (who was paid by the hedge fund DE Shaw), and Arthur Levitt (who is currently advising Goldman). And Born resigned from CFTC after the Congress voted to ban oversight of the OTC derivatives.
A simple question then arises. What about the current financial reform bill in the Congress? Will the final bill have real "reform" or will it be full of loopholes? For example, will the bill eliminate naked credit default swaps, or solve too-big-to-fail by breaking up the big banks, or reinstate the Glass-Steagall Act?
Actions of the FED give the impression that it is a front for Goldman and JP Morgan. For exam-ple:(1) When Bear Sterns was plunging due to rumors, naked shorting and CDS, the FED decided to hand over Bear to JPM at virtually no cost and asked taxpayers to bear a huge risk. If taxpayers had to bear most of the risk then the FED simply could have left Bear intact, change management, and have more oversight. And then investigate who was spreading rumors, who was naked shorting or using CDS to destroy Bear. Why simply give Bear to JPM and then have no investigation? (2) Now let us look at Lehman. According to Ben Bernanke, saving Bear was very important because of systematic risk. Then why was Lehman not saved? And why was Lehman told that it could not have access to the FED's credit facility, even though such facility was available to others? (3) Why is the FED allowing GS to remain a bank holding company and hence have access to money with very low interest rates where as for all practical purposes, GS is a giant hedge fund? Doesn't this amount to stealing from taxpayers with the FED's assistance?
Now Germany has decided unilaterally to ban naked short selling of some financial stocks, and naked shorting of government bonds of euro zone countries using credit-default swaps. Why? It looks like Germany's action was motivated by the following events: (a) repeated attempts to help solve Greece financial problems by Germany and other European countries were trumped by speculators using instruments like CDS; (b) US market crash of May 6; and (c) unwillingness by the US Congress to stop use of credit default swaps as a weapon to destroy companies and countries. Is it the German's way of saying to American regulators - **** you?
2010 Annual Report 3
Some extras:
1. Who is right: Goldman's CEO says that GS is doing "God's work" whereas Britain's ex-Prime Minister says GS is "morally bankrupt."
2. GS did not consider it to be material to disclose that they have received a Wells Notice from the SEC, not even in their 10K filing, unlike most other companies.
3. In the past, we used to have "bank run." Now, bankers in the western world have transformed the system where regulators believe that saving big banks is of the highest priority, even if it meant "country run."
4. Finance books teach "efficient market theory." Time has come to replace it with "rigged market theory."
5. The US is mostly divided as democrats and republicans. And bankers pull the strings - a classic case of divide and rule.
6. Checks designed to protect investors have generally failed. They have even worked against investors. Consider the following institutions: Congress, FED, SEC, CFTC, rating agencies, super large clearing firm Depository Trust Clearing Corporation (DTCC), exchanges, many sell side analysts, and even auditors. To understand the reason, we only need to see the financial link between an institution and firms like GS.
7. It is fairly common that before a major news is announced (like merger), stock moves aggressively. Media cites rumor as the basis for the move. Why are perpetrators of such rumors generally not caught? Is it another venue through which a few steal?
8. There are strong regulatory disclosure requirements and still many professionals do not understand the risks when they invest. It looks like too much disclosure in hundreds of pages only serves two purposes - to protect the underwriters and discourage investors in understanding the real risks of investing in a product. Probably, just one page in simple English can be more effective if risks are outlined with the expected likelihood of occurrence.
9. One needs to investigate if there is any correlation between the size of the physical market and financial instruments linked to them, say for example in commodities or precious metals? If not, then financial instruments like futures can be used to manipulate the prices of physical items. There have been references to the silver paper market being 100 times as large as the physical market. And I do remember that the crude oil prices shot up by 25 dollars on a single day two years ago during recession and without any reason.
10.I am finding one common scheme employed by destructive forces. They initially "help" by providing margin or low interest rate loans or upfront cash or buy bond etc; then they get inside information and use some destructive weapons to destroy and take over the assets when the time is right.
11. Destructive weapons are created as follows: starting with an existing instrument of fixed size, create a new instrument linked to the existing one, but unlimited in size. For example, create unlimited counterfeit shares of a company with fixed number of shares outstanding; or, create unlimited synthetic collateralized debt obligations (CDO, created by GS/Paulson) linked to some underlying bonds of fixed size; or create unlimited credit default swap on virtually anything (say buy 10 fold or 100 fold insurance on your neighbor's single home). If EMU members can come with a trillion dollar package for the euro zone countries for stabilization purposes, it will not stop speculators (say GS or JPM) from coming up with ten trillion dollars of credit default swaps? This is possible because to make a bet of $10 trillion, one does not need $10 trillion. Because of their unlimited size, these synthetic instruments have become easy tools to manipulate and destroy.
12.I don't understand why after the Enron collapse, we still had off-balance sheet or similar accounting to fool investors; and auditors were not issuing red flags or "going concern" clause. How did it happen?
13.It appears that some exchanges are providing some confidential information about order flow (or order execution) to firms like GS. If true, then this is very serious. It amounts to a giant front-running scam set up for the benefit of a few.
14.Since firms like GS and JPM are making huge profits by trading in their own accounts, and they have access to all kinds of information and virtually all institutions are finding ways to sup-
2010 Annual Report 4
port them in all possible means, then there must be lots of ordinary Joes who are losing by huge amounts. Since this has been going on for some time and it will probably continue, someone should create an appropriate model to reflect half-life of an investor's account worth. This will be an estimated time in which an investor's account will be depleted to half and cash will be transferred to firms like GS.
Back to Matt Taibbi. According to him (Rolling Stone, May 13, 2010, entitled, The Feds vs. Goldman, The Government's case against Goldman Sachs barely begins to target the depths of Wall Street's criminal sleaze), "There is more fraud out there, and everyone knows it: front-running, manipulation of the commodities markets, trading ahead of interest-rate moves, hidden losses, Enron-esque accounting, Ponzi schemes in the precious-metals markets, you name it. We gave these people nearly a trillion bailout dollars, and no one knows what service they actually provide beyond fraud, gross self-indulgence …" How business is conducted by firms like Goldman and how regulators protect them should be a warning to the rest of the world. Any client of GS needs to ask the question - what is the likelihood of me being taken advantage of by the firm? Do I have resources to understand the real motive of GS? And if I get taken advantage of, is there anyone to help? Just anyone? Good Luck.
Thank you for your continued support and trust with us.
__________________________________________________________________________________________________________________________
Birmiwal Oasis Fund
by Industry Sectors (as a percentage of Total Investment
Securities)
UNAUDITED
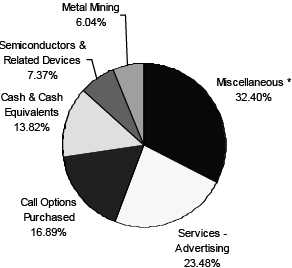
* Includes industry sectors that individually constitute no more than 4% of net assets.
See Schedule of Investments for additional information. |
2010 Annual Report 5
BIRMIWAL OASIS FUND (Unaudited)
PERFORMANCE INFORMATION
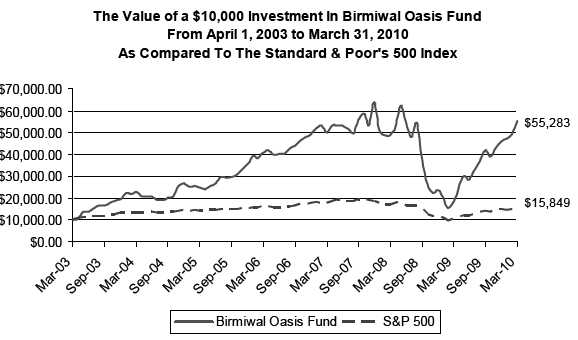
AVERAGE ANNUAL RATE OF RETURN (%) FOR THE PERIODS ENDED MARCH 31, 2010
03/31/10 NAV $25.59
| | | | | | | | | Since |
| | | 1 Year(A) | | 3 Years(A) | | 5 Years(A) | | Inception(A) |
| Birmiwal Oasis Fund | | 196.52% | | 3.34% | | 17.23% | | 27.66% |
| S&P 500(B) | | 49.72% | | -4.15% | | 1.92% | | 6.79% |
(A)1 Year, 3 Year, 5 Year and Since Inception returns include change in share prices and in each case includes reinvestment of any dividends and capital gain distributions. The inception date of the Birmiwal Oasis Fund was April 1, 2003.
(B)The S&P 500 is a broad market-weighted average dominated by blue-chip stocks and is an unmanaged group of stocks whose composition is different from the Fund.
PAST PERFORMANCE DOES NOT GUARANTEE FUTURE RESULTS. INVESTMENT RETURN AND PRINCIPAL VALUE WILL FLUCTUATE SO THAT SHARES, WHEN REDEEMED, MAY BE WORTH MORE OR LESS THAN THEIR ORIGINAL COST. RETURNS DO NOT REFLECT THE DEDUCTION OF TAXES THAT A SHAREHOLDER WOULD PAY ON FUND DISTRIBUTIONS OR THE REDEMPTION OF FUND SHARES. CURRENT PERFORMANCE MAY BE LOWER OR HIGHER THAN THE PERFORMANCE DATA QUOTED. TO OBTAIN PERFORMANCE DATA CURRENT TO THE MOST RECENT MONTH END, PLEASE CALL 1-800-417-5525.
2010 Annual Report 6
Availability of Quarterly Schedule of Investments (Unaudited)
The Fund files its complete schedule of portfolio holdings with the Securities and Exchange Commission ("SEC") for the first and third quarters of each fiscal year on Form N-Q. The Fund’s Forms N-Q are available on the SEC's website at http://www.sec.gov. The Fund’s Forms N-Q may also be reviewed and copied at the SEC's Public Reference Room in Washington, DC. Information on the operation of the Public Reference Room may be obtained by calling 1-800-SEC-0330.
| Proxy Voting Guidelines (Unaudited) |
Birmiwal Asset Management, Inc., the Fund’s Adviser (“Adviser”), is responsible for exercising the voting rights associated with the securities held by the Fund. For existing shareholders, a description of the policies and procedures used by the Adviser in fulfilling this responsibility is available without charge on the Fund’s website at www.birmiwal.com. It is also included in the Fund’s Statement of Additional Information, which is available on the Securities and Exchange Commission’s website at http://www.sec.gov.
Information regarding how the Fund voted proxies, contained on Form N-PX, relating to portfolio securities during the most recent 12-month period ended June 30 is available without charge, upon request, by calling our toll free number (1-800-417-5525). This information is also available on the SEC’s website at http://www.sec.gov.
| Disclosure of Expenses (Unaudited) |
Shareholders of this Fund incur ongoing operating expenses consisting solely of a base management fee and a performance-based management fee. The following example is intended to help you understand your ongoing costs of investing in the Fund and to compare these costs with similar costs of investing in other mutual funds. The example is based on an investment of $1,000 invested in the Fund on October 1, 2009 and held through March 31, 2010.
The first line of the table below provides information about actual account values and actual expenses. In order to estimate the expenses a shareholder paid during the period covered by this report, shareholders can divide their account value by $1,000 (for example, an $8,600 account value divided by $1,000 = 8.6) and then multiply the result by the number in the first line under the heading entitled "Expenses Paid During the Period."
The second line of the table below provides information about hypothetical account values and hypothetical expenses based on the Fund's actual expense ratio and an assumed rate of return of 5% per year before expenses, which is not the Fund’s actual return. The hypothetical account values and expenses may not be used to estimate the actual ending account balance or expenses paid by a shareholder for the period. Shareholders may use this information to compare the ongoing costs of investing in this Fund and other funds. To do so, compare this 5% hypothetical example with the 5% hypothetical examples that appear in other funds' shareholder reports.
| | | | | | | Expenses Paid |
| | | Beginning | | Ending | | During the Period* |
| | | Account Value | | Account Value | | October 1, 2009 |
| | | October 1, 2009 | | March 31, 2010 | | to March 31, 2010 |
| |
| Actual | | $1,000.00 | | $1,325.22 | | $26.72 |
| |
| Hypothetical | | $1,000.00 | | $1,001.94 | | $23.01 |
| (5% annual return | | | | | | |
| before expenses) | | | | | | |
* Expenses are equal to the Fund’s annualized expense ratio of 4.61%, multiplied
by the average account value over the period, multiplied by 182/365 (to reflect the
one-half year period). |
2010 Annual Report 7
| Birmiwal Oasis Fund |
| |
| | | | | Schedule of Investments |
| | | | | March 31, 2010 |
| |
| Shares/Principal Amount | | Fair Value | | % of Net Assets |
| |
| COMMON STOCKS | | | | |
| Agricultural Chemicals | | | | |
| 508,178 | | Bodisen Biotech Inc. * | | $ 329,299 | | 1.66% |
| Agricultural Production - Crops | | | | |
| 95,000 | | Agria Corporation * ** | | 222,300 | | 1.12% |
| Air Transportation, Scheduled | | | | |
| 10,000 | | Republic Airways Holdings Inc. * | | 59,400 | | 0.30% |
| Arrangement of Transportation of Freight & Cargo | | | | |
| 10,000 | | Pacer International Inc. * | | 60,200 | | 0.30% |
| Canned, Frozen & Preserved Fruit, Vegetables & Food Specialties | | | | |
| 104,816 | | SkyPeople Fruit Juice, Inc. * (China) | | 627,848 | | 3.16% |
| Commercial Banks, NEC | | | | |
| 30,000 | | Doral Financial Corp. * | | 129,300 | | 0.65% |
| Deep Sea Foreign Transportation of Freight | | | | |
| 5,000 | | DryShips, Inc. * (Greece) | | 29,200 | | |
| 10,000 | | Excel Maritime Carriers, Ltd. * (Greece) | | 60,300 | | |
| | | | | 89,500 | | 0.45% |
| Engines & Turbines | | | | |
| 20,000 | | China Yuchai International Limited (Singapore) | | 351,000 | | 1.77% |
| Games, Toys & Children's Vehicles (No Dolls & Bicycles) | | | | |
| 50,000 | | Mad Catz Interactive Inc. * | | 24,000 | | 0.12% |
| General Building Contractors - Residential Buildings | | | | |
| 30,000 | | China Housing and Land Development, Inc. * (China) | | 114,000 | | 0.57% |
| Gold and Silver Ores | | | | |
| 50,000 | | Northgate Minerals Corp. * | | 150,000 | | 0.76% |
| Hotels & Motels | | | | |
| 1,000 | | Melco PBL Entertainment (Macau) LTD. * ** | | 4,800 | | 0.02% |
| Industrial Organic Chemicals | | | | |
| 9,000 | | Gushan Environmental Energy Limited ** | | 10,440 | | 0.05% |
| Metal Mining | | | | | | |
| 116,102 | | General Moly, Inc. * | | 385,459 | | |
| 55,000 | | Lundin Mining Corp. * (Canada) | | 292,467 | | |
| 61,192 | | US Energy Corp. * | | 364,704 | | |
| | | | | 1,042,630 | | 5.25% |
| Mining, Quarrying of Nonmetallic Minerals (No Fuels) | | | | |
| 5,073 | | USEC Inc. * | | 29,271 | | 0.15% |
| Motor Vehicles & Passenger Car Bodies | | | | |
| 1,000 | | Tata Motors Ltd. ** | | 18,460 | | 0.09% |
| Newspapers: Publishing or Publishing & Printing | | | | |
| 30,000 | | The McClatchy Company * | | 147,300 | | 0.74% |
| Pharmaceutical Preparations | | | | |
| 30,000 | | Penwest Pharmaceuticals Co. * | | 103,500 | | 0.52% |
| Radiotelephone Communications | | | | |
| 10,000 | | DragonWave Inc. * (Canada) | | 92,500 | | 0.47% |
| Retail - Eating & Drinking Places | | | | |
| 1,000 | | Starbucks Corp. * | | 24,270 | | 0.12% |
| Rolling Drawing & Extruding of Nonferrous Metals | | | | |
| 30,000 | | Lihua International, Inc. * (China) | | 275,400 | | 1.39% |
| Semiconductors & Related Devices | | | | |
| 164,307 | | Actions Semiconductor Co., Ltd. * ** | | 384,478 | | |
| 1,000 | | Applied Materials Inc. | | 13,468 | | |
| 134,781 | | Conexant Systems Inc. * | | 458,255 | | |
| 30,000 | | Kulicke & Soffa Industries Inc. * | | 217,500 | | |
| 5,000 | | LSI Corporation * | | 30,600 | | |
| 2,000 | | OmniVision Technologies Inc. * | | 34,360 | | |
| 20,000 | | ReneSola Ltd. * ** | | 118,400 | | |
| 2,000 | | Solarfun Power Holdings Co. Ltd. * ** | | 15,705 | | |
| | | | | 1,272,766 | | 6.41% |
| | *Non-Income Producing Securities.
**ADR - American Depositary Receipt.
The accompanying notes are an integral part of the financial
statements. |
2010 Annual Report 8
| Birmiwal Oasis Fund |
| |
| | | | | | | Schedule of Investments |
| | | | | | | March 31, 2010 |
| |
| Shares/Principal Amount | | | | Fair Value | | % of Net Assets |
| |
| COMMON STOCKS | | | | | | |
| Services - Advertising | | | | | | |
| 294,038 | | China MediaExpress Holdings, Inc. * (China) | | $ 4,054,784 | | 20.42% |
| Services - Advertising Agencies | | | | | | |
| 2,000 | | Focus Media Holding Ltd. * ** | | | | 36,520 | | |
| 11,000 | | VisionChina Media Inc. * ** | | | | 51,700 | | |
| | | | | | | 88,220 | | 0.44% |
| Services - Business Services | | | | | | |
| 120,000 | | China INSOnline Corp. * (Hong Kong) | | | | 63,612 | | 0.32% |
| Services - Prepackaged Software | | | | | | |
| 1,000 | | Microsoft Corp. | | | | 29,288 | | 0.15% |
| Steel Works, Blast Furnace & Rolling & Finishing Mills | | | | | | |
| 15,000 | | Sutor Technology Group, Ltd. * (China) | | | | 43,500 | | 0.22% |
| Surety Insurance | | | | | | |
| 50,000 | | PMI Group Inc. * | | | | 271,000 | | 1.37% |
| Telephone & Telegraph Apparatus | | | | | | |
| 2,000 | | CIENA Corp. * | | | | 30,520 | | |
| 34,315 | | Qiao Xing Mobile Communication Co., Ltd. * (China) | | 80,297 | | |
| 109,084 | | Qiao Xing Universal Telephone Inc. * (China) | | 210,532 | | |
| | | | | | | 321,349 | | 1.62% |
| Wholesale - Drugs, Proprietaries & Druggists' Sundries | | | | | | |
| 200,000 | | China Medicine Corporation * | | | | 688,000 | | 3.47% |
| Total for Common Stock (Cost $12,050,197) | | | | 10,737,937 | | 54.08% |
| REAL ESTATE INVESTMENT TRUSTS | | | | | | |
| 70,000 | | iStar Financial Inc. * | | | | 321,300 | | |
| 100,000 | | Maguire Properties Inc. * | | | | 308,000 | | |
| 13,844 | | Strategic Hotels & Resorts, Inc. * | | | | 58,837 | | |
| Total for Real Estate Investment Trusts (Cost $362,069) | | | | 688,137 | | 3.47% |
| WARRANTS | | | | | | | | |
| 80,000 | | China Ceramics Co., Ltd * (China) (expires 11-16-2012) | | 120,800 | | |
| | | exercise price @ 7.50 | | | | | | |
| 50,000 | | China Gerui Advanced Materials * (China) (expires 3-19-2011) | | 130,800 | | |
| | | exercise price @ 5.00 | | | | | | |
| 99,260 | | Primoris Services Corporation * (expires 10-2-2010) | | 286,861 | | |
| | | exercise price @ 5.00 | | | | | | |
| Total for Warrants (Cost $359,948) | | | | 538,461 | | 2.71% |
| CALL OPTIONS | | Shares Subject | | | | |
| Expiration Date/Exercise Price | | to Call | | | | |
| AirTran Holdings Inc. * | | | | | | |
| April 2010 Calls @ 5.00 | | 100,000 | | $ 25,000 | | |
| October 2010 Calls @ 5.00 | | 110,000 | | 99,000 | | |
| | | | | | | 124,000 | | |
| AMR Corporation * | | 50,000 | | 26,000 | | |
| April 2010 Calls @ 9.00 | | | | | | |
| Alpha Natural Resources, Inc. * | | 20,000 | | 76,000 | | |
| April 2010 Calls @ 48.00 | | | | | | |
| BankAtlantic Bancorp Inc. * + | | 50,000 | | 5,000 | | |
| June 2010 Calls @ 2.50 | | | | | | |
| China Yuchai International Limited * + | | 50,000 | | 180,000 | | |
| August 2010 Calls @ 15.00 | | | | | | |
| Citigroup, Inc. * | | | | | | | | |
| April 2010 Calls @ 4.00 | | 1,048,700 | | 167,792 | | |
| May 2010 Calls @ 5.00 | | 2,000,000 | | 100,000 | | |
| June 2010 Calls @ 4.00 | | 1,000,000 | | 330,000 | | |
| June 2010 Calls @ 5.00 | | 6,300,000 | | 378,000 | | |
| September 2010 Calls @ 4.00 | | 200,000 | | 92,000 | | |
| January 2011 Calls @ 4.00 | | 200,000 | | 128,000 | | |
| January 2011 Calls @ 5.00 | | 100,000 | | 30,000 | | |
| | | | 1,225,792 | | |
| | *Non-Income Producing Securities.
**ADR - American Depositary Receipt.
+ Denotes Investments which are Level 2 Securities (See Note 3).
The accompanying notes are an integral part of the financial
statements. |
2010 Annual Report 9
| Birmiwal Oasis Fund |
| |
| | | | | Schedule of Investments |
| | | | | March 31, 2010 |
| |
| Shares/Principal Amount | | | | Fair Value | | % of Net Assets |
| |
| CALL OPTIONS | | Shares Subject | | | | |
| Expiration Date/Exercise Price | | to Call | | | | |
| Eastman Kodak Co. * | | 200,000 | | $ 30,000 | | |
| July 2010 Calls @ 8.00 | | | | | | |
| E*TRADE Financial Corporation * | | 72,100 | | 1,442 | | |
| April 2010 Calls @ 2.00 | | | | | | |
| General Moly, Inc. * | | 80,000 | | 24,000 | | |
| September 2010 Calls @ 5.00 | | | | | | |
| Huntington Bancshares Inc. * | | | | | | |
| April 2010 Calls @ 5.00 | | 100,000 | | 40,000 | | |
| July 2010 Calls @ 6.00 | | 400,000 | | 120,000 | | |
| | | | | 160,000 | | |
| Jackson Hewitt Tax Service Inc. * | | 100,000 | | - | | |
| April 2010 Calls @ 5.00 | | | | | | |
| KeyCorp * | | 50,000 | | 22,500 | | |
| January 2011 Calls @ 10.00 | | | | | | |
| LDK Solar Co.Ltd. * ** (China) | | | | | | |
| April 2010 Calls @ 6.00 | | 30,000 | | 21,000 | | |
| May 2010 Calls @ 7.00 | | 50,000 | | 22,500 | | |
| | | | | 43,500 | | |
| LeapFrog Enterprises Inc. * | | 50,000 | | 90,000 | | |
| September 2010 Calls @ 5.00 | | | | | | |
| Lennar Corp. * | | 30,000 | | 21,000 | | |
| April 2010 Calls @ 17.00 | | | | | | |
| The McClatchy Company * | | | | | | |
| May 2010 Calls @ 5.00 | | 100,000 | | 35,000 | | |
| July 2010 Calls @ 5.00 | | 30,000 | | 16,500 | | |
| | | | | 51,500 | | |
| Microsoft Corp. * | | 100,000 | | 23,000 | | |
| April 2010 Calls @ 30.00 | | | | | | |
| MKS Instruments Inc. * | | 50,000 | | 60,000 | | |
| July 2010 Calls @ 20.00 | | | | | | |
| Monsanto Co. * | | 50,000 | | 26,000 | | |
| April 2010 Calls @ 75.00 | | | | | | |
| Mosaic Co. * | | 20,000 | | 16,200 | | |
| April 2010 Calls @ 65.00 | | | | | | |
| PMI Group Inc. * | | | | | | |
| April 2010 Calls @ 5.00 | | 100,000 | | 75,000 | | |
| June 2010 Calls @ 5.00 | | 50,000 | | 62,500 | | |
| September 2010 Calls @ 5.00 | | 50,000 | | 79,500 | | |
| | | | | 217,000 | | |
| Research In Motion Ltd. | | 20,000 | | 62,000 | | |
| April 2010 Calls @ 75.00 | | | | | | |
| Qiao Xing Universal Telephone Inc. * (China) | | 200,000 | | 20,000 | | |
| June 2010 Calls @ 2.50 | | | | | | |
| QUALCOMM Inc. * | | 100,000 | | 75,000 | | |
| April 2010 Calls @ 42.00 | | | | | | |
| Regions Financial Corp. * | | 100,000 | | 18,000 | | |
| April 2010 Calls @ 8.00 | | | | | | |
| ReneSola Ltd. * ** (China) + | | 50,000 | | 67,500 | | |
| October 2010 Calls @ 5.00 | | | | | | |
| RINO International Corporation * | | 50,000 | | 45,000 | | |
| April 2010 Calls @ 25.00 | | | | | | |
| SandRidge Energy, Inc. * | | 50,000 | | 35,000 | | |
| September 2010 Calls @ 9.00 | | | | | | |
*Non-Income Producing Securities.
**ADR - American Depositary Receipt.
+ Denotes Investments which are Level 2 Securities (See Note 3).
The accompanying notes are an integral part of the financial
statements. |
2010 Annual Report 10
| Birmiwal Oasis Fund |
| |
| | | | | Schedule of Investments |
| | | | | March 31, 2010 |
| Shares/Principal Amount | | | | Fair Value | | % of Net Assets |
| |
| CALL OPTIONS | | Shares Subject | | | | |
| Expiration Date/Exercise Price | | to Call | | | | |
| Shanda Games Limited * ** (China) | | 30,000 | | $ 18,000 | | |
| June 2010 Calls @ 7.50 | | | | | | |
| Synovus Financial Corp. * | | | | | | |
| May 2010 Calls @ 5.00 | | 151,600 | | 7,580 | | |
| August 2010 Calls @ 5.00 | | 100,000 | | 15,000 | | |
| January 2011 Calls @ 5.00 | | 100,000 | | 30,000 | | |
| | | | | 52,580 | | |
| Universal Travel Group * (China) | | 50,000 | | 100,000 | | |
| November 2010 Calls @ 10.00 | | | | | | |
| Total (Premiums Paid - $3,785,242) | | | | 2,916,014 | | 14.69% |
| Money Market Funds | | | | | | |
| 2,385,795 Fidelity Institutional Government Portfolio 0.19% *** | | 2,385,795 | | 12.02% |
| (Cost $2,385,795) | | | | | | |
| Total Investment Securities | | | | 17,266,344 | | 86.97% |
| (Cost $18,943,251) | | | | | | |
| Other Assets In Excess of Liabilities | | | | 2,586,752 | | 13.03% |
| Net Assets | | | | $ 19,853,096 | | 100.00% |
*Non-Income Producing Securities.
**ADR - American Depositary Receipt.
*** Variable Rate Security; The Yield Rate shown represents
the rate at March 31, 2010.
+ Denotes Investments which are Level 2 Securities (See Note 3).
The accompanying notes are an integral part of the financial
statements. |
2010 Annual Report 11
| Birmiwal Oasis Fund |
| |
| | | | | Schedule of Written Options |
| | | | | March 31, 2010 |
| Underlying Security | | Shares Subject | | | | |
| Expiration Date/Exercise Price | | to Call | | Fair Value | | |
| Alpha Natural Resources, Inc. * | | 20,000 | | $ 35,000 | | |
| April 2010 Calls @ 50.00 | | | | | | |
| Lennar Corp. * | | 30,000 | | 7,500 | | |
| April 2010 Calls @ 18.00 | | | | | | |
| Total (Premiums Received - $61,170) | | | | $ 42,500 | | 0.21% |
*Non-Income Producing Securities.
**ADR - American Depositary Receipt.
The accompanying notes are an integral part of the financial
statements. |
2010 Annual Report 12
| Birmiwal Oasis Fund |
| |
| Statement of Assets and Liabilities | | |
| March 31, 2010 | | |
| |
| Assets: | | |
| Investment Securities at Fair Value | | $ 17,266,344 |
| (Identified Cost - $18,943,251) | | |
| Cash Held at Custodian and Broker for Written Options | | 84,854 |
| Cash Held at Custodian | | 370,789 |
| Receivables: | | |
| Dividends and Interest | | 4,087 |
| Receivable for Securities Sold | | 2,990,402 |
| Total Assets | | 20,716,476 |
| Liabilities | | |
| Written Options, at Fair Value (Proceeds - $61,170) | | 42,500 |
| Payable for Securities Purchased | | 739,599 |
| Management Fees Payable | | |
| Base Management Fee Payable to Adviser | | 50,831 |
| Performance Adjustment Payable to Adviser | | 30,450 |
| Total Liabilities | | 863,380 |
| |
| Net Assets | | $ 19,853,096 |
| Net Assets Consist of: | | |
| Paid In Capital | | 23,483,731 |
| Accumulated Net Realized Loss | | (1,972,398) |
| Unrealized Depreciation in Value of Investments, Written Options, and | | (1,658,237) |
| Options Purchased Based on Identified Cost - Net | | |
| Net Assets, for 775,868 Shares Outstanding | | $ 19,853,096 |
| (Unlimited number of shares authorized without par value) | | |
| Net Asset Value, Offering and Redemption Price | | |
| Per Share ($19,853,096/775,868 shares) | | $ 25.59 |
| |
| Statement of Operations | | |
| For the fiscal year ended March 31, 2010 | | |
| |
| Investment Income: | | |
| Dividends (Net of foreign withholding tax and ADR fees of $7,817) | | $ 21,706 |
| Interest | | 3,102 |
| Total Investment Income | | 24,808 |
| Expenses: (Note 4) | | |
| Management Fees | | |
| Base Management Fees | | 406,353 |
| Performance Based Management Fee - Net | | 50,241 |
| Net Management Fees | | 456,594 |
| Interest Expense | | 445 |
| Total Expenses | | 457,039 |
| |
| Net Investment Loss | | (432,231) |
| |
| Realized and Unrealized Gain (Loss) on Investments, Securities Sold Short, | | |
| Options Purchased & Options Written: | | |
| Net Realized Gain on Investments | | 5,140,474 |
| Net Realized Loss on Securities Sold Short | | (38,579) |
| Net Realized Loss on Options Purchased | | (180,576) |
| Net Realized Gain on Options Written | | 245,961 |
| Net Change In Unrealized Depreciation on Investments | | 9,161,287 |
| Net Change In Unrealized Appreciation on Securities Sold Short | | 9,558 |
| Net Change In Unrealized Appreciation on Options Written | | 18,670 |
| Net Change In Unrealized Depreciation on Options Purchased | | (757,046) |
| Net Realized and Unrealized Gain/(Loss) on Investments, Securities | | |
| Sold Short, Options Purchased & Options Written | | 13,599,749 |
| Net Increase in Net Assets from Operations | | $ 13,167,518 |
The accompanying notes are an integral part of the financial
statements. |
2010 Annual Report 13
| Birmiwal Oasis Fund |
| |
| Statements of Changes in Net Assets | | | | |
| | | 4/1/2009 | | 4/1/2008 |
| | | to | | to |
| | | 3/31/2010 | | 3/31/2009 |
| From Operations: | | | | |
| Net Investment Loss | | $ (432,231) | | $ (260,702) |
| Net Realized Gain/(Loss) on Investments, Securities Sold Short, | | 5,167,280 | | (6,063,779) |
| Options Purchased and Options Written | | | | |
| Net Change In Unrealized Depreciation | | 8,432,469 | | (5,464,565) |
| Increase/(Decrease) in Net Assets from Operations | | 13,167,518 | | (11,789,046) |
| From Distributions to Shareholders: | | | | |
| Net Investment Income | | 0 | | 0 |
| Net Realized Gain from Security Transactions | | 0 | | (194,651) |
| Change in Net Assets from Distributions | | 0 | | (194,651) |
| From Capital Share Transactions: | | | | |
| Proceeds From Sale of Shares | | 146,598 | | 90,449 |
| Shares Issued on Reinvestment of Dividends | | 0 | | 194,318 |
| Cost of Shares Redeemed | | (175,925) | | (660,046) |
| Net Increase/(Decrease) from Shareholder Activity | | (29,327) | | (375,279) |
| Net Increase/(Decrease) in Net Assets | | 13,138,191 | | (12,358,976) |
| Net Assets at Beginning of Period | | 6,714,905 | | 19,073,881 |
| Net Assets at End of Period (including accumulated | | $ 19,853,096 | | $ 6,714,905 |
| undistributed net investment income of $0 and $0, respectively) | | | | |
| Share Transactions: | | | | |
| Issued | | 7,473 | | 4,874 |
| Reinvested | | - | | 17,943 |
| Redeemed | | (9,331) | | (67,313) |
| Net Increase/(Decrease) in Shares | | (1,858) | | (44,496) |
| Shares Outstanding Beginning of Period | | 777,726 | | 822,222 |
| Shares Outstanding End of Period | | 775,868 | | 777,726 |
| Financial Highlights | | | | | | | | | | |
| Selected data for a share outstanding | | 4/1/2009 | | 4/1/2008 | | 4/1/2007 | | 4/1/2006 | | 4/1/2005 |
| throughout the period: | | to | | to | | to | | to | | to |
| | | 3/31/2010 | | 3/31/2009 | | 3/31/2008 | | 3/31/2007 | | 3/31/2006 |
| Net Asset Value - | | | | | | | | | | |
| Beginning of Period | | $ 8.63 | | $ 23.20 | | $ 32.56 | | $ 37.19 | | $ 29.34 |
| Net Investment Income/(Loss)* | | (0.56) | | (0.32) | | (0.80) | | (1.27) | | (1.18) |
| Net Gains or Losses on Securities | | | | | | | | | | |
| (realized and unrealized) ** | | 17.52 | | (14.01) | | 2.05 | | 9.26 | | 18.15 |
| Total from Investment Operations | | 16.96 | | (14.33) | | 1.25 | | 7.99 | | 16.97 |
| Distributions (From Net Investment Income) | | 0.00 | | 0.00 | | 0.00 | | 0.00 | | 0.00 |
| Distributions (From Capital Gains) | | 0.00 | | (0.24) | | (10.61) | | (12.62) | | (9.12) |
| Total Distributions | | 0.00 | | (0.24) | | (10.61) | | (12.62) | | (9.12) |
| Net Asset Value - | | | | | | | | | | |
| End of Period | | $ 25.59 | | $ 8.63 | | $ 23.20 | | $ 32.56 | | $ 37.19 |
| |
| Total Return (a) | | 196.52% | | (61.97)% | | (2.12)% | | 22.51% | | 63.83% |
| Ratios/Supplemental Data | | | | | | | | | | |
| Net Assets - End of Period (Thousands) | | 19,853 | | 6,715 | | 19,074 | | 20,292 | | 16,326 |
| Ratio of Expenses to Average Net Assets | | 3.25% | | 2.57% | | 4.28% | | 4.85% | | 4.70% |
| Ratio of Net Investment Loss to Average Net Assets | | -3.08% | | -1.81% | | -2.58% | | -3.46% | | -3.50% |
| Portfolio Turnover Rate | | 1477.97% | | 998.97% | | 932.44% | | 688.12% | | 637.98% |
| | * Per share amounts were calculated using the average shares method.
** Realized and unrealized gains and losses per share in this caption are balancing amounts necessary to reconcile the
change in net asset value per share for the period, and may not reconcile with the aggregate gains and losses in the
Statement of Operations due to share transactions for the period.
(a) Total return in the above table represents the rate that the investor would have earned or lost on an investment in the
Fund assuming reinvestment of all Fund distributions. |
The accompanying notes are an integral part of these
financial statements. |
2010 Annual Report 14
NOTES TO THE FINANCIAL STATEMENTS
BIRMIWAL OASIS FUND
March 31, 2010 |
1.) ORGANIZATION
Birmiwal Oasis Fund (the "Fund") is a non-diversified series of the Birmiwal Investment Trust (the "Trust"), an open-end investment company that commenced operations on April 1, 2003. The Trust was organized in Ohio as a business trust on January 3, 2003. The Trust may offer shares of beneficial interest in a number of separate series, each series representing a distinct fund with its own investment objectives and policies. At present, there is only one series authorized by the Trust. Birmiwal Asset Management, Inc. is the adviser to the Fund (the "Adviser"). As of the close of business on January 30, 2006, the Fund closed to new investors and would not take additional purchases from existing investors, except shareholders of record on January 30, 2006 were able to continue to add to their existing accounts only through the reinvestment of dividends and/or capital gain distributions from shares owned, and trustees of the Fund, as well as directors, officers and employees of the Adviser, were permitted to con tinue to open new accounts and make additional purchases in existing accounts. As of August 1, 2006, the Fund has revised its policies with respect to permitted investments in the Fund to reflect the following: The Fund remained closed to new investors except for non-profit organizations. Existing shareholders can purchase additional shares either by making new investments in their existing account(s) and/or by opening new account(s). The total of such new investments will be limited to a maximum of $25,000 per calendar year per taxpayer identification number/social security number. Existing shareholders may also continue to add to their existing accounts through the reinvestment of dividends and/or capital gain distributions from shares owned and may continue to participate in the Automatic Investment Plan (AIP). Non-profit organizations qualifying under Section 501(c)(3) of the Internal Revenue Code can open new accounts subject to a maximum investment limit of $25,000 per calendar year per taxpayer identi fication number. Trustees of the Fund, as well as directors, officers and employees of the Adviser, may continue to open new accounts and make additional purchases in existing accounts. The Fund’s primary investment objective is to seek capital aprecia-tion. Significant accounting policies of the Fund are presented below:
2.) SIGNIFICANT ACCOUNTING POLICIES
SECURITY VALUATION: All investments in securities are recorded at their estimated fair value, as described in note 3.
SHORT SALES: The Fund may sell a security it does not own in anticipation of a decline in the fair value of that security. When the Fund sells a security short, it must borrow the security sold short and deliver it to the broker-dealer through which it made the short sale. A gain, limited to the price at which the Fund sold the security short, or a loss, unlimited in size, will be recognized upon the termination of a short sale.
OPTION WRITING: When the Fund writes an option, an amount equal to the premium received by the Fund is recorded as a liability and is subsequently adjusted to the current fair value of the option written. Premiums received from writing options that expire unexercised are treated by the Fund on the expiration date as realized gains from investments. The difference between the premium and the amount paid on effecting a closing purchase transaction, including brokerage commissions, is also treated as a realized gain, or, if the premium is less than the amount paid for the closing purchase transaction, as a realized loss. If a call option is exercised, the premium is added to the proceeds from the sale of the underlying security or currency in determining whether the Fund has realized a gain or a loss. If a put option is exercised, the premium reduces the cost basis of the securities purchased by the Fund. The Fund as writer of an option bears the market risk of an unfavorable change in the price o f the security underlying the written option.
FEDERAL INCOME TAXES: The Fund’s policy is to continue to comply with the requirements of the Internal Revenue Code that are applicable to regulated investment companies and to distribute all of its taxable income to shareholders. Therefore, no federal income tax provision is required. It is the Fund’s policy to distribute annually, prior to the end of the calendar year, dividends sufficient to satisfy excise tax requirements of the Internal Revenue Code. This Internal Revenue Code requirement may cause an excess of distributions over the book year-end accumulated income. In addition, it is the Fund’s policy to distribute annually, after the end of the fiscal year, any remaining net investment income and net realized capital gains.
The Fund recognizes the tax benefits of certain tax positions only where the position is “more likely than not” to be sustained assuming examination by tax authorities. Management has analyzed the Fund’s tax positions, and has concluded that no liability for unrecognized tax benefits should be recorded related to uncertain tax positions taken on returns filed for open tax years (2006 -2008), or expected to be taken on the Fund’s 2009 tax return. The Fund identifies its major tax jurisdictions as U.S. Federal and State tax authorities; however the Fund is not aware of any tax
2010 Annual Report 15
Notes to the Financial Statements - continued
positions for which it is reasonably possible that the total amounts of unrecognized tax benefits will change materially in the next twelve months.
DISTRIBUTIONS TO SHAREHOLDERS: Distributions to shareholders, which are determined in accordance with income tax regulations, are recorded on the ex-dividend date. The treatment for financial reporting purposes of distributions made to shareholders during the year from net investment income or net realized capital gains may differ from their ultimate treatment for federal income tax purposes. These differences are caused primarily by differences in the timing of the recognition of certain components of income, expense, or realized capital gain for federal income tax purposes. Where such differences are permanent in nature, they are reclassified in the components of the net assets based on their ultimate characterization for federal income tax purposes. Any such reclassifications will have no effect on net assets, results of operations, or net asset values per share of the Fund. At March 31, 2010, the net impact of permanent book to tax adjustments resulted in net investment loss in the amount of $432,231 to be reclassified to accumulated net realized loss.
USE OF ESTIMATES: The preparation of financial statements in conformity with accounting principles generally accepted in the United States of America requires management to make estimates and assumptions that affect the reported amounts of assets and liabilities and disclosure of contingent assets and liabilities at the date of the financial statements and the reported amounts of revenues and expenses during the reporting period. Actual results could differ from those estimates.
OTHER: The Fund records security transactions based on a trade date. Dividend income is recognized on the ex-dividend date, and interest income is recognized on an accrual basis. Discounts and premiums on securities purchased are amortized over the lives of the respective securities. Withholding taxes on foreign dividends have been provided for in accordance with the Fund’s understanding of the applicable country’s tax rules and rates.
SUBSEQUENT EVENTS: Management has evaluated subsequent events through the date the financial statements were issued and determined there were no material subsequent events.
3.) SECURITIES VALUATIONS
As described in note 2, the Fund utilizes various methods to measure the fair value of most of its investments on a recurring basis. GAAP establishes a hierarchy that prioritizes inputs to valuation methods. The three levels of inputs are:
Level 1 - Unadjusted quoted prices in active markets for identical assets or liabilities that the Fund has the ability to access.
Level 2 - Observable inputs other than quoted prices included in level 1 that are observable for the asset or liability, either directly or indirectly. These inputs may include quoted prices for the identical instrument on an inactive market, prices for similar instruments, interest rates, prepayment speeds, credit risk, yield curves, default rates and similar data.
Level 3 - Unobservable inputs for the asset or liability, to the extent relevant observable inputs are not available, representing the Fund’s own assumptions about the assumptions a market participant would use in valuating the asset or liability, and would be based on the best information available.
The availability of observable inputs can vary from security to security and is affected by a wide variety of factors, including, for example, the type of security, whether the security is new and not yet established in the marketplace, the liquidity of markets, and other characteristics particular to the security. To the extent that valuation is based on models or inputs that are less observable or unobservable in the market, the determination of fair value requires more judgment. Accordingly, the degree of judgment exercised in determining fair value is greatest for instruments categorized in level 3.
The inputs used to measure fair value may fall into different levels of the fair value hierarchy. In such cases, for disclosure purposes, the level in the fair value hierarchy within which the fair value measurement falls in its entirety, is determined based on the lowest level input that is significant to the fair value measurement in its entirety.
FAIR VALUE MEASUREMENTS
A description of the valuation techniques applied to the Fund’s major categories of assets and liabilities measured at fair value on a recurring basis follows.
Equity securities (common stock, real estate investment trusts, and warrants). Equity securities that are traded on any exchange or on the NASDAQ over-the-counter market are valued at the
2010 Annual Report 16
Notes to the Financial Statements - continued
last quoted sale price. Lacking a last sale price, a security is valued at its last bid price except when, in the Adviser's opinion, the last bid price does not accurately reflect the current value of the security. All other securities for which over-the-counter market quotations are not readily available are valued at their last bid price. Generally, if the security is traded in an active market and is valued at the last sale price, the security is categorized as a level 1 security. When the security position is not considered to be part of an active market or when the security is valued at the bid price, the position is generally categorized as a level 2. When market quotations are not readily available, when the Adviser determines the last bid price does not accurately reflect the current value or when restricted securities are being valued, such securities are valued as determined in good faith by the Adviser, in conformity with guidelines adopted by and subject to revie w of the Board of Trustees and are generally categorized in level 3 of the fair value hierarchy.
Money markets. Money Market securities are valued at a net asset value of $1.00 and are classified in level 1 of the fair value hierarchy.
Options. Option positions that are traded on any exchange or on the NASDAQ over-the-counter market are valued at the last quoted sale price. To the extent these option positions are actively traded and valuation adjustments are not applied, they are classified in level 1 of the fair value hierarchy. Lacking a last sale price, an option position, is valued at its last bid price except when, in the Adviser’s opinion, the last bid price does not accurately reflect the current value of the option position. When a bid price is used for valuation or when the security is not actively traded, those securities are valued at their last bid price and are generally categorized in level 2 of the fair value hierarchy.
Fixed income securities. Fixed income securities generally are valued by using market quotations, but may be valued on the basis of prices furnished by a pricing service when the Adviser believes such prices accurately reflect the fair market value of such securities. A pricing service utilizes electronic data processing techniques based on yield spreads relating to securities with similar characteristics to determine prices for normal institutional-size trading units of debt securities without regard to sale or bid prices. If the Adviser decides that a price provided by the pricing service does not accurately reflect the fair market value of the securities, when prices are not readily available from a pricing service or when restricted or illiquid securities are being valued, securities are valued at fair value as determined in good faith by the Adviser, in conformity with guidelines adopted by and subject to review of the Board of Trustees . Short term investments in fixed income securities with maturities of less than 60 days when acquired, or which subsequently are within 60 days of maturity, are valued by using the amortized cost method of valuation, which the Board of Trustees has determined will represent fair value.
In accordance with the Trust's good faith pricing guidelines, the Adviser is required to consider all appropriate factors relevant to the value of securities for which it has determined other pricing sources are not available or reliable as described above. There is no single standard for determining fair value, since fair value depends upon the circumstances of each individual case. As a general principle, the current fair value of an issue of securities being valued by the Adviser would appear to be the amount which the owner might reasonably expect to receive for them upon their current sale. Methods which are in accordance with this principle may, for example, be based on (i) a multiple of earnings; (ii) a discount from market of a similar freely traded security (including a derivative security or a basket of securities traded on other markets, exchanges or among dealers); or (iii) yield to maturity with respect to debt issues, or a combination of these and other methods .
The following table summarizes the inputs used to value the Fund’s assets and liabilities measured at fair value as of March 31, 2010:
| Valuation Inputs of Assets | | Level 1 | | Level 2 | | Level 3 | | Total |
| Common Stock | | $10,737,937 | | $0 | | $0 | | $10,737,937 |
| Real Estate Investment Trusts | | 688,137 | | 0 | | 0 | | 688,137 |
| Warrants | | 538,461 | | 0 | | 0 | | 538,461 |
| Options Purchased | | 2,436,934 | | 479,080 | | 0 | | 2,916,014 |
| Money Market Funds | | 2,385,795 | | 0 | | 0 | | 2,385,795 |
| Total | | $16,787,264 | | $479,080 | | $0 | | $17,266,344 |
| |
| Valuation Inputs of Liabilities | | Level 1 | | Level 2 | | Level 3 | | Total |
| Options Written | | $42,500 | | $0 | | $0 | | $42,500 |
| Total | | $42,500 | | $0 | | $0 | | $42,500 |
Refer to the Fund’s Schedule of Investments for a listing of securities by industry. The Fund did not hold any Level 3 assets during the fiscal year ended March 31, 2010.
2010 Annual Report 17
Notes to the Financial Statements - continued
4.) INVESTMENT ADVISORY AGREEMENT
The Fund has entered into an Investment Advisory Agreement with Birmiwal Asset Management, Inc. (the “Adviser”). Under the terms of the Investment Advisory Agreement, the Adviser manages the investment portfolio of the Fund, subject to policies adopted by the Trust’s Board of Trustees. Under the Investment Advisory Agreement, the Adviser, at its own expense and without reimbursement from the Trust, furnishes office space and all necessary office facilities, equipment and executive personnel necessary for managing the assets of the Fund. The Adviser also pays the salaries and fees of all of its officers and employees that serve as officers and trustees of the Trust. The Adviser pays all operating expenses of the Fund, with the exception of taxes, borrowing expenses (such as (i) interest and (ii) dividend expenses on securities sold short), brokerage commissions, indirect expenses (such as the expenses of other investment companies in which the Fund may invest) and ext raordinary expenses.
For its services and its agreement to pay the Fund’s operating expenses, the Adviser receives an annual variable performance-based management fee comprised of a base rate of 2.90% of the Fund's average daily net assets and a performance adjustment, which is in accordance with a rate schedule. The performance adjustment increases or decreases the fee paid by the Fund to the Adviser based on the Fund's performance relative to the S&P 500 Index over the most recent 12-month period. If the Fund's return for the period is within 2.00% (two percentage points) of the return on the S&P 500 Index, no adjustment is made. If the difference between the performance of the Fund and the S&P 500 Index exceeds 2.00% (two percentage points), the performance adjustment is made at a rate that varies linearly with the difference between the Fund's performance and that of the S&P 500 Index. The resulting performance adjustment rate can be as high as 2.40% if the Fund outperfo rms the S&P 500 Index by 14% (fourteen percentage points) or more, and as low as -2.40% if the Fund underperforms the S&P 500 Index by 14% (fourteen percentage points) or more.
For the fiscal year ended March 31, 2010, the Adviser earned base management fees totaling $406,353 and performance-based management fees totaling $50,241. At March 31, 2010, the Fund owed the Adviser management fees in the amount of $81,281, which consisted of base management fees of $50,831 and performance-based management fees of $30,450.
5.) RELATED PARTY TRANSACTIONS
Kailash Birmiwal, Ph.D. is the control person of the Adviser and also serves as a trustee/officer of the Fund. This individual receives benefits from the Adviser resulting from management fees paid to the Adviser by the Fund.
The Trustees who are not interested persons of the Fund were paid a total of $8,000 in Trustee fees for the fiscal year ended March 31, 2010. Pursuant to the Investment Advisery Agreement, these fees are paid by the Adviser.
6.) CAPITAL STOCK
The Trust is authorized to issue an unlimited number of shares without par value. Paid in capital at March 31, 2010 was $23,483,731 representing 775,868 shares outstanding.
7.) INVESTMENT TRANSACTIONS
For the fiscal year ended March 31, 2010, purchases and sales of investment securities other than U.S. Government obligations and short-term investments aggregated $149,686,530 and $157,557,185, respectively. Purchases and sales of U.S. Government obligations aggregated $0 and $0, respectively.
For federal income tax purposes, the cost of total investment securities owned at March 31, 2010 was $21,316,025 and premiums received from options written amounted to $61,170. At March 31, 2010, the composition of unrealized appreciation (the excess of value over tax cost) and depreciation (the excess of tax cost over value), was as follows:
| Appreciation | | (Depreciation) | | Net Appreciation (Depreciation) |
| $3,402,433 | | ($7,433,444) | | ($4,031,011) |
8.) DERIVATIVES
Transactions in written options during the fiscal year ended March 31, 2010 were as follows:
| | | Number of | | Premiums |
| | | Contracts | | Received |
| Options outstanding at March 31, 2009 | | 0 | | $0 |
| Options written | | 7,180 | | $1,262,417 |
| Options terminated in closing purchase transactions | | (3,980) | | ($894,163) |
| Options expired | | 0 | | $0 |
| Options exercised | | (2,700) | | ($307,084) |
| Options outstanding at March 31, 2010 | | 500 | | $61,170 |
2010 Annual Report 18
Notes to the Financial Statements - continued
Transactions in purchased options during the fiscal year ended March 31, 2010 were as follows:
| | | Number of | | Premiums |
| | | Contracts | | Paid |
| Options outstanding at March 31, 2009 | | 200 | | $112,184 |
| Options purchased | | 331,545 | | $20,215,726 |
| Options terminated in closing purchase transactions | | (147,479) | | ($12,834,830) |
| Options expired | | (35,356) | | ($2,306,848) |
| Options exercised | | (9,486) | | ($1,400,990) |
| Options outstanding at March 31, 2010 | | 139,424 | | $3,785,242 |
The locations on the statement of assets and liabilities of the Fund's derivative positions, which are not accounted for as hedging instruments under GAAP, is as follows:
| | | Asset | | | | Liability |
| | | Derivatives | | | | Derivatives |
| Call options purchased: | | | | Written Options at | | |
| Included In Investments in | | $2,916,014 | | Fair Value | | $42,500 |
| Securities at Fair Value | | | | | | |
As of March 31, 2010, all of the Cash Held at the Custodian and Broker valued at $84,854 is restricted because it represents collateral for written options.
Realized and unrealized gains and losses on derivatives contracts entered into during the fiscal year ended March 31, 2010 by the Fund are recorded in the following locations in the Statement of Operations:
| | | | | Realized | | | | Unrealized |
| Equity Contracts | | Location | | Gain/(Loss) | | Location | | Gain/(Loss) |
| Call Options | | Net Realized | | | | Change In Unrealized | | |
| Purchased | | Loss on Options | | ($180,576) | | Appreciation/(Depreciation) | | ($757,046) |
| | | Purchased | | | | on Options Purchased | | |
| Call Options | | Net Realized | | | | Change In Unrealized | | |
| Written | | Gain on Options | | $245,961 | | Appreciation/(Depreciation) | | $18,670 |
| | | Written | | | | on Options Written | | |
The Fund engages in option transactions involving individual securities and stock indexes. An option involves either: (a) the right or the obligation to buy or sell a specific instrument at a specific price until the expiration date of the option; or (b) the right to receive payments or the obligation to make payments representing the difference between the closing price of a stock index and the exercise price of the option expressed in dollars times a specified multiple until the expiration date of the option. The Fund may purchase and write options. Options are sold (written) on securities and stock indexes. The purchaser of an option on a security pays the seller (the writer) a premium for the right granted but is not obligated to buy or sell the underlying security. The purchaser of an option on a stock index pays the seller a premium for the right granted, and in return the seller of such an option is obligated to make the payment. A writer of an option may terminate th e obligation prior to expiration of the option by making an offsetting purchase of an identical option. Options are traded on organized exchanges and in the over-the-counter market. To cover the potential obligations involved in writing options, a Fund will either: (a) own the underlying security, or in the case of an option on a market index, will hold a portfolio of stocks substantially replicating the movement of the index; or (b) the Fund will segregate with the custodian high grade liquid assets sufficient to purchase the underlying security or equal to the market value of the stock index option, marked to market daily.
The purchase of options limits a Fund's potential loss to the amount of the premium paid and can afford the Fund the opportunity to profit from favorable movements in the price of an underlying security to a greater extent than if transactions were effected in the security directly. However, the purchase of an option could result in the Fund losing a greater percentage of its investment than if the transaction were effected directly. When the Fund writes a call option, it will receive a premium, but it will give up the opportunity to profit from a price increase in the underlying security above the exercise price as long as its obligation as a writer continues, and it will retain the risk of loss should the price of the security decline. When the Fund writes a put option, it will assume the risk that the price of the underlying security or instrument will fall below the exercise price, in which case the Fund may be required to purchase the security or instrument at a higher price than the market price of the security or instrument. In addition, there can be no assurance that the Fund can effect a closing transaction on a particular option it has written. Further, the total premium paid for any option may be lost if the Fund does not exercise the option.
2010 Annual Report 19
Notes to the Financial Statements - continued
The Fund engages in option transactions involving securities and stock indices in order to gain exposure to particular securities or markets, in connection with hedging transactions, or to try to enhance returns. Options require additional skills and techniques beyond normal portfolio management. The Fund's use of options involves risk that such instruments may not work as intended due to unanticipated developments, especially in abnormal market conditions, or if the Adviser makes an error in judgment, or other causes. The use of options may magnify the increase or decrease in the performance of the Fund, and may also subject the Fund to higher price volatility.
The premiums paid for the options represent the cost of the investment and the options are valued daily at their closing price. The Fund recognize a realized gain or loss when the option is sold or expired. Option holdings within the Fund, which may include put options and call options, are subject to loss of value with the passage of time, and may experience a total loss of value upon expiration. With options, there is minimal counterparty risk to the Fund since they are exchange traded.
9.) CONTROL OWNERSHIP
The beneficial ownership, either directly or indirectly, of more than 25% of the voting securities of a fund creates a presumption of control of the fund, under Section 2(a)(9) of the Investment Company Act of 1940. As of March 31, 2010, Kailash Birmiwal, Ph.D., the control person of the Adviser, held, in aggregate, approximately 73% of the Fund.
10.) DISTRIBUTIONS TO SHAREHOLDERS
The tax character of distributions paid during the fiscal year ended March 31, 2010 and the fiscal year ended March 31, 2009 were as follows:
| Distributions paid from: | | | | |
| |
| | | Year ended | | Year ended |
| | | March 31, 2010 | | March 31, 2009 |
| Ordinary Income: | | $ 0 | | $ 0 |
| Short-term Capital Gain | | 0 | | 194,613 |
| Long-term Capital Gain | | 0 | | 38 |
| | | $ 0 | | $ 194,651 |
As of March 31, 2010, the components of distributable earnings/(accumulated losses) on a tax basis were as follows:
| Undistributed ordinary income | | $ 400,376 |
| Unrealized appreciation/(depreciation) | | (4,031,011) |
| | | $ (3,630,635) |
The differences between book basis and tax basis unrealized depreciation are attributable to the tax deferral of losses on wash sales and current year Post-October losses. The Fund elected to defer post-October losses in the amount of $832,433.
11.) AVERAGE BORROWINGS
Periodically, the Fund may seek to obtain loans from its brokers for the purpose of funding redemptions or purchasing securities up to the maximum amount that the Fund is permitted to borrow under the Investment Company Act of 1940 using the securities in its portfolio as collateral. Interest is computed on the settled margin balance in the account. The rate at which interest is charged on the settled margin balance may vary from the broker's base rate, depending on the amount of the settled debit balance in the account. During the year ended March 31, 2010, the Fund had borrowings. The Fund had an average loan balance of $9,545 and paid an average interest rate of 4.59% . As of March 31, 2010 there was no outstanding loan balance due.
2010 Annual Report 20
Cohen Fund Audit Services, Ltd.
Certified Public Accountants | 800 Westpoint Pkwy, Ste 1100
Westlake, Ohio 44145
Phone: (440) 835-8500
Fax: (440) 835-1093
www.cohenfund.com |
REPORT OF INDEPENDENT REGISTERED PUBLIC ACCOUNTING FIRM
To the Shareholders and Board of Trustees
Birmiwal Investment Trust |
We have audited the accompanying statement of assets and liabilities, including the schedules of investments and written options, of Birmiwal Investment Trust, comprising the Birmiwal Oasis Fund (the "Fund") as of March 31, 2010, and the related statement of operations for the year then ended, the statements of changes in net assets for each of the two years in the period then ended, and the financial highlights for each of the five years in the period then ended. These financial statements and financial highlights are the responsibility of Fund management. Our responsibility is to express an opinion on these financial statements and financial highlights based on our audits.
We conducted our audits in accordance with the standards of the Public Company Accounting Oversight Board (United States). Those standards require that we plan and perform the audit to obtain reasonable assurance about whether the financial statements and financial highlights are free of material misstatement. An audit includes examining, on a test basis, evidence supporting the amounts and disclosures in the financial statements. Our procedures included confirmation of securities owned as of March 31, 2010 by correspondence with the custodian and brokers. An audit also includes assessing the accounting principles used and significant estimates made by management, as well as evaluating the overall financial statement presentation. We believe that our audits provide a reasonable basis for our opinion.
In our opinion, the financial statements and financial highlights referred to above present fairly, in all material respects, the financial position of Birmiwal Oasis Fund as of March 31, 2010, the results of its operations for the year then ended, the changes in its net assets for each of the two years in the period then ended, and the financial highlights for each of the five years in the period then ended, in conformity with accounting principles generally accepted in the United States of America.

COHEN FUND AUDIT SERVICES, LTD.
Westlake, Ohio
June 1, 2010 |
2010 Annual Report 21
TRUSTEES AND OFFICERS - Unaudited
The Board of Trustees supervises the business activities of the Trust. The names of the Trustees and executive officers of the Trust are shown below. Each Trustee serves until the Trustee dies, resigns, retires or is removed. Officers hold office for one year and until their respective successors are chosen and qualified. For more information regarding the Trustees, please refer to the Statement of Additional Information, which is available upon request by calling 1-800-417-5525. The trustees and officers of the Trust and their principal business activities during the past five years are:
Interested Trustees & Officers
| | | | | | | | | | | Other |
| Name, | | Position | | Length of | | Principal | | Number of | | Directorships |
| Address(1), | | with the | | Time Served | | Occupation(s) | | Portfolios | | Held By |
| and Year of Birth | | Trust | | | | During | | Overseen By | | Trustee or |
| | | | | | | Past 5 Years | | Trustee | | Officer |
| |
| Kailash Birmiwal, Ph.D.(2) | | President, | | Since 2003 | | President of the Fund’s Adviser | | 1 | | None |
| 1957 | | Treasurer, | | | | since 2003. | | | | |
| | | Chief | | | | | | | | |
| | | Compliance | | | | | | | | |
| | | Officer and | | | | | | | | |
| | | Trustee | | | | | | | | |
| |
| Lea R. Birmiwal, Ph.D. | | Secretary | | Since 2003 | | Homemaker. | | N/A | | None |
| 1960 | | | | | | | | | | |
| | (1)The address of each trustee and officer is c/o Birmiwal Investment Trust, 24140 E. Greystone Lane, Woodway, WA 98020.
(2) Kailash Birmiwal is considered an "interested persons" as defined in Section 2(a)(19) of the Investment Company Act of 1940 by
virtue of his affiliation with the Adviser.
Independent Trustees |
| | | | | | | Principal | | Number of | | Other |
| Name, | | Position | | Length of | | Occupation(s) | | Portfolios | | Directorships |
| Address(3), | | with the | | Time Served | | During | | Overseen By | | Held By |
| and Year of Birth | | Trust | | | | Past 5 Years | | Trustee | | Trustee or |
| | | | | | | | | | | Officer |
| |
| Rajendra K. Bordia, Ph.D. | | Trustee | | Since 2003 | | Professor, Department of | | 1 | | None |
| 1957 | | | | | | Materials Science and | | | | |
| | | | | | | Engineering, University of | | | | |
| | | | | | | Washington (2003-Present). Chair | | | | |
| | | | | | | (1998-2005), Associate Professor | | | | |
| | | | | | | (1991-2003), Department of | | | | |
| | | | | | | Materials Science and | | | | |
| | | | | | | Engineering, University of | | | | |
| | | | | | | Washington. | | | | |
| |
| Hemant K. Gupta, Ph.D. | | Trustee | | Since 2003 | | President of Gupta Inc., a Retail | | 1 | | None |
| 1958 | | | | | | Corporation (1996-2006). | | | | |
| | | | | | | Assistant Professor, University of | | | | |
| | | | | | | Connecticut (1986-1998). | | | | |
| |
| Veera S. Karukonda | | Trustee | | Since 2003 | | Signal Systems Engineer, City of | | 1 | | None |
| 1957 | | | | | | Stamford, CT (2004-Present). Civil | | | | |
| | | | | | | Engineering Consultant (2003- | | | | |
| | | | | | | 2004). Civil Engineer, City of | | | | |
| | | | | | | Hartford, CT (1988-2003). | | | | |
| |
| Bal K. Sharma, Dr. | | Trustee | | Since 2003 | | Administrator (Chief of | | 1 | | None |
| 1953 | | | | | | Respiratory Division), V.A. Medical | | | | |
| | | | | | | Center, North Chicago (1990- | | | | |
| | | | | | | Present). | | | | |
(3)The address of each trustee and officer is c/o Birmiwal Investment Trust, 24140 E. Greystone Lane, Woodway, WA 98020.
2010 Annual Report 22
Board of Trustees
Kailash Birmiwal, Ph. D.
Rajendra K. Bordia, Ph. D.
Hemant K. Gupta, Ph. D.
Veera S. Karukonda
Bal K. Sharma, Dr.
Investment Adviser
Birmiwal Asset Management, Inc.
24140 E. Greystone Lane
Woodway, WA 98020
Dividend Paying Agent,
Shareholders' Servicing Agent,
Transfer Agent
Mutual Shareholder Services, LLC
8000 Town Centre Dr., Ste 400
Broadview Hts, OH 44147
Custodian
U.S. Bank, NA
425 Walnut Street
P.O. Box 1118
Cincinnati, OH 45201
Fund Administrator
Premier Fund Solutions Inc.
480 N. Magnolia Avenue, Suite 103
El Cajon, CA 92020
Legal Counsel
Thompson Hine LLP
312 Walnut Street, 14th Floor
Cincinnati, OH 45202
Independent Registered Public
Accounting Firm
Cohen Fund Audit Services, Ltd.
800 Westpoint Pkwy., Ste 1100
Westlake, OH 44145-1594 |
This report is provided for the general information of the shareholders of the Birmiwal Oasis
Fund. This report is not intended for distribution to prospective investors in the funds, unless
preceded or accompanied by an effective prospectus. |
Birmiwal Oasis Fund
24140 E. Greystone Lane
Woodway, WA 98020 |
Item 2. Code of Ethics.
The registrant has adopted a code of ethics that applies to the registrant’s principal executive officer and the principal financial officer. The registrant has made minor administrative changes and amended its code of ethics during the covered period. The registrant has not granted any waivers from any provisions of the code of ethics during the covered period. A copy of the registrant’s Code of Ethics is filed herewith.
Item 3. Audit Committee Financial Expert.
The registrant’s Board of Trustees has determined that it does not have an audit committee financial expert serving on its audit committee. The registrant believes that the experience provided by each member of the audit committee together offers the registrant adequate oversight for the registrant’s level of financial complexity.
Item 4. Principal Accountant Fees and Services.
(a-d) The following table details the aggregate fees billed for each of the last two fiscal years for audit fees, audit-related fees, tax fees and other fees by the principal accountant to the registrant. The principal accountant has provided no services to the adviser or any entity controlled by, or under common control with the adviser that provides ongoing services to the registrant.
| | | FYE 3/31/10 | | FYE 3/31/09 |
| Audit Fees | | $15,150 | | $15,325 |
| Audit-Related Fees | | $0 | | $0 |
| Tax Fees | | $3,500 | | $3,500 |
| All Other Fees | | $600 | | $600 |
Nature of Tax Fees: preparation of Excise Tax Statement and 1120 RIC. Nature of All Other Fees: Review of Semi-Annual Report.
(e) (1) The audit committee approves all audit and non-audit related services and, therefore, has not adopted pre-approval policies and procedures described in paragraph (c)(7) of Rule 2-01 of Regulation S-X.
(e) (2) None of the services described in paragraph (b) through (d) of this Item were approved by the audit committee pursuant to paragraph (c)(7)(i)(C) of Rule 2-01 of Regulation S-X.
(f) All of the principal accountant’s hours spent on auditing the registrant’s financial statements were attributed to work performed by full-time permanent employees of the principal accountant.
(g) The following table indicates the aggregate non-audit fees billed by the registrant’s principal accountant for services to the registrant , the registrant’s investment adviser (not sub-adviser), and any entity controlling, controlled by, or under common control with the adviser that provides ongoing services to the registrant, for the last two years.
| Non-Audit Fees | | FYE 3/31/10 | | FYE 3/31/09 |
| Registrant | | $4,100 | | $4,100 |
| Registrant’s Investment Adviser | | $0 | | $0 |
(h) The principal accountant provided no services to the investment adviser or any entity controlling, controlled by, or under common control with the adviser that provides ongoing services to the registrant.
Item 5. Audit Committee of Listed Companies. Not applicable.
Item 6. Schedule of Investments. Schedule filed with Item 1.
Item 7. Disclosure of Proxy Voting Policies and Procedures for Closed-End Management Investment Companies. Not applicable.
Item 8. Portfolio Managers of Closed End Management Investment Companies. Not applicable.
Item 9. Purchases of Equity Securities by Closed-End Management Investment Companies and Affiliated Purchasers. Not applicable.
Item 10. Submission of Matters to a Vote of Security Holders.
The registrant has not adopted procedures by which shareholders may recommend nominees to the registrant’s board of trustees.
Item 11. Controls and Procedures.
(a) The registrant’s president and chief financial officer concluded that the disclosure controls and procedures (as defined in Rule 30a-3(c) under the Investment Company Act of 1940 (the “Act”)) were effective as of a date within 90 days of the filing date of this report, based on the evaluation of these controls and procedures required by Rule 30a-3(b) under the Act.
(b) There were no changes in the registrant’s internal control over financial reporting (as defined in Rule 30a-3(d) under the Act) that occurred during the registrant’s second fiscal quarter of the period covered by this report that have materially affected, or are reasonably likely to materially affect, the registrant’s internal control over financial reporting.
Item 12. Exhibits.
(a)(1) Code of Ethics. Filed herewith.
(a)(2) Certifications pursuant to Section 302 of the Sarbanes-Oxley Act of 2002. Filed herewith.
(b) Certification pursuant to Section 906 Certification of the Sarbanes-Oxley Act of 2002. Filed herewith.
Pursuant to the requirements of the Securities Exchange Act of 1934 and the Investment Company Act of 1940, the registrant has duly caused this report to be signed on its behalf by the undersigned, thereunto duly authorized.
| | Birmiwal Investment Trust |
| | By: /s/ Kailash Birmiwal
Kailash Birmiwal
President |
Pursuant to the requirements of the Securities Exchange Act of 1934 and the Investment Company Act of 1940, this report has been signed below by the following persons on behalf of the registrant and in the capacities and on the dates indicated.
| | By: /s/ Kailash Birmiwal
Kailash Birmiwal
President |
| | By: /s/ Kailash Birmiwal
Kailash Birmiwal
Chief Financial Officer |