UNITED STATES
SECURITIES AND EXCHANGE COMMISSION
WASHINGTON, D.C. 20549
FORM N-CSR
CERTIFIED SHAREHOLDER REPORT OF REGISTERED MANAGEMENT
INVESTMENT COMPANIES
Investment Company Act file number 811-21289
Birmiwal Investment Trust
(Exact name of registrant as specified in charter)
24140 E. Greystone Lane, Woodway, WA 98020
(Address of principal executive offices) (Zip code)
Kailash Birmiwal
24140 E. Greystone Lane, Woodway, WA 98020
(Name and address of agent for service)
Registrant's telephone number, including area code: (206) 542-7652
Date of fiscal year end: March 31
Date of reporting period: March 31, 2013
Form N-CSR is to be used by management investment companies to file reports with the Commission not later than 10 days after the transmission to stockholders of any report that is required to be transmitted to stockholders under Rule 30e-1 under the Investment Company Act of 1940 (17 CFR 270.30e -1). The Commission may use the information provided on Form N-CSR in its regulatory, disclosure review, inspection and policymaking roles.
A registrant is required to disclose the information specified by Form N-CSR, and the Commission will make this information public. A registrant is not required to respond to the collection of information contained in Form N-CSR unless the Form displays a currently valid Office of Management and Budget ("OMB") control number. Please direct comments concerning the accuracy of the information collection burden estimate and any suggestions for reducing the burden to Secretary, Securities and Exchange Commission, 450 Fifth Street, NW, Washington, DC 20549-0609. The OMB has reviewed this collection of information under the clearance requirements of 44 U.S.C. § 3507.
Item 1. Reports to Stockholders.
Birmiwal Oasis Fund
For Investors Seeking Capital Appreciation
ANNUAL REPORT
March 31, 2013
Birmiwal Investment Trust
www.birmiwal.com
1-800-417-5525
Birmiwal Oasis Fund
Annual Report
May 24, 2013
Dear Fellow Shareholders:
The last fiscal year was disappointing with the Fund down 14.88% in comparison to S&P 500 which was up 13.96% for the fiscal year ended March 31, 2013. The primary reason for the poor performance of the Fund was poor performance in short-term derivative trading.
Though the Fund's performance has been dismal for the last few years, and we did expect a turnaround, it has not happened. It is our view that we are off in the timing. We remain optimistic about the Fund's future.
Thank you for your continued support and trust in us.

Kailash Birmiwal
2013 Annual Report 1
BIRMIWAL OASIS FUND
Birmiwal Oasis Fund by Industry Sectors
(as a percentage of Total Investment Securities)
UNAUDITED
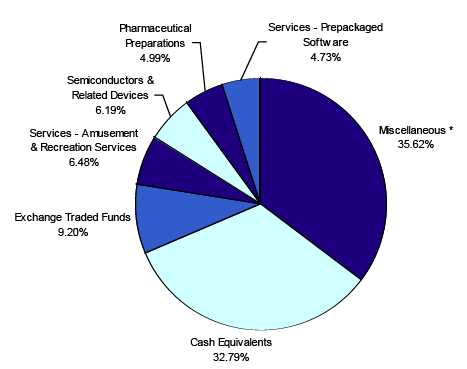
* Includes industry sectors that individually constitute no more than 4% of net assets.
See Schedule of Investments for additional information. |
Availability of Quarterly Schedule of Investments (Unaudited)
The Fund files its complete schedule of portfolio holdings with the Securities and Exchange Commission ("SEC") for the first and third quarters of each fiscal year on Form N-Q. The Fund’s Forms N-Q are available on the SEC's website at http://www.sec.gov. The Fund’s Forms N-Q may also be reviewed and copied at the SEC's Public Reference Room in Washington, DC. Information on the operation of the Public Reference Room may be obtained by calling 1-800-SEC-0330.
Proxy Voting Guidelines (Unaudited)
Birmiwal Asset Management, Inc., the Fund’s Adviser (“Adviser”), is responsible for exercising the voting rights associated with the securities held by the Fund. For existing shareholders, a description of the policies and procedures used by the Adviser in fulfilling this responsibility is available without charge on the Fund’s website at www.birmiwal.com. It is also included in the Fund’s Statement of Additional Information, which is available on the Securities and Exchange Commission’s website at http://www.sec.gov.
Information regarding how the Fund voted proxies, contained on Form N-PX, relating to portfolio securities during the most recent 12-month period ended June 30 is available without charge, upon request, by calling our toll free number (1-800-417-5525). This information is also available on the SEC’s website at http://www.sec.gov.
2013 Annual Report 2
BIRMIWAL OASIS FUND (Unaudited)
PERFORMANCE INFORMATION
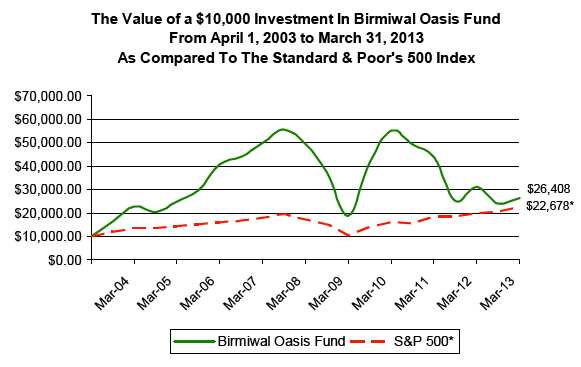
AVERAGE ANNUAL RATE OF RETURN (%) FOR THE PERIODS ENDED MARCH 31, 2013.
3/31/13 NAV $11.91
| | 1 Year(A) | | 3 Year(A) | | 5 Year(A) | | 10 Year(A) | |
| Birmiwal Oasis Fund | -14.88% | | -21.83% | | -11.64% | | 10.20% | |
| S&P 500(B) | 13.96% | | 12.67% | | 5.81% | | 8.53% | |
(A)1 Year, 3 Year, 5 Year and 10 Year returns include change in share prices and in each case includes reinvestment of any dividends and capital gain distributions. The inception date of the Birmiwal Oasis Fund was April 1, 2003.
(B)The S&P 500 is a broad market-weighted average dominated by blue-chip stocks and is an unmanaged group of stocks whose composition is different from the Fund.
PAST PERFORMANCE DOES NOT GUARANTEE FUTURE RESULTS. INVESTMENT RETURN AND PRINCIPAL VALUE WILL FLUCTUATE SO THAT SHARES, WHEN REDEEMED, MAY BE WORTH MORE OR LESS THAN THEIR ORIGINAL COST. RETURNS DO NOT REFLECT THE DEDUCTION OF TAXES THAT A SHAREHOLDER WOULD PAY ON FUND DISTRIBUTIONS OR THE REDEMPTION OF FUND SHARES. CURRENT PERFORMANCE MAY BE LOWER OR HIGHER THAN THE PERFORMANCE DATA QUOTED. TO OBTAIN PERFORMANCE DATA CURRENT TO THE MOST RECENT MONTH END, PLEASE CALL 1-800-417-5525.
2013 Annual Report 3
Disclosure of Expenses
(Unaudited)
Shareholders of this Fund incur ongoing operating expenses consisting of a base management fee, a performance-based management fee, borrowing expenses and other expenses. The following example is intended to help you understand your ongoing costs of investing in the Fund and to compare these costs with similar costs of investing in other mutual funds. The example is based on an investment of $1,000 invested in the Fund on October 1, 2012 and held through March 31, 2013.
The first line of the table below provides information about actual account values and actual expenses. In order to estimate the expenses a shareholder paid during the period covered by this report, shareholders can divide their account value by $1,000 (for example, an $8,600 account value divided by $1,000 = 8.6) and then multiply the result by the number in the first line under the heading entitled "Expenses Paid During the Period."
The second line of the table below provides information about hypothetical account values and hypothetical expenses based on the Fund's actual expense ratio and an assumed rate of return of 5% per year before expenses, which is not the Fund’s actual return. The hypothetical account values and expenses may not be used to estimate the actual ending account balance or expenses paid by a shareholder for the period. Shareholders may use this information to compare the ongoing costs of investing in this Fund and other funds. To do so, compare this 5% hypothetical example with the 5% hypothetical examples that appear in other funds' shareholder reports.
| | | | | | | Expenses Paid |
| | | Beginning | | Ending | | During the Period* |
| | | Account Value | | Account Value | | October 1, 2012 |
| | | October 1, 2012 | | March 31,2013 | | to March 31, 2013 |
| |
| Actual | | $1,000.00 | | $1,103.84 | | $4.62 |
| |
| Hypothetical | | $1,000.00 | | $1,020.54 | | $4.43 |
| (5% annual return | | | | | | |
| before expenses) | | | | | | |
* Expenses are equal to the Fund’s annualized expense ratio of 0.88%, multiplied by
the average account value over the period, multiplied by 182/365 (to reflect the one-
half year period). |
2013 Annual Report 4
| Birmiwal Oasis Fund |
| |
| | | | Schedule of Investments |
| | | | | March 31, 2013 |
| Shares/Principal Amount | | Fair Value | % of Net Assets |
| COMMON STOCKS | | | | |
| Beverages | | | | | |
| 2,000 | The Coca-Cola Company | $ | 80,880 | 0.89 | % |
| Bottled & Canned Soft Drinks & Carbonated Waters | | | | |
| 2,000 | Monster Beverage Corporation * | | 95,480 | 1.05 | % |
| Commercial Banks, NEC | | | | |
| 1,000 | ICICI Bank Limited * ** | | 42,900 | 0.47 | % |
| Communications Services, NEC | | | | |
| 20,000 | Calix, Inc. * | | 163,000 | 1.79 | % |
| Computer Peripheral Equipment, NEC | | | | |
| 1,000 | Palo Alto Networks, Inc. * | | 56,600 | 0.62 | % |
| Electric, Gas & Sanitary Services | | | | |
| 10,000 | Atlantic Power Corporation | | 49,300 | 0.54 | % |
| Engines & Turbines | | | | |
| 500 | Cummins Inc. | | 57,905 | 0.64 | % |
| Guided Missiles & Space Vehicles & Parts | | | | |
| 507 | Alliant Techsystems Inc. | | 36,722 | 0.40 | % |
| Hotels & Motels | | | | |
| 1,000 | Wynn Resorts, Limited | | 125,160 | 1.38 | % |
| Metal Mining | | | | | |
| 20,000 | Molycorp, Inc. * | | 104,000 | 1.14 | % |
| Miscellaneous Food Preparations & Kindred Products | | | | |
| 1,000 | Green Mountain Coffee Roasters Inc. * | | 56,760 | 0.62 | % |
| Miscellaneous Manufacturing Industries | | | | |
| 13,000 | Blyth, Inc. * | | 225,680 | 2.48 | % |
| Motor Vehicles & Passenger Car Bodies | | | | |
| 2,000 | General Motors Company * | | 55,640 | | |
| 1,000 | Tata Motors Ltd. ** | | 24,410 | | |
| | | | 80,050 | 0.88 | % |
| National Commercial Banks�� | | | | |
| 2,500 | Citigroup Inc. | | 110,600 | 1.22 | % |
| Oil & Gas Field Services, NEC | | | | |
| 1,000 | Schlumberger Limited | | 74,890 | 0.82 | % |
| Pharmaceutical Preparations | | | | |
| 2,000 | Alexion Pharmaceuticals, Inc. * | | 184,280 | | |
| 10,000 | Amarin Corporation plc * ** | | 74,100 | | |
| 22,505 | Keryx Biopharmaceuticals, Inc. * | | 158,548 | | |
| | | | 416,928 | 4.60 | % |
| Radio & TV Broadcasting & Communications Equipment | | | | |
| 10,000 | Youku Tudou Inc. * ** | | 167,700 | 1.85 | % |
| Retail - Catalog & Mail-Order Houses | | | | |
| 200 | Amazon.com Inc. * | | 53,298 | 0.59 | % |
| Retail - Department Stores | | | | |
| 2,000 | J. C. Penney Company, Inc. | | 30,220 | 0.33 | % |
| Retail - Family Clothing Stores | | | | |
| 5,669 | American Eagle Outfitters, Inc. | | 106,010 | 1.17 | % |
| Retail - Radio, TV & Consumer Electronics Stores | | | | |
| 3,000 | Best Buy Co., Inc. | | 66,450 | 0.73 | % |
| Retail - Retail Stores, NEC | | | | |
| 1,000 | Ulta Salon, Cosmetics & Fragrance, Inc. * | | 81,290 | 0.89 | % |
| Rubber & Plastics Footwear | | | | |
| 1,000 | Deckers Outdoor Corporation * | | 55,690 | 0.61 | % |
| Security & Commodity Brokers, Dealers, Exchanges & Services | | | | |
| 1,000 | IntercontinentalExchange, Inc. * | | 163,070 | 1.79 | % |
| Security Brokers, Dealers & Flotation Companies | | | | |
| 3,000 | Morgan Stanley | | 65,940 | 0.73 | % |
* Non-Income Producing Securities.
** ADR - American Depositary Receipt.
The accompanying notes are an integral part of the financial
statements. |
2013 Annual Report 5
| Birmiwal Oasis Fund |
| |
| | | | | Schedule of Investments |
| | | | | | March 31, 2013 |
| Shares/Principal Amount | | | Fair Value | % of Net Assets |
| COMMON STOCKS | | | | | |
| Semiconductors & Related Devices | | | | | |
| 164,307 | Actions Semiconductor Co., Ltd. * ** | | $ | 428,841 | | |
| 20,000 | MEMC Electronic Materials, Inc. * | | | 88,000 | | |
| | | | | 516,841 | 5.70 | % |
| Services - Advertising | | | | | |
| 522,868 | China MediaExpress Holdings, Inc. * (China) (a) | | | - | 0.00 | % |
| Services - Advertising Agencies | | | | | |
| 2,000 | Groupon, Inc. * | | | 12,240 | 0.13 | % |
| Services - Amusement & Recreation Services | | | | | |
| 125,980 Asia Entertainment & Resources Ltd. (China) | | | 541,714 | 5.96 | % |
| Services - Computer Processing & Data Preparation | | | | | |
| 5,000 | AOL Inc. * | | | 192,450 | | |
| 18,505 Renren Inc. * ** | | | 53,479 | | |
| | | | | 245,929 | 2.71 | % |
| Services - Computer Programming Services | | | | | |
| 1,000 | Qihoo 360 Technology Co. Ltd. * ** | | | 29,630 | 0.33 | % |
| Services - Educational Services | | | | | |
| 59,463 | Corinthian Colleges Inc. * | | | 125,170 | 1.38 | % |
| Services - Help Supply Services | | | | | |
| 7,140 | Monster Worldwide, Inc. * | | | 36,200 | 0.40 | % |
| Services - Prepackaged Software | | | | | |
| 3,000 | 3D Systems Corporation * | | | 96,720 | | |
| 30,000 | The Active Network, Inc. * | | | 125,700 | | |
| 2,000 | Citrix Systems, Inc. * | | | 144,300 | | |
| 1,000 | Microsoft Corporation | | | 28,605 | | |
| | | | | 395,325 | 4.36 | % |
| Steel Works, Blast Furnaces & Rolling Mills (Coke Ovens) | | | | | |
| 20,000 | Mechel OAO ** | | | 101,200 | 1.11 | % |
| Surety Insurance | | | | | |
| 10,000 | MGIC Investment Corporation * | | | 49,500 | 0.54 | % |
| Telephone & Telegraph Apparatus | | | | | |
| 2,000 | CIENA Corp. * | | | 32,020 | 0.35 | % |
| Telephone Communications (No Radiotelephone) | | | | | |
| 13,500 | Sprint Nextel Corporation * | | | 83,835 | 0.92 | % |
| Wholesale - Apparel, Piece Goods & Notions | | | | | |
| 1,000 | Michael Kors Holdings Limited * (Hong Kong) | | | 56,790 | 0.63 | % |
| Total for Common Stock (Cost $9,069,258) | | | 4,792,917 | 52.75 | % |
| EXCHANGE TRADED FUNDS | | | | | |
| 6,000 | Direxion Daily Small Cap Bear 3X Shares * | | | 55,320 | | |
| 4,000 | iShares Barclays 1-3 Year Treasury Bond Fund | | | 337,880 | | |
| 2,000 | iShares Silver Trust * | | | 54,860 | | |
| 7,000 | SPDR® Barclays Capital 1-3 Month T-Bill ETF * | | | 320,670 | | |
| Total for Exchange Traded Funds (Cost $886,296) | | | 768,730 | 8.46 | % |
| CALL OPTIONS | Shares Subject | | | | |
| Expiration Date/Exercise Price | to Call | | | | |
| ACADIA Pharmaceuticals Inc. * | | | | | |
| April 2013 Calls @ 8.00 | 50,000 | $ | 20,000 | | |
| The Active Network, Inc. * | | | | | |
| July 2013 Calls @ 5.00 | 20,000 | | 4,000 | | |
| Asia Entertainment & Resources Ltd. * (Hong Kong) | | | | | |
| April 2013 Calls @ 5.00 | 45,000 | | 2,250 | | |
| July 2013 Calls @ 5.00 | 65,000 | | 13,000 | | |
| | | | | 15,250 | | |
| | (a) There is no market for this security, therefore, this security is considered illiquid
and is valued according to the fair value procedures approved by the Board of Trustees.
*Non-Income Producing Securities.
**ADR - American Depositary Receipt. |
The accompanying notes are an integral part of the financial
statements. |
2013 Annual Report 6
| Birmiwal Oasis Fund |
| |
| | | | Schedule of Investments |
| | | | | | March 31, 2013 |
| Shares/Principal Amount | | | Fair Value | | % of Net Assets |
| CALL OPTIONS | Shares Subject | | | | | |
| Expiration Date/Exercise Price | to Call | | | | | |
| Lennar Corporation * | | | | | | |
| April 2013 Calls @ 44.00 | 20,000 | $ | 4,000 | | | |
| Sprint Nextel Corporation * | | | | | | |
| April 2013 Calls @ 6.00 | 50,000 | | 10,500 | | | |
| Total (Premiums Paid - $149,360) | | | 53,750 | | 0.59 | % |
| Money Market Funds | | | | | | |
| 2,740,001 Fidelity Governmental Fund 57 0.01% *** | | | 2,740,001 | | 30.16 | % |
| Total for Money Market Funds (Cost $2,740,001) | | | | | | |
| Total Investment Securities | | | 8,355,398 | | 91.96 | % |
| (Cost $12,844,915) | | | | | | |
| Other Assets In Excess of Liabilities | | | 730,420 | | 8.04 | % |
| Net Assets | | $ | 9,085,818 | | 100.00 | % |
*Non-Income Producing Securities.
*** Variable Rate Security; The Yield Rate shown represents the
rate at March 31, 2013.
The accompanying notes are an integral part of the financial
statements. |
2013 Annual Report 7
| Birmiwal Oasis Fund |
| |
| Statement of Assets and Liabilities | | | |
| March 31, 2013 | | | |
| |
| Assets: | | | |
| Investment Securities at Fair Value | $ | 8,355,398 | |
| (Cost $12,844,915) | | | |
| Cash | | 12,359 | |
| Due from Custodian | | 24,524 | |
| Receivables: | | | |
| Dividends and Interest | | 2,991 | |
| Receivable for Securities Sold | | 1,212,717 | |
| Total Assets | | 9,607,989 | |
| Liabilities: | | | |
| Payable for Securities Purchased | | 516,291 | |
| Management Fee Payable - Net | | 5,880 | |
| Total Liabilities | | 522,171 | |
| Net Assets | $ | 9,085,818 | |
| Net Assets Consist of: | | | |
| Paid In Capital | $ | 22,609,261 | |
| Accumulated Undistributed Net Investment Income | | 8,349 | |
| Accumulated Realized Loss on Investments - Net | | (9,042,275 | ) |
| Unrealized Depreciation in Value of Investments and Options | | | |
| Purchased Based on Identified Cost - Net | | (4,489,517 | ) |
| Net Assets, for 762,905 Shares Outstanding | $ | 9,085,818 | |
| (Unlimited number of shares authorized without par value) | | | |
| Net Asset Value, Offering and Redemption Price | | | |
| Per Share ($9,085,818/762,905 shares) | $ | 11.91 | |
| |
| Statement of Operations | | | |
| For the fiscal year ended March 31, 2013 | | | |
| |
| Investment Income: | | | |
| Dividends | $ | 58,827 | |
| Interest | | 330 | |
| Total Investment Income | | 59,157 | |
| Expenses: (Note 4) | | | |
| Management Fees: | | | |
| Base Management Fees | | 259,805 | |
| Less: Performance Based Management Fee Adjustment – Net | | (217,531 | ) |
| Net Management Fees | | 42,274 | |
| Borrowing Expense on Securities Sold Short | | 1,678 | |
| ADR fees | | 6,856 | |
| Total Expenses | | 50,808 | |
| |
| Net Investment Income | | 8,349 | |
| |
| Realized and Unrealized Gain/(Loss) on Investments, Securities Sold Short | | | |
| Options Purchased and Options Written: | | | |
| Net Realized Loss on Investments | | (1,557,717 | ) |
| Net Realized Loss on Securities Sold Short | | (10,051 | ) |
| Net Realized Gain on Options Written | | 76,697 | |
| Net Realized Loss on Options Purchased | | (2,046,307 | ) |
| Net Change In Unrealized Depreciation on Investments | | 1,949,814 | |
| Net Change In Unrealized Depreciation on Options Purchased | | (32,345 | ) |
| Net Realized and Unrealized Gain/(Loss) on Investments, Securities Sold Short | | | |
| Options Purchased and Options Written | | (1,619,909 | ) |
| Net Decrease in Net Assets from Operations | $ | (1,611,560 | ) |
The accompanying notes are an integral part of the financial
statements. |
2013 Annual Report 8
| Birmiwal Oasis Fund |
| |
| Statements of Changes in Net Assets | | | | | | |
| | | 4/1/2012 | | | 4/1/2011 | |
| | | to | | | to | |
| | | 3/31/2013 | | | 3/31/2012 | |
| From Operations: | | | | | | |
| Net Investment Income/(Loss) | $ | 8,349 | | $ | 52,719 | |
| Net Realized Gain/(Loss) on Investments, Securities Sold Short, | | (3,537,378 | ) | | (2,413,454 | ) |
| Options Purchased and Options Written | | | | | | |
| Net Change In Unrealized Appreciation/(Depreciation) | | 1,917,469 | | | (2,095,742 | ) |
| Increase/(Decrease) in Net Assets from Operations | | (1,611,560 | ) | | (4,456,477 | ) |
| From Distributions to Shareholders: | | | | | | |
| Net Investment Income | | (52,662 | ) | | - | |
| Net Realized Gain from Security Transactions | | - | | | - | |
| Change in Net Assets from Distributions | | (52,662 | ) | | - | |
| From Capital Share Transactions: | | | | | | |
| Proceeds From Sale of Shares | | 1,275 | | | 15,087 | |
| Shares Issued on Reinvestment of Dividends | | 52,599 | | | 0 | |
| Cost of Shares Redeemed | | (87,811 | ) | | (316,941 | ) |
| Net Increase/(Decrease) from Shareholder Activity | | (33,937 | ) | | (301,854 | ) |
| Net Increase/(Decrease) in Net Assets | | (1,698,159 | ) | | (4,758,331 | ) |
| Net Assets at Beginning of Period | | 10,783,977 | | | 15,542,308 | |
| Net Assets at End of Period (including accumulated | $ | 9,085,818 | | $ | 10,783,977 | |
| undistributed net investment income of $8,349 and $52,719, respectively) | | | | | | |
| Share Transactions: | | | | | | |
| Issued | | 107 | | | 972 | |
| Reinvested | | 4,249 | | | 0 | |
| Redeemed | | (7,919 | ) | | (18,412 | ) |
| Net Increase/(Decrease) in Shares | | (3,563 | ) | | (17,440 | ) |
| Shares Outstanding Beginning of Period | | 766,468 | | | 783,908 | |
| Shares Outstanding End of Period | | 762,905 | | | 766,468 | |
| Financial Highlights | | | | | | | | | | | | | | | |
| Selected data for a share outstanding | | 4/1/2012 | | | 4/1/2011 | | | 4/1/2010 | | | 4/1/2009 | | | 4/1/2008 | |
| throughout the period: | | to | | | to | | | to | | | to | | | to | |
| | | 3/31/2013 | | | 3/31/2012 | | | 3/31/2011 | | | 3/31/2010 | | | 3/31/2009 | |
| Net Asset Value - | | | | | | | | | | | | | | | |
| Beginning of Period | $ | 14.07 | | $ | 19.83 | | $ | 25.59 | | $ | 8.63 | | $ | 23.20 | |
| Net Investment Income/(Loss) (a) | | 0.01 | | | 0.07 | | | (0.98 | ) | | (0.56 | ) | | (0.32 | ) |
| Net Gains or Losses on Securities | | | | | | | | | | | | | | | |
| (realized and unrealized) (b) | | (2.10 | ) | | (5.83 | ) | | (4.26 | ) | | 17.52 | | | (14.01 | ) |
| Total from Investment Operations | | (2.09 | ) | | (5.76 | ) | | (5.24 | ) | | 16.96 | | | (14.33 | ) |
| Distributions (From Net Investment Income) | | (0.07 | ) | | 0.00 | | | 0.00 | | | 0.00 | | | 0.00 | |
| Distributions (From Capital Gains) | | 0.00 | | | 0.00 | | | (0.52 | ) | | 0.00 | | | (0.24 | ) |
| Total Distributions | | (0.07 | ) | | 0.00 | | | (0.52 | ) | | 0.00 | | | (0.24 | ) |
| Net Asset Value - | | | | | | | | | | | | | | | |
| End of Period | $ | 11.91 | | $ | 14.07 | | $ | 19.83 | | $ | 25.59 | | $ | 8.63 | |
| |
| Total Return (c) | | (14.88 | )% | | (29.05 | )% | | (20.91 | )% | | 196.52 | % | | (61.97 | )% |
| Ratios/Supplemental Data | | | | | | | | | | | | | | | |
| Net Assets - End of Period (Thousands) | $ | 9,086 | | $ | 10,784 | | $ | 15,542 | | $ | 19,853 | | $ | 6,715 | |
| Ratio of Expenses to Average Net Assets | | 0.57 | % | | -0.28 | % | | 4.03 | % | | 3.25 | % | | 2.57 | % |
| Ratio of Net Investment Income/(Loss) to Average Net Assets | | 0.09 | % | | 0.48 | % | | -4.00 | % | | -3.08 | % | | -1.81 | % |
| Portfolio Turnover Rate | | 1286.10 | % | | 1446.94 | % | | 1383.38 | % | | 1477.97 | % | | 998.97 | % |
(a) Per share amounts were calculated using the average shares method.
(b) Realized and unrealized gains and losses per share in this caption are balancing amounts necessary to reconcile the
change in net asset value per share for the period, and may not reconcile with the aggregate gains and losses in the
Statement of Operations due to share transactions for the period.
(c) Total return in the above table represents the rate that the investor would have earned or lost on an investment in the
Fund assuming reinvestment of all Fund distributions. |
The accompanying notes are an integral part of the
financial statements. |
2013 Annual Report 9
NOTES TO FINANCIAL STATEMENTS
BIRMIWAL OASIS FUND
March 31, 2013
1.) ORGANIZATION
Birmiwal Oasis Fund (the "Fund") is a non-diversified series of the Birmiwal Investment Trust (the "Trust"), an open-end investment company that commenced operations on April 1, 2003. The Trust was organized in Ohio as a business trust on January 3, 2003. The Trust may offer shares of beneficial interest in a number of separate series, each series representing a distinct fund with its own investment objectives and policies. At present, there is only one series authorized by the Trust. Birmiwal Asset Management, Inc. is the adviser to the Fund (the "Adviser"). As of August 1, 2006, the Fund revised its policies with respect to permitted investments in the Fund to reflect the following: The Fund remained closed to new investors except for non-profit organizations. Existing shareholders can purchase additional shares either by making new investments in their existing account(s) and/or by opening new account(s). The total of such new investments will be limited to a maximum of $25,000 per calendar year per taxpayer identification number/social security number. Existing shareholders may also continue to add to their existing accounts through the reinvestment of dividends and/or capital gain distributions from shares owned and may continue to participate in the Automatic Investment Plan (AIP). Non-profit organizations qualifying under Section 501(c)(3) of the Internal Revenue Code can open new accounts subject to a maximum investment limit of $25,000 per calendar year per taxpayer identification number. Trustees of the Fund, as well as directors, officers and employees of the Adviser, may continue to open new accounts and make additional purchases in existing accounts. The Fund’s primary investment objective is to seek capital appreciation. Significant accounting policies of the Fund are presented below:
2.) SIGNIFICANT ACCOUNTING POLICIES
SECURITY VALUATION: All investments in securities are recorded at their estimated fair value, as described in Note 3.
SHORT SALES: The Fund may sell a security it does not own in anticipation of a decline in the fair value of that security. When the Fund sells a security short, it must borrow the security sold short and deliver it to the broker-dealer through which it made the short sale. A gain, limited to the price at which the Fund sold the security short, or a loss, unlimited in size, will be recognized upon the termination of a short sale.
OPTION TRANSACTIONS: The purchase and writing of options requires additional skills and techniques beyond normal portfolio management, and involves certain risks. The purchase of options limits a Fund’s potential loss to the amount of the premium paid and can afford the Fund the opportunity to profit from favorable moments in the price of an underlying security to a greater extent than if transactions were effected in the security directly. However, the purchase of an option could result in the Fund losing a greater percentage of its investment than if the transaction were effected directly. When the Fund writes an option, an amount equal to the premium received by the Fund is recorded as a liability and is subsequently adjusted to the current fair value of the option written. Premiums received from writing options that expire unexercised are treated by the Fund on the expiration date as realized gains from investments. The difference between the premium and the amount paid on effecting a closing purchase transaction, including brokerage commissions, is also treated as a realized gain, or, if the premium is less than the amount paid for the closing purchase transaction, as a realized loss. If a written call option is exercised, the premium is added to the proceeds from the sale of the underlying security or currency in determining whether the Fund has realized a gain or a loss. If a written put option is exercised, the premium reduces the cost basis of the securities purchased by the Fund. The Fund as writer of an option bears the market risk of an unfavorable change in the price of the security underlying the written option. See Note 8 for additional information.
FEDERAL INCOME TAXES: The Fund’s policy is to continue to comply with the requirements of the Internal Revenue Code that are applicable to regulated investment companies and to distribute all of its taxable income to shareholders. Therefore, no federal income tax provision is required. It is the Fund’s policy to distribute annually, prior to the end of the calendar year, dividends sufficient to satisfy excise tax requirements of the Internal Revenue Code. This Internal Revenue Code requirement may cause an excess of distributions over the book year-end accumulated income. In addition, it is the Fund’s policy to distribute annually, after the end of the fiscal year, any remaining net investment income and net realized capital gains.
2013 Annual Report 10
Notes to Financial Statements - continued
The Fund recognizes the tax benefits of certain tax positions only where the position is “more likely than not” to be sustained assuming examination by tax authorities. Management has analyzed the Fund’s tax positions, and has concluded that no liability for unrecognized tax benefits should be recorded related to uncertain tax positions taken on returns filed for open tax years (2009 -2011), or expected to be taken on the Fund’s 2012 tax return. The Fund identifies its major tax jurisdictions as U.S. Federal tax authorities; however the Fund is not aware of any tax positions for which it is reasonably possible that the total amounts of unrecognized tax benefits will change materially in the next twelve months. The Fund recognizes interest and penalties, if any, related to unrecognized tax benefits as income tax expense on the Statement of Operations. During the fiscal year ended March 31, 2013, the Fund did not incur any interest or penalties.
DISTRIBUTIONS TO SHAREHOLDERS: Distributions to shareholders, which are determined in accordance with income tax regulations, are recorded on the ex-dividend date. The treatment for financial reporting purposes of distributions made to shareholders during the year from net investment income or net realized capital gains may differ from their ultimate treatment for federal income tax purposes. These differences are caused primarily by differences in the timing of the recognition of certain components of income, expense, or realized capital gain for federal income tax purposes. Where such differences are permanent in nature, they are reclassified in the components of the net assets based on their ultimate characterization for federal income tax purposes. Any such reclassifications will have no effect on net assets, results of operations, or net asset values per share of the Fund. As of March 31, 2013, $57 was reclassified from accumulated net investment income to paid in capital.
USE OF ESTIMATES: The preparation of financial statements in conformity with accounting principles generally accepted in the United States of America (GAAP) requires management to make estimates and assumptions that affect the reported amounts of assets and liabilities and disclosure of contingent assets and liabilities at the date of the financial statements and the reported amounts of revenues and expenses during the reporting period. Actual results could differ from those estimates.
OTHER: The Fund records security transactions based on a trade date. Dividend income is recognized on the ex-dividend date, and interest income is recognized on an accrual basis. Discounts and premiums on securities purchased are amortized over the lives of the respective securities. Withholding taxes on foreign dividends have been provided for in accordance with the Fund’s understanding of the applicable country’s tax rules and rates.
3.) SECURITIES VALUATIONS
As described in Note 2, the Fund utilizes various methods to measure the fair value of most of its investments on a recurring basis. GAAP establishes a hierarchy that prioritizes inputs to valuation methods. The three levels of inputs are:
Level 1 - Unadjusted quoted prices in active markets for identical assets or liabilities that the Fund has the ability to access.
Level 2 - Observable inputs other than quoted prices included in level 1 that are observable for the asset or liability, either directly or indirectly. These inputs may include quoted prices for the identical instrument on an inactive market, prices for similar instruments, interest rates, prepayment speeds, credit risk, yield curves, default rates and similar data.
Level 3 - Unobservable inputs for the asset or liability, to the extent relevant observable inputs are not available, representing the Fund’s own assumptions about the assumptions a market participant would use in valuing the asset or liability, and would be based on the best information available.
The availability of observable inputs can vary from security to security and is affected by a wide variety of factors, including, for example, the type of security, whether the security is new and not yet established in the marketplace, the liquidity of markets, and other characteristics particular to the security. To the extent that valuation is based on models or inputs that are less observable or unobservable in the market, the determination of fair value requires more judgment. Accordingly, the degree of judgment exercised in determining fair value is greatest for instruments categorized in level 3.
The inputs used to measure fair value may fall into different levels of the fair value hierarchy. In such cases, for disclosure purposes, the level in the fair value hierarchy within which the fair value measurement falls in its entirety, is determined based on the lowest level input that is significant to the fair value measurement in its entirety.
2013 Annual Report 11
Notes to Financial Statements - continued
FAIR VALUE MEASUREMENTS
A description of the valuation techniques applied to the Fund’s major categories of assets and liabilities measured at fair value on a recurring basis follows.
Equity securities (common stock and exchange traded funds). Equity securities that are traded on any exchange or on the NASDAQ over-the-counter market are valued at the last quoted sale price. Lacking a last sale price, a security is valued at its last bid price except when, in the Adviser's opinion, the last bid price does not accurately reflect the current value of the security. All other securities for which over-the-counter market quotations are not readily available are valued at their last bid price. Generally, if the security is traded in an active market and is valued at the last sale price, the security is categorized as a level 1 security. When the security position is not considered to be part of an active market or when the security is valued at the bid price, the position is generally categorized as a level 2. When market quotations are not readily available, when the Adviser determines the last bid price does not accurately reflect the current value or when restricted securities are being valued, such securities are valued as determined in good faith by the Adviser, in conformity with guidelines adopted by and subject to review of the Board of Trustees and are generally categorized in level 3 of the fair value hierarchy.
Money market funds. Shares of money market funds are valued at a net asset value of $1.00 and are classified in level 1 of the fair value hierarchy.
Options. Option positions that are traded on any exchange or on the NASDAQ over-the-counter market are valued at the last quoted sale price. To the extent these option positions are actively traded and valuation adjustments are not applied, they are classified in level 1 of the fair value hierarchy. Lacking a last sale price, a purchased option position, is valued at its last bid price except when, in the Adviser’s opinion, the last bid price does not accurately reflect the current value of the purchased option position. Conversely, if a written option lacks a last sale price, a written option position, is valued at its last ask price except when, in the Adviser's opinion, the last ask price does not accurately reflect the current value of the written option position. When a bid or ask price is used for valuation or when the security is not actively traded, those securities are generally categorized in level 2 or level 3 of the fair value hierarchy.
In accordance with the Trust's good faith pricing guidelines, the Adviser is required to consider all appropriate factors relevant to the value of securities for which it has determined other pricing sources are not available or reliable as described above. There is no single standard for determining fair value procedures, since fair value depends upon the circumstances of each individual case. As a general principle, the current fair value of an issue of securities being valued by the Adviser would appear to be the amount which the owner might reasonably expect to receive for them upon their current sale. Methods which are in accordance with this principle may, for example, be based on (i) a multiple of earnings; (ii) a discount from market of a similar freely traded security (including a derivative security or a basket of securities traded on other markets, exchanges or among dealers); or (iii) yield to maturity with respect to debt issues, or a combination of these and other methods.
The following table summarizes the inputs used to value the Fund’s assets measured at fair value as of March 31, 2013:
| Valuation Inputs of Assets | | Level 1 | | Level 2 | | Level 3 | | Total |
| Common Stock | | $4,792,917 | | $0 | | $0 | | $4,792,917 |
| Exchange Traded Funds | | 768,730 | | 0 | | 0 | | 768,730 |
| Options Purchased | | 0 | | 53,750 | | 0 | | 53,750 |
| Money Market Funds | | 2,740,001 | | 0 | | 0 | | 2,740,001 |
| Total | | $8,301,648 | | $53,750 | | $0 | | $8,355,398 |
Refer to the Fund's Schedule of Investments for a listing of securities by industry.
There were no transfers into or out of the levels during the fiscal year ended March 31, 2013. It is the Fund’s policy to consider transfers into or out of the levels as of the end of the reporting period. There was one Level 3 security as of March 31, 2013 valued at $0, therefore, no Level 3 reconciliation is presented.
4.) INVESTMENT ADVISORY AGREEMENT
The Fund has entered into an Investment Advisory Agreement with Birmiwal Asset Management, Inc. (the “Adviser”). Under the terms of the Investment Advisory Agreement, the Adviser manages the investment portfolio of the Fund, subject to policies adopted by the Trust’s Board of Trustees.
2013 Annual Report 12
Notes to Financial Statements - continued
Under the Investment Advisory Agreement, the Adviser, at its own expense and without reimbursement from the Trust, furnishes office space and all necessary office facilities, equipment and executive personnel necessary for managing the assets of the Fund. The Adviser also pays the salaries and fees of all of its officers and employees that serve as officers and trustees of the Trust. The Adviser pays all operating expenses of the Fund, with the exception of taxes, borrowing expenses (such as (i) interest and (ii) dividend expenses on securities sold short), brokerage commissions, indirect expenses (such as the expenses of other investment companies in which the Fund may invest) and extraordinary expenses.
For its services and its agreement to pay the Fund’s operating expenses, the Adviser receives an annual variable performance-based management fee comprised of a base rate of 2.90% of the Fund's average daily net assets and a performance adjustment, which is in accordance with a rate schedule. The performance adjustment increases or decreases the fee paid by the Fund to the Adviser based on the Fund's performance relative to the S&P 500 Index over the most recent 12-month period. If the Fund's return for the period is within 2.00% (two percentage points) of the return on the S&P 500 Index, no adjustment is made. If the difference between the performance of the Fund and the S&P 500 Index exceeds 2.00% (two percentage points), the performance adjustment is made at a rate that varies linearly with the difference between the Fund's performance and that of the S&P 500 Index. The resulting performance adjustment rate can be as high as 2.40% if the Fund outperforms the S&P 500 Index by 14% (fourteen percentage points) or more, and as low as -2.40% if the Fund underperforms the S&P 500 Index by 14% (fourteen percentage points) or more. The performance adjustment is calculated on the average net assets of the Fund on a rolling 12-month basis.
For the fiscal year ended March 31, 2013, the Adviser earned base management fees totaling $259,805 and repaid the Fund performance-based management fees totaling $217,531. As a result, as of March 31, 2013, under the Investment Advisory Agreement, the Fund owed the Adviser $5,880.
5.) RELATED PARTY TRANSACTIONS
Kailash Birmiwal, Ph.D. is the control person of the Adviser and also serves as a trustee/officer of the Fund. This individual receives benefits from the Adviser resulting from management fees paid to the Adviser by the Fund.
The Trustees who are not interested persons of the Fund were paid a total of $0 in Trustee fees for the fiscal year ended March 31, 2013. Pursuant to the Investment Advisory Agreement, these fees, if any are paid by the Adviser.
6.) CAPITAL STOCK
The Trust is authorized to issue an unlimited number of shares without par value. Paid in capital at March 31, 2013 was $22,609,261 representing 762,905 shares outstanding.
7.) INVESTMENT TRANSACTIONS
For the fiscal year ended March 31, 2013, purchases and sales of investment securities other than U.S. Government obligations and short-term investments aggregated $69,851,731 and $70,486,708, respectively. Purchases and sales of U.S. Government obligations aggregated $0 and $0, respectively.
For federal income tax purposes, the cost of total investment securities owned at March 31, 2013 was $14,523,653. At March 31, 2013, the composition of unrealized appreciation (the excess of value over tax cost) and depreciation (the excess of tax cost over value), was as follows:
| | Appreciation | | (Depreciation) | | Net Appreciation (Depreciation) | |
| | $333,317 | | ($6,501,572) | | ($6,168,255) | |
The primary differences between book and tax basis relate to the deferral of post-October losses totaling $3,361,881 and the tax deferral of wash sales. The post-October losses identified include losses of $2,982,506 from a security with a fair value of $0 which was deemed worthless for tax purposes.
8.) DERIVATIVES
Transactions in purchased options during the fiscal year ended March 31, 2013, were as follows:
2013 Annual Report 13
| Notes to Financial Statements - continued | | | | | |
| | | | | |
| | Number of | | | Premiums | |
| | Contracts | | | Paid | |
| Options outstanding at March 31, 2012 | 7,900 | | | $174,265 | |
| Options purchased | 735,549 | | | $27,066,943 | |
| Options terminated in closing transactions | (433,979 | ) | | ($18,530,270 | ) |
| Options expired | (287,491 | ) | | ($8,227,942 | ) |
| Options exercised | (19,479 | ) | | ($333,636 | ) |
| Options outstanding at March 31, 2013 | 2,500 | | | $149,360 | |
Transactions in written options during the fiscal year ended March 31, 2013, were as follows:
| | Number of | | | Premiums | |
| | Contracts | | | Received | |
| Options outstanding at March 31, 2012 | 0 | | | $0 | |
| Options written | 4,000 | | | $154,736 | |
| Options terminated in closing transactions | (1,200 | ) | | ($68,398 | ) |
| Options expired | (2,600 | ) | | ($60,698 | ) |
| Options exercised | (200 | ) | | ($25,640 | ) |
| Options outstanding at March 31, 2013 | 0 | | | $0 | |
The locations on the Statement of Assets and Liabilities of the Fund's derivative positions, which are not accounted for as hedging instruments under GAAP, are as follows:
| | | Asset | | | Liability |
| | | Derivatives | | | Derivatives |
| Options purchased: | | | Written Options at | | |
| Included In Investments in | | $53,750 | Fair Value | | $0 |
| Securities at Fair Value | | | | | |
Realized and unrealized gains and losses on derivatives contracts entered into during the fiscal year ended March 31, 2013, by the Fund are recorded in the following locations in the Statement of Operations:
| | | | Realized | | | | Unrealized | |
| Equity Contracts | Location | | Gain/(Loss) | | Location | | Gain/(Loss) | |
| Options | Net Realized | | | | Change In Unrealized | | | |
| Purchased | Loss on Options | | ($2,046,307) | | Appreciation/(Depreciation) | | ($32,345) | |
| | Purchased | | | | on Options Purchased | | | |
| |
| Options | Net Realized | | | | Change In Unrealized | | | |
| Written | Gain on Options | | $76,697 | | Appreciation/(Depreciation) | | $0 | |
| | Written | | | | on Options Written | | | |
The Fund engages in option transactions involving individual securities and stock indexes. An option involves either: (a) the right or the obligation to buy or sell a specific instrument at a specific price until the expiration date of the option; or (b) the right to receive payments or the obligation to make payments representing the difference between the closing price of a stock index and the exercise price of the option expressed in dollars times a specified multiple until the expiration date of the option. The Fund may purchase and write options. Options are sold (written) on securities and stock indexes. The purchaser of an option on a security pays the seller (the writer) a premium for the right granted but is not obligated to buy or sell the underlying security. The purchaser of an option on a stock index pays the seller a premium for the right granted, and in return the seller of such an option is obligated to make the payment. A writer of an option may terminate the obligation prior to expiration of the option by making an offsetting purchase of an identical option. Options are traded on organized exchanges and in the over-the-counter market. To cover the potential obligations involved in writing options, a Fund will either: (a) own the underlying security, or in the case of an option on a market index, will hold a portfolio of stocks substantially replicating the movement of the index; or (b) the Fund will segregate with the custodian high grade liquid assets sufficient to purchase the underlying security or equal to the fair value of the stock index option, marked to market daily.
The purchase of options limits the Fund's potential loss to the amount of the premium paid and can afford the Fund the opportunity to profit from favorable movements in the price of an underlying security to a greater extent than if transactions were effected in the security directly. However,
2013 Annual Report 14
Notes to Financial Statements - continued
the purchase of an option could result in the Fund losing a greater percentage of its investment than if the transaction were effected directly. When the Fund writes a call option, it will receive a premium, but it will give up the opportunity to profit from a price increase in the underlying security above the exercise price as long as its obligation as a writer continues. When the Fund writes a put option, it will assume the risk that the price of the underlying security or instrument will fall below the exercise price, in which case the Fund may be required to purchase the security or instrument at a higher price than the market price of the security or instrument. In addition, there can be no assurance that the Fund can effect a closing transaction on a particular option it has written. Further, the total premium paid for any option may be lost if the Fund does not exercise the option.
The Fund engages in option transactions involving securities and stock indices in order to gain exposure to particular securities or markets, in connection with hedging transactions, or to try to enhance returns. Options require additional skills and techniques beyond normal portfolio management. The Fund's use of options involves risk that such instruments may not work as intended due to unanticipated developments, especially in abnormal market conditions, or if the Adviser makes an error in judgment, or other causes. The use of options may magnify the increase or decrease in the performance of the Fund, and may also subject the Fund to higher price volatility.
The premiums paid for the options represent the cost of the investment and the options are valued daily at their closing price. The Fund recognizes a realized gain or loss when the option is sold or expired. Option holdings within the Fund, which may include put options and call options, are subject to loss of value with the passage of time, and may experience a total loss of value upon expiration. With options, there is minimal counterparty risk to the Fund since they are exchange traded.
9.) CONTROL OWNERSHIP
The beneficial ownership, either directly or indirectly, of more than 25% of the voting securities of a fund creates a presumption of control of the fund, under Section 2(a)(9) of the Investment Company Act of 1940. As of March 31, 2013, Kailash Birmiwal, Ph.D., the control person of the Adviser located at 24140 E. Greystone Lane, Woodway, Washington, held, in aggregate, approximately 77% of the Fund.
10.) DISTRIBUTIONS TO SHAREHOLDERS
The tax character of distributions paid during the fiscal year ended March 31, 2013 and fiscal year ended March 31, 2012 were as follows:
| Distributions paid from: | | | | |
| |
| | | Year ended | | Year ended |
| | | March 31, 2013 | | March 31, 2012 |
| Ordinary Income: | | $52,662 | | $0 |
| Long-term Capital Gain | | 0 | | 0 |
| | | $52,662 | | $0 |
As of March 31, 2013, the components of distributable earnings/(accumulated losses) on a tax basis were as follows:
| Undistributed ordinary income | | $ 8,099 | |
| Accumulated losses | | (7,363,287 | ) |
| Unrealized depreciation | | (6,168,255 | ) |
| | | $(13,523,443 | ) |
The primary differences between book and tax basis relate to the deferral of post-October losses totaling $3,361,881 and the tax deferral of wash sales. The post-October losses identified include losses of $2,982,506 from a security with a fair value of $0 which was deemed worthless for tax purposes.
11.) LOSS CARRYFORWARDS
As of March 31, 2013, the Fund had available for federal purposes an unused capital loss carry-forward of $7,363,287, of which $1,913,108 expires in 2019; $1,433,841 is short-term with no expiration; and $4,016,338 is long-term with no expiration. Capital loss carryforwards are available to offset future realized capital gains. To the extent that these carryforwards are used to offset future capital gains, it is probable that the amount that is offset will not be distributed to shareholders.
2013 Annual Report 15
Notes to Financial Statements - continued
12.) FOREIGN SECURITIES RISK
The Fund could be subject to greater risks because the Fund's performance may depend on issues other than the performance of a particular company. Changes in foreign economies and political climates are more likely to affect the Fund than a fund that invests exclusively in U.S. companies. The value of foreign securities also is affected by the value of the local currency relative to the U.S. dollar. There also may be less government supervision of foreign markets, resulting in non-uniform accounting practices and less publicly available information.
Investment in securities of issuers based in underdeveloped emerging markets entails all of the risks of investing in securities of foreign issuers outlined in this section to a heightened degree. These heightened risks include: (i) greater risks of expropriation, confiscatory taxation, nationalization, and less social, political and economic stability; (ii) the smaller size of the market for such securities and a low or nonexistent volume of trading, resulting in lack of liquidity and in price volatility; (iii) certain national policies which may restrict a Fund's investment opportunities; and (iv) in the case of Eastern Europe, China and other Asian countries, the absence of developed capital markets and legal structures governing private or foreign investment and private property, and the possibility that recent favorable economic and political developments could be slowed or reversed by unanticipated events. As of March 31, 2013, approximately 13% of the Fund’s investments were securities of issuers based in China.
2013 Annual Report 16
Cohen Fund Audit Services, Ltd.
1350 Euclid Avenue, Ste 800
Cleveland, Ohio 44115 www.cohenfund.com | 216.649.1700
216.579.0111 fax |
REPORT OF INDEPENDENT REGISTERED PUBLIC ACCOUNTING FIRM
To the Shareholders and Board of Trustees
Birmiwal Oasis Fund
We have audited the accompanying statement of assets and liabilities, including the schedule of investments, of Birmiwal Oasis Fund, (the "Fund") as of March 31, 2013, and the related statement of operations for the year then ended, the statements of changes in net assets for each of the two years in the period then ended, and the financial highlights for each of the five years in the period then ended. These financial statements and financial highlights are the responsibility of the Fund's management. Our responsibility is to express an opinion on these financial statements and financial highlights based on our audits.
We conducted our audits in accordance with the standards of the Public Company Accounting Oversight Board (United States). Those standards require that we plan and perform the audit to obtain reasonable assurance about whether the financial statements and financial highlights are free of material misstatement. An audit includes examining, on a test basis, evidence supporting the amounts and disclosures in the financial statements. Our procedures included confirmation of securities owned as of March 31, 2013, by correspondence with the custodian and brokers. An audit also includes assessing the accounting principles used and significant estimates made by management, as well as evaluating the overall financial statement presentation. We believe that our audits provide a reasonable basis for our opinion.
In our opinion, the financial statements and financial highlights referred to above present fairly, in all material respects, the financial position of Birmiwal Oasis Fund as of March 31, 2013, the results of its operations for the year then ended, the changes in its net assets for each of the two years in the period then ended, and the financial highlights for each of the five years in the period then ended, in conformity with accounting principles generally accepted in the United States of America.

COHEN FUND AUDIT SERVICES, LTD.
Cleveland, Ohio
May 29, 2013
2013 Annual Report 17
TRUSTEES AND OFFICERS - Unaudited
The Board of Trustees supervises the business activities of the Trust. The names of the Trustees and executive officers of the Trust are shown below. Each Trustee serves until the Trustee dies, resigns, retires or is removed. Officers hold office for one year and until their respective successors are chosen and qualified. For more information regarding the Trustees, please refer to the Statement of Additional Information, which is available upon request by calling 1-800-417-5525. The trustees and officers of the Trust and their principal business activities during the past five years are:
Interested Trustees & Officers
| | | | | | Other |
| Name, | Position | Length of | Principal | Number of | Directorships |
| Address(1), | with the | Time Served | Occupation(s) | Portfolios | Held By |
| and Year of Birth | Trust | | During | Overseen By | Trustee or |
| | | | Past 5 Years | Trustee | Officer |
| |
| Kailash Birmiwal, Ph.D.(2) | President, | Since 2003 | President of the Fund’s Adviser | 1 | None |
| Year of Birth: 1957 | Treasurer, | | since 2003. | | |
| | Chief | | | | |
| | Compliance | | | | |
| | Officer and | | | | |
| | Trustee | | | | |
| |
| Lea R. Birmiwal, Ph.D. | Secretary | Since 2003 | Homemaker. | N/A | None |
| Year of Birth: 1960 | | | | | |
(1)The address of each trustee and officer is c/o Birmiwal Investment Trust, 24140 E. Greystone Lane, Woodway, WA 98020.
(2) Kailash Birmiwal is considered an "interested persons" as defined in Section 2(a)(19) of the Investment Company Act of 1940 by virtue of his affiliation with the Adviser.
Independent Trustees
| | | | Principal | Number of | Other |
| Name, | Position | Length of | Occupation(s) | Portfolios | Directorships |
| Address(3), | with the | Time Served | During | Overseen By | Held By |
| and Year of Birth | Trust | | Past 5 Years | Trustee | Trustee or |
| | | | | | Officer |
| |
| Rajendra K. Bordia, Ph.D. | Trustee | Since 2003 | Professor, Department of | 1 | None |
| Year of Birth: 1957 | | | Materials Science and | | |
| | | | Engineering, University of | | |
| | | | Washington (2003-Present). Chair | | |
| | | | (1998-2005), Associate Professor | | |
| | | | (1991-2003), Department of | | |
| | | | Materials Science and | | |
| | | | Engineering, University of | | |
| | | | Washington. | | |
| |
| Hemant K. Gupta, Ph.D. | Trustee | Since 2003 | President of Gupta Inc., a Retail | 1 | None |
| Year of Birth: 1958 | | | Corporation (1996-2006). | | |
| | | | Assistant Professor, University of | | |
| | | | Connecticut (1986-1998). | | |
| |
| Veera S. Karukonda | Trustee | Since 2003 | Signal Systems Engineer, City of | 1 | None |
| Year of Birth: 1957 | | | Stamford, CT (2004-Present). Civil | | |
| | | | Engineering Consultant (2003- | | |
| | | | 2004). Civil Engineer, City of | | |
| | | | Hartford, CT (1988-2003). | | |
| |
| Bal K. Sharma, Dr. | Trustee | Since 2003 | Administrator (Chief of | 1 | None |
| Year of Birth: 1953 | | | Respiratory Division), V.A. Medical | | |
| | | | Center, North Chicago (1990- | | |
| Present). |
(3)The address of each trustee and officer is c/o Birmiwal Investment Trust, 24140 E. Greystone Lane, Woodway, WA 98020.
2013 Annual Report 18
Board of Trustees
Kailash Birmiwal, Ph. D.
Rajendra K. Bordia, Ph. D.
Hemant K. Gupta, Ph. D.
Veera S. Karukonda
Bal K. Sharma, Dr.
Investment Adviser
Birmiwal Asset Management, Inc.
24140 E. Greystone Lane
Woodway, WA 98020
Dividend Paying Agent,
Shareholders' Servicing Agent,
Transfer Agent
Mutual Shareholder Services, LLC
8000 Town Centre Dr., Ste 400
Broadview Hts, OH 44147
Custodian
U.S. Bank, NA
425 Walnut Street
P.O. Box 1118
Cincinnati, OH 45201
Fund Administrator
Premier Fund Solutions Inc.
1939 Friendship Drive, Suite C
El Cajon, CA 92020
Legal Counsel
Thompson Hine LLP
312 Walnut Street, 14th Floor
Cincinnati, OH 45202
Independent Registered Public
Accounting Firm
Cohen Fund Audit Services, Ltd.
1350 Euclid Avenue, Suite 800
Cleveland, OH 44115 |
This report is provided for the general information of the shareholders of the Birmiwal Oasis
Fund. This report is not intended for distribution to prospective investors in the funds, unless
preceded or accompanied by an effective prospectus. |
Birmiwal Oasis Fund
24140 E. Greystone Lane
Woodway, WA 98020 |
Item 2. Code of Ethics.
The registrant has adopted a code of ethics that applies to the registrant’s principal executive officer and the principal financial officer. The registrant has made minor administrative changes and amended its code of ethics during the covered period. The registrant has not granted any waivers from any provisions of the code of ethics during the covered period. A copy of the registrant’s Code of Ethics is filed herewith.
Item 3. Audit Committee Financial Expert.
The registrant’s Board of Trustees has determined that it does not have an audit committee financial expert serving on its audit committee. The registrant believes that the experience provided by each member of the audit committee together offers the registrant adequate oversight for the registrant’s level of financial complexity.
Item 4. Principal Accountant Fees and Services.
(a-d) The following table details the aggregate fees billed for each of the last two fiscal years for audit fees, audit-related fees, tax fees and other fees by the principal accountant to the registrant. The principal accountant has provided no services to the adviser or any entity controlled by, or under common control with the adviser that provides ongoing services to the registrant.
| | | FYE 3/31/13 | | FYE 3/31/12 |
| Audit Fees | | $15,795 | | $19,800 |
| Audit-Related Fees | | $0 | | $0 |
| Tax Fees | | $3,500 | | $3,500 |
| All Other Fees | | $600 | | $800 |
Nature of Tax Fees: preparation of Excise Tax Statement and 1120 RIC.
Nature of All Other Fees: Review of Semi-Annual Report.
(e) (1) The audit committee approves all audit and non-audit related services and, therefore, has not adopted pre-approval policies and procedures described in paragraph (c)(7) of Rule 2-01 of Regulation S-X.
(e) (2) None of the services described in paragraph (b) through (d) of this Item were approved by the audit committee pursuant to paragraph (c)(7)(i)(C) of Rule 2-01 of Regulation S-X.
(f) All of the principal accountant’s hours spent on auditing the registrant’s financial statements were attributed to work performed by full-time permanent employees of the principal accountant.
(g) The following table indicates the aggregate non-audit fees billed by the registrant’s principal accountant for services to the registrant , the registrant’s investment adviser (not sub-adviser), and any entity controlling, controlled by, or under common control with the adviser that provides ongoing services to the registrant, for the last two years.
| Non-Audit Fees | | FYE 3/31/13 | | FYE 3/31/12 |
| Registrant | $ | 4,100 | $ | 4,300 |
| Registrant’s Investment Adviser | $ | 0 | $ | 0 |
(h) The principal accountant provided no services to the investment adviser or any entity controlling, controlled by, or under common control with the adviser that provides ongoing services to the registrant.
Item 5. Audit Committee of Listed Companies. Not applicable.
Item 6. Schedule of Investments. Schedule filed with Item 1.
Item 7. Disclosure of Proxy Voting Policies and Procedures for Closed-End Management Investment Companies. Not applicable.
Item 8. Portfolio Managers of Closed End Management Investment Companies. Not applicable.
Item 9. Purchases of Equity Securities by Closed-End Management Investment Companies and Affiliated Purchasers. Not applicable.
Item 10. Submission of Matters to a Vote of Security Holders.
The registrant has not adopted procedures by which shareholders may recommend nominees to the registrant’s board of trustees.
Item 11. Controls and Procedures.
(a) The registrant’s president and chief financial officer concluded that the disclosure controls and procedures (as defined in Rule 30a-3(c) under the Investment Company Act of 1940 (the “Act”)) were effective as of a date within 90 days of the filing date of this report, based on the evaluation of these controls and procedures required by Rule 30a-3(b) under the Act.
(b) There were no changes in the registrant’s internal control over financial reporting (as defined in Rule 30a-3(d) under the Act) that occurred during the registrant’s second fiscal quarter of the period covered by this report that have materially affected, or are reasonably likely to materially affect, the registrant’s internal control over financial reporting.
Item 12. Exhibits.
(a)(1) Code of Ethics. Filed herewith.
(a)(2) Certifications pursuant to Section 302 of the Sarbanes-Oxley Act of 2002. Filed herewith.
(b) Certification pursuant to Section 906 Certification of the Sarbanes-Oxley Act of 2002. Filed herewith.
SIGNATURES
Pursuant to the requirements of the Securities Exchange Act of 1934 and the Investment Company Act of 1940, the registrant has duly caused this report to be signed on its behalf by the undersigned, thereunto duly authorized.
| | Birmiwal Investment Trust |
| | By: /s/Kailash Birmiwal
Kailash Birmiwal
President |
Pursuant to the requirements of the Securities Exchange Act of 1934 and the Investment Company Act of 1940, this report has been signed below by the following persons on behalf of the registrant and in the capacities and on the dates indicated.
| | By: /s/Kailash Birmiwal
Kailash Birmiwal
President |
| | By: /s/Kailash Birmiwal
Kailash Birmiwal
Chief Financial Officer |