UNITED STATES
SECURITIES AND EXCHANGE COMMISSION
Washington, D.C. 20549
FORM N-CSR
CERTIFIED SHAREHOLDER REPORT OF REGISTERED
MANAGEMENT INVESTMENT COMPANIES
Investment Company Act file number | 811-21293 | |||||
| ||||||
Nuveen Preferred Income Opportunities Fund | ||||||
(Exact name of registrant as specified in charter) | ||||||
| ||||||
Nuveen Investments | ||||||
(Address of principal executive offices) (Zip code) | ||||||
| ||||||
Kevin J. McCarthy | ||||||
(Name and address of agent for service) | ||||||
| ||||||
Registrant’s telephone number, including area code: | (312) 917-7700 |
| ||||
| ||||||
Date of fiscal year end: | July 31 |
| ||||
| ||||||
Date of reporting period: | July 31, 2013 |
| ||||
Form N-CSR is to be used by management investment companies to file reports with the Commission not later than 10 days after the transmission to stockholders of any report that is required to be transmitted to stockholders under Rule 30e-1 under the Investment Company Act of 1940 (17 CFR 270.30e-1). The Commission may use the information provided on Form N-CSR in its regulatory, disclosure review, inspection, and policymaking roles.
A registrant is required to disclose the information specified by Form N-CSR, and the Commission will make this information public. A registrant is not required to respond to the collection of information contained in Form N-CSR unless the Form displays a currently valid Office of Management and Budget (“OMB”) control number. Please direct comments concerning the accuracy of the information collection burden estimate and any suggestions for reducing the burden to Secretary, Securities and Exchange Commission, 450 Fifth Street, NW, Washington, DC 20549-0609. The OMB has reviewed this collection of information under the clearance requirements of 44 U.S.C. ss. 3507.
ITEM 1. REPORTS TO STOCKHOLDERS.

Closed-End Funds
Nuveen Investments
Closed-End Funds
Seeks Attractive Regular Distributions from a Portfolio of Preferred Securities.
Annual Report
July 31, 2013

Nuveen Preferred Income Opportunities Fund
JPC

LIFE IS COMPLEX.
Nuveen makes things e-simple.
It only takes a minute to sign up for e-Reports. Once enrolled, you'll receive an e-mail as soon as your Nuveen Fund information is ready. No more waiting for delivery by regular mail. Just click on the link within the e-mail to see the report and save it on your computer if you wish.
Free e-Reports right to your e-mail!
www.investordelivery.com
If you receive your Nuveen Fund distributions and statements from your financial advisor or brokerage account.
OR
www.nuveen.com/accountaccess
If you receive your Nuveen Fund distributions and statements directly from Nuveen.

Table of Contents
Letter to Shareholders | 4 | ||||||
Portfolio Managers' Comments | 5 | ||||||
Fund Leverage | 11 | ||||||
Common Share Information | 12 | ||||||
Risk Considerations | 14 | ||||||
Performance Overview and Holding Summary | 16 | ||||||
Shareholder Meeting Report | 17 | ||||||
Report of Independent Registered Public Accounting Firm | 18 | ||||||
Portfolio of Investments | 19 | ||||||
Statement of Assets & Liabilities | 27 | ||||||
Statement of Operations | 28 | ||||||
Statement of Changes in Net Assets | 29 | ||||||
Statement of Cash Flows | 30 | ||||||
Financial Highlights | 32 | ||||||
Notes to Financial Statements | 34 | ||||||
Annual Investment Management Agreement Approval Process | 43 | ||||||
Board Members & Officers | 51 | ||||||
Reinvest Automatically, Easily and Conveniently | 57 | ||||||
Glossary of Terms Used in this Report | 58 | ||||||
Additional Fund Information | 63 | ||||||
Letter to Shareholders

Dear Shareholders,
After nine years of serving as lead director and independent chairman of the Nuveen Fund Board, my term of office has come to an end as of June 30, 2013. It has been a privilege to use this space to communicate with you on some of the broad economic trends in the U.S. and abroad and how they are impacting the investment environment in which your funds operate. In addition, I have enjoyed offering some perspective on how your Board views the various Nuveen investment teams as they apply their investment disciplines in that investment environment.
My term has coincided with a particularly challenging period for both mutual fund sponsors and investors. Since 2000 there have been three periods of unusually strong stock market growth and two major market declines. Recent years have been characterized by a search for yield in fixed income securities to compensate for an extended period of very low interest rates. Funds are investing more in foreign and emerging markets that require extensive research capabilities to overcome the more limited transparency and higher volatility in those markets. New fund concepts often incorporate derivative financial instruments that offer efficient ways to hedge investment risk or gain exposure to selected markets. Fund trading teams operate in many new domestic and international venues with quite different characteristics. Electronic trading and global communication networks mean that fund managers must be able to thrive in financial markets that react instantaneously to newsworthy events and are more interconnected than ever.
Nuveen has committed additional resources to respond to these changes in the fund industry environment. It has added IT and research resources to assemble and evaluate the increased flow of detailed information on economies, markets and individual companies. Based on its experience during the financial crisis of 2008-09, Nuveen has expanded its resources dedicated to valuing and trading portfolio securities with a particular focus on stressed financial market conditions. It has added systems and experienced risk management professionals to work with investment teams to better help evaluate whether their funds' risk exposures are appropriate in view of the return targets. The investment teams have also reflected on recent experience to reaffirm or modify their investment disciplines. Finally, experienced professionals and IT resources have been added to address new regulatory requirements designed to better inform and protect investors. The Nuveen Fund Board has enthusiastically encouraged these initiatives.
The Board has always viewed itself as your representatives to assure that Nuveen brings together experienced people, proven technologies and effective processes designed to produce results that meet investor expectations. It is important to note that our activities are highlighted by the annual contract renewal process. Despite its somewhat formal language, I strongly encourage you to read the summary because it offers an insight into our oversight process. The report is included in the back of this shareholder report. The renewal process is very comprehensive and includes a number of evaluations and discussions between the Board and Nuveen during the year. The summary also describes what has been achieved across the Nuveen fund complex and at individual funds such as yours.
As I leave the chairmanship and resume my role as a member of the Board, please be assured that I and my fellow Board members will continue to hold your interests uppermost in our minds as we oversee the management of your funds and that we greatly appreciate your confidence in your Nuveen fund.
Very sincerely,

Robert P. Bremner
August 22, 2013
Nuveen Investments
4
Portfolio Managers' Comments
Nuveen Preferred Income Opportunities Fund (JPC)
Nuveen Asset Management, LLC (NAM) and NWQ Investment Management Company, LLC (NWQ), affiliates of Nuveen Investments, are the Fund's sub-advisers. NAM and NWQ each manage approximately half of the Fund's investment portfolio. Douglas Baker, CFA and Brenda Langenfeld, CFA, are the portfolio managers for the NAM team and Michael Carne, CFA, is the portfolio manager for the NWQ team.
Here they discuss the general market conditions, their management strategies and the performance of the Fund for the abbreviated annual seven-month period ended July 31, 2013.
It should be noted effective January 1, 2013 the Fund's fiscal year was changed to July 31st from December 31st and as a result, this report covers a seven-month reporting period ended July 31, 2013.
What were the general market conditions and trends over the course of this seven-month reporting period ended July 31, 2013?
During this reporting period, the U.S. economy's progress toward recovery from recession continued at a moderate pace. The Federal Reserve (Fed) maintained its efforts to improve the overall economic environment by holding the benchmark fed funds rate at the record low level of zero to 0.25% that it established in December 2008. The Fed also continued its monthly purchases of $40 billion of mortgage-backed securities and $45 billion of longer-term Treasury securities in an open-ended effort to bolster growth. However, at its June 2013 meeting, the Central Bank indicated that downside risks to the economy had diminished since the fall of 2012. Although the Fed made no changes to its highly accommodative monetary policies at the June meeting, Chairman Bernanke's remarks afterward indicated the Central Bank could slow the pace of its bond buying program later this year if the economy continues to improve.
As measured by gross domestic product (GDP), the U.S. economy grew at an estimated annualized rate of 1.7% in the second quarter of 2013, compared with 1.1% for the first quarter, continuing the pattern of positive economic growth for the 16th consecutive quarter. The Consumer Price Index (CPI) rose 2.0% year-over-year as of July 2013, while the core CPI (which excludes food and energy) increased 1.7% during the period, staying within the Fed's unofficial objective of 2.0% or lower for this inflation measure. Meanwhile, labor market conditions continued to slowly show signs of improvement, although unemployment remained above the Central Bank's 6.5% target. As of July 2013, the national unemployment rate was 7.4%. The housing market, long a major weak spot in the U.S. economic recovery, also delivered some good news as the average home price in the S&P/Case-Shiller Index of 20 major metropolitan areas rose 12.1% for the twelve months ended June 2013 (most recent data available at the time this report was prepared).
However, the outlook for the U.S. economy continued to be clouded by uncertainty about global financial markets and the outcome of the "fiscal cliff." The tax consequences of the fiscal cliff situation, which had been scheduled to become
Certain statements in this report are forward-looking statements. Discussions of specific investments are for illustration only and are not intended as recommendations of individual investments. The forward-looking statements and other views expressed herein are those of the portfolio managers as of the date of this report. Actual future results or occurrences may differ significantly from those anticipated in any forward-looking statements and the views expressed herein are subject to change at any time, due to numerous market and other factors. The Fund disclaims any obligation to update publicly or revise any forward-looking statements or views expressed herein.
Ratings shown are the highest rating given by one of the following national rating agencies: Standard & Poor's, Moody's Investors Service, Inc. or Fitch, Inc. Credit ratings are subject to change. AAA, AA, A, and BBB are investment grade ratings; BB, B, CCC, CC, C and D are below investment grade ratings. Certain bonds backed by U.S. Government or agency securities are regarded as having an implied rating equal to the rating of such securities. Holdings designated N/R are not rated by these national rating agencies.
Nuveen Investments
5
effective in January 2013, were averted through a last minute deal that raised payroll taxes, but left in place a number of tax breaks. However, lawmakers postponed and then failed to reach a resolution on $1.2 trillion in spending cuts intended to address the federal budget deficit. As a result, automatic spending cuts (or sequestration) affecting both defense and non-defense programs (excluding Social Security and Medicaid) took effect March 1, 2013, with potential implications for U.S. economic growth over the next decade. In late March 2013, Congress passed legislation that established federal funding levels for the remainder of fiscal 2013, which ends on September 30, 2013, preventing a federal government shutdown. The proposed federal budget for fiscal 2014 remains under debate.
For the majority of the reporting period, the backdrop of generally improving economic data and diminished systemic risk fears was supportive of risk assets in general and fixed income spread sectors specifically. The pressure to find yield continued to provide strong technical underpinnings to the market as investor flows indicated robust demand for fixed income securities for most of the reporting period. However, the tide quickly turned in the final month of the reporting period, triggered by the Fed Chairman's comments that the economic outlook had improved enough to warrant a possible "tapering" of the central bank's quantitative easing programs as soon as September of 2013, earlier than the market anticipated. In response, Treasury yields rose sharply, while global risk assets including equities, spread products and growth-sensitive currencies sold off significantly. The combination of rising yields and a sell-off in risk assets in June was somewhat unique in that the two have generally been negatively correlated over the past several years. The common thread in the markets appeared to be a general "de-risking" by investors based on concerns about the central bank's withdrawal of policy stimulus.
During the seven month period ended July 31, 2013, the preferred/hybrid asset class, as measured by the BofA/Merrill Lynch Preferred Stock Fixed Rate Index, posted slightly negative returns. While the asset class performed well during the beginning part of the reporting period, market volatility primarily due to uncertainty around the Fed's monetary policy as well as rising interest rates weighed broadly on the market, including preferred securities. During the measurement period, new issue supply gained continuing momentum. While some of the new issue deals have struggled as of late, we feel that the lagging performance has been more of a function of volatility and uncertainty in the broader market than anything specific to the preferred/hybrid asset class. And while new issue flow was quite healthy during the reporting period, total net supply was not as large as one might expect as low interest rates, tighter credit spreads and new bank capital regulations continued to fuel meaningful redemption activity. From the demand side of the equation, retail investors in search of income continued to find the asset class a compelling opportunity. We also observed increased demand from total return investors as fundamentals continued to improve across the financial services sector.
During the reporting period ended July 31, 2013, both $25 par and $1,000 par securities posted negative results, generating a -0.8% total return as measured by the Comparative Benchmark. Living up to the designation as a 'hybrid' asset class, preferred securities' total return performance fell between both comparable fixed income indexes (Barclays Corporate Financial Services Index, -0.9%) and equity indexes (S&P 500 Financials Sector Index, 25.9%). Given the 'hybrid' nature of the asset class, we generally expect the preferred securities market to perform somewhere between comparable senior debt and comparable equities. Indeed, the $1,000 par side of the market, as measured by the Barclays USD Capital Securities Index, posted a -0.4% return for the seven month reporting period, while the $25 par side of the market, as represented by the BofA/Merrill Lynch Preferred Stock Fixed Rate Index, performed slightly worse posting a -1.0% return for the same period. We believe that the $25 market previously had an extended period of outperformance versus the $1,000 par side of the market, which has begun to unwind itself over the past few quarters. That being said, the overall preferred security asset class outperformed Treasuries during the reporting period due to general credit spread compression across the preferred asset class, as well as the asset class's relatively higher yield level compared to similar duration U.S. Treasuries.
Nuveen Investments
6
What key strategies were used to manage the Fund during this seven-month reporting period ended July 31, 2013? How did these strategies influence performance?
The Fund invests at least 80% of its managed assets in preferred securities and up to 20% opportunistically over the market cycle in other types of securities, primarily income oriented securities such as corporate and taxable municipal debt and common equity. The Fund is managed by two experienced portfolio teams with distinctive, complementary approaches to the preferred market. NAM employs a debt-oriented approach that combines top down relative value analysis of industry sectors with fundamental credit analysis. NWQ employs a bottom up, fundamentally driven approach that combines equity research to identify which companies to own with fixed income analysis to identify the most attractive securities of a company to hold. This unique, multi-team approach gives investors access to a broader investment universe with greater diversification potential.
For the portion of the Fund managed by NAM, we continued to monitor developments across the domestic and international financial markets. Barring any unforeseen developments, we do not anticipate materially changing the Fund's relative positioning in the near future. Consistent with previous quarterly measurement periods, we continued to believe that $1,000 par structures were generally more attractive than corresponding $25 par retail securities. In addition, a dominance of the $25 par market, which was comprised of interest rate sensitive fixed-for-life coupon structures, did not align well with our outlook for higher interest rates. As a result, we will likely maintain a relative overweight to $1,000 par structures compared to the Comparative Benchmark's allocation of 35% to institutional securities and 65% to retail securities.
With respect to the Fund's allocation to lower investment-grade and below investment-grade securities, we continued to believe strategically that this segment, over the long run, may provide a more compelling risk-adjusted return profile versus higher rated preferred/hybrid securities. Lower rated securities are often overlooked by both retail and institutional investors, and especially by those investors with investment-grade only mandates. Below investment-grade securities typically are not index eligible, limiting the potential investor base and frequently creating opportunities within this particular segment of the asset class. And while lower-rated preferred securities may exhibit periods of relatively higher price volatility, we continued to believe that the return potential is disproportionately higher due to inefficiencies inherent to the segment. It is important to keep in mind that preferred/hybrid securities are often rated three to five notches below an issuer's senior unsecured debt rating. So, in most instances, a BB-rated preferred/hybrid security has been issued by an entity with an investment-grade senior unsecured credit rating of BBB or higher.
As in the past, our team continues to monitor the portfolio and will rotate out of premium-priced bank issued trust preferred and enhanced trust preferred securities into similar structures priced at discounts to par. As a result of recent regulation affecting bank capital securities, issuers may have the right to redeem certain structures at par, sometimes well before an explicit call date listed on a security or even for securities that appear to be non-callable. However, we feel that the risk of regulatory-driven early redemptions continues to abate as most issuers have already taken advantage of this opportunity. So while not as meaningful a risk as in previous measurement periods, it continues to be a situation that we will monitor closely.
For the portion of the Fund managed by NWQ, our investment strategy is to seek to provide high current income and high risk-adjusted return by selecting investments at the optimal point of a company's capital structure, where we find the combination of risk and return potential offer the greatest opportunity.
We invest in securities from across the capital structure of companies that possess favorable investment characteristics using a bottom-up, fundamentals-based approach. These characteristics include attractive valuation, a measure of downside protection and catalysts expected to unlock value. Once an undervalued security has been identified, the issuing company is then analyzed using a fundamental bottom-up approach in order to assess the intrinsic value of the company as well as its long-range prospects. Then the strategy's portfolio management team performs a comprehensive analysis of
Nuveen Investments
7
all available investment choices within the company's capital structure to decide the optimal investment for the portfolio that would offer the greatest expected return for a given level of risk.
We believe that by understanding the company from a fundamental basis, through our experienced research team, we can more effectively evaluate the risk and reward characteristics of the company's debt and equity securities, and then select the optimal point for investment in the company's capital structure.
How did the Fund perform during the seven-month reporting period ended July 31, 2013?
The table in the Performance Overview and Holding Summaries section of this report provides total return performance for the Fund for the seven-month, one-year, five-year and ten-year periods ended July 31, 2013. For the seven-month period ended July 31, 2013, the Fund's common shares at net asset value (NAV) underperformed the Comparative Benchmark and outperformed the BofA/Merrill Lynch Preferred Stock Fixed Rate Index.
For the portion of the Fund managed by NAM, several factors contributed to the sleeve's performance, including a relative overweight to $1,000 par structures versus $25 par structures, a relative overweight to the insurance sector versus the bank sector, a relative overweight to lower rated investment-grade and below investment-grade securities versus the index, and a relative overweight to the more subordinate tier-1 securities versus the relatively more senior lower tier-2 structures.
During the reporting period, an overweight to $1,000 par structures contributed meaningfully to the strategy's performance versus the Comparative Benchmark. As noted in the overview above, the $1,000 par institutional side of the market significantly outperformed the $25 par retail side during the reporting period. We did not find this relative performance surprising as the average option adjusted spread (OAS) valuation for the $25 par side of the market at the beginning of the period was again meaningfully richer compared to the $1,000 par side of the market. In addition, a greater proportion of the $1,000 par side of the market is comprised of fixed-to-floating rate coupon structures. These structures, all else equal, will have lower duration profiles and negligible negative convexity profiles compared to similar fixed-rate-for-life coupon securities. As a result, in an environment where investors are concerned about rising interest rates, relative demand naturally increases for the fixed-to-floating rate coupon structures. So, the outperformance from the overweight to $1,000 par securities was due to a combination of both relative value and investors' desire to position more defensively against rising interest rates.
Another factor contributing to the Fund's relative performance was our overweight to the insurance sector versus the bank sector. While the financial services sector continued to perform well during the period, the insurance sub-sector outperformed, posting a return of +0.4% for the period, which was above the bank sub-sector's return of -0.8%. While the fundamentals for both the bank and insurance sectors are strong and improving further, supply from the insurance sub-sector remained relatively light during the measurement period versus what was relatively healthy new issue flow out of the bank space. In addition, investors continued to anticipate that insurance companies might buy back high coupon, long non-call, preferred/hybrid security structures, which also helped support valuations in that subsector.
The Fund also benefited from overweights to lower rated investment-grade, below investment-grade and more subordinate tier-1 securities versus the Comparative Benchmark. During measurement periods when credit spreads in general have contracted, lower rated investment-grade and below investment-grade securities, as well as more subordinate tier-1 securities, have tended to outperform their higher rated counterparts. The abbreviated annual reporting period ended July 31, 2013 was no exception.
The preferred sleeve managed by NWQ also positively contributed to the Fund's performance relative to its comparative benchmark. Our top contributors to the performance of the Fund for the reporting period included R.R. Donnelley & Sons Company (RRD) senior debt, Liberty Mutual junior debt and Northstar Realty Finance (NRF) preferred stock.
Nuveen Investments
8
RRD Company provides commercial printing and information services. The company is one of the top players in the printing services industry, but the industry is intensely competitive, limiting organic profitability gains. Additionally, the firm faces long-term secular headwinds, as traditional print mediums are increasingly consumed via digital media. Still, despite soft earnings, RRD has been successful in its effort to reduce leverage after adopting a more conservative capital posture since the beginning of the year. We believe this deleveraging effort has had a positive impact to the valuation of their bonds.
Higher rates are typically perceived to have a positive impact to insurance companies as these companies can grow book values as the pressure of margin compression from lower rates is relieved. Liberty Mutual stands out from its peers due to its strong franchise, diversified product offering and adequate core underwriting earnings. Its mutual company structure also allows for a greater degree of operational flexibility. Liberty Mutual's junior debt not only offered attractive valuation but also provided significant downside protection from rising rates with its 7.80% coupon.
NRF is an internally-managed real estate company. The company makes investments in real estate debt, real estate securities and net lease properties. We view NRF as a well-diversified commercial mortgage real estate investment trust (REIT) with an in-house loan origination and asset management operations uniquely positioned to grow as the securitization markets thaw and commercial loan demand rises. NRF is very different from the agency mortgage REIT model, which is commoditized and requires substantial financial leverage to achieve return on equity hurdles. NRF's proprietary origination enhances return on capital as assets are self-created and not purchased in the secondary market. In addition, it allows for substantial flexibility. Given NRF's unique business franchise, we continue to believe NRF's preferred stock offers attractive upside potential.
During the reporting period, the anticipation that the Fed may begin to taper its asset purchases led to an overall re-pricing of risk assets, including credit risk assets. Both high yield bonds and preferred securities had reached all-time low yields, as measured on a yield to worst basis, early in May 2013. However, the combination of sharply higher Treasury yields, a steeper yield curve and the flight of investors in record numbers from fixed income mutual funds and exchange traded funds (ETFs) caused a sharp correction in the yields in these two sectors as well as in investment grade corporate bonds.
Several positions detracted from performance including National Retail Properties preferred stock, Senior Housing Property Trust senior debt, and PennyMac Mortgage Trust.
National Retail Properties Inc. (NNN) is a REIT that acquires, develops and manages retail properties subject to long-term net leases. NNN's preferred stock suffered during the reporting period on worries that NNN's long-term net lease business could result in significant margin compression due to the sharp rise in rates. Nevertheless, we believe NNN's preferred stock is attractive given its strong balance sheet and sufficient liquidity.
Senior Housing Properties (SNH) Trust, another REIT, owns senior living properties, which are leased to unaffiliated tenants. The Trust currently owns independent living and assisted living communities, continuing care retirement communities, nursing homes, wellness centers and medical office, clinic and biotech laboratory buildings located throughout the U.S. SNH suffered along with the health care REIT sector, as the sector historically underperformed in rising interest rate environments. Furthermore, the lackluster earnings growth and worries of further downward estimate revisions have kept a lid to SNH's senior debt performance during the reporting period. We still believe SNH's senior debt remains attractive given that SNH's leverage metrics remain strong and liquidity position healthy.
PennyMac Mortgage Trust (PMT), an externally managed REIT, primarily invests in residential mortgage loans and mortgage-related assets. A substantial portion of its investment portfolio is in distressed loans acquired at deep discounts to their unpaid principal balance. During the reporting period, PMT shares suffered on concerns that the sharp rise in rates would negatively impact the company's earnings and book value. We anticipate margins to trend lower over the next
Nuveen Investments
9
year as competition for loans increases, but we continue to believe PMT's superior technology and experienced management team positions it well to continue to capture market share and grow mortgage banking income.
As with any fixed income asset class, preferred securities are not immune from the impact of rising interest rates. We hope to minimize the impact of higher rates on the market value of the portfolio by positioning in less interest rate sensitive structures when possible, especially securities with fixed-to-floating rate coupon structures. We also believe that when interest rates rise it is likely within the context of an improving macro-economic picture and at a time when the domestic recovery has gained meaningful traction. In this type of environment, risk premiums should shrink reflecting the lower risk profile of the overall market. As a result, credit spreads may narrow as well. Therefore, it is also our view that credit spread compression in the preferred security asset class may likely help buffer the impact of rising interest rates.
Nuveen Investments
10
Fund Leverage
IMPACT OF THE FUND'S LEVERAGE STRATEGIES ON PERFORMANCE
One important factor impacting the return of the Fund relative to its benchmark was the Fund's use of leverage through the use of bank borrowings. The Fund uses leverage because its managers believe that, over time, leveraging provides opportunities for additional income and total return for common shareholders. However, use of leverage also can expose common shareholders to additional volatility. For example, as the prices of securities held by the Fund decline, the negative impact of these valuation changes on common share net asset value and common shareholder total return is magnified by the use of leverage. Conversely, leverage may enhance common share returns during periods when the prices of securities held by the Fund generally are rising. During the period, the Fund continued to hold swap contracts in order to hedge leverage costs, which contributed to the overall positive contribution of leverage.
THE FUND'S REGULATORY LEVERAGE
Bank Borrowings
As discussed previously, the Fund employs regulatory leverage through the use of bank borrowings. As of July 31, 2013, the Fund has outstanding bank borrowings of $402,500,000.
Refer to Notes to Financial Statements, Note 8—Borrowing Arrangements for further details.
As of July 31, 2013, the Fund's percentages of leverage are as shown in the accompanying table.
| Effective Leverage* | Regulatory Leverage* | ||||||||||
JPC | 28.79 | % | 28.79 | % | |||||||
* Effective leverage is the Fund's effective economic leverage, and includes both regulatory leverage and the leverage effects of certain derivative and other investments in the Fund's portfolio that increase the Fund's investment exposure. Regulatory leverage consists of preferred shares issued or borrowings of the Fund. Both of these are part of the Fund's capital structure. Regulatory leverage is sometimes referred to as "40 Act Leverage" and is subject to asset coverage limits set forth the Investment Company Act of 1940.
Nuveen Investments
11
Common Share Information
Distribution Information
The following information regarding the Fund's distributions is current as of July 31, 2013. The Fund's distribution levels may vary over time based on the Fund's investment activities and portfolio investment value changes.
During the current reporting period, the Fund's monthly distributions to shareholders were as shown in the accompanying table.
| JPC | Per Common Share Amounts | ||||||
January | $ | 0.0633 | |||||
February | 0.0633 | ||||||
March | 0.0633 | ||||||
April | 0.0633 | ||||||
May | 0.0633 | ||||||
June | 0.0633 | ||||||
July | 0.0633 | ||||||
Current Distribution Rate* | 8.12 | % | |||||
* Current distribution rate is based on the Fund's current annualized monthly distribution divided by the Fund's current market price. The Fund's monthly distributions to its shareholders may be comprised of ordinary income, net realized capital gains and, if at the end of the fiscal year the Fund's cumulative net ordinary income and net realized gains are less than the amount of the Fund's distributions, a return of capital for tax purposes.
The Fund employs financial leverage through the use of bank borrowings. Financial leverage provides the potential for higher earnings (net investment income), total returns and distributions over time, but also increases the variability of common shareholders' net asset value per share in response to changing market conditions.
During certain periods, the Fund may pay dividends at a rate that may be more or less than the amount of net investment income actually earned by the Fund during the period. If the Fund has cumulatively earned more than it has paid in dividends, it holds excess in reserve as undistributed net investment income (UNII) as part of the Fund's NAV. Conversely, if the Fund has cumulatively paid dividends in excess of its earnings, the excess constitutes negative UNII that is likewise reflected in the Fund's NAV. The Fund will, over time, pay all of its net investment income as dividends to shareholders. As of July 31, 2013, the Fund had a positive UNII balance for tax purposes and a negative UNII balance for financial reporting purposes.
Common Share Repurchases
As of July 31, 2013, and since the inception of the Fund's repurchase program, the Fund has cumulatively repurchased and retired its outstanding common shares as shown in the accompanying table.
| Common Shares Repurchased and Retired | % of Common Shares Authorized for Repurchase | ||||||||||
JPC | 2,724,287 | 28.1 | % | ||||||||
During the current reporting period, the Fund did not repurchase any of its outstanding common shares.
Nuveen Investments
12
Other Common Share Information
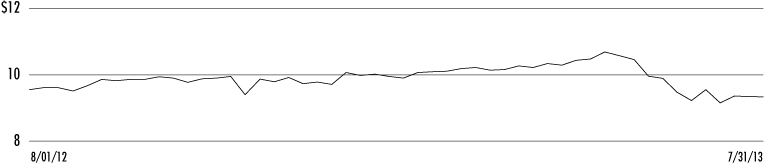
As of July 31, 2013, and during the current reporting period, the Fund's common share price was trading at a premium/(discount) to its common share NAV as shown in the accompanying table.
JPC | |||||||
Common Share NAV | $ | 10.26 | |||||
Common Share Price | $ | 9.35 | |||||
Premium/(Discount) to NAV | (8.87 | )% | |||||
7-Month Average Premium/(Discount) to NAV | (5.10 | )% | |||||
Nuveen Investments
13
Risk Considerations
Fund shares are not guaranteed or endorsed by any bank or other insured depository institution, and are not federally insured by the Federal Deposit Insurance Corporation. Shares of closed-end funds are subject to investment risks, including the possible loss of principal invested. Past performance is no guarantee of future results. Fund common shares are subject to a variety of risks, including:
Investment, Market and Price Risk. An investment in common shares is subject to investment risk, including the possible loss of the entire principal amount that you invest. Your investment in common shares represents an indirect investment in the corporate securities owned by the Fund, which generally trade in the over-the-counter markets. Shares of closed-end investment companies like the Fund frequently trade at a discount to their NAV. Your common shares at any point in time may be worth less than your original investment, even after taking into account the reinvestment of Fund dividends and distributions.
Leverage Risk. The Fund's use of leverage creates the possibility of higher volatility for the Fund's per share NAV, market price and distributions. Leverage risk can be introduced through regulatory leverage (issuing preferred shares or debt borrowings at the Fund level) or through certain derivative investments held in the Fund's portfolio. Leverage typically magnifies the total return of the Fund's portfolio, whether that return is positive or negative. The use of leverage creates an opportunity for increased common share net income, but there is no assurance that the Fund's leveraging strategy will be successful.
Tax Risk. The Fund's investment program and the tax treatment of Fund distributions may be affected by IRS interpretations of the Internal Revenue Code and future changes in tax laws and regulations.
Common Stock Risk. Common stock returns often have experienced significant volatility.
Issuer Credit Risk. This is the risk that a security in the Fund's portfolio will fail to make dividend or interest payments when due.
Non-U.S. Securities Risk. Investments in non-U.S securities involve special risks not typically associated with domestic investments including currency risk and adverse political, social and economic development. These risks often are magnified in emerging markets.
Interest Rate Risk. Fixed-income securities such as bonds, preferred, convertible and other debt securities will decline in value if market interest rates rise.
Preferred Stock Risk. Preferred stocks are subordinated to bonds and other debt instruments in a company's capital structure, and therefore are subject to greater credit risk.
Convertible Securities Risk. Convertible securities generally offer lower interest or dividend yields than non-convertible fixed-income securities of similar credit quality.
Reinvestment Risk. If market interest rates decline, income earned from the Fund's portfolio may be reinvested at rates below that of the original investment that generated the income.
Below-Investment Grade Risk. Investments in securities below investment grade quality are predominantly speculative and subject to greater volatility and risk of default.
Call Risk or Prepayment Risk. Issuers may exercise their option to prepay principal earlier than scheduled, forcing the Fund to reinvest in lower-yielding securities.
Nuveen Investments
14
Derivatives Risk. Derivative securities include, but are not limited to, calls, puts, warrants, swaps and forwards, The Fund's use of derivatives involves risks different from, and possibly greater than, the risks associated with the underlying investments. The derivatives market is largely unregulated.
Unrated Investment Risk. In determining whether an unrated security is an appropriate investment for the Fund, the portfolio manager will consider information from industry sources, as well as its own quantitative and qualitative analysis, in making such a determination. However such a determination by the portfolio manager is not the equivalent of a rating by a rating agency.
Counterparty Risk. To the extent that a Fund's derivative investments are purchased or sold in over-the-counter transactions, the Fund will be exposed to the risk that counter- parties to these transactions will be unable to meet their obligations.
Interest Rate Swaps Risk. The risk that yields will move in the direction opposite to the direction anticipated by a Fund, which would cause a Fund to make payments to its counterparty in the transaction that could adversely affect the Fund's performance.
Nuveen Investments
15
Nuveen Preferred Income Opportunities Fund (JPC)
Performance Overview and Holding Summaries as of July 31, 2013
Average Annual Total Returns as of July 31, 2013
Cumulative | Average Annual | ||||||||||||||||||
7-Month | 1-Year | 5-Year | 10-Year | ||||||||||||||||
JPC at Common Share NAV | 4.09 | % | 13.44 | % | 8.32 | % | 5.59 | % | |||||||||||
JPC at Common Share Price | 0.63 | % | 7.46 | % | 11.17 | % | 5.25 | % | |||||||||||
JPC Blended Index (Comparative Benchmark) | 6.63 | % | 15.64 | % | 7.39 | % | 6.94 | % | |||||||||||
BofA/Merrill Lynch Preferred Stock Fixed Rate Index | (1.00 | )% | 1.24 | % | 4.61 | % | 2.51 | % | |||||||||||
Past performance is not predictive of future results. Current performance may be higher or lower than the data shown. Returns do not reflect the deduction of taxes that shareholders may have to pay on Fund distributions or upon the sale of Fund shares. Comparative index return information is provided for the Fund's shares at NAV only. Indexes are not available for direct investment.
Common Share Price Performance — Weekly Closing Price
Portfolio Allocation1,2
(as a % of total investments)
$25 Par (or similar) Retail Structures | 47.4 | % | |||||
| $1,000 Par (or similar) Institutional Structures | 44.1 | % | |||||
Corporate Bonds | 5.9 | % | |||||
Common Stocks | 1.6 | % | |||||
Short-Term Investments | 1.0 | % | |||||
Convertible Preferred Securities | — | %3 | |||||
Portfolio Composition1,2
(as a % of total investments)
Insurance | 31.3 | % | |||||
Commercial Banks | 19.5 | % | |||||
Diversified Financial Services | 17.4 | % | |||||
Real Estate | 15.9 | % | |||||
Capital Markets | 6.8 | % | |||||
Short-Term Investments | 1.0 | % | |||||
Other | 8.1 | % | |||||
Country Allocation1,2
(as a % of total investments)
United States | 76.3 | % | |||||
Netherlands | 6.0 | % | |||||
United Kingdom | 5.8 | % | |||||
Switzerland | 2.9 | % | |||||
Other | 9.0 | % | |||||
Top Five Issuers1,4
(as a % of total investments)
General Electric Company | 3.5 | % | |||||
Wells Fargo and Company | 3.0 | % | |||||
JPMorgan Chase & Company | 2.9 | % | |||||
Bank of America Corporation | 2.8 | % | |||||
MetLife Inc | 2.7 | % | |||||
Refer to the Glossary of Terms Used in this Report for further definition of the terms used within this page.
1 Holdings are subject to change.
2 Excluding investments in derivatives.
3 Rounds to less than 0.1%
4 Excluding short-term investments and investments in derivatives.
Nuveen Investments
16
JPC
Shareholder Meeting Report
The annual meeting of shareholders was held in the offices of Nuveen Investments on April 3, 2013; at this meeting the shareholders were asked to vote on the election of Board Members.
JPC | |||||||
| Common Shares | |||||||
Approval of the Board Members was reached as follows: | |||||||
William C. Hunter | |||||||
For | 85,221,752 | ||||||
Withhold | 2,015,385 | ||||||
Total | 87,237,137 | ||||||
Judith M. Stockdale | |||||||
For | 85,156,092 | ||||||
Withhold | 2,081,045 | ||||||
Total | 87,237,137 | ||||||
Carole E. Stone | |||||||
For | 85,116,935 | ||||||
Withhold | 2,120,202 | ||||||
Total | 87,237,137 | ||||||
Virginia L. Stringer | |||||||
For | 85,143,420 | ||||||
Withhold | 2,093,717 | ||||||
Total | 87,237,137 | ||||||
Nuveen Investments
17
Report of INDEPENDENT REGISTERED
PUBLIC ACCOUNTING FIRM
The Board of Trustees and Shareholders
Nuveen Preferred Income Opportunities Fund
We have audited the accompanying statement of assets and liabilities, including the portfolio of investments, of Nuveen Preferred Income Opportunities Fund (the "Fund") as of July 31, 2013, and the related statements of operations, changes in net assets, and cash flows, and the financial highlights for each of the periods indicated therein. These financial statements and financial highlights are the responsibility of the Fund's management. Our responsibility is to express an opinion on these financial statements and financial highlights based on our audits.
We conducted our audits in accordance with the standards of the Public Company Accounting Oversight Board (United States). Those standards require that we plan and perform the audit to obtain reasonable assurance about whether the financial statements and financial highlights are free of material misstatement. We were not engaged to perform an audit of the Fund's internal control over financial reporting. Our audits included consideration of internal control over financial reporting as a basis for designing audit procedures that are appropriate in the circumstances, but not for the purpose of expressing an opinion on the effectiveness of the Fund's internal control over financial reporting. Accordingly, we express no such opinion. An audit also includes examining, on a test basis, evidence supporting the amounts and disclosures in the financial statements and financial highlights, assessing the accounting principles used and significant estimates made by management, and evaluating the overall financial statement presentation. Our procedures included confirmation of securities owned as of July 31, 2013, by correspondence with the custodian, counterparty, and brokers or by other appropriate auditing procedures where replies from brokers were not received. We believe that our audits provide a reasonable basis for our opinion.
In our opinion, the financial statements and financial highlights referred to above present fairly, in all material respects, the financial position of Nuveen Preferred Income Opportunities Fund at July 31, 2013, and the results of its operations, the changes in its net assets, its cash flows, and the financial highlights for each of the periods indicated therein, in conformity with U.S. generally accepted accounting principles.

Chicago, Illinois
September 12, 2013
Nuveen Investments
18
JPC
Nuveen Preferred Income Opportunities Fund
Portfolio of Investments
July 31, 2013
| Shares | Description (1) | Value | |||||||||
Common Stocks – 2.3% (1.6% of Total Investments) | |||||||||||
Capital Markets – 1.3% | |||||||||||
| 295,500 | Ares Capital Corporation | $ | 5,256,945 | ||||||||
| 193,775 | Medley Capital Corporation | 2,829,115 | |||||||||
| 290,512 | TCP Capital Corporation | 4,616,236 | |||||||||
Total Capital Markets | 12,702,296 | ||||||||||
Insurance – 0.3% | |||||||||||
| 65,000 | American International Group, (2) | 2,958,150 | |||||||||
Real Estate – 0.7% | |||||||||||
| 236,742 | PennyMac Mortgage Investment Trust | 5,227,263 | |||||||||
| 10,600 | Simon Property Group, Inc. | 1,696,636 | |||||||||
Total Real Estate | 6,923,899 | ||||||||||
Total Common Stocks (cost $22,260,441) | 22,584,345 | ||||||||||
| Shares | Description (1) | Coupon | Ratings (3) | Value | |||||||||||||||||||
Convertible Preferred Securities – 0.1% (0.0% of Total Investments) | |||||||||||||||||||||||
Thrifts & Mortgage Finance – 0.1% | |||||||||||||||||||||||
| 15,056 | New York Community Capital Trust V | 6.000 | % | Baa3 | $ | 711,396 | |||||||||||||||||
Total Convertible Preferred Securities (cost $725,119) | 711,396 | ||||||||||||||||||||||
| Shares | Description (1) | Coupon | Ratings (3) | Value | |||||||||||||||||||
$25 Par (or similar) Retail Structures – 66.3% (47.4% of Total Investments) | |||||||||||||||||||||||
Capital Markets – 6.8% | |||||||||||||||||||||||
| 28,978 | Allied Capital Corporation | 6.875 | % | BBB | $ | 721,552 | |||||||||||||||||
| 100,440 | Ameriprise Financial, Inc. | 7.750 | % | A | 2,656,638 | ||||||||||||||||||
| 75,000 | Apollo Investment Corporation, (2) | 6.875 | % | BBB | 1,754,250 | ||||||||||||||||||
| 167,975 | Apollo Investment Corporation | 6.625 | % | BBB | 4,002,844 | ||||||||||||||||||
| 257,923 | Ares Capital Corporation | 7.000 | % | BBB | 6,626,042 | ||||||||||||||||||
| 575,880 | Deutsche Bank Capital Funding Trust II | 6.550 | % | BBB- | 14,512,176 | ||||||||||||||||||
| 150,000 | Fifth Street Finance Corporation | 6.125 | % | BBB- | 3,562,500 | ||||||||||||||||||
| 66,500 | Gladstone Investment Corporation | 7.125 | % | N/R | 1,748,285 | ||||||||||||||||||
| 23,026 | Goldman Sachs Group Inc., Series 2004-4 (CORTS) | 6.000 | % | Baa3 | 568,512 | ||||||||||||||||||
| 49,600 | Goldman Sachs Group Inc., Series GSC-3 (PPLUS) | 6.000 | % | Baa3 | 1,231,072 | ||||||||||||||||||
| 220,800 | Goldman Sachs Group, Inc. | 5.500 | % | BB+ | 5,237,376 | ||||||||||||||||||
| 149,500 | Hercules Technology Growth Capital Incorporated | 7.000 | % | N/R | 3,885,505 | ||||||||||||||||||
| 118,000 | Hercules Technology Growth Capital Incorporated | 7.000 | % | N/A | 3,007,820 | ||||||||||||||||||
| 42,260 | Medley Capital Corporation | 7.125 | % | N/A | 1,085,659 | ||||||||||||||||||
| 1,100 | Morgan Stanley Capital Trust III | 6.250 | % | BB+ | 27,522 | ||||||||||||||||||
| 1,350 | Morgan Stanley Capital Trust IV | 6.250 | % | BB+ | 33,791 | ||||||||||||||||||
| 15,900 | Morgan Stanley Capital Trust V | 5.750 | % | Ba1 | 393,048 | ||||||||||||||||||
| 41,575 | Morgan Stanley Capital Trust VI | 6.600 | % | BB+ | 1,042,285 | ||||||||||||||||||
| 2,500 | Morgan Stanley Capital Trust VII | 6.600 | % | BB+ | 62,900 | ||||||||||||||||||
| 123,900 | MVC Capital Incorporated | 7.250 | % | N/A | 3,103,695 | ||||||||||||||||||
| 280,275 | Solar Capital Limited | 6.750 | % | BBB- | 6,536,013 | ||||||||||||||||||
Nuveen Investments
19
JPC
Nuveen Preferred Income Opportunities Fund (continued)
Portfolio of Investments July 31, 2013
| Shares | Description (1) | Coupon | Ratings (3) | Value | |||||||||||||||||||
| Capital Markets (continued) | |||||||||||||||||||||||
| 88,700 | Triangle Capital Corporation | 7.000 | % | N/R | $ | 2,271,607 | |||||||||||||||||
| 139,350 | Triangle Capital Corporation | 6.375 | % | N/A | 3,462,848 | ||||||||||||||||||
Total Capital Markets | 67,533,940 | ||||||||||||||||||||||
Commercial Banks – 12.5% | |||||||||||||||||||||||
| 508,200 | BB&T Corporation | 5.625 | % | BBB | 11,912,208 | ||||||||||||||||||
| 133,125 | Cobank Agricultural Credit Bank, (4) | 6.250 | % | A- | 13,674,440 | ||||||||||||||||||
| 38,725 | Cobank Agricultural Credit Bank, (4) | 6.125 | % | A- | 3,862,819 | ||||||||||||||||||
| 299,850 | First Naigara Finance Group | 8.625 | % | BB+ | 8,470,763 | ||||||||||||||||||
| 245,000 | First Republic Bank of San Francisco | 6.200 | % | BBB | 6,125,000 | ||||||||||||||||||
| 10,428 | GMAC LLC | 7.350 | % | BB- | 260,596 | ||||||||||||||||||
| 216,258 | GMAC LLC | 7.300 | % | BB- | 5,454,027 | ||||||||||||||||||
| 375,250 | HSBC Holdings PLC | 8.000 | % | BBB+ | 10,218,058 | ||||||||||||||||||
| 12,750 | HSBC Holdings PLC | 6.200 | % | BBB+ | 318,495 | ||||||||||||||||||
| 768,788 | PNC Financial Services, (5) | 6.125 | % | BBB | 20,180,685 | ||||||||||||||||||
| 225,900 | Private Bancorp Incorporated | 7.125 | % | N/A | 5,685,903 | ||||||||||||||||||
| 197,430 | Regions Financial Corporation | 6.375 | % | BB | 4,862,701 | ||||||||||||||||||
| 133,300 | TCF Financial Corporation | 7.500 | % | BB | 3,475,131 | ||||||||||||||||||
| 140,600 | Texas Capital Bancshares Inc., (2) | 6.500 | % | BB | 3,457,354 | ||||||||||||||||||
| 3,366 | Texas Capital Bancshares | 6.500 | % | BB+ | 79,370 | ||||||||||||||||||
| 113,600 | U.S. Bancorp. | 6.500 | % | BBB+ | 3,060,384 | ||||||||||||||||||
| 219,200 | Webster Financial Corporation | 6.400 | % | Ba1 | 5,436,160 | ||||||||||||||||||
| 217,100 | Wells Fargo & Company, (2) | 5.850 | % | BBB+ | 5,325,463 | ||||||||||||||||||
| 199,400 | Zions Bancorporation | 9.500 | % | BB | 5,092,676 | ||||||||||||||||||
| 269,863 | Zions Bancorporation | 7.900 | % | BB | 7,623,630 | ||||||||||||||||||
Total Commercial Banks | 124,575,863 | ||||||||||||||||||||||
Consumer Finance – 1.7% | |||||||||||||||||||||||
| 534,700 | Discover Financial Services | 6.500 | % | BB | 13,362,153 | ||||||||||||||||||
| 121,925 | GMAC LLC | 7.250 | % | BB- | 3,044,467 | ||||||||||||||||||
| 32,742 | SLM Corporation | 6.000 | % | BBB- | 733,093 | ||||||||||||||||||
Total Consumer Finance | 17,139,713 | ||||||||||||||||||||||
Diversified Financial Services – 8.7% | |||||||||||||||||||||||
| 102,000 | Citigroup Capital Trust XI | 6.000 | % | BB | 2,564,280 | ||||||||||||||||||
| 181,884 | Citigroup Capital XIII | 7.875 | % | BB+ | 5,001,810 | ||||||||||||||||||
| 16,300 | Citigroup Capital XVII | 6.350 | % | BB+ | 410,597 | ||||||||||||||||||
| 159,401 | Citigroup Inc. | 8.125 | % | BB | 4,732,616 | ||||||||||||||||||
| 451,651 | Countrywide Capital Trust V | 7.000 | % | BB+ | 11,340,957 | ||||||||||||||||||
| 136,200 | Countrywide Capital Trust IV | 6.750 | % | BB+ | 3,433,602 | ||||||||||||||||||
| 80,000 | GMAC LLC | 7.375 | % | BB- | 2,019,200 | ||||||||||||||||||
| 285,000 | ING Groep N.V. | 8.500 | % | BBB- | 7,301,700 | ||||||||||||||||||
| 65,000 | ING Groep N.V. | 7.375 | % | BBB- | 1,637,350 | ||||||||||||||||||
| 204,023 | ING Groep N.V. | 7.200 | % | BBB- | 5,110,776 | ||||||||||||||||||
| 783,499 | ING Groep N.V. | 7.050 | % | BBB- | 19,477,781 | ||||||||||||||||||
| 25,000 | ING Groep N.V. | 6.375 | % | BBB- | 601,750 | ||||||||||||||||||
| 50,000 | ING Groep N.V. | 6.125 | % | BBB- | 1,175,500 | ||||||||||||||||||
| 16,600 | Intl FCStone Inc., (2), (4) | 8.500 | % | N/R | 418,632 | ||||||||||||||||||
| 23,750 | JPMorgan Chase Capital Trust XXIX | 6.700 | % | BBB | 613,225 | ||||||||||||||||||
| 71,700 | KCAP Financial Inc. | 7.375 | % | N/A | 1,829,784 | ||||||||||||||||||
| 50,000 | KKR Financial Holdings LLC | 7.500 | % | BBB | 1,323,000 | ||||||||||||||||||
| 278,200 | KKR Financial Holdings LLC | 7.375 | % | BB+ | 7,038,460 | ||||||||||||||||||
| 220,300 | Main Street Capital Corporation | 6.125 | % | N/R | 5,287,200 | ||||||||||||||||||
| 21,825 | Merrill Lynch Capital Trust II | 6.450 | % | BB+ | 546,280 | ||||||||||||||||||
| 51,608 | Merrill Lynch Preferred Capital Trust V | 7.280 | % | BB+ | 1,309,811 | ||||||||||||||||||
| 119,700 | PennantPark Investment Corporation | 6.250 | % | BBB- | 2,960,181 | ||||||||||||||||||
Total Diversified Financial Services | 86,134,492 | ||||||||||||||||||||||
Nuveen Investments
20
| Shares | Description (1) | Coupon | Ratings (3) | Value | |||||||||||||||||||
Diversified Telecommunication Services – 1.2% | |||||||||||||||||||||||
| 208,137 | Qwest Corporation | 7.500 | % | BBB- | $ | 5,336,633 | |||||||||||||||||
| 2,500 | Qwest Corporation | 7.375 | % | BBB- | 63,375 | ||||||||||||||||||
| 255,000 | Qwest Corporation | 7.000 | % | BBB- | 6,418,350 | ||||||||||||||||||
Total Diversified Telecommunication Services | 11,818,358 | ||||||||||||||||||||||
Electric Utilities – 1.3% | |||||||||||||||||||||||
| 288,375 | Entergy Texas Inc. | 7.875 | % | A- | 7,711,148 | ||||||||||||||||||
| 91,529 | NextEra Energy Inc. | 5.000 | % | BBB | 1,901,973 | ||||||||||||||||||
| 143,568 | SCE Trust I | 5.625 | % | BBB+ | 3,271,915 | ||||||||||||||||||
Total Electric Utilities | 12,885,036 | ||||||||||||||||||||||
Energy Equipment & Services – 0.0% | |||||||||||||||||||||||
| 6,794 | Greenhunter Energy Incorporated | 10.000 | % | N/A | 126,029 | ||||||||||||||||||
Insurance – 10.1% | |||||||||||||||||||||||
| 104,045 | Aegon N.V. | 8.000 | % | Baa1 | 2,836,267 | ||||||||||||||||||
| 503,752 | Aegon N.V. | 6.375 | % | Baa1 | 12,422,524 | ||||||||||||||||||
| 708,410 | Arch Capital Group Limited | 6.750 | % | BBB | 17,972,362 | ||||||||||||||||||
| 269,500 | Argo Group US Inc. | 6.500 | % | BBB- | 6,438,355 | ||||||||||||||||||
| 54,020 | Aspen Insurance Holdings Limited | 7.250 | % | BBB- | 1,409,922 | ||||||||||||||||||
| 393,800 | Aspen Insurance Holdings Limited | 5.950 | % | BBB- | 10,120,660 | ||||||||||||||||||
| 511,908 | Axis Capital Holdings Limited | 6.875 | % | BBB | 13,299,370 | ||||||||||||||||||
| 150,000 | Endurance Specialty Holdings Limited | 7.500 | % | BBB- | 3,963,000 | ||||||||||||||||||
| 138,124 | Hartford Financial Services Group Inc. | 7.875 | % | BB+ | 4,062,227 | ||||||||||||||||||
| 299,470 | Maiden Holdings Limited | 8.250 | % | BB | 7,774,241 | ||||||||||||||||||
| 3,832 | Maiden Holdings NA Limited | 8.250 | % | BBB- | 99,670 | ||||||||||||||||||
| 200,000 | Maiden Holdings NA Limited | 8.000 | % | BBB- | 5,186,000 | ||||||||||||||||||
| 8,205 | Prudential PLC | 6.750 | % | A- | 202,664 | ||||||||||||||||||
| 520,415 | Reinsurance Group of America Inc. | 6.200 | % | BBB | 13,296,603 | ||||||||||||||||||
| 64,500 | W.R. Berkley Corporation | 5.625 | % | BBB- | 1,372,560 | ||||||||||||||||||
Total Insurance | 100,456,425 | ||||||||||||||||||||||
Marine – 0.2% | |||||||||||||||||||||||
| 59,200 | Costamare Inc., (2), (4) | 7.625 | % | �� | N/R | 1,459,280 | |||||||||||||||||
| 9,890 | International Shipholding Corporation, WI/DD (2) | 9.000 | % | N/R | 993,945 | ||||||||||||||||||
Total Marine | 2,453,225 | ||||||||||||||||||||||
Metals & Mining – 0.1% | |||||||||||||||||||||||
| 67,375 | Gamco Global Gold Natural Resources & Income Trust | 5.000 | % | A1 | 1,431,719 | ||||||||||||||||||
Multi-Utilities – 0.6% | |||||||||||||||||||||||
| 230,684 | Dominion Resources Inc. | 8.375 | % | BBB | 6,092,364 | ||||||||||||||||||
| 8,644 | DTE Energy Company | 6.500 | % | Baa2 | 222,929 | ||||||||||||||||||
Total Multi-Utilities | 6,315,293 | ||||||||||||||||||||||
Oil, Gas & Consumable Fuels – 0.5% | |||||||||||||||||||||||
| 184,705 | Nustar Logistics Limited Partnership | 7.625 | % | Ba2 | 4,872,518 | ||||||||||||||||||
Real Estate – 20.3% | |||||||||||||||||||||||
| 199,300 | AG Mortgage Investment Trust | 8.000 | % | N/A | 4,709,459 | ||||||||||||||||||
| 249,100 | Annaly Capital Management | 7.625 | % | N/A | 6,180,171 | ||||||||||||||||||
| 149,500 | Apollo Commercial Real Estate Finance | 8.625 | % | N/A | 3,863,080 | ||||||||||||||||||
| 249,100 | Apollo Residential Mortgage Inc. | 8.000 | % | N/A | 5,978,400 | ||||||||||||||||||
| 69,000 | Ashford Hospitality Trust Inc. | 9.000 | % | N/A | 1,821,600 | ||||||||||||||||||
| 1,938 | Ashford Hospitality Trust Inc. | 8.550 | % | N/A | 48,799 | ||||||||||||||||||
| 166,440 | Ashford Hospitality Trust Inc. | 8.450 | % | N/R | 4,185,966 | ||||||||||||||||||
| 200,000 | Capstead Mortgage Corporation | 7.500 | % | N/R | 4,780,000 | ||||||||||||||||||
| 160,091 | CBL & Associates Properties Inc. | 7.375 | % | BB | 4,016,683 | ||||||||||||||||||
Nuveen Investments
21
JPC
Nuveen Preferred Income Opportunities Fund (continued)
Portfolio of Investments July 31, 2013
| Shares | Description (1) | Coupon | Ratings (3) | Value | |||||||||||||||||||
| Real Estate (continued) | |||||||||||||||||||||||
| 186,579 | Cedar Shopping Centers Inc., Series A | 7.250 | % | N/A | $ | 4,683,133 | |||||||||||||||||
| 208,314 | Chesapeake Lodging Trust | 7.750 | % | N/A | 5,289,092 | ||||||||||||||||||
| 50,000 | Coresite Realty Corporation | 7.250 | % | N/A | 1,253,500 | ||||||||||||||||||
| 146,596 | CYS Invsetments Inc. | 7.750 | % | N/A | 3,401,027 | ||||||||||||||||||
| 144,200 | CYS Invsetments Inc. | 7.500 | % | N/R | 3,274,782 | ||||||||||||||||||
| 270,925 | DDR Corporation | 6.500 | % | Ba1 | 6,499,491 | ||||||||||||||||||
| 16,200 | Digital Realty Trust Inc. | 7.000 | % | Baa3 | 405,000 | ||||||||||||||||||
| 50,940 | Duke Realty Corporation, Series L | 6.600 | % | Baa3 | 1,272,991 | ||||||||||||||||||
| 175,000 | Dupont Fabros Technology | 7.875 | % | Ba2 | 4,506,250 | ||||||||||||||||||
| 99,700 | Dynex Capital inc. | 8.500 | % | N/A | 2,502,470 | ||||||||||||||||||
| 250,000 | First Potomac Realty Trust | 7.750 | % | N/R | 6,530,000 | ||||||||||||||||||
| 298,900 | Hatteras Financial Corporation | 7.625 | % | N/A | 7,164,633 | ||||||||||||||||||
| 80,000 | Health Care REIT, Inc. | 6.500 | % | Baa3 | 2,024,000 | ||||||||||||||||||
| 89,050 | Hersha Hospitality Trust | 6.875 | % | N/R | 2,146,105 | ||||||||||||||||||
| 63,750 | Hospitality Properties Trust | 7.125 | % | Baa3 | 1,626,900 | ||||||||||||||||||
| 178,580 | Inland Real Estate Corporation | 8.125 | % | N/R | 4,582,363 | ||||||||||||||||||
| 269,000 | Invesco Mortgage Capital Inc. | 7.750 | % | N/A | 6,426,410 | ||||||||||||||||||
| 39,551 | Kimco Realty Corporation, | 6.900 | % | Baa2 | 1,002,222 | ||||||||||||||||||
| 50,712 | Kimco Realty Corporation, | 6.000 | % | Baa2 | 1,230,780 | ||||||||||||||||||
| 1,700 | Kite Realty Group Trust | 8.250 | % | N/A | 44,302 | ||||||||||||||||||
| 198,500 | MFA Financial Inc. | 8.000 | % | N/R | 5,035,945 | ||||||||||||||||||
| 74,800 | National Retail Properties Inc. | 6.625 | % | Baa3 | 1,870,748 | ||||||||||||||||||
| 281,825 | National Retail Properties Inc., (2) | 5.700 | % | Baa3 | 6,259,333 | ||||||||||||||||||
| 150,000 | New York Mortgage Trust Inc. | 7.750 | % | N/R | 3,523,500 | ||||||||||||||||||
| 178,500 | Northstar Realty Finance Corporation | 8.875 | % | N/A | 4,542,825 | ||||||||||||||||||
| 327,600 | Northstar Realty Finance Corporation | 8.250 | % | N/R | 8,173,620 | ||||||||||||||||||
| 72,400 | Penn Real Estate Investment Trust | 7.375 | % | N/A | 1,814,344 | ||||||||||||||||||
| 200,000 | Penn Real Estate Investment Trust | 8.250 | % | N/A | 5,270,000 | ||||||||||||||||||
| 22,464 | Prologis Inc., (4) | 8.540 | % | BB+ | 1,399,087 | ||||||||||||||||||
| 21,000 | PS Business Parks, Inc. | 6.875 | % | Baa2 | 527,940 | ||||||||||||||||||
| 59,960 | PS Business Parks, Inc. | 6.450 | % | Baa2 | 1,474,416 | ||||||||||||||||||
| 27,006 | Public Storage, Inc. | 6.875 | % | A | 691,084 | ||||||||||||||||||
| 70,653 | Public Storage, Inc. | 5.900 | % | A | 1,712,629 | ||||||||||||||||||
| 138,000 | Rait Financial Trust | 7.750 | % | N/R | 3,252,660 | ||||||||||||||||||
| 250,000 | Realty Income Corporation | 6.625 | % | Baa2 | 6,380,000 | ||||||||||||||||||
| 217,000 | Regency Centers Corporation | 6.625 | % | Baa3 | 5,427,170 | ||||||||||||||||||
| 422,600 | Senior Housing Properties Trust | 5.625 | % | BBB- | 9,208,454 | ||||||||||||||||||
| 174,400 | Strategic Hotel Capital Inc., Series B | 8.250 | % | N/R | 4,168,160 | ||||||||||||||||||
| 174,400 | Strategic Hotel Capital Inc., Series C | 8.250 | % | N/R | 4,185,600 | ||||||||||||||||||
| 149,300 | Urstadt Biddle Properties | 7.125 | % | N/A | 3,813,122 | ||||||||||||||||||
| 438,595 | Vornado Realty LP | 7.875 | % | BBB | 11,649,083 | ||||||||||||||||||
| 8,248 | Weingarten Realty Trust | 6.500 | % | Baa3 | 208,015 | ||||||||||||||||||
| 236,425 | Winthrop Realty Trust Inc. | 9.250 | % | N/R | 6,388,204 | ||||||||||||||||||
| 149,400 | Winthrop Realty Trust Inc. | 7.750 | % | N/A | 3,817,170 | ||||||||||||||||||
Total Real Estate | 202,242,718 | ||||||||||||||||||||||
Real Estate Management & Development – 0.0% | |||||||||||||||||||||||
| 12,383 | Forest City Enterprises Inc. | 7.375 | % | BB- | 309,575 | ||||||||||||||||||
Thrifts & Mortgage Finance – 0.1% | |||||||||||||||||||||||
| 39,002 | Everbank Financial Corporation | 6.750 | % | N/A | 949,699 | ||||||||||||||||||
U.S. Agency – 2.2% | |||||||||||||||||||||||
| 213,500 | Farm Credit Bank of Texas, (2), (4) | 6.750 | % | Baa1 | 21,350,000 | ||||||||||||||||||
Total $25 Par (or similar) Retail Structures (cost $653,442,665) | 660,594,603 | ||||||||||||||||||||||
Nuveen Investments
22
| Principal Amount (000) | Description (1) | Coupon | Maturity | Ratings (3) | Value | ||||||||||||||||||
Corporate Bonds – 8.3% (5.9% of Total Investments) | |||||||||||||||||||||||
Capital Markets – 0.4% | |||||||||||||||||||||||
$ | 4,430 | Jefferies Group Inc. | 6.500 | % | 1/20/43 | BBB | $ | 4,427,027 | |||||||||||||||
Commercial Banks – 0.2% | |||||||||||||||||||||||
| 1,800 | PNC Financial Services Inc. | 4.850 | % | 12/01/63 | BBB | 1,638,000 | |||||||||||||||||
Commercial Services & Supplies – 1.1% | |||||||||||||||||||||||
| 7,588 | RR Donnelley & Son Company | 8.250 | % | 3/15/19 | BB | 8,384,740 | |||||||||||||||||
| 1,900 | RR Donnelley & Son Company | 7.875 | % | 3/15/21 | BB | 2,052,000 | |||||||||||||||||
| 9,488 | Total Commercial Services & Supplies | 10,436,740 | |||||||||||||||||||||
Consumer Finance – 0.4% | |||||||||||||||||||||||
| 5,000 | SLM Corporation | 5.625 | % | 8/01/33 | BBB- | 4,162,500 | |||||||||||||||||
Diversified Financial Services – 0.6% | |||||||||||||||||||||||
| 2,300 | Jefferies Finance LLC, 144A | 7.375 | % | 4/01/20 | B+ | 2,323,000 | |||||||||||||||||
| 3,900 | Icahn Enterprises Finance, 144A | 6.000 | % | 8/01/20 | BBB- | 3,900,000 | |||||||||||||||||
| 6,200 | Total Diversified Financial Services | 6,223,000 | |||||||||||||||||||||
Diversified Telecommunication Services – 1.3% | |||||||||||||||||||||||
| 13,000 | Frontier Communications Corporation | 7.125 | % | 1/15/23 | BB+ | 12,870,000 | |||||||||||||||||
Insurance – 4.3% | |||||||||||||||||||||||
| 4,800 | AIG Life Holdings Inc. | 8.500 | % | 7/01/30 | BBB | 6,228,000 | |||||||||||||||||
| 7,545 | American International Group, Inc. | 8.175 | % | 5/15/58 | BBB | 9,223,763 | |||||||||||||||||
| 7,957 | Protective Life Corporation | 8.450 | % | 10/15/39 | A- | 10,216,716 | |||||||||||||||||
| 15,900 | QBE Capital Funding Trust II, 144A | 7.250 | % | 5/24/41 | BBB | 17,092,500 | |||||||||||||||||
| 36,202 | Total Insurance | 42,760,979 | |||||||||||||||||||||
$ | 76,120 | Total Corporate Bonds (cost $79,816,147) | 82,518,246 | ||||||||||||||||||||
| Principal Amount (000)/ Shares | Description (1) | Coupon | Maturity | Ratings (3) | Value | ||||||||||||||||||
$ 1,000 Par (or similar) Institutional Structures – 61.7% (44.1% of Total Investments) | |||||||||||||||||||||||
Capital Markets – 1.1% | |||||||||||||||||||||||
| 1,420 | Aberdeen Asset Management PLC, Perpetual Subordinated Capital Securities, (7) | 7.000 | % | N/A (6) | BBB- | $ | 1,453,370 | ||||||||||||||||
| 5,423 | Credit Suisse Guernsey, (7) | 7.875 | % | 2/24/41 | BBB- | 5,748,380 | |||||||||||||||||
| 500 | Credit Suisse thru Claudius Limited, (7) | 8.250 | % | N/A (6) | BBB- | 511,250 | |||||||||||||||||
| 1,500 | Deutsche Bank Capital Funding Trust V., 144A, (7) | 4.901 | % | N/A (6) | Ba2 | 1,282,500 | |||||||||||||||||
| 1,500 | Macquarie PMI LLC, (7) | 8.375 | % | N/A (6) | BB+ | 1,560,000 | |||||||||||||||||
Total Capital Markets | 10,555,500 | ||||||||||||||||||||||
Commercial Banks – 14.6% | |||||||||||||||||||||||
| 19,361 | Abbey National Capital Trust I, (7) | 8.963 | % | N/A (6) | BBB- | 24,201,250 | |||||||||||||||||
| 3,575 | Barclays Bank PLC, 144A, (7) | 10.180 | % | 6/12/21 | A- | 4,581,792 | |||||||||||||||||
| 12,375 | BNP Paribas, 144A, (7) | 7.195 | % | N/A (6) | BBB | 12,443,063 | |||||||||||||||||
| 7,980 | Fifth Third Bancorp., (7) | 5.100 | % | N/A (6) | BB+ | 7,541,100 | |||||||||||||||||
| 4,500 | First Empire Capital Trust I, (7) | 8.234 | % | 2/01/27 | BBB | 4,427,307 | |||||||||||||||||
| 1,000 | HSBC Bank PLC, (7) | 1.000 | % | N/A (6) | A- | 597,500 | |||||||||||||||||
| 500 | HSBC Bank PLC, (7) | 0.850 | % | N/A (6) | A- | 294,750 | |||||||||||||||||
| 4,654 | HSBC Capital Funding LP, Debt, (7) | 10.176 | % | N/A (6) | BBB+ | 6,701,760 | |||||||||||||||||
| 5,000 | PNC Financial Services Inc., (7) | 6.750 | % | N/A (6) | BBB | 5,325,000 | |||||||||||||||||
| 22,113 | Rabobank Nederland, 144A, (7) | 11.000 | % | N/A (6) | A- | 28,525,770 | |||||||||||||||||
| 4,883 | Royal Bank of Scotland Group PLC, (7) | 7.648 | % | N/A (6) | BB | 4,638,850 | |||||||||||||||||
| 8,748 | Societe Generale, (7) | 8.750 | % | N/A (6) | BBB- | 9,167,904 | |||||||||||||||||
Nuveen Investments
23
JPC
Nuveen Preferred Income Opportunities Fund (continued)
Portfolio of Investments July 31, 2013
| Principal Amount (000)/ Shares | Description (1) | Coupon | Maturity | Ratings (3) | Value | ||||||||||||||||||
| Commercial Banks (continued) | |||||||||||||||||||||||
| 570 | Standard Chartered PLC, 144A, (7) | 7.014 | % | N/A (6) | BBB+ | $ | 581,400 | ||||||||||||||||
| 4,200 | Wells Fargo & Company | 7.500 | % | N/A (6) | BBB+ | 4,884,600 | |||||||||||||||||
| 27,871 | Wells Fargo & Company, Series K, (7) | 7.980 | % | N/A (6) | BBB+ | 31,285,198 | |||||||||||||||||
Total Commercial Banks | 145,197,244 | ||||||||||||||||||||||
Diversified Financial Services – 15.1% | |||||||||||||||||||||||
| 16,400 | Agstar Financial Services Inc., 144A, (7) | 6.750 | % | N/A (6) | BB | 16,333,375 | |||||||||||||||||
| 10,675 | Bank of America Corporation, (7) | 8.000 | % | N/A (6) | BB+ | 11,822,563 | |||||||||||||||||
| 6,191 | Bank of America Corporation | 7.250 | % | N/A (6) | BB+ | 6,951,502 | |||||||||||||||||
| 3,000 | Bank of America Corporation, (7) | 8.125 | % | N/A (6) | BB+ | 3,330,000 | |||||||||||||||||
| 2,935 | Bank of New York Mellon, (7) | 4.500 | % | N/A (6) | Baa1 | 2,733,219 | |||||||||||||||||
| 600 | Bank One Capital III, (7) | 8.750 | % | 9/01/30 | BBB | 789,766 | |||||||||||||||||
| 1,000 | Citigroup Inc., (7) | 8.400 | % | N/A (6) | BB | 1,102,500 | |||||||||||||||||
| 9,000 | Citigroup Inc., (7) | 5.950 | % | N/A (6) | BB | 8,730,000 | |||||||||||||||||
| 7,925 | Citigroup Inc., (7) | 5.900 | % | N/A (6) | BB | 7,647,625 | |||||||||||||||||
| 33,800 | General Electric Capital Corporation, (5), (7) | 7.125 | % | N/A (6) | AA- | 38,024,995 | |||||||||||||||||
| 9,500 | General Electric Capital Corporation, (7) | 6.250 | % | N/A (6) | AA- | 9,880,000 | |||||||||||||||||
| 4,810 | ING US Inc., 144A, (7) | 5.650 | % | 5/15/53 | Ba1 | 4,521,400 | |||||||||||||||||
| 25,427 | JPMorgan Chase & Company, (7) | 7.900 | % | N/A (6) | BBB | 28,287,538 | |||||||||||||||||
| 5,790 | JPMorgan Chase & Company, (7) | 6.000 | % | N/A (6) | BBB | 5,695,913 | |||||||||||||||||
| 4,465 | JPMorgan Chase & Company, (7) | 5.150 | % | N/A (6) | BBB | 4,141,288 | |||||||||||||||||
Total Diversified Financial Services | 149,991,684 | ||||||||||||||||||||||
Electric Utilities – 0.4% | |||||||||||||||||||||||
| 4,500 | Electricite de France, 144A, (7) | 5.250 | % | N/A (6) | A3 | 4,303,125 | |||||||||||||||||
Insurance – 29.1% | |||||||||||||||||||||||
| 1,183 | AG2R La Mondiale Vie, (7) | 7.625 | % | N/A (6) | BBB- | 1,224,521 | |||||||||||||||||
| 7,500 | Allstate Corporation, (7) | 6.500 | % | 5/15/57 | Baa1 | 8,081,250 | |||||||||||||||||
| 3,500 | Aquarius & Investments PLC fbo SwissRe, (7) | 8.250 | % | N/A (6) | N/R | 3,762,500 | |||||||||||||||||
| 7,000 | Aviva PLC, Reg S, (7) | 8.250 | % | N/A (6) | BBB | 7,488,600 | |||||||||||||||||
| 5,230 | AXA SA, (7) | 8.600 | % | 12/15/30 | A3 | 6,334,456 | |||||||||||||||||
| 28,324 | Catlin Insurance Company Limited, (7) | 7.249 | % | N/A (6) | BBB+ | 29,527,770 | |||||||||||||||||
| 6,815 | Cloverie PLC Zurich Insurance, (7) | 8.250 | % | N/A (6) | A | 7,820,213 | |||||||||||||||||
| 2,750 | Dai-Ichi Mutual Life, 144A, (7) | 7.250 | % | N/A (6) | A3 | 3,052,500 | |||||||||||||||||
| 32,040 | Financial Security Assurance Holdings, 144A, (7) | 6.400 | % | 12/15/66 | BBB | 28,515,600 | |||||||||||||||||
| 1,755 | Friends Life Group PLC, (7) | 7.875 | % | N/A (6) | BBB+ | 1,855,913 | |||||||||||||||||
| 18,335 | Glen Meadows Pass Through Trust, (7) | 6.505 | % | 2/12/67 | BB+ | 17,326,575 | |||||||||||||||||
| 1,030 | Great West Life & Annuity Insurance Capital LP II, 144A, (7) | 7.153 | % | 5/16/46 | A- | 1,066,050 | |||||||||||||||||
| 2,114 | Liberty Mutual Group Inc., 144A, (7) | 10.750 | % | 6/15/58 | Baa3 | 3,223,850 | |||||||||||||||||
| 12,000 | Liberty Mutual Group Inc., 144A, (7) | 7.800 | % | 3/15/37 | Baa3 | 13,950,000 | |||||||||||||||||
| 2,665 | Lincoln National Corporation, (7) | 7.000 | % | 5/17/66 | BBB | 2,744,950 | |||||||||||||||||
| 1,750 | Lincoln National Corporation, (7) | 6.050 | % | 4/20/67 | BBB | 1,750,000 | |||||||||||||||||
| 9,335 | MetLife Capital Trust IV, 144A, (7) | 7.875 | % | 12/15/37 | BBB | 11,015,300 | |||||||||||||||||
| 19,965 | MetLife Capital Trust X, 144A, (7) | 9.250 | % | 4/08/38 | BBB | 26,553,450 | |||||||||||||||||
| 13,770 | Nationwide Financial Services Inc., (7) | 6.750 | % | 5/15/37 | Baa2 | 14,045,400 | |||||||||||||||||
| 1,150 | Nationwide Financial Services Capital Trust, (7) | 7.899 | % | 3/01/37 | Baa2 | 1,263,484 | |||||||||||||||||
| 6,855 | Provident Financing Trust I, (7) | 7.405 | % | 3/15/38 | Baa3 | 7,577,318 | |||||||||||||||||
| 4,415 | Prudential Financial Inc., (7) | 5.875 | % | 9/15/42 | BBB+ | 4,459,150 | |||||||||||||||||
| 5,169 | Prudential PLC, (7) | 7.750 | % | N/A (6) | A- | 5,560,810 | |||||||||||||||||
| 7,200 | Prudential PLC, (7) | 6.500 | % | N/A (6) | A- | 7,227,000 | |||||||||||||||||
| 4,600 | QBE Capital Funding Trust II, 144A, (7) | 6.797 | % | N/A (6) | BBB | 4,628,750 | |||||||||||||||||
| 3,700 | Sompo Japan Insurance, (7) | 5.325 | % | 3/28/73 | A- | 3,653,976 | |||||||||||||||||
| 12,174 | Swiss Re Capital I, 144A, (7) | 6.854 | % | N/A (6) | A | 12,752,265 | |||||||||||||||||
| 18,168 | Symetra Financial Corporation, 144A, (7) | 8.300 | % | 10/15/37 | BBB- | 18,849,300 | |||||||||||||||||
| 17,440 | White Mountain Re Group Limited, (7) | 7.506 | % | N/A (6) | BB+ | 18,137,600 | |||||||||||||||||
| 7,500 | XL Capital Ltd, (7) | 6.500 | % | N/A (6) | BBB- | 7,368,750 | |||||||||||||||||
| 8,850 | ZFS Finance USA Trust II, 144A, (7) | 6.450 | % | 12/15/65 | A | 9,425,250 | |||||||||||||||||
Total Insurance | 290,242,551 | ||||||||||||||||||||||
Nuveen Investments
24
| Principal Amount (000)/ Shares | Description (1) | Coupon | Maturity | Ratings (3) | Value | ||||||||||||||||||
Real Estate – 1.2% | |||||||||||||||||||||||
| 9,465 | Sovereign Real Estate Investment Trust, 144A, (7) | 12.000 | % | N/A (6) | Ba1 | $ | 12,356,860 | ||||||||||||||||
U.S. Agency – 0.2% | |||||||||||||||||||||||
| 1,700 | Farm Credit Bank of Texas, (7) | 10.000 | % | N/A (6) | Baa1 | 2,039,469 | |||||||||||||||||
Total $1,000 Par (or similar) Institutional Structures (cost $576,126,036) | 614,686,433 | ||||||||||||||||||||||
| Principal Amount (000) | Description (1) | Coupon | Maturity | Value | |||||||||||||||||||
Short-Term Investments – 1.4% (1.0% of Total Investments) | |||||||||||||||||||||||
$ | 13,942 | Repurchase Agreement with Fixed Income Clearing Corporation, dated 7/31/13, repurchase price $13,942,310, collateralized by $14,385,000 U.S. Treasury Notes, 1.875%, due 6/30/20, value $14,223,169 | 0.010 | % | 8/01/13 | $ | 13,942,306 | ||||||||||||||||
Total Short-Term Investments (cost $13,942,306) | 13,942,306 | ||||||||||||||||||||||
Total Investments (cost $1,346,312,714) – 140.1% | 1,395,037,329 | ||||||||||||||||||||||
Borrowings – (40.4)% (8), (9) | (402,500,000 | ) | |||||||||||||||||||||
Other Assets Less Liabilities – 0.3% (10) | 2,922,964 | ||||||||||||||||||||||
Net Assets Applicable to Common Shares – 100% | $ | 995,460,293 | |||||||||||||||||||||
Investments in Derivatives as of July 31, 2013
Swaps outstanding:
| Counterparty | Notional Amount | Fund Pay/Receive Floating Rate | Floating Rate Index | Fixed Rate (Annualized) | Fixed Rate Payment Frequency | Effective Date (11) | Termination Date | Unrealized Appreciation (Depreciation) (10) | |||||||||||||||||||||||||||
JPMorgan | $ | 69,725,000 | Receive | 1-Month USD-LIBOR | 1.193 | % | Monthly | 3/21/11 | 3/21/14 | $ | (453,212 | ) | |||||||||||||||||||||||
JPMorgan | 114,296,000 | Receive | 1-Month USD-LIBOR | 1.255 | Monthly | 12/01/14 | 12/01/18 | 3,498,470 | |||||||||||||||||||||||||||
JPMorgan | 114,296,000 | Receive | 1-Month USD-LIBOR | 1.673 | Monthly | 12/01/14 | 12/01/20 | 6,231,427 | |||||||||||||||||||||||||||
Morgan Stanley | 69,725,000 | Receive | 1-Month USD-LIBOR | 2.064 | Monthly | 3/21/11 | 3/21/16 | (2,813,619 | ) | ||||||||||||||||||||||||||
$ | 368,042,000 | $ | 6,463,066 | ||||||||||||||||||||||||||||||||
Nuveen Investments
25
JPC
Nuveen Preferred Income Opportunities Fund (continued)
Portfolio of Investments July 31, 2013
For Fund portfolio compliance purposes, the Fund's industry classifications refer to any one or more of the industry sub-classifications used by one or more widely recognized market indexes or ratings group indexes, and/or as defined by Fund management. This definition may not apply for purposes of this report, which may combine industry sub-classifications into sectors for reporting ease.
(1) All percentages shown in the Portfolio of Investments are based on net assets applicable to common shares unless otherwise noted.
(2) Non-income producing; issuer has not declared a dividend within the past twelve months.
(3) Ratings (not covered by the report of independent registered public accounting firm): Using the highest of Standard & Poor's Group ("Standard & Poor's"), Moody's Investors Service, Inc. ("Moody's") or Fitch, Inc. ("Fitch") rating. Ratings below BBB by Standard & Poor's, Baa by Moody's or BBB by Fitch are considered to be below investment grade. Holdings designated N/R are not rated by any of these national rating agencies.
(4) For fair value measurement disclosure purposes, $25 Par (or similar) Retail Structures classified as Level 2. See Notes to Financial Statements, Note 2—Investment Valuation and Fair Value Measurements for more information.
(5) Investment, or portion of investment, has been pledged to collateralize the net payment obligations for investments in derivatives.
(6) Perpetual security. Maturity date is not applicable.
(7) For fair value measurement disclosure purposes, $1,000 Par (or similar) Institutional Structures classified as Level 2. See Notes to Financial Statements, Note 2—Investment Valuation and Fair Value Measurements for more information.
(8) The Fund may pledge up to 100% of its eligible investments in the Portfolio of Investments as collateral for Borrowings. As of the end of the reporting period, investments with a value of $857,273,406 have been pledged as collateral for Borrowings.
(9) Borrowings as a percentage of Total Investments is 28.9%.
(10) Other Assets Less Liabilities includes the Unrealized Appreciation (Depreciation) of derivative instruments as listed within Investments in Derivatives as of the end of the reporting period.
(11) Effective date represents the date on which both the Fund and Counterparty commence interest payment accruals on each swap contract.
N/A Not applicable.
N/R Not rated.
144A Investment is exempt from registration under Rule 144A of the Securities Act of 1933, as amended. These investments may only be resold in transactions exempt from registration, which are normally those transactions with qualified institutional buyers.
CORTS Corporate Backed Trust Securities.
PPLUS PreferredPlus Trust.
Reg S Regulation S allows U.S. companies to sell securities to persons or entities located outside of the United States without registering those securities with the Securities and Exchange Commission. Specifically, Regulation S provides a safe harbor from the registration requirements of the Securities Act for the offers and sales of securities by both foreign and domestic issuers that are made outside the United States.
REIT Real Estate Investment Trust.
WI/DD Investment, or portion of investment, purchased on a when-issued or delayed delivery basis.
USD-LIBOR United States Dollar – London Inter-Bank Offered Rate.
See accompanying notes to financial statements.
Nuveen Investments
26
Statement of
ASSETS & LIABILITIES
July 31, 2013
Assets | |||||||
Investments, at value (cost $1,346,312,714) | $ | 1,395,037,329 | |||||
Unrealized appreciation on swaps, net | 9,276,685 | ||||||
Receivable for: | |||||||
Dividends | 1,282,365 | ||||||
Interest | 9,317,743 | ||||||
Investments sold | 1,989,396 | ||||||
Reclaims | 65,967 | ||||||
Other assets | 194,959 | ||||||
Total assets | 1,417,164,444 | ||||||
Liabilities | |||||||
Borrowings | 402,500,000 | ||||||
Unrealized depreciation on swaps | 2,813,619 | ||||||
Payable for: | |||||||
| Dividends | 6,027,882 | ||||||
| Investments purchased | 8,831,138 | ||||||
Accrued expenses: | |||||||
Interest on borrowings | 25,239 | ||||||
Management fees | 980,242 | ||||||
Trustees fees | 193,339 | ||||||
Other | 332,692 | ||||||
Total liabilities | 421,704,151 | ||||||
Net assets applicable to common shares | $ | 995,460,293 | |||||
Common shares outstanding | 96,990,341 | ||||||
Net asset value per common share outstanding (net assets applicable to common shares, divided by common shares outstanding) | $ | 10.26 | |||||
Net assets applicable to common shares consist of: | |||||||
Common shares, $.01 par value per share | $ | 969,903 | |||||
Paid-in surplus | 1,291,757,040 | ||||||
Undistributed (Over-distribution of) net investment income | (8,123,697 | ) | |||||
Accumulated net realized gain (loss) | (344,332,274 | ) | |||||
Net unrealized appreciation (depreciation) | 55,189,321 | ||||||
Net assets applicable to common shares | $ | 995,460,293 | |||||
Authorized shares: | |||||||
Common | Unlimited | ||||||
| Preferred | Unlimited | ||||||
See accompanying notes to financial statements.
Nuveen Investments
27
Statement of
OPERATIONS
| Seven Months Ended 7/31/13 | Year Ended 12/31/12 | ||||||||||
Investment Income | |||||||||||
Dividends (net of tax withheld of $14,456 and $107,582, respectively) | $ | 26,847,059 | $ | 46,027,688 | |||||||
Interest | 27,345,122 | 44,103,292 | |||||||||
Total investment income | 54,192,181 | 90,130,980 | |||||||||
Expenses | |||||||||||
Management fees | 6,803,764 | 10,769,605 | |||||||||
Interest expense on borrowings | 2,691,722 | 4,837,000 | |||||||||
Shareholder servicing agent fees and expenses | 2,610 | 5,531 | |||||||||
Custodian fees and expenses | 142,030 | 310,599 | |||||||||
Trustees fees and expenses | 21,374 | 24,406 | |||||||||
Professional fees | 48,306 | 207,634 | |||||||||
Shareholder reporting expenses | 135,810 | 201,145 | |||||||||
Stock exchange listing fees | 17,992 | 30,500 | |||||||||
Investor relations expenses | 13,041 | 270,805 | |||||||||
Other expenses | 26,040 | 70,997 | |||||||||
Total expenses | 9,902,689 | 16,728,222 | |||||||||
Net investment income (loss) | 44,289,492 | 73,402,758 | |||||||||
Realized and Unrealized Gain (Loss) | |||||||||||
Net realized gain (loss) from: | |||||||||||
Investments and foreign currency | 29,849,203 | 37,117,450 | |||||||||
Securities sold short | — | (1,666,640 | ) | ||||||||
Call options written | — | 2,565,730 | |||||||||
Put options purchased | — | (158,961 | ) | ||||||||
Swaps | (1,164,775 | ) | (1,942,963 | ) | |||||||
Change in net unrealized appreciation (depreciation) of: | |||||||||||
Investments and foreign currency | (42,091,501 | ) | 120,367,362 | ||||||||
Securities sold short | — | 1,293,234 | |||||||||
Call options written | — | (1,365,960 | ) | ||||||||
Put options purchased | — | 158,251 | |||||||||
Swaps | 10,069,799 | 754,389 | |||||||||
Net realized and unrealized gain (loss) | (3,337,274 | ) | 157,121,892 | ||||||||
Net increase (decrease) in net assets applicable to common shares from operations | $ | 40,952,218 | $ | 230,524,650 | |||||||
See accompanying notes to financial statements.
Nuveen Investments
28
Statement of
CHANGES in NET ASSETS
| Seven Months Ended 7/31/13 | Year Ended 12/31/12 | Year Ended 12/31/11 | |||||||||||||
Operations | |||||||||||||||
Net investment income (loss) | $ | 44,289,492 | $ | 73,402,758 | $ | 49,769,100 | |||||||||
Net realized gain (loss) from: | |||||||||||||||
Investments and foreign currency | 29,849,203 | 37,117,450 | 20,827,371 | ||||||||||||
Securities sold short | — | (1,666,640 | ) | (257,417 | ) | ||||||||||
Call options written | — | 2,565,730 | 2,645,835 | ||||||||||||
| Put options purchased | — | (158,961 | ) | — | |||||||||||
| Swaps | (1,164,775 | ) | (1,942,963 | ) | (1,540,259 | ) | |||||||||
Change in net unrealized appreciation (depreciation) of: | |||||||||||||||
Investments and foreign currency | (42,091,501 | ) | 120,367,362 | (90,229,278 | ) | ||||||||||
Securities sold short | — | 1,293,234 | (64,105 | ) | |||||||||||
Call options written | — | (1,365,960 | ) | 2,935,353 | |||||||||||
| Put options purchased | — | 158,251 | (37,985 | ) | |||||||||||
| Swaps | 10,069,799 | 754,389 | (4,361,122 | ) | |||||||||||
Net increase (decrease) in net assets applicable to common shares from operations | 40,952,218 | 230,524,650 | (20,312,507 | ) | |||||||||||
Distributions to Common Shareholders | |||||||||||||||
From net investment income | (42,976,421 | ) | (73,683,563 | ) | (72,490,114 | ) | |||||||||
Return of capital | — | — | (334,401 | ) | |||||||||||
Decrease in net assets applicable to common shares from distributions to common shareholders | (42,976,421 | ) | (73,683,563 | ) | (72,824,515 | ) | |||||||||
Capital Share Transactions | |||||||||||||||
Common shares repurchased and retired | — | — | (5,063,325 | ) | |||||||||||
Net increase (decrease) in net assets applicable to common shares from capital share transactions | — | — | (5,063,325 | ) | |||||||||||
Net increase (decrease) in net assets applicable to common shares | (2,024,203 | ) | 156,841,087 | (98,200,347 | ) | ||||||||||
Net assets applicable to common shares at the beginning of period | 997,484,496 | 840,643,409 | 938,843,756 | ||||||||||||
Net assets applicable to common shares at the end of period | $ | 995,460,293 | $ | 997,484,496 | $ | 840,643,409 | |||||||||
Undistributed (Over-distribution of) net investment income at the end of period | $ | (8,123,697 | ) | $ | (8,330,468 | ) | $ | (12,176,715 | ) | ||||||
See accompanying notes to financial statements.
Nuveen Investments
29
Statement of
CASH FLOWS
| Seven Months Ended 7/31/13 | Year Ended 12/31/12 | ||||||||||
Cash Flows from Operating Activities: | |||||||||||
Net Increase (Decrease) in Net Assets Applicable to Common Shares from Operations | $ | 40,952,218 | $ | 230,524,650 | |||||||
| Adjustments to reconcile the net increase (decrease) in net assets applicable to common shares from operations to net cash provided by (used in) operating activities: | |||||||||||
Purchases of investments | (396,635,698 | ) | (1,686,856,060 | ) | |||||||
Proceeds from sales and maturities of investments and securities sold short | 375,546,705 | 1,572,031,828 | |||||||||
Proceeds from (Purchases of) short-term investments, net | (7,337,155 | ) | 77,624,446 | ||||||||
Proceeds from (Payments for) cash denominated in foreign currencies, net | — | 217,252 | |||||||||
Proceeds from (Payments for) swap contracts, net | (1,164,775 | ) | (1,942,963 | ) | |||||||
Premiums received for call options written | — | 836,854 | |||||||||
Cash paid for call options written | — | (1,531,478 | ) | ||||||||
Amortization (Accretion) of premiums and discounts, net | 312,316 | (2,795,535 | ) | ||||||||
(Increase) Decrease in: | |||||||||||
Deposits with brokers for securities sold short and options written | — | 4,624,233 | |||||||||
Receivable for dividends | 1,165,247 | (1,348,730 | ) | ||||||||
Receivable for interest | (2,246,270 | ) | (560,611 | ) | |||||||
Receivable for investments sold | (945,336 | ) | 2,461,768 | ||||||||
Receivable for matured senior loans | — | 505,206 | |||||||||
Receivable for reclaims | 8,837 | 34,462 | |||||||||
Other assets | (16,884 | ) | (29,535 | ) | |||||||
Increase (Decrease) in: | |||||||||||
Payable for dividends on securities sold short | — | (2,552 | ) | ||||||||
Payable for investment purchased | 2,896,595 | 5,850,743 | |||||||||
Accrued interest on borrowings | (21,826 | ) | 17,027 | ||||||||
Accrued management fees | 27,258 | 104,129 | |||||||||
Accrued Trustees fees | 14,015 | 7,513 | |||||||||
Accrued other expenses | (80,915 | ) | (3,904 | ) | |||||||
Net realized (gain) loss from: | |||||||||||
Investments and foreign currency | (29,849,203 | ) | (37,117,450 | ) | |||||||
Securities sold short | — | 1,666,640 | |||||||||
Call options written | — | (2,565,730 | ) | ||||||||
Put options purchased | — | 158,961 | |||||||||
Swaps | 1,164,775 | 1,942,963 | |||||||||
Change in net unrealized (appreciation) depreciation of: | |||||||||||
Investments and foreign currency | 42,091,501 | (120,367,362 | ) | ||||||||
Securities sold short | — | (1,293,234 | ) | ||||||||
Call options written | — | 1,365,960 | |||||||||
Put options purchased | — | (158,251 | ) | ||||||||
Swaps | (10,069,799 | ) | (754,389 | ) | |||||||
Net cash provided by (used in) operating activities | 15,811,606 | 42,646,851 | |||||||||
Cash Flows from Financing Activities: | |||||||||||
Increase in borrowings | 18,750,000 | 35,750,000 | |||||||||
Increase (Decrease) in cash overdraft balance | — | (2,326,355 | ) | ||||||||
Cash distributions paid to common shareholders | (36,948,539 | ) | (73,683,563 | ) | |||||||
Net cash provided by (used in) financing activities | (18,198,539 | ) | (40,259,918 | ) | |||||||
Net Increase (Decrease) in Cash | (2,386,933 | ) | 2,386,933 | ||||||||
Cash at the beginning of period | 2,386,933 | — | |||||||||
Cash at the End of Period | $ | — | $ | 2,386,933 | |||||||
See accompanying notes to financial statements.
Nuveen Investments
30
Statement of
CASH FLOWS (continued)
Supplemental Disclosure of Cash Flow Information
| Seven Months Ended 7/31/13 | Year Ended 12/31/12 | ||||||||||
Cash paid for interest on borrowings (excluding borrowing costs) | $ | 2,713,548 | $ | 4,819,973 | |||||||
See accompanying notes to financial statements.
Nuveen Investments
31
Financial
HIGHLIGHTS
Selected data for a common share outstanding throughout each period:
Investment Operations | Less Distributions | ||||||||||||||||||||||||||||||||||||||||||
| Beginning Common Share Net Asset Value | Net Investment Income (Loss)(a) | Net Realized/ Unrealized Gain (Loss) | Distributions from Net Investment Income to Fund- Preferred Share- holders(b) | Distributions from Accumulated Net Realized Gains to Fund- Preferred Share- holders(b) | Total | From Net Investment Income to Common Share- holders | From Accumulated Net Realized Gains to Common Share- holders | Return of Capital to Common Share- holders | Total | ||||||||||||||||||||||||||||||||||
Year Ended 7/31: | |||||||||||||||||||||||||||||||||||||||||||
| 2013(h) | $ | 10.28 | $ | .46 | $ | (.04 | ) | $ | — | $ | — | $ | 0.42 | $ | (.44 | ) | $ | — | $ | — | $ | (.44 | ) | ||||||||||||||||||||
Year Ended 12/31: | |||||||||||||||||||||||||||||||||||||||||||
2012 | 8.67 | .76 | 1.61 | — | — | 2.37 | (.76 | ) | — | — | (.76 | ) | |||||||||||||||||||||||||||||||
2011 | 9.62 | .51 | (.72 | ) | — | — | (.21 | ) | (.75 | ) | — | — | * | (.75 | ) | ||||||||||||||||||||||||||||
2010 | 8.56 | .50 | 1.23 | — | — | 1.73 | (.57 | ) | — | (.11 | ) | (.68 | ) | ||||||||||||||||||||||||||||||
2009 | 5.60 | .54 | 3.03 | — | * | — | 3.57 | (.61 | ) | — | (.02 | ) | (.63 | ) | |||||||||||||||||||||||||||||
2008 | 12.38 | .86 | (6.49 | ) | (.15 | ) | — | (5.78 | ) | (.69 | ) | — | (.31 | ) | (1.00 | ) | |||||||||||||||||||||||||||
FundPreferred Shares at End of Period | Borrowings at End of Period | ||||||||||||||||||||||
| Aggregate Amount Outstanding (000) | Liquidation and Market Value Per Share | Asset Coverage Per Share | Aggregate Amount Outstanding (000) | Asset Coverage Per $1,000 | |||||||||||||||||||
Year Ended 7/31: | |||||||||||||||||||||||
2013 | (h) | $ | — | $ | — | $ | — | $ | 402,500 | $ | 3,473 | ||||||||||||
Year Ended 12/31: | |||||||||||||||||||||||
2012 | — | — | — | 383,750 | 3,599 | ||||||||||||||||||
2011 | — | — | — | 348,000 | 3,416 | ||||||||||||||||||
2010 | — | — | — | 270,000 | 4,477 | ||||||||||||||||||
2009 | — | — | — | 270,000 | 4,111 | ||||||||||||||||||
2008 | 118,650 | 25,000 | 142,298 | 145,545 | 5,640 | ||||||||||||||||||
(a) Per share Net Investment Income (Loss) is calculated using the average daily shares method.
(b) The amounts shown are based on common share equivalents.
(c) Total Return Based on Market Value is the combination of changes in the market price per share and the effect of reinvested dividend income and reinvested capital gains distributions, if any, at the average price paid per share at the time of reinvestment. The last dividend declared in the period, which is typically paid on the first business day of the following month, is assumed to be reinvested at the ending market price. The actual reinvestment for the last dividend declared in the period may take place over several days, and in some instances may not be based on the market price, so the actual reinvestment price may be different from the price used in the calculation. Total returns are not annualized.
Total Return Based on Common Share Net Asset Value is the combination of changes in common share net asset value, reinvested dividend income at net asset value and reinvested capital gains distributions at net asset value, if any. The last dividend declared in the period, which is typically paid on the first business day of the following month, is assumed to be reinvested at the ending net asset value. The actual reinvest price for the last dividend declared in the period may often be based on the Fund's market price (and not its net asset value), and therefore may be different from the price used in the calculation. Total returns are not annualized.
Nuveen Investments
32
Ratios/Supplemental Data | |||||||||||||||||||||||||||||||||||||||||||||||
Total Returns | Ratios to Average Net Assets Applicable to Common Shares Before Reimbursement(d) | Ratios to Average Net Assets Applicable to Common Shares After Reimbursement(d)(e) | |||||||||||||||||||||||||||||||||||||||||||||
| Discount from Common Shares Repurchased and Retired | Ending Common Share Net Asset Value | Ending Market Value | Based on Common Share Net Asset Value(c) | Based on Market Value(c) | Ending Net Assets Applicable to Common Shares (000) | Expenses | Net Investment Income (Loss) | Expenses | Net Investment Income (Loss) | Portfolio Turnover Rate(g) | |||||||||||||||||||||||||||||||||||||
Year Ended 7/31: | |||||||||||||||||||||||||||||||||||||||||||||||
| 2013(h) | $ | — | $ | 10.26 | $ | 9.35 | 4.09 | % | .63 | % | $ | 995,460 | 1.67 | %*** | 7.47 | %*** | N/A | N/A | 27 | % | |||||||||||||||||||||||||||
Year Ended 12/31: | |||||||||||||||||||||||||||||||||||||||||||||||
2012 | — | 10.28 | 9.71 | 28.17 | 31.44 | 997,484 | 1.79 | 7.85 | N/A | N/A | 123 | ||||||||||||||||||||||||||||||||||||
2011 | .01 | 8.67 | 8.01 | (2.23 | ) | 4.95 | 840,643 | 1.73 | 5.40 | 1.70 | % | 5.43 | % | 34 | |||||||||||||||||||||||||||||||||
2010 | .01 | 9.62 | 8.35 | 21.06 | 21.28 | 938,844 | 1.67 | 5.39 | 1.54 | 5.52 | 49 | ||||||||||||||||||||||||||||||||||||
2009 | .02 | 8.56 | 7.49 | 67.37 | 81.73 | 839,846 | 1.80 | 7.76 | 1.57 | 7.99 | 50 | ||||||||||||||||||||||||||||||||||||
2008 | — | * | 5.60 | 4.60 | (49.27 | ) | (51.80 | ) | 556,698 | 2.47 | 8.14 | 2.04 | 8.57 | 36 | |||||||||||||||||||||||||||||||||
(d) • Ratios do not reflect the effect of dividend payments to FundPreferred shareholders, where applicable.
• Net Investment Income (Loss) ratios reflect income earned and expenses incurred on assets attributable to FundPreferred shares and/or borrowings, where applicable.
• Each ratio includes the effect of dividends expense on securities sold short and all interest expense paid and other costs related to borrowings, where applicable as follows:
| Ratios of Dividends Expense on Securities Sold Short to Average Net Assets Applicable to Common Shares(f) | Ratios of Borrowings Interest Expense to Average Net Assets Applicable to Common Shares | ||||||||||
Year Ended 7/31: | |||||||||||
2013 | (h) | — | % | 0.45 | %*** | ||||||
Year Ended 12/31: | |||||||||||
2012 | — | 0.52 | |||||||||
2011 | — | ** | 0.43 | ||||||||
2010 | — | ** | 0.40 | ||||||||
2009 | — | ** | 0.45 | ||||||||
2008 | 0.01 | 0.82 | |||||||||
(e) After expense reimbursement from the Adviser, where applicable. As of March 31, 2011, the Adviser is no longer reimbursing the Fund for any fees or expenses.
(f) Effective for periods beginning after December 31, 2011, the Fund no longer makes short sales of securities.
(g) Portfolio Turnover Rate is calculated based on the lesser of long-term purchases or sales (as disclosed in Note 5—Investment Transactions) divided by the average long-term market value during the period.
(h) For the seven months ended July 31, 2013.
N/A The Fund no longer has a contractual reimbursement agreement with the Adviser.
* Rounds to less than $.01 per share.
** Rounds to less than .01%.
*** Annualized.
See accompanying notes to financial statements.
Nuveen Investments
33
Notes to
FINANCIAL STATEMENTS
1. General Information and Significant Accounting Policies
General Information
Nuveen Preferred Income Opportunities Fund (the "Fund") is registered under the Investment Company Act of 1940, as amended, as diversified closed-end registered investment company. The Fund's common shares are listed on the New York Stock Exchange ("NYSE") and trade under the ticker symbol "JPC." The Fund was organized as a Massachusetts business trust on January 27, 2003.
The Fund's investment adviser is Nuveen Fund Advisors, LLC (the "Adviser"), a wholly-owned subsidiary of Nuveen Investments, Inc. ("Nuveen"). The Adviser is responsible for the Fund's overall investment strategy and asset allocation decisions. The Adviser has entered into sub-advisory agreements with NWQ Investment Management Company, LLC ("NWQ") and Nuveen Asset Management LLC ("NAM"), a subsidiary of the Adviser (collectively, the "Sub-Advisers"). NWQ and NAM are each responsible for approximately half of the Fund's portfolio, while the Adviser manages the Fund's investments in swap contracts.
Effective January 1, 2013, the Fund's fiscal year end changed from December 31 to July 31 as previously approved by the Fund's Board of Trustees.
The Fund seeks to provide high current income and total return by investing at least 80% of its managed assets (as defined in Note 7—Management Fees and Other Transactions with Affiliates) in preferred securities, and up to 20% opportunistically over the market cycle in other types of securities, primarily income-oriented securities such as corporate and taxable municipal debt and common equity. At least 60% of its managed assets are rated investment grade (BBB/Baa or better by S&P, Moody's, or Fitch) at the time of investment.
Significant Accounting Policies
The following is a summary of significant accounting policies followed by the Fund in the preparation of its financial statements in accordance with U.S. generally accepted accounting principles ("U.S. GAAP").
Investment Transactions
Investment transactions are recorded on a trade date basis. Realized gains and losses from investment transactions are determined on the specific identification method, which is the same basis used for federal income tax purposes. Investments purchased on a when-issued/delayed delivery basis may have extended settlement periods. Any investments so purchased are subject to market fluctuation during this period. The Fund has instructed the custodian to earmark securities in the Fund's portfolio with a current value at least equal to the amount of the when-issued/delayed delivery purchase commitments. As of July 31, 2013, the Fund had outstanding when-issued/delayed delivery purchase commitments of $940,000.
Investment Income
Dividend income is recorded on the ex-dividend date or, for foreign securities, when information is available. Interest income, which reflects the amortization of premiums and includes accretion of discounts for financial reporting purposes, is recorded on an accrual basis. Fee income consists primarily of amendment fees. Amendment fees are earned as compensation for evaluating and accepting changes to an original senior loan agreement and are recognized when received.
Professional Fees
Professional fees presented on the Statement of Operations consist of legal fees incurred in the normal course of operations, audit fees, tax consulting fees and, in some cases, workout expenditures. Workout expenditures are incurred in an attempt to protect or enhance an investment or to pursue other claims or legal actions on behalf of Fund shareholders. Should the Fund receive a refund of workout expenditures paid in a prior reporting period, such amounts will be recognized as "Legal fee refund" on the Statement of Operations.
Dividends and Distributions to Common Shareholders
Distributions to common shareholders are recorded on the ex-dividend date. The amount and timing of distributions are determined in accordance with federal income tax regulations, which may differ from U.S. GAAP.
Dividends to common shareholders are declared monthly. Net realized capital gains from investment transactions, if any, are declared and distributed to shareholders at least annually. Furthermore, capital gains are distributed only to the extent they exceed available capital loss carryforwards.
FundPreferred Shares
The Fund is authorized to issue auction rate preferred ("FundPreferred") shares. During prior fiscal periods, the Fund redeemed all of its outstanding FundPreferred shares, at liquidation value.
Nuveen Investments
34
Indemnifications
Under the Fund's organizational documents, its officers and trustees are indemnified against certain liabilities arising out of the performance of their duties to the Fund. In addition, in the normal course of business, the Fund enters into contracts that provide general indemnifications to other parties. The Fund's maximum exposure under these arrangements is unknown as this would involve future claims that may be made against the Fund that have not yet occurred. However, the Fund has not had prior claims or losses pursuant to these contracts and expects the risk of loss to be remote.
Netting Agreements
In the ordinary course of business, the Fund has entered into transactions subject to enforceable netting agreements or other similar arrangements ("netting agreements"). Generally, the right to offset in netting agreements allows the Fund to offset any exposure to a specific counterparty with any collateral received or delivered to that counterparty based on the terms of the agreements. Generally, the Fund manages its cash collateral and securities collateral on a counterparty basis. As of July 31, 2013, the Fund was not invested in any portfolio securities or derivatives, other than the swap contracts further described in Note 3—Portfolio Securities and Investments in Derivatives, with gross exposures on the Statement of Assets and Liabilities, that could be netted subject to netting agreements.
Use of Estimates
The preparation of financial statements in conformity with U.S. GAAP requires management to make estimates and assumptions that affect the reported amounts of assets and liabilities at the date of the financial statements and the reported amounts of increases and decreases in net assets applicable to Common shares from operations during the reporting period. Actual results may differ from those estimates.
2. Investment Valuation and Fair Value Measurements
Investment Valuation
Common stocks and other equity-type securities are valued at the last sales price on the securities exchange on which such securities are primarily traded and are generally classified as Level 1 for fair value measurement purposes. Securities primarily traded on the NASDAQ National Market ("NASDAQ") are valued, except as indicated below, at the NASDAQ Official Closing Price and are generally classified as Level 1. However, securities traded on a securities exchange or NASDAQ for which there were no transactions on a given day or securities not listed on a securities exchange or NASDAQ are valued at the quoted bid price and are generally classified as Level 2.
Prices of fixed-income securities and swap contracts are provided by a pricing service approved by the Fund's Board of Trustees. These securities are generally classified as Level 2. The pricing service establishes a security's fair value using methods that may include consideration of the following: yields or prices of investments of comparable quality, type of issue, coupon, maturity and rating, market quotes or indications of value from security dealers, evaluations of anticipated cash flows or collateral, general market conditions and other information and analysis, including the obligor's credit characteristics considered relevant. In pricing certain securities, particularly less liquid and lower quality securities, the pricing service may consider information about a security, its issuer or market activity, provided by the Adviser. These securities are generally classified as Level 2 or Level 3 depending on the priority of the significant inputs.
Repurchase agreements are valued at contract amount plus accrued interest, which approximates market value. These securities are generally classified as Level 2.
Certain securities may not be able to be priced by the pre-established pricing methods as described above. Such securities may be valued by the Fund's Board of Trustees or its designee at fair value. These securities generally include, but are not limited to, restricted securities (securities which may not be publicly sold without registration under the Securities Act of 1933, as amended) for which a pricing service is unable to provide a market price; securities whose trading has been formally suspended; debt securities that have gone into default and for which there is no current market quotation; a security whose market price is not available from a pre-established pricing source; a security with respect to which an event has occurred that is likely to materially affect the value of the security after the market has closed but before the calculation of a Fund's net asset value (as may be the case in non-U.S. markets on which the security is primarily traded) or make it difficult or impossible to obtain a reliable market quotation; and a security whose price, as provided by the pricing service, is not deemed to reflect the security's fair value. As a general principle, the fair value of a security would appear to be the amount that the owner might reasonably expect to receive for it in a current sale. A variety of factors may be considered in determining the fair value of such securities, which may include consideration of the following: yields or prices of investments of comparable quality, type of issue, coupon, maturity and rating, market quotes or indications of value from security dealers, evaluations of anticipated cash flows or collateral, general market conditions and other information and analysis, including the obligor's credit characteristics considered relevant. These securities are generally classified as Level 2 or as Level 3 depending on the priority of the significant inputs. Regardless of the method employed to value a particular security, all valuations are subject to review by the Fund's Board of Trustees or its designee.
Fair Value Measurements
Fair value is defined as the price that the Fund would receive upon selling an investment or transferring a liability in an orderly transaction to an independent buyer in the principal or most advantageous market for the investment. A three-tier hierarchy is used to maximize the use of observable
Nuveen Investments
35
Notes to
FINANCIAL STATEMENTS (continued)
market data and minimize the use of unobservable inputs and to establish classification of fair value measurements for disclosure purposes. Observable inputs reflect the assumptions market participants would use in pricing the asset or liability. Observable inputs are based on market data obtained from sources independent of the reporting entity. Unobservable inputs reflect the reporting entity's own assumptions about the assumptions market participants would use in pricing the asset or liability. Unobservable inputs are based on the best information available in the circumstances. The following is a summary of the three-tiered hierarchy of valuation input levels.
Level 1 — Inputs are unadjusted and prices are determined using quoted prices in active markets for identical securities.
Level 2 — Prices are determined using other significant observable inputs (including quoted prices for similar securities, interest rates, prepayment speeds, credit risk, etc.).
Level 3 — Prices are determined using significant unobservable inputs (including management's assumptions in determining the fair value of investments).
The inputs or methodologies used for valuing securities are not an indication of the risks associated with investing in those securities. The following is a summary of the Fund's fair value measurements as of the end of the reporting period:
Level 1 | Level 2 | Level 3 | Total | ||||||||||||||||
Long-Term Investments*: | |||||||||||||||||||
Common Stocks | $ | 22,584,345 | $ | — | $ | — | $ | 22,584,345 | |||||||||||
Convertible Preferred Securities | 711,396 | — | — | 711,396 | |||||||||||||||
$25 Par (or similar) Retail Structures | 618,430,345 | 42,164,258 | — | 660,594,603 | |||||||||||||||
Corporate Bonds | — | 82,518,246 | — | 82,518,246 | |||||||||||||||
$1,000 Par (or similar) Institutional Structures | 11,836,102 | 602,850,331 | — | 614,686,433 | |||||||||||||||
Short-Term Investments: | |||||||||||||||||||
Repurchase Agreements | — | 13,942,306 | — | 13,942,306 | |||||||||||||||
Derivatives: | |||||||||||||||||||
Swaps** | — | 6,463,066 | — | 6,463,066 | |||||||||||||||
Total | $ | 653,562,188 | $ | 747,938,207 | $ | — | $ | 1,401,500,395 | |||||||||||
* Refer to the Fund's Portfolio of Investments for industry classifications and breakdown of $25 Par (or similar) Retail Structures and $1,000 Par (or similar) Institutional Structures classified as Level 2.
** Represents net unrealized appreciation (depreciation) as reported in the Fund's Portfolio of Investments.
The Nuveen funds' Board of Directors/Trustees is responsible for the valuation process and has delegated the oversight of the daily valuation process to the Adviser's Valuation Committee. The Valuation Committee, pursuant to the valuation policies and procedures adopted by the Board of Directors/Trustees, is responsible for making fair value determinations, evaluating the effectiveness of the funds' pricing policies and reporting to the Board of Directors/Trustees. The Valuation Committee is aided in its efforts by the Adviser's dedicated Securities Valuation Team, which is responsible for administering the daily valuation process and applying fair value methodologies as approved by the Valuation Committee. When determining the reliability of independent pricing services for investments owned by the funds, the Valuation Committee, among other things, conducts due diligence reviews of the pricing services and monitors the quality of security prices received through various testing reports conducted by the Securities Valuation Team.
The Valuation Committee will consider pricing methodologies it deems relevant and appropriate when making a fair value determination, based on the facts and circumstances specific to the portfolio instrument. Fair value determinations generally will be derived as follows, using public or private market information:
(i.) If available, fair value determinations shall be derived by extrapolating from recent transactions or quoted prices for identical or comparable securities.
(ii.) If such information is not available, an analytical valuation methodology may be used based on other available information including, but not limited to: analyst appraisals, research reports, corporate action information, issuer financial statements and shelf registration statements. Such analytical valuation methodologies may include, but are not limited to: multiple of earnings, discount from market value of a similar freely-traded security, discounted cash flow analysis, book value or a multiple thereof, risk premium/yield analysis, yield to maturity and/or fundamental investment analysis.
The purchase price of a portfolio instrument will be used to fair value the instrument only if no other valuation methodology is available or deemed appropriate, and it is determined that the purchase price fairly reflects the instrument's current value.
Nuveen Investments
36
For each portfolio security that has been fair valued pursuant to the policies adopted by the Board of Directors/Trustees, the fair value price is compared against the last available and next available market quotations. The Valuation Committee reviews the results of such testing and fair valuation occurrences are reported to the Board of Directors/Trustees.
3. Portfolio Securities and Investments in Derivatives
Portfolio Securities
Foreign Currency Transactions
The Fund is authorized to engage in foreign currency exchange transactions, including forward foreign currency exchange, futures, options and swap contracts. To the extent that the Fund invests in securities and/or contracts that are denominated in a currency other than U.S. dollars, the Fund will be subject to currency risk, which is the risk that an increase in the U.S. dollar relative to the foreign currency will reduce returns or portfolio value. Generally, when the U.S. dollar rises in value against a foreign currency, the Fund's investments denominated in that currency will lose value because its currency is worth fewer U.S. dollars; the opposite effect occurs if the U.S. dollar falls in relative value. Investments and other assets and liabilities denominated in foreign currencies are converted into U.S. dollars on a spot (i.e. cash) basis at the spot rate prevailing in the foreign currency exchange market at the time of valuation. Purchases and sales of investments and income denominated in foreign currencies are translated into U.S. dollars on the respective dates of such transactions.
The books and records of the Fund are maintained in U.S. dollars. Foreign currencies, assets and liabilities are translated into U.S. dollars at 4:00 p.m. Eastern time. Investments transactions, income and expenses are translated on the respective dates of such transactions. Net realized foreign currency gains and losses resulting from changes in exchange rates include foreign currency gains and losses between trade date and settlement date of the transactions, foreign currency transactions and the difference between the amounts of interest and dividends recorded on the books of the Fund and the amounts actually received.
The realized gains and losses resulting from changes in foreign currency exchange rates and changes in foreign exchange rates associated with other assets and liabilities on investments are recognized as a component of "Net realized gain (loss) from investments and foreign currency" on the Statement of Operations, when applicable.
The unrealized gains and losses resulting from changes in foreign currency exchange rates and changes in foreign exchange rates associated with other assets and liabilities on investments are recognized as a component of "Change in net unrealized appreciation (depreciation) of investments and foreign currency" on the Statement of Operations, when applicable. The unrealized gains and losses resulting from changes in foreign exchange rates associated with forward foreign currency exchange contracts, futures, options purchased, options written and swaps contracts are recognized as a component of "Change in net unrealized appreciation (depreciation) of forward foreign currency exchange contracts, futures contracts, put options purchased, call options written and swaps," respectively, on the Statement of Operations, when applicable.
Repurchase Agreements
In connection with transactions in repurchase agreements, it is the Fund's policy that its custodian take possession of the underlying collateral securities, the fair value of which exceeds the principal amount of the repurchase transaction, including accrued interest, at all times. If the counterparty defaults, and the fair value of the collateral declines, realization of the collateral may be delayed or limited.
Short Sales
The Fund was authorized to make short sales of securities. To secure its obligation to deliver securities sold short, the Fund had instructed the custodian to segregate assets of the Fund, which were then held at the applicable broker, as collateral with an equivalent amount of the securities sold short. The collateral required was determined by reference to the market value of the short positions and was recognized as a component of "Deposits with brokers for securities sold short and options written" on the Statement of Assets and Liabilities. The Fund was obligated to pay to the party to which the securities were sold short, dividends declared on the stock by the issuer and recognized such amounts as "Dividends on securities sold short" on the Statement of Operations. Short sales were valued daily with the corresponding unrealized gains or losses recognized as a component of "Change in net unrealized appreciation (depreciation) of securities sold short" on the Statement of Operations.
Liabilities for securities sold short were reported at market value in the financial statements. Short sale transactions resulted in off-balance sheet risk because the ultimate obligation may exceed the related amounts shown on the Statement of Assets and Liabilities. The Fund incurred a loss if the price of the security increased between the date of the short sale and the date on which the Fund replaced the borrowed security. The Fund's loss on a short sale was potentially unlimited because there was no upward limit on the price a borrowed security could attain. The Fund realized a gain if the price of the security declined between those dates. Gains and losses from securities sold short are recognized as a component of "Net realized gain (loss) from securities sold short" on the Statement of Operations.
Zero Coupon Securities
The Fund is authorized to invest in zero coupon securities. A zero coupon security does not pay a regular interest coupon to its holders during the life of the security. Income to the holder of the security comes from accretion of the difference between the original purchase price of the security at
Nuveen Investments
37
Notes to
FINANCIAL STATEMENTS (continued)
issuance and the par value of the security at maturity and is effectively paid at maturity. The market prices of zero coupon securities generally are more volatile than the market prices of securities that pay interest periodically.
Investments in Derivatives
The Fund is authorized to invest in certain derivative instruments, such as futures, options and swap contracts. The Fund limits its investments in futures, options on futures and swap contracts to the extent necessary for the Adviser to claim the exclusion from registration by the Commodity Futures Trading Commission as a commodity pool operator with respect to the Fund. The Fund records derivative instruments at fair value, with changes in fair value recognized on the Statement of Operations, when applicable. Even though the Fund's investments in derivatives may represent economic hedges, they are not considered to be hedge transactions for financial reporting purposes.
Swap Contracts
The Fund is authorized to invest in interest rate swap and forward interest rate swap contracts ("swap contracts") to mitigate the negative impact that an increase in short-term interest rates could have on Common share net earnings as a result of leverage. Forward interest rate swap transactions involve the Fund's agreement with a counterparty to pay, in the future, a fixed or variable rate payment in exchange for the counterparty paying the Fund a variable or fixed rate payment, the accruals for which would begin at a specified date in the future (the "effective date"). Interest rate swap contracts involve the Fund's agreement with the counterparty to pay or receive a fixed rate payment in exchange for the counterparty receiving or paying a variable rate payment that is intended to approximate the Fund's variable rate payment obligation on any variable rate borrowing. The payment obligation is based on the notional amount of the swap contract. Swap contracts do not involve the delivery of securities or other underlying assets or principal. Accordingly, the risk of loss with respect to the swap counterparty on such transactions is limited to the net amount of interest payments that the Fund is to receive. Swap contracts are valued daily. Upon entering into an interest rate swap (and beginning on the effective date for a forward interest rate swap), the Fund accrues the fixed rate payment expected to be paid or received and the variable rate payment expected to be received or paid on the swap contracts on a daily basis, and recognizes the daily change in the fair value of the Fund's contractual rights and obligations under the contracts. The net amount recorded for these transactions for each counterparty is recognized on the Statement of Assets and Liabilities as a component of "Unrealized appreciation or depreciation on swaps (, net)" with the change during the fiscal period recognized on the Statement of Operations as a component of "Change in net unrealized appreciation (depreciation) on swaps." Income received or paid by the Fund is recognized as a component of "Net realized gain (loss) from swaps" on the Statement of Operations, in addition to the net realized gains or losses recognized upon the termination of the swap contracts and are equal to the difference between the Fund's basis in the swap and the proceeds from (or cost of) the closing transaction. Payments received or made at the beginning of the measurement period are recognized as a component of "Swap premiums paid and/or received" on the Statement of Assets and Liabilities, when applicable. For tax purposes, periodic payments are treated as ordinary income or expense.
During the seven months ended July 31, 2013, the Fund continued to use swap contracts to partially fix its interest cost of leverage, which the Fund uses through the use of bank borrowings.
The average notional amount of swap contracts outstanding during the seven months ended July 31, 2013, was as follows:
Average notional amount of swap contracts outstanding* | $ | 368,042,000 | |||||
* The average notional amount is calculated based on the outstanding notional amount at the beginning of the fiscal year and at the end of each fiscal quarter within the current fiscal period.
The following table presents the fair value of all swap contracts held by the Fund as of July 31, 2013, the location of these instruments on the Statement of Assets and Liabilities and the primary underlying risk exposure.
Location on the Statement of Assets and Liabilities | |||||||||||||||||||||||
Underlying | Derivative | Asset Derivatives | (Liability) Derivatives | ||||||||||||||||||||
Risk Exposure | Instrument | Location | Value | Location | Value | ||||||||||||||||||
Interest rate | Swaps | Unrealized appreciation on swaps, net | $ | 9,729,897 | Unrealized depreciation on swaps | $ | (2,813,619 | ) | |||||||||||||||
Interest rate | Swaps | Unrealized appreciation on swaps, net | (453,212 | ) | — | — | |||||||||||||||||
Total | $ | 9,276,685 | $ | (2,813,619 | ) | ||||||||||||||||||
Nuveen Investments
38
The following table presents the swap contracts, which are subject to netting agreements, as well as the collateral delivered related to those swap contracts.
| Counterparty | Gross Unrealized Appreciation on Swaps* | Gross Unrealized (Depreciation) on Swaps* | Amounts Netted on Statement of Assets and Liabilities | Net Unrealized Appreciation (Depreciation) on Swaps | Collateral Pledged to (from) Counterparty | Net Exposure | |||||||||||||||||||||
JPMorgan | $ | 9,729,897 | $ | (453,212 | ) | $ | (453,212 | ) | $ | 9,276,685 | $ | (9,276,685 | ) | $ | — | ||||||||||||
Morgan Stanley | — | (2,813,619 | ) | — | (2,813,619 | ) | 2,813,619 | — | |||||||||||||||||||
Total | $ | 9,729,897 | $ | (3,266,831 | ) | $ | (453,212 | ) | $ | 6,463,066 | $ | (6,463,066 | ) | $ | — | ||||||||||||
* Represents gross unrealized appreciation (depreciation) for the counterparty as reported in the Fund's Portfolio of Investments.
The following table presents the amount of net realized gain (loss) and change in net unrealized appreciation (depreciation) recognized on swap contracts for the seven months ended July 31, 2013, and the primary underlying risk exposure.
| Underlying Risk Exposure | Derivative Instrument | Net Realized Gain (Loss) | Change in Net Unrealized Appreciation (Depreciation) | ||||||||||||
| Interest rate | Swaps | $ | (1,164,775 | ) | $ | 10,069,799 | |||||||||
Market and Counterparty Credit Risk
In the normal course of business the Fund may invest in financial instruments and enter into financial transactions where risk of potential loss exists due to changes in the market (market risk) or failure of the other party to the transaction to perform (counterparty credit risk). The potential loss could exceed the value of the financial assets recorded on the financial statements. Financial assets, which potentially expose the Fund to counterparty credit risk, consist principally of cash due from counterparties on forward, option and swap transactions, when applicable. The extent of the Fund's exposure to counterparty credit risk in respect to these financial assets approximates their carrying value as recorded on the Statement of Assets and Liabilities. Credit risk is generally higher when a non-exchange-traded financial instrument is involved because the counterparty for exchange-traded financial instruments is the exchange's clearinghouse.
The Fund helps manage counterparty credit risk by entering into agreements only with counterparties the Adviser believes have the financial resources to honor their obligations and by having the Adviser monitor the financial stability of the counterparties. Additionally, counterparties may be required to pledge collateral daily (based on the daily valuation of the financial asset) on behalf of the Fund with a value approximately equal to the amount of any unrealized gain above a pre-determined threshold. Reciprocally, when the Fund has an unrealized loss, the Fund has instructed the custodian to pledge assets of the Fund as collateral with a value approximately equal to the amount of the unrealized loss above a pre-determined threshold. Collateral pledges are monitored and subsequently adjusted if and when the valuations fluctuate, either up or down, by at least the pre-determined threshold amount.
4. Fund Shares
Common Shares
Transactions in common shares were as follows:
| Seven Months Ended 7/31/13 | Year Ended 12/31/12 | Year Ended 12/31/11 | |||||||||||||
Common shares repurchased and retired | — | — | (601,037 | ) | |||||||||||
Weighted average: | |||||||||||||||
Price per common share repurchased and retired | $ | — | $ | — | $ | 8.40 | |||||||||
Discount per common share repurchased and retired | — | % | — | % | 13.78 | % | |||||||||
5. Investment Transactions
Purchases and sales (including maturities but excluding short-term investments and derivative transactions) during the seven months ended July 31, 2013, aggregated $396,635,698 and $375,546,705, respectively.
Nuveen Investments
39
Notes to
FINANCIAL STATEMENTS (continued)
6. Income Tax Information
The Fund intends to distribute substantially all of its investment company taxable income to shareholders and to otherwise comply with the requirements of Subchapter M of the Internal Revenue Code applicable to regulated investment companies. In any year when the Fund realizes net capital gains, the Fund may choose to distribute all or a portion of its net capital gains to shareholders, or alternatively, to retain all or a portion of its net capital gains and pay federal corporate income taxes on such retained gains.
For all open tax years and all major taxing jurisdictions, management of the Fund has concluded that there are no significant uncertain tax positions that would require recognition in the financial statements. Open tax years are those that are open for examination by taxing authorities (i.e., generally the last four tax year ends and the interim tax period since then). Furthermore, management of the Fund is also not aware of any tax positions for which it is reasonably possible that the total amounts of unrecognized tax benefits will significantly change in the next twelve months.
The following information is presented on an income tax basis. Differences between amounts for financial statement and federal income tax purposes are primarily due to recognition of premium amortization, timing differences in the recognition of income on real estate investment trust ("REIT") investments and timing differences in recognizing certain gains and losses on investment transactions. To the extent that differences arise that are permanent in nature, such amounts are reclassified within the capital accounts as detailed below. Temporary differences do not require reclassification. Temporary and permanent differences do not impact the net asset value of the Fund.
As of July 31, 2013, the cost and unrealized appreciation (depreciation) of investments (excluding investments in derivatives), as determined on a federal income tax basis, were as follows:
Cost of investments | $ | 1,353,606,932 | |||||
Gross unrealized: | |||||||
Appreciation | $ | 65,438,755 | |||||
Depreciation | (24,008,358 | ) | |||||
Net unrealized appreciation (depreciation) of investments | $ | 41,430,397 | |||||
Permanent differences, primarily due to notional principal contracts, tax basis earnings and profit adjustments, adjustments for REITs, complex securities character adjustments, litigation proceeds, and foreign currency reclasses, resulted in reclassifications among the Fund's components of common share net assets as of July 31, 2013, the Fund's tax year end, as follows:
Paid-in-surplus | $ | (383,932 | ) | ||||
Undistributed (Over-distribution of) net investment income | (1,106,300 | ) | |||||
Accumulated net realized gain (loss) | 1,490,232 | ||||||
The tax components of undistributed net ordinary income and net long-term capital gains as of July 31, 2013, the Fund's tax year end, were as follows:
Undistributed net ordinary income | $ | 6,045,230 | |||||
Undistributed net long-term capital gains | — | ||||||
The tax character of distributions paid during the Fund's tax years ended July 31, 2013, December 31, 2012 and December 31, 2011, was designated for purposes of the dividends paid deduction as follows:
Seven months ended July 31, 2013 | |||||||
Distributions from net ordinary income1 | $ | 36,836,933 | |||||
Distributions from net long-term capital gains | — | ||||||
Return of capital | — | ||||||
Nuveen Investments
40
Year ended December 31, 2012 | |||||||
Distributions from net ordinary income1 | $ | 73,683,563 | |||||
Distributions from net long-term capital gains | — | ||||||
Return of capital | — | ||||||
Year ended December 31, 2011 | |||||||
Distributions from net ordinary income1 | $ | 72,490,114 | |||||
Distributions from net long-term capital gains | — | ||||||
Return of capital | 334,401 | ||||||
1 Net ordinary income consists of net taxable income derived from dividends, interest and current year earnings and profits attributable to realized gains.
As of July 31, 2013, the Fund's tax year end, the Fund had unused capital loss carryforwards available for federal income tax purposes to be applied against future capital gains, if any. If not applied, the carryforwards will expire as shown in the following table. The losses not subject to expiration retain the character reflected and will be utilized first by the Fund, while the losses subject to expiration are considered short-term:
Expiration: | |||||||
July 31, 2016 | $ | 129,811,368 | |||||
July 31, 2017 | 204,895,930 | ||||||
July 31, 2018 | 9,385,427 | ||||||
Not subject to expiration: | |||||||
Short-term losses | — | ||||||
Long-term losses | — | ||||||
Total | $ | 344,092,725 | |||||
During the Fund's tax year ended July 31, 2013, the Fund utilized capital loss carryforwards as follows:
Utilized capital loss carryforwards | $ | 30,171,610 | |||||
7. Management Fees and Other Transactions with Affiliates
The Fund's management fee compensates the Adviser for overall investment strategy advisory and administrative services and general office facilities. The Sub-Advisers are compensated for their services to the Fund from the management fees paid to the Adviser.
The Fund's management fee consists of two components—a fund-level fee, based only on the amount of assets within the Fund, and a complex-level fee, based on the aggregate amount of all eligible fund assets managed by the Adviser. This pricing structure enables Fund shareholders to benefit from growth in the assets within the Fund as well as from growth in the amount of complex-wide assets managed by the Adviser.
The annual fund-level fee for the Fund, payable monthly, is calculated according to the following schedule:
Average Daily Managed Assets* | Fund-Level Fee Rate | ||||||
For the first $500 million | .6800 | % | |||||
For the next $500 million | .6550 | ||||||
For the next $500 million | .6300 | ||||||
For the next $500 million | .6050 | ||||||
For managed assets over $2 billion | .5800 | ||||||
Nuveen Investments
41
Notes to
FINANCIAL STATEMENTS (continued)
The annual complex-level fee for the Fund, payable monthly, is calculated according to the following schedule:
Complex-Level Managed Asset Breakpoint Level* | Effective Rate at Breakpoint Level | ||||||
| $55 billion | .2000 | % | |||||
| $56 billion | .1996 | ||||||
| $57 billion | .1989 | ||||||
| $60 billion | .1961 | ||||||
| $63 billion | .1931 | ||||||
| $66 billion | .1900 | ||||||
| $71 billion | .1851 | ||||||
| $76 billion | .1806 | ||||||
| $80 billion | .1773 | ||||||
| $91 billion | .1691 | ||||||
| $125 billion | .1599 | ||||||
| $200 billion | .1505 | ||||||
| $250 billion | .1469 | ||||||
| $300 billion | .1445 | ||||||
* For the fund-level and complex-level fees, managed assets include closed-end fund assets managed by the Adviser that are attributable to financial leverage. For these purposes, financial leverage includes the funds' use of preferred stock and borrowings and certain investments in the residual interest certificates (also called inverse floating rate securities) in tender option bond (TOB) trusts, including the portion of assets held by a TOB trust that has been effectively financed by the trust's issuance of floating rate securities, subject to an agreement by the Adviser as to certain funds to limit the amount of such assets for determining managed assets in certain circumstances. The complex-level fee is calculated based upon the aggregate daily managed assets of all Nuveen Funds that constitute "eligible assets." Eligible assets do not include assets attributable to investments in other Nuveen Funds and assets in excess of $2 billion added to the Nuveen Fund complex in connection with the Adviser's assumption of the management of the former First American Funds effective January 1, 2011. As of July 31, 2013, the complex-level fee rate for the Fund was .1683%.
The Fund pays no compensation directly to those of its trustees who are affiliated with the Adviser or to its officers, all of whom receive remuneration for their services to the Fund from the Adviser or its affiliates. The Board of Trustees has adopted a deferred compensation plan for independent trustees that enables trustees to elect to defer receipt of all or a portion of the annual compensation they are entitled to receive from certain Nuveen-advised funds. Under the plan, deferred amounts are treated as though equal dollar amounts had been invested in shares of select Nuveen-advised funds.
8. Borrowing Arrangements
The Fund has entered into a $405 million (maximum commitment amount) prime brokerage facility ("Borrowings") with BNP Paribas Prime Brokerage, Inc. ("BNP") as a means of financial leverage. As of July 31, 2013, the outstanding balance on these Borrowings was $403 million. During the seven months ended July 31, 2013, the average daily balance outstanding and annual interest rate on these Borrowings were $403 million and 1.13%, respectively.
In order to maintain these Borrowings, the Fund must meet certain collateral, asset coverage and other requirements. Borrowings outstanding are fully secured by securities held in the Fund's portfolio of investments. Interest is charged on these Borrowings at 3-Month LIBOR (London Inter-Bank Offered Rate) plus .85% on the amounts borrowed and .50% on the undrawn balance.
Borrowings outstanding are recognized as "Borrowings" on the Statement of Assets and Liabilities. Interest expense incurred on the borrowed amount and undrawn balance are recognized as a component of "Interest expense on borrowings" on the Statement of Operations.
Nuveen Investments
42
Annual Investment Management
Agreement Approval Process (Unaudited)
The Board of Trustees (the "Board" and each Trustee, a "Board Member") of the Fund, including the Board Members who are not parties to the Fund's advisory or sub-advisory agreement or "interested persons" of any such parties (the "Independent Board Members"), is responsible for approving the advisory agreement (the "Investment Management Agreement") between the Fund and Nuveen Fund Advisors, LLC (the "Advisor") and the sub-advisory agreements (each, a "Sub-Advisory Agreement") between (a) the Advisor and Nuveen Asset Management, LLC ("Nuveen Asset Management") and (b) the Advisor and NWQ Investment Management Company, LLC ("NWQ") (Nuveen Asset Management and NWQ are each a "Sub-Advisor") (the Investment Management Agreement and the Sub-Advisory Agreements are referred to collectively as the "Advisory Agreements") and their periodic continuation. Pursuant to the Investment Company Act of 1940, as amended (the "1940 Act"), the Board is required to consider the continuation of the Advisory Agreements on an annual basis. Accordingly, at an in-person meeting held on May 20-22, 2013 (the "May Meeting"), the Board, including a majority of the Independent Board Members, considered and approved the continuation of the Advisory Agreements for the Fund for an additional one-year period.
In preparation for its considerations at the May Meeting, the Board requested and received extensive materials prepared in connection with the review of the Advisory Agreements. The materials provided a broad range of information regarding the Fund, the Advisor and the Sub-Advisors (the Advisor and the Sub-Advisors are collectively, the "Fund Advisers" and each, a "Fund Adviser"). As described in more detail below, the information provided included, among other things, a review of Fund performance, including Fund investment performance assessments against peer groups and appropriate benchmarks; a comparison of Fund fees and expenses relative to peers; a description and assessment of shareholder service levels for the Fund; a summary of the performance of certain service providers; a review of product initiatives and shareholder communications; and an analysis of the Advisor's profitability with comparisons to comparable peers in the managed fund business. As part of its annual review, the Board also held a separate meeting on April 17-18, 2013, to review the Fund's investment performance and consider an analysis provided by the Advisor of the Sub-Advisors which generally evaluated the Sub-Advisors' investment teams, investment mandate, organizational structure and history, investment philosophy and process, performance of the Fund, and significant changes to the foregoing. As a result of its review of the materials and discussions, the Board presented the Advisor with questions and the Advisor responded.
The materials and information prepared in connection with the annual review of the Advisory Agreements supplement the information and analysis provided to the Board during the year. In this regard, throughout the year, the Board, acting directly or through its committees, regularly reviews the performance and various services provided by the Advisor and the Sub-Advisors. The Board meets at least quarterly as well as at other times as the need arises. At its quarterly meetings, the Board reviews reports by the Advisor regarding, among other things, fund performance, fund expenses, premium and discount levels of closed-end funds, the performance of the investment teams, and compliance, regulatory and risk management matters. In addition to regular reports, the Advisor provides special reports to the Board or a committee thereof from time to time to enhance the Board's understanding of various topics that impact some or all the Nuveen funds (such as accounting and financial statement presentations of the various forms of leverage that may be used by a closed-end fund or an update on the valuation policies and procedures), to update the Board on regulatory developments impacting the investment company industry or to update the Board on the business plans or
Nuveen Investments
43
Annual Investment Management Agreement
Approval Process (Unaudited) (continued)
other matters impacting the Advisor. The Board also meets with key investment personnel managing the fund portfolios during the year. In October 2011, the Board also created two standing committees (the Open-End Fund Committee and the Closed-End Fund Committee) to assist the full Board in monitoring and gaining a deeper insight into the distinctive business practices of open-end and closed-end funds. These Committees meet prior to each quarterly Board meeting, and the Advisor provides presentations to these Committees permitting them to delve further into specific matters or initiatives impacting the respective product line.
In addition, the Board continues its program of seeking to have the Board Members or a subset thereof visit each sub-advisor to the Nuveen funds at least once over a multiple year rotation, meeting with key investment and business personnel. In this regard, the Independent Board Members visited certain of Nuveen Asset Management's investment teams in Minneapolis in September 2012, and its municipal team in November 2012. In addition, the ad hoc Securities Lending Committee of the Board met with certain service providers and the Audit Committee of the Board made a site visit to three pricing service providers.
The Board considers the information provided and knowledge gained at these meetings and visits during the year when performing its annual review of the Advisory Agreements. The Independent Board Members also are assisted throughout the process by independent legal counsel. Counsel provided materials describing applicable law and the duties of directors or trustees in reviewing advisory contracts. During the course of the year and during their deliberations regarding the review of advisory contracts, the Independent Board Members met with independent legal counsel in executive sessions without management present. In addition, it is important to recognize that the management arrangements for the Nuveen funds are the result of many years of review and discussion between the Independent Board Members and fund management and that the Board Members' conclusions may be based, in part, on their consideration of fee arrangements and other factors developed in previous years.
The Board considered all factors it believed relevant with respect to the Fund, including among other factors: (a) the nature, extent and quality of the services provided by the Fund Advisers, (b) the investment performance of the Fund and Fund Advisers, (c) the advisory fees and costs of the services to be provided to the Fund and the profitability of the Fund Advisers, (d) the extent of any economies of scale, (e) any benefits derived by the Fund Advisers from the relationship with the Fund and (f) other factors. Each Board Member may have accorded different weight to the various factors in reaching his or her conclusions with respect to the Fund's Advisory Agreements. The Independent Board Members did not identify any single factor as all important or controlling. The Independent Board Members' considerations were instead based on a comprehensive consideration of all the information presented. The principal factors considered by the Board and its conclusions are described below.
A. Nature, Extent and Quality of Services
In considering renewal of the Advisory Agreements, the Independent Board Members considered the nature, extent and quality of the Fund Adviser's services, including advisory services and the resulting Fund performance and administrative services. The Independent Board Members further considered the overall reputation and capabilities of the Advisor and its affiliates, the commitment of the Advisor to provide high quality service to the Fund, their overall confidence in the capability and integrity of the Advisor and its staff and the Advisor's responsiveness to questions and concerns raised by them. The Independent Board Members reviewed materials outlining, among other things, the Fund Adviser's organization and business; the types of services that the Fund Adviser or its affiliates provide to the Fund; the performance record of the Fund (as described in further detail below); and any applicable initiatives Nuveen had taken for the closed-end fund product line.
In considering advisory services, the Board recognized that the Advisor provides various oversight, administrative, compliance and other services for the Fund and the Sub-Advisors generally provide the portfolio investment management services
Nuveen Investments
44
to the Fund. In reviewing the portfolio management services provided to the Fund, the Board reviewed the materials provided by the Nuveen Investment Services Oversight Team analyzing, among other things, the Sub-Advisors' investment teams and changes thereto, organization and history, assets under management, the investment teams' philosophies and strategies in managing the Fund, developments affecting the Sub-Advisors or Fund and Fund performance. The Independent Board Members also reviewed portfolio manager compensation arrangements to evaluate each Fund Adviser's ability to attract and retain high quality investment personnel, preserve stability, and reward performance but not provide an inappropriate incentive to take undue risks. In addition, the Board considered the Advisor's execution of its oversight responsibilities over the Sub-Advisors. Given the importance of compliance, the Independent Board Members also considered Nuveen's compliance program, including the report of the chief compliance officer regarding the Fund's compliance policies and procedures; the resources dedicated to compliance; and the record of compliance with the policies and procedures. Given the Advisor's emphasis on business risk, the Board also appointed an Independent Board Member as a point person to review and keep the Board apprised of developments in this area during the year.
In addition to advisory services, the Board considered the quality and extent of administrative and other non-investment advisory services the Advisor and its affiliates provide to the Fund, including product management, investment services (such as oversight of investment policies and procedures, risk management, and pricing), fund administration, oversight of service providers, shareholder services and communications, administration of Board relations, regulatory and portfolio compliance, legal support, managing leverage and promoting an orderly secondary market for common shares. The Board further recognized Nuveen's additional investments in personnel, including in compliance and risk management.
In reviewing the services provided, the Board considered the new services and service enhancements that the Advisor has implemented since the various advisory agreements were last reviewed. In reviewing the activities of 2012, the Board recognized the Advisor's focus on product rationalization for both closed-end and open-end funds during the year, consolidating certain Nuveen funds through mergers that were designed to improve efficiencies and economies of scale for shareholders, repositioning various Nuveen funds through updates in their investment policies and guidelines with the expectation of bringing greater value to shareholders, and liquidating certain Nuveen funds. The Board recognized the Advisor's significant investment in technology initiatives to, among other things, create a central repository for fund and other Nuveen product data, develop a group within the Advisor designed to handle and analyze fund performance data, and implement a data system to support the risk oversight group. The Board also recognized the enhancements in the valuation group within the Advisor, including upgrading the team and process and automating certain basic systems, and in the compliance group with the addition of personnel, particularly within the testing group. With the advent of the Open-End Fund Committee and Closed-End Fund Committee, the Board also noted the enhanced support and comprehensive in-depth presentations provided by the Advisor to these committees.
In addition to the foregoing actions, the Board also considered other initiatives related to the Nuveen closed-end funds, including the significant level of oversight and administration necessary to manage leverage that has become increasingly varied and complex and the ongoing redesign of technology systems to manage and track the various forms of leverage; completion of the repositioning of the Fund (formerly, the Nuveen Multi-Strategy Income and Growth Fund) continued capital management services, including developing shelf offering programs for various funds; the implementation of projects designed to enhance data integrity for information published on the web and to increase the use of data received from third parties to gain market intelligence; and the continued communication efforts with shareholders, fund analysts and financial advisers. With respect to the latter, the Independent Board Members noted Nuveen's continued commitment to supporting the secondary market for the common shares of its closed-end funds through a comprehensive secondary market communication program and campaigns designed to raise investor and analyst awareness and understanding of closed-end funds. Nuveen's support services included, among other things: developing materials covering the Nuveen closed-end fund product line and educational materials regarding closed-end funds; designing and executing various marketing campaigns; supporting and promoting the alternative minimum tax (AMT)-free funds; sponsoring and
Nuveen Investments
45
Annual Investment Management Agreement
Approval Process (Unaudited) (continued)
participating in conferences; communicating with closed-end fund analysts and financial advisors throughout the year; providing marketing and product updates for the closed-end funds; and maintaining and enhancing a closed-end fund website.
Based on their review, the Independent Board Members found that, overall, the nature, extent and quality of services provided to the Fund under each Advisory Agreement were satisfactory.
B. The Investment Performance of the Fund and Fund Advisers
The Board, including the Independent Board Members, considered the performance history of the Fund over various time periods. The Board reviewed reports, including an analysis of the Fund's performance and the applicable investment team. In general, in considering a fund's performance, the Board recognized that a fund's performance can be reviewed through various measures including the fund's absolute return, the fund's return compared to the performance of other peer funds, and the fund's performance compared to its respective benchmark. Accordingly, the Board reviewed, among other things, the Fund's historic investment performance as well as information comparing the Fund's performance information with that of other funds (the "Performance Peer Group") and with recognized and/or customized benchmarks (i.e., benchmarks derived from multiple recognized benchmarks) for the quarter, one-, three- and five-year periods ending December 31, 2012 as well as performance information reflecting the first quarter of 2013. In addition, with respect to closed-end funds (such as the Fund), the Independent Board Members also reviewed historic premium and discount levels, including a summary of actions taken to address or discuss other developments affecting the secondary market discounts of various funds. This information supplemented the fund performance information provided to the Board at each of its quarterly meetings.
In evaluating performance, the Board recognized several factors that may impact the performance data as well as the consideration given to particular performance data. The Board recognized that the performance data reflects a snapshot of time, in this case as of the end of the most recent calendar year or quarter. The Board noted that selecting a different performance period could derive significantly different results. Further, the Board recognized that it is possible that long-term performance can be adversely affected by even one period of significant underperformance so that a single investment decision or theme has the ability to disproportionately affect long-term performance. The Independent Board Members also noted that the investment experience of a particular shareholder in the Nuveen funds will vary depending on when such shareholder invests in the applicable fund, the class held (if multiple classes are offered in a fund) and the performance of the fund (or respective class) during that shareholder's investment period.
With respect to the comparative performance information, the Board recognized that the usefulness of comparative performance data as a frame of reference to measure a fund's performance may be limited because the Performance Peer Group, among other things, does not adequately reflect the objectives and strategies of the fund, has a different investable universe, or the composition of the peer set may be limited in size or number as well as other factors. In this regard, the Board noted that the Advisor classified, in relevant part, the Performance Peer Groups of certain funds (including the Fund) as having significant differences from the funds but to still be somewhat relevant while the Performance Peer Groups of other funds were classified as having such significant differences as to be irrelevant. Accordingly, while the Board is cognizant of the relative performance of a fund's peer set and/or benchmark(s), the Board evaluated fund performance in light of the respective fund's investment objectives, investment parameters and guidelines and considered that the variations between the objectives and investment parameters or guidelines of the funds with their peers and/or benchmarks result in differences in performance results. In addition, with respect to any Nuveen funds for which the Board has identified performance concerns, the Board monitors such funds closely until performance improves, discusses with the Advisor the reasons for such results, considers those steps necessary or appropriate to address such issues, and reviews the results of any efforts undertaken.
Nuveen Investments
46
In considering the performance data for the Fund, the Independent Board Members determined that the Fund had demonstrated generally favorable performance in comparison to peers. In this regard, although the Fund performed in the third quartile for the three- and five-year periods, it performed in the first quartile for the one-year period and outperformed its benchmark for the one-, three- and five-year periods. The Board, however, recognized that the Fund was significantly restructured recently, thereby limiting the usefulness of past performance prior to such changes.
Based on their review, the Independent Board Members determined that the Fund's investment performance had been satisfactory.
C. Fees, Expenses and Profitability
1. Fees and Expenses
The Board evaluated the management fees and expenses of the Fund reviewing, among other things, the Fund's gross management fee, net management fee and net expense ratio in absolute terms as well as compared to the fees and expenses of a comparable universe of funds provided by an independent fund data provider (the "Peer Universe") and any expense limitations.
The Independent Board Members further reviewed the methodology regarding the construction of the applicable Peer Universe. In reviewing the comparisons of fee and expense information, the Independent Board Members took into account that in certain instances various factors such as: the limited size and particular composition of the Peer Universe (including the inclusion of other Nuveen funds in the peer set); expense anomalies; changes in the funds comprising the Peer Universe from year to year; levels of reimbursement or fee waivers; the timing of information used; and the differences in the type and use of leverage may impact the comparative data, thereby limiting somewhat the ability to make a meaningful comparison with peers.
In reviewing the fee schedule for the Fund, the Independent Board Members also considered the fund-level and complex-wide breakpoint schedules (described in further detail below) and any fee waivers and reimbursements provided by Nuveen. In reviewing fees and expenses (excluding leverage costs and leveraged assets, as applicable), the Board considered the expenses and fees to be higher if they were over 10 basis points higher, slightly higher if they were approximately 6 to 10 basis points higher, in line if they were within approximately 5 basis points higher than the peer average and below if they were below the peer average of the Peer Universe. In reviewing the reports, the Board noted that the majority of the Nuveen funds were at, close to or below their peer set average based on the net total expense ratio.
The Independent Board Members noted that the Fund had a net management fee slightly higher than its peer average but a net expense ratio below its peer average.
Based on their review of the fee and expense information provided, the Independent Board Members determined that the Fund's management fees were reasonable in light of the nature, extent and quality of services provided to it.
2. Comparisons with the Fees of Other Clients
The Board recognized that all Nuveen funds have at least one sub-advisor (including the Fund, which has two affiliated sub-advisors), and therefore, the overall fund management fee can be divided into two components, the fee retained by the Advisor and the fee paid to the sub-advisor(s). In general terms, the fee to the Advisor reflects the administrative services it provides to support the funds, and while some administrative services may occur at the sub-advisor level, the fee generally reflects the portfolio management services provided by the sub-advisor(s). The Independent Board Members reviewed information regarding the nature of services provided by the Advisor, including through the Sub-Advisors, and the range of fees and average fee such affiliated Sub-Advisors assessed for
Nuveen Investments
47
Annual Investment Management Agreement
Approval Process (Unaudited) (continued)
such services to other clients. Such other clients include separately managed accounts (both retail and institutional accounts), foreign investment funds offered by Nuveen and funds that are not offered by Nuveen but are sub-advised by one of Nuveen's investment management teams. In evaluating the comparisons of fees, the Independent Board Members noted that the fee rates charged to the Fund and other clients vary, among other things, because of the different services involved and the additional regulatory and compliance requirements associated with registered investment companies, such as the Fund. Accordingly, the Independent Board Members considered the differences in the product types, including, but not limited to, the services provided, the structure and operations, product distribution and costs thereof, portfolio investment policies, investor profiles, account sizes and regulatory requirements. The Independent Board Members noted, in particular, that the range of services provided to the Fund (as discussed above) is much more extensive than that provided to separately managed accounts. Many of the additional administrative services provided by the Advisor are not required for institutional clients. The Independent Board Members further noted that the management fee rates of the foreign funds advised by the Advisor may vary due to, among other things, differences in the client base, governing bodies, operational complexities and services covered by the management fee. Given the inherent differences in the various products, particularly the extensive services provided to the Fund, the Independent Board Members believe such facts justify the different levels of fees.
3. Profitability of Fund Advisers
In conjunction with their review of fees, the Independent Board Members also considered the profitability of Nuveen for its advisory activities and its financial condition. The Independent Board Members reviewed the revenues and expenses of Nuveen's advisory activities for the last two calendar years, the allocation methodology used in preparing the profitability data and an analysis of the key drivers behind the changes in revenues and expenses that impacted profitability in 2012. The Independent Board Members noted this information supplemented the profitability information requested and received during the year to help keep them apprised of developments affecting profitability (such as changes in fee waivers and expense reimbursement commitments). In this regard, the Independent Board Members noted that they have an Independent Board Member serve as a point person to review and keep them apprised of changes to the profitability analysis and/or methodologies during the year. The Independent Board Members also considered Nuveen's revenues for advisory activities, expenses, and profit margin compared to that of various unaffiliated management firms with comparable assets under management (based on asset size and asset composition).
In reviewing profitability, the Independent Board Members recognized the Advisor's continued investment in its business to enhance its services, including capital improvements to investment technology, updated compliance systems, and additional personnel. In addition, in evaluating profitability, the Independent Board Members also recognized the subjective nature of determining profitability which may be affected by numerous factors including the allocation of expenses and that various allocation methodologies may each be reasonable but yield different results. Further, the Independent Board Members recognized the difficulties in making comparisons as the profitability of other advisers generally is not publicly available and the profitability information that is available for certain advisers or management firms may not be representative of the industry and may be affected by, among other things, the adviser's particular business mix, capital costs, types of funds managed and expense allocations. Notwithstanding the foregoing, the Independent Board Members reviewed Nuveen's methodology and assumptions for allocating expenses across product lines to determine profitability. Based on their review, the Independent Board Members concluded that the Advisor's level of profitability for its advisory activities was reasonable in light of the services provided.
With respect to each Sub-Advisor, the Independent Board Members reviewed its revenues, expenses and profitability margins (pre- and post-tax) for its advisory activities and the methodology used for allocating expenses
Nuveen Investments
48
among the internal sub-advisors. Based on their review, the Independent Board Members were satisfied that each Sub-Advisor's level of profitability was reasonable in light of the services provided.
In evaluating the reasonableness of the compensation, the Independent Board Members also considered other amounts paid to a Fund Adviser by the Fund as well as indirect benefits (such as soft dollar arrangements), if any, the Fund Adviser and its affiliates receive, or are expected to receive, that are directly attributable to the management of the Fund. See Section E below for additional information on indirect benefits a Fund Adviser may receive as a result of its relationship with the Fund. Based on their review of the overall fee arrangements of the Fund, the Independent Board Members determined that the advisory fees and expenses of the Fund were reasonable.
D. Economies of Scale and Whether Fee Levels Reflect These Economies of Scale
With respect to economies of scale, the Independent Board Members have recognized the potential benefits resulting from the costs of a fund being spread over a larger asset base, although economies of scale are difficult to measure and predict with precision, particularly on a fund-by-fund basis. One method to help ensure the shareholders share in these benefits is to include breakpoints in the advisory fee schedule. Generally, management fees for funds in the Nuveen complex are comprised of a fund-level component and a complex-level component, subject to certain exceptions. Accordingly, the Independent Board Members reviewed and considered the applicable fund-level breakpoints in the advisory fee schedules that reduce advisory fees as asset levels increase. Further, the Independent Board Members noted that although closed-end funds may from time-to-time make additional share offerings, the growth of their assets will occur primarily through the appreciation of such funds' investment portfolio.
In addition to fund-level advisory fee breakpoints, the Board also considered the Fund's complex-wide fee arrangement. Pursuant to the complex-wide fee arrangement, the fees of the funds in the Nuveen complex are generally reduced as the assets in the fund complex reach certain levels. The complex-wide fee arrangement seeks to provide the benefits of economies of scale to fund shareholders when total fund complex assets increase, even if assets of a particular fund are unchanged or have decreased. The approach reflects the notion that some of Nuveen's costs are attributable to services provided to all its funds in the complex and therefore all funds benefit if these costs are spread over a larger asset base. In addition, with the acquisition of the funds previously advised by FAF Advisors, Inc. at the end of 2010, the Board noted that a portion of such funds' assets at the time of acquisition were deemed eligible to be included in the complex-wide fee calculation in order to deliver fee savings to shareholders in the combined complex and such funds were subject to differing complex-level fee rates.
Based on their review, the Independent Board Members concluded that the breakpoint schedules and complex-wide fee arrangement were acceptable and reflect economies of scale to be shared with shareholders when assets under management increase.
E. Indirect Benefits
In evaluating fees, the Independent Board Members received and considered information regarding potential "fall out" or ancillary benefits the respective Fund Adviser or its affiliates may receive as a result of its relationship with the Fund. In this regard, the Independent Board Members considered any revenues received by affiliates of the Advisor for serving as co-manager in initial public offerings of new closed-end funds as well as revenues received in connection with secondary offerings.
In addition to the above, the Independent Board Members considered whether the Fund Advisers received any benefits from soft dollar arrangements whereby a portion of the commissions paid by the Fund for brokerage may be used to acquire research that may be useful to the Fund Adviser in managing the assets of the Fund and other clients. The Fund's portfolio transactions are determined by the Sub-Advisors. Accordingly, the Independent Board Members
Nuveen Investments
49
Annual Investment Management Agreement
Approval Process (Unaudited) (continued)
considered that each Sub-Advisor may benefit from its soft dollar arrangements pursuant to which it receives research from brokers that execute the Fund's portfolio transactions. With respect to fixed income securities, however, the Board recognized that such securities generally trade on a principal basis that does not generate soft dollar credits. Nevertheless, the Sub-Advisors may also engage in soft dollar arrangements on behalf of other clients, and the Fund as well as the Sub-Advisors may benefit from the research or other services received. Similarly, the Board recognized that the research received pursuant to soft dollar arrangements by the Sub-Advisors may also benefit the Fund and shareholders to the extent the research enhances the ability of the Sub-Advisors to manage the Fund. The Independent Board Members noted that the Sub-Advisors' profitability may be somewhat lower if they did not receive the research services pursuant to the soft dollar arrangements and had to acquire such services directly.
Based on their review, the Independent Board Members concluded that any indirect benefits received by a Fund Adviser as a result of its relationship with the Fund were reasonable and within acceptable parameters.
F. Other Considerations
The Independent Board Members did not identify any single factor discussed previously as all-important or controlling. The Board Members, including the Independent Board Members, unanimously concluded that the terms of each Advisory Agreement are fair and reasonable, that the respective Fund Adviser's fees are reasonable in light of the services provided to the Fund and that the Advisory Agreements be renewed.
Nuveen Investments
50
Board Members & Officers* (Unaudited)
The management of the Funds, including general supervision of the duties performed for the Funds by the Adviser, is the responsibility of the Board of Trustees of the Funds. The number of trustees of the Funds is currently set at twelve. None of the trustees who are not "interested" persons of the Funds (referred to herein as "independent trustees") has ever been a director or employee of, or consultant to, Nuveen or its affiliates. The names and business addresses of the trustees and officers of the Funds, their principal occupations and other affiliations during the past five years, the number of portfolios each oversees and other directorships they hold are set forth below.
| Name, Year of Birth & Address | Position(s) Held with the Funds | Year First Elected or Appointed and Term(1) | Principal Occupation(s) including other Directorships During Past 5 Years | Number of Portfolios in Fund Complex Overseen by Board Member | |||||||||||||||
Independent Board Members: | |||||||||||||||||||
| nWILLIAM J. SCHNEIDER | |||||||||||||||||||
| 1944 333 W. Wacker Drive Chicago, IL 60606 | Chairman of the Board and Board Member | 1996 Class III | Chairman of Miller-Valentine Partners Ltd., a real estate investment company; formerly, Senior Partner and Chief Operating Officer (retired 2004) of Miller-Valentine Group; an owner in several other Miller Valentine entities; member, Mid-America Health System; Board Member of Tech Town, Inc., a not-for-profit community development company; Board Member of WDPR Public Radio station; formerly, member, Business Advisory Council, Cleveland Federal Reserve Bank and University of Dayton Business School Advisory Council. | 211 | |||||||||||||||
| nROBERT P. BREMNER | |||||||||||||||||||
| 1940 333 W. Wacker Drive Chicago, IL 60606 | Board Member | 1996 Class III | Private Investor and Management Consultant; Treasurer and Director, Humanities Council of Washington, D.C.; Board Member, Independent Directors Council affiliated with the Investment Company Institute. | 211 | |||||||||||||||
| nJACK B. EVANS | |||||||||||||||||||
| 1948 333 W. Wacker Drive Chicago, IL 60606 | Board Member | 1999 Class III | President, The Hall-Perrine Foundation, a private philanthropic corporation (since 1996); Chairman, United Fire Group, a publicly held company; formerly, member and President Pro Tem of the Board of Regents for the State of Iowa University System; Director, Source Media Group; Life Trustee of Coe College; formerly, Director, Alliant Energy; formerly, Director, Federal Reserve Bank of Chicago; formerly, President and Chief Operating Officer, SCI Financial Group, Inc., a regional financial services firm. | 211 | |||||||||||||||
Nuveen Investments
51
Board Members & Officers* (Unaudited) (continued)
| Name, Year of Birth & Address | Position(s) Held with the Funds | Year First Elected or Appointed and Term(1) | Principal Occupation(s) including other Directorships During Past 5 Years | Number of Portfolios in Fund Complex Overseen by Board Member | |||||||||||||||
Independent Board Members (continued): | |||||||||||||||||||
| nWILLIAM C. HUNTER | |||||||||||||||||||
| 1948 333 W. Wacker Drive Chicago, IL 60606 | Board Member | 2004 Class I | Dean Emeritus (since June 30, 2012), formerly, Dean, Tippie College of Business, University of Iowa (2006-2012); Director (since 2004) of Xerox Corporation; Director (since 2005), and President (since July 2012) Beta Gamma Sigma, Inc., The International Honor Society; Director of Wellmark, Inc. (since 2009); formerly, Dean and Distinguished Professor of Finance, School of Business at the University of Connecticut (2003-2006); previously, Senior Vice President and Director of Research at the Federal Reserve Bank of Chicago (1995-2003); formerly, Director (1997-2007), Credit Research Center at Georgetown University. | 211 | |||||||||||||||
| nDAVID J. KUNDERT | |||||||||||||||||||
| 1942 333 W. Wacker Drive Chicago, IL 60606 | Board Member | 2005 Class II | Formerly, Director, Northwestern Mutual Wealth Management Company; (2006-2013) retired (since 2004) as Chairman, JPMorgan Fleming Asset Management, President and CEO, Banc One Investment Advisors Corporation, and President, One Group Mutual Funds; prior thereto, Executive Vice President, Banc One Corporation and Chairman and CEO, Banc One Investment Management Group; Regent Emeritus, Member of Investment Committee, Luther College; member of the Wisconsin Bar Association; member of Board of Directors, Friends of Boerner Botanical Gardens; member of Board of Directors and Chair of Investment Committee, Greater Milwaukee Foundation; member of the Board of Directors (Milwaukee), College Possible. | 211 | |||||||||||||||
| nJOHN K. NELSON | |||||||||||||||||||
| 1962 333 West Wacker Drive Chicago, IL 60606 | Board Member | 2013 Class II | Senior external advisor to the financial services practice of Deloitte Consulting LLP (since 2012); Member of Board of Directors of Core12 LLC (since 2008), a private firm which develops branding, marketing and communications strategies for clients; Chairman of the Board of Trustees of Marian University (since 2010 as trustee, 2011 as Chairman); Director of The Curran Center for Catholic American Studies (since 2009) and The President's Council, Fordham University (since 2010); formerly, Chief Executive Officer of ABN AMRO N.V. North America, and Global Head of its Financial Markets Division (2007-2008); prior senior positions held at ABN AMRO include Corporate Executive Vice President and Head of Global Markets—the Americas (2006-2007), CEO of Wholesale Banking—North America and Global Head of Foreign Exchange and Futures Markets (2001-2006), and Regional Commercial Treasurer and Senior Vice President Trading—North America (1996-2001); formerly, Trustee at St. Edmund Preparatory School in New York City. | 211 | |||||||||||||||
Nuveen Investments
52
| Name, Year of Birth & Address | Position(s) Held with the Funds | Year First Elected or Appointed and Term(1) | Principal Occupation(s) including other Directorships During Past 5 Years | Number of Portfolios in Fund Complex Overseen by Board Member | |||||||||||||||
Independent Board Members (continued): | |||||||||||||||||||
| nJUDITH M. STOCKDALE | |||||||||||||||||||
| 1947 333 W. Wacker Drive Chicago, IL 60606 | Board Member | 1997 Class I | Formerly, Executive Director (1994-2012), Gaylord and Dorothy Donnelley Foundation (since 1994); prior thereto, Executive Director, Great Lakes Protection Fund (1990-1994). | 211 | |||||||||||||||
| nCAROLE E. STONE | |||||||||||||||||||
| 1947 333 W. Wacker Drive Chicago, IL 60606 | Board Member | 2007 Class I | Director, Chicago Board Options Exchange (since 2006), C2 Options Exchange, Incorporated (since 2009) and CBOE Holdings, Inc. (since 2010); formerly, Commissioner, New York State Commission on Public Authority Reform (2005-2010); formerly, Chair, New York Racing Association Oversight Board (2005-2007). | 211 | |||||||||||||||
| nVIRGINIA L. STRINGER | |||||||||||||||||||
| 1944 333 W. Wacker Drive Chicago, IL 60606 | Board Member | 2011 Class I | Board Member, Mutual Fund Directors Forum; former governance consultant and non-profit board member; former Owner and President, Strategic Management Resources, Inc. a management consulting firm; former Member, Governing Board, Investment Company Institute's Independent Directors Council; previously, held several executive positions in general management, marketing and human resources at IBM and The Pillsbury Company; Independent Director, First American Fund Complex (1987-2010) and Chair (1997-2010). | 211 | |||||||||||||||
| nTERENCE J. TOTH | |||||||||||||||||||
| 1959 333 W. Wacker Drive Chicago, IL 60606 | Board Member | 2008 Class II | Managing Partner, Promus Capital (since 2008); Director, Fulcrum IT Service LLC (since 2010), Quality Control Corporation (since 2012) and LogicMark LLC (since 2012); formerly, Director, Legal & General Investment Management America, Inc. (2008-2013); formerly, CEO and President, Northern Trust Global Investments (2004-2007); Executive Vice President, Quantitative Management & Securities Lending (2000-2004); prior thereto, various positions with Northern Trust Company (since 1994); member: Chicago Fellowship Board (since 2005), Catalyst Schools of Chicago Board (since 2008) and Chairman, and Mather Foundation Board (since 2012), and a member of its investment committee; formerly, Member, Northern Trust Mutual Funds Board (2005-2007), Northern Trust Global Investments Board (2004-2007), Northern Trust Japan Board (2004-2007), Northern Trust Securities Inc. Board (2003-2007) and Northern Trust Hong Kong Board (1997-2004). | 211 | |||||||||||||||
Nuveen Investments
53
Board Members & Officers* (Unaudited) (continued)
| Name, Year of Birth & Address | Position(s) Held with the Funds | Year First Elected or Appointed and Term(1) | Principal Occupation(s) including other Directorships During Past 5 Years | Number of Portfolios in Fund Complex Overseen by Board Member | |||||||||||||||
Interested Board Members: | |||||||||||||||||||
| nWILLIAM ADAMS IV(2) | |||||||||||||||||||
| 1955 333 W. Wacker Drive Chicago, IL 60606 | Board Member | 2013 Class II | Senior Executive Vice President, Global Structured Products (since 2010); Co-President of Nuveen Fund Advisors, LLC (since 2011); President (since 2011), formerly, Managing Director (2010-2011) of Nuveen Commodities Asset Management, LLC; Board Member of the Chicago Symphony Orchestra and of Gilda's Club Chicago; formerly, Executive Vice President, U.S. Structured Products, of Nuveen Investments, Inc. (1999-2010). | 135 | |||||||||||||||
| nTHOMAS S. SCHREIER, JR.(2) | |||||||||||||||||||
| 1962 333 West Wacker Drive Chicago, IL 60606 | Board Member | 2013 Class III | Vice Chairman, Wealth Management of Nuveen Investments, Inc. (since 2011); Co-President of Nuveen Fund Advisors, LLC; Chairman of Nuveen Asset Management, LLC (since 2011); Co-Chief Executive Officer of Nuveen Securities, LLC (since 2011); Member of Board of Governors and Chairman's Council of the Investment Company Institute; formerly, Chief Executive Officer (2000-2010) and Chief Investment Officer (2007-2010) of FAF Advisors, Inc.; formerly, President of First American Funds (2001-2010). | 135 | |||||||||||||||
| Name, Year of Birth and Address | Position(s) Held with the Funds | Year First Elected or Appointed(3) | Principal Occupation(s) During Past 5 Years | Number of Portfolios in Fund Complex Overseen by Officer | |||||||||||||||
| Officers of the Funds: | |||||||||||||||||||
| nGIFFORD R. ZIMMERMAN | |||||||||||||||||||
| 1956 333 W. Wacker Drive Chicago, IL 60606 | Chief Administrative Officer | 1988 | Managing Director (since 2002), and Assistant Secretary of Nuveen Securities, LLC; Managing Director (since 2004) and Assistant Secretary (since 1994) of Nuveen Investments, Inc.; Managing Director (since 2002), Assistant Secretary (since 1997) and Co-General Counsel (since 2011) of Nuveen Fund Advisors, LLC; Managing Director, Assistant Secretary and Associate General Counsel of Nuveen Asset Management, LLC (since 2011); Managing Director, Associate General Counsel and Assistant Secretary, of Symphony Asset Management LLC (since 2003); Vice President and Assistant Secretary of NWQ Investment Management Company, LLC (since 2002), Nuveen Investments Advisers Inc. (since 2002), Santa Barbara Asset Management, LLC (since 2006), and of Winslow Capital Management, LLC, (since 2010); Vice President and Assistant Secretary (since 2013), formerly, Chief Administrative Officer and Chief Compliance Officer (2006-2013) of Nuveen Commodities Asset Management, LLC; Chartered Financial Analyst. | 211 | |||||||||||||||
Nuveen Investments
54
| Name, Year of Birth and Address | Position(s) Held with the Funds | Year First Elected or Appointed(3) | Principal Occupation(s) During Past 5 Years | Number of Portfolios in Fund Complex Overseen by Officer | |||||||||||||||
| Officers of the Funds (continued): | |||||||||||||||||||
| nCEDRIC H. ANTOSIEWICZ | |||||||||||||||||||
| 1962 333 W. Wacker Drive Chicago, IL 60606 | Vice President | 2007 | Managing Director of Nuveen Securities, LLC. | 103 | |||||||||||||||
| nMARGO L. COOK | |||||||||||||||||||
| 1964 333 W. Wacker Drive Chicago, IL 60606 | Vice President | 2009 | Executive Vice President (since 2008) of Nuveen Investments, Inc. and of Nuveen Fund Advisors, LLC (since 2011); Managing Director-Investment Services of Nuveen Commodities Asset Management, LLC (since August 2011), previously, Head of Institutional Asset Management (2007-2008) of Bear Stearns Asset Management; Head of Institutional Asset Management (1986-2007) of Bank of NY Mellon; Chartered Financial Analyst. | 211 | |||||||||||||||
| nLORNA C. FERGUSON | |||||||||||||||||||
| 1945 333 W. Wacker Drive Chicago, IL 60606 | Vice President | 1998 | Managing Director (since 2005) of Nuveen Fund Advisors, LLC and Nuveen Securities, LLC (since 2004). | 211 | |||||||||||||||
| nSTEPHEN D. FOY | |||||||||||||||||||
| 1954 333 W. Wacker Drive Chicago, IL 60606 | Vice President and Controller | 1998 | Senior Vice President (2010-2011), formerly, Vice President (2005-2010) and Funds Controller of Nuveen Securities, LLC; Senior Vice President (since 2013), formerly, Vice President of Nuveen Fund Advisors, LLC; Chief Financial Officer of Nuveen Commodities Asset Management, LLC (since 2010); Certified Public Accountant. | 211 | |||||||||||||||
| nSCOTT S. GRACE | |||||||||||||||||||
| 1970 333 W. Wacker Drive Chicago, IL 60606 | Vice President and Treasurer | 2009 | Managing Director, Corporate Finance & Development, Treasurer (since 2009) of Nuveen Securities, LLC; Managing Director and Treasurer (since 2009) of Nuveen Fund Advisors, LLC, Nuveen Investments Advisers, Inc., Nuveen Investments Holdings Inc. and (since 2011) Nuveen Asset Management, LLC; Vice President and Treasurer of NWQ Investment Management Company, LLC, Tradewinds Global Investors, LLC, Symphony Asset Management LLC and Winslow Capital Management, LLC.; Vice President of Santa Barbara Asset Management, LLC; formerly, Treasurer (2006-2009), Senior Vice President (2008-2009), previously, Vice President (2006-2008) of Janus Capital Group, Inc.; formerly, Senior Associate in Morgan Stanley's Global Financial Services Group (2000-2003); Chartered Accountant Designation. | 211 | |||||||||||||||
| nWALTER M. KELLY | |||||||||||||||||||
| 1970 333 W. Wacker Drive Chicago, IL 60606 | Chief Compliance Officer and Vice President | 2003 | Senior Vice President (since 2008) and Assistant Secretary (since 2003) of Nuveen Fund Advisors, LLC; Senior Vice President (since 2008) of Nuveen Investment Holdings, Inc.; formerly, Senior Vice President (2008-2011) of Nuveen Securities, LLC. | 211 | |||||||||||||||
Nuveen Investments
55
Board Members & Officers* (Unaudited) (continued)
| Name, Year of Birth and Address | Position(s) Held with the Funds | Year First Elected or Appointed(3) | Principal Occupation(s) During Past 5 Years | Number of Portfolios in Fund Complex Overseen by Officer | |||||||||||||||
| Officers of the Funds (continued): | |||||||||||||||||||
| nTINA M. LAZAR | |||||||||||||||||||
| 1961 333 W. Wacker Drive Chicago, IL 60606 | Vice President | 2002 | Senior Vice President (since 2010), formerly, Vice President (2005-2010) of Nuveen Fund Advisors, LLC. | 211 | |||||||||||||||
| nKEVIN J. MCCARTHY | |||||||||||||||||||
| 1966 333 W. Wacker Drive Chicago, IL 60606 | Vice President and Secretary | 2007 | Managing Director and Assistant Secretary (since 2008), Nuveen Securities, LLC; Managing Director (since 2008), Assistant Secretary (since 2007) and Co-General Counsel (since 2011) of Nuveen Fund Advisors, LLC; Managing Director, Assistant Secretary and Associate General Counsel (since 2011) of Nuveen Asset Management, LLC; Managing Director (since 2008), and Assistant Secretary, Nuveen Investment Holdings, Inc.; Vice President (since 2007) and Assistant Secretary of Nuveen Investments Advisers Inc., NWQ Investment Management Company, LLC, NWQ Holdings, LLC, Symphony Asset Management LLC, Santa Barbara Asset Management, LLC, and of Winslow Capital Management, LLC, (since 2010); Vice President and Secretary (since 2010) of Nuveen Commodities Asset Management, LLC. | 211 | |||||||||||||||
| nKATHLEEN L. PRUDHOMME | |||||||||||||||||||
| 1953 901 Marquette Avenue Minneapolis, MN 55402 | Vice President and Assistant Secretary | 2011 | Managing Director, Assistant Secretary and Co-General Counsel (since 2011) of Nuveen Fund Advisors, LLC; Managing Director, Assistant Secretary and Associate General Counsel (since 2011) of Nuveen Asset Management, LLC; Managing Director and Assistant Secretary (since 2011) of Nuveen Securities, LLC; formerly, Deputy General Counsel, FAF Advisors, Inc. (2004-2010). | 211 | |||||||||||||||
| nJOEL T. SLAGER | |||||||||||||||||||
| 1978 333 West Wacker Drive Chicago, IL 60606 | Vice President and Assistant Secretary | 2013 | Fund Tax Director for Nuveen Funds (since May, 2013); previously, Vice President of Morgan Stanley Investment Management, Inc., Assistant Treasurer of the Morgan Stanley Funds (from 2010 to 2013); Tax Director at PricewaterhouseCoopers LLP (from 2008 to 2010). | 211 | |||||||||||||||
(1) Board Members serve three year terms, except for two board members who are elected by the holders of Preferred Shares. The Board of Trustees is divided into three classes, Class I, Class II, and Class III, with each being elected to serve until the third succeeding annual shareholders' meeting subsequent to its election or thereafter in each case when its respective successors are duly elected or appointed. The first year elected or appointed represents the year in which the board member was first elected or appointed to any fund in the Nuveen Complex.
(2) "Interested person" as defined in the 1940 Act, by reason of his position with Nuveen Investments, Inc. and certain of its subsidiaries, which are affiliates of the Nuveen Funds.
(3) Officers serve one year terms through August of each year. The year first elected or appointed represents the year in which the Officer was first elected or appointed to any fund in the Nuveen Complex.
* Represents the Fund's Board of Trustees as of September 1, 2013.
Nuveen Investments
56
Reinvest Automatically,
Easily and Conveniently
Nuveen makes reinvesting easy. A phone call is all it takes to set up your reinvestment account.
Nuveen Closed-End Funds Automatic Reinvestment Plan
Your Nuveen Closed-End Fund allows you to conveniently reinvest distributions in additional Fund shares.
By choosing to reinvest, you'll be able to invest money regularly and automatically, and watch your investment grow through the power of compounding. Just like distributions in cash, there may be times when income or capital gains taxes may be payable on distributions that are reinvested.
It is important to note that an automatic reinvestment plan does not ensure a profit, nor does it protect you against loss in a declining market.
Easy and convenient
To make recordkeeping easy and convenient, each quarter you'll receive a statement showing your total distributions, the date of investment, the shares acquired and the price per share, and the total number of shares you own.
How shares are purchased
The shares you acquire by reinvesting will either be purchased on the open market or newly issued by the Fund. If the shares are trading at or above net asset value at the time of valuation, the Fund will issue new shares at the greater of the net asset value or 95% of the then-current market price. If the shares are trading at less than net asset value, shares for your account will be purchased on the open market. If the Plan Agent begins purchasing Fund shares on the open market while shares are trading below net asset value, but the Fund's shares subsequently trade at or above their net asset value before the Plan Agent is able to complete its purchases, the Plan Agent may cease open-market purchases and may invest the uninvested portion of the distribution in newly-issued Fund shares at a price equal to the greater of the shares' net asset value or 95% of the shares' market value on the last business day immediately prior to the purchase date. Distributions received to purchase shares in the open market will normally be invested shortly after the distribution payment date. No interest will be paid on distributions awaiting reinvestment. Because the market price of the shares may increase before purchases are completed, the average purchase price per share may exceed the market price at the time of valuation, resulting in the acquisition of fewer shares than if the distribution had been paid in shares issued by the Fund. A pro rata portion of any applicable brokerage commissions on open market purchases will be paid by Plan participants. These commissions usually will be lower than those charged on individual transactions.
Flexible
You may change your distribution option or withdraw from the Plan at any time, should your needs or situation change.
You can reinvest whether your shares are registered in your name, or in the name of a brokerage firm, bank, or other nominee. Ask your investment advisor if his or her firm will participate on your behalf. Participants whose shares are registered in the name of one firm may not be able to transfer the shares to another firm and continue to participate in the Plan.
The Fund reserves the right to amend or terminate the Plan at any time. Although the Fund reserves the right to amend the Plan to include a service charge payable by the participants, there is no direct service charge to participants in the Plan at this time.
Call today to start reinvesting distributions
For more information on the Nuveen Automatic Reinvestment Plan or to enroll in or withdraw from the Plan, speak with your financial advisor or call us at (800) 257-8787.
Nuveen Investments
57
Glossary of Terms
Used in this Report
• Average Annual Total Return: This is a commonly used method to express an investment's performance over a particular, usually multi-year time period. It expresses the return that would have been necessary each year to equal the investment's actual cumulative performance (including change in NAV or market price and reinvested dividends and capital gains distributions, if any) over the time period being considered.
• BofA/Merrill Lynch Preferred Stock Fixed Rate Index: An index that tracks the performance of fixed rate U.S. dollar denominated preferred securities issued in the U.S. Domestic Market. Qualifying securities must be rated investment grade (based on an average of Moody's, S&P, and Fitch, Inc.) and must have an investment grade rated country of risk (based on an average of Moody's Investors Service, Standard & Poor's, and Fitch foreign currency long-term sovereign debt ratings). In addition, qualifying securities must be issued as public securities or through a 144A filing, must be issued in $25, $50 or $100 par/liquidation preference increments, must have a fixed coupon or dividend schedule, and must have a minimum amount outstanding of $100 million. The index returns assume reinvestment of dividends, but do not reflect any applicable sales charges.
• Current Distribution Rate: Current distribution rate is based on the fund's current annualized monthly distribution divided by the fund's current market price. The fund's monthly distributions to its shareholders may be comprised of ordinary income, net realized capital gains and, if at the end of the calendar year the fund's cumulative net ordinary income and net realized gains are less than the amount of the fund's distributions, a tax return of capital.
• Comparative Benchmark: A blended return consisting of: 1) 27.5% of the BofA/Merrill Lynch Preferred Stock Hybrid Securities Index, an unmanaged index of investment-grade, exchange traded preferred issues with outstanding market values of at least $100 million and at least one year to maturity; 2) 22.5% of the Barclays Tier 1 Capital Securities Index, an unmanaged index that includes securities that can generally be viewed as hybrid fixed-income securities that either receive regulatory capital treatment or a degree of "equity credit" from a rating agency; 3) 10.0% of the Russell 3000 Index, which measures the performance of the largest 3000 U.S. companies representing approximately 98% of the investable U.S. equity market; 4) 10.0% of the MSCI EAFE Index, a free float-adjusted market capitalization index that is designed to measure the equity market performance of developed markets, excluding the U.S. & Canada; 5) 10.0% of the MSCI AC World Index, a free float-adjusted market capitalization weighted index that is designed to measure the equity market performance of developed and emerging markets; 6) 6.7% of the BofA/Merrill Lynch All U.S. Convertibles Index, which consists of approximately 595 securities with a par value greater than $50 million that were issued by U.S. companies or non-U.S. based issuers that have a significant business presence in the U.S.; 7) 6.7% of the CSFB High Yield Index, which includes approximately $515 billion of U.S.$-denominated high yield debt with a minimum of $75 million in par value and at least one rating below investment-grade; and 8) 6.6% of the CSFB Leverage Loan Index, which includes approximately $611 billion of U.S. dollar-denominated leveraged loans at least one rating below investment-grade. Benchmark returns do not include the effects of any sales charges or management fees.
• Gross Domestic Product (GDP): The total market value of all final goods and services produced in a country/region in a given year, equal to total consumer, investment and government spending, plus the value of exports, minus the value of imports.
Nuveen Investments
58
• Effective Leverage: Effective leverage is a fund's effective economic leverage, and includes both regulatory leverage (see below) and the leverage effects of certain derivative investments in a fund's portfolio that increase the fund's investment exposure.
• Leverage: Using borrowed money to invest in securities or other assets, seeking to increase the return of an investment or portfolio.
• Net Asset Value (NAV): The net market value of all securities held in a portfolio.
• Net Asset Value (NAV) Per Share: The market value of one share of a mutual fund or closed-end fund. For a fund, the NAV is calculated daily by taking the fund's total assets (securities, cash, and accrued earnings), subtracting the fund's liabilities, and dividing by the number of shares outstanding.
• Regulatory Leverage: Regulatory leverage consists of preferred shares issued by or borrowings of a fund. Both of these are part of a fund's capital structure. Regulatory leverage is sometimes referred to as "'40 Act Leverage" and is subject to asset coverage limits set in the Investment Company Act of 1940.
Nuveen Investments
59
Notes
Nuveen Investments
60
Notes
Nuveen Investments
61
Notes
Nuveen Investments
62
Additional Fund Information
Board of Trustees*
| William Adams IV William J. Schneider | Robert P. Bremner Thomas S. Schreier | Jack B. Evans Judith M. Stockdale | William C. Hunter Carole E. Stone | David J. Kundert Virginia L. Stringer | John K. Nelson Terence J. Toth | ||||||||||||||||||
* Represents the Fund's Board of Trustees as of September 1, 2013.
| Fund Manager Nuveen Fund Advisors, LLC 333 West Wacker Drive Chicago, IL 60606 | Custodian State Street Bank & Trust Company Boston, MA 02111 | Legal Counsel Chapman and Cutler LLP Chicago, IL 60603 | Independent Registered Public Accounting Firm Ernst & Young LLP Chicago, IL 60606 | Transfer Agent and Shareholder Services State Street Bank & Trust Company Nuveen Funds P.O. Box 43071 Providence, RI 02940-3071 (800) 257-8787 | |||||||||||||||
Quarterly Form N-Q Portfolio of Investments Information
The Fund is required to file its complete schedule of portfolio holdings with the Securities and Exchange Commission (SEC) for the first and third quarters of each fiscal year on Form N-Q. You may obtain this information directly from the SEC. Visit the SEC on-line at http://www.sec.gov or in person at the SEC's Public Reference Room in Washington, D.C. Call the SEC toll-free at (800) SEC -0330 for room hours and operation.
Nuveen Funds' Proxy Voting Information
You may obtain (i) information regarding how each fund voted proxies relating to portfolio securities held during the most recent twelve-month period ended June 30, without charge, upon request, by calling Nuveen Investments toll-free at (800) 257-8787 or on Nuveen's website at www.nuveen.com and (ii) a description of the policies and procedures that each fund used to determine how to vote proxies relating to portfolio securities without charge, upon request, by calling Nuveen Investments toll free at (800) 257-8787. You may also obtain this information directly from the SEC. Visit the SEC on-line at http://www.sec.gov.
CEO Certification Disclosure
The Fund's Chief Executive Officer has submitted to the New York Stock Exchange (NYSE) the annual CEO certification as required by Section 303A.12(a) of the NYSE Listed Company Manual. The Fund has filed with the SEC the certification of its Chief Executive Officer and Chief Financial Officer required by Section 302 of the Sarbanes-Oxley Act.
Common Share Information
The Fund intends to repurchase shares of its own common stock at such times and in such amounts as is deemed advisable. During the period covered by this report, the Fund repurchased shares of its common stock as shown in the accompanying table. Any future repurchases will be reported to shareholders in the next annual or semi-annual report.
Common shares repurchased | — | ||||||
Distribution Information
The Fund hereby designates its percentages of dividends paid from net ordinary income as dividends qualifying for the 70% dividends received deduction (DRD) for corporations and its percentages as qualified dividend income (QDI) for individuals under Section 1(h)(11) of the Internal Revenue Code as shown in the accompanying table. The actual qualified dividend income distributions will be reported to shareholders on Form 1099-DIV which will be sent to shareholders shortly after calendar year end.
| % QDI | 59.54 | % | |||||
| % DRD | 24.35 | % | |||||
Nuveen Investments
63
Nuveen Investments:
Serving Investors for Generations
Since 1898, financial advisors and their clients have relied on Nuveen Investments to provide dependable investment solutions through continued adherence to proven, long-term investing principles. Today, we offer a range of high quality equity and fixed-income solutions designed to be integral components of a well-diversified core portfolio.
Focused on meeting investor needs.
Nuveen Investments provides high-quality investment services designed to help secure the long-term goals of institutional and individual investors as well as the consultants and financial advisors who serve them. Nuveen Investments markets a wide range of specialized investment solutions which provide investors access to capabilities of its high-quality boutique investment affiliates—Nuveen Asset Management, Symphony Asset Management, NWQ Investment Management Company, Santa Barbara Asset Management, Tradewinds Global Investors, Winslow Capital Management and Gresham Investment Management. In total, Nuveen Investments managed approximately $216 billion as of June 30, 2013.
Find out how we can help you.
To learn more about how the products and services of Nuveen Investments may be able to help you meet your financial goals, talk to your financial advisor, or call us at (800) 257-8787. Please read the information provided carefully before you invest. Investors should consider the investment objective and policies, risk considerations, charges and expenses of any investment carefully. Where applicable, be sure to obtain a prospectus, which contains this and other relevant information. To obtain a prospectus, please contact your securities representative or Nuveen Investments, 333 W. Wacker Dr., Chicago, IL 60606. Please read the prospectus carefully before you invest or send money.
Learn more about Nuveen Funds at: www.nuveen.com/cef
Distributed by
Nuveen Securities, LLC
333 West Wacker Drive
Chicago, IL 60606
www.nuveen.com/cef
EAN-F-0713D
ITEM 2. CODE OF ETHICS.
As of the end of the period covered by this report, the registrant has adopted a code of ethics that applies to the registrant’s principal executive officer, principal financial officer, principal accounting officer or controller, or persons performing similar functions. There were no amendments to or waivers from the Code during the period covered by this report. The registrant has posted the code of ethics on its website at www.nuveen.com/CEF/Shareholder/FundGovernance.aspx. (To view the code, click on Code of Conduct.)
ITEM 3. AUDIT COMMITTEE FINANCIAL EXPERT.
The registrant’s Board of Directors or Trustees (“Board”) determined that the registrant has at least one “audit committee financial expert” (as defined in Item 3 of Form N-CSR) serving on its Audit Committee. The registrant’s audit committee financial expert is Carole E. Stone, who is “independent” for purposes of Item 3 of Form N-CSR.
Ms. Stone served for five years as Director of the New York State Division of the Budget. As part of her role as Director, Ms. Stone was actively involved in overseeing the development of the State’s operating, local assistance and capital budgets, its financial plan and related documents; overseeing the development of the State’s bond-related disclosure documents and certifying that they fairly presented the State’s financial position; reviewing audits of various State and local agencies and programs; and coordinating the State’s system of internal audit and control. Prior to serving as Director, Ms. Stone worked as a budget analyst/examiner with increasing levels of responsibility over a 30 year period, including approximately five years as Deputy Budget Director. Ms. Stone has also served as Chair of the New York State Racing Association Oversight Board, as Chair of the Public Authorities Control Board, as a Commissioner on the New York State Commission on Public Authority Reform and as a member of the Boards of Directors of several New York State public authorities. These positions have involved overseeing operations and finances of certain entities and assessing the adequacy of project/entity financing and financial reporting. Currently, Ms. Stone is on the Board of Directors of CBOE Holdings, Inc., of the Chicago Board Options Exchange, and of C2 Options Exchange. Ms. Stone’s position on the boards of these entities and as a member of both CBOE Holdings’ Audit Committee and its Finance Committee has involved, among other things, the oversight of audits, audit plans and preparation of financial statements.
ITEM 4. PRINCIPAL ACCOUNTANT FEES AND SERVICES.
Nuveen Preferred Income Opportunities Fund
The following tables show the amount of fees that Ernst & Young LLP, the Fund’s auditor, billed to the Fund during the Fund’s last two full fiscal years. For engagements with Ernst & Young LLP the Audit Committee approved in advance all audit services and non-audit services that Ernst & Young LLP provided to the Fund, except for those non-audit services that were subject to the pre-approval exception under Rule 2-01 of Regulation S-X (the “pre-approval exception”). The pre-approval exception for services provided directly to the Fund waives the pre-approval requirement for services other than audit, review or attest services if: (A) the aggregate amount of all such services provided constitutes no more than 5% of the total amount of revenues paid by the Fund to its accountant during the fiscal year in which the services are provided; (B) the Fund did not recognize the services as non-audit services at the time of the engagement; and (C) the services are promptly brought to the Audit Committee’s attention, and the Committee (or its delegate) approves the services before the audit is completed.
The Audit Committee has delegated certain pre-approval responsibilities to its Chairman (or, in his absence, any other member of the Audit Committee).
SERVICES THAT THE FUND’S AUDITOR BILLED TO THE FUND
|
| Audit Fees Billed |
| Audit-Related Fees |
| Tax Fees |
| All Other Fees |
| ||||
Fiscal Year Ended |
| to Fund (1) |
| Billed to Fund (2) |
| Billed to Fund (3) |
| Billed to Fund (4) |
| ||||
July 31, 2013 |
| $ | 25,300 |
| $ | 0 |
| $ | 2,000 |
| $ | 0 |
|
|
|
|
|
|
|
|
|
|
| ||||
Percentage approved pursuant to pre-approval exception |
| 0 | % | 0 | % | 0 | % | 0 | % | ||||
|
|
|
|
|
|
|
|
|
| ||||
July 31, 2012 |
| $ | 27,000 |
| $ | 0 |
| $ | 5,280 |
| $ | 0 |
|
|
|
|
|
|
|
|
|
|
| ||||
Percentage approved pursuant to pre-approval exception |
| 0 | % | 0 | % | 0 | % | 0 | % | ||||
(1) “Audit Fees” are the aggregate fees billed for professional services for the audit of the Fund’s annual financial statements and services provided in connection with statutory and regulatory filings or engagements.
(2) “Audit Related Fees” are the aggregate fees billed for assurance and related services reasonably related to the performance of the audit or review of financial statements that are not reported under “Audit Fees”. These fees include offerings related to the Fund’s common shares and leverage.
(3) “Tax Fees” are the aggregate fees billed for professional services for tax advice, tax compliance, and tax planning. These fees include: all global withholding tax services; excise and state tax reviews; capital gain, tax equalization and taxable basis calculation performed by the principal accountant.
(4) “All Other Fees” are the aggregate fees billed for products and services other than “Audit Fees”, “Audit-Related Fees” and “Tax Fees”. These fees represent all “Agreed-Upon Procedures” engagements pertaining to the Fund’s use of leverage.
SERVICES THAT THE FUND’S AUDITOR BILLED TO THE
ADVISER AND AFFILIATED FUND SERVICE PROVIDERS
The following tables show the amount of fees billed by Ernst & Young LLP to Nuveen Fund Advisors, LLC (formerly Nuveen Fund Advisors, Inc.) (the “Adviser”), and any entity controlling, controlled by or under common control with the Adviser that provides ongoing services to the Fund (“Affiliated Fund Service Provider”), for engagements directly related to the Fund’s operations and financial reporting, during the Fund’s last two full fiscal years.
The tables also show the percentage of fees subject to the pre-approval exception. The pre-approval exception for services provided to the Adviser and any Affiliated Fund Service Provider (other than audit, review or attest services) waives the pre-approval requirement if: (A) the aggregate amount of all such services provided constitutes no more than 5% of the total amount of revenues paid to Ernst & Young LLP by the Fund, the Adviser and Affiliated Fund Service Providers during the fiscal year in which the services are provided that would have to be pre-approved by the Audit Committee; (B) the Fund did not recognize the services as non-audit services at the time of the engagement; and (C) the services are promptly brought to the Audit Committee’s attention, and the Committee (or its delegate) approves the services before the Fund’s audit is completed.
|
| Audit-Related Fees |
| Tax Fees Billed to |
| All Other Fees |
| |||
|
| Billed to Adviser and |
| Adviser and |
| Billed to Adviser |
| |||
|
| Affiliated Fund |
| Affiliated Fund |
| and Affiliated Fund |
| |||
Fiscal Year Ended |
| Service Providers |
| Service Providers |
| Service Providers |
| |||
July 31, 2013 |
| $ | 0 |
| $ | 0 |
| $ | 0 |
|
|
|
|
|
|
|
|
| |||
Percentage approved pursuant to pre-approval exception |
| 0 | % | 0 | % | 0 | % | |||
|
|
|
|
|
|
|
| |||
July 31, 2012 |
| $ | 0 |
| $ | 0 |
| $ | 0 |
|
|
|
|
|
|
|
|
| |||
Percentage approved pursuant to pre-approval exception |
| 0 | % | 0 | % | 0 | % | |||
NON-AUDIT SERVICES
The following table shows the amount of fees that Ernst & Young LLP billed during the Fund’s last two full fiscal years for non-audit services. The Audit Committee is required to pre-approve non-audit services that Ernst & Young LLP provides to the Adviser and any Affiliated Fund Services Provider, if the engagement related directly to the Fund’s operations and financial reporting (except for those subject to the pre-approval exception described above). The Audit Committee requested and received information from Ernst & Young LLP about any non-audit services that Ernst & Young LLP rendered during the Fund’s last fiscal year to the Adviser and any Affiliated Fund Service Provider. The Committee considered this information in evaluating Ernst & Young LLP’s independence.
|
|
|
| Total Non-Audit Fees |
|
|
|
|
| ||||
|
|
|
| billed to Adviser and |
|
|
|
|
| ||||
|
|
|
| Affiliated Fund Service |
| Total Non-Audit Fees |
|
|
| ||||
|
|
|
| Providers (engagements |
| billed to Adviser and |
|
|
| ||||
|
|
|
| related directly to the |
| Affiliated Fund Service |
|
|
| ||||
|
| Total Non-Audit Fees |
| operations and financial |
| Providers (all other |
|
|
| ||||
Fiscal Year Ended |
| Billed to Fund |
| reporting of the Fund) |
| engagements) |
| Total |
| ||||
July 31, 2013 |
| $ | 2,000 |
| $ | 0 |
| $ | 0 |
| $ | 2,000 |
|
July 31, 2012 |
| $ | 5,280 |
| $ | 0 |
| $ | 0 |
| $ | 5,280 |
|
“Non-Audit Fees billed to Fund” for both fiscal year ends represent “Tax Fees” and “All Other Fees” billed to Fund in their respective amounts from the previous table.
Less than 50 percent of the hours expended on the principal accountant’s engagement to audit the registrant’s financial statements for the most recent fiscal year were attributed to work performed by persons other than the principal accountant’s full-time, permanent employees.
Audit Committee Pre-Approval Policies and Procedures. Generally, the Audit Committee must approve (i) all non-audit services to be performed for the Fund by the Fund’s independent accountants and (ii) all audit and non-audit services to be performed by the Fund’s independent accountants for the Affiliated Fund Service Providers with respect to operations and financial reporting of the Fund. Regarding tax and research projects conducted by the independent accountants for the Fund and Affiliated Fund Service Providers (with respect to operations and financial reports of the Fund) such engagements will be (i) pre-approved by the Audit Committee if they are expected to be for amounts greater than $10,000; (ii) reported to the Audit Committee chairman for his verbal approval prior to engagement if they are expected to be for amounts under $10,000 but greater than $5,000; and (iii) reported to the Audit Committee at the next Audit Committee meeting if they are expected to be for an amount under $5,000.
ITEM 5. AUDIT COMMITTEE OF LISTED REGISTRANTS.
The registrant’s Board has a separately designated Audit Committee established in accordance with Section 3(a)(58)(A) of the Securities Exchange Act of 1934, as amended (15 U.S.C. 78c(a)(58)(A)). The members of the audit committee are Robert P. Bremner, David J. Kundert, William J. Schneider, Carole E. Stone and Terence J. Toth.
ITEM 6. SCHEDULE OF INVESTMENTS.
(a) See Portfolio of Investments in Item 1.
(b) Not applicable.
ITEM 7. DISCLOSURE OF PROXY VOTING POLICIES AND PROCEDURES FOR CLOSED-END MANAGEMENT INVESTMENT COMPANIES.
Nuveen Fund Advisors, LLC, formerly known as Nuveen Fund Advisors, Inc., is the registrant’s investment adviser (also referred to as the “Adviser”). The Adviser is responsible for the on-going monitoring of the Fund’s investment portfolio, managing the Fund’s business affairs and providing certain clerical, bookkeeping and administrative services. The Adviser has engaged NWQ Investment Management Company, LLC (“NWQ”) and Nuveen Asset Management, LLC (“Nuveen Asset Management”) (NWQ and Nuveen Asset Management are collectively referred to as “Sub-Advisers”) as Sub-Advisers to provide discretionary investment advisory services. As part of these services, the Adviser has delegated to each Sub-Adviser the full responsibility for proxy voting and related duties in accordance with each Sub-Adviser’s policies and procedures. The Adviser periodically monitors each Sub-Adviser’s voting to ensure that it is carrying out its duties. Each Sub-Adviser’s proxy voting policies and procedures are attached to this filing as an exhibit and incorporated herein by reference.
ITEM 8. PORTFOLIO MANAGERS OF CLOSED-END MANAGEMENT INVESTMENT COMPANIES.
Nuveen Fund Advisors, LLC, formerly known as Nuveen Fund Advisors, Inc., is the registrant’s investment adviser (also referred to as the “Adviser”). The Adviser is responsible for the selection and on-going monitoring of the Fund’s investment portfolio, managing the Fund’s business affairs and providing certain clerical, bookkeeping and administrative services. The Adviser has engaged NWQ Investment Management Company, LLC (“NWQ”) and Nuveen Asset Management, LLC (“Nuveen Asset Management”) (NWQ and Nuveen Asset Management are also collectively referred to as “Sub-Advisers”), each responsible for a portion of the registrant’s portfolio as Sub-Advisers to provide discretionary investment advisory services. The following section provides information on the portfolio managers at each Sub-Adviser:
NUVEEN ASSET MANAGEMENT
Item 8(a)(1). PORTFOLIO MANAGER BIOGRAPHIES
Douglas M. Baker, CFA, and Brenda A. Langenfeld, CFA, are primarily responsible for the day-to-day management of the portion of the registrant’s portfolio managed by Nuveen Asset Management.
Douglas Baker, CFA, is a Senior Vice President at Nuveen Asset Management and a portfolio manager for the fund and related preferred security strategies. He originally joined Nuveen Asset Management in 2006 as a Vice President and Derivatives Analyst, and later that year his responsibilities expanded to include portfolio management duties for the Nuveen Preferred Securities Fund. In addition to managing various preferred securities strategies, Mr. Baker also manages Nuveen Asset Management’s derivative overlay group, where he is responsible for implementing derivatives-based hedging strategies across the Nuveen Asset Management complex, as well as managing collateral accounts for several commodity-based strategies.
Brenda A. Langenfeld, CFA, is a Vice President at Nuveen Asset Management and a portfolio manager for the fund and related preferred security strategies. She started working in the financial services industry with FAF Advisors, Inc. in 2004. Previously, Ms. Langenfeld was a member of the High Grade Credit Sector Team, responsible for trading corporate bonds, and prior to that, she was a member of the Securitized Debt Sector Team, trading mortgage-backed securities, asset-backed securities and commercial mortgage-backed securities.
Item 8(a)(2). OTHER ACCOUNTS MANAGED BY PORTFOLIO MANAGERS
In addition to the Fund, as of July 31, 2013, the portfolio managers are also primarily responsible for the day-to-day portfolio management of the following accounts:
Portfolio Manager |
| Type of Account |
| Number of |
| Assets* |
| |
|
|
|
|
|
|
|
| |
Douglas Baker |
| Registered Investment Companies |
| 5 |
| $ | 2,159,100,000 |
|
|
| Pooled Accounts |
| 4 |
| $ | 495,900,000 |
|
|
| Separately Managed accounts |
| 20 |
| $ | 152,900,000 |
|
|
|
|
|
|
|
|
|
|
Brenda Langenfeld |
| Registered Investment Companies |
| 2 |
| $ | 2,026,000,000 |
|
|
| Pooled Accounts |
| 0 |
| $ | 0 |
|
|
| Separately Managed accounts |
| 20 |
| $ | 152,900,000 |
|
* Assets are as of July 31, 2013. None of the assets in these accounts are subject to an advisory fee based on performance.
POTENTIAL MATERIAL CONFLICTS OF INTEREST
Actual or apparent conflicts of interest may arise when a portfolio manager has day-to-day management responsibilities with respect to more than one account. More specifically, portfolio managers who manage multiple accounts are presented a number of potential conflicts, including, among others, those discussed below.
The management of multiple accounts may result in a portfolio manager devoting unequal time and attention to the management of each account. Nuveen Asset Management seeks to manage such competing interests for the time and attention of portfolio managers by having portfolio managers focus on a particular investment discipline. Most accounts managed by a portfolio manager in a particular investment strategy are managed using the same investment models.
If a portfolio manager identifies a limited investment opportunity which may be suitable for more than one account, an account may not be able to take full advantage of that opportunity due to an allocation of filled purchase or sale orders across all eligible accounts. To deal with these situations, Nuveen Asset Management has adopted procedures for allocating limited opportunities across multiple accounts.
With respect to many of its clients’ accounts, Nuveen Asset Management determines which broker to use to execute transaction orders, consistent with its duty to seek best execution of the transaction. However, with respect to certain other accounts, Nuveen Asset Management may be limited by the client with respect to the selection of brokers or may be instructed to direct trades through a particular broker. In these cases, Nuveen Asset Management may place separate, non-simultaneous, transactions for a Fund and other accounts which may temporarily affect the market price of the security or the execution of the transaction, or both, to the detriment of the Fund or the other accounts.
Some clients are subject to different regulations. As a consequence of this difference in regulatory requirements, some clients may not be permitted to engage in all the investment techniques or transactions or to engage in these transactions to the same extent as the other accounts managed by the portfolio manager. Finally, the appearance of a conflict of interest may arise where Nuveen Asset Management has an incentive, such as a performance-based management fee, which relates to the management of some accounts, with respect to which a portfolio manager has day-to-day management responsibilities.
Nuveen Asset Management has adopted certain compliance procedures which are designed to address these types of conflicts common among investment managers. However, there is no guarantee that such procedures will detect each and every situation in which a conflict arises.
Item 8(a)(3). FUND MANAGER COMPENSATION
Portfolio manager compensation consists primarily of base pay, an annual cash bonus and long term incentive payments.
Base pay. Base pay is determined based upon an analysis of the portfolio manager’s general performance, experience, and market levels of base pay for such position.
Annual cash bonus. The Fund’s portfolio managers are eligible for an annual cash bonus based on investment performance, qualitative evaluation and financial performance of Nuveen Asset Management.
A portion of each portfolio manager’s annual cash bonus is based on the Fund’s investment performance, generally measured over the past one- and three or five-year periods unless the portfolio manager’s tenure is shorter. Investment performance for the Fund generally is determined by evaluating the Fund’s performance relative to its benchmark(s) and/or Lipper industry peer group.
A portion of the cash bonus is based on a qualitative evaluation made by each portfolio manager’s supervisor taking into consideration a number of factors, including the portfolio manager’s team collaboration, expense management, support of personnel responsible for asset growth, and his or her compliance with Nuveen Asset Management’s policies and procedures.
The final factor influencing a portfolio manager’s cash bonus is the financial performance of Nuveen Asset Management based on its operating earnings.
Long-term incentive compensation. Certain key employees of Nuveen Investments and its affiliates, including certain portfolio managers, have received equity interests in the parent company of Nuveen Investments. In addition, certain key employees of Nuveen Asset Management, including certain portfolio managers, have received profits interests in Nuveen Asset Management which entitle their holders to participate in the firm’s growth over time.
There are generally no differences between the methods used to determine compensation with respect to the Fund and the Other Accounts shown in the table above.
Item 8(a)(4). OWNERSHIP OF JPC SECURITIES AS OF JULY 31, 2013
Name of Portfolio |
| None |
| $1 - |
| $10,001- |
| $50,001- |
| $100,001- |
| $500,001- |
| Over |
|
Doug Baker |
| X |
|
|
|
|
|
|
|
|
|
|
|
|
|
Brenda Langenfeld |
| X |
|
|
|
|
|
|
|
|
|
|
|
|
|
NWQ
Item 8(a)(1). PORTFOLIO MANAGER BIOGRAPHY
Michael Carne, CFA, Managing Director and Portfolio Manager
Prior to joining NWQ in 2002, Mr. Carne managed institutional, private client fixed income and balanced portfolios for over twenty years. During this time, he held assignments as Director of Global Fixed Income at Aetna Capital Management, as Chief Investment Officer of a Phoenix Home Life affiliate and was a principal in Standard Asset Group. Mr. Carne graduated from the University of Massachusetts with a B.B.A. degree in Finance and received his M.B.A. from Harvard University. He earned the designation of Chartered Financial Analyst in 1989.
Item 8 (a)(2). OTHER ACCOUNTS MANAGED — AS OF JULY 31, 2013
|
| Michael Carne |
| |
(a) RICs |
|
|
| |
Number of accts |
| 5 |
| |
Assets ($000s) |
| $ | 883,902,021 |
|
|
|
|
| |
(b) Other pooled accts |
|
|
| |
Non-performance fee accts |
|
|
| |
Number of accts |
| 0 |
| |
Assets ($000s) |
| 0 |
| |
(c) Other |
|
|
| |
Non-performance fee accts |
|
|
| |
Number of accts |
| 4,922 |
| |
Assets ($000s) |
| $ | 1,006,945,998 |
|
Performance fee accts |
|
|
| |
Number of accts |
| 0 |
| |
Assets ($000s) |
| 0 |
| |
POTENTIAL MATERIAL CONFLICTS OF INTEREST
Actual or perceived conflicts of interest may arise when a portfolio manager has day-to-day management responsibilities with respect to more than one account. More specifically, portfolio managers who manage multiple accounts are presented with the following potential conflicts, which are not intended to be an exhaustive list:
· The management of multiple accounts may result in a portfolio manager devoting unequal time and attention to the management of each account. NWQ seeks to manage such competing interests for the time and attention of the portfolio manager by utilizing investment models for the management of most investment strategies.
· If a portfolio manager identifies a limited investment opportunity which may be suitable for more than one account, an account may not be able to take full advantage of that opportunity due to an allocation of filled purchase or sale orders across all eligible accounts. To deal with these situations, NWQ has adopted procedures for allocating limited opportunities across multiple accounts.
· With respect to many of its clients’ accounts, NWQ determines which broker to use to execute transaction orders, consistent with its duty to seek to obtain best execution of the transaction. However, with respect to certain other accounts, NWQ may be limited by the client with respect to the selection of brokers or may be instructed to direct trades through a particular broker. In these cases, NWQ may place separate transactions for certain accounts which may temporarily affect the market price of the security or the execution of the transactions, or both, to the detriment of other accounts. NWQ seeks to minimize market impact by using its discretion in releasing orders in a manner which seeks to cause the least possible impact while keeping within the approximate price range of the discretionary block trade.
· Finally, the appearance of a conflict of interest may arise where NWQ has an incentive, such as a performance-based management fee, which relates to the management of some accounts, with respect to which the portfolio manager has day-to-day management responsibilities. NWQ periodically performs a comparative analysis of the performance between accounts with performance fees and those without performance fees.
NWQ has adopted certain compliance procedures which are designed to address these types of conflicts common among investment managers. However, there is no guarantee that such procedures will detect each and every situation in which a conflict arises.
Item 8(a)(3). FUND MANAGER COMPENSATION
NWQ offers a highly competitive compensation structure with the purpose of attracting and retaining the most talented investment professionals. These professionals are rewarded through a combination of cash and long-term incentive compensation as determined by the firm’s executive committee. Total cash compensation (TCC) consists of both a base salary and an annual bonus that can be a multiple of the base salary. The firm annually benchmarks TCC to prevailing industry norms with the objective of achieving competitive levels for all contributing professionals.
Available bonus pool compensation is primarily a function of the firm’s overall annual profitability, and in the interest of employee and client interest alliance, NWQ’s bonus pool will be augmented should the firm outperform its benchmarks on a 1, 2 and 3 year basis. Individual bonuses are based primarily on the following:
· Overall performance of client portfolios
· Objective review of stock recommendations and the quality of primary research
· Subjective review of the professional’s contributions to portfolio strategy, teamwork, collaboration and work ethic
To further strengthen our incentive compensation package and to create an even stronger alignment to the long-term success of the firm, NWQ provides a number of other incentive opportunities through long-term employment contracts with senior executives, retention agreements, and an equity incentive plan with non-solicitation and non-compete provisions for participating employees. The equity incentive plan provides meaningful equity to employees which is similar to restricted stock and options and which vests over the next 5 to 7 years. Equity incentive plans allowing key employees of NWQ to participate in the firm’s growth over time have been in place since Nuveen’s acquisition of NWQ.
At NWQ, we believe that we are an employer of choice. Our analysts have a meaningful impact on the portfolio and, therefore, are compensated in a manner similar to portfolio managers at many other firms. Benefits besides compensation include a college tuition program for the children of all full-time employees whereby they are eligible for reimbursement of tuition and other mandatory fees, among others.
Item 8(a)(4). OWNERSHIP OF JPC SECURITIES AS OF JULY 31, 2013
Name of Portfolio Manager |
| None |
| $1 - |
| $10,001- |
| $50,001- |
| $100,001- |
| $500,001- |
| Over $1,000,000 |
|
Michael Carne |
|
|
|
|
|
|
|
|
| X |
|
|
|
|
|
ITEM 9. PURCHASES OF EQUITY SECURITIES BY CLOSED-END MANAGEMENT INVESTMENT COMPANY AND AFFILIATED PURCHASERS.
Not applicable.
ITEM 10. SUBMISSION OF MATTERS TO A VOTE OF SECURITY HOLDERS.
There have been no material changes to the procedures by which shareholders may recommend nominees to the registrant’s Board implemented after the registrant last provided disclosure in response to this Item.
ITEM 11. CONTROLS AND PROCEDURES.
(a) | The registrant’s principal executive and principal financial officers, or persons performing similar functions, have concluded that the registrant’s disclosure controls and procedures (as defined in Rule 30a-3(c) under the Investment Company Act of 1940, as amended (the “1940 Act”) (17 CFR 270.30a-3(c))) are effective, as of a date within 90 days of the filing date of this report that includes the disclosure required by this paragraph, based on their evaluation of the controls and procedures required by Rule 30a-3(b) under the 1940 Act (17 CFR 270.30a-3(b)) and Rules 13a-15(b) or 15d-15(b) under the Securities Exchange Act of 1934, as amended (the “Exchange Act”) (17 CFR 240.13a-15(b) or 240.15d-15(b)). |
|
|
(b) | There were no changes in the registrant’s internal control over financial reporting (as defined in Rule 30a-3(d) under the 1940 Act (17 CFR 270.30a-3(d)) that occurred during the second fiscal quarter of the period covered by this report that has materially affected, or is reasonably likely to materially affect, the registrant’s internal control over financial reporting. |
ITEM 12. EXHIBITS.
File the exhibits listed below as part of this Form.
(a)(1) Any code of ethics, or amendment thereto, that is the subject of the disclosure required by Item 2, to the extent that the registrant intends to satisfy the Item 2 requirements through filing of an exhibit: Not applicable because the code is posted on registrant’s website at www.nuveen.com/CEF/Shareholder/FundGovernance.aspx and there were no amendments during the period covered by this report. (To view the code, click on Code of Conduct.)
(a)(2) A separate certification for each principal executive officer and principal financial officer of the registrant as required by Rule 30a-2(a) under the 1940 Act (17 CFR 270.30a-2(a)) in the exact form set forth below: Ex-99.CERT Attached hereto.
(a)(3) Any written solicitation to purchase securities under Rule 23c-1 under the 1940 Act (17 CFR 270.23c-1) sent or given during the period covered by the report by or on behalf of the registrant to 10 or more persons. Not applicable.
(b) If the report is filed under Section 13(a) or 15(d) of the Exchange Act, provide the certifications required by Rule 30a-2(b) under the 1940 Act (17 CFR 270.30a-2(b)); Rule 13a-14(b) or Rule 15d-14(b) under the Exchange Act (17 CFR 240.13a-14(b) or 240.15d-14(b)), and Section 1350 of Chapter 63 of Title 18 of the United States Code (18 U.S.C. 1350) as an exhibit. A certification furnished pursuant to this paragraph will not be deemed “filed” for purposes of Section 18 of the Exchange Act (15 U.S.C. 78r), or otherwise subject to the liability of that section. Such certification will not be deemed to be incorporated by reference into any filing under the Securities Act of 1933 or the Exchange Act, except to the extent that the registrant specifically incorporates it by reference. Ex-99.906 CERT attached hereto.
SIGNATURES
Pursuant to the requirements of the Securities Exchange Act of 1934 and the Investment Company Act of 1940, the registrant has duly caused this report to be signed on its behalf by the undersigned, thereunto duly authorized.
(Registrant) Nuveen Preferred Income Opportunities Fund
By (Signature and Title) | /s/ Kevin J. McCarthy |
|
| Kevin J. McCarthy |
|
| Vice President and Secretary |
|
Date: September 20, 2013
Pursuant to the requirements of the Securities Exchange Act of 1934 and the Investment Company Act of 1940, this report has been signed below by the following persons on behalf of the registrant and in the capacities and on the dates indicated.
By (Signature and Title) | /s/ Gifford R. Zimmerman |
|
| Gifford R. Zimmerman |
|
| Chief Administrative Officer |
|
| (principal executive officer) |
|
Date: September 20, 2013
By (Signature and Title) | /s/ Stephen D. Foy |
|
| Stephen D. Foy |
|
| Vice President and Controller |
|
| (principal financial officer) |
|
Date: September 20, 2013