UNITED STATES
SECURITIES AND EXCHANGE COMMISSION
Washington, D.C. 20549
FORM N-CSR/A
CERTIFIED SHAREHOLDER REPORT OF REGISTERED
MANAGEMENT INVESTMENT COMPANIES
Investment Company Act file number: 811-21295
JPMorgan Trust I
(Exact name of registrant as specified in charter)
277 Park Avenue
New York, NY 10172
(Address of principal executive offices) (Zip code)
Gregory S. Samuels
277 Park Avenue
New York, NY 10172
(Name and Address of Agent for Service)
Registrant’s telephone number, including area code: (800) 480-4111
Date of fiscal year end: October 31
Date of reporting period: November 1, 2018 through October 31, 2022
Form N-CSR is to be used by management investment companies to file reports with the Commission not later than 10 days after the transmission to stockholders of any report that is required to be transmitted to stockholders under Rule 30e-1 under the Investment Company Act of 1940 (17 CFR 270.30e-1). The Commission may use the information provided on Form N-CSR in its regulatory, disclosure review, inspection, and policymaking roles.
A registrant is required to disclose the information specified by Form N-CSR, and the Commission will make this information public. A registrant is not required to respond to the collection of information contained in Form N-CSR unless the Form displays a currently valid Office of Management and Budget (“OMB”) control number. Please direct comments concerning the accuracy of the information collection burden estimate and any suggestions for reducing the burden to Secretary, Securities and Exchange Commission, 450 Fifth Street, NW, Washington, DC 20549-0609. The OMB has reviewed this collection of information under the clearance requirements of 44 U.S.C. Section 3507.
ITEM 1. REPORTS TO STOCKHOLDERS.
a.) The following is a copy of the report transmitted to shareholders pursuant to Rule 30e-1 under the Investment Company Act of 1940 (17 CFR 270.30e-1).
b.) A copy of the notice transmitted to shareholders in reliance on Rule 30e-3 under the 1940 Act that contains disclosures specified by paragraph (c)(3) of that rule is included in the Annual Reports. Not Applicable. Notices do not incorporate disclosures from the
shareholder report.
Annual Report
J.P. Morgan Specialty Funds
October 31, 2022
October 31, 2021
October 31, 2020
October 31, 2019
JPMorgan Research Market Neutral Fund

CONTENTS
Investments in a Fund are not deposits or obligations of, or guaranteed or endorsed by, any bank and are not insured or guaranteed by the FDIC, the Federal Reserve Board or any other government agency. You could lose money if you sell when a Fund’s share price is lower than when you invested.
Past performance is no guarantee of future performance. The general market views expressed in this report are opinions based on market and other conditions through the end of the reporting period and are subject to change without notice. These views are not intended to predict the future performance of a Fund or the securities markets. Prospective investors should refer to the Funds’ prospectuses for a discussion of the Funds’ investment objectives, strategies and risks. Call J.P. Morgan Funds Service Center at 1-800-480-4111 for a prospectus containing more complete information about a Fund, including management fees and other expenses. Please read it carefully before investing.
LETTER TO SHAREHOLDERS
DECEMBER 15, 2022 (Unaudited)
Dear Shareholder,
Global financial markets reflected turmoil in the global economy in 2022, stirred by sharply higher inflation, rising interest rates, sporadic pandemic disruptions and the widening impact of the Russia-Ukraine conflict. Prices for both equities and bonds tumbled during the first half of the year and remained under pressure through the end of October.
| | |
 | | “While investors seek to adapt to the current market environment, we believe a well-diversified portfolio and a patient outlook remain crucial components of a successful invest- ment approach.” —Brian S. Shlissel |
Emerging market equities underperformed both the U.S. and other developed equity markets amid economic weakness in China and slowing global demand during the period. Across Europe, the war in Ukraine set off an energy crisis as a result of reduced imports of natural gas from Russia. U.S. equity markets also fell in 2022, but surprisingly strong corporate earnings and consumer spending helped leading U.S. indexes to rebound from their lowest levels. For the twelve month period ended October 31, 2022, the MSCI Emerging Markets Index returned -31.0%, the MSCI EAFE Index returned -23.0% and the S&P 500 Index returned -14.6%.
Notably, some recent U.S. inflationary data has indicated signs of easing price pressures and U.S. economic output as measured by gross domestic product turned positive in the third quarter of 2022, following two consecutive quarters of negative growth. Though the U.S. economy has lost momentum in 2022, it has not yet fallen into recession. Meanwhile, as the potential for a rapid resolution to the war in Ukraine appears to have faded, the European Union and its largest constituent
nations have moved to secure sufficient winter energy supplies while decreasing their dependence on imports of natural gas from Russia. In the U.K., a year-long political crisis was resolved with the accession of Rishi Sunak to prime minister in October 2022, which helped shore up the value of British pound and stabilize U.K. financial markets. China has eased some of the social restrictions under its “Zero Covid” policy and domestic equity indexes recently rose amid investor expectations that China’s economy may fully reopen in the coming months.
As 2022 comes to a close, financial markets are likely to remain volatile due to investor uncertainty regarding the outlook for inflation, interest rates and economic momentum. Increased geo-political tensions between Russia and Ukraine’s Western allies also remains a headwind for global financial markets.
Investors this year have confronted economic and financial market conditions not experienced in many years. While investors seek to adapt to the current market environment, we believe a well-diversified portfolio and a patient outlook remain crucial components of a successful investment approach. Our broad array of investment solutions seeks to provide investors with ability to build durable portfolios that can help them meet their financial goals.
Sincerely yours,

Brian S. Shlissel
President, J.P. Morgan Funds
J.P. Morgan Asset Management
1-800-480-4111 or www.jpmorganfunds.com for more information
| | | | | | | | | | |
| | | | | |
| | J.P. MORGAN SPECIALTY FUNDS | | | | | | | | 1 |
J.P. Morgan Specialty Funds
MARKET OVERVIEW
TWELVE MONTHS ENDED OCTOBER 31, 2022 (Unaudited)
While developed market equities largely ended 2021 with positive returns, global prices for equities and bonds plummeted in 2022 amid accelerating inflation, rising interest rates, pandemic disruptions in China and the outbreak of conflict in Ukraine. Returns for both equity and bond markets broadly declined during the first half of 2022 and remained in negative territory through the end of October. Notably, global energy prices rose sharply in the first half of 2022 before receding somewhat in the third quarter.
In the U.S., investors largely kept their focus on inflation data as indicators of short-term policy of the U.S. Federal Reserve. In mid-March 2022, the central bank initiated its first interest rate increase since late 2018, and then followed with four more rate raises by the end of September 2022.
U.S. gross domestic product fell by 1.6% in the first quarter of 2022 and dropped 0.6% in the second quarter before rebounding to a 2.6% increase in the third quarter. Consumer spending declined but remained somewhat better than investors expected. By the end of June 2022, U.S. equity prices had tumbled more than 20% from the start of the year, which is generally considered a bear market. However, prices rebounded somewhat by the end of October 2022.
Within U.S. equities, growth stocks generally underperformed value stocks and small cap and mid cap stocks slightly underperformed large cap stocks. For the twelve months ended October 31, 2022, the S&P 500 Index returned -14.6%, the MSCI EAFE Index returned -23.0% and the MSCI Emerging Markets Index returned -31.0%.
| | | | | | | | | | |
| | | | | |
| 2 | | | | | | | | J.P. MORGAN SPECIALTY FUNDS | | |
J.P. Morgan Specialty Funds
MARKET OVERVIEW
TWELVE MONTHS ENDED OCTOBER 31, 2021 (Unaudited)
Globally, equity markets outperformed fixed income markets by a wide margin amid a global economic rebound from the initial economic shock of the pandemic. While the development and distribution of multiple vaccines unleashed a sharp increase in economic activity in the first half of the period, uneven success against the pandemic, supply chain constraints and inflationary pressure weighed on growth in the latter part of the period. Overall, U.S. equity outperformed both developed market and emerging market equities.
For the twelve months ended October 31, 2021, the S&P 500 returned 42.91%; the MSCI EAFE Index returned 34.18% and the MSCI Emerging Markets Index returned 16.96%. Within fixed income, the Bloomberg U.S. Aggregate Index returned -0.48%, the Bloomberg U.S. High Yield Index returned 10.53% and the Bloomberg Emerging Markets Index returned 3.01% for the period.
At the start of the period, global equity prices began to rebound amid development of the first vaccines against COVID-19 and its leading variants. The rally in equity prices was largely led by investor demand for U.S. large cap stocks, particularly in the technology sector. Notably, emerging markets equity surged ahead of developed markets in December as China, Taiwan and other emerging market nations appeared to have greater success in containing the pandemic.
While the global rally in equity markets appeared to take a pause in January 2021, equity prices surged higher from February through June 2021. In the U.S., the successful if uneven distribution of vaccines combined with a $1.9 trillion U.S. fiscal relief and recovery package—and the prospect of additional federal government spending – helped push leading equity indexes higher in the first half of 2021. Corporate earnings and cash flows reached record highs in the first quarter of 2021. Robust growth in consumer spending, business investments and manufacturing data added further fuel to the rally in U.S. equity markets.
In May, historically high valuations for U.S. equity fueled investor demand for higher returns elsewhere in both developed and emerging markets. However, the uneven distribution of vaccines, continued spread of COVID-19 and its variants, and disparities in the re-openings of national economies weighed on equity markets in June.
In the following months global economic growth was increasingly hindered by uneven progress against the pandemic, supply chain bottlenecks and rising prices for both commodities and finished goods. Energy prices rose sharply amid a rebound in demand, which helped petroleum exporting nations but weighed on the economies of net importers. Extended inflationary pressures led to modest divergence in central bank policies at the end of the period. Leading central banks maintained their ultra-low interest rate policies, while monetary authorities in emerging markets—particularly Brazil—raised rates to head off rising prices.
Global equity prices largely continued their upward trajectory in the final months of the period, with the exception of a modest retreat in September 2021. While developed markets equity and emerging markets equity generally provided positive returns, equity markets slumped in select nations facing political unrest and/or rapidly rising inflationary pressures. Notably, equity prices in China were weighed down by real estate company China Evergrande’s struggles to meet debt payments as investors worried about the potential impact on financial markets. Additionally, shares of large information technology companies in China were hurt by investor uncertainty over increased domestic regulatory scrutiny.
| | | | | | | | | | |
| | | | | |
| | | J.P. MORGAN SPECIALTY FUNDS | | | | | | | | 3 |
J.P. Morgan Specialty Funds
MARKET OVERVIEW
TWELVE MONTHS ENDED OCTOBER 31, 2020 (Unaudited)
While global financial markets largely entered the reporting period with support from an improving economic and trade outlook, the economic shock of the pandemic response sparked a drop in global asset prices and a spike in market volatility in the first quarter of 2020. Rapid interventions by the world’s central banks helped to calm investors and set the stage for general but uneven recovery in financial markets.
The final months of 2019 were marked by rising prices for global equity — led by U.S. markets — driven partly by gains in U.S. and European manufacturing and an initial U.S.-China agreement to lower trade barriers. Amid already low interest rates, the U.S. Federal Reserve declined to cut rates further at its December meeting.
In the first days of January 2020, financial markets largely shrugged off a brief flare-up in military tensions between the U.S. and Iran. However, the emergence and spread of Covid-19 fed increasing investor uncertainty and by early March, the novel coronavirus was declared a pandemic by the World Health Organization. The closure of large sectors of national economies on a global scale sparked a dramatic sell-off in financial markets across the globe. Yields on developed market sovereign bonds fell sharply and prices for commodity gold spiked. By the end of the first quarter of 2020, leading developed market equity indexes had lost 20% or more of their value from the start of the year. Corporate bond prices generally fell and the price of crude oil ended the first quarter down by 60%.
Leading central banks promptly responded with lower interest rates and/or asset purchasing programs, which helped to support asset price stability and head off a potential liquidity crunch in credit markets. Governments also responded with a range of fiscal stimulus or paycheck protection programs designed to cushion the economic impact of the pandemic. In the ensuing months, global equity markets staged a slow and uneven rebound, led by U.S. and emerging markets.
For the twelve months ended October 31, 2020, the S&P 500 Index returned a total of 9.71%, MSCI Emerging Markets Index returned 8.62% and the MSCI EAFE Index returned -6.46%. Among bond market indexes, the Bloomberg Barclays U.S. Aggregate Index returned 6.19% and the Bloomberg Barclays Emerging Markets Index returned 3.38%
| | | | | | | | | | |
| | | | | |
| 4 | | | | | | | | J.P. MORGAN SPECIALTY FUNDS | | |
J.P. Morgan Specialty Funds
MARKET OVERVIEW
TWELVE MONTHS ENDED OCTOBER 31, 2019 (Unaudited)
Global equity markets generally provided positive returns for the reporting period amid slowing but continued growth in both the global economy and corporate profits. Investor optimism over U.S.-China trade negotiations and an extension of the deadline for Britain’s exit from the European Union (“Brexit”) also bolstered investor sentiment. Bond markets also provided positive returns for the period but generally underperformed equity markets. Emerging markets debt and U.S. investment grade bonds largely outperformed U.S. Treasury bonds.
In the final months of 2018, global equity markets generally slumped as investors faced both slowing global economic growth — particularly in China and Europe — and the prospect of rising U.S. interest rates. Equity prices largely rebounded in the first months of 2019, and markets remained buoyant through April 2019. Global equity markets were hit with a selloff in May 2019 and leading indexes in the U.S. and Asian developed markets, as well as in emerging markets, dropped by more than 6%. Equity prices rebounded again in June and received further support at the end of July 2019, when the U.S. Federal Reserve (the “Fed”) responded to slowing economic growth by raising interest rates for the first time in more than a decade.
Investor concerns about increased U.S.-China trade tensions and uncertainty over the U.K.’s Brexit strategy led to increased market volatility in the final months of the reporting period. However, the Fed cut interest rates again in mid-September 2019 and, by the end of October 2019, leading U.S. equity indexes had returned to record highs.
For the twelve months ended October 31, 2019, the S&P 500 returned 14.33%, the MSCI EAFE Index returned 11.63% and the MSCI Emerging Markets Index returned 12.29%. Within bond markets, the Bloomberg Barclays Emerging Markets Aggregate Index returned 12.73% and the Bloomberg Barclays U.S. Aggregate Index returned 11.51%.
| | | | | | | | | | |
| | | | | |
| | | J.P. MORGAN SPECIALTY FUNDS | | | | | | | | 5 |
JPMorgan Research Market Neutral Fund
FUND COMMENTARY (AS RESTATED, SEE NOTE 8)
TWELVE MONTHS ENDED OCTOBER 31, 2022 (Unaudited)
| | | | |
| REPORTING PERIOD RETURN: | |
| Fund (Class I Shares)* | | | (2.37)% | |
| ICE BofAML 3-Month US Treasury Bill Index | | | 0.79% | |
| |
| Net Assets After Future Share Reacquisition Adjustment as of 10/31/2022 (In Thousands) | | $ | 161,221 | |
INVESTMENT OBJECTIVE**
The JPMorgan Research Market Neutral Fund (the “Fund”) seeks to provide long-term capital appreciation from a broadly diversified portfolio of U.S. stocks while neutralizing the general risks associated with stock market investing.
WHAT WERE THE MAIN DRIVERS OF THE FUND’S PERFORMANCE?
The Fund’s Class I Shares underperformed the ICE BofAML 3-Month US Treasury Bill Index (the “Benchmark”) for the twelve months ended October 31, 2022.
The Fund’s security selection in the media sector and the software & hardware sector was a leading detractor from performance relative to the Benchmark, while the Fund’s security selection in the pharmaceuticals & health care sector and the industrial cyclical sector was a leading contributor to relative performance.
The Fund’s security selection in the media sector and the software & hardware sector was a leading detractor from performance relative to the Benchmark, while the Fund’s security selection in the pharmaceuticals & health care sector and the industrial cyclical sector was a leading contributor to relative performance.
Leading individual detractors from relative performance included the Fund’s short positions in Omnicom Group Inc., Ceridian HCM Holding Inc. and Apple Inc. Shares of Omnicom Group, an advertising and marketing provider, rose after the company reported better-than-expected earnings and revenue
for the third quarter of 2022. Shares of Ceridian HCM Holding, a payroll and management software provider, rose after the company reported better-than-expected earnings and revenue for the third quarter of 2022. Shares of Apple, a maker of personal computers, mobile devices and related product and services, rose as investors sought large capitalization stocks amid a broad sell-off in equities during the period.
Leading individual contributors to relative performance included the Fund’s short position in Moderna Inc. and Intel Corp., and its long position in Mastercard Inc. Shares of Moderna, a pharmaceuticals maker, fell amid investor concerns about slowing demand for its COVID-19 vaccines. Shares of Intel, a semiconductor manufacturer, fell amid broad weakness in the semiconductor sector. Shares of Mastercard, a payment processing provider, rose amid consecutive quarters of better-than-expected earnings and revenue during the period.
HOW WAS THE FUND POSITIONED?
The Fund’s portfolio managers aimed to construct a portfolio of long and short positions with a low correlation to the broader market for stocks and bonds. The Fund’s portfolio managers used fundamental research to estimate companies’ long-term earnings forecasts, ranking approximately 600 large and mid-cap stocks into five quintiles. The Fund’s portfolio managers looked to the top two quintiles for potential long positions in stocks that they believed were undervalued and the bottom two quintiles for potential short positions in stocks that they believed were overvalued.
| | | | | | | | | | |
| | | | | |
| 6 | | | | | | | | J.P. MORGAN SPECIALTY FUNDS | | |
| | | | | | | | |
TOP TEN LONG POSITIONS OF THE
PORTFOLIO AS OF OCTOBER 31, 2022 | | PERCENT OF
TOTAL
INVESTMENTS | |
| | 1. | | | Mastercard, Inc., Class A | | | 1.9 | % |
| | 2. | | | NXP Semiconductors NV (China) | | | 1.7 | |
| | 3. | | | Amazon.com, Inc. | | | 1.4 | |
| | 4. | | | Intuit, Inc. | | | 1.3 | |
| | 5. | | | Progressive Corp. (The) | | | 1.3 | |
| | 6. | | | Lam Research Corp. | | | 1.3 | |
| | 7. | | | AbbVie, Inc. | | | 1.2 | |
| | 8. | | | Honeywell International, Inc. | | | 1.2 | |
| | 9. | | | Deere & Co. | | | 1.2 | |
| | 10. | | | Wells Fargo & Co. | | | 1.1 | |
| | | | | | | | |
TOP TEN SHORT POSITIONS OF THE
PORTFOLIO AS OF OCTOBER 31, 2022 | | PERCENT OF
TOTAL
INVESTMENTS | |
| | 1. | | | Apple, Inc. | | | 3.9 | % |
| | 2. | | | Kroger Co. (The) | | | 2.7 | |
| | 3. | | | Omnicom Group, Inc. | | | 2.1 | |
| | 4. | | | General Electric Co. | | | 2.0 | |
| | 5. | | | Walmart, Inc. | | | 1.8 | |
| | 6. | | | Moderna, Inc. | | | 1.7 | |
| | 7. | | | Boeing Co. (The) | | | 1.6 | |
| | 8. | | | 3M Co. | | | 1.5 | |
| | 9. | | | Gilead Sciences, Inc. | | | 1.5 | |
| | 10. | | | Johnson Controls International plc | | | 1.5 | |
| | | | |
LONG POSITION PORTFOLIO COMPOSITION
BY SECTOR AS OF OCTOBER 31, 2022 | | PERCENT OF
TOTAL
INVESTMENTS | |
| Information Technology | | | 14.6 | % |
| Industrials | | | 12.4 | |
| Health Care | | | 10.0 | |
| Financials | | | 8.3 | |
| Consumer Discretionary | | | 6.5 | |
| Communication Services | | | 4.9 | |
| Utilities | | | 3.5 | |
| Energy | | | 3.2 | |
| Consumer Staples | | | 2.4 | |
| Materials | | | 1.8 | |
| Real Estate | | | 1.8 | |
| Short-Term Investments | | | 30.6 | |
| | | | |
SHORT POSITION PORTFOLIO COMPOSITION BY SECTOR AS OF OCTOBER 31, 2022 | | PERCENT OF
TOTAL
INVESTMENTS | |
| Industrials | | | 20.3 | % |
| Information Technology | | | 17.6 | |
| Financials | | | 13.3 | |
| Health Care | | | 12.0 | |
| Consumer Staples | | | 10.1 | |
| Communication Services | | | 8.5 | |
| Utilities | | | 6.1 | |
| Real Estate | | | 3.5 | |
| Consumer Discretionary | | | 3.3 | |
| Energy | | | 3.0 | |
| Materials | | | 2.3 | |
| * | | The return shown is based on net asset values calculated for shareholder transactions and may differ from the return shown in the financial highlights, which reflects adjustments made to the net asset values in accordance with accounting principles generally accepted in the United States of America. |
| ** | | The adviser seeks to achieve the Fund’s objective. There can be no guarantee it will be achieved. |
| | | | | | | | | | |
| | | | | |
| | J.P. MORGAN SPECIALTY FUNDS | | | | | | | | 7 |
JPMorgan Research Market Neutral Fund
FUND COMMENTARY (AS RESTATED, SEE NOTE 8)
TWELVE MONTHS ENDED OCTOBER 31, 2022 (Unaudited) (continued)
| | | | | | | | | | | | | | |
AVERAGE ANNUAL TOTAL RETURNS AS OF OCTOBER 31, 2022 (AS RESTATED, SEE NOTE 8) | |
| | | | |
| | | INCEPTION DATE OF
CLASS | | 1 YEAR | | | 5 YEAR | | | 10 YEAR | |
CLASS A SHARES | | February 28, 2002 | | | | | | | | | | | | |
With Sales Charge* | | | | | (7.73 | )% | | | 1.85 | % | | | 1.38 | % |
Without Sales Charge | | | | | (2.61 | ) | | | 2.96 | | | | 1.92 | |
CLASS C SHARES | | November 2, 2009 | | | | | | | | | | | | |
With CDSC** | | | | | (4.10 | ) | | | 2.46 | | | | 1.51 | |
Without CDSC | | | | | (3.10 | ) | | | 2.46 | | | | 1.51 | |
Class I SHARES | | November 2, 2009 | | | (2.37 | ) | | | 3.23 | | | | 2.19 | |
| * | | Sales Charge for Class A Shares is 5.25%. |
| ** | | Assumes a 1% CDSC (contingent deferred sales charge) for the one year period and 0% CDSC thereafter. |
TEN YEAR FUND PERFORMANCE (10/31/12 TO 10/31/22) (AS RESTATED, SEE NOTE 8)
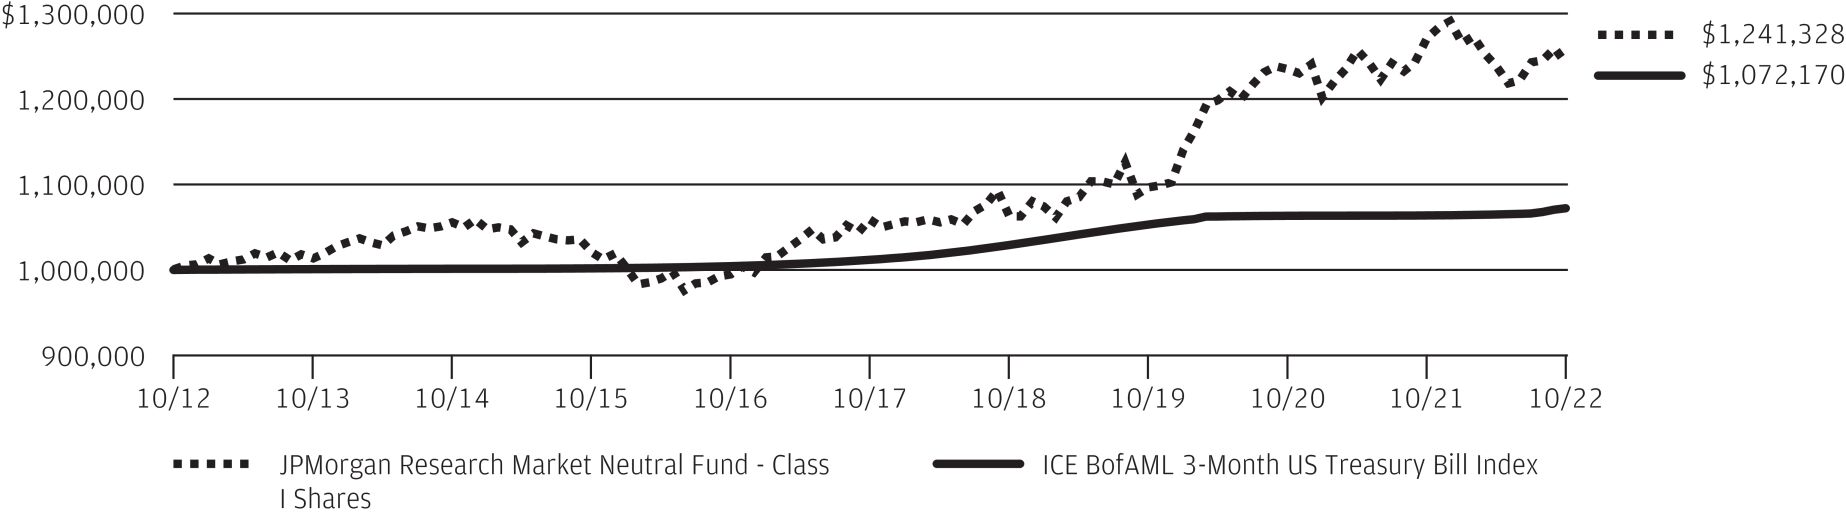
The performance quoted is past performance and is not a guarantee of future results. Mutual funds are subject to certain market risks. Investment returns and principal value of an investment will fluctuate so that an investor’s shares, when redeemed, may be worth more or less than their original cost. Current performance may be higher or lower than the performance data shown. For up-to-date month-end performance information, please call 1-800-480-4111.
The graph illustrates comparative performance for $1,000,000 invested in Class I Shares of the JPMorgan Research Market Neutral Fund and ICE BofAML 3-Month US Treasury Bill Index from October 31, 2012 to October 31, 2022. The performance of the Fund assumes reinvestment of all dividends and capital gain distributions, if any, and does not include a sales charge. The performance of the ICE BofAML 3-Month US Treasury Bill Index does not reflect the deduction of expenses or a sales charge associated with a mutual fund and has been adjusted to reflect reinvestment of all dividends and capital gain distributions of the securities included in the benchmark, if applicable. The ICE BofAML 3-Month US Treasury Bill Index is comprised of a single issue purchased at the beginning of the month and
held for a full month. Each month the index is rebalanced and the issue selected is the outstanding Treasury Bill that matures closest to, but not beyond, 3 months from the rebalancing date. Investors cannot invest directly in an index.
Class I Shares have a $1,000,000 minimum initial investment.
Fund performance may reflect the waiver of the Fund’s fees and reimbursement of expenses for certain periods. Without these waivers and reimbursements, performance would have been lower. Also, performance shown in this section does not reflect the deduction of taxes that a shareholder would pay on Fund distributions or on gains resulting from redemptions of Fund shares.
Because Class C Shares automatically convert to Class A Shares after 8 years, the 10 year average annual total return shown above for Class C reflects Class A performance for the period after conversion.
The returns shown are based on net asset values calculated for shareholder transactions and may differ from the returns shown in the financial highlights, which reflect adjustments made to the net asset values in accordance with accounting principles generally accepted in the United States of America.
| | | | | | | | | | |
| | | | | |
| 8 | | | | | | | | J.P. MORGAN SPECIALTY FUNDS | | |
JPMorgan Research Market Neutral Fund
FUND COMMENTARY (AS RESTATED, SEE NOTE 8)
TWELVE MONTHS ENDED OCTOBER 31, 2021 (Unaudited)
| | | | |
| REPORTING PERIOD RETURN: | |
| Fund (Class I Shares)* | | | 3.10% | |
| ICE BofAML 3-Month US Treasury Bill Index | | | 0.06% | |
| |
| Net Assets After Future Share Reacquisition Adjustment as of 10/31/2021 (In Thousands) | | | $93,795 | |
INVESTMENT OBJECTIVE**
The JPMorgan Research Market Neutral Fund (the “Fund”) seeks to provide long-term capital appreciation from a broadly diversified portfolio of U.S. stocks while neutralizing the general risks associated with stock market investing.
WHAT WERE THE MAIN DRIVERS OF THE FUND’S PERFORMANCE?
The Fund’s Class I Shares outperformed the ICE BofAML 3-Month US Treasury Bill Index (the “Benchmark”) for the twelve months ended October 31, 2021. During the period, equity markets generally outperformed bond markets.
The Fund’s security selection in the semiconductors and consumer stable sectors was a leading contributors to performance relative to the Benchmark, while the Fund’s security selection in the retail and industrial cyclical sectors was a leading detractors from relative performance.
Leading individual contributors to relative performance included the Fund’s short positions in Take-Two Interactive Software Inc. and Spotify Technology SA and its long position in Diamondback Energy Inc. Shares of Take-Two Interactive Software, a video game publisher, fell amid delays in the rollout of a key game update and a weaker-than-expected earnings forecast. Shares of Spotify Technology, a music streaming provider, fell in the middle of the period amid signs that the company’s user growth was slowing. Shares of Diamondback Energy, an oil and gas company focused on U.S. shale deposits, rose amid a rebound in global energy demand.
Leading individual detractors from relative performance included the Fund’s short positions in AMC Entertainment Holdings Inc., Macy’s Inc. and Acuity Brands Inc. Shares of AMC Entertainment Holdings, an owner/operator of movie theaters, rose sharply in the first half of 2021 as users of Internet forums pushed the share price higher in response to large short positions in the stock. Shares of Macy’s, a department store operator, rose after the company reported better-than-expected earnings for the second quarter of 2021 and reinstated its quarterly dividends. Shares of Acuity Brands, a provider of lighting and building management systems, rose amid consecutive quarters of better-than-expected earnings and revenue.
HOW WAS THE FUND POSITIONED?
The Fund’s portfolio managers aimed to construct a portfolio of long and short positions with a low correlation to the broader market for stocks and bonds. The Fund’s portfolio managers used fundamental research to estimate companies’ long-term earnings forecasts, ranking approximately 600 large and mid-cap stocks into five quintiles. The Fund’s portfolio managers looked to the top two quintiles for potential long positions in stocks that they believed were undervalued and the bottom two quintiles for potential short positions in stocks that they believed were overvalued.
| * | | The return shown is based on net asset values calculated for shareholder transactions and may differ from the return shown in the financial highlights, which reflects adjustments made to the net asset values in accordance with accounting principles generally accepted in the United States of America. |
| ** | | The adviser seeks to achieve the Fund’s objective. There can be no guarantee it will be achieved. |
| | | | | | | | | | |
| | | | | |
| | | J.P. MORGAN SPECIALTY FUNDS | | | | | | | | 9 |
JPMorgan Research Market Neutral Fund
FUND COMMENTARY (AS RESTATED, SEE NOTE 8)
TWELVE MONTHS ENDED OCTOBER 31, 2021 (Unaudited) (continued)
| | | | | | | | |
TOP TEN LONG HOLDINGS OF THE
PORTFOLIO AS OF OCTOBER 31, 2021 | | PERCENT OF
TOTAL
INVESTMENTS | |
| | 1. | | | Amazon.com, Inc. | | | 2.0 | % |
| | 2. | | | Diamondback Energy, Inc. | | | 2.0 | |
| | 3. | | | Mastercard, Inc., Class A | | | 1.9 | |
| | 4. | | | Wells Fargo & Co. | | | 1.7 | |
| | 5. | | | Ingersoll Rand, Inc. | | | 1.6 | |
| | 6. | | | Shopify, Inc., Class A (Canada) | | | 1.5 | |
| | 7. | | | Lyft, Inc., Class A | | | 1.3 | |
| | 8. | | | Ceridian HCM Holding, Inc. | | | 1.3 | |
| | 9. | | | Coterra Energy, Inc. | | | 1.2 | |
| | 10. | | | Deere & Co. | | | 1.2 | |
| | | | | | | | |
TOP TEN SHORT HOLDINGS OF THE
PORTFOLIO AS OF OCTOBER 31, 2021 | | PERCENT OF
TOTAL
INVESTMENTS | |
| | 1. | | | Kroger Co. (The) | | | 2.8 | % |
| | 2. | | | Intel Corp. | | | 2.5 | |
| | 3. | | | Omnicom Group, Inc. | | | 2.3 | |
| | 4. | | | Walmart, Inc. | | | 2.1 | |
| | 5. | | | Apple, Inc. | | | 2.0 | |
| | 6. | | | Exxon Mobil Corp. | | | 1.9 | |
| | 7. | | | 3M Co. | | | 1.8 | |
| | 8. | | | MSCI, Inc. | | | 1.7 | |
| | 9. | | | Walgreens Boots Alliance, Inc. | | | 1.5 | |
| | 10. | | | Stryker Corp. | | | 1.4 | |
| | | | |
LONG POSITION PORTFOLIO COMPOSITION
BY SECTOR AS OF OCTOBER 31, 2021 | | PERCENT OF
TOTAL
INVESTMENTS | |
| Information Technology | | | 15.0 | % |
| Industrials | | | 14.4 | |
| Health Care | | | 11.4 | |
| Consumer Discretionary | | | 10.3 | |
| Financials | | | 8.4 | |
| Communication Services | | | 7.5 | |
| Energy | | | 7.3 | |
| Utilities | | | 4.5 | |
| Materials | | | 4.2 | |
| Real Estate | | | 4.1 | |
| Consumer Staples | | | 2.3 | |
| Short-Term Investments | | | 10.6 | |
| | | | |
SHORT POSITION PORTFOLIO COMPOSITION
BY SECTOR AS OF OCTOBER 31, 2021 | | PERCENT OF
TOTAL
INVESTMENTS | |
| Industrials | | | 15.0 | % |
| Information Technology | | | 14.2 | |
| Financials | | | 12.1 | |
| Health Care | | | 10.7 | |
| Consumer Staples | | | 9.8 | |
| Communication Services | | | 9.5 | |
| Energy | | | 7.4 | |
| Utilities | | | 6.2 | |
| Real Estate | | | 5.5 | |
| Consumer Discretionary | | | 4.9 | |
| Materials | | | 4.7 | |
| | | | | | | | | | |
| | | | | |
| 10 | | | | | | | | J.P. MORGAN SPECIALTY FUNDS | | |
| | | | | | | | | | | | | | |
AVERAGE ANNUAL TOTAL RETURNS AS OF OCTOBER 31, 2021 (AS RESTATED, SEE NOTE 8) | |
| | | | |
| | | INCEPTION DATE OF
CLASS | | 1 YEAR | | | 5 YEAR | | | 10 YEAR | |
CLASS A SHARES | | February 28, 2002 | | | | | | | | | | | | |
With Sales Charge* | | | | | (2.70 | )% | | | 3.65 | % | | | 1.45 | % |
Without Sales Charge | | | | | 2.67 | | | | 4.78 | | | | 2.01 | |
CLASS C SHARES | | November 2, 2009 | | | | | | | | | | | | |
With CDSC** | | | | | 1.25 | | | | 4.26 | | | | 1.60 | |
Without CDSC | | | | | 2.25 | | | | 4.26 | | | | 1.60 | |
CLASS I SHARES | | November 2, 2009 | | | 3.10 | | | | 5.04 | | | | 2.26 | |
| * | | Sales Charge for Class A Shares is 5.25%. |
| ** | | Assumes a 1% CDSC (contingent deferred sales charge) for the one year period and 0% CDSC thereafter. |
TEN YEAR FUND PERFORMANCE (10/31/11 TO 10/31/21) (AS RESTATED, SEE NOTE 8)
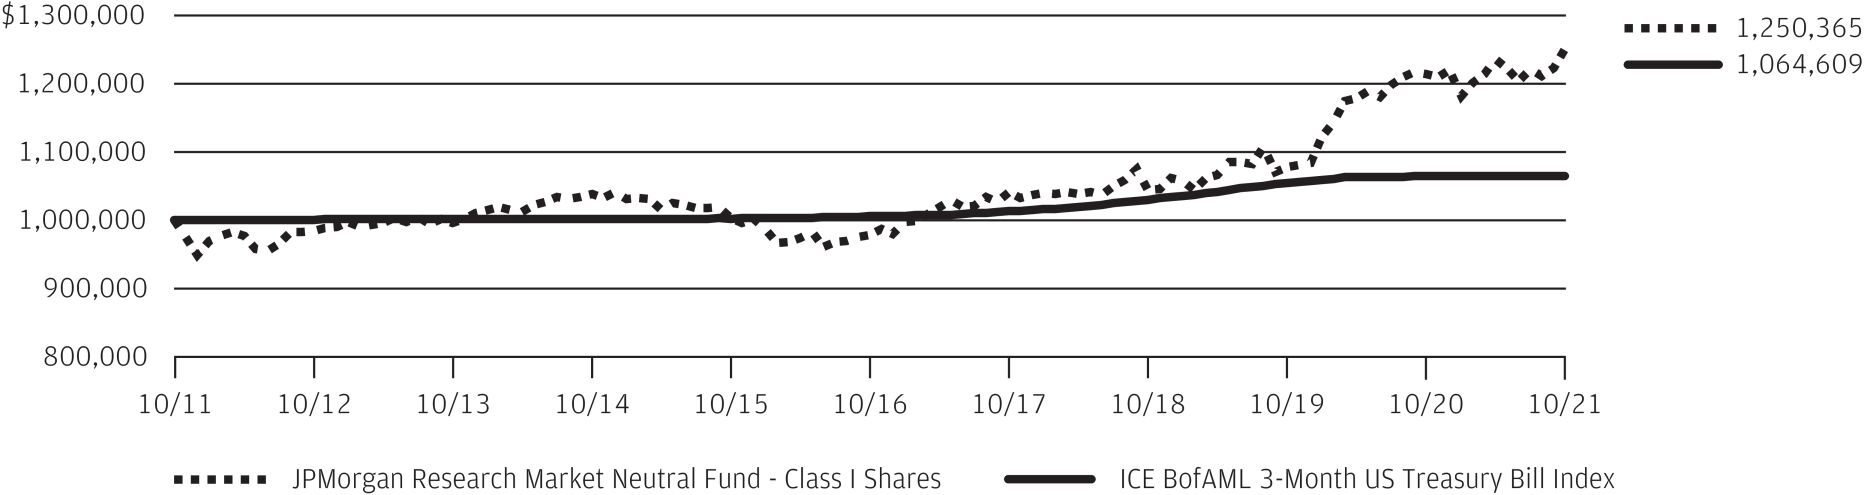
The performance quoted is past performance and is not a guarantee of future results. Mutual funds are subject to certain market risks. Investment returns and principal value of an investment will fluctuate so that an investor’s shares, when redeemed, may be worth more or less than their original cost. Current performance may be higher or lower than the performance data shown. For up-to-date month-end performance information please call 1-800-480-4111.
The graph illustrates comparative performance for $1,000,000 invested in Class I Shares of the JPMorgan Research Market Neutral Fund and ICE BofAML 3-Month US Treasury Bill Index from October 31, 2011 to October 31, 2021. The performance of the Fund assumes reinvestment of all dividends and capital gain distributions, if any, and does not include a sales charge. The performance of the ICE BofAML 3-Month US Treasury Bill Index does not reflect the deduction of expenses or a sales charge associated with a mutual fund and has been adjusted to reflect reinvestment of all dividends and capital gain distributions of the securities included in the benchmark, if applicable. The ICE BofAML 3-Month US Treasury Bill Index is comprised of a single issue purchased at the beginning of the month and held for a full month. Each month the index
is rebalanced and the issue selected is the outstanding Treasury Bill that matures closest to, but not beyond, 3 months from the rebalancing date. Investors cannot invest directly in an index.
Class I Shares have a $1,000,000 minimum initial investment.
Fund performance may reflect the waiver of the Fund’s fees and reimbursement of expenses for certain periods. Without these waivers and reimbursements, performance would have been lower. Also, performance shown in this section does not reflect the deduction of taxes that a shareholder would pay on Fund distributions or on gains resulting from redemptions of Fund shares.
Because Class C Shares automatically convert to Class A Shares after 8 years, the 10 year average annual total return shown above for Class C reflects Class A performance for the period after conversion.
The returns shown are based on net asset values calculated for shareholder transactions and may differ from the returns shown in the financial highlights, which reflect adjustments made to the net asset values in accordance with accounting principles generally accepted in the United States of America.
| | | | | | | | | | |
| | | | | |
| | | J.P. MORGAN SPECIALTY FUNDS | | | | | | | | 11 |
JPMorgan Research Market Neutral Fund
FUND COMMENTARY (AS RESTATED, SEE NOTE 8)
TWELVE MONTHS ENDED OCTOBER 31, 2020 (Unaudited)
| | | | |
| REPORTING PERIOD RETURN: | |
| Fund (Class I Shares)* | | | 12.49% | |
| ICE BofAML 3-Month US Treasury Bill Index | | | 0.92% | |
| |
| Net Assets After Future Share Reacquisition Adjustment as of 10/31/2020 (In Thousands) | | | $143,605 | |
INVESTMENT OBJECTIVE**
The JPMorgan Research Market Neutral Fund (the “Fund”) seeks to provide long-term capital appreciation from a broadly diversified portfolio of U.S. stocks while neutralizing the general risks associated with stock market investing.
WHAT WERE THE MAIN DRIVERS OF THE FUND’S PERFORMANCE?
The Fund’s Class I Shares outperformed the ICE BofAML 3-Month US Treasury Bill Index (the “Benchmark”) for the twelve months ended October 31, 2020.
The Fund’s security selection in the software & hardware sector and its overweight position in the semiconductors sector were leading contributors to performance relative to the Benchmark, while the Fund’s security selection in the consumer stable and the pharmaceutical & health care sector was a leading detractor from relative performance.
Leading individual contributors to relative performance included the Fund’s long position in Amazon.com Inc. and its short positions in Cinemark Holdings Inc. and Boeing Co. Shares of Amazon.com, a provider of online retail shopping and related services, rose amid consumer demand for online shopping and services. Shares of Cinemark Holdings, an operator of movie theaters, fell amid the closure of cinemas and other entertainment venues in response to the pandemic. Shares of Boeing, an airplane manufacturing and aerospace company, fell amid a sharp global decrease in air travel.
Leading individual detractors from relative performance included the Fund’s short positions in Spotify Technology SA,
and Kroger Co. and its long position in Diamondback Energy Inc. Shares of Spotify Technology, a provider of digital music streaming services, rose after the company reported better-than-expected user growth during the third quarter of 2020. Shares of Kroger, a grocery supermarket chain, rose after the company reported better-than-expected sales and earnings for the second quarter of 2020 and unveiled a $1 billion share repurchase plan. Shares of Diamondback Energy, an oil and gas company focused on U.S. shale deposits, fell amid consecutive quarters of lower-than-expected earnings.
HOW WAS THE FUND POSITIONED?
The Fund’s portfolio managers aimed to construct a portfolio of long and short positions with a low correlation to the broader market for stocks and bonds. The Fund’s portfolio managers used fundamental research to estimate companies’ long-term earnings forecasts, ranking approximately 600 large and mid cap stocks into five quintiles. The Fund’s portfolio managers looked to the top two quintiles for potential long positions in stocks that they believed were undervalued and the bottom two quintiles for potential short positions in stocks that they believed were overvalued.
| * | | The return shown is based on net asset values calculated for shareholder transactions and may differ from the return shown in the financial highlights, which reflects adjustments made to the net asset values in accordance with accounting principles generally accepted in the United States of America. |
| ** | | The adviser seeks to achieve the Fund’s objective. There can be no guarantee it will be achieved. |
| | | | | | | | | | |
| | | | | |
| 12 | | | | | | | | J.P. MORGAN SPECIALTY FUNDS | | |
| | | | | | | | |
| TOP TEN LONG POSITIONS OF THE PORTFOLIO*** | |
| | 1. | | | Amazon.com, Inc. | | | 2.0 | % |
| | 2. | | | NXP Semiconductors NV (Netherlands) | | | 2.0 | |
| | 3. | | | Netflix, Inc. | | | 1.7 | |
| | 4. | | | Trane Technologies plc | | | 1.5 | |
| | 5. | | | Truist Financial Corp. | | | 1.3 | |
| | 6. | | | Stanley Black & Decker, Inc. | | | 1.3 | |
| | 7. | | | Mastercard, Inc., Class A | | | 1.3 | |
| | 8. | | | Analog Devices, Inc. | | | 1.1 | |
| | 9. | | | O’Reilly Automotive, Inc. | | | 1.1 | |
| | 10. | | | Norfolk Southern Corp. | | | 1.1 | |
| | | | | | | | |
| TOP TEN SHORT POSITIONS OF THE PORTFOLIO**** | |
| | 1. | | | Cisco Systems, Inc. | | | 3.1 | % |
| | 2. | | | Broadcom, Inc. | | | 2.4 | |
| | 3. | | | ViacomCBS, Inc. | | | 2.4 | |
| | 4. | | | Walt Disney Co. (The) | | | 2.1 | |
| | 5. | | | Spotify Technology SA | | | 1.9 | |
| | 6. | | | Kroger Co. (The) | | | 1.9 | |
| | 7. | | | Clorox Co. (The) | | | 1.8 | |
| | 8. | | | Take-Two Interactive Software, Inc. | | | 1.8 | |
| | 9. | | | General Electric Co. | | | 1.7 | |
| | 10. | | | Gilead Sciences, Inc. | | | 1.7 | |
| | | | |
LONG POSITION PORTFOLIO COMPOSITION BY SECTOR*** | |
| Information Technology | | | 17.9 | % |
| Industrials | | | 11.9 | |
| Consumer Discretionary | | | 10.5 | |
| Health Care | | | 9.0 | |
| Communication Services | | | 7.8 | |
| Financials | | | 6.7 | |
| Materials | | | 4.6 | |
| Energy | | | 4.3 | |
| Real Estate | | | 3.8 | |
| Consumer Staples | | | 2.9 | |
| Utilities | | | 2.9 | |
| Short-Term Investments | | | 17.7 | |
| | | | |
SHORT POSITION PORTFOLIO COMPOSITION BY SECTOR**** | |
| Information Technology | | | 15.9 | % |
| Communication Services | | | 14.3 | |
| Industrials | | | 13.6 | |
| Health Care | | | 10.0 | |
| Financials | | | 9.3 | |
| Consumer Staples | | | 8.1 | |
| Consumer Discretionary | | | 7.8 | |
| Energy | | | 6.5 | |
| Materials | | | 5.4 | |
| Real Estate | | | 5.3 | |
| Utilities | | | 3.8 | |
| *** | | Percentages indicated are based on total long investments as of October 31, 2020. The Fund’s portfolio composition is subject to change. |
| **** | | Percentages indicated are based on total short investments as of October 31, 2020. The Fund’s portfolio composition is subject to change. |
| | | | | | | | | | |
| | | | | |
| | | J.P. MORGAN SPECIALTY FUNDS | | | | | | | | 13 |
JPMorgan Research Market Neutral Fund
FUND COMMENTARY (AS RESTATED, SEE NOTE 8)
TWELVE MONTHS ENDED OCTOBER 31, 2020 (Unaudited) (continued)
| | | | | | | | | | | | | | |
AVERAGE ANNUAL TOTAL RETURNS AS OF OCTOBER 31, 2020 (AS RESTATED, SEE NOTE 8) | |
| | | | |
| | | INCEPTION DATE OF
CLASS | | 1 YEAR | | | 5 YEAR | | | 10 YEAR | |
CLASS A SHARES | | February 28, 2002 | | | | | | | | | | | | |
With Sales Charge* | | | | | 6.52 | % | | | 2.51 | % | | | 0.79 | % |
Without Sales Charge | | | | | 12.39 | | | | 3.62 | | | | 1.34 | |
CLASS C SHARES | | November 2, 2009 | | | | | | | | | | | | |
With CDSC** | | | | | 10.76 | | | | 3.10 | | | | 0.93 | |
Without CDSC | | | | | 11.76 | | | | 3.10 | | | | 0.93 | |
CLASS I SHARES | | November 2, 2009 | | | 12.49 | | | | 3.86 | | | | 1.59 | |
| * | | Sales Charge for Class A Shares is 5.25%. |
| ** | | Assumes a 1% CDSC (contingent deferred sales charge) for the one year period and 0% CDSC thereafter. |
TEN YEAR FUND PERFORMANCE (10/31/10 TO 10/31/20) (AS RESTATED, SEE NOTE 8)
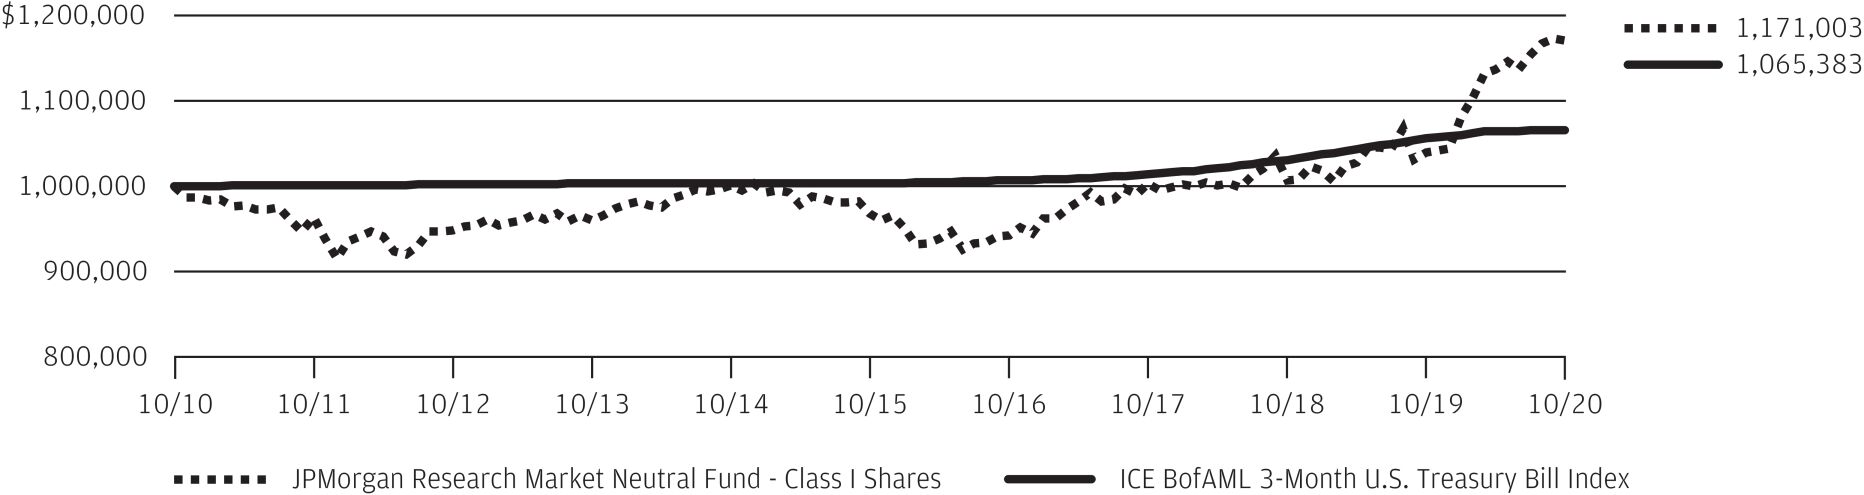
The performance quoted is past performance and is not a guarantee of future results. Mutual funds are subject to certain market risks. Investment returns and principal value of an investment will fluctuate so that an investor’s shares, when redeemed, may be worth more or less than their original cost. Current performance may be higher or lower than the performance data shown. For up-to-date month-end performance information please call 1-800-480-4111.
The graph illustrates comparative performance for $1,000,000 invested in Class I Shares of the JPMorgan Research Market Neutral Fund and ICE BofAML 3-Month U.S. Treasury Bill Index from October 31, 2010 to October 31, 2020. The performance of the Fund assumes reinvestment of all dividends and capital gain distributions, if any, and does not include a sales charge. The performance of the ICE BofAML 3-Month U.S. Treasury Bill Index does not reflect the deduction of expenses or a sales charge associated with a mutual fund and has been adjusted to reflect reinvestment of all dividends and capital gain distributions of the securities included in the benchmark, if applicable. The ICE BofAML 3-Month U.S. Treasury Bill Index is comprised of a single issue purchased at the beginning of the month and held for a full month. Each month the index is rebalanced and the issue selected is the outstanding Treasury Bill
that matures closest to, but not beyond, 3 months from the rebalancing date. Investors cannot invest directly in an index.
Class I Shares have a $1,000,000 minimum initial investment.
Fund performance may reflect the waiver of the Fund’s fees and reimbursement of expenses for certain periods since the applicable inception date. Without these waivers and reimbursements, performance would have been lower. Also, performance shown in this section does not reflect the deduction of taxes that a shareholder would pay on Fund distributions or on gains resulting from redemptions of Fund shares.
Because Class C Shares automatically convert to Class A Shares after 8 years, the 10 year average annual total return shown above for Class C reflects Class A performance for the period after conversion.
The returns shown are based on net asset values calculated for shareholder transactions and may differ from the returns shown in the financial highlights, which reflect adjustments made to the net asset values in accordance with accounting principles generally accepted in the United States of America.
| | | | | | | | | | |
| | | | | |
| 14 | | | | | | | | J.P. MORGAN SPECIALTY FUNDS | | |
JPMorgan Research Market Neutral Fund
FUND COMMENTARY (AS RESTATED, SEE NOTE 8)
TWELVE MONTHS ENDED OCTOBER 31, 2019 (Unaudited)
| | | | |
| REPORTING PERIOD RETURN: | | | |
| Fund (Class L Shares)* | | | 3.21% | |
| ICE BofAML 3-Month US Treasury Bill Index | | | 2.40% | |
| |
| Net Assets After Future Share Reacquisition Adjustment as of 10/31/2019 (In Thousands) | | $ | 63,105 | |
INVESTMENT OBJECTIVE**
The JPMorgan Research Market Neutral Fund (the “Fund”) seeks to provide long-term capital appreciation from a broadly diversified portfolio of U.S. stocks while neutralizing the general risks associated with stock market investing.
WHAT WERE THE MAIN DRIVERS OF THE FUND’S PERFORMANCE?
The Fund’s Class L Shares outperformed the ICE BofAML 3-Month US Treasury Bill Index (the “Benchmark”) for the twelve months ended October 31, 2019.
Leading individual contributors to relative performance included the Fund’s short positions in Albemarle Corp. and Range Resources Corp. and its long position in Anaplan Inc. Shares of Albemarle, a specialty chemicals manufacturer, fell in late 2018 after the company lowered its 2019 earnings forecast amid weakness in prices for lithium products. Shares of Range Resources, an oil and gas producer, fell amid investor concerns about the company’s debt level and 2019 production outlook. Shares of Anaplan, a provider of cloud-based software, rose amid investor expectations for further growth.
The Fund’s security selection in the semiconductors and consumer stable sectors was a leading detractor from performance relative to the Benchmark, while the Fund’s security selection in the basic materials and software & hardware sectors was a leading contributor to relative performance.
Leading individual detractors from relative performance included the Fund’s short positions in Chipotle Mexican Grill Inc. and Enbridge Inc., and its long position in Nvidia Corp. Shares
of Chipotle Mexican Grill, a fast food chain, rose after the company reported better-than-expected earnings and sales for the third quarter of 2019. Shares of Enbridge, an operator of petroleum and natural gas pipelines and terminals, rose after the company reported continued growth in earnings during the reporting period. Shares of Nvidia, a maker of semiconductors, fell amid weak demand for semiconductors during the reporting period.
HOW WAS THE FUND POSITIONED?
The Fund’s portfolio managers aimed to construct a portfolio of long and short positions with a low correlation to the broader market for stocks and bonds. The Fund’s portfolio managers used fundamental research to estimate companies’ long-term earnings forecasts, ranking approximately 600 large and mid cap stocks into five quintiles. The Fund’s portfolio managers looked to the top two quintiles for potential long positions in stocks that they believed were undervalued and the bottom two quintiles for potential short positions in stocks that they believed were overvalued.
| * | | The return shown is based on net asset values calculated for shareholder transactions and may differ from the return shown in the financial highlights, which reflects adjustments made to the net asset values in accordance with accounting principles generally accepted in the United States of America. |
| ** | | The adviser seeks to achieve the Fund’s objective. There can be no guarantee it will be achieved. |
| | | | | | | | | | |
| | | | | |
| | | J.P. MORGAN SPECIALTY FUNDS | | | | | | | | 15 |
JPMorgan Research Market Neutral Fund
FUND COMMENTARY (AS RESTATED, SEE NOTE 8)
TWELVE MONTHS ENDED OCTOBER 31, 2019 (Unaudited) (continued)
| | | | | | | | |
| TOP TEN LONG POSITIONS OF THE PORTFOLIO*** | |
| | 1. | | | Alphabet, Inc., Class C | | | 2.9 | % |
| | 2. | | | Norfolk Southern Corp. | | | 2.7 | |
| | 3. | | | Amazon.com, Inc. | | | 2.4 | |
| | 4. | | | NextEra Energy, Inc. | | | 1.9 | |
| | 5. | | | NVIDIA Corp. | | | 1.7 | |
| | 6. | | | Microsoft Corp. | | | 1.7 | |
| | 7. | | | Prologis, Inc. | | | 1.6 | |
| | 8. | | | Linde plc | | | 1.5 | |
| | 9. | | | Fidelity National Information Services, Inc. | | | 1.4 | |
| | 10. | | | Fiserv, Inc. | | | 1.4 | |
| | | | | | | | |
| TOP TEN SHORT POSITIONS OF THE PORTFOLIO**** | |
| | 1. | | | Dominion Energy, Inc. | | | 2.7 | % |
| | 2. | | | AT&T, Inc. | | | 1.9 | |
| | 3. | | | eBay, Inc. | | | 1.9 | |
| | 4. | | | Omnicom Group, Inc. | | | 1.8 | |
| | 5. | | | Duke Energy Corp. | | | 1.7 | |
| | 6. | | | Robert Half International, Inc. | | | 1.7 | |
| | 7. | | | Huntington Ingalls Industries, Inc. | | | 1.6 | |
| | 8. | | | Intel Corp. | | | 1.6 | |
| | 9. | | | Seagate Technology plc | | | 1.6 | |
| | 10. | | | Heartland Express, Inc. | | | 1.5 | |
| | | | |
LONG POSITION PORTFOLIO COMPOSITION BY SECTOR*** | |
| Information Technology | | | 16.4 | % |
| Industrials | | | 13.1 | |
| Consumer Discretionary | | | 12.1 | |
| Health Care | | | 7.5 | |
| Communication Services | | | 6.6 | |
| Energy | | | 6.2 | |
| Financials | | | 6.0 | |
| Utilities | | | 5.4 | |
| Materials | | | 4.6 | |
| Consumer Staples | | | 3.9 | |
| Real Estate | | | 3.2 | |
| Short-Term Investments | | | 15.0 | |
| | | | |
SHORT POSITION PORTFOLIO COMPOSITION BY SECTOR**** | |
| Industrials | | | 16.3 | % |
| Information Technology | | | 13.7 | |
| Consumer Discretionary | | | 13.5 | |
| Financials | | | 9.3 | |
| Communication Services | | | 8.6 | |
| Health Care | | | 8.2 | |
| Energy | | | 8.1 | |
| Utilities | | | 6.9 | |
| Consumer Staples | | | 6.8 | |
| Materials | | | 4.8 | |
| Real Estate | | | 3.8 | |
| *** | | Percentages indicated are based on total long investments as of October 31, 2019. The Fund’s portfolio composition is subject to change. |
| **** | | Percentages indicated are based on total short investments as of October 31, 2019. The Fund’s portfolio composition is subject to change. |
| | | | | | | | | | |
| | | | | |
| 16 | | | | | | | | J.P. MORGAN SPECIALTY FUNDS | | |
| | | | | | | | | | | | | | |
AVERAGE ANNUAL TOTAL RETURNS AS OF OCTOBER 31, 2019 (AS RESTATED, SEE NOTE 8) | |
| | | | |
| | | INCEPTION DATE OF
CLASS | | 1 YEAR | | | 5 YEAR | | | 10 YEAR | |
CLASS A SHARES | | February 28, 2002 | | | | | | | | | | | | |
With Sales Charge* | | | | | (2.46 | )% | | | (0.58 | )% | | | (0.33 | )% |
Without Sales Charge | | | | | 2.92 | | | | 0.49 | | | | 0.20 | |
CLASS C SHARES | | November 2, 2009 | | | | | | | | | | | | |
With CDSC** | | | | | 1.42 | | | | (0.01 | ) | | | (0.19 | ) |
Without CDSC | | | | | 2.42 | | | | (0.01 | ) | | | (0.19 | ) |
CLASS I SHARES | | November 2, 2009 | | | 3.21 | | | | 0.75 | | | | 0.45 | |
CLASS L SHARES | | December 31, 1998 | | | 3.21 | | | | 0.88 | | | | 0.65 | |
| * | | Sales Charge for Class A Shares is 5.25%. |
| ** | | Assumes a 1% CDSC (contingent deferred sales charge) for the one year period and 0% CDSC thereafter. |
TEN YEAR FUND PERFORMANCE (10/31/09 TO 10/31/19) (AS RESTATED, SEE NOTE 8)
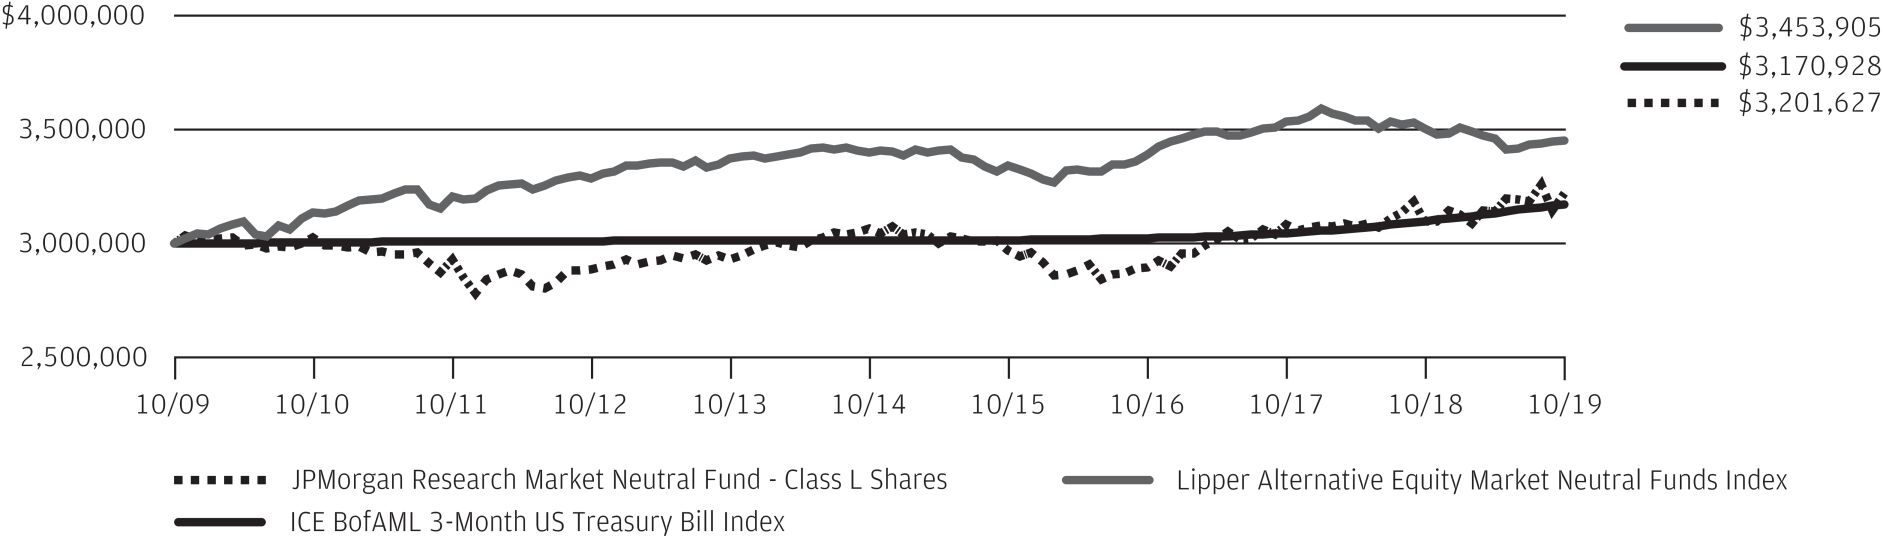
The performance quoted is past performance and is not a guarantee of future results. Mutual funds are subject to certain market risks. Investment returns and principal value of an investment will fluctuate so that an investor’s shares, when redeemed, may be worth more or less than their original cost. Current performance may be higher or lower than the performance data shown. For up-to-date month-end performance information please call 1-800-480-4111.
Returns for Class I Shares prior to its inception date are based on the performance of Class L Shares. The actual returns for Class I Shares would have been lower than shown because Class I Shares have higher expenses than Class L Shares.
Returns for Class C Shares prior to its inception date are based on the performance of Class B Shares, all of which converted to Class A Shares on June 19, 2015. The actual returns of Class C Shares would have been similar to those shown because Class C Shares have similar expenses to Class B Shares.
The graph illustrates comparative performance for $3,000,000 invested in Class L Shares of the JPMorgan Research Market Neutral Fund, ICE BofAML 3-Month US Treasury Bill Index and Lipper Alternative Equity Market Neutral Funds Index from October 31, 2009 to October 31, 2019. The performance of the Fund assumes reinvestment of all dividends and capital gain distributions, if any, and does not include a sales charge. The performance of the ICE BofAML 3-Month US Treasury Bill Index does not reflect the deduction of expenses or a sales charge associated with a mutual fund and has been adjusted to reflect
reinvestment of all dividends and capital gain distributions of the securities included in the benchmark, if applicable. The performance of the Lipper Alternative Equity Market Neutral Funds Index includes expenses associated with a mutual fund, such as investment management fees. These expenses are not identical to the expenses incurred by the Fund. The ICE BofAML 3-Month US Treasury Bill Index is comprised of a single issue purchased at the beginning of the month and held for a full month. Each month the index is rebalanced and the issue selected is the outstanding Treasury Bill that matures closest to, but not beyond, 3 months from the rebalancing date. Investors cannot invest directly in an index. The Lipper Alternative Equity Market Neutral Funds Index is an average based on the total returns of all mutual funds within the Fund’s designated category as determined by Lipper, Inc.
Class L Shares have a $3,000,000 minimum initial investment.
Fund performance may reflect the waiver of the Fund’s fees and reimbursement of expenses for certain periods since the inception date. Without these waivers and reimbursements, performance would have been lower. Also, performance shown in this section does not reflect the deduction of taxes that a shareholder would pay on Fund distributions or redemptions of Fund shares.
The returns shown are based on net asset values calculated for shareholder transactions and may differ from the returns shown in the financial highlights, which reflect adjustments made to the net asset values in accordance with accounting principles generally accepted in the United States of America.
| | | | | | | | | | |
| | | | | |
| | | J.P. MORGAN SPECIALTY FUNDS | | | | | | | | 17 |
JPMorgan Research Market Neutral Fund
SCHEDULE OF PORTFOLIO INVESTMENTS
AS OF OCTOBER 31, 2022 (AS RESTATED, SEE NOTE 8)
| | | | | | | | |
| INVESTMENTS | | SHARES (000) | | | VALUE ($000) | |
Long Positions — 97.1% | | | | | | | | |
Common Stocks — 67.4% | | | | | | | | |
| | |
Aerospace & Defense — 3.1% | | | | | | | | |
| | |
Howmet Aerospace, Inc. | | | 44 | | | | 1,576 | |
| | |
Northrop Grumman Corp. | | | 2 | | | | 1,217 | |
| | |
Raytheon Technologies Corp. | | | 15 | | | | 1,417 | |
| | |
Textron, Inc. | | | 4 | | | | 240 | |
| | |
TransDigm Group, Inc. | | | 1 | | | | 478 | |
| | | | | | | | |
| | |
| | | | | | | 4,928 | |
| | | | | | | | |
| | |
Air Freight & Logistics — 0.3% | | | | | | | | |
| | |
FedEx Corp. | | | — | | | | 56 | |
| | |
United Parcel Service, Inc., Class B | | | 3 | | | | 491 | |
| | | | | | | | |
| | |
| | | | | | | 547 | |
| | | | | | | | |
| | |
Auto Components — 0.3% | | | | | | | | |
| | |
Aptiv plc * | | | 2 | | | | 138 | |
| | |
Lear Corp. | | | 1 | | | | 163 | |
| | |
Magna International, Inc. (Canada) | | | 3 | | | | 181 | |
| | | | | | | | |
| | |
| | | | | | | 482 | |
| | | | | | | | |
| | |
Automobiles — 0.2% | | | | | | | | |
| | |
Rivian Automotive, Inc., Class A * | | | 7 | | | | 246 | |
| | | | | | | | |
| | |
Banks — 2.1% | | | | | | | | |
| | |
Bank of America Corp. | | | 2 | | | | 76 | |
| | |
Fifth Third Bancorp | | | 27 | | | | 962 | |
| | |
Truist Financial Corp. | | | 14 | | | | 625 | |
| | |
Wells Fargo & Co. (a) | | | 38 | | | | 1,730 | |
| | | | | | | | |
| | |
| | | | | | | 3,393 | |
| | | | | | | | |
| | |
Beverages — 1.5% | | | | | | | | |
| | |
Coca-Cola Co. (The) | | | 7 | | | | 401 | |
| | |
Constellation Brands, Inc., Class A | | | 1 | | | | 245 | |
| | |
Keurig Dr Pepper, Inc. | | | 3 | | | | 127 | |
| | |
Monster Beverage Corp. * | | | 11 | | | | 1,040 | |
| | |
PepsiCo, Inc. | | | 4 | | | | 627 | |
| | | | | | | | |
| | |
| | | | | | | 2,440 | |
| | | | | | | | |
| | |
Biotechnology — 5.1% | | | | | | | | |
| | |
AbbVie, Inc. (a) | | | 13 | | | | 1,959 | |
| | |
Biogen, Inc. * | | | 6 | | | | 1,637 | |
| | |
BioMarin Pharmaceutical, Inc. * | | | 11 | | | | 989 | |
| | |
Neurocrine Biosciences, Inc. * | | | 3 | | | | 383 | |
| | |
Regeneron Pharmaceuticals, Inc. * | | | 2 | | | | 1,309 | |
| | |
Sarepta Therapeutics, Inc. * | | | 6 | | | | 633 | |
| | |
Vertex Pharmaceuticals, Inc. * (a) | | | 4 | | | | 1,308 | |
| | | | | | | | |
| | |
| | | | | | | 8,218 | |
| | | | | | | | |
| | |
Building Products — 0.8% | | | | | | | | |
| | |
Trane Technologies plc | | | 8 | | | | 1,299 | |
| | | | | | | | |
| | | | | | | | |
| INVESTMENTS | | SHARES (000) | | | VALUE ($000) | |
| | | | | | | | |
| | | | | | | | |
| | |
Capital Markets — 3.2% | | | | | | | | |
| | |
Ameriprise Financial, Inc. | | | — | | | | 128 | |
| | |
Charles Schwab Corp. (The) | | | 16 | | | | 1,305 | |
| | |
CME Group, Inc. | | | 6 | | | | 971 | |
| | |
Morgan Stanley | | | 1 | | | | 86 | |
| | |
Raymond James Financial, Inc. | | | 10 | | | | 1,204 | |
| | |
S&P Global, Inc. | | | 4 | | | | 1,240 | |
| | |
State Street Corp. | | | 4 | | | | 263 | |
| | | | | | | | |
| | |
| | | | | | | 5,197 | |
| | | | | | | | |
| | |
Chemicals — 1.1% | | | | | | | | |
| | |
Air Products and Chemicals, Inc. (a) | | | 1 | | | | 267 | |
| | |
DuPont de Nemours, Inc. (a) | | | 6 | | | | 350 | |
| | |
Eastman Chemical Co. (a) | | | 2 | | | | 144 | |
| | |
Linde plc (United Kingdom) | | | 1 | | | | 342 | |
| | |
PPG Industries, Inc. | | | 1 | | | | 92 | |
| | |
Sherwin-Williams Co. (The) | | | 3 | | | | 638 | |
| | | | | | | | |
| | |
| | | | | | | 1,833 | |
| | | | | | | | |
| | |
Commercial Services & Supplies — 0.9% | | | | | | | | |
| | |
Republic Services, Inc. | | | 2 | | | | 314 | |
| | |
Waste Connections, Inc. | | | 9 | | | | 1,199 | |
| | | | | | | | |
| | |
| | | | | | | 1,513 | |
| | | | | | | | |
| | |
Construction Materials — 0.4% | | | | | | | | |
| | |
Martin Marietta Materials, Inc. | | | 1 | | | | 501 | |
| | |
Vulcan Materials Co. | | | 1 | | | | 160 | |
| | | | | | | | |
| | |
| | | | | | | 661 | |
| | | | | | | | |
| | |
Consumer Finance — 0.5% | | | | | | | | |
| | |
American Express Co. (a) | | | 6 | | | | 847 | |
| | | | | | | | |
| | |
Electric Utilities — 1.7% | | | | | | | | |
| | |
Exelon Corp. (a) | | | 24 | | | | 909 | |
| | |
PG&E Corp. * | | | 72 | | | | 1,073 | |
| | |
Xcel Energy, Inc. | | | 11 | | | | 752 | |
| | | | | | | | |
| | |
| | | | | | | 2,734 | |
| | | | | | | | |
| | |
Electrical Equipment — 0.5% | | | | | | | | |
| | |
Eaton Corp. plc | | | 6 | | | | 822 | |
| | | | | | | | |
| |
Electronic Equipment, Instruments & Components — 1.0% | | | | | |
| | |
Corning, Inc. | | | 10 | | | | 315 | |
| | |
Keysight Technologies, Inc. * | | | 6 | | | | 1,067 | |
| | |
Mobileye Global, Inc., Class A (Israel) * | | | 11 | | | | 298 | |
| | | | | | | | |
| | |
| | | | | | | 1,680 | |
| | | | | | | | |
SEE NOTES TO FINANCIAL STATEMENTS.
| | | | | | | | | | |
| | | | | |
| 18 | | | | | | | | J.P. MORGAN SPECIALTY FUNDS | | |
| | | | | | | | |
| INVESTMENTS | | SHARES (000) | | | VALUE ($000) | |
Long Positions — continued | | | | | | | | |
Common Stocks — continued | | | | | | | | |
| | |
Energy Equipment & Services — 0.5% | | | | | | | | |
| | |
Baker Hughes Co. | | | 27 | | | | 749 | |
| | | | | | | | |
| | |
Entertainment — 2.2% | | | | | | | | |
| | |
Endeavor Group Holdings, Inc., Class A * (a) | | | 65 | | | | 1,410 | |
| | |
Netflix, Inc. * (a) | | | 4 | | | | 1,136 | |
| | |
Take-Two Interactive Software, Inc. * | | | 3 | | | | 409 | |
| | |
Warner Music Group Corp., Class A | | | 20 | | | | 512 | |
| | | | | | | | |
| | |
| | | | | | | 3,467 | |
| | | | | | | | |
|
Equity Real Estate Investment Trusts (REITs) — 1.7% | |
| | |
American Homes 4 Rent, Class A | | | 7 | | | | 234 | |
| | |
Host Hotels & Resorts, Inc. | | | 3 | | | | 58 | |
| | |
Kimco Realty Corp. | | | 7 | | | | 144 | |
| | |
Prologis, Inc. | | | 8 | | | | 890 | |
| | |
SBA Communications Corp. | | | 1 | | | | 237 | |
| | |
Sun Communities, Inc. | | | 4 | | | | 593 | |
| | |
UDR, Inc. | | | 9 | | | | 349 | |
| | |
Ventas, Inc. | | | 6 | | | | 215 | |
| | |
WP Carey, Inc. | | | 1 | | | | 84 | |
| | | | | | | | |
| | |
| | | | | | | 2,804 | |
| | | | | | | | |
| | |
Food & Staples Retailing — 0.2% | | | | | | | | |
| | |
Costco Wholesale Corp. | | | 1 | | | | 251 | |
| | | | | | | | |
| | |
Food Products — 0.4% | | | | | | | | |
| | |
Hershey Co. (The) | | | 3 | | | | 631 | |
| | |
Mondelez International, Inc., Class A | | | 1 | | | | 78 | |
| | | | | | | | |
| | |
| | | | | | | 709 | |
| | | | | | | | |
| | |
Health Care Equipment & Supplies — 0.8% | | | | | | | | |
| | |
Boston Scientific Corp. * | | | 21 | | | | 874 | |
| | |
Intuitive Surgical, Inc. * | | | 1 | | | | 312 | |
| | |
Zimmer Biomet Holdings, Inc. | | | 1 | | | | 109 | |
| | | | | | | | |
| | |
| | | | | | | 1,295 | |
| | | | | | | | |
| | |
Health Care Providers & Services — 1.9% | | | | | | | | |
| | |
Centene Corp. * | | | 6 | | | | 476 | |
| | |
CVS Health Corp. (a) | | | 7 | | | | 697 | |
| | |
Humana, Inc. | | | 1 | | | | 710 | |
| | |
UnitedHealth Group, Inc. (a) | | | 2 | | | | 1,238 | |
| | | | | | | | |
| | |
| | | | | | | 3,121 | |
| | | | | | | | |
| | |
Hotels, Restaurants & Leisure — 2.2% | | | | | | | | |
| | |
Booking Holdings, Inc. * | | | — | | | | 256 | |
| | |
Chipotle Mexican Grill, Inc. * | | | 1 | | | | 926 | |
| | |
Hilton Worldwide Holdings, Inc. | | | 1 | | | | 156 | |
| | |
Marriott International, Inc., Class A | | | 2 | | | | 396 | |
| | |
McDonald’s Corp. | | | 4 | | | | 955 | |
| | |
Yum! Brands, Inc. (a) | | | 7 | | | | 874 | |
| | | | | | | | |
| | |
| | | | | | | 3,563 | |
| | | | | | | | |
| | | | | | | | |
| INVESTMENTS | | SHARES (000) | | | VALUE ($000) | |
| | | | | | | | |
| | | | | | | | |
| | |
Household Products — 0.2% | | | | | | | | |
| | |
Colgate-Palmolive Co. | | | 4 | | | | 324 | |
| | | | | | | | |
| | |
Industrial Conglomerates — 1.2% | | | | | | | | |
| | |
Honeywell International, Inc. (a) | | | 10 | | | | 1,950 | |
| | | | | | | | |
| | |
Insurance — 2.3% | | | | | | | | |
| | |
Globe Life, Inc. | | | 14 | | | | 1,593 | |
| | |
Progressive Corp. (The) (a) | | | 16 | | | | 2,053 | |
| | | | | | | | |
| | |
| | | | | | | 3,646 | |
| | | | | | | | |
| | |
Interactive Media & Services — 0.7% | | | | | | | | |
| | |
Meta Platforms, Inc., Class A * (a) | | | 11 | | | | 1,041 | |
| | | | | | | | |
| | |
Internet & Direct Marketing Retail — 1.4% | | | | | | | | |
| | |
Amazon.com, Inc. * (a) | | | 21 | | | | 2,149 | |
| | |
DoorDash, Inc., Class A * | | | 1 | | | | 31 | |
| | | | | | | | |
| | |
| | | | | | | 2,180 | |
| | | | | | | | |
| | |
IT Services — 3.6% | | | | | | | | |
| | |
Affirm Holdings, Inc. * | | | 23 | | | | 458 | |
| | |
Automatic Data Processing, Inc. | | | 1 | | | | 165 | |
| | |
Fiserv, Inc. * | | | 3 | | | | 320 | |
| | |
FleetCor Technologies, Inc. * | | | 5 | | | | 907 | |
| | |
Mastercard, Inc., Class A (a) | | | 9 | | | | 3,011 | |
| | |
WEX, Inc. * | | | 5 | | | | 894 | |
| | | | | | | | |
| | |
| | | | | | | 5,755 | |
| | | | | | | | |
| | |
Life Sciences Tools & Services — 1.0% | | | | | | | | |
| | |
Danaher Corp. | | | 3 | | | | 807 | |
| | |
Thermo Fisher Scientific, Inc. (a) | | | 2 | | | | 729 | |
| | | | | | | | |
| | |
| | | | | | | 1,536 | |
| | | | | | | | |
| | |
Machinery — 2.2% | | | | | | | | |
| | |
Deere & Co. (a) | | | 5 | | | | 1,917 | |
| | |
Dover Corp. | | | 7 | | | | 929 | |
| | |
Ingersoll Rand, Inc. | | | 15 | | | | 759 | |
| | | | | | | | |
| | |
| | | | | | | 3,605 | |
| | | | | | | | |
| | |
Media — 1.0% | | | | | | | | |
| | |
Charter Communications, Inc., Class A * | | | 1 | | | | 490 | |
| | |
Comcast Corp., Class A | | | 5 | | | | 156 | |
| | |
Liberty Media Corp.-Liberty SiriusXM, Class A * | | | 24 | | | | 1,000 | |
| | | | | | | | |
| | |
| | | | | | | 1,646 | |
| | | | | | | | |
| | |
Metals & Mining — 0.2% | | | | | | | | |
| | |
Freeport-McMoRan, Inc. | | | 10 | | | | 324 | |
| | | | | | | | |
| | |
Multiline Retail — 0.5% | | | | | | | | |
| | |
Dollar General Corp. | | | 3 | | | | 746 | |
| | | | | | | | |
SEE NOTES TO FINANCIAL STATEMENTS.
| | | | | | | | | | |
| | | | | |
| | J.P. MORGAN SPECIALTY FUNDS | | | | | | | | 19 |
JPMorgan Research Market Neutral Fund
SCHEDULE OF PORTFOLIO INVESTMENTS
AS OF OCTOBER 31, 2022 (AS RESTATED, SEE NOTE 8) (continued)
| | | | | | | | |
| INVESTMENTS | | SHARES (000) | | | VALUE ($000) | |
Long Positions — continued | | | | | | | | |
Common Stocks — continued | | | | | | | | |
| | |
Multi-Utilities — 1.8% | | | | | | | | |
| | |
Ameren Corp. (a) | | | 16 | | | | 1,247 | |
| | |
Dominion Energy, Inc. | | | 13 | | | | 931 | |
| | |
Sempra Energy | | | 4 | | | | 639 | |
| | | | | | | | |
| | |
| | | | | | | 2,817 | |
| | | | | | | | |
| | |
Oil, Gas & Consumable Fuels — 2.6% | | | | | | | | |
| | |
ConocoPhillips | | | 8 | | | | 928 | |
| | |
Coterra Energy, Inc. | | | 21 | | | | 657 | |
| | |
Diamondback Energy, Inc. | | | 6 | | | | 959 | |
| | |
EOG Resources, Inc. | | | 5 | | | | 694 | |
| | |
Exxon Mobil Corp. | | | 2 | | | | 252 | |
| | |
HF Sinclair Corp. | | | 4 | | | | 251 | |
| | |
Kinder Morgan, Inc. | | | 25 | | | | 457 | |
| | | | | | | | |
| | |
| | | | | | | 4,198 | |
| | | | | | | | |
| | |
Pharmaceuticals — 0.9% | | | | | | | | |
| | |
Bristol-Myers Squibb Co. (a) | | | 15 | | | | 1,185 | |
| | |
Elanco Animal Health, Inc. * | | | 26 | | | | 339 | |
| | | | | | | | |
| | |
| | | | | | | 1,524 | |
| | | | | | | | |
| | |
Professional Services — 1.1% | | | | | | | | |
| | |
Booz Allen Hamilton Holding Corp. | | | 5 | | | | 612 | |
| | |
Leidos Holdings, Inc. (a) | | | 12 | | | | 1,202 | |
| | | | | | | | |
| | |
| | | | | | | 1,814 | |
| | | | | | | | |
| | |
Road & Rail — 1.8% | | | | | | | | |
| | |
Canadian National Railway Co. (Canada) | | | 2 | | | | 268 | |
| | |
CSX Corp. | | | 12 | | | | 342 | |
| | |
Knight-Swift Transportation Holdings, Inc. | | | 3 | | | | 158 | |
| | |
Norfolk Southern Corp. | | | 3 | | | | 598 | |
| | |
Uber Technologies, Inc. * (a) | | | 36 | | | | 962 | |
| | |
Union Pacific Corp. | | | 3 | | | | 541 | |
| | | | | | | | |
| | |
| | | | | | | 2,869 | |
| | | | | | | | |
|
Semiconductors & Semiconductor Equipment — 6.3% | |
| | |
Advanced Micro Devices, Inc. * (a) | | | 20 | | | | 1,228 | |
| | |
Analog Devices, Inc. | | | 4 | | | | 592 | |
| | |
ASML Holding NV (Registered), NYRS (Netherlands) | | | 3 | | | | 1,337 | |
| | |
Lam Research Corp. (a) | | | 5 | | | | 1,968 | |
| | |
Marvell Technology, Inc. | | | 4 | | | | 159 | |
| | |
NXP Semiconductors NV (China) | | | 19 | | | | 2,728 | |
| | |
Taiwan Semiconductor Manufacturing Co. Ltd., ADR (Taiwan) | | | 10 | | | | 592 | |
| | |
Teradyne, Inc. | | | 19 | | | | 1,573 | |
| | | | | | | | |
| | |
| | | | | | | 10,177 | |
| | | | | | | | |
| | | | | | | | |
| INVESTMENTS | | SHARES (000) | | | VALUE ($000) | |
| | | | | | | | |
| | | | | | | | |
| | |
Software — 2.3% | | | | | | | | |
| | |
Coupa Software, Inc. * | | | 4 | | | | 208 | |
| | |
DocuSign, Inc. * | | | 1 | | | | 69 | |
| | |
Intuit, Inc. (a) | | | 5 | | | | 2,056 | |
| | |
Microsoft Corp. | | | 2 | | | | 363 | |
| | |
Roper Technologies, Inc. | | | 2 | | | | 763 | |
| | |
Workday, Inc., Class A * | | | 1 | | | | 237 | |
| | | | | | | | |
| | |
| | | | | | | 3,696 | |
| | | | | | | | |
| | |
Specialty Retail — 1.8% | | | | | | | | |
| | |
AutoZone, Inc. * | | | — | | | | 615 | |
| | |
Best Buy Co., Inc. | | | 5 | | | | 328 | |
| | |
Burlington Stores, Inc. * | | | 2 | | | | 318 | |
| | |
Lowe’s Cos., Inc. | | | 4 | | | | 736 | |
| | |
O’Reilly Automotive, Inc. * (a) | | | 1 | | | | 892 | |
| | | | | | | | |
| | |
| | | | | | | 2,889 | |
| | | | | | | | |
|
Technology Hardware, Storage & Peripherals — 0.9% | |
| | |
Seagate Technology Holdings plc | | | 30 | | | | 1,511 | |
| | | | | | | | |
| | |
Wireless Telecommunication Services — 1.0% | | | | | | | | |
| | |
T-Mobile US, Inc. * | | | 10 | | | | 1,586 | |
| | | | | | | | |
Total Common Stocks
(Cost $98,884) | | | | | | | 108,633 | |
| | | | | | | | |
Short-Term Investments — 29.7% | | | | | | | | |
| | |
Investment Companies — 19.2% | | | | | | | | |
| | |
JPMorgan Prime Money Market Fund Class Institutional Shares, 3.12% (b) (c)
(Cost $30,959) | | | 30,958 | | | | 30,961 | |
| | | | | | | | |
| | |
| | | PRINCIPAL AMOUNT ($000) | | | | |
U.S. Treasury Obligations — 10.5% | | | | | | | | |
| | |
U.S. Treasury Bills | | | | | | | | |
| | |
3.62%, 12/20/2022 (d) | | | 1 | | | | 1 | |
| | |
3.91%, 1/12/2023 (d) | | | 8,570 | | | | 8,503 | |
| | |
3.97%, 1/26/2023 (d) | | | 8,585 | | | | 8,503 | |
| | | | | | | | |
Total U.S. Treasury Obligations
(Cost $17,009) | | | | | | | 17,007 | |
| | | | | | | | |
Total Short-Term Investments
(Cost $47,968) | | | | | | | 47,968 | |
| | | | | | | | |
Total Long Positions
(Cost $146,852) | | | | | | | 156,601 | |
| | | | | | | | |
| | |
| | | SHARES (000) | | | | |
Short Positions — (64.8)% | | | | | | | | |
Common Stocks — (64.8)% | | | | | | | | |
| | |
Aerospace & Defense — (2.4)% | | | | | | | | |
| | |
Boeing Co. (The) * | | | (12 | ) | | | (1,679 | ) |
SEE NOTES TO FINANCIAL STATEMENTS.
| | | | | | | | | | |
| | | | | |
| 20 | | | | | | | | J.P. MORGAN SPECIALTY FUNDS | | |
| | | | | | | | |
| INVESTMENTS | | SHARES (000) | | | VALUE ($000) | |
Short Positions — continued | | | | | | | | |
Common Stocks — continued | | | | | | | | |
| | |
Aerospace & Defense — continued | | | | | | | | |
| | |
General Dynamics Corp. | | | (2 | ) | | | (332 | ) |
| | |
Hexcel Corp. | | | (3 | ) | | | (181 | ) |
| | |
Huntington Ingalls Industries, Inc. | | | (4 | ) | | | (1,094 | ) |
| | |
Lockheed Martin Corp. | | | (1 | ) | | | (619 | ) |
| | | | | | | | |
| | |
| | | | | | | (3,905 | ) |
| | | | | | | | |
| | |
Air Freight & Logistics — (0.8)% | | | | | | | | |
| | |
CH Robinson Worldwide, Inc. | | | (12 | ) | | | (1,146 | ) |
| | |
Expeditors International of Washington, Inc. | | | (1 | ) | | | (133 | ) |
| | | | | | | | |
| | |
| | | | | | | (1,279 | ) |
| | | | | | | | |
| | |
Auto Components — (0.7)% | | | | | | | | |
| | |
Autoliv, Inc. (Sweden) | | | (7 | ) | | | (530 | ) |
| | |
BorgWarner, Inc. | | | (17 | ) | | | (656 | ) |
| | | | | | | | |
| | |
| | | | | | | (1,186 | ) |
| | | | | | | | |
| | |
Automobiles — (0.1)% | | | | | | | | |
| | |
Harley-Davidson, Inc. | | | (3 | ) | | | (111 | ) |
| | | | | | | | |
| | |
Banks — (2.8)% | | | | | | | | |
| | |
Citizens Financial Group, Inc. | | | (11 | ) | | | (467 | ) |
| | |
Comerica, Inc. | | | (9 | ) | | | (603 | ) |
| | |
First Republic Bank | | | (7 | ) | | | (856 | ) |
| | |
Huntington Bancshares, Inc. | | | (67 | ) | | | (1,017 | ) |
| | |
KeyCorp | | | (53 | ) | | | (949 | ) |
| | |
PNC Financial Services Group, Inc. (The) | | | (4 | ) | | | (661 | ) |
| | | | | | | | |
| | |
| | | | | | | (4,553 | ) |
| | | | | | | | |
| | |
Beverages — (0.5)% | | | | | | | | |
| | |
Brown-Forman Corp., Class B | | | (2 | ) | | | (146 | ) |
| | |
Molson Coors Beverage Co., Class B | | | (12 | ) | | | (585 | ) |
| | | | | | | | |
| | |
| | | | | | | (731 | ) |
| | | | | | | | |
| | |
Biotechnology — (2.8)% | | | | | | | | |
| | |
Amgen, Inc. | | | (4 | ) | | | (1,157 | ) |
| | |
Gilead Sciences, Inc. | | | (20 | ) | | | (1,601 | ) |
| | |
Moderna, Inc. * | | | (12 | ) | | | (1,756 | ) |
| | | | | | | | |
| | |
| | | | | | | (4,514 | ) |
| | | | | | | | |
| | |
Building Products — (1.7)% | | | | | | | | |
| | |
Allegion plc | | | (9 | ) | | | (982 | ) |
| | |
Johnson Controls International plc | | | (27 | ) | | | (1,532 | ) |
| | |
Lennox International, Inc. | | | — | | | | (103 | ) |
| | |
Masco Corp. | | | (3 | ) | | | (125 | ) |
| | | | | | | | |
| | |
| | | | | | | (2,742 | ) |
| | | | | | | | |
| | |
Capital Markets — (2.3)% | | | | | | | | |
| | |
Franklin Resources, Inc. | | | (38 | ) | | | (896 | ) |
| | |
Goldman Sachs Group, Inc. (The) | | | (1 | ) | | | (348 | ) |
| | |
Moody’s Corp. | | | (2 | ) | | | (440 | ) |
| | | | | | | | |
| INVESTMENTS | | SHARES (000) | | | VALUE ($000) | |
| | |
| | | | | | | | |
| | |
| | | | | | | | |
| | |
Capital Markets — continued | | | | | | | | |
| | |
Nasdaq, Inc. | | | (8 | ) | | | (484 | ) |
| | |
Northern Trust Corp. | | | (8 | ) | | | (676 | ) |
| | |
T. Rowe Price Group, Inc. | | | (7 | ) | | | (810 | ) |
| | | | | | | | |
| | |
| | | | | | | (3,654 | ) |
| | | | | | | | |
| | |
Chemicals — (0.9)% | | | | | | | | |
| | |
Celanese Corp. | | | (3 | ) | | | (258 | ) |
| | |
Dow, Inc. | | | (10 | ) | | | (467 | ) |
| | |
Ecolab, Inc. | | | — | | | | (32 | ) |
| | |
LyondellBasell Industries NV, Class A | | | (4 | ) | | | (339 | ) |
| | |
Westlake Corp. | | | (3 | ) | | | (291 | ) |
| | | | | | | | |
| | |
| | | | | | | (1,387 | ) |
| | | | | | | | |
| | |
Commercial Services & Supplies — (0.1)% | | | | | | | | |
| | |
Waste Management, Inc. | | | (1 | ) | | | (216 | ) |
| | | | | | | | |
| | |
Communications Equipment — (1.1)% | | | | | | | | |
| | |
Cisco Systems, Inc. | | | (30 | ) | | | (1,374 | ) |
| | |
Juniper Networks, Inc. | | | (14 | ) | | | (429 | ) |
| | | | | | | | |
| | |
| | | | | | | (1,803 | ) |
| | | | | | | | |
| | |
Consumer Finance — (0.9)% | | | | | | | | |
| | |
Capital One Financial Corp. | | | (11 | ) | | | (1,185 | ) |
| | |
Synchrony Financial | | | (8 | ) | | | (266 | ) |
| | | | | | | | |
| | |
| | | | | | | (1,451 | ) |
| | | | | | | | |
| | |
Containers & Packaging — (0.7)% | | | | | | | | |
| | |
AptarGroup, Inc. | | | (4 | ) | | | (380 | ) |
| | |
International Paper Co. | | | (13 | ) | | | (428 | ) |
| | |
Packaging Corp. of America | | | (1 | ) | | | (97 | ) |
| | |
Silgan Holdings, Inc. | | | (3 | ) | | | (152 | ) |
| | | | | | | | |
| | |
| | | | | | | (1,057 | ) |
| | | | | | | | |
| | |
Diversified Financial Services — (0.3)% | | | | | | | | |
| | |
Voya Financial, Inc. | | | (7 | ) | | | (464 | ) |
| | | | | | | | |
|
Diversified Telecommunication Services — (0.8)% | |
| | |
AT&T, Inc. | | | (30 | ) | | | (552 | ) |
| | |
Lumen Technologies, Inc. | | | (80 | ) | | | (588 | ) |
| | |
Verizon Communications, Inc. | | | (4 | ) | | | (134 | ) |
| | | | | | | | |
| | |
| | | | | | | (1,274 | ) |
| | | | | | | | |
| | |
Electric Utilities — (2.8)% | | | | | | | | |
| | |
American Electric Power Co., Inc. | | | (11 | ) | | | (935 | ) |
| | |
Duke Energy Corp. | | | (12 | ) | | | (1,103 | ) |
| | |
Edison International | | | (16 | ) | | | (953 | ) |
| | |
Eversource Energy | | | (5 | ) | | | (403 | ) |
| | |
FirstEnergy Corp. | | | (3 | ) | | | (126 | ) |
| | |
Pinnacle West Capital Corp. | | | (8 | ) | | | (514 | ) |
| | |
PPL Corp. | | | (14 | ) | | | (374 | ) |
SEE NOTES TO FINANCIAL STATEMENTS.
| | | | | | | | | | |
| | | | | |
| | J.P. MORGAN SPECIALTY FUNDS | | | | | | | | 21 |
JPMorgan Research Market Neutral Fund
SCHEDULE OF PORTFOLIO INVESTMENTS
AS OF OCTOBER 31, 2022 (AS RESTATED, SEE NOTE 8) (continued)
| | | | | | | | |
| INVESTMENTS | | SHARES (000) | | | VALUE ($000) | |
Short Positions — continued | | | | | | | | |
Common Stocks — continued | | | | | | | | |
| | |
Electric Utilities — continued | | | | | | | | |
| | |
Southern Co. (The) | | | (1 | ) | | | (55 | ) |
| | | | | | | | |
| | |
| | | | | | | (4,463 | ) |
| | | | | | | | |
| | |
Electrical Equipment — (0.6)% | | | | | | | | |
| | |
Acuity Brands, Inc. | | | (3 | ) | | | (560 | ) |
| | |
Hubbell, Inc. | | | (2 | ) | | | (396 | ) |
| | |
Sensata Technologies Holding plc | | | (2 | ) | | | (95 | ) |
| | | | | | | | |
| | |
| | | | | | | (1,051 | ) |
| | | | | | | | |
| | |
Energy Equipment & Services — (0.2)% | | | | | | | | |
| | |
Schlumberger NV | | | (5 | ) | | | (263 | ) |
| | | | | | | | |
| | |
Entertainment — (1.2)% | | | | | | | | |
| | |
AMC Entertainment Holdings, Inc., Class A * | | | (30 | ) | | | (198 | ) |
| | |
Electronic Arts, Inc. | | | (5 | ) | | | (611 | ) |
| | |
ROBLOX Corp., Class A * | | | (25 | ) | | | (1,113 | ) |
| | |
Warner Bros Discovery, Inc. * | | | — | | | | — | |
| | | | | | | | |
| | |
| | | | | | | (1,922 | ) |
| | | | | | | | |
|
Equity Real Estate Investment Trusts (REITs) — (2.2)% | |
| | |
AvalonBay Communities, Inc. | | | — | | | | (78 | ) |
| | |
Digital Realty Trust, Inc. | | | (4 | ) | | | (413 | ) |
| | |
Extra Space Storage, Inc. | | | (2 | ) | | | (431 | ) |
| | |
Iron Mountain, Inc. | | | (17 | ) | | | (844 | ) |
| | |
National Retail Properties, Inc. | | | (2 | ) | | | (77 | ) |
| | |
Orion Office REIT, Inc. | | | — | | | | — | |
| | |
Prologis, Inc. | | | — | | | | — | |
| | |
Simon Property Group, Inc. | | | (10 | ) | | | (1,059 | ) |
| | |
SL Green Realty Corp. | | | (15 | ) | | | (574 | ) |
| | |
Vornado Realty Trust | | | (6 | ) | | | (142 | ) |
| | | | | | | | |
| | |
| | | | | | | (3,618 | ) |
| | | | | | | | |
| | |
Food & Staples Retailing — (4.1)% | | | | | | | | |
| | |
Kroger Co. (The) | | | (59 | ) | | | (2,775 | ) |
| | |
Sysco Corp. | | | (9 | ) | | | (812 | ) |
| | |
Walgreens Boots Alliance, Inc. | | | (29 | ) | | | (1,043 | ) |
| | |
Walmart, Inc. | | | (13 | ) | | | (1,928 | ) |
| | | | | | | | |
| | |
| | | | | | | (6,558 | ) |
| | | | | | | | |
| | |
Food Products — (1.6)% | | | | | | | | |
| | |
Campbell Soup Co. | | | (15 | ) | | | (762 | ) |
| | |
Conagra Brands, Inc. | | | (10 | ) | | | (361 | ) |
| | |
General Mills, Inc. | | | (7 | ) | | | (589 | ) |
| | |
Kellogg Co. | | | (8 | ) | | | (639 | ) |
| | |
Kraft Heinz Co. (The) | | | (7 | ) | | | (260 | ) |
| | | | | | | | |
| | |
| | | | | | | (2,611 | ) |
| | | | | | | | |
| | |
Gas Utilities — (0.4)% | | | | | | | | |
| | |
National Fuel Gas Co. | | | (10 | ) | | | (654 | ) |
| | | | | | | | |
| | | | | | | | |
| INVESTMENTS | | SHARES (000) | | | VALUE ($000) | |
| | | | | | | | |
| | | | | | | | |
| | |
Health Care Equipment & Supplies — (0.7)% | | | | | | | | |
| | |
Stryker Corp. | | | (5 | ) | | | (1,054 | ) |
| | | | | | | | |
| | |
Health Care Providers & Services — (0.7)% | | | | | | | | |
| | |
Henry Schein, Inc. * | | | (14 | ) | | | (962 | ) |
| | |
Quest Diagnostics, Inc. | | | (2 | ) | | | (202 | ) |
| | | | | | | | |
| | |
| | | | | | | (1,164 | ) |
| | | | | | | | |
| | |
Household Durables — (0.4)% | | | | | | | | |
| | |
Mohawk Industries, Inc. * | | | (4 | ) | | | (362 | ) |
| | |
NVR, Inc. * | | | — | | | | (182 | ) |
| | |
PulteGroup, Inc. | | | (3 | ) | | | (131 | ) |
| | | | | | | | |
| | |
| | | | | | | (675 | ) |
| | | | | | | | |
| | |
Household Products — (0.4)% | | | | | | | | |
| | |
Clorox Co. (The) | | | (5 | ) | | | (713 | ) |
| | | | | | | | |
| | |
Industrial Conglomerates — (2.3)% | | | | | | | | |
| | |
3M Co. | | | (13 | ) | | | 1,612 | ) |
| | |
General Electric Co. | | | (27 | ) | | | (2,127 | ) |
| | | | | | | | |
| | |
| | | | | | | (3,739 | ) |
| | | | | | | | |
| | |
Insurance — (2.4)% | | | | | | | | |
| | |
Allstate Corp. (The) | | | (7 | ) | | | (855 | ) |
| | |
Chubb Ltd. | | | (1 | ) | | | (178 | ) |
| | |
Hartford Financial Services Group, Inc. (The) | | | (5 | ) | | | (342 | ) |
| | |
Marsh & McLennan Cos., Inc. | | | (1 | ) | | | (235 | ) |
| | |
Principal Financial Group, Inc. | | | (15 | ) | | | (1,331 | ) |
| | |
Ryan Specialty Holdings, Inc., Class A * | | | (9 | ) | | | (424 | ) |
| | |
WR Berkley Corp. | | | (6 | ) | | | (444 | ) |
| | | | | | | | |
| | |
| | | | | | | (3,809 | ) |
| | | | | | | | |
| | |
Interactive Media & Services — (0.3)% | | | | | | | | |
| | |
Alphabet, Inc., Class A * | | | (3 | ) | | | (316 | ) |
| | |
Alphabet, Inc., Class C * | | | (3 | ) | | | (237 | ) |
| | | | | | | | |
| | |
| | | | | | | (553 | ) |
| | | | | | | | |
| | |
Internet & Direct Marketing Retail — (0.5)% | | | | | | | | |
| | |
eBay, Inc. | | | (18 | ) | | | (731 | ) |
| | | | | | | | |
| | |
IT Services — (2.3)% | | | | | | | | |
| | |
Cognizant Technology Solutions Corp., Class A | | | (11 | ) | | | (685 | ) |
| | |
DXC Technology Co. * | | | (1 | ) | | | (34 | ) |
| | |
Global Payments, Inc. | | | (6 | ) | | | (674 | ) |
| | |
Jack Henry & Associates, Inc. | | | (1 | ) | | | (217 | ) |
| | |
Paychex, Inc. | | | (3 | ) | | | (312 | ) |
| | |
Shopify, Inc. (Canada), Class A * | | | (20 | ) | | | (686 | ) |
| | |
Western Union Co. (The) | | | (87 | ) | | | (1,183 | ) |
| | | | | | | | |
| | |
| | | | | | | (3,791 | ) |
| | | | | | | | |
SEE NOTES TO FINANCIAL STATEMENTS.
| | | | | | | | | | |
| | | | | |
| 22 | | | | | | | | J.P. MORGAN SPECIALTY FUNDS | | |
| | | | | | | | |
INVESTMENTS | | SHARES (000) | | | VALUE ($000) | |
Short Positions — continued | | | | | | | | |
Common Stocks — continued | | | | | | | | |
| | |
Life Sciences Tools & Services — (0.8)% | | | | | | | | |
| | |
Agilent Technologies, Inc. | | | (4 | ) | | | (540 | ) |
| | |
PerkinElmer, Inc. | | | (1 | ) | | | (108 | ) |
| | |
Waters Corp. * | | | (2 | ) | | | (690 | ) |
| | | | | | | | |
| | |
| | | | | | | (1,338 | ) |
| | | | | | | | |
| | |
Machinery — (3.2)% | | | | | | | | |
| | |
Caterpillar, Inc. | | | (2 | ) | | | (516 | ) |
| | |
Donaldson Co., Inc. | | | (16 | ) | | | (945 | ) |
| | |
IDEX Corp. | | | (5 | ) | | | (1,081 | ) |
| | |
Illinois Tool Works, Inc. | | | (4 | ) | | | (806 | ) |
| | |
PACCAR, Inc. | | | (7 | ) | | | (641 | ) |
| | |
Stanley Black & Decker, Inc. | | | (14 | ) | | | (1,117 | ) |
| | | | | | | | |
| | |
| | | | | | | (5,106 | ) |
| | | | | | | | |
| | |
Media — (3.2)% | | | | | | | | |
| | |
Interpublic Group of Cos., Inc. (The) | | | (30 | ) | | | (904 | ) |
| | |
Omnicom Group, Inc. | | | (30 | ) | | | (2,155 | ) |
| | |
Paramount Global, Class B | | | (73 | ) | | | (1,334 | ) |
| | |
Sirius XM Holdings, Inc. | | | (118 | ) | | | (715 | ) |
| | | | | | | | |
| | |
| | | | | | | (5,108 | ) |
| | | | | | | | |
| | |
Multi-Utilities — (0.8)% | | | | | | | | |
| | |
Consolidated Edison, Inc. | | | (8 | ) | | | (700 | ) |
| | |
WEC Energy Group, Inc. | | | (6 | ) | | | (565 | ) |
| | | | | | | | |
| | |
| | | | | | | (1,265 | ) |
| | | | | | | | |
| | |
Oil, Gas & Consumable Fuels — (1.8)% | | | | | | | | |
| | |
Devon Energy Corp. | | | (8 | ) | | | (627 | ) |
| | |
Enbridge, Inc. (Canada) | | | (14 | ) | | | (549 | ) |
| | |
Hess Corp. | | | (9 | ) | | | (1,305 | ) |
| | |
Pioneer Natural Resources Co. | | | (2 | ) | | | (384 | ) |
| | | | | | | | |
| | |
| | | | | | | (2,865 | ) |
| | | | | | | | |
| | |
Pharmaceuticals — (2.8)% | | | | | | | | |
| | |
Catalent, Inc. * | | | (4 | ) | | | (252 | ) |
| | |
Eli Lilly & Co. | | | (2 | ) | | | (851 | ) |
| | |
Johnson & Johnson | | | (4 | ) | | | (650 | ) |
| | |
Merck & Co., Inc. | | | (12 | ) | | | (1,181 | ) |
| | |
Pfizer, Inc. | | | (16 | ) | | | (756 | ) |
| | |
Zoetis, Inc. | | | (5 | ) | | | (839 | ) |
| | | | | | | | |
| | |
| | | | | | | (4,529 | ) |
| | | | | | | | |
| | |
Professional Services — (1.1)% | | | | | | | | |
| | |
Equifax, Inc. | | | (4 | ) | | | (737 | ) |
| | |
TransUnion | | | (7 | ) | | | (413 | ) |
| | |
Verisk Analytics, Inc. | | | (3 | ) | | | (563 | ) |
| | | | | | | | |
| | |
| | | | | | | (1,713 | ) |
| | | | | | | | |
| | | | | | | | |
| INVESTMENTS | | SHARES (000) | | | VALUE ($000) | |
| | | | | | | | |
| | | | | | | | |
| | |
Road & Rail — (0.5)% | | | | | | | | |
| | |
Canadian Pacific Railway Ltd. (Canada) | | | (1 | ) | | | (50 | ) |
| | |
Heartland Express, Inc. | | | (21 | ) | | | (322 | ) |
| | |
JB Hunt Transport Services, Inc. | | | (2 | ) | | | (314 | ) |
| | |
Werner Enterprises, Inc. | | | (5 | ) | | | (204 | ) |
| | | | | | | | |
| | |
| | | | | | | (890 | ) |
| | | | | | | | |
|
Semiconductors & Semiconductor Equipment — (2.4)% | |
| | |
Intel Corp. | | | (46 | ) | | | (1,315 | ) |
| | |
Microchip Technology, Inc. | | | (14 | ) | | | (865 | ) |
| | |
QUALCOMM, Inc. | | | (11 | ) | | | (1,262 | ) |
| | |
Skyworks Solutions, Inc. | | | (6 | ) | | | (487 | ) |
| | | | | | | | |
| | |
| | | | | | | (3,929 | ) |
| | | | | | | | |
| |
Software — (1.3)% | | | | | |
| | |
Ceridian HCM Holding, Inc. * | | | (12 | ) | | | (826 | ) |
| | |
Oracle Corp. | | | (1 | ) | | | (91 | ) |
| | |
Paycom Software, Inc. * | | | (3 | ) | | | (896 | ) |
| | |
Salesforce, Inc. * | | | (2 | ) | | | (256 | ) |
| | | | | | | | |
| | |
| | | | | | | (2,069 | ) |
| | | | | | | | |
| |
Specialty Retail — (0.2)% | | | | | |
| | |
CarMax, Inc. * | | | (4 | ) | | | (225 | ) |
| | |
Williams-Sonoma, Inc. | | | (1 | ) | | | (179 | ) |
| | | | | | | | |
| | |
| | | | | | | (404 | ) |
| | | | | | | | |
| |
Technology Hardware, Storage & Peripherals —(4.2)% | | | | | |
| | |
Apple, Inc. | | | (26 | ) | | | (4,047 | ) |
| | |
Dell Technologies, Inc., Class C | | | (6 | ) | | | (249 | ) |
| | |
Hewlett Packard Enterprise Co. | | | (49 | ) | | | (694 | ) |
| | |
HP, Inc. | | | (18 | ) | | | (495 | ) |
| | |
NetApp, Inc. | | | (18 | ) | | | (1,214 | ) |
| | |
Xerox Holdings Corp. | | | (5 | ) | | | (77 | ) |
| | | | | | | | |
| | |
| | | | | | | (6,776 | ) |
| | | | | | | | |
| |
Textiles, Apparel & Luxury Goods — (0.2)% | | | | | |
| | |
VF Corp. | | | (12 | ) | | | (340 | ) |
| | | | | | | | |
|
Trading Companies & Distributors — (0.3)% | |
| | |
Fastenal Co. | | | (12 | ) | | | (558 | ) |
| | | | | | | | |
| | |
Total Common Stocks
(Proceeds $(110,785)) | | | | | | | (104,586 | ) |
| | | | | | | | |
| | |
Total Short Positions
(Proceeds $(110,785)) | | | | | | | (104,586 | ) |
| | | | | | | | |
Total Investments — 32.3%
(Cost $36,067) | | | | | | | 52,015 | |
Other Assets Less Liabilities — 63.7% | | | | | | | 102,781 | |
| | | | | | | | |
Net Assets — 96.0% | | | | | | | 154,796 | |
| | | | | | | | |
Future share reacquisition adjustment — 4.0% | | | | | | | 6,425 | |
| | | | | | | | |
Net assets after future share reacquisition adjustment — 100% | | | | | | $ | 161,221 | |
| | | | | | | | |
SEE NOTES TO FINANCIAL STATEMENTS.
| | | | | | | | | | |
| | | | | |
| | J.P. MORGAN SPECIALTY FUNDS | | | | | | | | 23 |
JPMorgan Research Market Neutral Fund
SCHEDULE OF PORTFOLIO INVESTMENTS
AS OF OCTOBER 31, 2022 (AS RESTATED, SEE NOTE 8) (continued)
Percentages indicated are based on net assets after future share reacquisition adjustment.
Amounts presented as a dash (“-”) represent amounts that round to less than a thousand.
| | |
Abbreviations | | |
| ADR | | American Depositary Receipt |
| NYRS | | New York Registry Shares |
| |
| * | | Non-income producing security. |
| (a) | | All or a portion of this security is segregated as collateral for short sales. The total value of securities and cash segregated as collateral is $19,759 and $105,856, respectively. |
| | |
| |
| (b) | | Investment in an affiliated fund, which is registered under the Investment Company Act of 1940, as amended, and is advised by J.P. Morgan Investment Management Inc. |
| (c) | | The rate shown is the current yield as of October 31, 2022. |
| (d) | | The rate shown is the effective yield as of October 31, 2022. |
| | | | | | | | | | | | | | | | | | | | |
| Futures contracts outstanding as of October 31, 2022 (amounts in thousands, except number of contracts): | |
| DESCRIPTION | | NUMBER OF CONTRACTS | | | EXPIRATION DATE | | | TRADING CURRENCY | | | NOTIONAL AMOUNT ($) | | | VALUE AND UNREALIZED APPRECIATION (DEPRECIATION) ($) | |
Short Contracts | | | | | | | | | | | | | | | | | | | | |
S&P 500 E-Mini Index | | | (3 | ) | | | 12/16/2022 | | | | USD | | | | (582 | ) | | | (1 | ) |
| | | | | | | | | | | | | | | | | | | | |
| | |
Abbreviations | | |
| USD | | United States Dollar |
SEE NOTES TO FINANCIAL STATEMENTS.
| | | | | | | | | | |
| | | | | |
| 24 | | | | | | | | J.P. MORGAN SPECIALTY FUNDS | | |
JPMorgan Research Market Neutral Fund
SCHEDULE OF PORTFOLIO INVESTMENTS
AS OF OCTOBER 31, 2021 (AS RESTATED, SEE NOTE 8)
| | | | | | | | |
| INVESTMENTS | | SHARES
(000) | | | VALUE
($000) | |
Long Positions — 97.6% | |
Common Stocks — 87.2% | |
|
Aerospace & Defense — 0.7% | |
| | |
Howmet Aerospace, Inc. | | | 7 | | | | 212 | |
| | |
Northrop Grumman Corp. | | | 1 | | | | 312 | |
| | |
TransDigm Group, Inc. * | | | — | (a) | | | 97 | |
| | | | | | | | |
| | |
| | | | | | | 621 | |
| | | | | | | | |
|
Air Freight & Logistics — 0.6% | |
| | |
FedEx Corp. | | | 1 | | | | 255 | |
| | |
United Parcel Service, Inc., Class B | | | 1 | | | | 284 | |
| | | | | | | | |
| | |
| | | | | | | 539 | |
| | | | | | | | |
|
Auto Components — 0.6% | |
| | |
Aptiv plc * | | | 1 | | | | 196 | |
| | |
Lear Corp. | | | 1 | | | | 197 | |
| | |
Magna International, Inc. (Canada) | | | 2 | | | | 136 | |
| | | | | | | | |
| | |
| | | | | | | 529 | |
| | | | | | | | |
|
Automobiles — 0.2% | |
| | |
General Motors Co. * | | | 3 | | | | 146 | |
| | | | | | | | |
|
Banks — 4.6% | |
| | |
Bank of America Corp. | | | 9 | | | | 416 | |
| | |
Fifth Third Bancorp | | | 14 | | | | 589 | |
| | |
M&T Bank Corp. | | | 1 | | | | 186 | |
| | |
SVB Financial Group * | | | 1 | | | | 1,052 | |
| | |
Truist Financial Corp. | | | 7 | | | | 415 | |
| | |
US Bancorp | | | 2 | | | | 99 | |
| | |
Wells Fargo & Co. (b) | | | 31 | | | | 1,572 | |
| | | | | | | | |
| | |
| | | | | | | 4,329 | |
| | | | | | | | |
|
Beverages — 0.9% | |
| | |
Coca-Cola Co. (The) | | | 3 | | | | 149 | |
| | |
Constellation Brands, Inc., Class A | | | — | (a) | | | 88 | |
| | |
PepsiCo, Inc. | | | 4 | | | | 570 | |
| | | | | | | | |
| | |
| | | | | | | 807 | |
| | | | | | | | |
|
Biotechnology — 3.6% | |
| | |
AbbVie, Inc. | | | 8 | | | | 946 | |
| | |
Biogen, Inc. * | | | 2 | | | | 531 | |
| | |
BioMarin Pharmaceutical, Inc. * | | | 4 | | | | 281 | |
| | |
Neurocrine Biosciences, Inc. * | | | 3 | | | | 364 | |
| | |
Regeneron Pharmaceuticals, Inc. * | | | 1 | | | | 805 | |
| | |
Vertex Pharmaceuticals, Inc. * | | | 2 | | | | 434 | |
| | | | | | | | |
| | |
| | | | | | | 3,361 | |
| | | | | | | | |
|
Building Products — 1.0% | |
| | |
Allegion plc | | | 1 | | | | 87 | |
| | |
Fortune Brands Home & Security, Inc. | | | — | (a) | | | 33 | |
| | | | | | | | |
| INVESTMENTS | | SHARES
(000) | | | VALUE
($000) | |
| | | | | | | | |
| | | | | | | | |
|
Building Products — continued | |
| | |
Johnson Controls International plc | | | 6 | | | | 446 | |
| | |
Trane Technologies plc | | | 2 | | | | 393 | |
| | | | | | | | |
| | |
| | | | | | | 959 | |
| | | | | | | | |
|
Capital Markets — 1.3% | |
| | |
Ameriprise Financial, Inc. | | | — | (a) | | | 66 | |
| | |
Charles Schwab Corp. (The) | | | 2 | | | | 123 | |
| | |
Intercontinental Exchange, Inc. | | | — | (a) | | | 66 | |
| | |
Morgan Stanley | | | 3 | | | | 295 | |
| | |
State Street Corp. | | | 4 | | | | 434 | |
| | |
T. Rowe Price Group, Inc. | | | 1 | | | | 195 | |
| | | | | | | | |
| | |
| | | | | | | 1,179 | |
| | | | | | | | |
|
Chemicals — 3.7% | |
| | |
Air Products and Chemicals, Inc. (b) | | | 1 | | | | 326 | |
| | |
Celanese Corp. | | | 3 | | | | 473 | |
| | |
Corteva, Inc. | | | 3 | | | | 147 | |
| | |
DuPont de Nemours, Inc. (b) | | | 14 | | | | 951 | |
| | |
Eastman Chemical Co. (b) | | | 5 | | | | 523 | |
| | |
Linde plc (United Kingdom) | | | 1 | | | | 322 | |
| | |
PPG Industries, Inc. | | | 5 | | | | 748 | |
| | | | | | | | |
| | |
| | | | | | | 3,490 | |
| | | | | | | | |
|
Commercial Services & Supplies — 0.3% | |
| | |
Waste Connections, Inc. | | | 2 | | | | 301 | |
| | | | | | | | |
|
Diversified Financial Services — 0.2% | |
| | |
Voya Financial, Inc. | | | 3 | | | | 234 | |
| | | | | | | | |
|
Electric Utilities — 1.8% | |
| | |
Alliant Energy Corp. | | | 5 | | | | 266 | |
| | |
FirstEnergy Corp. | | | 19 | | | | 740 | |
| | |
NextEra Energy, Inc. | | | 8 | | | | 700 | |
| | | | | | | | |
| | |
| | | | | | | 1,706 | |
| | | | | | | | |
|
Electrical Equipment — 0.9% | |
| | |
AMETEK, Inc. | | | — | (a) | | | 56 | |
| | |
Eaton Corp. plc | | | 5 | | | | 776 | |
| | | | | | | | |
| | |
| | | | | | | 832 | |
| | | | | | | | |
|
Electronic Equipment, Instruments & Components — 0.7% | |
| | |
Corning, Inc. | | | 13 | | | | 471 | |
| | |
Keysight Technologies, Inc. * | | | 1 | | | | 143 | |
| | | | | | | | |
| | |
| | | | | | | 614 | |
| | | | | | | | |
|
Energy Equipment & Services — 0.6% | |
| | |
Baker Hughes Co. | | | 24 | | | | 590 | |
| | | | | | | | |
SEE NOTES TO FINANCIAL STATEMENTS.
| | | | | | | | | | |
| | | | | |
| | | J.P. MORGAN SPECIALTY FUNDS | | | | | | | | 25 |
JPMorgan Research Market Neutral Fund
SCHEDULE OF PORTFOLIO INVESTMENTS
AS OF OCTOBER 31, 2021 (AS RESTATED, SEE NOTE 8) (continued)
| | | | | | | | |
| INVESTMENTS | | SHARES
(000) | | | VALUE
($000) | |
Long Positions — continued | |
Common Stocks — continued | |
|
Entertainment — 2.1% | |
| | |
Activision Blizzard, Inc. | | | 5 | | | | 420 | |
| | |
Electronic Arts, Inc. | | | 3 | | | | 416 | |
| | |
Endeavor Group Holdings, Inc., Class A * | | | 37 | | | | 1,000 | |
| | |
Netflix, Inc. * | | | — | (a) | | | 126 | |
| | | | | | | | |
| | |
| | | | | | | 1,962 | |
| | | | | | | | |
|
Equity Real Estate Investment Trusts (REITs) — 4.0% | |
| | |
American Homes 4 Rent, Class A | | | 6 | | | | 246 | |
| | |
Camden Property Trust | | | 2 | | | | 376 | |
| | |
Cousins Properties, Inc. | | | 8 | | | | 328 | |
| | |
Equinix, Inc. | | | — | (a) | | | 281 | |
| | |
Equity LifeStyle Properties, Inc. | | | 1 | | | | 109 | |
| | |
Host Hotels & Resorts, Inc. * | | | 11 | | | | 191 | |
| | |
Invitation Homes, Inc. | | | 11 | | | | 434 | |
| | |
Kimco Realty Corp. | | | 35 | | | | 792 | |
| | |
Prologis, Inc. | | | 2 | | | | 308 | |
| | |
Sun Communities, Inc. | | | 1 | | | | 264 | |
| | |
UDR, Inc. | | | 5 | | | | 277 | |
| | |
Ventas, Inc. | | | 1 | | | | 66 | |
| | |
WP Carey, Inc. | | | 1 | | | | 85 | |
| | | | | | | | |
| | |
| | | | | | | 3,757 | |
| | | | | | | | |
|
Food Products — 0.5% | |
| | |
Hershey Co. (The) | | | 1 | | | | 233 | |
| | |
Mondelez International, Inc., Class A | | | 5 | | | | 280 | |
| | | | | | | | |
| | |
| | | | | | | 513 | |
| | | | | | | | |
|
Health Care Equipment & Supplies — 2.3% | |
| | |
Abbott Laboratories | | | 1 | | | | 104 | |
| | |
Becton Dickinson and Co. | | | 1 | | | | 208 | |
| | |
Boston Scientific Corp. * | | | 9 | | | | 406 | |
| | |
Danaher Corp. | | | 2 | | | | 573 | |
| | |
Medtronic plc | | | 4 | | | | 438 | |
| | |
Zimmer Biomet Holdings, Inc. | | | 3 | | | | 396 | |
| | | | | | | | |
| | |
| | | | | | | 2,125 | |
| | | | | | | | |
|
Health Care Providers & Services — 2.4% | |
| | |
Centene Corp. * | | | 8 | | | | 553 | |
| | |
Cigna Corp. | | | 1 | | | | 163 | |
| | |
CVS Health Corp. | | | 8 | | | | 709 | |
| | |
Humana, Inc. | | | — | (a) | | | 157 | |
| | |
UnitedHealth Group, Inc. (b) | | | 2 | | | | 696 | |
| | | | | | | | |
| | |
| | | | | | | 2,278 | |
| | | | | | | | |
|
Hotels, Restaurants & Leisure — 2.2% | |
| | |
Booking Holdings, Inc. * | | | — | (a) | | | 545 | |
| | |
Hilton Worldwide Holdings, Inc. * | | | 1 | | | | 81 | |
| | | | | | | | |
| INVESTMENTS | | SHARES
(000) | | | VALUE
($000) | |
| | | | | | | | |
| | | | | | | | |
|
Hotels, Restaurants & Leisure — continued | |
| | |
McDonald’s Corp. | | | 3 | | | | 767 | |
| | |
Yum! Brands, Inc. (b) | | | 5 | | | | 655 | |
| | | | | | | | |
| | |
| | | | | | | 2,048 | |
| | | | | | | | |
|
Household Durables — 0.8% | |
| | |
KB Home | | | 7 | | | | 265 | |
| | |
Mohawk Industries, Inc. * | | | 1 | | | | 202 | |
| | |
Toll Brothers, Inc. | | | 5 | | | | 284 | |
| | | | | | | | |
| | |
| | | | | | | 751 | |
| | | | | | | | |
|
Household Products — 0.1% | |
| | |
Kimberly-Clark Corp. | | | — | (a) | | | 29 | |
| | |
Procter & Gamble Co. (The) | | | 1 | | | | 165 | |
| | | | | | | | |
| | |
| | | | | | | 194 | |
| | | | | | | | |
|
Industrial Conglomerates — 0.1% | |
| | |
Roper Technologies, Inc. | | | — | (a) | | | 49 | |
| | | | | | | | |
|
Insurance — 2.1% | |
| | |
Arthur J Gallagher & Co. | | | 2 | | | | 393 | |
| | |
Hartford Financial Services Group, Inc. (The) | | | 4 | | | | 287 | |
| | |
Lincoln National Corp. | | | 1 | | | | 74 | |
| | |
Marsh & McLennan Cos., Inc. | | | 1 | | | | 150 | |
| | |
Progressive Corp. (The) | | | 6 | | | | 544 | |
| | |
Prudential Financial, Inc. | | | 1 | | | | 125 | |
| | |
RenaissanceRe Holdings Ltd. (Bermuda) | | | — | (a) | | | 57 | |
| | |
Ryan Specialty Group Holdings, Inc., Class A * | | | 9 | | | | 325 | |
| | | | | | | | |
| | |
| | | | | | | 1,955 | |
| | | | | | | | |
|
Interactive Media & Services — 2.9% | |
| | |
Alphabet, Inc., Class A * | | | — | (a) | | | 376 | |
| | |
Alphabet, Inc., Class C * | | | — | (a) | | | 756 | |
| | |
Meta Platforms, Inc., Class A * (b) | | | — | (a) | | | 134 | |
| | |
Snap, Inc., Class A * | | | 13 | | | | 689 | |
| | |
ZoomInfo Technologies, Inc., Class A * | | | 12 | | | | 790 | |
| | | | | | | | |
| | |
| | | | | | | 2,745 | |
| | | | | | | | |
|
Internet & Direct Marketing Retail — 2.0% | |
| | |
Amazon.com, Inc. * (b) | | | 1 | | | | 1,848 | |
| | | | | | | | |
|
IT Services — 4.9% | |
| | |
Affirm Holdings, Inc. * | | | 4 | | | | 577 | |
| | |
FleetCor Technologies, Inc. * | | | 2 | | | | 522 | |
| | |
Mastercard, Inc., Class A (b) | | | 5 | | | | 1,704 | |
| | |
Shopify, Inc., Class A (Canada) * | | | 1 | | | | 1,350 | |
| | |
Square, Inc., Class A * | | | 1 | | | | 141 | |
| | |
WEX, Inc. * | | | 2 | | | | 328 | |
| | | | | | | | |
| | |
| | | | | | | 4,622 | |
| | | | | | | | |
SEE NOTES TO FINANCIAL STATEMENTS.
| | | | | | | | | | |
| | | | | |
| 26 | | | | | | | | J.P. MORGAN SPECIALTY FUNDS | | |
| | | | | | | | |
| INVESTMENTS | | SHARES
(000) | | | VALUE
($000) | |
Long Positions — continued | |
Common Stocks — continued | |
|
Life Sciences Tools & Services — 1.6% | |
| | |
PerkinElmer, Inc. | | | 4 | | | | 682 | |
| | |
Thermo Fisher Scientific, Inc. | | | 1 | | | | 790 | |
| | | | | | | | |
| | |
| | | | | | | 1,472 | |
| | | | | | | | |
|
Machinery — 5.1% | |
| | |
Deere & Co. (b) | | | 3 | | | | 1,082 | |
| | |
Dover Corp. | | | 4 | | | | 593 | |
| | |
Ingersoll Rand, Inc. * | | | 27 | | | | 1,472 | |
| | |
Otis Worldwide Corp. | | | 8 | | | | 607 | |
| | |
Parker-Hannifin Corp. | | | — | (a) | | | 48 | |
| | |
Stanley Black & Decker, Inc. | | | 5 | | | | 986 | |
| | | | | | | | |
| | |
| | | | | | | 4,788 | |
| | | | | | | | |
|
Media — 1.9% | |
| | |
Charter Communications, Inc., Class A * | | | 1 | | | | 520 | |
| | |
Comcast Corp., Class A | | | 11 | | | | 547 | |
| | |
Liberty Media Corp.-Liberty SiriusXM, Class A * | | | 14 | | | | 688 | |
| | | | | | | | |
| | |
| | | | | | | 1,755 | |
| | | | | | | | |
|
Metals & Mining — 0.4% | |
| | |
Freeport-McMoRan, Inc. | | | 11 | | | | 400 | |
| | | | | | | | |
|
Multiline Retail — 0.5% | |
| | |
Dollar General Corp. | | | 1 | | | | 320 | |
| | |
Dollar Tree, Inc. * | | | 1 | | | | 95 | |
| | | | | | | | |
| | |
| | | | | | | 415 | |
| | | | | | | | |
|
Multi-Utilities — 2.5% | |
| | |
Ameren Corp. | | | 3 | | | | 281 | |
| | |
CenterPoint Energy, Inc. | | | 25 | | | | 660 | |
| | |
DTE Energy Co. | | | 2 | | | | 274 | |
| | |
Public Service Enterprise Group, Inc. | | | 11 | | | | 731 | |
| | |
WEC Energy Group, Inc. | | | 5 | | | | 445 | |
| | | | | | | | |
| | |
| | | | | | | 2,391 | |
| | | | | | | | |
|
Oil, Gas & Consumable Fuels — 6.5% | |
| | |
Cheniere Energy, Inc. * | | | 4 | | | | 425 | |
| | |
Chevron Corp. | | | 3 | | | | 400 | |
| | |
ConocoPhillips | | | 8 | | | | 584 | |
| | |
Coterra Energy, Inc. | | | 54 | | | | 1,141 | |
| | |
Diamondback Energy, Inc. (b) | | | 17 | | | | 1,822 | |
| | |
EOG Resources, Inc. | | | 4 | | | | 373 | |
| | |
Phillips 66 | | | 5 | | | | 344 | |
| | |
Pioneer Natural Resources Co. (b) | | | 4 | | | | 690 | |
| | |
TC Energy Corp. (Canada) | | | 6 | | | | 311 | |
| | | | | | | | |
| | |
| | | | | | | 6,090 | |
| | | | | | | | |
| | | | | | | | |
| INVESTMENTS | | SHARES
(000) | | | VALUE
($000) | |
| | | | | | | | |
| | | | | | | | |
|
Personal Products — 0.6% | |
| | |
Estee Lauder Cos., Inc. (The), Class A | | | 2 | | | | 563 | |
| | | | | | | | |
|
Pharmaceuticals — 1.2% | |
| | |
Bristol-Myers Squibb Co. | | | 9 | | | | 518 | |
| | |
Eli Lilly & Co. | | | 2 | | | | 557 | |
| | |
Organon & Co. | | | 2 | | | | 89 | |
| | | | | | | | |
| | |
| | | | | | | 1,164 | |
| | | | | | | | |
|
Professional Services — 1.6% | |
| | |
Booz Allen Hamilton Holding Corp. | | | 5 | | | | 418 | |
| | |
IHS Markit Ltd. | | | 4 | | | | 485 | |
| | |
Leidos Holdings, Inc. (b) | | | 6 | | | | 573 | |
| | | | | | | | |
| | |
| | | | | | | 1,476 | |
| | | | | | | | |
|
Road & Rail — 3.9% | |
| | |
Canadian National Railway Co. (Canada) | | | 1 | | | | 154 | |
| | |
CSX Corp. | | | 9 | | | | 315 | |
| | |
Lyft, Inc., Class A * (b) | | | 26 | | | | 1,206 | |
| | |
Norfolk Southern Corp. (b) | | | 3 | | | | 1,025 | |
| | |
Old Dominion Freight Line, Inc. | | | 2 | | | | 624 | |
| | |
Uber Technologies, Inc. * (b) | | | 3 | | | | 132 | |
| | |
Union Pacific Corp. | | | 1 | | | | 169 | |
| | | | | | | | |
| | |
| | | | | | | 3,625 | |
| | | | | | | | |
|
Semiconductors & Semiconductor Equipment — 4.3% | |
| | |
Advanced Micro Devices, Inc. * (b) | | | 7 | | | | 889 | |
| | |
Analog Devices, Inc. | | | 3 | | | | 514 | |
| | |
Lam Research Corp. (b) | | | 1 | | | | 336 | |
| | |
Micron Technology, Inc. | | | 4 | | | | 276 | |
| | |
NXP Semiconductors NV (China) | | | 5 | | | | 931 | |
| | |
ON Semiconductor Corp. * | | | 6 | | | | 294 | |
| | |
Taiwan Semiconductor Manufacturing Co. Ltd., ADR (Taiwan) | | | 2 | | | | 223 | |
| | |
Texas Instruments, Inc. | | | 3 | | | | 554 | |
| | | | | | | | |
| | |
| | | | | | | 4,017 | |
| | | | | | | | |
|
Software — 3.2% | |
| | |
Ceridian HCM Holding, Inc. * | | | 9 | | | | 1,150 | |
| | |
Intuit, Inc. (b) | | | — | (a) | | | 303 | |
| | |
Microsoft Corp. (b) | | | 3 | | | | 923 | |
| | |
Workday, Inc., Class A * | | | 2 | | | | 656 | |
| | | | | | | | |
| | |
| | | | | | | 3,032 | |
| | | | | | | | |
|
Specialty Retail — 3.5% | |
| | |
AutoZone, Inc. * | | | — | (a) | | | 596 | |
| | |
Best Buy Co., Inc. | | | 2 | | | | 202 | |
| | |
Burlington Stores, Inc. * | | | 1 | | | | 253 | |
| | |
Home Depot, Inc. (The) | | | — | (a) | | | 178 | |
SEE NOTES TO FINANCIAL STATEMENTS.
| | | | | | | | | | |
| | | | | |
| | | J.P. MORGAN SPECIALTY FUNDS | | | | | | | | 27 |
JPMorgan Research Market Neutral Fund
SCHEDULE OF PORTFOLIO INVESTMENTS
AS OF OCTOBER 31, 2021 (AS RESTATED, SEE NOTE 8) (continued)
| | | | | | | | |
| INVESTMENTS | | SHARES
(000) | | | VALUE
($000) | |
Long Positions — continued | |
Common Stocks — continued | |
|
Specialty Retail — continued | |
| | |
Lowe’s Cos., Inc. (b) | | | 4 | | | | 1,027 | |
| | |
O’Reilly Automotive, Inc. * (b) | | | 2 | | | | 1,022 | |
| | |
TJX Cos., Inc. (The) | | | — | (a) | | | 32 | |
| | | | | | | | |
| | |
| | | | | | | 3,310 | |
| | | | | | | | |
|
Technology Hardware, Storage & Peripherals — 1.5% | |
| | |
Hewlett Packard Enterprise Co. | | | 60 | | | | 876 | |
| | |
Seagate Technology Holdings plc | | | 6 | | | | 569 | |
| | | | | | | | |
| | |
| | | | | | | 1,445 | |
| | | | | | | | |
|
Textiles, Apparel & Luxury Goods — 0.4% | |
| | |
NIKE, Inc., Class B | | | 2 | | | | 394 | |
| | | | | | | | |
|
Wireless Telecommunication Services — 0.4% | |
| | |
T-Mobile US, Inc. * | | | 3 | | | | 400 | |
| | | | | | | | |
| | |
Total Common Stocks
(Cost $58,575) | | | | | | | 81,821 | |
| | | | | | | | |
Short-Term Investments — 10.4% | |
|
Investment Companies — 10.4% | |
| | |
JPMorgan Prime Money Market Fund Class Institutional Shares, 0.05% (c) (d)
(Cost $9,749) | | | 9,747 | | | | 9,752 | |
| | | | | | | | |
| | |
Total Long Positions
(Cost $68,324) | | | | | | | 91,573 | |
| | | | | | | | |
Short Positions — (76.5)% | |
Common Stocks — (76.5)% | |
| | |
Aerospace & Defense — (1.3)% | | | | | | | | |
| | |
Boeing Co. (The) * | | | (2 | ) | | | (344 | ) |
| | |
Hexcel Corp. * | | | (2 | ) | | | (133 | ) |
| | |
Huntington Ingalls Industries, Inc. | | | (3 | ) | | | (654 | ) |
| | |
L3Harris Technologies, Inc. | | | (1 | ) | | | (125 | ) |
| | | | | | | | |
| | |
| | | | | | | (1,256 | ) |
| | | | | | | | |
|
Air Freight & Logistics — (0.9)% | |
| | |
CH Robinson Worldwide, Inc. | | | (5 | ) | | | (490 | ) |
| | |
Expeditors International of Washington, Inc. | | | (3 | ) | | | (382 | ) |
| | | | | | | | |
| | |
| | | | | | | (872 | ) |
| | | | | | | | |
|
Airlines — 0.0% (e) | |
| | |
United Airlines Holdings, Inc. * | | | (1 | ) | | | (43 | ) |
| | | | | | | | |
|
Auto Components — (0.6)% | |
| | |
Autoliv, Inc. (Sweden) | | | (2 | ) | | | (240 | ) |
| | |
BorgWarner, Inc. | | | (6 | ) | | | (281 | ) |
| | | | | | | | |
| | |
| | | | | | | (521 | ) |
| | | | | | | | |
|
Automobiles — (0.2)% | |
| | |
Ford Motor Co. * | | | (5 | ) | | | (88 | ) |
| | |
Harley-Davidson, Inc. | | | (2 | ) | | | (68 | ) |
| | | | | | | | |
| | |
| | | | | | | (156 | ) |
| | | | | | | | |
| | | | | | | | |
| INVESTMENTS | | SHARES
(000) | | | VALUE
($000) | |
| | | | | | | | |
| | | | | | | | |
|
Banks — (2.2)% | |
| | |
Associated Banc-Corp. | | | (5 | ) | | | (106 | ) |
| | |
Citizens Financial Group, Inc. | | | (12 | ) | | | (563 | ) |
| | |
First Republic Bank | | | (2 | ) | | | (467 | ) |
| | |
KeyCorp | | | (18 | ) | | | (418 | ) |
| | |
PNC Financial Services Group, Inc. (The) | | | (3 | ) | | | (555 | ) |
| | | | | | | | |
| | |
| | | | | | | (2,109 | ) |
| | | | | | | | |
|
Biotechnology — (2.2)% | |
| | |
Amgen, Inc. | | | (1 | ) | | | (268 | ) |
| | |
Gilead Sciences, Inc. | | | (14 | ) | | | (886 | ) |
| | |
Moderna, Inc. * | | | (3 | ) | | | (881 | ) |
| | | | | | | | |
| | |
| | | | | | | (2,035 | ) |
| | | | | | | | |
|
Building Products — (0.7)% | |
| | |
Lennox International, Inc. | | | (1 | ) | | | (285 | ) |
| | |
Masco Corp. | | | (5 | ) | | | (331 | ) |
| | | | | | | | |
| | |
| | | | | | | (616 | ) |
| | | | | | | | |
|
Capital Markets — (4.3)% | |
| | |
BlackRock, Inc. | | | (1 | ) | | | (670 | ) |
| | |
Franklin Resources, Inc. | | | (14 | ) | | | (432 | ) |
| | |
Goldman Sachs Group, Inc. (The) | | | (2 | ) | | | (709 | ) |
| | |
Moody’s Corp. | | | (1 | ) | | | (487 | ) |
| | |
MSCI, Inc. | | | (2 | ) | | | (1,218 | ) |
| | |
Northern Trust Corp. | | | (4 | ) | | | (516 | ) |
| | | | | | | | |
| | |
| | | | | | | (4,032 | ) |
| | | | | | | | |
|
Chemicals — (0.9)% | |
| | |
Dow, Inc. | | | (7 | ) | | | (373 | ) |
| | |
Ecolab, Inc. | | | (2 | ) | | | (432 | ) |
| | |
LyondellBasell Industries NV, Class A | | | (1 | ) | | | (77 | ) |
| | | | | | | | |
| | |
| | | | | | | (882 | ) |
| | | | | | | | |
|
Commercial Services & Supplies — (0.7)% | |
| | |
Republic Services, Inc. | | | (4 | ) | | | (604 | ) |
| | | | | | | | |
|
Communications Equipment — (0.6)% | |
| | |
Cisco Systems, Inc. | | | (11 | ) | | | (617 | ) |
| | | | | | | | |
|
Construction Materials — (0.2)% | |
| | |
Martin Marietta Materials, Inc. | | | — | (a) | | | (102 | ) |
| | |
Vulcan Materials Co. | | | — | (a) | | | (39 | ) |
| | | | | | | | |
| | |
| | | | | | | (141 | ) |
| | | | | | | | |
|
Consumer Finance — (0.7)% | |
| | |
Discover Financial Services | | | (6 | ) | | | (690 | ) |
| | | | | | | | |
|
Containers & Packaging — (2.5)% | |
| | |
AptarGroup, Inc. | | | (2 | ) | | | (209 | ) |
| | |
Ball Corp. | | | (4 | ) | | | (397 | ) |
SEE NOTES TO FINANCIAL STATEMENTS.
| | | | | | | | | | |
| | | | | |
| 28 | | | | | | | | J.P. MORGAN SPECIALTY FUNDS | | |
| | | | | | | | |
| INVESTMENTS | | SHARES
(000) | | | VALUE
($000) | |
Short Positions — continued | |
Common Stocks — continued | |
|
Containers & Packaging — continued | |
| | |
Crown Holdings, Inc. | | | (2 | ) | | | (196 | ) |
| | |
International Paper Co. | | | (9 | ) | | | (466 | ) |
| | |
Packaging Corp. of America | | | (1 | ) | | | (80 | ) |
| | |
Silgan Holdings, Inc. | | | (14 | ) | | | (572 | ) |
| | |
Sonoco Products Co. | | | (7 | ) | | | (397 | ) |
| | | | | | | | |
| | |
| | | | | | | (2,317 | ) |
| | | | | | | | |
|
Diversified Telecommunication Services — (1.9)% | |
| | |
AT&T, Inc. | | | (32 | ) | | | (804 | ) |
| | |
Lumen Technologies, Inc. | | | (43 | ) | | | (513 | ) |
| | |
Verizon Communications, Inc. | | | (9 | ) | | | (501 | ) |
| | | | | | | | |
| | |
| | | | | | | (1,818 | ) |
| | | | | | | | |
|
Electric Utilities — (2.5)% | |
| | |
American Electric Power Co., Inc. | | | (11 | ) | | | (895 | ) |
| | |
Eversource Energy | | | (5 | ) | | | (407 | ) |
| | |
Pinnacle West Capital Corp. | | | (3 | ) | | | (217 | ) |
| | |
Southern Co. (The) | | | (12 | ) | | | (770 | ) |
| | | | | | | | |
| | |
| | | | | | | (2,289 | ) |
| | | | | | | | |
|
Electrical Equipment — (1.9)% | |
| | |
Acuity Brands, Inc. | | | (5 | ) | | | (927 | ) |
| | |
Hubbell, Inc. | | | (2 | ) | | | (470 | ) |
| | |
Sensata Technologies Holding plc * | | | (7 | ) | | | (368 | ) |
| | | | | | | | |
| | |
| | | | | | | (1,765 | ) |
| | | | | | | | |
|
Electronic Equipment, Instruments & Components — (0.2)% | |
| | |
Cognex Corp. | | | (2 | ) | | | (191 | ) |
| | | | | | | | |
|
Energy Equipment & Services — (1.4)% | |
| | |
Halliburton Co. | | | (35 | ) | | | (870 | ) |
| | |
Schlumberger NV | | | (15 | ) | | | (478 | ) |
| | | | | | | | |
| | |
| | | | | | | (1,348 | ) |
| | | | | | | | |
|
Entertainment — (1.4)% | |
| | |
AMC Entertainment Holdings, Inc., Class A * | | | (19 | ) | | | (680 | ) |
| | |
Walt Disney Co. (The)* | | | (4 | ) | | | (628 | ) |
| | | | | | | | |
| | |
| | | | | | | (1,308 | ) |
| | | | | | | | |
|
Equity Real Estate Investment Trusts (REITs) — (4.2)% | |
| | |
AvalonBay Communities, Inc. | | | (1 | ) | | | (289 | ) |
| | |
Duke Realty Corp. | | | (5 | ) | | | (285 | ) |
| | |
Equity Residential | | | (5 | ) | | | (399 | ) |
| | |
Iron Mountain, Inc. | | | (17 | ) | | | (785 | ) |
| | |
National Retail Properties, Inc. | | | (12 | ) | | | (527 | ) |
| | |
Realty Income Corp. | | | (1 | ) | | | (95 | ) |
| | |
Simon Property Group, Inc. | | | (6 | ) | | | (892 | ) |
| | |
SL Green Realty Corp. | | | (4 | ) | | | (300 | ) |
| | | | | | | | |
| INVESTMENTS | | SHARES
(000) | | | VALUE
($000) | |
| | | | | | | | |
| | | | | | | | |
|
Equity Real Estate Investment Trusts (REITs) — continued | |
| | |
Vornado Realty Trust | | | (4 | ) | | | (185 | ) |
| | |
Welltower, Inc. | | | (2 | ) | | | (183 | ) |
| | | | | | | | |
| | |
| | | | | | | (3,940 | ) |
| | | | | | | | |
|
Food & Staples Retailing — (4.9)% | |
| | |
Kroger Co. (The) | | | (50 | ) | | | (1,992 | ) |
| | |
Walgreens Boots Alliance, Inc. | | | (23 | ) | | | (1,082 | ) |
| | |
Walmart, Inc. | | | (10 | ) | | | (1,485 | ) |
| | | | | | | | |
| | |
| | | | | | | (4,559 | ) |
| | | | | | | | |
|
Food Products — (1.4)% | |
| | |
Campbell Soup Co. | | | (8 | ) | | | (314 | ) |
| | |
Conagra Brands, Inc. | | | (8 | ) | | | (260 | ) |
| | |
General Mills, Inc. | | | (5 | ) | | | (316 | ) |
| | |
Kellogg Co. | | | (7 | ) | | | (459 | ) |
| | | | | | | | |
| | |
| | | | | | | (1,349 | ) |
| | | | | | | | |
|
Gas Utilities — (0.3)% | |
| | |
National Fuel Gas Co. | | | (6 | ) | | | (318 | ) |
| | | | | | | | |
|
Health Care Equipment & Supplies — (1.7)% | |
| | |
Baxter International, Inc. | | | (8 | ) | | | (610 | ) |
| | |
Stryker Corp. | | | (4 | ) | | | (986 | ) |
| | | | | | | | |
| | |
| | | | | | | (1,596 | ) |
| | | | | | | | |
|
Health Care Providers & Services — (0.5)% | |
| | |
Henry Schein, Inc. * | | | (6 | ) | | | (487 | ) |
| | | | | | | | |
|
Health Care Technology — (0.4)% | |
| | |
Cerner Corp. | | | (5 | ) | | | (376 | ) |
| | | | | | | | |
|
Hotels, Restaurants & Leisure — (0.7)% | |
| | |
Starbucks Corp. | | | (6 | ) | | | (675 | ) |
| | | | | | | | |
|
Household Durables — (0.4)% | |
| | |
NVR, Inc. * | | | — | (a) | | | (157 | ) |
| | |
PulteGroup, Inc. | | | (4 | ) | | | (182 | ) |
| | | | | | | | |
| | |
| | | | | | | (339 | ) |
| | | | | | | | |
|
Household Products — (1.2)% | |
| | |
Clorox Co. (The) | | | (5 | ) | | | (882 | ) |
| | |
Colgate-Palmolive Co. | | | (4 | ) | | | (280 | ) |
| | | | | | | | |
| | |
| | | | | | | (1,162 | ) |
| | | | | | | | |
|
Industrial Conglomerates — (2.2)% | |
| | |
3M Co. | | | (7 | ) | | | (1,258 | ) |
| | |
General Electric Co. | | | (8 | ) | | | (800 | ) |
| | | | | | | | |
| | |
| | | | | | | (2,058 | ) |
| | | | | | | | |
|
Insurance — (2.0)% | |
| | |
Aflac, Inc. | | | (3 | ) | | | (144 | ) |
SEE NOTES TO FINANCIAL STATEMENTS.
| | | | | | | | | | |
| | | | | |
| | | J.P. MORGAN SPECIALTY FUNDS | | | | | | | | 29 |
JPMorgan Research Market Neutral Fund
SCHEDULE OF PORTFOLIO INVESTMENTS
AS OF OCTOBER 31, 2021 (AS RESTATED, SEE NOTE 8) (continued)
| | | | | | | | |
| INVESTMENTS | | SHARES
(000) | | | VALUE
($000) | |
Short Positions — continued | |
Common Stocks — continued | |
|
Insurance — continued | |
| | |
Allstate Corp. (The) | | | (4 | ) | | | (437 | ) |
| | |
Aon plc, Class A | | | (2 | ) | | | (698 | ) |
| | |
Axis Capital Holdings Ltd. | | | (2 | ) | | | (111 | ) |
| | |
Globe Life, Inc. | | | (1 | ) | | | (79 | ) |
| | |
MetLife, Inc. | | | (2 | ) | | | (106 | ) |
| | |
Willis Towers Watson plc | | | (1 | ) | | | (138 | ) |
| | |
WR Berkley Corp. | | | (2 | ) | | | (150 | ) |
| | | | | | | | |
| | |
| | | | | | | (1,863 | ) |
| | | | | | | | |
|
Internet & Direct Marketing Retail — (0.9)% | |
| | |
eBay, Inc. | | | (11 | ) | | | (838 | ) |
| | | | | | | | |
|
IT Services — (3.5)% | |
| | |
Automatic Data Processing, Inc. | | | (1 | ) | | | (253 | ) |
| | |
Cognizant Technology Solutions Corp., Class A | | | (6 | ) | | | (455 | ) |
| | |
DXC Technology Co. * | | | (4 | ) | | | (129 | ) |
| | |
EPAM Systems, Inc. * | | | — | (a) | | | (135 | ) |
| | |
Global Payments, Inc. | | | (1 | ) | | | (123 | ) |
| | |
Infosys Ltd., ADR (India) | | | (18 | ) | | | (408 | ) |
| | |
Jack Henry & Associates, Inc. | | | (1 | ) | | | (176 | ) |
| | |
Paychex, Inc. | | | (5 | ) | | | (620 | ) |
| | |
PayPal Holdings, Inc. * | | | (1 | ) | | | (337 | ) |
| | |
Western Union Co. (The) | | | (37 | ) | | | (684 | ) |
| | | | | | | | |
| | |
| | | | | | | (3,320 | ) |
| | | | | | | | |
|
Life Sciences Tools & Services — (1.2)% | |
| | |
Agilent Technologies, Inc. | | | (3 | ) | | | (541 | ) |
| | |
Waters Corp. * | | | (2 | ) | | | (582 | ) |
| | | | | | | | |
| | |
| | | | | | | (1,123 | ) |
| | | | | | | | |
|
Machinery — (1.8)% | |
| | |
Caterpillar, Inc. | | | (3 | ) | | | (650 | ) |
| | |
Illinois Tool Works, Inc. | | | (3 | ) | | | (728 | ) |
| | |
PACCAR, Inc. | | | (4 | ) | | | (356 | ) |
| | | | | | | | |
| | |
| | | | | | | (1,734 | ) |
| | | | | | | | |
|
Media — (3.9)% | |
| | |
Interpublic Group of Cos., Inc. (The) | | | (19 | ) | | | (679 | ) |
| | |
Omnicom Group, Inc. | | | (24 | ) | | | (1,667 | ) |
| | |
Sirius XM Holdings, Inc. | | | (59 | ) | | | (359 | ) |
| | |
ViacomCBS, Inc. | | | (27 | ) | | | (969 | ) |
| | | | | | | | |
| | |
| | | | | | | (3,674 | ) |
| | | | | | | | |
|
Multiline Retail — (0.4)% | |
| | |
Kohl’s Corp. | | | (2 | ) | | | (110 | ) |
| | |
Macy’s, Inc. | | | (5 | ) | | | (138 | ) |
| | |
Nordstrom, Inc. * | | | (4 | ) | | | (116 | ) |
| | | | | | | | |
| | |
| | | | | | | (364 | ) |
| | | | | | | | |
| | | | | | | | |
| INVESTMENTS | | SHARES
(000) | | | VALUE
($000) | |
| | | | | | | | |
| | | | | | | | |
|
Multi-Utilities — (1.7)% | |
| | |
CMS Energy Corp. | | | (5 | ) | | | (274 | ) |
| | |
Consolidated Edison, Inc. | | | (12 | ) | | | (899 | ) |
| | |
Dominion Energy, Inc. | | | (5 | ) | | | (380 | ) |
| | | | | | | | |
| | |
| | | | | | | (1,553 | ) |
| | | | | | | | |
|
Oil, Gas & Consumable Fuels — (4.2)% | |
| | |
APA Corp. | | | (2 | ) | | | (65 | ) |
| | |
Devon Energy Corp. | | | (2 | ) | | | (100 | ) |
| | |
Enbridge, Inc. (Canada) | | | (24 | ) | | | (985 | ) |
| | |
Exxon Mobil Corp. | | | (21 | ) | | | (1,347 | ) |
| | |
Hess Corp. | | | (7 | ) | | | (582 | ) |
| | |
HollyFrontier Corp. | | | (6 | ) | | | (195 | ) |
| | |
Kinder Morgan, Inc. | | | (8 | ) | | | (139 | ) |
| | |
Marathon Oil Corp. | | | (34 | ) | | | (557 | ) |
| | | | | | | | |
| | |
| | | | | | | (3,970 | ) |
| | | | | | | | |
|
Paper & Forest Products — 0.0% (e) | |
| | |
Sylvamo Corp. * | | | — | (a) | | | — | (a) |
| | | | | | | | |
|
Pharmaceuticals — (2.2)% | |
| | |
Johnson & Johnson | | | (3 | ) | | | (414 | ) |
| | |
Merck & Co., Inc. | | | (5 | ) | | | (482 | ) |
| | |
Pfizer, Inc. | | | (16 | ) | | | (687 | ) |
| | |
Zoetis, Inc. | | | (2 | ) | | | (458 | ) |
| | | | | | | | |
| | |
| | | | | | | (2,041 | ) |
| | | | | | | | |
|
Professional Services — (0.9)% | |
| | |
TransUnion | | | (4 | ) | | | (421 | ) |
| | |
Verisk Analytics, Inc. | | | (2 | ) | | | (378 | ) |
| | | | | | | | |
| | |
| | | | | | | (799 | ) |
| | | | | | | | |
|
Road & Rail — (0.8)% | |
| | |
Canadian Pacific Railway Ltd. (Canada) | | | (2 | ) | | | (152 | ) |
| | |
Heartland Express, Inc. | | | (16 | ) | | | (254 | ) |
| | |
JB Hunt Transport Services, Inc. | | | (1 | ) | | | (206 | ) |
| | |
Werner Enterprises, Inc. | | | (3 | ) | | | (128 | ) |
| | | | | | | | |
| | |
| | | | | | | (740 | ) |
| | | | | | | | |
|
Semiconductors & Semiconductor Equipment — (3.3)% | |
| | |
Broadcom, Inc. | | | (1 | ) | | | (699 | ) |
| | |
Intel Corp. | | | (36 | ) | | | (1,769 | ) |
| | |
KLA Corp. | | | (1 | ) | | | (293 | ) |
| | |
Skyworks Solutions, Inc. | | | (2 | ) | | | (286 | ) |
| | | | | | | | |
| | |
| | | | | | | (3,047 | ) |
| | | | | | | | |
|
Software — (1.0)% | |
| | |
Adobe, Inc. * | | | — | (a) | | | (212 | ) |
| | |
Citrix Systems, Inc. | | | (1 | ) | | | (99 | ) |
SEE NOTES TO FINANCIAL STATEMENTS.
| | | | | | | | | | |
| | | | | |
| 30 | | | | | | | | J.P. MORGAN SPECIALTY FUNDS | | |
| | | | | | | | |
| INVESTMENTS | | SHARES
(000) | | | VALUE
($000) | |
Short Positions — continued | |
Common Stocks — continued | |
|
Software — continued | |
| | |
Oracle Corp. | | | (2 | ) | | | (165 | ) |
| | |
Palantir Technologies, Inc., Class A * | | | (12 | ) | | | (321 | ) |
| | |
VMware, Inc., Class A * | | | (1 | ) | | | (133 | ) |
| | | | | | | | |
| | |
| | | | | | | (930 | ) |
| | | | | | | | |
|
Specialty Retail — (0.4)% | |
| | |
CarMax, Inc. * | | | (1 | ) | | | (146 | ) |
| | |
Williams-Sonoma, Inc. | | | (1 | ) | | | (194 | ) |
| | | | | | | | |
| | |
| | | | | | | (340 | ) |
| | | | | | | | |
|
Technology Hardware, Storage & Peripherals — (2.2)% | |
| | |
Apple, Inc. | | | (10 | ) | | | (1,426 | ) |
| | |
NetApp, Inc. | | | (6 | ) | | | (578 | ) |
| | |
Xerox Holdings Corp. | | | (4 | ) | | | (68 | ) |
| | | | | | | | |
| | |
| | | | | | | (2,072 | ) |
| | | | | | | | |
|
Textiles, Apparel & Luxury Goods — (0.3)% | |
| | |
VF Corp. | | | (4 | ) | | | (293 | ) |
| | | | | | | | |
|
Trading Companies & Distributors — (0.3)% | |
| | |
Fastenal Co. | | | (5 | ) | | | (304 | ) |
| | | | | | | | |
| | | | | | | | |
| INVESTMENTS | | SHARES
(000) | | | VALUE
($000) | |
| | | | | | | | |
| | | | | | | | |
|
Water Utilities — (0.3)% | |
| | |
Essential Utilities, Inc. | | | (7 | ) | | | (314 | ) |
| | | | | | | | |
| | |
Total Common Stocks
(Proceeds $(67,933)) | | | | | | | (71,788 | ) |
| | | | | | | | |
| | |
Total Short Positions
(Proceeds $(67,933)) | | | | | | | (71,788 | ) |
| | | | | | | | |
Total Investments — 21.1%
(Cost $391) | | | | | | | 19,785 | |
Other Assets Less Liabilities — 74.5% | | | | | | | 69,873 | |
| | | | | | | | |
NET ASSETS — 95.6% | | | | | | | 89,658 | |
| | | | | | | | |
Future share reacquisition adjustment — 4.4% | | | | | | | 4,137 | |
| | | | | | | | |
Net assets after future share reacquisition
adjustment — 100% | | | | | | $ | 93,795 | |
| | | | | | | | |
Percentages indicated are based on net assets after future share reacquisition adjustment.
Abbreviations
| | |
| ADR | | American Depositary Receipt |
| |
| (a) | | Amount rounds to less than one thousand. |
| (b) | | All or a portion of this security is segregated as collateral for short sales. The total value of securities and cash segregated as collateral is $14,258 and $72,237 respectively. |
| (c) | | Investment in an affiliated fund, which is registered under the Investment Company Act of 1940, as amended, and is advised by J.P. Morgan Investment Management Inc. |
| (d) | | The rate shown is the current yield as of October 31, 2021. |
| (e) | | Amount rounds to less than 0.1% of net assets. |
| * | | Non-income producing security. |
| | | | | | | | | | | | | | | | | | |
| Futures contracts outstanding as of October 31, 2021 (amounts in thousands, except number of contracts): | |
| DESCRIPTION | | NUMBER OF
CONTRACTS | | | EXPIRATION
DATE | | | TRADING
CURRENCY | | NOTIONAL
AMOUNT ($) | | | VALUE AND
UNREALIZED
APPRECIATION
(DEPRECIATION) ($) | |
Short Contracts | |
S&P 500 E-Mini Index | | | (4 | ) | | | 12/2021 | | | USD | | | (920 | ) | | | (7 | ) |
| | | | | | | | | | | | | | | | | | |
Abbreviations
SEE NOTES TO FINANCIAL STATEMENTS.
| | | | | | | | | | |
| | | | | |
| | | J.P. MORGAN SPECIALTY FUNDS | | | | | | | | 31 |
JPMorgan Research Market Neutral Fund
SCHEDULE OF PORTFOLIO INVESTMENTS
AS OF OCTOBER 31, 2020 (AS RESTATED, SEE NOTE 8)
| | | | | | | | |
| INVESTMENTS | | SHARES
(000) | | | VALUE
($000) | |
Long Positions — 93.5% | |
|
Common Stocks — 77.0% | |
|
Aerospace & Defense — 1.0% | |
| | |
Northrop Grumman Corp. | | | 3 | | | | 813 | |
| | |
Raytheon Technologies Corp. | | | 10 | | | | 542 | |
| | | | | | | | |
| | |
| | | | | | | 1,355 | |
| | | | | | | | |
|
Air Freight & Logistics — 0.2% | |
| | |
FedEx Corp. | | | 1 | | | | 260 | |
| | |
United Parcel Service, Inc., Class B | | | 1 | | | | 81 | |
| | | | | | | | |
| | |
| | | | | | | 341 | |
| | | | | | | | |
|
Auto Components — 0.7% | |
| | |
Aptiv plc | | | 4 | | | | 352 | |
| | |
BorgWarner, Inc. | | | 1 | | | | 41 | |
| | |
Magna International, Inc. (Canada) | | | 12 | | | | 604 | |
| | | | | | | | |
| | |
| | | | | | | 997 | |
| | | | | | | | |
|
Automobiles — 0.1% | |
| | |
General Motors Co. | | | 4 | | | | 151 | |
| | | | | | | | |
|
Banks — 2.0% | |
| | |
Regions Financial Corp. | | | 37 | | | | 494 | |
| | |
SVB Financial Group * | | | 1 | | | | 340 | |
| | |
Truist Financial Corp. | | | 43 | | | | 1,806 | |
| | |
Wells Fargo & Co. | | | 10 | | | | 221 | |
| | | | | | | | |
| | |
| | | | | | | 2,861 | |
| | | | | | | | |
|
Beverages — 0.9% | |
| | |
Coca-Cola Co. (The) | | | 5 | | | | 232 | |
| | |
Constellation Brands, Inc., Class A | | | 3 | | | | 467 | |
| | |
PepsiCo, Inc. | | | 5 | | | | 635 | |
| | | | | | | | |
| | |
| | | | | | | 1,334 | |
| | | | | | | | |
|
Biotechnology — 2.1% | |
| | |
AbbVie, Inc. | | | 12 | | | | 1,032 | |
| | |
Alexion Pharmaceuticals, Inc. * | | | 5 | | | | 601 | |
| | |
Biogen, Inc. * | | | 4 | | | | 915 | |
| | |
Vertex Pharmaceuticals, Inc. * | | | 2 | | | | 516 | |
| | | | | | | | |
| | |
| | | | | | | 3,064 | |
| | | | | | | | |
|
Building Products — 1.8% | |
| | |
Allegion plc | | | 1 | | | | 102 | |
| | |
Masco Corp. | | | 7 | | | | 389 | |
| | |
Trane Technologies plc | | | 15 | | | | 2,043 | |
| | | | | | | | |
| | |
| | | | | | | 2,534 | |
| | | | | | | | |
|
Capital Markets — 1.3% | |
| | |
Ameriprise Financial, Inc. | | | — | (a) | | | 61 | |
| | |
Charles Schwab Corp. (The) | | | 12 | | | | 507 | |
| | |
Intercontinental Exchange, Inc. | | | 3 | | | | 310 | |
| | | | | | | | |
| INVESTMENTS | | SHARES
(000) | | | VALUE
($000) | |
| | | | | | | | |
| | | | | | | | |
|
Capital Markets — continued | |
| | |
Morgan Stanley | | | 13 | | | | 637 | |
| | |
MSCI, Inc. | | | — | (a) | | | 174 | |
| | |
State Street Corp. | | | 3 | | | | 182 | |
| | | | | | | | |
| | |
| | | | | | | 1,871 | |
| | | | | | | | |
|
Chemicals — 4.1% | |
| | |
Air Products and Chemicals, Inc. (b) | | | 1 | | | | 363 | |
| | |
Celanese Corp. | | | 6 | | | | 707 | |
| | |
Corteva, Inc. | | | 15 | | | | 483 | |
| | |
DuPont de Nemours, Inc. | | | 15 | | | | 877 | |
| | |
Eastman Chemical Co. (b) | | | 13 | | | | 1,047 | |
| | |
FMC Corp. | | | 3 | | | | 342 | |
| | |
Linde plc (United Kingdom) | | | 6 | | | | 1,242 | |
| | |
PPG Industries, Inc. | | | 5 | | | | 680 | |
| | |
Sherwin-Williams Co. (The) | | | — | (a) | | | 91 | |
| | | | | | | | |
| | |
| | | | | | | 5,832 | |
| | | | | | | | |
|
Consumer Finance — 0.8% | |
| | |
Capital One Financial Corp. | | | 16 | | | | 1,141 | |
| | | | | | | | |
|
Containers & Packaging — 0.2% | |
| | |
Crown Holdings, Inc. * | | | 4 | | | | 303 | |
| | | | | | | | |
|
Diversified Financial Services — 0.3% | |
| | |
Voya Financial, Inc. | | | 10 | | | | 496 | |
| | | | | | | | |
|
Electric Utilities — 1.9% | |
| | |
Entergy Corp. | | | 2 | | | | 251 | |
| | |
NextEra Energy, Inc. | | | 18 | | | | 1,331 | |
| | |
Xcel Energy, Inc. (b) | | | 15 | | | | 1,062 | |
| | | | | | | | |
| | |
| | | | | | | 2,644 | |
| | | | | | | | |
|
Electrical Equipment — 1.3% | |
| | |
AMETEK, Inc. | | | 7 | | | | 679 | |
| | |
Eaton Corp. plc | | | 6 | | | | 643 | |
| | |
Rockwell Automation, Inc. | | | — | (a) | | | 71 | |
| | |
Sensata Technologies Holding plc * | | | 11 | | | | 495 | |
| | | | | | | | |
| | |
| | | | | | | 1,888 | |
| | | | | | | | |
|
Electronic Equipment, Instruments & Components — 0.6% | |
| | |
TE Connectivity Ltd. | | | 8 | | | | 821 | |
| | | | | | | | |
|
Energy Equipment & Services — 0.3% | |
| | |
Baker Hughes Co. | | | 27 | | | | 398 | |
| | | | | | | | |
|
Entertainment — 2.9% | |
| | |
Electronic Arts, Inc. * | | | 7 | | | | 873 | |
| | |
Netflix, Inc. * (b) | | | 5 | | | | 2,272 | |
| | |
Warner Music Group Corp., Class A | | | 38 | | | | 1,005 | |
| | | | | | | | |
| | |
| | | | | | | 4,150 | |
| | | | | | | | |
SEE NOTES TO FINANCIAL STATEMENTS.
| | | | | | | | | | |
| | | | | |
| 32 | | | | | | | | J.P. MORGAN SPECIALTY FUNDS | | |
| | | | | | | | |
| INVESTMENTS | | SHARES
(000) | | | VALUE
($000) | |
Long Positions — continued | |
|
Common Stocks — continued | |
|
Equity Real Estate Investment Trusts (REITs) — 3.5% | |
| | |
Brixmor Property Group, Inc. | | | 43 | | | | 470 | |
| | |
Camden Property Trust | | | 6 | | | | 599 | |
| | |
Equity LifeStyle Properties, Inc. | | | 17 | | | | 987 | |
| | |
Host Hotels & Resorts, Inc. | | | 5 | | | | 56 | |
| | |
Kimco Realty Corp. | | | 23 | | | | 235 | |
| | |
Prologis, Inc. | | | 6 | | | | 603 | |
| | |
Realty Income Corp. | | | 2 | | | | 107 | |
| | |
SBA Communications Corp. | | | 1 | | | | 236 | |
| | |
Sun Communities, Inc. | | | 1 | | | | 89 | |
| | |
UDR, Inc. | | | 11 | | | | 331 | |
| | |
Ventas, Inc. | | | 20 | | | | 775 | |
| | |
WP Carey, Inc. | | | 9 | | | | 573 | |
| | | | | | | | |
| | |
| | | | | | | 5,061 | |
| | | | | | | | |
|
Food & Staples Retailing — 0.4% | |
| | |
Albertsons Cos., Inc., Class A | | | 26 | | | | 376 | |
| | |
Costco Wholesale Corp. | | | 1 | | | | 196 | |
| | | | | | | | |
| | |
| | | | | | | 572 | |
| | | | | | | | |
|
Food Products — 0.6% | |
| | |
Conagra Brands, Inc. | | | 9 | | | | 324 | |
| | |
Mondelez International, Inc., Class A | | | 9 | | | | 484 | |
| | | | | | | | |
| | |
| | | | | | | 808 | |
| | | | | | | | |
|
Health Care Equipment & Supplies — 2.3% | |
| | |
Baxter International, Inc. | | | 1 | | | | 97 | |
| | |
Becton Dickinson and Co. | | | 1 | | | | 128 | |
| | |
Boston Scientific Corp. * | | | 19 | | | | 666 | |
| | |
Intuitive Surgical, Inc. * | | | 1 | | | | 853 | |
| | |
Medtronic plc | | | 6 | | | | 609 | |
| | |
Zimmer Biomet Holdings, Inc. | | | 7 | | | | 989 | |
| | | | | | | | |
| | |
| | | | | | | 3,342 | |
| | | | | | | | |
|
Health Care Providers & Services — 1.5% | |
| | |
Centene Corp. * | | | 5 | | | | 294 | |
| | |
Cigna Corp.(b) | | | 4 | | | | 705 | |
| | |
McKesson Corp. | | | 7 | | | | 1,055 | |
| | |
UnitedHealth Group, Inc. (b) | | | — | (a) | | | 151 | |
| | | | | | | | |
| | |
| | | | | | | 2,205 | |
| | | | | | | | |
|
Hotels, Restaurants & Leisure — 1.7% | |
| | |
Choice Hotels International, Inc. | | | 2 | | | | 179 | |
| | |
Hilton Worldwide Holdings, Inc. | | | 3 | | | | 270 | |
| | |
Las Vegas Sands Corp. | | | 7 | | | | 340 | |
| | |
McDonald’s Corp. | | | 1 | | | | 188 | |
| | |
Yum! Brands, Inc. (b) | | | 15 | | | | 1,421 | |
| | | | | | | | |
| | |
| | | | | | | 2,398 | |
| | | | | | | | |
| | | | | | | | |
| INVESTMENTS | | SHARES
(000) | | | VALUE
($000) | |
| | | | | | | | |
| | | | | | | | |
|
Household Durables — 0.5% | |
| | |
KB Home | | | 14 | | | | 436 | |
| | |
Lennar Corp., Class A | | | 1 | | | | 62 | |
| | |
Mohawk Industries, Inc. * | | | 1 | | | | 68 | |
| | |
Toll Brothers, Inc. | | | 4 | | | | 173 | |
| | | | | | | | |
| | |
| | | | | | | 739 | |
| | | | | | | | |
|
Household Products — 0.6% | |
| | |
Kimberly-Clark Corp. | | | 2 | | | | 227 | |
| | |
Procter & Gamble Co. (The) | | | 5 | | | | 637 | |
| | | | | | | | |
| | |
| | | | | | | 864 | |
| | | | | | | | |
|
Industrial Conglomerates — 0.4% | |
| | |
Honeywell International, Inc. | | | 4 | | | | 618 | |
| | | | | | | | |
|
Insurance — 1.8% | |
| | |
American International Group, Inc. | | | 4 | | | | 125 | |
| | |
Arthur J Gallagher & Co. | | | 4 | | | | 379 | |
| | |
Chubb Ltd. | | | 9 | | | | 1,110 | |
| | |
Marsh & McLennan Cos., Inc. | | | 4 | | | | 405 | |
| | |
Progressive Corp. (The) | | | 6 | | | | 530 | |
| | |
RenaissanceRe Holdings Ltd. (Bermuda) | | | — | (a) | | | 48 | |
| | | | | | | | |
| | |
| | | | | | | 2,597 | |
| | | | | | | | |
|
Interactive Media & Services — 1.3% | |
| | |
Alphabet, Inc., Class C * (b) | | | 1 | | | | 1,357 | |
| | |
Facebook, Inc., Class A * | | | 2 | | | | 566 | |
| | | | | | | | |
| | |
| | | | | | | 1,923 | |
| | | | | | | | |
|
Internet & Direct Marketing Retail — 2.1% | |
| | |
Amazon.com, Inc. * (b) | | | 1 | | | | 2,730 | |
| | |
Booking Holdings, Inc. * | | | — | (a) | | | 258 | |
| | | | | | | | |
| | |
| | | | | | | 2,988 | |
| | | | | | | | |
|
IT Services — 4.8% | |
| | |
Booz Allen Hamilton Holding Corp. | | | 4 | | | | 321 | |
| | |
DXC Technology Co. | | | 6 | | | | 115 | |
| | |
Fiserv, Inc. * (b) | | | 11 | | | | 1,016 | |
| | |
FleetCor Technologies, Inc. * | | | 4 | | | | 808 | |
| | |
Leidos Holdings, Inc. (b) | | | 14 | | | | 1,150 | |
| | |
Mastercard, Inc., Class A (b) | | | 6 | | | | 1,754 | |
| | |
PayPal Holdings, Inc. * (b) | | | 5 | | | | 998 | |
| | |
WEX, Inc. * | | | 6 | | | | 726 | |
| | | | | | | | |
| | |
| | | | | | | 6,888 | |
| | | | | | | | |
|
Life Sciences Tools & Services — 0.8% | |
| | |
Thermo Fisher Scientific, Inc. | | | 2 | | | | 1,094 | |
| | | | | | | | |
SEE NOTES TO FINANCIAL STATEMENTS.
| | | | | | | | | | |
| | | | | |
| | | J.P. MORGAN SPECIALTY FUNDS | | | | | | | | 33 |
JPMorgan Research Market Neutral Fund
SCHEDULE OF PORTFOLIO INVESTMENTS
AS OF OCTOBER 31, 2020 (AS RESTATED, SEE NOTE 8) (continued)
| | | | | | | | |
| INVESTMENTS | | SHARES
(000) | | | VALUE
($000) | |
Long Positions — continued | |
|
Common Stocks — continued | |
|
Machinery — 2.2% | |
| | |
Deere & Co. | | | 2 | | | | 365 | |
| | |
Parker-Hannifin Corp. (b) | | | 5 | | | | 1,081 | |
| | |
Stanley Black & Decker, Inc. (b) | | | 11 | | | | 1,757 | |
| | | | | | | | |
| | |
| | | | | | | 3,203 | |
| | | | | | | | |
|
Media — 2.2% | |
| | |
Altice USA, Inc., Class A * | | | 2 | | | | 60 | |
| | |
Charter Communications, Inc., Class A * | | | 2 | | | | 1,119 | |
| | |
Comcast Corp., Class A | | | 15 | | | | 629 | |
| | |
Discovery, Inc., Class A * | | | 57 | | | | 1,146 | |
| | |
Discovery, Inc., Class C * | | | 8 | | | | 147 | |
| | | | | | | | |
| | |
| | | | | | | 3,101 | |
| | | | | | | | |
|
Multiline Retail — 0.4% | |
| | |
Dollar Tree, Inc. * | | | 7 | | | | 613 | |
| | | | | | | | |
|
Multi-Utilities — 0.9% | |
| | |
Ameren Corp. | | | 9 | | | | 712 | |
| | |
CMS Energy Corp. | | | 4 | | | | 261 | |
| | |
Public Service Enterprise Group, Inc. | | | 6 | | | | 338 | |
| | | | | | | | |
| | |
| | | | | | | 1,311 | |
| | | | | | | | |
|
Oil, Gas & Consumable Fuels — 3.7% | |
| | |
Cheniere Energy, Inc. * | | | 8 | | | | 399 | |
| | |
Chevron Corp.(b) | | | 6 | | | | 397 | |
| | |
Concho Resources, Inc. | | | 2 | | | | 83 | |
| | |
Diamondback Energy, Inc. | | | 41 | | | | 1,053 | |
| | |
EOG Resources, Inc. | | | 5 | | | | 164 | |
| | |
Kinder Morgan, Inc. | | | 56 | | | | 669 | |
| | |
Parsley Energy, Inc., Class A | | | 57 | | | | 571 | |
| | |
Pioneer Natural Resources Co. (b) | | | 7 | | | | 569 | |
| | |
TC Energy Corp. (Canada) | | | 21 | | | | 832 | |
| | |
Williams Cos., Inc. (The) | | | 31 | | | | 594 | |
| | | | | | | | |
| | |
| | | | | | | 5,331 | |
| | | | | | | | |
|
Personal Products — 0.3% | |
| | |
Estee Lauder Cos., Inc. (The), Class A | | | 2 | | | | 398 | |
| | | | | | | | |
|
Pharmaceuticals — 1.7% | |
| | |
Bristol-Myers Squibb Co. | | | 16 | | | | 959 | |
| | |
Elanco Animal Health, Inc. * | | | 7 | | | | 204 | |
| | |
Eli Lilly and Co. | | | 7 | | | | 909 | |
| | |
Merck & Co., Inc. | | | 4 | | | | 313 | |
| | | | | | | | |
| | |
| | | | | | | 2,385 | |
| | | | | | | | |
|
Road & Rail — 4.1% | |
| | |
Canadian Pacific Railway Ltd. (Canada) | | | 2 | | | | 483 | |
| | |
CSX Corp. | | | 11 | | | | 883 | |
| | | | | | | | |
| INVESTMENTS | | SHARES
(000) | | | VALUE
($000) | |
| | | | | | | | |
| | | | | | | | |
|
Road & Rail — continued | |
| | |
Lyft, Inc., Class A * | | | 46 | | | | 1,041 | |
| | |
Norfolk Southern Corp. (b) | | | 7 | | | | 1,446 | |
| | |
Old Dominion Freight Line, Inc. | | | 2 | | | | 447 | |
| | |
Uber Technologies, Inc. * | | | 36 | | | | 1,204 | |
| | |
Union Pacific Corp. | | | 2 | | | | 312 | |
| | | | | | | | |
| | |
| | | | | | | 5,816 | |
| | | | | | | | |
|
Semiconductors & Semiconductor Equipment — 7.1% | |
| | |
Advanced Micro Devices, Inc. * (b) | | | 17 | | | | 1,267 | |
| | |
Analog Devices, Inc. (b) | | | 12 | | | | 1,463 | |
| | |
Applied Materials, Inc. | | | 3 | | | | 172 | |
| | |
ASML Holding NV (Registered), NYRS (Netherlands) | | | — | (a) | | | 145 | |
| | |
Lam Research Corp. | | | 3 | | | | 1,189 | |
| | |
Microchip Technology, Inc. | | | 4 | | | | 374 | |
| | |
Micron Technology, Inc. * | | | 20 | | | | 987 | |
| | |
NXP Semiconductors NV (Netherlands) | | | 20 | | | | 2,677 | |
| | |
ON Semiconductor Corp. * | | | 19 | | | | 488 | |
| | |
Qorvo, Inc. * | | | 4 | | | | 452 | |
| | |
Taiwan Semiconductor Manufacturing Co. Ltd., ADR (Taiwan) | | | 11 | | | | 903 | |
| | |
Texas Instruments, Inc. (b) | | | 1 | | | | 121 | |
| | | | | | | | |
| | |
| | | | | | | 10,238 | |
| | | | | | | | |
|
Software — 3.7% | |
| | |
Ceridian HCM Holding, Inc. * | | | 10 | | | | 832 | |
| | |
Coupa Software, Inc. * | | | 3 | | | | 778 | |
| | |
Intuit, Inc. (b) | | | 1 | | | | 464 | |
| | |
Microsoft Corp. (b) | | | 4 | | | | 882 | |
| | |
Paylocity Holding Corp. * | | | 5 | | | | 884 | |
| | |
salesforce.com, Inc. * | | | 4 | | | | 923 | |
| | |
ServiceNow, Inc. * | | | 1 | | | | 259 | |
| | |
Workday, Inc., Class A * | | | 2 | | | | 332 | |
| | | | | | | | |
| | |
| | | | | | | 5,354 | |
| | | | | | | | |
|
Specialty Retail — 3.8% | |
| | |
AutoZone, Inc. * | | | 1 | | | | 1,136 | |
| | |
Best Buy Co., Inc. | | | 8 | | | | 937 | |
| | |
Home Depot, Inc. (The) | | | 1 | | | | 322 | |
| | |
Lowe’s Cos., Inc. (b) | | | 8 | | | | 1,278 | |
| | |
O’Reilly Automotive, Inc. * (b) | | | 3 | | | | 1,458 | |
| | |
Ross Stores, Inc. | | | — | (a) | | | 29 | |
| | |
TJX Cos., Inc. (The) | | | 6 | | | | 327 | |
| | | | | | | | |
| | |
| | | | | | | 5,487 | |
| | | | | | | | |
SEE NOTES TO FINANCIAL STATEMENTS.
| | | | | | | | | | |
| | | | | |
| 34 | | | | | | | | J.P. MORGAN SPECIALTY FUNDS | | |
| | | | | | | | |
| INVESTMENTS | | SHARES
(000) | | | VALUE
($000) | |
Long Positions — continued | |
|
Common Stocks — continued | |
|
Technology Hardware, Storage & Peripherals — 0.5% | |
| | |
Seagate Technology plc | | | 16 | | | | 763 | |
| | | | | | | | |
|
Textiles, Apparel & Luxury Goods — 0.5% | |
| | |
Carter’s, Inc. | | | 7 | | | | 574 | |
| | |
NIKE, Inc., Class B | | | 1 | | | | 169 | |
| | | | | | | | |
| | |
| | | | | | | 743 | |
| | | | | | | | |
|
Trading Companies & Distributors — 0.2% | |
| | |
WW Grainger, Inc. | | | 1 | | | | 273 | |
| | | | | | | | |
|
Wireless Telecommunication Services — 0.9% | |
| | |
T-Mobile US, Inc. * | | | 12 | | | | 1,271 | |
| | | | | | | | |
| | |
Total Common Stocks
(Cost $97,714) | | | | | | | 110,565 | |
| | | | | | | | |
Short-Term Investments — 16.5% | |
|
Investment Companies — 16.5% | |
| | |
JPMorgan Prime Money Market Fund Class Institutional Shares, 0.05% (c) (d)
(Cost $23,767) | | | 23,759 | | | | 23,773 | |
| | | | | | | | |
| | |
Total Long Positions
(Cost $121,481) | | | | | | | 134,338 | |
| | | | | | | | |
Short Positions — (69.5)% | |
|
Common Stocks — (69.5)% | |
|
Aerospace & Defense — (1.4)% | |
| | |
Boeing Co. (The) | | | (3 | ) | | | (447 | ) |
| | |
HEICO Corp. | | | (3 | ) | | | (336 | ) |
| | |
Huntington Ingalls Industries, Inc. | | | (3 | ) | | | (396 | ) |
| | |
Lockheed Martin Corp. | | | (1 | ) | | | (476 | ) |
| | |
TransDigm Group, Inc. | | | (1 | ) | | | (357 | ) |
| | | | | | | | |
| | |
| | | | | | | (2,012 | ) |
| | | | | | | | |
|
Air Freight & Logistics — (0.9)% | |
| | |
CH Robinson Worldwide, Inc. | | | (8 | ) | | | (668 | ) |
| | |
Expeditors International of Washington, Inc. | | | (7 | ) | | | (594 | ) |
| | | | | | | | |
| | |
| | | | | | | (1,262 | ) |
| | | | | | | | |
|
Auto Components — (0.1)% | |
| | |
Autoliv, Inc. (Sweden) | | | (1 | ) | | | (105 | ) |
| | | | | | | | |
|
Automobiles — (0.6)% | |
| | |
Ford Motor Co. | | | (97 | ) | | | (752 | ) |
| | |
Harley-Davidson, Inc. | | | (4 | ) | | | (141 | ) |
| | | | | | | | |
| | |
| | | | | | | (893 | ) |
| | | | | | | | |
|
Banks — (1.8)% | |
| | |
Associated Banc-Corp. | | | (7 | ) | | | (92 | ) |
| | |
Bank of Hawaii Corp. | | | (4 | ) | | | (269 | ) |
| | |
Citizens Financial Group, Inc. | | | (13 | ) | | | (362 | ) |
| | | | | | | | |
| INVESTMENTS | | SHARES
(000) | | | VALUE
($000) | |
| | | | | | | | |
| | |
| | | | | | | | |
|
Banks — continued | |
| | |
First Republic Bank | | | (3 | ) | | | (323 | ) |
| | |
Huntington Bancshares, Inc. | | | (30 | ) | | | (315 | ) |
| | |
KeyCorp | | | (39 | ) | | | (511 | ) |
| | |
PNC Financial Services Group, Inc. (The) | | | (7 | ) | | | (749 | ) |
| | | | | | | | |
| | |
| | | | | | | (2,621 | ) |
| | | | | | | | |
|
Beverages — (0.1)% | |
| | |
Brown-Forman Corp., Class B | | | (2 | ) | | | (129 | ) |
| | | | | | | | |
|
Biotechnology — (2.0)% | |
| | |
Amgen, Inc. | | | (6 | ) | | | (1,222 | ) |
| | |
Gilead Sciences, Inc. | | | (29 | ) | | | (1,685 | ) |
| | | | | | | | |
| | |
| | | | | | | (2,907 | ) |
| | | | | | | | |
|
Building Products — (0.4)% | |
| | |
Fortune Brands Home & Security, Inc. | | | (2 | ) | | | (181 | ) |
| | |
Johnson Controls International plc | | | (10 | ) | | | (429 | ) |
| | | | | | | | |
| | |
| | | | | | | (610 | ) |
| | | | | | | | |
|
Capital Markets — (2.6)% | |
| | |
BlackRock, Inc. | | | — | (a) | | | (244 | ) |
| | |
CME Group, Inc. | | | (1 | ) | | | (111 | ) |
| | |
Franklin Resources, Inc. | | | (40 | ) | | | (750 | ) |
| | |
Moody’s Corp. | | | (1 | ) | | | (222 | ) |
| | |
Nasdaq, Inc. | | | (7 | ) | | | (867 | ) |
| | |
Northern Trust Corp. | | | (11 | ) | | | (888 | ) |
| | |
T. Rowe Price Group, Inc. | | | (1 | ) | | | (91 | ) |
| | |
Waddell & Reed Financial, Inc., Class A | | | (41 | ) | | | (630 | ) |
| | | | | | | | |
| | |
| | | | | | | (3,803 | ) |
| | | | | | | | |
|
Chemicals — (1.0)% | |
| | |
Albemarle Corp. | | | (11 | ) | | | (1,009 | ) |
| | |
Ecolab, Inc. | | | (2 | ) | | | (449 | ) |
| | | | | | | | |
| | |
| | | | | | | (1,458 | ) |
| | | | | | | | |
|
Commercial Services & Supplies — (0.3)% | |
| | |
Republic Services, Inc. | | | (5 | ) | | | (447 | ) |
| | | | | | | | |
|
Communications Equipment — (2.8)% | |
| | |
Cisco Systems, Inc. | | | (86 | ) | | | (3,099 | ) |
| | |
Juniper Networks, Inc. | | | (47 | ) | | | (924 | ) |
| | | | | | | | |
| | |
| | | | | | | (4,023 | ) |
| | | | | | | | |
|
Construction Materials — (0.7)% | |
| | |
Martin Marietta Materials, Inc. | | | (1 | ) | | | (367 | ) |
| | |
Vulcan Materials Co. | | | (4 | ) | | | (569 | ) |
| | | | | | | | |
| | |
| | | | | | | (936 | ) |
| | | | | | | | |
SEE NOTES TO FINANCIAL STATEMENTS.
| | | | | | | | | | |
| | | | | |
| | | J.P. MORGAN SPECIALTY FUNDS | | | | | | | | 35 |
JPMorgan Research Market Neutral Fund
SCHEDULE OF PORTFOLIO INVESTMENTS
AS OF OCTOBER 31, 2020 (AS RESTATED, SEE NOTE 8) (continued)
| | | | | | | | |
| INVESTMENTS | | SHARES
(000) | | | VALUE
($000) | |
Short Positions — continued | |
|
Common Stocks — continued | |
|
Consumer Finance — (0.2)% | |
| | |
American Express Co. | | | (3 | ) | | | (245 | ) |
| | | | | | | | |
|
Containers & Packaging — (2.1)% | |
| | |
Avery Dennison Corp. | | | (1 | ) | | | (200 | ) |
| | |
Ball Corp. | | | (9 | ) | | | (805 | ) |
| | |
International Paper Co. | | | (29 | ) | | | (1,251 | ) |
| | |
Sealed Air Corp. | | | (4 | ) | | | (148 | ) |
| | |
Sonoco Products Co. | | | (13 | ) | | | (631 | ) |
| | | | | | | | |
| | |
| | | | | | | (3,035 | ) |
| | | | | | | | |
|
Diversified Telecommunication Services — (2.0)% | |
| | |
AT&T, Inc. | | | (62 | ) | | | (1,662 | ) |
| | |
CenturyLink, Inc. | | | (93 | ) | | | (800 | ) |
| | |
Verizon Communications, Inc. | | | (7 | ) | | | (427 | ) |
| | | | | | | | |
| | |
| | | | | | | (2,889 | ) |
| | | | | | | | |
|
Electric Utilities — (1.4)% | |
| | |
American Electric Power Co., Inc. | | | (6 | ) | | | (570 | ) |
| | |
Duke Energy Corp. | | | (4 | ) | | | (339 | ) |
| | |
FirstEnergy Corp. | | | (7 | ) | | | (201 | ) |
| | |
PPL Corp. | | | (8 | ) | | | (216 | ) |
| | |
Southern Co. (The) | | | (11 | ) | | | (660 | ) |
| | | | | | | | |
| | |
| | | | | | | (1,986 | ) |
| | | | | | | | |
|
Electrical Equipment — (0.8)% | |
| | |
Acuity Brands, Inc. | | | (12 | ) | | | (1,043 | ) |
| | |
Hubbell, Inc. | | | (1 | ) | | | (89 | ) |
| | | | | | | | |
| | |
| | | | | | | (1,132 | ) |
| | | | | | | | |
|
Electronic Equipment, Instruments & Components — (0.2)% | |
| | |
Cognex Corp. | | | (5 | ) | | | (331 | ) |
| | | | | | | | |
|
Energy Equipment & Services — (1.1)% | |
| | |
Halliburton Co. | | | (78 | ) | | | (940 | ) |
| | |
Schlumberger NV | | | (46 | ) | | | (685 | ) |
| | | | | | | | |
| | |
| | | | | | | (1,625 | ) |
| | | | | | | | |
|
Entertainment — (4.1)% | |
| | |
Cinemark Holdings, Inc. | | | (11 | ) | | | (94 | ) |
| | |
Spotify Technology SA * | | | (8 | ) | | | (1,948 | ) |
| | |
Take-Two Interactive Software, Inc. * | | | (12 | ) | | | (1,787 | ) |
| | |
Walt Disney Co. (The) | | | (17 | ) | | | (2,053 | ) |
| | | | | | | | |
| | |
| | | | | | | (5,882 | ) |
| | | | | | | | |
|
Equity Real Estate Investment Trusts (REITs) — (3.7)% | |
| | |
AvalonBay Communities, Inc. | | | (3 | ) | | | (358 | ) |
| | |
Crown Castle International Corp. | | | (1 | ) | | | (97 | ) |
| | |
Duke Realty Corp. | | | (7 | ) | | | (262 | ) |
| | | | | | | | |
| INVESTMENTS | | SHARES
(000) | | | VALUE
($000) | |
| | | | | | | | |
| | |
| | | | | | | | |
|
Equity Real Estate Investment Trusts (REITs) — continued | |
| | |
Equity Residential | | | (10 | ) | | | (470 | ) |
| | |
Essex Property Trust, Inc. | | | (2 | ) | | | (408 | ) |
| | |
Extra Space Storage, Inc. | | | (3 | ) | | | (391 | ) |
| | |
Iron Mountain, Inc. | | | (42 | ) | | | (1,100 | ) |
| | |
National Retail Properties, Inc. | | | (13 | ) | | | (403 | ) |
| | |
Simon Property Group, Inc. | | | (17 | ) | | | (1,071 | ) |
| | |
Vornado Realty Trust | | | (10 | ) | | | (316 | ) |
| | |
Welltower, Inc. | | | (8 | ) | | | (419 | ) |
| | | | | | | | |
| | |
| | | | | | | (5,295 | ) |
| | | | | | | | |
|
Food & Staples Retailing — (2.8)% | |
| | |
Kroger Co. (The) | | | (60 | ) | | | (1,929 | ) |
| | |
Sysco Corp. | | | (7 | ) | | | (363 | ) |
| | |
Walgreens Boots Alliance, Inc. | | | (15 | ) | | | (521 | ) |
| | |
Walmart, Inc. | | | (9 | ) | | | (1,225 | ) |
| | | | | | | | |
| | |
| | | | | | | (4,038 | ) |
| | | | | | | | |
|
Food Products — (1.5)% | |
| | |
Campbell Soup Co. | | | (17 | ) | | | (806 | ) |
| | |
General Mills, Inc. | | | (9 | ) | | | (538 | ) |
| | |
Kellogg Co. | | | (12 | ) | | | (732 | ) |
| | | | | | | | |
| | |
| | | | | | | (2,076 | ) |
| | | | | | | | |
|
Health Care Equipment & Supplies — (1.6)% | |
| | |
Abbott Laboratories | | | (5 | ) | | | (478 | ) |
| | |
Dentsply Sirona, Inc. | | | (2 | ) | | | (81 | ) |
| | |
Edwards Lifesciences Corp. * | | | (3 | ) | | | (217 | ) |
| | |
Stryker Corp. | | | (7 | ) | | | (1,437 | ) |
| | | | | | | | |
| | |
| | | | | | | (2,213 | ) |
| | | | | | | | |
|
Health Care Providers & Services — (1.4)% | |
| | |
AmerisourceBergen Corp. | | | (11 | ) | | | (1,022 | ) |
| | |
Henry Schein, Inc. * | | | (15 | ) | | | (935 | ) |
| | |
Patterson Cos., Inc. | | | (3 | ) | | | (84 | ) |
| | | | | | | | |
| | |
| | | | | | | (2,041 | ) |
| | | | | | | | |
|
Health Care Technology — (0.6)% | |
| | |
Cerner Corp. | | | (12 | ) | | | (815 | ) |
| | | | | | | | |
|
Hotels, Restaurants & Leisure — (1.8)% | |
| | |
Chipotle Mexican Grill, Inc. * | | | (1 | ) | | | (762 | ) |
| | |
Darden Restaurants, Inc. | | | (7 | ) | | | (651 | ) |
| | |
Marriott International, Inc., Class A | | | (1 | ) | | | (91 | ) |
| | |
Starbucks Corp. | | | (12 | ) | | | (1,010 | ) |
| | | | | | | | |
| | |
| | | | | | | (2,514 | ) |
| | | | | | | | |
SEE NOTES TO FINANCIAL STATEMENTS.
| | | | | | | | | | |
| | | | | |
| 36 | | | | | | | | J.P. MORGAN SPECIALTY FUNDS | | |
| | | | | | | | |
| INVESTMENTS | | SHARES
(000) | | | VALUE
($000) | |
Short Positions — continued | |
|
Common Stocks — continued | |
|
Household Durables — (0.2)% | |
| | |
NVR, Inc. * | | | — | (a) | | | (59 | ) |
| | |
PulteGroup, Inc. | | | (4 | ) | | | (151 | ) |
| | | | | | | | |
| | |
| | | | | | | (210 | ) |
| | | | | | | | |
|
Household Products — (1.3)% | |
| | |
Clorox Co. (The) | | | (9 | ) | | | (1,823 | ) |
| | | | | | | | |
|
Industrial Conglomerates — (2.0)% | |
| | |
3M Co. | | | (7 | ) | | | (1,189 | ) |
| | |
General Electric Co. | | | (229 | ) | | | (1,696 | ) |
| | | | | | | | |
| | |
| | | | | | | (2,885 | ) |
| | | | | | | | |
|
Insurance — (1.8)% | |
| | |
Aflac, Inc. | | | (6 | ) | | | (194 | ) |
| | |
Allstate Corp. (The) | | | (7 | ) | | | (592 | ) |
| | |
Aon plc, Class A | | | (2 | ) | | | (385 | ) |
| | |
Axis Capital Holdings Ltd. | | | (4 | ) | | | (191 | ) |
| | |
MetLife, Inc. | | | (6 | ) | | | (240 | ) |
| | |
Principal Financial Group, Inc. | | | (9 | ) | | | (338 | ) |
| | |
Travelers Cos., Inc. (The) | | | (6 | ) | | | (689 | ) |
| | | | | | | | |
| | |
| | | | | | | (2,629 | ) |
| | | | | | | | |
|
Interactive Media & Services — (0.5)% | |
| | |
Twitter, Inc. * | | | (18 | ) | | | (740 | ) |
| | | | | | | | |
|
Internet & Direct Marketing Retail — (0.8)% | |
| | |
eBay, Inc. | | | (25 | ) | | | (1,170 | ) |
| | | | | | | | |
|
IT Services — (3.2)% | |
| | |
EPAM Systems, Inc. * | | | (1 | ) | | | (218 | ) |
| | |
Global Payments, Inc. | | | (2 | ) | | | (350 | ) |
| | |
Infosys Ltd., ADR (India) | | | (34 | ) | | | (483 | ) |
| | |
Jack Henry & Associates, Inc. | | | (5 | ) | | | (815 | ) |
| | |
Paychex, Inc. | | | (16 | ) | | | (1,328 | ) |
| | |
Western Union Co. (The) | | | (72 | ) | | | (1,406 | ) |
| | | | | | | | |
| | |
| | | | | | | (4,600 | ) |
| | | | | | | | |
|
Life Sciences Tools & Services — (0.6)% | |
| | |
Agilent Technologies, Inc. | | | (3 | ) | | | (328 | ) |
| | |
Waters Corp. * | | | (3 | ) | | | (576 | ) |
| | | | | | | | |
| | |
| | | | | | | (904 | ) |
| | | | | | | | |
|
Machinery — (1.9)% | |
| | |
Caterpillar, Inc. | | | (8 | ) | | | (1,197 | ) |
| | |
Illinois Tool Works, Inc. | | | (6 | ) | | | (1,267 | ) |
| | |
PACCAR, Inc. | | | (4 | ) | | | (317 | ) |
| | | | | | | | |
| | |
| | | | | | | (2,781 | ) |
| | | | | | | | |
| | | | | | | | |
| INVESTMENTS | | SHARES
(000) | | | VALUE
($000) | |
| | | | | | | | |
| | |
| | | | | | | | |
|
Media — (3.3)% | |
| | |
Fox Corp., Class A | | | (34 | ) | | | (889 | ) |
| | |
Omnicom Group, Inc. | | | (22 | ) | | | (1,038 | ) |
| | |
Sirius XM Holdings, Inc. | | | (74 | ) | | | (426 | ) |
| | |
ViacomCBS, Inc. | | | (84 | ) | | | (2,386 | ) |
| | | | | | | | |
| | |
| | | | | | | (4,739 | ) |
| | | | | | | | |
|
Multiline Retail — (1.1)% | |
| | |
Kohl’s Corp. | | | (14 | ) | | | (295 | ) |
| | |
Macy’s, Inc. | | | (83 | ) | | | (514 | ) |
| | |
Nordstrom, Inc. | | | (37 | ) | | | (452 | ) |
| | |
Target Corp. | | | (2 | ) | | | (321 | ) |
| | | | | | | | |
| | |
| | | | | | | (1,582 | ) |
| | | | | | | | |
|
Multi-Utilities — (1.2)% | |
| | |
Consolidated Edison, Inc. | | | (18 | ) | | | (1,414 | ) |
| | |
NiSource, Inc. | | | (15 | ) | | | (352 | ) |
| | | | | | | | |
| | |
| | | | | | | (1,766 | ) |
| | | | | | | | |
|
Oil, Gas & Consumable Fuels — (3.4)% | |
| | |
Apache Corp. | | | (19 | ) | | | (158 | ) |
| | |
Devon Energy Corp. | | | (58 | ) | | | (514 | ) |
| | |
Enbridge, Inc. (Canada) | | | (51 | ) | | | (1,406 | ) |
| | |
Exxon Mobil Corp. | | | (22 | ) | | | (732 | ) |
| | |
Hess Corp. | | | (22 | ) | | | (823 | ) |
| | |
HollyFrontier Corp. | | | (13 | ) | | | (240 | ) |
| | |
Marathon Oil Corp. | | | (72 | ) | | | (285 | ) |
| | |
Occidental Petroleum Corp. | | | (58 | ) | | | (531 | ) |
| | |
Valero Energy Corp. | | | (4 | ) | | | (150 | ) |
| | | | | | | | |
| | |
| | | | | | | (4,839 | ) |
| | | | | | | | |
|
Personal Products — 0.0% (e) | |
| | |
Coty, Inc., Class A | | | (23 | ) | | | (68 | ) |
| | | | | | | | |
|
Pharmaceuticals — (0.8)% | |
| | |
Johnson & Johnson | | | (4 | ) | | | (514 | ) |
| | |
Pfizer, Inc. | | | (17 | ) | | | (604 | ) |
| | | | | | | | |
| | |
| | | | | | | (1,118 | ) |
| | | | | | | | |
|
Professional Services — (0.4)% | |
| | |
Robert Half International, Inc. | | | (6 | ) | | | (294 | ) |
| | |
TransUnion | | | (3 | ) | | | (259 | ) |
| | | | | | | | |
| | |
| | | | | | | (553 | ) |
| | | | | | | | |
|
Road & Rail — (0.9)% | |
| | |
Canadian National Railway Co. (Canada) | | | (5 | ) | | | (450 | ) |
| | |
Heartland Express, Inc. | | | (17 | ) | | | (315 | ) |
| | |
JB Hunt Transport Services, Inc. | | | (2 | ) | | | (257 | ) |
SEE NOTES TO FINANCIAL STATEMENTS.
| | | | | | | | | | |
| | | | | |
| | | J.P. MORGAN SPECIALTY FUNDS | | | | | | | | 37 |
JPMorgan Research Market Neutral Fund
SCHEDULE OF PORTFOLIO INVESTMENTS
AS OF OCTOBER 31, 2020 (AS RESTATED, SEE NOTE 8) (continued)
| | | | | | | | |
| INVESTMENTS | | SHARES
(000) | | | VALUE
($000) | |
Short Positions — continued | |
|
Common Stocks — continued | |
|
Road & Rail — continued | |
| | |
Werner Enterprises, Inc. | | | (8 | ) | | | (295 | ) |
| | | | | | | | |
| | |
| | | | | | | (1,317 | ) |
| | | | | | | | |
|
Semiconductors & Semiconductor Equipment — (2.3)% | |
| | |
Broadcom, Inc. | | | (7 | ) | | | (2,391 | ) |
| | |
Intel Corp. | | | (20 | ) | | | (894 | ) |
| | | | | | | | |
| | |
| | | | | | | (3,285 | ) |
| | | | | | | | |
|
Software — (1.2)% | |
| | |
Adobe, Inc. * | | | (2 | ) | | | (739 | ) |
| | |
Oracle Corp. | | | (9 | ) | | | (487 | ) |
| | |
Splunk, Inc. * | | | (3 | ) | | | (547 | ) |
| | | | | | | | |
| | |
| | | | | | | (1,773 | ) |
| | | | | | | | |
|
Specialty Retail — (0.5)% | |
| | |
Gap, Inc. (The) | | | (5 | ) | | | (90 | ) |
| | |
Ulta Beauty, Inc. * | | | (1 | ) | | | (236 | ) |
| | |
Williams-Sonoma, Inc. | | | (4 | ) | | | (359 | ) |
| | | | | | | | |
| | |
| | | | | | | (685 | ) |
| | | | | | | | |
|
Technology Hardware, Storage & Peripherals — (1.3)% | |
| | |
HP, Inc. | | | (54 | ) | | | (970 | ) |
| | |
NetApp, Inc. | | | (17 | ) | | | (758 | ) |
| | |
Xerox Holdings Corp. | | | (9 | ) | | | (152 | ) |
| | | | | | | | |
| | |
| | | | | | | (1,880 | ) |
| | | | | | | | |
|
Textiles, Apparel & Luxury Goods — (0.4)% | |
| | |
Canada Goose Holdings, Inc. (Canada) * | | | (2 | ) | | | (54 | ) |
| | |
VF Corp. | | | (8 | ) | | | (555 | ) |
| | | | | | | | |
| | |
| | | | | | | (609 | ) |
| | | | | | | | |
| | | | | | | | |
| INVESTMENTS | | SHARES
(000) | | | VALUE
($000) | |
| | |
| | | | | | | | |
| | |
| | | | | | | | |
|
Trading Companies & Distributors — (0.4)% | |
| | |
Fastenal Co. | | | (10 | ) | | | (448 | ) |
| | |
HD Supply Holdings, Inc. * | | | (5 | ) | | | (187 | ) |
| | | | | | | | |
| | |
| | | | | | | (635 | ) |
| | | | | | | | |
| | |
Total Common Stocks
(Proceeds $(108,392)) | | | | | | | (99,914 | ) |
| | | | | | | | |
| | |
Total Short Positions
(Proceeds $(108,392)) | | | | | | | (99,914 | ) |
| | | | | | | | |
Total Investments — 24.0%
(Cost $13,089) | | | | | | | 34,424 | |
Other Assets Less Liabilities — 74.0% | | | | | | | 106,231 | |
| | | | | | | | |
NET ASSETS — 98.0% | | | | | | | 140,655 | |
| | | | | | | | |
Future share reacquisition adjustment — 2.0% | | | | | | | 2,950 | |
| | | | | | | | |
Net assets after future share reacquisition adjustment — 100% | | | | | | $ | 143,605 | |
| | | | | | | | |
Percentages indicated are based on net assets after future share reacquisition adjustment.
| | |
Abbreviations |
| |
| ADR | | American Depositary Receipt |
| NYRS | | New York Registry Shares |
| |
| (a) | | Amount rounds to less than one thousand. |
| (b) | | All or a portion of this security is segregated as collateral for short sales. The total value of securities and cash segregated as collateral is approximately $18,239,000 and $96,488,000 respectively. |
| (c) | | Investment in an affiliated fund, which is registered under the Investment Company Act of 1940, as amended, and is advised by J.P. Morgan Investment Management Inc. |
| (d) | | The rate shown is the current yield as of October 31, 2020. |
| (e) | | Amount rounds to less than 0.1% of net assets. |
| * | | Non-income producing security. |
Futures contracts outstanding as of October 31, 2020 (amounts in thousands, except number of contracts):
| | | | | | | | | | | | | | | | | | |
| DESCRIPTION | | NUMBER OF
CONTRACTS | | | EXPIRATION
DATE | | | TRADING
CURRENCY | | NOTIONAL
AMOUNT ($) | | | VALUE AND
UNREALIZED
APPRECIATION
(DEPRECIATION) ($) | |
Short Contracts | |
S&P 500 E-Mini Index | | | (12 | ) | | | 12/2020 | | | USD | | | (1,959 | ) | | | 85 | |
| | | | | | | | | | | | | | | | | | |
| | |
Abbreviations |
| USD | | United States Dollar |
SEE NOTES TO FINANCIAL STATEMENTS.
| | | | | | | | | | |
| | | | | |
| 38 | | | | | | | | J.P. MORGAN SPECIALTY FUNDS | | |
JPMorgan Research Market Neutral Fund
SCHEDULE OF PORTFOLIO INVESTMENTS
AS OF OCTOBER 31, 2019 (AS RESTATED, SEE NOTE 8)
| | | | | | | | |
| INVESTMENTS | | SHARES
(000) | | | VALUE
($000) | |
Long Positions — 99.1% | |
|
Common Stocks — 84.2% | |
|
Aerospace & Defense — 2.4% | |
| | |
General Dynamics Corp. (a) | | | 4 | | | | 722 | |
| | |
Northrop Grumman Corp. | | | 2 | | | | 618 | |
| | |
United Technologies Corp. | | | 1 | | | | 203 | |
| | | | | | | | |
| | |
| | | | | | | 1,543 | |
| | | | | | | | |
|
Airlines — 0.5% | |
| | |
United Airlines Holdings, Inc. * | | | 3 | | | | 295 | |
| | | | | | | | |
|
Banks — 2.7% | |
| | |
Bank of America Corp. | | | 6 | | | | 185 | |
| | |
Citigroup, Inc. | | | 10 | | | | 711 | |
| | |
First Horizon National Corp. | | | 13 | | | | 215 | |
| | |
KeyCorp | | | 20 | | | | 363 | |
| | |
Regions Financial Corp. | | | 14 | | | | 221 | |
| | | | | | | | |
| | |
| | | | | | | 1,695 | |
| | | | | | | | |
|
Beverages — 1.5% | |
| | |
Coca-Cola Co. (The) | | | 9 | | | | 499 | |
| | |
Constellation Brands, Inc., Class A | | | 1 | | | | 270 | |
| | |
PepsiCo, Inc. | | | 1 | | | | 189 | |
| | | | | | | | |
| | |
| | | | | | | 958 | |
| | | | | | | | |
|
Biotechnology — 1.7% | |
| | |
AbbVie, Inc. | | | 3 | | | | 256 | |
| | |
Alexion Pharmaceuticals, Inc. * | | | 1 | | | | 151 | |
| | |
Celgene Corp. * | | | 6 | | | | 675 | |
| | | | | | | | |
| | |
| | | | | | | 1,082 | |
| | | | | | | | |
|
Building Products — 0.2% | |
| | |
Masco Corp. | | | 3 | | | | 141 | |
| | | | | | | | |
|
Capital Markets — 1.6% | |
| | |
Ameriprise Financial, Inc. | | | 1 | | | | 211 | |
| | |
BlackRock, Inc. | | | — | (b) | | | 225 | |
| | |
Intercontinental Exchange, Inc. | | | 2 | | | | 161 | |
| | |
S&P Global, Inc. | | | 1 | | | | 197 | |
| | |
T. Rowe Price Group, Inc. | | | 2 | | | | 201 | |
| | | | | | | | |
| | |
| | | | | | | 995 | |
| | | | | | | | |
|
Chemicals — 4.2% | |
| | |
Air Products & Chemicals, Inc. | | | 2 | | | | 428 | |
| | |
Celanese Corp. | | | 3 | | | | 406 | |
| | |
CF Industries Holdings, Inc. | | | 2 | | | | 89 | |
| | |
Corteva, Inc. | | | 4 | | | | 95 | |
| | |
DuPont de Nemours, Inc. | | | 6 | | | | 382 | |
| | |
FMC Corp. | | | 4 | | | | 330 | |
| | |
Linde plc (United Kingdom) | | | 5 | | | | 925 | |
| | | | | | | | |
| | |
| | | | | | | 2,655 | |
| | | | | | | | |
| | | | | | | | |
| INVESTMENTS | | SHARES
(000) | | | VALUE
($000) | |
| | | | | | | | |
| | | | | | | | |
|
Commercial Services & Supplies — 0.7% | |
| | |
Waste Management, Inc. | | | 4 | | | | 452 | |
| | | | | | | | |
|
Consumer Finance — 0.5% | |
| | |
Synchrony Financial | | | 9 | | | | 314 | |
| | | | | | | | |
|
Containers & Packaging — 0.3% | |
| | |
Crown Holdings, Inc. * | | | 3 | | | | 221 | |
| | | | | | | | |
|
Electric Utilities — 4.7% | |
| | |
American Electric Power Co., Inc. | | | 1 | | | | 100 | |
| | |
Edison International | | | 12 | | | | 734 | |
| | |
Entergy Corp. | | | 3 | | | | 356 | |
| | |
NextEra Energy, Inc. (a) | | | 5 | | | | 1,176 | |
| | |
Xcel Energy, Inc. | | | 10 | | | | 623 | |
| | | | | | | | |
| | |
| | | | | | | 2,989 | |
| | | | | | | | |
|
Electrical Equipment — 0.5% | |
| | |
Eaton Corp. plc | | | 3 | | | | 301 | |
| | | | | | | | |
|
Entertainment — 0.3% | |
| | |
Netflix, Inc. * | | | 1 | | | | 181 | |
| | | | | | | | |
|
Equity Real Estate Investment Trusts (REITs) — 3.1% | |
| | |
Equinix, Inc. | | | 1 | | | | 351 | |
| | |
Invitation Homes, Inc. | | | 10 | | | | 297 | |
| | |
Prologis, Inc. | | | 11 | | | | 972 | |
| | |
Ventas, Inc. | | | 2 | | | | 154 | |
| | |
VICI Properties, Inc. | | | 9 | | | | 201 | |
| | | | | | | | |
| | |
| | | | | | | 1,975 | |
| | | | | | | | |
|
Food & Staples Retailing — 0.4% | |
| | |
Costco Wholesale Corp. | | | 1 | | | | 222 | |
| | | | | | | | |
|
Food Products — 1.1% | |
| | |
Conagra Brands, Inc. | | | 4 | | | | 120 | |
| | |
General Mills, Inc. | | | 1 | | | | 57 | |
| | |
Mondelez International, Inc., Class A | | | 10 | | | | 533 | |
| | | | | | | | |
| | |
| | | | | | | 710 | |
| | | | | | | | |
|
Health Care Equipment & Supplies — 2.5% | |
| | |
Boston Scientific Corp. * | | | 19 | | | | 788 | |
| | |
Intuitive Surgical, Inc. * | | | 1 | | | | 415 | |
| | |
Medtronic plc | | | 1 | | | | 131 | |
| | |
Zimmer Biomet Holdings, Inc. | | | 2 | | | | 234 | |
| | | | | | | | |
| | |
| | | | | | | 1,568 | |
| | | | | | | | |
|
Health Care Providers & Services — 2.5% | |
| | |
Cigna Corp. | | | 4 | | | | 625 | |
| | |
HCA Healthcare, Inc. | | | 3 | | | | 413 | |
| | |
UnitedHealth Group, Inc. (a) | | | 2 | | | | 426 | |
SEE NOTES TO FINANCIAL STATEMENTS.
| | | | | | | | | | |
| | | | | |
| | | J.P. MORGAN SPECIALTY FUNDS | | | | | | | | 39 |
JPMorgan Research Market Neutral Fund
SCHEDULE OF PORTFOLIO INVESTMENTS
AS OF OCTOBER 31, 2019 (AS RESTATED, SEE NOTE 8) (continued)
| | | | | | | | |
| INVESTMENTS | | SHARES
(000) | | | VALUE
($000) | |
Long Positions — continued | |
|
Common Stocks — continued | |
|
Health Care Providers & Services — continued | |
| | |
Universal Health Services, Inc., Class B | | | 1 | | | | 84 | |
| | | | | | | | |
| | |
| | | | | | | 1,548 | |
| | | | | | | | |
|
Hotels, Restaurants & Leisure — 1.6% | |
| | |
Hilton Worldwide Holdings, Inc. | | | 2 | | | | 146 | |
| | |
Royal Caribbean Cruises Ltd. | | | 1 | | | | 133 | |
| | |
Yum! Brands, Inc. | | | 7 | | | | 755 | |
| | | | | | | | |
| | |
| | | | | | | 1,034 | |
| | | | | | | | |
|
Household Durables — 0.9% | |
| | |
DR Horton, Inc. | | | 3 | | | | 155 | |
| | |
Lennar Corp., Class A | | | 7 | | | | 403 | |
| | | | | | | | |
| | |
| | | | | | | 558 | |
| | | | | | | | |
|
Household Products — 0.5% | |
| | |
Procter & Gamble Co. (The) | | | 3 | | | | 322 | |
| | | | | | | | |
|
Industrial Conglomerates — 1.3% | |
| | |
Honeywell International, Inc. | | | 5 | | | | 843 | |
| | | | | | | | |
|
Insurance — 1.2% | |
| | |
Aon plc | | | — | (b) | | | 96 | |
| | |
Axis Capital Holdings Ltd. | | | 3 | | | | 207 | |
| | |
Hartford Financial Services Group, Inc. (The) | | | 2 | | | | 139 | |
| | |
Progressive Corp. (The) | | | 2 | | | | 146 | |
| | |
Prudential Financial, Inc. | | | 2 | | | | 196 | |
| | | | | | | | |
| | |
| | | | | | | 784 | |
| | | | | | | | |
|
Interactive Media & Services — 3.7% | |
| | |
Alphabet, Inc., Class C * (a) | | | 1 | | | | 1,823 | |
| | |
Facebook, Inc., Class A * | | | 1 | | | | 193 | |
| | |
Snap, Inc., Class A * | | | 19 | | | | 289 | |
| | | | | | | | |
| | |
| | | | | | | 2,305 | |
| | | | | | | | |
|
Internet & Direct Marketing Retail — 3.1% | |
| | |
Amazon.com, Inc. * (a) | | | 1 | | | | 1,531 | |
| | |
Expedia Group, Inc. | | | 3 | | | | 398 | |
| | | | | | | | |
| | |
| | | | | | | 1,929 | |
| | | | | | | | |
|
IT Services — 6.4% | |
| | |
Automatic Data Processing, Inc. (a) | | | 3 | | | | 474 | |
| | |
Fidelity National Information Services, Inc. | | | 7 | | | | 885 | |
| | |
Fiserv, Inc. * | | | 8 | | | | 852 | |
| | |
Leidos Holdings, Inc. | | | 4 | | | | 366 | |
| | |
Mastercard, Inc., Class A (a) | | | 3 | | | | 770 | |
| | |
PayPal Holdings, Inc. * | | | 2 | | | | 252 | |
| | |
WEX, Inc. * | | | 2 | | | | 422 | |
| | | | | | | | |
| | |
| | | | | | | 4,021 | |
| | | | | | | | |
| | | | | | | | |
| INVESTMENTS | | SHARES
(000) | | | VALUE
($000) | |
| | | | | | | | |
| | | | | | | | |
|
Life Sciences Tools & Services — 0.4% | |
| | |
Thermo Fisher Scientific, Inc. | | | 1 | | | | 281 | |
| | | | | | | | |
|
Machinery — 2.2% | |
| | |
Deere & Co. | | | 2 | | | | 301 | |
| | |
Ingersoll-Rand plc | | | 5 | | | | 631 | |
| | |
Parker-Hannifin Corp. | | | 1 | | | | 182 | |
| | |
Stanley Black & Decker, Inc. | | | 2 | | | | 295 | |
| | | | | | | | |
| | |
| | | | | | | 1,409 | |
| | | | | | | | |
|
Media — 2.6% | |
| | |
Altice USA, Inc., Class A * | | | 14 | | | | 432 | |
| | |
Charter Communications, Inc., Class A * | | | 1 | | | | 558 | |
| | |
Comcast Corp., Class A | | | 6 | | | | 279 | |
| | |
Discovery, Inc., Class A * | | | 11 | | | | 298 | |
| | |
Discovery, Inc., Class C * | | | 3 | | | | 87 | |
| | | | | | | | |
| | |
| | | | | | | 1,654 | |
| | | | | | | | |
|
Multiline Retail — 0.3% | |
| | |
Dollar General Corp. | | | 1 | | | | 187 | |
| | | | | | | | |
|
Multi-Utilities — 0.6% | |
| | |
CMS Energy Corp. | | | 3 | | | | 195 | |
| | |
Sempra Energy | | | 1 | | | | 173 | |
| | | | | | | | |
| | |
| | | | | | | 368 | |
| | | | | | | | |
|
Oil, Gas & Consumable Fuels — 6.2% | |
| | |
Chevron Corp. | | | 5 | | | | 638 | |
| | |
ConocoPhillips | | | 3 | | | | 187 | |
| | |
Diamondback Energy, Inc. | | | 6 | | | | 519 | |
| | |
EOG Resources, Inc. | | | 4 | | | | 299 | |
| | |
Marathon Petroleum Corp. | | | 11 | | | | 678 | |
| | |
ONEOK, Inc. | | | 7 | | | | 465 | |
| | |
Parsley Energy, Inc., Class A | | | 15 | | | | 237 | |
| | |
Pioneer Natural Resources Co. (a) | | | 3 | | | | 410 | |
| | |
TC Energy Corp. (Canada) | | | 9 | | | | 472 | |
| | | | | | | | |
| | |
| | | | | | | 3,905 | |
| | | | | | | | |
|
Pharmaceuticals — 0.3% | |
| | |
Merck & Co., Inc. | | | 2 | | | | 186 | |
| | | | | | | | |
|
Road & Rail — 5.1% | |
| | |
Canadian Pacific Railway Ltd. (Canada) | | | 1 | | | | 330 | |
| | |
Kansas City Southern | | | 4 | | | | 625 | |
| | |
Lyft, Inc., Class A * | | | 3 | | | | 120 | |
| | |
Norfolk Southern Corp. (a) | | | 9 | | | | 1,687 | |
| | |
Union Pacific Corp. | | | 3 | | | | 480 | |
| | | | | | | | |
| | |
| | | | | | | 3,242 | |
| | | | | | | | |
SEE NOTES TO FINANCIAL STATEMENTS.
| | | | | | | | | | |
| | | | | |
| 40 | | | | | | | | J.P. MORGAN SPECIALTY FUNDS | | |
| | | | | | | | |
| INVESTMENTS | | SHARES
(000) | | | VALUE
($000) | |
Long Positions — continued | |
|
Common Stocks — continued | |
|
Semiconductors & Semiconductor Equipment — 5.6% | |
| | |
Advanced Micro Devices, Inc. * | | | 15 | | | | 508 | |
| | |
Analog Devices, Inc. | | | 3 | | | | 276 | |
| | |
NVIDIA Corp. (a) | | | 5 | | | | 1,074 | |
| | |
NXP Semiconductors NV (Netherlands) | | | 5 | | | | 514 | |
| | |
ON Semiconductor Corp. * | | | 3 | | | | 70 | |
| | |
Taiwan Semiconductor Manufacturing Co. Ltd., ADR (Taiwan) | | | 10 | | | | 494 | |
| | |
Teradyne, Inc. | | | 4 | | | | 227 | |
| | |
Texas Instruments, Inc. (a) | | | 3 | | | | 349 | |
| | | | | | | | |
| | |
| | | | | | | 3,512 | |
| | | | | | | | |
|
Software — 4.3% | |
| | |
Intuit, Inc. | | | 1 | | | | 283 | |
| | |
Microsoft Corp. (a) | | | 7 | | | | 1,052 | |
| | |
salesforce.com, Inc. * | | | 5 | | | | 730 | |
| | |
ServiceNow, Inc. * | | | 1 | | | | 329 | |
| | |
Slack Technologies, Inc., Class A * | | | 10 | | | | 216 | |
| | |
Workday, Inc., Class A * | | | 1 | | | | 97 | |
| | | | | | | | |
| | |
| | | | | | | 2,707 | |
| | | | | | | | |
|
Specialty Retail — 5.2% | |
| | |
AutoZone, Inc. * | | | — | (b) | | | 477 | |
| | |
Best Buy Co., Inc. | | | 4 | | | | 315 | |
| | |
Home Depot, Inc. (The) | | | 1 | | | | 333 | |
| | |
Lowe’s Cos., Inc. | | | 5 | | | | 547 | |
| | |
O’Reilly Automotive, Inc. * | | | 2 | | | | 662 | |
| | |
Ross Stores, Inc. | | | 3 | | | | 322 | |
| | |
TJX Cos., Inc. (The) | | | 11 | | | | 618 | |
| | | | | | | | |
| | |
| | | | | | | 3,274 | |
| | | | | | | | |
|
Textiles, Apparel & Luxury Goods — 0.9% | |
| | |
NIKE, Inc., Class B | | | 6 | | | | 559 | |
| | | | | | | | |
|
Tobacco — 0.4% | |
| | |
Philip Morris International, Inc. | | | 3 | | | | 234 | |
| | | | | | | | |
| | |
Total Common Stocks
(Cost $41,232) | | | | | | | 53,159 | |
| | | | | | | | |
Short-Term Investments — 14.9% | |
|
Investment Companies — 14.9% | |
| | |
JPMorgan Prime Money Market Fund Class Institutional Shares, 1.88% (c) (d)
(Cost $9,416) | | | 9,415 | | | | 9,419 | |
| | | | | | | | |
| | |
Total Long Positions
(Cost $50,648) | | | | | | | 62,578 | |
| | | | | | | | |
| | | | | | | | |
| INVESTMENTS | | SHARES
(000) | | | VALUE
($000) | |
Short Positions — (82.6)% | |
|
Common Stocks — (82.6)% | |
| | |
Aerospace & Defense — (1.7)% | | | | | | | | |
| | |
Boeing Co. (The) | | | (1 | ) | | | (250 | ) |
| | |
Huntington Ingalls Industries, Inc. | | | (4 | ) | | | (836 | ) |
| | | | | | | | |
| | |
| | | | | | | (1,086 | ) |
| | | | | | | | |
|
Air Freight & Logistics — (1.8)% | |
| | |
CH Robinson Worldwide, Inc. | | | (6 | ) | | | (454 | ) |
| | |
Expeditors International of Washington, Inc. | | | (4 | ) | | | (273 | ) |
| | |
United Parcel Service, Inc., Class B | | | (4 | ) | | | (429 | ) |
| | | | | | | | |
| | |
| | | | | | | (1,156 | ) |
| | | | | | | | |
|
Auto Components — (1.2)% | |
| | |
Autoliv, Inc. (Sweden) | | | (9 | ) | | | (664 | ) |
| | |
BorgWarner, Inc. | | | (2 | ) | | | (101 | ) |
| | | | | | | | |
| | |
| | | | | | | (765 | ) |
| | | | | | | | |
|
Automobiles — (1.2)% | |
| | |
General Motors Co. | | | (10 | ) | | | (362 | ) |
| | |
Harley-Davidson, Inc. | | | (5 | ) | | | (197 | ) |
| | |
Tesla, Inc. * | | | (1 | ) | | | (173 | ) |
| | | | | | | | |
| | |
| | | | | | | (732 | ) |
| | | | | | | | |
|
Banks — (3.4)% | |
| | |
Associated Banc-Corp. | | | (19 | ) | | | (383 | ) |
| | |
BancorpSouth Bank | | | (10 | ) | | | (296 | ) |
| | |
Bank of Hawaii Corp. | | | (3 | ) | | | (275 | ) |
| | |
Commerce Bancshares, Inc. | | | (4 | ) | | | (272 | ) |
| | |
Huntington Bancshares, Inc. | | | (20 | ) | | | (287 | ) |
| | |
People’s United Financial, Inc. | | | (23 | ) | | | (378 | ) |
| | |
PNC Financial Services Group, Inc. (The) | | | (2 | ) | | | (236 | ) |
| | | | | | | | |
| | |
| | | | | | | (2,127 | ) |
| | | | | | | | |
|
Beverages — (1.1)% | |
| | |
Brown-Forman Corp., Class B | | | (10 | ) | | | (673 | ) |
| | | | | | | | |
|
Biotechnology — (1.4)% | |
| | |
Amgen, Inc. | | | (3 | ) | | | (612 | ) |
| | |
Gilead Sciences, Inc. | | | (5 | ) | | | (312 | ) |
| | | | | | | | |
| | |
| | | | | | | (924 | ) |
| | | | | | | | |
|
Building Products — (1.0)% | |
| | |
Johnson Controls International plc | | | (3 | ) | | | (149 | ) |
| | |
Lennox International, Inc. | | | (2 | ) | | | (480 | ) |
| | | | | | | | |
| | |
| | | | | | | (629 | ) |
| | | | | | | | |
|
Capital Markets — (3.0)% | |
| | |
Bank of New York Mellon Corp. (The) | | | (8 | ) | | | (390 | ) |
| | |
Charles Schwab Corp. (The) | | | (11 | ) | | | (428 | ) |
| | |
Franklin Resources, Inc. | | | (7 | ) | | | (184 | ) |
SEE NOTES TO FINANCIAL STATEMENTS.
| | | | | | | | | | |
| | | | | |
| | | J.P. MORGAN SPECIALTY FUNDS | | | | | | | | 41 |
JPMorgan Research Market Neutral Fund
SCHEDULE OF PORTFOLIO INVESTMENTS
AS OF OCTOBER 31, 2019 (AS RESTATED, SEE NOTE 8) (continued)
| | | | | | | | |
| INVESTMENTS | | SHARES
(000) | | | VALUE
($000) | |
Short Positions — continued | |
|
Common Stocks — continued | |
|
Capital Markets — continued | |
| | |
Northern Trust Corp. | | | (2 | ) | | | (195 | ) |
| | |
State Street Corp. | | | (5 | ) | | | (353 | ) |
| | |
Waddell & Reed Financial, Inc., Class A | | | (21 | ) | | | (356 | ) |
| | | | | | | | |
| | |
| | | | | | | (1,906 | ) |
| | | | | | | | |
|
Chemicals — (1.3)% | |
| | |
Albemarle Corp. | | | (7 | ) | | | (410 | ) |
| | |
Ecolab, Inc. | | | (1 | ) | | | (192 | ) |
| | |
LyondellBasell Industries NV, Class A | | | (3 | ) | | | (225 | ) |
| | | | | | | | |
| | |
| | | | | | | (827 | ) |
| | | | | | | | |
|
Communications Equipment — (1.2)% | |
| | |
Cisco Systems, Inc. | | | (6 | ) | | | (292 | ) |
| | |
Juniper Networks, Inc. | | | (18 | ) | | | (436 | ) |
| | | | | | | | |
| | |
| | | | | | | (728 | ) |
| | | | | | | | |
|
Containers & Packaging — (2.4)% | |
| | |
Avery Dennison Corp. | | | (2 | ) | | | (308 | ) |
| | |
Ball Corp. | | | (6 | ) | | | (389 | ) |
| | |
International Paper Co. | | | (11 | ) | | | (479 | ) |
| | |
Sonoco Products Co. | | | (6 | ) | | | (367 | ) |
| | | | | | | | |
| | |
| | | | | | | (1,543 | ) |
| | | | | | | | |
|
Diversified Telecommunication Services — (1.6)% | |
| | |
AT&T, Inc. | | | (26 | ) | | | (987 | ) |
| | | | | | | | |
|
Electric Utilities — (2.9)% | |
| | |
Duke Energy Corp. | | | (9 | ) | | | (889 | ) |
| | |
Eversource Energy | | | (5 | ) | | | (394 | ) |
| | |
Pinnacle West Capital Corp. | | | (5 | ) | | | (433 | ) |
| | |
Southern Co. (The) | | | (2 | ) | | | (112 | ) |
| | | | | | | | |
| | |
| | | | | | | (1,828 | ) |
| | | | | | | | |
|
Electrical Equipment — (1.9)% | |
| | |
Acuity Brands, Inc. | | | (4 | ) | | | (479 | ) |
| | |
Hubbell, Inc. | | | (2 | ) | | | (269 | ) |
| | |
Rockwell Automation, Inc. | | | (3 | ) | | | (477 | ) |
| | | | | | | | |
| | |
| | | | | | | (1,225 | ) |
| | | | | | | | |
|
Electronic Equipment, Instruments & Components — (0.1)% | |
| | |
Amphenol Corp., Class A | | | (1 | ) | | | (87 | ) |
| | | | | | | | |
|
Energy Equipment & Services — (1.8)% | |
| | |
Baker Hughes Co. | | | (5 | ) | | | (103 | ) |
| | |
Halliburton Co. | | | (34 | ) | | | (650 | ) |
| | |
National Oilwell Varco, Inc. | | | (6 | ) | | | (139 | ) |
| | |
Schlumberger Ltd. | | | (9 | ) | | | (295 | ) |
| | | | | | | | |
| | |
| | | | | | | (1,187 | ) |
| | | | | | | | |
| | | | | | | | |
| INVESTMENTS | | SHARES
(000) | | | VALUE
($000) | |
| | | | | | | | |
| | | | | | | | |
|
Entertainment — (1.8)% | |
| | |
Activision Blizzard, Inc. | | | (4 | ) | | | (199 | ) |
| | |
Cinemark Holdings, Inc. | | | (17 | ) | | | (611 | ) |
| | |
Take-Two Interactive Software, Inc. * | | | (2 | ) | | | (202 | ) |
| | |
Walt Disney Co. (The) | | | (1 | ) | | | (95 | ) |
| | | | | | | | |
| | |
| | | | | | | (1,107 | ) |
| | | | | | | | |
|
Equity Real Estate Investment Trusts (REITs) — (3.2)% | |
| | |
Apartment Investment & Management Co., Class A | | | (4 | ) | | | (211 | ) |
| | |
Apple Hospitality REIT, Inc. | | | (8 | ) | | | (133 | ) |
| | |
Iron Mountain, Inc. | | | (4 | ) | | | (128 | ) |
| | |
Macerich Co. (The) | | | (9 | ) | | | (236 | ) |
| | |
Realty Income Corp. | | | (6 | ) | | | (519 | ) |
| | |
Regency Centers Corp. | | | (3 | ) | | | (173 | ) |
| | |
Simon Property Group, Inc. | | | (4 | ) | | | (594 | ) |
| | | | | | | | |
| | |
| | | | | | | (1,994 | ) |
| | | | | | | | |
|
Food & Staples Retailing — (2.0)% | |
| | |
Kroger Co. (The) | | | (29 | ) | | | (720 | ) |
| | |
Walgreens Boots Alliance, Inc. | | | (10 | ) | | | (542 | ) |
| | | | | | | | |
| | |
| | | | | | | (1,262 | ) |
| | | | | | | | |
|
Food Products — (0.9)% | |
| | |
Hershey Co. (The) | | | (2 | ) | | | (235 | ) |
| | |
Kellogg Co. | | | (5 | ) | | | (307 | ) |
| | | | | | | | |
| | |
| | | | | | | (542 | ) |
| | | | | | | | |
|
Health Care Equipment & Supplies — (0.7)% | |
| | |
Abbott Laboratories | | | (2 | ) | | | (195 | ) |
| | |
Dentsply Sirona, Inc. | | | (4 | ) | | | (242 | ) |
| | | | | | | | |
| | |
| | | | | | | (437 | ) |
| | | | | | | | |
|
Health Care Providers & Services — (3.1)% | |
| | |
AmerisourceBergen Corp. | | | (5 | ) | | | (422 | ) |
| | |
Cardinal Health, Inc. | | | (15 | ) | | | (738 | ) |
| | |
Henry Schein, Inc. * | | | (9 | ) | | | (589 | ) |
| | |
Patterson Cos., Inc. | | | (10 | ) | | | (176 | ) |
| | | | | | | | |
| | |
| | | | | | | (1,925 | ) |
| | | | | | | | |
|
Health Care Technology — (0.7)% | |
| | |
Cerner Corp. | | | (6 | ) | | | (422 | ) |
| | | | | | | | |
|
Hotels, Restaurants & Leisure — (1.8)% | |
| | |
Chipotle Mexican Grill, Inc. * | | | (1 | ) | | | (785 | ) |
| | |
Domino’s Pizza, Inc. | | | (1 | ) | | | (189 | ) |
| | |
Starbucks Corp. | | | (2 | ) | | | (129 | ) |
| | | | | | | | |
| | |
| | | | | | | (1,103 | ) |
| | | | | | | | |
SEE NOTES TO FINANCIAL STATEMENTS.
| | | | | | | | | | |
| | | | | |
| 42 | | | | | | | | J.P. MORGAN SPECIALTY FUNDS | | |
| | | | | | | | |
| INVESTMENTS | | SHARES
(000) | | | VALUE
($000) | |
Short Positions — continued | |
|
Common Stocks — continued | |
|
Household Durables — (0.6)% | |
| | |
PulteGroup, Inc. | | | (3 | ) | | | (103 | ) |
| | |
Toll Brothers, Inc. | | | (8 | ) | | | (300 | ) |
| | | | | | | | |
| | |
| | | | | | | (403 | ) |
| | | | | | | | |
|
Household Products — (1.7)% | |
| | |
Clorox Co. (The) | | | (4 | ) | | | (571 | ) |
| | |
Colgate-Palmolive Co. | | | (7 | ) | | | (490 | ) |
| | | | | | | | |
| | |
| | | | | | | (1,061 | ) |
| | | | | | | | |
|
Industrial Conglomerates — (1.1)% | |
| | |
3M Co. | | | (4 | ) | | | (717 | ) |
| | | | | | | | |
|
Insurance — (1.3)% | |
| | |
Everest Re Group Ltd. | | | (1 | ) | | | (228 | ) |
| | |
Principal Financial Group, Inc. | | | (3 | ) | | | (177 | ) |
| | |
Travelers Cos., Inc. (The) | | | (2 | ) | | | (253 | ) |
| | |
Unum Group | | | (5 | ) | | | (133 | ) |
| | | | | | | | |
| | |
| | | | | | | (791 | ) |
| | | | | | | | |
|
Internet & Direct Marketing Retail — (1.5)% | |
| | |
eBay, Inc. | | | (28 | ) | | | (971 | ) |
| | | | | | | | |
|
IT Services — (2.4)% | |
| | |
Infosys Ltd., ADR (India) | | | (24 | ) | | | (231 | ) |
| | |
Jack Henry & Associates, Inc. | | | (3 | ) | | | (381 | ) |
| | |
Paychex, Inc. | | | (2 | ) | | | (181 | ) |
| | |
Western Union Co. (The) | | | (29 | ) | | | (731 | ) |
| | | | | | | | |
| | |
| | | | | | | (1,524 | ) |
| | | | | | | | |
|
Leisure Products — (0.5)% | |
| | |
Hasbro, Inc. | | | (1 | ) | | | (90 | ) |
| | |
Mattel, Inc. * | | | (21 | ) | | | (248 | ) |
| | | | | | | | |
| | |
| | | | | | | (338 | ) |
| | | | | | | | |
|
Life Sciences Tools & Services — (0.9)% | |
| | |
PerkinElmer, Inc. | | | (2 | ) | | | (193 | ) |
| | |
Waters Corp. * | | | (2 | ) | | | (379 | ) |
| | | | | | | | |
| | |
| | | | | | | (572 | ) |
| | | | | | | | |
|
Machinery — (1.5)% | |
| | |
Donaldson Co., Inc. | | | (9 | ) | | | (489 | ) |
| | |
Illinois Tool Works, Inc. | | | (3 | ) | | | (427 | ) |
| | | | | | | | |
| | |
| | | | | | | (916 | ) |
| | | | | | | | |
|
Media — (3.8)% | |
| | |
AMC Networks, Inc., Class A * | | | (11 | ) | | | (493 | ) |
| | |
Fox Corp., Class A | | | (13 | ) | | | (421 | ) |
| | |
Interpublic Group of Cos., Inc. (The) | | | (13 | ) | | | (288 | ) |
| | |
Omnicom Group, Inc. | | | (12 | ) | | | (953 | ) |
| | | | | | | | |
| INVESTMENTS | | SHARES
(000) | | | VALUE
($000) | |
| | | | | | | | |
| | |
| | | | | | | | |
|
Media — continued | |
| | |
Sirius XM Holdings, Inc. | | | (31 | ) | | | (211 | ) |
| | | | | | | | |
| | |
| | | | | | | (2,366 | ) |
| | | | | | | | |
|
Multiline Retail — (1.0)% | |
| | |
Kohl’s Corp. | | | (8 | ) | | | (393 | ) |
| | |
Macy’s, Inc. | | | (14 | ) | | | (218 | ) |
| | | | | | | | |
| | |
| | | | | | | (611 | ) |
| | | | | | | | |
|
Multi-Utilities — (2.8)% | |
| | |
Consolidated Edison, Inc. | | | (3 | ) | | | (279 | ) |
| | |
Dominion Energy, Inc. | | | (17 | ) | | | (1,412 | ) |
| | |
DTE Energy Co. | | | (1 | ) | | | (94 | ) |
| | | | | | | | |
| | |
| | | | | | | (1,785 | ) |
| | | | | | | | |
|
Oil, Gas & Consumable Fuels — (4.8)% | |
| | |
Apache Corp. | | | (28 | ) | | | (609 | ) |
| | |
Enbridge, Inc. (Canada) | | | (17 | ) | | | (631 | ) |
| | |
Exxon Mobil Corp. | | | (11 | ) | | | (762 | ) |
| | |
Hess Corp. | | | (3 | ) | | | (187 | ) |
| | |
Kinder Morgan, Inc. | | | (5 | ) | | | (93 | ) |
| | |
Occidental Petroleum Corp. | | | (9 | ) | | | (346 | ) |
| | |
Phillips 66 | | | (2 | ) | | | (207 | ) |
| | |
Range Resources Corp. | | | (23 | ) | | | (94 | ) |
| | |
Valero Energy Corp. | | | (1 | ) | | | (101 | ) |
| | | | | | | | |
| | |
| | | | | | | (3,030 | ) |
| | | | | | | | |
|
Paper & Forest Products — (0.2)% | |
| | |
Domtar Corp. | | | (4 | ) | | | (127 | ) |
| | | | | | | | |
|
Professional Services — (1.4)% | |
| | |
Robert Half International, Inc. | | | (15 | ) | | | (881 | ) |
| | | | | | | | |
|
Road & Rail — (2.5)% | |
| | |
Heartland Express, Inc. | | | (38 | ) | | | (805 | ) |
| | |
JB Hunt Transport Services, Inc. | | | (3 | ) | | | (376 | ) |
| | |
Knight-Swift Transportation Holdings, Inc. | | | (3 | ) | | | (98 | ) |
| | |
Schneider National, Inc., Class B | | | (11 | ) | | | (243 | ) |
| | |
Werner Enterprises, Inc. | | | (2 | ) | | | (80 | ) |
| | | | | | | | |
| | |
| | | | | | | (1,602 | ) |
| | | | | | | | |
|
Semiconductors & Semiconductor Equipment — (2.6)% | |
| | |
Applied Materials, Inc. | | | (1 | ) | | | (69 | ) |
| | |
Intel Corp. | | | (15 | ) | | | (830 | ) |
| | |
Micron Technology, Inc. * | | | (2 | ) | | | (115 | ) |
| | |
Qorvo, Inc. * | | | (2 | ) | | | (200 | ) |
| | |
QUALCOMM, Inc. | | | (5 | ) | | | (426 | ) |
| | | | | | | | |
| | |
| | | | | | | (1,640 | ) |
| | | | | | | | |
SEE NOTES TO FINANCIAL STATEMENTS.
| | | | | | | | | | |
| | | | | |
| | | J.P. MORGAN SPECIALTY FUNDS | | | | | | | | 43 |
JPMorgan Research Market Neutral Fund
SCHEDULE OF PORTFOLIO INVESTMENTS
AS OF OCTOBER 31, 2019 (AS RESTATED, SEE NOTE 8) (continued)
| | | | | | | | |
| INVESTMENTS | | SHARES
(000) | | | VALUE
($000) | |
Short Positions — continued | |
|
Common Stocks — continued | |
|
Software — (1.5)% | |
| | |
Citrix Systems, Inc. | | | (4 | ) | | | (448 | ) |
| | |
Splunk, Inc. * | | | (1 | ) | | | (102 | ) |
| | |
Teradata Corp. * | | | (13 | ) | | | (388 | ) |
| | | | | | | | |
| | |
| | | | | | | (938 | ) |
| | | | | | | | |
|
Specialty Retail — (2.7)% | |
| | |
Abercrombie & Fitch Co., Class A | | | (2 | ) | | | (38 | ) |
| | |
Ascena Retail Group, Inc. * | | | (103 | ) | | | (36 | ) |
| | |
Bed Bath & Beyond, Inc. | | | (21 | ) | | | (285 | ) |
| | |
Buckle, Inc. (The) | | | (5 | ) | | | (98 | ) |
| | |
CarMax, Inc. * | | | (1 | ) | | | (118 | ) |
| | |
Designer Brands, Inc., Class A | | | (14 | ) | | | (227 | ) |
| | |
Express, Inc. * | | | (12 | ) | | | (38 | ) |
| | |
Gap, Inc. (The) | | | (14 | ) | | | (225 | ) |
| | |
L Brands, Inc. | | | (11 | ) | | | (189 | ) |
| | |
Williams-Sonoma, Inc. | | | (7 | ) | | | (468 | ) |
| | | | | | | | |
| | |
| | | | | | | (1,722 | ) |
| | | | | | | | |
|
Technology Hardware, Storage & Peripherals — (3.5)% | |
| | |
Hewlett Packard Enterprise Co. | | | (24 | ) | | | (399 | ) |
| | |
HP, Inc. | | | (6 | ) | | | (103 | ) |
| | |
NetApp, Inc. | | | (8 | ) | | | (421 | ) |
| | |
Seagate Technology plc | | | (14 | ) | | | (824 | ) |
| | |
Western Digital Corp. | | | (9 | ) | | | (462 | ) |
| | | | | | | | |
| | |
| | | | | | | (2,209 | ) |
| | | | | | | | |
|
Textiles, Apparel & Luxury Goods — (0.7)% | |
| | |
Canada Goose Holdings, Inc. (Canada) * | | | (2 | ) | | | (93 | ) |
| | |
Under Armour, Inc., Class A * | | | (10 | ) | | | (201 | ) |
| | |
Under Armour, Inc., Class C * | | | (6 | ) | | | (117 | ) |
| | | | | | | | |
| | |
| | | | | | | (411 | ) |
| | | | | | | | |
| | | | | | | | |
| INVESTMENTS | | SHARES
(000) | | | VALUE
($000) | |
| | | | | | | | |
| | |
| | | | | | | | |
|
Trading Companies & Distributors — (0.4)% | |
| | |
Fastenal Co. | | | (8 | ) | | | (274 | ) |
| | | | | | | | |
| | |
Total Common Stocks
(Proceeds $(57,317)) | | | | | | | (52,091 | ) |
| | | | | | | | |
| | |
Total Short Positions
(Proceeds $(57,317)) | | | | | | | (52,091 | ) |
| | | | | | | | |
Total Investments — 16.6%
(Cost $(6,669)) | | | | | | | 10,487 | |
Other Assets Less Liabilities — 83.3% | | | | | | | 52,555 | |
| | | | | | | | |
NET ASSETS — 99.9% | | | | | | | 63,042 | |
| | | | | | | | |
Future share reacquisition adjustment — 0.1% | | | | | | | 63 | |
| | | | | | | | |
Net assets after future share reacquisition adjustment — 100% | | | | | | $ | 63,105 | |
| | | | | | | | |
Percentages indicated are based on net assets after future share reacquisition adjustment.
| | |
Abbreviations | | |
| ADR | | American Depositary Receipt |
| REIT | | Real Estate Investment Trust |
| |
| (a) | | All or a portion of this security is segregated as collateral for short sales. The total value of securities and cash segregated as collateral is $11,076,000 and $52,245,000 respectively. |
| (b) | | Amount rounds to less than one thousand. |
| (c) | | Investment in an affiliated fund, which is registered under the Investment Company Act of 1940, as amended, and is advised by J.P. Morgan Investment Management Inc. |
| (d) | | The rate shown is the current yield as of October 31, 2019. |
| * | | Non-income producing security. |
Futures contracts outstanding as of October 31, 2019 (amounts in thousands, except number of contracts):
| | | | | | | | | | | | | | | | | | | | |
| DESCRIPTION | | NUMBER OF
CONTRACTS | | | EXPIRATION
DATE | | | TRADING
CURRENCY | | | NOTIONAL
AMOUNT ($) | | | VALUE AND
UNREALIZED
APPRECIATION
(DEPRECIATION) ($) | |
Short Contracts | | | | | | | | | | | | | | | | | | | | |
S&P 500 E-Mini Index | | | (5 | ) | | | 12/2019 | | | | USD | | | | (759 | ) | | | 1 | |
| | | | | | | | | | | | | | | | | | | | |
| | |
Abbreviations | | |
| USD | | United States Dollar |
SEE NOTES TO FINANCIAL STATEMENTS.
| | | | | | | | | | |
| | | | | |
| 44 | | | | | | | | J.P. MORGAN SPECIALTY FUNDS | | |
STATEMENTS OF ASSETS AND LIABILITIES (AS RESTATED, SEE NOTE 8)
AS OF THE PERIODS INDICATED
(Amounts in thousands, except per share amounts)
| | | | | | | | | | | | | | | | |
| | | JPMorgan Research Market Neutral Fund | |
| | | October 31, 2022 | | | October 31, 2021 | | | October 31, 2020 | | | October 31, 2019 | |
ASSETS: | | | | | | | | | | | | | | | | |
Investments in non-affiliates, at a value | | $ | 125,640 | | | $ | 81,821 | | | $ | 110,565 | | | $ | 53,159 | |
Investments in affiliates, at value | | | 30,961 | | | | 9,752 | | | | 23,773 | | | | 9,419 | |
Cash | | | — | | | | — | (a) | | | 1 | | | | — | |
Deposits at broker for future contracts | | | 210 | | | | 89 | | | | 284 | | | | 29 | |
Deposits at broker for securities sold short | | | 105,856 | | | | 72,237 | | | | 96,488 | | | | 52,245 | |
Receivables: | | | | | | | | | | | | | | | | |
Investment securities sold | | | 3,293 | | | | 1,287 | | | | 5,689 | | | | 1,009 | |
Fund shares sold | | | 244 | | | | 61 | | | | 11,298 | | | | 143 | |
Interest from non-affiliates | | | 258 | | | | 38 | | | | 98 | | | | 26 | |
Dividends from non-affiliates | | | 59 | | | | 48 | | | | — | | | | 111 | |
Dividends from affiliates | | | 141 | | | | — | (a) | | | 2 | | | | 20 | |
Variation margin on futures contracts | | | 11 | | | | — | | | | 23 | | | | 3 | |
Class Action proceeds | | | 1,151 | | | | 1,129 | | | | 1,114 | | | | 795 | |
| | | | | | | | | | | | | | | | |
Total Assets | | | 267,824 | | | | 166,462 | | | | 249,335 | | | | 116,959 | |
| | | | | | | | | | | | | | | | |
| | | | |
LIABILITIES: | | | | | | | | | | | | | | | | |
Payables: | | | | | | | | | | | | | | | | |
Due to broker | | | — | | | | — | | | | — | | | | 1 | |
Securities sold short, at value | | | 104,586 | | | | 71,788 | | | | 99,914 | | | | 52,091 | |
Dividend expense to non-affiliates on securities sold short | | | 58 | | | | 74 | | | | 104 | | | | 60 | |
Investment securities purchased | | | 3,365 | | | | 1,059 | | | | 6,507 | | | | 1,314 | |
Interest expense to non-affiliates on securities sold short | | | — | | | | 10 | | | | 12 | | | | — | |
Fund shares redeemed | | | 105 | | | | 9 | | | | 34 | | | | 140 | |
Variation margin on futures contracts | | | — | | | | 2 | | | | — | | | | — | |
Accrued liabilities: | | | | | | | | | | | | | | | | |
Investment advisory fees | | | 33 | | | | 17 | | | | 7 | | | | 15 | |
Administration fees | | | 7 | | | | — | | | | — | | | | — | |
Distribution fees | | | 5 | | | | 4 | | | | 5 | | | | 5 | |
Service fees | | | 31 | | | | 18 | | | | 25 | | | | 10 | |
Custodian and accounting fees | | | 8 | | | | 14 | | | | 23 | | | | 6 | |
Trustees’ and Chief Compliance Officer’s fees | | | — | | | | — | (a) | | | 1 | | | | — | |
Due to shareholders upon reprocessing | | | 4,753 | | | | 3,699 | | | | 1,934 | | | | 176 | |
Other | | | 77 | | | | 110 | | | | 114 | | | | 99 | |
| | | | | | | | | | | | | | | | |
Total Liabilities | | | 113,028 | | | | 76,804 | | | | 108,680 | | | | 53,917 | |
| | | | | | | | | | | | | | | | |
Net Assets | | | 154,796 | | | | 89,658 | | | | 140,655 | | | | 63,042 | |
| | | | | | | | | | | | | | | | |
Future share reacquisition adjustment | | | 6,425 | | | | 4,137 | | | | 2,950 | | | | 63 | |
| | | | | | | | | | | | | | | | |
Net assets after future share reacquisition adjustment | | $ | 161,221 | | | $ | 93,795 | | | $ | 143,605 | | | $ | 63,105 | |
| | | | | | | | | | | | | | | | |
| (a) | Amount rounds to less than one thousand. |
SEE NOTES TO FINANCIAL STATEMENTS.
| | | | | | | | | | |
| | | | | |
| | J.P. MORGAN SPECIALTY FUNDS | | | | | | | | 45 |
STATEMENTS OF ASSETS AND LIABILITIES (AS RESTATED, SEE NOTE 8)
AS OF THE PERIODS INDICATED (continued)
(Amounts in thousands, except per share amounts)
| | | | | | | | | | | | | | | | |
| | | JPMorgan Research Market Neutral Fund | |
| | | October 31, 2022 | | | October 31, 2021 | | | October 31, 2020 | | | October 31, 2019 | |
NET ASSETS: | | | | | | | | | | | | | | | | |
Paid-in-Capital | | $ | 173,571 | | | $ | 106,746 | | | $ | 152,074 | | | $ | 75,746 | |
Total distributable earnings (loss) | | | (18,775 | ) | | | (17,088 | ) | | | (11,419 | ) | | | (12,704 | ) |
| | | | | | | | | | | | | | | | |
Total Net Assets | | | 154,796 | | | | 89,658 | | | | 140,655 | | | | 63,042 | |
| | | | | | | | | | | | | | | | |
Future share reacquisition adjustment | | | 6,425 | | | | 4,137 | | | | 2,950 | | | | 63 | |
| | | | | | | | | | | | | | | | |
Net assets after future share reacquisition adjustment | | | 161,221 | | | | 93,795 | | | | 143,605 | | | | 63,105 | |
| | | | | | | | | | | | | | | | |
| | | | |
Net Assets: | | | | | | | | | | | | | | | | |
Class A | | $ | 20,259 | | | | 17,161 | | | | 18,509 | | | | 14,442 | |
Class C | | | 1,504 | | | | 1,233 | | | | 1,982 | | | | 3,774 | |
Class I | | | 139,458 | | | | 75,401 | | | | 123,114 | | | | 28,014 | |
Class L (c) | | | — | | | | — | | | | — | | | | 16,875 | |
| | | | | | | | | | | | | | | | |
Total | | $ | 161,221 | | | $ | 93,795 | | | $ | 143,605 | | | $ | 63,105 | |
| | | | | | | | | | | | | | | | |
| | | | |
Outstanding units of beneficial interest (shares) ($0.0001 par value; unlimited number of shares authorized): | | | | | | | | | | | | | | | | |
Class A | | | 1,647 | | | | 1,359 | | | | 1,399 | | | | 1,089 | |
Class C | | | 137 | | | | 109 | | | | 166 | | | | 309 | |
Class I | | | 10,570 | | | | 5,582 | | | | 8,778 | | | | 2,007 | |
Class L (c) | | | — | | | | — | | | | — | | | | 1,182 | |
| | | | |
Net Asset Value (a): (after future share reacquisition adjustment) | | | | | | | | | | | | | | | | |
Class A — Redemption price per share | | $ | 12.30 | | | $ | 12.63 | | | $ | 13.23 | | | $ | 13.26 | |
Class C — Offering price per share (b) | | | 10.94 | | | | 11.29 | | | | 11.97 | | | | 12.20 | |
Class I — Offering and redemption price per share | | | 13.19 | | | | 13.51 | | | | 14.03 | | | | 13.96 | |
Class L (c) — Offering and redemption price per share | | | — | | | | — | | | | — | | | | 14.28 | |
Class A maximum sales charge | | | 5.25 | % | | | 5.25 | % | | | 5.25 | % | | | 5.25 | % |
Class A maximum public offering price per share
[net asset value per share/(100% — maximum sales charge)] | | $ | 12.98 | | | $ | 13.33 | | | $ | 13.96 | | | $ | 13.99 | |
| | | | | | | | | | | | | | | | |
| | | | |
Cost of investments in non-affiliates | | $ | 115,893 | | | $ | 58,575 | | | $ | 97,714 | | | $ | 41,232 | |
Cost of investments in affiliates | | | 30,959 | | | | 9,749 | | | | 23,767 | | | | 9,416 | |
Proceeds from securities sold short | | | 110,785 | | | | 67,933 | | | | 108,392 | | | | 57,317 | |
| (a) | Per share amounts may not recalculate due to rounding of net assets and/or shares outstanding. |
| (b) | Redemption price for Class C Shares varies based upon length of time the shares are held. |
| (c) | On July 2, 2020, the Fund’s Class L Shares were converted into Class I Shares. Additionally, as of July 2, 2020, the Class L Shares are no longer offered. |
SEE NOTES TO FINANCIAL STATEMENTS.
| | | | | | | | | | |
| | | | | |
| 46 | | | | | | | | J.P. MORGAN SPECIALTY FUNDS | | |
STATEMENTS OF OPERATIONS (AS RESTATED, SEE NOTE 8)
FOR THE PERIODS INDICATED
(Amounts in thousands)
| | | | | | | | | | | | | | | | |
| | | JPMorgan Research Market Neutral Fund | |
| | | Year Ended October 31, 2022 | | | Year Ended October 31, 2021 | | | Year Ended October 31, 2020 | | | Year Ended October 31, 2019 | |
INVESTMENT INCOME: | | | | | | | | | | | | | | | | |
Interest income from non-affiliates | | $ | 24 | | | $ | 2 | | | $ | 10 | | | $ | 20 | |
Interest income from affiliates | | | 4 | | | | — | | | | — | (a) | | | — | (a) |
Interest income from non-affiliates on securities sold short | | | 646 | | | | — | | | | 136 | | | | 2,070 | |
Dividend income from non-affiliates | | | 1,307 | | | | 1,239 | | | | 999 | | | | 1,647 | |
Dividend income from affiliates | | | 442 | | | | 7 | | | | 90 | | | | 392 | |
| | | | | | | | | | | | | | | | |
Total investment income | | | 2,423 | | | | 1,248 | | | | 1,235 | | | | 4,129 | |
| | | | | | | | | | | | | | | | |
| | | | |
EXPENSES: | | | | | | | | | | | | | | | | |
Investment advisory fees | | | 429 | | | | 353 | | | | 359 | | | | 906 | |
Administration fees | | | 92 | | | | 76 | | | | 58 | | | | 90 | |
Distribution fees: | | | | | | | | | | | | | | | | |
Class A | | | 48 | | | | 38 | | | | 39 | | | | 37 | |
Class C | | | 9 | | | | 12 | | | | 21 | | | | 36 | |
Service fees: | | | | | | | | | | | | | | | | |
Class A | | | 48 | | | | 38 | | | | 39 | | | | 37 | |
Class C | | | 3 | | | | 4 | | | | 7 | | | | 12 | |
Class I | | | 256 | | | | 210 | | | | 116 | | | | 81 | |
Class L (b) | | | — | | | | — | | | | 12 | | | | 65 | |
Custodian and accounting fees | | | 41 | | | | 40 | | | | 64 | | | | 38 | |
Interest expense to affiliates | | | — | | | | — | (a) | | | — | (a) | | | — | (a) |
Professional fees | | | 63 | | | | 60 | | | | 74 | | | | 71 | |
Trustees’ and Chief Compliance Officer’s fees | | | 26 | | | | 25 | | | | 26 | | | | 25 | |
Printing and mailing costs | | | 4 | | | | — | (a) | | | 36 | | | | 20 | |
Registration and filing fees | | | 43 | | | | 77 | | | | 65 | | | | 64 | |
Transfer agency fees (See Note 2.I.) | | | 6 | | | | 8 | | | | 12 | | | | 13 | |
Dividend expense to non-affiliates on securities sold short | | | 2,219 | | | | 1,920 | | | | 1,652 | | | | 2,894 | |
Interest expense from non-affiliates on securities sold short | | | — | | | | 160 | | | | — | | | | — | |
Other | | | 16 | | | | 9 | | | | 8 | | | | 7 | |
| | | | | | | | | | | | | | | | |
Total expenses | | | 3,303 | | | | 3,030 | | | | 2,588 | | | | 4,396 | |
| | | | | | | | | | | | | | | | |
Less fees waived | | | (225 | ) | | | (218 | ) | | | (271 | ) | | | (392 | ) |
| | | | | | | | | | | | | | | | |
Net expenses | | | 3,078 | | | | 2,812 | | | | 2,317 | | | | 4,004 | |
| | | | | | | | | | | | | | | | |
Net investment income (loss) | | | (655 | ) | | | (1,564 | ) | | | (1,082 | ) | | | 125 | |
| | | | | | | | | | | | | | | | |
| | | | |
REALIZED/UNREALIZED GAINS (LOSSES): | | | | | | | | | | | | | | | | |
Net realized gain (loss) on transactions from: | | | | | | | | | | | | | | | | |
Investments in non-affiliates | | | 2,667 | | | | 30,700 | | | | 11,359 | | | | 29,433 | |
Investments in affiliates | | | (14 | ) | | | 2 | | | | 6 | | | | 9 | |
Futures contracts | | | (367 | ) | | | (549 | ) | | | (178 | ) | | | 142 | |
Securities sold short | | | (1,423 | ) | | | (24,401 | ) | | | (6,573 | ) | | | (3,018 | ) |
Foreign currency transactions | | | — | | | | — | | | | — | | | | — | (a) |
| | | | | | | | | | | | | | | | |
Net realized gain (loss) | | | 863 | | | | 5,752 | | | | 4,614 | | | | 26,566 | |
| | | | | | | | | | | | | | | | |
Change in net unrealized appreciation/depreciation on: | | | | | | | | | | | | | | | | |
Investments in non-affiliates | | | (13,499 | ) | | | 10,395 | | | | 924 | | | | (14,300 | ) |
Investments in affiliates | | | (1 | ) | | | (3 | ) | | | 3 | | | | — | (a) |
Futures contracts | | | 6 | | | | (92 | ) | | | 84 | | | | (14 | ) |
Securities sold short | | | 10,054 | | | | (12,333 | ) | | | 3,252 | | | | (9,062 | ) |
Foreign currency translations | | | — | | | | — | (a) | | | — | | | | — | |
| | | | | | | | | | | | | | | | |
Change in net unrealized appreciation/depreciation | | | (3,440 | ) | | | (2,033 | ) | | | 4,263 | | | | (23,376 | ) |
| | | | | | | | | | | | | | | | |
Net realized/unrealized gains (losses) | | | (2,577 | ) | | | 3,719 | | | | 8,877 | | | | 3,190 | |
| | | | | | | | | | | | | | | | |
Change in net assets resulting from operations | | $ | (3,232 | ) | | $ | 2,155 | | | $ | 7,795 | | | $ | 3,315 | |
| | | | | | | | | | | | | | | | |
| (a) | Amount rounds to less than one thousand. |
| (b) | On July 2, 2020, Class L Shares were converted into Class I Shares. Additionally, as of July 2, 2020, the Class L Shares were no longer offered. |
SEE NOTES TO FINANCIAL STATEMENTS.
| | | | | | | | | | |
| | | | | |
| | J.P. MORGAN SPECIALTY FUNDS | | | | | | | | 47 |
STATEMENTS OF CHANGES IN NET ASSETS (AS RESTATED, SEE NOTE 8)
FOR THE PERIODS INDICATED
(Amounts in thousands)
| | | | | | | | | | | | | | | | |
| | | JPMorgan Research Market Neutral Fund | |
| | | Year Ended
October 31, 2022 | | | Year Ended
October 31, 2021 | | | Year Ended
October 31, 2020 | | | Year Ended
October 31, 2019 | |
CHANGE IN NET ASSETS RESULTING FROM OPERATIONS: | | | | | | | | | | | | | | | | |
Net investment income (loss) | | $ | (655 | ) | | $ | (1,564 | ) | | $ | (1,082 | ) | | $ | 125 | |
Net realized gain (loss) | | | 863 | | | | 5,752 | | | | 4,614 | | | | 26,566 | |
Change in net unrealized appreciation/depreciation | | | (3,440 | ) | | | (2,033 | ) | | | 4,263 | | | | (23,376 | ) |
| | | | | | | | | | | | | | | | |
Change in net assets resulting from operations | | | (3,232 | ) | | | 2,155 | | | | 7,795 | | | | 3,315 | |
| | | | | | | | | | | | | | | | |
| | | | |
DISTRIBUTION TO SHAREHOLDERS | | | | | | | | | | | | | | | | |
Class A | | | — | | | | (1,124 | ) | | | (1,559 | ) | | | (1,481 | ) |
Class C | | | — | | | | (159 | ) | | | (450 | ) | | | (543 | ) |
Class I | | | — | | | | (6,901 | ) | | | (2,527 | ) | | | (3,249 | ) |
Class L (a) | | | — | | | | — | | | | (1,689 | ) | | | (8,556 | ) |
| | | | | | | | | | | | | | | | |
Total distributions to shareholders | | | — | | | | (8,184 | ) | | | (6,225 | ) | | | (13,829 | ) |
| | | | | | | | | | | | | | | | |
| | | | |
CAPITAL TRANSACTIONS: | | | | | | | | | | | | | | | | |
Change in net assets resulting from capital transactions | | | 68,370 | | | | (44,968 | ) | | | 76,043 | | | | (112,143 | ) |
| | | | | | | | | | | | | | | | |
| | | | |
NET ASSETS: | | | | | | | | | | | | | | | | |
Change in net assets | | | 65,138 | | | | (50,997 | ) | | | 77,613 | | | | (122,657 | ) |
Beginning of period | | | 89,658 | | | | 140,655 | | | | 63,042 | | | | 185,699 | |
| | | | | | | | | | | | | | | | |
End of period | | | 154,796 | | | | 89,658 | | | | 140,655 | | | | 63,042 | |
| | | | | | | | | | | | | | | | |
Future share reacquisition adjustment | | | 6,425 | | | | 4,137 | | | | 2,950 | | | | 63 | |
| | | | | | | | | | | | | | | | |
End of period after future share reacquisition adjustment | | $ | 161,221 | | | $ | 93,795 | | | $ | 143,605 | | | $ | 63,105 | |
| | | | | | | | | | | | | | | | |
| (a) | On July 2, 2020, the Fund’s Class L Shares were converted into Class I Shares. Additionally, as of July 2, 2020, the Class L Shares are no longer offered. |
SEE NOTES TO FINANCIAL STATEMENTS.
| | | | | | | | | | |
| | | | | |
| 48 | | | | | | | | J.P. MORGAN SPECIALTY FUNDS | | |
| | | | | | | | | | | | | | | | |
| | | JPMorgan Research Market Neutral Fund | |
| | | Year Ended
October 31, 2022 | | | Year Ended
October 31, 2021 | | | Year Ended
October 31, 2020 | | | Year Ended
October 31, 2019 | |
CAPITAL TRANSACTIONS: | | | | | | | | | | | | | | | | |
Class A | | | | | | | | | | | | | | | | |
Proceeds from shares issued | | $ | 8,418 | | | $ | 6,793 | | | $ | 10,274 | | | $ | 3,101 | |
Distributions reinvested | | | — | | | | 1,075 | | | | 1,461 | | | | 1,394 | |
Cost of shares redeemed | | | (4,910 | ) | | | (8,656 | ) | | | (7,981 | ) | | | (4,019 | ) |
| | | | | | | | | | | | | | | | |
Change in net assets resulting from Class A capital transactions | | | 3,508 | | | | (788 | ) | | | 3,754 | | | | 476 | |
| | | | | | | | | | | | | | | | |
Class C | | | | | | | | | | | | | | | | |
Proceeds from shares issued | | | 521 | | | | 417 | | | | 1,554 | | | | 446 | |
Distributions reinvested | | | — | | | | 159 | | | | 426 | | | | 506 | |
Cost of shares redeemed | | | (222 | ) | | | (1,197 | ) | | | (3,677 | ) | | | (2,927 | ) |
| | | | | | | | | | | | | | | | |
Change in net assets resulting from Class C capital transactions | | | 299 | | | | (621 | ) | | | (1,697 | ) | | | (1,975 | ) |
| | | | | | | | | | | | | | | | |
Class I | | | | | | | | | | | | | | | | |
Proceeds from shares issued | | | 119,488 | | | | 41,158 | | | | 128,845 | | | | 11,144 | |
Distributions reinvested | | | — | | | | 6,758 | | | | 2,418 | | | | 3,139 | |
Cost of shares redeemed | | | (54,925 | ) | | | (91,475 | ) | | | (66,946 | ) | | | (19,083 | ) |
Conversion from Class L Shares (a) | | | — | | | | — | | | | 26,571 | | | | — | |
| | | | | | | | | | | | | | | | |
Change in net assets resulting from Class I capital transactions | | | 64,563 | | | | (43,559 | ) | | | 90,888 | | | | (4,800 | ) |
| | | | | | | | | | | | | | | | |
Class L (a) | | | | | | | | | | | | | | | | |
Proceeds from shares issued | | | — | | | | — | | | | 17,165 | | | | 2,711 | |
Distributions reinvested | | | — | | | | — | | | | 1,660 | | | | 8,526 | |
Cost of shares redeemed | | | — | | | | — | | | | (9,156 | ) | | | (117,081 | ) |
Conversion to Class I Shares | | | — | | | | — | | | | (26,571 | ) | | | — | |
| | | | | | | | | | | | | | | | |
Change in net assets resulting from Class L capital transactions | | | — | | | | — | | | | (16,902 | ) | | | (105,844 | ) |
| | | | | | | | | | | | | | | | |
Total change in net assets resulting from capital transactions | | $ | 68,370 | | | $ | (44,968 | ) | | $ | 76,043 | | | $ | (112,143 | ) |
| | | | | | | | | | | | | | | | |
| | | | |
SHARE TRANSACTIONS: | | | | | | | | | | | | | | | | |
Class A | | | | | | | | | | | | | | | | |
Issued | | | 683 | | | | 559 | | | | 812 | | | | 225 | |
Reinvested | | | — | | | | 90 | | | | 126 | | | | 106 | |
Redeemed | | | (395 | ) | | | (689 | ) | | | (628 | ) | | | (290 | ) |
| | | | | | | | | | | | | | | | |
Change in Class A Shares | | | 288 | | | | (40 | ) | | | 310 | | | | 41 | |
| | | | | | | | | | | | | | | | |
Class C | | | | | | | | | | | | | | | | |
Issued | | | 48 | | | | 37 | | | | 136 | | | | 34 | |
Reinvested | | | — | | | | 15 | | | | 40 | | | | 42 | |
Redeemed | | | (20 | ) | | | (109 | ) | | | (319 | ) | | | (229 | ) |
| | | | | | | | | | | | | | | | |
Change in Class C Shares | | | 28 | | | | (57 | ) | | | (143 | ) | | | (153 | ) |
| | | | | | | | | | | | | | | | |
Class I | | | | | | | | | | | | | | | | |
Issued | | | 9,115 | | | | 3,149 | | | | 9,519 | | | | 765 | |
Reinvested | | | — | | | | 532 | | | | 197 | | | | 228 | |
Redeemed | | | (4,127 | ) | | | (6,877 | ) | | | (4,916 | ) | | | (1,325 | ) |
Conversion from Class L Shares (a) | | | — | | | | — | | | | 1,971 | | | | — | |
| | | | | | | | | | | | | | | | |
Change in Class I Shares | | | 4,988 | | | | (3,196 | ) | | | 6,771 | | | | (332 | ) |
| | | | | | | | | | | | | | | | |
Class L (a) | | | | | | | | | | | | | | | | |
Issued | | | — | | | | — | | | | 1,254 | | | | 183 | |
Reinvested | | | — | | | | — | | | | 132 | | | | 603 | |
Redeemed | | | — | | | | — | | | | (651 | ) | | | (8,081 | ) |
Conversion to Class I Shares | | | — | | | | — | | | | (1,917 | ) | | | — | |
| | | | | | | | | | | | | | | | |
Change in Class L Shares | | | — | | | | — | | | | (1,182 | ) | | | (7,295 | ) |
| | | | | | | | | | | | | | | | |
| (a) | On July 2, 2020, the Fund’s Class L Shares were converted into Class I Shares. Additionally, as of July 2, 2020, the Class L Shares are no longer offered. |
SEE NOTES TO FINANCIAL STATEMENTS.
| | | | | | | | | | |
| | | | | |
| | J.P. MORGAN SPECIALTY FUNDS | | | | | | | | 49 |
FINANCIAL HIGHLIGHTS
FOR THE PERIODS INDICATED
| | | | | | | | | | | | | | | | | | | | |
| | | Per share operating performance | |
| | | | | | Investment operations | | | Distributions | |
| | | Net asset
value,
beginning
of period * | | | Net
investment
income
(loss) (a) | | |
Net realized
and unrealized
gains
(losses) on
investments | | | Total from
investment
operations | | | Net
realized
gain | |
JPMorgan Research Market Neutral Fund | | | | | | | | | | | | | | | | | | | | |
Class A | | | | | | | | | | | | | | | | | | | | |
Year Ended October 31, 2022 (as restated, See Note 8) | | $ | 12.63 | | | $ | (0.10 | ) | | $ | (0.32 | ) | | $ | (0.42 | ) | | $ | — | |
Year Ended October 31, 2021 (as restated, See Note 8) | | | 13.23 | | | | (0.21 | ) | | | 0.41 | | | | 0.20 | | | | (0.91 | ) |
Year Ended October 31, 2020 (as restated, See Note 8) | | | 13.26 | | | | (0.20 | ) | | | 1.51 | | | | 1.31 | | | | (1.49 | ) |
Year Ended October 31, 2019 (as restated, See Note 8) | | | 14.32 | | | | (0.03 | ) | | | 0.41 | | | | 0.38 | | | | (1.45 | ) |
| | | | | |
Class C | | | | | | | | | | | | | | | | | | | | |
Year Ended October 31, 2022 (as restated, See Note 8) | | | 11.29 | | | | (0.14 | ) | | | (0.30 | ) | | | (0.44 | ) | | | — | |
Year Ended October 31, 2021 (as restated, See Note 8) | | | 11.97 | | | | (0.25 | ) | | | 0.41 | | | | 0.16 | | | | (0.91 | ) |
Year Ended October 31, 2020 (as restated, See Note 8) | | | 12.20 | | | | (0.23 | ) | | | 1.36 | | | | 1.13 | | | | (1.49 | ) |
Year Ended October 31, 2019 (as restated, See Note 8) | | | 13.35 | | | | (0.09 | ) | | | 0.39 | | | | 0.30 | | | | (1.45 | ) |
| | | | | |
Class I | | | | | | | | | | | | | | | | | | | | |
Year Ended October 31, 2022 (as restated, See Note 8) | | | 13.51 | | | | (0.06 | ) | | | (0.53 | ) | | | (0.59 | ) | | | — | |
Year Ended October 31, 2021 (as restated, See Note 8) | | | 14.03 | | | | (0.20 | ) | | | 0.46 | | | | 0.26 | | | | (0.91 | ) |
Year Ended October 31, 2020 (as restated, See Note 8) | | | 13.96 | | | | (0.19 | ) | | | 1.00 | | | | 0.81 | | | | (1.49 | ) |
Year Ended October 31, 2019 (as restated, See Note 8) | | | 14.96 | | | | — | (f) | | | 0.43 | | | | 0.43 | | | | (1.45 | ) |
| | | | | |
Class L | | | | | | | | | | | | | | | | | | | | |
Year Ended October 31, 2019 (as restated, See Note 8) | | | 15.27 | | | | 0.04 | | | | 0.42 | | | | 0.46 | | | | (1.45 | ) |
| * | Net asset value per share has been calculated after future share reacquisition adjustment for the impacted periods. |
| ** | Amount presented after future share reacquisition adjustment. |
| (a) | Calculated based upon average shares outstanding. |
| (b) | Includes adjustments in accordance with accounting principles generally accepted in the United States of America and as such, the net asset values for financial reporting purposes and the returns based upon those net asset values may differ from the net asset values and returns for shareholder transactions. |
| (c) | Includes earnings credits and interest expense, if applicable, each of which is less than 0.005% unless otherwise noted. |
| | | | | | | | | | | | | | | | |
| | | October 31, 2022
(as restated,
See note 8) | | | October 31, 2021
(as restated,
See note 8) | | | October 31, 2020
(as restated,
See note 8) | | | October 31, 2019
(as restated,
See note 8) | |
Net expenses (excluding dividend and interest expense for securities sold short) | | | | | | | | | | | | | | | | |
Class A | | | 0.90 | % | | | 0.92 | % | | | 1.06 | % | | | 1.21 | % |
Class C | | | 1.39 | | | | 1.41 | | | | 1.58 | | | | 1.71 | |
Class I | | | 0.64 | | | | 0.66 | | | | 0.75 | | | | 0.95 | |
Class L | | | — | | | | — | | | | — | | | | 0.82 | |
Expenses without waivers and reimbursements (excluding dividend and interest expense for securities sold short) | | | | | | | | | | | | | | | | |
Class A | | | 1.08 | | | | 1.14 | | | | 1.44 | | | | 1.61 | |
Class C | | | 1.57 | | | | 1.64 | | | | 1.93 | | | | 2.07 | |
Class I | | | 0.82 | | | | 0.87 | | | | 1.11 | | | | 1.31 | |
Class L | | | — | | | | — | | | | — | | | | 1.12 | |
| (e) | Interest expense on securities sold short is 0.16%. |
| (f) | Amount rounds to less than $0.005. |
SEE NOTES TO FINANCIAL STATEMENTS.
| | | | | | | | | | |
| | | | | |
| 50 | | | | | | | | J.P. MORGAN SPECIALTY FUNDS | | |
| | | | | | | | | | | | | | | | | | | | | | | | | | | | | | | | | | |
| | | | | | Ratios/Supplemental data | |
| | | | | | | | | | | | | Ratios to average net assets | | | | | | | |
Future
share
reacquistion
adjustment | | | Net asset
value,
end of
period * | | | Total return
(excludes
sales charge) (b) | | | Net assets,
end of
period
(000’s) ** | | | Net
expenses
(including dividend
expense for
securities sold
short) (c)(d) | | | Net
investment
income
(loss) | | | Expenses without
waivers and
reimbursements
(including dividend
expense for
securities sold
short) (d) | | | Portfolio
turnover rate
(excluding securities
sold short) | | | Portfolio
turnover rate
(including securities
sold short) | |
| | | | | | | | | | | | | | | | | | | | | | | | | | | | | | | | | | |
| | | | | | | | | | | | | | | | | | | | | | | | | | | | | | | | | | |
| $ | 0.09 | | | $ | 12.30 | | | | (2.61 | )% | | $ | 20,259 | | | | 2.72 | % | | | (0.84 | )% | | | 2.90 | % | | | 100 | % | | | 252 | % |
| | 0.11 | | | | 12.63 | | | | 2.67 | | | | 17,161 | | | | 2.92 | (e) | | | (1.71 | ) | | | 3.14 | | | | 119 | | | | 307 | |
| | 0.15 | | | | 13.23 | | | | 12.39 | | | | 18,509 | | | | 3.18 | | | | (1.53 | ) | | | 3.56 | | | | 224 | | | | 531 | |
| | 0.01 | | | | 13.26 | | | | 2.92 | | | | 14,442 | | | | 3.66 | | | | (0.24 | ) | | | 4.06 | | | | 125 | | | | 356 | |
| | | | | | | | |
| | | | | | | | | | | | | | | | | | | | | | | | | | | | | | | | | | |
| | 0.09 | | | | 10.94 | | | | (3.10 | ) | | | 1,504 | | | | 3.21 | | | | (1.30 | ) | | | 3.39 | | | | 100 | | | | 252 | |
| | 0.07 | | | | 11.29 | | | | 2.25 | | | | 1,233 | | | | 3.44 | (e) | | | (2.22 | ) | | | 3.67 | | | | 119 | | | | 307 | |
| | 0.13 | | | | 11.97 | | | | 11.76 | | | | 1,982 | | | | 3.70 | | | | (1.94 | ) | | | 4.04 | | | | 224 | | | | 531 | |
| | — | | | | 12.20 | | | | 2.42 | | | | 3,774 | | | | 4.19 | | | | (0.73 | ) | | | 4.55 | | | | 125 | | | | 356 | |
| | | | | | | | |
| | | | | | | | | | | | | | | | | | | | | | | | | | | | | | | | | | |
| | 0.27 | | | | 13.19 | | | | (2.37 | ) | | | 139,458 | | | | 2.41 | | | | (0.47 | ) | | | 2.59 | | | | 100 | | | | 252 | |
| | 0.13 | | | | 13.51 | | | | 3.10 | | | | 75,401 | | | | 2.69 | (e) | | | (1.50 | ) | | | 2.90 | | | | 119 | | | | 307 | |
| | 0.75 | | | | 14.03 | | | | 12.49 | | | | 123,114 | | | | 2.87 | | | | (1.39 | ) | | | 3.23 | | | | 224 | | | | 531 | |
| | 0.02 | | | | 13.96 | | | | 3.21 | | | | 28,014 | | | | 3.40 | | | | 0.03 | | | | 3.76 | | | | 125 | | | | 356 | |
| | | | | | | | |
| | | | | | | | | | | | | | | | | | | | | | | | | | | | | | | | | | |
| | — | | | | 14.28 | | | | 3.21 | | | | 16,875 | | | | 3.27 | | | | 0.28 | | | | 3.57 | | | | 125 | | | | 356 | |
SEE NOTES TO FINANCIAL STATEMENTS.
| | | | | | | | | | |
| | | | | |
| | J.P. MORGAN SPECIALTY FUNDS | | | | | | | | 51 |
NOTES TO FINANCIAL STATEMENTS
AS OF OCTOBER 31, 2022, OCTOBER 31, 2021, OCTOBER 31, 2020 and OCTOBER 31, 2019
(Dollar values in thousands)
1. Organization
JPMorgan Trust I (the “Trust”) was formed on November 12, 2004, as a Delaware statutory trust, pursuant to a Declaration of Trust dated November 5, 2004 and is registered under the Investment Company Act of 1940, as amended (the “1940 Act”), as an open-end management investment company.
The following is a separate fund of the Trust (the “Fund”) covered by this report:
| | | | | | |
| | | Classes Offered | | | | Diversification Classification |
| JPMorgan Research Market Neutral Fund | | Class A, Class C, Class I and Class L | | | | Diversified |
The investment objective of the Fund is to seek to provide long-term capital appreciation from a broadly diversified portfolio of U.S. stocks while neutralizing the general risks associated with stock market investing.
Up through July 1, 2020, Class L Shares of the Fund were publicly offered on a limited basis. Investors were not eligible to purchase Class L Shares of the Fund unless they met certain requirements as described in the Fund’s prospectus. On July 2, 2020, the Fund’s Class L Shares were converted into Class I Shares. Additionally, as of July 2, 2020, Class L Shares were no longer offered.
Class A Shares generally provide for a front-end sales charge while Class C Shares provide for a contingent deferred sales charge (“CDSC”). No sales charges are assessed with respect to Class I Shares. Certain Class A Shares, for which front-end sales charges have been waived, may be subject to a CDSC as described in the Fund’s prospectus. Effective October 1, 2020, Class C Shares automatically convert to Class A Shares after eight years. Prior to October 1, 2020, Class C Shares automatically converted to Class A Shares after ten years. All classes of shares have equal rights as to earnings, assets and voting privileges, except that each class may bear different transfer agency, distribution and service fees and each class has exclusive voting rights with respect to its distribution plan and shareholder servicing agreements. No sales charges were assessed with respect to Class L Shares.
J.P. Morgan Investment Management Inc. (“JPMIM”), an indirect, wholly-owned subsidiary of JPMorgan Chase & Co. (“JPMorgan”), acts as Adviser (the “Adviser”) and Administrator (the “Administrator”) to the Fund.
2. Significant Accounting Policies
The following is a summary of significant accounting policies followed by the Fund in the preparation of its financial statements. The Fund is an investment company and, accordingly, follows the investment company accounting and reporting guidance of the Financial Accounting Standards Board (“FASB”) Accounting Standards Codification Topic 946 — Investment Companies, which is part of U.S. generally accepted accounting principles (“GAAP”). The preparation of financial statements in conformity with GAAP requires management to make estimates and assumptions that affect (i) the reported amounts of assets and liabilities, (ii) disclosure of contingent assets and liabilities at the date of the financial statements, and (iii) the reported amounts of increases and decreases in net assets from operations during the reporting period. Actual results could differ from those estimates.
A. Valuation of Investments — Investments are valued in accordance with GAAP and the Fund’s valuation policies set forth by, and under the supervision and responsibility of, the Board of Trustees of the Trust (the “Board”), which established the following approach to valuation, as described more fully below: (i) investments for which market quotations are readily available shall be valued at their market value and (ii) all other investments for which market quotations are not readily available shall be valued at their fair value as determined in good faith by the Board. Under Section 2(a)(41) of the Investment Company Act of 1940, the Board is required to determine fair value for securities that do not have readily available market quotations.
Effective September 9, 2022, under SEC Rule 2a-5 (Good Faith Determinations of Fair Value), the Board may designate the performance of these fair valuation determinations to a valuation designee. The Board has designated the Adviser as the “Valuation Designee” to perform fair valuation determinations for the Fund on behalf of the Board subject to appropriate oversight by the Board. The Adviser, as Valuation Designee, leverages the J.P. Morgan Asset Management Americas Valuation Committee (“AVC”) to help oversee and carry out the policies for the valuation of Investments held in the Fund. The Adviser, as Valuation Designee, remains responsible for the valuation determinations.
This oversight by the AVC includes monitoring the appropriateness of fair values based on results of ongoing valuation oversight including, but not limited to, consideration of macro or security specific events, market events, and pricing vendor and broker due diligence. The Administrator is responsible for discussing and assessing the potential impacts to the fair values on an ongoing basis, and, at least on a quarterly basis, with the AVC and the Board.
Prior to September 9, 2022, the Administrator had established the AVC to assist the Board with the oversight and monitoring of the valuation of the Fund’s investments. The Administrator implemented the valuation policies of the Fund’s investments, as directed by the Board. The AVC oversaw and carried out the policies for the valuation of investments held in the Fund. This included monitoring the appropriateness of fair values based on results of ongoing valuation oversight including, but not limited to, consideration of macro or security specific events, market events, and pricing vendor and broker due diligence. The Administrator was responsible for discussing and assessing the potential impacts to the fair values on an ongoing basis, and, at least on a quarterly basis, with the AVC and the Board.
| | | | | | | | | | |
| | | | | |
| 52 | | | | | | | | J.P. MORGAN SPECIALTY FUNDS | | |
Fixed income instruments are valued based on prices received from approved affiliated and unaffiliated pricing vendors or third party broker-dealers (collectively referred to as “Pricing Services”). The Pricing Services use multiple valuation techniques to determine the valuation of fixed income instruments. In instances where sufficient market activity exists, the Pricing Services may utilize a market-based approach through which trades or quotes from market makers are used to determine the valuation of these instruments. In instances where sufficient market activity may not exist, the Pricing Services also utilize proprietary valuation models which may consider market transactions in comparable securities and the various relationships between securities in determining fair value and/or market characteristics in order to estimate the relevant cash flows, which are then discounted to calculate the fair values.
Equities and other exchange-traded instruments are valued at the last sale price or official market closing price on the primary exchange on which the instrument is traded before the net asset values (“NAV”) of the Funds are calculated on a valuation date.
Certain foreign equity instruments are valued by applying international fair value factors provided by approved Pricing Services. The factors seek to adjust the local closing price for movements of local markets post-closing, but prior to the time the NAVs are calculated.
Investments in open-end investment companies, excluding exchange-traded funds (“ETFs”) (“Underlying Funds”), are valued at each Underlying Fund’s NAV per share as of the report date.
Futures contracts are generally valued on the basis of available market quotations.
Valuations reflected in this report are as of each of the report dates. As a result, changes in valuation due to market events and/or issuer-related events after the report date and prior to issuance of the report are not reflected herein.
The various inputs that are used in determining the valuation of the Fund’s investments are summarized into the three broad levels listed below.
| • | | Level 1 — Unadjusted inputs using quoted prices in active markets for identical investments. |
| • | | Level 2 — Other significant observable inputs including, but not limited to, quoted prices for similar investments, inputs other than quoted prices that are observable for investments (such as interest rates, prepayment speeds, credit risk, etc.) or other market corroborated inputs. |
| • | | Level 3 — Significant inputs based on the best information available in the circumstances, to the extent observable inputs are not available (including the Fund’s assumptions in determining the fair value of investments). |
A financial instrument’s level within the fair value hierarchy is based on the lowest level of any input, both individually and in the aggregate, that is significant to the fair value measurement. The inputs or methodology used for valuing instruments are not necessarily an indication of the risk associated with investing in those instruments.
The following tables represent each valuation input as presented on the Schedules of Portfolio Investments (“SOIs”):
October 31, 2022
| | | | | | | | | | | | | | | | |
| | | Level 1
Quoted Prices | | | Level 2
Other Significant
observable inputs | | | Level 3
Significant
unobservable inputs | | | Total | |
Total Investments in Securities | | | | | | | | | |
Common Stocks | | $ | 108,633 | | | $ | — | | | $ | — | | | $ | 108,633 | |
Short-Term Investments | | | | | | | | | |
Investment Companies | | | 30,961 | | | | — | | | | — | | | | 30,961 | |
U.S. Treasury Obligations | | | — | | | | 17,007 | | | | — | | | | 17,007 | |
| | | | | | | | | | | | | | | | |
Total Short-Term Investments | | | 30,961 | | | | 17,007 | | | | — | | | | 47,968 | |
| | | | | | | | | | | | | | | | |
Total Investments in Securities | | $ | 139,594 | | | $ | 17,007 | | | $ | — | | | $ | 156,601 | |
| | | | | | | | | | | | | | | | |
Liabilities | | | | | | | | | | | | | | | | |
Common Stocks | | $ | (104,586 | ) | | $ | — | | | $ | — | | | $ | (104,586 | ) |
| | | | | | | | | | | | | | | | |
Total Liabilities for Securities Sold Short (a) | | $ | (104,586 | ) | | $ | — | | | $ | — | | | $ | (104,586 | ) |
| | | | | | | | | | | | | | | | |
Depreciation in Other Financial Instruments | | | | | | | | | | | | | | | | |
Futures Contracts | | $ | (1 | ) | | $ | — | | | $ | — | | | $ | (1 | ) |
| | | | | | | | | | | | | | | | |
| | | | | | | | | | |
| | | | | |
| | J.P. MORGAN SPECIALTY FUNDS | | | | | | | | 53 |
NOTES TO FINANCIAL STATEMENTS
AS OF OCTOBER 31, 2022, OCTOBER 31, 2021, OCTOBER 31, 2020 and OCTOBER 31, 2019 (continued)
(Dollar values in thousands)
October 31, 2021
| | | | | | | | | | | | | | | | |
| | | Level 1
Quoted prices | | | Level 2
Other significant
observable
prices | | | Level 3
Significant
unobservable inputs | | | Total | |
Total Investments in Securities (a) | | $ | 91,573 | | | $ | — | | | $ | — | | | $ | 91,573 | |
| | | | | | | | | | | | | | | | |
Total Liabilities for Securities Sold Short (a) | | $ | (71,788 | ) | | $ | — | | | $ | — | | | $ | (71,788 | ) |
| | | | | | | | | | | | | | | | |
Depreciation in Other Financial Instruments | | | | | | | | | |
Futures Contracts (a) | | $ | (7 | ) | | $ | — | | | $ | — | | | $ | (7 | ) |
| | | | | | | | | | | | | | | | |
| (a) | Please refer to the SOI for specifics of portfolio holdings. |
October 31, 2020
| | | | | | | | | | | | | | | | |
| | | Level 1
Quoted prices | | | Level 2
Other significant
observable
prices | | | Level 3
Significant
unobservable inputs | | | Total | |
Total Investments in Securities (a) | | $ | 134,338 | | | $ | — | | | $ | — | | | $ | 134,338 | |
| | | | | | | | | | | | | | | | |
Total Liabilities for Securities Sold Short (a) | | $ | (99,914 | ) | | $ | — | | | $ | — | | | $ | (99,914 | ) |
| | | | | | | | | | | | | | | | |
Appreciation in Other Financial Instruments | | | | | | | | | |
Futures Contracts (a) | | $ | 85 | | | $ | — | | | $ | — | | | $ | 85 | |
| | | | | | | | | | | | | | | | |
| (a) | Please refer to the SOI for specifics of portfolio holdings. |
October 31, 2019
| | | | | | | | | | | | | | | | |
| | | Level 1
Quoted prices | | | Level 2
Other significant
observable prices | | | Level 3
Significant
unobservable inputs | | | Total | |
Total Investments in Securities (a) | | $ | 62,578 | | | $ | — | | | $ | — | | | $ | 62,578 | |
| | | | | | | | | | | | | | | | |
Total Liabilities for Securities Sold Short (a) | | $ | (52,091 | ) | | $ | — | | | $ | — | | | $ | (52,091 | ) |
| | | | | | | | | | | | | | | | |
Appreciation in Other Financial Instruments | | | | | | | | | | | | | | | | |
Futures Contracts (a) | | $ | 1 | | | $ | — | | | $ | — | | | $ | 1 | |
| | | | | | | | | | | | | | | | |
| (a) | Please refer to the SOI for specifics of portfolio holdings. |
There were no transfers into and out of level 3 for years ended October 31, 2022, October 31, 2021, October 31, 2020 and October 31, 2019.
B. Restricted Securities — Certain securities held by the Fund may be subject to legal or contractual restrictions on resale. Restricted securities generally are resold in transactions exempt from registration under the Securities Act of 1933, as amended (the “Securities Act”). Disposal of these securities may involve time-consuming negotiations and expense. Prompt sale at the current valuation may be difficult and could adversely affect the NAVs of the Fund.
As of October 31, 2022, October 31, 2021, October 31, 2020 and October 31, 2019, the Fund had no investments in restricted securities other than securities sold to the Fund under Rule 144A and/or Regulation S under the Securities Act.
C. Securities Lending — The Fund is authorized to engage in securities lending in order to generate additional income. The Fund is able to lend to approved borrowers. Citibank N.A. (“Citibank”) serves as lending agent for the Fund, pursuant to a Securities Lending Agency Agreement (the “Securities Lending Agency Agreement”). Securities loaned are collateralized by cash equal to at least 100% of the market value plus accrued interest on the securities lent, which is invested in an affiliated money market fund. The Fund retains the interest earned on cash collateral investments but is required to pay the borrower a rebate for the use of the cash collateral. In cases where the lent security is of high value to borrowers, there may be a negative rebate (i.e., a net payment from the borrower to the Fund). Upon termination of a loan, the Fund is required to return to the borrower an amount equal to the cash collateral, plus any rebate owed to the borrowers. The remaining maturities of the securities lending transactions are considered overnight and continuous. Loans are subject to termination by the Fund or the borrower at any time.
The net income earned on the securities lending (after payment of rebates and Citibank’s fee) is included on the Statements of Operations as Income from securities lending (net). The Fund also receives payments from the borrower during the period of the loan, equivalent to dividends and interest earned on the securities loaned, which are recorded as Dividend or Interest income, respectively, on the Statements of Operations.
Under the Securities Lending Agency Agreement, Citibank marks to market the loaned securities on a daily basis. In the event the cash received from the borrower is less than 102% of the value of the loaned securities (105% for loans of non-U.S. securities), Citibank requests additional cash
| | | | | | | | | | |
| | | | | |
| 54 | | | | | | | | J.P. MORGAN SPECIALTY FUNDS | | |
from the borrower so as to maintain a collateralization level of at least 102% of the value of the loaned securities plus accrued interest (105% for loans of non-U.S. securities), subject to certain de minimis amounts. The value of securities out on loan is recorded as an asset on the Statements of Assets and Liabilities.
The value of the cash collateral received is recorded as a liability on the Statements of Assets and Liabilities and details of collateral investments are disclosed on the SOIs.
The Fund bears the risk of loss associated with the collateral investments and is not entitled to additional collateral from the borrower to cover any such losses. To the extent that the value of the collateral investments declines below the amount owed to a borrower, the Fund may incur losses that exceed the amount they earned on lending the security. Upon termination of a loan, the Fund may use leverage (borrow money) to repay the borrower for cash collateral posted if the Adviser does not believe that it is prudent to sell the collateral investments to fund the payment of this liability. Securities lending activity is subject to master netting arrangements.
Securities lending also involves counterparty risks, including the risk that the loaned securities may not be returned in a timely manner or at all. Subject to certain conditions, Citibank has agreed to indemnify the Fund from losses resulting from a borrower’s failure to return a loaned security.
The Fund did not lend out any securities during the years ended October 31, 2022, October 31, 2021, October 2020 and October 31, 2019.
D. Investment Transactions with Affiliates — The Fund invested in Underlying Funds, which are advised by the Adviser. An issuer which is under common control with the Fund may be considered an affiliate. For the purposes of the financial statements, the Fund assumes the issuers listed in the tables below to be affiliated issuers. The Underlying Fund’s distributions may be reinvested into such Underlying Funds. Reinvestment amounts are included in the purchases at cost amounts in the tables below.
October 31, 2022
| | | | | | | | | | | | | | | | | | | | | | | | | | | | | | | | | | | | |
| Security Description | | Value at
October 31,
2021 | | | Purchase
at Cost | | | Proceeds
from
Sales | | | Net
Realized
Gain
(Loss) | | | Change in
Unrealized
Appreciation/
(Depreciation) | | | Value at
October 31,
2022 | | | Shares at
October 31,
2022 | | | Dividend
Income | | | Capital
Gain
Distribution | |
JPMorgan Prime Money Market Fund Class Institutional Shares, 3.12% (a) (b) | | $ | 9,752 | | | $ | 201,411 | | | $ | 180,187 | | | $ | (14 | ) | | $ | (1 | ) | | $ | 30,961 | | | | 30,958 | | | $ | 442 | | | $ | — | |
| | | | | | | | | | | | | | | | | | | | | | | | | | | | | | | | | | | | |
| (a) | Investment in an affiliated fund, which is registered under the Investment Company Act of 1940, as amended, and is advised by J.P. Morgan Investment Management Inc. |
| (b) | The rate shown is the current yield as of October 31, 2022. |
October 31, 2021
| | | | | | | | | | | | | | | | | | | | | | | | | | | | | | | | | | | | |
| Security Description | | Value at
October 31,
2020 | | | Purchase
at Cost | | | Proceeds
from
Sales | | | Net
Realized
Gain
(Loss) | | | Change in
Unrealized
Appreciation/
(Depreciation) | | | Value at
October 31,
2021 | | | Shares at
October 31,
2021 | | | Dividend
Income | | | Capital
Gain
Distribution | |
JPMorgan Prime Money Market Fund Class Institutional Shares, 0.05% (a) (b) | | $ | 23,773 | | | $ | 133,055 | | | $ | 147,075 | | | $ | 2 | | | $ | (3 | ) | | $ | 9,752 | | | | 9,747 | | | $ | 7 | | | $ | — | |
| | | | | | | | | | | | | | | | | | | | | | | | | | | | | | | | | | | | |
| (a) | Investment in an affiliated fund, which is registered under the Investment Company Act of 1940, as amended, and is advised by J.P. Morgan Investment Management Inc. |
| (b) | The rate shown is the current yield as of October 31, 2021. |
October 31, 2020
| | | | | | | | | | | | | | | | | | | | | | | | | | | | | | | | | | | | |
| Security Description | | Value at
October 31,
2019 | | | Purchase
at Cost | | | Proceeds
from
Sales | | | Net
Realized
Gain
(Loss) | | | Change in
Unrealized
Appreciation/
(Depreciation) | | | Value at
October 31,
2020 | | | Shares at
October 31,
2020 | | | Dividend
Income | | | Capital
Gain
Distribution | |
JPMorgan Prime Money Market Fund Class Institutional Shares, 0.05% (a) (b) | | $ | 9,419 | | | $ | 238,986 | | | $ | 224,641 | | | $ | 6 | | | $ | 3 | | | $ | 23,773 | | | | 23,759 | | | $ | 90 | | | $ | — | |
| | | | | | | | | | | | | | | | | | | | | | | | | | | | | | | | | | | | |
| (a) | Investment in an affiliated fund, which is registered under the Investment Company Act of 1940, as amended, and is advised by J.P. Morgan Investment Management Inc. |
| (b) | The rate shown is the current yield as of October 31, 2020. |
| | | | | | | | | | |
| | | | | |
| | J.P. MORGAN SPECIALTY FUNDS | | | | | | | | 55 |
NOTES TO FINANCIAL STATEMENTS
AS OF OCTOBER 31, 2022, OCTOBER 31, 2021, OCTOBER 31, 2020 and OCTOBER 31, 2019 (continued)
(Dollar values in thousands)
October 31, 2019
| | | | | | | | | | | | | | | | | | | | | | | | | | | | | | | | | | | | |
| Security Description | | Value at
October 31,
2018 | | | Purchase
at Cost | | | Proceeds
from
Sales | | | Net
Realized
Gain
(Loss) | | | Change in
Unrealized
Appreciation/
(Depreciation) | | | Value at
October 31,
2019 | | | Shares at
October 31,
2019 | | | Dividend
Income | | | Capital
Gain
Distribution | |
JPMorgan Prime Money Market Fund Class Institutional Shares, 1.88% (a) (b) | | $ | 22,866 | | | $ | 274,424 | | | $ | 287,880 | | | $ | 9 | | | $ | — | (c) | | $ | 9,419 | | | | 9,415 | | | $ | 392 | | | $ | — | |
| | | | | | | | | | | | | | | | | | | | | | | | | | | | | | | | | | | | |
| (a) | Investment in an affiliated fund, which is registered under the Investment Company Act of 1940, as amended, and is advised by J.P. Morgan Investment Management Inc. |
| (b) | The rate shown is the current yield as of October 31, 2019. |
| (c) | Amount rounds to less than one thousand. |
E. Foreign Currency Translation — The books and records of the Fund are maintained in U.S. dollars. Foreign currency amounts are translated into U.S. dollars at the prevailing exchange rates of such currencies against the U.S. dollar. The market value of investment securities and other assets and liabilities are translated at the exchange rate as of the valuation date. Purchases and sales of investment securities, income and expenses are translated at the exchange rate prevailing on the respective dates of such transactions.
The Fund does not isolate the effect of changes in foreign exchange rates from changes in market prices on securities held. Accordingly, such changes are included within Change in net unrealized appreciation/depreciation on investments in non-affiliates on the Statements of Operations.
Reported realized foreign currency gains and losses arise from the disposition of foreign currency, currency gains or losses realized between the trade and settlement dates on securities transactions, and the difference between the amounts of dividends, interest and foreign withholding taxes recorded on the Fund’s books on the transaction date and the U.S. dollar equivalent of the amounts actually received or paid. These reported realized foreign currency gains and losses are included in Net realized gain (loss) on foreign currency transactions on the Statements of Operations. Unrealized foreign currency gains and losses arise from changes (due to changes in exchange rates) in the value of foreign currency and other assets and liabilities denominated in foreign currencies, which are held at year end and are included in Change in net unrealized appreciation/depreciation on foreign currency translations on the Statements of Operations.
F. Derivatives — The Fund used derivative instruments including futures contracts in connection with their respective investment strategies. Derivative instruments may be used as substitutes for securities in which the Fund can invest, to hedge portfolio investments or to generate income or gain to the Fund. Derivatives may also be used to effectively manage the long and short equity exposures in the portfolio, manage duration, sector and yield curve exposures and credit and spread volatility.
The Fund may be subject to various risks from the use of derivatives, including the risk that changes in the value of a derivative may not correlate perfectly with the underlying asset, rate or index; counterparty credit risk related to derivatives counterparties’ failure to perform under contract terms; liquidity risk related to the potential lack of a liquid market for these contracts allowing the Fund to close out its position(s); and documentation risk relating to disagreement over contract terms. Investing in certain derivatives also results in a form of leverage and as such, the Fund’s risk of loss associated with these instruments may exceed their value, as recorded on the Statements of Assets and Liabilities.
Note F(1) below describes the derivatives used by the Fund.
(1) Futures Contracts —The Fund used index futures contracts to gain or reduce exposure to the stock market, or maintain liquidity or minimize transaction costs. The Fund also used index futures contracts to more effectively manage the long and short equity exposures in the portfolio. The Fund also purchased futures contracts to invest incoming cash in the market or sold futures in response to cash outflows, thereby simulating an invested position in the underlying index while maintaining a cash balance for liquidity.
Futures contracts provide for the delayed delivery of the underlying instrument at a fixed price or are settled for a cash amount based on the change in the value of the underlying instrument at a specific date in the future. Upon entering into a futures contract, the Fund is required to deposit with the broker, cash or securities in an amount equal to a certain percentage of the contract amount, which is referred to as the initial margin deposit. Subsequent payments, referred to as variation margin, are made or received by the Fund periodically and are based on changes in the market value of open futures contracts. Changes in the market value of open futures contracts are recorded as Change in net unrealized appreciation/depreciation on futures contracts on the Statements of Operations. Realized gains or losses, representing the difference between the value of the contract at the time it was opened and the value at the time it was closed, are reported on the Statements of Operations at the closing or expiration of the futures contract. Securities deposited as initial margin are designated on the SOIs, while cash deposited, which is considered restricted, is recorded on the Statements of Assets and Liabilities. A receivable from and/or a payable to brokers for the daily variation margin is also recorded on the Statements of Assets and Liabilities.
The use of futures contracts exposes the Fund to equity price risk. The Fund may be subject to the risk that the change in the value of the futures contract may not correlate perfectly with the underlying instrument. Use of long futures contracts subjects the Fund to risk of loss in excess of the
| | | | | | | | | | |
| | | | | |
| 56 | | | | | | | | J.P. MORGAN SPECIALTY FUNDS | | |
amounts shown on the Statements of Assets and Liabilities, up to the notional amount of the futures contracts. Use of short futures contracts subjects the Fund to unlimited risk of loss. The Fund may enter into futures contracts only on exchanges or boards of trade. The exchange or board of trade acts as the counterparty to each futures transaction; therefore, the Fund’s credit risk is limited to failure of the exchange or board of trade. Under some circumstances, futures exchanges may establish daily limits on the amount that the price of a futures contract can vary from the previous day’s settlement price, which could effectively prevent liquidation of positions.
The Fund’s futures contracts are not subject to master netting arrangements (the right to close out all transactions traded with a counterparty and net amounts owed or due across transactions).
(2) Summary of Derivatives Information — The following tables present the value of derivatives held as of the years ended October 31, 2022, October 31, 2021, October 31, 2020 and October 31, 2019, by their primary underlying risk exposure and respective location on the Statements of Assets and Liabilities:
| | | | | | | | | | |
| | | Derivative Contracts | | Statement of Assets and Liabilities Location | | | | |
| | | Gross Assets: | | | | | Futures
Contracts (a) | |
October 31, 2022 | | Equity Contracts | | | Receivables, Net Assets —Unrealized Appreciation | | | $ | (1 | ) |
October 31, 2021 | | Equity Contracts | | | Liabilities, Net Assets —Unrealized Depreciation | | | | (7 | ) |
October 31, 2020 | | Equity Contracts | | | Receivables, Net Assets —Unrealized Appreciation | | | | 85 | |
October 31, 2019 | | Equity Contracts | | | Receivables, Net Assets —Unrealized Appreciation | | | | 1 | |
| (a) | This amount represents the cumulative appreciation (depreciation) of futures contracts as reported on the SOI. The Statements of Assets and Liabilities only reflect the current day variation margin receivable/payable from/to brokers. |
| | | | | | | | |
| Amount of Realized Gain (Loss) on Derivatives Recognized on the Statements of Operations | |
| | | Derivative Contracts | | | Futures Contracts | |
October 31, 2022 | | | Equity contracts | | | $ | (367 | ) |
October 31, 2021 | | | Equity contracts | | | | (549 | ) |
October 31, 2020 | | | Equity contracts | | | | (178 | ) |
October 31, 2019 | | | Equity contracts | | | | 142 | |
| | | | | | | | |
| Amount of Change in Unrealized Appreciation (depreciation) on Derivatives Recognized on the Statements of Operations | |
| | | Derivative Contracts | | | Futures Contracts | |
October 31, 2022 | | | Equity contracts | | | $ | 6 | |
October 31, 2021 | | | Equity contracts | | | | (92 | ) |
October 31, 2020 | | | Equity contracts | | | | 84 | |
October 31, 2019 | | | Equity contracts | | | | (14 | ) |
The Fund’s derivatives contracts held at October 31, 2022, October 31, 2021, October 2020 and October 31, 2019, are not accounted for as hedging instruments under GAAP.
Derivatives Volume
The table below discloses the volume of the Fund’s futures contracts activity during the years ended October 31, 2022, October 31, 2021, October 31, 2020 and October 31, 2019. Please refer to the tables in the Summary of Derivatives Information for derivative-related gains and losses associated with volume activity:
| | | | | | | | | | | | | | | | |
| | | October 31,
2022 | | | October 31,
2021 | | | October 31,
2020 | | | October 31,
2019 | |
Futures Contracts: | | | | | | | | | | | | | | | | |
Average Notional Balance Long | | $ | 2,463 | | | $ | — | | | $ | 900 | (a) | | $ | 949 | (b) |
Average Notional Balance Short | | | (1,411 | ) | | | (1,543 | ) | | | (2,878 | ) | | | (800 | ) |
Ending Notional Balance Long | | | — | | | | — | | | | — | | | | — | |
Ending Notional Balance Short | | | (582 | ) | | | (920 | ) | | | (1,959 | ) | | | (759 | ) |
| (a) | For the period March 1, 2020 through March 31, 2020. |
| (b) | The average notional represents the futures contracts held for 1 day during the year. |
The Fund may be required to post or receive collateral based on the net value of the Fund’s outstanding OTC options with the counterparty in the form of cash or securities. Daily movement of cash collateral is subject to minimum threshold amounts. Collateral posted by the Fund is held in a segregated account at the Fund’s custodian bank. For certain counterparties cash collateral posted by the Fund is invested in an affiliated money market fund (See Note 3.F.), otherwise the cash collateral is included on the Statements of Assets and Liabilities as Restricted cash for OTC derivatives. Collateral received by the Fund is held in a separate segregated account maintained by JPMorgan Chase Bank, N.A. (“JPMCB”), an affiliate of the Fund.
| | | | | | | | | | |
| | | | | |
| | J.P. MORGAN SPECIALTY FUNDS | | | | | | | | 57 |
NOTES TO FINANCIAL STATEMENTS
AS OF OCTOBER 31, 2022, OCTOBER 31, 2021, OCTOBER 31, 2020 and OCTOBER 31, 2019 (continued)
(Dollar values in thousands)
G. Short Sales —The Fund engaged in short sales as part of its normal investment activities. In a short sale, the Fund sell securities it does not own in anticipation of a decline in the market value of those securities. In order to deliver securities to the purchaser, the Fund borrows securities from a broker. To close out a short position, the Fund delivers the same securities to the broker.
The Fund is required to pledge cash or securities to the broker as collateral for the securities sold short. Collateral requirements are calculated daily based on the current market value of the short positions. Cash collateral deposited with the broker is recorded as Deposits at broker for securities sold short, while cash collateral deposited at the Fund’s custodian for the benefit of the broker is recorded as Restricted cash for securities sold short on the Statements of Assets and Liabilities. Securities segregated as collateral are denoted on the SOIs. The Fund may receive or pay the net of the following amounts: (i) a portion of the income from the investment of cash collateral; (ii) the broker’s fee on the borrowed securities (calculated daily based upon the market value of each borrowed security and a variable rate that is dependent on availability of the security); and (iii) a financing charge for the difference between the market value of the short position and cash collateral deposited with the broker. The net amounts of income or fees are included as interest income or interest expense on securities sold short on the Statements of Operations.
The Fund is obligated to pay the broker dividends declared on short positions when a position is open on the record date. Dividends on short positions are reported on ex-dividend date on the Statements of Operations as Dividend expense on securities sold short. The Fund is obligated to pay the broker interest accrued on short positions while the position is outstanding. Interest expense on short positions is reported as Interest expense to non-affiliates on securities sold short on the Statements of Operations. Liabilities for securities sold short are reported at market value on the Statements of Assets and Liabilities and the change in market value is recorded as Change in net unrealized appreciation/depreciation on the Statements of Operations. Short sale transactions may result in unlimited losses as the security’s price increases and the short position loses value. There is no upward limit on the price a borrowed security could attain. The Fund is also subject to risk of loss if the broker were to fail to perform its obligations under the contractual terms.
The Fund will record a realized loss if the price of the borrowed security increases between the date of the short sale and the date on which the Fund replaces the borrowed security. The Fund will record a realized gain if the price of the borrowed security declines between those dates.
As of October 31, 2022, October 31, 2021, October 31, 2020 and October 31, 2019, the Fund had outstanding short sales as listed on its respective SOIs.
H. Security Transactions and Investment Income — Investment transactions are accounted for on the trade date (the date the order to buy or sell is executed). Securities gains and losses are calculated on a specifically identified cost basis. Interest income and interest expense on securities sold short, if any, is determined on the basis of coupon interest accrued using the effective interest method, which adjusts for amortization of premiums and accretion of discounts. Dividend income, net of foreign taxes withheld, if any, and dividend expense on securities sold short are recorded on the ex-dividend date or when a Fund first learns of the dividend.
To the extent such information is publicly available, the Fund records distributions received in excess of income earned from underlying investments as a reduction of cost of investments and/or realized gain. Such amounts are based on estimates if actual amounts are not available and actual amounts of income, realized gain and return of capital may differ from the estimated amounts. The Fund adjusts the estimated amounts of the components of distributions (and consequently their net investment income) as necessary, once the issuers provide information about the actual composition of the distributions.
I. Allocation of Income and Expenses — Expenses directly attributable to the Fund are charged directly to the Fund, while the expenses attributable to more than one fund of the Trust are allocated among the applicable funds. Investment income, realized and unrealized gains and losses and expenses, other than class-specific expenses, are allocated daily to each class of shares based upon the proportion of net assets of each class at the beginning of each day.
Transfer agency fees are class-specific expenses. The amount of the transfer agency fees charged to each share class of the Fund for the years ended as noted below are as follows:
| | | | | | | | | | | | | | | | | | | | |
| | | Class A | | | Class C | | | Class I | | | Class L | | | Total | |
October 31, 2022 | | $ | 3 | | | $ | — | (a) | | $ | 3 | | | | n/a | | | $ | 6 | |
October 31, 2021 | | | 3 | | | | 1 | | | | 4 | | | | n/a | | | | 8 | |
October 31, 2020 | | | 8 | | | | — | (a) | | | 3 | | | | 1 | | | | 12 | |
October 31, 2019 | | | 8 | | | | 1 | | | | 2 | | | | 2 | | | | 13 | |
| (a) | Amount rounds to less than one thousand. |
J. Federal Income Taxes — The Fund is treated as a separate taxable entity for Federal income tax purposes. The Fund’s policy is to comply with the provisions of the Internal Revenue Code (the “Code”) applicable to regulated investment companies and to distribute to shareholders all of its distributable net investment income and net realized capital gains on investments. Accordingly, no provision for Federal income tax is necessary. Management has reviewed the Fund’s tax positions for all open tax years and has determined that as of October 31, 2022, no liability for Federal income tax is required in the Fund’s financial statements for net unrecognized tax benefits. However, management’s conclusions may be subject to future review based on changes in, or the interpretation of, the accounting standards or tax laws and regulations. The Fund’s Federal tax returns for the prior three fiscal years remain subject to examination by the Internal Revenue Service.
| | | | | | | | | | |
| | | | | |
| 58 | | | | | | | | J.P. MORGAN SPECIALTY FUNDS | | |
K. Foreign Taxes — The Fund may be subject to foreign taxes on income, gains on investments or currency purchases/repatriation, a portion of which may be recoverable. The Fund will accrue such taxes and recoveries as applicable, based upon their current interpretation of tax rules and regulations that exist in the markets in which they invest. When a capital gains tax is determined to apply, the Fund records an estimated deferred tax liability in an amount that would be payable if the securities were disposed of on the valuation date.
L. Distributions to Shareholders — Distributions from net investment income, if any, are generally declared and paid at least annually and are declared separately for each class. No class has preferential dividend rights; differences in per share rates are due to differences in separate class expenses. Net realized capital gains, if any, are distributed by the Fund at least annually. The amount of distributions from net investment income and net realized capital gains is determined in accordance with Federal income tax regulations, which may differ from GAAP. To the extent these “book/tax” differences are permanent in nature (i.e., that they result from other than timing of recognition — “temporary differences”), such amounts are reclassified within the capital accounts based on their Federal tax basis treatment. The following amounts were reclassified within the capital accounts:
| | | | | | | | | | | | |
| | | Paid-in-Capital | | | Accumulated
undistributed
(distributions
in excess of)
net investment
income | | | Accumulated
net realized
gains
(losses) | |
October 31, 2022 (1) | | $ | (1,545 | ) | | $ | 1,565 | | | $ | (20 | ) |
October 31, 2021 (2) | | | (360 | ) | | | 377 | | | | (17 | ) |
October 31, 2020 (3) | | | 284 | | | | 1,088 | | | | (1,372 | ) |
October 31, 2019 (4) | | | 339 | | | | 456 | | | | (795 | ) |
| (1) | The reclassifications for the Fund relate primarily to net operating losses. |
| (2) | The reclassifications for the Fund relate primarily to net operating losses and securities sold short. |
| (3) | The reclassifications for the Fund relate primarily to dividend expense for securities sold short, taxable gains, and net operating losses. |
| (4) | The reclassifications for the Fund relate primarily to non-taxable dividends, dividend expense for securities sold short, litigation payments, and net operating losses. |
3. Fees and Other Transactions with Affiliates
A. Investment Advisory Fee — Pursuant to an Investment Advisory Agreement, the Adviser manages the investments of the Fund and for such services is paid a fee. The investment advisory fee is accrued daily and paid monthly at an annual rate based on the Fund’s average daily net assets. The annual rate for the Fund for each of the periods noted below is as follows:
| | | | |
October 31, 2022 | | | 0.35 | % |
October 31, 2021 | | | 0.35 | |
October 31, 2020 | | | 0.35 | (1) |
October 31, 2019 | | | 0.60 | (2) |
| (1) | Prior to June 1, 2020, the investment advisory fee was accrued daily and paid monthly at an annual rate of 0.60% of the Fund’s average daily net assets. |
| (2) | Prior to August 1, 2019, the investment advisory fee was accrued daily and paid monthly at an annual rate of 0.80% of the Fund’s average daily net assets. |
The Adviser waived investment advisory fees and/or reimbursed expenses as outlined in Note 3.F.
B. Administration Fee — Pursuant to an Administration Agreement, the Administrator provides certain administration services to the Fund. In consideration of these services, effective January 1, 2019, the Administrator receives a fee accrued daily and paid monthly at an annual rate of 0.075% of the first $10 billion of the Fund’s average daily net assets, plus 0.050% of the Fund’s average daily net assets between $10 billion and $20 billion, plus 0.025% of the Fund’s average daily net assets between $20 billion and $25 billion, plus 0.01% of the Fund’s average daily net assets in excess of $25 billion. Prior to January 1, 2019, the Administrator received a fee accrued daily and paid monthly at an annual rate of 0.15% of the first $25 billion of the average daily net assets of all funds in the J.P. Morgan Funds Complex covered by the Administration Agreement (excluding certain funds of funds and money market funds) and 0.075% of the average daily net assets in excess of $25 billion of all such funds. For the years ended October 31, 2022, October 31, 2021, October 31, 2020 and October 31, 2019, the effective rate for the Fund was 0.075%, 0.075%, 0.080% and 0.080% of the Fund’s average daily net assets, notwithstanding any fee waivers and/or expense reimbursements, respectively.
The Administrator waived administration fees as outlined in Note 3.F.
JPMCB, a wholly-owned subsidiary of JPMorgan, serves as the Fund’s sub-administrator (the “Sub-administrator”). For its services as Sub-administrator, JPMCB receives a portion of the fees payable to the Administrator.
| | | | | | | | | | |
| | | | | |
| | J.P. MORGAN SPECIALTY FUNDS | | | | | | | | 59 |
NOTES TO FINANCIAL STATEMENTS
AS OF OCTOBER 31, 2022, OCTOBER 31, 2021, OCTOBER 31, 2020 and OCTOBER 31, 2019 (continued)
(Dollar values in thousands)
C. Distribution Fees — Pursuant to a Distribution Agreement, JPMorgan Distribution Services, Inc. (“JPMDS”), an indirect, wholly-owned subsidiary of JPMorgan, serves as the Fund’s principal underwriter and promotes and arranges for the sale of the Fund’s shares. The Board has adopted a Distribution Plan (the “Distribution Plan”) for Class A and Class C Shares of the Fund pursuant to Rule 12b-1 under the 1940 Act. Class I and Class L of the Fund do not charge a distribution fee. The Distribution Plan provides that the Fund shall pay, with respect to the applicable share classes, distribution fees, including payments to JPMDS, at annual rates of the average daily net assets as shown in the table below:
| | | | | | | | |
| | | Class A | | | Class C | |
October 31, 2022 | | | 0.25 | % | | | 0.75 | % |
October 31, 2021 | | | 0.25 | | | | 0.75 | |
October 31, 2020 | | | 0.25 | | | | 0.75 | |
October 31, 2019 | | | 0.25 | | | | 0.75 | |
In addition, JPMDS is entitled to receive the front-end sales charges from purchases of Class A Shares and the CDSC from redemptions of Class C Shares and certain Class A Shares for which front-end sales charges have been waived. For the years indicated below JPMDS retained the following:
| | | | | | | | |
| | | Front-End Sales Charge | | | CDSC | |
October 31, 2022 | | $ | - | (a) | | $ | — | |
October 31, 2021 | | | 4 | | | | — | |
October 31, 2020 | | | 1 | | | | — | |
October 31, 2019 | | | - | (a) | | | — | |
| (a) | Amount rounds to less than one thousand. |
D. Service Fees — The Trust, on behalf of the Fund, has entered into a Shareholder Servicing Agreement with JPMDS under which JPMDS provides certain support services to fund shareholders. For performing these services, JPMDS receives a fee with respect to all share classes, that is accrued daily and paid monthly equal to a percentage of the average daily net assets as shown in the table below:
| | | | | | | | | | | | | | | | |
| | | Class A | | | Class C | | | Class I | | | Class L | |
October 31, 2022 | | | 0.25 | % | | | 0.25 | % | | | 0.25 | % | | | n/a | |
October 31, 2021 | | | 0.25 | | | | 0.25 | | | | 0.25 | | | | n/a | |
October 31, 2020 | | | 0.25 | | | | 0.25 | | | | 0.25 | | | | 0.10 | % |
October 31, 2019 | | | 0.25 | | | | 0.25 | | | | 0.25 | | | | 0.10 | |
JPMDS has entered into shareholder services contracts with affiliated and unaffiliated financial intermediaries who provide shareholder services and other related services to their clients or customers who invest in the Fund. Pursuant to such contracts, JPMDS will pay all or a portion of such fees earned to financial intermediaries for performing such services. JPMDS waived service fees as outlined in Note 3.F.
E. Custodian and Accounting Fees — JPMCB provides portfolio custody and accounting services to the Fund. For performing these services, the Fund pays JPMCB transaction and asset-based fees that vary according to the number of transactions and positions, plus out-of-pocket expenses. The amounts paid directly to JPMCB by the Fund for custody and accounting services are included in Custodian and accounting fees on the Statements of Operations.
Interest income earned on cash balances at the custodian, if any, is included in Interest income from affiliates on the Statements of Operations.
Interest expense paid to the custodian related to cash overdrafts, if any, is included in Interest expense to affiliates on the Statements of Operations.
F. Waivers and Reimbursements — The Adviser, Administrator and/or JPMDS have contractually agreed to waive fees and/or reimburse the Fund to the extent that total annual operating expenses (excluding acquired fund fees and expenses other than certain money market fund fees as described below, dividend and interest expenses related to short sales, interest, taxes, expenses related to litigation and potential litigation, expenses related to trustee elections and extraordinary expenses) exceed the percentages of the Fund’s respective average daily net assets as shown in the table below:
| | | | | | | | | | | | |
| | | Class A | | | Class C | | | Class I | |
October 31, 2022 | | | 0.95 | % | | | 1.45 | % | | | 0.69 | % |
The expense limitation agreements were in effect for the year ended October 31, 2022, and the contractual expense limitation percentages in the table above are in place until at least February 28, 2023.
| | | | | | | | | | | | |
| | | Class A | | | Class C | | | Class I | |
October 31, 2021 | | | 0.95 | % | | | 1.45 | % | | | 0.69 | %(1) |
| (1) | The contractual expense percentage in the table above is in place until as least May 31, 2022. |
| | | | | | | | | | |
| | | | | |
| 60 | | | | | | | | J.P. MORGAN SPECIALTY FUNDS | | |
Except as noted above, the expense limitation agreements were in effect for the year ended October 31, 2021, and the contractual expense limitation percentages in the table above are in place until at least February 28, 2022.
| | | | | | | | | | | | |
| | | Class A | | | Class C | | | Class I | |
October 31, 2020(1) | | | 0.95 | % | | | 1.45 | % | | | 0.69 | % |
Prior to June 1, 2020, the contractual expense limitation were 1.25%, 1.75% and 0.99% for Class A Share, Class C Shares and Class I Shares, respectively. Effective June 1, 2020, the contractual expense percentages in the able above were extended and are in place until at least May 31, 2021 for Class A and Class C Shares, and May 31, 2022 for Class I Shares.
| | | | | | | | | | | | | | | | |
| | | Class A | | | Class C | | | Class I | | | Class L | |
October 31, 2019 | | | 1.25 | % | | | 1.75 | % | | | 0.99 | % | | | 0.85 | % |
The expense limitation agreements were in effect for the year ended October 31, 2019, and are in place until at least February 29, 2020.
For the years indicated below, the Fund’s service providers waived fees and/or reimbursed expenses for the Fund as follows. None of these parties expects the Fund to repay any such waived fees and/or reimbursed expenses in future years.
| | | | | | | | | | | | | | | | |
| | | Contractual Waivers | |
| | | Investment
Advisory Fees | | | Administration
Fees | | | Service
Fees | | | Total | |
October 31, 2022 | | $ | 103 | | | $ | 63 | | | $ | 7 | | | $ | 173 | |
October 31, 2021 | | | 128 | | | | 69 | | | | 5 | | | | 202 | |
October 31, 2020 | | | 177 | | | | 51 | | | | 19 | | | | 247 | |
October 31, 2019 | | | 256 | | | | 90 | | | | 12 | | | | 358 | |
Additionally, the Fund may invest in one or more money market funds advised by the Adviser (affiliated money market funds). The Adviser, Administrator and/or JPMDS, as shareholder servicing agent, have contractually agreed to waive fees and/or reimburse expenses in an amount sufficient to offset the respective net fees each collects from the affiliated money market fund on the Fund’s investment in such affiliated money market fund, except for investments of securities lending cash collateral. None of these parties expect the Fund to repay any such waived fees and/ or reimbursed expenses in future years.
The amounts of these waivers resulting from investments in these money market funds for the years indicated below were as follows:
| | | | |
October 31, 2022 | | $ | 51 | |
October 31, 2021 | | | 16 | |
October 31, 2020 | | | 24 | |
October 31, 2019 | | | 34 | |
Effective January 1, 2022, JPMIM voluntarily agreed to reimburse the Fund for the Trustee Fees paid to one of the interested Trustees. For the period January 1, 2022 through October 31, 2022 the amount of these waivers were as follows:
G. Other — Certain officers of the Trust are affiliated with the Adviser, the Administrator and JPMDS. Such officers, with the exception of the Chief Compliance Officer, receive no compensation from the Fund for serving in their respective roles. The Board designated and appointed a Chief Compliance Officer to the Fund pursuant to Rule 38a-1 under the 1940 Act. The Fund, along with affiliated funds, makes reimbursement payments, on a pro-rata basis, to the Administrator for a portion of the fees associated with the office of the Chief Compliance Officer. Such fees are included in Trustees’ and Chief Compliance Officer’s fees on the Statements of Operations.
The Trust adopted a Trustee Deferred Compensation Plan (the “Plan”) which allows the independent Trustees to defer the receipt of all or a portion of compensation related to performance of their duties as Trustees. The deferred fees are invested in various J.P. Morgan Funds until distribution in accordance with the Plan.
During the years ended October 31, 2022, October 31, 2021, October 31, 2020, and October 31, 2019, the Fund purchased securities from an underwriting syndicate in which the principal underwriter or members of the syndicate were affiliated with the Adviser.
The Securities and Exchange Commission (“SEC”) has granted an exemptive order permitting the Fund to engage in principal transactions with J.P. Morgan Securities LLC, an affiliated broker, involving taxable money market instruments, subject to certain conditions.
| | | | | | | | | | |
| | | | | |
| | J.P. MORGAN SPECIALTY FUNDS | | | | | | | | 61 |
NOTES TO FINANCIAL STATEMENTS
AS OF OCTOBER 31, 2022, OCTOBER 31, 2021, OCTOBER 31, 2020 and OCTOBER 31, 2019 (continued)
(Dollar values in thousands)
4. Investment Transactions
During the years indicated below, purchases and sales of investments (excluding short-term investments) were as follows:
| | | | | | | | | | | | | | | | |
| | | Purchases
(excluding
U.S. Government) | | | Sales
(excluding
U.S. Government) | | | Securities
Sold Short | | | Covers on
Securities
Sold Short | |
October 31, 2022 | | $ | 127,625 | | | $ | 89,641 | | | $ | 139,119 | | | $ | 97,691 | |
October 31, 2021 | | | 105,671 | | | | 175,391 | | | | 101,833 | | | | 166,693 | |
October 31, 2020 | | | 193,699 | | | | 147,574 | | | | 201,859 | | | | 157,358 | |
October 31, 2019 | | | 125,501 | | | | 245,203 | | | | 114,072 | | | | 231,054 | |
During the years ended October 31, 2022, October 31, 2021, October 31, 2020 and October 31, 2019, there were no purchases or sales of U.S. Government securities.
5. Federal Income Tax Matters
For Federal income tax purposes, the estimated cost and unrealized appreciation (depreciation) in value of investments held at the dates noted were as follows:
| | | | | | | | | | | | | | | | |
| | | Aggregate
Cost * | | | Gross
Unrealized
Appreciation | | | Gross
Unrealized
Depreciation | | | Net Unrealized
Appreciation
(Depreciation) | |
October 31, 2022 (1) | | $ | 42,881 | | | $ | 20,435 | | | $ | 11,302 | | | $ | 9,133 | |
October 31, 2021 (2) | | | 6,333 | | | | 22,021 | | | | 8,576 | | | | 13,445 | |
October 31, 2020 (3) | | | 22,551 | | | | 17,456 | | | | 5,499 | | | | 11,957 | |
October 31, 2019 (4) | | | (4,591 | ) | | | 18,112 | | | | 3,033 | | | | 15,079 | |
| * | The tax cost includes the proceeds from short sales which may result in a net negative cost. |
| (1) | The difference between book and tax basis appreciation (depreciation) on investments is primarily attributed to wash sale loss deferrals. |
| (2) | The difference between book and tax basis appreciation (depreciation) on investments is primarily attributed to wash sale loss deferrals. |
| (3) | The difference between book and tax basis appreciation (depreciation) on investments is primarily attributed to mark to market of futures contracts and wash sale loss deferrals. |
| (4) | The difference between book and tax basis appreciation (depreciation) on investments is primarily attributed to wash sale loss deferrals. |
The tax character of distributions paid during the year ended October 31, 2021, October 31, 2020 and October 31, 2019, was as follows:
| | | | | | | | | | | | |
| | | Ordinary
Income* | | | Net
Long-Term
Capital Gains | | | Total
Distributions
Paid | |
October 31, 2021 | | $ | 1,657 | | | $ | 6,527 | | | $ | 8,184 | |
October 31, 2020 | | | — | | | | 6,225 | | | | 6,225 | |
October 31, 2019 | | | — | | | | 13,829 | | | | 13,829 | |
| * | Short-term gain distributions are treated as ordinary income for income tax purposes. |
As of October 31, 2022, the estimated components of net assets (excluding paid-in-capital) on a tax basis were as follows:
| | | | | | | | |
| | | Current
Distributable
Long-Term
Capital Gain
(Tax Basis Capital
Loss Carryover) | | | Unrealized
Appreciation
(Depreciation) | |
| | $ | (27,620 | ) | | $ | 9,092 | |
The cumulative timing differences primarily consist of tax adjustments on certain investments, late year loss deferrals and wash sale loss deferrals.
At October 31, 2021, the estimated components of net assets (excluding paid-in-capital) on a tax basis were as follows:
| | | | | | | | |
| | | Current
Distributable
Long-Term
Capital Gain
(Tax Basis Capital
Loss Carryover) | | | Unrealized
Appreciation
(Depreciation) | |
| | $ | (29,216 | ) | | $ | 13,304 | |
| | | | | | | | | | |
| | | | | |
| 62 | | | | | | | | J.P. MORGAN SPECIALTY FUNDS | | |
The cumulative timing differences primarily consist of late year loss deferrals, short sales, straddle loss deferrals and wash sale loss deferrals.
At October 31, 2020, the estimated components of net assets (excluding paid-in-capital) on a tax basis were as follows:
| | | | | | | | | | | | | | | | |
| | | Current
Distributable
Ordinary
Income | | | Current
Distributable
Long-Term
Capital Gain | | | Current
Tax Basis
Capital Loss
Carryover | | | Unrealized
Appreciation
(Depreciation) | |
| | $ | 1,667 | | | $ | 6,517 | | | $ | (31,380 | ) | | $ | 11,783 | |
For the Fund the cumulative timing differences primarily consist of mark to market of futures contracts, straddle loss deferral and wash sale loss deferrals.
At October 31, 2019, the estimated components of net assets (excluding paid-in-capital) on a tax basis were as follows:
| | | | | | | | | | |
| | | Current
Distributable
Long-Term
Capital Gain | | Current
Tax Basis
Capital
Loss
Carryover | | | Unrealized
Appreciation
(Depreciation) | |
| | $6,188 | | $ | (33,682 | ) | | $ | 14,801 | |
The cumulative timing differences primarily consist of wash sale loss deferrals loss deferrals on unsettled short sales, trustee deferred compensation and straddle loss deferrals.
The Fund had net capital loss carryforwards which are available to offset future realized gains as follows:
| | | | |
| | | Capital Loss Carryforward Character | |
| | | Short-Term* | |
October 31, 2022 | | $ | 27,620 | |
October 31, 2021 | | | 29,216 | |
October 31, 2020 | | | 31,380 | |
October 31, 2019 | | | 33,682 | |
| * | Amount includes capital loss carryforwards which are limited in future years under Internal Revenue Code sections 381-384. |
Late year ordinary losses incurred after December 31 and within the taxable year are deemed to arise on the first business day of the Fund’s next taxable year. For the years ended October 31, 2022 and October 31, 2021, the Fund deferred to November 1, 2022 and November 1, 2021, respectively, late year ordinary losses of:
| | | | |
| | | Late Year Ordinary
Loss Deferral | |
October 31, 2022 | | $ | 288 | |
October 31, 2021 | | | 1,186 | |
During the years ended October 31, 2022, October 31, 2021, October 31, 2020 and October 31, 2019, the Fund utilized capital loss carryforwards as follows:
| | | | |
| | | Capital Loss Utilized Short-Term | |
October 31, 2022 | | $ | 1,595 | |
October 31, 2021 | | | 2,164 | |
October 31, 2020 | | | 2,302 | |
October 31, 2019 | | | 2,302 | |
6. Borrowings
The Fund relies upon an exemptive order granted by the SEC (the “Order”) permitting the establishment and operation of an Interfund Lending Facility (the “Facility”). The Facility allows the Fund to directly lend and borrow money to or from any other fund relying upon the Order at rates beneficial to both the borrowing and lending funds. Advances under the Facility are taken primarily for temporary or emergency purposes, including the meeting of redemption requests that otherwise might require the untimely disposition of securities, and are subject to the Fund’s borrowing restrictions. The Interfund loan rate is determined, as specified in the Order, by averaging the current repurchase agreement rate and the current bank loan rate. The Order was granted to JPMorgan Trust II (“JPM II”) and may be relied upon by the Fund because the Fund and the series of JPM II are all investment companies in the same “group of investment companies” (as defined in Section 12(d)(1)(G) of the 1940 Act).
| | | | | | | | | | |
| | | | | |
| | J.P. MORGAN SPECIALTY FUNDS | | | | | | | | 63 |
NOTES TO FINANCIAL STATEMENTS
AS OF OCTOBER 31, 2022, OCTOBER 31, 2021, OCTOBER 31, 2020 and OCTOBER 31, 2019 (continued)
(Dollar values in thousands)
The Fund had no borrowings outstanding from another fund, or loans outstanding to another fund, during the years ended October 31, 2022, October 31, 2021, October 31, 2020, and October 31, 2019.
The Trust and JPMCB have entered into a financing arrangement. Under this arrangement, JPMCB provides an unsecured, uncommitted credit facility in the aggregate amount of $100 million to certain of the J.P. Morgan Funds, including the Fund. Advances under the arrangement are taken primarily for temporary or emergency purposes, including the meeting of redemption requests that otherwise might require the untimely disposition of securities, and are subject to the Fund’s borrowing restrictions. Interest on borrowings is payable at a rate determined by JPMCB at the time of borrowing. This agreement has been extended until October 30, 2023.
The Fund had no borrowings outstanding from the unsecured, uncommitted credit facility during the years ended October 31, 2022, October 31, 2021, October 31, 2020, and October 31, 2019.
The Trust, along with certain other trusts for J.P. Morgan Funds (“Borrowers”), has entered into a joint syndicated senior unsecured revolving credit facility totaling $1.5 billion (“Credit Facility”) with various lenders and The Bank of New York Mellon, as administrative agent for the lenders. This Credit Facility provides a source of funds to the Borrowers for temporary and emergency purposes, including the meeting of redemption requests that otherwise might require the untimely disposition of securities. Under the terms of the Credit Facility, a borrowing fund must have a minimum of $25 million in adjusted net asset value and not exceed certain adjusted net asset coverage ratios prior to and during the time in which any borrowings are outstanding. If a fund does not comply with the aforementioned requirements, the fund must remediate within three business days with respect to the $25 million minimum adjusted net asset value or within one business day with respect to certain asset coverage ratios or the administrative agent at the request of, or with the consent of, the lenders may terminate the Credit Facility and declare any outstanding borrowings to be due and payable immediately.
Interest associated with any borrowing under the Credit Facility is charged to the borrowing fund at a rate of interest equal to 1.00% during the period November 1, 2018 through August 10, 2020, 1.25% during the period August 11, 2020 through August 9, 2021 and 1.00% during the period August 10, 2021 through August 8, 2022, (the “Applicable Margin”), plus the greater of the federal funds effective rate or one month LIBOR. The annual commitment fee to maintain the Credit Facility is 0.15% and is incurred on the unused portion of the Credit Facility and is allocated to all participating funds pro rata based on their respective net assets. Effective August 9, 2022, the Credit Facility has been amended and restated for a term of 364 days, unless extended, and to include a change in the interest associated with any borrowing to the higher, on the day of the borrowing, of (a) the federal funds effective rate, or (b) the one-month Adjusted SOFR Rate plus reduction of the Applicable Margin charged for borrowing under the Credit Facility from 1.25% to 1.00%.
The Fund did not utilize the Credit Facility during the years ended October 31, 2022, October 31, 2021, October 31, 2020 and October 31, 2019.
7. Risks, Concentrations and Indemnifications
In the normal course of business, the Fund enters into contracts that contain a variety of representations which provide general indemnifications. The Fund’s maximum exposure under these arrangements is unknown. The amount of exposure would depend on future claims that may be brought against the Fund. However, based on experience, the Fund expects the risk of loss to be remote. For the years indicated below, the Fund had individual shareholder and/or omnibus accounts each owning more than 10% of the Fund’s outstanding shares as follows:
| | | | | | | | |
| | | Number of Individual
Shareholder and/or
Non-Affiliated
Omnibus Accounts | | | % of the Fund | |
October 31, 2022 | | | 4 | | | | 58.1 | % |
October 31, 2021 | | | 2 | | | | 38.0 | |
October 31, 2020 | | | 3 | | | | 55.5 | |
October 31, 2019 | | | 3 | | | | 46.7 | |
Significant shareholder transactions by these shareholders may impact the Fund’s performance and liquidity.
Derivatives may be riskier than other types of investments because they may be more sensitive to changes in economic and market conditions and could result in losses that significantly exceed the Fund’s original investment. Many derivatives create leverage thereby causing the Fund to be more volatile than it would have been if it had not used derivatives. Derivatives also exposes the Fund to counterparty risk (the risk that the derivative counterparty will not fulfill its contractual obligations), including credit risk of the derivative counterparty. The possible lack of a liquid secondary market for derivatives and the resulting inability of the Fund to sell or otherwise close a derivatives position could expose the Fund to losses.
The Fund is also subject to counterparty credit risk, which is the risk that a counterparty fails to perform on agreements with the Fund.
As of October 31, 2022, October 31, 2021, October 31, 2020 and October 31, 2019, the Fund pledged substantially all of its assets to Citigroup Global Markets, Inc. for securities sold short. For the Fund, deposits at broker for securities sold short, as noted on the Statements of Assets and Liabilities, are held at Citigroup Global Markets, Inc.
LIBOR is intended to represent the rate at which contributing banks may obtain short-term borrowings from each other in the London interbank market. On March 5, 2021, the U.K. Financial Conduct Authority (“FCA”) publicly announced that (i) immediately after December 31, 2021, publication
| | | | | | | | | | |
| | | | | |
| 64 | | | | | | | | J.P. MORGAN SPECIALTY FUNDS | | |
of the 1-week and 2-month U.S. Dollar LIBOR settings will permanently cease; (ii) immediately after June 30, 2023, publication of the overnight and 12-month U.S. Dollar LIBOR settings will permanently cease; and (iii) immediately after June 30, 2023, the 1-month, 3-month and 6-month U.S. Dollar LIBOR settings will cease to be provided or, subject to the FCA’s consideration of the case, be provided on a synthetic basis and no longer be representative of the underlying market and economic reality they are intended to measure and that representativeness will not be restored. There is no assurance that the dates announced by the FCA will not change or that the administrator of LIBOR and/or regulators will not take further action that could impact the availability, composition or characteristics of LIBOR or the currencies and/or tenors for which LIBOR is published. In addition, certain regulated entities ceased entering into most new LIBOR contracts in connection with regulatory guidance or prohibitions. Public and private sector industry initiatives are currently underway to implement new or alternative reference rates to be used in place of LIBOR. There is no assurance that any such alternative reference rate will be similar to or produce the same value or economic equivalence as LIBOR or that it will have the same volume or liquidity as did LIBOR prior to its discontinuance, unavailability or replacement, all of which may affect the value, volatility, liquidity or return on certain of a Fund’s loans, notes, derivatives and other instruments or investments comprising some or all of a Fund’s investments and result in costs incurred in connection with changing reference rates used for positions, closing out positions and entering into new trades. Certain of a Fund’s investments may transition from LIBOR prior to the dates announced by the FCA. The transition from LIBOR to alternative reference rates may result in operational issues for a Fund or its investments. No assurances can be given as to the impact of the LIBOR transition (and the timing of any such impact) on a Fund and its investments.
The Fund is subject to infectious disease epidemics/pandemics risk. The worldwide outbreak of COVID-19 has negatively affected economies, markets and individual companies throughout the world. The effects of this COVID-19 pandemic to public health, and business and market conditions, including among other things, reduced consumer demand and economic output, supply chain disruptions and increased government spending may continue to have a significant negative impact on the performance of a Fund’s investments, increase the Fund’s volatility, exacerbate other pre-existing political, social and economic risks to the Fund and negatively impact broad segments of businesses and populations. In addition, governments, their regulatory agencies, or self-regulatory organizations have taken or may take actions in response to the pandemic that affect the instruments in which the Fund invests, or the issuers of such instruments, in ways that could also have a significant negative impact on the Fund’s investment performance. The duration and extent of COVID-19 and associated economic and market conditions and uncertainty over the long-term cannot be reasonably estimated at this time. The ultimate impact of COVID-19 and the extent to which the associated conditions impact a Fund will also depend on future developments, which are highly uncertain, difficult to accurately predict and subject to frequent changes.
8. Restatement
Subsequent to the issuance of the October 31, 2022 financial statements, management identified a material error in accounting for the receipt of class action litigation payments, which resulted in an understatement of the Fund’s net assets, realized gain and investment income beginning on March 12, 2015. The Advisor determined that the error became material as of April 29, 2019. In accordance with the Fund’s NAV error correction policy, the Fund has the unilateral right to reprocess shareholder transactions effected from April 29, 2019 through July 17, 2024, (the “Error Period”), which includes adjusting existing shareholder accounts to remove excess shares attributable to purchases made during the Error Period. The Fund’s Adviser will be responsible (through cash payment) for any shortfall to the Fund to the extent reprocessing is not completed for any applicable purchases during the Error Period. In addition, the Fund’s Adviser will reimburse the Fund for any additional expenses as a result of this reprocessing.
The accompanying financial statements of the Fund for the four years ended in the period October 31, 2022 have been restated from amounts previously reported to correct the error. The following information presents the previously reported and corrected information on each of the impacted financial statements. The schedule of portfolio investments was required to be restated to reflect the impact of the restatement in net assets; there was no impact on fair value or cost of investments as previously reported.
| | | | | | | | | | |
| | | | | |
| | J.P. MORGAN SPECIALTY FUNDS | | | | | | | | 65 |
NOTES TO FINANCIAL STATEMENTS
AS OF OCTOBER 31, 2022, OCTOBER 31, 2021, OCTOBER 31, 2020 and OCTOBER 31, 2019 (continued)
(Dollar values in thousands)
STATEMENT OF ASSETS AND LIABILITIES
AS OF OCTOBER 31, 2022
(Amounts in thousands, except per share amounts)
| | | | | | | | | | | | | | | | |
| | | Previously Reported | | | Adjustments | | | As Restated | | | | |
Assets: | | | | | | | | | | | | | | | | |
Interest from non-affiliates | | $ | 206 | | | $ | 52 | | | $ | 258 | | | | | |
Class Action proceeds | | | — | | | | 1,151 | | | | 1,151 | | | | | |
| | | | | | | | | | | | | | | | |
Total Assets | | | 266,621 | | | | 1,203 | | | | 267,824 | | | | | |
| | | | | | | | | | | | | | | | |
Liabilities | | | | | | | | | | | | | | | | |
Due to shareholders upon reprocessing | | | — | | | | 4,753 | | | | 4,753 | | | | | |
| | | | | | | | | | | | | | | | |
Total Liabilities | | | 108,275 | | | | 4,753 | | | | 113,028 | | | | | |
| | | | | | | | | | | | | | | | |
Net Assets | | | 158,346 | | | | (3,550 | ) | | | 154,796 | | | | | |
| | | | | | | | | | | | | | | | |
Future share reacquisition adjustment | | | — | | | | 6,425 | | | | 6,425 | | | | | |
| | | | | | | | | | | | | | | | |
Net Assets after future share reacquisition adjustment | | $ | — | | | $ | 161,221 | | | $ | 161,221 | | | | | |
| | | | | | | | | | | | | | | | |
NET ASSETS: | | | | | | | | | | | | | | | | |
Paid-in-capital | | $ | 177,209 | | | $ | (3,638 | ) | | $ | 173,571 | | | | | |
Total distributable earnings (loss) | | | (18,863 | ) | | | 88 | | | | (18,775 | ) | | | | |
| | | | | | | | | | | | | | | | |
Net Assets | | | 158,346 | | | | (3,550 | ) | | | 154,796 | | | | | |
| | | | | | | | | | | | | | | | |
Future share reacquisition adjustment | | | — | | | | 6,425 | | | | 6,425 | | | | | |
| | | | | | | | | | | | | | | | |
Net Assets after future share reacquisition adjustment | | $ | — | | | $ | 161,221 | | | $ | 161,221 | | | | | |
| | | | | | | | | | | | | | | | |
Net Assets after future share reacquisition adjustment: | | | | | | | | | | | | | | | | |
Class A | | $ | 19,898 | | | $ | 361 | | | $ | 20,259 | | | | | |
Class C | | | 1,476 | | | | 28 | | | | 1,504 | | | | | |
Class I | | | 136,972 | | | | 2,486 | | | | 139,458 | | | | | |
| | | | | | | | | | | | | | | | |
Total | | $ | 158,346 | | | $ | 2,875 | | | $ | 161,221 | | | | | |
| | | | | | | | | | | | | | | | |
Net Asset Value (a) | | | | | | | | | | | | | | | | |
after future share reacquisition adjustment | | | | | | | | | | | | | | | | |
Class A — Redemption price per share | | $ | 12.08 | | | $ | 0.22 | | | $ | 12.30 | | | | | |
Class C — Offering price per share (b) | | | 10.74 | | | | 0.20 | | | | 10.94 | | | | | |
Class I — Offering and redemption per share | | | 12.96 | | | | 0.23 | | | | 13.19 | | | | | |
Class A maximum public offering price per share | | | | | | | | | | | | | | | | |
[net asset value per share/(100% – maximum sales charge] | | $ | 12.75 | | | $ | 0.23 | | | $ | 12.98 | | | | | |
| | | | | | | | | | | | | | | | |
| (a) | Per share amounts may not recalculate due to rounding of net assets and/or shares outstanding. |
| (b) | Redemption price for Class C Shares varies based upon length of time the shares are held. |
As presented above, in order to correct the Fund’s net assets under the Fund’s NAV correction policy, the Fund has recorded a future share reacquisition adjustment to net assets. This amount represents the value of shares the Fund has a unilateral right to reacquire through reprocessing for the Error Period and is determined by using the corrected NAV at each reprocessing date. The Fund’s Adviser will be responsible for any shortfall to the Fund to the extent reprocessing is not completed for any applicable purchases during the Error Period.
| | | | | | | | | | |
| | | | | |
| 66 | | | | | | | | J.P. MORGAN SPECIALTY FUNDS | | |
STATEMENT OF OPERATIONS
FOR THE YEAR ENDED OCTOBER 31, 2022
(Amounts in thousands)
| | | | | | | | | | | | | | | | |
| | | Previously Reported | | | Adjustments | | | As Restated | | | | |
INVESTMENT INCOME | | | | | | | | | | | | | | | | |
Interest income from non-affiliates | | $ | 10 | | | $ | 14 | | | $ | 24 | | | | | |
| | | | | | | | | | | | | | | | |
Total investment income | | | 2,409 | | | | 14 | | | | 2,423 | | | | | |
| | | | | | | | | | | | | | | | |
Net investment income (loss) | | | (669 | ) | | | 14 | | | | (655 | ) | | | | |
| | | | | | | | | | | | | | | | |
| | | | |
REALIZED/UNREALIZED GAINS (LOSSES) | | | | | | | | | | | | | | | | |
Net realized gain (loss) on transactions from: | | | | | | | | | | | | | | | | |
Investments in non-affiliates | | | 2,645 | | | | 22 | | | | 2,667 | | | | | |
| | | | | | | | | | | | | | | | |
Net realized gain (loss) | | | 841 | | | | 22 | | | | 863 | | | | | |
| | | | | | | | | | | | | | | | |
Net realized/unrealized gains (losses) | | | (2,599 | ) | | | 22 | | | | (2,577 | ) | | | | |
| | | | | | | | | | | | | | | | |
Change in net assets resulting from operations | | $ | (3,268 | ) | | $ | 36 | | | $ | (3,232 | ) | | | | |
| | | | | | | | | | | | | | | | |
STATEMENT OF CHANGES IN NET ASSETS
FOR THE YEAR ENDED OCTOBER 31, 2022
(Amounts in thousands)
| | | | | | | | | | | | | | | | |
| | | Previously Reported | | | Adjustments | | | As Restated | | | | |
CHANGE IN NET ASSETS RESULTING FROM OPERATIONS: | | | | | | | | | | | | | | | | |
Net investment income (loss) | | $ | (669 | ) | | $ | 14 | | | $ | (655 | ) | | | | |
Net realized gain (loss) | | | 841 | | | | 22 | | | | 863 | | | | | |
| | | | | | | | | | | | | | | | |
Change in net assets resulting from operations | | | (3,268 | ) | | | 36 | | | | (3,232 | ) | | | | |
| | | | | | | | | | | | | | | | |
| | | | |
CAPITAL TRANSACTIONS: | | | | | | | | | | | | | | | | |
Change in net assets resulting from capital transactions | | | 69,424 | | | | (1,054 | ) | | | 68,370 | | | | | |
| | | | |
NET ASSETS: | | | | | | | | | | | | | | | | |
Change in net assets | | | 66,156 | | | | (1,018 | ) | | | 65,138 | | | | | |
Beginning of period | | | 92,190 | | | | (2,532 | ) | | | 89,658 | | | | | |
| | | | | | | | | | | | | | | | |
End of Period | | | 158,346 | | | | (3,550 | ) | | | 154,796 | | | | | |
| | | | | | | | | | | | | | | | |
Future share reacquisition adjustment | | | — | | | | 6,425 | | | | 6,425 | | | | | |
| | | | | | | | | | | | | | | | |
End of period after future share reacquisition adjustment | | $ | — | | | $ | 161,221 | | | $ | 161,221 | | | | | |
| | | | | | | | | | | | | | | | |
| | | | |
CAPITAL TRANSACTIONS | | | | | | | | | | | | | | | | |
Class A | | | | | | | | | | | | | | | | |
Cost of shares redeemed | | $ | (4,824 | ) | | $ | (86 | ) | | $ | (4,910 | ) | | | | |
| | | | | | | | | | | | | | | | |
Change in net assets resulting from Class A capital transactions | | | 3,594 | | | | (86 | ) | | | 3,508 | | | | | |
| | | | | | | | | | | | | | | | |
| | | | |
Class C | | | | | | | | | | | | | | | | |
Cost of shares redeemed | | | (218 | ) | | | (4 | ) | | | (222 | ) | | | | |
| | | | | | | | | | | | | | | | |
Change in net assets resulting from Class C capital transactions | | | 303 | | | | (4 | ) | | | 299 | | | | | |
| | | | | | | | | | | | | | | | |
| | | | |
Class I | | | | | | | | | | | | | | | | |
Cost of shares redeemed | | | (53,961 | ) | | | (964 | ) | | | (54,925 | ) | | | | |
| | | | | | | | | | | | | | | | |
Change in net assets resulting from Class I capital transactions | | | 65,527 | | | | (964 | ) | | | 64,563 | | | | | |
| | | | | | | | | | | | | | | | |
Total change in net assets resulting from capital transactions | | $ | 69,424 | | | $ | (1,054 | ) | | $ | 68,370 | | | | | |
| | | | | | | | | | | | | | | | |
| | | | | | | | | | |
| | | | | |
| | J.P. MORGAN SPECIALTY FUNDS | | | | | | | | 67 |
NOTES TO FINANCIAL STATEMENTS
AS OF OCTOBER 31, 2022, OCTOBER 31, 2021, OCTOBER 31, 2020 and OCTOBER 31, 2019 (continued)
(Dollar values in thousands)
STATEMENT OF ASSETS AND LIABILITIES
AS OF OCTOBER 31, 2021
(Amounts in thousands)
| | | | | | | | | | | | | | | | |
| | | Previously Reported | | | Adjustments | | | As Restated | | | | |
Assets: | | | | | | | | | | | | | | | | |
Interest from non-affiliates | | $ | — | | | $ | 38 | | | $ | 38 | | | | | |
Class Action proceeds | | | — | | | | 1,129 | | | | 1,129 | | | | | |
| | | | | | | | | | | | | | | | |
Total Assets | | | 165,295 | | | | 1,167 | | | | 166,462 | | | | | |
| | | | | | | | | | | | | | | | |
Liabilities | | | | | | | | | | | | | | | | |
Due to shareholders upon reprocessing | | | — | | | | 3,699 | | | | 3,699 | | | | | |
| | | | | | | | | | | | | | | | |
Total Liabilities | | | 73,105 | | | | 3,699 | | | | 76,804 | | | | | |
| | | | | | | | | | | | | | | | |
Net Assets | | | 92,190 | | | | (2,532 | ) | | | 89,658 | | | | | |
| | | | | | | | | | | | | | | | |
Future share reacquisition adjustment | | | — | | | | 4,137 | | | | 4,137 | | | | | |
| | | | | | | | | | | | | | | | |
Net Assets after future share reacquisition adjustment | | $ | — | | | $ | 93,795 | | | $ | 93,795 | | | | | |
| | | | | | | | | | | | | | | | |
NET ASSETS: | | | | | | | | | | | | | | | | |
Paid-in-capital | | $ | 109,330 | | | $ | (2,584 | ) | | $ | 106,746 | | | | | |
Total distributable earnings (loss) | | | (17,140 | ) | | | 52 | | | | (17,088 | ) | | | | |
| | | | | | | | | | | | | | | | |
Net Assets | | | 92,190 | | | | (2,532 | ) | | | 89,658 | | | | | |
| | | | | | | | | | | | | | | | |
Future share reacquisition adjustment | | | — | | | | 4,137 | | | | 4,137 | | | | | |
| | | | | | | | | | | | | | | | |
Net Assets after future share reacquisition adjustment | | $ | — | | | $ | 93,795 | | | $ | 93,795 | | | | | |
| | | | | | | | | | | | | | | | |
Net Assets after future share reacquisition adjustment: | | | | | | | | | | | | | | | | |
Class A | | $ | 16,867 | | | $ | 294 | | | $ | 17,161 | | | | | |
Class C | | | 1,211 | | | | 22 | | | | 1,233 | | | | | |
Class I | | | 74,112 | | | | 1,289 | | | | 75,401 | | | | | |
| | | | | | | | | | | | | | | | |
Total | | $ | 92,190 | | | $ | 1,605 | | | $ | 93,795 | | | | | |
| | | | | | | | | | | | | | | | |
Net Asset Value (a) | | | | | | | | | | | | | | | | |
after future share reacquisition adjustment | | | | | | | | | | | | | | | | |
Class A — Redemption price per share | | $ | 12.41 | | | $ | 0.22 | | | $ | 12.63 | | | | | |
Class C — Offering price per share (b) | | | 11.09 | | | | 0.20 | | | | 11.29 | | | | | |
Class I — Offering and redemption per share | | | 13.28 | | | | 0.23 | | | | 13.51 | | | | | |
Class A maximum public offering price per share | | | | | | | | | | | | | | | | |
[net asset value per share/(100% – maximum sales charge] | | $ | 13.10 | | | $ | 0.23 | | | $ | 13.33 | | | | | |
| | | | | | | | | | | | | | | | |
| (a) | Per share amounts may not recalculate due to rounding of net assets and/or shares outstanding. |
| (b) | Redemption price for Class C Shares varies based upon length of time the shares are held. |
As presented above, in order to correct the Fund’s net assets under the Fund’s NAV correction policy, the Fund has recorded a future share reacquisition adjustment to net assets. This amount represents the value of shares the Fund has a unilateral right to reacquire through reprocessing for the Error Period and is determined by using the corrected NAV at each reprocessing date. The Fund’s Adviser will be responsible for any shortfall to the Fund to the extent reprocessing is not completed for any applicable purchases during the Error Period.
| | | | | | | | | | |
| | | | | |
| 68 | | | | | | | | J.P. MORGAN SPECIALTY FUNDS | | |
STATEMENT OF OPERATIONS
FOR THE YEAR ENDED OCTOBER 31, 2021
(Amounts in thousands)
| | | | | | | | | | | | | | | | |
| | | Previously Reported | | | Adjustments | | | As Restated | | | | |
INVESTMENT INCOME | | | | | | | | | | | | | | | | |
Interest income from non-affiliates | | $ | — | | | $ | 2 | | | $ | 2 | | | | | |
| | | | | | | | | | | | | | | | |
Total investment income | | | 1,246 | | | | 2 | | | | 1,248 | | | | | |
| | | | | | | | | | | | | | | | |
Net investment income (loss) | | | (1,566 | ) | | | 2 | | | | (1,564 | ) | | | | |
| | | | | | | | | | | | | | | | |
| | | | |
REALIZED/UNREALIZED GAINS (LOSSES) | | | | | | | | | | | | | | | | |
Net realized gain (loss) on transactions from: | | | | | | | | | | | | | | | | |
Investments in non-affiliates | | | 30,685 | | | | 15 | | | | 30,700 | | | | | |
| | | | | | | | | | | | | | | | |
Net realized gain (loss) | | | 5,737 | | | | 15 | | | | 5,752 | | | | | |
| | | | | | | | | | | | | | | | |
Net realized/unrealized gains (losses) | | | 3,704 | | | | 15 | | | | 3,719 | | | | | |
| | | | | | | | | | | | | | | | |
Change in net assets resulting from operations | | $ | 2,138 | | | $ | 17 | | | $ | 2,155 | | | | | |
| | | | | | | | | | | | | | | | |
STATEMENT OF CHANGES IN NET ASSETS
FOR THE YEAR ENDED OCTOBER 31, 2021
(Amounts in thousands)
| | | | | | | | | | | | | | | | |
| | | Previously Reported | | | Adjustments | | | As Restated | | | | |
CHANGE IN NET ASSETS RESULTING FROM OPERATIONS: | | | | | | | | | | | | | | | | |
Net investment income (loss) | | $ | (1,566 | ) | | $ | 2 | | | $ | (1,564 | ) | | | | |
Net realized gain (loss) | | | 5,737 | | | | 15 | | | | 5,752 | | | | | |
| | | | | | | | | | | | | | | | |
Change in net assets resulting from operations | | | 2,138 | | | | 17 | | | | 2,155 | | | | | |
| | | | | | | | | | | | | | | | |
| | | | |
CAPITAL TRANSACTIONS: | | | | | | | | | | | | | | | | |
Change in net assets resulting from capital transactions | | | (43,203 | ) | | | (1,765 | ) | | | (44,968 | ) | | | | |
| | | | |
NET ASSETS: | | | | | | | | | | | | | | | | |
Change in net assets | | | (49,249 | ) | | | (1,748 | ) | | | (50,997 | ) | | | | |
Beginning of period | | | 141,439 | | | | (784 | ) | | | 140,655 | | | | | |
| | | | | | | | | | | | | | | | |
End of Period | | | 92,190 | | | | (2,532 | ) | | | 89,658 | | | | | |
| | | | | | | | | | | | | | | | |
Future share reacquisition adjustment | | | — | | | | 4,137 | | | | 4,137 | | | | | |
| | | | | | | | | | | | | | | | |
End of period after future share reacquisition adjustment | | $ | — | | | $ | 93,795 | | | $ | 93,795 | | | | | |
| | | | | | | | | | | | | | | | |
| | | | |
CAPITAL TRANSACTIONS | | | | | | | | | | | | | | | | |
Class A | | | | | | | | | | | | | | | | |
Cost of shares redeemed | | $ | (8,506 | ) | | $ | (150 | ) | | $ | (8,656 | ) | | | | |
| | | | | | | | | | | | | | | | |
Change in net assets resulting from Class A capital transactions | | | (638 | ) | | | (150 | ) | | | (788 | ) | | | | |
| | | | | | | | | | | | | | | | |
| | | | |
Class C | | | | | | | | | | | | | | | | |
Cost of shares redeemed | | | (1,175 | ) | | | (22 | ) | | | (1,197 | ) | | | | |
| | | | | | | | | | | | | | | | |
Change in net assets resulting from Class C capital transactions | | | (599 | ) | | | (22 | ) | | | (621 | ) | | | | |
| | | | | | | | | | | | | | | | |
| | | | |
Class I | | | | | | | | | | | | | | | | |
Cost of shares redeemed | | | (89,882 | ) | | | (1,593 | ) | | | (91,475 | ) | | | | |
| | | | | | | | | | | | | | | | |
Change in net assets resulting from Class I capital transactions | | | (41,966 | ) | | | (1,593 | ) | | | (43,559 | ) | | | | |
| | | | | | | | | | | | | | | | |
Total change in net assets resulting from capital transactions | | $ | (43,203 | ) | | $ | (1,765 | ) | | $ | (44,968 | ) | | | | |
| | | | | | | | | | | | | | | | |
| | | | | | | | | | |
| | | | | |
| | J.P. MORGAN SPECIALTY FUNDS | | | | | | | | 69 |
NOTES TO FINANCIAL STATEMENTS
AS OF OCTOBER 31, 2022, OCTOBER 31, 2021, OCTOBER 31, 2020 and OCTOBER 31, 2019 (continued)
(Dollar values in thousands)
STATEMENT OF ASSETS AND LIABILITIES
AS OF OCTOBER 31, 2020
(Amounts in thousands)
| | | | | | | | | | | | | | | | |
| | | Previously Reported | | | Adjustments | | | As Restated | | | | |
Assets: | | | | | | | | | | | | | | | | |
Interest from non-affiliates | | $ | — | | | $ | 98 | | | $ | 98 | | | | | |
Interest and dividends from non-affiliates | | | 62 | | | | (62 | ) | | | — | | | | | |
Class Action proceeds | | | — | | | | 1,114 | | | | 1,114 | | | | | |
| | | | | | | | | | | | | | | | |
Total Assets | | | 248,185 | | | | 1,150 | | | | 249,335 | | | | | |
| | | | | | | | | | | | | | | | |
Liabilities | | | | | | | | | | | | | | | | |
Due to shareholders upon reprocessing | | | — | | | | 1,934 | | | | 1,934 | | | | | |
| | | | | | | | | | | | | | | | |
Total Liabilities | | | 106,746 | | | | 1,934 | | | | 108,680 | | | | | |
| | | | | | | | | | | | | | | | |
Net Assets | | | 141,439 | | | | (784 | ) | | | 140,655 | | | | | |
| | | | | | | | | | | | | | | | |
Future share reacquisition adjustment | | | — | | | | 2,950 | | | | 2,950 | | | | | |
| | | | | | | | | | | | | | | | |
Net Assets after future share reacquisition adjustment | | $ | — | | | $ | 143,605 | | | $ | 143,605 | | | | | |
| | | | | | | | | | | | | | | | |
NET ASSETS: | | | | | | | | | | | | | | | | |
Paid-in-capital | | $ | 152,893 | | | $ | (819 | ) | | $ | 152,074 | | | | | |
Total distributable earnings (loss) | | | (11,454 | ) | | | 35 | | | | (11,419 | ) | | | | |
| | | | | | | | | | | | | | | | |
Net Assets | | | 141,439 | | | | (784 | ) | | | 140,655 | | | | | |
| | | | | | | | | | | | | | | | |
Future share reacquisition adjustment | | | — | | | | 2,950 | | | | 2,950 | | | | | |
| | | | | | | | | | | | | | | | |
Net Assets after future share reacquisition adjustment | | $ | — | | | $ | 143,605 | | | $ | 143,605 | | | | | |
| | | | | | | | | | | | | | | | |
Net Assets after future share reacquisition adjustment: | | | | | | | | | | | | | | | | |
Class A | | $ | 18,205 | | | $ | 304 | | | $ | 18,509 | | | | | |
Class C | | | 1,949 | | | | 33 | | | | 1,982 | | | | | |
Class I | | | 121,285 | | | | 1,829 | | | | 123,114 | | | | | |
| | | | | | | | | | | | | | | | |
Total | | $ | 141,439 | | | $ | 2,166 | | | $ | 143,605 | | | | | |
| | | | | | | | | | | | | | | | |
Net Asset Value (a) | | | | | | | | | | | | | | | | |
after future share reacquisition adjustment | | | | | | | | | | | | | | | | |
Class A — Redemption price per share | | $ | 13.01 | | | $ | 0.22 | | | $ | 13.23 | | | | | |
Class C — Offering price per share (b) | | | 11.77 | | | | 0.20 | | | | 11.97 | | | | | |
Class I — Offering and redemption per share | | | 13.82 | | | | 0.21 | | | | 14.03 | | | | | |
Class A maximum public offering price per share | | | | | | | | | | | | | | | | |
[net asset value per share/(100% – maximum sales charge] | | $ | 13.73 | | | $ | 0.23 | | | $ | 13.96 | | | | | |
| | | | | | | | | | | | | | | | |
| (a) | Per share amounts may not recalculate due to rounding of net assets and/or shares outstanding. |
| (b) | Redemption price for Class C Shares varies based upon length of time the shares are held. |
As presented above, in order to correct the Fund’s net assets under the Fund’s NAV correction policy, the Fund has recorded a future share reacquisition adjustment to net assets. This amount represents the value of shares the Fund has a unilateral right to reacquire through reprocessing for the Error Period and is determined by using the corrected NAV at each reprocessing date. The Fund’s Adviser will be responsible for any shortfall to the Fund to the extent reprocessing is not completed for any applicable purchases during the Error Period.
| | | | | | | | | | |
| | | | | |
| 70 | | | | | | | | J.P. MORGAN SPECIALTY FUNDS | | |
STATEMENT OF OPERATIONS
FOR THE YEAR ENDED OCTOBER 31, 2020
(Amounts in thousands)
| | | | | | | | | | | | | | | | |
| | | Previously Reported | | | Adjustments | | | As Restated | | | | |
INVESTMENT INCOME | | | | | | | | | | | | | | | | |
Interest income from non-affiliates | | $ | — | | | $ | 10 | | | $ | 10 | | | | | |
| | | | | | | | | | | | | | | | |
Total investment income | | | 1,225 | | | | 10 | | | | 1,235 | | | | | |
| | | | | | | | | | | | | | | | |
Net investment income (loss) | | | (1,092 | ) | | | 10 | | | | (1,082 | ) | | | | |
| | | | | | | | | | | | | | | | |
| | | | |
REALIZED/UNREALIZED GAINS (LOSSES) | | | | | | | | | | | | | | | | |
Net realized gain (loss) on transactions from: | | | | | | | | | | | | | | | | |
Investments in non-affiliates | | | 11,039 | | | | 320 | | | | 11,359 | | | | | |
| | | | | | | | | | | | | | | | |
Net realized gain (loss) | | | 4,294 | | | | 320 | | | | 4,614 | | | | | |
| | | | | | | | | | | | | | | | |
Net realized/unrealized gains (losses) | | | 8,557 | | | | 320 | | | | 8,877 | | | | | |
| | | | | | | | | | | | | | | | |
Change in net assets resulting from operations | | $ | 7,465 | | | $ | 330 | | | $ | 7,795 | | | | | |
| | | | | | | | | | | | | | | | |
STATEMENT OF CHANGES IN NET ASSETS
FOR THE YEAR ENDED OCTOBER 31, 2020
(Amounts in thousands)
| | | | | | | | | | | | | | | | |
| | | Previously Reported | | | Adjustments | | | As Restated | | | | |
CHANGE IN NET ASSETS RESULTING FROM OPERATIONS: | | | | | | | | | | | | | | | | |
Net investment income (loss) | | $ | (1,092 | ) | | $ | 10 | | | $ | (1,082 | ) | | | | |
Net realized gain (loss) | | | 4,294 | | | | 320 | | | | 4,614 | | | | | |
| | | | | | | | | | | | | | | | |
Change in net assets resulting from operations | | | 7,465 | | | | 330 | | | | 7,795 | | | | | |
| | | | | | | | | | | | | | | | |
| | | | |
CAPITAL TRANSACTIONS: | | | | | | | | | | | | | | | | |
Change in net assets resulting from capital transactions | | | 77,802 | | | | (1,759 | ) | | | 76,043 | | | | | |
| | | | |
NET ASSETS: | | | | | | | | | | | | | | | | |
Change in net assets | | | 79,042 | | | | (1,429 | ) | | | 77,613 | | | | | |
Beginning of period | | | 62,397 | | | | 645 | | | | 63,042 | | | | | |
| | | | | | | | | | | | | | | | |
End of Period | | | 141,439 | | | | (784 | ) | | | 140,655 | | | | | |
| | | | | | | | | | | | | | | | |
Future share reacquisition adjustment | | | — | | | | 2,950 | | | | 2,950 | | | | | |
| | | | | | | | | | | | | | | | |
End of period after future share reacquisition adjustment | | $ | — | | | $ | 143,605 | | | $ | 143,605 | | | | | |
| | | | | | | | | | | | | | | | |
| | | | |
CAPITAL TRANSACTIONS | | | | | | | | | | | | | | | | |
Class A | | | | | | | | | | | | | | | | |
Cost of shares redeemed | | $ | (7,858 | ) | | $ | (123 | ) | | $ | (7,981 | ) | | | | |
| | | | | | | | | | | | | | | | |
Change in net assets resulting from Class A capital transactions | | | 3,877 | | | | (123 | ) | | | 3,754 | | | | | |
| | | | | | | | | | | | | | | | |
| | | | |
Class C | | | | | | | | | | | | | | | | |
Cost of shares redeemed | | | (3,621 | ) | | | (56 | ) | | | (3,677 | ) | | | | |
| | | | | | | | | | | | | | | | |
Change in net assets resulting from Class C capital transactions | | | (1,641 | ) | | | (56 | ) | | | (1,697 | ) | | | | |
| | | | | | | | | | | | | | | | |
| | | | |
Class I | | | | | | | | | | | | | | | | |
Cost of shares redeemed | | | (65,906 | ) | | | (1,040 | ) | | | (66,946 | ) | | | | |
| | | | | | | | | | | | | | | | |
Change in net assets resulting from Class I capital transactions | | | 91,928 | | | | (1,040 | ) | | | 90,888 | | | | | |
| | | | | | | | | | | | | | | | |
| | | | |
Class L | | | | | | | | | | | | | | | | |
Cost of shares redeemed | | | (8,616 | ) | | | (540 | ) | | | (9,156 | ) | | | | |
| | | | | | | | | | | | | | | | |
Change in net assets resulting from Class L capital transactions | | | (16,362 | ) | | | (540 | ) | | | (16,902 | ) | | | | |
| | | | | | | | | | | | | | | | |
Total change in net assets resulting from capital transactions | | $ | 77,802 | | | $ | (1,759 | ) | | $ | 76,043 | | | | | |
| | | | | | | | | | | | | | | | |
| | | | | | | | | | |
| | | | | |
| | J.P. MORGAN SPECIALTY FUNDS | | | | | | | | 71 |
NOTES TO FINANCIAL STATEMENTS
AS OF OCTOBER 31, 2022, OCTOBER 31, 2021, OCTOBER 31, 2020 and OCTOBER 31, 2019 (continued)
(Dollar values in thousands)
STATEMENT OF ASSETS AND LIABILITIES
AS OF OCTOBER 31, 2019
(Amounts in thousands)
| | | | | | | | | | | | | | | | |
| | | Previously Reported | | | Adjustments | | | As Restated | | | | |
Assets: | | | | | | | | | | | | | | | | |
Interest from non-affiliates | | $ | — | | | $ | 26 | | | $ | 26 | | | | | |
Class Action proceeds | | | — | | | | 795 | | | | 795 | | | | | |
| | | | | | | | | | | | | | | | |
Total Assets | | | 116,138 | | | | 821 | | | | 116,959 | | | | | |
| | | | | | | | | | | | | | | | |
Liabilities | | | | | | | | | | | | | | | | |
Due to shareholders upon reprocessing | | | — | | | | 176 | | | | 176 | | | | | |
| | | | | | | | | | | | | | | | |
Total Liabilities | | | 53,741 | | | | 176 | | | | 53,917 | | | | | |
| | | | | | | | | | | | | | | | |
Net Assets | | | 62,397 | | | | 645 | | | | 63,042 | | | | | |
| | | | | | | | | | | | | | | | |
Future share reacquisition adjustment | | | — | | | | 63 | | | | 63 | | | | | |
| | | | | | | | | | | | | | | | |
Net Assets after future share reacquisition adjustment | | $ | — | | | $ | 63,105 | | | $ | 63,105 | | | | | |
| | | | | | | | | | | | | | | | |
NET ASSETS: | | | | | | | | | | | | | | | | |
Paid-in-capital | | $ | 75,127 | | | $ | 619 | | | $ | 75,746 | | | | | |
Total distributable earnings (loss) | | | (12,730 | ) | | | 26 | | | | (12,704 | ) | | | | |
| | | | | | | | | | | | | | | | |
Net Assets | | | 62,397 | | | | 645 | | | | 63,042 | | | | | |
| | | | | | | | | | | | | | | | |
Future share reacquisition adjustment | | | — | | | | 63 | | | | 63 | | | | | |
| | | | | | | | | | | | | | | | |
Net Assets after future share reacquisition adjustment | | $ | — | | | $ | 63,105 | | | $ | 63,105 | | | | | |
| | | | | | | | | | | | | | | | |
Net Assets after future share reacquisition adjustment: | | | | | | | | | | | | | | | | |
Class A | | $ | 14,276 | | | $ | 166 | | | $ | 14,442 | | | | | |
Class C | | | 3,731 | | | | 43 | | | | 3,774 | | | | | |
Class I | | | 27,694 | | | | 320 | | | | 28,014 | | | | | |
Class L | | | 16,696 | | | | 179 | | | | 16,875 | | | | | |
| | | | | | | | | | | | | | | | |
Total | | $ | 62,397 | | | $ | 708 | | | $ | 63,105 | | | | | |
| | | | | | | | | | | | | | | | |
Net Asset Value (a) | | | | | | | | | | | | | | | | |
after future share reacquisition adjustment | | | | | | | | | | | | | | | | |
Class A — Redemption price per share | | $ | 13.11 | | | $ | 0.15 | | | $ | 13.26 | | | | | |
Class C — Offering price per share (b) | | | 12.06 | | | | 0.14 | | | | 12.20 | | | | | |
Class I — Offering and redemption per share | | | 13.80 | | | | 0.16 | | | | 13.96 | | | | | |
Class L — Offering and redemption per share | | | 14.13 | | | | 0.15 | | | | 14.28 | | | | | |
Class A maximum public offering price per share | | | | | | | | | | | | | | | | |
[net asset value per share/(100% – maximum sales charge] | | $ | 13.84 | | | $ | 0.15 | | | $ | 13.99 | | | | | |
| | | | | | | | | | | | | | | | |
| (a) | Per share amounts may not recalculate due to rounding of net assets and/or shares outstanding. |
| (b) | Redemption price for Class C Shares varies based upon length of time the shares are held. |
As presented above, in order to correct the Fund’s net assets under the Fund’s NAV correction policy, the Fund has recorded a future share reacquisition adjustment to net assets. This amount represents the value of shares the Fund has a unilateral right to reacquire through reprocessing for the Error Period and is determined by using the corrected NAV at each reprocessing date. The Fund’s Adviser will be responsible for any shortfall to the Fund to the extent reprocessing is not completed for any applicable purchases during the Error Period.
| | | | | | | | | | |
| | | | | |
| 72 | | | | | | | | J.P. MORGAN SPECIALTY FUNDS | | |
STATEMENT OF OPERATIONS
FOR THE YEAR ENDED OCTOBER 31, 2019
(Amounts in thousands)
| | | | | | | | | | | | | | | | |
| | | Previously Reported | | | Adjustments | | | As Restated | | | | |
INVESTMENT INCOME | | | | | | | | | | | | | | | | |
Interest income from non-affiliates | | $ | 3 | | | $ | 17 | | | $ | 20 | | | | | |
| | | | | | | | | | | | | | | | |
Total investment income | | | 4,112 | | | | 17 | | | | 4,129 | | | | | |
| | | | | | | | | | | | | | | | |
Net investment income (loss) | | | 108 | | | | 17 | | | | 125 | | | | | |
| | | | | | | | | | | | | | | | |
| | | | |
REALIZED/UNREALIZED GAINS (LOSSES) | | | | | | | | | | | | | | | | |
Net realized gain (loss) on transactions from: | | | | | | | | | | | | | | | | |
Investments in non-affiliates | | | 29,124 | | | | 309 | | | | 29,433 | | | | | |
| | | | | | | | | | | | | | | | |
Net realized gain (loss) | | | 26,257 | | | | 309 | | | | 26,566 | | | | | |
| | | | | | | | | | | | | | | | |
Net realized/unrealized gains (losses) | | | 2,881 | | | | 309 | | | | 3,190 | | | | | |
| | | | | | | | | | | | | | | | |
Change in net assets resulting from operations | | $ | 2,989 | | | $ | 326 | | | $ | 3,315 | | | | | |
| | | | | | | | | | | | | | | | |
STATEMENT OF CHANGES IN NET ASSETS
FOR THE YEAR ENDED OCTOBER 31, 2019
(Amounts in thousands)
| | | | | | | | | | | | | | | | |
| | | Previously Reported | | | Adjustments | | | As Restated | | | | |
CHANGE IN NET ASSETS RESULTING FROM OPERATIONS: | | | | | | | | | | | | | | | | |
Net investment income (loss) | | $ | 108 | | | $ | 17 | | | $ | 125 | | | | | |
Net realized gain (loss) | | | 26,257 | | | | 309 | | | | 26,566 | | | | | |
| | | | | | | | | | | | | | | | |
Change in net assets resulting from operations | | | 2,989 | | | | 326 | | | | 3,315 | | | | | |
| | | | | | | | | | | | | | | | |
| | | | |
CAPITAL TRANSACTIONS: | | | | | | | | | | | | | | | | |
Change in net assets resulting from capital transactions | | | (111,968 | ) | | | (175 | ) | | | (112,143 | ) | | | | |
| | | | |
NET ASSETS: | | | | | | | | | | | | | | | | |
Change in net assets | | | (122,808 | ) | | | 151 | | | | (122,657 | ) | | | | |
Beginning of period | | | 185,205 | | | | 494 | | | | 185,699 | | | | | |
| | | | | | | | | | | | | | | | |
End of Period | | | 62,397 | | | | 645 | | | | 63,042 | | | | | |
| | | | | | | | | | | | | | | | |
Future share reacquisition adjustment | | | — | | | | 63 | | | | 63 | | | | | |
| | | | | | | | | | | | | | | | |
End of period after future share reacquisition adjustment | | $ | — | | | $ | 63,105 | | | $ | 63,105 | | | | | |
| | | | | | | | | | | | | | | | |
| | | | |
CAPITAL TRANSACTIONS | | | | | | | | | | | | | | | | |
Class A | | | | | | | | | | | | | | | | |
Cost of shares redeemed | | $ | (4,003 | ) | | $ | (16 | ) | | $ | (4,019 | ) | | | | |
| | | | | | | | | | | | | | | | |
Change in net assets resulting from Class A capital transactions | | | 492 | | | | (16 | ) | | | 476 | | | | | |
| | | | | | | | | | | | | | | | |
| | | | |
Class C | | | | | | | | | | | | | | | | |
Cost of shares redeemed | | | (2,914 | ) | | | (13 | ) | | | (2,927 | ) | | | | |
| | | | | | | | | | | | | | | | |
Change in net assets resulting from Class C capital transactions | | | (1,962 | ) | | | (13 | ) | | | (1,975 | ) | | | | |
| | | | | | | | | | | | | | | | |
| | | | |
Class I | | | | | | | | | | | | | | | | |
Cost of shares redeemed | | | (18,992 | ) | | | (91 | ) | | | (19,083 | ) | | | | |
| | | | | | | | | | | | | | | | |
Change in net assets resulting from Class I capital transactions | | | (4,709 | ) | | | (91 | ) | | | (4,800 | ) | | | | |
| | | | | | | | | | | | | | | | |
| | | | |
Class L | | | | | | | | | | | | | | | | |
Cost of shares redeemed | | | (117,026 | ) | | | (55 | ) | | | (117,081 | ) | | | | |
| | | | | | | | | | | | | | | | |
Change in net assets resulting from Class L capital transactions | | | (105,789 | ) | | | (55 | ) | | | (105,844 | ) | | | | |
| | | | | | | | | | | | | | | | |
Total change in net assets resulting from capital transactions | | $ | (111,968 | ) | | $ | (175 | ) | | $ | (112,143 | ) | | | | |
| | | | | | | | | | | | | | | | |
As of July 25, 2024, the Fund has received the full balance reflected as a receivable on the Statement of Assets and Liabilities for class action payments and related interest.
As of October 15, 2024, the Advisor reimbursed the Fund $2,848 in cash towards the settlement of the future share reacquisition adjustment and due to shareholders upon reprocessing payable, net.
| | | | | | | | | | |
| | | | | |
| | J.P. MORGAN SPECIALTY FUNDS | | | | | | | | 73 |
FINANCIAL HIGHLIGHTS
FOR THE PERIODS INDICATED
(Dollar values in thousands)
| | | | | | | | | | | | | | | | | | | | | | | | |
| | | Per share operating performance | |
| | | | | | Investment operations | | | Distributions | | | | |
| | | Net asset
value,
beginning
of period * | | | Net
investment
income
(loss) (a) | | | Net realized
and unrealized
gains
(losses) on
investments | | | Total from
investment
operations | | | Net
realized
gain | | | Future
share
reacquisition
adjustment | |
Class A (As Previously Reported) | | | | | | | | | | | | | | | | | | | | | | | | |
Year Ended October 31, 2022 | | $ | 12.41 | | | $ | (0.10 | ) | | $ | (0.23 | ) | | $ | (0.33 | ) | | $ | — | | | $ | — | |
Year Ended October 31, 2021 | | | 13.01 | | | | (0.21 | ) | | | 0.52 | | | | 0.31 | | | | (0.91 | ) | | | — | |
Year Ended October 31, 2020 | | | 13.11 | | | | (0.20 | ) | | | 1.59 | | | | 1.39 | | | | (1.49 | ) | | | — | |
Year Ended October 31, 2019 | | | 14.29 | | | | (0.04 | ) | | | 0.31 | | | | 0.27 | | | | (1.45 | ) | | | — | |
| | | | | | |
Adjustment | | | | | | | | | | | | | | | | | | | | | | | | |
Year Ended October 31, 2022 | | | 0.22 | | | | — | | | | (0.09 | ) | | | (0.09 | ) | | | — | | | | 0.09 | |
Year Ended October 31, 2021 | | | 0.22 | | | | — | | | | (0.11 | ) | | | (0.11 | ) | | | — | | | | 0.11 | |
Year Ended October 31, 2020 | | | 0.15 | | | | — | | | | (0.08 | ) | | | (0.08 | ) | | | — | | | | 0.15 | |
Year Ended October 31, 2019 | | | 0.03 | | | | 0.01 | | | | 0.10 | | | | 0.11 | | | | — | | | | 0.01 | |
| | | | | | |
Class A (As Restated) | | | | | | | | | | | | | | | | | | | | | | | | |
Year Ended October 31, 2022 | | | 12.63 | | | | (0.10 | ) | | | (0.32 | ) | | | (0.42 | ) | | | — | | | | 0.09 | |
Year Ended October 31, 2021 | | | 13.23 | | | | (0.21 | ) | | | 0.41 | | | | 0.20 | | | | (0.91 | ) | | | 0.11 | |
Year Ended October 31, 2020 | | | 13.26 | | | | (0.20 | ) | | | 1.51 | | | | 1.31 | | | | (1.49 | ) | | | 0.15 | |
Year Ended October 31, 2019 | | | 14.32 | | | | (0.03 | ) | | | 0.41 | | | | 0.38 | | | | (1.45 | ) | | | 0.01 | |
| * | Net asset value per share has been calculated after future share reacquisition adjustment for the impacted periods. |
| ** | Amount presented after future share reacquisition adjustment |
| (a) | Calculated based upon average shares outstanding. |
| (b) | Includes adjustments in accordance with accounting principles generally accepted in the United States of America and as such, the net asset values for financial reporting purposes and the returns based upon those net asset values may differ from the net asset values and returns for shareholder transactions. |
| (c) | Includes interest expense, if applicable, each of which is less than 0.005% unless otherwise noted. |
| (d) | Interest expense on securities sold short is 0.16%. |
SEE NOTES TO FINANCIAL STATEMENTS.
| | | | | | | | | | |
| | | | | |
| 74 | | | | | | | | J.P. MORGAN SPECIALTY FUNDS | | |
| | | | | | | | | | | | | | | | | | | | | | | | | | | | | | |
| | | Ratios/Supplemental data | |
| | | | | | | | | | Ratios to average net assets | |
Net Asset
value,
end of
period * | | | Total return
(excludes
sales charge) (b) | | | Net assets,
end of
period
(000’s) ** | | | Net expenses
(including dividend
expense for
securities sold short) (c) | | | Net expenses
(excluding dividend
and interest
expense for
securities sold short) | | | Expenses without
waivers and
reimbursements
(including dividend
expense for
securities sold short) | | | Expenses without
waivers and
reimbursements
(excluding dividend
and interest
expense for
securities sold short) | | | Net
investment
income
(loss) | |
| | | | | | | | | | | | | | | | | | | | | | | | | | | | | | |
| $ | 12.08 | | | | (2.66 | )% | | $ | 19,898 | | | | 2.77 | % | | | 0.92 | % | | | 2.95 | % | | | 1.10 | % | | | (0.86 | )% |
| | 12.41 | | | | 2.72 | | | | 16,867 | | | | 2.99 | (d) | | | 0.93 | | | | 3.22 | | | | 1.16 | | | | (1.77 | ) |
| | 13.01 | | | | 11.97 | | | | 18,205 | | | | 3.23 | | | | 1.08 | | | | 3.61 | | | | 1.46 | | | | (1.57 | ) |
| | 13.11 | | | | 2.01 | | | | 14,276 | | | | 3.69 | | | | 1.22 | | | | 4.09 | | | | 1.62 | | | | (0.26 | ) |
| | | | | | | |
| | | | | | | | | | | | | | | | | | | | | | | | | | | | | | |
| | 0.22 | | | | 0.05 | | | | 361 | | | | (0.05 | ) | | | (0.02 | ) | | | (0.05 | ) | | | (0.02 | ) | | | 0.02 | |
| | 0.22 | | | | (0.05 | ) | | | 294 | | | | (0.07 | ) | | | (0.01 | ) | | | (0.08 | ) | | | (0.02 | ) | | | 0.06 | |
| | 0.22 | | | | 0.42 | | | | 304 | | | | (0.05 | ) | | | (0.02 | ) | | | (0.05 | ) | | | (0.02 | ) | | | 0.04 | |
| | 0.15 | | | | 0.91 | | | | 166 | | | | (0.03 | ) | | | (0.01 | ) | | | (0.03 | ) | | | (0.01 | ) | | | 0.02 | |
| | | | | | | |
| | | | | | | | | | | | | | | | | | | | | | | | | | | | | | |
| | 12.30 | | | | (2.61 | ) | | | 20,259 | | | | 2.72 | | | | 0.90 | | | | 2.90 | | | | 1.08 | | | | (0.84 | ) |
| | 12.63 | | | | 2.67 | | | | 17,161 | | | | 2.92 | (d) | | | 0.92 | | | | 3.14 | | | | 1.14 | | | | (1.71 | ) |
| | 13.23 | | | | 12.39 | | | | 18,509 | | | | 3.18 | | | | 1.06 | | | | 3.56 | | | | 1.44 | | | | (1.53 | ) |
| | 13.26 | | | | 2.92 | | | | 14,442 | | | | 3.66 | | | | 1.21 | | | | 4.06 | | | | 1.61 | | | | (0.24 | ) |
SEE NOTES TO FINANCIAL STATEMENTS.
| | | | | | | | | | |
| | | | | |
| | J.P. MORGAN SPECIALTY FUNDS | | | | | | | | 75 |
FINANCIAL HIGHLIGHTS
FOR THE PERIODS INDICATED (continued)
(Dollar values in thousands)
| | | | | | | | | | | | | | | | | | | | | | | | |
| | | Per share operating performance | |
| | | | | | Investment operations | | | Distributions | | | | |
| | | Net asset
value,
beginning
of period * | | | Net
investment
income
(loss) (a) | | | Net realized
and unrealized
gains
(losses) on
investments | | | Total from
investment
operations | | | Net
realized
gain | | | Future
share
reacquisition
adjustment | |
Class C (As Previously Reported) | | | | | | | | | | | | | | | | | | | | | | | | |
Year Ended October 31, 2022 | | $ | 11.09 | | | $ | (0.14 | ) | | $ | (0.21 | ) | | $ | (0.35 | ) | | $ | — | | | $ | — | |
Year Ended October 31, 2021 | | | 11.77 | | | | (0.25 | ) | | | 0.48 | | | | 0.23 | | | | (0.91 | ) | | | — | |
Year Ended October 31, 2020 | | | 12.06 | | | | (0.23 | ) | | | 1.43 | | | | 1.20 | | | | (1.49 | ) | | | — | |
Year Ended October 31, 2019 | | | 13.32 | | | | (0.10 | ) | | | 0.29 | | | | 0.19 | | | | (1.45 | ) | | | — | |
| | | | | | |
Adjustment | | | | | | | | | | | | | | | | | | | | | | | | |
Year Ended October 31, 2022 | | | 0.20 | | | | — | | | | (0.09 | ) | | | (0.09 | ) | | | — | | | | 0.09 | |
Year Ended October 31, 2021 | | | 0.20 | | | | — | | | | (0.07 | ) | | | (0.07 | ) | | | — | | | | 0.07 | |
Year Ended October 31, 2020 | | | 0.14 | | | | — | | | | (0.07 | ) | | | (0.07 | ) | | | — | | | | 0.13 | |
Year Ended October 31, 2019 | | | 0.03 | | | | 0.01 | | | | 0.10 | | | | 0.11 | | | | — | | | | — | |
| | | | | | |
Class C (As Restated) | | | | | | | | | | | | | | | | | | | | | | | | |
Year Ended October 31, 2022 | | | 11.29 | | | | (0.14 | ) | | | (0.30 | ) | | | (0.44 | ) | | | — | | | | 0.09 | |
Year Ended October 31, 2021 | | | 11.97 | | | | (0.25 | ) | | | 0.41 | | | | 0.16 | | | | (0.91 | ) | | | 0.07 | |
Year Ended October 31, 2020 | | | 12.20 | | | | (0.23 | ) | | | 1.36 | | | | 1.13 | | | | (1.49 | ) | | | 0.13 | |
Year Ended October 31, 2019 | | | 13.35 | | | | (0.09 | ) | | | 0.39 | | | | 0.30 | | | | (1.45 | ) | | | — | |
| * | Net asset value per share has been calculated after future share reacquisition adjustment for the impacted periods. |
| ** | Amount presented after future share reacquisition adjustment. |
| (a) | Calculated based upon average shares outstanding. |
| (b) | Includes adjustments in accordance with accounting principles generally accepted in the United States of America and as such, the net asset values for financial reporting purposes and the returns based upon those net asset values may differ from the net asset values and returns for shareholder transactions. |
| (c) | Includes interest expense, if applicable, each of which is less than 0.005% unless otherwise noted. |
| (d) | Interest expense on securities sold short is 0.16%. |
SEE NOTES TO FINANCIAL STATEMENTS.
| | | | | | | | | | |
| | | | | |
| 76 | | | | | | | | J.P. MORGAN SPECIALTY FUNDS | | |
| | | | | | | | | | | | | | | | | | | | | | | | | | | | | | |
| | | Ratios/Supplemental data | |
| | | | | | | | | | Ratios to average net assets | |
Net Asset
value,
end of
period * | | | Total return
(excludes
sales charge) (b) | | | Net assets,
end of
period
(000’s) ** | | | Net expenses
(including dividend
expense for
securities sold short) (c) | | | Net expenses
(excluding dividend
and interest
expense for
securities sold short) | | | Expenses without
waivers and
reimbursements
(including dividend
expense for
securities sold short) | | | Expenses without
waivers and
reimbursements
(excluding dividend
and interest
expense for
securities sold short) | | | Net
investment
income
(loss) | |
| | | | | | | | | | | | | | | | | | | | | | | | | | | | | | |
| $ | 10.74 | | | | (3.16 | )% | | $ | 1,476 | | | | 3.27 | % | | | 1.41 | % | | | 3.46 | % | | | 1.60 | % | | | (1.31 | )% |
| | 11.09 | | | | 2.29 | | | | 1,211 | | | | 3.49 | (d) | | | 1.43 | | | | 3.73 | | | | 1.67 | | | | (2.25 | ) |
| | 11.77 | | | | 11.36 | | | | 1,949 | | | | 3.75 | | | | 1.60 | | | | 4.10 | | | | 1.95 | | | | (2.00 | ) |
| | 12.06 | | | | 1.52 | | | | 3,731 | | | | 4.20 | | | | 1.73 | | | | 4.56 | | | | 2.09 | | | | (0.74 | ) |
| | | | | | | |
| | | | | | | | | | | | | | | | | | | | | | | | | | | | | | |
| | 0.20 | | | | 0.06 | | | | 28 | | | | (0.06 | ) | | | (0.02 | ) | | | (0.07 | ) | | | (0.03 | ) | | | 0.01 | |
| | 0.20 | | | | (0.04 | ) | | | 22 | | | | (0.05 | ) | | | (0.02 | ) | | | (0.06 | ) | | | (0.03 | ) | | | 0.03 | |
| | 0.20 | | | | 0.40 | | | | 33 | | | | (0.05 | ) | | | (0.02 | ) | | | (0.06 | ) | | | (0.02 | ) | | | 0.06 | |
| | 0.14 | | | | 0.90 | | | | 43 | | | | (0.01 | ) | | | (0.02 | ) | | | (0.01 | ) | | | (0.02 | ) | | | 0.01 | |
| | | | | | | |
| | | | | | | | | | | | | | | | | | | | | | | | | | | | | | |
| | 10.94 | | | | (3.10 | ) | | | 1,504 | | | | 3.21 | | | | 1.39 | | | | 3.39 | | | | 1.57 | | | | (1.30 | ) |
| | 11.29 | | | | 2.25 | | | | 1,233 | | | | 3.44 | (d) | | | 1.41 | | | | 3.67 | | | | 1.64 | | | | (2.22 | ) |
| | 11.97 | | | | 11.76 | | | | 1,982 | | | | 3.70 | | | | 1.58 | | | | 4.04 | | | | 1.93 | | | | (1.94 | ) |
| | 12.20 | | | | 2.42 | | | | 3,774 | | | | 4.19 | | | | 1.71 | | | | 4.55 | | | | 2.07 | | | | (0.73 | ) |
SEE NOTES TO FINANCIAL STATEMENTS.
| | | | | | | | | | |
| | | | | |
| | J.P. MORGAN SPECIALTY FUNDS | | | | | | | | 77 |
FINANCIAL HIGHLIGHTS
FOR THE PERIODS INDICATED (continued)
(Dollar values in thousands)
| | | | | | | | | | | | | | | | | | | | | | | | |
| | | Per share operating performance | |
| | | | | | Investment operations | | | Distributions | | | | |
| | | Net asset
value,
beginning
of period * | | | Net
investment
income
(loss) (a) | | | Net realized
and unrealized
gains
(losses) on
investments | | | Total from
investment
operations | | | Net
realized
gain | | | Future
share
reacquisition
adjustment | |
Class I (As Previously Reported) | | | | | | | | | | | | | | | | | | | | | | | | |
Year Ended October 31, 2022 | | $ | 13.28 | | | $ | (0.06 | ) | | $ | (0.26 | ) | | $ | (0.32 | ) | | $ | — | | | $ | — | |
Year Ended October 31, 2021 | | | 13.82 | | | | (0.20 | ) | | | 0.57 | | | | 0.37 | | | | (0.91 | ) | | | — | |
Year Ended October 31, 2020 | | | 13.80 | | | | (0.19 | ) | | | 1.70 | | | | 1.51 | | | | (1.49 | ) | | | — | |
Year Ended October 31, 2019 | | | 14.93 | | | | — | (e) | | | 0.32 | | | | 0.32 | | | | (1.45 | ) | | | — | |
| | | | | | |
Adjustment | | | | | | | | | | | | | | | | | | | | | | | | |
Year Ended October 31, 2022 | | | 0.23 | | | | — | | | | (0.27 | ) | | | (0.27 | ) | | | — | | | | 0.27 | |
Year Ended October 31, 2021 | | | 0.21 | | | | — | | | | (0.11 | ) | | | (0.11 | ) | | | — | | | | 0.13 | |
Year Ended October 31, 2020 | | | 0.16 | | | | — | | | | (0.70 | ) | | | (0.70 | ) | | | — | | | | 0.75 | |
Year Ended October 31, 2019 | | | 0.03 | | | | — | | | | 0.11 | | | | 0.11 | | | | — | | | | 0.02 | |
| | | | | | |
Class I (As Restated) | | | | | | | | | | | | | | | | | | | | | | | | |
Year Ended October 31, 2022 | | | 13.51 | | | | (0.06 | ) | | | (0.53 | ) | | | (0.59 | ) | | | — | | | | 0.27 | |
Year Ended October 31, 2021 | | | 14.03 | | | | (0.20 | ) | | | 0.46 | | | | 0.26 | | | | (0.91 | ) | | | 0.13 | |
Year Ended October 31, 2020 | | | 13.96 | | | | (0.19 | ) | | | 1.00 | | | | 0.81 | | | | (1.49 | ) | | | 0.75 | |
Year Ended October 31, 2019 | | | 14.96 | | | | — | (e) | | | 0.43 | | | | 0.43 | | | | (1.45 | ) | | | 0.02 | |
| * | Net asset value per share has been calculated after future share reacquisition adjustment for the impacted periods. |
| ** | Amount presented after future share reacquisition adjustment. |
| (a) | Calculated based upon average shares outstanding. |
| (b) | Includes adjustments in accordance with accounting principles generally accepted in the United States of America and as such, the net asset values for financial reporting purposes and the returns based upon those net asset values may differ from the net asset values and returns for shareholder transactions. |
| (c) | Includes interest expense, if applicable, each of which is less than 0.005% unless otherwise noted. |
| (d) | Interest expense on securities sold short is 0.16%. |
| (e) | Amount rounds to less than $0.005. |
SEE NOTES TO FINANCIAL STATEMENTS.
| | | | | | | | | | |
| | | | | |
| 78 | | | | | | | | J.P. MORGAN SPECIALTY FUNDS | | |
| | | | | | | | | | | | | | | | | | | | | | | | | | | | | | |
| | | Ratios/Supplemental data | |
| | | | | | | | | | Ratios to average net assets | |
Net Asset
value,
end of
period * | | | Total return
(excludes
sales charge) (b) | | | Net assets,
end of
period
(000’s) ** | | | Net expenses
(including dividend
expense for
securities sold short) (c) | | | Net expenses
(excluding dividend
and interest
expense for
securities sold short) | | | Expenses without
waivers and
reimbursements
(including dividend
expense for
securities sold short) | | | Expenses without
waivers and
reimbursements
(excluding dividend
and interest
expense for
securities sold short) | | | Net
investment
income
(loss) | |
| | | | | | | | | | | | | | | | | | | | | | | | | | | | | | |
| $ | 12.96 | | | | (2.41 | )% | | $ | 136,972 | | | | 2.45 | % | | | 0.65 | % | | | 2.64 | % | | | 0.84 | % | | | (0.48 | )% |
| | 13.28 | | | | 3.01 | | | | 74,112 | | | | 2.74 | (d) | | | 0.68 | | | | 2.95 | | | | 0.89 | | | | (1.50 | ) |
| | 13.82 | | | | 12.26 | | | | 121,285 | | | | 2.91 | | | | 0.76 | | | | 3.28 | | | | 1.13 | | | | (1.42 | ) |
| | 13.80 | | | | 2.27 | | | | 27,694 | | | | 3.43 | | | | 0.96 | | | | 3.79 | | | | 1.32 | | | | 0.01 | |
| | | | | | | |
| | | | | | | | | | | | | | | | | | | | | | | | | | | | | | |
| | 0.23 | | | | 0.04 | | | | 2,486 | | | | (0.04 | ) | | | (0.01 | ) | | | (0.05 | ) | | | (0.02 | ) | | | 0.01 | |
| | 0.23 | | | | 0.09 | | | | 1,289 | | | | (0.05 | ) | | | (0.02 | ) | | | (0.05 | ) | | | (0.02 | ) | | | — | |
| | 0.21 | | | | 0.23 | | | | 1,829 | | | | (0.04 | ) | | | (0.01 | ) | | | (0.05 | ) | | | (0.02 | ) | | | 0.03 | |
| | 0.16 | | | | 0.94 | | | | 320 | | | | (0.03 | ) | | | (0.01 | ) | | | (0.03 | ) | | | (0.01 | ) | | | 0.02 | |
| | | | | | | |
| | | | | | | | | | | | | | | | | | | | | | | | | | | | | | |
| | 13.19 | | | | (2.37 | ) | | | 139,458 | | | | 2.41 | | | | 0.64 | | | | 2.59 | | | | 0.82 | | | | (0.47 | ) |
| | 13.51 | | | | 3.10 | | | | 75,401 | | | | 2.69 | (d) | | | 0.66 | | | | 2.90 | | | | 0.87 | | | | (1.50 | ) |
| | 14.03 | | | | 12.49 | | | | 123,114 | | | | 2.87 | | | | 0.75 | | | | 3.23 | | | | 1.11 | | | | (1.39 | ) |
| | 13.96 | | | | 3.21 | | | | 28,014 | | | | 3.40 | | | | 0.95 | | | | 3.76 | | | | 1.31 | | | | 0.03 | |
SEE NOTES TO FINANCIAL STATEMENTS.
| | | | | | | | | | |
| | | | | |
| | J.P. MORGAN SPECIALTY FUNDS | | | | | | | | 79 |
FINANCIAL HIGHLIGHTS
FOR THE PERIODS INDICATED (continued)
(Dollar values in thousands)
| | | | | | | | | | | | | | | | | | | | | | | | |
| | | Per Share operating performance | | | | |
| | | | | | Investment operation | | | Distributions | | | | |
| | | Net Asset
value
beginning
of period* | | | Net
Investment
income
(loss) (a) | | | Net realized
and unrealized
gains (losses) on
investments | | | Total from
investment
operations | | | Net realized gain | | | Future
share
reacquisition
adjustment | |
Class L (As Previously Reported) | | | | | | | | | | | | | | | | | | | | | | | | |
Year ended October 31, 2019 | | $ | 15.24 | | | $ | 0.04 | | | $ | 0.30 | | | $ | 0.34 | | | $ | (1.45 | ) | | $ | — | |
| | | | | | |
Adjustment | | | | | | | | | | | | | | | | | | | | | | | | |
Year ended October 31, 2019 | | | 0.03 | | | | — | | | | 0.12 | | | | 0.12 | | | | — | | | | — | |
| | | | | | |
Class L (As Restated) | | | | | | | | | | | | | | | | | | | | | | | | |
Year ended October 31, 2019 | | | 15.27 | | | | 0.04 | | | | 0.42 | | | | 0.46 | | | | (1.45 | ) | | | — | |
| * | Net asset value per share has been calculated after future share reacquisition adjustment for the impacted periods. |
| ** | Amount presented after future share reacquisition adjustment. |
| (a) | Calculated based upon average shares outstanding. |
| (b) | Includes adjustments in accordance with accounting principles generally accepted in the United States of America and as such, the net asset values for financial reporting purposes and the returns based upon those net asset values may differ from the net asset values and returns for shareholder transactions |
| (c) | Includes interest expense, if applicable, each of which is less than 0.005% unless otherwise noted. |
Capital Accounts Reclassifications
| | | | | | | | | | | | |
| October 31, 2020 | | Previously Reported | | | Adjustments | | | As Restated | |
Paid-in-Capital | | $ | (36 | ) | | | 320 | | | $ | 284 | |
| | | |
Accumulated net realized gains (losses) | | $ | (1,052 | ) | | | (320 | ) | | $ | (1,372 | ) |
| | | | | | | | | | | | |
| October 31, 2019 | | Previously Reported | | | Adjustments | | | As Restated | |
Paid-in-Capital | | $ | (455 | ) | | | 794 | | | $ | 339 | |
| | | |
Accumulated net realized gains (losses) | | | (1 | ) | | | (794 | ) | | | (795 | ) |
SEE NOTES TO FINANCIAL STATEMENTS.
| | | | | | | | | | |
| | | | | |
| 80 | | | | | | | | J.P. MORGAN SPECIALTY FUNDS | | |
| | | | | | | | | | | | | | | | | | | | | | | | | | | | | | |
| | | Ratios/Supplemental data | |
| | | | | | | | | | Ratios to average net assets | |
Net Asset value end of period * | | | Total return (excludes sales charge) (b) | | | Net assets end of period (000’s) ** | | | Net expenses (including dividend expenses for securities sold short) (c) | | | Net expenses (excluding dividend expenses for securities sold short) (c) | | | Expense waivers and reimbursements (including dividend expenses for securities sold short) | | | Expense waivers and reimbursements (excluding dividend expenses for securities sold short) | | | Net Investment income (loss) | |
| | | | | | | | | | | | | | | | | | | | | | | | | | | | | | |
| $ | 14.13 | | | | 2.36 | % | | $ | 16,696 | | | | 3.30 | % | | | 0.83 | % | | | 3.60 | % | | | 1.13 | % | | | 0.26 | % |
| | | | | | | |
| | | | | | | | | | | | | | | | | | | | | | | | | | | | | | |
| | 0.15 | | | | 0.85 | | | | 179 | | | | (0.03 | ) | | | (0.01 | ) | | | (0.03 | ) | | | (0.01 | ) | | | 0.02 | |
| | | | | | | |
| | | | | | | | | | | | | | | | | | | | | | | | | | | | | | |
| | 14.28 | | | | 3.21 | | | | 16,875 | | | | 3.27 | | | | 0.82 | | | | 3.57 | | | | 1.12 | | | | 0.28 | |
SEE NOTES TO FINANCIAL STATEMENTS.
| | | | | | | | | | |
| | | | | |
| | J.P. MORGAN SPECIALTY FUNDS | | | | | | | | 81 |
REPORT OF INDEPENDENT REGISTERED PUBLIC ACCOUNTING FIRM
To the Board of Trustees of JPMorgan Trust I and Shareholders of JPMorgan Research Market Neutral Fund
Opinion on the Financial Statements
We have audited the accompanying statements of assets and liabilities, including the schedules of portfolio investments, of JPMorgan Research Market Neutral Fund (one of the funds constituting JPMorgan Trust I, referred to hereafter as the “Fund”) as of October 31, 2022, October 31, 2021, October 31, 2020 and October 31, 2019, the related statements of operations and of changes in net assets for each of the four years in the period ended October 31, 2022, including the related notes, and the financial highlights for each of the four years in the period ended October 31, 2022 (collectively referred to as the “financial statements”). In our opinion, the financial statements present fairly, in all material respects, the financial position of the Fund as of October 31, 2022, October 31, 2021, October 31, 2020 and October 31, 2019, the results of its operations, changes in its net assets and the financial highlights for each of the four years in the period ended October 31, 2022 in conformity with accounting principles generally accepted in the United States of America.
Restatement of Previously Issued Financial Statements
As discussed in Note 8 to the financial statements, the Fund has restated its 2022, 2021, 2020 and 2019 financial statements to correct an error.
Basis for Opinion
These financial statements are the responsibility of the Fund’s management. Our responsibility is to express an opinion on the Fund’s financial statements based on our audits. We are a public accounting firm registered with the Public Company Accounting Oversight Board (United States) (PCAOB) and are required to be independent with respect to the Fund in accordance with the U.S. federal securities laws and the applicable rules and regulations of the Securities and Exchange Commission and the PCAOB.
We conducted our audits of these financial statements in accordance with the standards of the PCAOB. Those standards require that we plan and perform the audit to obtain reasonable assurance about whether the financial statements are free of material misstatement, whether due to error or fraud.
Our audits included performing procedures to assess the risks of material misstatement of the financial statements, whether due to error or fraud, and performing procedures that respond to those risks. Such procedures included examining, on a test basis, evidence regarding the amounts and disclosures in the financial statements. Our audits also included evaluating the accounting principles used and significant estimates made by management, as well as evaluating the overall presentation of the financial statements. Our procedures included confirmation of securities owned as of October 31, 2022, October 31, 2021, October 31, 2020 and October 31, 2019 by correspondence with the custodian, transfer agent and brokers; when replies were not received from brokers, we performed other auditing procedures. We believe that our audits provide a reasonable basis for our opinion.
/s/ PricewaterhouseCoopers LLP
New York, New York
December 21, 2023, except for the effects of the restatement discussed in Note 8 to the financial statements, as to which the date is December 13, 2024
We have served as the auditor of one or more investment companies in the JPMorgan Funds complex since 1993.
| | | | | | | | | | |
| | | | | |
| 82 | | | | | | | | J.P. MORGAN SPECIALTY FUNDS | | |
TRUSTEES
(Unaudited)
The Fund’s Statement of Additional Information includes additional information about the Fund’s Trustees and is available, without charge, upon request by calling 1-800-480-4111 or on the J.P. Morgan Funds’ website at www.jpmorganfunds.com.
| | | | | | | | |
Name (Year of Birth); Positions With the Funds (1) | | Principal Occupation
During Past 5 Years | | Number of Funds in Fund Complex Overseen by Trustee (2) | | | Other Directorships Held During the Past 5 Years |
Independent Trustees | | | | | | | | |
| | | |
John F. Finn (1947); Chair since 2020; Trustee since 1998. | | Chairman, Gardner, Inc. (supply chain management company serving industrial and consumer markets) (serving in various roles 1974-present). | | | 166 | | | Director, Greif, Inc. (GEF) (industrial package products and services) (2007-present); Trustee, Columbus Association for the Performing Arts (1988-present). |
| | | |
| Stephen P. Fisher (1959); Trustee since 2018. | | Retired; Chairman and Chief Executive Officer, NYLIFE Distributors LLC (registered broker-dealer) (serving in various roles 2008-2013); Chairman, NYLIM Service Company LLC (transfer agent) (2008-2017); New York Life Investment Management LLC (registered investment adviser) (serving in various roles 2005-2017); Chairman, IndexIQ Advisors LLC (registered investment adviser for ETFs) (2014-2017); President, MainStay VP Funds Trust (2007-2017), MainStay DefinedTerm Municipal Opportunities Fund (2011-2017) and MainStay Funds Trust (2007-2017) (registered investment companies). | | | 166 | | | Honors Program Advisory Board Member, The Zicklin School of Business, Baruch College, The City University of New York (2017-present). |
| | | |
Gary L. French (1951); Trustee since 2014. | | Real Estate Investor (2011-2020); Investment management industry Consultant and Expert Witness (2011-present); Senior Consultant for The Regulatory Fundamentals Group LLC (2011-2017). | | | 166 | | | Independent Trustee, The China Fund, Inc. (2013-2019); Exchange Traded Concepts Trust II (2012-2014); Exchange Traded Concepts Trust I (2011-2014). |
| | | |
Kathleen M. Gallagher (1958); Trustee since 2018. | | Retired; Chief Investment Officer — Benefit Plans, Ford Motor Company (serving in various roles 1985-2016). | | | 166 | | | Non- Executive Director, Legal & General Investment Management (Holdings) (2018-present); Non-Executive Director, Legal & General Investment Management America (U.S. Holdings) (financial services and insurance) (2017-present); Advisory Board Member, State Street Global Advisors Total Portfolio Solutions (2017-present); Member, Client Advisory Council, Financial Engines, LLC (registered investment adviser) (2011-2016); Director, Ford Pension Funds Investment Management Ltd. (2007-2016). |
| | | |
Robert J. Grassi (1957); Trustee since 2014. | | Sole Proprietor, Academy Hills Advisors LLC (2012-present); Pension Director, Corning Incorporated (2002-2012). | | | 166 | | | None |
| | | |
Frankie D. Hughes (1952); Trustee since 2008. | | President, Ashland Hughes Properties (property management) (2014-present); President and Chief Investment Officer, Hughes Capital Management, Inc. (fixed income asset management) (1993-2014). | | | 166 | | | None |
| | | | | | | | | | |
| | | | | |
| | | J.P. MORGAN SPECIALTY FUNDS | | | | | | | | 83 |
TRUSTEES
(Unaudited) (continued)
| | | | | | |
Name (Year of Birth); Positions With the Funds (1) | | Principal Occupation
During Past 5 Years | | Number of Funds in Fund Complex Overseen by Trustee (2) | | Other Directorships Held During the Past 5 Years |
| | | |
| Raymond Kanner (1953); Trustee since 2017. | | Retired; Managing Director and Chief Investment Officer, IBM Retirement Funds (2007-2016). | | 166 | | Advisory Board Member, Penso Advisors, LLC (2020-present); Advisory Board Member, Los Angeles Capital (2018-present); Advisory Board Member, State Street Global Advisors Total Portfolio Solutions (2017-present); Acting Executive Director, Committee on Investment of Employee Benefit Assets (CIEBA) (2016-2017); Advisory Board Member, Betterment for Business (robo advisor) (2016- 2017); Advisory Board Member, BlueStar Indexes (index creator) (2013-2017); Director, Emerging Markets Growth Fund (registered investment company) (1997-2016); Member, Russell Index Client Advisory Board (2001-2015). |
| | | |
| Thomas P. Lemke (1954); Trustee since 2014. | | Retired since 2013. | | 166 | | (1) Independent Trustee of Advisors’ Inner Circle III fund platform, consisting of the following: (i) the Advisors’ Inner Circle Fund III, (ii) the Gallery Trust, (iii) the Schroder Series Trust, (iv) the Delaware Wilshire Private Markets Fund (since 2020), (v) Chiron Capital Allocation Fund Ltd., and (vi) formerly the Winton Diversified Opportunities Fund (2014-2018); and (2) Independent Trustee of the Symmetry Panoramic Trust (since 2018). |
| | | |
| Lawrence R. Maffia (1950); Trustee since 2014 | | Retired; Director and President, ICI Mutual Insurance Company (2006-2013). | | 166 | | Director, ICI Mutual Insurance Company (1999-2013). |
| | | |
Mary E. Martinez (1960); Vice Chair since 2021; Trustee since 2013. | | Associate, Special Properties, a Christie’s International Real Estate Affiliate (2010-present); Managing Director, Bank of America (asset management) (2007-2008); Chief Operating Officer, U.S. Trust Asset Management, U.S. Trust Company (asset management) (2003-2007); President, Excelsior Funds (registered investment companies) (2004-2005). | | 166 | | None |
| | | |
| Marilyn McCoy (1948); Trustee since 2005. | | Vice President of Administration and Planning, Northwestern University (1985-present). | | 166 | | None |
| | | |
| Dr. Robert A. Oden, Jr. (1946); Trustee since 2005. | | Retired; President, Carleton College (2002-2010); President, Kenyon College (1995-2002). | | 166 | | Trustee, The Coldwater Conservation Fund (2017-present); Trustee, American Museum of Fly Fishing (2013-present); Trustee and Vice Chair, Trout Unlimited (2017-2021);Trustee, Dartmouth- Hitchcock MedicalCenter (2011-2020). |
| | | | | | | | | | |
| | | | | |
| 84 | | | | | | | | J.P. MORGAN SPECIALTY FUNDS | | |
| | | | | | | | |
Name (Year of Birth); Positions With the Funds (1) | | Principal Occupation
During Past 5 Years | | Number of Funds in Fund Complex Overseen by Trustee (2) | | | Other Directorships Held During the Past 5 Years |
| | | |
| Marian U. Pardo* (1946); Trustee since 2013. | | Managing Director and Founder, Virtual Capital Management LLC (investment consulting) (2007-present); Managing Director, Credit Suisse Asset Management (portfolio manager) (2003-2006). | | | 166 | | | Board Chair and Member, Board of Governors, Columbus Citizens Foundation (not-for-profit supporting philanthropic and cultural programs) (2006-present). |
| | | |
| Emily A. Youssouf (1951); Trustee since 2022. | | Adjunct Professor (2011-present) and Clinical Professor (2009-2011), NYU Schack Institute of Real Estate; Board Member and Member of the Audit Committee (2013–present), Chair of Finance Committee (2019-present), Member of Related Parties Committee (2013-2018) and Member of the Enterprise Risk Committee (2015-2018), PennyMac Financial Services, Inc.; Board Member (2005-2018), Chair of Capital Committee (2006-2016), Chair of Audit Committee (2005-2018), Member of Finance Committee (2005-2018) and Chair of IT Committee (2016-2018), NYC Health and Hospitals Corporation. | | | 166 | | | Trustee, NYC School Construction Authority (2009-present); Board Member, NYS Job Development Authority (2008-present); Trustee and Chair of the Audit Committee of the Transit Center Foundation (2015-2019). |
Interested Trustees | | | | | | | | |
| | | |
| Robert F. Deutsch** (1957); Trustee since 2014. | | Retired; Head of ETF Business for JPMorgan Asset Management (2013-2017); Head of Global Liquidity Business for JPMorgan Asset Management (2003-2013). | | | 166 | | | Treasurer and Director of the JUST Capital Foundation (2017-present). |
| | | |
| Nina O. Shenker** (1957); Trustee since 2022. | | Vice Chair (2017-2021), General Counsel and Managing Director (2008-2016), Associate General Counsel and Managing Director (2004-2008), J.P. Morgan Asset & Wealth Management. | | | 166 | | | Director and Member of Legal and Human Resources Subcommittees, American Jewish Joint Distribution Committee (2018-present). |
| (1) | The year shown is the first year in which a Trustee became a member of any of the following: the Mutual Fund Board, the ETF Board, the heritage J.P. Morgan Funds or the heritage One Group Mutual Funds. Trustees serve an indefinite term, until resignation, retirement, removal or death. The Board’s current retirement policy sets retirement at the end of the calendar year in which the Trustee attains the age of 75, provided that any Board member who was a member of the Mutual Fund Board prior to January 1, 2022 and was born prior to January 1, 1950 shall retire from the Board at the end of the calendar year in which the Trustee attains the age of 78. |
| (2) | A Fund Complex means two or more registered investment companies that hold themselves out to investors as related companies for purposes of investment and investor services or have a common investment adviser or have an investment adviser that is an affiliated person of the investment adviser of any of the other registered investment companies. The J.P. Morgan Funds Complex for which the Board of Trustees serves currently includes nine registered investment companies (166 J.P. Morgan Funds). |
| * | In connection with prior employment with JPMorgan Chase, Ms. Pardo was the recipient of non-qualified pension plan payments from JPMorgan Chase in the amount of approximately $2,055 per month, which she irrevocably waived effective January 1, 2013, and deferred compensation payments from JPMorgan Chase in the amount of approximately $7,294 per year, which ended in January 2013. In addition, Ms. Pardo receives payments from a fully-funded qualified plan, which is not an obligation of JPMorgan Chase. |
| ** | Designation as an “Interested Trustee” is based on prior employment by the Adviser or an affiliate of the Adviser or interests in a control person of the Adviser. |
The contact address for each of the Trustees is 277 Park Avenue, New York, NY 10172.
The following Trustee changes occurred during the fiscal years ended October 31, 2019 through October 31, 2022:
| • | | Effective January 1, 2022, Mr. Gary L. French, Mr. Robert J. Grassi, Mr. Thomas P. Lemke, Mr. Lawrence R. Maffia, and Ms. Emily A. Youssouf became Independent Trustees of the Trust, and Mr. Robert F. Deutsch and Ms. Nina O. Shenker became Interested Trustees of the Trust. |
| • | | Dr. Matthew Goldstein resigned as Trustee and Chairman of the Trust as of January 1, 2021. |
| • | | Mr. Dennis P. Harrington, Mr. Mitchell M. Merin and Mr. Peter C. Marshall, each resigned as a Trustee of the Trust in 2020. |
| | | | | | | | | | |
| | | | | |
| | | J.P. MORGAN SPECIALTY FUNDS | | | | | | | | 85 |
OFFICERS
(Unaudited)
| | |
Name (Year of Birth), Positions Held with the Trust (Since) | | Principal Occupations During Past 5 Years |
| |
Brian S. Shlissel (1964), President and Principal Executive Officer (2016)* | | Managing Director and Chief Administrative Officer for J.P. Morgan pooled vehicles, J.P. Morgan Investment Management Inc. since 2014. |
| |
Timothy J. Clemens (1975), Treasurer and Principal Financial Officer (2018) | | Executive Director, J.P. Morgan Investment Management Inc. since February 2016. Mr. Clemens has been with J.P. Morgan Investment Management Inc. since 2013. |
| |
Gregory S. Samuels (1980), Secretary (2019) (formerly Assistant Secretary 2010-2019)** | | Managing Director and Assistant General Counsel, JPMorgan Chase & Co. Mr. Samuels has been with JPMorgan Chase & Co. since 2010. |
| |
Stephen M. Ungerman (1953), Chief Compliance Officer (2005) | | Managing Director, JPMorgan Chase & Co. Mr. Ungerman has been with JPMorgan Chase & Co. since 2000. |
| |
| Kiesha Astwood-Smith (1973), Assistant Secretary (2021)** | | Vice President and Assistant General Counsel, JPMorgan Chase & Co. since June 2021; Senior Director and Counsel, Equitable Financial Life Insurance Company (formerly, AXA Equitable Life Insurance Company) from September 2015 through June 2021. |
| |
Matthew Beck (1988), Assistant Secretary (2021)*** | | Vice President and Assistant General Counsel, JPMorgan Chase & Co. since May 2021; Senior Legal Counsel, Ultimus Fund Solutions from May 2018 through May 2021; General Counsel, The Nottingham Company from April 2014 through May 2018. |
| |
Elizabeth A. Davin (1964), Assistant Secretary (2005)*** | | Executive Director and Assistant General Counsel, JPMorgan Chase & Co. Ms. Davin has been with JPMorgan Chase & Co. (formerly Bank One Corporation) since 2004. |
| |
Jessica K. Ditullio (1962) Assistant Secretary (2005)*** | | Executive Director and Assistant General Counsel, JPMorgan Chase & Co. Ms. Ditullio has been with JPMorgan Chase & Co. (formerly Bank One Corporation) since 1990. |
| |
Anthony Geron (1971), Assistant Secretary (2018)** | | Vice President and Assistant General Counsel, JPMorgan Chase & Co. since September 2018; Lead Director and Counsel, AXA Equitable Life Insurance Company from 2015 to 2018 and Senior Director and Counsel, AXA Equitable Life Insurance Company from 2014 to 2015. |
| |
Carmine Lekstutis (1980), Assistant Secretary (2011)** | | Executive Director and Assistant General Counsel, JPMorgan Chase & Co. Mr. Lekstutis has been with JPMorgan Chase & Co. since 2011. |
| |
Max Vogel (1990), Assistant Secretary (2021)** | | Vice President and Assistant General Counsel, JPMorgan Chase & Co. since June 2021; Associate, Proskauer Rose LLP (law firm) from March 2017 to June 2021. |
| |
Zachary E. Vonnegut-Gabovitch (1986), Assistant Secretary (2017)** | | Vice President and Assistant General Counsel, JPMorgan Chase & Co. since September 2016. |
| |
| Michael M. D’Ambrosio (1969), Assistant Treasurer (2012) | | Managing Director, J.P. Morgan Investment Management Inc. Mr. D’Ambrosio has been with J.P. Morgan Investment Management Inc. since 2012. |
| |
Aleksandr Fleytekh (1972), Assistant Treasurer (2019) | | Vice President, J.P. Morgan Investment Management Inc. since February 2012. |
| |
Shannon Gaines (1977), Assistant Treasurer (2018)*** | | Vice President, J.P. Morgan Investment Management Inc. since January 2014. |
| |
Jeffrey D. House (1972), Assistant Treasurer (2017)*** | | Vice President, J.P. Morgan Investment Management Inc. since July 2006. |
| |
Michael Mannarino (1985), Assistant Treasurer (2020) | | Vice President, J.P. Morgan Investment Management Inc. since 2014. |
| |
| Joseph Parascondola (1963), Assistant Treasurer (2011)* | | Executive Director, J.P. Morgan Investment Management, Inc. Mr. Parascondola has been with J.P. Morgan Investment Management Inc. since 2006. |
| |
Gillian I. Sands (1969), Assistant Treasurer (2012) | | Executive Director, J.P. Morgan Investment Management Inc. Ms. Sands has been with J.P. Morgan Investment Management Inc. since 2012. |
The contact address for each of the officers, unless otherwise noted, is 277 Park Avenue, New York, NY 10172.
| * | The contact address for the officer is 575 Washington Boulevard, Jersey City, NJ 07310. |
| ** | The contact address for the officer is 4 New York Plaza, New York, NY 10004. |
| *** | The contact address for the officer is 1111 Polaris Parkway, Columbus, OH 43240. |
| | | | | | | | | | |
| | | | | |
| 86 | | | | | | | | J.P. MORGAN SPECIALTY FUNDS | | |
The following Officer changes occurred during the fiscal years ended October 31, 2019 through October 31, 2022:
| • | | Ms. Kiesha Astwood-Smith, Mr. Matthew Beck, and Mr. Max Vogel were each added as an Assistant Secretary of the Trust in 2021. |
| • | | Ms. Keri E. Reimer resigned as Assistant Secretary of the Trust in 2021. |
| • | | Mr. Michael Mannarino was added as Assistant Treasurer of the Trust in 2020. |
| • | | Ms. Lauren A. Paino resigned as Assistant Treasurer of the Trust in 2020. |
| | | | | | | | | | |
| | | | | |
| | | J.P. MORGAN SPECIALTY FUNDS | | | | | | | | 87 |
SCHEDULE OF SHAREHOLDER EXPENSES
(Unaudited)
Hypothetical $1,000 Investment
As a shareholder of the Fund, you incur two types of costs: (1) transaction costs, including sales charges (loads) on purchase payments and (2) ongoing costs, including investment advisory fees, administration fees, distribution fees and other Fund expenses. The examples below are intended to help you understand your ongoing costs (in dollars) of investing in the Fund (not including expenses of the Underlying Funds and ETFs) and to compare these ongoing costs with the ongoing costs of investing in other mutual funds. The examples assume that you had a $1,000 investment in each Class at the beginning of the reporting period, May 1, 2022, and continued to hold your shares at the end of the reporting period, October 31, 2022.
Actual Expenses
For each Class of the Fund in the table below, the first line provides information about actual account values and actual expenses. You may use the information in this line, together with the amount you invested, to estimate the expenses that you paid over the period. Simply divide your account value by $1,000 (for example, an $8,600 account value divided by $1,000 = 8.6), then multiply the result by the number in the first line of each Class under the heading titled “Expenses Paid During the Period” to estimate the expenses you paid on your account during this period.
Hypothetical Example for Comparison Purposes
The second line of each Class in the table below provides information about hypothetical account values and hypothetical expenses based on the Class’ actual expense ratio and an assumed rate of return of 5% per year before expenses, which is not the Class’ actual return. The hypothetical account values and expenses may not be used to estimate the actual ending account balance or expenses you paid for the period. You may use this information to compare the ongoing costs of investing in the Class of the Fund and other funds. To do so, compare this 5% hypothetical example with the 5% hypothetical examples that appear in the shareholder reports of the other funds. Please note that the expenses shown in the table are meant to highlight your ongoing costs only and do not reflect any transaction costs, such as sales charges (loads), or redemption fees, and expenses of the Underlying Funds and ETFs. Therefore, the second line for each Class in the table is useful in comparing ongoing costs only, and will not help you determine the relative total costs of owning different funds. In addition, if these transaction costs were included, your costs would have been higher. The examples also assume all dividends and distributions have been reinvested.
| | | | | | | | | | | | | | | | |
| | | Beginning Account Value May 1, 2022 | | | Ending Account Value October 31, 2022 | | | Expenses Paid During the Period* | | | Annualized Expense Ratio | |
JPMorgan Research Market Neutral Fund | | | | | | | | | | | | | | | | |
Class A | | | | | | | | | | | | | | | | |
Actual | | $ | 1,000.00 | | | $ | 1,000.80 | | | $ | 12.56 | | | | 2.49 | % |
Hypothetical | | | 1,000.00 | | | | 1,012.65 | | | | 12.63 | | | | 2.49 | |
Class C | | | | | | | | | | | | | | | | |
Actual | | | 1,000.00 | | | | 998.20 | | | | 14.91 | | | | 2.96 | |
Hypothetical | | | 1,000.00 | | | | 1,010.28 | | | | 15.00 | | | | 2.96 | |
Class I | | | | | | | | | | | | | | | | |
Actual | | | 1,000.00 | | | | 1,002.30 | | | | 10.95 | | | | 2.17 | |
Hypothetical | | | 1,000.00 | | | | 1,014.27 | | | | 11.02 | | | | 2.17 | |
| * | Expenses are equal to each Class’ respective annualized expense ratio, multiplied by the average account value over the period, multiplied by 184/365 (to reflect the one-half year period). |
| | | | | | | | | | |
| | | | | |
| 88 | | | | | | | | J.P. MORGAN SPECIALTY FUNDS | | |
SCHEDULE OF SHAREHOLDER EXPENSES
(Unaudited)
Hypothetical $1,000 Investment
As a shareholder of the Fund, you incur two types of costs: (1) transaction costs, including sales charges (loads) on purchase payments and (2) ongoing costs, including investment advisory fees, administration fees, distribution fees and other Fund expenses. The examples below are intended to help you understand your ongoing costs (in dollars) of investing in the Fund and to compare these ongoing costs with the ongoing costs of investing in other mutual funds. The examples assume that you had a $1,000 investment in each Class at the beginning of the reporting period, May 1, 2021, and continued to hold your shares at the end of the reporting period, October 31, 2021.
Actual Expenses
For each Class of the Fund in the table below, the first line provides information about actual account values and actual expenses. You may use the information in this line, together with the amount you invested, to estimate the expenses that you paid over the period. Simply divide your account value by $1,000 (for example, an $8,600 account value divided by $1,000 = 8.6), then multiply the result by the number in the first line of each Class under the heading titled “Expenses Paid During the Period” to estimate the expenses you paid on your account during this period.
Hypothetical Example for Comparison Purposes
The second line of each Class in the table below provides information about hypothetical account values and hypothetical expenses based on the Class’ actual expense ratio and an assumed rate of return of 5% per year before expenses, which is not the Class’ actual return. The hypothetical account values and expenses may not be used to estimate the actual ending account balance or expenses you paid for the period. You may use this information to compare the ongoing costs of investing in the Class of the Fund and other funds. To do so, compare this 5% hypothetical example with the 5% hypothetical examples that appear in the shareholder reports of the other funds. Please note that the expenses shown in the table are meant to highlight your ongoing costs only and do not reflect any transaction costs, such as sales charges (loads) or redemption fees. Therefore, the second line for each Class in the table is useful in comparing ongoing costs only, and will not help you determine the relative total costs of owning different funds. In addition, if these transaction costs were included, your costs would have been higher. The examples also assume all dividends and distributions have been reinvested.
| | | | | | | | | | | | | | | | |
| | | Beginning
Account Value
May 1, 2021 | | | Ending
Account Value
October 31, 2021 | | | Expenses
Paid During
the Period* | | | Annualized
Expense
Ratio | |
JPMorgan Research Market Neutral Fund | | | | | | | | | | | | | | | | |
Class A | | | | | | | | | | | | | | | | |
Actual | | $ | 1,000.00 | | | $ | 1,010.40 | | | $ | 14.59 | | | | 2.88 | % |
Hypothetical | | | 1,000.00 | | | | 1,010.69 | | | | 14.60 | | | | 2.88 | |
Class C | | | | | | | | | | | | | | | | |
Actual | | | 1,000.00 | | | | 1,008.00 | | | | 17.26 | | | | 3.41 | |
Hypothetical | | | 1,000.00 | | | | 1,008.01 | | | | 17.26 | | | | 3.41 | |
Class I | | | | | | | | | | | | | | | | |
Actual | | | 1,000.00 | | | | 1,011.20 | | | | 13.43 | | | | 2.65 | |
Hypothetical | | | 1,000.00 | | | | 1,011.85 | | | | 13.44 | | | | 2.65 | |
| * | Expenses are equal to each Class’ respective annualized expense ratio, multiplied by the average account value over the period, multiplied by 184/365 (to reflect the one-half year period). |
| | | | | | | | | | |
| | | | | |
| | J.P. MORGAN SPECIALTY FUNDS | | | | | | | | 89 |
SCHEDULE OF SHAREHOLDER EXPENSES
(Unaudited)
Hypothetical $1,000 Investment
As a shareholder of the Fund, you incur two types of costs: (1) transaction costs, including sales charges (loads) on purchase payments and (2) ongoing costs, including investment advisory fees, administration fees, distribution fees and other Fund expenses. The examples below are intended to help you understand your ongoing costs (in dollars) of investing in the Fund and to compare these ongoing costs with the ongoing costs of investing in other mutual funds. The examples assume that you had a $1,000 investment in each Class at the beginning of the reporting period, May 1, 2020, and continued to hold your shares at the end of the reporting period, October 31, 2020.
Actual Expenses
For each Class of the Fund in the table below, the first line provides information about actual account values and actual expenses. You may use the information in this line, together with the amount you invested, to estimate the expenses that you paid over the period. Simply divide your account value by $1,000 (for example, an $8,600 account value divided by $1,000 = 8.6), then multiply the result by the number in the first line of each Class under the heading titled “Expenses Paid During the Period” to estimate the expenses you paid on your account during this period.
Hypothetical Example for Comparison Purposes
The second line of each Class in the table below provides information about hypothetical account values and hypothetical expenses based on the Class’ actual expense ratio and an assumed rate of return of 5% per year before expenses, which is not the Class’ actual return. The hypothetical account values and expenses may not be used to estimate the actual ending account balance or expenses you paid for the period. You may use this information to compare the ongoing costs of investing in the Class of the Fund and other funds. To do so, compare this 5% hypothetical example with the 5% hypothetical examples that appear in the shareholder reports of the other funds. Please note that the expenses shown in the table are meant to highlight your ongoing costs only and do not reflect any transaction costs, such as sales charges (loads) or redemption fees. Therefore, the second line for each Class in the table is useful in comparing ongoing costs only, and will not help you determine the relative total costs of owning different funds. In addition, if these transaction costs were included, your costs would have been higher. The examples also assume all dividends and distributions have been reinvested.
| | | | | | | | | | | | | | | | |
| | | Beginning Account Value May 1, 2020 | | | Ending Account Value October 31, 2020 | | | Expenses
Paid During
the Period | | | Annualized
Expense
Ratio | |
| | | | |
JPMorgan Research Market Neutral Fund | | | | | | | | | | | | | | | | |
Class A | | | | | | | | | | | | | | | | |
Actual* | | $ | 1,000.00 | | | $ | 1,028.90 | | | $ | 15.10 | | | | 2.96 | % |
Hypothetical* | | | 1,000.00 | | | | 1,010.26 | | | | 14.96 | | | | 2.96 | |
Class C | | | | | | | | | | | | | | | | |
Actual* | | | 1,000.00 | | | | 1,025.90 | | | | 17.82 | | | | 3.50 | |
Hypothetical* | | | 1,000.00 | | | | 1,007.54 | | | | 17.66 | | | | 3.50 | |
Class I | | | | | | | | | | | | | | | | |
Actual* | | | 1,000.00 | | | | 1,030.20 | | | | 13.37 | | | | 2.62 | |
Hypothetical* | | | 1,000.00 | | | | 1,011.97 | | | | 13.25 | | | | 2.62 | |
| * | Expenses are equal to each Class’ respective annualized expense ratio, multiplied by the average account value over the period, multiplied by 184/366 (to reflect the one-half year period). |
| | | | | | | | | | |
| | | | | |
| 90 | | | | | | | | J.P. MORGAN SPECIALTY FUNDS | | |
SCHEDULE OF SHAREHOLDER EXPENSES
(Unaudited)
Hypothetical $1,000 Investment
As a shareholder of the Fund, you incur two types of costs: (1) transaction costs, including sales charges (loads) on purchase payments and (2) ongoing costs, including investment advisory fees, administration fees, distribution fees and other Fund expenses. The examples below are intended to help you understand your ongoing costs (in dollars) of investing in the Fund and to compare these ongoing costs with the ongoing costs of investing in other mutual funds. The examples assume that you had a $1,000 investment in each Class at the beginning of the reporting period, May 1, 2019, and continued to hold your shares at the end of the reporting period, October 31, 2019.
Actual Expenses
For each Class of the Fund in the table below, the first line provides information about actual account values and actual expenses. You may use the information in this line, together with the amount you invested, to estimate the expenses that you paid over the period. Simply divide your account value by $1,000 (for example, an $8,600 account value divided by $1,000 = 8.6), then multiply the result by the number in the first line of each Class under the heading entitled “Expenses Paid During the Period” to estimate the expenses you paid on your account during this period.
Hypothetical Example for Comparison Purposes
The second line of each Class in the table below provides information about hypothetical account values and hypothetical expenses based on the Class’ actual expense ratio and an assumed rate of return of 5% per year before expenses, which is not the Class’ actual return. The hypothetical account values and expenses may not be used to estimate the actual ending account balance or expenses you paid for the period. You may use this information to compare the ongoing costs of investing in the Class of the Fund and other funds. To do so, compare this 5% hypothetical example with the 5% hypothetical examples that appear in the shareholder reports of the other funds. Please note that the expenses shown in the table are meant to highlight your ongoing costs only and do not reflect any transaction costs, such as sales charges (loads) or redemption fees. Therefore, the second line for each Class in the table is useful in comparing ongoing costs only, and will not help you determine the relative total costs of owning different funds. In addition, if these transaction costs were included, your costs would have been higher. The examples also assume all dividends and distributions have been reinvested.
| | | | | | | | | | | | | | | | |
| | | Beginning
Account Value
May 1, 2019 | | | Ending
Account Value
October 31, 2019 | | | Expenses
Paid During
the Period* | | | Annualized
Expense
Ratio | |
JPMorgan Research Market Neutral Fund | | | | | | | | | | | | | | | | |
Class A | | | | | | | | | | | | | | | | |
Actual | | $ | 1,000.00 | | | $ | 1,010.10 | | | $ | 18.85 | | | | 3.72 | % |
Hypothetical | | | 1,000.00 | | | | 1,006.45 | | | | 18.81 | | | | 3.72 | |
Class C | | | | | | | | | | | | | | | | |
Actual | | | 1,000.00 | | | | 1,007.60 | | | | 21.20 | | | | 4.19 | |
Hypothetical | | | 1,000.00 | | | | 1,004.08 | | | | 21.17 | | | | 4.19 | |
Class I | | | | | | | | | | | | | | | | |
Actual | | | 1,000.00 | | | | 1,011.00 | | | | 17.64 | | | | 3.48 | |
Hypothetical | | | 1,000.00 | | | | 1,007.66 | | | | 17.61 | | | | 3.48 | |
Class L | | | | | | | | | | | | | | | | |
Actual | | | 1,000.00 | | | | 1,011.50 | | | | 17.04 | | | | 3.36 | |
Hypothetical | | | 1,000.00 | | | | 1,008.27 | | | | 17.01 | | | | 3.36 | |
| * | Expenses are equal to each Class’ respective annualized expense ratio, multiplied by the average account value over the period, multiplied by 184/365 (to reflect the one-half year period). |
| | | | | | | | | | |
| | | | | |
| | J.P. MORGAN SPECIALTY FUNDS | | | | | | | | 91 |
BOARD APPROVAL OF INVESTMENT ADVISORY AGREEMENT
(Unaudited)
The Board of Trustees (the “Board” or the “Trustees”) has established various standing committees composed of Trustees with diverse backgrounds, to which the Board has assigned specific subject matter responsibilities to further enhance the effectiveness of the Board’s oversight and decision making. Effective January 2022, the Board consolidated with the J.P. Morgan Exchange-Traded Fund Trust Board and now consists of Trustees from both Boards. The Board and its investment committees (money market and alternative products, equity, and fixed income) met regularly throughout the year and at each meeting considered factors that are relevant to their annual consideration of the continuation of the investment advisory agreement. The Board also met for the specific purpose of considering annual renewals for investment advisory agreement. The Board held meetings on June 21-22, 2022 and August 9-11, 2022, at which the Trustees considered the continuation of the investment advisory agreement for the Fund, whose annual report is contained herein (“Advisory Agreement”). At the June meeting, the Board’s investment committees met to review and consider performance, expense and related information for the J.P. Morgan Funds. Each investment committee reported to the full Board, which then considered each investment committee’s preliminary findings. At the August meeting, the Trustees continued their review and consideration. The Trustees, including a majority of the Trustees who are not parties to the Advisory Agreement or “interested persons” (as defined in the Investment Company Act of 1940) of any party to the Advisory Agreement or any of their affiliates, approved the continuation of the Advisory Agreement on August 11, 2022.
As part of their review of the Advisory Agreements, the Trustees considered and reviewed performance and other information about the Fund received from the Adviser. This information includes the Fund’s performance as compared to the performance of its peers and benchmarks and analyses by the Adviser of the Fund’s performance. In addition, at each of their regular meetings throughout the year, the Trustees considered reports on the performance of certain J.P. Morgan Funds (including certain ETFs, beginning in February 2022) provided by an independent investment consulting firm (“independent consultant”). In addition, in preparation for the June and August meetings, the Trustees requested, received, and evaluated extensive materials from the Adviser, including performance and expense information compiled by Broadridge, using data from Lipper Inc. and/or Morningstar Inc., independent providers of investment company data (together, “Broadridge”). The Trustees’ independent consultant also provided additional quantitative and statistical analyses of the Fund, including risk and performance return assessments as compared to the Fund’s objectives, benchmarks, and peers. Before voting on the Advisory Agreement, the Trustees reviewed the Advisory Agreement with representatives of the Adviser, counsel to the Trust, and independent legal counsel and received a memorandum from independent legal counsel to
the Trustees discussing the legal standards for their consideration of the Advisory Agreement. The Trustees also discussed the Advisory Agreement with independent legal counsel in executive sessions at which no representatives of the Adviser were present.
A summary of the material factors evaluated by the Trustees in determining whether to approve the Advisory Agreement is provided below. Each Trustee attributed different weights to the various factors and no factor alone was considered determinative. The Trustees considered information provided with respect to the Fund throughout the year, including additional reporting and information provided in connection with the COVID-19 pandemic, as well as materials furnished specifically in connection with the annual review process. From year to year, the Trustees consider and place emphasis on relevant information in light of changing circumstances in market and economic conditions.
After considering and weighing the factors and information they had received, the Trustees found that the compensation to be received by the Adviser from the Fund under the Advisory Agreement was fair and reasonable under the circumstances and determined that the continuance of the Advisory Agreement was in the best interests of the Fund and its shareholders.
Nature, Extent and Quality of Services Provided by the Adviser
The Trustees received and considered information regarding the nature, extent and quality of services provided to the Fund under the Advisory Agreement. The Trustees took into account information furnished throughout the year at Trustee meetings, as well as the materials furnished specifically in connection with this annual review process. Among other things, the Trustees considered:
| (i) | The background and experience of the Adviser’s senior management and investment personnel, including personnel changes, if any; |
| (ii) | The qualifications, backgrounds and responsibilities of the portfolio management team primarily responsible for the day-to-day management of the Fund, including personnel changes, if any; |
| (iii) | The investment strategy for the Fund, and the infrastructure supporting the portfolio management teams; |
| (iv) | Information about the structure and distribution strategy for the Fund and how it fits with the Trusts’ other fund offerings; |
| (v) | The administration services provided by the Adviser in its role as Administrator; |
| (vi) | Their knowledge of the nature and quality of the services provided by the Adviser and its affiliates gained from their experience as Trustees of the Trusts and in the financial industry generally; |
| | | | | | | | | | |
| | | | | |
| 92 | | | | | | | | J.P. MORGAN SPECIALTY FUNDS | | |
| (vii) | The overall reputation and capabilities of the Adviser and its affiliates; |
| (viii) | The commitment of the Adviser to provide high quality service to the Fund; |
| (ix) | Their overall confidence in the Adviser’s integrity; |
| (x) | The Adviser’s responsiveness to requests for additional information, questions or concerns raised by them, including the Adviser’s willingness to consider and implement organizational and operational changes designed to improve investment results and the services provided to the Fund; and |
| (xi) | The Adviser’s business continuity plan and steps the Adviser and its affiliates have taken to provide ongoing services to the Fund during the COVID-19 pandemic, and the Adviser’s and its affiliates’ success in continuing to provide services to the Fund and its shareholders throughout this period. |
Based upon these considerations and other factors, the Trustees concluded that they were satisfied with the nature, extent and quality of the services provided to the Fund by the Adviser.
Costs of Services Provided and Profitability to the Adviser and its Affiliates
The Trustees received and considered information regarding the profitability to the Adviser and its affiliates from providing services to the Fund. The Trustees reviewed and discussed this information. The Trustees recognized that this information is not audited and represents the Adviser’s determination of its and its affiliates’ revenues from the contractual services provided to the Fund, less expenses of providing such services. Expenses include direct and indirect costs and are calculated using an allocation methodology developed by the Adviser and reviewed with the Board. The Trustees also recognized that it is difficult to make comparisons of profitability from fund investment advisory contracts because comparative information is not generally publicly available and is affected by numerous factors, including the structure of the particular adviser, the types of funds it manages, its business mix, numerous assumptions regarding allocations and the fact that publicly-traded fund managers’ operating profits and net income are net of distribution and marketing expenses. Based upon their review, and taking into consideration the factors noted above, the Trustees concluded that the profitability to the Adviser under the Advisory Agreement was not unreasonable in light of the services and benefits provided to the Fund.
The Trustees also considered that JPMDS, an affiliate of the Adviser, and the Adviser earn fees from the Fund for providing shareholder and administration services, respectively. These fees were shown separately in the profitability analysis presented to the Trustees. The Trustees also considered the pay-
ments of Rule 12b-1 fees to JPMDS, which also acts as the Fund’s distributor and that these fees are in turn generally paid to financial intermediaries that sell the Fund, including financial intermediaries that are affiliates of the Adviser (although they are retained by JPMDS in certain instances). The Trustees also considered the fees earned by JPMorgan Chase Bank, N.A. (“JPMCB”), an affiliate of the Adviser, for custody and fund accounting, and other related services for the Fund, and the profitability of the arrangements to JPMCB.
Fall-Out Benefits
The Trustees reviewed information regarding potential “fall-out” or ancillary benefits received by the Adviser and its affiliates as a result of their relationship with the Fund. The Trustees considered that the J.P. Morgan Funds’ operating accounts are held at JPMCB, which, as a result, will receive float benefits for certain J.P. Morgan Funds, as applicable. The Trustees also noted that the Adviser supports a diverse set of products and services, which benefits the Adviser by allowing it to leverage its infrastructure to serve additional clients. The Trustees also reviewed the Adviser’s allocation of fund brokerage for the J.P. Morgan Funds complex, including allocations to brokers who provide research to the Adviser, as well as the Adviser’s use of affiliates to provide other services and the benefits to such affiliates of doing so.
Economies of Scale
The Trustees considered the extent to which the Fund may benefit from potential economies of scale. The Trustees considered that there may not be a direct relationship between economies of scale realized by the Fund and those realized by the Adviser as assets increase. The Trustees considered the extent to which the Fund was priced to scale and whether it would be appropriate to add advisory fee breakpoints. The Trustees noted that the Fund has implemented contractual expense limitations and fee waivers (“Fee Caps”), which allow the Fund’s shareholders to share potential economies of scale from the Fund’s inception, and that the fees remain satisfactory relative to peer funds. The Trustees considered the benefits to the Fund of the use of an affiliated distributor and custodian, including the ability to rely on existing infrastructure supporting distribution, custodial and transfer agent services and the ability to negotiate competitive fees for the Fund. The Trustees further considered the Adviser’s and JPMDS’s ongoing investments in their business in support of the Fund, including the Adviser’s and/or JPMDS’s investments in trading systems, technology (including improvements to the J.P. Morgan Funds’ website, and cybersecurity improvements), retention of key talent, and regulatory support enhancements. The Trustees concluded that the current fee structure for the Fund, including any Fee Caps the Adviser has in place that serve to limit the overall net expense ratios of the Fund at competitive levels, was reasonable. The Trustees concluded that the Fund’s shareholders received the
benefits of potential economies of scale through the Fee Caps
| | | | | | | | | | |
| | | | | |
| | J.P. MORGAN SPECIALTY FUNDS | | | | | | | | 93 |
BOARD APPROVAL OF INVESTMENT ADVISORY AGREEMENT
(Unaudited) (continued)
and from the Adviser’s reinvestment in its operations to serve the Fund and its shareholders. The Trustees noted that the Adviser’s reinvestment ensures sufficient resources in terms of personnel and infrastructure to support the Fund.
Fees Relative to Adviser’s Other Clients
The Trustees received and considered information about the nature and extent of investment advisory services and fee rates offered to other clients of the Adviser, including, to the extent applicable, institutional separate accounts, collective investment trusts, other registered investment companies and/or private funds sub-advised by the Adviser, for investment management styles substantially similar to that of the Fund. The Trustees considered the complexity of investment management for registered investment companies relative to the Adviser’s other clients and noted differences, as applicable, in the fee structure and the regulatory, legal and other risks and responsibilities of providing services to the different clients. The Trustees considered that serving as an adviser to a registered investment company involves greater responsibilities and risks than acting as a sub-adviser and observed that sub-advisory fees may be lower than those charged by the Adviser to the Fund. The Trustees also noted that the adviser, not the applicable registered investment company, typically bears the sub-advisory fee and that many responsibilities related to the advisory function are typically retained by the primary adviser. The Trustees concluded that the fee rates charged to the Fund in comparison to those charged to the Adviser’s other clients were reasonable.
Investment Performance
The Trustees receive and consider information about the Fund’s performance throughout the year. In addition, the Trustees received and considered absolute and/or relative performance information for the Fund in a report prepared by Broadridge. The Trustees considered the total return performance information, which included the ranking of the Fund within a performance universe comprised of funds with the same Broadridge investment classification and objective (the “Universe”), as well as a subset of funds within the Universe (the “Peer Group”), by total return for the applicable one-, three- and five-year periods. The Trustees reviewed a description of Broadridge methodology for selecting mutual funds in the Fund’s Universe and Peer Group and noted that Universe and Peer Group quintile rankings were not calculated if the number of funds in the Universe and/or Peer Group did not meet a predetermined minimum. The Broadridge materials provided to the Trustees highlighted information with respect to certain representative classes to assist the Trustees in their review. As part of this review, the Trustees also reviewed the Fund’s performance against its benchmark and considered the performance information provided for the Fund at regular Board meetings by the Adviser and the Trustees’ independent consultant, and also considered the special analysis prepared
for the Fund by the Trustees’ independent consultant. The Trustees also engaged with the Adviser to consider what steps might be taken to improve performance, as applicable. The Broadridge performance data noted by the Trustees as part of their review and the determinations made by the Trustees with respect to the Fund’s performance for certain representative classes are summarized below:
The Trustees noted that the Fund’s performance for Class A shares was in the third, first and first quintiles of the Universe, for the one-, three- and five-year periods ended December 31, 2021, respectively. Broadridge did not calculate quintile rankings for the Peer Group for Class A shares of the Fund due to the limited number of funds in the Peer Groups. The Trustees noted that the performance for Class I shares was in the fifth, second and first quintiles of the Peer Group, and in the third, first and first quintiles of the Universe, for the one-, three- and five-year periods ended December 31, 2021, respectively. The Trustees discussed the performance and investment strategy of the Fund with the Adviser and reviewed the performance analysis and evaluation prepared by the independent consultant. Based upon these discussions and various other factors, the Trustees concluded that the Fund’s performance was satisfactory under the circumstances.
Advisory Fees and Expense Ratios
The Trustees considered the contractual advisory fee rate and administration fee rate paid by the Fund to the Adviser and compared the combined rate to the information prepared by Broadridge concerning management fee rates paid by other funds in the same Broadridge category as the Fund. The Trustees recognized that Broadridge reported the Fund’s management fee rate as the combined contractual advisory fee and administration fee rates. The Trustees also reviewed information about other expenses and the expense ratios for the Fund and noted that Universe and Peer Group quintile rankings were not calculated if the number of funds in the Universe and/or Peer Groups did not meet a predetermined minimum. The Trustees considered the net advisory fee rate and net expense ratio for each class, as applicable, taking into account any waivers and/or reimbursements. The Trustees also considered any proposed changes to the Fee Cap, and, where deemed appropriate by the Trustees, additional waivers and/or reimbursements. The Trustees recognized that it can be difficult to make comparisons of advisory fees because there are variations in the services that are included in the fees paid by other funds. The Trustees’ determinations as a result of the review of the Fund’s advisory fees and expense ratios for certain representative classes are summarized below:
The Trustees noted that the Fund’s net advisory fee and actual total expenses for Class A shares were both in the first quintile of the Universe. Broadridge did not calculate quintile rankings for the Peer Group for Class A shares of the Fund due to the limited
| | | | | | | | | | |
| | | | | |
| 94 | | | | | | | | J.P. MORGAN SPECIALTY FUNDS | | |
number of funds in the Peer Groups. The Trustees noted that the net advisory fee and actual total expenses for Class I shares were both in the first quintile of both the Peer Group and Universe.
After considering the factors identified above, in light of this information, the Trustees concluded that the advisory fee was satisfactory in light of the services provided to the Fund.
| | | | | | | | | | |
| | | | | |
| | J.P. MORGAN SPECIALTY FUNDS | | | | | | | | 95 |
TAX LETTER
(Unaudited)
(Dollar values in thousands)
Certain tax information for the J.P. Morgan Funds is required to be provided to shareholders based upon the Fund’s income and distributions for the taxable year ended October 31, 2021. The information and distributions reported in this letter may differ from the information and taxable distributions reported to the shareholders for the calendar year ending December 31, 2021. The information necessary to complete your income tax returns for the calendar year ending December 31, 2021 will be provided under separate cover.
Dividends Received Deduction (DRD)
The Fund had the following percentage, or maximum allowable percentage, of ordinary income distributions eligible for the dividends received deduction for corporate shareholders for the fiscal year ended October 31, 2021:
| | | | |
| | | Dividends
Received
Deduction | |
| | | 60.18 | % |
Long Term Capital Gain
The Fund distributed the following amount, or maximum allowable amount, of long-term capital gain dividends for the fiscal year ended October 31, 2021:
| | | | |
| | | Long-Term
Capital Gain
Distribution | |
| | $ | 6,527 | |
Qualified Dividend Income (QDI)
The Fund had the following amount, or maximum allowable amount, of ordinary income distributions treated as qualified dividends for the fiscal year ended October 31, 2021:
| | | | |
| | | Qualified
Dividend
Income | |
| | $ | 1,094 | |
| | | | | | | | | | |
| | | | | |
| 96 | | | | | | | | J.P. MORGAN SPECIALTY FUNDS | | |
TAX LETTER
(Unaudited)
(Dollar values in thousands)
Certain tax information for the J.P. Morgan Funds is required to be provided to shareholders based upon the Fund’s income and distributions for the taxable year ended October 31, 2020. The information and distributions reported in this letter may differ from the information and taxable distributions reported to the shareholders for the calendar year ending December 31, 2020. The information necessary to complete your income tax returns for the calendar year ending December 31, 2020 will be provided under separate cover.
Long Term Capital Gain
The Fund distributed approximately $6,225, or maximum allowable amount, of long-term capital gain dividends for the fiscal year ended October 31, 2020.
| | | | | | | | | | |
| | | | | |
| | J.P. MORGAN SPECIALTY FUNDS | | | | | | | | 97 |
TAX LETTER
(Unaudited)
(Dollar values in thousands)
Certain tax information for the J.P. Morgan Funds is required to be provided to shareholders based upon the Fund’s income and distributions for the taxable year ended October 31, 2019. The information and distributions reported in this letter may differ from the information and taxable distributions reported to the shareholders for the calendar year ending December 31, 2019. The information necessary to complete your income tax returns for the calendar year ending December 31, 2019 will be provided under separate cover.
Long Term Capital Gain
The Fund distributed the following amount, or maximum allowable amount, of long-term capital gain dividends for the fiscal year ended October 31, 2019 (amounts in thousands):
| | | | |
| | | Long Term Capital Gain | |
| | $ | 13,829 | |
| | | | | | | | | | |
| | | | | |
| 98 | | | | | | | | J.P. MORGAN SPECIALTY FUNDS | | |

Rev. January 2011
| | |
| | |
| FACTS | | WHAT DOES J.P. MORGAN FUNDS DO WITH YOUR PERSONAL INFORMATION? |
| | |
| Why? | | Financial companies choose how they share your personal information. Federal law gives consumers the right to limit some but not all sharing. Federal law also requires us to tell you how we collect, share, and protect your personal information. Please read this notice carefully to understand what we do. |
| | |
| What? | | The types of personal information we collect and share depend on the product or service you have with us. This information can include: ◾ Social Security number and account balances ◾ transaction history and account transactions ◾ checking account information and wire transfer instructions When you are no longer our customer, we continue to share your information as described in this notice. |
| | |
| How? | | All financial companies need to share customers’ personal information to run their everyday business. In the section below, we list the reasons financial companies can share their customers’ personal information; the reasons J.P. Morgan Funds chooses to share; and whether you can limit this sharing. |
| | | | |
| | | |
| Reasons we can share your personal information | | Does J.P. Morgan
Funds share? | | Can you limit this
sharing? |
For our everyday business purposes — such as to process your transactions, maintain your account(s), respond to court orders and legal investigations, or report to credit bureaus | | Yes | | No |
For marketing purposes — to offer our products and services to you | | Yes | | No |
| For joint marketing with other financial companies | | No | | We don’t share |
For our affiliates’ everyday business purposes — information about your transactions and experiences | | No | | We don’t share |
For our affiliates’ everyday business purposes — information about your creditworthiness | | No | | We don’t share |
| For nonaffiliates to market to you | | No | | We don’t share |
| | |
| | |
| Questions? | | Call 1-800-480-4111 or go to www.jpmorganfunds.com |

| | |
| |
| Who we are |
| Who is providing this notice? | | J.P. Morgan Funds |
| | |
| |
| What we do |
| How does J.P. Morgan Funds protect my personal information? | | To protect your personal information from unauthorized access and use, we use security measures that comply with federal law. These measures include computer safeguards and secured files and buildings. We authorize our employees to access your information only when they need it to do their work and we require companies that work for us to protect your information. |
How does J.P. Morgan Funds collect my personal information? | | We collect your personal information, for example, when you: ◾ open an account or provide contact information ◾ give us your account information or pay us by check ◾ make a wire transfer We also collect your personal information from others, such as credit bureaus, affiliates and other companies. |
| Why can’t I limit all sharing? | | Federal law gives you the right to limit only ◾ sharing for affiliates’ everyday business purposes – information about your creditworthiness ◾ affiliates from using your information to market to you ◾ sharing for nonaffiliates to market to you State laws and individual companies may give you additional rights to limit sharing. |
| | |
| |
| Definitions |
| Affiliates | | Companies related by common ownership or control. They can be financial and nonfinancial companies. ◾ J.P. Morgan Funds does not share with our affiliates. |
| Nonaffiliates | | Companies not related by common ownership or control. They can be financial and nonfinancial companies. ◾ J.P. Morgan Funds does not share with nonaffiliates so they can market to you. |
| Joint Marketing | | A formal agreement between nonaffiliated financial companies that together market financial products or services to you. ◾ J.P. Morgan Funds doesn’t jointly market. |
J.P. Morgan Funds are distributed by JPMorgan Distribution Services, Inc., which is an affiliate of JPMorgan Chase & Co. Affiliates of JPMorgan Chase & Co. receive fees for providing various services to the funds.
Contact JPMorgan Distribution Services, Inc. at 1-800-480-4111 for a fund prospectus. You can also visit us at www.jpmorganfunds.com. Investors should carefully consider the investment objectives and risk as well as charges and expenses of the mutual fund before investing. The prospectus contains this and other information about the mutual fund. Read the prospectus carefully before investing.
Investors may obtain information about the Securities Investor Protection Corporation (SIPC), including the SIPC brochure, by visiting www.sipc.org or by calling SIPC at 202-371-8300.
The Fund files a complete schedule of its fund holdings for the first and third quarters of its fiscal year with the SEC as an exhibit to its report on Form N-PORT. The Fund’s Form N-PORT reports are available on the SEC’s website at http://www.sec.gov. The Fund’s quarterly holdings can be found by visiting the J.P. Morgan Funds’ website at www.jpmorganfunds.com.
A description of the Fund’s policies and procedures with respect to the disclosure of the Fund’s holdings is available in the prospectuses and Statement of Additional Information.
A copy of proxy policies and procedures is available without charge upon request by calling 1-800-480-4111 and on the Fund’s website at www.jpmorganfunds.com. A description of such policies and procedures is on the SEC’s website at www.sec.gov. The Trustees have delegated the authority to vote proxies for securities owned by the Fund to the Adviser. A copy of the Fund’s voting record for the most recent 12-month period ended June 30 is available on the SEC’s website at www.sec.gov or at the Fund’s website at www.jpmorganfunds.com no later than August 31 of each year. The Fund’s proxy voting record will include, among other things, a brief description of the matter voted on for each fund security, and will state how each vote was cast, for example, for or against the proposal.

J.P. Morgan Asset Management is the brand name for the asset management business of JPMorgan Chase & Co. and its affiliates worldwide.
| | | | |
| | © JPMorgan Chase & Co., 2022. All rights reserved. October 2022. | | |
ITEM 2. CODE OF ETHICS.
Disclose whether, as of the end of the period covered by the report, the registrant has adopted a code of ethics that applies to the registrant’s principal executive officer, principal financial officer, principal accounting officer or controller, or persons performing similar functions, regardless of whether these individuals are employed by the registrant or a third party. If the registrant has not adopted such a code of ethics, explain why it has not done so.
The registrant must briefly describe the nature of any amendment, during the period covered by the report, to a provision of its code of ethics that applies to the registrant’s principal executive officer, principal financial officer, principal accounting officer or controller, or persons performing similar functions, regardless of whether these individuals are employed by the registrant or a third party, and that relates to any element of the code of ethics definition enumerated in paragraph (b) of this Item. The registrant must file a copy of any such amendment as an exhibit pursuant to Item 13(a)(1), unless the registrant has elected to satisfy paragraph (f) of this Item by positing its code of ethics on its website pursuant to paragraph (f)(2) of this Item, or by undertaking to provide its code of ethics to any person without charge, upon request, pursuant to paragraph (f)(3) of this Item.
If the registrant has, during the period covered by the report, granted a waiver, including an implicit waiver, from a provision of the code of ethics that applies to the registrant’s principal executive officer, principal financial officer, principal accounting officer or controller, or persons performing similar functions, regardless of whether these individuals are employed by the registrant or third party, that relates to one or more items set forth in paragraph (b) of this Item, the registrant must briefly describe the nature of the waiver, the name of the person to whom the waiver was granted, and the date of the waiver.
The Registrant has adopted a code of ethics that applies to the Registrant’s principal executive officer and principal financial officer. There were no amendments to the code of ethics or waivers granted with respect to the code of ethics in the period covered by the report.
ITEM 3. AUDIT COMMITTEE FINANCIAL EXPERT.
(a) (1) Disclose that the registrant’s board of directors has determined that the registrant either:
(i) Has at least one audit committee financial expert serving on its audit committee; or
(ii) Does not have an audit committee financial expert serving on its audit committee.
The Registrant’s Board of Trustees has determined that the Registrant has at least one audit committee financial expert serving on its audit committee. The Securities and Exchange Commission has stated that the designation or identification of a person as an audit committee financial expert pursuant to this Item 3 of Form N-CSR does not impose on such person any duties, obligations or liabilities that are greater than the duties, obligations and liabilities imposed on such person as a member of the Audit Committee and the Board of Trustees in the absence of such designation or identification.
(2) If the registrant provides the disclosure required by paragraph (a)(1)(i) of this Item, it must disclose the name of the audit committee financial expert and whether that person is “independent.” In order to be considered “independent” for purposes of this Item, a member of an audit committee may not, other than in his or her capacity as a member of the audit committee, the board of directors, or any other board committee:
(i) Accept directly or indirectly any consulting, advisory, or other compensatory fee from the issuer; or
(ii) Be an “interested person” of the investment company as defined in Section 2(a)(19) of the Act (15 U.S.C. 80a-2(a)(19)).
The Audit committee financial expert is Kathleen M. Gallagher. Ms. Gallagher is not an “interested person” of the Registrant and is also “independent” as defined by the U.S. Securities and Exchange Commission for the purposes of the audit committee financial expert determination. Prior to April 1, 2021, the audit committee financial expert was Dennis P. Harrington. He was not an “interested person” of the Registrant and was also “independent” as defined by the U.S. Securities and Exchange Commission for purposes of audit committee financial expert determinations.
(3) If the registrant provides the disclosure required by paragraph (a)(1)(ii) of this Item, it must explain why it does not have an audit committee financial expert.
Not applicable.
ITEM 4. PRINCIPAL ACCOUNTANT FEES AND SERVICES.
(a) Disclose, under the caption Audit Fees, the aggregate fees billed for each of the last two fiscal years for professional services rendered by the principal accountant for the audit of the registrant’s annual financial statements or services that are normally provided by the accountant in connection with statutory and regulatory filings or engagements for those fiscal years.
|
AUDIT FEES |
2022 – $837,633 |
2021 – $715,339 |
2020 – $917,646 |
2019 – $1,144,003 |
2018 – $1,215,508 |
(b) Disclose, under the caption Audit-Related Fees, the aggregate fees billed in each of the last two fiscal years for assurance and related services by the principal accountant that are reasonably related to the performance of the audit of the registrant’s financial statements and are not reported under paragraph (a) of this Item. Registrants shall describe the nature of the services comprising the fees disclosed under this category.
|
AUDIT-RELATED FEES |
2022 – $152,543 |
2021 – $116,912 |
2020 – $139,797 |
2019 – $176,810 |
2018 – $222,110 |
Audit-related fees consists of security count procedures performed as required under Rule 17f-2 of the Investment Company Act of 1940 during the Registrant’s fiscal year.
(c) Disclose, under the caption Tax Fees, the aggregate fees billed in each of the last two fiscal years for professional services rendered by the principal accountant for tax compliance, tax advice, and tax planning. Registrants shall describe the nature of the services comprising the fees disclosed under this category.
|
TAX FEES |
2022 – $235,368 |
2021 – $172,595 |
2020 – $237,771 |
2019 – $270,666 |
2018 – $296,057 |
The tax fees consist of fees billed in connection with preparing the federal regulated investment company income tax returns for the Registrant for the tax years ended October 31, 2023 and 2022, respectively.
For the last fiscal year, no tax fees were required to be approved pursuant to paragraph (c)(7)(ii) of Rule 2-01 of Regulation S-X.
(d) Disclose, under the caption All Other Fees, the aggregate fees billed in each of the last two fiscal years for products and services provided by the principal accountant, other than the services reported in paragraphs (a) through (c) of this Item. Registrants shall describe the nature of the services comprising the fees disclosed under this category.
|
ALL OTHER FEES |
2022 – Not applicable |
2021 – Not applicable |
2020 – Not applicable |
2019 – Not applicable |
2018 – Not applicable |
(e) (1) Disclose the audit committee’s pre-approval policies and procedures described in paragraph (c)(7) of Rule 2-01 of Regulation S-X.
Pursuant to the Registrant’s Audit Committee Charter and written policies and procedures for the pre-approval of audit and non-audit services (the “Pre-approval Policy”), the Audit Committee pre-approves all audit and non-audit services performed by the Registrant’s independent public registered accounting firm for the Registrant. In addition, the Audit Committee pre-approves the auditor’s engagement for non-audit services with the Registrant’s investment adviser (not including a sub-adviser whose role is primarily portfolio management and is sub-contracted or overseen by another investment adviser) and any Service Affiliate in accordance with paragraph (c)(7)(ii) of Rule 2-01 of Regulation S-X, if the engagement relates directly to the operations and financial reporting of the Registrant. Proposed services may be pre-approved either 1) without consideration of specific case-by-case services or 2) require the specific pre-approval of the Audit Committee. Therefore, initially the Pre-approval Policy listed a number of audit and non-audit services that have been approved by the Audit Committee, or which were not subject to pre-approval under the transition provisions of Sarbanes-Oxley Act of 2002 (the
“Pre-approval List”). The Audit Committee annually reviews and pre-approves the services included on the Pre-approval List that may be provided by the independent public registered accounting firm without obtaining additional specific pre-approval of individual services from the Audit Committee. The Audit Committee adds to, or subtracts from, the list of general pre-approved services from time to time, based on subsequent determinations. All other audit and non-audit services not on the Pre-approval List must be specifically pre-approved by the Audit Committee.
One or more members of the Audit Committee may be appointed as the Committee’s delegate for the purposes of considering whether to approve such services. Any pre-approvals granted by the delegate will be reported, for informational purposes only, to the Audit Committee at its next scheduled meeting. The Audit Committee’s responsibilities to pre-approve services performed by the independent public registered accounting firm are not delegated to management.
(2) Disclose the percentage of services described in each of paragraphs (b) through (d) of this Item that were approved by the audit committee pursuant to paragraph (c)(7)(i)(C) of Rule 2-01 of Regulation S-X.
|
2022 – 0.0% |
2021 – 0.0% |
2020 – 0.0% |
2019 – 0.0% |
2018 – 0.0% |
(f) If greater than 50 percent, disclose the percentage of hours expended on the principal accountant’s engagement to audit the registrant’s financial statements for the most recent fiscal year that were attributed to work performed by persons other than the principal accountant’s full-time, permanent employees.
Not applicable - Less than 50%.
(g) Disclose the aggregate non-audit fees billed by the registrant’s accountant for services rendered to the registrant, and rendered to the registrant’s investment adviser (not including any sub-adviser whose role is primarily portfolio management and is subcontracted with or overseen by another investment adviser), and any entity controlling, controlled by, or under common control with the adviser that provides ongoing services to the registrant for each of the last two fiscal years of the registrant.
The aggregate non-audit fees billed by the independent registered public accounting firm for services rendered to the Registrant, and rendered to Service Affiliates, for the last two calendar year ends were:
|
2022 - $31.9 million |
2021 - $30.8 million |
2020 - $30.3 million |
2019 - $30.6 million |
2018 - $32.5 million |
(h) Disclose whether the registrant’s audit committee of the board of directors has considered whether the provision of non-audit services that were rendered to the registrant’s investment adviser (not including any subadviser whose role is primarily portfolio management and is subcontracted with or overseen by another investment adviser), and any entity controlling, controlled by, or under common control with the investment adviser that provides ongoing services to the registrant that were not pre-approved pursuant to paragraph (c)(7)(ii) of Rule 2-01 of Regulation S-X is compatible with maintaining the principal accountant’s independence.
The Registrant’s Audit Committee has considered whether the provision of the non-audit services that were rendered to Service Affiliates that were not pre-approved (not requiring pre-approval) is compatible with maintaining the independent public registered accounting firm’s independence. All services provided by the independent public registered accounting firm to the Registrant or to Service Affiliates that were required to be pre-approved were pre-approved as required.
(i) A registrant identified by the Commission pursuant to Section 104(i)(2)(A) of the Sarbanes-Oxley Act of 2002 (15 U.S.C. 7214(i)(2)(A)), as having retained, for the preparation of the audit report on its financial statements included in the Form NCSR, a registered public accounting firm that has a branch or office that is located in a foreign jurisdiction and that the Public Company Accounting Oversight Board has determined it is unable to inspect or investigate completely because of a position taken by an authority in the foreign jurisdiction must electronically submit to the Commission on a supplemental basis documentation that establishes that the registrant is not owned or controlled by a governmental entity in the foreign jurisdiction. The registrant must submit this documentation on or before the due date for this form. A registrant that is owned or controlled by a foreign governmental entity is not required to submit such documentation.
Not applicable.
(j) A registrant that is a foreign issuer, as defined in 17 CFR 240.3b-4, identified by the Commission pursuant to Section 104(i)(2)(A) of the Sarbanes-Oxley Act of 2002 (15 U.S.C. 7214(i)(2)(A)), as having retained, for the preparation of the audit report on its financial statements included in the Form N-CSR, a registered public accounting firm that has a branch or office that is located in a foreign jurisdiction and that the Public Company Accounting Oversight Board has determined it is unable to inspect or investigate completely because of a position taken by an authority in the foreign jurisdiction, for each year in which the registrant is so identified, must
provide the below disclosures. Also, any such identified foreign issuer that uses a variable-interest entity or any similar structure that results in additional foreign entities being consolidated in the financial statements of the registrant is required to provide the below disclosures for itself and its consolidated foreign operating entity or entities. A registrant must disclose:
| | (1) | That, for the immediately preceding annual financial statement period, a registered public accounting firm that the PCAOB was unable to inspect or investigate completely, because of a position taken by an authority in the foreign jurisdiction, issued an audit report for the registrant; |
| | (2) | The percentage of shares of the registrant owned by governmental entities in the foreign jurisdiction in which the registrant is incorporated or otherwise organized; |
| | (3) | Whether governmental entities in the applicable foreign jurisdiction with respect to that registered public accounting firm have a controlling financial interest with respect to the registrant; |
| | (4) | The name of each official of the Chinese Communist Party who is a member of the board of directors of the registrant or the operating entity with respect to the registrant; and |
| | (5) | Whether the articles of incorporation of the registrant (or equivalent organizing document) contains any charter of the Chinese Communist Party, including the text of any such charter. |
Not applicable.
ITEM 5. AUDIT COMMITTEE OF LISTED REGISTRANTS.
(a) If the registrant is a listed issuer as defined in Rule 10A-3 under the Exchange Act (17CFR 240.10A-3), state whether or not the registrant has a separately-designated standing audit committee established in accordance with Section 3(a)(58)(A) of the Exchange Act (15 U.S.C. 78c(a)(58)(A)). If the registrant has such a committee, however designated, identify each committee member. If the entire board of directors is acting as the registrant’s audit committee as specified in Section 3(a)(58)(B) of the Exchange Act (15 U.S.C. 78c(a)(58)(B)), so state.
(b) If applicable, provide the disclosure required by Rule 10A-3(d) under the Exchange Act (17CFR 240.10A-3(d)) regarding an exemption from the listing standards for all audit committees.
Not applicable.
ITEM 6. INVESTMENTS.
File Schedule I – Investments in securities of unaffiliated issuers as of the close of the reporting period as set forth in Section 210.12-12 of Regulation S-X, unless the schedule is included as part of the report to shareholders filed under Item 1 of this Form.
Included in Item 1.
ITEM 7. DISCLOSURE OF PROXY VOTING POLICIES AND PROCEDURES FOR CLOSED-END MANAGEMENT INVESTMENT COMPANIES.
Not applicable.
ITEM 8. PORTFOLIO MANAGERS OF CLOSED-END MANAGEMENT INVESTMENT COMPANIES.
Not applicable.
ITEM 9. PURCHASE OF EQUITY SECURITIES BY CLOSED-END MANAGEMENT INVESTMENT COMPANY AND AFFILIATED PURCHASERS.
Not applicable.
ITEM 10. SUBMISSION OF MATTERS TO A VOTE OF SECURITY HOLDERS.
Describe any material changes to the procedures by which shareholders may recommend nominees to the registrant’s board of directors, where those changes were implemented after the registrant last provided disclosure in response to the requirements of Item 7(d)(2)(ii)(G) of Schedule 14A (17 CFR 240.14a-101), or this Item.
No material changes to report.
ITEM 11. CONTROLS AND PROCEDURES.
(a) Disclose the conclusions of the registrant’s principal executive and principal financial officers, or persons performing similar functions, regarding the effectiveness of the registrant’s disclosure controls and procedures (as defined in Rule 30a-3(c) under the Act (17 CFR 270.30a-3(c))) as of a date within 90 days of the filing date of the report that includes the disclosure required by this paragraph, based on the evaluation of these controls and procedures required by Rule 30a-3(b) under the Act (17 CFR 270.30a-3(b)) and Rules 13a-15(b) or 15d-15(b) under the Exchange Act (17 CFR 240.13a-15(b) or 240.15d-15(b)).
The Registrant’s principal executive and principal financial officers have concluded, based on their evaluation of the Registrant’s disclosure controls and procedures as of a date within 90 days of the original filing date of this report, that the Registrant’s disclosure controls and procedures were reasonably designed to ensure that information required to be disclosed by the Registrant on Form N-CSR is recorded, processed, summarized and reported within the required time periods and that information required to be disclosed by the Registrant in the reports that it files or submits on Form N-CSR is accumulated and communicated to the Registrant’s management, including its principal executive and principal financial officers, as appropriate, to allow timely decisions regarding required disclosure. Subsequent to the period covered by this report, an error was identified regarding the untimely recognition of certain class action proceeds that resulted in a restatement of the financial statements for JPMorgan Research Market Neutral Fund (the “Fund”) to correct the impacts of the error for the years ended October 31, 2022, October 31, 2021, October 31, 2020 & October 31, 2019. Due to the error, a material weakness exists in the design of internal controls relating to the Fund’s monitoring of class action claims filed by the class action administrator (on behalf of the Fund) and reconciliation of class action claim disbursements from the class action administrator to ensure complete, accurate and timely receipt of class action claims by the Fund.
(b) Disclose any change in the registrant’s internal control over financial reporting (as defined in Rule 30a-3(d) under the Act (17 CFR 270.30a-3(d)) that occurred during the period covered by this report that has materially affected, or is reasonably likely to materially affect, the registrant’s internal control over financial reporting.
Subsequent to the identification of the error described above, management has remediated the material weakness described herein. A reconciliation has been implemented to ensure class action claims are monitored by the class action administrator and class action claims are recorded completely, accurately, and timely by the Fund. Other than this item, there were no other changes in the Registrant’s internal control over financial reporting that occurred during period covered by this report that have materially affected, or are reasonably likely to materially affect, the Registrant’s internal control over financial reporting.
ITEM 12. DISCLOSURE OF SECURITIES LENDING ACTIVITIES FOR CLOSED-END MANAGEMENT INVESTMENT COMPANIES.
Not applicable.
ITEM 13. EXHIBITS.
| | (a) | File the exhibits listed below as part of this Form. Letter or number the exhibits in the sequence indicated. |
(1) Any code of ethics, or amendment thereto, that is the subject of the disclosure required by Item 2, to the extent that the registrant intends to satisfy the Item 2 requirements through filing of an exhibit.
Code of Ethics applicable to its Principal Executive and Principal Financial Officers pursuant to Section 406 of the Sarbanes-Oxley Act of 2002 attached hereto.
(2) A separate certification for each principal executive officer and principal financial officer of the registrant as required by Rule 30a-2(a) under the Act (17 CFR 270.30a-2), exactly as set forth below:
Certifications pursuant to Rule 30a-2(a) under the Investment Company Act of 1940 are attached hereto.
(1) Any written solicitation to purchase securities under Rule 23c-1 under the Act (17 CFR 270.23c-1) sent or given during the period covered by the report by or on behalf of the registrant to 10 or more persons.
Not applicable.
(2) Change in the registrant’s independent public accountant. Provide the information called for by Item 4 of Form 8-K under the Exchange Act (17 CFR 249.308). Unless otherwise specified by Item 4, or related to and necessary for a complete understanding of information not previously disclosed, the information should relate to events occurring during the reporting period.
Not applicable.
| | (b) | A separate or combined certification for each principal executive officer and principal officer of the registrant as required by Rule 30a-2(b) under the Act of 1940. |
Certifications pursuant to Rule 30a-2(b) under the Investment Company Act of 1940 are attached hereto.
SIGNATURES
Pursuant to the requirements of the Securities Exchange Act of 1934 and the Investment Company Act of 1940, the registrant has duly caused this report to be signed on its behalf by the undersigned, thereunto duly authorized.
JPMorgan Trust I
| | |
| By: | | /s/ Brian S. Shlissel |
| | Brian S. Shlissel |
| | President and Principal Executive Officer |
| | December 13, 2024 |
Pursuant to the requirements of the Securities Exchange Act of 1934 and the Investment Company Act of 1940, this report has been signed below by the following persons on behalf of the registrant and in the capacities and on the dates indicated.
| | |
| By: | | /s/ Brian S. Shlissel |
| | Brian S. Shlissel |
| | President and Principal Executive Officer |
| | December 13, 2024 |
| |
| By: | | /s/ Timothy J. Clemens |
| | Timothy J. Clemens |
| | Treasurer and Principal Financial Officer |
| | December 13, 2024 |