0001217286 jpmt:ICEBofA3MonthUSTreasuryBillIndexMember 2018-10-31
UNITED STATES
SECURITIES AND EXCHANGE COMMISSION
Washington, D.C. 20549
FORM N-CSR
CERTIFIED SHAREHOLDER REPORT OF REGISTERED MANAGEMENT INVESTMENT COMPANIES
Investment Company Act file number
(Exact name of registrant as specified in charter)
277 Park Avenue
New York, NY 10172
(Address of principal executive offices) (Zip code)
Gregory S. Samuels
277 Park Avenue
New York, NY 10172
(Name and Address of Agent for Service)
Registrant's telephone number, including area code:
Date of reporting period:
Item 1. Report to Stockholders.
a.) The following is a copy of the report transmitted to shareholders pursuant to Rule 30e-1 under the Investment Company Act of 1940 (17 CFR 270.30e-1).
b.) A copy of the notice transmitted to shareholders in reliance on Rule 30e-3 under the 1940 Act that contains disclosures specified by paragraph (c)(3) of that rule is included in the Annual Report. Not Applicable. Notices do not incorporate disclosures from the shareholder reports.
ANNUAL SHAREHOLDER REPORT | October 31, 2024 (Unaudited)
JPMorgan Developed International Value Fund
Class A Shares/Ticker: JFEAX
ANNUAL SHAREHOLDER REPORT
This annual shareholder report contains important information about the JPMorgan Developed International Value Fund (the "Fund") for the period of November 1, 2023 to October 31, 2024. You can find additional information about the Fund at www.jpmorganfunds.com/funddocuments. You can also request this information by contacting us at 1-800-480-4111 or by sending an e-mail request to Funds.Website.Support@jpmorganfunds.com or by asking any financial intermediary that offers shares of the Fund.
What were the Fund costs for the last year?
(based on a hypothetical $10,000 investment)
| Fund (Class) | Costs of a
$10,000 investment | Costs paid as a percentage
of a $10,000 investment |
JPMorgan Developed International Value Fund
(Class A Shares) | $111 | 1.00% |
How did the Fund Perform?
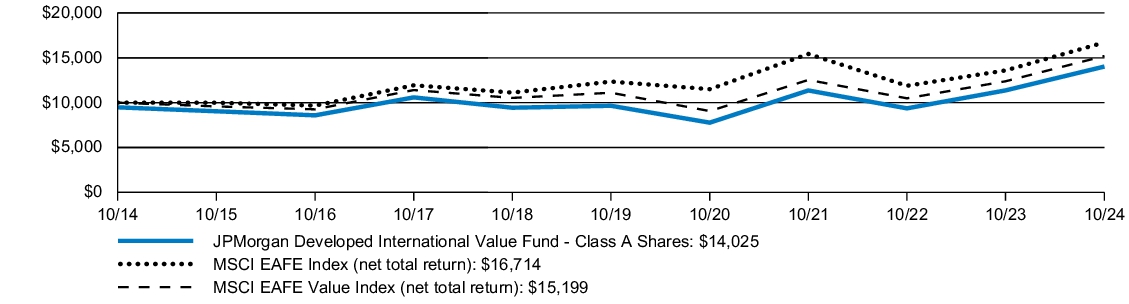
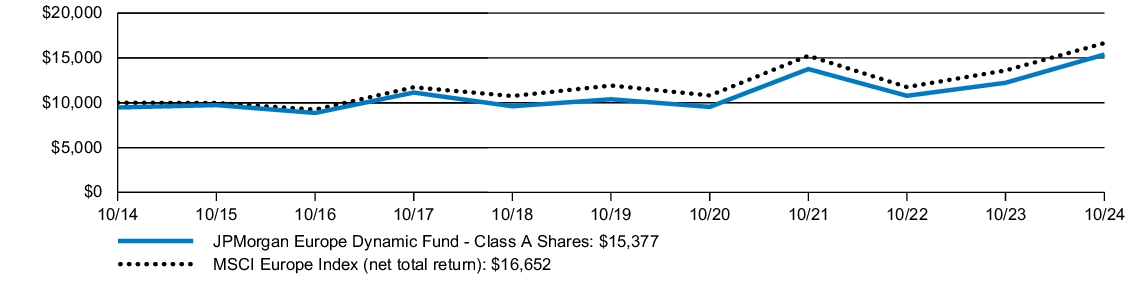
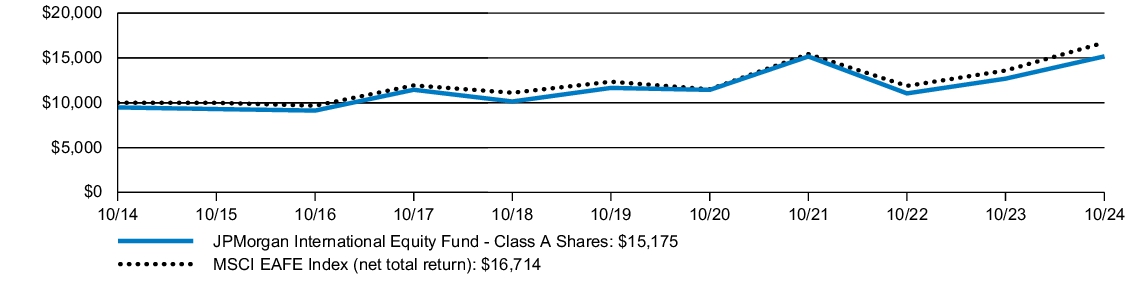
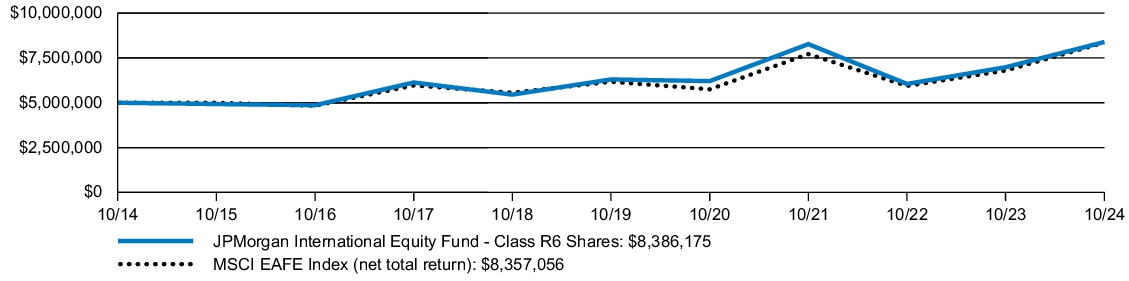
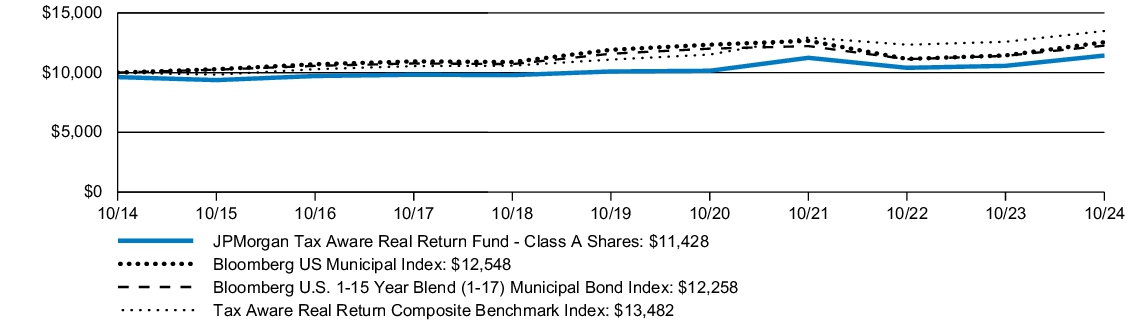
The JPMorgan Developed International Value Fund's Class A Shares, without a sales charge, returned 23.40% for the year ended October 31, 2024. The MSCI EAFE Index (net total return) returned 22.97% and the MSCI EAFE Value Index (net total return) (the "Index") returned 22.75% for the year ended October 31, 2024.
The Fund’s security selection in capital goods and insurance sectors contributed to performance relative to the Index.
The Fund’s security selection in telecommunication services and utilities sectors detracted from performance relative to the Index.
| AVERAGE ANNUAL TOTAL RETURNS | INCEPTION
DATE | 1 YEAR | | 5 YEAR | | 10 YEAR | |
| JPMorgan Developed International Value Fund (Class A Shares) | September 28, 2001 | 16.88 | % | 6.60 | % | 3.44 | % |
| JPMorgan Developed International Value Fund (Class A Shares) - excluding sales charge | | 23.40 | | 7.76 | | 4.00 | |
| MSCI EAFE Index (net total return) | | 22.97 | | 6.24 | | 5.27 | |
| MSCI EAFE Value Index (net total return) | | 22.75 | | 6.47 | | 4.28 | |
The performance quoted is past performance and is not a guarantee of future results. Mutual funds are subject to certain market risks. Investment returns and principal value of an investment will fluctuate so that an investor’s shares, when redeemed, may be worth more or less than their original cost. Current performance may be higher or lower than the performance data shown. Updated performance information is available by visiting www.jpmorganfunds.com or by calling 1-800-480-4111. Effective May 2018, some of the Fund’s investment strategies changed. The Fund’s past performance would have been different if the Fund was managed under the current strategies.
The graph illustrates comparative performance for $10,000 invested in Class A Shares of the JPMorgan Developed International Value Fund, the MSCI EAFE Index (net total return) and the MSCI EAFE Value Index (net total return) from October 31, 2014 to October 31, 2024. The performance of the Fund assumes reinvestment of all dividends and capital gain distributions, if any, and includes a sales charge. The performance of the MSCI EAFE Index (net total return) and MSCI EAFE Value Index (net total return) does not reflect the deduction of expenses or a sales charge associated with a mutual fund and approximates the minimum possible dividend reinvestment of the securities included in the benchmark, if applicable. The MSCI EAFE Index (net total return) is a free float-adjusted market capitalization weighted index that is designed to measure the performance of large- and midcap stocks in developed markets, excluding the U.S. and Canada. Net total return figures assume the reinvestment of dividends after deduction of withholding tax, applying the maximum rate to nonresident individual investors who do not benefit from double taxation treaties. The MSCI EAFE Value Index (net total return) is a free float-adjusted market capitalization weighted index that is designed to measure the performance of value-oriented large- and mid- cap stocks in developed markets, excluding the U.S. and Canada. Net total return figures assume the reinvestment of dividends after deduction of withholding tax, applying the maximum rate to nonresident individual investors who do not benefit from double taxation treaties. Investors cannot invest directly in an index. As a result of new regulatory requirements, effective July 24, 2024, the Fund's regulatory index has changed from the Index, as defined above, to the MSCI EAFE Index, a broad-based securities market index. In addition to the Fund's performance, the tables in this section include performance of the new regulatory index and the Index.
Fund performance may reflect the waiver of the Fund’s fees and reimbursement of expenses for certain periods since the applicable inception date. Without these waivers and reimbursements, performance would have been lower. Also, performance shown in this section does not reflect the deduction of taxes that a shareholder would pay on Fund distributions or on gains resulting from redemptions of Fund shares.
The returns shown are based on net asset values calculated for shareholder transactions and may differ from the returns shown in the financial highlights, which reflect adjustments made to the net asset values in accordance with accounting principles generally accepted in the United States of America.
Source: MSCI. The MSCI information may only be used for your internal use, may not be reproduced or redisseminated in any form and may not be used as a basis for or a component of any financial instruments or products or indices. None of the MSCI information is intended to constitute investment advice or a recommendation to make (or refrain from making) any kind of investment decision and may not be relied on as such. Historical data and analysis should not be taken as an indication or guarantee of any future performance analysis, forecast, or prediction. The MSCI information is provided on an "as is" basis and the user of this information assumes the entire risk of any use made of this information. MSCI, each of its affiliates and each other person involved in or related to compiling, computing or creating any MSCI information (collectively, the "MSCI Parties") expressly disclaims all warranties (including, without limitation, any warranties of originality, accuracy, completeness, timeliness, non-infringement, merchantability and fitness for a particular purpose) with respect to this information. Without limiting any of the foregoing, in no event shall any MSCI Party have any liability for any direct, indirect, special, incidental, punitive, consequential (including, without limitation, lost profits) or any other damages. (www.msci.com)
| Fund net assets (000's) | $637,882 | |
| Total number of portfolio holdings | 255 | |
| Portfolio turnover rate | 50 | % |
| Total advisory fees paid (000's) | $2,495 | |
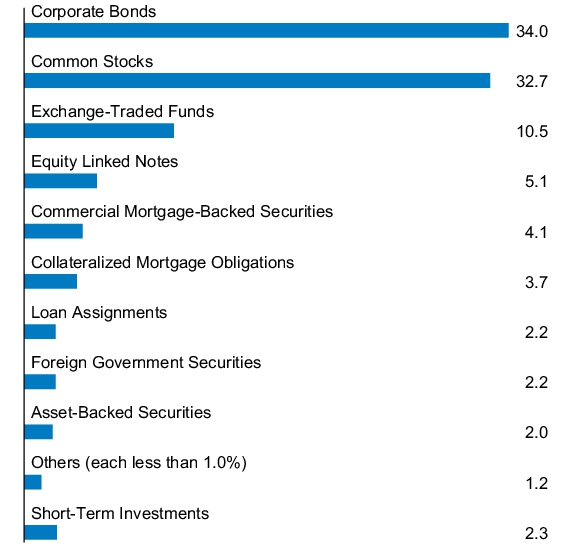
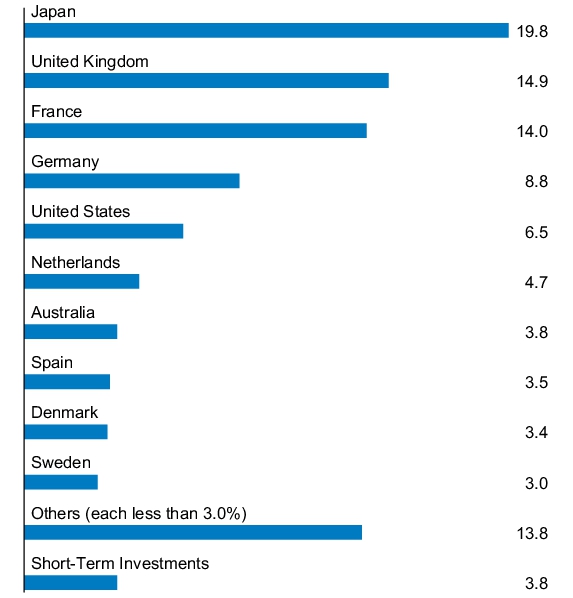
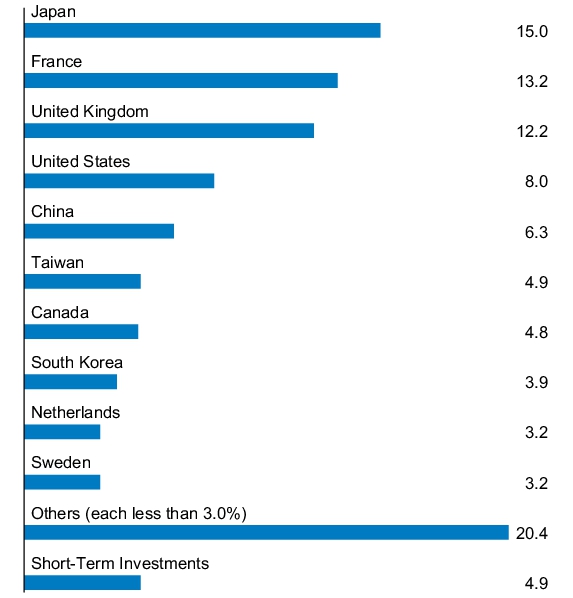
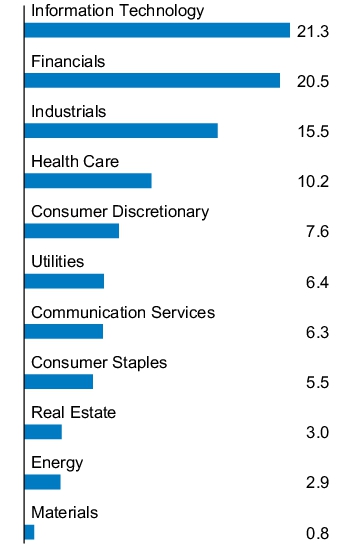
PORTFOLIO COMPOSITION - COUNTRY
(% of Total Investments)
Availability of Additional Information
At www.jpmorganfunds.com/funddocuments, you can find additional information about the Fund, including the Fund’s:
Prospectus
Financial information
Fund holdings
Proxy voting information
You can also request this information by contacting us at 1-800-480-4111.
ANNUAL SHAREHOLDER REPORT | October 31, 2024 (Unaudited)
JPMorgan Developed International Value Fund
Class C Shares/Ticker: JIUCX
ANNUAL SHAREHOLDER REPORT
This annual shareholder report contains important information about the JPMorgan Developed International Value Fund (the "Fund") for the period of November 1, 2023 to October 31, 2024. You can find additional information about the Fund at www.jpmorganfunds.com/funddocuments. You can also request this information by contacting us at 1-800-480-4111 or by sending an e-mail request to Funds.Website.Support@jpmorganfunds.com or by asking any financial intermediary that offers shares of the Fund.
What were the Fund costs for the last year?
(based on a hypothetical $10,000 investment)
| Fund (Class) | Costs of a
$10,000 investment | Costs paid as a percentage
of a $10,000 investment |
JPMorgan Developed International Value Fund
(Class C Shares) | $167 | 1.50% |
How did the Fund Perform?
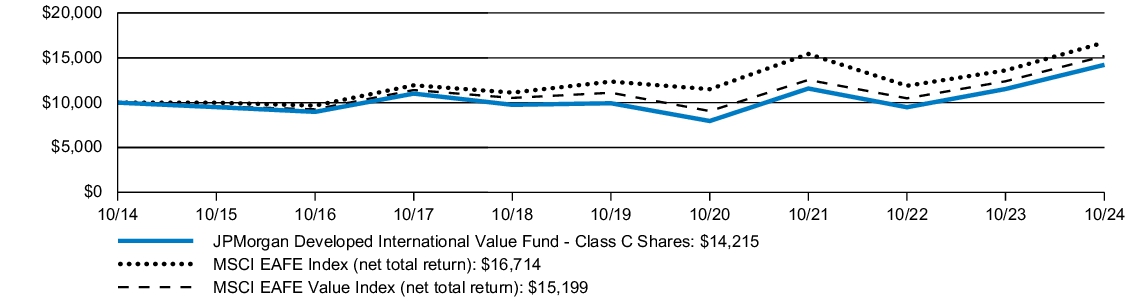
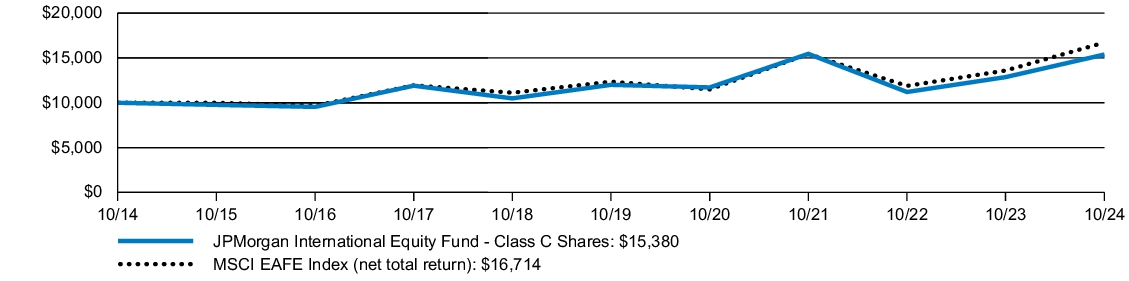
The JPMorgan Developed International Value Fund's Class C Shares, without a sales charge, returned 22.87% for the year ended October 31, 2024. The MSCI EAFE Index (net total return) returned 22.97% and the MSCI EAFE Value Index (net total return) (the "Index") returned 22.75% for the year ended October 31, 2024.
The Fund’s security selection in capital goods and insurance sectors contributed to performance relative to the Index.
The Fund’s security selection in telecommunication services and utilities sectors detracted from performance relative to the Index.
| AVERAGE ANNUAL TOTAL RETURNS | INCEPTION
DATE | 1 YEAR | | 5 YEAR | | 10 YEAR | |
| JPMorgan Developed International Value Fund (Class C Shares) | July 11, 2006 | 21.87 | % | 7.23 | % | 3.58 | % |
| JPMorgan Developed International Value Fund (Class C Shares) - excluding sales charge | | 22.87 | | 7.23 | | 3.58 | |
| MSCI EAFE Index (net total return) | | 22.97 | | 6.24 | | 5.27 | |
| MSCI EAFE Value Index (net total return) | | 22.75 | | 6.47 | | 4.28 | |
The performance quoted is past performance and is not a guarantee of future results. Mutual funds are subject to certain market risks. Investment returns and principal value of an investment will fluctuate so that an investor’s shares, when redeemed, may be worth more or less than their original cost. Current performance may be higher or lower than the performance data shown. Updated performance information is available by visiting www.jpmorganfunds.com or by calling 1-800-480-4111. Effective May 2018, some of the Fund’s investment strategies changed. The Fund’s past performance would have been different if the Fund was managed under the current strategies.
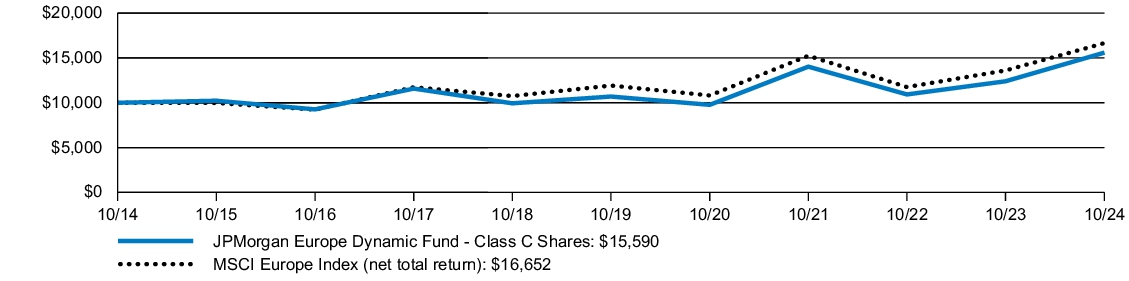
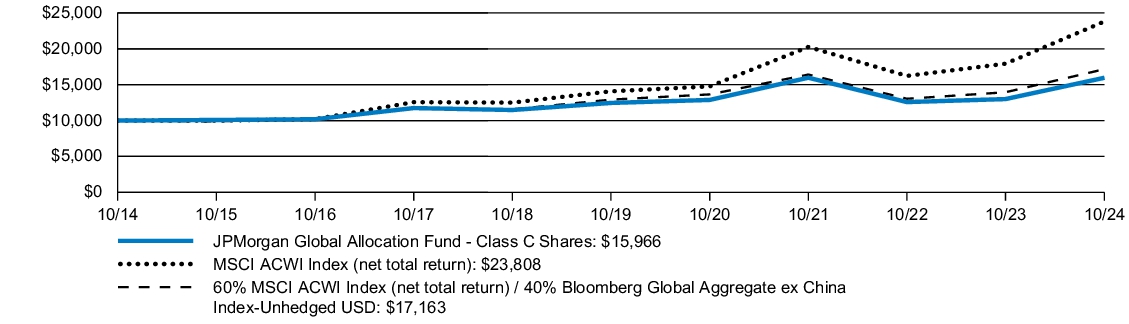
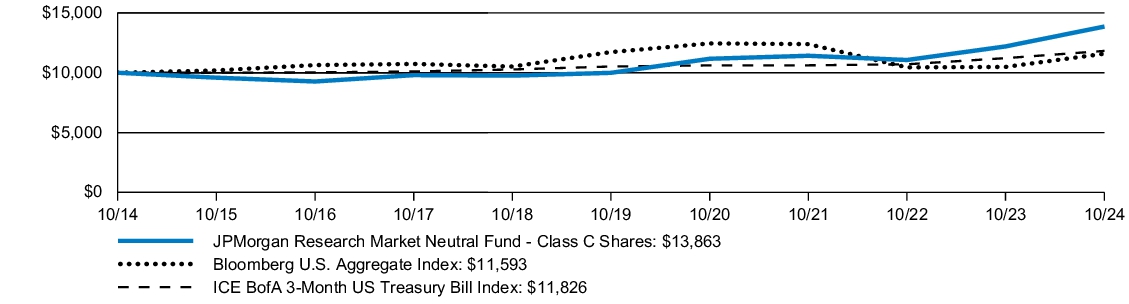
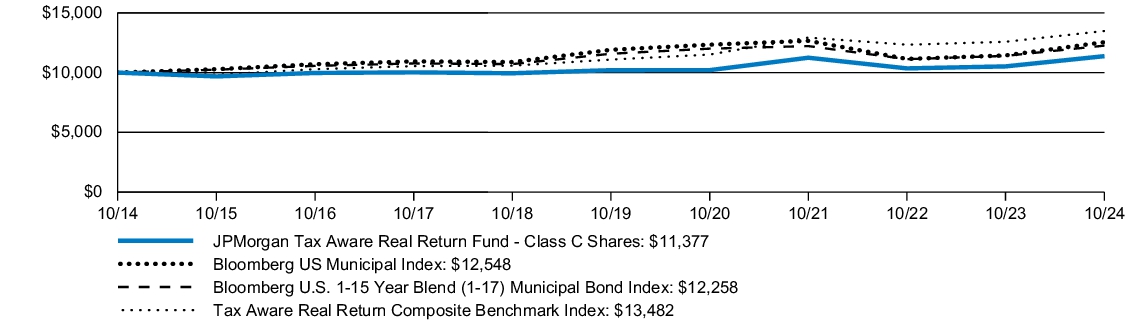
The graph illustrates comparative performance for $10,000 invested in Class C Shares of the JPMorgan Developed International Value Fund, the MSCI EAFE Index (net total return) and the MSCI EAFE Value Index (net total return) from October 31, 2014 to October 31, 2024. The performance of the Fund assumes reinvestment of all dividends and capital gain distributions, if any, and does not include a sales charge. The performance of the MSCI EAFE Index (net total return) and MSCI EAFE Value Index (net total return) does not reflect the deduction of expenses or a sales charge associated with a mutual fund and approximates the minimum possible dividend reinvestment of the securities included in the benchmark, if applicable. The MSCI EAFE Index (net total return) is a free float-adjusted market capitalization weighted index that is designed to measure the performance of large- and midcap stocks in developed markets, excluding the U.S. and Canada. Net total return figures assume the reinvestment of dividends after deduction of withholding tax, applying the maximum rate to nonresident individual investors who do not benefit from double taxation treaties. The MSCI EAFE Value Index (net total return) is a free float-adjusted market capitalization weighted index that is designed to measure the performance of value-oriented large- and mid- cap stocks in developed markets, excluding the U.S. and Canada. Net total return figures assume the reinvestment of dividends after deduction of withholding tax, applying the maximum rate to nonresident individual investors who do not benefit from double taxation treaties. Investors cannot invest directly in an index. As a result of new regulatory requirements, effective July 24, 2024, the Fund's regulatory index has changed from the Index, as defined above, to the MSCI EAFE Index, a broad-based securities market index. In addition to the Fund's performance, the tables in this section include performance of the new regulatory index and the Index.
Fund performance may reflect the waiver of the Fund’s fees and reimbursement of expenses for certain periods since the applicable inception date. Without these waivers and reimbursements, performance would have been lower. Also, performance shown in this section does not reflect the deduction of taxes that a shareholder would pay on Fund distributions or on gains resulting from redemptions of Fund shares.
Because Class C Shares automatically convert to Class A Shares after 8 years, the 10 year average annual total return shown above for Class C Shares reflects Class A Share's performance for the period after conversion.
The returns shown are based on net asset values calculated for shareholder transactions and may differ from the returns shown in the financial highlights, which reflect adjustments made to the net asset values in accordance with accounting principles generally accepted in the United States of America.
Source: MSCI. The MSCI information may only be used for your internal use, may not be reproduced or redisseminated in any form and may not be used as a basis for or a component of any financial instruments or products or indices. None of the MSCI information is intended to constitute investment advice or a recommendation to make (or refrain from making) any kind of investment decision and may not be relied on as such. Historical data and analysis should not be taken as an indication or guarantee of any future performance analysis, forecast, or prediction. The MSCI information is provided on an "as is" basis and the user of this information assumes the entire risk of any use made of this information. MSCI, each of its affiliates and each other person involved in or related to compiling, computing or creating any MSCI information (collectively, the "MSCI Parties") expressly disclaims all warranties (including, without limitation, any warranties of originality, accuracy, completeness, timeliness, non-infringement, merchantability and fitness for a particular purpose) with respect to this information. Without limiting any of the foregoing, in no event shall any MSCI Party have any liability for any direct, indirect, special, incidental, punitive, consequential (including, without limitation, lost profits) or any other damages. (www.msci.com)
| Fund net assets (000's) | $637,882 | |
| Total number of portfolio holdings | 255 | |
| Portfolio turnover rate | 50 | % |
| Total advisory fees paid (000's) | $2,495 | |
PORTFOLIO COMPOSITION - COUNTRY
(% of Total Investments)
Availability of Additional Information
At www.jpmorganfunds.com/funddocuments, you can find additional information about the Fund, including the Fund’s:
Prospectus
Financial information
Fund holdings
Proxy voting information
You can also request this information by contacting us at 1-800-480-4111.
ANNUAL SHAREHOLDER REPORT | October 31, 2024 (Unaudited)
JPMorgan Developed International Value Fund
Class I Shares/Ticker: JIESX
ANNUAL SHAREHOLDER REPORT
This annual shareholder report contains important information about the JPMorgan Developed International Value Fund (the "Fund") for the period of November 1, 2023 to October 31, 2024. You can find additional information about the Fund at www.jpmorganfunds.com/funddocuments. You can also request this information by contacting us at 1-800-480-4111 or by sending an e-mail request to Funds.Website.Support@jpmorganfunds.com or by asking any financial intermediary that offers shares of the Fund.
What were the Fund costs for the last year?
(based on a hypothetical $10,000 investment)
| Fund (Class) | Costs of a
$10,000 investment | Costs paid as a percentage
of a $10,000 investment |
JPMorgan Developed International Value Fund
(Class I Shares) | $83 | 0.75% |
How did the Fund Perform?
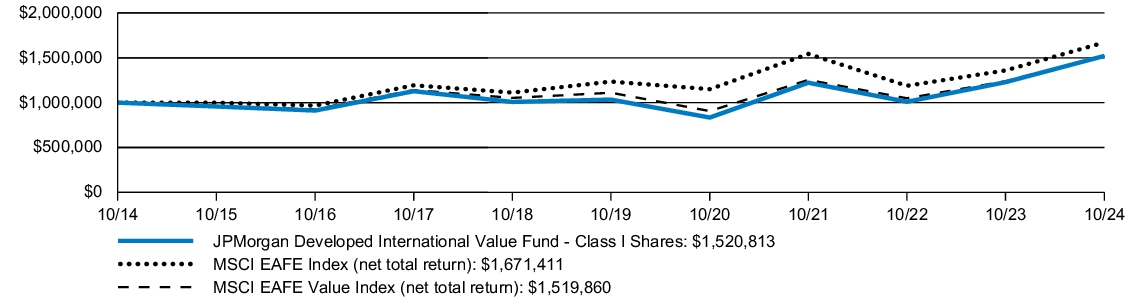
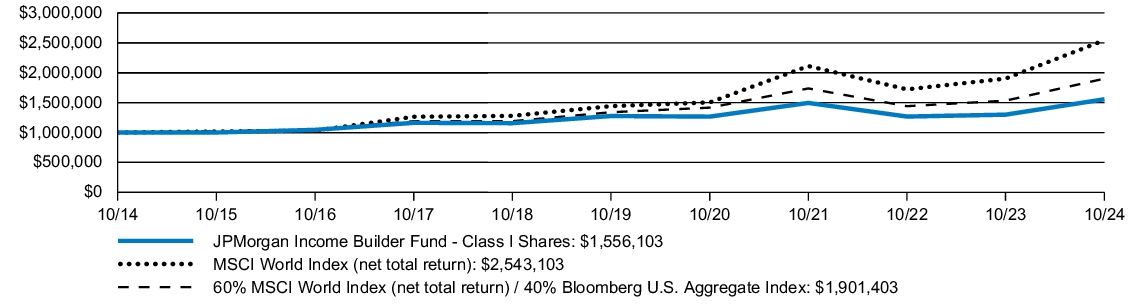
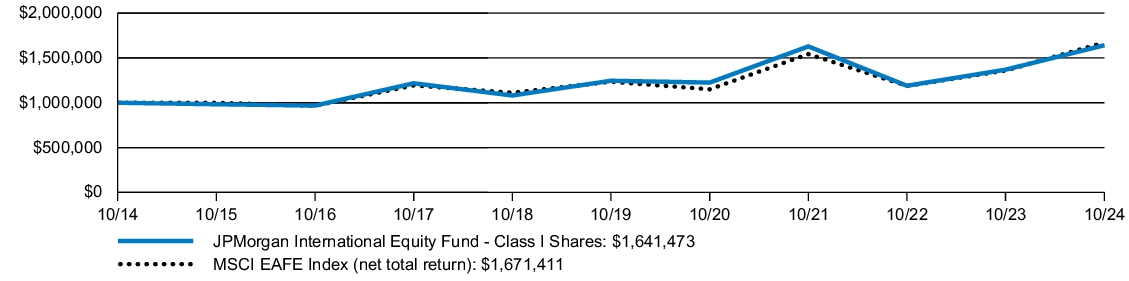
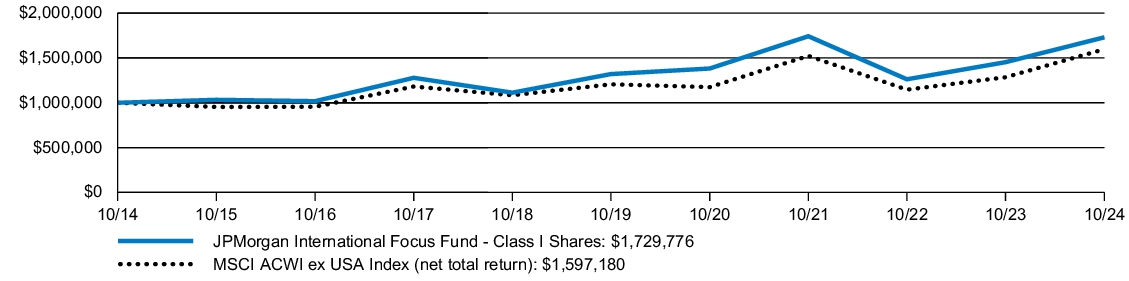
The JPMorgan Developed International Value Fund's Class I Shares returned 23.80% for the year ended October 31, 2024. The MSCI EAFE Index (net total return) returned 22.97% and the MSCI EAFE Value Index (net total return) (the "Index") returned 22.75% for the year ended October 31, 2024.
The Fund’s security selection in capital goods and insurance sectors contributed to performance relative to the Index.
The Fund’s security selection in telecommunication services and utilities sectors detracted from performance relative to the Index.
| AVERAGE ANNUAL TOTAL RETURNS | INCEPTION
DATE | 1 YEAR | | 5 YEAR | | 10 YEAR | |
| JPMorgan Developed International Value Fund (Class I Shares) | September 10, 2001 | 23.80 | % | 8.03 | % | 4.28 | % |
| MSCI EAFE Index (net total return) | | 22.97 | | 6.24 | | 5.27 | |
| MSCI EAFE Value Index (net total return) | | 22.75 | | 6.47 | | 4.28 | |
The performance quoted is past performance and is not a guarantee of future results. Mutual funds are subject to certain market risks. Investment returns and principal value of an investment will fluctuate so that an investor’s shares, when redeemed, may be worth more or less than their original cost. Current performance may be higher or lower than the performance data shown. Updated performance information is available by visiting www.jpmorganfunds.com or by calling 1-800-480-4111. Effective May 2018, some of the Fund’s investment strategies changed. The Fund’s past performance would have been different if the Fund was managed under the current strategies.
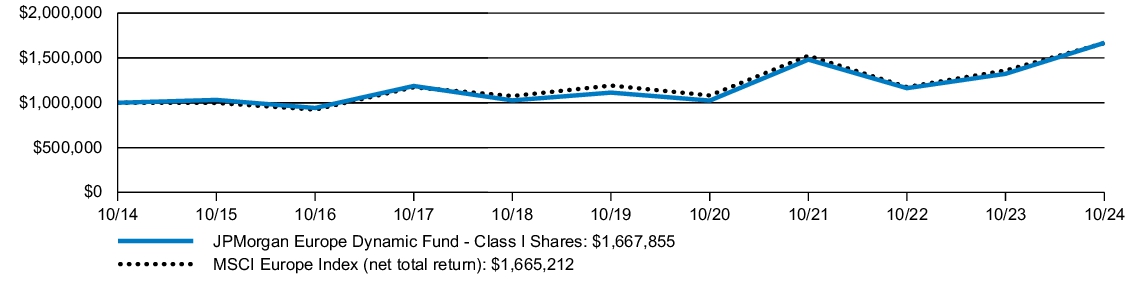
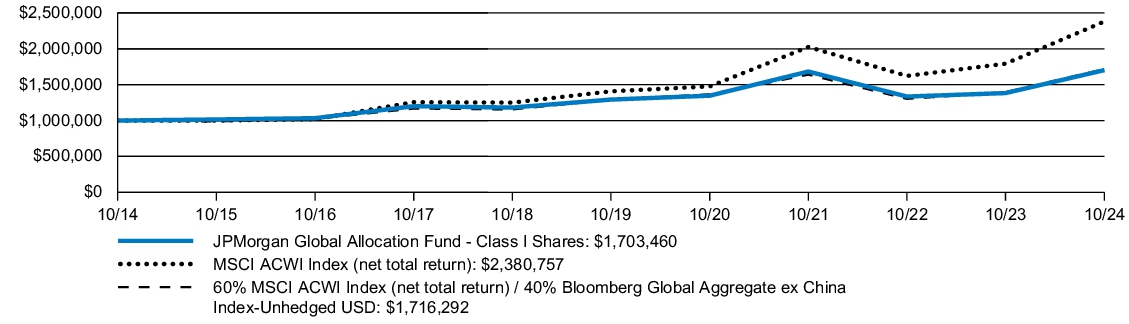
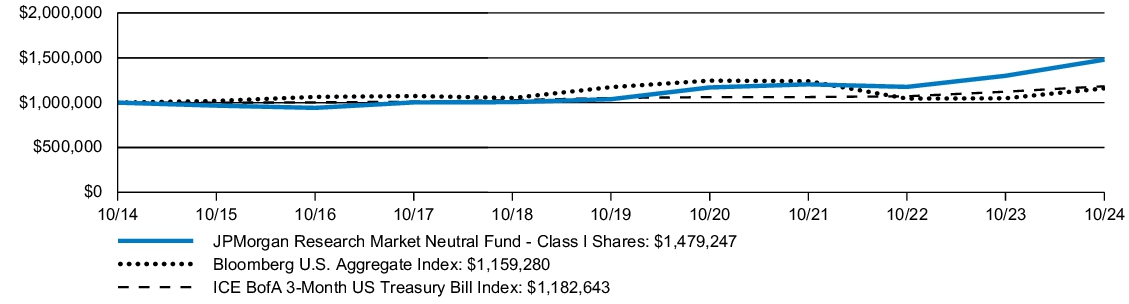
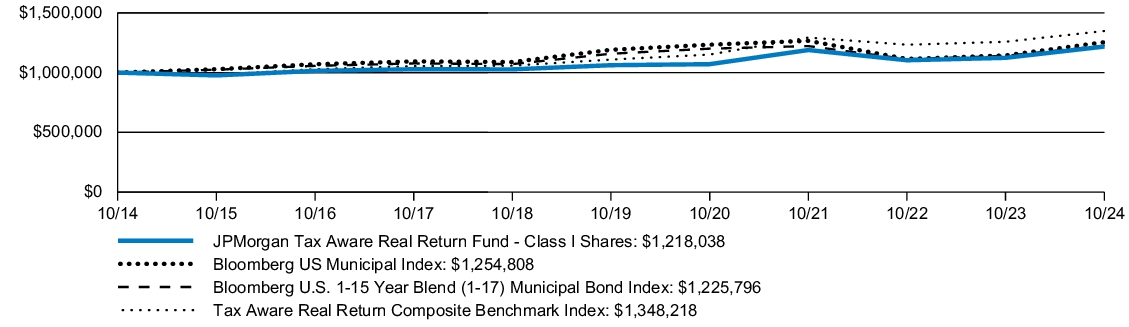
The graph illustrates comparative performance for $1,000,000 invested in Class I Shares of the JPMorgan Developed International Value Fund, the MSCI EAFE Index (net total return) and the MSCI EAFE Value Index (net total return) from October 31, 2014 to October 31, 2024. The performance of the Fund assumes reinvestment of all dividends and capital gain distributions, if any, and does not include a sales charge. The performance of the MSCI EAFE Index (net total return) and MSCI EAFE Value Index (net total return) does not reflect the deduction of expenses or a sales charge associated with a mutual fund and approximates the minimum possible dividend reinvestment of the securities included in the benchmark, if applicable. The MSCI EAFE Index (net total return) is a free float-adjusted market capitalization weighted index that is designed to measure the performance of large- and midcap stocks in developed markets, excluding the U.S. and Canada. Net total return figures assume the reinvestment of dividends after deduction of withholding tax, applying the maximum rate to nonresident individual investors who do not benefit from double taxation treaties. The MSCI EAFE Value Index (net total return) is a free float-adjusted market capitalization weighted index that is designed to measure the performance of value-oriented large- and mid- cap stocks in developed markets, excluding the U.S. and Canada. Net total return figures assume the reinvestment of dividends after deduction of withholding tax, applying the maximum rate to nonresident individual investors who do not benefit from double taxation treaties. Investors cannot invest directly in an index. As a result of new regulatory requirements, effective July 24, 2024, the Fund's regulatory index has changed from the Index, as defined above, to the MSCI EAFE Index, a broad-based securities market index. In addition to the Fund's performance, the tables in this section include performance of the new regulatory index and the Index.
Fund performance may reflect the waiver of the Fund’s fees and reimbursement of expenses for certain periods since the applicable inception date. Without these waivers and reimbursements, performance would have been lower. Also, performance shown in this section does not reflect the deduction of taxes that a shareholder would pay on Fund distributions or on gains resulting from redemptions of Fund shares.
The returns shown are based on net asset values calculated for shareholder transactions and may differ from the returns shown in the financial highlights, which reflect adjustments made to the net asset values in accordance with accounting principles generally accepted in the United States of America.
Source: MSCI. The MSCI information may only be used for your internal use, may not be reproduced or redisseminated in any form and may not be used as a basis for or a component of any financial instruments or products or indices. None of the MSCI information is intended to constitute investment advice or a recommendation to make (or refrain from making) any kind of investment decision and may not be relied on as such. Historical data and analysis should not be taken as an indication or guarantee of any future performance analysis, forecast, or prediction. The MSCI information is provided on an "as is" basis and the user of this information assumes the entire risk of any use made of this information. MSCI, each of its affiliates and each other person involved in or related to compiling, computing or creating any MSCI information (collectively, the "MSCI Parties") expressly disclaims all warranties (including, without limitation, any warranties of originality, accuracy, completeness, timeliness, non-infringement, merchantability and fitness for a particular purpose) with respect to this information. Without limiting any of the foregoing, in no event shall any MSCI Party have any liability for any direct, indirect, special, incidental, punitive, consequential (including, without limitation, lost profits) or any other damages. (www.msci.com)
| Fund net assets (000's) | $637,882 | |
| Total number of portfolio holdings | 255 | |
| Portfolio turnover rate | 50 | % |
| Total advisory fees paid (000's) | $2,495 | |
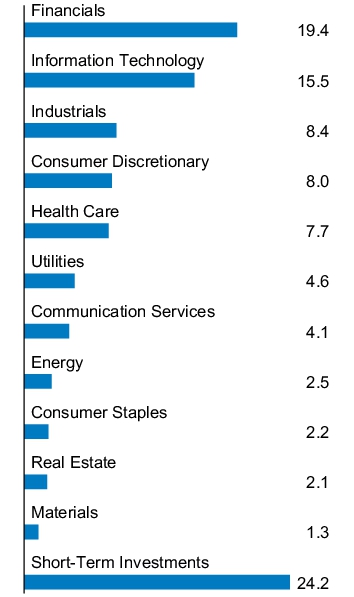
PORTFOLIO COMPOSITION - COUNTRY
(% of Total Investments)
Availability of Additional Information
At www.jpmorganfunds.com/funddocuments, you can find additional information about the Fund, including the Fund’s:
Prospectus
Financial information
Fund holdings
Proxy voting information
You can also request this information by contacting us at 1-800-480-4111.
ANNUAL SHAREHOLDER REPORT | October 31, 2024 (Unaudited)
JPMorgan Developed International Value Fund
Class L Shares/Ticker: JNUSX
ANNUAL SHAREHOLDER REPORT
This annual shareholder report contains important information about the JPMorgan Developed International Value Fund (the "Fund") for the period of November 1, 2023 to October 31, 2024. You can find additional information about the Fund at www.jpmorganfunds.com/funddocuments. You can also request this information by contacting us at 1-800-480-4111 or by sending an e-mail request to Funds.Website.Support@jpmorganfunds.com or by asking any financial intermediary that offers shares of the Fund.
What were the Fund costs for the last year?
(based on a hypothetical $10,000 investment)
| Fund (Class) | Costs of a
$10,000 investment | Costs paid as a percentage
of a $10,000 investment |
JPMorgan Developed International Value Fund
(Class L Shares) | $73 | 0.65% |
How did the Fund Perform?
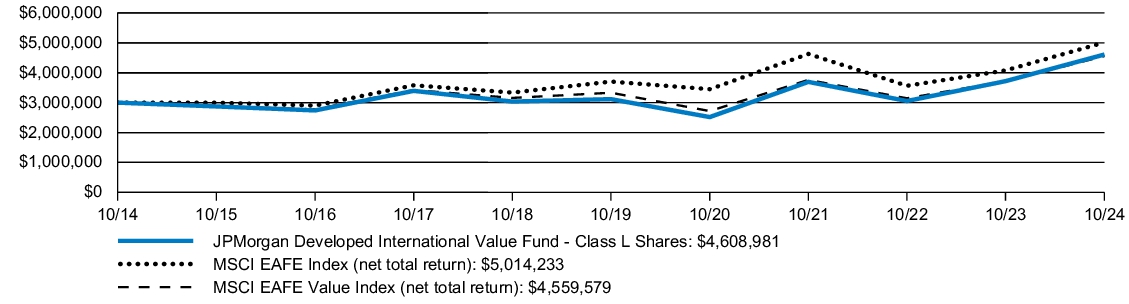
The JPMorgan Developed International Value Fund's Class L Shares returned 23.95% for the year ended October 31, 2024. The MSCI EAFE Index (net total return) returned 22.97% and the MSCI EAFE Value Index (net total return) (the "Index") returned 22.75% for the year ended October 31, 2024.
The Fund’s security selection in capital goods and insurance sectors contributed to performance relative to the Index.
The Fund’s security selection in telecommunication services and utilities sectors detracted from performance relative to the Index.
| AVERAGE ANNUAL TOTAL RETURNS | INCEPTION
DATE | 1 YEAR | | 5 YEAR | | 10 YEAR | |
| JPMorgan Developed International Value Fund (Class L Shares) | November 4, 1993 | 23.95 | % | 8.14 | % | 4.39 | % |
| MSCI EAFE Index (net total return) | | 22.97 | | 6.24 | | 5.27 | |
| MSCI EAFE Value Index (net total return) | | 22.75 | | 6.47 | | 4.28 | |
The performance quoted is past performance and is not a guarantee of future results. Mutual funds are subject to certain market risks. Investment returns and principal value of an investment will fluctuate so that an investor’s shares, when redeemed, may be worth more or less than their original cost. Current performance may be higher or lower than the performance data shown. Updated performance information is available by visiting www.jpmorganfunds.com or by calling 1-800-480-4111. Effective May 2018, some of the Fund’s investment strategies changed. The Fund’s past performance would have been different if the Fund was managed under the current strategies.
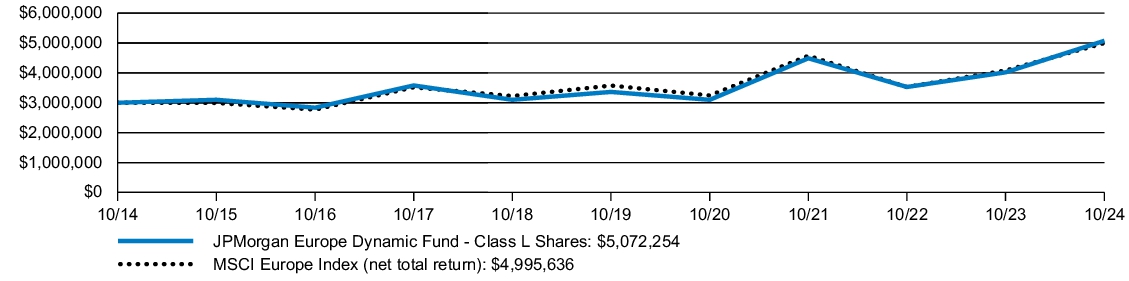
The graph illustrates comparative performance for $3,000,000 invested in Class L Shares of the JPMorgan Developed International Value Fund, the MSCI EAFE Index (net total return) and the MSCI EAFE Value Index (net total return) from October 31, 2014 to October 31, 2024. The performance of the Fund assumes reinvestment of all dividends and capital gain distributions, if any, and does not include a sales charge. The performance of the MSCI EAFE Index (net total return) and MSCI EAFE Value Index (net total return) does not reflect the deduction of expenses or a sales charge associated with a mutual fund and approximates the minimum possible dividend reinvestment of the securities included in the benchmark, if applicable. The MSCI EAFE Index (net total return) is a free float-adjusted market capitalization weighted index that is designed to measure the performance of large- and midcap stocks in developed markets, excluding the U.S. and Canada. Net total return figures assume the reinvestment of dividends after deduction of withholding tax, applying the maximum rate to nonresident individual investors who do not benefit from double taxation treaties. The MSCI EAFE Value Index (net total return) is a free float-adjusted market capitalization weighted index that is designed to measure the performance of value-oriented large- and mid- cap stocks in developed markets, excluding the U.S. and Canada. Net total return figures assume the reinvestment of dividends after deduction of withholding tax, applying the maximum rate to nonresident individual investors who do not benefit from double taxation treaties. Investors cannot invest directly in an index. As a result of new regulatory requirements, effective July 24, 2024, the Fund's regulatory index has changed from the Index, as defined above, to the MSCI EAFE Index, a broad-based securities market index. In addition to the Fund's performance, the tables in this section include performance of the new regulatory index and the Index.
Fund performance may reflect the waiver of the Fund’s fees and reimbursement of expenses for certain periods since the applicable inception date. Without these waivers and reimbursements, performance would have been lower. Also, performance shown in this section does not reflect the deduction of taxes that a shareholder would pay on Fund distributions or on gains resulting from redemptions of Fund shares.
The returns shown are based on net asset values calculated for shareholder transactions and may differ from the returns shown in the financial highlights, which reflect adjustments made to the net asset values in accordance with accounting principles generally accepted in the United States of America.
Source: MSCI. The MSCI information may only be used for your internal use, may not be reproduced or redisseminated in any form and may not be used as a basis for or a component of any financial instruments or products or indices. None of the MSCI information is intended to constitute investment advice or a recommendation to make (or refrain from making) any kind of investment decision and may not be relied on as such. Historical data and analysis should not be taken as an indication or guarantee of any future performance analysis, forecast, or prediction. The MSCI information is provided on an "as is" basis and the user of this information assumes the entire risk of any use made of this information. MSCI, each of its affiliates and each other person involved in or related to compiling, computing or creating any MSCI information (collectively, the "MSCI Parties") expressly disclaims all warranties (including, without limitation, any warranties of originality, accuracy, completeness, timeliness, non-infringement, merchantability and fitness for a particular purpose) with respect to this information. Without limiting any of the foregoing, in no event shall any MSCI Party have any liability for any direct, indirect, special, incidental, punitive, consequential (including, without limitation, lost profits) or any other damages. (www.msci.com)
| Fund net assets (000's) | $637,882 | |
| Total number of portfolio holdings | 255 | |
| Portfolio turnover rate | 50 | % |
| Total advisory fees paid (000's) | $2,495 | |
PORTFOLIO COMPOSITION - COUNTRY
(% of Total Investments)
Availability of Additional Information
At www.jpmorganfunds.com/funddocuments, you can find additional information about the Fund, including the Fund’s:
Prospectus
Financial information
Fund holdings
Proxy voting information
You can also request this information by contacting us at 1-800-480-4111.
ANNUAL SHAREHOLDER REPORT | October 31, 2024 (Unaudited)
JPMorgan Developed International Value Fund
Class R2 Shares/Ticker: JPVZX
ANNUAL SHAREHOLDER REPORT
This annual shareholder report contains important information about the JPMorgan Developed International Value Fund (the "Fund") for the period of November 1, 2023 to October 31, 2024. You can find additional information about the Fund at www.jpmorganfunds.com/funddocuments. You can also request this information by contacting us at 1-800-480-4111 or by sending an e-mail request to Funds.Website.Support@jpmorganfunds.com or by asking any financial intermediary that offers shares of the Fund.
What were the Fund costs for the last year?
(based on a hypothetical $10,000 investment)
| Fund (Class) | Costs of a
$10,000 investment | Costs paid as a percentage
of a $10,000 investment |
JPMorgan Developed International Value Fund
(Class R2 Shares) | $144 | 1.30% |
How did the Fund Perform?
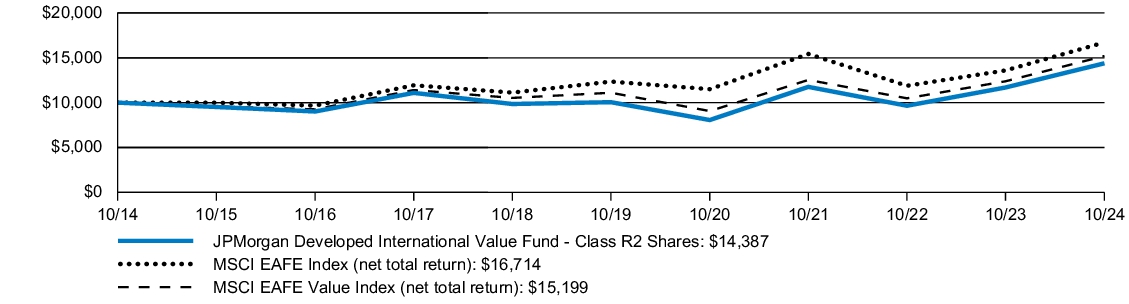
The JPMorgan Developed International Value Fund's Class R2 Shares returned 23.08% for the year ended October 31, 2024. The MSCI EAFE Index (net total return) returned 22.97% and the MSCI EAFE Value Index (net total return) (the "Index") returned 22.75% for the year ended October 31, 2024.
The Fund’s security selection in capital goods and insurance sectors contributed to performance relative to the Index.
The Fund’s security selection in telecommunication services and utilities sectors detracted from performance relative to the Index.
| AVERAGE ANNUAL TOTAL RETURNS | INCEPTION
DATE | 1 YEAR | | 5 YEAR | | 10 YEAR | |
| JPMorgan Developed International Value Fund (Class R2 Shares) | November 3, 2008 | 23.08 | % | 7.43 | % | 3.70 | % |
| MSCI EAFE Index (net total return) | | 22.97 | | 6.24 | | 5.27 | |
| MSCI EAFE Value Index (net total return) | | 22.75 | | 6.47 | | 4.28 | |
The performance quoted is past performance and is not a guarantee of future results. Mutual funds are subject to certain market risks. Investment returns and principal value of an investment will fluctuate so that an investor’s shares, when redeemed, may be worth more or less than their original cost. Current performance may be higher or lower than the performance data shown. Updated performance information is available by visiting www.jpmorganfunds.com or by calling 1-800-480-4111. Effective May 2018, some of the Fund’s investment strategies changed. The Fund’s past performance would have been different if the Fund was managed under the current strategies.
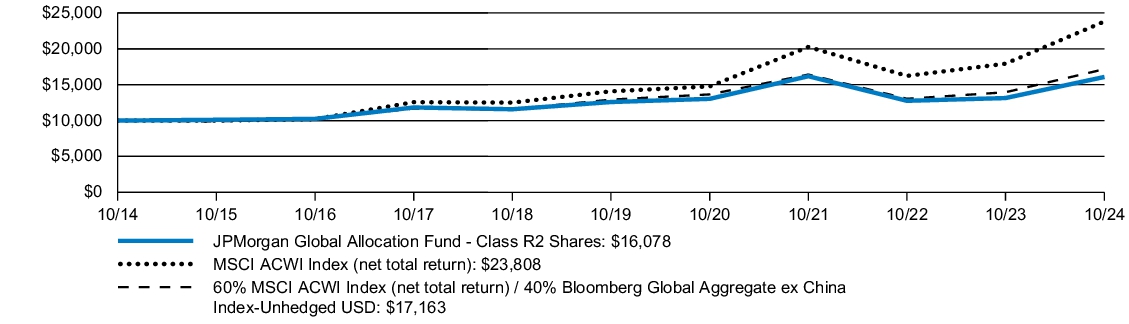
The graph illustrates comparative performance for $10,000 invested in Class R2 Shares of the JPMorgan Developed International Value Fund, the MSCI EAFE Index (net total return) and the MSCI EAFE Value Index (net total return) from October 31, 2014 to October 31, 2024. The performance of the Fund assumes reinvestment of all dividends and capital gain distributions, if any, and does not include a sales charge. The performance of the MSCI EAFE Index (net total return) and MSCI EAFE Value Index (net total return) does not reflect the deduction of expenses or a sales charge associated with a mutual fund and approximates the minimum possible dividend reinvestment of the securities included in the benchmark, if applicable. The MSCI EAFE Index (net total return) is a free float-adjusted market capitalization weighted index that is designed to measure the performance of large- and midcap stocks in developed markets, excluding the U.S. and Canada. Net total return figures assume the reinvestment of dividends after deduction of withholding tax, applying the maximum rate to nonresident individual investors who do not benefit from double taxation treaties. The MSCI EAFE Value Index (net total return) is a free float-adjusted market capitalization weighted index that is designed to measure the performance of value-oriented large- and mid- cap stocks in developed markets, excluding the U.S. and Canada. Net total return figures assume the reinvestment of dividends after deduction of withholding tax, applying the maximum rate to nonresident individual investors who do not benefit from double taxation treaties. Investors cannot invest directly in an index. As a result of new regulatory requirements, effective July 24, 2024, the Fund's regulatory index has changed from the Index, as defined above, to the MSCI EAFE Index, a broad-based securities market index. In addition to the Fund's performance, the tables in this section include performance of the new regulatory index and the Index.
Fund performance may reflect the waiver of the Fund’s fees and reimbursement of expenses for certain periods since the applicable inception date. Without these waivers and reimbursements, performance would have been lower. Also, performance shown in this section does not reflect the deduction of taxes that a shareholder would pay on Fund distributions or on gains resulting from redemptions of Fund shares.
The returns shown are based on net asset values calculated for shareholder transactions and may differ from the returns shown in the financial highlights, which reflect adjustments made to the net asset values in accordance with accounting principles generally accepted in the United States of America.
Source: MSCI. The MSCI information may only be used for your internal use, may not be reproduced or redisseminated in any form and may not be used as a basis for or a component of any financial instruments or products or indices. None of the MSCI information is intended to constitute investment advice or a recommendation to make (or refrain from making) any kind of investment decision and may not be relied on as such. Historical data and analysis should not be taken as an indication or guarantee of any future performance analysis, forecast, or prediction. The MSCI information is provided on an "as is" basis and the user of this information assumes the entire risk of any use made of this information. MSCI, each of its affiliates and each other person involved in or related to compiling, computing or creating any MSCI information (collectively, the "MSCI Parties") expressly disclaims all warranties (including, without limitation, any warranties of originality, accuracy, completeness, timeliness, non-infringement, merchantability and fitness for a particular purpose) with respect to this information. Without limiting any of the foregoing, in no event shall any MSCI Party have any liability for any direct, indirect, special, incidental, punitive, consequential (including, without limitation, lost profits) or any other damages. (www.msci.com)
| Fund net assets (000's) | $637,882 | |
| Total number of portfolio holdings | 255 | |
| Portfolio turnover rate | 50 | % |
| Total advisory fees paid (000's) | $2,495 | |
PORTFOLIO COMPOSITION - COUNTRY
(% of Total Investments)
Availability of Additional Information
At www.jpmorganfunds.com/funddocuments, you can find additional information about the Fund, including the Fund’s:
Prospectus
Financial information
Fund holdings
Proxy voting information
You can also request this information by contacting us at 1-800-480-4111.
ANNUAL SHAREHOLDER REPORT | October 31, 2024 (Unaudited)
JPMorgan Developed International Value Fund
Class R5 Shares/Ticker: JPVRX
ANNUAL SHAREHOLDER REPORT
This annual shareholder report contains important information about the JPMorgan Developed International Value Fund (the "Fund") for the period of November 1, 2023 to October 31, 2024. You can find additional information about the Fund at www.jpmorganfunds.com/funddocuments. You can also request this information by contacting us at 1-800-480-4111 or by sending an e-mail request to Funds.Website.Support@jpmorganfunds.com or by asking any financial intermediary that offers shares of the Fund.
What were the Fund costs for the last year?
(based on a hypothetical $10,000 investment)
| Fund (Class) | Costs of a
$10,000 investment | Costs paid as a percentage
of a $10,000 investment |
JPMorgan Developed International Value Fund
(Class R5 Shares) | $72 | 0.64% |
How did the Fund Perform?
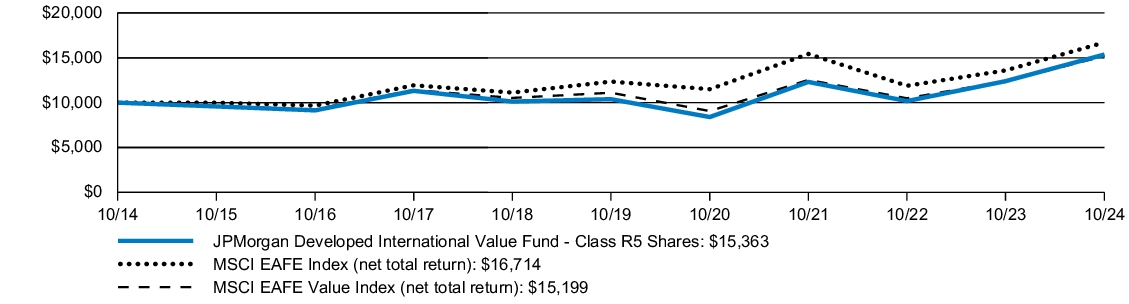
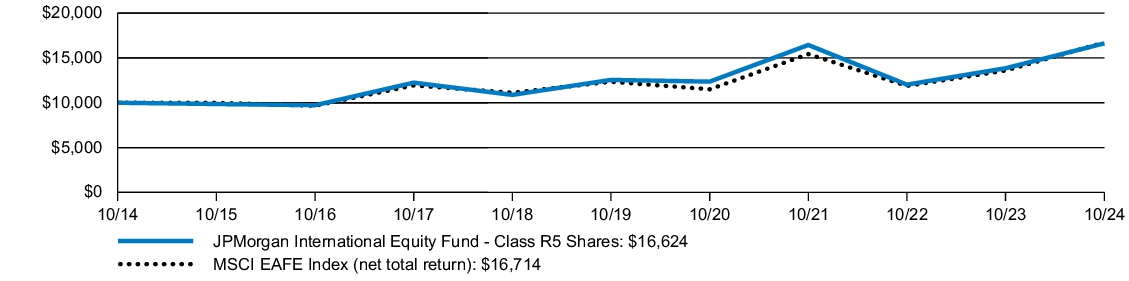
The JPMorgan Developed International Value Fund's Class R5 Shares returned 23.95% for the year ended October 31, 2024. The MSCI EAFE Index (net total return) returned 22.97% and the MSCI EAFE Value Index (net total return) (the "Index") returned 22.75% for the year ended October 31, 2024.
The Fund’s security selection in capital goods and insurance sectors contributed to performance relative to the Index.
The Fund’s security selection in telecommunication services and utilities sectors detracted from performance relative to the Index.
| AVERAGE ANNUAL TOTAL RETURNS | INCEPTION
DATE | 1 YEAR | | 5 YEAR | | 10 YEAR | |
| JPMorgan Developed International Value Fund (Class R5 Shares) | September 9, 2016 | 23.95 | % | 8.14 | % | 4.39 | % |
| MSCI EAFE Index (net total return) | | 22.97 | | 6.24 | | 5.27 | |
| MSCI EAFE Value Index (net total return) | | 22.75 | | 6.47 | | 4.28 | |
The performance quoted is past performance and is not a guarantee of future results. Mutual funds are subject to certain market risks. Investment returns and principal value of an investment will fluctuate so that an investor’s shares, when redeemed, may be worth more or less than their original cost. Current performance may be higher or lower than the performance data shown. Updated performance information is available by visiting www.jpmorganfunds.com or by calling 1-800-480-4111. Effective May 2018, some of the Fund’s investment strategies changed. The Fund’s past performance would have been different if the Fund was managed under the current strategies.
Returns for Class R5 Shares prior to its inception date are based on the performance of Class L Shares. The actual returns of Class R5 Shares would have been different than those shown because Class R5 Shares have different expenses than Class L Shares.
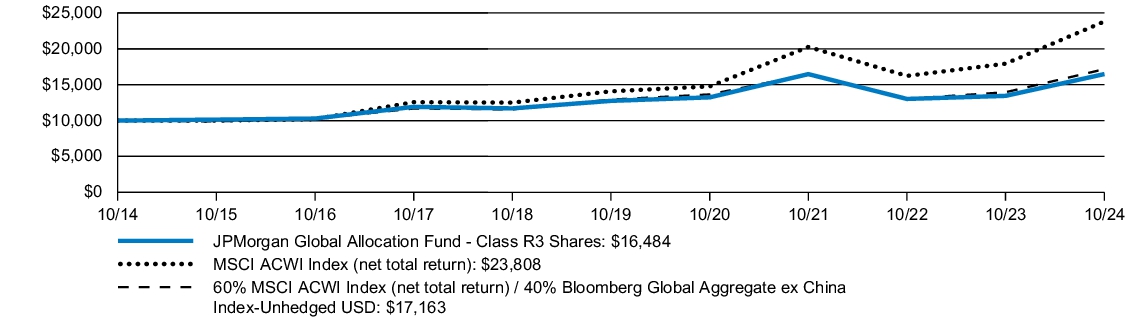
The graph illustrates comparative performance for $10,000 invested in Class R5 Shares of the JPMorgan Developed International Value Fund, the MSCI EAFE Index (net total return) and the MSCI EAFE Value Index (net total return) from October 31, 2014 to October 31, 2024. The performance of the Fund assumes reinvestment of all dividends and capital gain distributions, if any, and does not include a sales charge. The performance of the MSCI EAFE Index (net total return) and MSCI EAFE Value Index (net total return) does not reflect the deduction of expenses or a sales charge associated with a mutual fund and approximates the minimum possible dividend reinvestment of the securities included in the benchmark, if applicable. The MSCI EAFE Index (net total return) is a free float-adjusted market capitalization weighted index that is designed to measure the performance of large- and midcap stocks in developed markets, excluding the U.S. and Canada. Net total return figures assume the reinvestment of dividends after deduction of withholding tax, applying the maximum rate to nonresident individual investors who do not benefit from double taxation treaties. The MSCI EAFE Value Index (net total return) is a free float-adjusted market capitalization weighted index that is designed to measure the performance of value-oriented large- and mid- cap stocks in developed markets, excluding the U.S. and Canada. Net total return figures assume the reinvestment of dividends after deduction of withholding tax, applying the maximum rate to nonresident individual investors who do not benefit from double taxation treaties. Investors cannot invest directly in an index. As a result of new regulatory requirements, effective July 24, 2024, the Fund's regulatory index has changed from the Index, as defined above, to the MSCI EAFE Index, a broad-based securities market index. In addition to the Fund's performance, the tables in this section include performance of the new regulatory index and the Index.
Fund performance may reflect the waiver of the Fund’s fees and reimbursement of expenses for certain periods since the applicable inception date. Without these waivers and reimbursements, performance would have been lower. Also, performance shown in this section does not reflect the deduction of taxes that a shareholder would pay on Fund distributions or on gains resulting from redemptions of Fund shares.
The returns shown are based on net asset values calculated for shareholder transactions and may differ from the returns shown in the financial highlights, which reflect adjustments made to the net asset values in accordance with accounting principles generally accepted in the United States of America.
Source: MSCI. The MSCI information may only be used for your internal use, may not be reproduced or redisseminated in any form and may not be used as a basis for or a component of any financial instruments or products or indices. None of the MSCI information is intended to constitute investment advice or a recommendation to make (or refrain from making) any kind of investment decision and may not be relied on as such. Historical data and analysis should not be taken as an indication or guarantee of any future performance analysis, forecast, or prediction. The MSCI information is provided on an "as is" basis and the user of this information assumes the entire risk of any use made of this information. MSCI, each of its affiliates and each other person involved in or related to compiling, computing or creating any MSCI information (collectively, the "MSCI Parties") expressly disclaims all warranties (including, without limitation, any warranties of originality, accuracy, completeness, timeliness, non-infringement, merchantability and fitness for a particular purpose) with respect to this information. Without limiting any of the foregoing, in no event shall any MSCI Party have any liability for any direct, indirect, special, incidental, punitive, consequential (including, without limitation, lost profits) or any other damages. (www.msci.com)
| Fund net assets (000's) | $637,882 | |
| Total number of portfolio holdings | 255 | |
| Portfolio turnover rate | 50 | % |
| Total advisory fees paid (000's) | $2,495 | |
PORTFOLIO COMPOSITION - COUNTRY
(% of Total Investments)
Availability of Additional Information
At www.jpmorganfunds.com/funddocuments, you can find additional information about the Fund, including the Fund’s:
Prospectus
Financial information
Fund holdings
Proxy voting information
You can also request this information by contacting us at 1-800-480-4111.
ANNUAL SHAREHOLDER REPORT | October 31, 2024 (Unaudited)
JPMorgan Developed International Value Fund
Class R6 Shares/Ticker: JNVMX
ANNUAL SHAREHOLDER REPORT
This annual shareholder report contains important information about the JPMorgan Developed International Value Fund (the "Fund") for the period of November 1, 2023 to October 31, 2024. You can find additional information about the Fund at www.jpmorganfunds.com/funddocuments. You can also request this information by contacting us at 1-800-480-4111 or by sending an e-mail request to Funds.Website.Support@jpmorganfunds.com or by asking any financial intermediary that offers shares of the Fund.
What were the Fund costs for the last year?
(based on a hypothetical $10,000 investment)
| Fund (Class) | Costs of a
$10,000 investment | Costs paid as a percentage
of a $10,000 investment |
JPMorgan Developed International Value Fund
(Class R6 Shares) | $61 | 0.55% |
How did the Fund Perform?
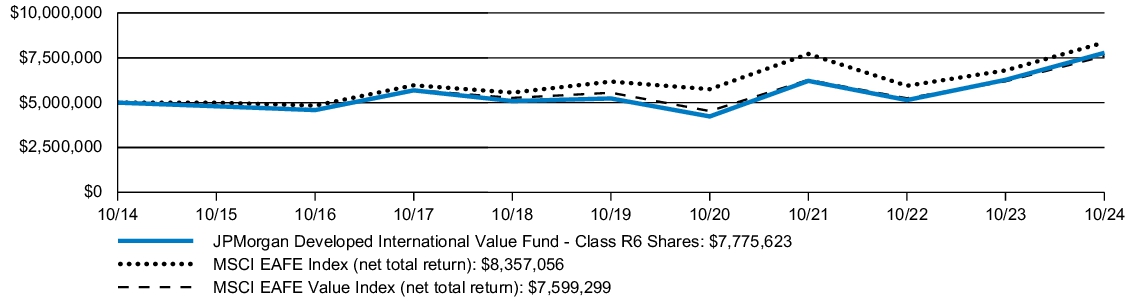
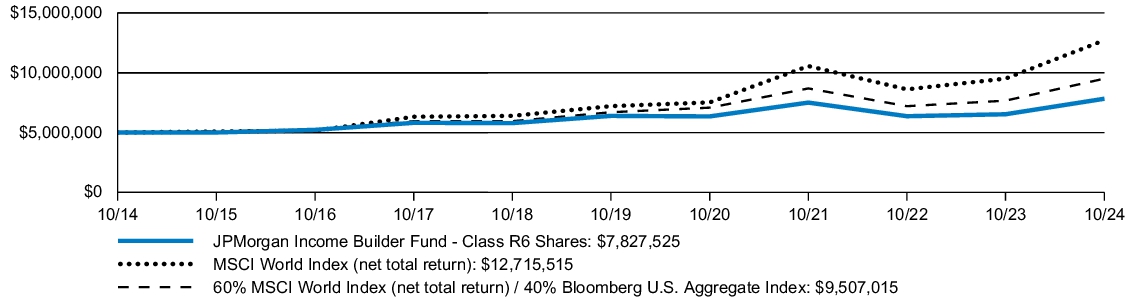
The JPMorgan Developed International Value Fund's Class R6 Shares returned 24.05% for the year ended October 31, 2024. The MSCI EAFE Index (net total return) returned 22.97% and the MSCI EAFE Value Index (net total return) (the "Index") returned 22.75% for the year ended October 31, 2024.
The Fund’s security selection in capital goods and insurance sectors contributed to performance relative to the Index.
The Fund’s security selection in telecommunication services and utilities sectors detracted from performance relative to the Index.
| AVERAGE ANNUAL TOTAL RETURNS | INCEPTION
DATE | 1 YEAR | | 5 YEAR | | 10 YEAR | |
| JPMorgan Developed International Value Fund (Class R6 Shares) | November 30, 2010 | 24.05 | % | 8.25 | % | 4.51 | % |
| MSCI EAFE Index (net total return) | | 22.97 | | 6.24 | | 5.27 | |
| MSCI EAFE Value Index (net total return) | | 22.75 | | 6.47 | | 4.28 | |
The performance quoted is past performance and is not a guarantee of future results. Mutual funds are subject to certain market risks. Investment returns and principal value of an investment will fluctuate so that an investor’s shares, when redeemed, may be worth more or less than their original cost. Current performance may be higher or lower than the performance data shown. Updated performance information is available by visiting www.jpmorganfunds.com or by calling 1-800-480-4111. Effective May 2018, some of the Fund’s investment strategies changed. The Fund’s past performance would have been different if the Fund was managed under the current strategies.
The graph illustrates comparative performance for $5,000,000 invested in Class R6 Shares of the JPMorgan Developed International Value Fund, the MSCI EAFE Index (net total return) and the MSCI EAFE Value Index (net total return) from October 31, 2014 to October 31, 2024. The performance of the Fund assumes reinvestment of all dividends and capital gain distributions, if any, and does not include a sales charge. The performance of the MSCI EAFE Index (net total return) and MSCI EAFE Value Index (net total return) does not reflect the deduction of expenses or a sales charge associated with a mutual fund and approximates the minimum possible dividend reinvestment of the securities included in the benchmark, if applicable. The MSCI EAFE Index (net total return) is a free float-adjusted market capitalization weighted index that is designed to measure the performance of large- and midcap stocks in developed markets, excluding the U.S. and Canada. Net total return figures assume the reinvestment of dividends after deduction of withholding tax, applying the maximum rate to nonresident individual investors who do not benefit from double taxation treaties. The MSCI EAFE Value Index (net total return) is a free float-adjusted market capitalization weighted index that is designed to measure the performance of value-oriented large- and mid- cap stocks in developed markets, excluding the U.S. and Canada. Net total return figures assume the reinvestment of dividends after deduction of withholding tax, applying the maximum rate to nonresident individual investors who do not benefit from double taxation treaties. Investors cannot invest directly in an index. As a result of new regulatory requirements, effective July 24, 2024, the Fund's regulatory index has changed from the Index, as defined above, to the MSCI EAFE Index, a broad-based securities market index. In addition to the Fund's performance, the tables in this section include performance of the new regulatory index and the Index.
Fund performance may reflect the waiver of the Fund’s fees and reimbursement of expenses for certain periods since the applicable inception date. Without these waivers and reimbursements, performance would have been lower. Also, performance shown in this section does not reflect the deduction of taxes that a shareholder would pay on Fund distributions or on gains resulting from redemptions of Fund shares.
The returns shown are based on net asset values calculated for shareholder transactions and may differ from the returns shown in the financial highlights, which reflect adjustments made to the net asset values in accordance with accounting principles generally accepted in the United States of America.
Source: MSCI. The MSCI information may only be used for your internal use, may not be reproduced or redisseminated in any form and may not be used as a basis for or a component of any financial instruments or products or indices. None of the MSCI information is intended to constitute investment advice or a recommendation to make (or refrain from making) any kind of investment decision and may not be relied on as such. Historical data and analysis should not be taken as an indication or guarantee of any future performance analysis, forecast, or prediction. The MSCI information is provided on an "as is" basis and the user of this information assumes the entire risk of any use made of this information. MSCI, each of its affiliates and each other person involved in or related to compiling, computing or creating any MSCI information (collectively, the "MSCI Parties") expressly disclaims all warranties (including, without limitation, any warranties of originality, accuracy, completeness, timeliness, non-infringement, merchantability and fitness for a particular purpose) with respect to this information. Without limiting any of the foregoing, in no event shall any MSCI Party have any liability for any direct, indirect, special, incidental, punitive, consequential (including, without limitation, lost profits) or any other damages. (www.msci.com)
| Fund net assets (000's) | $637,882 | |
| Total number of portfolio holdings | 255 | |
| Portfolio turnover rate | 50 | % |
| Total advisory fees paid (000's) | $2,495 | |
PORTFOLIO COMPOSITION - COUNTRY
(% of Total Investments)
Availability of Additional Information
At www.jpmorganfunds.com/funddocuments, you can find additional information about the Fund, including the Fund’s:
Prospectus
Financial information
Fund holdings
Proxy voting information
You can also request this information by contacting us at 1-800-480-4111.
ANNUAL SHAREHOLDER REPORT | October 31, 2024 (Unaudited)
JPMorgan Emerging Markets Equity Fund
Class A Shares/Ticker: JFAMX
ANNUAL SHAREHOLDER REPORT
This annual shareholder report contains important information about the JPMorgan Emerging Markets Equity Fund (the "Fund") for the period of November 1, 2023 to October 31, 2024. You can find additional information about the Fund at www.jpmorganfunds.com/funddocuments. You can also request this information by contacting us at 1-800-480-4111 or by sending an e-mail request to Funds.Website.Support@jpmorganfunds.com or by asking any financial intermediary that offers shares of the Fund.
What were the Fund costs for the last year?
(based on a hypothetical $10,000 investment)
| Fund (Class) | Costs of a
$10,000 investment | Costs paid as a percentage
of a $10,000 investment |
JPMorgan Emerging Markets Equity Fund
(Class A Shares) | $136 | 1.24% |
How did the Fund Perform?
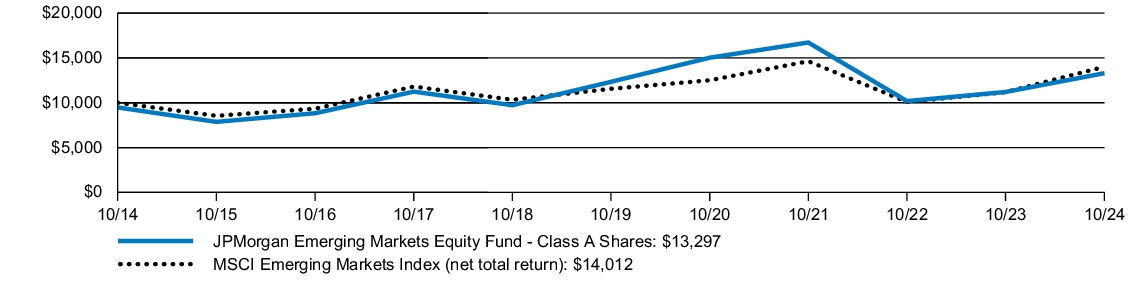
The JPMorgan Emerging Markets Equity Fund's Class A Shares, without a sales charge, returned 18.69% for the year ended October 31, 2024. The MSCI Emerging Markets Index (net total return) (the "Index") returned 25.32% for the year ended October 31, 2024.
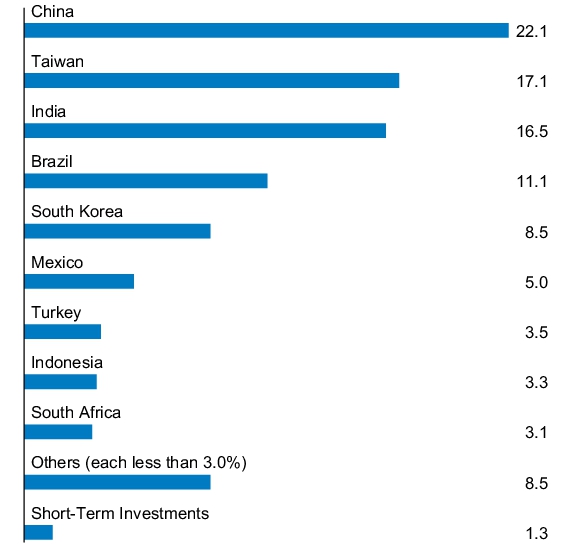
The Fund's holdings in China detracted from performance relative to the Index.
The Fund's underweight position in India detracted from performance relative to the Index.
The Fund's overweight position in Taiwan contributed to performance relative to the Index, driven by strong returns in the region.
Exposure to Argentina also added to the Fund’s positive performance, reflecting favorable market conditions and investment decisions.
| AVERAGE ANNUAL TOTAL RETURNS | INCEPTION
DATE | 1 YEAR | | 5 YEAR | | 10 YEAR | |
| JPMorgan Emerging Markets Equity Fund (Class A Shares) | September 28, 2001 | 12.46 | % | 0.42 | % | 2.89 | % |
| JPMorgan Emerging Markets Equity Fund (Class A Shares) - excluding sales charge | | 18.69 | | 1.52 | | 3.44 | |
| MSCI Emerging Markets Index (net total return) | | 25.32 | | 3.93 | | 3.43 | |
The performance quoted is past performance and is not a guarantee of future results. Mutual funds are subject to certain market risks. Investment returns and principal value of an investment will fluctuate so that an investor’s shares, when redeemed, may be worth more or less than their original cost. Current performance may be higher or lower than the performance data shown. Updated performance information is available by visiting www.jpmorganfunds.com or by calling 1-800-480-4111.
The graph illustrates comparative performance for $10,000 invested in Class A Shares of the JPMorgan Emerging Markets Equity Fund and the MSCI Emerging Markets Index (net total return) from October 31, 2014 to October 31, 2024. The performance of the Fund assumes reinvestment of all dividends and capital gain distributions, if any, and includes a sales charge. The performance of the MSCI Emerging Markets Index (net total return) does not reflect the deduction of expenses or a sales charge associated with a mutual fund and approximates the minimum possible dividend reinvestment of the securities included in the benchmark, if applicable. The MSCI Emerging Markets Index (net total return) is a free float-adjusted market capitalization weighted index that is designed to measure the performance of large- and mid- cap stocks in emerging markets. Net total return figures assume the reinvestment of dividends after deduction of withholding tax, applying the maximum rate to nonresident individual investors who do not benefit from double taxation treaties. Investors cannot invest directly in an index.
Fund performance may reflect the waiver of the Fund’s fees and reimbursement of expenses for certain periods since the applicable inception date. Without these waivers and reimbursements, performance would have been lower. Also, performance shown in this section does not reflect the deduction of taxes that a shareholder would pay on Fund distributions or on gains resulting from redemptions of Fund shares.
The returns shown are based on net asset values calculated for shareholder transactions and may differ from the returns shown in the financial highlights, which reflect adjustments made to the net asset values in accordance with accounting principles generally accepted in the United States of America.
Source: MSCI. The MSCI information may only be used for your internal use, may not be reproduced or redisseminated in any form and may not be used as a basis for or a component of any financial instruments or products or indices. None of the MSCI information is intended to constitute investment advice or a recommendation to make (or refrain from making) any kind of investment decision and may not be relied on as such. Historical data and analysis should not be taken as an indication or guarantee of any future performance analysis, forecast, or prediction. The MSCI information is provided on an "as is" basis and the user of this information assumes the entire risk of any use made of this information. MSCI, each of its affiliates and each other person involved in or related to compiling, computing or creating any MSCI information (collectively, the "MSCI Parties") expressly disclaims all warranties (including, without limitation, any warranties of originality, accuracy, completeness, timeliness, non-infringement, merchantability and fitness for a particular purpose) with respect to this information. Without limiting any of the foregoing, in no event shall any MSCI Party have any liability for any direct, indirect, special, incidental, punitive, consequential (including, without limitation, lost profits) or any other damages. (www.msci.com)
| Fund net assets (000's) | $6,959,199 | |
| Total number of portfolio holdings | 81 | |
| Portfolio turnover rate | 36 | % |
| Total advisory fees paid (000's) | $48,624 | |
PORTFOLIO COMPOSITION - COUNTRY
(% of Total Investments)
Availability of Additional Information
At www.jpmorganfunds.com/funddocuments, you can find additional information about the Fund, including the Fund’s:
Prospectus
Financial information
Fund holdings
Proxy voting information
You can also request this information by contacting us at 1-800-480-4111.
ANNUAL SHAREHOLDER REPORT | October 31, 2024 (Unaudited)
JPMorgan Emerging Markets Equity Fund
Class C Shares/Ticker: JEMCX
ANNUAL SHAREHOLDER REPORT
This annual shareholder report contains important information about the JPMorgan Emerging Markets Equity Fund (the "Fund") for the period of November 1, 2023 to October 31, 2024. You can find additional information about the Fund at www.jpmorganfunds.com/funddocuments. You can also request this information by contacting us at 1-800-480-4111 or by sending an e-mail request to Funds.Website.Support@jpmorganfunds.com or by asking any financial intermediary that offers shares of the Fund.
What were the Fund costs for the last year?
(based on a hypothetical $10,000 investment)
| Fund (Class) | Costs of a
$10,000 investment | Costs paid as a percentage
of a $10,000 investment |
JPMorgan Emerging Markets Equity Fund
(Class C Shares) | $190 | 1.74% |
How did the Fund Perform?
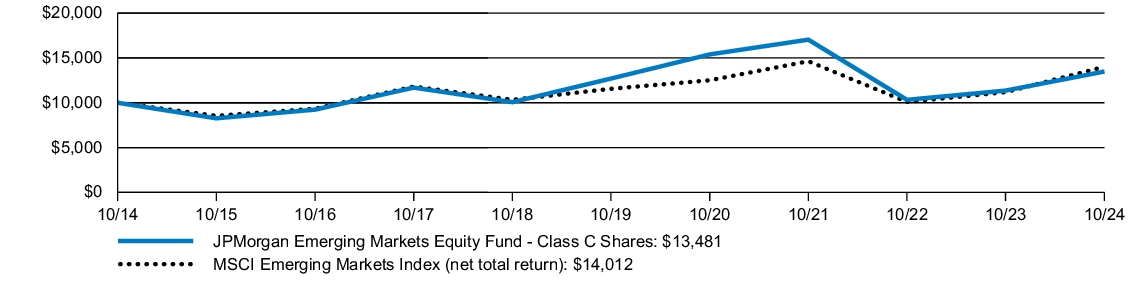
The JPMorgan Emerging Markets Equity Fund's Class C Shares, without a sales charge, returned 18.10% for the year ended October 31, 2024. The MSCI Emerging Markets Index (net total return) (the "Index") returned 25.32% for the year ended October 31, 2024.
The Fund's holdings in China detracted from performance relative to the Index.
The Fund's underweight position in India detracted from performance relative to the Index.
The Fund's overweight position in Taiwan contributed to performance relative to the Index, driven by strong returns in the region.
Exposure to Argentina also added to the Fund’s positive performance, reflecting favorable market conditions and investment decisions.
| AVERAGE ANNUAL TOTAL RETURNS | INCEPTION
DATE | 1 YEAR | | 5 YEAR | | 10 YEAR | |
| JPMorgan Emerging Markets Equity Fund (Class C Shares) | February 28, 2006 | 17.10 | % | 1.01 | % | 3.03 | % |
| JPMorgan Emerging Markets Equity Fund (Class C Shares) - excluding sales charge | | 18.10 | | 1.01 | | 3.03 | |
| MSCI Emerging Markets Index (net total return) | | 25.32 | | 3.93 | | 3.43 | |
The performance quoted is past performance and is not a guarantee of future results. Mutual funds are subject to certain market risks. Investment returns and principal value of an investment will fluctuate so that an investor’s shares, when redeemed, may be worth more or less than their original cost. Current performance may be higher or lower than the performance data shown. Updated performance information is available by visiting www.jpmorganfunds.com or by calling 1-800-480-4111.
The graph illustrates comparative performance for $10,000 invested in Class C Shares of the JPMorgan Emerging Markets Equity Fund and the MSCI Emerging Markets Index (net total return) from October 31, 2014 to October 31, 2024. The performance of the Fund assumes reinvestment of all dividends and capital gain distributions, if any, and does not include a sales charge. The performance of the MSCI Emerging Markets Index (net total return) does not reflect the deduction of expenses or a sales charge associated with a mutual fund and approximates the minimum possible dividend reinvestment of the securities included in the benchmark, if applicable. The MSCI Emerging Markets Index (net total return) is a free float-adjusted market capitalization weighted index that is designed to measure the performance of large- and mid- cap stocks in emerging markets. Net total return figures assume the reinvestment of dividends after deduction of withholding tax, applying the maximum rate to nonresident individual investors who do not benefit from double taxation treaties. Investors cannot invest directly in an index.
Fund performance may reflect the waiver of the Fund’s fees and reimbursement of expenses for certain periods since the applicable inception date. Without these waivers and reimbursements, performance would have been lower. Also, performance shown in this section does not reflect the deduction of taxes that a shareholder would pay on Fund distributions or on gains resulting from redemptions of Fund shares.
Because Class C Shares automatically convert to Class A Shares after 8 years, the 10 year average annual total return shown above for Class C Shares reflects Class A Share's performance for the period after conversion.
The returns shown are based on net asset values calculated for shareholder transactions and may differ from the returns shown in the financial highlights, which reflect adjustments made to the net asset values in accordance with accounting principles generally accepted in the United States of America.
Source: MSCI. The MSCI information may only be used for your internal use, may not be reproduced or redisseminated in any form and may not be used as a basis for or a component of any financial instruments or products or indices. None of the MSCI information is intended to constitute investment advice or a recommendation to make (or refrain from making) any kind of investment decision and may not be relied on as such. Historical data and analysis should not be taken as an indication or guarantee of any future performance analysis, forecast, or prediction. The MSCI information is provided on an "as is" basis and the user of this information assumes the entire risk of any use made of this information. MSCI, each of its affiliates and each other person involved in or related to compiling, computing or creating any MSCI information (collectively, the "MSCI Parties") expressly disclaims all warranties (including, without limitation, any warranties of originality, accuracy, completeness, timeliness, non-infringement, merchantability and fitness for a particular purpose) with respect to this information. Without limiting any of the foregoing, in no event shall any MSCI Party have any liability for any direct, indirect, special, incidental, punitive, consequential (including, without limitation, lost profits) or any other damages. (www.msci.com)
| Fund net assets (000's) | $6,959,199 | |
| Total number of portfolio holdings | 81 | |
| Portfolio turnover rate | 36 | % |
| Total advisory fees paid (000's) | $48,624 | |
PORTFOLIO COMPOSITION - COUNTRY
(% of Total Investments)
Availability of Additional Information
At www.jpmorganfunds.com/funddocuments, you can find additional information about the Fund, including the Fund’s:
Prospectus
Financial information
Fund holdings
Proxy voting information
You can also request this information by contacting us at 1-800-480-4111.
ANNUAL SHAREHOLDER REPORT | October 31, 2024 (Unaudited)
JPMorgan Emerging Markets Equity Fund
Class I Shares/Ticker: JEMSX
ANNUAL SHAREHOLDER REPORT
This annual shareholder report contains important information about the JPMorgan Emerging Markets Equity Fund (the "Fund") for the period of November 1, 2023 to October 31, 2024. You can find additional information about the Fund at www.jpmorganfunds.com/funddocuments. You can also request this information by contacting us at 1-800-480-4111 or by sending an e-mail request to Funds.Website.Support@jpmorganfunds.com or by asking any financial intermediary that offers shares of the Fund.
What were the Fund costs for the last year?
(based on a hypothetical $10,000 investment)
| Fund (Class) | Costs of a
$10,000 investment | Costs paid as a percentage
of a $10,000 investment |
JPMorgan Emerging Markets Equity Fund
(Class I Shares) | $108 | 0.99% |
How did the Fund Perform?
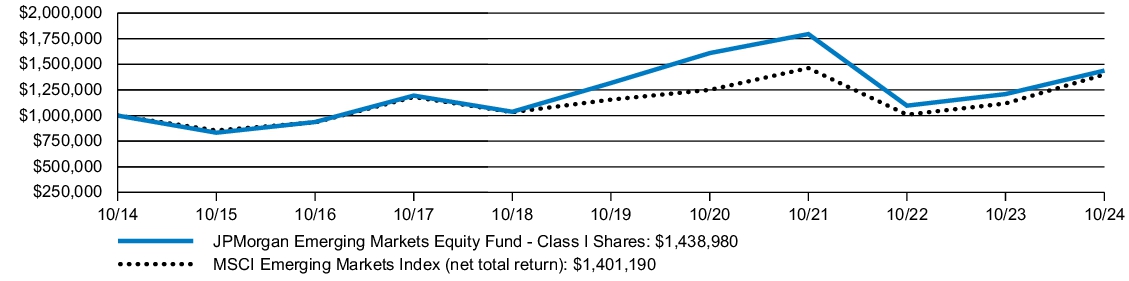
The JPMorgan Emerging Markets Equity Fund's Class I Shares returned 18.97% for the year ended October 31, 2024. The MSCI Emerging Markets Index (net total return) (the "Index") returned 25.32% for the year ended October 31, 2024.
The Fund's holdings in China detracted from performance relative to the Index.
The Fund's underweight position in India detracted from performance relative to the Index.
The Fund's overweight position in Taiwan contributed to performance relative to the Index, driven by strong returns in the region.
Exposure to Argentina also added to the Fund’s positive performance, reflecting favorable market conditions and investment decisions.
| AVERAGE ANNUAL TOTAL RETURNS | INCEPTION
DATE | 1 YEAR | | 5 YEAR | | 10 YEAR | |
| JPMorgan Emerging Markets Equity Fund (Class I Shares) | September 10, 2001 | 18.97 | % | 1.78 | % | 3.71 | % |
| MSCI Emerging Markets Index (net total return) | | 25.32 | | 3.93 | | 3.43 | |
The performance quoted is past performance and is not a guarantee of future results. Mutual funds are subject to certain market risks. Investment returns and principal value of an investment will fluctuate so that an investor’s shares, when redeemed, may be worth more or less than their original cost. Current performance may be higher or lower than the performance data shown. Updated performance information is available by visiting www.jpmorganfunds.com or by calling 1-800-480-4111.
The graph illustrates comparative performance for $1,000,000 invested in Class I Shares of the JPMorgan Emerging Markets Equity Fund and the MSCI Emerging Markets Index (net total return) from October 31, 2014 to October 31, 2024. The performance of the Fund assumes reinvestment of all dividends and capital gain distributions, if any, and does not include a sales charge. The performance of the MSCI Emerging Markets Index (net total return) does not reflect the deduction of expenses or a sales charge associated with a mutual fund and approximates the minimum possible dividend reinvestment of the securities included in the benchmark, if applicable. The MSCI Emerging Markets Index (net total return) is a free float-adjusted market capitalization weighted index that is designed to measure the performance of large- and mid- cap stocks in emerging markets. Net total return figures assume the reinvestment of dividends after deduction of withholding tax, applying the maximum rate to nonresident individual investors who do not benefit from double taxation treaties. Investors cannot invest directly in an index.
Fund performance may reflect the waiver of the Fund’s fees and reimbursement of expenses for certain periods since the applicable inception date. Without these waivers and reimbursements, performance would have been lower. Also, performance shown in this section does not reflect the deduction of taxes that a shareholder would pay on Fund distributions or on gains resulting from redemptions of Fund shares.
The returns shown are based on net asset values calculated for shareholder transactions and may differ from the returns shown in the financial highlights, which reflect adjustments made to the net asset values in accordance with accounting principles generally accepted in the United States of America.
Source: MSCI. The MSCI information may only be used for your internal use, may not be reproduced or redisseminated in any form and may not be used as a basis for or a component of any financial instruments or products or indices. None of the MSCI information is intended to constitute investment advice or a recommendation to make (or refrain from making) any kind of investment decision and may not be relied on as such. Historical data and analysis should not be taken as an indication or guarantee of any future performance analysis, forecast, or prediction. The MSCI information is provided on an "as is" basis and the user of this information assumes the entire risk of any use made of this information. MSCI, each of its affiliates and each other person involved in or related to compiling, computing or creating any MSCI information (collectively, the "MSCI Parties") expressly disclaims all warranties (including, without limitation, any warranties of originality, accuracy, completeness, timeliness, non-infringement, merchantability and fitness for a particular purpose) with respect to this information. Without limiting any of the foregoing, in no event shall any MSCI Party have any liability for any direct, indirect, special, incidental, punitive, consequential (including, without limitation, lost profits) or any other damages. (www.msci.com)
| Fund net assets (000's) | $6,959,199 | |
| Total number of portfolio holdings | 81 | |
| Portfolio turnover rate | 36 | % |
| Total advisory fees paid (000's) | $48,624 | |
PORTFOLIO COMPOSITION - COUNTRY
(% of Total Investments)
Availability of Additional Information
At www.jpmorganfunds.com/funddocuments, you can find additional information about the Fund, including the Fund’s:
Prospectus
Financial information
Fund holdings
Proxy voting information
You can also request this information by contacting us at 1-800-480-4111.
ANNUAL SHAREHOLDER REPORT | October 31, 2024 (Unaudited)
JPMorgan Emerging Markets Equity Fund
Class L Shares/Ticker: JMIEX
ANNUAL SHAREHOLDER REPORT
This annual shareholder report contains important information about the JPMorgan Emerging Markets Equity Fund (the "Fund") for the period of November 1, 2023 to October 31, 2024. You can find additional information about the Fund at www.jpmorganfunds.com/funddocuments. You can also request this information by contacting us at 1-800-480-4111 or by sending an e-mail request to Funds.Website.Support@jpmorganfunds.com or by asking any financial intermediary that offers shares of the Fund.
What were the Fund costs for the last year?
(based on a hypothetical $10,000 investment)
| Fund (Class) | Costs of a
$10,000 investment | Costs paid as a percentage
of a $10,000 investment |
JPMorgan Emerging Markets Equity Fund
(Class L Shares) | $98 | 0.89% |
How did the Fund Perform?
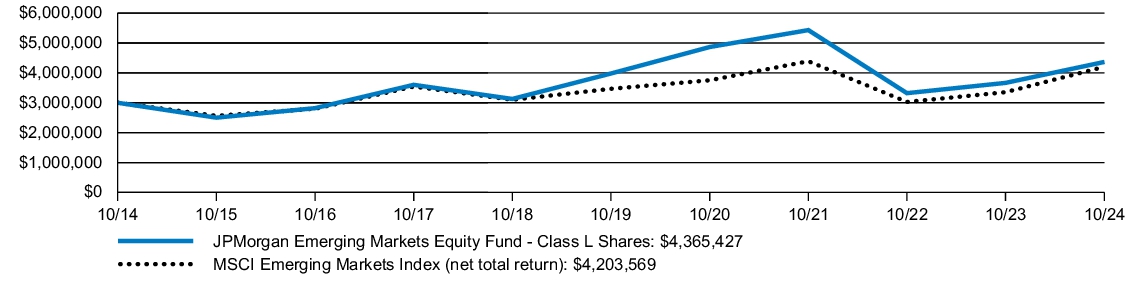
The JPMorgan Emerging Markets Equity Fund's Class L Shares returned 19.11% for the year ended October 31, 2024. The MSCI Emerging Markets Index (net total return) (the "Index") returned 25.32% for the year ended October 31, 2024.
The Fund's holdings in China detracted from performance relative to the Index.
The Fund's underweight position in India detracted from performance relative to the Index.
The Fund's overweight position in Taiwan contributed to performance relative to the Index, driven by strong returns in the region.
Exposure to Argentina also added to the Fund’s positive performance, reflecting favorable market conditions and investment decisions.
| AVERAGE ANNUAL TOTAL RETURNS | INCEPTION
DATE | 1 YEAR | | 5 YEAR | | 10 YEAR | |
| JPMorgan Emerging Markets Equity Fund (Class L Shares) | November 15, 1993 | 19.11 | % | 1.87 | % | 3.82 | % |
| MSCI Emerging Markets Index (net total return) | | 25.32 | | 3.93 | | 3.43 | |
The performance quoted is past performance and is not a guarantee of future results. Mutual funds are subject to certain market risks. Investment returns and principal value of an investment will fluctuate so that an investor’s shares, when redeemed, may be worth more or less than their original cost. Current performance may be higher or lower than the performance data shown. Updated performance information is available by visiting www.jpmorganfunds.com or by calling 1-800-480-4111.
The graph illustrates comparative performance for $3,000,000 invested in Class L Shares of the JPMorgan Emerging Markets Equity Fund and the MSCI Emerging Markets Index (net total return) from October 31, 2014 to October 31, 2024. The performance of the Fund assumes reinvestment of all dividends and capital gain distributions, if any, and does not include a sales charge. The performance of the MSCI Emerging Markets Index (net total return) does not reflect the deduction of expenses or a sales charge associated with a mutual fund and approximates the minimum possible dividend reinvestment of the securities included in the benchmark, if applicable. The MSCI Emerging Markets Index (net total return) is a free float-adjusted market capitalization weighted index that is designed to measure the performance of large- and mid- cap stocks in emerging markets. Net total return figures assume the reinvestment of dividends after deduction of withholding tax, applying the maximum rate to nonresident individual investors who do not benefit from double taxation treaties. Investors cannot invest directly in an index.
Fund performance may reflect the waiver of the Fund’s fees and reimbursement of expenses for certain periods since the applicable inception date. Without these waivers and reimbursements, performance would have been lower. Also, performance shown in this section does not reflect the deduction of taxes that a shareholder would pay on Fund distributions or on gains resulting from redemptions of Fund shares.
The returns shown are based on net asset values calculated for shareholder transactions and may differ from the returns shown in the financial highlights, which reflect adjustments made to the net asset values in accordance with accounting principles generally accepted in the United States of America.
Source: MSCI. The MSCI information may only be used for your internal use, may not be reproduced or redisseminated in any form and may not be used as a basis for or a component of any financial instruments or products or indices. None of the MSCI information is intended to constitute investment advice or a recommendation to make (or refrain from making) any kind of investment decision and may not be relied on as such. Historical data and analysis should not be taken as an indication or guarantee of any future performance analysis, forecast, or prediction. The MSCI information is provided on an "as is" basis and the user of this information assumes the entire risk of any use made of this information. MSCI, each of its affiliates and each other person involved in or related to compiling, computing or creating any MSCI information (collectively, the "MSCI Parties") expressly disclaims all warranties (including, without limitation, any warranties of originality, accuracy, completeness, timeliness, non-infringement, merchantability and fitness for a particular purpose) with respect to this information. Without limiting any of the foregoing, in no event shall any MSCI Party have any liability for any direct, indirect, special, incidental, punitive, consequential (including, without limitation, lost profits) or any other damages. (www.msci.com)
| Fund net assets (000's) | $6,959,199 | |
| Total number of portfolio holdings | 81 | |
| Portfolio turnover rate | 36 | % |
| Total advisory fees paid (000's) | $48,624 | |
PORTFOLIO COMPOSITION - COUNTRY
(% of Total Investments)
Availability of Additional Information
At www.jpmorganfunds.com/funddocuments, you can find additional information about the Fund, including the Fund’s:
Prospectus
Financial information
Fund holdings
Proxy voting information
You can also request this information by contacting us at 1-800-480-4111.
ANNUAL SHAREHOLDER REPORT | October 31, 2024 (Unaudited)
JPMorgan Emerging Markets Equity Fund
Class R2 Shares/Ticker: JHUJX
ANNUAL SHAREHOLDER REPORT
This annual shareholder report contains important information about the JPMorgan Emerging Markets Equity Fund (the "Fund") for the period of November 1, 2023 to October 31, 2024. You can find additional information about the Fund at www.jpmorganfunds.com/funddocuments. You can also request this information by contacting us at 1-800-480-4111 or by sending an e-mail request to Funds.Website.Support@jpmorganfunds.com or by asking any financial intermediary that offers shares of the Fund.
What were the Fund costs for the last year?
(based on a hypothetical $10,000 investment)
| Fund (Class) | Costs of a
$10,000 investment | Costs paid as a percentage
of a $10,000 investment |
JPMorgan Emerging Markets Equity Fund
(Class R2 Shares) | $168 | 1.54% |
How did the Fund Perform?
The JPMorgan Emerging Markets Equity Fund's Class R2 Shares returned 18.32% for the year ended October 31, 2024. The MSCI Emerging Markets Index (net total return) (the "Index") returned 25.32% for the year ended October 31, 2024.
The Fund's holdings in China detracted from performance relative to the Index.
The Fund's underweight position in India detracted from performance relative to the Index.
The Fund's overweight position in Taiwan contributed to performance relative to the Index, driven by strong returns in the region.
Exposure to Argentina also added to the Fund’s positive performance, reflecting favorable market conditions and investment decisions.
| AVERAGE ANNUAL TOTAL RETURNS | INCEPTION
DATE | 1 YEAR | | 5 YEAR | | 10 YEAR | |
| JPMorgan Emerging Markets Equity Fund (Class R2 Shares) | July 31, 2017 | 18.32 | % | 1.22 | % | 3.19 | % |
| MSCI Emerging Markets Index (net total return) | | 25.32 | | 3.93 | | 3.43 | |
The performance quoted is past performance and is not a guarantee of future results. Mutual funds are subject to certain market risks. Investment returns and principal value of an investment will fluctuate so that an investor’s shares, when redeemed, may be worth more or less than their original cost. Current performance may be higher or lower than the performance data shown. Updated performance information is available by visiting www.jpmorganfunds.com or by calling 1-800-480-4111.
Returns for Class R2 Shares prior to its inception date are based on the performance of Class A Shares. The actual returns of Class R2 Shares and Class R3 Shares would have been lower than those shown because Class R2 Shares have higher expenses than Class A Shares.
The graph illustrates comparative performance for $10,000 invested in Class R2 Shares of the JPMorgan Emerging Markets Equity Fund and the MSCI Emerging Markets Index (net total return) from October 31, 2014 to October 31, 2024. The performance of the Fund assumes reinvestment of all dividends and capital gain distributions, if any, and does not include a sales charge. The performance of the MSCI Emerging Markets Index (net total return) does not reflect the deduction of expenses or a sales charge associated with a mutual fund and approximates the minimum possible dividend reinvestment of the securities included in the benchmark, if applicable. The MSCI Emerging Markets Index (net total return) is a free float-adjusted market capitalization weighted index that is designed to measure the performance of large- and mid- cap stocks in emerging markets. Net total return figures assume the reinvestment of dividends after deduction of withholding tax, applying the maximum rate to nonresident individual investors who do not benefit from double taxation treaties. Investors cannot invest directly in an index.
Fund performance may reflect the waiver of the Fund’s fees and reimbursement of expenses for certain periods since the applicable inception date. Without these waivers and reimbursements, performance would have been lower. Also, performance shown in this section does not reflect the deduction of taxes that a shareholder would pay on Fund distributions or on gains resulting from redemptions of Fund shares.
The returns shown are based on net asset values calculated for shareholder transactions and may differ from the returns shown in the financial highlights, which reflect adjustments made to the net asset values in accordance with accounting principles generally accepted in the United States of America.
Source: MSCI. The MSCI information may only be used for your internal use, may not be reproduced or redisseminated in any form and may not be used as a basis for or a component of any financial instruments or products or indices. None of the MSCI information is intended to constitute investment advice or a recommendation to make (or refrain from making) any kind of investment decision and may not be relied on as such. Historical data and analysis should not be taken as an indication or guarantee of any future performance analysis, forecast, or prediction. The MSCI information is provided on an "as is" basis and the user of this information assumes the entire risk of any use made of this information. MSCI, each of its affiliates and each other person involved in or related to compiling, computing or creating any MSCI information (collectively, the "MSCI Parties") expressly disclaims all warranties (including, without limitation, any warranties of originality, accuracy, completeness, timeliness, non-infringement, merchantability and fitness for a particular purpose) with respect to this information. Without limiting any of the foregoing, in no event shall any MSCI Party have any liability for any direct, indirect, special, incidental, punitive, consequential (including, without limitation, lost profits) or any other damages. (www.msci.com)
| Fund net assets (000's) | $6,959,199 | |
| Total number of portfolio holdings | 81 | |
| Portfolio turnover rate | 36 | % |
| Total advisory fees paid (000's) | $48,624 | |
PORTFOLIO COMPOSITION - COUNTRY
(% of Total Investments)
Availability of Additional Information
At www.jpmorganfunds.com/funddocuments, you can find additional information about the Fund, including the Fund’s:
Prospectus
Financial information
Fund holdings
Proxy voting information
You can also request this information by contacting us at 1-800-480-4111.
ANNUAL SHAREHOLDER REPORT | October 31, 2024 (Unaudited)
JPMorgan Emerging Markets Equity Fund
Class R3 Shares/Ticker: JHURX
ANNUAL SHAREHOLDER REPORT
This annual shareholder report contains important information about the JPMorgan Emerging Markets Equity Fund (the "Fund") for the period of November 1, 2023 to October 31, 2024. You can find additional information about the Fund at www.jpmorganfunds.com/funddocuments. You can also request this information by contacting us at 1-800-480-4111 or by sending an e-mail request to Funds.Website.Support@jpmorganfunds.com or by asking any financial intermediary that offers shares of the Fund.
What were the Fund costs for the last year?
(based on a hypothetical $10,000 investment)
| Fund (Class) | Costs of a
$10,000 investment | Costs paid as a percentage
of a $10,000 investment |
JPMorgan Emerging Markets Equity Fund
(Class R3 Shares) | $141 | 1.29% |
How did the Fund Perform?
The JPMorgan Emerging Markets Equity Fund's Class R3 Shares returned 18.62% for the year ended October 31, 2024. The MSCI Emerging Markets Index (net total return) (the "Index") returned 25.32% for the year ended October 31, 2024.
The Fund's holdings in China detracted from performance relative to the Index.
The Fund's underweight position in India detracted from performance relative to the Index.
The Fund's overweight position in Taiwan contributed to performance relative to the Index, driven by strong returns in the region.
Exposure to Argentina also added to the Fund’s positive performance, reflecting favorable market conditions and investment decisions.
| AVERAGE ANNUAL TOTAL RETURNS | INCEPTION
DATE | 1 YEAR | | 5 YEAR | | 10 YEAR | |
| JPMorgan Emerging Markets Equity Fund (Class R3 Shares) | July 31, 2017 | 18.62 | % | 1.47 | % | 3.41 | % |
| MSCI Emerging Markets Index (net total return) | | 25.32 | | 3.93 | | 3.43 | |
The performance quoted is past performance and is not a guarantee of future results. Mutual funds are subject to certain market risks. Investment returns and principal value of an investment will fluctuate so that an investor’s shares, when redeemed, may be worth more or less than their original cost. Current performance may be higher or lower than the performance data shown. Updated performance information is available by visiting www.jpmorganfunds.com or by calling 1-800-480-4111.
Returns for Class R3 Shares prior to its inception date are based on the performance of Class A Shares. The actual returns of Class R2 Shares and Class R3 Shares would have been lower than those shown because Class R3 Shares have higher expenses than Class A Shares.
The graph illustrates comparative performance for $10,000 invested in Class R3 Shares of the JPMorgan Emerging Markets Equity Fund and the MSCI Emerging Markets Index (net total return) from October 31, 2014 to October 31, 2024. The performance of the Fund assumes reinvestment of all dividends and capital gain distributions, if any, and does not include a sales charge. The performance of the MSCI Emerging Markets Index (net total return) does not reflect the deduction of expenses or a sales charge associated with a mutual fund and approximates the minimum possible dividend reinvestment of the securities included in the benchmark, if applicable. The MSCI Emerging Markets Index (net total return) is a free float-adjusted market capitalization weighted index that is designed to measure the performance of large- and mid- cap stocks in emerging markets. Net total return figures assume the reinvestment of dividends after deduction of withholding tax, applying the maximum rate to nonresident individual investors who do not benefit from double taxation treaties. Investors cannot invest directly in an index.
Fund performance may reflect the waiver of the Fund’s fees and reimbursement of expenses for certain periods since the applicable inception date. Without these waivers and reimbursements, performance would have been lower. Also, performance shown in this section does not reflect the deduction of taxes that a shareholder would pay on Fund distributions or on gains resulting from redemptions of Fund shares.
The returns shown are based on net asset values calculated for shareholder transactions and may differ from the returns shown in the financial highlights, which reflect adjustments made to the net asset values in accordance with accounting principles generally accepted in the United States of America.
Source: MSCI. The MSCI information may only be used for your internal use, may not be reproduced or redisseminated in any form and may not be used as a basis for or a component of any financial instruments or products or indices. None of the MSCI information is intended to constitute investment advice or a recommendation to make (or refrain from making) any kind of investment decision and may not be relied on as such. Historical data and analysis should not be taken as an indication or guarantee of any future performance analysis, forecast, or prediction. The MSCI information is provided on an "as is" basis and the user of this information assumes the entire risk of any use made of this information. MSCI, each of its affiliates and each other person involved in or related to compiling, computing or creating any MSCI information (collectively, the "MSCI Parties") expressly disclaims all warranties (including, without limitation, any warranties of originality, accuracy, completeness, timeliness, non-infringement, merchantability and fitness for a particular purpose) with respect to this information. Without limiting any of the foregoing, in no event shall any MSCI Party have any liability for any direct, indirect, special, incidental, punitive, consequential (including, without limitation, lost profits) or any other damages. (www.msci.com)
| Fund net assets (000's) | $6,959,199 | |
| Total number of portfolio holdings | 81 | |
| Portfolio turnover rate | 36 | % |
| Total advisory fees paid (000's) | $48,624 | |
PORTFOLIO COMPOSITION - COUNTRY
(% of Total Investments)
Availability of Additional Information
At www.jpmorganfunds.com/funddocuments, you can find additional information about the Fund, including the Fund’s:
Prospectus
Financial information
Fund holdings
Proxy voting information
You can also request this information by contacting us at 1-800-480-4111.
ANNUAL SHAREHOLDER REPORT | October 31, 2024 (Unaudited)
JPMorgan Emerging Markets Equity Fund
Class R4 Shares/Ticker: JHUKX
ANNUAL SHAREHOLDER REPORT
This annual shareholder report contains important information about the JPMorgan Emerging Markets Equity Fund (the "Fund") for the period of November 1, 2023 to October 31, 2024. You can find additional information about the Fund at www.jpmorganfunds.com/funddocuments. You can also request this information by contacting us at 1-800-480-4111 or by sending an e-mail request to Funds.Website.Support@jpmorganfunds.com or by asking any financial intermediary that offers shares of the Fund.
What were the Fund costs for the last year?
(based on a hypothetical $10,000 investment)
| Fund (Class) | Costs of a
$10,000 investment | Costs paid as a percentage
of a $10,000 investment |
JPMorgan Emerging Markets Equity Fund
(Class R4 Shares) | $114 | 1.04% |
How did the Fund Perform?
The JPMorgan Emerging Markets Equity Fund's Class R4 Shares returned 18.91% for the year ended October 31, 2024. The MSCI Emerging Markets Index (net total return) (the "Index") returned 25.32% for the year ended October 31, 2024.
The Fund's holdings in China detracted from performance relative to the Index.
The Fund's underweight position in India detracted from performance relative to the Index.
The Fund's overweight position in Taiwan contributed to performance relative to the Index, driven by strong returns in the region.
Exposure to Argentina also added to the Fund’s positive performance, reflecting favorable market conditions and investment decisions.
| AVERAGE ANNUAL TOTAL RETURNS | INCEPTION
DATE | 1 YEAR | | 5 YEAR | | 10 YEAR | |
| JPMorgan Emerging Markets Equity Fund (Class R4 Shares) | July 31, 2017 | 18.91 | % | 1.72 | % | 3.67 | % |
| MSCI Emerging Markets Index (net total return) | | 25.32 | | 3.93 | | 3.43 | |
The performance quoted is past performance and is not a guarantee of future results. Mutual funds are subject to certain market risks. Investment returns and principal value of an investment will fluctuate so that an investor’s shares, when redeemed, may be worth more or less than their original cost. Current performance may be higher or lower than the performance data shown. Updated performance information is available by visiting www.jpmorganfunds.com or by calling 1-800-480-4111.
Returns for Class R4 Shares prior to its inception date are based on the performance of Class I Shares. The actual returns of Class R4 Shares would have been lower than those shown because Class R4 Shares have higher expenses than Class I Shares.
The graph illustrates comparative performance for $10,000 invested in Class R4 Shares of the JPMorgan Emerging Markets Equity Fund and the MSCI Emerging Markets Index (net total return) from October 31, 2014 to October 31, 2024. The performance of the Fund assumes reinvestment of all dividends and capital gain distributions, if any, and does not include a sales charge. The performance of the MSCI Emerging Markets Index (net total return) does not reflect the deduction of expenses or a sales charge associated with a mutual fund and approximates the minimum possible dividend reinvestment of the securities included in the benchmark, if applicable. The MSCI Emerging Markets Index (net total return) is a free float-adjusted market capitalization weighted index that is designed to measure the performance of large- and mid- cap stocks in emerging markets. Net total return figures assume the reinvestment of dividends after deduction of withholding tax, applying the maximum rate to nonresident individual investors who do not benefit from double taxation treaties. Investors cannot invest directly in an index.
Fund performance may reflect the waiver of the Fund’s fees and reimbursement of expenses for certain periods since the applicable inception date. Without these waivers and reimbursements, performance would have been lower. Also, performance shown in this section does not reflect the deduction of taxes that a shareholder would pay on Fund distributions or on gains resulting from redemptions of Fund shares.
The returns shown are based on net asset values calculated for shareholder transactions and may differ from the returns shown in the financial highlights, which reflect adjustments made to the net asset values in accordance with accounting principles generally accepted in the United States of America.
Source: MSCI. The MSCI information may only be used for your internal use, may not be reproduced or redisseminated in any form and may not be used as a basis for or a component of any financial instruments or products or indices. None of the MSCI information is intended to constitute investment advice or a recommendation to make (or refrain from making) any kind of investment decision and may not be relied on as such. Historical data and analysis should not be taken as an indication or guarantee of any future performance analysis, forecast, or prediction. The MSCI information is provided on an "as is" basis and the user of this information assumes the entire risk of any use made of this information. MSCI, each of its affiliates and each other person involved in or related to compiling, computing or creating any MSCI information (collectively, the "MSCI Parties") expressly disclaims all warranties (including, without limitation, any warranties of originality, accuracy, completeness, timeliness, non-infringement, merchantability and fitness for a particular purpose) with respect to this information. Without limiting any of the foregoing, in no event shall any MSCI Party have any liability for any direct, indirect, special, incidental, punitive, consequential (including, without limitation, lost profits) or any other damages. (www.msci.com)
| Fund net assets (000's) | $6,959,199 | |
| Total number of portfolio holdings | 81 | |
| Portfolio turnover rate | 36 | % |
| Total advisory fees paid (000's) | $48,624 | |
PORTFOLIO COMPOSITION - COUNTRY
(% of Total Investments)
Availability of Additional Information
At www.jpmorganfunds.com/funddocuments, you can find additional information about the Fund, including the Fund’s:
Prospectus
Financial information
Fund holdings
Proxy voting information
You can also request this information by contacting us at 1-800-480-4111.
ANNUAL SHAREHOLDER REPORT | October 31, 2024 (Unaudited)
JPMorgan Emerging Markets Equity Fund
Class R5 Shares/Ticker: JEMOX
ANNUAL SHAREHOLDER REPORT
This annual shareholder report contains important information about the JPMorgan Emerging Markets Equity Fund (the "Fund") for the period of November 1, 2023 to October 31, 2024. You can find additional information about the Fund at www.jpmorganfunds.com/funddocuments. You can also request this information by contacting us at 1-800-480-4111 or by sending an e-mail request to Funds.Website.Support@jpmorganfunds.com or by asking any financial intermediary that offers shares of the Fund.
What were the Fund costs for the last year?
(based on a hypothetical $10,000 investment)
| Fund (Class) | Costs of a
$10,000 investment | Costs paid as a percentage
of a $10,000 investment |
JPMorgan Emerging Markets Equity Fund
(Class R5 Shares) | $98 | 0.89% |
How did the Fund Perform?
The JPMorgan Emerging Markets Equity Fund's Class R5 Shares returned 19.10% for the year ended October 31, 2024. The MSCI Emerging Markets Index (net total return) (the "Index") returned 25.32% for the year ended October 31, 2024.
The Fund's holdings in China detracted from performance relative to the Index.
The Fund's underweight position in India detracted from performance relative to the Index.
The Fund's overweight position in Taiwan contributed to performance relative to the Index, driven by strong returns in the region.
Exposure to Argentina also added to the Fund’s positive performance, reflecting favorable market conditions and investment decisions.
| AVERAGE ANNUAL TOTAL RETURNS | INCEPTION
DATE | 1 YEAR | | 5 YEAR | | 10 YEAR | |
| JPMorgan Emerging Markets Equity Fund (Class R5 Shares) | September 9, 2016 | 19.10 | % | 1.87 | % | 3.82 | % |
| MSCI Emerging Markets Index (net total return) | | 25.32 | | 3.93 | | 3.43 | |
The performance quoted is past performance and is not a guarantee of future results. Mutual funds are subject to certain market risks. Investment returns and principal value of an investment will fluctuate so that an investor’s shares, when redeemed, may be worth more or less than their original cost. Current performance may be higher or lower than the performance data shown. Updated performance information is available by visiting www.jpmorganfunds.com or by calling 1-800-480-4111.
Returns for Class R5 Shares prior to its inception date are based on the performance of Class L Shares. The actual returns of Class R5 Shares would have been different than those shown because Class R5 Shares have different expenses than Class L Shares.
The graph illustrates comparative performance for $10,000 invested in Class R5 Shares of the JPMorgan Emerging Markets Equity Fund and the MSCI Emerging Markets Index (net total return) from October 31, 2014 to October 31, 2024. The performance of the Fund assumes reinvestment of all dividends and capital gain distributions, if any, and does not include a sales charge. The performance of the MSCI Emerging Markets Index (net total return) does not reflect the deduction of expenses or a sales charge associated with a mutual fund and approximates the minimum possible dividend reinvestment of the securities included in the benchmark, if applicable. The MSCI Emerging Markets Index (net total return) is a free float-adjusted market capitalization weighted index that is designed to measure the performance of large- and mid- cap stocks in emerging markets. Net total return figures assume the reinvestment of dividends after deduction of withholding tax, applying the maximum rate to nonresident individual investors who do not benefit from double taxation treaties. Investors cannot invest directly in an index.
Fund performance may reflect the waiver of the Fund’s fees and reimbursement of expenses for certain periods since the applicable inception date. Without these waivers and reimbursements, performance would have been lower. Also, performance shown in this section does not reflect the deduction of taxes that a shareholder would pay on Fund distributions or on gains resulting from redemptions of Fund shares.
The returns shown are based on net asset values calculated for shareholder transactions and may differ from the returns shown in the financial highlights, which reflect adjustments made to the net asset values in accordance with accounting principles generally accepted in the United States of America.
Source: MSCI. The MSCI information may only be used for your internal use, may not be reproduced or redisseminated in any form and may not be used as a basis for or a component of any financial instruments or products or indices. None of the MSCI information is intended to constitute investment advice or a recommendation to make (or refrain from making) any kind of investment decision and may not be relied on as such. Historical data and analysis should not be taken as an indication or guarantee of any future performance analysis, forecast, or prediction. The MSCI information is provided on an "as is" basis and the user of this information assumes the entire risk of any use made of this information. MSCI, each of its affiliates and each other person involved in or related to compiling, computing or creating any MSCI information (collectively, the "MSCI Parties") expressly disclaims all warranties (including, without limitation, any warranties of originality, accuracy, completeness, timeliness, non-infringement, merchantability and fitness for a particular purpose) with respect to this information. Without limiting any of the foregoing, in no event shall any MSCI Party have any liability for any direct, indirect, special, incidental, punitive, consequential (including, without limitation, lost profits) or any other damages. (www.msci.com)
| Fund net assets (000's) | $6,959,199 | |
| Total number of portfolio holdings | 81 | |
| Portfolio turnover rate | 36 | % |
| Total advisory fees paid (000's) | $48,624 | |
PORTFOLIO COMPOSITION - COUNTRY
(% of Total Investments)
Availability of Additional Information
At www.jpmorganfunds.com/funddocuments, you can find additional information about the Fund, including the Fund’s:
Prospectus
Financial information
Fund holdings
Proxy voting information
You can also request this information by contacting us at 1-800-480-4111.
ANNUAL SHAREHOLDER REPORT | October 31, 2024 (Unaudited)
JPMorgan Emerging Markets Equity Fund
Class R6 Shares/Ticker: JEMWX
ANNUAL SHAREHOLDER REPORT
This annual shareholder report contains important information about the JPMorgan Emerging Markets Equity Fund (the "Fund") for the period of November 1, 2023 to October 31, 2024. You can find additional information about the Fund at www.jpmorganfunds.com/funddocuments. You can also request this information by contacting us at 1-800-480-4111 or by sending an e-mail request to Funds.Website.Support@jpmorganfunds.com or by asking any financial intermediary that offers shares of the Fund.
What were the Fund costs for the last year?
(based on a hypothetical $10,000 investment)
| Fund (Class) | Costs of a
$10,000 investment | Costs paid as a percentage
of a $10,000 investment |
JPMorgan Emerging Markets Equity Fund
(Class R6 Shares) | $87 | 0.79% |
How did the Fund Perform?
The JPMorgan Emerging Markets Equity Fund's Class R6 Shares returned 19.22% for the year ended October 31, 2024. The MSCI Emerging Markets Index (net total return) (the "Index") returned 25.32% for the year ended October 31, 2024.
The Fund's holdings in China detracted from performance relative to the Index.
The Fund's underweight position in India detracted from performance relative to the Index.
The Fund's overweight position in Taiwan contributed to performance relative to the Index, driven by strong returns in the region.
Exposure to Argentina also added to the Fund’s positive performance, reflecting favorable market conditions and investment decisions.
| AVERAGE ANNUAL TOTAL RETURNS | INCEPTION
DATE | 1 YEAR | | 5 YEAR | | 10 YEAR | |
| JPMorgan Emerging Markets Equity Fund (Class R6 Shares) | December 23, 2013 | 19.22 | % | 1.97 | % | 3.93 | % |
| MSCI Emerging Markets Index (net total return) | | 25.32 | | 3.93 | | 3.43 | |
The performance quoted is past performance and is not a guarantee of future results. Mutual funds are subject to certain market risks. Investment returns and principal value of an investment will fluctuate so that an investor’s shares, when redeemed, may be worth more or less than their original cost. Current performance may be higher or lower than the performance data shown. Updated performance information is available by visiting www.jpmorganfunds.com or by calling 1-800-480-4111.
The graph illustrates comparative performance for $5,000,000 invested in Class R6 Shares of the JPMorgan Emerging Markets Equity Fund and the MSCI Emerging Markets Index (net total return) from October 31, 2014 to October 31, 2024. The performance of the Fund assumes reinvestment of all dividends and capital gain distributions, if any, and does not include a sales charge. The performance of the MSCI Emerging Markets Index (net total return) does not reflect the deduction of expenses or a sales charge associated with a mutual fund and approximates the minimum possible dividend reinvestment of the securities included in the benchmark, if applicable. The MSCI Emerging Markets Index (net total return) is a free float-adjusted market capitalization weighted index that is designed to measure the performance of large- and mid- cap stocks in emerging markets. Net total return figures assume the reinvestment of dividends after deduction of withholding tax, applying the maximum rate to nonresident individual investors who do not benefit from double taxation treaties. Investors cannot invest directly in an index.
Fund performance may reflect the waiver of the Fund’s fees and reimbursement of expenses for certain periods since the applicable inception date. Without these waivers and reimbursements, performance would have been lower. Also, performance shown in this section does not reflect the deduction of taxes that a shareholder would pay on Fund distributions or on gains resulting from redemptions of Fund shares.
The returns shown are based on net asset values calculated for shareholder transactions and may differ from the returns shown in the financial highlights, which reflect adjustments made to the net asset values in accordance with accounting principles generally accepted in the United States of America.
Source: MSCI. The MSCI information may only be used for your internal use, may not be reproduced or redisseminated in any form and may not be used as a basis for or a component of any financial instruments or products or indices. None of the MSCI information is intended to constitute investment advice or a recommendation to make (or refrain from making) any kind of investment decision and may not be relied on as such. Historical data and analysis should not be taken as an indication or guarantee of any future performance analysis, forecast, or prediction. The MSCI information is provided on an "as is" basis and the user of this information assumes the entire risk of any use made of this information. MSCI, each of its affiliates and each other person involved in or related to compiling, computing or creating any MSCI information (collectively, the "MSCI Parties") expressly disclaims all warranties (including, without limitation, any warranties of originality, accuracy, completeness, timeliness, non-infringement, merchantability and fitness for a particular purpose) with respect to this information. Without limiting any of the foregoing, in no event shall any MSCI Party have any liability for any direct, indirect, special, incidental, punitive, consequential (including, without limitation, lost profits) or any other damages. (www.msci.com)
| Fund net assets (000's) | $6,959,199 | |
| Total number of portfolio holdings | 81 | |
| Portfolio turnover rate | 36 | % |
| Total advisory fees paid (000's) | $48,624 | |
PORTFOLIO COMPOSITION - COUNTRY
(% of Total Investments)
Availability of Additional Information
At www.jpmorganfunds.com/funddocuments, you can find additional information about the Fund, including the Fund’s:
Prospectus
Financial information
Fund holdings
Proxy voting information
You can also request this information by contacting us at 1-800-480-4111.
ANNUAL SHAREHOLDER REPORT | October 31, 2024 (Unaudited)
JPMorgan Europe Dynamic Fund
Class A Shares/Ticker: VEUAX
ANNUAL SHAREHOLDER REPORT
This annual shareholder report contains important information about the JPMorgan Europe Dynamic Fund (the "Fund") for the period of November 1, 2023 to October 31, 2024. You can find additional information about the Fund at www.jpmorganfunds.com/funddocuments. You can also request this information by contacting us at 1-800-480-4111 or by sending an e-mail request to Funds.Website.Support@jpmorganfunds.com or by asking any financial intermediary that offers shares of the Fund.
What were the Fund costs for the last year?
(based on a hypothetical $10,000 investment)
| Fund (Class) | Costs of a
$10,000 investment | Costs paid as a percentage
of a $10,000 investment |
JPMorgan Europe Dynamic Fund
(Class A Shares) | $140 | 1.24% |
How did the Fund Perform?
The JPMorgan Europe Dynamic Fund's Class A Shares, without a sales charge, returned 25.78% for the year ended October 31, 2024. The MSCI Europe Index (net total return) (the "Index") returned 22.43% for the year ended October 31, 2024.
The Fund’s security selection in the capital goods and the food, beverage and tobacco sectors contributed to performance relative to the Index.
The Fund’s security selection in the consumer services and utilities sectors detracted from performance relative to the Index.
| AVERAGE ANNUAL TOTAL RETURNS | INCEPTION
DATE | 1 YEAR | | 5 YEAR | | 10 YEAR | |
| JPMorgan Europe Dynamic Fund (Class A Shares) | November 2, 1995 | 19.17 | % | 7.00 | % | 4.40 | % |
| JPMorgan Europe Dynamic Fund (Class A Shares) - excluding sales charge | | 25.78 | | 8.15 | | 4.96 | |
| MSCI Europe Index (net total return) | | 22.43 | | 6.91 | | 5.23 | |
The performance quoted is past performance and is not a guarantee of future results. Mutual funds are subject to certain market risks. Investment returns and principal value of an investment will fluctuate so that an investor’s shares, when redeemed, may be worth more or less than their original cost. Current performance may be higher or lower than the performance data shown. Updated performance information is available by visiting www.jpmorganfunds.com or by calling 1-800-480-4111.
The graph illustrates comparative performance for $10,000 invested in Class A Shares of the JPMorgan Europe Dynamic Fund and the MSCI Europe Index (net total return) from October 31, 2014 to October 31, 2024. The performance of the Fund assumes reinvestment of all dividends and capital gain distributions, if any, and includes a sales charge. The performance of the MSCI Europe Index (net total return) does not reflect the deduction of expenses or a sales charge associated with a mutual fund and approximates the minimum possible dividend reinvestment of the securities included in the benchmark, if applicable. The MSCI Europe Index (net total return) is a free float-adjusted market capitalization weighted index that is designed to measure the performance of large- and mid- cap stocks in the developed markets countries in Europe. Net total return figures assume the reinvestment of dividends after deduction of withholding tax, applying the maximum rate to nonresident individual investors who do not benefit from double taxation treaties. Investors cannot invest directly in an index.
Fund performance may reflect the waiver of the Fund’s fees and reimbursement of expenses for certain periods since the applicable inception date. Without these waivers and reimbursements, performance would have been lower. Also, performance shown in this section does not reflect the deduction of taxes that a shareholder would pay on Fund distributions or on gains resulting from redemptions of Fund shares.
The returns shown are based on net asset values calculated for shareholder transactions and may differ from the returns shown in the financial highlights, which reflect adjustments made to the net asset values in accordance with accounting principles generally accepted in the United States of America.
Source: MSCI. The MSCI information may only be used for your internal use, may not be reproduced or redisseminated in any form and may not be used as a basis for or a component of any financial instruments or products or indices. None of the MSCI information is intended to constitute investment advice or a recommendation to make (or refrain from making) any kind of investment decision and may not be relied on as such. Historical data and analysis should not be taken as an indication or guarantee of any future performance analysis, forecast, or prediction. The MSCI information is provided on an "as is" basis and the user of this information assumes the entire risk of any use made of this information. MSCI, each of its affiliates and each other person involved in or related to compiling, computing or creating any MSCI information (collectively, the "MSCI Parties") expressly disclaims all warranties (including, without limitation, any warranties of originality, accuracy, completeness, timeliness, non-infringement, merchantability and fitness for a particular purpose) with respect to this information. Without limiting any of the foregoing, in no event shall any MSCI Party have any liability for any direct, indirect, special, incidental, punitive, consequential (including, without limitation, lost profits) or any other damages. (www.msci.com)
| Fund net assets (000's) | $519,263 | |
| Total number of portfolio holdings | 70 | |
| Portfolio turnover rate | 95 | % |
| Total advisory fees paid (000's) | $3,191 | |
PORTFOLIO COMPOSITION - COUNTRY
(% of Total Investments)
Availability of Additional Information
At www.jpmorganfunds.com/funddocuments, you can find additional information about the Fund, including the Fund’s:
Prospectus
Financial information
Fund holdings
Proxy voting information
You can also request this information by contacting us at 1-800-480-4111.
ANNUAL SHAREHOLDER REPORT | October 31, 2024 (Unaudited)
JPMorgan Europe Dynamic Fund
Class C Shares/Ticker: VEUCX
ANNUAL SHAREHOLDER REPORT
This annual shareholder report contains important information about the JPMorgan Europe Dynamic Fund (the "Fund") for the period of November 1, 2023 to October 31, 2024. You can find additional information about the Fund at www.jpmorganfunds.com/funddocuments. You can also request this information by contacting us at 1-800-480-4111 or by sending an e-mail request to Funds.Website.Support@jpmorganfunds.com or by asking any financial intermediary that offers shares of the Fund.
What were the Fund costs for the last year?
(based on a hypothetical $10,000 investment)
| Fund (Class) | Costs of a
$10,000 investment | Costs paid as a percentage
of a $10,000 investment |
JPMorgan Europe Dynamic Fund
(Class C Shares) | $196 | 1.74% |
How did the Fund Perform?
The JPMorgan Europe Dynamic Fund's Class C Shares, without a sales charge, returned 25.16% for the year ended October 31, 2024. The MSCI Europe Index (net total return) (the "Index") returned 22.43% for the year ended October 31, 2024.
The Fund’s security selection in the capital goods and the food, beverage and tobacco sectors contributed to performance relative to the Index.
The Fund’s security selection in the consumer services and utilities sectors detracted from performance relative to the Index.
| AVERAGE ANNUAL TOTAL RETURNS | INCEPTION
DATE | 1 YEAR | | 5 YEAR | | 10 YEAR | |
| JPMorgan Europe Dynamic Fund (Class C Shares) | November 1, 1998 | 24.16 | % | 7.62 | % | 4.54 | % |
| JPMorgan Europe Dynamic Fund (Class C Shares) - excluding sales charge | | 25.16 | | 7.62 | | 4.54 | |
| MSCI Europe Index (net total return) | | 22.43 | | 6.91 | | 5.23 | |
The performance quoted is past performance and is not a guarantee of future results. Mutual funds are subject to certain market risks. Investment returns and principal value of an investment will fluctuate so that an investor’s shares, when redeemed, may be worth more or less than their original cost. Current performance may be higher or lower than the performance data shown. Updated performance information is available by visiting www.jpmorganfunds.com or by calling 1-800-480-4111.
The graph illustrates comparative performance for $10,000 invested in Class C Shares of the JPMorgan Europe Dynamic Fund and the MSCI Europe Index (net total return) from October 31, 2014 to October 31, 2024. The performance of the Fund assumes reinvestment of all dividends and capital gain distributions, if any, and does not include a sales charge. The performance of the MSCI Europe Index (net total return) does not reflect the deduction of expenses or a sales charge associated with a mutual fund and approximates the minimum possible dividend reinvestment of the securities included in the benchmark, if applicable. The MSCI Europe Index (net total return) is a free float-adjusted market capitalization weighted index that is designed to measure the performance of large- and mid- cap stocks in the developed markets countries in Europe. Net total return figures assume the reinvestment of dividends after deduction of withholding tax, applying the maximum rate to nonresident individual investors who do not benefit from double taxation treaties. Investors cannot invest directly in an index.
Fund performance may reflect the waiver of the Fund’s fees and reimbursement of expenses for certain periods since the applicable inception date. Without these waivers and reimbursements, performance would have been lower. Also, performance shown in this section does not reflect the deduction of taxes that a shareholder would pay on Fund distributions or on gains resulting from redemptions of Fund shares.
Because Class C Shares automatically convert to Class A Shares after 8 years, the 10 year average annual total return shown above for Class C Shares reflects Class A Share's performance for the period after conversion.
The returns shown are based on net asset values calculated for shareholder transactions and may differ from the returns shown in the financial highlights, which reflect adjustments made to the net asset values in accordance with accounting principles generally accepted in the United States of America.
Source: MSCI. The MSCI information may only be used for your internal use, may not be reproduced or redisseminated in any form and may not be used as a basis for or a component of any financial instruments or products or indices. None of the MSCI information is intended to constitute investment advice or a recommendation to make (or refrain from making) any kind of investment decision and may not be relied on as such. Historical data and analysis should not be taken as an indication or guarantee of any future performance analysis, forecast, or prediction. The MSCI information is provided on an "as is" basis and the user of this information assumes the entire risk of any use made of this information. MSCI, each of its affiliates and each other person involved in or related to compiling, computing or creating any MSCI information (collectively, the "MSCI Parties") expressly disclaims all warranties (including, without limitation, any warranties of originality, accuracy, completeness, timeliness, non-infringement, merchantability and fitness for a particular purpose) with respect to this information. Without limiting any of the foregoing, in no event shall any MSCI Party have any liability for any direct, indirect, special, incidental, punitive, consequential (including, without limitation, lost profits) or any other damages. (www.msci.com)
| Fund net assets (000's) | $519,263 | |
| Total number of portfolio holdings | 70 | |
| Portfolio turnover rate | 95 | % |
| Total advisory fees paid (000's) | $3,191 | |
PORTFOLIO COMPOSITION - COUNTRY
(% of Total Investments)
Availability of Additional Information
At www.jpmorganfunds.com/funddocuments, you can find additional information about the Fund, including the Fund’s:
Prospectus
Financial information
Fund holdings
Proxy voting information
You can also request this information by contacting us at 1-800-480-4111.
ANNUAL SHAREHOLDER REPORT | October 31, 2024 (Unaudited)
JPMorgan Europe Dynamic Fund
Class I Shares/Ticker: JFESX
ANNUAL SHAREHOLDER REPORT
This annual shareholder report contains important information about the JPMorgan Europe Dynamic Fund (the "Fund") for the period of November 1, 2023 to October 31, 2024. You can find additional information about the Fund at www.jpmorganfunds.com/funddocuments. You can also request this information by contacting us at 1-800-480-4111 or by sending an e-mail request to Funds.Website.Support@jpmorganfunds.com or by asking any financial intermediary that offers shares of the Fund.
What were the Fund costs for the last year?
(based on a hypothetical $10,000 investment)
| Fund (Class) | Costs of a
$10,000 investment | Costs paid as a percentage
of a $10,000 investment |
JPMorgan Europe Dynamic Fund
(Class I Shares) | $112 | 0.99% |
How did the Fund Perform?
The JPMorgan Europe Dynamic Fund's Class I Shares returned 26.09% for the year ended October 31, 2024. The MSCI Europe Index (net total return) (the "Index") returned 22.43% for the year ended October 31, 2024.
The Fund’s security selection in the capital goods and the food, beverage and tobacco sectors contributed to performance relative to the Index.
The Fund’s security selection in the consumer services and utilities sectors detracted from performance relative to the Index.
| AVERAGE ANNUAL TOTAL RETURNS | INCEPTION
DATE | 1 YEAR | | 5 YEAR | | 10 YEAR | |
| JPMorgan Europe Dynamic Fund (Class I Shares) | September 10, 2001 | 26.09 | % | 8.42 | % | 5.25 | % |
| MSCI Europe Index (net total return) | | 22.43 | | 6.91 | | 5.23 | |
The performance quoted is past performance and is not a guarantee of future results. Mutual funds are subject to certain market risks. Investment returns and principal value of an investment will fluctuate so that an investor’s shares, when redeemed, may be worth more or less than their original cost. Current performance may be higher or lower than the performance data shown. Updated performance information is available by visiting www.jpmorganfunds.com or by calling 1-800-480-4111.
The graph illustrates comparative performance for $1,000,000 invested in Class I Shares of the JPMorgan Europe Dynamic Fund and the MSCI Europe Index (net total return) from October 31, 2014 to October 31, 2024. The performance of the Fund assumes reinvestment of all dividends and capital gain distributions, if any, and does not include a sales charge. The performance of the MSCI Europe Index (net total return) does not reflect the deduction of expenses or a sales charge associated with a mutual fund and approximates the minimum possible dividend reinvestment of the securities included in the benchmark, if applicable. The MSCI Europe Index (net total return) is a free float-adjusted market capitalization weighted index that is designed to measure the performance of large- and mid- cap stocks in the developed markets countries in Europe. Net total return figures assume the reinvestment of dividends after deduction of withholding tax, applying the maximum rate to nonresident individual investors who do not benefit from double taxation treaties. Investors cannot invest directly in an index.
Fund performance may reflect the waiver of the Fund’s fees and reimbursement of expenses for certain periods since the applicable inception date. Without these waivers and reimbursements, performance would have been lower. Also, performance shown in this section does not reflect the deduction of taxes that a shareholder would pay on Fund distributions or on gains resulting from redemptions of Fund shares.
The returns shown are based on net asset values calculated for shareholder transactions and may differ from the returns shown in the financial highlights, which reflect adjustments made to the net asset values in accordance with accounting principles generally accepted in the United States of America.
Source: MSCI. The MSCI information may only be used for your internal use, may not be reproduced or redisseminated in any form and may not be used as a basis for or a component of any financial instruments or products or indices. None of the MSCI information is intended to constitute investment advice or a recommendation to make (or refrain from making) any kind of investment decision and may not be relied on as such. Historical data and analysis should not be taken as an indication or guarantee of any future performance analysis, forecast, or prediction. The MSCI information is provided on an "as is" basis and the user of this information assumes the entire risk of any use made of this information. MSCI, each of its affiliates and each other person involved in or related to compiling, computing or creating any MSCI information (collectively, the "MSCI Parties") expressly disclaims all warranties (including, without limitation, any warranties of originality, accuracy, completeness, timeliness, non-infringement, merchantability and fitness for a particular purpose) with respect to this information. Without limiting any of the foregoing, in no event shall any MSCI Party have any liability for any direct, indirect, special, incidental, punitive, consequential (including, without limitation, lost profits) or any other damages. (www.msci.com)
| Fund net assets (000's) | $519,263 | |
| Total number of portfolio holdings | 70 | |
| Portfolio turnover rate | 95 | % |
| Total advisory fees paid (000's) | $3,191 | |
PORTFOLIO COMPOSITION - COUNTRY
(% of Total Investments)
Availability of Additional Information
At www.jpmorganfunds.com/funddocuments, you can find additional information about the Fund, including the Fund’s:
Prospectus
Financial information
Fund holdings
Proxy voting information
You can also request this information by contacting us at 1-800-480-4111.
ANNUAL SHAREHOLDER REPORT | October 31, 2024 (Unaudited)
JPMorgan Europe Dynamic Fund
Class L Shares/Ticker: JFEIX
ANNUAL SHAREHOLDER REPORT
This annual shareholder report contains important information about the JPMorgan Europe Dynamic Fund (the "Fund") for the period of November 1, 2023 to October 31, 2024. You can find additional information about the Fund at www.jpmorganfunds.com/funddocuments. You can also request this information by contacting us at 1-800-480-4111 or by sending an e-mail request to Funds.Website.Support@jpmorganfunds.com or by asking any financial intermediary that offers shares of the Fund.
What were the Fund costs for the last year?
(based on a hypothetical $10,000 investment)
| Fund (Class) | Costs of a
$10,000 investment | Costs paid as a percentage
of a $10,000 investment |
JPMorgan Europe Dynamic Fund
(Class L Shares) | $99 | 0.88% |
How did the Fund Perform?
The JPMorgan Europe Dynamic Fund's Class L Shares returned 26.25% for the year ended October 31, 2024. The MSCI Europe Index (net total return) (the "Index") returned 22.43% for the year ended October 31, 2024.
The Fund’s security selection in the capital goods and the food, beverage and tobacco sectors contributed to performance relative to the Index.
The Fund’s security selection in the consumer services and utilities sectors detracted from performance relative to the Index.
| AVERAGE ANNUAL TOTAL RETURNS | INCEPTION
DATE | 1 YEAR | | 5 YEAR | | 10 YEAR | |
| JPMorgan Europe Dynamic Fund (Class L Shares) | September 10, 2001 | 26.25 | % | 8.57 | % | 5.39 | % |
| MSCI Europe Index (net total return) | | 22.43 | | 6.91 | | 5.23 | |
The performance quoted is past performance and is not a guarantee of future results. Mutual funds are subject to certain market risks. Investment returns and principal value of an investment will fluctuate so that an investor’s shares, when redeemed, may be worth more or less than their original cost. Current performance may be higher or lower than the performance data shown. Updated performance information is available by visiting www.jpmorganfunds.com or by calling 1-800-480-4111.
The graph illustrates comparative performance for $3,000,000 invested in Class L Shares of the JPMorgan Europe Dynamic Fund and the MSCI Europe Index (net total return) from October 31, 2014 to October 31, 2024. The performance of the Fund assumes reinvestment of all dividends and capital gain distributions, if any, and does not include a sales charge. The performance of the MSCI Europe Index (net total return) does not reflect the deduction of expenses or a sales charge associated with a mutual fund and approximates the minimum possible dividend reinvestment of the securities included in the benchmark, if applicable. The MSCI Europe Index (net total return) is a free float-adjusted market capitalization weighted index that is designed to measure the performance of large- and mid- cap stocks in the developed markets countries in Europe. Net total return figures assume the reinvestment of dividends after deduction of withholding tax, applying the maximum rate to nonresident individual investors who do not benefit from double taxation treaties. Investors cannot invest directly in an index.
Fund performance may reflect the waiver of the Fund’s fees and reimbursement of expenses for certain periods since the applicable inception date. Without these waivers and reimbursements, performance would have been lower. Also, performance shown in this section does not reflect the deduction of taxes that a shareholder would pay on Fund distributions or on gains resulting from redemptions of Fund shares.
The returns shown are based on net asset values calculated for shareholder transactions and may differ from the returns shown in the financial highlights, which reflect adjustments made to the net asset values in accordance with accounting principles generally accepted in the United States of America.
Source: MSCI. The MSCI information may only be used for your internal use, may not be reproduced or redisseminated in any form and may not be used as a basis for or a component of any financial instruments or products or indices. None of the MSCI information is intended to constitute investment advice or a recommendation to make (or refrain from making) any kind of investment decision and may not be relied on as such. Historical data and analysis should not be taken as an indication or guarantee of any future performance analysis, forecast, or prediction. The MSCI information is provided on an "as is" basis and the user of this information assumes the entire risk of any use made of this information. MSCI, each of its affiliates and each other person involved in or related to compiling, computing or creating any MSCI information (collectively, the "MSCI Parties") expressly disclaims all warranties (including, without limitation, any warranties of originality, accuracy, completeness, timeliness, non-infringement, merchantability and fitness for a particular purpose) with respect to this information. Without limiting any of the foregoing, in no event shall any MSCI Party have any liability for any direct, indirect, special, incidental, punitive, consequential (including, without limitation, lost profits) or any other damages. (www.msci.com)
| Fund net assets (000's) | $519,263 | |
| Total number of portfolio holdings | 70 | |
| Portfolio turnover rate | 95 | % |
| Total advisory fees paid (000's) | $3,191 | |
PORTFOLIO COMPOSITION - COUNTRY
(% of Total Investments)
Availability of Additional Information
At www.jpmorganfunds.com/funddocuments, you can find additional information about the Fund, including the Fund’s:
Prospectus
Financial information
Fund holdings
Proxy voting information
You can also request this information by contacting us at 1-800-480-4111.
ANNUAL SHAREHOLDER REPORT | October 31, 2024 (Unaudited)
JPMorgan Europe Dynamic Fund
Class R6 Shares/Ticker: VEUVX
ANNUAL SHAREHOLDER REPORT
This annual shareholder report contains important information about the JPMorgan Europe Dynamic Fund (the "Fund") for the period of November 1, 2023 to October 31, 2024. You can find additional information about the Fund at www.jpmorganfunds.com/funddocuments. You can also request this information by contacting us at 1-800-480-4111 or by sending an e-mail request to Funds.Website.Support@jpmorganfunds.com or by asking any financial intermediary that offers shares of the Fund.
What were the Fund costs for the last year?
(based on a hypothetical $10,000 investment)
| Fund (Class) | Costs of a
$10,000 investment | Costs paid as a percentage
of a $10,000 investment |
JPMorgan Europe Dynamic Fund
(Class R6 Shares) | $86 | 0.76% |
How did the Fund Perform?
The JPMorgan Europe Dynamic Fund's Class R6 Shares returned 26.39% for the year ended October 31, 2024. The MSCI Europe Index (net total return) (the "Index") returned 22.43% for the year ended October 31, 2024.
The Fund’s security selection in the capital goods and the food, beverage and tobacco sectors contributed to performance relative to the Index.
The Fund’s security selection in the consumer services and utilities sectors detracted from performance relative to the Index.
| AVERAGE ANNUAL TOTAL RETURNS | INCEPTION
DATE | 1 YEAR | | 5 YEAR | | 10 YEAR | |
| JPMorgan Europe Dynamic Fund (Class R6 Shares) | October 1, 2018 | 26.39 | % | 8.69 | % | 5.46 | % |
| MSCI Europe Index (net total return) | | 22.43 | | 6.91 | | 5.23 | |
The performance quoted is past performance and is not a guarantee of future results. Mutual funds are subject to certain market risks. Investment returns and principal value of an investment will fluctuate so that an investor’s shares, when redeemed, may be worth more or less than their original cost. Current performance may be higher or lower than the performance data shown. Updated performance information is available by visiting www.jpmorganfunds.com or by calling 1-800-480-4111.
The graph illustrates comparative performance for $5,000,000 invested in Class R6 Shares of the JPMorgan Europe Dynamic Fund and the MSCI Europe Index (net total return) from October 31, 2014 to October 31, 2024. The performance of the Fund assumes reinvestment of all dividends and capital gain distributions, if any, and does not include a sales charge. The performance of the MSCI Europe Index (net total return) does not reflect the deduction of expenses or a sales charge associated with a mutual fund and approximates the minimum possible dividend reinvestment of the securities included in the benchmark, if applicable. The MSCI Europe Index (net total return) is a free float-adjusted market capitalization weighted index that is designed to measure the performance of large- and mid- cap stocks in the developed markets countries in Europe. Net total return figures assume the reinvestment of dividends after deduction of withholding tax, applying the maximum rate to nonresident individual investors who do not benefit from double taxation treaties. Investors cannot invest directly in an index.
Fund performance may reflect the waiver of the Fund’s fees and reimbursement of expenses for certain periods since the applicable inception date. Without these waivers and reimbursements, performance would have been lower. Also, performance shown in this section does not reflect the deduction of taxes that a shareholder would pay on Fund distributions or on gains resulting from redemptions of Fund shares.
Returns for Class R6 Shares prior to its inception date are based on the performance of Class L Shares. The actual returns of Class R6 Shares would have been different than those shown because Class R6 Shares have different expenses than Class L Shares.
The returns shown are based on net asset values calculated for shareholder transactions and may differ from the returns shown in the financial highlights, which reflect adjustments made to the net asset values in accordance with accounting principles generally accepted in the United States of America.
Source: MSCI. The MSCI information may only be used for your internal use, may not be reproduced or redisseminated in any form and may not be used as a basis for or a component of any financial instruments or products or indices. None of the MSCI information is intended to constitute investment advice or a recommendation to make (or refrain from making) any kind of investment decision and may not be relied on as such. Historical data and analysis should not be taken as an indication or guarantee of any future performance analysis, forecast, or prediction. The MSCI information is provided on an "as is" basis and the user of this information assumes the entire risk of any use made of this information. MSCI, each of its affiliates and each other person involved in or related to compiling, computing or creating any MSCI information (collectively, the "MSCI Parties") expressly disclaims all warranties (including, without limitation, any warranties of originality, accuracy, completeness, timeliness, non-infringement, merchantability and fitness for a particular purpose) with respect to this information. Without limiting any of the foregoing, in no event shall any MSCI Party have any liability for any direct, indirect, special, incidental, punitive, consequential (including, without limitation, lost profits) or any other damages. (www.msci.com)
| Fund net assets (000's) | $519,263 | |
| Total number of portfolio holdings | 70 | |
| Portfolio turnover rate | 95 | % |
| Total advisory fees paid (000's) | $3,191 | |
PORTFOLIO COMPOSITION - COUNTRY
(% of Total Investments)
Availability of Additional Information
At www.jpmorganfunds.com/funddocuments, you can find additional information about the Fund, including the Fund’s:
Prospectus
Financial information
Fund holdings
Proxy voting information
You can also request this information by contacting us at 1-800-480-4111.
ANNUAL SHAREHOLDER REPORT | October 31, 2024 (Unaudited)
JPMorgan Global Allocation Fund
Class A Shares/Ticker: GAOAX
ANNUAL SHAREHOLDER REPORT
This annual shareholder report contains important information about the JPMorgan Global Allocation Fund (the "Fund") for the period of November 1, 2023 to October 31, 2024. You can find additional information about the Fund at www.jpmorganfunds.com/funddocuments. You can also request this information by contacting us at 1-800-480-4111 or by sending an e-mail request to Funds.Website.Support@jpmorganfunds.com or by asking any financial intermediary that offers shares of the Fund.
What were the Fund costs for the last year?
(based on a hypothetical $10,000 investment)
| Fund (Class) | Costs of a
$10,000 investment | Costs paid as a percentage
of a $10,000 investment |
JPMorgan Global Allocation Fund
(Class A Shares) | $114 | 1.03% |
How did the Fund Perform?
The JPMorgan Global Allocation Fund's Class A Shares, without a sales charge, returned 22.83% for the year ended October 31, 2024. The MSCI ACWI Index (net total return) returned 32.79% and the 60% MSCI ACWI Index (net total return) / 40% Bloomberg Global Aggregate ex China Index - Unhedged USD (the "Index") returned 23.56% for the year ended October 31, 2024.
The allocation to equities contributed the most to overall Fund performance as global growth continued to be strong, with overall economic growth remaining resilient, inflation continuing its downward trend and central banks starting to cut rates. Within equities, the Fund preferred U.S. large-cap and international developed equities, which contributed positively to the Fund's performance.
The Fund's allocation to corporate credit, including high-yield bonds and securitized credit, also contributed positively to the performance.
Relative to the JPMorgan Global Allocation Composite Benchmark, the Fund’s overall overweight position in equities was a leading contributor to performance. The Fund’s allocation to a diversified mix of non-government bonds also contributed positively to performance. However, the Fund's allocation to international developed equities detracted from performance.
| AVERAGE ANNUAL TOTAL RETURNS | INCEPTION
DATE | 1 YEAR | | 5 YEAR | | 10 YEAR | |
| JPMorgan Global Allocation Fund (Class A Shares) | May 31, 2011 | 17.32 | % | 4.45 | % | 4.72 | % |
| JPMorgan Global Allocation Fund (Class A Shares) - excluding sales charge | | 22.83 | | 5.42 | | 5.21 | |
| MSCI ACWI Index (net total return) | | 32.79 | | 11.08 | | 9.06 | |
| 60% MSCI ACWI Index (net total return) / 40% Bloomberg Global Aggregate ex China Index - Unhedged USD | | 23.56 | | 6.61 | | 6.08 | |
The performance quoted is past performance and is not a guarantee of future results. Mutual funds are subject to certain market risks. Investment returns and principal value of an investment will fluctuate so that an investor’s shares, when redeemed, may be worth more or less than their original cost. Current performance may be higher or lower than the performance data shown. Updated performance information is available by visiting www.jpmorganfunds.com or by calling 1-800-480-4111.
The graph illustrates comparative performance for $10,000 invested in Class A Shares of the JPMorgan Global Allocation Fund, the MSCI ACWI Index (net total return) and the 60% MSCI ACWI Index (net total return) / 40% Bloomberg Global Aggregate ex China Index - Unhedged USD from October 31, 2014 to October 31, 2024. The performance of the Fund assumes reinvestment of all dividends and capital gain distributions, if any, and includes a sales charge. The performance of the MSCI ACWI Index (net total return) and the 60% MSCI ACWI Index (net total return) / 40% Bloomberg Global Aggregate ex China Index - Unhedged USD do not reflect the deduction of expenses or a sales charge associated with a mutual fund and approximates the minimum possible dividend reinvestment of the securities included in the benchmark, if applicable. The dividend is reinvested after deduction of withholding tax, applying the maximum rate to non-resident individual investors who do not benefit from double taxation treaties. The MSCI ACWI Index (net total return) is a free float-adjusted market capitalization weighted index that is designed to measure the equity market performance of developed and emerging markets. The performance of 60% MSCI ACWI Index (net total return) / 40% Bloomberg Global Aggregate ex China Index - Unhedged USD does not reflect the deduction of expenses associated with a mutual fund, such as investment management fees and has been adjusted to reflect reinvestment of all dividends and capital gain distributions of securities included in the benchmark, if applicable. As a result of new regulatory requirements, effective July 24, 2024, the Fund’s regulatory index has changed from the Index, as defined above, to the MSCI ACWI Index (net total return), a broad-based securities market index. In addition to the Fund’s performance, the tables in this section include performance of the new regulatory index and the Index.
Fund performance may reflect the waiver of the Fund’s fees and reimbursement of expenses for certain periods. Without these waivers and reimbursements, performance would have been lower. Also, performance shown in this section does not reflect the deduction of taxes that a shareholder would pay on Fund distributions or on gains resulting from redemptions of Fund shares.
The returns shown are based on net asset values calculated for shareholder transactions and may differ from the returns shown in the financial highlights, which reflect adjustments made to the net asset values in accordance with accounting principles generally accepted in the United States of America.
Source: MSCI. The MSCI information may only be used for your internal use, may not be reproduced or redisseminated in any form and may not be used as a basis for or a component of any financial instruments or products or indices. None of the MSCI information is intended to constitute investment advice or a recommendation to make (or refrain from making) any kind of investment decision and may not be relied on as such. Historical data and analysis should not be taken as an indication or guarantee of any future performance analysis, forecast, or prediction. The MSCI information is provided on an "as is" basis and the user of this information assumes the entire risk of any use made of this information. MSCI, each of its affiliates and each other person involved in or related to compiling, computing or creating any MSCI information (collectively, the "MSCI Parties") expressly disclaims all warranties (including, without limitation, any warranties of originality, accuracy, completeness, timeliness, non-infringement, merchantability and fitness for a particular purpose) with respect to this information. Without limiting any of the foregoing, in no event shall any MSCI Party have any liability for any direct, indirect, special, incidental, punitive, consequential (including, without limitation, lost profits) or any other damages. (www.msci.com)
Source: Bloomberg Index Services Limited. BLOOMBERG® is a trademark and service mark of Bloomberg Finance L.P. and its affiliates (collectively "Bloomberg"). Bloomberg or Bloomberg's licensors own all proprietary rights in the Bloomberg Indices. Bloomberg does not approve or endorse this material, or guarantee the accuracy or completeness of any information herein, or make any warranty, express or implied, as to the results to be obtained therefrom and, to the maximum extent allowed by law, shall have any liability or responsibility for injury or damages arising in connection therewith.
| Fund net assets (000's) | $2,857,204 | |
| Total number of portfolio holdings | 1,854 | |
| Portfolio turnover rate | 94 | % |
| Total advisory fees paid (000's) | $16,248 | |
PORTFOLIO COMPOSITION - ASSET TYPE
(% of Total Investments)
Availability of Additional Information
At www.jpmorganfunds.com/funddocuments, you can find additional information about the Fund, including the Fund’s:
Prospectus
Financial information
Fund holdings
Proxy voting information
You can also request this information by contacting us at 1-800-480-4111.
ANNUAL SHAREHOLDER REPORT | October 31, 2024 (Unaudited)
JPMorgan Global Allocation Fund
Class C Shares/Ticker: GAOCX
ANNUAL SHAREHOLDER REPORT
This annual shareholder report contains important information about the JPMorgan Global Allocation Fund (the "Fund") for the period of November 1, 2023 to October 31, 2024. You can find additional information about the Fund at www.jpmorganfunds.com/funddocuments. You can also request this information by contacting us at 1-800-480-4111 or by sending an e-mail request to Funds.Website.Support@jpmorganfunds.com or by asking any financial intermediary that offers shares of the Fund.
What were the Fund costs for the last year?
(based on a hypothetical $10,000 investment)
| Fund (Class) | Costs of a
$10,000 investment | Costs paid as a percentage
of a $10,000 investment |
JPMorgan Global Allocation Fund
(Class C Shares) | $169 | 1.53% |
How did the Fund Perform?
The JPMorgan Global Allocation Fund's Class C Shares, without a sales charge, returned 22.18% for the year ended October 31, 2024. The MSCI ACWI Index (net total return) returned 32.79% and the 60% MSCI ACWI Index (net total return) / 40% Bloomberg Global Aggregate ex China Index - Unhedged USD (the "Index") returned 23.56% for the year ended October 31, 2024.
The allocation to equities contributed the most to overall Fund performance as global growth continued to be strong, with overall economic growth remaining resilient, inflation continuing its downward trend and central banks starting to cut rates. Within equities, the Fund preferred U.S. large-cap and international developed equities, which contributed positively to the Fund's performance.
The Fund's allocation to corporate credit, including high-yield bonds and securitized credit, also contributed positively to the performance.
Relative to the JPMorgan Global Allocation Composite Benchmark, the Fund’s overall overweight position in equities was a leading contributor to performance. The Fund’s allocation to a diversified mix of non-government bonds also contributed positively to performance. However, the Fund's allocation to international developed equities detracted from performance.
| AVERAGE ANNUAL TOTAL RETURNS | INCEPTION
DATE | 1 YEAR | | 5 YEAR | | 10 YEAR | |
| JPMorgan Global Allocation Fund (Class C Shares) | May 31, 2011 | 21.18 | % | 4.88 | % | 4.79 | % |
| JPMorgan Global Allocation Fund (Class C Shares) - excluding sales charge | | 22.18 | | 4.88 | | 4.79 | |
| MSCI ACWI Index (net total return) | | 32.79 | | 11.08 | | 9.06 | |
| 60% MSCI ACWI Index (net total return) / 40% Bloomberg Global Aggregate ex China Index - Unhedged USD | | 23.56 | | 6.61 | | 6.08 | |
The performance quoted is past performance and is not a guarantee of future results. Mutual funds are subject to certain market risks. Investment returns and principal value of an investment will fluctuate so that an investor’s shares, when redeemed, may be worth more or less than their original cost. Current performance may be higher or lower than the performance data shown. Updated performance information is available by visiting www.jpmorganfunds.com or by calling 1-800-480-4111.
The graph illustrates comparative performance for $10,000 invested in Class C Shares of the JPMorgan Global Allocation Fund, the MSCI ACWI Index (net total return) and the 60% MSCI ACWI Index (net total return) / 40% Bloomberg Global Aggregate ex China Index - Unhedged USD from October 31, 2014 to October 31, 2024. The performance of the Fund assumes reinvestment of all dividends and capital gain distributions, if any, and does not include a sales charge. The performance of the MSCI ACWI Index (net total return) and the 60% MSCI ACWI Index (net total return) / 40% Bloomberg Global Aggregate ex China Index - Unhedged USD do not reflect the deduction of expenses or a sales charge associated with a mutual fund and approximates the minimum possible dividend reinvestment of the securities included in the benchmark, if applicable. The dividend is reinvested after deduction of withholding tax, applying the maximum rate to non-resident individual investors who do not benefit from double taxation treaties. The MSCI ACWI Index (net total return) is a free float-adjusted market capitalization weighted index that is designed to measure the equity market performance of developed and emerging markets. The performance of 60% MSCI ACWI Index (net total return) / 40% Bloomberg Global Aggregate ex China Index - Unhedged USD does not reflect the deduction of expenses associated with a mutual fund, such as investment management fees and has been adjusted to reflect reinvestment of all dividends and capital gain distributions of securities included in the benchmark, if applicable. As a result of new regulatory requirements, effective July 24, 2024, the Fund’s regulatory index has changed from the Index, as defined above, to the MSCI ACWI Index (net total return), a broad-based securities market index. In addition to the Fund’s performance, the tables in this section include performance of the new regulatory index and the Index.
Fund performance may reflect the waiver of the Fund’s fees and reimbursement of expenses for certain periods. Without these waivers and reimbursements, performance would have been lower. Also, performance shown in this section does not reflect the deduction of taxes that a shareholder would pay on Fund distributions or on gains resulting from redemptions of Fund shares.
Because Class C Shares automatically convert to Class A Shares after 8 years, the 10 year average annual total return shown above for Class C Shares reflects Class A Share's performance for the period after conversion.
The returns shown are based on net asset values calculated for shareholder transactions and may differ from the returns shown in the financial highlights, which reflect adjustments made to the net asset values in accordance with accounting principles generally accepted in the United States of America.
Source: MSCI. The MSCI information may only be used for your internal use, may not be reproduced or redisseminated in any form and may not be used as a basis for or a component of any financial instruments or products or indices. None of the MSCI information is intended to constitute investment advice or a recommendation to make (or refrain from making) any kind of investment decision and may not be relied on as such. Historical data and analysis should not be taken as an indication or guarantee of any future performance analysis, forecast, or prediction. The MSCI information is provided on an "as is" basis and the user of this information assumes the entire risk of any use made of this information. MSCI, each of its affiliates and each other person involved in or related to compiling, computing or creating any MSCI information (collectively, the "MSCI Parties") expressly disclaims all warranties (including, without limitation, any warranties of originality, accuracy, completeness, timeliness, non-infringement, merchantability and fitness for a particular purpose) with respect to this information. Without limiting any of the foregoing, in no event shall any MSCI Party have any liability for any direct, indirect, special, incidental, punitive, consequential (including, without limitation, lost profits) or any other damages. (www.msci.com)
Source: Bloomberg Index Services Limited. BLOOMBERG® is a trademark and service mark of Bloomberg Finance L.P. and its affiliates (collectively "Bloomberg"). Bloomberg or Bloomberg's licensors own all proprietary rights in the Bloomberg Indices. Bloomberg does not approve or endorse this material, or guarantee the accuracy or completeness of any information herein, or make any warranty, express or implied, as to the results to be obtained therefrom and, to the maximum extent allowed by law, shall have any liability or responsibility for injury or damages arising in connection therewith.
| Fund net assets (000's) | $2,857,204 | |
| Total number of portfolio holdings | 1,854 | |
| Portfolio turnover rate | 94 | % |
| Total advisory fees paid (000's) | $16,248 | |
PORTFOLIO COMPOSITION - ASSET TYPE
(% of Total Investments)
Availability of Additional Information
At www.jpmorganfunds.com/funddocuments, you can find additional information about the Fund, including the Fund’s:
Prospectus
Financial information
Fund holdings
Proxy voting information
You can also request this information by contacting us at 1-800-480-4111.
ANNUAL SHAREHOLDER REPORT | October 31, 2024 (Unaudited)
JPMorgan Global Allocation Fund
Class I Shares/Ticker: GAOSX
ANNUAL SHAREHOLDER REPORT
This annual shareholder report contains important information about the JPMorgan Global Allocation Fund (the "Fund") for the period of November 1, 2023 to October 31, 2024. You can find additional information about the Fund at www.jpmorganfunds.com/funddocuments. You can also request this information by contacting us at 1-800-480-4111 or by sending an e-mail request to Funds.Website.Support@jpmorganfunds.com or by asking any financial intermediary that offers shares of the Fund.
What were the Fund costs for the last year?
(based on a hypothetical $10,000 investment)
| Fund (Class) | Costs of a
$10,000 investment | Costs paid as a percentage
of a $10,000 investment |
JPMorgan Global Allocation Fund
(Class I Shares) | $86 | 0.78% |
How did the Fund Perform?
The JPMorgan Global Allocation Fund's Class I Shares returned 23.15% for the year ended October 31, 2024. The MSCI ACWI Index (net total return) returned 32.79% and the 60% MSCI ACWI Index (net total return) / 40% Bloomberg Global Aggregate ex China Index - Unhedged USD (the "Index") returned 23.56% for the year ended October 31, 2024.
The allocation to equities contributed the most to overall Fund performance as global growth continued to be strong, with overall economic growth remaining resilient, inflation continuing its downward trend and central banks starting to cut rates. Within equities, the Fund preferred U.S. large-cap and international developed equities, which contributed positively to the Fund's performance.
The Fund's allocation to corporate credit, including high-yield bonds and securitized credit, also contributed positively to the performance.
Relative to the JPMorgan Global Allocation Composite Benchmark, the Fund’s overall overweight position in equities was a leading contributor to performance. The Fund’s allocation to a diversified mix of non-government bonds also contributed positively to performance. However, the Fund's allocation to international developed equities detracted from performance.
| AVERAGE ANNUAL TOTAL RETURNS | INCEPTION
DATE | 1 YEAR | | 5 YEAR | | 10 YEAR | |
| JPMorgan Global Allocation Fund (Class I Shares) | May 31, 2011 | 23.15 | % | 5.67 | % | 5.47 | % |
| MSCI ACWI Index (net total return) | | 32.79 | | 11.08 | | 9.06 | |
| 60% MSCI ACWI Index (net total return) / 40% Bloomberg Global Aggregate ex China Index - Unhedged USD | | 23.56 | | 6.61 | | 6.08 | |
The performance quoted is past performance and is not a guarantee of future results. Mutual funds are subject to certain market risks. Investment returns and principal value of an investment will fluctuate so that an investor’s shares, when redeemed, may be worth more or less than their original cost. Current performance may be higher or lower than the performance data shown. Updated performance information is available by visiting www.jpmorganfunds.com or by calling 1-800-480-4111.
The graph illustrates comparative performance for $1,000,000 invested in Class I Shares of the JPMorgan Global Allocation Fund, the MSCI ACWI Index (net total return) and the 60% MSCI ACWI Index (net total return) / 40% Bloomberg Global Aggregate ex China Index - Unhedged USD from October 31, 2014 to October 31, 2024. The performance of the Fund assumes reinvestment of all dividends and capital gain distributions, if any, and does not include a sales charge. The performance of the MSCI ACWI Index (net total return) and the 60% MSCI ACWI Index (net total return) / 40% Bloomberg Global Aggregate ex China Index - Unhedged USD do not reflect the deduction of expenses or a sales charge associated with a mutual fund and approximates the minimum possible dividend reinvestment of the securities included in the benchmark, if applicable. The dividend is reinvested after deduction of withholding tax, applying the maximum rate to non-resident individual investors who do not benefit from double taxation treaties. The MSCI ACWI Index (net total return) is a free float-adjusted market capitalization weighted index that is designed to measure the equity market performance of developed and emerging markets. The performance of 60% MSCI ACWI Index (net total return) / 40% Bloomberg Global Aggregate ex China Index - Unhedged USD does not reflect the deduction of expenses associated with a mutual fund, such as investment management fees and has been adjusted to reflect reinvestment of all dividends and capital gain distributions of securities included in the benchmark, if applicable. As a result of new regulatory requirements, effective July 24, 2024, the Fund’s regulatory index has changed from the Index, as defined above, to the MSCI ACWI Index (net total return), a broad-based securities market index. In addition to the Fund’s performance, the tables in this section include performance of the new regulatory index and the Index.
Fund performance may reflect the waiver of the Fund’s fees and reimbursement of expenses for certain periods. Without these waivers and reimbursements, performance would have been lower. Also, performance shown in this section does not reflect the deduction of taxes that a shareholder would pay on Fund distributions or on gains resulting from redemptions of Fund shares.
The returns shown are based on net asset values calculated for shareholder transactions and may differ from the returns shown in the financial highlights, which reflect adjustments made to the net asset values in accordance with accounting principles generally accepted in the United States of America.
Source: MSCI. The MSCI information may only be used for your internal use, may not be reproduced or redisseminated in any form and may not be used as a basis for or a component of any financial instruments or products or indices. None of the MSCI information is intended to constitute investment advice or a recommendation to make (or refrain from making) any kind of investment decision and may not be relied on as such. Historical data and analysis should not be taken as an indication or guarantee of any future performance analysis, forecast, or prediction. The MSCI information is provided on an "as is" basis and the user of this information assumes the entire risk of any use made of this information. MSCI, each of its affiliates and each other person involved in or related to compiling, computing or creating any MSCI information (collectively, the "MSCI Parties") expressly disclaims all warranties (including, without limitation, any warranties of originality, accuracy, completeness, timeliness, non-infringement, merchantability and fitness for a particular purpose) with respect to this information. Without limiting any of the foregoing, in no event shall any MSCI Party have any liability for any direct, indirect, special, incidental, punitive, consequential (including, without limitation, lost profits) or any other damages. (www.msci.com)
Source: Bloomberg Index Services Limited. BLOOMBERG® is a trademark and service mark of Bloomberg Finance L.P. and its affiliates (collectively "Bloomberg"). Bloomberg or Bloomberg's licensors own all proprietary rights in the Bloomberg Indices. Bloomberg does not approve or endorse this material, or guarantee the accuracy or completeness of any information herein, or make any warranty, express or implied, as to the results to be obtained therefrom and, to the maximum extent allowed by law, shall have any liability or responsibility for injury or damages arising in connection therewith.
| Fund net assets (000's) | $2,857,204 | |
| Total number of portfolio holdings | 1,854 | |
| Portfolio turnover rate | 94 | % |
| Total advisory fees paid (000's) | $16,248 | |
PORTFOLIO COMPOSITION - ASSET TYPE
(% of Total Investments)
Availability of Additional Information
At www.jpmorganfunds.com/funddocuments, you can find additional information about the Fund, including the Fund’s:
Prospectus
Financial information
Fund holdings
Proxy voting information
You can also request this information by contacting us at 1-800-480-4111.
ANNUAL SHAREHOLDER REPORT | October 31, 2024 (Unaudited)
JPMorgan Global Allocation Fund
Class R2 Shares/Ticker: GAONX
ANNUAL SHAREHOLDER REPORT
This annual shareholder report contains important information about the JPMorgan Global Allocation Fund (the "Fund") for the period of November 1, 2023 to October 31, 2024. You can find additional information about the Fund at www.jpmorganfunds.com/funddocuments. You can also request this information by contacting us at 1-800-480-4111 or by sending an e-mail request to Funds.Website.Support@jpmorganfunds.com or by asking any financial intermediary that offers shares of the Fund.
What were the Fund costs for the last year?
(based on a hypothetical $10,000 investment)
| Fund (Class) | Costs of a
$10,000 investment | Costs paid as a percentage
of a $10,000 investment |
JPMorgan Global Allocation Fund
(Class R2 Shares) | $155 | 1.40% |
How did the Fund Perform?
The JPMorgan Global Allocation Fund's Class R2 Shares returned 22.35% for the year ended October 31, 2024. The MSCI ACWI Index (net total return) returned 32.79% and the 60% MSCI ACWI Index (net total return) / 40% Bloomberg Global Aggregate ex China Index - Unhedged USD (the "Index") returned 23.56% for the year ended October 31, 2024.
The allocation to equities contributed the most to overall Fund performance as global growth continued to be strong, with overall economic growth remaining resilient, inflation continuing its downward trend and central banks starting to cut rates. Within equities, the Fund preferred U.S. large-cap and international developed equities, which contributed positively to the Fund's performance.
The Fund's allocation to corporate credit, including high-yield bonds and securitized credit, also contributed positively to the performance.
Relative to the JPMorgan Global Allocation Composite Benchmark, the Fund’s overall overweight position in equities was a leading contributor to performance. The Fund’s allocation to a diversified mix of non-government bonds also contributed positively to performance. However, the Fund's allocation to international developed equities detracted from performance.
| AVERAGE ANNUAL TOTAL RETURNS | INCEPTION
DATE | 1 YEAR | | 5 YEAR | | 10 YEAR | |
| JPMorgan Global Allocation Fund (Class R2 Shares) | May 31, 2011 | 22.35 | % | 5.02 | % | 4.86 | % |
| MSCI ACWI Index (net total return) | | 32.79 | | 11.08 | | 9.06 | |
| 60% MSCI ACWI Index (net total return) / 40% Bloomberg Global Aggregate ex China Index - Unhedged USD | | 23.56 | | 6.61 | | 6.08 | |
The performance quoted is past performance and is not a guarantee of future results. Mutual funds are subject to certain market risks. Investment returns and principal value of an investment will fluctuate so that an investor’s shares, when redeemed, may be worth more or less than their original cost. Current performance may be higher or lower than the performance data shown. Updated performance information is available by visiting www.jpmorganfunds.com or by calling 1-800-480-4111.
The graph illustrates comparative performance for $10,000 invested in Class R2 Shares of the JPMorgan Global Allocation Fund, the MSCI ACWI Index (net total return) and the 60% MSCI ACWI Index (net total return) / 40% Bloomberg Global Aggregate ex China Index - Unhedged USD from October 31, 2014 to October 31, 2024. The performance of the Fund assumes reinvestment of all dividends and capital gain distributions, if any, and does not include a sales charge. The performance of the MSCI ACWI Index (net total return) and the 60% MSCI ACWI Index (net total return) / 40% Bloomberg Global Aggregate ex China Index - Unhedged USD do not reflect the deduction of expenses or a sales charge associated with a mutual fund and approximates the minimum possible dividend reinvestment of the securities included in the benchmark, if applicable. The dividend is reinvested after deduction of withholding tax, applying the maximum rate to non-resident individual investors who do not benefit from double taxation treaties. The MSCI ACWI Index (net total return) is a free float-adjusted market capitalization weighted index that is designed to measure the equity market performance of developed and emerging markets. The performance of 60% MSCI ACWI Index (net total return) / 40% Bloomberg Global Aggregate ex China Index - Unhedged USD does not reflect the deduction of expenses associated with a mutual fund, such as investment management fees and has been adjusted to reflect reinvestment of all dividends and capital gain distributions of securities included in the benchmark, if applicable. As a result of new regulatory requirements, effective July 24, 2024, the Fund’s regulatory index has changed from the Index, as defined above, to the MSCI ACWI Index (net total return), a broad-based securities market index. In addition to the Fund’s performance, the tables in this section include performance of the new regulatory index and the Index.
Fund performance may reflect the waiver of the Fund’s fees and reimbursement of expenses for certain periods. Without these waivers and reimbursements, performance would have been lower. Also, performance shown in this section does not reflect the deduction of taxes that a shareholder would pay on Fund distributions or on gains resulting from redemptions of Fund shares.
The returns shown are based on net asset values calculated for shareholder transactions and may differ from the returns shown in the financial highlights, which reflect adjustments made to the net asset values in accordance with accounting principles generally accepted in the United States of America.
Source: MSCI. The MSCI information may only be used for your internal use, may not be reproduced or redisseminated in any form and may not be used as a basis for or a component of any financial instruments or products or indices. None of the MSCI information is intended to constitute investment advice or a recommendation to make (or refrain from making) any kind of investment decision and may not be relied on as such. Historical data and analysis should not be taken as an indication or guarantee of any future performance analysis, forecast, or prediction. The MSCI information is provided on an "as is" basis and the user of this information assumes the entire risk of any use made of this information. MSCI, each of its affiliates and each other person involved in or related to compiling, computing or creating any MSCI information (collectively, the "MSCI Parties") expressly disclaims all warranties (including, without limitation, any warranties of originality, accuracy, completeness, timeliness, non-infringement, merchantability and fitness for a particular purpose) with respect to this information. Without limiting any of the foregoing, in no event shall any MSCI Party have any liability for any direct, indirect, special, incidental, punitive, consequential (including, without limitation, lost profits) or any other damages. (www.msci.com)
Source: Bloomberg Index Services Limited. BLOOMBERG® is a trademark and service mark of Bloomberg Finance L.P. and its affiliates (collectively "Bloomberg"). Bloomberg or Bloomberg's licensors own all proprietary rights in the Bloomberg Indices. Bloomberg does not approve or endorse this material, or guarantee the accuracy or completeness of any information herein, or make any warranty, express or implied, as to the results to be obtained therefrom and, to the maximum extent allowed by law, shall have any liability or responsibility for injury or damages arising in connection therewith.
| Fund net assets (000's) | $2,857,204 | |
| Total number of portfolio holdings | 1,854 | |
| Portfolio turnover rate | 94 | % |
| Total advisory fees paid (000's) | $16,248 | |
PORTFOLIO COMPOSITION - ASSET TYPE
(% of Total Investments)
Availability of Additional Information
At www.jpmorganfunds.com/funddocuments, you can find additional information about the Fund, including the Fund’s:
Prospectus
Financial information
Fund holdings
Proxy voting information
You can also request this information by contacting us at 1-800-480-4111.
ANNUAL SHAREHOLDER REPORT | October 31, 2024 (Unaudited)
JPMorgan Global Allocation Fund
Class R3 Shares/Ticker: GAOTX
ANNUAL SHAREHOLDER REPORT
This annual shareholder report contains important information about the JPMorgan Global Allocation Fund (the "Fund") for the period of November 1, 2023 to October 31, 2024. You can find additional information about the Fund at www.jpmorganfunds.com/funddocuments. You can also request this information by contacting us at 1-800-480-4111 or by sending an e-mail request to Funds.Website.Support@jpmorganfunds.com or by asking any financial intermediary that offers shares of the Fund.
What were the Fund costs for the last year?
(based on a hypothetical $10,000 investment)
| Fund (Class) | Costs of a
$10,000 investment | Costs paid as a percentage
of a $10,000 investment |
JPMorgan Global Allocation Fund
(Class R3 Shares) | $127 | 1.15% |
How did the Fund Perform?
The JPMorgan Global Allocation Fund's Class R3 Shares returned 22.61% for the year ended October 31, 2024. The MSCI ACWI Index (net total return) returned 32.79% and the 60% MSCI ACWI Index (net total return) / 40% Bloomberg Global Aggregate ex China Index - Unhedged USD (the "Index") returned 23.56% for the year ended October 31, 2024.
The allocation to equities contributed the most to overall Fund performance as global growth continued to be strong, with overall economic growth remaining resilient, inflation continuing its downward trend and central banks starting to cut rates. Within equities, the Fund preferred U.S. large-cap and international developed equities, which contributed positively to the Fund's performance.
The Fund's allocation to corporate credit, including high-yield bonds and securitized credit, also contributed positively to the performance.
Relative to the JPMorgan Global Allocation Composite Benchmark, the Fund’s overall overweight position in equities was a leading contributor to performance. The Fund’s allocation to a diversified mix of non-government bonds also contributed positively to performance. However, the Fund's allocation to international developed equities detracted from performance.
| AVERAGE ANNUAL TOTAL RETURNS | INCEPTION
DATE | 1 YEAR | | 5 YEAR | | 10 YEAR | |
| JPMorgan Global Allocation Fund (Class R3 Shares) | October 1, 2018 | 22.61 | % | 5.28 | % | 5.13 | % |
| MSCI ACWI Index (net total return) | | 32.79 | | 11.08 | | 9.06 | |
| 60% MSCI ACWI Index (net total return) / 40% Bloomberg Global Aggregate ex China Index - Unhedged USD | | 23.56 | | 6.61 | | 6.08 | |
The performance quoted is past performance and is not a guarantee of future results. Mutual funds are subject to certain market risks. Investment returns and principal value of an investment will fluctuate so that an investor’s shares, when redeemed, may be worth more or less than their original cost. Current performance may be higher or lower than the performance data shown. Updated performance information is available by visiting www.jpmorganfunds.com or by calling 1-800-480-4111.
Returns for Class R3 Shares prior to its inception date are based on the performance of Class A Shares. The actual returns for Class R3 Shares would have been lower than those shown because Class R3 Shares have higher expenses than Class A Shares.
The graph illustrates comparative performance for $10,000 invested in Class R3 Shares of the JPMorgan Global Allocation Fund, the MSCI ACWI Index (net total return) and the 60% MSCI ACWI Index (net total return) / 40% Bloomberg Global Aggregate ex China Index - Unhedged USD from October 31, 2014 to October 31, 2024. The performance of the Fund assumes reinvestment of all dividends and capital gain distributions, if any, and does not include a sales charge. The performance of the MSCI ACWI Index (net total return) and the 60% MSCI ACWI Index (net total return) / 40% Bloomberg Global Aggregate ex China Index - Unhedged USD do not reflect the deduction of expenses or a sales charge associated with a mutual fund and approximates the minimum possible dividend reinvestment of the securities included in the benchmark, if applicable. The dividend is reinvested after deduction of withholding tax, applying the maximum rate to non-resident individual investors who do not benefit from double taxation treaties. The MSCI ACWI Index (net total return) is a free float-adjusted market capitalization weighted index that is designed to measure the equity market performance of developed and emerging markets. The performance of 60% MSCI ACWI Index (net total return) / 40% Bloomberg Global Aggregate ex China Index - Unhedged USD does not reflect the deduction of expenses associated with a mutual fund, such as investment management fees and has been adjusted to reflect reinvestment of all dividends and capital gain distributions of securities included in the benchmark, if applicable. As a result of new regulatory requirements, effective July 24, 2024, the Fund’s regulatory index has changed from the Index, as defined above, to the MSCI ACWI Index (net total return), a broad-based securities market index. In addition to the Fund’s performance, the tables in this section include performance of the new regulatory index and the Index.
Fund performance may reflect the waiver of the Fund’s fees and reimbursement of expenses for certain periods. Without these waivers and reimbursements, performance would have been lower. Also, performance shown in this section does not reflect the deduction of taxes that a shareholder would pay on Fund distributions or on gains resulting from redemptions of Fund shares.
The returns shown are based on net asset values calculated for shareholder transactions and may differ from the returns shown in the financial highlights, which reflect adjustments made to the net asset values in accordance with accounting principles generally accepted in the United States of America.
Source: MSCI. The MSCI information may only be used for your internal use, may not be reproduced or redisseminated in any form and may not be used as a basis for or a component of any financial instruments or products or indices. None of the MSCI information is intended to constitute investment advice or a recommendation to make (or refrain from making) any kind of investment decision and may not be relied on as such. Historical data and analysis should not be taken as an indication or guarantee of any future performance analysis, forecast, or prediction. The MSCI information is provided on an "as is" basis and the user of this information assumes the entire risk of any use made of this information. MSCI, each of its affiliates and each other person involved in or related to compiling, computing or creating any MSCI information (collectively, the "MSCI Parties") expressly disclaims all warranties (including, without limitation, any warranties of originality, accuracy, completeness, timeliness, non-infringement, merchantability and fitness for a particular purpose) with respect to this information. Without limiting any of the foregoing, in no event shall any MSCI Party have any liability for any direct, indirect, special, incidental, punitive, consequential (including, without limitation, lost profits) or any other damages. (www.msci.com)
Source: Bloomberg Index Services Limited. BLOOMBERG® is a trademark and service mark of Bloomberg Finance L.P. and its affiliates (collectively "Bloomberg"). Bloomberg or Bloomberg's licensors own all proprietary rights in the Bloomberg Indices. Bloomberg does not approve or endorse this material, or guarantee the accuracy or completeness of any information herein, or make any warranty, express or implied, as to the results to be obtained therefrom and, to the maximum extent allowed by law, shall have any liability or responsibility for injury or damages arising in connection therewith.
| Fund net assets (000's) | $2,857,204 | |
| Total number of portfolio holdings | 1,854 | |
| Portfolio turnover rate | 94 | % |
| Total advisory fees paid (000's) | $16,248 | |
PORTFOLIO COMPOSITION - ASSET TYPE
(% of Total Investments)
Availability of Additional Information
At www.jpmorganfunds.com/funddocuments, you can find additional information about the Fund, including the Fund’s:
Prospectus
Financial information
Fund holdings
Proxy voting information
You can also request this information by contacting us at 1-800-480-4111.
ANNUAL SHAREHOLDER REPORT | October 31, 2024 (Unaudited)
JPMorgan Global Allocation Fund
Class R4 Shares/Ticker: GAOFX
ANNUAL SHAREHOLDER REPORT
This annual shareholder report contains important information about the JPMorgan Global Allocation Fund (the "Fund") for the period of November 1, 2023 to October 31, 2024. You can find additional information about the Fund at www.jpmorganfunds.com/funddocuments. You can also request this information by contacting us at 1-800-480-4111 or by sending an e-mail request to Funds.Website.Support@jpmorganfunds.com or by asking any financial intermediary that offers shares of the Fund.
What were the Fund costs for the last year?
(based on a hypothetical $10,000 investment)
| Fund (Class) | Costs of a
$10,000 investment | Costs paid as a percentage
of a $10,000 investment |
JPMorgan Global Allocation Fund
(Class R4 Shares) | $100 | 0.90% |
How did the Fund Perform?
The JPMorgan Global Allocation Fund's Class R4 Shares returned 22.98% for the year ended October 31, 2024. The MSCI ACWI Index (net total return) returned 32.79% and the 60% MSCI ACWI Index (net total return) / 40% Bloomberg Global Aggregate ex China Index - Unhedged USD (the "Index") returned 23.56% for the year ended October 31, 2024.
The allocation to equities contributed the most to overall Fund performance as global growth continued to be strong, with overall economic growth remaining resilient, inflation continuing its downward trend and central banks starting to cut rates. Within equities, the Fund preferred U.S. large-cap and international developed equities, which contributed positively to the Fund's performance.
The Fund's allocation to corporate credit, including high-yield bonds and securitized credit, also contributed positively to the performance.
Relative to the JPMorgan Global Allocation Composite Benchmark, the Fund’s overall overweight position in equities was a leading contributor to performance. The Fund’s allocation to a diversified mix of non-government bonds also contributed positively to performance. However, the Fund's allocation to international developed equities detracted from performance.
| AVERAGE ANNUAL TOTAL RETURNS | INCEPTION
DATE | 1 YEAR | | 5 YEAR | | 10 YEAR | |
| JPMorgan Global Allocation Fund (Class R4 Shares) | October 1, 2018 | 22.98 | % | 5.56 | % | 5.40 | % |
| MSCI ACWI Index (net total return) | | 32.79 | | 11.08 | | 9.06 | |
| 60% MSCI ACWI Index (net total return) / 40% Bloomberg Global Aggregate ex China Index - Unhedged USD | | 23.56 | | 6.61 | | 6.08 | |
The performance quoted is past performance and is not a guarantee of future results. Mutual funds are subject to certain market risks. Investment returns and principal value of an investment will fluctuate so that an investor’s shares, when redeemed, may be worth more or less than their original cost. Current performance may be higher or lower than the performance data shown. Updated performance information is available by visiting www.jpmorganfunds.com or by calling 1-800-480-4111.
Returns for Class R4 Shares prior to its inception date are based on the performance of Class I Shares. The actual returns for Class R4 Shares would have been lower than those shown because Class R4 Shares have higher expenses than Class I Shares.
The graph illustrates comparative performance for $10,000 invested in Class R4 Shares of the JPMorgan Global Allocation Fund, the MSCI ACWI Index (net total return) and the 60% MSCI ACWI Index (net total return) / 40% Bloomberg Global Aggregate ex China Index - Unhedged USD from October 31, 2014 to October 31, 2024. The performance of the Fund assumes reinvestment of all dividends and capital gain distributions, if any, and does not include a sales charge. The performance of the MSCI ACWI Index (net total return) and the 60% MSCI ACWI Index (net total return) / 40% Bloomberg Global Aggregate ex China Index - Unhedged USD do not reflect the deduction of expenses or a sales charge associated with a mutual fund and approximates the minimum possible dividend reinvestment of the securities included in the benchmark, if applicable. The dividend is reinvested after deduction of withholding tax, applying the maximum rate to non-resident individual investors who do not benefit from double taxation treaties. The MSCI ACWI Index (net total return) is a free float-adjusted market capitalization weighted index that is designed to measure the equity market performance of developed and emerging markets. The performance of 60% MSCI ACWI Index (net total return) / 40% Bloomberg Global Aggregate ex China Index - Unhedged USD does not reflect the deduction of expenses associated with a mutual fund, such as investment management fees and has been adjusted to reflect reinvestment of all dividends and capital gain distributions of securities included in the benchmark, if applicable. As a result of new regulatory requirements, effective July 24, 2024, the Fund’s regulatory index has changed from the Index, as defined above, to the MSCI ACWI Index (net total return), a broad-based securities market index. In addition to the Fund’s performance, the tables in this section include performance of the new regulatory index and the Index.
Fund performance may reflect the waiver of the Fund’s fees and reimbursement of expenses for certain periods. Without these waivers and reimbursements, performance would have been lower. Also, performance shown in this section does not reflect the deduction of taxes that a shareholder would pay on Fund distributions or on gains resulting from redemptions of Fund shares.
The returns shown are based on net asset values calculated for shareholder transactions and may differ from the returns shown in the financial highlights, which reflect adjustments made to the net asset values in accordance with accounting principles generally accepted in the United States of America.
Source: MSCI. The MSCI information may only be used for your internal use, may not be reproduced or redisseminated in any form and may not be used as a basis for or a component of any financial instruments or products or indices. None of the MSCI information is intended to constitute investment advice or a recommendation to make (or refrain from making) any kind of investment decision and may not be relied on as such. Historical data and analysis should not be taken as an indication or guarantee of any future performance analysis, forecast, or prediction. The MSCI information is provided on an "as is" basis and the user of this information assumes the entire risk of any use made of this information. MSCI, each of its affiliates and each other person involved in or related to compiling, computing or creating any MSCI information (collectively, the "MSCI Parties") expressly disclaims all warranties (including, without limitation, any warranties of originality, accuracy, completeness, timeliness, non-infringement, merchantability and fitness for a particular purpose) with respect to this information. Without limiting any of the foregoing, in no event shall any MSCI Party have any liability for any direct, indirect, special, incidental, punitive, consequential (including, without limitation, lost profits) or any other damages. (www.msci.com)
Source: Bloomberg Index Services Limited. BLOOMBERG® is a trademark and service mark of Bloomberg Finance L.P. and its affiliates (collectively "Bloomberg"). Bloomberg or Bloomberg's licensors own all proprietary rights in the Bloomberg Indices. Bloomberg does not approve or endorse this material, or guarantee the accuracy or completeness of any information herein, or make any warranty, express or implied, as to the results to be obtained therefrom and, to the maximum extent allowed by law, shall have any liability or responsibility for injury or damages arising in connection therewith.
| Fund net assets (000's) | $2,857,204 | |
| Total number of portfolio holdings | 1,854 | |
| Portfolio turnover rate | 94 | % |
| Total advisory fees paid (000's) | $16,248 | |
PORTFOLIO COMPOSITION - ASSET TYPE
(% of Total Investments)
Availability of Additional Information
At www.jpmorganfunds.com/funddocuments, you can find additional information about the Fund, including the Fund’s:
Prospectus
Financial information
Fund holdings
Proxy voting information
You can also request this information by contacting us at 1-800-480-4111.
ANNUAL SHAREHOLDER REPORT | October 31, 2024 (Unaudited)
JPMorgan Global Allocation Fund
Class R5 Shares/Ticker: GAORX
ANNUAL SHAREHOLDER REPORT
This annual shareholder report contains important information about the JPMorgan Global Allocation Fund (the "Fund") for the period of November 1, 2023 to October 31, 2024. You can find additional information about the Fund at www.jpmorganfunds.com/funddocuments. You can also request this information by contacting us at 1-800-480-4111 or by sending an e-mail request to Funds.Website.Support@jpmorganfunds.com or by asking any financial intermediary that offers shares of the Fund.
What were the Fund costs for the last year?
(based on a hypothetical $10,000 investment)
| Fund (Class) | Costs of a
$10,000 investment | Costs paid as a percentage
of a $10,000 investment |
JPMorgan Global Allocation Fund
(Class R5 Shares) | $83 | 0.74% |
How did the Fund Perform?
The JPMorgan Global Allocation Fund's Class R5 Shares returned 23.09% for the year ended October 31, 2024. The MSCI ACWI Index (net total return) returned 32.79% and the 60% MSCI ACWI Index (net total return) / 40% Bloomberg Global Aggregate ex China Index - Unhedged USD (the "Index") returned 23.56% for the year ended October 31, 2024.
The allocation to equities contributed the most to overall Fund performance as global growth continued to be strong, with overall economic growth remaining resilient, inflation continuing its downward trend and central banks starting to cut rates. Within equities, the Fund preferred U.S. large-cap and international developed equities, which contributed positively to the Fund's performance.
The Fund's allocation to corporate credit, including high-yield bonds and securitized credit, also contributed positively to the performance.
Relative to the JPMorgan Global Allocation Composite Benchmark, the Fund’s overall overweight position in equities was a leading contributor to performance. The Fund’s allocation to a diversified mix of non-government bonds also contributed positively to performance. However, the Fund's allocation to international developed equities detracted from performance.
| AVERAGE ANNUAL TOTAL RETURNS | INCEPTION
DATE | 1 YEAR | | 5 YEAR | | 10 YEAR | |
| JPMorgan Global Allocation Fund (Class R5 Shares) | October 1, 2018 | 23.09 | % | 5.70 | % | 5.49 | % |
| MSCI ACWI Index (net total return) | | 32.79 | | 11.08 | | 9.06 | |
| 60% MSCI ACWI Index (net total return) / 40% Bloomberg Global Aggregate ex China Index - Unhedged USD | | 23.56 | | 6.61 | | 6.08 | |
The performance quoted is past performance and is not a guarantee of future results. Mutual funds are subject to certain market risks. Investment returns and principal value of an investment will fluctuate so that an investor’s shares, when redeemed, may be worth more or less than their original cost. Current performance may be higher or lower than the performance data shown. Updated performance information is available by visiting www.jpmorganfunds.com or by calling 1-800-480-4111.
Returns for Class R5 Shares prior to its inception date are based on the performance of Class I Shares. The actual returns for Class R5 Shares would have been different than those shown because Class R5 Shares have different expenses than Class I Shares.
The graph illustrates comparative performance for $10,000 invested in Class R5 Shares of the JPMorgan Global Allocation Fund, the MSCI ACWI Index (net total return) and the 60% MSCI ACWI Index (net total return) / 40% Bloomberg Global Aggregate ex China Index - Unhedged USD from October 31, 2014 to October 31, 2024. The performance of the Fund assumes reinvestment of all dividends and capital gain distributions, if any, and does not include a sales charge. The performance of the MSCI ACWI Index (net total return) and the 60% MSCI ACWI Index (net total return) / 40% Bloomberg Global Aggregate ex China Index - Unhedged USD do not reflect the deduction of expenses or a sales charge associated with a mutual fund and approximates the minimum possible dividend reinvestment of the securities included in the benchmark, if applicable. The dividend is reinvested after deduction of withholding tax, applying the maximum rate to non-resident individual investors who do not benefit from double taxation treaties. The MSCI ACWI Index (net total return) is a free float-adjusted market capitalization weighted index that is designed to measure the equity market performance of developed and emerging markets. The performance of 60% MSCI ACWI Index (net total return) / 40% Bloomberg Global Aggregate ex China Index - Unhedged USD does not reflect the deduction of expenses associated with a mutual fund, such as investment management fees and has been adjusted to reflect reinvestment of all dividends and capital gain distributions of securities included in the benchmark, if applicable. As a result of new regulatory requirements, effective July 24, 2024, the Fund’s regulatory index has changed from the Index, as defined above, to the MSCI ACWI Index (net total return), a broad-based securities market index. In addition to the Fund’s performance, the tables in this section include performance of the new regulatory index and the Index.
Fund performance may reflect the waiver of the Fund’s fees and reimbursement of expenses for certain periods. Without these waivers and reimbursements, performance would have been lower. Also, performance shown in this section does not reflect the deduction of taxes that a shareholder would pay on Fund distributions or on gains resulting from redemptions of Fund shares.
The returns shown are based on net asset values calculated for shareholder transactions and may differ from the returns shown in the financial highlights, which reflect adjustments made to the net asset values in accordance with accounting principles generally accepted in the United States of America.
Source: MSCI. The MSCI information may only be used for your internal use, may not be reproduced or redisseminated in any form and may not be used as a basis for or a component of any financial instruments or products or indices. None of the MSCI information is intended to constitute investment advice or a recommendation to make (or refrain from making) any kind of investment decision and may not be relied on as such. Historical data and analysis should not be taken as an indication or guarantee of any future performance analysis, forecast, or prediction. The MSCI information is provided on an "as is" basis and the user of this information assumes the entire risk of any use made of this information. MSCI, each of its affiliates and each other person involved in or related to compiling, computing or creating any MSCI information (collectively, the "MSCI Parties") expressly disclaims all warranties (including, without limitation, any warranties of originality, accuracy, completeness, timeliness, non-infringement, merchantability and fitness for a particular purpose) with respect to this information. Without limiting any of the foregoing, in no event shall any MSCI Party have any liability for any direct, indirect, special, incidental, punitive, consequential (including, without limitation, lost profits) or any other damages. (www.msci.com)
Source: Bloomberg Index Services Limited. BLOOMBERG® is a trademark and service mark of Bloomberg Finance L.P. and its affiliates (collectively "Bloomberg"). Bloomberg or Bloomberg's licensors own all proprietary rights in the Bloomberg Indices. Bloomberg does not approve or endorse this material, or guarantee the accuracy or completeness of any information herein, or make any warranty, express or implied, as to the results to be obtained therefrom and, to the maximum extent allowed by law, shall have any liability or responsibility for injury or damages arising in connection therewith.
| Fund net assets (000's) | $2,857,204 | |
| Total number of portfolio holdings | 1,854 | |
| Portfolio turnover rate | 94 | % |
| Total advisory fees paid (000's) | $16,248 | |
PORTFOLIO COMPOSITION - ASSET TYPE
(% of Total Investments)
Availability of Additional Information
At www.jpmorganfunds.com/funddocuments, you can find additional information about the Fund, including the Fund’s:
Prospectus
Financial information
Fund holdings
Proxy voting information
You can also request this information by contacting us at 1-800-480-4111.
ANNUAL SHAREHOLDER REPORT | October 31, 2024 (Unaudited)
JPMorgan Global Allocation Fund
Class R6 Shares/Ticker: GAOZX
ANNUAL SHAREHOLDER REPORT
This annual shareholder report contains important information about the JPMorgan Global Allocation Fund (the "Fund") for the period of November 1, 2023 to October 31, 2024. You can find additional information about the Fund at www.jpmorganfunds.com/funddocuments. You can also request this information by contacting us at 1-800-480-4111 or by sending an e-mail request to Funds.Website.Support@jpmorganfunds.com or by asking any financial intermediary that offers shares of the Fund.
What were the Fund costs for the last year?
(based on a hypothetical $10,000 investment)
| Fund (Class) | Costs of a
$10,000 investment | Costs paid as a percentage
of a $10,000 investment |
JPMorgan Global Allocation Fund
(Class R6 Shares) | $72 | 0.65% |
How did the Fund Perform?
The JPMorgan Global Allocation Fund's Class R6 Shares returned 23.25% for the year ended October 31, 2024. The MSCI ACWI Index (net total return) returned 32.79% and the 60% MSCI ACWI Index (net total return) / 40% Bloomberg Global Aggregate ex China Index - Unhedged USD (the "Index") returned 23.56% for the year ended October 31, 2024.
The allocation to equities contributed the most to overall Fund performance as global growth continued to be strong, with overall economic growth remaining resilient, inflation continuing its downward trend and central banks starting to cut rates. Within equities, the Fund preferred U.S. large-cap and international developed equities, which contributed positively to the Fund's performance.
The Fund's allocation to corporate credit, including high-yield bonds and securitized credit, also contributed positively to the performance.
Relative to the JPMorgan Global Allocation Composite Benchmark, the Fund’s overall overweight position in equities was a leading contributor to performance. The Fund’s allocation to a diversified mix of non-government bonds also contributed positively to performance. However, the Fund's allocation to international developed equities detracted from performance.
| AVERAGE ANNUAL TOTAL RETURNS | INCEPTION
DATE | 1 YEAR | | 5 YEAR | | 10 YEAR | |
| JPMorgan Global Allocation Fund (Class R6 Shares) | November 1, 2017 | 23.25 | % | 5.81 | % | 5.56 | % |
| MSCI ACWI Index (net total return) | | 32.79 | | 11.08 | | 9.06 | |
| 60% MSCI ACWI Index (net total return) / 40% Bloomberg Global Aggregate ex China Index - Unhedged USD | | 23.56 | | 6.61 | | 6.08 | |
The performance quoted is past performance and is not a guarantee of future results. Mutual funds are subject to certain market risks. Investment returns and principal value of an investment will fluctuate so that an investor’s shares, when redeemed, may be worth more or less than their original cost. Current performance may be higher or lower than the performance data shown. Updated performance information is available by visiting www.jpmorganfunds.com or by calling 1-800-480-4111.
Returns for Class R6 Shares prior to its inception date are based on the performance of Class I Shares. The actual returns for Class R6 Shares would have been different than those shown because Class R6 Shares have different expenses than Class I Shares.
The graph illustrates comparative performance for $5,000,000 invested in Class R6 Shares of the JPMorgan Global Allocation Fund, the MSCI ACWI Index (net total return) and the 60% MSCI ACWI Index (net total return) / 40% Bloomberg Global Aggregate ex China Index - Unhedged USD from October 31, 2014 to October 31, 2024. The performance of the Fund assumes reinvestment of all dividends and capital gain distributions, if any, and does not include a sales charge. The performance of the MSCI ACWI Index (net total return) and the 60% MSCI ACWI Index (net total return) / 40% Bloomberg Global Aggregate ex China Index - Unhedged USD do not reflect the deduction of expenses or a sales charge associated with a mutual fund and approximates the minimum possible dividend reinvestment of the securities included in the benchmark, if applicable. The dividend is reinvested after deduction of withholding tax, applying the maximum rate to non-resident individual investors who do not benefit from double taxation treaties. The MSCI ACWI Index (net total return) is a free float-adjusted market capitalization weighted index that is designed to measure the equity market performance of developed and emerging markets. The performance of 60% MSCI ACWI Index (net total return) / 40% Bloomberg Global Aggregate ex China Index - Unhedged USD does not reflect the deduction of expenses associated with a mutual fund, such as investment management fees and has been adjusted to reflect reinvestment of all dividends and capital gain distributions of securities included in the benchmark, if applicable. As a result of new regulatory requirements, effective July 24, 2024, the Fund’s regulatory index has changed from the Index, as defined above, to the MSCI ACWI Index (net total return), a broad-based securities market index. In addition to the Fund’s performance, the tables in this section include performance of the new regulatory index and the Index.
Fund performance may reflect the waiver of the Fund’s fees and reimbursement of expenses for certain periods. Without these waivers and reimbursements, performance would have been lower. Also, performance shown in this section does not reflect the deduction of taxes that a shareholder would pay on Fund distributions or on gains resulting from redemptions of Fund shares.
The returns shown are based on net asset values calculated for shareholder transactions and may differ from the returns shown in the financial highlights, which reflect adjustments made to the net asset values in accordance with accounting principles generally accepted in the United States of America.
Source: MSCI. The MSCI information may only be used for your internal use, may not be reproduced or redisseminated in any form and may not be used as a basis for or a component of any financial instruments or products or indices. None of the MSCI information is intended to constitute investment advice or a recommendation to make (or refrain from making) any kind of investment decision and may not be relied on as such. Historical data and analysis should not be taken as an indication or guarantee of any future performance analysis, forecast, or prediction. The MSCI information is provided on an "as is" basis and the user of this information assumes the entire risk of any use made of this information. MSCI, each of its affiliates and each other person involved in or related to compiling, computing or creating any MSCI information (collectively, the "MSCI Parties") expressly disclaims all warranties (including, without limitation, any warranties of originality, accuracy, completeness, timeliness, non-infringement, merchantability and fitness for a particular purpose) with respect to this information. Without limiting any of the foregoing, in no event shall any MSCI Party have any liability for any direct, indirect, special, incidental, punitive, consequential (including, without limitation, lost profits) or any other damages. (www.msci.com)
Source: Bloomberg Index Services Limited. BLOOMBERG® is a trademark and service mark of Bloomberg Finance L.P. and its affiliates (collectively "Bloomberg"). Bloomberg or Bloomberg's licensors own all proprietary rights in the Bloomberg Indices. Bloomberg does not approve or endorse this material, or guarantee the accuracy or completeness of any information herein, or make any warranty, express or implied, as to the results to be obtained therefrom and, to the maximum extent allowed by law, shall have any liability or responsibility for injury or damages arising in connection therewith.
| Fund net assets (000's) | $2,857,204 | |
| Total number of portfolio holdings | 1,854 | |
| Portfolio turnover rate | 94 | % |
| Total advisory fees paid (000's) | $16,248 | |
PORTFOLIO COMPOSITION - ASSET TYPE
(% of Total Investments)
Availability of Additional Information
At www.jpmorganfunds.com/funddocuments, you can find additional information about the Fund, including the Fund’s:
Prospectus
Financial information
Fund holdings
Proxy voting information
You can also request this information by contacting us at 1-800-480-4111.
ANNUAL SHAREHOLDER REPORT | October 31, 2024 (Unaudited)
JPMorgan Income Builder Fund
Class A Shares/Ticker: JNBAX
ANNUAL SHAREHOLDER REPORT
This annual shareholder report contains important information about the JPMorgan Income Builder Fund (the "Fund") for the period of November 1, 2023 to October 31, 2024. You can find additional information about the Fund at www.jpmorganfunds.com/funddocuments. You can also request this information by contacting us at 1-800-480-4111 or by sending an e-mail request to Funds.Website.Support@jpmorganfunds.com or by asking any financial intermediary that offers shares of the Fund.
What were the Fund costs for the last year?
(based on a hypothetical $10,000 investment)
| Fund (Class) | Costs of a
$10,000 investment | Costs paid as a percentage
of a $10,000 investment |
JPMorgan Income Builder Fund
(Class A Shares) | $78 | 0.71% |
How did the Fund Perform?
The JPMorgan Income Builder Fund's Class A Shares, without a sales charge, returned 19.66% for the year ended October 31, 2024. The MSCI World Index (net total return) returned 33.68% and the 60% MSCI World Index (net total return) / 40% Bloomberg U.S. Aggregate Index (the "Index") returned 24.00% for the year ended October 31, 2024.
Relative to the JPMorgan Income Builder Composite Benchmark, the Fund’s overall underweight to growth-style equities and allocations to Global REITs were detractors from performance for the first half of the period. However, the Fund’s allocation to developed market equities and its mix of corporate credit helped the Fund's relative performance.
The allocation to equities contributed the most to overall Fund performance as global growth continued to be strong, with overall economic growth remaining resilient, inflation continuing its downward trend, and central banks starting to cut rates. Within equities, the Fund preferred U.S. large-cap and developed market equities, which contributed positively to performance.
The Fund's allocation to corporate credit, including high-yield bonds and emerging markets debt, also contributed positively to performance.
| AVERAGE ANNUAL TOTAL RETURNS | INCEPTION
DATE | 1 YEAR | | 5 YEAR | | 10 YEAR | |
| JPMorgan Income Builder Fund (Class A Shares) | May 31, 2007 | 14.32 | % | 2.92 | % | 3.88 | % |
| JPMorgan Income Builder Fund (Class A Shares) - excluding sales charge | | 19.66 | | 3.88 | | 4.36 | |
| MSCI World Index (net total return) | | 33.68 | | 12.03 | | 9.78 | |
| 60% MSCI World Index (net total return) / 40% Bloomberg U.S. Aggregate Index | | 24.00 | | 7.26 | | 6.64 | |
The performance quoted is past performance and is not a guarantee of future results. Mutual funds are subject to certain market risks. Investment returns and principal value of an investment will fluctuate so that an investor’s shares, when redeemed, may be worth more or less than their original cost. Current performance may be higher or lower than the performance data shown. Updated performance information is available by visiting www.jpmorganfunds.com or by calling 1-800-480-4111.
The graph illustrates comparative performance for $10,000 invested in Class A Shares of the JPMorgan Income Builder Fund, the MSCI World Index (net total return) and the 60% MSCI World Index (net total return) / 40% Bloomberg U.S. Aggregate Index from October 31, 2014 to October 31, 2024. The performance of the Fund assumes reinvestment of all dividends and capital gain distributions, if any, and includes a sales charge. The performance of the MSCI World Index (net total return) and the 60% MSCI World Index (net total return) / 40% Bloomberg U.S. Aggregate Index do not reflect the deduction of expenses or a sales charge associated with a mutual fund and have been adjusted to reflect reinvestment of all dividends and capital gain distributions of securities included in the benchmarks, if applicable. The MSCI World Index (net total return) assumes the dividend is reinvested after deduction of withholding tax, applying the maximum rate to non-resident individual investors who do not benefit from double taxation treaties. The MSCI World Index (net total return) is a free float-adjusted market capitalization weighted index that is designed to measure the equity market performance of developed markets. The 60% MSCI World Index (net total return) / 40% Bloomberg U.S. Aggregate Index is a customized blend of unmanaged indices that includes 60% MSCI World Index (net total return) and 40% Bloomberg U.S. Aggregate Index. As a result of new regulatory requirements, effective July 24, 2024, the Fund’s regulatory index has changed from the Index, as defined above, to the MSCI World Index (net total return), a broad-based securities market index. In addition to the Fund’s performance, the tables in this section include performance of the new regulatory index and the Index.
Fund performance may reflect the waiver of the Fund’s fees and reimbursement of expenses for certain periods. Without these waivers and reimbursements, performance would have been lower. Also, performance shown in this section does not reflect the deduction of taxes that a shareholder would pay on Fund distributions or on gains resulting from redemptions of Fund shares.
The returns shown are based on net asset values calculated for shareholder transactions and may differ from the returns shown in the financial highlights, which reflect adjustments made to the net asset values in accordance with accounting principles generally accepted in the United States of America.
Source: MSCI. The MSCI information may only be used for your internal use, may not be reproduced or redisseminated in any form and may not be used as a basis for or a component of any financial instruments or products or indices. None of the MSCI information is intended to constitute investment advice or a recommendation to make (or refrain from making) any kind of investment decision and may not be relied on as such. Historical data and analysis should not be taken as an indication or guarantee of any future performance analysis, forecast, or prediction. The MSCI information is provided on an "as is" basis and the user of this information assumes the entire risk of any use made of this information. MSCI, each of its affiliates and each other person involved in or related to compiling, computing or creating any MSCI information (collectively, the "MSCI Parties") expressly disclaims all warranties (including, without limitation, any warranties of originality, accuracy, completeness, timeliness, non-infringement, merchantability and fitness for a particular purpose) with respect to this information. Without limiting any of the foregoing, in no event shall any MSCI Party have any liability for any direct, indirect, special, incidental, punitive, consequential (including, without limitation, lost profits) or any other damages. (www.msci.com)
Source: Bloomberg Index Services Limited. BLOOMBERG® is a trademark and service mark of Bloomberg Finance L.P. and its affiliates (collectively "Bloomberg"). Bloomberg or Bloomberg's licensors own all proprietary rights in the Bloomberg Indices. Bloomberg does not approve or endorse this material, or guarantee the accuracy or completeness of any information herein, or make any warranty, express or implied, as to the results to be obtained therefrom and, to the maximum extent allowed by law, shall have any liability or responsibility for injury or damages arising in connection therewith.
| Fund net assets (000's) | $8,506,066 | |
| Total number of portfolio holdings | 2,808 | |
| Portfolio turnover rate | 107 | % |
| Total advisory fees paid (000's) | $34,212 | |
PORTFOLIO COMPOSITION - ASSET TYPE
(% of Total Investments)
Availability of Additional Information
At www.jpmorganfunds.com/funddocuments, you can find additional information about the Fund, including the Fund’s:
Prospectus
Financial information
Fund holdings
Proxy voting information
You can also request this information by contacting us at 1-800-480-4111.
ANNUAL SHAREHOLDER REPORT | October 31, 2024 (Unaudited)
JPMorgan Income Builder Fund
Class C Shares/Ticker: JNBCX
ANNUAL SHAREHOLDER REPORT
This annual shareholder report contains important information about the JPMorgan Income Builder Fund (the "Fund") for the period of November 1, 2023 to October 31, 2024. You can find additional information about the Fund at www.jpmorganfunds.com/funddocuments. You can also request this information by contacting us at 1-800-480-4111 or by sending an e-mail request to Funds.Website.Support@jpmorganfunds.com or by asking any financial intermediary that offers shares of the Fund.
What were the Fund costs for the last year?
(based on a hypothetical $10,000 investment)
| Fund (Class) | Costs of a
$10,000 investment | Costs paid as a percentage
of a $10,000 investment |
JPMorgan Income Builder Fund
(Class C Shares) | $133 | 1.21% |
How did the Fund Perform?
The JPMorgan Income Builder Fund's Class C Shares, without a sales charge, returned 19.13% for the year ended October 31, 2024. The MSCI World Index (net total return) returned 33.68% and the 60% MSCI World Index (net total return) / 40% Bloomberg U.S. Aggregate Index (the "Index") returned 24.00% for the year ended October 31, 2024.
Relative to the JPMorgan Income Builder Composite Benchmark, the Fund’s overall underweight to growth-style equities and allocations to Global REITs were detractors from performance for the first half of the period. However, the Fund’s allocation to developed market equities and its mix of corporate credit helped the Fund's relative performance.
The allocation to equities contributed the most to overall Fund performance as global growth continued to be strong, with overall economic growth remaining resilient, inflation continuing its downward trend, and central banks starting to cut rates. Within equities, the Fund preferred U.S. large-cap and developed market equities, which contributed positively to performance.
The Fund's allocation to corporate credit, including high-yield bonds and emerging markets debt, also contributed positively to performance.
| AVERAGE ANNUAL TOTAL RETURNS | INCEPTION
DATE | 1 YEAR | | 5 YEAR | | 10 YEAR | |
| JPMorgan Income Builder Fund (Class C Shares) | May 31, 2007 | 18.13 | % | 3.36 | % | 3.94 | % |
| JPMorgan Income Builder Fund (Class C Shares) - excluding sales charge | | 19.13 | | 3.36 | | 3.94 | |
| MSCI World Index (net total return) | | 33.68 | | 12.03 | | 9.78 | |
| 60% MSCI World Index (net total return) / 40% Bloomberg U.S. Aggregate Index | | 24.00 | | 7.26 | | 6.64 | |
The performance quoted is past performance and is not a guarantee of future results. Mutual funds are subject to certain market risks. Investment returns and principal value of an investment will fluctuate so that an investor’s shares, when redeemed, may be worth more or less than their original cost. Current performance may be higher or lower than the performance data shown. Updated performance information is available by visiting www.jpmorganfunds.com or by calling 1-800-480-4111.
The graph illustrates comparative performance for $10,000 invested in Class C Shares of the JPMorgan Income Builder Fund, the MSCI World Index (net total return) and the 60% MSCI World Index (net total return) / 40% Bloomberg U.S. Aggregate Index from October 31, 2014 to October 31, 2024. The performance of the Fund assumes reinvestment of all dividends and capital gain distributions, if any, and does not include a sales charge. The performance of the MSCI World Index (net total return) and the 60% MSCI World Index (net total return) / 40% Bloomberg U.S. Aggregate Index do not reflect the deduction of expenses or a sales charge associated with a mutual fund and have been adjusted to reflect reinvestment of all dividends and capital gain distributions of securities included in the benchmarks, if applicable. The MSCI World Index (net total return) assumes the dividend is reinvested after deduction of withholding tax, applying the maximum rate to non-resident individual investors who do not benefit from double taxation treaties. The MSCI World Index (net total return) is a free float-adjusted market capitalization weighted index that is designed to measure the equity market performance of developed markets. The 60% MSCI World Index (net total return) / 40% Bloomberg U.S. Aggregate Index is a customized blend of unmanaged indices that includes 60% MSCI World Index (net total return) and 40% Bloomberg U.S. Aggregate Index. As a result of new regulatory requirements, effective July 24, 2024, the Fund’s regulatory index has changed from the Index, as defined above, to the MSCI World Index (net total return), a broad-based securities market index. In addition to the Fund’s performance, the tables in this section include performance of the new regulatory index and the Index.
Fund performance may reflect the waiver of the Fund’s fees and reimbursement of expenses for certain periods. Without these waivers and reimbursements, performance would have been lower. Also, performance shown in this section does not reflect the deduction of taxes that a shareholder would pay on Fund distributions or on gains resulting from redemptions of Fund shares.
Because Class C Shares automatically convert to Class A Shares after 8 years, the 10 year average annual total return shown above for Class C Shares reflects Class A Share's performance for the period after conversion.
The returns shown are based on net asset values calculated for shareholder transactions and may differ from the returns shown in the financial highlights, which reflect adjustments made to the net asset values in accordance with accounting principles generally accepted in the United States of America.
Source: MSCI. The MSCI information may only be used for your internal use, may not be reproduced or redisseminated in any form and may not be used as a basis for or a component of any financial instruments or products or indices. None of the MSCI information is intended to constitute investment advice or a recommendation to make (or refrain from making) any kind of investment decision and may not be relied on as such. Historical data and analysis should not be taken as an indication or guarantee of any future performance analysis, forecast, or prediction. The MSCI information is provided on an "as is" basis and the user of this information assumes the entire risk of any use made of this information. MSCI, each of its affiliates and each other person involved in or related to compiling, computing or creating any MSCI information (collectively, the "MSCI Parties") expressly disclaims all warranties (including, without limitation, any warranties of originality, accuracy, completeness, timeliness, non-infringement, merchantability and fitness for a particular purpose) with respect to this information. Without limiting any of the foregoing, in no event shall any MSCI Party have any liability for any direct, indirect, special, incidental, punitive, consequential (including, without limitation, lost profits) or any other damages. (www.msci.com)
Source: Bloomberg Index Services Limited. BLOOMBERG® is a trademark and service mark of Bloomberg Finance L.P. and its affiliates (collectively "Bloomberg"). Bloomberg or Bloomberg's licensors own all proprietary rights in the Bloomberg Indices. Bloomberg does not approve or endorse this material, or guarantee the accuracy or completeness of any information herein, or make any warranty, express or implied, as to the results to be obtained therefrom and, to the maximum extent allowed by law, shall have any liability or responsibility for injury or damages arising in connection therewith.
| Fund net assets (000's) | $8,506,066 | |
| Total number of portfolio holdings | 2,808 | |
| Portfolio turnover rate | 107 | % |
| Total advisory fees paid (000's) | $34,212 | |
PORTFOLIO COMPOSITION - ASSET TYPE
(% of Total Investments)
Availability of Additional Information
At www.jpmorganfunds.com/funddocuments, you can find additional information about the Fund, including the Fund’s:
Prospectus
Financial information
Fund holdings
Proxy voting information
You can also request this information by contacting us at 1-800-480-4111.
ANNUAL SHAREHOLDER REPORT | October 31, 2024 (Unaudited)
JPMorgan Income Builder Fund
Class I Shares/Ticker: JNBSX
ANNUAL SHAREHOLDER REPORT
This annual shareholder report contains important information about the JPMorgan Income Builder Fund (the "Fund") for the period of November 1, 2023 to October 31, 2024. You can find additional information about the Fund at www.jpmorganfunds.com/funddocuments. You can also request this information by contacting us at 1-800-480-4111 or by sending an e-mail request to Funds.Website.Support@jpmorganfunds.com or by asking any financial intermediary that offers shares of the Fund.
What were the Fund costs for the last year?
(based on a hypothetical $10,000 investment)
| Fund (Class) | Costs of a
$10,000 investment | Costs paid as a percentage
of a $10,000 investment |
JPMorgan Income Builder Fund
(Class I Shares) | $62 | 0.56% |
How did the Fund Perform?
The JPMorgan Income Builder Fund's Class I Shares returned 19.80% for the year ended October 31, 2024. The MSCI World Index (net total return) returned 33.68% and the 60% MSCI World Index (net total return) / 40% Bloomberg U.S. Aggregate Index (the "Index") returned 24.00% for the year ended October 31, 2024.
Relative to the JPMorgan Income Builder Composite Benchmark, the Fund’s overall underweight to growth-style equities and allocations to Global REITs were detractors from performance for the first half of the period. However, the Fund’s allocation to developed market equities and its mix of corporate credit helped the Fund's relative performance.
The allocation to equities contributed the most to overall Fund performance as global growth continued to be strong, with overall economic growth remaining resilient, inflation continuing its downward trend, and central banks starting to cut rates. Within equities, the Fund preferred U.S. large-cap and developed market equities, which contributed positively to performance.
The Fund's allocation to corporate credit, including high-yield bonds and emerging markets debt, also contributed positively to performance.
| AVERAGE ANNUAL TOTAL RETURNS | INCEPTION
DATE | 1 YEAR | | 5 YEAR | | 10 YEAR | |
| JPMorgan Income Builder Fund (Class I Shares) | May 31, 2007 | 19.80 | % | 4.05 | % | 4.52 | % |
| MSCI World Index (net total return) | | 33.68 | | 12.03 | | 9.78 | |
| 60% MSCI World Index (net total return) / 40% Bloomberg U.S. Aggregate Index | | 24.00 | | 7.26 | | 6.64 | |
The performance quoted is past performance and is not a guarantee of future results. Mutual funds are subject to certain market risks. Investment returns and principal value of an investment will fluctuate so that an investor’s shares, when redeemed, may be worth more or less than their original cost. Current performance may be higher or lower than the performance data shown. Updated performance information is available by visiting www.jpmorganfunds.com or by calling 1-800-480-4111.
The graph illustrates comparative performance for $1,000,000 invested in Class I Shares of the JPMorgan Income Builder Fund, the MSCI World Index (net total return) and the 60% MSCI World Index (net total return) / 40% Bloomberg U.S. Aggregate Index from October 31, 2014 to October 31, 2024. The performance of the Fund assumes reinvestment of all dividends and capital gain distributions, if any, and does not include a sales charge. The performance of the MSCI World Index (net total return) and the 60% MSCI World Index (net total return) / 40% Bloomberg U.S. Aggregate Index do not reflect the deduction of expenses or a sales charge associated with a mutual fund and have been adjusted to reflect reinvestment of all dividends and capital gain distributions of securities included in the benchmarks, if applicable. The MSCI World Index (net total return) assumes the dividend is reinvested after deduction of withholding tax, applying the maximum rate to non-resident individual investors who do not benefit from double taxation treaties. The MSCI World Index (net total return) is a free float-adjusted market capitalization weighted index that is designed to measure the equity market performance of developed markets. The 60% MSCI World Index (net total return) / 40% Bloomberg U.S. Aggregate Index is a customized blend of unmanaged indices that includes 60% MSCI World Index (net total return) and 40% Bloomberg U.S. Aggregate Index. As a result of new regulatory requirements, effective July 24, 2024, the Fund’s regulatory index has changed from the Index, as defined above, to the MSCI World Index (net total return), a broad-based securities market index. In addition to the Fund’s performance, the tables in this section include performance of the new regulatory index and the Index.
Fund performance may reflect the waiver of the Fund’s fees and reimbursement of expenses for certain periods. Without these waivers and reimbursements, performance would have been lower. Also, performance shown in this section does not reflect the deduction of taxes that a shareholder would pay on Fund distributions or on gains resulting from redemptions of Fund shares.
The returns shown are based on net asset values calculated for shareholder transactions and may differ from the returns shown in the financial highlights, which reflect adjustments made to the net asset values in accordance with accounting principles generally accepted in the United States of America.
Source: MSCI. The MSCI information may only be used for your internal use, may not be reproduced or redisseminated in any form and may not be used as a basis for or a component of any financial instruments or products or indices. None of the MSCI information is intended to constitute investment advice or a recommendation to make (or refrain from making) any kind of investment decision and may not be relied on as such. Historical data and analysis should not be taken as an indication or guarantee of any future performance analysis, forecast, or prediction. The MSCI information is provided on an "as is" basis and the user of this information assumes the entire risk of any use made of this information. MSCI, each of its affiliates and each other person involved in or related to compiling, computing or creating any MSCI information (collectively, the "MSCI Parties") expressly disclaims all warranties (including, without limitation, any warranties of originality, accuracy, completeness, timeliness, non-infringement, merchantability and fitness for a particular purpose) with respect to this information. Without limiting any of the foregoing, in no event shall any MSCI Party have any liability for any direct, indirect, special, incidental, punitive, consequential (including, without limitation, lost profits) or any other damages. (www.msci.com)
Source: Bloomberg Index Services Limited. BLOOMBERG® is a trademark and service mark of Bloomberg Finance L.P. and its affiliates (collectively "Bloomberg"). Bloomberg or Bloomberg's licensors own all proprietary rights in the Bloomberg Indices. Bloomberg does not approve or endorse this material, or guarantee the accuracy or completeness of any information herein, or make any warranty, express or implied, as to the results to be obtained therefrom and, to the maximum extent allowed by law, shall have any liability or responsibility for injury or damages arising in connection therewith.
| Fund net assets (000's) | $8,506,066 | |
| Total number of portfolio holdings | 2,808 | |
| Portfolio turnover rate | 107 | % |
| Total advisory fees paid (000's) | $34,212 | |
PORTFOLIO COMPOSITION - ASSET TYPE
(% of Total Investments)
Availability of Additional Information
At www.jpmorganfunds.com/funddocuments, you can find additional information about the Fund, including the Fund’s:
Prospectus
Financial information
Fund holdings
Proxy voting information
You can also request this information by contacting us at 1-800-480-4111.
ANNUAL SHAREHOLDER REPORT | October 31, 2024 (Unaudited)
JPMorgan Income Builder Fund
Class R6 Shares/Ticker: JNBZX
ANNUAL SHAREHOLDER REPORT
This annual shareholder report contains important information about the JPMorgan Income Builder Fund (the "Fund") for the period of November 1, 2023 to October 31, 2024. You can find additional information about the Fund at www.jpmorganfunds.com/funddocuments. You can also request this information by contacting us at 1-800-480-4111 or by sending an e-mail request to Funds.Website.Support@jpmorganfunds.com or by asking any financial intermediary that offers shares of the Fund.
What were the Fund costs for the last year?
(based on a hypothetical $10,000 investment)
| Fund (Class) | Costs of a
$10,000 investment | Costs paid as a percentage
of a $10,000 investment |
JPMorgan Income Builder Fund
(Class R6 Shares) | $53 | 0.48% |
How did the Fund Perform?
The JPMorgan Income Builder Fund's Class R6 Shares returned 19.89% for the year ended October 31, 2024. The MSCI World Index (net total return) returned 33.68% and the 60% MSCI World Index (net total return) / 40% Bloomberg U.S. Aggregate Index (the "Index") returned 24.00% for the year ended October 31, 2024.
Relative to the JPMorgan Income Builder Composite Benchmark, the Fund’s overall underweight to growth-style equities and allocations to Global REITs were detractors from performance for the first half of the period. However, the Fund’s allocation to developed market equities and its mix of corporate credit helped the Fund's relative performance.
The allocation to equities contributed the most to overall Fund performance as global growth continued to be strong, with overall economic growth remaining resilient, inflation continuing its downward trend, and central banks starting to cut rates. Within equities, the Fund preferred U.S. large-cap and developed market equities, which contributed positively to performance.
The Fund's allocation to corporate credit, including high-yield bonds and emerging markets debt, also contributed positively to performance.
| AVERAGE ANNUAL TOTAL RETURNS | INCEPTION
DATE | 1 YEAR | | 5 YEAR | | 10 YEAR | |
| JPMorgan Income Builder Fund (Class R6 Shares) | November 1, 2017 | 19.89 | % | 4.13 | % | 4.58 | % |
| MSCI World Index (net total return) | | 33.68 | | 12.03 | | 9.78 | |
| 60% MSCI World Index (net total return) / 40% Bloomberg U.S. Aggregate Index | | 24.00 | | 7.26 | | 6.64 | |
The performance quoted is past performance and is not a guarantee of future results. Mutual funds are subject to certain market risks. Investment returns and principal value of an investment will fluctuate so that an investor’s shares, when redeemed, may be worth more or less than their original cost. Current performance may be higher or lower than the performance data shown. Updated performance information is available by visiting www.jpmorganfunds.com or by calling 1-800-480-4111.
Returns for Class R6 Shares prior to its inception date are based on the performance of Class I Shares. The actual returns for Class R6 Shares would have been different than those shown because Class R6 Shares have different expenses than Class I Shares.
The graph illustrates comparative performance for $5,000,000 invested in Class R6 Shares of the JPMorgan Income Builder Fund, the MSCI World Index (net total return) and the 60% MSCI World Index (net total return) / 40% Bloomberg U.S. Aggregate Index from October 31, 2014 to October 31, 2024. The performance of the Fund assumes reinvestment of all dividends and capital gain distributions, if any, and does not include a sales charge. The performance of the MSCI World Index (net total return) and the 60% MSCI World Index (net total return) / 40% Bloomberg U.S. Aggregate Index do not reflect the deduction of expenses or a sales charge associated with a mutual fund and have been adjusted to reflect reinvestment of all dividends and capital gain distributions of securities included in the benchmarks, if applicable. The MSCI World Index (net total return) assumes the dividend is reinvested after deduction of withholding tax, applying the maximum rate to non-resident individual investors who do not benefit from double taxation treaties. The MSCI World Index (net total return) is a free float-adjusted market capitalization weighted index that is designed to measure the equity market performance of developed markets. The 60% MSCI World Index (net total return) / 40% Bloomberg U.S. Aggregate Index is a customized blend of unmanaged indices that includes 60% MSCI World Index (net total return) and 40% Bloomberg U.S. Aggregate Index. As a result of new regulatory requirements, effective July 24, 2024, the Fund’s regulatory index has changed from the Index, as defined above, to the MSCI World Index (net total return), a broad-based securities market index. In addition to the Fund’s performance, the tables in this section include performance of the new regulatory index and the Index.
Fund performance may reflect the waiver of the Fund’s fees and reimbursement of expenses for certain periods. Without these waivers and reimbursements, performance would have been lower. Also, performance shown in this section does not reflect the deduction of taxes that a shareholder would pay on Fund distributions or on gains resulting from redemptions of Fund shares.
The returns shown are based on net asset values calculated for shareholder transactions and may differ from the returns shown in the financial highlights, which reflect adjustments made to the net asset values in accordance with accounting principles generally accepted in the United States of America.
Source: MSCI. The MSCI information may only be used for your internal use, may not be reproduced or redisseminated in any form and may not be used as a basis for or a component of any financial instruments or products or indices. None of the MSCI information is intended to constitute investment advice or a recommendation to make (or refrain from making) any kind of investment decision and may not be relied on as such. Historical data and analysis should not be taken as an indication or guarantee of any future performance analysis, forecast, or prediction. The MSCI information is provided on an "as is" basis and the user of this information assumes the entire risk of any use made of this information. MSCI, each of its affiliates and each other person involved in or related to compiling, computing or creating any MSCI information (collectively, the "MSCI Parties") expressly disclaims all warranties (including, without limitation, any warranties of originality, accuracy, completeness, timeliness, non-infringement, merchantability and fitness for a particular purpose) with respect to this information. Without limiting any of the foregoing, in no event shall any MSCI Party have any liability for any direct, indirect, special, incidental, punitive, consequential (including, without limitation, lost profits) or any other damages. (www.msci.com)
Source: Bloomberg Index Services Limited. BLOOMBERG® is a trademark and service mark of Bloomberg Finance L.P. and its affiliates (collectively "Bloomberg"). Bloomberg or Bloomberg's licensors own all proprietary rights in the Bloomberg Indices. Bloomberg does not approve or endorse this material, or guarantee the accuracy or completeness of any information herein, or make any warranty, express or implied, as to the results to be obtained therefrom and, to the maximum extent allowed by law, shall have any liability or responsibility for injury or damages arising in connection therewith.
| Fund net assets (000's) | $8,506,066 | |
| Total number of portfolio holdings | 2,808 | |
| Portfolio turnover rate | 107 | % |
| Total advisory fees paid (000's) | $34,212 | |
PORTFOLIO COMPOSITION - ASSET TYPE
(% of Total Investments)
Availability of Additional Information
At www.jpmorganfunds.com/funddocuments, you can find additional information about the Fund, including the Fund’s:
Prospectus
Financial information
Fund holdings
Proxy voting information
You can also request this information by contacting us at 1-800-480-4111.
ANNUAL SHAREHOLDER REPORT | October 31, 2024 (Unaudited)
JPMorgan International Equity Fund
Class A Shares/Ticker: JSEAX
ANNUAL SHAREHOLDER REPORT
This annual shareholder report contains important information about the JPMorgan International Equity Fund (the "Fund") for the period of November 1, 2023 to October 31, 2024. You can find additional information about the Fund at www.jpmorganfunds.com/funddocuments. You can also request this information by contacting us at 1-800-480-4111 or by sending an e-mail request to Funds.Website.Support@jpmorganfunds.com or by asking any financial intermediary that offers shares of the Fund.
What were the Fund costs for the last year?
(based on a hypothetical $10,000 investment)
| Fund (Class) | Costs of a
$10,000 investment | Costs paid as a percentage
of a $10,000 investment |
JPMorgan International Equity Fund
(Class A Shares) | $104 | 0.95% |
How did the Fund Perform?
The JPMorgan International Equity Fund's Class A Shares, without a sales charge, returned 19.61% for the year ended October 31, 2024. The MSCI EAFE Index (net total return) (the "Index") returned 22.97% for the year ended October 31, 2024.
The Fund’s security selection in the consumer staples and utilities sectors detracted from performance relative to the Index.
The Fund’s security selection in the industrials and financials sectors contributed to performance relative to the Index.
| AVERAGE ANNUAL TOTAL RETURNS | INCEPTION
DATE | 1 YEAR | | 5 YEAR | | 10 YEAR | |
| JPMorgan International Equity Fund (Class A Shares) | February 28, 2002 | 13.30 | % | 4.28 | % | 4.26 | % |
| JPMorgan International Equity Fund (Class A Shares) - excluding sales charge | | 19.61 | | 5.42 | | 4.82 | |
| MSCI EAFE Index (net total return) | | 22.97 | | 6.24 | | 5.27 | |
The performance quoted is past performance and is not a guarantee of future results. Mutual funds are subject to certain market risks. Investment returns and principal value of an investment will fluctuate so that an investor’s shares, when redeemed, may be worth more or less than their original cost. Current performance may be higher or lower than the performance data shown. Updated performance information is available by visiting www.jpmorganfunds.com or by calling 1-800-480-4111.
The graph illustrates comparative performance for $10,000 invested in Class A Shares of the JPMorgan International Equity Fund and the MSCI EAFE Index (net total return) from October 31, 2014 to October 31, 2024. The performance of the Fund assumes reinvestment of all dividends and capital gain distributions, if any, and includes a sales charge. The performance of the MSCI EAFE Index (net total return) does not reflect the deduction of expenses or a sales charge associated with a mutual fund and approximates the minimum possible dividend reinvestment of the securities included in the benchmark, if applicable. The MSCI EAFE Index (net total return) is a free float-adjusted market capitalization weighted index that is designed to measure the performance of large- and mid- cap stocks in developed markets, excluding the U.S. and Canada. Net total return figures assume the reinvestment of dividends after deduction of withholding tax, applying the maximum rate to nonresident individual investors who do not benefit from double taxation treaties. Investors cannot invest directly in an index.
Fund performance may reflect the waiver of the Fund’s fees and reimbursement of expenses for certain periods since the applicable inception date. Without these waivers and reimbursements, performance would have been lower. Also, performance shown in this section does not reflect the deduction of taxes that a shareholder would pay on Fund distributions or on gains resulting from redemptions of Fund shares.
The returns shown are based on net asset values calculated for shareholder transactions and may differ from the returns shown in the financial highlights, which reflect adjustments made to the net asset values in accordance with accounting principles generally accepted in the United States of America.
Source: MSCI. The MSCI information may only be used for your internal use, may not be reproduced or redisseminated in any form and may not be used as a basis for or a component of any financial instruments or products or indices. None of the MSCI information is intended to constitute investment advice or a recommendation to make (or refrain from making) any kind of investment decision and may not be relied on as such. Historical data and analysis should not be taken as an indication or guarantee of any future performance analysis, forecast, or prediction. The MSCI information is provided on an "as is" basis and the user of this information assumes the entire risk of any use made of this information. MSCI, each of its affiliates and each other person involved in or related to compiling, computing or creating any MSCI information (collectively, the "MSCI Parties") expressly disclaims all warranties (including, without limitation, any warranties of originality, accuracy, completeness, timeliness, non-infringement, merchantability and fitness for a particular purpose) with respect to this information. Without limiting any of the foregoing, in no event shall any MSCI Party have any liability for any direct, indirect, special, incidental, punitive, consequential (including, without limitation, lost profits) or any other damages. (www.msci.com)
| Fund net assets (000's) | $4,286,809 | |
| Total number of portfolio holdings | 76 | |
| Portfolio turnover rate | 39 | % |
| Total advisory fees paid (000's) | $19,262 | |
PORTFOLIO COMPOSITION - COUNTRY
(% of Total Investments)
Availability of Additional Information
At www.jpmorganfunds.com/funddocuments, you can find additional information about the Fund, including the Fund’s:
Prospectus
Financial information
Fund holdings
Proxy voting information
You can also request this information by contacting us at 1-800-480-4111.
ANNUAL SHAREHOLDER REPORT | October 31, 2024 (Unaudited)
JPMorgan International Equity Fund
Class C Shares/Ticker: JIECX
ANNUAL SHAREHOLDER REPORT
This annual shareholder report contains important information about the JPMorgan International Equity Fund (the "Fund") for the period of November 1, 2023 to October 31, 2024. You can find additional information about the Fund at www.jpmorganfunds.com/funddocuments. You can also request this information by contacting us at 1-800-480-4111 or by sending an e-mail request to Funds.Website.Support@jpmorganfunds.com or by asking any financial intermediary that offers shares of the Fund.
What were the Fund costs for the last year?
(based on a hypothetical $10,000 investment)
| Fund (Class) | Costs of a
$10,000 investment | Costs paid as a percentage
of a $10,000 investment |
JPMorgan International Equity Fund
(Class C Shares) | $159 | 1.45% |
How did the Fund Perform?
The JPMorgan International Equity Fund's Class C Shares, without a sales charge, returned 19.04% for the year ended October 31, 2024. The MSCI EAFE Index (net total return) (the "Index") returned 22.97% for the year ended October 31, 2024.
The Fund’s security selection in the consumer staples and utilities sectors detracted from performance relative to the Index.
The Fund’s security selection in the industrials and financials sectors contributed to performance relative to the Index.
| AVERAGE ANNUAL TOTAL RETURNS | INCEPTION
DATE | 1 YEAR | | 5 YEAR | | 10 YEAR | |
| JPMorgan International Equity Fund (Class C Shares) | January 31, 2003 | 18.04 | % | 4.89 | % | 4.40 | % |
| JPMorgan International Equity Fund (Class C Shares) - excluding sales charge | | 19.04 | | 4.89 | | 4.40 | |
| MSCI EAFE Index (net total return) | | 22.97 | | 6.24 | | 5.27 | |
The performance quoted is past performance and is not a guarantee of future results. Mutual funds are subject to certain market risks. Investment returns and principal value of an investment will fluctuate so that an investor’s shares, when redeemed, may be worth more or less than their original cost. Current performance may be higher or lower than the performance data shown. Updated performance information is available by visiting www.jpmorganfunds.com or by calling 1-800-480-4111.
The graph illustrates comparative performance for $10,000 invested in Class C Shares of the JPMorgan International Equity Fund and the MSCI EAFE Index (net total return) from October 31, 2014 to October 31, 2024. The performance of the Fund assumes reinvestment of all dividends and capital gain distributions, if any, and does not include a sales charge. The performance of the MSCI EAFE Index (net total return) does not reflect the deduction of expenses or a sales charge associated with a mutual fund and approximates the minimum possible dividend reinvestment of the securities included in the benchmark, if applicable. The MSCI EAFE Index (net total return) is a free float-adjusted market capitalization weighted index that is designed to measure the performance of large- and mid- cap stocks in developed markets, excluding the U.S. and Canada. Net total return figures assume the reinvestment of dividends after deduction of withholding tax, applying the maximum rate to nonresident individual investors who do not benefit from double taxation treaties. Investors cannot invest directly in an index.
Fund performance may reflect the waiver of the Fund’s fees and reimbursement of expenses for certain periods since the applicable inception date. Without these waivers and reimbursements, performance would have been lower. Also, performance shown in this section does not reflect the deduction of taxes that a shareholder would pay on Fund distributions or on gains resulting from redemptions of Fund shares.
Because Class C Shares automatically convert to Class A Shares after 8 years, the 10 year average annual total return shown above for Class C Shares reflects Class A Share's performance for the period after conversion.
The returns shown are based on net asset values calculated for shareholder transactions and may differ from the returns shown in the financial highlights, which reflect adjustments made to the net asset values in accordance with accounting principles generally accepted in the United States of America.
Source: MSCI. The MSCI information may only be used for your internal use, may not be reproduced or redisseminated in any form and may not be used as a basis for or a component of any financial instruments or products or indices. None of the MSCI information is intended to constitute investment advice or a recommendation to make (or refrain from making) any kind of investment decision and may not be relied on as such. Historical data and analysis should not be taken as an indication or guarantee of any future performance analysis, forecast, or prediction. The MSCI information is provided on an "as is" basis and the user of this information assumes the entire risk of any use made of this information. MSCI, each of its affiliates and each other person involved in or related to compiling, computing or creating any MSCI information (collectively, the "MSCI Parties") expressly disclaims all warranties (including, without limitation, any warranties of originality, accuracy, completeness, timeliness, non-infringement, merchantability and fitness for a particular purpose) with respect to this information. Without limiting any of the foregoing, in no event shall any MSCI Party have any liability for any direct, indirect, special, incidental, punitive, consequential (including, without limitation, lost profits) or any other damages. (www.msci.com)
| Fund net assets (000's) | $4,286,809 | |
| Total number of portfolio holdings | 76 | |
| Portfolio turnover rate | 39 | % |
| Total advisory fees paid (000's) | $19,262 | |
PORTFOLIO COMPOSITION - COUNTRY
(% of Total Investments)
Availability of Additional Information
At www.jpmorganfunds.com/funddocuments, you can find additional information about the Fund, including the Fund’s:
Prospectus
Financial information
Fund holdings
Proxy voting information
You can also request this information by contacting us at 1-800-480-4111.
ANNUAL SHAREHOLDER REPORT | October 31, 2024 (Unaudited)
JPMorgan International Equity Fund
Class I Shares/Ticker: VSIEX
ANNUAL SHAREHOLDER REPORT
This annual shareholder report contains important information about the JPMorgan International Equity Fund (the "Fund") for the period of November 1, 2023 to October 31, 2024. You can find additional information about the Fund at www.jpmorganfunds.com/funddocuments. You can also request this information by contacting us at 1-800-480-4111 or by sending an e-mail request to Funds.Website.Support@jpmorganfunds.com or by asking any financial intermediary that offers shares of the Fund.
What were the Fund costs for the last year?
(based on a hypothetical $10,000 investment)
| Fund (Class) | Costs of a
$10,000 investment | Costs paid as a percentage
of a $10,000 investment |
JPMorgan International Equity Fund
(Class I Shares) | $77 | 0.70% |
How did the Fund Perform?
The JPMorgan International Equity Fund's Class I Shares returned 19.89% for the year ended October 31, 2024. The MSCI EAFE Index (net total return) (the "Index") returned 22.97% for the year ended October 31, 2024.
The Fund’s security selection in the consumer staples and utilities sectors detracted from performance relative to the Index.
The Fund’s security selection in the industrials and financials sectors contributed to performance relative to the Index.
| AVERAGE ANNUAL TOTAL RETURNS | INCEPTION
DATE | 1 YEAR | | 5 YEAR | | 10 YEAR | |
| JPMorgan International Equity Fund (Class I Shares) | January 1, 1997 | 19.89 | % | 5.68 | % | 5.08 | % |
| MSCI EAFE Index (net total return) | | 22.97 | | 6.24 | | 5.27 | |
The performance quoted is past performance and is not a guarantee of future results. Mutual funds are subject to certain market risks. Investment returns and principal value of an investment will fluctuate so that an investor’s shares, when redeemed, may be worth more or less than their original cost. Current performance may be higher or lower than the performance data shown. Updated performance information is available by visiting www.jpmorganfunds.com or by calling 1-800-480-4111.
The graph illustrates comparative performance for $1,000,000 invested in Class I Shares of the JPMorgan International Equity Fund and the MSCI EAFE Index (net total return) from October 31, 2014 to October 31, 2024. The performance of the Fund assumes reinvestment of all dividends and capital gain distributions, if any, and does not include a sales charge. The performance of the MSCI EAFE Index (net total return) does not reflect the deduction of expenses or a sales charge associated with a mutual fund and approximates the minimum possible dividend reinvestment of the securities included in the benchmark, if applicable. The MSCI EAFE Index (net total return) is a free float-adjusted market capitalization weighted index that is designed to measure the performance of large- and mid- cap stocks in developed markets, excluding the U.S. and Canada. Net total return figures assume the reinvestment of dividends after deduction of withholding tax, applying the maximum rate to nonresident individual investors who do not benefit from double taxation treaties. Investors cannot invest directly in an index.
Fund performance may reflect the waiver of the Fund’s fees and reimbursement of expenses for certain periods since the applicable inception date. Without these waivers and reimbursements, performance would have been lower. Also, performance shown in this section does not reflect the deduction of taxes that a shareholder would pay on Fund distributions or on gains resulting from redemptions of Fund shares.
The returns shown are based on net asset values calculated for shareholder transactions and may differ from the returns shown in the financial highlights, which reflect adjustments made to the net asset values in accordance with accounting principles generally accepted in the United States of America.
Source: MSCI. The MSCI information may only be used for your internal use, may not be reproduced or redisseminated in any form and may not be used as a basis for or a component of any financial instruments or products or indices. None of the MSCI information is intended to constitute investment advice or a recommendation to make (or refrain from making) any kind of investment decision and may not be relied on as such. Historical data and analysis should not be taken as an indication or guarantee of any future performance analysis, forecast, or prediction. The MSCI information is provided on an "as is" basis and the user of this information assumes the entire risk of any use made of this information. MSCI, each of its affiliates and each other person involved in or related to compiling, computing or creating any MSCI information (collectively, the "MSCI Parties") expressly disclaims all warranties (including, without limitation, any warranties of originality, accuracy, completeness, timeliness, non-infringement, merchantability and fitness for a particular purpose) with respect to this information. Without limiting any of the foregoing, in no event shall any MSCI Party have any liability for any direct, indirect, special, incidental, punitive, consequential (including, without limitation, lost profits) or any other damages. (www.msci.com)
| Fund net assets (000's) | $4,286,809 | |
| Total number of portfolio holdings | 76 | |
| Portfolio turnover rate | 39 | % |
| Total advisory fees paid (000's) | $19,262 | |
PORTFOLIO COMPOSITION - COUNTRY
(% of Total Investments)
Availability of Additional Information
At www.jpmorganfunds.com/funddocuments, you can find additional information about the Fund, including the Fund’s:
Prospectus
Financial information
Fund holdings
Proxy voting information
You can also request this information by contacting us at 1-800-480-4111.
ANNUAL SHAREHOLDER REPORT | October 31, 2024 (Unaudited)
JPMorgan International Equity Fund
Class R2 Shares/Ticker: JIEZX
ANNUAL SHAREHOLDER REPORT
This annual shareholder report contains important information about the JPMorgan International Equity Fund (the "Fund") for the period of November 1, 2023 to October 31, 2024. You can find additional information about the Fund at www.jpmorganfunds.com/funddocuments. You can also request this information by contacting us at 1-800-480-4111 or by sending an e-mail request to Funds.Website.Support@jpmorganfunds.com or by asking any financial intermediary that offers shares of the Fund.
What were the Fund costs for the last year?
(based on a hypothetical $10,000 investment)
| Fund (Class) | Costs of a
$10,000 investment | Costs paid as a percentage
of a $10,000 investment |
JPMorgan International Equity Fund
(Class R2 Shares) | $137 | 1.25% |
How did the Fund Perform?
The JPMorgan International Equity Fund's Class R2 Shares returned 19.30% for the year ended October 31, 2024. The MSCI EAFE Index (net total return) (the "Index") returned 22.97% for the year ended October 31, 2024.
The Fund’s security selection in the consumer staples and utilities sectors detracted from performance relative to the Index.
The Fund’s security selection in the industrials and financials sectors contributed to performance relative to the Index.
| AVERAGE ANNUAL TOTAL RETURNS | INCEPTION
DATE | 1 YEAR | | 5 YEAR | | 10 YEAR | |
| JPMorgan International Equity Fund (Class R2 Shares) | November 3, 2008 | 19.30 | % | 5.10 | % | 4.52 | % |
| MSCI EAFE Index (net total return) | | 22.97 | | 6.24 | | 5.27 | |
The performance quoted is past performance and is not a guarantee of future results. Mutual funds are subject to certain market risks. Investment returns and principal value of an investment will fluctuate so that an investor’s shares, when redeemed, may be worth more or less than their original cost. Current performance may be higher or lower than the performance data shown. Updated performance information is available by visiting www.jpmorganfunds.com or by calling 1-800-480-4111.
The graph illustrates comparative performance for $10,000 invested in Class R2 Shares of the JPMorgan International Equity Fund and the MSCI EAFE Index (net total return) from October 31, 2014 to October 31, 2024. The performance of the Fund assumes reinvestment of all dividends and capital gain distributions, if any, and does not include a sales charge. The performance of the MSCI EAFE Index (net total return) does not reflect the deduction of expenses or a sales charge associated with a mutual fund and approximates the minimum possible dividend reinvestment of the securities included in the benchmark, if applicable. The MSCI EAFE Index (net total return) is a free float-adjusted market capitalization weighted index that is designed to measure the performance of large- and mid- cap stocks in developed markets, excluding the U.S. and Canada. Net total return figures assume the reinvestment of dividends after deduction of withholding tax, applying the maximum rate to nonresident individual investors who do not benefit from double taxation treaties. Investors cannot invest directly in an index.
Fund performance may reflect the waiver of the Fund’s fees and reimbursement of expenses for certain periods since the applicable inception date. Without these waivers and reimbursements, performance would have been lower. Also, performance shown in this section does not reflect the deduction of taxes that a shareholder would pay on Fund distributions or on gains resulting from redemptions of Fund shares.
The returns shown are based on net asset values calculated for shareholder transactions and may differ from the returns shown in the financial highlights, which reflect adjustments made to the net asset values in accordance with accounting principles generally accepted in the United States of America.
Source: MSCI. The MSCI information may only be used for your internal use, may not be reproduced or redisseminated in any form and may not be used as a basis for or a component of any financial instruments or products or indices. None of the MSCI information is intended to constitute investment advice or a recommendation to make (or refrain from making) any kind of investment decision and may not be relied on as such. Historical data and analysis should not be taken as an indication or guarantee of any future performance analysis, forecast, or prediction. The MSCI information is provided on an "as is" basis and the user of this information assumes the entire risk of any use made of this information. MSCI, each of its affiliates and each other person involved in or related to compiling, computing or creating any MSCI information (collectively, the "MSCI Parties") expressly disclaims all warranties (including, without limitation, any warranties of originality, accuracy, completeness, timeliness, non-infringement, merchantability and fitness for a particular purpose) with respect to this information. Without limiting any of the foregoing, in no event shall any MSCI Party have any liability for any direct, indirect, special, incidental, punitive, consequential (including, without limitation, lost profits) or any other damages. (www.msci.com)
| Fund net assets (000's) | $4,286,809 | |
| Total number of portfolio holdings | 76 | |
| Portfolio turnover rate | 39 | % |
| Total advisory fees paid (000's) | $19,262 | |
PORTFOLIO COMPOSITION - COUNTRY
(% of Total Investments)
Availability of Additional Information
At www.jpmorganfunds.com/funddocuments, you can find additional information about the Fund, including the Fund’s:
Prospectus
Financial information
Fund holdings
Proxy voting information
You can also request this information by contacting us at 1-800-480-4111.
ANNUAL SHAREHOLDER REPORT | October 31, 2024 (Unaudited)
JPMorgan International Equity Fund
Class R5 Shares/Ticker: JIERX
ANNUAL SHAREHOLDER REPORT
This annual shareholder report contains important information about the JPMorgan International Equity Fund (the "Fund") for the period of November 1, 2023 to October 31, 2024. You can find additional information about the Fund at www.jpmorganfunds.com/funddocuments. You can also request this information by contacting us at 1-800-480-4111 or by sending an e-mail request to Funds.Website.Support@jpmorganfunds.com or by asking any financial intermediary that offers shares of the Fund.
What were the Fund costs for the last year?
(based on a hypothetical $10,000 investment)
| Fund (Class) | Costs of a
$10,000 investment | Costs paid as a percentage
of a $10,000 investment |
JPMorgan International Equity Fund
(Class R5 Shares) | $66 | 0.60% |
How did the Fund Perform?
The JPMorgan International Equity Fund's Class R5 Shares returned 20.02% for the year ended October 31, 2024. The MSCI EAFE Index (net total return) (the "Index") returned 22.97% for the year ended October 31, 2024.
The Fund’s security selection in the consumer staples and utilities sectors detracted from performance relative to the Index.
The Fund’s security selection in the industrials and financials sectors contributed to performance relative to the Index.
| AVERAGE ANNUAL TOTAL RETURNS | INCEPTION
DATE | 1 YEAR | | 5 YEAR | | 10 YEAR | |
| JPMorgan International Equity Fund (Class R5 Shares) | May 15, 2006 | 20.02 | % | 5.78 | % | 5.21 | % |
| MSCI EAFE Index (net total return) | | 22.97 | | 6.24 | | 5.27 | |
The performance quoted is past performance and is not a guarantee of future results. Mutual funds are subject to certain market risks. Investment returns and principal value of an investment will fluctuate so that an investor’s shares, when redeemed, may be worth more or less than their original cost. Current performance may be higher or lower than the performance data shown. Updated performance information is available by visiting www.jpmorganfunds.com or by calling 1-800-480-4111.
The graph illustrates comparative performance for $10,000 invested in Class R5 Shares of the JPMorgan International Equity Fund and the MSCI EAFE Index (net total return) from October 31, 2014 to October 31, 2024. The performance of the Fund assumes reinvestment of all dividends and capital gain distributions, if any, and does not include a sales charge. The performance of the MSCI EAFE Index (net total return) does not reflect the deduction of expenses or a sales charge associated with a mutual fund and approximates the minimum possible dividend reinvestment of the securities included in the benchmark, if applicable. The MSCI EAFE Index (net total return) is a free float-adjusted market capitalization weighted index that is designed to measure the performance of large- and mid- cap stocks in developed markets, excluding the U.S. and Canada. Net total return figures assume the reinvestment of dividends after deduction of withholding tax, applying the maximum rate to nonresident individual investors who do not benefit from double taxation treaties. Investors cannot invest directly in an index.
Fund performance may reflect the waiver of the Fund’s fees and reimbursement of expenses for certain periods since the applicable inception date. Without these waivers and reimbursements, performance would have been lower. Also, performance shown in this section does not reflect the deduction of taxes that a shareholder would pay on Fund distributions or on gains resulting from redemptions of Fund shares.
The returns shown are based on net asset values calculated for shareholder transactions and may differ from the returns shown in the financial highlights, which reflect adjustments made to the net asset values in accordance with accounting principles generally accepted in the United States of America.
Source: MSCI. The MSCI information may only be used for your internal use, may not be reproduced or redisseminated in any form and may not be used as a basis for or a component of any financial instruments or products or indices. None of the MSCI information is intended to constitute investment advice or a recommendation to make (or refrain from making) any kind of investment decision and may not be relied on as such. Historical data and analysis should not be taken as an indication or guarantee of any future performance analysis, forecast, or prediction. The MSCI information is provided on an "as is" basis and the user of this information assumes the entire risk of any use made of this information. MSCI, each of its affiliates and each other person involved in or related to compiling, computing or creating any MSCI information (collectively, the "MSCI Parties") expressly disclaims all warranties (including, without limitation, any warranties of originality, accuracy, completeness, timeliness, non-infringement, merchantability and fitness for a particular purpose) with respect to this information. Without limiting any of the foregoing, in no event shall any MSCI Party have any liability for any direct, indirect, special, incidental, punitive, consequential (including, without limitation, lost profits) or any other damages. (www.msci.com)
| Fund net assets (000's) | $4,286,809 | |
| Total number of portfolio holdings | 76 | |
| Portfolio turnover rate | 39 | % |
| Total advisory fees paid (000's) | $19,262 | |
PORTFOLIO COMPOSITION - COUNTRY
(% of Total Investments)
Availability of Additional Information
At www.jpmorganfunds.com/funddocuments, you can find additional information about the Fund, including the Fund’s:
Prospectus
Financial information
Fund holdings
Proxy voting information
You can also request this information by contacting us at 1-800-480-4111.
ANNUAL SHAREHOLDER REPORT | October 31, 2024 (Unaudited)
JPMorgan International Equity Fund
Class R6 Shares/Ticker: JNEMX
ANNUAL SHAREHOLDER REPORT
This annual shareholder report contains important information about the JPMorgan International Equity Fund (the "Fund") for the period of November 1, 2023 to October 31, 2024. You can find additional information about the Fund at www.jpmorganfunds.com/funddocuments. You can also request this information by contacting us at 1-800-480-4111 or by sending an e-mail request to Funds.Website.Support@jpmorganfunds.com or by asking any financial intermediary that offers shares of the Fund.
What were the Fund costs for the last year?
(based on a hypothetical $10,000 investment)
| Fund (Class) | Costs of a
$10,000 investment | Costs paid as a percentage
of a $10,000 investment |
JPMorgan International Equity Fund
(Class R6 Shares) | $55 | 0.50% |
How did the Fund Perform?
The JPMorgan International Equity Fund's Class R6 Shares returned 20.14% for the year ended October 31, 2024. The MSCI EAFE Index (net total return) (the "Index") returned 22.97% for the year ended October 31, 2024.
The Fund’s security selection in the consumer staples and utilities sectors detracted from performance relative to the Index.
The Fund’s security selection in the industrials and financials sectors contributed to performance relative to the Index.
| AVERAGE ANNUAL TOTAL RETURNS | INCEPTION
DATE | 1 YEAR | | 5 YEAR | | 10 YEAR | |
| JPMorgan International Equity Fund (Class R6 Shares) | November 30, 2010 | 20.14 | % | 5.89 | % | 5.31 | % |
| MSCI EAFE Index (net total return) | | 22.97 | | 6.24 | | 5.27 | |
The performance quoted is past performance and is not a guarantee of future results. Mutual funds are subject to certain market risks. Investment returns and principal value of an investment will fluctuate so that an investor’s shares, when redeemed, may be worth more or less than their original cost. Current performance may be higher or lower than the performance data shown. Updated performance information is available by visiting www.jpmorganfunds.com or by calling 1-800-480-4111.
The graph illustrates comparative performance for $5,000,000 invested in Class R6 Shares of the JPMorgan International Equity Fund and the MSCI EAFE Index (net total return) from October 31, 2014 to October 31, 2024. The performance of the Fund assumes reinvestment of all dividends and capital gain distributions, if any, and does not include a sales charge. The performance of the MSCI EAFE Index (net total return) does not reflect the deduction of expenses or a sales charge associated with a mutual fund and approximates the minimum possible dividend reinvestment of the securities included in the benchmark, if applicable. The MSCI EAFE Index (net total return) is a free float-adjusted market capitalization weighted index that is designed to measure the performance of large- and mid- cap stocks in developed markets, excluding the U.S. and Canada. Net total return figures assume the reinvestment of dividends after deduction of withholding tax, applying the maximum rate to nonresident individual investors who do not benefit from double taxation treaties. Investors cannot invest directly in an index.
Fund performance may reflect the waiver of the Fund’s fees and reimbursement of expenses for certain periods since the applicable inception date. Without these waivers and reimbursements, performance would have been lower. Also, performance shown in this section does not reflect the deduction of taxes that a shareholder would pay on Fund distributions or on gains resulting from redemptions of Fund shares.
The returns shown are based on net asset values calculated for shareholder transactions and may differ from the returns shown in the financial highlights, which reflect adjustments made to the net asset values in accordance with accounting principles generally accepted in the United States of America.
Source: MSCI. The MSCI information may only be used for your internal use, may not be reproduced or redisseminated in any form and may not be used as a basis for or a component of any financial instruments or products or indices. None of the MSCI information is intended to constitute investment advice or a recommendation to make (or refrain from making) any kind of investment decision and may not be relied on as such. Historical data and analysis should not be taken as an indication or guarantee of any future performance analysis, forecast, or prediction. The MSCI information is provided on an "as is" basis and the user of this information assumes the entire risk of any use made of this information. MSCI, each of its affiliates and each other person involved in or related to compiling, computing or creating any MSCI information (collectively, the "MSCI Parties") expressly disclaims all warranties (including, without limitation, any warranties of originality, accuracy, completeness, timeliness, non-infringement, merchantability and fitness for a particular purpose) with respect to this information. Without limiting any of the foregoing, in no event shall any MSCI Party have any liability for any direct, indirect, special, incidental, punitive, consequential (including, without limitation, lost profits) or any other damages. (www.msci.com)
| Fund net assets (000's) | $4,286,809 | |
| Total number of portfolio holdings | 76 | |
| Portfolio turnover rate | 39 | % |
| Total advisory fees paid (000's) | $19,262 | |
PORTFOLIO COMPOSITION - COUNTRY
(% of Total Investments)
Availability of Additional Information
At www.jpmorganfunds.com/funddocuments, you can find additional information about the Fund, including the Fund’s:
Prospectus
Financial information
Fund holdings
Proxy voting information
You can also request this information by contacting us at 1-800-480-4111.
ANNUAL SHAREHOLDER REPORT | October 31, 2024 (Unaudited)
JPMorgan International Focus Fund
Class A Shares/Ticker: IUAEX
ANNUAL SHAREHOLDER REPORT
This annual shareholder report contains important information about the JPMorgan International Focus Fund (the "Fund") for the period of November 1, 2023 to October 31, 2024. You can find additional information about the Fund at www.jpmorganfunds.com/funddocuments. You can also request this information by contacting us at 1-800-480-4111 or by sending an e-mail request to Funds.Website.Support@jpmorganfunds.com or by asking any financial intermediary that offers shares of the Fund.
What were the Fund costs for the last year?
(based on a hypothetical $10,000 investment)
| Fund (Class) | Costs of a
$10,000 investment | Costs paid as a percentage
of a $10,000 investment |
JPMorgan International Focus Fund
(Class A Shares) | $109 | 1.00% |
How did the Fund Perform?
The JPMorgan International Focus Fund's Class A Shares, without a sales charge, returned 18.81% for the year ended October 31, 2024. The MSCI ACWI ex USA Index (net total return) (the "Index") returned 24.33% for the year ended October 31, 2024.
The Fund’s security selection in the consumer staples and energy sectors detracted from performance relative to the Index.
The Fund’s security selection in the financials and health care sectors contributed to performance relative to the Index.
| AVERAGE ANNUAL TOTAL RETURNS | INCEPTION
DATE | 1 YEAR | | 5 YEAR | | 10 YEAR | |
| JPMorgan International Focus Fund (Class A Shares) | November 30, 2011 | 12.59 | % | 4.16 | % | 4.78 | % |
| JPMorgan International Focus Fund (Class A Shares) - excluding sales charge | | 18.81 | | 5.28 | | 5.34 | |
| MSCI ACWI ex USA Index (net total return) | | 24.33 | | 5.78 | | 4.79 | |
The performance quoted is past performance and is not a guarantee of future results. Mutual funds are subject to certain market risks. Investment returns and principal value of an investment will fluctuate so that an investor’s shares, when redeemed, may be worth more or less than their original cost. Current performance may be higher or lower than the performance data shown. Updated performance information is available by visiting www.jpmorganfunds.com or by calling 1-800-480-4111.
The graph illustrates comparative performance for $10,000 invested in Class A Shares of the JPMorgan International Focus Fund and the MSCI ACWI ex USA Index (net total return) from October 31, 2014 to October 31, 2024. The performance of the Fund assumes reinvestment of all dividends and capital gain distributions, if any, and includes a sales charge. The performance of the MSCI ACWI ex USA Index (net total return) does not reflect the deduction of expenses or a sales charge associated with a mutual fund and approximates the minimum possible dividend reinvestment of the securities included in the benchmark, if applicable. The MSCI ACWI ex USA Index (net total return) is a free float-adjusted market capitalization weighted index that is designed to measure the performance of large- and mid- cap stocks in developed and emerging markets, excluding the U.S. Net total return figures assume the reinvestment of dividends after deduction of withholding tax, applying the maximum rate to nonresident individual investors who do not benefit from double taxation treaties. Investors cannot invest directly in an index.
Fund performance may reflect the waiver of the Fund’s fees and reimbursement of expenses for certain periods since the applicable inception date. Without these waivers and reimbursements, performance would have been lower. Also, performance shown in this section does not reflect the deduction of taxes that a shareholder would pay on Fund distributions or on gains resulting from redemptions of Fund shares.
The returns shown are based on net asset values calculated for shareholder transactions and may differ from the returns shown in the financial highlights, which reflect adjustments made to the net asset values in accordance with accounting principles generally accepted in the United States of America.
Source: MSCI. The MSCI information may only be used for your internal use, may not be reproduced or redisseminated in any form and may not be used as a basis for or a component of any financial instruments or products or indices. None of the MSCI information is intended to constitute investment advice or a recommendation to make (or refrain from making) any kind of investment decision and may not be relied on as such. Historical data and analysis should not be taken as an indication or guarantee of any future performance analysis, forecast, or prediction. The MSCI information is provided on an "as is" basis and the user of this information assumes the entire risk of any use made of this information. MSCI, each of its affiliates and each other person involved in or related to compiling, computing or creating any MSCI information (collectively, the "MSCI Parties") expressly disclaims all warranties (including, without limitation, any warranties of originality, accuracy, completeness, timeliness, non-infringement, merchantability and fitness for a particular purpose) with respect to this information. Without limiting any of the foregoing, in no event shall any MSCI Party have any liability for any direct, indirect, special, incidental, punitive, consequential (including, without limitation, lost profits) or any other damages. (www.msci.com)
| Fund net assets (000's) | $1,513,955 | |
| Total number of portfolio holdings | 54 | |
| Portfolio turnover rate | 45 | % |
| Total advisory fees paid (000's) | $7,622 | |
PORTFOLIO COMPOSITION - COUNTRY
(% of Total Investments)
Availability of Additional Information
At www.jpmorganfunds.com/funddocuments, you can find additional information about the Fund, including the Fund’s:
Prospectus
Financial information
Fund holdings
Proxy voting information
You can also request this information by contacting us at 1-800-480-4111.
ANNUAL SHAREHOLDER REPORT | October 31, 2024 (Unaudited)
JPMorgan International Focus Fund
Class C Shares/Ticker: IUCEX
ANNUAL SHAREHOLDER REPORT
This annual shareholder report contains important information about the JPMorgan International Focus Fund (the "Fund") for the period of November 1, 2023 to October 31, 2024. You can find additional information about the Fund at www.jpmorganfunds.com/funddocuments. You can also request this information by contacting us at 1-800-480-4111 or by sending an e-mail request to Funds.Website.Support@jpmorganfunds.com or by asking any financial intermediary that offers shares of the Fund.
What were the Fund costs for the last year?
(based on a hypothetical $10,000 investment)
| Fund (Class) | Costs of a
$10,000 investment | Costs paid as a percentage
of a $10,000 investment |
JPMorgan International Focus Fund
(Class C Shares) | $163 | 1.50% |
How did the Fund Perform?
The JPMorgan International Focus Fund's Class C Shares, without a sales charge, returned 18.22% for the year ended October 31, 2024. The MSCI ACWI ex USA Index (net total return) (the "Index") returned 24.33% for the year ended October 31, 2024.
The Fund’s security selection in the consumer staples and energy sectors detracted from performance relative to the Index.
The Fund’s security selection in the financials and health care sectors contributed to performance relative to the Index.
| AVERAGE ANNUAL TOTAL RETURNS | INCEPTION
DATE | 1 YEAR | | 5 YEAR | | 10 YEAR | |
| JPMorgan International Focus Fund (Class C Shares) | November 30, 2011 | 17.22 | % | 4.77 | % | 4.92 | % |
| JPMorgan International Focus Fund (Class C Shares) - excluding sales charge | | 18.22 | | 4.77 | | 4.92 | |
| MSCI ACWI ex USA Index (net total return) | | 24.33 | | 5.78 | | 4.79 | |
The performance quoted is past performance and is not a guarantee of future results. Mutual funds are subject to certain market risks. Investment returns and principal value of an investment will fluctuate so that an investor’s shares, when redeemed, may be worth more or less than their original cost. Current performance may be higher or lower than the performance data shown. Updated performance information is available by visiting www.jpmorganfunds.com or by calling 1-800-480-4111.
The graph illustrates comparative performance for $10,000 invested in Class C Shares of the JPMorgan International Focus Fund and the MSCI ACWI ex USA Index (net total return) from October 31, 2014 to October 31, 2024. The performance of the Fund assumes reinvestment of all dividends and capital gain distributions, if any, and does not include a sales charge. The performance of the MSCI ACWI ex USA Index (net total return) does not reflect the deduction of expenses or a sales charge associated with a mutual fund and approximates the minimum possible dividend reinvestment of the securities included in the benchmark, if applicable. The MSCI ACWI ex USA Index (net total return) is a free float-adjusted market capitalization weighted index that is designed to measure the performance of large- and mid- cap stocks in developed and emerging markets, excluding the U.S. Net total return figures assume the reinvestment of dividends after deduction of withholding tax, applying the maximum rate to nonresident individual investors who do not benefit from double taxation treaties. Investors cannot invest directly in an index.
Fund performance may reflect the waiver of the Fund’s fees and reimbursement of expenses for certain periods since the applicable inception date. Without these waivers and reimbursements, performance would have been lower. Also, performance shown in this section does not reflect the deduction of taxes that a shareholder would pay on Fund distributions or on gains resulting from redemptions of Fund shares.
Because Class C Shares automatically convert to Class A Shares after 8 years, the 10 year average annual total return shown above for Class C Shares reflects Class A Share's performance for the period after conversion.
The returns shown are based on net asset values calculated for shareholder transactions and may differ from the returns shown in the financial highlights, which reflect adjustments made to the net asset values in accordance with accounting principles generally accepted in the United States of America.
Source: MSCI. The MSCI information may only be used for your internal use, may not be reproduced or redisseminated in any form and may not be used as a basis for or a component of any financial instruments or products or indices. None of the MSCI information is intended to constitute investment advice or a recommendation to make (or refrain from making) any kind of investment decision and may not be relied on as such. Historical data and analysis should not be taken as an indication or guarantee of any future performance analysis, forecast, or prediction. The MSCI information is provided on an "as is" basis and the user of this information assumes the entire risk of any use made of this information. MSCI, each of its affiliates and each other person involved in or related to compiling, computing or creating any MSCI information (collectively, the "MSCI Parties") expressly disclaims all warranties (including, without limitation, any warranties of originality, accuracy, completeness, timeliness, non-infringement, merchantability and fitness for a particular purpose) with respect to this information. Without limiting any of the foregoing, in no event shall any MSCI Party have any liability for any direct, indirect, special, incidental, punitive, consequential (including, without limitation, lost profits) or any other damages. (www.msci.com)
| Fund net assets (000's) | $1,513,955 | |
| Total number of portfolio holdings | 54 | |
| Portfolio turnover rate | 45 | % |
| Total advisory fees paid (000's) | $7,622 | |
PORTFOLIO COMPOSITION - COUNTRY
(% of Total Investments)
Availability of Additional Information
At www.jpmorganfunds.com/funddocuments, you can find additional information about the Fund, including the Fund’s:
Prospectus
Financial information
Fund holdings
Proxy voting information
You can also request this information by contacting us at 1-800-480-4111.
ANNUAL SHAREHOLDER REPORT | October 31, 2024 (Unaudited)
JPMorgan International Focus Fund
Class I Shares/Ticker: IUESX
ANNUAL SHAREHOLDER REPORT
This annual shareholder report contains important information about the JPMorgan International Focus Fund (the "Fund") for the period of November 1, 2023 to October 31, 2024. You can find additional information about the Fund at www.jpmorganfunds.com/funddocuments. You can also request this information by contacting us at 1-800-480-4111 or by sending an e-mail request to Funds.Website.Support@jpmorganfunds.com or by asking any financial intermediary that offers shares of the Fund.
What were the Fund costs for the last year?
(based on a hypothetical $10,000 investment)
| Fund (Class) | Costs of a
$10,000 investment | Costs paid as a percentage
of a $10,000 investment |
JPMorgan International Focus Fund
(Class I Shares) | $82 | 0.75% |
How did the Fund Perform?
The JPMorgan International Focus Fund's Class I Shares returned 19.09% for the year ended October 31, 2024. The MSCI ACWI ex USA Index (net total return) (the "Index") returned 24.33% for the year ended October 31, 2024.
The Fund’s security selection in the consumer staples and energy sectors detracted from performance relative to the Index.
The Fund’s security selection in the financials and health care sectors contributed to performance relative to the Index.
| AVERAGE ANNUAL TOTAL RETURNS | INCEPTION
DATE | 1 YEAR | | 5 YEAR | | 10 YEAR | |
| JPMorgan International Focus Fund (Class I Shares) | November 30, 2011 | 19.09 | % | 5.56 | % | 5.63 | % |
| MSCI ACWI ex USA Index (net total return) | | 24.33 | | 5.78 | | 4.79 | |
The performance quoted is past performance and is not a guarantee of future results. Mutual funds are subject to certain market risks. Investment returns and principal value of an investment will fluctuate so that an investor’s shares, when redeemed, may be worth more or less than their original cost. Current performance may be higher or lower than the performance data shown. Updated performance information is available by visiting www.jpmorganfunds.com or by calling 1-800-480-4111.
The graph illustrates comparative performance for $1,000,000 invested in Class I Shares of the JPMorgan International Focus Fund and the MSCI ACWI ex USA Index (net total return) from October 31, 2014 to October 31, 2024. The performance of the Fund assumes reinvestment of all dividends and capital gain distributions, if any, and does not include a sales charge. The performance of the MSCI ACWI ex USA Index (net total return) does not reflect the deduction of expenses or a sales charge associated with a mutual fund and approximates the minimum possible dividend reinvestment of the securities included in the benchmark, if applicable. The MSCI ACWI ex USA Index (net total return) is a free float-adjusted market capitalization weighted index that is designed to measure the performance of large- and mid- cap stocks in developed and emerging markets, excluding the U.S. Net total return figures assume the reinvestment of dividends after deduction of withholding tax, applying the maximum rate to nonresident individual investors who do not benefit from double taxation treaties. Investors cannot invest directly in an index.
Fund performance may reflect the waiver of the Fund’s fees and reimbursement of expenses for certain periods since the applicable inception date. Without these waivers and reimbursements, performance would have been lower. Also, performance shown in this section does not reflect the deduction of taxes that a shareholder would pay on Fund distributions or on gains resulting from redemptions of Fund shares.
The returns shown are based on net asset values calculated for shareholder transactions and may differ from the returns shown in the financial highlights, which reflect adjustments made to the net asset values in accordance with accounting principles generally accepted in the United States of America.
Source: MSCI. The MSCI information may only be used for your internal use, may not be reproduced or redisseminated in any form and may not be used as a basis for or a component of any financial instruments or products or indices. None of the MSCI information is intended to constitute investment advice or a recommendation to make (or refrain from making) any kind of investment decision and may not be relied on as such. Historical data and analysis should not be taken as an indication or guarantee of any future performance analysis, forecast, or prediction. The MSCI information is provided on an "as is" basis and the user of this information assumes the entire risk of any use made of this information. MSCI, each of its affiliates and each other person involved in or related to compiling, computing or creating any MSCI information (collectively, the "MSCI Parties") expressly disclaims all warranties (including, without limitation, any warranties of originality, accuracy, completeness, timeliness, non-infringement, merchantability and fitness for a particular purpose) with respect to this information. Without limiting any of the foregoing, in no event shall any MSCI Party have any liability for any direct, indirect, special, incidental, punitive, consequential (including, without limitation, lost profits) or any other damages. (www.msci.com)
| Fund net assets (000's) | $1,513,955 | |
| Total number of portfolio holdings | 54 | |
| Portfolio turnover rate | 45 | % |
| Total advisory fees paid (000's) | $7,622 | |
PORTFOLIO COMPOSITION - COUNTRY
(% of Total Investments)
Availability of Additional Information
At www.jpmorganfunds.com/funddocuments, you can find additional information about the Fund, including the Fund’s:
Prospectus
Financial information
Fund holdings
Proxy voting information
You can also request this information by contacting us at 1-800-480-4111.
ANNUAL SHAREHOLDER REPORT | October 31, 2024 (Unaudited)
JPMorgan International Focus Fund
Class R2 Shares/Ticker: IUERX
ANNUAL SHAREHOLDER REPORT
This annual shareholder report contains important information about the JPMorgan International Focus Fund (the "Fund") for the period of November 1, 2023 to October 31, 2024. You can find additional information about the Fund at www.jpmorganfunds.com/funddocuments. You can also request this information by contacting us at 1-800-480-4111 or by sending an e-mail request to Funds.Website.Support@jpmorganfunds.com or by asking any financial intermediary that offers shares of the Fund.
What were the Fund costs for the last year?
(based on a hypothetical $10,000 investment)
| Fund (Class) | Costs of a
$10,000 investment | Costs paid as a percentage
of a $10,000 investment |
JPMorgan International Focus Fund
(Class R2 Shares) | $142 | 1.30% |
How did the Fund Perform?
The JPMorgan International Focus Fund's Class R2 Shares returned 18.46% for the year ended October 31, 2024. The MSCI ACWI ex USA Index (net total return) (the "Index") returned 24.33% for the year ended October 31, 2024.
The Fund’s security selection in the consumer staples and energy sectors detracted from performance relative to the Index.
The Fund’s security selection in the financials and health care sectors contributed to performance relative to the Index.
| AVERAGE ANNUAL TOTAL RETURNS | INCEPTION
DATE | 1 YEAR | | 5 YEAR | | 10 YEAR | |
| JPMorgan International Focus Fund (Class R2 Shares) | November 30, 2011 | 18.46 | % | 4.98 | % | 5.04 | % |
| MSCI ACWI ex USA Index (net total return) | | 24.33 | | 5.78 | | 4.79 | |
The performance quoted is past performance and is not a guarantee of future results. Mutual funds are subject to certain market risks. Investment returns and principal value of an investment will fluctuate so that an investor’s shares, when redeemed, may be worth more or less than their original cost. Current performance may be higher or lower than the performance data shown. Updated performance information is available by visiting www.jpmorganfunds.com or by calling 1-800-480-4111.
The graph illustrates comparative performance for $10,000 invested in Class R2 Shares of the JPMorgan International Focus Fund and the MSCI ACWI ex USA Index (net total return) from October 31, 2014 to October 31, 2024. The performance of the Fund assumes reinvestment of all dividends and capital gain distributions, if any, and does not include a sales charge. The performance of the MSCI ACWI ex USA Index (net total return) does not reflect the deduction of expenses or a sales charge associated with a mutual fund and approximates the minimum possible dividend reinvestment of the securities included in the benchmark, if applicable. The MSCI ACWI ex USA Index (net total return) is a free float-adjusted market capitalization weighted index that is designed to measure the performance of large- and mid- cap stocks in developed and emerging markets, excluding the U.S. Net total return figures assume the reinvestment of dividends after deduction of withholding tax, applying the maximum rate to nonresident individual investors who do not benefit from double taxation treaties. Investors cannot invest directly in an index.
Fund performance may reflect the waiver of the Fund’s fees and reimbursement of expenses for certain periods since the applicable inception date. Without these waivers and reimbursements, performance would have been lower. Also, performance shown in this section does not reflect the deduction of taxes that a shareholder would pay on Fund distributions or on gains resulting from redemptions of Fund shares.
The returns shown are based on net asset values calculated for shareholder transactions and may differ from the returns shown in the financial highlights, which reflect adjustments made to the net asset values in accordance with accounting principles generally accepted in the United States of America.
Source: MSCI. The MSCI information may only be used for your internal use, may not be reproduced or redisseminated in any form and may not be used as a basis for or a component of any financial instruments or products or indices. None of the MSCI information is intended to constitute investment advice or a recommendation to make (or refrain from making) any kind of investment decision and may not be relied on as such. Historical data and analysis should not be taken as an indication or guarantee of any future performance analysis, forecast, or prediction. The MSCI information is provided on an "as is" basis and the user of this information assumes the entire risk of any use made of this information. MSCI, each of its affiliates and each other person involved in or related to compiling, computing or creating any MSCI information (collectively, the "MSCI Parties") expressly disclaims all warranties (including, without limitation, any warranties of originality, accuracy, completeness, timeliness, non-infringement, merchantability and fitness for a particular purpose) with respect to this information. Without limiting any of the foregoing, in no event shall any MSCI Party have any liability for any direct, indirect, special, incidental, punitive, consequential (including, without limitation, lost profits) or any other damages. (www.msci.com)
| Fund net assets (000's) | $1,513,955 | |
| Total number of portfolio holdings | 54 | |
| Portfolio turnover rate | 45 | % |
| Total advisory fees paid (000's) | $7,622 | |
PORTFOLIO COMPOSITION - COUNTRY
(% of Total Investments)
Availability of Additional Information
At www.jpmorganfunds.com/funddocuments, you can find additional information about the Fund, including the Fund’s:
Prospectus
Financial information
Fund holdings
Proxy voting information
You can also request this information by contacting us at 1-800-480-4111.
ANNUAL SHAREHOLDER REPORT | October 31, 2024 (Unaudited)
JPMorgan International Focus Fund
Class R5 Shares/Ticker: IUEFX
ANNUAL SHAREHOLDER REPORT
This annual shareholder report contains important information about the JPMorgan International Focus Fund (the "Fund") for the period of November 1, 2023 to October 31, 2024. You can find additional information about the Fund at www.jpmorganfunds.com/funddocuments. You can also request this information by contacting us at 1-800-480-4111 or by sending an e-mail request to Funds.Website.Support@jpmorganfunds.com or by asking any financial intermediary that offers shares of the Fund.
What were the Fund costs for the last year?
(based on a hypothetical $10,000 investment)
| Fund (Class) | Costs of a
$10,000 investment | Costs paid as a percentage
of a $10,000 investment |
JPMorgan International Focus Fund
(Class R5 Shares) | $71 | 0.65% |
How did the Fund Perform?
The JPMorgan International Focus Fund's Class R5 Shares returned 19.24% for the year ended October 31, 2024. The MSCI ACWI ex USA Index (net total return) (the "Index") returned 24.33% for the year ended October 31, 2024.
The Fund’s security selection in the consumer staples and energy sectors detracted from performance relative to the Index.
The Fund’s security selection in the financials and health care sectors contributed to performance relative to the Index.
| AVERAGE ANNUAL TOTAL RETURNS | INCEPTION
DATE | 1 YEAR | | 5 YEAR | | 10 YEAR | |
| JPMorgan International Focus Fund (Class R5 Shares) | November 30, 2011 | 19.24 | % | 5.66 | % | 5.74 | % |
| MSCI ACWI ex USA Index (net total return) | | 24.33 | | 5.78 | | 4.79 | |
The performance quoted is past performance and is not a guarantee of future results. Mutual funds are subject to certain market risks. Investment returns and principal value of an investment will fluctuate so that an investor’s shares, when redeemed, may be worth more or less than their original cost. Current performance may be higher or lower than the performance data shown. Updated performance information is available by visiting www.jpmorganfunds.com or by calling 1-800-480-4111.
The graph illustrates comparative performance for $10,000 invested in Class R5 Shares of the JPMorgan International Focus Fund and the MSCI ACWI ex USA Index (net total return) from October 31, 2014 to October 31, 2024. The performance of the Fund assumes reinvestment of all dividends and capital gain distributions, if any, and does not include a sales charge. The performance of the MSCI ACWI ex USA Index (net total return) does not reflect the deduction of expenses or a sales charge associated with a mutual fund and approximates the minimum possible dividend reinvestment of the securities included in the benchmark, if applicable. The MSCI ACWI ex USA Index (net total return) is a free float-adjusted market capitalization weighted index that is designed to measure the performance of large- and mid- cap stocks in developed and emerging markets, excluding the U.S. Net total return figures assume the reinvestment of dividends after deduction of withholding tax, applying the maximum rate to nonresident individual investors who do not benefit from double taxation treaties. Investors cannot invest directly in an index.
Fund performance may reflect the waiver of the Fund’s fees and reimbursement of expenses for certain periods since the applicable inception date. Without these waivers and reimbursements, performance would have been lower. Also, performance shown in this section does not reflect the deduction of taxes that a shareholder would pay on Fund distributions or on gains resulting from redemptions of Fund shares.
The returns shown are based on net asset values calculated for shareholder transactions and may differ from the returns shown in the financial highlights, which reflect adjustments made to the net asset values in accordance with accounting principles generally accepted in the United States of America.
Source: MSCI. The MSCI information may only be used for your internal use, may not be reproduced or redisseminated in any form and may not be used as a basis for or a component of any financial instruments or products or indices. None of the MSCI information is intended to constitute investment advice or a recommendation to make (or refrain from making) any kind of investment decision and may not be relied on as such. Historical data and analysis should not be taken as an indication or guarantee of any future performance analysis, forecast, or prediction. The MSCI information is provided on an "as is" basis and the user of this information assumes the entire risk of any use made of this information. MSCI, each of its affiliates and each other person involved in or related to compiling, computing or creating any MSCI information (collectively, the "MSCI Parties") expressly disclaims all warranties (including, without limitation, any warranties of originality, accuracy, completeness, timeliness, non-infringement, merchantability and fitness for a particular purpose) with respect to this information. Without limiting any of the foregoing, in no event shall any MSCI Party have any liability for any direct, indirect, special, incidental, punitive, consequential (including, without limitation, lost profits) or any other damages. (www.msci.com)
| Fund net assets (000's) | $1,513,955 | |
| Total number of portfolio holdings | 54 | |
| Portfolio turnover rate | 45 | % |
| Total advisory fees paid (000's) | $7,622 | |
PORTFOLIO COMPOSITION - COUNTRY
(% of Total Investments)
Availability of Additional Information
At www.jpmorganfunds.com/funddocuments, you can find additional information about the Fund, including the Fund’s:
Prospectus
Financial information
Fund holdings
Proxy voting information
You can also request this information by contacting us at 1-800-480-4111.
ANNUAL SHAREHOLDER REPORT | October 31, 2024 (Unaudited)
JPMorgan International Focus Fund
Class R6 Shares/Ticker: IUENX
ANNUAL SHAREHOLDER REPORT
This annual shareholder report contains important information about the JPMorgan International Focus Fund (the "Fund") for the period of November 1, 2023 to October 31, 2024. You can find additional information about the Fund at www.jpmorganfunds.com/funddocuments. You can also request this information by contacting us at 1-800-480-4111 or by sending an e-mail request to Funds.Website.Support@jpmorganfunds.com or by asking any financial intermediary that offers shares of the Fund.
What were the Fund costs for the last year?
(based on a hypothetical $10,000 investment)
| Fund (Class) | Costs of a
$10,000 investment | Costs paid as a percentage
of a $10,000 investment |
JPMorgan International Focus Fund
(Class R6 Shares) | $60 | 0.55% |
How did the Fund Perform?
The JPMorgan International Focus Fund's Class R6 Shares returned 19.34% for the year ended October 31, 2024. The MSCI ACWI ex USA Index (net total return) (the "Index") returned 24.33% for the year ended October 31, 2024.
The Fund’s security selection in the consumer staples and energy sectors detracted from performance relative to the Index.
The Fund’s security selection in the financials and health care sectors contributed to performance relative to the Index.
| AVERAGE ANNUAL TOTAL RETURNS | INCEPTION
DATE | 1 YEAR | | 5 YEAR | | 10 YEAR | |
| JPMorgan International Focus Fund (Class R6 Shares) | November 30, 2011 | 19.34 | % | 5.76 | % | 5.83 | % |
| MSCI ACWI ex USA Index (net total return) | | 24.33 | | 5.78 | | 4.79 | |
The performance quoted is past performance and is not a guarantee of future results. Mutual funds are subject to certain market risks. Investment returns and principal value of an investment will fluctuate so that an investor’s shares, when redeemed, may be worth more or less than their original cost. Current performance may be higher or lower than the performance data shown. Updated performance information is available by visiting www.jpmorganfunds.com or by calling 1-800-480-4111.
The graph illustrates comparative performance for $5,000,000 invested in Class R6 Shares of the JPMorgan International Focus Fund and the MSCI ACWI ex USA Index (net total return) from October 31, 2014 to October 31, 2024. The performance of the Fund assumes reinvestment of all dividends and capital gain distributions, if any, and does not include a sales charge. The performance of the MSCI ACWI ex USA Index (net total return) does not reflect the deduction of expenses or a sales charge associated with a mutual fund and approximates the minimum possible dividend reinvestment of the securities included in the benchmark, if applicable. The MSCI ACWI ex USA Index (net total return) is a free float-adjusted market capitalization weighted index that is designed to measure the performance of large- and mid- cap stocks in developed and emerging markets, excluding the U.S. Net total return figures assume the reinvestment of dividends after deduction of withholding tax, applying the maximum rate to nonresident individual investors who do not benefit from double taxation treaties. Investors cannot invest directly in an index.
Fund performance may reflect the waiver of the Fund’s fees and reimbursement of expenses for certain periods since the applicable inception date. Without these waivers and reimbursements, performance would have been lower. Also, performance shown in this section does not reflect the deduction of taxes that a shareholder would pay on Fund distributions or on gains resulting from redemptions of Fund shares.
The returns shown are based on net asset values calculated for shareholder transactions and may differ from the returns shown in the financial highlights, which reflect adjustments made to the net asset values in accordance with accounting principles generally accepted in the United States of America.
Source: MSCI. The MSCI information may only be used for your internal use, may not be reproduced or redisseminated in any form and may not be used as a basis for or a component of any financial instruments or products or indices. None of the MSCI information is intended to constitute investment advice or a recommendation to make (or refrain from making) any kind of investment decision and may not be relied on as such. Historical data and analysis should not be taken as an indication or guarantee of any future performance analysis, forecast, or prediction. The MSCI information is provided on an "as is" basis and the user of this information assumes the entire risk of any use made of this information. MSCI, each of its affiliates and each other person involved in or related to compiling, computing or creating any MSCI information (collectively, the "MSCI Parties") expressly disclaims all warranties (including, without limitation, any warranties of originality, accuracy, completeness, timeliness, non-infringement, merchantability and fitness for a particular purpose) with respect to this information. Without limiting any of the foregoing, in no event shall any MSCI Party have any liability for any direct, indirect, special, incidental, punitive, consequential (including, without limitation, lost profits) or any other damages. (www.msci.com)
| Fund net assets (000's) | $1,513,955 | |
| Total number of portfolio holdings | 54 | |
| Portfolio turnover rate | 45 | % |
| Total advisory fees paid (000's) | $7,622 | |
PORTFOLIO COMPOSITION - COUNTRY
(% of Total Investments)
Availability of Additional Information
At www.jpmorganfunds.com/funddocuments, you can find additional information about the Fund, including the Fund’s:
Prospectus
Financial information
Fund holdings
Proxy voting information
You can also request this information by contacting us at 1-800-480-4111.
ANNUAL SHAREHOLDER REPORT | October 31, 2024 (Unaudited)
JPMorgan Research Market Neutral Fund
Class A Shares/Ticker: JMNAX
ANNUAL SHAREHOLDER REPORT
This annual shareholder report contains important information about the JPMorgan Research Market Neutral Fund (the "Fund") for the period of November 1, 2023 to October 31, 2024. You can find additional information about the Fund at www.jpmorganfunds.com/funddocuments. You can also request this information by contacting us at 1-800-480-4111 or by sending an e-mail request to Funds.Website.Support@jpmorganfunds.com or by asking any financial intermediary that offers shares of the Fund.
What were the Fund costs for the last year?
(based on a hypothetical $10,000 investment)
| Fund (Class) | Costs of a
$10,000 investment | Costs paid as a percentage
of a $10,000 investment* |
JPMorgan Research Market Neutral Fund
(Class A Shares) | $289 | 2.71% |
| * | Includes dividend and interest expenses on short sales. |
How did the Fund Perform?
The JPMorgan Research Market Neutral Fund's Class A Shares, without a sales charge, returned 13.62% for the year ended October 31, 2024. The Bloomberg U.S. Aggregate Index returned 10.55% and the ICE BofA 3-Month US Treasury Bill Index ("the Index") returned 5.39% for the year ended October 31, 2024.
The Fund’s allocation to equities was the leading contributor to the Fund's performance compared to the Index.
The hardware & semiconductors and industrial cyclical sectors were leading contributors to the Fund's absolute performance.
The financial services and retail sectors were leading detractors from the Fund's absolute performance.
The Fund’s short allocation to Teradyne and long allocation to Digital Realty Trust contributed positively to the Fund's performance.
The Fund’s long allocation to Regeneron Pharmaceuticals and short allocation to Toast detracted from the Fund's performance.
| AVERAGE ANNUAL TOTAL RETURNS | INCEPTION
DATE | 1 YEAR | | 5 YEAR | | 10 YEAR | |
| JPMorgan Research Market Neutral Fund (Class A Shares) | February 28, 2002 | 7.67 | % | 5.94 | % | 3.18 | % |
| JPMorgan Research Market Neutral Fund (Class A Shares) - excluding sales charge | | 13.62 | | 7.08 | | 3.73 | |
| Bloomberg U.S. Aggregate Index | | 10.55 | | (0.23 | ) | 1.49 | |
| ICE BofA 3-Month US Treasury Bill Index | | 5.39 | | 2.37 | | 1.69 | |
The performance quoted is past performance and is not a guarantee of future results. Mutual funds are subject to certain market risks. Investment returns and principal value of an investment will fluctuate so that an investor’s shares, when redeemed, may be worth more or less than their original cost. Current performance may be higher or lower than the performance data shown. Updated performance information is available by visiting www.jpmorganfunds.com or by calling 1-800-480-4111.
The graph illustrates comparative performance for $10,000 invested in Class A Shares of the JPMorgan Research Market Neutral Fund, the Bloomberg U.S. Aggregate Index and the ICE BofA 3-Month US Treasury Bill Index from October 31, 2014 to October 31, 2024. The performance of the Fund assumes reinvestment of all dividends and capital gain distributions, if any, and includes a sales charge. The performance of the Bloomberg U.S. Aggregate Index and the ICE BofA 3-Month US Treasury Bill Index does not reflect the deduction of expenses or a sales charge associated with a mutual fund and has been adjusted to reflect reinvestment of all dividends and capital gain distributions of the securities included in the benchmark, if applicable. The Bloomberg U.S. Aggregate Index is an unmanaged index that represents securities that are SEC-registered, taxable, and dollar denominated. The index covers the U.S. investment grade fixed rate bond market, with index components for government and corporate securities, mortgage pass-through securities, and asset-backed securities. Investors cannot invest directly in an index. The ICE BofA 3-Month US Treasury Bill Index is comprised of a single issue purchased at the beginning of the month and held for a full month. Each month the index is rebalanced and the issue selected is the outstanding Treasury Bill that matures closest to, but not beyond, 3 months from the rebalancing date. Investors cannot invest directly in an index. As a result of new regulatory requirements, effective July 24, 2024, the Fund’s regulatory index has changed from the Index, as defined above, to the Bloomberg U.S. Aggregate Index, a broad-based securities market index. In addition to the Fund’s performance, the tables in this section include performance of the new regulatory index and the Index.
Fund performance may reflect the waiver of the Fund’s fees and reimbursement of expenses for certain periods. Without these waivers and reimbursements, performance would have been lower. Also, performance shown in this section does not reflect the deduction of taxes that a shareholder would pay on Fund distributions or on gains resulting from redemptions of Fund shares.
The returns shown are based on net asset values calculated for shareholder transactions and may differ from the returns shown in the financial highlights,which reflect adjustments made to the net asset values in accordance with accounting principles generally accepted in the United States of America.
Source: Bloomberg Index Services Limited. BLOOMBERG® is a trademark and service mark of Bloomberg Finance L.P. and its affiliates (collectively "Bloomberg"). Bloomberg or Bloomberg's licensors own all proprietary rights in the Bloomberg Indices. Bloomberg does not approve or endorse this material, or guarantee the accuracy or completeness of any information herein, or make any warranty, express or implied, as to the results to be obtained therefrom and, to the maximum extent allowed by law, shall have any liability or responsibility for injury or damages arising in connection therewith.
Source ICE Data Indices, LLC is used with permission. ICE® is a registered trademark of ICE Data Indices, LLC or its affiliates and BofA® is a registered trademark of Bank of America Corporation licensed by Bank of America Corporation and its affiliates ("BofA"), and may not be used without BofA's prior written approval. The index data referenced herein is the property of ICE Data Indices, LLC, its affiliates (“ICE Data”) and/or its third party suppliers and has been licensed for use by J.P. Morgan Investment Management, Inc. ICE Data and its Third Party Suppliers accept no liability in connection with the use of such index data or marks. See prospectus for a full copy of the Disclaimer.
| Fund net assets (000's) | $339,688 | |
| Total number of portfolio holdings | 314 | |
| Portfolio turnover rate | 218 | % |
| Total advisory fees paid (000's) | $683 | |
PORTFOLIO COMPOSITION - LONG
(% of Total Investments)
PORTFOLIO COMPOSITION - SHORT
(% of Total Investments)
Availability of Additional Information
At www.jpmorganfunds.com/funddocuments, you can find additional information about the Fund, including the Fund’s:
Prospectus
Financial information
Fund holdings
Proxy voting information
You can also request this information by contacting us at 1-800-480-4111.
ANNUAL SHAREHOLDER REPORT | October 31, 2024 (Unaudited)
JPMorgan Research Market Neutral Fund
Class C Shares/Ticker: JMNCX
ANNUAL SHAREHOLDER REPORT
This annual shareholder report contains important information about the JPMorgan Research Market Neutral Fund (the "Fund") for the period of November 1, 2023 to October 31, 2024. You can find additional information about the Fund at www.jpmorganfunds.com/funddocuments. You can also request this information by contacting us at 1-800-480-4111 or by sending an e-mail request to Funds.Website.Support@jpmorganfunds.com or by asking any financial intermediary that offers shares of the Fund.
What were the Fund costs for the last year?
(based on a hypothetical $10,000 investment)
| Fund (Class) | Costs of a
$10,000 investment | Costs paid as a percentage
of a $10,000 investment* |
JPMorgan Research Market Neutral Fund
(Class C Shares) | $341 | 3.20% |
| * | Includes dividend and interest expenses on short sales. |
How did the Fund Perform?
The JPMorgan Research Market Neutral Fund's Class C Shares, without a sales charge, returned 13.02% for the year ended October 31, 2024. The Bloomberg U.S. Aggregate Index returned 10.55% and the ICE BofA 3-Month US Treasury Bill Index ("the Index") returned 5.39% for the year ended October 31, 2024.
The Fund’s allocation to equities was the leading contributor to the Fund's performance compared to the Index.
The hardware & semiconductors and industrial cyclical sectors were leading contributors to the Fund's absolute performance.
The financial services and retail sectors were leading detractors from the Fund's absolute performance.
The Fund’s short allocation to Teradyne and long allocation to Digital Realty Trust contributed positively to the Fund's performance.
The Fund’s long allocation to Regeneron Pharmaceuticals and short allocation to Toast detracted from the Fund's performance.
| AVERAGE ANNUAL TOTAL RETURNS | INCEPTION
DATE | 1 YEAR | | 5 YEAR | | 10 YEAR | |
| JPMorgan Research Market Neutral Fund (Class C Shares) | November 2, 2009 | 12.02 | % | 6.54 | % | 3.32 | % |
| JPMorgan Research Market Neutral Fund (Class C Shares) - excluding sales charge | | 13.02 | | 6.54 | | 3.32 | |
| Bloomberg U.S. Aggregate Index | | 10.55 | | (0.23 | ) | 1.49 | |
| ICE BofA 3-Month US Treasury Bill Index | | 5.39 | | 2.37 | | 1.69 | |
The performance quoted is past performance and is not a guarantee of future results. Mutual funds are subject to certain market risks. Investment returns and principal value of an investment will fluctuate so that an investor’s shares, when redeemed, may be worth more or less than their original cost. Current performance may be higher or lower than the performance data shown. Updated performance information is available by visiting www.jpmorganfunds.com or by calling 1-800-480-4111.
The graph illustrates comparative performance for $10,000 invested in Class C Shares of the JPMorgan Research Market Neutral Fund, the Bloomberg U.S. Aggregate Index and the ICE BofA 3-Month US Treasury Bill Index from October 31, 2014 to October 31, 2024. The performance of the Fund assumes reinvestment of all dividends and capital gain distributions, if any, and does not include a sales charge. The performance of the Bloomberg U.S. Aggregate Index and the ICE BofA 3-Month US Treasury Bill Index does not reflect the deduction of expenses or a sales charge associated with a mutual fund and has been adjusted to reflect reinvestment of all dividends and capital gain distributions of the securities included in the benchmark, if applicable. The Bloomberg U.S. Aggregate Index is an unmanaged index that represents securities that are SEC-registered, taxable, and dollar denominated. The index covers the U.S. investment grade fixed rate bond market, with index components for government and corporate securities, mortgage pass-through securities, and asset-backed securities. Investors cannot invest directly in an index. The ICE BofA 3-Month US Treasury Bill Index is comprised of a single issue purchased at the beginning of the month and held for a full month. Each month the index is rebalanced and the issue selected is the outstanding Treasury Bill that matures closest to, but not beyond, 3 months from the rebalancing date. Investors cannot invest directly in an index. As a result of new regulatory requirements, effective July 24, 2024, the Fund’s regulatory index has changed from the Index, as defined above, to the Bloomberg U.S. Aggregate Index, a broad-based securities market index. In addition to the Fund’s performance, the tables in this section include performance of the new regulatory index and the Index.
Fund performance may reflect the waiver of the Fund’s fees and reimbursement of expenses for certain periods. Without these waivers and reimbursements, performance would have been lower. Also, performance shown in this section does not reflect the deduction of taxes that a shareholder would pay on Fund distributions or on gains resulting from redemptions of Fund shares.
Because Class C Shares automatically convert to Class A Shares after 8 years, the 10 year average annual total return shown above for Class C Shares reflects Class A Share's performance for the period after conversion.
The returns shown are based on net asset values calculated for shareholder transactions and may differ from the returns shown in the financial highlights,which reflect adjustments made to the net asset values in accordance with accounting principles generally accepted in the United States of America.
Source: Bloomberg Index Services Limited. BLOOMBERG® is a trademark and service mark of Bloomberg Finance L.P. and its affiliates (collectively "Bloomberg"). Bloomberg or Bloomberg's licensors own all proprietary rights in the Bloomberg Indices. Bloomberg does not approve or endorse this material, or guarantee the accuracy or completeness of any information herein, or make any warranty, express or implied, as to the results to be obtained therefrom and, to the maximum extent allowed by law, shall have any liability or responsibility for injury or damages arising in connection therewith.
Source ICE Data Indices, LLC is used with permission. ICE® is a registered trademark of ICE Data Indices, LLC or its affiliates and BofA® is a registered trademark of Bank of America Corporation licensed by Bank of America Corporation and its affiliates ("BofA"), and may not be used without BofA's prior written approval. The index data referenced herein is the property of ICE Data Indices, LLC, its affiliates (“ICE Data”) and/or its third party suppliers and has been licensed for use by J.P. Morgan Investment Management, Inc. ICE Data and its Third Party Suppliers accept no liability in connection with the use of such index data or marks. See prospectus for a full copy of the Disclaimer.
| Fund net assets (000's) | $339,688 | |
| Total number of portfolio holdings | 314 | |
| Portfolio turnover rate | 218 | % |
| Total advisory fees paid (000's) | $683 | |
PORTFOLIO COMPOSITION - LONG
(% of Total Investments)
PORTFOLIO COMPOSITION - SHORT
(% of Total Investments)
Availability of Additional Information
At www.jpmorganfunds.com/funddocuments, you can find additional information about the Fund, including the Fund’s:
Prospectus
Financial information
Fund holdings
Proxy voting information
You can also request this information by contacting us at 1-800-480-4111.
ANNUAL SHAREHOLDER REPORT | October 31, 2024 (Unaudited)
JPMorgan Research Market Neutral Fund
Class I Shares/Ticker: JMNSX
ANNUAL SHAREHOLDER REPORT
This annual shareholder report contains important information about the JPMorgan Research Market Neutral Fund (the "Fund") for the period of November 1, 2023 to October 31, 2024. You can find additional information about the Fund at www.jpmorganfunds.com/funddocuments. You can also request this information by contacting us at 1-800-480-4111 or by sending an e-mail request to Funds.Website.Support@jpmorganfunds.com or by asking any financial intermediary that offers shares of the Fund.
What were the Fund costs for the last year?
(based on a hypothetical $10,000 investment)
| Fund (Class) | Costs of a
$10,000 investment | Costs paid as a percentage
of a $10,000 investment* |
JPMorgan Research Market Neutral Fund
(Class I Shares) | $261 | 2.44% |
| * | Includes dividend and interest expenses on short sales. |
How did the Fund Perform?
The JPMorgan Research Market Neutral Fund's Class I Shares returned 13.84% for the year ended October 31, 2024. The Bloomberg U.S. Aggregate Index returned 10.55% and the ICE BofA 3-Month US Treasury Bill Index ("the Index") returned 5.39% for the year ended October 31, 2024.
The Fund’s allocation to equities was the leading contributor to the Fund's performance compared to the Index.
The hardware & semiconductors and industrial cyclical sectors were leading contributors to the Fund's absolute performance.
The financial services and retail sectors were leading detractors from the Fund's absolute performance.
The Fund’s short allocation to Teradyne and long allocation to Digital Realty Trust contributed positively to the Fund's performance.
The Fund’s long allocation to Regeneron Pharmaceuticals and short allocation to Toast detracted from the Fund's performance.
| AVERAGE ANNUAL TOTAL RETURNS | INCEPTION
DATE | 1 YEAR | | 5 YEAR | | 10 YEAR | |
| JPMorgan Research Market Neutral Fund (Class I Shares) | November 2, 2009 | 13.84 | % | 7.34 | % | 3.99 | % |
| Bloomberg U.S. Aggregate Index | | 10.55 | | (0.23 | ) | 1.49 | |
| ICE BofA 3-Month US Treasury Bill Index | | 5.39 | | 2.37 | | 1.69 | |
The performance quoted is past performance and is not a guarantee of future results. Mutual funds are subject to certain market risks. Investment returns and principal value of an investment will fluctuate so that an investor’s shares, when redeemed, may be worth more or less than their original cost. Current performance may be higher or lower than the performance data shown. Updated performance information is available by visiting www.jpmorganfunds.com or by calling 1-800-480-4111.
The graph illustrates comparative performance for $1,000,000 invested in Class I Shares of the JPMorgan Research Market Neutral Fund, the Bloomberg U.S. Aggregate Index and the ICE BofA 3-Month US Treasury Bill Index from October 31, 2014 to October 31, 2024. The performance of the Fund assumes reinvestment of all dividends and capital gain distributions, if any, and does not include a sales charge. The performance of the Bloomberg U.S. Aggregate Index and the ICE BofA 3-Month US Treasury Bill Index does not reflect the deduction of expenses or a sales charge associated with a mutual fund and has been adjusted to reflect reinvestment of all dividends and capital gain distributions of the securities included in the benchmark, if applicable. The Bloomberg U.S. Aggregate Index is an unmanaged index that represents securities that are SEC-registered, taxable, and dollar denominated. The index covers the U.S. investment grade fixed rate bond market, with index components for government and corporate securities, mortgage pass-through securities, and asset-backed securities. Investors cannot invest directly in an index. The ICE BofA 3-Month US Treasury Bill Index is comprised of a single issue purchased at the beginning of the month and held for a full month. Each month the index is rebalanced and the issue selected is the outstanding Treasury Bill that matures closest to, but not beyond, 3 months from the rebalancing date. Investors cannot invest directly in an index. As a result of new regulatory requirements, effective July 24, 2024, the Fund’s regulatory index has changed from the Index, as defined above, to the Bloomberg U.S. Aggregate Index, a broad-based securities market index. In addition to the Fund’s performance, the tables in this section include performance of the new regulatory index and the Index.
Fund performance may reflect the waiver of the Fund’s fees and reimbursement of expenses for certain periods. Without these waivers and reimbursements, performance would have been lower. Also, performance shown in this section does not reflect the deduction of taxes that a shareholder would pay on Fund distributions or on gains resulting from redemptions of Fund shares.
The returns shown are based on net asset values calculated for shareholder transactions and may differ from the returns shown in the financial highlights,which reflect adjustments made to the net asset values in accordance with accounting principles generally accepted in the United States of America.
Source: Bloomberg Index Services Limited. BLOOMBERG® is a trademark and service mark of Bloomberg Finance L.P. and its affiliates (collectively "Bloomberg"). Bloomberg or Bloomberg's licensors own all proprietary rights in the Bloomberg Indices. Bloomberg does not approve or endorse this material, or guarantee the accuracy or completeness of any information herein, or make any warranty, express or implied, as to the results to be obtained therefrom and, to the maximum extent allowed by law, shall have any liability or responsibility for injury or damages arising in connection therewith.
Source ICE Data Indices, LLC is used with permission. ICE® is a registered trademark of ICE Data Indices, LLC or its affiliates and BofA® is a registered trademark of Bank of America Corporation licensed by Bank of America Corporation and its affiliates ("BofA"), and may not be used without BofA's prior written approval. The index data referenced herein is the property of ICE Data Indices, LLC, its affiliates (“ICE Data”) and/or its third party suppliers and has been licensed for use by J.P. Morgan Investment Management, Inc. ICE Data and its Third Party Suppliers accept no liability in connection with the use of such index data or marks. See prospectus for a full copy of the Disclaimer.
| Fund net assets (000's) | $339,688 | |
| Total number of portfolio holdings | 314 | |
| Portfolio turnover rate | 218 | % |
| Total advisory fees paid (000's) | $683 | |
PORTFOLIO COMPOSITION - LONG
(% of Total Investments)
PORTFOLIO COMPOSITION - SHORT
(% of Total Investments)
Availability of Additional Information
At www.jpmorganfunds.com/funddocuments, you can find additional information about the Fund, including the Fund’s:
Prospectus
Financial information
Fund holdings
Proxy voting information
You can also request this information by contacting us at 1-800-480-4111.
ANNUAL SHAREHOLDER REPORT | October 31, 2024 (Unaudited)
JPMorgan Tax Aware Real Return Fund
Class A Shares/Ticker: TXRAX
ANNUAL SHAREHOLDER REPORT
This annual shareholder report contains important information about the JPMorgan Tax Aware Real Return Fund (the "Fund") for the period of November 1, 2023 to October 31, 2024. You can find additional information about the Fund at www.jpmorganfunds.com/funddocuments. You can also request this information by contacting us at 1-800-480-4111 or by sending an e-mail request to Funds.Website.Support@jpmorganfunds.com or by asking any financial intermediary that offers shares of the Fund.
What were the Fund costs for the last year?
(based on a hypothetical $10,000 investment)
| Fund (Class) | Costs of a
$10,000 investment | Costs paid as a percentage
of a $10,000 investment |
JPMorgan Tax Aware Real Return Fund
Class A Shares | $72 | 0.69% |
How did the Fund Perform?
The JPMorgan Tax Aware Real Return Fund's Class A Shares, without a sales charge, returned 8.15% for the year ended October 31, 2024. The Bloomberg US Municipal Index (the "Index") returned 9.70%, the Bloomberg U.S. 1-15 Year Blend (1-17) Municipal Bond Index returned 7.53%, and the Tax Aware Real Return Composite Benchmark Index returned 7.17% for the period.
The Fund’s shorter overall duration detracted from performance, as municipal rates fell across the curve over the period. Generally, when interest rates fall (as they did during the reporting period), bonds of shorter duration will experience less price appreciation than longer duration bonds. Additionally, being overweight to the front end of the curve, specifically the 0-1yr. effective duration bucket, detracted from the Fund's performance.
The Fund’s hedge against inflation, which was implemented using swaps contracts, detracted from the Fund's absolute performance.
The overweight to the long end of the curve, specifically the 10+ year effective duration bucket, was a positive contributor to the Fund's performance as it outperformed over the period.
The overweight to A-rated and BBB-rated bonds was additive to the Fund's performance over the period as they outperformed higher quality bonds. Additionally, the Fund’s overweight to the industrial development revenue/pollution control revenue sector positively contributed to the Fund's performance.
| AVERAGE ANNUAL TOTAL RETURNS | INCEPTION
DATE | 1 YEAR | | 5 YEAR | | 10 YEAR | |
| JPMorgan Tax Aware Real Return Fund Class A Shares | August 31, 2005 | 4.08 | % | 1.73 | % | 1.34 | % |
| JPMorgan Tax Aware Real Return Fund Class A Shares - excluding sales charge | | 8.15 | | 2.51 | | 1.73 | |
| Bloomberg US Municipal Index | | 9.70 | | 1.05 | | 2.30 | |
| Bloomberg U.S. 1-15 Year Blend (1-17) Municipal Bond Index | | 7.53 | | 1.14 | | 2.06 | |
| Tax Aware Real Return Composite Benchmark Index | | 7.17 | | 3.98 | | 3.03 | |
The performance quoted is past performance and is not a guarantee of future results. Mutual funds are subject to certain market risks. Investment returns and principal value of an investment will fluctuate so that an investor’s shares, when redeemed, may be worth more or less than their original cost. Current performance may be higher or lower than the performance data shown. Updated performance information is available by visiting www.jpmorganfunds.com or by calling 1-800-480-4111.
The graph illustrates comparative performance for $10,000 invested in Class A Shares of the JPMorgan Tax Aware Real Return Fund, the Bloomberg US Municipal Index, the Bloomberg U.S. 1-15 Year Blend (1-17) Municipal Bond Index and the Tax Aware Real Return Composite Benchmark Index from October 31, 2014 to October 31, 2024. The performance of the Fund assumes reinvestment of all dividends and capital gain distributions, if any, and includes a sales charge. The performance of the Bloomberg US Municipal Index, Bloomberg U.S. 1-15 Year Blend (1-17) Municipal Bond Index and the Tax Aware Real Return Composite Benchmark Index does not reflect the deduction of expenses or a sales charge associated with a mutual fund and has been adjusted to reflect reinvestment of all dividends and capital gain distributions of the securities included in the benchmarks, if applicable. The Bloomberg US Municipal Index is a total return performance benchmark for the long-term, investment-grade tax-exempt bond market. The Bloomberg U.S. 1-15 Year Blend (1-17) Municipal Bond Index represents the performance of municipal bonds with maturities from 1 to 17 years. The Tax Aware Real Return Composite Benchmark Index is determined by adding the return of the Bloomberg U.S. 1-15 Year Blend (1-17) Municipal Bond Index and the Bloomberg Inflation Swap 5 Year Zero Coupon Index. Investors cannot invest directly in an index. Effective August 8, 2024, the Fund’s primary benchmark changed from the Bloomberg U.S. 1-15 Year Blend (1-17) Municipal Bond Index to the Bloomberg US Municipal Index, which more closely reflects the Fund’s investment universe.
For some investors, income from municipal bonds may be subject to the Alternative Minimum Tax. Capital gains, if any, are federally taxable. Income may be subject to state and local taxes.
The Tax Aware strategy seeks to minimize shareholders’ tax liability in connection with the Fund’s distribution of realized capital gains. There can be no guarantee the strategy will minimize or eliminate such tax liability.
Fund performance may reflect the waiver of the Fund’s fees and reimbursement of expenses for certain periods since the applicable inception date. Without these waivers and reimbursements, performance would have been lower.
Also, performance shown in this section does not reflect the deduction of taxes that a shareholder would pay on Fund distributions or on gains resulting from redemptions of Fund shares, with the exception of returns noted above as returns after taxes.
The returns shown are based on net asset values calculated for shareholder transactions and may differ from the returns shown in the financial highlights, which reflect adjustments made to the net asset values in accordance with accounting principles generally accepted in the United States of America.
Source: Bloomberg Index Services Limited. BLOOMBERG® is a trademark and service mark of Bloomberg Finance L.P. and its affiliates (collectively "Bloomberg"). Bloomberg or Bloomberg's licensors own all proprietary rights in the Bloomberg Indices. Bloomberg does not approve or endorse this material, or guarantee the accuracy or completeness of any information herein, or make any warranty, express or implied, as to the results to be obtained therefrom and, to the maximum extent allowed by law, shall have any liability or responsibility for injury or damages arising in connection therewith.
| Fund net assets (000's) | $565,838 | |
| Total number of portfolio holdings | 324 | |
| Portfolio turnover rate | 74 | % |
| Total advisory fees paid (000's) | $1,296 | |
CREDIT QUALITY ALLOCATIONS
(% of Total Investments)
The Portfolio manager uses credit quality ratings on underlying securities of the portfolio from three major ratings agencies - S&P, Moody's and Fitch. When calculating the credit quality breakdown, the Portfolio manager selects the middle rating of the agencies when all three agencies rate a security. The Portfolio manager will use the lower of the two ratings if only two agencies rate a security and will use one rating if that is all that is provided. Securities that are not rated by any of the three agencies are reflected as not rated.
Availability of Additional Information
At www.jpmorganfunds.com/funddocuments, you can find additional information about the Fund, including the Fund’s:
Prospectus
Financial information
Fund holdings
Proxy voting information
You can also request this information by contacting us at 1-800-480-4111.
ANNUAL SHAREHOLDER REPORT | October 31, 2024 (Unaudited)
JPMorgan Tax Aware Real Return Fund
Class C Shares/Ticker: TXRCX
ANNUAL SHAREHOLDER REPORT
This annual shareholder report contains important information about the JPMorgan Tax Aware Real Return Fund (the "Fund") for the period of November 1, 2023 to October 31, 2024. You can find additional information about the Fund at www.jpmorganfunds.com/funddocuments. You can also request this information by contacting us at 1-800-480-4111 or by sending an e-mail request to Funds.Website.Support@jpmorganfunds.com or by asking any financial intermediary that offers shares of the Fund.
What were the Fund costs for the last year?
(based on a hypothetical $10,000 investment)
| Fund (Class) | Costs of a
$10,000 investment | Costs paid as a percentage
of a $10,000 investment |
JPMorgan Tax Aware Real Return Fund
Class C Shares | $124 | 1.19% |
How did the Fund Perform?
The JPMorgan Tax Aware Real Return Fund's Class C Shares, without a sales charge, returned 7.62% for the year ended October 31, 2024. The Bloomberg US Municipal Index (the "Index") returned 9.70%, the Bloomberg U.S. 1-15 Year Blend (1-17) Municipal Bond Index returned 7.53%, and the Tax Aware Real Return Composite Benchmark Index returned 7.17% for the period.
The Fund’s shorter overall duration detracted from performance, as municipal rates fell across the curve over the period. Generally, when interest rates fall (as they did during the reporting period), bonds of shorter duration will experience less price appreciation than longer duration bonds. Additionally, being overweight to the front end of the curve, specifically the 0-1yr. effective duration bucket, detracted from the Fund's performance.
The Fund’s hedge against inflation, which was implemented using swaps contracts, detracted from the Fund's absolute performance.
The overweight to the long end of the curve, specifically the 10+ year effective duration bucket, was a positive contributor to the Fund's performance as it outperformed over the period.
The overweight to A-rated and BBB-rated bonds was additive to the Fund's performance over the period as they outperformed higher quality bonds. Additionally, the Fund’s overweight to the industrial development revenue/pollution control revenue sector positively contributed to the Fund's performance.
| AVERAGE ANNUAL TOTAL RETURNS | INCEPTION
DATE | 1 YEAR | | 5 YEAR | | 10 YEAR | |
| JPMorgan Tax Aware Real Return Fund Class C Shares | August 31, 2005 | 6.62 | % | 2.00 | % | 1.30 | % |
| JPMorgan Tax Aware Real Return Fund Class C Shares - excluding sales charge | | 7.62 | | 2.00 | | 1.30 | |
| Bloomberg US Municipal Index | | 9.70 | | 1.05 | | 2.30 | |
| Bloomberg U.S. 1-15 Year Blend (1-17) Municipal Bond Index | | 7.53 | | 1.14 | | 2.06 | |
| Tax Aware Real Return Composite Benchmark Index | | 7.17 | | 3.98 | | 3.03 | |
The performance quoted is past performance and is not a guarantee of future results. Mutual funds are subject to certain market risks. Investment returns and principal value of an investment will fluctuate so that an investor’s shares, when redeemed, may be worth more or less than their original cost. Current performance may be higher or lower than the performance data shown. Updated performance information is available by visiting www.jpmorganfunds.com or by calling 1-800-480-4111.
The graph illustrates comparative performance for $10,000 invested in Class C Shares of the JPMorgan Tax Aware Real Return Fund, the Bloomberg US Municipal Index, the Bloomberg U.S. 1-15 Year Blend (1-17) Municipal Bond Index and the Tax Aware Real Return Composite Benchmark Index from October 31, 2014 to October 31, 2024. The performance of the Fund assumes reinvestment of all dividends and capital gain distributions, if any, and does not include a sales charge. The performance of the Bloomberg US Municipal Index, Bloomberg U.S. 1-15 Year Blend (1-17) Municipal Bond Index and the Tax Aware Real Return Composite Benchmark Index does not reflect the deduction of expenses or a sales charge associated with a mutual fund and has been adjusted to reflect reinvestment of all dividends and capital gain distributions of the securities included in the benchmarks, if applicable. The Bloomberg US Municipal Index is a total return performance benchmark for the long-term, investment-grade tax-exempt bond market. The Bloomberg U.S. 1-15 Year Blend (1-17) Municipal Bond Index represents the performance of municipal bonds with maturities from 1 to 17 years. The Tax Aware Real Return Composite Benchmark Index is determined by adding the return of the Bloomberg U.S. 1-15 Year Blend (1-17) Municipal Bond Index and the Bloomberg Inflation Swap 5 Year Zero Coupon Index. Investors cannot invest directly in an index. Effective August 8, 2024, the Fund’s primary benchmark changed from the Bloomberg U.S. 1-15 Year Blend (1-17) Municipal Bond Index to the Bloomberg US Municipal Index, which more closely reflects the Fund’s investment universe.
For some investors, income from municipal bonds may be subject to the Alternative Minimum Tax. Capital gains, if any, are federally taxable. Income may be subject to state and local taxes.
The Tax Aware strategy seeks to minimize shareholders’ tax liability in connection with the Fund’s distribution of realized capital gains. There can be no guarantee the strategy will minimize or eliminate such tax liability.
Fund performance may reflect the waiver of the Fund’s fees and reimbursement of expenses for certain periods since the applicable inception date. Without these waivers and reimbursements, performance would have been lower.
Also, performance shown in this section does not reflect the deduction of taxes that a shareholder would pay on Fund distributions or on gains resulting from redemptions of Fund shares, with the exception of returns noted above as returns after taxes.
Because Class C Shares automatically convert to Class A Shares after 8 years, the 10 year average annual total return shown above for Class C Shares reflects Class A Share's performance for the period after conversion.
The returns shown are based on net asset values calculated for shareholder transactions and may differ from the returns shown in the financial highlights, which reflect adjustments made to the net asset values in accordance with accounting principles generally accepted in the United States of America.
Source: Bloomberg Index Services Limited. BLOOMBERG® is a trademark and service mark of Bloomberg Finance L.P. and its affiliates (collectively "Bloomberg"). Bloomberg or Bloomberg's licensors own all proprietary rights in the Bloomberg Indices. Bloomberg does not approve or endorse this material, or guarantee the accuracy or completeness of any information herein, or make any warranty, express or implied, as to the results to be obtained therefrom and, to the maximum extent allowed by law, shall have any liability or responsibility for injury or damages arising in connection therewith.
| Fund net assets (000's) | $565,838 | |
| Total number of portfolio holdings | 324 | |
| Portfolio turnover rate | 74 | % |
| Total advisory fees paid (000's) | $1,296 | |
CREDIT QUALITY ALLOCATIONS
(% of Total Investments)
The Portfolio manager uses credit quality ratings on underlying securities of the portfolio from three major ratings agencies - S&P, Moody's and Fitch. When calculating the credit quality breakdown, the Portfolio manager selects the middle rating of the agencies when all three agencies rate a security. The Portfolio manager will use the lower of the two ratings if only two agencies rate a security and will use one rating if that is all that is provided. Securities that are not rated by any of the three agencies are reflected as not rated.
Availability of Additional Information
At www.jpmorganfunds.com/funddocuments, you can find additional information about the Fund, including the Fund’s:
Prospectus
Financial information
Fund holdings
Proxy voting information
You can also request this information by contacting us at 1-800-480-4111.
ANNUAL SHAREHOLDER REPORT | October 31, 2024 (Unaudited)
JPMorgan Tax Aware Real Return Fund
Class I Shares/Ticker: TXRIX
ANNUAL SHAREHOLDER REPORT
This annual shareholder report contains important information about the JPMorgan Tax Aware Real Return Fund (the "Fund") for the period of November 1, 2023 to October 31, 2024. You can find additional information about the Fund at www.jpmorganfunds.com/funddocuments. You can also request this information by contacting us at 1-800-480-4111 or by sending an e-mail request to Funds.Website.Support@jpmorganfunds.com or by asking any financial intermediary that offers shares of the Fund.
What were the Fund costs for the last year?
(based on a hypothetical $10,000 investment)
| Fund (Class) | Costs of a
$10,000 investment | Costs paid as a percentage
of a $10,000 investment |
JPMorgan Tax Aware Real Return Fund
Class I Shares | $46 | 0.44% |
How did the Fund Perform?
The JPMorgan Tax Aware Real Return Fund's Class I Shares returned 8.39% for the year ended October 31, 2024. The Bloomberg US Municipal Index (the "Index") returned 9.70%, the Bloomberg U.S. 1-15 Year Blend (1-17) Municipal Bond Index returned 7.53%, and the Tax Aware Real Return Composite Benchmark Index returned 7.17% for the period.
The Fund’s shorter overall duration detracted from performance, as municipal rates fell across the curve over the period. Generally, when interest rates fall (as they did during the reporting period), bonds of shorter duration will experience less price appreciation than longer duration bonds. Additionally, being overweight to the front end of the curve, specifically the 0-1yr. effective duration bucket, detracted from the Fund's performance.
The Fund’s hedge against inflation, which was implemented using swaps contracts, detracted from the Fund's absolute performance.
The overweight to the long end of the curve, specifically the 10+ year effective duration bucket, was a positive contributor to the Fund's performance as it outperformed over the period.
The overweight to A-rated and BBB-rated bonds was additive to the Fund's performance over the period as they outperformed higher quality bonds. Additionally, the Fund’s overweight to the industrial development revenue/pollution control revenue sector positively contributed to the Fund's performance.
| AVERAGE ANNUAL TOTAL RETURNS | INCEPTION
DATE | 1 YEAR | | 5 YEAR | | 10 YEAR | |
| JPMorgan Tax Aware Real Return Fund Class I Shares | August 31, 2005 | 8.39 | % | 2.78 | % | 1.99 | % |
| Bloomberg US Municipal Index | | 9.70 | | 1.05 | | 2.30 | |
| Bloomberg U.S. 1-15 Year Blend (1-17) Municipal Bond Index | | 7.53 | | 1.14 | | 2.06 | |
| Tax Aware Real Return Composite Benchmark Index | | 7.17 | | 3.98 | | 3.03 | |
The performance quoted is past performance and is not a guarantee of future results. Mutual funds are subject to certain market risks. Investment returns and principal value of an investment will fluctuate so that an investor’s shares, when redeemed, may be worth more or less than their original cost. Current performance may be higher or lower than the performance data shown. Updated performance information is available by visiting www.jpmorganfunds.com or by calling 1-800-480-4111.
The graph illustrates comparative performance for $1,000,000 invested in Class I Shares of the JPMorgan Tax Aware Real Return Fund, the Bloomberg US Municipal Index, the Bloomberg U.S. 1-15 Year Blend (1-17) Municipal Bond Index and the Tax Aware Real Return Composite Benchmark Index from October 31, 2014 to October 31, 2024. The performance of the Fund assumes reinvestment of all dividends and capital gain distributions, if any, and does not include a sales charge. The performance of the Bloomberg US Municipal Index, Bloomberg U.S. 1-15 Year Blend (1-17) Municipal Bond Index and the Tax Aware Real Return Composite Benchmark Index does not reflect the deduction of expenses or a sales charge associated with a mutual fund and has been adjusted to reflect reinvestment of all dividends and capital gain distributions of the securities included in the benchmarks, if applicable. The Bloomberg US Municipal Index is a total return performance benchmark for the long-term, investment-grade tax-exempt bond market. The Bloomberg U.S. 1-15 Year Blend (1-17) Municipal Bond Index represents the performance of municipal bonds with maturities from 1 to 17 years. The Tax Aware Real Return Composite Benchmark Index is determined by adding the return of the Bloomberg U.S. 1-15 Year Blend (1-17) Municipal Bond Index and the Bloomberg Inflation Swap 5 Year Zero Coupon Index. Investors cannot invest directly in an index. Effective August 8, 2024, the Fund’s primary benchmark changed from the Bloomberg U.S. 1-15 Year Blend (1-17) Municipal Bond Index to the Bloomberg US Municipal Index, which more closely reflects the Fund’s investment universe.
For some investors, income from municipal bonds may be subject to the Alternative Minimum Tax. Capital gains, if any, are federally taxable. Income may be subject to state and local taxes.
The Tax Aware strategy seeks to minimize shareholders’ tax liability in connection with the Fund’s distribution of realized capital gains. There can be no guarantee the strategy will minimize or eliminate such tax liability.
Fund performance may reflect the waiver of the Fund’s fees and reimbursement of expenses for certain periods since the applicable inception date. Without these waivers and reimbursements, performance would have been lower.
Also, performance shown in this section does not reflect the deduction of taxes that a shareholder would pay on Fund distributions or on gains resulting from redemptions of Fund shares, with the exception of returns noted above as returns after taxes.
The returns shown are based on net asset values calculated for shareholder transactions and may differ from the returns shown in the financial highlights, which reflect adjustments made to the net asset values in accordance with accounting principles generally accepted in the United States of America.
Source: Bloomberg Index Services Limited. BLOOMBERG® is a trademark and service mark of Bloomberg Finance L.P. and its affiliates (collectively "Bloomberg"). Bloomberg or Bloomberg's licensors own all proprietary rights in the Bloomberg Indices. Bloomberg does not approve or endorse this material, or guarantee the accuracy or completeness of any information herein, or make any warranty, express or implied, as to the results to be obtained therefrom and, to the maximum extent allowed by law, shall have any liability or responsibility for injury or damages arising in connection therewith.
| Fund net assets (000's) | $565,838 | |
| Total number of portfolio holdings | 324 | |
| Portfolio turnover rate | 74 | % |
| Total advisory fees paid (000's) | $1,296 | |
CREDIT QUALITY ALLOCATIONS
(% of Total Investments)
The Portfolio manager uses credit quality ratings on underlying securities of the portfolio from three major ratings agencies - S&P, Moody's and Fitch. When calculating the credit quality breakdown, the Portfolio manager selects the middle rating of the agencies when all three agencies rate a security. The Portfolio manager will use the lower of the two ratings if only two agencies rate a security and will use one rating if that is all that is provided. Securities that are not rated by any of the three agencies are reflected as not rated.
Availability of Additional Information
At www.jpmorganfunds.com/funddocuments, you can find additional information about the Fund, including the Fund’s:
Prospectus
Financial information
Fund holdings
Proxy voting information
You can also request this information by contacting us at 1-800-480-4111.
ANNUAL SHAREHOLDER REPORT | October 31, 2024 (Unaudited)
JPMorgan Tax Aware Real Return Fund
Class R6 Shares/Ticker: TXRRX
ANNUAL SHAREHOLDER REPORT
This annual shareholder report contains important information about the JPMorgan Tax Aware Real Return Fund (the "Fund") for the period of November 1, 2023 to October 31, 2024. You can find additional information about the Fund at www.jpmorganfunds.com/funddocuments. You can also request this information by contacting us at 1-800-480-4111 or by sending an e-mail request to Funds.Website.Support@jpmorganfunds.com or by asking any financial intermediary that offers shares of the Fund.
What were the Fund costs for the last year?
(based on a hypothetical $10,000 investment)
| Fund (Class) | Costs of a
$10,000 investment | Costs paid as a percentage
of a $10,000 investment |
JPMorgan Tax Aware Real Return Fund
Class R6 Shares | $36 | 0.34% |
How did the Fund Perform?
The JPMorgan Tax Aware Real Return Fund's Class R6 Shares returned 8.51% for the year ended October 31, 2024. The Bloomberg US Municipal Index (the "Index") returned 9.70%, the Bloomberg U.S. 1-15 Year Blend (1-17) Municipal Bond Index returned 7.53%, and the Tax Aware Real Return Composite Benchmark Index returned 7.17% for the period.
The Fund’s shorter overall duration detracted from performance, as municipal rates fell across the curve over the period. Generally, when interest rates fall (as they did during the reporting period), bonds of shorter duration will experience less price appreciation than longer duration bonds. Additionally, being overweight to the front end of the curve, specifically the 0-1yr. effective duration bucket, detracted from the Fund's performance.
The Fund’s hedge against inflation, which was implemented using swaps contracts, detracted from the Fund's absolute performance.
The overweight to the long end of the curve, specifically the 10+ year effective duration bucket, was a positive contributor to the Fund's performance as it outperformed over the period.
The overweight to A-rated and BBB-rated bonds was additive to the Fund's performance over the period as they outperformed higher quality bonds. Additionally, the Fund’s overweight to the industrial development revenue/pollution control revenue sector positively contributed to the Fund's performance.
| AVERAGE ANNUAL TOTAL RETURNS | INCEPTION
DATE | 1 YEAR | | 5 YEAR | | 10 YEAR | |
| JPMorgan Tax Aware Real Return Fund Class R6 Shares | August 16, 2013 | 8.51 | % | 2.86 | % | 2.08 | % |
| Bloomberg US Municipal Index | | 9.70 | | 1.05 | | 2.30 | |
| Bloomberg U.S. 1-15 Year Blend (1-17) Municipal Bond Index | | 7.53 | | 1.14 | | 2.06 | |
| Tax Aware Real Return Composite Benchmark Index | | 7.17 | | 3.98 | | 3.03 | |
The performance quoted is past performance and is not a guarantee of future results. Mutual funds are subject to certain market risks. Investment returns and principal value of an investment will fluctuate so that an investor’s shares, when redeemed, may be worth more or less than their original cost. Current performance may be higher or lower than the performance data shown. Updated performance information is available by visiting www.jpmorganfunds.com or by calling 1-800-480-4111.
The graph illustrates comparative performance for $5,000,000 invested in Class R6 Shares of the JPMorgan Tax Aware Real Return Fund, the Bloomberg US Municipal Index, the Bloomberg U.S. 1-15 Year Blend (1-17) Municipal Bond Index and the Tax Aware Real Return Composite Benchmark Index from October 31, 2014 to October 31, 2024. The performance of the Fund assumes reinvestment of all dividends and capital gain distributions, if any, and does not include a sales charge. The performance of the Bloomberg US Municipal Index, Bloomberg U.S. 1-15 Year Blend (1-17) Municipal Bond Index and the Tax Aware Real Return Composite Benchmark Index does not reflect the deduction of expenses or a sales charge associated with a mutual fund and has been adjusted to reflect reinvestment of all dividends and capital gain distributions of the securities included in the benchmarks, if applicable. The Bloomberg US Municipal Index is a total return performance benchmark for the long-term, investment-grade tax-exempt bond market. The Bloomberg U.S. 1-15 Year Blend (1-17) Municipal Bond Index represents the performance of municipal bonds with maturities from 1 to 17 years. The Tax Aware Real Return Composite Benchmark Index is determined by adding the return of the Bloomberg U.S. 1-15 Year Blend (1-17) Municipal Bond Index and the Bloomberg Inflation Swap 5 Year Zero Coupon Index. Investors cannot invest directly in an index. Effective August 8, 2024, the Fund’s primary benchmark changed from the Bloomberg U.S. 1-15 Year Blend (1-17) Municipal Bond Index to the Bloomberg US Municipal Index, which more closely reflects the Fund’s investment universe.
For some investors, income from municipal bonds may be subject to the Alternative Minimum Tax. Capital gains, if any, are federally taxable. Income may be subject to state and local taxes.
The Tax Aware strategy seeks to minimize shareholders’ tax liability in connection with the Fund’s distribution of realized capital gains. There can be no guarantee the strategy will minimize or eliminate such tax liability.
Fund performance may reflect the waiver of the Fund’s fees and reimbursement of expenses for certain periods since the applicable inception date. Without these waivers and reimbursements, performance would have been lower.
Also, performance shown in this section does not reflect the deduction of taxes that a shareholder would pay on Fund distributions or on gains resulting from redemptions of Fund shares, with the exception of returns noted above as returns after taxes.
The returns shown are based on net asset values calculated for shareholder transactions and may differ from the returns shown in the financial highlights, which reflect adjustments made to the net asset values in accordance with accounting principles generally accepted in the United States of America.
Source: Bloomberg Index Services Limited. BLOOMBERG® is a trademark and service mark of Bloomberg Finance L.P. and its affiliates (collectively "Bloomberg"). Bloomberg or Bloomberg's licensors own all proprietary rights in the Bloomberg Indices. Bloomberg does not approve or endorse this material, or guarantee the accuracy or completeness of any information herein, or make any warranty, express or implied, as to the results to be obtained therefrom and, to the maximum extent allowed by law, shall have any liability or responsibility for injury or damages arising in connection therewith.
| Fund net assets (000's) | $565,838 | |
| Total number of portfolio holdings | 324 | |
| Portfolio turnover rate | 74 | % |
| Total advisory fees paid (000's) | $1,296 | |
CREDIT QUALITY ALLOCATIONS
(% of Total Investments)
The Portfolio manager uses credit quality ratings on underlying securities of the portfolio from three major ratings agencies - S&P, Moody's and Fitch. When calculating the credit quality breakdown, the Portfolio manager selects the middle rating of the agencies when all three agencies rate a security. The Portfolio manager will use the lower of the two ratings if only two agencies rate a security and will use one rating if that is all that is provided. Securities that are not rated by any of the three agencies are reflected as not rated.
Availability of Additional Information
At www.jpmorganfunds.com/funddocuments, you can find additional information about the Fund, including the Fund’s:
Prospectus
Financial information
Fund holdings
Proxy voting information
You can also request this information by contacting us at 1-800-480-4111.
ITEM 2. CODE OF ETHICS.
Disclose whether, as of the end of the period covered by the report, the registrant has adopted a code of ethics that applies to the registrant’s principal executive officer, principal financial officer, principal accounting officer or controller, or persons performing similar functions, regardless of whether these individuals are employed by the registrant or a third party. If the registrant has not adopted such a code of ethics, explain why it has not done so.
The registrant must briefly describe the nature of any amendment, during the period covered by the report, to a provision of its code of ethics that applies to the registrant’s principal executive officer, principal financial officer, principal accounting officer or controller, or persons performing similar functions, regardless of whether these individuals are employed by the registrant or a third party, and that relates to any element of the code of ethics definition enumerated in paragraph (b) of this Item. The registrant must file a copy of any such amendment as an exhibit pursuant to Item 13(a)(1), unless the registrant has elected to satisfy paragraph (f) of this Item by positing its code of ethics on its website pursuant to paragraph (f)(2) of this Item, or by undertaking to provide its code of ethics to any person without charge, upon request, pursuant to paragraph (f)(3) of this Item.
If the registrant has, during the period covered by the report, granted a waiver, including an implicit waiver, from a provision of the code of ethics that applies to the registrant’s principal executive officer, principal financial officer, principal accounting officer or controller, or persons performing similar functions, regardless of whether these individuals are employed by the registrant or third party, that relates to one or more items set forth in paragraph (b) of this Item, the registrant must briefly describe the nature of the waiver, the name of the person to whom the waiver was granted, and the date of the waiver.
The Registrant has adopted a code of ethics that applies to the Registrant’s principal executive officer and principal financial officer. There were no amendments to the code of ethics or waivers granted with respect to the code of ethics in the period covered by the report.
ITEM 3. AUDIT COMMITTEE FINANCIAL EXPERT.
(a) (1) Disclose that the registrant’s board of directors has determined that the registrant either:
(i) Has at least one audit committee financial expert serving on its audit committee; or
(ii) Does not have an audit committee financial expert serving on its audit committee.
The Registrant’s Board of Trustees has determined that the Registrant has at least one audit committee financial expert serving on its audit committee. The Securities and Exchange Commission has stated that the designation or identification of a person as an audit committee financial expert pursuant to this Item 3 of Form N-CSR does not impose on such person any duties, obligations or liabilities that are greater than the duties, obligations and liabilities imposed on such person as a member of the Audit Committee and the Board of Trustees in the absence of such designation or identification.
(2) If the registrant provides the disclosure required by paragraph (a)(1)(i) of this Item, it must disclose the name of the audit committee financial expert and whether that person is “independent.” In order to be considered “independent” for purposes of this Item, a member of an audit committee may not, other than in his or her capacity as a member of the audit committee, the board of directors, or any other board committee:
(i) Accept directly or indirectly any consulting, advisory, or other compensatory fee from the issuer; or
(ii) Be an “interested person” of the investment company as defined in Section 2(a)(19) of the Act (15 U.S.C. 80a-2(a)(19)).
The Audit committee financial experts are Gary L. French, Kathleen M. Gallagher, Raymond Kanner and Lawrence R. Maffia, each of whom is not an “interested person” of the Registrant and is also “independent” as defined by the U.S. Securities and Exchange Commission for the purposes of the audit committee financial expert determination.
(3) If the registrant provides the disclosure required by paragraph (a)(1)(ii) of this Item, it must explain why it does not have an audit committee financial expert.
Not applicable.
ITEM 4. PRINCIPAL ACCOUNTANT FEES AND SERVICES.
(a) Disclose, under the caption Audit Fees, the aggregate fees billed for each of the last two fiscal years for professional services rendered by the principal accountant for the audit of the registrant’s annual financial statements or services that are normally provided by the accountant in connection with statutory and regulatory filings or engagements for those fiscal years.
AUDIT FEES
2024 – $596,214
2023 – $625,893
(b) Disclose, under the caption Audit-Related Fees, the aggregate fees billed in each of the last two fiscal years for assurance and related services by the principal accountant that are reasonably related to the performance of the audit of the registrant’s financial statements and are not reported under paragraph (a) of this Item. Registrants shall describe the nature of the services comprising the fees disclosed under this category.
AUDIT-RELATED FEES
2024 – $101,669
2023 – $105,514
Audit-related fees consists of security count procedures performed as required under Rule 17f-2 of the Investment Company Act of 1940 during the Registrant’s fiscal year.
(c) Disclose, under the caption Tax Fees, the aggregate fees billed in each of the last two fiscal years for professional services rendered by the principal accountant for tax compliance, tax advice, and tax planning. Registrants shall describe the nature of the services comprising the fees disclosed under this category.
TAX FEES
2024 – $128,864
2023 – $153,757
The tax fees consist of fees billed in connection with preparing the federal regulated investment company income tax returns for the Registrant for the tax years ended October 31, 2024 and 2023, respectively.
For the last fiscal year, no tax fees were required to be approved pursuant to paragraph (c)(7)(ii) of Rule 2-01 of Regulation S-X.
(d) Disclose, under the caption All Other Fees, the aggregate fees billed in each of the last two fiscal years for products and services provided by the principal accountant, other than the services reported in paragraphs (a) through (c) of this Item. Registrants shall describe the nature of the services comprising the fees disclosed under this category.
ALL OTHER FEES
2024 – Not applicable
2023 – Not applicable
(e) (1) Disclose the audit committee’s pre-approval policies and procedures described in paragraph (c)(7) of Rule 2-01 of Regulation S-X.
Pursuant to the Registrant’s Audit Committee Charter and written policies and procedures for the pre-approval of audit and non-audit services (the “Pre-approval Policy”), the Audit Committee pre-approves all audit and non-audit services performed by the Registrant’s independent public registered accounting firm for the Registrant. In addition, the Audit Committee pre-approves the auditor’s engagement for non-audit services with the Registrant’s investment adviser (not including a sub-adviser whose role is primarily portfolio management and is sub-contracted or overseen by another investment adviser) and any Service Affiliate in accordance with paragraph (c)(7)(ii) of Rule 2-01 of Regulation S-X, if the engagement relates directly to the operations and financial reporting of the Registrant. Proposed services may be pre-approved either 1) without consideration of specific case-by-case services or 2) require the specific pre-approval of the Audit Committee. Therefore, initially the Pre-approval Policy listed a number of audit and non-audit services that have been approved by the Audit Committee, or which were not subject to pre-approval under the transition provisions of Sarbanes-Oxley Act of 2002 (the
“Pre-approval List”). The Audit Committee annually reviews and pre-approves the services included on the Pre-approval List that may be provided by the independent public registered accounting firm without obtaining additional specific pre-approval of individual services from the Audit Committee. The Audit Committee adds to, or subtracts from, the list of general pre-approved services from time to time, based on subsequent determinations. All other audit and non-audit services not on the Pre-approval List must be specifically pre-approved by the Audit Committee.
One or more members of the Audit Committee may be appointed as the Committee’s delegate for the purposes of considering whether to approve such services. Any pre-approvals granted by the delegate will be reported, for informational purposes only, to the Audit Committee at its next scheduled meeting. The Audit Committee’s responsibilities to pre-approve services performed by the independent public registered accounting firm are not delegated to management.
(2) Disclose the percentage of services described in each of paragraphs (b) through (d) of this Item that were approved by the audit committee pursuant to paragraph (c)(7)(i)(C) of Rule 2-01 of Regulation S-X.
2024 – 0.0%
2023 – 0.0%
(f) If greater than 50 percent, disclose the percentage of hours expended on the principal accountant’s engagement to audit the registrant’s financial statements for the most recent fiscal year that were attributed to work performed by persons other than the principal accountant’s full-time, permanent employees.
Not applicable—Less than 50%.
(g) Disclose the aggregate non-audit fees billed by the registrant’s accountant for services rendered to the registrant, and rendered to the registrant’s investment adviser (not including any sub-adviser whose role is primarily portfolio management and is subcontracted with or overseen by another investment adviser), and any entity controlling, controlled by, or under common control with the adviser that provides ongoing services to the registrant for each of the last two fiscal years of the registrant.
The aggregate non-audit fees billed by the independent registered public accounting firm for services rendered to the Registrant, and rendered to Service Affiliates, for the last two calendar year ends were:
2023 - $35.1 million
2022 - $31.9 million
(h) Disclose whether the registrant’s audit committee of the board of directors has considered whether the provision of non-audit services that were rendered to the registrant’s investment adviser (not including any subadviser whose role is primarily portfolio management and is subcontracted with or overseen by another investment adviser), and any entity controlling, controlled by, or under common control with the investment adviser that provides ongoing services to the registrant that were not pre-approved pursuant to paragraph (c)(7)(ii) of Rule 2-01 of Regulation S-X is compatible with maintaining the principal accountant’s independence.
The Registrant’s Audit Committee has considered whether the provision of the non-audit services that were rendered to Service Affiliates that were not pre-approved (not requiring pre-approval) is compatible with maintaining the independent public registered accounting firm’s independence. All services provided by the independent public registered accounting firm to the Registrant or to Service Affiliates that were required to be pre-approved were pre-approved as required.
(i) A registrant identified by the Commission pursuant to Section 104(i)(2)(A) of the Sarbanes-Oxley Act of 2002 (15 U.S.C. 7214(i)(2)(A)), as having retained, for the preparation of the audit report on its financial statements included in the Form NCSR, a registered public accounting firm that has a branch or office that is located in a foreign jurisdiction and that the Public Company Accounting Oversight Board has determined it is unable to inspect or investigate completely because of a position taken by an authority in the foreign jurisdiction must electronically submit to the Commission on a supplemental basis documentation that establishes that the registrant is not owned or controlled by a governmental entity in the foreign jurisdiction. The registrant must submit this documentation on or before the due date for this form. A registrant that is owned or controlled by a foreign governmental entity is not required to submit such documentation.
Not applicable.
(j) A registrant that is a foreign issuer, as defined in 17 CFR 240.3b-4, identified by the Commission pursuant to Section 104(i)(2)(A) of the Sarbanes-Oxley Act of 2002 (15 U.S.C. 7214(i)(2)(A)), as having retained, for the preparation of the audit report on its financial statements included in the Form N-CSR, a registered public accounting firm that has a branch or office that is located in a foreign jurisdiction and that the Public Company Accounting Oversight Board has determined it is unable to inspect or investigate completely because of a position taken by an authority in the foreign jurisdiction, for each year in which the registrant is so identified, must provide the below disclosures. Also, any such identified foreign issuer that uses a variable-interest entity or any similar structure that results in additional foreign entities being consolidated in the financial statements of the registrant is required to provide the below disclosures for itself and its consolidated foreign operating entity or entities. A registrant must disclose:
| | (1) | That, for the immediately preceding annual financial statement period, a registered public accounting firm that the PCAOB was unable to inspect or investigate completely, because of a position taken by an authority in the foreign jurisdiction, issued an audit report for the registrant; |
| | (2) | The percentage of shares of the registrant owned by governmental entities in the foreign jurisdiction in which the registrant is incorporated or otherwise organized; |
| | (3) | Whether governmental entities in the applicable foreign jurisdiction with respect to that registered public accounting firm have a controlling financial interest with respect to the registrant; |
| | (4) | The name of each official of the Chinese Communist Party who is a member of the board of directors of the registrant or the operating entity with respect to the registrant; and |
| | (5) | Whether the articles of incorporation of the registrant (or equivalent organizing document) contains any charter of the Chinese Communist Party, including the text of any such charter. |
Not applicable.
ITEM 5. AUDIT COMMITTEE OF LISTED REGISTRANTS.
(a) If the registrant is a listed issuer as defined in Rule 10A-3 under the Exchange Act (17CFR 240.10A-3), state whether or not the registrant has a separately-designated standing audit committee established in accordance with Section 3(a)(58)(A) of the Exchange Act (15 U.S.C. 78c(a)(58)(A)). If the registrant has such a committee, however designated, identify each committee member. If the entire board of directors is acting as the registrant’s audit committee as specified in Section 3(a)(58)(B) of the Exchange Act (15 U.S.C. 78c(a)(58)(B)), so state.
(b) If applicable, provide the disclosure required by Rule 10A-3(d) under the Exchange Act (17CFR 240.10A-3(d)) regarding an exemption from the listing standards for all audit committees.
Not applicable.
ITEM 6. INVESTMENTS.
File Schedule I – Investments in securities of unaffiliated issuers as of the close of the reporting period as set forth in Section 210.12-12 of Regulation S-X, unless the schedule is included as part of the report to shareholders filed under Item 1 of this Form.
Included in Item 1.
ITEM 7. FINANCIAL STATEMENTS AND FINANCIAL HIGHLIGHTS FOR OPEN-END MANAGEMENT INVESTMENT COMPANIES
Annual Financial Statements
J.P. Morgan International Equity Funds
October 31, 2024
JPMorgan Developed International Value Fund |
JPMorgan Emerging Markets Equity Fund |
JPMorgan Emerging Markets Research Enhanced Equity Fund |
JPMorgan Europe Dynamic Fund |
JPMorgan International Equity Fund |
JPMorgan International Focus Fund |
JPMorgan International Hedged Equity Fund |
CONTENTS
Investments in a Fund are not deposits or obligations of, or guaranteed or endorsed by, any bank and are not insured or guaranteed by the FDIC, the Federal Reserve Board or any other government agency. You could lose money if you sell when a Fund’s share price is lower than when you invested.
Past performance is no guarantee of future performance. The general market views expressed in this report are opinions based on market and other conditions through the end of the reporting period and are subject to change without notice. These views are not intended to predict the future performance of a Fund or the securities markets.
Prospective investors should refer to the Funds’ prospectuses for a discussion of the Funds’ investment objectives, strategies and risks. Call J.P. Morgan Funds Service Center at 1-800-480-4111 for a prospectus containing more complete information about a Fund, including management fees and other expenses. Please read it carefully before investing.
JPMorgan Developed International Value Fund
SCHEDULE OF PORTFOLIO INVESTMENTSAS OF October 31, 2024
| | |
|
|
| | |
| | |
| | |
| | |
| | |
| | |
| | |
Ventia Services Group Pty. Ltd. | | |
| | |
|
| | |
| | |
| | |
| | |
| | |
|
| | |
| | |
| | |
| | |
| | |
|
BOC Hong Kong Holdings Ltd. | | |
Yangzijiang Shipbuilding Holdings Ltd. | | |
| | |
|
| | |
| | |
| | |
| | |
Jyske Bank A/S (Registered) | | |
| | |
| | |
|
| | |
| | |
| | |
| | |
| | |
| | |
| | |
|
|
| | |
| | |
| | |
| | |
Cie Generale des Etablissements Michelin SCA | | |
| | |
| | |
| | |
| | |
| | |
| | |
| | |
| | |
| | |
Television Francaise 1 SA | | |
| | |
Unibail-Rodamco-Westfield, REIT | | |
| | |
| | |
| | |
| | |
|
Bank of Georgia Group plc | | |
|
| | |
| | |
| | |
Deutsche Bank AG (Registered) | | |
Deutsche Telekom AG (Registered) | | |
| | |
| | |
| | |
Fresenius SE & Co. KGaA * | | |
| | |
Henkel AG & Co. KGaA (Preference) | | |
| | |
Hornbach Holding AG & Co. KGaA | | |
| | |
| | |
Muenchener Rueckversicherungs-Gesellschaft AG (Registered) | | |
| | |
| | |
SEE NOTES TO FINANCIAL STATEMENTS.
| J.P. Morgan International Equity Funds | |
JPMorgan Developed International Value Fund
SCHEDULE OF PORTFOLIO INVESTMENTSAS OF October 31, 2024 (continued)
| | |
Common Stocks — continued |
|
| | |
| | |
| | |
| | |
| | |
|
| | |
Pacific Basin Shipping Ltd. | | |
| | |
United Laboratories International Holdings Ltd. (The) | | |
| | |
|
| | |
| | |
Bank of Ireland Group plc | | |
| | |
Glenveagh Properties plc * (a) | | |
| | |
| | |
|
| | |
|
| | |
Banca Monte dei Paschi di Siena SpA | | |
| | |
| | |
| | |
| | |
Danieli & C Officine Meccaniche SpA | | |
| | |
| | |
| | |
| | |
Mediobanca Banca di Credito Finanziario SpA | | |
MFE-MediaForEurope NV, Class B | | |
| | |
| | |
| | |
| | |
| | |
|
|
| | |
| | |
| | |
|
Asahi Group Holdings Ltd. | | |
Cosmo Energy Holdings Co. Ltd. | | |
| | |
Dai-ichi Life Holdings, Inc. | | |
Daiwa Securities Group, Inc. | | |
| | |
Furukawa Electric Co. Ltd. | | |
Hokkaido Electric Power Co., Inc. | | |
| | |
| | |
| | |
| | |
| | |
| | |
| | |
Kansai Electric Power Co., Inc. (The) | | |
| | |
| | |
| | |
| | |
Mitsubishi UFJ Financial Group, Inc. | | |
| | |
Mizuho Financial Group, Inc. | | |
| | |
MS&AD Insurance Group Holdings, Inc. | | |
| | |
Nomura Real Estate Holdings, Inc. | | |
| | |
| | |
| | |
| | |
Sega Sammy Holdings, Inc. | | |
| | |
| | |
SKY Perfect JSAT Holdings, Inc. | | |
| | |
| | |
| | |
Sumitomo Electric Industries Ltd. | | |
SEE NOTES TO FINANCIAL STATEMENTS.
| J.P. Morgan International Equity Funds | |
| | |
Common Stocks — continued |
|
Sumitomo Forestry Co. Ltd. | | |
Sumitomo Mitsui Financial Group, Inc. | | |
Sumitomo Realty & Development Co. Ltd. | | |
| | |
| | |
Tokyo Steel Manufacturing Co. Ltd. | | |
| | |
Tokyu Fudosan Holdings Corp. | | |
| | |
| | |
| | |
Yokohama Rubber Co. Ltd. (The) | | |
| | |
|
ABN AMRO Bank NV, CVA (a) | | |
| | |
| | |
Eurocommercial Properties NV, REIT | | |
| | |
| | |
Koninklijke Heijmans N.V., CVA | | |
| | |
| | |
| | |
| | |
|
| | |
| | |
| | |
| | |
| | |
| | |
Wallenius Wilhelmsen ASA (b) | | |
| | |
|
| | |
|
Banco Comercial Portugues SA, Class R | | |
|
| | |
| | |
| | |
|
|
Oversea-Chinese Banking Corp. Ltd. | | |
United Overseas Bank Ltd. | | |
| | |
|
Banco Bilbao Vizcaya Argentaria SA | | |
| | |
| | |
| | |
| | |
| | |
| | |
| | |
|
| | |
| | |
| | |
| | |
| | |
Skandinaviska Enskilda Banken AB, Class A | | |
Storskogen Group AB, Class B | | |
Svenska Handelsbanken AB, Class A | | |
| | |
| | |
| | |
| | |
|
| | |
| | |
Zurich Insurance Group AG | | |
| | |
|
| | |
| | |
| | |
| | |
| | |
| | |
British American Tobacco plc | | |
British Land Co. plc (The), REIT | | |
| | |
| | |
| | |
SEE NOTES TO FINANCIAL STATEMENTS.
| J.P. Morgan International Equity Funds | |
JPMorgan Developed International Value Fund
SCHEDULE OF PORTFOLIO INVESTMENTSAS OF October 31, 2024 (continued)
| | |
Common Stocks — continued |
United Kingdom — continued |
| | |
Great Portland Estates plc, REIT | | |
| | |
| | |
| | |
| | |
| | |
| | |
| | |
International Consolidated Airlines Group SA | | |
| | |
| | |
| | |
| | |
| | |
| | |
Land Securities Group plc, REIT | | |
| | |
| | |
Marks & Spencer Group plc | | |
| | |
| | |
| | |
Paragon Banking Group plc | | |
| | |
| | |
Shaftesbury Capital plc, REIT | | |
| | |
| | |
| | |
| | |
| | |
Watches of Switzerland Group plc * (c) | | |
| | |
|
| | |
| | |
| | |
| | |
| | |
| | |
| | |
| | |
|
United States — continued |
| | |
| | |
| | |
Total Common Stocks
(Cost $501,833) | | |
Short-Term Investments — 5.2% |
Investment Companies — 4.9% |
JPMorgan Prime Money Market Fund Class Institutional Shares, 4.81% (d) (e)
(Cost $31,320) | | |
Investment of Cash Collateral from Securities Loaned — 0.3% |
JPMorgan Securities Lending Money Market Fund Agency SL Class Shares, 4.85% (d) (e)(Cost $1,743) | | |
Total Short-Term Investments
(Cost $33,063) | | |
Total Investments — 99.8%
(Cost $534,896) | | |
Other Assets in Excess of Liabilities — 0.2% | | |
| | |
Percentages indicated are based on net assets. |
| |
| Certificaten Van Aandelen (Dutch Certificate) |
| |
| A special type of equity investment that shares in the earnings of the company, has limited voting rights, and may have a dividend preference. Preference shares may also have liquidation preference. |
| Real Estate Investment Trust |
| Limited partnership with share capital |
| Non-income producing security. |
| Security exempt from registration pursuant to Regulation S under the Securities Act of 1933, as amended. Regulation S applies to securities offerings that are made outside of the United States and do not involve direct selling efforts in the United States and as such may have restrictions on resale. |
| The security or a portion of this security is on loan at October 31, 2024. The total value of securities on loan at October 31, 2024 is $1,666. |
| Securities exempt from registration under Rule 144A or section 4(a)(2), of the Securities Act of 1933, as amended. |
SEE NOTES TO FINANCIAL STATEMENTS.
| J.P. Morgan International Equity Funds | |
| Investment in an affiliated fund, which is registered under the Investment Company Act of 1940, as amended, and is advised by J.P. Morgan Investment Management Inc. |
| The rate shown is the current yield as of October 31, 2024. |
Summary of Investments by Industry, October 31, 2024
The following table represents the portfolio investments of the Fund by industry classifications as a percentage of total investments:
| PERCENT OF
TOTAL
INVESTMENTS |
| |
| |
| |
Oil, Gas & Consumable Fuels | |
| |
Construction & Engineering | |
Trading Companies & Distributors | |
Diversified Telecommunication Services | |
| |
| |
| |
Real Estate Management & Development | |
| |
| |
| |
| |
| |
Energy Equipment & Services | |
| |
| |
| |
Wireless Telecommunication Services | |
Consumer Staples Distribution & Retail | |
| |
| |
Others (each less than 1.0%) | |
| |
SEE NOTES TO FINANCIAL STATEMENTS.
| J.P. Morgan International Equity Funds | |
JPMorgan Developed International Value Fund
SCHEDULE OF PORTFOLIO INVESTMENTSAS OF October 31, 2024 (continued)
Futures contracts outstanding as of October 31, 2024 (amounts in thousands, except number of contracts):
| | | | | VALUE AND
UNREALIZED
APPRECIATION
(DEPRECIATION) ($) |
| | | | | |
| | | | | |
| | | | | |
| | | | | |
| | | | | |
| |
| |
| Financial Times and the London Stock Exchange |
| |
| |
| |
SEE NOTES TO FINANCIAL STATEMENTS.
| J.P. Morgan International Equity Funds | |
JPMorgan Emerging Markets Equity Fund
SCHEDULE OF PORTFOLIO INVESTMENTSAS OF October 31, 2024
| | |
|
|
| | |
Itau Unibanco Holding SA, ADR | | |
| | |
NU Holdings Ltd., Class A * | | |
Petroleo Brasileiro SA, ADR | | |
| | |
| | |
| | |
|
Alibaba Group Holding Ltd., ADR | | |
Contemporary Amperex Technology Co. Ltd., Class A | | |
Full Truck Alliance Co. Ltd., ADR | | |
Fuyao Glass Industry Group Co. Ltd., Class A | | |
| | |
Jiangsu Hengli Hydraulic Co. Ltd., Class A | | |
| | |
Kweichow Moutai Co. Ltd., Class A | | |
Midea Group Co. Ltd., Class A | | |
Montage Technology Co. Ltd., Class A | | |
PDD Holdings, Inc., ADR * | | |
Shenzhen Mindray Bio-Medical Electronics Co. Ltd., Class A | | |
Shenzhou International Group Holdings Ltd. | | |
| | |
Trip.com Group Ltd., ADR * | | |
Wuliangye Yibin Co. Ltd., Class A | | |
| | |
| | |
|
National Bank of Greece SA | | |
|
| | |
Techtronic Industries Co. Ltd. | | |
Techtronic Industries Co. Ltd. | | |
| | |
|
Apollo Hospitals Enterprise Ltd. | | |
| | |
| | |
| | |
| | |
| | |
| | |
|
|
Hindustan Aeronautics Ltd. (a) | | |
| | |
| | |
| | |
| | |
| | |
| | |
| | |
Tata Consultancy Services Ltd. | | |
| | |
| | |
| | |
|
Bank Central Asia Tbk. PT | | |
Bank Rakyat Indonesia Persero Tbk. PT | | |
| | |
|
| | |
|
Fomento Economico Mexicano SAB de CV, ADR | | |
Grupo Financiero Banorte SAB de CV, Class O | | |
| | |
Vista Energy SAB de CV, ADR * | | |
Wal-Mart de Mexico SAB de CV | | |
| | |
|
Copa Holdings SA, Class A | | |
|
| | |
|
| | |
Capitec Bank Holdings Ltd. | | |
| | |
| | |
|
Hanwha Aerospace Co. Ltd. | | |
Hanwha Industrial Solutions Co. Ltd. * | | |
| | |
SEE NOTES TO FINANCIAL STATEMENTS.
| J.P. Morgan International Equity Funds | |
JPMorgan Emerging Markets Equity Fund
SCHEDULE OF PORTFOLIO INVESTMENTSAS OF October 31, 2024 (continued)
| | |
Common Stocks — continued |
|
Samsung Electronics Co. Ltd. | | |
| | |
| | |
|
Banco Bilbao Vizcaya Argentaria SA | | |
|
ASE Technology Holding Co. Ltd. | | |
Chailease Holding Co. Ltd. | | |
| | |
| | |
Taiwan Semiconductor Manufacturing Co. Ltd., ADR | | |
Taiwan Semiconductor Manufacturing Co. Ltd. | | |
| | |
| | |
|
Aselsan Elektronik Sanayi ve Ticaret A/S | | |
BIM Birlesik Magazalar A/S | | |
| | |
Turkiye Garanti Bankasi A/S | | |
Yapi ve Kredi Bankasi A/S | | |
| | |
|
| | |
Total Common Stocks
(Cost $5,015,090) | | |
Short-Term Investments — 1.3% |
Investment Companies — 1.3% |
JPMorgan Prime Money Market Fund Class Institutional Shares, 4.81% (b) (c)
(Cost $89,923) | | |
Total Investments — 100.4%
(Cost $5,105,013) | | |
Liabilities in Excess of Other Assets — (0.4)% | | |
| | |
Percentages indicated are based on net assets. |
| |
| American Depositary Receipt |
| Limited liability company |
| |
| Non-income producing security. |
| Security exempt from registration pursuant to Regulation S under the Securities Act of 1933, as amended. Regulation S applies to securities offerings that are made outside of the United States and do not involve direct selling efforts in the United States and as such may have restrictions on resale. |
| Investment in an affiliated fund, which is registered under the Investment Company Act of 1940, as amended, and is advised by J.P. Morgan Investment Management Inc. |
| The rate shown is the current yield as of October 31, 2024. |
Summary of Investments by Industry, October 31, 2024
The following table represents the portfolio investments of the Fund by industry classifications as a percentage of total investments:
| PERCENT OF
TOTAL
INVESTMENTS |
| |
Semiconductors & Semiconductor Equipment | |
Interactive Media & Services | |
Consumer Staples Distribution & Retail | |
| |
Hotels, Restaurants & Leisure | |
Technology Hardware, Storage & Peripherals | |
| |
| |
| |
| |
| |
| |
| |
Oil, Gas & Consumable Fuels | |
| |
Independent Power and Renewable Electricity Producers | |
| |
| |
Electronic Equipment, Instruments & Components | |
| |
Others (each less than 1.0%) | |
| |
SEE NOTES TO FINANCIAL STATEMENTS.
| J.P. Morgan International Equity Funds | |
JPMorgan Emerging Markets Research Enhanced Equity Fund
SCHEDULE OF PORTFOLIO INVESTMENTSAS OF October 31, 2024
| | |
|
|
Raiffeisen Bank International AG | | |
|
| | |
B3 SA - Brasil Bolsa Balcao | | |
Banco Bradesco SA (Preference) | | |
| | |
| | |
BB Seguridade Participacoes SA | | |
Centrais Eletricas Brasileiras SA | | |
Cia de Saneamento Basico do Estado de Sao Paulo SABESP | | |
Cia Energetica de Minas Gerais (Preference) | | |
| | |
Itau Unibanco Holding SA (Preference) | | |
| | |
| | |
| | |
| | |
NU Holdings Ltd., Class A * | | |
Petroleo Brasileiro SA (Preference) | | |
| | |
| | |
| | |
| | |
| | |
| | |
| | |
| | |
| | |
|
Banco Santander Chile, ADR | | |
|
Agricultural Bank of China Ltd., Class H | | |
Alibaba Group Holding Ltd. | | |
Aluminum Corp. of China Ltd., Class H | | |
Amoy Diagnostics Co. Ltd., Class A | | |
Anker Innovations Technology Co. Ltd., Class A | | |
ANTA Sports Products Ltd. | | |
| | |
| | |
Bank of China Ltd., Class H | | |
| | |
BOE Technology Group Co. Ltd., Class A | | |
| | |
|
|
| | |
BYD Electronic International Co. Ltd. | | |
CGN Power Co. Ltd., Class H (a) | | |
China Construction Bank Corp., Class H | | |
China International Capital Corp. Ltd., Class H (a) | | |
China Life Insurance Co. Ltd., Class H | | |
China Mengniu Dairy Co. Ltd. | | |
China Merchants Bank Co. Ltd., Class A | | |
China Merchants Bank Co. Ltd., Class H | | |
China Oilfield Services Ltd., Class H | | |
China Overseas Land & Investment Ltd. | | |
China Pacific Insurance Group Co. Ltd., Class H | | |
China Petroleum & Chemical Corp., Class H | | |
China Resources Gas Group Ltd. | | |
China Resources Land Ltd. | | |
China Resources Mixc Lifestyle Services Ltd. (a) | | |
China Resources Sanjiu Medical & Pharmaceutical Co. Ltd., Class A | | |
China Shenhua Energy Co. Ltd., Class H | | |
China Yangtze Power Co. Ltd., Class A | | |
CITIC Securities Co. Ltd., Class H | | |
Contemporary Amperex Technology Co. Ltd., Class A | | |
COSCO SHIPPING Holdings Co. Ltd., Class A | | |
| | |
Flat Glass Group Co. Ltd., Class H | | |
Foxconn Industrial Internet Co. Ltd., Class A | | |
Full Truck Alliance Co. Ltd., ADR | | |
Fuyao Glass Industry Group Co. Ltd., Class H (a) | | |
Ganfeng Lithium Group Co. Ltd. (a) | | |
GRG Banking Equipment Co. Ltd., Class A | | |
| | |
| | |
Haier Smart Home Co. Ltd., Class H | | |
Haitian International Holdings Ltd. | | |
Hongfa Technology Co. Ltd., Class A | | |
Industrial & Commercial Bank of China Ltd., Class H | | |
Inner Mongolia Yili Industrial Group Co. Ltd., Class A | | |
| | |
Jiangsu Hengli Hydraulic Co. Ltd., Class A | | |
Jiangsu Hengrui Pharmaceuticals Co. Ltd., Class A | | |
| | |
| | |
Kuaishou Technology * (a) | | |
Kweichow Moutai Co. Ltd., Class A | | |
SEE NOTES TO FINANCIAL STATEMENTS.
| J.P. Morgan International Equity Funds | |
JPMorgan Emerging Markets Research Enhanced Equity Fund
SCHEDULE OF PORTFOLIO INVESTMENTSAS OF October 31, 2024 (continued)
| | |
Common Stocks — continued |
|
| | |
Luzhou Laojiao Co. Ltd., Class A | | |
| | |
Midea Group Co. Ltd., Class A | | |
Montage Technology Co. Ltd., Class A | | |
| | |
Nongfu Spring Co. Ltd., Class H (a) | | |
PDD Holdings, Inc., ADR * | | |
PetroChina Co. Ltd., Class H | | |
PICC Property & Casualty Co. Ltd., Class H | | |
Ping An Insurance Group Co. of China Ltd., Class H | | |
Postal Savings Bank of China Co. Ltd., Class H (a) | | |
Sany Heavy Industry Co. Ltd., Class A | | |
Shanghai Baosight Software Co. Ltd., Class A | | |
Shenzhen Mindray Bio-Medical Electronics Co. Ltd., Class A | | |
Shenzhou International Group Holdings Ltd. | | |
| | |
Sinopharm Group Co. Ltd., Class H | | |
Sunny Optical Technology Group Co. Ltd. | | |
Sunresin New Materials Co. Ltd., Class A | | |
| | |
Tencent Music Entertainment Group, ADR | | |
Tianshan Aluminum Group Co. Ltd., Class A | | |
Tingyi Cayman Islands Holding Corp. | | |
Trip.com Group Ltd., ADR * | | |
| | |
Weichai Power Co. Ltd., Class H | | |
Wuliangye Yibin Co. Ltd., Class A | | |
Xiaomi Corp., Class B * (a) | | |
Xinyi Solar Holdings Ltd. | | |
| | |
| | |
Yum China Holdings, Inc. (b) | | |
| | |
Zhejiang Dingli Machinery Co. Ltd., Class A | | |
Zhejiang Jingsheng Mechanical & Electrical Co. Ltd., Class A | | |
Zhuzhou CRRC Times Electric Co. Ltd., Class H | | |
Zijin Mining Group Co. Ltd., Class H | | |
| | |
| | |
| | |
|
|
| | |
| | |
| | |
|
| | |
|
Alpha Services and Holdings SA | | |
Hellenic Telecommunications Organization SA | | |
Metlen Energy & Metals SA | | |
National Bank of Greece SA | | |
| | |
Piraeus Financial Holdings SA | | |
| | |
| | |
|
Techtronic Industries Co. Ltd. | | |
|
MOL Hungarian Oil & Gas plc | | |
| | |
| | |
| | |
|
| | |
Apollo Hospitals Enterprise Ltd. | | |
| | |
| | |
| | |
| | |
| | |
| | |
Bharat Petroleum Corp. Ltd. | | |
| | |
| | |
Britannia Industries Ltd. | | |
Cholamandalam Investment and Finance Co. Ltd. | | |
| | |
| | |
Colgate-Palmolive India Ltd. | | |
Computer Age Management Services Ltd. | | |
Crompton Greaves Consumer Electricals Ltd. | | |
| | |
SEE NOTES TO FINANCIAL STATEMENTS.
| J.P. Morgan International Equity Funds | |
| | |
Common Stocks — continued |
|
| | |
| | |
| | |
Dr Reddy's Laboratories Ltd. | | |
| | |
| | |
| | |
| | |
| | |
| | |
HDFC Life Insurance Co. Ltd. (a) | | |
| | |
Hindustan Aeronautics Ltd. (a) | | |
Hindustan Petroleum Corp. Ltd. | | |
| | |
| | |
ICICI Lombard General Insurance Co. Ltd. (a) | | |
| | |
InterGlobe Aviation Ltd. * (a) | | |
| | |
Jindal Steel & Power Ltd. | | |
| | |
| | |
| | |
| | |
| | |
| | |
Max Healthcare Institute Ltd. | | |
| | |
| | |
| | |
Oil & Natural Gas Corp. Ltd. | | |
| | |
| | |
| | |
Power Grid Corp. of India Ltd. | | |
| | |
| | |
| | |
| | |
| | |
Sun Pharmaceutical Industries Ltd. | | |
| | |
Syngene International Ltd. (a) | | |
| | |
|
|
Tata Consultancy Services Ltd. | | |
| | |
Tata Power Co. Ltd. (The) | | |
| | |
| | |
Tube Investments of India Ltd. | | |
| | |
| | |
| | |
| | |
| | |
| | |
|
Bank Central Asia Tbk. PT | | |
Bank Mandiri Persero Tbk. PT | | |
Bank Rakyat Indonesia Persero Tbk. PT | | |
Telkom Indonesia Persero Tbk. PT | | |
| | |
| | |
|
| | |
|
National Bank of Kuwait SAKP | | |
|
| | |
| | |
Petronas Chemicals Group Bhd. | | |
| | |
| | |
| | |
| | |
|
| | |
| | |
Arca Continental SAB de CV | | |
| | |
| | |
Coca-Cola Femsa SAB de CV | | |
Fomento Economico Mexicano SAB de CV | | |
Grupo Aeroportuario del Sureste SAB de CV, Class B | | |
Grupo Financiero Banorte SAB de CV, Class O | | |
SEE NOTES TO FINANCIAL STATEMENTS.
| J.P. Morgan International Equity Funds | |
JPMorgan Emerging Markets Research Enhanced Equity Fund
SCHEDULE OF PORTFOLIO INVESTMENTSAS OF October 31, 2024 (continued)
| | |
Common Stocks — continued |
|
| | |
Kimberly-Clark de Mexico SAB de CV, Class A | | |
| | |
| | |
Wal-Mart de Mexico SAB de CV | | |
| | |
|
Copa Holdings SA, Class A | | |
|
| | |
|
| | |
Bank of the Philippine Islands | | |
| | |
| | |
|
Bank Polska Kasa Opieki SA | | |
| | |
Powszechna Kasa Oszczednosci Bank Polski SA | | |
Powszechny Zaklad Ubezpieczen SA | | |
| | |
|
| | |
| | |
| | |
| | |
|
| | |
GMK Norilskiy Nickel PAO, ADR ‡ * | | |
GMK Norilskiy Nickel PAO ‡ | | |
Magnitogorsk Iron & Steel Works PJSC ‡ | | |
| | |
| | |
Sberbank of Russia PJSC ‡ | | |
Severstal PAO, GDR ‡ * (a) | | |
| | |
|
| | |
| | |
| | |
| | |
|
|
Dr Sulaiman Al Habib Medical Services Group Co. | | |
| | |
Mouwasat Medical Services Co. | | |
| | |
Saudi Arabian Oil Co. (a) | | |
| | |
Saudi Basic Industries Corp. | | |
Saudi National Bank (The) | | |
| | |
Saudia Dairy & Foodstuff Co. | | |
| | |
|
| | |
Aspen Pharmacare Holdings Ltd. | | |
| | |
| | |
Capitec Bank Holdings Ltd. | | |
| | |
| | |
| | |
| | |
Harmony Gold Mining Co. Ltd. | | |
Impala Platinum Holdings Ltd. * | | |
| | |
| | |
| | |
| | |
|
| | |
| | |
| | |
Doosan Enerbility Co. Ltd. * | | |
Hana Financial Group, Inc. | | |
Hankook Tire & Technology Co. Ltd. | | |
| | |
Hanwha Aerospace Co. Ltd. | | |
Hanwha Industrial Solutions Co. Ltd. * | | |
HD Korea Shipbuilding & Offshore Engineering Co. Ltd. * | | |
| | |
| | |
| | |
| | |
SEE NOTES TO FINANCIAL STATEMENTS.
| J.P. Morgan International Equity Funds | |
| | |
Common Stocks — continued |
|
| | |
JB Financial Group Co. Ltd. | | |
| | |
| | |
| | |
KIWOOM Securities Co. Ltd. | | |
Korea Investment Holdings Co. Ltd. | | |
Korean Air Lines Co. Ltd. | | |
Kumho Petrochemical Co. Ltd. | | |
| | |
LG Energy Solution Ltd. * | | |
| | |
| | |
| | |
Samsung Biologics Co. Ltd. * (a) | | |
| | |
| | |
Samsung Electro-Mechanics Co. Ltd. | | |
Samsung Electronics Co. Ltd. | | |
Samsung Fire & Marine Insurance Co. Ltd. | | |
Samsung Heavy Industries Co. Ltd. * | | |
Samsung Life Insurance Co. Ltd. | | |
Samsung Securities Co. Ltd. | | |
Shinhan Financial Group Co. Ltd. | | |
| | |
| | |
| | |
SM Entertainment Co. Ltd. | | |
| | |
| | |
| | |
|
| | |
| | |
ASE Technology Holding Co. Ltd. | | |
| | |
Asia Vital Components Co. Ltd. | | |
| | |
| | |
Cathay Financial Holding Co. Ltd. | | |
Chailease Holding Co. Ltd. | | |
Chunghwa Telecom Co. Ltd. | | |
CTBC Financial Holding Co. Ltd. | | |
| | |
|
|
| | |
E.Sun Financial Holding Co. Ltd. | | |
| | |
| | |
Evergreen Marine Corp. Taiwan Ltd. | | |
Fubon Financial Holding Co. Ltd. | | |
Hon Hai Precision Industry Co. Ltd. | | |
Largan Precision Co. Ltd. | | |
| | |
Mega Financial Holding Co. Ltd. | | |
| | |
Nien Made Enterprise Co. Ltd. | | |
Novatek Microelectronics Corp. | | |
| | |
| | |
| | |
President Chain Store Corp. | | |
| | |
Realtek Semiconductor Corp. | | |
| | |
Taiwan Semiconductor Manufacturing Co. Ltd. | | |
TCC Group Holdings Co. Ltd. | | |
Tong Yang Industry Co. Ltd. | | |
Uni-President Enterprises Corp. | | |
United Microelectronics Corp. | | |
| | |
| | |
| | |
Yuanta Financial Holding Co. Ltd. | | |
| | |
|
Bangkok Dusit Medical Services PCL, Class F | | |
| | |
| | |
PTT Exploration & Production PCL | | |
| | |
| | |
| | |
Siam Cement PCL (The) (Registered) | | |
| | |
| | |
|
BIM Birlesik Magazalar A/S | | |
SEE NOTES TO FINANCIAL STATEMENTS.
| J.P. Morgan International Equity Funds | |
JPMorgan Emerging Markets Research Enhanced Equity Fund
SCHEDULE OF PORTFOLIO INVESTMENTSAS OF October 31, 2024 (continued)
| | |
Common Stocks — continued |
|
| | |
| | |
| | |
Turkiye Garanti Bankasi A/S | | |
Turkiye Petrol Rafinerileri A/S | | |
Yapi ve Kredi Bankasi A/S | | |
| | |
United Arab Emirates — 1.3% |
Abu Dhabi Commercial Bank PJSC | | |
| | |
| | |
| | |
| | |
Emirates Telecommunications Group Co. PJSC | | |
First Abu Dhabi Bank PJSC | | |
| | |
|
| | |
|
ExlService Holdings, Inc. * | | |
| | |
| | |
| | |
Total Common Stocks
(Cost $1,798,401) | | |
Short-Term Investments — 3.3% |
Investment Companies — 2.1% |
JPMorgan Prime Money Market Fund Class Institutional Shares, 4.81% (d) (e)
(Cost $47,167) | | |
Investment of Cash Collateral from Securities Loaned — 1.2% |
JPMorgan Securities Lending Money Market Fund Agency SL Class Shares, 4.85% (d) (e)(Cost $25,964) | | |
Total Short-Term Investments
(Cost $73,131) | | |
| | |
Total Investments — 99.8%
(Cost $1,871,532) | | |
Other Assets in Excess of Liabilities — 0.2% | | |
| | |
Percentages indicated are based on net assets. |
Amounts presented as a dash ("-") represent amounts that round to less than a thousand. |
| |
| American Depositary Receipt |
| Global Depositary Receipt |
| |
| Public Joint Stock Company |
| A special type of equity investment that shares in the earnings of the company, has limited voting rights, and may have a dividend preference. Preference shares may also have liquidation preference. |
| Limited liability company |
| Amount rounds to less than 0.1% of net assets. |
| Value determined using significant unobservable inputs. | |
| Non-income producing security. | |
| Security exempt from registration pursuant to Regulation S under the Securities Act of 1933, as amended. Regulation S applies to securities offerings that are made outside of the United States and do not involve direct selling efforts in the United States and as such may have restrictions on resale. | |
| The security or a portion of this security is on loan at October 31, 2024. The total value of securities on loan at October 31, 2024 is $24,585. | |
| | |
| Investment in an affiliated fund, which is registered under the Investment Company Act of 1940, as amended, and is advised by J.P. Morgan Investment Management Inc. | |
| The rate shown is the current yield as of October 31, 2024. | |
SEE NOTES TO FINANCIAL STATEMENTS.
| J.P. Morgan International Equity Funds | |
Summary of Investments by Industry, October 31, 2024
The following table represents the portfolio investments of the Fund by industry classifications as a percentage of total investments:
| PERCENT OF
TOTAL
INVESTMENTS |
| |
Semiconductors & Semiconductor Equipment | |
Interactive Media & Services | |
Technology Hardware, Storage & Peripherals | |
| |
Oil, Gas & Consumable Fuels | |
| |
Hotels, Restaurants & Leisure | |
| |
| |
| |
Consumer Staples Distribution & Retail | |
Electronic Equipment, Instruments & Components | |
Wireless Telecommunication Services | |
Diversified Telecommunication Services | |
| |
Real Estate Management & Development | |
| |
| |
| |
Others (each less than 1.0%) | |
| |
Futures contracts outstanding as of October 31, 2024 (amounts in thousands, except number of contracts):
| | | | | VALUE AND
UNREALIZED
APPRECIATION
(DEPRECIATION) ($) |
| | | | | |
MSCI Emerging Markets E-Mini Index | | | | | |
| |
| Morgan Stanley Capital International |
| |
SEE NOTES TO FINANCIAL STATEMENTS.
| J.P. Morgan International Equity Funds | |
JPMorgan Europe Dynamic Fund
SCHEDULE OF PORTFOLIO INVESTMENTSAS OF October 31, 2024
| | |
|
|
| | |
|
| | |
|
Novo Nordisk A/S, Class B | | |
| | |
| | |
| | |
|
| | |
|
| | |
Cie Generale des Etablissements Michelin SCA | | |
| | |
Gaztransport Et Technigaz SA | | |
| | |
| | |
| | |
| | |
| | |
| | |
| | |
|
| | |
| | |
CTS Eventim AG & Co. KGaA | | |
Deutsche Telekom AG (Registered) | | |
DWS Group GmbH & Co. KGaA (a) | | |
| | |
Muenchener Rueckversicherungs-Gesellschaft AG (Registered) | | |
| | |
| | |
| | |
|
| | |
Bank of Ireland Group plc | | |
| | |
|
| | |
| | |
| | |
|
|
| | |
| | |
| | |
| | |
|
| | |
| | |
| | |
| | |
| | |
| | |
| | |
|
| | |
|
| | |
| | |
Industria de Diseno Textil SA | | |
| | |
|
| | |
| | |
| | |
| | |
|
| | |
| | |
| | |
|
| | |
Auto Trader Group plc (a) | | |
| | |
| | |
| | |
| | |
British Land Co. plc (The), REIT | | |
| | |
Intermediate Capital Group plc | | |
Marks & Spencer Group plc | | |
| | |
| | |
SEE NOTES TO FINANCIAL STATEMENTS.
| J.P. Morgan International Equity Funds | |
| | |
Common Stocks — continued |
United Kingdom — continued |
| | |
Rolls-Royce Holdings plc * | | |
| | |
| | |
| | |
|
| | |
| | |
| | |
| | |
| | |
Total Common Stocks
(Cost $412,008) | | |
Short-Term Investments — 0.6% |
Investment Companies — 0.6% |
JPMorgan Prime Money Market Fund Class Institutional Shares, 4.81% (b) (c)
(Cost $3,146) | | |
Total Investments — 98.8%
(Cost $415,154) | | |
Other Assets in Excess of Liabilities — 1.2% | | |
| | |
Percentages indicated are based on net assets. |
| |
| |
| Real Estate Investment Trust |
| Limited partnership with share capital |
| Non-income producing security. |
| Security exempt from registration pursuant to Regulation S under the Securities Act of 1933, as amended. Regulation S applies to securities offerings that are made outside of the United States and do not involve direct selling efforts in the United States and as such may have restrictions on resale. |
| Investment in an affiliated fund, which is registered under the Investment Company Act of 1940, as amended, and is advised by J.P. Morgan Investment Management Inc. |
| The rate shown is the current yield as of October 31, 2024. |
Summary of Investments by Industry, October 31, 2024
The following table represents the portfolio investments of the Fund by industry classifications as a percentage of total investments:
| PERCENT OF
TOTAL
INVESTMENTS |
| |
| |
| |
Oil, Gas & Consumable Fuels | |
| |
| |
| |
| |
| |
| |
| |
| |
Construction & Engineering | |
| |
Diversified Telecommunication Services | |
| |
Consumer Staples Distribution & Retail | |
| |
Energy Equipment & Services | |
| |
| |
Commercial Services & Supplies | |
| |
| |
| |
| |
| |
| |
Interactive Media & Services | |
Others (each less than 1.0%) | |
| |
SEE NOTES TO FINANCIAL STATEMENTS.
| J.P. Morgan International Equity Funds | |
JPMorgan Europe Dynamic Fund
SCHEDULE OF PORTFOLIO INVESTMENTSAS OF October 31, 2024 (continued)
Futures contracts outstanding as of October 31, 2024 (amounts in thousands, except number of contracts):
| | | | | VALUE AND
UNREALIZED
APPRECIATION
(DEPRECIATION) ($) |
| | | | | |
| | | | | |
| | | | | |
| | | | | |
| |
| |
| Financial Times and the London Stock Exchange |
| |
SEE NOTES TO FINANCIAL STATEMENTS.
| J.P. Morgan International Equity Funds | |
JPMorgan International Equity Fund
SCHEDULE OF PORTFOLIO INVESTMENTSAS OF October 31, 2024
| | |
|
|
| | |
| | |
| | |
| | |
| | |
| | |
|
| | |
|
| | |
|
| | |
Novo Nordisk A/S, Class B | | |
| | |
|
| | |
|
| | |
| | |
| | |
Cie Generale des Etablissements Michelin SCA | | |
| | |
| | |
LVMH Moet Hennessy Louis Vuitton SE | | |
| | |
| | |
| | |
| | |
| | |
|
| | |
| | |
Deutsche Telekom AG (Registered) | | |
Muenchener Rueckversicherungs-Gesellschaft AG (Registered) | | |
| | |
| | |
|
| | |
Techtronic Industries Co. Ltd. | | |
| | |
| | |
|
|
| | |
|
| | |
| | |
| | |
| | |
| | |
| | |
Mitsubishi UFJ Financial Group, Inc. | | |
| | |
Nippon Telegraph & Telephone Corp. | | |
Recruit Holdings Co. Ltd. | | |
| | |
Shin-Etsu Chemical Co. Ltd. | | |
| | |
| | |
Tokio Marine Holdings, Inc. | | |
| | |
|
| | |
| | |
| | |
| | |
|
| | |
|
Samsung Electronics Co. Ltd., GDR (b) | | |
Samsung Electronics Co. Ltd., GDR (c) | | |
| | |
|
| | |
| | |
Industria de Diseno Textil SA (a) | | |
| | |
|
| | |
| | |
| | |
SEE NOTES TO FINANCIAL STATEMENTS.
| J.P. Morgan International Equity Funds | |
JPMorgan International Equity Fund
SCHEDULE OF PORTFOLIO INVESTMENTSAS OF October 31, 2024 (continued)
| | |
Common Stocks — continued |
|
Cie Financiere Richemont SA (Registered) | | |
Lonza Group AG (Registered) | | |
| | |
|
Taiwan Semiconductor Manufacturing Co. Ltd., ADR | | |
|
| | |
| | |
| | |
| | |
InterContinental Hotels Group plc | | |
| | |
London Stock Exchange Group plc | | |
| | |
| | |
| | |
| | |
| | |
|
| | |
| | |
| | |
| | |
| | |
Total Common Stocks
(Cost $3,002,985) | | |
Short-Term Investments — 3.9% |
Investment Companies — 2.1% |
JPMorgan Prime Money Market Fund Class Institutional Shares, 4.81% (d) (e)
(Cost $90,822) | | |
Investment of Cash Collateral from Securities Loaned — 1.8% |
JPMorgan Securities Lending Money Market Fund Agency SL Class Shares, 4.85% (d) (e)(Cost $73,806) | | |
Total Short-Term Investments
(Cost $164,628) | | |
| | |
Total Investments — 100.0%
(Cost $3,167,613) | | |
Other Assets in Excess of Liabilities — 0.0% ^ | | |
| | |
Percentages indicated are based on net assets. |
| |
| American Depositary Receipt |
| Global Depositary Receipt |
| Real Estate Investment Trust |
| Limited partnership with share capital |
| Amount rounds to less than 0.1% of net assets. |
| The security or a portion of this security is on loan at October 31, 2024. The total value of securities on loan at October 31, 2024 is $68,697. | |
| Security exempt from registration pursuant to Regulation S under the Securities Act of 1933, as amended. Regulation S applies to securities offerings that are made outside of the United States and do not involve direct selling efforts in the United States and as such may have restrictions on resale. | |
| Securities exempt from registration under Rule 144A or section 4(a)(2), of the Securities Act of 1933, as amended. | |
| Investment in an affiliated fund, which is registered under the Investment Company Act of 1940, as amended, and is advised by J.P. Morgan Investment Management Inc. | |
| The rate shown is the current yield as of October 31, 2024. | |
SEE NOTES TO FINANCIAL STATEMENTS.
| J.P. Morgan International Equity Funds | |
Summary of Investments by Industry, October 31, 2024
The following table represents the portfolio investments of the Fund by industry classifications as a percentage of total investments:
| PERCENT OF
TOTAL
INVESTMENTS |
| |
| |
| |
| |
Diversified Telecommunication Services | |
Semiconductors & Semiconductor Equipment | |
| |
Oil, Gas & Consumable Fuels | |
| |
| |
| |
| |
| |
Health Care Equipment & Supplies | |
| |
Textiles, Apparel & Luxury Goods | |
| |
| |
Hotels, Restaurants & Leisure | |
| |
Trading Companies & Distributors | |
| |
| |
Construction & Engineering | |
| |
| |
Electronic Equipment, Instruments & Components | |
| |
Life Sciences Tools & Services | |
Real Estate Management & Development | |
Others (each less than 1.0%) | |
| |
SEE NOTES TO FINANCIAL STATEMENTS.
| J.P. Morgan International Equity Funds | |
JPMorgan International Focus Fund
SCHEDULE OF PORTFOLIO INVESTMENTSAS OF October 31, 2024
| | |
|
|
| | |
|
| | |
|
Alimentation Couche-Tard, Inc. | | |
Canadian Pacific Kansas City Ltd. | | |
| | |
| | |
|
| | |
| | |
| | |
|
Novo Nordisk A/S, Class B | | |
|
| | |
Cie Generale des Etablissements Michelin SCA | | |
| | |
| | |
LVMH Moet Hennessy Louis Vuitton SE | | |
| | |
| | |
| | |
|
Deutsche Telekom AG (Registered) | | |
Muenchener Rueckversicherungs-Gesellschaft AG (Registered) | | |
| | |
|
Hong Kong Exchanges & Clearing Ltd. | | |
|
| | |
|
Bank Central Asia Tbk. PT | | |
|
| | |
|
| | |
| | |
| | |
| | |
|
|
| | |
Mitsubishi UFJ Financial Group, Inc. | | |
| | |
Shin-Etsu Chemical Co. Ltd. | | |
| | |
| | |
Tokio Marine Holdings, Inc. | | |
| | |
|
Wal-Mart de Mexico SAB de CV | | |
|
| | |
| | |
| | |
|
| | |
|
| | |
Samsung Electronics Co. Ltd. | | |
| | |
|
Industria de Diseno Textil SA (a) | | |
|
| | |
| | |
| | |
|
Taiwan Semiconductor Manufacturing Co. Ltd., ADR | | |
Taiwan Semiconductor Manufacturing Co. Ltd. | | |
| | |
|
| | |
| | |
InterContinental Hotels Group plc | | |
| | |
London Stock Exchange Group plc | | |
| | |
| | |
| | |
SEE NOTES TO FINANCIAL STATEMENTS.
| J.P. Morgan International Equity Funds | |
| | |
Common Stocks — continued |
|
| | |
| | |
| | |
| | |
Total Common Stocks
(Cost $1,184,098) | | |
Short-Term Investments — 5.0% |
Investment Companies — 1.7% |
JPMorgan Prime Money Market Fund Class Institutional Shares, 4.81% (b) (c)
(Cost $26,161) | | |
Investment of Cash Collateral from Securities Loaned — 3.3% |
JPMorgan Securities Lending Money Market Fund Agency SL Class Shares, 4.85% (b) (c)(Cost $49,416) | | |
Total Short-Term Investments
(Cost $75,577) | | |
Total Investments — 102.9%
(Cost $1,259,675) | | |
Liabilities in Excess of Other Assets — (2.9)% | | |
| | |
Percentages indicated are based on net assets. |
| |
| American Depositary Receipt |
| Limited liability company |
| Limited partnership with share capital |
| The security or a portion of this security is on loan at October 31, 2024. The total value of securities on loan at October 31, 2024 is $45,994. |
| Investment in an affiliated fund, which is registered under the Investment Company Act of 1940, as amended, and is advised by J.P. Morgan Investment Management Inc. |
| The rate shown is the current yield as of October 31, 2024. |
Summary of Investments by Industry, October 31, 2024
The following table represents the portfolio investments of the Fund by industry classifications as a percentage of total investments:
| PERCENT OF
TOTAL
INVESTMENTS |
| |
Semiconductors & Semiconductor Equipment | |
| |
| |
| |
Interactive Media & Services | |
Oil, Gas & Consumable Fuels | |
Hotels, Restaurants & Leisure | |
| |
| |
| |
Technology Hardware, Storage & Peripherals | |
Health Care Equipment & Supplies | |
Consumer Staples Distribution & Retail | |
| |
| |
Textiles, Apparel & Luxury Goods | |
| |
Construction & Engineering | |
| |
| |
| |
| |
| |
| |
Diversified Telecommunication Services | |
Real Estate Management & Development | |
| |
| |
Trading Companies & Distributors | |
| |
Others (each less than 1.0%) | |
| |
SEE NOTES TO FINANCIAL STATEMENTS.
| J.P. Morgan International Equity Funds | |
JPMorgan International Hedged Equity Fund
SCHEDULE OF PORTFOLIO INVESTMENTSAS OF October 31, 2024
| | |
|
|
| | |
| | |
| | |
Commonwealth Bank of Australia | | |
| | |
| | |
| | |
| | |
Insurance Australia Group Ltd. | | |
| | |
| | |
| | |
National Australia Bank Ltd. | | |
| | |
| | |
| | |
| | |
| | |
| | |
| | |
Woodside Energy Group Ltd. | | |
| | |
| | |
|
| | |
| | |
| | |
|
| | |
|
| | |
Novo Nordisk A/S, Class B | | |
| | |
|
| | |
| | |
| | |
|
| | |
| | |
| | |
| | |
|
|
| | |
| | |
Cie Generale des Etablissements Michelin SCA | | |
| | |
| | |
| | |
| | |
| | |
| | |
LVMH Moet Hennessy Louis Vuitton SE | | |
| | |
| | |
| | |
| | |
| | |
| | |
| | |
|
| | |
| | |
| | |
| | |
| | |
Deutsche Telekom AG (Registered) | | |
| | |
| | |
| | |
| | |
| | |
Muenchener Rueckversicherungs-Gesellschaft AG (Registered) | | |
| | |
| | |
| | |
| | |
| | |
| | |
|
| | |
| | |
| | |
Hong Kong Exchanges & Clearing Ltd. | | |
| | |
SEE NOTES TO FINANCIAL STATEMENTS.
| J.P. Morgan International Equity Funds | |
| | |
Common Stocks — continued |
|
| | |
Sun Hung Kai Properties Ltd. | | |
Techtronic Industries Co. Ltd. | | |
| | |
|
| | |
| | |
| | |
|
| | |
FinecoBank Banca Fineco SpA | | |
| | |
| | |
|
| | |
| | |
Asahi Group Holdings Ltd. | | |
| | |
| | |
Chugai Pharmaceutical Co. Ltd. | | |
| | |
| | |
| | |
| | |
| | |
| | |
| | |
| | |
| | |
| | |
| | |
| | |
| | |
| | |
| | |
| | |
Mitsubishi UFJ Financial Group, Inc. | | |
| | |
| | |
Murata Manufacturing Co. Ltd. | | |
| | |
Nippon Paint Holdings Co. Ltd. | | |
| | |
|
|
| | |
Nippon Telegraph & Telephone Corp. | | |
Nomura Research Institute Ltd. | | |
| | |
| | |
| | |
Pan Pacific International Holdings Corp. | | |
Recruit Holdings Co. Ltd. | | |
Renesas Electronics Corp. | | |
| | |
| | |
Seven & i Holdings Co. Ltd. | | |
| | |
Shin-Etsu Chemical Co. Ltd. | | |
| | |
| | |
| | |
| | |
Sumitomo Electric Industries Ltd. | | |
Sumitomo Metal Mining Co. Ltd. | | |
Sumitomo Mitsui Financial Group, Inc. | | |
| | |
| | |
| | |
Takeda Pharmaceutical Co. Ltd. | | |
| | |
Tokio Marine Holdings, Inc. | | |
| | |
| | |
| | |
|
| | |
|
| | |
| | |
| | |
Koninklijke Ahold Delhaize NV | | |
| | |
| | |
| | |
| | |
SEE NOTES TO FINANCIAL STATEMENTS.
| J.P. Morgan International Equity Funds | |
JPMorgan International Hedged Equity Fund
SCHEDULE OF PORTFOLIO INVESTMENTSAS OF October 31, 2024 (continued)
| | |
Common Stocks — continued |
|
| | |
Oversea-Chinese Banking Corp. Ltd. | | |
| | |
United Overseas Bank Ltd. | | |
| | |
|
Banco Bilbao Vizcaya Argentaria SA | | |
| | |
| | |
Industria de Diseno Textil SA | | |
| | |
|
| | |
| | |
| | |
| | |
|
Cie Financiere Richemont SA (Registered) | | |
| | |
| | |
Lonza Group AG (Registered) | | |
| | |
| | |
| | |
| | |
UBS Group AG (Registered) | | |
Zurich Insurance Group AG | | |
| | |
|
| | |
| | |
| | |
Berkeley Group Holdings plc | | |
British American Tobacco plc | | |
| | |
| | |
| | |
| | |
InterContinental Hotels Group plc | | |
| | |
| | |
London Stock Exchange Group plc | | |
| | |
|
United Kingdom — continued |
| | |
| | |
Reckitt Benckiser Group plc | | |
| | |
Rolls-Royce Holdings plc * | | |
| | |
| | |
| | |
| | |
| | |
| | |
| | |
|
| | |
| | |
| | |
| | |
| | |
| | |
| | |
| | |
| | |
| | |
| | |
Total Common Stocks
(Cost $135,520) | | |
| | |
|
Put Options Purchased — 2.1% |
|
| | |
12/31/2024 at USD 2,340.00, European Style | | |
Notional Amount: USD (177,070) | | |
Counterparty: Exchange-Traded * (Cost $2,344) | | |
| | |
Short-Term Investments — 0.8% |
Investment Companies — 0.8% |
JPMorgan Prime Money Market Fund Class IM Shares, 4.90% (b) (c)
(Cost $1,422) | | |
SEE NOTES TO FINANCIAL STATEMENTS.
| J.P. Morgan International Equity Funds | |
| | |
Total Investments — 98.1%
(Cost $139,286) | | |
Other Assets in Excess of Liabilities — 1.9% | | |
| | |
Percentages indicated are based on net assets. |
Amounts presented as a dash ("-") represent amounts that round to less than a thousand. |
| |
| American Depositary Receipt |
| Europe, Australasia and Far East |
| Morgan Stanley Capital International |
| |
| Real Estate Investment Trust |
| Limited partnership with share capital |
| |
| Non-income producing security. |
| Security exempt from registration pursuant to Regulation S under the Securities Act of 1933, as amended. Regulation S applies to securities offerings that are made outside of the United States and do not involve direct selling efforts in the United States and as such may have restrictions on resale. |
| Investment in an affiliated fund, which is registered under the Investment Company Act of 1940, as amended, and is advised by J.P. Morgan Investment Management Inc. |
| The rate shown is the current yield as of October 31, 2024. |
Summary of Investments by Industry, October 31, 2024
The following table represents the portfolio investments of the Fund by industry classifications as a percentage of total investments:
| PERCENT OF
TOTAL
INVESTMENTS |
| |
| |
| |
Semiconductors & Semiconductor Equipment | |
Oil, Gas & Consumable Fuels | |
Textiles, Apparel & Luxury Goods | |
| |
| |
| |
| |
Diversified Telecommunication Services | |
| |
| |
| |
| |
| |
| |
| |
| |
| |
| |
| |
Trading Companies & Distributors | |
| |
| |
Construction & Engineering | |
| |
Consumer Staples Distribution & Retail | |
Health Care Equipment & Supplies | |
| |
Electronic Equipment, Instruments & Components | |
| |
Others (each less than 1.0%) | |
| |
SEE NOTES TO FINANCIAL STATEMENTS.
| J.P. Morgan International Equity Funds | |
JPMorgan International Hedged Equity Fund
SCHEDULE OF PORTFOLIO INVESTMENTSAS OF October 31, 2024 (continued)
Futures contracts outstanding as of October 31, 2024 (amounts in thousands, except number of contracts):
| | | | | VALUE AND
UNREALIZED
APPRECIATION
(DEPRECIATION) ($) |
| | | | | |
| | | | | |
| |
| Europe, Australasia and Far East |
| Morgan Stanley Capital International |
| |
Written Call Options Contracts as of October 31, 2024 (amounts in thousands, except number of contracts):
|
| | | | | | |
| | | | | | |
Written Put Options Contracts as of October 31, 2024 (amounts in thousands, except number of contracts):
|
| | | | | | |
| | | | | | |
Total Written Options Contracts (Premiums Received $2,274) | |
| |
| Europe, Australasia and Far East |
| Morgan Stanley Capital International |
| |
SEE NOTES TO FINANCIAL STATEMENTS.
| J.P. Morgan International Equity Funds | |
STATEMENTS OF ASSETS AND LIABILITIESAS OF October 31, 2024
(Amounts in thousands, except per share amounts)
| JPMorgan
Developed
International
Value Fund | JPMorgan
Emerging
Markets
Equity Fund | JPMorgan
Emerging
Markets
Research
Enhanced
|
| | | |
Investments in non-affiliates, at value | | | |
Investments in affiliates, at value | | | |
Investments of cash collateral received from securities loaned, at value (See Note 2.C.) | | | |
| | | |
Foreign currency, at value | | | |
Deposits at broker for futures contracts | | | |
| | | |
Investment securities sold | | | |
| | | |
Dividends from non-affiliates | | | |
Dividends from affiliates | | | |
| | | |
Securities lending income (See Note 2.C.) | | | |
| | | |
| | | |
| | | |
Collateral received on securities loaned (See Note 2.C.) | | | |
| | | |
Variation margin on futures contracts | | | |
IRS compliance fees for foreign withholding tax claims (See Note 2.K.) | | | |
| | | |
| | | |
| | | |
| | | |
| | | |
Custodian and accounting fees | | | |
Trustees’ and Chief Compliance Officer’s fees | | | |
Deferred foreign capital gains tax | | | |
| | | |
| | | |
| | | |
(a)
Amount rounds to less than one thousand.
SEE NOTES TO FINANCIAL STATEMENTS.
| J.P. Morgan International Equity Funds | |
STATEMENTS OF ASSETS AND LIABILITIESAS OF October 31, 2024 (continued)
(Amounts in thousands, except per share amounts)
| JPMorgan Developed International Value Fund | JPMorgan Emerging Markets Equity Fund | JPMorgan Emerging Markets Research Enhanced |
| | | |
| | | |
Total distributable earnings (loss) | | | |
| | | |
| | | |
| | | |
| | | |
| | | |
| | | |
| | | |
| | | |
| | | |
| | | |
| | | |
| | | |
Outstanding units of beneficial interest (shares)
($0.0001 par value; unlimited number of shares authorized): | | | |
| | | |
| | | |
| | | |
| | | |
| | | |
| | | |
| | | |
| | | |
| | | |
| | | |
Class A — Redemption price per share | | | |
Class C — Offering price per share (b) | | | |
Class I — Offering and redemption price per share | | | |
Class L — Offering and redemption price per share | | | |
Class R2 — Offering and redemption price per share | | | |
Class R3 — Offering and redemption price per share | | | |
Class R4 — Offering and redemption price per share | | | |
Class R5 — Offering and redemption price per share | | | |
Class R6 — Offering and redemption price per share | | | |
Class A maximum sales charge | | | |
Class A maximum public offering price per share
[net asset value per share/(100% – maximum sales charge)] | | | |
Cost of investments in non-affiliates | | | |
Cost of investments in affiliates | | | |
| | | |
Investment securities on loan, at value (See Note 2.C.) | | | |
Cost of investment of cash collateral (See Note 2.C.) | | | |
(a)
Per share amounts may not recalculate due to rounding of net assets and/or shares outstanding.
(b)
Redemption price for Class C Shares varies based upon length of time the shares are held.
SEE NOTES TO FINANCIAL STATEMENTS.
| J.P. Morgan International Equity Funds | |
| JPMorgan
Europe
Dynamic
Fund | JPMorgan
International
Equity Fund | JPMorgan
International
Focus Fund | JPMorgan
International
Hedged
|
| | | | |
Investments in non-affiliates, at value | | | | |
Investments in affiliates, at value | | | | |
Investments of cash collateral received from securities loaned, at value (See Note 2.C.) | | | | |
Options purchased, at value | | | | |
| | | | |
Foreign currency, at value | | | | |
Deposits at broker for futures contracts | | | | |
| | | | |
Investment securities sold | | | | |
| | | | |
Dividends from non-affiliates | | | | |
Dividends from affiliates | | | | |
| | | | |
Securities lending income (See Note 2.C.) | | | | |
| | | | |
| | | | |
| | | | |
Investment securities purchased | | | | |
Collateral received on securities loaned (See Note 2.C.) | | | | |
| | | | |
Variation margin on futures contracts | | | | |
Outstanding options written, at fair value | | | | |
| | | | |
| | | | |
| | | | |
| | | | |
| | | | |
Custodian and accounting fees | | | | |
Trustees’ and Chief Compliance Officer’s fees | | | | |
| | | | |
| | | | |
| | | | |
(a)
Amount rounds to less than one thousand.
SEE NOTES TO FINANCIAL STATEMENTS.
| J.P. Morgan International Equity Funds | |
STATEMENTS OF ASSETS AND LIABILITIESAS OF October 31, 2024 (continued)
(Amounts in thousands, except per share amounts)
| JPMorgan Europe Dynamic Fund | JPMorgan International Equity Fund | JPMorgan International Focus Fund | JPMorgan International Hedged |
| | | | |
| | | | |
Total distributable earnings (loss) | | | | |
| | | | |
| | | | |
| | | | |
| | | | |
| | | | |
| | | | |
| | | | |
| | | | |
| | | | |
| | | | |
Outstanding units of beneficial interest (shares)
($0.0001 par value; unlimited number of shares authorized): | | | | |
| | | | |
| | | | |
| | | | |
| | | | |
| | | | |
| | | | |
| | | | |
| | | | |
Class A — Redemption price per share | | | | |
Class C — Offering price per share (b) | | | | |
Class I — Offering and redemption price per share | | | | |
Class L — Offering and redemption price per share | | | | |
Class R2 — Offering and redemption price per share | | | | |
Class R5 — Offering and redemption price per share | | | | |
Class R6 — Offering and redemption price per share | | | | |
Class A maximum sales charge | | | | |
Class A maximum public offering price per share
[net asset value per share/(100% – maximum sales charge)] | | | | |
Cost of investments in non-affiliates | | | | |
Cost of investments in affiliates | | | | |
Cost of options purchased | | | | |
| | | | |
Investment securities on loan, at value (See Note 2.C.) | | | | |
Cost of investment of cash collateral (See Note 2.C.) | | | | |
Premiums received from options written | | | | |
(a)
Per share amounts may not recalculate due to rounding of net assets and/or shares outstanding.
(b)
Redemption price for Class C Shares varies based upon length of time the shares are held.
SEE NOTES TO FINANCIAL STATEMENTS.
| J.P. Morgan International Equity Funds | |
STATEMENTS OF OPERATIONSFOR THE YEAR ENDED October 31, 2024
(Amounts in thousands)
| JPMorgan
Developed
International
Value Fund | JPMorgan
Emerging
Markets
Equity Fund | JPMorgan
Emerging
Markets
Research
Enhanced
|
| | | |
Interest income from non-affiliates | | | |
Interest income from affiliates | | | |
Dividend income from non-affiliates | | | |
Dividend income from affiliates | | | |
Income from securities lending (net) (See Note 2.C.) | | | |
Foreign taxes withheld (net) | | | |
IRS compliance fees for foreign withholding tax claims (See Note 2.K.) | | | |
| | | |
| | | |
| | | |
| | | |
| | | |
| | | |
| | | |
| | | |
| | | |
| | | |
| | | |
| | | |
| | | |
| | | |
| | | |
| | | |
| | | |
| | | |
Custodian and accounting fees | | | |
Interest expense to affiliates | | | |
| | | |
Trustees’ and Chief Compliance Officer’s fees | | | |
Printing and mailing costs | | | |
Registration and filing fees | | | |
Transfer agency fees (See Note 2.I.) | | | |
| | | |
| | | |
| | | |
Less expense reimbursements | | | |
| | | |
Net investment income (loss) | | | |
(a)
Amount rounds to less than one thousand.
SEE NOTES TO FINANCIAL STATEMENTS.
| J.P. Morgan International Equity Funds | |
STATEMENTS OF OPERATIONSFOR THE YEAR ENDED October 31, 2024 (continued)
(Amounts in thousands)
| JPMorgan Developed International Value Fund | JPMorgan Emerging Markets Equity Fund | JPMorgan Emerging Markets Research Enhanced |
REALIZED/UNREALIZED GAINS (LOSSES): | | | |
Net realized gain (loss) on transactions from: | | | |
Investments in non-affiliates | | | |
Investments in affiliates | | | |
| | | |
Foreign currency transactions | | | |
| | | |
Change in net unrealized appreciation/depreciation on: | | | |
Investments in non-affiliates | | | |
Investments in affiliates | | | |
| | | |
Foreign currency translations | | | |
Change in net unrealized appreciation/depreciation | | | |
Net realized/unrealized gains (losses) | | | |
Change in net assets resulting from operations | | | |
(a)
Net of foreign capital gains tax of $(21,406).
(b)
Net of foreign capital gains tax of $(4,789).
(c)
Net of change in foreign capital gains tax of $2,150.
(d)
Net of change in foreign capital gains tax of $(8,308).
SEE NOTES TO FINANCIAL STATEMENTS.
| J.P. Morgan International Equity Funds | |
| JPMorgan
Europe
Dynamic
Fund | JPMorgan
International
Equity Fund | JPMorgan
International
Focus Fund | JPMorgan
International
Hedged
|
| | | | |
Interest income from non-affiliates | | | | |
Interest income from affiliates | | | | |
Dividend income from non-affiliates | | | | |
Dividend income from affiliates | | | | |
Income from securities lending (net) (See Note 2.C.) | | | | |
Foreign taxes withheld (net) | | | | |
| | | | |
| | | | |
| | | | |
| | | | |
| | | | |
| | | | |
| | | | |
| | | | |
| | | | |
| | | | |
| | | | |
| | | | |
| | | | |
| | | | |
| | | | |
Custodian and accounting fees | | | | |
Interest expense to affiliates | | | | |
| | | | |
Trustees’ and Chief Compliance Officer’s fees | | | | |
Printing and mailing costs | | | | |
Registration and filing fees | | | | |
Transfer agency fees (See Note 2.I.) | | | | |
| | | | |
| | | | |
| | | | |
Less expense reimbursements | | | | |
| | | | |
Net investment income (loss) | | | | |
(a)
Amount rounds to less than one thousand.
SEE NOTES TO FINANCIAL STATEMENTS.
| J.P. Morgan International Equity Funds | |
STATEMENTS OF OPERATIONSFOR THE YEAR ENDED October 31, 2024 (continued)
(Amounts in thousands)
| JPMorgan Europe Dynamic Fund | JPMorgan International Equity Fund | JPMorgan International Focus Fund | JPMorgan International Hedged |
REALIZED/UNREALIZED GAINS (LOSSES): | | | | |
Net realized gain (loss) on transactions from: | | | | |
Investments in non-affiliates | | | | |
Investments in affiliates | | | | |
| | | | |
| | | | |
Foreign currency transactions | | | | |
| | | | |
| | | | |
Change in net unrealized appreciation/depreciation on: | | | | |
Investments in non-affiliates | | | | |
Investments in affiliates | | | | |
| | | | |
| | | | |
Foreign currency translations | | | | |
| | | | |
Change in net unrealized appreciation/depreciation | | | | |
Net realized/unrealized gains (losses) | | | | |
Change in net assets resulting from operations | | | | |
SEE NOTES TO FINANCIAL STATEMENTS.
| J.P. Morgan International Equity Funds | |
STATEMENTS OF CHANGES IN NET ASSETSFOR THE PERIODS INDICATED
(Amounts in thousands)
| JPMorgan Developed International
Value Fund | JPMorgan Emerging Markets
Equity Fund |
| Year Ended
October 31, 2024 | Year Ended
October 31, 2023 | Year Ended
October 31, 2024 | Year Ended
October 31, 2023 |
CHANGE IN NET ASSETS RESULTING FROM OPERATIONS: | | | | |
Net investment income (loss) | | | | |
| | | | |
Change in net unrealized appreciation/depreciation | | | | |
Change in net assets resulting from operations | | | | |
DISTRIBUTIONS TO SHAREHOLDERS: | | | | |
| | | | |
| | | | |
| | | | |
| | | | |
| | | | |
| | | | |
| | | | |
| | | | |
| | | | |
Total distributions to shareholders | | | | |
| | | | |
Change in net assets resulting from capital transactions | | | | |
| | | | |
| | | | |
| | | | |
| | | | |
SEE NOTES TO FINANCIAL STATEMENTS.
| J.P. Morgan International Equity Funds | |
STATEMENTS OF CHANGES IN NET ASSETSFOR THE PERIODS INDICATED (continued)
(Amounts in thousands)
| JPMorgan Emerging Markets Research
Enhanced Equity Fund | JPMorgan Europe Dynamic Fund |
| Year Ended
October 31, 2024 | Year Ended
October 31, 2023 | Year Ended
October 31, 2024 | Year Ended
October 31, 2023 |
CHANGE IN NET ASSETS RESULTING FROM OPERATIONS: | | | | |
Net investment income (loss) | | | | |
| | | | |
Change in net unrealized appreciation/depreciation | | | | |
Change in net assets resulting from operations | | | | |
DISTRIBUTIONS TO SHAREHOLDERS: | | | | |
| | | | |
| | | | |
| | | | |
| | | | |
| | | | |
Total distributions to shareholders | | | | |
| | | | |
Change in net assets resulting from capital transactions | | | | |
| | | | |
| | | | |
| | | | |
| | | | |
SEE NOTES TO FINANCIAL STATEMENTS.
| J.P. Morgan International Equity Funds | |
| JPMorgan International Equity Fund | JPMorgan International Focus Fund |
| Year Ended
October 31, 2024 | Year Ended
October 31, 2023 | Year Ended
October 31, 2024 | Year Ended
October 31, 2023 |
CHANGE IN NET ASSETS RESULTING FROM OPERATIONS: | | | | |
Net investment income (loss) | | | | |
| | | | |
Change in net unrealized appreciation/depreciation | | | | |
Change in net assets resulting from operations | | | | |
DISTRIBUTIONS TO SHAREHOLDERS: | | | | |
| | | | |
| | | | |
| | | | |
| | | | |
| | | | |
| | | | |
Total distributions to shareholders | | | | |
| | | | |
Change in net assets resulting from capital transactions | | | | |
| | | | |
| | | | |
| | | | |
| | | | |
SEE NOTES TO FINANCIAL STATEMENTS.
| J.P. Morgan International Equity Funds | |
STATEMENTS OF CHANGES IN NET ASSETSFOR THE PERIODS INDICATED (continued)
(Amounts in thousands)
| JPMorgan International Hedged Equity Fund |
| Year Ended
October 31, 2024 | |
CHANGE IN NET ASSETS RESULTING FROM OPERATIONS: | | |
Net investment income (loss) | | |
| | |
Change in net unrealized appreciation/depreciation | | |
Change in net assets resulting from operations | | |
DISTRIBUTIONS TO SHAREHOLDERS: | | |
| | |
| | |
| | |
| | |
| | |
Total distributions to shareholders | | |
| | |
Change in net assets resulting from capital transactions | | |
| | |
| | |
| | |
| | |
(a)
Amount rounds to less than one thousand.
SEE NOTES TO FINANCIAL STATEMENTS.
| J.P. Morgan International Equity Funds | |
| JPMorgan Developed International
Value Fund | JPMorgan Emerging Markets
Equity Fund |
| Year Ended October 31, 2024 | Year Ended October 31, 2023 | Year Ended October 31, 2024 | |
| | | | |
| | | | |
Proceeds from shares issued | | | | |
| | | | |
| | | | |
Change in net assets resulting from Class A capital transactions | | | | |
| | | | |
Proceeds from shares issued | | | | |
| | | | |
| | | | |
Change in net assets resulting from Class C capital transactions | | | | |
| | | | |
Proceeds from shares issued | | | | |
| | | | |
| | | | |
Change in net assets resulting from Class I capital transactions | | | | |
| | | | |
Proceeds from shares issued | | | | |
| | | | |
| | | | |
Change in net assets resulting from Class L capital transactions | | | | |
| | | | |
Proceeds from shares issued | | | | |
| | | | |
| | | | |
Change in net assets resulting from Class R2 capital transactions | | | | |
| | | | |
Proceeds from shares issued | | | | |
| | | | |
| | | | |
Change in net assets resulting from Class R3 capital transactions | | | | |
| | | | |
Proceeds from shares issued | | | | |
| | | | |
| | | | |
Change in net assets resulting from Class R4 capital transactions | | | | |
SEE NOTES TO FINANCIAL STATEMENTS.
| J.P. Morgan International Equity Funds | |
STATEMENTS OF CHANGES IN NET ASSETSFOR THE PERIODS INDICATED (continued)
(Amounts in thousands)
| JPMorgan Developed International Value Fund | JPMorgan Emerging Markets Equity Fund |
| Year Ended October 31, 2024 | Year Ended October 31, 2023 | Year Ended October 31, 2024 | |
CAPITAL TRANSACTIONS: (continued) | | | | |
| | | | |
Proceeds from shares issued | | | | |
| | | | |
| | | | |
Change in net assets resulting from Class R5 capital transactions | | | | |
| | | | |
Proceeds from shares issued | | | | |
| | | | |
| | | | |
Change in net assets resulting from Class R6 capital transactions | | | | |
Total change in net assets resulting from capital transactions | | | | |
| | | | |
| | | | |
| | | | |
| | | | |
| | | | |
| | | | |
| | | | |
| | | | |
| | | | |
| | | | |
| | | | |
| | | | |
| | | | |
| | | | |
| | | | |
| | | | |
| | | | |
| | | | |
| | | | |
| | | | |
| | | | |
| | | | |
| | | | |
| | | | |
| | | | |
Change in Class R2 Shares | | | | |
(a)
Amount rounds to less than one thousand.
SEE NOTES TO FINANCIAL STATEMENTS.
| J.P. Morgan International Equity Funds | |
| JPMorgan Developed International Value Fund | JPMorgan Emerging Markets Equity Fund |
| Year Ended October 31, 2024 | Year Ended October 31, 2023 | Year Ended October 31, 2024 | |
SHARE TRANSACTIONS: (continued) | | | | |
| | | | |
| | | | |
| | | | |
| | | | |
Change in Class R3 Shares | | | | |
| | | | |
| | | | |
| | | | |
| | | | |
Change in Class R4 Shares | | | | |
| | | | |
| | | | |
| | | | |
| | | | |
Change in Class R5 Shares | | | | |
| | | | |
| | | | |
| | | | |
| | | | |
Change in Class R6 Shares | | | | |
(a)
Amount rounds to less than one thousand.
SEE NOTES TO FINANCIAL STATEMENTS.
| J.P. Morgan International Equity Funds | |
STATEMENTS OF CHANGES IN NET ASSETSFOR THE PERIODS INDICATED (continued)
(Amounts in thousands)
| JPMorgan Emerging Markets Research
Enhanced Equity Fund | JPMorgan Europe Dynamic Fund |
| Year Ended October 31, 2024 | Year Ended October 31, 2023 | Year Ended October 31, 2024 | |
| | | | |
| | | | |
Proceeds from shares issued | | | | |
| | | | |
| | | | |
Change in net assets resulting from Class A capital transactions | | | | |
| | | | |
Proceeds from shares issued | | | | |
| | | | |
| | | | |
Change in net assets resulting from Class C capital transactions | | | | |
| | | | |
Proceeds from shares issued | | | | |
| | | | |
| | | | |
Change in net assets resulting from Class I capital transactions | | | | |
| | | | |
Proceeds from shares issued | | | | |
| | | | |
| | | | |
Change in net assets resulting from Class L capital transactions | | | | |
| | | | |
Proceeds from shares issued | | | | |
| | | | |
| | | | |
Change in net assets resulting from Class R6 capital transactions | | | | |
Total change in net assets resulting from capital transactions | | | | |
| | | | |
| | | | |
| | | | |
| | | | |
| | | | |
| | | | |
| | | | |
| | | | |
| | | | |
| | | | |
| | | | |
(a)
Amount rounds to less than one thousand.
SEE NOTES TO FINANCIAL STATEMENTS.
| J.P. Morgan International Equity Funds | |
| JPMorgan Emerging Markets Research Enhanced Equity Fund | JPMorgan Europe Dynamic Fund |
| Year Ended October 31, 2024 | Year Ended October 31, 2023 | Year Ended October 31, 2024 | |
SHARE TRANSACTIONS: (continued) | | | | |
| | | | |
| | | | |
| | | | |
| | | | |
| | | | |
| | | | |
| | | | |
| | | | |
| | | | |
| | | | |
| | | | |
| | | | |
| | | | |
| | | | |
Change in Class R6 Shares | | | | |
SEE NOTES TO FINANCIAL STATEMENTS.
| J.P. Morgan International Equity Funds | |
STATEMENTS OF CHANGES IN NET ASSETSFOR THE PERIODS INDICATED (continued)
(Amounts in thousands)
| JPMorgan International Equity Fund | JPMorgan International Focus Fund |
| Year Ended October 31, 2024 | Year Ended October 31, 2023 | Year Ended October 31, 2024 | |
| | | | |
| | | | |
Proceeds from shares issued | | | | |
| | | | |
| | | | |
Change in net assets resulting from Class A capital transactions | | | | |
| | | | |
Proceeds from shares issued | | | | |
| | | | |
| | | | |
Change in net assets resulting from Class C capital transactions | | | | |
| | | | |
Proceeds from shares issued | | | | |
| | | | |
| | | | |
Change in net assets resulting from Class I capital transactions | | | | |
| | | | |
Proceeds from shares issued | | | | |
| | | | |
| | | | |
Change in net assets resulting from Class R2 capital transactions | | | | |
| | | | |
Proceeds from shares issued | | | | |
| | | | |
| | | | |
Change in net assets resulting from Class R5 capital transactions | | | | |
| | | | |
Proceeds from shares issued | | | | |
| | | | |
| | | | |
Change in net assets resulting from Class R6 capital transactions | | | | |
Total change in net assets resulting from capital transactions | | | | |
| | | | |
| | | | |
| | | | |
| | | | |
| | | | |
| | | | |
SEE NOTES TO FINANCIAL STATEMENTS.
| J.P. Morgan International Equity Funds | |
| JPMorgan International Equity Fund | JPMorgan International Focus Fund |
| Year Ended October 31, 2024 | Year Ended October 31, 2023 | Year Ended October 31, 2024 | |
SHARE TRANSACTIONS: (continued) | | | | |
| | | | |
| | | | |
| | | | |
| | | | |
| | | | |
| | | | |
| | | | |
| | | | |
| | | | |
| | | | |
| | | | |
| | | | |
| | | | |
| | | | |
Change in Class R2 Shares | | | | |
| | | | |
| | | | |
| | | | |
| | | | |
Change in Class R5 Shares | | | | |
| | | | |
| | | | |
| | | | |
| | | | |
Change in Class R6 Shares | | | | |
(a)
Amount rounds to less than one thousand.
SEE NOTES TO FINANCIAL STATEMENTS.
| J.P. Morgan International Equity Funds | |
STATEMENTS OF CHANGES IN NET ASSETSFOR THE PERIODS INDICATED (continued)
(Amounts in thousands)
| JPMorgan International Hedged Equity Fund |
| Year Ended October 31, 2024 | |
| | |
| | |
Proceeds from shares issued | | |
| | |
| | |
Change in net assets resulting from Class A capital transactions | | |
| | |
Proceeds from shares issued | | |
| | |
| | |
Change in net assets resulting from Class C capital transactions | | |
| | |
Proceeds from shares issued | | |
| | |
| | |
Change in net assets resulting from Class I capital transactions | | |
| | |
| | |
Change in net assets resulting from Class R5 capital transactions | | |
| | |
Proceeds from shares issued | | |
| | |
| | |
Change in net assets resulting from Class R6 capital transactions | | |
Total change in net assets resulting from capital transactions | | |
| | |
| | |
| | |
| | |
| | |
| | |
| | |
| | |
| | |
| | |
| | |
(a)
Amount rounds to less than one thousand.
SEE NOTES TO FINANCIAL STATEMENTS.
| J.P. Morgan International Equity Funds | |
| JPMorgan International Hedged Equity Fund |
| Year Ended October 31, 2024 | |
SHARE TRANSACTIONS: (continued) | | |
| | |
| | |
| | |
| | |
| | |
| | |
| | |
Change in Class R5 Shares | | |
| | |
| | |
| | |
| | |
Change in Class R6 Shares | | |
(a)
Amount rounds to less than one thousand.
SEE NOTES TO FINANCIAL STATEMENTS.
| J.P. Morgan International Equity Funds | |
FINANCIAL HIGHLIGHTSFOR THE PERIODS INDICATED
| Per share operating performance |
| | | |
| Net asset
value,
beginning
of period | Net
investment
income
(loss)(a) | Net realized
and unrealized
gains
(losses) on
investments | Total from
investment
operations | |
JPMorgan Developed International Value Fund | | | | | |
| | | | | |
Year Ended October 31, 2024 | | | | | |
Year Ended October 31, 2023 | | | | | |
Year Ended October 31, 2022 | | | | | |
Year Ended October 31, 2021 | | | | | |
Year Ended October 31, 2020 | | | | | |
| | | | | |
Year Ended October 31, 2024 | | | | | |
Year Ended October 31, 2023 | | | | | |
Year Ended October 31, 2022 | | | | | |
Year Ended October 31, 2021 | | | | | |
Year Ended October 31, 2020 | | | | | |
| | | | | |
Year Ended October 31, 2024 | | | | | |
Year Ended October 31, 2023 | | | | | |
Year Ended October 31, 2022 | | | | | |
Year Ended October 31, 2021 | | | | | |
Year Ended October 31, 2020 | | | | | |
| | | | | |
Year Ended October 31, 2024 | | | | | |
Year Ended October 31, 2023 | | | | | |
Year Ended October 31, 2022 | | | | | |
Year Ended October 31, 2021 | | | | | |
Year Ended October 31, 2020 | | | | | |
| | | | | |
Year Ended October 31, 2024 | | | | | |
Year Ended October 31, 2023 | | | | | |
Year Ended October 31, 2022 | | | | | |
Year Ended October 31, 2021 | | | | | |
Year Ended October 31, 2020 | | | | | |
| | | | | |
Year Ended October 31, 2024 | | | | | |
Year Ended October 31, 2023 | | | | | |
Year Ended October 31, 2022 | | | | | |
Year Ended October 31, 2021 | | | | | |
Year Ended October 31, 2020 | | | | | |
SEE NOTES TO FINANCIAL STATEMENTS.
| J.P. Morgan International Equity Funds | |
| |
| | | Ratios to average net assets |
Net asset
value,
end of
period | Total return
(excludes
sales charge)(b) | Net assets,
end of
period
(000's) | | Net
investment
income
(loss) | Expenses without
waivers and
reimbursements | |
| | | | | | |
| | | | | | |
| | | | | | |
| | | | | | |
| | | | | | |
| | | | | | |
| | | | | | |
| | | | | | |
| | | | | | |
| | | | | | |
| | | | | | |
| | | | | | |
| | | | | | |
| | | | | | |
| | | | | | |
| | | | | | |
| | | | | | |
| | | | | | |
| | | | | | |
| | | | | | |
| | | | | | |
| | | | | | |
| | | | | | |
| | | | | | |
| | | | | | |
| | | | | | |
| | | | | | |
| | | | | | |
| | | | | | |
| | | | | | |
| | | | | | |
| | | | | | |
| | | | | | |
| | | | | | |
| | | | | | |
| | | | | | |
| | | | | | |
SEE NOTES TO FINANCIAL STATEMENTS.
| J.P. Morgan International Equity Funds | |
FINANCIAL HIGHLIGHTSFOR THE PERIODS INDICATED (continued)
| Per share operating performance |
| | | |
| Net asset
value,
beginning
of period | Net
investment
income
(loss)(a) | Net realized
and unrealized
gains
(losses) on
investments | Total from
investment
operations | |
JPMorgan Developed International Value Fund (continued) | | | | | |
| | | | | |
Year Ended October 31, 2024 | | | | | |
Year Ended October 31, 2023 | | | | | |
Year Ended October 31, 2022 | | | | | |
Year Ended October 31, 2021 | | | | | |
Year Ended October 31, 2020 | | | | | |
| | | | | |
|
| Calculated based upon average shares outstanding. |
| Includes adjustments in accordance with accounting principles generally accepted in the United States of America and as such, the net asset values for financial reporting purposes and the returns based upon those net asset values may differ from the net asset values and returns for shareholder transactions. |
| Includes interest expense, if applicable, which is less than 0.005% unless otherwise noted. |
| Reflects income from foreign withholding tax claims, including related interest income, less IRS compliance fees. Had the Fund not received these proceeds, the net investment income (loss) per share would have been $0.46, $0.39, $0.51, $0.52, $0.41, $0.64 and $0.53 for Class A, Class C, Class I, Class L, Class R2, Class R5 and Class R6, respectively, and the net investment income (loss) ratios would have been 3.73%, 3.27%, 3.96%, 4.09%, 3.42%, 5.07% and 4.20% for Class A, Class C, Class I, Class L, Class R2, Class R5 and Class R6, respectively. |
| Reflects income from foreign withholding tax claims, including related interest income, less IRS compliance fees. Without these proceeds, the net investment income (loss) per share would have been $0.38, $0.28, $0.42, $0.41, $0.34, $0.35 and $0.44 for Class A, Class C, Class I, Class L, Class R2, Class R5, and Class R6,respectively, and the net investment income (loss) ratios would have been 3.00%, 2.26%, 3.19%, 3.23%, 2.72%, 2.80% and 3.44% for Class A, Class C, Class I, Class L, Class R2, Class R5, and Class R6, respectively. |
SEE NOTES TO FINANCIAL STATEMENTS.
| J.P. Morgan International Equity Funds | |
| |
| | | Ratios to average net assets |
Net asset
value,
end of
period | Total return
(excludes
sales charge)(b) | Net assets,
end of
period
(000's) | | Net
investment
income
(loss) | Expenses without
waivers and
reimbursements | |
|
| | | | | | |
| | | | | | |
| | | | | | |
| | | | | | |
| | | | | | |
| | | | | | |
| | | | | | |
SEE NOTES TO FINANCIAL STATEMENTS.
| J.P. Morgan International Equity Funds | |
FINANCIAL HIGHLIGHTSFOR THE PERIODS INDICATED
| Per share operating performance |
| | | |
| Net asset
value,
beginning
of period | Net
investment
income
(loss)(a) | Net realized
and unrealized
gains
(losses) on
investments | Total from
investment
operations | | | |
JPMorgan Emerging Markets Equity Fund | | | | | | | |
| | | | | | | |
Year Ended October 31, 2024 | | | | | | | |
Year Ended October 31, 2023 | | | | | | | |
Year Ended October 31, 2022 | | | | | | | |
Year Ended October 31, 2021 | | | | | | | |
Year Ended October 31, 2020 | | | | | | | |
| | | | | | | |
Year Ended October 31, 2024 | | | | | | | |
Year Ended October 31, 2023 | | | | | | | |
Year Ended October 31, 2022 | | | | | | | |
Year Ended October 31, 2021 | | | | | | | |
Year Ended October 31, 2020 | | | | | | | |
| | | | | | | |
Year Ended October 31, 2024 | | | | | | | |
Year Ended October 31, 2023 | | | | | | | |
Year Ended October 31, 2022 | | | | | | | |
Year Ended October 31, 2021 | | | | | | | |
Year Ended October 31, 2020 | | | | | | | |
| | | | | | | |
Year Ended October 31, 2024 | | | | | | | |
Year Ended October 31, 2023 | | | | | | | |
Year Ended October 31, 2022 | | | | | | | |
Year Ended October 31, 2021 | | | | | | | |
Year Ended October 31, 2020 | | | | | | | |
| | | | | | | |
Year Ended October 31, 2024 | | | | | | | |
Year Ended October 31, 2023 | | | | | | | |
Year Ended October 31, 2022 | | | | | | | |
Year Ended October 31, 2021 | | | | | | | |
Year Ended October 31, 2020 | | | | | | | |
| | | | | | | |
Year Ended October 31, 2024 | | | | | | | |
Year Ended October 31, 2023 | | | | | | | |
Year Ended October 31, 2022 | | | | | | | |
Year Ended October 31, 2021 | | | | | | | |
Year Ended October 31, 2020 | | | | | | | |
| | | | | | | |
Year Ended October 31, 2024 | | | | | | | |
Year Ended October 31, 2023 | | | | | | | |
Year Ended October 31, 2022 | | | | | | | |
Year Ended October 31, 2021 | | | | | | | |
Year Ended October 31, 2020 | | | | | | | |
| | | | | | | |
Year Ended October 31, 2024 | | | | | | | |
Year Ended October 31, 2023 | | | | | | | |
Year Ended October 31, 2022 | | | | | | | |
Year Ended October 31, 2021 | | | | | | | |
Year Ended October 31, 2020 | | | | | | | |
SEE NOTES TO FINANCIAL STATEMENTS.
| J.P. Morgan International Equity Funds | |
| |
| | | Ratios to average net assets |
Net asset
value,
end of
period | Total return
(excludes
sales charge)(b) | Net assets,
end of
period
(000's) | | Net
investment
income
(loss) | Expenses without
waivers and
reimbursements | |
| | | | | | |
| | | | | | |
| | | | | | |
| | | | | | |
| | | | | | |
| | | | | | |
| | | | | | |
| | | | | | |
| | | | | | |
| | | | | | |
| | | | | | |
| | | | | | |
| | | | | | |
| | | | | | |
| | | | | | |
| | | | | | |
| | | | | | |
| | | | | | |
| | | | | | |
| | | | | | |
| | | | | | |
| | | | | | |
| | | | | | |
| | | | | | |
| | | | | | |
| | | | | | |
| | | | | | |
| | | | | | |
| | | | | | |
| | | | | | |
| | | | | | |
| | | | | | |
| | | | | | |
| | | | | | |
| | | | | | |
| | | | | | |
| | | | | | |
| | | | | | |
| | | | | | |
| | | | | | |
| | | | | | |
| | | | | | |
| | | | | | |
| | | | | | |
| | | | | | |
| | | | | | |
| | | | | | |
| | | | | | |
| | | | | | |
SEE NOTES TO FINANCIAL STATEMENTS.
| J.P. Morgan International Equity Funds | |
FINANCIAL HIGHLIGHTSFOR THE PERIODS INDICATED (continued)
| Per share operating performance |
| | | |
| Net asset
value,
beginning
of period | Net
investment
income
(loss)(a) | Net realized
and unrealized
gains
(losses) on
investments | Total from
investment
operations | | | |
JPMorgan Emerging Markets Equity Fund (continued) | | | | | | | |
| | | | | | | |
Year Ended October 31, 2024 | | | | | | | |
Year Ended October 31, 2023 | | | | | | | |
Year Ended October 31, 2022 | | | | | | | |
Year Ended October 31, 2021 | | | | | | | |
Year Ended October 31, 2020 | | | | | | | |
| | | | | | | |
|
| Calculated based upon average shares outstanding. |
| Includes adjustments in accordance with accounting principles generally accepted in the United States of America and as such, the net asset values for financial reporting purposes and the returns based upon those net asset values may differ from the net asset values and returns for shareholder transactions. |
| Includes interest expense, if applicable, which is less than 0.005% unless otherwise noted. |
SEE NOTES TO FINANCIAL STATEMENTS.
| J.P. Morgan International Equity Funds | |
| |
| | | Ratios to average net assets |
Net asset
value,
end of
period | Total return
(excludes
sales charge)(b) | Net assets,
end of
period
(000's) | | Net
investment
income
(loss) | Expenses without
waivers and
reimbursements | |
|
| | | | | | |
| | | | | | |
| | | | | | |
| | | | | | |
| | | | | | |
| | | | | | |
| | | | | | |
SEE NOTES TO FINANCIAL STATEMENTS.
| J.P. Morgan International Equity Funds | |
FINANCIAL HIGHLIGHTSFOR THE PERIODS INDICATED
| Per share operating performance |
| | | |
| Net asset
value,
beginning
of period | Net
investment
income
(loss)(a) | Net realized
and unrealized
gains
(losses) on
investments | Total from
investment
operations | | | |
JPMorgan Emerging Markets Research Enhanced Equity Fund | | | | | | | |
| | | | | | | |
Year Ended October 31, 2024 | | | | | | | |
Year Ended October 31, 2023 | | | | | | | |
Year Ended October 31, 2022 | | | | | | | |
Year Ended October 31, 2021 | | | | | | | |
Year Ended October 31, 2020 | | | | | | | |
| | | | | | | |
Year Ended October 31, 2024 | | | | | | | |
Year Ended October 31, 2023 | | | | | | | |
Year Ended October 31, 2022 | | | | | | | |
Year Ended October 31, 2021 | | | | | | | |
Year Ended October 31, 2020 | | | | | | | |
| | | | | | | |
|
| Calculated based upon average shares outstanding. |
| Includes adjustments in accordance with accounting principles generally accepted in the United States of America and as such, the net asset values for financial reporting purposes and the returns based upon those net asset values may differ from the net asset values and returns for shareholder transactions. |
| Includes interest expense, if applicable, which is less than 0.005% unless otherwise noted. |
| Interest expense is 0.02% |
SEE NOTES TO FINANCIAL STATEMENTS.
| J.P. Morgan International Equity Funds | |
| |
| | | Ratios to average net assets |
Net asset
value,
end of
period | | Net assets,
end of
period
(000's) | | Net
investment
income
(loss) | Expenses without
waivers and
reimbursements | |
| | | | | | |
| | | | | | |
| | | | | | |
| | | | | | |
| | | | | | |
| | | | | | |
| | | | | | |
| | | | | | |
| | | | | | |
| | | | | | |
| | | | | | |
| | | | | | |
| | | | | | |
| | | | | | |
SEE NOTES TO FINANCIAL STATEMENTS.
| J.P. Morgan International Equity Funds | |
FINANCIAL HIGHLIGHTSFOR THE PERIODS INDICATED
| Per share operating performance |
| | | |
| Net asset
value,
beginning
of period | Net
investment
income
(loss)(a) | Net realized
and unrealized
gains
(losses) on
investments | Total from
investment
operations | |
JPMorgan Europe Dynamic Fund | | | | | |
| | | | | |
Year Ended October 31, 2024 | | | | | |
Year Ended October 31, 2023 | | | | | |
Year Ended October 31, 2022 | | | | | |
Year Ended October 31, 2021 | | | | | |
Year Ended October 31, 2020 | | | | | |
| | | | | |
Year Ended October 31, 2024 | | | | | |
Year Ended October 31, 2023 | | | | | |
Year Ended October 31, 2022 | | | | | |
Year Ended October 31, 2021 | | | | | |
Year Ended October 31, 2020 | | | | | |
| | | | | |
Year Ended October 31, 2024 | | | | | |
Year Ended October 31, 2023 | | | | | |
Year Ended October 31, 2022 | | | | | |
Year Ended October 31, 2021 | | | | | |
Year Ended October 31, 2020 | | | | | |
| | | | | |
Year Ended October 31, 2024 | | | | | |
Year Ended October 31, 2023 | | | | | |
Year Ended October 31, 2022 | | | | | |
Year Ended October 31, 2021 | | | | | |
Year Ended October 31, 2020 | | | | | |
| | | | | |
Year Ended October 31, 2024 | | | | | |
Year Ended October 31, 2023 | | | | | |
Year Ended October 31, 2022 | | | | | |
Year Ended October 31, 2021 | | | | | |
Year Ended October 31, 2020 | | | | | |
| | | | | |
|
| Calculated based upon average shares outstanding. |
| Includes adjustments in accordance with accounting principles generally accepted in the United States of America and as such, the net asset values for financial reporting purposes and the returns based upon those net asset values may differ from the net asset values and returns for shareholder transactions. |
| Includes interest expense, if applicable, which is less than 0.005% unless otherwise noted. |
| Reflects income from foreign withholding tax claims, including related interest income. Had the Fund not received these proceeds, the net investment income (loss) per share would have been $0.47, $0.31, $0.56, $0.73 and $0.64 for Class A, Class C, Class I, Class L and Class R6, respectively, and the net investment income (loss) ratios would have been 1.69%, 1.28%, 1.98%, 2.54% and 2.24% for Class A, Class C, Class I, Class L and Class R6, respectively. |
| Reflects income from foreign withholding tax claims, including related interest income. Had the Fund not received these proceeds, the net investment income (loss) per share would have been $0.38, $0.20, $0.45, $0.52 and $0.53 for Class A, Class C, Class I, Class L and Class R6, respectively, and the net investment income (loss) ratios would have been 1.29%, 0.78%, 1.44%, 1.70% and 1.75% for Class A, Class C, Class I, Class L and Class R6, respectively. |
SEE NOTES TO FINANCIAL STATEMENTS.
| J.P. Morgan International Equity Funds | |
| |
| | | Ratios to average net assets |
Net asset
value,
end of
period | Total return
(excludes
sales charge)(b) | Net assets,
end of
period
(000's) | | Net
investment
income
(loss) | Expenses without
waivers and
reimbursements | |
| | | | | | |
| | | | | | |
| | | | | | |
| | | | | | |
| | | | | | |
| | | | | | |
| | | | | | |
| | | | | | |
| | | | | | |
| | | | | | |
| | | | | | |
| | | | | | |
| | | | | | |
| | | | | | |
| | | | | | |
| | | | | | |
| | | | | | |
| | | | | | |
| | | | | | |
| | | | | | |
| | | | | | |
| | | | | | |
| | | | | | |
| | | | | | |
| | | | | | |
| | | | | | |
| | | | | | |
| | | | | | |
| | | | | | |
| | | | | | |
| | | | | | |
| | | | | | |
SEE NOTES TO FINANCIAL STATEMENTS.
| J.P. Morgan International Equity Funds | |
FINANCIAL HIGHLIGHTSFOR THE PERIODS INDICATED
| Per share operating performance |
| | | |
| Net asset
value,
beginning
of period | Net
investment
income
(loss)(a) | Net realized
and unrealized
gains
(losses) on
investments | Total from
investment
operations | | | |
JPMorgan International Equity Fund | | | | | | | |
| | | | | | | |
Year Ended October 31, 2024 | | | | | | | |
Year Ended October 31, 2023 | | | | | | | |
Year Ended October 31, 2022 | | | | | | | |
Year Ended October 31, 2021 | | | | | | | |
Year Ended October 31, 2020 | | | | | | | |
| | | | | | | |
Year Ended October 31, 2024 | | | | | | | |
Year Ended October 31, 2023 | | | | | | | |
Year Ended October 31, 2022 | | | | | | | |
Year Ended October 31, 2021 | | | | | | | |
Year Ended October 31, 2020 | | | | | | | |
| | | | | | | |
Year Ended October 31, 2024 | | | | | | | |
Year Ended October 31, 2023 | | | | | | | |
Year Ended October 31, 2022 | | | | | | | |
Year Ended October 31, 2021 | | | | | | | |
Year Ended October 31, 2020 | | | | | | | |
| | | | | | | |
Year Ended October 31, 2024 | | | | | | | |
Year Ended October 31, 2023 | | | | | | | |
Year Ended October 31, 2022 | | | | | | | |
Year Ended October 31, 2021 | | | | | | | |
Year Ended October 31, 2020 | | | | | | | |
| | | | | | | |
Year Ended October 31, 2024 | | | | | | | |
Year Ended October 31, 2023 | | | | | | | |
Year Ended October 31, 2022 | | | | | | | |
Year Ended October 31, 2021 | | | | | | | |
Year Ended October 31, 2020 | | | | | | | |
| | | | | | | |
Year Ended October 31, 2024 | | | | | | | |
Year Ended October 31, 2023 | | | | | | | |
Year Ended October 31, 2022 | | | | | | | |
Year Ended October 31, 2021 | | | | | | | |
Year Ended October 31, 2020 | | | | | | | |
| | | | | | | |
|
| Calculated based upon average shares outstanding. |
| Includes adjustments in accordance with accounting principles generally accepted in the United States of America and as such, the net asset values for financial reporting purposes and the returns based upon those net asset values may differ from the net asset values and returns for shareholder transactions. |
| Includes interest expense, if applicable, which is less than 0.005% unless otherwise noted. |
| Reflects income from foreign withholding tax claims, including related interest income. Had the Fund not received these proceeds, the net investment income (loss) per share would have been $0.32, $0.23, $0.37, $0.37, $0.37 and $0.40 for Class A, Class C, Class I, Class R2, Class R5 and Class R6, respectively, and the net investment income (loss) ratios would have been 1.85%, 1.39%, 2.08%, 2.20%, 2.07% and 2.29% for Class A, Class C, Class I, Cass R2, Class R5 and Class R6, respectively. |
| Reflects income from foreign withholding tax claims. Had the Fund not received these proceeds, the net investment income (loss) per share and the net investment income (loss) ratios for each share class would have remained the same. |
SEE NOTES TO FINANCIAL STATEMENTS.
| J.P. Morgan International Equity Funds | |
| |
| | | Ratios to average net assets |
Net asset
value,
end of
period | Total return
(excludes
sales charge)(b) | Net assets,
end of
period
(000's) | | Net
investment
income
(loss) | Expenses without
waivers and
reimbursements | |
| | | | | | |
| | | | | | |
| | | | | | |
| | | | | | |
| | | | | | |
| | | | | | |
| | | | | | |
| | | | | | |
| | | | | | |
| | | | | | |
| | | | | | |
| | | | | | |
| | | | | | |
| | | | | | |
| | | | | | |
| | | | | | |
| | | | | | |
| | | | | | |
| | | | | | |
| | | | | | |
| | | | | | |
| | | | | | |
| | | | | | |
| | | | | | |
| | | | | | |
| | | | | | |
| | | | | | |
| | | | | | |
| | | | | | |
| | | | | | |
| | | | | | |
| | | | | | |
| | | | | | |
| | | | | | |
| | | | | | |
| | | | | | |
| | | | | | |
| | | | | | |
SEE NOTES TO FINANCIAL STATEMENTS.
| J.P. Morgan International Equity Funds | |
FINANCIAL HIGHLIGHTSFOR THE PERIODS INDICATED
| Per share operating performance |
| | | |
| Net asset
value,
beginning
of period | Net
investment
income
(loss)(a) | Net realized
and unrealized
gains
(losses) on
investments | Total from
investment
operations | |
JPMorgan International Focus Fund | | | | | |
| | | | | |
Year Ended October 31, 2024 | | | | | |
Year Ended October 31, 2023 | | | | | |
Year Ended October 31, 2022 | | | | | |
Year Ended October 31, 2021 | | | | | |
Year Ended October 31, 2020 | | | | | |
| | | | | |
Year Ended October 31, 2024 | | | | | |
Year Ended October 31, 2023 | | | | | |
Year Ended October 31, 2022 | | | | | |
Year Ended October 31, 2021 | | | | | |
Year Ended October 31, 2020 | | | | | |
| | | | | |
Year Ended October 31, 2024 | | | | | |
Year Ended October 31, 2023 | | | | | |
Year Ended October 31, 2022 | | | | | |
Year Ended October 31, 2021 | | | | | |
Year Ended October 31, 2020 | | | | | |
| | | | | |
Year Ended October 31, 2024 | | | | | |
Year Ended October 31, 2023 | | | | | |
Year Ended October 31, 2022 | | | | | |
Year Ended October 31, 2021 | | | | | |
Year Ended October 31, 2020 | | | | | |
| | | | | |
Year Ended October 31, 2024 | | | | | |
Year Ended October 31, 2023 | | | | | |
Year Ended October 31, 2022 | | | | | |
Year Ended October 31, 2021 | | | | | |
Year Ended October 31, 2020 | | | | | |
| | | | | |
Year Ended October 31, 2024 | | | | | |
Year Ended October 31, 2023 | | | | | |
Year Ended October 31, 2022 | | | | | |
Year Ended October 31, 2021 | | | | | |
Year Ended October 31, 2020 | | | | | |
| | | | | |
|
| Calculated based upon average shares outstanding. |
| Includes adjustments in accordance with accounting principles generally accepted in the United States of America and as such, the net asset values for financial reporting purposes and the returns based upon those net asset values may differ from the net asset values and returns for shareholder transactions. |
| Includes interest expense, if applicable, which is less than 0.005% unless otherwise noted. |
| Reflects income from foreign withholding tax claims. Had the Fund not received these proceeds, the net investment income (loss) per share and the net investment income (loss) ratios for each share class would have remained the same. |
SEE NOTES TO FINANCIAL STATEMENTS.
| J.P. Morgan International Equity Funds | |
| |
| | | Ratios to average net assets |
Net asset
value,
end of
period | Total return
(excludes
sales charge)(b) | Net assets,
end of
period
(000's) | | Net
investment
income
(loss) | Expenses without
waivers and
reimbursements | |
| | | | | | |
| | | | | | |
| | | | | | |
| | | | | | |
| | | | | | |
| | | | | | |
| | | | | | |
| | | | | | |
| | | | | | |
| | | | | | |
| | | | | | |
| | | | | | |
| | | | | | |
| | | | | | |
| | | | | | |
| | | | | | |
| | | | | | |
| | | | | | |
| | | | | | |
| | | | | | |
| | | | | | |
| | | | | | |
| | | | | | |
| | | | | | |
| | | | | | |
| | | | | | |
| | | | | | |
| | | | | | |
| | | | | | |
| | | | | | |
| | | | | | |
| | | | | | |
| | | | | | |
| | | | | | |
| | | | | | |
| | | | | | |
| | | | | | |
| | | | | | |
SEE NOTES TO FINANCIAL STATEMENTS.
| J.P. Morgan International Equity Funds | |
FINANCIAL HIGHLIGHTSFOR THE PERIODS INDICATED
| Per share operating performance |
| | | |
| Net asset
value,
beginning
of period | Net
investment
income
(loss)(a) | Net realized
and unrealized
gains
(losses) on
investments | Total from
investment
operations | |
JPMorgan International Hedged Equity Fund | | | | | |
| | | | | |
Year Ended October 31, 2024 | | | | | |
Year Ended October 31, 2023 | | | | | |
Year Ended October 31, 2022 | | | | | |
Year Ended October 31, 2021 | | | | | |
Year Ended October 31, 2020 | | | | | |
| | | | | |
Year Ended October 31, 2024 | | | | | |
Year Ended October 31, 2023 | | | | | |
Year Ended October 31, 2022 | | | | | |
Year Ended October 31, 2021 | | | | | |
Year Ended October 31, 2020 | | | | | |
| | | | | |
Year Ended October 31, 2024 | | | | | |
Year Ended October 31, 2023 | | | | | |
Year Ended October 31, 2022 | | | | | |
Year Ended October 31, 2021 | | | | | |
Year Ended October 31, 2020 | | | | | |
| | | | | |
Year Ended October 31, 2024 | | | | | |
Year Ended October 31, 2023 | | | | | |
Year Ended October 31, 2022 | | | | | |
Year Ended October 31, 2021 | | | | | |
Year Ended October 31, 2020 | | | | | |
| | | | | |
Year Ended October 31, 2024 | | | | | |
Year Ended October 31, 2023 | | | | | |
Year Ended October 31, 2022 | | | | | |
Year Ended October 31, 2021 | | | | | |
Year Ended October 31, 2020 | | | | | |
| | | | | |
|
| Calculated based upon average shares outstanding. |
| Includes adjustments in accordance with accounting principles generally accepted in the United States of America and as such, the net asset values for financial reporting purposes and the returns based upon those net asset values may differ from the net asset values and returns for shareholder transactions. |
| Includes interest expense, if applicable, which is less than 0.005% unless otherwise noted. |
| Interest expense is 0.01% |
SEE NOTES TO FINANCIAL STATEMENTS.
| J.P. Morgan International Equity Funds | |
| |
| | | Ratios to average net assets |
Net asset
value,
end of
period | Total return
(excludes
sales charge)(b) | Net assets,
end of
period
(000's) | | Net
investment
income
(loss) | Expenses without
waivers and
reimbursements | |
| | | | | | |
| | | | | | |
| | | | | | |
| | | | | | |
| | | | | | |
| | | | | | |
| | | | | | |
| | | | | | |
| | | | | | |
| | | | | | |
| | | | | | |
| | | | | | |
| | | | | | |
| | | | | | |
| | | | | | |
| | | | | | |
| | | | | | |
| | | | | | |
| | | | | | |
| | | | | | |
| | | | | | |
| | | | | | |
| | | | | | |
| | | | | | |
| | | | | | |
| | | | | | |
| | | | | | |
| | | | | | |
| | | | | | |
| | | | | | |
| | | | | | |
| | | | | | |
SEE NOTES TO FINANCIAL STATEMENTS.
| J.P. Morgan International Equity Funds | |
NOTES TO FINANCIAL STATEMENTSAS OF October 31, 2024
(Dollar values in thousands)
1. Organization
JPMorgan Trust I (“JPM I") and JPMorgan Trust IV (“JPM IV") (collectively, the “Trusts”) were formed on November 12, 2004 and November 11, 2015, respectively, as Delaware statutory trusts, pursuant to Declarations of Trust dated November 5, 2004 and November 11, 2015, respectively, and are registered under the Investment Company Act of 1940, as amended (the “1940 Act”), as open-end management investment companies.
The following are 7 separate funds of the Trusts (each, a "Fund" and collectively, the "Funds") covered by this report:
| | | Diversification Classification |
JPMorgan Developed International Value Fund | Class A, Class C, Class I, Class L, Class R2, Class R5 and Class R6 | | |
JPMorgan Emerging Markets Equity Fund | Class A, Class C, Class I, Class L, Class R2, Class R3, Class R4, Class R5 and Class R6 | | |
JPMorgan Emerging Markets Research Enhanced Equity Fund | | | |
JPMorgan Europe Dynamic Fund | Class A, Class C, Class I, Class L and Class R6 | | |
JPMorgan International Equity Fund | Class A, Class C, Class I, Class R2, Class R5 and Class R6 | | |
JPMorgan International Focus Fund | Class A, Class C, Class I, Class R2, Class R5 and Class R6 | | |
JPMorgan International Hedged Equity Fund | Class A, Class C, Class I, Class R5 and Class R6 | | |
The investment objective of JPMorgan Developed International Value Fund (“Developed International Value Fund”), JPMorgan Emerging Markets Research Enhanced Equity Fund (“Emerging Markets Research Enhanced Equity Fund”) and JPMorgan International Focus Fund (“International Focus Fund”) is to seek to provide long-term capital appreciation.
The investment objective of JPMorgan Emerging Markets Equity Fund (“Emerging Markets Equity Fund”) is to seek to provide high total return.
The investment objective of JPMorgan Europe Dynamic Fund (“Europe Dynamic Fund”) is to seek total return from long-term capital growth. Total return consists of capital growth and current income.
The investment objective of JPMorgan International Equity Fund (“International Equity Fund”) is to seek total return from long-term capital growth and income. Total return consists of capital growth and current income.
The investment objective of JPMorgan International Hedged Equity Fund (“International Hedged Equity Fund”) is to seek to provide capital appreciation.
Class L Shares of Developed International Value Fund and Europe Dynamic Fund are publicly offered on a limited basis. Investors are not eligible to purchase Class L Shares of Developed International Value Fund and Europe Dynamic Fund unless they meet certain requirements as described in the Funds' prospectuses.
Effective as of the close of business on December 31, 2020, all share classes of Emerging Markets Equity Fund are publicly offered on a limited basis. Investors are not eligible to purchase shares of the Fund unless they meet certain requirements as described in the Fund's prospectuses.
Class A Shares generally provide for a front-end sales charge while Class C Shares provide for a contingent deferred sales charge ("CDSC"). No sales charges are assessed with respect to Class I, Class L, Class R2, Class R3, Class R4, Class R5 and Class R6 Shares. Certain Class A Shares, for which front-end sales charges have been waived, may be subject to a CDSC as described in the Funds' prospectus. Effective October 1, 2020, Class C Shares automatically convert to Class A Shares after eight years. Prior to October 1, 2020, Class C Shares automatically converted to Class A Shares after ten years. All classes of shares have equal rights as to earnings, assets and voting privileges, except that each class may bear different transfer agency, distribution and service fees and each class has exclusive voting rights with respect to its distribution plan and shareholder servicing agreements.
J.P. Morgan Investment Management Inc. ("JPMIM"), an indirect, wholly-owned subsidiary of JPMorgan Chase & Co. ("JPMorgan"), acts as Adviser (the "Adviser") and Administrator (the "Administrator") to the Funds.
2. Significant Accounting Policies
The following is a summary of significant accounting policies followed by the Funds in the preparation of their financial statements. The Funds are investment companies and, accordingly, follow the investment company accounting and reporting guidance of the Financial Accounting Standards Board (“FASB”) Accounting Standards Codification Topic 946 — Investment Companies, which is part of U.S. generally accepted accounting principles (“GAAP”). The preparation of financial statements in conformity with GAAP requires management to make estimates and assumptions that affect (i)
| J.P. Morgan International Equity Funds | |
the reported amounts of assets and liabilities, (ii) disclosure of contingent assets and liabilities at the date of the financial statements, and (iii) the reported amounts of increases and decreases in net assets from operations during the reporting period. Actual results could differ from those estimates.
A. Valuation of Investments— Investments are valued in accordance with GAAP and the Funds' valuation policies set forth by, and under the supervision and responsibility of, the Boards of Trustees of the Trusts (the "Boards"), which established the following approach to valuation, as described more fully below: (i) investments for which market quotations are readily available shall be valued at their market value and (ii) all other investments for which market quotations are not readily available shall be valued at their fair value as determined in good faith by the Boards.
Under Section 2(a)(41) of the 1940 Act, the Boards are required to determine fair value for securities that do not have readily available market quotations. Under Securities and Exchange Commission ("SEC") Rule 2a-5 (Good Faith Determinations of Fair Value), the Boards may designate the performance of these fair valuation determinations to a valuation designee. The Boards have designated the Adviser as the “Valuation Designee” to perform fair valuation determinations for the Funds on behalf of the Boards subject to appropriate oversight by the Boards. The Adviser, as Valuation Designee, leverages the J.P. Morgan Asset Management Americas Valuation Committee (“AVC”) to help oversee and carry out the policies for the valuation of investments held in the Funds. The Adviser, as Valuation Designee, remains responsible for the valuation determinations.
This oversight by the AVC includes monitoring the appropriateness of fair values based on results of ongoing valuation oversight including, but not limited to, consideration of macro or security specific events, market events, and pricing vendor and broker due diligence. The Administrator is responsible for discussing and assessing the potential impacts to the fair values on an ongoing basis, and, at least on a quarterly basis, with the AVC and the Boards.
A market-based approach is primarily used to value the Funds' investments. Investments for which market quotations are not readily available are fair valued using prices supplied by approved affiliated and/or unaffiliated pricing vendors or third party broker-dealers (collectively referred to as “Pricing Services”) or may be internally fair valued using methods set forth by the valuation policies approved by the Boards. This may include the use of related or comparable assets or liabilities, recent transactions, market multiples, book values and other relevant information for the investment. An income-based valuation approach may be used in which the anticipated future cash flows of the investment are discounted to calculate the fair value. Discounts may also be applied due to the nature or duration of any restrictions on the disposition of the investments. Valuations may be based upon current market prices of securities that are comparable in coupon, rating, maturity and industry. It is possible that the estimated values may differ significantly from the values that would have been used had a ready market for the investments existed, and such differences could be material.
Equities and other exchange-traded instruments are valued at the last sale price or official market closing price on the primary exchange on which the instrument is traded before the net asset values ("NAV") of the Funds are calculated on a valuation date. Certain foreign equity instruments are valued by applying international fair value factors provided by approved Pricing Services. The factors seek to adjust the local closing price for movements of local markets post-closing, but prior to the time the NAV is calculated.
Investments in open-end investment companies (“Underlying Funds”) are valued at each Underlying Fund’s NAV per share as of the report date.
Futures contracts and options are generally valued on the basis of available market quotations.
Valuations reflected in this report are as of the report date. As a result, changes in valuation due to market events and/or issuer-related events after the report date and prior to issuance of the report are not reflected herein.
The various inputs that are used in determining the valuation of the Funds' investments are summarized into the three broad levels listed below.
•
Level 1 — Unadjusted inputs using quoted prices in active markets for identical investments.
•
Level 2 — Other significant observable inputs including, but not limited to, quoted prices for similar investments, inputs other than quoted prices that are observable for investments (such as interest rates, prepayment speeds, credit risk, etc.) or other market corroborated inputs.
•
Level 3 — Significant inputs based on the best information available in the circumstances, to the extent observable inputs are not available (including the Funds' assumptions in determining the fair value of investments).
A financial instrument’s level within the fair value hierarchy is based on the lowest level of any input, both individually and in the aggregate, that is significant to the fair value measurement. The inputs or methodology used for valuing instruments are not necessarily an indication of the risk associated with investing in those instruments.
| J.P. Morgan International Equity Funds | |
NOTES TO FINANCIAL STATEMENTSAS OF October 31, 2024 (continued)
(Dollar values in thousands)
The following tables represent each valuation input as presented on the Schedules of Portfolio Investments ("SOIs"):
Developed International Value Fund | | |
| | Level 2
Other significant
observable inputs | Level 3
Significant
unobservable inputs | |
Investments in Securities | | | | |
| | | | |
| | | | |
| | | | |
| | | | |
| | | | |
| | | | |
| | | | |
| | | | |
| | | | |
| | | | |
| | | | |
| | | | |
| | | | |
| | | | |
| | | | |
| | | | |
| | | | |
| | | | |
| | | | |
| | | | |
| | | | |
| | | | |
| | | | |
| | | | |
| | | | |
| | | | |
| | | | |
| | | | |
Investment of Cash Collateral from Securities Loaned | | | | |
Total Short-Term Investments | | | | |
Total Investments in Securities | | | | |
Appreciation in Other Financial Instruments | | | | |
| | | | |
Depreciation in Other Financial Instruments | | | | |
| | | | |
Total Net Appreciation/ Depreciation in Other
Financial Instruments | | | | |
| J.P. Morgan International Equity Funds | |
Emerging Markets Equity Fund | | |
| | Level 2
Other significant
observable inputs | Level 3
Significant
unobservable inputs | |
Investments in Securities | | | | |
| | | | |
| | | | |
| | | | |
| | | | |
| | | | |
| | | | |
| | | | |
| | | | |
| | | | |
| | | | |
| | | | |
| | | | |
| | | | |
| | | | |
| | | | |
| | | | |
| | | | |
| | | | |
| | | | |
| | | | |
Total Investments in Securities | | | | |
Emerging Markets Research Enhanced Equity Fund | | |
| | Level 2
Other significant
observable inputs | Level 3
Significant
unobservable inputs | |
Investments in Securities | | | | |
| | | | |
| | | | |
| | | | |
| | | | |
| | | | |
| | | | |
| | | | |
| | | | |
| | | | |
| | | | |
| | | | |
| | | | |
| | | | |
| | | | |
| | | | |
| | | | |
| | | | |
| | | | |
| | | | |
| | | | |
| J.P. Morgan International Equity Funds | |
NOTES TO FINANCIAL STATEMENTSAS OF October 31, 2024 (continued)
(Dollar values in thousands)
Emerging Markets Research Enhanced Equity Fund (continued) | | |
| | Level 2 Other significant observable inputs | Level 3 Significant unobservable inputs | |
| | | | |
| | | | |
| | | | |
| | | | |
| | | | |
| | | | |
| | | | |
| | | | |
| | | | |
| | | | |
| | | | |
| | | | |
| | | | |
| | | | |
Investment of Cash Collateral from Securities Loaned | | | | |
Total Short-Term Investments | | | | |
Total Investments in Securities | | | | |
Depreciation in Other Financial Instruments | | | | |
| | | | |
|
| Amount rounds to less than one thousand. |
| | |
| | Level 2
Other significant
observable inputs | Level 3
Significant
unobservable inputs | |
Investments in Securities | | | | |
| | | | |
| | | | |
| | | | |
| | | | |
| | | | |
| | | | |
| | | | |
| | | | |
| | | | |
| | | | |
| | | | |
| | | | |
| | | | |
| | | | |
| | | | |
| | | | |
| | | | |
| | | | |
| | | | |
Total Investments in Securities | | | | |
| J.P. Morgan International Equity Funds | |
Europe Dynamic Fund (continued) | | |
| | Level 2 Other significant observable inputs | Level 3 Significant unobservable inputs | |
Depreciation in Other Financial Instruments | | | | |
| | | | |
International Equity Fund | | |
| | Level 2
Other significant
observable inputs | Level 3
Significant
unobservable inputs | |
Investments in Securities | | | | |
| | | | |
| | | | |
| | | | |
| | | | |
| | | | |
| | | | |
| | | | |
| | | | |
| | | | |
| | | | |
| | | | |
| | | | |
| | | | |
| | | | |
| | | | |
| | | | |
| | | | |
| | | | |
| | | | |
| | | | |
| | | | |
| | | | |
| | | | |
Investment of Cash Collateral from Securities Loaned | | | | |
Total Short-Term Investments | | | | |
Total Investments in Securities | | | | |
| | |
| | Level 2
Other significant
observable inputs | Level 3
Significant
unobservable inputs | |
Investments in Securities | | | | |
| | | | |
| | | | |
| | | | |
| | | | |
| | | | |
| | | | |
| | | | |
| | | | |
| J.P. Morgan International Equity Funds | |
NOTES TO FINANCIAL STATEMENTSAS OF October 31, 2024 (continued)
(Dollar values in thousands)
International Focus Fund (continued) | | |
| | Level 2 Other significant observable inputs | Level 3 Significant unobservable inputs | |
| | | | |
| | | | |
| | | | |
| | | | |
| | | | |
| | | | |
| | | | |
| | | | |
| | | | |
| | | | |
| | | | |
| | | | |
| | | | |
| | | | |
| | | | |
| | | | |
| | | | |
Investment of Cash Collateral from Securities Loaned | | | | |
Total Short-Term Investments | | | | |
Total Investments in Securities | | | | |
International Hedged Equity Fund | | |
| | Level 2
Other significant
observable inputs | Level 3
Significant
unobservable inputs | |
Investments in Securities | | | | |
| | | | |
| | | | |
| | | | |
| | | | |
| | | | |
| | | | |
| | | | |
| | | | |
| | | | |
| | | | |
| | | | |
| | | | |
| | | | |
| | | | |
| | | | |
| | | | |
| | | | |
| | | | |
| | | | |
| | | | |
| | | | |
| J.P. Morgan International Equity Funds | |
International Hedged Equity Fund (continued) | | |
| | Level 2 Other significant observable inputs | Level 3 Significant unobservable inputs | |
| | | | |
| | | | |
| | | | |
Total Investments in Securities | | | | |
Depreciation in Other Financial Instruments | | | | |
| | | | |
| | | | |
| | | | |
| | | | |
Total Depreciation in Other Financial Instruments | | | | |
B. Restricted Securities— Certain securities held by the Funds may be subject to legal or contractual restrictions on resale. Restricted securities generally are resold in transactions exempt from registration under the Securities Act of 1933, as amended (the “Securities Act”). Disposal of these securities may involve time-consuming negotiations and expense. Prompt sale at the current valuation may be difficult and could adversely affect the NAVs of the Funds.
As of October 31, 2024, the Funds had no investments in restricted securities other than securities sold to the Funds under Rule 144A and/or Regulation S under the Securities Act.
C. Securities Lending — The Funds are authorized to engage in securities lending in order to generate additional income. The Funds are able to lend to approved borrowers. Citibank N.A. (“Citibank”) serves as lending agent for the Funds, pursuant to a Securities Lending Agency Agreement (the “Securities Lending Agency Agreement”). Securities loaned are collateralized by cash equal to at least 100% of the market value plus accrued interest on the securities lent, which is invested in the Class IM Shares of the JPMorgan U.S. Government Money Market Fund and the Agency SL Class Shares of the JPMorgan Securities Lending Money Market Fund. The Funds retain the interest earned on cash collateral investments but are required to pay the borrower a rebate for the use of the cash collateral. In cases where the lent security is of high value to borrowers, there may be a negative rebate (i.e., a net payment from the borrower to the Funds). Upon termination of a loan, the Funds are required to return to the borrower an amount equal to the cash collateral, plus any rebate owed to the borrowers. The remaining maturities of the securities lending transactions are considered overnight and continuous. Loans are subject to termination by the Funds or the borrower at any time.
The net income earned on the securities lending (after payment of rebates and Citibank’s fee) is included on the Statements of Operations as Income from securities lending (net). The Funds also receive payments from the borrower during the period of the loan, equivalent to dividends and interest earned on the securities loaned, which are recorded as Dividend or Interest income, respectively, on the Statements of Operations.
Under the Securities Lending Agency Agreement, Citibank marks to market the loaned securities on a daily basis. In the event the cash received from the borrower is less than 102% of the value of the loaned securities (105% for loans of non-U.S. securities), Citibank requests additional cash from the borrower so as to maintain a collateralization level of at least 102% of the value of the loaned securities plus accrued interest (105% for loans of non-U.S. securities), subject to certain de minimis amounts.
The value of securities out on loan is recorded as an asset on the Statements of Assets and Liabilities. The value of the cash collateral received is recorded as a liability on the Statements of Assets and Liabilities and details of collateral investments are disclosed on the SOIs.
The Funds bear the risk of loss associated with the collateral investments and are not entitled to additional collateral from the borrower to cover any such losses. To the extent that the value of the collateral investments declines below the amount owed to a borrower, the Funds may incur losses that exceed the amount they earned on lending the security. Upon termination of a loan, the Funds may use leverage (borrow money) to repay the borrower for cash collateral posted if the Adviser does not believe that it is prudent to sell the collateral investments to fund the payment of this liability. Securities lending activity is subject to master netting arrangements.
| J.P. Morgan International Equity Funds | |
NOTES TO FINANCIAL STATEMENTSAS OF October 31, 2024 (continued)
(Dollar values in thousands)
The following table presents for each lending Fund, the value of the securities on loan with Citibank, net of amounts available for offset under the master netting arrangements and any related collateral received or posted by the Funds as of October 31, 2024.
| Investment Securities
on Loan, at value,
Presented on the
Statements of Assets
and Liabilities | Cash Collateral
Posted by Borrower* | Net Amount Due
to Counterparty
(not less than zero) |
Developed International Value Fund | | | |
Emerging Markets Research Enhanced Equity Fund | | | |
International Equity Fund | | | |
| | | |
|
| Collateral posted reflects the value of securities on loan and does not include any additional amounts received from the borrower. |
Securities lending also involves counterparty risks, including the risk that the loaned securities may not be returned in a timely manner or at all. Subject to certain conditions, Citibank has agreed to indemnify the Funds from losses resulting from a borrower’s failure to return a loaned security.
JPMIM voluntarily waived investment advisory fees charged to the Funds to reduce the impact of the cash collateral investment in the JPMorgan U.S. Government Money Market Fund from 0.13% to 0.06%. For the year ended October 31, 2024, JPMIM waived fees associated with the Funds' investment in the JPMorgan U.S. Government Money Market Fund as follows:
Developed International Value Fund | |
Emerging Markets Equity Fund | |
Emerging Markets Research Enhanced Equity Fund | |
| |
International Equity Fund | |
| |
|
| Amount rounds to less than one thousand. |
The above waiver is included in the determination of earnings on cash collateral investment and in the calculation of Citibank’s compensation and is included on the Statements of Operations as Income from securities lending (net).
International Hedged Equity Fund did not lend out any securities during the year ended October 31, 2024. Emerging Markets Equity Fund and Europe Dynamic Fund did not have any securities out on loan at October 31, 2024.
D. Investment Transactions with Affiliates— The Funds invested in Underlying Funds advised by the Adviser. An issuer which is under common control with a Fund may be considered an affiliate. For the purposes of the financial statements, the Funds assume the issuers listed in the tables below to be affiliated issuers. The Underlying Funds’ distributions may be reinvested into such Underlying Funds. Reinvestment amounts are included in the purchases at cost amounts in the tables below.
Developed International Value Fund |
For the year ended October 31, 2024 |
| | | | | Change in
Unrealized
Appreciation/
(Depreciation) | | | | Capital Gain
Distributions |
JPMorgan Prime Money Market Fund Class Institutional Shares, 4.81% (a) (b) | | | | | | | | | |
JPMorgan Securities Lending Money Market Fund Agency SL Class Shares, 4.85% (a) (b) | | | | | | | | | |
JPMorgan U.S. Government Money Market Fund Class IM Shares, 4.80% (a) (b) | | | | | | | | | |
| | | | | | | | | |
|
| Investment in an affiliated fund, which is registered under the Investment Company Act of 1940, as amended, and is advised by J.P. Morgan Investment Management Inc. |
| J.P. Morgan International Equity Funds | |
| The rate shown is the current yield as of October 31, 2024. |
| Amount rounds to less than one thousand. |
| Amount is included on the Statements of Operations as Income from securities lending (net) (after payments of rebates and Citibank’s fee). |
Emerging Markets Equity Fund |
For the year ended October 31, 2024 |
| | | | | Change in
Unrealized
Appreciation/
(Depreciation) | | | | Capital Gain
Distributions |
JPMorgan Prime Money Market Fund Class Institutional Shares, 4.81% (a) (b) | | | | | | | | | |
JPMorgan Securities Lending Money Market Fund Agency SL Class Shares, 4.85% (a) (b) | | | | | | | | | |
JPMorgan U.S. Government Money Market Fund Class IM Shares, 4.80% (a) (b) | | | | | | | | | |
| | | | | | | | | |
|
| Investment in an affiliated fund, which is registered under the Investment Company Act of 1940, as amended, and is advised by J.P. Morgan Investment Management Inc. |
| The rate shown is the current yield as of October 31, 2024. |
| Amount rounds to less than one thousand. |
| Amount is included on the Statements of Operations as Income from securities lending (net) (after payments of rebates and Citibank’s fee). |
Emerging Markets Research Enhanced Equity Fund |
For the year ended October 31, 2024 |
| | | | | Change in
Unrealized
Appreciation/
(Depreciation) | | | | Capital Gain
Distributions |
JPMorgan Prime Money Market Fund Class Institutional Shares, 4.81% (a) (b) | | | | | | | | | |
JPMorgan Securities Lending Money Market Fund Agency SL Class Shares, 4.85% (a) (b) | | | | | | | | | |
JPMorgan U.S. Government Money Market Fund Class IM Shares, 4.80% (a) (b) | | | | | | | | | |
| | | | | | | | | |
|
| Investment in an affiliated fund, which is registered under the Investment Company Act of 1940, as amended, and is advised by J.P. Morgan Investment Management Inc. |
| The rate shown is the current yield as of October 31, 2024. |
| Amount is included on the Statements of Operations as Income from securities lending (net) (after payments of rebates and Citibank’s fee). |
|
For the year ended October 31, 2024 |
| | | | | Change in
Unrealized
Appreciation/
(Depreciation) | | | | Capital Gain
Distributions |
JPMorgan Prime Money Market Fund Class Institutional Shares, 4.81% (a) (b) | | | | | | | | | |
| J.P. Morgan International Equity Funds | |
NOTES TO FINANCIAL STATEMENTSAS OF October 31, 2024 (continued)
(Dollar values in thousands)
Europe Dynamic Fund (continued) |
For the year ended October 31, 2024 |
| | | | | Change in Unrealized Appreciation/ (Depreciation) | | | | Capital Gain Distributions |
JPMorgan Securities Lending Money Market Fund Agency SL Class Shares, 4.85% (a) (b) | | | | | | | | | |
JPMorgan U.S. Government Money Market Fund Class IM Shares, 4.80% (a) (b) | | | | | | | | | |
| | | | | | | | | |
|
| Investment in an affiliated fund, which is registered under the Investment Company Act of 1940, as amended, and is advised by J.P. Morgan Investment Management Inc. |
| The rate shown is the current yield as of October 31, 2024. |
| Amount is included on the Statements of Operations as Income from securities lending (net) (after payments of rebates and Citibank’s fee). |
International Equity Fund |
For the year ended October 31, 2024 |
| | | | | Change in
Unrealized
Appreciation/
(Depreciation) | | | | Capital Gain
Distributions |
JPMorgan Prime Money Market Fund Class Institutional Shares, 4.81% (a) (b) | | | | | | | | | |
JPMorgan Securities Lending Money Market Fund Agency SL Class Shares, 4.85% (a) (b) | | | | | | | | | |
JPMorgan U.S. Government Money Market Fund Class IM Shares, 4.80% (a) (b) | | | | | | | | | |
| | | | | | | | | |
|
| Investment in an affiliated fund, which is registered under the Investment Company Act of 1940, as amended, and is advised by J.P. Morgan Investment Management Inc. |
| The rate shown is the current yield as of October 31, 2024. |
| Amount is included on the Statements of Operations as Income from securities lending (net) (after payments of rebates and Citibank’s fee). |
|
For the year ended October 31, 2024 |
| | | | | Change in
Unrealized
Appreciation/
(Depreciation) | | | | Capital Gain
Distributions |
JPMorgan Prime Money Market Fund Class Institutional Shares, 4.81% (a) (b) | | | | | | | | | |
JPMorgan Securities Lending Money Market Fund Agency SL Class Shares, 4.85% (a) (b) | | | | | | | | | |
JPMorgan U.S. Government Money Market Fund Class IM Shares, 4.80% (a) (b) | | | | | | | | | |
| | | | | | | | | |
|
| Investment in an affiliated fund, which is registered under the Investment Company Act of 1940, as amended, and is advised by J.P. Morgan Investment Management Inc. |
| The rate shown is the current yield as of October 31, 2024. |
| Amount is included on the Statements of Operations as Income from securities lending (net) (after payments of rebates and Citibank’s fee). |
| J.P. Morgan International Equity Funds | |
International Hedged Equity Fund |
For the year ended October 31, 2024 |
| | | | | Change in
Unrealized
Appreciation/
(Depreciation) | | | | Capital Gain
Distributions |
JPMorgan Prime Money Market Fund Class IM Shares, 4.90% (a) (b) | | | | | | | | | |
JPMorgan U.S. Government Money Market Fund Class Institutional Shares, 4.72% (a) (b) | | | | | | | | | |
| | | | | | | | | |
|
| Investment in an affiliated fund, which is registered under the Investment Company Act of 1940, as amended, and is advised by J.P. Morgan Investment Management Inc. |
| The rate shown is the current yield as of October 31, 2024. |
E. Foreign Currency Translation — The books and records of the Funds are maintained in U.S. dollars. Foreign currency amounts are translated into U.S. dollars at the prevailing exchange rates of such currencies against the U.S. dollar. The market value of investment securities and other assets and liabilities are translated at the exchange rate as of the valuation date. Purchases and sales of investment securities, income and expenses are translated at the exchange rate prevailing on the respective dates of such transactions.
The Funds do not isolate the effect of changes in foreign exchange rates from changes in market prices on securities held. Accordingly, such changes are included within Change in net unrealized appreciation/depreciation on investments in non-affiliates on the Statements of Operations.
Reported realized foreign currency gains and losses arise from the disposition of foreign currency, currency gains or losses realized between the trade and settlement dates on securities transactions, and the difference between the amounts of dividends, interest and foreign withholding taxes recorded on each Fund's books on the transaction date and the U.S. dollar equivalent of the amounts actually received or paid. These reported realized foreign currency gains and losses are included in Net realized gain (loss) on foreign currency transactions on the Statements of Operations. Unrealized foreign currency gains and losses arise from changes (due to changes in exchange rates) in the value of foreign currency and other assets and liabilities denominated in foreign currencies, which are held at year end and are included in Change in net unrealized appreciation/depreciation on foreign currency translations on the Statements of Operations.
F. Options— International Hedged Equity Fund purchased put and call options on securities to gain long or short exposure to the underlying instrument. A purchaser of a put option has the right, but not the obligation, to sell the underlying instrument at an agreed upon price (“strike price”) to the option seller. A purchaser of a call option has the right, but not the obligation, to purchase the underlying instrument at the strike price from the option seller.
Options Purchased— Premiums paid by the Fund for options purchased are included on the Statements of Assets and Liabilities as Options purchased. The option is adjusted daily to reflect the current market value of the option and the change is recorded as Change in net unrealized appreciation/depreciation on options purchased on the Statements of Operations. If the option is allowed to expire, the Fund will lose the entire premium it paid and record a realized loss for the premium amount. Premiums paid for options purchased which are exercised or closed are added to the amounts paid or offset against the proceeds on the underlying investment transaction to determine the realized gain (loss) or cost basis of the underlying investment.
Options Written— Premiums received by the Fund for options written are included on the Statements of Assets and Liabilities as a liability. The amount of the liability is adjusted daily to reflect the current market value of the option written and the change in market value is recorded as Change in net unrealized appreciation/depreciation of options written on the Statements of Operations. Premiums received from options written that expire are treated as realized gains. If a written option is closed, the Fund records a realized gain or loss on options written based on whether the cost of the closing transaction exceeds the premium received. If a call option is exercised by the option buyer, the premium received by the Fund is added to the proceeds from the sale of the underlying security to the option buyer and compared to the cost of the closing transaction to determine whether there has been a realized gain or loss. If a put option is exercised by an option buyer, the premium received by the option seller reduces the cost basis of the purchased security.
Written uncovered call options subject the Fund to unlimited risk of loss. Written covered call options limit the upside potential of a security above the strike price. Written put options subject the Fund to risk of loss if the value of the security declines below the exercise price minus the put premium.
The Fund is not subject to credit risk on options written as the counterparty has already performed its obligation by paying the premium at the inception of the contract.
| J.P. Morgan International Equity Funds | |
NOTES TO FINANCIAL STATEMENTSAS OF October 31, 2024 (continued)
(Dollar values in thousands)
The Fund's exchange-traded option contracts are not subject to master netting arrangements (the right to close out all transactions traded with a counterparty and net amounts owed or due across transactions).
G. Futures Contracts— Developed International Value Fund, Emerging Markets Research Enhanced Equity Fund, Europe Dynamic Fund and International Hedged Equity Fund used index futures contracts to gain or reduce exposure to the stock market, or maintain liquidity or minimize transaction costs. The Funds also purchased futures contracts to invest incoming cash in the market or sold futures in response to cash outflows, thereby simulating an invested position in the underlying index while maintaining a cash balance for liquidity.
Futures contracts provide for the delayed delivery of the underlying instrument at a fixed price or are settled for a cash amount based on the change in the value of the underlying instrument at a specific date in the future. Upon entering into a futures contract, the Funds are required to deposit with the broker, cash or securities in an amount equal to a certain percentage of the contract amount, which is referred to as the initial margin deposit. Subsequent payments, referred to as variation margin, are made or received by the Funds periodically and are based on changes in the market value of open futures contracts. Changes in the market value of open futures contracts are recorded as Change in net unrealized appreciation/depreciation on futures contracts on the Statements of Operations. Realized gains or losses, representing the difference between the value of the contract at the time it was opened and the value at the time it was closed, are reported on the Statements of Operations at the closing or expiration of the futures contract. Securities deposited as initial margin are designated on the SOIs, while cash deposited, which is considered restricted, is recorded on the Statements of Assets and Liabilities. A receivable from and/or a payable to brokers for the daily variation margin is also recorded on the Statements of Assets and Liabilities.
The use of futures contracts exposes the Funds to equity price risk. The Funds may be subject to the risk that the change in the value of the futures contract may not correlate perfectly with the underlying instrument. Use of long futures contracts subjects the Funds to risk of loss in excess of the amounts shown on the Statements of Assets and Liabilities, up to the notional amount of the futures contracts. Use of short futures contracts subjects the Funds to unlimited risk of loss. The Funds may enter into futures contracts only on exchanges or boards of trade. The exchange or board of trade acts as the counterparty to each futures transaction; therefore, the Funds' credit risk is limited to failure of the exchange or board of trade. Under some circumstances, futures exchanges may establish daily limits on the amount that the price of a futures contract can vary from the previous day’s settlement price, which could effectively prevent liquidation of positions.
The Funds' futures contracts are not subject to master netting arrangements (the right to close out all transactions traded with a counterparty and net amounts owed or due across transactions).
The table below discloses the volume of the Funds' options and futures contracts activity during the year ended October 31, 2024 (amounts in thousands, except for number of contracts):
| Developed
International
Value Fund | Emerging
Markets
Research
Enhanced
Equity Fund | | International
Hedged
Equity Fund |
| | | | |
Average Notional Balance Long | | | | |
Ending Notional Balance Long | | | | |
| | | | |
Average Number of Contracts Purchased | | | | |
Average Number of Contracts Written | | | | |
Ending Number of Contracts Purchased | | | | |
Ending Number of Contracts Written | | | | |
The Funds' derivatives contracts held at October 31, 2024 are not accounted for as hedging instruments under GAAP.
H. Security Transactions and Investment Income— Investment transactions are accounted for on the trade date (the date the order to buy or sell is executed). Securities gains and losses are calculated on a specifically identified cost basis.
Interest income and interest expense on securities sold short, if any, is determined on the basis of coupon interest accrued using the effective interest method, which adjusts for amortization of premiums and accretion of discounts.
Dividend income, net of foreign taxes withheld, if any, is recorded on the ex-dividend date or when the Fund first learns of the dividend.
To the extent such information is publicly available, the Funds record distributions received in excess of income earned from underlying investments as a reduction of cost of investments and/or realized gain. Such amounts are based on estimates if actual amounts are not available and actual amounts of income, realized gain and return of capital may differ from the estimated amounts. The Funds adjust the estimated amounts of the components of distributions (and consequently their net investment income) as necessary, once the issuers provide information about the actual composition of the distributions.
| J.P. Morgan International Equity Funds | |
I. Allocation of Income and Expenses— Expenses directly attributable to a Fund are charged directly to that Fund, while the expenses attributable to more than one fund of the Trusts are allocated among the applicable funds. Investment income, realized and unrealized gains and losses and expenses, other than class-specific expenses, are allocated daily to each class of shares based upon the proportion of net assets of each class at the beginning of each day.
Transfer agency fees are class-specific expenses. The amount of the transfer agency fees charged to each share class of the Funds for the year ended October 31, 2024 are as follows:
| | | | | | | | | | |
Developed International Value Fund | | | | | | | | | | |
| | | | | | | | | | |
Emerging Markets Equity Fund | | | | | | | | | | |
| | | | | | | | | | |
Emerging Markets Research Enhanced Equity Fund | | | | | | | | | | |
| | | | | | | | | | |
| | | | | | | | | | |
| | | | | | | | | | |
International Equity Fund | | | | | | | | | | |
| | | | | | | | | | |
| | | | | | | | | | |
| | | | | | | | | | |
International Hedged Equity Fund | | | | | | | | | | |
| | | | | | | | | | |
|
| Amount rounds to less than one thousand. |
J. Federal Income Taxes— Each Fund is treated as a separate taxable entity for Federal income tax purposes. Each Fund's policy is to comply with the provisions of the Internal Revenue Code (the “Code”) applicable to regulated investment companies and to distribute to shareholders all of its distributable net investment income and net realized capital gains on investments. Accordingly, no provision for Federal income tax is necessary. Management has reviewed the Funds' tax positions for all open tax years and has determined that as of October 31, 2024, no liability for Federal income tax is required in the Funds' financial statements for net unrecognized tax benefits. However, management’s conclusions may be subject to future review based on changes in, or the interpretation of, the accounting standards or tax laws and regulations. Each Fund's Federal tax returns for the prior three fiscal years remain subject to examination by the Internal Revenue Service.
K. Foreign Taxes—The Funds may be subject to foreign taxes on income, gains on investments or currency purchases/repatriation, a portion of which may be recoverable. The Funds will accrue such taxes and recoveries as applicable, based upon their current interpretation of tax rules and regulations that exist in the markets in which they invest. When a capital gains tax is determined to apply, the Funds record an estimated deferred tax liability in an amount that would be payable if the securities were disposed of on the valuation date.
As a result of several court rulings in certain European countries, the tax authorities of each of these countries, recently paid Europe Dynamic Fund (Spain and Sweden) and International Equity Fund (Sweden) tax reclaims for prior tax withholding. These tax reclaim payments are included in Foreign withholding tax reclaims on the Statements of Operations. Interest income, if any, related to these tax reclaim payments is included in Interest income from non-affiliates on the Statements of Operations.
The Fund would have a U.S. tax liability if it received refunds of foreign taxes previously passed through as tax credits to shareholders greater than foreign withholding taxes paid for the year. The Fund would then enter into a closing agreement with the Internal Revenue Service (IRS) to pay the associated tax liability (fees) on behalf of the Funds' shareholders. No closing agreements are required for the Funds for the year ended October 31, 2024. The IRS fees to be paid for prior years closing agreements are estimated through the year ended October 31, 2024, and are included in IRS Compliance Fees for foreign withholding tax reclaims on the Statements of Operations, if applicable. At October 31, 2024, Developed International Value Fund had a U.S. tax liability amounting to $3,804.
| J.P. Morgan International Equity Funds | |
NOTES TO FINANCIAL STATEMENTSAS OF October 31, 2024 (continued)
(Dollar values in thousands)
L. Distributions to Shareholders— Distributions from net investment income, if any, are generally declared and paid at least annually and are declared separately for each class. No class has preferential dividend rights; differences in per share rates are due to differences in separate class expenses. Net realized capital gains, if any, are distributed by each Fund at least annually. The amount of distributions from net investment income and net realized capital gains is determined in accordance with Federal income tax regulations, which may differ from GAAP. To the extent these “book/tax” differences are permanent in nature (i.e., that they result from other than timing of recognition — “temporary differences”), such amounts are reclassified within the capital accounts based on their Federal tax basis treatment.
The following amounts were reclassified within the capital accounts:
| | Accumulated
undistributed
(distributions in
excess of)
net investment
income | Accumulated
net realized
gains (losses) |
Developed International Value Fund | | | |
Emerging Markets Equity Fund | | | |
Emerging Markets Research Enhanced Equity Fund | | | |
| | | |
International Equity Fund | | | |
| | | |
International Hedged Equity Fund | | | |
The reclassifications for the Funds relate primarily to tax adjustments on certain investments, foreign currency gains or losses and foreign taxes.
3. Fees and Other Transactions with Affiliates
A. Investment Advisory Fee — Pursuant to an Investment Advisory Agreement, the Adviser manages the investments of each Fund and for such services is paid a fee. The investment advisory fee is accrued daily and paid monthly at an annual rate based on each Fund's respective average daily net assets. The annual rate for each Fund is as follows:
| |
Developed International Value Fund | |
Emerging Markets Equity Fund | |
Emerging Markets Research Enhanced Equity Fund | |
| |
International Equity Fund | |
| |
International Hedged Equity Fund | |
The Adviser waived investment advisory fees and/or reimbursed expenses as outlined in Note 3.F.
B. Administration Fee— Pursuant to an Administration Agreement, the Administrator provides certain administration services to each Fund. In consideration of these services, the Administrator receives a fee accrued daily and paid monthly at an annual rate of 0.075% of the first $10 billion of each Fund’s respective average daily net assets, plus 0.050% of each Fund’s respective average daily net assets between $10 billion and $20 billion, plus 0.025% of each Fund’s respective average daily net assets between $20 billion and $25 billion, plus 0.01% of each Fund’s respective average daily net assets in excess of $25 billion. For the year ended October 31, 2024, the effective rate was 0.07% of each Fund's average daily net assets, except for International Focus Fund, which was 0.08%, notwithstanding any fee waivers and/or expense reimbursements.
The Administrator waived administration fees as outlined in Note 3.F.
JPMorgan Chase Bank, N.A. ("JPMCB"), a wholly-owned subsidiary of JPMorgan, serves as the Funds' sub-administrator (the “Sub-administrator”). For its services as Sub-administrator, JPMCB receives a portion of the fees payable to the Administrator.
C. Distribution Fees— Pursuant to a Distribution Agreement, JPMorgan Distribution Services, Inc. (“JPMDS”), an indirect, wholly-owned subsidiary of JPMorgan, serves as each Fund's principal underwriter and promotes and arranges for the sale of each Fund's shares.
The Boards have adopted a Distribution Plan (the “Distribution Plan”) for Class A, Class C, Class R2 and Class R3 Shares of the Funds, as applicable, pursuant to Rule 12b-1 under the 1940 Act. Class I, Class L, Class R4, Class R5 and Class R6 Shares of the Funds do not charge a distribution fee. The
| J.P. Morgan International Equity Funds | |
Distribution Plan provides that the following Funds shall pay, with respect to the applicable share classes, distribution fees, including payments to JPMDS, at annual rates of the average daily net assets as shown in the table below:
| | | | |
Developed International Value Fund | | | | |
Emerging Markets Equity Fund | | | | |
| | | | |
International Equity Fund | | | | |
| | | | |
International Hedged Equity Fund | | | | |
In addition, JPMDS is entitled to receive the front-end sales charges from purchases of Class A Shares and the CDSC from redemptions of Class C Shares and certain Class A Shares for which front-end sales charges have been waived. For the year ended October 31, 2024, JPMDS retained the following:
| | |
Developed International Value Fund | | |
Emerging Markets Equity Fund | | |
| | |
International Equity Fund | | |
| | |
International Hedged Equity Fund | | |
|
| Amount rounds to less than one thousand. |
D. Service Fees— The Trusts, on behalf of the Funds, has entered into a Shareholder Servicing Agreement with JPMDS under which JPMDS provides certain support services to fund shareholders. For performing these services, JPMDS receives a fee with respect to all share classes, except Class R6 Shares which do not charge a service fee, that is accrued daily and paid monthly equal to a percentage of the average daily net assets as shown in the table below:
| | | | | | | | |
Developed International Value Fund | | | | | | | | |
Emerging Markets Equity Fund | | | | | | | | |
Emerging Markets Research Enhanced Equity Fund | | | | | | | | |
| | | | | | | | |
International Equity Fund | | | | | | | | |
| | | | | | | | |
International Hedged Equity Fund | | | | | | | | |
| | | | | | | | |
JPMDS has entered into shareholder services contracts with affiliated and unaffiliated financial intermediaries who provide shareholder services and other related services to their clients or customers who invest in the Funds. Pursuant to such contracts, JPMDS will pay all or a portion of such fees earned to financial intermediaries for performing such services.
JPMDS waived service fees as outlined in Note 3.F.
E. Custodian and Accounting Fees— JPMCB provides portfolio custody and accounting services to the Funds. For performing these services, the Funds pay JPMCB transaction and asset-based fees that vary according to the number of transactions and positions, plus out-of-pocket expenses. The amounts paid directly to JPMCB by the Funds for custody and accounting services are included in Custodian and accounting fees on the Statements of Operations.
Interest income earned on cash balances at the custodian, if any, is included in Interest income from affiliates on the Statements of Operations.
Interest expense paid to the custodian related to cash overdrafts, if any, is included in Interest expense to affiliates on the Statements of Operations.
| J.P. Morgan International Equity Funds | |
NOTES TO FINANCIAL STATEMENTSAS OF October 31, 2024 (continued)
(Dollar values in thousands)
F. Waivers and Reimbursements—The Adviser, Administrator and/or JPMDS have contractually agreed to waive fees and/or reimburse the Funds to the extent that total annual operating expenses (excluding acquired fund fees and expenses other than certain money market fund fees as described below, dividend and interest expenses related to short sales, interest, taxes, expenses related to litigation and potential litigation, expenses related to trustee elections and extraordinary expenses) exceed the percentages of the Funds' respective average daily net assets as shown in the table below:
| | | | | | | | |
Developed International Value Fund | | | | | | | | |
Emerging Markets Equity Fund | | | | | | | | |
Emerging Markets Research Enhanced Equity Fund | | | | | | | | |
| | | | | | | | |
International Equity Fund | | | | | | | | |
| | | | | | | | |
International Hedged Equity Fund | | | | | | | | |
| | | | | | | | |
The expense limitation agreements were in effect for the year ended October 31, 2024 and the contractual expense limitation percentages in the table above are in place until at least February 28, 2025.
For the year ended October 31, 2024, the Funds' service providers waived fees and/or reimbursed expenses for each of the Funds as follows. None of these parties expect the Funds to repay any such waived fees and/or reimbursed expenses in future years.
| | |
| | | | | Contractual
Reimbursements |
Developed International Value Fund | | | | | |
Emerging Markets Equity Fund | | | | | |
Emerging Markets Research Enhanced Equity Fund | | | | | |
| | | | | |
International Equity Fund | | | | | |
| | | | | |
International Hedged Equity Fund | | | | | |
|
| Amount rounds to less than one thousand. |
Additionally, the Funds may invest in one or more money market funds advised by the Adviser (affiliated money market funds). The Adviser, Administrator and/or JPMDS, as shareholder servicing agent, have contractually agreed to waive fees and/or reimburse expenses in an amount sufficient to offset the respective net fees each collects from the affiliated money market fund on the applicable Fund's investment in such affiliated money market fund, except for investments of securities lending cash collateral. None of these parties expect the Funds to repay any such waived fees and/or reimbursed expenses in future years.
The amounts of these waivers resulting from investments in these money market funds for the year ended October 31, 2024 were as follows:
| |
Developed International Value Fund | |
Emerging Markets Equity Fund | |
Emerging Markets Research Enhanced Equity Fund | |
| |
International Equity Fund | |
| |
International Hedged Equity Fund | |
| J.P. Morgan International Equity Funds | |
JPMIM voluntarily agreed to reimburse the Funds for the Trustee Fees paid to one of the interested Trustees. For the year ended October 31, 2024, the amount of these reimbursements were as follows:
| |
Developed International Value Fund | |
Emerging Markets Equity Fund | |
Emerging Markets Research Enhanced Equity Fund | |
| |
International Equity Fund | |
| |
International Hedged Equity Fund | |
|
| Amount rounds to less than one thousand. |
G. Other— Certain officers of the Trusts are affiliated with the Adviser, the Administrator and JPMDS. Such officers, with the exception of the Chief Compliance Officer, receive no compensation from the Funds for serving in their respective roles.
The Boards designated and appointed a Chief Compliance Officer to the Funds pursuant to Rule 38a-1 under the 1940 Act. Each Fund, along with affiliated funds, makes reimbursement payments, on a pro-rata basis, to the Administrator for a portion of the fees associated with the office of the Chief Compliance Officer. Such fees are included in Trustees’ and Chief Compliance Officer’s fees on the Statements of Operations.
The Trusts adopted a Trustee Deferred Compensation Plan (the “Plan”) which allows the independent Trustees to defer the receipt of all or a portion of compensation related to performance of their duties as Trustees. The deferred fees are invested in various J.P. Morgan Funds until distribution in accordance with the Plan.
The SEC has granted an exemptive order permitting the Funds to engage in principal transactions with J.P. Morgan Securities LLC, an affiliated broker, involving taxable money market instruments, subject to certain conditions.
4. Investment Transactions
During the year ended October 31, 2024, purchases and sales of investments (excluding short-term investments) were as follows:
| Purchases
(excluding
U.S. Government) | Sales
(excluding
U.S. Government) |
Developed International Value Fund | | |
Emerging Markets Equity Fund | | |
Emerging Markets Research Enhanced Equity Fund | | |
| | |
International Equity Fund | | |
| | |
International Hedged Equity Fund | | |
During the year ended October 31, 2024, there were no purchases or sales of U.S. Government securities.
| J.P. Morgan International Equity Funds | |
NOTES TO FINANCIAL STATEMENTSAS OF October 31, 2024 (continued)
(Dollar values in thousands)
5. Federal Income Tax Matters
For Federal income tax purposes, the estimated cost and unrealized appreciation (depreciation) in value of investments held at October 31, 2024 were as follows:
| | Gross
Unrealized
Appreciation | Gross
Unrealized
Depreciation | Net Unrealized
Appreciation
(Depreciation) |
Developed International Value Fund | | | | |
Emerging Markets Equity Fund | | | | |
Emerging Markets Research Enhanced Equity Fund | | | | |
| | | | |
International Equity Fund | | | | |
| | | | |
International Hedged Equity Fund | | | | |
The difference between book and tax basis appreciation (depreciation) on investments is primarily attributed to tax adjustments on certain investments, tax adjustments on certain derivatives and wash sale loss deferrals.
The tax character of distributions paid during the year ended October 31, 2024 was as follows:
| | |
Developed International Value Fund | | |
Emerging Markets Equity Fund | | |
Emerging Markets Research Enhanced Equity Fund | | |
| | |
International Equity Fund | | |
| | |
International Hedged Equity Fund | | |
|
| Short-term gain distributions are treated as ordinary income for income tax purposes. |
The tax character of distributions paid during the year ended October 31, 2023 was as follows:
| | |
Developed International Value Fund | | |
Emerging Markets Equity Fund | | |
Emerging Markets Research Enhanced Equity Fund | | |
| | |
International Equity Fund | | |
| | |
International Hedged Equity Fund | | |
|
| Short-term gain distributions are treated as ordinary income for income tax purposes. |
| J.P. Morgan International Equity Funds | |
As of October 31, 2024, the estimated components of net assets (excluding paid-in-capital) on a tax basis were as follows:
| Current
Distributable
Ordinary
Income | Current
Distributable
Long-Term
Capital Gain
(Tax Basis Capital
Loss Carryover) | Unrealized
Appreciation
(Depreciation) |
Developed International Value Fund | | | |
Emerging Markets Equity Fund | | | |
Emerging Markets Research Enhanced Equity Fund | | | |
| | | |
International Equity Fund | | | |
| | | |
International Hedged Equity Fund | | | |
| | | |
The cumulative timing differences primarily consist of tax adjustments on certain investments, tax adjustments on certain derivatives and wash sale loss deferrals.
As of October 31, 2024, the following Funds had net capital loss carryforwards, which are available to offset future realized gains:
| Capital Loss Carryforward Character |
| | |
Developed International Value Fund | | |
Emerging Markets Equity Fund | | |
Emerging Markets Research Enhanced Equity Fund | | |
| | |
International Equity Fund | | |
| | |
International Hedged Equity Fund | | |
During the year ended October 31, 2024, the following Funds utilized capital loss carryforwards as follows:
| |
| | |
Developed International Value Fund | | |
Emerging Markets Equity Fund | | |
Emerging Markets Research Enhanced Equity Fund | | |
| | |
International Equity Fund | | |
| | |
The Funds rely upon an exemptive order granted by the SEC (the “Order”) permitting the establishment and operation of an Interfund Lending Facility (the “Facility”). The Facility allows the Funds to directly lend and borrow money to or from any other fund relying upon the Order at rates beneficial to both the borrowing and lending funds. Advances under the Facility are taken primarily for temporary or emergency purposes, including the meeting of redemption requests that otherwise might require the untimely disposition of securities, and are subject to each Fund's borrowing restrictions. The interfund loan rate is determined, as specified in the Order, by averaging the current repurchase agreement rate and the current bank loan rate. The Order was granted to JPMorgan Trust II ("JPM II") and may be relied upon by the Funds because the Funds and the series of JPM II are all investment companies in the same “group of investment companies” (as defined in Section 12(d)(1)(G) of the 1940 Act).
| J.P. Morgan International Equity Funds | |
NOTES TO FINANCIAL STATEMENTSAS OF October 31, 2024 (continued)
(Dollar values in thousands)
The Funds had no borrowings outstanding from another fund, or loans outstanding to another fund, during the year ended October 31, 2024. Average borrowings from the Facility during the year ended October 31, 2024 were as follows:
| | | | |
Emerging Markets Equity Fund | | | | |
Emerging Markets Research Enhanced Equity Fund | | | | |
| | | | |
International Equity Fund | | | | |
| | | | |
International Hedged Equity Fund | | | | |
The Trusts and JPMCB have entered into a financing arrangement. Under this arrangement, JPMCB provides an unsecured, uncommitted credit facility in the aggregate amount of $100 million to certain of the J.P. Morgan Funds, including the Funds. Advances under the arrangement are taken primarily for temporary or emergency purposes, including the meeting of redemption requests that otherwise might require the untimely disposition of securities, and are subject to each Fund's borrowing restrictions. Interest on borrowings is payable at a rate determined by JPMCB at the time of borrowing. This agreement has been extended until October 28, 2025.
The Funds had no borrowings outstanding from the unsecured, uncommitted credit facility during the year ended October 31, 2024.
The Trusts, along with certain other trusts for J.P. Morgan Funds (“Borrowers”), have entered into a joint syndicated senior unsecured revolving credit facility totaling $1.5 billion (“Credit Facility”) with various lenders and The Bank of New York Mellon, as administrative agent for the lenders. This Credit Facility provides a source of funds to the Borrowers for temporary and emergency purposes, including the meeting of redemption requests that otherwise might require the untimely disposition of securities. Under the terms of the Credit Facility, a borrowing fund must have a minimum of $25 million in adjusted net asset value and not exceed certain adjusted net asset coverage ratios prior to and during the time in which any borrowings are outstanding. If a fund does not comply with the aforementioned requirements, the fund must remediate within three business days with respect to the $25 million minimum adjusted net asset value or within one business day with respect to certain asset coverage ratios or the administrative agent at the request of, or with the consent of, the lenders may terminate the Credit Facility and declare any outstanding borrowings to be due and payable immediately.
Interest associated with any borrowing under the Credit Facility is charged to the borrowing fund at a rate of interest equal to 1.00%, plus the greater on the day of the borrowing, of the federal funds effective rate, or the Adjusted Secured Overnight Financing Rate (SOFR). Effective August 6, 2024, the Credit Facility was amended and restated for a term of 364 days, unless extended.
The Funds did not utilize the Credit Facility during the year ended October 31, 2024.
7. Risks, Concentrations and Indemnifications
In the normal course of business, the Funds enter into contracts that contain a variety of representations which provide general indemnifications. Each Fund's maximum exposure under these arrangements is unknown. The amount of exposure would depend on future claims that may be brought against each Fund. However, based on experience, the Funds expect the risk of loss to be remote.
As of October 31, 2024, the Funds had individual shareholder and/or omnibus accounts each owning more than 10% of the respective Fund's outstanding shares as follows:
| Number of
Individual Shareholder
and/or Affiliated
Omnibus Accounts | | Number of
Individual Shareholder
and/or Non-Affiliated
Omnibus Accounts | |
Developed International Value Fund | | | | |
Emerging Markets Equity Fund | | | | |
Emerging Markets Research Enhanced Equity Fund | | | | |
| | | | |
International Equity Fund | | | | |
| | | | |
International Hedged Equity Fund | | | | |
| J.P. Morgan International Equity Funds | |
As of October 31, 2024, J.P. Morgan Investor Funds, JPMorgan SmartRetirement Funds and JPMorgan SmartRetirement Blend Funds, which are affiliated fund of funds, each owned in the aggregate, shares representing more than 10% of the net assets of the Funds as follows:
| | JPMorgan
SmartRetirement
Funds | JPMorgan
SmartRetirement
Blend Funds |
Emerging Markets Research Enhanced Equity Fund | | | |
| | | |
International Equity Fund | | | |
| | | |
Significant shareholder transactions by these shareholders may impact the Funds' performance and liquidity.
The Funds may have elements of risk not typically associated with investments in the United States of America due to concentrated investments in a limited number of foreign countries or regions, which may vary throughout the period. Such concentrations may subject each of these Funds to additional risks resulting from political or economic conditions in such countries or regions and the possible imposition of adverse governmental laws or currency exchange restrictions could cause the securities and their markets to be less liquid and their prices to be more volatile than those of comparable U.S. securities.
As of October 31, 2024, the following Funds had non-U.S. country allocations representing greater than 10% of total investments (excluding investment of cash collateral from securities loaned) as follows:
| Developed
International
Value Fund | Emerging
Markets
Equity Fund | Emerging
Markets
Research
Enhanced
Equity Fund | | | | International
Hedged
Equity Fund |
| | | | | | | |
| | | | | | | |
| | | | | | | |
| | | | | | | |
| | | | | | | |
| | | | | | | |
| | | | | | | |
| | | | | | | |
| | | | | | | |
As of October 31, 2024, a significant portion of each Fund's investments consisted of securities that were denominated in foreign currencies. Changes in currency exchange rates will affect the value of, and investment income from, such securities.
Derivatives may be riskier than other types of investments because they may be more sensitive to changes in economic and market conditions and could result in losses that significantly exceed the Funds' original investment. Many derivatives create leverage thereby causing the Funds to be more volatile than they would have been if they had not used derivatives. Derivatives also expose the Funds to counterparty risk (the risk that the derivative counterparty will not fulfill its contractual obligations), including credit risk of the derivative counterparty. The possible lack of a liquid secondary market for derivatives and the resulting inability of the Funds to sell or otherwise close a derivatives position could expose the Funds to losses.
The Funds invest in foreign issuers and foreign securities (including depositary receipts) that are subject to additional risks, including political and economic risks, civil conflicts and war, greater volatility, expropriation and nationalization risks, sanctions or other measures by the United States or other governments, currency fluctuations, higher transaction costs, delayed settlement, possible foreign controls on investment, liquidity risks and less stringent investor protection and disclosure standards of foreign markets. In certain markets where securities and other instruments are not traded “delivery versus payment,” a Fund may not receive timely payment for securities or other instruments it has delivered or receive delivery of securities paid for and may be subject to increased risk that the counterparty will fail to make payments or delivery when due or default completely.
Events and evolving conditions in certain economies or markets may alter the risks associated with investments tied to countries or regions that historically were perceived as comparatively stable becoming riskier and more volatile. Emerging Markets Equity Fund and Emerging Markets Research Enhanced Equity Fund each invests a substantial portion of their assets in emerging market countries. These risks are magnified in countries in emerging markets. Emerging market countries typically have less established market economies than developed countries and may face greater social, economic, regulatory and political uncertainties. In addition, emerging markets typically present greater illiquidity and price volatility concerns due to smaller or limited local capital markets and greater difficulty in determining market valuations of securities due to limited public
| J.P. Morgan International Equity Funds | |
NOTES TO FINANCIAL STATEMENTSAS OF October 31, 2024 (continued)
(Dollar values in thousands)
information on issuers. Certain emerging market countries may be subject to less stringent requirements regarding accounting, auditing, financial reporting and record keeping and therefore, material information related to an investment may not be available or reliable.
Additionally, the Funds may have substantial difficulties exercising their legal rights or enforcing a counterparty’s legal obligations in certain jurisdictions outside of the United States, in particular in emerging market countries, which can increase the risks of loss.
The Funds are subject to infectious disease epidemics/pandemics risk. The effects of any future pandemic or other global event to public health and business and market conditions, may have a significant negative impact on the performance of a Fund's investments, increase a Fund's volatility, negatively impact a Fund’s arbitrage and pricing mechanisms, exacerbate pre-existing political, social and economic risks to the Funds, and negatively impact broad segments of businesses and populations. In addition, governments, their regulatory agencies, or self-regulatory organizations have taken or may take actions in response to a pandemic or other global event that affect the instruments in which the Funds invest, or the issuers of such instruments, in ways that could have a significant negative impact on a Fund’s investment performance. The ultimate impact of any pandemic or other global event and the extent to which the associated conditions and governmental responses impact a Fund will also depend on future developments, which are highly uncertain, difficult to accurately predict and subject to frequent changes.
At a meeting held on November 19-21, 2024, the JPM IV Board agreed to consider the reorganization (the “Reorganization”) of the International Hedged Equity Fund (the “Fund”) into a newly created exchange-traded fund, JPMorgan International Hedged Equity Laddered Overlay ETF (“JPM International Hedged Equity Laddered ETF”), a series of J.P. Morgan Exchange-Traded Fund Trust. If approved at a meeting in February 2025, the Reorganization is expected to occur as of the close of business on or about July 11, 2025. Following the Reorganization, the Fund’s performance and financial history would be adopted by JPM International Hedged Equity Laddered ETF. JPM International Hedged Equity Laddered ETF’s underlying equity portfolio will be managed in a substantially similar way, but the exchange-traded put and call options overlay strategy will be modified. Instead of buying the options at the beginning of the quarter and holding them for three months, the options will be “laddered” across the quarter so that normally there will be three three-months periods designed to mitigate potential risk.
At a meeting held on November 19-21, 2024, the JPM IV Board approved the liquidation of Class R5 Shares of International Hedged Equity Fund, which occurred on December 10, 2024.
| J.P. Morgan International Equity Funds | |
REPORT OF INDEPENDENT REGISTERED PUBLIC ACCOUNTING FIRM
To the Board of Trustees of JPMorgan Trust I and JPMorgan Trust IV and Shareholders of JPMorgan Developed International Value Fund, JPMorgan Emerging Markets Equity Fund, JPMorgan Emerging Markets Research Enhanced Equity Fund, JPMorgan Europe Dynamic Fund, JPMorgan International Equity Fund, JPMorgan International Focus Fund and JPMorgan International Hedged Equity Fund
Opinions on the Financial Statements
We have audited the accompanying statements of assets and liabilities, including the schedules of portfolio investments, of JPMorgan Developed International Value Fund, JPMorgan Emerging Markets Equity Fund, JPMorgan Europe Dynamic Fund, JPMorgan International Equity Fund and JPMorgan International Focus Fund (five of the funds constituting JPMorgan Trust I) and JPMorgan Emerging Markets Research Enhanced Equity Fund and JPMorgan International Hedged Equity Fund (two of the funds constituting JPMorgan Trust IV) (hereafter collectively referred to as the "Funds") as of October 31, 2024, the related statements of operations for the year ended October 31, 2024, the statements of changes in net assets for each of the two years in the period ended October 31, 2024, including the related notes, and the financial highlights for each of the five years in the period ended October 31, 2024 (collectively referred to as the “financial statements”). In our opinion, the financial statements present fairly, in all material respects, the financial position of each of the Funds as of October 31, 2024, the results of each of their operations for the year then ended, the changes in each of their net assets for each of the two years in the period ended October 31, 2024 and each of the financial highlights for each of the five years in the period ended October 31, 2024, in conformity with accounting principles generally accepted in the United States of America.
These financial statements are the responsibility of the Funds’ management. Our responsibility is to express an opinion on the Funds’ financial statements based on our audits. We are a public accounting firm registered with the Public Company Accounting Oversight Board (United States) (PCAOB) and are required to be independent with respect to the Funds in accordance with the U.S. federal securities laws and the applicable rules and regulations of the Securities and Exchange Commission and the PCAOB.
We conducted our audits of these financial statements in accordance with the standards of the PCAOB. Those standards require that we plan and perform the audit to obtain reasonable assurance about whether the financial statements are free of material misstatement, whether due to error or fraud.
Our audits included performing procedures to assess the risks of material misstatement of the financial statements, whether due to error or fraud, and performing procedures that respond to those risks. Such procedures included examining, on a test basis, evidence regarding the amounts and disclosures in the financial statements. Our audits also included evaluating the accounting principles used and significant estimates made by management, as well as evaluating the overall presentation of the financial statements. Our procedures included confirmation of securities owned as of October 31, 2024 by correspondence with the custodian, transfer agent and brokers; when replies were not received from brokers, we performed other auditing procedures. We believe that our audits provide a reasonable basis for our opinions.
/s/ PricewaterhouseCoopers LLP
New York, New York
December 23, 2024
We have served as the auditor of one or more investment companies in the JPMorgan Funds complex since 1993.
| J.P. Morgan International Equity Funds | |
TAX LETTER(Unaudited)
(Dollar values in thousands)
Certain tax information for the J.P. Morgan Funds is required to be provided to shareholders based upon the Funds' income and distributions for the taxable year ended October 31, 2024. The information and distributions reported in this letter may differ from the information and taxable distributions reported to the shareholders for the calendar year ending December 31, 2024. The information necessary to complete your income tax returns for the calendar year ending December 31, 2024 will be provided under separate cover.
Qualified Dividend Income (QDI)
Each Fund listed below had the following amount, or maximum allowable amount, of ordinary income distributions and foreign tax credits (if applicable) treated as qualified dividends for the fiscal year ended October 31, 2024:
| |
JPMorgan Developed International Value Fund | |
JPMorgan Emerging Markets Equity Fund | |
JPMorgan Emerging Markets Research Enhanced Equity Fund | |
JPMorgan Europe Dynamic Fund | |
JPMorgan International Equity Fund | |
JPMorgan International Focus Fund | |
JPMorgan International Hedged Equity Fund | |
Foreign Source Income and Foreign Tax Credit Pass Through
For the fiscal year ended October 31, 2024, the following Funds intend to elect to pass through to shareholders taxes paid to foreign countries. Gross income and foreign tax expenses are as follows or amounts as finally determined:
| Total Foreign
Source Income | |
JPMorgan Developed International Value Fund | | |
JPMorgan Emerging Markets Equity Fund | | |
JPMorgan Emerging Markets Research Enhanced Equity Fund | | |
JPMorgan Europe Dynamic Fund | | |
JPMorgan International Equity Fund | | |
JPMorgan International Focus Fund | | |
JPMorgan International Hedged Equity Fund | | |
| J.P. Morgan International Equity Funds | |
THIS PAGE IS INTENTIONALLY LEFT BLANK
THIS PAGE IS INTENTIONALLY LEFT BLANK
J.P. Morgan Funds are distributed by JPMorgan Distribution Services, Inc., which is an affiliate of JPMorgan Chase & Co. Affiliates of JPMorgan Chase & Co. receive fees for providing various services to the Funds.
Contact JPMorgan Distribution Services, Inc. at 1-800-480-4111 for a fund prospectus. You can also visit us at www.jpmorganfunds.com. Investors should carefully consider the investment objectives and risk as well as charges and expenses of the mutual fund before investing. The prospectus contains this and other information about the mutual fund. Read the prospectus carefully before investing.
Investors may obtain information about the Securities Investor Protection Corporation (SIPC), including the SIPC brochure, by visiting www.sipc.org or by calling SIPC at 202-371-8300.
Each Fund files a complete schedule of its fund holdings for the first and third quarters of its fiscal year with the SEC as an exhibit to its report on Form N-PORT. The Funds' Form N-PORT reports are available on the SEC’s website at http://www.sec.gov. Each Fund's quarterly holdings can be found by visiting the J.P. Morgan Funds’ website at www.jpmorganfunds.com.
A description of each Fund's policies and procedures with respect to the disclosure of each Fund's holdings is available in the prospectuses and Statement of Additional Information.
A copy of proxy policies and procedures is available without charge upon request by calling 1-800-480-4111 and on the Funds' website at www.jpmorganfunds.com. A description of such policies and procedures is on the SEC’s website at www.sec.gov. The Trustees have delegated the authority to vote proxies for securities owned by the Funds to the Adviser. A copy of the Funds' voting record for the most recent 12-month period ended June 30 is available on the SEC’s website at www.sec.gov or at the Funds' website at www.jpmorganfunds.com no later than August 31 of each year. The Funds' proxy voting record will include, among other things, a brief description of the matter voted on for each fund security, and will state how each vote was cast, for example, for or against the proposal.
J.P. Morgan Asset Management is the brand name for the asset management business of JPMorgan Chase & Co. and its affiliates worldwide.
© JPMorgan Chase & Co., 2024. All rights reserved. October 2024.
AN-INTEQ-1024
Changes in and Disagreements with Accountants for Open-End Management Investment Companies
Proxy Disclosures for Open-End Management Investment Companies
Remuneration Paid to Directors, Officers, and Others of Open-End Management Investment Companies
Included in the Statements of Operations within the Funds' Financial Statements.
Statement Regarding Basis for Approval of Investment Advisory Agreements
The Board of Trustees (the “Board” or the “Trustees”) has established various standing committees composed of Trustees with diverse backgrounds, to which the Board has assigned specific subject matter responsibilities to further enhance the effectiveness of the Board’s oversight and decision making. The Board and its investment committees (Money Market and Alternative Products Committee, Equity Committee, and Fixed Income Committee) met regularly throughout the year and, at each meeting, considered factors that are relevant to their annual consideration of the continuation of the investment advisory agreements. The Board also met for the specific purpose of considering investment advisory agreement annual renewals. The Board held meetings June 25-26, 2024 and August 20-22, 2024, at which the Trustees considered the continuation of the investment advisory agreements for each Fund whose annual report is contained herein (each an “Advisory Agreement” and collectively, the “Advisory Agreements”). At the June meeting, the Board’s investment committees met to review and consider performance, expense and related information for the J.P. Morgan Funds. Each investment committee reported to the full Board, which then considered each investment committee’s preliminary findings. At the August meeting, the Trustees continued their review and consideration. The Trustees, including a majority of the Trustees who are not parties to an Advisory Agreement or “interested persons” (as defined in the Investment Company Act of 1940) of any party to an Advisory Agreement or any of their affiliates, approved the continuation of each Advisory Agreement on August 22, 2024.
As part of their review of the Advisory Agreements, the Trustees considered and reviewed performance and other information about the Funds received from J.P. Morgan Investment Management Inc. (the “Adviser”). This information included the Funds’ performance as compared to the performance of their peers and benchmarks, and analyses by the Adviser of the Funds’ performance. In addition, at each of their regular meetings throughout the year, the Trustees considered reports on the performance of certain J.P. Morgan Funds provided by an independent investment consulting firm (the “independent consultant”). In addition, in preparation for the June and August meetings, the Trustees requested, received and evaluated extensive materials from the Adviser, including performance and expense information compiled by Broadridge, using data from Lipper Inc. and/or Morningstar Inc., independent providers of investment company data (together, “Broadridge”). The Trustees’ independent consultant also provided additional quantitative and statistical analyses of certain Funds, including risk and performance return assessments as compared to the Funds’ objectives, benchmarks, and peers. Before voting on the Advisory Agreements, the Trustees reviewed the Advisory Agreements with representatives of the Adviser, counsel to the Funds, and independent legal counsel to the Trustees, and received a memorandum from independent legal counsel to the Trustees discussing the legal standards for their consideration of the Advisory Agreements. The Trustees also discussed the Advisory Agreements with independent legal counsel in executive sessions at which no representatives of the Adviser were present.
A summary of the material factors evaluated by the Trustees in determining whether to approve each Advisory Agreement is provided below. Each Trustee attributed different weights to the various factors and no factor alone was considered determinative. The Trustees considered information provided with respect to the Funds throughout the year, as well as materials furnished specifically in connection with the annual review process. From year to year, the Trustees consider and place emphasis on relevant information in light of changing circumstances in market and economic conditions.
After considering and weighing the factors and information they had received, the Trustees found that the compensation to be received by the Adviser from each Fund under the applicable Advisory Agreement was fair and reasonable under the circumstances, and determined that the continuance of each Advisory Agreement was in the best interests of each Fund and its shareholders.
Nature, Extent and Quality of Services Provided by the Adviser
The Trustees received and considered information regarding the nature, extent and quality of services provided to each Fund under the applicable Advisory Agreement. The Trustees took into account information furnished throughout the year at Trustee meetings, as well as the materials furnished specifically in connection with this annual review process. Among other things, the Trustees considered:
•
The background and experience of the Adviser’s senior management and investment personnel, including personnel changes, if any;
•
The qualifications, backgrounds and responsibilities of the portfolio management team primarily responsible for the day-to-day management of each Fund, including personnel changes, if any;
•
The investment strategy for each Fund, and the infrastructure supporting the portfolio management teams;
•
Information about the structure and distribution strategy for each Fund and how it fits within the Adviser’s other fund offerings within the J.P. Morgan Funds complex;
•
The administration services provided by the Adviser in its role as Administrator;
•
Their knowledge of the nature and quality of the services provided by the Adviser and its affiliates gained from their experience as Trustees of the Funds and in the financial industry generally;
•
The overall reputation and capabilities of the Adviser and its affiliates;
•
The commitment of the Adviser to provide high quality service to the Funds;
•
Their overall confidence in the Adviser’s integrity; and
•
The Adviser’s responsiveness to requests for additional information, questions or concerns raised by them, including the Adviser’s willingness to consider and implement organizational and operational changes designed to improve investment results and the services provided to each Fund.
Based upon these considerations and other factors, the Trustees concluded that they were satisfied with the nature, extent and quality of the services provided to the Funds by the Adviser.
Costs of Services Provided and Profitability to the Adviser and its Affiliates
The Trustees received and considered information regarding the profitability to the Adviser and its affiliates from providing services to each Fund. The Trustees reviewed and discussed this information. The Trustees recognized that this information is not audited and represents the Adviser’s determination of its and its affiliates’ revenues from the contractual services provided to the Funds, less expenses of providing such services. Expenses include direct and indirect costs and are calculated using an allocation methodology developed by the Adviser and reviewed with the Board. The Trustees also recognized that it is difficult to make comparisons of profitability from fund investment advisory contracts because comparative information is not generally publicly available and is affected by numerous factors, including the structure of the particular adviser, the types of funds it manages, its business mix, numerous assumptions regarding allocations and the fact that publicly-traded fund managers’ operating profits and net income are net of distribution and marketing expenses. Based upon their review, and taking into consideration the factors noted above, the Trustees concluded that the profitability to the Adviser under each Advisory Agreement was not unreasonable in light of the services and benefits provided to each Fund.
The Trustees also considered that JPMorgan Distribution Services, Inc. (“JPMDS”), an affiliate of the Adviser, and the Adviser earn fees from the Funds for providing shareholder and administration services, respectively. These fees were shown separately in the profitability analysis presented to the Trustees. The Trustees also considered the payments of Rule 12b-1 fees to JPMDS, which also acts as the Funds’ distributor, and that these fees are in turn generally paid to financial intermediaries that sell the Funds, including financial intermediaries that are affiliates of the Adviser (although they are retained by JPMDS in certain instances). The Trustees also considered the fees earned by JPMorgan Chase Bank, N.A. (“JPMCB”), an affiliate of the Adviser, for custody, fund accounting and other related services for each Fund, and the profitability of the arrangements to JPMCB.
The Trustees reviewed information regarding potential “fall-out” or ancillary benefits received by the Adviser and its affiliates as a result of their relationship with the Funds. The Trustees considered that the J.P. Morgan Funds' operating accounts are held at JPMCB, which, as a result, will receive float benefits for certain J.P. Morgan Funds, as applicable. The Trustees also noted that the Adviser supports a diverse set of products and services, which benefits the Adviser by allowing it to leverage its infrastructure to serve additional clients, including benefits that may be received by the Adviser and its affiliates in connection with the Funds’ potential investments in other funds advised by the Adviser. The Trustees also reviewed the Adviser’s allocation of fund brokerage for the J.P. Morgan Funds complex, including allocations to brokers who provide research to the Adviser, as well as the Adviser’s use of affiliates to provide other services and the benefits to such affiliates of doing so. The Trustees also considered the benefit to the Adviser and its affiliates from allocating client assets to the Funds.
The Trustees considered the extent to which the Funds may benefit from potential economies of scale. The Trustees considered that there may not be a direct relationship between economies of scale realized by the Funds and those realized by the Adviser as assets increase. The Trustees considered the extent to which the Funds were priced to scale and whether it would be appropriate to add advisory fee breakpoints. The Trustees noted certain Funds with contractual expense limitations and fee waivers (“Fee Caps”), which allow a Fund’s shareholders to share potential economies of scale from a Fund’s inception, prior to reaching scale. The Trustees also noted that certain other Funds that had achieved scale as asset levels had increased no longer had Fee Caps in place for some or all of their share classes, but shared economies of scale through lower average expenses. The Trustees noted that the fees remain fair
and reasonable relative to peer funds. The Trustees considered the benefits to the Funds of the use of an affiliated distributor and custodian, including the ability to rely on existing infrastructure supporting distribution, custodial and transfer agent services and the ability to negotiate competitive fees for the Funds. The Trustees further considered the Adviser's and JPMDS's ongoing investments in their business in support of the Funds, including the Adviser's and/or JPMDS's investments in trading systems, technology (including improvements to the J.P. Morgan Funds’ website, and cybersecurity improvements), retention of key talent, and regulatory support enhancements. The Trustees concluded that the current fee structure for each Fund, including any Fee Caps the Adviser has in place that serve to limit the overall net expense ratios of each Fund at competitive levels, was reasonable. The Trustees concluded that, for Funds with Fee Caps in place for some or all of their share classes, the relevant Fund’s shareholders received the benefits of potential economies of scale through the Fee Caps and, for Funds that achieved scale and no longer had Fee Caps in place for some or all of their share classes, the relevant Fund’s shareholders benefited from lower average expenses resulting from increased assets. The Trustees also concluded that all Funds benefited from the Adviser’s reinvestment in its operations to serve the Funds and their shareholders. The Trustees noted that the Adviser’s reinvestment ensures sufficient resources in terms of personnel and infrastructure to support the Funds.
Independent Written Evaluation of the Funds’ Senior Officer
The Trustees noted that, upon their direction, the Senior Officer for the International Equity Fund had prepared an independent written evaluation in order to assist the Trustees in determining the reasonableness of the proposed management fees. In determining whether to continue the Advisory Agreements, the Trustees considered the Senior Officer’s report.
Fees Relative to Adviser’s Other Clients
The Trustees received and considered information about the nature and extent of investment advisory services and fee rates offered to other clients of the Adviser, including, to the extent applicable, institutional separate accounts, collective investment trusts, other registered investment companies and/or private funds sub-advised by the Adviser, for investment management styles substantially similar to that of each Fund. The Trustees considered the complexity of investment management for registered investment companies relative to the Adviser’s other clients and noted differences, as applicable, in the fee structure and the regulatory, legal and other risks and responsibilities of providing services to the different clients. The Trustees considered that serving as an adviser to a registered investment company involves greater responsibilities and risks than acting as a sub-adviser and observed that sub-advisory fees may be lower than those charged by the Adviser to each Fund. The Trustees also noted that the adviser, not the applicable registered investment company, typically bears the sub-advisory fee and that many responsibilities related to the advisory function are typically retained by the primary adviser. The Trustees concluded that the fee rates charged to each Fund in comparison to those charged to the Adviser’s other clients were reasonable.
The Trustees receive and consider information about each Fund’s performance throughout the year. In addition, the Trustees received and considered absolute and/or relative performance information for the Funds in a report prepared by Broadridge. The Trustees considered the total return performance information, which included the ranking of the Funds within a performance universe comprised of funds’ selected share classes with the same Broadridge investment classification and objective (the “Universe”), by total return for the applicable one-, three- and five-year periods. The Trustees reviewed a description of Broadridge’s methodology for selecting mutual funds in each Fund’s Universe and noted that Universe quintile rankings were not calculated if the number of funds in the Universe did not meet a predetermined minimum. The Trustees also considered enhancements to the methodology employed by Broadridge for identifying funds in the Peer Groups for Class I shares, based upon discussions with the Adviser, Broadridge and certain Trustees in advance of, and in preparation for, the June meeting. The Broadridge materials provided to the Trustees highlighted information with respect to certain representative classes to assist the Trustees in their review. As part of this review, the Trustees also reviewed each Fund’s performance against its benchmark and considered the performance information provided for the Funds at regular Board meetings by the Adviser and the Trustees’ independent consultant and also considered the special analysis prepared for certain Funds by the Trustees’ independent consultant. The Trustees also engaged with the Adviser to consider what steps might be taken to improve performance, as applicable. The Broadridge performance data noted by the Trustees as part of their review and the determinations made by the Trustees with respect to each Fund’s performance for certain representative classes are summarized below:
The Trustees noted that the Developed International Value Fund’s performance for Class A and Class I shares was in the second, first and third quintiles of the Universe for the one-, three- and five-year periods ended December 31, 2023, respectively. The Trustee noted that performance for Class R6 shares was in the second, first, and second quintiles of the Universe for the one-, three- and
five-year periods ended December 31, 2023, respectively. The Trustees discussed the performance and investment strategy of the Fund with the Adviser and reviewed the performance analysis and evaluation prepared by the independent consultant. Based upon these discussions, and various other factors, the Trustees concluded that the Fund’s performance was satisfactory.
The Trustees noted that the Emerging Markets Equity Fund’s performance for Class A, Class I and Class R6 shares was in the fifth, fifth and second quintiles of the Universe for the one-, three- and five-year periods ended December 31, 2023, respectively. The Trustees discussed the performance and investment strategy of the Fund with the Adviser and reviewed the performance analysis and evaluation prepared by the independent consultant. Based upon these discussions and various other factors, the Trustees concluded that the Fund’s performance was satisfactory under the circumstances. The Trustees requested, however, that the Fund’s Adviser provide additional Fund performance information to be reviewed with members of the Equity Committee at each of their regular meetings over the course of the next year.
The Trustees noted that the Emerging Markets Research Enhanced Equity Fund’s performance for Class I shares was in the fourth and third quintiles of the Universe for the one- and three-year periods ended December 31, 2023, respectively. The Trustees noted that performance for Class R6 shares was in the fourth, third and fourth quintiles of the Universe for the one-, three- and five-year periods ended December 31, 2023, respectively. The Trustees discussed the performance and investment strategy of the Fund with the Adviser and reviewed the performance analysis and evaluation prepared by the independent consultant. Based upon these discussions and various other factors, the Trustees concluded that the Fund’s performance was satisfactory under the circumstances. The Trustees requested, however, that the Fund’s Adviser provide additional Fund performance information to be reviewed with members of the Equity Committee at each of their regular meetings over the course of the next year.
The Trustees noted that the Europe Dynamic Fund’s performance for both Class A and Class I shares was in the fourth, second and third quintiles of the Universe for the one-, three- and five-year periods ended December 31, 2023, respectively. The Trustees noted that performance for Class R6 shares was in the third, second and second quintiles of the Universe for the one-, three- and five-year periods ended December 31, 2023, respectively. The Trustees discussed the performance and investment strategy of the Fund with the Adviser and reviewed the performance analysis and evaluation prepared by the independent consultant. Based upon these discussions and various other factors, the Trustees concluded that the Fund’s performance was satisfactory under the circumstances.
The Trustees noted that the International Equity Fund’s performance for Class A shares was in the second, third and second quintiles of the Universe for the one-, three- and five-year periods ended December 31, 2023, respectively. The Trustees noted that performance for Class I shares was in the second, fourth and second quintiles of the Universe for the one-, three- and five-year periods ended December 31, 2023, respectively. The Trustees noted that performance for Class R6 shares was in the second, third and first quintiles of the Universe for the one-, three- and five-year periods ended December 31, 2023, respectively. The Trustees discussed the performance and investment strategy of the Fund with the Adviser and reviewed the performance analysis and evaluation prepared by the independent consultant. Based upon these discussions and various other factors, the Trustees concluded that the Fund’s performance was satisfactory under the circumstances.
The Trustees noted that the International Focus Fund’s performance for Class A shares was in the second, fourth and second quintiles of the Universe for the one-, three- and five-year periods ended December 31, 2023, respectively. The Trustees noted that the performance for both Class I and Class R6 shares was in the third, fifth and second quintiles of the Universe for the one-, three- and five-year periods ended December 31, 2023, respectively. The Trustees discussed the performance and investment strategy of the Fund with the Adviser and reviewed the performance analysis and evaluation prepared by the independent consultant. Based upon these discussions, and various other factors, the Trustees concluded that the Fund’s performance was satisfactory under the circumstances.
The Trustees noted that the International Hedged Equity Fund’s performance for Class A shares was in the fourth and third quintiles of the Universe for the one- and three-year periods ended December 31, 2023, respectively. The Trustees noted that the performance for both Class I and Class R6 shares was in the fifth and fourth quintiles of the Universe for the one- and three-year periods ended December 31, 2023, respectively. The Trustees discussed the performance and investment strategy of the Fund with the Adviser and reviewed the performance analysis and evaluation prepared by the independent consultant. Based upon these discussions, and various other factors, the Trustees concluded that the Fund’s performance was satisfactory under the circumstances.
Advisory Fees and Expense Ratios
The Trustees considered the contractual advisory fee rate and administration fee rate paid by each Fund to the Adviser and compared the combined rate to the information prepared by Broadridge concerning management fee rates paid by other funds’ selected share classes in the Universe, as well as a subset of funds within the Universe (the “Peer Group”). The Trustees recognized that Broadridge reported each Fund’s management fee rate as the combined contractual advisory fee and administration fee rates. The Trustees also
reviewed information about other expenses and the expense ratios for each Fund, and noted that Universe and Peer Group quintile rankings were not calculated if the number of funds in the Universe and/or Peer Group did not meet a predetermined minimum. For each Fund that had a Fee Cap in place, the Trustees considered the net advisory fee rate and net expense ratio for each share class, as applicable, taking into account any waivers and/or reimbursements. The Trustees recognized that it can be difficult to make comparisons of advisory fees because there are variations in the services that are included in the fees paid by other funds. The Trustees’ determinations as a result of the review of each Fund’s advisory fees and expense ratios for certain representative classes are summarized below:
The Trustees noted that the Developed International Value Fund’s net advisory fee and actual total expenses for Class A and Class R6 shares were in the first quintile of both the Peer Group and Universe. The Trustees noted that the net advisory fee for Class I shares was in the first quintile of both the Peer Group and Universe, and that the actual total expenses for Class I shares were in the second and first quintiles of the Peer Group and Universe, respectively. After considering the factors identified above, in light of this information, the Trustees concluded that the advisory fee was fair and reasonable in light of the services provided to the Fund.
The Trustees noted that the Emerging Markets Equity Fund’s net advisory fee for Class A shares was in the second quintile of the both the Peer Group and Universe, and that the actual total expenses for Class A shares were in the second and first quintiles of the Peer Group and Universe, respectively. The Trustees noted that the net advisory fee for Class I shares was in the second and third quintiles of the Peer Group and Universe, respectively, and that the actual total expenses for Class I shares were in the second quintile of both the Peer Group and Universe. The Trustees noted that the net advisory fee for Class R6 shares was in the first and third quintiles of the Peer Group and Universe, respectively, and that the actual total expenses for Class R6 shares were in the first quintile of both the Peer Group and Universe. After considering the factors identified above, in light of this information, the Trustees concluded that the advisory fee was fair and reasonable in light of the services provided to the Fund.
The Trustees noted that the Emerging Markets Research Enhanced Equity Fund’s net advisory fee and actual total expenses for Class I and Class R6 shares were in the first quintile of both the Peer Group and Universe. After considering the factors identified above, in light of this information, the Trustees concluded that the advisory fee was fair and reasonable in light of the services provided to the Fund.
The Trustees noted that the Europe Dynamic Fund’s net advisory fee for the Class A shares was in the second and third quintiles of the Peer Group and Universe, respectively, and that the actual total expenses for Class A shares were in the first quintile of both the Peer Group and Universe. The Trustees noted that the net advisory fee and actual total expenses for Class I shares were in the second quintile of the Universe. Broadridge did not calculate quintile rankings for the Peer Group for Class I shares of this Fund due to the limited number of funds in the Peer Group. The Trustees noted that the net advisory fee for Class R6 shares was in the second quintile of both the Peer Group and Universe, and that the actual total expenses for Class R6 shares were in the second and first quintiles of the Peer Group and Universe, respectively. After considering the factors identified above, in light of this information, the Trustees concluded that the advisory fee was fair and reasonable in light of the services provided to the Fund.
The Trustees noted that the International Equity Fund’s net advisory fee and actual total expenses for Class A and Class R6 shares were in the first quintile of both the Peer Group and Universe. The Trustees noted that the net advisory fee for Class I shares was in the first quintile of both the Peer Group and Universe, and that the actual total expenses for Class I shares were in the first and second quintiles of the Peer Group and Universe, respectively. After considering the factors identified above, in light of this information, the Trustees concluded that the advisory fee was fair and reasonable in light of the services provided to the Fund.
The Trustees noted that the International Focus Fund’s net advisory fee for Class A shares was in the second quintile of both the Peer Group and Universe, and that actual total expenses for Class A shares were in the first quintile of both the Peer Group and Universe. The Trustees noted that both the net advisory fee and actual total expenses for Class I shares were in the first and second quintiles of the Peer Group and Universe, respectively. The Trustees noted that the net advisory fee for Class R6 shares was in the second quintile of both the Peer Group and Universe, and that the actual total expenses for Class R6 shares were in the second and first quintiles of the Peer Group and Universe, respectively. After considering the factors identified above, in light of this information, the Trustees concluded that the advisory fee was fair and reasonable in light of the services provided to the Fund.
The Trustees noted that the International Hedged Equity Fund’s net advisory fee and actual total expenses for Class A and Class R6 shares were in the first quintile of both the Peer Group and Universe. The Trustees noted that the net advisory fee for Class I shares was in the first quintile of both the Peer Group and Universe, and that the actual total expenses for Class I shares were in the first and second quintiles of the Peer Group and Universe, respectively. After considering the factors identified above, in light of this information, the Trustees concluded that the advisory fee was fair and reasonable in light of the services provided to the Fund.
Annual Financial Statements
J.P. Morgan Tax Aware Fund
October 31, 2024
JPMorgan Tax Aware Real Return Fund |
CONTENTS
Investments in the Fund are not deposits or obligations of, or guaranteed or endorsed by, any bank and are not insured or guaranteed by the FDIC, the Federal Reserve Board or any other government agency. You could lose money if you sell when the Fund’s share price is lower than when you invested.
Past performance is no guarantee of future performance. The general market views expressed in this report are opinions based on market and other conditions through the end of the reporting period and are subject to change without notice. These views are not intended to predict the future performance of the Fund or the securities markets.
Prospective investors should refer to the Fund's prospectuses for a discussion of the Fund's investment objectives, strategies and risks. Call J.P. Morgan Funds Service Center at 1-800-480-4111 for a prospectus containing more complete information about the Fund, including management fees and other expenses. Please read it carefully before investing.
JPMorgan Tax Aware Real Return Fund
SCHEDULE OF PORTFOLIO INVESTMENTSAS OF October 31, 2024
| | |
Municipal Bonds — 91.0% (a) |
|
Black Belt Energy Gas District, Gas Project Series 2022C-1, Rev., 5.25%, 12/1/2028 | | |
County of Jefferson sewer | | |
Series 2024, Rev., 5.00%, 10/1/2035 | | |
Series 2024, Rev., 5.00%, 10/1/2038 | | |
Mobile County Industrial Development Authority, Calvert LLC Project Series 2024 A, Rev., AMT, 5.00%, 6/1/2054 | | |
Selma Industrial Development Board, International Paper Co. Projects Series 2019A, Rev., 3.45%, 10/1/2031 (b) | | |
Southeast Energy Authority A Cooperative District, Project No. 3 Series 2022A-1, Rev., 5.50%, 12/1/2029 (b) | | |
| | |
|
Northern Tobacco Securitization Corp., Tobacco Settlement Asset-Backed Senior Capital Appreciation Series 2021 B-2, Class 2, Rev., Zero Coupon, 6/1/2066 | | |
|
Arizona Board of Regents, Stimulus Plan For Economic and Educational Development Series 2024, Rev., 5.00%, 8/1/2043 | | |
Arizona Industrial Development Authority, Academic of Math and Science Projects | | |
Rev., 5.00%, 7/1/2038 (c) | | |
Rev., 5.25%, 7/1/2043 (c) | | |
Arizona Industrial Development Authority, Equitable School Revolving Fund LLC Series 2024 A, Rev., 5.00%, 11/1/2029 | | |
City of Phoenix Civic Improvement Corp., Senior Lien, Rev., AMT, 5.00%, 7/1/2030 | | |
Industrial Development Authority of the County of Pima (The), La Posada at Pusch Ridge Project Series 2022B-3, Rev., 5.13%, 11/15/2029 (c) | | |
Maricopa County Industrial Development Authority, Valley Christian School Project Series 2023A, Rev., 6.25%, 7/1/2053 (c) | | |
Maricopa County Unified School District No. 60 Higley | | |
COP, AGM, 5.00%, 6/1/2037 | | |
COP, AGM, 5.00%, 6/1/2038 | | |
Pima County Unified School District No. 1 Tucson, Project of 2023 Series 2024 A, GO, AGM, 5.00%, 7/1/2040 | | |
| | |
|
|
Pinal County Electric District No. 3, Rev., 4.00%, 7/1/2034 | | |
Salt Verde Financial Corp. Series 2007-1, Rev., 5.00%, 12/1/2032 | | |
| | |
|
City of Fort Smith, Water and Sewer, Rev., 5.00%, 10/1/2027 | | |
County of Pulaski, Arkansas Children's Hospital, Rev., 5.00%, 3/1/2037 | | |
University of Arkansas, Various Facilities Fayetteville Campus Series 2024 A, Rev., 5.00%, 11/1/2049 | | |
| | |
|
California Community Choice Financing Authority, Clean Energy Project Series 2021B-1, Rev., 4.00%, 8/1/2031 (b) | | |
California County Tobacco Securitization Agency Series 2006 A, Rev., Zero Coupon, 6/1/2046 | | |
California Health Facilities Financing Authority, Adventist Health System Series 2024A, Rev., 5.00%, 12/1/2036 | | |
California Infrastructure and Economic Development Bank, Brightline West Passenger Rail Project Series 2020 A-4, Rev., AMT, 8.00%, 8/15/2025 (b) (c) | | |
California Pollution Control Financing Authority, Poseidon Resources Channelside LP Desalination Project, Rev., AMT, 5.00%, 7/1/2036 (c) | | |
California Statewide Communities Development Authority Series 2009 C-2, Rev., 5.00%, 11/1/2029 (b) | | |
Golden State Tobacco Securitization Corp., Enhanced Tobacco Settlement Series 2021B-2, Rev., Zero Coupon, 6/1/2066 | | |
Golden State Tobacco Securitization Corp., Tobacco Settlement Asset-Backed Bonds Series 2015A, Rev., 5.00%, 6/1/2025 (d) | | |
Southern California Public Power Authority Series 2024-1, Rev., 5.00%, 7/1/2044 | | |
Vista Unified School District Series 2022B, GO, 5.00%, 8/1/2033 | | |
| | |
|
City and County of Denver, Airport System | | |
Series 2022D, Rev., AMT, 5.50%, 11/15/2032 | | |
Series 2022A, Rev., AMT, 5.50%, 11/15/2042 | | |
SEE NOTES TO FINANCIAL STATEMENTS.
| J.P. Morgan Tax Aware Fund | |
JPMorgan Tax Aware Real Return Fund
SCHEDULE OF PORTFOLIO INVESTMENTSAS OF October 31, 2024 (continued)
| | |
Municipal Bonds — continued |
|
Denver Health and Hospital Authority Series 2019A, Rev., 4.00%, 12/1/2037 | | |
Dominion Water and Sanitation District, Rev., 5.25%, 12/1/2032 | | |
Jefferson County School District R-1, GO, 5.00%, 12/15/2035 | | |
Third Creek Metropolitan District No. 1, Limited Tax Series 2022A-1, GO, 4.50%, 12/1/2037 | | |
| | |
|
Stamford Housing Authority, The Dogwoods Project, Rev., BAN, 11.00%, 12/1/2027 (c) | | |
State of Connecticut, Special Tax Transportation Infrastructure Purposes | | |
Series 2022A, Rev., 5.00%, 7/1/2031 | | |
Series 2022B, Rev., 5.00%, 7/1/2031 | | |
| | |
District of Columbia — 0.5% |
District of Columbia Series 2024A, GO, 5.00%, 8/1/2049 | | |
Metropolitan Washington Airports Authority Dulles Toll Road Series 2019A, Rev., 5.00%, 10/1/2036 | | |
Total District of Columbia | | |
|
Capital Trust Agency, Inc., Legends Academy Project Series 2021A, Rev., 5.00%, 12/1/2045 (c) | | |
| | |
Series 2024, Rev., 5.00%, 10/1/2027 | | |
Series 2024, Rev., 5.00%, 10/1/2030 | | |
Series 2024, Rev., 5.00%, 10/1/2049 | | |
City of Melbourne Water and Sewer Series 2023, Rev., 5.00%, 11/15/2039 | | |
Florida Development Finance Corp., Brightline Florida Passenger Rail Project Series 2024, Rev., AMT, 5.50%, 7/1/2053 | | |
Florida Development Finance Corp., GFL Solid Waste Southeast LLC Project Series 2024A, Rev., AMT, 4.38%, 10/1/2031 (b) (c) | | |
Florida Development Finance Corp., Idea Florida, Inc., Jacksonville IV Project, Rev., 5.25%, 6/15/2029 (c) | | |
Hillsborough County Industrial Development Authority, Baycare Health System Series 2024C, Rev., 5.00%, 11/15/2029 | | |
| | |
|
|
JEA Electric System Series 2017 B, Rev., 5.00%, 10/1/2031 | | |
Lee County School Board (The) Series 2023A, COP, 5.00%, 8/1/2042 | | |
Palm Beach County School District, COP, 5.00%, 8/1/2036 | | |
Tampa Bay Water, Regional Water Supply Authority, Utility System Series 2024A, Rev., 5.25%, 10/1/2054 | | |
| | |
|
Brookhaven Urban Redevelopment Agency Series 2023A, Rev., 5.00%, 7/1/2040 | | |
City of Atlanta Series 2021B, Rev., 4.00%, 7/1/2040 | | |
Development Authority of Burke County (The), Georgia Power Co. Plant Vogtle Project Series 2013-1, Rev., 3.38%, 3/12/2027 (b) | | |
Development Authority of Monroe County (The), Georgia Power Co. Plant Scherer Project Series 2009-2, Rev., 3.88%, 3/6/2026 (b) | | |
Gainesville and Hall County Hospital Authority, Northeast Georgia Health System, Inc., Project | | |
Rev., RAN, 5.00%, 10/15/2030 | | |
Rev., RAN, 5.00%, 10/15/2034 | | |
Main Street Natural Gas, Inc., Gas Supply | | |
Series 2023B, Rev., 5.00%, 3/1/2030 (b) | | |
Series 2023A, Rev., 5.00%, 6/1/2030 (b) | | |
Series 2024D, Rev., 5.00%, 4/1/2031 (b) | | |
Series 2023E, Subseries E-1, Rev., 5.00%, 6/1/2031 (b) | | |
Municipal Electric Authority of Georgia Project Series 2024A, Rev., 5.25%, 1/1/2044 | | |
Rome Building Authority, Rome City School Project | | |
Series 2023, Rev., 5.00%, 3/1/2037 | | |
Series 2023, Rev., 5.00%, 3/1/2038 | | |
Series 2023, Rev., 5.00%, 3/1/2039 | | |
| | |
|
Chicago Midway International Airport, Senior Lien Series 2023A, Rev., AMT, 5.00%, 1/1/2030 | | |
Chicago O'Hare International Airport, General Airport, Senior Lien | | |
Series 2024D, Rev., 5.00%, 1/1/2026 | | |
Series 2024 B, Rev., 5.50%, 1/1/2059 | | |
SEE NOTES TO FINANCIAL STATEMENTS.
| J.P. Morgan Tax Aware Fund | |
| | |
Municipal Bonds — continued |
|
Chicago O'Hare International Airport, Senior Lien Series 2023A, Rev., AMT, 5.00%, 1/1/2033 | | |
City of Chicago, Second Lien Waterworks Project, Rev., 5.00%, 12/23/2024 | | |
Cook County Community Consolidated School District No. 15 Palatine, GO, 5.00%, 12/1/2038 | | |
Illinois Finance Authority, University of Chicago Series 2024 A, Rev., 5.00%, 4/1/2034 | | |
Illinois Housing Development Authority Series 2024 A, Rev., GNMA / FNMA / FHLMC, 6.00%, 10/1/2054 | | |
Illinois State Toll Highway Authority Series 2023A, Rev., 5.00%, 1/1/2042 | | |
| | |
Series 2017D, GO, 5.00%, 11/1/2025 | | |
Series 2022A, GO, 5.00%, 3/1/2033 | | |
Series 2024B, GO, 5.25%, 5/1/2047 | | |
Series 2024B, GO, 5.25%, 5/1/2048 | | |
| | |
|
City of Valparaiso, Green Oaks of Valparaiso Project, Rev., 5.38%, 12/1/2041 (c) | | |
Fort Wayne Redevelopment Authority Lease Rental, Harrison Square Project, Rev., 5.00%, 2/1/2026 | | |
Greater Clark County School Building Corp. Series 2024A, Rev., 5.00%, 7/15/2026 | | |
Indiana Finance Authority, CHF- Tippecanoe LLC- Student Housing Project Series 2023A, Rev., 5.00%, 6/1/2043 | | |
Indiana Housing and Community Development Authority, Vita of New Whiteland Project, Rev., 6.75%, 1/1/2043 | | |
Indianapolis Local Public Improvement Bond Bank Series 2024E, Rev., 5.00%, 2/1/2028 | | |
Indianapolis Local Public Improvement Bond Bank, Stormwater Project Series 2013D, Rev., 5.00%, 1/1/2025 | | |
| | |
|
Iowa Tobacco Settlement Authority, Subordinate Senior Capital Appreciation Asset Backed Series 2021-B-2, Class 2, Rev., Zero Coupon, 6/1/2065 | | |
|
City of Wichita Series 2016B, Rev., 4.00%, 10/1/2026 | | |
| | |
|
|
County of Boone, Duke Energy Kentucky, Inc. Series 2008A, Rev., 3.70%, 8/1/2027 | | |
County of Knott, Solid Waste Water Project Series 2024, Rev., AMT, 4.00%, 4/1/2025 (b) (c) | | |
Kentucky Public Energy Authority Series 2024B, Rev., 5.00%, 8/1/2032 (b) | | |
Kentucky State Property and Building Commission, Project No. 131 Series A, Rev., 5.00%, 10/1/2029 | | |
| | |
|
Parish of St. John the Baptist, Marathon Oil Corp., Project Series 2017A-1, Rev., 4.05%, 7/1/2026 (b) | | |
State of Louisiana Gasoline and Fuels Tax Series A, Rev., 4.50%, 5/1/2025 (d) | | |
| | |
|
Maine Health and Higher Educational Facilities Authority Series 2023A, Rev., AGM, 5.00%, 7/1/2026 | | |
|
County of Montgomery Series 2022A, GO, 5.00%, 8/1/2026 | | |
Maryland Stadium Authority, Build to Learn Series 2024, Rev., 5.25%, 6/1/2051 | | |
State of Maryland Series 2021-A, GO, 4.00%, 8/1/2036 | | |
| | |
|
Commonwealth of Massachusetts | | |
Series 2018B, GO, 5.00%, 1/1/2030 | | |
Series 2022 E, GO, 5.00%, 11/1/2049 | | |
Commonwealth of Massachusetts Transportation Fund Series 2015 A, Rev., 5.00%, 6/1/2028 | | |
Massachusetts Clean Water Trust (The) Series 25B, Rev., 5.00%, 2/1/2039 | | |
Massachusetts Development Finance Agency, Boston Medical Center Issue | | |
Series 2023G, Rev., 5.25%, 7/1/2048 | | |
SEE NOTES TO FINANCIAL STATEMENTS.
| J.P. Morgan Tax Aware Fund | |
JPMorgan Tax Aware Real Return Fund
SCHEDULE OF PORTFOLIO INVESTMENTSAS OF October 31, 2024 (continued)
| | |
Municipal Bonds — continued |
Massachusetts — continued |
Series 2023G, Rev., 4.38%, 7/1/2052 | | |
Massachusetts Development Finance Agency, Children's Hospital Corp Obligated Group Series 2024 U-1, Rev., VRDO, LOC : TD Bank NA, 1.40%, 11/1/2024 (b) | | |
| | |
|
City of Detroit, Unlimited Tax Series 2021A, GO, 5.00%, 4/1/2037 | | |
Michigan Strategic Fund, Graphic Packaging International, LLC Coated Recycled Board Machine Project, Rev., AMT, 4.00%, 10/1/2026 (b) | | |
| | |
|
Chisholm Independent School District No. 695 Series 2023A, GO, Zero Coupon, 2/1/2039 | | |
County of Hennepin Series 2018 A, GO, 5.00%, 12/1/2029 | | |
Minnesota Higher Education Facilities Authority, University of St. Thomas Series 2022A, Rev., 5.00%, 10/1/2025 | | |
Minnesota Housing Finance Agency, Residential Housing Series 2024 O, Rev., GNMA / FNMA / FHLMC, 6.25%, 1/1/2055 | | |
Minnesota Municipal Gas Agency Series Subseries,2022A, Rev., LIQ : Royal Bank of Canada, 4.00%, 12/1/2027 | | |
| | |
|
Curators of the University of Missouri (The) Series 2024, Rev., 5.00%, 11/1/2030 | | |
Kansas City Industrial Development Authority, Historic Northeast Redevelopment Plan Series 2024 A-1, Rev., 5.00%, 6/1/2054 (c) | | |
Missouri Housing Development Commission, Single Family, First Place Homeownership Loan Program Series 2024 A, Rev., GNMA / FNMA / FHLMC, 5.75%, 5/1/2055 | | |
Missouri Joint Municipal Electric Utility Commission, Plum Point Project Series 2024, Rev., 5.00%, 1/1/2028 | | |
Missouri State Environmental Improvement and Energy Resources Authority, Water Pollution Control and Drinking Water Series 2015 B, Rev., 5.00%, 7/1/2026 | | |
| | |
| | |
|
|
Nebraska Public Power District Series C, Rev., 5.00%, 1/1/2029 | | |
|
County of Clark, Nevada Improvement District No. 158, 5.00%, 8/1/2034 | | |
State of Nevada, Capital Improvement and Cultural Affairs Series 2015B, GO, 5.00%, 11/1/2026 | | |
| | |
|
Camden County Improvement Authority (The), Camden Prep High School Project, Rev., 5.00%, 7/15/2042 (c) | | |
New Jersey Economic Development Authority, School Facilities Construction Series 2023RRR, Rev., 5.00%, 3/1/2026 | | |
New Jersey Transportation Trust Fund Authority, Transportation Program Series 2024 AA, Rev., 5.25%, 6/15/2041 | | |
Tobacco Settlement Financing Corp. Series 2018 A, Rev., 5.00%, 6/1/2034 | | |
| | |
|
City of Farmington, San Juan Project Series 2010 B, Rev., 3.88%, 6/1/2029 (b) | | |
Loving Municipal School District No. 10 | | |
| | |
| | |
| | |
| | |
| | |
| | |
|
Build NYC Resource Corp., Kipp NYC Public School Facilities - Canal West Project | | |
| | |
| | |
Camden Central School District, GO, BAN, 4.50%, 6/26/2025 | | |
City of New York, Fiscal Year 2014 Series 2014D-4, GO, VRDO, LOC : TD Bank NA, 1.50%, 11/1/2024 (b) | | |
City of New York, Fiscal Year 2021 | | |
Series 2021F, Subseries F-1, GO, 5.00%, 3/1/2036 | | |
SEE NOTES TO FINANCIAL STATEMENTS.
| J.P. Morgan Tax Aware Fund | |
| | |
Municipal Bonds — continued |
|
Series 2021F, Subseries F-1, GO, 5.00%, 3/1/2037 | | |
City of Oneida, GO, BAN, 4.50%, 3/28/2025 | | |
Gloversville Enlarged School District, GO, BAN, 4.50%, 6/26/2025 | | |
Hudson Yards Infrastructure Corp., Second Indenture Series 2017 A, Rev., 5.00%, 2/15/2031 | | |
Long Island Power Authority, Electric System | | |
Series 2024B, Rev., 3.00%, 9/1/2029 (b) | | |
Series 2024B, Rev., 3.00%, 9/1/2031 (b) | | |
Metropolitan Transportation Authority Series C-1, Rev., 5.25%, 11/15/2028 | | |
New York City Municipal Water Finance Authority, Second Generation, Fiscal Year 2024 Series 2024, Subseries BB-2, Rev., 5.25%, 6/15/2047 | | |
New York City Transitional Finance Authority, Future Tax Secured, Fiscal Year 2020 Series 2020B-1, Rev., 5.00%, 11/1/2025 | | |
New York City Transitional Finance Authority, Future Tax Secured, Fiscal Year 2022 Series 2022B, Subseries B-1, Rev., 4.00%, 8/1/2038 | | |
New York City Transitional Finance Authority, Future Tax Secured, Fiscal Year 2023 Series 2023D, Subseries D-1, Rev., 5.00%, 11/1/2046 | | |
New York City Transitional Finance Authority, Future Tax Secured, Fiscal Year 2024 | | |
Series 2024C, Rev., 5.25%, 5/1/2050 | | |
Series 2024F, Subseries F-1, Rev., 5.25%, 2/1/2053 | | |
Series 2024F, Subseries F-1, Rev., 4.25%, 2/1/2054 | | |
New York City Transitional Finance Authority, Future Tax Secured, Fiscal Year 2025 | | |
Series 2025A, Subseries A-1, Rev., 5.00%, 11/1/2035 | | |
Series 2025C, Subseries C-1, Rev., 5.00%, 5/1/2048 | | |
New York Convention Center Development Corp., Subordinate Lien, Hotel Unit Fee Secured Series B, Rev., AGM - CR, Zero Coupon, 11/15/2049 | | |
New York Liberty Development Corp., Secured by Port Authority Series 1WTC-2021, Rev., 2.75%, 2/15/2044 | | |
New York Liberty Development Corp., World Trade Centre Series 1WTC-2021, Rev., 2.25%, 2/15/2041 | | |
New York Power Authority Series 2020A, Rev., 4.00%, 11/15/2045 | | |
| | |
|
|
New York State Dormitory Authority, Cornell University Series 2024A, Rev., 5.50%, 7/1/2054 | | |
New York State Dormitory Authority, Langone Hospitals Series 2024A, Rev., 5.00%, 7/1/2031 | | |
New York State Dormitory Authority, Northwell Health Obligated Group | | |
Series 2024A, Rev., 4.00%, 5/1/2054 | | |
Series 2024A, Rev., 5.25%, 5/1/2054 | | |
New York State Dormitory Authority, Pace University | | |
Series 2024 A, Rev., 5.25%, 5/1/2031 | | |
Series 2024 A, Rev., 5.25%, 5/1/2039 | | |
New York State Dormitory Authority, Personal Income Tax, General Purpose Series 2017A, Rev., 4.00%, 2/15/2034 | | |
New York State Dormitory Authority, State Personal Income Tax, General Purpose | | |
Series 2021 E, Rev., 4.00%, 3/15/2042 | | |
Series 2020A, Rev., 4.00%, 3/15/2047 | | |
New York State Environmental Facilities Corp. | | |
Series 2022B, Rev., 5.00%, 9/15/2031 | | |
Series 2022B, Rev., 5.00%, 9/15/2032 | | |
Series 2022B, Rev., 5.00%, 9/15/2033 | | |
Series 2022B, Rev., 5.00%, 9/15/2035 | | |
Series 2022B, Rev., 5.00%, 9/15/2036 | | |
Series 2022B, Rev., 5.00%, 9/15/2037 | | |
New York Transportation Development Corp., Delta Air Lines, Inc., Laguardia Airport Terminals C&D Redevelopment Project Series 2023, Rev., AMT, 6.00%, 4/1/2035 | | |
New York Transportation Development Corp., Delta Air Lines, Inc., LaGuardia Airport Terminals C&D Redevelopment Project | | |
Rev., AMT, 5.00%, 1/1/2028 | | |
Series 2018, Rev., AMT, 5.00%, 1/1/2031 | | |
New York Transportation Development Corp., JFK International Airport New Terminal One Project Series 2023, Rev., AMT, AGM, 5.00%, 6/30/2049 | | |
Northeastern Clinton Central School District, GO, BAN, 4.50%, 6/26/2025 | | |
Port Authority of New York and New Jersey, Consolidated Series 245, Rev., 5.00%, 9/1/2049 | | |
Sherburne Earlville Central School District, GO, BAN, 4.50%, 7/18/2025 | | |
Triborough Bridge and Tunnel Authority Series 2024B, Subseries B-1, Rev., 5.25%, 5/15/2054 | | |
SEE NOTES TO FINANCIAL STATEMENTS.
| J.P. Morgan Tax Aware Fund | |
JPMorgan Tax Aware Real Return Fund
SCHEDULE OF PORTFOLIO INVESTMENTSAS OF October 31, 2024 (continued)
| | |
Municipal Bonds — continued |
|
Triborough Bridge and Tunnel Authority, Payroll Mobility Tax Series 2024C, Rev., 5.00%, 11/15/2035 | | |
Westchester County Local Development Corp., Purchase Senior Learning Community, Inc., Project Series 2021A, Rev., 5.00%, 7/1/2041 (c) | | |
| | |
|
County of Durham Series 2023A, Rev., 5.00%, 6/1/2026 | | |
County of Wake, GO, 5.00%, 4/1/2028 | | |
North Carolina Housing Finance Agency, Homeownership | | |
Series 55-C, Rev., GNMA / FNMA / FHLMC, 3.20%, 1/15/2026 (b) | | |
Series 53-A, Rev., GNMA / FNMA / FHLMC, 6.25%, 1/1/2055 | | |
| | |
|
North Dakota Building Authority Series 2020A, Rev., 5.00%, 12/1/2035 | | |
|
Akron Bath Copley Joint Township Hospital District, Children's Hospital Medical Center of Akron Series 2022A, Rev., 5.00%, 11/15/2029 | | |
Buckeye Tobacco Settlement Financing Authority | | |
Series 2020B-2, Rev., 5.00%, 6/1/2055 | | |
Series 2020B-3, Rev., Zero Coupon, 6/1/2057 | | |
County of Montgomery, Ohio Health care Facilities Solvita Project Series 2024, Rev., 5.25%, 9/1/2049 | | |
Jefferson County Port Authority, JSW Steel USA Ohio, Inc., Project Series 2023, Rev., 5.00%, 12/1/2028 (b) (c) | | |
North Ridgeville City School District | | |
Series 2024, GO, 5.25%, 12/1/2054 | | |
Series 2024, GO, 4.50%, 12/1/2061 | | |
Northeast Ohio Regional Sewer District, Wastewater Improvement Series 2024, Rev., 5.00%, 11/15/2045 | | |
Ohio Air Quality Development Authority, American Electric Power Co. Project Series 2005C, Rev., AMT, 3.70%, 4/1/2028 | | |
Ohio Water Development Authority, Drinking Water Assistance Series 2024 A, Rev., 5.00%, 12/1/2043 | | |
| | |
|
|
Ohio Water Development Authority, Water Pollution Control Loan Fund | | |
Series 2021A, Rev., 4.00%, 12/1/2041 | | |
Series 2024A, Rev., 5.00%, 12/1/2043 | | |
Port of Greater Cincinnati Development Authority, Duke Energy Convention Center Project Series 2024B, Rev., 5.00%, 12/1/2040 | | |
State of Ohio Series Y, GO, 5.00%, 5/1/2038 | | |
University of Cincinnati Series 2024A, Rev., 5.25%, 6/1/2049 | | |
| | |
|
Oklahoma Industries Authority, Oklahoma County Independent School District No. 89 Oklahoma City Series 2024, Rev., 5.00%, 4/1/2032 | | |
Oklahoma Turnpike Authority, Turnpike System, Second Senior Series 2017A, Rev., 5.00%, 1/1/2038 | | |
Oklahoma Water Resources Board, State Loan Program Series 2023 C, Rev., 5.00%, 10/1/2037 | | |
| | |
|
City of Portland, Second Lien Sewer System Series 2014B, Rev., 4.00%, 10/1/2036 | | |
Hospital Facilities Authority of Multnomah County Oregon, Terwilliger Plaza, Inc. Series 2021B1, Rev., 1.20%, 6/1/2028 | | |
Multnomah and Clackamas Counties School District No. 10JT Gresham-Barlow Series B, GO, Zero Coupon, 6/15/2035 | | |
Oregon State Facilities Authority, Peacehealth Series 2018A, Rev., VRDO, LOC : US Bank NA, 1.70%, 11/1/2024 (b) | | |
Washington and Multnomah Counties School District No. 48J Beaverton Series B, GO, 5.00%, 6/15/2025 | | |
| | |
|
Allegheny County Airport Authority, Pittsburgh International Airport Series 2023A, Rev., AMT, AGM, 5.50%, 1/1/2043 | | |
Allegheny County Sanitary Authority, Sewer Series 2024, Rev., 5.00%, 12/1/2028 | | |
Commonwealth Financing Authority, Tobacco Master Settlement Payment | | |
| | |
SEE NOTES TO FINANCIAL STATEMENTS.
| J.P. Morgan Tax Aware Fund | |
| | |
Municipal Bonds — continued |
|
| | |
| | |
| | |
| | |
Commonwealth of Pennsylvania | | |
Series 2024-1, GO, 4.00%, 8/15/2042 | | |
Series 2024-1, GO, 4.00%, 8/15/2043 | | |
Health Care Facilities Authority of Sayre, Guthrie Clinic (The), Rev., (3-MONTH CME TERM SOFR + 0.78%), 4.34%, 12/1/2024 (e) | | |
Montgomery County Industrial Development Authority, Constellation Energy Generation Series 2023A, Rev., 4.10%, 4/3/2028 (b) | | |
Pennsylvania Economic Development Financing Authority, Junior Guaranteed, Capitol Region Parking System Series 2024 B, Rev., GTD, 4.25%, 1/1/2050 | | |
Pennsylvania Economic Development Financing Authority, The Penndot Major Bridges, Rev., AMT, AGM, 5.00%, 12/31/2057 | | |
Pennsylvania Higher Educational Facilities Authority, Thomas Jefferson University Series 2024B-2, Rev., 4.38%, 11/1/2054 (f) | | |
Pennsylvania Housing Finance Agency, Single Family Mortgage Series 2024-146A, Rev., 6.25%, 10/1/2054 | | |
Pennsylvania Turnpike Commission | | |
Series 2016 A-3, Rev., 5.00%, 12/1/2027 | | |
Series 2024-1, Rev., 5.00%, 12/1/2043 | | |
Pennsylvania Turnpike Commission, Subordinate Series 2024-1, Rev., 5.00%, 6/1/2031 | | |
Philadelphia Authority for Industrial Development, Holy Family University, Rev., 5.00%, 9/1/2029 | | |
Philadelphia Gas Works Co., 1998 General Ordinance Series 17B, Rev., 5.00%, 8/1/2026 | | |
| | |
|
Puerto Rico Sales Tax Financing Corp. Sales Tax (Puerto Rico) | | |
Series A-1, Rev., Zero Coupon, 7/1/2027 | | |
Series A-1, Rev., Zero Coupon, 7/1/2029 | | |
Series A-1, Rev., 4.75%, 7/1/2053 | | |
| | |
| | |
|
|
Rhode Island Health and Educational Building Corp., Lifespan Obligated Group | | |
| | |
| | |
Tobacco Settlement Financing Corp. Series B, Rev., 5.00%, 6/1/2050 | | |
| | |
|
Charleston Educational Excellence Finance Corp., Installment Purchase, Charleston County School District, South Carolina Project Series 2024, Rev., 5.00%, 12/1/2030 | | |
Horry County School District Series 2015A, GO, SCSDE, 4.00%, 3/1/2028 | | |
| | |
|
City of Clarksville Series 2021A, Rev., 4.00%, 2/1/2051 | | |
City of Murfreesboro, GO, 5.00%, 6/1/2029 | | |
County of Sumner Series 2021, GO, 5.00%, 6/1/2025 | | |
Knox County Health Educational and Housing Facility Board, University of Tennessee Project Series 2024A-1, Rev., 5.50%, 7/1/2054 | | |
Metropolitan Government Nashville and Davidson County, Health and Educational Facilities Board, Blakeford at Green Hills Series 2020A, Rev., 4.00%, 11/1/2038 | | |
Metropolitan Government Nashville and Davidson County, Health and Educational Facilities Board, Vanderbilt University Medical Center Series 2024A, Rev., 5.00%, 7/1/2029 | | |
Metropolitan Nashville Airport Authority (The) | | |
Series 2022B, Rev., AMT, 5.50%, 7/1/2038 | | |
Series 2022B, Rev., AMT, 5.25%, 7/1/2047 | | |
Shelby County Health Educational and Housing Facilities Board, Baptism Memorial Health Obligated Group | | |
Series 2024B, Rev., 5.00%, 9/1/2029 (b) | | |
Series 2024 A, Rev., 5.25%, 9/1/2034 | | |
Tennergy Corp., Gas Supply Series 2021 A, Rev., 4.00%, 9/1/2028 (b) | | |
Tennessee Energy Acquisition Corp., Gas Project Series 2023A-1, Rev., 5.00%, 5/1/2028 (b) | | |
| | |
SEE NOTES TO FINANCIAL STATEMENTS.
| J.P. Morgan Tax Aware Fund | |
JPMorgan Tax Aware Real Return Fund
SCHEDULE OF PORTFOLIO INVESTMENTSAS OF October 31, 2024 (continued)
| | |
Municipal Bonds — continued |
|
Aledo Independent School District, Unlimited Tax | | |
GO, PSF-GTD, 5.00%, 2/15/2042 | | |
GO, PSF-GTD, 5.00%, 2/15/2043 | | |
GO, PSF-GTD, 5.00%, 2/15/2048 | | |
Bryan Independent School District, GO, PSF-GTD, 4.00%, 2/15/2032 | | |
Central Texas Turnpike System, First Tier Series 2024 B, Rev., 5.00%, 5/15/2030 (b) | | |
Central Texas Turnpike System, Second Tier | | |
Series 2024 C, Rev., 5.00%, 8/15/2032 | | |
Series 2024 C, Rev., 5.00%, 8/15/2034 | | |
City of Austin, Airport System, Rev., AMT, 5.00%, 11/15/2034 | | |
City of Houston, Combined Utility System, Junior Lien Series 2002A, Rev., AGM, 5.75%, 12/1/2032 (d) | | |
City of Mesquite, Waterworks and Sewer System, Rev., 5.00%, 3/1/2035 | | |
City of Round Rock, GO, 5.00%, 8/15/2027 | | |
City of San Antonio Electric and Gas Systems Series 2024 B, Rev., 5.00%, 2/1/2039 | | |
County of Fort Bend Toll Road, Senior Lien Series 2024, Rev., AGM, 5.00%, 3/1/2039 | | |
County of Tarrant, GO, 5.00%, 7/15/2033 | | |
Crandall Independent School District, Unlimited Tax | | |
GO, PSF-GTD, 4.25%, 2/1/2053 | | |
GO, PSF-GTD, 5.25%, 2/1/2053 | | |
Irving Independent School District | | |
Series 2023, GO, PSF-GTD, 5.00%, 2/15/2036 | | |
Series 2023, GO, PSF-GTD, 5.00%, 2/15/2037 | | |
Series 2023, GO, PSF-GTD, 5.00%, 2/15/2039 | | |
Lower Colorado River Authority Series 2024, Rev., 5.00%, 5/15/2037 | | |
Lower Colorado River Authority, LCRA Transmission Services Corp. Project | | |
Series 2019 A, Rev., 5.00%, 5/15/2029 | | |
Series 2021, Rev., 5.00%, 5/15/2029 | | |
Mansfield Independent School District, Unlimited Tax Series 2024, GO, PSF-GTD, 4.00%, 2/15/2054 | | |
McKinney Independent School District, GO, PSF-GTD, 5.00%, 2/15/2033 | | |
New Hope Cultural Education Facilities Finance Corp., Morningside Ministries Project, Rev., 4.00%, 1/1/2037 | | |
North Texas Tollway Authority, First Tier Series 2023 A, Rev., 5.00%, 1/1/2026 | | |
| | |
|
|
North Texas Tollway Authority, Second Tier Series 2024B, Rev., 5.00%, 1/1/2030 | | |
Pearland Independent School District Series 2017, GO, PSF-GTD, 5.00%, 2/15/2026 | | |
State of Texas, Transportation Commission Mobility Fund Series 2024, GO, 5.00%, 10/1/2027 | | |
Taylor Independent School District, GO, PSF-GTD, 5.00%, 2/15/2026 (d) | | |
Texas Water Development Board, State Water Implementation Fund | | |
Series 2019 A, Rev., 5.00%, 10/15/2026 | | |
Series 2018B, Rev., 5.00%, 10/15/2029 | | |
Trinity River Authority, Walker-Calloway System, Rev., 5.00%, 2/1/2031 | | |
| | |
|
Utah Charter School Finance Authority, Wallace Stegner Academy Series 2022A, Rev., 5.63%, 6/15/2042 (c) | | |
Utah Housing Corp. Series 2024 I, Rev., GNMA/FNMA/FHLMC, 6.25%, 7/1/2055 (f) | | |
| | |
|
Henrico County Economic Development Authority, Westminster-Canterbury Corp., Rev., 4.00%, 10/1/2040 | | |
Virginia Public Building Authority Series 2015A, Rev., 4.00%, 8/1/2031 | | |
Virginia Public School Authority, Prince William County Series 2023, Rev., 4.25%, 10/1/2039 | | |
| | |
|
King County School District No. 403 Renton, Unlimited Tax, GO, 4.00%, 12/1/2039 | | |
Port of Seattle, Intermediate Lien Series B, Rev., 5.00%, 11/12/2024 | | |
State of Washington Motor Vehicle Fuel Tax Series 2024 B, GO, 5.00%, 6/1/2045 | | |
State of Washington, Various Purpose | | |
Series R-2022A, GO, 4.00%, 2/1/2036 | | |
Series 2023C, GO, 5.00%, 6/1/2041 | | |
Series 2022C, GO, 5.00%, 2/1/2042 | | |
Series 2024 A, GO, 5.00%, 8/1/2046 | | |
SEE NOTES TO FINANCIAL STATEMENTS.
| J.P. Morgan Tax Aware Fund | |
| | |
Municipal Bonds — continued |
|
Washington State Housing Finance Commission, Bitter Lake Village Associates 1 LP, Rev., VRDO, LOC : FNMA, 3.27%, 11/9/2024 (b) | | |
Washington State Housing Finance Commission, Rockwood Retirement Communities Project Series 2020A, Rev., 5.00%, 1/1/2041 (c) | | |
| | |
|
Public Finance Authority, Ascend Leadership Academy Project Series 2021A, Rev., 5.00%, 6/15/2041 (c) | | |
Public Finance Authority, Carmelite System, Inc. (The), Rev., 3.25%, 1/1/2029 | | |
Public Finance Authority, Eastern Michigan University Student Housing Project Series 2022A-1, Rev., 5.25%, 7/1/2033 | | |
State of Wisconsin Series 2021A, GO, 5.00%, 5/1/2036 | | |
University of Wisconsin Hospitals and Clinics Series 2024B, Rev., 5.00%, 10/1/2031 (b) | | |
Wisconsin Department of Transportation Series 2017-1, Rev., 5.00%, 7/1/2025 | | |
Wisconsin Health and Educational Facilities Authority, Marquette University, Rev., 5.00%, 10/1/2032 | | |
Wisconsin Health and Educational Facilities Authority, Medical College of Wisconsin, Inc., (The) Series 2008B, Rev., VRDO, LOC : TD Bank NA, 1.50%, 11/1/2024 (b) | | |
Wisconsin Housing and Economic Development Authority Home Ownership Series 2024 A, Rev., GNMA / FNMA / FHLMC, 6.00%, 9/1/2054 | | |
| | |
Total Municipal Bonds
(Cost $509,609) | | |
| | |
Short-Term Investments — 6.6% |
Investment Companies — 6.6% |
JPMorgan Institutional Tax Free Money Market Fund Class IM Shares, 3.38% (g) (h)
(Cost $37,413) | | |
Total Investments — 97.6%
(Cost $547,022) | | |
Other Assets in Excess of Liabilities — 2.4% | | |
| | |
Percentages indicated are based on net assets. |
| |
| Insured by Assured Guaranty Municipal Corp. |
| |
| |
| Chicago Mercantile Exchange |
| Certificate of Participation |
| |
| Federal Home Loan Mortgage Corp. |
| Federal National Mortgage Association |
| Government National Mortgage Association |
| |
| |
| |
| |
| Permanent School Fund Guaranteed |
| Revenue Anticipation Note |
| |
| South Carolina School District Enhancement |
| Secured Overnight Financing Rate |
| Variable Rate Demand Obligation |
| Amount rounds to less than 0.1% of net assets. |
| The date shown represents the earliest of the prerefunded date, next put date or final maturity date. | |
| Variable or floating rate security, the interest rate of which adjusts periodically based on changes in current interest rates and prepayments on the underlying pool of assets. The interest rate shown is the current rate as of October 31, 2024. | |
| Securities exempt from registration under Rule 144A or section 4(a)(2), of the Securities Act of 1933, as amended. | |
| Security is prerefunded or escrowed to maturity. | |
| Variable or floating rate security, linked to the referenced benchmark. The interest rate shown is the current rate as of October 31, 2024. | |
| All or a portion of the security is a when-issued security, delayed delivery security, or forward commitment. | |
SEE NOTES TO FINANCIAL STATEMENTS.
| J.P. Morgan Tax Aware Fund | |
JPMorgan Tax Aware Real Return Fund
SCHEDULE OF PORTFOLIO INVESTMENTSAS OF October 31, 2024 (continued)
| Investment in an affiliated fund, which is registered under the Investment Company Act of 1940, as amended, and is advised by J.P. Morgan Investment Management Inc. | |
| The rate shown is the current yield as of October 31, 2024. | |
Futures contracts outstanding as of October 31, 2024 (amounts in thousands, except number of contracts):
| | | | | VALUE AND
UNREALIZED
APPRECIATION
(DEPRECIATION) ($) |
| | | | | |
U.S. Treasury 10 Year Note | | | | | |
| | | | | |
U.S. Treasury 5 Year Note | | | | | |
| | | | | |
Centrally Cleared Inflation-linked swap contracts outstanding as of October 31, 2024 (amounts in thousands):
| | | | | UPFRONT
PAYMENTS
(RECEIPTS)
$ | UNREALIZED
APPRECIATION
(DEPRECIATION) ($) | |
| | | | | | | |
| | | | | | | |
| | | | | | | |
| | | | | | | |
| | | | | | | |
| | | | | | | |
| | | | | | | |
| | | | | | | |
| | | | | | | |
| | | | | | | |
| | | | | | | |
| | | | | | | |
| | | | | | | |
| | | | | | | |
| | | | | | | |
| |
| Consumer Price Index for All Urban Consumers |
| |
(a) Value of floating rate index at October 31, 2024 was as follows: |
SEE NOTES TO FINANCIAL STATEMENTS.
| J.P. Morgan Tax Aware Fund | |
STATEMENT OF ASSETS AND LIABILITIESAS OF October 31, 2024
(Amounts in thousands, except per share amounts)
| |
| |
Investments in non-affiliates, at value | |
Investments in affiliates, at value | |
Deposits at broker for futures contracts | |
Deposits at broker for centrally cleared swaps | |
| |
Investment securities sold — delayed delivery securities | |
| |
Interest from non-affiliates | |
Dividends from affiliates | |
Variation margin on centrally cleared swaps | |
| |
| |
| |
| |
Investment securities purchased — delayed delivery securities | |
| |
Variation margin on futures contracts | |
| |
| |
| |
| |
| |
Custodian and accounting fees | |
Trustees’ and Chief Compliance Officer’s fees | |
| |
| |
| |
(a)
Amount rounds to less than one thousand.
SEE NOTES TO FINANCIAL STATEMENTS.
| J.P. Morgan Tax Aware Fund | |
STATEMENT OF ASSETS AND LIABILITIESAS OF October 31, 2024 (continued)
(Amounts in thousands, except per share amounts)
| |
| |
| |
Total distributable earnings (loss) | |
| |
| |
| |
| |
| |
| |
| |
Outstanding units of beneficial interest (shares)
($0.0001 par value; unlimited number of shares authorized): | |
| |
| |
| |
| |
| |
Class A — Redemption price per share | |
Class C — Offering price per share (b) | |
Class I — Offering and redemption price per share | |
Class R6 — Offering and redemption price per share | |
Class A maximum sales charge | |
Class A maximum public offering price per share
[net asset value per share/(100% – maximum sales charge)] | |
Cost of investments in non-affiliates | |
Cost of investments in affiliates | |
Net upfront receipts on centrally cleared swaps | |
(a)
Per share amounts may not recalculate due to rounding of net assets and/or shares outstanding.
(b)
Redemption price for Class C Shares varies based upon length of time the shares are held.
SEE NOTES TO FINANCIAL STATEMENTS.
| J.P. Morgan Tax Aware Fund | |
STATEMENT OF OPERATIONSFOR THE YEAR ENDED October 31, 2024
(Amounts in thousands)
| |
| |
Interest income from non-affiliates | |
Interest income from affiliates | |
Dividend income from affiliates | |
| |
| |
| |
| |
| |
| |
| |
| |
| |
| |
| |
Custodian and accounting fees | |
Interest expense to affiliates | |
| |
Trustees’ and Chief Compliance Officer’s fees | |
Printing and mailing costs | |
Registration and filing fees | |
| |
| |
| |
| |
Less expense reimbursements | |
| |
Net investment income (loss) | |
(a)
Amount rounds to less than one thousand.
SEE NOTES TO FINANCIAL STATEMENTS.
| J.P. Morgan Tax Aware Fund | |
STATEMENT OF OPERATIONSFOR THE YEAR ENDED October 31, 2024 (continued)
(Amounts in thousands)
| |
REALIZED/UNREALIZED GAINS (LOSSES): | |
Net realized gain (loss) on transactions from: | |
Investments in non-affiliates | |
Investments in affiliates | |
| |
| |
| |
Change in net unrealized appreciation/depreciation on: | |
Investments in non-affiliates | |
Investments in affiliates | |
| |
| |
Change in net unrealized appreciation/depreciation | |
Net realized/unrealized gains (losses) | |
Change in net assets resulting from operations | |
SEE NOTES TO FINANCIAL STATEMENTS.
| J.P. Morgan Tax Aware Fund | |
STATEMENTS OF CHANGES IN NET ASSETSFOR THE PERIODS INDICATED
(Amounts in thousands)
| JPMorgan Tax Aware Real Return Fund |
| Year Ended
October 31, 2024 | Year Ended
October 31, 2023 |
CHANGE IN NET ASSETS RESULTING FROM OPERATIONS: | | |
Net investment income (loss) | | |
| | |
Distributions of capital gains received from investment company affiliates | | |
Change in net unrealized appreciation/depreciation | | |
Change in net assets resulting from operations | | |
DISTRIBUTIONS TO SHAREHOLDERS: | | |
| | |
| | |
| | |
| | |
Total distributions to shareholders | | |
| | |
Change in net assets resulting from capital transactions | | |
| | |
| | |
| | |
| | |
SEE NOTES TO FINANCIAL STATEMENTS.
| J.P. Morgan Tax Aware Fund | |
STATEMENTS OF CHANGES IN NET ASSETSFOR THE PERIODS INDICATED (continued)
(Amounts in thousands)
| JPMorgan Tax Aware Real Return Fund |
| Year Ended October 31, 2024 | Year Ended October 31, 2023 |
| | |
| | |
Proceeds from shares issued | | |
| | |
| | |
Change in net assets resulting from Class A capital transactions | | |
| | |
Proceeds from shares issued | | |
| | |
| | |
Change in net assets resulting from Class C capital transactions | | |
| | |
Proceeds from shares issued | | |
| | |
| | |
Change in net assets resulting from Class I capital transactions | | |
| | |
Proceeds from shares issued | | |
| | |
| | |
Change in net assets resulting from Class R6 capital transactions | | |
Total change in net assets resulting from capital transactions | | |
| | |
| | |
| | |
| | |
| | |
| | |
| | |
| | |
| | |
| | |
| | |
| | |
| | |
| | |
| | |
| | |
SEE NOTES TO FINANCIAL STATEMENTS.
| J.P. Morgan Tax Aware Fund | |
| JPMorgan Tax Aware Real Return Fund |
| Year Ended October 31, 2024 | Year Ended October 31, 2023 |
SHARE TRANSACTIONS: (continued) | | |
| | |
| | |
| | |
| | |
Change in Class R6 Shares | | |
SEE NOTES TO FINANCIAL STATEMENTS.
| J.P. Morgan Tax Aware Fund | |
FINANCIAL HIGHLIGHTSFOR THE PERIODS INDICATED
| Per share operating performance |
| | | |
| Net asset
value,
beginning
of period | Net
investment
income
(loss)(a) | Net realized
and unrealized
gains
(losses) on
investments | Total from
investment
operations | |
JPMorgan Tax Aware Real Return Fund | | | | | |
| | | | | |
Year Ended October 31, 2024 | | | | | |
Year Ended October 31, 2023 | | | | | |
Year Ended October 31, 2022 | | | | | |
Year Ended October 31, 2021 | | | | | |
Year Ended October 31, 2020 | | | | | |
| | | | | |
Year Ended October 31, 2024 | | | | | |
Year Ended October 31, 2023 | | | | | |
Year Ended October 31, 2022 | | | | | |
Year Ended October 31, 2021 | | | | | |
Year Ended October 31, 2020 | | | | | |
| | | | | |
Year Ended October 31, 2024 | | | | | |
Year Ended October 31, 2023 | | | | | |
Year Ended October 31, 2022 | | | | | |
Year Ended October 31, 2021 | | | | | |
Year Ended October 31, 2020 | | | | | |
| | | | | |
Year Ended October 31, 2024 | | | | | |
Year Ended October 31, 2023 | | | | | |
Year Ended October 31, 2022 | | | | | |
Year Ended October 31, 2021 | | | | | |
Year Ended October 31, 2020 | | | | | |
| | | | | |
|
| Calculated based upon average shares outstanding. |
| Includes adjustments in accordance with accounting principles generally accepted in the United States of America and as such, the net asset values for financial reporting purposes and the returns based upon those net asset values may differ from the net asset values and returns for shareholder transactions. |
| Includes interest expense, if applicable, which is less than 0.005% unless otherwise noted. |
| Amount rounds to less than $0.005. |
SEE NOTES TO FINANCIAL STATEMENTS.
| J.P. Morgan Tax Aware Fund | |
| |
| | | Ratios to average net assets |
Net asset
value,
end of
period | Total return
(excludes
sales charge)(b) | Net assets,
end of
period
(000's) | | Net
investment
income
(loss) | Expenses without
waivers and
reimbursements | |
| | | | | | |
| | | | | | |
| | | | | | |
| | | | | | |
| | | | | | |
| | | | | | |
| | | | | | |
| | | | | | |
| | | | | | |
| | | | | | |
| | | | | | |
| | | | | | |
| | | | | | |
| | | | | | |
| | | | | | |
| | | | | | |
| | | | | | |
| | | | | | |
| | | | | | |
| | | | | | |
| | | | | | |
| | | | | | |
| | | | | | |
| | | | | | |
| | | | | | |
| | | | | | |
SEE NOTES TO FINANCIAL STATEMENTS.
| J.P. Morgan Tax Aware Fund | |
NOTES TO FINANCIAL STATEMENTSAS OF October 31, 2024
(Dollar values in thousands)
1. Organization
JPMorgan Trust I (the “Trust”) was formed on November 12, 2004, as a Delaware statutory trust, pursuant to a Declaration of Trust dated November 5, 2004 and is registered under the Investment Company Act of 1940, as amended (the “1940 Act”), as an open-end management investment company.
The following is a separate fund of the Trust (the "Fund") covered by this report:
| | Diversification Classification |
JPMorgan Tax Aware Real Return Fund | Class A, Class C, Class I and Class R6 | |
The investment objective of the Fund is to seek to maximize after-tax inflation protected return.
Class A Shares generally provide for a front-end sales charge while Class C Shares provide for a contingent deferred sales charge ("CDSC"). No sales charges are assessed with respect to Class I and Class R6 Shares. Certain Class A Shares, for which front-end sales charges have been waived, may be subject to a CDSC as described in the Fund's prospectus. Class C Shares automatically convert to Class A Shares after eight years. All classes of shares have equal rights as to earnings, assets and voting privileges, except that each class may bear different transfer agency, distribution and service fees and each class has exclusive voting rights with respect to its distribution plan and shareholder servicing agreements.
J.P. Morgan Investment Management Inc. (“JPMIM”), an indirect, wholly-owned subsidiary of JPMorgan Chase & Co. (“JPMorgan”), acts as adviser (the “Adviser”) and administrator (the “Administrator”) to the Fund.
2. Significant Accounting Policies
The following is a summary of significant accounting policies followed by the Fund in the preparation of its financial statements. The Fund is an investment company and, accordingly, follows the investment company accounting and reporting guidance of the Financial Accounting Standards Board (“FASB”) Accounting Standards Codification Topic 946 — Investment Companies, which is part of U.S. generally accepted accounting principles (“GAAP”). The preparation of financial statements in conformity with GAAP requires management to make estimates and assumptions that affect (i) the reported amounts of assets and liabilities, (ii) disclosure of contingent assets and liabilities at the date of the financial statements, and (iii) the reported amounts of increases and decreases in net assets from operations during the reporting period. Actual results could differ from those estimates.
A. Valuation of Investments— Investments are valued in accordance with GAAP and the Fund's valuation policies set forth by, and under the supervision and responsibility of, the Board of Trustees of the Trust (the "Board"), which established the following approach to valuation, as described more fully below: (i) investments for which market quotations are readily available shall be valued at their market value and (ii) all other investments for which market quotations are not readily available shall be valued at their fair value as determined in good faith by the Board.
Under Section 2(a)(41) of the 1940 Act, the Board is required to determine fair value for securities that do not have readily available market quotations. Under Securities and Exchange Commission ("SEC") Rule 2a-5 (Good Faith Determinations of Fair Value), the Board may designate the performance of these fair valuation determinations to a valuation designee. The Board has designated the Adviser as the “Valuation Designee” to perform fair valuation determinations for the Fund on behalf of the Board subject to appropriate oversight by the Board. The Adviser, as Valuation Designee, leverages the J.P. Morgan Asset Management Americas Valuation Committee (“AVC”) to help oversee and carry out the policies for the valuation of investments held in the Fund. The Adviser, as Valuation Designee, remains responsible for the valuation determinations.
This oversight by the AVC includes monitoring the appropriateness of fair values based on results of ongoing valuation oversight including, but not limited to, consideration of macro or security specific events, market events, and pricing vendor and broker due diligence. The Administrator is responsible for discussing and assessing the potential impacts to the fair values on an ongoing basis, and, at least on a quarterly basis, with the AVC and the Board.
Fixed income instruments are valued based on prices received from approved affiliated and unaffiliated pricing vendors or third party broker-dealers (collectively referred to as “Pricing Services”). The Pricing Services use multiple valuation techniques to determine the valuation of fixed income instruments. In instances where sufficient market activity exists, the Pricing Services may utilize a market-based approach through which trades or quotes from market makers are used to determine the valuation of these instruments. In instances where sufficient market activity may not exist, the Pricing Services also utilize proprietary valuation models which may consider market transactions in comparable securities and the various relationships between securities in determining fair value and/or market characteristics in order to estimate the relevant cash flows, which are then discounted to calculate the fair values.
Equities and other exchange-traded instruments are valued at the last sale price or official market closing price on the primary exchange on which the instrument is traded before the net asset values (“NAV”) of the Fund is calculated on a valuation date.
Investments in open-end investment companies (“Underlying Funds”) are valued at each Underlying Fund’s NAV per share as of the report date.
Futures contracts are generally valued on the basis of available market quotations.
| J.P. Morgan Tax Aware Fund | |
Swaps are valued utilizing market quotations from approved Pricing Services.
Valuations reflected in this report are as of the report date. As a result, changes in valuation due to market events and/or issuer-related events after the report date and prior to issuance of the report are not reflected herein.
The various inputs that are used in determining the valuation of the Fund's investments are summarized into the three broad levels listed below.
•
Level 1 — Unadjusted inputs using quoted prices in active markets for identical investments.
•
Level 2 — Other significant observable inputs including, but not limited to, quoted prices for similar investments, inputs other than quoted prices that are observable for investments (such as interest rates, prepayment speeds, credit risk, etc.) or other market corroborated inputs.
•
Level 3 — Significant inputs based on the best information available in the circumstances, to the extent observable inputs are not available (including the Fund's assumptions in determining the fair value of investments).
A financial instrument’s level within the fair value hierarchy is based on the lowest level of any input, both individually and in the aggregate, that is significant to the fair value measurement. The inputs or methodology used for valuing instruments are not necessarily an indication of the risk associated with investing in those instruments.
The following table represents each valuation input as presented on the Schedule of Portfolio Investments ("SOI"):
| | | | |
| | Level 2
Other significant
observable inputs | Level 3
Significant
unobservable inputs | |
Investments in Securities | | | | |
| | | | |
| | | | |
| | | | |
Total Investments in Securities | | | | |
Appreciation in Other Financial Instruments | | | | |
| | | | |
| | | | |
Depreciation in Other Financial Instruments | | | | |
| | | | |
| | | | |
Total Net Appreciation/ Depreciation in Other Financial Instruments | | | | |
B. Restricted Securities— Certain securities held by the Fund may be subject to legal or contractual restrictions on resale. Restricted securities generally are resold in transactions exempt from registration under the Securities Act of 1933, as amended (the “Securities Act”). Disposal of these securities may involve time-consuming negotiations and expense. Prompt sale at the current valuation may be difficult and could adversely affect the NAVs of the Fund.
As of October 31, 2024, the Fund had no investments in restricted securities other than securities sold to the Fund under Rule 144A and/or Regulation S under the Securities Act.
C. When-Issued Securities, Delayed Delivery Securities and Forward Commitments— The Fund purchased when-issued securities, including To-Be-Announced (“TBA”) securities, and entered into contracts to purchase or sell securities for a fixed price that may be settled a month or more after the trade date, or purchased delayed delivery securities which generally settle seven days after the trade date. When-issued securities are securities that have been authorized, but not issued in the market. A forward commitment involves entering into a contract to purchase or sell securities for a fixed price at a future date that may be settled a month or more after the trade date. A delayed delivery security is agreed upon in advance between the buyer and the seller of the security and is generally delivered beyond seven days of the agreed upon date. The purchase of securities on a when-issued, delayed delivery or forward commitment basis involves the risk that the value of the security to be purchased declines before the settlement date. The sale of securities on a forward commitment basis involves the risk that the value of the securities sold may increase before the settlement date. The Fund may be exposed to credit risk if the counterparty fails to perform under the terms of the transaction. Interest income for securities purchased on a when-issued, delayed delivery or forward commitment basis is not accrued until the settlement date.
The Fund had when-issued securities, delayed delivery securities or forward commitments outstanding as of October 31, 2024, which are shown as a Receivable for Investment securities sold - delayed delivery securities and a Payable for Investment securities purchased - delayed delivery securities, respectively, on the Statement of Assets and Liabilities. The values of these securities held at October 31, 2024 are detailed on the SOI, if any.
| J.P. Morgan Tax Aware Fund | |
NOTES TO FINANCIAL STATEMENTSAS OF October 31, 2024 (continued)
(Dollar values in thousands)
D. Securities Lending — The Fund is authorized to engage in securities lending in order to generate additional income. The Fund is able to lend to approved borrowers. Citibank N.A. (“Citibank”) serves as lending agent for the Fund, pursuant to a Securities Lending Agency Agreement (the “Securities Lending Agency Agreement”). Securities loaned are collateralized by cash equal to at least 100% of the market value plus accrued interest on the securities lent, which is invested in an affiliated money market fund. The Fund retains the interest earned on cash collateral investments but is required to pay the borrower a rebate for the use of the cash collateral. In cases where the lent security is of high value to borrowers, there may be a negative rebate (i.e., a net payment from the borrower to the Fund). Upon termination of a loan, the Fund is required to return to the borrower an amount equal to the cash collateral, plus any rebate owed to the borrowers. The remaining maturities of the securities lending transactions are considered overnight and continuous. Loans are subject to termination by the Fund or the borrower at any time.
The net income earned on the securities lending (after payment of rebates and Citibank’s fee) is included on the Statement of Operations as Income from securities lending (net). The Fund also receives payments from the borrower during the period of the loan, equivalent to dividends and interest earned on the securities loaned, which are recorded as Dividend or Interest income, respectively, on the Statement of Operations.
Under the Securities Lending Agency Agreement, Citibank marks to market the loaned securities on a daily basis. In the event the cash received from the borrower is less than 102% of the value of the loaned securities (105% for loans of non-U.S. securities), Citibank requests additional cash from the borrower so as to maintain a collateralization level of at least 102% of the value of the loaned securities plus accrued interest (105% for loans of non-U.S. securities), subject to certain de minimis amounts.
The value of securities out on loan is recorded as an asset on the Statement of Assets and Liabilities. The value of the cash collateral received is recorded as a liability on the Statement of Assets and Liabilities and details of collateral investments are disclosed on the SOI.
The Fund bears the risk of loss associated with the collateral investments and is not entitled to additional collateral from the borrower to cover any such losses. To the extent that the value of the collateral investments declines below the amount owed to a borrower, the Fund may incur losses that exceed the amount it earned on lending the security. Upon termination of a loan, the Fund may use leverage (borrow money) to repay the borrower for cash collateral posted if the Adviser does not believe that it is prudent to sell the collateral investments to fund the payment of this liability. Securities lending activity is subject to master netting arrangements.
Securities lending also involves counterparty risks, including the risk that the loaned securities may not be returned in a timely manner or at all. Subject to certain conditions, Citibank has agreed to indemnify the Fund from losses resulting from a borrower’s failure to return a loaned security.
The Fund did not lend out any securities during the year ended October 31, 2024.
E. Investment Transactions with Affiliates— The Fund invested in an Underlying Fund advised by the Adviser. An issuer which is under common control with the Fund may be considered an affiliate. For the purposes of the financial statements, the Fund assumes the issuer listed in the table below to be an affiliated issuer. The Underlying Fund's distributions may be reinvested into such Underlying Fund. Reinvestment amounts are included in the purchases at cost amounts in the table below.
|
For the year ended October 31, 2024 |
| | | | | Change in
Unrealized
Appreciation/
(Depreciation) | | | | Capital Gain
Distributions |
JPMorgan Institutional Tax Free Money Market Fund Class IM Shares, 3.38% (a) (b) | | | | | | | | | |
|
| Investment in an affiliated fund, which is registered under the Investment Company Act of 1940, as amended, and is advised by J.P. Morgan Investment Management Inc. |
| The rate shown is the current yield as of October 31, 2024. |
F. Futures Contracts—The Fund used treasury futures contracts to manage and hedge interest rate risk associated with portfolio investments. The Fund also used futures contracts to lengthen or shorten the duration of the overall investment portfolio.
Futures contracts provide for the delayed delivery of the underlying instrument at a fixed price or are settled for a cash amount based on the change in the value of the underlying instrument at a specific date in the future. Upon entering into a futures contract, the Fund is required to deposit with the broker, cash or securities in an amount equal to a certain percentage of the contract amount, which is referred to as the initial margin deposit. Subsequent payments, referred to as variation margin, are made or received by the Fund periodically and are based on changes in the market value of open futures contracts. Changes in the market value of open futures contracts are recorded as Change in net unrealized appreciation/depreciation on futures contracts on the Statement of Operations. Realized gains or losses, representing the difference between the value of the contract at the time it was opened and the value at the time it was closed, are reported on the Statement of Operations at the closing or expiration of the futures
| J.P. Morgan Tax Aware Fund | |
contract. Securities deposited as initial margin are designated on the SOI, while cash deposited, which is considered restricted, is recorded on the Statement of Assets and Liabilities. A receivable from and/or a payable to brokers for the daily variation margin is also recorded on the Statement of Assets and Liabilities.
The use of futures contracts exposes the Fund to interest rate risk. The Fund may be subject to the risk that the change in the value of the futures contract may not correlate perfectly with the underlying instrument. Use of long futures contracts subjects the Fund to risk of loss in excess of the amounts shown on the Statement of Assets and Liabilities, up to the notional amount of the futures contracts. Use of short futures contracts subjects the Fund to unlimited risk of loss. The Fund may enter into futures contracts only on exchanges or boards of trade. The exchange or board of trade acts as the counterparty to each futures transaction; therefore, the Fund's credit risk is limited to failure of the exchange or board of trade. Under some circumstances, futures exchanges may establish daily limits on the amount that the price of a futures contract can vary from the previous day’s settlement price, which could effectively prevent liquidation of positions.
The Fund's futures contracts are not subject to master netting arrangements (the right to close out all transactions traded with a counterparty and net amounts owed or due across transactions).
G. Swaps—The Fund engaged in various swap transactions to manage credit, interest rate (e.g., duration, yield curve) and inflation risks within its portfolio. The Fund also used swaps as alternatives to direct investments. Swap transactions are contracts negotiated over-the-counter (“OTC swaps”) between the fund and a counterparty or are centrally cleared (“centrally cleared swaps”) through a central clearinghouse managed by a Futures Commission Merchant (“FCM”) that exchange investment cash flows, assets, foreign currencies or market-linked returns at specified, future intervals.
Upfront payments made and/or received by the Fund are recorded as assets or liabilities, respectively, on the Statement of Assets and Liabilities and are amortized over the term of the swap. The value of an OTC swap agreement is recorded as either an asset or a liability on the Statement of Assets and Liabilities at the beginning of the measurement period. Upon entering into a centrally cleared swap, the Fund is required to deposit with the FCM cash or securities, which is referred to as initial margin deposit. Securities deposited as initial margin are designated on the SOIs, while cash deposited, which is considered restricted, is reported as Deposits at broker for centrally cleared swaps on the Statement of Assets and Liabilities. Daily changes in valuation of centrally cleared swaps, if any, are recorded as a variation margin receivable or payable on the Statement of Assets and Liabilities. The change in the value of swaps, including accruals of periodic amounts of interest to be paid or received on swaps, is reported as Change in net unrealized appreciation/ depreciation on swaps on the Statement of Operations. A realized gain or loss is recorded upon payment or receipt of a periodic payment or payment made upon termination of a swap agreement.
The central clearinghouse acts as the counterparty to each centrally cleared swap transaction; therefore credit risk is limited to the failure of the clearinghouse.
The Fund entered into credit default swaps to simulate long and/or short bond positions or to take an active long and/or short position with respect to the likelihood of a default or credit event by the issuer of the underlying reference obligation.
The underlying reference obligation may be a single issuer of corporate or sovereign debt, a basket of issuers or a credit index. A credit index is a list of credit instruments or exposures that reference a fixed number of obligors with shared characteristics that represents some part of the credit market as a whole. Index credit default swaps have standardized terms including a fixed spread and standard maturity dates. The composition of the obligations within a particular index changes periodically.
Credit default swaps involve one party, the protection buyer, making a stream of payments to another party, the protection seller, in exchange for the right to receive a contingent payment if there is a credit event related to the underlying reference obligation. In the event that the reference obligation matures prior to the termination date of the contract, a similar security will be substituted for the duration of the contract term. Credit events are defined under individual swap agreements and generally include bankruptcy, failure to pay, restructuring, repudiation/moratorium, obligation acceleration and obligation default.
If a credit event occurs, the Fund, as protection sellers, would be obligated to make a payment, which may be either: (i) a net cash settlement equal to the notional amount of the swap less the auction value of the reference obligation or (ii) the notional amount of the swap in exchange for the delivery of the reference obligation. Selling protection effectively adds leverage to the Fund’s portfolio up to the notional amount of swap agreements. The notional amount represents the maximum potential liability under a contract and is not reflected on the Statement of Assets and Liabilities. Potential liabilities under these contracts may be reduced by: the auction rates of the underlying reference obligations; upfront payments received at the inception of a swap; and net amounts received from credit default swaps purchased with the identical reference obligation.
| J.P. Morgan Tax Aware Fund | |
NOTES TO FINANCIAL STATEMENTSAS OF October 31, 2024 (continued)
(Dollar values in thousands)
Inflation-Linked Swaps
The Fund used inflation-linked swaps to provide inflation protection within its portfolio. These are agreements between counterparties to exchange interest payments based on interest rates over the life of the swap. One cash flow stream will typically be a floating rate payment based upon the Consumer Price Index upon while the other is a pre-determined fixed interest rate. The use of swaps exposes the Fund to interest rate risk.
(1) Summary of Derivatives Information—The following table presents the value of derivatives held as of October 31, 2024, by its primary underlying risk exposure and respective location on the Statement of Assets and Liabilities:
Interest Rate Risk Exposure: | |
Unrealized Appreciation on Futures Contracts * | |
Swaps at Value (Assets) ** | |
Unrealized Depreciation on Futures Contracts * | |
Swaps at Value (Liabilities) ** | |
Net Fair Value of Derivative Contracts: | |
Unrealized Appreciation (Depreciation) on Futures Contracts * | |
| |
|
| Includes cumulative appreciation/(depreciation) on futures contracts, if any, as reported on the SOI. Only current day’s variation margin is reported within the Statement of Assets and Liabilities. |
| Includes the fair value of centrally cleared swap contracts as reported on the SOI. Only current day’s variation margin is reported within the Statement of Assets and Liabilities. |
The following table presents the effect of derivatives on the Statement of Operations for the year ended October 31, 2024, by primary underlying risk exposure:
Realized Gain (Loss) on Derivatives Recognized as a Result From Operations: |
Interest Rate Risk Exposure: |
| |
| |
|
| |
Net Change in Unrealized Appreciation (Depreciation) on Derivatives Recognized as a Result of Operations: |
Interest Rate Risk Exposure: |
| |
| |
|
| |
The table below discloses the volume of the Fund's futures contracts and swaps activity during the year ended October 31, 2024. Please refer to the tables in the Summary of Derivatives Information for derivative-related gains and losses associated with volume activity:
| |
| |
Average Notional Balance Long | |
Average Notional Balance Short | |
Ending Notional Balance Long | |
Ending Notional Balance Short | |
Interest Rate-Related Swaps (Inflation-Linked Swaps): | |
Average Notional Balance - Pays Fixed Rate | |
Ending Notional Balance - Pays Fixed Rate | |
| J.P. Morgan Tax Aware Fund | |
| |
| |
Average Notional Balance - Buy Protection | |
H. Security Transactions and Investment Income— Investment transactions are accounted for on the trade date (the date the order to buy or sell is executed). Securities gains and losses are calculated on a specifically identified cost basis. Interest income is determined on the basis of coupon interest accrued using the effective interest method, which adjusts for amortization of premiums and accretion of discounts. Dividend income and distributions of net investment income and realized capital gains from the Underlying Funds, if any, are recorded on the ex-dividend date or when the Fund first learns of the dividend.
I. Allocation of Income and Expenses— Expenses directly attributable to the Fund are charged directly to the Fund, while the expenses attributable to more than one fund of the Trust are allocated among the applicable funds. Investment income, realized and unrealized gains and losses and expenses, other than class-specific expenses, are allocated daily to each class of shares based upon the proportion of net assets of each class at the beginning of each day.
Transfer agency fees are class-specific expenses. The amount of the transfer agency fees charged to each share class of the Fund for the year ended October 31, 2024 are as follows:
J. Federal Income Taxes— The Fund is treated as a separate taxable entity for Federal income tax purposes. The Fund's policy is to comply with the provisions of the Internal Revenue Code (the “Code”) applicable to regulated investment companies and to distribute to shareholders all of its distributable net investment income and net realized capital gains on investments. Accordingly, no provision for Federal income tax is necessary. Management has reviewed the Fund's tax positions for all open tax years and has determined that as of October 31, 2024, no liability for Federal income tax is required in the Fund's financial statements for net unrecognized tax benefits. However, management’s conclusions may be subject to future review based on changes in, or the interpretation of, the accounting standards or tax laws and regulations. The Fund's Federal tax returns for the prior three fiscal years, remain subject to examination by the Internal Revenue Service.
K. Distributions to Shareholders— Distributions from net investment income, if any, are generally declared and paid at least monthly and are declared separately for each class. No class has preferential dividend rights; differences in per share rates are due to differences in separate class expenses. Net realized capital gains, if any, are distributed at least annually. The amount of distributions from net investment income and net realized capital gains is determined in accordance with Federal income tax regulations, which may differ from GAAP. To the extent these “book/tax” differences are permanent in nature (i.e., that they result from other than timing of recognition — “temporary differences”), such amounts are reclassified within the capital accounts based on their Federal tax basis treatment.
The following amounts were reclassified within the capital accounts:
| | Accumulated
undistributed
(distributions in
excess of)
net investment
income | Accumulated
net realized
gains (losses) |
| | | |
The reclassifications for the Funds relate primarily to tax adjustments on certain investments.
3. Fees and Other Transactions with Affiliates
A. Investment Advisory Fee — Pursuant to an Investment Advisory Agreement, the Adviser manages the investments of each Fund and for such services is paid a fee. The investment advisory fee is accrued daily and paid monthly at an annual rate of 0.35% of each Fund’s respective average daily net assets.
The Adviser waived investment advisory fees and/or reimbursed expenses as outlined in Note 3.F.
| J.P. Morgan Tax Aware Fund | |
NOTES TO FINANCIAL STATEMENTSAS OF October 31, 2024 (continued)
(Dollar values in thousands)
B. Administration Fee— Pursuant to an Administration Agreement, the Administrator provides certain administration services to the Fund. In consideration of these services, the Administrator receives a fee accrued daily and paid monthly at an annual rate of 0.075% of the first $10 billion of the Fund's average daily net assets, plus 0.050% of the Fund's average daily net assets between $10 billion and $20 billion, plus 0.025% of the Fund's average daily net assets between $20 billion and $25 billion, plus 0.010% of the Fund's average daily net assets in excess of $25 billion. For the year ended October 31, 2024, the effective rate was 0.075% of the Fund's average daily net assets, notwithstanding any fee waivers and/or expense reimbursements.
The Administrator waived administration fees as outlined in Note 3.F.
JPMorgan Chase Bank, N.A. ("JPMCB"), a wholly-owned subsidiary of JPMorgan, serves as the Fund's sub-administrator (the “Sub-administrator”). For its services as Sub-administrator, JPMCB receives a portion of the fees payable to the Administrator.
C. Distribution Fees— Pursuant to a Distribution Agreement, JPMorgan Distribution Services, Inc. (“JPMDS”), an indirect, wholly-owned subsidiary of JPMorgan, serves as the Fund's principal underwriter and promotes and arranges for the sale of the Fund's shares.
The Board has adopted a Distribution Plan (the “Distribution Plan”) for Class A and Class C Shares of the Fund pursuant to Rule 12b-1 under the 1940 Act. Class I and Class R6 Shares of each Fund do not charge a distribution fee. The Distribution Plan provides that Fund shall pay, with respect to the applicable share classes, distribution fees, including payments to JPMDS, at annual rates of the average daily net assets as shown in the table below:
In addition, JPMDS is entitled to receive the front-end sales charges from purchases of Class A Shares and the CDSC from redemptions of Class C Shares and certain Class A Shares for which front-end sales charges have been waived. For the year ended October 31, 2024, JPMDS retained the following:
D. Service Fees— The Trust, on behalf of the Fund, has entered into a Shareholder Servicing Agreement with JPMDS under which JPMDS provides certain support services to fund shareholders. For performing these services, JPMDS receives a fee with respect to all share classes, except Class R6 Shares which do not charge a service fee, that is accrued daily and paid monthly equal to a percentage of the average daily net assets as shown in the table below:
JPMDS has entered into shareholder services contracts with affiliated and unaffiliated financial intermediaries who provide shareholder services and other related services to their clients or customers who invest in the Fund. Pursuant to such contracts, JPMDS will pay all or a portion of such fees earned to financial intermediaries for performing such services.
JPMDS waived service fees as outlined in Note 3.F.
E. Custodian and Accounting Fees— JPMCB provides portfolio custody and accounting services to the Fund. For performing these services, the Fund pays JPMCB transaction and asset-based fees that vary according to the number of transactions and positions, plus out-of-pocket expenses. The amounts paid directly to JPMCB by the Fund for custody and accounting services are included in Custodian and accounting fees on the Statement of Operations.
Interest income earned on cash balances at the custodian, if any, is included in Interest income from affiliates on the Statement of Operations.
Interest expense paid to the custodian related to cash overdrafts, if any, is included in Interest expense to affiliates on the Statement of Operations.
| J.P. Morgan Tax Aware Fund | |
F. Waivers and Reimbursements—The Adviser, Administrator and/or JPMDS have contractually agreed to waive fees and/or reimburse the Fund to the extent that total annual operating expenses (excluding acquired fund fees and expenses other than certain money market fund fees as described below, dividend and interest expenses related to short sales, interest, taxes, expenses related to litigation and potential litigation, expenses related to trustee elections and extraordinary expenses) exceed the percentages of the Fund's respective average daily net assets as shown in the table below:
The expense limitation agreements were in effect for the year ended October 31, 2024 and the contractual expense limitation percentages in the table above are in place until at least February 28, 2025.
For the year ended October 31, 2024, the Fund's service providers waived fees and/or reimbursed expenses for the Fund as follows. None of these parties expect the Fund to repay any such waived fees and/or reimbursed expenses in future years.
Additionally, the Fund may invest in one or more money market funds advised by the Adviser (affiliated money market funds). The Adviser, Administrator and/or JPMDS, as shareholder servicing agent, have contractually agreed to waive fees and/or reimburse expenses in an amount sufficient to offset the respective net fees each collects from the affiliated money market fund on the Fund's investment in such affiliated money market fund, except for investments of securities lending cash collateral. None of these parties expect the Fund to repay any such waived fees and/or reimbursed expenses in future years.
The amount of these waivers resulting from investments in these money market funds for the year ended October 31, 2024 was $41.
JPMIM voluntarily agreed to reimburse the Fund for the Trustee Fees paid to one of the interested Trustees. For the year ended October 31, 2024, the amount of this reimbursement was less than one thousand.
G. Other— Certain officers of the Trust are affiliated with the Adviser, the Administrator and JPMDS. Such officers, with the exception of the Chief Compliance Officer, receive no compensation from the Fund for serving in their respective roles.
The Board designated and appointed a Chief Compliance Officer to the Fund pursuant to Rule 38a-1 under the 1940 Act. The Fund, along with affiliated funds, makes reimbursement payments, on a pro-rata basis, to the Administrator for a portion of the fees associated with the office of the Chief Compliance Officer. Such fees are included in Trustees’ and Chief Compliance Officer’s fees on the Statement of Operations.
The Trust adopted a Trustee Deferred Compensation Plan (the “Plan”) which allows the independent Trustees to defer the receipt of all or a portion of compensation related to performance of their duties as Trustees. The deferred fees are invested in various J.P. Morgan Funds until distribution in accordance with the Plan.
During the year ended October 31, 2024, the Fund purchased securities from an underwriting syndicate in which the principal underwriter or members of the syndicate were affiliated with the Adviser.
The SEC has granted an exemptive order permitting the Fund to engage in principal transactions with J.P. Morgan Securities LLC, an affiliated broker, involving taxable money market instruments, subject to certain conditions.
4. Investment Transactions
During the year ended October 31, 2024, purchases and sales of investments (excluding short-term investments) were as follows:
| Purchases
(excluding
U.S. Government) | Sales
(excluding
U.S. Government) |
| | |
During the year ended October 31, 2024, there were no purchases or sales of U.S. Government securities.
| J.P. Morgan Tax Aware Fund | |
NOTES TO FINANCIAL STATEMENTSAS OF October 31, 2024 (continued)
(Dollar values in thousands)
5. Federal Income Tax Matters
For Federal income tax purposes, the estimated cost and unrealized appreciation (depreciation) in value of investments held at October 31, 2024 were as follows:
| | Gross
Unrealized
Appreciation | Gross
Unrealized
Depreciation | Net Unrealized
Appreciation
(Depreciation) |
| | | | |
The tax character of distributions paid during the year ended October 31, 2024 was as follows:
|
| Short-term gain distributions are treated as ordinary income for income tax purposes. |
The tax character of distributions paid during the year ended October 31, 2023 was as follows:
|
| Short-term gain distributions are treated as ordinary income for income tax purposes. |
As of October 31, 2024, the estimated components of net assets (excluding paid-in-capital) on a tax basis were as follows:
| Current
Distributable
Long-Term
Capital Gain
(Tax Basis Capital
Loss Carryover) | | Unrealized
Appreciation
(Depreciation) |
| | | |
| | | |
As of October 31, 2024, the Fund had net capital loss carryforwards, which are available to offset future realized gains:
| Capital Loss Carryforward Character |
| | |
| | |
The Fund relies upon an exemptive order granted by the SEC (the “Order”) permitting the establishment and operation of an Interfund Lending Facility (the “Facility”). The Facility allows the Fund to directly lend and borrow money to or from any other fund relying upon the Order at rates beneficial to both the borrowing and lending funds. Advances under the Facility are taken primarily for temporary or emergency purposes, including the meeting of redemption requests that otherwise might require the untimely disposition of securities, and are subject to the Fund's borrowing restrictions. The interfund loan rate is determined, as specified in the Order, by averaging the current repurchase agreement rate and the current bank loan rate. The Order was granted to JPMorgan Trust II and may be relied upon by the Fund because the Fund and the series of JPMorgan Trust II are all investment companies in the same “group of investment companies” (as defined in Section 12(d)(1)(G) of the 1940 Act).
The Fund had no borrowings outstanding from another fund, or loans outstanding to another fund, during the year ended October 31, 2024.
| J.P. Morgan Tax Aware Fund | |
The Trust and JPMCB have entered into a financing arrangement. Under this arrangement, JPMCB provides an unsecured, uncommitted credit facility in the aggregate amount of $100 million to certain of the J.P. Morgan Funds, including the Fund. Advances under the arrangement are taken primarily for temporary or emergency purposes, including the meeting of redemption requests that otherwise might require the untimely disposition of securities, and are subject to each Fund's borrowing restrictions. Interest on borrowings is payable at a rate determined by JPMCB at the time of borrowing. This agreement has been extended until October 28, 2025.
The Fund had no borrowings outstanding from the unsecured, uncommitted credit facility during the year ended October 31, 2024.
The Trust, along with certain other trusts for J.P. Morgan Funds (“Borrowers”), has entered into a joint syndicated senior unsecured revolving credit facility totaling $1.5 billion (“Credit Facility”) with various lenders and The Bank of New York Mellon, as administrative agent for the lenders. This Credit Facility provides a source of funds to the Borrowers for temporary and emergency purposes, including the meeting of redemption requests that otherwise might require the untimely disposition of securities. Under the terms of the Credit Facility, a borrowing fund must have a minimum of $25 million in adjusted net asset value and not exceed certain adjusted net asset coverage ratios prior to and during the time in which any borrowings are outstanding. If a fund does not comply with the aforementioned requirements, the fund must remediate within three business days with respect to the $25 million minimum adjusted net asset value or within one business day with respect to certain asset coverage ratios or the administrative agent at the request of, or with the consent of, the lenders may terminate the Credit Facility and declare any outstanding borrowings to be due and payable immediately.
Interest associated with any borrowing under the Credit Facility is charged to the borrowing fund at a rate of interest equal to 1.00%, plus the greater on the day of the borrowing, of the federal funds effective rate, or the Adjusted Secured Overnight Financing Rate (SOFR). Effective August 6, 2024, the Credit Facility was amended and restated for a term of 364 days, unless extended.
The Fund did not utilize the Credit Facility during the year ended October 31, 2024.
7. Risks, Concentrations and Indemnifications
In the normal course of business, the Fund enters into contracts that contain a variety of representations which provide general indemnifications. The Fund's maximum exposure under these arrangements is unknown. The amount of exposure would depend on future claims that may be brought against the Fund. However, based on experience, the Fund expects the risk of loss to be remote.
As of October 31, 2024, the Fund had two individual shareholder and/or non-affiliated omnibus accounts, which owned 35.8% of the Fund’s outstanding shares.
Significant shareholder transactions by these shareholders may impact the Fund's performance and liquidity.
The Fund is subject to interest rate risk. Investments in bonds and other debt securities will change in value based on changes in interest rates. If rates increase, the value of these investments generally declines. Securities with greater interest rate sensitivity and longer maturities generally are subject to greater fluctuations in value. The Fund invest in variable and floating rate loans and other variable and floating rate securities. Although these investments are generally less sensitive to interest rate changes than fixed rate instruments, the value of floating rate loans and other securities may decline if their interest rates do not rise as quickly, or as much, as general interest rates. The Fund may face a heightened level of interest rate risk due to certain changes in monetary policy. It is difficult to predict the pace at which central banks or monetary authorities may change interest rates or the timing, frequency, or magnitude of such changes. Any such changes could be sudden and could expose debt markets to significant volatility and reduced liquidity for Fund investments.
The Fund is subject to credit risk. The Fund’s investments are subject to the risk that an issuer and/or a counterparty will fail to make payments when due or default completely. Prices of the Fund's investments may be adversely affected if any of the issuers or counterparties it is invested in are subject to an actual or perceived deterioration in their credit quality. Credit spreads may increase, which may reduce the market values of the Fund’s securities. Credit spread risk is the risk that economic and market conditions or any actual or perceived credit deterioration may lead to an increase in the credit spreads (i.e. the difference in yield between two securities of similar maturity but different credit quality) and a decline in price of the issuer’s securities.
The Fund invests primarily in a portfolio of debt obligations issued by states, territories and possessions of the United States and by the District of Columbia, and by their political subdivisions and duly constituted authorities. An issuer's ability to meet its payment obligations may be affected by economic or political developments in a specific state or region. These debt obligations may be insured by private insurers who guarantee the payment of principal and interest in the event of issuer default. The value of these investments may be impacted by changes to bond insurers' ratings and the Fund's ability to collect principal and interest, in the event of an issuer's default, may be limited if the private insurer does not have the wherewithal to satisfy its obligation.
The Fund is subject to infectious disease epidemics/pandemics risk. The effects of any future pandemic or other global event to public health and business and market conditions, may have a significant negative impact on the performance of the Fund's investments, increase the Fund's volatility, negatively impact a Fund’s arbitrage and pricing mechanisms, exacerbate pre-existing political, social and economic risks to the Fund, and negatively impact broad segments of businesses and populations. In addition, governments, their regulatory agencies, or self-regulatory organizations have taken or may take actions in response to a pandemic or other global event that affect the instruments in which the Fund invests, or the issuers of
| J.P. Morgan Tax Aware Fund | |
NOTES TO FINANCIAL STATEMENTSAS OF October 31, 2024 (continued)
(Dollar values in thousands)
such instruments, in ways that could have a significant negative impact on the Fund's investment performance. The ultimate impact of any pandemic or other global event and the extent to which the associated conditions and governmental responses impact the Fund will also depend on future developments, which are highly uncertain, difficult to accurately predict and subject to frequent changes.
| J.P. Morgan Tax Aware Fund | |
REPORT OF INDEPENDENT REGISTERED PUBLIC ACCOUNTING FIRM
To the Board of Trustees of JPMorgan Trust I and Shareholders of JPMorgan Tax Aware Real Return Fund
Opinion on the Financial Statements
We have audited the accompanying statement of assets and liabilities, including the schedule of portfolio investments, of JPMorgan Tax Aware Real Return Fund (one of the funds constituting JPMorgan Trust I, referred to hereafter as the “Fund”) as of October 31, 2024, the related statement of operations for the year ended October 31, 2024, the statement of changes in net assets for each of the two years in the period ended October 31, 2024, including the related notes, and the financial highlights for each of the five years in the period ended October 31, 2024 (collectively referred to as the “financial statements”). In our opinion, the financial statements present fairly, in all material respects, the financial position of the Fund as of October 31, 2024, the results of its operations for the year then ended, the changes in its net assets for each of the two years in the period ended October 31, 2024 and the financial highlights for each of the five years in the period ended October 31, 2024 in conformity with accounting principles generally accepted in the United States of America.
These financial statements are the responsibility of the Fund’s management. Our responsibility is to express an opinion on the Fund’s financial statements based on our audits. We are a public accounting firm registered with the Public Company Accounting Oversight Board (United States) (PCAOB) and are required to be independent with respect to the Fund in accordance with the U.S. federal securities laws and the applicable rules and regulations of the Securities and Exchange Commission and the PCAOB.
We conducted our audits of these financial statements in accordance with the standards of the PCAOB. Those standards require that we plan and perform the audit to obtain reasonable assurance about whether the financial statements are free of material misstatement, whether due to error or fraud.
Our audits included performing procedures to assess the risks of material misstatement of the financial statements, whether due to error or fraud, and performing procedures that respond to those risks. Such procedures included examining, on a test basis, evidence regarding the amounts and disclosures in the financial statements. Our audits also included evaluating the accounting principles used and significant estimates made by management, as well as evaluating the overall presentation of the financial statements. Our procedures included confirmation of securities owned as of October 31, 2024 by correspondence with the custodian, transfer agent and brokers; when replies were not received from brokers, we performed other auditing procedures. We believe that our audits provide a reasonable basis for our opinion.
/s/ PricewaterhouseCoopers LLP
New York, New York
December 23, 2024
We have served as the auditor of one or more investment companies in the JPMorgan Funds complex since 1993.
| J.P. Morgan Tax Aware Fund | |
TAX LETTER(Unaudited)
(Dollar values in thousands)
Certain tax information for the J.P. Morgan Funds is required to be provided to shareholders based upon the Fund's income and distributions for the taxable year ended October 31, 2024. The information and distributions reported in this letter may differ from the information and taxable distributions reported to the shareholders for the calendar year ending December 31, 2024. The information necessary to complete your income tax returns for the calendar year ending December 31, 2024 will be provided under separate cover.
Tax Exempt Income
The Fund had $17,005, or maximum allowable amount, of dividends paid from investment income that are exempt from federal income tax for the fiscal year ended October 31, 2024.
| J.P. Morgan Tax Aware Fund | |
THIS PAGE IS INTENTIONALLY LEFT BLANK
THIS PAGE IS INTENTIONALLY LEFT BLANK
THIS PAGE IS INTENTIONALLY LEFT BLANK
J.P. Morgan Funds are distributed by JPMorgan Distribution Services, Inc., which is an affiliate of JPMorgan Chase & Co. Affiliates of JPMorgan Chase & Co. receive fees for providing various services to the Fund.
Contact JPMorgan Distribution Services, Inc. at 1-800-480-4111 for a fund prospectus. You can also visit us at www.jpmorganfunds.com. Investors should carefully consider the investment objectives and risk as well as charges and expenses of the mutual fund before investing. The prospectus contains this and other information about the mutual fund. Read the prospectus carefully before investing.
Investors may obtain information about the Securities Investor Protection Corporation (SIPC), including the SIPC brochure, by visiting www.sipc.org or by calling SIPC at 202-371-8300.
The Fund files a complete schedule of its fund holdings for the first and third quarters of its fiscal year with the SEC as an exhibit to its report on Form N-PORT. The Fund's Form N-PORT reports are available on the SEC’s website at http://www.sec.gov. The Fund's quarterly holdings can be found by visiting the J.P. Morgan Funds’ website at www.jpmorganfunds.com.
A description of the Fund's policies and procedures with respect to the disclosure of the Fund's holdings is available in the prospectuses and Statement of Additional Information.
A copy of proxy policies and procedures is available without charge upon request by calling 1-800-480-4111 and on the Fund's website at www.jpmorganfunds.com. A description of such policies and procedures is on the SEC’s website at www.sec.gov. The Trustees have delegated the authority to vote proxies for securities owned by the Fund to the Adviser. A copy of the Fund's voting record for the most recent 12-month period ended June 30 is available on the SEC’s website at www.sec.gov or at the Fund's website at www.jpmorganfunds.com no later than August 31 of each year. The Fund's proxy voting record will include, among other things, a brief description of the matter voted on for each fund security, and will state how each vote was cast, for example, for or against the proposal.
J.P. Morgan Asset Management is the brand name for the asset management business of JPMorgan Chase & Co. and its affiliates worldwide.
© JPMorgan Chase & Co., 2024. All rights reserved. October 2024.
AN-TA-1024
Changes in and Disagreements with Accountants for Open-End Management Investment Companies
Proxy Disclosures for Open-End Management Investment Companies
Remuneration Paid to Directors, Officers, and Others of Open-End Management Investment Companies
Included in the Statement of Operations within the Fund's Financial Statements.
Statement Regarding Basis for Approval of Investment Advisory Agreement
The Board of Trustees (the “Board” or the “Trustees”) has established various standing committees composed of Trustees with diverse backgrounds, to which the Board has assigned specific subject matter responsibilities to further enhance the effectiveness of the Board’s oversight and decision making. The Board and its investment committees (Money Market and Alternative Products Committee, Equity Committee, and Fixed Income Committee) met regularly throughout the year, and at each meeting, considered factors that are relevant to their annual consideration of the continuation of the investment advisory agreements. The Board also met for the specific purpose of considering investment advisory agreement annual renewals. The Board held meetings June 25-26, 2024 and August 20-22, 2024, at which the Trustees considered the continuation of the investment advisory agreement for the Fund whose annual report is contained herein (the “Advisory Agreement”). At the June meeting, the Board’s investment committees met to review and consider performance, expense and related information for the J.P. Morgan Funds. Each investment committee reported to the full Board, which then considered each investment committee’s preliminary findings. At the August meeting, the Trustees continued their review and consideration. The Trustees, including a majority of the Trustees who are not parties to the Advisory Agreement or “interested persons” (as defined in the Investment Company Act of 1940) of any party to the Advisory Agreement or any of their affiliates, approved the continuation of the Advisory Agreement on August 22, 2024.
As part of their review of the Advisory Agreement, the Trustees considered and reviewed performance and other information about the Fund received from J.P. Morgan Investment Management Inc. (the “Adviser”). This information included the Fund’s performance as compared to the performance of its peers and benchmarks, and analyses by the Adviser of the Fund’s performance. In addition, at each of their regular meetings throughout the year, the Trustees considered reports on the performance of certain J.P. Morgan Funds provided by an independent investment consulting firm (the “independent consultant”). In addition, in preparation for the June and August meetings, the Trustees requested, received and evaluated extensive materials from the Adviser, including performance and expense information compiled by Broadridge, using data from Lipper Inc. and/or Morningstar Inc., independent providers of investment company data (together, “Broadridge”). The Trustees’ independent consultant also provided additional quantitative and statistical analyses of certain Funds, including risk and performance return assessments as compared to the Funds’ objectives, benchmarks, and peers. Before voting on the Advisory Agreement, the Trustees reviewed the Advisory Agreement with representatives of the Adviser, counsel to the Fund, and independent legal counsel to the Trustees, and
received a memorandum from independent legal counsel to the Trustees discussing the legal standards for their consideration of the Advisory Agreement. The Trustees also discussed the Advisory Agreement with independent legal counsel in executive sessions at which no representatives of the Adviser were present.
A summary of the material factors evaluated by the Trustees in determining whether to approve the Advisory Agreement is provided below. Each Trustee attributed different weights to the various factors and no factor alone was considered determinative. The Trustees considered information provided with respect to the Fund throughout the year, as well as materials furnished specifically in connection with the annual review process. From year to year, the Trustees consider and place emphasis on relevant information in light of changing circumstances in market and economic conditions.
After considering and weighing the factors and information they had received, the Trustees found that the compensation to be received by the Adviser from the Fund under the Advisory Agreement was fair and reasonable under the circumstances, and determined that the continuance of the Advisory Agreement was in the best interests of the Fund and its shareholders.
Nature, Extent and Quality of Services Provided by the Adviser
The Trustees received and considered information regarding the nature, extent and quality of services provided to the Fund under the Advisory Agreement. The Trustees took into account information furnished throughout the year at Trustee meetings, as well as the materials furnished specifically in connection with this annual review process. Among other things, the Trustees considered:
•
The background and experience of the Adviser’s senior management and investment personnel, including personnel changes, if any;
•
The qualifications, backgrounds and responsibilities of the portfolio management team primarily responsible for the day-to-day management of the Fund, including personnel changes, if any;
•
The investment strategy for the Fund, and the infrastructure supporting the portfolio management team;
•
Information about the structure and distribution strategy for the Fund and how it fits within the Adviser’s other fund offerings within the J.P. Morgan Funds complex;
•
The administration services provided by the Adviser in its role as Administrator;
•
Their knowledge of the nature and quality of the services
provided by the Adviser and its affiliates gained from their experience as Trustees of the Fund and in the financial industry generally;
•
The overall reputation and capabilities of the Adviser and its affiliates;
•
The commitment of the Adviser to provide high quality service to the Fund;
•
Their overall confidence in the Adviser’s integrity; and
•
The Adviser’s responsiveness to requests for additional information, questions or concerns raised by them, including the Adviser’s willingness to consider and implement organizational and operational changes designed to improve investment results and the services provided to the Fund.
Based upon these considerations and other factors, the Trustees concluded that they were satisfied with the nature, extent and quality of the services provided to the Fund by the Adviser.
Costs of Services Provided and Profitability to the Adviser and its Affiliates
The Trustees received and considered information regarding the profitability to the Adviser and its affiliates from providing services to the Fund. The Trustees reviewed and discussed this information. The Trustees recognized that this information is not audited and represents the Adviser’s determination of its and its affiliates’ revenues from the contractual services provided to the Fund, less expenses of providing such services. Expenses include direct and indirect costs and are calculated using an allocation methodology developed by the Adviser and reviewed with the Board. The Trustees also recognized that it is difficult to make comparisons of profitability from fund investment advisory contracts because comparative information is not generally publicly available and is affected by numerous factors, including the structure of the particular adviser, the types of funds it manages, its business mix, numerous assumptions regarding allocations and the fact that publicly-traded fund managers’ operating profits and net income are net of distribution and marketing expenses. Based upon their review, and taking into consideration the factors noted above, the Trustees concluded that the profitability to the Adviser under the Advisory Agreement was not unreasonable in light of the services and benefits provided to the Fund.
The Trustees also considered that JPMorgan Distribution Services, Inc. (“JPMDS”), an affiliate of the Adviser, and the Adviser earn fees from the Fund for providing shareholder and administration services, respectively. These fees were shown separately in the profitability analysis presented to the Trustees. The Trustees also considered the payments of Rule 12b-1 fees to JPMDS, which also acts as the Fund’s distributor, and that these fees are in turn generally paid to financial intermediaries that sell the Fund, including financial
intermediaries that are affiliates of the Adviser (although they are retained by JPMDS in certain instances). The Trustees also considered the fees earned by JPMorgan Chase Bank, N.A. (“JPMCB”), an affiliate of the Adviser, for custody, fund accounting and other related services for the Fund, and the profitability of the arrangements to JPMCB.
The Trustees reviewed information regarding potential “fall-out” or ancillary benefits received by the Adviser and its affiliates as a result of their relationship with the Fund. The Trustees considered that the J.P. Morgan Funds' operating accounts are held at JPMCB, which, as a result, will receive float benefits for certain J.P. Morgan Funds, as applicable. The Trustees also noted that the Adviser supports a diverse set of products and services, which benefits the Adviser by allowing it to leverage its infrastructure to serve additional clients, including benefits that may be received by the Adviser and its affiliates in connection with the Fund’s potential investments in other funds advised by the Adviser. The Trustees also reviewed the Adviser’s allocation of fund brokerage for the J.P. Morgan Funds complex, including allocations to brokers who provide research to the Adviser, as well as the Adviser’s use of affiliates to provide other services and the benefits to such affiliates of doing so. The Trustees also considered the benefit to the Adviser and its affiliates from allocating client assets to the Fund.
The Trustees considered the extent to which the Fund may benefit from potential economies of scale. The Trustees considered that there may not be a direct relationship between economies of scale realized by the Fund and those realized by the Adviser as assets increase. The Trustees considered the extent to which the Fund was priced to scale and whether it would be appropriate to add advisory fee breakpoints, but noted that the Fund has implemented contractual expense limitations and fee waivers (“Fee Caps”) which allow the Fund’s shareholders to share potential economies of scale from the Fund’s inception The Trustees noted that the fees remain fair and reasonable relative to peer funds. The Trustees considered the benefits to the Fund of the use of an affiliated distributor and custodian, including the ability to rely on existing infrastructure supporting distribution, custodial and transfer agent services and the ability to negotiate competitive fees for the Fund The Trustees further considered the Adviser's and JPMDS's ongoing investments in their business in support of the Fund, including the Adviser's and/or JPMDS's investments in trading systems, technology (including improvements to the J.P. Morgan Funds’ website, and cybersecurity improvements), retention of key talent, and regulatory support enhancements. The Trustees concluded that the current fee structure for the Fund, including Fee Caps the Adviser has in place that serve to limit the overall net expense ratios of the Fund at competitive
levels, was reasonable. The Trustees concluded that the Fund’s shareholders received the benefits of potential economies of scale through the Fee Caps and from the Adviser’s reinvestment in its operations to serve the Fund and its shareholders. The Trustees noted that the Adviser’s reinvestment ensures sufficient resources in terms of personnel and infrastructure to support the Fund.
Fees Relative to Adviser’s Other Clients
The Trustees received and considered information about the nature and extent of investment advisory services and fee rates offered to other clients of the Adviser, including, to the extent applicable, institutional separate accounts, collective investment trusts, other registered investment companies and/or private funds sub-advised by the Adviser, for investment management styles substantially similar to that of the Fund. The Trustees considered the complexity of investment management for registered investment companies relative to the Adviser’s other clients and noted differences, as applicable, in the fee structure and the regulatory, legal and other risks and responsibilities of providing services to the different clients. The Trustees considered that serving as an adviser to a registered investment company involves greater responsibilities and risks than acting as a sub-adviser and observed that sub-advisory fees may be lower than those charged by the Adviser to the Fund. The Trustees also noted that the adviser, not the applicable registered investment company, typically bears the sub-advisory fee and that many responsibilities related to the advisory function are typically retained by the primary adviser. The Trustees concluded that the fee rates charged to the Fund in comparison to those charged to the Adviser’s other clients were reasonable.
The Trustees receive and consider information about the Fund’s performance throughout the year. In addition, the Trustees received and considered absolute and/or relative performance information for the Fund in a report prepared by Broadridge. The Trustees considered the total return performance information, which included the ranking of the Fund within a performance universe comprised of funds’ selected shares classes with the same Broadridge investment classification and objective (the “Universe”), by total return for the applicable one-, three- and five-year periods. The Trustees reviewed a description of Broadridge methodology for selecting mutual funds in the Fund’s Universe and noted that Universe quintile rankings were not calculated if the number of funds in the Universe did not meet a predetermined minimum. The Trustees also considered enhancements to the methodology employed by Broadridge for identifying funds in the Peer Group for Class I shares, based upon discussions with the Adviser, Broadridge and certain Trustees in advance of, and in preparation for, the June meeting. The Broadridge materials provided to the Trustees highlighted information with respect to certain
representative classes to assist the Trustees in their review. As part of this review, the Trustees also reviewed the Fund’s performance against its benchmark and considered the performance information provided for the Fund at regular Board meetings by the Adviser and the Trustees’ independent consultant and also considered the special analysis prepared for certain Funds by the Trustees’ independent consultant. The Trustees also engaged with the Adviser to consider what steps might be taken to improve performance, as applicable. The Broadridge performance data noted by the Trustees as part of their review and the determinations made by the Trustees with respect to the Fund’s performance for certain representative classes are summarized below:
The Trustees noted that the Fund’s performance for Class A, Class I and Class R6 shares was in the fifth, first and first quintile of the Universe for the one-, three- and five-year periods ended December 31, 2023, respectively. The Trustees discussed the performance and investment strategy of the Fund with the Adviser and reviewed the analysis and evaluation prepared by the independent consultant. Based upon these discussions and various other factors, the Trustees concluded that the Fund’s performance was satisfactory under the circumstances.
Advisory Fees and Expense Ratios
The Trustees considered the contractual advisory fee rate and administration fee rate paid by the Fund to the Adviser and compared the combined rate to the information prepared by Broadridge concerning management fee rates paid by other funds’ selected share classes in the Universe, as well as a subset of funds within the Universe (the “Peer Group”). The Trustees recognized that Broadridge reported the Fund’s management fee rate as the combined contractual advisory fee and administration fee rates. The Trustees also reviewed information about other expenses and the expense ratios for the Fund and noted that Universe and Peer Group quintile rankings were not calculated if the number of funds in the Universe and/or Peer Group did not meet a predetermined minimum. The Trustees considered the Fee Caps currently in place for the Fund, the net advisory fee rate and net expense ratio for each share class, taking into account any waivers and/or reimbursements. The Trustees recognized that it can be difficult to make comparisons of advisory fees because there are variations in the services that are included in the fees paid by other funds. The Trustees’ determinations as a result of the review of the Fund’s advisory fees and expense ratios for certain representative classes are summarized below:
The Trustees noted that the Fund’s net advisory fee and actual total expenses for Class A shares were both in the first and second quintiles of the Peer Group and Universe, respectively. The Trustees noted that the net advisory fee for Class I shares was in the second quintile of the Peer Group and Universe, and that the actual total expenses for Class I shares were in the first
and second quintiles of the Peer Group and Universe, respectively. The Trustees noted that the net advisory fee for Class R6 shares was in the third and second quintiles of the Peer Group and Universe, respectively, and that the actual total expenses for Class R6 shares were in the first quintile of both the Peer
Group and Universe. After considering the factors identified above, in light of this information, the Trustees concluded that the advisory fee was fair and reasonable in light of the services provided to the Fund.
Annual Financial Statements
October 31, 2024
JPMorgan Global Allocation Fund |
JPMorgan Income Builder Fund |
CONTENTS
Investments in a Fund are not deposits or obligations of, or guaranteed or endorsed by, any bank and are not insured or guaranteed by the FDIC, the Federal Reserve Board or any other government agency. You could lose money if you sell when a Fund’s share price is lower than when you invested.
Past performance is no guarantee of future performance. The general market views expressed in this report are opinions based on market and other conditions through the end of the reporting period and are subject to change without notice. These views are not intended to predict the future performance of a Fund or the securities markets.
Prospective investors should refer to the Funds’ prospectuses for a discussion of the Funds’ investment objectives, strategies and risks. Call J.P. Morgan Funds Service Center at 1-800-480-4111 for a prospectus containing more complete information about a Fund, including management fees and other expenses. Please read it carefully before investing.
JPMorgan Global Allocation Fund
SCHEDULE OF PORTFOLIO INVESTMENTSAS OF October 31, 2024
| | |
|
|
| | |
| | |
| | |
| | |
| | |
| | |
| | |
| | |
| | |
| | |
| | |
| | |
Commonwealth Bank of Australia | | |
| | |
| | |
| | |
| | |
| | |
| | |
| | |
Insurance Australia Group Ltd. | | |
| | |
| | |
| | |
| | |
| | |
National Australia Bank Ltd. | | |
Northern Star Resources Ltd. | | |
| | |
| | |
| | |
| | |
| | |
| | |
| | |
| | |
| | |
| | |
| | |
| | |
| | |
| | |
Seven Group Holdings Ltd. (a) | | |
| | |
| | |
|
|
| | |
| | |
| | |
| | |
| | |
Treasury Wine Estates Ltd. | | |
| | |
Washington H Soul Pattinson & Co. Ltd. (a) | | |
| | |
| | |
| | |
Woodside Energy Group Ltd. | | |
| | |
| | |
|
| | |
| | |
| | |
| | |
| | |
| | |
|
| | |
| | |
| | |
| | |
Groupe Bruxelles Lambert NV | | |
| | |
| | |
| | |
| | |
| | |
Warehouses De Pauw CVA, REIT | | |
| | |
|
| | |
B3 SA - Brasil Bolsa Balcao | | |
| | |
| | |
| | |
| | |
SEE NOTES TO FINANCIAL STATEMENTS.
JPMorgan Global Allocation Fund
SCHEDULE OF PORTFOLIO INVESTMENTSAS OF October 31, 2024 (continued)
| | |
Common Stocks — continued |
|
Petroleo Brasileiro SA (Preference) | | |
| | |
| | |
| | |
| | |
| | |
|
| | |
|
Alimentation Couche-Tard, Inc. | | |
Canadian Pacific Kansas City Ltd. | | |
| | |
| | |
|
| | |
| | |
| | |
|
Alibaba Group Holding Ltd. | | |
Anjoy Foods Group Co. Ltd., Class A | | |
BOC Hong Kong Holdings Ltd. | | |
| | |
China Construction Bank Corp., Class H | | |
China Merchants Bank Co. Ltd., Class H | | |
China Resources Gas Group Ltd. | | |
China Yangtze Power Co. Ltd., Class A | | |
Contemporary Amperex Technology Co. Ltd., Class A | | |
Fuyao Glass Industry Group Co. Ltd., Class H (b) | | |
Ganfeng Lithium Group Co. Ltd., Class A | | |
| | |
Haier Smart Home Co. Ltd., Class H | | |
Inner Mongolia Yili Industrial Group Co. Ltd., Class A | | |
Jiangsu Hengli Hydraulic Co. Ltd., Class A | | |
Jiangsu Hengrui Pharmaceuticals Co. Ltd., Class A | | |
| | |
| | |
| | |
Midea Group Co. Ltd., Class A | | |
| | |
|
|
| | |
| | |
PDD Holdings, Inc., ADR * | | |
PICC Property & Casualty Co. Ltd., Class H | | |
Ping An Insurance Group Co. of China Ltd., Class H | | |
| | |
| | |
SITC International Holdings Co. Ltd. | | |
| | |
Tingyi Cayman Islands Holding Corp. | | |
Wharf Holdings Ltd. (The) | | |
Wilmar International Ltd. | | |
Wuliangye Yibin Co. Ltd., Class A | | |
Xiaomi Corp., Class B * (b) | | |
| | |
| | |
Zijin Mining Group Co. Ltd., Class H | | |
| | |
| | |
|
AP Moller - Maersk A/S, Class A | | |
AP Moller - Maersk A/S, Class B | | |
| | |
| | |
| | |
| | |
| | |
| | |
Novo Nordisk A/S, Class B | | |
| | |
| | |
| | |
| | |
| | |
Vestas Wind Systems A/S * | | |
| | |
| | |
|
| | |
| | |
| | |
SEE NOTES TO FINANCIAL STATEMENTS.
| | |
Common Stocks — continued |
|
| | |
| | |
| | |
| | |
| | |
| | |
| | |
| | |
| | |
| | |
| | |
|
| | |
| | |
| | |
| | |
| | |
| | |
| | |
| | |
| | |
| | |
| | |
| | |
| | |
| | |
| | |
| | |
Cie Generale des Etablissements Michelin SCA | | |
| | |
| | |
| | |
| | |
| | |
| | |
| | |
| | |
| | |
| | |
| | |
| | |
| | |
| | |
|
|
| | |
| | |
| | |
La Francaise des Jeux SAEM (b) | | |
| | |
| | |
LVMH Moet Hennessy Louis Vuitton SE | | |
| | |
| | |
| | |
| | |
| | |
| | |
| | |
| | |
| | |
| | |
| | |
| | |
| | |
Unibail-Rodamco-Westfield, REIT | | |
| | |
| | |
| | |
| | |
|
| | |
| | |
| | |
| | |
Bayerische Motoren Werke AG | | |
Bayerische Motoren Werke AG (Preference) | | |
| | |
| | |
| | |
Carl Zeiss Meditec AG (a) | | |
| | |
| | |
| | |
CTS Eventim AG & Co. KGaA | | |
| | |
Deutsche Bank AG (Registered) | | |
SEE NOTES TO FINANCIAL STATEMENTS.
JPMorgan Global Allocation Fund
SCHEDULE OF PORTFOLIO INVESTMENTSAS OF October 31, 2024 (continued)
| | |
Common Stocks — continued |
|
| | |
Deutsche Lufthansa AG (Registered) (a) | | |
| | |
Deutsche Telekom AG (Registered) | | |
Dr Ing hc F Porsche AG (Preference) (b) | | |
| | |
| | |
Fresenius Medical Care AG | | |
Fresenius SE & Co. KGaA * | | |
| | |
| | |
| | |
| | |
Henkel AG & Co. KGaA (Preference) | | |
| | |
| | |
| | |
| | |
| | |
| | |
Muenchener Rueckversicherungs- Gesellschaft AG (Registered) | | |
| | |
Porsche Automobil Holding SE (Preference) | | |
| | |
| | |
| | |
| | |
| | |
Sartorius AG (Preference) (a) | | |
| | |
| | |
| | |
Siemens Healthineers AG (b) | | |
| | |
| | |
Volkswagen AG (Preference) | | |
| | |
| | |
| | |
|
Hellenic Telecommunications Organization SA | | |
| | |
|
|
| | |
| | |
CK Infrastructure Holdings Ltd. | | |
| | |
Futu Holdings Ltd., ADR * | | |
| | |
Henderson Land Development Co. Ltd. | | |
| | |
Hong Kong & China Gas Co. Ltd. | | |
Hong Kong Exchanges & Clearing Ltd. | | |
Hongkong Land Holdings Ltd. | | |
Jardine Matheson Holdings Ltd. | | |
| | |
| | |
Power Assets Holdings Ltd. | | |
| | |
| | |
Sun Hung Kai Properties Ltd. | | |
Swire Pacific Ltd., Class A | | |
Techtronic Industries Co. Ltd. | | |
| | |
Wharf Real Estate Investment Co. Ltd. | | |
| | |
|
| | |
|
| | |
| | |
Britannia Industries Ltd. | | |
CG Power & Industrial Solutions Ltd. | | |
| | |
Crompton Greaves Consumer Electricals Ltd. | | |
| | |
Embassy Office Parks, REIT | | |
| | |
| | |
| | |
| | |
| | |
| | |
| | |
| | |
SEE NOTES TO FINANCIAL STATEMENTS.
| | |
Common Stocks — continued |
|
| | |
| | |
| | |
Reliance Industries Ltd., GDR (c) | | |
SBI Life Insurance Co. Ltd. (b) | | |
| | |
| | |
| | |
| | |
| | |
|
Bank Central Asia Tbk. PT | | |
Bank Mandiri Persero Tbk. PT | | |
Bank Rakyat Indonesia Persero Tbk. PT | | |
Telkom Indonesia Persero Tbk. PT | | |
| | |
|
| | |
| | |
| | |
Bank of Ireland Group plc | | |
| | |
| | |
| | |
| | |
| | |
|
| | |
| | |
| | |
Check Point Software Technologies Ltd. * | | |
| | |
| | |
| | |
Israel Discount Bank Ltd., Class A | | |
Mizrahi Tefahot Bank Ltd. | | |
| | |
Teva Pharmaceutical Industries Ltd., ADR * | | |
| | |
| | |
| | |
|
|
| | |
| | |
| | |
| | |
| | |
| | |
| | |
| | |
FinecoBank Banca Fineco SpA | | |
| | |
Infrastrutture Wireless Italiane SpA (b) | | |
| | |
| | |
Mediobanca Banca di Credito Finanziario SpA | | |
| | |
| | |
| | |
| | |
Recordati Industria Chimica e Farmaceutica SpA | | |
| | |
| | |
Terna - Rete Elettrica Nazionale | | |
| | |
| | |
|
| | |
| | |
| | |
| | |
| | |
| | |
Asahi Group Holdings Ltd. | | |
| | |
| | |
| | |
Bandai Namco Holdings, Inc. | | |
| | |
| | |
| | |
| | |
Central Japan Railway Co. | | |
SEE NOTES TO FINANCIAL STATEMENTS.
JPMorgan Global Allocation Fund
SCHEDULE OF PORTFOLIO INVESTMENTSAS OF October 31, 2024 (continued)
| | |
Common Stocks — continued |
|
| | |
Chubu Electric Power Co., Inc. | | |
Chugai Pharmaceutical Co. Ltd. | | |
Concordia Financial Group Ltd. | | |
Dai Nippon Printing Co. Ltd. | | |
| | |
Dai-ichi Life Holdings, Inc. | | |
| | |
| | |
Daito Trust Construction Co. Ltd. | | |
Daiwa House Industry Co. Ltd. | | |
Daiwa Securities Group, Inc. | | |
| | |
| | |
| | |
| | |
| | |
| | |
| | |
| | |
| | |
| | |
| | |
| | |
Hankyu Hanshin Holdings, Inc. | | |
| | |
Hitachi Construction Machinery Co. Ltd. | | |
| | |
| | |
| | |
| | |
| | |
| | |
| | |
| | |
| | |
| | |
| | |
Japan Exchange Group, Inc. | | |
| | |
Japan Post Holdings Co. Ltd. | | |
Japan Post Insurance Co. Ltd. | | |
Japan Real Estate Investment Corp., REIT | | |
| | |
|
|
| | |
| | |
| | |
Kansai Electric Power Co., Inc. (The) | | |
| | |
Kawasaki Kisen Kaisha Ltd. | | |
| | |
Keisei Electric Railway Co. Ltd. | | |
| | |
| | |
| | |
| | |
| | |
| | |
| | |
| | |
| | |
| | |
| | |
| | |
| | |
| | |
| | |
| | |
| | |
McDonald's Holdings Co. Japan Ltd. | | |
| | |
| | |
Mitsubishi Chemical Group Corp. | | |
| | |
Mitsubishi Electric Corp. | | |
Mitsubishi Estate Co. Ltd. | | |
Mitsubishi HC Capital, Inc. | | |
Mitsubishi Heavy Industries Ltd. | | |
Mitsubishi UFJ Financial Group, Inc. | | |
| | |
| | |
| | |
| | |
Mizuho Financial Group, Inc. | | |
| | |
MS&AD Insurance Group Holdings, Inc. | | |
Murata Manufacturing Co. Ltd. | | |
| | |
SEE NOTES TO FINANCIAL STATEMENTS.
| | |
Common Stocks — continued |
|
| | |
| | |
| | |
Nippon Building Fund, Inc., REIT | | |
Nippon Paint Holdings Co. Ltd. | | |
Nippon Prologis REIT, Inc., REIT | | |
Nippon Sanso Holdings Corp. | | |
| | |
Nippon Telegraph & Telephone Corp. | | |
| | |
| | |
Nissin Foods Holdings Co. Ltd. | | |
| | |
| | |
| | |
Nomura Real Estate Holdings, Inc. | | |
Nomura Research Institute Ltd. | | |
| | |
| | |
| | |
| | |
| | |
Ono Pharmaceutical Co. Ltd. | | |
| | |
| | |
| | |
| | |
| | |
| | |
Pan Pacific International Holdings Corp. | | |
| | |
| | |
Recruit Holdings Co. Ltd. | | |
Renesas Electronics Corp. | | |
| | |
| | |
| | |
| | |
| | |
| | |
| | |
| | |
Sekisui Chemical Co. Ltd. | | |
| | |
| | |
|
|
Seven & i Holdings Co. Ltd. | | |
| | |
| | |
| | |
Shin-Etsu Chemical Co. Ltd. | | |
| | |
| | |
Shizuoka Financial Group, Inc. | | |
| | |
| | |
| | |
| | |
| | |
| | |
| | |
| | |
Sumitomo Electric Industries Ltd. | | |
Sumitomo Metal Mining Co. Ltd. | | |
Sumitomo Mitsui Financial Group, Inc. | | |
Sumitomo Mitsui Trust Group, Inc. | | |
Sumitomo Realty & Development Co. Ltd. | | |
Suntory Beverage & Food Ltd. | | |
| | |
| | |
| | |
| | |
Takeda Pharmaceutical Co. Ltd. | | |
| | |
| | |
| | |
| | |
Tokio Marine Holdings, Inc. | | |
Tokyo Electric Power Co. Holdings, Inc. * | | |
| | |
| | |
| | |
| | |
| | |
| | |
| | |
| | |
| | |
SEE NOTES TO FINANCIAL STATEMENTS.
JPMorgan Global Allocation Fund
SCHEDULE OF PORTFOLIO INVESTMENTSAS OF October 31, 2024 (continued)
| | |
Common Stocks — continued |
|
| | |
| | |
| | |
| | |
| | |
| | |
| | |
| | |
| | |
| | |
|
Hikma Pharmaceuticals plc | | |
|
| | |
| | |
| | |
|
Galaxy Entertainment Group Ltd. | | |
| | |
| | |
|
| | |
|
| | |
| | |
| | |
Grupo Aeroportuario del Sureste SAB de CV, ADR | | |
Grupo Financiero Banorte SAB de CV, Class O | | |
| | |
Wal-Mart de Mexico SAB de CV | | |
| | |
|
ABN AMRO Bank NV, CVA (b) | | |
| | |
| | |
| | |
| | |
| | |
| | |
| | |
|
|
| | |
BE Semiconductor Industries NV | | |
| | |
| | |
| | |
| | |
| | |
| | |
| | |
Koninklijke Ahold Delhaize NV | | |
| | |
| | |
| | |
| | |
| | |
| | |
| | |
|
Auckland International Airport Ltd. | | |
Fisher & Paykel Healthcare Corp. Ltd. | | |
| | |
| | |
| | |
| | |
| | |
|
| | |
| | |
| | |
Gjensidige Forsikring ASA (a) | | |
| | |
| | |
| | |
| | |
| | |
| | |
| | |
|
| | |
SEE NOTES TO FINANCIAL STATEMENTS.
| | |
Common Stocks — continued |
|
| | |
| | |
| | |
|
| | |
| | |
| | |
| | |
|
Severstal PAO, GDR ‡ * (b) | | |
|
| | |
Saudi Arabian Oil Co. (b) | | |
Saudi National Bank (The) | | |
| | |
|
CapitaLand Ascendas, REIT | | |
CapitaLand Integrated Commercial Trust, REIT | | |
CapitaLand Investment Ltd. | | |
| | |
| | |
Grab Holdings Ltd., Class A * | | |
| | |
Oversea-Chinese Banking Corp. Ltd. | | |
| | |
| | |
| | |
| | |
Singapore Technologies Engineering Ltd. | | |
Singapore Telecommunications Ltd. | | |
| | |
United Overseas Bank Ltd. | | |
| | |
|
| | |
| | |
Aspen Pharmacare Holdings Ltd. | | |
| | |
Capitec Bank Holdings Ltd. | | |
| | |
|
|
| | |
| | |
| | |
|
| | |
Hana Financial Group, Inc. | | |
| | |
| | |
JB Financial Group Co. Ltd. | | |
| | |
| | |
| | |
Samsung Electronics Co. Ltd. | | |
Samsung Fire & Marine Insurance Co. Ltd. | | |
| | |
| | |
SM Entertainment Co. Ltd. | | |
| | |
| | |
|
| | |
ACS Actividades de Construccion y Servicios SA | | |
| | |
| | |
Banco Bilbao Vizcaya Argentaria SA | | |
| | |
| | |
| | |
| | |
| | |
| | |
| | |
| | |
Industria de Diseno Textil SA | | |
| | |
| | |
| | |
| | |
|
| | |
SEE NOTES TO FINANCIAL STATEMENTS.
JPMorgan Global Allocation Fund
SCHEDULE OF PORTFOLIO INVESTMENTSAS OF October 31, 2024 (continued)
| | |
Common Stocks — continued |
|
| | |
| | |
| | |
| | |
| | |
| | |
| | |
| | |
| | |
| | |
| | |
Fastighets AB Balder, Class B * (a) | | |
| | |
H & M Hennes & Mauritz AB, Class B (a) | | |
| | |
| | |
Husqvarna AB, Class B (a) | | |
Industrivarden AB, Class A | | |
Industrivarden AB, Class C | | |
| | |
Investment AB Latour, Class B | | |
| | |
L E Lundbergforetagen AB, Class B | | |
| | |
Nibe Industrier AB, Class B | | |
| | |
| | |
| | |
Securitas AB, Class B (a) | | |
Skandinaviska Enskilda Banken AB, Class A | | |
| | |
| | |
Svenska Cellulosa AB SCA, Class B | | |
Svenska Handelsbanken AB, Class A | | |
| | |
Swedish Orphan Biovitrum AB * | | |
| | |
Telefonaktiebolaget LM Ericsson, Class B | | |
| | |
| | |
| | |
| | |
|
|
| | |
Volvo Car AB, Class B * (a) | | |
| | |
|
| | |
Adecco Group AG (Registered) | | |
| | |
| | |
Baloise Holding AG (Registered) | | |
Banque Cantonale Vaudoise (Registered) | | |
Barry Callebaut AG (Registered) (a) | | |
| | |
Chocoladefabriken Lindt & Spruengli AG | | |
Cie Financiere Richemont SA (Registered) | | |
| | |
| | |
EMS-Chemie Holding AG (Registered) | | |
| | |
| | |
| | |
Helvetia Holding AG (Registered) | | |
| | |
Kuehne + Nagel International AG (Registered) | | |
Logitech International SA (Registered) | | |
Lonza Group AG (Registered) | | |
| | |
Partners Group Holding AG | | |
| | |
| | |
Schindler Holding AG (Registered) | | |
| | |
| | |
| | |
Sonova Holding AG (Registered) | | |
Straumann Holding AG (Registered) | | |
| | |
Swatch Group AG (The) (Registered) | | |
Swiss Life Holding AG (Registered) | | |
Swiss Prime Site AG (Registered) | | |
| | |
| | |
SEE NOTES TO FINANCIAL STATEMENTS.
| | |
Common Stocks — continued |
|
UBS Group AG (Registered) | | |
| | |
Zurich Insurance Group AG | | |
| | |
|
| | |
ASE Technology Holding Co. Ltd. | | |
| | |
| | |
| | |
Hon Hai Precision Industry Co. Ltd. | | |
| | |
Realtek Semiconductor Corp. | | |
Taiwan Semiconductor Manufacturing Co. Ltd. | | |
Taiwan Semiconductor Manufacturing Co. Ltd., ADR | | |
| | |
Yuanta Financial Holding Co. Ltd. | | |
| | |
|
PTT Exploration & Production PCL | | |
Siam Cement PCL (The) (Registered) | | |
| | |
| | |
|
BIM Birlesik Magazalar A/S | | |
United Arab Emirates — 0.0% ^ |
| | |
|
| | |
| | |
| | |
| | |
Associated British Foods plc | | |
| | |
Auto Trader Group plc (b) | | |
| | |
| | |
| | |
| | |
Berkeley Group Holdings plc | | |
| | |
|
United Kingdom — continued |
British American Tobacco plc | | |
| | |
| | |
| | |
CK Hutchison Holdings Ltd. | | |
Coca-Cola Europacific Partners plc | | |
| | |
| | |
| | |
| | |
| | |
| | |
| | |
| | |
| | |
| | |
| | |
InterContinental Hotels Group plc | | |
| | |
| | |
| | |
| | |
Land Securities Group plc, REIT | | |
Legal & General Group plc | | |
| | |
London Stock Exchange Group plc | | |
| | |
| | |
| | |
| | |
| | |
| | |
| | |
Phoenix Group Holdings plc | | |
Reckitt Benckiser Group plc | | |
| | |
| | |
| | |
Rolls-Royce Holdings plc * | | |
| | |
| | |
| | |
| | |
| | |
SEE NOTES TO FINANCIAL STATEMENTS.
JPMorgan Global Allocation Fund
SCHEDULE OF PORTFOLIO INVESTMENTSAS OF October 31, 2024 (continued)
| | |
Common Stocks — continued |
United Kingdom — continued |
| | |
| | |
| | |
| | |
| | |
| | |
| | |
| | |
United Utilities Group plc | | |
| | |
| | |
| | |
| | |
| | |
|
| | |
| | |
| | |
Advanced Micro Devices, Inc. * | | |
| | |
| | |
| | |
Air Products and Chemicals, Inc. | | |
| | |
| | |
Alnylam Pharmaceuticals, Inc. * | | |
| | |
| | |
American Airlines Group, Inc. * | | |
| | |
American Homes 4 Rent, Class A, REIT | | |
| | |
| | |
| | |
Apple Hospitality REIT, Inc., REIT | | |
| | |
Arch Capital Group Ltd. * | | |
Archer-Daniels-Midland Co. | | |
| | |
| | |
Atlassian Corp., Class A * | | |
| | |
Axalta Coating Systems Ltd. * | | |
| | |
|
United States — continued |
| | |
| | |
| | |
Berkshire Hathaway, Inc., Class B * | | |
| | |
| | |
BioMarin Pharmaceutical, Inc. * | | |
BJ's Wholesale Club Holdings, Inc. * | | |
| | |
| | |
| | |
| | |
Booz Allen Hamilton Holding Corp. | | |
| | |
| | |
| | |
| | |
Capital One Financial Corp. | | |
| | |
| | |
| | |
| | |
CBRE Group, Inc., Class A * | | |
| | |
Charles Schwab Corp. (The) | | |
Charter Communications, Inc., Class A * | | |
| | |
| | |
| | |
| | |
| | |
| | |
Claire's Stores, Inc. ‡ * (e) | | |
| | |
| | |
| | |
Cognizant Technology Solutions Corp., Class A | | |
| | |
| | |
| | |
Constellation Brands, Inc., Class A | | |
Cooper Cos., Inc. (The) * | | |
| | |
SEE NOTES TO FINANCIAL STATEMENTS.
| | |
Common Stocks — continued |
United States — continued |
| | |
| | |
| | |
Crowdstrike Holdings, Inc., Class A * | | |
| | |
| | |
| | |
| | |
Dell Technologies, Inc., Class C | | |
| | |
Dick's Sporting Goods, Inc. | | |
Digital Realty Trust, Inc., REIT | | |
Discover Financial Services | | |
| | |
DoorDash, Inc., Class A * | | |
| | |
| | |
| | |
EastGroup Properties, Inc., REIT | | |
| | |
| | |
Elanco Animal Health, Inc. * | | |
| | |
| | |
| | |
| | |
| | |
| | |
| | |
| | |
Equity LifeStyle Properties, Inc., REIT | | |
| | |
ExlService Holdings, Inc. * | | |
| | |
| | |
| | |
Federal Realty Investment Trust, REIT | | |
| | |
| | |
Fidelity National Information Services, Inc. | | |
| | |
First Citizens BancShares, Inc., Class A | | |
| | |
| | |
|
United States — continued |
| | |
| | |
Fortune Brands Innovations, Inc. | | |
| | |
| | |
| | |
| | |
| | |
| | |
| | |
Goldman Sachs Group, Inc. (The) | | |
Graphic Packaging Holding Co. | | |
| | |
| | |
| | |
| | |
| | |
Hewlett Packard Enterprise Co. | | |
Hilton Worldwide Holdings, Inc. | | |
| | |
| | |
Honeywell International, Inc. | | |
Host Hotels & Resorts, Inc., REIT | | |
| | |
| | |
| | |
| | |
| | |
| | |
Interactive Brokers Group, Inc., Class A | | |
International Business Machines Corp. | | |
| | |
Intra-Cellular Therapies, Inc. * | | |
| | |
Intuitive Surgical, Inc. * | | |
| | |
| | |
James Hardie Industries plc, CHDI * | | |
JB Hunt Transport Services, Inc. | | |
Jefferies Financial Group, Inc. | | |
| | |
| | |
| | |
| | |
SEE NOTES TO FINANCIAL STATEMENTS.
JPMorgan Global Allocation Fund
SCHEDULE OF PORTFOLIO INVESTMENTSAS OF October 31, 2024 (continued)
| | |
Common Stocks — continued |
United States — continued |
| | |
| | |
| | |
| | |
Lamar Advertising Co., Class A, REIT | | |
Lamb Weston Holdings, Inc. | | |
| | |
| | |
Live Nation Entertainment, Inc. * | | |
| | |
| | |
LPL Financial Holdings, Inc. | | |
| | |
Martin Marietta Materials, Inc. | | |
Mastercard, Inc., Class A | | |
| | |
| | |
| | |
| | |
Meta Platforms, Inc., Class A | | |
| | |
Mettler-Toledo International, Inc. * | | |
| | |
Microchip Technology, Inc. | | |
| | |
| | |
Mid-America Apartment Communities, Inc., REIT | | |
| | |
Mohawk Industries, Inc. * | | |
| | |
Mondelez International, Inc., Class A | | |
| | |
| | |
Moran Foods Backstop Equity ‡ * | | |
| | |
| | |
| | |
| | |
| | |
| | |
Nexstar Media Group, Inc. | | |
| | |
| | |
| | |
|
United States — continued |
| | |
| | |
| | |
| | |
| | |
| | |
| | |
Oscar Health, Inc., Class A * | | |
| | |
Outfront Media, Inc., REIT | | |
| | |
Packaging Corp. of America | | |
Palo Alto Networks, Inc. * | | |
Paylocity Holding Corp. * | | |
| | |
Performance Food Group Co. * | | |
| | |
Philip Morris International, Inc. | | |
| | |
Pinterest, Inc., Class A * | | |
PNC Financial Services Group, Inc. (The) | | |
| | |
| | |
Procter & Gamble Co. (The) | | |
| | |
| | |
Public Service Enterprise Group, Inc. | | |
| | |
| | |
| | |
Raymond James Financial, Inc. | | |
| | |
| | |
Regency Centers Corp., REIT | | |
Regeneron Pharmaceuticals, Inc. * | | |
| | |
| | |
| | |
| | |
| | |
| | |
| | |
| | |
SBA Communications Corp., REIT | | |
SEE NOTES TO FINANCIAL STATEMENTS.
| | |
Common Stocks — continued |
United States — continued |
| | |
Seagate Technology Holdings plc | | |
| | |
| | |
Sirius XM Holdings, Inc. (a) | | |
| | |
Snowflake, Inc., Class A * | | |
| | |
| | |
| | |
| | |
| | |
| | |
| | |
Take-Two Interactive Software, Inc. * | | |
| | |
| | |
| | |
| | |
| | |
Texas Instruments, Inc. (f) | | |
| | |
| | |
Thermo Fisher Scientific, Inc. | | |
| | |
| | |
| | |
Trade Desk, Inc. (The), Class A * | | |
| | |
Travelers Cos., Inc. (The) | | |
| | |
Uber Technologies, Inc. * | | |
| | |
| | |
United Parcel Service, Inc., Class B | | |
UnitedHealth Group, Inc. (f) | | |
| | |
Verizon Communications, Inc. | | |
Vertex Pharmaceuticals, Inc. * | | |
Vertiv Holdings Co., Class A | | |
Vornado Realty Trust, REIT | | |
| | |
| | |
| | |
| | |
|
United States — continued |
| | |
WESCO International, Inc. | | |
| | |
| | |
Williams Cos., Inc. (The) | | |
WillScot Holdings Corp. * | | |
Windstream Holdings, Inc. ‡ * | | |
| | |
| | |
| | |
Zillow Group, Inc., Class C * | | |
| | |
Total Common Stocks
(Cost $1,038,805) | | |
| | |
|
|
Mineral Resources Ltd. 8.13%, 5/1/2027 (c) | | |
National Australia Bank Ltd. 3.15%, 2/5/2031 (b) | | |
Scentre Group Trust 1 REIT, 3.50%, 2/12/2025 (c) | | |
Sydney Airport Finance Co. Pty. Ltd. 3.38%, 4/30/2025 (c) | | |
Woolworths Group Ltd. 0.38%, 11/15/2028 (b) | | |
| | |
|
| | |
(3-MONTH CME TERM SOFR + 3.68%), 5.50%, 7/15/2077 (g) | | |
(US Treasury Yield Curve Rate T Note Constant Maturity 5 Year + 3.71%), 7.38%, 1/15/2083 (g) | | |
National Bank of Canada (SOFRINDX + 0.90%), 5.74%, 3/25/2027 (g) | | |
Ontario Teachers' Finance Trust | | |
| | |
| | |
| | |
| | |
SEE NOTES TO FINANCIAL STATEMENTS.
JPMorgan Global Allocation Fund
SCHEDULE OF PORTFOLIO INVESTMENTSAS OF October 31, 2024 (continued)
| | |
Corporate Bonds — continued |
|
| | |
Toronto-Dominion Bank (The) 3.19%, 2/16/2029 (b) | | |
| | |
|
Danske Bank A/S (EUR Swap Annual 1 Year + 1.35%), 4.50%, 11/9/2028 (b) (g) | | |
|
Alstom SA 0.13%, 7/27/2027 (b) | | |
BNP Paribas SA 2.10%, 4/7/2032 (b) | | |
| | |
| | |
(EURIBOR 3 Month + 1.45%), 4.13%, 3/8/2033 (b) (g) | | |
Electricite de France SA (EUR Swap Annual 5 Year + 2.86%), 2.63%, 12/1/2027 (b) (g) (h) (i) | | |
| | |
(EURIBOR 3 Month + 0.95%), 0.50%, 6/12/2029 (b) (g) | | |
(EURIBOR 3 Month + 1.80%), 4.25%, 12/6/2030 (b) (g) | | |
TotalEnergies SE (EUR Swap Annual 5 Year + 2.40%), 2.00%, 6/4/2030 (b) (g) (h) (i) | | |
| | |
|
Deutsche Bank AG (SOFR + 1.22%), 2.31%, 11/16/2027 (g) | | |
Kreditanstalt fuer Wiederaufbau | | |
| | |
| | |
Traton Finance Luxembourg SA 3.75%, 3/27/2030 (b) | | |
| | |
| | |
| | |
Vonovia SE 1.00%, 7/9/2030 (b) | | |
| | |
|
| | |
(EUR Swap Annual 1 Year + 1.95%), 4.63%, 7/23/2029 (b) (g) | | |
| | |
|
|
(EURIBOR ICE Swap Rate 5 Year + 4.39%), 7.13%, 10/30/2029 (b) (g) (h) (i) (j) | | |
Avolon Holdings Funding Ltd. 3.25%, 2/15/2027 (c) | | |
Bank of Ireland Group plc (EURIBOR ICE Swap Rate 1 Year + 2.05%), 5.00%, 7/4/2031 (b) (g) | | |
| | |
|
Autostrade per l'Italia SpA 5.13%, 6/14/2033 (b) | | |
Banca Monte dei Paschi di Siena SpA 3.50%, 4/23/2029 (b) | | |
Banco BPM SpA 4.63%, 11/29/2027 (b) | | |
Enel SpA (EURIBOR ICE Swap Rate 5 Year + 3.49%), 6.38%, 4/16/2028 (b) (g) (h) (i) | | |
Intesa Sanpaolo SpA 5.13%, 8/29/2031 (b) | | |
| | |
(EURIBOR ICE Swap Rate 5 Year + 7.33%), 7.50%, 6/3/2026 (b) (g) (h) (i) (j) | | |
(EURIBOR 3 Month + 1.60%), 4.45%, 2/16/2029 (b) (g) | | |
| | |
|
Mitsubishi HC Capital, Inc. 3.64%, 4/13/2025 (c) | | |
Mitsubishi UFJ Financial Group, Inc. 2.19%, 2/25/2025 | | |
| | |
|
ABN AMRO Bank NV (US Treasury Yield Curve Rate T Note Constant Maturity 1 Year + 1.65%), 6.34%, 9/18/2027 (c) (g) | | |
Nederlandse Waterschapsbank NV 3.50%, 7/20/2027 | | |
Viterra Finance BV 1.00%, 9/24/2028 (b) | | |
| | |
SEE NOTES TO FINANCIAL STATEMENTS.
| | |
Corporate Bonds — continued |
|
Banco Santander Totta SA 3.25%, 2/15/2031 (b) | | |
|
LCPR Senior Secured Financing DAC | | |
| | |
| | |
| | |
|
| | |
| | |
| | |
| | |
|
Korea Southern Power Co. Ltd. 0.75%, 1/27/2026 (c) | | |
|
Banco de Sabadell SA (EURIBOR ICE Swap Rate 1 Year + 1.60%), 4.25%, 9/13/2030 (b) (g) | | |
Banco Santander SA (US Treasury Yield Curve Rate T Note Constant Maturity 5 Year + 5.31%), 9.63%, 11/21/2028 (g) (h) (i) (j) | | |
Bankinter SA 0.88%, 7/8/2026 (b) | | |
| | |
(EURIBOR 3 Month + 1.65%), 5.00%, 7/19/2029 (b) (g) | | |
(EURIBOR ICE Swap Rate 5 Year + 5.29%), 7.50%, 1/16/2030 (b) (g) (h) (i) (j) | | |
Iberdrola Finanzas SA (EUR Swap Annual 5 Year + 2.26%), 4.88%, 4/25/2028 (b) (g) (h) (i) | | |
Iberdrola International BV 5.81%, 3/15/2025 | | |
| | |
|
| | |
(EURIBOR ICE Swap Rate 1 Year + 4.95%), 7.75%, 3/1/2029 (b) (g) | | |
| | |
|
|
(US Treasury Yield Curve Rate T Note Constant Maturity 5 Year + 4.76%), 9.25%, 11/13/2033 (c) (g) (h) (i) (j) | | |
UBS Switzerland AG 3.30%, 3/5/2029 (b) | | |
| | |
|
Barclays plc (EURIBOR ICE Swap Rate 1 Year + 2.05%), 4.51%, 1/31/2033 (b) (g) | | |
Cadent Finance plc 0.63%, 3/19/2030 (b) | | |
Lloyds Banking Group plc 4.45%, 5/8/2025 | | |
NatWest Group plc (US Treasury Yield Curve Rate T Note Constant Maturity 5 Year + 3.75%), 8.13%, 11/10/2033 (g) (h) (i) (j) | | |
Santander UK Group Holdings plc (US Treasury Yield Curve Rate T Note Constant Maturity 1 Year + 1.25%), 1.53%, 8/21/2026 (g) | | |
TSB Bank plc 3.32%, 3/5/2029 (b) | | |
| | |
|
Acrisure LLC 4.25%, 2/15/2029 (c) | | |
Adient Global Holdings Ltd. 7.00%, 4/15/2028 (c) | | |
Advantage Sales & Marketing, Inc. 6.50%, 11/15/2028 (c) | | |
Affinity Interactive 6.88%, 12/15/2027 (c) | | |
AG Issuer LLC 6.25%, 3/1/2028 (c) | | |
AG TTMT Escrow Issuer LLC 8.63%, 9/30/2027 (c) | | |
Albertsons Cos., Inc. 4.63%, 1/15/2027 (c) | | |
Allegiant Travel Co. 7.25%, 8/15/2027 (c) | | |
Alliant Holdings Intermediate LLC | | |
| | |
| | |
Allied Universal Holdco LLC 4.63%, 6/1/2028 (c) | | |
SEE NOTES TO FINANCIAL STATEMENTS.
JPMorgan Global Allocation Fund
SCHEDULE OF PORTFOLIO INVESTMENTSAS OF October 31, 2024 (continued)
| | |
Corporate Bonds — continued |
United States — continued |
Alta Equipment Group, Inc. 9.00%, 6/1/2029 (c) | | |
AMC Networks, Inc. 10.25%, 1/15/2029 (a) (c) | | |
| | |
| | |
| | |
| | |
| | |
American Axle & Manufacturing, Inc. 5.00%, 10/1/2029 | | |
American Builders & Contractors Supply Co., Inc. 4.00%, 1/15/2028 (c) | | |
AmeriTex HoldCo Intermediate LLC 10.25%, 10/15/2028 (c) | | |
ANGI Group LLC 3.88%, 8/15/2028 (c) | | |
Antero Midstream Partners LP 5.75%, 3/1/2027 (c) | | |
Antero Resources Corp. 5.38%, 3/1/2030 (c) | | |
Arches Buyer, Inc. 4.25%, 6/1/2028 (c) | | |
| | |
| | |
| | |
Ardagh Metal Packaging Finance USA LLC 3.25%, 9/1/2028 (c) | | |
Ascent Resources Utica Holdings LLC 8.25%, 12/31/2028 (c) | | |
ASGN, Inc. 4.63%, 5/15/2028 (c) | | |
AutoZone, Inc. 3.63%, 4/15/2025 | | |
Avantor Funding, Inc. 4.63%, 7/15/2028 (c) | | |
Avis Budget Car Rental LLC 5.38%, 3/1/2029 (c) | | |
Axalta Coating Systems LLC 4.75%, 6/15/2027 (c) | | |
B&G Foods, Inc. 8.00%, 9/15/2028 (c) | | |
Ball Corp. 6.88%, 3/15/2028 | | |
Bank of America Corp. (EURIBOR 3 Month + 0.95%), 1.10%, 5/24/2032 (b) (g) | | |
Bausch + Lomb Corp. 8.38%, 10/1/2028 (c) | | |
Bausch Health Cos., Inc. 6.13%, 2/1/2027 (c) | | |
| | |
|
United States — continued |
Block, Inc. 2.75%, 6/1/2026 | | |
Boyd Gaming Corp. 4.75%, 12/1/2027 | | |
Brookfield Property REIT, Inc. | | |
REIT, 5.75%, 5/15/2026 (c) | | |
REIT, 4.50%, 4/1/2027 (c) | | |
Buckeye Partners LP 6.88%, 7/1/2029 (c) | | |
Caesars Entertainment, Inc. 8.13%, 7/1/2027 (c) | | |
California Resources Corp. | | |
| | |
| | |
| | |
| | |
| | |
Camelot Return Merger Sub, Inc. 8.75%, 8/1/2028 (c) | | |
Cargo Aircraft Management, Inc. 4.75%, 2/1/2028 (c) | | |
| | |
| | |
| | |
| | |
Carnival Holdings Bermuda Ltd. 10.38%, 5/1/2028 (c) | | |
Catalent Pharma Solutions, Inc. 5.00%, 7/15/2027 (c) | | |
CCO Holdings LLC 6.38%, 9/1/2029 (c) | | |
CEC Entertainment LLC 6.75%, 5/1/2026 (c) | | |
Celanese US Holdings LLC 4.78%, 7/19/2026 | | |
Century Communities, Inc. 3.88%, 8/15/2029 (c) | | |
Champions Financing, Inc. 8.75%, 2/15/2029 (a) (c) | | |
Charter Communications Operating LLC | | |
| | |
| | |
Chemours Co. (The) 5.75%, 11/15/2028 (c) | | |
Chevron Phillips Chemical Co. LLC 3.40%, 12/1/2026 (c) | | |
Cinemark USA, Inc. 5.25%, 7/15/2028 (c) | | |
SEE NOTES TO FINANCIAL STATEMENTS.
| | |
Corporate Bonds — continued |
United States — continued |
Citigroup, Inc. (SOFR + 1.34%), 4.54%, 9/19/2030 (g) | | |
Civitas Resources, Inc. 8.38%, 7/1/2028 (c) | | |
Clarios Global LP 6.75%, 5/15/2028 (c) | | |
Clear Channel Outdoor Holdings, Inc. | | |
| | |
| | |
Cleveland-Cliffs, Inc. 5.88%, 6/1/2027 | | |
Cloud Software Group, Inc. 6.50%, 3/31/2029 (c) | | |
Cogent Communications Group LLC 3.50%, 5/1/2026 (c) | | |
Coinbase Global, Inc. 3.38%, 10/1/2028 (c) | | |
Community Health Systems, Inc. | | |
| | |
| | |
| | |
Comstock Resources, Inc. 6.75%, 3/1/2029 (c) | | |
Consolidated Communications, Inc. 6.50%, 10/1/2028 (c) | | |
Corebridge Financial, Inc. (US Treasury Yield Curve Rate T Note Constant Maturity 5 Year + 3.85%), 6.88%, 12/15/2052 (g) | | |
CoreLogic, Inc. 4.50%, 5/1/2028 (c) | | |
Cornerstone Building Brands, Inc. 9.50%, 8/15/2029 (c) | | |
Credit Acceptance Corp. 9.25%, 12/15/2028 (c) | | |
Crescent Energy Finance LLC 9.25%, 2/15/2028 (c) | | |
| | |
| | |
| | |
Cushman & Wakefield US Borrower LLC 6.75%, 5/15/2028 (c) | | |
CVR Energy, Inc. 8.50%, 1/15/2029 (c) | | |
CVR Partners LP 6.13%, 6/15/2028 (c) | | |
Delek Logistics Partners LP 8.63%, 3/15/2029 (c) | | |
| | |
|
United States — continued |
Directv Financing LLC 5.88%, 8/15/2027 (c) | | |
Discovery Communications LLC 4.95%, 5/15/2042 | | |
Dominion Energy, Inc. 3.90%, 10/1/2025 | | |
Domtar Corp. 6.75%, 10/1/2028 (c) | | |
Duquesne Light Holdings, Inc. 3.62%, 8/1/2027 (c) | | |
Eco Material Technologies, Inc. 7.88%, 1/31/2027 (c) | | |
Edgewell Personal Care Co. 5.50%, 6/1/2028 (c) | | |
Edison International (US Treasury Yield Curve Rate T Note Constant Maturity 5 Year + 3.86%), 8.13%, 6/15/2053 (g) | | |
Encino Acquisition Partners Holdings LLC 8.50%, 5/1/2028 (c) | | |
Encore Capital Group, Inc. 9.25%, 4/1/2029 (c) | | |
| | |
| | |
| | |
Energy Transfer LP (US Treasury Yield Curve Rate T Note Constant Maturity 5 Year + 2.83%), 7.13%, 10/1/2054 (g) | | |
Entergy Corp. 0.90%, 9/15/2025 | | |
EQM Midstream Partners LP | | |
| | |
| | |
EquipmentShare.com, Inc. 9.00%, 5/15/2028 (c) | | |
Fair Isaac Corp. 4.00%, 6/15/2028 (c) | | |
| | |
| | |
| | |
Five Point Operating Co. LP 10.50%, 1/15/2028 (c) (k) | | |
Fortress Transportation and Infrastructure Investors LLC 5.50%, 5/1/2028 (c) | | |
| | |
| | |
| | |
SEE NOTES TO FINANCIAL STATEMENTS.
JPMorgan Global Allocation Fund
SCHEDULE OF PORTFOLIO INVESTMENTSAS OF October 31, 2024 (continued)
| | |
Corporate Bonds — continued |
United States — continued |
Freedom Mortgage Holdings LLC 9.25%, 2/1/2029 (c) | | |
Frontier Communications Holdings LLC | | |
| | |
| | |
FTAI Infra Escrow Holdings LLC 10.50%, 6/1/2027 (c) | | |
GCI LLC 4.75%, 10/15/2028 (c) | | |
Gen Digital, Inc. 6.75%, 9/30/2027 (c) | | |
| | |
| | |
| | |
Global Net Lease, Inc. REIT, 3.75%, 12/15/2027 (c) | | |
Go Daddy Operating Co. LLC 5.25%, 12/1/2027 (c) | | |
Goldman Sachs Bank USA (SOFR + 0.77%), 5.62%, 3/18/2027 (g) | | |
Goldman Sachs Group, Inc. (The) | | |
| | |
(SOFR + 1.14%), 4.69%, 10/23/2030 (g) | | |
Goodyear Tire & Rubber Co. (The) 9.50%, 5/31/2025 | | |
Gray Television, Inc. 10.50%, 7/15/2029 (c) | | |
Griffon Corp. 5.75%, 3/1/2028 | | |
Group 1 Automotive, Inc. 4.00%, 8/15/2028 (c) | | |
H&E Equipment Services, Inc. 3.88%, 12/15/2028 (c) | | |
Harvest Midstream I LP 7.50%, 9/1/2028 (c) | | |
Healthpeak OP LLC REIT, 3.40%, 2/1/2025 | | |
Heartland Dental LLC 10.50%, 4/30/2028 (c) | | |
Herc Holdings, Inc. 5.50%, 7/15/2027 (c) | | |
Hertz Corp. (The) 12.63%, 7/15/2029 (a) (c) | | |
Hess Midstream Operations LP 6.50%, 6/1/2029 (c) | | |
Hilcorp Energy I LP 5.75%, 2/1/2029 (c) | | |
| | |
|
United States — continued |
Hilton Domestic Operating Co., Inc. 5.75%, 5/1/2028 (c) | | |
HLF Financing Sarl LLC 12.25%, 4/15/2029 (c) | | |
Howard Hughes Corp. (The) 4.13%, 2/1/2029 (c) | | |
Hunt Cos., Inc. 5.25%, 4/15/2029 (c) | | |
Huntington Bancshares, Inc. (SOFR + 2.02%), 6.21%, 8/21/2029 (g) | | |
Hyundai Capital America 4.30%, 9/24/2027 (c) | | |
| | |
| | |
| | |
Ingevity Corp. 3.88%, 11/1/2028 (c) | | |
International Game Technology plc | | |
| | |
| | |
| | |
REIT, 5.00%, 7/15/2028 (c) | | |
REIT, 7.00%, 2/15/2029 (c) | | |
ITT Holdings LLC 6.50%, 8/1/2029 (c) | | |
Jacobs Entertainment, Inc. 6.75%, 2/15/2029 (c) | | |
Jazz Securities DAC 4.38%, 1/15/2029 (a) (c) | | |
Jefferies Finance LLC 5.00%, 8/15/2028 (c) | | |
Kaiser Aluminum Corp. 4.63%, 3/1/2028 (c) | | |
KeHE Distributors LLC 9.00%, 2/15/2029 (c) | | |
Kennedy-Wilson, Inc. 4.75%, 3/1/2029 | | |
KeyCorp (SOFRINDX + 2.42%), 6.40%, 3/6/2035 (g) | | |
LABL, Inc. 5.88%, 11/1/2028 (c) | | |
Lamar Media Corp. 3.75%, 2/15/2028 | | |
Level 3 Financing, Inc. 10.50%, 4/15/2029 (c) | | |
Liberty Mutual Group, Inc. (US Treasury Yield Curve Rate T Note Constant Maturity 5 Year + 3.31%), 4.13%, 12/15/2051 (c) (g) | | |
Life Time, Inc. 5.75%, 1/15/2026 (c) | | |
LifePoint Health, Inc. 4.38%, 2/15/2027 (c) | | |
SEE NOTES TO FINANCIAL STATEMENTS.
| | |
Corporate Bonds — continued |
United States — continued |
Light & Wonder International, Inc. 7.00%, 5/15/2028 (c) | | |
Lithia Motors, Inc. 3.88%, 6/1/2029 (c) | | |
Live Nation Entertainment, Inc. | | |
| | |
| | |
Madison IAQ LLC 4.13%, 6/30/2028 (c) | | |
Mallinckrodt International Finance SA 14.75%, 11/14/2028 (c) | | |
Marathon Petroleum Corp. 4.70%, 5/1/2025 | | |
Matador Resources Co. 6.88%, 4/15/2028 (c) | | |
Match Group Holdings II LLC 4.63%, 6/1/2028 (c) | | |
Mauser Packaging Solutions Holding Co. 7.88%, 4/15/2027 (c) | | |
McGraw-Hill Education, Inc. 5.75%, 8/1/2028 (c) | | |
| | |
| | |
| | |
| | |
Michaels Cos., Inc. (The) 5.25%, 5/1/2028 (c) | | |
Midcap Financial Issuer Trust 6.50%, 5/1/2028 (c) | | |
Mohegan Tribal Gaming Authority 8.00%, 2/1/2026 (c) | | |
Molina Healthcare, Inc. 4.38%, 6/15/2028 (c) | | |
Moog, Inc. 4.25%, 12/15/2027 (c) | | |
Nationstar Mortgage Holdings, Inc. | | |
| | |
| | |
| | |
| | |
| | |
| | |
| | |
| | |
| | |
| | |
NCR Atleos Corp. 9.50%, 4/1/2029 (c) | | |
| | |
|
United States — continued |
NCR Voyix Corp. 5.00%, 10/1/2028 (c) | | |
Necessity Retail REIT, Inc. REIT, 4.50%, 9/30/2028 (c) | | |
Neptune Bidco US, Inc. 9.29%, 4/15/2029 (c) | | |
NESCO Holdings II, Inc. 5.50%, 4/15/2029 (c) | | |
New Enterprise Stone & Lime Co., Inc. 5.25%, 7/15/2028 (c) | | |
New Fortress Energy, Inc. 6.50%, 9/30/2026 (c) | | |
| | |
| | |
| | |
Newfold Digital Holdings Group, Inc. 11.75%, 10/15/2028 (c) | | |
News Corp. 3.88%, 5/15/2029 (c) | | |
| | |
| | |
| | |
NextEra Energy Operating Partners LP | | |
| | |
| | |
NGL Energy Operating LLC 8.13%, 2/15/2029 (c) | | |
Northern Oil & Gas, Inc. 8.13%, 3/1/2028 (c) | | |
Novelis Corp. 3.25%, 11/15/2026 (c) | | |
Olympus Water US Holding Corp. | | |
| | |
| | |
| | |
| | |
| | |
| | |
Organon & Co. 4.13%, 4/30/2028 (c) | | |
Outfront Media Capital LLC | | |
| | |
| | |
Owens-Brockway Glass Container, Inc. 6.63%, 5/13/2027 (c) | | |
Pactiv Evergreen Group Issuer, Inc. 4.00%, 10/15/2027 (c) | | |
SEE NOTES TO FINANCIAL STATEMENTS.
JPMorgan Global Allocation Fund
SCHEDULE OF PORTFOLIO INVESTMENTSAS OF October 31, 2024 (continued)
| | |
Corporate Bonds — continued |
United States — continued |
Paramount Global (US Treasury Yield Curve Rate T Note Constant Maturity 5 Year + 4.00%), 6.38%, 3/30/2062 (g) | | |
Pattern Energy Operations LP 4.50%, 8/15/2028 (c) | | |
PBF Holding Co. LLC 6.00%, 2/15/2028 | | |
PennyMac Financial Services, Inc. 5.38%, 10/15/2025 (c) | | |
Penske Automotive Group, Inc. 3.50%, 9/1/2025 | | |
Performance Food Group, Inc. 5.50%, 10/15/2027 (c) | | |
Permian Resources Operating LLC 8.00%, 4/15/2027 (c) | | |
| | |
| | |
| | |
PG&E Corp. 5.00%, 7/1/2028 | | |
Phinia, Inc. 6.75%, 4/15/2029 (c) | | |
Pike Corp. 5.50%, 9/1/2028 (c) | | |
Playtika Holding Corp. 4.25%, 3/15/2029 (c) | | |
Prime Security Services Borrower LLC | | |
| | |
| | |
| | |
| | |
| | |
| | |
QVC, Inc. 6.88%, 4/15/2029 (a) (c) | | |
Range Resources Corp. 8.25%, 1/15/2029 | | |
Realty Income Corp. REIT, 4.88%, 7/6/2030 | | |
Rithm Capital Corp. REIT, 8.00%, 4/1/2029 (c) | | |
Rocket Mortgage LLC 2.88%, 10/15/2026 (c) | | |
Rocket Software, Inc. 9.00%, 11/28/2028 (c) | | |
Royal Caribbean Cruises Ltd. | | |
| | |
| | |
| | |
| | |
|
United States — continued |
| | |
RR Donnelley & Sons Co. 9.50%, 8/1/2029 (c) | | |
| | |
| | |
| | |
| | |
| | |
| | |
SCIH Salt Holdings, Inc. 4.88%, 5/1/2028 (c) | | |
SCIL IV LLC 5.38%, 11/1/2026 (c) | | |
Scripps Escrow II, Inc. 3.88%, 1/15/2029 (c) | | |
Sealed Air Corp. 6.13%, 2/1/2028 (c) | | |
Silgan Holdings, Inc. 4.13%, 2/1/2028 | | |
Simmons Foods, Inc. 4.63%, 3/1/2029 (c) | | |
| | |
| | |
| | |
| | |
| | |
| | |
Southern Power Co. 1.85%, 6/20/2026 | | |
Stagwell Global LLC 5.63%, 8/15/2029 (a) (c) | | |
Staples, Inc. 10.75%, 9/1/2029 (c) | | |
Starwood Property Trust, Inc. | | |
REIT, 4.38%, 1/15/2027 (c) | | |
REIT, 7.25%, 4/1/2029 (c) | | |
Station Casinos LLC 4.50%, 2/15/2028 (c) | | |
| | |
| | |
| | |
| | |
| | |
| | |
| | |
Teleflex, Inc. 4.25%, 6/1/2028 (c) | | |
Tempur Sealy International, Inc. 4.00%, 4/15/2029 (c) | | |
SEE NOTES TO FINANCIAL STATEMENTS.
| | |
Corporate Bonds — continued |
United States — continued |
| | |
| | |
| | |
| | |
Tenneco, Inc. 8.00%, 11/17/2028 (c) | | |
Time Warner Cable LLC 5.50%, 9/1/2041 | | |
Townsquare Media, Inc. 6.88%, 2/1/2026 (c) | | |
| | |
| | |
| | |
| | |
| | |
Transocean Titan Financing Ltd. 8.38%, 2/1/2028 (c) | | |
Travel + Leisure Co. 6.63%, 7/31/2026 (c) | | |
TriNet Group, Inc. 3.50%, 3/1/2029 (c) | | |
Trinity Industries, Inc. 7.75%, 7/15/2028 (c) | | |
Triumph Group, Inc. 9.00%, 3/15/2028 (c) | | |
Tronox, Inc. 4.63%, 3/15/2029 (c) | | |
| | |
| | |
| | |
United Rentals North America, Inc. 3.88%, 11/15/2027 | | |
United Wholesale Mortgage LLC | | |
| | |
| | |
| | |
REIT, 10.50%, 2/15/2028 (c) | | |
REIT, 4.75%, 4/15/2028 (c) | | |
Univision Communications, Inc. | | |
| | |
| | |
| | |
Urban One, Inc. 7.38%, 2/1/2028 (c) | | |
US Acute Care Solutions LLC 9.75%, 5/15/2029 (c) | | |
Ventas Realty LP REIT, 2.65%, 1/15/2025 | | |
| | |
|
United States — continued |
| | |
| | |
| | |
Victoria's Secret & Co. 4.63%, 7/15/2029 (c) | | |
Viking Cruises Ltd. 7.00%, 2/15/2029 (c) | | |
Vistra Operations Co. LLC 5.00%, 7/31/2027 (c) | | |
Walgreens Boots Alliance, Inc. 8.13%, 8/15/2029 | | |
Warnermedia Holdings, Inc. 4.30%, 1/17/2030 | | |
WASH Multifamily Acquisition, Inc. 5.75%, 4/15/2026 (c) | | |
Wesco Aircraft Holdings, Inc. 9.00%, 11/15/2026 (a) (c) (l) | | |
| | |
| | |
| | |
Western Alliance Bancorp (3-MONTH CME TERM SOFR + 2.25%), 3.00%, 6/15/2031 (g) | | |
Westlake Corp. 1.63%, 7/17/2029 | | |
| | |
| | |
| | |
Windstream Escrow LLC 7.75%, 8/15/2028 | | |
Windstream Services LLC 7.75%, 8/15/2028 (c) | | |
WPC Eurobond BV REIT, 1.35%, 4/15/2028 | | |
WR Grace Holdings LLC 4.88%, 6/15/2027 (c) | | |
| | |
| | |
| | |
XHR LP REIT, 6.38%, 8/15/2025 (c) | | |
Zayo Group Holdings, Inc. 4.00%, 3/1/2027 (c) | | |
ZoomInfo Technologies LLC 3.88%, 2/1/2029 (c) | | |
| | |
Total Corporate Bonds
(Cost $874,347) | | |
SEE NOTES TO FINANCIAL STATEMENTS.
JPMorgan Global Allocation Fund
SCHEDULE OF PORTFOLIO INVESTMENTSAS OF October 31, 2024 (continued)
| | |
Foreign Government Securities — 8.9% |
|
Commonwealth of Australia | | |
| | |
| | |
| | |
| | |
| | |
| | |
| | |
| | |
|
Dexia SA 0.25%, 12/10/2026 (b) | | |
| | |
| | |
| | |
| | |
| | |
| | |
| | |
| | |
| | |
| | |
| | |
| | |
| | |
|
| | |
| | |
| | |
| | |
| | |
| | |
| | |
| | |
| | |
| | |
| | |
| | |
| | |
| | |
Province of Alberta 2.90%, 12/1/2028 | | |
Province of British Columbia | | |
| | |
| | |
|
|
| | |
Province of Ontario 0.01%, 11/25/2030 (b) | | |
| | |
|
| | |
| | |
| | |
| | |
| | |
| | |
| | |
| | |
|
| | |
| | |
| | |
| | |
| | |
| | |
| | |
| | |
| | |
| | |
|
Bundesobligation 2.10%, 4/12/2029 (b) | | |
Bundesrepublik Deutschland | | |
| | |
| | |
| | |
| | |
| | |
| | |
| | |
|
| | |
| | |
| | |
| | |
SEE NOTES TO FINANCIAL STATEMENTS.
| | |
Foreign Government Securities — continued |
|
| | |
| | |
| | |
|
Buoni Poliennali del Tesoro | | |
| | |
| | |
| | |
| | |
| | |
| | |
| | |
| | |
| | |
| | |
| | |
| | |
| | |
| | |
| | |
| | |
| | |
|
Japan Bank for International Cooperation | | |
| | |
| | |
| | |
| | |
| | |
| | |
| | |
| | |
| | |
| | |
| | |
| | |
| | |
| | |
| | |
| | |
| | |
| | |
| | |
|
|
| | |
| | |
| | |
| | |
| | |
| | |
| | |
| | |
| | |
| | |
| | |
| | |
|
Mex Bonos Desarr Fix Rt 7.75%, 5/29/2031 | | |
| | |
| | |
| | |
| | |
| | |
| | |
| | |
|
| | |
| | |
| | |
| | |
| | |
| | |
| | |
| | |
| | |
| | |
| | |
|
Republic of Peru 1.86%, 12/1/2032 | | |
|
Romania Government Bond 2.00%, 4/14/2033 (c) | | |
SEE NOTES TO FINANCIAL STATEMENTS.
JPMorgan Global Allocation Fund
SCHEDULE OF PORTFOLIO INVESTMENTSAS OF October 31, 2024 (continued)
| | |
Foreign Government Securities — continued |
|
| | |
| | |
| | |
| | |
|
Export-Import Bank of Korea | | |
| | |
| | |
Republic of Korea 0.00%, 9/16/2025 | | |
| | |
|
Bonos and Obligaciones del Estado | | |
| | |
| | |
| | |
| | |
| | |
| | |
| | |
| | |
| | |
| | |
| | |
| | |
| | |
| | |
| | |
| | |
| | |
| | |
|
| | |
| | |
| | |
| | |
| | |
| | |
| | |
|
United Kingdom of Great Britain and Northern Ireland | | |
| | |
| | |
|
United Kingdom — continued |
| | |
| | |
| | |
| | |
| | |
| | |
| | |
| | |
| | |
| | |
| | |
| | |
| | |
| | |
| | |
| | |
| | |
| | |
| | |
| | |
| | |
| | |
| | |
| | |
| | |
| | |
Total Foreign Government Securities
(Cost $273,551) | | |
| | |
Investment Companies — 4.6% |
| | |
JPMorgan Income Fund, Class R6 Shares (m)(Cost $131,021) | | |
| | |
U.S. Treasury Obligations — 1.3% |
| | |
| | |
| | |
Total U.S. Treasury Obligations
(Cost $37,652) | | |
SEE NOTES TO FINANCIAL STATEMENTS.
| | |
Mortgage-Backed Securities — 0.4% |
|
| | |
| | |
| | |
FNMA UMBS, 30 Year Pool # FS1583, 3.00%, 4/1/2052 | | |
Total Mortgage-Backed Securities
(Cost $11,239) | | |
|
Asian Development Bank, 3.40%, 9/10/2027 (b) | | |
European Union, 3.00%, 3/4/2053 (b) | | |
Inter-American Development Bank, 4.40%, 1/26/2026 | | |
Total Supranational
(Cost $3,727) | | |
Loan Assignments — 0.0% ‡ (g) (o) ^ |
|
FGI Operating Co. LLC, 1st Lien Term Loan (6-MONTH CME TERM SOFR), 12.00%, 12/31/2024 | | |
Moran Foods LLC, 1st Lien Super Senior Delayed Term Loan (TERM SOFR + 11.50% + 0.10%), 16.71%, 6/30/2026 | | |
Moran Foods LLC, 1st Lien Term Loan | | |
(TERM SOFR + 5.25% (PIK) + 2.00% (Cash) + 0.10% (CAS)), 11.95%, 6/30/2026 | | |
(TERM SOFR + 5.25% (PIK) + 2.00% (Cash) + 0.10% (CAS)), 11.95%, 6/30/2026 | | |
Total Loan Assignments
(Cost $1,098) | | |
| | |
Convertible Preferred Stocks — 0.0% ^ |
|
Claire's Stores, Inc. ‡ * (e)(Cost $414) | | |
| | |
Commercial Mortgage-Backed Securities — 0.0% ^ |
|
Velocity Commercial Capital Loan Trust | | |
Series 2018-2, Class M2, 4.51%, 10/26/2048 (c) (p) | | |
Series 2018-2, Class M3, 4.72%, 10/26/2048 (c) (p) | | |
Total Commercial Mortgage-Backed Securities
(Cost $305) | | |
| | |
Preferred Stocks — 0.0% ^ |
|
MYT Holding LLC Series A, 10.00%, 6/6/2029 ‡(Cost $39) | | |
| | |
|
|
Nmg Research Ltd., expiring 9/24/2027, price 1.00 USD ‡ *(Cost $—) | | |
| | |
Collateralized Mortgage Obligations — 0.0% ^ |
|
CHL Mortgage Pass-Through Trust Series 2007-10, Class A4, 5.50%, 7/25/2037 | | |
Deutsche Alt-A Securities Mortgage Loan Trust Series 2006-AF1, Class A4, 5.45%, 4/25/2036 (p) | | |
HarborView Mortgage Loan Trust Series 2006-14, Class 1A1A, 5.23%, 1/25/2047 (p) | | |
JPMorgan Mortgage Trust Series 2005-A8, Class 2A3, 5.78%, 11/25/2035 (p) | | |
Total Collateralized Mortgage Obligations
(Cost $—) | | |
SEE NOTES TO FINANCIAL STATEMENTS.
JPMorgan Global Allocation Fund
SCHEDULE OF PORTFOLIO INVESTMENTSAS OF October 31, 2024 (continued)
| | |
Short-Term Investments — 2.9% |
Commercial Paper — 0.0% ^ |
First Abu Dhabi Bank PJSC, 5.50%, 1/7/2025 (c) | | |
Procter & Gamble Co. (The), 5.22%, 3/11/2025 (c) | | |
Total Commercial Paper
(Cost $493) | | |
| | |
Investment Companies — 2.5% |
JPMorgan Prime Money Market Fund Class Institutional Shares, 4.81% (m) (q) (Cost $70,691) | | |
Investment of Cash Collateral from Securities Loaned — 0.4% |
JPMorgan Securities Lending Money Market FundAgency SL Class Shares, 4.85% (m) (q) (Cost $12,483) | | |
Total Short-Term Investments
(Cost $83,667) | | |
Total Investments — 100.0%
(Cost $2,455,865) | | |
Liabilities in Excess of Other Assets — (0.0)% | | |
| | |
Percentages indicated are based on net assets. |
Amounts presented as a dash ("-") represent amounts that round to less than a thousand. |
| |
| American Depositary Receipt |
| |
| |
| |
| Clearing House Electronic Subregister System (CHESS) Depository Interest |
| Chicago Mercantile Exchange |
| Certificaten Van Aandelen (Dutch Certificate) |
| |
| |
| Euro Interbank Offered Rate |
| Federal Home Loan Mortgage Corp. |
| Federal National Mortgage Association |
| |
| Global Depositary Receipt |
| |
| Intercontinental Exchange |
| |
| |
| |
| |
| Public Joint Stock Company |
| A special type of equity investment that shares in the earnings of the company, has limited voting rights, and may have a dividend preference. Preference shares may also have liquidation preference. |
| Limited liability company |
| Real Estate Investment Trust |
| Limited partnership with share capital |
| |
| |
| Secured Overnight Financing Rate |
| Compounding index of the Secured Overnight Financing Rate |
| Uniform Mortgage-Backed Securities |
| |
| Amount rounds to less than 0.1% of net assets. |
| Value determined using significant unobservable inputs. | |
| Non-income producing security. | |
| The security or a portion of this security is on loan at October 31, 2024. The total value of securities on loan at October 31, 2024 is $11,980. | |
| Security exempt from registration pursuant to Regulation S under the Securities Act of 1933, as amended. Regulation S applies to securities offerings that are made outside of the United States and do not involve direct selling efforts in the United States and as such may have restrictions on resale. | |
| Securities exempt from registration under Rule 144A or section 4(a)(2), of the Securities Act of 1933, as amended. | |
| | |
| Fund is subject to legal or contractual restrictions on the resale of the security. | |
| All or a portion of this security is segregated as collateral for short sales. The total value of securities and cash segregated as collateral is $1,474 and $0, respectively. | |
| Variable or floating rate security, linked to the referenced benchmark. The interest rate shown is the current rate as of October 31, 2024. | |
| Security is an interest bearing note with preferred security characteristics. | |
| Security is perpetual and thus, does not have a predetermined maturity date. The coupon rate for this security is fixed for a period of time and may be structured to adjust thereafter. The date shown, if applicable, reflects the next call date. The coupon rate shown is the rate in effect as of October 31, 2024. | |
SEE NOTES TO FINANCIAL STATEMENTS.
| Contingent Capital security (“CoCo”). CoCos are hybrid debt securities that may be convertible into equity or may be written down if a pre-specified trigger event occurs. The total value of aggregate CoCo holdings at October 31, 2024 is $4,149 or 0.15% of the Fund’s net assets as of October 31, 2024. | |
| Step bond. Interest rate is a fixed rate for an initial period that either resets at a specific date or may reset in the future contingent upon a predetermined trigger. The interest rate shown is the current rate as of October 31, 2024. | |
| | |
| Investment in an affiliated fund, which is registered under the Investment Company Act of 1940, as amended, and is advised by J.P. Morgan Investment Management Inc. | |
| All or a portion of this security is deposited with the broker as initial margin for futures contracts. | |
| Loan assignments are presented by obligor. Each series or loan tranche underlying each obligor may have varying terms. | |
| Variable or floating rate security, the interest rate of which adjusts periodically based on changes in current interest rates and prepayments on the underlying pool of assets. The interest rate shown is the current rate as of October 31, 2024. | |
| The rate shown is the current yield as of October 31, 2024. | |
Summary of Investments by Industry, October 31, 2024
The following table represents the portfolio investments of the Fund by industry classifications as a percentage of total investments:
| PERCENT OF
TOTAL
INVESTMENTS |
Foreign Government Securities | |
| |
Semiconductors & Semiconductor Equipment | |
Oil, Gas & Consumable Fuels | |
| |
Hotels, Restaurants & Leisure | |
| |
| |
| |
| |
| |
| |
Health Care Providers & Services | |
| |
Technology Hardware, Storage & Peripherals | |
| |
Interactive Media & Services | |
| |
| |
| |
| |
| |
| |
Health Care Equipment & Supplies | |
Diversified Telecommunication Services | |
Textiles, Apparel & Luxury Goods | |
| |
| |
Consumer Staples Distribution & Retail | |
| |
Others (each less than 1.0%) | |
| |
Detailed information about investment portfolios of the Underlying Funds, as defined in the Notes to Financial Statements, and ETFs can be found in the financial statements filed with the Securities and Exchange Commission (SEC) by each such underlying fund semi-annually on Form N-CSR and in portfolio holdings filed quarterly on Form N-PORT, and are available for download from both the SEC’s as well as each respective underlying fund’s website. Detailed information about Underlying J.P. Morgan Funds can also be found at www.jpmorganfunds.com or by calling 1-800-480-4111.
SEE NOTES TO FINANCIAL STATEMENTS.
JPMorgan Global Allocation Fund
SCHEDULE OF PORTFOLIO INVESTMENTSAS OF October 31, 2024 (continued)
Futures contracts outstanding as of October 31, 2024 (amounts in thousands, except number of contracts):
| | | | | VALUE AND
UNREALIZED
APPRECIATION
(DEPRECIATION) ($) |
| | | | | |
| | | | | |
| | | | | |
| | | | | |
| | | | | |
| | | | | |
| | | | | |
| | | | | |
| | | | | |
| | | | | |
| | | | | |
| | | | | |
U.S. Treasury 10 Year Note | | | | | |
U.S. Treasury 10 Year Ultra Note | | | | | |
| | | | | |
MSCI Emerging Markets E-Mini Index | | | | | |
S&P 500 E-Mini Equal Weight Index | | | | | |
| | | | | |
S&P MidCap 400 E-Mini Index | | | | | |
U.S. Treasury 5 Year Note | | | | | |
| | | | | |
| | | | | |
| | | | | |
| | | | | |
| | | | | |
| | | | | |
U.S. Treasury 10 Year Note | | | | | |
| | | | | |
| | | | | |
| | | | | |
| | | | | |
| | | | | |
| | | | | |
| | | | | |
| | | | | |
| |
| |
| |
| Europe, Australasia and Far East |
| |
| |
| |
| Morgan Stanley Capital International |
| Secured Overnight Financing Rate |
| |
SEE NOTES TO FINANCIAL STATEMENTS.
Forward foreign currency exchange contracts outstanding as of October 31, 2024 (amounts in thousands):
| | | | UNREALIZED
APPRECIATION
(DEPRECIATION) ($) |
| | | | | | |
| | | | | | |
| | | | | | |
| | | | | | |
| | | | | | |
| | | | | | |
| | | | | | |
| | | | | | |
| | | | | | |
| | | | | | |
| | | | | | |
| | | | | | |
| | | | | | |
| | | | | | |
| | | | | | |
| | | | Goldman Sachs International | | |
| | | | | | |
| | | | | | |
| | | | | | |
| | | | | | |
| | | | Goldman Sachs International** | | |
| | | | | | |
| | | | | | |
| | | | | | |
Total unrealized appreciation | |
| | | | | | |
| | | | | | |
| | | | | | |
| | | | | | |
| | | | | | |
| | | | | | |
| | | | | | |
| | | | | | |
| | | | Goldman Sachs International** | | |
| | | | | | |
| | | | | | |
| | | | Goldman Sachs International | | |
| | | | | | |
| | | | | | |
| | | | | | |
| | | | Goldman Sachs International | | |
| | | | Citigroup Global Markets Holdings, Inc.** | | |
| | | | | | |
| | | | | | |
| | | | Goldman Sachs International | | |
| | | | | | |
| | | | Citigroup Global Markets Holdings, Inc.** | | |
| | | | | | |
| | | | Goldman Sachs International | | |
| | | | | | |
| | | | | | |
SEE NOTES TO FINANCIAL STATEMENTS.
JPMorgan Global Allocation Fund
SCHEDULE OF PORTFOLIO INVESTMENTSAS OF October 31, 2024 (continued)
| | | | UNREALIZED APPRECIATION (DEPRECIATION) ($) |
| | | | | | |
| | | | | | |
| | | | | | |
| | | | | | |
| | | | | | |
| | | | | | |
| | | | Goldman Sachs International | | |
| | | | Goldman Sachs International | | |
| | | | | | |
| | | | | | |
| | | | Goldman Sachs International | | |
| | | | | | |
| | | | Goldman Sachs International** | | |
Total unrealized depreciation | |
Net unrealized depreciation | |
| Amount rounds to less than one thousand. |
| |
SEE NOTES TO FINANCIAL STATEMENTS.
JPMorgan Income Builder Fund
SCHEDULE OF PORTFOLIO INVESTMENTSAS OF October 31, 2024
| | |
|
|
Pampa Energia SA 7.95%, 9/10/2031 (a) | | |
Transportadora de Gas del Sur SA 8.50%, 7/24/2031 (a) | | |
YPF SA 8.50%, 6/27/2029 (a) | | |
| | |
|
Australia & New Zealand Banking Group Ltd. (SOFR + 0.56%), 5.41%, 3/18/2026 (b) (c) | | |
| | |
| | |
| | |
Macquarie Group Ltd. 6.21%, 11/22/2024 (b) | | |
Scentre Group Trust 1, REIT | | |
| | |
| | |
| | |
|
ams-OSRAM AG 12.25%, 3/30/2029 (b) | | |
|
State Oil Co. of the Azerbaijan Republic 6.95%, 3/18/2030 (a) | | |
|
Bapco Energies BSC Closed 7.50%, 10/25/2027 (a) | | |
|
Braskem Netherlands Finance BV | | |
| | |
| | |
Centrais Eletricas Brasileiras SA 6.50%, 1/11/2035 (b) | | |
CSN Resources SA 4.63%, 6/10/2031 (b) | | |
FS Luxembourg Sarl 8.88%, 2/12/2031 (a) | | |
Guara Norte SARL 5.20%, 6/15/2034 (b) | | |
Klabin Austria GmbH 7.00%, 4/3/2049 (a) | | |
LD Celulose International GmbH 7.95%, 1/26/2032 (b) | | |
Minerva Luxembourg SA 8.88%, 9/13/2033 (b) | | |
MV24 Capital BV 6.75%, 6/1/2034 (b) | | |
Petrobras Global Finance BV 6.85%, 6/5/2115 | | |
| | |
|
|
Vale Overseas Ltd. 3.75%, 7/8/2030 | | |
Yinson Boronia Production BV 8.95%, 7/31/2042 (b) | | |
| | |
|
| | |
| | |
| | |
| | |
ATS Corp. 4.13%, 12/15/2028 (b) | | |
| | |
| | |
| | |
(US Treasury Yield Curve Rate T Note Constant Maturity 5 Year + 3.01%), 7.30%, 11/26/2084 (c) (d) | | |
Bank of Nova Scotia (The) | | |
(US Treasury Yield Curve Rate T Note Constant Maturity 5 Year + 4.55%), 4.90%, 6/4/2025 (c) (d) (e) (f) | | |
| | |
| | |
Series 2, (US Treasury Yield Curve Rate T Note Constant Maturity 5 Year + 2.61%), 3.63%, 10/27/2081 (c) (d) | | |
(US Treasury Yield Curve Rate T Note Constant Maturity 5 Year + 4.39%), 8.63%, 10/27/2082 (c) (d) | | |
| | |
| | |
| | |
| | |
| | |
| | |
| | |
| | |
| | |
Canadian Imperial Bank of Commerce | | |
| | |
| | |
Emera US Finance LP 2.64%, 6/15/2031 | | |
Emera, Inc. Series 16-A, (3-MONTH SOFR + 5.44%), 6.75%, 6/15/2076 (c) | | |
SEE NOTES TO FINANCIAL STATEMENTS.
JPMorgan Income Builder Fund
SCHEDULE OF PORTFOLIO INVESTMENTSAS OF October 31, 2024 (continued)
| | |
Corporate Bonds — continued |
|
| | |
Series 16-A, (3-MONTH CME TERM SOFR + 4.15%), 6.00%, 1/15/2077 (c) | | |
Series 20-A, (US Treasury Yield Curve Rate T Note Constant Maturity 5 Year + 5.31%), 5.75%, 7/15/2080 (c) | | |
(US Treasury Yield Curve Rate T Note Constant Maturity 5 Year + 4.42%), 7.63%, 1/15/2083 (c) | | |
(US Treasury Yield Curve Rate T Note Constant Maturity 5 Year + 4.43%), 8.50%, 1/15/2084 (c) | | |
Federation des Caisses Desjardins du Quebec | | |
| | |
| | |
| | |
Garda World Security Corp. | | |
| | |
| | |
| | |
MEG Energy Corp. 5.88%, 2/1/2029 (b) | | |
Northriver Midstream Finance LP 6.75%, 7/15/2032 (b) | | |
| | |
| | |
| | |
| | |
| | |
| | |
| | |
| | |
Primo Water Holdings, Inc. 4.38%, 4/30/2029 (b) | | |
Ritchie Bros Holdings, Inc. | | |
| | |
| | |
Rogers Communications, Inc. | | |
| | |
(US Treasury Yield Curve Rate T Note Constant Maturity 5 Year + 3.59%), 5.25%, 3/15/2082 (b) (c) | | |
| | |
| | |
(SOFRINDX + 1.08%), 4.65%, 10/18/2030 (c) | | |
| | |
|
|
(US Treasury Yield Curve Rate T Note Constant Maturity 5 Year + 2.89%), 7.50%, 5/2/2084 (c) (d) | | |
Superior Plus LP 4.50%, 3/15/2029 (b) | | |
Toronto-Dominion Bank (The) | | |
| | |
| | |
(US Treasury Yield Curve Rate T Note Constant Maturity 5 Year + 4.08%), 8.13%, 10/31/2082 (c) (d) | | |
| | |
Series 16-A, (3-MONTH SOFR + 4.64%), 5.88%, 8/15/2076 (c) | | |
(SOFR + 4.42%), 5.50%, 9/15/2079 (c) | | |
| | |
| | |
| | |
Wrangler Holdco Corp. 6.63%, 4/1/2032 (b) | | |
| | |
|
| | |
| | |
| | |
| | |
| | |
| | |
EnfraGen Energia Sur SA 5.38%, 12/30/2030 (a) | | |
| | |
|
Danske Bank A/S (US Treasury Yield Curve Rate T Note Constant Maturity 1 Year + 1.40%), 5.71%, 3/1/2030 (b) (c) | | |
|
Amer Sports Co. 6.75%, 2/16/2031 (b) (g) | | |
| | |
| | |
(US Treasury Yield Curve Rate T Note Constant Maturity 5 Year + 4.11%), 6.63%, 3/26/2026 (b) (c) (d) (e) (f) | | |
SEE NOTES TO FINANCIAL STATEMENTS.
| | |
Corporate Bonds — continued |
|
| | |
(US Treasury Yield Curve Rate T Note Constant Maturity 5 Year + 2.66%), 6.30%, 9/25/2031 (b) (c) (d) (e) (f) | | |
| | |
|
| | |
| | |
| | |
| | |
| | |
Banque Federative du Credit Mutuel SA | | |
| | |
| | |
| | |
(US Treasury Yield Curve Rate T Note Constant Maturity 5 Year + 4.97%), 9.25%, 11/17/2027 (b) (c) (d) (e) (f) | | |
(US Treasury Yield Curve Rate T Note Constant Maturity 5 Year + 4.90%), 7.75%, 8/16/2029 (b) (c) (d) (e) (f) | | |
(SOFR + 1.59%), 5.50%, 5/20/2030 (b) (c) | | |
(US Treasury Yield Curve Rate T Note Constant Maturity 5 Year + 3.54%), 7.38%, 9/10/2034 (b) (c) (d) (e) (f) | | |
| | |
| | |
(SOFR + 1.52%), 1.65%, 10/6/2026 (b) (c) | | |
(SOFR + 1.98%), 6.61%, 10/19/2027 (b) (c) | | |
| | |
| | |
| | |
| | |
(SOFR + 1.69%), 5.34%, 1/10/2030 (b) (c) | | |
(USD SOFR Spread-Adjusted ICE Swap Rate 5 Year + 3.60%), 6.70%, 9/23/2034 (b) (c) (d) (e) (f) | | |
| | |
|
|
| | |
(US Treasury Yield Curve Rate T Note Constant Maturity 1 Year + 2.30%), 6.45%, 1/12/2027 (b) (c) | | |
(US Treasury Yield Curve Rate T Note Constant Maturity 5 Year + 5.39%), 9.38%, 11/22/2027 (b) (c) (d) (e) (f) | | |
(US Treasury Yield Curve Rate T Note Constant Maturity 1 Year + 1.30%), 2.80%, 1/19/2028 (b) (c) | | |
(US Treasury Yield Curve Rate T Note Constant Maturity 1 Year + 1.50%), 5.52%, 1/19/2028 (b) (c) | | |
(US Treasury Yield Curve Rate T Note Constant Maturity 1 Year + 1.75%), 5.63%, 1/19/2030 (b) (c) | | |
(US Treasury Yield Curve Rate T Note Constant Maturity 5 Year + 4.51%), 5.38%, 11/18/2030 (b) (c) (d) (e) (f) | | |
| | |
| | |
|
Georgian Railway JSC 4.00%, 6/17/2028 (a) | | |
|
Allianz SE (US Treasury Yield Curve Rate T Note Constant Maturity 5 Year + 2.77%), 5.60%, 9/3/2054 (b) (c) | | |
| | |
(SOFRINDX + 0.55%), 5.39%, 4/2/2026 (b) (c) | | |
| | |
Daimler Truck Finance North America LLC 5.20%, 1/17/2025 (b) | | |
Deutsche Bank AG (SOFR + 1.87%), 2.13%, 11/24/2026 (c) | | |
Deutsche Telekom International Finance BV 8.75%, 6/15/2030 (h) | | |
| | |
7.75% (Cash), 11/15/2030 (b) (i) | | |
SEE NOTES TO FINANCIAL STATEMENTS.
JPMorgan Income Builder Fund
SCHEDULE OF PORTFOLIO INVESTMENTSAS OF October 31, 2024 (continued)
| | |
Corporate Bonds — continued |
|
8.00% (Cash), 11/15/2032 (b) (i) | | |
Volkswagen Group of America Finance LLC (SOFR + 0.83%), 5.68%, 3/20/2026 (b) (c) | | |
| | |
|
Energuate Trust 5.88%, 5/3/2027 (a) | | |
|
Greenko Dutch BV 3.85%, 3/29/2026 (a) | | |
Greenko Power II Ltd. 4.30%, 12/13/2028 (b) | | |
| | |
|
AerCap Ireland Capital DAC | | |
| | |
(US Treasury Yield Curve Rate T Note Constant Maturity 5 Year + 2.72%), 6.95%, 3/10/2055 (c) | | |
AIB Group plc (SOFR + 3.46%), 7.58%, 10/14/2026 (b) (c) | | |
Bank of Ireland Group plc (US Treasury Yield Curve Rate T Note Constant Maturity 1 Year + 2.65%), 6.25%, 9/16/2026 (b) (c) | | |
EndoDesign 0.00%, 10/15/2024 ‡ (j) | | |
| | |
|
Energean Israel Finance Ltd. | | |
| | |
| | |
Leviathan Bond Ltd. 6.50%, 6/30/2027 (a) | | |
| | |
|
Intesa Sanpaolo SpA 7.00%, 11/21/2025 (b) | | |
| | |
Series 2033, 6.38%, 11/15/2033 (b) | | |
Series 2034, 6.00%, 9/30/2034 (b) | | |
Series 2038, 7.72%, 6/4/2038 (b) | | |
Telecom Italia Capital SA | | |
| | |
| | |
|
|
| | |
| | |
| | |
|
Kingston Airport Revenue Finance Ltd. 6.75%, 12/15/2036 (b) | | |
|
Mitsubishi HC Capital, Inc. 3.64%, 4/13/2025 (b) | | |
Mitsubishi UFJ Financial Group, Inc. | | |
| | |
(US Treasury Yield Curve Rate T Note Constant Maturity 1 Year + 1.13%), 3.84%, 4/17/2026 (c) (g) | | |
(US Treasury Yield Curve Rate T Note Constant Maturity 1 Year + 0.75%), 1.54%, 7/20/2027 (c) | | |
(US Treasury Yield Curve Rate T Note Constant Maturity 1 Year + 0.67%), 1.64%, 10/13/2027 (c) | | |
Mizuho Financial Group, Inc. | | |
(3-MONTH CME TERM SOFR + 1.09%), 2.23%, 5/25/2026 (c) | | |
(US Treasury Yield Curve Rate T Note Constant Maturity 1 Year + 0.67%), 1.23%, 5/22/2027 (c) | | |
(US Treasury Yield Curve Rate T Note Constant Maturity 1 Year + 1.08%), 5.38%, 7/10/2030 (c) | | |
(US Treasury Yield Curve Rate T Note Constant Maturity 1 Year + 1.30%), 5.59%, 7/10/2035 (c) | | |
Sumitomo Mitsui Financial Group, Inc. | | |
| | |
(US Treasury Yield Curve Rate T Note Constant Maturity 5 Year + 2.28%), 6.60%, 6/5/2034 (c) (d) (e) (f) | | |
| | |
|
Altice Financing SA 5.75%, 8/15/2029 (b) | | |
Altice France Holding SA 10.50%, 5/15/2027 (b) | | |
GCB144A Endo 0.00%, 4/1/2029 ‡ | | |
SEE NOTES TO FINANCIAL STATEMENTS.
| | |
Corporate Bonds — continued |
|
| | |
| | |
| | |
Intelsat Jackson Holdings SA 6.50%, 3/15/2030 (b) | | |
| | |
|
Studio City Finance Ltd. 5.00%, 1/15/2029 (a) | | |
Wynn Macau Ltd. 5.63%, 8/26/2028 (a) | | |
| | |
|
Braskem Idesa SAPI 7.45%, 11/15/2029 (a) | | |
Comision Federal de Electricidad 6.45%, 1/24/2035 (b) | | |
FIEMEX Energia - Banco Actinver SA Institucion de Banca Multiple 7.25%, 1/31/2041 (b) | | |
| | |
| | |
| | |
| | |
| | |
| | |
| | |
| | |
| | |
| | |
| | |
| | |
| | |
| | |
|
| | |
| | |
| | |
| | |
| | |
| | |
| | |
|
|
ABN AMRO Bank NV (EUR Swap Annual 5 Year + 4.67%), 4.38%, 9/22/2025 (a) (c) (d) (e) (f) | | |
| | |
| | |
| | |
(EUR Swap Annual 5 Year + 4.68%), 4.38%, 6/29/2027 (a) (c) (d) (e) (f) | | |
(US Treasury Yield Curve Rate T Note Constant Maturity 1 Year + 0.73%), 1.98%, 12/15/2027 (b) (c) | | |
(US Treasury Yield Curve Rate T Note Constant Maturity 1 Year + 1.40%), 5.56%, 2/28/2029 (b) (c) | | |
(US Treasury Yield Curve Rate T Note Constant Maturity 1 Year + 1.12%), 5.45%, 3/5/2030 (b) (c) | | |
| | |
| | |
(US Treasury Yield Curve Rate T Note Constant Maturity 5 Year + 4.34%), 5.75%, 11/16/2026 (c) (d) (e) (f) | | |
| | |
(US Treasury Yield Curve Rate T Note Constant Maturity 5 Year + 2.86%), 3.88%, 5/16/2027 (c) (d) (e) (f) | | |
(USD SOFR Spread-Adjusted ICE Swap Rate 5 Year + 4.36%), 8.00%, 5/16/2030 (a) (c) (d) (e) (f) | | |
Trivium Packaging Finance BV | | |
| | |
| | |
| | |
|
| | |
(US Treasury Yield Curve Rate T Note Constant Maturity 1 Year + 0.85%), 1.13%, 9/16/2026 (b) (c) | | |
(SOFRINDX + 1.95%), 5.90%, 10/9/2026 (b) (c) | | |
| | |
|
Bioceanico Sovereign Certificate Ltd. Zero Coupon, 6/5/2034 (b) | | |
SEE NOTES TO FINANCIAL STATEMENTS.
JPMorgan Income Builder Fund
SCHEDULE OF PORTFOLIO INVESTMENTSAS OF October 31, 2024 (continued)
| | |
Corporate Bonds — continued |
|
Niagara Energy SAC 5.75%, 10/3/2034 (b) | | |
| | |
| | |
| | |
| | |
|
| | |
| | |
| | |
Transnet SOC Ltd. 8.25%, 2/6/2028 (b) | | |
| | |
|
Banco Bilbao Vizcaya Argentaria SA | | |
(US Treasury Yield Curve Rate T Note Constant Maturity 1 Year + 2.30%), 5.86%, 9/14/2026 (c) | | |
| | |
(US Treasury Yield Curve Rate T Note Constant Maturity 5 Year + 5.10%), 9.38%, 3/19/2029 (c) (d) (e) (f) | | |
| | |
| | |
(US Treasury Yield Curve Rate T Note Constant Maturity 1 Year + 1.25%), 5.55%, 3/14/2028 (c) | | |
| | |
(US Treasury Yield Curve Rate T Note Constant Maturity 5 Year + 5.30%), 9.63%, 5/21/2033 (c) (d) (e) (f) | | |
Grifols SA 4.75%, 10/15/2028 (b) (g) | | |
| | |
|
Skandinaviska Enskilda Banken AB | | |
1.40%, 11/19/2025 (b) (g) | | |
| | |
| | |
| | |
| | |
|
|
(US Treasury Yield Curve Rate T Note Constant Maturity 5 Year + 4.05%), 4.75%, 3/1/2031 (a) (c) (d) (e) (f) | | |
Swedbank AB 6.14%, 9/12/2026 (b) | | |
| | |
|
| | |
(US Treasury Yield Curve Rate T Note Constant Maturity 5 Year + 4.86%), 5.13%, 7/29/2026 (a) (c) (d) (e) (f) | | |
(US Treasury Yield Curve Rate T Note Constant Maturity 5 Year + 3.40%), 4.88%, 2/12/2027 (b) (c) (d) (e) (f) | | |
(US Treasury Yield Curve Rate T Note Constant Maturity 5 Year + 4.75%), 9.25%, 11/13/2028 (b) (c) (d) (e) (f) | | |
(USD SOFR Spread-Adjusted ICE Swap Rate 1 Year + 1.34%), 5.62%, 9/13/2030 (b) (c) | | |
(SOFR + 3.92%), 6.54%, 8/12/2033 (b) (c) | | |
(US Treasury Yield Curve Rate T Note Constant Maturity 5 Year + 4.76%), 9.25%, 11/13/2033 (b) (c) (d) (e) (f) | | |
VistaJet Malta Finance plc 9.50%, 6/1/2028 (b) (g) | | |
| | |
|
TC Ziraat Bankasi A/S 8.00%, 1/16/2029 (a) | | |
Turkiye Varlik Fonu Yonetimi A/S 8.25%, 2/14/2029 (a) | | |
| | |
|
180 Medical, Inc. 3.88%, 10/15/2029 (b) | | |
| | |
| | |
(U.K. Government Bonds 5 Year Note Generic Bid Yield + 6.02%), 6.38%, 12/15/2025 (a) (c) (d) (e) (f) | | |
SEE NOTES TO FINANCIAL STATEMENTS.
| | |
Corporate Bonds — continued |
United Kingdom — continued |
(US Treasury Yield Curve Rate T Note Constant Maturity 5 Year + 5.43%), 8.00%, 3/15/2029 (c) (d) (e) (f) | | |
(USD SOFR Spread-Adjusted ICE Swap Rate 5 Year + 5.78%), 9.63%, 12/15/2029 (c) (d) (e) (f) | | |
(SOFR + 1.74%), 5.69%, 3/12/2030 (c) | | |
| | |
(US Treasury Yield Curve Rate T Note Constant Maturity 5 Year + 3.86%), 8.00%, 3/7/2028 (c) (d) (e) (f) | | |
(SOFR + 1.73%), 2.01%, 9/22/2028 (c) | | |
(US Treasury Yield Curve Rate T Note Constant Maturity 5 Year + 3.65%), 4.60%, 12/17/2030 (c) (d) (e) (f) | | |
(SOFR + 1.52%), 5.73%, 5/17/2032 (c) | | |
(SOFR + 1.19%), 2.80%, 5/24/2032 (c) | | |
(US Treasury Yield Curve Rate T Note Constant Maturity 5 Year + 3.19%), 6.95%, 3/11/2034 (c) (d) (e) (f) | | |
INEOS Quattro Finance 2 plc 9.63%, 3/15/2029 (b) (g) | | |
| | |
| | |
| | |
(US Treasury Yield Curve Rate T Note Constant Maturity 5 Year + 4.82%), 6.75%, 6/27/2026 (c) (d) (e) (f) | | |
(US Treasury Yield Curve Rate T Note Constant Maturity 1 Year + 1.75%), 4.72%, 8/11/2026 (c) | | |
(US Treasury Yield Curve Rate T Note Constant Maturity 1 Year + 1.38%), 5.46%, 1/5/2028 (c) | | |
(US Treasury Yield Curve Rate T Note Constant Maturity 5 Year + 3.15%), 6.75%, 9/27/2031 (c) (d) (e) (f) | | |
(US Treasury Yield Curve Rate T Note Constant Maturity 1 Year + 1.75%), 5.68%, 1/5/2035 (c) | | |
Nationwide Building Society | | |
| | |
| | |
|
United Kingdom — continued |
| | |
| | |
(US Treasury Yield Curve Rate T Note Constant Maturity 5 Year + 5.63%), 6.00%, 12/29/2025 (c) (d) (e) (f) | | |
(US Treasury Yield Curve Rate T Note Constant Maturity 5 Year + 3.75%), 8.13%, 11/10/2033 (c) (d) (e) (f) | | |
(US Treasury Yield Curve Rate T Note Constant Maturity 1 Year + 1.50%), 5.78%, 3/1/2035 (c) | | |
NatWest Markets plc 5.41%, 5/17/2029 (b) | | |
Santander UK Group Holdings plc | | |
(US Treasury Yield Curve Rate T Note Constant Maturity 1 Year + 1.25%), 1.53%, 8/21/2026 (c) | | |
(SOFR + 2.75%), 6.83%, 11/21/2026 (c) | | |
(SOFR + 0.99%), 1.67%, 6/14/2027 (c) | | |
| | |
(US Treasury Yield Curve Rate T Note Constant Maturity 1 Year + 3.10%), 7.78%, 11/16/2025 (b) (c) | | |
(3-MONTH SOFR + 1.21%), 2.82%, 1/30/2026 (b) (c) | | |
(US Treasury Yield Curve Rate T Note Constant Maturity 1 Year + 1.65%), 3.97%, 3/30/2026 (b) (c) | | |
(US Treasury Yield Curve Rate T Note Constant Maturity 1 Year + 2.05%), 6.17%, 1/9/2027 (b) (c) | | |
(US Treasury Yield Curve Rate T Note Constant Maturity 5 Year + 4.98%), 7.75%, 8/15/2027 (b) (c) (d) (e) (f) | | |
Virgin Media Secured Finance plc 5.50%, 5/15/2029 (b) | | |
Vodafone Group plc (US Treasury Yield Curve Rate T Note Constant Maturity 5 Year + 2.77%), 4.13%, 6/4/2081 (c) | | |
| | |
|
| | |
| | |
| | |
SEE NOTES TO FINANCIAL STATEMENTS.
JPMorgan Income Builder Fund
SCHEDULE OF PORTFOLIO INVESTMENTSAS OF October 31, 2024 (continued)
| | |
Corporate Bonds — continued |
United States — continued |
Acadia Healthcare Co., Inc. | | |
| | |
| | |
ACCO Brands Corp. 4.25%, 3/15/2029 (b) | | |
ACI Worldwide, Inc. 5.75%, 8/15/2026 (b) | | |
Acushnet Co. 7.38%, 10/15/2028 (b) | | |
Adient Global Holdings Ltd. | | |
| | |
| | |
| | |
| | |
| | |
| | |
Advanced Drainage Systems, Inc. | | |
| | |
| | |
| | |
Aethon United BR LP 7.50%, 10/1/2029 (b) | | |
| | |
| | |
| | |
| | |
| | |
| | |
| | |
| | |
| | |
Alcoa Nederland Holding BV | | |
| | |
| | |
Alexandria Real Estate Equities, Inc., REIT | | |
| | |
| | |
Allied Universal Holdco LLC 4.63%, 6/1/2028 (b) | | |
Allison Transmission, Inc. | | |
| | |
| | |
| | |
Allstate Corp. (The) (3-MONTH SOFR + 2.12%), 6.50%, 5/15/2057 (c) | | |
| | |
| | |
| | |
|
United States — continued |
Series C, (US Treasury Yield Curve Rate T Note Constant Maturity 7 Year + 3.48%), 4.70%, 5/15/2028 (c) (e) (f) | | |
Altria Group, Inc. 4.80%, 2/14/2029 | | |
| | |
| | |
| | |
American Axle & Manufacturing, Inc. | | |
| | |
| | |
| | |
American Builders & Contractors Supply Co., Inc. 4.00%, 1/15/2028 (b) | | |
American Electric Power Co., Inc. (US Treasury Yield Curve Rate T Note Constant Maturity 5 Year + 2.68%), 3.88%, 2/15/2062 (c) | | |
| | |
| | |
(US Treasury Yield Curve Rate T Note Constant Maturity 5 Year + 2.85%), 3.55%, 9/15/2026 (c) (e) (f) | | |
(SOFR + 0.93%), 5.04%, 7/26/2028 (c) | | |
American Honda Finance Corp. (SOFR + 0.50%), 5.33%, 10/10/2025 (c) | | |
American International Group, Inc. Series A-9, (3-MONTH SOFR + 2.87%), 5.75%, 4/1/2048 (c) | | |
American Tower Corp., REIT | | |
| | |
| | |
| | |
| | |
| | |
| | |
| | |
| | |
Amkor Technology, Inc. 6.63%, 9/15/2027 (b) | | |
ANGI Group LLC 3.88%, 8/15/2028 (b) | | |
Antero Midstream Partners LP | | |
| | |
| | |
| | |
| | |
| | |
SEE NOTES TO FINANCIAL STATEMENTS.
| | |
Corporate Bonds — continued |
United States — continued |
| | |
| | |
Anywhere Real Estate Group LLC 5.25%, 4/15/2030 (b) | | |
| | |
| | |
| | |
Aramark Services, Inc. 5.00%, 2/1/2028 (b) | | |
| | |
| | |
| | |
| | |
| | |
| | |
| | |
Ardagh Metal Packaging Finance USA LLC 6.00%, 6/15/2027 (b) | | |
Ardagh Packaging Finance plc | | |
| | |
| | |
Asbury Automotive Group, Inc. | | |
| | |
| | |
| | |
| | |
Ascent Resources Utica Holdings LLC | | |
| | |
| | |
| | |
ASGN, Inc. 4.63%, 5/15/2028 (b) | | |
AthenaHealth Group, Inc. 6.50%, 2/15/2030 (b) | | |
Athene Global Funding 4.86%, 8/27/2026 (b) | | |
| | |
| | |
| | |
| | |
| | |
Audacy Capital LLC 6.50%, 5/1/2027 (b) (j) | | |
Avantor Funding, Inc. 4.63%, 7/15/2028 (b) | | |
Avient Corp. 7.13%, 8/1/2030 (b) | | |
Avis Budget Car Rental LLC | | |
| | |
|
United States — continued |
| | |
| | |
| | |
| | |
| | |
Axalta Coating Systems Dutch Holding B BV 7.25%, 2/15/2031 (b) | | |
Axalta Coating Systems LLC | | |
| | |
| | |
| | |
Series AA, (3-MONTH CME TERM SOFR + 4.16%), 6.10%, 3/17/2025 (c) (e) (f) | | |
(SOFR + 0.65%), 1.53%, 12/6/2025 (c) | | |
Series DD, (3-MONTH CME TERM SOFR + 4.81%), 6.30%, 3/10/2026 (c) (e) (f) | | |
Series RR, (US Treasury Yield Curve Rate T Note Constant Maturity 5 Year + 2.76%), 4.38%, 1/27/2027 (c) (e) (f) | | |
Series TT, (US Treasury Yield Curve Rate T Note Constant Maturity 5 Year + 3.23%), 6.13%, 4/27/2027 (c) (e) (f) | | |
Series FF, (3-MONTH CME TERM SOFR + 3.19%), 5.88%, 3/15/2028 (c) (e) (f) | | |
(3-MONTH CME TERM SOFR + 1.44%), 3.19%, 7/23/2030 (c) | | |
(SOFR + 1.21%), 2.57%, 10/20/2032 (c) | | |
(SOFR + 1.83%), 4.57%, 4/27/2033 (c) | | |
(SOFR + 1.65%), 5.47%, 1/23/2035 (c) | | |
(US Treasury Yield Curve Rate T Note Constant Maturity 5 Year + 1.20%), 2.48%, 9/21/2036 (c) | | |
Bank of New York Mellon Corp. (The) | | |
(SOFR + 0.62%), 5.44%, 4/25/2025 (c) | | |
Series F, (3-MONTH CME TERM SOFR + 3.39%), 4.63%, 9/20/2026 (c) (e) (f) | | |
(SOFRINDX + 2.07%), 5.83%, 10/25/2033 (c) | | |
| | |
| | |
| | |
| | |
Bausch + Lomb Corp. 8.38%, 10/1/2028 (b) | | |
SEE NOTES TO FINANCIAL STATEMENTS.
JPMorgan Income Builder Fund
SCHEDULE OF PORTFOLIO INVESTMENTSAS OF October 31, 2024 (continued)
| | |
Corporate Bonds — continued |
United States — continued |
Bausch Health Americas, Inc. 8.50%, 1/31/2027 (b) | | |
| | |
| | |
| | |
| | |
| | |
| | |
| | |
| | |
| | |
Big River Steel LLC 6.63%, 1/31/2029 (b) | | |
| | |
| | |
| | |
| | |
| | |
| | |
| | |
| | |
Boise Cascade Co. 4.88%, 7/1/2030 (b) | | |
Boyd Gaming Corp. 4.75%, 6/15/2031 (b) | | |
Boyne USA, Inc. 4.75%, 5/15/2029 (b) | | |
| | |
(U.K. Government Bonds 5 Year Note Generic Bid Yield + 3.89%), 4.25%, 3/22/2027 (a) (c) (e) (f) | | |
(EUR Swap Annual 5 Year + 3.78%), 3.63%, 3/22/2029 (a) (c) (e) (f) | | |
(US Treasury Yield Curve Rate T Note Constant Maturity 5 Year + 4.40%), 4.88%, 3/22/2030 (c) (e) (f) | | |
(US Treasury Yield Curve Rate T Note Constant Maturity 5 Year + 2.15%), 6.45%, 12/1/2033 (c) (e) (f) | | |
| | |
| | |
| | |
Broadcom, Inc. 4.30%, 11/15/2032 | | |
| | |
| | |
| | |
| | |
Builders FirstSource, Inc. | | |
| | |
| | |
|
United States — continued |
| | |
| | |
| | |
Bunge Ltd. Finance Corp. 1.63%, 8/17/2025 | | |
| | |
| | |
| | |
Cable One, Inc. 4.00%, 11/15/2030 (b) (g) | | |
Caesars Entertainment, Inc. | | |
| | |
4.63%, 10/15/2029 (b) (g) | | |
| | |
| | |
California Resources Corp. 7.13%, 2/1/2026 (b) | | |
| | |
| | |
| | |
| | |
Capital One Financial Corp. Series M, (US Treasury Yield Curve Rate T Note Constant Maturity 5 Year + 3.16%), 3.95%, 9/1/2026 (c) (e) (f) | | |
| | |
| | |
| | |
| | |
| | |
Carnival Holdings Bermuda Ltd. 10.38%, 5/1/2028 (b) | | |
Carpenter Technology Corp. | | |
| | |
| | |
Catalent Pharma Solutions, Inc. | | |
| | |
| | |
Caterpillar Financial Services Corp. (SOFR + 0.45%), 5.30%, 1/6/2025 (c) | | |
| | |
| | |
| | |
| | |
| | |
| | |
SEE NOTES TO FINANCIAL STATEMENTS.
| | |
Corporate Bonds — continued |
United States — continued |
| | |
| | |
| | |
CD&R Smokey Buyer, Inc. 9.50%, 10/15/2029 (b) | | |
CDW LLC 4.25%, 4/1/2028 (g) | | |
| | |
| | |
| | |
| | |
| | |
| | |
Charles Schwab Corp. (The) | | |
Series G, (US Treasury Yield Curve Rate T Note Constant Maturity 5 Year + 4.97%), 5.38%, 6/1/2025 (c) (e) (f) | | |
Series I, (US Treasury Yield Curve Rate T Note Constant Maturity 5 Year + 3.17%), 4.00%, 6/1/2026 (c) (e) (f) | | |
Series H, (US Treasury Yield Curve Rate T Note Constant Maturity 10 Year + 3.08%), 4.00%, 12/1/2030 (c) (e) (f) | | |
| | |
| | |
| | |
Chemours Co. (The) 5.75%, 11/15/2028 (b) | | |
Cheniere Energy Partners LP | | |
| | |
| | |
| | |
Chevron Phillips Chemical Co. LLC 3.40%, 12/1/2026 (b) | | |
Chord Energy Corp. 6.38%, 6/1/2026 (b) | | |
Churchill Downs, Inc. 4.75%, 1/15/2028 (b) | | |
Ciena Corp. 4.00%, 1/31/2030 (b) | | |
Cigna Group (The) 3.25%, 4/15/2025 | | |
| | |
| | |
| | |
Citibank NA 4.93%, 8/6/2026 | | |
| | |
Series P, (3-MONTH CME TERM SOFR + 4.17%), 5.95%, 5/15/2025 (c) (e) (f) | | |
| | |
|
United States — continued |
Series W, (US Treasury Yield Curve Rate T Note Constant Maturity 5 Year + 3.60%), 4.00%, 12/10/2025 (c) (e) (f) | | |
(SOFR + 0.69%), 2.01%, 1/25/2026 (c) | | |
Series X, (US Treasury Yield Curve Rate T Note Constant Maturity 5 Year + 3.42%), 3.88%, 2/18/2026 (c) (e) (f) | | |
Series T, (3-MONTH CME TERM SOFR + 4.78%), 6.25%, 8/15/2026 (c) (e) (f) | | |
Series CC, (US Treasury Yield Curve Rate T Note Constant Maturity 5 Year + 2.69%), 7.13%, 8/15/2029 (c) (e) (f) | | |
(SOFR + 2.11%), 2.57%, 6/3/2031 (c) | | |
(SOFR + 1.18%), 2.52%, 11/3/2032 (c) | | |
(SOFR + 1.35%), 3.06%, 1/25/2033 (c) | | |
(SOFR + 1.94%), 3.79%, 3/17/2033 (c) | | |
Series DD, (US Treasury Yield Curve Rate T Note Constant Maturity 10 Year + 2.76%), 7.00%, 8/15/2034 (c) (e) (f) | | |
Citizens Financial Group, Inc. Series B, (3-MONTH CME TERM SOFR + 3.26%), 7.85%, 1/6/2025 (c) (e) (f) | | |
| | |
| | |
| | |
| | |
| | |
| | |
| | |
| | |
| | |
Clarivate Science Holdings Corp. | | |
| | |
| | |
Clear Channel Outdoor Holdings, Inc. | | |
| | |
| | |
| | |
| | |
| | |
| | |
| | |
| | |
Clydesdale Acquisition Holdings, Inc. 6.63%, 4/15/2029 (b) | | |
SEE NOTES TO FINANCIAL STATEMENTS.
JPMorgan Income Builder Fund
SCHEDULE OF PORTFOLIO INVESTMENTSAS OF October 31, 2024 (continued)
| | |
Corporate Bonds — continued |
United States — continued |
CMS Energy Corp. (US Treasury Yield Curve Rate T Note Constant Maturity 5 Year + 4.12%), 4.75%, 6/1/2050 (c) | | |
CNX Midstream Partners LP 4.75%, 4/15/2030 (b) | | |
CNX Resources Corp. 7.38%, 1/15/2031 (b) | | |
Cogent Communications Group LLC 3.50%, 5/1/2026 (b) | | |
Coherent Corp. 5.00%, 12/15/2029 (b) | | |
| | |
| | |
| | |
| | |
| | |
| | |
| | |
CommScope Technologies LLC 6.00%, 6/15/2025 (b) | | |
Community Health Systems, Inc. | | |
| | |
| | |
| | |
| | |
| | |
| | |
| | |
| | |
| | |
Concentra Escrow Issuer Corp. 6.88%, 7/15/2032 (b) | | |
Conduent Business Services LLC 6.00%, 11/1/2029 (b) | | |
Cooper-Standard Automotive, Inc. | | |
13.50% (Cash), 3/31/2027 (b) (i) | | |
5.63% (Cash), 5/15/2027 (b) (i) | | |
Corebridge Financial, Inc. (US Treasury Yield Curve Rate T Note Constant Maturity 5 Year + 3.85%), 6.88%, 12/15/2052 (c) | | |
CoreCivic, Inc. 8.25%, 4/15/2029 | | |
| | |
| | |
| | |
Cox Communications, Inc. 4.80%, 2/1/2035 (b) | | |
| | |
|
United States — continued |
Crescent Energy Finance LLC | | |
| | |
| | |
| | |
Crown Castle, Inc., REIT 3.65%, 9/1/2027 | | |
| | |
| | |
| | |
| | |
| | |
| | |
Dana, Inc. 5.63%, 6/15/2028 | | |
| | |
| | |
| | |
| | |
Diamond Foreign Asset Co. 8.50%, 10/1/2030 (b) | | |
Directv Financing LLC 5.88%, 8/15/2027 (b) | | |
Discovery Communications LLC 3.63%, 5/15/2030 | | |
| | |
| | |
| | |
| | |
| | |
DISH Network Corp. 11.75%, 11/15/2027 (b) | | |
| | |
| | |
| | |
| | |
| | |
Series C, (US Treasury Yield Curve Rate T Note Constant Maturity 5 Year + 3.20%), 4.35%, 1/15/2027 (c) (e) (f) | | |
Series B, (US Treasury Yield Curve Rate T Note Constant Maturity 5 Year + 2.51%), 7.00%, 6/1/2054 (c) | | |
Series A, (US Treasury Yield Curve Rate T Note Constant Maturity 5 Year + 2.39%), 6.88%, 2/1/2055 (c) | | |
Dornoch Debt Merger Sub, Inc. 6.63%, 10/15/2029 (b) (g) | | |
SEE NOTES TO FINANCIAL STATEMENTS.
| | |
Corporate Bonds — continued |
United States — continued |
| | |
| | |
| | |
Duke Energy Corp. (US Treasury Yield Curve Rate T Note Constant Maturity 5 Year + 2.59%), 6.45%, 9/1/2054 (c) | | |
Dycom Industries, Inc. 4.50%, 4/15/2029 (b) | | |
Edgewell Personal Care Co. | | |
| | |
| | |
Edison International Series B, (US Treasury Yield Curve Rate T Note Constant Maturity 5 Year + 3.90%), 5.00%, 12/15/2026 (c) (e) (f) | | |
Elanco Animal Health, Inc. 6.65%, 8/28/2028 (h) | | |
Element Solutions, Inc. 3.88%, 9/1/2028 (b) | | |
Embarq Corp. 8.00%, 6/1/2036 | | |
Emergent BioSolutions, Inc. 3.88%, 8/15/2028 (b) | | |
| | |
| | |
| | |
Encino Acquisition Partners Holdings LLC | | |
| | |
| | |
| | |
| | |
| | |
| | |
Endo Finance Holdings, Inc. 8.50%, 4/15/2031 (b) (g) | | |
| | |
| | |
| | |
| | |
| | |
| | |
| | |
(US Treasury Yield Curve Rate T Note Constant Maturity 5 Year + 4.02%), 8.00%, 5/15/2054 (c) | | |
| | |
| | |
| | |
|
United States — continued |
| | |
EnLink Midstream Partners LP | | |
| | |
| | |
Enpro, Inc. 5.75%, 10/15/2026 | | |
| | |
| | |
| | |
| | |
| | |
| | |
| | |
(US Treasury Yield Curve Rate T Note Constant Maturity 5 Year + 2.67%), 7.13%, 12/1/2054 (c) | | |
Enterprise Products Operating LLC Series E, (3-MONTH CME TERM SOFR + 3.29%), 5.25%, 8/16/2077 (c) | | |
EQM Midstream Partners LP | | |
| | |
| | |
| | |
| | |
| | |
| | |
EQT Corp. 7.00%, 2/1/2030 (h) | | |
| | |
| | |
| | |
| | |
Equitable Financial Life Global Funding 5.50%, 12/2/2025 (b) | | |
Equitable Holdings, Inc. Series B, (US Treasury Yield Curve Rate T Note Constant Maturity 5 Year + 4.74%), 4.95%, 9/15/2025 (c) (e) (f) | | |
Esab Corp. 6.25%, 4/15/2029 (b) | | |
Escrow Rite Aid 0.00%, 12/31/2049 ‡ | | |
| | |
| | |
| | |
| | |
| | |
| | |
| | |
SEE NOTES TO FINANCIAL STATEMENTS.
JPMorgan Income Builder Fund
SCHEDULE OF PORTFOLIO INVESTMENTSAS OF October 31, 2024 (continued)
| | |
Corporate Bonds — continued |
United States — continued |
Fair Isaac Corp. 4.00%, 6/15/2028 (b) | | |
Fertitta Entertainment LLC 4.63%, 1/15/2029 (b) | | |
| | |
Series L, (US Treasury Yield Curve Rate T Note Constant Maturity 5 Year + 4.22%), 4.50%, 9/30/2025 (c) (e) (f) | | |
(SOFRINDX + 2.19%), 6.36%, 10/27/2028 (c) | | |
(SOFR + 1.84%), 5.63%, 1/29/2032 (c) | | |
Five Point Operating Co. LP 10.50%, 1/15/2028 (b) (h) | | |
Ford Motor Credit Co. LLC | | |
| | |
| | |
| | |
| | |
| | |
| | |
| | |
| | |
| | |
| | |
| | |
| | |
| | |
| | |
| | |
| | |
| | |
Frontier Communications Holdings LLC | | |
| | |
| | |
| | |
| | |
| | |
| | |
Gap, Inc. (The) 3.63%, 10/1/2029 (b) | | |
| | |
| | |
| | |
| | |
Gates Corp. 6.88%, 7/1/2029 (b) | | |
GCI LLC 4.75%, 10/15/2028 (b) | | |
| | |
|
United States — continued |
General Motors Financial Co., Inc. 4.30%, 4/6/2029 | | |
| | |
| | |
| | |
| | |
| | |
| | |
GEO Group, Inc. (The) 8.63%, 4/15/2029 | | |
| | |
| | |
| | |
| | |
| | |
Global Infrastructure Solutions, Inc. | | |
| | |
| | |
Global Medical Response, Inc. 10.00% (Blend (Cash 8.75% + PIK 1.25%)), 10/31/2028 (b) (i) | | |
| | |
| | |
| | |
Go Daddy Operating Co. LLC 3.50%, 3/1/2029 (b) | | |
Goldman Sachs Bank USA (SOFR + 0.77%), 5.62%, 3/18/2027 (c) | | |
Goldman Sachs Group, Inc. (The) | | |
Series S, (US Treasury Yield Curve Rate T Note Constant Maturity 5 Year + 2.85%), 4.40%, 2/10/2025 (c) (e) (f) | | |
Series R, (US Treasury Yield Curve Rate T Note Constant Maturity 5 Year + 3.22%), 4.95%, 2/10/2025 (c) (e) (f) | | |
Series T, (US Treasury Yield Curve Rate T Note Constant Maturity 5 Year + 2.97%), 3.80%, 5/10/2026 (c) (e) (f) | | |
Series U, (US Treasury Yield Curve Rate T Note Constant Maturity 5 Year + 2.92%), 3.65%, 8/10/2026 (c) (e) (f) | | |
(SOFR + 0.82%), 1.54%, 9/10/2027 (c) | | |
(SOFR + 0.91%), 1.95%, 10/21/2027 (c) | | |
(SOFR + 1.11%), 2.64%, 2/24/2028 (c) | | |
(SOFR + 1.85%), 3.62%, 3/15/2028 (c) | | |
SEE NOTES TO FINANCIAL STATEMENTS.
| | |
Corporate Bonds — continued |
United States — continued |
Series W, (US Treasury Yield Curve Rate T Note Constant Maturity 5 Year + 3.16%), 7.50%, 2/10/2029 (c) (e) (f) | | |
Series X, (US Treasury Yield Curve Rate T Note Constant Maturity 5 Year + 2.81%), 7.50%, 5/10/2029 (c) (e) (f) | | |
(SOFR + 1.28%), 2.62%, 4/22/2032 (c) | | |
(SOFR + 1.25%), 2.38%, 7/21/2032 (c) | | |
(SOFR + 1.26%), 2.65%, 10/21/2032 (c) | | |
Series Y, (US Treasury Yield Curve Rate T Note Constant Maturity 10 Year + 2.40%), 6.13%, 11/10/2034 (c) (e) (f) | | |
(SOFR + 1.55%), 5.33%, 7/23/2035 (c) | | |
(SOFR + 1.42%), 5.02%, 10/23/2035 (c) | | |
Goodyear Tire & Rubber Co. (The) | | |
| | |
| | |
| | |
Graham Packaging Co., Inc. 7.13%, 8/15/2028 (b) | | |
| | |
| | |
| | |
4.75%, 10/15/2030 (b) (g) | | |
| | |
Griffon Corp. 5.75%, 3/1/2028 | | |
| | |
| | |
| | |
Gulfport Energy Operating Corp. 6.75%, 9/1/2029 (b) | | |
Hanesbrands, Inc. 9.00%, 2/15/2031 (b) (g) | | |
Harvest Midstream I LP 7.50%, 5/15/2032 (b) | | |
HCA, Inc. 2.38%, 7/15/2031 | | |
HealthEquity, Inc. 4.50%, 10/1/2029 (b) | | |
Healthpeak OP LLC, REIT 3.40%, 2/1/2025 | | |
| | |
| | |
| | |
| | |
| | |
| | |
|
United States — continued |
12.63%, 7/15/2029 (b) (g) | | |
| | |
Hertz Corp. (The), Escrow | | |
| | |
| | |
| | |
| | |
Hess Midstream Operations LP | | |
| | |
| | |
| | |
| | |
| | |
| | |
| | |
| | |
| | |
| | |
Hilton Domestic Operating Co., Inc. | | |
| | |
| | |
| | |
| | |
| | |
| | |
Hologic, Inc. 3.25%, 2/15/2029 (b) | | |
Howard Midstream Energy Partners LLC | | |
| | |
| | |
Hughes Satellite Systems Corp. 6.63%, 8/1/2026 (g) | | |
Huntington Bancshares, Inc. Series G, (US Treasury Yield Curve Rate T Note Constant Maturity 7 Year + 4.05%), 4.45%, 10/15/2027 (c) (e) (f) | | |
| | |
| | |
| | |
| | |
iHeartCommunications, Inc. | | |
| | |
| | |
| | |
SEE NOTES TO FINANCIAL STATEMENTS.
JPMorgan Income Builder Fund
SCHEDULE OF PORTFOLIO INVESTMENTSAS OF October 31, 2024 (continued)
| | |
Corporate Bonds — continued |
United States — continued |
ILFC E-Capital Trust I (3-MONTH CME TERM SOFR + 1.81%), 6.56%, 12/21/2065 (b) (c) | | |
ILFC E-Capital Trust II (3-MONTH CME TERM SOFR + 2.06%), 6.81%, 12/21/2065 (b) (c) | | |
Imola Merger Corp. 4.75%, 5/15/2029 (b) | | |
Insight Enterprises, Inc. 6.63%, 5/15/2032 (b) | | |
| | |
| | |
| | |
Iron Mountain, Inc., REIT | | |
| | |
| | |
| | |
| | |
ITC Holdings Corp. 2.95%, 5/14/2030 (b) | | |
| | |
| | |
| | |
JetBlue Airways Corp. 9.88%, 9/20/2031 (b) | | |
KFC Holding Co. 4.75%, 6/1/2027 (b) | | |
Kimco Realty OP LLC, REIT 2.25%, 12/1/2031 | | |
| | |
| | |
| | |
Knife River Corp. 7.75%, 5/1/2031 (b) | | |
Kodiak Gas Services LLC 7.25%, 2/15/2029 (b) | | |
LABL, Inc. 10.50%, 7/15/2027 (b) | | |
Lamar Media Corp. 4.00%, 2/15/2030 | | |
Lamb Weston Holdings, Inc. | | |
| | |
| | |
LD Holdings Group LLC 8.75%, 11/1/2027 (b) (g) | | |
Lear Corp. 2.60%, 1/15/2032 | | |
| | |
| | |
| | |
| | |
| | |
| | |
|
United States — continued |
Liberty Interactive LLC 8.25%, 2/1/2030 (g) | | |
Lithia Motors, Inc. 4.38%, 1/15/2031 (b) | | |
Live Nation Entertainment, Inc. | | |
| | |
| | |
| | |
| | |
| | |
| | |
| | |
| | |
| | |
| | |
| | |
10.00%, 10/15/2032 (b) (g) | | |
M/I Homes, Inc. 4.95%, 2/1/2028 | | |
| | |
| | |
| | |
Mallinckrodt International Finance SA 14.75%, 11/14/2028 (b) | | |
Marathon Petroleum Corp. 4.70%, 5/1/2025 | | |
Markel Group, Inc. (US Treasury Yield Curve Rate T Note Constant Maturity 5 Year + 5.66%), 6.00%, 6/1/2025 (c) (e) (f) | | |
Marriott Ownership Resorts, Inc. | | |
| | |
| | |
MassMutual Global Funding II (SOFR + 0.87%), 5.72%, 3/21/2025 (b) (c) | | |
MasTec, Inc. 4.50%, 8/15/2028 (b) | | |
Masterbrand, Inc. 7.00%, 7/15/2032 (b) | | |
| | |
| | |
| | |
Mauser Packaging Solutions Holding Co. | | |
| | |
| | |
McGraw-Hill Education, Inc. 5.75%, 8/1/2028 (b) | | |
| | |
| | |
| | |
SEE NOTES TO FINANCIAL STATEMENTS.
| | |
Corporate Bonds — continued |
United States — continued |
| | |
MetLife Capital Trust IV 7.88%, 12/15/2037 (b) | | |
| | |
Series G, (US Treasury Yield Curve Rate T Note Constant Maturity 5 Year + 3.58%), 3.85%, 9/15/2025 (c) (e) (f) | | |
Series D, (3-MONTH CME TERM SOFR + 3.22%), 5.88%, 3/15/2028 (c) (e) (f) | | |
MGM Resorts International | | |
| | |
| | |
| | |
Microchip Technology, Inc. 4.25%, 9/1/2025 | | |
Midcontinent Communications 8.00%, 8/15/2032 (b) | | |
Midwest Gaming Borrower LLC 4.88%, 5/1/2029 (b) | | |
Mileage Plus Holdings LLC 6.50%, 6/20/2027 (b) | | |
Miter Brands Acquisition Holdco, Inc. 6.75%, 4/1/2032 (b) | | |
MIWD Holdco II LLC 5.50%, 2/1/2030 (b) | | |
Molina Healthcare, Inc. 4.38%, 6/15/2028 (b) | | |
Moog, Inc. 4.25%, 12/15/2027 (b) | | |
| | |
(SOFR + 0.94%), 2.63%, 2/18/2026 (c) | | |
Series M, 5.87%, 9/15/2026 (e) (f) (h) (k) | | |
(SOFR + 0.86%), 1.51%, 7/20/2027 (c) | | |
(SOFR + 1.61%), 4.21%, 4/20/2028 (c) | | |
(SOFR + 1.45%), 5.17%, 1/16/2030 (c) | | |
(SOFR + 1.02%), 1.93%, 4/28/2032 (c) | | |
(SOFR + 1.20%), 2.51%, 10/20/2032 (c) | | |
(SOFR + 1.73%), 5.47%, 1/18/2035 (c) | | |
(SOFR + 1.56%), 5.32%, 7/19/2035 (c) | | |
(US Treasury Yield Curve Rate T Note Constant Maturity 5 Year + 2.43%), 5.95%, 1/19/2038 (c) | | |
(SOFR + 1.49%), 3.22%, 4/22/2042 (c) | | |
Morgan Stanley Bank NA (SOFR + 1.08%), 4.95%, 1/14/2028 (c) | | |
| | |
|
United States — continued |
| | |
| | |
| | |
Nationstar Mortgage Holdings, Inc. | | |
| | |
| | |
| | |
| | |
| | |
NCR Atleos Corp. 9.50%, 4/1/2029 (b) | | |
| | |
| | |
| | |
NESCO Holdings II, Inc. 5.50%, 4/15/2029 (b) | | |
| | |
| | |
| | |
| | |
| | |
| | |
| | |
| | |
| | |
| | |
| | |
| | |
| | |
| | |
| | |
| | |
| | |
| | |
NextEra Energy Capital Holdings, Inc. | | |
(US Treasury Yield Curve Rate T Note Constant Maturity 5 Year + 2.46%), 6.75%, 6/15/2054 (c) | | |
(US Treasury Yield Curve Rate T Note Constant Maturity 5 Year + 2.36%), 6.70%, 9/1/2054 (c) | | |
(3-MONTH SOFR + 3.16%), 5.65%, 5/1/2079 (c) | | |
| | |
| | |
| | |
SEE NOTES TO FINANCIAL STATEMENTS.
JPMorgan Income Builder Fund
SCHEDULE OF PORTFOLIO INVESTMENTSAS OF October 31, 2024 (continued)
| | |
Corporate Bonds — continued |
United States — continued |
| | |
(US Treasury Yield Curve Rate T Note Constant Maturity 5 Year + 2.45%), 6.95%, 11/30/2054 (c) | | |
(US Treasury Yield Curve Rate T Note Constant Maturity 5 Year + 2.53%), 6.38%, 3/31/2055 (c) | | |
NMG Holding Co., Inc. 8.50%, 10/1/2028 (b) | | |
Noble Finance II LLC 8.00%, 4/15/2030 (b) | | |
Nordstrom, Inc. 4.38%, 4/1/2030 | | |
| | |
| | |
| | |
| | |
| | |
| | |
| | |
| | |
| | |
| | |
| | |
| | |
| | |
| | |
Occidental Petroleum Corp. 8.88%, 7/15/2030 | | |
ON Semiconductor Corp. 3.88%, 9/1/2028 (b) | | |
| | |
| | |
| | |
| | |
| | |
| | |
| | |
| | |
| | |
Outfront Media Capital LLC | | |
| | |
| | |
| | |
| | |
| | |
| | |
| | |
|
United States — continued |
| | |
Owens-Brockway Glass Container, Inc. 6.63%, 5/13/2027 (b) | | |
Pactiv Evergreen Group Issuer, Inc. 4.00%, 10/15/2027 (b) | | |
Par Pharmaceutical, Inc. 0.00%, 4/1/2027 ‡ (j) | | |
| | |
| | |
(3-MONTH SOFR + 3.90%), 6.25%, 2/28/2057 (c) | | |
(US Treasury Yield Curve Rate T Note Constant Maturity 5 Year + 4.00%), 6.38%, 3/30/2062 (c) | | |
Patrick Industries, Inc. 7.50%, 10/15/2027 (b) | | |
Performance Food Group, Inc. | | |
| | |
| | |
| | |
Permian Resources Operating LLC | | |
| | |
| | |
| | |
| | |
Perrigo Finance Unlimited Co. Series USD, 6.13%, 9/30/2032 | | |
| | |
| | |
| | |
| | |
| | |
(US Treasury Yield Curve Rate T Note Constant Maturity 5 Year + 3.88%), 7.38%, 3/15/2055 (c) | | |
| | |
| | |
| | |
PM General Purchaser LLC 9.50%, 10/1/2028 (b) | | |
PNC Financial Services Group, Inc. (The) | | |
Series R, (3-MONTH CME TERM SOFR + 3.30%), 8.32%, 12/2/2024 (c) (e) (f) | | |
Series T, (US Treasury Yield Curve Rate T Note Constant Maturity 5 Year + 2.60%), 3.40%, 9/15/2026 (c) (e) (f) | | |
SEE NOTES TO FINANCIAL STATEMENTS.
| | |
Corporate Bonds — continued |
United States — continued |
Series V, (US Treasury Yield Curve Rate T Note Constant Maturity 5 Year + 3.24%), 6.20%, 9/15/2027 (c) (e) (f) | | |
(SOFR + 1.34%), 5.30%, 1/21/2028 (c) | | |
(SOFR + 1.62%), 5.35%, 12/2/2028 (c) | | |
(SOFR + 1.90%), 5.68%, 1/22/2035 (c) | | |
| | |
| | |
| | |
| | |
| | |
PPL Capital Funding, Inc. Series A, (3-MONTH CME TERM SOFR + 2.93%), 7.53%, 3/30/2067 (c) | | |
Prairie Acquiror LP 9.00%, 8/1/2029 (b) | | |
| | |
| | |
| | |
Pricoa Global Funding I 1.15%, 12/6/2024 (b) | | |
Prime Security Services Borrower LLC | | |
| | |
| | |
Prudential Financial, Inc. | | |
(US Treasury Yield Curve Rate T Note Constant Maturity 5 Year + 3.16%), 5.13%, 3/1/2052 (c) | | |
(US Treasury Yield Curve Rate T Note Constant Maturity 5 Year + 3.23%), 6.00%, 9/1/2052 (c) | | |
(US Treasury Yield Curve Rate T Note Constant Maturity 5 Year + 2.85%), 6.75%, 3/1/2053 (c) | | |
(US Treasury Yield Curve Rate T Note Constant Maturity 5 Year + 2.40%), 6.50%, 3/15/2054 (c) | | |
PTC, Inc. 4.00%, 2/15/2028 (b) | | |
QVC, Inc. 6.88%, 4/15/2029 (b) | | |
Qwest Corp. 7.25%, 9/15/2025 | | |
| | |
Radiology Partners, Inc. 7.78% (Blend (Cash 4.28% + PIK 3.50%)), 1/31/2029 (b) (i) | | |
| | |
| | |
| | |
| | |
|
United States — continued |
| | |
Raven Acquisition Holdings LLC 6.88%, 11/15/2031 (b) (l) | | |
| | |
| | |
| | |
| | |
Resideo Funding, Inc. 6.50%, 7/15/2032 (b) | | |
RHP Hotel Properties LP, REIT | | |
| | |
| | |
| | |
| | |
RingCentral, Inc. 8.50%, 8/15/2030 (b) | | |
| | |
| | |
| | |
| | |
(3-MONTH CME TERM SOFR + 7.00%), 12.06%, 8/30/2031 ‡ (b) (c) (g) | | |
Series A, 15.00% (PIK), 8/30/2031 ‡ (g) (i) | | |
Series B, 15.00% (PIK), 8/30/2031 ‡ (i) | | |
| | |
| | |
| | |
| | |
Rockies Express Pipeline LLC 4.80%, 5/15/2030 (b) | | |
Royal Caribbean Cruises Ltd. | | |
| | |
| | |
| | |
Royalty Pharma plc 2.15%, 9/2/2031 | | |
RXO, Inc. 7.50%, 11/15/2027 (b) | | |
SBA Communications Corp., REIT | | |
| | |
| | |
Scotts Miracle-Gro Co. (The) | | |
| | |
| | |
| | |
| | |
SEE NOTES TO FINANCIAL STATEMENTS.
JPMorgan Income Builder Fund
SCHEDULE OF PORTFOLIO INVESTMENTSAS OF October 31, 2024 (continued)
| | |
Corporate Bonds — continued |
United States — continued |
Scripps Escrow, Inc. 5.88%, 7/15/2027 (b) | | |
| | |
| | |
| | |
| | |
(US Treasury Yield Curve Rate T Note Constant Maturity 5 Year + 4.55%), 4.88%, 10/15/2025 (c) (e) (f) | | |
(US Treasury Yield Curve Rate T Note Constant Maturity 5 Year + 2.87%), 4.13%, 4/1/2052 (c) | | |
| | |
| | |
| | |
Sensata Technologies, Inc. 3.75%, 2/15/2031 (b) | | |
Service Corp. International | | |
| | |
| | |
| | |
| | |
| | |
Shift4 Payments LLC 6.75%, 8/15/2032 (b) | | |
| | |
8.50% (Blend (Cash 4.25% + PIK 4.25%)), 10/1/2027 (b) (i) | | |
| | |
Sinclair Television Group, Inc. | | |
| | |
| | |
| | |
| | |
| | |
| | |
| | |
| | |
Six Flags Entertainment Corp. | | |
| | |
| | |
| | |
Six Flags Theme Parks, Inc. 7.00%, 7/1/2025 (b) | | |
| | |
| | |
| | |
|
United States — continued |
| | |
| | |
| | |
| | |
Sonic Automotive, Inc. 4.63%, 11/15/2029 (b) (g) | | |
Sotera Health Holdings LLC 7.38%, 6/1/2031 (b) | | |
Spectrum Brands, Inc. 3.88%, 3/15/2031 (b) | | |
Spirit AeroSystems, Inc. 9.38%, 11/30/2029 (b) | | |
Sprint LLC 7.63%, 2/15/2025 | | |
SS&C Technologies, Inc. 5.50%, 9/30/2027 (b) | | |
Stagwell Global LLC 5.63%, 8/15/2029 (b) (g) | | |
Standard Industries, Inc. | | |
| | |
| | |
| | |
| | |
| | |
| | |
| | |
| | |
Starwood Property Trust, Inc., REIT 7.25%, 4/1/2029 (b) | | |
| | |
Series I, (US Treasury Yield Curve Rate T Note Constant Maturity 5 Year + 2.61%), 6.70%, 3/15/2029 (c) (d) (e) (f) | | |
Series J, (US Treasury Yield Curve Rate T Note Constant Maturity 5 Year + 2.63%), 6.70%, 9/15/2029 (c) (e) (f) | | |
(SOFR + 1.57%), 4.82%, 1/26/2034 (c) | | |
Station Casinos LLC 4.50%, 2/15/2028 (b) | | |
Stericycle, Inc. 3.88%, 1/15/2029 (b) | | |
| | |
| | |
| | |
SunCoke Energy, Inc. 4.88%, 6/30/2029 (b) | | |
| | |
| | |
SEE NOTES TO FINANCIAL STATEMENTS.
| | |
Corporate Bonds — continued |
United States — continued |
| | |
| | |
| | |
Surgery Center Holdings, Inc. 7.25%, 4/15/2032 (b) | | |
Synaptics, Inc. 4.00%, 6/15/2029 (b) | | |
Take-Two Interactive Software, Inc. 4.00%, 4/14/2032 (g) | | |
Tallgrass Energy Partners LP | | |
| | |
| | |
| | |
| | |
Targa Resources Partners LP | | |
| | |
| | |
| | |
| | |
| | |
| | |
Tempur Sealy International, Inc. | | |
| | |
| | |
| | |
| | |
| | |
| | |
| | |
| | |
| | |
| | |
| | |
T-Mobile USA, Inc. 2.25%, 11/15/2031 | | |
TopBuild Corp. 4.13%, 2/15/2032 (b) | | |
| | |
| | |
| | |
Transocean Poseidon Ltd. 6.88%, 2/1/2027 (b) | | |
Transocean Titan Financing Ltd. 8.38%, 2/1/2028 (b) | | |
Transocean, Inc. 8.75%, 2/15/2030 (b) | | |
TreeHouse Foods, Inc. 4.00%, 9/1/2028 | | |
TriMas Corp. 4.13%, 4/15/2029 (b) | | |
| | |
|
United States — continued |
TriNet Group, Inc. 7.13%, 8/15/2031 (b) | | |
Trinity Industries, Inc. 7.75%, 7/15/2028 (b) | | |
Trinseo Materials Operating SCA | | |
| | |
| | |
Triton Water Holdings, Inc. 6.25%, 4/1/2029 (b) | | |
Triumph Group, Inc. 9.00%, 3/15/2028 (b) | | |
| | |
Series N, (US Treasury Yield Curve Rate T Note Constant Maturity 5 Year + 3.00%), 4.80%, 3/1/2025 (c) (e) (f) | | |
Series M, (3-MONTH CME TERM SOFR + 3.05%), 5.13%, 12/15/2027 (c) (e) (f) | | |
(SOFR + 1.62%), 5.44%, 1/24/2030 (c) | | |
Series Q, (US Treasury Yield Curve Rate T Note Constant Maturity 10 Year + 4.35%), 5.10%, 3/1/2030 (c) (e) (f) | | |
(SOFR + 1.92%), 5.71%, 1/24/2035 (c) | | |
| | |
| | |
| | |
United Rentals North America, Inc. | | |
| | |
| | |
| | |
United States Cellular Corp. 6.70%, 12/15/2033 | | |
United States Steel Corp. 6.88%, 3/1/2029 | | |
Uniti Group LP, REIT 4.75%, 4/15/2028 (b) | | |
Univision Communications, Inc. | | |
| | |
| | |
| | |
| | |
(US Treasury Yield Curve Rate T Note Constant Maturity 5 Year + 2.54%), 3.70%, 1/15/2027 (c) (e) (f) | | |
Series J, (3-MONTH CME TERM SOFR + 3.18%), 5.30%, 4/15/2027 (c) (e) (f) | | |
(SOFR + 1.56%), 5.38%, 1/23/2030 (c) | | |
(SOFR + 1.02%), 2.68%, 1/27/2033 (c) | | |
(SOFR + 1.86%), 5.68%, 1/23/2035 (c) | | |
US Foods, Inc. 6.88%, 9/15/2028 (b) | | |
SEE NOTES TO FINANCIAL STATEMENTS.
JPMorgan Income Builder Fund
SCHEDULE OF PORTFOLIO INVESTMENTSAS OF October 31, 2024 (continued)
| | |
Corporate Bonds — continued |
United States — continued |
Vail Resorts, Inc. 6.50%, 5/15/2032 (b) (g) | | |
Valaris Ltd. 8.38%, 4/30/2030 (b) | | |
| | |
| | |
| | |
| | |
| | |
| | |
| | |
| | |
| | |
| | |
| | |
| | |
| | |
| | |
| | |
Vista Outdoor, Inc. 4.50%, 3/15/2029 (b) | | |
Vistra Corp. (US Treasury Yield Curve Rate T Note Constant Maturity 5 Year + 5.74%), 7.00%, 12/15/2026 (b) (c) (e) (f) | | |
Vistra Operations Co. LLC | | |
| | |
| | |
| | |
| | |
| | |
| | |
Vital Energy, Inc. 7.88%, 4/15/2032 (b) | | |
VMware LLC 2.20%, 8/15/2031 | | |
Wabash National Corp. 4.50%, 10/15/2028 (b) | | |
Wand NewCo 3, Inc. 7.63%, 1/30/2032 (b) | | |
Warnermedia Holdings, Inc. | | |
| | |
| | |
Wayfair LLC 7.25%, 10/31/2029 (b) | | |
Weekley Homes LLC 4.88%, 9/15/2028 (b) | | |
| | |
(3-MONTH CME TERM SOFR + 1.01%), 2.16%, 2/11/2026 (c) | | |
Series BB, (US Treasury Yield Curve Rate T Note Constant Maturity 5 Year + 3.45%), 3.90%, 3/15/2026 (c) (e) (f) | | |
(SOFR + 1.51%), 3.53%, 3/24/2028 (c) | | |
| | |
|
United States — continued |
(US Treasury Yield Curve Rate T Note Constant Maturity 5 Year + 3.61%), 7.63%, 9/15/2028 (c) (e) (f) | | |
(US Treasury Yield Curve Rate T Note Constant Maturity 5 Year + 2.77%), 6.85%, 9/15/2029 (c) (e) (f) | | |
(SOFR + 1.50%), 5.20%, 1/23/2030 (c) | | |
(SOFR + 2.10%), 4.90%, 7/25/2033 (c) | | |
(SOFR + 2.02%), 5.39%, 4/24/2034 (c) | | |
(SOFR + 1.78%), 5.50%, 1/23/2035 (c) | | |
Wesco Aircraft Holdings, Inc. | | |
8.50%, 11/15/2024 (b) (j) | | |
9.00%, 11/15/2026 (b) (g) (j) | | |
13.13%, 11/15/2027 (b) (j) | | |
| | |
| | |
| | |
| | |
William Carter Co. (The) 5.63%, 3/15/2027 (b) | | |
Williams Cos., Inc. (The) 2.60%, 3/15/2031 | | |
| | |
| | |
| | |
WMG Acquisition Corp. 3.75%, 12/1/2029 (b) (g) | | |
| | |
| | |
| | |
| | |
| | |
| | |
| | |
| | |
| | |
| | |
| | |
| | |
| | |
XHR LP, REIT 4.88%, 6/1/2029 (b) | | |
| | |
| | |
| | |
| | |
| | |
SEE NOTES TO FINANCIAL STATEMENTS.
| | |
Corporate Bonds — continued |
United States — continued |
| | |
| | |
Ziff Davis, Inc. 4.63%, 10/15/2030 (b) | | |
| | |
|
Jscb Agrobank 9.25%, 10/2/2029 (b) | | |
Navoi Mining & Metallurgical Combinat 6.95%, 10/17/2031 (b) | | |
Uzbekneftegaz JSC 4.75%, 11/16/2028 (b) | | |
| | |
Venezuela, Bolivarian Republic of — 0.0% ^ |
Petroleos de Venezuela SA | | |
8.50%, 10/27/2020 (a) (j) | | |
6.00%, 11/15/2026 (a) (j) | | |
| | |
| | |
Total Corporate Bonds
(Cost $2,974,464) | | |
| | |
|
|
| | |
| | |
| | |
Bendigo & Adelaide Bank Ltd. | | |
| | |
| | |
| | |
| | |
| | |
| | |
Magellan Financial Group Ltd. | | |
| | |
| | |
| | |
| | |
| | |
| | |
| | |
| | |
| | |
|
|
Woodside Energy Group Ltd. | | |
| | |
| | |
|
| | |
| | |
| | |
| | |
|
| | |
| | |
| | |
| | |
| | |
|
B3 SA - Brasil Bolsa Balcao | | |
| | |
Itau Unibanco Holding SA (Preference) | | |
| | |
| | |
|
| | |
Bank of Nova Scotia (The) | | |
| | |
Canadian Imperial Bank of Commerce | | |
Canadian Natural Resources Ltd. | | |
| | |
| | |
| | |
| | |
Magna International, Inc. | | |
| | |
| | |
| | |
| | |
Restaurant Brands International, Inc. | | |
| | |
| | |
| | |
| | |
| | |
SEE NOTES TO FINANCIAL STATEMENTS.
JPMorgan Income Builder Fund
SCHEDULE OF PORTFOLIO INVESTMENTSAS OF October 31, 2024 (continued)
| | |
Common Stocks — continued |
|
Banco Santander Chile, ADR | | |
|
Alibaba Group Holding Ltd. | | |
China Construction Bank Corp., Class H | | |
China Mengniu Dairy Co. Ltd. | | |
China Merchants Bank Co. Ltd., Class H | | |
China Petroleum & Chemical Corp., Class H | | |
China Resources Gas Group Ltd. | | |
China Yangtze Power Co. Ltd., Class A | | |
Fuyao Glass Industry Group Co. Ltd., Class A | | |
Fuyao Glass Industry Group Co. Ltd., Class H (a) | | |
Haier Smart Home Co. Ltd., Class A | | |
Haier Smart Home Co. Ltd., Class H | | |
Inner Mongolia Yili Industrial Group Co. Ltd., Class A | | |
| | |
Midea Group Co. Ltd., Class A | | |
| | |
Ping An Insurance Group Co. of China Ltd., Class H | | |
Shenzhou International Group Holdings Ltd. | | |
Sinopharm Group Co. Ltd., Class H | | |
| | |
Tingyi Cayman Islands Holding Corp. | | |
Wilmar International Ltd. | | |
Wuliangye Yibin Co. Ltd., Class A | | |
Zhejiang Supor Co. Ltd., Class A | | |
| | |
|
| | |
Novo Nordisk A/S, Class B | | |
| | |
| | |
| | |
|
| | |
| | |
| | |
| | |
| | |
| | |
| | |
| | |
|
|
| | |
| | |
| | |
| | |
|
| | |
| | |
| | |
| | |
| | |
| | |
| | |
| | |
| | |
Cie Generale des Etablissements Michelin SCA | | |
| | |
| | |
| | |
| | |
| | |
Gaztransport Et Technigaz SA | | |
| | |
La Francaise des Jeux SAEM (a) | | |
| | |
LVMH Moet Hennessy Louis Vuitton SE | | |
| | |
| | |
| | |
| | |
| | |
| | |
| | |
| | |
Unibail-Rodamco-Westfield, REIT | | |
| | |
| | |
| | |
| | |
|
| | |
| | |
| | |
SEE NOTES TO FINANCIAL STATEMENTS.
| | |
Common Stocks — continued |
|
| | |
Deutsche Telekom AG (Registered) | | |
| | |
| | |
| | |
| | |
| | |
| | |
| | |
Muenchener Rueckversicherungs- Gesellschaft AG (Registered) | | |
| | |
| | |
| | |
|
| | |
Cathay Pacific Airways Ltd. | | |
Hang Lung Properties Ltd. | | |
Henderson Land Development Co. Ltd. | | |
Hong Kong Exchanges & Clearing Ltd. | | |
Hysan Development Co. Ltd. | | |
New World Development Co. Ltd. | | |
Orient Overseas International Ltd. | | |
| | |
Power Assets Holdings Ltd. | | |
| | |
| | |
| | |
Yue Yuen Industrial Holdings Ltd. | | |
| | |
|
| | |
| | |
| | |
| | |
Power Grid Corp. of India Ltd. | | |
| | |
Tata Consultancy Services Ltd. | | |
| | |
|
Bank Mandiri Persero Tbk. PT | | |
| | |
|
|
Bank Rakyat Indonesia Persero Tbk. PT | | |
Telkom Indonesia Persero Tbk. PT | | |
| | |
|
| | |
| | |
| | |
| | |
|
| | |
| | |
| | |
|
| | |
| | |
| | |
| | |
| | |
| | |
| | |
| | |
| | |
| | |
FinecoBank Banca Fineco SpA | | |
| | |
| | |
| | |
Mediobanca Banca di Credito Finanziario SpA | | |
| | |
| | |
| | |
| | |
|
Activia Properties, Inc., REIT | | |
AEON REIT Investment Corp., REIT | | |
| | |
| | |
| | |
Chubu Electric Power Co., Inc. | | |
Chugoku Electric Power Co., Inc. (The) | | |
Dai Nippon Printing Co. Ltd. | | |
Dai-ichi Life Holdings, Inc. | | |
SEE NOTES TO FINANCIAL STATEMENTS.
JPMorgan Income Builder Fund
SCHEDULE OF PORTFOLIO INVESTMENTSAS OF October 31, 2024 (continued)
| | |
Common Stocks — continued |
|
| | |
Electric Power Development Co. Ltd. | | |
| | |
| | |
Frontier Real Estate Investment Corp., REIT | | |
| | |
| | |
Industrial & Infrastructure Fund Investment Corp., REIT | | |
| | |
| | |
Japan Exchange Group, Inc. | | |
Japan Metropolitan Fund Invest, REIT | | |
Japan Post Holdings Co. Ltd. | | |
Japan Prime Realty Investment Corp., REIT | | |
| | |
Kansai Electric Power Co., Inc. (The) | | |
KDX Realty Investment Corp., REIT | | |
| | |
| | |
| | |
Matsui Securities Co. Ltd. | | |
Mitsubishi Chemical Group Corp. | | |
Mori Hills REIT Investment Corp., REIT | | |
Nippon Building Fund, Inc., REIT | | |
| | |
Nippon Telegraph & Telephone Corp. | | |
| | |
Pola Orbis Holdings, Inc. | | |
| | |
Sekisui House REIT, Inc., REIT | | |
Shin-Etsu Chemical Co. Ltd. | | |
| | |
Sumitomo Rubber Industries Ltd. | | |
Takeda Pharmaceutical Co. Ltd. | | |
Tokio Marine Holdings, Inc. | | |
| | |
United Urban Investment Corp., REIT | | |
| | |
|
| | |
| | |
| | |
| | |
|
|
Grupo Financiero Banorte SAB de CV, Class O | | |
Kimberly-Clark de Mexico SAB de CV, Class A | | |
| | |
Wal-Mart de Mexico SAB de CV | | |
| | |
|
ABN AMRO Bank NV, CVA (a) | | |
| | |
| | |
BE Semiconductor Industries NV | | |
| | |
| | |
Koninklijke Ahold Delhaize NV | | |
| | |
| | |
| | |
| | |
| | |
| | |
| | |
| | |
|
| | |
|
| | |
| | |
| | |
| | |
| | |
| | |
| | |
| | |
| | |
| | |
Wallenius Wilhelmsen ASA (g) | | |
| | |
|
| | |
SEE NOTES TO FINANCIAL STATEMENTS.
| | |
Common Stocks — continued |
|
Powszechny Zaklad Ubezpieczen SA | | |
| | |
| | |
|
Banco Comercial Portugues SA, Class R | | |
| | |
| | |
|
Moscow Exchange MICEX-RTS PJSC ‡ | | |
Severstal PAO, GDR ‡ * (a) | | |
| | |
|
| | |
Saudi Arabian Oil Co. (a) | | |
Saudi National Bank (The) | | |
| | |
|
| | |
CapitaLand Ascendas, REIT | | |
| | |
| | |
| | |
Singapore Telecommunications Ltd. | | |
| | |
| | |
|
| | |
| | |
| | |
| | |
| | |
| | |
| | |
|
Hana Financial Group, Inc. | | |
| | |
| | |
| | |
| | |
| | |
Samsung Electronics Co. Ltd. | | |
| | |
|
|
Samsung Electronics Co. Ltd. (Preference) | | |
Samsung Fire & Marine Insurance Co. Ltd. | | |
Shinhan Financial Group Co. Ltd. | | |
| | |
Woori Financial Group, Inc. | | |
| | |
|
| | |
ACS Actividades de Construccion y Servicios SA | | |
| | |
Banco Bilbao Vizcaya Argentaria SA | | |
| | |
| | |
| | |
| | |
| | |
| | |
Industria de Diseno Textil SA | | |
| | |
| | |
| | |
| | |
| | |
|
Skandinaviska Enskilda Banken AB, Class A | | |
| | |
Svenska Handelsbanken AB, Class A | | |
| | |
| | |
| | |
| | |
|
| | |
| | |
Adecco Group AG (Registered) | | |
| | |
| | |
UBS Group AG (Registered) | | |
Zurich Insurance Group AG | | |
| | |
SEE NOTES TO FINANCIAL STATEMENTS.
JPMorgan Income Builder Fund
SCHEDULE OF PORTFOLIO INVESTMENTSAS OF October 31, 2024 (continued)
| | |
Common Stocks — continued |
|
| | |
ASE Technology Holding Co. Ltd. | | |
| | |
Novatek Microelectronics Corp. | | |
President Chain Store Corp. | | |
| | |
Realtek Semiconductor Corp. | | |
Taiwan Semiconductor Manufacturing Co. Ltd. | | |
Vanguard International Semiconductor Corp. | | |
| | |
| | |
| | |
|
| | |
Siam Cement PCL (The) (Registered) | | |
| | |
|
| | |
| | |
| | |
| | |
B&M European Value Retail SA | | |
| | |
| | |
| | |
| | |
Berkeley Group Holdings plc | | |
British American Tobacco plc | | |
British Land Co. plc (The), REIT | | |
| | |
| | |
Coca-Cola Europacific Partners plc | | |
| | |
| | |
| | |
| | |
| | |
| | |
| | |
InterContinental Hotels Group plc | | |
Intermediate Capital Group plc | | |
| | |
| | |
|
United Kingdom — continued |
| | |
| | |
| | |
Land Securities Group plc, REIT | | |
| | |
| | |
| | |
| | |
| | |
| | |
| | |
| | |
Phoenix Group Holdings plc | | |
| | |
| | |
| | |
| | |
| | |
| | |
| | |
| | |
| | |
| | |
|
| | |
| | |
| | |
| | |
American Electric Power Co., Inc. | | |
| | |
| | |
Annaly Capital Management, Inc., REIT | | |
| | |
| | |
| | |
| | |
| | |
| | |
| | |
| | |
| | |
| | |
| | |
SEE NOTES TO FINANCIAL STATEMENTS.
| | |
Common Stocks — continued |
United States — continued |
| | |
CF Industries Holdings, Inc. | | |
CH Robinson Worldwide, Inc. | | |
| | |
| | |
Citizens Financial Group, Inc. | | |
Claire's Stores, Inc. ‡ * (m) | | |
Clear Channel Outdoor Holdings, Inc. * | | |
| | |
| | |
| | |
| | |
| | |
| | |
| | |
Consolidated Edison, Inc. | | |
| | |
| | |
| | |
| | |
| | |
| | |
Digital Realty Trust, Inc., REIT | | |
| | |
| | |
| | |
| | |
| | |
| | |
| | |
| | |
| | |
| | |
Envision Healthcare Corp. ‡ * | | |
| | |
| | |
| | |
| | |
| | |
| | |
Fidelity National Information Services, Inc. | | |
| | |
| | |
Frontier Communications Parent, Inc. * | | |
| | |
|
United States — continued |
| | |
| | |
| | |
| | |
| | |
| | |
Healthpeak Properties, Inc., REIT | | |
Hewlett Packard Enterprise Co. | | |
| | |
Honeywell International, Inc. | | |
| | |
Host Hotels & Resorts, Inc., REIT | | |
| | |
iHeartMedia, Inc., Class A * | | |
| | |
International Business Machines Corp. | | |
International Flavors & Fragrances, Inc. | | |
| | |
Interpublic Group of Cos., Inc. (The) | | |
Iron Mountain, Inc., REIT | | |
| | |
| | |
| | |
| | |
| | |
| | |
| | |
| | |
| | |
| | |
| | |
| | |
LyondellBasell Industries NV, Class A | | |
| | |
| | |
Meta Platforms, Inc., Class A | | |
Microchip Technology, Inc. | | |
| | |
| | |
Mid-America Apartment Communities, Inc., REIT | | |
Moran Foods Backstop Equity ‡ * | | |
| | |
| | |
SEE NOTES TO FINANCIAL STATEMENTS.
JPMorgan Income Builder Fund
SCHEDULE OF PORTFOLIO INVESTMENTSAS OF October 31, 2024 (continued)
| | |
Common Stocks — continued |
United States — continued |
| | |
National CineMedia, Inc. * | | |
| | |
| | |
| | |
| | |
| | |
| | |
| | |
| | |
| | |
| | |
| | |
| | |
Philip Morris International, Inc. | | |
| | |
| | |
Procter & Gamble Co. (The) | | |
| | |
Prudential Financial, Inc. | | |
| | |
Regency Centers Corp., REIT | | |
| | |
| | |
| | |
| | |
| | |
Seagate Technology Holdings plc | | |
| | |
| | |
Simon Property Group, Inc., REIT | | |
| | |
| | |
| | |
| | |
| | |
| | |
T. Rowe Price Group, Inc. | | |
| | |
| | |
| | |
United Parcel Service, Inc., Class B | | |
| | |
| | |
| | |
|
United States — continued |
Venator Materials plc ‡ * | | |
| | |
Verizon Communications, Inc. | | |
VICI Properties, Inc., REIT | | |
| | |
| | |
Williams Cos., Inc. (The) | | |
Windstream Holdings, Inc. ‡ * | | |
| | |
| | |
| | |
Total Common Stocks
(Cost $2,310,680) | | |
Exchange-Traded Funds — 10.6% |
|
JPMorgan Equity Premium Income ETF (n) | | |
| | |
JPMorgan Nasdaq Equity Premium Income ETF (n) | | |
| | |
Total Exchange-Traded Funds
(Cost $838,740) | | |
| | |
Equity Linked Notes — 5.1% |
|
Royal Bank of Canada, ELN, 10.80%, 11/15/2024 (a) | | |
Royal Bank of Canada, ELN, 10.80%, 11/22/2024 (a) | | |
Royal Bank of Canada, ELN, 12.60%, 11/15/2024 (a) | | |
Royal Bank of Canada, ELN, 13.00%, 11/8/2024 (a) | | |
Royal Bank of Canada, ELN, 13.50%, 11/15/2024 (a) | | |
Royal Bank of Canada, ELN, 13.90%, 11/8/2024 (a) | | |
Royal Bank of Canada, ELN, 14.80%, 11/8/2024 (a) | | |
Royal Bank of Canada, ELN, 16.70%, 11/15/2024 (a) | | |
SEE NOTES TO FINANCIAL STATEMENTS.
| | |
Equity Linked Notes — continued |
|
Royal Bank of Canada, ELN, 16.70%, 11/15/2024 (a) | | |
Royal Bank of Canada, ELN, 16.70%, 11/22/2024 (a) | | |
Royal Bank of Canada, ELN, 16.70%, 11/29/2024 (a) | | |
Royal Bank of Canada, ELN, 17.20%, 11/29/2024 (a) | | |
Royal Bank of Canada, ELN, 17.60%, 11/29/2024 (a) | | |
Royal Bank of Canada, ELN, 17.70%, 11/29/2024 (a) | | |
Royal Bank of Canada, ELN, 18.70%, 11/8/2024 (a) | | |
Royal Bank of Canada, ELN, 19.30%, 11/22/2024 (a) | | |
Royal Bank of Canada, ELN, 19.30%, 11/22/2024 (a) | | |
Royal Bank of Canada, ELN, 23.10%, 11/22/2024 (a) | | |
Royal Bank of Canada, ELN, 7.50%, 11/29/2024 (a) | | |
Royal Bank of Canada, ELN, 7.70%, 11/22/2024 (a) | | |
Royal Bank of Canada, ELN, 8.90%, 11/15/2024 (a) | | |
Toronto-Dominion Bank (The), ELN, 12.90%, 11/8/2024 (a) | | |
Toronto-Dominion Bank (The), ELN, 14.30%, 11/15/2024 (a) | | |
Toronto-Dominion Bank (The), ELN, 14.40%, 11/15/2024 (a) | | |
Toronto-Dominion Bank (The), ELN, 15.40%, 11/8/2024 (a) | | |
Toronto-Dominion Bank (The), ELN, 21.60%, 11/8/2024 (a) | | |
Toronto-Dominion Bank (The), ELN, 27.80%, 11/15/2024 (a) | | |
| | |
|
BNP Paribas Issuance BV, ELN, 10.60%, 11/22/2024 (a) | | |
BNP Paribas Issuance BV, ELN, 11.30%, 11/15/2024 (a) | | |
BNP Paribas Issuance BV, ELN, 11.30%, 11/8/2024 (a) | | |
| | |
|
|
BNP Paribas Issuance BV, ELN, 15.40%, 11/8/2024 (a) | | |
BNP Paribas Issuance BV, ELN, 16.60%, 11/29/2024 (a) | | |
BNP Paribas Issuance BV, ELN, 19.20%, 11/8/2024 (a) | | |
BNP Paribas Issuance BV, ELN, 19.90%, 11/8/2024 (a) | | |
| | |
|
Nomura America Finance LLC, ELN, 11.60%, 11/15/2024 (a) | | |
Nomura America Finance LLC, ELN, 13.20%, 11/15/2024 (a) | | |
Nomura America Finance LLC, ELN, 17.30%, 11/22/2024 (a) | | |
| | |
|
Barclays Bank PLC, ELN, 16.30%, 11/29/2024 (a) | | |
Barclays Bank PLC, ELN, 16.70%, 11/15/2024 (a) | | |
Barclays Bank PLC, ELN, 18.90%, 11/8/2024 (a) | | |
Barclays Bank PLC, ELN, 19.80%, 11/15/2024 (a) | | |
Barclays Bank plc, ELN, 8.50%, 11/22/2024 (a) | | |
| | |
|
Citigroup Global Markets Holdings, Inc., ELN, 14.40%, 11/22/2024 (a) | | |
Citigroup Global Markets Holdings, Inc., ELN, 19.70%, 11/22/2024 (a) | | |
Goldman Sachs International, ELN, 14.60%, 11/15/2024 (a) | | |
Goldman Sachs International, ELN, 16.40%, 11/8/2024 (a) | | |
Goldman Sachs International, ELN, 18.10%, 11/15/2024 (a) | | |
Morgan Stanley Finance LLC, ELN, 13.20%, 11/8/2024 (a) | | |
Morgan Stanley Finance LLC, ELN, 16.70%, 11/8/2024 (a) | | |
SEE NOTES TO FINANCIAL STATEMENTS.
JPMorgan Income Builder Fund
SCHEDULE OF PORTFOLIO INVESTMENTSAS OF October 31, 2024 (continued)
| | |
Equity Linked Notes — continued |
United States — continued |
Morgan Stanley Finance LLC, ELN, 18.10%, 11/29/2024 (a) | | |
Morgan Stanley Finance LLC, ELN, 21.30%, 11/8/2024 (a) | | |
Morgan Stanley Finance LLC, ELN, 22.30%, 11/29/2024 (a) | | |
Societe Generale SA, ELN, 12.00%, 11/15/2024 (a) | | |
Societe Generale SA, ELN, 14.00%, 11/29/2024 (a) | | |
Societe Generale SA, ELN, 15.30%, 11/22/2024 (a) | | |
Societe Generale SA, ELN, 17.60%, 11/29/2024 (a) | | |
Societe Generale SA, ELN, 18.20%, 11/29/2024 (a) | | |
Societe Generale SA, ELN, 21.20%, 11/22/2024 (a) | | |
Societe Generale SA, ELN, 21.60%, 11/29/2024 (a) | | |
Societe Generale SA, ELN, 22.60%, 11/22/2024 (a) | | |
Societe Generale SA, ELN, 22.80%, 11/22/2024 (a) | | |
Wells Fargo Bank NA, ELN, 12.20%, 11/22/2024 (a) | | |
Wells Fargo Bank NA, ELN, 13.00%, 11/22/2024 (a) | | |
Wells Fargo Bank NA, ELN, 13.70%, 11/29/2024 (a) | | |
Wells Fargo Bank NA, ELN, 14.20%, 11/22/2024 (a) | | |
Wells Fargo Bank NA, ELN, 15.30%, 11/29/2024 (a) | | |
Wells Fargo Bank NA, ELN, 17.50%, 11/29/2024 (a) | | |
Wells Fargo Bank NA, ELN, 31.70%, 11/29/2024 (a) | | |
Wells Fargo Bank NA, ELN, 4.90%, 11/29/2024 (a) | | |
| | |
Total Equity Linked Notes
(Cost $445,182) | | |
| | |
Commercial Mortgage-Backed Securities — 4.2% |
|
| | |
Series 2019-BN16, Class D, 3.00%, 2/15/2052 (b) | | |
Series 2019-BN16, Class F, 3.68%, 2/15/2052 (b) (k) | | |
Series 2019-BN21, Class F, 2.68%, 10/17/2052 (b) | | |
Series 2019-BN23, Class D, 2.50%, 12/15/2052 (b) | | |
Series 2021-BN31, Class E, 2.50%, 2/15/2054 (b) (k) | | |
Series 2017-BNK5, Class D, 3.08%, 6/15/2060 (b) (k) | | |
Series 2018-BN14, Class F, 3.94%, 9/15/2060 (b) | | |
Series 2019-BN19, Class C, 4.03%, 8/15/2061 (k) | | |
Series 2018-BN15, Class E, 3.00%, 11/15/2061 (b) | | |
Series 2019-BN24, Class D, 2.50%, 11/15/2062 (b) | | |
Series 2019-BN24, Class C, 3.52%, 11/15/2062 (k) | | |
Series 2020-BN26, Class D, 2.50%, 3/15/2063 (b) | | |
Series 2020-BN28, Class E, 2.50%, 3/15/2063 (b) | | |
BBCMS Mortgage Trust Series 2017-C1, Class D, 3.53%, 2/15/2050 (b) (k) | | |
| | |
Series 2018-B1, Class D, 2.75%, 1/15/2051 (b) | | |
Series 2019-B9, Class F, 3.74%, 3/15/2052 (b) (k) | | |
Series 2019-B11, Class D, 3.00%, 5/15/2052 (b) | | |
Series 2019-B11, Class C, 3.75%, 5/15/2052 (k) | | |
Series 2020-B21, Class E, 2.00%, 12/17/2053 (b) | | |
Series 2019-B14, Class E, 2.50%, 12/15/2062 (b) | | |
Series 2019-B15, Class E, 2.75%, 12/15/2072 (b) | | |
BX Series 2021-MFM1, Class G, 8.82%, 1/15/2034 (b) (k) | | |
SEE NOTES TO FINANCIAL STATEMENTS.
| | |
Commercial Mortgage-Backed Securities — continued |
United States — continued |
| | |
Series 2016-CD2, Class C, 3.98%, 11/10/2049 (k) | | |
Series 2017-CD4, Class D, 3.30%, 5/10/2050 (b) | | |
Series 2017-CD5, Class D, 3.35%, 8/15/2050 (b) | | |
Series 2017-CD6, Class C, 4.23%, 11/13/2050 (k) | | |
Series 2018-CD7, Class D, 3.09%, 8/15/2051 (b) (k) | | |
Series 2019-CD8, Class E, 3.00%, 8/15/2057 (b) | | |
CFCRE Commercial Mortgage Trust Series 2016-C6, Class D, 4.17%, 11/10/2049 (b) (k) | | |
CGMS Commercial Mortgage Trust Series 2017-B1, Class E, 3.30%, 8/15/2050 (b) (k) | | |
Citigroup Commercial Mortgage Trust | | |
Series 2015-GC27, Class D, 4.39%, 2/10/2048 (b) (k) | | |
Series 2015-GC29, Class C, 4.20%, 4/10/2048 (k) | | |
Series 2015-P1, Class D, 3.23%, 9/15/2048 (b) | | |
Series 2016-C1, Class D, 4.94%, 5/10/2049 (b) (k) | | |
Series 2016-C2, Class D, 3.25%, 8/10/2049 (b) (k) | | |
Series 2016-P6, Class D, 3.25%, 12/10/2049 (b) | | |
Series 2017-P7, Class B, 4.14%, 4/14/2050 (k) | | |
Series 2017-P7, Class C, 4.38%, 4/14/2050 (k) | | |
Series 2020-GC46, Class E, 2.60%, 2/15/2053 (b) | | |
COLEM Mortgage Trust Series 2022-HLNE, Class A, 2.46%, 4/12/2042 (b) (k) | | |
Commercial Mortgage Trust | | |
Series 2020-CBM, Class F, 3.63%, 2/10/2037 (b) (k) | | |
Series 2014-CR15, Class C, 3.98%, 2/10/2047 (k) | | |
Series 2014-LC15, Class D, 4.77%, 4/10/2047 (b) (k) | | |
| | |
|
United States — continued |
Series 2014-CR19, Class D, 4.54%, 8/10/2047 (b) (k) | | |
Series 2014-UBS5, Class D, 3.50%, 9/10/2047 (b) | | |
Series 2014-LC17, Class D, 3.69%, 10/10/2047 (b) | | |
Series 2015-CR22, Class E, 3.00%, 3/10/2048 (b) | | |
Series 2015-CR22, Class D, 4.11%, 3/10/2048 (b) (k) | | |
Series 2015-LC21, Class D, 4.31%, 7/10/2048 (k) | | |
Series 2015-CR24, Class D, 3.46%, 8/10/2048 (k) | | |
Series 2015-CR25, Class D, 3.77%, 8/10/2048 (k) | | |
Series 2015-CR27, Class D, 3.45%, 10/10/2048 (b) (k) | | |
Series 2015-CR26, Class D, 3.46%, 10/10/2048 (k) | | |
Series 2015-LC23, Class D, 3.54%, 10/10/2048 (b) (k) | | |
Series 2015-LC23, Class E, 3.54%, 10/10/2048 (b) (k) | | |
Series 2016-CR28, Class D, 3.84%, 2/10/2049 (k) | | |
Series 2016-CR28, Class C, 4.59%, 2/10/2049 (k) | | |
Series 2018-COR3, Class D, 2.81%, 5/10/2051 (b) (k) | | |
CSAIL Commercial Mortgage Trust | | |
Series 2015-C4, Class C, 4.55%, 11/15/2048 (k) | | |
Series 2015-C2, Class B, 4.21%, 6/15/2057 (k) | | |
| | |
Series 2016-C3, Class D, 3.48%, 8/10/2049 (b) (k) | | |
Series 2016-C3, Class E, 4.23%, 8/10/2049 (b) (k) | | |
FHLMC, Multi-Class Certificates | | |
Series 2020-RR05, Class X, IO, 2.01%, 1/27/2029 | | |
Series 2020-RR14, Class X, IO, 2.13%, 3/27/2034 (k) | | |
SEE NOTES TO FINANCIAL STATEMENTS.
JPMorgan Income Builder Fund
SCHEDULE OF PORTFOLIO INVESTMENTSAS OF October 31, 2024 (continued)
| | |
Commercial Mortgage-Backed Securities — continued |
United States — continued |
FHLMC, Multi-Family Structured Credit Risk | | |
Series 2021-MN2, Class B1, 10.36%, 7/25/2041 (b) (k) | | |
Series 2022-MN5, Class B1, 14.36%, 11/25/2042 (b) (k) | | |
Series 2021-MN1, Class M1, 6.86%, 1/25/2051 (b) (k) | | |
Series 2021-MN1, Class M2, 8.61%, 1/25/2051 (b) (k) | | |
Series 2021-MN1, Class B1, 12.61%, 1/25/2051 (b) (k) | | |
Series 2021-MN3, Class M1, 7.16%, 11/25/2051 (b) (k) | | |
FHLMC, Multi-Family Structured Pass-Through Certificates | | |
Series KC03, Class X1, IO, 0.43%, 11/25/2024 (k) | | |
Series K734, Class X3, IO, 2.17%, 7/25/2026 (k) | | |
Series KC04, Class X1, IO, 1.25%, 12/25/2026 (k) | | |
Series K084, Class X3, IO, 2.24%, 11/25/2028 (k) | | |
Series K090, Class X3, IO, 2.31%, 10/25/2029 (k) | | |
Series Q012, Class X, IO, 4.06%, 9/25/2035 (k) | | |
Series K727, Class X3, IO, 3.39%, 10/25/2044 (k) | | |
Series K060, Class X3, IO, 1.90%, 12/25/2044 (k) | | |
Series K061, Class X3, IO, 1.98%, 12/25/2044 (k) | | |
Series K728, Class X3, IO, 4.11%, 11/25/2045 (k) | | |
Series K089, Class X3, IO, 2.30%, 1/25/2046 (k) | | |
Series K087, Class X3, IO, 2.32%, 1/25/2046 (k) | | |
Series K102, Class X3, IO, 1.89%, 12/25/2046 (k) | | |
Series K088, Class X3, IO, 2.35%, 2/25/2047 (k) | | |
Series K093, Class X3, IO, 2.21%, 5/25/2047 (k) | | |
Series K116, Class X3, IO, 3.02%, 9/25/2047 (k) | | |
| | |
|
United States — continued |
Series K108, Class X3, IO, 3.49%, 4/25/2048 (k) | | |
| | |
Series 2019-M21, Class X2, IO, 1.28%, 2/25/2031 (k) | | |
Series 2020-M37, Class X, IO, 1.02%, 4/25/2032 (k) | | |
Series 2016-M4, Class X2, IO, 2.70%, 1/25/2039 (k) | | |
| | |
Series 2018-KF47, Class B, 7.28%, 5/25/2025 (b) (k) | | |
Series 2019-KC03, Class B, 4.33%, 1/25/2026 (b) (k) | | |
Series 2019-KF58, Class B, 7.43%, 1/25/2026 (b) (k) | | |
Series 2019-KF62, Class B, 7.33%, 4/25/2026 (b) (k) | | |
Series 2017-KL1E, Class BE, 3.91%, 2/25/2027 (b) (k) | | |
Series 2017-KF33, Class B, 7.83%, 6/25/2027 (b) (k) | | |
Series 2017-KF40, Class B, 7.98%, 11/25/2027 (b) (k) | | |
Series 2018-KF43, Class B, 7.43%, 1/25/2028 (b) (k) | | |
Series 21K-F116, Class CS, 11.56%, 6/25/2028 (b) (k) | | |
Series 2018-KF50, Class B, 7.18%, 7/25/2028 (b) (k) | | |
Series 2019-KG01, Class B, 4.16%, 4/25/2029 (b) (k) | | |
Series 2019-KW09, Class X2A, IO, 0.10%, 5/25/2029 (b) | | |
Series 2019-KW09, Class C, PO, 6/25/2029 (b) | | |
Series 2019-KW09, Class X2B, IO, 0.10%, 6/25/2029 (b) | | |
Series 2022-KF132, Class CS, 11.56%, 2/25/2032 (b) (k) | | |
Series 2023-KF149, Class CS, 11.31%, 12/25/2032 (b) (k) | | |
Series 2017-K724, Class D, PO, 12/25/2049 (b) | | |
Series 2017-K724, Class X2B, IO, 0.10%, 12/25/2049 (b) | | |
SEE NOTES TO FINANCIAL STATEMENTS.
| | |
Commercial Mortgage-Backed Securities — continued |
United States — continued |
| | |
Series 2012-89, IO, 0.09%, 12/16/2053 (k) | | |
Series 2019-53, Class IA, IO, 0.77%, 6/16/2061 (k) | | |
Series 2021-169, IO, 1.11%, 6/16/2061 (k) | | |
Series 2021-153, Class SA, IF, IO, 3.60%, 8/16/2061 (k) | | |
Series 2020-2, IO, 0.59%, 3/16/2062 (k) | | |
Series 2020-169, IO, 0.85%, 7/16/2062 (k) | | |
Series 2021-33, IO, 0.84%, 10/16/2062 (k) | | |
Series 2020-145, IO, 0.73%, 3/16/2063 (k) | | |
Series 2021-10, IO, 0.99%, 5/16/2063 (k) | | |
Series 2024-32, IO, 0.71%, 6/16/2063 (k) | | |
Series 2023-28, IO, 0.85%, 2/16/2065 (k) | | |
GS Mortgage Securities Trust | | |
Series 2012-GCJ9, Class D, 4.60%, 11/10/2045 (b) (k) | | |
Series 2015-GC28, Class D, 4.36%, 2/10/2048 (b) (k) | | |
Series 2016-GS2, Class D, 2.75%, 5/10/2049 (b) | | |
Series 2017-GS5, Class D, 3.51%, 3/10/2050 (b) (k) | | |
Series 2017-GS6, Class D, 3.24%, 5/10/2050 (b) | | |
Series 2015-GC30, Class D, 3.38%, 5/10/2050 | | |
Series 2019-GC40, Class D, 3.00%, 7/10/2052 (b) | | |
Series 2019-GC40, Class E, 3.00%, 7/10/2052 (b) | | |
Series 2020-GC45, Class D, 2.85%, 2/13/2053 (b) (k) | | |
JPMBB Commercial Mortgage Securities Trust | | |
Series 2013-C15, Class E, 3.50%, 11/15/2045 (b) | | |
| | |
|
United States — continued |
Series 2014-C26, Class D, 3.83%, 1/15/2048 (b) (k) | | |
Series 2014-C26, Class C, 4.33%, 1/15/2048 (k) | | |
Series 2015-C33, Class C, 4.64%, 12/15/2048 (k) | | |
Series 2016-C1, Class D2, 4.20%, 3/17/2049 (b) (k) | | |
Series 2016-C1, Class C, 4.70%, 3/17/2049 (k) | | |
JPMCC Commercial Mortgage Securities Trust Series 2017-JP5, Class D, 4.50%, 3/15/2050 (b) (k) | | |
JPMDB Commercial Mortgage Securities Trust Series 2016-C4, Class D, 3.04%, 12/15/2049 (b) (k) | | |
JPMorgan Chase Commercial Mortgage Securities Trust Series 2016-JP3, Class D, 3.42%, 8/15/2049 (b) (k) | | |
LB-UBS Commercial Mortgage Trust Series 2006-C6, Class AJ, 5.45%, 9/15/2039 (k) | | |
Morgan Stanley Bank of America Merrill Lynch Trust | | |
Series 2012-C5, Class G, 4.50%, 8/15/2045 (b) | | |
Series 2014-C16, Class C, 4.72%, 6/15/2047 (k) | | |
Series 2014-C19, Class D, 3.25%, 12/15/2047 (b) | | |
Series 2015-C20, Class C, 4.42%, 2/15/2048 (k) | | |
Series 2015-C24, Class D, 3.26%, 5/15/2048 (b) | | |
Series 2015-C25, Class C, 4.52%, 10/15/2048 (k) | | |
Series 2016-C31, Class C, 4.26%, 11/15/2049 (k) | | |
Morgan Stanley Capital I Trust | | |
Series 2018-MP, Class D, 4.28%, 7/11/2040 (b) (k) | | |
Series 2018-L1, Class E, 3.00%, 10/15/2051 (b) | | |
Series 2019-L2, Class D, 3.00%, 3/15/2052 (b) | | |
Series 2019-L2, Class E, 3.00%, 3/15/2052 (b) | | |
SEE NOTES TO FINANCIAL STATEMENTS.
JPMorgan Income Builder Fund
SCHEDULE OF PORTFOLIO INVESTMENTSAS OF October 31, 2024 (continued)
| | |
Commercial Mortgage-Backed Securities — continued |
United States — continued |
| | |
Series 2019-PARK, Class F, 2.72%, 12/15/2036 (b) | | |
Series 2019-PARK, Class G, 2.72%, 12/15/2036 (b) | | |
Series 2019-PARK, Class J, 4.25%, 12/15/2036 (b) | | |
Multi-Family Connecticut Avenue Securities Trust | | |
Series 2019-01, Class M10, 8.22%, 10/25/2049 (b) (k) | | |
Series 2020-01, Class M10, 8.72%, 3/25/2050 (b) (k) | | |
NYC Commercial Mortgage Trust Series 2021-909, Class E, 3.21%, 4/10/2043 (b) (k) | | |
ROCK Trust Series 2024-CNTR, Class E, 8.82%, 11/13/2041 (b) | | |
VASA Trust Series 2021-VASA, Class G, 9.92%, 7/15/2039 (b) (k) | | |
Velocity Commercial Capital Loan Trust | | |
Series 2018-2, Class A, 4.05%, 10/26/2048 (b) (k) | | |
Series 2018-2, Class M2, 4.51%, 10/26/2048 (b) (k) | | |
Series 2018-2, Class M3, 4.72%, 10/26/2048 (b) (k) | | |
Wells Fargo Commercial Mortgage Trust | | |
Series 2021-SAVE, Class E, 8.57%, 2/15/2040 (b) (k) | | |
Series 2015-NXS1, Class E, 2.88%, 5/15/2048 (b) (k) | | |
Series 2015-C28, Class D, 4.07%, 5/15/2048 (k) | | |
Series 2016-C35, Class D, 3.14%, 7/15/2048 (b) | | |
Series 2018-C43, Class D, 3.00%, 3/15/2051 (b) | | |
Series 2018-C44, Class D, 3.00%, 5/15/2051 (b) | | |
Series 2019-C52, Class XA, IO, 1.56%, 8/15/2052 (k) | | |
Series 2015-NXS3, Class D, 3.15%, 9/15/2057 (b) | | |
| | |
|
United States — continued |
WFRBS Commercial Mortgage Trust Series 2014-C22, Class D, 3.77%, 9/15/2057 (b) (k) | | |
Total Commercial Mortgage-Backed Securities
(Cost $408,809) | | |
Collateralized Mortgage Obligations — 3.7% |
|
Adjustable Rate Mortgage Trust | | |
Series 2004-2, Class 6A1, 6.32%, 2/25/2035 (k) | | |
Series 2005-2, Class 3A1, 6.33%, 6/25/2035 (k) | | |
| | |
Series 2004-28CB, Class 4A1, 5.00%, 1/25/2020 | | |
Series 2005-50CB, Class 4A1, 5.00%, 11/25/2020 | | |
Series 2005-85CB, Class 3A2, 5.25%, 2/25/2021 | | |
Series 2007-9T1, Class 3A1, 5.50%, 5/25/2022 ‡ | | |
Series 2005-J6, Class 2A1, 5.50%, 7/25/2025 | | |
Series 2006-J3, Class 4A1, 5.75%, 5/25/2026 | | |
Series 2005-J1, Class 3A1, 6.50%, 8/25/2032 | | |
Series 2004-12CB, Class 2A1, 6.00%, 6/25/2034 | | |
Series 2004-28CB, Class 2A4, 5.75%, 1/25/2035 | | |
Series 2004-28CB, Class 6A1, 6.00%, 1/25/2035 | | |
Series 2004-32CB, Class 2A5, 5.50%, 2/25/2035 | | |
Series 2005-J2, Class 1A5, 5.35%, 4/25/2035 (k) | | |
Series 2005-6CB, Class 1A4, 5.50%, 4/25/2035 | | |
Series 2005-6CB, Class 1A6, 5.50%, 4/25/2035 | | |
Series 2005-13CB, Class A4, 5.50%, 5/25/2035 | | |
Series 2005-21CB, Class A4, 5.25%, 6/25/2035 | | |
SEE NOTES TO FINANCIAL STATEMENTS.
| | |
Collateralized Mortgage Obligations — continued |
United States — continued |
Series 2005-21CB, Class A17, 6.00%, 6/25/2035 | | |
Series 2005-20CB, Class 1A1, 5.50%, 7/25/2035 | | |
Series 2005-23CB, Class A15, 5.50%, 7/25/2035 | | |
Series 2005-64CB, Class 1A1, 5.50%, 12/25/2035 | | |
Series 2005-64CB, Class 1A15, 5.50%, 12/25/2035 | | |
Series 2005-J14, Class A3, 5.50%, 12/25/2035 | | |
Series 2005-J14, Class A7, 5.50%, 12/25/2035 | | |
Series 2005-J14, Class A8, 5.50%, 12/25/2035 | | |
Series 2005-86CB, Class A4, 5.50%, 2/25/2036 | | |
Series 2006-J1, Class 1A13, 5.50%, 2/25/2036 | | |
Series 2006-4CB, Class 2A5, 5.50%, 4/25/2036 | | |
Series 2006-14CB, Class A1, 6.00%, 6/25/2036 | | |
Series 2006-19CB, Class A15, 6.00%, 8/25/2036 | | |
Series 2006-25CB, Class A2, 6.00%, 10/25/2036 | | |
Series 2006-41CB, Class 2A13, 5.75%, 1/25/2037 | | |
Series 2007-8CB, Class A9, 6.00%, 5/25/2037 | | |
Series 2007-19, Class 1A8, 6.00%, 8/25/2037 | | |
American Home Mortgage Investment Trust Series 2007-2, Class 12A1, 5.39%, 3/25/2037 (k) | | |
| | |
Series 2019-5, Class B1, 3.96%, 10/25/2049 (b) (k) | | |
Series 2019-6, Class B1, 3.94%, 11/25/2059 (b) (k) | | |
Series 2019-6, Class B3, 6.00%, 11/25/2059 (b) (k) | | |
Angel Oak Mortgage Trust I LLC Series 2019-2, Class B2, 6.29%, 3/25/2049 (b) (k) | | |
| | |
|
United States — continued |
Banc of America Alternative Loan Trust | | |
Series 2006-4, Class 2A1, 6.00%, 3/25/2029 | | |
Series 2005-11, Class 4A5, 5.75%, 12/25/2035 | | |
Series 2006-4, Class 3CB4, 6.00%, 5/25/2046 | | |
Series 2006-4, Class 4CB1, 6.50%, 5/25/2046 | | |
Series 2006-5, Class CB7, 6.00%, 6/25/2046 | | |
Banc of America Funding Trust | | |
Series 2007-4, Class 8A1, 5.50%, 11/25/2034 | | |
Series 2005-6, Class 1A2, 5.50%, 10/25/2035 | | |
Series 2005-7, Class 4A7, 6.00%, 11/25/2035 | | |
Series 2006-A, Class 1A1, 6.49%, 2/20/2036 (k) | | |
Series 2006-2, Class 2A20, 5.75%, 3/25/2036 | | |
Series 2007-5, Class 4A1, 5.22%, 7/25/2037 (k) | | |
Banc of America Mortgage Trust | | |
Series 2004-A, Class 2A2, 5.58%, 2/25/2034 (k) | | |
Series 2007-3, Class 1A1, 6.00%, 9/25/2037 | | |
Bear Stearns ALT-A Trust Series 2006-8, Class 3A1, 5.17%, 2/25/2034 (k) | | |
Bear Stearns Asset-Backed Securities I Trust Series 2004-AC5, Class M1, 5.86%, 10/25/2034 (k) | | |
BRAVO Residential Funding Trust | | |
Series 2023-NQM5, Class B1, 7.44%, 6/25/2063 (b) (k) | | |
Series 2023-NQM7, Class A1, 7.13%, 9/25/2063 (b) (h) | | |
Chase Mortgage Finance Trust | | |
Series 2006-S3, Class 1A2, 6.00%, 11/25/2036 | | |
Series 2006-S4, Class A5, 6.00%, 12/25/2036 | | |
Series 2007-S2, Class 1A8, 6.00%, 3/25/2037 | | |
SEE NOTES TO FINANCIAL STATEMENTS.
JPMorgan Income Builder Fund
SCHEDULE OF PORTFOLIO INVESTMENTSAS OF October 31, 2024 (continued)
| | |
Collateralized Mortgage Obligations — continued |
United States — continued |
CHL Mortgage Pass-Through Trust | | |
Series 2005-20, Class A7, 5.25%, 12/25/2027 | | |
Series 2004-25, Class 2A1, 5.53%, 2/25/2035 (k) | | |
Series 2005-26, Class 1A11, 5.50%, 11/25/2035 | | |
Series 2005-31, Class 2A1, 4.15%, 1/25/2036 (k) | | |
Series 2005-30, Class A5, 5.50%, 1/25/2036 | | |
Series 2006-HYB1, Class 2A2C, 4.51%, 3/20/2036 (k) | | |
Series 2006-HYB2, Class 2A1B, 4.60%, 4/20/2036 (k) | | |
Series 2006-J2, Class 1A1, 6.00%, 4/25/2036 | | |
Series 2006-10, Class 1A16, 6.00%, 5/25/2036 | | |
Series 2006-17, Class A2, 6.00%, 12/25/2036 | | |
Series 2006-18, Class 2A4, 6.00%, 12/25/2036 | | |
Series 2007-2, Class A2, 6.00%, 3/25/2037 | | |
Series 2007-3, Class A18, 6.00%, 4/25/2037 | | |
Series 2007-10, Class A4, 5.50%, 7/25/2037 | | |
Series 2007-13, Class A4, 6.00%, 8/25/2037 | | |
Series 2007-16, Class A1, 6.50%, 10/25/2037 | | |
Series 2007-18, Class 2A1, 6.50%, 11/25/2037 | | |
Series 2006-OA5, Class 2A1, 5.25%, 4/25/2046 (k) | | |
Citicorp Mortgage Securities Trust Series 2007-4, Class 1A9, 6.00%, 5/25/2037 | | |
Citigroup Mortgage Loan Trust | | |
Series 2005-9, Class 2A2, 5.50%, 11/25/2035 | | |
Series 2006-AR3, Class 1A1A, 5.73%, 6/25/2036 (k) | | |
Series 2006-AR5, Class 1A5A, 4.96%, 7/25/2036 (k) | | |
| | |
|
United States — continued |
Citigroup Mortgage Loan Trust, Inc. | | |
Series 2005-6, Class A1, 6.00%, 9/25/2035 (k) | | |
Series 2006-8, Class A3, 5.31%, 10/25/2035 (b) (k) | | |
| | |
Series 2021-3, Class B1, 3.06%, 9/27/2066 (b) (k) | | |
Series 2021-5, Class B2, 4.16%, 11/26/2066 (b) (k) | | |
Series 2022-1, Class B2, 4.06%, 12/27/2066 (b) (k) | | |
Series 2023-2, Class A1, 6.60%, 7/25/2068 (b) (h) | | |
Series 2023-4, Class A1, 7.16%, 10/25/2068 (b) (h) | | |
Connecticut Avenue Securities Trust | | |
Series 2019-R04, Class 2B1, 10.22%, 6/25/2039 (b) (k) | | |
Series 2019-R05, Class 1B1, 9.07%, 7/25/2039 (b) (k) | | |
Series 2019-R06, Class 2B1, 8.72%, 9/25/2039 (b) (k) | | |
Series 2019-R07, Class 1B1, 8.37%, 10/25/2039 (b) (k) | | |
Series 2020-R02, Class 2B1, 7.97%, 1/25/2040 (b) (k) | | |
Series 2020-R01, Class 1B1, 8.22%, 1/25/2040 (b) (k) | | |
Series 2021-R01, Class 1B1, 7.96%, 10/25/2041 (b) (k) | | |
Series 2021-R03, Class 1B2, 10.36%, 12/25/2041 (b) (k) | | |
Series 2022-R01, Class 1B2, 10.86%, 12/25/2041 (b) (k) | | |
Series 2023-R02, Class 1M1, 7.16%, 1/25/2043 (b) (k) | | |
Series 2023-R06, Class 1M2, 7.56%, 7/25/2043 (b) (k) | | |
Series 2024-R02, Class 1M2, 6.66%, 2/25/2044 (b) (k) | | |
CSFB Mortgage-Backed Pass-Through Certificates | | |
Series 2005-10, Class 11A1, 5.50%, 11/25/2020 | | |
Series 2004-AR4, Class 2A1, 5.70%, 5/25/2034 (k) | | |
SEE NOTES TO FINANCIAL STATEMENTS.
| | |
Collateralized Mortgage Obligations — continued |
United States — continued |
Series 2004-AR4, Class 4A1, 6.63%, 5/25/2034 (k) | | |
Series 2004-AR5, Class 6A1, 6.37%, 6/25/2034 (k) | | |
Series 2004-4, Class 4A1, 5.50%, 8/25/2034 | | |
Series 2005-4, Class 2A5, 5.40%, 6/25/2035 (k) | | |
Series 2005-10, Class 5A3, 5.50%, 11/25/2035 | | |
CSFB Mortgage-Backed Trust Series 2004-AR6, Class 7A1, 6.56%, 10/25/2034 (k) | | |
CSMC Mortgage-Backed Trust | | |
Series 2006-8, Class 5A1, 5.50%, 10/25/2026 (k) | | |
Series 2007-2, Class 3A13, 5.50%, 3/25/2037 | | |
Deephaven Residential Mortgage Trust | | |
Series 2021-3, Class B2, 4.13%, 8/25/2066 (b) (k) | | |
Series 2021-4, Class B1, 4.16%, 11/25/2066 (b) (k) | | |
Series 2021-4, Class B2, 4.44%, 11/25/2066 (b) (k) | | |
Series 2022-1, Class B1, 4.28%, 1/25/2067 (b) (k) | | |
Series 2022-1, Class B2, 4.28%, 1/25/2067 (b) (k) | | |
Deutsche Alt-A Securities, Inc. Mortgage Loan Trust Series 2005-1, Class 2A1, 3.41%, 2/25/2020 (k) | | |
DSLA Mortgage Loan Trust Series 2005-AR4, Class 2A1A, 5.39%, 8/19/2045 (k) | | |
FHLMC Seasoned Credit Risk Transfer Trust Series 2017-3, Class A, IO, 0.00%, 7/25/2056 (k) | | |
| | |
Series 2021-DNA2, Class B2, 10.86%, 8/25/2033 (b) (k) | | |
Series 2021-DNA5, Class B2, 10.36%, 1/25/2034 (b) (k) | | |
Series 2021-DNA6, Class B1, 8.26%, 10/25/2041 (b) (k) | | |
Series 2023-HQA1, Class M1A, 6.86%, 5/25/2043 (b) (k) | | |
Series 2020-HQA1, Class B2, 10.07%, 1/25/2050 (b) (k) | | |
| | |
|
United States — continued |
Series 2021-DNA1, Class B2, 9.61%, 1/25/2051 (b) (k) | | |
First Horizon Alternative Mortgage Securities Trust Series 2006-FA6, Class 3A1, 5.75%, 11/25/2021 | | |
FNMA, Connecticut Avenue Securities Series 2021-R02, Class 2B2, 11.06%, 11/25/2041 (b) (k) | | |
GCAT Trust Series 2020-NQM1, Class B1, 3.64%, 1/25/2060 (b) (k) | | |
GMACM Mortgage Loan Trust | | |
Series 2004-AR2, Class 3A, 5.15%, 8/19/2034 (k) | | |
Series 2005-AR1, Class 3A, 3.90%, 3/18/2035 (k) | | |
GSMSC Pass-Through Trust Series 2008-2R, Class 2A1, 7.50%, 10/25/2036 (b) (k) | | |
| | |
Series 2004-15F, Class 1A2, 5.50%, 12/25/2034 | | |
Series 2005-1F, Class 2A3, 6.00%, 2/25/2035 | | |
Series 2005-AR3, Class 6A1, 4.49%, 5/25/2035 (k) | | |
Series 2005-6F, Class 3A18, 5.50%, 7/25/2035 | | |
Series 2005-AR4, Class 3A5, 5.67%, 7/25/2035 (k) | | |
Series 2005-AR7, Class 6A1, 4.73%, 11/25/2035 (k) | | |
Series 2006-1F, Class 2A16, 6.00%, 2/25/2036 | | |
Series 2006-1F, Class 2A9, 6.00%, 2/25/2036 | | |
Series 2006-9F, Class 3A1, 6.25%, 10/25/2036 | | |
Series 2007-1F, Class 3A13, 6.00%, 1/25/2037 | | |
HarborView Mortgage Loan Trust Series 2005-11, Class 2A1A, 5.49%, 8/19/2045 (k) | | |
| | |
Series 2004-5, Class 1A1, 5.57%, 10/25/2034 (k) | | |
Series 2004-5, Class 1M2, 5.72%, 10/25/2034 (k) | | |
Series 2004-7, Class 1A2, 5.77%, 11/25/2034 (k) | | |
SEE NOTES TO FINANCIAL STATEMENTS.
JPMorgan Income Builder Fund
SCHEDULE OF PORTFOLIO INVESTMENTSAS OF October 31, 2024 (continued)
| | |
Collateralized Mortgage Obligations — continued |
United States — continued |
Series 2004-10, Class 2A, 5.49%, 3/25/2035 (k) | | |
Series 2005-1, Class 1A1, 5.37%, 4/25/2035 (k) | | |
Series 2005-1, Class 1A2, 5.47%, 4/25/2035 (k) | | |
Series 2005-2, Class 1A2, 5.47%, 4/25/2035 (k) | | |
Impac Secured Assets CMN Owner Trust Series 2003-2, Class A4, 3.75%, 8/25/2033 | | |
Impac Secured Assets Trust | | |
Series 2007-3, Class A1B, 5.33%, 9/25/2037 (k) | | |
Series 2007-3, Class A1C, 5.57%, 9/25/2037 (k) | | |
IndyMac INDX Mortgage Loan Trust | | |
Series 2005-AR3, Class 3A1, 4.47%, 4/25/2035 (k) | | |
Series 2005-AR14, Class 2A1A, 5.45%, 7/25/2035 (k) | | |
Series 2007-AR21, Class 6A1, 4.02%, 9/25/2037 (k) | | |
| | |
Series 2006-S3, Class 2A4, 5.50%, 8/25/2021 | | |
Series 2004-A6, Class 1A1, 4.26%, 12/25/2034 (k) | | |
Series 2005-A3, Class 6A6, 5.65%, 6/25/2035 (k) | | |
Series 2005-A6, Class 1A2, 6.45%, 9/25/2035 (k) | | |
Series 2005-A8, Class 4A1, 5.52%, 11/25/2035 (k) | | |
Series 2005-A8, Class 1A1, 5.64%, 11/25/2035 (k) | | |
Series 2006-A7, Class 2A4, 4.44%, 1/25/2037 (k) | | |
Series 2007-S1, Class 2A17, 5.18%, 3/25/2037 (k) | | |
Legacy Mortgage Asset Trust | | |
Series 2021-GS3, Class A2, 6.25%, 7/25/2061 (b) (h) | | |
Series 2021-GS1, Class A2, 6.84%, 10/25/2066 (b) (h) | | |
| | |
|
United States — continued |
| | |
Series 2005-2, Class 2A5, 5.50%, 12/25/2035 | | |
Series 2007-7, Class 5A7, 6.50%, 8/25/2037 | | |
| | |
Series 2023-RTL3, Class A1, 8.00%, 8/25/2028 (b) (h) | | |
Series 2024-RTL1, Class A1, 7.02%, 1/25/2029 (b) (h) | | |
Series 2024-RTL2, Class A1, 7.13%, 3/25/2029 (b) (h) | | |
Series 2024-RTL3, Class A1, 6.90%, 5/25/2029 (b) (h) | | |
Series 2024-RTL5, Class A1, 5.32%, 9/25/2039 (b) (h) | | |
MASTR Alternative Loan Trust | | |
Series 2004-12, Class 3A1, 6.00%, 12/25/2034 | | |
Series 2005-3, Class 1A1, 5.50%, 4/25/2035 | | |
Series 2005-5, Class 3A1, 5.75%, 8/25/2035 | | |
Series 2005-6, Class 1A2, 5.50%, 12/25/2035 | | |
Merrill Lynch Mortgage Investors Trust | | |
Series 2005-1, Class 2A2, 5.55%, 4/25/2035 (k) | | |
Series 2006-1, Class 2A1, 6.10%, 2/25/2036 (k) | | |
Series 2006-AF2, Class AF2, 6.25%, 10/25/2036 | | |
Metlife Securitization Trust Series 2017-1A, Class A, 3.00%, 4/25/2055 (b) (k) | | |
MFA Trust Series 2024-NPL1, Class A1, 6.33%, 9/25/2054 (h) | | |
Morgan Stanley Mortgage Loan Trust | | |
Series 2006-2, Class 1A, 5.25%, 2/25/2021 | | |
Series 2004-9, Class 1A, 5.32%, 11/25/2034 (k) | | |
Series 2005-4, Class 1A, 5.00%, 8/25/2035 | | |
New Residential Mortgage Loan Trust | | |
Series 2024-RTL1, Class A1, 6.66%, 3/25/2039 (b) (h) | | |
SEE NOTES TO FINANCIAL STATEMENTS.
| | |
Collateralized Mortgage Obligations — continued |
United States — continued |
Series 2019-NQM4, Class B1, 3.74%, 9/25/2059 (b) (k) | | |
Series 2019-NQM4, Class B2, 5.16%, 9/25/2059 (b) (k) | | |
Series 2019-NQM5, Class B1, 4.04%, 11/25/2059 (b) (k) | | |
Nomura Asset Acceptance Corp. Alternative Loan Trust Series 2005-WF1, Class 2A5, 5.66%, 3/25/2035 (h) | | |
| | |
Series 2023-NQM3, Class A1, 5.95%, 2/25/2063 (b) (h) | | |
Series 2024-NQM4, Class A3, 6.32%, 1/25/2064 (b) (h) | | |
PRPM Series 2024-3, Class A1, 6.99%, 5/25/2029 ‡ (b) (h) | | |
| | |
Series 2020-4, Class A2, 9.19%, 10/25/2025 (b) (h) | | |
Series 2020-6, Class A2, 7.70%, 11/25/2025 (b) (h) | | |
Series 2024-1, Class A1, 6.96%, 2/25/2029 (b) (h) | | |
Series 2024-2, Class A1, 7.03%, 3/25/2029 (b) (h) | | |
Series 2024-4, Class A1, 6.41%, 8/25/2029 (b) (h) | | |
| | |
Series 2003-QS20, Class CB, 5.00%, 11/25/2018 ‡ | | |
Series 2005-QA5, Class A2, 5.11%, 4/25/2035 (k) | | |
Series 2005-QS17, Class A3, 6.00%, 12/25/2035 | | |
Series 2006-QS3, Class 1A10, 6.00%, 3/25/2036 | | |
Series 2006-QS4, Class A2, 6.00%, 4/25/2036 | | |
Series 2006-QS17, Class A5, 6.00%, 12/25/2036 | | |
Residential Asset Securitization Trust | | |
Series 2005-A8CB, Class A11, 6.00%, 7/25/2035 | | |
Series 2005-A14, Class A1, 5.50%, 12/25/2035 | | |
Series 2006-A8, Class 3A1, 6.00%, 8/25/2036 | | |
| | |
|
United States — continued |
| | |
Series 2005-S7, Class A6, 5.50%, 11/25/2035 | | |
Series 2006-S10, Class 1A1, 6.00%, 10/25/2036 | | |
Series 2006-SA4, Class 2A1, 5.64%, 11/25/2036 (k) | | |
Sequoia Mortgage Trust Series 2007-3, Class 1A1, 5.27%, 7/20/2036 (k) | | |
Starwood Mortgage Residential Trust | | |
Series 2020-1, Class B1, 3.73%, 2/25/2050 (b) (k) | | |
Series 2020-INV1, Class B2, 4.26%, 11/25/2055 (b) | | |
Structured Adjustable Rate Mortgage Loan Trust Series 2005-1, Class 1A1, 4.71%, 2/25/2035 (k) | | |
Structured Asset Mortgage Investments II Trust | | |
Series 2005-AR3, Class 1A1, 5.39%, 8/25/2035 (k) | | |
Series 2007-AR7, Class 1A1, 5.70%, 5/25/2047 (k) | | |
Verus Securitization Trust | | |
Series 2019-INV3, Class B1, 3.73%, 11/25/2059 (b) (k) | | |
Series 2021-R1, Class B1, 3.20%, 10/25/2063 (b) (k) | | |
Series 2021-R1, Class B2, 4.20%, 10/25/2063 (b) (k) | | |
Series 2021-R3, Class B1, 3.07%, 4/25/2064 (b) (k) | | |
Series 2021-R3, Class B2, 4.07%, 4/25/2064 (b) (k) | | |
Series 2020-5, Class B1, 3.71%, 5/25/2065 (b) (k) | | |
Series 2020-5, Class B2, 4.71%, 5/25/2065 (b) (k) | | |
Series 2021-5, Class B1, 3.04%, 9/25/2066 (b) (k) | | |
Series 2021-5, Class B2, 3.94%, 9/25/2066 (b) (k) | | |
Series 2023-INV1, Class A3, 6.76%, 2/25/2068 (b) (h) | | |
Series 2023-4, Class A1, 5.81%, 5/25/2068 (b) (h) | | |
SEE NOTES TO FINANCIAL STATEMENTS.
JPMorgan Income Builder Fund
SCHEDULE OF PORTFOLIO INVESTMENTSAS OF October 31, 2024 (continued)
| | |
Collateralized Mortgage Obligations — continued |
United States — continued |
Series 2023-6, Class B1, 7.82%, 9/25/2068 (b) (k) | | |
WaMu Mortgage Pass-Through Certificates Trust | | |
Series 2004-AR11, Class A, 6.97%, 10/25/2034 (k) | | |
Series 2005-AR5, Class A6, 5.78%, 5/25/2035 (k) | | |
Series 2005-AR16, Class 1A1, 4.79%, 12/25/2035 (k) | | |
Series 2005-AR14, Class 1A3, 5.09%, 12/25/2035 (k) | | |
Series 2005-AR14, Class 1A4, 5.09%, 12/25/2035 (k) | | |
Series 2005-AR18, Class 1A3A, 5.04%, 1/25/2036 (k) | | |
Series 2006-AR2, Class 1A1, 4.57%, 3/25/2036 (k) | | |
Series 2004-AR10, Class A1B, 5.69%, 7/25/2044 (k) | | |
Series 2005-AR15, Class A1A1, 5.37%, 11/25/2045 (k) | | |
Washington Mutual Mortgage Pass-Through Certificates WMALT Trust | | |
Series 2005-1, Class 1A3, 5.50%, 3/25/2035 | | |
Series 2005-4, Class CB7, 5.50%, 6/25/2035 | | |
Series 2005-10, Class 2A5, 5.75%, 11/25/2035 | | |
Series 2005-10, Class 4CB1, 5.75%, 12/25/2035 | | |
Series 2006-5, Class 2CB5, 6.50%, 7/25/2036 | | |
Series 2007-1, Class 1A7, 5.45%, 2/25/2037 (k) | | |
Wells Fargo Mortgage-Backed Securities Trust | | |
Series 2006-AR19, Class A3, 6.79%, 12/25/2036 (k) | | |
Series 2007-15, Class A1, 6.00%, 11/25/2037 | | |
Total Collateralized Mortgage Obligations
(Cost $349,019) | | |
| | |
Loan Assignments — 2.3% (c) (o) |
|
1011778 BC Unlimited Liability Co., 1st Lien Term Loan B-6 (1-MONTH CME TERM SOFR + 1.75%), 6.44%, 9/20/2030 | | |
Bausch & Lomb, Inc., 1st Lien Term Loan B (1-MONTH CME TERM SOFR + 3.25%), 8.09%, 5/10/2027 | | |
Bausch Health Cos., Inc., 1st Lien Term Loan (1-MONTH CME TERM SOFR + 5.25%), 10.04%, 2/1/2027 | | |
BIFM CA Buyer, Inc., 1st Lien Term Loan B (1-MONTH CME TERM SOFR + 4.25%), 8.94%, 5/31/2028 | | |
Four Seasons Hotels Ltd., 1st Lien Term Loan B (1-MONTH CME TERM SOFR + 1.75%), 6.44%, 11/30/2029 | | |
Garda World Security Corp., 1st Lien Term Loan B (1-MONTH CME TERM SOFR + 3.50%), 8.29%, 2/1/2029 | | |
NorthRiver Midstream Finance LP, 1st Lien Term Loan B (3-MONTH CME TERM SOFR + 2.25%), 6.86%, 8/16/2030 | | |
Nuvei Technologies Corp., 1st Lien Term Loan (1-MONTH CME TERM SOFR + 3.00%), 7.79%, 12/19/2030 | | |
| | |
|
Altice France SA, 1st Lien Term Loan B-14 (3-MONTH CME TERM SOFR + 5.50%), 10.16%, 8/15/2028 | | |
|
TK Elevator Midco GmbH, 1st Lien Term Loan B (6-MONTH CME TERM SOFR + 3.50%), 8.59%, 4/30/2030 | | |
|
Altice Financing SA, 1st Lien Term Loan B (3-MONTH CME TERM SOFR + 5.00%), 9.66%, 10/29/2027 | | |
ICON Luxembourg SARL, 1st Lien Term Loan B (3-MONTH CME TERM SOFR + 2.00%), 6.60%, 7/3/2028 | | |
Jazz Financing Lux SARL, 1st Lien Term Loan B-2 (1-MONTH CME TERM SOFR + 2.25%), 6.94%, 5/5/2028 | | |
Summer (BC) Holdco B SARL, 1st Lien Term Loan B (3-MONTH CME TERM SOFR + 5.00%), 9.86%, 2/15/2029 | | |
| | |
SEE NOTES TO FINANCIAL STATEMENTS.
| | |
Loan Assignments — continued |
|
nVent Electric Public Ltd. Co., 1st Lien Term Loan B (12-MONTH CME TERM SOFR + 3.50%), 3.75%, 9/12/2031 (p) | | |
|
AAdvantage Loyalty IP Ltd., 1st Lien Term Loan B (3-MONTH CME TERM SOFR + 4.75%), 9.63%, 4/20/2028 | | |
AAL Delware Holdco, Inc., 1st Lien Term Loan B (1-MONTH CME TERM SOFR + 3.50%), 8.19%, 7/30/2031 (p) | | |
ACProducts, Inc., 1st Lien Term Loan B (3-MONTH CME TERM SOFR + 4.25%), 9.12%, 5/17/2028 | | |
Adient US LLC, 1st Lien Term Loan B-2 (1-MONTH CME TERM SOFR + 2.75%), 7.44%, 1/31/2031 | | |
Advanced Drainage Systems, Inc., 1st Lien Term Loan B (1-MONTH CME TERM SOFR + 2.25%), 7.19%, 7/31/2026 | | |
Ahead DB Holdings LLC, 1st Lien Term Loan B-3 (3-MONTH CME TERM SOFR + 3.50%), 8.10%, 2/3/2031 | | |
AHP Health Partners, Inc., 1st Lien Term Loan B (1-MONTH CME TERM SOFR + 2.75%), 7.60%, 8/24/2028 | | |
Alliant Holdings Intermediate LLC, 1st Lien Term Loan B (1-MONTH CME TERM SOFR + 3.00%), 7.76%, 9/19/2031 | | |
Allied Universal HoldCo LLC, 1st Lien Term Loan B (1-MONTH CME TERM SOFR + 3.75%), 8.54%, 5/12/2028 | | |
Altar Bidco, Inc., 1st Lien Term Loan B (12-MONTH CME TERM SOFR + 3.10%), 7.24%, 2/1/2029 | | |
Altar Bidco, Inc., 2nd Lien Term Loan (12-MONTH CME TERM SOFR + 5.60%), 9.75%, 2/1/2030 | | |
American Axle & Manufacturing, Inc., 1st Lien Term Loan B (1-MONTH CME TERM SOFR), 7.44%, 12/13/2029 | | |
API Group DE, Inc., 1st Lien Term Loan B (1-MONTH CME TERM SOFR + 2.00%), 6.69%, 1/3/2029 | | |
Arches Buyer, Inc., 1st Lien Term Loan B (1-MONTH CME TERM SOFR + 3.25%), 8.04%, 12/6/2027 | | |
Asplundh Tree Expert LLC, 1st Lien Term Loan B (1-MONTH CME TERM SOFR + 1.75%), 6.54%, 9/6/2027 | | |
| | |
|
United States — continued |
Astoria Energy LLC, 1st Lien Term Loan B (1-MONTH CME TERM SOFR + 3.25%; 3-MONTH CME TERM SOFR + 3.25%), 7.85%, 12/10/2027 | | |
Asurion LLC, 1st Lien Term Loan B (1-MONTH CME TERM SOFR + 3.25%), 8.05%, 7/30/2027 | | |
Asurion LLC, 1st Lien Term Loan B-11 (1-MONTH CME TERM SOFR + 4.25%), 9.04%, 8/21/2028 | | |
Asurion LLC, 2nd Lien Term Loan B-3 (1-MONTH CME TERM SOFR + 5.25%), 10.05%, 1/31/2028 | | |
Asurion LLC, Term Loan B-10 (1-MONTH CME TERM SOFR + 4.00%), 8.79%, 8/21/2028 | | |
AthenaHealth Group, Inc., 1st Lien Term Loan (1-MONTH CME TERM SOFR + 3.25%), 7.94%, 2/15/2029 | | |
Avantor Funding, Inc., 1st Lien Term Loan B-6 (1-MONTH CME TERM SOFR + 2.00%), 6.79%, 11/8/2027 | | |
Axalta Coating Systems US Holdings, Inc., 1st Lien Term Loan B-6 (3-MONTH CME TERM SOFR + 2.00%), 6.60%, 12/20/2029 | | |
AZZ, Inc., 1st Lien Term Loan B (1-MONTH CME TERM SOFR + 2.50%), 7.35%, 5/14/2029 | | |
B&G Foods, Inc., 1st Lien Term Loan B (3-MONTH CME TERM SOFR + 3.50%), 8.56%, 10/10/2029 | | |
Banijay Group US Holding, Inc., 1st Lien Term Loan B (1-MONTH CME TERM SOFR + 3.25%), 8.20%, 3/1/2028 | | |
BCPE Pequod Buyer, Inc., 1st Lien Term Loan (12-MONTH CME TERM SOFR + 3.50%), 3.50%, 9/20/2031 (p) | | |
Belron Finance US LLC, 1st Lien Term Loan B (1-MONTH CME TERM SOFR + 2.75%), 3.50%, 10/2/2031 (p) | | |
Bleriot US Bidco, Inc., 1st Lien Term Loan B (3-MONTH CME TERM SOFR + 3.25%), 7.85%, 10/31/2030 | | |
Boost Newco Borrower LLC, 1st Lien Term Loan B (3-MONTH CME TERM SOFR + 2.50%), 7.10%, 1/31/2031 | | |
Boxer Parent Co., Inc., 1st Lien Term Loan B (3-MONTH CME TERM SOFR + 3.75%), 8.34%, 7/30/2031 | | |
SEE NOTES TO FINANCIAL STATEMENTS.
JPMorgan Income Builder Fund
SCHEDULE OF PORTFOLIO INVESTMENTSAS OF October 31, 2024 (continued)
| | |
Loan Assignments — continued |
United States — continued |
Buckeye Partners LP, 1st Lien Term Loan B (1-MONTH CME TERM SOFR + 2.00%), 6.69%, 11/22/2030 | | |
Buckeye Partners LP, 1st Lien Term Loan B-5 (1-MONTH CME TERM SOFR + 1.75%), 6.44%, 11/2/2026 | | |
Caesars Entertainment, Inc., 1st Lien Term Loan B (1-MONTH CME TERM SOFR + 2.75%), 7.44%, 2/6/2030 | | |
Caesars Entertainment, Inc., 1st Lien Term Loan B-1 (1-MONTH CME TERM SOFR + 2.75%), 7.44%, 2/6/2031 | | |
Calpine Construction Finance Co. LP, 1st Lien Term Loan B (1-MONTH CME TERM SOFR + 2.00%), 6.69%, 7/19/2030 | | |
Camelot U.S. Acquisition LLC, 1st Lien Term Loan B (1-MONTH CME TERM SOFR + 2.75%), 7.44%, 1/31/2031 | | |
Carnival Corp., 1st Lien Term Loan B (1-MONTH CME TERM SOFR + 2.75%), 7.60%, 8/9/2027 | | |
Cedar Fair LP, 1st Lien Term Loan B (1-MONTH CME TERM SOFR + 2.00%), 6.85%, 5/1/2031 | | |
Central Parent LLC, 1st Lien Term Loan B (3-MONTH CME TERM SOFR + 3.25%), 7.85%, 7/6/2029 | | |
Chariot Buyer LLC, 1st Lien Term Loan B (1-MONTH CME TERM SOFR + 3.25%), 8.04%, 11/3/2028 | | |
Charter Communications Operating LLC, 1st Lien Term Loan B-4 (3-MONTH CME TERM SOFR + 2.00%), 6.59%, 12/9/2030 | | |
Cincinnati Bell, Inc., 1st Lien Term Loan B-2 (1-MONTH CME TERM SOFR + 3.25%), 8.04%, 11/22/2028 | | |
Claire's Stores, 1st Lien Term Loan B (1-MONTH CME TERM SOFR + 6.50%), 11.29%, 12/18/2026 (m) | | |
Clarios Global LP, 1st Lien Term Loan B (1-MONTH CME TERM SOFR + 2.50%), 7.19%, 5/6/2030 | | |
Clear Channel Outdoor Holdings, Inc., 1st Lien Term Loan B (1-MONTH CME TERM SOFR + 4.00%), 8.80%, 8/23/2028 | | |
Cloud Software Group, Inc., 1st Lien Term Loan B (3-MONTH CME TERM SOFR + 4.50%), 9.83%, 3/21/2031 | | |
| | |
|
United States — continued |
Coherent Corp., 1st Lien Term Loan B (1-MONTH CME TERM SOFR + 2.50%), 7.19%, 7/2/2029 | | |
CommScope, Inc., 1st Lien Term Loan B2 (1-MONTH CME TERM SOFR + 3.25%), 8.05%, 4/6/2026 | | |
Conair Holdings LLC, 1st Lien Term Loan B (1-MONTH CME TERM SOFR + 3.75%), 8.55%, 5/17/2028 | | |
Conservice Midco LLC, 1st Lien Term Loan B (1-MONTH CME TERM SOFR + 3.50%), 8.19%, 5/13/2027 | | |
CPI HoldCo B LLC, 1st Lien Term Loan B (1-MONTH CME TERM SOFR + 2.00%), 6.69%, 5/12/2031 | | |
CPPIB OVM Member U.S. LLC, 1st Lien Term Loan B-1 (3-MONTH CME TERM SOFR + 3.25%), 7.85%, 8/7/2031 | | |
Creative Artists Agency LLC, 1st Lien Term Loan B (1-MONTH CME TERM SOFR + 2.75%), 7.44%, 10/1/2031 | | |
Creative Planning LLC, 1st Lien Term Loan B (1-MONTH CME TERM SOFR + 2.75%), 7.41%, 10/1/2031 (p) | | |
Crosby US Acquisition Corp., 1st Lien Term Loan B (1-MONTH CME TERM SOFR + 3.50%), 8.19%, 8/16/2029 | | |
Crown Finance US, Inc., 1st Lien Term Loan B (12-MONTH CME TERM SOFR + 5.25%), 5.00%, 10/30/2031 (p) | | |
CSC Holdings LLC, Term Loan B-6 (1-MONTH CME TERM SOFR + 4.50%), 9.30%, 1/18/2028 | | |
DaVita, Inc., 1st Lien Term Loan B-1 (1-MONTH CME TERM SOFR + 2.00%), 6.69%, 4/25/2031 | | |
DCert Buyer, Inc., 1st Lien Term Loan | | |
(1-MONTH CME TERM SOFR + 4.00%), 8.69%, 10/16/2026 | | |
(1-MONTH CME TERM SOFR + 7.00%), 11.69%, 2/16/2029 | | |
DexKo Global, Inc., 1st Lien Term Loan B (3-MONTH CME TERM SOFR + 3.75%), 8.62%, 10/4/2028 | | |
DirectV Financing LLC, 1st Lien Term Loan (3-MONTH CME TERM SOFR + 5.00%), 9.85%, 8/2/2027 | | |
SEE NOTES TO FINANCIAL STATEMENTS.
| | |
Loan Assignments — continued |
United States — continued |
Dun & Bradstreet Corp. (The), 1st Lien Term Loan B-2 (1-MONTH CME TERM SOFR + 2.75%), 7.47%, 1/18/2029 | | |
Ecovyst Catalyst Technologies LLC, 1st Lien Term Loan B (3-MONTH CME TERM SOFR + 2.25%), 6.84%, 6/12/2031 | | |
EMRLD Borrower LP, 1st Lien Term Loan B | | |
(3-MONTH CME TERM SOFR + 2.50%), 7.56%, 5/31/2030 | | |
(3-MONTH CME TERM SOFR + 2.50%), 7.56%, 8/4/2031 | | |
Endo Finance Holdings, Inc., 1st Lien Term Loan B (1-MONTH CME TERM SOFR + 4.50%), 8.71%, 4/9/2031 | | |
Ensemble RCM LLC, 1st Lien Term Loan B (3-MONTH CME TERM SOFR + 3.00%), 7.59%, 8/1/2029 | | |
Entegris, Inc., 1st Lien Term Loan B (3-MONTH CME TERM SOFR + 1.75%), 6.35%, 7/6/2029 | | |
Epic Crude Services LP, 1st Lien Term Loan B (3-MONTH CME TERM SOFR + 3.00%), 7.66%, 10/15/2031 | | |
Exgen Renewables IV LLC, 1st Lien Term Loan B (3-MONTH CME TERM SOFR + 2.25%), 7.31%, 12/15/2027 | | |
FGI Operating Co. LLC, 1st Lien Term Loan (6-MONTH CME TERM SOFR), 12.00%, 12/31/2024 ‡ | | |
First Advantage Holdings LLC, 1st Lien Term Loan (12-MONTH CME TERM SOFR + 3.25%), 3.00%, 9/19/2031 (p) | | |
First Student Bidco, Inc., 1st Lien Term Loan B (3-MONTH CME TERM SOFR + 3.00%), 7.87%, 7/21/2028 | | |
First Student Bidco, Inc., 1st Lien Term Loan C (3-MONTH CME TERM SOFR + 3.00%), 7.87%, 7/21/2028 | | |
First Student Bidco, Inc., Term Loan B (3-MONTH CME TERM SOFR + 3.00%), 7.70%, 7/21/2028 | | |
Gates Global LLC, 1st Lien Term Loan B (1-MONTH CME TERM SOFR + 2.25%), 7.10%, 11/16/2029 | | |
Gemini HDPE LLC, 1st Lien Term Loan B (3-MONTH CME TERM SOFR + 3.00%), 7.85%, 12/31/2027 | | |
| | |
|
United States — continued |
Genesee & Wyoming, Inc., 1st Lien Term Loan B (3-MONTH CME TERM SOFR + 2.00%), 6.60%, 4/10/2031 | | |
Genesys Cloud Services Holdings II LLC, 1st Lien Term Loan B (1-MONTH CME TERM SOFR + 3.00%), 7.69%, 12/1/2027 | | |
Getty Images, Inc., 1st Lien Term Loan B (6-MONTH CME TERM SOFR + 4.50%), 8.85%, 2/19/2026 | | |
Go Daddy Operating Co. LLC, 1st Lien Term Loan B-6 (1-MONTH CME TERM SOFR + 2.00%), 6.69%, 11/12/2029 | | |
Graham Packaging Co., Inc., 1st Lien Term Loan B (1-MONTH CME TERM SOFR + 2.50%), 7.35%, 8/4/2027 | | |
Grant Thornton Advisors LLC, 1st Lien Term Loan B (1-MONTH CME TERM SOFR + 3.25%), 7.94%, 5/31/2031 | | |
Gray Television, Inc., 1st Lien Term Loan D (1-MONTH CME TERM SOFR + 3.00%), 7.96%, 12/1/2028 | | |
Griffon Corp., 1st Lien Term Loan B (1-MONTH CME TERM SOFR + 2.00%), 6.72%, 1/24/2029 | | |
Guardian US Holdco LLC, 1st Lien Term Loan B (3-MONTH CME TERM SOFR + 3.50%), 8.10%, 1/31/2030 | | |
Harsco Corp., Term Loan B-3 (1-MONTH CME TERM SOFR + 2.25%), 7.05%, 3/10/2028 | | |
Hertz Corp. (The), 1st Lien Term Loan B (1-MONTH CME TERM SOFR + 3.50%), 8.30%, 6/30/2028 | | |
Hertz Corp. (The), 1st Lien Term Loan C (1-MONTH CME TERM SOFR + 3.50%), 8.30%, 6/30/2028 | | |
Hub International Ltd., 1st Lien Term Loan B (3-MONTH CME TERM SOFR + 2.75%), 7.37%, 6/20/2030 (p) | | |
Icon Parent, Inc., 1st Lien Term Loan B (1-MONTH CME TERM SOFR + 3.25%), 7.91%, 9/12/2031 (p) | | |
iHeartCommunications, Inc., 1st Lien Term Loan (1-MONTH CME TERM SOFR + 3.00%), 7.80%, 5/1/2026 | | |
iHeartCommunications, Inc., Term Loan B (1-MONTH CME TERM SOFR + 3.25%), 8.05%, 5/1/2026 | | |
SEE NOTES TO FINANCIAL STATEMENTS.
JPMorgan Income Builder Fund
SCHEDULE OF PORTFOLIO INVESTMENTSAS OF October 31, 2024 (continued)
| | |
Loan Assignments — continued |
United States — continued |
Indy US Bidco LLC, Term Loan B-3 (1-MONTH CME TERM SOFR + 3.75%), 8.55%, 3/6/2028 | | |
Ineos Enterprises Holdings US Finco LLC, 1st Lien Term Loan (3-MONTH CME TERM SOFR + 3.75%), 9.20%, 7/7/2030 | | |
Ineos US Finance LLC, 1st Lien Term Loan B (1-MONTH CME TERM SOFR + 3.25%), 7.94%, 2/18/2030 | | |
Ingram Micro, Inc., 1st Lien Term Loan B (3-MONTH CME TERM SOFR + 2.75%), 7.56%, 9/19/2031 | | |
Instructure Holdings, Inc., 2nd Lien Term Loan B (12-MONTH CME TERM SOFR + 5.00%), 5.25%, 9/13/2032 (p) | | |
Insulet Corp., 1st Lien Term Loan B (1-MONTH CME TERM SOFR + 2.50%), 2.50%, 8/1/2031 (p) | | |
Iridium Satellite LLC, 1st Lien Term Loan B (1-MONTH CME TERM SOFR + 2.25%), 6.94%, 9/20/2030 | | |
Jetblue Airways Corp., 1st Lien Term Loan B (6-MONTH CME TERM SOFR + 5.50%), 10.27%, 8/13/2029 | | |
KBR, Inc., 1st Lien Term Loan B (1-MONTH CME TERM SOFR + 2.00%), 6.69%, 1/17/2031 | | |
KDC US Holdings, Inc., 1st Lien Term Loan B (1-MONTH CME TERM SOFR + 4.50%), 9.36%, 8/15/2028 | | |
LABL, Inc., 1st Lien Term Loan B (1-MONTH CME TERM SOFR + 5.00%), 9.95%, 10/30/2028 | | |
Leslie's Poolmart, Inc., 1st Lien Term Loan B (1-MONTH CME TERM SOFR + 2.75%), 7.55%, 3/9/2028 | | |
Live Nation Entertainment, Inc., 1st Lien Term Loan (1-MONTH CME TERM SOFR + 1.75%), 6.61%, 10/19/2026 | | |
LSF12 Crown US Commercial Bidco LLC, 1st Lien Term Loan B (12-MONTH CME TERM SOFR + 4.25%), 4.00%, 10/10/2031 (p) | | |
Lumen Technologies, Inc., 1st Lien Term Loan B-1 (1-MONTH CME TERM SOFR + 2.35%), 7.18%, 4/16/2029 | | |
Lumen Technologies, Inc., 1st Lien Term Loan B-2 (1-MONTH CME TERM SOFR + 2.35%), 7.18%, 4/15/2030 | | |
| | |
|
United States — continued |
Madison IAQ LLC, 1st Lien Term Loan (6-MONTH CME TERM SOFR + 2.75%), 7.89%, 6/21/2028 | | |
Madison Safety & Flow LLC, 1st Lien Term Loan (1-MONTH CME TERM SOFR + 3.25%), 3.50%, 9/26/2031 (p) | | |
Mauser Packaging Solutions Holding Co., 1st Lien Term Loan B 8.35%, 4/15/2027 | | |
Med Parentco, LP, 1st Lien Term Loan B (1-MONTH CME TERM SOFR + 4.00%), 8.84%, 4/15/2031 | | |
Medline Borrower LP, 1st Lien Term Loan B (1-MONTH CME TERM SOFR + 2.75%), 7.85%, 10/23/2028 | | |
MH Sub I LLC, 1st Lien Term Loan B (1-MONTH CME TERM SOFR + 4.25%), 8.94%, 5/3/2028 (p) | | |
MI OpCo Holdings, Inc., Delayed Draw Term Loan B (12-MONTH CME TERM SOFR + 7.25%), 12.04%, 3/31/2028 | | |
Mirion Technologies, Inc, 1st Lien Term Loan B (3-MONTH CME TERM SOFR + 2.25%), 6.85%, 10/20/2028 | | |
Mister Car Wash Holdings, Inc., 1st Lien Term Loan B (1-MONTH CME TERM SOFR + 3.00%), 7.85%, 3/27/2031 | | |
MITER Brands Acquisition Holdco, Inc., 1st Lien Term Loan B-2 (1-MONTH CME TERM SOFR + 3.00%), 7.69%, 3/28/2031 | | |
Modena Buyer LLC, 1st Lien Term Loan B (3-MONTH CME TERM SOFR + 4.50%), 9.10%, 7/1/2031 | | |
Moran Foods LLC, 1st Lien Super Senior Delayed Term Loan (TERM SOFR + 11.50% + 0.10%), 16.71%, 6/30/2026 ‡ | | |
Moran Foods LLC, 1st Lien Term Loan | | |
(TERM SOFR + 9.50% (PIK) + 2.00% (Cash) + 0.10% (CAS)), 11.95%, 6/30/2026 ‡ | | |
(TERM SOFR + 5.25% (PIK) + 2.00% (Cash) + 0.10% (CAS)), 11.95%, 6/30/2026 ‡ | | |
Moran Foods LLC, Term Loan A (TERM SOFR + 2.50%), 7.61%, 1/2/2029 ‡ | | |
Moran Foods LLC, Term Loan B (TERM SOFR + 6.50% (PIK) + 2.00% (Cash) + 0.10% (CAS)), 13.61%, 1/2/2029 ‡ | | |
SEE NOTES TO FINANCIAL STATEMENTS.
| | |
Loan Assignments — continued |
United States — continued |
Naked Juice LLC, 1st Lien Term Loan (3-MONTH CME TERM SOFR + 3.25%), 8.68%, 1/24/2029 | | |
NCR Atleos LLC, Term Loan B (3-MONTH CME TERM SOFR + 3.75%), 8.30%, 3/22/2029 | | |
Neon Maple US Debt Mergersub, Inc., 1st Lien Term Loan B (12-MONTH CME TERM SOFR + 3.00%), 3.00%, 7/18/2031 (p) | | |
NGL Energy Operating LLC, 1st Lien Term Loan B (1-MONTH CME TERM SOFR + 3.75%), 8.44%, 2/3/2031 | | |
Option Care Health, Inc., 1st Lien Term Loan B (1-MONTH CME TERM SOFR + 2.25%), 6.94%, 10/27/2028 | | |
Orion Advisor Solutions, Inc., 1st Lien Term Loan B (12-MONTH CME TERM SOFR), 2.75%, 9/1/2031 (p) | | |
Osmose Holdings, Inc., 1st Lien Term Loan (1-MONTH CME TERM SOFR + 3.25%), 8.05%, 6/23/2028 | | |
Packaging Coordinators Midco, Inc., 1st Lien Term Loan B (3-MONTH CME TERM SOFR + 3.25%), 7.84%, 11/30/2027 | | |
Pactiv Evergreen Group Holdings, Inc., 1st Lien Term Loan B-4 (1-MONTH CME TERM SOFR + 2.50%), 7.19%, 9/25/2028 | | |
Parexel International, Inc., 1st Lien Term Loan B (1-MONTH CME TERM SOFR + 3.00%), 7.69%, 11/15/2028 | | |
Park River Holdings, Inc., 1st Lien Term Loan B (3-MONTH CME TERM SOFR + 3.25%), 8.10%, 12/28/2027 | | |
Petco Health & Wellness Co., Inc., Term Loan B (3-MONTH CME TERM SOFR + 3.25%), 8.12%, 3/3/2028 | | |
PetSmart, Inc., 1st Lien Term Loan B (1-MONTH CME TERM SOFR + 3.75%), 8.54%, 2/11/2028 (p) | | |
Pike Corp., Delayed Draw Term Loan B (1-MONTH CME TERM SOFR + 3.00%), 7.80%, 1/21/2028 | | |
Pra Health Sciences, Inc., 1st Lien Term Loan B (3-MONTH CME TERM SOFR + 2.00%), 6.60%, 7/3/2028 | | |
Prairie Eci Acquiror LP, 1st Lien Term Loan B (1-MONTH CME TERM SOFR + 4.75%), 9.44%, 8/1/2029 | | |
| | |
|
United States — continued |
Pre-Paid Legal Services, Inc., 1st Lien Term Loan (1-MONTH CME TERM SOFR + 3.75%), 8.55%, 12/7/2028 | | |
Prime Security Services Borrower LLC, 1st Lien Term Loan B-1 (1-MONTH CME TERM SOFR + 2.25%), 7.11%, 10/11/2030 | | |
Project Boost Purchaser LLC, 1st Lien Term Loan B (3-MONTH CME TERM SOFR + 3.50%), 8.15%, 7/16/2031 | | |
Proofpoint, Inc., 1st Lien Term Loan (1-MONTH CME TERM SOFR + 3.00%), 7.85%, 8/31/2028 | | |
Quikrete Holdings, Inc., 1st Lien Term Loan B (1-MONTH CME TERM SOFR + 2.25%), 7.10%, 3/19/2029 | | |
Radiology Partners, Inc., 1st Lien PIK Term Loan B (3-MONTH CME TERM SOFR + 3.50%), 8.88%, 1/31/2029 | | |
Raven Acquisition Holdings LLC, 1st Lien Term Loan B (12-MONTH CME TERM SOFR + 3.75%), 3.50%, 10/24/2031 (p) | | |
RealPage, Inc., 1st Lien Term Loan B (1-MONTH CME TERM SOFR + 3.00%), 7.96%, 4/24/2028 | | |
Recess Holdings, Inc., 1st Lien Term Loan B (3-MONTH CME TERM SOFR + 4.50%), 9.09%, 2/20/2030 | | |
Resonetics LLC, 1st Lien Term Loan B (3-MONTH CME TERM SOFR + 3.75%), 8.37%, 6/18/2031 | | |
Ring Container Technologies Group LLC, 1st Lien Term Loan B (1-MONTH CME TERM SOFR + 2.75%), 7.44%, 8/14/2028 | | |
Rocket Software, Inc., 1st Lien Term Loan B (1-MONTH CME TERM SOFR + 4.25%), 9.44%, 11/28/2028 | | |
Sedgwick Claims Management Services, Inc., 1st Lien Term Loan B (3-MONTH CME TERM SOFR + 3.00%), 7.59%, 7/31/2031 | | |
Shutterfly Finance LLC, 1st Lien Term Loan (3-MONTH CME TERM SOFR + 6.00%), 11.06%, 10/1/2027 ‡ | | |
Shutterfly Finance LLC, 2nd Lien Term Loan (3-MONTH CME TERM SOFR + 1.00%), 5.60%, 10/1/2027 | | |
Skopima Merger Sub, Inc., 1st Lien Term Loan B (1-MONTH CME TERM SOFR + 4.00%), 8.80%, 5/15/2028 | | |
SEE NOTES TO FINANCIAL STATEMENTS.
JPMorgan Income Builder Fund
SCHEDULE OF PORTFOLIO INVESTMENTSAS OF October 31, 2024 (continued)
| | |
Loan Assignments — continued |
United States — continued |
Spirit Aerosystems, Inc., 1st Lien Term Loan B (3-MONTH CME TERM SOFR + 4.50%), 9.09%, 1/15/2027 | | |
SPX Flow, Inc., 1st Lien Term Loan B (1-MONTH CME TERM SOFR + 3.50%), 8.19%, 4/5/2029 | | |
St. George's University Scholastic Services LLC, 1st Lien Term Loan B (1-MONTH CME TERM SOFR + 2.75%), 7.44%, 2/12/2029 | | |
Staples, Inc., 1st Lien Term Loan B (3-MONTH CME TERM SOFR + 5.75%), 10.69%, 8/23/2029 | | |
Star Parent, Inc., 1st Lien Term Loan B (3-MONTH CME TERM SOFR + 3.75%), 8.35%, 9/27/2030 | | |
Star US Bidco LLC, 1st Lien Term Loan B (1-MONTH CME TERM SOFR + 3.75%), 8.60%, 3/17/2027 | | |
Station Casinos LLC, 1st Lien Term Loan B (1-MONTH CME TERM SOFR + 2.25%), 6.94%, 3/14/2031 | | |
Summit Materials LLC, 1st Lien Term Loan B (1-MONTH CME TERM SOFR + 1.75%), 6.55%, 1/12/2029 | | |
Surgery Center Holdings, Inc., 1st Lien Term Loan B (1-MONTH CME TERM SOFR + 2.75%), 7.49%, 12/19/2030 | | |
Synaptics, Inc., 1st Lien Term Loan B (1-MONTH CME TERM SOFR + 2.25%), 7.22%, 12/4/2028 | | |
Terex Corp., 1st Lien Term Loan B (1-MONTH CME TERM SOFR + 2.00%), 6.66%, 10/8/2031 (p) | | |
TGP Holdings III LLC, 1st Lien Term Loan (1-MONTH CME TERM SOFR + 3.25%), 8.04%, 6/29/2028 | | |
The E.W. Scripps Co., 1st Lien Term Loan B-3 (1-MONTH CME TERM SOFR + 3.00%), 7.80%, 1/7/2028 (p) | | |
Thoughtworks, Inc., 1st Lien Term Loan (1-MONTH CME TERM SOFR + 2.75%), 0.00%, 3/24/2028 | | |
Topgolf Callaway Brands Corp., 1st Lien Term Loan B (1-MONTH CME TERM SOFR + 3.00%), 7.69%, 3/18/2030 | | |
TransDigm, Inc., 1st Lien Term Loan J (3-MONTH CME TERM SOFR + 2.50%), 7.10%, 2/28/2031 (p) | | |
| | |
|
United States — continued |
TransDigm, Inc., 1st Lien Term Loan K (3-MONTH CME TERM SOFR + 2.75%), 7.35%, 3/22/2030 | | |
TransUnion LLC, 1st Lien Term Loan B-7 (1-MONTH CME TERM SOFR + 2.00%), 6.69%, 12/1/2028 | | |
Trident TPI Holdings, Inc., 1st Lien Term Loan B (3-MONTH CME TERM SOFR + 4.00%), 8.19%, 9/15/2028 | | |
Triton Water Holdings, Inc., 1st Lien Term Loan B (3-MONTH CME TERM SOFR + 3.25%), 8.12%, 3/31/2028 | | |
Truck Hero, Inc., 1st Lien Term Loan (1-MONTH CME TERM SOFR + 3.50%), 8.30%, 1/31/2028 | | |
U.S. Renal Care, Inc., 1st Lien Term Loan C (1-MONTH CME TERM SOFR + 5.00%), 9.80%, 6/28/2028 | | |
UFC Holdings LLC, 1st Lien Term Loan B-3 (3-MONTH CME TERM SOFR + 2.75%), 7.64%, 4/29/2026 | | |
UKG, Inc., 1st Lien Term Loan B (3-MONTH CME TERM SOFR + 3.00%), 7.62%, 2/10/2031 | | |
USI, Inc., 1st Lien Term Loan B (3-MONTH CME TERM SOFR + 2.75%), 7.35%, 11/21/2029 | | |
Utz Quality Foods LLC, 1st Lien Term Loan B (3-MONTH CME TERM SOFR + 2.75%), 7.35%, 1/20/2028 | | |
Varsity Brands LLC, 1st Lien Term Loan B (3-MONTH CME TERM SOFR + 3.75%), 8.82%, 8/26/2031 | | |
Venator Materials LLC, 1st Lien PIK Term Loan (3-MONTH CME TERM SOFR + 2.00%), 15.29%, 10/12/2028 | | |
Venator Materials LLC, 1st Lien Term Loan (3-MONTH CME TERM SOFR + 2.00%), 15.29%, 7/16/2026 | | |
Vertex Aerospace Services LLC, 1st Lien Term Loan B (1-MONTH CME TERM SOFR + 2.75%), 7.44%, 12/6/2030 | | |
Vertiv Group Corp., 1st Lien Term Loan B-2 (1-MONTH CME TERM SOFR + 2.00%), 6.85%, 3/2/2027 | | |
Virtusa Corp., 1st Lien Term Loan B (1-MONTH CME TERM SOFR + 3.25%), 7.94%, 2/15/2029 | | |
SEE NOTES TO FINANCIAL STATEMENTS.
| | |
Loan Assignments — continued |
United States — continued |
VT Topco, Inc., 1st Lien Term Loan B (1-MONTH CME TERM SOFR + 3.50%), 7.66%, 8/9/2030 | | |
W.R. Grace Holdings LLC, 1st Lien Term Loan B (3-MONTH CME TERM SOFR + 3.25%), 7.85%, 9/22/2028 (p) | | |
Wand Newco 3, Inc., 1st Lien Term Loan B-1 (1-MONTH CME TERM SOFR + 3.25%; 3-MONTH CME TERM SOFR + 3.25%), 8.50%, 1/30/2031 | | |
WEC US Holdings Ltd., 1st Lien Term Loan B (1-MONTH CME TERM SOFR + 2.75%), 7.60%, 1/27/2031 | | |
Whatabrands LLC, 1st Lien Term Loan B (1-MONTH CME TERM SOFR + 2.75%), 7.44%, 8/3/2028 | | |
White Cap Supply Holdings LLC, 1st Lien Term Loan B (1-MONTH CME TERM SOFR + 3.25%), 7.94%, 10/19/2029 | | |
WhiteWater Whistler Holdings LLC, 1st Lien Term Loan B (3-MONTH CME TERM SOFR + 2.25%), 6.85%, 2/15/2030 | | |
WMG Acquisition Corp., 1st Lien Term Loan (3-MONTH CME TERM SOFR + 1.75%), 6.60%, 1/24/2031 | | |
Zekelman Industries, Inc., 1st Lien Term Loan B (1-MONTH CME TERM SOFR + 2.25%), 7.17%, 1/24/2031 | | |
| | |
Total Loan Assignments
(Cost $192,858) | | |
Foreign Government Securities — 2.2% |
|
| | |
| | |
| | |
| | |
| | |
| | |
| | |
|
| | |
| | |
| | |
| | |
| | |
| | |
|
|
| | |
| | |
| | |
|
Commonwealth of the Bahamas 6.00%, 11/21/2028 (a) | | |
|
| | |
| | |
| | |
| | |
| | |
| | |
| | |
|
Benin Government Bond 7.96%, 2/13/2038 (b) | | |
|
Federative Republic of Brazil | | |
| | |
| | |
| | |
| | |
| | |
| | |
| | |
|
| | |
| | |
| | |
| | |
| | |
| | |
| | |
| | |
| | |
| | |
| | |
| | |
SEE NOTES TO FINANCIAL STATEMENTS.
JPMorgan Income Builder Fund
SCHEDULE OF PORTFOLIO INVESTMENTSAS OF October 31, 2024 (continued)
| | |
Foreign Government Securities — continued |
|
| | |
| | |
| | |
| | |
| | |
Dominican Republic — 0.1% |
Dominican Republic Government Bond | | |
| | |
| | |
| | |
| | |
| | |
| | |
| | |
| | |
| | |
| | |
|
| | |
| | |
| | |
| | |
| | |
|
| | |
| | |
| | |
| | |
| | |
| | |
| | |
| | |
| | |
| | |
| | |
| | |
| | |
| | |
| | |
| | |
|
| | |
| | |
|
|
| | |
| | |
| | |
| | |
| | |
| | |
| | |
|
| | |
| | |
| | |
| | |
|
| | |
Zero Coupon, 7/3/2026 (b) | | |
| | |
Zero Coupon, 1/3/2030 (b) | | |
| | |
| | |
|
| | |
| | |
| | |
| | |
|
Republic of Honduras 6.25%, 1/19/2027 (a) | | |
|
Republic of Iraq 5.80%, 1/15/2028 (a) | | |
|
Republic of Cote d'Ivoire | | |
| | |
5.75%, 12/31/2032 (a) (h) | | |
| | |
| | |
| | |
| | |
|
Hashemite Kingdom of Jordan | | |
| | |
| | |
SEE NOTES TO FINANCIAL STATEMENTS.
| | |
Foreign Government Securities — continued |
|
| | |
| | |
| | |
| | |
|
| | |
| | |
| | |
| | |
| | |
| | |
| | |
|
| | |
| | |
| | |
| | |
| | |
|
| | |
| | |
| | |
| | |
| | |
|
Republic of Montenegro 7.25%, 3/12/2031 (a) | | |
|
Republic of Mozambique 9.00%, 9/15/2031 (a) (h) | | |
|
Republic of Namibia 5.25%, 10/29/2025 (a) | | |
|
Federal Republic of Nigeria | | |
| | |
| | |
| | |
| | |
| | |
| | |
| | |
|
|
| | |
| | |
| | |
|
Sultanate of Oman Government Bond | | |
| | |
| | |
| | |
| | |
| | |
|
Islamic Republic of Pakistan | | |
| | |
| | |
| | |
| | |
| | |
| | |
| | |
|
| | |
| | |
| | |
| | |
| | |
| | |
| | |
|
Republic of Rwanda 5.50%, 8/9/2031 (a) | | |
|
| | |
| | |
| | |
| | |
| | |
| | |
|
| | |
| | |
| | |
| | |
SEE NOTES TO FINANCIAL STATEMENTS.
JPMorgan Income Builder Fund
SCHEDULE OF PORTFOLIO INVESTMENTSAS OF October 31, 2024 (continued)
| | |
Foreign Government Securities — continued |
|
| | |
| | |
| | |
|
Democratic Socialist Republic of Sri Lanka | | |
| | |
| | |
| | |
| | |
| | |
| | |
| | |
|
Suriname Government International Bond 7.95%, 7/15/2033 (a) (i) | | |
|
Banque Centrale de Tunisie 5.75%, 1/30/2025 (a) | | |
|
Istanbul Metropolitan Municipality 10.50%, 12/6/2028 (b) | | |
Republic of Turkiye (The) | | |
| | |
| | |
| | |
| | |
| | |
| | |
| | |
| | |
| | |
Turkiye Ihracat Kredi Bankasi A/S | | |
| | |
| | |
| | |
|
| | |
| | |
| | |
| | |
| | |
|
Venezuela, Bolivarian Republic of — 0.0% ^ |
Bolivarian Republic of Venezuela | | |
| | |
| | |
| | |
|
| | |
5.75%, 6/30/2033 (b) (g) (h) | | |
| | |
| | |
Total Foreign Government Securities
(Cost $196,019) | | |
Asset-Backed Securities — 2.0% |
|
Ares CLO Ltd. Series 2017-43A, Class BR, 6.62%, 7/15/2034 (b) (k) | | |
Ballyrock CLO Ltd. Series 2020-2A, Class A2R, 6.43%, 10/20/2031 (b) (k) | | |
Barings CLO Ltd. Series 2022-1A, Class B, 6.57%, 4/15/2035 (b) (k) | | |
Buttermilk Park CLO Ltd. Series 2018-1A, Class CR, 6.61%, 10/15/2031 (b) (k) | | |
Carlyle Global Market Strategies CLO Ltd. | | |
Series 2015-4A, Class A2RR, 6.47%, 7/20/2032 (b) (k) | | |
Series 2015-4A, Class BRR, 7.07%, 7/20/2032 (b) (k) | | |
| | |
Series 2018-1A, Class A, 5.89%, 4/18/2031 (b) (k) | | |
Series 2018-4A, Class A1, 6.06%, 10/17/2031 (b) (k) | | |
| | |
Series 2018-64A, Class A, 5.86%, 4/18/2031 (b) (k) | | |
Series 2019-68A, Class BR, 6.62%, 7/15/2035 (b) (k) | | |
Dryden Senior Loan Fund Series 2015-37A, Class AR, 6.02%, 1/15/2031 (b) (k) | | |
Madison Park Funding Ltd. Series 2018-29A, Class BR, 6.43%, 10/18/2030 (b) (k) | | |
| | |
Series 2019-22A, Class BRR, 6.26%, 7/15/2036 (b) (k) | | |
Series 2019-22A, Class CRR, 6.51%, 7/15/2036 (b) (k) | | |
SEE NOTES TO FINANCIAL STATEMENTS.
| | |
Asset-Backed Securities — continued |
Cayman Islands — continued |
Neuberger Berman Loan Advisers CLO Ltd. | | |
Series 2019-31A, Class AR, 5.92%, 4/20/2031 (b) (k) | | |
Series 2019-34A, Class BR, 6.37%, 1/20/2035 (b) (k) | | |
OCP CLO Ltd. Series 2020-8RA, Class A1, 6.13%, 1/17/2032 (b) (k) | | |
Octagon Investment Partners Ltd. Series 2013-1A, Class A1RR, 5.85%, 7/19/2030 (b) (k) | | |
Palmer Square Loan Funding Ltd. | | |
Series 2024-3A, Class A2, 6.81%, 8/8/2032 (b) (k) | | |
Series 2024-3A, Class B, 7.06%, 8/8/2032 (b) (k) | | |
Series 2024-1A, Class A2, 6.56%, 10/15/2032 (b) (k) | | |
RR Ltd. Series 2020-12A, Class A2R3, 6.26%, 1/15/2036 (b) (k) | | |
Symphony CLO Ltd. Series 2018-19A, Class B, 6.26%, 4/16/2031 (b) (k) | | |
| | |
Series 2016-3A, Class CR, 8.14%, 10/18/2031 (b) (k) | | |
Series 2022-1A, Class BR, 6.37%, 4/20/2035 (b) (k) | | |
| | |
|
Neuberger Berman Loan Advisers CLO Ltd. | | |
Series 2022-50A, Class BR, 6.28%, 7/23/2036 (b) (k) | | |
Series 2022-50A, Class CR, 6.53%, 7/23/2036 (b) (k) | | |
| | |
|
| | |
Series 2003-OPT1, Class A1A, 5.67%, 4/25/2033 (k) | | |
Series 2004-OPT3, Class M1, 5.60%, 9/25/2033 (k) | | |
Series 2004-HE1, Class M1, 5.75%, 3/25/2034 (k) | | |
Accredited Mortgage Loan Trust Series 2004-4, Class M1, 5.13%, 1/25/2035 (k) | | |
| | |
|
United States — continued |
ACE Securities Corp. Home Equity Loan Trust | | |
Series 2003-FM1, Class M1, 6.14%, 11/25/2032 (k) | | |
Series 2004-OP1, Class M2, 6.43%, 4/25/2034 (k) | | |
American Credit Acceptance Receivables Trust | | |
Series 2024-1, Class D, 5.86%, 5/13/2030 (b) | | |
Series 2023-4, Class D, 7.65%, 9/12/2030 (b) | | |
Series 2024-4, Class C, 4.91%, 8/12/2031 (b) | | |
Series 2024-4, Class D, 5.34%, 8/12/2031 (b) | | |
Ameriquest Mortgage Securities, Inc. Asset-Backed Pass-Through Certificates Series 2002-AR1, Class M1, 3.57%, 9/25/2032 (k) | | |
Asset-Backed Securities Corp. Home Equity Loan Trust | | |
Series 2004-HE2, Class M2, 6.73%, 4/25/2034 (k) | | |
Series 2004-HE7, Class M2, 6.43%, 10/25/2034 (k) | | |
Bayview Opportunity Master Fund LLC Series 2024-CAR1, Class C, 6.36%, 12/26/2031 (b) (k) | | |
Bear Stearns Asset-Backed Securities Trust | | |
Series 2003-SD1, Class M1, 6.13%, 12/25/2033 (k) | | |
Series 2004-SD4, Class A1, 5.75%, 8/25/2044 (k) | | |
Bridgecrest Lending Auto Securitization Trust Series 2024-3, Class D, 5.83%, 5/15/2030 | | |
Carlyle Global Market Strategies CLO Ltd. Series 2012-3A, Class A1A2, 6.10%, 1/14/2032 (b) (k) | | |
Centex Home Equity Loan Trust | | |
Series 2004-C, Class M2, 4.69%, 6/25/2034 (k) | | |
Series 2004-D, Class MV2, 5.16%, 9/25/2034 (k) | | |
Series 2004-D, Class MF2, 6.06%, 9/25/2034 (h) | | |
SEE NOTES TO FINANCIAL STATEMENTS.
JPMorgan Income Builder Fund
SCHEDULE OF PORTFOLIO INVESTMENTSAS OF October 31, 2024 (continued)
| | |
Asset-Backed Securities — continued |
United States — continued |
| | |
Series 2003-5, Class 1M2, 5.64%, 9/25/2032 (k) | | |
Series 2004-1, Class 1M1, 4.73%, 5/25/2033 | | |
Series 2003-4, Class 1A5, 4.91%, 5/25/2033 (h) | | |
CHEC Loan Trust Series 2004-1, Class M1, 5.75%, 7/25/2034 (b) (k) | | |
Citigroup Mortgage Loan Trust, Inc. | | |
Series 2005-OPT1, Class M4, 5.90%, 2/25/2035 (k) | | |
Series 2005-WF2, Class AF7, 5.75%, 8/25/2035 (h) | | |
Consumer Loan Underlying Bond Certificate Issuer Trust I Series 2020-9, Class PT, 7.50%, 4/15/2045 ‡ (b) (k) | | |
Countrywide Asset-Backed Certificates Series 2004-3, Class M1, 5.60%, 6/25/2034 (k) | | |
Credit Acceptance Auto Loan Trust | | |
Series 2022-3A, Class D, 9.00%, 4/18/2033 (b) | | |
Series 2023-3A, Class B, 7.09%, 10/17/2033 (b) | | |
Series 2024-1A, Class A, 5.68%, 3/15/2034 (b) | | |
Series 2024-1A, Class B, 6.03%, 5/15/2034 (b) | | |
Series 2024-1A, Class C, 6.71%, 7/17/2034 (b) | | |
CWABS Asset-Backed Certificates Trust Series 2005-11, Class AF6, 5.05%, 2/25/2036 (k) | | |
CWABS Asset-Backed Certificates Trust, Series 2004-BC4, Class M1, 5.90%, 11/25/2034 (k) | | |
CWABS, Inc. Asset-Backed Certificates Series 2004-1, Class M2, 5.68%, 3/25/2034 (k) | | |
| | |
Series 2022-1A, Class E, 5.53%, 3/15/2029 (b) | | |
Series 2023-3A, Class C, 6.40%, 5/15/2029 (b) | | |
Series 2022-3A, Class E, 10.99%, 7/16/2029 (b) | | |
| | |
|
United States — continued |
Exeter Automobile Receivables Trust | | |
Series 2023-3A, Class C, 6.21%, 6/15/2028 | | |
Series 2022-6A, Class D, 8.03%, 4/6/2029 | | |
FFMLT Trust Series 2004-FF3, Class M1, 5.68%, 5/25/2034 (k) | | |
Finance America Mortgage Loan Trust Series 2004-3, Class M2, 5.80%, 11/25/2034 (k) | | |
| | |
Series 2002-1, Class M1, 6.10%, 8/25/2033 (k) | | |
Series 2004-B, Class M2, 5.80%, 5/25/2034 (k) | | |
Series 2004-C, Class M1, 5.83%, 8/25/2034 (k) | | |
Series 2004-D, Class M2, 5.75%, 11/25/2034 (k) | | |
GLS Auto Receivables Issuer Trust | | |
Series 2021-3A, Class E, 3.20%, 10/16/2028 (b) | | |
Series 2022-2A, Class E, 5.50%, 6/15/2029 (b) | | |
| | |
Series 2003-SEA, Class A1, 5.65%, 2/25/2033 (k) | | |
Series 2003-HE1, Class M1, 6.12%, 6/20/2033 (k) | | |
Hertz Vehicle Financing LLC | | |
Series 2023-3A, Class A, 5.94%, 2/25/2028 (b) | | |
Series 2023-2A, Class D, 9.40%, 9/25/2029 (b) | | |
Home Equity Mortgage Loan Asset-Backed Trust | | |
Series 2004-B, Class M2, 4.90%, 11/25/2034 (k) | | |
Series 2004-C, Class M2, 4.52%, 3/25/2035 (k) | | |
LendingClub Loan Certificate Issuer Trust | | |
Series 2022-NP3, Class CERT, 0.00%, 5/15/2037 ‡ (b) | | |
Series 2022-P3, Class CERT, 0.00%, 5/15/2037 ‡ (b) | | |
Series 2022-NP5, Class CERT, 0.00%, 6/15/2037 ‡ (b) | | |
SEE NOTES TO FINANCIAL STATEMENTS.
| | |
Asset-Backed Securities — continued |
United States — continued |
Series 2022-P4, Class CERT, 0.00%, 6/15/2037 ‡ (b) | | |
Series 2022-NP6, Class CERT, 0.00%, 7/15/2037 ‡ (b) | | |
Lendmark Funding Trust Series 2021-2A, Class B, 2.37%, 4/20/2032 (b) | | |
Long Beach Mortgage Loan Trust Series 2003-4, Class M1, 5.87%, 8/25/2033 (k) | | |
Magnetite Ltd. Series 2023-39A, Class B, 6.78%, 10/25/2033 (b) (k) | | |
MASTR Asset-Backed Securities Trust | | |
Series 2004-OPT2, Class M2, 5.83%, 9/25/2034 (k) | | |
Series 2005-NC1, Class M4, 5.99%, 12/25/2034 (k) | | |
Merrill Lynch Mortgage Investors Trust | | |
Series 2003-OPT1, Class M1, 5.83%, 7/25/2034 (k) | | |
Series 2004-HE2, Class M1, 6.05%, 8/25/2035 (k) | | |
Morgan Stanley ABS Capital I, Inc. Trust | | |
Series 2003-NC10, Class M1, 5.87%, 10/25/2033 (k) | | |
Series 2004-WMC2, Class M1, 5.77%, 7/25/2034 (k) | | |
Series 2004-WMC2, Class M2, 6.65%, 7/25/2034 (k) | | |
Series 2004-HE6, Class M2, 5.75%, 8/25/2034 (k) | | |
Series 2004-HE7, Class M2, 5.80%, 8/25/2034 (k) | | |
Series 2004-HE6, Class M3, 5.83%, 8/25/2034 (k) | | |
Series 2004-HE8, Class M2, 5.87%, 9/25/2034 (k) | | |
Series 2004-NC8, Class M3, 5.96%, 9/25/2034 (k) | | |
Series 2004-HE8, Class M3, 5.98%, 9/25/2034 (k) | | |
Series 2005-HE1, Class M2, 5.56%, 12/25/2034 (k) | | |
Series 2005-NC1, Class M3, 5.62%, 1/25/2035 (k) | | |
Morgan Stanley Mortgage Loan Trust Series 2007-5AX, Class 2A2, 5.15%, 2/25/2037 (k) | | |
| | |
|
United States — continued |
New Century Home Equity Loan Trust | | |
Series 2004-2, Class M2, 5.78%, 8/25/2034 (k) | | |
Series 2004-3, Class M2, 5.83%, 11/25/2034 (k) | | |
Series 2004-4, Class M2, 5.65%, 2/25/2035 (k) | | |
NovaStar Mortgage Funding Trust Series 2003-2, Class M2, 7.63%, 9/25/2033 (k) | | |
Oak Street Investment Grade Net Lease Fund | | |
Series 2021-1A, Class A3, 2.80%, 1/20/2051 (b) | | |
Series 2021-1A, Class B1, 4.23%, 1/20/2051 (b) | | |
Oportun Issuance Trust Series 2022-3, Class B, 8.53%, 1/8/2030 (b) | | |
Option One Mortgage Accept Corp. Asset-Backed Certificates Series 2003-5, Class A2, 5.49%, 8/25/2033 (k) | | |
Option One Mortgage Loan Trust Series 2004-3, Class M2, 5.71%, 11/25/2034 (k) | | |
Pagaya AI Debt Selection Trust Series 2021-3, Class C, 3.27%, 5/15/2029 (b) | | |
| | |
Series 2021-NPL3, Class A2, 3.72%, 7/25/2051 (b) (h) | | |
Series 2021-RN4, Class A2, 5.19%, 10/25/2051 (b) (k) | | |
Series 2024-NPL2, Class A1, 7.02%, 2/25/2054 (b) (h) | | |
Series 2024-RN1, Class A1, 7.14%, 3/25/2054 (b) (h) | | |
Series 2024-NPL3, Class A1, 7.52%, 4/27/2054 (b) (h) | | |
Pretium Mortgage Credit Partners LLC Series 2021-RN1, Class A2, 3.60%, 2/25/2061 (b) (h) | | |
Progress Residential Trust | | |
Series 2021-SFR8, Class G, 4.01%, 10/17/2038 (b) | | |
Series 2022-SFR3, Class D, 4.45%, 4/17/2039 (b) | | |
| | |
Series 2021-3, Class A2, 6.72%, 4/25/2026 (b) (h) | | |
SEE NOTES TO FINANCIAL STATEMENTS.
JPMorgan Income Builder Fund
SCHEDULE OF PORTFOLIO INVESTMENTSAS OF October 31, 2024 (continued)
| | |
Asset-Backed Securities — continued |
United States — continued |
Series 2021-6, Class A2, 6.47%, 7/25/2026 (b) (h) | | |
Series 2021-8, Class A2, 6.60%, 9/25/2026 (b) (k) | | |
Series 2021-10, Class A2, 7.83%, 10/25/2026 (b) (h) | | |
Series 2021-11, Class A1, 2.49%, 11/25/2026 (b) (h) | | |
Series 2021-11, Class A2, 4.58%, 11/25/2026 (b) (h) | | |
RAMP Trust Series 2002-RS2, Class AI5, 6.03%, 3/25/2032 (k) | | |
RCO Mortgage LLC Series 2024-1, Class A1, 7.02%, 1/25/2029 (b) (h) | | |
Renaissance Home Equity Loan Trust | | |
Series 2002-3, Class M1, 6.35%, 12/25/2032 (k) | | |
Series 2003-1, Class M1, 6.35%, 6/25/2033 (k) | | |
Series 2003-4, Class M1, 6.13%, 3/25/2034 (k) | | |
Series 2003-4, Class M2F, 6.24%, 3/25/2034 (h) | | |
Republic Finance Issuance Trust Series 2024-A, Class A, 5.91%, 8/20/2032 (b) | | |
Santander Bank Auto Credit-Linked Notes | | |
Series 2022-C, Class B, 6.45%, 12/15/2032 (b) | | |
Series 2022-C, Class C, 6.99%, 12/15/2032 (b) | | |
Series 2022-C, Class D, 8.20%, 12/15/2032 (b) | | |
Series 2022-C, Class E, 11.37%, 12/15/2032 (b) | | |
Santander Drive Auto Receivables Trust | | |
Series 2024-1, Class B, 5.23%, 12/15/2028 | | |
Series 2024-1, Class C, 5.45%, 3/15/2030 | | |
Series 2024-4, Class C, 4.95%, 4/15/2030 | | |
Series 2023-6, Class C, 6.40%, 3/17/2031 | | |
Series 2024-4, Class D, 5.32%, 12/15/2031 | | |
| | |
|
United States — continued |
SASCO Mortgage Loan Trust Series 2004-GEL3, Class M1, 4.97%, 8/25/2034 (k) | | |
Saxon Asset Securities Trust Series 2004-2, Class MV2, 4.09%, 8/25/2035 (k) | | |
SBA Small Business Investment Cos. | | |
Series 2023-10A, Class 1, 5.17%, 3/10/2033 | | |
Series 2023-10B, Class 1, 5.69%, 9/10/2033 | | |
Securitized Asset-Backed Receivables LLC Trust Series 2005-OP1, Class M2, 5.53%, 1/25/2035 (k) | | |
Stanwich Mortgage Loan Co. LLC Series 2021-NPB1, Class A2, 4.38%, 10/16/2026 (b) (h) | | |
Structured Asset Securities Corp. Pass-Through Certificates Series 2002-AL1, Class A3, 3.45%, 2/25/2032 | | |
Theorem Funding Trust Series 2022-3A, Class A, 7.60%, 4/15/2029 (b) | | |
Upstart Pass-Through Trust | | |
Series 2022-PT3, Class A, HB, 22.25%, 4/20/2030 ‡ (b) (k) | | |
Series 2022-PT4, Class A, 18.89%, 5/20/2030 ‡ (b) (k) | | |
Upstart Securitization Trust | | |
Series 2022-1, Class C, 5.71%, 3/20/2032 (b) | | |
Series 2022-4, Class A, 5.98%, 8/20/2032 (b) | | |
Wells Fargo Home Equity Asset-Backed Securities Trust | | |
Series 2004-2, Class M8B, 5.00%, 10/25/2034 (b) (k) | | |
Series 2004-2, Class M8A, 9.35%, 10/25/2034 (b) (k) | | |
| | |
Total Asset-Backed Securities
(Cost $173,472) | | |
U.S. Treasury Obligations — 0.6% |
|
| | |
| | |
SEE NOTES TO FINANCIAL STATEMENTS.
| | |
U.S. Treasury Obligations — continued |
United States — continued |
| | |
| | |
Total U.S. Treasury Obligations
(Cost $48,228) | | |
| | |
|
|
Allstate Corp. (The) Series J, 7.38%, 7/15/2028 ($25 par value) (r) | | |
| | |
Series I, 6.38%, 1/15/2025 ($25 par value) (r) | | |
Series K, 5.85%, 4/15/2027 ($25 par value) (r) | | |
Series P, 6.50%, 10/15/2027 ($25 par value) (r) | | |
Series Q, 6.63%, 10/15/2029 ($25 par value) (r) | | |
MYT Holding LLC Series A, 10.00%, 6/6/2029 ‡ | | |
SCE Trust VI 5.00%, 12/6/2024 ($25 par value) (r) | | |
| | |
Series Y, 5.63%, 12/15/2024 ($25 par value) (r) | | |
Series Z, 4.75%, 3/15/2025 ($25 par value) (r) | | |
Total Preferred Stocks
(Cost $38,853) | | |
| | |
|
|
DISH Network Corp. 3.38%, 8/15/2026 | | |
Gulfport Energy Corp. 10.00% (Cash), 12/7/2024 ‡ * (e) (f) (i) | | |
Liberty Interactive LLC 3.75%, 2/15/2030 | | |
Total Convertible Bonds
(Cost $5,234) | | |
| | |
Convertible Preferred Stocks — 0.1% |
|
Claire's Stores, Inc. ‡ * (m)
(Cost $5,208) | | |
| | |
Mortgage-Backed Securities — 0.0% ^ |
|
FHLMC UMBS, 30 Year Pool # SD8238, 4.50%, 8/1/2052 | | |
FNMA UMBS, 20 Year Pool # CA1231, 3.50%, 2/1/2038 | | |
| | |
Pool # MA4398, 2.00%, 8/1/2051 | | |
Pool # MA4465, 2.00%, 11/1/2051 | | |
Pool # MA4548, 2.50%, 2/1/2052 | | |
Pool # MA4563, 2.50%, 3/1/2052 | | |
Pool # MA4564, 3.00%, 3/1/2052 | | |
Pool # MA4624, 3.00%, 6/1/2052 | | |
Pool # MA4733, 4.50%, 9/1/2052 | | |
Total Mortgage-Backed Securities
(Cost $1,068) | | |
| | |
|
|
Cineworld Group plc expiring 12/23/2025, price 4,149.00 GBP * | | |
Nmg Research Ltd. expiring 9/24/2027, price 1.00 USD ‡ * | | |
| | |
| | |
Short-Term Investments — 2.3% |
Certificates of Deposits — 0.0% ^ |
Kookmin Bank, 5.47%, 5/14/2025 | | |
Standard Chartered Bank, 5.51%, 4/10/2025 | | |
Total Certificates of Deposits
(Cost $544) | | |
SEE NOTES TO FINANCIAL STATEMENTS.
JPMorgan Income Builder Fund
SCHEDULE OF PORTFOLIO INVESTMENTSAS OF October 31, 2024 (continued)
| | |
Short-Term Investments — continued |
|
Brookfield Corporate Treasury Ltd., 5.04%, 12/27/2024 (b) | | |
Caisse d'Amortissement de la Dette Sociale, 5.30%, 4/1/2025 (b) | | |
Caisse des Depots et Consignations, 4.62%, 1/22/2025 (b) | | |
| | |
| | |
| | |
Cisco Systems, Inc., 5.24%, 1/24/2025 (b) | | |
DNB Bank ASA, 5.49%, 5/29/2025 (b) | | |
Glencore Funding LLC, 4.98%, 11/4/2024 (b) | | |
Kookmin Bank, 5.51%, 1/17/2025 (b) | | |
National Bank of Canada, 5.55%, 4/30/2025 (b) | | |
NatWest Markets plc, 4.62%, 2/4/2025 (b) | | |
Nutrien Ltd., 4.94%, 11/20/2024 (b) | | |
Total Commercial Paper
(Cost $3,174) | | |
| | |
Investment Companies — 1.2% |
JPMorgan Prime Money Market Fund Class IM Shares, 4.90% (n) (s) | | |
JPMorgan Prime Money Market Fund Class Institutional Shares, 4.81% (n) (s) | | |
Total Investment Companies
(Cost $104,619) | | |
Investment of Cash Collateral from Securities Loaned — 1.0% |
JPMorgan Securities Lending Money Market Fund Agency SL Class Shares, 4.85% (n) (s)(Cost $86,568) | | |
Total Short-Term Investments
(Cost $194,905) | | |
Total Investments — 100.8%
(Cost $8,182,739) | | |
Liabilities in Excess of Other Assets — (0.8)% | | |
| | |
Percentages indicated are based on net assets. |
Amounts presented as a dash ("-") represent amounts that round to less than a thousand. |
| |
| |
| Alternative Credit Enhancement Securities |
| American Depositary Receipt |
| |
| Commercial Industrial Finance Corp. |
| Collateralized Loan Obligations |
| Chicago Mercantile Exchange |
| Credit Suisse Mortgage Trust |
| Certificaten Van Aandelen (Dutch Certificate) |
| |
| |
| |
| Federal Home Loan Mortgage Corp. |
| Federal National Mortgage Association |
| |
| Global Depositary Receipt |
| Government National Mortgage Association |
| High Coupon Bonds (a.k.a. "IOettes") represent the right to receive interest payments on an underlying pool of mortgages with similar features as those associated with IO securities. Unlike IO's the owner also has a right to receive a very small portion of principal. The high interest rates result from taking interest payments from other classes in the Real Estate Mortgage Investment Conduit trust and allocating them to the small principal of the HB class. |
| Intercontinental Exchange |
| Inverse Floaters represent securities that pay interest at a rate that increases (decreases) with a decline (incline) in a specified index or have an interest rate that adjusts periodically based on changes in current interest rates and prepayments on the underlying pool of assets. The interest rate shown is the rate in effect as of October 31, 2024. The rate may be subject to a cap and floor. |
| Interest Only represents the right to receive the monthly interest payments on an underlying pool of mortgage loans. The principal amount shown represents the par value on the underlying pool. The yields on these securities are subject to accelerated principal paydowns as a result of prepayment or refinancing of the underlying pool of mortgage instruments. As a result, interest income may be reduced considerably. |
| |
| |
| |
| Public Joint Stock Company |
| Principal Only represents the right to receive the principal portion only on an underlying pool of mortgage loans. The market value of these securities is extremely volatile in response to changes in market interest rates. As prepayments on the underlying mortgages of these securities increase, the yield on these securities increases. |
SEE NOTES TO FINANCIAL STATEMENTS.
| A special type of equity investment that shares in the earnings of the company, has limited voting rights, and may have a dividend preference. Preference shares may also have liquidation preference. |
| Limited liability company |
| |
| Real Estate Investment Trust |
| Real Estate Mortgage Investment Conduit |
| |
| Limited partnership with share capital |
| Secured Overnight Financing Rate |
| Compounding index of the Secured Overnight Financing Rate |
| Uniform Mortgage-Backed Securities |
| |
| Amount rounds to less than 0.1% of net assets. |
| Value determined using significant unobservable inputs. | |
| Non-income producing security. | |
| Security exempt from registration pursuant to Regulation S under the Securities Act of 1933, as amended. Regulation S applies to securities offerings that are made outside of the United States and do not involve direct selling efforts in the United States and as such may have restrictions on resale. | |
| Securities exempt from registration under Rule 144A or section 4(a)(2), of the Securities Act of 1933, as amended. | |
| Variable or floating rate security, linked to the referenced benchmark. The interest rate shown is the current rate as of October 31, 2024. | |
| Contingent Capital security (“CoCo”). CoCos are hybrid debt securities that may be convertible into equity or may be written down if a pre-specified trigger event occurs. The total value of aggregate CoCo holdings at October 31, 2024 is $198,334 or 2.33% of the Fund’s net assets as of October 31, 2024. | |
| Security is an interest bearing note with preferred security characteristics. | |
| Security is perpetual and thus, does not have a predetermined maturity date. The coupon rate for this security is fixed for a period of time and may be structured to adjust thereafter. The date shown, if applicable, reflects the next call date. The coupon rate shown is the rate in effect as of October 31, 2024. | |
| The security or a portion of this security is on loan at October 31, 2024. The total value of securities on loan at October 31, 2024 is $82,646. | |
| Step bond. Interest rate is a fixed rate for an initial period that either resets at a specific date or may reset in the future contingent upon a predetermined trigger. The interest rate shown is the current rate as of October 31, 2024. | |
| Security has the ability to pay in kind (“PIK”) or pay income in cash. When applicable, separate rates of such payments are disclosed. | |
| | |
| Variable or floating rate security, the interest rate of which adjusts periodically based on changes in current interest rates and prepayments on the underlying pool of assets. The interest rate shown is the current rate as of October 31, 2024. | |
| All or a portion of the security is a when-issued security, delayed delivery security, or forward commitment. | |
| Fund is subject to legal or contractual restrictions on the resale of the security. | |
| Investment in an affiliated fund, which is registered under the Investment Company Act of 1940, as amended, and is advised by J.P. Morgan Investment Management Inc. | |
| Loan assignments are presented by obligor. Each series or loan tranche underlying each obligor may have varying terms. | |
| All or a portion of this security is unsettled as of October 31, 2024. Unless otherwise indicated, the coupon rate is undetermined. The coupon rate shown may not be accrued for the entire position. | |
| All or a portion of this security is deposited with the broker as initial margin for futures contracts. | |
| The date shown reflects the next call date on which the issuer may redeem the security at par value. The coupon rate for this security is based on par value and is in effect as of October 31, 2024. | |
| The rate shown is the current yield as of October 31, 2024. | |
SEE NOTES TO FINANCIAL STATEMENTS.
JPMorgan Income Builder Fund
SCHEDULE OF PORTFOLIO INVESTMENTSAS OF October 31, 2024 (continued)
Summary of Investments by Industry, October 31, 2024
The following table represents the portfolio investments of the Fund by industry classifications as a percentage of total investments:
| PERCENT OF
TOTAL
INVESTMENTS |
| |
| |
Oil, Gas & Consumable Fuels | |
| |
Commercial Mortgage-Backed Securities | |
Collateralized Mortgage Obligations | |
| |
Diversified Telecommunication Services | |
| |
| |
Semiconductors & Semiconductor Equipment | |
| |
Foreign Government Securities | |
Hotels, Restaurants & Leisure | |
| |
| |
| |
| |
| |
Health Care Providers & Services | |
| |
| |
Commercial Services & Supplies | |
| |
| |
| |
| |
Others (each less than 1.0%) | |
| |
Detailed information about investment portfolios of the Underlying Funds, as defined in the Notes to Financial Statements, and ETFs can be found in the financial statements filed with the Securities and Exchange Commission (SEC) by each such underlying fund semi-annually on Form N-CSR and in portfolio holdings filed quarterly on Form N-PORT, and are available for download from both the SEC’s as well as each respective underlying fund’s website. Detailed information about Underlying J.P. Morgan Funds can also be found at www.jpmorganfunds.com or by calling 1-800-480-4111.
Futures contracts outstanding as of October 31, 2024 (amounts in thousands, except number of contracts):
| | | | | VALUE AND
UNREALIZED
APPRECIATION
(DEPRECIATION) ($) |
| | | | | |
U.S. Treasury 10 Year Note | | | | | |
| | | | | |
| | | | | |
| | | | | |
| | | | | |
SEE NOTES TO FINANCIAL STATEMENTS.
| | | | | VALUE AND UNREALIZED APPRECIATION (DEPRECIATION) ($) |
| | | | | |
| | | | | |
| | | | | |
| | | | | |
| | | | | |
| |
| |
| Financial Times and the London Stock Exchange |
| |
| |
SEE NOTES TO FINANCIAL STATEMENTS.
STATEMENTS OF ASSETS AND LIABILITIESAS OF October 31, 2024
(Amounts in thousands, except per share amounts)
| JPMorgan
Global
Allocation Fund | |
| | |
Investments in non-affiliates, at value | | |
Investments in affiliates, at value | | |
Investments of cash collateral received from securities loaned, at value (See Note 2.E.) | | |
| | |
Foreign currency, at value | | |
Deposits at broker for futures contracts | | |
| | |
| | |
Investment securities sold | | |
Investment securities sold — delayed delivery securities | | |
| | |
Interest from non-affiliates | | |
Dividends from non-affiliates | | |
Dividends from affiliates | | |
| | |
Securities lending income (See Note 2.E.) | | |
Variation margin on futures contracts | | |
Unrealized appreciation on forward foreign currency exchange contracts | | |
| | |
| | |
| | |
Investment securities purchased | | |
Investment securities purchased — delayed delivery securities | | |
Collateral received on securities loaned (See Note 2.E.) | | |
| | |
Variation margin on futures contracts | | |
Unrealized depreciation on forward foreign currency exchange contracts | | |
| | |
| | |
| | |
| | |
| | |
Custodian and accounting fees | | |
Deferred foreign capital gains tax | | |
| | |
| | |
| | |
SEE NOTES TO FINANCIAL STATEMENTS.
| JPMorgan Global Allocation Fund | |
| | |
| | |
Total distributable earnings (loss) | | |
| | |
| | |
| | |
| | |
| | |
| | |
| | |
| | |
| | |
| | |
| | |
Outstanding units of beneficial interest (shares)
($0.0001 par value; unlimited number of shares authorized): | | |
| | |
| | |
| | |
| | |
| | |
| | |
| | |
| | |
| | |
Class A — Redemption price per share | | |
Class C — Offering price per share (b) | | |
Class I — Offering and redemption price per share | | |
Class R2 — Offering and redemption price per share | | |
Class R3 — Offering and redemption price per share | | |
Class R4 — Offering and redemption price per share | | |
Class R5 — Offering and redemption price per share | | |
Class R6 — Offering and redemption price per share | | |
Class A maximum sales charge | | |
Class A maximum public offering price per share
[net asset value per share/(100% – maximum sales charge)] | | |
Cost of investments in non-affiliates | | |
Cost of investments in affiliates | | |
| | |
Investment securities on loan, at value (See Note 2.E.) | | |
Cost of investment of cash collateral (See Note 2.E.) | | |
(a)
Per share amounts may not recalculate due to rounding of net assets and/or shares outstanding.
(b)
Redemption price for Class C Shares varies based upon length of time the shares are held.
SEE NOTES TO FINANCIAL STATEMENTS.
STATEMENTS OF OPERATIONSFOR THE YEAR ENDED October 31, 2024
(Amounts in thousands)
| JPMorgan
Global
Allocation Fund | |
| | |
Interest income from non-affiliates | | |
Interest income from affiliates | | |
Dividend income from non-affiliates | | |
Dividend income from affiliates | | |
Income from securities lending (net) (See Note 2.E.) | | |
Foreign taxes withheld (net) | | |
| | |
| | |
| | |
| | |
| | |
| | |
| | |
| | |
| | |
| | |
| | |
| | |
| | |
| | |
| | |
| | |
| | |
Custodian and accounting fees | | |
Interest expense to affiliates | | |
| | |
Trustees’ and Chief Compliance Officer’s fees | | |
Printing and mailing costs | | |
Registration and filing fees | | |
Transfer agency fees (See Note 2.K.) | | |
| | |
| | |
| | |
Less expense reimbursements | | |
| | |
Net investment income (loss) | | |
(a)
Amount rounds to less than one thousand.
SEE NOTES TO FINANCIAL STATEMENTS.
| JPMorgan Global Allocation Fund | |
REALIZED/UNREALIZED GAINS (LOSSES): | | |
Net realized gain (loss) on transactions from: | | |
Investments in non-affiliates | | |
Investments in affiliates | | |
| | |
| | |
Foreign currency transactions | | |
Forward foreign currency exchange contracts | | |
| | |
Change in net unrealized appreciation/depreciation on: | | |
Investments in non-affiliates | | |
Investments in affiliates | | |
| | |
Foreign currency translations | | |
Forward foreign currency exchange contracts | | |
Change in net unrealized appreciation/depreciation | | |
Net realized/unrealized gains (losses) | | |
Change in net assets resulting from operations | | |
(a)
Net of foreign capital gains tax of $(39).
(b)
Net of foreign capital gains tax of $(418).
(c)
Net of change in foreign capital gains tax of $(10).
(d)
Net of change in foreign capital gains tax of $(1,103).
SEE NOTES TO FINANCIAL STATEMENTS.
STATEMENTS OF CHANGES IN NET ASSETSFOR THE PERIODS INDICATED
(Amounts in thousands)
| JPMorgan Global Allocation Fund | JPMorgan Income Builder Fund |
| Year Ended
October 31, 2024 | Year Ended
October 31, 2023 | Year Ended
October 31, 2024 | |
CHANGE IN NET ASSETS RESULTING FROM OPERATIONS: | | | | |
Net investment income (loss) | | | | |
| | | | |
Change in net unrealized appreciation/depreciation | | | | |
Change in net assets resulting from operations | | | | |
DISTRIBUTIONS TO SHAREHOLDERS: | | | | |
| | | | |
| | | | |
| | | | |
| | | | |
| | | | |
| | | | |
| | | | |
| | | | |
Total distributions to shareholders | | | | |
| | | | |
Change in net assets resulting from capital transactions | | | | |
| | | | |
| | | | |
| | | | |
| | | | |
(a)
Amount rounds to less than one thousand.
SEE NOTES TO FINANCIAL STATEMENTS.
| JPMorgan Global Allocation Fund | JPMorgan Income Builder Fund |
| Year Ended October 31, 2024 | Year Ended October 31, 2023 | Year Ended October 31, 2024 | |
| | | | |
| | | | |
Proceeds from shares issued | | | | |
| | | | |
| | | | |
Change in net assets resulting from Class A capital transactions | | | | |
| | | | |
Proceeds from shares issued | | | | |
| | | | |
| | | | |
Change in net assets resulting from Class C capital transactions | | | | |
| | | | |
Proceeds from shares issued | | | | |
| | | | |
| | | | |
Change in net assets resulting from Class I capital transactions | | | | |
| | | | |
Proceeds from shares issued | | | | |
| | | | |
| | | | |
Change in net assets resulting from Class R2 capital transactions | | | | |
| | | | |
Proceeds from shares issued | | | | |
| | | | |
| | | | |
Change in net assets resulting from Class R3 capital transactions | | | | |
| | | | |
Proceeds from shares issued | | | | |
| | | | |
| | | | |
Change in net assets resulting from Class R4 capital transactions | | | | |
| | | | |
Proceeds from shares issued | | | | |
| | | | |
| | | | |
Change in net assets resulting from Class R5 capital transactions | | | | |
(a)
Amount rounds to less than one thousand.
SEE NOTES TO FINANCIAL STATEMENTS.
STATEMENTS OF CHANGES IN NET ASSETSFOR THE PERIODS INDICATED (continued)
(Amounts in thousands)
| JPMorgan Global Allocation Fund | JPMorgan Income Builder Fund |
| Year Ended October 31, 2024 | Year Ended October 31, 2023 | Year Ended October 31, 2024 | |
CAPITAL TRANSACTIONS: (continued) | | | | |
| | | | |
Proceeds from shares issued | | | | |
| | | | |
| | | | |
Change in net assets resulting from Class R6 capital transactions | | | | |
Total change in net assets resulting from capital transactions | | | | |
| | | | |
| | | | |
| | | | |
| | | | |
| | | | |
| | | | |
| | | | |
| | | | |
| | | | |
| | | | |
| | | | |
| | | | |
| | | | |
| | | | |
| | | | |
| | | | |
| | | | |
| | | | |
| | | | |
| | | | |
Change in Class R2 Shares | | | | |
| | | | |
| | | | |
| | | | |
| | | | |
Change in Class R3 Shares | | | | |
| | | | |
| | | | |
| | | | |
| | | | |
Change in Class R4 Shares | | | | |
SEE NOTES TO FINANCIAL STATEMENTS.
| JPMorgan Global Allocation Fund | JPMorgan Income Builder Fund |
| Year Ended October 31, 2024 | Year Ended October 31, 2023 | Year Ended October 31, 2024 | |
SHARE TRANSACTIONS: (continued) | | | | |
| | | | |
| | | | |
| | | | |
| | | | |
Change in Class R5 Shares | | | | |
| | | | |
| | | | |
| | | | |
| | | | |
Change in Class R6 Shares | | | | |
(a)
Amount rounds to less than one thousand.
SEE NOTES TO FINANCIAL STATEMENTS.
FINANCIAL HIGHLIGHTSFOR THE PERIODS INDICATED
| Per share operating performance |
| | | |
| Net asset
value,
beginning
of period | Net
investment
income
(loss)(a)(b) | Net realized
and unrealized
gains
(losses) on
investments | Total from
investment
operations | | | |
JPMorgan Global Allocation Fund | | | | | | | |
| | | | | | | |
Year Ended October 31, 2024 | | | | | | | |
Year Ended October 31, 2023 | | | | | | | |
Year Ended October 31, 2022 | | | | | | | |
Year Ended October 31, 2021 | | | | | | | |
Year Ended October 31, 2020 | | | | | | | |
| | | | | | | |
Year Ended October 31, 2024 | | | | | | | |
Year Ended October 31, 2023 | | | | | | | |
Year Ended October 31, 2022 | | | | | | | |
Year Ended October 31, 2021 | | | | | | | |
Year Ended October 31, 2020 | | | | | | | |
| | | | | | | |
Year Ended October 31, 2024 | | | | | | | |
Year Ended October 31, 2023 | | | | | | | |
Year Ended October 31, 2022 | | | | | | | |
Year Ended October 31, 2021 | | | | | | | |
Year Ended October 31, 2020 | | | | | | | |
| | | | | | | |
Year Ended October 31, 2024 | | | | | | | |
Year Ended October 31, 2023 | | | | | | | |
Year Ended October 31, 2022 | | | | | | | |
Year Ended October 31, 2021 | | | | | | | |
Year Ended October 31, 2020 | | | | | | | |
| | | | | | | |
Year Ended October 31, 2024 | | | | | | | |
Year Ended October 31, 2023 | | | | | | | |
Year Ended October 31, 2022 | | | | | | | |
Year Ended October 31, 2021 | | | | | | | |
Year Ended October 31, 2020 | | | | | | | |
| | | | | | | |
Year Ended October 31, 2024 | | | | | | | |
Year Ended October 31, 2023 | | | | | | | |
Year Ended October 31, 2022 | | | | | | | |
Year Ended October 31, 2021 | | | | | | | |
Year Ended October 31, 2020 | | | | | | | |
| | | | | | | |
Year Ended October 31, 2024 | | | | | | | |
Year Ended October 31, 2023 | | | | | | | |
Year Ended October 31, 2022 | | | | | | | |
Year Ended October 31, 2021 | | | | | | | |
Year Ended October 31, 2020 | | | | | | | |
SEE NOTES TO FINANCIAL STATEMENTS.
| |
| | | Ratios to average net assets |
Net asset
value,
end of
period | Total return
(excludes
sales charge)(c) | Net assets,
end of
period
(000's) | Net
expenses
(including dividend
and interest expense
for securities sold
short)(d)(e) | Net
investment
income
(loss)(a) | Expenses without
waivers and
reimbursements
(including dividend
and interest expense
for securities sold
short)(d) | Portfolio
turnover rate
(excluding securities
sold short)(f) | Portfolio
turnover rate
(including securities
sold short)(f) |
| | | | | | | |
| | | | | | | |
| | | | | | | |
| | | | | | | |
| | | | | | | |
| | | | | | | |
| | | | | | | |
| | | | | | | |
| | | | | | | |
| | | | | | | |
| | | | | | | |
| | | | | | | |
| | | | | | | |
| | | | | | | |
| | | | | | | |
| | | | | | | |
| | | | | | | |
| | | | | | | |
| | | | | | | |
| | | | | | | |
| | | | | | | |
| | | | | | | |
| | | | | | | |
| | | | | | | |
| | | | | | | |
| | | | | | | |
| | | | | | | |
| | | | | | | |
| | | | | | | |
| | | | | | | |
| | | | | | | |
| | | | | | | |
| | | | | | | |
| | | | | | | |
| | | | | | | |
| | | | | | | |
| | | | | | | |
| | | | | | | |
| | | | | | | |
| | | | | | | |
| | | | | | | |
| | | | | | | |
| | | | | | | |
SEE NOTES TO FINANCIAL STATEMENTS.
FINANCIAL HIGHLIGHTSFOR THE PERIODS INDICATED (continued)
| Per share operating performance |
| | | |
| Net asset
value,
beginning
of period | Net
investment
income
(loss)(a)(b) | Net realized
and unrealized
gains
(losses) on
investments | Total from
investment
operations | | | |
JPMorgan Global Allocation Fund (continued) | | | | | | | |
| | | | | | | |
Year Ended October 31, 2024 | | | | | | | |
Year Ended October 31, 2023 | | | | | | | |
Year Ended October 31, 2022 | | | | | | | |
Year Ended October 31, 2021 | | | | | | | |
Year Ended October 31, 2020 | | | | | | | |
| | | | | | | |
|
| Net investment income (loss) is affected by the timing of distributions from Underlying Funds. |
| Calculated based upon average shares outstanding. |
| Includes adjustments in accordance with accounting principles generally accepted in the United States of America and as such, the net asset values for financial reporting purposes and the returns based upon those net asset values may differ from the net asset values and returns for shareholder transactions. |
| Does not include expenses of Underlying Funds. |
| Includes interest expense, if applicable, which is less than 0.005% unless otherwise noted. |
| The Fund presents portfolio turnover in two ways, one including securities sold short and the other excluding securities sold short. For the years ended October 31, 2023 and October 31, 2024 the Fund did not transact in securities sold short. |
| |
| | | | | |
Net expenses (excluding dividend and interest expense for securities sold short) | | | | | |
| | | | | |
| | | | | |
| | | | | |
| | | | | |
| | | | | |
| | | | | |
| | | | | |
| | | | | |
Expenses without waivers and reimbursements (excluding dividend and interest expense for securities sold short) | | | | | |
| | | | | |
| | | | | |
| | | | | |
| | | | | |
| | | | | |
| | | | | |
| | | | | |
| | | | | |
SEE NOTES TO FINANCIAL STATEMENTS.
| |
| | | Ratios to average net assets |
Net asset
value,
end of
period | Total return
(excludes
sales charge)(c) | Net assets,
end of
period
(000's) | Net
expenses
(including dividend
and interest expense
for securities sold
short)(d)(e) | Net
investment
income
(loss)(a) | Expenses without
waivers and
reimbursements
(including dividend
and interest expense
for securities sold
short)(d) | Portfolio
turnover rate
(excluding securities
sold short)(f) | Portfolio
turnover rate
(including securities
sold short)(f) |
|
| | | | | | | |
| | | | | | | |
| | | | | | | |
| | | | | | | |
| | | | | | | |
| | | | | | | |
| | | | | | | |
SEE NOTES TO FINANCIAL STATEMENTS.
FINANCIAL HIGHLIGHTSFOR THE PERIODS INDICATED
| Per share operating performance |
| | | |
| Net asset
value,
beginning
of period | Net
investment
income
(loss)(a) | Net realized
and unrealized
gains
(losses) on
investments | Total from
investment
operations | | | |
JPMorgan Income Builder Fund | | | | | | | |
| | | | | | | |
Year Ended October 31, 2024 | | | | | | | |
Year Ended October 31, 2023 | | | | | | | |
Year Ended October 31, 2022 | | | | | | | |
Year Ended October 31, 2021 | | | | | | | |
Year Ended October 31, 2020 | | | | | | | |
| | | | | | | |
Year Ended October 31, 2024 | | | | | | | |
Year Ended October 31, 2023 | | | | | | | |
Year Ended October 31, 2022 | | | | | | | |
Year Ended October 31, 2021 | | | | | | | |
Year Ended October 31, 2020 | | | | | | | |
| | | | | | | |
Year Ended October 31, 2024 | | | | | | | |
Year Ended October 31, 2023 | | | | | | | |
Year Ended October 31, 2022 | | | | | | | |
Year Ended October 31, 2021 | | | | | | | |
Year Ended October 31, 2020 | | | | | | | |
| | | | | | | |
Year Ended October 31, 2024 | | | | | | | |
Year Ended October 31, 2023 | | | | | | | |
Year Ended October 31, 2022 | | | | | | | |
Year Ended October 31, 2021 | | | | | | | |
Year Ended October 31, 2020 | | | | | | | |
| | | | | | | |
|
| Calculated based upon average shares outstanding. |
| Includes adjustments in accordance with accounting principles generally accepted in the United States of America and as such, the net asset values for financial reporting purposes and the returns based upon those net asset values may differ from the net asset values and returns for shareholder transactions. |
| Includes interest expense, if applicable, which is less than 0.005% unless otherwise noted. |
| |
| | | Ratios to average net assets |
Net asset
value,
end of
period | Total return
(excludes
sales charge)(b) | Net assets,
end of
period
(000's) | | Net
investment
income
(loss) | Expenses without
waivers and
reimbursements | |
| | | | | | |
| | | | | | |
| | | | | | |
| | | | | | |
| | | | | | |
| | | | | | |
| | | | | | |
| | | | | | |
| | | | | | |
| | | | | | |
| | | | | | |
| | | | | | |
| | | | | | |
| | | | | | |
| | | | | | |
| | | | | | |
| | | | | | |
| | | | | | |
| | | | | | |
| | | | | | |
| | | | | | |
| | | | | | |
| | | | | | |
| | | | | | |
| | | | | | |
| | | | | | |
NOTES TO FINANCIAL STATEMENTSAS OF October 31, 2024
(Dollar values in thousands)
1. Organization
JPMorgan Trust I (the “Trust”) was formed on November 12, 2004, as a Delaware statutory trust, pursuant to a Declaration of Trust dated November 5, 2004 and is registered under the Investment Company Act of 1940, as amended (the “1940 Act”), as an open-end management investment company.
The following are 2 separate funds of the Trust (each, a "Fund" and collectively, the "Funds") covered by this report:
| | Diversification Classification |
JPMorgan Global Allocation Fund | Class A, Class C, Class I, Class R2, Class R3, Class R4, Class R5 and Class R6 | |
JPMorgan Income Builder Fund | Class A, Class C, Class I and Class R6 | |
The investment objective of JPMorgan Global Allocation Fund (“Global Allocation Fund”) is to seek to maximize long-term total return.
The investment objective of JPMorgan Income Builder Fund (“Income Builder Fund”) is to seek to maximize income while maintaining prospects for capital appreciation.
Class A Shares generally provide for a front-end sales charge while Class C Shares provide for a contingent deferred sales charge ("CDSC"). No sales charges are assessed with respect to Class I, Class R2, Class R3, Class R4, Class R5 and Class R6 Shares. Certain Class A Shares, for which front-end sales charges have been waived, may be subject to a CDSC as described in the Funds' prospectus. Class C Shares automatically convert to Class A Shares after eight years. All classes of shares have equal rights as to earnings, assets and voting privileges, except that each class may bear different transfer agency, distribution and service fees and each class has exclusive voting rights with respect to its distribution plan and shareholder servicing agreements.
J.P. Morgan Investment Management Inc. (“JPMIM”), an indirect, wholly-owned subsidiary of JPMorgan Chase & Co. (“JPMorgan”), acts as adviser (the “Adviser”) and administrator (the “Administrator”) to the Funds.
2. Significant Accounting Policies
The following is a summary of significant accounting policies followed by the Funds in the preparation of their financial statements. The Funds are investment companies and, accordingly, follow the investment company accounting and reporting guidance of the Financial Accounting Standards Board (“FASB”) Accounting Standards Codification Topic 946 — Investment Companies, which is part of U.S. generally accepted accounting principles (“GAAP”). The preparation of financial statements in conformity with GAAP requires management to make estimates and assumptions that affect (i) the reported amounts of assets and liabilities, (ii) disclosure of contingent assets and liabilities at the date of the financial statements, and (iii) the reported amounts of increases and decreases in net assets from operations during the reporting period. Actual results could differ from those estimates.
A. Valuation of Investments— Investments are valued in accordance with GAAP and the Funds' valuation policies set forth by, and under the supervision and responsibility of, the Board of Trustees of the Trust (the "Board"), which established the following approach to valuation, as described more fully below: (i) investments for which market quotations are readily available shall be valued at their market value and (ii) all other investments for which market quotations are not readily available shall be valued at their fair value as determined in good faith by the Board.
Under Section 2(a)(41) of the 1940 Act, the Board is required to determine fair value for securities that do not have readily available market quotations. Under Securities and Exchange Commission ("SEC") Rule 2a-5 (Good Faith Determinations of Fair Value), the Board may designate the performance of these fair valuation determinations to a valuation designee. The Board has designated the Adviser as the “Valuation Designee” to perform fair valuation determinations for the Funds on behalf of the Board subject to appropriate oversight by the Board. The Adviser, as Valuation Designee, leverages the J.P. Morgan Asset Management Americas Valuation Committee (“AVC”) to help oversee and carry out the policies for the valuation of Investments held in the Funds. The Adviser, as Valuation Designee, remains responsible for the valuation determinations.
This oversight by the AVC includes monitoring the appropriateness of fair values based on results of ongoing valuation oversight including, but not limited to, consideration of macro or security specific events, market events, and pricing vendor and broker due diligence. The Administrator is responsible for discussing and assessing the potential impacts to the fair values on an ongoing basis, and, at least on a quarterly basis, with the AVC and the Board.
A market-based approach is primarily used to value the Funds' investments. Investments for which market quotations are not readily available are fair valued using prices supplied by approved affiliated and/or unaffiliated pricing vendors or third party broker-dealers (collectively referred to as “Pricing Services”) or may be internally fair valued using methods set forth by the valuation policies approved by the Boards. This may include the use of related or comparable assets or liabilities, recent transactions, market multiples, book values and other relevant information for the investment. An income-based valuation approach may be used in which the anticipated future cash flows of the investment are discounted to calculate the fair value. Discounts may also be applied due to the nature or duration of any restrictions on the disposition of the investments. Valuations may be based upon current market prices of securities that are comparable in coupon, rating, maturity and industry. It is possible that the estimated values may differ significantly from the values that would have been used had a ready market for the investments existed, and such differences could be material.
Fixed income instruments are valued based on prices received from Pricing Services. The Pricing Services use multiple valuation techniques to determine the valuation of fixed income instruments. In instances where sufficient market activity exists, the Pricing Services may utilize a market-based approach through which trades or quotes from market makers are used to determine the valuation of these instruments. In instances where sufficient market activity may not exist, the Pricing Services also utilize proprietary valuation models which may consider market transactions in comparable securities and the various relationships between securities in determining fair value and/or market characteristics in order to estimate the relevant cash flows, which are then discounted to calculate the fair values.
Equities and other exchange-traded instruments are valued at the last sale price or official market closing price on the primary exchange on which the instrument is traded before the net asset values ("NAV") of the Funds are calculated on a valuation date. Certain foreign equity instruments are valued by applying international fair value factors provided by approved Pricing Services. The factors seek to adjust the local closing price for movements of local markets post-closing, but prior to the time the NAV is calculated.
Investments in open-end investment companies, excluding exchange-traded funds (“ETFs”) (“Underlying Funds”), are valued at each Underlying Fund’s NAV per share as of the report date.
Futures contracts and options are generally valued on the basis of available market quotations. Forward foreign currency exchange contracts are valued utilizing market quotations from approved Pricing Services.
See the tables on “Quantitative Information about Level 3 Fair Value Measurements” for information on the valuation techniques and inputs used to value level 3 securities held by Income Builder Fund at October 31, 2024.
Valuations reflected in this report are as of the report date. As a result, changes in valuation due to market events and/or issuer-related events after the report date and prior to issuance of the report are not reflected herein.
The various inputs that are used in determining the valuation of the Funds' investments are summarized into the three broad levels listed below.
•
Level 1 — Unadjusted inputs using quoted prices in active markets for identical investments.
•
Level 2 — Other significant observable inputs including, but not limited to, quoted prices for similar investments, inputs other than quoted prices that are observable for investments (such as interest rates, prepayment speeds, credit risk, etc.) or other market corroborated inputs.
•
Level 3 — Significant inputs based on the best information available in the circumstances, to the extent observable inputs are not available (including the Funds' assumptions in determining the fair value of investments).
A financial instrument’s level within the fair value hierarchy is based on the lowest level of any input, both individually and in the aggregate, that is significant to the fair value measurement. The inputs or methodology used for valuing instruments are not necessarily an indication of the risk associated with investing in those instruments.
The following tables represent each valuation input as presented on the Schedules of Portfolio Investments ("SOIs"):
| | |
| | Level 2
Other significant
observable inputs | Level 3
Significant
unobservable inputs | |
Investments in Securities | | | | |
Collateralized Mortgage Obligations | | | | |
Commercial Mortgage-Backed Securities | | | | |
| | | | |
| | | | |
| | | | |
| | | | |
| | | | |
| | | | |
| | | | |
| | | | |
| | | | |
| | | | |
| | | | |
| | | | |
| | | | |
| | | | |
| | | | |
NOTES TO FINANCIAL STATEMENTSAS OF October 31, 2024 (continued)
(Dollar values in thousands)
Global Allocation Fund (continued) | | |
| | Level 2 Other significant observable inputs | Level 3 Significant unobservable inputs | |
| | | | |
| | | | |
| | | | |
| | | | |
| | | | |
| | | | |
| | | | |
| | | | |
| | | | |
| | | | |
| | | | |
| | | | |
| | | | |
| | | | |
| | | | |
| | | | |
| | | | |
| | | | |
| | | | |
| | | | |
| | | | |
| | | | |
| | | | |
| | | | |
| | | | |
| | | | |
| | | | |
| | | | |
| | | | |
| | | | |
| | | | |
| | | | |
| | | | |
Convertible Preferred Stocks | | | | |
| | | | |
Foreign Government Securities | | | | |
| | | | |
| | | | |
Mortgage-Backed Securities | | | | |
| | | | |
| | | | |
U.S. Treasury Obligations | | | | |
| | | | |
| | | | |
| | | | |
| | | | |
Investment of Cash Collateral from Securities Loaned | | | | |
Total Short-Term Investments | | | | |
Global Allocation Fund (continued) | | |
| | Level 2 Other significant observable inputs | Level 3 Significant unobservable inputs | |
Total Investments in Securities | | | | |
Appreciation in Other Financial Instruments | | | | |
Forward Foreign Currency Exchange Contracts | | | | |
| | | | |
Depreciation in Other Financial Instruments | | | | |
Forward Foreign Currency Exchange Contracts | | | | |
| | | | |
Total Net Appreciation/ Depreciation in Other
Financial Instruments | | | | |
|
| Amount rounds to less than one thousand. |
| |
| | |
| | Level 2
Other significant
observable inputs | Level 3
Significant
unobservable inputs | |
Investments in Securities | | | | |
| | | | |
| | | | |
| | | | |
| | | | |
Total Asset-Backed Securities | | | | |
Collateralized Mortgage Obligations | | | | |
| | | | |
Commercial Mortgage-Backed Securities | | | | |
| | | | |
| | | | |
| | | | |
| | | | |
| | | | |
| | | | |
| | | | |
| | | | |
| | | | |
| | | | |
| | | | |
| | | | |
| | | | |
| | | | |
| | | | |
| | | | |
| | | | |
| | | | |
| | | | |
| | | | |
| | | | |
NOTES TO FINANCIAL STATEMENTSAS OF October 31, 2024 (continued)
(Dollar values in thousands)
Income Builder Fund (continued) | | |
| | Level 2 Other significant observable inputs | Level 3 Significant unobservable inputs | |
| | | | |
| | | | |
| | | | |
| | | | |
| | | | |
| | | | |
| | | | |
| | | | |
| | | | |
| | | | |
| | | | |
| | | | |
| | | | |
| | | | |
| | | | |
| | | | |
| | | | |
| | | | |
| | | | |
| | | | |
| | | | |
Convertible Preferred Stocks | | | | |
| | | | |
| | | | |
| | | | |
| | | | |
| | | | |
| | | | |
| | | | |
| | | | |
| | | | |
| | | | |
| | | | |
| | | | |
| | | | |
| | | | |
| | | | |
| | | | |
| | | | |
| | | | |
| | | | |
| | | | |
| | | | |
| | | | |
| | | | |
| | | | |
| | | | |
| | | | |
Income Builder Fund (continued) | | |
| | Level 2 Other significant observable inputs | Level 3 Significant unobservable inputs | |
| | | | |
| | | | |
| | | | |
| | | | |
| | | | |
| | | | |
| | | | |
| | | | |
| | | | |
| | | | |
| | | | |
Venezuela, Bolivarian Republic of | | | | |
| | | | |
| | | | |
| | | | |
Foreign Government Securities | | | | |
| | | | |
| | | | |
| | | | |
| | | | |
| | | | |
| | | | |
| | | | |
| | | | |
Mortgage-Backed Securities | | | | |
| | | | |
| | | | |
U.S. Treasury Obligations | | | | |
| | | | |
| | | | |
| | | | |
| | | | |
| | | | |
| | | | |
Investment of Cash Collateral from Securities Loaned | | | | |
Total Short-Term Investments | | | | |
Total Investments in Securities | | | | |
Appreciation in Other Financial Instruments | | | | |
| | | | |
Depreciation in Other Financial Instruments | | | | |
| | | | |
Total Net Appreciation/ Depreciation in Other
Financial Instruments | | | | |
|
| Amount rounds to less than one thousand. |
NOTES TO FINANCIAL STATEMENTSAS OF October 31, 2024 (continued)
(Dollar values in thousands)
The following is a summary of investments for which significant unobservable inputs (level 3) were used in determining fair value:
| Balance as of
October 31,
2023 | | Change in net
unrealized
appreciation
(depreciation) | Net
accretion
(amortization) | | | | | Balance as of
October 31,
2024 |
Investments in Securities: | | | | | | | | | |
| | | | | | | | | |
Collateralized Mortgage Obligations | | | | | | | | | |
| | | | | | | | | |
| | | | | | | | | |
Convertible Preferred Stocks | | | | | | | | | |
| | | | | | | | | |
| | | | | | | | | |
| | | | | | | | | |
| | | | | | | | | |
| | | | | | | | | |
| | | | | | | | | |
|
| Purchases include all purchases of securities and securities received in corporate actions. |
| Sales include all sales of securities, maturities, paydowns and securities tendered in corporate actions. |
| Amount rounds to less than one thousand. |
The changes in net unrealized appreciation (depreciation) attributable to securities owned at October 31, 2024, which were valued using significant unobservable inputs (level 3) amounted to $3,811. This amount is included in Change in net unrealized appreciation/depreciation on investments in non-affiliates on the Statements of Operations.
There were no significant transfers into or out of level 3 for the year ended October 31, 2024.
The significant unobservable inputs used in the fair value measurement of the Funds' investments are listed below. Generally, a change in the assumptions used in any input in isolation may be accompanied by a change in another input. Significant changes in any of the unobservable inputs may significantly impact the fair value measurement. The impact is based on the relationship between each unobservable input and the fair value measurement. Significant increases (decreases) in enterprise multiples may increase (decrease) the fair value measurement. Significant increases (decreases) in the discount for lack of marketability, liquidity discount, probability of default, yield and default rate may decrease (increase) the fair value measurement. A significant change in the discount rate or prepayment rate (Constant Prepayment Rate or PSA Prepayment Model) may decrease or increase the fair value measurement.
Quantitative Information about Level 3 Fair Value Measurements #
| Fair Value at October 31, 2024 | | | Range (Weighted Average) (a) |
| | | | |
| | | | |
| | | | |
| | Market Comparable Companies | | |
| | | | |
Convertible Preferred Stocks | | | | |
| | | | |
| | | | |
| | | | |
| | | | |
| Fair Value at October 31, 2024 | | | Range (Weighted Average) (a) |
| | | | |
| | | Yield (Discount Rate of Cash Flows) | |
| | | | |
| | | | |
| | | | |
| | | Yield (Discount Rate of Cash Flows) | |
| | | | |
Collateralized Mortgage Obligations | | | | |
| | | | |
| | | Yield (Discount Rate of Cash Flows) | |
| | | | |
| | | | |
| | | | |
| | | | |
| | | | |
| | | | |
| The table above does not include certain level 3 investments that are valued by brokers and Pricing Services. At October 31, 2024, the value of these investments was $35,631. The inputs for these investments are not readily available or cannot be reasonably estimated and are generally those inputs described in Note 2.A. |
| Unobservable inputs were weighted by the relative fair value of the instruments. |
| Amount rounds to less than one thousand. |
| Represents amounts used when the reporting entity has determined that market participants would take into account such multiples when pricing the investments. |
B. Restricted Securities— Certain securities held by the Funds may be subject to legal or contractual restrictions on resale. Restricted securities generally are resold in transactions exempt from registration under the Securities Act of 1933, as amended (the “Securities Act”). Disposal of these securities may involve time-consuming negotiations and expense. Prompt sale at the current valuation may be difficult and could adversely affect the NAVs of the Funds.
As of October 31, 2024, the Funds held restricted securities, other than securities sold to the Funds under Rule 144A and/or Regulation S under the Securities Act, as follows:
| | | | Percentage
of Fund's
Net Assets |
| | | | |
| | | | |
| | | | |
| | | | Percentage
of Fund's
Net Assets |
| | | | |
| | | | |
Claire's Stores, 1st Lien Term Loan B | | | | |
| | | | |
NOTES TO FINANCIAL STATEMENTSAS OF October 31, 2024 (continued)
(Dollar values in thousands)
C. Loan Assignments— The Funds invested in debt instruments that are interests in amounts owed to lenders or lending syndicates (a “Lender”) by corporate, governmental or other borrowers (a “Borrower”). A loan is often administered by a bank or other financial institution (the “Agent”) that acts as Agent for all holders. The Agent administers the terms of the loan, as specified in the loan agreement. The Funds invested in loan assignments of all or a portion of the loans. When a Fund purchases a loan assignment, the Fund has direct rights against the Borrower on a loan. In addition, it is unclear whether loans, loan assignments and other forms of direct indebtedness offer securities law protections against fraud and misrepresentation. Also, because JPMIM may wish to invest in publicly traded securities of a Borrower, it may not have access to material non-public information regarding the Borrower to which other investors have access. Although certain loans are secured by collateral a Fund could experience delays or limitations in realizing the value on such collateral or have its interest subordinated to other indebtedness of the Borrower.
Loan assignments are vulnerable to market conditions such that economic conditions or other events may reduce the demand for assignments and certain assignments which were liquid when purchased, may become illiquid and difficult to value. In addition, the settlement period for loans is uncertain as there is no standardized settlement schedule applicable to such investments. Therefore, a Fund may not receive the proceeds from a sale of such investments for a period after the sale.
Certain loan assignments are also subject to the risks associated with high yield securities described under Note 7.
D. When-Issued Securities, Delayed Delivery Securities and Forward Commitments— The Funds purchased when-issued securities, including To-Be-Announced (“TBA”) securities, and entered into contracts to purchase or sell securities for a fixed price that may be settled a month or more after the trade date, or purchased delayed delivery securities which generally settle seven days after the trade date. When-issued securities are securities that have been authorized, but not issued in the market. A forward commitment involves entering into a contract to purchase or sell securities for a fixed price at a future date that may be settled a month or more after the trade date. A delayed delivery security is agreed upon in advance between the buyer and the seller of the security and is generally delivered beyond seven days of the agreed upon date. The purchase of securities on a when-issued, delayed delivery or forward commitment basis involves the risk that the value of the security to be purchased declines before the settlement date. The sale of securities on a forward commitment basis involves the risk that the value of the securities sold may increase before the settlement date. The Funds may be exposed to credit risk if the counterparty fails to perform under the terms of the transaction. Interest income for securities purchased on a when-issued, delayed delivery or forward commitment basis is not accrued until the settlement date.
The Funds may be required to post or receive collateral for delayed delivery securities in the form of cash or securities under a Master Securities Forward Transaction Agreement with the counterparties (each, an “MSFTA”). The collateral requirements are generally calculated by netting the mark-to-market amount for a Fund's transactions under the MSFTA and comparing that amount to the value of the collateral pledged by a fund and the counterparty. Daily movement of cash collateral is subject to minimum threshold amounts. Collateral posted by a Fund is held in a segregated account at the Fund's custodian bank and is included on the Statements of Assets and Liabilities as Restricted cash. Collateral received by the Funds is held in a separate segregated account maintained by JPMorgan Chase Bank, N.A. ("JPMCB"), a wholly-owned subsidiary of JPMorgan. These amounts are not reflected on the Funds' Statements of Assets and Liabilities.
The Funds had when-issued securities, delayed delivery securities or forward commitments outstanding as of October 31, 2024, which are shown as a Receivable for Investment securities sold — delayed delivery securities and a Payable for Investment securities purchased — delayed delivery securities, respectively, on the Statements of Assets and Liabilities. The values of these securities held at October 31, 2024 are detailed on the SOIs, if any.
E. Securities Lending — The Funds are authorized to engage in securities lending in order to generate additional income. The Funds are able to lend to approved borrowers. Citibank N.A. (“Citibank”) serves as lending agent for the Funds, pursuant to a Securities Lending Agency Agreement (the “Securities Lending Agency Agreement”). Securities loaned are collateralized by cash equal to at least 100% of the market value plus accrued interest on the securities lent, which is invested in the Class IM Shares of the JPMorgan U.S. Government Money Market Fund and the Agency SL Class Shares of the JPMorgan Securities Lending Money Market Fund. The Funds retain the interest earned on cash collateral investments but are required to pay the borrower a rebate for the use of the cash collateral. In cases where the lent security is of high value to borrowers, there may be a negative rebate (i.e., a net payment from the borrower to the Funds). Upon termination of a loan, the Funds are required to return to the borrower an amount equal to the cash collateral, plus any rebate owed to the borrowers. The remaining maturities of the securities lending transactions are considered overnight and continuous. Loans are subject to termination by the Funds or the borrower at any time.
The net income earned on the securities lending (after payment of rebates and Citibank’s fee) is included on the Statements of Operations as Income from securities lending (net). The Funds also receive payments from the borrower during the period of the loan, equivalent to dividends and interest earned on the securities loaned, which are recorded as Dividend or Interest income, respectively, on the Statements of Operations.
Under the Securities Lending Agency Agreement, Citibank marks to market the loaned securities on a daily basis. In the event the cash received from the borrower is less than 102% of the value of the loaned securities (105% for loans of non-U.S. securities), Citibank requests additional cash from the borrower so as to maintain a collateralization level of at least 102% of the value of the loaned securities plus accrued interest (105% for loans of non-U.S. securities), subject to certain de minimis amounts.
The value of securities out on loan is recorded as an asset on the Statements of Assets and Liabilities. The value of the cash collateral received is recorded as a liability on the Statements of Assets and Liabilities and details of collateral investments are disclosed on the SOIs.
The Funds bear the risk of loss associated with the collateral investments and are not entitled to additional collateral from the borrower to cover any such losses. To the extent that the value of the collateral investments declines below the amount owed to a borrower, the Funds may incur losses that exceed the amount they earned on lending the security. Upon termination of a loan, the Funds may use leverage (borrow money) to repay the borrower for cash collateral posted if the Adviser does not believe that it is prudent to sell the collateral investments to fund the payment of this liability. Securities lending activity is subject to master netting arrangements.
The following table presents for each lending Fund, the value of the securities on loan with Citibank, net of amounts available for offset under the master netting arrangements and any related collateral received or posted by the Funds as of October 31, 2024.
| Investment Securities
on Loan, at value,
Presented on the
Statements of Assets
and Liabilities | Cash Collateral
Posted by Borrower* | Net Amount Due
to Counterparty
(not less than zero) |
| | | |
| | | |
|
| Collateral posted reflects the value of securities on loan and does not include any additional amounts received from the borrower. |
Securities lending also involves counterparty risks, including the risk that the loaned securities may not be returned in a timely manner or at all. Subject to certain conditions, Citibank has agreed to indemnify the Funds from losses resulting from a borrower’s failure to return a loaned security.
JPMIM voluntarily waived investment advisory fees charged to the Funds to reduce the impact of the cash collateral investment in the JPMorgan U.S. Government Money Market Fund from 0.13% to 0.06%. For the year ended October 31, 2024, JPMIM waived fees associated with the Funds' investment in the JPMorgan U.S. Government Money Market Fund as follows:
The above waiver is included in the determination of earnings on cash collateral investment and in the calculation of Citibank’s compensation and is included on the Statements of Operations as Income from securities lending (net).
F. Investment Transactions with Affiliates— The Funds invested in Underlying Funds and ETFs advised by the Adviser. An issuer which is under common control with a Fund may be considered an affiliate. For the purposes of the financial statements, the Funds assume the issuers listed in the tables below to be affiliated issuers. The Underlying Funds’ and ETFs' distributions may be reinvested into such Underlying Funds and ETFs. Reinvestment amounts are included in the purchases at cost amounts in the tables below.
|
For the year ended October 31, 2024 |
| | | | | Change in
Unrealized
Appreciation/
(Depreciation) | | | | Capital Gain
Distributions |
JPMorgan Income Fund Class R6 Shares (a) | | | | | | | | | |
JPMorgan Prime Money Market Fund Class Institutional Shares, 4.81% (a) (b) | | | | | | | | | |
JPMorgan Securities Lending Money Market Fund Agency SL Class Shares, 4.85% (a) (b) | | | | | | | | | |
JPMorgan U.S. Government Money Market Fund Class IM Shares, 4.80% (a) (b) | | | | | | | | | |
| | | | | | | | | |
|
| Investment in an affiliated fund, which is registered under the Investment Company Act of 1940, as amended, and is advised by J.P. Morgan Investment Management Inc. |
| The rate shown is the current yield as of October 31, 2024. |
| Amount is included on the Statements of Operations as Income from securities lending (net) (after payments of rebates and Citibank’s fee). |
NOTES TO FINANCIAL STATEMENTSAS OF October 31, 2024 (continued)
(Dollar values in thousands)
|
For the year ended October 31, 2024 |
| | | | | Change in
Unrealized
Appreciation/
(Depreciation) | | | | Capital Gain
Distributions |
JPMorgan Equity Premium Income ETF (a) | | | | | | | | | |
| | | | | | | | | |
JPMorgan Nasdaq Equity Premium Income ETF (a) | | | | | | | | | |
JPMorgan Prime Money Market Fund Class IM Shares, 4.90% (a) (b) | | | | | | | | | |
JPMorgan Prime Money Market Fund Class Institutional Shares, 4.81% (a) (b) | | | | | | | | | |
JPMorgan Securities Lending Money Market Fund Agency SL Class Shares, 4.85% (a) (b) | | | | | | | | | |
JPMorgan U.S. Government Money Market Fund Class IM Shares, 4.80% (a) (b) | | | | | | | | | |
| | | | | | | | | |
|
| Investment in an affiliated fund, which is registered under the Investment Company Act of 1940, as amended, and is advised by J.P. Morgan Investment Management Inc. |
| The rate shown is the current yield as of October 31, 2024. |
| Amount is included on the Statements of Operations as Income from securities lending (net) (after payments of rebates and Citibank’s fee). |
G. Foreign Currency Translation — The books and records of the Funds are maintained in U.S. dollars. Foreign currency amounts are translated into U.S. dollars at the prevailing exchange rates of such currencies against the U.S. dollar. The market value of investment securities and other assets and liabilities are translated at the exchange rate as of the valuation date. Purchases and sales of investment securities, income and expenses are translated at the exchange rate prevailing on the respective dates of such transactions.
The Funds do not isolate the effect of changes in foreign exchange rates from changes in market prices on securities held. Accordingly, such changes are included within Change in net unrealized appreciation/depreciation on investments in non-affiliates on the Statements of Operations.
Reported realized foreign currency gains and losses arise from the disposition of foreign currency, currency gains or losses realized between the trade and settlement dates on securities transactions, and the difference between the amounts of dividends, interest and foreign withholding taxes recorded on each Fund's books on the transaction date and the U.S. dollar equivalent of the amounts actually received or paid. These reported realized foreign currency gains and losses are included in Net realized gain (loss) on foreign currency transactions on the Statements of Operations. Unrealized foreign currency gains and losses arise from changes (due to changes in exchange rates) in the value of foreign currency and other assets and liabilities denominated in foreign currencies, which are held at year end and are included in Change in net unrealized appreciation/depreciation on foreign currency translations on the Statements of Operations.
H. Derivatives— The Funds used derivative instruments including options, futures contracts and forward foreign currency exchange contracts, in connection with their respective investment strategy. Derivative instruments may be used as substitutes for securities in which the Funds can invest, to hedge portfolio investments or to generate income or gain to the Funds. Derivatives may also be used to manage duration, sector and yield curve exposures and credit and spread volatility. Certain derivatives are synthetic instruments that attempt to replicate the performance of certain reference assets.
The Funds may be subject to various risks from the use of derivatives, including the risk that changes in the value of a derivative may not correlate perfectly with the underlying asset, rate or index; counterparty credit risk related to derivatives counterparties’ failure to perform under contract terms; liquidity risk related to the potential lack of a liquid market for these contracts allowing the Funds to close out their position(s); and documentation risk relating to disagreement over contract terms. Investing in certain derivatives also results in a form of leverage and as such, the Funds’ risk of loss associated with these instruments may exceed their value, as recorded on the Statements of Assets and Liabilities.
The Funds are party to various derivative contracts governed by International Swaps and Derivatives Association master agreements (“ISDA agreements”). The Funds’ ISDA agreements, which are separately negotiated with each dealer counterparty, may contain provisions allowing, absent other considerations, a counterparty to exercise rights, to the extent not otherwise waived, against the Funds in the event the Funds’ net assets decline over time by a pre-determined percentage or fall below a pre-determined floor. The ISDA agreements may also contain provisions allowing, absent other conditions, the Funds to exercise rights, to the extent not otherwise waived, against a counterparty (e.g., decline in a counterparty’s credit rating below a specified level). Such rights for both a counterparty and the Funds often include the ability to terminate (i.e., close out) open
contracts at prices which may favor a counterparty, which could have an adverse effect on the Funds. The ISDA agreements give the Funds and a counterparty the right, upon an event of default, to close out all transactions traded under such agreements and to net amounts owed or due across all transactions and offset such net payable or receivable against collateral posted to a segregated account by one party for the benefit of the other.
Counterparty credit risk may be mitigated to the extent a counterparty posts additional collateral for mark-to-market gains to the Funds.
Notes I(1) - I(3) below describe the various derivatives used by the Funds.
(1) Options— Global Allocation Fund purchased put and call options on various instruments including futures, securities and currencies to manage and hedge interest rate risks within its portfolio and also to gain long or short exposure to the underlying instrument, index, currency or rate. A purchaser of a put option has the right, but not the obligation, to sell the underlying instrument at an agreed upon price (“strike price”) to the option seller. A purchaser of a call option has the right, but not the obligation, to purchase the underlying instrument at the strike price from the option seller. Swaptions and Eurodollar options are settled for cash.
Options Purchased— Premiums paid by the Fund for options purchased are included on the Statements of Assets and Liabilities as Options Purchased. The option is adjusted daily to reflect the current market value of the option and the change is recorded as Change in unrealized appreciation/depreciation on options purchased on the Statements of Operations. If the option is allowed to expire, the Fund will lose the entire premium it paid and record a realized loss for the premium amount. Premiums paid for options purchased which are exercised or closed are added to the amounts paid or will offset against the proceeds on the underlying investment transaction to determine the realized gain (loss) or cost basis of the underlying investment.
The Fund’s exchange-traded option contracts are not subject to master netting arrangements (the right to close out all transactions traded with a counterparty and net amounts owed or due across transactions).
(2) Futures Contracts— The Funds used currency, index, interest rate, treasury or other financial futures contracts to manage and hedge interest rate risk associated with portfolio investments and to gain or reduce exposure to particular countries or regions. The Funds also used futures contracts to lengthen or shorten the duration of the overall investment portfolio.
Futures contracts provide for the delayed delivery of the underlying instrument at a fixed price or are settled for a cash amount based on the change in the value of the underlying instrument at a specific date in the future. Upon entering into a futures contract, the Funds are required to deposit with the broker, cash or securities in an amount equal to a certain percentage of the contract amount, which is referred to as the initial margin deposit. Subsequent payments, referred to as variation margin, are made or received by the Funds periodically and are based on changes in the market value of open futures contracts. Changes in the market value of open futures contracts are recorded as Change in net unrealized appreciation/depreciation on futures contracts on the Statements of Operations. Realized gains or losses, representing the difference between the value of the contract at the time it was opened and the value at the time it was closed, are reported on the Statements of Operations at the closing or expiration of the futures contract. Securities deposited as initial margin are designated on the SOIs, while cash deposited, which is considered restricted, is recorded on the Statements of Assets and Liabilities. A receivable from and/or a payable to brokers for the daily variation margin is also recorded on the Statements of Assets and Liabilities.
The use of futures contracts exposes the Funds to equity price, foreign exchange and interest rate risks. The Funds may be subject to the risk that the change in the value of the futures contract may not correlate perfectly with the underlying instrument. Use of long futures contracts subjects the Funds to risk of loss in excess of the amounts shown on the Statements of Assets and Liabilities, up to the notional amount of the futures contracts. Use of short futures contracts subjects the Funds to unlimited risk of loss. The Funds may enter into futures contracts only on exchanges or boards of trade. The exchange or board of trade acts as the counterparty to each futures transaction; therefore, the Funds' credit risk is limited to failure of the exchange or board of trade. Under some circumstances, futures exchanges may establish daily limits on the amount that the price of a futures contract can vary from the previous day’s settlement price, which could effectively prevent liquidation of positions.
The Funds' futures contracts are not subject to master netting arrangements (the right to close out all transactions traded with a counterparty and net amounts owed or due across transactions).
(3) Forward Foreign Currency Exchange Contracts— Global Allocation Fund is exposed to foreign currency risks associated with some or all of its portfolio investments and used forward foreign currency exchange contracts to hedge or manage certain of these exposures as part of its investment strategy. The Fund also bought forward foreign currency exchange contracts to gain exposure to currencies. Forward foreign currency exchange contracts represent obligations to purchase or sell foreign currency on a specified future date at a price fixed at the time the contracts are entered into. Non-deliverable forward foreign currency exchange contracts are settled with the counterparty in U.S. dollar without the delivery of the foreign currency.
The values of the forward foreign currency exchange contracts are adjusted daily based on the applicable exchange rates of the underlying currencies. Changes in the value of these contracts are recorded as Change in net unrealized appreciation or depreciation until the contract settlement date. When the forward foreign currency exchange contract is closed, the Fund records a realized gain or loss equal to the difference between the value at the time the contract was opened and the value at the time it was closed. The Fund also records a realized gain or loss, upon settlement, when a forward foreign currency exchange contract offsets another forward foreign currency exchange contract with the same counterparty.
NOTES TO FINANCIAL STATEMENTSAS OF October 31, 2024 (continued)
(Dollar values in thousands)
The Fund’s forward foreign currency exchange contracts are subject to master netting arrangements (the right to close out all transactions with a counterparty and net amounts owed or due across transactions).
The Fund may be required to post or receive collateral for non-deliverable forward foreign currency exchange contracts.
(4) Summary of Derivatives Information—The following tables present the value of derivatives held as of October 31, 2024, by their primary underlying risk exposure and respective location on the Statements of Assets and Liabilities:
| | |
| | |
Unrealized Appreciation on Futures Contracts * | | |
Unrealized Depreciation on Futures Contracts * | | |
Foreign Exchange Rate Risk Exposure: | | |
Unrealized Appreciation on Forward Foreign Currency Exchange Contracts | | |
Unrealized Depreciation on Futures Contracts * | | |
Unrealized Depreciation on Forward Foreign Currency Exchange Contracts | | |
Interest Rate Risk Exposure: | | |
Unrealized Appreciation on Futures Contracts * | | |
Unrealized Depreciation on Futures Contracts * | | |
Net Fair Value of Derivative Contracts: | | |
Unrealized Appreciation (Depreciation) on Futures Contracts * | | |
Unrealized Appreciation (Depreciation) on Forward Foreign Currency Exchange Contracts | | |
|
| Includes cumulative appreciation/(depreciation) on futures contracts, if any, as reported on the SOIs. Only current day’s variation margin is reported within the Statements of Assets and Liabilities. |
The following tables present the effect of derivatives on the Statements of Operations for the year ended October 31, 2024, by primary underlying risk exposure:
| | |
Realized Gain (Loss) on Derivatives Recognized as a Result From Operations: |
|
| | |
| | |
Foreign Exchange Rate Risk Exposure: |
| | |
Forward Foreign Currency Exchange Contracts | | |
Interest Rate Risk Exposure: |
| | |
Net Change in Unrealized Appreciation (Depreciation) on Derivatives Recognized as a Result of Operations: |
|
| | |
Foreign Exchange Rate Risk Exposure: |
| | |
Forward Foreign Currency Exchange Contracts | | |
Interest Rate Risk Exposure: |
| | |
Derivatives Volume
The table below discloses the volume of the Funds' options, futures contracts and forward foreign currency exchange contracts activity during the year ended October 31, 2024. Please refer to the tables in the Summary of Derivatives Information for derivative-related gains and losses associated with volume activity (amounts in thousands, except number of contracts):
| | |
| | |
Average Notional Balance Long | | |
Average Notional Balance Short | | |
Ending Notional Balance Long | | |
Ending Notional Balance Short | | |
Forward Foreign Currency Exchange Contracts: | | |
Average Settlement Value Purchased | | |
Average Settlement Value Sold | | |
Ending Settlement Value Purchased | | |
Ending Settlement Value Sold | | |
| | |
Average Number of Contracts Purchased | | |
The Funds may be required to post or receive collateral based on the net value of the Funds’ outstanding options, non-deliverable forward foreign currency exchange contracts and/or OTC swap contracts with the counterparty in the form of cash or securities. Daily movement of cash collateral is subject to minimum threshold amounts. Collateral posted by the Funds is held in a segregated account at the Funds’ custodian bank. For certain counterparties cash collateral posted by the Funds is invested in an affiliated money market fund (See Note 3.F), otherwise the cash collateral is included on the Statements of Assets and Liabilities as Restricted cash for OTC derivatives. Collateral received by the Funds is held in a separate segregated account maintained by JPMCB, an affiliate of the Funds.
The Funds' derivatives contracts held at October 31, 2024 are not accounted for as hedging instruments under GAAP.
I. Equity-Linked Notes— The Funds invested in Equity-Linked Notes (“ELNs”). These are hybrid instruments which combine both debt and equity characteristics into a single note form. ELNs' values are linked to the performance of an underlying index. ELNs are unsecured debt obligations of an issuer and may not be publicly listed or traded on an exchange. ELNs are valued daily, under procedures adopted by the Board, based on values provided by an approved pricing source. These notes have a coupon which is accrued and recorded as interest income on the Statements of Operations. Changes in the market value of ELNs are recorded as Change in net unrealized appreciation or depreciation on the Statements of Operations. The Funds realize a gain or loss when an ELN is sold or matures, which is recorded as Net realized gain (loss) on transactions from investments in non-affiliates on the Statements of Operations.
As of October 31, 2024, the Funds had outstanding ELNs as listed on the SOIs.
J. Security Transactions and Investment Income— Investment transactions are accounted for on the trade date (the date the order to buy or sell is executed). Securities gains and losses are calculated on a specifically identified cost basis. Interest income and interest expense on securities sold short, if any, is determined on the basis of coupon interest accrued using the effective interest method, which adjusts for amortization of premiums and accretion of discounts. Dividend income, net of foreign taxes withheld, if any, and dividend expense on securities sold short are recorded on the ex-dividend date or when a Fund first learns of the dividend. Certain Funds may receive other income from investment in loan assignments and/or unfunded commitments, including amendment fees, consent fees and commitment fees. These fees are recorded as income when received by the Funds. These amounts are included in Interest income from non-affiliates on the Statements of Operations.
To the extent such information is publicly available, the Funds record distributions received in excess of income earned from underlying investments as a reduction of cost of investments and/or realized gain. Such amounts are based on estimates if actual amounts are not available and actual amounts of income, realized gain and return of capital may differ from the estimated amounts. The Funds adjust the estimated amounts of the components of distributions (and consequently their net investment income) as necessary, once the issuers provide information about the actual composition of the distributions.
NOTES TO FINANCIAL STATEMENTSAS OF October 31, 2024 (continued)
(Dollar values in thousands)
K. Allocation of Income and Expenses— Expenses directly attributable to a Fund are charged directly to that Fund, while the expenses attributable to more than one fund of the Trust are allocated among the applicable funds. Investment income, realized and unrealized gains and losses and expenses, other than class-specific expenses, are allocated daily to each class of shares based upon the proportion of net assets of each class at the beginning of each day.
Transfer agency fees are class-specific expenses. The amount of the transfer agency fees charged to each share class of the Funds for the year ended October 31, 2024 are as follows:
|
| Amount rounds to less than one thousand. |
L. Federal Income Taxes— Each Fund is treated as a separate taxable entity for Federal income tax purposes. Each Fund's policy is to comply with the provisions of the Internal Revenue Code (the “Code”) applicable to regulated investment companies and to distribute to shareholders all of its distributable net investment income and net realized capital gains on investments. Accordingly, no provision for Federal income tax is necessary. Management has reviewed the Funds' tax positions for all open tax years and has determined that as of October 31, 2024, no liability for Federal income tax is required in the Funds' financial statements for net unrecognized tax benefits. However, management’s conclusions may be subject to future review based on changes in, or the interpretation of, the accounting standards or tax laws and regulations. Each Fund's Federal tax returns for the prior three fiscal years remain subject to examination by the Internal Revenue Service.
M. Foreign Taxes—The Funds may be subject to foreign taxes on income, gains on investments or currency purchases/repatriation, a portion of which may be recoverable. The Funds will accrue such taxes and recoveries as applicable, based upon their current interpretation of tax rules and regulations that exist in the markets in which they invest. When a capital gains tax is determined to apply, the Funds record an estimated deferred tax liability in an amount that would be payable if the securities were disposed of on the valuation date.
N. Distributions to Shareholders— Distributions from net investment income, if any, are generally declared and paid at least monthly for Income Builder Fund and declared and paid at least quarterly for Global Allocation Fund. Distributions are declared separately for each class. No class has preferential dividend rights; differences in per share rates are due to differences in separate class expenses. Net realized capital gains, if any, are distributed by each Fund at least annually. The amount of distributions from net investment income and net realized capital gains is determined in accordance with Federal income tax regulations, which may differ from GAAP. To the extent these “book/tax” differences are permanent in nature (i.e., that they result from other than timing of recognition — “temporary differences”), such amounts are reclassified within the capital accounts based on their Federal tax basis treatment.
The following amounts were reclassified within the capital accounts:
| | Accumulated
undistributed
(distributions in
excess of)
net investment
income | Accumulated
net realized
gains (losses) |
| | | |
| | | |
The reclassifications for the Funds relate primarily to foreign currency gains or losses and tax adjustments on certain investments.
3. Transactions with Affiliates
A. Investment Advisory Fee — Pursuant to an Investment Advisory Agreement, the Adviser manages the investments of each Fund and for such services is paid a fee. The investment advisory fee is accrued daily and paid monthly at an annual rate based on each Fund's respective average daily net assets. The annual rate for each Fund is as follows:
The Adviser waived investment advisory fees and/or reimbursed expenses as outlined in Note 3.F.
B. Administration Fee— Pursuant to an Administration Agreement, the Administrator provides certain administration services to each Fund. In consideration of these services, the Administrator receives a fee accrued daily and paid monthly at an annual rate of 0.075% of the first $10 billion of each Fund's respective average daily net assets, plus 0.050% of each Fund's respective average daily net assets between $10 billion and $20 billion, plus 0.025% of each Fund's respective average daily net assets between $20 billion and $25 billion, plus 0.010% of each Fund's respective average daily net assets in excess of $25 billion. For the year ended October 31, 2024, the effective rate was 0.075% of each Fund's average daily net assets, notwithstanding any fee waivers and/or expense reimbursements.
The Administrator waived administration fees as outlined in Note 3.F.
JPMCB, a wholly-owned subsidiary of JPMorgan, serves as the Funds' sub-administrator (the “Sub-administrator”). For its services as Sub-administrator, JPMCB receives a portion of the fees payable to the Administrator.
C. Distribution Fees— Pursuant to a Distribution Agreement, JPMorgan Distribution Services, Inc. (“JPMDS”), an indirect, wholly-owned subsidiary of JPMorgan, serves as each Fund's principal underwriter and promotes and arranges for the sale of each Fund's shares.
The Board has adopted a Distribution Plan (the “Distribution Plan”) for Class A, Class C, Class R2 and Class R3 Shares of the Funds, as applicable, pursuant to Rule 12b-1 under the 1940 Act. Class I, Class R4, Class R5 and Class R6 Shares of each Fund do not charge a distribution fee. The Distribution Plan provides that each Fund shall pay, with respect to the applicable share classes, distribution fees, including payments to JPMDS, at annual rates of the average daily net assets as shown in the table below:
In addition, JPMDS is entitled to receive the front-end sales charges from purchases of Class A Shares and the CDSC from redemptions of Class C Shares and certain Class A Shares for which front-end sales charges have been waived. For the year ended October 31, 2024, JPMDS retained the following:
|
| Amount rounds to less than one thousand. |
D. Service Fees— The Trust, on behalf of the Funds, has entered into a Shareholder Servicing Agreement with JPMDS under which JPMDS provides certain support services to fund shareholders. For performing these services, JPMDS receives a fee with respect to all share classes, except Class R6 Shares which do not charge a service fee, that is accrued daily and paid monthly equal to a percentage of the average daily net assets as shown in the table below:
JPMDS has entered into shareholder services contracts with affiliated and unaffiliated financial intermediaries who provide shareholder services and other related services to their clients or customers who invest in the Funds. Pursuant to such contracts, JPMDS will pay all or a portion of such fees earned to financial intermediaries for performing such services.
JPMDS waived service fees as outlined in Note 3.F.
E. Custodian and Accounting Fees— JPMCB provides portfolio custody and accounting services to the Funds. For performing these services, the Funds pay JPMCB transaction and asset-based fees that vary according to the number of transactions and positions, plus out-of-pocket expenses. The amounts paid directly to JPMCB by the Funds for custody and accounting services are included in Custodian and accounting fees on the Statements of Operations.
Interest income earned on cash balances at the custodian, if any, is included in Interest income from affiliates on the Statements of Operations.
Interest expense paid to the custodian related to cash overdrafts, if any, is included in Interest expense to affiliates on the Statements of Operations.
NOTES TO FINANCIAL STATEMENTSAS OF October 31, 2024 (continued)
(Dollar values in thousands)
F. Waivers and Reimbursements—The Adviser, Administrator and/or JPMDS have contractually agreed to waive fees and/or reimburse the Funds to the extent that total annual operating expenses (excluding acquired fund fees and expenses other than certain money market fund fees as described below, dividend and interest expenses related to short sales, interest, taxes, expenses related to litigation and potential litigation, expenses related to trustee elections and extraordinary expenses) exceed the percentages of the Funds' respective average daily net assets as shown in the table below:
The expense limitation agreements were in effect for the year ended October 31, 2024 and are in place until at least February 28, 2025.
For the year ended October 31, 2024, the Funds' service providers waived fees and/or reimbursed expenses for each of the Funds as follows. None of these parties expect the Funds to repay any such waived fees and/or reimbursed expenses in future years.
| | |
| | | | | Contractual
Reimbursements |
| | | | | |
| | | | | |
|
| Amount rounds to less than one thousand. |
Additionally, the Funds may invest in one or more money market funds advised by the Adviser (affiliated money market funds). The Adviser, Administrator and/or JPMDS, as shareholder servicing agent, have contractually agreed to waive fees and/or reimburse expenses in an amount sufficient to offset the respective net fees each collects from the affiliated money market fund on the applicable Fund’s investment in such affiliated money market fund, except for investments of securities lending cash collateral. None of these parties expect the Funds to repay any such waived fees and/ or reimbursed expenses in future years.
The amounts of these waivers resulting from investments in these money market funds for the year ended October 31, 2024 were as follows:
JPMIM voluntarily agreed to reimburse the Funds for the Trustee Fees paid to one of the interested Trustees. For the year ended October 31, 2024, the amount of these reimbursements were as follows:
|
| Amount rounds to less than one thousand. |
G. Other— Certain officers of the Trust are affiliated with the Adviser, the Administrator and JPMDS. Such officers, with the exception of the Chief Compliance Officer, receive no compensation from the Funds for serving in their respective roles.
The Board designated and appointed a Chief Compliance Officer to the Funds pursuant to Rule 38a-1 under the 1940 Act. Each Fund, along with affiliated funds, makes reimbursement payments, on a pro-rata basis, to the Administrator for a portion of the fees associated with the office of the Chief Compliance Officer. Such fees are included in Trustees’ and Chief Compliance Officer’s fees on the Statements of Operations.
The Trust adopted a Trustee Deferred Compensation Plan (the “Plan”) which allows the independent Trustees to defer the receipt of all or a portion of compensation related to performance of their duties as Trustees. The deferred fees are invested in various J.P. Morgan Funds until distribution in accordance with the Plan.
During the year ended October 31, 2024, the Funds purchased securities from an underwriting syndicate in which the principal underwriter or members of the syndicate were affiliated with the Adviser.
The SEC has granted an exemptive order permitting the Funds to engage in principal transactions with J.P. Morgan Securities LLC, an affiliated broker, involving taxable money market instruments, subject to certain conditions.
4. Investment Transactions
During the year ended October 31, 2024, purchases and sales of investments (excluding short-term investments) were as follows:
| Purchases
(excluding
U.S. Government) | Sales
(excluding
U.S. Government) | Purchases
of U.S.
Government | |
| | | | |
| | | | |
5. Federal Income Tax Matters
For Federal income tax purposes, the estimated cost and unrealized appreciation (depreciation) in value of investments held at October 31, 2024 were as follows:
| | Gross
Unrealized
Appreciation | Gross
Unrealized
Depreciation | Net Unrealized
Appreciation
(Depreciation) |
| | | | |
| | | | |
The difference between book and tax basis appreciation (depreciation) on investments is primarily attributed to tax adjustments on certain investments, tax adjustments on certain derivatives and wash sale loss deferrals.
The tax character of distributions paid during the year ended October 31, 2024 was as follows:
|
| Short-term gain distributions are treated as ordinary income for income tax purposes. |
The tax character of distributions paid during the year ended October 31, 2023 was as follows:
|
| Short-term gain distributions are treated as ordinary income for income tax purposes. |
As of October 31, 2024, the estimated components of net assets (excluding paid-in-capital) on a tax basis were as follows:
| Current
Distributable
Ordinary
Income | Current
Distributable
Long-Term
Capital Gain
(Tax Basis Capital
Loss Carryover) | Unrealized
Appreciation
(Depreciation) |
| | | |
| | | |
| | | |
NOTES TO FINANCIAL STATEMENTSAS OF October 31, 2024 (continued)
(Dollar values in thousands)
The cumulative timing differences primarily consist of tax adjustments on certain investments, tax adjustments on certain derivatives, straddle loss deferrals and wash sale loss deferrals.
As of October 31, 2024, the following Funds had net capital loss carryforwards, which are available to offset future realized gains:
| Capital Loss Carryforward Character |
| | |
| | |
| | |
During the year ended October 31, 2024, the following Fund utilized capital loss carryforwards as follows:
The Funds rely upon an exemptive order granted by the SEC (the “Order”) permitting the establishment and operation of an Interfund Lending Facility (the “Facility”). The Facility allows the Funds to directly lend and borrow money to or from any other fund relying upon the Order at rates beneficial to both the borrowing and lending funds. Advances under the Facility are taken primarily for temporary or emergency purposes, including the meeting of redemption requests that otherwise might require the untimely disposition of securities, and are subject to each Fund's borrowing restrictions. The interfund loan rate is determined, as specified in the Order, by averaging the current repurchase agreement rate and the current bank loan rate. The Order was granted to JPM II and may be relied upon by the Funds because the Funds and the series of JPM II are all investment companies in the same “group of investment companies” (as defined in Section 12(d)(1)(G) of the 1940 Act).
The Funds had no borrowings outstanding from another fund, or loans outstanding to another fund, during the year ended October 31, 2024.
The Trust and JPMCB have entered into a financing arrangement. Under this arrangement, JPMCB provides an unsecured, uncommitted credit facility in the aggregate amount of $100 million to certain of the J.P. Morgan Funds, including the Funds. Advances under the arrangement are taken primarily for temporary or emergency purposes, including the meeting of redemption requests that otherwise might require the untimely disposition of securities, and are subject to each Fund's borrowing restrictions. Interest on borrowings is payable at a rate determined by JPMCB at the time of borrowing. This agreement has been extended until October 28, 2025.
The Funds had no borrowings outstanding from the unsecured, uncommitted credit facility during the year ended October 31, 2024.
The Trust, along with certain other trusts for J.P. Morgan Funds (“Borrowers”), have entered into a joint syndicated senior unsecured revolving credit facility totaling $1.5 billion (“Credit Facility”) with various lenders and The Bank of New York Mellon, as administrative agent for the lenders. This Credit Facility provides a source of funds to the Borrowers for temporary and emergency purposes, including the meeting of redemption requests that otherwise might require the untimely disposition of securities. Under the terms of the Credit Facility, a borrowing fund must have a minimum of $25 million in adjusted net asset value and not exceed certain adjusted net asset coverage ratios prior to and during the time in which any borrowings are outstanding. If a fund does not comply with the aforementioned requirements, the fund must remediate within three business days with respect to the $25 million minimum adjusted net asset value or within one business day with respect to certain asset coverage ratios or the administrative agent at the request of, or with the consent of, the lenders may terminate the Credit Facility and declare any outstanding borrowings to be due and payable immediately.
Interest associated with any borrowing under the Credit Facility is charged to the borrowing fund at a rate of interest equal to 1.00%, plus the greater on the day of the borrowing, of the federal funds effective rate, or the Adjusted Secured Overnight Financing Rate (SOFR). Effective August 6, 2024, the Credit Facility was amended and restated for a term of 364 days, unless extended.
The Funds did not utilize the Credit Facility during the year ended October 31, 2024.
7. Risks, Concentrations and Indemnifications
In the normal course of business, the Funds enter into contracts that contain a variety of representations which provide general indemnifications. Each Fund's maximum exposure under these arrangements is unknown. The amount of exposure would depend on future claims that may be brought against each Fund. However, based on experience, the Funds expect the risk of loss to be remote.
| Number of
Individual Shareholder
and/or Affiliated
Omnibus Accounts | | Number of
Individual Shareholder
and/or Non-Affiliated
Omnibus Accounts | |
| | | | |
| | | | |
Significant shareholder transactions by these shareholders may impact the Funds' performance and liquidity.
The Funds are subject to interest rate risk. Investments in bonds and other debt securities will change in value based on changes in interest rates. If rates increase, the value of these investments generally declines. Securities with greater interest rate sensitivity and longer maturities generally are subject to greater fluctuations in value. The Funds invest in variable and floating rate loans and other variable and floating rate securities. Although these investments are generally less sensitive to interest rate changes than fixed rate instruments, the value of floating rate loans and other securities may decline if their interest rates do not rise as quickly, or as much, as general interest rates. The Funds may face a heightened level of interest rate risk due to certain changes in monetary policy. It is difficult to predict the pace at which central banks or monetary authorities may change interest rates or the timing, frequency, or magnitude of such changes. Any such changes could be sudden and could expose debt markets to significant volatility and reduced liquidity for Fund investments.
The Funds are subject to credit risk. The Funds' investments are subject to the risk that an issuer and/or a counterparty will fail to make payments when due or default completely. Prices of the Funds' investments may be adversely affected if any of the issuers or counterparties it is invested in are subject to an actual or perceived deterioration in their credit quality. Credit spreads may increase, which may reduce the market values of the Funds' securities. Credit spread risk is the risk that economic and market conditions or any actual or perceived credit deterioration may lead to an increase in the credit spreads (i.e. the difference in yield between two securities of similar maturity but different credit quality) and a decline in price of the issuer’s securities.
The Funds invest in high yield securities that are not rated or rated below investment grade (commonly known as "junk bonds"). These securities are considered to be high risk investments. Investments in lower-rated securities or unrated securities of comparable quality tend to be more sensitive to economic conditions than higher rated securities. Junk bonds involve a greater risk of default by the issuer because such securities are generally unsecured and are often subordinated to other creditors' claims. The market price of these securities can change suddenly and unexpectedly. As a result, the Funds are intended for investors who are able and willing to assume a high degree of risk.
Global Allocation Fund may have elements of risk not typically associated with investments in the United States of America due to concentrated investments in a limited number of foreign countries or regions, which may vary throughout the period. Such concentrations may subject the Fund to additional risks resulting from political or economic conditions in such countries or regions and the possible imposition of adverse governmental laws or currency exchange restrictions could cause the securities and their markets to be less liquid and their prices to be more volatile than those of comparable U.S. securities.
As of October 31, 2024, a significant portion of each Fund's investments consisted of securities that were denominated in foreign currencies. Changes in currency exchange rates will affect the value of, and investment income from, such securities.
Derivatives may be riskier than other types of investments because they may be more sensitive to changes in economic and market conditions and could result in losses that significantly exceed the Funds’ original investment. Many derivatives create leverage thereby causing the Funds to be more volatile than they would have been if they had not used derivatives. Derivatives also expose the Funds to counterparty risk (the risk that the derivative counterparty will not fulfill its contractual obligations), including credit risk of the derivative counterparty. The possible lack of a liquid secondary market for derivatives and the resulting inability of the Funds to sell or otherwise close a derivatives position could expose the Funds to losses and could make derivatives more difficult for the Funds to value accurately. Certain derivatives are synthetic instruments that attempt to replicate the performance of certain reference assets. With regard to such derivatives, the Funds do not have a claim on the reference assets and is subject to enhanced counterparty risk. Derivatives may not perform as expected, so the Funds may not realize the intended benefits. When used for hedging, the change in value of a derivative may not correlate as expected with the security or other risk being hedged. In addition, given their complexity, derivatives expose the Funds to risks of mispricing or improper valuation.
The Funds are subject to counterparty credit risk, which is the risk that a counterparty fails to perform on agreements with the Funds.
The Funds invest in foreign issuers and foreign securities (including depositary receipts) that are subject to additional risks, including political and economic risks, civil conflicts and war, greater volatility, expropriation and nationalization risks, sanctions or other measures by the United States or other governments, currency fluctuations, higher transaction costs, delayed settlement, possible foreign controls on investment, liquidity risks and
NOTES TO FINANCIAL STATEMENTSAS OF October 31, 2024 (continued)
(Dollar values in thousands)
less stringent investor protection and disclosure standards of foreign markets. In certain markets where securities and other instruments are not traded “delivery versus payment,” a Fund may not receive timely payment for securities or other instruments it has delivered or receive delivery of securities paid for and may be subject to increased risk that the counterparty will fail to make payments or delivery when due or default completely.
Events and evolving conditions in certain economies or markets may alter the risks associated with investments tied to countries or regions that historically were perceived as comparatively stable becoming riskier and more volatile.
The Funds are subject to infectious disease epidemics/pandemics risk. The effects of any future pandemic or other global event to public health and business and market conditions, may have a significant negative impact on the performance of a Fund's investments, increase a Fund's volatility, negatively impact a Fund’s arbitrage and pricing mechanisms, exacerbate pre-existing political, social and economic risks to the Funds, and negatively impact broad segments of businesses and populations. In addition, governments, their regulatory agencies, or self-regulatory organizations have taken or may take actions in response to a pandemic or other global event that affect the instruments in which the Funds invest, or the issuers of such instruments, in ways that could have a significant negative impact on a Fund’s investment performance. The ultimate impact of any pandemic or other global event and the extent to which the associated conditions and governmental responses impact a Fund will also depend on future developments, which are highly uncertain, difficult to accurately predict and subject to frequent changes.
REPORT OF INDEPENDENT REGISTERED PUBLIC ACCOUNTING FIRM
To the Board of Trustees of JPMorgan Trust I and Shareholders of JPMorgan Global Allocation Fund and JPMorgan Income Builder Fund
Opinions on the Financial Statements
We have audited the accompanying statements of assets and liabilities, including the schedules of portfolio investments, of JPMorgan Global Allocation Fund and JPMorgan Income Builder Fund (two of the funds constituting JPMorgan Trust I, hereafter collectively referred to as the "Funds") as of October 31, 2024, the related statements of operations for the year ended October 31, 2024, the statements of changes in net assets for each of the two years in the period ended October 31, 2024, including the related notes, and the financial highlights for each of the five years in the period ended October 31, 2024 (collectively referred to as the “financial statements”). In our opinion, the financial statements present fairly, in all material respects, the financial position of each of the Funds as of October 31, 2024, the results of each of their operations for the year then ended, the changes in each of their net assets for each of the two years in the period ended October 31, 2024 and each of the financial highlights for each of the five years in the period ended October 31, 2024 in conformity with accounting principles generally accepted in the United States of America.
These financial statements are the responsibility of the Funds’ management. Our responsibility is to express an opinion on the Funds’ financial statements based on our audits. We are a public accounting firm registered with the Public Company Accounting Oversight Board (United States) (PCAOB) and are required to be independent with respect to the Funds in accordance with the U.S. federal securities laws and the applicable rules and regulations of the Securities and Exchange Commission and the PCAOB.
We conducted our audits of these financial statements in accordance with the standards of the PCAOB. Those standards require that we plan and perform the audit to obtain reasonable assurance about whether the financial statements are free of material misstatement, whether due to error or fraud.
Our audits included performing procedures to assess the risks of material misstatement of the financial statements, whether due to error or fraud, and performing procedures that respond to those risks. Such procedures included examining, on a test basis, evidence regarding the amounts and disclosures in the financial statements. Our audits also included evaluating the accounting principles used and significant estimates made by management, as well as evaluating the overall presentation of the financial statements. Our procedures included confirmation of securities owned as of October 31, 2024 by correspondence with the custodian, transfer agents, agent banks and brokers; when replies were not received from brokers, we performed other auditing procedures. We believe that our audits provide a reasonable basis for our opinions.
/s/ PricewaterhouseCoopers LLP
New York, New York
December 23, 2024
We have served as the auditor of one or more investment companies in the JPMorgan Funds complex since 1993.
TAX LETTER(Unaudited)
(Dollar values in thousands)
Certain tax information for the J.P. Morgan Funds is required to be provided to shareholders based upon the Funds' income and distributions for the taxable year ended October 31, 2024. The information and distributions reported in this letter may differ from the information and taxable distributions reported to the shareholders for the calendar year ending December 31, 2024. The information necessary to complete your income tax returns for the calendar year ending December 31, 2024 will be provided under separate cover.
Dividends Received Deduction (DRD)
Each Fund listed below had the following percentage, or maximum allowable percentage, of ordinary income distributions eligible for the dividends received deduction for corporate shareholders for the fiscal year ended October 31, 2024:
| Dividends
Received
Deduction |
JPMorgan Global Allocation Fund | |
JPMorgan Income Builder Fund | |
Qualified Dividend Income (QDI)
Each Fund listed below had the following amount, or maximum allowable amount, of ordinary income distributions treated as qualified dividends for the fiscal year ended October 31, 2024:
| |
JPMorgan Global Allocation Fund | |
JPMorgan Income Builder Fund | |
THIS PAGE IS INTENTIONALLY LEFT BLANK
J.P. Morgan Funds are distributed by JPMorgan Distribution Services, Inc., which is an affiliate of JPMorgan Chase & Co. Affiliates of JPMorgan Chase & Co. receive fees for providing various services to the Funds.
Contact JPMorgan Distribution Services, Inc. at 1-800-480-4111 for a fund prospectus. You can also visit us at www.jpmorganfunds.com. Investors should carefully consider the investment objectives and risk as well as charges and expenses of the mutual fund before investing. The prospectus contains this and other information about the mutual fund. Read the prospectus carefully before investing.
Investors may obtain information about the Securities Investor Protection Corporation (SIPC), including the SIPC brochure, by visiting www.sipc.org or by calling SIPC at 202-371-8300.
Each Fund files a complete schedule of its fund holdings for the first and third quarters of its fiscal year with the SEC as an exhibit to its report on Form N-PORT. The Funds' Form N-PORT reports are available on the SEC’s website at http://www.sec.gov. Each Fund's quarterly holdings can be found by visiting the J.P. Morgan Funds’ website at www.jpmorganfunds.com.
A description of each Fund's policies and procedures with respect to the disclosure of each Fund's holdings is available in the prospectuses and Statement of Additional Information.
A copy of proxy policies and procedures is available without charge upon request by calling 1-800-480-4111 and on the Funds' website at www.jpmorganfunds.com. A description of such policies and procedures is on the SEC’s website at www.sec.gov. The Trustees have delegated the authority to vote proxies for securities owned by the Funds to the Adviser. A copy of the Funds' voting record for the most recent 12-month period ended June 30 is available on the SEC’s website at www.sec.gov or at the Funds' website at www.jpmorganfunds.com no later than August 31 of each year. The Funds' proxy voting record will include, among other things, a brief description of the matter voted on for each fund security, and will state how each vote was cast, for example, for or against the proposal.
J.P. Morgan Asset Management is the brand name for the asset management business of JPMorgan Chase & Co. and its affiliates worldwide.
© JPMorgan Chase & Co., 2024. All rights reserved. October 2024.
AN-IB-GAL-1024
Changes in and Disagreements with Accountants for Open-End Management Investment Companies
Proxy Disclosures for Open-End Management Investment Companies
Remuneration Paid to Directors, Officers, and Others of Open-End Management Investment Companies
Included in the Statements of Operations within the Funds' Financial Statements.
Statement Regarding Basis for Approval of Investment Advisory Agreements
The Board of Trustees (the “Board” or the “Trustees”) has established various standing committees composed of Trustees with diverse backgrounds, to which the Board has assigned specific subject matter responsibilities to further enhance the effectiveness of the Board’s oversight and decision making. The Board and its investment committees (Money Market and Alternative Products Committee, Equity Committee, and Fixed Income Committee) met regularly throughout the year and, at each meeting, considered factors that are relevant to their annual consideration of the continuation of the investment advisory agreements. The Board also met for the specific purpose of considering investment advisory agreement annual renewals. The Board held meetings June 25-26, 2024 and August 20-22, 2024, at which the Trustees considered the continuation of the investment advisory agreement for each Fund whose annual report is contained herein (each an “Advisory Agreement” and collectively, the “Advisory Agreements”). At the June meeting, the Board’s investment committees met to review and consider performance, expense and related information for each Fund and the other J.P. Morgan Funds overseen by the Board in which the Funds may invest (“Underlying Funds”). Each investment committee reported to the full Board, which then considered each investment committee’s preliminary findings. At the August meeting, the Trustees continued their review and consideration. The Trustees, including a majority of the Trustees who are not parties to an Advisory Agreement or “interested persons” (as defined in the Investment Company Act of 1940) of any party to an Advisory Agreement or any of their affiliates, approved the continuation of each Advisory Agreement on August 22, 2024.
As part of their review of the Advisory Agreements, the Trustees considered and reviewed performance and other information about the Funds and Underlying Funds received from J.P. Morgan Investment Management Inc. (the “Adviser”). This information included the Funds’ and Underlying Funds’ performance as compared to the performance of the Funds’ and Underlying Funds’ peers and benchmarks and analyses by the Adviser of the Funds’ and Underlying Funds’ performance. In addition, at each of their regular meetings throughout the year, the Trustees considered reports on the performance of certain J.P. Morgan Funds provided by an independent investment consulting firm (the “independent consultant”). In addition, in preparation for the June and August meetings, the Trustees requested, received and evaluated extensive materials from the Adviser, including, with respect to the Funds and/or Underlying Funds, performance and expense information compiled by Broadridge, using data from Lipper Inc. and/or Morningstar Inc., independent providers of investment company data (together, “Broadridge”). The Trustees’ independent consultant also provided additional quantitative and statistical analyses of certain Funds, including risk and
performance return assessments as compared to the Funds’ objectives, benchmarks, and peers. Before voting on the Advisory Agreements, the Trustees reviewed the Advisory Agreements with representatives of the Adviser, counsel to the Funds and independent legal counsel to the Trustees, and received a memorandum from independent legal counsel to the Trustees discussing the legal standards for their consideration of the Advisory Agreements. The Trustees also discussed the Advisory Agreements with independent legal counsel in executive sessions at which no representatives of the Adviser were present.
A summary of the material factors evaluated by the Trustees in determining whether to approve each Advisory Agreement is provided below. Each Trustee attributed different weights to the various factors and no factor alone was considered determinative. The Trustees considered information provided with respect to the Funds and Underlying Funds throughout the year, as well as materials furnished specifically in connection with the annual review process. From year to year, the Trustees consider and place emphasis on relevant information in light of changing circumstances in market and economic conditions.
After considering and weighing the factors and information they had received, the Trustees found that the compensation to be received by the Adviser from each Fund under the applicable Advisory Agreement was fair and reasonable under the circumstances, and determined that the continuance of each Advisory Agreement was in the best interests of each Fund and its shareholders.
Nature, Extent and Quality of Services Provided by the Adviser
The Trustees received and considered information regarding the nature, extent and quality of services provided to each Fund under the applicable Advisory Agreement. The Trustees took into account information furnished throughout the year at Trustee meetings, as well as the materials furnished specifically in connection with this annual review process. Among other things, the Trustees considered:
•
The background and experience of the Adviser’s senior management and investment personnel, including personnel changes, if any;
•
The qualifications, backgrounds and responsibilities of the portfolio management team primarily responsible for the day-to-day management of each Fund, including personnel changes, if any;
•
The investment strategy for each Fund, and the infrastructure supporting the portfolio management teams;
•
Information about the structure and distribution strategy for
each Fund and how it fits within the Adviser’s other fund offerings within the J.P. Morgan Funds complex;
•
The administration services provided by the Adviser in its role as Administrator;
•
Their knowledge of the nature and quality of the services provided by the Adviser and its affiliates gained from their experience as Trustees of the Funds and in the financial industry generally;
•
The overall reputation and capabilities of the Adviser and its affiliates;
•
The commitment of the Adviser to provide high quality service to the Funds and Underlying Funds;
•
Their overall confidence in the Adviser’s integrity; and
•
The Adviser’s responsiveness to requests for additional information, questions or concerns raised by them, including the Adviser’s willingness to consider and implement organizational and operational changes designed to improve investment results and the services provided to each Fund and Underlying Fund.
Based upon these considerations and other factors, the Trustees concluded that they were satisfied with the nature, extent and quality of the services provided to the Funds by the Adviser.
Costs of Services Provided and Profitability to the Adviser and its Affiliates
The Trustees received and considered information regarding the profitability to the Adviser and its affiliates from providing services to each Fund and Underlying Fund. The Trustees reviewed and discussed this information. The Trustees recognized that this information is not audited and represents the Adviser’s determination of its and its affiliates’ revenues from the contractual services provided to the Funds, less expenses of providing such services. Expenses include direct and indirect costs and are calculated using an allocation methodology developed by the Adviser and reviewed with the Board. The Trustees also recognized that it is difficult to make comparisons of profitability from fund investment advisory contracts because comparative information is not generally publicly available and is affected by numerous factors, including the structure of the particular adviser, the types of funds it manages, its business mix, numerous assumptions regarding allocations and the fact that publicly-traded fund managers’ operating profits and net income are net of distribution and marketing expenses. Based upon their review, and taking into consideration the factors noted above, the Trustees concluded that the profitability to the Adviser under each Advisory Agreement was not unreasonable in light of the services and benefits provided to each Fund.
The Trustees also considered that JPMorgan Distribution Services, Inc. (“JPMDS”), an affiliate of the Adviser, and the Adviser, earn fees from each Fund and/or Underlying Funds for providing shareholder and administration services, respectively. These fees were shown separately in the profitability analysis presented to the Trustees. The Trustees also considered the payments of Rule 12b-1 fees to JPMDS, which also acts as the Funds’ distributor, and that these fees are in turn generally paid to financial intermediaries that sell the Funds, including financial intermediaries that are affiliates of the Adviser (although they are retained by JPMDS in certain instances). The Trustees also considered the fees earned by JPMorgan Chase Bank, N.A. (“JPMCB”), an affiliate of the Adviser, for custody, fund accounting and other related services for each Fund and/or Underlying Funds, and the profitability of the arrangements to JPMCB.
The Trustees reviewed information regarding potential “fall-out” or ancillary benefits received by the Adviser and its affiliates as a result of their relationship with the Funds. The Trustees considered that the J.P. Morgan Funds' operating accounts are held at JPMCB, which, as a result, will receive float benefits for certain J.P. Morgan Funds, as applicable. The Trustees also noted that the Adviser supports a diverse set of products and services, which benefits the Adviser by allowing it to leverage its infrastructure to serve additional clients, including the benefits received by the Adviser and its affiliates in connection with the Funds’ investments in the Underlying Funds. The Trustees also reviewed the Adviser’s allocation of fund brokerage for the J.P. Morgan Funds complex, including allocations to brokers who provide research to the Adviser, as well as the Adviser’s use of affiliates to provide other services and the benefits to such affiliates of doing so. The Trustees also considered the benefit to the Adviser and its affiliates from allocating client assets to the Funds.
The Trustees considered the extent to which the Funds may benefit from potential economies of scale. The Trustees considered that there may not be a direct relationship between economies of scale realized by the Funds and those realized by the Adviser as assets increase. The Trustees considered the extent to which the Funds were priced to scale and whether it would be appropriate to add advisory fee breakpoints. The Trustees noted certain Funds with contractual expense limitations and fee waivers (“Fee Caps”), which allow a Fund’s shareholders to share potential economies of scale from a Fund’s inception, prior to reaching scale. The Trustees also noted that certain other Funds that had achieved scale as asset levels had increased, no longer had Fee Caps in place for some or all of their share classes, but shared economies of scale through lower average expenses. The Trustees noted that the fees remain fair and reasonable relative to peer funds. The
Trustees considered the benefits to the Funds of the use of an affiliated distributor and custodian, including the ability to rely on existing infrastructure supporting distribution, custodial and transfer agent services and the ability to negotiate competitive fees for the Funds. The Trustees further considered the Adviser's and JPMDS's ongoing investments in their business in support of the Funds, including the Adviser's and/or JPMDS's investments in trading systems, technology (including improvements to the J.P. Morgan Funds’ website, and cybersecurity improvements), retention of key talent, and regulatory support enhancements. The Trustees concluded that the current fee structure for each Fund, including any Fee Caps the Adviser has in place that serve to limit the overall net expense ratios of each Fund at competitive levels, was reasonable. The Trustees concluded that, for Funds with Fee Caps in place for some or all of their share classes, the relevant Fund’s shareholders received the benefits of potential economies of scale through the Fee Caps and, for Funds that achieved scale and no longer had Fee Caps in place for some or all of their share classes, the relevant Fund’s shareholders benefited from lower average expenses resulting from increased assets. The Trustees also concluded that all Funds benefited from the Adviser’s reinvestment in its operations to serve the Funds and their shareholders. The Trustees noted that the Adviser’s reinvestment ensures sufficient resources in terms of personnel and infrastructure to support the Funds.
Fees Relative to Adviser’s Other Clients
The Trustees received and considered information about the nature and extent of investment advisory services and fee rates offered to other clients of the Adviser, including, to the extent applicable, institutional separate accounts, collective investment trusts, other registered investment companies and/or private funds sub-advised by the Adviser, for investment management styles substantially similar to that of each Fund. The Trustees considered the complexity of investment management for registered investment companies relative to the Adviser’s other clients and noted differences, as applicable, in the fee structure and the regulatory, legal and other risks and responsibilities of providing services to the different clients. The Trustees considered that serving as an adviser to a registered investment company involves greater responsibilities and risks than acting as a sub-adviser and observed that sub-advisory fees may be lower than those charged by the Adviser to each Fund. The Trustees also noted that the adviser, not the applicable registered investment company, typically bears the sub-advisory fee and that many responsibilities related to the advisory function are typically retained by the primary adviser. The Trustees concluded that the fee rates charged to each Fund in comparison to those charged to the Adviser’s other clients were reasonable.
Investment Performance
The Trustees receive and consider information about each Fund’s performance throughout the year. In addition, the Trustees received and considered absolute and/or relative performance information for each Fund in a report prepared by Broadridge. The Trustees considered the total return performance information, which included the ranking of each Fund within a performance universe comprised of funds’ selected share classes with the same Broadridge investment classification and objective (the “Universe”), by total return for the applicable one-, three- and five-year periods. The Trustees reviewed a description of Broadridge’s methodology for selecting mutual funds in each Fund’s Universe and noted that Universe quintile rankings were not calculated if the number of funds in the Universe did not meet a predetermined minimum. The Trustees also considered enhancements to the methodology employed by Broadridge for identifying funds in the Peer Groups for Class I shares, based upon discussions with the Adviser, Broadridge and certain Trustees in advance of, and in preparation for, the June meeting. The Broadridge materials provided to the Trustees highlighted information with respect to certain representative classes to assist the Trustees in their review. As part of this review, the Trustees also reviewed each Fund’s performance against its benchmark and considered the performance information provided for each Fund at regular Board meetings by the Adviser and the independent consultant and also considered the special analysis prepared for certain Funds by the independent consultant. The Trustees also engaged with the Adviser to consider what steps might be taken to improve performance, as applicable. The Broadridge performance data noted by the Trustees as part of their review and the determinations made by the Trustees with respect to each Fund’s performance for certain representative classes are summarized below:
The Trustees noted that the Global Allocation Fund’s performance for Class A shares was in the second, fifth and fourth quintiles of the Universe for the one-, three- and five-year periods ended December 31, 2023, respectively. The Trustees noted that the performance for Class I shares was in the third, fifth and fourth quintiles of the Universe for the one-, three- and five-year periods ended December 31, 2023, respectively. The Trustees noted that the performance for Class R6 shares was in the second, fifth and third quintiles of the Universe for the one-, three- and five-year periods ended December 31, 2023, respectively. The Trustees discussed the performance and investment strategy of the Fund with the Adviser and reviewed the performance analysis and evaluation prepared by the independent consultant. Based upon these discussions and various other factors, the Trustees concluded that the Fund’s performance was satisfactory under the circumstances.
The Trustees noted that the Income Builder Fund’s performance for Class A shares was in the fifth, third and fourth quintiles of the Universe for the one-, three- and five-year periods ended December 31, 2023, respectively. The Trustees noted that the performance for Class I shares was in the fourth, third and fourth quintiles of the Universe for the one-, three- and five-year periods ended December 31, 2023, respectively. The Trustees noted that the performance for Class R6 shares was in the fourth, second and fourth quintiles of the Universe for the one-, three- and five-year periods ended December 31, 2023, respectively. The Trustees discussed the performance and investment strategy of the Fund with the Adviser and reviewed the performance analysis and evaluation prepared by the independent consultant. Based upon these discussions and various other factors, the Trustees concluded that the Fund’s performance was satisfactory under the circumstances.
Advisory Fees and Expense Ratios
The Trustees considered the contractual advisory fee rate and administration fee rate paid by each Fund to the Adviser and compared the combined rate to the information prepared by Broadridge concerning management fee rates paid by other funds’ selected share classes in the Universe, as well as a subset of funds within the Universe (the “Peer Group”). The Trustees recognized that Broadridge reported each Fund’s management fee rate as the combined contractual advisory fee and administration fee rates. The Trustees also reviewed information about other expenses and the expense ratios for each Fund and noted that Universe and Peer Group quintile rankings were not calculated if the number of funds in the Universe and/or Peer Groups did not meet a predetermined minimum. For each Fund that had a Fee Cap in place, the Trustees considered the net advisory fee rate and net expense ratio for each class, as applicable, taking into account any waivers and/or reimbursements. The Trustees recognized that it can be difficult to make comparisons of advisory fees because there are variations in the services that are included in the fees paid by other funds. The Trustees’ determinations as a result of the review of each Fund’s advisory fees and expense ratios for certain representative classes are summarized below:
The Trustees noted that the Global Allocation Fund’s net advisory fee and actual total expenses for Class A shares were in the first and second quintiles of the Peer Group and
Universe, respectively. The Trustees noted that the net advisory fee for Class I shares was in the first and third quintiles of the Peer Group and Universe, respectively, and that the actual total expenses for Class I shares were in the first and second quintiles of the Peer Group and Universe, respectively. The Trustees noted that the net advisory fee for Class R6 shares was in the second and third quintiles of the Peer Group and Universe, respectively, and that the actual total expenses for Class R6 shares were in the first quintile of both the Peer Group and Universe. After considering the factors identified above, in light of this information, the Trustees concluded that the advisory fee was fair and reasonable in light of the services provided to the Fund and that such fees would be for services provided in addition to, rather than duplicative of, services provided under the advisory contracts of the Underlying Funds in which the Fund invests.
The Trustees noted that the Income Builder Fund’s net advisory fee for Class A shares was in the third quintile of both the Peer Group and Universe, and that the actual total expenses for Class A shares were in the first quintile of both the Peer Group and Universe. The Trustees noted that net advisory fee for Class I shares was in the second and third quintiles of the Peer Group and Universe, respectively, and that actual total expenses for Class I shares were in the second quintile of both the Peer Group and Universe. The Trustees noted that net advisory fee and actual total expenses for Class R6 shares were in the third and first quintiles of the Universe, respectively. Broadridge did not calculate quintile rankings for the Peer Group for Class R6 shares of this Fund due to the limited number of funds in the peer group. After considering the factors identified above, in light of this information, the Trustees concluded that the advisory fee was fair and reasonable in light of the services provided to the Fund and that such fees would be for services provided in addition to, rather than duplicative of, services provided under the advisory contracts of the Underlying Funds in which the Fund may invest.
Annual Financial Statements
J.P. Morgan Specialty Funds
October 31, 2024
JPMorgan Research Market Neutral Fund |
CONTENTS
Investments in the Fund are not deposits or obligations of, or guaranteed or endorsed by, any bank and are not insured or guaranteed by the FDIC, the Federal Reserve Board or any other government agency. You could lose money if you sell when the Fund’s share price is lower than when you invested.
Past performance is no guarantee of future performance. The general market views expressed in this report are opinions based on market and other conditions through the end of the reporting period and are subject to change without notice. These views are not intended to predict the future performance of the Fund or the securities markets.
Prospective investors should refer to the Fund's prospectuses for a discussion of the Fund's investment objectives, strategies and risks. Call J.P. Morgan Funds Service Center at 1-800-480-4111 for a prospectus containing more complete information about the Fund, including management fees and other expenses. Please read it carefully before investing.
JPMorgan Research Market Neutral Fund
SCHEDULE OF PORTFOLIO INVESTMENTSAS OF October 31, 2024
| | |
|
|
Aerospace & Defense — 2.3% |
| | |
Howmet Aerospace, Inc. (a) | | |
| | |
| | |
| | |
Air Freight & Logistics — 0.1% |
| | |
|
| | |
| | |
| | |
| | |
| | |
|
| | |
| | |
| | |
| | |
| | |
|
| | |
| | |
BioMarin Pharmaceutical, Inc. * | | |
| | |
Neurocrine Biosciences, Inc. * | | |
Regeneron Pharmaceuticals, Inc. * | | |
Sarepta Therapeutics, Inc. * | | |
Vertex Pharmaceuticals, Inc. * (a) | | |
| | |
|
| | |
|
| | |
| | |
| | |
|
Ameriprise Financial, Inc. | | |
Charles Schwab Corp. (The) (a) | | |
| | |
|
|
Capital Markets — continued |
Goldman Sachs Group, Inc. (The) (a) | | |
Raymond James Financial, Inc. | | |
| | |
|
Air Products and Chemicals, Inc. | | |
| | |
Sherwin-Williams Co. (The) | | |
| | |
Communications Equipment — 0.2% |
| | |
Construction Materials — 0.7% |
Martin Marietta Materials, Inc. | | |
|
Capital One Financial Corp. | | |
Consumer Staples Distribution & Retail — 0.6% |
| | |
| | |
| | |
Diversified Telecommunication Services — 0.2% |
| | |
Electric Utilities — 2.6% |
| | |
| | |
| | |
| | |
| | |
Electrical Equipment — 0.8% |
| | |
| | |
| | |
| | |
Electronic Equipment, Instruments & Components — 0.0% ^ |
Keysight Technologies, Inc. * | | |
Energy Equipment & Services — 0.3% |
| | |
|
Take-Two Interactive Software, Inc. * | | |
SEE NOTES TO FINANCIAL STATEMENTS.
| J.P. Morgan Specialty Funds | |
JPMorgan Research Market Neutral Fund
SCHEDULE OF PORTFOLIO INVESTMENTSAS OF October 31, 2024 (continued)
| | |
Long Positions — continued |
Common Stocks — continued |
Entertainment — continued |
| | |
Warner Music Group Corp., Class A | | |
| | |
Financial Services — 8.8% |
| | |
| | |
| | |
Fidelity National Information Services, Inc. | | |
| | |
Jack Henry & Associates, Inc. | | |
Mastercard, Inc., Class A (a) | | |
| | |
| | |
|
Mondelez International, Inc., Class A | | |
Ground Transportation — 1.5% |
| | |
| | |
| | |
Uber Technologies, Inc. * (a) | | |
| | |
| | |
Health Care Equipment & Supplies — 1.2% |
Boston Scientific Corp. * | | |
Edwards Lifesciences Corp. * | | |
| | |
| | |
Health Care Providers & Services — 1.5% |
| | |
| | |
UnitedHealth Group, Inc. (a) | | |
| | |
|
Alexandria Real Estate Equities, Inc. | | |
| | |
| | |
Hotels, Restaurants & Leisure — 3.5% |
Chipotle Mexican Grill, Inc. * | | |
| | |
| | |
|
|
Hotels, Restaurants & Leisure — continued |
DoorDash, Inc., Class A * | | |
Hilton Worldwide Holdings, Inc. | | |
| | |
Royal Caribbean Cruises Ltd. | | |
| | |
| | |
Household Durables — 0.1% |
| | |
Household Products — 0.3% |
Church & Dwight Co., Inc. | | |
Industrial Conglomerates — 0.3% |
Honeywell International, Inc. (a) | | |
|
| | |
| | |
| | |
Marsh & McLennan Cos., Inc. | | |
| | |
Principal Financial Group, Inc. | | |
Progressive Corp. (The) (a) | | |
Ryan Specialty Holdings, Inc. | | |
Travelers Cos., Inc. (The) | | |
| | |
Interactive Media & Services — 1.4% |
| | |
Meta Platforms, Inc., Class A (a) | | |
Pinterest, Inc., Class A * | | |
| | |
|
Cognizant Technology Solutions Corp., Class A | | |
| | |
| | |
Life Sciences Tools & Services — 1.0% |
| | |
Thermo Fisher Scientific, Inc. | | |
| | |
|
| | |
SEE NOTES TO FINANCIAL STATEMENTS.
| J.P. Morgan Specialty Funds | |
| | |
Long Positions — continued |
Common Stocks — continued |
|
| | |
| | |
| | |
|
Charter Communications, Inc., Class A * | | |
| | |
| | |
| | |
|
| | |
| | |
| | |
| | |
| | |
| | |
Oil, Gas & Consumable Fuels — 2.3% |
| | |
| | |
| | |
| | |
| | |
| | |
| | |
| | |
|
Bristol-Myers Squibb Co. (a) | | |
Elanco Animal Health, Inc. * | | |
| | |
Professional Services — 0.5% |
| | |
|
American Homes 4 Rent, Class A | | |
Equity LifeStyle Properties, Inc. | | |
| | |
Semiconductors & Semiconductor Equipment — 7.7% |
Advanced Micro Devices, Inc. * | | |
| | |
ASML Holding NV (Registered), NYRS (Netherlands) | | |
| | |
| | |
|
|
Semiconductors & Semiconductor Equipment — continued |
| | |
Microchip Technology, Inc. | | |
Micron Technology, Inc. (a) | | |
| | |
NXP Semiconductors NV (China) (a) | | |
| | |
| | |
Taiwan Semiconductor Manufacturing Co. Ltd., ADR (Taiwan) | | |
Texas Instruments, Inc. (a) | | |
| | |
|
Cadence Design Systems, Inc. * | | |
Crowdstrike Holdings, Inc., Class A * | | |
| | |
| | |
| | |
| | |
| | |
| | |
|
| | |
Digital Realty Trust, Inc. | | |
| | |
|
| | |
| | |
Burlington Stores, Inc. * | | |
| | |
O'Reilly Automotive, Inc. * (a) | | |
| | |
| | |
Technology Hardware, Storage & Peripherals — 3.5% |
Hewlett Packard Enterprise Co. (a) | | |
Seagate Technology Holdings plc | | |
Western Digital Corp. * (a) | | |
| | |
Textiles, Apparel & Luxury Goods — 0.2% |
Lululemon Athletica, Inc. * | | |
SEE NOTES TO FINANCIAL STATEMENTS.
| J.P. Morgan Specialty Funds | |
JPMorgan Research Market Neutral Fund
SCHEDULE OF PORTFOLIO INVESTMENTSAS OF October 31, 2024 (continued)
| | |
Long Positions — continued |
Common Stocks — continued |
Trading Companies & Distributors — 0.2% |
| | |
| | |
| | |
Total Common Stocks
(Cost $216,737) | | |
Short-Term Investments — 25.4% |
Investment Companies — 25.4% |
JPMorgan Prime Money Market Fund Class Institutional Shares, 4.81% (b) (c)(Cost $86,504) | | |
Total Long Positions
(Cost $303,241) | | |
Short Positions — (77.5)% |
|
Aerospace & Defense — (1.5)% |
| | |
Huntington Ingalls Industries, Inc. | | |
L3Harris Technologies, Inc. | | |
| | |
| | |
Air Freight & Logistics — (0.2)% |
Expeditors International of Washington, Inc. | | |
|
| | |
| | |
| | |
| | |
|
Citizens Financial Group, Inc. | | |
Huntington Bancshares, Inc. | | |
PNC Financial Services Group, Inc. (The) | | |
| | |
|
Brown-Forman Corp., Class B | | |
Brown-Forman Corp., Class A | | |
Molson Coors Beverage Co., Class B | | |
| | |
|
| | |
| | |
|
|
Biotechnology — continued |
| | |
| | |
| | |
Building Products — (1.0)% |
Fortune Brands Innovations, Inc. | | |
Johnson Controls International plc | | |
| | |
|
Bank of New York Mellon Corp. (The) | | |
| | |
FactSet Research Systems, Inc. | | |
| | |
LPL Financial Holdings, Inc. | | |
| | |
| | |
| | |
T. Rowe Price Group, Inc. | | |
| | |
Commercial Services & Supplies — (1.4)% |
| | |
| | |
| | |
| | |
Communications Equipment — (0.5)% |
| | |
Consumer Finance — (0.4)% |
| | |
Consumer Staples Distribution & Retail — (2.4)% |
| | |
| | |
| | |
Walgreens Boots Alliance, Inc. | | |
| | |
Containers & Packaging — (0.6)% |
| | |
| | |
| | |
Diversified Telecommunication Services — (0.3)% |
Verizon Communications, Inc. | | |
SEE NOTES TO FINANCIAL STATEMENTS.
| J.P. Morgan Specialty Funds | |
| | |
Short Positions — continued |
Common Stocks — continued |
Electric Utilities — (3.7)% |
American Electric Power Co., Inc. | | |
| | |
| | |
| | |
| | |
Pinnacle West Capital Corp. | | |
| | |
Electrical Equipment — (0.7)% |
| | |
Rockwell Automation, Inc. | | |
| | |
Energy Equipment & Services — (0.3)% |
| | |
|
| | |
| | |
| | |
Financial Services — (3.2)% |
| | |
| | |
| | |
| | |
| | |
|
| | |
| | |
| | |
|
| | |
Ground Transportation — (0.3)% |
| | |
Old Dominion Freight Line, Inc. | | |
| | |
Health Care Equipment & Supplies — (1.0)% |
| | |
| | |
Intuitive Surgical, Inc. * | | |
Zimmer Biomet Holdings, Inc. | | |
| | |
| | |
|
|
Health Care Providers & Services — (2.1)% |
| | |
| | |
| | |
| | |
| | |
| | |
Molina Healthcare, Inc. * | | |
| | |
Hotels, Restaurants & Leisure — (1.7)% |
| | |
Choice Hotels International, Inc. | | |
| | |
| | |
| | |
Household Durables — (0.2)% |
| | |
Mohawk Industries, Inc. * | | |
| | |
| | |
Household Products — (0.1)% |
| | |
| | |
| | |
|
| | |
| | |
American International Group, Inc. | | |
Arch Capital Group Ltd. * | | |
| | |
Hartford Financial Services Group, Inc. (The) | | |
RenaissanceRe Holdings Ltd. (Bermuda) | | |
| | |
| | |
| | |
Interactive Media & Services — (0.2)% |
| | |
SEE NOTES TO FINANCIAL STATEMENTS.
| J.P. Morgan Specialty Funds | |
JPMorgan Research Market Neutral Fund
SCHEDULE OF PORTFOLIO INVESTMENTSAS OF October 31, 2024 (continued)
| | |
Short Positions — continued |
Common Stocks — continued |
|
| | |
International Business Machines Corp. | | |
| | |
Life Sciences Tools & Services — (1.1)% |
Agilent Technologies, Inc. | | |
| | |
| | |
| | |
| | |
|
| | |
| | |
Illinois Tool Works, Inc. | | |
| | |
Stanley Black & Decker, Inc. | | |
| | |
|
| | |
Interpublic Group of Cos., Inc. (The) | | |
| | |
| | |
|
| | |
Consolidated Edison, Inc. | | |
| | |
|
| | |
Oil, Gas & Consumable Fuels — (1.9)% |
| | |
| | |
| | |
Occidental Petroleum Corp. | | |
| | |
| | |
| | |
Passenger Airlines — (0.2)% |
| | |
|
| | |
| | |
|
|
Pharmaceuticals — continued |
| | |
| | |
| | |
| | |
| | |
Professional Services — (3.3)% |
Automatic Data Processing, Inc. | | |
Booz Allen Hamilton Holding Corp. | | |
| | |
| | |
| | |
| | |
| | |
| | |
| | |
Residential REITs — (0.4)% |
Essex Property Trust, Inc. | | |
Mid-America Apartment Communities, Inc. | | |
| | |
|
| | |
Simon Property Group, Inc. | | |
| | |
Semiconductors & Semiconductor Equipment — (8.0)% |
| | |
| | |
| | |
| | |
| | |
Monolithic Power Systems, Inc. | | |
| | |
| | |
| | |
| | |
|
| | |
| | |
| | |
SEE NOTES TO FINANCIAL STATEMENTS.
| J.P. Morgan Specialty Funds | |
| | |
Short Positions — continued |
Common Stocks — continued |
|
| | |
| | |
| | |
Specialized REITs — (0.7)% |
Extra Space Storage, Inc. | | |
| | |
| | |
Specialty Retail — (2.0)% |
| | |
| | |
| | |
| | |
| | |
Technology Hardware, Storage & Peripherals — (4.0)% |
| | |
| | |
| | |
| | |
Textiles, Apparel & Luxury Goods — (1.4)% |
| | |
On Holding AG (Switzerland), Class A * | | |
| | |
| | |
Trading Companies & Distributors — (0.8)% |
| | |
Total Common Stocks
(Proceeds $(251,929)) | | |
Total Short Positions
(Proceeds $(251,929)) | | |
Total Investments — 27.7%
(Cost $51,312) | | |
Other Assets Less Liabilities — 72.3% | | |
| | |
Percentages indicated are based on net assets. |
Amounts presented as a dash ("-") represent amounts that round to less than a thousand. |
| |
| American Depositary Receipt |
| |
| Real Estate Investment Trust |
| Amount rounds to less than 0.1% of net assets. |
| Non-income producing security. | |
| All or a portion of this security is segregated as collateral for short sales. The total value of securities and cash segregated as collateral is $44,175 and $244,863, respectively. | |
| Investment in an affiliated fund, which is registered under the Investment Company Act of 1940, as amended, and is advised by J.P. Morgan Investment Management Inc. | |
| The rate shown is the current yield as of October 31, 2024. | |
SEE NOTES TO FINANCIAL STATEMENTS.
| J.P. Morgan Specialty Funds | |
JPMorgan Research Market Neutral Fund
SCHEDULE OF PORTFOLIO INVESTMENTSAS OF October 31, 2024 (continued)
Futures contracts outstanding as of October 31, 2024 (amounts in thousands, except number of contracts):
| | | | | VALUE AND
UNREALIZED
APPRECIATION
(DEPRECIATION) ($) |
| | | | | |
| | | | | |
SEE NOTES TO FINANCIAL STATEMENTS.
| J.P. Morgan Specialty Funds | |
STATEMENT OF ASSETS AND LIABILITIESAS OF October 31, 2024
(Amounts in thousands, except per share amounts)
| |
| |
Investments in non-affiliates, at value | |
Investments in affiliates, at value | |
| |
Deposits at broker for futures contracts | |
Deposits at broker for securities sold short | |
| |
Investment securities sold | |
| |
Interest from non-affiliates | |
Dividends from non-affiliates | |
Dividends from affiliates | |
Variation margin on futures contracts | |
| |
| |
| |
Securities sold short, at value | |
Dividend expense to non-affiliates on securities sold short | |
Investment securities purchased | |
| |
| |
| |
| |
| |
| |
Custodian and accounting fees | |
Trustees’ and Chief Compliance Officer’s fees | |
| |
| |
| |
(a)
Amount rounds to less than one thousand.
SEE NOTES TO FINANCIAL STATEMENTS.
| J.P. Morgan Specialty Funds | |
STATEMENT OF ASSETS AND LIABILITIESAS OF October 31, 2024 (continued)
(Amounts in thousands, except per share amounts)
| |
| |
| |
Total distributable earnings (loss) | |
| |
| |
| |
| |
| |
| |
Outstanding units of beneficial interest (shares)
($0.0001 par value; unlimited number of shares authorized): | |
| |
| |
| |
| |
Class A — Redemption price per share | |
Class C — Offering price per share (b) | |
Class I — Offering and redemption price per share | |
Class A maximum sales charge | |
Class A maximum public offering price per share
[net asset value per share/(100% – maximum sales charge)] | |
Cost of investments in non-affiliates | |
Cost of investments in affiliates | |
Proceeds from securities sold short | |
(a)
Per share amounts may not recalculate due to rounding of net assets and/or shares outstanding.
(b)
Redemption price for Class C Shares varies based upon length of time the shares are held.
SEE NOTES TO FINANCIAL STATEMENTS.
| J.P. Morgan Specialty Funds | |
STATEMENT OF OPERATIONSFOR THE YEAR ENDED October 31, 2024
(Amounts in thousands)
| |
| |
Interest income from non-affiliates | |
Interest income from non-affiliates on securities sold short | |
Dividend income from non-affiliates | |
Dividend income from affiliates | |
| |
| |
| |
| |
| |
| |
| |
| |
| |
| |
| |
Custodian and accounting fees | |
Interest expense to affiliates | |
| |
Trustees’ and Chief Compliance Officer’s fees | |
Printing and mailing costs | |
Registration and filing fees | |
Transfer agency fees (See Note 2.H.) | |
Dividend expense to non-affiliates on securities sold short | |
| |
| |
| |
Less expense reimbursements | |
| |
Net investment income (loss) | |
REALIZED/UNREALIZED GAINS (LOSSES): | |
Net realized gain (loss) on transactions from: | |
Investments in non-affiliates | |
Investments in affiliates | |
| |
| |
| |
Change in net unrealized appreciation/depreciation on: | |
Investments in non-affiliates | |
Investments in affiliates | |
| |
| |
Change in net unrealized appreciation/depreciation | |
Net realized/unrealized gains (losses) | |
Change in net assets resulting from operations | |
(a)
Amount rounds to less than one thousand.
SEE NOTES TO FINANCIAL STATEMENTS.
| J.P. Morgan Specialty Funds | |
STATEMENTS OF CHANGES IN NET ASSETSFOR THE PERIODS INDICATED
(Amounts in thousands)
| JPMorgan
Research Market
Neutral Fund |
| Year Ended
October 31, 2024 | |
CHANGE IN NET ASSETS RESULTING FROM OPERATIONS: | | |
Net investment income (loss) | | |
| | |
Change in net unrealized appreciation/depreciation | | |
Change in net assets resulting from operations | | |
DISTRIBUTIONS TO SHAREHOLDERS: | | |
| | |
| | |
| | |
Total distributions to shareholders | | |
| | |
Change in net assets resulting from capital transactions | | |
| | |
| | |
| | |
| | |
Future share reacquisition adjustment | | |
End of period after future share reacquisition adjustment | | |
(a)
Beginning of period net assets is shown after future share reacquisition adjustment.
SEE NOTES TO FINANCIAL STATEMENTS.
| J.P. Morgan Specialty Funds | |
| JPMorgan
Research Market
Neutral Fund |
| Year Ended October 31, 2024 | Year Ended October 31, 2023 |
| | |
| | |
Proceeds from shares issued | | |
| | |
| | |
Change in net assets resulting from Class A capital transactions | | |
| | |
Proceeds from shares issued | | |
| | |
| | |
Change in net assets resulting from Class C capital transactions | | |
| | |
Proceeds from shares issued | | |
| | |
| | |
Change in net assets resulting from Class I capital transactions | | |
Total change in net assets resulting from capital transactions | | |
| | |
| | |
| | |
| | |
| | |
| | |
| | |
| | |
| | |
| | |
| | |
| | |
| | |
| | |
| | |
| | |
SEE NOTES TO FINANCIAL STATEMENTS.
| J.P. Morgan Specialty Funds | |
FINANCIAL HIGHLIGHTSFOR THE PERIODS INDICATED
| Per share operating performance |
| | | |
| Net asset
value,
beginning
of period | Net
investment
income
(loss)(a) | Net realized
and unrealized
gains
(losses) on
investments | Total from
investment
operations | | | |
JPMorgan Research Market Neutral Fund | | | | | | | |
| | | | | | | |
Year Ended October 31, 2024 | | | | | | | |
Year Ended October 31, 2023 | | | | | | | |
Year Ended October 31, 2022 | | | | | | | |
Year Ended October 31, 2021 | | | | | | | |
Year Ended October 31, 2020 | | | | | | | |
| | | | | | | |
Year Ended October 31, 2024 | | | | | | | |
Year Ended October 31, 2023 | | | | | | | |
Year Ended October 31, 2022 | | | | | | | |
Year Ended October 31, 2021 | | | | | | | |
Year Ended October 31, 2020 | | | | | | | |
| | | | | | | |
Year Ended October 31, 2024 | | | | | | | |
Year Ended October 31, 2023 | | | | | | | |
Year Ended October 31, 2022 | | | | | | | |
Year Ended October 31, 2021 | | | | | | | |
Year Ended October 31, 2020 | | | | | | | |
| | | | | | | |
|
| Net asset value per share has been calculated after future share reacquisition adjustment for the impacted periods. |
| Amount presented after future share reacquisition adjustment. |
| Calculated based upon average shares outstanding. |
| Includes adjustments in accordance with accounting principles generally accepted in the United States of America and as such, the net asset values for financial reporting purposes and the returns based upon those net asset values may differ from the net asset values and returns for shareholder transactions. |
| Includes interest expense, if applicable, which is less than 0.005% unless otherwise noted. |
| |
| | | | | |
Net expenses (excluding dividend and interest expense for securities sold short) | | | | | |
| | | | | |
| | | | | |
| | | | | |
Expenses without waivers and reimbursements (excluding dividend and interest expense for securities sold short) | | | | | |
| | | | | |
| | | | | |
| | | | | |
|
| Interest expense on securities sold short is 0.16%. |
SEE NOTES TO FINANCIAL STATEMENTS.
| J.P. Morgan Specialty Funds | |
| | |
| | | | Ratios to average net assets |
Future
share
reacquisition
adjustment | Net asset
value,
end of
period | Total return
(excludes
sales charge)(b) | Net assets,
end of
period
(000's) | Net
expenses
(including dividend
expense for
securities sold
short)(c)(d) | Net
investment
income
(loss) | Expenses without
waivers and
reimbursements
(including dividend
expense for
securities sold
short)(d) | Portfolio
turnover rate
(excluding securities
sold short) | Portfolio
turnover rate
(including securities
sold short) |
| | | | | | | | |
| | | | | | | | |
| | | | | | | | |
| | | | | | | | |
| | | | | | | | |
| | | | | | | | |
| | | | | | | | |
| | | | | | | | |
| | | | | | | | |
| | | | | | | | |
| | | | | | | | |
| | | | | | | | |
| | | | | | | | |
| | | | | | | | |
| | | | | | | | |
| | | | | | | | |
| | | | | | | | |
| | | | | | | | |
| | | | | | | | |
| | | | | | | | |
SEE NOTES TO FINANCIAL STATEMENTS.
| J.P. Morgan Specialty Funds | |
NOTES TO FINANCIAL STATEMENTSAS OF October 31, 2024
(Dollar values in thousands)
1. Organization
JPMorgan Trust I (the “Trust”) was formed on November 12, 2004, as a Delaware statutory trust, pursuant to a Declaration of Trust dated November 5, 2004 and is registered under the Investment Company Act of 1940, as amended (the “1940 Act”), as an open-end management investment company.
The following is a separate fund of the Trust (the "Fund") covered by this report:
| | Diversification Classification |
JPMorgan Research Market Neutral Fund | Class A, Class C and Class I | |
The investment objective of the Fund is to seek to provide long-term capital appreciation from a broadly diversified portfolio of U.S. stocks while neutralizing the general risks associated with stock market investing.
Class A Shares generally provide for a front-end sales charge while Class C Shares provide for a contingent deferred sales charge ("CDSC"). No sales charges are assessed with respect to Class I Shares. Certain Class A Shares, for which front-end sales charges have been waived, may be subject to a CDSC as described in the Fund's prospectus. Class C Shares automatically convert to Class A Shares after eight years. All classes of shares have equal rights as to earnings, assets and voting privileges, except that each class may bear different transfer agency, distribution and service fees and each class has exclusive voting rights with respect to its distribution plan and shareholder servicing agreements.
J.P. Morgan Investment Management Inc. (“JPMIM”), an indirect, wholly-owned subsidiary of JPMorgan Chase & Co. (“JPMorgan”), acts as adviser (the “Adviser”) and administrator (the “Administrator”) to the Fund.
2. Significant Accounting Policies
The following is a summary of significant accounting policies followed by the Fund in the preparation of its financial statements. The Fund is an investment company and, accordingly, follows the investment company accounting and reporting guidance of the Financial Accounting Standards Board (“FASB”) Accounting Standards Codification Topic 946 — Investment Companies, which is part of U.S. generally accepted accounting principles (“GAAP”). The preparation of financial statements in conformity with GAAP requires management to make estimates and assumptions that affect (i) the reported amounts of assets and liabilities, (ii) disclosure of contingent assets and liabilities at the date of the financial statements, and (iii) the reported amounts of increases and decreases in net assets from operations during the reporting period. Actual results could differ from those estimates.
A. Valuation of Investments— Investments are valued in accordance with GAAP and the Fund's valuation policies set forth by, and under the supervision and responsibility of, the Board of Trustees of the Trust (the "Board"), which established the following approach to valuation, as described more fully below: (i) investments for which market quotations are readily available shall be valued at their market value and (ii) all other investments for which market quotations are not readily available shall be valued at their fair value as determined in good faith by the Board.
Under Section 2(a)(41) of the 1940 Act, the Board is required to determine fair value for securities that do not have readily available market quotations. Under Securities and Exchange Commission ("SEC") Rule 2a-5 (Good Faith Determinations of Fair Value), the Board may designate the performance of these fair valuation determinations to a valuation designee. The Board has designated the Adviser as the “Valuation Designee” to perform fair valuation determinations for the Fund on behalf of the Board subject to appropriate oversight by the Board. The Adviser, as Valuation Designee, leverages the J.P. Morgan Asset Management Americas Valuation Committee (“AVC”) to help oversee and carry out the policies for the valuation of investments held in the Fund. The Adviser, as Valuation Designee, remains responsible for the valuation determinations.
This oversight by the AVC includes monitoring the appropriateness of fair values based on results of ongoing valuation oversight including, but not limited to, consideration of macro or security specific events, market events, and pricing vendor and broker due diligence. The Administrator is responsible for discussing and assessing the potential impacts to the fair values on an ongoing basis, and, at least on a quarterly basis, with the AVC and the Board.
Equities and other exchange-traded instruments are valued at the last sale price or official market closing price on the primary exchange on which the instrument is traded before the NAV of the Fund is calculated on a valuation date.
Investments in open-end investment companies (“Underlying Funds”) are valued at each Underlying Fund’s NAV per share as of the report date.
Futures contracts are generally valued on the basis of available market quotations.
Valuations reflected in this report are as of the report date. As a result, changes in valuation due to market events and/or issuer-related events after the report date and prior to issuance of the report are not reflected herein.
The various inputs that are used in determining the valuation of the Fund's investments are summarized into the three broad levels listed below.
•
Level 1 — Unadjusted inputs using quoted prices in active markets for identical investments.
| J.P. Morgan Specialty Funds | |
•
Level 2 — Other significant observable inputs including, but not limited to, quoted prices for similar investments, inputs other than quoted prices that are observable for investments (such as interest rates, prepayment speeds, credit risk, etc.) or other market corroborated inputs.
•
Level 3 — Significant inputs based on the best information available in the circumstances, to the extent observable inputs are not available (including the Fund's assumptions in determining the fair value of investments).
A financial instrument’s level within the fair value hierarchy is based on the lowest level of any input, both individually and in the aggregate, that is significant to the fair value measurement. The inputs or methodology used for valuing instruments are not necessarily an indication of the risk associated with investing in those instruments.
The following table represents each valuation input as presented on the Schedule of Portfolio Investments ("SOI"):
| | | | |
| | Level 2
Other significant
observable inputs | Level 3
Significant
unobservable inputs | |
Total Investments in Securities (a) | | | | |
Total Liabilities for Securities Sold Short (a) | | | | |
Appreciation in Other Financial Instruments | | | | |
| | | | |
|
| Please refer to the SOI for specifics of portfolio holdings. |
B. Restricted Securities— Certain securities held by the Fund may be subject to legal or contractual restrictions on resale. Restricted securities generally are resold in transactions exempt from registration under the Securities Act of 1933, as amended (the “Securities Act”). Disposal of these securities may involve time-consuming negotiations and expense. Prompt sale at the current valuation may be difficult and could adversely affect the NAVs of the Fund.
As of October 31, 2024, the Fund had no investments in restricted securities other than securities sold to the Fund under Rule 144A and/or Regulation S under the Securities Act.
C. Securities Lending — The Fund is authorized to engage in securities lending in order to generate additional income. The Fund is able to lend to approved borrowers. Citibank N.A. (“Citibank”) serves as lending agent for the Fund, pursuant to a Securities Lending Agency Agreement (the “Securities Lending Agency Agreement”). Securities loaned are collateralized by cash equal to at least 100% of the market value plus accrued interest on the securities lent, which is invested in an affiliated money market fund. The Fund retains the interest earned on cash collateral investments but is required to pay the borrower a rebate for the use of the cash collateral. In cases where the lent security is of high value to borrowers, there may be a negative rebate (i.e., a net payment from the borrower to the Fund). Upon termination of a loan, the Fund is required to return to the borrower an amount equal to the cash collateral, plus any rebate owed to the borrowers. The remaining maturities of the securities lending transactions are considered overnight and continuous. Loans are subject to termination by the Fund or the borrower at any time.
The net income earned on the securities lending (after payment of rebates and Citibank’s fee) is included on the Statement of Operations as Income from securities lending (net). The Fund also receives payments from the borrower during the period of the loan, equivalent to dividends and interest earned on the securities loaned, which are recorded as Dividend or Interest income, respectively, on the Statement of Operations.
Under the Securities Lending Agency Agreement, Citibank marks to market the loaned securities on a daily basis. In the event the cash received from the borrower is less than 102% of the value of the loaned securities (105% for loans of non-U.S. securities), Citibank requests additional cash from the borrower so as to maintain a collateralization level of at least 102% of the value of the loaned securities plus accrued interest (105% for loans of non-U.S. securities), subject to certain de minimis amounts.
The value of securities out on loan is recorded as an asset on the Statement of Assets and Liabilities. The value of the cash collateral received is recorded as a liability on the Statement of Assets and Liabilities and details of collateral investments are disclosed on the SOI.
The Fund bears the risk of loss associated with the collateral investments and is not entitled to additional collateral from the borrower to cover any such losses. To the extent that the value of the collateral investments declines below the amount owed to a borrower, the Fund may incur losses that exceed the amount it earned on lending the security. Upon termination of a loan, the Fund may use leverage (borrow money) to repay the borrower for cash collateral posted if the Adviser does not believe that it is prudent to sell the collateral investments to fund the payment of this liability. Securities lending activity is subject to master netting arrangements.
Securities lending also involves counterparty risks, including the risk that the loaned securities may not be returned in a timely manner or at all. Subject to certain conditions, Citibank has agreed to indemnify the Fund from losses resulting from a borrower’s failure to return a loaned security.
The Fund did not lend out any securities during the year ended October 31, 2024.
| J.P. Morgan Specialty Funds | |
NOTES TO FINANCIAL STATEMENTSAS OF October 31, 2024 (continued)
(Dollar values in thousands)
D. Investment Transactions with Affiliates— The Fund invested in an Underlying Fund advised by the Adviser. An issuer which is under common control with the Fund may be considered an affiliate. For the purposes of the financial statements, the Fund assumes the issuer listed in the table below to be an affiliated issuer. The Underlying Fund's distributions may be reinvested into the Underlying Fund. Reinvestment amounts are included in the purchases at cost amounts in the table below.
|
For the year ended October 31, 2024 |
| | | | | Change in
Unrealized
Appreciation/
(Depreciation) | | | | Capital Gain
Distributions |
JPMorgan Prime Money Market Fund Class Institutional Shares, 4.81% (a) (b) | | | | | | | | | |
|
| Investment in an affiliated fund, which is registered under the Investment Company Act of 1940, as amended, and is advised by J.P. Morgan Investment Management Inc. |
| The rate shown is the current yield as of October 31, 2024. |
E. Futures Contracts—The Fund used index futures contracts to gain or reduce exposure to the stock market, or maintain liquidity or minimize transaction costs. The Fund also used index futures contracts to more effectively manage the long and short equity exposures in the portfolio. The Fund also purchased futures contracts to invest incoming cash in the market or sold futures in response to cash outflows, thereby simulating an invested position in the underlying index while maintaining a cash balance for liquidity.
Futures contracts provide for the delayed delivery of the underlying instrument at a fixed price or are settled for a cash amount based on the change in the value of the underlying instrument at a specific date in the future. Upon entering into a futures contract, the Fund is required to deposit with the broker, cash or securities in an amount equal to a certain percentage of the contract amount, which is referred to as the initial margin deposit. Subsequent payments, referred to as variation margin, are made or received by the Fund periodically and are based on changes in the market value of open futures contracts. Changes in the market value of open futures contracts are recorded as Change in net unrealized appreciation/depreciation on futures contracts on the Statement of Operations. Realized gains or losses, representing the difference between the value of the contract at the time it was opened and the value at the time it was closed, are reported on the Statement of Operations at the closing or expiration of the futures contract. Securities deposited as initial margin are designated on the SOI, while cash deposited, which is considered restricted, is recorded on the Statement of Assets and Liabilities. A receivable from and/or a payable to brokers for the daily variation margin is also recorded on the Statement of Assets and Liabilities.
The use of futures contracts exposes the Fund to equity price risk. The Fund may be subject to the risk that the change in the value of the futures contract may not correlate perfectly with the underlying instrument. Use of long futures contracts subjects the Fund to risk of loss in excess of the amounts shown on the Statement of Assets and Liabilities, up to the notional amount of the futures contracts. Use of short futures contracts subjects the Fund to unlimited risk of loss. The Fund may enter into futures contracts only on exchanges or boards of trade. The exchange or board of trade acts as the counterparty to each futures transaction; therefore, the Fund's credit risk is limited to failure of the exchange or board of trade. Under some circumstances, futures exchanges may establish daily limits on the amount that the price of a futures contract can vary from the previous day’s settlement price, which could effectively prevent liquidation of positions.
The Fund's futures contracts are not subject to master netting arrangements (the right to close out all transactions traded with a counterparty and net amounts owed or due across transactions).
The table below discloses the volume of the futures contracts activity during the year ended October 31, 2024:
| |
| |
Average Notional Balance Short | |
Ending Notional Balance Short | |
F. Short Sales— The Fund engaged in short sales as part of its normal investment activities. In a short sale, the Fund sells securities it does not own in anticipation of a decline in the market value of those securities. In order to deliver securities to the purchaser, the Fund borrows securities from a broker. To close out a short position, the Fund delivers the same securities to the broker.
The Fund is required to pledge cash or securities to the broker as collateral for the securities sold short. Collateral requirements are calculated daily based on the current market value of the short positions. Cash collateral deposited with the broker is recorded as Deposits at broker for securities sold short, while cash collateral deposited at the Fund's custodian for the benefit of the broker is recorded as Restricted cash for securities sold short on the Statement of Assets and Liabilities. Securities segregated as collateral are denoted on the SOI. The Fund may receive or pay the net of the following amounts: (i) a portion of the income from the investment of cash collateral; (ii) the broker’s fee on the borrowed securities (calculated
| J.P. Morgan Specialty Funds | |
daily based upon the market value of each borrowed security and a variable rate that is dependent on availability of the security); and (iii) a financing charge for the difference between the market value of the short position and cash collateral deposited with the broker. The net amounts of income or fees are included as interest income or interest expense on securities sold short on the Statement of Operations.
The Fund is obligated to pay the broker dividends declared on short positions when a position is open on the record date. Dividends on short positions are reported on ex-dividend date on the Statement of Operations as Dividend expense on securities sold short. The Fund is obligated to pay the broker interest accrued on short positions while the position is outstanding. Interest expense on short positions is reported as Interest expense to non-affiliates on securities sold short on the Statement of Operations. Liabilities for securities sold short are reported at market value on the Statement of Assets and Liabilities and the change in market value is recorded as Change in net unrealized appreciation/depreciation on the Statement of Operations. Short sale transactions may result in unlimited losses as the security’s price increases and the short position loses value. There is no upward limit on the price a borrowed security could attain. The Fund is also subject to risk of loss if the broker were to fail to perform its obligations under the contractual terms.
The Fund will record a realized loss if the price of the borrowed security increases between the date of the short sale and the date on which the Fund replaces the borrowed security. The Fund will record a realized gain if the price of the borrowed security declines between those dates.
As of October 31, 2024, the Fund had outstanding short sales as listed on its SOI.
G. Security Transactions and Investment Income— Investment transactions are accounted for on the trade date (the date the order to buy or sell is executed). Securities gains and losses are calculated on a specifically identified cost basis. Interest income and interest expense on securities sold short, if any, is determined on the basis of coupon interest accrued using the effective interest method, which adjusts for amortization of premiums and accretion of discounts. Dividend income, net of foreign taxes withheld, if any, and dividend expense on securities sold short are recorded on the ex-dividend date or when the Fund first learns of the dividend.
To the extent such information is publicly available, the Fund records distributions received in excess of income earned from underlying investments as a reduction of cost of investments and/or realized gain. Such amounts are based on estimates if actual amounts are not available and actual amounts of income, realized gain and return of capital may differ from the estimated amounts. The Fund adjusts the estimated amounts of the components of distributions (and consequently its net investment income) as necessary, once the issuers provide information about the actual composition of the distributions.
H. Allocation of Income and Expenses— Expenses directly attributable to the Fund are charged directly to the Fund, while the expenses attributable to more than one fund of the Trust are allocated among the applicable funds. Investment income, realized and unrealized gains and losses and expenses, other than class-specific expenses, are allocated daily to each class of shares based upon the proportion of net assets of each class at the beginning of each day.
Transfer agency fees are class-specific expenses. The amount of the transfer agency fees charged to each share class of the Fund for the year ended October 31, 2024 are as follows:
| J.P. Morgan Specialty Funds | |
NOTES TO FINANCIAL STATEMENTSAS OF October 31, 2024 (continued)
(Dollar values in thousands)
I. Federal Income Taxes— The Fund is treated as a separate taxable entity for Federal income tax purposes. The Fund's policy is to comply with the provisions of the Internal Revenue Code (the “Code”) applicable to regulated investment companies and to distribute to shareholders all of its distributable net investment income and net realized capital gains on investments. Accordingly, no provision for Federal income tax is necessary. Management has reviewed the Fund's tax positions for all open tax years and has determined that as of October 31, 2024, no liability for Federal income tax is required in the Fund's financial statements for net unrecognized tax benefits. However, management’s conclusions may be subject to future review based on changes in, or the interpretation of, the accounting standards or tax laws and regulations. The Fund's Federal tax returns for the prior three fiscal years remain subject to examination by the Internal Revenue Service.
J. Distributions to Shareholders— Distributions from net investment income, if any, are generally declared and paid at least annually and are declared separately for each class. No class has preferential dividend rights; differences in per share rates are due to differences in separate class expenses. Net realized capital gains, if any, are distributed at least annually. The amount of distributions from net investment income and net realized capital gains is determined in accordance with Federal income tax regulations, which may differ from GAAP. To the extent these “book/tax” differences are permanent in nature (i.e., that they result from other than timing of recognition — “temporary differences”), such amounts are reclassified within the capital accounts based on their Federal tax basis treatment.
The following amounts were reclassified within the capital accounts:
| | Accumulated
undistributed
(distributions in
excess of)
net investment
income | Accumulated
net realized
gains (losses) |
| | | |
The reclassifications for the Fund relate primarily to book / tax differences on the treatment of adviser reimbursements and on certain other investments.
3. Fees and Other Transactions with Affiliates
A. Investment Advisory Fee— Pursuant to an Investment Advisory Agreement, the Adviser manages the investments of the Fund and for such services is paid a fee. The investment advisory fee is accrued daily and paid monthly at an annual rate of 0.35% of the Fund's average daily net assets.
The Adviser waived investment advisory fees and/or reimbursed expenses as outlined in Note 3.F.
B. Administration Fee— Pursuant to an Administration Agreement, the Administrator provides certain administration services to the Fund. In consideration of these services, the Administrator receives a fee accrued daily and paid monthly at an annual rate of 0.075% of the first $10 billion of the Fund's average daily net assets, plus 0.050% of the Fund's average daily net assets between $10 billion and $20 billion, plus 0.025% of the Fund's average daily net assets between $20 billion and $25 billion, plus 0.010% of the Fund's average daily net assets in excess of $25 billion. For the year ended October 31, 2024, the effective rate was 0.075% of the Fund's average daily net assets, notwithstanding any fee waivers and/or expense reimbursements.
The Administrator waived administration fees as outlined in Note 3.F.
JPMorgan Chase Bank, N.A. ("JPMCB"), a wholly-owned subsidiary of JPMorgan, serves as the Fund's sub-administrator (the “Sub-administrator”). For its services as Sub-administrator, JPMCB receives a portion of the fees payable to the Administrator.
C. Distribution Fees— Pursuant to a Distribution Agreement, JPMorgan Distribution Services, Inc. (“JPMDS”), an indirect, wholly-owned subsidiary of JPMorgan, serves as the Fund's principal underwriter and promotes and arranges for the sale of the Fund's shares.
The Board has adopted a Distribution Plan (the “Distribution Plan”) for Class A and Class C Shares of the Fund pursuant to Rule 12b-1 under the 1940 Act. Class I Shares of the Fund do not charge a distribution fee. The Distribution Plan provides that the Fund shall pay, with respect to the applicable share classes, distribution fees, including payments to JPMDS, at annual rates of the average daily net assets as shown in the table below:
| J.P. Morgan Specialty Funds | |
In addition, JPMDS is entitled to receive the front-end sales charges from purchases of Class A Shares and the CDSC from redemptions of Class C Shares and certain Class A Shares for which front-end sales charges have been waived. For the year ended October 31, 2024, JPMDS retained the following:
|
| Amount rounds to less than one thousand. |
D. Service Fees— The Trust, on behalf of the Fund, has entered into a Shareholder Servicing Agreement with JPMDS under which JPMDS provides certain support services to fund shareholders. For performing these services, JPMDS receives a fee with respect to all share classes, except Class R6 Shares which do not charge a service fee, that is accrued daily and paid monthly equal to a percentage of the average daily net assets as shown in the table below:
JPMDS has entered into shareholder services contracts with affiliated and unaffiliated financial intermediaries who provide shareholder services and other related services to their clients or customers who invest in the Fund. Pursuant to such contracts, JPMDS will pay all or a portion of such fees earned to financial intermediaries for performing such services.
JPMDS waived service fees as outlined in Note 3.F.
E. Custodian and Accounting Fees— JPMCB provides portfolio custody and accounting services to the Fund. For performing these services, the Fund pays JPMCB transaction and asset-based fees that vary according to the number of transactions and positions, plus out-of-pocket expenses. The amounts paid directly to JPMCB by the Fund for custody and accounting services are included in Custodian and accounting fees on the Statement of Operations.
Interest income earned on cash balances at the custodian, if any, is included in Interest income from affiliates on the Statement of Operations.
Interest expense paid to the custodian related to cash overdrafts, if any, is included in Interest expense to affiliates on the Statement of Operations.
F. Waivers and Reimbursements— The Adviser, Administrator and/or JPMDS have contractually agreed to waive fees and/or reimburse the Fund to the extent that total annual operating expenses (excluding acquired fund fees and expenses other than certain money market fund fees as described below, dividend and interest expenses related to short sales, interest, taxes, expenses related to litigation and potential litigation, expenses related to trustee elections and extraordinary expenses) exceed the percentages of the Fund’s respective average daily net assets as shown in the table below:
The expense limitation agreement was in effect for the year ended October 31, 2024 and are in place until at least February 28, 2025.
For the year ended October 31, 2024, the Fund's service providers waived fees and/or reimbursed expenses for the Fund as follows. None of these parties expect the Fund to repay any such waived fees and/or reimbursed expenses in future years.
Additionally, the Fund may invest in one or more money market funds advised by the Adviser (affiliated money market funds). The Adviser, Administrator and/or JPMDS, as shareholder servicing agent, have contractually agreed to waive fees and/or reimburse expenses in an amount sufficient to offset the respective net fees each collects from the affiliated money market fund on the Fund's investment in such affiliated money market fund, except for investments of securities lending cash collateral. None of these parties expect the Fund to repay any such waived fees and/or reimbursed expenses in future years.
The amount of these waivers resulting from investments in these money market funds for the year ended October 31, 2024 was $57.
| J.P. Morgan Specialty Funds | |
NOTES TO FINANCIAL STATEMENTSAS OF October 31, 2024 (continued)
(Dollar values in thousands)
JPMIM voluntarily agreed to reimburse the Fund for the Trustee Fees paid to one of the interested Trustees. For the year ended October 31, 2024, the amount of this reimbursement was less than a thousand.
G. Other— Certain officers of the Trust are affiliated with the Adviser, the Administrator and JPMDS. Such officers, with the exception of the Chief Compliance Officer, receive no compensation from the Fund for serving in their respective roles.
The Board designated and appointed a Chief Compliance Officer to the Fund pursuant to Rule 38a-1 under the 1940 Act. The Fund, along with affiliated funds, makes reimbursement payments, on a pro-rata basis, to the Administrator for a portion of the fees associated with the office of the Chief Compliance Officer. Such fees are included in Trustees’ and Chief Compliance Officer’s fees on the Statement of Operations.
The Trust adopted a Trustee Deferred Compensation Plan (the “Plan”) which allows the independent Trustees to defer the receipt of all or a portion of compensation related to performance of their duties as Trustees. The deferred fees are invested in various J.P. Morgan Funds until distribution in accordance with the Plan.
The SEC has granted an exemptive order permitting the Fund to engage in principal transactions with J.P. Morgan Securities LLC, an affiliated broker, involving taxable money market instruments, subject to certain conditions.
During the year ended October 31, 2024, the Fund identified a material error in accounting for the receipt of class action litigation payments which resulted in an understatement of the Fund’s net assets during the period April 29, 2019 through July 17, 2024, (the “Error Period”). The Fund applied its NAV error correction policy, and, for each financial reporting period during the Error Period, recorded a future share reacquisition adjustment to reflect the Fund’s unilateral right to remove excess shares attributable to purchases made during the Error Period and a Due to shareholders upon reprocessing payable for cash owed to shareholders who redeemed their shares of the Fund during the Error Period. As of October 15, 2024, the Adviser determined it would not reprocess share transactions and instead fully reimbursed the Fund $2,848 in cash towards the settlement of the future share reacquisition adjustment and due to shareholders upon reprocessing payable, net.
4. Investment Transactions
During the year ended October 31, 2024, purchases and sales of investments (excluding short-term investments) were as follows:
| Purchases
(excluding
U.S. Government) | Sales
(excluding
U.S. Government) | | Covers on
Securities
Sold Short |
| | | | |
5. Federal Income Tax Matters
For Federal income tax purposes, the estimated cost and unrealized appreciation (depreciation) in value of investments held at October 31, 2024 were as follows:
| | Gross
Unrealized
Appreciation | Gross
Unrealized
Depreciation | Net Unrealized
Appreciation
(Depreciation) |
| | | | |
|
| The tax cost includes the proceeds from short sales which may result in a net negative cost. |
The difference between book and tax basis appreciation (depreciation) on investments is primarily attributed to tax adjustments on certain investments and wash sale loss deferrals.
The tax character of distributions paid during the year ended October 31, 2024 was as follows:
|
| Short-term gain distributions are treated as ordinary income for income tax purposes. |
| J.P. Morgan Specialty Funds | |
As of October 31, 2024, the estimated components of net assets (excluding paid-in-capital) on a tax basis were as follows:
| Current
Distributable
Ordinary
Income | Current
Distributable
Long-Term
Capital Gain | Tax Basis
Capital Loss
Carryover | Unrealized
Appreciation
(Depreciation) |
| | | | |
| | | | |
The cumulative timing differences primarily consist of tax adjustments on certain investments and wash sale loss deferrals.
As of October 31, 2024, the Fund had net capital loss carryforwards, which are available to offset future realized gains:
| Capital Loss Carryforward Character |
| |
| |
|
| Amount includes capital loss carryforwards which are limited in future years under Internal Revenue Code sections 381-384. |
During the year ended October 31, 2024, the following Fund utilized capital loss carryforwards as follows:
The Fund relies upon an exemptive order granted by the SEC (the “Order”) permitting the establishment and operation of an Interfund Lending Facility (the “Facility”). The Facility allows the Fund to directly lend and borrow money to or from any other fund relying upon the Order at rates beneficial to both the borrowing and lending funds. Advances under the Facility are taken primarily for temporary or emergency purposes, including the meeting of redemption requests that otherwise might require the untimely disposition of securities, and are subject to the Fund's borrowing restrictions. The interfund loan rate is determined, as specified in the Order, by averaging the current repurchase agreement rate and the current bank loan rate. The Order was granted to JPMorgan Trust II ("JPM II") and may be relied upon by the Fund because the Fund and the series of JPM II are all investment companies in the same “group of investment companies” (as defined in Section 12(d)(1)(G) of the 1940 Act).
The Fund had no borrowings outstanding from another fund, or loans outstanding to another fund, during the year ended October 31, 2024.
The Trust and JPMCB have entered into a financing arrangement. Under this arrangement, JPMCB provides an unsecured, uncommitted credit facility in the aggregate amount of $100 million to certain of the J.P. Morgan Funds, including the Fund. Advances under the arrangement are taken primarily for temporary or emergency purposes, including the meeting of redemption requests that otherwise might require the untimely disposition of securities, and are subject to the Fund's borrowing restrictions. Interest on borrowings is payable at a rate determined by JPMCB at the time of borrowing. This agreement has been extended until October 28, 2025.
The Fund had no borrowings outstanding from the unsecured, uncommitted credit facility during the year ended October 31, 2024.
The Trust, along with certain other trusts for J.P. Morgan Funds (“Borrowers”), has entered into a joint syndicated senior unsecured revolving credit facility totaling $1.5 billion (“Credit Facility”) with various lenders and The Bank of New York Mellon, as administrative agent for the lenders. This Credit Facility provides a source of funds to the Borrowers for temporary and emergency purposes, including the meeting of redemption requests that otherwise might require the untimely disposition of securities. Under the terms of the Credit Facility, a borrowing fund must have a minimum of $25 million in adjusted net asset value and not exceed certain adjusted net asset coverage ratios prior to and during the time in which any borrowings are outstanding. If a fund does not comply with the aforementioned requirements, the fund must remediate within three business days with respect to the $25 million minimum adjusted net asset value or within one business day with respect to certain asset coverage ratios or the administrative agent at the request of, or with the consent of, the lenders may terminate the Credit Facility and declare any outstanding borrowings to be due and payable immediately.
Interest associated with any borrowing under the Credit Facility is charged to the borrowing fund at a rate of interest equal to 1.00%, plus the greater on the day of the borrowing, of the federal funds effective rate, or the Adjusted Secured Overnight Financing Rate (SOFR). Effective August 6, 2024, the Credit Facility was amended and restated for a term of 364 days, unless extended.
The Fund did not utilize the Credit Facility during the year ended October 31, 2024.
| J.P. Morgan Specialty Funds | |
NOTES TO FINANCIAL STATEMENTSAS OF October 31, 2024 (continued)
(Dollar values in thousands)
7. Risks, Concentrations and Indemnifications
In the normal course of business, the Fund enters into contracts that contain a variety of representations which provide general indemnifications. The Fund's maximum exposure under these arrangements is unknown. The amount of exposure would depend on future claims that may be brought against the Fund. However, based on experience, the Fund expects the risk of loss to be remote.
As of October 31, 2024, the Fund had five individual shareholders and/or non-affiliated omnibus accounts each owning more than 10% of the Fund's outstanding shares, and collectively owning 78.4% of the Fund's outstanding shares.
Significant shareholder transactions by these shareholders may impact the Fund's performance and liquidity.
As of October 31, 2024, the Fund pledged a significant portion of its assets to Citigroup Global Markets, Inc. for securities sold short. For the Fund,
deposits at broker for securities sold short, as noted on the Statement of Assets and Liabilities, are held at Citigroup Global Markets, Inc.
The Fund is subject to infectious disease epidemics/pandemics risk. The effects of any future pandemic or other global event to public health and business and market conditions, may have a significant negative impact on the performance of the Fund's investments, increase the Fund's volatility, negatively impact a Fund’s arbitrage and pricing mechanisms, exacerbate pre-existing political, social and economic risks to the Fund, and negatively impact broad segments of businesses and populations. In addition, governments, their regulatory agencies, or self-regulatory organizations have taken or may take actions in response to a pandemic or other global event that affect the instruments in which the Fund invests, or the issuers of such instruments, in ways that could have a significant negative impact on the Fund's investment performance. The ultimate impact of any pandemic or other global event and the extent to which the associated conditions and governmental responses impact the Fund will also depend on future developments, which are highly uncertain, difficult to accurately predict and subject to frequent changes.
| J.P. Morgan Specialty Funds | |
REPORT OF INDEPENDENT REGISTERED PUBLIC ACCOUNTING FIRM
To the Board of Trustees of JPMorgan Trust I and Shareholders of JPMorgan Research Market Neutral Fund
Opinion on the Financial Statements
We have audited the accompanying statement of assets and liabilities, including the schedule of portfolio investments, of JPMorgan Research Market Neutral Fund (one of the funds constituting JPMorgan Trust I, referred to hereafter as the “Fund”) as of October 31, 2024, the related statement of operations for the year ended October 31, 2024, the statement of changes in net assets for each of the two years in the period ended October 31, 2024, including the related notes, and the financial highlights for each of the five years in the period ended October 31, 2024 (collectively referred to as the “financial statements”). In our opinion, the financial statements present fairly, in all material respects, the financial position of the Fund as of October 31, 2024, the results of its operations for the year then ended, the changes in its net assets for each of the two years in the period ended October 31, 2024 and the financial highlights for each of the five years in the period ended October 31, 2024 in conformity with accounting principles generally accepted in the United States of America.
These financial statements are the responsibility of the Fund’s management. Our responsibility is to express an opinion on the Fund’s financial statements based on our audits. We are a public accounting firm registered with the Public Company Accounting Oversight Board (United States) (PCAOB) and are required to be independent with respect to the Fund in accordance with the U.S. federal securities laws and the applicable rules and regulations of the Securities and Exchange Commission and the PCAOB.
We conducted our audits of these financial statements in accordance with the standards of the PCAOB. Those standards require that we plan and perform the audit to obtain reasonable assurance about whether the financial statements are free of material misstatement, whether due to error or fraud.
Our audits included performing procedures to assess the risks of material misstatement of the financial statements, whether due to error or fraud, and performing procedures that respond to those risks. Such procedures included examining, on a test basis, evidence regarding the amounts and disclosures in the financial statements. Our audits also included evaluating the accounting principles used and significant estimates made by management, as well as evaluating the overall presentation of the financial statements. Our procedures included confirmation of securities owned as of October 31, 2024 by correspondence with the custodian, transfer agent and brokers; when replies were not received from brokers, we performed other auditing procedures. We believe that our audits provide a reasonable basis for our opinion.
/s/ PricewaterhouseCoopers LLP
New York, New York
December 26, 2024
We have served as the auditor of one or more investment companies in the JPMorgan Funds complex since 1993.
| J.P. Morgan Specialty Funds | |
TAX LETTER(Unaudited)
(Dollar values in thousands)
Certain tax information for the J.P. Morgan Funds is required to be provided to shareholders based upon the Funds' income and distributions for the taxable year ended October 31, 2024. The information and distributions reported in this letter may differ from the information and taxable distributions reported to the shareholders for the calendar year ending December 31, 2024. The information necessary to complete your income tax returns for the calendar year ending December 31, 2024 will be provided under separate cover.
Dividends Received Deduction (DRD)
The Fund had 39.60%, or maximum allowable percentage, of ordinary income distributions eligible for the dividends received deduction for corporate shareholders for the fiscal year ended October 31, 2024.
Qualified Dividend Income (QDI)
The Fund had $2,762, or maximum allowable amount, of ordinary income distributions treated as qualified dividends for the fiscal year ended October 31, 2024.
| J.P. Morgan Specialty Funds | |
THIS PAGE IS INTENTIONALLY LEFT BLANK
J.P. Morgan Funds are distributed by JPMorgan Distribution Services, Inc., which is an affiliate of JPMorgan Chase & Co. Affiliates of JPMorgan Chase & Co. receive fees for providing various services to the Fund.
Contact JPMorgan Distribution Services, Inc. at 1-800-480-4111 for a fund prospectus. You can also visit us at www.jpmorganfunds.com. Investors should carefully consider the investment objectives and risk as well as charges and expenses of the mutual fund before investing. The prospectus contains this and other information about the mutual fund. Read the prospectus carefully before investing.
Investors may obtain information about the Securities Investor Protection Corporation (SIPC), including the SIPC brochure, by visiting www.sipc.org or by calling SIPC at 202-371-8300.
The Fund files a complete schedule of its fund holdings for the first and third quarters of its fiscal year with the SEC as an exhibit to its report on Form N-PORT. The Fund's Form N-PORT reports are available on the SEC’s website at http://www.sec.gov. The Fund's quarterly holdings can be found by visiting the J.P. Morgan Funds’ website at www.jpmorganfunds.com.
A description of the Fund's policies and procedures with respect to the disclosure of the Fund's holdings is available in the prospectuses and Statement of Additional Information.
A copy of proxy policies and procedures is available without charge upon request by calling 1-800-480-4111 and on the Fund's website at www.jpmorganfunds.com. A description of such policies and procedures is on the SEC’s website at www.sec.gov. The Trustees have delegated the authority to vote proxies for securities owned by the Fund to the Adviser. A copy of the Fund's voting record for the most recent 12-month period ended June 30 is available on the SEC’s website at www.sec.gov or at the Fund's website at www.jpmorganfunds.com no later than August 31 of each year. The Fund's proxy voting record will include, among other things, a brief description of the matter voted on for each fund security, and will state how each vote was cast, for example, for or against the proposal.
J.P. Morgan Asset Management is the brand name for the asset management business of JPMorgan Chase & Co. and its affiliates worldwide.
© JPMorgan Chase & Co., 2024. All rights reserved. October 2024.
AN-SPEC-1024
Changes in and Disagreements with Accountants for Open-End Management Investment Companies
Proxy Disclosures for Open-End Management Investment Companies
Remuneration Paid to Directors, Officers, and Others of Open-End Management Investment Companies
Included in the Statement of Operations within the Fund's Financial Statements.
Statement Regarding Basis for Approval of Investment Advisory Agreement
The Board of Trustees (the “Board” or the “Trustees”) has established various standing committees composed of Trustees with diverse backgrounds, to which the Board has assigned specific subject matter responsibilities to further enhance the effectiveness of the Board’s oversight and decision making. The Board and its investment committees (Money Market and Alternative Products Committee, Equity Committee, and Fixed Income Committee) met regularly throughout the year and at each meeting considered factors that are relevant to their annual consideration of the continuation of the investment advisory agreements. The Board also met for the specific purpose of considering investment advisory agreement annual renewals. The Board held meetings June 25-26, 2024 and August 20-22, 20242023, at which the Trustees considered the continuation of the investment advisory agreement for the Fund, whose annual report is contained herein (the “Advisory Agreement”). At the June meeting, the Board’s investment committees met to review and consider performance, expense and related information for the J.P. Morgan Funds. Each investment committee reported to the full Board, which then considered each investment committee’s preliminary findings. At the August meeting, the Trustees continued their review and consideration. The Trustees, including a majority of the Trustees who are not parties to the Advisory Agreement or “interested persons” (as defined in the Investment Company Act of 1940) of any party to the Advisory Agreement or any of their affiliates, approved the continuation of the Advisory Agreement on August 22, 2024.
As part of their review of the Advisory Agreement, the Trustees considered and reviewed performance and other information about the Fund received from J.P. Morgan Investment Management Inc. (the “Adviser”). This information included the Fund’s performance as compared to the performance of its peers and benchmark and analyses by the Adviser of the Fund’s performance. In addition, at each of their regular meetings throughout the year, the Trustees considered reports on the performance of certain J.P. Morgan Funds provided by an independent investment consulting firm (the “independent consultant”). In addition, in preparation for the June and August meetings, the Trustees requested, received, and evaluated extensive materials from the Adviser, including performance and expense information compiled by Broadridge, using data from Lipper Inc. and/or Morningstar Inc., independent providers of investment company data (together, “Broadridge”). The Trustees’ independent consultant also provided additional quantitative and statistical analyses of certain Funds, including risk and performance return assessments as compared to the Fund’s objectives, benchmarks, and peers. Before voting on the Advisory Agreement, the Trustees reviewed the Advisory Agreement with representatives of the Adviser, counsel to the Fund, and independent legal counsel to the Trustees, and
received a memorandum from independent legal counsel to the Trustees discussing the legal standards for their consideration of the Advisory Agreement. The Trustees also discussed the Advisory Agreement with independent legal counsel in executive sessions at which no representatives of the Adviser were present.
A summary of the material factors evaluated by the Trustees in determining whether to approve the Advisory Agreement is provided below. Each Trustee attributed different weights to the various factors and no factor alone was considered determinative. The Trustees considered information provided with respect to the Fund throughout the year, as well as materials furnished specifically in connection with the annual review process. From year to year, the Trustees consider and place emphasis on relevant information in light of changing circumstances in market and economic conditions.
After considering and weighing the factors and information they had received, the Trustees found that the compensation to be received by the Adviser from the Fund under the Advisory Agreement was fair and reasonable under the circumstances and determined that the continuance of the Advisory Agreement was in the best interests of the Fund and its shareholders.
Nature, Extent and Quality of Services Provided by the Adviser
•
The Trustees received and considered information regarding the nature, extent and quality of services provided to the Fund under the Advisory Agreement. The Trustees took into account information furnished throughout the year at Trustee meetings, as well as the materials furnished specifically in connection with this annual review process. Among other things, the Trustees considered:
•
The background and experience of the Adviser’s senior management and investment personnel, including personnel changes, if any;
•
The qualifications, backgrounds and responsibilities of the portfolio management team primarily responsible for the day-to-day management of the Fund, including personnel changes, if any;
•
The investment strategy for the Fund, and the infrastructure supporting the portfolio management teams;
•
Information about the structure and distribution strategy for the Fund and how it fits within the Adviser’s other fund offerings within the J.P. Morgan Funds complex;
•
The administration services provided by the Adviser in its role as Administrator;
•
Their knowledge of the nature and quality of the services provided by the Adviser and its affiliates gained from their
experience as Trustees of the Fund and in the financial industry generally;
•
The overall reputation and capabilities of the Adviser and its affiliates;
•
The commitment of the Adviser to provide high quality service to the Fund;
•
Their overall confidence in the Adviser’s integrity; and
•
The Adviser’s responsiveness to requests for additional information, questions or concerns raised by them, including the Adviser’s willingness to consider and implement organizational and operational changes designed to improve investment results and the services provided to the Fund, including steps taken by the Adviser to address certain compliance and related issues impacting the Fund.
Based upon these considerations and other factors, the Trustees concluded that they were satisfied with the nature, extent and quality of the services provided to the Fund by the Adviser.
Costs of Services Provided and Profitability to the Adviser and its Affiliates
The Trustees received and considered information regarding the profitability to the Adviser and its affiliates from providing services to the Fund. The Trustees reviewed and discussed this information. The Trustees recognized that this information is not audited and represents the Adviser’s determination of its and its affiliates’ revenues from the contractual services provided to the Fund, less expenses of providing such services. Expenses include direct and indirect costs and are calculated using an allocation methodology developed by the Adviser and reviewed with the Board. The Trustees also recognized that it is difficult to make comparisons of profitability from fund investment advisory contracts because comparative information is not generally publicly available and is affected by numerous factors, including the structure of the particular adviser, the types of funds it manages, its business mix, numerous assumptions regarding allocations and the fact that publicly-traded fund managers’ operating profits and net income are net of distribution and marketing expenses. Based upon their review, and taking into consideration the factors noted above, the Trustees concluded that the profitability to the Adviser under the Advisory Agreement was not unreasonable in light of the services and benefits provided to the Fund.
The Trustees also considered that JPMorgan Distribution Services, Inc. (“JPMDS”), an affiliate of the Adviser, and the Adviser earn fees from the Fund for providing shareholder and administration services, respectively. These fees were shown separately in the profitability analysis presented to the Trustees. The Trustees also considered the payments of Rule 12b-1 fees to JPMDS, which also acts as the Fund’s distributor, and that these fees are in turn generally paid to
financial intermediaries that sell the Fund, including financial intermediaries that are affiliates of the Adviser (although they are retained by JPMDS in certain instances). The Trustees also considered the fees earned by JPMorgan Chase Bank, N.A. (“JPMCB”), an affiliate of the Adviser, for custody, fund accounting and other related services for the Fund, and the profitability of the arrangements to JPMCB.
The Trustees reviewed information regarding potential “fall-out” or ancillary benefits received by the Adviser and its affiliates as a result of their relationship with the Fund. The Trustees considered that the J.P. Morgan Funds' operating accounts are held at JPMCB, which, as a result, will receive float benefits for certain J.P. Morgan Funds, as applicable. The Trustees also noted that the Adviser supports a diverse set of products and services, which benefits the Adviser by allowing it to leverage its infrastructure to serve additional clients. The Trustees also reviewed the Adviser’s allocation of fund brokerage for the J.P. Morgan Funds complex, including allocations to brokers who provide research to the Adviser, as well as the Adviser’s use of affiliates to provide other services and the benefits to such affiliates of doing so. The Trustees also considered the benefit to the Adviser and its affiliates from allocating client assets to the Fund.
The Trustees considered the extent to which the Fund may benefit from potential economies of scale. The Trustees considered that there may not be a direct relationship between economies of scale realized by the Fund and those realized by the Adviser as assets increase. The Trustees considered the extent to which the Fund was priced to scale and whether it would be appropriate to add advisory fee breakpoints, but noted that the Fund has implemented contractual expense limitations and fee waivers (“Fee Caps”), which allow the Fund’s shareholders to share potential economies of scale from the Fund’s inception and that the fees remain fair and reasonable relative to peer funds. The Trustees considered the benefits to the Fund of the use of an affiliated distributor and custodian, including the ability to rely on existing infrastructure supporting distribution, custodial and transfer agent services and the ability to negotiate competitive fees for the Fund. The Trustees further considered the Adviser's and JPMDS's ongoing investments in their business in support of the Fund, including the Adviser's and/or JPMDS's investments in trading systems, technology (including improvements to the J.P. Morgan Funds’ website, and cybersecurity improvements), retention of key talent, and regulatory support enhancements. The Trustees concluded that the current fee structure for the Fund, including Fee Caps that the Adviser has in place that serve to limit the overall net expense ratios of the Fund at competitive levels, was reasonable. The Trustees concluded that the Fund’s shareholders received the benefits of potential economies of scale
through the Fee Caps and from the Adviser’s reinvestment in its operations to serve the Fund and its shareholders. The Trustees noted that the Adviser’s reinvestment ensures sufficient resources in terms of personnel and infrastructure to support the Fund.
Fees Relative to Adviser’s Other Clients
The Trustees received and considered information about the nature and extent of investment advisory services and fee rates offered to other clients of the Adviser, including, to the extent applicable, institutional separate accounts, collective investment trusts, other registered investment companies and/or private funds sub-advised by the Adviser, for investment management styles substantially similar to that of the Fund. The Trustees considered the complexity of investment management for registered investment companies relative to the Adviser’s other clients and noted differences, as applicable, in the fee structure and the regulatory, legal and other risks and responsibilities of providing services to the different clients. The Trustees considered that serving as an adviser to a registered investment company involves greater responsibilities and risks than acting as a sub-adviser and observed that sub-advisory fees may be lower than those charged by the Adviser to the Fund. The Trustees also noted that the adviser, not the applicable registered investment company, typically bears the sub-advisory fee and that many responsibilities related to the advisory function are typically retained by the primary adviser. The Trustees concluded that the fee rates charged to the Fund in comparison to those charged to the Adviser’s other clients were reasonable.
The Trustees receive and consider information about the Fund’s performance throughout the year. In addition, the Trustees received and considered absolute and/or relative performance information for the Fund in a report prepared by Broadridge. The Trustees considered the total return performance information, which included the ranking of the Fund within a performance universe comprised of funds’ selected share classes with the same Broadridge investment classification and objective (the “Universe”), by total return for the applicable one-, three- and five-year periods. The Trustees reviewed a description of Broadridge’s methodology for selecting mutual funds in the Fund’s Universe, and noted that Universe quintile rankings were not calculated if the number of funds in the Universe did not meet a predetermined minimum. The Trustees also considered enhancements to the methodology employed by Broadridge for identifying funds in the Peer Groups for Class I shares, based upon discussions with the Adviser, Broadridge and certain Trustees in advance of, and in preparation for, the June meeting. The Broadridge materials provided to the Trustees highlighted information with respect to certain representative classes to assist the Trustees in their review. As part of this review, the Trustees also reviewed the Fund’s performance
against its benchmark and considered the performance information provided for the Fund at regular Board meetings by the Adviser and the Trustees’ independent consultant, and also considered the special analysis prepared for certain Funds by the Trustees’ independent consultant. The Trustees also engaged with the Adviser to consider what steps might be taken to improve performance, as applicable. The Broadridge performance data noted by the Trustees as part of their review and the determinations made by the Trustees with respect to the Fund’s performance for certain representative classes are summarized below:
The Trustees noted that the Research Market Neutral Fund’s performance for Class A shares was in the first, second and first quintiles of the Universe for the one-, three- and five-year periods ended December 31, 2023, respectively. The Trustees noted that the performance for Class I shares was in the second, third and first quintiles of the Universe for the one-, three- and five-year periods ended December 31, 2023, respectively. The Trustees discussed the performance and investment strategy of the Fund with the Adviser and reviewed the performance analysis and evaluation prepared by the independent consultant. Based upon these discussions and various other factors, the Trustees concluded that the Fund’s performance was satisfactory.
Advisory Fees and Expense Ratios
The Trustees considered the contractual advisory fee rate and administration fee rate paid by the Fund to the Adviser and compared the combined rate to the information prepared by Broadridge concerning management fee rates paid by other funds’ selected share classes in the Universe, as well as a subset of funds within the Universe (the “Peer Group”). The Trustees recognized that Broadridge reported the Fund’s management fee rate as the combined contractual advisory fee and administration fee rates. The Trustees also reviewed information about other expenses and the expense ratios for the Fund, and noted that Universe and Peer Group quintile rankings were not calculated if the number of funds in the Universe and/or Peer Group did not meet a predetermined minimum. The Trustees considered the Fee Caps currently in place for the Fund, the net advisory fee rate and net expense ratio for each share class, taking into account any waivers and/or reimbursements. The Trustees recognized that it can be difficult to make comparisons of advisory fees because there are variations in the services that are included in the fees paid by other funds. The Trustees’ determinations as a result of the review of the Fund’s advisory fees and expense ratios for certain representative classes are summarized below:
The Trustees noted that the Fund’s net advisory fee and actual total expenses for Class A and Class I shares were in the first quintile of both the Peer Group and Universe. After considering
the factors identified above, in light of this information, the Trustees concluded that the advisory fee was fair and reasonable in light of the services provided to the Fund.
ITEM 8. CHANGES IN AND DISAGREEMENTS WITH ACCOUNTANTS FOR OPEN-END MANAGEMENT INVESTMENT COMPANIES.
Refer to Item 7.
ITEM 9. PROXY DISCLOSURES FOR OPEN-END MANAGEMENT INVESTMENT COMPANIES.
Refer to Item 7.
ITEM 10. REMUNERATION PAID TO DIRECTORS, OFFICERS, AND OTHERS OF OPEN-END MANAGEMENT INVESTMENT COMPANIES.
Refer to Item 7.
ITEM 11. STATEMENT REGARDING BASIS FOR APPROVAL OF INVESTMENT ADVISORY CONTRACT.
Refer to Item 7.
ITEM 12. DISCLOSURE OF PROXY VOTING POLICIES AND PROCEDURES FOR CLOSED-END MANAGEMENT INVESTMENT COMPANIES.
Not applicable.
ITEM 13. PORTFOLIO MANAGERS OF CLOSED-END MANAGEMENT INVESTMENT COMPANIES.
Not applicable.
ITEM 14. PURCHASES OF EQUITY SECURITIES BY CLOSED-END MANAGEMENT INVESTMENT COMPANY AND AFFILIATED PURCHASERS.
Not applicable.
ITEM 15. SUBMISSION OF MATTERS TO A VOTE OF SECURITY HOLDERS.
Describe any material changes to the procedures by which shareholders may recommend nominees to the registrant’s board of directors, where those changes were implemented after the registrant last provided disclosure in response to the requirements of Item 7(d)(2)(ii)(G) of Schedule 14A (17 CFR 240.14a-101), or this Item.
No material changes to report.
ITEM 16. CONTROLS AND PROCEDURES.
(a) Disclose the conclusions of the registrant’s principal executive and principal financial officers, or persons performing similar functions, regarding the effectiveness of the registrant’s disclosure controls and procedures (as defined in Rule 30a-3(c) under the Act (17 CFR 270.30a-3(c))) as of a date within 90 days of the filing date of the report that includes the disclosure required by this paragraph, based on the evaluation of these controls and procedures required by Rule 30a-3(b) under the Act (17 CFR 270.30a-3(b)) and Rules 13a-15(b) or 15d-15(b) under the Exchange Act (17 CFR 240.13a-15(b) or 240.15d-15(b)).
The Registrant’s principal executive and principal financial officers have concluded, based on their evaluation of the Registrant’s disclosure controls and procedures as of a date within 90 days of the filing date of this report, that the Registrant’s disclosure controls and procedures are reasonably designed to ensure that information required to be disclosed by the Registrant on Form N-CSR is recorded, processed, summarized and reported within the required time periods and that information required to be disclosed by the Registrant in the reports that it files or submits on Form N-CSR is accumulated and communicated to the Registrant’s management, including its principal executive and principal financial officers, as appropriate to allow timely decisions regarding required disclosure.
(b) Disclose any change in the registrant’s internal control over financial reporting (as defined in Rule 30a-3(d) under the Act (17 CFR 270.30a-3(d)) that occurred during the period covered by this report that has materially affected, or is reasonably likely to materially affect, the registrant’s internal control over financial reporting.
For the JPMorgan Research Market Neutral Fund, a reconciliation has been implemented to ensure class action claims are recorded completely, accurately, and timely by the Fund. There were no other changes in the Registrant’s internal control over financial reporting that occurred during the period covered by this report that have materially affected, or are reasonably likely to materially affect, the Registrant’s internal control over financial reporting.
ITEM 17. DISCLOSURE OF SECURITIES LENDING ACTIVITIES FOR CLOSED-END MANAGEMENT INVESTMENT COMPANIES.
Not applicable.
ITEM 18. RECOVERY OF ERRONEOUSLY AWARDED COMPENSATION.
Not applicable.
ITEM 19. EXHIBITS.
| | (a) | File the exhibits listed below as part of this Form. Letter or number the exhibits in the sequence indicated. |
(1) Any code of ethics, or amendment thereto, that is the subject of the disclosure required by Item 2, to the extent that the registrant intends to satisfy the Item 2 requirements through filing of an exhibit.
Code of Ethics applicable to its Principal Executive and Principal Financial Officers pursuant to Section 406 of the Sarbanes-Oxley Act of 2002 attached hereto.
(2) A separate certification for each principal executive officer and principal financial officer of the registrant as required by Rule 30a-2(a) under the Act (17 CFR 270.30a-2(2) A separate certification for each principal executive officer and principal financial officer of the registrant as required by Rule 30a-2(a) under the Act (17 CFR 270.30a-2), exactly as set forth below:
Certifications pursuant to Rule 30a-2(a) under the Investment Company Act of 1940 are attached hereto.
(1) Any written solicitation to purchase securities under Rule 23c-1 under the Act (17 CFR 270.23c-1) sent or given during the period covered by the report by or on behalf of the registrant to 10 or more persons.
Not applicable.
(2) Change in the registrant’s independent public accountant. Provide the information called for by Item 4 of Form 8-K under the Exchange Act (17 CFR 249.308). Unless otherwise specified by Item 4, or related to and necessary for a complete understanding of information not previously disclosed, the information should relate to events occurring during the reporting period.
Not applicable.
Certifications pursuant to Rule 30a-2(b) under the Investment Company Act of 1940 are attached hereto.
SIGNATURES
Pursuant to the requirements of the Securities Exchange Act of 1934 and the Investment Company Act of 1940, the registrant has duly caused this report to be signed on its behalf by the undersigned, thereunto duly authorized.
JPMorgan Trust I
| | |
| By: | | /s/ Brian S. Shlissel |
| | Brian S. Shlissel |
| | President and Principal Executive Officer |
| |
| | January 3, 2025 |
Pursuant to the requirements of the Securities Exchange Act of 1934 and the Investment Company Act of 1940, this report has been signed below by the following persons on behalf of the registrant and in the capacities and on the dates indicated.
| | |
| By: | | /s/ Brian S. Shlissel |
| | Brian S. Shlissel |
| | President and Principal Executive Officer |
| |
| | January 3, 2025 |
| |
| By: | | /s/ Timothy J. Clemens |
| | Timothy J. Clemens |
| | Treasurer and Principal Financial Officer |
| |
| | January 3, 2025 |